UNITED STATES
SECURITIES AND EXCHANGE COMMISSION
Washington, D.C. 20549
FORM N-CSR
CERTIFIED SHAREHOLDER REPORT OF REGISTERED
MANAGEMENT INVESTMENT COMPANIES
Investment Company Act File Number: 811-02340
Montgomery Street Income Securities, Inc.
(Exact name of registrant as specified in charter)
225 W. Wacker Drive, Suite 1200
Chicago, IL 60606
(Address of principal executive offices)
Mark D. Nerud, President
225 W. Wacker Drive, Suite 1200
Chicago, IL 60606
(Name and address of agent for service)
Registrant’s telephone number, including area code: (312) 338-5801
Date of fiscal year end: December 31
Date of reporting period: December 31, 2011
Form N-CSR is to be used by management investment companies to file reports with the Commission not later than 10 days after the transmission to stockholders of any report that is required to be transmitted to stockholders under Rule 30e-1 under the Investment Company Act of 1940 (17 CFR 270.30e-1). The Commission may use the information provided on Form N-CSR in its regulatory, disclosure review, inspection, and policymaking roles.
A registrant is required to disclose the information specified by Form N-CSR, and the Commission will make this information public. A registrant is not required to respond to the collection of information contained in Form N-CSR unless the Form displays a currently valid Office of Management and Budget (“OMB”) control number. Please direct comments concerning the accuracy of the information collection burden estimate and any suggestions for reducing the burden to Secretary, Securities and Exchange Commission, 450 Fifth Street, NW, Washington, DC 20549-0609. The OMB has reviewed this collection of information under the clearance requirements of 44 U.S.C. §3507.
Item 1. Report to Stockholders.

Montgomery Street
Income Securities, Inc. (MTS)
Annual Report to Stockholders
December 31, 2011
Portfolio Manager Review
Montgomery Street Income Securities, Inc. (the “Fund”) had a total return based on net asset value (“NAV”) of 4.54% for the twelve-month period ended December 31, 2011. The total return of the Fund, based on the market price of its New York Stock Exchange traded shares, was 2.28% for the same period.1 The Fund’s NAV total return underperformed the Barclays Capital U.S. Aggregate Bond Index, the Fund’s benchmark, which posted a total return of 7.84% for the twelve-month period.2
In 2011, the global financial markets consistently made headlines for their persistent volatility resulting from a variety of unpredictable forces on both Main Street and Wall Street. At the start of 2011, most fixed income sectors generated positive returns as global markets struggled to absorb implications of intensified political unrest across the Middle East and North Africa, rising commodity prices and the terrible earthquake and nuclear accidents in Japan. Yields on U.S. Treasuries (“Treasuries”) rose overall amid signs of economic recovery in the U.S. and concerns the U.S. Federal Reserve’s (the “Fed”) second round of quantitative easing (“QE2”) might spark inflation.
As the first quarter neared its close, a confluence of events prompted a move toward the perceived safety of Treasuries. With this flight to quality, Treasury yields fell in the second quarter as higher gasoline prices and lingering effects of Japan’s earthquake on global supply chains crimped U.S. growth. Concern about the sovereign debt crisis in the Eurozone further boosted demand for Treasuries. On June 30, 2011 the Fed ended its $600 billion program of buying Treasuries known as QE2, and indicated its intention to continue buying Treasuries with proceeds from maturing debt on its $2.9 trillion balance sheet. The Fed also reiterated its “extended period” language for a near zero federal funds rate.
With the Fed’s continued participation in the financial markets, Treasury yields continued to fall in the third quarter as U.S. debt ceiling negotiations deteriorated, Standard & Poor’s downgrade of the U.S. long term credit rating and concern about the sovereign debt crisis in Europe sparked a flight to safety and boosted demand for Treasuries. The Eurozone sovereign debt crisis intensified as the likelihood of a Greek debt restructuring increased. Other European countries, including Ireland, Italy, and Spain, continued to struggle with sovereign debt levels, increasing pressure on European leaders to develop a comprehensive policy response. In an effort to reinvigorate the faltering economy, the Fed launched “Operation Twist,” signaling its intent to buy $400 billion of long dated Treasuries by the end of June 2012. To finance this program, the Fed agreed to sell Treasury securities with remaining maturities of 3 years or less to make financial conditions more accommodative by putting downward pressure on longer term interest rates.
U.S. Treasury Bond Yield Curve
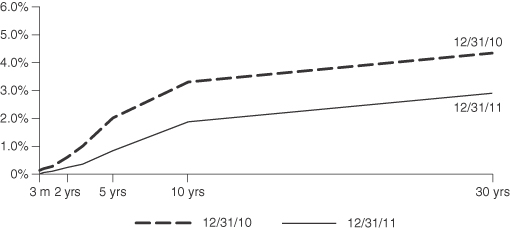
Source: Bloomberg
Performance is historical and does not guarantee future results.
| 1 | Total return based on NAV reflects changes in the Fund’s net asset value during the period. Total return based on market value reflects changes in market value. Each figure assumes that dividend and capital gain distributions, if any, were reinvested. These figures will differ depending upon the level of any discount from or premium to NAV at which the Fund’s shares traded during the period. Past results are not necessarily indicative of the future performance of the Fund. Investment return and principal value will fluctuate. |
| 2 | The Barclays Capital U.S. Aggregate Bond Index is a broad-based benchmark that measures the investment grade, U.S. dollar-denominated, fixed-rate taxable bond market, including Treasuries, government-related and corporate securities, mortgage backed securities (agency fixed-rate and hybrid adjustable rate mortgage pass-throughs), asset backed securities and commercial mortgage backed securities. The Index does not include exposure to high yield, non-dollar securities or cash. Index returns assume reinvestment of dividends and interest, and unlike Fund returns, do not reflect fees or expenses. It is not possible to invest directly in an index. |
| | | | |
| Montgomery Street Income Securities, Inc. | | | 1 | |
Following the Fed’s announcement of “Operation Twist,” most bonds gained during the fourth quarter, as global financial markets digested improving U.S. economic data and continued uncertainty surrounding the Eurozone sovereign debt crisis. A rebound in U.S. consumption towards the end of the year improved investor risk appetites and helped most fixed income sectors outperform Treasuries. Despite improving consumer confidence in the U.S., the Eurozone sovereign debt crisis continued to fuel volatility in the global financial markets. In response to these pressures, the International Monetary Fund (“IMF”) announced a liquidity program designed to provide more favorable financing conditions for countries struggling with escalating borrowing costs. Despite the IMF’s efforts and the growth of the European Financial Stability Fund (“EFSF”), many Eurozone countries still faced increasing unemployment and worsening debt-to-gross domestic product (“GDP”) ratios into the year end.
Given the Fund’s primary focus on income generation, the Fund remained overweight in investment grade corporate bonds during the period. The yield to maturity for the Fund at year end was 4.47% versus 2.24% for the benchmark. Additionally, the following highlights the investment concentration differences to the benchmark: the Fund was overweight emerging markets while underweight mortgages and governments. The Fund also had out of index exposure to high yield and non-U.S. developed corporates.
During the year, the Fund increased exposure to governments, mortgage, non-U.S. developed, emerging markets and cash equivalents, while reducing exposure to corporates.
Sector Distribution
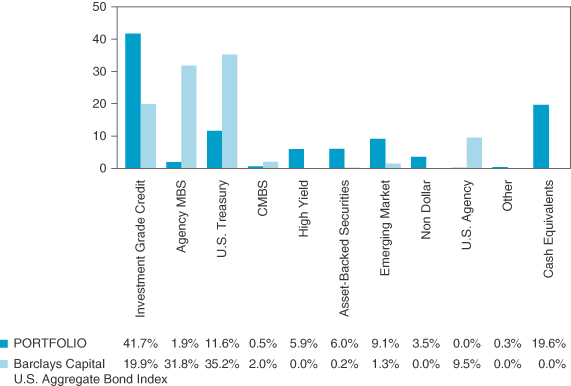
As of December 31, 2011.
Sector distribution is subject to change.
Percentages are based on total value of the investment portfolio.
| | |
| 2 | | Montgomery Street Income Securities, Inc. |
Quality Distribution
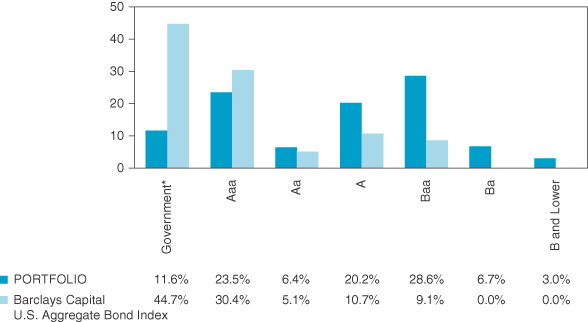
| * | Government includes U.S. Treasury Bonds and Notes. |
As of December 31, 2011.
Quality distribution is subject to change.
Portfolio percentages are based on total value of the investment portfolio.
The quality ratings represent the higher of Moody’s Investors Service, Inc. (“Moody’s”) or Standard & Poor’s Corporation (“S&P”) credit ratings. The ratings of Moody’s and S&P represent these companies’ opinions as to the quality of the securities they rate. Ratings are relative and subjective and are not absolute standards of quality. A bond’s credit quality does not remove the risk of an increase in interest rates or illiquidity in the market.
The following is a summary of the detractors or neutral contributors from the Fund’s performance relative to its benchmark in 2011:
| | • | | U.S. duration and curve positioning during the year as rates fell due to global economic weakness and the flight to quality |
| | • | | An overweight to financials, which lagged the broader corporate market amid fears of a slowdown in global growth and uncertainty surrounding contagion related to European sovereign risk; a focus on the banking sector detracted further from returns |
| | • | | Security selection in mortgages drove underperformance in mortgage-backed securities for the year |
The following is a summary of the positive contributors to the Fund’s performance relative to its benchmark in 2011:
| | • | | Exposure to non-U.S. developed interest rates, particularly core Europe, as investors searched for bonds of nations with stronger balance sheets and top credit ratings |
The following is a summary of derivative investments’ impact to the Fund’s performance in 2011:
| | • | | Modest exposure to money market futures, including Eurodollar and Euribor futures, added to returns |
| | • | | An underweight to the long end of the Treasury curve via interest rate swaps was a detractor on performance, as the 30-year yield fell 144 basis points over the year |
| | | | |
| Montgomery Street Income Securities, Inc. | | | 3 | |
| | • | | An overweight to investment grade corporates, partially implemented via credit default swaps, was negative for performance |
| | • | | Exposure to emerging market currencies such as the Singapore Dollar and Mexican Peso was a detractor on performance, as the U.S. Dollar strengthened and investors sought safety |
PIMCO expects global growth to fall to a real rate of 1.0% to 1.5% over the year ahead. Growth faces several hurdles that could impose greater uncertainty and volatility on financial markets. As the European sovereign debt crisis continues to unfold and austerity measures are implemented throughout the region, negative effects will continue to influence growth dynamics in the U.S. and other developed markets. Global balance sheet deleveraging will play a dominant role over the cyclical horizon as deleveraging limits finance based consumption and growth prospects worldwide.
PIMCO expects a contraction in real GDP in Europe between 1.0% and 1.5% over the next year, driven by broad based deleveraging, austerity measures and continued risk of sovereign downgrades or default. While PIMCO does not expect a contraction in the U.S., PIMCO forecasts anemic growth of between 0% and 1.0%. Despite a recent slew of positive economic data, PIMCO remains concerned that the apparent rebound in U.S. domestic demand has been driven by seasonal rather than permanent factors. PIMCO awaits evidence of a more stable growth model based upon investment rather than consumption. While the U.S. private sector continues to reduce debt levels, the government persists in running large structural deficits to support aggregate demand. Such dynamics ensure that the domestic deleveraging process has a long way to go.
PIMCO expects to maintain a defensively positioned portfolio for the Fund while the European sovereign debt crisis remains a risk to the global economy. In an effort to avoid what PIMCO views as a heightened risk of defaults, particularly in companies levered to Europe, PIMCO will retain focus on sources of high quality yield.
This material contains the current opinions of the investment adviser only through the end of the period of the report as stated on the cover. Such opinions are subject to change without notice and should not be construed as a recommendation.
Investment in the Fund involves risk. The Fund invests in individual bonds whose yields and value fluctuate so that an investment in the Fund may be worth more or less than its original cost. Bond investments are subject to interest rate risk such that when interest rates rise, the price of the bonds, and thus the value of the Fund, can decline and the investor can lose principal value. The Fund’s investments are also subject to credit risk and liquidity risk. Additionally, investing in foreign securities presents certain unique risks not associated with domestic investments, such as currency fluctuation, political and economic changes, and market risks. All of these factors may result in greater share price volatility. Closed-end funds, unlike open-end funds, are not continuously offered or redeemed.
NOT FDIC/NCUA INSURED. NO BANK GUARANTEE. MAY LOSE VALUE. NOT A DEPOSIT.
NOT INSURED BY ANY FEDERAL GOVERNMENT AGENCY.
Past performance is no guarantee of future results.
This report is sent to stockholders of Montgomery Street Income Securities, Inc., for their information. It is not a prospectus, circular or representation intended for use in the purchase or sale of shares of the Fund or of any securities mentioned in the report.
| | |
| 4 | | Montgomery Street Income Securities, Inc. |
Other Information
Market Price and Net Asset Value
The Fund’s market price was $15.43 as of December 31, 2011, compared with $15.78 as of December 31, 2010. The Fund’s shares traded at a 9.8% discount to NAV of $17.11 at December 31, 2011, compared with a 7.8% discount to NAV of $17.12 at December 31, 2010. Shares of closed-end funds frequently trade at a discount to NAV. The price of the Fund’s shares is determined by a number of factors, several of which are beyond the control of Fund management. The Fund, therefore, cannot predict whether its shares will trade at, below or above its NAV.
The Fund’s market price is published daily in The New York Times and on The Wall Street Journal website at www.wsj.com. The Fund’s NAV is available daily on its website at www.montgomerystreetincome.com and published weekly in Barron’s.
Dividends Paid
The Fund paid dividends of $0.19 per share on April 29, 2011 and July 29, 2011, $0.18 per share on October 31, 2011, and $0.15 on December 30, 2011.
Dividend Reinvestment and Cash Purchase Option
The Fund maintains an optional Dividend Reinvestment and Cash Purchase Plan (the “Plan”) for the automatic reinvestment of your dividends and capital gain distributions in shares of the Fund. Stockholders who participate in the Plan also can purchase additional shares of the Fund through the Plan’s voluntary cash investment feature. We recommend that you consider enrolling in the Plan to build your investment. The Plan’s features, including the voluntary cash investment feature, are described on page 30 of this report.
Limited Share Repurchases
The Fund is authorized to repurchase a limited number of shares of the Fund’s common stock from time to time when the shares are trading at less than 95% of their NAV. Repurchases are limited to a number of shares each calendar quarter approximately equal to the number of new shares issued under the Plan with respect to income distributed for the second preceding calendar quarter. There were 6,000 shares repurchased in each quarter of 2011. During the first quarter of 2012, 6,000 shares will be repurchased.
Investment Portfolio
Following the Fund’s first and third quarter ends, a complete Investment Portfolio is filed with the U.S. Securities and Exchange Commission (“SEC”) on Form N-Q. The form is available in the “Financial Reports” tab on the Fund’s website at www.montgomerystreetincome.com, or on the SEC’s website at www.sec.gov, and it also may be reviewed and copied at the SEC’s Public Reference Room in Washington, DC. Information on the operation of the SEC’s Public Reference Room may be obtained by calling (800) SEC-0330.
Proxy Voting
Information about how the Fund voted any proxies related to its portfolio securities during the twelve-month period ended June 30, 2011 is available in the “Financial Reports” tab on the Fund’s website at www.montgomerystreetincome.com or on the SEC’s website at www.sec.gov. A description of the policies that the Fund uses to determine how to vote proxies relating to portfolio securities is available without charge, upon request, by calling (877) 437-3938 or on the SEC’s website at www.sec.gov.
Under the Fund’s current policy, it is the intention of the Fund to invest exclusively in non-voting securities. Under normal circumstances, the Fund does not intend to hold voting securities. In the event that the Fund does come into possession of any voting securities, the Fund intends to dispose of such securities as soon as it is reasonably practicable and prudent to do so. The Fund’s Board of Directors (the “Board”) may change this policy at any time.
Reports to Stockholders
The Fund’s annual and semiannual reports to stockholders will be mailed to stockholders, and also are available in the “Financial Reports” tab on the Fund’s website at www.montgomerystreetincome.com or by calling (877) 437-3938. Those stockholders who wish to view the Fund’s complete Investment Portfolio for the first and third quarters may view the Fund’s Form N-Q, as described above in “Investment Portfolio.”
| | | | |
| Montgomery Street Income Securities, Inc. | | | 5 | |
Change in Officers
Effective July 14, 2011, Megan E. Garcy was appointed Secretary of the Fund. Effective October 27, 2011, Susan S. Rhee was appointed Chief Compliance Officer of the Fund.
Change in Transfer Agent
Effective January 2, 2012, the Fund’s Transfer Agent was acquired by Computershare Shareowner Services LLC.
Investment Objectives
The primary investment objective of the Fund is to seek as high a level of current income as is consistent with prudent investment risks, from a diversified portfolio primarily of debt securities. Capital appreciation is a secondary objective. The investment objectives of the Fund may be changed by the Fund’s Board of Directors (the “Board”) without stockholder approval. There can be no assurance that the investment objectives of the Fund will be attained.
| | |
| 6 | | Montgomery Street Income Securities, Inc. |
| | |
| Investment Portfolio | | as of December 31, 2011 |
| | | | | | | | |
| | | Principal
Amount ($) | | | Value ($) | |
| | | | | | | |
Corporate Bonds (61.4%) | | | | | | | | |
| | |
| Consumer Discretionary 2.4% | | | | | | | | |
Aviation Capital Group, 7.13%, 10/15/20 (a) | | | 600,000 | | | | 580,398 | |
COX Communications Inc., 6.25%, 06/01/18 (a) | | | 263,000 | | | | 306,270 | |
CSC Holdings Inc., 8.63%, 02/15/19 | | | 2,000,000 | | | | 2,305,000 | |
NBCUniversal Media LLC, 2.88%, 04/01/16 | | | 300,000 | | | | 305,854 | |
Reynolds Group Inc., 7.13%, 04/15/19 (a) | | | 300,000 | | | | 305,250 | |
TCI Communications Inc., 8.75%, 08/01/15 | | | 35,000 | | | | 42,519 | |
Time Warner Cable Inc., 8.25%, 04/01/19 | | | 290,000 | | | | 364,243 | |
| | | | | | | | |
| | | | | | | 4,209,534 | |
| Consumer Staples 3.5% | | | | | | | | |
Altria Group Inc., 9.70%, 11/10/18 | | | 3,000,000 | | | | 4,036,239 | |
Altria Group Inc., 9.25%, 08/06/19 | | | 500,000 | | | | 671,378 | |
Kraft Foods Inc., 5.38%, 02/10/20 | | | 512,000 | | | | 590,772 | |
Wesfarmers Ltd., 2.98%, 05/18/16 (a) | | | 900,000 | | | | 907,159 | |
| | | | | | | | |
| | | | | | | 6,205,548 | |
| Energy 10.2% | | | | | | | | |
Anadarko Petroleum Corp., 6.45%, 09/15/36 | | | 800,000 | | | | 912,081 | |
BP Capital Markets Plc, 2.75%, 02/27/12 | | | 16,000 | | | | 16,041 | |
BP Capital Markets Plc, 3.13%, 03/10/12 | | | 38,000 | | | | 38,174 | |
BP Capital Markets Plc, 3.75%, 06/17/13 | | | 24,000 | | | | 24,785 | |
BP Capital Markets Plc, 3.63%, 05/08/14 | | | 521,000 | | | | 547,489 | |
BP Capital Markets Plc, 3.13%, 10/01/15 | | | 800,000 | | | | 837,938 | |
Coffeyville Resources LLC, 9.00%, 04/01/15 (a) | | | 1,011,000 | | | | 1,071,660 | |
Energy Transfer Partners LP, 8.50%, 04/15/14 | | | 200,000 | | | | 224,237 | |
Energy Transfer Partners LP, 9.70%, 03/15/19 | | | 500,000 | | | | 612,575 | |
Energy Transfer Partners LP, 9.00%, 04/15/19 | | | 800,000 | | | | 951,574 | |
Gazprom OAO, 9.25%, 04/23/19 (a) | | | 300,000 | | | | 356,670 | |
Midcontinent Express Pipeline LLC, 6.70%, 09/15/19 (a) | | | 400,000 | | | | 445,046 | |
NGPL PipeCo LLC, 6.51%, 12/15/12 (a) | | | 2,475,000 | | | | 2,500,107 | |
NGPL PipeCo LLC, 7.12%, 12/15/17 (a) | | | 400,000 | | | | 394,872 | |
Novatek Finance Ltd., 6.60%, 02/03/21 (a) | | | 800,000 | | | | 808,000 | |
Odebrecht Drilling Norbe VIII/IX Ltd., 6.35%, 06/30/21 (a) | | | 1,700,000 | | | | 1,751,000 | |
Pioneer Natural Resources Co., 7.20%, 01/15/28 | | | 200,000 | | | | 228,647 | |
Pride International Inc., 6.88%, 08/15/20 | | | 500,000 | | | | 586,215 | |
Ras Laffan Liquefied Natural Gas Co. Ltd. III, 5.30%, 09/30/20 | | | 881,200 | | | | 945,087 | |
Rockies Express Pipeline LLC, 6.25%, 07/15/13 (a) | | | 3,000,000 | | | | 3,165,969 | |
Rockies Express Pipeline LLC, 5.63%, 04/15/20 (a) | | | 1,000,000 | | | | 952,336 | |
Transcontinental Gas Pipe Line Corp., 6.40%, 04/15/16 | | | 250,000 | | | | 289,467 | |
Transocean Inc., 6.50%, 11/15/20 | | | 500,000 | | | | 516,496 | |
| | | | | | | | |
| | | | | | | 18,176,466 | |
| Financials 36.4% | | | | | | | | |
Abbey National Treasury Services Plc, 2.00%, 04/25/14 (b) | | | 800,000 | | | | 728,306 | |
ABN AMRO Holding NA, 6.52%, (callable at 100 beginning 11/08/12) (a) (c) (d) | | | 1,000,000 | | | | 681,250 | |
American Express Co., 6.15%, 08/28/17 | | | 1,000,000 | | | | 1,143,655 | |
American Express Credit Corp., 7.30%, 08/20/13 | | | 700,000 | | | | 759,681 | |
American International Group Inc., 4.95%, 03/20/12 | | | 3,000,000 | | | | 2,970,000 | |
American International Group Inc., 8.25%, 08/15/18 | | | 500,000 | | | | 529,251 | |
Asciano Finance Ltd., 5.00%, 04/07/18 (a) | | | 300,000 | | | | 300,824 | |
Australia & New Zealand Banking Group Ltd., 5.10%, 01/13/20 (a) | | | 400,000 | | | | 429,292 | |
Banco Bradesco SA, 2.56%, 05/16/14 (a) (b) | | | 500,000 | | | | 490,766 | |
Banco do Brasil SA, 6.00%, 01/22/20 (a) | | | 500,000 | | | | 545,000 | |
The accompanying notes are an integral part of the financial statements.
| | | | |
| Montgomery Street Income Securities, Inc. | | | 7 | |
| | | | | | | | |
| | | Principal
Amount ($) | | | Value ($) | |
| | | | | | | |
Banco Santander Brasil SA, 4.50%, 04/06/15 (a) | | | 100,000 | | | | 97,000 | |
Banco Santander Brasil SA, 4.50%, 04/06/15 | | | 300,000 | | | | 291,000 | |
Banco Santander Chile, 1.66%, 04/20/12 (a) (b) | | | 900,000 | | | | 900,287 | |
Banco Santander Chile, 3.75%, 09/22/15 (a) | | | 500,000 | | | | 498,468 | |
Banco Votorantim SA, 5.25%, 02/11/16 (a) | | | 400,000 | | | | 402,400 | |
Bank of America Corp., 6.00%, 09/01/17 | | | 115,000 | | | | 112,312 | |
Banque PSA Finance, 2.48%, 04/04/14 (a) (b) | | | 300,000 | | | | 277,808 | |
Barclays Bank Plc, 5.00%, 09/22/16 | | | 400,000 | | | | 414,266 | |
Barclays Bank Plc, 10.18%, 06/12/21 (a) | | | 1,400,000 | | | | 1,465,996 | |
BBVA Bancomer SA, 4.50%, 03/10/16 (a) | | | 500,000 | | | | 490,000 | |
BBVA Bancomer SA, 6.50%, 03/10/21 (a) | | | 400,000 | | | | 385,500 | |
BNP Paribas, 7.78%, (callable at 100 beginning 07/02/18) (c) (d), EUR | | | 500,000 | | | | 522,551 | |
BPCE SA, 2.19%, 02/07/14 (a) (b) | | | 700,000 | | | | 666,149 | |
Capital One Capital V, 10.25%, 08/15/39 | | | 1,000,000 | | | | 1,037,500 | |
CBA Capital Trust II, 6.02%, (callable at 100 beginning 03/15/16) (a) (c) (d) | | | 200,000 | | | | 184,887 | |
Citigroup Inc., 6.01%, 01/15/15 | | | 2,200,000 | | | | 2,298,351 | |
Citigroup Inc., 8.50%, 05/22/19 | | | 1,235,000 | | | | 1,453,701 | |
Commonwealth Bank of Australia, 1.29%, 03/17/14 (a) (b) | | | 200,000 | | | | 196,796 | |
Commonwealth Bank of Australia, 5.00%, 10/15/19 (a) | | | 50,000 | | | | 53,027 | |
Credit Agricole SA, 1.86%, 01/21/14 (a) (b) | | | 400,000 | | | | 369,715 | |
Export-Import Bank of Korea, 4.00%, 01/29/21 | | | 200,000 | | | | 193,005 | |
FCE Bank Plc, 7.13%, 01/16/12, EUR | | | 1,000,000 | | | | 1,294,688 | |
Fibria Overseas Finance Ltd., 7.50%, 05/04/20 | | | 100,000 | | | | 97,750 | |
Fibria Overseas Finance Ltd., 6.75%, 03/03/21 (a) | | | 200,000 | | | | 182,500 | |
Goldman Sachs Group Inc., 5.95%, 01/18/18 | | | 650,000 | | | | 665,744 | |
Goldman Sachs Group Inc., 6.00%, 06/15/20 | | | 2,000,000 | | | | 2,048,724 | |
HBOS Plc, 6.75%, 05/21/18 (a) | | | 700,000 | | | | 561,254 | |
HSBC Bank Plc, 4.13%, 08/12/20 (a) | | | 2,000,000 | | | | 1,973,528 | |
HSBC Bank Plc, 5.00%, 03/20/23 (c), GBP | | | 500,000 | | | | 725,119 | |
HSBC Finance Corp., 6.68%, 01/15/21 | | | 300,000 | | | | 310,319 | |
International Lease Finance Corp., 7.13%, 09/01/18 (a) | | | 1,700,000 | | | | 1,759,500 | |
Intesa Sanpaolo SpA, 2.91%, 02/24/14 (a) (b) | | | 800,000 | | | | 704,357 | |
IPIC GMTN Ltd., 5.88%, 03/14/21, EUR | | | 200,000 | | | | 250,437 | |
JPMorgan Chase & Co., 6.30%, 04/23/19 | | | 2,500,000 | | | | 2,831,590 | |
JPMorgan Chase Capital XVII, 7.00%, 11/01/39 | | | 400,000 | | | | 402,500 | |
Lazard Group LLC, 6.85%, 06/15/17 | | | 500,000 | | | | 524,486 | |
LBG Capital No.1 Plc, 7.87%, 08/25/20, GBP | | | 1,000,000 | | | | 1,141,446 | |
LBG Capital No.1 Plc, 7.88%, 11/01/20 (a) | | | 450,000 | | | | 341,100 | |
Lloyds TSB Bank Plc, 6.38%, 01/21/21 | | | 100,000 | | | | 100,214 | |
Merrill Lynch & Co. Inc., 6.88%, 04/25/18 | | | 2,900,000 | | | | 2,859,223 | |
Metropolitan Life Global Funding I, 1.33%, 01/10/14 (a) (b) | | | 300,000 | | | | 299,686 | |
Morgan Stanley, 6.63%, 04/01/18 | | | 1,000,000 | | | | 987,443 | |
Morgan Stanley, 7.30%, 05/13/19 | | | 800,000 | | | | 814,759 | |
Morgan Stanley, 5.50%, 01/26/20 | | | 2,850,000 | | | | 2,594,284 | |
Morgan Stanley, 5.38%, 08/10/20, EUR | | | 100,000 | | | | 114,154 | |
OJSC Russian Agricultural Bank, 6.30%, 05/15/17 | | | 500,000 | | | | 499,375 | |
Rabobank Capital Funding Trust III, 5.25%, (callable at 100 beginning 10/21/16) (a) (c) (d) | | | 800,000 | | | | 740,027 | |
Rabobank Nederland NV, 11.00%, (callable at 100 beginning 06/30/19) (a) (c) (d) | | | 1,000,000 | | | | 1,170,000 | |
RCI Banque SA, 2.45%, 04/11/14 (a) (b) | | | 600,000 | | | | 571,811 | |
Regions Financial Corp., 4.88%, 04/26/13 | | | 975,000 | | | | 953,063 | |
Royal Bank of Scotland Plc, 5.38%, 09/30/19, EUR | | | 1,600,000 | | | | 1,919,689 | |
Sberbank, 5.50%, 07/07/15 | | | 700,000 | | | | 707,000 | |
Sberbank Via SB Capital SA, 5.40%, 03/24/17 | | | 1,200,000 | | | | 1,194,000 | |
Shinhan Bank, 4.13%, 10/04/16 (a) | | | 200,000 | | | | 201,369 | |
The accompanying notes are an integral part of the financial statements.
| | |
| 8 | | Montgomery Street Income Securities, Inc. |
| | | | | | | | |
| | | Principal
Amount ($) | | | Value ($) | |
| | | | | | | |
SLM Corp., 5.38%, 01/15/13 | | | 1,200,000 | | | | 1,208,279 | |
SLM Corp., 8.45%, 06/15/18 | | | 500,000 | | | | 515,000 | |
Sydney Airport Finance Co. Pty Ltd., 5.13%, 02/22/21 (a) | | | 2,100,000 | | | | 2,130,775 | |
TNK-BP Finance SA, 7.50%, 03/13/13 | | | 1,600,000 | | | | 1,668,000 | |
TransCapitalInvest Ltd., 8.70%, 08/07/18 | | | 2,250,000 | | | | 2,710,575 | |
UBS AG Stamford, 5.88%, 12/20/17 | | | 300,000 | | | | 312,315 | |
USB Capital IX, 3.50%, (callable at 100 beginning 04/15/11) (c) (d) | | | 625,000 | | | | 435,806 | |
Ventas Realty LP, 3.13%, 11/30/15 | | | 100,000 | | | | 97,789 | |
Wachovia Corp., 5.75%, 02/01/18 | | | 800,000 | | | | 908,818 | |
White Nights Finance BV, 10.50%, 03/25/14 | | | 2,000,000 | | | | 2,242,600 | |
| | | | | | | | |
| | | | | | | 64,659,840 | |
| Health Care 2.5% | | | | | | | | |
Boston Scientific Corp., 6.40%, 06/15/16 | | | 1,200,000 | | | | 1,345,397 | |
Fresenius Medical Care Term Loan B, 2.33%, 03/31/13 (b) | | | 158,905 | | | | 157,538 | |
Fresenius Medical Care Term Loan B, 2.33%, 03/31/13 (b) | | | 162,148 | | | | 160,754 | |
Fresenius Medical Care Term Loan B, 2.33%, 03/31/13 (b) | | | 654,371 | | | | 648,743 | |
Fresenius Medical Care Term Loan B, 2.33%, 03/31/13 (b) | | | 14,105 | | | | 13,984 | |
HCA Inc., 6.50%, 02/15/20 | | | 2,000,000 | | | | 2,075,000 | |
| | | | | | | | |
| | | | | | | 4,401,416 | |
| Industrials 0.8% | | | | | | | | |
CSN Islands XI Corp., 6.88%, 09/21/19 (a) | | | 1,100,000 | | | | 1,162,150 | |
CSN Resources SA, 6.50%, 07/21/20 (a) | | | 200,000 | | | | 209,000 | |
| | | | | | | | |
| | | | | | | 1,371,150 | |
| Materials 3.3% | | | | | | | | |
Anglo American Capital Plc, 9.38%, 04/08/14 (a) | | | 543,000 | | | | 619,857 | |
Cliffs Natural Resources Inc., 5.90%, 03/15/20 | | | 1,000,000 | | | | 1,065,858 | |
Dow Chemical Co., 8.55%, 05/15/19 | | | 990,000 | | | | 1,295,244 | |
Georgia-Pacific LLC, 5.40%, 11/01/20 (a) | | | 1,600,000 | | | | 1,772,237 | |
Lyondell Chemical Co., 8.00%, 11/01/17 | | | 302,000 | | | | 329,935 | |
Rio Tinto Finance USA Ltd., 9.00%, 05/01/19 | | | 200,000 | | | | 272,954 | |
Teck Resources Ltd., 10.75%, 05/15/19 | | | 360,000 | | | | 439,200 | |
| | | | | | | | |
| | | | | | | 5,795,285 | |
| Telecommunication Services 0.3% | | | | | | | | |
Qtel International Finance Ltd., 4.75%, 02/16/21 (a) | | | 300,000 | | | | 302,250 | |
Rogers Communications Inc., 7.50%, 03/15/15 | | | 179,000 | | | | 209,592 | |
| | | | | | | | |
| | | | | | | 511,842 | |
| Utilities 2.0% | | | | | | | | |
Centrais Eletricas Brasileiras SA, 6.88%, 07/30/19 | | | 400,000 | | | | 452,000 | |
Consumers Energy Co., 6.70%, 09/15/19 | | | 540,000 | | | | 683,904 | |
Duquesne Light Holdings Inc., 6.40%, 09/15/20 (a) | | | 400,000 | | | | 425,348 | |
Florida Power Corp., 5.80%, 09/15/17 | | | 195,000 | | | | 233,684 | |
Korea Electric Power Corp., 3.00%, 10/05/15 (a) | | | 1,400,000 | | | | 1,403,025 | |
NRG Energy Inc., 8.25%, 09/01/20 | | | 200,000 | | | | 201,000 | |
NRG Energy Inc. Term Loan, 2.51%, 05/05/18 (b) | | | 112,500 | | | | 112,037 | |
NRG Energy Inc. Term Loan, 4.00%, 05/05/18 (b) | | | 86,500 | | | | 86,144 | |
| | | | | | | | |
| | | | | | | 3,597,142 | |
| |
Total Corporate Bonds (cost $109,579,020) | | | | | | | 108,928,223 | |
| | | | | | | | |
The accompanying notes are an integral part of the financial statements.
| | | | |
| Montgomery Street Income Securities, Inc. | | | 9 | |
| | | | | | | | |
| | | Principal
Amount ($) | | | Value ($) | |
| | | | | | | |
Non-U.S. Government Agency Asset-Backed Securities 9.4% | | | | | | | | |
Aircraft Certificate Owner Trust, (2003, 1A, D), 6.46%, 09/20/22 (a) (e) | | | 65,227 | | | | 64,249 | |
Ally Auto Receivables Trust, (2009, B, A3), 1.98%, 10/15/13 (a) | | | 649,384 | | | | 652,462 | |
American Airlines Pass-Through Trust, 10.38%, 07/02/19 | | | 610,101 | | | | 648,232 | |
Banc of America Funding Corp. REMIC, (2004, A, 1A3), 5.35%, 09/20/34 (b) | | | 855,385 | | | | 862,147 | |
Banc of America Mortgage Securities Inc. REMIC, (2005, H, 2A5), 2.76%, 09/25/35 (b) | | | 1,065,000 | | | | 790,070 | |
Bayview Commercial Asset Trust, Interest Only REMIC, (2007, 2A, IO), 3.57%, 05/25/14 (a) (b) | | | 4,586,306 | | | | 359,883 | |
Bayview Commercial Asset Trust, Interest Only REMIC, (2007, 4A, IO), 3.86%, 09/25/37 (a) (b) | | | 5,012,262 | | | | 507,730 | |
Bayview Financial Acquisition Trust REMIC, (2007, B, 2A1), 0.59%, 08/28/37 (b) | | | 274,191 | | | | 266,801 | |
Bear Stearns Adjustable Rate Mortgage Trust REMIC, (2004, 6, 2A1), 2.83%, 09/25/34 (b) | | | 731,774 | | | | 585,539 | |
Citigroup Mortgage Loan Trust Inc. REMIC, (2004, NCM2, 1CB2), 6.75%, 08/25/34 | | | 180,667 | | | | 191,899 | |
Continental Airlines Pass-Through Trust Class A, 9.00%, 07/08/16 | | | 1,824,127 | | | | 2,001,979 | |
Countrywide Alternative Loan Trust REMIC, (2004, 14T2, A4), 5.50%, 08/25/34 | | | 58,276 | | | | 58,239 | |
Countrywide Alternative Loan Trust REMIC, (2004, 35T2, A4), 6.00%, 02/25/35 | | | 74,102 | | | | 73,869 | |
Credit Suisse First Boston Mortgage Securities Corp. REMIC, (2004, AR8, 2A1), 2.65%, 09/25/34 (b) | | | 1,301,945 | | | | 1,230,888 | |
Credit-Based Asset Servicing and Securitization LLC REMIC, (2006, SC1, A), 0.56%, 05/25/36 (a) (b) | | | 97,897 | | | | 80,990 | |
Galaxy CLO Ltd., (2005, 4A, A1VB), 0.68%, 04/17/17 (a) (b) | | | 772,525 | | | | 750,174 | |
GMAC Mortgage Corp. Loan Trust (insured by Financial Guaranty Insurance Co.)
REMIC, (2006, HE3, A2), 5.75%, 10/25/36 (b) | | | 250,063 | | | | 162,196 | |
Holmes Master Issuer Plc, (2011, 1A, A3), 2.92%, 10/15/54 (b), EUR | | | 700,000 | | | | 903,066 | |
Lehman Brothers Small Balance Commercial REMIC, (2006, 2A, 2A2), 5.62%, 09/25/36 (a) (b) | | | 101,644 | | | | 95,171 | |
Nationstar NIM Trust, (2007, A, A), 9.79%, 03/25/37 | | | 22,008 | | | | — | |
Residential Asset Securitization Trust REMIC, (2005, A1, A3), 5.50%, 04/25/35 | | | 2,261,805 | | | | 1,974,993 | |
Truman Capital Mortgage Loan Trust REMIC, (2006, 1, A), 0.55%, 03/25/36 (a) (b) | | | 1,721,387 | | | | 1,183,070 | |
United Air Lines Inc. 2009-1 Pass-Through Trust, 10.40%, 11/01/16 | | | 1,535,713 | | | | 1,698,882 | |
Washington Mutual Mortgage Pass-Through Certificates REMIC, (2005, AR16, 1A3), 2.47%, 12/25/35 | | | 1,320,000 | | | | 952,952 | |
Wells Fargo Mortgage Backed Securities Trust REMIC, (2006, 1, A3), 5.00%, 03/25/21 | | | 527,913 | | | | 526,699 | |
| |
Total Non-U.S. Government Agency Asset-Backed Securities (cost $18,046,337) | | | | | | | 16,622,180 | |
| | | | | | | | |
Government and Agency Obligations 16.7% | | | | | | | | |
| Government Securities 12.9% | | | | | | | | |
| Sovereign 0.2% | | | | | | | | |
Banco Nacional de Desenvolvimento Economico e Social, 5.50%, 07/12/20 (a) | | | 400,000 | | | | 432,500 | |
| Treasury Inflation Index Securities 0.3% | | | | | | | | |
Australian Government Treasury Inflation Indexed Bond, 4.00%, 08/20/20, AUD (f) | | | 300,000 | | | | 569,702 | |
| U.S. Treasury Securities 12.4% | | | | | | | | |
U.S. Treasury Bond, 5.50%, 08/15/28 | | | 1,700,000 | | | | 2,399,922 | |
U.S. Treasury Bond, 4.25%, 11/15/40 (g) | | | 3,300,000 | | | | 4,208,530 | |
U.S. Treasury Bond, 4.75%, 02/15/41 | | | 300,000 | | | | 413,437 | |
U.S. Treasury Bond, 4.38%, 05/15/41 | | | 1,100,000 | | | | 1,433,266 | |
U.S. Treasury Bond, 3.75%, 08/15/41 | | | 4,700,000 | | | | 5,527,642 | |
U.S. Treasury Note, 2.13%, 08/15/21 | | | 6,200,000 | | | | 6,358,875 | |
U.S. Treasury Note, 2.00%, 11/15/21 | | | 1,600,000 | | | | 1,618,250 | |
| | | | | | | | |
| | | | | | | 21,959,922 | |
| U.S. Government Agency Mortgage-Backed Securities 3.8% | | | | | | | | |
| Federal Home Loan Mortgage Corp. 0.0% | | | | | | | | |
Federal Home Loan Mortgage Corp. REMIC, 7.00%, 08/15/21 | | | 14,646 | | | | 16,473 | |
| Federal National Mortgage Association 3.8% | | | | | | | | |
Federal National Mortgage Association REMIC, 5.00%, 06/25/34 | | | 62,322 | | | | 62,283 | |
Federal National Mortgage Association, 4.50%, 08/01/35 | | | 15,186 | | | | 16,192 | |
Federal National Mortgage Association, 4.00%, 02/01/41 | | | 2,800,494 | | | | 2,944,528 | |
The accompanying notes are an integral part of the financial statements.
| | |
| 10 | | Montgomery Street Income Securities, Inc. |
| | | | | | | | |
| | | Principal
Amount ($) Contracts | | | Value ($) | |
| | | | | | | |
Federal National Mortgage Association, 4.50%, 02/01/41 | | | 1,847,809 | | | | 1,967,879 | |
Federal National Mortgage Association, 4.50%, 05/01/41 | | | 1,647,568 | | | | 1,754,626 | |
| | | | | | | | |
| | | | | | | 6,745,508 | |
| |
Total Government and Agency Obligations (cost $27,183,353) | | | | | | | 29,724,105 | |
Purchased Options 0.0% | | | | | | | | |
Interest Rate Put Swaption, 3 month LIBOR versus 1.25% fixed, Expiration 04/30/12, GSC | | | 20 | | | | 252 | |
| |
Total Purchased Options (cost $7,600) | | | | | | | 252 | |
| | | | | | | | |
Short Term Investments 20.9% | | | | | | | | |
| | |
| U.S. Treasury Securities 0.7% | | | | | | | | |
U.S. Treasury Bill, 0.02%, 02/23/12 (g) | | | 280,000 | | | | 279,996 | |
U.S. Treasury Bill, 0.04%, 03/29/12 (g) | | | 1,000,000 | | | | 999,952 | |
| | |
| Repurchase Agreements 20.2% | | | | | | | | |
Repurchase Agreement with Barclays Capital Inc., 0.10% (Collateralized by $18,148,000 Federal National Mortgage Association, 4.00%, due 01/01/42, value $19,066,794) acquired on 12/30/2011, due 01/04/2012 at $18,500,257 | | | 18,500,000 | | | | 18,500,000 | |
Repurchase Agreement with J.P. Morgan Securities LLC, 0.07% (Collateralized by $17,730,000 Federal Home Loan Mortgage Corp., 0.90%, due 09/12/14, value $17,748,575) acquired on 12/29/2011, due 01/03/2012 at $17,400,169 | | | 17,400,000 | | | | 17,400,000 | |
| |
Total Short Term Investments (cost $37,179,907) | | | | | | | 37,179,948 | |
| |
Total Investments — 108.4% (cost $191,996,217) | | | | | | | 192,454,708 | |
Total Forward Sales Commitments — (1.8%) (proceeds $3,113,906) | | | | | | | (3,151,406 | ) |
Other Assets and Liabilities, Net (6.6%) (g) | | | | | | | (11,815,360 | ) |
| |
Total Net Assets — 100% | | | | | | $ | 177,487,942 | |
| | | | | | | | |
Forward Sales Commitments (1.8%) | | | | | | | | |
| | |
| U.S. Government Agency Mortgage-Backed Securities (1.8%) | | | | | | | | |
Federal National Mortgage Association, 4.00%, 01/15/42 | | | (3,000,000 | ) | | | (3,151,406 | ) |
| |
Total Forward Sales Commitments (cost $3,113,906) | | | | | | | (3,151,406 | ) |
Notes to the Investment Portfolio
| (a) | Rule 144A or Section 4(2) liquid security. The Fund’s investment adviser has deemed this security to be liquid based on procedures approved by the Fund’s Board of Directors. As of December 31, 2011, the aggregate value of Rule 144A or Section 4(2) liquid securities was $42,635,905 (24.0% of net assets). |
| (b) | Floating rate note. Floating rate notes are securities whose yields vary with a designated market index or market rate. These securities are shown at their current rate as of December 31, 2011. |
| (c) | Interest rate is fixed until stated call date and variable thereafter. |
| (d) | Perpetual maturity security. |
| (e) | Security fair valued in good faith in accordance with the procedures established by the Fund’s Board of Directors. As of December 31, 2011, the value of fair valued securities was $64,249 (0.0% of net assets). |
| (f) | Foreign or U.S. Treasury inflation indexed note. Par amount is not adjusted for inflation. |
| (g) | All or a portion of the security or cash pledged as collateral for open futures contracts or swap agreements. Total value of securities or cash pledged as of December 31, 2011 was $577,014. |
| | |
| |
| Abbreviations: | | |
| |
| AUD – Australian Dollar | | MXN – Mexican Peso |
| |
| BRL – Brazilian Real | | NOK – Norwegian Krone |
| |
| CAD – Canadian Dollar | | SGD – Singapore Dollar |
| |
| CNY – Chinese Yuan | | USD – United States Dollar |
| |
| EUR – European Currency Unit (Euro) | | BBP – Barclays Bank Plc |
| |
| GBP – British Pound | | BCL – Barclays Capital Inc. |
| |
| JPY – Japanese Yen | | GSC– Goldman Sachs & Co. |
| |
| KRW – Korean Won | | GSI – Goldman Sachs International |
The accompanying notes are an integral part of the financial statements.
| | | | |
| Montgomery Street Income Securities, Inc. | | | 11 | |
| | | | | | | | | | | | | | | | |
| Schedule of Written Option Contracts | | Expiration
Date | | | Exercise
Price | | | Contracts | | | Value | |
| Eurodollar Future Call Option | | | 06/18/2012 | | | | 99 | | | | 12 | | | $ | (1,125 | ) |
| Eurodollar Future Call Option | | | 06/18/2012 | | | | 100 | | | | 36 | | | | (1,125 | ) |
| Eurodollar Future Put Option | | | 03/19/2012 | | | | 99 | | | | 37 | | | | (3,006 | ) |
| Eurodollar Future Put Option | | | 06/18/2012 | | | | 99 | | | | 12 | | | | (7,275 | ) |
| Eurodollar Future Put Option | | | 06/18/2012 | | | | 100 | | | | 36 | | | | (30,825 | ) |
| | | | $ | (43,356 | ) |
| | | | | | | | | | | | |
| Summary of Written Options | | | | | | Contracts | | | Premiums | |
| Options outstanding at December 31, 2010 | | | | | | | — | | | $ | — | |
| Options written during the year | | | | | | | (202 | ) | | | (73,244 | ) |
| Options closed during the year | | | | | | | 43 | | | | 7,633 | |
| Options expired during the year | | | | | | | 26 | | | | 3,997 | |
| Options outstanding at December 31, 2011 | | | | | | | (133 | ) | | $ | (61,614 | ) |
| | | | |
| Schedule of Open Futures Contracts | | | | | | Contracts
Long | | | Unrealized
Appreciation/
(Depreciation) | |
| 90-Day Eurodollar Future, Expiration March 2014 | | | | | | | 5 | | | $ | (428 | ) |
| 3-Month Euro Euribor Interest Rate Future, Expiration September 2014 | | | | | | | 55 | | | | 68,983 | |
| 3-Month Euro Euribor Interest Rate Future, Expiration December 2013 | | | | | | | 15 | | | | 15,699 | |
| U.S. Treasury Note Future, 10-Year, Expiration March 2012 | | | | | | | 50 | | | | 29,172 | |
| | | | | | | | | | | $ | 113,426 | |
Schedule of Open Forward Foreign Currency Contracts
| | | | | | | | | | | | | | | | | | |
| Counterparty | | Currency
Purchased/Sold | | Settlement
Date | | Notional
Amount | | | Currency
Value | | | Unrealized
Gain/(Loss) | |
| GSC | | BRL/USD | | 01/04/2012 | | BRL | | | 31,440 | | | $ | 16,856 | | | $ | (553 | ) |
| BCL | | CAD/USD | | 02/09/2012 | | CAD | | | 2,687,000 | | | | 2,635,353 | | | | 10,752 | |
| BCL | | CNY/USD | | 02/01/2013 | | CNY | | | 9,363,750 | | | | 1,481,606 | | | | (18,394 | ) |
| BCL | | CNY/USD | | 08/05/2013 | | CNY | | | 1,741,964 | | | | 275,627 | | | | (4,837 | ) |
| BCL | | CNY/USD | | 02/01/2013 | | CNY | | | 3,781,800 | | | | 598,386 | | | | (1,614 | ) |
| BCL | | CNY/USD | | 06/01/2012 | | CNY | | | 3,220,353 | | | | 510,573 | | | | 5,301 | |
| BCL | | EUR/USD | | 01/17/2012 | | EUR | | | 903,000 | | | | 1,168,810 | | | | (74,838 | ) |
| BCL | | GBP/USD | | 03/12/2012 | | GBP | | | 162,000 | | | | 251,422 | | | | (1,495 | ) |
| BCL | | JPY/USD | | 02/14/2012 | | JPY | | | 68,671,000 | | | | 892,779 | | | | 7,752 | |
| BCL | | KRW/USD | | 02/27/2012 | | KRW | | | 2,930,620,000 | | | | 2,534,330 | | | | (86,507 | ) |
| BCL | | MXN/USD | | 03/15/2012 | | MXN | | | 8,385,571 | | | | 597,457 | | | | (20,743 | ) |
| BCL | | MXN/USD | | 03/15/2012 | | MXN | | | 63,497 | | | | 4,524 | | | | (22 | ) |
| BCL | | NOK/USD | | 01/12/2012 | | NOK | | | 7,891,000 | | | | 1,319,010 | | | | (52,789 | ) |
| GSC | | SGD/USD | | 02/10/2012 | | SGD | | | 2,313,662 | | | | 1,783,602 | | | | 3,178 | |
| BCL | | USD/AUD | | 02/02/2012 | | AUD | | | (595,000 | ) | | | (606,371 | ) | | | (18,235 | ) |
| BCL | | USD/AUD | | 02/02/2012 | | AUD | | | (1,392,000 | ) | | | (1,418,602 | ) | | | (38,998 | ) |
The accompanying notes are an integral part of the financial statements.
| | |
| 12 | | Montgomery Street Income Securities, Inc. |
| | | | | | | | | | | | | | | | | | |
| Counterparty | | Currency
Purchased/Sold | | Settlement
Date | | Notional
Amount | | | Currency
Value | | | Unrealized
Gain/(Loss) | |
| BCL | | USD/AUD | | 02/02/2012 | | AUD | | | (1,838,000 | ) | | $ | (1,873,126 | ) | | $ | (58,317 | ) |
| GSC | | USD/AUD | | 02/02/2012 | | AUD | | | (2,116,000 | ) | | | (2,156,438 | ) | | | (74,548 | ) |
| BCL | | USD/BRL | | 01/04/2012 | | BRL | | | (31,440 | ) | | | (16,856 | ) | | | (465 | ) |
| GSC | | USD/BRL | | 03/02/2012 | | BRL | | | (31,440 | ) | | | (16,637 | ) | | | 576 | |
| BCL | | USD/CAD | | 02/09/2012 | | CAD | | | (860,000 | ) | | | (843,470 | ) | | | (13,561 | ) |
| BCL | | USD/JPY | | 01/13/2012 | | JPY | | | (68,297,000 | ) | | | (887,444 | ) | | | 2,241 | |
| BCL | | USD/EUR | | 01/17/2012 | | EUR | | | (7,286,000 | ) | | | (9,430,730 | ) | | | 576,591 | |
| BCL | | USD/EUR | | 01/17/2012 | | EUR | | | (1,460,000 | ) | | | (1,889,770 | ) | | | 182,513 | |
| BCL | | USD/GBP | | 03/12/2012 | | GBP | | | (1,515,000 | ) | | | (2,351,258 | ) | | | 17,619 | |
| BCL | | USD/KRW | | 02/27/2012 | | KRW | | | (373,360,000 | ) | | | (322,873 | ) | | | (2,873 | ) |
| GSC | | USD/MXN | | 03/15/2012 | | MXN | | | (2,442,330 | ) | | | (174,012 | ) | | | 5,988 | |
| GSC | | USD/SGD | | 02/10/2012 | | SGD | | | (1,185,184 | ) | | | (913,659 | ) | | | (3,659 | ) |
| | | | | | | | | | | | | $ | (8,830,911 | ) | | $ | 340,063 | |
Schedule of Credit Default Swap Agreements
| | | | | | | | | | | | | | | | | | | | | | | | | | |
| Counterparty | | Reference Obligation | | Implied
Credit
Spread4 | | | Fixed Rate
Received/
Pay Rate | | | Expiration
Date | | | Notional
Amount1,5 | | | Value | | | Unrealized
Appreciation/
(Depreciation) | |
| Credit default swap agreements — sell protection2 | |
| GSI | | Arcelormittal, 6.13%, 06/01/18 | | | 5.12 | % | | | 1.00 | % | | | 03/20/2016 | | | $ | (1,600,000 | ) | | $ | (238,195 | ) | | $ | (179,006 | ) |
| GSI | | Canadian Natural Resources Ltd., 6.25%, 03/15/38 | | | 1.29 | % | | | 1.00 | % | | | 12/20/2015 | | | | (500,000 | ) | | | (5,518 | ) | | | (6,991 | ) |
| BBP | | Federative Republic of Brazil, 12.25%, 03/06/30 | | | 1.48 | % | | | 1.00 | % | | | 06/20/2016 | | | | (2,400,000 | ) | | | (48,990 | ) | | | (40,424 | ) |
| BBP | | People’s Republic of China,
4.75%, 10/29/13 | | | 1.35 | % | | | 1.00 | % | | | 06/20/2016 | | | | (1,800,000 | ) | | | (26,882 | ) | | | (54,690 | ) |
| BBP | | Republic of Korea, 4.88%, 09/22/14 | | | 1.50 | % | | | 1.00 | % | | | 06/20/2016 | | | | (2,700,000 | ) | | | (57,557 | ) | | | (65,918 | ) |
| BBP | | United Mexican States, 7.50%, 04/08/33 | | | 1.41 | % | | | 1.00 | % | | | 06/20/2016 | | | | (1,200,000 | ) | | | (21,164 | ) | | | (21,831 | ) |
| | | | | | | | | | | | | | | | | $ | (10,200,000 | ) | | $ | (398,306 | ) | | $ | (368,860 | ) |
| Credit default swap agreements — purchase protection3 | | | | | |
| GSI | | Intesa Sanpaolo SpA, 4.75%, 06/15/17 | | | N/A | | | | 1.00 | % | | | 09/20/2014 | | | | EUR 300,000 | | | $ | 37,710 | | | $ | 22,682 | |
Schedule of Interest Rate Swaps
| | | | | | | | | | | | | | | | | | | | | | | | | | |
| Counterparty | | Floating Rate Index | | Fund Paying/Receiving
Floating Rate | | | Fixed
Rate | | | Expiration
Date | | | | | | Notional
Amount1 | | | Unrealized
Appreciation/
(Depreciation) | |
| BBP | | Brazil Interbank Rate | | | Paying | | | | 12.51 | % | | | 01/02/2014 | | | | BRL | | | | 3,000,000 | | | $ | 54,370 | |
| BBP | | Brazil Interbank Rate | | | Paying | | | | 12.51 | % | | | 01/02/2014 | | | | BRL | | | | 3,000,000 | | | | 46,552 | |
| BBP | | Mexican Interbank Rate | | | Paying | | | | 6.65 | % | | | 06/02/2021 | | | | MXN | | | | 2,000,000 | | | | (2,853 | ) |
The accompanying notes are an integral part of the financial statements.
| | | | |
| Montgomery Street Income Securities, Inc. | | | 13 | |
| | | | | | | | | | | | | | | | | | | | | | | | | | |
| Counterparty | | Floating Rate Index | | Fund Paying /Receiving
Floating Rate | | | Fixed
Rate | | | Expiration
Date | | | | | | Notional
Amount1 | | | Unrealized
Appreciation/
(Depreciation) | |
| BBP | | Mexican Interbank Rate | | | Paying | | | | 6.65 | % | | | 06/02/2021 | | | | MXN | | | | 3,000,000 | | | $ | (3,789 | ) |
| BBP | | Mexican Interbank Rate | | | Paying | | | | 5.60 | % | | | 09/06/2016 | | | | MXN | | | | 22,000,000 | | | | (29,745 | ) |
| GSC | | Brazil Interbank Rate | | | Paying | | | | 9.98 | % | | | 01/02/2014 | | | | BRL | | | | 4,000,000 | | | | (13,932 | ) |
| | | | | | | | | | | | | | | | | | | | | | | | | $ | 50,603 | |
| 1 | | Notional Amount is stated in USD unless otherwise noted. |
| 2 | | When the Fund is a seller of protection and a credit event occurs, as defined under the terms of that particular swap agreement, the Fund will either (i) pay the buyer of protection an amount equal to the notional amount of the referenced obligation and take delivery of the referenced obligation or impacted security from the referenced index or (ii) pay a net settlement amount in the form of cash or securities equal to the notional amount of the swap agreement less the recovery value of the referenced obligation or impacted security from the referenced index. |
| 3 | | When the Fund is a buyer of protection and a credit event occurs, as defined under the terms of that particular swap agreement, the Fund will either (i) receive from the seller of protection an amount equal to the notional amount of the referenced obligation agreement and deliver the referenced obligation or impacted security from the referenced index or (ii) receive a net settlement amount in the form of cash or securities equal to the notional amount of the swap agreement less the recovery value of the referenced obligation or impacted security from the referenced index. |
| 4 | | Implied credit spreads, represented in absolute terms, utilized in determining the market value of credit default swap agreements on corporate issues serve as an indicator of the current status of the payment/performance risk and represent the likelihood or risk of default for the credit derivative. The implied credit spread of a particular referenced entity reflects the cost of buying/selling protection and may include upfront payments required to be made to enter into the agreement. Wider credit spreads represent a deterioration of the referenced entity’s credit soundness and a greater likelihood or risk of default or other credit event occurring as defined under the terms of the agreement. |
| 5 | | The maximum potential amount the Fund could be required to pay as a seller of credit protection or receive as a buyer of credit protection if a credit event occurs is limited to the total notional amount which is defined under the terms of the swap agreement. |
Financial Accounting Standards Board (“FASB”) Accounting Standards Codification (“ASC”) Topic 815, “Derivatives and Hedging”*
The following is a summary of the fair valuations of the Fund’s derivative instruments categorized by risk exposure.
Fair values of derivative instruments on the Statement of Assets and Liabilities as of December 31, 2011:
| | | | | | | | | | | | |
| Assets | | Credit
Contracts | | | Interest Rate
Contracts | | | Foreign Currency
Exchange Rate
Contracts | |
| Investments in securities, at value | | $ | — | | | $ | 252 | | | $ | — | |
| Forward foreign currency contracts | | | — | | | | — | | | | 812,511 | |
| Variation margin** | | | — | | | | 21,644 | | | | — | |
| Unrealized appreciation on swap agreements | | | 22,682 | | | | 100,922 | | | | — | |
| Swap premiums paid | | | 12,901 | | | | 29,401 | | | | — | |
| | | $ | 35,583 | | | $ | 152,219 | | | $ | 812,511 | |
| | | |
| Liabilities | | Credit
Contracts | | | Interest Rate
Contracts | | | Foreign Currency
Exchange Rate
Contracts | |
| Written options, at value | | $ | — | | | $ | 43,356 | | | $ | — | |
| Forward foreign currency contracts | | | — | | | | — | | | | 472,448 | |
| Variation margin** | | | — | | | | — | | | | — | |
| Unrealized depreciation on swap agreements | | | 368,860 | | | | 50,319 | | | | — | |
| Swap premiums received | | | 20,775 | | | | 1,538 | | | | — | |
| | | $ | 389,635 | | | $ | 95,213 | | | $ | 472,448 | |
The accompanying notes are an integral part of the financial statements.
| | |
| 14 | | Montgomery Street Income Securities, Inc. |
The effect of derivative instruments on the Statement of Operations for the year ended December 31, 2011:
| | | | | | | | | | | | | | | | |
| Net realized gain (loss) from: | | Credit
Contracts | | | Interest Rate
Contracts | | | Foreign Currency
Exchange Rate
Contracts | | | Total | |
| Investment transactions | | $ | — | | | $ | — | | | $ | — | | | $ | — | |
| Foreign currency related items*** | | | | | | | | | | | (548,893 | ) | | | (548,893 | ) |
| Futures contracts | | | — | | | | 508,323 | | | | — | | | | 508,323 | |
| Written options contracts | | | — | | | | 10,663 | | | | — | | | | 10,663 | |
| Swap agreements | | | 80,902 | | | | (194,390 | ) | | | — | | | | (113,488 | ) |
| | | $ | 80,902 | | | $ | 324,596 | | | $ | (548,893 | ) | | $ | (143,395 | ) |
| | | | |
| Net change in unrealized appreciation (depreciation) on: | | Credit
Contracts | | | Interest Rate
Contracts | | | Foreign Currency
Exchange Rate
Contracts | | | Total | |
| Investments**** | | $ | — | | | $ | (7,348 | ) | | $ | — | | | $ | (7,348 | ) |
| Foreign currency related items*** | | | — | | | | — | | | | 222,733 | | | | 222,733 | |
| Futures contracts | | | — | | | | 103,290 | | | | — | | | | 103,290 | |
| Written options contracts | | | — | | | | 18,258 | | | | — | | | | 18,258 | |
| Swap agreements | | | (350,965 | ) | | | 50,602 | | | | — | | | | (300,363 | ) |
| | | $ | (350,965 | ) | | $ | 172,402 | | | $ | 222,733 | | | $ | 44,170 | |
| * | | See Note C in the Notes to Financial Statements for additional information. |
| ** | | The fair value of derivative instruments may include cumulative appreciation (depreciation) of futures contracts as reported in the Notes to the Investment Portfolio. Only the current day’s variation margin is reported within the Statement of Assets and Liabilities. |
| *** | | Net realized gain (loss) on forward foreign currency contracts is included in net realized gain (loss) from foreign currency related items in the Statement of Operations. Net change in unrealized appreciation (depreciation) on forward foreign currency contracts is included in net change in unrealized appreciation (depreciation) on foreign currency related items. |
| **** | | Includes change in unrealized appreciation (depreciation) on purchased options. |
FASB ASC Topic 820, “Fair Value Measurements and Disclosure”
This standard establishes a single authoritative definition of fair value, sets out a framework for measuring fair value and requires additional disclosures about fair value measurements. Various inputs are used in determining the value of the Fund’s investments under FASB ASC Topic 820 guidance. The inputs are summarized into three broad categories. Level 1 includes exchange listed prices. Level 2 includes valuations determined from significant direct or indirect observable inputs. Direct observable inputs include broker quotes, closing prices of similar securities in active markets, closing prices for identical or similar securities in non-active markets or corporate action or reorganization entitlement values. Indirect observable inputs include factors such as interest rates, yield curves, prepayment speeds or credit ratings. Level 2 includes valuations of vendor evaluated debt instruments, broker quotes in active markets, securities valued at amortized cost, modeled over-the-counter derivatives contracts and swap agreements valued by pricing services. Level 3 includes valuations determined from significant unobservable inputs including management’s own assumptions in determining the fair value of the investment. Inputs used to determine the fair value of Level 3 securities include security specific inputs such as: credit quality, credit rating spreads, issuer news, trading characteristics, call features or maturity; or industry specific inputs such as trading activity of similar markets or securities, changes in the security’s underlying index or comparable securities’ models. Level 3 valuations include certain single source quotes received from brokers (either directly or through a vendor), securities restricted to resale due to market events, newly issued securities or securities for which reliable quotes are not available. There were no significant transfers between Level 1 and Level 2 during the year. The only significant transfer between Level 2 and Level 3 valuations during the period, related to certain mortgage backed securities valued by an approved independent pricing service, that were previously valued using Adviser guidance. Fixed income investments valued by an approved independent pricing service generally are considered a Level 2 valuation. Fixed income investments valued by Adviser guidance generally are considered a Level 3 valuation. The inputs or methodology used for valuing securities are not necessarily an indication of the risk associated with investing in those securities. See “Security Valuation” in the Notes to the Financial Statements for security valuation accounting policies.
The accompanying notes are an integral part of the financial statements.
| | | | |
| Montgomery Street Income Securities, Inc. | | | 15 | |
The following table summarizes the Fund’s investments in securities and other financial instruments as of December 31, 2011 by valuation level:
| | | | | | | | | | | | | | | | |
| | | Assets — Investments in Securities | |
| | | Level 1 | | | Level 2 | | | Level 3 | | | Total | |
| Corporate Bonds | | $ | — | | | $ | 108,928,223 | | | $ | — | | | $ | 108,928,223 | |
| Non-U.S. Government Agency Asset-Backed Securities | | | — | | | | 16,557,931 | | | | 64,249 | | | | 16,622,180 | |
| Government and Agency Obligations | | | — | | | | 29,724,105 | | | | — | | | | 29,724,105 | |
| Short Term Investments | | | — | | | | 37,179,948 | | | | — | | | | 37,179,948 | |
| Purchased Options | | | — | | | | 252 | | | | — | | | | 252 | |
| Fund Total | | $ | — | | | $ | 192,390,459 | | | $ | 64,249 | | | $ | 192,454,708 | |
| |
| | | Liabilities — Investments in Securities | |
| | | Level 1 | | | Level 2 | | | Level 3 | | | Total | |
| Government and Agency Obligations | | $ | — | | | $ | (3,151,406 | ) | | $ | — | | | $ | (3,151,406 | ) |
| Fund Total | | $ | — | | | $ | (3,151,406 | ) | | $ | — | | | $ | (3,151,406 | ) |
| |
| | | Assets — Other Financial Instruments† | |
| | | Level 1 | | | Level 2 | | | Level 3 | | | Total | |
| Futures Contracts | | $ | 113,854 | | | $ | — | | | $ | — | | | $ | 113,854 | |
| Forward Foreign Currency Contracts | | | — | | | | 812,511 | | | | — | | | | 812,511 | |
| Interest Rate Swaps | | | — | | | | 100,922 | | | | — | | | | 100,922 | |
| Credit Default Swap Agreements | | | — | | | | 22,682 | | | | — | | | | 22,682 | |
| Fund Total | | $ | 113,854 | | | $ | 936,115 | | | $ | — | | | $ | 1,049,969 | |
| |
| | | Liabilities — Other Financial Instruments† | |
| | | Level 1 | | | Level 2 | | | Level 3 | | | Total | |
| Written Options | | $ | (43,356 | ) | | $ | — | | | $ | — | | | $ | (43,356 | ) |
| Futures Contracts | | | (428 | ) | | | — | | | | — | | | | (428 | ) |
| Forward Foreign Currency Contracts | | | — | | | | (472,448 | ) | | | — | | | | (472,448 | ) |
| Interest Rate Swaps | | | — | | | | (50,319 | ) | | | — | | | | (50,319 | ) |
| Credit Default Swap Agreements | | | — | | | | (368,860 | ) | | | — | | | | (368,860 | ) |
| Fund Total | | $ | (43,784 | ) | | $ | (891,627 | ) | | $ | — | | | $ | (935,411 | ) |
| † | Investments in other financial instruments are derivative instruments not reflected in the Investment Portfolio and include written options, futures contracts, forward foreign currency contracts and swap agreements. Purchased options are included in the Investment Portfolio. All derivatives are reflected at the unrealized appreciation/(depreciation) on the instrument, except for written options which are reflected at value. |
The following table is a rollforward of Level 3 investments by category for which significant unobservable inputs were used to determine fair value for the year ended December 31, 2011:
| | | | | | | | | | | | | | | | | | | | | | | | | | | | | | | | |
| | | Balance at Beginning of Period | | | Transfers Into Level 3 During the
Period | | | Transfers Out of Level 3 During the Period | | | Total Realized and Change in Unrealized Gain/(Loss) | | | Purchases | | | (Sales) | | | Balance
at End of Period | | | Change In Unrealized Appreciation/ (Depreciation) on Investments Held at End of Period | |
Non-U.S. Government
Agency Asset-Backed
Securities | | $ | — | | | $ | — | | | $ | — | | | $ | (527 | ) | | $ | 90,172 | | | $ | (25,396 | ) | | $ | 64,249 | | | $ | (652 | ) |
The accompanying notes are an integral part of the financial statements.
| | |
| 16 | | Montgomery Street Income Securities, Inc. |
Financial Statements
Statement of Assets and Liabilities as of December 31, 2011
| | | | |
| Assets | | | |
| Investments in securities, at value (cost $156,096,217) | | $ | 156,554,708 | |
| Repurchase Agreement (cost $35,900,000) | | | 35,900,000 | |
| Cash | | | 1,417,020 | |
| Foreign currency (cost $147,210) | | | 144,572 | |
| Receivables: | | | | |
Investments sold | | | 3,147,523 | |
Forward foreign currency contracts | | | 812,511 | |
Interest | | | 2,083,119 | |
Variation margin | | | 21,644 | |
Dividend reinvestment | | | 77,697 | |
Deposits with brokers | | | 9,000 | |
| Deposits with counterparties | | | 260,000 | |
| Unrealized appreciation on swap agreements | | | 123,604 | |
| Swap premiums paid | | | 42,302 | |
| Other assets | | | 19,230 | |
| Total assets | | | 200,612,930 | |
| |
| Liabilities | | | |
| Accrued management and investment advisory fee | | | 111,808 | |
| Accrued administrative fee | | | 34,364 | |
| Written options, at value (premiums $61,614) | | | 43,356 | |
| Payables: | | | | |
Investment securities purchased | | | 18,533,617 | |
Investment forward sales commitments, at value (cost $3,113,906) | | | 3,151,406 | |
Forward foreign currency contracts | | | 472,448 | |
| Deposits from counterparties | | | 260,000 | |
| Unrealized depreciation on swap agreements | | | 419,179 | |
| Swap premiums received | | | 22,313 | |
| Other liabilities | | | 76,497 | |
| Total liabilities | | | 23,124,988 | |
| Net assets, at value | | $ | 177,487,942 | |
| Net assets consist of: | | | | |
| Paid-in capital | | | 202,536,988 | |
| Undistributed (excess of distributions over) net investment income | | | (44,744 | ) |
| Net unrealized appreciation on investments and foreign currency related items | | | 581,656 | |
| Accumulated net realized loss | | | (25,585,958 | ) |
| Net assets, at value | | $ | 177,487,942 | |
| Net Asset Value per share ($177,487,942/10,371,852 shares of common stock outstanding, $.01 par value, 30,000,000 shares authorized) | | $ | 17.11 | |
The accompanying notes are an integral part of the financial statements.
| | | | |
| Montgomery Street Income Securities, Inc. | | | 17 | |
Statement of Operations for the year ended December 31, 2011
| | | | |
| Investment Income | | | |
| Income: | | | | |
| Interest | | $ | 8,905,532 | |
| Total income | | | 8,905,532 | |
| Expenses: | | | | |
| Management and investment advisory fee | | | 449,427 | |
| Administrative fee | | | 409,543 | |
| Directors’ fees and expenses | | | 109,302 | |
| Legal | | | 96,780 | |
| Insurance | | | 48,373 | |
| Stockholder reporting | | | 45,434 | |
| Audit fees | | | 40,743 | |
| Stockholder services | | | 26,546 | |
| NYSE listing fee | | | 24,226 | |
| Custodian fees | | | 5,910 | |
| Other | | | 25,971 | |
| Total expenses | | | 1,282,255 | |
| Net investment income | | | 7,623,277 | |
| |
| Realized and Unrealized Gain (Loss) on Investment Transactions and Foreign Currency Related Items | | | |
| Net realized gain from investment transactions | | | 995,288 | |
| Net realized gain from futures contracts | | | 508,323 | |
| Net realized loss from swap agreements | | | (113,488 | ) |
| Net realized loss from foreign currency related items | | | (321,359 | ) |
| Net realized gain from written options contracts | | | 10,663 | |
| Net change in unrealized appreciation (depreciation) investments | | | (1,481,036 | ) |
| Net change in unrealized appreciation (depreciation) on swap agreements | | | (300,363 | ) |
| Net change in unrealized appreciation (depreciation) on futures contracts | | | 103,290 | |
| Net change in unrealized appreciation (depreciation) on written options contracts | | | 18,258 | |
| Net change in unrealized appreciation (depreciation) on foreign currency related items | | | 209,400 | |
| Net loss on investment transactions and foreign currency related Items | | | (371,024 | ) |
| Net increase in net assets resulting from operations | | $ | 7,252,253 | |
The accompanying notes are an integral part of the financial statements.
| | |
| 18 | | Montgomery Street Income Securities, Inc. |
Statements of Changes in Net Assets
| | | | | | | | |
| | | Year Ended December 31, | |
| Decrease in Net Assets | | 2011 | | | 2010 | |
| Operations: | | | | | | | | |
| Net investment income | | $ | 7,623,277 | | | $ | 7,530,260 | |
| Net realized gain on investment transactions and foreign currency related items | | | 1,079,427 | | | | 5,025,920 | |
| Net change in unrealized appreciation (depreciation) during the year on investment transactions and foreign currency related items | | | (1,450,451 | ) | | | 2,313,852 | |
| Net increase in net assets resulting from operations | | | 7,252,253 | | | | 14,870,032 | |
| Distributions to stockholders from net investment income | | | (7,360,210 | ) | | | (7,567,767 | ) |
| Fund share transactions: | | | | | | | | |
| Reinvestment of distributions | | | 374,855 | | | | 409,906 | |
| Cost of shares repurchased | | | (376,187 | ) | | | (457,942 | ) |
| Net decrease in net assets from fund share transactions | | | (1,332 | ) | | | (48,036 | ) |
| Increase (decrease) in net assets | | | (109,289 | ) | | | 7,254,229 | |
| Net assets at beginning of year | | | 177,597,231 | | | | 170,343,002 | |
| Net assets at end of year (including undistributed (excess of distributions over) net investment income of $(44,744) and $132,084, respectively) | | $ | 177,487,942 | | | $ | 177,597,231 | |
| | |
| Other information | | | | | | |
| Shares outstanding at beginning of year | | | 10,371,952 | | | | 10,375,256 | |
| Shares issued to stockholders in reinvestment of distributions | | | 23,900 | | | | 25,696 | |
| Shares repurchased | | | (24,000 | ) | | | (29,000 | ) |
| Net decrease in fund shares outstanding | | | (100 | ) | | | (3,304 | ) |
| Shares outstanding at end of year | | | 10,371,852 | | | | 10,371,952 | |
The accompanying notes are an integral part of the financial statements.
| | | | |
| Montgomery Street Income Securities, Inc. | | | 19 | |
Financial Highlights
| | | | | | | | | | | | | | | | | | | | |
| Years Ended December 31, | | 2011 | | | 2010c | | | 2009 | | | 2008 | | | 2007 | |
| | | | | |
| Selected Per Share Data | | | | | | | | | | | | | | | |
| Net asset value, beginning of year | | $ | 17.12 | | | $ | 16.42 | | | $ | 15.13 | | | $ | 18.07 | | | $ | 18.81 | |
| Income from investment operations: | | | | | | | | | | | | | | | | | | | | |
Incomea | | | 0.86 | | | | 0.86 | | | | 0.85 | | | | 1.07 | | | | 1.18 | |
Operating expensesa | | | (0.12 | ) | | | (0.14 | ) | | | (0.12 | ) | | | (0.12 | ) | | | (0.13 | ) |
Net investment incomea | | | 0.74 | | | | 0.72 | | | | 0.73 | | | | 0.95 | | | | 1.05 | |
Net realized and unrealized gain (loss) on investment transactions | | | (0.04 | ) | | | 0.71 | | | | 1.33 | | | | (2.84 | ) | | | (0.67 | ) |
| Total from investment operations | | | 0.70 | | | | 1.43 | | | | 2.06 | | | | (1.89 | ) | | | 0.38 | |
| Less distributions from: | | | | | | | | | | | | | | | | | | | | |
Net investment income | | | (0.71 | ) | | | (0.73 | ) | | | (0.77 | ) | | | (1.05 | ) | | | (1.12 | ) |
| Net asset value, end of year | | $ | 17.11 | | | $ | 17.12 | | | $ | 16.42 | | | $ | 15.13 | | | $ | 18.07 | |
| Per share market value, end of year | | $ | 15.43 | | | $ | 15.78 | | | $ | 14.68 | | | $ | 13.82 | | | $ | 16.13 | |
Closing price range on New York Stock Exchange for each share of
Common Stock outstanding: | | | | | | | | | | | | | | | | | | | | |
High ($) | | | 16.03 | | | | 16.78 | | | | 15.10 | | | | 17.27 | | | | 17.80 | |
Low ($) | | | 15.05 | | | | 14.67 | | | | 13.19 | | | | 11.25 | | | | 15.77 | |
| | | | | |
| Total Return | | | | | | | | | | | | | | | |
| Based on market value (%)b | | | 2.28 | | | | 12.50 | | | | 12.04 | | | | (7.94 | ) | | | (0.23 | ) |
| Based on net asset value (%)b | | | 4.54 | | | | 9.12 | | | | 14.47 | | | | (10.04 | ) | | | 2.68 | |
| | | | | |
| Ratio to Average Net Assets and Supplemental Data | | | | | | | | | | | | | | | |
| Net assets, end of year ($ millions) | | | 177 | | | | 178 | | | | 170 | | | | 157 | | | | 188 | |
| Ratio of expenses (%) | | | 0.71 | | | | 0.82 | | | | 0.76 | | | | 0.73 | | | | 0.67 | |
| Ratio of net investment income (%) | | | 4.24 | | | | 4.28 | | | | 4.64 | | | | 5.57 | | | | 5.64 | |
| Portfolio turnover rate (%) | | | 49 | | | | 132 | | | | 175 | | | | 170 | | | | 122 | |
| a | Based on average shares outstanding during the year. |
| b | Total return based on net asset value reflects changes in the Fund’s net asset value during the year. Total return based on market value reflects changes in market price. Each figure includes reinvestment of dividends. These figures will differ depending upon the level of any discount or premium between market price and net asset value. |
| c | The Fund changed investment adviser effective March 15, 2010. |
The accompanying notes are an integral part of the financial statements.
| | |
| 20 | | Montgomery Street Income Securities, Inc. |
Notes to Financial Statements
A. Significant Accounting Policies
Montgomery Street Income Securities Inc. (the “Fund”) is registered under the Investment Company Act of 1940, as amended (the “1940 Act”), as a closed-end, diversified management investment company.
The Fund’s financial statements are prepared in accordance with accounting principles generally accepted in the United States of America (“GAAP”) which requires the use of management estimates. Actual results could differ from those estimates. The policies described below are followed consistently by the Fund in the preparation of its financial statements.
Security Valuation. Investments are stated at value determined as of the close of regular trading (generally, 4:00 PM Eastern Time) on the NYSE on each day the exchange is open for trading. Debt securities are valued by independent pricing services approved by, or at the direction of, the Fund’s Board of Directors (the “Board”). If the pricing services are unable to provide valuations, debt securities are valued at the most recent bid quotation or evaluated price, as applicable, obtained from a broker/dealer or widely used quotation system. Fixed income securities with a remaining maturity of sixty days or less, maturing at par, are valued at amortized cost, unless it is determined that such price does not approximate market value. Forward foreign currency contracts are generally valued at the forward foreign currency exchange rate as of the close of the NYSE. Futures contracts traded on a liquid exchange are valued at the settlement price. If the settlement price is not available, exchange traded futures are valued at the last sales price as of the close of business on the local exchange. Options traded on a liquid exchange are valued at the last traded price as of the close of business on the local exchange. If the last trade is determined to not be representative of fair value, exchange traded options are valued at the last bid. Options traded on an illiquid exchange are valued at the most recent bid quotation obtained from a broker/dealer. Non-exchange traded derivatives, including swap agreements, are generally valued by approved pricing services. If the pricing services are unable to provide valuations, non-exchange traded derivatives are valued at the most recent bid quotation or evaluated price, as applicable, obtained from a broker/dealer or by pricing models using observable inputs. Pricing services used to value debt and derivative securities may use various pricing techniques which take into account appropriate factors such as yield, quality, coupon rate, maturity, type of issue, trading characteristics, call features, credit ratings and other data, as well as broker quotes.
Market quotations may not be readily available for certain debt and derivative investments. If market quotations are not readily available or if it is determined that a quotation of an investment does not represent market value, then the investment is valued at a “fair value” as determined in good faith using procedures approved by the Board. Although there can be no assurance, in general, the fair value of a security is the amount the owner of such security might reasonably expect to receive upon its current sale. Situations that may require a security to be fair valued may include instances where a security is thinly traded or restricted as to resale. In addition, securities may be fair valued based on the occurrence of a significant event. Significant events may be specific to a particular issuer, such as mergers, restructurings or defaults. Alternatively, significant events may affect an entire market, such as natural disasters or government actions. Securities are fair valued based on observable and unobservable inputs including Jackson Fund Services’ (“JFS” or the “Administrator”) own assumptions in determining fair value. Under the procedures adopted by the Board, the Administrator may rely on independent pricing services or other sources to assist in determining the fair value of a security. Factors considered to determine fair value include the correlation with price movement of similar securities in the same or other markets; the type, cost and investment characteristics of the security; the business and financial condition of the issuer; and trading or other market data. The value of an investment for purposes of calculating the Fund’s net asset value (“NAV”) can differ depending on the source and method used to determine the value.
Recent Accounting Pronouncements. In April 2011, the Financial Accounting Standards Board (“FASB”) released Accounting Standards Update (“ASU”) No. 2011-03 “Reconsideration of Effective Control for Repurchase Agreements.” ASU 2011-03 is intended to improve financial reporting of repurchase agreements and other agreements that both entitle and obligate a transferor to repurchase or redeem the financial assets before their maturity. The ASU 2011-03 eliminates the collateral maintenance provision that an entity may use to determine whether a transfer of securities in a repurchase agreement is accounted for as a sale or a secured borrowing. The ASU 2011-03 may cause certain dollar roll transactions that are currently accounted for as purchase and sale to be characterized as a secured borrowing transaction. The ASU 2011-03 is effective for the first interim or annual period beginning on or after December 15, 2011. Management is currently evaluating the impact ASU 2011-03 will have on the Fund’s financial statement disclosures.
In May 2011, FASB released ASU No. 2011-04 “Amendments to Achieve Common Fair Value Measurement and Disclosure Requirements in U.S. GAAP and International Financial Reporting Standards.” ASU 2011-04 further clarifies fair value measurement principles and requires additional disclosures. Effective for interim and annual periods beginning after
| | | | |
| Montgomery Street Income Securities, Inc. | | | 21 | |
December 15, 2011, entities will need to disclose the amounts and reasons for any transfers between Level 1 and Level 2 securities, quantitative information relating to significant observable inputs, a narrative description of the valuation process and a narrative description of the sensitivity of the fair value measurement to changes in unobservable or Level 3 fair valuation inputs. Management is currently evaluating the impact ASU 2011-04 will have on the Fund’s financial statement disclosures.
Security Transactions, Investment Income and Expenses. Investment transactions are accounted for on a trade date plus one basis for daily NAV calculations. However, for financial reporting purposes, investment transactions are reported on trade date. Interest income is recorded on the accrual basis. All premiums and discounts are amortized/accreted for financial reporting purposes. Dividend income is recorded on the ex-dividend date. Expenses are recorded on an accrual basis.
Federal Income Taxes. The Fund intends to qualify as a “regulated investment company” and to distribute substantially all net investment income and net capital gains, if any, to its stockholders and otherwise comply with Subchapter M of the Internal Revenue Code applicable to regulated investment companies. Therefore, no federal income tax provision is required.
Distribution of Income and Capital Gains. The amount and timing of distributions are determined in accordance with federal income tax regulations, which may differ from GAAP. Distributions of net investment income are paid quarterly. Net realized gains from investment transactions will be distributed to stockholders at least annually to the extent they exceed available capital loss carryforwards. The Fund uses the specific identification method for determining realized gain or loss on investments sold for both financial and federal income tax reporting purposes.
Contingencies. In the normal course of business, the Fund may enter into contracts with service providers that contain general indemnification clauses. The Fund’s maximum exposure under these arrangements is unknown, as this would involve future claims that may be made against the Fund that have not yet been made. However, based on experience to date, the Fund expects any risk of loss to be remote.
B. Investments and Risks
Forward Sales Commitments. The Fund may purchase or sell forward sales commitments. A forward sales commitment involves the Fund entering into a contract to purchase or sell securities for a fixed price at a future date beyond the customary settlement period. The purchase of a forward sales commitment involves the risk of loss if the value of the security to be purchased declines before the settlement date while the sale of a forward sales commitment involves the risk that the value of the securities to be sold may increase before the settlement date. The Fund may dispose of or renegotiate forward sales commitments after they are entered into, and may sell these securities before they are delivered, which may result in capital gain or loss.
When-Issued/Delayed-Delivery Securities. The Fund may purchase securities with delivery or payment to occur at a date beyond the normal settlement period. At the time the Fund enters into a commitment to purchase a security, the transaction is recorded and the value of the security is reflected in the NAV. The price of such security and the date when the security will be delivered and paid for are fixed at the time the transaction is negotiated. The value of the security may vary with market fluctuations. No interest accrues to the Fund until settlement of the trade. Certain risks may arise upon entering into when-issued or delayed-delivery securities from the potential inability of counterparties to meet the terms of their contracts or if the issuer does not issue the securities due to political, economic or other factors. Additionally, losses may arise due to changes in the value of the underlying securities.
Illiquid Investments and Restricted Securities. Illiquid securities and other investments are those that may not be sold or disposed of in the ordinary course of business within seven days, at approximately the price used to determine the Fund’s NAV per share. The Fund may not be able to sell illiquid investments when Pacific Investment Management Company (“PIMCO” or the “Adviser”) considers it desirable to do so or may have to sell such investments at a price that is lower than the price that could be obtained if the investments were liquid. A sale of illiquid investments may require more time and may result in higher dealer discounts and other selling expenses than would the sale of those that are liquid. Illiquid investments also may be more difficult to value, due to the unavailability of reliable market quotations for such investments, and investment in them may have an adverse impact on NAV. The Fund may also purchase certain restricted securities, commonly known as Rule 144A and Section 4(2) paper securities, which may be determined to be liquid pursuant to policies and guidelines established by the Board.
| | |
| 22 | | Montgomery Street Income Securities, Inc. |
Repurchase Agreements. The Fund may enter into repurchase agreements with certain banks and broker/dealers whereby the Fund agrees to purchase a security with a simultaneous agreement by the seller to repurchase the security back from the Fund at a specified price and date or upon demand. The Fund, through the custodian or sub-custodian bank, receives delivery of underlying securities used as collateral, the amount of which, at the time of purchase and each subsequent business day, is required to be maintained at such a level that the collateral’s value is at least equal to the principal amount of the repurchase price plus accrued interest. The custodian holds the collateral in a separate account until the agreement matures. If the counterparty defaults and the value of the collateral declines or if bankruptcy proceedings are commenced with respect to the counterparty, realization of the collateral by the Fund may be delayed or limited.
U.S. Government Agencies or Government Sponsored Enterprises. The Fund may invest in U.S. government agencies or government sponsored enterprises. U.S. government securities are obligations of and, in certain cases, guaranteed by, the U.S. government, its agencies or instrumentalities. Some U.S. government securities, such as Treasury bills, notes and bonds, and securities guaranteed by the Government National Mortgage Association, are supported by the full faith and credit of the U.S. government; others, such as those of the Federal Home Loan Bank, are supported by the right of the issuer to borrow from the U.S. Department of the Treasury (“U.S. Treasury”); others, such as those of the Federal National Mortgage Association (“FNMA”) are supported by the discretionary authority of the U.S. government to purchase the agency’s obligations. U.S. government securities may include zero coupon securities, which do not distribute interest on a current basis and tend to be subject to greater risk than interest-paying securities of similar maturities.
Government-related guarantors (i.e., guarantors who are not backed by the full faith and credit of the U.S. government) include FNMA and the Federal Home Loan Mortgage Corporation (“FHLMC”). FNMA purchases conventional (i.e., not insured or guaranteed by any government agency) residential mortgages from a list of approved seller/servicers which include state and federally chartered savings and loan associations, mutual savings banks, commercial banks and credit unions and mortgage bankers. Pass-through securities issued by FNMA are guaranteed as to timely payment of principal and interest by FNMA, but are not backed by the full faith and credit of the U.S. government. FHLMC issues Participation Certificates (“PCs”), which are pass-through securities, each representing an undivided interest in a pool of residential mortgages. FHLMC guarantees the timely payment of interest and ultimate collection of principal, but PCs are not backed by the full faith and credit of the U.S. government.
FNMA and FHMLC were placed into conservatorship by the Federal Housing Finance Agency (“FHFA”). As the conservator, FHFA succeeded to all rights, titles, powers and privileges of FNMA and FHLMC and of any stockholder, officer or director of FNMA and FHLMC with respect to FNMA and FHLMC and each enterprise’s assets. In connection with the conservatorship, the U.S. Treasury entered into a Senior Preferred Stock Purchase Agreement with FNMA and FHLMC. This agreement contains various covenants that severely limit each enterprise’s operations. In exchange for entering into these agreements, the U.S. Treasury received senior preferred stock in each enterprise and warrants to purchase each enterprise’s common stock. The U.S. Treasury announced the creation of a new secured lending facility, which is available to FNMA and FHLMC as a liquidity backstop and the creation of a temporary program to purchase mortgage-backed securities issued by FNMA and FHLMC. FNMA and FHLMC are continuing to operate as going concerns while in conservatorship and each remains liable for all of its obligations, including its guaranty obligations, associated with its mortgage-backed securities.
Market, Credit and Counterparty Risk. In the normal course of business the Fund trades and holds financial instruments and enters into financial transactions where risk of potential loss exists due to changes in the market including rates and liquidity (“market risk”) or failure of the issuer to perform (“credit risk”). Similar to credit risk, the Fund may be exposed to counterparty risk, or the risk that an institution or other entity with which the Fund has unsettled or open transactions will default. Financial assets, which potentially expose the Fund to market, credit and counterparty risk, consist principally of cash due from counterparties and investments. The extent of the Fund’s exposure to market, credit and counterparty risks with respect to these financial assets is reflected in their carrying value as recorded in the Fund’s Statement of Assets and Liabilities. For certain derivative contracts, the potential loss could exceed the value of the financial assets recorded in the financial statements.
C. Financial Derivative Instruments
FASB ASC Topic 815, “Derivatives and Hedging”. This standard includes the requirement for enhanced qualitative disclosures about objectives and strategies for using derivative instruments and disclosures regarding credit related contingent features in derivative instruments, as well as quantitative disclosures in the semi-annual and annual financial statements about fair value, gains and losses and volume of activity for derivative instruments. Information about these
| | | | |
| Montgomery Street Income Securities, Inc. | | | 23 | |
instruments is disclosed in the context of each instrument’s primary underlying risk exposure that is categorized as credit, equity price, interest rate and foreign currency exchange rate risk. The objectives, strategies and underlying risks for each instrument are discussed in the following paragraphs.
A tabular disclosure for each derivative investment by risk category is presented in the Notes to the Investment Portfolio which references the location on the Statement of Assets and Liabilities and the realized and unrealized gain (loss) in the Statement of Operations for each derivative investment. The derivative instruments outstanding as of the year ended December 31, 2011 as disclosed in the Notes to the Investment Portfolio and the amounts of realized and changes in unrealized gains and losses on derivative instruments during the year as disclosed in the Statement of Operations serve as indicators of the volume of derivative activity for the Fund. During the year, the Fund initiated transactions in options and gradually increased the trading volume. The Fund also initiated transactions in interest rate swap agreements and the level of exposure changed from $0 notional amount at December 31, 2010 to $7,297,414 notional amount at December 31,2011. In addition, in implementing the Fund’s investment strategy, the Fund increased exposure to credit default swap agreements from $500,000 notional amount at December 31, 2010 to $9,810,390 notional amount at December 31, 2011. There were no significant changes in volume in other derivatives investments during the year.
Futures Contracts. The Fund may be subject to interest rate risk in the normal course of pursuing its investment objective. The Fund entered into futures contracts to manage exposure to or hedge changes in interest rates, as a substitute for investment in physical securities and as an efficient means of adjusting overall exposure to certain markets as part of its investment strategy. A futures contract is a standardized contract obligating two parties to exchange a specified asset at an agreed upon price and date. Upon entering into a futures contract, the Fund is required to deposit with the broker an amount of cash or cash equivalents equal to a certain percentage of the contract amount known as the “initial margin”. The Fund receives from or pays to the counterparty an amount of cash equal to the daily fluctuation in the value of the contracts. Such receipts or payments, known as the “variation margin”, are recorded by the Fund until the contracts are terminated at which time realized gains and losses are recognized. Futures contracts involve, to varying degrees, risk of loss in excess of the variation margin recorded by the Fund. The primary risks associated with the use of futures contracts are the imperfect correlation between the change in value of the securities held by the Fund and the prices of the futures contracts and the possibility the Fund may not be able to enter into a closing transaction because of an illiquid market. With futures, there is minimal counterparty risk to the Fund since future contracts are exchange traded and the exchange’s clearinghouse, acting as counterparty to all exchange traded futures, guarantees the futures contracts against default.
The Fund has claimed an exclusion from the definition of the term “commodity pool operator” under the Commodity Exchange Act and, therefore, it is not subject to registration or regulation as a commodity pool operator under that Act.
Options Contracts. The Fund may be subject to interest rate risk in the normal course of pursuing its investment objective. During the year, the Fund entered into option contracts to manage exposure to or hedge changes in interest rates.
An option is a contract that gives the purchaser of the option, in return for a premium paid, the right to buy a specified underlying instrument from the writer of the option (in the case of a call option), or to sell a specified underlying instrument to the writer of the option (in the case of a put option) at a designated price during the term of the option. When the Fund purchases an option, the premium paid by the Fund is recorded as an asset and is subsequently marked-to-market to reflect the current value of the option. Premiums paid for purchasing options which expire are treated as realized losses. Premiums paid for purchasing options which are exercised or closed are added to the cost basis of the underlying investment or offset against the proceeds of the underlying investment transaction to determine realized gain or loss. Purchasing call options tends to increase the Fund’s exposure to the underlying instrument. Purchasing put options tends to decrease the Fund’s exposure to the underlying instrument. The risks associated with purchasing options are limited to premiums paid and the failure of the counterparty to honor its obligation under the contract. When the Fund writes a call or put option, the premium received by the Fund is recorded as a liability and is subsequently marked to market to reflect the current value of the option. Premiums received from writing options which expire are treated as realized gains. Premiums received from writing options which are exercised or closed are added to the proceeds of the underlying investment transaction or reduce the cost basis of the underlying investment to determine the realized gain or loss. Writing call options tends to decrease the Fund’s exposure to the underlying instrument. Writing put options tends to increase the Fund’s exposure to the underlying instrument. The risk associated with writing an option that is exercised is that an unfavorable change in the price of the security underlying the option could result in the Fund buying the underlying security at a price higher than the current value or selling the underlying security at a price lower than the current market value. There is also the risk the Fund may not be able to enter into a closing transaction because of an illiquid market. Options written by the Fund do not give rise to counterparty credit risk, as they obligate the Fund, not the counterparty, to perform.
| | |
| 24 | | Montgomery Street Income Securities, Inc. |
The Fund may buy and sell (“write”) call and put options on futures, currencies and swaps agreements (“swaptions”). Swaptions are similar to options on securities except that instead of purchasing the right to buy or sell a security, the writer or purchaser of the swap option is granting or buying the right to enter into a previously agreed upon interest rate swap agreement at any time before the expiration of the option. Swaptions are illiquid investments.
Options contracts involve, to varying degrees, risk of loss in excess of the premium paid or received recorded by the Fund. The primary risks associated with the use of option contracts on futures contracts involve similar risks to trading in the underlying futures contracts, including the imperfect correlation between the change in value of the securities held by the Fund and the prices of the underlying futures contracts and the possibility the Fund may not be able to enter into a closing transaction because of an illiquid market. Option contracts entered into by the Fund during the year were traded on public markets that are regulated by the Commodities Futures Trading Commission. Similar to futures contracts, there is minimal counterparty risk to the Fund since the options on futures contracts traded by the Fund were exchange traded and the exchange’s clearing house, as counterparty to all exchange traded options, guarantees the options contracts against default.
Forward Foreign Currency Contracts. The Fund may be subject to foreign currency exchange rate risk in the normal course of pursuing its investment objective. The Fund entered into forward foreign currency contracts to minimize foreign currency risk on portfolio securities denominated in foreign currencies and as part of its overall investment strategy. A forward foreign currency contract is an agreement between two parties to buy and sell a currency at a set price on a future date. The use of forward foreign currency contracts does not eliminate fluctuations in the underlying prices of the Fund’s portfolio securities, but it does establish a fixed rate of currency exchange that can be achieved in the future. The market value of a forward foreign currency contact fluctuates with changes in foreign currency exchange rates. Forward foreign currency contracts are marked-to-market daily and the change in value is recorded by the Fund as an unrealized gain or loss and as a receivable or payable from forward foreign currency contracts. Upon settlement, delivery or receipt of the currency, a realized gain or loss is recorded, which is equal to the difference between the value of the contract at the time it was opened and the value at the time it was closed. Forward foreign currency contracts involve market risk in excess of the receivable or payable related to forward foreign currency contracts recorded by the Fund. Although contracts limit the risk of loss due to a decline in the value of the hedged currency, they also limit any potential gain that might result should the value of the currency increase. Additionally, the Fund could be exposed to the risk of a previously hedged position becoming unhedged if the counterparty to a contract is unable to meet the terms of the contract or if the value of the currency changes unfavorably to the offsetting currency.
Swap Agreements. Swap agreements are privately negotiated agreements between the Fund and a counterparty to exchange the return generated by one instrument for the return generated by another instrument. Swap agreements are illiquid investments. If the Fund transacts in swap agreements, they are a party to International Swaps and Derivatives Association, Inc. (“ISDA”) Master Agreements (“ISDA Master Agreements”) with select counterparties. The ISDA Master Agreements govern transactions in over-the-counter derivative and forward foreign currency contracts and maintain provisions for general obligations, representations, agreements, collateral and events of default or termination. Events of termination include conditions that may entitle counterparties to elect to terminate early and cause settlement of all outstanding transactions under the applicable ISDA Master Agreement. Any election of early termination could be material to the financial statements. The amount of collateral exchanged is based on provisions within the ISDA Master Agreements and is determined by the net exposure with the counterparty and is not identified for a specific swap agreement. The Fund’s collateral delivered to counterparties as of December 31, 2011, is identified with a footnote in the Investment Portfolio. Collateral received from counterparties is included in deposits with/from counterparties in the Statement of Assets and Liabilities.
Swap agreements are marked-to-market daily and change in value is recorded by the Fund as an unrealized gain or loss. Swap premiums paid or received at the beginning of the measurement period which are recorded by the Fund represent payments made or received upon entering into the swap agreement to compensate for differences between the stated terms of the swap agreement and prevailing market conditions relating to credit spreads, interest rates, currency exchange rates and other relevant factors as appropriate. These upfront payments are amortized over the life of the swap agreement and recorded as a realized gain or loss upon termination or maturity of the swap agreement. A liquidation payment received or made at the termination of the swap agreement is recorded as realized gain or loss. Net periodic payments received or paid by the Fund are included as part of realized gain or loss.
Entering into swap agreements involves, to varying degrees, elements of credit and market risk in excess of the unrealized gain or loss recorded by the Fund. Such risks involve the possibility that there will be no liquid market for these agreements,
| | | | |
| Montgomery Street Income Securities, Inc. | | | 25 | |
that there may be unfavorable changes the value of underlying securities and that the counterparty to the agreements may default on its obligation to perform. In addition, entering into swap agreements involves documentation risk resulting from the possibility that that the parties to the swap agreements may disagree as to the meaning of contractual terms in the agreements. The credit risk associated with contracts is reduced by master netting arrangements to the extent that if an event of default occurs, all amounts with the counterparty are terminated and settled on a net basis. The Fund’s overall exposure to credit risk subject to master netting arrangements can change substantially within a short period, as it is affected by each transaction subject to the arrangement.
Credit Default Swap Agreements. The Fund may be subject to credit risk in the normal course of pursuing its investment objective. The Fund entered into credit default swap agreements to manage credit exposure, used in combination with cash bonds exposure to take advantage of spread variances between cash bonds and the credit default swap agreement and to hedge the underlying exposure to the cash bonds. Credit default swap agreements involve one party making a stream of payments (referred to as the buyer of protection) to another party (the seller of protection) in exchange for the right to receive a specified return if a credit event occurs for the referenced entity. A credit event is defined under the terms of each swap agreement and may include, but is not limited to, underlying entity default, bankruptcy, write-down, principal shortfall or interest shortfall. If a credit event occurs and cash settlement is not elected, a variety of other deliverable obligations may be delivered in lieu of the specific referenced obligation. The ability to deliver other obligations may result in a cheapest-to-deliver option (the buyer of protection’s right to choose the deliverable obligation with the lowest value following a credit event).
The Fund can be either a seller or buyer of protection when entering into a credit default swap agreement. As a seller of protection, the Fund will generally receive from the buyer of protection a premium in return for such protection and/or a fixed rate of income throughout the term of the swap if there is no credit event. As a seller, the Fund adds leverage to its portfolio because, in addition to its total net assets, the Fund is subject to investment exposure on the notional amount of the swap. If the Fund is a seller of protection and a credit event occurs, as defined under the terms of that particular swap agreement, the Fund will either pay to the buyer of protection an amount equal to the notional amount of the swap and take delivery of the referenced obligation or other deliverable obligations or pay a net settlement amount in the form of cash or securities equal to the notional amount of the swap less the recovery value of the referenced obligation. If the Fund is a buyer of protection and a credit event occurs, as defined under the terms of that particular swap agreement, the Fund will either receive from the seller of protection an amount equal to the notional amount of the swap and deliver the referenced obligation or other deliverable obligations or receive a net settlement amount in the form of cash or securities equal to the notional amount of the swap less the recovery value of the referenced obligation. Until a credit event occurs, recovery values are determined by market makers considering either industry standard recovery rates or entity specific factors and considerations. When a credit event occurs, the recovery value is determined by a facilitated auction, administered by ISDA, whereby a minimum number of allowable broker bids, together with a specified valuation method, are used to calculate the settlement value.
Either as a seller of protection or a buyer of protection of a credit default swap agreement, the Fund’s maximum risk of loss from counterparty risk is the fair value of the agreement. This risk is mitigated by having a master netting arrangement between the Fund and the counterparty and by posting collateral by the counterparty to the Fund to cover the Fund’s exposure to the counterparty. The maximum potential amount of future payments (undiscounted) that the Fund as a seller of protection could be required to make under a credit default swap agreement would be an amount equal to the notional amount of the agreement. These potential amounts would be partially offset by any recovery values of the respective referenced obligations, upfront payments received upon entering into the agreement or net amounts received from the settlement of buy protection credit default swap agreements entered into by the Fund for the same referenced entity or entities.
Interest Rate Swap Agreements. The Fund may be subject to interest rate risk in the normal course of pursuing its investment objective. The Fund entered into interest rate swap agreements to manage duration, to manage interest rate and yield curve exposure and as a substitute for investment in physical securities. Interest rate swap agreements involve the exchange by the Fund with another party of their respective commitments to pay or receive interest with respect to the notional amount of principal. Forms of interest rate swap agreements that the Fund has entered into may include: fixed-for-floating rate swaps, under which a party agrees to pay a fixed rate in exchange for receiving a floating rate tied to a benchmark and floating-for-fixed rate swaps, under which a party agrees to pay a floating rate in exchange for receiving a fixed rate.
| | |
| 26 | | Montgomery Street Income Securities, Inc. |
The Fund’s maximum risk of loss from counterparty credit risk for an interest rate swap agreement is the discounted net value of the cash flows to be received from or paid to the counterparty over the contract’s remaining life, to the extent this amount is positive. This risk is mitigated by having a master netting arrangement between the Fund and the counterparty and by posting of collateral by the counterparty to the Fund to cover the Fund’s exposure to the counterparty.
D. Purchases and Sales of Securities
During the year ended December 31, 2011, purchases and sales of investment securities, excluding U.S. government obligations and short-term investments, aggregated $36,998,412 and $81,939,250, respectively. During the year ended December 31, 2011, purchases and sales of long-term U.S. government obligations aggregated $32,702,707 and $6,744,799, respectively.
Fund Transactions and Brokerage. Subject to compliance with Rule 17a-7 under the 1940 Act, the Adviser is permitted to cause the Fund to purchase securities from or sell securities to another account, including another investment company, advised by the Adviser.
There are occasions when portfolio transactions for the Fund are executed as part of concurrent authorizations to purchase or sell the same security for the Fund and for other accounts served by the Adviser or an affiliated company. They are affected only when the Adviser believes that to do so is in the best interest of the Fund and the other accounts participating. When such concurrent authorizations occur, the executions will be allocated in an equitable manner.
E. Fees and Agreements
Investment Advisory Agreement. Pursuant to an Investment Advisory Agreement, the Fund pays PIMCO a quarterly fee at the annual rate of 0.25% of the average daily net assets of the Fund.
Fund Accounting and Administration Services Agreement. Pursuant to a Fund Accounting and Administration Services Agreement, the Fund pays JFS an annual fee, payable monthly, equal to 0.25% of the average daily value of the net assets of the Fund up to $100 million; 0.20% of the average daily value of the net assets of the Fund from $100 million to $200 million; and 0.15% of the average daily value of the net assets of the Fund over $200 million. JFS makes individuals available to the Fund to serve as its officers. Officers are not directly compensated by the Fund.
Directors’ Fees and Expenses. The Fund pays each Board Director a retainer fee plus specified amounts for each Board and Committee meeting attended.
F. Income Tax Matters
The following information is presented on an income tax basis. The timing and characterization of certain income and capital gains are determined in accordance with federal tax regulations, which may differ from GAAP. These differences primarily relate to timing differences in recognizing certain gains and losses on investment transactions and accounting treatment for notional principal contracts. To the extent that differences arise that are permanent in nature, such amounts are reclassified within the components of net assets on the Statement of Assets and Liabilities based on their federal income tax treatment; timing differences do not require reclassification. Timing and permanent differences do not impact the NAV of the Fund. On December 31, 2011, permanent differences decreased undistributed net investment income and decreased accumulated realized loss by $439,895.
At December 31, 2011, the cost of investments and the components of net unrealized depreciation are listed in the following table.
| | | | | | | | | | | | | | |
Cost of
Investments | | | Gross Unrealized
Depreciation | | | Gross Unrealized
Appreciation | | | Net Unrealized
Appreciation | |
| | $192,066,780 | | | $ | (5,320,697 | ) | | $ | 5,708,625 | | | $ | 387,928 | |
At December 31, 2011, the Fund had undistributed net ordinary income of $298,748.
The distributions paid of $7,360,210 and $7,567,767 for the years ended December 31, 2011 and 2010, respectively, were from net ordinary income.
The Regulated Investment Company Modernization Act of 2010 (“Act”) was enacted on December 22, 2010. In general, the provisions of the Act are effective for the Fund’s fiscal year ending December 31, 2011. Under the Act, the Fund is
| | | | |
| Montgomery Street Income Securities, Inc. | | | 27 | |
permitted to carry forward capital losses for an unlimited period. However, any losses incurred during those future taxable years are required to be utilized prior to the losses incurred in pre-enactment taxable years. As a result of this ordering rule, pre-enactment capital loss carry forwards may be more likely to expire unused. Additionally, post-enactment capital losses that are carried forward will retain their character as either short-term or long-term capital losses, and will not be considered exclusively short-term as under previous law.
At December 31, 2011, the Fund had unused pre-enactment capital loss carryforwards available for federal income tax purposes which may be applied against any future realized net taxable capital gains or until the respective expiration dates occur as noted below.
| | | | |
| Year of Expiration | | Amount | |
| 2014 | | $ | 529,300 | |
| 2015 | | | 596,899 | |
| 2016 | | | 12,721,218 | |
| 2017 | | | 11,494,100 | |
| Total | | $ | 25,341,517 | |
The Fund had $126,874 of capital losses realized from November 1, 2011, through December 31, 2011, which were deferred for tax purposes to January 1, 2012, the first day of the current fiscal year.
FASB ASC Topic 740, “Income Taxes”, provides guidance for how uncertain tax positions should be recognized, measured, presented and disclosed in the financial statements. FASB ASC Topic 740 requires the evaluation of tax positions taken or expected to be taken in the course of preparing the Fund’s tax returns to determine whether the tax positions are “more-likely-than-not” of being sustained by the applicable tax authority. Tax positions not deemed to meet the “more-likely-than-not” threshold would result in the Fund recording a tax expense in the current year. FASB ASC Topic 740 requires that management evaluate the tax positions taken in returns for 2008 through 2011 which remain subject to examination, by the Internal Revenue Service. These returns are not subject to examination by any other tax jurisdictions. Management completed an evaluation of the Fund’s tax positions and based on that evaluation, determined that no provision for federal income tax was required in the Fund’s financial statements during the year ended December 31, 2011.
G. Share Repurchases
The Fund is authorized to effect repurchases of its shares in the open market from time to time when the Fund’s shares trade at a discount to their NAV. During the year ended December 31, 2011, the Fund purchased 24,000 shares of common stock on the open market at a total cost of $376,187. The weighted average discount of these purchases, comparing the purchase price to the NAV at the time of purchase, was 10.03%. During the year ended December 31, 2010, the Fund purchased 29,000 shares of common stock on the open market at a total cost of $457,941. The weighted average discount of these purchases, comparing the purchase price to the NAV on the day of purchase, was 7.42%.
H. Subsequent Events
Management has evaluated subsequent events for the Fund through the date the financial statements are issued, and has concluded there are no events that require financial statement disclosure and/or adjustments to the financial statements.
| | |
| 28 | | Montgomery Street Income Securities, Inc. |
Report of Independent Registered Public Accounting Firm
To the Stockholders and Board of Directors of
Montgomery Street Income Securities, Inc.:
We have audited the accompanying statement of assets and liabilities, including the investment portfolio, of Montgomery Street Income Securities, Inc. (the “Fund”) as of December 31, 2011, the related statement of operations for the year then ended, and the statements of changes in net assets and the financial highlights for each of the years in the two-year period then ended. These financial statements and financial highlights are the responsibility of the Fund’s management. Our responsibility is to express an opinion on these financial statements and financial highlights based on our audits. The financial highlights for each of the fiscal years presented in the three-year period ended December 31, 2009 were audited by other auditors, whose report dated February 24, 2010, expressed an unqualified opinion on the financial highlights.
We conducted our audits in accordance with the standards of the Public Company Accounting Oversight Board (United States). Those standards require that we plan and perform the audit to obtain reasonable assurance about whether the financial statements and financial highlights are free of material misstatement. An audit includes examining, on a test basis, evidence supporting the amounts and disclosures in the financial statements. Our procedures included confirmation of securities owned as of December 31, 2011, by correspondence with the custodian and brokers or other appropriate auditing procedures. An audit also includes assessing the accounting principles used and significant estimates made by management, as well as evaluating the overall financial statement presentation. We believe that our audits provide a reasonable basis for our opinion.
In our opinion, the financial statements and financial highlights referred to above present fairly, in all material respects, the financial position of the Fund as of December 31, 2011, the results of its operations for the year then ended, and the changes in its net assets and the financial highlights for each of the years in the two-year period then ended, in conformity with U.S. generally accepted accounting principles.
/s/ KPMG LLP
February 24, 2012
Chicago, Illinois
| | | | |
| Montgomery Street Income Securities, Inc. | | | 29 | |
Dividend Reinvestment and Cash Purchase Plan
All registered stockholders of the Fund’s Common Stock are offered the opportunity of participating in the Plan. Registered stockholders, on request or on becoming registered stockholders, are mailed information regarding the Plan, including a form by which they may elect to participate in the Plan and thereby cause their future net investment income dividends and capital gains distributions to be invested in shares of the Fund’s common stock. The Custodian is the agent (the “Plan Agent”) for stockholders who elect to participate in the Plan.
If a stockholder chooses to participate in the Plan, the stockholder’s dividends and capital gains distributions will be promptly invested, automatically increasing the stockholder’s holdings in the Fund. If the Fund declares a dividend or capital gains distributions payable either in cash or in stock of the Fund, the stockholder will automatically receive stock. If the market price per share on the payment date for the dividend (the “Valuation Date”) equals or exceeds the net asset value per share, the Fund will issue new shares to the stockholder at the greater of the following on the Valuation Date: (a) net asset value per share or (b) 95% of the market price per share. If the market price per share on the Valuation Date is less than the net asset value per share, the Fund will issue new shares to the stockholder at the market price per share on the Valuation Date. In either case, for federal income tax purposes the stockholder will be deemed to receive a distribution equal to the market value on the Valuation Date of the new shares issued. If dividends or capital gains distributions are payable only in cash, then the stockholder will receive shares purchased on the New York Stock Exchange or otherwise on the open market. In this event, for federal income tax purposes the amount of the distribution will equal the cash distribution paid. State and local taxes may also apply. All reinvestments are in full and fractional shares, carried to three decimal places.
Stockholders participating in the Plan can also purchase additional shares quarterly in any amount from $100 to $5,000 (a “Voluntary Cash Investment”) by sending in a check together with the cash remittance slip, which will be sent with each statement of the stockholder’s account, to Computershare Shareowner Services LLC, the Fund’s transfer agent (the “Transfer Agent”). Such additional shares will be purchased on the open market by the Plan Agent or its delegate. The purchase price of shares purchased on the open market, whether pursuant to a reinvestment of dividends payable only in cash or a Voluntary Cash Investment, will be the average price (including brokerage commissions) of all shares purchased by the Plan Agent or its delegate on the date such purchases are effected. In addition, stockholders may be charged a service fee in an amount up to 5% of the value of the Voluntary Cash Investment. Although subject to change, stockholders are currently charged $1 for each Voluntary Cash Investment.
Stockholders may terminate their participation in the Plan at any time and elect to receive dividends and other distributions in cash by notifying the Transfer Agent in writing. Such notification must be received not less than 10 days prior to the record date of any distribution. There is no charge or other penalty for such termination. The Plan may be terminated by the Fund upon written notice mailed to the stockholders at least 30 days prior to the record date of any distribution. Upon termination, the Fund will issue certificates for all full shares held under the Plan and cash for any fractional share.
Alternatively, stockholders may request the Transfer Agent to instruct the Plan Agent or its delegate to sell any full shares and remit the proceeds, less a $2.50 service fee and less brokerage commissions. The sale of shares (including fractional shares) will be a taxable event for federal income tax purposes and may be taxable for state and local tax purposes.
The Plan may be amended by the Fund at any time. Except when required by law, written notice of any amendment will be mailed to stockholders at least 30 days prior to its effective date. The amendment will be deemed accepted unless written notice of termination is received by the Transfer Agent prior to the effective date.
An investor holding shares in its own name can participate directly in the Plan. An investor holding shares in the name of a brokerage firm, bank or other nominee should contact that nominee, or any successor nominee, to determine whether the nominee can participate in the Plan on the investor’s behalf and to make any necessary arrangements for such participation.
Additional information, including a copy of the Plan and its Terms and Conditions and an enrollment form, can be obtained from the Transfer Agent by writing Computershare Shareowner Services LLC, 480 Washington Boulevard, Jersey City, NJ 07310, or by calling (877) 437-3938.
| | |
| 30 | | Montgomery Street Income Securities, Inc. |
Directors and Officers
The following table presents certain information regarding the Directors and Officers of Montgomery Street Income Securities, Inc. as of December 31, 2011. Each Director’s and Officer’s age is set forth in parentheses after his or her name. The mailing address for each Director and Officer is 225 W. Wacker Drive, Suite 1200, Chicago, IL 60606. Unless otherwise noted, each Director and Officer has engaged in the principal occupation(s) noted in the table for at least the most recent five years, although not necessarily in the same capacity. The term of office for each Director is until the next annual meeting of stockholders or until the election and qualification of a successor. Officers are appointed annually by, and serve at the discretion of, the Board of Directors. The Fund’s 2011 proxy statement includes additional information about Directors of the Fund and is available, without charge, upon request, by calling (877) 437-3938.
| | | | |
Non-Interested Directors |
| | |
Name, Age, Position(s) Held with the Fund and Length of Time Served | | Principal Occupation(s) During Past 5 Years and Other Directorships Held | | Number of Funds in
the Fund Complex
Overseen |
Richard J. Bradshaw (63) Chairman and Director 1991 – present | | Consultant (2010 – present). Formerly, Partner and Chief Operating Officer of Venrock (venture capital firm) (2008 – 2010) and Executive Director of Cooley LLP (law firm) (1997 – 2008). Chairman of the Board of Directors of the Fund (since 2004). | | 1 |
Victor L. Hymes (54) Director 2005 – present | | Chief Executive Officer, Chief Investment Officer, and Director of Legato Capital Management LLC (investment adviser) (2004 –present). Formerly, Managing Director, Zurich Scudder Investments, Inc. (a former adviser of the Fund) (1997 – 2002); and President of the Fund (2000 – 2002). | | 1 |
Wendell G. Van Auken (67) Director 1994 – present | | Partner Emeritus at Mayfield Fund and Managing Director of several venture capital funds affiliated with Mayfield Fund. Directorship: Advent Software (portfolio software company). | | 1 |
Nancy E. Wallace (63) Director 2010 – present | | Professor of Real Estate and Finance, Haas School of Business, University of California, Berkeley (1986 – present). | | 1 |
| | | | |
| Montgomery Street Income Securities, Inc. | | | 31 | |
| | | | |
Officers |
| | |
Name, Age, Position(s) Held with the Fund and Length of Time Served | | Principal Occupation(s) During Past 5 Years and Other Directorships Held | | Number of Funds in
Fund Complex
Overseen |
Mark D. Nerud (45) President and Chief Executive Officer 2006 – present | | Chief Executive Officer of Jackson National Asset Management, LLC (“JNAM”) and Jackson Fund Services (“JFS”) (2010 – present); President of JNAM and JFS (2006-present); President, CEO and Trustee/Manager of investment companies advised by JNAM (2007 – present); Managing Board Member of Curian Capital LLC and Curian Clearing (2011 – present). Formerly, Managing Board Member of JNAM (2007 – 2010); Vice President – Fund Accounting & Administration of Jackson National Life Insurance Company (“Jackson”) (2000 – 2009). | | n/a |
Daniel W. Koors (41) Chief Financial Officer 2006 – present | | Chief Operating Officer of JNAM and JFS (2011 – present); Senior Vice President of JNAM and JFS (2009 – present); Treasurer and Chief Financial Officer of Curian Series Trust and Curian Variable Series Trust (2011 – present); Formerly, Chief Financial Officer of JNAM and JFS (2007 – 2011); Vice President, Treasurer and Chief Financial Officer of investment companies advised by JNAM or its affiliates (2006 – 2011); Assistant Vice President – Fund Administration of Jackson (2006 – 2009); Vice President of JNAM and JFS (2007 – 2008). | | n/a |
Susan S. Rhee (40) Chief Compliance Officer and
Chief Legal Officer 2006 – present | | Senior Vice President and General Counsel of JNAM and JFS (2010 – present); Secretary of JNAM (2000 – present); Vice President, Counsel, and Secretary of investment companies advised by JNAM (2004 – present). Formerly, Chief Legal Officer of JNAM (2004 – 2009); Associate General Counsel of Jackson
(2001 –2009); Assistant Vice President of Jackson (2003 – 2009). | | n/a |
Megan E. Garcy (26) Secretary 2011 – present | | Compliance Supervisor of JNAM and JFS (2010 – present). | | n/a |
| | |
| 32 | | Montgomery Street Income Securities, Inc. |
General Information
| | |
Investment
Adviser | | Pacific Investment Management Company LLC 840 Newport Center Drive Newport Beach, CA 92660 |
| Administrator | | Jackson Fund Services 225 West Wacker Drive Chicago, IL 60606 |
| Transfer Agent | | Computershare Shareowner Services LLC 480 Washington Boulevard Jersey City, NJ 07310 (Tel) 1/877/437-3938 |
| Custodian | | The Bank of New York Mellon Corporation One Mellon Center Pittsburgh, PA 15258 |
| Legal Counsel | | Arnold & Porter LLP Three Embarcadero Center San Francisco, CA 94111 |
Independent Registered Public Accounting Firm | | KPMG LLP 303 East Wacker Drive Chicago, IL 60601 |
| | | | |
| Montgomery Street Income Securities, Inc. | | | 33 | |

Jackson Fund Services
225 West Wacker Drive Suite 1200
Chicago, IL 60606
Presorted Standard
U.S. Postage
PAID
Lancaster, PA
Permit No. 1313
MSIS
(42065 2/11)
Item 2. Code of Ethics.
As of December 31, 2011, the registrant had adopted a “code of ethics” (as such term is defined in the instructions to Item 2 of Form N-CSR) that applies to the registrant’s principal executive officer and principal financial officer. This code is filed as Exhibit 12(a)(1) hereto. There were no substantive amendments or waivers to the code of ethics during the period covered by this report.
Item 3. Audit Committee Financial Expert.
The registrant’s Board of Directors has determined that Mr. Victor L. Hymes, Mr. Wendell G. Van Auken, and Ms. Nancy E. Wallace are “audit committee financial experts” (as such term is defined in the instructions to Item 3 of Form N-CSR). Each of these individuals is “independent,” meaning that he or she is not an “interested person” of the registrant (as that term is defined in Section 2(a)(19) of the Investment Company Act of 1940, as amended) and he or she does not accept any consulting, advisory, or other compensatory fee from the registrant (except in his or her capacity as a Board or committee member).
An “audit committee financial expert” is not an “expert” for any purpose, including for purposes of Section 11 of the Securities Act of 1933, as amended, as a result of being designated as an “audit committee financial expert.” Further, the designation of a person as an “audit committee financial expert” does not mean that the person has any greater duties, obligations, or liability than those imposed on the person without the “audit committee financial expert” designation. Similarly, the designation of a person as an “audit committee financial expert” does not affect the duties, obligations, or liability of any other member of the Audit Committee or Board of Directors.
Item 4. Principal Accountant Fees and Services.
(a) – (d)
KPMG LLP (“KPMG”) was appointed by the Board of Directors as the independent registered public accounting firm of the registrant for the fiscal years ended December 31, 2010 and December 31, 2011.
The following table sets forth the amount of fees that were billed by the principal accountant for the respective period to the registrant.
Fees for Services Rendered to the Registrant by the Principal Accountant
| | | | | | | | | | | | | | | | |
Fiscal Year | | Audit Fees | | | Audit-Related Fees | | | Tax Fees | | | All Other Fees | |
2010 | | $ | 40,000 | | | $ | 0 | | | $ | 3,500 | | | $ | 0 | |
2011 | | $ | 44,000 | | | $ | 0 | | | $ | 3,700 | | | $ | 0 | |
Tax Fees for 2010 and 2011 represent fees for services rendered to the registrant for review of tax returns, quarterly diversification tests, and income and capital gains distributions.
Pacific Investment Management Company (“PIMCO”) is the investment adviser of the registrant. The following table sets for the amount of fees that were billed by the principal accountant for the respective period to any entity controlling, controlled by or under common control with PIMCO that provided ongoing services to the registrant (“Adviser Entities”) that were directly related to the registrant’s operations and financial reporting.
Fees for Services Rendered to Adviser Entities by the Principal Accountant
| | | | | | | | | | | | |
Fiscal Year | | Audit-Related Fees | | | Tax Fees | | | All Other Fees | |
2010 | | $ | 0 | | | $ | 0 | | | $ | 0 | |
2011 | | $ | 0 | | | $ | 0 | | | $ | 0 | |
| (e)(1) | The Audit Committee has adopted procedures for the pre-approval by the Audit Committee of the engagement of the registrant’s independent auditors to provide audit and non-audit services to the registrant and the engagement of the registrant’s independent auditors to provide non-audit services to the registrant’s investment adviser or its related entities that related directly to the registrant’s operations and financial reporting. If time does not permit, the Chairman of the Audit Committee is authorized to pre-approve the engagement of the independent auditors on behalf of the Audit Committee. The independent auditors and the investment adviser are required to report on the initiation of any such engagement at the next regular Audit Committee meeting. |
| (g) | The aggregate amount of non-audit fees billed by the principal accountant to the registrant and Adviser Entities was $3,500 for 2010, and is detailed in the tables above. The aggregate amount of non-audit fees billed by the principal accountant to the registrant and Adviser Entities was $3,700 for 2011, and is detailed in the tables above. |
| (h) | For the fiscal years ended December 31, 2010 and December 31, 2011, the Audit Committee of the registrant’s Board of Directors considered the provision of non-audit services that were rendered to the respective Adviser Entities that were not pre-approved pursuant to paragraph (c)(7)(ii) of Rule 2-01 of Regulation S-X and concluded that such services were compatible with maintaining the respective principal accountant’s independence. |
Item 5. Audit Committee of Listed Registrants.
| (a) | The registrant has a separately-designated standing audit committee established in accordance with Section 3(a)(58)(A) of the Securities Exchange Act of 1934, as amended. The registrant’s audit committee consists of Wendell G. Van Auken (Chairman), Victor L. Hymes, and Nancy E. Wallace. |
Item 6. Investments.
| (a) | Included in Report to Stockholders under Item 1. |
Item 7. Disclosure of Proxy Voting Policies and Procedures for Closed-End Management Investment Companies.
It is the intention of the registrant to invest exclusively in non-voting securities. Under normal circumstances, the registrant does not intend to exercise conversion, exchange or other rights to purchase common stock or other equity securities, or otherwise to hold voting securities. In the unlikely event that the registrant does come into possession of any voting securities, the registrant intends to dispose of such securities as soon as it is reasonably practicable and prudent to do so.
Item 8. Portfolio Managers of Closed-End Management Investment Companies.
| (a) | As of March 15, 2010 and through the present, Mark R. Kiesel and Saumil H. Parikh of Pacific Investment Management Company LLC (“PIMCO”) are responsible for the day-to-day investment management of the registrant. Below are descriptions of each individual’s business experience: |
Mark R. Kiesel
Mr. Kiesel is a managing director in the Newport Beach office, a generalist portfolio manager, global head of the corporate bond portfolio management group and a senior member of the investment strategy and portfolio management group. In his role as global head of corporate bond portfolio management, he oversees the firm’s investment grade credit, high yield and bank loan business. He also manages corporate and equity portfolios for the firm. He joined PIMCO in 1996 and previously served as PIMCO’s head of equity derivatives and as a senior credit analyst. He has 18 years of investment experience and holds an MBA from the University of Chicago Graduate School of Business. He received his undergraduate degree from the University of Michigan.
Saumil H. Parikh, CFA
Mr. Parikh is a managing director in the Newport Beach office, generalist portfolio manager and a member of the PIMCO Investment Committee. He leads the firm’s cyclical economic forums and also serves as a member of the short-term, mortgage and global specialist portfolio management teams. Prior to joining PIMCO in 2000, Mr. Parikh was a financial economist and market strategist at UBS Warburg. He has 13 years of investment experience and holds undergraduate degrees in economics and biology from Grinnell College.
The other accounts managed by the registrant’s portfolio managers are as follows as of December 31, 2011:
| | | | | | | | |
| All Accounts | | | | | |
| | | |
Portfolio Manager | | Account Category | | Number of Accounts | | MV USD ($MM) | |
Mark R. Kiesel | | | | | | | | |
| | Registered Investment Companies | | 7 | | | 27,811.10 | |
| | Other Pooled Vehicle | | 15 | | | 27,637.43 | |
| | Separate Account | | 115 | | | 45,674.74 | |
Saumil H. Parikh | | | | | | | | |
| | Registered Investment Companies | | 10 | | | 4,851.05 | |
| | Other Pooled Vehicle | | 9 | | | 2,387.84 | |
| | Separate Account | | 88 | | | 39,372.16 | |
| | |
| Performance Fee Based Accounts | | | | | |
| | | |
Portfolio Manager | | Account Category | | Number of Accounts | | MV USD ($MM) | |
Mark R. Kiesel | | | | | | | | |
| | Other Pooled Vehicle | | 1 | | | 113.58 | |
| | Separate Account | | 9 | | | 5,313.70 | |
Saumil H. Parikh | | | | | | | | |
| | Separate Account | | 8 | | | 3,760.69 | |
Conflicts of Interest
From time to time, potential and actual conflicts of interest may arise between a portfolio manager’s management of the investments of a Fund, on the one hand, and the management of other accounts, on the other. Potential and actual conflicts of interest may also arise as a result of PIMCO’s other business activities and PIMCO’s possession of material non-public information about an issuer. Other accounts managed by a portfolio manager might have similar investment objectives or strategies as the Funds, track the same index a Fund tracks or otherwise hold, purchase, or sell securities that are eligible to be held, purchased or sold by the Funds. The other accounts might also have different investment objectives or strategies than the Funds.
Knowledge and Timing of Fund Trades. A potential conflict of interest may arise as a result of the portfolio manager’s day-to-day management of a Fund. Because of their positions with the Funds, the portfolio managers know the size, timing
and possible market impact of a Fund’s trades. It is theoretically possible that the portfolio managers could use this information to the advantage of other accounts they manage and to the possible detriment of a Fund.
Investment Opportunities. A potential conflict of interest may arise as a result of the portfolio manager’s management of a number of accounts with varying investment guidelines. Often, an investment opportunity may be suitable for both a Fund and other accounts managed by the portfolio manager, but may not be available in sufficient quantities for both the Fund and the other accounts to participate fully. Similarly, there may be limited opportunity to sell an investment held by a Fund and another account. PIMCO has adopted policies and procedures reasonably designed to allocate investment opportunities on a fair and equitable basis over time.
Under PIMCO’s allocation procedures, investment opportunities are allocated among various investment strategies based on individual account investment guidelines and PIMCO’s investment outlook. PIMCO has also adopted additional procedures to complement the general trade allocation policy that are designed to address potential conflicts of interest due to the side-by-side management of the Funds and certain pooled investment vehicles, including investment opportunity allocation issues.
Conflicts potentially limiting a Fund’s investment opportunities may also arise when the Fund and other PIMCO clients invest in different parts of an issuer’s capital structure, such as when the Fund owns senior debt obligations of an issuer and other clients own junior tranches of the same issuer. In such circumstances, decisions over whether to trigger an event of default, over the terms of any workout, or how to exit an investment may result in conflicts of interest. In order to minimize such conflicts, a portfolio manager may avoid certain investment opportunities that would potentially give rise to conflicts with other PIMCO clients or PIMCO may enact internal procedures designed to minimize such conflicts, which could have the effect of limiting a Fund’s investment opportunities.
Additionally, if PIMCO acquires material non-public confidential information in connection with its business activities for other clients, a portfolio manager may be restricted from purchasing securities or selling securities for a Fund. When making investment decisions where a conflict of interest may arise, PIMCO will endeavor to act in a fair and equitable manner as between a Fund and other clients; however, in certain instances the resolution of the conflict may result in PIMCO acting on behalf of another client in a manner that may not be in the best interest, or may be opposed to the best interest, of a Fund.
Performance Fees. A portfolio manager may advise certain accounts with respect to which the advisory fee is based entirely or partially on performance. Performance fee arrangements may create a conflict of interest for the portfolio manager in that the portfolio manager may have an incentive to allocate the
investment opportunities that he or she believes might be the most profitable to such other accounts instead of allocating them to a Fund. PIMCO has adopted policies and procedures reasonably designed to allocate investment opportunities between the Funds and such other accounts on a fair and equitable basis over time.
Portfolio Manager Compensation
PIMCO has adopted a “Total Compensation Plan” for its professional level employees, including its portfolio managers, that is designed to pay competitive compensation and reward performance, integrity and teamwork consistent with the firm’s mission statement. The Total Compensation Plan includes an incentive component that rewards high performance standards, work ethic and consistent individual and team contributions to the firm. The compensation of portfolio managers consists of a base salary, discretionary performance bonus, and may include an equity or long term incentive component.
Certain employees of PIMCO, including portfolio managers, may elect to defer compensation through PIMCO’s deferred compensation plan. PIMCO also offers its employees a non-contributory defined contribution plan through which PIMCO makes a contribution based on the employee’s compensation. PIMCO’s contribution rate increases at a specified compensation level, which is a level that would include portfolio managers.
The Total Compensation Plan consists of three components:
| | • | | Base Salary - Base salary is determined based on core job responsibilities, market factors and internal equity. Base salary levels are reviewed annually, when there is a significant change in job responsibilities or a significant change in the market. Base salary is paid in regular installments throughout the year and payment dates are in line with local practice. |
| | • | | Performance Bonus - Performance bonuses are designed to reward individual performance. Each professional and his or her supervisor will agree upon performance objectives to serve as a basis for performance evaluation during the year. The objectives will outline individual goals according to pre-established measures of the group or department success. Achievement against these goals as measured by the employee and supervisor will be an important, but not exclusive, element of the Compensation Committee’s bonus decision process. Final award amounts are determined at the discretion of the Compensation Committee and will also consider firm performance. |
| | • | | Equity or Long Term Incentive Compensation - Equity allows certain professionals to participate in the long-term growth of the firm. The M unit program provides for annual option grants which vest over a number of years and may convert into PIMCO equity that shares in the profit distributions of the firm. M Units are non-voting common equity of PIMCO and provide a |
| | mechanism for individuals to build a significant equity stake in PIMCO over time. Option awards may represent a significant portion of individual’s total compensation. |
In certain countries with significant tax implications for employees to participate in the M Unit Option Plan, PIMCO continues to use the Long Term Incentive Plan (“LTIP”) in place of the M Unit Option Plan. The LTIP provides cash awards that appreciate or depreciate based upon the performance of PIMCO’s parent company, Allianz Asset Management, and PIMCO over a three-year period. The aggregate amount available for distribution to participants is based upon Allianz Asset Management’s profit growth and PIMCO’s profit growth.
Participation in the M Unit Option Plan and LTIP is contingent upon continued employment at PIMCO.
In addition, the following non-exclusive list of qualitative criteria may be considered when specifically determining the total compensation for portfolio managers:
| | • | | 3-year, 2-year and 1-year dollar-weighted and account-weighted, pre-tax investment performance as judged against the applicable benchmarks for each account managed by a portfolio manager (including the Portfolios) and relative to applicable industry peer groups; |
| | • | | Appropriate risk positioning that is consistent with PIMCO’s investment philosophy and the Investment Committee/CIO approach to the generation of alpha; |
| | • | | Amount and nature of assets managed by the portfolio manager; |
| | • | | Consistency of investment performance across portfolios of similar mandate and guidelines (reward low dispersion); |
| | • | | Generation and contribution of investment ideas in the context of PIMCO’s secular and cyclical forums, portfolio strategy meetings, Investment Committee meetings, and on a day-to-day basis; |
| | • | | Absence of defaults and price defaults for issues in the portfolios managed by the portfolio manager; |
| | • | | Contributions to asset retention, gathering and client satisfaction; |
| | • | | Contributions to mentoring, coaching and/or supervising; and |
| | • | | Personal growth and skills added. |
A portfolio manager’s compensation is not based directly on the performance of any Portfolio or any other account managed by that portfolio manager.
Profit Sharing Plan. Instead of a bonus, portfolio managers who are Managing Directors of PIMCO receive compensation from a non-qualified profit sharing plan consisting of a portion of PIMCO’s net profits. Portfolio managers who are Managing Directors receive an amount determined by the Partner Compensation Committee, based upon an individual’s overall contribution to the firm.
Securities Ownership
The respective portfolio managers were not a beneficial owner of shares of the registrant as of December 31, 2011.
The information in this Item 8(a) was provided by PIMCO.
Item 9. Purchases of Equity Securities by Closed-End Management Investment Company and Affiliated Purchasers.
| | | | | | | | | | | | | | | | |
Period | | (a)
Total Number
of Shares (or
Units)
Purchased(1) | | | (b)
Average
Price Paid
per Share
(or Unit) | | | (c)
Total Number of
Shares (or Units)
Purchased as Part
of Publicly
Announced Plans
or Programs | | | (d)
Maximum Number (or
Approximate Dollar
Value) of Shares (or
Units) that May Yet Be
Purchased Under the
Plans or Programs | |
July 1 – July 31 | | | 0 | | | | 0 | | | | n/a | | | | n/a | |
August 1 – August 31 | | | 6,000 | | | | 15.58 | | | | n/a | | | | n/a | |
September 1 – September 30 | | | 0 | | | | 0 | | | | n/a | | | | n/a | |
October 1 – October 31 | | | 0 | | | | 0 | | | | n/a | | | | n/a | |
November 1 – November 30 | | | 6,000 | | | | 15.57 | | | | n/a | | | | n/a | |
December 1 – December 31 | | | 0 | | | | 0 | | | | n/a | | | | n/a | |
| | | | | | | | | | | | | | | | |
Total | | | 12,000 | | | | 15.58 | | | | n/a | | | | n/a | |
| (1) | All purchases were made on the open market pursuant to the registrant’s Repurchase Program and related guidelines. |
Item 10. Submission of Matters to a Vote of Security Holders.
There have been no material changes to the procedures by which stockholders may recommend nominees to the registrant’s Board of Directors since the registrant last disclosed such procedures in a Proxy Statement or Form N-CSR.
Item 11. Controls and Procedures.
| (a) | The President/Principal Executive Officer and the Treasurer/Principal Financial Officer of the registrant have concluded, based on their evaluation of the registrant’s disclosure controls and procedures (as defined in Rule 30a-3(c) under the Investment Company Act of 1940, as amended) as of a date within ninety (90) days of the filing date of this report on Form N-CSR, that such controls and procedures are effective and that the design and operation of such procedures ensures that information required to be disclosed by the registrant in this report on Form N-CSR is recorded, processed, summarized, and reported within the time periods specified in the U.S. Securities and Exchange Commission’s rules and forms. |
| (b) | There has been no change in the registrant’s internal controls over financial reporting (as defined in Rule 30a-3(d) under the Investment Company Act of 1940, as amended) that occurred during the second fiscal quarter of the period covered by this report that has materially affected, or is reasonably likely to materially affect, the registrant’s internal control over financial reporting. |
Item 12. Exhibits.
| | |
(a)(1) | | Code of Ethics (as defined in Item 2(b) of Form N-CSR). |
| |
(2) | | Certifications required by Rule 30a-2(a) under the Investment Company Act of 1940, as amended. |
| |
(3) | | Not applicable. |
| |
(b) | | Certification required by Rule 30a-2(b) under the Investment Company Act of 1940, as amended. |
SIGNATURES
Pursuant to the requirements of the Securities Exchange Act of 1934 and the Investment Company Act of 1940, the registrant has duly caused this report to be signed on its behalf by the undersigned, thereunto duly authorized.
| | |
| | Montgomery Street Income Securities, Inc. |
| |
| By: | | /s/ Mark D. Nerud |
| Name: | | Mark D. Nerud |
| Title: | | President and Principal Executive Officer |
| Date: | | March 5, 2012 |
Pursuant to the requirements of the Securities Exchange Act of 1934 and the Investment Company Act of 1940, this report has been signed below by the following persons on behalf of the registrant and in the capacities and on the dates indicated.
| | |
| By: | | /s/ Mark D. Nerud |
| Name: | | Mark D. Nerud |
| Title: | | President and Principal Executive Officer |
| Date: | | March 5, 2012 |
| | |
| By: | | /s/ Daniel W. Koors |
| Name: | | Daniel W. Koors |
| Title: | | Treasurer and Principal Financial Officer |
| Date: | | March 5, 2012 |
EXHIBIT LIST
| | |
Exhibit 12(a)(1): | | Code of Ethics (as defined in Item 2(b) of Form N-CSR) |
| |
Exhibit 12(a)(2)(a): | | Certification of the Principal Executive Officer required by Rule 30a-2(a) under the Act |
| |
Exhibit 12(a)(2)(b): | | Certification of the Principal Financial Officer required by Rule 30a-2(a) under the Act |
| |
Exhibit 12(b): | | Certification required by Rule 30a-2(b) under the Act |