UNITED STATES
SECURITIES AND EXCHANGE COMMISSION
Washington, D.C. 20549
FORM N-CSR
CERTIFIED SHAREHOLDER REPORT
OF
REGISTERED MANAGEMENT INVESTMENT COMPANIES
| |
| Investment Company Act file number: 811-01685 |
| Name of Registrant: | Vanguard Morgan Growth Fund |
| Address of Registrant: | P.O. Box 2600 |
| | Valley Forge, PA 19482 |
| |
| |
| |
| Name and address of agent for service: | Anne E. Robinson, Esquire |
| | P.O. Box 876 |
| | Valley Forge, PA 19482 |
| Registrant’s telephone number, including area code: (610) 669-1000 |
| Date of fiscal year end: September 30 | |
| Date of reporting period: October 1, 2017 – September 30, 2018 |
|
| Item 1: Reports to Shareholders | |

Annual Report | September 30, 2018
Vanguard Morgan™ Growth Fund
Vanguard’s Principles for Investing Success
We want to give you the best chance of investment success. These principles, grounded in Vanguard’s research and experience, can put you on the right path.
Goals. Create clear, appropriate investment goals.
Balance. Develop a suitable asset allocation using broadly diversified funds. Cost. Minimize cost.
Discipline. Maintain perspective and long-term discipline.
A single theme unites these principles: Focus on the things you can control.
We believe there is no wiser course for any investor.
| |
| Contents | |
| Your Fund’s Performance at a Glance. | 1 |
| CEO’s Perspective. | 3 |
| Advisors’ Report. | 5 |
| Fund Profile. | 10 |
| Performance Summary. | 12 |
| Financial Statements. | 14 |
| Your Fund’s After-Tax Returns. | 31 |
| About Your Fund’s Expenses. | 32 |
| Glossary. | 34 |
Please note: The opinions expressed in this report are just that—informed opinions. They should not be considered promises or advice. Also, please keep in mind that the information and opinions cover the period through the date on the front of this report. Of course, the risks of investing in your fund are spelled out in the prospectus.
See the Glossary for definitions of investment terms used in this report.
Your Fund’s Performance at a Glance
• Vanguard Morgan Growth Fund returned more than 24% for the 12 months ended September 30, 2018. It lagged its benchmark, the Russell 3000 Growth Index, but exceeded the average return of its peers.
• The fund seeks long-term capital appreciation, using a multimanager approach that
provides exposure to a broad range of large- and mid-capitalization U.S. growth stocks.
• During the period, growth stocks outperformed value, and large-caps topped small-
and mid-caps. U.S. stocks outpaced those of both developed and emerging markets.
• Six of the fund’s 11 sectors produced positive returns. Consumer staples, information
technology, and telecommunication services contributed most to relative performance;
consumer discretionary, health care, and financials were the biggest detractors.
• Over the past ten years, the fund’s average annual return trailed that of its benchmark
but surpassed that of its peers.
| |
| Total Returns: Fiscal Year Ended September 30, 2018 | |
| | Total |
| | Returns |
| Vanguard Morgan Growth Fund | |
| Investor Shares | 24.54% |
| Admiral™ Shares | 24.68 |
| Russell 3000 Growth Index | 25.89 |
| Multi-Cap Growth Funds Average | 23.04 |
Multi-Cap Growth Funds Average: Derived from data provided by Lipper, a Thomson Reuters Company.
Admiral Shares carry lower expenses and are available to investors who meet certain account-balance requirements.
| |
| Total Returns: Ten Years Ended September 30, 2018 | |
| | Average |
| | Annual Return |
| Morgan Growth Fund Investor Shares | 13.15% |
| Russell 3000 Growth Index | 14.18 |
| Multi-Cap Growth Funds Average | 11.84 |
Multi-Cap Growth Funds Average: Derived from data provided by Lipper, a Thomson Reuters Company.
The figures shown represent past performance, which is not a guarantee of future results. (Current performance may be lower or higher than the performance data cited. For performance data current to the most recent month-end, visit our website at vanguard.com/performance.) Note, too, that both investment returns and principal value can fluctuate widely, so an investor’s shares, when sold, could be worth more or less than their original cost.
1
| | | |
| Expense Ratios | | | |
| Your Fund Compared With Its Peer Group | | | |
| | Investor | Admiral | Peer Group |
| | Shares | Shares | Average |
| Morgan Growth Fund | 0.38% | 0.28% | 1.17% |
The fund expense ratios shown are from the prospectus dated January 26, 2018, and represent estimated costs for the current fiscal year. For the fiscal year ended September 30, 2018, the fund’s expense ratios were 0.37% for Investor Shares and 0.27% for Admiral Shares. The peer-group expense ratio is derived from data provided by Lipper, a Thomson Reuters Company, and captures information through year-end 2017.
Peer group: Multi-Cap Growth Funds.
2
CEO’s Perspective

Tim Buckley
President and Chief Executive Officer
Dear Shareholder,
Over the years, I’ve found that prudent investors exhibit a common trait: discipline. No matter how the markets move or what new investing fad hits the headlines, those who stay focused on their goals and tune out the noise are set up for long-term success.
The prime gateway to investing is saving, and you don’t usually become a saver without a healthy dose of discipline. Savers make the decision to sock away part of their income, which means spending less and delaying gratification, no matter how difficult that may be.
Of course, disciplined investing extends beyond diligent saving. The financial markets, in the short term especially, are unpredictable; I have yet to meet the investor who can time them perfectly. It takes discipline to resist the urge to go all-in when markets are frothy or to retreat when things look bleak.
Staying put with your investments is one strategy for handling volatility. Another, rebalancing, requires even more discipline because it means steering your money away from strong performers and toward poorer performers.
Patience—a form of discipline—is also the friend of long-term investors. Higher returns are the potential reward for weathering the market’s turbulence and uncertainty.
3
We have been enjoying one of the longest bull markets in history, but it won’t continue forever. Prepare yourself now for how you will react when volatility comes back. Don’t panic. Don’t chase returns or look for answers outside the asset classes you trust. And be sure to rebalance periodically, even when there’s turmoil.
Whether you’re a master of self-control, get a boost from technology, or work with a professional advisor, know that discipline
is necessary to get the most out of your investment portfolio. And know that Vanguard is with you for the entire ride.
Thank you for your continued loyalty.

Mortimer J. Buckley
President and Chief Executive Officer
October 18, 2018
| | | |
| Market Barometer | | | |
| | | Average Annual Total Returns |
| | Periods Ended September 30, 2018 |
| | One Year | Three Years | Five Years |
| Stocks | | | |
| Russell 1000 Index (Large-caps) | 17.76% | 17.07% | 13.67% |
| Russell 2000 Index (Small-caps) | 15.24 | 17.12 | 11.07 |
| Russell 3000 Index (Broad U.S. market) | 17.58 | 17.07 | 13.46 |
| FTSE All-World ex US Index (International) | 2.13 | 10.18 | 4.51 |
| |
| Bonds | | | |
| Bloomberg Barclays U.S. Aggregate Bond Index | | | |
| (Broad taxable market) | -1.22% | 1.31% | 2.16% |
| Bloomberg Barclays Municipal Bond Index | | | |
| (Broad tax-exempt market) | 0.35 | 2.24 | 3.54 |
| FTSE Three-Month U. S. Treasury Bill Index | 1.57 | 0.80 | 0.48 |
| |
| CPI | | | |
| Consumer Price Index | 2.28% | 1.99% | 1.52% |
4
Advisors’ Report
For the fiscal year ended September 30, 2018, Vanguard Morgan Growth Fund returned 24.54% for Investor Shares and 24.68% for the lower-cost Admiral Shares. The Russell 3000 Growth Index returned 25.89%, and the average return of multi-capitalization growth funds was 23.04%.
Your fund is managed by four independent advisors, a strategy that enhances the fund’s diversification by providing exposure to distinct yet complementary investment approaches. It’s not uncommon for different advisors to have different views about individual securities or the broader investment environment.
The advisors, the percentage of fund assets each manages, and brief descriptions of their investment strategies are presented in the accompanying table. The advisors have also prepared a discussion of the investment environment that existed during the fiscal year and of how portfolio positioning reflects this assessment. (Please note that the Frontier Capital Management discussion refers to sectors as defined by Russell classifications, rather than by the Global Industry Classification Standard used elsewhere in this report.)
These comments were prepared on October 16, 2018.
Wellington Management Company LLP
Portfolio Manager:
Paul E. Marrkand, CFA,
Senior Managing Director
Our portion of the fund uses traditional methods of stock selection—fundamental research and analysis—to identify mid-and large-capitalization companies that we believe have above-average growth prospects. We seek to build a portfolio of diversified sources of return with a balance of growth, quality, and valuation attributes.
It was a strong 12 months for U.S. and international equities. The S&P 500 Index returned 17.91% and the MSCI World Index returned 11.84%. Fixed income markets struggled in an environment of rising rates and global trade tensions. The Bloomberg Barclays U.S. Aggregate Bond Index returned –1.22%.
Sector allocation, a residual of our bottom-up stock selection process, added to the portfolio’s relative return. Our overweighted allocation to information technology was helped by the two largest relative individual contributors: NetApp and Microsoft. Underweights to consumer staples, materials, and real estate further boosted results. And stock selection was positive in consumer discretionary and energy.
5
Security selection detracted from relative performance overall, particularly in health care and information technology. The largest relative detractors included an underweight to Apple (information technology) and a position in Celgene (health care). We sold Celgene during the period as we no longer felt the risk-reward profile was compelling.
We remain optimistic about the portfolio’s positioning and continue to purchase, at attractive valuations, capital-compounding companies with what we believe to be long-term competitive advantages that can maintain a free-cash-flow growth rate beyond that of the market. Through this process, the portfolio ended the period most overweighted in information technology and energy and most underweighted in industrials and consumer staples.
Jennison Associates LLC
Portfolio managers:
Kathleen A. McCarragher,
Managing Director
Blair A. Boyer,
Managing Director
Equity returns were strong for the fiscal year. Global GDP advanced at a healthy pace, long-term interest rates remained low, and central banks tightened monetary policy gradually in light of subdued inflation. Solid U.S. economic fundamentals included accelerating economic expansion, robust employment, strong corporate profit growth, accumulating cash on company balance sheets, and rising business and consumer confidence.
Reduced regulatory pressures and corporate taxation also contributed to market performance. However, trade-related tensions gathered steam as threats from Washington sparked retaliatory measures from global trade partners.
Our successes included Amazon.com, which advanced as execution in all business segments led to better-than-expected revenue, gross margin, and operating margin. Netflix continued to raise its competitive barriers with investments in content, resulting in subscriber growth and increased pricing and operating leverage. Our position in Adobe also helped results. The company has transformed itself into a subscription-based provider of digital services in two of the fastest-growing enterprise software markets—content creation and digital marketing.
Celgene detracted from the portfolio, falling on pipeline disappointments. Still largely tied to its leading product, the company is in the early stages of its diversification strategy.
We eliminated our position in cable operator Charter Communications after key operating metrics in video and broadband subscriptions fell short of expectations. Tesla declined when investor focus shifted from the Model 3 production schedule
6
to the company’s founder and CEO, who was sued by the Securities and Exchange Commission (SEC) after tweeting about taking Tesla private. Tesla’s settlement with the SEC should allow investors to resume a focus on company fundamentals.
Vanguard Quantitative Equity Group
Portfolio Managers:
James P. Stetler
Binbin Guo, Principal,
Head of Alpha Equity Investments
Global markets continued to advance over the 12 months ended September 30, 2018. U.S. stocks led the way as increasing profits and a strong economy outweighed investor concerns about rising interest rates, higher inflation, and trade tensions. Large-cap stocks outperformed small-caps, and growth stocks outpaced value.
Emerging markets stocks were in negative territory, hurt by trade tensions and a rising dollar. Results in Europe and the Asia-Pacific region were muted in part because of these areas’ greater economic dependence on emerging markets.
The Federal Reserve raised rates in September—its eighth increase since the current tightening cycle began—and signaled more hikes to come. Attention is now focused on the pace of rate increases for the rest of 2018; many analysts expect another one in December and three in 2019.
Although it’s important to understand how overall performance is affected by such macro factors, our approach to investing focuses on specific fundamentals, not technical analysis of stock price movements. We believe that attractive stocks exhibit five key characteristics: high quality—healthy balance sheets and steady cash-flow generation; effective management decisions—sound investment policies that favor internal over external funding; consistent earnings growth—ability to grow earnings year after year; strong market sentiment—market confirmation of our view; and reasonable valuation—shares that are not overpriced.
Using these five themes, we generate a daily composite stock ranking. We then monitor our portfolio based on those rankings and adjust when appropriate to maximize expected returns while minimizing exposure to risks that our research indicates don’t improve returns (such as industry selection and other risks relative to our benchmark).
For the fiscal year, our quality and growth models made significant contributions to our relative performance, our management decisions model was flat, and our sentiment and valuation models detracted. Our strongest sector results were in industrials, information technology, and health care. Our weakest were in consumer discretionary, consumer staples, and real estate.
7
At the stock level, the largest contributions came from overweighted positions in Square, Advanced Micro Devices, Burlington, Fortinet, and ConocoPhillips as well as underweights to Charter Communications and Tesla. Underweights to Netflix, Amazon.com, Salesforce.com, and Nike detracted, as did overweights to Nektar Therapeutics and Lear Corporation.
Frontier Capital Management Co., LLC
Portfolio Managers:
Stephen M. Knightly, CFA, President
Christopher J. Scarpa, Vice President
Our portion of the portfolio was strongest in the energy and real estate sectors. Energy benefited as investors gained greater appreciation for the production profile of our holdings in a rising commodity environment. In consumer services, our focus on dollar stores and auto suppliers was rewarded.
Many of our investments in the materials sector were hurt by short-term inflation concerns. Our technology holdings were challenged when trade worries drove investors to more domestic software
companies and away from semiconductors. In health care, a regulatory change in the United Kingdom and a drug development failure hindered returns. Financials were mired in proposed regulatory changes in Europe and tax changes in the United States.
We have an underweighted allocation to industrials because of the sector’s maturing cyclical recovery and high valuations. We are taking a selective approach to our exposure to technology, where valuations have become extended. We are finding attractive opportunities in health care and financials. And we remain selective in both consumer sectors, which are experiencing disruptive competitive forces.
We are constructive on the economy. It appears that the Federal Reserve is embarking on policy normalization without hurting GDP. Yet after nine years of strong returns, valuations appear lofty. In this environment, we continue to focus on investing in companies that have strong secular appeal, are gaining share in growth markets, and have initiatives to augment shareholder returns through management actions.
8
Vanguard Morgan Growth Fund Investment Advisors
| | | |
| | Fund Assets Managed | |
| Investment Advisor | % | $ Million | Investment Strategy |
| Wellington Management | 46 | 7,535 | Uses traditional methods of stock selection— |
| Company LLP | | | fundamental research and analysis—to identify |
| | | | companies that it believes have above-average |
| | | | growth prospects. Research focuses on mid- and |
| | | | large-cap companies, evaluating and ranking each |
| | | | stock on a consistent set of growth, quality, and |
| | | | valuation criteria. We seek to build a portfolio with |
| | | | diversified sources of return with a balance of |
| | | | growth, quality, and valuation attributes. |
| Jennison Associates LLC | 23 | 3,685 | Uses a research-driven, fundamental investment |
| | | | approach that relies on in-depth company knowledge |
| | | | gleaned through meetings with management, |
| | | | customers, and suppliers. |
| Vanguard Quantitative Equity | 15 | 2,448 | Employs a quantitative fundamental management |
| Group | | | approach, using models that assess valuation, growth |
| | | | prospects, management decisions, market |
| | | | sentiment, and earnings and balance-sheet quality of |
| | | | companies as compared with their peers. |
| Frontier Capital Management | 14 | 2,373 | Uses a research-driven, fundamental investment |
| Co., LLC | | | approach that seeks companies with above-average |
| | | | growth prospects, reasonable valuations, and |
| | | | competitive advantages. |
| Cash Investments | 2 | 336 | These short-term reserves are invested by Vanguard |
| | | | in equity index products to simulate investments in |
| | | | stocks. Each advisor also may maintain a modest |
| | | | cash position. |
9
Morgan Growth Fund
Fund Profile
As of September 30, 2018
| | |
| Share-Class Characteristics | |
| | Investor | Admiral |
| | Shares | Shares |
| Ticker Symbol | VMRGX | VMRAX |
| Expense Ratio1 | 0.38% | 0.28% |
| 30-Day SEC Yield | 0.56% | 0.66% |
| | | |
| Portfolio Characteristics | | |
| | | Russell | DJ |
| | | 3000 | U.S. Total |
| | | Growth | Market |
| | Fund | Index | FA Index |
| Number of Stocks | 269 | 1,797 | 3,825 |
| Median Market Cap | $84.7B | $102.0B | $73.9B |
| Price/Earnings Ratio | 32.1x | 28.9x | 21.0x |
| Price/Book Ratio | 6.0x | 7.1x | 3.1x |
| Return on Equity | 16.1% | 21.2% | 14.9% |
| Earnings Growth | | | |
| Rate | 11.1% | 11.2% | 8.5% |
| Dividend Yield | 0.8% | 1.1% | 1.7% |
| Foreign Holdings | 4.8% | 0% | 0% |
| Turnover Rate | 47% | — | — |
| Short-Term | | | |
| Reserves | 0.8% | — | — |
| | | |
| Sector Diversification (% of equity exposure) |
| | | Russell | DJ |
| | | 3000 | U.S. Total |
| | | Growth | Market |
| | Fund | Index | FA Index |
| Consumer Discretionary 18.6% | 15.4% | 10.8% |
| Consumer Staples | 2.3 | 5.3 | 6.0 |
| Energy | 2.9 | 1.0 | 5.8 |
| Financials | 6.5 | 4.4 | 13.8 |
| Health Care | 14.4 | 14.8 | 14.6 |
| Industrials | 8.0 | 12.5 | 10.4 |
| Information Technology | 43.9 | 31.8 | 20.8 |
| Materials | 2.2 | 1.8 | 2.9 |
| Real Estate | 1.0 | 2.0 | 3.6 |
| Telecommunication | | | |
| Services | 0.1 | 10.9 | 8.5 |
| Utilities | 0.1 | 0.1 | 2.8 |
Sector categories are based on the Global Industry Classification Standard (“GICS”), except for the “Other” category (if applicable), which includes securities that have not been provided a GICS classification as of the effective reporting period.
| | |
| Volatility Measures | | |
| | Russell | DJ |
| | 3000 | U.S. Total |
| | Growth | Market |
| | Index | FA Index |
| R-Squared | 0.97 | 0.83 |
| Beta | 1.02 | 1.03 |
These measures show the degree and timing of the fund’s fluctuations compared with the indexes over 36 months.
| | |
| Ten Largest Holdings (% of total net assets) |
| Microsoft Corp. | Systems Software | 4.9% |
| Amazon.com Inc. | Internet & Direct | |
| | Marketing Retail | 4.9 |
| Alphabet Inc. | Internet Software & | |
| | Services | 4.4 |
| Apple Inc. | Technology | |
| | Hardware, Storage & | |
| | Peripherals | 4.1 |
| Visa Inc. | Data Processing & | |
| | Outsourced Services | 2.3 |
| Mastercard Inc. | Data Processing & | |
| | Outsourced Services | 2.2 |
| Home Depot Inc. | Home Improvement | |
| | Retail | 2.0 |
| Adobe Systems Inc. | Application Software | 1.7 |
| Salesforce.com Inc. | Application Software | 1.6 |
| Facebook Inc. | Internet Software & | |
| | Services | 1.6 |
| Top Ten | | 29.7% |
The holdings listed exclude any temporary cash investments and equity index products.
1 The expense ratios shown are from the prospectus dated January 26, 2018, and represent estimated costs for the current fiscal year. For the fiscal year ended September 30, 2018, the expense ratios were 0.37% for Investor Shares and 0.27% for Admiral Shares.
10
Morgan Growth Fund
Investment Focus
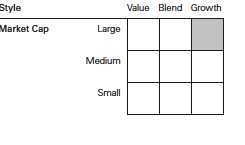
11
Morgan Growth Fund
Performance Summary
All of the returns in this report represent past performance, which is not a guarantee of future results that may be achieved by the fund. (Current performance may be lower or higher than the performance data cited. For performance data current to the most recent month-end, visit our website at vanguard.com/performance.) Note, too, that both investment returns and principal value can fluctuate widely, so an investor’s shares, when sold, could be worth more or less than their original cost. The returns shown do not reflect taxes that a shareholder would pay on fund distributions or on the sale of fund shares.
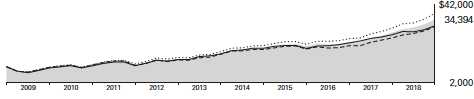
Cumulative Performance: September 30, 2008, Through September 30, 2018
Initial Investment of $10,000
| | | | |
| | Average Annual Total Returns | |
| | Periods Ended September 30, 2018 | |
| | | | | Final Value |
| | One | Five | Ten | of a $10,000 |
| | Year | Years | Years | Investment |
| Morgan Growth Fund*Investor Shares | 24.54% | 15.57% | 13.15% | $34,394 |
| Russell 3000 Growth Index | 25.89 | 16.23 | 14.18 | 37,654 |
| Multi-Cap Growth Funds Average | 23.04 | 13.23 | 11.84 | 30,628 |
| Dow Jones U.S. Total Stock Market | | | | |
| Float Adjusted Index | 17.58 | 13.42 | 12.05 | 31,191 |
Multi-Cap Growth Funds Average: Derived from data provided by Lipper, a Thomson Reuters Company.
| | | | |
| | | | | Final Value |
| | One | Five | Ten | of a $50,000 |
| | Year | Years | Years | Investment |
| Morgan Growth Fund Admiral Shares | 24.68% | 15.70% | 13.30% | $174,251 |
| Russell 3000 Growth Index | 25.89 | 16.23 | 14.18 | 188,270 |
| Dow Jones U.S. Total Stock Market Float | | | | |
| Adjusted Index | 17.58 | 13.42 | 12.05 | 155,955 |
See Financial Highlights for dividend and capital gains information.
12
Morgan Growth Fund
Fiscal-Year Total Returns (%): September 30, 2008, Through September 30, 2018
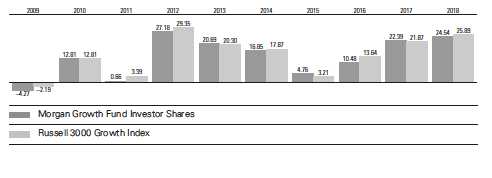
13
Morgan Growth Fund
Financial Statements
Statement of Net Assets
As of September 30, 2018
The fund reports a complete list of its holdings in regulatory filings four times in each fiscal year, at the quarter-ends. For the second and fourth fiscal quarters, the lists appear in the fund’s semiannual and annual reports to shareholders. For the first and third fiscal quarters, the fund files the lists with the Securities and Exchange Commission on Form N-Q. Shareholders can look up the fund’s Forms N-Q on the SEC’s website at sec.gov. Forms N-Q may also be reviewed and copied at the SEC’s Public Reference Room (see the back cover of this report for further information).
| | | |
| | | | Market |
| | | | Value• |
| | | Shares | ($000) |
| Common Stocks (98.3%)1 | | |
| Consumer Discretionary (18.2%) | |
| * | Amazon.com Inc. | 401,422 | 804,048 |
| | Home Depot Inc. | 1,599,902 | 331,420 |
| * | Netflix Inc. | 477,905 | 178,798 |
| * | O’Reilly Automotive Inc. | 456,109 | 158,416 |
| | TJX Cos. Inc. | 1,308,893 | 146,622 |
| | Ross Stores Inc. | 1,417,870 | 140,511 |
| | NIKE Inc. Class B | 1,550,439 | 131,353 |
| | McDonald’s Corp. | 755,178 | 126,334 |
| * | Booking Holdings Inc. | 58,395 | 115,856 |
| | Marriott International | | |
| | Inc. Class A | 648,852 | 85,668 |
| | Domino’s Pizza Inc. | 239,084 | 70,482 |
| *,^ | Tesla Inc. | 266,126 | 70,462 |
| | Yum! Brands Inc. | 642,230 | 58,385 |
| | Kering SA | 99,548 | 53,394 |
| | Dollar General Corp. | 370,909 | 40,540 |
| | Lowe’s Cos. Inc. | 329,472 | 37,830 |
| | Advance Auto Parts Inc. | 194,625 | 32,761 |
| | Las Vegas Sands Corp. | 538,374 | 31,942 |
| * | Michael Kors Holdings Ltd. 451,673 | 30,967 |
| * | LKQ Corp. | 972,336 | 30,794 |
| *,^ | Eldorado Resorts Inc. | 593,091 | 28,824 |
| * | ServiceMaster Global | | |
| | Holdings Inc. | 447,054 | 27,731 |
| * | Ulta Beauty Inc. | 87,575 | 24,707 |
| * | Dollar Tree Inc. | 264,808 | 21,595 |
| | Aramark | 415,568 | 17,878 |
| | Walt Disney Co. | 151,141 | 17,674 |
| * | Lululemon Athletica Inc. | 104,900 | 17,045 |
| * | Bright Horizons Family | | |
| | Solutions Inc. | 144,620 | 17,042 |
| * | Burlington Stores Inc. | 96,819 | 15,774 |
| | Texas Roadhouse Inc. | | |
| | Class A | 220,862 | 15,303 |
| * | Liberty Global plc | 498,991 | 14,051 |
| ^ | Sirius XM Holdings Inc. | 2,069,970 | 13,082 |
| *,^ | Carvana Co. Class A | 218,070 | 12,886 |
| | | |
| | Hyatt Hotels Corp. | | |
| | Class A | 130,089 | 10,354 |
| | Lear Corp. | 62,354 | 9,041 |
| * | Chipotle Mexican Grill Inc. | |
| | Class A | 19,597 | 8,907 |
| * | Liberty Media Corp-Liberty | |
| | SiriusXM Class A | 201,790 | 8,766 |
| | PulteGroup Inc. | 212,987 | 5,276 |
| | Tractor Supply Co. | 44,202 | 4,017 |
| * | Norwegian Cruise Line | | |
| | Holdings Ltd. | 59,076 | 3,393 |
| | Gentex Corp. | 144,879 | 3,109 |
| | Polaris Industries Inc. | 21,926 | 2,213 |
| | Starbucks Corp. | 16,498 | 938 |
| * | NVR Inc. | 184 | 455 |
| | | | 2,976,644 |
| Consumer Staples (2.1%) | | |
| | Costco Wholesale Corp. | 460,219 | 108,096 |
| * | Monster Beverage Corp. 1,418,875 | 82,692 |
| | Estee Lauder Cos. Inc. | | |
| | Class A | 452,329 | 65,732 |
| | Procter & Gamble Co. | 350,473 | 29,170 |
| | Kroger Co. | 633,081 | 18,429 |
| | Lamb Weston Holdings | | |
| | Inc. | 209,947 | 13,983 |
| * | Herbalife Nutrition Ltd. | 242,140 | 13,209 |
| | Sysco Corp. | 153,041 | 11,210 |
| * | US Foods Holding Corp. | 244,515 | 7,536 |
| | PepsiCo Inc. | 12,351 | 1,381 |
| | | | 351,438 |
| Energy (2.8%) | | |
| | Chevron Corp. | 670,126 | 81,943 |
| | BP plc ADR | 1,722,013 | 79,385 |
| | Pioneer Natural | | |
| | Resources Co. | 349,909 | 60,951 |
| | National Oilwell Varco | | |
| | Inc. | 1,198,037 | 51,611 |
| | Baker Hughes a GE Co. | 1,382,877 | 46,783 |
| * | Carrizo Oil & Gas Inc. | 881,751 | 22,220 |
14
Morgan Growth Fund
| | | |
| | | | Market |
| | | | Value• |
| | | Shares | ($000) |
| * | Apergy Corp. | 485,505 | 21,149 |
| | Occidental Petroleum | | |
| | Corp. | 237,753 | 19,536 |
| * | Concho Resources Inc. | 112,822 | 17,233 |
| | Anadarko Petroleum Corp. | 237,097 | 15,983 |
| | ConocoPhillips | 197,650 | 15,298 |
| * | Continental Resources Inc. | 207,979 | 14,201 |
| | HollyFrontier Corp. | 198,334 | 13,863 |
| | EOG Resources Inc. | 5,849 | 746 |
| | | | 460,902 |
| Financials (6.3%) | | |
| | S&P Global Inc. | 577,063 | 112,752 |
| | American Express Co. | 1,008,039 | 107,346 |
| | Intercontinental | | |
| | Exchange Inc. | 1,244,391 | 93,192 |
| | TD Ameritrade Holding | | |
| | Corp. | 1,465,306 | 77,412 |
| | Bank of America Corp. | 2,046,180 | 60,280 |
| * | Berkshire Hathaway Inc. | | |
| | Class B | 278,663 | 59,665 |
| | Morgan Stanley | 1,163,486 | 54,184 |
| | FactSet Research | | |
| | Systems Inc. | 229,727 | 51,392 |
| | JPMorgan Chase & Co. | 424,610 | 47,913 |
| | Goldman Sachs Group Inc. | 202,129 | 45,325 |
| | Raymond James Financial | | |
| | Inc. | 419,099 | 38,578 |
| | Nasdaq Inc. | 399,903 | 34,312 |
| | LPL Financial Holdings | | |
| | Inc. | 488,398 | 31,507 |
| | Aon plc | 198,552 | 30,533 |
| | Webster Financial Corp. | 482,798 | 28,466 |
| * | E*TRADE Financial Corp. | 543,333 | 28,465 |
| | Evercore Inc. Class A | 273,632 | 27,514 |
| | Moody’s Corp. | 151,019 | 25,250 |
| | T. Rowe Price Group Inc. | 150,914 | 16,477 |
| | Progressive Corp. | 229,181 | 16,281 |
| | MSCI Inc. Class A | 80,337 | 14,253 |
| | Comerica Inc. | 91,026 | 8,211 |
| | Charles Schwab Corp. | 158,890 | 7,809 |
| | Virtu Financial Inc. Class A | 231,336 | 4,731 |
| | Brown & Brown Inc. | 120,226 | 3,555 |
| | | | 1,025,403 |
| Health Care (14.0%) | | |
| | Bristol-Myers Squibb | | |
| | Co. | 3,375,350 | 209,542 |
| * | Edwards Lifesciences | | |
| | Corp. | 861,251 | 149,944 |
| * | Illumina Inc. | 377,659 | 138,624 |
| | Amgen Inc. | 643,391 | 133,369 |
| | Anthem Inc. | 400,256 | 109,690 |
| | Aetna Inc. | 525,100 | 106,517 |
| * | BioMarin Pharmaceutical | | |
| | Inc. | 1,066,665 | 103,435 |
| | | |
| | Thermo Fisher Scientific | | |
| | Inc. | 407,375 | 99,432 |
| | Danaher Corp. | 864,112 | 93,894 |
| | Gilead Sciences Inc. | 1,036,679 | 80,042 |
| | Baxter International Inc. | 980,328 | 75,574 |
| * | ICON plc | 452,949 | 69,641 |
| * | Alexion Pharmaceuticals | | |
| | Inc. | 455,882 | 63,372 |
| | AstraZeneca plc ADR | 1,586,659 | 62,784 |
| * | Vertex Pharmaceuticals | | |
| | Inc. | 320,821 | 61,835 |
| | Cooper Cos. Inc. | 209,621 | 58,096 |
| | UnitedHealth Group Inc. | 204,995 | 54,537 |
| * | Align Technology Inc. | 107,066 | 41,886 |
| * | Intuitive Surgical Inc. | 64,347 | 36,935 |
| | AbbVie Inc. | 384,894 | 36,403 |
| * | Cerner Corp. | 554,633 | 35,724 |
| * | Centene Corp. | 244,191 | 35,354 |
| * | Nektar Therapeutics | | |
| | Class A | 526,480 | 32,094 |
| * | ABIOMED Inc. | 69,686 | 31,341 |
| | STERIS plc | 263,622 | 30,158 |
| * | Exact Sciences Corp. | 341,777 | 26,973 |
| * | PRA Health Sciences Inc. | 217,767 | 23,996 |
| * | QIAGEN NV | 627,577 | 23,773 |
| * | Insulet Corp. | 213,995 | 22,673 |
| * | Waters Corp. | 115,895 | 22,562 |
| | Cigna Corp. | 108,285 | 22,550 |
| *,^ | TESARO Inc. | 561,942 | 21,921 |
| | Humana Inc. | 63,157 | 21,380 |
| | Zoetis Inc. | 218,671 | 20,022 |
| | Teleflex Inc. | 66,597 | 17,721 |
| * | WellCare Health Plans Inc. 48,052 | 15,400 |
| * | Incyte Corp. | 220,962 | 15,264 |
| * | IQVIA Holdings Inc. | 116,082 | 15,060 |
| * | Neurocrine Biosciences | | |
| | Inc. | 121,122 | 14,892 |
| * | DexCom Inc. | 96,757 | 13,840 |
| | Eli Lilly & Co. | 126,185 | 13,541 |
| * | Varian Medical Systems | | |
| | Inc. | 96,793 | 10,834 |
| * | Merit Medical Systems | | |
| | Inc. | 151,893 | 9,334 |
| * | Alkermes plc | 208,658 | 8,855 |
| * | DaVita Inc. | 68,718 | 4,922 |
| * | IDEXX Laboratories Inc. | 4,033 | 1,007 |
| | | | 2,296,743 |
| Industrials (7.8%) | | |
| | Caterpillar Inc. | 1,075,612 | 164,020 |
| | Boeing Co. | 435,184 | 161,845 |
| | Raytheon Co. | 647,395 | 133,791 |
| | Roper Technologies Inc. | 257,916 | 76,397 |
| * | IHS Markit Ltd. | 1,323,068 | 71,393 |
| ^ | Fortive Corp. | 787,620 | 66,451 |
| | Emerson Electric Co. | 791,626 | 60,623 |
15
Morgan Growth Fund
| | | |
| | | | Market |
| | | | Value• |
| | | Shares | ($000) |
| | Cintas Corp. | 280,388 | 55,463 |
| | Parker-Hannifin Corp. | 266,831 | 49,078 |
| | Waste Connections Inc. | 580,088 | 46,274 |
| * | HD Supply Holdings Inc. | 793,510 | 33,954 |
| | Experian plc | 1,265,018 | 32,461 |
| | Union Pacific Corp. | 194,053 | 31,598 |
| | Lockheed Martin Corp. | 81,616 | 28,236 |
| | KAR Auction Services Inc. | 410,347 | 24,494 |
| | Knight-Swift | | |
| | Transportation | | |
| | Holdings Inc. | 620,415 | 21,392 |
| * | JetBlue Airways Corp. | 1,042,393 | 20,181 |
| | BWX Technologies Inc. | 291,013 | 18,200 |
| | Rockwell Automation Inc. | 95,777 | 17,960 |
| | Allison Transmission | | |
| | Holdings Inc. | 301,778 | 15,695 |
| | Harris Corp. | 87,822 | 14,860 |
| | Old Dominion Freight Line | | |
| | Inc. | 88,683 | 14,301 |
| | Expeditors International | | |
| | of Washington Inc. | 182,403 | 13,412 |
| | AO Smith Corp. | 240,314 | 12,825 |
| * | Beacon Roofing Supply | | |
| | Inc. | 345,322 | 12,497 |
| | Robert Half International | | |
| | Inc. | 176,589 | 12,428 |
| * | Copart Inc. | 235,881 | 12,155 |
| * | Teledyne Technologies Inc. | 48,038 | 11,850 |
| | Huntington Ingalls | | |
| | Industries Inc. | 39,385 | 10,086 |
| * | XPO Logistics Inc. | 84,662 | 9,666 |
| | Spirit AeroSystems | | |
| | Holdings Inc. Class A | 75,664 | 6,936 |
| | IDEX Corp. | 28,443 | 4,285 |
| * | CoStar Group Inc. | 6,746 | 2,839 |
| | CSX Corp. | 31,933 | 2,365 |
| | United Parcel Service Inc. | | |
| | Class B | 13,410 | 1,566 |
| * | United Rentals Inc. | 7,200 | 1,178 |
| | HEICO Corp. Class A | 15,123 | 1,142 |
| | CH Robinson Worldwide Inc. | 7,672 | 751 |
| | | | 1,274,648 |
| Information Technology (43.1%) | |
| | Microsoft Corp. | 7,052,872 | 806,637 |
| | Apple Inc. | 2,987,858 | 674,479 |
| * | Alphabet Inc. Class C | 466,395 | 556,629 |
| | Visa Inc. Class A | 2,514,625 | 377,420 |
| | Mastercard Inc. Class A | 1,642,522 | 365,642 |
| * | Adobe Systems Inc. | 1,035,732 | 279,596 |
| * | salesforce.com Inc. | 1,685,467 | 268,040 |
| * | Facebook Inc. Class A | 1,602,808 | 263,598 |
| * | PayPal Holdings Inc. | 2,037,086 | 178,938 |
| * | Alphabet Inc. Class A | 137,356 | 165,800 |
| | Global Payments Inc. | 1,250,573 | 159,323 |
| | | |
| * | Alibaba Group Holding | | |
| | Ltd. ADR | 933,637 | 153,826 |
| * | Workday Inc. Class A | 1,048,019 | 152,990 |
| * | Worldpay Inc. Class A | 1,495,633 | 151,463 |
| | NVIDIA Corp. | 465,105 | 130,704 |
| | SS&C Technologies | | |
| | Holdings Inc. | 2,101,147 | 119,408 |
| | Intuit Inc. | 484,555 | 110,188 |
| | Tencent Holdings Ltd. | 2,614,073 | 106,735 |
| | Texas Instruments Inc. | 870,398 | 93,385 |
| | Activision Blizzard Inc. | 1,047,725 | 87,160 |
| * | VeriSign Inc. | 540,431 | 86,534 |
| * | ServiceNow Inc. | 422,508 | 82,655 |
| | NetApp Inc. | 939,061 | 80,656 |
| * | Gartner Inc. | 497,774 | 78,897 |
| | Cisco Systems Inc. | 1,587,547 | 77,234 |
| * | Square Inc. | 722,609 | 71,546 |
| * | Fiserv Inc. | 855,453 | 70,472 |
| * | FleetCor Technologies | | |
| | Inc. | 304,697 | 69,422 |
| * | Red Hat Inc. | 508,391 | 69,284 |
| * | Check Point Software | | |
| | Technologies Ltd. | 586,388 | 69,000 |
| * | Electronic Arts Inc. | 522,217 | 62,922 |
| * | VMware Inc. Class A | 363,314 | 56,699 |
| | DXC Technology Co. | 502,691 | 47,012 |
| * | WEX Inc. | 229,117 | 45,998 |
| | QUALCOMM Inc. | 637,120 | 45,892 |
| | Broadcom Inc. | 172,268 | 42,504 |
| | Maxim Integrated | | |
| | Products Inc. | 737,438 | 41,584 |
| * | Qorvo Inc. | 507,429 | 39,016 |
| * | Guidewire Software Inc. | 373,511 | 37,728 |
| * | Palo Alto Networks Inc. | 166,852 | 37,585 |
| * | Fortinet Inc. | 400,783 | 36,980 |
| * | InterXion Holding NV | 548,410 | 36,908 |
| * | Atlassian Corp. plc | | |
| | Class A | 383,773 | 36,896 |
| * | Semtech Corp. | 647,127 | 35,980 |
| * | Splunk Inc. | 269,494 | 32,585 |
| | Accenture plc Class A | 184,039 | 31,323 |
| | Amphenol Corp. Class A | 317,554 | 29,856 |
| | Marvell Technology | | |
| | Group Ltd. | 1,509,123 | 29,126 |
| | Jack Henry & | | |
| | Associates Inc. | 153,888 | 24,634 |
| * | Yandex NV Class A | 700,075 | 23,026 |
| | Monolithic Power | | |
| | Systems Inc. | 176,740 | 22,186 |
| * | Autodesk Inc. | 142,037 | 22,173 |
| *,2 | Adyen NV | 25,520 | 20,877 |
| ^ | Universal Display Corp. | 169,455 | 19,979 |
| | Lam Research Corp. | 128,387 | 19,476 |
| * | Micron Technology Inc. | 402,016 | 18,183 |
16
Morgan Growth Fund
| | | |
| | | | Market |
| | | | Value• |
| | | Shares | ($000) |
| * | Advanced Micro Devices | | |
| | Inc. | 567,415 | 17,528 |
| | CDK Global Inc. | 268,586 | 16,803 |
| | Broadridge Financial | | |
| | Solutions Inc. | 125,345 | 16,539 |
| | CDW Corp. | 175,348 | 15,592 |
| * | Dell Technologies Inc. | | |
| | Class V | 151,876 | 14,750 |
| * | Citrix Systems Inc. | 132,210 | 14,697 |
| *,^ | Match Group Inc. | 253,000 | 14,651 |
| * | Nutanix Inc. | 284,058 | 12,135 |
| * | Silicon Laboratories Inc. | 131,768 | 12,096 |
| * | Twitter Inc. | 384,906 | 10,954 |
| * | 2U Inc. | 136,694 | 10,278 |
| * | ON Semiconductor Corp. | 555,304 | 10,234 |
| * | Zebra Technologies Corp. | 55,635 | 9,838 |
| * | Cadence Design Systems | | |
| | Inc. | 191,357 | 8,672 |
| * | PTC Inc. | 70,227 | 7,457 |
| * | F5 Networks Inc. | 28,689 | 5,721 |
| | | | 7,052,734 |
| Materials (2.1%) | | |
| | CF Industries Holdings | | |
| | Inc. | 1,269,959 | 69,136 |
| ^ | Rio Tinto plc ADR | 1,347,747 | 68,762 |
| | FMC Corp. | 522,661 | 45,566 |
| | Ball Corp. | 880,676 | 38,741 |
| | Sherwin-Williams Co. | 68,509 | 31,186 |
| * | Allegheny Technologies | | |
| | Inc. | 992,585 | 29,331 |
| | Vulcan Materials Co. | 192,130 | 21,365 |
| | Martin Marietta Materials | | |
| | Inc. | 104,424 | 19,000 |
| | Freeport-McMoRan Inc. | 925,572 | 12,884 |
| | Steel Dynamics Inc. | 269,306 | 12,170 |
| | | | 348,141 |
| Other (1.0%) | | |
| ^,3 | Vanguard Growth ETF | 974,900 | 156,998 |
| |
| Real Estate (0.9%) | | |
| | American Tower Corp. | 505,209 | 73,407 |
| * | SBA Communications | | |
| | Corp. Class A | 143,646 | 23,074 |
| * | CBRE Group Inc. Class A | 303,064 | 13,365 |
| | CubeSmart | 393,397 | 11,224 |
| | Vornado Realty Trust | 112,251 | 8,194 |
| | | |
| | Sun Communities Inc. | 74,633 | 7,578 |
| | UDR Inc. | 109,113 | 4,411 |
| | SL Green Realty Corp. | 25,045 | 2,443 |
| | | | 143,696 |
| Telecommunication Services (0.0%) | |
| * | Zayo Group Holdings Inc. | 75,767 | 2,631 |
| |
| Utilities (0.0%) | | |
| | NRG Energy Inc. | 171,224 | 6,404 |
| Total Common Stocks | | |
| (Cost $9,866,505) | | 16,096,382 |
| Temporary Cash Investments (2.9%)1 | |
| Money Market Fund (2.4%) | | |
| 4,5 | Vanguard Market | | |
| | Liquidity Fund, 2.209% | 3,976,627 | 397,663 |
| |
| | | Face | |
| | | Amount | |
| | | ($000) | |
| Repurchase Agreement (0.4%) | |
| | Bank of America Securities, | |
| | LLC 2.270%, 10/1/18 | | |
| | (Dated 9/28/18, | | |
| | Repurchase Value | | |
| | $69,313,000, | | |
| | collateralized by | | |
| | Government National | | |
| | Mortgage Assn. | | |
| | 3.000%– 6.000%, | | |
| | 8/20/31–8/15/58, with | | |
| | value of $70,686,000) | 69,300 | 69,300 |
| |
| U. S. Government and Agency Obligations (0.1%) |
| 6 | United States Treasury | | |
| | Bill, 2.034%–2.078%, | | |
| | 11/15/18 | 5,500 | 5,486 |
| 6 | United States Treasury | | |
| | Bill, 2.093%, 12/20/18 | 5,000 | 4,976 |
| | | | 10,462 |
| Total Temporary Cash Investments | |
| (Cost $477,415) | | 477,425 |
| Total Investments (101.2%) | | |
| (Cost $10,343,920) | | 16,573,807 |
17
Morgan Growth Fund
| |
| | Amount |
| | ($000) |
| Other Assets and Liabilities (-1.2%) | |
| Other Assets | |
| Investment in Vanguard | 824 |
| Receivables for Investment | |
| Securities Sold | 42,308 |
| Receivables for Accrued Income | 4,096 |
| Receivables for Capital Shares Issued | 17,963 |
| Other Assets | 5,395 |
| Total Other Assets | 70,586 |
| Liabilities | |
| Payables for Investment | |
| Securities Purchased | (74,183) |
| Collateral for Securities on Loan | (159,785) |
| Payable for Capital Shares Redeemed | (13,423) |
| Payables to Investment Advisor | (4,880) |
| Payables to Vanguard | (14,716) |
| Variation Margin Payable— | |
| Future Contracts | (56) |
| Total Liabilities | (267,043) |
| Net Assets (100%) | 16,377,350 |
| |
| At September 30, 2018, net assets consisted of: |
| | Amount |
| | ($000) |
| Paid-in Capital | 9,017,817 |
| Undistributed Net Investment Income | 60,374 |
| Accumulated Net Realized Gains | 1,068,916 |
| Unrealized Appreciation (Depreciation) | |
| Investment Securities | 6,229,887 |
| Futures Contracts | 355 |
| Foreign Currencies | 1 |
| Net Assets | 16,377,350 |
| |
| | Amount |
| | ($000) |
| Investor Shares—Net Assets | |
| Applicable to 132,077,968 outstanding |
| $.001 par value shares of beneficial | |
| interest (unlimited authorization) | 4,537,064 |
| Net Asset Value Per Share— | |
| Investor Shares | $34.35 |
| |
| |
| Admiral Shares—Net Assets | |
| Applicable to 111,089,865 outstanding |
| $.001 par value shares of beneficial | |
| interest (unlimited authorization) | 11,840,286 |
| Net Asset Value Per Share— | |
| Admiral Shares | $106.58 |
• See Note A in Notes to Financial Statements. * Non-income-producing security.
^ Includes partial security positions on loan to broker-dealers. The total value of securities on loan is $149,004,000.
1 The fund invests a portion of its cash reserves in equity markets through the use of index futures contracts. After giving effect to futures investments, the fund’s effective common stock and temporary cash investment positions represent 99.4% and 1.8%, respectively, of net assets.
2 Security exempt from registration under Rule 144A of the Securities Act of 1933. Such securities may be sold in transactions exempt from registration, normally to qualified institutional buyers. At September 30, 2018, the value of this security represented 0.1% of net assets.
3 Considered an affiliated company of the fund as the issuer is another member of The Vanguard Group.
4 Affiliated money market fund available only to Vanguard funds and certain trusts and accounts managed by Vanguard. Rate shown is the 7-day yield.
5 Includes $159,785,000 of collateral received for securities on loan.
6 Securities with a value of $7,871,000 have been segregated as initial margin for open futures contracts.
ADR—American Depositary Receipt.
| | | | |
| Derivative Financial Instruments Outstanding as of Period End | | |
| Futures Contracts | | | | |
| | | | | ($000) |
| | | | | Value and |
| | | Number of | | Unrealized |
| | | Long (Short) | Notional | Appreciation |
| | Expiration | Contracts | Amount | (Depreciation) |
| Long Futures Contracts | | | | |
| E-mini S&P 500 Index | December 2018 | 1,236 | 180,394 | 355 |
See accompanying Notes, which are an integral part of the Financial Statements.
18
Morgan Growth Fund
Statement of Operations
| |
| | Year Ended |
| | September 30, 2018 |
| | ($000) |
| Investment Income | |
| Income | |
| Dividends—Unaffiliated Issuers1 | 142,952 |
| Dividends—Affiliated Issuers | 1,678 |
| Interest—Unaffiliated Issuers | 1,302 |
| Interest—Affiliated Issuers | 4,734 |
| Securities Lending—Net | 975 |
| Total Income | 151,641 |
| Expenses | |
| Investment Advisory Fees—Note B | |
| Basic Fee | 21,863 |
| Performance Adjustment | 386 |
| The Vanguard Group—Note C | |
| Management and Administrative—Investor Shares | 8,858 |
| Management and Administrative—Admiral Shares | 11,820 |
| Marketing and Distribution—Investor Shares | 609 |
| Marketing and Distribution—Admiral Shares | 547 |
| Custodian Fees | 164 |
| Auditing Fees | 38 |
| Shareholders’ Reports and Proxy—Investor Shares | 113 |
| Shareholders’ Reports and Proxy—Admiral Shares | 57 |
| Trustees’ Fees and Expenses | 24 |
| Total Expenses | 44,479 |
| Expenses Paid Indirectly | (373) |
| Net Expenses | 44,106 |
| Net Investment Income | 107,535 |
| Realized Net Gain (Loss) | |
| Investment Securities Sold—Unaffiliated Issuers | 1,233,844 |
| Investment Securities Sold—Affiliated Issuers | (54) |
| Futures Contracts | 21,777 |
| Foreign Currencies | (149) |
| Realized Net Gain (Loss) | 1,255,418 |
| Change in Unrealized Appreciation (Depreciation) | |
| Investment Securities—Unaffiliated Issuers | 1,816,659 |
| Investment Securities—Affiliated Issuers | 27,565 |
| Futures Contracts | (2,379) |
| Foreign Currencies | (5) |
| Change in Unrealized Appreciation (Depreciation) | 1,841,840 |
| Net Increase (Decrease) in Net Assets Resulting from Operations | 3,204,793 |
| 1 Dividends are net of foreign withholding taxes of $1,011,000. | |
See accompanying Notes, which are an integral part of the Financial Statements. | |
19
Morgan Growth Fund
Statement of Changes in Net Assets
| | |
| | Year Ended September 30, |
| | 2018 | 2017 |
| | ($000) | ($000) |
| Increase (Decrease) in Net Assets | | |
| Operations | | |
| Net Investment Income | 107,535 | 128,143 |
| Realized Net Gain (Loss) | 1,255,418 | 975,056 |
| Change in Unrealized Appreciation (Depreciation) | 1,841,840 | 1,283,043 |
| Net Increase (Decrease) in Net Assets Resulting from Operations | 3,204,793 | 2,386,242 |
| Distributions | | |
| Net Investment Income | | |
| Investor Shares | (35,011) | (31,763) |
| Admiral Shares | (78,282) | (63,618) |
| Realized Capital Gain1 | | |
| Investor Shares | (284,516) | (179,416) |
| Admiral Shares | (639,751) | (317,116) |
| Total Distributions | (1,037,560) | (591,913) |
| Capital Share Transactions | | |
| Investor Shares | (275,859) | (491,323) |
| Admiral Shares | 1,494,639 | 503,058 |
| Net Increase (Decrease) from Capital Share Transactions | 1,218,780 | 11,735 |
| Total Increase (Decrease) | 3,386,013 | 1,806,064 |
| Net Assets | | |
| Beginning of Period | 12,991,337 | 11,185,273 |
| End of Period2 | 16,377,350 | 12,991,337 |
1 Includes fiscal 2018 and 2017 short-term gain distributions totaling $82,554,000 and $0, respectively. Short-term gain distributions are treated as ordinary income dividends for tax purposes.
2 Net Assets—End of Period includes undistributed (overdistributed) net investment income of $60,374,000 and $72,679,000.
See accompanying Notes, which are an integral part of the Financial Statements.
20
Morgan Growth Fund
Financial Highlights
| | | | | |
| Investor Shares | | | | | |
| |
| For a Share Outstanding | | | Year Ended September 30, |
| Throughout Each Period | 2018 | 2017 | 2016 | 2015 | 2014 |
| Net Asset Value, Beginning of Period | $29.83 | $25.74 | $25.29 | $27.07 | $24.26 |
| Investment Operations | | | | | |
| Net Investment Income | . 2091 | .2771,2 | .207 | .219 | .187 |
| Net Realized and Unrealized Gain (Loss) | | | | | |
| on Investments | 6.718 | 5.196 | 2.385 | 1.017 | 3.785 |
| Total from Investment Operations | 6.927 | 5.473 | 2.592 | 1.236 | 3.972 |
| Distributions | | | | | |
| Dividends from Net Investment Income | (. 264) | (. 208) | (.175) | (.191) | (.172) |
| Distributions from Realized Capital Gains | (2.143) | (1.175) | (1.967) | (2.825) | (.990) |
| Total Distributions | (2.407) | (1.383) | (2.142) | (3.016) | (1.162) |
| Net Asset Value, End of Period | $34.35 | $29.83 | $25.74 | $25.29 | $27.07 |
| |
| Total Return3 | 24.54% | 22.39% | 10.48% | 4.76% | 16.85% |
| |
| Ratios/Supplemental Data | | | | | |
| Net Assets, End of Period (Millions) | $4,537 | $4,177 | $4,063 | $4,077 | $4,580 |
| Ratio of Total Expenses to Average Net Assets4 | 0.37% | 0.38% | 0.38% | 0.40% | 0.40% |
| Ratio of Net Investment Income to | | | | | |
| Average Net Assets | 0.66% | 1.02%2 | 0.81% | 0.80% | 0.72% |
| Portfolio Turnover Rate | 47% | 48% | 51% | 41% | 52% |
1 Calculated based on average shares outstanding.
2 Net investment income per share and the ratio of net investment income to average net assets include $.043 and 0.16%, respectively,
from income received as a result of the General Electric Co. and Baker Hughes Inc. merger in July 2017.
3 Total returns do not include account service fees that may have applied in the periods shown. Fund prospectuses provide information
about any applicable account service fees.
4 Includes performance-based investment advisory fee increases (decreases) of 0.00%, 0.00%, 0.01%, (0.01%), and (0.04%).
See accompanying Notes, which are an integral part of the Financial Statements.
21
Morgan Growth Fund
Financial Highlights
| | | | | |
| Admiral Shares | | | | | |
| |
| For a Share Outstanding | | | Year Ended September 30, |
| Throughout Each Period | 2018 | 2017 | 2016 | 2015 | 2014 |
| Net Asset Value, Beginning of Period | $92.45 | $79.80 | $78.42 | $83.97 | $75.26 |
| Investment Operations | | | | | |
| Net Investment Income | .7461 | .9431,2 | .726 | .804 | .719 |
| Net Realized and Unrealized Gain (Loss) | | | | | |
| on Investments | 20.840 | 16.076 | 7.402 | 3.123 | 11.722 |
| Total from Investment Operations | 21.586 | 17.019 | 8.128 | 3.927 | 12.441 |
| Distributions | | | | | |
| Dividends from Net Investment Income | (. 813) | (.730) | (. 656) | (.727) | (. 664) |
| Distributions from Realized Capital Gains | (6.643) | (3.639) | (6.092) | (8.750) | (3.067) |
| Total Distributions | (7.456) | (4.369) | (6.748) | (9.477) | (3.731) |
| Net Asset Value, End of Period | $106.58 | $92.45 | $79.80 | $78.42 | $83.97 |
| |
| Total Return3 | 24.68% | 22.48% | 10.60% | 4.88% | 17.03% |
| |
| Ratios/Supplemental Data | | | | | |
| Net Assets, End of Period (Millions) | $11,840 | $8,814 | $7,122 | $6,806 | $6,250 |
| Ratio of Total Expenses to Average Net Assets4 | 0.27% | 0.28% | 0.28% | 0.27% | 0.26% |
| Ratio of Net Investment Income to | | | | | |
| Average Net Assets | 0.76% | 1.12%2 | 0.91% | 0.93% | 0.86% |
| Portfolio Turnover Rate | 47% | 48% | 51% | 41% | 52% |
1 Calculated based on average shares outstanding.
2 Net investment income per share and the ratio of net investment income to average net assets include $.134 and 0.16%, respectively,
from income received as a result of the General Electric Co. and Baker Hughes Inc. merger in July 2017.
3 Total returns do not include account service fees that may have applied in the periods shown. Fund prospectuses provide information
about any applicable account service fees.
4 Includes performance-based investment advisory fee increases (decreases) of 0.00%, 0.00%, 0.01%, (0.01%), and (0.04%).
See accompanying Notes, which are an integral part of the Financial Statements.
22
Morgan Growth Fund
Notes to Financial Statements
Vanguard Morgan Growth Fund is registered under the Investment Company Act of 1940 as an open-end investment company, or mutual fund. The fund offers two classes of shares: Investor Shares and Admiral Shares. Investor Shares are available to any investor who meets the fund’s minimum purchase requirements. Admiral Shares are designed for investors who meet certain administrative, service, and account-size criteria.
A. The following significant accounting policies conform to generally accepted accounting principles for U.S. investment companies. The fund consistently follows such policies in preparing its financial statements.
1. Security Valuation: Securities are valued as of the close of trading on the New York Stock Exchange (generally 4 p.m., Eastern time) on the valuation date. Equity securities are valued at the latest quoted sales prices or official closing prices taken from the primary market in which each security trades; such securities not traded on the valuation date are valued at the mean of the latest quoted bid and asked prices. Securities for which market quotations are not readily available, or whose values have been affected by events occurring before the fund’s pricing time but after the close of the securities’ primary markets, are valued at their fair values calculated according to procedures adopted by the board of trustees. These procedures include obtaining quotations from an independent pricing service, monitoring news to identify significant market-or security-specific events, and evaluating changes in the values of foreign market proxies (for example, ADRs, futures contracts, or exchange-traded funds), between the time the foreign markets close and the fund’s pricing time. When fair-value pricing is employed, the prices of securities used by a fund to calculate its net asset value may differ from quoted or published prices for the same securities. Investments in Vanguard Market Liquidity Fund are valued at that fund’s net asset value. Temporary cash investments are valued using the latest bid prices or using valuations based on a matrix system (which considers such factors as security prices, yields, maturities, and ratings), both as furnished by independent pricing services.
2. Foreign Currency: Securities and other assets and liabilities denominated in foreign currencies are translated into U.S. dollars using exchange rates obtained from an independent third party as of the fund’s pricing time on the valuation date. Realized gains (losses) and unrealized appreciation (depreciation) on investment securities include the effects of changes in exchange rates since the securities were purchased, combined with the effects of changes in security prices. Fluctuations in the value of other assets and liabilities resulting from changes in exchange rates are recorded as unrealized foreign currency gains (losses) until the assets or liabilities are settled in cash, at which time they are recorded as realized foreign currency gains (losses).
3. Futures Contracts: The fund uses index futures contracts to a limited extent, with the objective of maintaining full exposure to the stock market while maintaining liquidity. The fund may purchase or sell futures contracts to achieve a desired level of investment, whether to accommodate portfolio turnover or cash flows from capital share transactions. The primary risks associated with the use of futures contracts are imperfect correlation between changes in market values of stocks held by the fund and the prices of futures contracts, and the possibility of an illiquid market. Counterparty risk involving futures is mitigated because a regulated clearinghouse is the counterparty instead of the clearing broker. To further mitigate counterparty risk, the fund trades futures contracts on an exchange, monitors the financial strength of its clearing brokers and clearinghouse, and has entered into clearing agreements with its clearing brokers. The clearinghouse imposes initial margin
23
Morgan Growth Fund
requirements to secure the fund’s performance and requires daily settlement of variation margin representing changes in the market value of each contract. Any assets pledged as initial margin for open contracts are noted in the Statement of Net Assets.
Futures contracts are valued at their quoted daily settlement prices. The notional amounts of the contracts are not recorded in the Statement of Net Assets. Fluctuations in the value of the contracts are recorded in the Statement of Net Assets as an asset (liability) and in the Statement of Operations as unrealized appreciation (depreciation) until the contracts are closed, when they are recorded as realized futures gains (losses).
During the year ended September 30, 2018, the fund’s average investments in long and short futures contracts represented 1% and 0% of net assets, respectively, based on the average of the notional amounts at each quarter-end during the period.
4. Repurchase Agreements: The fund enters into repurchase agreements with institutional counterparties. Securities pledged as collateral to the fund under repurchase agreements are held by a custodian bank until the agreements mature, and in the absence of a default, such collateral cannot be repledged, resold, or rehypothecated. Each agreement requires that the market value of the collateral be sufficient to cover payments of interest and principal. The fund further mitigates its counterparty risk by entering into repurchase agreements only with a diverse group of prequalified counterparties, monitoring their financial strength, and entering into master repurchase agreements with its counterparties. The master repurchase agreements provide that, in the event of a counter-party’s default (including bankruptcy), the fund may terminate any repurchase agreements with that counterparty, determine the net amount owed, and sell or retain the collateral up to the net amount owed to the fund. Such action may be subject to legal proceedings, which may delay or limit the disposition of collateral.
5. Federal Income Taxes: The fund intends to continue to qualify as a regulated investment company and distribute all of its taxable income. Management has analyzed the fund’s tax positions taken for all open federal income tax years (September 30, 2015–2018), and has concluded that no provision for federal income tax is required in the fund’s financial statements.
6. Distributions: Distributions to shareholders are recorded on the ex-dividend date. Distributions are determined on a tax basis and may differ from net investment income and realized capital gains for financial reporting purposes.
7. Securities Lending: To earn additional income, the fund lends its securities to qualified institutional borrowers. Security loans are subject to termination by the fund at any time, and are required to be secured at all times by collateral in an amount at least equal to the market value of securities loaned. Daily market fluctuations could cause the value of loaned securities to be more or less than the value of the collateral received. When this occurs, the collateral is adjusted and settled before the opening of the market on the next business day. The fund further mitigates its counterparty risk by entering into securities lending transactions only with a diverse group of prequalified counter-parties, monitoring their financial strength, and entering into master securities lending agreements with its counterparties. The master securities lending agreements provide that, in the event of a counterparty’s default (including bankruptcy), the fund may terminate any loans with that borrower, determine the net amount owed, and sell or retain the collateral up to the net amount owed to the fund; however, such actions may be subject to legal proceedings. While collateral mitigates
24
Morgan Growth Fund
counterparty risk, in the event of a default, the fund may experience delays and costs in recovering the securities loaned. The fund invests cash collateral received in Vanguard Market Liquidity Fund, and records a liability in the Statement of Net Assets for the return of the collateral, during the period the securities are on loan. Securities lending income represents fees charged to borrowers plus income earned on invested cash collateral, less expenses associated with the loan. During the term of the loan, the fund is entitled to all distributions made on or in respect of the loaned securities.
8. Credit Facility: The fund and certain other funds managed by The Vanguard Group (“Vanguard”) participate in a $3.1 billion committed credit facility provided by a syndicate of lenders pursuant to a credit agreement that may be renewed annually; each fund is individually liable for its borrowings, if any, under the credit facility. Borrowings may be utilized for temporary and emergency purposes, and are subject to the fund’s regulatory and contractual borrowing restrictions. The participating funds are charged administrative fees and an annual commitment fee of 0.10% of the undrawn amount of the facility; these fees are allocated to the funds based on a method approved by the fund’s board of trustees and included in Management and Administrative expenses on the fund’s Statement of Operations. Any borrowings under this facility bear interest at a rate based upon the higher of the one-month London Interbank Offered Rate, federal funds effective rate, or overnight bank funding rate plus an agreed-upon spread.
The fund had no borrowings outstanding at September 30, 2018, or at any time during the period then ended.
9. Other: Dividend income is recorded on the ex-dividend date. Interest income includes income distributions received from Vanguard Market Liquidity Fund and is accrued daily. Premiums and discounts on debt securities purchased are amortized and accreted, respectively, to interest income over the lives of the respective securities. Security transactions are accounted for on the date securities are bought or sold. Costs used to determine realized gains (losses) on the sale of investment securities are those of the specific securities sold.
Each class of shares has equal rights as to assets and earnings, except that each class separately bears certain class-specific expenses related to maintenance of shareholder accounts (included in Management and Administrative expenses), shareholder reporting, and the proxy. Marketing and distribution expenses are allocated to each class of shares based on a method approved by the board of trustees. Income, other non-class-specific expenses, and gains and losses on investments are allocated to each class of shares based on its relative net assets.
B. The investment advisory firms Wellington Management Company LLP, Jennison Associates LLC, and Frontier Capital Management Co., LLC, each provide investment advisory services to a portion of the fund for a fee calculated at an annual percentage rate of average net assets managed by the advisor. The basic fee of Wellington Management Company LLP is subject to quarterly adjustments based on performance relative to the Russell 3000 Growth Index for the preceding three years. The basic fee of Jennison Associates LLC is subject to quarterly adjustments based on performance relative to the Russell 1000 Growth Index for the preceding three years. The basic fee of Frontier Capital Management Co., LLC, is subject to quarterly adjustments based on performance relative to the Russell Midcap Growth Index for the preceding three years.
Vanguard provides investment advisory services to a portion of the fund as described below; the fund paid Vanguard advisory fees of $1,218,000 for the year ended September 30, 2018.
25
Morgan Growth Fund
For the year ended September 30, 2018, the aggregate investment advisory fee paid to all advisors represented an effective annual basic rate of 0.15% of the fund’s average net assets, before an increase of $386,000 (0.00%) based on performance.
C. In accordance with the terms of a Funds’ Service Agreement (the “FSA”) between Vanguard and the fund, Vanguard furnishes to the fund investment advisory, corporate management, administrative, marketing, and distribution services at Vanguard’s cost of operations (as defined by the FSA). These costs of operations are allocated to the fund based on methods and guidelines approved by the board of trustees. Vanguard does not require reimbursement in the current period for certain costs of operations (such as deferred compensation/benefits and risk/insurance costs); the fund’s liability for these costs of operations is included in Payables to Vanguard on the Statement of Net Assets. All other costs of operations payable to Vanguard are generally settled twice a month.
Upon the request of Vanguard, the fund may invest up to 0.40% of its net assets as capital in Vanguard. At September 30, 2018, the fund had contributed to Vanguard capital in the amount of $824,000, representing 0.01% of the fund’s net assets and 0.33% of Vanguard’s capitalization. The fund’s trustees and officers are also directors and employees, respectively, of Vanguard.
D. The fund has asked its investment advisors to direct certain security trades, subject to obtaining the best price and execution, to brokers who have agreed to rebate to the fund part of the commissions generated. Such rebates are used solely to reduce the fund’s management and administrative expenses. The fund’s custodian bank has also agreed to reduce its fees when the fund maintains cash on deposit in the non-interest-bearing custody account. For the year ended September 30, 2018, these arrangements reduced the fund’s management and administrative expenses by $368,000 and custodian fees by $5,000. The total expense reduction represented an effective annual rate of 0.00% of the fund’s average net assets.
E. Various inputs may be used to determine the value of the fund’s investments. These inputs are summarized in three broad levels for financial statement purposes. The inputs or methodologies used to value securities are not necessarily an indication of the risk associated with investing in those securities.
Level 1—Quoted prices in active markets for identical securities.
Level 2—Other significant observable inputs (including quoted prices for similar securities, interest rates, prepayment speeds, credit risk, etc.).
Level 3—Significant unobservable inputs (including the fund’s own assumptions used to determine the fair value of investments). Any investments valued with significant unobservable inputs are noted on the Statement of Net Assets.
The following table summarizes the market value of the fund’s investments as of September 30, 2018, based on the inputs used to value them:
| | | |
| | Level 1 | Level 2 | Level 3 |
| Investments | ($000) | ($000) | ($000) |
| Common Stocks | 15,816,464 | 279,918 | — |
| Temporary Cash Investments | 397,663 | 79,762 | — |
| Futures Contracts—Liabilities1 | (56) | — | — |
| Total | 16,214,071 | 359,680 | — |
1 Represents variation margin on the last day of the reporting period.
26
Morgan Growth Fund
F. Permanent differences between book-basis and tax-basis components of net assets are reclassified among capital accounts in the financial statements to reflect their tax character. These reclassifications have no effect on net assets or net asset value per share. As of period end, the following permanent differences primarily attributable to the accounting for foreign currency transactions and distributions in connection with fund share redemptions were reclassified to the following accounts:
| |
| | Amount |
| | ($000) |
| Paid-in Capital | 84,006 |
| Undistributed (Overdistributed) Net Investment Income | (6,547) |
| Accumulated Net Realized Gains (Losses) | (77,459) |
Temporary differences between book-basis and tax-basis components of accumulated net earnings (losses) arise when certain items of income, gain, or loss are recognized in different periods for financial statement and tax purposes; these differences will reverse at some time in the future. The differences are primarily related to the tax deferral of losses on wash sales and the realization of unrealized gains or losses on certain futures contracts. As of period end, the tax-basis components of accumulated net earnings (losses) are detailed in the table as follows:
| |
| | Amount |
| | ($000) |
| Undistributed Ordinary Income | 119,966 |
| Undistributed Long-Term Gains | 1,024,024 |
| Capital Loss Carryforwards | — |
| Net Unrealized Gains (Losses) | 6,229,241 |
As of September 30, 2018, gross unrealized appreciation and depreciation for investments and derivatives based on cost for U.S. federal income tax purposes were as follows:
| |
| | Amount |
| | ($000) |
| Tax Cost | 10,344,567 |
| Gross Unrealized Appreciation | 6,318,272 |
| Gross Unrealized Depreciation | (89,032) |
| Net Unrealized Appreciation (Depreciation) | 6,229,240 |
G. During the year ended September 30, 2018, the fund purchased $7,102,348,000 of investment securities and sold $6,648,418,000 of investment securities, other than temporary cash investments.
27
Morgan Growth Fund
| | | | |
| H. Capital share transactions for each class of shares were: | | | |
| | | | Year Ended September 30, |
| | | 2018 | | 2017 |
| | Amount | Shares | Amount | Shares |
| | ($000) | (000) | ($000) | (000) |
| Investor Shares | | | | |
| Issued | 858,804 | 27,445 | 389,859 | 14,339 |
| Issued in Lieu of Cash Distributions | 311,810 | 10,563 | 207,382 | 8,416 |
| Redeemed | (1,446,473) | (45,967) | (1,088,564) | (40,543) |
| Net Increase (Decrease)—Investor Shares | (275,859) | (7,959) | (491,323) | (17,788) |
| Admiral Shares | | | | |
| Issued | 2,477,220 | 25,379 | 1,161,157 | 13,763 |
| Issued in Lieu of Cash Distributions | 664,366 | 7,259 | 352,218 | 4,614 |
| Redeemed | (1,646,947) | (16,888) | (1,010,317) | (12,291) |
| Net Increase (Decrease)—Admiral Shares | 1,494,639 | 15,750 | 503,058 | 6,086 |
I. Transactions during the period in investments where the issuer is another member of The Vanguard Group were as follows:
| | | | | | | | |
| | | | | | Current Period Transactions | |
| | Sept. 30, | | Proceeds | Net | Change | | | Sept. 30, |
| | 2017 | | from Realized | in Net | | Capital Gain | 2018 |
| | Market | Purchases | Securities | Gain | Unrealized | | Distributions | Market |
| | Value | at Cost | Sold | (Loss) | App. (Dep.) | Income | Received | Value |
| | ($000) | ($000) | ($000) | ($000) | ($000) | ($000) | ($000) | ($000) |
| Vanguard | | | | | | | | |
| Growth ETF | 129,418 | — | — | — | 27,580 | 1,678 | — | 156,998 |
| Vanguard Market | | | | | | | | |
| Liquidity Fund | 388,722 | NA1 | NA1 | (54) | (15) | 4,734 | — | 397,663 |
| Total | 518,140 | | | (54) | 27,565 | 6,412 | — | 554,661 |
1 Not applicable—purchases and sales are for temporary cash investment purposes.
J. Management has determined that no events or transactions occurred subsequent to September 30, 2018, that would require recognition or disclosure in these financial statements.
28
Report of Independent Registered
Public Accounting Firm
To the Board of Trustees and Shareholders of Vanguard Morgan Growth Fund
Opinion on the Financial Statements
We have audited the accompanying statement of net assets of Vanguard Morgan Growth Fund (the “Fund”) as of September 30, 2018, the related statement of operations for the year ended September 30, 2018, the statement of changes in net assets for each of the two years in the period ended September 30, 2018, including the related notes, and the financial highlights for each of the five years in the period ended September 30, 2018 (collectively referred to as the “financial statements”). In our opinion, the financial statements present fairly, in all material respects, the financial position of the Fund as of September 30, 2018, the results of its operations for the year then ended, the changes in its net assets for each of the two years in the period ended September 30, 2018 and the financial highlights for each of the five years in the period ended September 30, 2018 in conformity with accounting principles generally accepted in the United States of America.
Basis for Opinion
These financial statements are the responsibility of the Fund’s management. Our responsibility is to express an opinion on the Fund’s financial statements based on our audits. We are a public accounting firm registered with the Public Company Accounting Oversight Board (United States) (“PCAOB”) and are required to be independent with respect to the Fund in accordance with the U.S. federal securities laws and the applicable rules and regulations of the Securities and Exchange Commission and the PCAOB.
We conducted our audits of these financial statements in accordance with the standards of the PCAOB. Those standards require that we plan and perform the audit to obtain reasonable assurance about whether the financial statements are free of material misstatement, whether due to error or fraud.
Our audits included performing procedures to assess the risks of material misstatement of the financial statements, whether due to error or fraud, and performing procedures that respond to those risks. Such procedures included examining, on a test basis, evidence regarding the amounts and disclosures in the financial statements. Our audits also included evaluating the accounting principles used and significant estimates made by management, as well as evaluating the overall presentation of the financial statements. Our procedures included confirmation of securities owned as of September 30, 2018 by correspondence with the custodians and brokers and by agreement to the underlying ownership records of the transfer agent; when replies were not received from brokers, we performed other auditing procedures. We believe that our audits provide a reasonable basis for our opinion.
/s/PricewaterhouseCoopers LLP
Philadelphia, Pennsylvania
November 15, 2018
We have served as the auditor of one or more investment companies in The Vanguard Group of Funds since 1975.
29
Special 2018 tax information (unaudited) for Vanguard Morgan Growth Fund
This information for the fiscal year ended September 30, 2018, is included pursuant to provisions
of the Internal Revenue Code.
The fund distributed $916,192,000 as capital gain dividends (20% rate gain distributions) to
shareholders during the fiscal year.
For nonresident alien shareholders, 100% of short-term capital gain dividends by the fund are
qualified short-term capital gains.
The fund distributed $141,428,000 of qualified dividend income to shareholders during the fiscal year.
For corporate shareholders, 79.6% of investment income (dividend income plus short-term gains,
if any) qualifies for the dividends-received deduction.
30
Your Fund’s After-Tax Returns
This table presents returns for your fund both before and after taxes. The after-tax returns are shown in two ways: (1) assuming that an investor owned the fund during the entire period and paid taxes on the fund’s distributions, and (2) assuming that an investor paid taxes on the fund’s distributions and sold all shares at the end of each period.
Calculations are based on the highest individual federal income tax and capital gains tax rates in effect at the times of the distributions and the hypothetical sales. State and local taxes were not considered. After-tax returns reflect any qualified dividend income, using actual prior-year figures and estimates for 2018. (In the example, returns after the sale of fund shares may be higher than those assuming no sale. This occurs when the sale would have produced a capital loss. The calculation assumes that the investor received a tax deduction for the loss.)
The table shows returns for Investor Shares only; returns for other share classes will differ. Please note that your actual after-tax returns will depend on your tax situation and may differ from those shown. Also note that if you own the fund in a tax-deferred account, such as an individual retirement account or a 401(k) plan, this information does not apply to you. Such accounts are not subject to current taxes.
Finally, keep in mind that a fund’s performance—whether before or after taxes—does not guarantee future results.
| | | |
| Average Annual Total Returns: Morgan Growth Fund Investor Shares | | |
| Periods Ended September 30, 2018 | | | |
| | One | Five | Ten |
| | Year | Years | Years |
| Returns Before Taxes | 24.54% | 15.57% | 13.15% |
| Returns After Taxes on Distributions | 22.21 | 13.52 | 12.07 |
| Returns After Taxes on Distributions and Sale of Fund Shares | 15.62 | 11.92 | 10.70 |
31
About Your Fund’s Expenses
As a shareholder of the fund, you incur ongoing costs, which include costs for portfolio management, administrative services, and shareholder reports (like this one), among others. Operating expenses, which are deducted from a fund’s gross income, directly reduce the investment return of the fund.
A fund’s expenses are expressed as a percentage of its average net assets. This figure is known as the expense ratio. The following examples are intended to help you understand the ongoing costs (in dollars) of investing in your fund and to compare these costs with those of other mutual funds. The examples are based on an investment of $1,000 made at the beginning of the period shown and held for the entire period.
The accompanying table illustrates your fund’s costs in two ways:
• Based on actual fund return. This section helps you to estimate the actual expenses that you paid over the period. The ”Ending Account Value“ shown is derived from the fund‘s actual return, and the third column shows the dollar amount that would have been paid by an investor who started with $1,000 in the fund. You may use the information here, together with the amount you invested, to estimate the expenses that you paid over the period.
To do so, simply divide your account value by $1,000 (for example, an $8,600 account value divided by $1,000 = 8.6), then multiply the result by the number given for your fund under the heading ”Expenses Paid During Period.“
• Based on hypothetical 5% yearly return. This section is intended to help you compare your fund‘s costs with those of other mutual funds. It assumes that the fund had a yearly return of 5% before expenses, but that the expense ratio is unchanged. In this case—because the return used is not the fund’s actual return—the results do not apply to your investment. The example is useful in making comparisons because the Securities and Exchange Commission requires all mutual funds to calculate expenses based on a 5% return. You can assess your fund’s costs by comparing this hypothetical example with the hypothetical examples that appear in shareholder reports of other funds.
Note that the expenses shown in the table are meant to highlight and help you compare ongoing costs only and do not reflect transaction costs incurred by the fund for buying and selling securities. Further, the expenses do not include any purchase, redemption, or account service fees described in the fund prospectus. If such fees were applied to your account, your costs would be higher. Your fund does not carry a “sales load.”
The calculations assume no shares were bought or sold during the period. Your actual costs may have been higher or lower, depending on the amount of your investment and the timing of any purchases or redemptions.
You can find more information about the fund’s expenses, including annual expense ratios, in the Financial Statements section of this report. For additional information on operating expenses and other shareholder costs, please refer to your fund’s current prospectus.
32
| | | |
| Six Months Ended September 30, 2018 | | | |
| | Beginning | Ending | Expenses |
| | Account Value | Account Value | Paid During |
| Morgan Growth Fund | 3/31/2018 | 9/30/2018 | Period |
| Based on Actual Fund Return | | | |
| Investor Shares | $1,000.00 | $1,138.55 | $2.20 |
| Admiral Shares | 1,000.00 | 1,139.28 | 1.82 |
| Based on Hypothetical 5% Yearly Return | | | |
| Investor Shares | $1,000.00 | $1,023.01 | $2.08 |
| Admiral Shares | 1,000.00 | 1,023.36 | 1.72 |
The calculations are based on expenses incurred in the most recent six-month period. The fund’s annualized six-month expense ratios for that period are 0.41% for Investor Shares and 0.34% for Admiral Shares. The dollar amounts shown as “Expenses Paid” are equal to the annualized expense ratio multiplied by the average account value over the period, multiplied by the number of days in the most recent six-month period, then divided by the number of days in the most recent 12-month period (183/365).
33
Glossary
30-Day SEC Yield. A fund’s 30-day SEC yield is derived using a formula specified by the U.S. Securities and Exchange Commission. Under the formula, data related to the fund’s security holdings in the previous 30 days are used to calculate the fund’s hypothetical net income for that period, which is then annualized and divided by the fund’s estimated average net assets over the calculation period. For the purposes of this calculation, a security’s income is based on its current market yield to maturity (for bonds), its actual income (for asset-backed securities), or its projected dividend yield (for stocks). Because the SEC yield represents hypothetical annualized income, it will differ—at times significantly—from the fund’s actual experience. As a result, the fund’s income distributions may be higher or lower than implied by the SEC yield.
Beta. A measure of the magnitude of a fund’s past share-price fluctuations in relation to the ups and downs of a given market index. The index is assigned a beta of 1.00. Compared with a given index, a fund with a beta of 1.20 typically would have seen its share price rise or fall by 12% when the index rose or fell by 10%. For this report, beta is based on returns over the past 36 months for both the fund and the index. Note that a fund’s beta should be reviewed in conjunction with its R-squared (see definition). The lower the R-squared, the less correlation there is between the fund and the index, and the less reliable beta is as an indicator of volatility.
Dividend Yield. Dividend income earned by stocks, expressed as a percentage of the aggregate market value (or of net asset value, for a fund). The yield is determined by dividing the amount of the annual dividends by the aggregate value (or net asset value) at the end of the period. For a fund, the dividend yield is based solely on stock holdings and does not include any income produced by other investments.
Earnings Growth Rate. The average annual rate of growth in earnings over the past five years for the stocks now in a fund.
Equity Exposure. A measure that reflects a fund’s investments in stocks and stock futures. Any holdings in short-term reserves are excluded.
Expense Ratio. A fund’s total annual operating expenses expressed as a percentage of the fund’s average net assets. The expense ratio includes management and administrative expenses, but does not include the transaction costs of buying and selling portfolio securities.
Foreign Holdings. The percentage of a fund represented by securities or depositary receipts of companies based outside the United States.
Inception Date. The date on which the assets of a fund (or one of its share classes) are first invested in accordance with the fund’s investment objective. For funds with a subscription period, the inception date is the day after that period ends. Investment performance is measured from the inception date.
Median Market Cap. An indicator of the size of companies in which a fund invests; the midpoint of market capitalization (market price x shares outstanding) of a fund’s stocks, weighted by the proportion of the fund’s assets invested in each stock. Stocks representing half of the fund’s assets have market capitalizations above the median, and the rest are below it.
Price/Book Ratio. The share price of a stock divided by its net worth, or book value, per share. For a fund, the weighted average price/book ratio of the stocks it holds.
34
Price/Earnings Ratio. The ratio of a stock’s current price to its per-share earnings over the past year. For a fund, the weighted average P/E of the stocks it holds. P/E is an indicator of market expectations about corporate prospects; the higher the P/E, the greater the expectations for a company’s future growth.
R-Squared. A measure of how much of a fund’s past returns can be explained by the returns from the market in general, as measured by a given index. If a fund’s total returns were precisely synchronized with an index’s returns, its R-squared would be 1.00. If the fund’s returns bore no relationship to the index’s returns, its R-squared would be 0. For this report, R-squared is based on returns over the past 36 months for both the fund and the index.
Return on Equity. The annual average rate of return generated by a company during the past five years for each dollar of shareholder’s equity (net income divided by shareholder’s equity). For a fund, the weighted average return on equity for the companies whose stocks it holds.
Short-Term Reserves. The percentage of a fund invested in highly liquid, short-term securities that can be readily converted to cash.
Turnover Rate. An indication of the fund’s trading activity. Funds with high turnover rates incur higher transaction costs and may be more likely to distribute capital gains (which may be taxable to investors). The turnover rate excludes in-kind transactions, which have minimal impact on costs.
35
The Global Industry Classification Standard (“GICS”) was developed by and is the exclusive property and a service mark of MSCI Inc. (“MSCI”) and Standard and Poor’s, a division of McGraw-Hill Companies, Inc. (“S&P”), and is licensed for use by Vanguard. Neither MSCI, S&P nor any third party involved in making or compiling the GICS or any GICS classification makes any express or implied warranties or representations with respect to such standard or classification (or the results to be obtained by the use thereof), and all such parties hereby expressly disclaim all warranties of originality, accuracy, completeness, merchantability or fitness for a particular purpose with respect to any such standard or classification. Without limiting any of the foregoing, in no event shall MSCI, S&P, any of its affiliates or any third party involved in making or compiling the GICS or any GICS classification have any liability for any direct, indirect, special, punitive, consequential or any other damages (including lost profits) even if notified of the possibility of such damages.
36
This page intentionally left blank.
This page intentionally left blank.
The People Who Govern Your Fund
The trustees of your mutual fund are there to see that the fund is operated and managed in your best interests since, as a shareholder, you are a part owner of the fund. Your fund’s trustees also serve on the board of directors of The Vanguard Group, Inc., which is owned by the Vanguard funds and provides services to them on an at-cost basis.
A majority of Vanguard’s board members are independent, meaning that they have no affiliation with Vanguard or the funds they oversee, apart from the sizable personal investments they have made as private individuals. The independent board members have distinguished backgrounds in business, academia, and public service. Each of the trustees and executive officers oversees 211 Vanguard funds.
Information for each trustee and executive officer of the fund appears below. The mailing address of the trustees and officers is P.O. Box 876, Valley Forge, PA 19482. More information about the trustees is in the Statement of Additional Information, which can be obtained, without charge, by contacting Vanguard at 800-662-7447, or online at vanguard.com.
Interested Trustees1
F. William McNabb III
Born in 1957. Trustee since July 2009. Principal occupation(s) during the past five years and other experience: chairman of the board (January 2010–present) of Vanguard and of each of the investment companies served by Vanguard, trustee (2009–present) of each of the investment companies served by Vanguard, and director (2008–present) of Vanguard. Chief executive officer and president (2008–2017) of Vanguard and each of the investment companies served by Vanguard, managing director (1995–2008) of Vanguard, and director (1997–2018) of Vanguard Marketing Corporation. Director (2018–present) of UnitedHealth Group.
Mortimer J. Buckley
Born in 1969. Trustee since January 2018. Principal occupation(s) during the past five years and other experience: chief executive officer (January 2018–present) of Vanguard; chief executive officer, president, and trustee (January 2018–present) of each of the investment companies served by Vanguard; president and director (2017–present) of Vanguard; and president (February 2018–present) of Vanguard Marketing Corporation. Chief investment officer (2013–2017), managing director (2002–2017), head of the Retail Investor Group (2006–2012), and chief information officer (2001–2006) of Vanguard. Chairman of the board (2011–2017) of the Children’s Hospital of Philadelphia.
Independent Trustees
Emerson U. Fullwood
Born in 1948. Trustee since January 2008. Principal occupation(s) during the past five years and other experience: executive chief staff and marketing officer for North America and corporate vice president (retired 2008) of Xerox Corporation (document management products and services). Former president of the Worldwide Channels Group, Latin America, and Worldwide Customer Service and executive chief staff officer of Developing Markets of Xerox. Executive in residence and 2009–2010 Distinguished Minett Professor at the Rochester Institute of Technology. Lead director of SPX FLOW, Inc. (multi-industry manufacturing). Director of the University of Rochester Medical Center, the Monroe Community College Foundation, the United Way of Rochester, North Carolina A&T University, and Roberts Wesleyan College. Trustee of the University of Rochester.
Amy Gutmann
Born in 1949. Trustee since June 2006. Principal occupation(s) during the past five years and other experience: president (2004–present) of the University of Pennsylvania. Christopher H. Browne Distinguished Professor of Political Science, School of Arts and Sciences, and professor of communication, Annenberg School for Communication, with secondary faculty appointments in the Department of Philosophy, School of Arts and Sciences, and at the Graduate School of Education, University of Pennsylvania. Trustee of the National Constitution Center.
1 Mr. McNabb and Mr. Buckley are considered “interested persons,” as defined in the Investment Company Act of 1940, because they are officers of the Vanguard funds.
JoAnn Heffernan Heisen
Born in 1950. Trustee since July 1998. Principal occupation(s) during the past five years and other experience: corporate vice president of Johnson & Johnson (pharmaceuticals/medical devices/consumer products) and member of its executive committee (1997–2008). Chief global diversity officer (retired 2008), vice president and chief information officer (1997–2006), controller (1995–1997), treasurer (1991–1995), and assistant treasurer (1989–1991) of Johnson & Johnson. Director of Skytop Lodge Corporation (hotels) and the Robert Wood Johnson Foundation. Member of the advisory board of the Institute for Women’s Leadership at Rutgers University.
F. Joseph Loughrey
Born in 1949. Trustee since October 2009. Principal occupation(s) during the past five years and other experience: president and chief operating officer (retired 2009) and vice chairman of the board (2008–2009) of Cummins Inc. (industrial machinery). Chairman of the board of Hillenbrand, Inc. (specialized consumer services), Oxfam America, and the Lumina Foundation for Education. Director of the V Foundation for Cancer Research. Member of the advisory council for the College of Arts and Letters and chair of the advisory board to the Kellogg Institute for International Studies, both at the University of Notre Dame.
Mark Loughridge
Born in 1953. Trustee since March 2012. Principal occupation(s) during the past five years and other experience: senior vice president and chief financial officer (retired 2013) of IBM (information technology services). Fiduciary member of IBM’s Retirement Plan Committee (2004–2013), senior vice president and general manager (2002–2004) of IBM Global Financing, vice president and controller (1998–2002) of IBM, and a variety of other prior management roles at IBM. Member of the Council on Chicago Booth.
Scott C. Malpass
Born in 1962. Trustee since March 2012. Principal occupation(s) during the past five years and other experience: chief investment officer (1989–present) and vice president (1996–present) of the University of Notre Dame. Assistant professor of finance at the Mendoza College of Business, University of Notre Dame, and member of the Notre Dame 403(b) Investment Committee. Chairman of the board of TIFF Advisory Services, Inc. Member of the board of Catholic Investment Services, Inc. (investment advisors), the board of advisors for Spruceview Capital Partners, and the board of superintendence of the Institute for the Works of Religion.
Deanna Mulligan
Born in 1963. Trustee since January 2018. Principal occupation(s) during the past five years and other experience: president (2010–present) and chief executive officer (2011–present) of The Guardian Life Insurance Company of America. Chief operating officer (2010–2011) and executive vice president (2008–2010) of Individual Life and Disability of The Guardian Life Insurance Company of America. Member of the board of The Guardian Life Insurance Company of America, the American Council of Life Insurers, the Partnership for New York City (business leadership), and the Committee Encouraging Corporate Philanthropy. Trustee of the Economic Club of New York and the Bruce Museum (arts and science). Member of the Advisory Council for the Stanford Graduate School of Business.
André F. Perold
Born in 1952. Trustee since December 2004. Principal occupation(s) during the past five years and other experience: George Gund Professor of Finance and Banking, Emeritus at the Harvard Business School (retired 2011). Chief investment officer and co-managing partner of HighVista Strategies LLC (private investment firm). Overseer of the Museum of Fine Arts Boston.
Sarah Bloom Raskin
Born in 1961. Trustee since January 2018. Principal occupation(s) during the past five years and other experience: deputy secretary (2014–2017) of the United States Department of the Treasury. Governor (2010–2014) of the Federal Reserve Board. Commissioner (2007–2010) of financial regulation for the State of Maryland. Member of the board of directors (2012–2014) of Neighborhood Reinvestment Corporation. Director of i(x) Investments, LLC.
Peter F. Volanakis
Born in 1955. Trustee since July 2009. Principal occupation(s) during the past five years and other experience: president and chief operating officer (retired 2010) of Corning Incorporated (communications equipment) and director of Corning Incorporated (2000–2010) and Dow Corning (2001–2010). Director (2012) of SPX Corporation (multi-industry manufacturing). Overseer of the Amos Tuck School of Business Administration, Dartmouth College (2001–2013). Chairman of the board of trustees of Colby-Sawyer College. Member of the Board of Hypertherm Inc. (industrial cutting systems, software, and consumables).
Executive Officers
Glenn Booraem
Born in 1967. Principal occupation(s) during the past five years and other experience: principal of Vanguard. Investment stewardship officer (2017–present), treasurer (2015–2017), controller (2010–2015), and assistant controller (2001–2010) of each of the investment companies served by Vanguard.
Christine M. Buchanan
Born in 1970. Principal occupation(s) during the past five years and other experience: principal of Vanguard and global head of Fund Administration at Vanguard. Treasurer (2017–present) of each of the investment companies served by Vanguard. Partner (2005–2017) at KPMG LLP (audit, tax, and advisory services).
Brian Dvorak
Born in 1973. Principal occupation(s) during the past five years and other experience: principal of Vanguard. Chief compliance officer (2017–present) of Vanguard and each of the investment companies served by Vanguard. Assistant vice president (2017–present) of Vanguard Marketing Corporation. Vice president and director of Enterprise Risk Management (2011–2013) at Oppenheimer Funds, Inc.
Thomas J. Higgins
Born in 1957. Principal occupation(s) during the past five years and other experience: principal of Vanguard. Chief financial officer (2008–present) and treasurer (1998–2008) of each of the investment companies served by Vanguard.
Peter Mahoney
Born in 1974. Principal occupation(s) during the past five years and other experience: principal of Vanguard. Controller (2015–present) of each of the investment companies served by Vanguard. Head of International Fund Services (2008–2014) at Vanguard.
Anne E. Robinson
Born in 1970. Principal occupation(s) during the past five years and other experience: general counsel (2016–present) of Vanguard. Secretary (2016–present) of Vanguard and of each of the investment companies served by Vanguard. Managing director (2016–present) of Vanguard. Director and senior vice president (2016–2018) of Vanguard Marketing Corporation. Managing director and general counsel of Global Cards and Consumer Services (2014–2016) at Citigroup. Counsel (2003–2014) at American Express.
Michael Rollings
Born in 1963. Principal occupation(s) during the past five years and other experience: finance director (2017–present) and treasurer (2017) of each of the investment companies served by Vanguard. Managing director (2016–present) of Vanguard. Chief financial officer (2016–present) of Vanguard. Director (2016–present) of Vanguard Marketing Corporation. Executive vice president and chief financial officer (2006–2016) of MassMutual Financial Group.
| |
| Vanguard Senior Management Team |
| |
| Joseph Brennan | Chris D. McIsaac |
| Mortimer J. Buckley | James M. Norris |
| Gregory Davis | Thomas M. Rampulla |
| John James | Karin A. Risi |
| Martha G. King | Anne E. Robinson |
| John T. Marcante | Michael Rollings |
Chairman Emeritus and Senior Advisor
John J. Brennan
Chairman, 1996–2009
Chief Executive Officer and President, 1996–2008
Founder
John C. Bogle
Chairman and Chief Executive Officer, 1974–1996

P.O. Box 2600
Valley Forge, PA 19482-2600
Connect with Vanguard® > vanguard.com
Fund Information > 800-662-7447
Direct Investor Account Services > 800-662-2739 Institutional Investor Services > 800-523-1036 Text Telephone for People Who Are Deaf or Hard of Hearing > 800-749-7273
This material may be used in conjunction with the offering of shares of any Vanguard fund only if preceded or accompanied by the fund’s current prospectus.
All comparative mutual fund data are from Lipper, a Thomson Reuters Company, or Morningstar, Inc., unless otherwise noted.
You can obtain a free copy of Vanguard’s proxy voting guidelines by visiting vanguard.com/proxyreporting or by calling Vanguard at 800-662-2739. The guidelines are also available from the SEC’s website, sec.gov. In addition, you may obtain a free report on how your fund voted the proxies for securities it owned during the 12 months ended June 30. To get the report, visit either vanguard.com/proxyreporting or sec.gov.
You can review and copy information about your fund at the SEC’s Public Reference Room in Washington, D.C. To find out more about this public service, call the SEC at 202-551-8090. Information about your fund is also available on the SEC’s website, and you can receive copies of this information, for a fee, by sending a request in either of two ways: via email addressed to publicinfo@sec.gov or via regular mail addressed to the Public Reference Section, Securities and Exchange Commission, Washington, DC 20549-1520.
Source for Bloomberg Barclays indexes: Bloomberg Index Services Limited. Copyright 2018, Bloomberg. All rights reserved.
CFA® is a registered trademark owned by CFA Institute.
© 2018 The Vanguard Group, Inc. All rights reserved.
Vanguard Marketing Corporation, Distributor.
Q260 112018
Item 2: Code of Ethics. The Registrant has adopted a code of ethics that applies to the Registrant’s principal executive officer, principal financial officer, principal accounting officer or controller or persons performing similar functions. The Code of Ethics was amended during the reporting period covered by this report to make certain technical, non-material changes.
Item 3: Audit Committee Financial Expert. All members of the Audit Committee have been determined by the Registrant’s Board of Trustees to be Audit Committee Financial Experts and to be independent: JoAnn Heffernan Heisen, F. Joseph Loughrey, Mark Loughridge, Sarah Bloom Raskin, and Peter F. Volanakis.
Item 4: Principal Accountant Fees and Services.
(a) Audit Fees.
Audit Fees of the Registrant
Fiscal Year Ended September 30, 2018: $38,000
Fiscal Year Ended September 30, 2017: $40,000
Aggregate Audit Fees of Registered Investment Companies in the Vanguard Group.
Fiscal Year Ended September 30, 2018: $9,734,277
Fiscal Year Ended September 30, 2017: $8,424,459
Includes fees billed in connection with audits of the Registrant, other registered investment companies in the Vanguard complex, The Vanguard Group, Inc. and Vanguard Marketing Corporation.
(b) Audit-Related Fees.
Fiscal Year Ended September 30, 2018: $5,581,336
Fiscal Year Ended September 30, 2017: $3,194,093
Includes fees billed in connection with assurance and related services provided to the Registrant, other registered investment companies in the Vanguard complex, The Vanguard Group, Inc., and Vanguard Marketing Corporation.
(c) Tax Fees.
Fiscal Year Ended September 30, 2018: $347,985
Fiscal Year Ended September 30, 2017: $274,313
Includes fees billed in connection with tax compliance, planning, and advice services provided to the Registrant, other registered investment companies in the Vanguard complex, The Vanguard Group, Inc., and Vanguard Marketing Corporation.
(d) All Other Fees.
Fiscal Year Ended September 30, 2018: $0
Fiscal Year Ended September 30, 2017: $0
Includes fees billed for services related to tax reported information provided to the Registrant, other registered investment companies in the Vanguard complex, The Vanguard Group, Inc., and Vanguard Marketing Corporation.
(e) (1) Pre-Approval Policies. The policy of the Registrant’s Audit Committee is to consider and, if appropriate, approve before the principal accountant is engaged for such services, all specific audit and non-audit services provided to: the Registrant, other registered investment companies in the Vanguard complex, The Vanguard Group, Inc., and entities controlled by The Vanguard Group, Inc. that provide ongoing services to the Registrant. In making a determination, the Audit Committee considers whether the services are consistent with maintaining the principal accountant’s independence.
In the event of a contingency situation in which the principal accountant is needed to provide services in between scheduled Audit Committee meetings, the Chairman of the Audit Committee would be called on to consider and, if appropriate, pre-approve audit or permitted non-audit services in an amount sufficient to complete services through the next Audit Committee meeting, and to determine if such services would be consistent with maintaining the accountant’s independence. At the next scheduled Audit Committee meeting, services and fees would be presented to the Audit Committee for formal consideration, and, if appropriate, approval by the entire Audit Committee. The Audit Committee would again consider whether such services and fees are consistent with maintaining the principal accountant’s independence.
The Registrant’s Audit Committee is informed at least annually of all audit and non-audit services provided by the principal accountant to the Vanguard complex, whether such services are provided to: the Registrant, other registered investment companies in the Vanguard complex, The Vanguard Group, Inc., or other entities controlled by The Vanguard Group, Inc. that provide ongoing services to the Registrant.
(2) No percentage of the principal accountant’s fees or services were approved pursuant to the waiver provision of paragraph (c)(7)(i)(C) of Rule 2-01 of Regulation S-X.
(f) For the most recent fiscal year, over 50% of the hours worked under the principal accountant’s engagement were not performed by persons other than full-time, permanent employees of the principal accountant.
(g) Aggregate Non-Audit Fees.
Fiscal Year Ended September 30, 2018: $347,985
Fiscal Year Ended September 30, 2017: $274,313
Includes fees billed for non-audit services provided to the Registrant, other registered investment companies in the Vanguard complex, The Vanguard Group, Inc., and Vanguard Marketing Corporation.
(h) For the most recent fiscal year, the Audit Committee has determined that the provision of all non-audit services was consistent with maintaining the principal accountant’s independence.
Item 5: Audit Committee of Listed Registrants.
The Registrant is a listed issuer as defined in rule 10A-3 under the Securities Exchange Act of 1934 (“Exchange Act”). The Registrant has a separately-designated standing audit committee established in accordance with Section 3(a)(58)(A) of the Exchange Act. The Registrant’s audit committee members are: JoAnn Heffernan Heisen, F. Joseph Loughrey, Mark Loughridge, Sarah Bloom Raskin, and Peter F. Volanakis.
Item 6: Investments.
Not Applicable.
Item 7: Disclosure of Proxy Voting Policies and Procedures for Closed-End Management Investment Companies.
Not Applicable.
Item 8: Portfolio Managers of Closed-End Management Investment Companies.
Not Applicable.
Item 9: Purchase of Equity Securities by Closed-End Management Investment Company and Affiliated Purchasers.
Not Applicable.
Item 10: Submission of Matters to a Vote of Security Holders.
Not Applicable.
Item 11: Controls and Procedures.
(a) Disclosure Controls and Procedures. The Principal Executive and Financial Officers concluded that the Registrant’s Disclosure Controls and Procedures are effective based on their evaluation of the Disclosure Controls and Procedures as of a date within 90 days of the filing date of this report.
(b) Internal Control Over Financial Reporting. There were no significant changes in Registrant’s Internal Control Over Financial Reporting or in other factors that could significantly
affect this control subsequent to the date of the evaluation, including any corrective actions with regard to significant deficiencies and material weaknesses.
Item 12: Disclosure of Securities Lending Activities for Closed-End Management Investment Companies.
Not Applicable.
Item 13: Exhibits.
(a) Code of Ethics.
(b) Certifications.
Pursuant to the requirements of the Securities Exchange Act of 1934 and the Investment Company Act of 1940, the registrant has duly caused this report to be signed on its behalf by the undersigned, thereunto duly authorized.
| |
| | VANGUARD MORGAN GROWTH FUND |
| BY: | /s/ MORTIMER J. BUCKLEY*
|
| MORTIMER J. BUCKLEY |
| | CHIEF EXECUTIVE OFFICER |
Date: November 16, 2018
Pursuant to the requirements of the Securities Exchange Act of 1934 and the Investment Company Act of 1940, this report has been signed below by the following persons on behalf of the registrant and in the capacities and on the dates indicated.
| VANGUARD MORGAN GROWTH FUND |
| BY: | /s/ MORTIMER J. BUCKLEY *
|
| | MORTIMER J. BUCKLEY |
| | CHIEF EXECUTIVE OFFICER |
Date: November 16, 2018
| VANGUARD MORGAN GROWTH FUND |
| BY: | /s/ THOMAS J. HIGGINS*
|
| | THOMAS J. HIGGINS |
| | CHIEF FINANCIAL OFFICER |
Date: November 16, 2018
* By: /s/ Anne E. Robinson
Anne E. Robinson, pursuant to a Power of Attorney filed on January 18, 2018 see file Number 33-32216, Incorporated by Reference.