UNITED STATES
SECURITIES AND EXCHANGE COMMISSION
Washington, D.C. 20549
FORM N-CSR
CERTIFIED SHAREHOLDER REPORT
OF
REGISTERED MANAGEMENT INVESTMENT COMPANIES
Investment Company Act file number: 811-01685
Name of Registrant: Vanguard Morgan Growth Fund
Address of Registrant:
P.O. Box 2600
Valley Forge, PA 19482
Name and address of agent for service:
Anne E. Robinson, Esquire
P.O. Box 876
Valley Forge, PA 19482
Registrant’s telephone number, including area code: (610) 669-1000
Date of fiscal year end: September 30
Date of reporting period: October 1, 2015 – September 30, 2016
Item 1: Reports to Shareholders
Annual Report | September 30, 2016
Vanguard Morgan™ Growth Fund
A new format, unwavering commitment
As you begin reading this report, you’ll notice that we’ve made some improvements to the opening sections—based on feedback from you, our clients.
Page 1 starts with a new ”Your Fund’s Performance at a Glance,” a concise, handy summary of how your fund performed during the period.
In the renamed ”Chairman’s Perspective,” Bill McNabb will focus on enduring principles and investment insights.
We’ve modified some tables, and eliminated some redundancy, but we haven’t removed any information.
At Vanguard, we’re always looking for better ways to communicate and to help you make sound investment decisions. Thank you for entrusting your assets to us.
| |
| Contents | |
| Your Fund’s Performance at a Glance. | 1 |
| Chairman’s Perspective. | 3 |
| Advisors’ Report. | 6 |
| Fund Profile. | 11 |
| Performance Summary. | 12 |
| Financial Statements. | 14 |
| Your Fund’s After-Tax Returns. | 31 |
| About Your Fund’s Expenses. | 32 |
| Glossary. | 34 |
Please note: The opinions expressed in this report are just that—informed opinions. They should not be considered promises or advice. Also, please keep in mind that the information and opinions cover the period through the date on the front of this report. Of course, the risks of investing in your fund are spelled out in the prospectus.
See the Glossary for definitions of investment terms used in this report.
About the cover: No matter what language you speak, Vanguard has one consistent message and set of principles. Our primary focus is on you, our clients. We conduct our business with integrity as a faithful steward of your assets. This message is shown translated into seven languages, reflecting our expanding global presence.
Your Fund’s Performance at a Glance
• Vanguard Morgan Growth Fund returned more than 10% for the 12 months ended September 30, 2016. It trailed its benchmark index’s return of more than 13% but exceeded the nearly 9% average return of its peer group.
• In general, value stocks outpaced their growth counterparts.
• Although the fund’s industry sectors posted positive results, the advisors’ stock selection weighed on performance relative to the benchmark.
• Health care was the biggest relative detractor. The advisors’ pharmaceuticals holdings struggled most as they confronted regulatory and drug market challenges. Information technology and consumer discretionary, the fund’s two largest sectors, also underperformed.
• Energy, a relatively small holding, was the only sector to best the benchmark.
• Over the past ten years, the fund’s average annual return trailed that of its benchmark but outdistanced that of its peers.
| |
| Total Returns: Fiscal Year Ended September 30, 2016 | |
| | Total |
| | Returns |
| Vanguard Morgan Growth Fund | |
| Investor Shares | 10.48% |
| Admiral™ Shares | 10.60 |
| Russell 3000 Growth Index | 13.64 |
| Multi-Cap Growth Funds Average | 8.91 |
| Multi-Cap Growth Funds Average: Derived from data provided by Lipper, a Thomson Reuters Company. | |
| Admiral Shares carry lower expenses and are available to investors who meet certain account-balance requirements. | |
| |
| |
| Total Returns: Ten Years Ended September 30, 2016 | |
| | Average |
| | Annual Return |
| Morgan Growth Fund Investor Shares | 7.64% |
| Russell 3000 Growth Index | 8.80 |
| Multi-Cap Growth Funds Average | 6.81 |
| Multi-Cap Growth Funds Average: Derived from data provided by Lipper, a Thomson Reuters Company. | |
The figures shown represent past performance, which is not a guarantee of future results. (Current performance may be lower or higher than the performance data cited. For performance data current to the most recent month-end, visit our website at vanguard.com/performance.) Note, too, that both investment returns and principal value can fluctuate widely, so an investor’s shares, when sold, could be worth more or less than their original cost.
1
| | | |
| Expense Ratios | | | |
| Your Fund Compared With Its Peer Group | | | |
| | Investor | Admiral | Peer Group |
| | Shares | Shares | Average |
| Morgan Growth Fund | 0.40% | 0.27% | 1.25% |
The fund expense ratios shown are from the prospectus dated January 26, 2016, and represent estimated costs for the current fiscal year. For the fiscal year ended September 30, 2016, the fund’s expense ratios were 0.38% for Investor Shares and 0.28% for Admiral Shares. The peer-group expense ratio is derived from data provided by Lipper, a Thomson Reuters Company, and captures information through year-end 2015.
Peer group: Multi-Cap Growth Funds.
2
Chairman’s Perspective

Bill McNabb
Chairman and Chief Executive Officer
Dear Shareholder,
If you think you’ve had reason to feel uneasy about the investment environment lately, you’re not imagining things. In just the past few months, we’ve seen economic uncertainty, intense political polarization, and super-low bond yields. Yet at the same time, the stock market kept pushing higher.
In this confusing and sometimes contradictory climate, you may be asking yourself a question that I hear often: How do I make sense of all this, keep investing, and still get a good night’s sleep?
As with any problem, there are multiple ways to go at it. But there’s one approach in particular that is simple, straightforward, and nearly foolproof: Save more money. Not only can saving more give you a greater sense of control over your investment plan, it can help compensate for long-term returns that, in our estimation, could fall short of historical averages.
I love the way one of our investment pros put it. Fran Kinniry this summer told The Wall Street Journal, “Investing is always a partnership between you and the markets.” He explained that the markets carried more than their fair share of the weight for a couple of decades, through the 1990s, providing outsized returns that made the investor’s half of the partnership relatively light work. “But now you are going to have to be the majority partner.”
Sobering? Sure. Hopeless? Definitely not.
3
Over the 12 months since last September, U.S. stocks returned 15%, though the rise has not been a one-way ticket straight up. International markets have also posted strong returns, but lower than those of the broad U.S. market. The decision by United Kingdom voters in June to exit the European Union came as a surprise but caused market heartburn for only a few days.
In fixed income, yields remained extremely low—about 1.60% on the 10-year U.S. Treasury note at the end of September, after dipping below 1.40% over the summer. And bond yields in some international markets were negative.
Even this relatively small window of time illustrates a truism of the financial markets: There will always be segments that perform well and others that don’t. Saving more saves you from trying to control the uncontrollable—how economies and the markets perform. And it keeps you in control of one of the most vital parts of your investment program.
Although the “save more” logic is easy to grasp, it’s not always easy to follow. Bills, illness, the loss of a job—these can affect any of us.
But whatever our circumstances, figuring out how to save more is worth the effort. It requires that we make difficult decisions to forgo some consumption today to increase the likelihood of consuming (or consuming more) in the future. This is the very heart of investing. Sacrifices are never fun, so consider carrying them out systematically and in doses that you
| | | |
| Market Barometer | | | |
| | | Average Annual Total Returns |
| | | Periods Ended September 30, 2016 |
| | One | Three | Five |
| | Year | Years | Years |
| Stocks | | | |
| Russell 1000 Index (Large-caps) | 14.93% | 10.78% | 16.41% |
| Russell 2000 Index (Small-caps) | 15.47 | 6.71 | 15.82 |
| Russell 3000 Index (Broad U.S. market) | 14.96 | 10.44 | 16.36 |
| FTSE All-World ex US Index (International) | 9.62 | 0.71 | 6.50 |
| |
| Bonds | | | |
| Bloomberg Barclays U.S. Aggregate Bond Index | | | |
| (Broad taxable market) | 5.19% | 4.03% | 3.08% |
| Bloomberg Barclays Municipal Bond Index | | | |
| (Broad tax-exempt market) | 5.58 | 5.54 | 4.48 |
| Citigroup Three-Month U.S. Treasury Bill Index | 0.20 | 0.06 | 0.06 |
| |
| CPI | | | |
| Consumer Price Index | 1.46% | 1.03% | 1.25% |
4
can be comfortable with—for instance, gradually getting up to the max in your IRA, or adding a percentage point or so to the amount you stash in your employer’s retirement plan. As a point of reference, we generally suggest that investors strive for a retirement savings rate of 12%–15%, including any employer contributions.
If you need more convincing about the wisdom of the “save more” course of action, it might be helpful to examine your alternatives. This list is by no means exhaustive, but it hits on a few of the big ones, and none are without risk.
• Reach for yield. With yields so low on many types of bonds, it’s tempting to find the corners of the fixed income market where payouts are juicier. But with the juice comes considerable risk. You need to be aware that you’d be taking on more risk—and how much more.
• Go all-in on a hot-performing asset class or fund. By now, you know better than that, right?
• Sit tight. This approach isn’t a terrible idea; it’s better than panicking and deciding to just “do something,” particularly if that means changing your approach in response to the market’s movements.
Here’s the inescapably challenging part of your partnership with the markets: In the short run, your “partner” is fickle, emotional, and wildly unpredictable. But in the long run, your partner is mostly rational and extremely helpful.
The best way to minimize your vulnerability to the market’s mood swings, and to maximize the benefit of your partner’s longer-term strengths, is to expect less and save more. Maybe the markets will deliver better-than-expected returns. Maybe they’ll be consistent with our more modest expectations. In either case, a higher savings rate can help put you in a better position to reach your goals.
As always, thank you for investing with Vanguard.
Sincerely,

F. William McNabb III
Chairman and Chief Executive Officer
October 18, 2016
5
Advisors’ Report
For the fiscal year ended September 30, 2016, Vanguard Morgan Growth Fund returned 10.48% for Investor Shares and 10.60% for the lower-cost Admiral Shares. Your fund is managed by four independent advisors, a strategy that enhances the fund’s diversification by providing exposure to distinct yet complementary investment approaches. It’s not uncommon for different advisors to have different views about individual securities or the broader investment environment.
The advisors, the percentage of fund assets each manages, and brief descriptions of their investment strategies are presented in the accompanying table. The advisors have also prepared a discussion of the investment environment that existed during the fiscal year and of how portfolio positioning reflects this assessment. (Please note that the Frontier Capital Management discussion refers to industry sectors as defined by Russell classifications, rather than by the Global Industry Classification Standard used elsewhere in this report.)
On a separate note, we want to congratulate Paul Marrkand of Wellington Management Company for completing a decade as a portfolio manager of the Morgan Growth Fund earlier this fiscal year. We thank him for serving our shareholders with distinction.
These comments were prepared on October 18, 2016.
Wellington Management Company LLP
Portfolio Manager: Paul E. Marrkand, CFA, Senior Managing Director
Our portion of the fund uses traditional methods of stock selection—fundamental research and analysis—to identify mid-and large-capitalization companies that we believe have above-average growth prospects. We seek to build a portfolio of diversified sources of return with a balance of growth, quality, and valuation attributes.
It was a strong period for U.S. and foreign equities as the S&P 500 Index returned 15.43% and the MSCI World Index returned 12.02%. Fixed income markets also moved up, and the Bloomberg Barclays U.S. Aggregate Bond Index returned 5.19%.
Successes
Our stock selection was strongest in the consumer discretionary, energy, and industrial sectors. An overweighted allocation to information technology also aided relative results as the sector contained two of the largest individual contributors: Linear Technology and Facebook. Not owning consumer discretionary benchmark index constituents Walt Disney and Nike helped as well.
6
Shortfalls
Sector allocation, a residual of our bottom-up stock selection process, detracted from the portfolio’s relative return. A modest cash position in a strong equity market, underweighted allocations to materials and consumer staples, and an overweighted allocation to telecommunication services hurt most.
Security selection was another drag on relative performance, particularly in financials, information technology, and consumer staples. The largest detractors included Chipotle Mexican Grill and Advance Auto Parts in the consumer discretionary sector and Bristol-Myers Squibb in health care; we eliminated our positions in Chipotle and Advance Auto. An out-of-benchmark position in Check Point Software (information technology) also weighed on returns.
We remain optimistic about the portfolio’s favorable risk/reward profile and continue to purchase, at attractive valuations, capital-compounding companies with what we believe to be long-term competitive advantages that can maintain a free-cash-flow growth rate beyond that of the market. Through this bottom-up process, the portfolio ended the period most overweighted in information technology and energy and most underweighted in consumer discretionary and real estate.1
Jennison Associates LLC
Portfolio managers:
Kathleen A. McCarragher,
Managing Director
Blair A. Boyer,
Managing Director
Decelerating growth in China, the effect of lower energy prices on industrial sectors, and the United Kingdom’s vote to leave the European Union contributed to a volatile global landscape. Adding to this were fears of slowing growth in the United States and uncertainty about future Federal Reserve monetary tightening. Risk aversion affected how investors valued securities. Low-volatility, high-dividend-paying stocks were significant drivers of market returns: Dividend-paying and other “safety” stocks outperformed, and stocks of higher-growth companies generally did less well.
Successes
Amazon benefited from strong execution, margin expansion, and development of an important business opportunity in cloud infrastructure. The company continues to invest to drive unit growth in its core retail business and through the proliferation of digital commerce via the mobile market.
Facebook rose following impressive revenue and margins, accelerating advertising revenue growth, and solid
1 Effective September 1, 2016, S&P Dow Jones Indices and MSCI implemented a new real estate sector under the Global Industry Classification Standard (GICS); holdings in this sector were previously classified as financials. Our analysis attributes real estate to the financial sector for the period from October 1, 2015, through August 31, 2016, and to the new real estate sector thereafter.
7
user growth and engagement. As the company solidifies its dominant position, it increases its appeal to users and advertisers. Long-term growth drivers include Instagram, WhatsApp, and Messenger.
Alibaba advanced on strong revenue, earnings, user metrics, gross merchandise value, monetization revenue, and margins. We believe the company, with dominant positions in several Chinese markets, offers an attractive opportunity to invest in the long-term growth of Chinese e-commerce.
Shortfalls
We eliminated our position in online professional network LinkedIn after significant deceleration in its previously high growth rates.
Many biotechnology companies that sell innovative, high-priced drugs, including Alexion Pharmaceuticals, faced concerns about pricing. Alexion makes and develops drugs that target rare genetic and potentially life-threatening blood and metabolic disorders.
Global athletic footwear and apparel brand Under Armour declined amid the liquidation of a key wholesale partner, management changes, and heightened competition.
Frontier Capital Management Co., LLC
Portfolio Managers:
Stephen Knightly, CFA, President Christopher J. Scarpa, Vice President
Successes
Our performance was strongest in the information technology and consumer discretionary sectors. In technology, investments in video game firms and financial data processors did well. In consumer discretionary, our focus on improved fundamentals for lower-income consumers led to solid gains.
Shortfalls
Our results for the period were hindered largely by stock selection in the health care and consumer staples sectors. In health care, our portion of the portfolio incurred setbacks in biotechnology and specialty pharmaceuticals. In consumer staples, increased competitive pressures among health and nutrition companies dampened investments.
We were also hurt by our positioning within these sectors. We remain overweighted in health care because of its attractive innovation and secular growth characteristics. We continue to be underweighted in consumer staples because we consider the sector’s valuations to be extended and its growth relatively muted.
8
After three consecutive years of flat S&P 500 operating earnings, Wall Street is forecasting 14% earnings growth in 2017. Because expectations for a sharp acceleration seem overly optimistic, selectivity will be vital.
We continue to find attractive investments in gaming software, transaction processing, information services, health care, infrastructure materials, and wireless communications. Conversely, we have become more concerned about consumer fundamentals and valuations in safe-haven sectors such as REITs, utilities, and staples; we have positioned the portfolio accordingly.
Vanguard Quantitative Equity Group
Portfolio Managers: James P. Stetler, Principal Anatoly Shtekhman, CFA
Binbin Guo, Principal, Head of Equity Research and Portfolio Strategies
Growth around the globe remained subdued. The U.S. economy grew at an annual rate of 2.8% in the third quarter of 2016, and the IMF estimated global growth at 2.9% for the first half of the year. Brexit is still unfolding; the long-term arrangements between the United Kingdom and the European Union will be uncertain for some time.
Over the past 12 months, our investment process and resulting portfolio struggled to keep pace with the benchmark index. Our quantitative approach to stock selection focuses on five factors: valuation, quality, management decisions, sentiment, and growth. We use these factors to systematically identify stocks that, when combined in a diversified, risk-controlled portfolio, we believe will exhibit long-term outperformance.
Successes
One of the largest contributions to our relative return came from an overweighted position in real estate firm Communications Sales & Leasing.
Shortfalls
Unfortunately, over this period, the most successful firms had attributes that our model does not seek. Our selections in energy detracted the most from relative returns; overweighted positions in Tesoro and Plains GP Holdings did not perform as expected. We are disappointed with these results but not surprised, as all investment styles endure periods of underperformance. Through different market environments, we continue our commitment to identifying firms with attractive fundamentals that we believe the market will reward in the long term.
9
| | | |
| Vanguard Morgan Growth Fund Investment Advisors | |
| |
| | Fund Assets Managed | |
| Investment Advisor | % | $ Million | Investment Strategy |
| Wellington Management | 47 | 5,291 | Uses traditional methods of stock selection— |
| Company LLP | | | fundamental research and analysis—to identify |
| | | | companies that it believes have above-average growth |
| | | | prospects. Research focuses on mid- and large-cap |
| | | | companies, evaluating and ranking each stock on a |
| | | | consistent set of growth, quality, and valuation criteria. |
| | | | We seek to build a portfolio with diversified sources of |
| | | | return with a balance of growth, quality, and valuation |
| | | | attributes. |
| Jennison Associates LLC | 22 | 2,430 | Uses a research-driven, fundamental investment |
| | | | approach that relies on in-depth company knowledge |
| | | | gleaned through meetings with management, |
| | | | customers, and suppliers. |
| Frontier Capital Management Co., | 15 | 1,654 | Uses a research-driven, fundamental investment |
| LLC | | | approach that seeks companies with above-average |
| | | | growth prospects, reasonable valuations, and |
| | | | competitive advantages. |
| Vanguard Quantitative Equity | 15 | 1,646 | Employs a quantitative fundamental management |
| Group | | | approach, using models that assess valuation, growth |
| | | | prospects, management decisions, market sentiment, |
| | | | and earnings and balance-sheet quality of companies |
| | | | as compared with their peers. |
| Cash Investments | 1 | 164 | These short-term reserves are invested by Vanguard in |
| | | | equity index products to simulate investments in |
| | | | stocks. Each advisor also may maintain a modest cash |
| | | | position. |
10
Morgan Growth Fund
Fund Profile
As of September 30, 2016
| | | |
| Share-Class Characteristics | | |
| | Investor | | Admiral |
| | Shares | | Shares |
| Ticker Symbol | VMRGX | | VMRAX |
| Expense Ratio1 | 0.40% | | 0.27% |
| 30-Day SEC Yield | 0.94% | | 0.89% |
| |
| Portfolio Characteristics | | |
| | | | DJ |
| | | | U.S. |
| | | Russell | Total |
| | | 3000 | Market |
| | | Growth | FA |
| | Fund | Index | Index |
| Number of Stocks | 309 | 1,753 | 3,850 |
| Median Market Cap | $48.3B | $64.6B | $51.8B |
| Price/Earnings Ratio | 26.1x | 25.5x | 23.7x |
| Price/Book Ratio | 5.0x | 5.5x | 2.8x |
| Return on Equity | 20.9% | 21.4% | 16.6% |
| Earnings Growth | | | |
| Rate | 14.0% | 11.9% | 7.6% |
| Dividend Yield | 1.2% | 1.5% | 2.0% |
| Foreign Holdings | 4.8% | 0.0% | 0.0% |
| Turnover Rate | 51% | — | — |
| Short-Term | | | |
| Reserves | 0.8% | — | — |
Sector Diversification (% of equity exposure)
| | | |
| | | Russell | DJ |
| | | 3000 | U.S. Total |
| | | Growth | Market |
| | Fund | Index | FA Index |
| Consumer | | | |
| Discretionary | 19.9% | 20.2% | 12.8% |
| Consumer Staples | 6.0 | 9.1 | 8.7 |
| Energy | 1.8 | 0.7 | 6.7 |
| Financials | 3.7 | 2.9 | 13.3 |
| Health Care | 16.2 | 17.3 | 14.2 |
| Industrials | 9.3 | 10.8 | 10.3 |
| Information | | | |
| Technology | 38.5 | 31.0 | 20.7 |
| Materials | 2.0 | 3.7 | 3.3 |
| Real Estate | 0.9 | 3.0 | 4.3 |
| Telecommunication | | | |
| Services | 1.5 | 1.2 | 2.4 |
| Utilities | 0.2 | 0.1 | 3.3 |
| | |
| Volatility Measures | | |
| | Russell | DJ |
| | 3000 | U.S. Total |
| | Growth | Market |
| | Index | FA Index |
| R-Squared | 0.98 | 0.92 |
| Beta | 1.02 | 1.04 |
These measures show the degree and timing of the fund’s fluctuations compared with the indexes over 36 months.
Ten Largest Holdings (% of total net assets)
| | |
| Alphabet Inc. | Internet Software & | |
| | Services | 4.3% |
| Apple Inc. | Technology | |
| | Hardware, Storage & | |
| | Peripherals | 4.1 |
| Amazon.com Inc. | Internet & Direct | |
| | Marketing Retail | 3.4 |
| Facebook Inc. | Internet Software & | |
| | Services | 3.1 |
| Visa Inc. | Data Processing & | |
| | Outsourced Services | 2.0 |
| Microsoft Corp. | Systems Software | 2.0 |
| Home Depot Inc. | Home Improvement | |
| | Retail | 1.4 |
| Amgen Inc. | Biotechnology | 1.3 |
| PepsiCo Inc. | Soft Drinks | 1.2 |
| Bristol-Myers Squibb Co. Pharmaceuticals | 1.2 |
| Top Ten | | 24.0% |
The holdings listed exclude any temporary cash investments and equity index products.
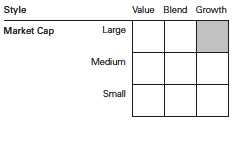
Investment Focus
1 The expense ratios shown are from the prospectus dated January 26, 2016, and represent estimated costs for the current fiscal year. For the fiscal year ended September 30, 2016, the expense ratios were 0.38% for Investor Shares and 0.28% for Admiral Shares.
11
Morgan Growth Fund
Performance Summary
All of the returns in this report represent past performance, which is not a guarantee of future results that may be achieved by the fund. (Current performance may be lower or higher than the performance data cited. For performance data current to the most recent month-end, visit our website at vanguard.com/performance.) Note, too, that both investment returns and principal value can fluctuate widely, so an investor’s shares, when sold, could be worth more or less than their original cost. The returns shown do not reflect taxes that a shareholder would pay on fund distributions or on the sale of fund shares.
See Financial Highlights for dividend and capital gains information.
12
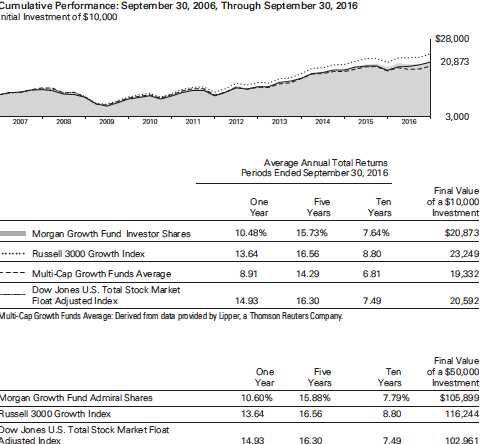
Morgan Growth Fund
Fiscal-Year Total Returns (%): September 30, 2006, Through September 30, 2016
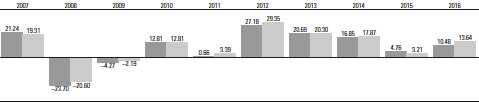
Morgan Growth Fund Investor Shares
Russell 3000 Growth Index
13
Morgan Growth Fund
Financial Statements
Statement of Net Assets
As of September 30, 2016
The fund reports a complete list of its holdings in regulatory filings four times in each fiscal year, at the quarter-ends. For the second and fourth fiscal quarters, the lists appear in the fund’s semiannual and annual reports to shareholders. For the first and third fiscal quarters, the fund files the lists with the Securities and Exchange Commission on Form N-Q. Shareholders can look up the fund’s Forms N-Q on the SEC’s website at sec.gov. Forms N-Q may also be reviewed and copied at the SEC’s Public Reference Room (see the back cover of this report for further information).
| | | |
| | | | Market |
| | | | Value• |
| | | Shares | ($000) |
| Common Stocks (98.8%)1 | | |
| Consumer Discretionary (19.5%) | |
| * | Amazon.com Inc. | 447,585 | 374,767 |
| | Home Depot Inc. | 1,187,862 | 152,854 |
| | Comcast Corp. Class A | 1,926,490 | 127,803 |
| * | Priceline Group Inc. | 83,944 | 123,523 |
| | Ross Stores Inc. | 1,343,246 | 86,371 |
| * | Netflix Inc. | 751,874 | 74,097 |
| * | O’Reilly Automotive Inc. | 243,214 | 68,127 |
| | Lowe’s Cos. Inc. | 904,921 | 65,344 |
| | Industria de Diseno | | |
| | Textil SA ADR | 3,407,336 | 62,865 |
| | adidas AG | 351,358 | 60,981 |
| | NIKE Inc. Class B | 1,158,184 | 60,978 |
| | Omnicom Group Inc. | 676,849 | 57,532 |
| | Starbucks Corp. | 948,386 | 51,346 |
| | Marriott International Inc. | | |
| | Class A | 734,624 | 49,462 |
| | Scripps Networks | | |
| | Interactive Inc. Class A | 777,036 | 49,334 |
| | TJX Cos. Inc. | 647,198 | 48,397 |
| | Dollar General Corp. | 662,875 | 46,395 |
| * | Michael Kors Holdings Ltd. | 870,836 | 40,746 |
| | Aramark | 971,855 | 36,960 |
| * | Discovery | | |
| | Communications Inc. | | |
| | Class A | 1,281,167 | 34,489 |
| | McDonald’s Corp. | 294,893 | 34,019 |
| * | Tesla Motors Inc. | 165,922 | 33,853 |
| | Las Vegas Sands Corp. | 547,977 | 31,531 |
| | Walt Disney Co. | 294,703 | 27,366 |
| | Wyndham Worldwide | | |
| | Corp. | 369,658 | 24,889 |
| | Brunswick Corp. | 508,631 | 24,811 |
| * | LKQ Corp. | 668,781 | 23,715 |
| | Dunkin’ Brands Group Inc. | 405,606 | 21,124 |
| | Viacom Inc. Class B | 517,658 | 19,723 |
| | | |
| | | | Market |
| | | | Value• |
| | | Shares | ($000) |
| * | Ulta Salon Cosmetics & | | |
| | Fragrance Inc. | 74,558 | 17,743 |
| * | Dollar Tree Inc. | 211,873 | 16,723 |
| | Expedia Inc. | 125,890 | 14,694 |
| | Target Corp. | 211,217 | 14,506 |
| | Royal Caribbean Cruises | | |
| | Ltd. | 193,286 | 14,487 |
| | Harman International | | |
| | Industries Inc. | 155,850 | 13,162 |
| * | Liberty Global plc Class A | 300,822 | 10,282 |
| * | Sirius XM Holdings Inc. | 2,443,582 | 10,190 |
| ^ | Nordstrom Inc. | 195,231 | 10,129 |
| * | IMAX Corp. | 346,410 | 10,035 |
| *,^ | Shake Shack Inc. Class A | 285,334 | 9,893 |
| | Foot Locker Inc. | 141,350 | 9,572 |
| * | Urban Outfitters Inc. | 268,391 | 9,265 |
| * | Bright Horizons Family | | |
| | Solutions Inc. | 135,329 | 9,052 |
| | Carnival Corp. | 179,899 | 8,783 |
| | Whirlpool Corp. | 53,093 | 8,610 |
| * | Michaels Cos. Inc. | 349,708 | 8,452 |
| | Lear Corp. | 69,324 | 8,403 |
| | Advance Auto Parts Inc. | 55,745 | 8,313 |
| | DR Horton Inc. | 227,073 | 6,858 |
| | | |
| | Class A | 201,174 | 6,836 |
| * | MGM Resorts International | 255,859 | 6,660 |
| | CBS Corp. Class B | 120,971 | 6,622 |
| * | lululemon athletica Inc. | 106,632 | 6,502 |
| | PVH Corp. | 42,289 | 4,673 |
| | Domino’s Pizza Inc. | 26,694 | 4,053 |
| | Yum! Brands Inc. | 26,832 | 2,437 |
| * | Liberty SiriusXM Group | | |
| | Class C | 51,985 | 1,737 |
| * | Discovery | | |
| | Communications Inc. | 47,938 | 1,261 |
| | Leggett & Platt Inc. | 27,312 | 1,245 |
| * | Hyatt Hotels Corp. Class A | 23,851 | 1,174 |
| | | | 2,175,754 |
14
| | | |
| Morgan Growth Fund | | |
| |
| |
| |
| | | | Market |
| | | | Value• |
| | | Shares | ($000) |
| Consumer Staples (5.8%) | | |
| | PepsiCo Inc. | 1,282,291 | 139,475 |
| | CVS Health Corp. | 693,930 | 61,753 |
| | Altria Group Inc. | 969,001 | 61,270 |
| | Costco Wholesale Corp. | 363,940 | 55,504 |
| | Colgate-Palmolive Co. | 618,639 | 45,866 |
| * | Monster Beverage Corp. | 301,473 | 44,259 |
| | Hershey Co. | 417,763 | 39,938 |
| | Estee Lauder Cos. Inc. | | |
| | Class A | 361,739 | 32,036 |
| | Wal-Mart Stores Inc. | 393,548 | 28,383 |
| | Mondelez International Inc. | | |
| | Class A | 565,686 | 24,834 |
| | Tyson Foods Inc. Class A | 173,439 | 12,951 |
| | Kroger Co. | 385,356 | 11,437 |
| ^ | BRF SA ADR | 666,888 | 11,377 |
| | Ingredion Inc. | 78,444 | 10,438 |
| | Brown-Forman Corp. | | |
| | Class B | 205,639 | 9,755 |
| | Walgreens Boots | | |
| | Alliance Inc. | 120,579 | 9,721 |
| | Sysco Corp. | 197,788 | 9,694 |
| | Kimberly-Clark Corp. | 75,072 | 9,469 |
| * | Blue Buffalo Pet Products | | |
| | Inc. | 386,474 | 9,183 |
| | Mead Johnson Nutrition | | |
| | Co. | 103,121 | 8,148 |
| ^ | Pilgrim’s Pride Corp. | 356,730 | 7,534 |
| * | Sprouts Farmers Market | | |
| | Inc. | 241,071 | 4,978 |
| * | Edgewell Personal Care | | |
| | Co. | 45,476 | 3,616 |
| | | | 651,619 |
| Energy (1.7%) | | |
| * | Concho Resources Inc. | 308,351 | 42,352 |
| | BP plc ADR | 1,181,574 | 41,544 |
| | Baker Hughes Inc. | 793,712 | 40,059 |
| | Chevron Corp. | 311,378 | 32,047 |
| * | Carrizo Oil & Gas Inc. | 405,164 | 16,458 |
| * | Newfield Exploration Co. | 204,029 | 8,867 |
| * | Southwestern Energy Co. | 357,932 | 4,954 |
| | Energen Corp. | 78,589 | 4,536 |
| | | | 190,817 |
| Financials (3.5%) | | |
| | Intercontinental | | |
| | Exchange Inc. | 202,954 | 54,668 |
| | Aon plc | 348,194 | 39,168 |
| | Morgan Stanley | 1,020,294 | 32,711 |
| | Nasdaq Inc. | 380,572 | 25,704 |
| | FactSet Research | | |
| | Systems Inc. | 154,536 | 25,050 |
| | Raymond James | | |
| | Financial Inc. | 408,328 | 23,769 |
| | | |
| | | | Market |
| | | | Value• |
| | | Shares | ($000) |
| * | E*TRADE Financial Corp. | 686,598 | 19,994 |
| * | Berkshire Hathaway Inc. | | |
| | Class B | 136,760 | 19,758 |
| | American International | | |
| | Group Inc. | 297,471 | 17,652 |
| | Moody’s Corp. | 136,965 | 14,830 |
| | JPMorgan Chase & Co. | 219,691 | 14,629 |
| * | Signature Bank | 123,397 | 14,616 |
| | Willis Towers Watson plc | 107,800 | 14,313 |
| | Bank of America Corp. | 864,639 | 13,532 |
| | Citigroup Inc. | 260,558 | 12,306 |
| | MSCI Inc. Class A | 122,225 | 10,259 |
| | Marsh & McLennan Cos. | | |
| | Inc. | 150,157 | 10,098 |
| | Ameriprise Financial Inc. | 87,803 | 8,760 |
| | S&P Global Inc. | 67,139 | 8,497 |
| | WisdomTree Investments | | |
| | Inc. | 691,053 | 7,111 |
| | Voya Financial Inc. | 118,711 | 3,421 |
| | | | 390,846 |
| Health Care (15.9%) | | |
| | Amgen Inc. | 865,791 | 144,423 |
| | Bristol-Myers Squibb Co. | 2,471,258 | 133,250 |
| * | Allergan plc | 416,482 | 95,920 |
| | CR Bard Inc. | 369,157 | 82,794 |
| * | BioMarin Pharmaceutical | | |
| | Inc. | 887,532 | 82,114 |
| | Gilead Sciences Inc. | 965,583 | 76,397 |
| * | Celgene Corp. | 606,484 | 63,396 |
| | Johnson & Johnson | 481,661 | 56,899 |
| | Aetna Inc. | 487,416 | 56,272 |
| | Becton Dickinson and Co. | 297,411 | 53,454 |
| | Shire plc ADR | 267,711 | 51,898 |
| * | Alexion Pharmaceuticals | | |
| | Inc. | 422,152 | 51,730 |
| | Merck & Co. Inc. | 720,069 | 44,939 |
| | Cardinal Health Inc. | 572,097 | 44,452 |
| | Danaher Corp. | 557,704 | 43,718 |
| * | HCA Holdings Inc. | 529,818 | 40,070 |
| | Cooper Cos. Inc. | 216,654 | 38,837 |
| | Medtronic plc | 436,037 | 37,674 |
| | Zoetis Inc. | 640,383 | 33,306 |
| * | Biogen Inc. | 99,025 | 30,998 |
| * | Illumina Inc. | 166,567 | 30,259 |
| * | Varian Medical Systems | | |
| | Inc. | 287,261 | 28,591 |
| * | Incyte Corp. | 291,999 | 27,533 |
| * | Align Technology Inc. | 282,237 | 26,460 |
| * | Vertex Pharmaceuticals Inc. 282,623 | 24,648 |
| | STERIS plc | 333,897 | 24,408 |
| * | ICON plc | 307,285 | 23,775 |
| | Zimmer Biomet Holdings | | |
| | Inc. | 164,716 | 21,416 |
15
| | | |
| Morgan Growth Fund | | |
| |
| |
| |
| | | | Market |
| | | | Value• |
| | | Shares | ($000) |
| * | PAREXEL International | | |
| | Corp. | 298,903 | 20,759 |
| * | Edwards Lifesciences | | |
| | Corp. | 161,449 | 19,464 |
| | Anthem Inc. | 145,343 | 18,213 |
| | Teleflex Inc. | 105,993 | 17,812 |
| ^ | AstraZeneca plc ADR | 530,471 | 17,431 |
| * | Express Scripts Holding Co. 226,392 | 15,967 |
| | McKesson Corp. | 81,851 | 13,649 |
| | Eli Lilly & Co. | 167,280 | 13,426 |
| | UnitedHealth Group Inc. | 94,095 | 13,173 |
| | Baxter International Inc. | 237,071 | 11,285 |
| * | Mettler-Toledo | | |
| | International Inc. | 26,841 | 11,269 |
| | AmerisourceBergen Corp. | | |
| | Class A | 134,472 | 10,863 |
| * | Laboratory Corp. of | | |
| | America Holdings | 78,284 | 10,762 |
| * | Hologic Inc. | 276,450 | 10,735 |
| * | Quintiles Transnational | | |
| | Holdings Inc. | 131,945 | 10,695 |
| * | Cerner Corp. | 171,688 | 10,602 |
| | Novo Nordisk A/S ADR | 241,676 | 10,051 |
| * | United Therapeutics Corp. | 80,139 | 9,463 |
| * | Alkermes plc | 197,028 | 9,266 |
| | Agilent Technologies Inc. | 192,298 | 9,055 |
| * | DexCom Inc. | 100,566 | 8,816 |
| | PerkinElmer Inc. | 155,354 | 8,717 |
| | Universal Health Services | | |
| | Inc. Class B | 68,509 | 8,442 |
| * | IDEXX Laboratories Inc. | 50,148 | 5,653 |
| * | Charles River Laboratories | | |
| | International Inc. | 42,000 | 3,500 |
| * | Regeneron | | |
| | Pharmaceuticals Inc. | 8,591 | 3,454 |
| | AbbVie Inc. | 41,011 | 2,587 |
| | Thermo Fisher Scientific | | |
| | Inc. | 15,107 | 2,403 |
| | Abbott Laboratories | 39,509 | 1,671 |
| | | | 1,778,814 |
| Industrials (9.1%) | | |
| | Honeywell International | | |
| | Inc. | 694,329 | 80,952 |
| | Boeing Co. | 585,176 | 77,091 |
| * | TransDigm Group Inc. | 233,898 | 67,625 |
| * | IHS Markit Ltd. | 1,463,480 | 54,954 |
| | Rockwell Automation Inc. | 421,843 | 51,608 |
| | Equifax Inc. | 315,847 | 42,507 |
| | Cintas Corp. | 365,827 | 41,192 |
| | Nielsen Holdings plc | 763,573 | 40,905 |
| * | Verisk Analytics Inc. | | |
| | Class A | 490,330 | 39,854 |
| | | |
| | | | Market |
| | | | Value• |
| | | Shares | ($000) |
| | Cummins Inc. | 302,180 | 38,724 |
| | Emerson Electric Co. | 693,675 | 37,812 |
| | CH Robinson Worldwide | | |
| | Inc. | 476,883 | 33,601 |
| | Parker-Hannifin Corp. | 240,149 | 30,146 |
| * | HD Supply Holdings Inc. | 852,975 | 27,278 |
| | Waste Connections Inc. | 363,999 | 27,191 |
| | AO Smith Corp. | 267,846 | 26,460 |
| | Experian plc | 1,292,088 | 25,888 |
| | Fortive Corp. | 437,358 | 22,261 |
| | Wabtec Corp. | 245,140 | 20,016 |
| * | Beacon Roofing Supply | | |
| | Inc. | 441,085 | 18,556 |
| | JB Hunt Transport | | |
| | Services Inc. | 208,350 | 16,905 |
| | KAR Auction Services Inc. | 386,680 | 16,689 |
| | Roper Technologies Inc. | 89,665 | 16,361 |
| | Delta Air Lines Inc. | 354,335 | 13,947 |
| | Woodward Inc. | 202,267 | 12,638 |
| | Stanley Black & Decker Inc. 86,526 | 10,641 |
| * | United Continental | | |
| | Holdings Inc. | 198,428 | 10,411 |
| | Masco Corp. | 301,598 | 10,348 |
| * | United Rentals Inc. | 129,505 | 10,165 |
| | Alaska Air Group Inc. | 154,299 | 10,162 |
| | Huntington Ingalls | | |
| | Industries Inc. | 61,912 | 9,499 |
| * | JetBlue Airways Corp. | 545,583 | 9,406 |
| | Owens Corning | 176,093 | 9,402 |
| * | Spirit AeroSystems | | |
| | Holdings Inc. Class A | 210,880 | 9,393 |
| | Lennox International Inc. | 55,261 | 8,678 |
| | Ingersoll-Rand plc | 111,779 | 7,594 |
| * | Johnson Controls | | |
| | International plc | 160,055 | 7,447 |
| | Southwest Airlines Co. | 173,982 | 6,766 |
| * | Hertz Global Holdings Inc. | 123,958 | 4,978 |
| | Union Pacific Corp. | 40,537 | 3,954 |
| | United Parcel Service Inc. | | |
| | Class B | 35,029 | 3,831 |
| | Northrop Grumman Corp. | 12,729 | 2,723 |
| | 3M Co. | 14,509 | 2,557 |
| | Lockheed Martin Corp. | 8,956 | 2,147 |
| | Allison Transmission | | |
| | Holdings Inc. | 43,000 | 1,233 |
| * | Copart Inc. | 14,200 | 761 |
| | | | 1,023,257 |
| Information Technology (37.9%) | |
| | Apple Inc. | 4,091,119 | 462,501 |
| * | Alphabet Inc. Class C | 469,085 | 364,615 |
| * | Facebook Inc. Class A | 2,723,505 | 349,344 |
| | Visa Inc. Class A | 2,733,195 | 226,035 |
16
| | | |
| Morgan Growth Fund | | |
| |
| |
| |
| | | | Market |
| | | | Value• |
| | | Shares | ($000) |
| | Microsoft Corp. | 3,897,751 | 224,510 |
| * | Alibaba Group Holding | | |
| | Ltd. ADR | 1,240,724 | 131,256 |
| | Oracle Corp. | 3,312,398 | 130,111 |
| * | Alphabet Inc. Class A | 143,069 | 115,036 |
| * | salesforce.com Inc. | 1,531,576 | 109,247 |
| | Mastercard Inc. | 909,748 | 92,585 |
| | Texas Instruments Inc. | 1,288,232 | 90,408 |
| * | Electronic Arts Inc. | 1,044,201 | 89,175 |
| * | Vantiv Inc. Class A | 1,409,199 | 79,296 |
| | Tencent Holdings Ltd. | 2,597,653 | 71,976 |
| * | Red Hat Inc. | 888,068 | 71,783 |
| | Linear Technology Corp. | 1,194,921 | 70,847 |
| * | eBay Inc. | 2,056,514 | 67,659 |
| | Global Payments Inc. | 866,639 | 66,523 |
| | QUALCOMM Inc. | 961,630 | 65,872 |
| * | Check Point Software | | |
| | Technologies Ltd. | 839,496 | 65,153 |
| * | Adobe Systems Inc. | 579,294 | 62,877 |
| | Jack Henry & Associates | | |
| | Inc. | 689,027 | 58,946 |
| * | Workday Inc. Class A | 641,804 | 58,847 |
| * | PayPal Holdings Inc. | 1,388,844 | 56,901 |
| | Maxim Integrated | | |
| | Products Inc. | 1,398,343 | 55,836 |
| | Paychex Inc. | 952,087 | 55,097 |
| * | Fiserv Inc. | 496,302 | 49,367 |
| * | Alliance Data Systems | | |
| | Corp. | 227,106 | 48,721 |
| * | Gartner Inc. | 530,826 | 46,952 |
| | CDK Global Inc. | 765,262 | 43,895 |
| * | F5 Networks Inc. | 334,619 | 41,707 |
| | Cisco Systems Inc. | 1,314,626 | 41,700 |
| * | Cadence Design | | |
| | Systems Inc. | 1,607,629 | 41,043 |
| * | Euronet Worldwide Inc. | 453,367 | 37,099 |
| | Activision Blizzard Inc. | 830,678 | 36,799 |
| | Intuit Inc. | 322,069 | 35,431 |
| * | Palo Alto Networks Inc. | 219,481 | 34,970 |
| * | Yandex NV Class A | 1,656,637 | 34,872 |
| | Amdocs Ltd. | 556,788 | 32,210 |
| * | Baidu Inc. ADR | 163,365 | 29,744 |
| *,^ | Mobileye NV | 638,952 | 27,200 |
| * | Splunk Inc. | 450,132 | 26,414 |
| * | Cirrus Logic Inc. | 495,612 | 26,342 |
| * | Fortinet Inc. | 695,976 | 25,702 |
| * | Qorvo Inc. | 419,996 | 23,411 |
| | Lam Research Corp. | 245,497 | 23,251 |
| | Accenture plc Class A | 177,388 | 21,671 |
| | Xilinx Inc. | 305,758 | 16,615 |
| | Amphenol Corp. Class A | 249,076 | 16,170 |
| * | NXP Semiconductors NV | 148,869 | 15,186 |
| | Applied Materials Inc. | 481,296 | 14,511 |
| | | |
| | | | Market |
| | | | Value• |
| | | Shares | ($000) |
| * | First Solar Inc. | 361,388 | 14,271 |
| * | Universal Display Corp. | 251,019 | 13,934 |
| | Sabre Corp. | 469,113 | 13,220 |
| * | Genpact Ltd. | 486,180 | 11,644 |
| * | Citrix Systems Inc. | 127,658 | 10,879 |
| | Broadridge Financial | | |
| | Solutions Inc. | 151,437 | 10,266 |
| | CDW Corp. | 224,251 | 10,255 |
| *,^ | VMware Inc. Class A | 133,837 | 9,817 |
| * | Teradata Corp. | 312,997 | 9,703 |
| * | First Data Corp. Class A | 723,719 | 9,524 |
| * | Flex Ltd. | 697,129 | 9,495 |
| | Fair Isaac Corp. | 64,836 | 8,078 |
| | NVIDIA Corp. | 99,416 | 6,812 |
| * | GoDaddy Inc. Class A | 149,281 | 5,155 |
| * | Synopsys Inc. | 71,826 | 4,263 |
| | MercadoLibre Inc. | 13,970 | 2,584 |
| | Broadcom Ltd. | 12,989 | 2,241 |
| * | Black Knight Financial | | |
| | Services Inc. Class A | 28,868 | 1,181 |
| | | | 4,236,741 |
| Materials (1.9%) | | |
| | Sherwin-Williams Co. | 222,901 | 61,668 |
| ^ | Rio Tinto plc ADR | 1,014,663 | 33,890 |
| | Nucor Corp. | 600,114 | 29,676 |
| | Eagle Materials Inc. | 294,082 | 22,732 |
| | Martin Marietta Materials | | |
| | Inc. | 95,777 | 17,155 |
| * | Berry Plastics Group Inc. | 368,463 | 16,157 |
| * | Crown Holdings Inc. | 188,446 | 10,758 |
| | Steel Dynamics Inc. | 355,126 | 8,874 |
| | Packaging Corp. of | | |
| | America | 76,163 | 6,189 |
| | Freeport-McMoRan Inc. | 361,956 | 3,931 |
| | WR Grace & Co. | 50,004 | 3,690 |
| | | | 214,720 |
| Other (1.1%) | | |
| ^,2 | Vanguard Growth ETF | 1,044,900 | 117,332 |
| |
| Real Estate (0.8%) | | |
| | Public Storage | 186,519 | 41,620 |
| | Macerich Co. | 124,739 | 10,087 |
| | Communications Sales & | | |
| | Leasing Inc. | 317,596 | 9,976 |
| | Brixmor Property Group | | |
| | Inc. | 344,939 | 9,586 |
| | Regency Centers Corp. | 80,095 | 6,206 |
| | Crown Castle International | | |
| | Corp. | 48,505 | 4,570 |
| | Equity LifeStyle Properties | | |
| | Inc. | 43,506 | 3,358 |
| | Simon Property Group Inc. | 12,203 | 2,526 |
| | | | 87,929 |
17
| | | |
| Morgan Growth Fund | | |
| |
| |
| |
| | | | Market |
| | | | Value• |
| | | Shares | ($000) |
| Telecommunication Services (1.4%) | |
| | Verizon Communications | | |
| | Inc. | 1,555,660 | 80,863 |
| * | SBA Communications | | |
| | Corp. Class A | 527,233 | 59,135 |
| | Cogent Communications | | |
| | Holdings Inc. | 398,207 | 14,658 |
| * | T-Mobile US Inc. | 157,147 | 7,342 |
| | | | 161,998 |
| Utilities (0.2%) | | |
| | NextEra Energy Inc. | 179,932 | 22,009 |
| Total Common Stocks | | |
| (Cost $7,946,747) | | 11,051,836 |
| Temporary Cash Investments (1.7%)1 | |
| Money Market Fund (1.5%) | | |
| 3,4 | Vanguard Market | | |
| | Liquidity Fund, | | |
| | 0.640% | 1,678,059 | 167,822 |
| |
| | | Face | |
| | | Amount | |
| | | ($000) | |
| Repurchase Agreement (0.1%) | |
| | Bank of America Securities, | |
| | LLC 0.490%, 10/3/16 | | |
| | (Dated 9/30/16, | | |
| | Repurchase Value | | |
| �� | $7,000,000, | | |
| | collateralized by | | |
| | Federal National | | |
| | Mortgage Assn. | | |
| | 2.090%, 8/1/44, | | |
| | with a value of | | |
| | $7,140,000) | 7,000 | 7,000 |
| U. | S. Government and Agency Obligations (0.1%) |
| 5 | Federal Home Loan Bank |
| | |
| Discount Notes, 0.365%, | | |
| 10/5/16 | 11,000 | 11,000 |
| 5,6 Federal Home Loan Bank | | |
| Discount Notes, 0.340%, | | |
| 11/16/16 | 300 | 300 |
| | | 11,300 |
| Total Temporary Cash Investments | |
| (Cost $186,114) | | 186,122 |
| Total Investments (100.5%) | | |
| (Cost $8,132,861) | | 11,237,958 |
| |
| | Amount |
| | ($000) |
| Other Assets and Liabilities (-0.5%) | |
| Other Assets | |
| Investment in Vanguard | 862 |
Receivables for Investment Securities Sold 81,563
| |
| Receivables for Accrued Income | 4,320 |
| Receivables for Capital Shares Issued | 5,559 |
| Other Assets | 2,669 |
| Total Other Assets | 94,973 |
| Liabilities | |
| Payables for Investment Securities | |
| Purchased | (73,644) |
| Collateral for Securities on Loan | (35,750) |
| Payable for Capital Shares Redeemed | (13,306) |
| Payables to Investment Advisor | (4,009) |
| Payables to Vanguard | (18,717) |
| Other Liabilities | (2,232) |
| Total Liabilities | (147,658) |
| Net Assets (100%) | 11,185,273 |
18
Morgan Growth Fund
| |
| At September 30, 2016, net assets consisted of: |
| | Amount |
| | ($000) |
| Paid-in Capital | 7,651,483 |
| Undistributed Net Investment Income | 45,916 |
| Accumulated Net Realized Gains | 382,514 |
| Unrealized Appreciation (Depreciation) | |
| Investment Securities | 3,105,097 |
| Futures Contracts | 263 |
| Net Assets | 11,185,273 |
| |
| |
| Investor Shares—Net Assets | |
| Applicable to 157,824,985 outstanding | |
| $.001 par value shares of beneficial | |
| interest (unlimited authorization) | 4,063,050 |
| Net Asset Value Per Share— | |
| Investor Shares | $25.74 |
| |
| |
| Admiral Shares—Net Assets | |
| Applicable to 89,254,107 outstanding | |
| $.001 par value shares of beneficial | |
| interest (unlimited authorization) | 7,122,223 |
| Net Asset Value Per Share— | |
| Admiral Shares | $79.80 |
• See Note A in Notes to Financial Statements.
* Non-income-producing security.
^ Includes partial security positions on loan to broker-dealers. The total value of securities on loan is $34,865,000.
1 The fund invests a portion of its cash reserves in equity markets through the use of index futures contracts. After giving effect to futures
investments, the fund’s effective common stock and temporary cash investment positions represent 99.3% and 1.2%, respectively, of net
assets.
2 Considered an affiliated company of the fund as the issuer is another member of The Vanguard Group.
3 Affiliated money market fund available only to Vanguard funds and certain trusts and accounts managed by Vanguard. Rate shown is the
7-day yield.
4 Includes $35,750,000 of collateral received for securities on loan.
5 The issuer operates under a congressional charter; its securities are generally neither guaranteed by the U.S. Treasury nor backed by the full
faith and credit of the U.S. government.
6 Securities with a value of $300,000 and cash of $2,300,000 have been segregated as initial margin for open futures contracts.
ADR—American Depositary Receipt.
See accompanying Notes, which are an integral part of the Financial Statements.
19
| |
| Morgan Growth Fund | |
| |
| |
| Statement of Operations | |
| |
| | Year Ended |
| | September 30, 2016 |
| | ($000) |
| Investment Income | |
| Income | |
| Dividends1,2 | 130,581 |
| Interest2 | 1,217 |
| Securities Lending—Net | 2,031 |
| Total Income | 133,829 |
| Expenses | |
| Investment Advisory Fees—Note B | |
| Basic Fee | 17,578 |
| Performance Adjustment | 615 |
| The Vanguard Group—Note C | |
| Management and Administrative—Investor Shares | 8,265 |
| Management and Administrative—Admiral Shares | 7,739 |
| Marketing and Distribution—Investor Shares | 740 |
| Marketing and Distribution—Admiral Shares | 583 |
| Custodian Fees | 194 |
| Auditing Fees | 45 |
| Shareholders’ Reports—Investor Shares | 55 |
| Shareholders’ Reports—Admiral Shares | 48 |
| Trustees’ Fees and Expenses | 16 |
| Total Expenses | 35,878 |
| Expenses Paid Indirectly | (226) |
| Net Expenses | 35,652 |
| Net Investment Income | 98,177 |
| Realized Net Gain (Loss) | |
| Investment Securities Sold2 | 516,835 |
| Futures Contracts | (20,076) |
| Foreign Currencies | 473 |
| Realized Net Gain (Loss) | 497,232 |
| Change in Unrealized Appreciation (Depreciation) | |
| Investment Securities | 513,262 |
| Futures Contracts | 2,671 |
| Change in Unrealized Appreciation (Depreciation) | 515,933 |
| Net Increase (Decrease) in Net Assets Resulting from Operations | 1,111,342 |
1 Dividends are net of foreign withholding taxes of $331,000.
2 Dividend income, interest income, and realized net gain (loss) from affiliated companies of the fund were $1,496,000, $886,000, and $14,000, respectively.
See accompanying Notes, which are an integral part of the Financial Statements.
20
| | |
| Morgan Growth Fund | | |
| |
| |
| Statement of Changes in Net Assets | | |
| |
| | Year Ended September 30, |
| | 2016 | 2015 |
| | ($000) | ($000) |
| Increase (Decrease) in Net Assets | | |
| Operations | | |
| Net Investment Income | 98,177 | 100,389 |
| Realized Net Gain (Loss) | 497,232 | 953,860 |
| Change in Unrealized Appreciation (Depreciation) | 515,933 | (527,102) |
| Net Increase (Decrease) in Net Assets Resulting from Operations | 1,111,342 | 527,147 |
| Distributions | | |
| Net Investment Income | | |
| Investor Shares | (28,118) | (31,623) |
| Admiral Shares | (58,129) | (53,891) |
| Realized Capital Gain1 | | |
| Investor Shares | (316,049) | (467,717) |
| Admiral Shares | (539,822) | (648,615) |
| Total Distributions | (942,118) | (1,201,846) |
| Capital Share Transactions | | |
| Investor Shares | (81,629) | (250,796) |
| Admiral Shares | 214,073 | 978,782 |
| Net Increase (Decrease) from Capital Share Transactions | 132,444 | 727,986 |
| Total Increase (Decrease) | 301,668 | 53,287 |
| Net Assets | | |
| Beginning of Period | 10,883,605 | 10,830,318 |
| End of Period2 | 11,185,273 | 10,883,605 |
1 Includes fiscal 2016 and 2015 short-term gain distributions totaling $6,527,000 and $135,145,000, respectively. Short-term gain distributions are treated as ordinary income dividends for tax purposes.
2 Net Assets—End of Period includes undistributed (overdistributed) net investment income of $45,916,000 and $43,316,000.
See accompanying Notes, which are an integral part of the Financial Statements.
21
| | | | | |
| Morgan Growth Fund | | | | | |
| |
| |
| Financial Highlights | | | | | |
| |
| |
| Investor Shares | | | | | |
| |
| For a Share Outstanding | | | Year Ended September 30, |
| Throughout Each Period | 2016 | 2015 | 2014 | 2013 | 2012 |
| Net Asset Value, Beginning of Period | $25.29 | $27.07 | $24.26 | $20.31 | $16.06 |
| Investment Operations | | | | | |
| Net Investment Income | .207 | .219 | .187 | .230 | .141 |
| Net Realized and Unrealized Gain (Loss) | | | | | |
| on Investments | 2.385 | 1.017 | 3.785 | 3.925 | 4.209 |
| Total from Investment Operations | 2.592 | 1.236 | 3.972 | 4.155 | 4.350 |
| Distributions | | | | | |
| Dividends from Net Investment Income | (.175) | (.191) | (.172) | (. 205) | (.100) |
| Distributions from Realized Capital Gains | (1.967) | (2.825) | (.990) | — | — |
| Total Distributions | (2.142) | (3.016) | (1.162) | (.205) | (.100) |
| Net Asset Value, End of Period | $25.74 | $25.29 | $27.07 | $24.26 | $20.31 |
| |
| Total Return1 | 10.48% | 4.76% | 16.85% | 20.69% | 27.18% |
| |
| Ratios/Supplemental Data | | | | | |
| Net Assets, End of Period (Millions) | $4,063 | $4,077 | $4,580 | $4,922 | $5,283 |
| Ratio of Total Expenses to | | | | | |
| Average Net Assets2 | 0.38% | 0.40% | 0.40% | 0.39% | 0.40% |
| Ratio of Net Investment Income to | | | | | |
| Average Net Assets | 0.81% | 0.80% | 0.72% | 1.06% | 0.74% |
| Portfolio Turnover Rate | 51% | 41% | 52% | 53% | 49% |
1 Total returns do not include account service fees that may have applied in the periods shown. Fund prospectuses provide information about any applicable account service fees.
2 Includes performance-based investment advisory fee increases (decreases) of 0.01%, (0.01%), (0.04%), (0.05%), and (0.04%).
See accompanying Notes, which are an integral part of the Financial Statements.
22
| | | | | |
| Morgan Growth Fund | | | | | |
| |
| |
| Financial Highlights | | | | | |
| |
| |
| Admiral Shares | | | | | |
| |
| For a Share Outstanding | | | Year Ended September 30, |
| Throughout Each Period | 2016 | 2015 | 2014 | 2013 | 2012 |
| Net Asset Value, Beginning of Period | $78.42 | $83.97 | $75.26 | $63.02 | $49.84 |
| Investment Operations | | | | | |
| Net Investment Income | .726 | . 804 | .719 | . 831 | . 535 |
| Net Realized and Unrealized Gain (Loss) | | | | | |
| on Investments | 7.402 | 3.123 | 11.722 | 12.144 | 13.036 |
| Total from Investment Operations | 8.128 | 3.927 | 12.441 | 12.975 | 13.571 |
| Distributions | | | | | |
| Dividends from Net Investment Income | (. 656) | (.727) | (. 664) | (.735) | (. 391) |
| Distributions from Realized Capital Gains | (6.092) | (8.750) | (3.067) | — | — |
| Total Distributions | (6.748) | (9.477) | (3.731) | (.735) | (.391) |
| Net Asset Value, End of Period | $79.80 | $78.42 | $83.97 | $75.26 | $63.02 |
| |
| Total Return1 | 10.60% | 4.88% | 17.03% | 20.86% | 27.35% |
| |
| Ratios/Supplemental Data | | | | | |
| Net Assets, End of Period (Millions) | $7,122 | $6,806 | $6,250 | $5,019 | $3,725 |
| Ratio of Total Expenses to | | | | | |
| Average Net Assets2 | 0.28% | 0.27% | 0.26% | 0.25% | 0.26% |
| Ratio of Net Investment Income to | | | | | |
| Average Net Assets | 0.91% | 0.93% | 0.86% | 1.20% | 0.88% |
| Portfolio Turnover Rate | 51% | 41% | 52% | 53% | 49% |
1 Total returns do not include account service fees that may have applied in the periods shown. Fund prospectuses provide information about any applicable account service fees.
2 Includes performance-based investment advisory fee increases (decreases) of 0.01%, (0.01%), (0.04%), (0.05%), and (0.04%).
See accompanying Notes, which are an integral part of the Financial Statements.
23
Morgan Growth Fund
Notes to Financial Statements
Vanguard Morgan Growth Fund is registered under the Investment Company Act of 1940 as an open-end investment company, or mutual fund. The fund offers two classes of shares: Investor Shares and Admiral Shares. Investor Shares are available to any investor who meets the fund’s minimum purchase requirements. Admiral Shares are designed for investors who meet certain administrative, service, and account-size criteria.
A. The following significant accounting policies conform to generally accepted accounting principles for U.S. investment companies. The fund consistently follows such policies in preparing its financial statements.
1. Security Valuation: Securities are valued as of the close of trading on the New York Stock Exchange (generally 4 p.m., Eastern time) on the valuation date. Equity securities are valued at the latest quoted sales prices or official closing prices taken from the primary market in which each security trades; such securities not traded on the valuation date are valued at the mean of the latest quoted bid and asked prices. Securities for which market quotations are not readily available, or whose values have been affected by events occurring before the fund’s pricing time but after the close of the securities’ primary markets, are valued at their fair values calculated according to procedures adopted by the board of trustees. These procedures include obtaining quotations from an independent pricing service, monitoring news to identify significant market- or security-specific events, and evaluating changes in the values of foreign market proxies (for example, ADRs, futures contracts, or exchange-traded funds), between the time the foreign markets close and the fund’s pricing time. When fair-value pricing is employed, the prices of securities used by a fund to calculate its net asset value may differ from quoted or published prices for the same securities. Investments in Vanguard Market Liquidity Fund are valued at that fund’s net asset value. Temporary cash investments acquired over 60 days to maturity are valued using the latest bid prices or using valuations based on a matrix system (which considers such factors as security prices, yields, maturities, and ratings), both as furnished by independent pricing services. Other temporary cash investments are valued at amortized cost, which approximates market value.
2. Foreign Currency: Securities and other assets and liabilities denominated in foreign currencies are translated into U.S. dollars using exchange rates obtained from an independent third party as of the fund’s pricing time on the valuation date. Realized gains (losses) and unrealized appreciation (depreciation) on investment securities include the effects of changes in exchange rates since the securities were purchased, combined with the effects of changes in security prices. Fluctuations in the value of other assets and liabilities resulting from changes in exchange rates are recorded as unrealized foreign currency gains (losses) until the assets or liabilities are settled in cash, at which time they are recorded as realized foreign currency gains (losses).
3. Futures Contracts: The fund uses index futures contracts to a limited extent, with the objective of maintaining full exposure to the stock market while maintaining liquidity. The fund may purchase or sell futures contracts to achieve a desired level of investment, whether to accommodate portfolio turnover or cash flows from capital share transactions. The primary risks associated with the use of futures contracts are imperfect correlation between changes in market values of stocks held by the fund and the prices of futures contracts, and the possibility of an illiquid market. Counterparty risk involving futures is mitigated because a regulated clearinghouse is the counterparty instead of the clearing broker. To further mitigate counterparty risk, the fund trades futures contracts on an exchange, monitors the financial strength of its clearing brokers and clearinghouse, and has entered into clearing agreements with its clearing brokers. The clearinghouse imposes initial margin requirements to secure the fund’s performance and requires daily settlement of variation margin representing changes in the market value of each contract.
24
Morgan Growth Fund
Futures contracts are valued at their quoted daily settlement prices. The aggregate settlement values of the contracts are not recorded in the Statement of Net Assets. Fluctuations in the value of the contracts are recorded in the Statement of Net Assets as an asset (liability) and in the Statement of Operations as unrealized appreciation (depreciation) until the contracts are closed, when they are recorded as realized futures gains (losses).
During the year ended September 30, 2016, the fund’s average investments in long and short futures contracts represented less than 1% and 0% of net assets, respectively, based on the average of aggregate settlement values at each quarter-end during the period.
4. Repurchase Agreements: The fund enters into repurchase agreements with institutional counterparties. Securities pledged as collateral to the fund under repurchase agreements are held by a custodian bank until the agreements mature, and in the absence of a default, such collateral cannot be repledged, resold or rehypothecated. Each agreement requires that the market value of the collateral be sufficient to cover payments of interest and principal. The fund further mitigates its counterparty risk by entering into repurchase agreements only with a diverse group of prequalified counterparties, monitoring their financial strength, and entering into master repurchase agreements with its counterparties. The master repurchase agreements provide that, in the event of a counterparty’s default (including bankruptcy), the fund may terminate any repurchase agreements with that counterparty, determine the net amount owed, and sell or retain the collateral up to the net amount owed to the fund. Such action may be subject to legal proceedings, which may delay or limit the disposition of collateral.
5. Federal Income Taxes: The fund intends to continue to qualify as a regulated investment company and distribute all of its taxable income. Management has analyzed the fund’s tax positions taken for all open federal income tax years (September 30, 2013–2016), and has concluded that no provision for federal income tax is required in the fund’s financial statements.
6. Distributions: Distributions to shareholders are recorded on the ex-dividend date.
7. Securities Lending: To earn additional income, the fund lends its securities to qualified institutional borrowers. Security loans are subject to termination by the fund at any time, and are required to be secured at all times by collateral in an amount at least equal to the market value of securities loaned. Daily market fluctuations could cause the value of loaned securities to be more or less than the value of the collateral received. When this occurs, the collateral is adjusted and settled on the next business day. The fund further mitigates its counterparty risk by entering into securities lending transactions only with a diverse group of prequalified counterparties, monitoring their financial strength, and entering into master securities lending agreements with its counterparties. The master securities lending agreements provide that, in the event of a counterparty’s default (including bankruptcy), the fund may terminate any loans with that borrower, determine the net amount owed, and sell or retain the collateral up to the net amount owed to the fund; however, such actions may be subject to legal proceedings. While collateral mitigates counterparty risk, in the absence of a default the fund may experience delays and costs in recovering the securities loaned. The fund invests cash collateral received in Vanguard Market Liquidity Fund, and records a liability in the Statement of Net Assets for the return of the collateral, during the period the securities are on loan. Securities lending income represents fees charged to borrowers plus income earned on invested cash collateral, less expenses associated with the loan. During the term of the loan, the fund is entitled to all distributions made on or in respect of the loaned securities.
25
Morgan Growth Fund
8. Credit Facility: The fund and certain other funds managed by The Vanguard Group (“Vanguard”) participate in a $3.1 billion committed credit facility provided by a syndicate of lenders pursuant to a credit agreement that may be renewed annually; each fund is individually liable for its borrowings, if any, under the credit facility. Borrowings may be utilized for temporary and emergency purposes, and are subject to the fund’s regulatory and contractual borrowing restrictions. The participating funds are charged administrative fees and an annual commitment fee of 0.10% of the undrawn amount of the facility; these fees are allocated to the funds based on a method approved by the fund’s board of trustees and included in Management and Administrative expenses on the fund’s Statement of Operations. Any borrowings under this facility bear interest at a rate based upon the higher of the one-month London Interbank Offered Rate, federal funds effective rate, or overnight bank funding rate plus an agreed-upon spread.
The fund had no borrowings outstanding at September 30, 2016, or at any time during the period then ended.
9. Other: Dividend income is recorded on the ex-dividend date. Interest income includes income distributions received from Vanguard Market Liquidity Fund and is accrued daily. Premiums and discounts on debt securities purchased are amortized and accreted, respectively, to interest income over the lives of the respective securities. Security transactions are accounted for on the date securities are bought or sold. Costs used to determine realized gains (losses) on the sale of investment securities are those of the specific securities sold.
Each class of shares has equal rights as to assets and earnings, except that each class separately bears certain class-specific expenses related to maintenance of shareholder accounts (included in Management and Administrative expenses) and shareholder reporting. Marketing and distribution expenses are allocated to each class of shares based on a method approved by the board of trustees. Income, other non-class-specific expenses, and gains and losses on investments are allocated to each class of shares based on its relative net assets.
B. The investment advisory firms Wellington Management Company LLP, Jennison Associates LLC, and Frontier Capital Management Co., LLC, each provide investment advisory services to a portion of the fund for a fee calculated at an annual percentage rate of average net assets managed by the advisor. The basic fee of Wellington Management Company LLP is subject to quarterly adjustments based on performance relative to the Russell 3000 Growth Index for the preceding three years. The basic fee of Jennison Associates LLC is subject to quarterly adjustments based on performance relative to the Russell 1000 Growth Index for the preceding three years. The basic fee of Frontier Capital Management Co., LLC, is subject to quarterly adjustments based on performance relative to the Russell Midcap Growth Index for the preceding three years. Until January 2016, a portion of the fund was managed by Kalmar Investment Advisers. The basic fee paid to Kalmar Investment Advisers was subject to quarterly adjustments based on performance relative to the Russell Midcap Growth Index for the preceding three years.
Vanguard provides investment advisory services to a portion of the fund as described below; the fund paid Vanguard advisory fees of $1,205,000 for the year ended September 30, 2016.
For the year ended September 30, 2016, the aggregate investment advisory fee paid to all advisors represented an effective annual basic rate of 0.16% of the fund’s average net assets, before a net increase of $615,000 (0.01%) based on performance.
26
Morgan Growth Fund
C. In accordance with the terms of a Funds’ Service Agreement (the “FSA”) between Vanguard and the fund, Vanguard furnishes to the fund investment advisory, corporate management, administrative, marketing, and distribution services at Vanguard’s cost of operations (as defined by the FSA). These costs of operations are allocated to the fund based on methods and guidelines approved by the board of trustees. Vanguard does not require reimbursement in the current period for certain costs of operations (such as deferred compensation/benefits and risk/insurance costs); the fund’s liability for these costs of operations is included in Payables to Vanguard on the Statement of Net Assets.
Upon the request of Vanguard, the fund may invest up to 0.40% of its net assets as capital in Vanguard. At September 30, 2016, the fund had contributed to Vanguard capital in the amount of $862,000, representing 0.01% of the fund’s net assets and 0.34% of Vanguard’s capitalization. The fund’s trustees and officers are also directors and employees, respectively, of Vanguard.
D. The fund has asked its investment advisors to direct certain security trades, subject to obtaining the best price and execution, to brokers who have agreed to rebate to the fund part of the commissions generated. Such rebates are used solely to reduce the fund’s management and administrative expenses. For the year ended September 30, 2016, these arrangements reduced the fund’s expenses by $226,000 (an annual rate of 0.00% of average net assets).
E. Various inputs may be used to determine the value of the fund’s investments. These inputs are summarized in three broad levels for financial statement purposes. The inputs or methodologies used to value securities are not necessarily an indication of the risk associated with investing in those securities.
Level 1—Quoted prices in active markets for identical securities.
Level 2—Other significant observable inputs (including quoted prices for similar securities, interest rates, prepayment speeds, credit risk, etc.).
Level 3—Significant unobservable inputs (including the fund’s own assumptions used to determine the fair value of investments).
The following table summarizes the market value of the fund’s investments as of September 30, 2016, based on the inputs used to value them:
| | | |
| | Level 1 | Level 2 | Level 3 |
| Investments | ($000) | ($000) | ($000) |
| Common Stocks | 10,892,991 | 158,845 | — |
| Temporary Cash Investments | 167,822 | 18,300 | — |
| Futures Contracts—Assets1 | 370 | — | — |
| Futures Contracts—Liabilities1 | (30) | — | — |
| Total | 11,061,153 | 177,145 | — |
| 1 Represents variation margin on the last day of the reporting period. | | | |
27
Morgan Growth Fund
F. At September 30, 2016, the aggregate settlement value of open futures contracts and the related unrealized appreciation (depreciation) were:
| | | | |
| | | | | ($000) |
| | | | Aggregate | |
| | | Number of | Settlement | Unrealized |
| | | Long (Short) | Value | Appreciation |
| Futures Contracts | Expiration | Contracts | Long (Short) | (Depreciation) |
| E-mini S&P 500 Index | December 2016 | 525 | 56,711 | 263 |
Unrealized appreciation (depreciation) on open futures contracts is required to be treated as realized gain (loss) for tax purposes.
G. Distributions are determined on a tax basis and may differ from net investment income and realized capital gains for financial reporting purposes. Differences may be permanent or temporary. Permanent differences are reclassified among capital accounts in the financial statements to reflect their tax character. Temporary differences arise when certain items of income, expense, gain, or loss are recognized in different periods for financial statement and tax purposes. These differences will reverse at some time in the future. Differences in classification may also result from the treatment of short-term gains as ordinary income for tax purposes.
During the year ended September 30, 2016, the fund realized net foreign currency gains of $473,000, which increased distributable net income for tax purposes; accordingly, such gains have been reclassified from accumulated net realized gains to undistributed net investment income.
The fund used a tax accounting practice to treat a portion of the price of capital shares redeemed during the year as distributions from net investment income and realized capital gains. Accordingly, the fund has reclassified $9,803,000 from undistributed net investment income, and $54,735,000 from accumulated net realized gains, to paid-in capital.
For tax purposes, at September 30, 2016, the fund had $64,019,000 of ordinary income and $384,732,000 of long-term capital gains available for distribution.
At September 30, 2016, the cost of investment securities for tax purposes was $8,134,597,000. Net unrealized appreciation of investment securities for tax purposes was $3,103,361,000, consisting of unrealized gains of $3,220,421,000 on securities that had risen in value since their purchase and $117,060,000 in unrealized losses on securities that had fallen in value since their purchase.
H. During the year ended September 30, 2016, the fund purchased $5,539,936,000 of investment securities and sold $5,986,463,000 of investment securities, other than temporary cash investments.
28
Morgan Growth Fund
| | | | |
| I. Capital share transactions for each class of shares were: | | | |
| | | | Year Ended September 30, |
| | | 2016 | | 2015 |
| | Amount | Shares | Amount | Shares |
| | ($000) | (000) | ($000) | (000) |
| Investor Shares | | | | |
| Issued | 442,809 | 17,724 | 404,548 | 15,134 |
| Issued in Lieu of Cash Distributions | 338,254 | 13,492 | 489,705 | 19,699 |
| Redeemed | (862,692) | (34,608) | (1,145,049) | (42,799) |
| Net Increase (Decrease)—Investor Shares | (81,629) | (3,392) | (250,796) | (7,966) |
| Admiral Shares | | | | |
| Issued | 992,705 | 12,715 | 1,287,786 | 15,507 |
| Issued in Lieu of Cash Distributions | 554,245 | 7,138 | 648,115 | 8,415 |
| Redeemed | (1,332,877) | (17,390) | (957,119) | (11,566) |
| Net Increase (Decrease)—Admiral Shares | 214,073 | 2,463 | 978,782 | 12,356 |
J. Management has determined that no material events or transactions occurred subsequent to September 30, 2016, that would require recognition or disclosure in these financial statements.
29
Report of Independent Registered Public Accounting Firm
To the Board of Trustees and Shareholders of Vanguard Morgan Growth Fund:
In our opinion, the accompanying statement of net assets and the related statements of operations and of changes in net assets and the financial highlights present fairly, in all material respects, the financial position of Vanguard Morgan Growth Fund (the “Fund”) at September 30, 2016, the results of its operations for the year then ended, the changes in its net assets for each of the two years in the period then ended, and the financial highlights for each of the five years in the period then ended, in conformity with accounting principles generally accepted in the United States of America. These financial statements and financial highlights (hereafter referred to as “financial statements”) are the responsibility of the Fund’s management. Our responsibility is to express an opinion on these financial statements based on our audits. We conducted our audits of these financial statements in accordance with the standards of the Public Company Accounting Oversight Board (United States). Those standards require that we plan and perform the audit to obtain reasonable assurance about whether the financial statements are free of material misstatement. An audit includes examining, on a test basis, evidence supporting the amounts and disclosures in the financial statements, assessing the accounting principles used and significant estimates made by management, and evaluating the overall financial statement presentation. We believe that our audits, which included confirmation of securities at September 30, 2016 by correspondence with the custodians and brokers and by agreement to the underlying ownership records of the transfer agent, provide a reasonable basis for our opinion.
/s/PricewaterhouseCoopers LLP
Philadelphia, Pennsylvania
November 10, 2016
Special 2016 tax information (unaudited) for Vanguard Morgan Growth Fund
This information for the fiscal year ended September 30, 2016, is included pursuant to provisions of the Internal Revenue Code.
The fund distributed $904,079,000 as capital gain dividends (20% rate gain distributions) to shareholders during the fiscal year.
For nonresident alien shareholders, 100% of short-term capital gain dividends distributed by the fund are qualified short-term capital gains.
The fund distributed $92,774,000 of qualified dividend income to shareholders during the fiscal year.
For corporate shareholders, 100% of investment income (dividend income plus short-term gains, if any) qualifies for the dividends-received deduction.
30
Your Fund’s After-Tax Returns
This table presents returns for your fund both before and after taxes. The after-tax returns are shown in two ways: (1) assuming that an investor owned the fund during the entire period and paid taxes on the fund’s distributions, and (2) assuming that an investor paid taxes on the fund’s distributions and sold all shares at the end of each period.
Calculations are based on the highest individual federal income tax and capital gains tax rates in effect at the times of the distributions and the hypothetical sales. State and local taxes were not considered. After-tax returns reflect any qualified dividend income, using actual prior-year figures and estimates for 2016. (In the example, returns after the sale of fund shares may be higher than those assuming no sale. This occurs when the sale would have produced a capital loss. The calculation assumes that the investor received a tax deduction for the loss.)
The table shows returns for Investor Shares only; returns for other share classes will differ. Please note that your actual after-tax returns will depend on your tax situation and may differ from those shown. Also note that if you own the fund in a tax-deferred account, such as an individual retirement account or a 401(k) plan, this information does not apply to you. Such accounts are not subject to current taxes.
Finally, keep in mind that a fund’s performance—whether before or after taxes—does not guarantee future results.
Average Annual Total Returns: Morgan Growth Fund Investor Shares
Periods Ended September 30, 2016
| | | |
| | One | Five | Ten |
| | Year | Years | Years |
| Returns Before Taxes | 10.48% | 15.73% | 7.64% |
| Returns After Taxes on Distributions | 8.41 | 14.34 | 6.73 |
| Returns After Taxes on Distributions and Sale of Fund Shares | 7.56 | 12.56 | 6.09 |
31
About Your Fund’s Expenses
As a shareholder of the fund, you incur ongoing costs, which include costs for portfolio management, administrative services, and shareholder reports (like this one), among others. Operating expenses, which are deducted from a fund’s gross income, directly reduce the investment return of the fund.
A fund’s expenses are expressed as a percentage of its average net assets. This figure is known as the expense ratio. The following examples are intended to help you understand the ongoing costs (in dollars) of investing in your fund and to compare these costs with those of other mutual funds. The examples are based on an investment of $1,000 made at the beginning of the period shown and held for the entire period.
The accompanying table illustrates your fund’s costs in two ways:
• Based on actual fund return. This section helps you to estimate the actual expenses that you paid over the period. The ”Ending Account Value“ shown is derived from the fund‘s actual return, and the third column shows the dollar amount that would have been paid by an investor who started with $1,000 in the fund. You may use the information here, together with the amount you invested, to estimate the expenses that you paid over the period.
To do so, simply divide your account value by $1,000 (for example, an $8,600 account value divided by $1,000 = 8.6), then multiply the result by the number given for your fund under the heading ”Expenses Paid During Period.“
• Based on hypothetical 5% yearly return. This section is intended to help you compare your fund‘s costs with those of other mutual funds. It assumes that the fund had a yearly return of 5% before expenses, but that the expense ratio is unchanged. In this case—because the return used is not the fund’s actual return—the results do not apply to your investment. The example is useful in making comparisons because the Securities and Exchange Commission requires all mutual funds to calculate expenses based on a 5% return. You can assess your fund’s costs by comparing this hypothetical example with the hypothetical examples that appear in shareholder reports of other funds.
Note that the expenses shown in the table are meant to highlight and help you compare ongoing costs only and do not reflect transaction costs incurred by the fund for buying and selling securities. Further, the expenses do not include any purchase, redemption, or account service fees described in the fund prospectus. If such fees were applied to your account, your costs would be higher. Your fund does not carry a “sales load.”
The calculations assume no shares were bought or sold during the period. Your actual costs may have been higher or lower, depending on the amount of your investment and the timing of any purchases or redemptions.
You can find more information about the fund’s expenses, including annual expense ratios, in the Financial Statements section of this report. For additional information on operating expenses and other shareholder costs, please refer to your fund’s current prospectus.
32
| | | |
| Six Months Ended September 30, 2016 | | | |
| | Beginning | Ending | Expenses |
| | Account Value | Account Value | Paid During |
| Morgan Growth Fund | 3/31/2016 | 9/30/2016 | Period |
| Based on Actual Fund Return | | | |
| Investor Shares | $1,000.00 | $1,052.76 | $1.95 |
| Admiral Shares | 1,000.00 | 1,053.33 | 1.49 |
| Based on Hypothetical 5% Yearly Return | | | |
| Investor Shares | $1,000.00 | $1,023.10 | $1.92 |
| Admiral Shares | 1,000.00 | 1,023.55 | 1.47 |
The calculations are based on expenses incurred in the most recent six-month period. The fund’s annualized six-month expense ratios for that period are 0.38% for Investor Shares and 0.29% for Admiral Shares. The dollar amounts shown as “Expenses Paid” are equal to the annualized expense ratio multiplied by the average account value over the period, multiplied by the number of days in the most recent six-month period, then divided by the number of days in the most recent 12-month period (183/366).
33
Glossary
30-Day SEC Yield. A fund’s 30-day SEC yield is derived using a formula specified by the U.S. Securities and Exchange Commission. Under the formula, data related to the fund’s security holdings in the previous 30 days are used to calculate the fund’s hypothetical net income for that period, which is then annualized and divided by the fund’s estimated average net assets over the calculation period. For the purposes of this calculation, a security’s income is based on its current market yield to maturity (for bonds), its actual income (for asset-backed securities), or its projected dividend yield (for stocks). Because the SEC yield represents hypothetical annualized income, it will differ—at times significantly—from the fund’s actual experience. As a result, the fund’s income distributions may be higher or lower than implied by the SEC yield.
Beta. A measure of the magnitude of a fund’s past share-price fluctuations in relation to the ups and downs of a given market index. The index is assigned a beta of 1.00. Compared with a given index, a fund with a beta of 1.20 typically would have seen its share price rise or fall by 12% when the index rose or fell by 10%. For this report, beta is based on returns over the past 36 months for both the fund and the index. Note that a fund’s beta should be reviewed in conjunction with its R-squared (see definition). The lower the R-squared, the less correlation there is between the fund and the index, and the less reliable beta is as an indicator of volatility.
Dividend Yield. Dividend income earned by stocks, expressed as a percentage of the aggregate market value (or of net asset value, for a fund). The yield is determined by dividing the amount of the annual dividends by the aggregate value (or net asset value) at the end of the period. For a fund, the dividend yield is based solely on stock holdings and does not include any income produced by other investments.
Earnings Growth Rate. The average annual rate of growth in earnings over the past five years for the stocks now in a fund.
Equity Exposure. A measure that reflects a fund’s investments in stocks and stock futures. Any holdings in short-term reserves are excluded.
Expense Ratio. A fund’s total annual operating expenses expressed as a percentage of the fund’s average net assets. The expense ratio includes management and administrative expenses, but does not include the transaction costs of buying and selling portfolio securities.
Foreign Holdings. The percentage of a fund represented by securities or depositary receipts of companies based outside the United States.
Inception Date. The date on which the assets of a fund (or one of its share classes) are first invested in accordance with the fund’s investment objective. For funds with a subscription period, the inception date is the day after that period ends. Investment performance is measured from the inception date.
Median Market Cap. An indicator of the size of companies in which a fund invests; the midpoint of market capitalization (market price x shares outstanding) of a fund’s stocks, weighted by the proportion of the fund’s assets invested in each stock. Stocks representing half of the fund’s assets have market capitalizations above the median, and the rest are below it.
Price/Book Ratio. The share price of a stock divided by its net worth, or book value, per share. For a fund, the weighted average price/book ratio of the stocks it holds.
34
Price/Earnings Ratio. The ratio of a stock’s current price to its per-share earnings over the past year. For a fund, the weighted average P/E of the stocks it holds. P/E is an indicator of market expectations about corporate prospects; the higher the P/E, the greater the expectations for a company’s future growth.
R-Squared. A measure of how much of a fund’s past returns can be explained by the returns from the market in general, as measured by a given index. If a fund’s total returns were precisely synchronized with an index’s returns, its R-squared would be 1.00. If the fund’s returns bore no relationship to the index’s returns, its R-squared would be 0. For this report, R-squared is based on returns over the past 36 months for both the fund and the index.
Return on Equity. The annual average rate of return generated by a company during the past five years for each dollar of shareholder’s equity (net income divided by shareholder’s equity). For a fund, the weighted average return on equity for the companies whose stocks it holds.
Short-Term Reserves. The percentage of a fund invested in highly liquid, short-term securities that can be readily converted to cash.
Turnover Rate. An indication of the fund’s trading activity. Funds with high turnover rates incur higher transaction costs and may be more likely to distribute capital gains (which may be taxable to investors). The turnover rate excludes in-kind transactions, which have minimal impact on costs.
35
The People Who Govern Your Fund
The trustees of your mutual fund are there to see that the fund is operated and managed in your best interests since, as a shareholder, you are a part owner of the fund. Your fund’s trustees also serve on the board of directors of The Vanguard Group, Inc., which is owned by the Vanguard funds and provides services to them on an at-cost basis.
A majority of Vanguard’s board members are independent, meaning that they have no affiliation with Vanguard or the funds they oversee, apart from the sizable personal investments they have made as private individuals. The independent board members have distinguished backgrounds in business, academia, and public service. Each of the trustees and executive officers oversees 198 Vanguard funds.
The following table provides information for each trustee and executive officer of the fund. The mailing address of the trustees and officers is P.O. Box 876, Valley Forge, PA 19482. More information about the trustees is in the Statement of Additional Information, which can be obtained, without charge, by contacting Vanguard at 800-662-7447, or online at vanguard.com.
InterestedTrustee1
F. William McNabb III
Born 1957. Trustee Since July 2009. Chairman of the Board. Principal Occupation(s) During the Past Five Years and Other Experience: Chairman of the Board of The Vanguard Group, Inc., and of each of the investment companies served by The Vanguard Group, since January 2010; Director of The Vanguard Group since 2008; Chief Executive Officer and President of The Vanguard Group, and of each of the investment companies served by The Vanguard Group, since 2008; Director of Vanguard Marketing Corporation; Managing Director of The Vanguard Group (1995–2008).
IndependentTrustees
Emerson U. Fullwood
Born 1948. Trustee Since January 2008. Principal Occupation(s) During the Past Five Years and Other Experience: Executive Chief Staff and Marketing Officer for North America and Corporate Vice President (retired 2008) of Xerox Corporation (document management products and services); Executive in Residence and 2009–2010 Distinguished Minett Professor at the Rochester Institute of Technology; Lead Director of SPX FLOW, Inc. (multi-industry manufacturing); Director of the United Way of Rochester, the University of Rochester Medical Center, Monroe Community College Foundation, North Carolina A&T University, and Roberts Wesleyan College.
Rajiv L. Gupta
Born 1945. Trustee Since December 2001.2 Principal Occupation(s) During the Past Five Years and Other Experience: Chairman and Chief Executive Officer (retired 2009) and President (2006–2008) of Rohm and Haas Co. (chemicals); Director of Tyco International plc (diversified manufacturing and services), HP Inc. (printer and personal computer manufacturing), and Delphi Automotive plc (automotive components); Senior Advisor at New Mountain Capital.
Amy Gutmann
Born 1949. Trustee Since June 2006. Principal Occupation(s) During the Past Five Years and Other Experience: President of the University of Pennsylvania; Christopher H. Browne Distinguished Professor of Political Science, School of Arts and Sciences, and Professor of Communication, Annenberg School for Communication, with secondary faculty appointments in the Department of Philosophy, School of Arts and Sciences, and at the Graduate School of Education, University of Pennsylvania; Trustee of the National Constitution Center; Chair of the Presidential Commission for the Study of Bioethical Issues.
JoAnn Heffernan Heisen
Born 1950. Trustee Since July 1998. Principal Occupation(s) During the Past Five Years and Other Experience: Corporate Vice President and Chief Global Diversity Officer (retired 2008) and Member of the Executive Committee (1997–2008) of Johnson & Johnson (pharmaceuticals/medical devices/consumer products); Director of Skytop Lodge Corporation (hotels) and the Robert Wood Johnson Foundation; Member of the Advisory Board of the Institute for Women’s Leadership at Rutgers University.
F. Joseph Loughrey
Born 1949. Trustee Since October 2009. Principal Occupation(s) During the Past Five Years and Other Experience: President and Chief Operating Officer (retired 2009) of Cummins Inc. (industrial machinery); Chairman of the Board of Hillenbrand, Inc. (specialized consumer services), and of Oxfam America; Director of SKF AB (industrial machinery), Hyster-Yale Materials Handling, Inc. (forklift trucks), the Lumina Foundation for Education, and the V Foundation for Cancer Research; Member of the Advisory Council for the College of Arts and Letters and of the Advisory Board to the Kellogg Institute for International Studies, both at the University of Notre Dame.
Mark Loughridge
Born 1953. Trustee Since March 2012. Principal Occupation(s) During the Past Five Years and Other Experience: Senior Vice President and Chief Financial Officer (retired 2013) at IBM (information technology services); Fiduciary Member of IBM’s Retirement Plan Committee (2004–2013); Director of the Dow Chemical Company; Member of the Council on Chicago Booth.
Scott C. Malpass
Born 1962. Trustee Since March 2012. Principal Occupation(s) During the Past Five Years and Other Experience: Chief Investment Officer and Vice President at the University of Notre Dame; Assistant Professor of Finance at the Mendoza College of Business at Notre Dame; Member of the Notre Dame 403(b) Investment Committee, the Board of Advisors for Spruceview Capital Partners, and the Investment Advisory Committee of Major League Baseball; Board Member of TIFF Advisory Services, Inc., and Catholic Investment Services, Inc. (investment advisors).
André F. Perold
Born 1952. Trustee Since December 2004. Principal Occupation(s) During the Past Five Years and Other Experience: George Gund Professor of Finance and Banking, Emeritus at the Harvard Business School (retired 2011); Chief Investment Officer and Managing Partner of HighVista Strategies LLC (private investment firm); Director of Rand Merchant Bank; Overseer of the Museum of Fine Arts Boston.
Peter F. Volanakis
Born 1955. Trustee Since July 2009. Principal Occupation(s) During the Past Five Years and Other Experience: President and Chief Operating Officer (retired 2010) of Corning Incorporated (communications equipment); Chairman of the Board of Trustees of Colby-Sawyer College; Member of the Advisory Board of the Norris Cotton Cancer Center.
Executive Officers
Glenn Booraem
Born 1967. Treasurer Since May 2015. Principal Occupation(s) During the Past Five Years and Other Experience: Principal of The Vanguard Group, Inc.; Treasurer of each of the investment companies served by The Vanguard Group; Controller of each of the investment companies served by The Vanguard Group (2010–2015); Assistant Controller of each of the investment companies served by The Vanguard Group (2001–2010).
Thomas J. Higgins
Born 1957. Chief Financial Officer Since September 2008. Principal Occupation(s) During the Past Five Years and Other Experience: Principal of The Vanguard Group, Inc.; Chief Financial Officer of each of the investment companies served by The Vanguard Group; Treasurer of each of the investment companies served by The Vanguard Group (1998–2008).
Peter Mahoney
Born 1974. Controller Since May 2015. Principal Occupation(s) During the Past Five Years and Other Experience: Head of Global Fund Accounting at The Vanguard Group, Inc.; Controller of each of the investment companies served by The Vanguard Group; Head of International Fund Services at The Vanguard Group (2008–2014).
Anne E. Robinson
Born 1970. Secretary Since September 2016. Principal Occupation(s) During the Past Five Years and Other Experience: Managing Director of The Vanguard Group, Inc.; General Counsel of The Vanguard Group; Secretary of The Vanguard Group and of each of the investment companies served by The Vanguard Group; Director and Senior Vice President of Vanguard Marketing Corporation; Managing Director and General Counsel of Global Cards and Consumer Services at Citigroup (2014–2016); Counsel at American Express (2003–2014).
Vanguard Senior Management Team
| |
Mortimer J. Buckley Kathleen C. Gubanich Martha G. King John T. Marcante Chris D. McIsaac | James M. Norris Thomas M. Rampulla Glenn W. Reed Karin A. Risi Michael Rollings |
Chairman Emeritus and Senior Advisor John J. Brennan
Chairman, 1996–2009
Chief Executive Officer and President, 1996–2008
Founder
John C. Bogle
Chairman and Chief Executive Officer, 1974–1996
1 Mr. McNabb is considered an “interested person,” as defined in the Investment Company Act of 1940, because he is an officer of the Vanguard funds.
2 December 2002 for Vanguard Equity Income Fund, the Vanguard Municipal Bond Funds, and the Vanguard State Tax-Exempt Funds.
 |
| P.O. Box 2600 |
| Valley Forge, PA 19482-2600 |
Connect with Vanguard® > vanguard.com
| |
| Fund Information > 800-662-7447 | CFA® is a registered trademark owned by CFA Institute. |
| Direct Investor Account Services > 800-662-2739 | |
| Institutional Investor Services > 800-523-1036 | |
| Text Telephone for People | |
| Who Are Deaf or Hard of Hearing> 800-749-7273 | |
| |
| This material may be used in conjunction | |
| with the offering of shares of any Vanguard | |
| fund only if preceded or accompanied by | |
| the fund’s current prospectus. | |
| |
| All comparative mutual fund data are from Lipper, a | |
| Thomson Reuters Company, or Morningstar, Inc., unless | |
| otherwise noted. | |
| |
| You can obtain a free copy of Vanguard’s proxy voting | |
| guidelines by visiting vanguard.com/proxyreporting or by | |
| calling Vanguard at 800-662-2739. The guidelines are | |
| also available from the SEC’s website, sec.gov. In | |
| addition, you may obtain a free report on how your fund | |
| voted the proxies for securities it owned during the 12 | |
| months ended June 30. To get the report, visit either | |
| vanguard.com/proxyreporting or sec.gov. | |
| |
| You can review and copy information about your fund at | |
| the SEC’s Public Reference Room in Washington, D.C. To | |
| find out more about this public service, call the SEC at | |
| 202-551-8090. Information about your fund is also | |
| available on the SEC’s website, and you can receive | |
| copies of this information, for a fee, by sending a | |
| request in either of two ways: via email addressed to | |
| publicinfo@sec.gov or via regular mail addressed to the | |
| Public Reference Section, Securities and Exchange | |
| Commission, Washington, DC 20549-1520. | |
| |
| | © 2016 The Vanguard Group, Inc. |
| | All rights reserved. |
| | Vanguard Marketing Corporation, Distributor. |
| |
| | Q260 112016 |
Item 2: Code of Ethics. The Registrant has adopted a code of ethics that applies to the Registrant’s principal executive officer, principal financial officer, principal accounting officer or controller or persons performing similar functions. The Code of Ethics was amended during the reporting period covered by this report to make certain technical, non-material changes.
Item 3: Audit Committee Financial Expert. All members of the Audit Committee have been determined by the Registrant’s Board of Trustees to be Audit Committee Financial Experts and to be independent: Rajiv L. Gupta, JoAnn Heffernan Heisen, F. Joseph Loughrey, Mark Loughridge, and Peter F. Volanakis.
Item 4: Principal Accountant Fees and Services.
(a) Audit Fees.
Audit Fees of the Registrant
Fiscal Year Ended September 30, 2016: $45,000
Fiscal Year Ended September 30, 2015: $37,000
Aggregate Audit Fees of Registered Investment Companies in the Vanguard Group.
Fiscal Year Ended September 30, 2016: $9,629,849
Fiscal Year Ended September 30, 2015: $7,000,200
Includes fees billed in connection with audits of the Registrant, other registered investment companies in the Vanguard complex, The Vanguard Group, Inc. and Vanguard Marketing Corporation.
(b) Audit-Related Fees.
Fiscal Year Ended September 30, 2016: $2,717,627
Fiscal Year Ended September 30, 2015: $2,899,096
Includes fees billed in connection with assurance and related services provided to the Registrant, other registered investment companies in the Vanguard complex, The Vanguard Group, Inc., and Vanguard Marketing Corporation.
(c) Tax Fees.
Fiscal Year Ended September 30, 2016: $254,050
Fiscal Year Ended September 30, 2015: $353,389
Includes fees billed in connection with tax compliance, planning, and advice services provided to the Registrant, other registered investment companies in the Vanguard complex, The Vanguard Group, Inc., and Vanguard Marketing Corporation.
(d) All Other Fees.
Fiscal Year Ended September 30, 2016: $214,225
Fiscal Year Ended September 30, 2015: $202,313
Includes fees billed for services related to tax reported information provided to the Registrant, other registered investment companies in the Vanguard complex, The Vanguard Group, Inc., and Vanguard Marketing Corporation.
(e) (1) Pre-Approval Policies. The policy of the Registrant’s Audit Committee is to consider and, if appropriate, approve before the principal accountant is engaged for such services, all specific audit and non-audit services provided to: the Registrant, other registered investment companies in the Vanguard complex, The Vanguard Group, Inc., and entities controlled by The Vanguard Group, Inc. that provide ongoing services to the Registrant. In making a determination, the Audit Committee considers whether the services are consistent with maintaining the principal accountant’s independence.
In the event of a contingency situation in which the principal accountant is needed to provide services in between scheduled Audit Committee meetings, the Chairman of the Audit Committee would be called on to consider and, if appropriate, pre-approve audit or permitted non-audit services in an amount sufficient to complete services through the next Audit Committee meeting, and to determine if such services would be consistent with maintaining the accountant’s independence. At the next scheduled Audit Committee meeting, services and fees would be presented to the Audit Committee for formal consideration, and, if appropriate, approval by the entire Audit Committee. The Audit Committee would again consider whether such services and fees are consistent with maintaining the principal accountant’s independence.
The Registrant’s Audit Committee is informed at least annually of all audit and non-audit services provided by the principal accountant to the Vanguard complex, whether such services are provided to: the Registrant, other registered investment companies in the Vanguard complex, The Vanguard Group, Inc., or other entities controlled by The Vanguard Group, Inc. that provide ongoing services to the Registrant.
(2) No percentage of the principal accountant’s fees or services were approved pursuant to the waiver provision of paragraph (c)(7)(i)(C) of Rule 2-01 of Regulation S-X.
(f) For the most recent fiscal year, over 50% of the hours worked under the principal accountant’s engagement were not performed by persons other than full-time, permanent employees of the principal accountant.
(g) Aggregate Non-Audit Fees.
Fiscal Year Ended September 30, 2016: $468,275
Fiscal Year Ended September 30, 2015: $555,702
Includes fees billed for non-audit services provided to the Registrant, other registered investment companies in the Vanguard complex, The Vanguard Group, Inc., and Vanguard Marketing Corporation.
(h) For the most recent fiscal year, the Audit Committee has determined that the provision of all non-audit services was consistent with maintaining the principal accountant’s independence.
Item 5: Audit Committee of Listed Registrants.
Not Applicable.
Item 6: Investments.
Not Applicable.
Item 7: Disclosure of Proxy Voting Policies and Procedures for Closed-End Management Investment Companies.
Not Applicable.
Item 8: Portfolio Managers of Closed-End Management Investment Companies.
Not Applicable.
Item 9: Purchase of Equity Securities by Closed-End Management Investment Company and Affiliated Purchasers.
Not Applicable.
Item 10: Submission of Matters to a Vote of Security Holders.
Not Applicable.
Item 11: Controls and Procedures.
(a) Disclosure Controls and Procedures. The Principal Executive and Financial Officers concluded that the Registrant’s Disclosure Controls and Procedures are effective based on their evaluation of the Disclosure Controls and Procedures as of a date within 90 days of the filing date of this report.
(b) Internal Control Over Financial Reporting. There were no significant changes in Registrant’s Internal Control Over Financial Reporting or in other factors that could significantly affect this control subsequent to the date of the evaluation, including any corrective actions with regard to significant deficiencies and material weaknesses.
Item 12: Exhibits.
(a) Code of Ethics.
(b) Certifications.
Pursuant to the requirements of the Securities Exchange Act of 1934 and the Investment Company Act of 1940, the registrant has duly caused this report to be signed on its behalf by the undersigned, thereunto duly authorized.
| |
| | VANGUARD MORGAN GROWTH FUND |
| |
| By: | /s/ F. WILLIAM MCNABB III* |
| | F. WILLIAM MCNABB III |
| | CHIEF EXECUTIVE OFFICER |
| |
| Date: November 17, 2016 |
Pursuant to the requirements of the Securities Exchange Act of 1934 and the Investment Company Act of 1940, this report has been signed below by the following persons on behalf of the registrant and in the capacities and on the dates indicated.
| |
| | VANGUARD MORGAN GROWTH FUND |
| |
| By: | /s/ F. WILLIAM MCNABB III* |
| | F. WILLIAM MCNABB III |
| | CHIEF EXECUTIVE OFFICER |
| |
| Date: November 17, 2016 |
| |
| | VANGUARD MORGAN GROWTH FUND |
| |
| By: | /s/ THOMAS J. HIGGINS* |
| | THOMAS J. HIGGINS |
| | CHIEF FINANCIAL OFFICER |
| |
| Date: November 17, 2016 |
* By: /s/ Anne E. Robinson
Anne E. Robinson, pursuant to a Power of Attorney filed on October 4, 2016 see file Number 33-32548, Incorporated by Reference.