UNITED STATES
SECURITIES AND EXCHANGE COMMISSION
Washington, D.C. 20549
FORM N-CSR
CERTIFIED SHAREHOLDER REPORT
OF
REGISTERED MANAGEMENT INVESTMENT COMPANIES
| |
| Investment Company Act file number: | 811-01685 |
Name of Registrant: | Vanguard Morgan Growth Fund |
Address of Registrant: | P.O. Box 2600 |
| | Valley Forge, PA 19482 |
Name and address of agent for service: | Heidi Stam, Esquire |
| | P.O. Box 876 |
| | Valley Forge, PA 19482 |
Registrant’s telephone number, including area code: (610) 669-1000 |
Date of fiscal year end: September 30 | |
Date of reporting period: October 1, 2014 – September 30, 2015 |
Item 1: Reports to Shareholders | |

Annual Report | September 30, 2015
Vanguard Morgan™ Growth Fund
Vanguard’s Principles for Investing Success
We want to give you the best chance of investment success. These principles, grounded in Vanguard’s research and experience, can put you on the right path.
Goals. Create clear, appropriate investment goals.
Balance. Develop a suitable asset allocation using broadly diversified funds. Cost. Minimize cost.
Discipline. Maintain perspective and long-term discipline.
A single theme unites these principles: Focus on the things you can control.
We believe there is no wiser course for any investor.
| |
| Contents | |
| Your Fund’s Total Returns. | 1 |
| Chairman’s Letter. | 2 |
| Advisors’ Report. | 8 |
| Fund Profile. | 13 |
| Performance Summary. | 14 |
| Financial Statements. | 16 |
| Your Fund’s After-Tax Returns. | 32 |
| About Your Fund’s Expenses. | 33 |
| Glossary. | 35 |
Please note: The opinions expressed in this report are just that—informed opinions. They should not be considered promises or advice.
Also, please keep in mind that the information and opinions cover the period through the date on the front of this report. Of course, the
risks of investing in your fund are spelled out in the prospectus.
See the Glossary for definitions of investment terms used in this report.
About the cover: Pictured is a sailing block on the Brilliant, a 1932 schooner docked in Mystic, Connecticut. A type of pulley, the
sailing block helps coordinate the setting of the sails. At Vanguard, the intricate coordination of technology and people allows
us to help millions of clients around the world reach their financial goals.
Your Fund’s Total Returns
| |
| Fiscal Year Ended September 30, 2015 | |
| | Total |
| | Returns |
| Vanguard Morgan Growth Fund | |
| Investor Shares | 4.76% |
| Admiral™ Shares | 4.88 |
| Russell 3000 Growth Index | 3.21 |
| Multi-Cap Growth Funds Average | 1.40 |
Multi-Cap Growth Funds Average: Derived from data provided by Lipper, a Thomson Reuters Company.
Admiral Shares carry lower expenses and are available to investors who meet certain account-balance requirements.
Your Fund’s Performance at a Glance
September 30, 2014, Through September 30, 2015
| | | | |
| | | | Distributions Per Share |
| | Starting | Ending | | |
| | Share | Share | Income | Capital |
| | Price | Price | Dividends | Gains |
| Vanguard Morgan Growth Fund | | | | |
| Investor Shares | $27.07 | $25.29 | $0.191 | $2.825 |
| Admiral Shares | 83.97 | 78.42 | 0.727 | 8.750 |
1

Chairman’s Letter
Dear Shareholder,
After a strong showing in the first half of the fiscal year, Vanguard Morgan Growth Fund gave back some ground in the second half as the broad market dipped into a summer swoon. Still, the fund finished ahead of both its comparative standards.
For the 12 months ended September 30, 2015, Investor Shares returned 4.76% and the lower-cost Admiral Shares returned 4.88%. These returns compare with the 1.40% average return of peer funds and the 3.21% return of the fund’s benchmark index, the Russell 3000 Growth Index.
Despite market turbulence in August and September, the growth stocks that your fund specializes in generally found favor with investors during the period, and they outpaced their value counterparts by a sizable margin.
If you hold shares in a taxable account, you may wish to review the information about after-tax returns, based on the highest federal income tax bracket, that appears later in the report. Please note that as of September 30, 2015, the Morgan Growth Fund realized fractional short-term capital gains equal to less than 1% of fund assets and long-term capital gains equal to about 7%. Gains will be distributed in December.
2
China’s economic woes weighed on U.S. stocks
The broad U.S. stock market returned –0.49% for the 12 months. The final two months were especially rocky as investors worried in particular about the global ripple effects of slower economic growth in China.
For much of the fiscal year, investors were preoccupied with the possibility of an increase in short-term U.S. interest rates. On September 17, the Federal Reserve announced that it would hold rates steady for the time being, a decision that to some investors indicated that the Fed was concerned about the fragility of global markets.
International stocks returned about –11% as the dollar’s strength against many foreign currencies hindered results. Returns for emerging markets, which were especially hard hit by concerns about China, trailed those of the developed markets of the Pacific region and Europe.
Taxable bonds recorded gains as investors searched for safety
The broad U.S. taxable bond market returned 2.94% as investors gravitated toward safe-haven assets amid global stock market volatility. Stimulative monetary policies from the world’s central banks, declining inflation expectations, and global investors’ search for higher yields also helped lift U.S. bonds.
| | | |
| Market Barometer | | | |
| |
| | Average Annual Total Returns |
| | Periods Ended September 30, 2015 |
| | One | Three | Five |
| | Year | Years | Years |
| Stocks | | | |
| Russell 1000 Index (Large-caps) | -0.61% | 12.66% | 13.42% |
| Russell 2000 Index (Small-caps) | 1.25 | 11.02 | 11.73 |
| Russell 3000 Index (Broad U.S. market) | -0.49 | 12.53 | 13.28 |
| FTSE All-World ex US Index (International) | -11.34 | 2.87 | 2.19 |
| |
| Bonds | | | |
| Barclays U.S. Aggregate Bond Index (Broad taxable market) | 2.94% | 1.71% | 3.10% |
| Barclays Municipal Bond Index (Broad tax-exempt market) | 3.16 | 2.88 | 4.14 |
| Citigroup Three-Month U.S. Treasury Bill Index | 0.02 | 0.02 | 0.04 |
| |
| CPI | | | |
| Consumer Price Index | -0.04% | 0.93% | 1.73% |
3
The yield of the 10-year Treasury note ended September at 2.05%, down from 2.48% a year earlier. (Bond prices and yields move in opposite directions.)
International bond markets (as measured by the Barclays Global Aggregate Index ex USD) returned –7.67%, hurt by the dollar’s strength against many foreign currencies. Without this currency effect, international bonds advanced modestly.
The Fed’s 0%–0.25% target for short-term interest rates continued to limit returns for money market funds and savings accounts.
In a tale of two halves, your fund held up well
As I mentioned earlier in this letter, the Morgan Growth Fund opened the fiscal year with an impressive first-half advance that was fueled by robust returns for health care stocks. That advance faltered in the late summer as market gyrations returned following an extended period of relative calm.
Biotechnology and pharmaceutical shares were especially affected by the second-half retreat. After surging amid merger-and-acquisition activity and optimism about new therapies, these
| | | |
| Expense Ratios | | | |
| Your Fund Compared With Its Peer Group | | | |
| |
| | Investor | Admiral | Peer Group |
| | Shares | Shares | Average |
| Morgan Growth Fund | 0.40% | 0.26% | 1.28% |
The fund expense ratios shown are from the prospectus dated January 26, 2015, and represent estimated costs for the current fiscal year. For
the fiscal year ended September 30, 2015, the fund’s expense ratios were 0.40% for Investor Shares and 0.27% for Admiral Shares. The
peer-group expense ratio is derived from data provided by Lipper, a Thomson Reuters Company, and captures information through year-end
2014.
Peer group: Multi-Cap Growth Funds.
4
stocks struggled toward the end of the period, roiled by controversy over drug prices and concerns about lofty valuations.
Although the Morgan Growth Fund has substantial holdings in health care, the sector is by no means the only one in which the fund invests. The fund recorded double-digit returns for consumer discretionary stocks, which were buoyed by hopes that lower gas prices would prompt consumers to open their wallets for other purchases. Success in this broad category, which includes everything from home builders to internet retailers, helped blunt the effect of the second-half falloff in health care.
The fund recorded its worst returns among energy stocks, which plummeted after a sharp drop in the price of oil; however, its small allocation to this sector helped limit the damage. (The Fund Profile page later in this report shows the fund’s exact weighting in energy and other sectors as of September 30.)
The Morgan Growth Fund owns more than 300 stocks across several industries, with information technology, consumer discretionary, and health care representing the largest allocations. It also benefits from a variety of perspectives: Each of the fund’s five advisors employs a distinct investment strategy. This approach provides diversification, which can mute some of the volatility associated with the stocks of fast-growing companies.
| Total Returns | |
| Ten Years Ended September 30, 2015 | |
| | Average |
| | Annual Return |
| Morgan Growth Fund Investor Shares | 7.41% |
| Russell 3000 Growth Index | 8.05 |
| Multi-Cap Growth Funds Average | 6.40 |
| Multi-Cap Growth Funds Average: Derived from data provided by Lipper, a Thomson Reuters Company. |
The figures shown represent past performance, which is not a guarantee of future results. (Current performance may be
lower or higher than the performance data cited. For performance data current to the most recent month-end, visit our
website at vanguard.com/performance.) Note, too, that both investment returns and principal value can fluctuate widely, so
an investor’s shares, when sold, could be worth more or less than their original cost.
5
| Staying the course can help you stay closer to your fund’s return |
| |
| When stock markets are highly volatile, as in recent months, it’s tempting to run for cover. |
| But the price of panic can be high. |
| |
| A rough measure of what can be lost from attempts to time the market is the difference |
| between the returns produced by a fund and the returns earned by the fund’s investors. |
| |
| The results shown in the Performance Summary later in this report are your fund’s time- |
| weighted returns—the average annual returns investors would have earned if they had invested |
| a lump sum in the fund at the start of the period and reinvested any distributions they received. |
| Their actual returns, however, depend on whether they subsequently bought or sold any shares. |
| There’s often a gap between this dollar-weighted return for investors and the fund’s time- |
| weighted return, as shown below. |
| |
| Many sensible investment behaviors can contribute to the difference in returns, but industry |
| cash flow data suggest that one important factor is the generally counterproductive effort to |
| buy and sell at the “right” time. Keeping your emotions in check can help narrow the gap. |
| |
| Mutual fund returns and investor returns over the last decade |
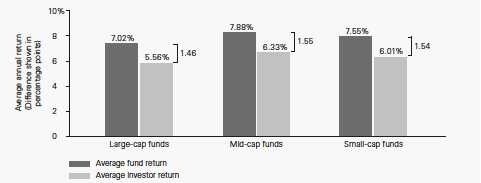
| Notes: Data are as of December 31, 2014. The average fund returns and average investor returns are from Morningstar. The average |
| fund returns are the average of the funds’ time-weighted returns in each category. The average investor returns assume that the growth |
| of a fund’s total net assets for a given period is driven by market returns and investor cash ow. To calculate investor return, a fund’s |
| change in assets for the period is discounted by the return of the fund to isolate how much of the asset growth was driven by cash ow. |
| A model, similar to an internal rate-of-return calculation, is then used to calculate a constant growth rate that links the beginning total |
| net assets and periodic cash ows to the ending total net assets. |
| Sources: Vanguard and Morningstar, Inc. |
For more information about the advisors’ strategies and the fund’s positioning, please see the Advisors’ Report that follows this letter.
Morgan Growth Fund showed resilience in the last ten years
For the ten years ended September 30, 2015, your fund recorded an average annual return of 7.41% for Investor Shares—a full percentage point ahead of peer funds but more than half a percentage point behind the benchmark index.
The decade was marked by the 2008–2009 financial crisis, which thrust global markets into turmoil. Morgan Growth recovered nicely from those bleak years, notching a positive return for six consecutive fiscal years. Its multi-manager advisory team deserves credit for delivering these solid long-term results. In addition to the advisors’ skill, low investment costs helped the fund’s bottom line.
A dose of discipline is crucial when markets become volatile
While the broad U.S. stock market has posted gains for six straight calendar years—from 2009 to 2014—that streak may not last a seventh. Stocks tumbled in August and swung up and down in September.
Nobody can control the direction of the markets or predict where they’ll go in the short term. However, investors can control how they react to unstable and turbulent markets.
During periods of market adversity, it’s more important than ever to keep sight of one of Vanguard’s key principles: Maintain perspective and long-term discipline. Whether you’re investing for yourself or on behalf of clients, your success is affected greatly by how you respond—or don’t respond—during turbulent markets. (You can read Vanguard’s Principles for Investing Success at vanguard.com/research.)
As I’ve written in the past, the best course for long-term investors is generally to ignore daily market moves and not make decisions based on emotion. (See the box on page 6 for more discussion on the benefit of staying the course.) This is also a good time to evaluate your portfolio and make sure your asset allocation is aligned with your time horizon, goals, and risk tolerance.
The markets are unpredictable and often confounding. Keeping long-term plans clearly in focus can help you weather these periodic storms.
As always, thank you for investing with Vanguard.
Sincerely,

F. William McNabb III
Chairman and Chief Executive Officer
October 12, 2015
7
Advisors’ Report
For the fiscal year ended September 30, 2015, Vanguard Morgan Growth Fund returned 4.76% for Investor Shares and 4.88% for the lower-cost Admiral Shares. Your fund is managed by five independent advisors, a strategy that enhances the fund’s diversification by providing exposure to distinct yet complementary investment approaches. It’s not uncommon for different advisors to have different views about individual securities or the broader investment environment.
The advisors, the percentage of fund assets each manages, and brief descriptions of their investment strategies are presented in the accompanying table. The advisors have also prepared a discussion of the investment environment that existed during the fiscal year and of how portfolio positioning reflects this assessment. (Please note that the Kalmar Investment Advisers and Frontier Capital Management discussions refer to industry sectors as defined by Russell classifications, rather than by the Global Industry Classification Standard used elsewhere in this report.) These comments were prepared on October 16, 2015.
Wellington Management Company llp
Portfolio Manager:
Paul E. Marrkand, CFA,
Senior Managing Director
Our portion of the fund uses traditional methods of stock selection—fundamental research and analysis—to identify companies that we believe have above-average growth prospects. Our research focuses on mid- and large-capitalization companies. We seek to build a portfolio that has diversified sources of return as well as a balance of growth, quality, and valuation attributes.
U.S. and foreign equities pulled back in the past 12 months, as shown by returns of –0.61% for the S&P 500 Index and –4.57% for the MSCI World Index. Fixed income markets held up better; the Barclays U.S. Aggregate Bond Index returned 2.94% for the period.
Successes
Sector allocation, a residual outcome of our bottom-up stock selection process, contributed to the portfolio’s relative return. Results were driven mainly by our underweighting of the materials, energy, and industrial sectors.
Stock selection was strongest within consumer discretionary and industrials. Top individual contributors to relative performance included Altera (information technology), O’Reilly Automotive (consumer discretionary), and Aetna (health care). Not holding benchmark constituent IBM (information technology) also helped.
Shortfalls
Security selection detracted from relative performance, particularly in information technology, health care, and financials. Top detractors included NetApp, Microsoft, and Qualcomm (all information technology companies). Our out-of-benchmark position in energy company Apache also detracted
8
from relative performance. We eliminated our positions in NetApp and Apache during the period.
We remain optimistic about the portfolio’s favorable risk/reward profile. We continue to purchase, at attractive valuations, capital-compounding companies that we believe have long-term competitive advantages that should help them maintain free-cash-flow growth rates beyond that of the market. Through our bottom-up process, the portfolio ended the period most overweighted in information technology and health care and most underweighted in industrials and consumer staples.
Jennison Associates LLC
Portfolio Managers:
Kathleen A. McCarragher,
Managing Director
Blair A. Boyer,
Managing Director
Weak energy prices, a strong U.S. dollar, and slowing economic growth in China were key influences on the global economic landscape during the fiscal year. These challenges, combined with uncertainty about the timing of anticipated monetary tightening in the United States, contributed to continued volatility in global financial markets.
Successes
Strong subscriber growth at Netflix reflected the appeal of the on-demand streaming media network’s original programming. We believe the company’s shift toward exclusive deals and original content, along with its increasing pricing power, international expansion, and scale advantage, has strengthened its long-term competitive positioning.
Amazon benefited as investors increasingly appreciated its strong execution, long-term revenue growth, margin-expansion potential, and cloud infrastructure opportunities. The company has been increasing its business investment to drive unit growth, not only in its core retail business but also through the proliferation of digital commerce via the mobile market.
BioMarin Pharmaceutical advanced on strong sales of its innovative drugs for neurometabolic degenerative disorders. Drugs in development include therapies for other serious diseases that lack effective treatments.
Shortfalls
Twitter’s user growth and revenue generation lacked consistency. Although we believe monetization opportunities remain, the social media company needs to reinvigorate user growth and engagement.
Canadian Pacific Railway was hurt because lower volumes of a variety of commodities, including oil, grain, and coal, were being shipped on its rail lines. We sold the position.
We eliminated our position in Schlumberger, the oil equipment and services provider. The company had
9
come under pressure as falling energy prices caused its customers to curtail future spending.
Vanguard Quantitative Equity Group
Portfolio Managers:
James P. Stetler, Principal
James D. Troyer, CFA, Principal
Michael R. Roach, CFA
For the 12-month period, our stock selection models were effective in identifying the outperformers from the underperformers in most industry groups. Our growth, quality, and valuation models contributed positively to performance; however, our management decisions and sentiment models didn’t fare as well.
Successes
Our stock selections were positive in eight of ten sectors. The largest contributors to relative return came from information technology and consumer discretionary. In information technology, overweights in Electronic Arts and Freescale Semiconductor contributed the most.
In consumer discretionary, O’Reilly Automotive and Expedia performed well.
Shortfalls
Our overall selections in financials and materials detracted as our overweights in Discover Financial Services and American Express, as well as our holdings Westlake Chemical and Alcoa, did not perform as expected.
Frontier Capital Management Co., LLC
Portfolio Managers:
Stephen Knightly, CFA,
President
Christopher J. Scarpa,
Vice President
Equities languished as improved domestic economic fundamentals were muted by tepid corporate earnings. Weak emerging markets, reduced commodity prices, and the strengthening dollar depressed earnings.
Successes
Strong stock selection, helped by sector allocations, drove favorable relative performance. Substantial gains in technology and health care offset losses in producer durables. Technology was the largest source of positive stock selection; holdings in security and entertainment software as well as wireless semiconductors helped the most. In health care, investments centered on affordability—in segments such as health maintenance organizations—did well.
An overweight position in health care and an underweight position in energy helped. Health care offered the potential for compelling secular growth and innovation, while uncertainty in emerging markets warranted caution in energy.
Shortfalls
Producer durables hindered performance as the drop in oil prices reduced energy infrastructure spending. We remain
10
optimistic about the U.S. economy and the outlook for continued low interest rates. However, after a six-year period of very high liquidity, valuations are elevated, merger-and-acquisition activity is heated, and the cost of capital is depressed. Concurrently, investors are seeking “safe-haven” growth areas that depend less on global macroeconomic conditions. The resulting crowding effect has raised multiples in select industries to lofty levels that warrant caution. Nonetheless, opportunities are arising—from both the improved employment landscape and the fall in commodity prices—to add to companies that have strong secular appeal, enduring demand, and attractive valuations.
Kalmar Investment Advisers
Portfolio Managers:
Ford B. Draper, Jr., President
and Chief Investment Officer
Dana F. Walker, CFA, Co-Head
of the Investment Team
For the first ten months of the fiscal year ended September 30, 2015, growth stocks fared relatively well. That was before the first significant correction in four years commenced, prompted mainly by fear of a deepening global slowdown emanating primarily from China and the emerging markets.
Since the bull market began in 2009, the United States has been “the best house on the world block” thanks to its resilient economy. Indicators for our economy continue to appear healthy. If the United States and Europe are not headed for recession—and a recession seems a low probability now—the current correction should prove to be a swoon, not the end of markets that reward investors.
Successes
With the U.S. industrial economy slowing, our biggest individual successes came from among our consumer discretionary and technology holdings. These included O’Reilly Automotive, CarMax, Tractor Supply, and Ulta Salon in consumer discretionary, and Cognizant Technology and Altera in technology. Leaders from other sectors included Watsco, Acuity Brands, and Salix Pharmaceuticals.
Shortfalls
The top detractors included producer durables companies—including Weatherford International, Southwestern Energy, Chicago Bridge & Iron, and United Rentals—that were hurt by the collapse of crude oil and natural gas prices. We believe the supply/demand imbalance in oil is righting itself now, with higher prices ahead.
Another prominent detractor was CBS, which declined on secular concerns that “cord cutting” would reduce audiences for broadcast TV. We believe, however, that the company’s earnings prospects from the monetization of its content are robust and that its stock is very cheap for an irreplaceable business.
11
| | | |
| Vanguard Morgan Growth Fund Investment Advisors | |
| |
| Fund Assets Managed | |
| Investment Advisor | % | $ Million | Investment Strategy |
| Wellington Management | 47 | 5,072 | Uses traditional methods of stock selection— |
| Company LLP | | | fundamental research and analysis—to identify |
| | | | companies that it believes have above-average growth |
| | | | prospects. Research focuses on mid- and large-cap |
| | | | companies, evaluating and ranking each stock on a |
| | | | consistent set of growth, quality, and valuation criteria. |
| | | | We seek to build a portfolio with diversified sources of |
| | | | return with a balance of growth, quality, and valuation |
| | | | attributes. |
| Jennison Associates LLC | 20 | 2,135 | Uses a research-driven, fundamental investment |
| | | | approach that relies on in-depth company knowledge |
| | | | gleaned through meetings with management, |
| | | | customers, and suppliers. |
| Vanguard Quantitative Equity Group | 13 | 1,406 | Employs a quantitative fundamental management |
| | | | approach, using models that assess valuation, growth |
| | | | prospects, management decisions, market sentiment, |
| | | | and earnings and balance-sheet quality of companies |
| | | | as compared with their peers. |
| Frontier Capital Management Co., | 10 | 1,056 | Uses a research-driven, fundamental investment |
| LLC | | | approach that seeks companies with above-average |
| | | | growth prospects, reasonable valuations, and |
| | | | competitive advantages. |
| Kalmar Investment Advisers | 9 | 972 | Employs a “growth-with-value” strategy using creative, |
| | | | bottom-up research to uncover vigorously growing, |
| | | | high-quality businesses whose stocks can also be |
| | | | bought inefficiently valued. The strategy has a dual |
| | | | objective of strong returns with lower risk. |
| Cash Investments | 1 | 243 | These short-term reserves are invested by Vanguard in |
| | | | equity index products to simulate investments in |
| | | | stocks. Each advisor also may maintain a modest cash |
| | | | position. |
12
Morgan Growth Fund
Fund Profile
As of September 30, 2015
| | |
| Share-Class Characteristics | |
| |
| | Investor | Admiral |
| | Shares | Shares |
| Ticker Symbol | VMRGX | VMRAX |
| Expense Ratio1 | 0.40% | 0.26% |
| 30-Day SEC Yield | 0.66% | 0.79% |
| | | |
| Portfolio Characteristics | | |
| | | | DJ |
| | | | U.S. |
| | | Russell | Total |
| | | 3000 | Market |
| | | Growth | FA |
| | Fund | Index | Index |
| Number of Stocks | 332 | 1,797 | 4,000 |
| Median Market Cap | $45.5B | $54.7B | $46.5B |
| Price/Earnings Ratio | 26.1x | 23.8x | 20.2x |
| Price/Book Ratio | 4.5x | 5.1x | 2.5x |
| Return on Equity | 21.0% | 22.6% | 17.2% |
| Earnings Growth | | | |
| Rate | 15.5% | 14.8% | 10.1% |
| Dividend Yield | 1.1% | 1.6% | 2.1% |
| Foreign Holdings | 3.1% | 0.0% | 0.0% |
| Turnover Rate | 41% | — | — |
| Short-Term | | | |
| Reserves | 2.8% | — | — |
| | | |
| Sector Diversification (% of equity exposure) |
| | | Russell | DJ |
| | | 3000 | U.S. Total |
| | | Growth | Market |
| | Fund | Index | FA Index |
| Consumer | | | |
| Discretionary | 23.3% | 21.3% | 13.7% |
| Consumer Staples | 5.6 | 10.6 | 8.7 |
| Energy | 1.4 | 0.7 | 6.3 |
| Financials | 5.9 | 5.6 | 18.3 |
| Health Care | 19.5 | 17.5 | 14.4 |
| Industrials | 9.2 | 11.2 | 10.6 |
| Information | | | |
| Technology | 32.2 | 27.5 | 19.6 |
| Materials | 1.6 | 3.5 | 3.1 |
| Telecommunication | | | |
| Services | 1.2 | 2.0 | 2.1 |
| Utilities | 0.1 | 0.1 | 3.2 |
| | |
| Volatility Measures | | |
| | Russell | DJ |
| | 3000 | U.S. Total |
| | Growth | Market |
| | Index | FA Index |
| R-Squared | 0.97 | 0.89 |
| Beta | 1.02 | 1.01 |
These measures show the degree and timing of the fund’s fluctuations compared with the indexes over 36 months.
| | |
| Ten Largest Holdings (% of total net assets) |
| Apple Inc. | Technology | |
| | Hardware, Storage & | |
| | Peripherals | 4.7% |
| Google Inc. | Internet Software & | |
| | Services | 3.5 |
| Amazon.com Inc. | Internet Retail | 2.6 |
| Facebook Inc. | Internet Software & | |
| | Services | 2.2 |
| Visa Inc. | Data Processing & | |
| | Outsourced Services | 1.7 |
| Home Depot Inc. | Home Improvement | |
| | Retail | 1.5 |
| Oracle Corp. | Systems Software | 1.5 |
| Gilead Sciences Inc. | Biotechnology | 1.4 |
| Bristol-Myers Squibb Co. Pharmaceuticals | 1.4 |
| Microsoft Corp. | Systems Software | 1.3 |
| Top Ten | | 21.8% |
| The holdings listed exclude any temporary cash investments and equity index products. |
Investment Focus
1 The expense ratios shown are from the prospectus dated January 26, 2015, and represent estimated costs for the current fiscal year. For the fiscal
year ended September 30, 2015, the expense ratios were 0.40% for Investor Shares and 0.27% for Admiral Shares.
13
Morgan Growth Fund
Performance Summary
All of the returns in this report represent past performance, which is not a guarantee of future results that may be achieved by the fund. (Current performance may be lower or higher than the performance data cited. For performance data current to the most recent month-end, visit our website at vanguard.com/performance.) Note, too, that both investment returns and principal value can fluctuate widely, so an investor’s shares, when sold, could be worth more or less than their original cost. The returns shown do not reflect taxes that a shareholder would pay on fund distributions or on the sale of fund shares.
Cumulative Performance: September 30, 2005, Through September 30, 2015
Initial Investment of $10,000
| | | | | |
| | | Average Annual Total Returns | |
| | | Periods Ended September 30, 2015 | |
| | | | | | Final Value |
| | | One | Five | Ten | of a $10,000 |
| | | Year | Years | Years | Investment |
| | Morgan Growth Fund*Investor Shares | 4.76% | 13.59% | 7.41% | $20,443 |
| •••••••• | Russell 3000 Growth Index | 3.21 | 14.38 | 8.05 | 21,696 |
| |
| – – – – | Dow Multi-Cap Jones Growth U.S. Total Funds Stock Average Market | 1.40 | 12.02 | 6.40 | 18,592 |
| | Float Adjusted Index | -0.55 | 13.26 | 7.06 | 19,778 |
| Multi-Cap Growth Funds Average: Derived from data provided by Lipper, a Thomson Reuters Company. |
| | | | |
| | | | | Final Value |
| | One | Five | Ten | of a $50,000 |
| | Year | Years | Years | Investment |
| Morgan Growth Fund Admiral Shares | 4.88% | 13.75% | 7.58% | $103,778 |
| Russell 3000 Growth Index | 3.21 | 14.38 | 8.05 | 108,480 |
| Dow Jones U.S. Total Stock Market Float | | | | |
| Adjusted Index | -0.55 | 13.26 | 7.06 | 98,892 |
See Financial Highlights for dividend and capital gains information.
14
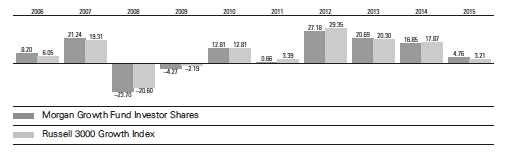
Morgan Growth Fund
Fiscal-Year Total Returns (%): September 30, 2005, Through September 30, 2015
15
Morgan Growth Fund
Financial Statements
Statement of Net Assets
As of September 30, 2015
The fund reports a complete list of its holdings in regulatory filings four times in each fiscal year, at the quarter-ends. For the second and fourth fiscal quarters, the lists appear in the fund’s semiannual and annual reports to shareholders. For the first and third fiscal quarters, the fund files the lists with the Securities and Exchange Commission on Form N-Q. Shareholders can look up the fund’s Forms N-Q on the SEC’s website at sec.gov. Forms N-Q may also be reviewed and copied at the SEC’s Public Reference Room (see the back cover of this report for further information).
| | | |
| | | | Market |
| | | | Value• |
| | | Shares | ($000) |
| Common Stocks (96.2%)1 | | |
| Consumer Discretionary (22.5%) | |
| * | Amazon.com Inc. | 554,713 | 283,952 |
| | Home Depot Inc. | 1,433,084 | 165,507 |
| * | O’Reilly Automotive Inc. | 461,473 | 115,368 |
| * | Priceline Group Inc. | 90,465 | 111,893 |
| | Comcast Corp. Class A | 1,936,995 | 110,176 |
| | Lowe’s Cos. Inc. | 1,489,651 | 102,667 |
| | NIKE Inc. Class B | 818,667 | 100,671 |
| | TJX Cos. Inc. | 1,397,142 | 99,784 |
| | Ross Stores Inc. | 1,739,393 | 84,308 |
| * | Netflix Inc. | 752,969 | 77,752 |
| | Walt Disney Co. | 739,287 | 75,555 |
| | Starbucks Corp. | 1,313,988 | 74,687 |
| * | Chipotle Mexican Grill Inc. | | |
| | Class A | 101,816 | 73,333 |
| | Advance Auto Parts Inc. | 384,235 | 72,824 |
| | Expedia Inc. | 542,637 | 63,858 |
| * | Under Armour Inc. | | |
| | Class A | 558,974 | 54,098 |
| | Marriott International Inc. | | |
| | Class A | 682,245 | 46,529 |
| | Industria de Diseno | | |
| | Textil SA ADR | 2,779,704 | 46,421 |
| | Wyndham Worldwide | | |
| | Corp. | 592,476 | 42,599 |
| *,^ | Tesla Motors Inc. | 160,646 | 39,904 |
| | PulteGroup Inc. | 1,973,812 | 37,246 |
| | Dunkin’ Brands Group Inc. | 687,179 | 33,672 |
| * | LKQ Corp. | 1,115,698 | 31,641 |
| | Hilton Worldwide | | |
| | Holdings Inc. | 1,235,879 | 28,351 |
| | Dollar General Corp. | 338,352 | 24,510 |
| | Carter’s Inc. | 230,083 | 20,855 |
| * | Ulta Salon Cosmetics & | | |
| | Fragrance Inc. | 116,915 | 19,098 |
| * | Michaels Cos. Inc. | 766,245 | 17,700 |
| | Scripps Networks | | |
| | Interactive Inc. Class A | 337,389 | 16,596 |
| | | |
| | Tractor Supply Co. | 191,440 | 16,142 |
| | Wolverine World Wide Inc. | 717,635 | 15,530 |
| * | Urban Outfitters Inc. | 519,085 | 15,251 |
| * | Dollar Tree Inc. | 227,835 | 15,187 |
| | Brunswick Corp./DE | 312,727 | 14,976 |
| * | Jarden Corp. | 302,747 | 14,798 |
| | Harman International | | |
| | Industries Inc. | 149,743 | 14,374 |
| *,^ | Shake Shack Inc. Class A | 274,188 | 12,997 |
| * | Bright Horizons Family | | |
| | Solutions Inc. | 194,226 | 12,477 |
| * | CarMax Inc. | 209,360 | 12,419 |
| | GNC Holdings Inc. | | |
| | Class A | 295,177 | 11,931 |
| | Hanesbrands Inc. | 412,260 | 11,931 |
| | DSW Inc. Class A | 457,855 | 11,588 |
| | Service Corp. International | 424,275 | 11,498 |
| | BorgWarner Inc. | 270,060 | 11,232 |
| | CBS Corp. Class B | 273,600 | 10,917 |
| | Comcast Corp. Special | | |
| | Class A | 186,500 | 10,675 |
| | Delphi Automotive plc | 138,900 | 10,562 |
| | Starwood Hotels & | | |
| | Resorts Worldwide Inc. | 158,090 | 10,510 |
| * | JD.com Inc. ADR | 402,297 | 10,484 |
| * | Discovery | | |
| | Communications Inc. | 415,495 | 10,092 |
| | L Brands Inc. | 106,833 | 9,629 |
| | Harley-Davidson Inc. | 168,715 | 9,262 |
| * | DISH Network Corp. | | |
| | Class A | 155,500 | 9,072 |
| | Foot Locker Inc. | 119,100 | 8,572 |
| * | Sirius XM Holdings Inc. | 2,276,900 | 8,516 |
| * | NVR Inc. | 5,540 | 8,450 |
| * | Discovery | | |
| | Communications Inc. | | |
| | Class A | 310,053 | 8,071 |
| * | Norwegian Cruise Line | | |
| | Holdings Ltd. | 133,100 | 7,627 |
| * | IMAX Corp. | 223,213 | 7,542 |
16
Morgan Growth Fund
| | | |
| | | | Market |
| | | | Value• |
| | | Shares | ($000) |
| * | lululemon athletica Inc. | 136,002 | 6,888 |
| | Goodyear Tire & Rubber | | |
| | Co. | 219,200 | 6,429 |
| * | MGM Resorts International | 276,484 | 5,101 |
| | Ralph Lauren Corp. Class A | 30,087 | 3,555 |
| | DR Horton Inc. | 110,000 | 3,230 |
| * | Liberty Interactive Corp. | | |
| | QVC Group Class A | 112,800 | 2,959 |
| * | AMC Networks Inc. | | |
| | Class A | 32,800 | 2,400 |
| | PVH Corp. | 19,800 | 2,018 |
| | Time Warner Inc. | 21,400 | 1,471 |
| | | | 2,447,918 |
| Consumer Staples (5.2%) | | |
| | Costco Wholesale Corp. | 940,957 | 136,034 |
| | CVS Health Corp. | 976,474 | 94,210 |
| | Mondelez International Inc. | | |
| | Class A | 1,828,938 | 76,578 |
| * | Monster Beverage Corp. | 465,418 | 62,897 |
| | Estee Lauder Cos. Inc. | | |
| | Class A | 618,057 | 49,865 |
| | Colgate-Palmolive Co. | 490,715 | 31,141 |
| | PepsiCo Inc. | 158,600 | 14,956 |
| | Anheuser-Busch InBev | | |
| | SA/NV ADR | 126,896 | 13,491 |
| | Brown-Forman Corp. | | |
| | Class B | 135,343 | 13,115 |
| | Kroger Co. | 347,000 | 12,516 |
| * | United Natural Foods Inc. | 234,979 | 11,399 |
| | Altria Group Inc. | 151,500 | 8,242 |
| ^ | Pilgrim’s Pride Corp. | 371,400 | 7,718 |
| | Coty Inc. Class A | 270,400 | 7,317 |
| * | Hain Celestial Group Inc. | 132,582 | 6,841 |
| | Clorox Co. | 54,600 | 6,308 |
| | Mead Johnson Nutrition Co. | 71,881 | 5,060 |
| | Walgreens Boots Alliance | | |
| | Inc. | 40,800 | 3,390 |
| | Hormel Foods Corp. | 26,800 | 1,697 |
| | | | 562,775 |
| Energy (1.1%) | | |
| | Schlumberger Ltd. | 272,600 | 18,801 |
| | Core Laboratories NV | 174,775 | 17,443 |
| * | Cameron International Corp. | 193,020 | 11,836 |
| * | Carrizo Oil & Gas Inc. | 296,714 | 9,062 |
| | Cabot Oil & Gas Corp. | 414,300 | 9,057 |
| * | Weatherford International | | |
| | plc | 920,580 | 7,806 |
| | Plains GP Holdings LP | | |
| | Class A | 436,400 | 7,637 |
| * | Gulfport Energy Corp. | 256,615 | 7,616 |
| | Tesoro Corp. | 75,200 | 7,312 |
| | Valero Energy Corp. | 118,200 | 7,104 |
| * | Continental Resources Inc. | 177,630 | 5,146 |
| * | FMC Technologies Inc. | 153,400 | 4,755 |
| | | |
| * | Southwestern Energy Co. | 300,070 | 3,808 |
| | Superior Energy Services | | |
| | Inc. | 240,685 | 3,040 |
| * | InterOil Corp. | 82,081 | 2,767 |
| | | | 123,190 |
| Financials (5.3%) | | |
| | Public Storage | 246,124 | 52,087 |
| | Intercontinental Exchange | | |
| | Inc. | 204,367 | 48,024 |
| | Goldman Sachs Group Inc. | 265,507 | 46,135 |
| | Moody’s Corp. | 465,699 | 45,732 |
| | Bank of America Corp. | 2,869,051 | 44,700 |
| | Morgan Stanley | 1,280,776 | 40,344 |
| | JPMorgan Chase & Co. | 623,616 | 38,022 |
| | American International | | |
| | Group Inc. | 626,926 | 35,622 |
| * | E*TRADE Financial Corp. | 893,558 | 23,527 |
| | American Tower | | |
| | Corporation | 248,755 | 21,885 |
| | Aon plc | 216,324 | 19,169 |
| * | Signature Bank | 132,098 | 18,171 |
| | Citigroup Inc. | 365,000 | 18,108 |
| | Raymond James Financial | | |
| | Inc. | 332,088 | 16,482 |
| * | Affiliated Managers Group | | |
| | Inc. | 83,265 | 14,238 |
| | T. Rowe Price Group Inc. | 177,455 | 12,333 |
| | Simon Property Group Inc. | 50,700 | 9,315 |
| | Allied World Assurance | | |
| | Co. Holdings AG | 223,634 | 8,536 |
| | Voya Financial Inc. | 191,700 | 7,432 |
| * | Berkshire Hathaway Inc. | | |
| | Class B | 56,400 | 7,355 |
| | AvalonBay Communities | | |
| | Inc. | 41,900 | 7,325 |
| | Northern Trust Corp. | 104,900 | 7,150 |
| | Legg Mason Inc. | 158,200 | 6,583 |
| | WisdomTree Investments | | |
| | Inc. | 403,491 | 6,508 |
| | American Express Co. | 84,150 | 6,238 |
| | Equinix Inc. | 21,600 | 5,905 |
| | Jones Lang LaSalle Inc. | 30,800 | 4,428 |
| | Ameriprise Financial Inc. | 34,000 | 3,710 |
| * | Realogy Holdings Corp. | 90,400 | 3,402 |
| | Prologis Inc. | 48,700 | 1,894 |
| | Crown Castle International | | |
| | Corp. | 8,800 | 694 |
| | Camden Property Trust | 4,200 | 310 |
| * | CBRE Group Inc. Class A | 8,300 | 266 |
| | | | 581,630 |
| Health Care (18.7%) | | |
| | Gilead Sciences Inc. | 1,526,786 | 149,915 |
| | Bristol-Myers Squibb Co. | 2,482,239 | 146,949 |
| * | Celgene Corp. | 1,068,996 | 115,633 |
17
Morgan Growth Fund
| | | | |
| | | | | Market |
| | | | | Value• |
| | | | Shares | ($000) |
| | Amgen Inc. | | 769,031 | 106,372 |
| * | Allergan plc | | 387,914 | 105,439 |
| * | BioMarin Pharmaceutical | | |
| | Inc. | | 673,107 | 70,892 |
| | Merck & Co. Inc. | 1,413,417 | 69,809 |
| * | Biogen Inc. | | 235,307 | 68,665 |
| | Eli Lilly & Co. | | 798,110 | 66,794 |
| * | Vertex Pharmaceuticals | | |
| | Inc. | | 622,667 | 64,845 |
| | Aetna Inc. | | 572,423 | 62,629 |
| | Cardinal Health Inc. | | 752,544 | 57,810 |
| * | Alexion Pharmaceuticals | | |
| | Inc. | | 359,287 | 56,189 |
| | CR Bard Inc. | | 297,537 | 55,434 |
| | Becton Dickinson and Co. | 381,755 | 50,644 |
| | Medtronic plc | | 729,603 | 48,840 |
| * | Illumina Inc. | | 267,165 | 47,026 |
| | Shire plc ADR | | 185,494 | 38,069 |
| | Novo Nordisk A/S ADR | 648,575 | 35,179 |
| | Zimmer Biomet Holdings | | |
| | Inc. | | 360,952 | 33,904 |
| | Johnson & Johnson | | 336,660 | 31,427 |
| * | HCA Holdings Inc. | | 367,493 | 28,429 |
| | Cooper Cos. Inc. | | 189,063 | 28,144 |
| | AstraZeneca plc ADR | | 849,871 | 27,043 |
| | UnitedHealth Group Inc. | 203,200 | 23,573 |
| | Anthem Inc. | | 166,384 | 23,294 |
| * | Varian Medical Systems | | |
| | Inc. | | 282,132 | 20,816 |
| | Perrigo Co. plc | | 129,932 | 20,434 |
| | Agilent Technologies Inc. | 577,310 | 19,819 |
| | AbbVie Inc. | | 357,100 | 19,430 |
| | Zoetis Inc. | | 458,450 | 18,879 |
| | Thermo Fisher Scientific | | |
| | Inc. | | 149,190 | 18,243 |
| * | Cerner Corp. | | 297,581 | 17,843 |
| * | MEDNAX Inc. | | 215,334 | 16,535 |
| * | Medivation Inc. | | 387,891 | 16,485 |
| | ResMed Inc. | | 318,895 | 16,251 |
| | Universal Health Services | | |
| | Inc. Class B | | 128,992 | 16,099 |
| * | PAREXEL International | | |
| | Corp. | | 254,289 | 15,746 |
| * | Hologic Inc. | | 389,050 | 15,224 |
| * | Sirona Dental Systems Inc. | 158,320 | 14,778 |
| * | Incyte Corp. | | 133,201 | 14,696 |
| * | Express Scripts Holding Co. | 146,855 | 11,889 |
| | HealthSouth Corp. | | 289,067 | 11,091 |
| * | Align Technology Inc. | | 190,075 | 10,789 |
| | Humana Inc. | | 58,826 | 10,530 |
| * | Jazz Pharmaceuticals plc | 72,885 | 9,680 |
| | AmerisourceBergen Corp. | | |
| | Class A | | 99,400 | 9,442 |
| * | Molina Healthcare Inc. | 131,322 | 9,041 |
| | Baxalta Inc. | | 278,200 | 8,766 |
| | | |
| * | Quintiles Transnational | | |
| | Holdings Inc. | 118,200 | 8,223 |
| * | Mettler-Toledo | | |
| | International Inc. | 28,200 | 8,030 |
| * | Centene Corp. | 131,900 | 7,153 |
| * | DexCom Inc. | 80,269 | 6,892 |
| * | Akorn Inc. | 239,815 | 6,836 |
| * | Mallinckrodt plc | 100,360 | 6,417 |
| * | Isis Pharmaceuticals Inc. | 155,300 | 6,277 |
| * | Alkermes plc | 104,583 | 6,136 |
| * | United Therapeutics Corp. | 42,300 | 5,551 |
| | Abbott Laboratories | 124,700 | 5,015 |
| | Cigna Corp. | 36,600 | 4,942 |
| | McKesson Corp. | 21,200 | 3,923 |
| * | Alnylam Pharmaceuticals | | |
| | Inc. | 42,725 | 3,433 |
| * | Charles River Laboratories | | |
| | International Inc. | 42,000 | 2,668 |
| * | Regeneron | | |
| | Pharmaceuticals Inc. | 1,400 | 651 |
| | | | 2,037,600 |
| Industrials (8.8%) | | |
| | Boeing Co. | 970,141 | 127,040 |
| | Honeywell International Inc. | 732,380 | 69,349 |
| | United Parcel Service Inc. | | |
| | Class B | 595,959 | 58,815 |
| * | TransDigm Group Inc. | 242,534 | 51,517 |
| * | IHS Inc. Class A | 408,655 | 47,404 |
| | Danaher Corp. | 529,570 | 45,125 |
| * | Verisk Analytics Inc. | | |
| | Class A | 598,449 | 44,231 |
| | Equifax Inc. | 314,720 | 30,584 |
| | Rockwell Automation Inc. | 253,563 | 25,729 |
| | JB Hunt Transport | | |
| | Services Inc. | 359,497 | 25,668 |
| | Cintas Corp. | 274,990 | 23,580 |
| | Wabtec Corp. | 246,002 | 21,660 |
| | American Airlines Group | | |
| | Inc. | 494,175 | 19,189 |
| * | Stericycle Inc. | 137,605 | 19,170 |
| | Acuity Brands Inc. | 105,875 | 18,590 |
| | AMETEK Inc. | 340,383 | 17,809 |
| | Lockheed Martin Corp. | 77,600 | 16,087 |
| | Carlisle Cos. Inc. | 181,405 | 15,851 |
| * | HD Supply Holdings Inc. | 548,919 | 15,710 |
| | Pentair plc | 296,920 | 15,155 |
| | 3M Co. | 104,000 | 14,744 |
| | Fastenal Co. | 362,025 | 13,254 |
| * | Nielsen Holdings plc | 297,591 | 13,234 |
| | Roper Technologies Inc. | 78,976 | 12,376 |
| | Delta Air Lines Inc. | 268,100 | 12,030 |
| * | Copart Inc. | 357,436 | 11,760 |
| | Southwest Airlines Co. | 305,000 | 11,602 |
| * | Spirit Airlines Inc. | 229,048 | 10,834 |
18
Morgan Growth Fund
| | | |
| | | | Market |
| | | | Value• |
| | | Shares | ($000) |
| * | United Continental | | |
| | Holdings Inc. | 193,300 | 10,255 |
| | MSC Industrial Direct Co. | | |
| | Inc. Class A | 163,680 | 9,989 |
| | Expeditors International of | | |
| | Washington Inc. | 196,245 | 9,233 |
| | CEB Inc. | 132,181 | 9,033 |
| * | Armstrong World Industries | |
| | Inc. | 188,595 | 9,004 |
| | KAR Auction Services Inc. | 246,643 | 8,756 |
| * | Hertz Global Holdings Inc. | 522,880 | 8,748 |
| | Alaska Air Group Inc. | 108,700 | 8,636 |
| | Watsco Inc. | 68,080 | 8,066 |
| | Huntington Ingalls | | |
| | Industries Inc. | 72,600 | 7,779 |
| | PACCAR Inc. | 146,200 | 7,627 |
| | Flowserve Corp. | 162,795 | 6,697 |
| | Donaldson Co. Inc. | 226,330 | 6,355 |
| * | Quanta Services Inc. | 252,975 | 6,125 |
| * | United Rentals Inc. | 101,895 | 6,119 |
| | Robert Half International | | |
| | Inc. | 118,200 | 6,047 |
| * | Kirby Corp. | 74,486 | 4,614 |
| * | Spirit AeroSystems | | |
| | Holdings Inc. Class A | 93,700 | 4,529 |
| | Trinity Industries Inc. | 195,700 | 4,436 |
| | Union Pacific Corp. | 47,900 | 4,235 |
| | Textron Inc. | 34,500 | 1,299 |
| | Allison Transmission | | |
| | Holdings Inc. | 43,000 | 1,148 |
| | | | 956,827 |
| Information Technology (31.0%) | |
| | Apple Inc. | 4,598,235 | 507,185 |
| * | Google Inc. Class C | 483,389 | 294,104 |
| * | Facebook Inc. Class A | 2,630,791 | 236,508 |
| | Visa Inc. Class A | 2,672,263 | 186,150 |
| | Oracle Corp. | 4,438,482 | 160,318 |
| | Microsoft Corp. | 3,241,294 | 143,460 |
| * | salesforce.com inc | 1,633,635 | 113,423 |
| * | Alliance Data Systems | | |
| | Corp. | 357,514 | 92,589 |
| | MasterCard Inc. Class A | 954,046 | 85,979 |
| * | Google Inc. Class A | 132,649 | 84,679 |
| | Cisco Systems Inc. | 2,935,035 | 77,045 |
| * | Check Point Software | | |
| | Technologies Ltd. | 885,406 | 70,239 |
| * | Red Hat Inc. | 771,778 | 55,475 |
| * | Vantiv Inc. Class A | 1,177,001 | 52,871 |
| | Activision Blizzard Inc. | 1,701,030 | 52,545 |
| | Paychex Inc. | 1,049,783 | 50,001 |
| * | F5 Networks Inc. | 418,533 | 48,466 |
| | Intuit Inc. | 544,063 | 48,286 |
| * | Fiserv Inc. | 538,284 | 46,621 |
| | Altera Corp. | 929,741 | 46,561 |
| * | LinkedIn Corp. Class A | 233,232 | 44,344 |
| | | |
| * | Adobe Systems Inc. | 531,469 | 43,697 |
| * | Cognizant Technology | | |
| | Solutions Corp. Class A | 690,720 | 43,246 |
| * | Electronic Arts Inc. | 635,107 | 43,029 |
| * | Workday Inc. Class A | 573,872 | 39,517 |
| | Maxim Integrated | | |
| | Products Inc. | 1,175,366 | 39,257 |
| | Global Payments Inc. | 305,982 | 35,105 |
| * | PayPal Holdings Inc. | 1,071,548 | 33,261 |
| * | Alibaba Group Holding | | |
| | Ltd. ADR | 542,796 | 32,009 |
| | Tencent Holdings Ltd. | 1,866,648 | 31,465 |
| | Linear Technology Corp. | 728,562 | 29,397 |
| | Amphenol Corp. Class A | 551,813 | 28,120 |
| | FactSet Research | | |
| | Systems Inc. | 175,243 | 28,006 |
| | Amdocs Ltd. | 465,974 | 26,505 |
| | CDW Corp. | 640,989 | 26,191 |
| * | Splunk Inc. | 416,722 | 23,066 |
| | QUALCOMM Inc. | 396,132 | 21,284 |
| | Jack Henry & Associates | | |
| | Inc. | 297,898 | 20,737 |
| * | Twitter Inc. | 764,026 | 20,583 |
| * | eBay Inc. | 820,653 | 20,057 |
| * | Euronet Worldwide Inc. | 255,233 | 18,910 |
| | Accenture plc Class A | 171,800 | 16,881 |
| | Broadcom Corp. Class A | 318,082 | 16,359 |
| * | Gartner Inc. | 194,532 | 16,327 |
| * | FireEye Inc. | 481,669 | 15,327 |
| * | Baidu Inc. ADR | 109,798 | 15,087 |
| | Analog Devices Inc. | 252,287 | 14,232 |
| * | Fortinet Inc. | 317,090 | 13,470 |
| | Avago Technologies Ltd. | | |
| | Class A | 94,900 | 11,863 |
| | Fidelity National | | |
| | Information Services Inc. | 176,055 | 11,810 |
| * | VeriFone Systems Inc. | 415,415 | 11,519 |
| * | Akamai Technologies Inc. | 154,014 | 10,636 |
| | CDK Global Inc. | 217,537 | 10,394 |
| | Fair Isaac Corp. | 122,642 | 10,363 |
| | Atmel Corp. | 1,265,778 | 10,215 |
| | Lam Research Corp. | 148,861 | 9,725 |
| * | NXP Semiconductors NV | 109,913 | 9,570 |
| * | Zebra Technologies Corp. | 123,480 | 9,452 |
| | Skyworks Solutions Inc. | 112,100 | 9,440 |
| * | Palo Alto Networks Inc. | 54,056 | 9,298 |
| * | Rackspace Hosting Inc. | 353,300 | 8,719 |
| * | Cadence Design Systems | | |
| | Inc. | 385,707 | 7,976 |
| | Jabil Circuit Inc. | 327,400 | 7,324 |
| * | Qorvo Inc. | 128,314 | 5,781 |
| | FLIR Systems Inc. | 168,455 | 4,715 |
| * | Autodesk Inc. | 97,315 | 4,296 |
| * | Citrix Systems Inc. | 12,300 | 852 |
| | | | 3,371,922 |
19
Morgan Growth Fund
| | | | |
| | | | | Market |
| | | | | Value• |
| | | | Shares | ($000) |
| Materials (1.5%) | | | |
| | Sherwin-Williams Co. | 245,806 | 54,761 |
| | Monsanto Co. | | 199,651 | 17,038 |
| | Ashland Inc. | | 166,160 | 16,719 |
| | Cytec Industries Inc. | 222,087 | 16,401 |
| * | WR Grace & Co. | | 161,870 | 15,062 |
| | PolyOne Corp. | | 371,070 | 10,887 |
| | Worthington Industries Inc. | 343,295 | 9,090 |
| | Valspar Corp. | | 99,100 | 7,123 |
| | CF Industries Holdings Inc. | 139,150 | 6,248 |
| | International Flavors & | | |
| | Fragrances Inc. | | 41,600 | 4,296 |
| * | Crown Holdings Inc. | 78,700 | 3,601 |
| | Packaging Corp. of America | 35,300 | 2,124 |
| | NewMarket Corp. | | 4,600 | 1,642 |
| | | | | 164,992 |
| Other (1.0%) | | | |
| 2 | Vanguard Growth ETF | 1,044,900 | 104,793 |
| |
| Telecommunication Services (1.1%) | |
| | Verizon Communications | | |
| | Inc. | | 1,515,238 | 65,928 |
| * | SBA Communications | | |
| | Corp. Class A | | 442,938 | 46,393 |
| | Cogent Communications | | |
| | Holdings Inc. | | 279,224 | 7,584 |
| | | | | 119,905 |
| Total Common Stocks | | | |
| (Cost $7,879,717) | | | 10,471,552 |
| Temporary Cash Investments (3.8%)1 | |
| Money Market Fund (2.6%) | | |
| 3,4 | Vanguard Market | | | |
| | Liquidity Fund, | | | |
| | 0.189% | 280,129,840 | 280,130 |
| |
| | | | Face | |
| | | | Amount | |
| | | | ($000) | |
| Repurchase Agreement (1.1%) | |
| | Bank of America Securities, | |
| | LLC 0.120%, 10/1/15 | | |
| | (Dated 9/30/15, | | | |
| | Repurchase Value | | | |
| | $127,000,000, | | | |
| | collateralized by | | | |
| | Government National | | |
| | Mortgage Assn. 3.500%, | | |
| | 8/20/45, with a value of | | |
| | $129,540,000) | | 127,000 | 127,000 |
| | | |
| | | Face | Market |
| | | Amount | Value• |
| | | ($000) | ($000) |
| U.S. Government and Agency Obligations (0.1%) |
| 5,6 | Federal Home Loan Bank | | |
| | Discount Notes, 0.095%, | | |
| | 10/21/15 | 500 | 500 |
| 5,6 | Federal Home Loan Bank | | |
| | Discount Notes, 0.100%, | | |
| | 10/23/15 | 3,400 | 3,400 |
| 5,6 | Federal Home Loan Bank | | |
| | Discount Notes, 0.114%, | | |
| | 10/28/15 | 3,400 | 3,400 |
| 5,6 | Federal Home Loan Bank | | |
| | Discount Notes, 0.150%, | | |
| | 11/13/15 | 200 | 200 |
| 5,6 | Federal Home Loan Bank | | |
| | Discount Notes, 0.192%, | | |
| | 11/27/15 | 100 | 100 |
| 5,6 | Federal Home Loan Bank | | |
| | Discount Notes, 0.208%, | | |
| | 12/9/15 | 1,000 | 999 |
| | | | 8,599 |
| Total Temporary Cash Investments | |
| (Cost $415,729) | | 415,729 |
| Total Investments (100.0%) | | |
| (Cost $8,295,446) | | 10,887,281 |
| |
| | | | Amount |
| | | | ($000) |
| Other Assets and Liabilities (0.0%) | |
| Other Assets | | |
| Investment in VGI | | 1,019 |
| Receivables for Accrued Income | | 7,738 |
| Receivables for Investment Securities Sold 88,236 |
| Receivables for Capital Shares Issued | 26,696 |
| Other Assets | | 100 |
| Total Other Assets | | 123,789 |
| Liabilities | | |
| Payables for Investment Securities | |
| Purchased | | (36,140) |
| Collateral for Securities on Loan | | (28,919) |
| Payables for Capital Shares Redeemed | (38,299) |
| Payables to Investment Advisor | | (4,432) |
| Payables to Vanguard | | (19,280) |
| Other Liabilities | | (395) |
| Total Liabilities | | (127,465) |
| Net Assets (100%) | | 10,883,605 |
20
Morgan Growth Fund
| |
| At September 30, 2015, net assets consisted of: |
| | Amount |
| | ($000) |
| Paid-in Capital | 7,454,501 |
| Undistributed Net Investment Income | 43,316 |
| Accumulated Net Realized Gains | 796,361 |
| Unrealized Appreciation (Depreciation) | |
| Investment Securities | 2,591,835 |
| Futures Contracts | (2,408) |
| Net Assets | 10,883,605 |
| |
| |
| Investor Shares—Net Assets | |
| Applicable to 161,217,213 outstanding | |
| $.001 par value shares of beneficial | |
| interest (unlimited authorization) | 4,077,437 |
| Net Asset Value Per Share— | |
| Investor Shares | $25.29 |
| |
| |
| Admiral Shares—Net Assets | |
| Applicable to 86,791,357 outstanding | |
| $.001 par value shares of beneficial | |
| interest (unlimited authorization) | 6,806,168 |
| Net Asset Value Per Share— | |
| Admiral Shares | $78.42 |
• See Note A in Notes to Financial Statements.
* Non-income-producing security.
^ Includes partial security positions on loan to broker-dealers. The total value of securities on loan is $28,537,000.
1 The fund invests a portion of its cash reserves in equity markets through the use of index futures contracts. After giving effect to futures
investments, the fund’s effective common stock and temporary cash investment positions represent 97.4% and 2.6%, respectively,
of net assets.
2 Considered an affiliated company of the fund as the issuer is another member of The Vanguard Group.
3 Affiliated money market fund available only to Vanguard funds and certain trusts and accounts managed by Vanguard. Rate shown is the
7-day yield.
4 Includes $28,919,000 of collateral received for securities on loan.
5 The issuer operates under a congressional charter; its securities are generally neither guaranteed by the U.S. Treasury nor backed by the
full faith and credit of the U.S. government.
6 Securities with a value of $7,999,000 have been segregated as initial margin for open futures contracts.
ADR—American Depositary Receipt.
See accompanying Notes, which are an integral part of the Financial Statements.
21
Morgan Growth Fund
Statement of Operations
| |
| | Year Ended |
| | September 30, 2015 |
| | ($000) |
| Investment Income | |
| Income | |
| Dividends1,2 | 136,139 |
| Interest2 | 300 |
| Securities Lending | 414 |
| Total Income | 136,853 |
| Expenses | |
| Investment Advisory Fees—Note B | |
| Basic Fee | 18,007 |
| Performance Adjustment | (1,291) |
| The Vanguard Group—Note C | |
| Management and Administrative—Investor Shares | 10,846 |
| Management and Administrative—Admiral Shares | 7,276 |
| Marketing and Distribution—Investor Shares | 667 |
| Marketing and Distribution—Admiral Shares | 829 |
| Custodian Fees | 233 |
| Auditing Fees | 37 |
| Shareholders’ Reports—Investor Shares | 32 |
| Shareholders’ Reports—Admiral Shares | 40 |
| Trustees’ Fees and Expenses | 20 |
| Total Expenses | 36,696 |
| Expenses Paid Indirectly | (232) |
| Net Expenses | 36,464 |
| Net Investment Income | 100,389 |
| Realized Net Gain (Loss) | |
| Investment Securities Sold2 | 966,517 |
| Futures Contracts | (12,635) |
| Foreign Currencies | (22) |
| Realized Net Gain (Loss) | 953,860 |
| Change in Unrealized Appreciation (Depreciation) | |
| Investment Securities | (524,857) |
| Futures Contracts | (2,246) |
| Foreign Currencies | 1 |
| Change in Unrealized Appreciation (Depreciation) | (527,102) |
| Net Increase (Decrease) in Net Assets Resulting from Operations | 527,147 |
1 Dividends are net of foreign withholding taxes of $525,000.
2 Dividend income, interest income, and realized net gain (loss) from affiliated companies of the fund were $1,443,000, $271,000, and $0,
respectively.
See accompanying Notes, which are an integral part of the Financial Statements.
22
Morgan Growth Fund
Statement of Changes in Net Assets
| | |
| | Year Ended September 30, |
| | 2015 | 2014 |
| | ($000) | ($000) |
| Increase (Decrease) in Net Assets | | |
| Operations | | |
| Net Investment Income | 100,389 | 85,467 |
| Realized Net Gain (Loss) | 953,860 | 1,188,527 |
| Change in Unrealized Appreciation (Depreciation) | (527,102) | 377,642 |
| Net Increase (Decrease) in Net Assets Resulting from Operations | 527,147 | 1,651,636 |
| Distributions | | |
| Net Investment Income | | |
| Investor Shares | (31,623) | (32,172) |
| Admiral Shares | (53,891) | (46,958) |
| Realized Capital Gain1 | | |
| Investor Shares | (467,717) | (185,177) |
| Admiral Shares | (648,615) | (216,896) |
| Total Distributions | (1,201,846) | (481,203) |
| Capital Share Transactions | | |
| Investor Shares | (250,796) | (892,889) |
| Admiral Shares | 978,782 | 611,582 |
| Net Increase (Decrease) from Capital Share Transactions | 727,986 | (281,307) |
| Total Increase (Decrease) | 53,287 | 889,126 |
| Net Assets | | |
| Beginning of Period | 10,830,318 | 9,941,192 |
| End of Period2 | 10,883,605 | 10,830,318 |
1 Includes fiscal 2015 and 2014 short-term gain distributions totaling $135,145,000 and $11,778,000, respectively. Short-term gain
distributions are treated as ordinary income dividends for tax purposes.
2 Net Assets—End of Period includes undistributed (overdistributed) net investment income of $43,316,000 and $37,745,000.
See accompanying Notes, which are an integral part of the Financial Statements.
23
Morgan Growth Fund
Financial Highlights
| | | | | |
| Investor Shares | | | | | |
| |
| For a Share Outstanding | Year Ended September 30, |
| Throughout Each Period | 2015 | 2014 | 2013 | 2012 | 2011 |
| Net Asset Value, Beginning of Period | $27.07 | $24.26 | $20.31 | $16.06 | $16.04 |
| Investment Operations | | | | | |
| Net Investment Income | . 219 | .187 | .230 | .141 | .087 |
| Net Realized and Unrealized Gain (Loss) | | | | | |
| on Investments | 1.017 | 3.785 | 3.925 | 4.209 | .029 |
| Total from Investment Operations | 1.236 | 3.972 | 4.155 | 4.350 | .116 |
| Distributions | | | | | |
| Dividends from Net Investment Income | (.191) | (.172) | (. 205) | (.100) | (. 096) |
| Distributions from Realized Capital Gains | (2.825) | (.990) | — | — | — |
| Total Distributions | (3.016) | (1.162) | (.205) | (.100) | (.096) |
| Net Asset Value, End of Period | $25.29 | $27.07 | $24.26 | $20.31 | $16.06 |
| |
| Total Return1 | 4.76% | 16.85% | 20.69% | 27.18% | 0.66% |
| |
| Ratios/Supplemental Data | | | | | |
| Net Assets, End of Period (Millions) | $4,077 | $4,580 | $4,922 | $5,283 | $5,009 |
| Ratio of Total Expenses to Average Net Assets2 | 0.40% | 0.40% | 0.39% | 0.40% | 0.42% |
| Ratio of Net Investment Income to | | | | | |
| Average Net Assets | 0.80% | 0.72% | 1.06% | 0.74% | 0.47% |
| Portfolio Turnover Rate | 41% | 52% | 53% | 49% | 55% |
1 Total returns do not include account service fees that may have applied in the periods shown. Fund prospectuses provide information about any applicable account service fees.
2 Includes performance-based investment advisory fee increases (decreases) of (0.01%), (0.04%), (0.05%), (0.04%), and (0.01%).
See accompanying Notes, which are an integral part of the Financial Statements.
24
Morgan Growth Fund
Financial Highlights
| | | | | |
| Admiral Shares | | | | | |
| |
| For a Share Outstanding | Year Ended September 30, |
| Throughout Each Period | 2015 | 2014 | 2013 | 2012 | 2011 |
| Net Asset Value, Beginning of Period | $83.97 | $75.26 | $63.02 | $49.84 | $49.75 |
| Investment Operations | | | | | |
| Net Investment Income | . 804 | .719 | .831 | .535 | .342 |
| Net Realized and Unrealized Gain (Loss) | | | | | |
| on Investments | 3.123 | 11.722 | 12.144 | 13.036 | .110 |
| Total from Investment Operations | 3.927 | 12.441 | 12.975 | 13.571 | .452 |
| Distributions | | | | | |
| Dividends from Net Investment Income | (.727) | (.664) | (.735) | (. 391) | (. 362) |
| Distributions from Realized Capital Gains | (8.750) | (3.067) | — | — | — |
| Total Distributions | (9.477) | (3.731) | (.735) | (. 391) | (. 362) |
| Net Asset Value, End of Period | $78.42 | $83.97 | $75.26 | $63.02 | $49.84 |
| |
| Total Return1 | 4.88% | 17.03% | 20.86% | 27.35% | 0.83% |
| |
| Ratios/Supplemental Data | | | | | |
| Net Assets, End of Period (Millions) | $6,806 | $6,250 | $5,019 | $3,725 | $2,554 |
| Ratio of Total Expenses to Average Net Assets2 | 0.27% | 0.26% | 0.25% | 0.26% | 0.28% |
| Ratio of Net Investment Income to | | | | | |
| Average Net Assets | 0.93% | 0.86% | 1.20% | 0.88% | 0.61% |
| Portfolio Turnover Rate | 41% | 52% | 53% | 49% | 55% |
1 Total returns do not include account service fees that may have applied in the periods shown. Fund prospectuses provide information about any applicable account service fees.
2 Includes performance-based investment advisory fee increases (decreases) of (0.01%), (0.04%), (0.05%), (0.04%), and (0.01%).
See accompanying Notes, which are an integral part of the Financial Statements.
25
Morgan Growth Fund
Notes to Financial Statements
Vanguard Morgan Growth Fund is registered under the Investment Company Act of 1940 as an open-end investment company, or mutual fund. The fund offers two classes of shares: Investor Shares and Admiral Shares. Investor Shares are available to any investor who meets the fund’s minimum purchase requirements. Admiral Shares are designed for investors who meet certain administrative, service, and account-size criteria.
A. The following significant accounting policies conform to generally accepted accounting principles for U.S. investment companies. The fund consistently follows such policies in preparing its financial statements.
1. Security Valuation: Securities are valued as of the close of trading on the New York Stock Exchange (generally 4 p.m., Eastern time) on the valuation date. Equity securities are valued at the latest quoted sales prices or official closing prices taken from the primary market in which each security trades; such securities not traded on the valuation date are valued at the mean of the latest quoted bid and asked prices. Securities for which market quotations are not readily available, or whose values have been affected by events occurring before the fund’s pricing time but after the close of the securities’ primary markets, are valued at their fair values calculated according to procedures adopted by the board of trustees. These procedures include obtaining quotations from an independent pricing service, monitoring news to identify significant market- or security-specific events, and evaluating changes in the values of foreign market proxies (for example, ADRs, futures contracts, or exchange-traded funds), between the time the foreign markets close and the fund’s pricing time. When fair-value pricing is employed, the prices of securities used by a fund to calculate its net asset value may differ from quoted or published prices for the same securities. Investments in Vanguard Market Liquidity Fund are valued at that fund’s net asset value. Temporary cash investments acquired over 60 days to maturity are valued using the latest bid prices or using valuations based on a matrix system (which considers such factors as security prices, yields, maturities, and ratings), both as furnished by independent pricing services. Other temporary cash investments are valued at amortized cost, which approximates market value.
2. Foreign Currency: Securities and other assets and liabilities denominated in foreign currencies are translated into U.S. dollars using exchange rates obtained from an independent third party as of the fund’s pricing time on the valuation date. Realized gains (losses) and unrealized appreciation (depreciation) on investment securities include the effects of changes in exchange rates since the securities were purchased, combined with the effects of changes in security prices. Fluctuations in the value of other assets and liabilities resulting from changes in exchange rates are recorded as unrealized foreign currency gains (losses) until the assets or liabilities are settled in cash, at which time they are recorded as realized foreign currency gains (losses).
3. Futures Contracts: The fund uses index futures contracts to a limited extent, with the objective of maintaining full exposure to the stock market while maintaining liquidity. The fund may purchase or sell futures contracts to achieve a desired level of investment, whether to accommodate portfolio turnover or cash flows from capital share transactions. The primary risks associated with the use of futures contracts are imperfect correlation between changes in market values of stocks held by the fund and the prices of futures contracts, and the possibility of an illiquid market. Counterparty risk involving futures is mitigated because a regulated clearinghouse is the counterparty instead of the clearing broker. To further mitigate counterparty risk, the fund trades futures contracts on an exchange, monitors the financial strength of its clearing brokers and clearinghouse, and has entered into clearing agreements with its clearing brokers. The clearinghouse imposes initial margin requirements to secure the fund’s performance and requires daily settlement of variation margin representing changes in the market value of each contract.
26
Morgan Growth Fund
Futures contracts are valued at their quoted daily settlement prices. The aggregate settlement values of the contracts are not recorded in the Statement of Net Assets. Fluctuations in the value of the contracts are recorded in the Statement of Net Assets as an asset (liability) and in the Statement of Operations as unrealized appreciation (depreciation) until the contracts are closed, when they are recorded as realized futures gains (losses).
During the year ended September 30, 2015, the fund’s average investments in long and short futures contracts represented less than 1% and 0% of net assets, respectively, based on the average of aggregate settlement values at each quarter-end during the period.
4. Repurchase Agreements: The fund enters into repurchase agreements with institutional counter-parties. Securities pledged as collateral to the fund under repurchase agreements are held by a custodian bank until the agreements mature. Each agreement requires that the market value of the collateral be sufficient to cover payments of interest and principal. The fund further mitigates its counterparty risk by entering into repurchase agreements only with a diverse group of prequalified counterparties, monitoring their financial strength, and entering into master repurchase agreements with its counterparties. The master repurchase agreements provide that, in the event of a counter-party’s default (including bankruptcy), the fund may terminate any repurchase agreements with that counterparty, determine the net amount owed, and sell or retain the collateral up to the net amount owed to the fund. Such action may be subject to legal proceedings, which may delay or limit the disposition of collateral.
5. Federal Income Taxes: The fund intends to continue to qualify as a regulated investment company and distribute all of its taxable income. Management has analyzed the fund’s tax positions taken for all open federal income tax years (September 30, 2012–2015), and has concluded that no provision for federal income tax is required in the fund’s financial statements.
6. Distributions: Distributions to shareholders are recorded on the ex-dividend date.
7. Securities Lending: To earn additional income, the fund lends its securities to qualified institutional borrowers. Security loans are required to be secured at all times by collateral in an amount at least equal to the market value of securities loaned. Daily market fluctuations could cause the value of loaned securities to be more or less than the value of the collateral received. When this occurs, the collateral is adjusted and settled on the next business day. The fund further mitigates its counterparty risk by entering into securities lending transactions only with a diverse group of prequalified counter-parties, monitoring their financial strength, and entering into master securities lending agreements with its counterparties. The master securities lending agreements provide that, in the event of a counterparty’s default (including bankruptcy), the fund may terminate any loans with that borrower, determine the net amount owed, and sell or retain the collateral up to the net amount owed to the fund; however, such actions may be subject to legal proceedings. While collateral mitigates counter-party risk, in the absence of a default the fund may experience delays and costs in recovering the securities loaned. The fund invests cash collateral received in Vanguard Market Liquidity Fund, and records a liability in the Statement of Net Assets for the return of the collateral, during the period the securities are on loan. Securities lending income represents fees charged to borrowers plus income earned on invested cash collateral, less expenses associated with the loan.
8. Credit Facility: The fund and certain other funds managed by The Vanguard Group (“Vanguard”) participate in a $3 billion committed credit facility provided by a syndicate of lenders pursuant to a credit agreement that may be renewed annually; each fund is individually liable for its borrowings, if any, under the credit facility. Borrowings may be utilized for temporary and emergency purposes, and are subject to the fund’s regulatory and contractual borrowing restrictions. The participating funds are
27
Morgan Growth Fund
charged administrative fees and an annual commitment fee of 0.06% of the undrawn amount of the facility; these fees are allocated to the funds based on a method approved by the fund’s board of trustees and included in Management and Administrative expenses on the fund’s Statement of Operations. Any borrowings under this facility bear interest at a rate equal to the higher of the federal funds rate or LIBOR reference rate plus an agreed-upon spread.
The fund had no borrowings outstanding at September 30, 2015, or at any time during the period then ended.
9. Other: Dividend income is recorded on the ex-dividend date. Interest income includes income distributions received from Vanguard Market Liquidity Fund and is accrued daily. Premiums and discounts on debt securities purchased are amortized and accreted, respectively, to interest income over the lives of the respective securities. Security transactions are accounted for on the date securities are bought or sold. Costs used to determine realized gains (losses) on the sale of investment securities are those of the specific securities sold.
Each class of shares has equal rights as to assets and earnings, except that each class separately bears certain class-specific expenses related to maintenance of shareholder accounts (included in Management and Administrative expenses) and shareholder reporting. Marketing and distribution expenses are allocated to each class of shares based on a method approved by the board of trustees. Income, other non-class-specific expenses, and gains and losses on investments are allocated to each class of shares based on its relative net assets.
B. The investment advisory firms Wellington Management Company llp, Jennison Associates LLC, Frontier Capital Management Co., LLC, and Kalmar Investment Advisers each provide investment advisory services to a portion of the fund for a fee calculated at an annual percentage rate of average net assets managed by the advisor. The basic fee of Wellington Management Company llp is subject to quarterly adjustments based on performance relative to the Russell 3000 Growth Index for the preceding three years. The basic fee of Jennison Associates LLC is subject to quarterly adjustments based on performance relative to the Russell 1000 Growth Index for the preceding three years. The basic fees of Frontier Capital Management Co., LLC, and Kalmar Investment Advisers are subject to quarterly adjustments based on performance relative to the Russell Midcap Growth Index for the preceding three years.
Vanguard provides investment advisory services to a portion of the fund as described below; the fund paid Vanguard advisory fees of $653,000 for the year ended September 30, 2015.
For the year ended September 30, 2015, the aggregate investment advisory fee paid to all advisors represented an effective annual basic rate of 0.16% of the fund’s average net assets, before a net decrease of $1,291,000 (0.01%) based on performance.
C. In accordance with the terms of a Funds’ Service Agreement (the “FSA”) between Vanguard and the fund, Vanguard furnishes to the fund investment advisory, corporate management, administrative, marketing, distribution and cash management services at Vanguard’s cost of operations (as defined by the FSA). These costs of operations are allocated to the fund based on methods and guidelines approved by the board of trustees. Vanguard does not require reimbursement in the current period for certain costs of operations (such as deferred compensation/benefits and risk/ insurance costs); the fund’s liability for these costs of operations is included in Payables to Vanguard on the Statement of Net Assets.
28
Morgan Growth Fund
Upon the request of Vanguard, the fund may invest up to 0.40% of its net assets as capital in Vanguard. At September 30, 2015, the fund had contributed to Vanguard capital in the amount of $1,019,000, representing 0.01% of the fund’s net assets and 0.41% of Vanguard’s capitalization. The fund’s trustees and officers are also directors and employees, respectively, of Vanguard.
D. The fund has asked its investment advisors to direct certain security trades, subject to obtaining the best price and execution, to brokers who have agreed to rebate to the fund part of the commissions generated. Such rebates are used solely to reduce the fund’s management and administrative expenses. For the year ended September 30, 2015, these arrangements reduced the fund’s expenses by $232,000 (an annual rate of 0.00% of average net assets).
E. Various inputs may be used to determine the value of the fund’s investments. These inputs are summarized in three broad levels for financial statement purposes. The inputs or methodologies used to value securities are not necessarily an indication of the risk associated with investing in those securities.
Level 1—Quoted prices in active markets for identical securities.
Level 2—Other significant observable inputs (including quoted prices for similar securities, interest rates, prepayment speeds, credit risk, etc.).
Level 3—Significant unobservable inputs (including the fund’s own assumptions used to determine the fair value of investments).
The following table summarizes the market value of the fund’s investments as of September 30, 2015, based on the inputs used to value them:
| | | |
| | Level 1 | Level 2 | Level 3 |
| Investments | ($000) | ($000) | ($000) |
| Common Stocks | 10,440,087 | 31,465 | — |
| Temporary Cash Investments | 280,130 | 135,599 | — |
| Futures Contracts—Assets1 | 3,186 | — | — |
| Futures Contracts—Liabilities1 | (393) | — | — |
| Total | 10,723,010 | 167,064 | — |
| 1 Represents variation margin on the last day of the reporting period. |
F. At September 30, 2015, the aggregate settlement value of open futures contracts and the related unrealized appreciation (depreciation) were:
| | | | |
| | | | ($000) |
| | | | Aggregate | |
| | | Number of | Settlement | Unrealized |
| | | Long (Short) | Value | Appreciation |
| Futures Contracts | Expiration | Contracts | Long (Short) | (Depreciation) |
| S&P 500 Index | December 2015 | 276 | 131,700 | (2,443) |
| E-mini S&P 500 Index | December 2015 | 25 | 2,386 | 35 |
| | | | | (2,408) |
Unrealized appreciation (depreciation) on open futures contracts is required to be treated as realized gain (loss) for tax purposes.
29
Morgan Growth Fund
G. Distributions are determined on a tax basis and may differ from net investment income and realized capital gains for financial reporting purposes. Differences may be permanent or temporary. Permanent differences are reclassified among capital accounts in the financial statements to reflect their tax character. Temporary differences arise when certain items of income, expense, gain, or loss are recognized in different periods for financial statement and tax purposes. These differences will reverse at some time in the future. Differences in classification may also result from the treatment of short-term gains as ordinary income for tax purposes.
During the year ended September 30, 2015, the fund realized net foreign currency losses of $22,000, which decreased distributable net income for tax purposes; accordingly, such losses have been reclassified from accumulated net realized gains to undistributed net investment income.
The fund used a tax accounting practice to treat a portion of the price of capital shares redeemed during the year as distributions from net investment income and realized capital gains. Accordingly, the fund has reclassified $9,282,000 from undistributed net investment income, and $88,670,000 from accumulated net realized gains, to paid-in capital.
For tax purposes, at September 30, 2015, the fund had $68,569,000 of ordinary income and $788,502,000 of long-term capital gains available for distribution.
At September 30, 2015, the cost of investment securities for tax purposes was $8,296,303,000. Net unrealized appreciation of investment securities for tax purposes was $2,590,978,000, consisting of unrealized gains of $2,957,405,000 on securities that had risen in value since their purchase and $366,427,000 in unrealized losses on securities that had fallen in value since their purchase.
H. During the year ended September 30, 2015, the fund purchased $4,586,032,000 of investment securities and sold $5,280,684,000 of investment securities, other than temporary cash investments.
I. Capital share transactions for each class of shares were:
| | | | |
| | Year Ended September 30, |
| | 2015 | 2014 |
| | Amount | Shares | Amount | Shares |
| | ($000) | (000) | ($000) | (000) |
| Investor Shares | | | | |
| Issued | 404,548 | 15,134 | 320,152 | 12,401 |
| Issued in Lieu of Cash Distributions | 489,705 | 19,699 | 213,461 | 8,667 |
| Redeemed | (1,145,049) | (42,799) | (1,426,502) | (54,768) |
| Net Increase (Decrease)—Investor Shares | (250,796) | (7,966) | (892,889) | (33,700) |
| Admiral Shares | | | | |
| Issued | 1,287,786 | 15,507 | 1,260,885 | 15,671 |
| Issued in Lieu of Cash Distributions | 648,115 | 8,415 | 242,786 | 3,182 |
| Redeemed | (957,119) | (11,566) | (892,089) | (11,116) |
| Net Increase (Decrease) —Admiral Shares | 978,782 | 12,356 | 611,582 | 7,737 |
J. Management has determined that no material events or transactions occurred subsequent to September 30, 2015, that would require recognition or disclosure in these financial statements.
30
Report of Independent Registered
Public Accounting Firm
To the Board of Trustees and Shareholders of Vanguard Morgan Growth Fund:
In our opinion, the accompanying statement of net assets and the related statements of operations and of changes in net assets and the financial highlights present fairly, in all material respects, the financial position of Vanguard Morgan Growth Fund (the “Fund”) at September 30, 2015, the results of its operations for the year then ended, the changes in its net assets for each of the two years in the period then ended, and the financial highlights for each of the five years in the period then ended, in conformity with accounting principles generally accepted in the United States of America. These financial statements and financial highlights (hereafter referred to as “financial statements”) are the responsibility of the Fund’s management. Our responsibility is to express an opinion on these financial statements based on our audits. We conducted our audits of these financial statements in accordance with the standards of the Public Company Accounting Oversight Board (United States). Those standards require that we plan and perform the audit to obtain reasonable assurance about whether the financial statements are free of material misstatement. An audit includes examining, on a test basis, evidence supporting the amounts and disclosures in the financial statements, assessing the accounting principles used and significant estimates made by management, and evaluating the overall financial statement presentation. We believe that our audits, which included confirmation of securities at September 30, 2015 by correspondence with the custodian and brokers, by agreement to the underlying ownership records of the transfer agent and the application of alternative auditing procedures where securities purchased had not been received, provide a reasonable basis for our opinion.
/s/PricewaterhouseCoopers LLP
Philadelphia, Pennsylvania
November 10, 2015
Special 2015 tax information (unaudited) for Vanguard Morgan Growth Fund
This information for the fiscal year ended September 30, 2015, is included pursuant to provisions
of the Internal Revenue Code.
The fund distributed $1,069,196,000 as capital gain dividends (20% rate gain distributions) to
shareholders during the fiscal year.
For nonresident alien shareholders, 100% of short-term capital gain dividends distributed by the fund
are qualified short-term capital gains.
The fund distributed $115,245,000 of qualified dividend income to shareholders during the fiscal year.
For corporate shareholders, 100% of investment income (dividend income plus short-term gains,
if any) qualifies for the dividends-received deduction.
31
Your Fund’s After-Tax Returns
This table presents returns for your fund both before and after taxes. The after-tax returns are shown in two ways: (1) assuming that an investor owned the fund during the entire period and paid taxes on the fund’s distributions, and (2) assuming that an investor paid taxes on the fund’s distributions and sold all shares at the end of each period.
Calculations are based on the highest individual federal income tax and capital gains tax rates in effect at the times of the distributions and the hypothetical sales. State and local taxes were not considered. After-tax returns reflect any qualified dividend income, using actual prior-year figures and estimates for 2015. (In the example, returns after the sale of fund shares may be higher than those assuming no sale. This occurs when the sale would have produced a capital loss. The calculation assumes that the investor received a tax deduction for the loss.)
The table shows returns for Investor Shares only; returns for other share classes will differ. Please note that your actual after-tax returns will depend on your tax situation and may differ from those shown. Also note that if you own the fund in a tax-deferred account, such as an individual retirement account or a 401(k) plan, this information does not apply to you. Such accounts are not subject to current taxes.
Finally, keep in mind that a fund’s performance—whether before or after taxes—does not guarantee future results.
Average Annual Total Returns: Morgan Growth Fund Investor Shares
Periods Ended September 30, 2015
| | | |
| | One | Five | Ten |
| | Year | Years | Years |
| Returns Before Taxes | 4.76% | 13.59% | 7.41% |
| Returns After Taxes on Distributions | 1.86 | 12.64 | 6.70 |
| Returns After Taxes on Distributions and Sale of Fund Shares | 4.66 | 10.84 | 5.95 |
32
About Your Fund’s Expenses
As a shareholder of the fund, you incur ongoing costs, which include costs for portfolio management, administrative services, and shareholder reports (like this one), among others. Operating expenses, which are deducted from a fund’s gross income, directly reduce the investment return of the fund.
A fund’s expenses are expressed as a percentage of its average net assets. This figure is known as the expense ratio. The following examples are intended to help you understand the ongoing costs (in dollars) of investing in your fund and to compare these costs with those of other mutual funds. The examples are based on an investment of $1,000 made at the beginning of the period shown and held for the entire period.
The accompanying table illustrates your fund’s costs in two ways:
• Based on actual fund return. This section helps you to estimate the actual expenses that you paid over the period. The ”Ending Account Value“ shown is derived from the fund‘s actual return, and the third column shows the dollar amount that would have been paid by an investor who started with $1,000 in the fund. You may use the information here, together with the amount you invested, to estimate the expenses that you paid over the period.
To do so, simply divide your account value by $1,000 (for example, an $8,600 account value divided by $1,000 = 8.6), then multiply the result by the number given for your fund under the heading ”Expenses Paid During Period.“
• Based on hypothetical 5% yearly return. This section is intended to help you compare your fund‘s costs with those of other mutual funds. It assumes that the fund had a yearly return of 5% before expenses, but that the expense ratio is unchanged. In this case—because the return used is not the fund’s actual return—the results do not apply to your investment. The example is useful in making comparisons because the Securities and Exchange Commission requires all mutual funds to calculate expenses based on a 5% return. You can assess your fund’s costs by comparing this hypothetical example with the hypothetical examples that appear in shareholder reports of other funds.
Note that the expenses shown in the table are meant to highlight and help you compare ongoing costs only and do not reflect transaction costs incurred by the fund for buying and selling securities. Further, the expenses do not include any purchase, redemption, or account service fees described in the fund prospectus. If such fees were applied to your account, your costs would be higher. Your fund does not carry a “sales load.”
The calculations assume no shares were bought or sold during the period. Your actual costs may have been higher or lower, depending on the amount of your investment and the timing of any purchases or redemptions.
You can find more information about the fund’s expenses, including annual expense ratios, in the Financial Statements section of this report. For additional information on operating expenses and other shareholder costs, please refer to your fund’s current prospectus.
33
| | | |
| Six Months Ended September 30, 2015 | | | |
| | Beginning | Ending | Expenses |
| | Account Value | Account Value | Paid During |
| Morgan Growth Fund | 3/31/2015 | 9/30/2015 | Period |
| Based on Actual Fund Return | | | |
| Investor Shares | $1,000.00 | $954.70 | $1.96 |
| Admiral Shares | 1,000.00 | 955.41 | 1.32 |
| Based on Hypothetical 5% Yearly Return | | | |
| Investor Shares | $1,000.00 | $1,023.06 | $2.03 |
| Admiral Shares | 1,000.00 | 1,023.71 | 1.37 |
The calculations are based on expenses incurred in the most recent six-month period. The fund’s annualized six-month expense ratios for that
period are 0.40% for Investor Shares and 0.27% for Admiral Shares. The dollar amounts shown as “Expenses Paid” are equal to the
annualized expense ratio multiplied by the average account value over the period, multiplied by the number of days in the most recent
six-month period, then divided by the number of days in the most recent 12-month period (183/365).
34
Glossary
30-Day SEC Yield. A fund’s 30-day SEC yield is derived using a formula specified by the U.S. Securities and Exchange Commission. Under the formula, data related to the fund’s security holdings in the previous 30 days are used to calculate the fund’s hypothetical net income for that period, which is then annualized and divided by the fund’s estimated average net assets over the calculation period. For the purposes of this calculation, a security’s income is based on its current market yield to maturity (for bonds), its actual income (for asset-backed securities), or its projected dividend yield (for stocks). Because the SEC yield represents hypothetical annualized income, it will differ—at times significantly—from the fund’s actual experience. As a result, the fund’s income distributions may be higher or lower than implied by the SEC yield.
Beta. A measure of the magnitude of a fund’s past share-price fluctuations in relation to the ups and downs of a given market index. The index is assigned a beta of 1.00. Compared with a given index, a fund with a beta of 1.20 typically would have seen its share price rise or fall by 12% when the index rose or fell by 10%. For this report, beta is based on returns over the past 36 months for both the fund and the index. Note that a fund’s beta should be reviewed in conjunction with its R-squared (see definition). The lower the R-squared, the less correlation there is between the fund and the index, and the less reliable beta is as an indicator of volatility.
Dividend Yield. Dividend income earned by stocks, expressed as a percentage of the aggregate market value (or of net asset value, for a fund). The yield is determined by dividing the amount of the annual dividends by the aggregate value (or net asset value) at the end of the period. For a fund, the dividend yield is based solely on stock holdings and does not include any income produced by other investments.
Earnings Growth Rate. The average annual rate of growth in earnings over the past five years for the stocks now in a fund.
Equity Exposure. A measure that reflects a fund’s investments in stocks and stock futures. Any holdings in short-term reserves are excluded.
Expense Ratio. A fund’s total annual operating expenses expressed as a percentage of the fund’s average net assets. The expense ratio includes management and administrative expenses, but does not include the transaction costs of buying and selling portfolio securities.
Foreign Holdings. The percentage of a fund represented by securities or depositary receipts of companies based outside the United States.
Inception Date. The date on which the assets of a fund (or one of its share classes) are first invested in accordance with the fund’s investment objective. For funds with a subscription period, the inception date is the day after that period ends. Investment performance is measured from the inception date.
Median Market Cap. An indicator of the size of companies in which a fund invests; the midpoint of market capitalization (market price x shares outstanding) of a fund’s stocks, weighted by the proportion of the fund’s assets invested in each stock. Stocks representing half of the fund’s assets have market capitalizations above the median, and the rest are below it.
Price/Book Ratio. The share price of a stock divided by its net worth, or book value, per share. For a fund, the weighted average price/book ratio of the stocks it holds.
35
Price/Earnings Ratio. The ratio of a stock’s current price to its per-share earnings over the past year. For a fund, the weighted average P/E of the stocks it holds. P/E is an indicator of market expectations about corporate prospects; the higher the P/E, the greater the expectations for a company’s future growth.
R-Squared. A measure of how much of a fund’s past returns can be explained by the returns from the market in general, as measured by a given index. If a fund’s total returns were precisely synchronized with an index’s returns, its R-squared would be 1.00. If the fund’s returns bore no relationship to the index’s returns, its R-squared would be 0. For this report, R-squared is based on returns over the past 36 months for both the fund and the index.
Return on Equity. The annual average rate of return generated by a company during the past five years for each dollar of shareholder’s equity (net income divided by shareholder’s equity). For a fund, the weighted average return on equity for the companies whose stocks it holds.
Short-Term Reserves. The percentage of a fund invested in highly liquid, short-term securities that can be readily converted to cash.
Turnover Rate. An indication of the fund’s trading activity. Funds with high turnover rates incur higher transaction costs and may be more likely to distribute capital gains (which may be taxable to investors). The turnover rate excludes in-kind transactions, which have minimal impact on costs.
36
This page intentionally left blank.
This page intentionally left blank.
This page intentionally left blank.
The People Who Govern Your Fund
The trustees of your mutual fund are there to see that the fund is operated and managed in your best interests since, as a shareholder, you are a part owner of the fund. Your fund’s trustees also serve on the board of directors of The Vanguard Group, Inc., which is owned by the Vanguard funds and provides services to them on an at-cost basis.
A majority of Vanguard’s board members are independent, meaning that they have no affiliation with Vanguard or the funds they oversee, apart from the sizable personal investments they have made as private individuals. The independent board members have distinguished backgrounds in business, academia, and public service. Each of the trustees and executive officers oversees 194 Vanguard funds.
The following table provides information for each trustee and executive officer of the fund. More information about the trustees is in the Statement of Additional Information, which can be obtained, without charge, by contacting Vanguard at 800-662-7447, or online at vanguard.com.
| |
| InterestedTrustee1 | Rajiv L. Gupta |
| | Born 1945. Trustee Since December 2001.2 Principal |
| F. William McNabb III | Occupation(s) During the Past Five Years and Other |
| Born 1957. Trustee Since July 2009. Chairman of | Experience: Chairman and Chief Executive Officer |
| the Board. Principal Occupation(s) During the Past | (retired 2009) and President (2006–2008) of |
| Five Years and Other Experience: Chairman of the | Rohm and Haas Co. (chemicals); Director of Tyco |
| Board of The Vanguard Group, Inc., and of each of | International PLC (diversified manufacturing and |
| the investment companies served by The Vanguard | services), Hewlett-Packard Co. (electronic computer |
| Group, since January 2010; Director of The Vanguard | manufacturing), and Delphi Automotive PLC |
| Group since 2008; Chief Executive Officer and | (automotive components); Senior Advisor at New |
| President of The Vanguard Group, and of each of | Mountain Capital. |
| the investment companies served by The Vanguard | |
| Group, since 2008; Director of Vanguard Marketing | Amy Gutmann |
| Corporation; Managing Director of The Vanguard | Born 1949. Trustee Since June 2006. Principal |
| Group (1995–2008). | Occupation(s) During the Past Five Years and |
| | Other Experience: President of the University of |
| IndependentTrustees | Pennsylvania; Christopher H. Browne Distinguished |
| | Professor of Political Science, School of Arts and |
| Emerson U. Fullwood | Sciences, and Professor of Communication, Annenberg |
| Born 1948. Trustee Since January 2008. Principal | School for Communication, with secondary faculty |
| Occupation(s) During the Past Five Years and | appointments in the Department of Philosophy, School |
| Other Experience: Executive Chief Staff and | of Arts and Sciences, and at the Graduate School of |
| Marketing Officer for North America and Corporate | Education, University of Pennsylvania; Trustee of the |
| Vice President (retired 2008) of Xerox Corporation | National Constitution Center; Chair of the Presidential |
| (document management products and services); | Commission for the Study of Bioethical Issues. |
| Executive in Residence and 2009–2010 Distinguished | |
| Minett Professor at the Rochester Institute of | JoAnn Heffernan Heisen |
| Technology; Director of SPX Corporation (multi-industry | Born 1950. Trustee Since July 1998. Principal |
| manufacturing), the United Way of Rochester, | Occupation(s) During the Past Five Years and Other |
| Amerigroup Corporation (managed health care), the | Experience: Corporate Vice President and Chief |
| University of Rochester Medical Center, Monroe | Global Diversity Officer (retired 2008) and Member |
| Community College Foundation, and North Carolina | of the Executive Committee (1997–2008) of Johnson |
| A&T University. | & Johnson (pharmaceuticals/medical devices/ |
| | consumer products); Director of Skytop Lodge |
| | Corporation (hotels), the University Medical Center |
| | at Princeton, the Robert Wood Johnson Foundation, |
| | and the Center for Talent Innovation; Member of |
| | the Advisory Board of the Institute for Women’s |
| | Leadership at Rutgers University. |
| | |
| F. Joseph Loughrey | Executive Officers | |
| Born 1949. Trustee Since October 2009. Principal | | |
| Occupation(s) During the Past Five Years and Other | Glenn Booraem | |
| Experience: President and Chief Operating Officer | Born 1967. Treasurer Since May 2015. Principal |
| (retired 2009) of Cummins Inc. (industrial machinery); | Occupation(s) During the Past Five Years and |
| Chairman of the Board of Hillenbrand, Inc. (specialized | Other Experience: Principal of The Vanguard Group, |
| consumer services), and of Oxfam America; Director | Inc.; Treasurer of each of the investment companies |
| of SKF AB (industrial machinery), Hyster-Yale Materials | served by The Vanguard Group; Controller of each of |
| Handling, Inc. (forklift trucks), the Lumina Foundation | the investment companies served by The Vanguard |
| for Education, and the V Foundation for Cancer | Group (2010–2015); Assistant Controller of each of |
| Research; Member of the Advisory Council for the | the investment companies served by The Vanguard |
| College of Arts and Letters and of the Advisory Board | Group (2001–2010). | |
| to the Kellogg Institute for International Studies, both | | |
| at the University of Notre Dame. | Thomas J. Higgins | |
| Born 1957. Chief Financial Officer Since September |
| Mark Loughridge | 2008. Principal Occupation(s) During the Past Five |
| Born 1953. Trustee Since March 2012. Principal | Years and Other Experience: Principal of The Vanguard |
| Occupation(s) During the Past Five Years and Other | Group, Inc.; Chief Financial Officer of each of the |
| Experience: Senior Vice President and Chief Financial | investment companies served by The Vanguard Group; |
| Officer (retired 2013) at IBM (information technology | Treasurer of each of the investment companies served |
| services); Fiduciary Member of IBM’s Retirement Plan | by The Vanguard Group (1998–2008). |
| Committee (2004–2013); Director of the Dow Chemical | | |
| Company; Member of the Council on Chicago Booth. | Peter Mahoney | |
| Born 1974. Controller Since May 2015. Principal |
| Scott C. Malpass | Occupation(s) During the Past Five Years and |
| Born 1962. Trustee Since March 2012. Principal | Other Experience: Head of Global Fund Accounting |
| Occupation(s) During the Past Five Years and Other | at The Vanguard Group, Inc.; Controller of each of the |
| Experience: Chief Investment Officer and Vice | investment companies served by The Vanguard Group; |
| President at the University of Notre Dame; Assistant | Head of International Fund Services at The Vanguard |
| Professor of Finance at the Mendoza College of | Group (2008–2014). | |
| Business at Notre Dame; Member of the Notre Dame | | |
| 403(b) Investment Committee; Board Member of | Heidi Stam | |
| TIFF Advisory Services, Inc., and Catholic Investment | Born 1956. Secretary Since July 2005. Principal |
| Services, Inc. (investment advisors); Member of | Occupation(s) During the Past Five Years and Other |
| the Investment Advisory Committee of Major | Experience: Managing Director of The Vanguard |
| League Baseball. | Group, Inc.; General Counsel of The Vanguard Group; |
| Secretary of The Vanguard Group and of each of the |
| André F. Perold | investment companies served by The Vanguard Group; |
| Born 1952. Trustee Since December 2004. Principal | Director and Senior Vice President of Vanguard |
| Occupation(s) During the Past Five Years and Other | Marketing Corporation. | |
| Experience: George Gund Professor of Finance and | | |
| Banking, Emeritus at the Harvard Business School | Vanguard Senior ManagementTeam |
| (retired 2011); Chief Investment Officer and Managing | Mortimer J. Buckley | Chris D. McIsaac |
| Partner of HighVista Strategies LLC (private investment | Kathleen C. Gubanich | James M. Norris |
| firm); Director of Rand Merchant Bank; Overseer of | Paul A. Heller | Thomas M. Rampulla |
| the Museum of Fine Arts Boston. | Martha G. King | Glenn W. Reed |
| John T. Marcante | Karin A. Risi |
| Peter F. Volanakis | | |
| Born 1955. Trustee Since July 2009. Principal | | |
| Occupation(s) During the Past Five Years and Other | Chairman Emeritus and Senior Advisor |
| Experience: President and Chief Operating Officer | | |
| (retired 2010) of Corning Incorporated (communications | John J. Brennan | |
| equipment); Trustee of Colby-Sawyer College; | | |
| Member of the Advisory Board of the Norris Cotton | Chairman, 1996–2009 | |
| Cancer Center and of the Advisory Board of the | | |
| Parthenon Group (strategy consulting). | Chief Executive Officer and President, 1996–2008 |
| | |
| | |
| Founder | |
| | John C. Bogle | |
| | Chairman and Chief Executive Officer, 1974–1996 |
1 Mr. McNabb is considered an “interested person,” as defined in the Investment Company Act of 1940, because he is an officer of the Vanguard funds.
2 December 2002 for Vanguard Equity Income Fund, the Vanguard Municipal Bond Funds, and the Vanguard State Tax-Exempt Funds.
|  |
| | P.O. Box 2600 |
| | Valley Forge, PA 19482-2600 |
| |
| |
| |
| Connect with Vanguard® > vanguard.com | |
| |
| |
| |
| Fund Information > 800-662-7447 | CFA® is a registered trademark owned by CFA Institute. |
| Direct Investor Account Services > 800-662-2739 | |
| Institutional Investor Services > 800-523-1036 | |
| Text Telephone for People | |
| Who Are Deaf or Hard of Hearing> 800-749-7273 | |
| |
| This material may be used in conjunction | |
| with the offering of shares of any Vanguard | |
| fund only if preceded or accompanied by | |
| the fund’s current prospectus. | |
| |
| All comparative mutual fund data are from Lipper, a | |
| Thomson Reuters Company, or Morningstar, Inc., unless | |
| otherwise noted. | |
| |
| You can obtain a free copy of Vanguard’s proxy voting | |
| guidelines by visiting vanguard.com/proxyreporting or by | |
| calling Vanguard at 800-662-2739. The guidelines are | |
| also available from the SEC’s website, sec.gov. In | |
| addition, you may obtain a free report on how your fund | |
| voted the proxies for securities it owned during the 12 | |
| months ended June 30. To get the report, visit either | |
| vanguard.com/proxyreporting or sec.gov. | |
| |
| You can review and copy information about your fund at | |
| the SEC’s Public Reference Room in Washington, D.C. To | |
| find out more about this public service, call the SEC at | |
| 202-551-8090. Information about your fund is also | |
| available on the SEC’s website, and you can receive | |
| copies of this information, for a fee, by sending a | |
| request in either of two ways: via email addressed to | |
| publicinfo@sec.gov or via regular mail addressed to the | |
| Public Reference Section, Securities and Exchange | |
| Commission, Washington, DC 20549-1520. | |
| |
| | © 2015 The Vanguard Group, Inc. |
| | All rights reserved. |
| | Vanguard Marketing Corporation, Distributor. |
| |
| | Q260 112015 |
Item 2: Code of Ethics. The Registrant has adopted a code of ethics that applies to the Registrant’s principal executive officer, principal financial officer, principal accounting officer or controller or persons performing similar functions. The Code of Ethics was amended during the reporting period covered by this report to make certain technical, non-material changes.
Item 3: Audit Committee Financial Expert. The following members of the Audit Committee have been determined by the Registrant’s Board of Trustees to be Audit Committee Financial Experts serving on its Audit Committee, and to be independent: Rajiv L. Gupta, Amy Gutmann, JoAnn Heffernan Heisen, F. Joseph Loughrey, Mark Loughridge, Scott C. Malpass, and André F. Perold.
Item 4: Principal Accountant Fees and Services.
(a) Audit Fees.
Audit Fees of the Registrant
Fiscal Year Ended September 30, 2015: $37,000
Fiscal Year Ended September 30, 2014: $35,000
Aggregate Audit Fees of Registered Investment Companies in the Vanguard Group.
Fiscal Year Ended September 30, 2015: $7,000,200
Fiscal Year Ended September 30, 2014: $6,605,127
Includes fees billed in connection with audits of the Registrant, other registered investment companies in the Vanguard complex, The Vanguard Group, Inc. and Vanguard Marketing Corporation.
(b) Audit-Related Fees.
Fiscal Year Ended September 30, 2015: $2,899,096
Fiscal Year Ended September 30, 2014: $2,176,479
Includes fees billed in connection with assurance and related services provided to the Registrant, other registered investment companies in the Vanguard complex, The Vanguard Group, Inc., and Vanguard Marketing Corporation.
(c) Tax Fees.
Fiscal Year Ended September 30, 2015: $353,389
Fiscal Year Ended September 30, 2014: $316,869
Includes fees billed in connection with tax compliance, planning, and advice services provided to the Registrant, other registered investment companies in the Vanguard complex, The Vanguard Group, Inc., and Vanguard Marketing Corporation.
(d) All Other Fees.
Fiscal Year Ended September 30, 2015: $202,313
Fiscal Year Ended September 30, 2014: $198,163
Includes fees billed for services related to tax reported information provided to the Registrant, other registered investment companies in the Vanguard complex, The Vanguard Group, Inc., and Vanguard Marketing Corporation.
(e) (1) Pre-Approval Policies. The policy of the Registrant’s Audit Committee is to consider and, if appropriate, approve before the principal accountant is engaged for such services, all specific audit and non-audit services provided to: the Registrant, other registered investment companies in the Vanguard complex, The Vanguard Group, Inc., and entities controlled by The Vanguard Group, Inc. that provide ongoing services to the Registrant. In making a determination, the Audit Committee considers whether the services are consistent with maintaining the principal accountant’s independence.
In the event of a contingency situation in which the principal accountant is needed to provide services in between scheduled Audit Committee meetings, the Chairman of the Audit Committee would be called on to consider and, if appropriate, pre-approve audit or permitted non-audit services in an amount sufficient to complete services through the next Audit Committee meeting, and to determine if such services would be consistent with maintaining the accountant’s independence. At the next scheduled Audit Committee meeting, services and fees would be presented to the Audit Committee for formal consideration, and, if appropriate, approval by the entire Audit Committee. The Audit Committee would again consider whether such services and fees are consistent with maintaining the principal accountant’s independence.
The Registrant’s Audit Committee is informed at least annually of all audit and non-audit services provided by the principal accountant to the Vanguard complex, whether such services are provided to: the Registrant, other registered investment companies in the Vanguard complex, The Vanguard Group, Inc., or other entities controlled by The Vanguard Group, Inc. that provide ongoing services to the Registrant.
(2) No percentage of the principal accountant’s fees or services were approved pursuant to the waiver provision of paragraph (c)(7)(i)(C) of Rule 2-01 of Regulation S-X.
(f) For the most recent fiscal year, over 50% of the hours worked under the principal accountant’s engagement were not performed by persons other than full-time, permanent employees of the principal accountant.
(g) Aggregate Non-Audit Fees.
Fiscal Year Ended September 30, 2015: $555,702
Fiscal Year Ended September 30, 2014: $515,032
Includes fees billed for non-audit services provided to the Registrant, other registered investment companies in the Vanguard complex, The Vanguard Group, Inc., and Vanguard Marketing Corporation.
(h) For the most recent fiscal year, the Audit Committee has determined that the provision of all non-audit services was consistent with maintaining the principal accountant’s independence.
Item 5: Audit Committee of Listed Registrants.
Not Applicable.
Item 6: Investments.
Not Applicable.
Item 7: Disclosure of Proxy Voting Policies and Procedures for Closed-End Management
Investment Companies.
Not Applicable.
Item 8: Portfolio Managers of Closed-End Management Investment Companies.
Not Applicable.
Item 9: Purchase of Equity Securities by Closed-End Management Investment Company and
Affiliated Purchasers.
Not Applicable.
Item 10: Submission of Matters to a Vote of Security Holders.
Not Applicable.
Item 11: Controls and Procedures.
(a) Disclosure Controls and Procedures. The Principal Executive and Financial Officers concluded that the Registrant’s Disclosure Controls and Procedures are effective based on their evaluation of the Disclosure Controls and Procedures as of a date within 90 days of the filing date of this report.
(b) Internal Control Over Financial Reporting. There were no significant changes in Registrant’s Internal Control Over Financial Reporting or in other factors that could significantly affect this control subsequent to the date of the evaluation, including any corrective actions with regard to significant deficiencies and material weaknesses.
Item 12: Exhibits.
(a) Code of Ethics.
(b) Certifications.
Pursuant to the requirements of the Securities Exchange Act of 1934 and the Investment Company Act of 1940, the registrant has duly caused this report to be signed on its behalf by the undersigned, thereunto duly authorized.
| |
| | VANGUARD MORGAN GROWTH FUND |
| |
| |
| BY: | /s/ F. WILLIAM MCNABB III* |
| F. WILLIAM MCNABB III |
| | CHIEF EXECUTIVE OFFICER |
| |
| Date: November 18, 2015 |
Pursuant to the requirements of the Securities Exchange Act of 1934 and the Investment Company Act of 1940, this report has been signed below by the following persons on behalf of the registrant and in the capacities and on the dates indicated.
| |
| | VANGUARD MORGAN GROWTH FUND |
| |
BY: | /s/ F. WILLIAM MCNABB III* |
| F. WILLIAM MCNABB III |
| | CHIEF EXECUTIVE OFFICER |
Date: November 18, 2015 |
| VANGUARD MORGAN GROWTH FUND |
BY: | /s/ THOMAS J. HIGGINS* |
| | THOMAS J. HIGGINS |
| CHIEF FINANCIAL OFFICER |
Date: November 18, 2015 |
* By: /s/ Heidi Stam
Heidi Stam, pursuant to a Power of Attorney filed on April 22, 2014 see file Number 2-17620, Incorporated by Reference.

