UNITED STATES
SECURITIES AND EXCHANGE COMMISSION
Washington, D.C. 20549
FORM N-CSR
CERTIFIED SHAREHOLDER REPORT
OF
REGISTERED MANAGEMENT INVESTMENT COMPANIES
Investment Company Act file number: 811-01685
Name of Registrant: Vanguard Morgan Growth Fund
Address of Registrant:
P.O. Box 2600
Valley Forge, PA 19482
Name and address of agent for service:
Heidi Stam, Esquire
P.O. Box 876
Valley Forge, PA 19482
Registrant’s telephone number, including area code: (610) 669-1000
Date of fiscal year end: September 30
Date of reporting period: October 1, 2013 – September 30, 2014
Item 1: Reports to Shareholders
Annual Report | September 30, 2014
Vanguard Morgan™ Growth Fund
The mission continues
On May 1, 1975, Vanguard began operations, a fledgling company based on the simple but revolutionary idea that a mutual fund company should be managed solely in the interest of its investors.
Four decades later, that revolutionary spirit continues to animate the enterprise. Vanguard remains on a mission to give investors the best chance of investment success.
As we mark our 40th anniversary, we thank you for entrusting your assets to Vanguard and giving us the opportunity to help you reach your financial goals in the decades to come.
| |
| Contents | |
| Your Fund’s Total Returns. | 1 |
| Chairman’s Letter. | 2 |
| Advisors’ Report. | 7 |
| Fund Profile. | 12 |
| Performance Summary. | 13 |
| Financial Statements. | 15 |
| Your Fund’s After-Tax Returns. | 31 |
| About Your Fund’s Expenses. | 32 |
| Glossary. | 34 |
Please note: The opinions expressed in this report are just that—informed opinions. They should not be considered promises or advice.
Also, please keep in mind that the information and opinions cover the period through the date on the front of this report. Of course, the
risks of investing in your fund are spelled out in the prospectus.
See the Glossary for definitions of investment terms used in this report.
About the cover: Since our founding, Vanguard has drawn inspiration from the enterprise and valor demonstrated by British
naval hero Horatio Nelson and his command at the Battle of the Nile in 1798. The photograph displays a replica of a merchant
ship from the same era as Nelson’s flagship, the HMS Vanguard.
Your Fund’s Total Returns
Fiscal Year Ended September 30, 2014
| | | | |
| | | | | Total |
| | | | | Returns |
| Vanguard Morgan Growth Fund | | | | |
| Investor Shares | | | | 16.85% |
| Admiral™ Shares | | | | 17.03 |
| Russell 3000 Growth Index | | | | 17.87 |
| Multi-Cap Growth Funds Average | | | | 14.86 |
| Multi-Cap Growth Funds Average: Derived from data provided by Lipper, a Thomson Reuters Company. |
| Admiral Shares carry lower expenses and are available to investors who meet certain account-balance requirements. |
| |
| |
| Your Fund’s Performance at a Glance | | | | |
| September 30, 2013, Through September 30, 2014 | | | | |
| | | | Distributions Per Share |
| | Starting | Ending | | |
| | Share | Share | Income | Capital |
| | Price | Price | Dividends | Gains |
| Vanguard Morgan Growth Fund | | | | |
| Investor Shares | $24.26 | $27.07 | $0.172 | $0.990 |
| Admiral Shares | 75.26 | 83.97 | 0.664 | 3.067 |
1

Chairman’s Letter
Dear Shareholder,
For the third straight fiscal year, Vanguard Morgan Growth Fund delivered a double-digit advance, helped by a strong showing in the health care sector. For the 12 months ended September 30, 2014, Investor Shares returned 16.85%, while the lower-cost Admiral Shares returned 17.03%. These returns were comfortably ahead of the 14.86% average return of peer funds, but trailed the 17.87% return of the fund’s benchmark index, the Russell 3000 Growth Index.
As you know, the Morgan Growth Fund invests in both mid- and large-capitalization growth stocks. In the period under review, that middle-market exposure pulled down the fund’s results a bit as large-cap growth stocks outpaced their smaller counterparts. Of course, the positions of mid- and large-cap stocks are bound to switch from time to time. Market leadership changes in unpredictable ways, and that’s one of the reasons that Vanguard believes broad diversification is the wisest choice for many investors.
If you hold shares in a taxable account, you may wish to review the information about after-tax returns, based on the highest federal income tax bracket, that appears later in the report.
Please note that as of September 30, 2014, the fund had realized short-term capital gains equal to about 1% of assets and long-term gains accounting for about 8% of fund assets. Gains are distributed in December.
2
For stocks, brief patchiness didn’t hinder strong returns
The broad U.S. stock market managed a robust return of nearly 18% for the 12 months ended September 30, despite stumbling in two of the final three months. Generally strong corporate profits and progress in the U.S. economy carried the markets through most of the period. High stock valuations, international tensions, the unsettled global economy, and a gradual shift from the Federal Reserve’s accommodative policies weighed on more recent results.
Over the period’s final months, the performance gap between U.S. stocks and their international counterparts widened amid tensions in the Middle East and Ukraine, coupled with China’s slower growth and Europe’s slumping economy. International stocks returned about 5%. Emerging markets and the developed markets of Europe and the Pacific region all recorded single-digit returns.
Bonds bounced back strongly, despite a pause late in the year
Bond returns, which were surprisingly robust through most of the fiscal year, also met resistance late in the period. Still, the broad U.S. taxable bond market returned 3.96%, a significant recovery from its negative outcome a year ago.
Since January, the Fed has pared back its bond-buying program, with the aim of ending it in October. Until recently, interest rates did not rise as analysts had predicted. The yield of the 10-year U.S. Treasury note
| | | |
| Market Barometer | | | |
| |
| | | Average Annual Total Returns |
| | Periods Ended September 30, 2014 |
| | One | Three | Five |
| | Year | Years | Years |
| Stocks | | | |
| Russell 1000 Index (Large-caps) | 19.01% | 23.23% | 15.90% |
| Russell 2000 Index (Small-caps) | 3.93 | 21.26 | 14.29 |
| Russell 3000 Index (Broad U.S. market) | 17.76 | 23.08 | 15.78 |
| FTSE All-World ex US Index (International) | 5.11 | 12.12 | 6.31 |
| |
| Bonds | | | |
| Barclays U.S. Aggregate Bond Index (Broad taxable market) | 3.96% | 2.43% | 4.12% |
| Barclays Municipal Bond Index (Broad tax-exempt market) | 7.93 | 4.56 | 4.67 |
| Citigroup Three-Month U.S. Treasury Bill Index | 0.04 | 0.04 | 0.06 |
| |
| CPI | | | |
| Consumer Price Index | 1.66% | 1.61% | 1.96% |
3
ended September at 2.48%, down from 2.63% a year earlier. (Bond prices and yields move in opposite directions.)
Municipal bonds, which returned 7.93%, benefited from the broad market rally and a limited supply of new issues.
Following this advance for U.S. taxable and tax-exempt bonds, it’s worth remembering that the current low yields imply lower future returns: As yields drop, the scope for further declines—and increases in prices—diminishes.
International bond markets (as measured by the Barclays Global Aggregate Index ex USD) returned –0.81% after sinking in September.
Money market funds and savings accounts posted negligible returns, as the Fed kept its target for short-term interest rates at 0%–0.25%.
In its search for opportunity, the fund veers from its benchmark
Vanguard Morgan Growth Fund is managed by five investment advisors, each responsible for a portion of the fund’s assets. The advisors rely on different but complementary strategies for identifying opportunities among large- and mid-cap growth stocks. This multi-manager approach provides diversification, along with the potential for less volatility than is typical for a single-manager fund.
| | | |
| Expense Ratios | | | |
| Your Fund Compared With Its Peer Group | | | |
| | Investor | Admiral | Peer Group |
| | Shares | Shares | Average |
| Morgan Growth Fund | 0.39% | 0.25% | 1.34% |
The fund expense ratios shown are from the prospectus dated January 28, 2014, and represent estimated costs for the current fiscal year. Forthe fiscal year ended September 30, 2014, the fund’s expense ratios were 0.40% for Investor Shares and 0.26% for Admiral Shares. Thepeer-group expense ratio is derived from data provided by Lipper, a Thomson Reuters Company, and captures information through year-end2013.Peer group: Multi-Cap Growth Funds.4
For the 12-month period, as I mentioned earlier, mid- and small-cap stocks under-performed their larger counterparts, reflecting investor concerns about smaller companies’ rich valuations. This provided a relative boost to the fund’s benchmark index, which has a greater weighting in large-cap stocks (based on median market capitalization).
Keep in mind that your fund differs from its benchmark in more ways than market capitalization (the total value of a company’s shares). For example, the fund has a small portion of assets in non-U.S. stocks, while the benchmark does not include foreign holdings. See the Fund Profile that follows the Advisors’ Report for more details.
The fund’s weightings among industry sectors also diverge, to some degree, from those of the benchmark. For example, as of the end of the period, the fund had greater representation in technology and less in consumer staples (a category that includes everything from drug stores to supermarkets to tobacco companies) than the Russell 3000 Growth Index did.
Diverging from benchmarks is how active fund managers strive to achieve outperformance. Of course, along with opportunity, this parting of ways brings the risk of underperformance.
During the fiscal year, the health care sector was fertile territory for your fund. Many of the advisors’ choices among biotechnology
| |
| Total Returns | |
| Ten Years Ended September 30, 2014 | |
| | Average |
| | Annual Return |
| Morgan Growth Fund Investor Shares | 8.52% |
| Russell 3000 Growth Index | 8.95 |
| Multi-Cap Growth Funds Average | 8.01 |
| Multi-Cap Growth Funds Average: Derived from data provided by Lipper, a Thomson Reuters Company. |
The figures shown represent past performance, which is not a guarantee of future results. (Current performance may be
lower or higher than the performance data cited. For performance data current to the most recent month-end, visit our
website at vanguard.com/performance.) Note, too, that both investment returns and principal value can fluctuate widely, so
an investor’s shares, when sold, could be worth more or less than their original cost.
5
and pharmaceutical stocks soared. The shares fared well amid clinical-trial advancements for new therapies and a flurry of merger and acquisition activity. The fund also had disappointments during the 12 months; for example, some high-flying tech and internet firms, which had enjoyed robust advances earlier, reversed course.
For more information about the advisors’ strategies and the fund’s positioning, please see the Advisors’ Report that follows this letter.
The fund has achieved solid long-term results
For the ten years ended September 30, 2014, your fund recorded an average annual return of 8.52%—about half a percentage point ahead of peer funds, but also about half a percentage point behind the benchmark index.
To put it mildly, this period included both highs and lows for investors. There was the extreme pain of the 2008–2009 financial crisis, followed by a sharp rebound that’s been marked by an extended rally for U.S. stocks.
Through it all, the multi-manager advisory team steered your fund to deliver solid long-term results. In addition to the advisors’ skill, low investment costs helped the fund’s bottom line.
High costs don’t equal strong fund performance
Speaking of investment costs, as a Vanguard investor, you probably realize that the adage “you get what you pay for” doesn’t apply to mutual funds. In fact, the reverse is true: Research suggests that higher costs are consistent with weaker returns. (See, for example, Shopping for Alpha: You Get What You Don’t Pay For at vanguard.com/research.)
Wouldn’t paying the highest fees allow you to purchase the services of the greatest talents, and therefore get you the best returns? As it turns out, the data don’t support that argument. The explanation is simple: Every dollar paid for management fees is a dollar less earning potential return. Keeping expenses down can help narrow the gap between what the markets return and what investors actually earn.
That’s why Vanguard always seeks to minimize costs. Indexing, of course, is the purest form of low-cost investing. And we negotiate low fees for our actively managed funds, which are run by world-class advisors. It’s a strategy that reflects decades of experience and research, boiled down to one tenet: The less you pay, the more you earn.
As always, thank you for investing with Vanguard.
Sincerely,

F. William McNabb III
Chairman and Chief Executive Officer
October 14, 2014
6
Advisors’ Report
For the fiscal year ended September 30, 2014, Vanguard Morgan Growth Fund returned 16.85% for Investor Shares and 17.03% for the lower-cost Admiral Shares. Your fund is managed by five independent advisors, a strategy that enhances the fund’s diversification by providing exposure to distinct yet complementary investment approaches. It’s not uncommon for different advisors to have different views about individual securities or the broader investment environment.
The advisors, the percentage of fund assets each manages, and brief descriptions of their investment strategies are presented in the accompanying table. The advisors have also prepared a discussion of the investment environment that existed during the fiscal year and of how portfolio positioning reflects this assessment. (Please note that the Kalmar Investment Advisers and Frontier Capital Management discussions refer to industry sectors as defined by Russell classifications, rather than by the Global Industry Classification Standard used elsewhere in this report.) These comments were prepared on October 17, 2014.
Wellington Management Company, llp
Portfolio Manager:
Paul E. Marrkand, CFA,
Senior Vice President
Our portion of the fund uses traditional methods of stock selection—fundamental research and analysis—to identify companies that we believe have above-average growth prospects. Our research focuses on mid- and large-capitalization companies, evaluating and ranking each stock on a consistent set of growth, quality, and valuation criteria. We seek to build a portfolio with diversified sources of return with a balance of growth, quality, and valuation attributes.
It was a strong 12 months for U.S. equities and other developed-market stocks around the world as the S&P 500 Index posted a return of about 20% and the return of the MSCI World Index exceeded 12%. Fixed income markets also moved up, with the Barclays U.S. Aggregate Index returning 3.96% for the period.
Successes
Sector allocation, a residual outcome of our bottom-up stock selection process, contributed to the portfolio’s relative return during the period, primarily through our overweighting of the information technology sector and our underweighting of the consumer staples and consumer discretionary sectors.
Our stock selection was strongest within the health care and consumer staples sectors. The largest individual contributors to benchmark-relative performance included Skyworks Solutions, Microsoft, and SanDisk (all information technology companies), as well as Vertex Pharmaceuticals.
7
Shortfalls
Security selection detracted from relative performance during the period, particularly in information technology, industrials, and energy. The largest detractors included Cisco Systems, Apple, and NetApp.
We ended the period most overweighted in the information technology and health care sectors and most underweighted in the industrials and consumer discretionary sectors. We remain optimistic about our portfolio’s favorable risk/reward profile, and continue to purchase, at attractive valuations, capital-compounding companies with long-term competitive advantages that can sustain a free-cash-flow growth rate beyond that of the market.
Jennison Associates LLC
Portfolio Managers:
Kathleen A. McCarragher,
Managing Director
Blair A. Boyer,
Managing Director
The U.S. economy continued to grow slowly, with gauges of employment, housing, sentiment, and confidence showing incremental improvement. The Federal Reserve continued to taper its quantitative stimulus, signaling confidence in the sustainability of U.S. economic expansion. Growth prospects weakened for much of the rest of the world.
Successes
Apple’s revenue and earnings strength reflected successful product updates and expanding global acceptance of its platform. Gilead Sciences benefited from impressive sales of a new hepatitis C drug, Sovaldi. Allergan advanced on a takeover bid.
Shortfalls
We eliminated our position in Whole Foods Market, as the company’s aggressive expansion and its investment in more competitive pricing limited its potential for higher profit margins. We closed our position in Kate Spade, an accessories and apparel retailer, because of scaled-back margin-improvement targets. We sold ASOS, a global online apparel retailer, amid currency headwinds and margin pressures stemming from accelerating business investments.
Vanguard Equity Investment Group
Portfolio Managers:
James P. Stetler, Principal
James D. Troyer, CFA, Principal
Michael R. Roach, CFA
For the 12 months, three of the five components of our stock selection model were effective in distinguishing the outperformers from the underperformers within each industry group. Our growth, management decisions, and valuation components helped performance, while the quality component detracted from results. Our sentiment component was neutral, neither helping nor hindering results.
8
Successes
Our selections had a positive impact in six of the ten industry sectors, with the largest positive impact in industrials and consumer staples. Within industrials, Southwest Airlines, Delta Air Lines, and Lockheed Martin contributed the most to our relative results; within staples, Keurig Green Mountain, CVS Health, and Kroger contributed the most.
Shortfalls
Our overall selections in health care and financials were disappointing, largely because of underweighted positions in Allergan, Actavis, and Bank of America.
Frontier Capital Management Co., LLC
Portfolio Managers:
Stephen Knightly, CFA, President
Christopher J. Scarpa,
Vice President
Improved domestic economic momentum, along with low inflation and modest earnings growth, helped drive U.S. stocks’ advance for the 12 months.
Successes
Performance was quite favorable in technology and financial services. Within technology, strong demand for wireless devices produced solid growth for NXP Semiconductors and Avago Technologies, two proprietary semiconductor suppliers. Results within financial services were strong, helped by a concentration on financial processing companies with recurring earnings characteristics (Alliance Data Systems, for example).
Shortfalls
Selection in consumer staples and producer durables hurt performance. Within consumer staples, management dislocation and weak sales at GNC Holdings held back results, as did not owning a number of companies involved in mergers and acquisition activity, such as cigarette maker Lorillard. Producer durables suffered as lower energy prices weighed on demand for infrastructure from Chart Industries and Jacobs Engineering Group.
Kalmar Investment Advisers
Portfolio Managers:
Ford B. Draper, Jr., President
and Chief Investment Officer
Dana F. Walker, CFA, Co-Head
of the Investment Team
The last 12 months represented a rewarding time for medium- and large-cap stocks in the U.S. equity market, with relatively low volatility and no major corrections. More recently, however, market volatility has picked up, spurred by the rising number of geopolitical flash points, the approaching switch of the Federal Reserve from stimulus to tightening, and additional slowing of global growth outside the United States, particularly in Europe. This has resulted in a sharp advance in the U.S. dollar and widespread weakness in commodities, including oil.
9
Still, it’s helpful that recession risk appears several years away and that the now-sturdier U.S. growth appears likely to provide demand in other important world economies, which should allow earnings growth to continue. Thus, with equity valuations not extreme, we believe the beneficial outlook for equities of the last several years can continue, albeit with more corrections. Importantly for our markets, the United States should continue to remain, as we like to put it, “the best house on the world block.”
Successes
For the fiscal year ended September 30, our biggest contributors were health care and financial services; top contributors included Salix Pharmaceuticals and Actavis in health care, and Alliance Data Systems in financial services. Other notable successes included United Rentals, F5 Networks, and Weatherford International.
Shortfalls
Our biggest detractors were consumer discretionary, largely because of the extreme winter weather that continued through spring; materials & processing, because of global slowing concerns; and consumer staples, because our Herbalife holding is under short attack—unfairly, in our view—by a prominent hedge fund manager. Other notable individual detractors included Chicago Bridge & Iron, LKQ Corporation, and Cabot Oil & Gas.
10
Vanguard Morgan Growth Fund Investment Advisors
| | | | |
| | Fund Assets Managed | | |
| Investment Advisor | % | $ Million | Investment Strategy |
| Wellington Management | 47 | 5,102 | | Uses traditional methods of stock selection— |
| Company, LLP | | | | fundamental research and analysis—to identify |
| | | | | companies that it believes have above-average growth |
| | | | | prospects. Research focuses on mid- and large-cap |
| | | | | companies, evaluating and ranking each stock on a |
| | | | | consistent set of growth, quality, and valuation criteria. |
| | | | | We seek to build a portfolio with diversified sources of |
| | | | | return with a balance of growth, quality, and valuation |
| | | | attributes. |
| Jennison Associates LLC | 20 | 2,148 | | Uses a research-driven, fundamental investment |
| | | | | approach that relies on in-depth company knowledge |
| | | | | gleaned through meetings with management, |
| | | | customers, and suppliers. |
| Vanguard Equity Investment | 13 | 1,388 | | Employs a quantitative fundamental management |
| Group | | | | approach, using models that assess valuation, growth |
| | | | | prospects, management decisions, market sentiment, |
| | | | | and earnings and balance-sheet quality of companies |
| | | | as compared with their peers. |
| Frontier Capital Management Co., | 10 | 1,038 | | Uses a research-driven, fundamental investment |
| LLC | | | | approach that seeks companies with above-average |
| | | | | growth prospects, reasonable valuations, and |
| | | | competitive advantages. |
| Kalmar Investment Advisers | 9 | 1,020 | | Employs a “growth-with-value” strategy using creative, |
| | | | | bottom-up research to uncover vigorously growing, |
| | | | | high-quality businesses whose stocks can also be |
| | | | | bought inefficiently valued. The strategy has a dual |
| | | | objective of strong returns with lower risk. |
| Cash Investments | 1 | 134 | | These short-term reserves are invested by Vanguard in |
| | | | | equity index products to simulate investments in |
| | | | | stocks. Each advisor also may maintain a modest cash |
| | | | position. |
11
Morgan Growth Fund
Fund Profile
As of September 30, 2014
| | |
| Share-Class Characteristics | |
| | Investor | Admiral |
| | Shares | Shares |
| Ticker Symbol | VMRGX | VMRAX |
| Expense Ratio1 | 0.39% | 0.25% |
| 30-Day SEC Yield | 0.75% | 0.89% |
| | | |
| Portfolio Characteristics | | |
| | | | DJ |
| | | | U.S. |
| | | Russell | Total |
| | | 3000 | Market |
| | | Growth | FA |
| | Fund | Index | Index |
| Number of Stocks | 335 | 1,825 | 3,768 |
| Median Market Cap | $37.1B | $53.9B | $51.1B |
| Price/Earnings Ratio | 24.6x | 23.7x | 20.5x |
| Price/Book Ratio | 4.2x | 5.0x | 2.6x |
| Return on Equity | 22.3% | 23.1% | 17.8% |
| Earnings Growth | | | |
| Rate | 20.0% | 17.3% | 15.2% |
| Dividend Yield | 1.2% | 1.5% | 1.9% |
| Foreign Holdings | 4.1% | 0.0% | 0.0% |
| Turnover Rate | 52% | — | — |
| Short-Term Reserves | 0.7% | — | — |
| | | |
| Sector Diversification (% of equity exposure) |
| | | Russell | DJ |
| | | 3000 | U.S. Total |
| | | Growth | Market |
| | Fund | Index | FA Index |
| Consumer | | | |
| Discretionary | 16.1% | 18.0% | 12.5% |
| Consumer Staples | 5.0 | 9.9 | 8.3 |
| Energy | 5.5 | 5.6 | 9.1 |
| Financials | 5.3 | 5.3 | 17.4 |
| Health Care | 17.9 | 14.2 | 13.5 |
| Industrials | 10.5 | 12.1 | 11.2 |
| Information | | | |
| Technology | 35.2 | 28.2 | 19.0 |
| Materials | 2.3 | 4.3 | 3.8 |
| Telecommunication | | | |
| Services | 2.2 | 2.3 | 2.2 |
| Utilities | 0.0 | 0.1 | 3.0 |
| | |
| Volatility Measures | | |
| | | DJ |
| | | U.S. Total |
| | Russell 3000 | Market |
| | Growth Index | FA Index |
| R-Squared | 0.97 | 0.90 |
| Beta | 1.11 | 1.10 |
| These measures show the degree and timing of the fund’s fluctuations compared with the indexes over 36 months. |
|
| | |
| Ten Largest Holdings (% of total net assets) |
| Apple Inc. | Technology | |
| | Hardware, Storage & | |
| | Peripherals | 5.0% |
| Google Inc. | Internet Software & | |
| | Services | 3.1 |
| Microsoft Corp. | Systems Software | 2.3 |
| Gilead Sciences Inc. | Biotechnology | 2.0 |
| Facebook Inc. | Internet Software & | |
| | Services | 1.9 |
| Oracle Corp. | Systems Software | 1.7 |
| Verizon Communications Integrated | |
| Inc. | Telecommunication | |
| | Services | 1.6 |
| QUALCOMM Inc. | Communications | |
| | Equipment | 1.1 |
| Home Depot Inc. | Home Improvement | |
| | Retail | 1.1 |
| Boeing Co. | Aerospace & | |
| | Defense | 1.1 |
| Top Ten | | 20.9% |
| The holdings listed exclude any temporary cash investments and equity index products. |
|
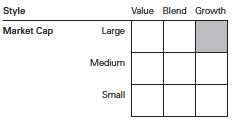
Investment Focus
1 The expense ratios shown are from the prospectus dated January 28, 2014, and represent estimated costs for the current fiscal year. For the fiscal
year ended September 30, 2014, the expense ratios were 0.40% for Investor Shares and 0.26% for Admiral Shares.
12
Morgan Growth Fund
Performance Summary
All of the returns in this report represent past performance, which is not a guarantee of future results that may be achieved by the fund. (Current performance may be lower or higher than the performance data cited. For performance data current to the most recent month-end, visit our website at vanguard.com/performance.) Note, too, that both investment returns and principal value can fluctuate widely, so an investor’s shares, when sold, could be worth more or less than their original cost. The returns shown do not reflect taxes that a shareholder would pay on fund distributions or on the sale of fund shares.
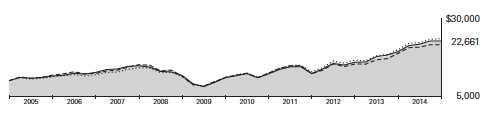
Cumulative Performance: September 30, 2004, Through September 30, 2014
Initial Investment of $10,000
| | | | | |
| | | | Average Annual Total Returns | |
| | | Periods Ended September 30, 2014 | |
| | | | | | Final Value |
| | | One | Five | Ten | of a $10,000 |
| | | Year | Years | Years | Investment |
| | Morgan Growth Fund*Investor | | | | |
| | Shares | 16.85% | 15.29% | 8.52% | $22,661 |
| •••••••• | Russell 3000 Growth Index | 17.87 | 16.43 | 8.95 | 23,570 |
| – – – – | Multi-Cap Growth Funds Average | 14.86 | 14.32 | 8.01 | 21,601 |
| | Dow Jones U.S. Total Stock Market | | | | |
| | Float Adjusted Index | 17.69 | 15.84 | 8.59 | 22,805 |
| Multi-Cap Growth Funds Average: Derived from data provided by Lipper, a Thomson Reuters Company. |
| | | | |
| | | | | Final Value |
| | One | Five | Ten | of a $50,000 |
| | Year | Years | Years | Investment |
| Morgan Growth Fund Admiral Shares | 17.03% | 15.45% | 8.69% | $115,095 |
| Russell 3000 Growth Index | 17.87 | 16.43 | 8.95 | 117,849 |
| Dow Jones U.S. Total Stock Market Float | | | | |
| Adjusted Index | 17.69 | 15.84 | 8.59 | 114,024 |
See Financial Highlights for dividend and capital gains information.
13
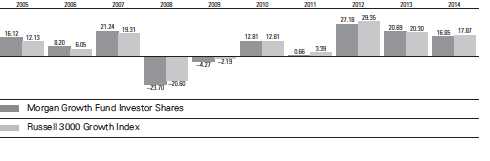
Morgan Growth Fund
Fiscal-Year Total Returns (%): September 30, 2004, Through September 30, 2014
14
Morgan Growth Fund
Financial Statements
Statement of Net Assets
As of September 30, 2014
The fund reports a complete list of its holdings in regulatory filings four times in each fiscal year, at the quarter-ends. For the second and fourth fiscal quarters, the lists appear in the fund’s semiannual and annual reports to shareholders. For the first and third fiscal quarters, the fund files the lists with the Securities and Exchange Commission on Form N-Q. Shareholders can look up the fund’s Forms N-Q on the SEC’s website at sec.gov. Forms N-Q may also be reviewed and copied at the SEC’s Public Reference Room (see the back cover of this report for further information).
| | | |
| | | | Market |
| | | | Value |
| | | Shares | ($000) |
| Common Stocks (99.1%)1 | | |
| Consumer Discretionary (15.7%) | |
| | Home Depot Inc. | 1,309,379 | 120,122 |
| | Comcast Corp. Class A | 1,908,610 | 102,645 |
| * | Priceline Group Inc. | 86,097 | 99,750 |
| * | O’Reilly Automotive Inc. | 517,452 | 77,804 |
| * | Amazon.com Inc. | 212,913 | 68,652 |
| | TJX Cos. Inc. | 1,150,948 | 68,102 |
| | NIKE Inc. Class B | 705,758 | 62,954 |
| | Wyndham Worldwide Corp. | 774,471 | 62,934 |
| | Starwood Hotels & Resorts | | |
| | Worldwide Inc. | 747,246 | 62,178 |
| * | Netflix Inc. | 129,984 | 58,646 |
| * | DIRECTV | 617,684 | 53,442 |
| | Lowe’s Cos. Inc. | 993,591 | 52,581 |
| * | Michael Kors Holdings Ltd. | 668,657 | 47,735 |
| | Expedia Inc. | 482,139 | 42,245 |
| | Inditex SA ADR | 2,946,288 | 40,187 |
| | Starbucks Corp. | 507,142 | 38,269 |
| * | LKQ Corp. | 1,421,318 | 37,793 |
| | PulteGroup Inc. | 2,099,900 | 37,084 |
| * | Discovery | | |
| | Communications Inc. | 892,785 | 33,283 |
| * | Tesla Motors Inc. | 127,844 | 31,025 |
| | Scripps Networks | | |
| | Interactive Inc. Class A | 372,804 | 29,112 |
| | Wynn Resorts Ltd. | 154,490 | 28,902 |
| | Walt Disney Co. | 322,800 | 28,739 |
| | VF Corp. | 344,264 | 22,732 |
| * | Discovery Communications | | |
| | Inc. Class A | 593,472 | 22,433 |
| | Burberry Group plc | 806,688 | 19,677 |
| * | Urban Outfitters Inc. | 519,085 | 19,050 |
| * | Jarden Corp. | 315,205 | 18,947 |
| | Hanesbrands Inc. | 166,165 | 17,853 |
| * | Chipotle Mexican Grill Inc. | | |
| | Class A | 25,390 | 16,925 |
| * | Ulta Salon Cosmetics | | |
| | & Fragrance Inc. | 138,940 | 16,419 |
| | | |
| | | | Market |
| | | | Value |
| | | Shares | ($000) |
| | Harley-Davidson Inc. | 279,715 | 16,279 |
| | Tractor Supply Co. | 234,930 | 14,451 |
| * | CarMax Inc. | 285,035 | 13,240 |
| * | MGM Resorts International | 520,600 | 11,859 |
| | Advance Auto Parts Inc. | 90,600 | 11,805 |
| | Harman International | | |
| | Industries Inc. | 102,800 | 10,079 |
| | Marriott International Inc. | | |
| | Class A | 143,300 | 10,017 |
| | BorgWarner Inc. | 184,780 | 9,721 |
| | Wolverine World Wide Inc. | 385,045 | 9,649 |
| | Las Vegas Sands Corp. | 152,900 | 9,512 |
| * | Imax Corp. | 338,320 | 9,290 |
| * | AutoZone Inc. | 18,000 | 9,174 |
| | Service Corp. International | 424,275 | 8,969 |
| | DSW Inc. Class A | 295,000 | 8,883 |
| | Dunkin’ Brands Group Inc. | 193,673 | 8,680 |
| | Tiffany & Co. | 89,100 | 8,581 |
| * | Bright Horizons Family | | |
| | Solutions Inc. | 198,870 | 8,365 |
| | Ross Stores Inc. | 103,900 | 7,853 |
| | Gap Inc. | 182,400 | 7,604 |
| * | NVR Inc. | 6,600 | 7,458 |
| | Comcast Corp. | 138,000 | 7,383 |
| | Macy’s Inc. | 123,700 | 7,197 |
| | Whirlpool Corp. | 48,100 | 7,006 |
| | Cablevision Systems Corp. | | |
| | Class A | 398,700 | 6,981 |
| | McDonald’s Corp. | 64,100 | 6,077 |
| | PetSmart Inc. | 82,400 | 5,775 |
| | Delphi Automotive plc | 90,600 | 5,557 |
| | Aramark | 190,300 | 5,005 |
| | Time Warner Cable Inc. | 32,400 | 4,649 |
| | Twenty-First Century Fox | | |
| | Inc. Class A | 107,800 | 3,697 |
| | Time Warner Inc. | 38,500 | 2,896 |
| | Omnicom Group Inc. | 23,100 | 1,591 |
| * | Liberty Global plc | 30,601 | 1,255 |
| | | | 1,704,758 |
15
Morgan Growth Fund
| | | |
| | | | Market |
| | | | Value |
| | | Shares | ($000) |
| Consumer Staples (4.9%) | | |
| | Costco Wholesale Corp. | 697,360 | 87,393 |
| | Anheuser-Busch InBev | | |
| | NV ADR | 615,559 | 68,235 |
| | CVS Health Corp. | 809,755 | 64,448 |
| | Mondelez International Inc. | | |
| | Class A | 1,703,866 | 58,383 |
| | Philip Morris | | |
| | International Inc. | 679,443 | 56,665 |
| | Keurig Green Mountain Inc. | 347,111 | 45,170 |
| * | Monster Beverage Corp. | 437,504 | 40,106 |
| ^ | Herbalife Ltd. | 495,360 | 21,672 |
| | Wal-Mart Stores Inc. | 268,000 | 20,494 |
| | PepsiCo Inc. | 158,600 | 14,764 |
| | Brown-Forman Corp. | | |
| | Class B | 138,579 | 12,503 |
| | Kroger Co. | 173,900 | 9,043 |
| * | Hain Celestial Group Inc. | 79,100 | 8,096 |
| * | United Natural Foods Inc. | 118,300 | 7,271 |
| | Mead Johnson Nutrition Co. | 67,600 | 6,504 |
| * | Pilgrim’s Pride Corp. | 164,800 | 5,036 |
| * | Rite Aid Corp. | 538,300 | 2,605 |
| | Colgate-Palmolive Co. | 25,900 | 1,689 |
| | Kimberly-Clark Corp. | 5,900 | 635 |
| | | | 530,712 |
| Energy (5.4%) | | |
| | Schlumberger Ltd. | 700,880 | 71,272 |
| | Cabot Oil & Gas Corp. | 1,978,402 | 64,674 |
| | Apache Corp. | 645,587 | 60,601 |
| | Devon Energy Corp. | 847,102 | 57,755 |
| | National Oilwell Varco Inc. | 746,867 | 56,837 |
| | Baker Hughes Inc. | 790,671 | 51,441 |
| * | Cameron International Corp. | 361,710 | 24,010 |
| * | Carrizo Oil & Gas Inc. | 311,160 | 16,747 |
| * | Continental Resources Inc. | 223,400 | 14,852 |
| | EOG Resources Inc. | 145,300 | 14,388 |
| | Anadarko Petroleum Corp. | 138,300 | 14,029 |
| | Core Laboratories NV | 95,185 | 13,930 |
| * | Weatherford | | |
| | International plc | 647,640 | 13,471 |
| | Halliburton Co. | 194,500 | 12,547 |
| | Superior Energy | | |
| | Services Inc. | 380,270 | 12,499 |
| * | Southwestern Energy Co. | 341,770 | 11,945 |
| * | Concho Resources Inc. | 81,346 | 10,200 |
| * | Gulfport Energy Corp. | 157,455 | 8,408 |
| *,^ | SandRidge Energy Inc. | 1,861,800 | 7,987 |
| * | Whiting Petroleum Corp. | 101,300 | 7,856 |
| | SM Energy Co. | 99,400 | 7,753 |
| | Valero Energy Corp. | 166,300 | 7,695 |
| | Chesapeake Energy Corp. | 334,000 | 7,679 |
| | Nabors Industries Ltd. | 325,800 | 7,415 |
| * | EP Energy Corp. Class A | 359,300 | 6,281 |
| | Cimarex Energy Co. | 14,800 | 1,873 |
| | | | 584,145 |
| | | |
| | | | Market |
| | | | Value |
| | | Shares | ($000) |
| Financials (5.1%) | | |
| | American Express Co. | 1,091,449 | 95,545 |
| | Bank of America Corp. | 3,411,323 | 58,163 |
| | Morgan Stanley | 1,416,831 | 48,980 |
| | Goldman Sachs Group Inc. | 178,844 | 32,830 |
| | Itau Unibanco Holding | | |
| | SA ADR | 2,241,579 | 31,113 |
| | Intercontinental | | |
| | Exchange Inc. | 131,931 | 25,733 |
| | Waddell & Reed Financial | | |
| | Inc. Class A | 480,561 | 24,840 |
| | Aon plc | 256,800 | 22,514 |
| | T. Rowe Price Group Inc. | 240,865 | 18,884 |
| | American | | |
| | Tower Corporation | 195,345 | 18,290 |
| * | Affiliated Managers | | |
| | Group Inc. | 83,265 | 16,683 |
| | Raymond James | | |
| | Financial Inc. | 293,600 | 15,731 |
| * | Berkshire Hathaway Inc. | | |
| | Class B | 105,900 | 14,629 |
| * | Signature Bank | 126,232 | 14,146 |
| | Ameriprise Financial Inc. | 89,800 | 11,079 |
| * | E*TRADE Financial Corp. | 489,800 | 11,065 |
| | McGraw Hill Financial Inc. | 123,600 | 10,438 |
| | Simon Property Group Inc. | 60,200 | 9,898 |
| | Arthur J Gallagher & Co. | 217,480 | 9,865 |
| | JPMorgan Chase & Co. | 162,725 | 9,802 |
| * | SVB Financial Group | 86,357 | 9,680 |
| | Discover Financial Services | 147,800 | 9,517 |
| | Legg Mason Inc. | 159,500 | 8,160 |
| | Allied World Assurance Co. | | |
| | Holdings AG | 172,900 | 6,370 |
| | General Growth | | |
| | Properties Inc. | 200,500 | 4,722 |
| * | WisdomTree | | |
| | Investments Inc. | 356,400 | 4,056 |
| | SL Green Realty Corp. | 31,100 | 3,151 |
| | Ventas Inc. | 43,500 | 2,695 |
| | Public Storage | 13,200 | 2,189 |
| | Crown Castle | | |
| | International Corp. | 5,600 | 451 |
| | | | 551,219 |
| Health Care (17.6%) | | |
| * | Gilead Sciences Inc. | 2,033,067 | 216,420 |
| * | Celgene Corp. | 1,172,885 | 111,166 |
| * | Vertex | | |
| | Pharmaceuticals Inc. | 975,469 | 109,555 |
| | Merck & Co. Inc. | 1,585,756 | 94,004 |
| | Bristol-Myers Squibb Co. | 1,705,907 | 87,308 |
| * | Biogen Idec Inc. | 253,325 | 83,802 |
| | Amgen Inc. | 593,660 | 83,385 |
| | Eli Lilly & Co. | 1,143,759 | 74,173 |
| | Johnson & Johnson | 648,018 | 69,072 |
| | CR Bard Inc. | 451,980 | 64,502 |
16
Morgan Growth Fund
| | | |
| | | | Market |
| | | | Value |
| | | Shares | ($000) |
| * | Alexion | | |
| | Pharmaceuticals Inc. | 360,970 | 59,856 |
| | Aetna Inc. | 727,911 | 58,961 |
| | Medtronic Inc. | 930,885 | 57,668 |
| * | Illumina Inc. | 338,687 | 55,518 |
| * | BioMarin | | |
| | Pharmaceutical Inc. | 709,142 | 51,172 |
| | Novo Nordisk A/S ADR | 963,535 | 45,884 |
| | Allergan Inc. | 241,750 | 43,077 |
| | Becton Dickinson and Co. | 361,425 | 41,134 |
| | Zimmer Holdings Inc. | 384,576 | 38,669 |
| * | Salix Pharmaceuticals Ltd. | 238,152 | 37,209 |
| * | HCA Holdings Inc. | 514,178 | 36,260 |
| | Cooper Cos. Inc. | 221,234 | 34,457 |
| | Perrigo Co. plc | 225,480 | 33,865 |
| | Zoetis Inc. | 626,185 | 23,138 |
| | Thermo Fisher | | |
| | Scientific Inc. | 187,035 | 22,762 |
| * | Actavis plc | 83,057 | 20,040 |
| * | Cerner Corp. | 328,043 | 19,542 |
| * | Alkermes plc | 370,970 | 15,903 |
| | ResMed Inc. | 318,895 | 15,712 |
| * | Express Scripts | | |
| | Holding Co. | 214,655 | 15,161 |
| * | MEDNAX Inc. | 247,382 | 13,561 |
| * | Centene Corp. | 163,300 | 13,507 |
| * | Mallinckrodt plc | 142,920 | 12,884 |
| * | Incyte Corp. | 235,900 | 11,571 |
| | Humana Inc. | 88,800 | 11,570 |
| | Cigna Corp. | 113,300 | 10,275 |
| * | Mylan Inc. | 214,900 | 9,776 |
| * | Edwards Lifesciences Corp. | 88,000 | 8,989 |
| | Cardinal Health Inc. | 118,300 | 8,863 |
| * | Quintiles Transnational | | |
| | Holdings Inc. | 146,800 | 8,189 |
| * | Boston Scientific Corp. | 690,600 | 8,156 |
| * | Align Technology Inc. | 157,575 | 8,143 |
| | AbbVie Inc. | 137,600 | 7,948 |
| | Agilent Technologies Inc. | 135,300 | 7,709 |
| * | Covance Inc. | 90,800 | 7,146 |
| * | Medivation Inc. | 70,900 | 7,010 |
| * | Catamaran Corp. | 162,890 | 6,866 |
| * | Mettler-Toledo | | |
| | International Inc. | 26,800 | 6,864 |
| * | Allscripts Healthcare | | |
| | Solutions Inc. | 379,300 | 5,088 |
| | UnitedHealth Group Inc. | 58,800 | 5,072 |
| * | Charles River Laboratories | | |
| | International Inc. | 42,000 | 2,509 |
| | Abbott Laboratories | 53,800 | 2,238 |
| * | Premier Inc. Class A | 15,100 | 496 |
| * | Intuitive Surgical Inc. | 800 | 369 |
| | | | 1,904,174 |
| | | |
| | | | Market |
| | | | Value |
| | | Shares | ($000) |
| Industrials (10.3%) | | |
| | Boeing Co. | 932,903 | 118,833 |
| | Honeywell International Inc. | 693,127 | 64,544 |
| | United Parcel Service Inc. | | |
| | Class B | 626,920 | 61,620 |
| | Canadian Pacific | | |
| | Railway Ltd. | 284,732 | 59,073 |
| | TransDigm Group Inc. | 279,340 | 51,491 |
| | Illinois Tool Works Inc. | 484,067 | 40,865 |
| | Danaher Corp. | 536,915 | 40,795 |
| * | IHS Inc. Class A | 317,616 | 39,762 |
| | 3M Co. | 251,959 | 35,698 |
| | Pentair plc | 454,120 | 29,740 |
| * | B/E Aerospace Inc. | 340,929 | 28,618 |
| | Dover Corp. | 344,181 | 27,648 |
| | Rockwell Automation Inc. | 231,520 | 25,439 |
| * | Stericycle Inc. | 195,505 | 22,788 |
| | Union Pacific Corp. | 202,100 | 21,912 |
| * | Kirby Corp. | 177,300 | 20,895 |
| | American Airlines | | |
| | Group Inc. | 574,600 | 20,387 |
| * | United Rentals Inc. | 183,395 | 20,375 |
| | JB Hunt Transport | | |
| | Services Inc. | 255,371 | 18,910 |
| | Tyco International Ltd. | 391,793 | 17,462 |
| | Fastenal Co. | 362,025 | 16,255 |
| * | Spirit Airlines Inc. | 232,200 | 16,054 |
| | AMETEK Inc. | 317,593 | 15,946 |
| | Wabtec Corp. | 195,100 | 15,811 |
| | Caterpillar Inc. | 159,100 | 15,756 |
| ^ | Chicago Bridge & Iron | | |
| | Co. NV | 267,780 | 15,491 |
| | Lockheed Martin Corp. | 84,000 | 15,354 |
| * | Genesee & Wyoming Inc. | | |
| | Class A | 154,760 | 14,750 |
| | Watsco Inc. | 165,060 | 14,225 |
| | MSC Industrial Direct Co. | | |
| | Inc. Class A | 163,680 | 13,988 |
| * | Hertz Global Holdings Inc. | 522,880 | 13,276 |
| * | MasTec Inc. | 421,100 | 12,894 |
| | Delta Air Lines Inc. | 320,300 | 11,579 |
| | Flowserve Corp. | 162,795 | 11,480 |
| | Southwest Airlines Co. | 333,400 | 11,259 |
| | Carlisle Cos. Inc. | 140,045 | 11,257 |
| * | Armstrong World | | |
| | Industries Inc. | 188,595 | 10,561 |
| | Acuity Brands Inc. | 86,925 | 10,232 |
| * | Jacobs Engineering | | |
| | Group Inc. | 188,500 | 9,203 |
| * | Quanta Services Inc. | 252,975 | 9,180 |
| * | WESCO International Inc. | 116,344 | 9,105 |
| * | Copart Inc. | 288,600 | 9,037 |
| | Emerson Electric Co. | 135,900 | 8,505 |
| | Masco Corp. | 352,500 | 8,432 |
17
Morgan Growth Fund
| | | |
| | | | Market |
| | | | Value |
| | | Shares | ($000) |
| | Expeditors International | | |
| | of Washington Inc. | 196,245 | 7,964 |
| * | Spirit AeroSystems | | |
| | Holdings Inc. Class A | 201,500 | 7,669 |
| | Alaska Air Group Inc. | 175,900 | 7,659 |
| | Pall Corp. | 88,192 | 7,382 |
| | IDEX Corp. | 101,800 | 7,367 |
| | KAR Auction Services Inc. | 252,540 | 7,230 |
| * | Verisk Analytics Inc. | | |
| | Class A | 76,830 | 4,678 |
| | Textron Inc. | 34,500 | 1,242 |
| | Robert Half | | |
| | International Inc. | 18,900 | 926 |
| | | | 1,118,602 |
| Information Technology (34.7%) | |
| | Apple Inc. | 5,428,025 | 546,874 |
| | Microsoft Corp. | 5,481,334 | 254,115 |
| * | Google Inc. Class C | 362,942 | 209,548 |
| * | Facebook Inc. Class A | 2,607,988 | 206,135 |
| | Oracle Corp. | 4,700,952 | 179,952 |
| * | Google Inc. Class A | 211,942 | 124,709 |
| | QUALCOMM Inc. | 1,659,521 | 124,082 |
| | Altera Corp. | 2,854,885 | 102,148 |
| | MasterCard Inc. Class A | 1,371,451 | 101,378 |
| | Cisco Systems Inc. | 3,732,014 | 93,935 |
| * | F5 Networks Inc. | 785,001 | 93,211 |
| * | Alibaba Group | | |
| | Holding Ltd. ADR | 971,863 | 86,350 |
| * | Twitter Inc. | 1,587,518 | 81,884 |
| * | Alliance Data | | |
| | Systems Corp. | 326,690 | 81,107 |
| | SanDisk Corp. | 781,170 | 76,516 |
| | Intuit Inc. | 739,605 | 64,826 |
| | Visa Inc. Class A | 299,224 | 63,845 |
| * | LinkedIn Corp. Class A | 280,331 | 58,250 |
| | Western Digital Corp. | 586,205 | 57,049 |
| | NetApp Inc. | 1,257,374 | 54,017 |
| | Maxim Integrated | | |
| | Products Inc. | 1,781,320 | 53,867 |
| * | Check Point Software | | |
| | Technologies Ltd. | 725,301 | 50,220 |
| | Broadcom Corp. Class A | 1,134,171 | 45,843 |
| | Microchip Technology Inc. | 941,763 | 44,479 |
| * | salesforce.com inc | 725,332 | 41,728 |
| * | Red Hat Inc. | 695,471 | 39,051 |
| * | VMware Inc. Class A | 403,019 | 37,819 |
| | Skyworks Solutions Inc. | 629,573 | 36,547 |
| | Linear Technology Corp. | 809,612 | 35,939 |
| | Intel Corp. | 1,013,720 | 35,298 |
| | Xilinx Inc. | 819,620 | 34,711 |
| | Amphenol Corp. Class A | 340,260 | 33,978 |
| | KLA-Tencor Corp. | 413,942 | 32,610 |
| * | Cognizant Technology | | |
| | Solutions Corp. Class A | 726,020 | 32,504 |
| * | Electronic Arts Inc. | 880,245 | 31,346 |
| | | |
| | | | Market |
| | | | Value |
| | | Shares | ($000) |
| | Paychex Inc. | 678,355 | 29,983 |
| | Activision Blizzard Inc. | 1,413,190 | 29,380 |
| * | NXP Semiconductor NV | 408,500 | 27,954 |
| * | Splunk Inc. | 430,125 | 23,812 |
| * | Yahoo! Inc. | 572,862 | 23,344 |
| * | Workday Inc. Class A | 280,806 | 23,167 |
| | Lam Research Corp. | 308,525 | 23,047 |
| * | FleetCor Technologies Inc. | 155,806 | 22,143 |
| | International Business | | |
| | Machines Corp. | 109,600 | 20,805 |
| | Fidelity National | | |
| | Information Services Inc. | 354,595 | 19,964 |
| | Avago Technologies Ltd. | | |
| | Class A | 218,900 | 19,044 |
| * | Cadence Design | | |
| | Systems Inc. | 1,082,168 | 18,624 |
| * | Gartner Inc. | 251,629 | 18,487 |
| | Global Payments Inc. | 241,700 | 16,890 |
| * | Atmel Corp. | 1,947,303 | 15,734 |
| *,^ | FireEye Inc. | 510,535 | 15,602 |
| | IAC/InterActiveCorp | 231,304 | 15,243 |
| * | Informatica Corp. | 445,075 | 15,239 |
| | Accenture plc Class A | 180,900 | 14,711 |
| * | Akamai Technologies Inc. | 191,267 | 11,438 |
| * | Autodesk Inc. | 205,320 | 11,313 |
| | Brocade Communications | | |
| | Systems Inc. | 944,804 | 10,270 |
| | Marvell Technology | | |
| | Group Ltd. | 717,217 | 9,668 |
| * | WEX Inc. | 86,130 | 9,502 |
| * | Fortinet Inc. | 370,000 | 9,348 |
| | Jack Henry | | |
| | & Associates Inc. | 153,990 | 8,571 |
| * | Concur Technologies Inc. | 66,550 | 8,440 |
| | Texas Instruments Inc. | 159,300 | 7,597 |
| | CDW Corp. | 231,100 | 7,176 |
| * | Freescale | | |
| | Semiconductor Ltd. | 363,400 | 7,097 |
| * | Yelp Inc. Class A | 81,074 | 5,533 |
| * | Flextronics | | |
| | International Ltd. | 411,000 | 4,242 |
| * | Zynga Inc. Class A | 971,300 | 2,623 |
| * | eBay Inc. | 29,700 | 1,682 |
| | EMC Corp. | 34,300 | 1,004 |
| | | | 3,754,548 |
| Materials (2.2%) | | |
| | Sherwin-Williams Co. | 288,798 | 63,244 |
| | Monsanto Co. | 347,078 | 39,050 |
| | Eagle Materials Inc. | 215,320 | 21,926 |
| | Ashland Inc. | 166,160 | 17,297 |
| * | WR Grace & Co. | 161,870 | 14,721 |
| | Worthington Industries Inc. | 343,295 | 12,777 |
| | PPG Industries Inc. | 57,491 | 11,311 |
| | Cytec Industries Inc. | 215,800 | 10,205 |
| | Alcoa Inc. | 578,300 | 9,305 |
18
Morgan Growth Fund
| | | |
| | | | Market |
| | | | Value |
| | | Shares | ($000) |
| | Praxair Inc. | 68,560 | 8,844 |
| | Ball Corp. | 137,900 | 8,725 |
| | Westlake Chemical Corp. | 81,800 | 7,083 |
| | PolyOne Corp. | 150,275 | 5,347 |
| | Vulcan Materials Co. | 69,400 | 4,180 |
| | FMC Corp. | 69,722 | 3,987 |
| | | | 238,002 |
| Other (1.0%) | | |
| ^,2 | Vanguard Growth ETF | 1,044,900 | 104,145 |
| |
| Telecommunication Services (2.2%) | |
| | Verizon | | |
| | Communications Inc. | 3,391,872 | 169,560 |
| * | SBA Communications | | |
| | Corp. Class A | 469,483 | 52,065 |
| | Cogent Communications | | |
| | Holdings Inc. | 285,900 | 9,609 |
| * | Level 3 | | |
| | Communications Inc. | 179,200 | 8,195 |
| | | | 239,429 |
| Total Common Stocks | | |
| (Cost $7,613,042) | | 10,729,734 |
| Temporary Cash Investments (1.1%)1 | |
| Money Market Fund (1.0%) | | |
| 3,4 | Vanguard Market Liquidity | | |
| | Fund, 0.109% | 113,423,135 | 113,423 |
| |
| | | Face | |
| | | Amount | |
| | | ($000) | |
| Repurchase Agreement (0.0%) | |
| | Bank of America Securities, | |
| | LLC 0.001%, 10/1/14 | | |
| | (Dated 9/30/14, Repurchase | |
| | Value $5,300,000, | | |
| | collateralized by Federal | | |
| | Home Loan Bank 0.200%, | |
| | 9/25/15, with a value of | | |
| | $5,409,000) | 5,300 | 5,300 |
| | | |
| | | Face | Market |
| | | Amount | Value |
| | | ($000) | ($000) |
| U.S. Government and Agency Obligations (0.1%) |
| 5 | Federal Home Loan | | |
| | Bank Discount | | |
| | Notes, 0.078%, 10/1/14 | 100 | 100 |
| 5,6 | Federal Home Loan | | |
| | Bank Discount | | |
| | Notes, 0.080%, 10/8/14 | 200 | 200 |
| 5,6 | Federal Home Loan | | |
| | Bank Discount | | |
| | Notes, 0.074%, 12/3/14 | 100 | 100 |
| 5,6 | Federal Home Loan | | |
| | Bank Discount | | |
| | Notes, 0.100%, 2/4/15 | 3,000 | 2,999 |
| 5 | Federal Home Loan | | |
| | Bank Discount Notes, | | |
| | 0.070%, 3/27/15 | 100 | 100 |
| 6,7 | Freddie Mac Discount | | |
| | Notes, 0.077%, 10/20/14 | 2,000 | 2,000 |
| | | | 5,499 |
| Total Temporary Cash Investments | |
| (Cost $124,222) | | 124,222 |
| Total Investments (100.2%) | | |
| (Cost $7,737,264) | | 10,853,956 |
| Other Assets and Liabilities (-0.2%) | |
| Other Assets | | 118,110 |
| Liabilities4 | | (141,748) |
| | | | (23,638) |
| Net Assets (100%) | | 10,830,318 |
19
Morgan Growth Fund
| |
| At September 30, 2014, net assets consisted of: |
| | Amount |
| | ($000) |
| Paid-in Capital | 6,628,563 |
| Undistributed Net Investment Income | 37,745 |
| Accumulated Net Realized Gains | 1,047,481 |
| Unrealized Appreciation (Depreciation) | |
| Investment Securities | 3,116,692 |
| Futures Contracts | (162) |
| Foreign Currencies | (1) |
| Net Assets | 10,830,318 |
| |
| |
| Investor Shares—Net Assets | |
| Applicable to 169,182,860 outstanding | |
| $.001 par value shares of beneficial | |
| interest (unlimited authorization) | 4,580,274 |
| Net Asset Value Per Share— | |
| Investor Shares | $27.07 |
| |
| |
| Admiral Shares—Net Assets | |
| Applicable to 74,435,833 outstanding | |
| $.001 par value shares of beneficial | |
| interest (unlimited authorization) | 6,250,044 |
| Net Asset Value Per Share— | |
| Admiral Shares | $83.97 |
See Note A in Notes to Financial Statements.
* Non-income-producing security.
^ Includes partial security positions on loan to broker-dealers. The total value of securities on loan is $20,100,000.
1 The fund invests a portion of its cash reserves in equity markets through the use of index futures contracts. After giving effect to futures
investments, the fund’s effective common stock and temporary cash investment positions represent 99.3% and 0.9%, respectively,
of net assets.
2 Considered an affiliated company of the fund as the issuer is another member of The Vanguard Group.
3 Affiliated money market fund available only to Vanguard funds and certain trusts and accounts managed by Vanguard. Rate shown is the
7-day yield.
4 Includes $21,258,000 of collateral received for securities on loan.
5 The issuer operates under a congressional charter; its securities are generally neither guaranteed by the U.S. Treasury nor backed by the
full faith and credit of the U.S. government.
6 Securities with a value of $3,799,000 have been segregated as initial margin for open futures contracts.
7 The issuer was placed under federal conservatorship in September 2008; since that time, its daily operations have been managed by the
Federal Housing Finance Agency and it receives capital from the U.S. Treasury, as needed to maintain a positive net worth, in exchange
for senior preferred stock.
ADR—American Depositary Receipt.
See accompanying Notes, which are an integral part of the Financial Statements.
20
Morgan Growth Fund
Statement of Operations
| |
| | Year Ended |
| | September 30, 2014 |
| | ($000) |
| Investment Income | |
| Income | |
| Dividends1,2 | 118,244 |
| Interest2 | 229 |
| Securities Lending | 1,025 |
| Total Income | 119,498 |
| Expenses | |
| Investment Advisory Fees—Note B | |
| Basic Fee | 17,208 |
| Performance Adjustment | (4,031) |
| The Vanguard Group—Note C | |
| Management and Administrative—Investor Shares | 12,374 |
| Management and Administrative—Admiral Shares | 6,662 |
| Marketing and Distribution—Investor Shares | 785 |
| Marketing and Distribution—Admiral Shares | 977 |
| Custodian Fees | 126 |
| Auditing Fees | 35 |
| Shareholders’ Reports—Investor Shares | 50 |
| Shareholders’ Reports—Admiral Shares | 54 |
| Trustees’ Fees and Expenses | 20 |
| Total Expenses | 34,260 |
| Expenses Paid Indirectly | (229) |
| Net Expenses | 34,031 |
| Net Investment Income | 85,467 |
| Realized Net Gain (Loss) | |
| Investment Securities Sold2 | 1,166,465 |
| Futures Contracts | 21,966 |
| Foreign Currencies | 96 |
| Realized Net Gain (Loss) | 1,188,527 |
| Change in Unrealized Appreciation (Depreciation) | |
| Investment Securities | 377,006 |
| Futures Contracts | 641 |
| Foreign Currencies | (5) |
| Change in Unrealized Appreciation (Depreciation) | 377,642 |
| Net Increase (Decrease) in Net Assets Resulting from Operations | 1,651,636 |
1 Dividends are net of foreign withholding taxes of $622,000.2 Dividend income, interest income, and realized net gain (loss) from affiliated companies of the fund were $1,255,000, $190,000,and $0, respectively.See accompanying Notes, which are an integral part of the Financial Statements.
21
Morgan Growth Fund
Statement of Changes in Net Assets
| | |
| | Year Ended September 30, |
| | 2014 | 2013 |
| | ($000) | ($000) |
| Increase (Decrease) in Net Assets | | |
| Operations | | |
| Net Investment Income | 85,467 | 105,086 |
| Realized Net Gain (Loss) | 1,188,527 | 998,555 |
| Change in Unrealized Appreciation (Depreciation) | 377,642 | 665,448 |
| Net Increase (Decrease) in Net Assets Resulting from Operations | 1,651,636 | 1,769,089 |
| Distributions | | |
| Net Investment Income | | |
| Investor Shares | (32,172) | (51,062) |
| Admiral Shares | (46,958) | (44,266) |
| Realized Capital Gain1 | | |
| Investor Shares | (185,177) | — |
| Admiral Shares | (216,896) | — |
| Total Distributions | (481,203) | (95,328) |
| Capital Share Transactions | | |
| Investor Shares | (892,889) | (1,262,867) |
| Admiral Shares | 611,582 | 522,261 |
| Net Increase (Decrease) from Capital Share Transactions | (281,307) | (740,606) |
| Total Increase (Decrease) | 889,126 | 933,155 |
| Net Assets | | |
| Beginning of Period | 9,941,192 | 9,008,037 |
| End of Period2 | 10,830,318 | 9,941,192 |
1 Includes fiscal 2014 short-term gain distributions totaling $11,778,000. Short-term gain distributions are treated as ordinary incomedividends for tax purposes.2 Net Assets—End of Period includes undistributed (overdistributed) net investment income of $37,745,000 and $37,964,000.See accompanying Notes, which are an integral part of the Financial Statements.
22
Morgan Growth Fund
Financial Highlights
| | | | | |
| Investor Shares | | | | | |
| |
| For a Share Outstanding | Year Ended September 30, |
| Throughout Each Period | 2014 | 2013 | 2012 | 2011 | 2010 |
| Net Asset Value, Beginning of Period | $24.26 | $20.31 | $16.06 | $16.04 | $14.32 |
| Investment Operations | | | | | |
| Net Investment Income | .187 | .230 | .141 | .087 | .097 |
| Net Realized and Unrealized Gain (Loss) | | | | | |
| on Investments | 3.785 | 3.925 | 4.209 | .029 | 1.733 |
| Total from Investment Operations | 3.972 | 4.155 | 4.350 | .116 | 1.830 |
| Distributions | | | | | |
| Dividends from Net Investment Income | (.172) | (. 205) | (.100) | (. 096) | (.110) |
| Distributions from Realized Capital Gains | (.990) | — | — | — | — |
| Total Distributions | (1.162) | (. 205) | (.100) | (. 096) | (.110) |
| Net Asset Value, End of Period | $27.07 | $24.26 | $20.31 | $16.06 | $16.04 |
| |
| Total Return1 | 16.85% | 20.69% | 27.18% | 0.66% | 12.81% |
| |
| Ratios/Supplemental Data | | | | | |
| Net Assets, End of Period (Millions) | $4,580 | $4,922 | $5,283 | $5,009 | $5,432 |
| Ratio of Total Expenses to | | | | | |
| Average Net Assets2 | 0.40% | 0.39% | 0.40% | 0.42% | 0.44% |
| Ratio of Net Investment Income to | | | | | |
| Average Net Assets | 0.72% | 1.06% | 0.74% | 0.47% | 0.62% |
| Portfolio Turnover Rate | 52% | 53% | 49% | 55% | 60% |
1 Total returns do not include account service fees that may have applied in the periods shown. Fund prospectuses provide information aboutany applicable account service fees.2 Includes performance-based investment advisory fee increases (decreases) of (0.04%), (0.05%), (0.04%), (0.01%), and 0.01%.See accompanying Notes, which are an integral part of the Financial Statements.
23
Morgan Growth Fund
Financial Highlights
| | | | | |
| Admiral Shares | | | | | |
| |
| For a Share Outstanding | Year Ended September 30, |
| Throughout Each Period | 2014 | 2013 | 2012 | 2011 | 2010 |
| Net Asset Value, Beginning of Period | $75.26 | $63.02 | $49.84 | $49.75 | $44.42 |
| Investment Operations | | | | | |
| Net Investment Income | .719 | .831 | .535 | .342 | .372 |
| Net Realized and Unrealized Gain (Loss) | | | | | |
| on Investments | 11.722 | 12.144 | 13.036 | .110 | 5.364 |
| Total from Investment Operations | 12.441 | 12.975 | 13.571 | .452 | 5.736 |
| Distributions | | | | | |
| Dividends from Net Investment Income | (.664) | (.735) | (. 391) | (. 362) | (. 406) |
| Distributions from Realized Capital Gains | (3.067) | — | — | — | — |
| Total Distributions | (3.731) | (.735) | (. 391) | (. 362) | (. 406) |
| Net Asset Value, End of Period | $83.97 | $75.26 | $63.02 | $49.84 | $49.75 |
| |
| Total Return | 17.03% | 20.86% | 27.35% | 0.83% | 12.95% |
| |
| Ratios/Supplemental Data | | | | | |
| Net Assets, End of Period (Millions) | $6,250 | $5,019 | $3,725 | $2,554 | $2,445 |
| Ratio of Total Expenses to | | | | | |
| Average Net Assets1 | 0.26% | 0.25% | 0.26% | 0.28% | 0.30% |
| Ratio of Net Investment Income to | | | | | |
| Average Net Assets | 0.86% | 1.20% | 0.88% | 0.61% | 0.76% |
| Portfolio Turnover Rate | 52% | 53% | 49% | 55% | 60% |
1 Includes performance-based investment advisory fee increases (decreases) of (0.04%), (0.05%), (0.04%), (0.01%), and 0.01%.See accompanying Notes, which are an integral part of the Financial Statements.
24
Morgan Growth Fund
Notes to Financial Statements
Vanguard Morgan Growth Fund is registered under the Investment Company Act of 1940 as an open-end investment company, or mutual fund. The fund offers two classes of shares: Investor Shares and Admiral Shares. Investor Shares are available to any investor who meets the fund’s minimum purchase requirements. Admiral Shares are designed for investors who meet certain administrative, service, and account-size criteria.
A. The following significant accounting policies conform to generally accepted accounting principles for U.S. investment companies. The fund consistently follows such policies in preparing its financial statements.
1. Security Valuation: Securities are valued as of the close of trading on the New York Stock Exchange (generally 4 p.m., Eastern time) on the valuation date. Equity securities are valued at the latest quoted sales prices or official closing prices taken from the primary market in which each security trades; such securities not traded on the valuation date are valued at the mean of the latest quoted bid and asked prices. Securities for which market quotations are not readily available, or whose values have been affected by events occurring before the fund’s pricing time but after the close of the securities’ primary markets, are valued at their fair values calculated according to procedures adopted by the board of trustees. These procedures include obtaining quotations from an independent pricing service, monitoring news to identify significant market- or security-specific events, and evaluating changes in the values of foreign market proxies (for example, ADRs, futures contracts, or exchange-traded funds), between the time the foreign markets close and the fund’s pricing time. When fair-value pricing is employed, the prices of securities used by a fund to calculate its net asset value may differ from quoted or published prices for the same securities. Investments in Vanguard Market Liquidity Fund are valued at that fund’s net asset value. Temporary cash investments acquired over 60 days to maturity are valued using the latest bid prices or using valuations based on a matrix system (which considers such factors as security prices, yields, maturities, and ratings), both as furnished by independent pricing services. Other temporary cash investments are valued at amortized cost, which approximates market value.
2. Foreign Currency: Securities and other assets and liabilities denominated in foreign currencies are translated into U.S. dollars using exchange rates obtained from an independent third party as of the fund’s pricing time on the valuation date. Realized gains (losses) and unrealized appreciation (depreciation) on investment securities include the effects of changes in exchange rates since the securities were purchased, combined with the effects of changes in security prices. Fluctuations in the value of other assets and liabilities resulting from changes in exchange rates are recorded as unrealized foreign currency gains (losses) until the assets or liabilities are settled in cash, at which time they are recorded as realized foreign currency gains (losses).
3. Futures Contracts: The fund uses index futures contracts to a limited extent, with the objective of maintaining full exposure to the stock market while maintaining liquidity. The fund may purchase or sell futures contracts to achieve a desired level of investment, whether to accommodate portfolio turnover or cash flows from capital share transactions. The primary risks associated with the use of futures contracts are imperfect correlation between changes in market values of stocks held by the fund and the prices of futures contracts, and the possibility of an illiquid market. Counterparty risk involving futures is mitigated because a regulated clearinghouse is the counterparty instead of the clearing broker. To further mitigate counterparty risk, the fund trades futures contracts on an exchange, monitors the financial strength of its clearing brokers and clearinghouse, and has entered into clearing agreements with its clearing brokers. The clearinghouse imposes initial margin requirements to secure the fund’s performance and requires daily settlement of variation margin representing changes in the market value of each contract.
25
Morgan Growth Fund
Futures contracts are valued at their quoted daily settlement prices. The aggregate settlement values of the contracts are not recorded in the Statement of Net Assets. Fluctuations in the value of the contracts are recorded in the Statement of Net Assets as an asset (liability) and in the Statement of Operations as unrealized appreciation (depreciation) until the contracts are closed, when they are recorded as realized futures gains (losses).
During the year ended September 30, 2014, the fund’s average investments in long and short futures contracts represented less than 1% and 0% of net assets, respectively, based on the average of aggregate settlement values at each quarter-end during the period.
4. Repurchase Agreements: The fund enters into repurchase agreements with institutional counterparties. Securities pledged as collateral to the fund under repurchase agreements are held by a custodian bank until the agreements mature. Each agreement requires that the market value of the collateral be sufficient to cover payments of interest and principal. The fund further mitigates its counterparty risk by entering into repurchase agreements only with a diverse group of prequalified counterparties, monitoring their financial strength, and entering into master repurchase agreements with its counterparties. The master repurchase agreements provide that, in the event of a counterparty’s default (including bankruptcy), the fund may terminate any repurchase agreements with that counterparty, determine the net amount owed, and sell or retain the collateral up to the net amount owed to the fund. Such action may be subject to legal proceedings, which may delay or limit the disposition of collateral.
5. Federal Income Taxes: The fund intends to continue to qualify as a regulated investment company and distribute all of its taxable income. Management has analyzed the fund’s tax positions taken for all open federal income tax years (September 30, 2011–2014), and has concluded that no provision for federal income tax is required in the fund’s financial statements.
6. Distributions: Distributions to shareholders are recorded on the ex-dividend date.
7. Securities Lending: To earn additional income, the fund lends its securities to qualified institutional borrowers. Security loans are required to be secured at all times by collateral in an amount at least equal to the market value of securities loaned. Daily market fluctuations could cause the value of loaned securities to be more or less than the value of the collateral received. When this occurs, the collateral is adjusted and settled on the next business day. The fund further mitigates its counterparty risk by entering into securities lending transactions only with a diverse group of prequalified counterparties, monitoring their financial strength, and entering into master securities lending agreements with its counterparties. The master securities lending agreements provide that, in the event of a counterparty’s default (including bankruptcy), the fund may terminate any loans with that borrower, determine the net amount owed, and sell or retain the collateral up to the net amount owed to the fund; however, such actions may be subject to legal proceedings. While collateral mitigates counterparty risk, in the absence of a default the fund may experience delays and costs in recovering the securities loaned. The fund invests cash collateral received in Vanguard Market Liquidity Fund, and records a liability in the Statement of Net Assets for the return of the collateral, during the period the securities are on loan. Securities lending income represents fees charged to borrowers plus income earned on invested cash collateral, less expenses associated with the loan.
8. Credit Facility: The fund and certain other funds managed by The Vanguard Group participate in a $2.89 billion committed credit facility provided by a syndicate of lenders pursuant to a credit agreement that may be renewed annually; each fund is individually liable for its borrowings, if any, under the credit facility. Borrowings may be utilized for temporary and emergency purposes, and
26
Morgan Growth Fund
are subject to the fund’s regulatory and contractual borrowing restrictions. The participating funds are charged administrative fees and an annual commitment fee of 0.06% of the undrawn amount of the facility; these fees are allocated to the funds based on a method approved by the fund’s board of trustees and included in Management and Administrative expenses on the fund’s Statement of Operations. Any borrowings under this facility bear interest at a rate equal to the higher of the federal funds rate or LIBOR reference rate plus an agreed-upon spread.
The fund had no borrowings outstanding at September 30, 2014, or at any time during the period then ended.
9. Other: Dividend income is recorded on the ex-dividend date. Interest income includes income distributions received from Vanguard Market Liquidity Fund and is accrued daily. Premiums and discounts on debt securities purchased are amortized and accreted, respectively, to interest income over the lives of the respective securities. Security transactions are accounted for on the date securities are bought or sold. Costs used to determine realized gains (losses) on the sale of investment securities are those of the specific securities sold.
Each class of shares has equal rights as to assets and earnings, except that each class separately bears certain class-specific expenses related to maintenance of shareholder accounts (included in Management and Administrative expenses) and shareholder reporting. Marketing and distribution expenses are allocated to each class of shares based on a method approved by the board of trustees. Income, other non-class-specific expenses, and gains and losses on investments are allocated to each class of shares based on its relative net assets.
B. Wellington Management Company, LLP, Jennison Associates LLC, Frontier Capital Management Co., LLC, and Kalmar Investment Advisers each provide investment advisory services to a portion of the fund for a fee calculated at an annual percentage rate of average net assets managed by the advisor. The basic fee of Wellington Management Company, LLP is subject to quarterly adjustments based on performance for the preceding three years relative to the Russell 3000 Growth Index. The basic fee of Jennison Associates LLC is subject to quarterly adjustments based on performance for the preceding three years relative to the Russell 1000 Growth Index. The basic fees of Frontier Capital Management Co., LLC, and Kalmar Investment Advisers are subject to quarterly adjustments based on performance for the preceding three years relative to the Russell Midcap Growth Index.
The Vanguard Group provides investment advisory services to a portion of the fund on an at-cost basis; the fund paid Vanguard advisory fees of $718,000 for the year ended September 30, 2014.
For the year ended September 30, 2014, the aggregate investment advisory fee represented an effective annual basic rate of 0.16% of the fund’s average net assets, before a decrease of $4,031,000 (0.04%) based on performance.
C. The Vanguard Group furnishes at cost corporate management, administrative, marketing, and distribution services. The costs of such services are allocated to the fund based on methods approved by the board of trustees. The fund has committed to invest up to 0.40% of its net assets in Vanguard. At September 30, 2014, the fund had contributed capital of $1,093,000 to Vanguard (included in Other Assets), representing 0.01% of the fund’s net assets and 0.44% of Vanguard’s capitalization. The fund’s trustees and officers are also directors and officers of Vanguard.
27
Morgan Growth Fund
D. The fund has asked its investment advisors to direct certain security trades, subject to obtaining the best price and execution, to brokers who have agreed to rebate to the fund part of the commissions generated. Such rebates are used solely to reduce the fund’s management and administrative expenses. For the year ended September 30, 2014, these arrangements reduced the fund’s expenses by $229,000 (an annual rate of 0.00% of average net assets).
E. Various inputs may be used to determine the value of the fund’s investments. These inputs are summarized in three broad levels for financial statement purposes. The inputs or methodologies used to value securities are not necessarily an indication of the risk associated with investing in those securities.
Level 1—Quoted prices in active markets for identical securities.
Level 2—Other significant observable inputs (including quoted prices for similar securities, interest rates, prepayment speeds, credit risk, etc.).
Level 3—Significant unobservable inputs (including the fund’s own assumptions used to determine the fair value of investments).
The following table summarizes the market value of the fund’s investments as of September 30, 2014, based on the inputs used to value them:
| | | |
| | Level 1 | Level 2 | Level 3 |
| Investments | ($000) | ($000) | ($000) |
| Common Stocks | 10,710,057 | 19,677 | — |
| Temporary Cash Investments | 113,423 | 10,799 | — |
| Futures Contracts—Assets1 | 16 | — | — |
| Futures Contracts—Liabilities1 | (190) | — | — |
| Total | 10,823,306 | 30,476 | — |
| 1 Represents variation margin on the last day of the reporting period. |
F. At September 30, 2014, the aggregate settlement value of open futures contracts and the related unrealized appreciation (depreciation) were:
| | | | |
| | | | ($000) |
| | | | Aggregate | |
| | | Number of | Settlement | Unrealized |
| | | Long (Short) | Value | Appreciation |
| Futures Contracts | Expiration | Contracts | Long (Short) | (Depreciation) |
| S&P 500 Index | December 2014 | 59 | 28,991 | (159) |
| E-mini S&P 500 Index | December 2014 | 4 | 393 | (3) |
| | | | | (162) |
Unrealized appreciation (depreciation) on open futures contracts is required to be treated as realized gain (loss) for tax purposes.
28
Morgan Growth Fund
G. Distributions are determined on a tax basis and may differ from net investment income and realized capital gains for financial reporting purposes. Differences may be permanent or temporary. Permanent differences are reclassified among capital accounts in the financial statements to reflect their tax character. Temporary differences arise when certain items of income, expense, gain, or loss are recognized in different periods for financial statement and tax purposes. These differences will reverse at some time in the future. Differences in classification may also result from the treatment of short-term gains as ordinary income for tax purposes.
During the year ended September 30, 2014, the fund realized net foreign currency gains of $96,000, which increased distributable net income for tax purposes; accordingly, such gains have been reclassified from accumulated net realized gains to undistributed net investment income.
The fund used a tax accounting practice to treat a portion of the price of capital shares redeemed during the year as distributions from net investment income and realized capital gains. Accordingly, the fund has reclassified $6,652,000 from undistributed net investment income, and $92,222,000 from accumulated net realized gains, to paid-in capital.
For tax purposes, at September 30, 2014, the fund had $192,405,000 of ordinary income and $912,636,000 of long-term capital gains available for distribution.
At September 30, 2014, the cost of investment securities for tax purposes was $7,737,605,000. Net unrealized appreciation of investment securities for tax purposes was $3,116,351,000, consisting of unrealized gains of $3,239,246,000 on securities that had risen in value since their purchase and $122,895,000 in unrealized losses on securities that had fallen in value since their purchase.
H. During the year ended September 30, 2014, the fund purchased $5,455,001,000 of investment securities and sold $6,070,062,000 of investment securities, other than temporary cash investments.
| | | | |
| I. Capital share transactions for each class of shares were: | | | |
| | Year Ended September 30, |
| | 2014 | 2013 |
| | Amount | Shares | Amount | Shares |
| | ($000) | (000) | ($000) | (000) |
| Investor Shares | | | | |
| Issued | 320,152 | 12,401 | 268,773 | 12,587 |
| Issued in Lieu of Cash Distributions | 213,461 | 8,667 | 49,772 | 2,519 |
| Redeemed | (1,426,502) | (54,768) | (1,581,412) | (72,367) |
| Net Increase (Decrease)—Investor Shares | (892,889) | (33,700) | (1,262,867) | (57,261) |
| Admiral Shares | | | | |
| Issued | 1,260,885 | 15,671 | 1,256,023 | 18,539 |
| Issued in Lieu of Cash Distributions | 242,786 | 3,182 | 39,037 | 638 |
| Redeemed | (892,089) | (11,116) | (772,799) | (11,580) |
| Net Increase (Decrease) —Admiral Shares | 611,582 | 7,737 | 522,261 | 7,597 |
J. Management has determined that no material events or transactions occurred subsequent to September 30, 2014, that would require recognition or disclosure in these financial statements.
29
Report of Independent Registered Public Accounting Firm
To the Board of Trustees and Shareholders of Vanguard Morgan Growth Fund:
In our opinion, the accompanying statement of net assets and the related statements of operations and of changes in net assets and the financial highlights present fairly, in all material respects, the financial position of Vanguard Morgan Growth Fund (the “Fund”) at September 30, 2014, the results of its operations for the year then ended, the changes in its net assets for each of the two years in the period then ended, and the financial highlights for each of the five years in the period then ended, in conformity with accounting principles generally accepted in the United States of America. These financial statements and financial highlights (hereafter referred to as “financial statements”) are the responsibility of the Fund’s management. Our responsibility is to express an opinion on these financial statements based on our audits. We conducted our audits of these financial statements in accordance with the standards of the Public Company Accounting Oversight Board (United States). Those standards require that we plan and perform the audit to obtain reasonable assurance about whether the financial statements are free of material misstatement. An audit includes examining, on a test basis, evidence supporting the amounts and disclosures in the financial statements, assessing the accounting principles used and significant estimates made by management, and evaluating the overall financial statement presentation. We believe that our audits, which included confirmation of securities at September 30, 2014 by correspondence with the custodians and brokers and by agreement to the underlying ownership records of the transfer agent, provide a reasonable basis for our opinion.
/s/PricewaterhouseCoopers LLP
Philadelphia, Pennsylvania
November 10, 2014

Special 2014 tax information (unaudited) for Vanguard Morgan Growth Fund
This information for the fiscal year ended September 30, 2014, is included pursuant to provisions of the Internal Revenue Code.
The fund distributed $470,138,000 as capital gain dividends (from net long-term capital gains) to shareholders during the fiscal year.
For non-resident alien shareholders, 100% of short-term capital gain dividends distributed by the fund are qualified short-term capital gains.
The fund distributed $90,908,000 of qualified dividend income to shareholders during the fiscal year.
For corporate shareholders, 44.9% of investment income (dividend income plus short-term gains, if any) qualifies for the dividends-received deduction.
30
Your Fund’s After-Tax Returns
This table presents returns for your fund both before and after taxes. The after-tax returns are shown in two ways: (1) assuming that an investor owned the fund during the entire period and paid taxes on the fund’s distributions, and (2) assuming that an investor paid taxes on the fund’s distributions and sold all shares at the end of each period.
Calculations are based on the highest individual federal income tax and capital gains tax rates in effect at the times of the distributions and the hypothetical sales. State and local taxes were not considered. After-tax returns reflect any qualified dividend income, using actual prior-year figures and estimates for 2014. (In the example, returns after the sale of fund shares may be higher than those assuming no sale. This occurs when the sale would have produced a capital loss. The calculation assumes that the investor received a tax deduction for the loss.)
The table shows returns for Investor Shares only; returns for other share classes will differ. Please note that your actual after-tax returns will depend on your tax situation and may differ from those shown. Also note that if you own the fund in a tax-deferred account, such as an individual retirement account or a 401(k) plan, this information does not apply to you. Such accounts are not subject to current taxes.
Finally, keep in mind that a fund’s performance—whether before or after taxes—does not guarantee future results.
Average Annual Total Returns: Morgan Growth Fund Investor Shares
Periods Ended September 30, 2014
| | | |
| | One | Five | Ten |
| | Year | Years | Years |
| Returns Before Taxes | 16.85% | 15.29% | 8.52% |
| Returns After Taxes on Distributions | 15.59 | 14.94 | 8.10 |
| Returns After Taxes on Distributions and Sale of Fund Shares | 10.41 | 12.32 | 6.94 |
31
About Your Fund’s Expenses
As a shareholder of the fund, you incur ongoing costs, which include costs for portfolio management, administrative services, and shareholder reports (like this one), among others. Operating expenses, which are deducted from a fund’s gross income, directly reduce the investment return of the fund.
A fund’s expenses are expressed as a percentage of its average net assets. This figure is known as the expense ratio. The following examples are intended to help you understand the ongoing costs (in dollars) of investing in your fund and to compare these costs with those of other mutual funds. The examples are based on an investment of $1,000 made at the beginning of the period shown and held for the entire period.
The accompanying table illustrates your fund’s costs in two ways:
• Based on actual fund return. This section helps you to estimate the actual expenses that you paid over the period. The ”Ending Account Value“ shown is derived from the fund‘s actual return, and the third column shows the dollar amount that would have been paid by an investor who started with $1,000 in the fund. You may use the information here, together with the amount you invested, to estimate the expenses that you paid over the period.
To do so, simply divide your account value by $1,000 (for example, an $8,600 account value divided by $1,000 = 8.6), then multiply the result by the number given for your fund under the heading ”Expenses Paid During Period.“
• Based on hypothetical 5% yearly return. This section is intended to help you compare your fund‘s costs with those of other mutual funds. It assumes that the fund had a yearly return of 5% before expenses, but that the expense ratio is unchanged. In this case—because the return used is not the fund’s actual return—the results do not apply to your investment. The example is useful in making comparisons because the Securities and Exchange Commission requires all mutual funds to calculate expenses based on a 5% return. You can assess your fund’s costs by comparing this hypothetical example with the hypothetical examples that appear in shareholder reports of other funds.
Note that the expenses shown in the table are meant to highlight and help you compare ongoing costs only and do not reflect transaction costs incurred by the fund for buying and selling securities. Further, the expenses do not include any purchase, redemption, or account service fees described in the fund prospectus. If such fees were applied to your account, your costs would be higher. Your fund does not carry a “sales load.”
The calculations assume no shares were bought or sold during the period. Your actual costs may have been higher or lower, depending on the amount of your investment and the timing of any purchases or redemptions.
You can find more information about the fund’s expenses, including annual expense ratios, in the Financial Statements section of this report. For additional information on operating expenses and other shareholder costs, please refer to your fund’s current prospectus.
32
| | | |
| Six Months Ended September 30, 2014 | | | |
| | Beginning | Ending | Expenses |
| | Account Value | Account Value | Paid During |
| Morgan Growth Fund | 3/31/2014 | 9/30/2014 | Period |
| Based on Actual Fund Return | | | |
| Investor Shares | $1,000.00 | $1,047.60 | $2.00 |
| Admiral Shares | 1,000.00 | 1,048.58 | 1.28 |
| Based on Hypothetical 5% Yearly Return | | | |
| Investor Shares | $1,000.00 | $1,023.11 | $1.98 |
| Admiral Shares | 1,000.00 | 1,023.82 | 1.27 |
The calculations are based on expenses incurred in the most recent six-month period. The fund’s annualized six-month expense ratios for thatperiod are 0.39% for Investor Shares and 0.25% for Admiral Shares. The dollar amounts shown as “Expenses Paid” are equal to theannualized expense ratio multiplied by the average account value over the period, multiplied by the number of days in the most recentsix-month period, then divided by the number of days in the most recent 12-month period.33
Glossary
30-Day SEC Yield. A fund’s 30-day SEC yield is derived using a formula specified by the U.S. Securities and Exchange Commission. Under the formula, data related to the fund’s security holdings in the previous 30 days are used to calculate the fund’s hypothetical net income for that period, which is then annualized and divided by the fund’s estimated average net assets over the calculation period. For the purposes of this calculation, a security’s income is based on its current market yield to maturity (for bonds), its actual income (for asset-backed securities), or its projected dividend yield (for stocks). Because the SEC yield represents hypothetical annualized income, it will differ—at times significantly—from the fund’s actual experience. As a result, the fund’s income distributions may be higher or lower than implied by the SEC yield.
Beta. A measure of the magnitude of a fund’s past share-price fluctuations in relation to the ups and downs of a given market index. The index is assigned a beta of 1.00. Compared with a given index, a fund with a beta of 1.20 typically would have seen its share price rise or fall by 12% when the index rose or fell by 10%. For this report, beta is based on returns over the past 36 months for both the fund and the index. Note that a fund’s beta should be reviewed in conjunction with its R-squared (see definition). The lower the R-squared, the less correlation there is between the fund and the index, and the less reliable beta is as an indicator of volatility.
Dividend Yield. Dividend income earned by stocks, expressed as a percentage of the aggregate market value (or of net asset value, for a fund). The yield is determined by dividing the amount of the annual dividends by the aggregate value (or net asset value) at the end of the period. For a fund, the dividend yield is based solely on stock holdings and does not include any income produced by other investments.
Earnings Growth Rate. The average annual rate of growth in earnings over the past five years for the stocks now in a fund.
Equity Exposure. A measure that reflects a fund’s investments in stocks and stock futures. Any holdings in short-term reserves are excluded.
Expense Ratio. A fund’s total annual operating expenses expressed as a percentage of the fund’s average net assets. The expense ratio includes management and administrative expenses, but does not include the transaction costs of buying and selling portfolio securities.
Foreign Holdings. The percentage of a fund represented by securities or depositary receipts of companies based outside the United States.
Inception Date. The date on which the assets of a fund (or one of its share classes) are first invested in accordance with the fund’s investment objective. For funds with a subscription period, the inception date is the day after that period ends. Investment performance is measured from the inception date.
Median Market Cap. An indicator of the size of companies in which a fund invests; the midpoint of market capitalization (market price x shares outstanding) of a fund’s stocks, weighted by the proportion of the fund’s assets invested in each stock. Stocks representing half of the fund’s assets have market capitalizations above the median, and the rest are below it.
Price/Book Ratio. The share price of a stock divided by its net worth, or book value, per share. For a fund, the weighted average price/book ratio of the stocks it holds.
34
Price/Earnings Ratio. The ratio of a stock’s current price to its per-share earnings over the past year. For a fund, the weighted average P/E of the stocks it holds. P/E is an indicator of market expectations about corporate prospects; the higher the P/E, the greater the expectations for a company’s future growth.
R-Squared. A measure of how much of a fund’s past returns can be explained by the returns from the market in general, as measured by a given index. If a fund’s total returns were precisely synchronized with an index’s returns, its R-squared would be 1.00. If the fund’s returns bore no relationship to the index’s returns, its R-squared would be 0. For this report, R-squared is based on returns over the past 36 months for both the fund and the index.
Return on Equity. The annual average rate of return generated by a company during the past five years for each dollar of shareholder’s equity (net income divided by shareholder’s equity). For a fund, the weighted average return on equity for the companies whose stocks it holds.
Short-Term Reserves. The percentage of a fund invested in highly liquid, short-term securities that can be readily converted to cash.
Turnover Rate. An indication of the fund’s trading activity. Funds with high turnover rates incur higher transaction costs and may be more likely to distribute capital gains (which may be taxable to investors). The turnover rate excludes in-kind transactions, which have minimal impact on costs.
35
The People Who Govern Your Fund
The trustees of your mutual fund are there to see that the fund is operated and managed in your best interests since, as a shareholder, you are a part owner of the fund. Your fund’s trustees also serve on the board of directors of The Vanguard Group, Inc., which is owned by the Vanguard funds and provides services to them on an at-cost basis.
A majority of Vanguard’s board members are independent, meaning that they have no affiliation with Vanguard or the funds they oversee, apart from the sizable personal investments they have made as private individuals. The independent board members have distinguished backgrounds in business, academia, and public service. Each of the trustees and executive officers oversees 177 Vanguard funds.
The following table provides information for each trustee and executive officer of the fund. More information about the trustees is in the Statement of Additional Information, which can be obtained, without charge, by contacting Vanguard at 800-662-7447, or online at vanguard.com.
| |
| InterestedTrustee1 | and Delphi Automotive LLP (automotive components); |
| | Senior Advisor at New Mountain Capital. |
| F. William McNabb III | |
| Born 1957. Trustee Since July 2009. Chairman of the | Amy Gutmann |
| Board. Principal Occupation(s) During the Past Five | Born 1949. Trustee Since June 2006. Principal |
| Years: Chairman of the Board of The Vanguard Group, | Occupation(s) During the Past Five Years: President of |
| Inc., and of each of the investment companies served | the University of Pennsylvania; Christopher H. Browne |
| by The Vanguard Group, since January 2010; Director | Distinguished Professor of Political Science, School of |
| of The Vanguard Group since 2008; Chief Executive | Arts and Sciences, and Professor of Communication, |
| Officer and President of The Vanguard Group, and of | Annenberg School for Communication, with secondary |
| each of the investment companies served by The | faculty appointments in the Department of Philosophy, |
| Vanguard Group, since 2008; Director of Vanguard | School of Arts and Sciences, and at the Graduate |
| Marketing Corporation; Managing Director of The | School of Education, University of Pennsylvania; |
| Vanguard Group (1995–2008). | Trustee of the National Constitution Center; Chair |
| | of the Presidential Commission for the Study of |
| | Bioethical Issues. |
| IndependentTrustees | |
| | JoAnn Heffernan Heisen |
| Emerson U. Fullwood | Born 1950. Trustee Since July 1998. Principal |
| Born 1948. Trustee Since January 2008. Principal | Occupation(s) During the Past Five Years: Corporate |
| Occupation(s) During the Past Five Years: Executive | Vice President and Chief Global Diversity Officer |
| Chief Staff and Marketing Officer for North America | (retired 2008) and Member of the Executive |
| and Corporate Vice President (retired 2008) of Xerox | Committee (1997–2008) of Johnson & Johnson |
| Corporation (document management products and | (pharmaceuticals/medical devices/consumer |
| services); Executive in Residence and 2009–2010 | products); Director of Skytop Lodge Corporation |
| Distinguished Minett Professor at the Rochester | (hotels), the University Medical Center at Princeton, |
| Institute of Technology; Director of SPX Corporation | the Robert Wood Johnson Foundation, and the Center |
| (multi-industry manufacturing), the United Way of | for Talent Innovation; Member of the Advisory Board |
| Rochester, Amerigroup Corporation (managed health | of the Maxwell School of Citizenship and Public Affairs |
| care), the University of Rochester Medical Center, | at Syracuse University. |
| Monroe Community College Foundation, and North | |
| Carolina A&T University. | F. Joseph Loughrey |
| | Born 1949. Trustee Since October 2009. Principal |
| Rajiv L. Gupta | Occupation(s) During the Past Five Years: President |
| Born 1945. Trustee Since December 2001.2 | and Chief Operating Officer (retired 2009) of Cummins |
| Principal Occupation(s) During the Past Five Years: | Inc. (industrial machinery); Chairman of the Board |
| Chairman and Chief Executive Officer (retired 2009) | of Hillenbrand, Inc. (specialized consumer services), |
| and President (2006–2008) of Rohm and Haas Co. | and of Oxfam America; Director of SKF AB (industrial |
| (chemicals); Director of Tyco International, Ltd. | machinery), Hyster-Yale Materials Handling, Inc. |
| (diversified manufacturing and services), Hewlett- | (forklift trucks), the Lumina Foundation for Education, |
| Packard Co. (electronic computer manufacturing), | |
| | |
| and the V Foundation for Cancer Research; Member | Executive Officers | |
| of the Advisory Council for the College of Arts and | | |
| Letters and of the Advisory Board to the Kellogg | Glenn Booraem | |
| Institute for International Studies, both at the | Born 1967. Controller Since July 2010. Principal |
| University of Notre Dame. | Occupation(s) During the Past Five Years: Principal |
| | of The Vanguard Group, Inc.; Controller of each of |
| Mark Loughridge | the investment companies served by The Vanguard |
| Born 1953. Trustee Since March 2012. Principal | Group; Assistant Controller of each of the investment |
| Occupation(s) During the Past Five Years: Senior Vice | companies served by The Vanguard Group (2001–2010). |
| President and Chief Financial Officer (retired 2013) | | |
| at IBM (information technology services); Fiduciary | Thomas J. Higgins | |
| Member of IBM’s Retirement Plan Committee (2004– | Born 1957. Chief Financial Officer Since September |
| 2013); Member of the Council on Chicago Booth. | 2008. Principal Occupation(s) During the Past Five |
| | Years: Principal of The Vanguard Group, Inc.; Chief |
| Scott C. Malpass | Financial Officer of each of the investment companies |
| Born 1962. Trustee Since March 2012. Principal | served by The Vanguard Group; Treasurer of each of |
| Occupation(s) During the Past Five Years: Chief | the investment companies served by The Vanguard |
| Investment Officer and Vice President at the University | Group (1998–2008). | |
| of Notre Dame; Assistant Professor of Finance at the | | |
| Mendoza College of Business at Notre Dame; Member | Kathryn J. Hyatt | |
| of the Notre Dame 403(b) Investment Committee; | Born 1955. Treasurer Since November 2008. Principal |
| Board Member of TIFF Advisory Services, Inc. | Occupation(s) During the Past Five Years: Principal of |
| (investment advisor); Member of the Investment | The Vanguard Group, Inc.; Treasurer of each of the |
| Advisory Committees of the Financial Industry | investment companies served by The Vanguard |
| Regulatory Authority (FINRA) and of Major League | Group; Assistant Treasurer of each of the investment |
| Baseball. | companies served by The Vanguard Group (1988–2008). |
| |
| André F. Perold | Heidi Stam | |
| Born 1952. Trustee Since December 2004. Principal | Born 1956. Secretary Since July 2005. Principal |
| Occupation(s) During the Past Five Years: George | Occupation(s) During the Past Five Years: Managing |
| Gund Professor of Finance and Banking, Emeritus | Director of The Vanguard Group, Inc.; General Counsel |
| at the Harvard Business School (retired 2011); | of The Vanguard Group; Secretary of The Vanguard |
| Chief Investment Officer and Managing Partner of | Group and of each of the investment companies |
| HighVista Strategies LLC (private investment firm); | served by The Vanguard Group; Director and Senior |
| Director of Rand Merchant Bank; Overseer of the | Vice President of Vanguard Marketing Corporation. |
| Museum of Fine Arts Boston. | | |
| | Vanguard Senior ManagementTeam |
| Alfred M. Rankin, Jr. | | |
| Born 1941. Trustee Since January 1993. Principal | Mortimer J. Buckley | Chris D. McIsaac |
| Occupation(s) During the Past Five Years: Chairman, | Kathleen C. Gubanich | Michael S. Miller |
| President, and Chief Executive Officer of NACCO | Paul A. Heller | James M. Norris |
| Industries, Inc. (housewares/lignite), and of Hyster- | Martha G. King | Glenn W. Reed |
| Yale Materials Handling, Inc. (forklift trucks); Chairman | John T. Marcante | |
| of the Board of University Hospitals of Cleveland. | | |
| |
| Peter F. Volanakis | Chairman Emeritus and Senior Advisor |
| Born 1955. Trustee Since July 2009. Principal | | |
| Occupation(s) During the Past Five Years: President | John J. Brennan | |
| and Chief Operating Officer (retired 2010) of Corning | Chairman, 1996–2009 | |
| Incorporated (communications equipment); Trustee of | Chief Executive Officer and President, 1996–2008 |
| Colby-Sawyer College; Member of the Advisory Board | | |
| of the Norris Cotton Cancer Center and of the Advisory | Founder | |
| Board of the Parthenon Group (strategy consulting). | | |
| | John C. Bogle | |
| | Chairman and Chief Executive Officer, 1974–1996 |
1 Mr. McNabb is considered an “interested person,” as defined in the Investment Company Act of 1940, because he is an officer of the
Vanguard funds.
2 December 2002 for Vanguard Equity Income Fund, the Vanguard Municipal Bond Funds, and the Vanguard State Tax-Exempt Funds.
| 
|
| | P.O. Box 2600 |
| | Valley Forge, PA 19482-2600 |
| |
| |
| |
| Connect with Vanguard® > vanguard.com | |
| |
| |
| |
| Fund Information > 800-662-7447 | CFA® is a registered trademark owned by CFA Institute. |
| Direct Investor Account Services > 800-662-2739 | |
| Institutional Investor Services > 800-523-1036 | |
| Text Telephone for People | |
| Who Are Deaf or Hard of Hearing> 800-749-7273 | |
| |
| This material may be used in conjunction | |
| with the offering of shares of any Vanguard | |
| fund only if preceded or accompanied by | |
| the fund’s current prospectus. | |
| |
| All comparative mutual fund data are from Lipper, a | |
| Thomson Reuters Company, or Morningstar, Inc., unless | |
| otherwise noted. | |
| |
| You can obtain a free copy of Vanguard’s proxy voting | |
| guidelines by visiting vanguard.com/proxyreporting or by | |
| calling Vanguard at 800-662-2739. The guidelines are | |
| also available from the SEC’s website, sec.gov. In | |
| addition, you may obtain a free report on how your fund | |
| voted the proxies for securities it owned during the 12 | |
| months ended June 30. To get the report, visit either | |
| vanguard.com/proxyreporting or sec.gov. | |
| |
| You can review and copy information about your fund at | |
| the SEC’s Public Reference Room in Washington, D.C. To | |
| find out more about this public service, call the SEC at | |
| 202-551-8090. Information about your fund is also | |
| available on the SEC’s website, and you can receive | |
| copies of this information, for a fee, by sending a | |
| request in either of two ways: via e-mail addressed to | |
| publicinfo@sec.gov or via regular mail addressed to the | |
| Public Reference Section, Securities and Exchange | |
| Commission, Washington, DC 20549-1520. | |
| |
| | © 2014 The Vanguard Group, Inc. |
| | All rights reserved. |
| | Vanguard Marketing Corporation, Distributor. |
| |
| | Q260 112014 |
Item 2: Code of Ethics. The Registrant has adopted a code of ethics that applies to the Registrant’s principal executive officer, principal financial officer, principal accounting officer or controller or persons performing similar functions. The Code of Ethics was amended during the reporting period covered by this report to make certain technical, non-material changes.
Item 3: Audit Committee Financial Expert. The following members of the Audit Committee have been determined by the Registrant’s Board of Trustees to be Audit Committee Financial Experts serving on its Audit Committee, and to be independent: Rajiv L. Gupta, Amy Gutmann, JoAnn Heffernan Heisen, F. Joseph Loughrey, Mark Loughridge, Scott C. Malpass, André F. Perold, and Alfred M. Rankin, Jr.
Item 4: Principal Accountant Fees and Services.
(a) Audit Fees.
Audit Fees of the Registrant
Fiscal Year Ended September 30, 2014: $35,000
Fiscal Year Ended September 30, 2013: $31,000
Aggregate Audit Fees of Registered Investment Companies in the Vanguard Group.
Fiscal Year Ended September 30, 2014: $6,605,127
Fiscal Year Ended September 30, 2013: $5,714,113
Includes fees billed in connection with audits of the Registrant, other registered investment companies in the Vanguard complex, The Vanguard Group, Inc. and Vanguard Marketing Corporation.
(b) Audit-Related Fees.
Fiscal Year Ended September 30, 2014: $2,176,479
Fiscal Year Ended September 30, 2013: $1,552,950
Includes fees billed in connection with assurance and related services provided to the Registrant, other registered investment companies in the Vanguard complex, The Vanguard Group, Inc., and Vanguard Marketing Corporation.
(c) Tax Fees.
Fiscal Year Ended September 30, 2014: $316,869
Fiscal Year Ended September 30, 2013: $110,000
Includes fees billed in connection with tax compliance, planning, and advice services provided to the Registrant, other registered investment companies in the Vanguard complex, The Vanguard Group, Inc., and Vanguard Marketing Corporation.
(d) All Other Fees.
Fiscal Year Ended September 30, 2014: $198,163
Fiscal Year Ended September 30, 2013: $132,000
Includes fees billed for services related to tax reported information provided to the Registrant, other registered investment companies in the Vanguard complex, The Vanguard Group, Inc., and Vanguard Marketing Corporation.
(e) (1) Pre-Approval Policies. The policy of the Registrant’s Audit Committee is to consider and, if appropriate, approve before the principal accountant is engaged for such services, all specific audit and non-audit services provided to: the Registrant, other registered investment companies in the Vanguard complex, The Vanguard Group, Inc., and entities controlled by The Vanguard Group, Inc. that provide ongoing services to the Registrant. In making a determination, the Audit Committee considers whether the services are consistent with maintaining the principal accountant’s independence.
In the event of a contingency situation in which the principal accountant is needed to provide services in between scheduled Audit Committee meetings, the Chairman of the Audit Committee would be called on to consider and, if appropriate, pre-approve audit or permitted non-audit services in an amount sufficient to complete services through the next Audit Committee meeting, and to determine if such services would be consistent with maintaining the accountant’s independence. At the next scheduled Audit Committee meeting, services and fees would be presented to the Audit Committee for formal consideration, and, if appropriate, approval by the entire Audit Committee. The Audit Committee would again consider whether such services and fees are consistent with maintaining the principal accountant’s independence.
The Registrant’s Audit Committee is informed at least annually of all audit and non-audit services provided by the principal accountant to the Vanguard complex, whether such services are provided to: the Registrant, other registered investment companies in the Vanguard complex, The Vanguard Group, Inc., or other entities controlled by The Vanguard Group, Inc. that provide ongoing services to the Registrant.
(2) No percentage of the principal accountant’s fees or services were approved pursuant to the waiver provision of paragraph (c)(7)(i)(C) of Rule 2-01 of Regulation S-X.
(f) For the most recent fiscal year, over 50% of the hours worked under the principal accountant’s engagement were not performed by persons other than full-time, permanent employees of the principal accountant.
(g) Aggregate Non-Audit Fees.
Fiscal Year Ended September 30, 2014: $515,032
Fiscal Year Ended September 30, 2013: $242,000
Includes fees billed for non-audit services provided to the Registrant, other registered investment companies in the Vanguard complex, The Vanguard Group, Inc., and Vanguard Marketing Corporation.
(h) For the most recent fiscal year, the Audit Committee has determined that the provision of all non-audit services was consistent with maintaining the principal accountant’s independence.
Item 5: Audit Committee of Listed Registrants.
Not Applicable.
Item 6: Investments.
Not Applicable.
Item 7: Disclosure of Proxy Voting Policies and Procedures for Closed-End Management Investment Companies.
Not Applicable.
Item 8: Portfolio Managers of Closed-End Management Investment Companies.
Not Applicable.
Item 9: Purchase of Equity Securities by Closed-End Management Investment Company and Affiliated Purchasers.
Not Applicable.
Item 10: Submission of Matters to a Vote of Security Holders.
Not Applicable.
Item 11: Controls and Procedures.
(a) Disclosure Controls and Procedures. The Principal Executive and Financial Officers concluded that the Registrant’s Disclosure Controls and Procedures are effective based on their evaluation of the Disclosure Controls and Procedures as of a date within 90 days of the filing date of this report.
(b) Internal Control Over Financial Reporting. There were no significant changes in Registrant’s Internal Control Over Financial Reporting or in other factors that could significantly affect this control subsequent to the date of the evaluation, including any corrective actions with regard to significant deficiencies and material weaknesses.
Item 12: Exhibits.
(a) Code of Ethics. (b) Certifications.
Pursuant to the requirements of the Securities Exchange Act of 1934 and the Investment Company Act of 1940, the registrant has duly caused this report to be signed on its behalf by the undersigned, thereunto duly authorized.
| |
| | VANGUARD MORGAN GROWTH FUND |
| |
| |
| BY: | /s/ F. WILLIAM MCNABB III* |
| F. WILLIAM MCNABB III |
| | CHIEF EXECUTIVE OFFICER |
| |
| Date: November 19, 2014 |
Pursuant to the requirements of the Securities Exchange Act of 1934 and the Investment Company Act of 1940, this report has been signed below by the following persons on behalf of the registrant and in the capacities and on the dates indicated.
| |
| | VANGUARD MORGAN GROWTH FUND |
| |
| |
| BY: | /s/ F. WILLIAM MCNABB III* |
| F. WILLIAM MCNABB III |
| | CHIEF EXECUTIVE OFFICER |
| |
| Date: November 19, 2014 |
| |
| | VANGUARD MORGAN GROWTH FUND |
| |
| |
| BY: | /s/ THOMAS J. HIGGINS* |
| | THOMAS J. HIGGINS |
| CHIEF FINANCIAL OFFICER |
| |
| Date: November 19, 2014 |
* By: /s/ Heidi Stam
Heidi Stam, pursuant to a Power of Attorney filed on April 22, 2014 see file Number 2-17620, Incorporated by Reference.