UNITED STATES
SECURITIES AND EXCHANGE COMMISSION
Washington, D.C. 20549
FORM N-CSR
CERTIFIED SHAREHOLDER REPORT
OF
REGISTERED MANAGEMENT INVESTMENT COMPANIES
| Investment Company Act file number: 811-1685 |
| Name of Registrant: Vanguard Morgan Growth Fund |
| Address of Registrant: |
| P.O. Box 2600 |
| Valley Forge, PA 19482 |
| Name and address of agent for service: |
| Heidi Stam, Esquire |
| P.O. Box 876 |
| Valley Forge, PA 19482 |
| Registrant’s telephone number, including area code: (610) 669-1000 |
| Date of fiscal year end: September 30 |
| Date of reporting period: October 1, 2010 – September 30, 2011 |
| Item 1: Reports to Shareholders |
![]()

Annual Report | September 30, 2011
Vanguard MorganTM Growth Fund
- For the 12 months ended September 30, 2011, Investor Shares of Vanguard Morgan Growth Fund returned 0.66% and Admiral Shares returned 0.83%.
- The fund lagged the Russell 3000 Growth Index (+3.39%) but outpaced the average return of multi-cap growth funds (–1.49%).
- The fund’s ten-year results outpaced those of its benchmark index.
| Contents | |
| Your Fund’s Total Returns. | 1 |
| Chairman’s Letter. | 2 |
| Advisors’ Report. | 7 |
| Fund Profile. | 11 |
| Performance Summary. | 12 |
| Financial Statements. | 14 |
| Your Fund’s After-Tax Returns. | 29 |
| About Your Fund’s Expenses. | 30 |
| Glossary. | 32 |
The figures shown represent past performance, which is not a guarantee of future results. (Current performance may be lower or higher than the performance data cited. For performance data current to the most recent month-end, visit our website at vanguard.com/performance.)
Please note: The opinions expressed in this report are just that—informed opinions. They should not be considered promises or advice. Also, please keep in mind that the information and opinions cover the period through the date on the front of this report. Of course, the risks of investing in your fund are spelled out in the prospectus.
See the Glossary for definitions of investment terms used in this report.
About the cover: Vanguard was named for the HMS Vanguard, flagship of British Admiral Horatio Nelson. A ship—whose performance and safety depend on the work of all hands—has served as a fitting metaphor for the Vanguard crew as we strive to help clients reach their financial goals.
Your Fund’s Total Returns
| Fiscal Year Ended September 30, 2011 | |
| Total | |
| Returns | |
| Vanguard Morgan Growth Fund | |
| Investor Shares | 0.66% |
| Admiral™ Shares | 0.83 |
| Russell 3000 Growth Index | 3.39 |
| Multi-Cap Growth Funds Average | -1.49 |
| Multi-Cap Growth Funds Average: Derived from data provided by Lipper Inc. | |
Admiral Shares carry lower expenses and are available to investors who meet certain account-balance requirements.
Your Fund’s Performance at a Glance
September 30, 2010 , Through September 30, 2011
| Distributions Per Share | ||||
| Starting | Ending | Income | Capital | |
| Share Price | Share Price | Dividends | Gains | |
| Vanguard Morgan Growth Fund | ||||
| Investor Shares | $16.04 | $16.06 | $0.096 | $0.000 |
| Admiral Shares | 49.75 | 49.84 | 0.362 | 0.000 |
1

Chairman’s Letter
Dear Shareholder,
As the global economic and financial outlook dominated the headlines in the second half of the fiscal year just ended, stocks of all types slid from their strong first-half results. Growth stocks held up better than value stocks. Although Vanguard Morgan Growth Fund’s stock selection didn’t completely take advantage of the situation, the fund outperformed its peers.
For the 12 months ended September 30, 2011, Investor Shares of Morgan Growth Fund returned 0.66% and Admiral Shares returned 0.83%, compared with the 3.39% posted by the Russell 3000 Growth Index. In contrast to these unexceptional but positive results, the average return of Morgan Growth’s peers dipped into negative territory, ending at –1.49%.
If you hold shares in a taxable account, you may wish to review the information about after-tax returns, based on the highest federal income tax bracket, that appears later in the report.
A swift change in sentiment weighed on stock prices
Global stock markets rallied through the first half of the fiscal year as corporate earnings surged and the economic recovery seemed to be gathering steam. In the second half, however, stock prices tumbled as economic indicators took a turn for the worse and U.S. and European policymaking strife dominated the headlines. (Standard & Poor’s, the ratings agency, downgraded the U.S. credit rating, in large part because
2
of the political gridlock on display during the debt-ceiling debate. Vanguard’s confidence in the “full faith and credit” of the U.S. Treasury remains unshaken.)
The U.S. stock market’s second-half weakness sapped its first-half strength. The broad market returned 0.31% for the full 12 months. Growth stocks sank less than value stocks: The Russell 3000 Growth index returned 3.39%, the Russell 3000 Value Index –2.22%. International stocks, which gained less at the start of the year and lost more at the end, returned –10.81% in U.S. dollars.
Bond prices rallied as optimism faded
The stock market’s pattern of strength and weakness was inverted in the bond market. Early in the year, bond prices retreated, consistent with investor optimism about economic growth. Later in the year, as optimism gave way to anxiety, bond prices surged, driving yields to remarkable lows. At the end of September, the yield of the 10-year U.S. Treasury note, a benchmark for longer-term interest rates, stood at 1.93%. Bond indexes recorded impressive returns, though it’s worth noting that shrinking yields imply lower returns on prospective investments.
| Market Barometer | |||
| Average Annual Total Returns | |||
| Periods Ended September 30, 2011 | |||
| One | Three | Five | |
| Year | Years | Years | |
| Stocks | |||
| Russell 1000 Index (Large-caps) | 0.91% | 1.61% | -0.91% |
| Russell 2000 Index (Small-caps) | -3.53 | -0.37 | -1.02 |
| Dow Jones U.S. Total Stock Market Index | 0.31 | 1.75 | -0.57 |
| MSCI All Country World Index ex USA (International) | -10.81 | 0.52 | -1.57 |
| Bonds | |||
| Barclays Capital U.S. Aggregate Bond Index (Broad | |||
| taxable market) | 5.26% | 7.97% | 6.53% |
| Barclays Capital Municipal Bond Index (Broad | |||
| tax-exempt market) | 3.88 | 8.08 | 5.01 |
| Citigroup Three-Month U.S. Treasury Bill Index | 0.11 | 0.19 | 1.61 |
| CPI | |||
| Consumer Price Index | 3.87% | 1.22% | 2.26% |
3
The yields of money market instruments hovered near zero, as they have since December 2008, when the Federal Reserve cut its target for short-term interest rates to between 0% and 0.25%. Toward the end of the period, the Fed indicated that it expected to maintain this exceptionally low target at least through mid-2013.
Consumer discretionary holdings helped the fund’s return
The largest contributors to Morgan Growth’s return during the fiscal year were its consumer discretionary and information technology stocks.
The fund’s consumer discretionary holdings also helped its performance compared with its benchmark index.
The advisors’ selections among the stocks of specialty retailers and makers of apparel accessories and luxury goods were particularly successful. Despite IT’s significant contribution to return, the advisors missed some opportunities in this sector, which accounted for more than a third of the fund’s holdings. Poor selection among software companies and manufacturers of computers and peripheral equipment held back returns compared with the benchmark.
Also contributing to return were the advisors’ choices among health care and consumer staples stocks. The fund’s health care holdings performed well against its benchmark on the strength of the advisors’ choices among health care supply firms and managed health care
| Expense Ratios | |||
| Your Fund Compared With Its Peer Group | |||
| Investor | Admiral | Peer Group | |
| Shares | Shares | Average | |
| Morgan Growth Fund | 0.44% | 0.30% | 1.45% |
The fund expense ratios shown are from the prospectus dated January 26, 2011, and represent estimated costs for the current fiscal year. For the fiscal year ended September 30, 2011, the fund’s expense ratios were 0.42% for Investor Shares and 0.28% for Admiral Shares. The peer-group expense ratio is derived from data provided by Lipper Inc. and captures information through year-end 2010.
Peer group: Multi-Cap Growth Funds.
companies. In the case of consumer staples, however, the advisors’ smaller allocation to the sector countered the effect of their good stock selections.
Morgan Growth’s oil-price-sensitive holdings in the energy sector, though less than 10% of the portfolio’s assets, did the most to restrain return, both overall and relative to the index. As oil prices fell significantly (albeit to still-high levels), the energy stocks in the benchmark index rose about 6%, while the advisors’ choices rose about 2%.
The fund’s long-term returns continue to outpace its benchmark
For the ten years through September 30, Morgan Growth’s average annual return was 4.03%—nearly a percentage point
higher than that of the Russell 3000 Growth Index. The latest results continued a decade-long pattern: In each fiscal year since 2001, the fund has posted a ten-year annualized return that outpaced its benchmark index.
In carrying out its strategy, the fund is aided by its multimanager approach: It is currently managed by four external advisors and Vanguard Quantitative Equity Group. This approach provides our shareholders access to some of the world’s best investment talent—providing diversity of investment process and style, thought, and holdings—and also has the potential to mute some of the natural volatility of returns that can come from investing in fast-growing companies.
| Total Returns | |
| Ten Years Ended September 30, 2011 | |
| Average | |
| Annual Return | |
| Morgan Growth Fund Investor Shares | 4.03% |
| Russell 3000 Growth Index | 3.18 |
| Multi-Cap Growth Funds Average | 3.08 |
| Multi-Cap Growth Funds Average: Derived from data provided by Lipper Inc. | |
The figures shown represent past performance, which is not a guarantee of future results. (Current performance may be
lower or higher than the performance data cited. For performance data current to the most recent month-end, visit our
website at vanguard.com/performance.) Note, too, that both investment returns and principal value can fluctuate widely, so
an investor’s shares, when sold, could be worth more or less than their original cost.
5
Balance and diversification make for a smoother ride in bumpy markets
In August, as our fiscal year neared its end, the stock market experienced some dramatic volatility as concerns about a possible double-dip domestic recession and a weakening of the Eurozone reached a crescendo before receding somewhat. According to recent Vanguard research,* the market turbulence wasn’t unusual; in fact, it was actually “ordinary”—though painful—when compared with other periods of similar uncertainty. Of course, it certainly didn’t feel that way in August, at least in contrast with the relative calm of the preceding months.
Still, the Vanguard researchers looked at other periods of major economic and political dislocation, such as the 2008–2009 global financial crisis, and found that the recent experience was in some ways typical. The implications for investors: Greater-than-normal volatility tied to broad economic and financial angst is to be expected from time to time, although we can never know for certain when these periods will occur. During such periods, Vanguard research shows, the ride for a stock-heavy portfolio has been a lot bumpier than that of a portfolio that also included allocations to broad-based bond investments and/or cash.
As Vanguard’s research shows, the ride for a stock-heavy portfolio has been a lot bumpier during these periods than for a portfolio that also included allocations to broad-based bond investments and short-term reserves.
The historical results reinforce the benefits of a balanced and diversified portfolio. Morgan Growth Fund can play an important role as one element of such a portfolio.
Thank you for entrusting your assets to Vanguard.
Sincerely,

F. William McNabb III
Chairman and Chief Executive Officer
October 17, 2011
* The commentary, August 2011 stock market volatility: Extraordinary or ‘ordinary’?, is available on vanguard.com.
6
Advisors’ Report
For the fiscal year ended September 30, 2011, Vanguard Morgan Growth Fund returned 0.66% for Investor Shares and 0.83% for the lower-cost Admiral Shares. Your fund is managed by five independent advisors, a strategy that enhances the fund’s diversification by providing exposure to distinct, yet complementary, investment approaches. It’s not uncommon for
different advisors to have different views about individual securities or the broader investment environment.
The advisors, the percentage of fund assets each manages, and brief descriptions of their investment strategies are presented in the table below. The advisors have also prepared a discussion of the investment
| Vanguard Morgan Growth Fund Investment Advisors | |||
| Fund Assets Managed | |||
| Investment Advisor | % | $ Million | Investment Strategy |
| Wellington Management | 45 | 3,371 | Uses traditional methods of stock selection—research |
| Company, LLP | and analysis—that identify companies believed to have | ||
| above-average growth prospects, particularly those in | |||
| industries undergoing change. Focuses on mid- and | |||
| large-capitalization companies with proven records of | |||
| sales and earnings growth, profitability, and cash-flow | |||
| generation. | |||
| Jennison Associates LLC | 19 | 1,421 | Research-driven, fundamental investment approach |
| that relies on in-depth company knowledge gleaned | |||
| through meetings with management, customers, and | |||
| suppliers. | |||
| Vanguard Quantitative Equity | 12 | 918 | Employs a quantitative, fundamental management |
| Group | approach, using models that assess valuation, growth | ||
| prospects, management decisions, market sentiment, | |||
| and earnings quality of companies versus their peers. | |||
| Frontier Capital Management Co., | 11 | 847 | Research-driven, fundamental investment approach |
| LLC | that seeks companies with above-average growth | ||
| prospects, reasonable valuations, and competitive | |||
| advantages. | |||
| Kalmar Investment Advisers | 11 | 806 | Employs a “growth-with-value” strategy using creative, |
| bottom-up research to uncover vigorously growing, | |||
| high-quality businesses whose stocks can also be | |||
| bought inefficiently valued. The strategy has a dual | |||
| objective of strong returns with lower risk. | |||
| Cash Investments | 2 | 200 | These short-term reserves are invested by Vanguard in |
| equity index products to simulate investments in | |||
| stocks. Each advisor also may maintain a modest cash | |||
| position. | |||
7
environment that existed during the fiscal period and of how portfolio positioning reflects this assessment. These comments were prepared on October 19, 2011.
Wellington Management Company, llp
Portfolio Manager:
Paul E. Marrkand, CFA,
Senior Vice President
Our portion of the Morgan Growth Fund utilizes traditional methods of stock selection—research and analysis—to identify companies that we believe have above-average growth prospects, particularly those in industries undergoing change. Our research focuses on mid- and large-cap companies with a proven record of sales and earnings growth, profitability, and cash-flow generation.
The 2011 fiscal year has seen a market driven largely by top-down macroeconomic factors, but we have remained true to our bottom-up process and continued to build the portfolio on a stock-by-stock basis, investing in undervalued companies that have the ability to innovate, gain market share, and grow their sales and free cash flow at an above-average rate.
Our allocation to the health care sector, a result of individual stock decisions, contributed to the portfolio’s relative results, as did security selection within the sector. UnitedHealth Group was among our top contributors for the period. The company has begun to execute after
years of weak performance, management turmoil, and massive regulatory hurdles, and the stock has responded accordingly.
Security selection detracted from relative results overall, but especially within the information technology sector. Cisco Systems was our biggest detractor for the period, as the company suffered from a sharp decline in gross margins. Cisco has a dominant franchise and solid balance sheet, and the shares remain very attractively valued in our view.
Jennison Associates LLC
Portfolio Manager:
Kathleen A. McCarragher,
Managing Director
Stock selection in the consumer discretionary and consumer staples sectors contributed most to our portfolio’s return. Also beneficial was an overweighting of consumer discretionary stocks relative to our benchmark index. Amazon.com’s strong earnings reflected continued gains in market share. Starbucks benefited from strong traffic growth. Whole Foods and Costco both climbed on strong sales and increases in market share.
Underweighted positions in industrials and materials, the benchmark’s worst-performing sectors, also benefited relative return.
Stock selection in health care and technology hurt results, despite strong performance from names like Vertex, Shire, Apple, and IBM. In health care, pharmacy benefits manager Express Scripts declined on Walgreens’ threat to withdraw from the Express network and the regulatory uncertainty about a proposed acquisition. In the information technology sector, Juniper Networks declined on an earnings shortfall, while EMC was hurt by concerns about deteriorating macroeconomics.
Vanguard Quantitative Equity Group
Portfolio Manager:
James P. Stetler, Principal
What a contrast between the first half of the fiscal year and the second half. When we last reported to you in April, the Morgan Growth Fund had gained almost 20% over six months. Since then, and particularly in the last three months, equities large and small, in the United States and abroad, have sold off strongly.
Driving the pullback and increasing the overall market volatility over this period were the continued concerns about a stalling U.S. economy, a lack of improvement in the U.S. employment picture, and the unresolved European sovereign-debt crisis. Most economists have reduced their growth estimates for the next year or two, and this has cast a cloud of uncertainty over the near-term prospects for equities. Multi-cap growth
stocks, the focus of your investment in the fund, outperformed the broad market by about 3 percentage points for the fiscal year, with stocks of consumer-oriented and information technology companies leading the way. Utility, telecommunications, and financial stocks were the laggards in this stock universe.
Although overall portfolio performance was influenced by the macroeconomic factors described above, our approach to investing focuses on specific stock fundamentals. Because we believe there is no single indicator for identifying attractive stocks, our evaluation process is based on computerized models that focus on a variety of factors: valuation, growth, quality, management decisions, and market sentiment. For the 2011 fiscal year, our growth, quality, and sentiment indicators were the most effective, while the management decisions and valuation models lagged.
Relative to the benchmark index, our stock selection results were strongest in the health care, consumer discretionary, technology, and energy sectors. Within these groups, the largest contributors were Biogen Idec and Perrigo in health care, Starbucks in the consumer category, Altera in information technology, and Peabody and El Paso in energy. Stock selection was disappointing in industrials and materials. Hertz Global and Southwest Airlines in industrials and PPG Industries in materials did not perform as expected.
9
Frontier Capital Management Co., LLC
Portfolio Managers:
Stephen Knightly, CFA,
Senior Vice President
Christopher J. Scarpa,
Vice President
In our portion of the Morgan Growth Fund, relative performance for the period was aided by stock selection and hurt by an underweighted position in the more defensive consumer staples and utilities sectors. Strong gains in the health care and financial services sectors supported the stocks we chose there.
Although there is uncertainty in the trajectory of the global economy, we are confident that the market will create compelling long-term investment opportunities. We are looking for growth in a low-growth environment. We are finding many attractive opportunities in the health care, technology, and producer durables sectors. A recent correction in commodities is also creating a more conducive backdrop for consumer discretionary investments. In all cases, we are balancing attractive earnings power with rewarding valuations.
Kalmar Investment Advisers
Portfolio Manager:
Ford B. Draper, Jr., President and
Chief Investment Officer
The equity markets here and abroad presently are suffering a confidence crisis. In our view, this was substantially brought on by politicians’ and policymakers’ dysfunctional reaction to critical post-recession challenges, including the Eurozone sovereign-debt problems and renewed signs that the U.S. economy is weakening. This ratcheted-up level of uncertainty makes both the economic and market outlook abnormally unpredictable.
As we see it, all this reinforces the importance of owning stocks in high-quality, well-managed growth companies that possess the ability to gain competitive advantages during tough times and thus emerge stronger when the outlook improves. Moreover, given the market’s behavior, the stocks of such good companies appear extremely cheap in a longer-term context.
Over the last 12 months, our under-performers included Urban Outfitters, DeVry, Navistar, McDermott International, and Sand Ridge Energy. In contrast, our successes included Petrohawk Energy, Herbalife, Cooper Cos, Alliance Data Systems, Fastenal, and Tractor Supply.
10
Morgan Growth Fund
Fund Profile
As of September 30, 2011
| Share-Class Characteristics | ||
| Investor | Admiral | |
| Shares | Shares | |
| Ticker Symbol | VMRGX | VMRAX |
| Expense Ratio1 | 0.44% | 0.30% |
| 30-Day SEC Yield | 0.61% | 0.75% |
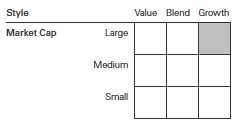
| Portfolio Characteristics | |||
| Russell | DJ | ||
| 3000 | U.S. Total | ||
| Growth | Market | ||
| Fund | Index | Index | |
| Number of Stocks | 327 | 1,728 | 3,717 |
| Median Market Cap $16.0B | $28.8B | $28.7B | |
| Price/Earnings Ratio | 16.1x | 15.4x | 13.6x |
| Price/Book Ratio | 3.0x | 3.4x | 1.9x |
| Return on Equity | 22.7% | 24.6% | 19.1% |
| Earnings Growth Rate 16.6% | 13.4% | 7.3% | |
| Dividend Yield | 1.0% | 1.7% | 2.2% |
| Foreign Holdings | 5.5% | 0.0% | 0.0% |
| Turnover Rate | 55% | — | — |
| Short-Term Reserves | 2.2% | — | — |
| Sector Diversification (% of equity exposure) | |||
| Russell | DJ | ||
| 3000 | U.S. Total | ||
| Growth | Market | ||
| Fund | Index | Index | |
| Consumer | |||
| Discretionary | 17.3% | 14.5% | 12.2% |
| Consumer Staples | 4.7 | 12.4 | 11.0 |
| Energy | 8.6 | 10.1 | 10.3 |
| Financials | 2.6 | 4.1 | 14.3 |
| Health Care | 13.0 | 11.8 | 11.7 |
| Industrials | 11.3 | 12.4 | 10.6 |
| Information | |||
| Technology | 38.2 | 28.4 | 19.4 |
| Materials | 2.6 | 5.0 | 4.0 |
| Telecommunication | |||
| Services | 1.5 | 1.2 | 2.8 |
| Utilities | 0.2 | 0.1 | 3.7 |
| Volatility Measures | ||
| DJ | ||
| U.S. Total | ||
| Russell 3000 | Market | |
| Growth Index | Index | |
| R-Squared | 0.99 | 0.97 |
| Beta | 1.02 | 0.98 |
| These measures show the degree and timing of the fund’s fluctuations compared with the indexes over 36 months. | ||
| Ten Largest Holdings (% of total net assets) | ||
| Apple Inc. | Computer | |
| Hardware | 4.8% | |
| International Business | IT Consulting & | |
| Machines Corp. | Other Services | 3.6 |
| Oracle Corp. | Systems Software | 2.4 |
| Microsoft Corp. | Systems Software | 2.1 |
| Cisco Systems Inc. | Communications | |
| Equipment | 2.0 | |
| EMC Corp. | Computer Storage | |
| & Peripherals | 1.9 | |
| Amazon.com Inc. | Internet Retail | 1.5 |
| Starbucks Corp. | Restaurants | 1.4 |
| Altera Corp. | Semiconductors | 1.4 |
| Google Inc. Class A | Internet Software & | |
| Services | 1.4 | |
| Top Ten | 22.5% | |
| The holdings listed exclude any temporary cash investments and equity index products. | ||
Investment Focus
1 The expense ratios shown are from the prospectus dated January 26, 2011, and represent estimated costs for the current fiscal year. For
the fiscal year ended September 30, 2011, the expense ratios were 0.42% for Investor Shares and 0.28% for Admiral Shares.
11
Morgan Growth Fund
Performance Summary
All of the returns in this report represent past performance, which is not a guarantee of future results that may be achieved by the fund. (Current performance may be lower or higher than the performance data cited. For performance data current to the most recent month-end, visit our website at vanguard.com/performance.) Note, too, that both investment returns and principal value can fluctuate widely, so an investor’s shares, when sold, could be worth more or less than their original cost. The returns shown do not reflect taxes that a shareholder would pay on fund distributions or on the sale of fund shares.
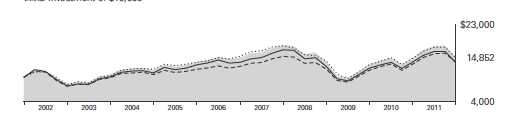
Cumulative Performance: September 30, 2001, Through September 30, 2011
Initial Investment of $10,000
| Average Annual Total Returns | |||||
| Periods Ended September 30, 2011 | |||||
| Final Value | |||||
| One | Five | Ten | of a $10,000 | ||
| Year | Years | Years | Investment | ||
| Morgan Growth Fund Investor Shares | 0.66% | 0.11% | 4.03% | $14,852 | |
| •••••••• | Dow Jones U.S. Total Stock Market | ||||
| Index | 0.31 | -0.57 | 3.93 | 14,709 | |
| – – – – | Russell 3000 Growth Index | 3.39 | 1.56 | 3.18 | 13,680 |
| Multi-Cap Growth Funds Average | -1.49 | -0.17 | 3.08 | 13,544 | |
| Multi-Cap Growth Funds Average: Derived from data provided by Lipper Inc. | |||||
| Final Value | ||||
| One | Five | Ten | of a $50,000 | |
| Year | Years | Years | Investment | |
| Morgan Growth Fund Admiral | ||||
| Shares | 0.83% | 0.27% | 4.20% | $75,414 |
| Dow Jones U.S. Total Stock Market | ||||
| Index | 0.31 | -0.57 | 3.93 | 73,544 |
| Russell 3000 Growth Index | 3.39 | 1.56 | 3.18 | 68,398 |
See Financial Highlights for dividend and capital gains information.
12
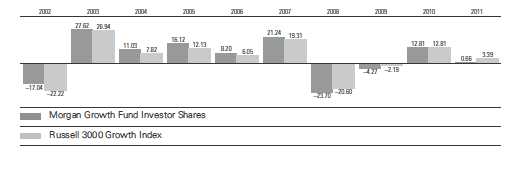
Morgan Growth Fund
Fiscal-Year Total Returns (%): September 30, 2001, Through September 30, 2011
13
Morgan Growth Fund
Financial Statements
Statement of Net Assets
As of September 30, 2011
The fund reports a complete list of its holdings in regulatory filings four times in each fiscal year, at the quarter-ends. For the second and fourth fiscal quarters, the lists appear in the fund’s semiannual and annual reports to shareholders. For the first and third fiscal quarters, the fund files the lists with the Securities and Exchange Commission on Form N-Q. Shareholders can look up the fund’s Forms N-Q on the SEC’s website at sec.gov. Forms N-Q may also be reviewed and copied at the SEC’s Public Reference Room (see the back cover of this report for further information).
| Market | |||
| Value | |||
| Shares | ($000) | ||
| Common Stocks (95.6%)1 | |||
| Consumer Discretionary (16.5%) | |||
| * | Amazon.com Inc. | 529,390 | 114,470 |
| Starbucks Corp. | 2,857,696 | 106,563 | |
| Ralph Lauren Corp. | |||
| Class A | 499,277 | 64,756 | |
| Coach Inc. | 1,120,058 | 58,053 | |
| Omnicom Group Inc. | 1,223,448 | 45,072 | |
| * | priceline.com Inc. | 98,840 | 44,425 |
| * | Bed Bath & Beyond Inc. | 742,799 | 42,570 |
| NIKE Inc. Class B | 497,272 | 42,522 | |
| * | LKQ Corp. | 1,586,551 | 38,331 |
| *,^ | ITT Educational | ||
| Services Inc. | 654,746 | 37,700 | |
| TJX Cos. Inc. | 672,470 | 37,302 | |
| * | DIRECTV Class A | 857,308 | 36,221 |
| Ross Stores Inc. | 455,025 | 35,806 | |
| News Corp. Class A | 2,056,470 | 31,814 | |
| * | Apollo Group Inc. Class A | 802,976 | 31,806 |
| * | Lululemon Athletica Inc. | 591,184 | 28,761 |
| * | Deckers Outdoor Corp. | 279,645 | 26,080 |
| Tractor Supply Co. | 337,585 | 21,116 | |
| * | O’Reilly Automotive Inc. | 313,200 | 20,868 |
| Bayerische Motoren | |||
| Werke AG ADR | 914,864 | 20,063 | |
| * | LVMH Moet Hennessy | ||
| Louis Vuitton SA ADR | 739,574 | 19,477 | |
| * | BorgWarner Inc. | 307,503 | 18,613 |
| * | CarMax Inc. | 747,025 | 17,816 |
| Gentex Corp. | 736,440 | 17,711 | |
| Nordstrom Inc. | 370,070 | 16,905 | |
| * | Dollar Tree Inc. | 215,550 | 16,190 |
| ^ | Buckle Inc. | 417,496 | 16,057 |
| * | Discovery | ||
| Communications Inc. | 432,415 | 15,199 | |
| * | Sirius XM Radio Inc. | 10,009,718 | 15,115 |
| McDonald’s Corp. | 139,700 | 12,268 | |
| DeVry Inc. | 277,625 | 10,261 | |
| * | Discovery | ||
| Communications Inc. | |||
| Class A | 251,200 | 9,450 | |
| Williams-Sonoma Inc. | 304,635 | 9,380 | |
| Harley-Davidson Inc. | 272,900 | 9,369 | |
| Target Corp. | 188,500 | 9,244 | |
| Starwood Hotels & | |||
| Resorts Worldwide Inc. | 232,600 | 9,029 | |
| Chico’s FAS Inc. | 789,653 | 9,026 | |
| * | Dick’s Sporting Goods Inc. | 269,000 | 9,001 |
| Time Warner Cable Inc. | 136,500 | 8,554 | |
| Service Corp. International | 924,415 | 8,468 | |
| * | Urban Outfitters Inc. | 375,400 | 8,379 |
| PetSmart Inc. | 196,225 | 8,369 | |
| Viacom Inc. Class B | 199,300 | 7,721 | |
| Tiffany & Co. | 111,600 | 6,787 | |
| CBS Corp. Class B | 327,400 | 6,672 | |
| * | AutoZone Inc. | 20,800 | 6,639 |
| * | Warnaco Group Inc. | 139,525 | 6,431 |
| Advance Auto Parts Inc. | 102,100 | 5,932 | |
| * | Ctrip.com International | ||
| Ltd. ADR | 177,239 | 5,700 | |
| Wynn Resorts Ltd. | 49,300 | 5,673 | |
| * | Fossil Inc. | 66,380 | 5,381 |
| * | Tenneco Inc. | 207,758 | 5,321 |
| * | DISH Network Corp. | ||
| Class A | 209,500 | 5,250 | |
| Comcast Corp. Class A | 233,100 | 4,872 | |
| Harman International | |||
| Industries Inc. | 158,140 | 4,520 | |
| * | Ford Motor Co. | 453,000 | 4,380 |
| * | TRW Automotive | ||
| Holdings Corp. | 120,200 | 3,934 | |
| *,^ | Tesla Motors Inc. | 121,918 | 2,974 |
| Weight Watchers | |||
| International Inc. | 42,200 | 2,458 | |
| Home Depot Inc. | 55,100 | 1,811 | |
| VF Corp. | 10,300 | 1,252 | |
| 1,251,888 |
14
Morgan Growth Fund
| Market | |||
| Value | |||
| Shares | ($000) | ||
| Consumer Staples (4.3%) | |||
| Whole Foods Market Inc. | 633,392 | 41,367 | |
| Mead Johnson Nutrition Co. 561,083 | 38,619 | ||
| Costco Wholesale Corp. | 373,852 | 30,701 | |
| Estee Lauder Cos. Inc. | |||
| Class A | 338,559 | 29,739 | |
| * | Green Mountain | ||
| Coffee Roasters Inc. | 313,799 | 29,164 | |
| Philip Morris | |||
| International Inc. | 362,800 | 22,631 | |
| Herbalife Ltd. | 336,310 | 18,026 | |
| Coca-Cola Co. | 258,178 | 17,443 | |
| Wal-Mart Stores Inc. | 326,200 | 16,930 | |
| * | Hansen Natural Corp. | 167,438 | 14,616 |
| Colgate-Palmolive Co. | 133,800 | 11,865 | |
| PepsiCo Inc. | 174,100 | 10,777 | |
| Walgreen Co. | 283,400 | 9,321 | |
| Kroger Co. | 327,500 | 7,192 | |
| Dr Pepper Snapple | |||
| Group Inc. | 146,600 | 5,685 | |
| Hershey Co. | 94,000 | 5,569 | |
| Sara Lee Corp. | 335,000 | 5,477 | |
| Coca-Cola Enterprises Inc. | 198,700 | 4,944 | |
| Hormel Foods Corp. | 94,800 | 2,561 | |
| 322,627 | |||
| Energy (8.1%) | |||
| Exxon Mobil Corp. | 1,111,502 | 80,728 | |
| Occidental | |||
| Petroleum Corp. | 747,088 | 53,417 | |
| * | Cameron | ||
| International Corp. | 930,993 | 38,673 | |
| Schlumberger Ltd. | 632,530 | 37,781 | |
| Valero Energy Corp. | 2,110,510 | 37,525 | |
| ^ | Diamond Offshore | ||
| Drilling Inc. | 676,931 | 37,055 | |
| * | Concho Resources Inc. | 468,359 | 33,319 |
| Anadarko Petroleum Corp. | 514,588 | 32,445 | |
| Core Laboratories NV | 335,408 | 30,130 | |
| Oceaneering | |||
| International Inc. | 701,306 | 24,784 | |
| Canadian Natural | |||
| Resources Ltd. | 821,796 | 24,054 | |
| * | McDermott | ||
| International Inc. | 1,792,470 | 19,287 | |
| Baker Hughes Inc. | 415,018 | 19,157 | |
| * | SandRidge Energy Inc. | 2,700,323 | 15,014 |
| Cabot Oil & Gas Corp. | 192,200 | 11,899 | |
| EOG Resources Inc. | 163,429 | 11,605 | |
| * | Continental Resources Inc. | 238,800 | 11,551 |
| *,^ | InterOil Corp. | 223,100 | 10,869 |
| Ensco plc ADR | 205,063 | 8,291 | |
| BP plc ADR | 203,549 | 7,342 | |
| National Oilwell Varco Inc. | 142,840 | 7,316 | |
| * | Superior Energy | ||
| Services Inc. | 272,860 | 7,160 | |
| Hess Corp. | 134,100 | 7,035 | |
| * | Weatherford | ||
| International Ltd. | 556,960 | 6,801 | |
| Williams Cos. Inc. | 266,100 | 6,477 | |
| * | Southwestern Energy Co. | 178,780 | 5,959 |
| Pioneer Natural | |||
| Resources Co. | 84,400 | 5,551 | |
| * | Complete Production | ||
| Services Inc. | 269,769 | 5,085 | |
| HollyFrontier Corp. | 183,100 | 4,801 | |
| * | Tesoro Corp. | 244,800 | 4,766 |
| Noble Energy Inc. | 44,500 | 3,151 | |
| Halliburton Co. | 42,800 | 1,306 | |
| 610,334 | |||
| Exchange-Traded Fund (0.8%) | |||
| ^,2 | Vanguard Growth ETF | 1,044,900 | 58,452 |
| Financials (2.3%) | |||
| American Express Co. | 1,544,132 | 69,331 | |
| T Rowe Price Group Inc. | 403,090 | 19,256 | |
| Raymond James | |||
| Financial Inc. | 514,700 | 13,362 | |
| * | Affiliated Managers | ||
| Group Inc. | 168,250 | 13,132 | |
| Moody’s Corp. | 300,390 | 9,147 | |
| Goldman Sachs Group Inc. | 93,819 | 8,871 | |
| Simon Property Group Inc. | 66,400 | 7,303 | |
| Discover Financial Services | 301,300 | 6,912 | |
| * | CB Richard Ellis Group Inc. | ||
| Class A | 430,770 | 5,798 | |
| Capital One Financial Corp. | 117,600 | 4,660 | |
| Franklin Resources Inc. | 45,600 | 4,361 | |
| Public Storage | 36,400 | 4,053 | |
| TD Ameritrade | |||
| Holding Corp. | 235,700 | 3,466 | |
| US Bancorp | 115,600 | 2,721 | |
| Weyerhaeuser Co. | 25,100 | 390 | |
| 172,763 | |||
| Health Care (12.3%) | |||
| UnitedHealth Group Inc. | 1,699,670 | 78,389 | |
| Shire plc ADR | 559,618 | 52,565 | |
| * | Waters Corp. | 692,939 | 52,310 |
| Amgen Inc. | 935,757 | 51,420 | |
| * | Agilent Technologies Inc. | 1,548,451 | 48,389 |
| * | Intuitive Surgical Inc. | 128,239 | 46,715 |
| * | Watson | ||
| Pharmaceuticals Inc. | 650,470 | 44,395 | |
| Cooper Cos. Inc. | 545,675 | 43,190 | |
| AmerisourceBergen Corp. | |||
| Class A | 985,928 | 36,745 | |
| * | Express Scripts Inc. | 982,999 | 36,440 |
| Cardinal Health Inc. | 829,860 | 34,754 | |
| * | Celgene Corp. | 456,437 | 28,263 |
| * | Hologic Inc. | 1,665,592 | 25,334 |
15
Morgan Growth Fund
| Market | |||
| Value | |||
| Shares | ($000) | ||
| Abbott Laboratories | 479,155 | 24,504 | |
| Novo Nordisk A/S ADR | 243,487 | 24,232 | |
| * | Vertex | ||
| Pharmaceuticals Inc. | 536,456 | 23,894 | |
| * | Laboratory Corp. of | ||
| America Holdings | 249,009 | 19,684 | |
| * | Illumina Inc. | 460,246 | 18,833 |
| Perrigo Co. | 179,300 | 17,412 | |
| Valeant Pharmaceuticals | |||
| International Inc. | 447,501 | 16,611 | |
| * | DaVita Inc. | 235,700 | 14,771 |
| * | ResMed Inc. | 511,880 | 14,737 |
| * | Bruker Corp. | 1,053,655 | 14,256 |
| * | Edwards Lifesciences Corp. | 189,770 | 13,527 |
| * | Allscripts Healthcare | ||
| Solutions Inc. | 730,100 | 13,156 | |
| * | Catalyst Health | ||
| Solutions Inc. | 202,463 | 11,680 | |
| Baxter International Inc. | 186,900 | 10,493 | |
| * | Hospira Inc. | 280,145 | 10,365 |
| * | Life Technologies Corp. | 238,655 | 9,171 |
| Patterson Cos. Inc. | 319,900 | 9,159 | |
| * | Alexion | ||
| Pharmaceuticals Inc. | 137,778 | 8,826 | |
| * | Biogen Idec Inc. | 92,250 | 8,593 |
| McKesson Corp. | 110,900 | 8,062 | |
| * | Thoratec Corp. | 241,500 | 7,882 |
| * | Cerner Corp. | 111,654 | 7,650 |
| * | Gen-Probe Inc. | 124,955 | 7,154 |
| * | ICON plc ADR | 441,100 | 7,093 |
| * | Covance Inc. | 137,320 | 6,241 |
| * | SXC Health | ||
| Solutions Corp. | 105,400 | 5,871 | |
| * | Mednax Inc. | 89,905 | 5,632 |
| Allergan Inc. | 65,000 | 5,355 | |
| * | Medco Health | ||
| Solutions Inc. | 66,000 | 3,095 | |
| * | Amylin | ||
| Pharmaceuticals Inc. | 306,578 | 2,830 | |
| * | HCA Holdings Inc. | 111,500 | 2,248 |
| * | IDEXX Laboratories Inc. | 22,200 | 1,531 |
| Medtronic Inc. | 20,599 | 685 | |
| * | Charles River Laboratories | ||
| International Inc. | 13,900 | 398 | |
| 934,540 | |||
| Industrials (10.8%) | |||
| Caterpillar Inc. | 983,229 | 72,602 | |
| Boeing Co. | 1,122,931 | 67,949 | |
| Parker Hannifin Corp. | 745,826 | 47,084 | |
| General Electric Co. | 3,066,875 | 46,739 | |
| Honeywell | |||
| International Inc. | 927,114 | 40,710 | |
| Precision Castparts Corp. | 258,767 | 40,228 | |
| Cummins Inc. | 382,885 | 31,266 | |
| * | BE Aerospace Inc. | 894,564 | 29,619 |
| Joy Global Inc. | 467,109 | 29,138 | |
| AMETEK Inc. | 795,378 | 26,224 | |
| Dover Corp. | 448,569 | 20,903 | |
| Fastenal Co. | 615,725 | 20,491 | |
| * | IHS Inc. Class A | 266,205 | 19,915 |
| Tyco International Ltd. | 459,629 | 18,730 | |
| MSC Industrial Direct Co. | |||
| Class A | 296,816 | 16,758 | |
| Waste Connections Inc. | 483,700 | 16,359 | |
| * | Corrections Corp. of | ||
| America | 718,304 | 16,298 | |
| * | Navistar International Corp. | 455,340 | 14,625 |
| Deere & Co. | 219,468 | 14,171 | |
| ^ | Progressive Waste | ||
| Solutions Ltd. | 669,080 | 13,770 | |
| Pentair Inc. | 403,980 | 12,931 | |
| * | Alaska Air Group Inc. | 226,307 | 12,739 |
| Cooper Industries plc | 272,860 | 12,584 | |
| * | Hertz Global Holdings Inc. | 1,340,080 | 11,927 |
| * | HUB Group Inc. Class A | 375,162 | 10,606 |
| Chicago Bridge & Iron Co. | 343,070 | 9,822 | |
| * | Quanta Services Inc. | 502,360 | 9,439 |
| JB Hunt Transport | |||
| Services Inc. | 256,445 | 9,263 | |
| Expeditors International of | |||
| Washington Inc. | 207,180 | 8,401 | |
| Norfolk Southern Corp. | 130,100 | 7,939 | |
| Flowserve Corp. | 106,245 | 7,862 | |
| * | Foster Wheeler AG | 418,820 | 7,451 |
| * | Stericycle Inc. | 92,245 | 7,446 |
| Landstar System Inc. | 176,745 | 6,992 | |
| United Parcel Service Inc. | |||
| Class B | 109,800 | 6,934 | |
| PACCAR Inc. | 180,900 | 6,118 | |
| * | WESCO International Inc. | 182,100 | 6,109 |
| Pall Corp. | 142,592 | 6,046 | |
| Rockwell Automation Inc. | 102,900 | 5,762 | |
| * | Swift Transportation Co. | 863,230 | 5,559 |
| * | United Continental | ||
| Holdings Inc. | 281,500 | 5,455 | |
| Textron Inc. | 298,500 | 5,266 | |
| UTi Worldwide Inc. | 393,781 | 5,135 | |
| * | AGCO Corp. | 147,600 | 5,103 |
| Donaldson Co. Inc. | 84,463 | 4,629 | |
| Iron Mountain Inc. | 94,800 | 2,998 | |
| * | Verisk Analytics Inc. | ||
| Class A | 80,500 | 2,799 | |
| Union Pacific Corp. | 27,200 | 2,221 | |
| Pitney Bowes Inc. | 84,700 | 1,592 | |
| CSX Corp. | 76,000 | 1,419 | |
| FedEx Corp. | 19,000 | 1,286 | |
| Emerson Electric Co. | 13,900 | 574 | |
| * | Kansas City Southern | 3,900 | 195 |
| 814,181 |
16
Morgan Growth Fund
| Market | |||
| Value | |||
| Shares | ($000) | ||
| Information Technology (36.6%) | |||
| * | Apple Inc. | 953,456 | 363,438 |
| International Business | |||
| Machines Corp. | 1,570,554 | 274,894 | |
| Oracle Corp. | 6,386,073 | 183,536 | |
| Microsoft Corp. | 6,408,321 | 159,503 | |
| Cisco Systems Inc. | 9,709,446 | 150,399 | |
| * | EMC Corp. | 6,850,708 | 143,796 |
| Altera Corp. | 3,294,057 | 103,862 | |
| * | Google Inc. Class A | 199,696 | 102,720 |
| Qualcomm Inc. | 1,811,298 | 88,083 | |
| * | NetApp Inc. | 1,669,294 | 56,656 |
| Avago Technologies Ltd. | 1,709,638 | 56,025 | |
| * | eBay Inc. | 1,772,050 | 52,258 |
| * | Alliance Data | ||
| Systems Corp. | 532,855 | 49,396 | |
| * | VMware Inc. Class A | 609,823 | 49,018 |
| * | Autodesk Inc. | 1,686,424 | 46,849 |
| * | IAC/InterActiveCorp | 1,178,464 | 46,608 |
| * | Dell Inc. | 3,217,272 | 45,524 |
| * | Check Point Software | ||
| Technologies Ltd. | 843,676 | 44,512 | |
| * | QLogic Corp. | 3,452,317 | 43,775 |
| Xilinx Inc. | 1,551,069 | 42,561 | |
| * | Red Hat Inc. | 999,165 | 42,225 |
| * | Baidu Inc. ADR | 384,974 | 41,158 |
| * | Cognizant Technology | ||
| Solutions Corp. Class A | 640,151 | 40,137 | |
| Analog Devices Inc. | 1,131,003 | 35,344 | |
| * | Citrix Systems Inc. | 550,284 | 30,007 |
| Intersil Corp. Class A | 2,849,566 | 29,322 | |
| * | Salesforce.com Inc. | 250,677 | 28,647 |
| * | BMC Software Inc. | 685,415 | 26,430 |
| * | Rovi Corp. | 585,260 | 25,154 |
| * | VeriFone Systems Inc. | 644,481 | 22,570 |
| * | Adobe Systems Inc. | 924,511 | 22,345 |
| * | F5 Networks Inc. | 248,500 | 17,656 |
| * | Emulex Corp. | 2,665,637 | 17,060 |
| * | Riverbed Technology Inc. | 767,016 | 15,310 |
| Mastercard Inc. Class A | 46,440 | 14,729 | |
| Fidelity National | |||
| Information Services Inc. | 594,670 | 14,462 | |
| * | Juniper Networks Inc. | 751,595 | 12,973 |
| * | Trimble Navigation Ltd. | 347,265 | 11,651 |
| ADTRAN Inc. | 433,300 | 11,465 | |
| * | Intuit Inc. | 232,600 | 11,035 |
| Amphenol Corp. Class A | 264,910 | 10,800 | |
| Accenture plc Class A | 204,200 | 10,757 | |
| * | Nuance | ||
| Communications Inc. | 516,040 | 10,507 | |
| * | Teradata Corp. | 184,378 | 9,870 |
| * | MICROS Systems Inc. | 220,403 | 9,678 |
| * | Sohu.com Inc. | 182,061 | 8,775 |
| * | Ariba Inc. | 294,589 | 8,163 |
| Broadcom Corp. Class A | 241,192 | 8,029 | |
| * | Lam Research Corp. | 209,870 | 7,971 | |
| * | Microsemi Corp. | 454,500 | 7,263 | |
| * | Symantec Corp. | 441,000 | 7,188 | |
| FLIR Systems Inc. | 271,900 | 6,811 | ||
| * | RF Micro Devices Inc. | 1,054,775 | 6,687 | |
| * | Skyworks Solutions Inc. | 365,900 | 6,564 | |
| Western Union Co. | 398,700 | 6,096 | ||
| Jabil Circuit Inc. | 341,063 | 6,067 | ||
| Motorola Solutions Inc. | 142,257 | 5,961 | ||
| * | Polycom Inc. | 310,900 | 5,711 | |
| * | NVIDIA Corp. | 435,700 | 5,446 | |
| * | Fairchild Semiconductor | |||
| International Inc. Class A | 502,372 | 5,426 | ||
| Global Payments Inc. | 125,400 | 5,065 | ||
| Hewlett-Packard Co. | 191,400 | 4,297 | ||
| * | Western Digital Corp. | 164,800 | 4,239 | |
| * | JDS Uniphase Corp. | 409,900 | 4,087 | |
| * | Novellus Systems Inc. | 137,400 | 3,745 | |
| * | Freescale Semiconductor | |||
| Holdings I Ltd. | 328,804 | 3,627 | ||
| * | Fiserv Inc. | 67,100 | 3,407 | |
| * | GT Advanced | |||
| Technologies Inc. | 446,480 | 3,134 | ||
| * | Flextronics International Ltd. | 389,072 | 2,190 | |
| Visa Inc. Class A | 22,500 | 1,929 | ||
| * | Motorola Mobility | |||
| Holdings Inc. | 45,837 | 1,732 | ||
| Intel Corp. | 66,000 | 1,408 | ||
| * | Advanced Micro | |||
| Devices Inc. | 271,200 | 1,378 | ||
| * | Youku.com Inc. ADR | 69,479 | 1,137 | |
| * | Electronic Arts Inc. | 46,300 | 947 | |
| 2,769,185 | ||||
| Materials (2.4%) | ||||
| Freeport-McMoRan | ||||
| Copper & Gold Inc. | 742,373 | 22,605 | ||
| Sherwin-Williams Co. | 209,803 | 15,592 | ||
| * | WR Grace & Co. | 442,820 | 14,746 | |
| Rio Tinto plc ADR | 331,618 | 14,618 | ||
| Teck Resources Ltd. | ||||
| Class B | 498,362 | 14,547 | ||
| Cliffs Natural | ||||
| Resources Inc. | 278,236 | 14,237 | ||
| Walter Energy Inc. | 233,459 | 14,010 | ||
| FMC Corp. | 182,294 | 12,607 | ||
| * | Crown Holdings Inc. | 325,600 | 9,967 | |
| Praxair Inc. | 95,130 | 8,893 | ||
| Monsanto Co. | 142,700 | 8,568 | ||
| Albemarle Corp. | 178,240 | 7,201 | ||
| PPG Industries Inc. | 81,700 | 5,773 | ||
| Allegheny Technologies Inc. | 151,742 | 5,613 | ||
| CF Industries Holdings Inc. | 41,200 | 5,084 | ||
| International Paper Co. | 198,500 | 4,615 | ||
| Alcoa Inc. | 379,800 | 3,635 | ||
| Ball Corp. | 66,800 | 2,072 | ||
17
Morgan Growth Fund
| Market | ||||
| Value | ||||
| Shares | ($000) | |||
| EI du Pont de | ||||
| Nemours & Co. | 39,200 | 1,567 | ||
| 185,950 | ||||
| Telecommunication Services (1.4%) | ||||
| * | American Tower Corp. | |||
| Class A | 853,945 | 45,942 | ||
| Vodafone Group plc ADR | 964,156 | 24,731 | ||
| * | Crown Castle | |||
| International Corp. | 523,900 | 21,307 | ||
| * | NII Holdings Inc. | 313,130 | 8,439 | |
| * | MetroPCS | |||
| Communications Inc. | 351,800 | 3,064 | ||
| 103,483 | ||||
| Utilities (0.1%) | ||||
| * | AES Corp. | 838,370 | 8,182 | |
| Total Common Stocks | ||||
| (Cost $6,532,397) | 7,231,585 | |||
| Temporary Cash Investments (4.8%)1 | ||||
| Money Market Fund (3.9%) | ||||
| 3,4 | Vanguard Market Liquidity | |||
| Fund, 0.144% | 296,369,000 | 296,369 | ||
| Face | ||
| Amount | ||
| ($000) | ||
| Repurchase Agreement (0.6%) | ||
| Bank of America Securities, | ||
| LLC 0.080%, 10/3/11 | ||
| (Dated 9/30/11, Repurchase | ||
| Value $45,900,000, | ||
| collateralized by Federal | ||
| Home Loan Mortgage | ||
| Corp. 4.000%, 4/1/26, and | ||
| Federal National Mortgage | ||
| Assn. 4.000%, 11/1/40) | 45,900 | 45,900 |
| Face | Market | ||
| Amount | Value | ||
| ($000) | ($000) | ||
| U.S. Government and Agency Obligations (0.3%) | |||
| 5,6 | Fannie Mae Discount | ||
| Notes, 0.080%, 12/19/11 | 15,000 | 14,994 | |
| 5,6 | Fannie Mae Discount | ||
| Notes, 0.075%, 12/21/11 | 5,000 | 4,998 | |
| 5,6 | Federal Home Loan Bank | ||
| Discount Notes, 0.040%, | |||
| 11/25/11 | 400 | 400 | |
| 5,6 | Freddie Mac Discount | ||
| Notes, 0.080%, 12/29/11 | 1,000 | 1,000 | |
| 21,392 | |||
| Total Temporary Cash Investments | |||
| (Cost $363,666) | 363,661 | ||
| Total Investments (100.4%) | |||
| (Cost $6,896,063) | 7,595,246 | ||
| Other Assets and Liabilities (–0.4%) | |||
| Other Assets | 69,729 | ||
| Liabilities4 | (101,824) | ||
| (32,095) | |||
| Net Assets (100%) | 7,563,151 | ||
18
Morgan Growth Fund
| At September 30, 2011, net assets consisted of: | |
| Amount | |
| ($000) | |
| Paid-in Capital | 8,043,060 |
| Undistributed Net Investment Income | 15,675 |
| Accumulated Net Realized Losses | (1,189,680) |
| Unrealized Appreciation (Depreciation) | |
| Investment Securities | 699,183 |
| Futures Contracts | (5,087) |
| Net Assets | 7,563,151 |
| Investor Shares—Net Assets | |
| Applicable to 311,841,018 outstanding | |
| $.001 par value shares of beneficial | |
| interest (unlimited authorization) | 5,008,883 |
| Net Asset Value Per Share— | |
| Admiral Shares | $16.06 |
| Admiral Shares—Net Assets | |
| Applicable to 51,245,031 outstanding | |
| $.001 par value shares of beneficial | |
| interest (unlimited authorization) | 2,554,268 |
| Net Asset Value Per Share— | |
| Admiral Shares | $49.84 |
See Note A in Notes to Financial Statements.
* Non-income-producing security.
^ Part of security position is on loan to broker-dealers. The total value of securities on loan is $47,342,000.
1 The fund invests a portion of its cash reserves in equity markets through the use of index futures contracts. After giving effect to futures
investments, the fund’s effective common stock and temporary cash investment positions represent 97.5% and 2.9%, respectively, of
net assets.
2 Considered an affiliated company of the fund as the issuer is another member of The Vanguard Group.
3 Affiliated money market fund available only to Vanguard funds and certain trusts and accounts managed by Vanguard. Rate shown is the
7-day yield.
4 Includes $49,651,000 of collateral received for securities on loan.
5 The issuer operates under a congressional charter; its securities are not backed by the full faith and credit of the U.S. government.
6 Securities with a value of $21,392,000 have been segregated as initial margin for open futures contracts.
ADR—American Depositary Receipt.
See accompanying Notes, which are an integral part of the Financial Statements.
19
Morgan Growth Fund
Statement of Operations
| Year Ended | |
| September 30, 2011 | |
| ($000) | |
| Investment Income | |
| Income | |
| Dividends1,2 | 77,767 |
| Interest2 | 575 |
| Security Lending | 307 |
| Total Income | 78,649 |
| Expenses | |
| Investment Advisory Fees—Note B | |
| Basic Fee | 14,710 |
| Performance Adjustment | (1,214) |
| The Vanguard Group—Note C | |
| Management and Administrative—Investor Shares | 14,193 |
| Management and Administrative—Admiral Shares | 3,243 |
| Marketing and Distribution—Investor Shares | 1,325 |
| Marketing and Distribution—Admiral Shares | 695 |
| Custodian Fees | 158 |
| Auditing Fees | 31 |
| Shareholders’ Reports—Investor Shares | 113 |
| Shareholders’ Reports—Admiral Shares | 42 |
| Trustees’ Fees and Expenses | 19 |
| Total Expenses | 33,315 |
| Expenses Paid Indirectly | (360) |
| Net Expenses | 32,955 |
| Net Investment Income | 45,694 |
| Realized Net Gain (Loss) | |
| Investment Securities Sold2 | 763,265 |
| Futures Contracts | 30,365 |
| Realized Net Gain (Loss) | 793,630 |
| Change in Unrealized Appreciation (Depreciation) | |
| Investment Securities | (735,205) |
| Futures Contracts | (6,621) |
| Change in Unrealized Appreciation (Depreciation) | (741,826) |
| Net Increase (Decrease) in Net Assets Resulting from Operations | 97,498 |
| 1 Dividends are net of foreign withholding taxes of $355,000. | |
| 2 Dividend income, interest income, and realized net gain (loss) from affiliated companies of the fund were $775,000, $434,000, and $0, respectively. | |
See accompanying Notes, which are an integral part of the Financial Statements.
20
Morgan Growth Fund
Statement of Changes in Net Assets
| Year Ended September 30, | ||
| 2011 | 2010 | |
| ($000) | ($000) | |
| Increase (Decrease) in Net Assets | ||
| Operations | ||
| Net Investment Income | 45,694 | 52,591 |
| Realized Net Gain (Loss) | 793,630 | 412,692 |
| Change in Unrealized Appreciation (Depreciation) | (741,826) | 467,615 |
| Net Increase (Decrease) in Net Assets Resulting from Operations | 97,498 | 932,898 |
| Distributions | ||
| Net Investment Income | ||
| Investor Shares | (30,610) | (39,716) |
| Admiral Shares | (19,672) | (20,471) |
| Realized Capital Gain | ||
| Investor Shares | — | — |
| Admiral Shares | — | — |
| Total Distributions | (50,282) | (60,187) |
| Capital Share Transactions | ||
| Investor Shares | (475,300) | (417,198) |
| Admiral Shares | 114,941 | (69,202) |
| Net Increase (Decrease) from Capital Share Transactions | (360,359) | (486,400) |
| Total Increase (Decrease) | (313,143) | 386,311 |
| Net Assets | ||
| Beginning of Period | 7,876,294 | 7,489,983 |
| End of Period1 | 7,563,151 | 7,876,294 |
| 1 Net Assets—End of Period includes undistributed net investment income of $15,675,000 and $20,263,000. | ||
See accompanying Notes, which are an integral part of the Financial Statements.
21
Morgan Growth Fund
Financial Highlights
| Investor Shares | |||||
| For a Share Outstanding | Year Ended September 30, | ||||
| Throughout Each Period | 2011 | 2010 | 2009 | 2008 | 2007 |
| Net Asset Value, Beginning of Period | $16.04 | $14.32 | $15.15 | $21.45 | $18.34 |
| Investment Operations | |||||
| Net Investment Income | .087 | .097 | .114 | .148 | .207 |
| Net Realized and Unrealized Gain (Loss) | |||||
| on Investments | .029 | 1.733 | (.804) | (4.912) | 3.604 |
| Total from Investment Operations | .116 | 1.830 | (.690) | (4.764) | 3.811 |
| Distributions | |||||
| Dividends from Net Investment Income | (.096) | (.110) | (.140) | (.175) | (.204) |
| Distributions from Realized Capital Gains | — | — | — | (1.361) | (.497) |
| Total Distributions | (.096) | (.110) | (.140) | (1.536) | (.701) |
| Net Asset Value, End of Period | $16.06 | $16.04 | $14.32 | $15.15 | $21.45 |
| Total Return1 | 0.66% | 12.81% | -4.27% | -23.70% | 21.24% |
| Ratios/Supplemental Data | |||||
| Net Assets, End of Period (Millions) | $5,009 | $5,432 | $5,239 | $5,418 | $6,590 |
| Ratio of Total Expenses to | |||||
| Average Net Assets2 | 0.42% | 0.44% | 0.48% | 0.38% | 0.37% |
| Ratio of Net Investment Income to | |||||
| Average Net Assets | 0.47% | 0.62% | 0.94% | 0.80% | 1.06% |
| Portfolio Turnover Rate | 55% | 60% | 87% | 88% | 79% |
| 1 Total returns do not include account service fees that may have applied in the periods shown. Fund prospectuses provide information about | |||||
| any applicable account service fees. | |||||
| 2 Includes performance-based investment advisory fee increases (decreases) of (0.01%), 0.01%, 0.02%, 0.00%, and 0.00%. | |||||
See accompanying Notes, which are an integral part of the Financial Statements.
22
Morgan Growth Fund
Financial Highlights
| Admiral Shares | |||||
| For a Share Outstanding | Year Ended September 30, | ||||
| Throughout Each Period | 2011 | 2010 | 2009 | 2008 | 2007 |
| Net Asset Value, Beginning of Period | $49.75 | $44.42 | $47.03 | $66.58 | $56.94 |
| Investment Operations | |||||
| Net Investment Income | .342 | .372 | .414 | .555 | .742 |
| Net Realized and Unrealized Gain (Loss) | |||||
| on Investments | .110 | 5.364 | (2.502) | (15.244) | 11.184 |
| Total from Investment Operations | .452 | 5.736 | (2.088) | (14.689) | 11.926 |
| Distributions | |||||
| Dividends from Net Investment Income | (.362) | (.406) | (.522) | (.641) | (.745) |
| Distributions from Realized Capital Gains | — | — | — | (4.220) | (1.541) |
| Total Distributions | (.362) | (.406) | (.522) | (4.861) | (2.286) |
| Net Asset Value, End of Period | $49.84 | $49.75 | $44.42 | $47.03 | $66.58 |
| Total Return | 0.83% | 12.95% | -4.09% | -23.57% | 21.43% |
| Ratios/Supplemental Data | |||||
| Net Assets, End of Period (Millions) | $2,554 | $2,445 | $2,251 | $2,512 | $2,683 |
| Ratio of Total Expenses to | |||||
| Average Net Assets1 | 0.28% | 0.30% | 0.31% | 0.21% | 0.21% |
| Ratio of Net Investment Income to | |||||
| Average Net Assets | 0.61% | 0.76% | 1.11% | 0.97% | 1.22% |
| Portfolio Turnover Rate | 55% | 60% | 87% | 88% | 79% |
| 1 Includes performance-based investment advisory fee increases (decreases) of (0.01%), 0.01%, 0.02%, 0.00%, and 0.00%. | |||||
See accompanying Notes, which are an integral part of the Financial Statements.
23
Morgan Growth Fund
Notes to Financial Statements
Vanguard Morgan Growth Fund is registered under the Investment Company Act of 1940 as an open-end investment company, or mutual fund. The fund offers two classes of shares: Investor Shares and Admiral Shares. Investor Shares are available to any investor who meets the fund’s minimum purchase requirements. Admiral Shares are designed for investors who meet certain administrative, service, and account-size criteria.
A. The following significant accounting policies conform to generally accepted accounting principles for U.S. mutual funds. The fund consistently follows such policies in preparing its financial statements.
1. Security Valuation: Securities are valued as of the close of trading on the New York Stock Exchange (generally 4 p.m., Eastern time) on the valuation date. Equity securities are valued at the latest quoted sales prices or official closing prices taken from the primary market in which each security trades; such securities not traded on the valuation date are valued at the mean of the latest quoted bid and asked prices. Securities for which market quotations are not readily available, or whose values have been affected by events occurring before the fund’s pricing time but after the close of the securities’ primary markets, are valued at their fair values calculated according to procedures adopted by the board of trustees. These procedures include obtaining quotations from an independent pricing service, monitoring news to identify significant market- or security-specific events, and evaluating changes in the values of foreign market proxies (for example, ADRs, futures contracts, or exchange-traded funds), between the time the foreign markets close and the fund’s pricing time. When fair-value pricing is employed, the prices of securities used by a fund to calculate its net asset value may differ from quoted or published prices for the same securities. Investments in Vanguard Market Liquidity Fund are valued at that fund’s net asset value. Temporary cash investments acquired over 60 days to maturity are valued using the latest bid prices or using valuations based on a matrix system (which considers such factors as security prices, yields, maturities, and ratings), both as furnished by independent pricing services. Other temporary cash investments are valued at amortized cost, which approximates market value.
2. Futures Contracts: The fund uses index futures contracts to a limited extent, with the objective of maintaining full exposure to the stock market while maintaining liquidity. The fund may purchase or sell futures contracts to achieve a desired level of investment, whether to accommodate portfolio turnover or cash flows from capital share transactions. The primary risks associated with the use of futures contracts are imperfect correlation between changes in market values of stocks held by the fund and the prices of futures contracts, and the possibility of an illiquid market.
Futures contracts are valued at their quoted daily settlement prices. The aggregate principal amounts of the contracts are not recorded in the Statement of Net Assets. Fluctuations in the value of the contracts are recorded in the Statement of Net Assets as an asset (liability) and in the Statement of Operations as unrealized appreciation (depreciation) until the contracts are closed, when they are recorded as realized futures gains (losses).
3. Repurchase Agreements: The fund invests in repurchase agreements. Securities pledged as collateral for repurchase agreements are held by a custodian bank until the agreements mature. Each agreement requires that the market value of the collateral be sufficient to cover payments of interest and principal; however, in the event of default or bankruptcy by the other party to the agreement, retention of the collateral may be subject to legal proceedings.
4. Federal Income Taxes: The fund intends to continue to qualify as a regulated investment company and distribute all of its taxable income. Management has analyzed the fund’s tax positions taken for all open federal income tax years (September 30, 2008–2011), and has concluded that no provision for federal income tax is required in the fund’s financial statements.
5. Distributions: Distributions to shareholders are recorded on the ex-dividend date.
24
Morgan Growth Fund
6. Security Lending: The fund may lend its securities to qualified institutional borrowers to earn additional income. Security loans are required to be secured at all times by collateral at least equal to the market value of securities loaned. The fund invests cash collateral received in Vanguard Market Liquidity Fund, and records a liability for the return of the collateral, during the period the securities are on loan. Security lending income represents fees charged to borrowers plus income earned on investing cash collateral, less expenses associated with the loan.
7. Other: Dividend income is recorded on the ex-dividend date. Interest income includes income distributions received from Vanguard Market Liquidity Fund and is accrued daily. Security transactions are accounted for on the date securities are bought or sold. Costs used to determine realized gains (losses) on the sale of investment securities are those of the specific securities sold.
Each class of shares has equal rights as to assets and earnings, except that each class separately bears certain class-specific expenses related to maintenance of shareholder accounts (included in Management and Administrative expenses) and shareholder reporting. Marketing and distribution expenses are allocated to each class of shares based on a method approved by the board of trustees. Income, other non-class-specific expenses, and gains and losses on investments are allocated to each class of shares based on its relative net assets.
B. Wellington Management Company, LLP, Jennison Associates LLC, Frontier Capital Management Co., LLC, and Kalmar Investment Advisers each provide investment advisory services to a portion of the fund for a fee calculated at an annual percentage rate of average net assets managed by the advisor. The basic fee of Wellington Management Company, LLP, is subject to quarterly adjustments based on performance for the preceding three years relative to the Russell 3000 Growth Index. The basic fee of Jennison Associates LLC is subject to quarterly adjustments based on performance for the preceding three years relative to the Russell 1000 Growth Index. The basic fees of Frontier Capital Management Co., LLC, and Kalmar Investment Advisers are subject to quarterly adjustments based on performance since December 31, 2008, relative to the Russell Midcap Growth Index.
The Vanguard Group provides investment advisory services to a portion of the fund on an at-cost basis; the fund paid Vanguard advisory fees of $711,000 for the year ended September 30, 2011.
For the year ended September 30, 2011, the aggregate investment advisory fee represented an effective annual basic rate of 0.17% of the fund’s average net assets, before a decrease of $1,214,000 (0.01%) based on performance.
C. The Vanguard Group furnishes at cost corporate management, administrative, marketing, and distribution services. The costs of such services are allocated to the fund under methods approved by the board of trustees. The fund has committed to provide up to 0.40% of its net assets in capital contributions to Vanguard. At September 30, 2011, the fund had contributed capital of $1,365,000 to Vanguard (included in Other Assets), representing 0.02% of the fund’s net assets and 0.55% of Vanguard’s capitalization. The fund’s trustees and officers are also directors and officers of Vanguard.
D. The fund has asked its investment advisors to direct certain security trades, subject to obtaining the best price and execution, to brokers who have agreed to rebate to the fund part of the commissions generated. Such rebates are used solely to reduce the fund’s management and administrative expenses. For the year ended September 30, 2011, these arrangements reduced the fund’s expenses by $360,000 (an annual rate of 0.00% of average net assets).
25
Morgan Growth Fund
E. Various inputs may be used to determine the value of the fund’s investments. These inputs are summarized in three broad levels for financial statement purposes. The inputs or methodologies used to value securities are not necessarily an indication of the risk associated with investing in those securities.
Level 1—Quoted prices in active markets for identical securities.
Level 2—Other significant observable inputs (including quoted prices for similar securities, interest rates, prepayment speeds, credit risk, etc.).
Level 3—Significant unobservable inputs (including the fund’s own assumptions used to determine the fair value of investments).
The following table summarizes the fund’s investments as of September 30, 2011, based on the inputs used to value them:
| Level 1 | Level 2 | Level 3 | |
| Investments | ($000) | ($000) | ($000) |
| Common Stocks | 7,231,585 | — | — |
| Temporary Cash Investments | 296,369 | 67,292 | — |
| Futures Contracts—Liabilities1 | (3,941) | — | — |
| Total | 7,524,013 | 67,292 | — |
| 1 Represents variation margin on the last day of the reporting period. | |||
F. At September 30, 2011, the aggregate settlement value of open futures contracts and the related unrealized appreciation (depreciation) were:
| ($000) | ||||
| Aggregate | ||||
| Number of | Settlement | Unrealized | ||
| Long (Short) | Value | Appreciation | ||
| Futures Contracts | Expiration | Contracts | Long (Short) | (Depreciation) |
| S&P 500 Index | December 2011 | 498 | 140,187 | (5,062) |
| E-mini S&P 500 Index | December 2011 | 110 | 6,193 | (19) |
| E-mini S&P Mid-Cap 400 Index | December 2011 | 1 | 78 | (6) |
Unrealized appreciation (depreciation) on open futures contracts is required to be treated as realized gain (loss) for tax purposes.
G. Distributions are determined on a tax basis and may differ from net investment income and realized capital gains for financial reporting purposes. Differences may be permanent or temporary. Permanent differences are reclassified among capital accounts in the financial statements to reflect their tax character. Temporary differences arise when certain items of income, expense, gain, or loss are recognized in different periods for financial statement and tax purposes; these differences will reverse at some time in the future. Differences in classification may also result from the treatment of short-term gains as ordinary income for tax purposes.
26
Morgan Growth Fund
For tax purposes, at September 30, 2011, the fund had $33,398,000 of ordinary income available for distribution. The fund had available capital loss carryforwards totaling $1,190,331,000 to offset future net capital gains of $90,903,000 through September 30, 2017 and $1,099,428,000 through September 30, 2018.
At September 30, 2011, the cost of investment securities for tax purposes was $6,900,198,000. Net unrealized appreciation of investment securities for tax purposes was $695,048,000, consisting of unrealized gains of $1,413,119,000 on securities that had risen in value since their purchase and $718,071,000 in unrealized losses on securities that had fallen in value since their purchase.
H. During the year ended September 30, 2011, the fund purchased $4,644,534,000 of investment securities and sold $5,083,422,000 of investment securities, other than temporary cash investments.
| I. Capital share transactions for each class of shares were: | ||||
| Year Ended September 30, | ||||
| 2011 | 2010 | |||
| Amount | Shares | Amount | Shares | |
| ($000) | (000) | ($000) | (000) | |
| Investor Shares | ||||
| Issued | 881,191 | 48,755 | 656,780 | 43,144 |
| Issued in Lieu of Cash Distributions | 29,637 | 1,644 | 38,554 | 2,500 |
| Redeemed | (1,386,128) | (77,285) | (1,112,532) | (72,852) |
| Net Increase (Decrease)—Investor Shares | (475,300) | (26,886) | (417,198) | (27,208) |
| Admiral Shares | ||||
| Issued | 800,719 | 14,395 | 381,035 | 8,051 |
| Issued in Lieu of Cash Distributions | 17,322 | 310 | 17,395 | 364 |
| Redeemed | (703,100) | (12,596) | (467,632) | (9,955) |
| Net Increase (Decrease)—Admiral Shares | 114,941 | 2,109 | (69,202) | (1,540) |
J. In preparing the financial statements as of September 30, 2011, management considered the impact of subsequent events for potential recognition or disclosure in these financial statements.
27
Report of Independent Registered Public Accounting Firm
To the Trustees and Shareholders of Vanguard Morgan Growth Fund:
In our opinion, the accompanying statement of net assets and the related statements of operations and of changes in net assets and the financial highlights present fairly, in all material respects, the financial position of Vanguard Morgan Growth Fund (the “Fund”) at September 30, 2011, the results of its operations for the year then ended, the changes in its net assets for each of the two years in the period then ended and the financial highlights for each of the five years in the period then ended, in conformity with accounting principles generally accepted in the United States of America. These financial statements and financial highlights (hereafter referred to as “financial statements”) are the responsibility of the Fund’s management; our responsibility is to express an opinion on these financial statements based on our audits. We conducted our audits of these financial statements in accordance with the standards of the Public Company Accounting Oversight Board (United States). Those standards require that we plan and perform the audit to obtain reasonable assurance about whether the financial statements are free of material misstatement. An audit includes examining, on a test basis, evidence supporting the amounts and disclosures in the financial statements, assessing the accounting principles used and significant estimates made by management, and evaluating the overall financial statement presentation. We believe that our audits, which included confirmation of securities at September 30, 2011 by correspondence with the custodians and brokers and by agreement to the underlying ownership records of Vanguard Market Liquidity Fund, provide a reasonable basis for our opinion.
PricewaterhouseCoopers LLP
Philadelphia, Pennsylvania
November 15, 2011
Special 2011 tax information (unaudited) for Vanguard Morgan Growth Fund
This information for the fiscal year ended September 30, 2011, is included pursuant to provisions of the Internal Revenue Code.
The fund distributed $50,282,000 of qualified dividend income to shareholders during the fiscal year.
For corporate shareholders, 100% of investment income (dividend income plus short-term gains, if any) qualifies for the dividends-received deduction.
28
Your Fund’s After-Tax Returns
This table presents returns for your fund both before and after taxes. The after-tax returns are shown in two ways: (1) assuming that an investor owned the fund during the entire period and paid taxes on the fund’s distributions, and (2) assuming that an investor paid taxes on the fund’s distributions and sold all shares at the end of each period.
Calculations are based on the highest individual federal income tax and capital gains tax rates in effect at the times of the distributions and the hypothetical sales. State and local taxes were not considered. After-tax returns reflect any qualified dividend income, using actual prior-year figures and estimates for 2011. (In the example, returns after the sale of fund shares may be higher than those assuming no sale. This occurs when the sale would have produced a capital loss. The calculation assumes that the investor received a tax deduction for the loss.)
The table shows returns for Investor Shares only; returns for other share classes will differ. Please note that your actual after-tax returns will depend on your tax situation and may differ from those shown. Also note that if you own the fund in a tax-deferred account, such as an individual retirement account or a 401(k) plan, this information does not apply to you. Such accounts are not subject to current taxes.
Finally, keep in mind that a fund’s performance—whether before or after taxes—does not guarantee future results.
| Average Annual Total Returns: Morgan Growth Fund Investor Shares | |||
| Periods Ended September 30, 2011 | |||
| One | Five | Ten | |
| Year | Years | Years | |
| Returns Before Taxes | 0.66% | 0.11% | 4.03% |
| Returns After Taxes on Distributions | 0.58 | -0.38 | 3.72 |
| Returns After Taxes on Distributions and Sale of Fund Shares | 0.55 | 0.04 | 3.46 |
29
About Your Fund’s Expenses
As a shareholder of the fund, you incur ongoing costs, which include costs for portfolio management, administrative services, and shareholder reports (like this one), among others. Operating expenses, which are deducted from a fund’s gross income, directly reduce the investment return of the fund.
A fund’s expenses are expressed as a percentage of its average net assets. This figure is known as the expense ratio. The following examples are intended to help you understand the ongoing costs (in dollars) of investing in your fund and to compare these costs with those of other mutual funds. The examples are based on an investment of $1,000 made at the beginning of the period shown and held for the entire period.
The accompanying table illustrates your fund’s costs in two ways:
• Based on actual fund return. This section helps you to estimate the actual expenses that you paid over the period. The ”Ending Account Value“ shown is derived from the fund‘s actual return, and the third column shows the dollar amount that would have been paid by an investor who started with $1,000 in the fund. You may use the information here, together with the amount you invested, to estimate the expenses that you paid over the period.
To do so, simply divide your account value by $1,000 (for example, an $8,600 account value divided by $1,000 = 8.6), then multiply the result by the number given for your fund under the heading ”Expenses Paid During Period.“
• Based on hypothetical 5% yearly return. This section is intended to help you compare your fund‘s costs with those of other mutual funds. It assumes that the fund had a yearly return of 5% before expenses, but that the expense ratio is unchanged. In this case—because the return used is not the fund’s actual return—the results do not apply to your investment. The example is useful in making comparisons because the Securities and Exchange Commission requires all mutual funds to calculate expenses based on a 5% return. You can assess your fund’s costs by comparing this hypothetical example with the hypothetical examples that appear in shareholder reports of other funds.
Note that the expenses shown in the table are meant to highlight and help you compare ongoing costs only and do not reflect transaction costs incurred by the fund for buying and selling securities. Further, the expenses do not include any purchase, redemption, or account service fees described in the fund prospectus. If such fees were applied to your account, your costs would be higher. Your fund does not carry a “sales load.”
The calculations assume no shares were bought or sold during the period. Your actual costs may have been higher or lower, depending on the amount of your investment and the timing of any purchases or redemptions.
You can find more information about the fund’s expenses, including annual expense ratios, in the Financial Statements section of this report. For additional information on operating expenses and other shareholder costs, please refer to your fund’s current prospectus.
30
| Six Months Ended September 30, 2011 | |||
| Beginning | Ending | Expenses | |
| Account Value | Account Value | Paid During | |
| Morgan Growth Fund | 3/31/2011 | 9/30/2011 | Period |
| Based on Actual Fund Return | |||
| Investor Shares | $1,000.00 | $840.40 | $1.94 |
| Admiral Shares | 1,000.00 | 841.18 | 1.29 |
| Based on Hypothetical 5% Yearly Return | |||
| Investor Shares | $1,000.00 | $1,022.96 | $2.13 |
| Admiral Shares | 1,000.00 | 1,023.66 | 1.42 |
The calculations are based on expenses incurred in the most recent six-month period. The fund’s annualized six-month expense ratios for that
period are 0.42% for Investor Shares and 0.28% for Admiral Shares. The dollar amounts shown as “Expenses Paid” are equal to the
annualized expense ratio multiplied by the average account value over the period, multiplied by the number of days in the most recent
six-month period, then divided by the number of days in the most recent 12-month period.
Glossary
30-Day SEC Yield. A fund’s 30-day SEC yield is derived using a formula specified by the U.S. Securities and Exchange Commission. Under the formula, data related to the fund’s security holdings in the previous 30 days are used to calculate the fund’s hypothetical net income for that period, which is then annualized and divided by the fund’s estimated average net assets over the calculation period. For the purposes of this calculation, a security’s income is based on its current market yield to maturity (for bonds; excluding inflation for inflation-protected securities), its actual income (for asset-backed securities), or its projected dividend yield (for stocks). Because the SEC yield represents hypothetical annualized income, it will differ—at times significantly—from the fund’s actual experience. As a result, the fund’s income distributions may be higher or lower than implied by the SEC yield.
Beta. A measure of the magnitude of a fund’s past share-price fluctuations in relation to the ups and downs of a given market index. The index is assigned a beta of 1.00. Compared with a given index, a fund with a beta of 1.20 typically would have seen its share price rise or fall by 12% when the index rose or fell by 10%. For this report, beta is based on returns over the past 36 months for both the fund and the index. Note that a fund’s beta should be reviewed in conjunction with its R-squared (see definition). The lower the R-squared, the less correlation there is between the fund and the index, and the less reliable beta is as an indicator of volatility.
Dividend Yield. Dividend income earned by stocks, expressed as a percentage of the aggregate market value (or of net asset value, for a fund). The yield is determined by dividing the amount of the annual dividends by the aggregate value (or net asset value) at the end of the period. For a fund, the dividend yield is based solely on stock holdings and does not include any income produced by other investments.
Earnings Growth Rate. The average annual rate of growth in earnings over the past five years for the stocks now in a fund.
Equity Exposure. A measure that reflects a fund’s investments in stocks and stock futures. Any holdings in short-term reserves are excluded.
Expense Ratio. The percentage of a fund’s average net assets used to pay its annual administrative and advisory expenses. These expenses directly reduce returns to investors.
Foreign Holdings. The percentage of a fund represented by securities or depositary receipts of companies based outside the United States.
Inception Date. The date on which the assets of a fund (or one of its share classes) are first invested in accordance with the fund’s investment objective. For funds with a subscription period, the inception date is the day after that period ends. Investment performance is measured from the inception date.
Median Market Cap. An indicator of the size of companies in which a fund invests; the midpoint of market capitalization (market price x shares outstanding) of a fund’s stocks, weighted by the proportion of the fund’s assets invested in each stock. Stocks representing half of the fund’s assets have market capitalizations above the median, and the rest are below it.
Price/Book Ratio. The share price of a stock divided by its net worth, or book value, per share. For a fund, the weighted average price/book ratio of the stocks it holds.
32
Price/Earnings Ratio. The ratio of a stock’s current price to its per-share earnings over the past year. For a fund, the weighted average P/E of the stocks it holds. P/E is an indicator of market expectations about corporate prospects; the higher the P/E, the greater the expectations for a company’s future growth.
R-Squared. A measure of how much of a fund’s past returns can be explained by the returns from the market in general, as measured by a given index. If a fund’s total returns were precisely synchronized with an index’s returns, its R-squared would be 1.00. If the fund’s returns bore no relationship to the index’s returns, its R-squared would be 0. For this report, R-squared is based on returns over the past 36 months for both the fund and the index.
Return on Equity. The annual average rate of return generated by a company during the past five years for each dollar of shareholder’s equity (net income divided by shareholder’s equity). For a fund, the weighted average return on equity for the companies whose stocks it holds.
Short-Term Reserves. The percentage of a fund invested in highly liquid, short-term securities that can be readily converted to cash.
Turnover Rate. An indication of the fund’s trading activity. Funds with high turnover rates incur higher transaction costs and may be more likely to distribute capital gains (which may be taxable to investors). The turnover rate excludes in-kind transactions, which have minimal impact on costs.
33
This page intentionally left blank.
This page intentionally left blank.
The People Who Govern Your Fund
The trustees of your mutual fund are there to see that the fund is operated and managed in your best interests since, as a shareholder, you are a part owner of the fund. Your fund’s trustees also serve on the board of directors of The Vanguard Group, Inc., which is owned by the Vanguard funds and provides services to them on an at-cost basis.
A majority of Vanguard’s board members are independent, meaning that they have no affiliation with Vanguard or the funds they oversee, apart from the sizable personal investments they have made as private individuals. The independent board members have distinguished backgrounds in business, academia, and public service. Each of the trustees and executive officers oversees 178 Vanguard funds.
The following table provides information for each trustee and executive officer of the fund. More information about the trustees is in the Statement of Additional Information, which can be obtained, without charge, by contacting Vanguard at 800-662-7447, or online at vanguard.com.
Interested Trustee1 and President (2006–2008) of Rohm and Haas Co. (chemicals); Director of Tyco International, Ltd.
F. William McNabb III (diversified manufacturing and services) and Hewlett-Born 1957. Trustee Since July 2009. Chairman of the Packard Co. (electronic computer manufacturing); Board. Principal Occupation(s) During the Past Five Senior Advisor at New Mountain Capital; Trustee Years: Chairman of the Board of The Vanguard Group, of The Conference Board; Member of the Board of Inc., and of each of the investment companies served Managers of Delphi Automotive LLP (automotive by The Vanguard Group, since January 2010; Director components). of The Vanguard Group since 2008; Chief Executive Officer and President of The Vanguard Group and of Amy Gutmann each of the investment companies served by The Born 1949. Trustee Since June 2006. Principal Vanguard Group since 2008; Director of Vanguard Occupation(s) During the Past Five Years: President Marketing Corporation; Managing Director of The of the University of Pennsylvania; Christopher H. Vanguard Group (1995–2008). Browne Distinguished Professor of Political Science in the School of Arts and Sciences with secondary appointments at the Annenberg School for Commu-Independent Trustees nication and the Graduate School of Education of the University of Pennsylvania; Director of Emerson U. Fullwood Carnegie Corporation of New York, Schuylkill River Born 1948. Trustee Since January 2008. Principal Development Corporation, and Greater Philadelphia Occupation(s) During the Past Five Years: Executive Chamber of Commerce; Trustee of the National Chief Staff and Marketing Officer for North America Constitution Center; Chair of the Presidential and Corporate Vice President (retired 2008) of Xerox Commission for the Study of Bioethical Issues. Corporation (document management products and services); Executive in Residence and 2010 JoAnn Heffernan Heisen Distinguished Minett Professor at the Rochester Born 1950. Trustee Since July 1998. Principal Institute of Technology; Director of SPX Corporation Occupation(s) During the Past Five Years: Corporate (multi-industry manufacturing), the United Way of Vice President and Chief Global Diversity Officer Rochester, Amerigroup Corporation (managed health (retired 2008) and Member of the Executive care), the University of Rochester Medical Center, Committee (1997–2008) of Johnson & Johnson Monroe Community College Foundation, and North (pharmaceuticals/consumer products); Director of Carolina A&T University. Skytop Lodge Corporation (hotels), the University Medical Center at Princeton, the Robert Wood Rajiv L. Gupta Johnson Foundation, and the Center for Work Life Born 1945. Trustee Since December 2001.2 Policy; Member of the Advisory Board of the Principal Occupation(s) During the Past Five Years: Maxwell School of Citizenship and Public Affairs Chairman and Chief Executive Officer (retired 2009) at Syracuse University.
| F. Joseph Loughrey | Thomas J. Higgins | |
| Born 1949. Trustee Since October 2009. Principal | Born 1957. Chief Financial Officer Since September | |
| Occupation(s) During the Past Five Years: President | 2008. Principal Occupation(s) During the Past Five | |
| and Chief Operating Officer (retired 2009) and Vice | Years: Principal of The Vanguard Group, Inc.; Chief | |
| Chairman of the Board (2008–2009) of Cummins Inc. | Financial Officer of each of the investment companies | |
| (industrial machinery); Director of SKF AB (industrial | served by The Vanguard Group since 2008; Treasurer | |
| machinery), Hillenbrand, Inc. (specialized consumer | of each of the investment companies served by The | |
| services), the Lumina Foundation for Education, and | Vanguard Group (1998–2008). | |
| Oxfam America; Chairman of the Advisory Council | ||
| for the College of Arts and Letters and Member | Kathryn J. Hyatt | |
| of the Advisory Board to the Kellogg Institute for | Born 1955. Treasurer Since November 2008. Principal | |
| International Studies at the University of Notre Dame. | Occupation(s) During the Past Five Years: Principal | |
| of The Vanguard Group, Inc.; Treasurer of each of | ||
| André F. Perold | the investment companies served by The Vanguard | |
| Born 1952. Trustee Since December 2004. Principal | Group since 2008; Assistant Treasurer of each of the | |
| Occupation(s) During the Past Five Years: George | investment companies served by The Vanguard Group | |
| Gund Professor of Finance and Banking at the Harvard | (1988–2008). | |
| Business School (retired July 2011); Chief Investment | ||
| Officer and co-Managing Partner of HighVista | Heidi Stam | |
| Strategies LLC (private investment firm); Director of | Born 1956. Secretary Since July 2005. Principal | |
| Rand Merchant Bank; Overseer of the Museum of | Occupation(s) During the Past Five Years: Managing | |
| Fine Arts Boston. | Director of The Vanguard Group, Inc., since 2006; | |
| General Counsel of The Vanguard Group since 2005; | ||
| Alfred M. Rankin, Jr. | Secretary of The Vanguard Group and of each of the | |
| Born 1941. Trustee Since January 1993. Principal | investment companies served by The Vanguard Group | |
| Occupation(s) During the Past Five Years: Chairman, | since 2005; Director and Senior Vice President of | |
| President, and Chief Executive Officer of NACCO | Vanguard Marketing Corporation since 2005; | |
| Industries, Inc. (forklift trucks/housewares/lignite); | Principal of The Vanguard Group (1997–2006). | |
| Director of Goodrich Corporation (industrial products/ | ||
| aircraft systems and services) and the National | ||
| Association of Manufacturers; Chairman of the | Vanguard Senior Management Team | |
| Federal Reserve Bank of Cleveland; Vice Chairman | ||
| of University Hospitals of Cleveland; President of | R. Gregory Barton | Chris D. McIsaac |
| the Board of The Cleveland Museum of Art. | Mortimer J. Buckley | Michael S. Miller |
| Kathleen C. Gubanich | James M. Norris | |
| Peter F. Volanakis | Paul A. Heller | Glenn W. Reed |
| Born 1955. Trustee Since July 2009. Principal | Martha G. King | George U. Sauter |
| Occupation(s) During the Past Five Years: President | ||
| and Chief Operating Officer (retired 2010) of Corning | ||
| Incorporated (communications equipment); Director of | Chairman Emeritus and Senior Advisor | |
| Corning Incorporated (2000–2010) and Dow Corning | ||
| (2001–2010); Overseer of the Amos Tuck School of | John J. Brennan | |
| Business Administration at Dartmouth College. | Chairman, 1996–2009 | |
| Chief Executive Officer and President, 1996–2008 | ||
| Executive Officers | ||
| Founder | ||
| Glenn Booraem | ||
| Born 1967. Controller Since July 2010. Principal | John C. Bogle | |
| Occupation(s) During the Past Five Years: Principal | Chairman and Chief Executive Officer, 1974–1996 | |
| of The Vanguard Group, Inc.; Controller of each of | ||
| the investment companies served by The Vanguard | ||
| Group since 2010; Assistant Controller of each of | ||
| the investment companies served by The Vanguard | ||
| Group (2001–2010). | ||
1 Mr. McNabb is considered an “interested person,” as defined in the Investment Company Act of 1940, because he is an officer of the
Vanguard funds.
2 December 2002 for Vanguard Equity Income Fund, Vanguard Growth Equity Fund, the Vanguard Municipal Bond Funds, and the Vanguard
State Tax-Exempt Funds.

| P.O. Box 2600 | |
| Valley Forge, PA 19482-2600 | |
| Connect with Vanguard® > vanguard.com | |
| Fund Information > 800-662-7447 | CFA® is a trademark owned by CFA Institute. |
| Direct Investor Account Services > 800-662-2739 | |
| Institutional Investor Services > 800-523-1036 | |
| Text Telephone for People | |
| With Hearing Impairment > 800-749-7273 | |
| This material may be used in conjunction | |
| with the offering of shares of any Vanguard | |
| fund only if preceded or accompanied by | |
| the fund’s current prospectus. | |
| All comparative mutual fund data are from Lipper Inc. or | |
| Morningstar, Inc., unless otherwise noted. | |
| You can obtain a free copy of Vanguard’s proxy voting | |
| guidelines by visiting vanguard.com/proxyreporting or by | |
| calling Vanguard at 800-662-2739. The guidelines are | |
| also available from the SEC’s website, sec.gov. In | |
| addition, you may obtain a free report on how your fund | |
| voted the proxies for securities it owned during the 12 | |
| months ended June 30. To get the report, visit either | |
| vanguard.com/proxyreporting or sec.gov. | |
| You can review and copy information about your fund at | |
| the SEC’s Public Reference Room in Washington, D.C. To | |
| find out more about this public service, call the SEC at | |
| 202-551-8090. Information about your fund is also | |
| available on the SEC’s website, and you can receive | |
| copies of this information, for a fee, by sending a | |
| request in either of two ways: via e-mail addressed to | |
| publicinfo@sec.gov or via regular mail addressed to the | |
| Public Reference Section, Securities and Exchange | |
| Commission, Washington, DC 20549-1520. | |
| © 2011 The Vanguard Group, Inc. | |
| All rights reserved. | |
| Vanguard Marketing Corporation, Distributor. | |
| Q260 112011 | |
Item 2: Code of Ethics. The Registrant has adopted a code of ethics that applies to the Registrant’s principal executive officer, principal financial officer, principal accounting officer or controller or persons performing similar functions. The Code of Ethics was amended during the reporting period covered by this report to make certain technical, non-material changes.
Item 3: Audit Committee Financial Expert. The following members of the Audit Committee have been determined by the Registrant’s Board of Trustees to be Audit Committee Financial Experts serving on its Audit Committee, and to be independent: Charles D. Ellis, Rajiv L. Gupta, JoAnn Heffernan Heisen, André F. Perold, and Alfred M. Rankin, Jr.
Item 4: Principal Accountant Fees and Services.
(a) Audit Fees.
Audit Fees of the Registrant
Fiscal Year Ended September 30, 2011: $31,000
Fiscal Year Ended September 30, 2010: $29,000
Aggregate Audit Fees of Registered Investment Companies in the Vanguard Group.
Fiscal Year Ended September 30, 2011: $3,978,540
Fiscal Year Ended September 30, 2010: $3,607,060
(b) Audit-Related Fees.
Fiscal Year Ended September 30, 2011: $1,341,750
Fiscal Year Ended September 30, 2010: $791,350
Includes fees billed in connection with assurance and related services provided to the Registrant, The Vanguard Group, Inc., Vanguard Marketing Corporation, and other registered investment companies in the Vanguard Group.
(c) Tax Fees.
Fiscal Year Ended September 30, 2011: $373,830
Fiscal Year Ended September 30, 2010: $336,090
Includes fees billed in connection with tax compliance, planning and advice services provided to the Registrant, The Vanguard Group, Inc., Vanguard Marketing Corporation, and other registered investment companies in the Vanguard Group and related to income and excise taxes.
(d) All Other Fees.
Fiscal Year Ended September 30, 2011: $16,000
Fiscal Year Ended September 30, 2010: $16,000
Includes fees billed for services related to risk management and privacy matters. Services were provided to the Registrant, The Vanguard Group, Inc., Vanguard Marketing Corporation, and other registered investment companies in the Vanguard Group.
(e) (1) Pre-Approval Policies. The policy of the Registrant’s Audit Committee is to consider and, if appropriate, approve before the principal accountant is engaged for such services, all specific audit and non-audit services provided to: (1) the Registrant; (2) The Vanguard Group, Inc.; (3) other entities controlled by The Vanguard Group, Inc. that provide ongoing services to the Registrant; and (4) other registered investment companies in the Vanguard Group. In making a determination, the Audit Committee considers whether the services are consistent with maintaining the principal accountant’s independence.
In the event of a contingency situation in which the principal accountant is needed to provide services in between scheduled Audit Committee meetings, the Chairman of the Audit Committee would be called on to consider and, if appropriate, pre-approve audit or permitted non-audit services in an amount sufficient to complete services through the next Audit Committee meeting, and to determine if such services would be consistent with maintaining the accountant’s independence. At the next scheduled Audit Committee meeting, services and fees would be presented to the Audit Committee for formal consideration, and, if appropriate, approval by the entire Audit Committee. The Audit Committee would again consider whether such services and fees are consistent with maintaining the principal accountant’s independence.
The Registrant’s Audit Committee is informed at least annually of all audit and non-audit services provided by the principal accountant to the Vanguard complex, whether such services are provided to: (1) the Registrant; (2) The Vanguard Group, Inc.; (3) other entities controlled by The Vanguard Group, Inc. that provide ongoing services to the Registrant; or (4) other registered investment companies in the Vanguard Group.
(2) No percentage of the principal accountant’s fees or services were approved pursuant to the waiver provision of paragraph (c)(7)(i)(C) of Rule 2-01 of Regulation S-X.
(f) For the most recent fiscal year, over 50% of the hours worked under the principal accountant’s engagement were not performed by persons other than full-time, permanent employees of the principal accountant.
(g) Aggregate Non-Audit Fees.
Fiscal Year Ended September 30, 2011: $389,830
Fiscal Year Ended September 30, 2010: $352,090
Includes fees billed for non-audit services provided to the Registrant, The Vanguard Group, Inc., Vanguard Marketing Corporation, and other registered investment companies in the Vanguard Group.
(h) For the most recent fiscal year, the Audit Committee has determined that the provision of all non-audit services was consistent with maintaining the principal accountant’s independence.
Item 5: Audit Committee of Listed Registrants. Not Applicable.
Item 6: Investments.
Not Applicable.
Item 7: Disclosure of Proxy Voting Policies and Procedures for Closed-End Management Investment Companies.
Not Applicable.
Item 8: Portfolio Managers of Closed-End Management Investment Companies. Not Applicable.
Item 9: Purchase of Equity Securities by Closed-End Management Investment Company and Affiliated Purchasers.
Not Applicable.
Item 10: Submission of Matters to a Vote of Security Holders. Not Applicable.
Item 11: Controls and Procedures.
(a) Disclosure Controls and Procedures. The Principal Executive and Financial Officers concluded that the Registrant's Disclosure Controls and Procedures are effective based on their evaluation of the Disclosure Controls and Procedures as of a date within 90 days of the filing date of this report.
(b) Internal Control Over Financial Reporting. There were no significant changes in Registrant’s Internal Control Over Financial Reporting or in other factors that could
significantly affect this control subsequent to the date of the evaluation, including any corrective actions with regard to significant deficiencies and material weaknesses.
Item 12: Exhibits.
(a) Code of Ethics.
(b) Certifications.
Pursuant to the requirements of the Securities Exchange Act of 1934 and the Investment Company Act of 1940, the registrant has duly caused this report to be signed on its behalf by the undersigned, thereunto duly authorized.
| VANGUARD MORGAN GROWTH FUND | |
| BY: | /s/ F. WILLIAM MCNABB III* |
| F. WILLIAM MCNABB III | |
| CHIEF EXECUTIVE OFFICER | |
| Date: November 18, 2011 | |
Pursuant to the requirements of the Securities Exchange Act of 1934 and the Investment Company Act of 1940, this report has been signed below by the following persons on behalf of the registrant and in the capacities and on the dates indicated.
| VANGUARD MORGAN GROWTH FUND | |
| BY: | /s/ F. WILLIAM MCNABB III* |
| F. WILLIAM MCNABB III | |
| CHIEF EXECUTIVE OFFICER | |
| Date: November 18, 2011 | |
| VANGUARD MORGAN GROWTH FUND | |
| BY: | /s/ THOMAS J. HIGGINS* |
| THOMAS J. HIGGINS | |
| CHIEF FINANCIAL OFFICER | |
| Date: November 18, 2011 | |
* By: /s/ Heidi Stam
*By: /s/ Heidi Stam
Heidi Stam, pursuant to a Power of Attorney filed on November 28, 2011, see File Number 33-23444,
Incorporated by Reference.