UNITED STATES
SECURITIES AND EXCHANGE COMMISSION
Washington, D.C. 20549
FORM N-CSR
CERTIFIED SHAREHOLDER REPORT
OF
REGISTERED MANAGEMENT INVESTMENT COMPANIES
| |
| Investment Company Act file number: 811-1685 | |
| Name of Registrant: Vanguard Morgan Growth Fund | |
| Address of Registrant: P.O. Box 2600 | |
| Valley Forge, PA 19482 | |
| |
| Name and address of agent for service: Heidi Stam, Esquire | |
| P.O. Box 876 | |
| Valley Forge, PA 19482 | |
| |
| Registrant’s telephone number, including area code: (610) 669-1000 | |
| |
| Date of fiscal year end: September 30 | |
| |
| Date of reporting period: October 1, 2009 – September 30, 2010 | |
| |
| Item 1: Reports to Shareholders | |

|
| Vanguard Morgan™ Growth Fund |
| Annual Report |
|
| September 30, 2010 |

> For the 12 months ended September 30, 2010, Vanguard Morgan Growth Fund returned 12.81% for Investor Shares and 12.95% for Admiral Shares.
> The fund’s return was in line with that of its benchmark index and a bit higher than the average return of peer funds.
> Information technology holdings were the primary drivers of fund returns during the period.
| |
| Contents | |
| Your Fund’s Total Returns. | 1 |
| Chairman’s Letter. | 2 |
| Advisors’ Report. | 7 |
| Fund Profile. | 12 |
| Performance Summary. | 13 |
| Financial Statements. | 15 |
| Your Fund’s After-Tax Returns. | 29 |
| About Your Fund’s Expenses. | 30 |
| Glossary. | 32 |
Please note: The opinions expressed in this report are just that—informed opinions. They should not be considered promises or advice. Also, please keep in mind that the information and opinions cover the period through the date on the front of this report. Of course, the risks of investing in your fund are spelled out in the prospectus.
See the Glossary for definitions of investment terms used in this report.
Cover photograph: Jean Maher.
Your Fund’s Total Returns
| |
| Fiscal Year Ended September 30, 2010 | |
| | Total |
| | Returns |
| Vanguard Morgan Growth Fund | |
| Investor Shares | 12.81% |
| Admiral™ Shares | 12.95 |
| Russell 3000 Growth Index | 12.81 |
| Multi-Cap Growth Funds Average | 12.25 |
| Multi-Cap Growth Funds Average: Derived from data provided by Lipper Inc. |
| Admiral Shares carry lower expenses and are available to investors who meet certain account-balance requirements. |
| | | | |
| Your Fund’s Performance at a Glance | | | | |
| September 30, 2009, Through September 30, 2010 | | | | |
| | | | Distributions Per Share |
| | Starting | Ending | Income | Capital |
| | Share Price | Share Price | Dividends | Gains |
| Vanguard Morgan Growth Fund | | | | |
| Investor Shares | $14.32 | $16.04 | $0.110 | $0.000 |
| Admiral Shares | 44.42 | 49.75 | 0.406 | 0.000 |
1

Chairman’s Letter
Dear Shareholder,
For the 12 months ended September 30, 2010, a period of nerve-wracking market swings, the Investor Shares of Vanguard Morgan Growth Fund returned 12.81%. The lower-cost Admiral Shares returned 12.95%. These results were in line with the 12.81% return of the Russell 3000 Growth Index and a bit better than the average return of competing multi-capitalization growth funds.
The fund benefited from astute selections among information technology, industrial, and energy stocks. A handful of poor performers from the financial sector weighed on both the fund’s absolute returns and its performance relative to its benchmark.
If you own the Morgan Growth Fund in a taxable account, you may wish to review our report on the fund’s after-tax returns on page 29.
Also, please note that on October 6, after the close of the period, Vanguard broadened the availability of our Admiral Shares. We reduced the Admiral minimums on most of our actively managed funds to $50,000 from $100,000, as part of our ongoing efforts to lower the cost of investing for our clients.
An upbeat end to a worrisome 12 months
Although global stock markets traced a ragged trajectory, they ultimately gained ground for the 12 months ended
2
September 30. Europe’s sovereign debt crisis and a dispiriting lack of vigor in the U.S. economy weighed on stock prices through the spring and summer. In September, however, investor sentiment perked up, buoyed by continued signs of strength in corporate financial statements. The broad U.S. stock market rallied to close the 12-month period with a return of more than 11%. Small-capitalization stocks finished a few steps ahead of their large-cap counterparts.
International stock markets were a mixed bag: middling returns in Europe, stagnation in the Pacific region’s developed markets, and a return of more than 20% from emerging markets. The combined result,
as measured by the MSCI All Country World Index ex USA, was a 12-month return of 8%.
Bond prices rallied, driving yields to surprising lows
Bonds produced strong 12-month returns, a gratifying performance that nevertheless raises questions about the prospects for total returns in a fixed income market where yields hover near all-time lows.
At the start of the period, the 10-year U.S. Treasury note yielded 3.31%; at the end of the period, the figure was 2.51% as investors bid up bond prices. As yields move lower, of course, the scope for continued declines—and the attendant rise in prices—diminishes. Corporate
| | | |
| Market Barometer | | | |
| |
| | Average Annual Total Returns |
| | Periods Ended September 30, 2010 |
| | One | Three | Five |
| | Year | Years | Years |
| Stocks | | | |
| Russell 1000 Index (Large-caps) | 10.75% | -6.79% | 0.86% |
| Russell 2000 Index (Small-caps) | 13.35 | -4.29 | 1.60 |
| Dow Jones U.S. Total Stock Market Index | 11.51 | -6.12 | 1.37 |
| MSCI All Country World Index ex USA (International) | 8.00 | -6.98 | 4.72 |
| |
| Bonds | | | |
| Barclays Capital U.S. Aggregate Bond Index (Broad | | | |
| taxable market) | 8.16% | 7.42% | 6.20% |
| Barclays Capital Municipal Bond Index (Broad | | | |
| tax-exempt market) | 5.81 | 6.04 | 5.13 |
| Citigroup Three-Month U.S. Treasury Bill Index | 0.12 | 1.01 | 2.47 |
| |
| CPI | | | |
| Consumer Price Index | 1.14% | 1.57% | 1.90% |
3
bonds performed best for the 12 months. Municipal bonds delivered solid, but more modest, returns.
As has been the case for almost two years now, the yields of money market securities remained near 0%, a consequence of the Federal Reserve Board’s efforts to stimulate the economy by keeping a tight lid on borrowing costs.
Astute tech selections supported the fund’s results
Vanguard Morgan Growth Fund’s information technology stocks were a notable bright spot during the fiscal year. Representing around 40% of the portfolio’s capitalization, on average, the fund’s tech selections contributed about half of its return. Standouts included NetApp, a
computer storage firm, and VMware, a software firm. Overall, the fund’s selections returned almost 17% for the year; the benchmark’s tech stocks, by contrast, returned about 12%.
Consumer discretionary and industrial stocks were also significant contributors. The fund benefited from the general strength of the retailers, restaurants, and entertainment purveyors that make up the consumer discretionary sector, even as its stock selections were relatively undistinguished. In the industrial sector, machinery makers began to grind into gear as federal stimulus money in the United States and rapid economic growth in emerging markets boosted demand for construction equipment, heavy trucks, and farm machinery.
| | | |
| Expense Ratios | | | |
| Your Fund Compared With Its Peer Group | | | |
| | Investor | Admiral | Peer Group |
| | Shares | Shares | Average |
| Morgan Growth Fund | 0.48% | 0.31% | 1.40% |
The fund expense ratios shown are from the prospectus dated January 26, 2010, and represent estimated costs for the current fiscal year. For the fiscal year ended September 30, 2010, the fund’s expense ratios were 0.44% for Investor Shares and 0.30% for Admiral Shares. The peer-group expense ratio is derived from data provided by Lipper Inc. and captures information through year-end 2009.
Peer group: Multi-Cap Growth Funds.
4
The financial sector, a small piece of the portfolio, was the biggest restraint on the fund’s 12-month return. The fund’s investment banking holdings produced dismal returns as the companies continued to grapple with the regulatory and financial aftershocks of the markets’ recent traumas.
Bear market results won’t go away soon
Although the stock market continued to snap back in fiscal 2010 from its one-and-a-half-year plunge, the fund’s long-term returns are a sobering reminder of the recent past. Despite the fund’s double-digit gain in fiscal 2010, Morgan Growth Fund’s Investor Shares have
posted an average annual return of –0.51% over the past decade. Although such a performance is hardly reason to cheer, the fund’s return was significantly better than that of its benchmark index, which returned –3.19%, and the –3.76% average annual return of its peer group for the same period.
The Morgan Growth Fund’s relative long-term strength, even if it didn’t add up to much in the past decade, highlights the value of our efforts to provide shareholders with access to some of the world’s best growth-stock managers at a very modest cost. Of course, the value of excellent investment management is easier to appreciate when the stock market is more buoyant.
| Total Returns | |
| Ten Years Ended September 30, 2010 | |
| | Average |
| | Annual Return |
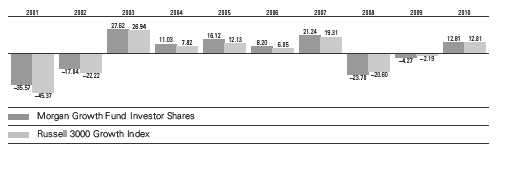
| Morgan Growth Fund Investor Shares | -0.51% |
| Russell 3000 Growth Index | -3.19 |
| Multi-Cap Growth Funds Average | -3.76 |
| Multi-Cap Growth Funds Average: Derived from data provided by Lipper Inc. |
The figures shown represent past performance, which is not a guarantee of future results. (Current performance may be lower or higher than the performance data cited. For performance data current to the most recent month-end, visit our website at vanguard.com/performance.) Note, too, that both investment returns and principal value can fluctuate widely, so an investor’s shares, when sold, could be worth more or less than their original cost.
5
New developments, time-tested responses
In recent years, bold-faced headlines have routinely announced some financial development—the Lehman Brothers bankruptcy, Europe’s sovereign debt crisis—that would have been difficult to contemplate even a few years ago. These unusual events have reverberated through the investment markets, producing the sort of volatility that can shake investor confidence.
As new and dramatic as these events may seem, the prudent response to uncertainty remains unchanged—balance and diversification—principles that, over time, have helped investors reach their goals through good markets and bad.
We counsel investors to strike a balance between the potentially higher returns of stocks and the more muted returns
from bonds that is best suited to their circumstances. Vanguard Morgan Growth Fund can play a valuable role in such a plan, providing broadly diversified exposure to U.S. growth stocks and giving investors the opportunity to benefit from the stock selection talents of excellent managers.
As always, thank you for entrusting your assets to Vanguard.
Sincerely,

F. William McNabb III
Chairman and Chief Executive Officer
October 13, 2010
6
Advisors’ Report
For the fiscal year ended September 30, 2010, Vanguard Morgan Growth Fund returned 12.81% for Investor Shares and 12.95% for the lower-cost Admiral Shares. Your fund is managed by five independent advisors, a strategy that enhances the fund’s diversification by providing exposure to distinct, yet complementary, investment approaches. It’s not uncommon for different advisors to have different views about individual securities or the broader investment environment.
The advisors, the percentage of fund assets each manages, and brief descriptions of their investment strategies are presented in the table below. The advisors have also prepared a discussion of the investment environment that existed during the fiscal year and of how portfolio positioning reflects this assessment. These comments were prepared on October 19, 2010.
| | | |
| Vanguard Morgan Growth Fund Investment Advisors | |
| |
| | Fund Assets Managed | |
| Investment Advisor | % | $ Million | Investment Strategy |
| Wellington Management | 44 | 3,449 | Uses traditional methods of stock selection—research |
| Company, LLP | | | and analysis—that identify companies believed to have |
| | | | above-average growth prospects, particularly those in |
| | | | industries undergoing change. Focuses on mid- and |
| | | | large-capitalization companies with proven records of |
| | | | sales and earnings growth, profitability, and cash-flow generation. |
| Jennison Associates LLC | 18 | 1,445 | Research-driven, fundamental investment approach |
| | | | that relies on in-depth company knowledge gleaned |
| | | | through meetings with management, customers, and suppliers. |
| Vanguard Quantitative Equity | 14 | 1,128 | Employs a quantitative, fundamental management |
| Group | | | approach, using models that assess valuation, growth |
| | | | prospects, management decisions, market sentiment, |
| | | | and earnings quality of companies versus their peers. |
| Frontier Capital Management Co., | 11 | 855 | Research-driven, fundamental investment approach |
| LLC | | | that seeks companies with above-average growth |
| | | | prospects, reasonable valuations, and competitive advantages. |
| Kalmar Investment Advisers | 11 | 840 | Employs a “growth-with-value” strategy using creative, |
| | | | bottom-up research to uncover vigorously growing, |
| | | | high-quality businesses whose stocks can also be |
| | | | bought inefficiently valued. The strategy has a dual |
| | | | objective of strong returns with lower risk. |
| Cash Investments | 2 | 159 | These short-term reserves are invested by Vanguard in |
| | | | equity index products to simulate investments in |
| | | | stocks. Each advisor also may maintain a modest cash position. |
7
Wellington Management Company, llp
Portfolio Manager:
Paul E. Marrkand, CFA,
Senior Vice President
Our portion of the fund uses traditional methods of stock selection—research and analysis—to identify companies that we believe have above-average growth prospects, particularly those in industries undergoing change. Research focuses on mid- and large-capitalization companies with a proven record of sales and earnings growth, profitability, and cash-flow generation.
Based on our growth, quality, and valuation investment process, we were able to take advantage of the volatility in the market over the past fiscal year by purchasing sustainable growth companies at extremely attractive valuations. We remained true to our process and continued to invest in undervalued companies that have the ability to innovate, gain market share, and grow sales and free cash flow at an above-average rate.
In October 2009, we initiated a new position in General Electric in the belief that the stock was an excellent risk/reward opportunity. We think the management team learned a valuable lesson during the market downturn. We expect that management will focus on execution and the company will regain its above-average return-on-capital business model. We also initiated a new position in Las Vegas Sands, which has continued to grow sales with increased volume at its Macao
properties. We believe the company will sustain an above-average revenue growth rate with its new casino and retail complex in Singapore, which opened in April 2010.
We trimmed our position in NetApp, the San Jose, California-based network storage equipment manufacturer, on strong performance after management raised revenue guidance, citing improved customer spending on computer upgrades and data storage networks. We continue to think the company is well-positioned for growth supported by market share gains, strong underlying dynamics for the storage industry, and a data center upgrade cycle. We also trimmed holdings in Apple shares on gains from the launch of the iPad and steady iPhone sales. With growth trends remaining steady, we have retained our position in the stock.
Unfortunately, we initiated investments in certain companies, including Honeywell, that did not perform well during this 12-month period. However, based on our growth, quality, and valuation process, we continue to hold these positions because we think they offer attractive risk/reward opportunities.
Jennison Associates LLC
Portfolio Manager:
Kathleen A. McCarragher,
Managing Director
We build our portfolio from the bottom up, based on our research of company fundamentals.
8
Technology positions contributed most to return. Baidu, the world’s dominant Chinese-language internet search engine, rose more than 160%. We believe the Chinese search market is in its early growth stage, and we like Baidu’s improving execution and exploration of long-term monetization opportunities. VMware climbed more than 100%. Companies use VMware’s software to integrate and manage server, storage, and networking functions, thereby lowering their operating costs. We believe VMware is positioned to benefit from greater corporate interest in the use of virtual machines that let multiple network users maintain individualized desktops on a single, centrally located server. NetApp, which provides data management solutions that simplify storing, managing, and protecting enterprise data, advanced 87%. We believe NetApp stands to benefit from growth in the storage business because of increased digital content.
In the consumer discretionary sector, Amazon.com’s strong earnings reflected the ongoing secular shift toward e-commerce and market share gains.
Illumina was a notable contributor in health care. The company’s genotyping, next-generation sequencing, and gene-expression tools isolate and analyze genetic information, allowing researchers to determine which genetic combinations are associated with various diseases.
We expect Illumina to benefit as next-generation sequencing enters what we expect to be a significant growth stage. Other health care holdings hurt performance. Baxter International fell
after it lowered its financial outlook on weakness in its blood plasma products business. We eliminated the portfolio’s position in the company’s shares. Gilead Sciences’ decline reflected reduced earnings and revenue guidance stemming from health care reform.
Stock selection also detracted from return in financials, where Goldman Sachs was hurt by uncertainty surrounding proposed financial reform.
Vanguard Quantitative Equity Group
Portfolio Manager:
James P. Stetler, Principal
After starting the fiscal year with two strong quarters, the U.S. equity market headed south during the third quarter, declining more than 10%, only to finish the fiscal fourth quarter and year with a strong rally. The recovery in September came despite continued weakness and uncertainty in economic data. There has been a slow and steady decline in GDP results since the fourth calendar quarter of 2009, when GDP growth registered a 5.0% gain followed by a 3.7% gain in the first quarter of 2010, and finally, a 1.6% gain in the second quarter. Although corporate earnings have continued to surprise to the upside and may continue for this third calendar quarter, an uncertain recovery, near-10% unemployment rate, sovereign debt concerns, and recent Federal Reserve statements discussing the possibility of additional stimulus measures have investors cautious and concerned about where equity markets are headed.
9
Multi-capitalization growth stocks, the focus of your investment in the Morgan Growth Fund, returned 12.81% for the period as measured by the Russell 3000 Growth Index. For the 12-month period, returns in this area of the equity market were led by telecommunication services, consumer discretionary, and industrial companies. Utility and energy company returns were the laggards for the fiscal year.
Results from our stock selections were strongest in the technology and health care sectors. In technology, selections such as Sybase, NetApp, and Apple added most to our returns. In health care, UnitedHealth Group and Perrigo were the largest contributors to our relative results. On the other hand, our selections in the consumer discretionary, industrial, and energy sectors held back our overall return. DeVry, Alliant Techsystems, and Transocean did not perform as we expected.
Frontier Capital Management Co., LLC
Portfolio Manager:
Stephen Knightly, CFA,
Senior Vice President
Healthy earnings, economic expansion, and low interest rates propelled markets higher during 2010. Growth managers with a valuation discipline were challenged as the highest-valuation stocks provided some of the best performance. Relative returns were hindered by stocks not
owned and a few setbacks in owned stocks. A narrow subset of high-priced, high-growth stocks contributed materially to index performance. Over the years, we have found it unwise to overpay for growth. We also had disappointments in a number of consumer and health care stocks reflective of a tenuous consumer environment.
With the “V” recovery in earnings concluding, we expect the sustainable growth characteristics of companies in the portfolio to stand out. Our team added to a number of producer durables and technology companies in light of unique opportunities in the networking, communications, and aerospace sectors. Each offers attractive valuations and appealing growth catalysts relative to an expected broad slowdown in earnings. Given an anticipated business-led recovery rather than a consumer-driven recovery, the fund remains selective within the consumer, financial, and health care sectors.
In an uncertain market, investors have paid a premium for companies offering the highest growth. Our discipline balances attractive earnings power with rewarding valuations. We are finding such qualities in companies that have promising secular growth opportunities and are share gainers in growth markets.
10
Kalmar Investment Advisers
Portfolio Manager:
Ford B. Draper, Jr., President and
Chief Investment Officer
After accelerating in late 2009 and early 2010 thanks to a snap-back in inventory replenishment and government stimulus, the economy has now undeniably entered a soft patch. Investors’ fear of European sovereign debt problems and the potential for a double-dip recession triggered a substantial market correction in late April that extended through the summer. Even though current economic news is far from rosy, we believe the sharp rally in September—in addition to other fundamental evidence and the likelihood of more Fed pump-priming—suggests slow but continuing growth, rather than an economic relapse in the near term. Kalmar believes that its focus on undervalued stocks of growth companies is well suited for a challenging environment in which general corporate progress may be hard to attain.
For more than a year we have concentrated our research and purchases on companies that have differentiated growth business models and have had the strength to invest in the future and optimize their competitive positioning during the Great Recession. Their ability to remain competitive during the recession has enabled these companies to gain market share and raise their future earnings power through strategic business improvement. Such improved competitive positioning should benefit the portfolio in healthier and more arduous economic conditions, which we
may experience for some time. And, when internal company initiatives can be aligned with other secular business tailwinds, growth that stands out even more notably can potentially be achieved.
Examples of companies in the portfolio whose internal growth drivers have generated meaningful improvement in revenues, earnings, and stock prices include:
• Cooper, the worldwide contact lens provider, which is benefiting from both significant manufacturing yield improvement and enhanced market share
in new-generation silicone hydrogel lenses.
• Rovi, whose proprietary interactive video guides are gaining penetration among both cable operators and entertainment hardware manufacturers.
• O’Reilly Automotive, the well-managed auto parts distribution company, which is benefiting from substantial margin improvement because of a recent
large acquisition.
More problematic holdings in the last fiscal year include:
• Natural gas exploration and production companies, whose reserve growth has remained very strong, but whose stock prices have suffered from the sharp
decline in the prices of gas.
• GameStop, the biggest video-game retailer, which has a lock on used game resales, may be threatened by direct-to-consumer web downloads.
11
Morgan Growth Fund
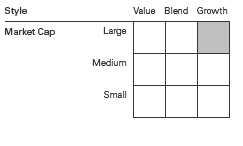
Fund Profile
As of September 30, 2010
| | | | |
| Share-Class Characteristics | | | |
| | Investor | | Admiral | |
| | Shares | | Shares | |
| Ticker Symbol | VMRGX | | VMRAX | |
| Expense Ratio1 | 0.48 | % | 0.31 | % |
| 30-Day SEC Yield | 0.55 | % | 0.62 | % |
| | | | | | | | |
| Portfolio Characteristics | | | | | | | |
| | | | | Russell | | | DJ | |
| | | | | 3000 | | | U.S. Total | |
| | | | | Growth | | | Market | |
| | Fund | | | Index | | | Index | |
| Number of Stocks | 321 | | | 1,888 | | | 3,920 | |
| Median Market Cap | $18.6B | | $ | 29.9 | B | $ | 27.3 | B |
| Price/Earnings Ratio | 19.2 | x | | 18.6 | x | | 17.1 | x |
| Price/Book Ratio | 3.2 | x | | 3.5 | x | | 2.1 | x |
| Return on Equity | 22.0 | % | | 23.8 | % | | 19.1 | % |
| Earnings Growth Rate | 11.9% | | | 11.6 | % | | 6.4 | % |
| Dividend Yield | 1.0 | % | | 1.5 | % | | 1.8 | % |
| Foreign Holdings | 3.7 | % | | 0.0 | % | | 0.0 | % |
| Turnover Rate | 60 | % | | — | | | — | |
| Short-Term Reserves | 1.7 | % | | — | | | — | |
| | | | | | |
| Sector Diversification (% of equity exposure) | |
| | | | Russell | | DJ | |
| | | | 3000 | | U.S. Total | |
| | | | Growth | | Market | |
| | Fund | | Index | | Index | |
| Consumer | | | | | | |
| Discretionary | 15.9 | % | 14.9 | % | 11.7 | % |
| Consumer Staples | 4.7 | | 9.5 | | 10.1 | |
| Energy | 5.7 | | 9.5 | | 9.7 | |
| Financials | 4.5 | | 4.6 | | 16.6 | |
| Health Care | 10.6 | | 10.9 | | 11.2 | |
| Industrials | 14.0 | | 13.4 | | 11.1 | |
| Information | | | | | | |
| Technology | 40.6 | | 31.1 | | 19.0 | |
| Materials | 2.3 | | 5.0 | | 4.2 | |
| Telecommunication | | | | | | |
| Services | 1.5 | | 1.0 | | 2.9 | |
| Utilities | 0.2 | | 0.1 | | 3.5 | |
| | |
| Volatility Measures | | |
| | | DJ |
| | | U.S. Total |
| | Russell 3000 | Market |
| | Growth Index | Index |
| R-Squared | 0.99 | 0.95 |
| Beta | 1.02 | 1.00 |
| These measures show the degree and timing of the fund’s fluctuations compared with the indexes over 36 months. |
| | | |
| Ten Largest Holdings (% of total net assets) | |
| Apple Inc. | Computer | | |
| | Hardware | 3.6 | % |
| International Business | IT Consulting & | | |
| Machines Corp. | Other Services | 3.1 | |
| Cisco Systems Inc. | Communications | | |
| | Equipment | 2.7 | |
| NetApp Inc. | Computer Storage | | |
| | & Peripherals | 2.2 | |
| Microsoft Corp. | Systems Software | 2.1 | |
| Oracle Corp. | Systems Software | 2.1 | |
| Google Inc. Class A | Internet Software & | | |
| | Services | 2.1 | |
| Caterpillar Inc. | Construction & | | |
| | Farm Machinery & | | |
| | Heavy Trucks | 1.6 | |
| EMC Corp. | Computer Storage | | |
| | & Peripherals | 1.4 | |
| Altera Corp. | Semiconductors | 1.4 | |
| Top Ten | | 22.3 | % |
| The holdings listed exclude any temporary cash investments and equity index products. |
Investment Focus
1 The expense ratios shown are from the prospectus dated January 26, 2010, and represent estimated costs for the current fiscal year. For
the fiscal year ended September 30, 2010, the expense ratios were 0.44% for Investor Shares and 0.30% for Admiral Shares.
12
Morgan Growth Fund
Performance Summary
All of the returns in this report represent past performance, which is not a guarantee of future results that may be achieved by the fund. (Current performance may be lower or higher than the performance data cited. For performance data current to the most recent month-end, visit our website at vanguard.com/performance.) Note, too, that both investment returns and principal value can fluctuate widely, so an investor’s shares, when sold, could be worth more or less than their original cost. The returns shown do not reflect taxes that a shareholder would pay on fund distributions or on the sale of fund shares.
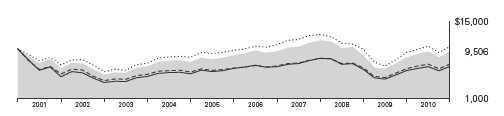
Cumulative Performance: September 30, 2000, Through September 30, 2010
Initial Investment of $10,000
| | | | | |
| | | Average Annual Total Returns | |
| | | Periods Ended September 30, 2010 | |
| | | | | | Final Value |
| | | One | Five | Ten | $ of a 10,000 |
| | | Year | Years | Years | Investment |
| | Morgan Growth Fund Investor Shares | 12.81% | 1.57% | -0.51% | $ 9,506 |
| •••••••• | Dow Jones U.S. Total Stock Market | | | | |
| | Index | 11.51 | 1.37 | 0.41 | 10,421 |
| – – – – | Russell 3000 Growth Index | 12.81 | 2.08 | -3.19 | 7,228 |
| | Multi-Cap Growth Funds Average | 12.25 | 1.06 | -3.76 | 6,818 |
| Multi-Cap Growth Funds Average: Derived from data provided by Lipper Inc. | | | |
See Financial Highlights for dividend and capital gains information.
13
Morgan Growth Fund
| | | | |
| | Average Annual Total Returns | |
| | Periods Ended September 30, 2010 | |
| | | | Since | Final Value |
| | One | Five | of a Inception | $ 50,000 |
| | Year | Years | (5/14/2001) | Investment |
| Morgan Growth Fund Admiral | | | | |
| Shares | 12.95% | 1.73% | 1.78% | $ 58,997 |
| Dow Jones U.S. Total Stock Market | | | | |
| Index | 11.51 | 1.37 | 2.18 | 61,212 |
| Russell 3000 Growth Index | 12.81 | 2.08 | 0.39 | 51,873 |
| "Since Inception" performance is calculated from the Admiral Shares’ inception date for both the fund and its comparative standards. |
Fiscal-Year Total Returns (%): September 30, 2000, Through September 30, 2010
14
Morgan Growth Fund
Financial Statements
Statement of Net Assets
As of September 30, 2010
The fund reports a complete list of its holdings in regulatory filings four times in each fiscal year, at the quarter-ends. For the second and fourth fiscal quarters, the lists appear in the fund’s semiannual and annual reports to shareholders. For the first and third fiscal quarters, the fund files the lists with the Securities and Exchange Commission on Form N-Q. Shareholders can look up the fund’s Forms N-Q on the SEC’s website at sec.gov. Forms N-Q may also be reviewed and copied at the SEC’s Public Reference Room (see the back cover of this report for further information).
| | | |
| | | | Market |
| | | | Value |
| | | Shares | ($000) |
| Common Stocks (97.1%)1 | | |
| Consumer Discretionary (15.4%) | |
| * | Amazon.com Inc. | 679,394 | 106,706 |
| | Starbucks Corp. | 3,251,643 | 83,177 |
| | Coach Inc. | 1,278,652 | 54,931 |
| * | Ford Motor Co. | 3,579,519 | 43,813 |
| | Omnicom Group Inc. | 1,101,816 | 43,500 |
| | McDonald’s Corp. | 572,641 | 42,667 |
| | Walt Disney Co. | 1,207,438 | 39,978 |
| | Ross Stores Inc. | 725,346 | 39,618 |
| | Advance Auto Parts Inc. | 649,890 | 38,136 |
| | TJX Cos. Inc. | 853,801 | 38,105 |
| | Target Corp. | 670,067 | 35,808 |
| | Expedia Inc. | 1,256,989 | 35,460 |
| * | Las Vegas Sands Corp. | 1,012,620 | 35,290 |
| | NIKE Inc. Class B | 428,570 | 34,346 |
| | Home Depot Inc. | 1,000,860 | 31,707 |
| * | LKQ Corp. | 1,501,951 | 31,241 |
| * | Dollar Tree Inc. | 498,990 | 24,331 |
| * | ITT Educational | | |
| | Services Inc. | 333,896 | 23,463 |
| * | Kohl’s Corp. | 427,850 | 22,539 |
| | Tractor Supply Co. | 562,970 | 22,327 |
| * | Dollar General Corp. | 697,537 | 20,403 |
| | News Corp. Class A | 1,549,000 | 20,230 |
| * | O’Reilly Automotive Inc. | 356,310 | 18,956 |
| * | priceline.com Inc. | 49,776 | 17,339 |
| * | Discovery | | |
| | Communications Inc. | | |
| | Class A | 397,500 | 17,311 |
| * | Discovery | | |
| | Communications Inc. | 432,415 | 16,514 |
| * | CarMax Inc. | 583,345 | 16,252 |
| | Carnival Corp. | 386,058 | 14,751 |
| | DeVry Inc. | 290,910 | 14,316 |
| | Service Corp. International | 1,645,300 | 14,182 |
| * | DIRECTV Class A | 328,600 | 13,680 |
| | Starwood Hotels & | | |
| | Resorts Worldwide Inc. | 230,300 | 12,102 |
| * | Harman International | | |
| | Industries Inc. | 338,900 | 11,323 |
| | Guess? Inc. | 264,631 | 10,752 |
| * | GameStop Corp. Class A | 535,350 | 10,552 |
| * | Bed Bath & Beyond Inc. | 239,100 | 10,379 |
| * | Warnaco Group Inc. | 193,225 | 9,880 |
| | Scripps Networks | | |
| | Interactive Inc. Class A | 206,000 | 9,801 |
| | Williams-Sonoma Inc. | 304,635 | 9,657 |
| * | WMS Industries Inc. | 250,675 | 9,543 |
| | Gentex Corp. | 488,095 | 9,523 |
| | Darden Restaurants Inc. | 209,480 | 8,962 |
| ^ | Buckle Inc. | 310,658 | 8,245 |
| * | AutoZone Inc. | 34,000 | 7,783 |
| * | TRW Automotive | | |
| | Holdings Corp. | 174,800 | 7,265 |
| | Whirlpool Corp. | 87,000 | 7,043 |
| * | Urban Outfitters Inc. | 222,280 | 6,988 |
| | Autoliv Inc. | 105,440 | 6,888 |
| | DR Horton Inc. | 505,100 | 5,617 |
| * | Liberty Media Corp. - Capital | 107,100 | 5,576 |
| | American Eagle | | |
| | Outfitters Inc. | 322,400 | 4,823 |
| | McGraw-Hill Cos. Inc. | 144,000 | 4,761 |
| | DISH Network Corp. | | |
| | Class A | 238,900 | 4,577 |
| | Chico’s FAS Inc. | 434,053 | 4,566 |
| | Comcast Corp. | | |
| | Special Class A Shares | 218,134 | 3,710 |
| | Tiffany & Co. | 55,600 | 2,613 |
| * | NetFlix Inc. | 14,400 | 2,335 |
| | Comcast Corp. Class A | 127,425 | 2,304 |
| | H&R Block Inc. | 111,900 | 1,449 |
| * | Liberty Media Corp. - Starz | 21,700 | 1,408 |
| | Cablevision Systems Corp. | | |
| | Class A | 43,800 | 1,147 |
| | Lowe’s Cos. Inc. | 25,000 | 557 |
| | | | 1,213,206 |
15
Morgan Growth Fund
| | | |
| | | | Market |
| | | | Value |
| | | Shares | ($000) |
| Consumer Staples (4.4%) | | |
| | Anheuser-Busch | | |
| | InBev NV ADR | 485,793 | 28,540 |
| | Kraft Foods Inc. | 923,969 | 28,514 |
| | Wal-Mart Stores Inc. | 524,600 | 28,077 |
| * | Whole Foods Market Inc. | 684,650 | 25,407 |
| | General Mills Inc. | 641,118 | 23,426 |
| | Philip Morris | | |
| | International Inc. | 402,000 | 22,520 |
| | Mead Johnson Nutrition Co. | 375,654 | 21,379 |
| | Coca-Cola Co. | 316,278 | 18,509 |
| | Clorox Co. | 262,151 | 17,501 |
| | Herbalife Ltd. | 271,510 | 16,386 |
| | Costco Wholesale Corp. | 245,896 | 15,858 |
| | PepsiCo Inc. | 236,700 | 15,726 |
| | Avon Products Inc. | 436,600 | 14,019 |
| | Kroger Co. | 413,600 | 8,959 |
| | Coca-Cola Enterprises Inc. | 270,400 | 8,382 |
| | Estee Lauder Cos. Inc. | | |
| | Class A | 125,500 | 7,935 |
| | Dr Pepper | | |
| | Snapple Group Inc. | 204,000 | 7,246 |
| | Sysco Corp. | 253,160 | 7,220 |
| | Campbell Soup Co. | 201,700 | 7,211 |
| * | Hansen Natural Corp. | 142,238 | 6,631 |
| | Procter & Gamble Co. | 93,055 | 5,581 |
| | Hormel Foods Corp. | 92,600 | 4,130 |
| | Kimberly-Clark Corp. | 46,600 | 3,031 |
| | Colgate-Palmolive Co. | 26,300 | 2,021 |
| | | | 344,209 |
| Energy (5.4%) | | |
| | Occidental Petroleum Corp. | 827,870 | 64,822 |
| | Schlumberger Ltd. | 781,389 | 48,141 |
| | Exxon Mobil Corp. | 702,844 | 43,429 |
| | Valero Energy Corp. | 1,820,512 | 31,877 |
| | Anadarko Petroleum Corp. | 524,315 | 29,912 |
| * | Oceaneering | | |
| | International Inc. | 337,947 | 18,202 |
| * | Concho Resources Inc. | 262,746 | 17,386 |
| * | Ultra Petroleum Corp. | 381,005 | 15,995 |
| | Baker Hughes Inc. | 339,686 | 14,471 |
| * | Cameron International Corp. | 323,955 | 13,917 |
| | Core Laboratories NV | 147,840 | 13,016 |
| *,^ | InterOil Corp. | 183,100 | 12,531 |
| | Peabody Energy Corp. | 188,700 | 9,248 |
| * | Pride International Inc. | 287,700 | 8,467 |
| | National Oilwell Varco Inc. | 190,340 | 8,464 |
| | El Paso Corp. | 666,500 | 8,251 |
| * | Alpha Natural | | |
| | Resources Inc. | 191,310 | 7,872 |
| | Pioneer Natural | | |
| | Resources Co. | 120,300 | 7,823 |
| * | Petrohawk Energy Corp. | 483,980 | 7,812 |
| | EXCO Resources Inc. | 450,200 | 6,695 |
| * | Whiting Petroleum Corp. | 62,900 | 6,008 |
| * | Southwestern Energy Co. | 178,780 | 5,978 |
| * | Continental Resources Inc. | 117,300 | 5,438 |
| * | Denbury Resources Inc. | 326,500 | 5,188 |
| * | Weatherford | | |
| | International Ltd. | 290,380 | 4,966 |
| | Cabot Oil & Gas Corp. | 163,200 | 4,914 |
| | Murphy Oil Corp. | 56,100 | 3,474 |
| | | | 424,297 |
| Exchange-Traded Fund (0.7%) | | |
| ^,2 | Vanguard Growth ETF | 1,044,900 | 57,443 |
| |
| Financials (4.2%) | | |
| | Goldman Sachs Group Inc. | 420,231 | 60,757 |
| | American Express Co. | 1,150,605 | 48,360 |
| | Lincoln National Corp. | 1,887,471 | 45,148 |
| | Wells Fargo & Co. | 1,168,813 | 29,372 |
| | Franklin Resources Inc. | 218,500 | 23,358 |
| | JPMorgan Chase & Co. | 520,296 | 19,808 |
| | Morgan Stanley | 693,997 | 17,128 |
| * | Affiliated Managers | | |
| | Group Inc. | 196,400 | 15,321 |
| | T Rowe Price Group Inc. | 254,290 | 12,731 |
| | Raymond James | | |
| | Financial Inc. | 443,200 | 11,226 |
| | Capital One Financial Corp. | 255,100 | 10,089 |
| | Lazard Ltd. Class A | 271,270 | 9,516 |
| | Aflac Inc. | 159,900 | 8,268 |
| | Waddell & Reed | | |
| | Financial Inc. Class A | 242,475 | 6,634 |
| * | CB Richard Ellis Group Inc. | | |
| | Class A | 175,300 | 3,205 |
| | US Bancorp | 115,600 | 2,499 |
| * | Berkshire Hathaway Inc. | | |
| | Class B | 27,950 | 2,311 |
| | Jefferies Group Inc. | 46,100 | 1,046 |
| | Public Storage | 7,200 | 699 |
| | Simon Property Group Inc. | 1,700 | 158 |
| | | | 327,634 |
| Health Care (10.2%) | | |
| | Medtronic Inc. | 1,548,866 | 52,011 |
| * | Express Scripts Inc. | 939,017 | 45,730 |
| * | Waters Corp. | 538,792 | 38,136 |
| | UnitedHealth Group Inc. | 1,039,903 | 36,511 |
| * | Laboratory Corp. of | | |
| | America Holdings | 435,764 | 34,177 |
| | Teva Pharmaceutical | | |
| | Industries Ltd. ADR | 616,870 | 32,540 |
| * | Medco Health Solutions Inc. | 622,418 | 32,403 |
| | Shire PLC ADR | 473,600 | 31,864 |
| | Abbott Laboratories | 575,066 | 30,041 |
| * | Mylan Inc. | 1,580,520 | 29,730 |
| * | Celgene Corp. | 513,742 | 29,597 |
| | Cooper Cos. Inc. | 622,280 | 28,762 |
| | Alcon Inc. | 149,350 | 24,910 |
| * | Illumina Inc. | 505,330 | 24,862 |
| | Eli Lilly & Co. | 571,599 | 20,880 |
| * | WellPoint Inc. | 359,881 | 20,384 |
16
Morgan Growth Fund
| | | |
| | | | Market |
| | | | Value |
| | | Shares | ($000) |
| * | Vertex Pharmaceuticals Inc. | 573,111 | 19,812 |
| * | Hospira Inc. | 333,600 | 19,019 |
| * | Gilead Sciences Inc. | 507,889 | 18,086 |
| * | Amgen Inc. | 305,200 | 16,820 |
| * | ResMed Inc. | 511,880 | 16,795 |
| * | United Therapeutics Corp. | 281,140 | 15,747 |
| * | Hologic Inc. | 956,480 | 15,313 |
| * | Varian Medical | | |
| | Systems Inc. | 243,500 | 14,732 |
| | Perrigo Co. | 225,400 | 14,475 |
| | Stryker Corp. | 248,462 | 12,435 |
| * | Watson | | |
| | Pharmaceuticals Inc. | 268,800 | 11,373 |
| * | ICON PLC ADR | 441,100 | 9,537 |
| | Patterson Cos. Inc. | 319,900 | 9,165 |
| | Cardinal Health Inc. | 266,800 | 8,815 |
| | McKesson Corp. | 135,600 | 8,377 |
| * | DaVita Inc. | 119,300 | 8,235 |
| | AmerisourceBergen Corp. | | |
| | Class A | 266,900 | 8,183 |
| * | Amylin Pharmaceuticals Inc. | 344,200 | 7,177 |
| | Lincare Holdings Inc. | 283,700 | 7,118 |
| * | Covance Inc. | 134,420 | 6,289 |
| * | Allscripts Healthcare | | |
| | Solutions Inc. | 334,065 | 6,170 |
| * | Cephalon Inc. | 97,880 | 6,112 |
| * | Catalyst Health | | |
| | Solutions Inc. | 171,063 | 6,023 |
| | Johnson & Johnson | 94,300 | 5,843 |
| * | Edwards Lifesciences Corp. | 86,600 | 5,806 |
| | Allergan Inc. | 70,200 | 4,670 |
| * | Mednax Inc. | 86,900 | 4,632 |
| * | Intuitive Surgical Inc. | 14,975 | 4,249 |
| * | Endo Pharmaceuticals | | |
| | Holdings Inc. | 91,300 | 3,035 |
| * | Community Health | | |
| | Systems Inc. | 10,000 | 310 |
| | | | 806,891 |
| Industrials (13.6%) | | |
| | Caterpillar Inc. | 1,571,261 | 123,627 |
| | Boeing Co. | 1,022,292 | 68,023 |
| | General Electric Co. | 3,752,465 | 60,977 |
| | Parker Hannifin Corp. | 801,836 | 56,177 |
| | Joy Global Inc. | 669,437 | 47,075 |
| | Cummins Inc. | 495,912 | 44,920 |
| | Honeywell International Inc. | 962,419 | 42,289 |
| | CH Robinson | | |
| | Worldwide Inc. | 555,003 | 38,806 |
| | Emerson Electric Co. | 700,007 | 36,862 |
| | Ingersoll-Rand PLC | 1,031,811 | 36,846 |
| | Dover Corp. | 689,613 | 36,005 |
| | AMETEK Inc. | 735,924 | 35,155 |
| | Southwest Airlines Co. | 2,572,643 | 33,624 |
| | Illinois Tool Works Inc. | 658,029 | 30,940 |
| | Precision Castparts Corp. | 239,534 | 30,505 |
| * | IHS Inc. Class A | 414,050 | 28,155 |
| | Fastenal Co. | 456,090 | 24,259 |
| | United Technologies Corp. | 336,000 | 23,933 |
| * | Chicago Bridge & | | |
| | Iron Co. NV | 787,520 | 19,255 |
| | Landstar System Inc. | 441,730 | 17,060 |
| * | BE Aerospace Inc. | 543,646 | 16,478 |
| | Flowserve Corp. | 150,335 | 16,450 |
| | United Parcel Service Inc. | | |
| | Class B | 229,500 | 15,305 |
| * | Foster Wheeler AG | 591,740 | 14,474 |
| | Goodrich Corp. | 191,100 | 14,090 |
| * | Stericycle Inc. | 186,900 | 12,986 |
| | AO Smith Corp. | 201,139 | 11,644 |
| * | Corrections Corp. | | |
| | of America | 459,150 | 11,332 |
| * | HUB Group Inc. Class A | 361,162 | 10,568 |
| | Republic Services Inc. | | |
| | Class A | 311,500 | 9,498 |
| | MSC Industrial Direct Co. | | |
| | Class A | 172,800 | 9,338 |
| | Deere & Co. | 132,300 | 9,232 |
| | Pall Corp. | 211,952 | 8,826 |
| | CLARCOR Inc. | 216,988 | 8,382 |
| * | Delta Air Lines Inc. | 706,000 | 8,218 |
| | JB Hunt Transport | | |
| | Services Inc. | 223,445 | 7,753 |
| | Rockwell Automation Inc. | 120,300 | 7,426 |
| | Watsco Inc. | 128,800 | 7,172 |
| | Donaldson Co. Inc. | 134,403 | 6,334 |
| | Lockheed Martin Corp. | 88,700 | 6,322 |
| * | Navistar International Corp. | 120,700 | 5,267 |
| | Lennox International Inc. | 125,728 | 5,242 |
| * | Owens Corning | 185,610 | 4,757 |
| | FedEx Corp. | 29,500 | 2,522 |
| | Union Pacific Corp. | 24,000 | 1,963 |
| | Pitney Bowes Inc. | 81,700 | 1,747 |
| | | | 1,067,819 |
| Information Technology (39.5%) | | |
| * | Apple Inc. | 1,003,841 | 284,840 |
| | International Business | | |
| | Machines Corp. | 1,798,375 | 241,234 |
| * | Cisco Systems Inc. | 9,839,689 | 215,489 |
| * | NetApp Inc. | 3,416,665 | 170,116 |
| | Microsoft Corp. | 6,774,630 | 165,911 |
| | Oracle Corp. | 6,044,312 | 162,290 |
| * | Google Inc. Class A | 307,726 | 161,799 |
| * | EMC Corp. | 5,479,417 | 111,287 |
| | Altera Corp. | 3,580,470 | 107,987 |
| * | Juniper Networks Inc. | 3,245,992 | 98,516 |
| * | VMware Inc. Class A | 1,078,507 | 91,608 |
| | Intel Corp. | 4,074,575 | 78,354 |
| | Xilinx Inc. | 2,740,674 | 72,929 |
| * | QLogic Corp. | 3,575,487 | 63,072 |
| | Broadcom Corp. Class A | 1,759,671 | 62,275 |
| * | Cognizant Technology | | |
| | Solutions Corp. Class A | 768,300 | 49,532 |
17
Morgan Growth Fund
| | | |
| | | | Market |
| | | | Value |
| | | Shares | ($000) |
| | Analog Devices Inc. | 1,536,215 | 48,206 |
| | Mastercard Inc. Class A | 214,990 | 48,158 |
| * | Baidu Inc. ADR | 428,822 | 44,006 |
| * | Check Point Software | | |
| | Technologies Ltd. | 1,112,632 | 41,089 |
| * | Agilent Technologies Inc. | 1,117,525 | 37,292 |
| * | Dell Inc. | 2,837,627 | 36,776 |
| * | Marvell Technology | | |
| | Group Ltd. | 1,959,197 | 34,306 |
| * | Riverbed Technology Inc. | 751,163 | 34,238 |
| | Intersil Corp. Class A | 2,923,898 | 34,180 |
| * | Red Hat Inc. | 831,395 | 34,087 |
| * | Adobe Systems Inc. | 1,271,372 | 33,246 |
| * | Alliance Data | | |
| | Systems Corp. | 480,530 | 31,359 |
| * | Rovi Corp. | 621,660 | 31,338 |
| * | Emulex Corp. | 2,890,874 | 30,181 |
| * | Skyworks Solutions Inc. | 1,347,800 | 27,872 |
| | Hewlett-Packard Co. | 627,500 | 26,399 |
| | Amphenol Corp. Class A | 535,010 | 26,205 |
| * | BMC Software Inc. | 605,617 | 24,515 |
| * | Intuit Inc. | 509,900 | 22,339 |
| * | Autodesk Inc. | 639,990 | 20,460 |
| * | SanDisk Corp. | 524,035 | 19,206 |
| | Fidelity National | | |
| | Information Services Inc. | 594,670 | 16,133 |
| * | Amdocs Ltd. | 544,600 | 15,608 |
| * | F5 Networks Inc. | 148,190 | 15,384 |
| | Tyco Electronics Ltd. | 518,388 | 15,147 |
| * | Citrix Systems Inc. | 196,305 | 13,396 |
| * | Longtop Financial | | |
| | Technologies Ltd. ADR | 333,236 | 13,113 |
| * | Equinix Inc. | 122,000 | 12,487 |
| * | Trimble Navigation Ltd. | 347,265 | 12,168 |
| | Tencent Holdings Ltd. ADR | 532,245 | 11,664 |
| * | NeuStar Inc. Class A | 465,750 | 11,579 |
| * | eBay Inc. | 472,700 | 11,534 |
| * | Avago Technologies Ltd. | 417,740 | 9,403 |
| | Texas Instruments Inc. | 344,205 | 9,342 |
| | QUALCOMM Inc. | 196,124 | 8,849 |
| * | Lam Research Corp. | 209,870 | 8,783 |
| * | Atheros | | |
| | Communications Inc. | 315,951 | 8,325 |
| * | Nuance | | |
| | Communications Inc. | 516,040 | 8,071 |
| * | Microsemi Corp. | 454,500 | 7,795 |
| | ADTRAN Inc. | 205,500 | 7,254 |
| * | FLIR Systems Inc. | 271,900 | 6,988 |
| * | Genpact Ltd. | 388,730 | 6,892 |
| * | Teradata Corp. | 176,500 | 6,806 |
| * | Micron Technology Inc. | 813,200 | 5,863 |
| * | Ariba Inc. | 299,489 | 5,660 |
| * | Polycom Inc. | 190,420 | 5,195 |
| *,^ | Blackboard Inc. | 142,864 | 5,149 |
| | Jabil Circuit Inc. | 333,463 | 4,805 |
| * | Seagate Technology PLC | 358,900 | 4,228 |
| | | |
| * | Novellus Systems Inc. | 146,200 | 3,886 |
| * | TiVo Inc. | 405,300 | 3,672 |
| * | Salesforce.com Inc. | 27,845 | 3,113 |
| * | Flextronics International Ltd. | 314,072 | 1,897 |
| | Factset Research | | |
| | Systems Inc. | 20,500 | 1,663 |
| * | Motorola Inc. | 188,500 | 1,608 |
| | Visa Inc. Class A | 18,000 | 1,337 |
| * | Hewitt Associates Inc. | | |
| | Class A | 21,507 | 1,085 |
| | Solera Holdings Inc. | 20,845 | 921 |
| * | Advanced Micro Devices Inc. | 25,900 | 184 |
| | | | 3,109,684 |
| Materials (2.1%) | | |
| | Nucor Corp. | 927,121 | 35,416 |
| | Teck Resources Ltd. | | |
| | Class B | 478,472 | 19,694 |
| | Albemarle Corp. | 391,000 | 18,303 |
| | Freeport-McMoRan | | |
| | Copper & Gold Inc. | 160,600 | 13,714 |
| | Praxair Inc. | 143,930 | 12,991 |
| | Newmont Mining Corp. | 198,400 | 12,461 |
| | Cliffs Natural | | |
| | Resources Inc. | 175,512 | 11,219 |
| * | Crown Holdings Inc. | 278,200 | 7,973 |
| | Lubrizol Corp. | 74,000 | 7,842 |
| | International Paper Co. | 353,500 | 7,689 |
| | Walter Energy Inc. | 85,000 | 6,910 |
| | Ecolab Inc. | 115,400 | 5,855 |
| | CF Industries Holdings Inc. | 52,100 | 4,975 |
| | Celanese Corp. Class A | 107,900 | 3,464 |
| | Monsanto Co. | 5,457 | 261 |
| | | | 168,767 |
| Telecommunication Services (1.5%) | | |
| * | American Tower Corp. | | |
| | Class A | 1,408,445 | 72,197 |
| * | NII Holdings Inc. | 452,630 | 18,603 |
| * | Crown Castle | | |
| | International Corp. | 272,000 | 12,009 |
| * | Syniverse Holdings Inc. | 309,000 | 7,005 |
| | Millicom International | | |
| | Cellular SA | 44,150 | 4,236 |
| | | | 114,050 |
| Utilities (0.1%) | | |
| * | AES Corp. | 838,370 | 9,516 |
| Total Common Stocks | | |
| (Cost $6,209,128) | | 7,643,516 |
| Temporary Cash Investments (3.1%)1 | | |
| Money Market Fund (2.7%) | | |
| 3,4 | Vanguard Market | | |
| | Liquidity Fund, | | |
| | 0.261% | 212,747,665 | 212,748 |
18
Morgan Growth Fund
| | | |
| | | Face | Market |
| | | Amount | Value |
| | | ($000) | ($000) |
| Repurchase Agreement (0.2%) | | |
| | Banc of America Securities, | | |
| | LLC 0.300%, 10/1/10 | | |
| | (Dated 9/30/10, Repurchase | | |
| | Value $19,900,000, | | |
| | collateralized by Federal | | |
| | Home Loan Mortgage Corp. | | |
| | 0.000%, 11/16/39, and | | |
| | Federal National Mortgage | | |
| | Assn. 5.125%, 1/2/14) | 19,900 | 19,900 |
| |
| U.S. Government and Agency Obligations (0.2%) |
| 5,6 | Federal Home Loan | | |
| | Bank Discount Notes, | | |
| | 0.260%, 3/23/11 | 1,750 | 1,748 |
| 5,6 | Freddie Mac Discount | | |
| | Notes, 0.230%, 10/12/10 | 3,000 | 3,000 |
| 5,6 | Freddie Mac Discount | | |
| | Notes, 0.240%, 3/14/11 | 10,000 | 9,989 |
| 5,6 | Freddie Mac Discount | | |
| | Notes, 0.271%, 6/7/11 | 220 | 219 |
| | | | 14,956 |
| Total Temporary Cash Investments | | |
| (Cost $247,604) | | 247,604 |
| Total Investments (100.2%) | | |
| (Cost $6,456,732) | | 7,891,120 |
| Other Assets and Liabilities (-0.2%) | |
| Other Assets | | 126,347 |
| Liabilities4 | | (141,173 |
| | | | (14,826 |
| Net Assets (100%) | | 7,876,294 |
| |
| At September 30, 2010, net assets consisted of: | |
| | Amount |
| | ($000) |
| Paid-in Capital | 8,403,419 |
| Undistributed Net Investment Income | 20,263 |
| Accumulated Net Realized Losses | (1,983,310) |
| Unrealized Appreciation (Depreciation) | |
| Investment Securities | 1,434,388 |
| Futures Contracts | 1,534 |
| Net Assets | 7,876,294 |
| |
| |
| Investor Shares—Net Assets | |
| Applicable to 338,727,136 outstanding | |
| $.001 par value shares of beneficial | |
| interest (unlimited authorization) | 5,431,792 |
| Net Asset Value Per Share— | |
| Investor Shares | $ 16.04 |
| |
| |
| Admiral Shares—Net Assets | |
| Applicable to 49,136,126 outstanding | |
| $.001 par value shares of beneficial | |
| interest (unlimited authorization) | 2,444,502 |
| Net Asset Value Per Share— | |
| Admiral Shares | $ 49.75 |
See Note A in Notes to Financial Statements.
* Non-income-producing security.
^ Part of security position is on loan to broker-dealers. The total value of securities on loan is $16,397,000.
1 The fund invests a portion of its cash reserves in equity markets through the use of index futures contracts. After giving effect to futures
investments, the fund’s effective common stock and temporary cash investment positions represent 98.3% and 1.9%, respectively, of
net assets.
2 Considered an affiliated company of the fund as the issuer is another member of The Vanguard Group.
3 Affiliated money market fund available only to Vanguard funds and certain trusts and accounts managed by Vanguard. Rate shown is the
7-day yield.
4 Includes $17,068,000 of collateral received for securities on loan.
5 The issuer operates under a congressional charter; its securities are not backed by the full faith and credit of the U.S. government.
6 Securities with a value of $14,956,000 have been segregated as initial margin for open futures contracts.
ADR—American Depositary Receipt.
See accompanying Notes, which are an integral part of the Financial Statements.
19
Morgan Growth Fund
Statement of Operations
| |
| | Year Ended |
| | September 30, 2010 |
| | ($ 000) |
| Investment Income | |
| Income | |
| Dividends1,2 | 80,337 |
| Interest2 | 557 |
| Security Lending | 2,271 |
| Total Income | 83,165 |
| Expenses | |
| Investment Advisory Fees—Note B | |
| Basic Fee | 12,586 |
| Performance Adjustment | 838 |
| The Vanguard Group—Note C | |
| Management and Administrative—Investor Shares | 13,112 |
| Management and Administrative—Admiral Shares | 2,327 |
| Marketing and Distribution—Investor Shares | 1,299 |
| Marketing and Distribution—Admiral Shares | 638 |
| Custodian Fees | 127 |
| Auditing Fees | 29 |
| Shareholders’ Reports—Investor Shares | 104 |
| Shareholders’ Reports—Admiral Shares | 39 |
| Trustees’ Fees and Expenses | 16 |
| Total Expenses | 31,115 |
| Expenses Paid Indirectly | (541) |
| Net Expenses | 30,574 |
| Net Investment Income | 52,591 |
| Realized Net Gain (Loss) | |
| Investment Securities Sold2 | 395,865 |
| Futures Contracts | 16,819 |
| Foreign Currencies | 8 |
| Realized Net Gain (Loss) | 412,692 |
| Change in Unrealized Appreciation (Depreciation) | |
| Investment Securities | 471,761 |
| Futures Contracts | (4,139) |
| Foreign Currencies | (7) |
| Change in Unrealized Appreciation (Depreciation) | 467,615 |
| Net Increase (Decrease) in Net Assets Resulting from Operations | 932,898 |
| 1 Dividends are net of foreign withholding taxes of $318,000. |
| 2 Dividend income, interest income, and realized net gain (loss) from affiliated companies of the fund were $706,000, $455,000, and $0, respectively. |
See accompanying Notes, which are an integral part of the Financial Statements.
20
Morgan Growth Fund
Statement of Changes in Net Assets
| | |
| | Year Ended September 30, |
| | 2010 | 2009 |
| | ($000) | ($ 000) |
| Increase (Decrease) in Net Assets | | |
| Operations | | |
| Net Investment Income | 52,591 | 62,567 |
| Realized Net Gain (Loss) | 412,692 | (1,995,393) |
| Change in Unrealized Appreciation (Depreciation) | 467,615 | 1,591,889 |
| Net Increase (Decrease) in Net Assets Resulting from Operations | 932,898 | (340,937) |
| Distributions | | |
| Net Investment Income | | |
| Investor Shares | (39,716) | (50,414) |
| Admiral Shares | (20,471) | (27,239) |
| Realized Capital Gain | | |
| Investor Shares | — | — |
| Admiral Shares | — | — |
| Total Distributions | (60,187) | (77,653) |
| Capital Share Transactions | | |
| Investor Shares | (417,198) | 96,224 |
| Admiral Shares | (69,202) | (117,934) |
| Net Increase (Decrease) from Capital Share Transactions | (486,400) | (21,710) |
| Total Increase (Decrease) | 386,311 | (440,300) |
| Net Assets | | |
| Beginning of Period | 7,489,983 | 7,930,283 |
| End of Period1 | 7,876,294 | 7,489,983 |
| 1 Net Assets—End of Period includes undistributed net investment income of $20,263,000 and $27,851,000. | |
See accompanying Notes, which are an integral part of the Financial Statements.
21
Morgan Growth Fund
Financial Highlights
| | | | | |
| Investor Shares | | | | | |
| |
| For a Share Outstanding | Year Ended September 30, |
| Throughout Each Period | 2010 | 2009 | 2008 | 2007 | 2006 |
| Net Asset Value, Beginning of Period | $ 14.32 | $15.15 | $ 21.45 | $ 18.34 | $ 17.04 |
| Investment Operations | | | | | |
| Net Investment Income | .097 | .114 | .148 | .207 | .165 |
| Net Realized and Unrealized Gain (Loss) | | | | | |
| on Investments | 1.733 | (.804) | (4.912) | 3.604 | 1.230 |
| Total from Investment Operations | 1.830 | (.690) | (4.764) | 3.811 | 1.395 |
| Distributions | | | | | |
| Dividends from Net Investment Income | (.110) | (.140) | (.175) | (.204) | (.095) |
| Distributions from Realized Capital Gains | — | — | (1.361) | (.497) | — |
| Total Distributions | (.110) | (.140) | (1.536) | (.701) | (.095) |
| Net Asset Value, End of Period | $ 16.04 | $ 14.32 | $ 15.15 | $ 21.45 | $ 18.34 |
| |
| Total Return1 | 12.81% | -4.27% | -23.70% | 21.24 | 8.20% |
| |
| Ratios/Supplemental Data | | | | | |
| Net Assets, End of Period (Millions) | $ 5,432 | $ 5,239 | $ 5,418 | $ 6,590 | $ 5,171 |
| Ratio of Total Expenses to | | | | | |
| Average Net Assets2 | 0.44% | 0.48% | 0.38% | 0.37% | 0.42 |
| Ratio of Net Investment Income to | | | | | |
| Average Net Assets | 0.62% | 0.94% | 0.80% | 1.06% | 0.95% |
| Portfolio Turnover Rate | 60% | 87% | 88% | 79% | 90% |
| 1 Total returns do not include account service fees that may have applied in the periods shown. Fund prospectuses provide information about any applicable account service fees. |
| 2 Includes performance-based investment advisory fee increases (decreases) of 0.01%, 0.02%, 0.00%, 0.00%, and 0.02%. |
See accompanying Notes, which are an integral part of the Financial Statements.
22
Morgan Growth Fund
Financial Highlights
| | | | | |
| Admiral Shares | | | | | |
| |
| For a Share Outstanding | Year Ended September 30, |
| Throughout Each Period | 2010 | 2009 | 2008 | 2007 | 2006 |
| Net Asset Value, Beginning of Period | $ 44.42 | $ 47.03 | $ 66.58 | $ 56.94 | $ 52.91 |
| Investment Operations | | | | | |
| Net Investment Income | .372 | .414 | .555 | .742 | .620 |
| Net Realized and Unrealized Gain (Loss) | | | | | |
| on Investments | 5.364 | (2.502) | (15.244) | 11.184 | 3.808 |
| Total from Investment Operations | 5.736 | (2.088) | (14.689) | 11.926 | 4.428 |
| Distributions | | | | | |
| Dividends from Net Investment Income | (.406) | (.522) | (.641) | (.745) | (.398) |
| Distributions from Realized Capital Gains | — | — | (4.220) | (1.541) | — |
| Total Distributions | (.406) | (.522) | (4.861) | (2.286) | (.398) |
| Net Asset Value, End of Period | $ 49.75 | $ 44.42 | 47.03 | $ 66.58 | 56.94 |
| |
| Total Return | 12.95% | -4.09% | -23.57% | 21.43 | 8.39% |
| |
| Ratios/Supplemental Data | | | | | |
| Net Assets, End of Period (Millions) | $ 2,445 | $ 2,251 | $ 2,512 | $ 2,683 | $ 1,691 |
| Ratio of Total Expenses to | | | | | |
| Average Net Assets1 | 0.30% | 0.31% | 0.21% | 0.21% | 0.23% |
| Ratio of Net Investment Income to | | | | | |
| Average Net Assets | 0.76% | 1.11% | 0.97% | 1.22% | 1.14% |
| Portfolio Turnover Rate | 60% | 87% | 88% | 79% | 90% |
| 1 Includes performance-based investment advisory fee increases (decreases) of 0.01%, 0.02%, 0.00%, 0.00%, and 0.02%. |
See accompanying Notes, which are an integral part of the Financial Statements.
23
Morgan Growth Fund
Notes to Financial Statements
Vanguard Morgan Growth Fund is registered under the Investment Company Act of 1940 as an open-end investment company, or mutual fund. The fund offers two classes of shares: Investor Shares and Admiral Shares. Investor Shares are available to any investor who meets the fund’s minimum purchase requirements. Admiral Shares are designed for investors who meet certain administrative, service, and account-size criteria.
A. The following significant accounting policies conform to generally accepted accounting principles for U.S. mutual funds. The fund consistently follows such policies in preparing its financial statements.
1. Security Valuation: Securities are valued as of the close of trading on the New York Stock Exchange (generally 4 p.m., Eastern time) on the valuation date. Equity securities are valued at the latest quoted sales prices or official closing prices taken from the primary market in which each security trades; such securities not traded on the valuation date are valued at the mean of the latest quoted bid and asked prices. Securities for which market quotations are not readily available, or whose values have been affected by events occurring before the fund’s pricing time but after the close of the securities’ primary markets, are valued at their fair values calculated according to procedures adopted by the board of trustees. These procedures include obtaining quotations from an independent pricing service, monitoring news to identify significant market- or security-specific events, and evaluating changes in the va lues of foreign market proxies (for example, ADRs, futures contracts, or exchange-traded funds), between the time the foreign markets close and the fund’s pricing time. When fair-value pricing is employed, the prices of securities used by a fund to calculate its net asset value may differ from quoted or published prices for the same securities. Investments in Vanguard Market Liquidity Fund are valued at that fund’s net asset value. Temporary cash investments acquired over 60 days to maturity are valued using the latest bid prices or using valuations based on a matrix system (which considers such factors as security prices, yields, maturities, and ratings), both as furnished by independent pricing services. Other temporary cash investments are valued at amortized cost, which approximates market value.
2. Foreign Currency: Securities and other assets and liabilities denominated in foreign currencies are translated into U.S. dollars using exchange rates obtained from an independent third party as of the fund’s pricing time on the valuation date. Realized gains (losses) and unrealized appreciation (depreciation) on investment securities include the effects of changes in exchange rates since the securities were purchased, combined with the effects of changes in security prices. Fluctuations in the value of other assets and liabilities resulting from changes in exchange rates are recorded as unrealized foreign currency gains (losses) until the assets or liabilities are settled in cash, at which time they are recorded as realized foreign currency gains (losses).
3. Futures Contracts: The fund uses index futures contracts to a limited extent, with the objective of maintaining full exposure to the stock market while maintaining liquidity. The fund may purchase or sell futures contracts to achieve a desired level of investment, whether to accommodate portfolio turnover or cash flows from capital share transactions. The primary risks associated with the use of futures contracts are imperfect correlation between changes in market values of stocks held by the fund and the prices of futures contracts, and the possibility of an illiquid market.
Futures contracts are valued at their quoted daily settlement prices. The aggregate principal amounts of the contracts are not recorded in the Statement of Net Assets. Fluctuations in the value of the contracts are recorded in the Statement of Net Assets as an asset (liability) and in the Statement of Operations as unrealized appreciation (depreciation) until the contracts are closed, when they are recorded as realized futures gains (losses).
24
Morgan Growth Fund
4. Repurchase Agreements: The fund may invest in repurchase agreements. Securities pledged as collateral for repurchase agreements are held by a custodian bank until the agreements mature. Each agreement requires that the market value of the collateral be sufficient to cover payments of interest and principal; however, in the event of default or bankruptcy by the other party to the agreement, retention of the collateral may be subject to legal proceedings.
5. Federal Income Taxes: The fund intends to continue to qualify as a regulated investment company and distribute all of its taxable income. Management has analyzed the fund’s tax positions taken for all open federal income tax years (September 30, 2007–2010), and has concluded that no provision for federal income tax is required in the fund’s financial statements.
6. Distributions: Distributions to shareholders are recorded on the ex-dividend date.
7. Security Lending: The fund may lend its securities to qualified institutional borrowers to earn additional income. Security loans are required to be secured at all times by collateral at least equal to the market value of securities loaned. The fund invests cash collateral received in Vanguard Market Liquidity Fund, and records a liability for the return of the collateral, during the period the securities are on loan. Security lending income represents fees charged to borrowers plus income earned on investing cash collateral, less expenses associated with the loan.
8. Other: Dividend income is recorded on the ex-dividend date. Interest income includes income distributions received from Vanguard Market Liquidity Fund and is accrued daily. Security transactions are accounted for on the date securities are bought or sold. Costs used to determine realized gains (losses) on the sale of investment securities are those of the specific securities sold.
Each class of shares has equal rights as to assets and earnings, except that each class separately bears certain class-specific expenses related to maintenance of shareholder accounts (included in Management and Administrative expenses) and shareholder reporting. Marketing and distribution expenses are allocated to each class of shares based on a method approved by the board of trustees. Income, other non-class-specific expenses, and gains and losses on investments are allocated to each class of shares based on its relative net assets.
B. Wellington Management Company, LLP, Jennison Associates LLC, Frontier Capital Management Co., LLC, and Kalmar Investment Advisers each provide investment advisory services to a portion of the fund for a fee calculated at an annual percentage rate of average net assets managed by the advisor. The basic fee of Wellington Management Company, LLP, is subject to quarterly adjustments based on performance for the preceding three years relative to the Russell 3000 Growth Index. The basic fee of Jennison Associates LLC is subject to quarterly adjustments based on performance for the preceding three years relative to the Russell 1000 Growth Index. The basic fees of Frontier Capital Management Co., LLC, and Kalmar Investment Advisers are subject to quarterly adjustments based on performance since December 31, 2008, relative to the Russell Midcap Growth Index.
The Vanguard Group provides investment advisory services to a portion of the fund on an at-cost basis; the fund paid Vanguard advisory fees of $850,000 for the year ended September 30, 2010.
For the year ended September 30, 2010, the aggregate investment advisory fee represented an effective annual basic rate of 0.16% of the fund’s average net assets, before an increase of $838,000 (0.01%) based on performance.
C. The Vanguard Group furnishes at cost corporate management, administrative, marketing, and distribution services. The costs of such services are allocated to the fund under methods approved by the board of trustees. The fund has committed to provide up to 0.40% of its net assets in capital
25
Morgan Growth Fund
contributions to Vanguard. At September 30, 2010, the fund had contributed capital of $1,390,000 to Vanguard (included in Other Assets), representing 0.02% of the fund’s net assets and 0.56% of Vanguard’s capitalization. The fund’s trustees and officers are also directors and officers of Vanguard.
D. The fund has asked its investment advisors to direct certain security trades, subject to obtaining the best price and execution, to brokers who have agreed to rebate to the fund part of the commissions generated. Such rebates are used solely to reduce the fund’s management and administrative expenses. For the year ended September 30, 2010, these arrangements reduced the fund’s expenses by $541,000 (an annual rate of 0.01% of average net assets).
E. Various inputs may be used to determine the value of the fund’s investments. These inputs are summarized in three broad levels for financial statement purposes. The inputs or methodologies used to value securities are not necessarily an indication of the risk associated with investing in those securities.
Level 1—Quoted prices in active markets for identical securities.
Level 2—Other significant observable inputs (including quoted prices for similar securities, interest rates, prepayment speeds, credit risk, etc.).
Level 3—Significant unobservable inputs (including the fund’s own assumptions used to determine the fair value of investments).
The following table summarizes the fund’s investments as of September 30, 2010, based on the inputs used to value them:
| | | |
| | Level 1 | Level 2 | Level 3 |
| Investments | ($ 000) | ($ 000) | ($ 000) |
| Common Stocks | 7,643,516 | — | — |
| Temporary Cash Investments | 212,748 | 34,856 | — |
| Futures Contracts—Assets1 | 21 | — | — |
| Futures Contracts—Liabilities1 | (350) | — | — |
| Total | 7,855,935 | 34,856 | — |
| 1 Represents variation margin on the last day of the reporting period. |
F. At September 30, 2010, the aggregate settlement value of open futures contracts and the related unrealized appreciation (depreciation) were:
| | | | |
| | | | ($ 000) |
| | | | Aggregate | |
| | | Number of | Settlement | Unrealized |
| | | Long (Short) | Value | Appreciation |
| Futures Contracts | Expiration | Contracts | Long (Short) | (Depreciation) |
| S&P 500 Index | December 2010 | 296 | 84,116 | 1,546 |
| E-mini S&P 500 Index | December 2010 | 281 | 15,970 | (12) |
Unrealized appreciation (depreciation) on open futures contracts is required to be treated as realized gain (loss) for tax purposes.
26
Morgan Growth Fund
G. Distributions are determined on a tax basis and may differ from net investment income and realized capital gains for financial reporting purposes. Differences may be permanent or temporary. Permanent differences are reclassified among capital accounts in the financial statements to reflect their tax character. Temporary differences arise when certain items of income, expense, gain, or loss are recognized in different periods for financial statement and tax purposes; these differences will reverse at some time in the future. Differences in classification may also result from the treatment of short-term gains as ordinary income for tax purposes.
During the year ended September 30, 2010, the fund realized net foreign currency gains of $8,000, which increased distributable net income for tax purposes; accordingly, such gains have been reclassified from accumulated net realized losses to undistributed net investment income.
For tax purposes, at September 30, 2010, the fund had $37,335,000 of ordinary income available for distribution. The fund had available capital loss carryforwards totaling $1,978,510,000 to offset future net capital gains of $879,082,000 through September 30, 2017, and $1,099,428,000 through September 30, 2018.
At September 30, 2010, the cost of investment securities for tax purposes was $6,459,698,000. Net unrealized appreciation of investment securities for tax purposes was $1,431,422,000, consisting of unrealized gains of $1,650,618,000 on securities that had risen in value since their purchase and $219,196,000 in unrealized losses on securities that had fallen in value since their purchase.
H. During the year ended September 30, 2010, the fund purchased $4,501,351,000 of investment securities and sold $4,978,571,000 of investment securities, other than temporary cash investments.
I. Capital share transactions for each class of shares were:
| | | | |
| | Year Ended September 30, |
| | 2010 | 2009 |
| | Amount | Shares | Amount | Shares |
| | ($ 000) | (000) | ($ 000) | (000) |
| Investor Shares | | | | |
| Issued | 656,780 | 43,144 | 838,795 | 70,793 |
| Issued in Lieu of Cash Distributions | 38,554 | 2,500 | 48,928 | 4,472 |
| Redeemed | (1,112,532) | (72,852) | (791,499) | (67,053) |
| Net Increase (Decrease)—Investor Shares | (417,198) | (27,208) | 96,224 | 8,212 |
| Admiral Shares | | | | |
| Issued | 381,035 | 8,051 | 371,510 | 10,237 |
| Issued in Lieu of Cash Distributions | 17,395 | 364 | 22,380 | 660 |
| Redeemed | (467,632) | (9,955) | (511,824) | (13,638) |
| Net Increase (Decrease)—Admiral Shares | (69,202) | (1,540) | (117,934) | (2,741) |
J. In preparing the financial statements as of September 30, 2010, management considered the impact of subsequent events for potential recognition or disclosure in these financial statements.
27
Report of Independent Registered
Public Accounting Firm
To the Trustees and Shareholders of Vanguard Morgan Growth Fund:
In our opinion, the accompanying statement of net assets and the related statements of operations and of changes in net assets and the financial highlights present fairly, in all material respects, the financial position of Vanguard Morgan Growth Fund (the “Fund”) at September 30, 2010, the results of its operations for the year then ended, the changes in its net assets for each of the two years in the period then ended and the financial highlights for each of the five years in the period then ended, in conformity with accounting principles generally accepted in the United States of America. These financial statements and financial highlights (hereafter referred to as “financial statements”) are the responsibility of the Fund’s management; our responsibility is to express an opinion on these financial statements based on our audits. We conducted our audits of these financial statements in accordanc e with the standards of the Public Company Accounting Oversight Board (United States). Those standards require that we plan and perform the audit to obtain reasonable assurance about whether the financial statements are free of material misstatement. An audit includes examining, on a test basis, evidence supporting the amounts and disclosures in the financial statements, assessing the accounting principles used and significant estimates made by management, and evaluating the overall financial statement presentation. We believe that our audits, which included confirmation of securities at September 30, 2010 by correspondence with the custodians and brokers and by agreement to the underlying ownership records of Vanguard Market Liquidity Fund, provide a reasonable basis for our opinion.
PricewaterhouseCoopers LLP
Philadelphia, Pennsylvania
November 8, 2010
Special 2010 tax information (unaudited) for Vanguard Morgan Growth Fund
This information for the fiscal year ended September 30, 2010, is included pursuant to provisions of the Internal Revenue Code.
The fund distributed $60,187,000 of qualified dividend income to shareholders during the fiscal year.
For corporate shareholders, 100% of investment income (dividend income plus short-term gains, if any) qualifies for the dividends-received deduction.
28
Your Fund’s After-Tax Returns
This table presents returns for your fund both before and after taxes. The after-tax returns are shown in two ways: (1) assuming that an investor owned the fund during the entire period and paid taxes on the fund’s distributions, and (2) assuming that an investor paid taxes on the fund’s distributions and sold all shares at the end of each period.
Calculations are based on the highest individual federal income tax and capital gains tax rates in effect at the times of the distributions and the hypothetical sales. State and local taxes were not considered. After-tax returns reflect any qualified dividend income , using actual prior-year figures and estimates for 2010. (In the example, returns after the sale of fund shares may be higher than those assuming no sale. This occurs when the sale would have produced a capital loss. The calculation assumes that the investor received a tax deduction for the loss.) The table shows returns for Investor Shares only; returns for other share classes will differ. Please note that your actual after-tax returns will depend on your tax situation and may differ from those shown. Also note that if you own the fund in a tax-deferred account, such as an individual retirement account or a 401(k) plan, this information does not apply to you. Such accounts are not subject to current taxes.
Finally, keep in mind that a fund’s performance—whether before or after taxes—does not guarantee future results.
| | | |
| Average Annual Total Returns: Morgan Growth Fund Investor Shares | | |
| Periods Ended September 30, 2010 | | | |
| | One | Five | Ten |
| | Year | Years | Years |
| Returns Before Taxes | 12.81% | 1.57% | -0.51% |
| Returns After Taxes on Distributions | 12.69 | 1.07 | -1.13 |
| Returns After Taxes on Distributions and Sale of Fund Shares | 8.48 | 1.28 | -0.64 |
29
About Your Fund’s Expenses
As a shareholder of the fund, you incur ongoing costs, which include costs for portfolio management, administrative services, and shareholder reports (like this one), among others. Operating expenses, which are deducted from a fund’s gross income, directly reduce the investment return of the fund.
A fund’s expenses are expressed as a percentage of its average net assets. This figure is known as the expense ratio. The following examples are intended to help you understand the ongoing costs (in dollars) of investing in your fund and to compare these costs with those of other mutual funds. The examples are based on an investment of $1,000 made at the beginning of the period shown and held for the entire period.
The accompanying table illustrates your fund’s costs in two ways:
• Based on actual fund return. This section helps you to estimate the actual expenses that you paid over the period. The ”Ending Account Value“ shown is derived from the fund‘s actual return, and the third column shows the dollar amount that would have been paid by an investor who started with $1,000 in the fund. You may use the information here, together with the amount you invested, to estimate the expenses that you paid over the period.
To do so, simply divide your account value by $1,000 (for example, an $8,600 account value divided by $1,000 = 8.6), then multiply the result by the number given for your fund under the heading ”Expenses Paid During Period.“
• Based on hypothetical 5% yearly return. This section is intended to help you compare your fund‘s costs with those of other mutual funds. It assumes that the fund had a yearly return of 5% before expenses, but that the expense ratio is unchanged. In this case—because the return used is not the fund’s actual return—the results do not apply to your investment. The example is useful in making comparisons because the Securities and Exchange Commission requires all mutual funds to calculate expenses based on a 5% return. You can assess your fund’s costs by comparing this hypothetical example with the hypothetical examples that appear in shareholder reports of other funds.
Note that the expenses shown in the table are meant to highlight and help you compare ongoing costs only and do not reflect transaction costs incurred by the fund for buying and selling securities. Further, the expenses do not include the account service fee described in the prospectus. If such a fee were applied to your account, your costs would be higher. Your fund does not charge transaction fees, such as purchase or redemption fees, nor does it carry a “sales load.” The calculations assume no shares were bought or sold during the period. Your actual costs may have been higher or lower, depending on the amount of your investment and the timing of any purchases or redemptions.
You can find more information about the fund’s expenses, including annual expense ratios, in the Financial Statements section of this report. For additional information on operating expenses and other shareholder costs, please refer to your fund’s current prospectus.
30
| | | |
| Six Months Ended September 30, 2010 | | | |
| | Beginning | Ending | Expenses |
| | Account Value | Account Value | Paid During |
| Morgan Growth Fund | 3/31/2010 | 9/30/2010 | Period |
| Based on Actual Fund Return | | | |
| Investor Shares | $1,000.00 | $999.38 | $1.95 |
| Admiral Shares | 1,000.00 | 999.80 | 1.45 |
| Based on Hypothetical 5% Yearly Return | | | |
| Investor Shares | $1,000.00 | $1,023.11 | $1.98 |
| Admiral Shares | 1,000.00 | 1,023.61 | 1.47 |
The calculations are based on expenses incurred in the most recent six-month period. The fund’s annualized six-month expense ratios for that period are 0.39% for Investor Shares and 0.29% for Admiral Shares. The dollar amounts shown as “Expenses Paid” are equal to the annualized expense ratio multiplied by the average account value over the period, multiplied by the number of days in the most recent six-month period, then divided by the number of days in the most recent 12-month period.
31
Glossary
30-Day SEC Yield. A fund’s 30-day SEC yield is derived using a formula specified by the U.S. Securities and Exchange Commission. Under the formula, data related to the fund’s security holdings in the previous 30 days are used to calculate the fund’s hypothetical net income for that period, which is then annualized and divided by the fund’s estimated average net assets over the calculation period. For the purposes of this calculation, a security’s income is based on its current market yield to maturity (in the case of bonds) or its projected dividend yield (for stocks). Because the SEC yield represents hypothetical annualized income, it will differ—at times significantly—from the fund’s actual experience. As a result, the fund’s income distributions may be higher or lower than implied by the SEC yield.
Beta. A measure of the magnitude of a fund’s past share-price fluctuations in relation to the ups and downs of a given market index. The index is assigned a beta of 1.00. Compared with a given index, a fund with a beta of 1.20 typically would have seen its share price rise or fall by 12% when the index rose or fell by 10%. For this report, beta is based on returns over the past 36 months for both the fund and the index. Note that a fund’s beta should be reviewed in conjunction with its R-squared (see definition). The lower the R-squared, the less correlation there is between the fund and the index, and the less reliable beta is as an indicator of volatility.
Dividend Yield. Dividend income earned by stocks, expressed as a percentage of the aggregate market value (or of net asset value, for a fund). The yield is determined by dividing the amount of the annual dividends by the aggregate value (or net asset value) at the end of the period. For a fund, the dividend yield is based solely on stock holdings and does not include any income produced by other investments.
Earnings Growth Rate. The average annual rate of growth in earnings over the past five years for the stocks now in a fund.
Equity Exposure. A measure that reflects a fund’s investments in stocks and stock futures. Any holdings in short-term reserves are excluded.
Expense Ratio. The percentage of a fund’s average net assets used to pay its annual administrative and advisory expenses. These expenses directly reduce returns to investors.
Foreign Holdings. The percentage of a fund represented by stocks or depositary receipts of companies based outside the United States.
Inception Date. The date on which the assets of a fund (or one of its share classes) are first invested in accordance with the fund’s investment objective. For funds with a subscription period, the inception date is the day after that period ends. Investment performance is measured from the inception date.
Median Market Cap. An indicator of the size of companies in which a fund invests; the midpoint of market capitalization (market price x shares outstanding) of a fund’s stocks, weighted by the proportion of the fund’s assets invested in each stock. Stocks representing half of the fund’s assets have market capitalizations above the median, and the rest are below it.
Price/Book Ratio. The share price of a stock divided by its net worth, or book value, per share. For a fund, the weighted average price/book ratio of the stocks it holds.
32
Price/Earnings Ratio. The ratio of a stock’s current price to its per-share earnings over the past year. For a fund, the weighted average P/E of the stocks it holds. P/E is an indicator of market expectations about corporate prospects; the higher the P/E, the greater the expectations for a company’s future growth.
R-Squared. A measure of how much of a fund’s past returns can be explained by the returns from the market in general, as measured by a given index. If a fund’s total returns were precisely synchronized with an index’s returns, its R-squared would be 1.00. If the fund’s returns bore no relationship to the index’s returns, its R-squared would be 0. For this report, R-squared is based on returns over the past 36 months for both the fund and the index.
Return on Equity. The annual average rate of return generated by a company during the past five years for each dollar of shareholder’s equity (net income divided by shareholder’s equity). For a fund, the weighted average return on equity for the companies whose stocks it holds.
Short-Term Reserves. The percentage of a fund invested in highly liquid, short-term securities that can be readily converted to cash.
Turnover Rate. An indication of the fund’s trading activity. Funds with high turnover rates incur higher transaction costs and may be more likely to distribute capital gains (which may be taxable to investors). The turnover rate excludes in-kind transactions, which have minimal impact on costs.
33
This page intentionally left blank.
This page intentionally left blank.
The People Who Govern Your Fund
The trustees of your mutual fund are there to see that the fund is operated and managed in your best interests since, as a shareholder, you are a part owner of the fund. Your fund’s trustees also serve on the board of directors of The Vanguard Group, Inc., which is owned by the Vanguard funds and provides services to them on an at-cost basis.
A majority of Vanguard’s board members are independent, meaning that they have no affiliation with Vanguard or the funds they oversee, apart from the sizable personal investments they have made as private individuals. The independent board members have distinguished backgrounds in business, academia, and public service. Each of the trustees and executive officers oversees 178 Vanguard funds.
The following table provides information for each trustee and executive officer of the fund. More information about the trustees is in the Statement of Additional Information, which can be obtained, without charge, by contacting Vanguard at 800-662-7447, or online at Vanguard.com.
| |
| Interested Trustee1 | Amy Gutmann |
| | Born 1949. Trustee Since June 2006. Principal |
| F. William McNabb III | Occupation(s) During the Past Five Years: President |
| Born 1957. Trustee Since July 2009. Chairman of the | of the University of Pennsylvania; Christopher H. |
| Board. Principal Occupation(s) During the Past Five | Browne Distinguished Professor of Political Science |
| Years: Chairman of the Board of The Vanguard Group, | in the School of Arts and Sciences with secondary |
| Inc., and of each of the investment companies served | appointments at the Annenberg School for Commu- |
| by The Vanguard Group, since January 2010; Director | nication and the Graduate School of Education |
| of The Vanguard Group since 2008; Chief Executive | of the University of Pennsylvania; Director of |
| Officer and President of The Vanguard Group and of | Carnegie Corporation of New York, Schuylkill River |
| each of the investment companies served by The | Development Corporation, and Greater Philadelphia |
| Vanguard Group since 2008; Director of Vanguard | Chamber of Commerce; Trustee of the National |
| Marketing Corporation; Managing Director of The | Constitution Center; Chair of the Presidential |
| Vanguard Group (1995–2008) . | Commission for the Study of Bioethical Issues. |
| |
| | JoAnn Heffernan Heisen |
| Independent Trustees | Born 1950. Trustee Since July 1998. Principal |
| | Occupation(s) During the Past Five Years: Corporate |
| Emerson U. Fullwood | Vice President and Chief Global Diversity Officer |
| Born 1948. Trustee Since January 2008. Principal | since 2006 (retired 2008) and Member of the |
| Occupation(s) During the Past Five Years: Executive | Executive Committee (retired 2008) of Johnson & |
| Chief Staff and Marketing Officer for North America | Johnson (pharmaceuticals/consumer products); Vice |
| and Corporate Vice President (retired 2008) of Xerox | President and Chief Information Officer of Johnson & |
| Corporation (document management products and | Johnson (1997–2005); Director of the University |
| services); Director of SPX Corporation (multi-industry | Medical Center at Princeton and Women’s Research |
| manufacturing), the United Way of Rochester, | and Education Institute; Member of the Advisory |
| Amerigroup Corporation (managed health care), | Board of the Maxwell School of Citizenship and Public |
| the University of Rochester Medical Center, and | Affairs at Syracuse University. |
| Monroe Community College Foundation. | |
| | F. Joseph Loughrey |
| Rajiv L. Gupta | Born 1949. Trustee Since October 2009. Principal |
| Born 1945. Trustee Since December 2001.2 | Occupation(s) During the Past Five Years: President |
| Principal Occupation(s) During the Past Five Years: | and Chief Operating Officer since 2005 (retired 2009) |
| Chairman and Chief Executive Officer (retired 2009) | and Vice Chairman of the Board (2008–2009) of |
| and President (2006–2008) of Rohm and Haas Co. | Cummins Inc. (industrial machinery); Director of |
| (chemicals); Director of Tyco International, Ltd. | SKF AB (industrial machinery), Hillenbrand, Inc. |
| (diversified manufacturing and services) and Hewlett- | (specialized consumer services), Sauer-Danfoss Inc. |
| Packard Co. (electronic computer manufacturing); | (machinery), the Lumina Foundation for Education, |
| Trustee of The Conference Board; Member of the | and Oxfam America; Chairman of the Advisory |
| Board of Managers of Delphi Automotive LLP | Council for the College of Arts and Letters at the |
| (automotive components) . | University of Notre Dame. |
| | |
| André F. Perold | Kathryn J. Hyatt | |
| Born 1952. Trustee Since December 2004. Principal | Born 1955. Treasurer Since November 2008. Principal |
| Occupation(s) During the Past Five Years: George | Occupation(s) During the Past Five Years: Principal |
| Gund Professor of Finance and Banking at the Harvard | of The Vanguard Group, Inc.; Treasurer of each of |
| Business School; Chair of the Investment Committee | the investment companies served by The Vanguard |
| of HighVista Strategies LLC (private investment firm) . | Group since 2008; Assistant Treasurer of each of the |
| | investment companies served by The Vanguard Group |
| Alfred M. Rankin, Jr. | (1988–2008). | |
| Born 1941. Trustee Since January 1993. Principal | | |
| Occupation(s) During the Past Five Years: Chairman, | Heidi Stam | |
| President, and Chief Executive Officer of NACCO | Born 1956. Secretary Since July 2005. Principal |
| Industries, Inc. (forklift trucks/housewares/lignite); | Occupation(s) During the Past Five Years: Managing |
| Director of Goodrich Corporation (industrial products/ | Director of The Vanguard Group, Inc., since 2006; |
| aircraft systems and services); Chairman of the | General Counsel of The Vanguard Group since 2005; |
| Federal Reserve Bank of Cleveland; Trustee of The | Secretary of The Vanguard Group and of each of the |
| Cleveland Museum of Art. | investment companies served by The Vanguard Group |
| | since 2005; Director and Senior Vice President of |
| Peter F. Volanakis | Vanguard Marketing Corporation since 2005; |
| Born 1955. Trustee Since July 2009. Principal | Principal of The Vanguard Group (1997–2006). |
| Occupation(s) During the Past Five Years: President | | |
| since 2007 and Chief Operating Officer since 2005 | | |
| of Corning Incorporated (communications equipment); | |
| President of Corning Technologies (2001–2005); | Vanguard Senior Management Team |
| Director of Corning Incorporated and Dow Corning; | R. Gregory Barton | Michael S. Miller |
| Trustee of the Corning Incorporated Foundation and | Mortimer J. Buckley | James M. Norris |
| the Corning Museum of Glass; Overseer of the | Kathleen C. Gubanich | Glenn W. Reed |
| Amos Tuck School of Business Administration at | Paul A. Heller | George U. Sauter |
| Dartmouth College. | | |
| |
| | |
| Chairman Emeritus and Senior Advisor |
| Executive Officers | John J. Brennan | |
| Glenn Booraem | Chairman, 1996–2009 | |
| Born 1967. Controller Since July 2010. Principal | Chief Executive Officer and President, 1996–2008 |
| Occupation(s) During the Past Five Years: Principal | | |
| of The Vanguard Group, Inc.; Controller of each of | | |
| the investment companies served by The Vanguard | | |
| Group since 2010; Assistant Controller of each of | Founder | |
| the investment companies served by The Vanguard | John C. Bogle | |
| Group (2001–2010) . | Chairman and Chief Executive Officer, 1974–1996 |
| |
| Thomas J. Higgins | | |
| Born 1957. Chief Financial Officer Since September | | |
| 2008. Principal Occupation(s) During the Past Five | | |
| Years: Principal of The Vanguard Group, Inc.; Chief | | |
| Financial Officer of each of the investment companies | | |
| served by The Vanguard Group since 2008; Treasurer | | |
| of each of the investment companies served by The | | |
| Vanguard Group (1998–2008) . | | |
1 Mr. McNabb is considered an “interested person,” as defined in the Investment Company Act of 1940, because he is an officer of the
Vanguard funds.
2 December 2002 for Vanguard Equity Income Fund, Vanguard Growth Equity Fund, the Vanguard Municipal Bond Funds, and the
Vanguard State Tax-Exempt Funds.

| |
| | P.O. Box 2600 |
| | Valley Forge, PA 19482-2600 |
| |
| |
| |
| Connect with Vanguard® > Vanguard.com | |
| |
| |
| |
| Fund Information > 800-662-7447 | CFA® is a trademark owned by CFA Institute. |
| Direct Investor Account Services > 800-662-2739 | |
| Institutional Investor Services > 800-523-1036 | |
| Text Telephone for People | |
| With Hearing Impairment > 800-749-7273 | |
| |
| This material may be used in conjunction | |
| with the offering of shares of any Vanguard | |
| fund only if preceded or accompanied by | |
| the fund’s current prospectus. | |
| |
| All comparative mutual fund data are from Lipper Inc. or | |
| Morningstar, Inc., unless otherwise noted. | |
| |
| You can obtain a free copy of Vanguard’s proxy voting | |
| guidelines by visiting vanguard.com/proxyreporting or by | |
| calling Vanguard at 800-662-2739. The guidelines are | |
| also available from the SEC’s website, sec.gov. In | |
| addition, you may obtain a free report on how your fund | |
| voted the proxies for securities it owned during the 12 | |
| months ended June 30. To get the report, visit either | |
| vanguard.com/proxyreporting or sec.gov. | |
| |
| You can review and copy information about your fund at | |
| the SEC’s Public Reference Room in Washington, D.C. To | |
| find out more about this public service, call the SEC at | |
| 202-551-8090. Information about your fund is also | |
| available on the SEC’s website, and you can receive | |
| copies of this information, for a fee, by sending a | |
| request in either of two ways: via e-mail addressed to | |
| publicinfo@sec.gov or via regular mail addressed to the | |
| Public Reference Section, Securities and Exchange | |
| Commission, Washington, DC 20549-1520. | |
| |
| |
| | © 2010 The Vanguard Group, Inc. |
| | All rights reserved. |
| | Vanguard Marketing Corporation, Distributor. |
| |
| | Q260 112010 |
Item 2: Code of Ethics. The Registrant has adopted a code of ethics that applies to the Registrant’s principal executive officer, principal financial officer, principal accounting officer or controller or persons performing similar functions. The Code of Ethics was amended during the reporting period covered by this report to make certain technical, non-material changes.
Item 3: Audit Committee Financial Expert. The following members of the Audit Committee have been determined by the Registrant’s Board of Trustees to be Audit Committee Financial Experts serving on its Audit Committee, and to be independent: Charles D. Ellis, Rajiv L. Gupta, JoAnn Heffernan Heisen, André F. Perold, and Alfred M. Rankin, Jr.
Item 4: Principal Accountant Fees and Services.
(a) Audit Fees.
Audit Fees of the Registrant
Fiscal Year Ended September 30, 2010: $29,000
Fiscal Year Ended September 30, 2009: $27,000
Aggregate Audit Fees of Registered Investment Companies in the Vanguard Group.
Fiscal Year Ended September 30, 2010: $3,607,060
Fiscal Year Ended September 30, 2009: $3,354,640
(b) Audit-Related Fees.
Fiscal Year Ended September 30, 2010: $791,350
Fiscal Year Ended September 30, 2009: $876,210
Includes fees billed in connection with assurance and related services provided to the Registrant, The Vanguard Group, Inc., Vanguard Marketing Corporation, and other registered investment companies in the Vanguard Group.
(c) Tax Fees.
Fiscal Year Ended September 30, 2010: $336,090
Fiscal Year Ended September 30, 2009: $423,070
Includes fees billed in connection with tax compliance, planning and advice services provided to the Registrant, The Vanguard Group, Inc., Vanguard Marketing Corporation, and other registered investment companies in the Vanguard Group and related to income and excise taxes.
(d) All Other Fees.
Fiscal Year Ended September 30, 2010: $16,000
Fiscal Year Ended September 30, 2009: $0
Includes fees billed for services related to risk management and privacy matters. Services were provided to the Registrant, The Vanguard Group, Inc., Vanguard Marketing Corporation, and other registered investment companies in the Vanguard Group.
(e) (1) Pre-Approval Policies. The policy of the Registrant’s Audit Committee is to consider and, if appropriate, approve before the principal accountant is engaged for such services, all specific audit and non-audit services provided to: (1) the Registrant; (2) The Vanguard Group, Inc.; (3) other entities controlled by The Vanguard Group, Inc. that provide ongoing services to the Registrant; and (4) other registered investment companies in the Vanguard Group. In making a determination, the Audit Committee considers whether the services are consistent with maintaining the principal accountant’s independence.
In the event of a contingency situation in which the principal accountant is needed to provide services in between scheduled Audit Committee meetings, the Chairman of the Audit Committee would be called on to consider and, if appropriate, pre-approve audit or permitted non-audit services in an amount sufficient to complete services through the next Audit Committee meeting, and to determine if such services would be consistent with maintaining the accountant’s independence. At the next scheduled Audit Committee meeting, services and fees would be presented to the Audit Committee for formal consideration, and, if appropriate, approval by the entire Audit Committee. The Audit Committee would again consider whether such services and fees are consistent with maintaining the principal accountant’s independence.
The Registrant’s Audit Committee is informed at least annually of all audit and non-audit services provided by the principal accountant to the Vanguard complex, whether such services are provided to: (1) the Registrant; (2) The Vanguard Group, Inc.; (3) other entities controlled by The Vanguard Group, Inc. that provide ongoing services to the Registrant; or (4) other registered investment companies in the Vanguard Group.
(2) No percentage of the principal accountant’s fees or services were approved pursuant to the waiver provision of paragraph (c)(7)(i)(C) of Rule 2-01 of Regulation S-X.
(f) For the most recent fiscal year, over 50% of the hours worked under the principal accountant’s engagement were not performed by persons other than full-time, permanent employees of the principal accountant.
(g) Aggregate Non-Audit Fees.
Fiscal Year Ended September 30, 2010: $352,090
Fiscal Year Ended September 30, 2009: $423,070
Includes fees billed for non-audit services provided to the Registrant, The Vanguard Group, Inc., Vanguard Marketing Corporation, and other registered investment companies in the Vanguard Group.
(h) For the most recent fiscal year, the Audit Committee has determined that the provision of all non-audit services was consistent with maintaining the principal accountant’s independence.
Item 5: Audit Committee of Listed Registrants.
Not Applicable.
Item 6: Investments.
Not Applicable.
Item 7: Disclosure of Proxy Voting Policies and Procedures for Closed-End Management Investment Companies.
Not Applicable.
Item 8: Portfolio Managers of Closed-End Management Investment Companies.
Not Applicable.
Item 9: Purchase of Equity Securities by Closed-End Management Investment Company and Affiliated Purchasers.
Not Applicable.
Item 10: Submission of Matters to a Vote of Security Holders.
Not Applicable.
Item 11: Controls and Procedures.
(a) Disclosure Controls and Procedures. The Principal Executive and Financial Officers concluded that the Registrant's Disclosure Controls and Procedures are effective based on their evaluation of the Disclosure Controls and Procedures as of a date within 90 days of the filing date of this report.
(b) Internal Control Over Financial Reporting. There were no significant changes in Registrant’s Internal Control Over Financial Reporting or in other factors that could significantly affect this control subsequent to the date of the evaluation, including any corrective actions with regard to significant deficiencies and material weaknesses.
Item 12: Exhibits.
(a) Code of Ethics.
(b) Certifications.
Pursuant to the requirements of the Securities Exchange Act of 1934 and the Investment Company Act of 1940, the registrant has duly caused this report to be signed on its behalf by the undersigned, thereunto duly authorized.
| |
| | VANGUARD MORGAN GROWTH FUND |
| |
| BY: | /s/ F. WILLIAM MCNABB III* |
| F. WILLIAM MCNABB III |
| | CHIEF EXECUTIVE OFFICER |
| |
| Date: November 18, 2010 |
Pursuant to the requirements of the Securities Exchange Act of 1934 and the Investment Company Act of 1940, this report has been signed below by the following persons on behalf of the registrant and in the capacities and on the dates indicated.
| |
| | VANGUARD MORGAN GROWTH FUND |
| |
| BY: | /s/ F. WILLIAM MCNABB III* |
| F. WILLIAM MCNABB III |
| | CHIEF EXECUTIVE OFFICER |
|
| Date: November 18, 2010 |
| |
| | VANGUARD MORGAN GROWTH FUND |
| |
| BY: | /s/ THOMAS J. HIGGINS* |
| | THOMAS J. HIGGINS |
| CHIEF FINANCIAL OFFICER |
|
| Date: November 18, 2010 |
* By: /s/ Heidi Stam
Heidi Stam, pursuant to a Power of Attorney filed on April 26, 2010, see file Number
33-53683, Incorporated by Reference.