UNITED STATES
SECURITIES AND EXCHANGE COMMISSION
Washington, D.C. 20549
FORM N-CSR
CERTIFIED SHAREHOLDER REPORT
OF
REGISTERED MANAGEMENT INVESTMENT COMPANIES
Investment Company Act file number: 811-1685
Name of Registrant: Vanguard Morgan Growth Fund
Address of Registrant: | P.O. Box 2600 |
| Valley Forge, PA 19482 |
|
|
Name and address of agent for service: | Heidi Stam, Esquire |
| P.O. Box 876 |
| Valley Forge, PA 19482 |
|
|
Registrant’s telephone number, including area code: (610) 669-1000
Date of fiscal year end: September 30
Date of reporting period: October 1, 2007–September 30, 2008
Item 1: Reports to Shareholders |

> | For the fiscal year ended September 30, 2008, Vanguard Morgan Growth Fund returned –23.7% for Investor Shares and –23.6% for Admiral Shares. |
> | The fund declined somewhat more than its market benchmark, but was ahead of the average return of competing funds. |
> | The fund’s long-term performance versus its comparative standards remains strong. |
See page 33 for a Notice to Shareholders concerning the fund’s investment advisors.
Contents |
|
|
|
Your Fund’s Total Returns | 1 |
President’s Letter | 2 |
Advisors’ Report | 7 |
Fund Profile | 12 |
Performance Summary | 13 |
Financial Statements | 15 |
Your Fund’s After-Tax Returns | 30 |
About Your Fund’s Expenses | 31 |
Glossary | 38 |
Past performance is not a guarantee of future results. (Current performance may be lower or higher than the performance data cited. For performance data current to the most recent month-end, visit our website at www.vanguard.com/performance.)
Please note: The opinions expressed in this report are just that—informed opinions. They should not be considered promises or advice. Also, please keep in mind that the information and opinions cover the period through the date on the front of this report. Of course, the risks of investing in your fund are spelled out in the prospectus.
Your Fund’s Total Returns
Fiscal Year Ended September 30, 2008 |
|
|
| Ticker | Total |
| Symbol | Returns |
Vanguard Morgan Growth Fund |
|
|
Investor Shares | VMRGX | –23.7% |
Admiral™ Shares1 | VMRAX | –23.6 |
Russell 3000 Growth Index |
| –20.6 |
Average Multi-Cap Growth Fund2 |
| –24.1 |
Your Fund’s Performance at a Glance |
|
| ||
September 30, 2007–September 30, 2008 |
|
| ||
|
|
| Distributions Per Share | |
| Starting | Ending | Income | Capital |
| Share Price | Share Price | Dividends | Gains |
Vanguard Morgan Growth Fund |
|
|
|
|
Investor Shares | $21.45 | $15.15 | $0.175 | $1.361 |
Admiral Shares | 66.58 | 47.03 | 0.641 | 4.220 |
1 A lower-cost class of shares available to many longtime shareholders and to those with significant investments in the fund.
2 Derived from data provided by Lipper Inc.
1

President’s Letter
Dear Shareholder,
Vanguard Morgan Growth Fund returned –23.7% for Investor Shares and –23.6% for Admiral Shares in the 12 months ended September 30, 2008. This disappointing result reflects a tumultuous time in the U.S. and foreign financial markets that drove most stock funds to register double-digit losses.
The Morgan Growth Fund declined a bit more than its index benchmark, but slightly less than the average return of peer funds.
If you own the fund in a taxable account, you may wish to review our report on the fund’s after-tax returns on page 30.
Credit-market turbulence weighed heavily on stock prices
Troubles simmering in the credit markets for much of the past year came to a boil at the end of the fiscal period, producing several high-profile bankruptcies and putting severe pressure on stock prices around the world. The broad U.S. stock market returned –21.2% for the 12 months ended September 30. In September alone, stock prices fell more than 9%. International stock markets were similarly disappointing, returning –30.0% for the full 12 months.
Policymakers and elected officials, both in the United States and abroad, responded to the upheavals with dramatic new programs designed to help stabilize the
2
credit markets. As participants struggled to make sense of the markets’ fast-changing dynamics, stock prices were exceptionally volatile, with daily ups and downs of 2 percentage points or more becoming commonplace.
U.S. Treasuries rallied in a nervous market Nervousness in the stock market was echoed, and even amplified, in the bond market. For the 12 months, the broad U.S. bond market returned 3.7%, largely on the strength of Treasuries—investors’ security of choice in times of duress. Corporate bonds generally produced negative returns for the period, coming under heavy selling pressure during investors’ flight to safety. Even the municipal market, made up of generally high-quality securities issued by states and municipalities, recorded a negative 12-month return.
The U.S. Federal Reserve Board responded to the turmoil with a dramatic easing of monetary policy. Over the full 12 months, the Fed reduced its target for the federal funds rate from 4.75% to 2.00%. On October 8, shortly after the close of the fiscal period, the Fed cut rates again, to 1.50%. The move was made in coordination with rate cuts by several other central banks.
Market Barometer |
|
|
|
Average Annual Total Returns | |||
Periods Ended September 30, 2008 | |||
| One Year | Three Years | Five Years |
Stocks |
|
|
|
Russell 1000 Index (Large-caps) | –22.1% | 0.1% | 5.5% |
Russell 2000 Index (Small-caps) | –14.5 | 1.8 | 8.1 |
Dow Jones Wilshire 5000 Index (Entire market) | –21.2 | 0.6 | 6.0 |
MSCI All Country World Index ex USA (International) | –30.0 | 3.1 | 11.8 |
|
|
|
|
Bonds |
|
|
|
Lehman U.S. Aggregate Bond Index (Broad taxable market) | 3.7% | 4.2% | 3.8% |
Lehman Municipal Bond Index | –1.9 | 1.9 | 2.8 |
Citigroup 3-Month Treasury Bill Index | 2.6 | 4.0 | 3.1 |
|
|
|
|
CPI |
|
|
|
Consumer Price Index | 4.9% | 3.2% | 3.4% |
3
The fiscal year was marked by rising uncertainty
Over the Morgan Growth Fund’s fiscal year, the market environment grew increasingly difficult for stocks as investors worried about the economic outlook and the growing distress in the financial markets.
These challenges were reflected in Morgan Growth’s –23.7% return (Investor Shares)—its first decline in six years—which was moderately below the –20.6% return of growth stocks in general, as measured by the Russell 3000 Growth Index. (By comparison, the Russell 3000 Value Index posted a –22.7% return.)
The fund did perform a bit better than the average result for its peer group (–24.1%). In relative terms, however, the advisors’ stock selection in the industrials and health care sector fell short. Among the poorest performers were Boeing (–44%), which faced aircraft-construction delays; Fluor (–22%), an energy-industry construction and engineering firm that was affected by the recent drop in oil prices as well as by the credit crisis; and Elan (–49%), an Irish biotech company, which discovered that two drugs it was developing appeared to have serious side effects.
Expense Ratios1 |
|
|
|
Your Fund Compared With Its Peer Group |
|
|
|
|
|
| Average |
| Investor | Admiral | Multi-Cap |
| Shares | Shares | Growth Fund |
Morgan Growth Fund | 0.37% | 0.21% | 1.43% |
1 | The fund expense ratios shown are from the prospectus dated January 25, 2008. For the fiscal year ended September 30, 2008, the fund’s expense ratios were 0.38% for Investor Shares and 0.21% for Admiral Shares. The peer-group expense ratio is derived from data provided by Lipper Inc. and captures information through year-end 2007. |
4
Stock selection was also disappointing in the information technology sector. Many firms in this sector—the fund’s largest industry group, approaching one-third of assets—faced tighter customer budgets as corporations reacted to the economic slowdown.
Compared with the benchmark index, the fund had a relatively modest exposure to consumer staples, and one of the market’s better-performing sectors. During economic downturns, investors typically consider consumer staples a “defensive” sector because people generally are reluctant to curtail spending on basic foods and household items.
The Morgan Growth Fund benefited from generally good stock selection in the materials sector, especially from its holdings of fertilizer suppliers enjoying strong worldwide demand from farmers. The fund’s relatively small holdings in the troubled financial sector had little impact on overall returns.
Don’t lose sight of the long term during short-term ups and downs
As Vanguard has long advised investors, a sensible approach to evaluating an investment is to assess its longer-term performance. That can help you put short-term swings (especially downward swings) in perspective—something particularly valuable in trying times like these.
Total Returns |
|
Ten Years Ended September 30, 2008 |
|
| Average |
| Annual Return |
Morgan Growth Fund Investor Shares | 4.2% |
Russell 3000 Growth Index | 0.9 |
Average Multi-Cap Growth Fund1 | 3.5 |
The figures shown represent past performance, which is not a guarantee of future results. (Current performance may be lower or higher than the performance data cited. For performance data current to the most recent month-end, visit our website at www.vanguard.com/performance.) Note, too, that both investment returns and principal value can fluctuate widely, so an investor’s shares, when sold, could be worth more or less than their original cost.
1 Derived from data provided by Lipper Inc.
5
However, an investment’s long-term record can be skewed, for better or worse, by the most recent short-term results. The Morgan Growth Fund provides a good example. When we reported to you 12 months ago, the fund had provided an average annual return of 6.7% for its Investor Shares over the ten years ended September 30, 2007. Now, following the difficult 2008 fiscal year, the ten-year picture looks very different: For the decade that ended this past September 30, the fund’s average annual return was 4.2%.
A look at the performance of the best available benchmarks during the same period can provide additional context and perspective. As you can see in the table on page 5, over those ten years the Morgan Growth Fund outpaced the performance of its benchmark index as well as the average return of its competitors.
Some things about investing never go out of style
Over the past year—and more acutely in recent weeks—global financial markets have experienced an unnerving confluence of events. History teaches us that selling in a panic, or letting your emotions drive your investment decisions, is often a recipe for disappointment.
Instead, it’s important to focus on the time-tested principles of balance and diversification, both within and across asset classes. Vanguard Morgan Growth Fund can play a useful supporting role within the stock portion of a diversified portfolio built with those ideas in mind.
Of course, even balanced portfolios of stocks and bonds have faced tough times during the past 12 months. But everything that history has taught us about the markets suggests that these principles can put you in the best position to achieve long-term investment success.
Thank you for your confidence in Vanguard.
Sincerely,

F. William McNabb III
President and Chief Executive Officer
October 14, 2008
Vanguard Morgan Growth Fund realigns advisory team
On November 25, after the close of the fiscal year, the board of trustees of Vanguard Morgan Growth Fund announced the realignment of the fund’s investment advisory team. The board added Frontier Capital Management Co., LLC, and Kalmar Investment Advisers to the fund’s existing advisory team, which includes Wellington Management Company, LLP, Jennison Associates LLC, and The Vanguard Group, Inc. Frontier Capital and Kalmar will manage the portion of the fund previously managed by Franklin Portfolio Associates, LLC. We thank Franklin for its years of service to the fund’s shareholders.
Please see the Notice to Shareholders later in this report for more information about the fund’s new advisors.
6
Advisors’ Report
During the fiscal year ended September 30, 2008, the Investor Shares of Vanguard Morgan Growth Fund returned –23.7%, while the Admiral Shares returned –23.6%. This performance reflects the combined efforts of your fund’s four independent advisors. The use of four advisors provides exposure to distinct, yet complementary, investment approaches, enhancing the fund’s diversification.
The advisors, the percentage of fund assets each manages, and brief descriptions of their investment strategies are presented in the table below. The advisors have also prepared a discussion of the investment environment that existed during the fiscal year and of how their portfolio positioning reflects this assessment.These comments were prepared on October 17, 2008.
Wellington Management Company, LLP
Portfolio Manager:
Paul E. Marrkand, CFA, Vice President
Global equity markets declined sharply amid increasing signs that deteriorating housing, employment, and credit markets in the United States are driving slower global economic growth. Shares tumbled at the end of the period after a proposed financial-market bailout plan was temporarily rejected by the U.S. House of Representatives. Passage by Congress came a few days later, after the end of the fund’s fiscal year.
Vanguard Morgan Growth Fund Investment Advisors | |||
| Fund Assets Managed |
| |
Investment Advisor | % | $ Million | Investment Strategy |
Wellington Management | 37 | 2,884 | Traditional methods of stock selection— |
Company, LLP |
|
| research and analysis—that identify |
|
|
| companies believed to have above- |
|
|
| average growth prospects, particularly |
|
|
| those in industries undergoing change. |
|
|
| Focuses on mid- and large-capitalization |
|
|
| companies with proven records of sales |
|
|
| and earnings growth, profitability, and cash |
|
|
| flow generation. |
Vanguard Quantitative | 24 | 1,883 | Quantitative management using models |
Equity Group |
|
| that assess valuation, marketplace |
|
|
| sentiment, and balance-sheet |
|
|
| characteristics of companies versus their |
|
|
| peers. |
Franklin Portfolio | 20 | 1,624 | Quantitative management using a blend of |
Associates, LLC |
|
| valuation and growth/momentum factors |
|
|
| to drive stock-selection decisions for a |
|
|
| mid-cap growth subportfolio. |
Jennison Associates LLC | 15 | 1,186 | Research-driven fundamental investment |
|
|
| approach that relies on in-depth company |
|
|
| knowledge gleaned through meetings |
|
|
| with management, customers, and |
|
|
| suppliers. |
Cash Investments1 | 4 | 353 | — |
1 | These short-term reserves are invested by Vanguard in equity index products to simulate investments in stocks. Each advisor also may maintain a modest cash position. |
7
Our investment results benefited from strong stock selection in telecommunication services, energy, and materials. Energy has been a continued area of focus in our portfolio. Forest Oil, for example, a Colorado-based independent oil and gas exploration and development company, continued to successfully increase its reserves and production capacity with its recent acreage development of the Haynesville/Bossier shale in East Texas and Northern Louisiana. We also favored telecommunications over the period. Our holdings in Telefónica aided return, as the company had solid financial results, including increased revenues across its core operations. Holdings in materials also helped, with Agrium and Potash Corp. of Saskatchewan among the top contributors, as both companies gained from strong global demand and rising fertilizer prices.
Information technology, industrials, and health care holdings detracted from results. IT company Cadence Design suffered from a decline in revenues, operating margins, and cash flow stemming from decreased demand from semiconductor customers. Boeing, an industrials holding, suffered from delays with its 787 program, which caused investor concern and pressured the stock. Merck’s stock price declined as sales of Vytorin started to drop after a clinical trial showed equivocal results. We added to our position as the stock fell.
Our purchases over the previous 12 months were driven by valuation and growth opportunities. New names included Microsoft; QLogic, the leading semiconductor component supplier to the storage industry; and PerkinElmer, a major diagnostic test and analytical equipment provider to the health care and optoelectronic markets. We eliminated holdings in Parker Hannifin, PepsiCo, and GlobalSantaFe. At the end of the period, our largest sector positions were in IT, energy, and health care.
Vanguard Quantitative Equity Group
Portfolio Manager:
James P. Stetler, Principal
Growth stocks, as represented by the Morgan Growth Fund’s benchmark (Russell 3000 Growth Index), performed somewhat better than the overall market, falling –20.6%. To place the fiscal year in historical context, since 1926, the broad U.S. market has declined by more than –20% in a single calendar year five times. This doesn’t make the current fiscal year losses any easier to swallow, but it does remind us that what we’ve been experiencing is nothing truly new.
Our portion of the fund’s performance relative to its benchmark is based on results from our stock evaluation methodology, which ranks stocks against their industry and market-cap peers and seeks to predict those that
8
will outperform or underperform. This evaluation process uses three independent and distinct stock-selection models to rank companies on their relative valuation, market sentiment, and earnings-quality characteristics.
Relative to the benchmark, our portfolio will generally have a lower price-to-earnings profile, a return-on-equity premium, and a similar expected earnings growth rate and dividend yield. In other words, we’re investing in profitable companies that are trading at lower valuation levels than their industry peers.
In our portion of the fund, our stock picks were strongest in IT and consumer discretionary. MasterCard, Western Union, and TJX contributed positively to our results. Disappointments in industrials and energy offset those results. Selections such as Hertz, Manitowoc, Plains Exploration & Production Company, and Denbury Resources detracted from our overall returns.
Uncertainty and volatility may stay with us for awhile as we enter the 2009 fiscal year. However, we will continue to manage the portfolio in a disciplined and prudent fashion, and we look forward to reporting to you at the semiannual mark.
Franklin Portfolio Associates, LLC
Oliver E. Buckley, Chief Investment Officer
and Chief Executive Officer
Over the 12 months ended September 30, 2008, the market declined significantly. Since July, the deterioration of world financial markets has been accompanied by big declines in energy and commodity prices. We do not foresee a quick recovery from the current credit crisis. The financial and corporate deleveraging of the economy will reverberate through the system for a significant period as its effects make their way down to individuals.
Our stock-ranking process, which emphasizes stocks with positive value and growth/momentum characteristics, struggled during the period because the market did not reward attractive valuation metrics. Despite some gains from stock picks resulting from our additional strategy based on positive earnings momentum, overall our stock-ranking model experienced a tough 12 months.
Stock selections in basic materials, health care, and financial services hindered results in the fiscal year. Specific holdings that reduced returns included managed-care provider WellCare Health Plans, which was implicated in a Medicaid fraud investigation and fined; financial services firm First Marblehead, which focused on student loan securitization and was hurt by the credit crisis; and, in the most recent quarter, fertilizer maker Mosaic, which
9
was hampered by the recent decline in commodity prices and concern about demand for its products from farmers.
Factors that aided performance included the tilt toward stocks with strong earnings momentum, and an emphasis on stocks with lower leverage. Our best-performing holdings included tech stocks such as semiconductor-maker Microchip Technology and hard-drive maker Western Digital, which held up better than peers. In other sectors, toymaker Hasbro outperformed rival Mattel and positioned itself successfully with well-known, affordable toys and games.
We remain focused on our investment discipline while, at the same time, controlling non-stock-specific risks. Although we always seek to minimize the impact of top-down risk exposures, in the current environment of increased volatility we need to be more cautious. For example, we are being particularly careful to avoid positive exposure to leverage as firms face increasing difficulties in renewing credit lines.
Jennison Associates LLC
Portfolio Manager:
Kathleen A. McCarragher,
Managing Director
Our stock selection aided returns in most sectors, notably materials, financials, consumer discretionary, and health care. Monsanto, a key contributor in materials, benefited from a bullish agricultural cycle supported by its leading market position, brand strength, operational performance, and technological innovation. In financials, Charles Schwab was a safe haven amid financial turmoil. Its business model proved resilient, with monthly cash flows remaining positive despite market weakness. A top performer in consumer discretionary, NIKE executed well and should benefit from product and geographic diversification, a strong balance sheet, and healthy cash flow. In health care, Genentech gained after Roche, its majority shareholder, offered to acquire Genentech’s remaining shares at a premium price. Genentech’s oncology franchise and research pipeline are among the most attractive in the biotechnology industry.
10
Stock selection in information technology hurt return, as Google fell on worries that a slowing economy could curtail spending for online advertising. Apple was pressured by slowing PC sales in both the broad market and the market’s upper-end, which Apple’s Mac franchise dominates. In industrials, McDermott fell on weak oil and gas drilling results.
The credit crisis has prompted unprecedented coordination between the U.S. Treasury Department and the Federal Reserve Board in efforts to resuscitate credit markets and stabilize the financial system. Inflation concerns have abated, as declining U.S. demand and the weakening global economy have hit commodities prices. The ongoing housing correction, debt deflation, rising unemployment, and sluggish production and consumption patterns all point to a recession.
Monetary policymakers have moved aggressively to provide temporary relief, but long-term credit-market recovery hinges on permanent new capital on lenders’ balance sheets. The contours of new regulation won’t be apparent until a new U.S. president has settled in, but meaningful changes will likely reflect the Fed’s recently expanded role and result in constraints on leverage, a key catalyst for past economic growth. The next administration can be expected to foster economic growth through fiscal stimulus.
Given this backdrop, earnings expectations are coming down. We have had the portfolio positioned somewhat conservatively; however, earnings and growth projections for the companies we hold will also likely be reduced. It will take time before the financial system begins to function normally again, a prerequisite for the restoration of market confidence and the reacceleration of earnings growth.
11
Fund Profile
As of September 30, 2008
Portfolio Characteristics |
|
| |
| Comparative | Broad | |
| Fund | Index1 | Index2 |
Number of Stocks | 351 | 1,854 | 4,679 |
Median Market Cap | $25.7B | $29.5B | $29.6B |
Price/Earnings Ratio | 15.2x | 16.6x | 15.5x |
Price/Book Ratio | 3.1x | 3.4x | 2.2x |
Yield3 |
| 1.4% | 2.3% |
Investor Shares | 0.8% |
|
|
Admiral Shares | 1.0% |
|
|
Return on Equity | 22.8% | 22.9% | 20.0% |
Earnings Growth Rate | 25.1% | 22.5% | 17.7% |
Foreign Holdings | 4.4% | 0.0% | 0.0% |
Turnover Rate | 88% | — | — |
Expense Ratio |
|
|
|
(9/30/2007)4 |
| — | — |
Investor Shares | 0.37% |
|
|
Admiral Shares | 0.21% |
|
|
Short-Term Reserves | 1.4% | — | — |
Sector Diversification (% of equity exposure) | |||
| Comparative | Broad | |
| Fund | Index1 | Index2 |
Consumer Discretionary | 10.2% | 9.8% | 9.2% |
Consumer Staples | 8.1 | 12.8 | 10.5 |
Energy | 10.7 | 10.1 | 12.6 |
Financials | 5.6 | 4.6 | 17.3 |
Health Care | 17.1 | 15.0 | 13.0 |
Industrials | 11.9 | 13.5 | 11.4 |
Information Technology | 29.8 | 27.9 | 15.7 |
Materials | 4.6 | 3.8 | 3.7 |
Telecommunication Services | 0.9 | 0.8 | 2.8 |
Utilities | 1.1 | 1.7 | 3.8 |
Volatility Measures5 |
| |
| Fund Versus | Fund Versus |
| Comparative Index1 | Broad Index2 |
R-Squared | 0.97 | 0.91 |
Beta | 1.06 | 1.12 |
Ten Largest Holdings6 (% of total net assets) | ||
|
|
|
Microsoft Corp. | software systems | 3.1% |
Cisco Systems, Inc. | communications equipment | 2.8 |
Oracle Corp. | software systems | 2.1 |
International Business Machines Corp. | computer hardware | 1.9 |
Abbott Laboratories | pharmaceuticals | 1.5 |
Monsanto Co. | fertilizers and agricultural chemicals | 1.2 |
Apple Inc. | computer hardware | 1.2 |
Occidental Petroleum Corp. | integrated oil and gas | 1.2 |
Altera Corp. | semiconductors | 1.2 |
QUALCOMM Inc. | communications equipment | 1.1 |
Top Ten |
| 17.3% |
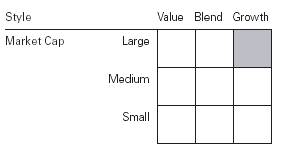
Investment Focus
1 | Russell 3000 Growth Index. |
2 | Dow Jones Wilshire 5000 Index. |
3 | 30-day SEC yield for the fund; annualized dividend yield for the indexes. See the Glossary. |
4 | The fund expense ratios shown are from the prospectus dated January 25, 2008. For the fiscal year ended September 30, 2008, expense ratios were 0.38% for Investor Shares and 0.21% for Admiral Shares. |
5 | For an explanation of R-squared, beta, and other terms used here, see the Glossary. |
6 | The holdings listed exclude any temporary cash investments and equity index products. |
12
Performance Summary
All of the returns in this report represent past performance, which is not a guarantee of future results that may be achieved by the fund. (Current performance may be lower or higher than the performance data cited. For performance data current to the most recent month-end, visit our website at www.vanguard.com/performance.) Note, too, that both investment returns and principal value can fluctuate widely, so an investor’s shares, when sold, could be worth more or less than their original cost. The returns shown do not reflect taxes that a shareholder would pay on fund distributions or on the sale of fund shares.
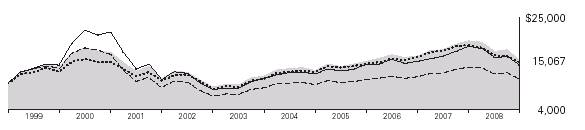
Cumulative Performance: September 30, 1998–September 30, 2008
Initial Investment of $10,000
|
|
| ||
|
|
|
|
|
Average Annual Total Returns | Final Value | |||
| Periods Ended September 30, 2008 | of a $10,000 | ||
| One Year | Five Years | Ten Years | Investment |
Morgan Growth Fund Investor Shares1 | –23.70% | 5.23% | 4.18% | $15,067 |
Dow Jones Wilshire 5000 Index | –21.20 | 6.04 | 4.00 | 14,801 |
Russell 3000 Growth Index | –20.60 | 3.96 | 0.89 | 10,928 |
Average Multi-Cap Growth Fund2 | –24.07 | 4.79 | 3.45 | 14,043 |
|
|
|
| Final Value |
|
|
| Since | of a $100,000 |
| One Year | Five Years | Inception3 | Investment |
Morgan Growth Fund Admiral Shares | –23.57% | 5.40% | 1.16% | $108,926 |
Dow Jones Wilshire 5000 Index | –21.20 | 6.04 | 2.10 | 116,589 |
Russell 3000 Growth Index | –20.60 | 3.96 | –0.83 | 94,026 |
1 Total returns do not include the account service fee that may be applicable to certain accounts with balances below $10,000.
2 Derived from data provided by Lipper Inc.
3 Performance for the fund’s Admiral Shares and comparative standards is calculated since the Admiral Shares’ inception: May 14, 2001.
13
Fiscal-Year Total Returns (%): September 30, 1998 – September 30, 2008
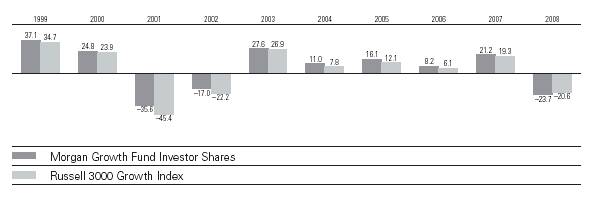
Note: See Financial Highlights tables for dividend and capital gains information.
14
Financial Statements
Statement of Net Assets
As of September 30, 2008
The fund provides a complete list of its holdings four times in each fiscal year, at the quarter-ends. For the second and fourth fiscal quarters, the lists appear in the fund’s semiannual and annual reports to shareholders. For the first and third fiscal quarters, the fund files the lists with the Securities and Exchange Commission on Form N-Q. Shareholders can look up the fund’s Forms N-Q on the SEC’s website at www.sec.gov. Forms N-Q may also be reviewed and copied at the SEC’s Public Reference Room (see the back cover of this report for further information).
|
|
| Market |
|
|
| Value• |
|
| Shares | ($000) |
Common Stocks (94.2%)1 |
|
| |
Consumer Discretionary (9.6%) |
|
| |
| NIKE, Inc. Class B | 1,217,200 | 81,431 |
| TJX Cos., Inc. | 2,105,400 | 64,257 |
* | AutoZone Inc. | 387,700 | 47,819 |
* | Amazon.com, Inc. | 572,900 | 41,684 |
*,^ | Panera Bread Co. | 619,800 | 31,548 |
* | Urban Outfitters, Inc. | 925,500 | 29,496 |
* | Apollo Group, Inc. Class A | 467,000 | 27,693 |
| Tiffany & Co. | 724,400 | 25,731 |
| Burger King Holdings Inc. | 995,700 | 24,454 |
| The Walt Disney Co. | 766,400 | 23,521 |
* | The Goodyear Tire & Rubber Co. | 1,276,200 | 19,539 |
| The Gap, Inc. | 1,025,600 | 18,235 |
* | GameStop Corp. Class A | 454,300 | 15,542 |
| Yum! Brands, Inc. | 463,500 | 15,115 |
| Comcast Corp. Class A | 751,926 | 14,760 |
| Hasbro, Inc. | 411,200 | 14,277 |
| Target Corp. | 290,800 | 14,264 |
* | ITT Educational Services, Inc. | 172,100 | 13,925 |
| McDonald’s Corp. | 224,700 | 13,864 |
* | DreamWorks Animation SKG, Inc. | 410,000 | 12,895 |
* | Dollar Tree, Inc. | 297,700 | 10,824 |
* | Coach, Inc. | 413,300 | 10,349 |
| Best Buy Co., Inc. | 266,150 | 9,981 |
| Omnicom Group Inc. | 256,300 | 9,883 |
| Wyndham Worldwide Corp. | 618,600 | 9,718 |
| Polo Ralph Lauren Corp. | 144,900 | 9,656 |
| Lowe’s Cos., Inc. | 403,700 | 9,564 |
| Meredith Corp. | 334,200 | 9,374 |
| Darden Restaurants Inc. | 319,800 | 9,156 |
| News Corp., Class A | 754,500 | 9,046 |
* | Expedia, Inc. | 555,021 | 8,386 |
* | NVR, Inc. | 14,600 | 8,351 |
| Scripps Networks Interactive | 227,900 | 8,275 |
* | DISH Network Corp. | 384,400 | 8,072 |
| John Wiley & Sons Class A | 160,700 | 6,500 |
| Ctrip.com International Ltd. ADR | 164,200 | 6,340 |
* | Scientific Games Corp. | 274,400 | 6,317 |
| Comcast Corp. Special Class A | 317,734 | 6,266 |
* | Hanesbrands Inc. | 270,300 | 5,879 |
* | Liberty Media Corp.– Interactive Series A | 449,900 | 5,808 |
| Starwood Hotels & Resorts Worldwide, Inc. | 195,600 | 5,504 |
* | Central European Media Enterprises Ltd. Class A | 79,100 | 5,173 |
| H & R Block, Inc. | 229,400 | 5,173 |
* | Priceline.com, Inc. | 73,200 | 5,009 |
* | Liberty Media Corp. | 155,000 | 3,870 |
* | DIRECTV Group, Inc. | 147,026 | 3,848 |
| News Corp., Class B | 293,600 | 3,567 |
| Autoliv, Inc. | 103,700 | 3,500 |
| Sherwin-Williams Co. | 51,400 | 2,938 |
* | Viacom Inc. Class B | 112,900 | 2,804 |
| Johnson Controls, Inc. | 61,100 | 1,853 |
* | CTC Media, Inc. | 95,800 | 1,437 |
* | Interpublic Group of Cos., Inc. | 161,300 | 1,250 |
| Cablevision Systems NY Group Class A | 9,300 | 234 |
* | Clear Channel Outdoor Holdings, Inc. Class A | 5,800 | 79 |
* | Las Vegas Sands Corp. | 1,400 | 51 |
|
|
| 764,085 |
Consumer Staples (7.3%) |
|
| |
| Wal-Mart Stores, Inc. | 1,503,400 | 90,039 |
| Philip Morris International Inc. | 1,619,400 | 77,893 |
| PepsiCo, Inc. | 931,500 | 66,388 |
| The Procter & Gamble Co. | 693,375 | 48,321 |
| The Coca-Cola Co. | 771,278 | 40,785 |
| Costco Wholesale Corp. | 607,199 | 39,425 |
15
|
|
| Market |
|
|
| Value• |
|
| Shares | ($000) |
| CVS/Caremark Corp. | 1,131,810 | 38,097 |
| Avon Products, Inc. | 735,200 | 30,562 |
| Colgate-Palmolive Co. | 368,800 | 27,789 |
| Herbalife Ltd. | 655,700 | 25,913 |
* | Central European Distribution Corp. | 444,000 | 20,162 |
| The Pepsi Bottling Group, Inc. | 427,500 | 12,470 |
| Walgreen Co. | 377,100 | 11,675 |
| Anheuser-Busch Cos., Inc. | 160,152 | 10,391 |
| McCormick & Co., Inc. | 235,800 | 9,067 |
* | Dr. Pepper Snapple Group, Inc. | 323,100 | 8,556 |
| Archer-Daniels-Midland Co. | 274,967 | 6,025 |
| Sysco Corp. | 163,500 | 5,041 |
| The Estee Lauder Cos. Inc. Class A | 91,200 | 4,552 |
| Brown-Forman Corp. Class B | 51,800 | 3,720 |
| Lorillard, Inc. | 33,100 | 2,355 |
*,^ | Bare Escentuals, Inc. | 203,500 | 2,212 |
| The Kroger Co. | 26,800 | 736 |
|
|
| 582,174 |
Energy (9.9%) |
|
| |
| Occidental |
|
|
| Petroleum Corp. | 1,355,500 | 95,495 |
| Schlumberger Ltd. | 885,400 | 69,141 |
* | Transocean, Inc. | 510,107 | 56,030 |
| XTO Energy, Inc. | 1,187,002 | 55,219 |
| Williams Cos., Inc. | 1,795,900 | 42,473 |
| Diamond Offshore Drilling, Inc. | 400,500 | 41,276 |
* | Southwestern Energy Co. | 1,314,000 | 40,130 |
| Hess Corp. | 468,500 | 38,454 |
| Murphy Oil Corp. | 506,500 | 32,487 |
| Smith International, Inc. | 524,100 | 30,733 |
* | FMC Technologies Inc. | 579,900 | 26,994 |
| Halliburton Co. | 770,600 | 24,960 |
| Peabody Energy Corp. | 502,300 | 22,604 |
* | National Oilwell Varco Inc. | 419,016 | 21,047 |
* | Forest Oil Corp. | 386,300 | 19,160 |
| Canadian Natural Resources Ltd. | 223,300 | 15,287 |
| Noble Energy, Inc. | 271,300 | 15,082 |
| Anadarko Petroleum Corp. | 268,000 | 13,001 |
* | Alpha Natural Resources, Inc. | 239,200 | 12,302 |
| Noble Corp. | 264,306 | 11,603 |
| Arch Coal, Inc. | 311,500 | 10,245 |
* | Plains Exploration & Production Co. | 246,200 | 8,656 |
| ENSCO International, Inc. | 146,951 | 8,469 |
| Patterson-UTI Energy, Inc. | 416,917 | 8,347 |
| EOG Resources, Inc. | 82,800 | 7,407 |
| Chesapeake Energy Corp. | 195,000 | 6,993 |
| Massey Energy Co. | 187,400 | 6,685 |
* | Superior Energy Services, Inc. | 214,500 | 6,680 |
* | Dresser Rand Group, Inc. | 207,500 | 6,530 |
* | Denbury Resources, Inc. | 273,300 | 5,204 |
* | Encore Acquisition Co. | 122,000 | 5,097 |
* | Ultra Petroleum Corp. | 84,300 | 4,665 |
| Baker Hughes, Inc. | 74,400 | 4,504 |
* | Weatherford International Ltd. | 169,400 | 4,259 |
* | Continental Resources, Inc. | 83,500 | 3,276 |
* | Pride International, Inc. | 57,800 | 1,711 |
| Valero Energy Corp. | 16,700 | 506 |
|
|
| 782,712 |
2 | Exchange Traded Fund (0.7%) |
|
|
| Vanguard Growth ETF | 1,044,900 | 54,554 |
|
|
|
|
Financials (4.9%) |
|
| |
| The Goldman |
|
|
| Sachs Group, Inc. | 442,500 | 56,640 |
| Northern Trust Corp. | 629,400 | 45,443 |
| Charles Schwab Corp. | 1,580,455 | 41,092 |
* | Nasdaq Stock Market Inc. | 1,047,800 | 32,031 |
| Banco Itau Holding Financeira SA ADR | 1,742,684 | 30,497 |
* | TD Ameritrade Holding Corp. | 1,313,300 | 21,275 |
| ProLogis REIT | 413,400 | 17,061 |
* | Berkshire Hathaway Inc. Class B | 3,700 | 16,262 |
| Invesco, Ltd. | 768,400 | 16,121 |
| HCC Insurance Holdings, Inc. | 496,200 | 13,397 |
| Bank of New York Mellon Corp. | 330,900 | 10,781 |
| American Express Co. | 292,100 | 10,349 |
| JPMorgan Chase & Co. | 207,300 | 9,681 |
| AFLAC Inc. | 158,200 | 9,294 |
| BM&F BOVESPA SA | 1,890,397 | 8,325 |
| State Street Corp. | 122,800 | 6,985 |
| Lazard Ltd. Class A | 160,700 | 6,872 |
| Discover Financial Services | 402,000 | 5,556 |
| CME Group, Inc. | 14,950 | 5,554 |
| Simon Property Group, Inc. REIT | 49,900 | 4,840 |
| SL Green Realty Corp. REIT | 71,500 | 4,633 |
| Franklin Resources Corp. | 34,900 | 3,076 |
*,^ | The St. Joe Co. | 70,000 | 2,736 |
| Apartment Investment & Management Co. Class A REIT | 76,500 | 2,679 |
| Eaton Vance Corp. | 68,700 | 2,420 |
| Public Storage, Inc. REIT | 22,400 | 2,218 |
* | Arch Capital Group Ltd. | 4,138 | 302 |
| Boston Properties, Inc. REIT | 800 | 75 |
|
|
| 386,195 |
16
|
|
| Market |
|
|
|
| Value• |
|
|
| Shares | ($000) |
|
Health Care (16.1%) |
|
|
| |
| Abbott Laboratories | 2,087,230 | 120,183 |
|
| Eli Lilly & Co. | 1,770,100 | 77,938 |
|
* | Gilead Sciences, Inc. | 1,648,300 | 75,130 |
|
| Merck & Co., Inc. | 2,208,000 | 69,684 |
|
* | Genentech, Inc. | 726,545 | 64,430 |
|
| Baxter International, Inc. | 914,772 | 60,036 |
|
| Medtronic, Inc. | 1,191,199 | 59,679 |
|
* | Invitrogen Corp. | 1,518,100 | 57,384 |
|
| Johnson & Johnson | 631,500 | 43,750 |
|
* | Celgene Corp. | 655,600 | 41,486 |
|
| Alcon, Inc. | 248,200 | 40,087 |
|
* | St. Jude Medical, Inc. | 898,300 | 39,067 |
|
* | Express Scripts Inc. | 506,000 | 37,353 |
|
* | Thermo Fisher Scientific, Inc. | 657,900 | 36,185 |
|
| Teva Pharmaceutical Industries Ltd. Sponsored ADR | 762,200 | 34,901 |
|
| AstraZeneca Group PLC ADR | 780,200 | 34,235 |
|
* | Medco Health Solutions, Inc. | 758,600 | 34,137 |
|
* | Intuitive Surgical, Inc. | 108,728 | 26,201 |
|
| AmerisourceBergen Corp. | 621,200 | 23,388 |
|
* | Amgen, Inc. | 368,900 | 21,865 |
|
| PerkinElmer, Inc. | 813,100 | 20,303 |
|
* | Lincare Holdings, Inc. | 664,300 | 19,989 |
|
*,^ | Mylan Inc. | 1,717,800 | 19,617 |
|
* | Patterson Cos. | 544,700 | 16,564 |
|
| Perrigo Co. | 415,400 | 15,976 |
|
| Wyeth | 426,400 | 15,751 |
|
* | BioMarin Pharmaceutical Inc. | 569,400 | 15,083 |
|
* | Endo Pharmaceuticals Holdings, Inc. | 731,500 | 14,630 |
|
| DENTSPLY International Inc. | 340,000 | 12,764 |
|
* | Biogen Idec Inc. | 199,400 | 10,028 |
|
| UnitedHealth Group Inc. | 349,600 | 8,876 |
|
| PDL BioPharma Inc. | 933,900 | 8,695 |
|
* | WellCare Health Plans Inc. | 241,100 | 8,680 |
|
| Schering-Plough Corp. | 438,020 | 8,090 |
|
* | DaVita, Inc. | 137,500 | 7,839 |
|
| Aetna Inc. | 216,172 | 7,806 |
|
* | Amylin Pharmaceuticals, Inc. | 344,200 | 6,960 |
|
* | Elan Corp. PLC ADR | 641,800 | 6,848 |
|
* | Warner Chilcott Ltd. | 428,400 | 6,477 |
|
* | Cephalon, Inc. | 79,180 | 6,136 |
|
| McKesson Corp. | 100,200 | 5,392 |
|
* | Forest Laboratories, Inc. | 184,700 | 5,223 |
|
* | Waters Corp. | 88,300 | 5,137 |
|
* | WellPoint Inc. | 102,872 | 4,811 |
|
* | Humana Inc. | 116,000 | 4,779 |
|
* | Varian Medical Systems, Inc. | 74,200 | 4,239 |
|
| Stryker Corp. | 62,800 | 3,912 |
|
* | Watson Pharmaceuticals, Inc. | 113,200 | 3,226 | |
* | Edwards Lifesciences Corp. | 51,900 | 2,998 | |
| Shionogi & Co., Ltd. | 133,000 | 2,694 | |
* | Genzyme Corp. | 29,200 | 2,362 | |
| Becton, Dickinson & Co. | 4,000 | 321 |
|
|
| 1,279,325 |
Industrials (11.2%) |
|
| |
| Fluor Corp. | 1,418,118 | 78,989 |
| Caterpillar, Inc. | 1,123,900 | 66,984 |
| Emerson Electric Co. | 1,421,400 | 57,979 |
| Raytheon Co. | 970,400 | 51,926 |
* | Jacobs Engineering Group Inc. | 758,000 | 41,167 |
| General Dynamics Corp. | 499,500 | 36,773 |
| Dover Corp. | 748,800 | 30,364 |
| Norfolk Southern Corp. | 452,200 | 29,940 |
| United Technologies Corp. | 460,100 | 27,634 |
| Precision Castparts Corp. | 348,900 | 27,486 |
| The Dun & Bradstreet Corp. | 290,600 | 27,421 |
* | First Solar, Inc. | 133,300 | 25,182 |
| The Boeing Co. | 403,700 | 23,152 |
| Cummins Inc. | 431,500 | 18,865 |
* | Foster Wheeler Ltd. | 502,400 | 18,142 |
| Manpower Inc. | 379,100 | 16,362 |
| GATX Corp. | 398,000 | 15,749 |
| Joy Global Inc. | 340,200 | 15,357 |
| Lockheed Martin Corp. | 134,300 | 14,729 |
* | McDermott International, Inc. | 558,800 | 14,277 |
| CSX Corp. | 243,200 | 13,271 |
| 3M Co. | 193,000 | 13,184 |
| Ingersoll-Rand Co. | 411,200 | 12,817 |
| Burlington Northern Santa Fe Corp. | 138,400 | 12,792 |
| Textron, Inc. | 411,800 | 12,058 |
* | Kirby Corp. | 298,000 | 11,306 |
| Tyco International, Ltd. | 317,800 | 11,129 |
| Expeditors International of Washington, Inc. | 303,400 | 10,570 |
| L-3 Communications Holdings, Inc. | 104,600 | 10,284 |
| Robert Half International, Inc. | 403,400 | 9,984 |
* | Gardner Denver Inc. | 277,700 | 9,642 |
| The Manitowoc Co., Inc. | 619,900 | 9,639 |
| Hubbell Inc. Class B | 257,000 | 9,008 |
| Deere & Co. | 168,400 | 8,336 |
* | Allied Waste Industries, Inc. | 744,200 | 8,268 |
| Honeywell International Inc. | 198,600 | 8,252 |
| Parker Hannifin Corp. | 137,700 | 7,298 |
* | Iron Mountain, Inc. | 281,100 | 6,862 |
| Goodrich Corp. | 156,800 | 6,523 |
| Rockwell Collins, Inc. | 130,600 | 6,281 |
| Waste Management, Inc. | 195,500 | 6,156 |
* | AGCO Corp. | 144,100 | 6,140 |
17
|
|
| Market | ||
|
|
| Value• | ||
|
| Shares | ($000) | ||
| FedEx Corp. | 73,100 | 5,778 | ||
| Gamesa Corporacion |
|
| ||
| Tecnologica SA | 163,963 | 5,618 | ||
| Bucyrus International, Inc. | 118,600 | 5,299 | ||
| Danaher Corp. | 56,100 | 3,893 | ||
�� | The Brink’s Co. | 63,800 | 3,893 | ||
| Oshkosh Truck Corp. | 286,300 | 3,768 | ||
| C.H. Robinson |
|
| ||
| Worldwide Inc. | 72,500 | 3,695 | ||
* | Hertz Global Holdings Inc. | 457,500 | 3,463 | ||
| United Parcel Service, Inc. | 48,300 | 3,038 | ||
| J.B. Hunt Transport |
|
| ||
| Services, Inc. | 52,400 | 1,749 | ||
|
|
| 888,472 | ||
Information Technology (28.5%) |
| ||||
| Communications Equipment (5.1%) |
| |||
* | Cisco Systems, Inc. | 9,788,300 | 220,824 | ||
| QUALCOMM Inc. | 2,106,330 | 90,509 | ||
* | Juniper Networks, Inc. | 1,522,000 | 32,069 | ||
* | Research In Motion Ltd. | 339,800 | 23,208 | ||
* | Emulex Corp. | 2,068,100 | 22,067 | ||
| Corning, Inc. | 631,000 | 9,869 | ||
| Nokia Corp. ADR | 178,200 | 3,323 | ||
| Harris Corp. | 31,900 | 1,474 | ||
|
|
|
| ||
| Computers & Peripherals (5.8%) |
| |||
| International Business Machines Corp. | 1,295,700 | 151,545 | ||
* | Apple Inc. | 853,200 | 96,975 | ||
| Hewlett-Packard Co. | 1,725,200 | 79,773 | ||
* | NetApp, Inc. | 2,143,700 | 39,080 | ||
* | QLogic Corp. | 1,691,200 | 25,977 | ||
* | Western Digital Corp. | 969,300 | 20,665 | ||
* | Teradata Corp. | 806,400 | 15,725 | ||
* | Dell Inc. | 614,800 | 10,132 | ||
* | EMC Corp. | 810,300 | 9,691 | ||
* | NCR Corp. | 425,600 | 9,384 | ||
* | Lexmark International, Inc. | 65,900 | 2,146 | ||
|
|
|
| ||
| Electronic Equipment & |
|
| ||
| Instruments (0.8%) |
|
| ||
| Amphenol Corp. | 460,500 | 18,484 | ||
* | Mettler-Toledo International Inc. | 176,200 | 17,268 | ||
* | Avnet, Inc. | 529,800 | 13,049 | ||
* | Trimble Navigation Ltd. | 224,300 | 5,800 | ||
* | Arrow Electronics, Inc. | 198,000 | 5,191 | ||
* | Dolby Laboratories Inc. | 32,700 | 1,151 | ||
|
|
|
| ||
| Internet Software & Services (1.6%) |
| |||
* | Google Inc. | 199,200 | 79,784 | ||
* | Yahoo! Inc. | 1,309,500 | 22,654 | ||
* | VeriSign, Inc. | 596,400 | 15,554 | ||
* | Sohu.com Inc. | 129,400 | 7,214 | ||
* | eBay Inc. | 293,200 | 6,562 |
| IT Services (2.2%) |
|
|
| Visa Inc. | 1,017,700 | 62,477 |
| Western Union Co. | 1,911,436 | 47,155 |
| Accenture Ltd. | 867,144 | 32,951 |
| Automatic Data Processing, Inc. | 222,700 | 9,520 |
* | Alliance Data Systems Corp. | 106,300 | 6,737 |
| MasterCard, Inc. Class A | 33,800 | 5,994 |
* | Affiliated Computer Services, Inc. Class A | 92,500 | 4,683 |
* | Hewitt Associates, Inc. | 104,900 | 3,823 |
|
|
|
|
| Office Electronics (0.1%) |
|
|
* | Zebra Technologies Corp. Class A | 269,100 | 7,494 |
|
|
|
|
| Semiconductors & Semiconductor |
|
|
| Equipment (3.7%) |
|
|
| Altera Corp. | 4,490,100 | 92,855 |
| Intel Corp. | 2,644,400 | 49,530 |
| Xilinx, Inc. | 1,437,600 | 33,712 |
| Microchip Technology, Inc. | 757,100 | 22,281 |
* | Marvell Technology Group Ltd. | 1,802,400 | 16,762 |
* | NVIDIA Corp. | 1,338,350 | 14,334 |
| Analog Devices, Inc. | 538,600 | 14,192 |
* | MEMC Electronic Materials, Inc. | 456,900 | 12,912 |
| Texas Instruments, Inc. | 412,300 | 8,864 |
| Linear Technology Corp. | 221,400 | 6,788 |
| National Semiconductor Corp. | 371,500 | 6,394 |
* | LSI Corp. | 975,100 | 5,227 |
| Applied Materials, Inc. | 335,999 | 5,084 |
* | International Rectifier Corp. | 119,100 | 2,265 |
|
|
|
|
| Software (9.2%) |
|
|
| Microsoft Corp. | 9,084,075 | 242,454 |
* | Oracle Corp. | 8,378,700 | 170,171 |
* | BMC Software, Inc. | 2,767,999 | 79,248 |
* | Adobe Systems, Inc. | 1,622,700 | 64,048 |
* | Cadence Design Systems, Inc. | 4,250,018 | 28,730 |
* | Autodesk, Inc. | 660,900 | 22,173 |
* | ANSYS, Inc. | 488,600 | 18,503 |
| Nintendo Co. | 42,600 | 18,070 |
* | Shanda Interactive Entertainment, Ltd. | 630,100 | 16,099 |
*,^ | Giant Interactive Group Inc. | 1,896,500 | 12,631 |
* | Symantec Corp. | 601,900 | 11,785 |
* | Intuit, Inc. | 307,000 | 9,704 |
* | Activision Blizzard, Inc. | 614,700 | 9,485 |
* | Compuware Corp. | 963,000 | 9,331 |
* | salesforce.com, inc. | 176,900 | 8,562 |
| CA, Inc. | 328,000 | 6,547 |
|
|
| 2,256,722 |
18
|
|
| Market |
| ||
|
|
| Value• |
| ||
|
| Shares | ($000) |
| ||
Materials (4.4%) |
|
|
| |||
| Monsanto Co. | 991,857 | 98,174 |
| ||
| The Mosaic Co. | 771,500 | 52,493 |
| ||
| Freeport-McMoRan Copper & Gold, Inc. Class B | 464,000 | 26,378 |
| ||
* | Owens-Illinois, Inc. | 810,300 | 23,823 |
| ||
| Praxair, Inc. | 329,000 | 23,602 |
| ||
| Potash Corp. of Saskatchewan, Inc. | 172,600 | 22,785 |
| ||
| FMC Corp. | 403,500 | 20,736 |
| ||
| Airgas, Inc. | 225,600 | 11,201 |
| ||
| Newmont Mining Corp. (Holding Co.) | 285,700 | 11,074 |
| ||
* | Crown Holdings, Inc. | 453,300 | 10,068 |
| ||
| Agrium, Inc. | 178,500 | 10,010 |
| ||
| United States Steel Corp. | 92,600 | 7,187 |
| ||
| Sealed Air Corp. | 305,900 | 6,727 |
| ||
| AK Steel Holding Corp. | 232,400 | 6,024 |
| ||
| Celanese Corp. Series A | 196,500 | 5,484 |
| ||
| CF Industries Holdings, Inc. | 54,400 | 4,975 |
| ||
| Steel Dynamics, Inc. | 185,700 | 3,174 |
| ||
| Schnitzer Steel Industries, Inc. Class A | 75,600 | 2,967 |
| ||
|
|
| 346,882 |
| ||
Telecommunication Services (0.7%) |
|
| ||||
* | American Tower Corp. Class A | 447,900 | 16,111 |
| ||
| Windstream Corp. | 1,131,100 | 12,374 |
| ||
* | NII Holdings Inc. | 259,700 | 9,848 |
| ||
| Telephone & Data Systems, Inc. | 264,300 | 9,449 |
| ||
| Brasil Telecom SA-ADR | 375,193 | 8,209 |
| ||
* | Level 3 Communications, Inc. | 535,400 | 1,446 |
| ||
* | Crown Castle International Corp. | 47,100 | 1,364 |
| ||
|
|
| 58,801 |
| ||
Utilities (0.9%) |
|
|
| |||
| DPL Inc. | 781,000 | 19,369 |
| ||
* | AES Corp. | 1,376,100 | 16,087 |
| ||
| Sierra Pacific Resources | 1,162,000 | 11,132 |
| ||
| Energen Corp. | 173,800 | 7,870 |
| ||
| Exelon Corp. | 81,800 | 5,122 |
| ||
| Equitable Resources, Inc. | 104,300 | 3,827 |
| ||
| Questar Corp. | 88,200 | 3,609 |
| ||
| Allegheny Energy, Inc. | 75,200 | 2,765 |
| ||
* | Reliant Energy, Inc. | 115,600 | 850 |
| ||
|
|
| 70,631 |
| ||
Total Common Stocks |
|
|
| |||
(Cost $8,073,830) |
| 7,470,553 |
| |||
|
|
| Market | |||
|
|
| Value• | |||
|
| Shares | ($000) | |||
Temporary Cash Investments (5.4%)1 |
|
| ||||
Money Market Fund (3.5%) |
|
| ||||
3,4 | Vanguard Market Liquidity |
|
| |||
| Fund, 2.296% | 279,745,638 | 279,746 | |||
|
|
|
| |||
|
|
|
| |||
|
| Face |
| |
|
| Amount |
| |
|
| ($000) |
| |
Repurchase Agreement (1.5%) |
|
| ||
| JPMorgan Securities Inc. |
|
| |
| 1.750%, 10/1/08 |
|
| |
| (Dated 9/30/08, |
|
| |
| Repurchase Value |
|
| |
| $120,206,000, |
|
| |
| collateralized by Federal |
|
| |
| National Mortgage Assn. |
|
| |
| 4.500%–7.500%, |
|
| |
| 8/1/18–8/1/38) | 120,200 | 120,200 | |
|
|
|
| |
U.S. Agency Obligations (0.4%) |
| |||
5 | Federal Home Loan Bank |
|
| |
6 | 2.576%, 11/24/08 | 21,500 | 21,396 | |
5 | Federal National |
|
| |
| Mortgage Assn. |
|
| |
6 | 2.576%, 10/15/08 | 5,000 | 4,994 | |
Total Temporary Cash Investments |
| |||
(Cost $426,358) |
| 426,336 | ||
Total Investments (99.6%) |
|
| ||
(Cost $8,500,188) |
| 7,896,889 | ||
Other Assets and Liabilities (0.4%) |
| |||
Other Assets |
| 102,656 | ||
Liabilities4 |
| (69,262) | ||
|
|
| 33,394 | |
Net Assets (100%) |
| 7,930,283 | ||
19
At September 30, 2008, net assets consisted of: | |
| Amount |
| ($000) |
Paid-in Capital | 8,911,529 |
Undistributed Net Investment Income | 43,146 |
Accumulated Net Realized Losses | (400,810) |
Unrealized Appreciation (Depreciation) |
|
Investment Securities | (603,299) |
Futures Contracts | (20,296) |
Foreign Currencies | 13 |
Net Assets | 7,930,283 |
|
|
Investor Shares—Net Assets |
|
Applicable to 357,722,779 outstanding |
|
$.001 par value shares of beneficial |
|
interest (unlimited authorization) | 5,418,189 |
Net Asset Value Per Share— |
|
Investor Shares | $15.15 |
|
|
Admiral Shares—Net Assets |
|
Applicable to 53,417,110 outstanding |
|
$.001 par value shares of beneficial |
|
interest (unlimited authorization) | 2,512,094 |
Net Asset Value Per Share— Admiral Shares | $47.03 |
• See Note A in Notes to Financial Statements.
* Non-income-producing security.
^ Part of security position is on loan to broker-dealers. The total value of securities on loan is $11,774,000.
1 The fund invests a portion of its cash reserves in equity markets through the use of index futures contracts. After giving effect to futures investments, the fund’s effective common stock and temporary cash investment positions represent 98.1% and 1.5%, respectively, of net assets.
2 Considered an affiliated company of the fund as the issuer is another member of The Vanguard Group.
3 Affiliated money market fund available only to Vanguard funds and certain trusts and accounts managed by Vanguard. Rate shown is the 7-day yield.
4 Includes $12,207,000 of collateral received for securities on loan.
5 The issuer operates under a congressional charter; its securities are neither issued nor guaranteed by the U.S. government.
6 Securities with a value of $26,390,000 have been segregated as initial margin for open futures contracts. See accompanying Notes, which are an integral part of the Financial Statements.
ADR—American Depositary Receipt.
REIT—Real Estate Investment Trust.
20
Statement of Operations
| Year Ended |
| September 30, 2008 |
| ($000) |
Investment Income |
|
Income |
|
Dividends1,2 | 90,646 |
Interest2 | 15,456 |
Security Lending | 1,736 |
Total Income | 107,838 |
Expenses |
|
Investment Advisory Fees—Note B |
|
Basic Fee | 10,281 |
Performance Adjustment | (366) |
The Vanguard Group—Note C |
|
Management and Administrative—Investor Shares | 15,673 |
Management and Administrative—Admiral Shares | 2,110 |
Marketing and Distribution—Investor Shares | 1,374 |
Marketing and Distribution—Admiral Shares | 692 |
Custodian Fees | 97 |
Auditing Fees | 26 |
Shareholders’ Reports—Investor Shares | 182 |
Shareholders’ Reports—Admiral Shares | 43 |
Trustees’ Fees and Expenses | 14 |
Total Expenses | 30,126 |
Expenses Paid Indirectly | (680) |
Net Expenses | 29,446 |
Net Investment Income | 78,392 |
Realized Net Gain (Loss) |
|
Investment Securities Sold2 | (242,889) |
Futures Contracts | (59,199) |
Foreign Currencies | (173) |
Realized Net Gain (Loss) | (302,261) |
Change in Unrealized Appreciation (Depreciation) |
|
Investment Securities | (2,134,478) |
Futures Contracts | (25,973) |
Foreign Currencies | (25) |
Change in Unrealized Appreciation (Depreciation) | (2,160,476) |
Net Increase (Decrease) in Net Assets Resulting from Operations | (2,384,345) |
1 Dividends are net of foreign withholding taxes of $889,000.
2 Dividend income, interest income, and realized net gain (loss) from affiliated companies of the fund were $594,000, $11,471,000, and $0, respectively.
See accompanying Notes, which are an integral part of the Financial Statements.
21
Statement of Changes in Net Assets
| Year Ended September 30, | |
| 2008 | 2007 |
| ($000) | ($000) |
Increase (Decrease) in Net Assets |
|
|
Operations |
|
|
Net Investment Income | 78,392 | 89,181 |
Realized Net Gain (Loss) | (302,261) | 586,161 |
Change in Unrealized Appreciation (Depreciation) | (2,160,476) | 856,394 |
Net Increase (Decrease) in Net Assets Resulting from Operations | (2,384,345) | 1,531,736 |
Distributions |
|
|
Net Investment Income |
|
|
Investor Shares | (54,791) | (57,770) |
Admiral Shares | (27,586) | (23,226) |
Realized Capital Gain1 |
|
|
Investor Shares | (426,117) | (140,745) |
Admiral Shares | (181,607) | (48,041) |
Total Distributions | (690,101) | (269,782) |
Capital Share Transactions |
|
|
Investor Shares | 949,252 | 492,866 |
Admiral Shares | 782,658 | 656,214 |
Net Increase (Decrease) from Capital Share Transactions | 1,731,910 | 1,149,080 |
Total Increase (Decrease) | (1,342,536) | 2,411,034 |
Net Assets |
|
|
Beginning of Period | 9,272,819 | 6,861,785 |
End of Period2 | 7,930,283 | 9,272,819 |
1 | Includes fiscal 2008 and 2007 short-term gain distributions totaling $172,806,000 and $11,775,000. Short-term gain distributions are treated as ordinary income dividends for tax purposes. |
2 Net Assets—End of Period includes undistributed net investment income of $43,146,000 and $47,304,000. See accompanying Notes, which are an integral part of the Financial Statements.
22
Financial Highlights
Investor Shares |
|
|
|
|
|
|
|
|
|
|
|
| Year Ended September 30, | ||||
For a Share Outstanding |
|
|
|
|
|
Throughout Each Period | 2008 | 2007 | 2006 | 2005 | 2004 |
Net Asset Value, Beginning of Period | $21.45 | $18.34 | $17.04 | $14.77 | $13.34 |
Investment Operations |
|
|
|
|
|
Net Investment Income | .148 | .207 | .165 | .1291 | .050 |
Net Realized and Unrealized Gain (Loss) |
|
|
|
|
|
on Investments | (4.912) | 3.604 | 1.230 | 2.246 | 1.420 |
Total from Investment Operations | (4.764) | 3.811 | 1.395 | 2.375 | 1.470 |
Distributions |
|
|
|
|
|
Dividends from Net Investment Income | (.175) | (.204) | (.095) | (.105) | (.040) |
Distributions from Realized Capital Gains | (1.361) | (.497) | — | — | — |
Total Distributions | (1.536) | (.701) | (.095) | (.105) | (.040) |
Net Asset Value, End of Period | $15.15 | $21.45 | $18.34 | $17.04 | $14.77 |
|
|
|
|
|
|
Total Return2 | –23.70% | 21.24% | 8.20% | 16.12% | 11.03% |
|
|
|
|
|
|
Ratios/Supplemental Data |
|
|
|
|
|
Net Assets, End of Period (Millions) | $5,418 | $6,590 | $5,171 | $4,539 | $4,115 |
Ratio of Total Expenses to |
|
|
|
|
|
Average Net Assets3 | 0.38% | 0.37% | 0.42% | 0.41% | 0.44% |
Ratio of Net Investment Income to |
|
|
|
|
|
Average Net Assets | 0.80% | 1.06% | 0.95% | 0.82%1 | 0.32% |
Portfolio Turnover Rate | 88% | 79% | 90% | 88% | 88% |
1 Net investment income per share and the ratio of net investment income to average net assets include $0.044 and 0.28%, respectively, resulting from a special dividend from Microsoft Corp. in November 2004.
2 Total returns do not include the account service fee that may be applicable to certain accounts with balances below $10,000.
3 Includes performance-based investment advisory fee increases (decreases) of 0.00%, 0.00%, 0.02%, 0.00%, and 0.01%. See accompanying Notes, which are an integral part of the Financial Statements.
23
Admiral Shares |
|
|
|
|
|
|
|
|
|
|
|
| Year Ended September 30, | ||||
For a Share Outstanding |
|
|
|
|
|
Throughout Each Period | 2008 | 2007 | 2006 | 2005 | 2004 |
Net Asset Value, Beginning of Period | $66.58 | $56.94 | $52.91 | $45.84 | $41.40 |
Investment Operations |
|
|
|
|
|
Net Investment Income | .555 | .742 | .620 | .5001 | .212 |
Net Realized and Unrealized Gain (Loss) |
|
|
|
|
|
on Investments | (15.244) | 11.184 | 3.808 | 6.956 | 4.416 |
Total from Investment Operations | (14.689) | 11.926 | 4.428 | 7.456 | 4.628 |
Distributions |
|
|
|
|
|
Dividends from Net Investment Income | (.641) | (.745) | (.398) | (.386) | (.188) |
Distributions from Realized Capital Gains | (4.220) | (1.541) | — | — | — |
Total Distributions | (4.861) | (2.286) | (.398) | (.386) | (.188) |
Net Asset Value, End of Period | $47.03 | $66.58 | $56.94 | $52.91 | $45.84 |
|
|
|
|
|
|
Total Return | –23.57% | 21.43% | 8.39% | 16.32% | 11.19% |
|
|
|
|
|
|
Ratios/Supplemental Data |
|
|
|
|
|
Net Assets, End of Period (Millions) | $2,512 | $2,683 | $1,691 | $1,110 | $513 |
Ratio of Total Expenses to |
|
|
|
|
|
Average Net Assets2 | 0.21% | 0.21% | 0.23% | 0.24% | 0.30% |
Ratio of Net Investment Income to |
|
|
|
|
|
Average Net Assets | 0.97% | 1.22% | 1.14% | 0.96%1 | 0.47% |
Portfolio Turnover Rate | 88% | 79% | 90% | 88% | 88% |
1 | Net investment income per share and the ratio of net investment income to average net assets include $0.184 and 0.28%, respectively, resulting from a special dividend from Microsoft Corp. in November 2004. |
2 | Includes performance-based investment advisory fee increases (decreases) of 0.00%, 0.00%, 0.02%, 0.00%, and 0.01%. See accompanying Notes, which are an integral part of the Financial Statements. |
24
Notes to Financial Statements
Vanguard Morgan Growth Fund is registered under the Investment Company Act of 1940 as an open-end investment company, or mutual fund. The fund offers two classes of shares, Investor Shares and Admiral Shares. Investor Shares are available to any investor who meets the fund’s minimum purchase requirements. Admiral Shares are designed for investors who meet certain administrative, service, tenure, and account-size criteria.
A. The following significant accounting policies conform to generally accepted accounting principles for U.S. mutual funds. The fund consistently follows such policies in preparing its financial statements.
1. Security Valuation: Securities are valued as of the close of trading on the New York Stock Exchange (generally 4 p.m., Eastern time) on the valuation date. Equity securities are valued at the latest quoted sales prices or official closing prices taken from the primary market in which each security trades; such securities not traded on the valuation date are valued at the mean of the latest quoted bid and asked prices. Securities for which market quotations are not readily available, or whose values have been affected by events occurring before the fund’s pricing time but after the close of the securities’ primary markets, are valued at their fair values calculated according to procedures adopted by the board of trustees. These procedures include obtaining quotations from an independent pricing service, monitoring news to identify significant market- or security-specific events, and evaluating changes in the values of foreign market proxies (for example, ADRs, futures contracts, or exchange-traded funds), between the time the foreign markets close and the fund’s pricing time. When fair-value pricing is employed, the prices of securities used by a fund to calculate its net asset value may differ from quoted or published prices for the same securities. Investments in Vanguard Market Liquidity Fund are valued at that fund’s net asset value. Temporary cash investments acquired over 60 days to maturity are valued using the latest bid prices or using valuations based on a matrix system (which considers such factors as security prices, yields, maturities, and ratings), both as furnished by independent pricing services. Other temporary cash investments are valued at amortized cost, which approximates market value.
2. Foreign Currency: Securities and other assets and liabilities denominated in foreign currencies are translated into U.S. dollars using exchange rates obtained from an independent third party as of the fund’s pricing time on the valuation date. Realized gains (losses) and unrealized appreciation (depreciation) on investment securities include the effects of changes in exchange rates since the securities were purchased, combined with the effects of changes in security prices. Fluctuations in the value of other assets and liabilities resulting from changes in exchange rates are recorded as unrealized foreign currency gains (losses) until the assets or liabilities are settled in cash, at which time they are recorded as realized foreign currency gains (losses).
3. Futures Contracts: The fund uses index futures contracts to a limited extent, with the objective of maintaining full exposure to the stock market while maintaining liquidity. The fund may purchase or sell futures contracts to achieve a desired level of investment, whether to accommodate portfolio turnover or cash flows from capital share transactions. The primary risks associated with the use of futures contracts are imperfect correlation between changes in market values of stocks held by the fund and the prices of futures contracts, and the possibility of an illiquid market.
Futures contracts are valued at their quoted daily settlement prices. The aggregate principal amounts of the contracts are not recorded in the Statement of Net Assets. Fluctuations in the value of the contracts are recorded in the Statement of Net Assets as an asset (liability) and in the Statement of Operations as unrealized appreciation (depreciation) until the contracts are closed, when they are recorded as realized futures gains (losses).
25
4. Repurchase Agreements: The fund may invest in repurchase agreements. Securities pledged as collateral for repurchase agreements are held by a custodian bank until the agreements mature. Each agreement requires that the market value of the collateral be sufficient to cover payments of interest and principal; however, in the event of default or bankruptcy by the other party to the agreement, retention of the collateral may be subject to legal proceedings.
5. Federal Income Taxes: The fund intends to continue to qualify as a regulated investment company and distribute all of its taxable income. Management has analyzed the fund’s tax positions taken on federal income tax returns for all open tax years (tax years ended September 30, 2005–2008), and has concluded that no provision for federal income tax is required in the fund’s financial statements.
6. Distributions: Distributions to shareholders are recorded on the ex-dividend date.
7. Security Lending: The fund may lend its securities to qualified institutional borrowers to earn additional income. Security loans are required to be secured at all times by collateral at least equal to the market value of securities loaned. The fund invests cash collateral received in Vanguard Market Liquidity Fund, and records a liability for the return of the collateral, during the period the securities are on loan. Security lending income represents the income earned on investing cash collateral, less expenses associated with the loan.
8. Other: Dividend income is recorded on the ex-dividend date. Interest income includes income distributions received from Vanguard Market Liquidity Fund and is accrued daily. Security transactions are accounted for on the date securities are bought or sold. Costs used to determine realized gains (losses) on the sale of investment securities are those of the specific securities sold.
Each class of shares has equal rights as to assets and earnings, except that each class separately bears certain class-specific expenses related to maintenance of shareholder accounts (included in Management and Administrative expenses) and shareholder reporting. Marketing and distribution expenses are allocated to each class of shares based on a method approved by the board of trustees. Income, other non-class-specific expenses, and gains and losses on investments are allocated to each class of shares based on its relative net assets.
B. Wellington Management Company, LLP, Franklin Portfolio Associates, LLC, and Jennison Associates LLC each provide investment advisory services to a portion of the fund for a fee calculated at an annual percentage rate of average net assets managed by the advisor. The basic fee for Wellington Management Company, LLP, is subject to quarterly adjustments based on performance for the preceding three years relative to the Russell 3000 Growth Index; the basic fee of Franklin Portfolio Associates, LLC, is subject to quarterly adjustments based on performance for the preceding three years relative to the Russell Midcap Growth Index; the basic fee of Jennison Associates LLC is subject to quarterly adjustments based on performance since March 31, 2007, relative to the Russell 1000 Growth Index.
The Vanguard Group provides investment advisory services to a portion of the fund on an at-cost basis; the fund paid Vanguard advisory fees of $433,000 for the year ended September 30, 2008.
For the year ended September 30, 2008, the aggregate investment advisory fee represented an effective annual basic rate of 0.11% of the fund’s average net assets, before a decrease of $366,000 (0.00%) based on performance.
In November 2008, the board of trustees approved the addition of Frontier Capital Management Co., LLC and Kalmar Investment Advisers as advisors to the fund to manage the portion of the assets previously managed by Franklin Portfolio Associates, LLC.
26
C. The Vanguard Group furnishes at cost corporate management, administrative, marketing, and distribution services. The costs of such services are allocated to the fund under methods approved by the board of trustees. The fund has committed to provide up to 0.40% of its net assets in capital contributions to Vanguard. At September 30, 2008, the fund had contributed capital of $781,000 to Vanguard (included in Other Assets), representing 0.01% of the fund’s net assets and 0.78% of Vanguard’s capitalization. The fund’s trustees and officers are also directors and officers of Vanguard.
D. The fund has asked its investment advisors to direct certain security trades, subject to obtaining the best price and execution, to brokers who have agreed to rebate to the fund part of the commissions generated. Such rebates are used solely to reduce the fund’s management and administrative expenses. The fund’s custodian bank has also agreed to reduce its fees when the fund maintains cash on deposit in the non-interest-bearing custody account. For the year ended September 30, 2008, these arrangements reduced the fund’s management and administrative expenses by $661,000 and custodian fees by $19,000. The total expense reduction represented an effective annual rate of 0.01% of the fund’s average net assets.
E. Distributions are determined on a tax basis and may differ from net investment income and realized capital gains for financial reporting purposes. Differences may be permanent or temporary. Permanent differences are reclassified among capital accounts in the financial statements to reflect their tax character. Temporary differences arise when certain items of income, expense, gain, or loss are recognized in different periods for financial statement and tax purposes; these differences will reverse at some time in the future. Differences in classification may also result from the treatment of short-term gains as ordinary income for tax purposes.
During the year ended September 30, 2008, the fund realized net foreign currency losses of $173,000, which decreased distributable net income for tax purposes; accordingly, such losses have been reclassified from accumulated net realized losses to undistributed net investment income.
For tax purposes, at September 30, 2008, the fund had $57,180,000 of ordinary income available for distribution. Tax-basis capital gains required to be distributed in December 2007 included net capital gains realized through October 31, 2007. Subsequently, the fund realized capital losses of $411,147,000, which are available to offset future net capital gains.
At September 30, 2008, the cost of investment securities for tax purposes was $8,509,847,000. Net unrealized depreciation of investment securities for tax purposes was $612,958,000, consisting of unrealized gains of $502,250,000 on securities that had risen in value since their purchase and $1,115,208,000 in unrealized losses on securities that had fallen in value since their purchase.
At September 30, 2008, the aggregate settlement value of open futures contracts expiring in December 2008 and the related unrealized appreciation (depreciation) were:
|
| ($000) | |
| Number of | Aggregate | Unrealized |
| Long (Short) | Settlement | Appreciation |
Futures Contracts | Contracts | Value | (Depreciation) |
S&P 500 Index | 942 | 275,300 | (19,955) |
E-mini S&P 500 Index | 487 | 28,465 | (341) |
27
Unrealized appreciation (depreciation) on open futures contracts is required to be treated as realized gain (loss) for tax purposes.
F. During the year ended September 30, 2008, the fund purchased $8,663,385,000 of investment securities and sold $7,635,796,000 of investment securities, other than temporary cash investments.
G. Capital share transactions for each class of shares were:
| Year Ended September 30, | |||
| 2008 | 2007 | ||
| Amount | Shares | Amount | Shares |
| ($000) | (000) | ($000) | (000) |
Investor Shares |
|
|
|
|
Issued | 1,538,894 | 82,992 | 1,220,304 | 61,572 |
Issued in Lieu of Cash Distributions | 469,940 | 24,566 | 193,647 | 10,112 |
Redeemed | (1,059,582) | (57,122) | (921,085) | (46,368) |
Net Increase (Decrease)—Investor Shares | 949,252 | 50,436 | 492,866 | 25,316 |
Admiral Shares |
|
|
|
|
Issued | 1,043,087 | 17,859 | 915,586 | 14,803 |
Issued in Lieu of Cash Distributions | 176,658 | 2,979 | 58,650 | 988 |
Redeemed | (437,087) | (7,717) | (318,022) | (5,190) |
Net Increase (Decrease)—Admiral Shares | 782,658 | 13,121 | 656,214 | 10,601 |
H. In September 2006, the Financial Accounting Standards Board issued Statement of Financial Accounting Standards No. 157 (“FAS 157”), “Fair Value Measurements.” FAS 157 establishes a framework for measuring fair value and expands disclosures about fair value measurements in financial statements.
The various inputs that may be used to determine the value of the fund’s investments are summarized in three broad levels. The inputs or methodologies used for valuing securities are not necessarily an indication of the risk associated with investing in those securities.
Level 1—Quoted prices in active markets for identical securities.
Level 2—Other significant observable inputs (including quoted prices for similar securities, interest rates, prepayment speeds, credit risk, etc.).
Level 3—Significant unobservable inputs (including the fund’s own assumptions used to determine the fair value of investments).
The following table summarizes the fund’s investments as of September 30, 2008, based on the inputs used to value them:
| Investments | Futures |
| in Securities | Contracts |
Valuation Inputs | ($000) | ($000) |
Level 1—Quoted Prices | 7,723,918 | (20,296) |
Level 2—Other Significant Observable Inputs | 172,971 | — |
Level 3—Significant Unobservable Inputs | — | — |
Total | 7,896,889 | (20,296) |
28
Report of Independent Registered
Public Accounting Firm
To the Trustees and Shareholders of Vanguard Morgan Growth Fund:
In our opinion, the accompanying statement of net assets and the related statements of operations and of changes in net assets and the financial highlights present fairly, in all material respects, the financial position of Vanguard Morgan Growth Fund (the “Fund”) at September 30, 2008, the results of its operations for the year then ended, the changes in its net assets for each of the two years in the period then ended and the financial highlights for each of the five years in the period then ended, in conformity with accounting principles generally accepted in the United States of America. These financial statements and financial highlights (hereafter referred to as “financial statements”) are the responsibility of the Fund’s management; our responsibility is to express an opinion on these financial statements based on our audits. We conducted our audits of these financial statements in accordance with the standards of the Public Company Accounting Oversight Board (United States). Those standards require that we plan and perform the audit to obtain reasonable assurance about whether the financial statements are free of material misstatement. An audit includes examining, on a test basis, evidence supporting the amounts and disclosures in the financial statements, assessing the accounting principles used and significant estimates made by management, and evaluating the overall financial statement presentation. We believe that our audits, which included confirmation of securities at September 30, 2008 by correspondence with the custodians and brokers, and by agreement to the underlying ownership records for Vanguard Market Liquidity Fund, provide a reasonable basis for our opinion.
PricewaterhouseCoopers LLP
Philadelphia, Pennsylvania
November 19, 2008
Special 2008 tax information (unaudited) for Vanguard Morgan Growth Fund
This information for the fiscal year ended September 30, 2008, is included pursuant to provisions of the Internal Revenue Code.
The fund distributed $434,917,000 as capital gain dividends (from net long-term capital gains) to shareholders during the fiscal year.
For non-resident alien shareholders, 100% of short-term capital gain dividends distributed by the fund are qualified short-term capital gains.
The fund distributed $82,394,000 of qualified dividend income to shareholders during the fiscal year.
For corporate shareholders, 81.9% of investment income (dividend income plus short-term gains, if any) qualifies for the dividends-received deduction.
29
Your Fund’s After-Tax Returns
This table presents returns for your fund both before and after taxes. The after-tax returns are shown in two ways: (1) assuming that an investor owned the fund during the entire period and paid taxes on the fund’s distributions, and (2) assuming that an investor paid taxes on the fund’s distributions and sold all shares at the end of each period.
Calculations are based on the highest individual federal income tax and capital gains tax rates in effect at the times of the distributions and the hypothetical sales. State and local taxes were not considered. After-tax returns reflect any qualified dividend income, using actual prior-year figures and estimates for 2008. (In the example, returns after the sale of fund shares may be higher than those assuming no sale. This occurs when the sale would have produced a capital loss. The calculation assumes that the investor received a tax deduction for the loss.)
The table shows returns for Investor Shares only; returns for other share classes will differ. Please note that your actual after-tax returns will depend on your tax situation and may differ from those shown. Also note that if you own the fund in a tax-deferred account, such as an individual retirement account or a 401(k) plan, this information does not apply to you. Such accounts are not subject to current taxes.
Finally, keep in mind that a fund’s performance—whether before or after taxes—does not guarantee future results.
Average Annual Total Returns: Morgan Growth Fund Investor Shares1
Periods Ended September 30, 2008
| One | Five | Ten |
| Year | Years | Years |
Returns Before Taxes | –23.70% | 5.23% | 4.18% |
Returns After Taxes on Distributions | –24.84 | 4.75 | 2.97 |
Returns After Taxes on Distributions and Sale of Fund Shares | –14.14 | 4.49 | 3.24 |
1 Total returns do not include the account service fee that may be applicable to certain accounts with balances below $10,000.
30
About Your Fund’s Expenses
As a shareholder of the fund, you incur ongoing costs, which include costs for portfolio management, administrative services, and shareholder reports (like this one), among others. Operating expenses, which are deducted from a fund’s gross income, directly reduce the investment return of the fund.
A fund’s expenses are expressed as a percentage of its average net assets. This figure is known as the expense ratio. The following examples are intended to help you understand the ongoing costs (in dollars) of investing in your fund and to compare these costs with those of other mutual funds. The examples are based on an investment of $1,000 made at the beginning of the period shown and held for the entire period.
The accompanying table illustrates your fund’s costs in two ways:
• Based on actual fund return. This section helps you to estimate the actual expenses that you paid over the period. The “Ending Account Value” shown is derived from the fund’s actual return, and the third column shows the dollar amount that would have been paid by an investor who started with $1,000 in the fund. You may use the information here, together with the amount you invested, to estimate the expenses that you paid over the period.
To do so, simply divide your account value by $1,000 (for example, an $8,600 account value divided by $1,000 = 8.6), then multiply the result by the number given for your fund under the heading “Expenses Paid During Period.”
• Based on hypothetical 5% yearly return. This section is intended to help you compare your fund’s costs with those of other mutual funds. It assumes that the fund had a yearly return of 5% before expenses, but that the expense ratio is unchanged. In this case—because the return used is not the fund’s actual return—the results do not apply to your investment. The example is useful in making comparisons because the Securities and Exchange Commission requires all mutual funds to calculate expenses based on a 5% return. You can assess your fund’s costs by comparing this hypothetical example with the hypothetical examples that appear in shareholder reports of other funds.
Six Months Ended September 30, 2008 |
|
|
|
| Beginning | Ending | Expenses |
| Account Value | Account Value | Paid During |
Morgan Growth Fund | 3/31/2008 | 9/30/2008 | Period1 |
Based on Actual Fund Return |
|
|
|
Investor Shares | $1,000.00 | $872.19 | $1.83 |
Admiral Shares | 1,000.00 | 872.54 | 1.03 |
Based on Hypothetical 5% Yearly Return |
|
|
|
Investor Shares | $1,000.00 | $1,023.11 | $1.98 |
Admiral Shares | 1,000.00 | 1,023.97 | 1.12 |
1 | The calculations are based on expenses incurred in the most recent six-month period. The fund’s annualized six-month expense ratios for that period are 0.39% for Investor Shares and 0.22% for Admiral Shares. The dollar amounts shown as “Expenses Paid” are equal to the annualized expense ratio multiplied by the average account value over the period, multiplied by the number of days in the most recent six-month period, then divided by the number of days in the most recent 12-month period. |
31
Note that the expenses shown in the table are meant to highlight and help you compare ongoing costs only and do not reflect transaction costs incurred by the fund for buying and selling securities. Further, the expenses do not include the account service fee described in the prospectus. If such a fee were applied to your account, your costs would be higher. Your fund does not charge transaction fees, such as purchase or redemption fees, nor does it carry a “sales load.”
The calculations assume no shares were bought or sold during the period. Your actual costs may have been higher or lower, depending on the amount of your investment and the timing of any purchases or redemptions.
You can find more information about the fund’s expenses, including annual expense ratios, in the Financial Statements section of this report. For additional information on operating expenses and other shareholder costs, please refer to your fund’s current prospectus.
32
Notice to Shareholders
Morgan Growth Fund Realigns Investment Advisory Team
The board of trustees of Vanguard Morgan Growth Fund has announced the realignment of the fund’s investment advisory team by adding Frontier Capital Management Co., LLC (Frontier) and Kalmar Investment Advisers (Kalmar) as investment advisors and removing Franklin Portfolio Associates, LLC (FPA). Frontier, Kalmar, and the fund’s continuing investment advisors— Wellington Management Company, LLP, Jennison Associates LLC, and The Vanguard Group, Inc. (Vanguard)—each independently select and maintain a portfolio of common stocks for the fund. The assets from the portion of the fund formerly managed by FPA, which accounted for approximately 20% of the fund as of September 30, 2008, will be divided equally between Frontier and Kalmar.
Founded in 1980, Frontier is a Boston-based investment management boutique with approximately $4.8 billion in assets under management, primarily in small- to mid-cap stocks. Frontier’s 16-member investment team consists of 5 experienced portfolio managers averaging 24 years of experience, and 11 analysts, averaging 10 years of experience. The Affiliated Managers Group, Inc., a publicly traded asset management company with equity investments in a diverse group of boutique investment management firms located at 600 Hale Street, Prides Crossing, MA, 01965, indirectly owns a controlling interest in Frontier.
Kalmar, based in Wilmington, Delaware, is an investment management firm specializing in small- and mid-cap equity portfolios. Kalmar, together with its parent company, Kalmar Investments Inc., founded in 1982, manages more than $2.7 billion in assets. The nine investment team members have an average of 20 years of investment management experience.
The restructuring of the fund’s investment advisory team is expected to result in an increase in the estimated expense ratio for the fund’s Investor Shares to 0.43% from 0.38% of the fund’s average net assets; the estimated expense ratio for the fund’s Admiral Shares is expected to increase to 0.26% from 0.21% of the fund’s average net assets. These expenses remain at a substantial discount to the 1.43% expense ratio of the average multi-cap growth fund (derived from data provided by Lipper Inc.). In addition, the fund’s investment objective, primary investment strategies, and primary risks will not change. The following table and examples show the fund’s actual expenses and cost of investing for its most recent fiscal year compared with the pro forma expenses and cost of investing that would have applied if the new advisory realignment had been in effect for that period.
Annual Fund Operating Expenses
(Expenses deducted from the Fund’s assets)
| Actual | Pro Forma | ||
| Investor | Admiral | Investor | Admiral |
| Shares | Shares | Shares | Shares |
Management Expenses | 0.35% | 0.18% | 0.40% | 0.22% |
12b-1 Distribution Fee | None | None | None | None |
Other Expenses | 0.03% | 0.03% | 0.03% | 0.04% |
Total Annual Fund Operating Expenses | 0.38% | 0.21% | 0.43% | 0.26% |
33
The following examples are intended to help you compare the cost of investing in the fund’s Investor Shares or Admiral Shares with the cost of investing in other mutual funds. They illustrate the hypothetical expenses that you would incur over various periods if you invest $10,000 in the fund’s shares. These examples assume that the shares provide a return of 5% a year and that operating expenses remain the same or match our estimates, as applicable. The results apply whether or not you redeem your investment at the end of the given period.
Actual | One Year | Three Years | Five Years | Ten Years |
Investor Shares | $39 | $122 | $213 | $480 |
Admiral Shares | 22 | 168 | 118 | 268 |
|
|
|
|
|
Pro Forma | One Year | Three Years | Five Years | Ten Years |
Investor Shares | $44 | $138 | $241 | $542 |
Admiral Shares | 27 | 84 | 146 | 331 |
These examples should not be considered to represent actual expenses or performance from the past or for the future. Actual future expenses may be higher or lower than those shown.
Additional Information
Vanguard Morgan Growth Fund has entered into new investment advisory agreements with Frontier and Kalmar. These additions will not affect the fund’s investment objective, policies, or strategies. The fee schedules for the advisory services provided by Wellington Management, Jennison Associates, and Vanguard have not changed.
Under the terms of the fund’s agreements with Frontier and Kalmar, the fund will pay Frontier and Kalmar a fee at the end of each fiscal quarter. The fee is calculated by applying an annual percentage rate to the average daily net assets of the portions of the fund managed by Frontier and Kalmar, respectively, during the quarter. In addition, the quarterly payments to Frontier and Kalmar may be increased or decreased by applying a performance adjustment. The adjustment is based on the cumulative total return of the portions of the fund managed by Frontier and Kalmar, respectively, over a trailing 36-month period relative to the total return of the Russell Midcap Growth Index over the same period. Transition rules apply to the fee calculation during the initial 36-month period.
For the fiscal year ended September 30, 2008, the fund paid approximately $10.3 million in base investment advisory fees to its advisors, or 0.11% of the fund’s average net assets. Of these fees, the investment advisory fee paid to Vanguard for this same period was $433,000 (representing an effective annual rate of less than 0.01%). Note that these figures do not reflect any potential adjustments based on the performance of assets managed by any advisor.
Vanguard Morgan Growth Fund receives corporate, management, administrative, and distribution services on an at-cost basis from The Vanguard Group, Inc., P.O. Box 1110, Valley Forge, PA 19482.
34
Board Approval of the Investment Advisory Agreement with Frontier Capital Management Co., LLC
With respect to its portion of Morgan Growth Fund, each advisor is responsible for managing the investment and reinvestment of a portion of the fund’s assets and for continuously reviewing, supervising, and administering the fund’s investment program. Each advisor is subject to supervision and oversight by Vanguard’s Portfolio Review Department and the officers and trustees of the fund. The fund’s board of trustees designates the proportion of fund assets to be managed by each advisor and may change these proportions at any time.
Morgan Growth Fund’s board of trustees retained Frontier under the terms of a new investment advisory agreement. The board’s decision to hire Frontier as part of the fund’s multimanager structure was based upon the board’s most recent evaluation of the fund’s current investment staff, portfolio management process, and investment advisory arrangements. In considering whether to approve the agreement, the board engaged in arm’s-length discussions with Frontier and considered the following factors, among others:
• The board considered the benefits to shareholders of adding Frontier as a new advisor to the fund, particularly in light of the nature, extent, and quality of services to be provided by Frontier. The board noted that Frontier employs a fundamental, bottom-up, research-intensive investment approach that seeks companies with a combination of superior growth potential and attractive valuation. The board concluded that it is in the best interests of the fund and its shareholders to add a high-quality manager with a track record of success. The board noted that adding Frontier as an advisor would allow the fund to retain its character as a diversified multi-cap growth equity offering with a mix of differentiated active managers who each have the opportunity to generate superior returns. The combination provides an attractive blend of proven managers, and should benefit fund shareholders over the long term.
• The board analyzed the performance of other funds and portfolios managed by Frontier. The board concluded that Frontier’s other investment portfolios have produced returns that have exceeded both their indexes and peer averages over short- and long-term periods.
• The board considered the advisory fee schedule and estimated expense ratio of the fund and compared them with the average advisory fee and expense ratio of the fund’s peer group. The board concluded that the addition of Frontier would result in an increase in the fund’s investment management fees, but that the fund’s advisory fee rate and expense ratio would remain significantly below those of the fund’s peers.
• The board considered the extent to which economies of scale would be realized as the fund grows, including a consideration of appropriate breakpoints in Frontier’s advisory fee schedule. By including asset-based breakpoints in the fee schedule, the fund’s trustees ensure that, if the portion of the fund managed by Frontier continues to grow, investors will capture economies of scale in the form of a lower advisory fee rate.
• Based on its informed business judgment, the board concluded that the course of action in the best interests of the fund and its shareholders was to approve the agreement to hire Frontier.
The new agreement will continue for two years from its effective date and is renewable after that for successive one-year periods. The agreement will be reviewed annually by the fund’s board of trustees, a majority of whom are not “interested persons” of either the fund or its advisors as defined in federal securities laws. The board may, at any time, reallocate the fund’s assets between the fund’s advisors, or allocate assets of the fund to other investment advisors, without terminating or revising the new agreement with Frontier.
35
Board Approval of the Investment Advisory Agreement with Kalmar Investment Advisers
The Morgan Growth Fund’s board of trustees retained Kalmar under the terms of a new investment advisory agreement. The board’s decision to hire Kalmar as part of the fund’s multimanager structure was based upon the board’s most recent evaluation of the fund’s current investment staff, portfolio management process, and investment advisory arrangements. In considering whether to approve the agreement, the board engaged in arm’s-length discussions with Kalmar and considered the following factors, among others:
• The board considered the benefits to shareholders of adding Kalmar as a new advisor to the fund, particularly in light of the nature, extent, and quality of services to be provided by Kalmar. The board noted that Kalmar uses original and in-depth fundamental research to identify stocks of solid, well-managed, rapidly growing companies, which, for a variety of reasons, do not appear on the radar screens of many growth investors. The board concluded that it is in the best interests of the fund and its shareholders to add a high-quality manager with a track record of success. The board noted that adding Kalmar as an advisor would allow the fund to retain its character as a diversified multi-cap growth equity offering with a mix of differentiated active managers who each have the opportunity to generate superior returns. The combination provides an attractive blend of proven managers, and should benefit fund shareholders over the long term.
• The board analyzed the performance of other funds and portfolios managed by Kalmar. The board concluded that Kalmar’s other investment portfolios have strong investment returns and have posted competitive results by outperforming relevant benchmarks and competitors over various time periods, both short and long term.
• The board considered the advisory fee schedule and estimated expense ratio of the fund and compared them with the average advisory fee and expense ratio of the fund’s peer group. The board concluded that the addition of Kalmar would result in an increase in the fund’s investment management fees, but that the fund’s advisory fee rate and expense ratio would remain significantly below those of the fund’s peers.
• The board considered the extent to which economies of scale would be realized as the fund grows, including a consideration of appropriate breakpoints in Kalmar’s advisory fee schedule. By including asset-based breakpoints in the fee schedule, the fund’s trustees ensure that, if the portion of the fund managed by Kalmar continues to grow, investors will capture economies of scale in the form of a lower advisory fee rate.
• Based on its informed business judgment, the board concluded that the course of action in the best interests of the fund and its shareholders was to approve the agreement to hire Kalmar.
The new agreement will continue for two years from its effective date and is renewable after that for successive one-year periods. The agreement will be reviewed annually by the fund’s board of trustees, a majority of whom are not “interested persons” of either the fund or its advisors as defined in federal securities laws. The board may, at any time, reallocate the fund’s assets between the fund’s advisors, or allocate assets of the fund to other investment advisors, without terminating or revising the new agreement with Kalmar.
36
Background Information on Frontier Capital Management Co., LLC
Frontier Capital Management Co., LLC, 99 Summer Street, Boston, MA 02110, is an investment management firm founded in 1980. As of September 30, 2008, Frontier had assets under management that totaled approximately $4.8 billion. The manager primarily responsible for overseeing Frontier’s portion of Vanguard Morgan Growth Fund is:
Stephen Knightly, CFA, Senior Vice President of Frontier. He has worked in investment management since 1989; has been with Frontier since 1992; and has managed a portion of the fund since 2008. Education: B.S., Lehigh University; M.B.A., The Wharton School of the University of Pennsylvania.
Background Information on Kalmar Investment Advisers
Kalmar Investment Advisers, Barley Mill House, 3701 Kennett Pike, Wilmington, DE 19807, is an investment advisory firm founded in 1996. As of September 30, 2008, Kalmar, together with its parent company, Kalmar Investments Inc., had assets under management that totaled more than $2.7 billion. The manager primarily responsible for overseeing Kalmar’s portion of Vanguard Morgan Growth Fund is:
Ford B. Draper, Jr., President, Chief Investment Officer, and Founder of Kalmar. He has worked in investment management since 1967; founded Kalmar Investments Inc. in 1982; and has managed a portion of the fund since 2008. Education: B.A., Yale University; M.B.A., Columbia University.
37
Glossary
Beta. A measure of the magnitude of a fund’s past share-price fluctuations in relation to the ups and downs of a given market index. The index is assigned a beta of 1.00. Compared with a given index, a fund with a beta of 1.20 typically would have seen its share price rise or fall by 12% when the index rose or fell by 10%. For this report, beta is based on returns over the past 36 months for both the fund and the index. Note that a fund’s beta should be reviewed in conjunction with its R-squared (see definition). The lower the R-squared, the less correlation there is between the fund and the index, and the less reliable beta is as an indicator of volatility.
Earnings Growth Rate. The average annual rate of growth in earnings over the past five years for the stocks now in a fund.
Equity Exposure. A measure that reflects a fund’s investments in stocks and stock futures. Any holdings in short-term reserves are excluded.
Expense Ratio. The percentage of a fund’s average net assets used to pay its annual administrative and advisory expenses. These expenses directly reduce returns to investors.
Foreign Holdings. The percentage of a fund represented by stocks or depositary receipts of companies based outside the United States.
Inception Date. The date on which the assets of a fund (or one of its share classes) are first invested in accordance with the fund’s investment objective. For funds with a subscription period, the inception date is the day after that period ends. Investment performance is measured from the inception date.
Median Market Cap. An indicator of the size of companies in which a fund invests; the midpoint of market capitalization (market price x shares outstanding) of a fund’s stocks, weighted by the proportion of the fund’s assets invested in each stock. Stocks representing half of the fund’s assets have market capitalizations above the median, and the rest are below it.
Price/Book Ratio. The share price of a stock divided by its net worth, or book value, per share. For a fund, the weighted average price/book ratio of the stocks it holds.
Price/Earnings Ratio. The ratio of a stock’s current price to its per-share earnings over the past year. For a fund, the weighted average P/E of the stocks it holds. P/E is an indicator of market expectations about corporate prospects; the higher the P/E, the greater the expectations for a company’s future growth.
R-Squared. A measure of how much of a fund’s past returns can be explained by the returns from the market in general, as measured by a given index. If a fund’s total returns were precisely synchronized with an index’s returns, its R-squared would be 1.00. If the fund’s returns bore no relationship to the index’s returns, its R-squared would be 0. For this report, R-squared is based on returns over the past 36 months for both the fund and the index.
Return on Equity. The annual average rate of return generated by a company during the past five years for each dollar of shareholder’s equity (net income divided by shareholder’s equity). For a fund, the weighted average return on equity for the companies whose stocks it holds.
Short-Term Reserves. The percentage of a fund invested in highly liquid, short-term securities that can be readily converted to cash.
38
Turnover Rate. An indication of the fund’s trading activity. Funds with high turnover rates incur higher transaction costs and may be more likely to distribute capital gains (which may be taxable to investors). The turnover rate excludes in-kind transactions, which have minimal impact on costs.
Yield. A fund’s 30-day SEC yield is derived using a formula specified by the U.S. Securities and Exchange Commission. Under the formula, data related to the fund’s security holdings in the previous 30 days are used to calculate the fund’s hypothetical net income for that period, which is then annualized and divided by the fund’s estimated average net assets over the calculation period. For the purposes of this calculation, a security’s income is based on its current market yield to maturity (in the case of bonds) or its projected dividend yield (for stocks). Because the SEC yield represents hypothetical annualized income, it will differ—at times significantly—from the fund’s actual experience. As a result, the fund’s income distributions may be higher or lower than implied by the SEC yield.
39
The People Who Govern Your Fund
The trustees of your mutual fund are there to see that the fund is operated and managed in your best interests since, as a shareholder, you are a part owner of the fund. Your fund’s trustees also serve on the board of directors of The Vanguard Group, Inc., which is owned by the Vanguard funds and provides services to them on an at-cost basis.
A majority of Vanguard’s board members are independent, meaning that they have no affiliation with Vanguard or the funds they oversee, apart from the sizable personal investments they have made as private individuals.
Our independent board members bring distinguished backgrounds in business, academia, and public service to their task of working with Vanguard officers to establish the policies and oversee the activities of the funds. Among board members’ responsibilities are selecting investment advisors for the funds; monitoring fund operations, performance, and costs; reviewing contracts; nominating and selecting new trustees/directors; and electing Vanguard officers.
Each trustee serves a fund until its termination; or until the trustee’s retirement, resignation, or death; or otherwise as specified in the fund’s organizational documents. Any trustee may be removed at a shareholders’ meeting by a vote representing two-thirds of the net asset value of all shares of the fund together with shares of other Vanguard funds organized within the same trust. The table on these two pages shows information for each trustee and executive officer of the fund. The mailing address of the trustees and officers is P.O. Box 876, Valley Forge, PA 19482.
Chairman of the Board and Trustee | |
|
|
John J. Brennan1 |
|
Born 1954 | Principal Occupation(s) During the Past Five Years: Chairman of the Board and Director/ |
Trustee Since May 1987; | Trustee of The Vanguard Group, Inc., and of each of the investment companies served |
Chairman of the Board | by The Vanguard Group; Chief Executive Officer and President of The Vanguard Group |
156 Vanguard Funds Overseen | and of each of the investment companies served by The Vanguard Group (1996–2008). |
|
|
Independent Trustees |
|
|
|
Charles D. Ellis |
|
Born 1937 | Principal Occupation(s) During the Past Five Years: Applecore Partners (pro bono ventures |
Trustee Since January 2001 | in education); Senior Advisor to Greenwich Associates (international business strategy |
156 Vanguard Funds Overseen | consulting); Successor Trustee of Yale University; Overseer of the Stern School of Business |
| at New York University; Trustee of the Whitehead Institute for Biomedical Research. |
|
|
Emerson U. Fullwood |
|
Born 1948 | Principal Occupation(s) During the Past Five Years: Executive Chief Staff and Marketing |
Trustee Since January 2008 | Officer for North America since 2004 and Corporate Vice President of Xerox Corporation |
156 Vanguard Funds Overseen | (photocopiers and printers); Director of SPX Corporation (multi-industry manufacturing), |
| of the United Way of Rochester, and of the Boy Scouts of America. |
|
|
Rajiv L. Gupta |
|
Born 1945 | Principal Occupation(s) During the Past Five Years: Chairman, President, and |
Trustee Since December 20012 | Chief Executive Officer of Rohm and Haas Co. (chemicals); Board Member of |
156 Vanguard Funds Overseen | the American Chemistry Council; Director of Tyco International, Ltd. (diversified |
| manufacturing and services) since 2005. |
|
|
Amy Gutmann |
|
Born 1949 | Principal Occupation(s) During the Past Five Years: President of the University of |
Trustee Since June 2006 | Pennsylvania since 2004; Professor in the School of Arts and Sciences, Annenberg School |
156 Vanguard Funds Overseen | for Communication, and Graduate School of Education of the University of Pennsylvania |
| since 2004; Provost (2001–2004) and Laurance S. Rockefeller Professor of Politics and |
| the University Center for Human Values (1990–2004), Princeton University; Director of |
| Carnegie Corporation of New York since 2005 and of Schuylkill River Development |
| Corporation and Greater Philadelphia Chamber of Commerce since 2004; Trustee of |
| the National Constitution Center since 2007. |
JoAnn Heffernan Heisen |
|
Born 1950 | Principal Occupation(s) During the Past Five Years: Corporate Vice President and |
Trustee Since July 1998 | Chief Global Diversity Officer since 2006, Vice President and Chief Information |
156 Vanguard Funds Overseen | Officer (1997–2005), and Member of the Executive Committee of Johnson & |
| Johnson (pharmaceuticals/consumer products); Director of the University Medical |
| Center at Princeton and Women’s Research and Education Institute. |
|
|
André F. Perold |
|
Born 1952 | Principal Occupation(s) During the Past Five Years: George Gund Professor of Finance |
Trustee Since December 2004 | and Banking, Harvard Business School; Senior Associate Dean and Director of Faculty |
156 Vanguard Funds Overseen | Recruiting, Harvard Business School; Director and Chairman of UNX, Inc. (equities |
| trading firm); Chair of the Investment Committee of HighVista Strategies LLC (private |
| investment firm) since 2005. |
|
|
Alfred M. Rankin, Jr. |
|
Born 1941 | Principal Occupation(s) During the Past Five Years: Chairman, President, Chief Executive |
Trustee Since January 1993 | Officer, and Director of NACCO Industries, Inc. (forklift trucks/housewares/lignite); Director |
156 Vanguard Funds Overseen | of Goodrich Corporation (industrial products/aircraft systems and services). |
|
|
J. Lawrence Wilson |
|
Born 1936 | Principal Occupation(s) During the Past Five Years: Retired Chairman and Chief Executive |
Trustee Since April 1985 | Officer of Rohm and Haas Co. (chemicals); Director of Cummins Inc. (diesel engines) and |
156 Vanguard Funds Overseen | AmerisourceBergen Corp. (pharmaceutical distribution); Trustee of Vanderbilt University |
| and of Culver Educational Foundation. |
|
|
Executive Officers1 |
|
|
|
Thomas J. Higgins |
|
Born 1957 | Principal Occupation(s) During the Past Five Years: Principal of The Vanguard Group, Inc.; |
Chief Financial Officer | Treasurer of each of the investment companies served by The Vanguard Group; Chief |
Since September 2008 | Financial Officer of each of the investment companies served by The Vanguard |
Treasurer Since July 1998 | Group since 2008. |
156 Vanguard Funds Overseen |
|
|
|
F. William McNabb III |
|
Born 1957 | Principal Occupation(s) During the Past Five Years: Chief Executive Officer, Director, |
Chief Executive Officer | and President of The Vanguard Group, Inc., since 2008; Chief Executive Officer and |
Since August 31, 2008 | President of each of the investment companies served by The Vanguard Group since |
President Since March 2008 | 2008; Director of Vanguard Marketing Corporation; Managing Director of The Vanguard |
156 Vanguard Funds Overseen | Group (1995–2008). |
|
|
Heidi Stam |
|
Born 1956 | Principal Occupation(s) During the Past Five Years: Managing Director of The Vanguard |
Secretary Since July 2005 | Group, Inc., since 2006; General Counsel of The Vanguard Group since 2005; Secretary of |
156 Vanguard Funds Overseen | The Vanguard Group and of each of the investment companies served by The Vanguard |
| Group since 2005; Director and Senior Vice President of Vanguard Marketing Corporation |
| since 2005; Principal of The Vanguard Group (1997–2006). |
1 These individuals are “interested persons” as defined in the Investment Company Act of 1940.
2 December 2002 for Vanguard Equity Income Fund, Vanguard Growth Equity Fund, the Vanguard Municipal Bond Funds, and the Vanguard State Tax-Exempt Funds.
More information about the trustees is in the Statement of Additional Information, available from The Vanguard Group.

P.O. Box 2600
Valley Forge, PA 19482-2600
Connect with Vanguard® > www.vanguard.com
Fund Information > 800-662-7447 | All comparative mutual fund data are |
| from Lipper Inc. or Morningstar, Inc., |
| unless otherwise noted. |
|
|
Direct Investor Account Services > 800-662-2739 |
|
| You can obtain a free copy of Vanguard’s |
| proxy voting guidelines by visiting our |
| website, www.vanguard.com, |
Institutional Investor Services > 800-523-1036 | and searching for “proxy voting |
| guidelines,” or by calling Vanguard |
Text Telephone for People | at 800-662-2739. The guidelines are |
With Hearing Impairment > 800-952-3335 | also available from the SEC’s website, |
| www.sec.gov. In addition, you may |
| obtain a free report on how your fund |
| voted the proxies for securities it owned |
This material may be used in conjunction | during the 12 months ended June 30. |
with the offering of shares of any Vanguard | To get the report, visit either |
fund only if preceded or accompanied by | www.vanguard.com or www.sec.gov. |
the fund’s current prospectus. |
|
| You can review and copy information |
CFA® is a trademark owned by CFA Institute. | about your fund at the SEC’s Public |
| Reference Room in Washington, D.C. |
The funds or securities referred to herein are not | To find out more about this public |
sponsored, endorsed, or promoted by MSCI, and | service, call the SEC at 202-551-8090. |
MSCI bears no liability with respect to any such funds | Information about your fund is also |
or securities. For any such funds or securities, the | available on the SEC’s website, and you |
prospectus or the Statement of Additional Information | can receive copies of this information, |
contains a more detailed description of the limited | for a fee, by sending a request in either |
relationship MSCI has with The Vanguard Group and | of two ways: via e-mail addressed to |
any related funds. | publicinfo@sec.gov or via regular mail |
| addressed to the Public Reference |
Russell is a trademark of The Frank Russell | Section, Securities and Exchange |
Company. | Commission, Washington, DC 20549- |
| 0102. |
S&P 500® is a trademark of The McGraw-Hill |
|
Companies, Inc., and has been licensed for use by |
|
The Vanguard Group, Inc. Vanguard mutual funds |
|
are not sponsored, endorsed, sold, or promoted by |
|
Standard & Poor’s, and Standard & Poor’s makes no |
|
representation regarding the advisability of investing | © 2008 The Vanguard Group, Inc. |
in the funds. | All rights reserved. |
| Vanguard Marketing Corporation, |
| Distributor. |
| Q260 112008 |
Item 2: Code of Ethics. The Registrant has adopted a code of ethics that applies to the Registrant’s principal executive officer, principal financial officer, principal accounting officer or controller or persons performing similar functions. The Code of Ethics was amended during the reporting period covered by this report to make certain technical, non-material changes.
Item 3: Audit Committee Financial Expert. The following members of the Audit Committee have been determined by the Registrant’s Board of Trustees to be Audit Committee Financial Experts serving on its Audit Committee, and to be independent: Charles D. Ellis, Rajiv L. Gupta, JoAnn Heffernan Heisen, André F. Perold, Alfred M. Rankin, Jr., and J. Lawrence Wilson.
Item 4: Principal Accountant Fees and Services.
(a) Audit Fees.
Audit Fees of the Registrant
Fiscal Year Ended September 30, 2008: $26,000
Fiscal Year Ended September 30, 2007: $26,000
Aggregate Audit Fees of Registered Investment Companies in the Vanguard Group.
Fiscal Year Ended September 30, 2008: $3,055,590
Fiscal Year Ended September 30, 2007: $2,835,320
(b) Audit-Related Fees.
Fiscal Year Ended September 30, 2008: $626,240
Fiscal Year Ended September 30, 2007: $630,400
Includes fees billed in connection with assurance and related services provided to the Registrant, The Vanguard Group, Inc., Vanguard Marketing Corporation, and other registered investment companies in the Vanguard Group.
(c) Tax Fees.
Fiscal Year Ended September 30, 2008: $230,400
Fiscal Year Ended September 30, 2007: $215,900
Includes fees billed in connection with tax compliance, planning and advice services provided to the Registrant, The Vanguard Group, Inc., Vanguard Marketing Corporation, and other registered investment companies in the Vanguard Group and related to income and excise taxes.
(d) All Other Fees.
Fiscal Year Ended September 30, 2008: $0
Fiscal Year Ended September 30, 2007: $0
Includes fees billed for services related to risk management and privacy matters. Services were provided to the Registrant, The Vanguard Group, Inc., Vanguard Marketing Corporation, and other registered investment companies in the Vanguard Group.
(e) (1) Pre-Approval Policies. The policy of the Registrant’s Audit Committee is to consider and, if appropriate, approve before the principal accountant is engaged for such services, all specific audit and non-audit services provided to: (1) the Registrant; (2) The Vanguard Group, Inc.; (3) other entities controlled by The Vanguard Group, Inc. that provide ongoing services to the Registrant; and (4) other registered investment companies in the Vanguard Group. In making a determination, the Audit Committee considers whether the services are consistent with maintaining the principal accountant’s independence.
In the event of a contingency situation in which the principal accountant is needed to provide services in between scheduled Audit Committee meetings, the Chairman of the Audit Committee would be called on to consider and, if appropriate, pre-approve audit or permitted non-audit services in an amount sufficient to complete services through the next Audit Committee meeting, and to determine if such services would be consistent with maintaining the accountant’s independence. At the next scheduled Audit Committee meeting, services and fees would be presented to the Audit Committee for formal consideration, and, if appropriate, approval by the entire Audit Committee. The Audit Committee would again consider whether such services and fees are consistent with maintaining the principal accountant’s independence.
The Registrant’s Audit Committee is informed at least annually of all audit and non-audit services provided by the principal accountant to the Vanguard complex, whether such services are provided to: (1) the Registrant; (2) The Vanguard Group, Inc.; (3) other entities controlled by The Vanguard Group, Inc. that provide ongoing services to the Registrant; or (4) other registered investment companies in the Vanguard Group.
(2) No percentage of the principal accountant’s fees or services were approved pursuant to the waiver provision of paragraph (c)(7)(i)(C) of Rule 2-01 of Regulation S-X.
(f) For the most recent fiscal year, over 50% of the hours worked under the principal accountant’s engagement were not performed by persons other than full-time, permanent employees of the principal accountant.
(g) Aggregate Non-Audit Fees.
Fiscal Year Ended September 30, 2008: $230,400
Fiscal Year Ended September 30, 2007: $215,900
Includes fees billed for non-audit services provided to the Registrant, The Vanguard Group, Inc., Vanguard Marketing Corporation, and other registered investment companies in the Vanguard Group.
(h) For the most recent fiscal year, the Audit Committee has determined that the provision of all non-audit services was consistent with maintaining the principal accountant’s independence.
Item 5: Not Applicable.
Item 6: Not Applicable.
Item 7: Not Applicable.
Item 8: Not Applicable.
Item 9: Not Applicable.
Item 10: Not Applicable.
Item 11: Controls and Procedures.
(a) Disclosure Controls and Procedures. The Principal Executive and Financial Officers concluded that the Registrant's Disclosure Controls and Procedures are effective based on their evaluation of the Disclosure Controls and Procedures as of a date within 90 days of the filing date of this report.
(b) Internal Control Over Financial Reporting. There were no significant changes in Registrant’s Internal Control Over Financial Reporting or in other factors that could significantly affect this control subsequent to the date of the evaluation, including any corrective actions with regard to significant deficiencies and material weaknesses.
Item 12: Exhibits.
| (a) | Code of Ethics. |
| (b) | Certifications. |
Pursuant to the requirements of the Securities Exchange Act of 1934 and the Investment Company Act of 1940, the registrant has duly caused this report to be signed on its behalf by the undersigned, thereunto duly authorized.
| VANGUARD MORGAN GROWTH FUND |
|
|
By: | /s/ F. WILLIAM MCNABB III* |
| F. WILLIAM MCNABB III |
| CHIEF EXECUTIVE OFFICER |
|
|
Date: November 18, 2008 | |
Pursuant to the requirements of the Securities Exchange Act of 1934 and the Investment Company Act of 1940, this report has been signed below by the following persons on behalf of the registrant and in the capacities and on the dates indicated.
| VANGUARD MORGAN GROWTH FUND |
|
|
By: | /s/ F. WILLIAM MCNABB III* |
| F. WILLIAM MCNABB III |
| CHIEF EXECUTIVE OFFICER |
|
|
Date: November 18, 2008 | |
| VANGUARD MORGAN GROWTH FUND |
|
|
By: | /s/ THOMAS J. HIGGINS* |
| THOMAS J. HIGGINS |
| CHIEF FINANCIAL OFFICER |
|
|
Date: November 18, 2008 | |
* By: /s/ Heidi Stam
Heidi Stam, pursuant to a Power of Attorney filed on January 18, 2008, see file Number 2-29601, Incorporated by Reference; and pursuant to a Power of Attorney filed on September 26, 2008, see File Number 2-47371, Incorporated by Reference.