UNITED STATES
SECURITIES AND EXCHANGE COMMISSION
Washington, D.C. 20549
FORM N-CSR
CERTIFIED SHAREHOLDER REPORT
OF
REGISTERED MANAGEMENT COMPANY
| Investment Company Act file number: | 811-1685 |
| Name of Registrant: | Vanguard Morgan Growth Fund |
| Address of Registrant: | P.O. Box 2600 Valley Forge, PA 19482 |
| Name and address of agent for service: | Heidi Stam, Esquire P.O. Box 876 Valley Forge, PA 19482 |
Registrant’s telephone number, including area code: (610) 669-1000
| Date of fiscal year end: | September 30 |
| Date of reporting period: | October 1, 200- September 30, 2006 |
| Item 1: | Reports to Shareholders |
|
|
|
|
| Vanguard® Morgan™ Growth Fund |
|
|
|
|
|
|
|
|
|
|
| > Annual Report |
|
|
|
|
|
|
|
|
|
|
|
|
|
|
|
|
|
|
| September 30, 2006 |
|
|
|
|
|
|
|
| ||
|
|
| |
|
|
| |
|
|
| |
|
|
| |
|
|
| |
|
|
| |
|
|
| |
|
|
| |

> | For the fiscal year ended September 30, 2006, Vanguard Morgan Growth Fund |
| returned slightly more than 8%, outpacing its average peer and the Russell 3000 |
| Growth Index. |
|
|
|
|
> | Growth-oriented stocks underperformed their value counterparts during the period. |
|
|
|
|
> | Strong results in the information technology, industrials, and financials sectors |
| generated much of the fund’s total return. |
Contents |
|
|
|
Your Fund’s Total Returns | 1 |
Chairman’s Letter | 2 |
Advisors’ Report | 6 |
Fund Profile | 9 |
Performance Summary | 10 |
Financial Statements | 12 |
Your Fund’s After-Tax Returns | 27 |
About Your Fund’s Expenses | 28 |
Glossary | 30 |
Please note: The opinions expressed in this report are just that—informed opinions. They should not be considered promises or advice. Also, please keep in mind that the information and opinions cover the period through the date on the cover of this report. Of course, the risks of investing in your fund are spelled out in the prospectus.
Your Fund’s Total Returns
Fiscal Year Ended September 30, 2006 |
|
| Total |
| Returns |
Vanguard Morgan Growth Fund |
|
Investor Shares | 8.2% |
Admiral™ Shares1 | 8.4 |
Russell 3000 Growth Index | 6.1 |
Average Multi-Cap Growth Fund2 | 4.9 |
Dow Jones Wilshire 5000 Composite Index | 10.5 |
Your Fund’s Performance at a Glance |
|
|
|
|
September 30, 2005–September 30, 2006 |
|
|
|
|
|
|
| Distributions Per Share | |
| Starting | Ending | Income | Capital |
| Share Price | Share Price | Dividends | Gains |
Vanguard Morgan Growth Fund |
|
|
|
|
Investor Shares | $17.04 | $18.34 | $0.095 | $0.000 |
Admiral Shares | 52.91 | 56.94 | 0.398 | 0.000 |
1 A lower-cost class of shares available to many longtime shareholders and to those with significant investments in the fund.
2 Derived from data provided by Lipper Inc.
1

Chairman’s Letter
Dear Shareholder,
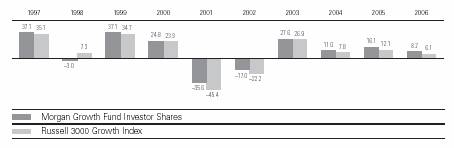
Vanguard Morgan Growth Fund returned more than 8% during the 12 months ended September 30, 2006, a respectable return outpacing the result of its benchmark index and the average return of its peers. For the fifth time in the fund’s last six fiscal years, returns for growth stocks (as measured by the Russell 3000 Growth Index) trailed those of their value-oriented counterparts. Still, the advisors’ strong security selection, particularly among industrial and technology stocks, guided the fund to solid results and success when measured against its comparative standards.
Stocks endured some rough going, then recovered to post strong results
The stock market advanced through the first part of the fund’s fiscal year, then hit a speed bump in May, as investors feared that the economy was growing too rapidly. But a slowdown in the housing market, coupled with a late-summer decline in oil prices, helped to allay inflation concerns. The broad market rebounded to post a solid 10.5% return for the 12-month period. Value-oriented stocks outperformed growth stocks, and large-capitalization stocks edged out small-caps, one of the market’s best-performing segments in recent years.
International stocks handily outpaced domestic issues, continuing a multiyear trend. European and emerging market stocks fared particularly well. Stocks in the Pacific region also performed admirably, even though Japanese stocks did not fully participate in the global market’s summer recovery.
2
In the bond market, prices rallied as the Fed paused
At its August and September meetings, the Federal Reserve Board twice voted to maintain the federal funds rate at 5.25%, marking a pause in the central bank’s two-year inflation-fighting campaign. With investor sentiment buoyed by the Fed’s near-term inflation outlook, interest rates decreased, driving bond prices higher. The broad taxable bond market finished the period with a 3.7% return, and municipal bonds performed slightly better.
Although rates decreased along the entire maturity spectrum in late summer, the difference between the yields of the shortest- and longest-term issues remained narrow by historical standards. At the end of September, the U.S. Treasury yield curve was actually inverted, meaning that short-term issues such as 3-month and 6-month Treasury notes offered higher yields than those with longer maturities.
Keen stock selection drove Morgan Growth’s performance
As has been the case for the past several years, investors again favored value-oriented stocks over growth stocks during your fund’s fiscal year. Despite this headwind, the advisors steered the Morgan Growth Fund to a respectable 8.2% result (for Investor Shares). Their fine stock selection in a number of key areas drove the fund to outperform its benchmark and its peer group.
In information technology, the fund’s largest sector, the advisors found success in a diverse collection of companies. Tech giants such as Microsoft and Google were large contributors to return, as were smaller issues in the storage and semiconductor areas. In guiding the fund to a 12% return in this sector, the advisors also skillfully avoided or underweighted several stocks that experienced large declines and dragged the benchmark’s tech stocks down to a modest 3% return for the year.
Market Barometer |
|
|
| |||
|
| Average Annual Total Returns | ||||
|
| Periods Ended September 30, 2006 | ||||
| One Year | Three Years | Five Years | |||
Stocks |
|
|
| |||
Russell 1000 Index (Large-caps) | 10.2% | 12.8% | 7.6% | |||
Russell 2000 Index (Small-caps) | 9.9 | 15.5 | 13.8 | |||
Dow Jones Wilshire 5000 Index (Entire market) | 10.5 | 13.3 | 8.6 | |||
MSCI All Country World Index ex USA (International) | 19.4 | 23.9 | 16.4 | |||
|
|
|
| |||
Bonds |
|
|
| |||
Lehman Aggregate Bond Index (Broad taxable market) | 3.7% | 3.4% | 4.8% | |||
Lehman Municipal Bond Index | 4.5 | 4.4 | 5.2 | |||
Citigroup 3-Month Treasury Bill Index | 4.4 | 2.6 | 2.2 | |||
|
|
|
| |||
CPI |
|
|
| |||
Consumer Price Index | 2.1% | 3.1% | 2.6% | |||
3
The fund’s industrial holdings also performed well, particularly its investments in aviation-related companies. From aircraft manufacturers and aviation equipment makers to air freight delivery services and commercial airliners, these stocks helped to lift the sector to a 21% result.
Other bright spots for the fund included the financials sector, which returned nearly 20%, and the tiny materials sector, which, driven by concentrated positions in metals and mining stocks, posted a 33% return—the highest of any group.
Energy was the only sector to record a negative result (–8%) for the fiscal year, as oil prices fell toward the end of the summer. The large health care and consumer discretionary sectors also registered below-market returns.
Performance should be viewed through a wide-angle lens
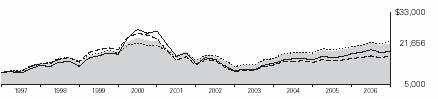
If you’re looking for perspective on a fund’s performance, it’s smart to take a step back and get the long-term view. Investment returns are best measured not in months or quarters, but rather, over the span of several years. Morgan Growth Fund, now in its 38th year, has weathered many market cycles. Over the past ten years—a period that included steep bull and bear markets—the fund returned 8.0%. A hypothetical investment of $10,000 made in the fund a decade ago would now be worth $21,656—almost $5,000 more than if the same investment were made in its unmanaged benchmark.
That success is a tribute to the skilled group of advisors who manage the fund: Wellington Management Company, Franklin Portfolio Associates, and Vanguard Quantitative Equity Group. Their task is
Total Returns |
|
|
Ten Years Ended September 30, 2006 |
|
|
| Average | Final Value of a $10,000 |
| Annual Return | Initial Investment |
Morgan Growth Fund Investor Shares | 8.0% | $21,656 |
Russell 3000 Growth Index | 5.3 | 16,718 |
Average Multi-Cap Growth Fund | 6.5 | 18,700 |
Dow Jones Wilshire 5000 Index | 8.6 | 22,871 |
4
aided by the fund’s low expense ratio, which allows a greater portion of the total return to go to shareholders.
Robert D. Rands, who has served as portfolio manager for Wellington’s portion of Morgan Growth since 1994, will retire on December 31. I’d like to thank Bob for his significant contributions and dedication to the fund. Paul E. Marrkand, who has served as co-manager of Wellington’s portion of the fund since 2005, will assume Bob’s responsibilities upon his retirement.
A diversification of thought plays a role in your fund’s success
Like many Vanguard funds, Morgan Growth uses a multimanager approach. The fund’s three advisors bring a diverse set of experiences, ideas, and strategies to their respective portions of the fund. In a sense, this approach reflects Vanguard’s emphasis on one of the core tenets of investing: diversification. Each advisor contributes to the fund’s return while collectively diluting the risks associated with any single strategy.
You can take a page from that book in your own investment plan. A portfolio that is diversified among different investment styles, asset classes, and market segments can capture the returns of the market’s best performers while limiting exposure to the worst. We believe that Morgan Growth Fund can be a key part of such a balanced and diversified investment plan.
Thank you for investing with Vanguard.
Sincerely,

John J. Brennan
Chairman and Chief Executive Officer
October 18, 2006
Expense Ratios1 |
|
|
|
Your fund compared with its peer group |
|
|
|
|
|
| Average |
| Investor | Admiral | Multi-Cap |
| Shares | Shares | Growth Fund |
Morgan Growth Fund | 0.42% | 0.23% | 1.65% |
1.Fund expense ratios reflect the 12 months ended September 30, 2006. Peer-group expense ratio is derived from data provided by Lipper Inc. and captures information through year-end 2005.
5
Advisors’ Report
During the fiscal year ended September 30, 2006, Vanguard Morgan Growth Fund returned 8.2% for Investor Shares and 8.4% for Admiral Shares. This performance reflects the combined efforts of your fund’s three independent advisors. The use of three advisors provides exposure to distinct, yet complementary, investment approaches, enhancing the fund’s diversification.
The advisors, the percentage of fund assets each manages, and a brief description of their investment strategies are presented in the table below. The advisors have also prepared a discussion of the investment environment that existed during the fiscal year and of how their portfolio positioning reflects this assessment.
Wellington Management Company, LLP
Portfolio Managers:
Robert D. Rands, CFA, Senior Vice President
Paul E. Marrkand, CFA, Vice President
Over the last 12 months, our portion of the Morgan Growth Fund benefited primarily from favorable security selection in the information technology sector. Within technology, the largest contributor to performance was Oracle, the world’s leading database software company. Oracle’s stock price rose as investors began to anticipate the future growth opportunities for the company’s virtualization and application products.
Other meaningful contributors to performance within the sector were NVIDIA, Nokia, and Network Appliance. NVIDIA’s share price increased on the
Vanguard Morgan Growth Fund Investment Advisors | ||||
|
|
|
| |
| Fund Assets Managed |
| ||
Investment Advisor | % | $ Million | Investment Strategy | |
Wellington Management Company, LLP | 38 | 2,630 | Traditional methods of stock selection—research and analysis—that identify companies believed | |
|
|
| to have above-average growth prospects, | |
|
|
| particularly those in industries undergoing change. Focuses on mid- and | |
|
|
| large-capitalization companies with proven | |
|
|
| records of sales and earnings growth, | |
|
|
| profitability, and cash-flow generation. | |
Franklin Portfolio Associates, LLC | 29 | 1,977 | Quantitative management using a blend of valuation and growth/momentum factors | |
|
|
| to drive stock selection decisions for a mid-cap growth subportfolio. | |
Vanguard Quantitative Equity Group | 29 | 1,992 | Quantitative management using models that assess valuation, marketplace sentiment, | |
|
|
| and balance-sheet characteristics | |
|
|
| of companies versus their peers. | |
Cash Investments1 | 4 | 263 | — | |
1 These short-term reserves are invested by Vanguard in equity index products to simulate investment in stocks. Each advisor may also maintain a modest cash position.
6
potential for growth opportunities for the company’s dominant graphics business with the upcoming rollout of Microsoft’s new operating system, Vista. Because of that share appreciation, we sold our position in the company. Nokia’s stock price rose because the company is expected to generate strong profit growth over the coming years with the adoption of third-generation wireless technology. Shares of Network Appliance gained because the firm’s single architecture storage solutions, which offer customers one operating system across all storage systems, allowed the company to gain a significant amount of market share.
Positive stock selection within the industrials sector also boosted the fund’s returns. Strong performers here included Boeing and Rockwell Collins—both companies are expected to experience positive growth during the next aerospace cycle, which should last several years—and Suntech Power, which has strong growth prospects, given its position in the solar panel industry.
Conversely, the consumer discretionary sector detracted from performance—in particular, our holdings in XM Satellite Radio, a satellite radio service provider. Shares of XM Satellite declined after missteps by the management team caused a decline in the company’s free cash flow and market share. We eliminated the holding during the period as we no longer believe that management will be able to generate strong growth in free cash flow in the coming years.
In terms of the economic environment, we remain concerned about the massive United States trade deficit, the high cost of energy, and the debt levels of U.S. consumers. We believe these impediments will reduce the sales growth rates and profit levels of numerous companies over the next several years. Therefore, we seek to invest in innovative companies with the ability to gain market share and grow sales and profits at a solid rate despite a challenging economic environment. At the end of the period, the fund’s largest overweighted positions were in technology, industrials, and energy; the largest underweighted positions were in consumer discretionary and consumer staples.
Franklin Portfolio Associates, LLC
Portfolio Manager: John S. Cone, CFA
Our portion of the fund is benchmarked to the Russell Midcap Growth Index. As a result of our stock selection process, certain characteristics of the portfolio differ from those of the benchmark. For instance, the portfolio had an emphasis on positive momentum (stocks with near-term price-and-earnings growth momentum), as well as an emphasis on positive valuation (stocks with lower price-to-earnings ratios). During the fiscal year, the portfolio’s emphasis on positive valuation helped to boost the fund’s return; however, these gains were greatly offset by our emphasis on positive momentum, which detracted from the portfolio’s performance.
The portfolio benefited from strong stock selection in a mix of industries. In information technology, semiconductor-related stocks such as NVIDIA and LAM Research did well, as did Western Digital, a hard-disk-drive manufacturer. In materials, steelmaker Nucor and mining company Freeport-McMoRan Copper & Gold posted
7
strong results. First Marblehead, a provider of outsourcing services for education lending, was a top pick in the financials sector. Clothing retailer American Eagle Outfitters contributed to the portfolio’s performance in the consumer discretionary sector.
Returns were hindered by poor results from open-source software firm Red Hat, oil- and gas-driller Patterson-UTI Energy, electronic component provider Jabil Circuit, private education firm Career Education, and homebuilder D.R. Horton. Overall results were hurt by our holdings in companies that announced weak earnings or reduced expectations for earnings in the coming year.
Our investment process has identified opportunities in attractively valued mid-cap stocks such as American Eagle Outfitters (retail clothing), Cummins (diesel engines), LAM Research (semiconductor processing equipment), Joy Global (underground and surface mining equipment), and Sherwin-Williams (paints and coatings).
Vanguard Quantitative Equity Group
Portfolio Manager: James P. Stetler, Principal
Our investment management process combines three stock-ranking models (based on valuation, sentiment, and earnings prospects) to determine attractive investment opportunities among companies of similar sizes and business characteristics. Over the long term, we expect all three models to generate positive and consistent excess returns while providing diversification within our stock-ranking strategy. However, over shorter time periods, the models can vary in their effectiveness. Over the past year, for example, our valuation model performed quite well, while both the marketplace-sentiment and earnings-growth models were less effective. This variance in model contribution is normal within a quantitative framework.
Because we maintain sector weightings that are essentially the same as those in the benchmark index, our results are driven by our success (or lack thereof) in picking the better-performing stocks in each group. During the recent fiscal year, strong stock selection within the consumer discretionary and information technology sectors boosted our results. However, the results were offset by less-successful picks in health care and energy. For example, overweighted positions in retailers J.C. Penney (+46% for the fiscal year), Abercrombie & Fitch (+41%), and American Eagle Outfitters (+89%), as well as in restaurant operator Darden Restaurants (+41%), led our consumer picks. In technology, Agere Systems (+43%) and Freescale Semiconductor (+61%) led the way. On the other hand, overweighted positions in hospital operator Tenet Healthcare (–28%) and energy concerns Patterson-UTI Energy (–34%) and Nabors Industries (–17%) performed poorly.
We continue to believe that the best way to deliver consistent investment results is through a quantitative assessment of fundamental stock factors, coupled with a disciplined risk-control framework that neutralizes those market and company factors that we do not believe can add value over the long term.
8
Fund Profile |
|
|
|
As of September 30, 2006 |
|
| |
|
|
|
|
Portfolio Characteristics |
|
| |
| Comparative | Broad | |
| Fund | Index1 | Index2 |
Number of Stocks | 345 | 1,977 | 4,974 |
Median Market Cap | $15.8B | $27.7B | $27.5B |
Price/Earnings Ratio | 17.6x | 21.5x | 17.2x |
Price/Book Ratio | 3.5x | 3.9x | 3.7x |
Yield |
| 1.1% | 1.7% |
Investor Shares | 0.9% |
|
|
Admiral Shares | 1.1% |
|
|
Return on Equity | 18.9% | 19.2% | 15.4% |
Earnings Growth Rate | 21.4% | 18.8% | 15.7% |
Foreign Holdings | 4.6% | 0.0% | 1.1% |
Turnover Rate | 90% | — | — |
Expense Ratio |
| — | — |
Investor Shares | 0.42% |
|
|
Admiral Shares | 0.23% |
|
|
Short-Term Reserves | 3% | — | — |
Sector Diversification (% of portfolio) |
| ||
| Comparative | Broad | |
| Fund | Index1 | Index2 |
Consumer Discretionary | 13% | 14% | 12% |
Consumer Staples | 6 | 9 | 9 |
Energy | 7 | 4 | 9 |
Financials | 9 | 9 | 23 |
Health Care | 16 | 18 | 12 |
Industrials | 16 | 15 | 11 |
Information Technology | 25 | 26 | 15 |
Materials | 3 | 3 | 3 |
Telecommunication |
|
|
|
Services | 1 | 1 | 3 |
Utilities | 1 | 1 | 3 |
Short-Term Reserves | 3% | — | — |
Volatility Measures3 |
| |
| Fund Versus | Fund Versus |
| Comparative Index1 | Broad Index2 |
R-Squared | 0.93 | 0.91 |
Beta | 1.06 | 1.17 |
Ten Largest Holdings4(% of total net assets) |
| |
|
|
|
Microsoft Corp. | systems software | 3.0% |
Oracle Corp. | systems software | 2.3 |
Cisco Systems, Inc. | communications equipment | 1.8 |
The Walt Disney Co. | movies and entertainment | 1.6 |
ConocoPhillips Co. | integrated oil and gas | 1.2 |
Manpower Inc. | human resource and employment services | 1.1 |
GlobalSantaFe Corp. | oil and gas drilling | 1.1 |
Accenture Ltd. | IT consulting and other services | 1.1 |
Network Appliance, Inc. | computer storage and peripherals | 1.0 |
Freeport-McMoRan Copper & Gold, Inc. | diversified metals and mining | 1.0 |
Top Ten |
| 15.2% |
Investment Focus
1 Russell 3000 Growth Index.
2 Dow Jones Wilshire 5000 Index.
3 For an explanation of R-squared, beta, and other terms used here, see the Glossary on page 30.
4 “Ten Largest Holdings” excludes any temporary cash investments and equity index products.
9
Performance Summary
All of the returns in this report represent past performance, which is not a guarantee of future results that may be achieved by the fund. (Current performance may be lower or higher than the performance data cited. For performance data current to the most recent month-end, visit our website at www.vanguard.com.) Note, too, that both investment returns and principal value can fluctuate widely, so an investor’s shares, when sold, could be worth more or less than their original cost. The returns shown do not reflect taxes that a shareholder would pay on fund distributions or on the sale of fund shares.
Cumulative Performance: September 30, 1996–September 30, 2006
Initial Investment of $10,000
|
|
|
| |
|
|
|
|
|
| Average Annual Total Returns | Final Value | ||
| Periods Ended September 30, 2006 | of a $10,000 | ||
| One Year | Five Years | Ten Years | Investment |
Morgan Growth Fund Investor Shares | 8.20% | 8.11% | 8.03% | $21,656 |
Dow Jones Wilshire 5000 Index | 10.48 | 8.64 | 8.62 | 22,871 |
Russell 3000 Growth Index | 6.05 | 4.83 | 5.27 | 16,718 |
Average Multi-Cap Growth Fund1 | 4.86 | 6.75 | 6.46 | 18,700 |
|
|
|
| Final Value |
|
|
| Since | of a $100,000 |
| One Year | Five Years | Inception2 | Investment |
Morgan Growth Fund Admiral Shares | 8.39% | 8.27% | 3.02% | $117,369 |
Dow Jones Wilshire 5000 Index | 10.48 | 8.64 | 4.45 | 126,376 |
Russell 3000 Growth Index | 6.05 | 4.83 | –0.14 | 99,260 |
1 Derived from data provided by Lipper Inc.
2 May 14, 2001.
10
Fiscal-Year Total Returns (%): September 30, 1996–September 30, 2006
Note: See Financial Highlights tables on pages 20 and 21 for dividend and capital gains information.
11
Financial Statements
Statement of Net Assets
As of September 30, 2006
The fund provides a complete list of its holdings four times in each fiscal year, at the quarter-ends. For the second and fourth fiscal quarters, the lists appear in the fund’s semiannual and annual reports to shareholders. For the first and third fiscal quarters, the fund files the lists with the Securities and Exchange Commission on Form N-Q. Shareholders can look up the fund’s Forms N-Q on the SEC’s website at www.sec.gov. Forms N-Q may also be reviewed and copied at the SEC’s Public Reference Room (see the back cover of this report for further information).
|
|
| Market | |
|
|
| Value• | |
|
| Shares | ($000) | |
Common Stocks (94.2%)1 |
|
| ||
Consumer Discretionary (12.5%) |
| |||
| The Walt Disney Co. | 3,612,700 | 111,669 | |
| News Corp., Class A | 3,334,000 | 65,513 | |
| J.C. Penney Co., Inc. (Holding Co.) | 837,700 | 57,290 | |
| American Eagle Outfitters, Inc. | 1,282,500 | 56,212 | |
| Sherwin-Williams Co. | 662,600 | 36,960 | |
* | Viacom Inc. Class B | 950,300 | 35,332 | |
| Abercrombie & Fitch Co. | 462,455 | 32,131 | |
| Darden Restaurants Inc. | 753,600 | 32,005 | |
| International Game Technology | 661,800 | 27,465 | |
| Yum! Brands, Inc. | 497,100 | 25,874 | |
| Home Depot, Inc. | 663,400 | 24,062 | |
| Hilton Hotels Corp. | 809,500 | 22,545 | |
* | Comcast Corp. Class A | 575,351 | 21,202 | |
^ | Garmin Ltd. | 390,000 | 19,024 | |
| Brinker International, Inc. | 456,100 | 18,285 | |
| Lowe’s Cos., Inc. | 502,800 | 14,109 | |
| Claire’s Stores, Inc. | 454,900 | 13,265 | |
| Target Corp. | 222,400 | 12,288 | |
| Black & Decker Corp. | 142,500 | 11,307 | |
| NIKE, Inc. Class B | 128,300 | 11,242 | |
| Omnicom Group Inc. | 119,600 | 11,195 | |
| Dollar General Corp. | 774,700 | 10,559 | |
| Barnes & Noble, Inc. | 275,100 | 10,437 | |
| Meredith Corp. | 202,400 | 9,984 | |
* | Starbucks Corp. | 241,900 | 8,237 | |
* | Kohl’s Corp. | 126,800 | 8,232 | |
* | Liberty Media Capital A | 97,875 | 8,179 | |
* | EchoStar Communications Corp. Class A | 246,300 | 8,064 | |
| Polo Ralph Lauren Corp. | 123,800 | 8,009 | |
| Williams-Sonoma, Inc. | 242,100 | 7,842 | |
| Thor Industries, Inc. | 184,500 | 7,596 | |
* | MGM Mirage, Inc. | 191,300 | 7,554 | |
| Best Buy Co., Inc. | 128,550 | 6,885 | |
| Limited Brands, Inc. | 258,300 | 6,842 | |
|
|
| Market |
|
|
| Value• |
|
| Shares | ($000) |
| Harman International Industries, Inc. | 80,500 | 6,717 |
* | DIRECTV Group, Inc. | 326,226 | 6,420 |
| Family Dollar Stores, Inc. | 195,754 | 5,724 |
* | DreamWorks Animation SKG, Inc. | 226,200 | 5,635 |
| Staples, Inc. | 224,350 | 5,458 |
* | Expedia, Inc. | 318,700 | 4,997 |
| Nordstrom, Inc. | 117,400 | 4,966 |
| International Speedway Corp. | 99,000 | 4,934 |
| Harley-Davidson, Inc. | 74,200 | 4,656 |
| The McGraw-Hill Cos., Inc. | 78,300 | 4,544 |
| TJX Cos., Inc. | 152,700 | 4,280 |
| Johnson Controls, Inc. | 59,300 | 4,254 |
* | Las Vegas Sands Corp. | 62,100 | 4,245 |
| Harte-Hanks, Inc. | 130,500 | 3,439 |
| News Corp., Class B | 161,353 | 3,330 |
* | Liberty Media-Interactive A | 139,374 | 2,840 |
* | Univision Communications Inc. | 64,200 | 2,205 |
| Clear Channel Communications, Inc. | 55,299 | 1,595 |
* | NVR, Inc. | 2,770 | 1,482 |
| Advance Auto Parts, Inc. | 31,770 | 1,047 |
| Gentex Corp. | 45,000 | 639 |
| Ross Stores, Inc. | 18,300 | 465 |
* | Comcast Corp. Special Class A | 10,156 | 374 |
| Regal Entertainment Group Class A | 6,400 | 127 |
|
|
| 851,768 |
Consumer Staples (5.3%) |
|
| |
| The Procter & Gamble Co. | 1,033,975 | 64,086 |
| PepsiCo, Inc. | 942,500 | 61,508 |
| Altria Group, Inc. | 626,200 | 47,936 |
| Wal-Mart Stores, Inc. | 770,500 | 38,001 |
| The Pepsi Bottling Group, Inc. | 681,600 | 24,197 |
| The Kroger Co. | 970,200 | 22,450 |
| Brown-Forman Corp. Class B | 171,493 | 13,145 |
| Walgreen Co. | 278,900 | 12,380 |
| Colgate-Palmolive Co. | 162,200 | 10,073 |
| Anheuser-Busch Cos., Inc. | 198,700 | 9,440 |
| Costco Wholesale Corp. | 181,899 | 9,037 |
12
|
|
| Market |
|
|
| Value• |
|
| Shares | ($000) |
| CVS Corp. | 252,200 | 8,101 |
* | Energizer Holdings, Inc. | 106,900 | 7,696 |
| Alberto-Culver Co. Class B | 142,600 | 7,214 |
| McCormick & Co., Inc. | 183,700 | 6,977 |
* | Herbalife Ltd. | 182,400 | 6,909 |
| Carolina Group | 104,000 | 5,761 |
| Estee Lauder Cos. Class A | 131,100 | 5,287 |
| Sysco Corp. | 136,100 | 4,553 |
| Kellogg Co. | 13,700 | 678 |
|
|
| 365,429 |
Energy (6.9%) |
|
| |
| ConocoPhillips Co. | 1,331,900 | 79,288 |
| GlobalSantaFe Corp. | 1,465,000 | 73,235 |
| Patterson-UTI Energy, Inc. | 1,794,681 | 42,642 |
| Chevron Corp. | 585,000 | 37,943 |
| XTO Energy, Inc. | 864,862 | 36,437 |
| Schlumberger Ltd. | 363,600 | 22,554 |
| Kinder Morgan, Inc. | 206,000 | 21,599 |
* | Unit Corp. | 357,600 | 16,439 |
* | Petro-Canada | 394,654 | 15,922 |
| Tidewater Inc. | 357,200 | 15,785 |
* | Grant Prideco, Inc. | 391,606 | 14,893 |
| Holly Corp. | 279,600 | 12,115 |
* | Helix Energy Solutions Group, Inc. | 327,900 | 10,952 |
| Halliburton Co. | 297,100 | 8,452 |
* | Nabors Industries, Inc. | 272,000 | 8,092 |
| ENSCO International, Inc. | 183,200 | 8,030 |
| Baker Hughes, Inc. | 105,100 | 7,168 |
* | Pride International, Inc. | 239,300 | 6,562 |
| Rowan Cos., Inc. | 207,200 | 6,554 |
* | Transocean Inc. | 74,800 | 5,478 |
| Petroleo Brasileiro Series A ADR | 70,000 | 5,239 |
| Diamond Offshore Drilling, Inc. | 66,400 | 4,805 |
| BJ Services Co. | 156,500 | 4,715 |
| Occidental Petroleum Corp. | 96,800 | 4,657 |
| Noble Corp. | 42,500 | 2,728 |
| EOG Resources, Inc. | 31,000 | 2,017 |
|
|
| 474,301 |
Financials (8.5%) |
|
| |
| UBS AG (New York Shares) | 982,000 | 58,242 |
| The Goldman Sachs Group, Inc. | 261,000 | 44,153 |
| Muenchener Rueckversicherungs–Gesellschaft AG (Registered) | 262,000 | 41,303 |
* | E*TRADE Financial Corp. | 1,554,900 | 37,193 |
* | CB Richard Ellis Group, Inc. | 1,466,700 | 36,081 |
| ACE Ltd. | 599,400 | 32,805 |
| AFLAC Inc. | 658,400 | 30,128 |
| W.R. Berkley Corp. | 850,323 | 30,093 |
| American International |
|
|
| Group, Inc. | 453,886 | 30,074 |
| IndyMac Bancorp, Inc. | 639,300 | 26,314 |
| Northern Trust Corp. | 340,200 | 19,878 |
|
|
| Market | |
|
|
| Value• | |
|
| Shares | ($000) | |
| American Express Co. | 342,200 | 19,191 | |
^ | The First Marblehead Corp. | 218,900 | 15,161 | |
| Jones Lang LaSalle Inc. | 176,700 | 15,104 | |
* | AmeriCredit Corp. | 571,400 | 14,279 | |
| Synovus Financial Corp. | 450,800 | 13,240 | |
| State Street Corp. | 194,700 | 12,149 | |
| SEI Investments Co. | 207,800 | 11,676 | |
| Hudson City Bancorp, Inc. | 860,400 | 11,400 | |
| Ambac Financial Group, Inc. | 111,000 | 9,185 | |
| Host Marriott Corp. REIT | 326,800 | 7,494 | |
| Prudential Financial, Inc. | 88,100 | 6,718 | |
| Mellon Financial Corp. | 156,700 | 6,127 | |
| Charles Schwab Corp. | 330,155 | 5,910 | |
* | CBOT Holdings, Inc. Class A | 44,300 | 5,351 | |
| Golden West Financial Corp. | 68,400 | 5,284 | |
* | Berkshire Hathaway Inc.Class B | 1,630 | 5,174 | |
| Progressive Corp. of Ohio | 197,500 | 4,847 | |
| SLM Corp. | 89,400 | 4,647 | |
| MBIA, Inc. | 68,800 | 4,227 | |
| Franklin Resources Corp. | 37,400 | 3,955 | |
| Simon Property Group, Inc. REIT | 38,500 | 3,489 | |
| Forest City Enterprise Class A | 58,127 | 3,156 | |
*^ | NYSE Group Inc. | 26,900 | 2,011 | |
| Commerce Bancorp, Inc. | 53,900 | 1,979 | |
| Capital One Financial Corp. | 20,001 | 1,573 | |
^ | The St. Joe Co. | 21,000 | 1,152 | |
| Investors Financial Services Corp. | 20,600 | 887 | |
* | Arch Capital Group Ltd. | 4,838 | 307 | |
| Everest Re Group, Ltd. | 850 | 83 | |
|
|
| 582,020 | |
Health Care (15.1%) |
|
| ||
| Abbott Laboratories | 1,429,100 | 69,397 | |
| AstraZeneca Group PLC ADR | 1,103,700 | 68,981 | |
| Johnson & Johnson | 960,800 | 62,394 | |
| Merck & Co., Inc. | 1,480,000 | 62,012 | |
| Schering-Plough Corp. | 2,599,320 | 57,419 | |
* | Coventry Health Care Inc. | 635,775 | 32,755 | |
| AmerisourceBergen Corp. | 597,800 | 27,021 | |
* | Amgen, Inc. | 371,000 | 26,538 | |
| Cardinal Health, Inc. | 401,100 | 26,368 | |
| Sanofi-Aventis | 295,768 | 26,268 | |
* | Intuitive Surgical, Inc. | 248,000 | 26,152 | |
* | Express Scripts Inc. | 336,800 | 25,425 | |
| Mylan Laboratories, Inc. | 1,258,600 | 25,336 | |
| Becton, Dickinson & Co. | 354,100 | 25,024 | |
* | Biogen Idec Inc. | 559,500 | 24,998 | |
| Eli Lilly & Co. | 425,000 | 24,225 | |
| Shionogi & Co., Ltd. | 1,241,000 | 22,832 | |
| Eisai Co., Ltd. | 453,100 | 21,949 | |
| UnitedHealth Group Inc. | 416,400 | 20,487 | |
* | Community Health Systems, Inc. | 492,000 | 18,376 | |
13
|
|
| Market |
|
|
| Value• |
|
| Shares | ($000) |
* | WellPoint Inc. | 221,072 | 17,034 |
| Medtronic, Inc. | 338,499 | 15,720 |
* | Endo Pharmaceuticals Holdings, Inc. | 482,500 | 15,705 |
* | ICOS Corp. | 589,100 | 14,763 |
* | ImClone Systems, Inc. | 518,500 | 14,684 |
* | Forest Laboratories, Inc. | 285,299 | 14,439 |
* | Emdeon Corp. | 1,166,079 | 13,655 |
| McKesson Corp. | 208,500 | 10,992 |
* | Thermo Electron Corp. | 273,200 | 10,745 |
* | Cytyc Corp. | 434,100 | 10,627 |
* | Genentech, Inc. | 125,699 | 10,395 |
* | Lincare Holdings, Inc. | 299,775 | 10,384 |
| Quest Diagnostics, Inc. | 155,600 | 9,516 |
| Wyeth | 185,798 | 9,446 |
* | Amylin Pharmaceuticals, Inc. | 204,400 | 9,008 |
| Caremark Rx, Inc. | 155,900 | 8,835 |
| Aetna Inc. | 221,472 | 8,759 |
* | Laboratory Corp.of America Holdings | 132,200 | 8,668 |
* | Alkermes, Inc. | 535,000 | 8,480 |
* | Celgene Corp. | 193,100 | 8,361 |
| Bausch & Lomb, Inc. | 165,400 | 8,292 |
| Dade Behring Holdings Inc. | 204,800 | 8,225 |
| Baxter International, Inc. | 180,501 | 8,206 |
* | Techne Corp. | 155,500 | 7,909 |
* | Gilead Sciences, Inc. | 113,000 | 7,763 |
* | Barr Pharmaceuticals Inc. | 141,100 | 7,329 |
| CIGNA Corp. | 57,307 | 6,666 |
* | WellCare Health Plans Inc. | 110,600 | 6,263 |
* | Millennium Pharmaceuticals, Inc. | 598,700 | 5,957 |
* | Hospira, Inc. | 153,500 | 5,874 |
* | Cephalon, Inc. | 91,480 | 5,649 |
| HCA Inc. | 112,300 | 5,603 |
* | Genzyme Corp. | 78,200 | 5,276 |
* | Zimmer Holdings, Inc. | 76,027 | 5,132 |
* | Sierra Health Services, Inc. | 122,200 | 4,624 |
* | Boston Scientific Corp. | 249,224 | 3,686 |
| Manor Care, Inc. | 60,900 | 3,184 |
| Stryker Corp. | 49,000 | 2,430 |
* | Invitrogen Corp. | 15,600 | 989 |
* | Medco Health Solutions, Inc. | 3,100 | 186 |
|
|
| 1,033,416 |
Industrials (15.2%) |
|
| |
| Manpower Inc. | 1,270,300 | 77,831 |
| The Boeing Co. | 850,400 | 67,054 |
| Parker Hannifin Corp. | 857,000 | 66,615 |
| Joy Global Inc. | 1,620,350 | 60,940 |
| Emerson Electric Co. | 715,400 | 59,993 |
| Illinois Tool Works, Inc. | 1,152,600 | 51,753 |
| Rockwell Collins, Inc. | 886,200 | 48,599 |
| Cummins Inc. | 385,900 | 46,011 |
* | AMR Corp. | 1,810,800 | 41,902 |
|
|
| Market |
|
|
| Value• |
|
| Shares | ($000) |
| C.H. Robinson Worldwide Inc. | 706,400 | 31,491 |
| Fluor Corp. | 330,000 | 25,374 |
| General Electric Co. | 674,400 | 23,806 |
| Vallourec SA | 87,000 | 20,261 |
| Southwest Airlines Co. | 1,215,300 | 20,247 |
| General Dynamics Corp. | 274,400 | 19,666 |
| PACCAR, Inc. | 303,100 | 17,283 |
| United Technologies Corp. | 271,600 | 17,206 |
| Trinity Industries, Inc. | 529,000 | 17,018 |
| Robert Half International, Inc. | 490,000 | 16,645 |
| 3M Co. | 219,900 | 16,365 |
| Norfolk Southern Corp. | 367,600 | 16,193 |
| Caterpillar, Inc. | 236,100 | 15,535 |
* | Thomas & Betts Corp. | 304,600 | 14,532 |
| W.W. Grainger, Inc. | 199,800 | 13,391 |
| The Corporate Executive Board Co. | 144,500 | 12,992 |
* | Terex Corp. | 285,000 | 12,888 |
| United Parcel Service, Inc. | 178,700 | 12,856 |
* | Continental Airlines, Inc.Class B | 427,200 | 12,094 |
| Lockheed Martin Corp. | 140,100 | 12,057 |
| Oshkosh Truck Corp. | 234,400 | 11,830 |
| Equifax, Inc. | 312,100 | 11,457 |
| Avery Dennison Corp. | 183,800 | 11,059 |
* | Allied Waste Industries, Inc. | 930,600 | 10,488 |
* | Gardner Denver Inc. | 310,200 | 10,261 |
| MSC Industrial Direct Co., Inc. Class A | 243,100 | 9,904 |
| FedEx Corp. | 88,600 | 9,629 |
| Gol-Linhas Aereas Inteligentes S.A. | 267,216 | 9,179 |
| Union Pacific Corp. | 101,900 | 8,967 |
| Burlington Northern Santa Fe Corp. | 112,400 | 8,255 |
| Waste Management, Inc. | 213,800 | 7,842 |
* | Alliant Techsystems, Inc. | 93,600 | 7,587 |
| Masco Corp. | 258,800 | 7,096 |
| The Toro Co. | 160,800 | 6,781 |
| Rockwell Automation, Inc. | 113,100 | 6,571 |
| Knight Transportation, Inc. | 375,000 | 6,356 |
* | McDermott International, Inc. | 151,400 | 6,329 |
* | Covanta Holding Corp. | 286,400 | 6,166 |
* | USG Corp. | 131,000 | 6,162 |
| Herman Miller, Inc. | 151,300 | 5,176 |
| Aramark Corp. Class B | 136,800 | 4,495 |
| Precision Castparts Corp. | 47,425 | 2,995 |
* | Monster Worldwide Inc. | 54,815 | 1,984 |
| Republic Services, Inc.Class A | 20,700 | 832 |
| Deere & Co. | 2,600 | 218 |
* | Raytheon Co.Warrants Exp. 6/16/11 | 4,580 | 65 |
|
|
| 1,046,282 |
14
|
|
| Market | |
|
|
| Value• | |
|
| Shares | ($000) | |
Information Technology (24.4%) |
| |||
| Communications Equipment (4.2%) |
| ||
* | Cisco Systems, Inc. | 5,234,600 | 120,396 | |
| QUALCOMM Inc. | 1,649,300 | 59,952 | |
| Motorola, Inc. | 2,091,199 | 52,279 | |
| Nokia Corp. ADR | 1,453,200 | 28,614 | |
| Harris Corp. | 421,100 | 18,735 | |
* | Corning, Inc. | 474,600 | 11,585 | |
|
|
|
| |
| Computers & Peripherals (3.5%) |
| ||
* | Network Appliance, Inc. | 1,935,200 | 71,622 | |
| Hewlett-Packard Co. | 1,482,400 | 54,389 | |
* | Western Digital Corp. | 2,019,300 | 36,549 | |
| International Business Machines Corp. | 268,900 | 22,034 | |
* | Apple Computer, Inc. | 262,100 | 20,190 | |
* | NCR Corp. | 359,600 | 14,197 | |
* | Dell Inc. | 603,600 | 13,786 | |
* | EMC Corp. | 579,900 | 6,947 | |
|
|
|
| |
| Electronic Equipment & Instruments (2.0%) | |||
| CDW Corp. | 436,400 | 26,917 | |
| Jabil Circuit, Inc. | 897,600 | 25,644 | |
| Molex, Inc. | 577,600 | 22,509 | |
* | Agilent Technologies, Inc. | 327,700 | 10,713 | |
| Amphenol Corp. | 161,600 | 10,007 | |
* | Ingram Micro, Inc. Class A | 482,200 | 9,239 | |
* | Mettler-Toledo International Inc. | 138,500 | 9,162 | |
| Hon Hai Precision Industry Co., Ltd. | 1,391,602 | 8,470 | |
* | Vishay Intertechnology, Inc. | 496,000 | 6,964 | |
* | Flextronics International Ltd. | 436,326 | 5,515 | |
| AVX Corp. | 283,900 | 5,021 | |
|
|
|
| |
| Internet Software & Services (0.6%) |
| ||
* | Google Inc. | 66,200 | 26,606 | |
* | Yahoo! Inc. | 333,100 | 8,421 | |
* | eBay Inc. | 263,700 | 7,479 | |
|
|
|
| |
| IT Services (2.9%) |
|
| |
| Accenture Ltd. | 2,301,500 | 72,981 | |
* | Fiserv, Inc. | 911,100 | 42,904 | |
| Global Payments Inc. | 434,200 | 19,109 | |
* | Ceridian Corp. | 693,239 | 15,501 | |
| First Data Corp. | 286,800 | 12,046 | |
| Automatic Data Processing, Inc. | 177,900 | 8,422 | |
* | DST Systems, Inc. | 133,400 | 8,227 | |
| Electronic Data Systems Corp. | 303,200 | 7,434 | |
* | CheckFree Corp. | 135,708 | 5,607 | |
* | Alliance Data Systems Corp. | 91,176 | 5,032 | |
* | Affiliated Computer Services, Inc. Class A | 51,000 | 2,645 | |
* | Iron Mountain, Inc. | 33,200 | 1,426 | |
15
|
|
| Market |
|
|
| Value• |
|
| Shares | ($000) |
| Semiconductors & Semiconductor Equipment (4.1%) | ||
* | LAM Research Corp. | 1,259,000 | 57,070 |
* | Altera Corp. | 2,550,000 | 46,869 |
| Intel Corp. | 1,832,900 | 37,703 |
* | NVIDIA Corp. | 1,074,000 | 31,780 |
| National Semiconductor Corp. | 940,300 | 22,125 |
| Microchip Technology, Inc. | 509,000 | 16,502 |
| Texas Instruments, Inc. | 491,000 | 16,326 |
| Linear Technology Corp. | 480,200 | 14,944 |
* | Micron Technology, Inc. | 554,800 | 9,654 |
* | Advanced Micro Devices, Inc. | 354,000 | 8,797 |
| Applied Materials, Inc. | 436,999 | 7,748 |
* | Teradyne, Inc. | 485,300 | 6,387 |
* | Freescale Semiconductor, Inc.Class B | 84,800 | 3,223 |
* | MEMC Electronic Materials, Inc. | 51,700 | 1,894 |
|
|
|
|
| Software (7.1%) |
|
|
| Microsoft Corp. | 7,533,975 | 205,904 |
* | Oracle Corp. | 8,746,100 | 155,156 |
* | Mercury Interactive Corp. | 422,000 | 21,748 |
* | Red Hat, Inc. | 809,800 | 17,071 |
* | Amdocs Ltd. | 422,300 | 16,723 |
* | BMC Software, Inc. | 506,699 | 13,792 |
* | Cadence Design |
|
|
| Systems, Inc. | 620,200 | 10,519 |
| Fair Isaac, Inc. | 275,600 | 10,079 |
* | Intuit, Inc. | 283,600 | 9,101 |
* | Autodesk, Inc. | 210,000 | 7,304 |
* | Adobe Systems, Inc. | 124,800 | 4,674 |
* | Compuware Corp. | 579,100 | 4,511 |
* | Symantec Corp. | 208,188 | 4,430 |
|
|
| 1,677,310 |
Materials (3.3%) |
|
| |
|
|
|
|
|
|
|
|
| Freeport-McMoRan Copper & Gold, Inc.Class B | 1,328,264 | 70,743 |
| Newmont Mining Corp. (Holding Co.) | 988,398 | 42,252 |
| Nucor Corp. | 520,500 | 25,760 |
* | Pactiv Corp. | 890,500 | 25,308 |
| Antofagasta PLC | 2,775,000 | 23,724 |
| Martin Marietta Materials, Inc. | 213,400 | 18,058 |
| Phelps Dodge Corp. | 122,696 | 10,392 |
| Allegheny Technologies Inc. | 120,100 | 7,469 |
| Monsanto Co. | 130,157 | 6,119 |
|
|
| 229,825 |
Telecommunication Services (1.3%) |
| ||
| AT&T Inc. | 875,000 | 28,489 |
* | American Tower Corp.Class A | 525,000 | 19,162 |
| Sprint Nextel Corp. | 783,131 | 13,431 |
* | Qwest Communications International Inc. | 1,186,700 | 10,348 |
|
|
| Market |
|
|
| Value• |
|
| Shares | ($000) |
|
|
|
|
| Telephone & Data Systems, Inc. | 239,500 | 10,083 |
* | Leap Wireless International, Inc. | 80,900 | 3,923 |
* | U.S. Cellular Corp. | 31,200 | 1,863 |
|
|
| 87,299 |
Utilities (0.9%) |
|
| |
* | AES Corp. | 1,944,800 | 39,654 |
* | Allegheny Energy, Inc. | 470,136 | 18,885 |
| Questar Corp. | 25,200 | 2,061 |
|
|
| 60,600 |
Exchange-Traded Fund (0.8%) |
| ||
2 | Vanguard Growth ETF | 1,044,900 | 57,302 |
Total Common Stocks |
|
| |
(Cost $5,788,167) |
| 6,465,552 | |
Temporary Cash Investments (6.7%)1 |
| ||
Money Market Fund (3.0%) |
|
| |
3 | Vanguard Market |
|
|
| Liquidity Fund, |
|
|
| 5.306% | 175,587,513 | 175,588 |
3 | Vanguard Market |
|
|
| Liquidity Fund, |
|
|
| 5.306%—Note G | 27,406,400 | 27,406 |
|
|
| 202,994 |
16
|
| Face | Market |
|
| Amount | Value• |
|
| ($000) | ($000) |
Repurchase Agreement (3.5%) |
|
| |
| Morgan Stanley Holdings, Inc. |
| |
| 5.35%, 10/2/06 (Dated 9/29/06, |
| |
| Repurchase Value $242,208,000, |
| |
| collateralized by Federal Home |
| |
| Loan Mortgage Corp. |
|
|
| 4.500%–6.500%, 4/1/21–10/1/36, |
| |
| Federal National Mortgage Assn. |
| |
| 4.500%–6.000%, |
|
|
| 7/1/19–9/1/36) | 242,100 | 242,100 |
U.S. Agency Obligations (0.2%) |
|
| |
4 | Federal Home Loan Mortgage Corp. |
| |
5 | 5.150%, 12/26/06 | 8,000 | 7,904 |
4 | Federal National Mortgage Assn. |
| |
5 | 5.341%, 10/18/06 | 8,000 | 7,979 |
|
|
| 15,883 |
Total Temporary Cash Investments |
| ||
(Cost $460,977) |
| 460,977 | |
Total Investments (100.9%) |
|
| |
(Cost $6,249,144) |
| 6,926,529 | |
Other Assets and Liabilities (–0.9%) |
| ||
Other Assets—Note C |
| 132,964 | |
Payables for Investment |
|
| |
| Securities Purchased |
| (153,405) |
Other Liabilities—Note G |
| (44,303) | |
|
|
| (64,744) |
Net Assets (100%) |
| 6,861,785 | |
At September 30, 2006, net assets consisted of:6 | |
| Amount |
| ($000) |
Paid-in Capital | 5,995,284 |
Undistributed Net Investment Income | 43,399 |
Accumulated Net Realized Gains | 142,602 |
Unrealized Appreciation (Depreciation) |
|
Investment Securities | 677,385 |
Futures Contracts | 3,119 |
Foreign Currencies | (4) |
Net Assets | 6,861,785 |
|
|
Investor Shares—Net Assets |
|
Applicable to 281,971,093 outstanding $.001 | |
par value shares of beneficial interest |
|
(unlimited authorization) | 5,170,825 |
Net Asset Value Per Share—Investor Shares | $18.34 |
|
|
Admiral Shares—Net Assets |
|
Applicable to 29,695,900 outstanding $.001 | |
par value shares of beneficial interest |
|
(unlimited authorization) | 1,690,960 |
Net Asset Value Per Share— |
|
Admiral Shares | $56.94 |
• | See Note A in Notes to Financial Statements. |
* | Non-income-producing security. |
^ | Part of security position is on loan to broker-dealers. See Note G in Notes to Financial Statements. |
1The fund invests a portion of its cash reserves in equity markets through the use of index futures contracts. After giving effect to futures investments, the fund’s effective common stock and temporary cash investment positions represent 97.9% and 3.0%, respectively, of net assets. See Note E in Notes to Financial Statements.
2 Considered an affiliated company of the fund as the issuer is another member of The Vanguard Group.
3 Affiliated money market fund available only to Vanguard funds and certain trusts and accounts managed by Vanguard. Rate shown is the 7-day yield.
4 The issuer operates under a congressional charter; its securities are neither issued nor guaranteed by the U.S. government. If needed, access to additional funding from the U.S. Treasury (beyond the issuer’s line of credit) would require congressional action.
5 Securities with a value of $15,883,000 have been segregated as initial margin for open futures contracts.
6 See Note E in Notes to Financial Statements for the tax-basis components of net assets.
ADR—American Depositary Receipt.
REIT—Real Estate Investment Trust.
17
Statement of Operations
| Year Ended |
| September 30, 2006 |
| ($000) |
Investment Income |
|
Income |
|
Dividends1,2 | 69,687 |
Interest2 | 16,170 |
Security Lending | 830 |
Total Income | 86,687 |
Expenses |
|
Investment Advisory Fees—Note B |
|
Basic Fee | 5,061 |
Performance Adjustment | 950 |
The Vanguard Group—Note C |
|
Management and Administrative—Investor Shares | 14,292 |
Management and Administrative—Admiral Shares | 1,537 |
Marketing and Distribution—Investor Shares | 1,194 |
Marketing and Distribution—Admiral Shares | 309 |
Custodian Fees | 83 |
Auditing Fees | 23 |
Shareholders’ Reports—Investor Shares | 137 |
Shareholders’ Reports—Admiral Shares | 3 |
Trustees’ Fees and Expenses | 8 |
Total Expenses | 23,597 |
Expenses Paid Indirectly—Note D | (912) |
Net Expenses | 22,685 |
Net Investment Income | 64,002 |
Realized Net Gain (Loss) |
|
Investment Securities Sold2 | 564,512 |
Futures Contracts | 2,479 |
Foreign Currencies | (440) |
Realized Net Gain (Loss) | 566,551 |
Change in Unrealized Appreciation (Depreciation) |
|
Investment Securities | (149,556) |
Futures Contracts | 2,147 |
Foreign Currencies | (23) |
Change in Unrealized Appreciation (Depreciation) | (147,432) |
Net Increase (Decrease) in Net Assets Resulting from Operations | 483,121 |
1 Dividends are net of foreign withholding taxes of $1,023,000.
2 Dividend income, interest income, and realized net gain (loss) from affiliated companies of the fund were $545,000, $9,710,000, and $0, respectively.
18
Statement of Changes in Net Assets
| Year Ended September 30, | |
| 2006 | 2005 |
| ($000) | ($000) |
Increase (Decrease) in Net Assets |
|
|
Operations |
|
|
Net Investment Income | 64,002 | 43,197 |
Realized Net Gain (Loss) | 566,551 | 345,489 |
Change in Unrealized Appreciation (Depreciation) | (147,432) | 370,462 |
Net Increase (Decrease) in Net Assets Resulting from Operations | 483,121 | 759,148 |
Distributions |
|
|
Net Investment Income |
|
|
Investor Shares | (25,348) | (29,142) |
Admiral Shares | (9,445) | (4,441) |
Realized Capital Gain |
|
|
Investor Shares | — | — |
Admiral Shares | — | — |
Total Distributions | (34,793) | (33,583) |
Capital Share Transactions—Note H |
|
|
Investor Shares | 281,742 | (210,401) |
Admiral Shares | 482,819 | 505,807 |
Net Increase (Decrease) from Capital Share Transactions | 764,561 | 295,406 |
Total Increase (Decrease) | 1,212,889 | 1,020,971 |
Net Assets |
|
|
Beginning of Period | 5,648,896 | 4,627,925 |
End of Period1 | 6,861,785 | 5,648,896 |
1 Net Assets—End of Period includes undistributed net investment income of $43,399,000 and $17,099,000.
19
Financial Highlights
Morgan Growth Fund Investor Shares |
|
|
|
|
| ||||
|
|
|
|
|
| ||||
|
|
| Year Ended September 30, | ||||||
For a Share Outstanding Throughout Each Period | 2006 | 2005 | 2004 | 2003 | 2002 | ||||
Net Asset Value,Beginning of Period | $17.04 | $14.77 | $13.34 | $10.49 | $12.71 | ||||
Investment Operations |
|
|
|
|
| ||||
Net Investment Income | .165 | .1291 | .05 | .04 | .049 | ||||
Net Realized and Unrealized Gain (Loss) on Investments | 1.230 | 2.246 | 1.42 | 2.85 | (2.194) | ||||
Total from Investment Operations | 1.395 | 2.375 | 1.47 | 2.89 | (2.145) | ||||
Distributions |
|
|
|
|
| ||||
Dividends from Net Investment Income | (.095) | (.105) | (.04) | (.04) | (.075) | ||||
Distributions from Realized Capital Gains | — | — | — | — | — | ||||
Total Distributions | (.095) | (.105) | (.04) | (.04) | (.075) | ||||
Net Asset Value,End of Period | $18.34 | $17.04 | $14.77 | $13.34 | $10.49 | ||||
|
|
|
|
|
| ||||
Total Return | 8.20% | 16.12% | 11.03% | 27.62% | –17.04% | ||||
|
|
|
|
|
| ||||
Ratios/Supplemental Data |
|
|
|
|
| ||||
Net Assets,End of Period (Millions) | $5,171 | $4,539 | $4,115 | $3,329 | $2,369 | ||||
Ratio of Total Expenses to Average Net Assets2 | 0.42% | 0.41% | 0.44% | 0.50% | 0.48% | ||||
Ratio of Net Investment Income to Average Net Assets | 0.95% | 0.82%1 | 0.32% | 0.31% | 0.37% | ||||
Portfolio Turnover Rate | 90% | 88% | 88% | 91% | 104% | ||||
1 Net investment income per share and the ratio of net investment income to average net assets include $0.044 and 0.28%, respectively, resulting from a special dividend from Microsoft Corp. in November 2004.
2 Includes performance-based investment advisory fee increases (decreases) of 0.02%, 0.00%, 0.01%, 0.00%, and 0.00%.
20
Morgan Growth Fund Admiral Shares |
|
|
|
|
| ||
|
|
| Year Ended September 30, | ||||
For a Share Outstanding Throughout Each Period | 2006 | 2005 | 2004 | 2003 | 2002 | ||
Net Asset Value, Beginning of Period | $52.91 | $45.84 | $41.40 | $32.58 | $39.44 | ||
Investment Operations |
|
|
|
|
| ||
Net Investment Income | .620 | .5001 | .212 | .17 | .20 | ||
Net Realized and Unrealized Gain (Loss)on Investments | 3.808 | 6.956 | 4.416 | 8.83 | (6.79) | ||
Total from Investment Operations | 4.428 | 7.456 | 4.628 | 9.00 | (6.59) | ||
Distributions |
|
|
|
|
| ||
Dividends from Net Investment Income | (.398) | (.386) | (.188) | (.18) | (.27) | ||
Distributions from Realized Capital Gains | — | — | — | — | — | ||
Total Distributions | (.398) | (.386) | (.188) | (.18) | (.27) | ||
Net Asset Value, End of Period | $56.94 | $52.91 | $45.84 | $41.40 | $32.58 | ||
|
|
|
|
|
| ||
Total Return | 8.39% | 16.32% | 11.19% | 27.73% | –16.90% | ||
|
|
|
|
|
| ||
Ratios/Supplemental Data |
|
|
|
|
| ||
Net Assets, End of Period (Millions) | $1,691 | $1,110 | $513 | $390 | $246 | ||
Ratio of Total Expenses to Average Net Assets2 | 0.23% | 0.24% | 0.30% | 0.36% | 0.36% | ||
Ratio of Net Investment Income to Average Net Assets | 1.14% | 0.96%1 | 0.47% | 0.45% | 0.49% | ||
Portfolio Turnover Rate | 90% | 88% | 88% | 91% | 104% | ||
1 Net investment income per share and the ratio of net investment income to average net assets include $0.184 and 0.28%, respectively, resulting from a special dividend from Microsoft Corp. in November 2004.
2 Includes performance-based investment advisory fee increases (decreases) of 0.02%, 0.00%, 0.01%, 0.00%, and 0.00%. See accompanying Notes, which are an integral part of the Financial Statements.
21
Notes to Financial Statements
Vanguard Morgan Growth Fund is registered under the Investment Company Act of 1940 as an open-end investment company, or mutual fund. The fund offers two classes of shares, Investor Shares and Admiral Shares. Investor Shares are available to any investor who meets the fund’s minimum purchase requirements. Admiral Shares are designed for investors who meet certain administrative, servicing, tenure, and account-size criteria.
A. The following significant accounting policies conform to generally accepted accounting principles for U.S. mutual funds. The fund consistently follows such policies in preparing its financial statements.
1. Security Valuation: Securities are valued as of the close of trading on the New York Stock Exchange (generally 4:00 p.m. Eastern time) on the valuation date. Equity securities are valued at the latest quoted sales prices or official closing prices taken from the primary market in which each security trades; such securities not traded on the valuation date are valued at the mean of the latest quoted bid and asked prices. Securities for which market quotations are not readily available, or whose values have been affected by events occurring before the fund’s pricing time but after the close of the securities’ primary markets, are valued at their fair values calculated according to procedures adopted by the board of trustees. These procedures include obtaining quotations from an independent pricing service, monitoring news to identify significant market- or security-specific events, and evaluating changes in the values of foreign market proxies (for example, ADRs, futures contracts or exchange-traded funds), between the time the foreign markets close and the fund’s pricing time. When fair-value pricing is employed, the prices of securities used by a fund to calculate its net asset value may differ from quoted or published prices for the same securities. Investments in Vanguard Market Liquidity Fund are valued at that fund’s net asset value. Temporary cash investments acquired over 60 days to maturity are valued using the latest bid prices or using valuations based on a matrix system (which considers such factors as security prices, yields, maturities, and ratings), both as furnished by independent pricing services. Other temporary cash investments are valued at amortized cost, which approximates market value.
2. Foreign Currency: Securities and other assets and liabilities denominated in foreign currencies are translated into U.S. dollars at the exchange rates on the valuation date as employed by Morgan Stanley Capital International (MSCI) in the calculation of its indexes. As part of the fund’s fair-value procedures, exchange rates may be adjusted if they change significantly before the fund’s pricing time but after the time at which the MSCI rates are determined (generally 11:00 a.m. Eastern time).
Realized gains (losses) and unrealized appreciation (depreciation) on investment securities include the effects of changes in exchange rates since the securities were purchased, combined with the effects of changes in security prices. Fluctuations in the value of other assets and liabilities resulting from changes in exchange rates are recorded as unrealized foreign currency gains (losses) until the asset or liability is settled in cash, when they are recorded as realized foreign currency gains (losses).
3. Futures Contracts: The fund uses index futures contracts to a limited extent, with the objective of maintaining full exposure to the stock market while maintaining liquidity. The fund may purchase or sell futures contracts to achieve a desired level of investment, whether to accommodate portfolio turnover or cash flows from capital share transactions. The primary risks associated with the use of futures contracts are imperfect correlation between changes in market values of stocks held by the fund and the prices of futures contracts, and the possibility of an illiquid market.
22
Futures contracts are valued at their quoted daily settlement prices. The aggregate principal amounts of the contracts are not recorded in the Statement of Net Assets. Fluctuations in the value of the contracts are recorded in the Statement of Net Assets as an asset (liability) and in the Statement of Operations as unrealized appreciation (depreciation) until the contracts are closed, when they are recorded as realized futures gains (losses).
4. Repurchase Agreements: The fund may invest in repurchase agreements. Securities pledged as collateral for repurchase agreements are held by a custodian bank until the agreements mature. Each agreement requires that the market value of the collateral be sufficient to cover payments of interest and principal; however, in the event of default or bankruptcy by the other party to the agreement, retention of the collateral may be subject to legal proceedings.
5. Federal Income Taxes: The fund intends to continue to qualify as a regulated investment company and distribute all of its taxable income. Accordingly, no provision for federal income taxes is required in the financial statements.
6. Distributions: Distributions to shareholders are recorded on the ex-dividend date.
7. Security Lending: The fund may lend its securities to qualified institutional borrowers to earn additional income. Security loans are required to be secured at all times by collateral at least equal to the market value of securities loaned. The fund invests cash collateral received in Vanguard Market Liquidity Fund, and records a liability for the return of the collateral, during the period the securities are on loan. Security lending income represents the income earned on investing cash collateral, less expenses associated with the loan.
8. Other: Dividend income is recorded on the ex-dividend date. Interest income includes income distributions received from Vanguard Market Liquidity Fund and is accrued daily. Security transactions are accounted for on the date securities are bought or sold. Costs used to determine realized gains (losses) on the sale of investment securities are those of the specific securities sold.
Each class of shares has equal rights as to assets and earnings, except that each class separately bears certain class-specific expenses related to maintenance of shareholder accounts (included in Management and Administrative expenses) and shareholder reporting. Marketing and distribution expenses are allocated to each class of shares based on a method approved by the board of trustees. Income, other non-class-specific expenses, and gains and losses on investments are allocated to each class of shares based on its relative net assets.
B. Wellington Management Company, LLP, and Franklin Portfolio Associates, LLC, each provide investment advisory services to a portion of the fund for fees calculated at an annual percentage rate of average net assets managed by the advisor. The basic fee of Wellington Management Company, LLP, is subject to quarterly adjustments based on performance for the preceding three years relative to the Russell 3000 Growth Index; the basic fee of Franklin Portfolio Associates, LLC, is subject to quarterly adjustments based on performance for the preceding three years relative to the Russell Midcap Growth Index.
The Vanguard Group provides investment advisory services to a portion of the fund on an at-cost basis; the fund paid Vanguard advisory fees of $475,000 for the year ended September 30, 2006.
23
For the year ended September 30, 2006, the aggregate investment advisory fee represented an effective annual basic rate of 0.08% of the fund’s average net assets, before an increase of $950,000 (0.02%) based on performance.
C. The Vanguard Group furnishes at cost corporate management, administrative, marketing, and distribution services. The costs of such services are allocated to the fund under methods approved by the board of trustees. The fund has committed to provide up to 0.40% of its net assets in capital contributions to Vanguard. At September 30, 2006, the fund had contributed capital of $707,000 to Vanguard (included in Other Assets), representing 0.01% of the fund’s net assets and 0.71% of Vanguard’s capitalization. The fund’s trustees and officers are also directors and officers of Vanguard.
D. The fund has asked its investment advisors to direct certain security trades, subject to obtaining the best price and execution, to brokers who have agreed to rebate to the fund part of the commissions generated. Such rebates are used solely to reduce the fund’s management and administrative expenses. The fund’s custodian bank has also agreed to reduce its fees when the fund maintains cash on deposit in the non-interest-bearing custody account. For the year ended September 30, 2006, these arrangements reduced the fund’s management and administrative expenses by $900,000 and custodian fees by $12,000. The total expense reduction represented an effective annual rate of 0.01% of the fund’s average net assets.
E. Distributions are determined on a tax basis and may differ from net investment income and realized capital gains for financial reporting purposes. Differences may be permanent or temporary. Permanent differences are reclassified among capital accounts in the financial statements to reflect their tax character. Temporary differences arise when certain items of income, expense, gain, or loss are recognized in different periods for financial statement and tax purposes; these differences will reverse at some time in the future. Differences in classification may also result from the treatment of short-term gains as ordinary income for tax purposes.
During the year ended September 30, 2006, the fund realized net foreign currency losses of $440,000, which decreased distributable net income for tax purposes; accordingly, such losses have been reclassified from accumulated net realized losses to undistributed net investment income.
The fund used a tax accounting practice to treat a portion of the price of capital shares redeemed during the year as distributions from net investment income and realized capital gains. Accordingly, the fund has reclassified $2,469,000 from undistributed net investment income, and $5,706,000 from accumulated net realized gains, to paid-in capital.
The fund used a capital loss carryforward of $417,320,000 to offset taxable capital gains realized during the year ended September 30, 2006, reducing the amount of capital gains that would otherwise be available to distribute to shareholders. For tax purposes, at September 30, 2006, the fund had $53,858,000 of ordinary income and $146,400,000 of long-term capital gains available for distribution.
At September 30, 2006, the cost of investment securities for tax purposes was $6,249,826,000. Net unrealized appreciation of investment securities for tax purposes was $676,703,000, consisting of unrealized gains of $855,525,000 on securities that had risen in value since their purchase and $178,822,000 in unrealized losses on securities that had fallen in value since their purchase.
24
At September 30, 2006, the aggregate settlement value of open futures contracts expiring in December 2006 and the related unrealized appreciation (depreciation) were:
|
|
| ($000) |
| Number | Aggregate | Unrealized |
| of Long | Settlement | Appreciation |
Futures Contracts | Contracts | Value | (Depreciation) |
S&P 500 Index | 536 | 180,284 | 3,114 |
E-mini S&P 500 Index | 408 | 27,446 | 5 |
Unrealized appreciation (depreciation) on open futures contracts is required to be treated as realized gain (loss) for tax purposes.
F. During the year ended September 30, 2006, the fund purchased $6,097,119,000 of investment securities and sold $5,400,596,000 of investment securities, other than temporary cash investments.
G. The market value of securities on loan to broker-dealers at September 30, 2006, was $26,743,000, for which the fund received cash collateral of $27,406,000.
H. Capital share transactions for each class of shares were:
|
| Year Ended September 30, | ||
|
| 2006 |
| 2005 |
| Amount | Shares | Amount | Shares |
| ($000) | (000) | ($000) | (000) |
Investor Shares |
|
|
|
|
Issued | 1,021,080 | 57,014 | 761,581 | 47,482 |
Issued in Lieu of Cash Distributions | 24,672 | 1,378 | 28,186 | 1,757 |
Redeemed | (764,010) | (42,825) | (1,000,168) | (61,446) |
Net Increase (Decrease)—Investor Shares | 281,742 | 15,567 | (210,401) | (12,207) |
Admiral Shares |
|
|
|
|
Issued | 680,890 | 12,292 | 575,357 | 11,175 |
Issued in Lieu of Cash Distributions | 6,969 | 125 | 3,187 | 64 |
Redeemed | (205,040) | (3,693) | (72,737) | (1,457) |
Net Increase (Decrease)—Admiral Shares | 482,819 | 8,724 | 505,807 | 9,782 |
I.In June 2006, the Financial Accounting Standards Board issued Interpretation No. 48 (“FIN 48”), “Accounting for Uncertainty in Income Taxes”. FIN 48 establishes the minimum threshold for recognizing, and a system for measuring, the benefits of tax-return positions in financial statements. FIN 48 will be effective for the fund’s fiscal year beginning October 1, 2007. Management is in the process of analyzing the fund’s tax positions for purposes of implementing FIN 48; based on the analysis completed to date, management does not believe the adoption of FIN 48 will result in any material impact to the fund’s financial statements.
25
Report of Independent Registered Public Accounting Firm
To the Trustees and Shareholders of Vanguard Morgan Growth Fund:
In our opinion, the accompanying statement of net assets and the related statements of operations and of changes in net assets and the financial highlights present fairly, in all material respects, the financial position of Vanguard Morgan Growth Fund (the “Fund”) at September 30, 2006, the results of its operations for the year then ended, the changes in its net assets for each of the two years in the period then ended, and the financial highlights for each of the five years in the period then ended, in conformity with accounting principles generally accepted in the United States of America. These financial statements and financial highlights (hereafter referred to as “financial statements”) are the responsibility of the Fund’s management; our responsibility is to express an opinion on these financial statements based on our audits. We conducted our audits of these financial statements in accordance with the standards of the Public Company Accounting Oversight Board (United States), which require that we plan and perform the audit to obtain reasonable assurance about whether the financial statements are free of material misstatement. An audit includes examining, on a test basis, evidence supporting the amounts and disclosures in the financial statements, assessing the accounting principles used and significant estimates made by management, and evaluating the overall financial statement presentation. We believe that our audits, which included confirmation of securities at September 30, 2006 by correspondence with the custodian and brokers, and by agreement to the underlying ownership records for Vanguard Market Liquidity Fund, provide a reasonable basis for our opinion.
PricewaterhouseCoopers LLP
Philadelphia, Pennsylvania
November 13, 2006
Special 2006 tax information (unaudited) for Vanguard Morgan Growth Fund
This information for the fiscal year ended September 30, 2006, is included pursuant to provisions of the Internal Revenue Code.
The fund distributed $5,706,000 as capital gain dividends (from net long-term capital gains) to shareholders during the fiscal year.
The fund distributed $34,793,000 of qualified dividend income to shareholders during the fiscal year.
For corporate shareholders, 90.1% of investment income (dividend income plus short-term gains, if any) qualifies for the dividends-received deduction.
26
Your Fund’s After-Tax Returns
This table presents returns for your fund both before and after taxes. The after-tax returns are shown in two ways: (1) assuming that an investor owned the fund during the entire period and paid taxes on the fund’s distributions, and (2) assuming that an investor paid taxes on the fund’s distributions and sold all shares at the end of each period.
Calculations are based on the highest individual federal income tax and capital gains tax rates in effect at the times of the distributions and the hypothetical sales. State and local taxes were not considered. After-tax returns reflect any qualified dividend income, using actual prior-year figures and estimates for 2006. (In the example, returns after the sale of fund shares may be higher than those assuming no sale. This occurs when the sale would have produced a capital loss. The calculation assumes that the investor received a tax deduction for the loss.)
The table shows returns for Investor Shares only; returns for other share classes will differ. Please note that your actual after-tax returns will depend on your tax situation and may differ from those shown. Also note that if you own the fund in a tax-deferred account, such as an individual retirement account or a 401(k) plan, this information does not apply to you. Such accounts are not subject to current taxes.
Finally, keep in mind that a fund’s performance—whether before or after taxes—does not guarantee future results.
Average Annual Total Returns: Morgan Growth Fund Investor Shares |
|
|
|
Periods Ended September 30, 2006 |
|
|
|
| One | Five | Ten |
| Year | Years | Years |
Returns Before Taxes | 8.20% | 8.11% | 8.03% |
Returns After Taxes on Distributions | 8.11 | 7.99 | 6.24 |
Returns After Taxes on Distributions and Sale of Fund Shares | 5.44 | 6.99 | 6.13 |
27
About Your Fund’s Expenses
As a shareholder of the fund, you incur ongoing costs, which include costs for portfolio management, administrative services, and shareholder reports (like this one), among others. Operating expenses, which are deducted from a fund’s gross income, directly reduce the investment return of the fund.
A fund’s expenses are expressed as a percentage of its average net assets. This figure is known as the expense ratio. The following examples are intended to help you understand the ongoing costs (in dollars) of investing in your fund and to compare these costs with those of other mutual funds. The examples are based on an investment of $1,000 made at the beginning of the period shown and held for the entire period.
The table below illustrates your fund’s costs in two ways:
• Based on actual fund return. This section helps you to estimate the actual expenses that you paid over the period. The “Ending Account Value” shown is derived from the fund’s actual return, and the third column shows the dollar amount that would have been paid by an investor who started with $1,000 in the fund. You may use the information here, together with the amount you invested, to estimate the expenses that you paid over the period.
To do so, simply divide your account value by $1,000 (for example, an $8,600 account value divided by $1,000 = 8.6), then multiply the result by the number given for your fund under the heading “Expenses Paid During Period.”
• Based on hypothetical 5% yearly return. This section is intended to help you compare your fund’s costs with those of other mutual funds. It assumes that the fund had a yearly return of 5% before expenses, but that the expense ratio is unchanged. In this case—because the return used is not the fund’s actual return—the results do not apply to your investment. The example is useful in making comparisons because the Securities and Exchange Commission requires all mutual funds to calculate expenses based on a 5% return. You can assess your fund’s costs by comparing this hypothetical example with the hypothetical examples that appear in shareholder reports of other funds.
Six Months Ended September 30, 2006 |
|
|
|
| Beginning | Ending | Expenses |
| Account Value | Account Value | Paid During |
Morgan Growth Fund | 3/31/2006 | 9/30/2006 | Period1 |
Based on Actual Fund Return |
|
|
|
Investor Shares | $1,000.00 | $983.91 | $2.09 |
Admiral Shares | 1,000.00 | 984.95 | 1.09 |
Based on Hypothetical 5% Yearly Return |
|
|
|
Investor Shares | $1,000.00 | $1,022.96 | $2.13 |
Admiral Shares | 1,000.00 | 1,023.97 | 1.12 |
1 The calculations are based on expenses incurred in the most recent six-month period. The fund’s annualized six-month expense ratios for that period are 0.42% for Investor Shares and 0.22% for Admiral Shares. The dollar amounts shown as “Expenses Paid” are equal to the annualized expense ratio multiplied by the average account value over the period, multiplied by the number of days in the most recent six-month period, then divided by the number of days in the most recent 12-month period.
28
Note that the expenses shown in the table are meant to highlight and help you compare ongoing costs only and do not reflect any transactional costs or account maintenance fees. They do not include your fund’s low-balance fee, which is described in the prospectus. If this fee were applied to your account, your costs would be higher. Your fund does not charge transaction fees, such as purchase or redemption fees, nor does it carry a “sales load.”
The calculations assume no shares were bought or sold during the period. Your actual costs may have been higher or lower, depending on the amount of your investment and the timing of any purchases or redemptions.
You can find more information about the fund’s expenses, including annual expense ratios, in the Financial Statements section of this report. For additional information on operating expenses and other shareholder costs, please refer to the appropriate fund prospectus.
29
Glossary
Beta. A measure of the magnitude of a fund’s past share-price fluctuations in relation to the ups and downs of a given market index. The index is assigned a beta of 1.00. Compared with a given index, a fund with a beta of 1.20 typically would have seen its share price rise or fall by 12% when the index rose or fell by 10%. A fund’s beta should be reviewed in conjunction with its R-squared (see definition below). The lower the R-squared, the less correlation there is between the fund and the index, and the less reliable beta is as an indicator of volatility.
Earnings Growth Rate. The average annual rate of growth in earnings over the past five years for the stocks now in a fund.
Expense Ratio. The percentage of a fund’s average net assets used to pay its annual administrative and advisory expenses. These expenses directly reduce returns to investors.
Foreign Holdings. The percentage of a fund represented by stocks or depositary receipts of companies based outside the United States.
Median Market Cap. An indicator of the size of companies in which a fund invests; the midpoint of market capitalization (market price x shares outstanding) of a fund’s stocks, weighted by the proportion of the fund’s assets invested in each stock. Stocks representing half of the fund’s assets have market capitalizations above the median, and the rest are below it.
Price/Book Ratio. The share price of a stock divided by its net worth, or book value, per share. For a fund, the weighted average price/book ratio of the stocks it holds.
Price/Earnings Ratio. The ratio of a stock’s current price to its per-share earnings over the past year. For a fund, the weighted average P/E of the stocks it holds. P/E is an indicator of market expectations about corporate prospects; the higher the P/E, the greater the expectations for a company’s future growth.
R-Squared. A measure of how much of a fund’s past returns can be explained by the returns from the market in general, as measured by a given index. If a fund’s total returns were precisely synchronized with an index’s returns, its R-squared would be 1.00. If the fund’s returns bore no relationship to the index’s returns, its R-squared would be 0.
Return on Equity. The annual average rate of return generated by a company during the past five years for each dollar of shareholder’s equity (net income divided by shareholder’s equity). For a fund, the weighted average return on equity for the companies whose stocks it holds.
Short-Term Reserves. The percentage of a fund invested in highly liquid, short-term securities that can be readily converted to cash.
Turnover Rate. An indication of the fund’s trading activity. Funds with high turnover rates incur higher transaction costs and may be more likely to distribute capital gains (which may be taxable to investors). The turnover rate excludes in-kind transactions, which have minimal impact on costs.
Yield. A snapshot of a fund’s income from interest and dividends. The yield, expressed as a percentage of the fund’s net asset value, is based on income earned over the past 30 days and is annualized, or projected forward for the coming year. The index yield is based on the current annualized rate of income provided by securities in the index.
This page intentionally left blank.
30
The People Who Govern Your Fund
The trustees of your mutual fund are there to see that the fund is operated and managed in your best interests since, as a shareholder, you are a part owner of the fund. Your fund’s trustees also serve on the board of directors of The Vanguard Group, Inc., which is owned by the Vanguard funds and provides services to them on an at-cost basis.
A majority of Vanguard’s board members are independent, meaning that they have no affiliation with Vanguard or the funds they oversee, apart from the sizable personal investments they have made as private individuals.
Our independent board members bring distinguished backgrounds in business, academia, and public service to their task of working with Vanguard officers to establish the policies and oversee the activities of the funds. Among board members’ responsibilities are selecting investment advisors for the funds; monitoring fund operations, performance, and costs; reviewing contracts; nominating and selecting new trustees/directors; and electing Vanguard officers.
Each trustee serves a fund until its termination; or until the trustee’s retirement, resignation, or death; or otherwise as specified in the fund’s organizational documents. Any trustee may be removed at a shareholders’ meeting by a vote representing two-thirds of the net asset value of all shares of the fund together with shares of other Vanguard funds organized within the same trust. The table on these two pages shows information for each trustee and executive officer of the fund. The mailing address of the trustees and officers is P.O. Box 876, Valley Forge, PA 19482.
Chairman of the Board, Chief Executive Officer, and Trustee | |
|
|
John J. Brennan1 |
|
Born 1954 | Principal Occupation(s) During the Past Five Years: Chairman of the Board, Chief |
Trustee since May 1987; | Executive Officer, and Director/Trustee of The Vanguard Group, Inc., and of each |
Chairman of the Board and | of the investment companies served by The Vanguard Group. |
Chief Executive Officer |
|
142 Vanguard Funds Overseen | |
|
|
Independent Trustees |
|
|
|
Charles D. Ellis |
|
Born 1937 | Principal Occupation(s) During the Past Five Years: Applecore Partners (pro bono ventures |
Trustee since January 2001 | in education); Senior Advisor to Greenwich Associates (international business strategy |
142 Vanguard Funds Overseen | consulting); Successor Trustee of Yale University; Overseer of the Stern School of Business |
| at New York University; Trustee of the Whitehead Institute for Biomedical Research. |
|
|
Rajiv L. Gupta |
|
Born 1945 | Principal Occupation(s) During the Past Five Years: Chairman and Chief Executive Officer |
Trustee since December 20012 | of Rohm and Haas Co. (chemicals); Board Member of the American Chemistry Council; |
142 Vanguard Funds Overseen | Director of Tyco International, Ltd. (diversified manufacturing and services) (since 2005); |
| Trustee of Drexel University and of the Chemical Heritage Foundation. |
|
|
Amy Gutmann |
|
Born 1949 | Principal Occupation(s) During the Past Five Years: President of the University of |
Trustee since June 2006 | Pennsylvania since 2004; Professor in the School of Arts and Sciences, Annenberg School |
142 Vanguard Funds Overseen | for Communication, and Graduate School of Education of the University of Pennsylvania |
| since 2004; Provost (2001–2004) and Laurance S. Rockefeller Professor of Politics and the |
| University Center for Human Values (1990–2004), Princeton University; Director of Carnegie |
| Corporation of New York and of Philadelphia 2016 (since 2005) and of Schuylkill River |
| Development Corporation and Greater Philadelphia Chamber of Commerce (since 2004). |
JoAnn Heffernan Heisen |
| |
Born 1950 | Principal Occupation(s) During the Past Five Years: Corporate Vice President and Chief | |
Trustee since July 1998 | Global Diversity Officer (since January 2006), Vice President and Chief Information | |
142 Vanguard Funds Overseen | Officer (1997–2005), and Member of the Executive Committee of Johnson & Johnson | |
| (pharmaceuticals/consumer products); Director of the University Medical Center at | |
| Princeton and Women’s Research and Education Institute. | |
|
| |
André F. Perold |
| |
Born 1952 | Principal Occupation(s) During the Past Five Years: George Gund Professor of Finance and | |
Trustee since December 2004 | Banking, Harvard Business School (since 2000); Senior Associate Dean, Director of Faculty | |
142 Vanguard Funds Overseen | Recruiting, and Chair of Finance Faculty, Harvard Business School; Director and Chairman | |
| of UNX, Inc. (equities trading firm) (since 2003); Director of registered investment | |
| companies advised by Merrill Lynch Investment Managers and affiliates (1985–2004), | |
| Genbel Securities Limited (South African financial services firm) (1999–2003), Gensec | |
| Bank (1999–2003), Sanlam, Ltd. (South African insurance company) (2001–2003), and | |
| Stockback, Inc. (credit card firm) (2000–2002). | |
|
| |
Alfred M. Rankin, Jr. |
| |
Born 1941 | Principal Occupation(s) During the Past Five Years: Chairman, President, Chief Executive | |
Trustee since January 1993 | Officer, and Director of NACCO Industries, Inc. (forklift trucks/housewares/ lignite); | |
142 Vanguard Funds Overseen | Director of Goodrich Corporation (industrial products/aircraft systems and services). | |
|
| |
J. Lawrence Wilson |
| |
Born 1936 | Principal Occupation(s) During the Past Five Years: Retired Chairman and Chief Executive | |
Trustee since April 1985 | Officer of Rohm and Haas Co. (chemicals); Director of Cummins Inc. (diesel engines), | |
142 Vanguard Funds Overseen | MeadWestvaco Corp. (packaging products), and AmerisourceBergen Corp. (pharmaceutical | |
| distribution); Trustee of Vanderbilt University and of Culver Educational Foundation. | |
|
| |
Executive Officers1 |
| |
|
| |
Heidi Stam |
| |
Born 1956 | Principal Occupation(s) During the Past Five Years: Principal of The Vanguard Group, Inc., | |
Secretary since July 2005 | since November 1997; General Counsel of The Vanguard Group since July 2005; | |
142 Vanguard Funds Overseen | Secretary of The Vanguard Group and of each of the investment companies served | |
| by The Vanguard Group since July 2005. | |
|
| |
Thomas J. Higgins |
| |
Born 1957 | Principal Occupation(s) During the Past Five Years: Principal of The Vanguard Group, Inc.; | |
Treasurer since July 1998 | Treasurer of each of the investment companies served by The Vanguard Group. | |
142 Vanguard Funds Overseen |
| |
|
| |
Vanguard Senior Management Team | ||
|
| |
R. Gregory Barton | Kathleen C. Gubanich | Michael S. Miller |
Mortimer J. Buckley | Paul A. Heller | Ralph K. Packard |
James H. Gately | F. William McNabb, III | George U. Sauter |
|
| |
Founder |
| |
|
| |
John C. Bogle |
| |
Chairman and Chief Executive Officer, 1974–1996 | ||
1 Officers of the funds are “interested persons” as defined in the Investment Company Act of 1940.
2 December 2002 for Vanguard Equity Income Fund, Vanguard Growth Equity Fund, the Vanguard Municipal Bond Funds, and the Vanguard State Tax-Exempt Funds.
More information about the trustees is in the Statement of Additional Information, available from The Vanguard Group.
|
|
| P.O. Box 2600 |
| Valley Forge, PA 19482-2600 |

Connect with Vanguard™ > www.vanguard.com
Fund Information > 800-662-7447 | Vanguard, Admiral ,Connect with Vanguard, and the ship |
| logo are trademarks of The Vanguard Group, Inc. |
Direct Investor Account Services > 800-662-2739 |
|
| All other marks are the exclusive property of their |
Institutional Investor Services > 800-523-1036 | respective owners. |
|
|
Text Telephone > 800-952-3335 | All comparative mutual fund data are from Lipper Inc. |
| or Morningstar, Inc., unless otherwise noted. |
|
|
|
|
|
|
|
|
This material may be used in conjunction | You can obtain a free copy of Vanguard’s proxy voting |
with the offering of shares of any Vanguard | guidelines by visiting our website, www.vanguard.com, |
fund only if preceded or accompanied by | and searching for “proxy voting guidelines,” or by calling |
the fund’s current prospectus. | Vanguard at 800-662-2739. They are also available from |
| the SEC’s website, www.sec.gov. In addition, you may |
| obtain a free report on how your fund voted the proxies for |
| securities it owned during the 12 months ended June 30. |
| To get the report, visit either www.vanguard.com |
| or www.sec.gov. |
|
|
| You can review and copy information about your fund |
| at the SEC’s Public Reference Room in Washington, D.C. |
| To find out more about this public service, call the SEC |
| at 202-551-8090. Information about your fund is also |
| available on the SEC’s website, and you can receive |
| copies of this information, for a fee, by sending a |
| request in either of two ways: via e-mail addressed to |
| publicinfo@sec.gov or via regular mail addressed to the |
| Public Reference Section, Securities and Exchange |
| Commission, Washington, DC 20549-0102. |
|
|
|
|
|
|
|
|
| © 2006 The Vanguard Group, Inc. |
| All rights reserved. |
| Vanguard Marketing Corporation, Distributor. |
|
|
| Q260 112006 |
Item 2: Code of Ethics. The Registrant has adopted a code of ethics that applies to the Registrant's principal executive officer, principal financial officer, principal accounting officer or controller or persons performing similar functions. The Code of Ethics was amended during the reporting period covered by this report to make certain technical, non-material changes.
Item 3: Audit Committee Financial Expert. The following members of the Audit Committee have been determined by the Registrant’s Board of Trustees to be Audit Committee Financial Experts serving on its Audit Committee, and to be independent: Charles D. Ellis, Rajiv L. Gupta, JoAnn Heffernan Heisen, André F. Perold, Alfred M. Rankin, Jr., and J. Lawrence Wilson.
Item 4: Principal Accountant Fees and Services.
(a) Audit Fees.
Audit Fees of the Registrant
Fiscal Year Ended September 30, 2006: $23,000
Fiscal Year Ended September 30, 2005: $20,000
Aggregate Audit Fees of Registered Investment Companies in the Vanguard Group
Fiscal Year Ended September 30, 2006: $2,347,620
Fiscal Year Ended September 30, 2005: $2,152,740
(b) Audit-Related Fees.
Fiscal Year Ended September 30, 2006: $530,000
Fiscal Year Ended September 30, 2005: $382,200
Includes fees billed in connection with assurance and related services provided to the Registrant, The Vanguard Group, Inc., Vanguard Marketing Corporation, and other registered investment companies in the Vanguard Group.
(c) Tax Fees.
Fiscal Year Ended September 30, 2006: $101,300
Fiscal Year Ended September 30, 2005: $98,400
Includes fees billed in connection with tax compliance, planning and advice services provided to the Registrant, The Vanguard Group, Inc., Vanguard Marketing Corporation, and other registered investment companies in the Vanguard Group and related to income and excise taxes.
(d) All Other Fees.
Fiscal Year Ended September 30, 2006: $0
Fiscal Year Ended September 30, 2005: $0
Includes fees billed for services related to risk management and privacy matters. Services were provided to the Registrant, The Vanguard Group, Inc., Vanguard Marketing Corporation, and other registered investment companies in the Vanguard Group.
(e) (1) Pre-Approval Policies. The policy of the Registrant’s Audit Committee is to consider and, if appropriate, approve before the principal accountant is engaged for such services, all specific audit and non-audit services provided to: (1) the Registrant; (2) The Vanguard Group, Inc.; (3) other entities controlled by The Vanguard Group, Inc. that provide ongoing services to the Registrant; and (4) other registered investment companies in the Vanguard Group. In making a determination, the Audit Committee considers whether the services are consistent with maintaining the principal accountant’s independence.
In the event of a contingency situation in which the principal accountant is needed to provide services in between scheduled Audit Committee meetings, the Chairman of the Audit Committee would be called on to consider and, if appropriate, pre-approve audit or permitted non-audit services in an amount sufficient to complete services through the next Audit Committee meeting, and to determine if such services would be consistent with maintaining the accountant’s independence. At the next scheduled Audit Committee meeting, services and fees would be presented to the Audit Committee for formal consideration, and, if appropriate, approval by the entire Audit Committee. The Audit Committee would again consider whether such services and fees are consistent with maintaining the principal accountant’s independence.
The Registrant’s Audit Committee is informed at least annually of all audit and non-audit services provided by the principal accountant to the Vanguard complex, whether such services are provided to: (1) the Registrant; (2) The Vanguard Group, Inc.; (3) other entities controlled by The Vanguard Group, Inc. that provide ongoing services to the Registrant; or other registered investment companies in the Vanguard Group.
(2) No percentage of the principal accountant’s fees or services were approved pursuant to the waiver provision of paragraph (c)(7)(i)(C) of Rule 2-01 of Regulation S-X.
(f) For the most recent fiscal year, over 50% of the hours worked under the principal accountant’s engagement were not performed by persons other than full-time, permanent employees of the principal accountant.
(g) Aggregate Non-Audit Fees.
Fiscal Year Ended September 30, 2006: $101,300
Fiscal Year Ended September 30, 2005: $98,400
Includes fees billed for non-audit services provided to the Registrant, The Vanguard Group, Inc., Vanguard Marketing Corporation, and other registered investment companies in the Vanguard Group.
(h) For the most recent fiscal year, the Audit Committee has determined that the provision of all non-audit services was consistent with maintaining the principal accountant’s independence.
Item 5: Not applicable.
Item 6: Not applicable.
Item 7: Not applicable.
Item 8: Not applicable.
Item 9: Not applicable.
Item 10: Not applicable
Item 11: Controls and Procedures.
(a) Disclosure Controls and Procedures. The Principal Executive and Financial Officers concluded that the Registrant’s Disclosure Controls and Procedures are effective based on their evaluation of the Disclosure Controls and Procedures as of a date within 90 days of the filing date of this report.
(b) Internal Control Over Financial Reporting. There were no significant changes in Registrant’s internal control over financial reporting or in other factors that could significantly affect this control subsequent to the date of the evaluation, including any corrective actions with regard to significant deficiencies and material weaknesses.
Item 12: Exhibits.
(a) Code of Ethics.
(b) Certifications.
Pursuant to the requirements of the Securities Exchange Act of 1934 and the Investment Company Act of 1940, the registrant has duly caused this report to be signed on its behalf by the undersigned, thereunto duly authorized.
| VANGUARD MORGAN GROWTH FUND | |
| BY: | (signature) |
| (HEIDI STAM) JOHN J. BRENNAN* CHIEF EXECUTIVE OFFICER |
| Date: | November 17, 2006 |
Pursuant to the requirements of the Securities Exchange Act of 1934 and the Investment Company Act of 1940, this report has been signed below by the following persons on behalf of the registrant and in the capacities and on the dates indicated.
| VANGUARD MORGAN GROWTH FUND | |
| BY: | (signature) |
| (HEIDI STAM) JOHN J. BRENNAN* CHIEF EXECUTIVE OFFICER |
| Date: | November 17, 2006 |
| VANGUARD MORGAN GROWTH FUND | |
| BY: | (signature) |
| (HEIDI STAM) THOMAS J. HIGGINS* TREASURER |
| Date: | November 17, 2006 |
* By Power of Attorney. See File Number 002-65955-99, filed on July 27, 2006. Incorporated by Reference.