
Vanguard Morgan™ Growth Fund Annual Report

- For the volatile 12 months ended September 30, 2009, Vanguard Morgan Growth Fund returned –4.27% for Investor Shares and –4.09% for Admiral Shares.
- The fund lagged the return of its benchmark, the Russell 3000 Growth Index, as well as the average return of multi-capitalization growth funds.
- The fund has outperformed both its benchmark and the average return of multi-cap growth funds over the past decade.
| |
| Contents | |
| |
| Your Fund’s Total Returns | 1 |
| President’s Letter | 2 |
| Advisors’ Report | 8 |
| Results of Proxy Voting | 14 |
| Fund Profile | 15 |
| Performance Summary | 16 |
| Financial Statements | 18 |
| Your Fund’s After-Tax Returns | 33 |
| About Your Fund’s Expenses | 34 |
| Glossary | 36 |
The figures shown represent past performance, which is not a guarantee of future results. (Current performance may be lower or higher than the performance data cited. For performance data current to the most recent month-end, visit our website at www.vanguard.com/performance.)
Please note: The opinions expressed in this report are just that—informed opinions. They should not be considered promises or advice. Also, please keep in mind that the information and opinions cover the period through the date on the front of this report. Of course, the risks of investing in your fund are spelled out in the prospectus.
Cover photograph: Veronica Coia.
| | | | | | | | | |
| Your Fund’s Total Returns | | | | | | | |
| |
| |
| |
| |
| Fiscal Year Ended September 30, 2009 | | | | | | | | | |
| | | | | | | Ticker | | Total | |
| | | | | | | Symbol | | Returns | |
| Vanguard Morgan Growth Fund | | | | | | | | | |
| Investor Shares | | | | | | VMRGX | | –4.27 | % |
| Admiral™ Shares1 | | | | | | VMRAX | | –4.09 | |
| Russell 3000 Growth Index | | | | | | | | –2.19 | |
| Multi-Cap Growth Funds Average2 | | | | | | | | –3.19 | |
| |
| |
| Your Fund’s Performance at a Glance | | | | | | | | | |
| September 30, 2008–September 30, 2009 | | | | | | | | | |
| | | | | | | Distributions Per Share | |
| | | Starting | | Ending | | Income | | Capital | |
| | | Share Price | | Share Price | | Dividends | | Gains | |
| Vanguard Morgan Growth Fund | | | | | | | | | |
| Investor Shares | $ | 15.15 | $ | 14.32 | $ | 0.140 | $ | 0.000 | |
| Admiral Shares | | 47.03 | | 44.42 | | 0.522 | | 0.000 | |
1 A lower-cost class of shares available to many longtime shareholders and to those with significant investments in the fund.
2 Derived from data provided by Lipper Inc.
1

President’s Letter
Dear Shareholder,
The fiscal year covered in this report was an extremely turbulent time for the U.S. stock market. During the first half of the year, stocks suffered some of their worst returns on record. Starting in mid-March, the market began to rally. Despite the strong second-half rebound, the gains weren’t enough to make up for the dramatic losses of the first several months.
For the 12 months ended September 30, 2009, Vanguard Morgan Growth Fund returned –4.27% for Investor Shares and –4.09% for Admiral Shares. The fund trailed its benchmark, the Russell 3000 Growth Index, which returned –2.19%. The fund also lagged behind the average return of multi-cap growth funds for the period.
If you own Morgan Growth Fund in a taxable account, you may wish to review our report on the fund’s after-tax returns on page 33.
After a precipitous fall, stock markets rebound
In recent months, the financial markets have performed so strongly that it’s almost hard to remember that less than a year ago the global financial system stood on the brink of collapse. Since then, markets have pulled back from the abyss. Although unemployment remains near generational highs, and the prospects of a robust recovery seem dim, the global economy has begun to grind into gear.

Reminders of the markets’ dark days are nevertheless apparent in the index returns for both the past 12 months and the past three years. Over both periods, U.S. stocks recorded negative returns. Global stocks did better over the past 12 months, recouping their late-2008 losses thanks to general strength in developed economies and a powerful rally in emerging markets. Over the past three years, however, international stocks posted a modestly negative return.
The bond market’s turnabout has been equally dramatic
The stock market’s collapse and recovery echo even more dramatic developments in the bond market. At the end of 2008, as the credit markets nearly ceased to function, the difference between the yields
of corporate bonds and U.S. Treasury bonds spiked to levels last seen during the Great Depression.
The Federal Reserve and its central bank counterparts around the world responded with aggressive monetary stimulus efforts, while global governments opened the fiscal taps. Investors first tiptoed, then stampeded, back into the market, boosting bond prices and bringing down yields. Over the past 12 months, taxable U.S. bonds returned more than 10%; municipal securities did even better, returning almost 15%, as measured by the Barclays Capital Municipal Bond Index.
The Fed’s rescue campaign has imposed a heavy price on short-term savings vehicles such as money market funds.
| | | | | | |
| Market Barometer | | | | | | |
| | | | Average Annual Total Returns | |
| | | | Periods Ended September 30, 2009 | |
| | One Year | | Three Years | | Five Years | |
| Stocks | | | | | | |
| Russell 1000 Index (Large-caps) | –6.14 | % | –5.10 | % | 1.49 | % |
| Russell 2000 Index (Small-caps) | –9.55 | | –4.57 | | 2.41 | |
| Dow Jones U.S. Total Stock Market Index | –5.83 | | –4.58 | | 1.93 | |
| MSCI All Country World Index ex USA (International) | 6.43 | | –0.78 | | 8.59 | |
| |
| Bonds | | | | | | |
| Barclays Capital U.S. Aggregate Bond Index | | | | | | |
| (Broad taxable market) | 10.56 | % | 6.41 | % | 5.13 | % |
| Barclays Capital Municipal Bond Index | 14.85 | | 5.13 | | 4.78 | |
| Citigroup 3-Month Treasury Bill Index | 0.39 | | 2.63 | | 2.96 | |
| |
| CPI | | | | | | |
| Consumer Price Index | –1.29 | % | 2.10 | % | 2.61 | % |
3
In December 2008, the Fed reduced its target for the federal funds rate, a benchmark for the interest rates paid by money market instruments and other very short-term securities, to between 0% and 0.25%. The Fed has said it expects to maintain its target at this level “for an extended period.”
Early losses trump stocks’ recent substantial gains
By blending the distinctive growth strategies of its five advisors—Frontier Capital Management Co., LLC, Jennison Associates LLC, Kalmar Investment Advisers, Vanguard Quantitative Equity Group, and Wellington Management Company, LLP—Vanguard Morgan Growth Fund aims to outperform the Russell 3000 Growth Index. For the 12 months ended
September 30, 2009, the fund was unable to achieve its goal, ending the period about 2 percentage points behind its benchmark.
The fund’s most substantial losses for the period came from the health care sector. The portfolio was hurt by poor stock selection in biotechnology. Biotech companies struggled during the period amid the heightened financial and regulatory uncertainties. Poor stock selection in pharmaceutical stocks also weighed on returns.
Industrial stocks were also among the fund’s worst performers. Industrial conglomerates, machinery companies, and railroads were badly battered during the downturn as manufacturers suffered from shrinking orders and high inventories.
Expense Ratios1
Your Fund Compared With Its Peer Group
| | | | | | | |
| | | | | | | Multi-Cap | |
| | Investor | | Admiral | | | Growth Funds | |
| | Shares | | Shares | | | Average | |
| Morgan Growth Fund | 0.46 | % | 0.29 | % | | 1.41 | % |
1 The fund expense ratios shown are from the prospectus dated January 27, 2009, and represent estimated costs for the current fiscal year based on the fund’s net assets as of the prospectus date. For the fiscal year ended September 30, 2009, the expense ratios were 0.48% for Investor Shares and 0.31% for Admiral Shares. The peer-group expense ratio is derived from data provided by Lipper Inc. and captures information through year-end 2008.
4
Although these stocks have begun to bounce back in recent months, it wasn’t enough to make up for the first half of the fiscal year. Overall, the sector finished the period behind the broad market.
In consumer staples, the fund’s stock selection among companies in the packaged food industry, which included Kellogg (–9%), Nestlé (–8%), and Campbell Soup (–13%), hurt returns relative to the benchmark. Although these companies held up relatively well during the downturn, they were hit hard during the second half of the period as investors favored riskier investments. Poor stock selection in materials, particularly in the chemicals and metals and mining industries, also put a damper on performance.
Despite negative returns, there were a few bright spots for the fund during the 12-month period. The fund got a boost from its information technology holdings, which spiked as corporations seemed ready to resume spending on communications equipment, computer hardware, and computer software.
The portfolio also benefited from strong stock selection in energy and financials. Although the fund posted negative results in both sectors, the fund’s advisors avoided some of these industries’ hardest-hit stocks. This aided returns relative to the index.
Months of volatility took a toll on returns
Vanguard often advises that investors consider the long-term results when evaluating a fund’s performance. The long-
| | |
| Total Returns | | |
| Ten Years Ended September 30, 2009 | | |
| | Average | |
| | Annual Return | |
| Morgan Growth Fund Investor Shares | 0.51 | % |
| Russell 3000 Growth Index | –2.28 | |
| Multi-Cap Growth Funds Average1 | –1.11 | |
The figures shown represent past performance, which is not a guarantee of future results. (Current performance may be lower or higher than the performance data cited. For performance data current to the most recent month-end, visit our website at www.vanguard.com/performance). Note, too, that both investment returns and principal value can fluctuate widely, so an investor’s shares, when sold, could be worth more or less than their original cost.
1 Derived from data provided by Lipper Inc.
5
term perspective can nevertheless be distorted, for better or worse, by the most recent short-term results. Morgan Growth Fund’s sizable losses over the past two years have obscured some signs of strength in the longer-term record.
Over the past decade, Morgan Growth Fund Investor Shares have returned 0.51%, on average, per year. Just two years ago, at the end of fiscal 2007, and before long-term performance was hammered by the recent downturn, those shares reported a more palatable ten-year average return of 6.71%, significantly better than the result of the fund’s benchmark index, which returned 3.97% over the same period. Despite recent difficulties, the fund outperformed both its benchmark and the average return of multi-cap growth funds for the ten years ended September 30, 2009.
As I indicated in our semiannual report to you, changes have been made to the fund’s management structure. The fund’s advisory team now includes Frontier Capital Management and Kalmar Investment Advisers, which oversee the assets formerly managed by Franklin Portfolio Associates. The fund’s investment objective remains unchanged. Going forward, we believe that Morgan Growth Fund has the potential to produce competitive returns over the long term, just as it has over substantial periods in its history.
A word on expenses
The fund’s expense ratio has risen over the past fiscal year. The explanation is threefold.
First, as the value of fund assets has declined, the fund’s fixed expenses have accounted for a modestly higher percentage of fund assets. Second, the Vanguard funds’ contracts with external advisors typically include breakpoint pricing. As assets rise above a breakpoint threshold, advisory fees are paid at a lower rate. When assets fall, as they have during fiscal 2009, a smaller portion of assets is subject to the lower rate, causing the overall rate to increase.
Finally, Vanguard’s contracts with external advisors generally include an incentive-fee provision that is contingent on the advisors’ performance relative to their benchmarks. This fee structure helps to ensure that the interests of the fund shareholders and advisors remain aligned. Over the past year, the advisory fee increased as the fund’s relative performance improved. The fund’s financial statements include more information about Vanguard Morgan Growth Fund’s incentive fee.
Focus on the long term regardless of market conditions
Although the stock market seems to be on the right path for now, its near-term direction is impossible to forecast with accuracy. Because such uncertainty is forever present in the financial markets, Vanguard encourages investors to maintain a long-term perspective and stay focused on their future goals. Establishing a well-balanced and diversified portfolio that is consistent with your long-term goals and risk tolerance can help you follow these guidelines.
6
With its low costs and broad diversification among domestic growth stocks, we believe that the Morgan Growth Fund can play an important role in a well-balanced portfolio.
As always, thank you for entrusting your assets to Vanguard.

F. William McNabb III
President and Chief Executive Officer
October 13, 2009
7
Advisors’ Report
During the fiscal year ended September 30, 2009, the Investor Shares of Vanguard Morgan Growth Fund returned –4.27%, while the Admiral Shares returned –4.09%. Your fund is managed by five independent advisors, a strategy that enhances the fund’s diversification by providing exposure to distinct, yet complementary, investment approaches. It’s not uncommon for different advisors to have different views about individual securities or the broader investment environment.
The advisors, the percentage of fund assets each manages, and brief descriptions of their investment strategies are presented in the table below. The advisors have also prepared a discussion of the investment environment that existed during the fiscal year and of how portfolio positioning reflects this assessment. These comments were prepared on October 19, 2009.
| | | |
| Vanguard Morgan Growth Fund Investment Advisors | |
| |
| | Fund Assets Managed | |
| Investment Advisor | % | $ Million | Investment Strategy |
| Wellington Management | 40 | 3,046 | Traditional methods of stock selection— |
| Company, LLP | | | research and analysis—that identify companies |
| | | | believed to have above-average growth prospects, |
| | | | particularly those in industries undergoing change. |
| | | | Focuses on mid- and large-capitalization companies |
| | | | with proven records of sales and earnings growth, |
| | | | profitability, and cash-flow generation. |
| Vanguard Quantitative | 20 | 1,462 | Employs a quantitative, fundamental management |
| Equity Group | | | approach, using models that assess valuation, growth |
| | | | prospects, management decisions, market sentiment, |
| | | | and earnings quality of companies versus their peers. |
| Jennison Associates LLC | 17 | 1,305 | Research-driven, fundamental investment approach |
| | | | that relies on in-depth company knowledge gleaned |
| | | | through meetings with management, customers, |
| | | | and suppliers. |
| Frontier Capital | 10 | 752 | Research-driven, fundamental investment approach |
| Management Co., LLC | | | that seeks companies with above-average growth |
| | | | prospects, reasonable valuations, and competitive |
| | | | advantages. |
| Kalmar Investment Advisers | 10 | 712 | Employs a “growth-with-value” strategy using |
| | | | creative, bottom-up research to uncover vigorously |
| | | | growing, high-quality businesses whose stocks can |
| | | | also be bought inefficiently valued. The strategy has a |
| | | | dual objective of strong returns with lower risk. |
| Cash Investments | 3 | 213 | These short-term reserves are invested by Vanguard in |
| | | | equity index products to simulate investments in stocks. |
| | | | Each advisor also may maintain a modest cash position. |
8
Wellington Management Company, LLP
Portfolio Manager:
Paul E. Marrkand, CFA,
Senior Vice President
Our investment results benefited from solid stock selection in the consumer discretionary, financial, industrial, and energy sectors, as well as from our allocation to the information technology sector.
Among holdings that contributed to performance were NetApp and Amazon.com. Shares of NetApp, a network storage equipment manufacturer, rose after the firm walked away from a bidding war with EMC for Data Domain, a provider of de-duplication storage systems. NetApp’s low-cost, unified architecture approach to storage is very attractive and should enable the company to continue to grow market share as IT spending improves.
Amazon.com shares gained as the U.S.-based online retailer continued to expand its customer base, taking share both within e-commerce activity and from storefront retailers. Amazon is poised for future growth as the economy rebounds, based on the company’s high return on capital business model. In addition to adding scale, Amazon should also see growth from its new product offerings, including the number-one e-book reader, Kindle, and the company’s cloud computing service.
Stock selection in materials and health care detracted from results. In materials, shares of Potash Corp. of Saskatchewan
declined after the company lowered its earnings guidance owing to weak sales volumes in fourth-quarter 2008—as a result of an excessive supply of potash in the market, which will negatively affect pricing and lower the return on capital. Because of this, we eliminated our position in the stock.
In health care, Eli Lilly shares came under pressure on concerns about the impact of future patent expirations on the company’s long-term growth, as well as near-term pressures due to a slower ramp-up period for a new anticlotting drug.
Earlier in the fiscal year, during a time of extreme volatility and frequent comparisons in the media of the U.S. recession to the Great Depression, we were able to initiate positions in high-quality growth companies such as eBay, Juniper Networks, Amazon.com, EMC, Urban Outfitters, Guess, Morgan Stanley, and State Street. We eliminated our holdings in Hess, XTO Energy, and Nike. At the end of the period, our largest sector positions were in IT, industrials, and consumer discretionary.
Vanguard Quantitative Equity Group
Portfolio Manager:
James P. Stetler, Principal
It has been a roller-coaster year for the Morgan Growth Fund and equity markets in general. The credit crisis that began in 2007 accelerated with the failure of Lehman Brothers in late 2008. Equity markets plunged for the first six months of
9
the fund’s fiscal year by more than 31%, as measured by the Russell 3000 Index. Growth stocks fared a little better than their value counterparts, declining –26.6% versus –35.6% for value companies.
As government rescue and stimulus plans were announced and it became apparent that the financial markets were not going to implode, the second half of the fiscal year witnessed a dramatic snapback. The Russell 3000 Index reversed course and climbed back over 35%, leaving the total return of the U.S. equity market for the 12-month period at –5.8%. Growth stocks outperformed their value counterparts by a margin of over 8%.
Although the worst recession in decades has not been officially declared over, many investment professionals believe it ended during third-quarter 2009. [On October 29, the U.S. Commerce Department reported that the economy grew by 3.5% in the three months ended September 30.] However, many challenges still lie ahead. Rising unemployment, the state of credit markets, and massive government deficits are just a few of the issues that need to be addressed for long-term economic growth to be restored.
In dissecting our portfolio’s performance for the year, our investment process struggled during this period.
We have five components to our company evaluation process: valuation, growth prospects, earnings quality, management decisions, and market
sentiment. Valuation measures the price we will pay for a stock’s earnings or cash flow. Our quality score separates cheap stocks that deserve their low valuations because of poor margins from their more profitable peers. Our growth indicator differentiates between companies with low valuations due to poor growth prospects and firms with more attractive prospects. Since actions often speak louder than words, our management decisions model evaluates the decisions corporate managers make to enhance shareholder value. Finally, our market sentiment score measures the market’s overall evaluation of the company’s value.
Our company-ranking process was ineffective during this period, because the market did not reward the metrics we deem important to superior performance: low valuation, balance sheet quality, attractive growth prospects, and positive market sentiment. Some are calling the market recovery a “junk rally,” as companies with the poorest prospects, which had fallen the most during the crisis, rallied the most in the market comeback.
Our stock-selection results were strongest in the utilities sector, led by NRG Energy. Relative performance was also enhanced by Joy Global, Peabody Energy, and Marvell Technology. Our selection results were most disappointing in the health care, financial, and industrial sectors, as companies like Intuitive Surgical, Discover Financial, and Cummins did not perform as expected.
10
Jennison Associates LLC
Portfolio Manager:
Kathleen A. McCarragher,
Managing Director
We build our portfolio from the bottom up, based on our research of company fundamentals.
During the past six months, technology positions contributed the most to returns, as several holdings posted 30%-plus advances. Apple’s powerful gain was fueled by better-than-expected iPod and iPhone sales. We believe Apple’s creativity and innovation in product design and marketing will continue to drive share gains. Internet search leader Google advanced on solid earnings growth and margin expansion. The company’s continued investment in capacity and in research and development should lead to new streams of revenue through product innovation, new formats, and new technologies.
Stock selection was strong in the consumer discretionary sector, with Amazon.com’s solid earnings reflecting the secular shift toward e-commerce and Amazon’s continued market-share gains. Goldman Sachs, a standout in financials, significantly, benefited from a solid balance sheet and deft navigation of uneven markets. In health care, pharmacy-benefits manager Medco Health Solutions gained on robust retail prescriptions and operating leverage.
Key individual detractors from the fund’s return included Thermo Fisher Scientific, a provider of instruments and services to scientists and manufacturers, which declined on disappointing earnings and revenue, and First Solar, which fell as price discounting by competitors pressured its pricing and margins. We eliminated our positions in both stocks.
We expect the earnings growth of companies held in the portfolio to be spurred by topline growth that is fueled by economic expansion and market-share gains borne of weakened competition and new product introductions. We believe business fundamentals are improving at a greater number of companies, despite what may be an uneven and fitful path to recovery.
Frontier Capital Management Co., LLC
Portfolio Manager:
Stephen Knightly, CFA,
Senior Vice President
For the abbreviated period that we have been part of Morgan Growth Fund’s advisory team, our portion of the portfolio has been under pressure from the market’s wild volatility. The portfolio performed as expected from November 2008 through March 2009 by exceeding the index during a tumultuous decline in the markets. However, the market’s sharp reversal and its embracement of risky assets have challenged the fund’s performance since that time.
11
Our portion of the portfolio was notably hindered by our selections in financials and health care, both of which penalized relative results. Our performance within financials highlights what hindered our overall outcome: The balance-sheet-distressed financials rallied the most since the spring, while our focus has been on higher-quality asset managers and property and casualty insurers.
Indeed, across most market sectors, our style has been challenged by attributes that are counter to our time-tested process. For example, the market has championed small-cap stocks, low-priced stocks (under $10), low-return-on-equity businesses, companies that don’t earn a profit, and stocks whose ultra-low price/earnings multiples can reflect pressing debt. We are not “chasing” these risky, outperforming attributes, but, instead, are sticking to our well-proven process.
As for health care, we had setbacks in one of our larger holdings, Genzyme, that we expect will recover. In addition, we were not invested in many capital-intensive equipment stocks—including Intuitive Surgical—that had fallen sharply as a reflection of hospitals’ reduced funding capacity, but have subsequently rebounded with an easing of credit concerns.
Kalmar Investment Advisers
Portfolio Manager:
Ford B. Draper, Jr., President and
Chief Investment Officer
In the ten months since Kalmar joined the Morgan Growth Fund’s advisory team, the U.S. stock market underwent a wrenching decline to a bottoming on March 9, followed by a huge, nearly straight-up seven-month rally. In simplest terms, the recovery was triggered and sustained by recognition that the financial crisis would not descend into a Depression, and that the “Great Recession” would bottom out and economic recovery would begin in the second half of the year.
This pronounced swing in sentiment from despair to relief led to massive outperformance by stocks of the smallest, least-profitable, lowest-quality, and most cyclically stretched companies. In such an environment, quality growth company managers like Kalmar have faced daunting challenges. Never mind that our portfolio’s companies gained competitive advantage through the depths of the recession, because of their ability to invest for future growth, while many others were only scraping by.
Given the rapidity of the market’s rise, we appear to be in the “faith part” of the market cycle now. Either the recovery surpasses the prevailing tepid expectations of economists, or a period
12
of consolidation would seem likely. Meanwhile, our portfolio’s companies should continue to generate material, forward progress as businesses. They should grow even more powerfully if the economy is stronger, but far more successfully than most if it does prove to be anemic.
During Kalmar’s brief tenure with Morgan Growth, the largest detractor to returns through September 30 was our health care holdings, with most losses occurring in our first few months. Our original overweighting to health care—because of its apparent ability to better protect in the rapidly plunging economy—became an instant sectoral negative as uncertainty arose over President Barack Obama’s proposed health care system overhaul. In addition, company-specific negative developments also hurt our holdings of Genzyme, Cephalon, and Immucor.
In keeping with our bottom-up growth style, the portfolio’s largest contribution to returns came from a mix of companies from different industries whose revenues and earnings actually grew in line with our positive forecasts despite the sinking economy. These included Cognizant Technology Solutions, Alliance Data Systems, Corrections Corp. of America, Rovi, and Tractor Supply, among others.
13
Results of Proxy Voting
At a special meeting of shareholders on July 2, 2009, fund shareholders approved the following two proposals:
Proposal 1—Elect trustees for each fund.
The individuals listed in the table below were elected as trustees for each fund. All trustees with the exception of Messrs. McNabb and Volanakis (both of whom already served as directors of The Vanguard Group, Inc.) served as trustees to the funds prior to the shareholder meeting.
| | | | |
| | | | Percentage | |
| Trustee | For | Withheld | For | |
| John J. Brennan | 294,914,783 | 9,090,543 | 97.0 | % |
| Charles D. Ellis | 294,321,043 | 9,684,282 | 96.8 | % |
| Emerson U. Fullwood | 296,384,060 | 7,621,266 | 97.5 | % |
| Rajiv L. Gupta | 294,808,056 | 9,197,269 | 97.0 | % |
| Amy Gutmann | 296,475,294 | 7,530,032 | 97.5 | % |
| JoAnn Heffernan Heisen | 294,850,271 | 9,155,054 | 97.0 | % |
| F. William McNabb III | 296,235,072 | 7,770,254 | 97.4 | % |
| André F. Perold | 294,721,968 | 9,283,358 | 96.9 | % |
| Alfred M. Rankin, Jr. | 294,676,119 | 9,329,207 | 96.9 | % |
| Peter F. Volanakis | 296,462,815 | 7,542,511 | 97.5 | % |
Proposal 2—Update and standardize the funds’ fundamental policies regarding:
(a) Purchasing and selling real estate.
(b) Issuing senior securities.
(c) Borrowing money.
(d) Making loans.
(e) Purchasing and selling commodities.
(f) Concentrating investments in a particular industry or group of industries.
(g) Eliminating outdated fundamental investment policies not required by law.
The revised fundamental policies are clearly stated and simple, yet comprehensive, making oversight and compliance more efficient than under the former policies. The revised fundamental policies will allow the funds to respond more quickly to regulatory and market changes, while avoiding the costs and delays associated with successive shareholder meetings.
| | | | | | | |
| | | | | | Broker | Percentage | |
| Morgan Growth Fund | | For | Abstain | Against | Non-Votes | For | |
| 2a | | 277,993,355 | 3,844,507 | 7,973,611 | 14,193,851 | 91.4 | % |
| 2b | | 277,588,526 | 4,202,346 | 8,020,602 | 14,193,852 | 91.3 | % |
| 2c | | 241,136,054 | 4,655,596 | 44,019,824 | 14,193,852 | 79.3 | % |
| 2d | | 246,640,662 | 4,556,567 | 38,614,243 | 14,193,854 | 81.1 | % |
| 2e | | 272,597,397 | 3,911,661 | 13,302,416 | 14,193,851 | 89.7 | % |
| 2f | | 276,888,030 | 4,083,553 | 8,839,894 | 14,193,848 | 91.1 | % |
| 2g | | 277,891,105 | 4,077,446 | 7,842,922 | 14,193,852 | 91.4 | % |
14
Morgan Growth Fund
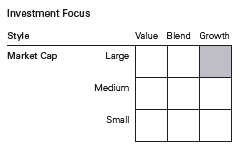
Fund Profile
As of September 30, 2009
| | | | | | | | | |
| Portfolio Characteristics | | | | | | | |
| | | | | | Comparative | | | Broad | |
| | | Fund | | | Index1 | | | Index2 | |
| Number of Stocks | | 337 | | | 1,885 | | | 4,324 | |
| Median Market Cap | $ | 19.7 | B | $ | 30.2 | B | $ | 29.0 | B |
| Price/Earnings Ratio | | 23.5 | x | | 23.4 | x | | 27.9 | x |
| Price/Book Ratio | | 3.2 | x | | 3.5 | x | | 2.1 | x |
| Yield3 | | | | | 1.5 | % | | 1.9 | % |
| Investor Shares | | 0.6 | % | | | | | | |
| Admiral Shares | | 0.8 | % | | | | | | |
| Return on Equity | | 22.5 | % | | 22.9 | % | | 19.1 | % |
| Earnings Growth Rate | | 18.7 | % | | 16.5 | % | | 9.6 | % |
| Foreign Holdings | | 5.1 | % | | 0.0 | % | | 0.0 | % |
| Turnover Rate | | 87 | % | | — | | | — | |
| Expense Ratio4 | | | | | — | | | — | |
| Investor Shares | | 0.46 | % | | | | | | |
| Admiral Shares | | 0.29 | % | | | | | | |
| Short-Term Reserves | | 1.0 | % | | — | | | — | |
Sector Diversification (% of equity exposure)
| | | | | |
| | Comparative | | Broad | |
| | Fund | Index1 | | Index2 | |
| Consumer Discretionary 12.9% | 10.8 | % | 10.1 | % |
| Consumer Staples | 5.9 | 15.1 | | 9.9 | |
| Energy | 8.0 | 4.2 | | 11.0 | |
| Financials | 6.9 | 5.3 | | 16.7 | |
| Health Care | 12.6 | 17.2 | | 12.9 | |
| Industrials | 9.5 | 10.5 | | 10.6 | |
| Information Technology | 39.4 | 31.5 | | 18.2 | |
| Materials | 3.7 | 3.8 | | 3.9 | |
| Telecommunication | | | | | |
| Services | 0.9 | 0.7 | | 2.9 | |
| Utilities | 0.2 | 0.9 | | 3.8 | |
| | |
| Volatility Measures5 | |
| | Fund Versus | Fund Versus |
| | Comparative Index1 | Broad Index2 |
| R-Squared | 0.99 | 0.94 |
| Beta | 1.01 | 0.97 |
Ten Largest Holdings6 (% of total net assets)
| | | |
| Cisco Systems Inc. | communications | | |
| | equipment | 3.1 | % |
| Microsoft Corp. | systems software | 3.1 | |
| Apple Inc. | computer hardware | 2.9 | |
| Google Inc. Class A | internet software | | |
| | and services | 2.3 | |
| International Business | | | |
| Machines Corp. | computer hardware | 2.2 | |
| Oracle Corp. | systems software | 1.8 | |
| QUALCOMM Inc. | communications | | |
| | equipment | 1.8 | |
| NetApp Inc. | computer storage | | |
| | and peripherals | 1.8 | |
| Goldman Sachs Group Inc. | investment banking | | |
| | and brokerage | 1.5 | |
| Amazon.com Inc. | internet retail | 1.2 | |
| Top Ten | | 21.7 | % |
1 Russell 3000 Growth Index.
2 Dow Jones U.S. Total Stock Market Index.
3 30-day SEC yield for the fund; annualized dividend yield for the indexes. See the Glossary.
4 The expense ratios shown are from the prospectus dated January 27, 2009, and represent estimated costs for the current fiscal year based on the fund’s net assets as of the prospectus date. For the fiscal year ended September 30, 2009, the expense ratios were 0.48% for Investor Shares and 0.31% for Admiral Shares.
5 For an explanation of R-squared, beta, and other terms used here, see the Glossary.
6 The holdings listed exclude any temporary cash investments and equity index products.
15
Morgan Growth Fund
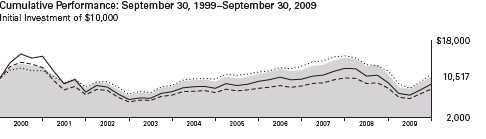
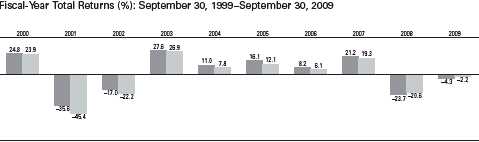
Performance Summary
All of the returns in this report represent past performance, which is not a guarantee of future results that may be achieved by the fund. (Current performance may be lower or higher than the performance data cited. For performance data current to the most recent month-end, visit our website at www.vanguard.com/performance.) Note, too, that both investment returns and principal value can fluctuate widely, so an investor’s shares, when sold, could be worth more or less than their original cost. The returns shown do not reflect taxes that a shareholder would pay on fund distributions or on the sale of fund shares.
| | | | | | | | |
| | | | Average Annual Total Returns | | | Final Value |
| | Periods Ended September 30, 2009 | | $ | of a 10,000 |
| | One Year | | Five Years | | Ten Years | | | Investment |
| Morgan Growth Fund Investor Shares1 | –4.27 | % | 2.16 | % | 0.51 | % | $ | 10,517 |
| Dow Jones U.S. Total Stock Market Index | –5.83 | | 1.93 | | 0.94 | | | 10,978 |
| Russell 3000 Growth Index | –2.19 | | 1.96 | | –2.28 | | | 7,937 |
| Multi-Cap Growth Funds Average2 | –3.19 | | 2.04 | | –1.11 | | | 8,942 |
| |
| | | | | | | | | Final Value |
| | | | | | Since | | $ | of a 100,000 |
| | One Year | | Five Years | | Inception3 | | | Investment |
| Morgan Growth Fund Admiral Shares | –4.09 | % | 2.33 | % | 0.52 | % | $ | 104,465 |
| Dow Jones U.S. Total Stock Market Index | –5.83 | | 1.93 | | 1.12 | | | 109,788 |
| Russell 3000 Growth Index | –2.19 | | 1.96 | | –0.99 | | | 91,964 |
1 Total returns do not include the account service fee that may be applicable to certain accounts with balances below $10,000.
2 Derived from data provided by Lipper Inc.
3 Performance for the fund’s Admiral Shares and comparative standards is calculated since the Admiral Shares’ inception: May 14, 2001.
16
Morgan Growth Fund
Morgan Growth Fund Investor Shares
Russell 3000 Growth Index
Note: See Financial Highlights tables for dividend and capital gains information.
17
Morgan Growth Fund
Financial Statements
Statement of Net Assets
As of September 30, 2009
The fund reports a complete list of its holdings in regulatory filings four times in each fiscal year, at the quarter-ends. For the second and fourth fiscal quarters, the lists appear in the fund’s semiannual and annual reports to shareholders. For the first and third fiscal quarters, the fund files the lists with the Securities and Exchange Commission on Form N-Q. Shareholders can look up the fund’s Forms N-Q on the SEC’s website at www.sec.gov. Forms N-Q may also be reviewed and copied at the SEC’s Public Reference Room (see the back cover of this report for further information).
| | | | | |
| | | | | Market | |
| | | | | Value• | |
| | | Shares | ($ | 000 | ) |
| Common Stocks (96.9%)1 | | | | |
| Consumer Discretionary (12.5%) | | | |
| * | Amazon.com Inc. | 1,000,192 | | 93,378 | |
| | TJX Cos. Inc. | 1,544,337 | | 57,372 | |
| * | Apollo Group Inc. Class A | 710,902 | | 52,372 | |
| * | Starbucks Corp. | 2,035,439 | | 42,032 | |
| | Coach Inc. | 1,168,825 | | 38,478 | |
| | Abercrombie & Fitch Co. | 1,027,383 | | 33,780 | |
| | NIKE Inc. Class B | 501,470 | | 32,445 | |
| | Target Corp. | 628,797 | | 29,352 | |
| | Walt Disney Co. | 965,100 | | 26,502 | |
| | Advance Auto Parts Inc. | 667,292 | | 26,211 | |
| * | Urban Outfitters Inc. | 846,604 | | 25,542 | |
| * | ITT Educational | | | | |
| | Services Inc. | 225,028 | | 24,845 | |
| * | Kohl’s Corp. | 427,850 | | 24,409 | |
| | Best Buy Co. Inc. | 614,238 | | 23,046 | |
| | Guess? Inc. | 621,306 | | 23,013 | |
| * | LKQ Corp. | 1,199,555 | | 22,240 | |
| ^ | Buckle Inc. | 606,748 | | 20,714 | |
| | Scripps Networks | | | | |
| | Interactive Inc. Class A | 535,729 | | 19,795 | |
| * | AutoZone Inc. | 124,947 | | 18,270 | |
| | American Eagle | | | | |
| | Outfitters Inc. | 1,059,450 | | 17,862 | |
| * | Dollar Tree Inc. | 346,000 | | 16,843 | |
| | McDonald’s Corp. | 294,300 | | 16,796 | |
| | DeVry Inc. | 290,910 | | 16,093 | |
| | Omnicom Group Inc. | 432,100 | | 15,962 | |
| | Home Depot Inc. | 547,800 | | 14,593 | |
| * | Penn National Gaming Inc. | 520,200 | | 14,389 | |
| * | Bally Technologies Inc. | 373,001 | | 14,312 | |
| * | Ford Motor Co. | 1,977,900 | | 14,261 | |
| | Yum! Brands Inc. | 355,300 | | 11,995 | |
| * | GameStop Corp. Class A | 451,520 | | 11,952 | |
| * | O’Reilly Automotive Inc. | 327,810 | | 11,847 | |
| * | Bed Bath & Beyond Inc. | 314,400 | | 11,803 | |
| | Service Corp. | | | | |
| | International | 1,645,300 | | 11,534 | |
| * | Tractor Supply Co. | 220,820 | | 10,692 | |
| | Comcast Corp. | 637,734 | | 10,255 | |
| | Ross Stores Inc. | 201,100 | | 9,606 | |
| | | | | |
| | | | | Market | |
| | | | | Value• | |
| | | Shares | ($ | 000 | ) |
| | Gentex Corp. | 610,160 | | 8,634 | |
| | Family Dollar Stores Inc. | 312,400 | | 8,247 | |
| | Comcast Corp. Class A | 468,525 | | 7,913 | |
| | Darden Restaurants Inc. | 209,480 | | 7,150 | |
| | DR Horton Inc. | 505,100 | | 5,763 | |
| | Harman International | | | | |
| | Industries Inc. | 166,900 | | 5,655 | |
| * | DISH Network Corp. | | | | |
| | Class A | 249,900 | | 4,813 | |
| * | WMS Industries Inc. | 96,900 | | 4,318 | |
| | Nordstrom Inc. | 126,465 | | 3,862 | |
| | McGraw-Hill Cos. Inc. | 150,900 | | 3,794 | |
| * | Discovery | | | | |
| | Communications Inc. | | | | |
| | Class A | 130,030 | | 3,757 | |
| | Gap Inc. | 125,300 | | 2,681 | |
| | H&R Block Inc. | 120,400 | | 2,213 | |
| | Lowe’s Cos. Inc. | 93,300 | | 1,954 | |
| * | DIRECTV Group Inc. | 41,200 | | 1,136 | |
| * | NVR Inc. | 700 | | 446 | |
| * | priceline.com Inc. | 1,500 | | 249 | |
| | | | | 937,176 | |
| Consumer Staples (5.5%) | | | | |
| | Philip Morris | | | | |
| | International Inc. | 1,517,727 | | 73,974 | |
| | Colgate-Palmolive Co. | 601,000 | | 45,844 | |
| | Wal-Mart Stores Inc. | 849,300 | | 41,692 | |
| | PepsiCo Inc. | 692,800 | | 40,640 | |
| | Cadbury PLC ADR | 517,400 | | 26,496 | |
| | Costco Wholesale Corp. | 455,300 | | 25,706 | |
| | Procter & Gamble Co. | 420,936 | | 24,381 | |
| | CVS Caremark Corp. | 472,810 | | 16,898 | |
| | Unilever PLC ADR | 571,100 | | 16,379 | |
| * | Central European | | | | |
| | Distribution Corp. | 466,300 | | 15,276 | |
| | Avon Products Inc. | 436,600 | | 14,827 | |
| | Kellogg Co. | 185,100 | | 9,113 | |
| | Coca-Cola Enterprises Inc. | 363,400 | | 7,780 | |
| | Bunge Ltd. | 98,900 | | 6,192 | |
| | Alberto-Culver Co. Class B | 223,400 | | 6,184 | |
| | Sara Lee Corp. | 546,700 | | 6,090 | |
| | General Mills Inc. | 86,900 | | 5,595 | |
18
| | | | | |
| Morgan Growth Fund | | | | |
| |
| |
| |
| | | | | Market | |
| | | | | Value• | |
| | | Shares | ($ | 000 | ) |
| | Clorox Co. | 91,400 | | 5,376 | |
| | Campbell Soup Co. | 154,600 | | 5,043 | |
| * | Dr Pepper | | | | |
| | Snapple \Group Inc. | 163,600 | | 4,704 | |
| | Coca-Cola Co. | 73,078 | | 3,924 | |
| | Walgreen Co. | 82,600 | | 3,095 | |
| | Mead Johnson | | | | |
| | Nutrition Co. Class A | 55,400 | | 2,499 | |
| | Archer-Daniels-Midland Co. | 54,967 | | 1,606 | |
| | | | | 409,314 | |
| Energy (7.6%) | | | | |
| | Occidental | | | | |
| | Petroleum Corp. | 1,170,952 | | 91,803 | |
| | Diamond Offshore | | | | |
| | Drilling Inc. | 441,639 | | 42,185 | |
| | Baker Hughes Inc. | 965,885 | | 41,205 | |
| | Smith International Inc. | 1,310,321 | | 37,606 | |
| * | Weatherford | | | | |
| | International Ltd. | 1,689,490 | | 35,023 | |
| | Noble Energy Inc. | 467,386 | | 30,829 | |
| * | Southwestern Energy Co. | 687,980 | | 29,363 | |
| * | Oceaneering | | | | |
| | International Inc. | 484,985 | | 27,523 | |
| | Schlumberger Ltd. | 442,500 | | 26,373 | |
| * | Transocean Ltd. | 302,729 | | 25,892 | |
| | Petroleo Brasileiro SA ADR | 491,300 | | 22,551 | |
| * | Continental Resources Inc. | 455,900 | | 17,858 | |
| * | Cameron | | | | |
| | International Corp. | 334,900 | | 12,666 | |
| * | Ultra Petroleum Corp. | 255,500 | | 12,509 | |
| * | PetroHawk Energy Corp. | 483,980 | | 11,717 | |
| * | National Oilwell Varco Inc. | 259,900 | | 11,209 | |
| | Peabody Energy Corp. | 270,500 | | 10,068 | |
| * | Pride International Inc. | 287,700 | | 8,758 | |
| | Murphy Oil Corp. | 149,900 | | 8,630 | |
| | Noble Corp. | 217,800 | | 8,268 | |
| | Core Laboratories NV | 73,920 | | 7,620 | |
| | ENSCO International Inc. | 173,951 | | 7,400 | |
| | XTO Energy Inc. | 166,050 | | 6,861 | |
| *,^ | InterOil Corp. | 173,900 | | 6,831 | |
| | Tidewater Inc. | 117,700 | | 5,543 | |
| * | Denbury Resources Inc. | 358,200 | | 5,420 | |
| | Consol Energy Inc. | 90,700 | | 4,091 | |
| * | FMC Technologies Inc. | 78,300 | | 4,090 | |
| | Cabot Oil & Gas Corp. | 109,400 | | 3,911 | |
| | Frontier Oil Corp. | 209,000 | | 2,909 | |
| | Helmerich & Payne Inc. | 39,400 | | 1,557 | |
| | | | | 568,269 | |
| Exchange-Traded Fund (0.7%) | | | | |
| ^,2 | Vanguard Growth ETF | 1,044,900 | | 51,493 | |
| |
| Financials (6.5%) | | | | |
| | Goldman Sachs Group Inc. | 601,835 | | 110,948 | |
| | Itau Unibanco | | | | |
| | Holding SA ADR | 1,896,823 | | 38,221 | |
| | Wells Fargo & Co. | 1,163,326 | | 32,783 | |
| | State Street Corp. | 557,782 | | 29,339 | |
| | Bank of America Corp. | 1,618,309 | | 27,382 | |
| | | | | |
| | | | | Market | |
| | | | | Value• | |
| | | Shares | ($ | 000 | ) |
| | Lincoln National Corp. | 1,033,272 | | 26,772 | |
| | JPMorgan Chase & Co. | 591,700 | | 25,928 | |
| | Franklin Resources Inc. | 205,900 | | 20,714 | |
| | Morgan Stanley | 642,055 | | 19,827 | |
| | Raymond James | | | | |
| | Financial Inc. | 696,600 | | 16,217 | |
| | Northern Trust Corp. | 233,100 | | 13,557 | |
| | SEI Investments Co. | 661,780 | | 13,024 | |
| * | Affiliated Managers | | | | |
| | Group Inc. | 196,400 | | 12,768 | |
| | Everest Re Group Ltd. | 144,000 | | 12,629 | |
| | Invesco Ltd. | 446,300 | | 10,158 | |
| | T Rowe Price Group Inc. | 189,900 | | 8,678 | |
| | Aflac Inc. | 200,100 | | 8,552 | |
| | Hudson City Bancorp Inc. | 579,500 | | 7,620 | |
| * | TD Ameritrade | | | | |
| | Holding Corp. | 373,600 | | 7,330 | |
| | Annaly Capital | | | | |
| | Management Inc. | 398,200 | | 7,223 | |
| | Principal Financial | | | | |
| | Group Inc. | 226,300 | | 6,198 | |
| | Charles Schwab Corp. | 305,055 | | 5,842 | |
| | BlackRock Inc. | 21,800 | | 4,727 | |
| | US Bancorp | 191,000 | | 4,175 | |
| | Legg Mason Inc. | 131,700 | | 4,087 | |
| * | Berkshire Hathaway Inc. | | | | |
| | Class B | 1,019 | | 3,386 | |
| * | St Joe Co. | 66,700 | | 1,942 | |
| | Public Storage | 17,500 | | 1,317 | |
| * | Jefferies Group Inc. | 46,100 | | 1,255 | |
| | | | | 482,599 | |
| Health Care (12.1%) | | | | |
| * | Medco Health | | | | |
| | Solutions Inc. | 1,105,200 | | 61,129 | |
| | Baxter International Inc. | 918,072 | | 52,339 | |
| * | Gilead Sciences Inc. | 1,118,500 | | 52,100 | |
| | Eli Lilly & Co. | 1,489,793 | | 49,208 | |
| | Medtronic Inc. | 1,196,862 | | 44,045 | |
| | Teva Pharmaceutical | | | | |
| | Industries Ltd. ADR | 837,600 | | 42,349 | |
| | Abbott Laboratories | 822,330 | | 40,681 | |
| * | Mylan Inc. | 2,153,700 | | 34,481 | |
| | Alcon Inc. | 244,000 | | 33,835 | |
| | Roche Holding AG ADR | 781,300 | | 31,693 | |
| | CR Bard Inc. | 355,761 | | 27,966 | |
| * | Celgene Corp. | 495,200 | | 27,682 | |
| * | Amgen Inc. | 431,200 | | 25,971 | |
| | Johnson & Johnson | 383,600 | | 23,357 | |
| | AstraZeneca PLC ADR | 417,773 | | 18,779 | |
| * | Psychiatric Solutions Inc. | 639,968 | | 17,126 | |
| * | Express Scripts Inc. | 216,270 | | 16,778 | |
| * | Vertex Pharmaceuticals Inc. | 435,800 | | 16,517 | |
| * | Varian Medical Systems Inc. | 391,696 | | 16,502 | |
| *,^ | QIAGEN NV | 732,000 | | 15,577 | |
| * | ResMed Inc. | 313,600 | | 14,175 | |
| * | Hospira Inc. | 303,407 | | 13,532 | |
| * | Covance Inc. | 244,800 | | 13,256 | |
19
| | | | | |
| Morgan Growth Fund | | | | |
| |
| |
| |
| | | | | Market | |
| | | | | Value• | |
| | | Shares | ($ | 000 | ) |
| * | Thermo Fisher | | | | |
| | Scientific Inc. | 293,400 | | 12,813 | |
| * | Life Technologies Corp. | 267,887 | | 12,470 | |
| | Beckman Coulter Inc. | 172,400 | | 11,885 | |
| * | Biogen Idec Inc. | 202,800 | | 10,245 | |
| | Cooper Cos. Inc. | 337,280 | | 10,027 | |
| | UnitedHealth Group Inc. | 389,200 | | 9,746 | |
| * | Intuitive Surgical Inc. | 35,160 | | 9,221 | |
| | Schering-Plough Corp. | 324,720 | | 9,173 | |
| | Quest Diagnostics Inc. | 175,400 | | 9,154 | |
| * | VCA Antech Inc. | 334,200 | | 8,987 | |
| | McKesson Corp. | 147,800 | | 8,802 | |
| * | Cephalon Inc. | 150,280 | | 8,752 | |
| * | Patterson Cos. Inc. | 319,900 | | 8,717 | |
| * | Idexx Laboratories Inc. | 174,000 | | 8,700 | |
| * | Watson | | | | |
| | Pharmaceuticals Inc. | 200,200 | | 7,335 | |
| * | ICON PLC ADR | 288,560 | | 7,067 | |
| * | Laboratory Corp. of | | | | |
| | America Holdings | 101,700 | | 6,682 | |
| * | Edwards Lifesciences Corp. | 87,500 | | 6,117 | |
| * | St Jude Medical Inc. | 156,800 | | 6,117 | |
| * | DaVita Inc. | 107,700 | | 6,100 | |
| * | Lincare Holdings Inc. | 188,300 | | 5,884 | |
| * | Genzyme Corp. | 101,393 | | 5,752 | |
| * | Catalyst Health | | | | |
| | Solutions Inc. | 169,263 | | 4,934 | |
| * | Amylin | | | | |
| | Pharmaceuticals Inc. | 344,200 | | 4,712 | |
| * | Millipore Corp. | 65,317 | | 4,594 | |
| | Techne Corp. | 64,200 | | 4,016 | |
| * | Eclipsys Corp. | 191,500 | | 3,696 | |
| * | Warner Chilcott PLC | | | | |
| | Class A | 163,100 | | 3,526 | |
| * | Myriad Genetics Inc. | 125,200 | | 3,430 | |
| | | | | 907,732 | |
| Industrials (9.1%) | | | | |
| | Caterpillar Inc. | 1,327,516 | | 68,141 | |
| | Joy Global Inc. | 973,484 | | 47,642 | |
| | Dover Corp. | 1,060,045 | | 41,087 | |
| | Fluor Corp. | 783,427 | | 39,837 | |
| | Raytheon Co. | 789,009 | | 37,849 | |
| | Emerson Electric Co. | 893,699 | | 35,819 | |
| | Illinois Tool Works Inc. | 788,001 | | 33,655 | |
| | Cummins Inc. | 727,201 | | 32,586 | |
| | Boeing Co. | 534,133 | | 28,923 | |
| | Parker Hannifin Corp. | 438,882 | | 22,752 | |
| | AMETEK Inc. | 511,894 | | 17,870 | |
| | CH Robinson | | | | |
| | Worldwide Inc. | 290,630 | | 16,784 | |
| * | Corrections Corp. | | | | |
| | of America | 705,600 | | 15,982 | |
| | Pall Corp. | 485,952 | | 15,687 | |
| | Lockheed Martin Corp. | 185,700 | | 14,499 | |
| | Fastenal Co. | 372,350 | | 14,410 | |
| | Union Pacific Corp. | 229,200 | | 13,374 | |
| | United Parcel Service Inc. | | | | |
| | Class B | 233,200 | | 13,169 | |
| | | | | |
| | | | | Market | |
| | | | | Value• | |
| | | Shares | ($ | 000 | ) |
| * | Aecom Technology Corp. | 441,300 | | 11,977 | |
| ^ | Ritchie Bros | | | | |
| | Auctioneers Inc. | 477,975 | | 11,729 | |
| | Republic Services Inc. | | | | |
| | Class A | 410,600 | | 10,910 | |
| * | IHS Inc. Class A | 205,350 | | 10,500 | |
| | Expeditors International | | | | |
| | of Washington Inc. | 273,400 | | 9,610 | |
| * | McDermott | | | | |
| | International Inc. | 375,300 | | 9,484 | |
| * | Foster Wheeler AG | 289,740 | | 9,246 | |
| * | Stericycle Inc. | 186,900 | | 9,055 | |
| | MSC Industrial Direct Co. | | | | |
| | Class A | 172,800 | | 7,531 | |
| | Goodrich Corp. | 137,300 | | 7,461 | |
| | AO Smith Corp. | 183,839 | | 7,004 | |
| | ITT Corp. | 130,200 | | 6,790 | |
| | Flowserve Corp. | 63,900 | | 6,297 | |
| | Chicago Bridge & | | | | |
| | Iron Co. NV | 333,100 | | 6,222 | |
| * | HUB Group Inc. Class A | 266,862 | | 6,098 | |
| | Burlington Northern | | | | |
| | Santa Fe Corp. | 69,500 | | 5,548 | |
| * | Navistar International Corp. | 128,547 | | 4,810 | |
| | Ingersoll-Rand PLC | 147,070 | | 4,511 | |
| | Precision Castparts Corp. | 36,700 | | 3,739 | |
| * | Hertz Global Holdings Inc. | 335,600 | | 3,635 | |
| | Dun & Bradstreet Corp. | 41,480 | | 3,124 | |
| | Honeywell International Inc. | 79,000 | | 2,935 | |
| * | Shaw Group Inc. | 90,600 | | 2,907 | |
| | L-3 Communications | | | | |
| | Holdings Inc. | 32,300 | | 2,594 | |
| * | Jacobs Engineering | | | | |
| | Group Inc. | 54,900 | | 2,523 | |
| | Pitney Bowes Inc. | 81,700 | | 2,030 | |
| | United Technologies Corp. | 31,600 | | 1,925 | |
| * | Alliant Techsystems Inc. | 22,000 | | 1,713 | |
| * | Iron Mountain Inc. | 19,600 | | 523 | |
| | | | | 682,497 | |
| Information Technology (38.5%) | | | |
| * | Cisco Systems Inc. | 9,978,121 | | 234,885 | |
| | Microsoft Corp. | 8,970,096 | | 232,236 | |
| * | Apple Inc. | 1,189,873 | | 220,567 | |
| * | Google Inc. Class A | 354,757 | | 175,906 | |
| | International Business | | | | |
| | Machines Corp. | 1,367,959 | | 163,622 | |
| | Oracle Corp. | 6,485,949 | | 135,167 | |
| | QUALCOMM Inc. | 2,927,329 | | 131,671 | |
| * | NetApp Inc. | 4,913,968 | | 131,105 | |
| | Hewlett-Packard Co. | 1,518,600 | | 71,693 | |
| | Altera Corp. | 3,382,220 | | 69,369 | |
| * | EMC Corp. | 3,954,207 | | 67,380 | |
| | Intel Corp. | 3,208,438 | | 62,789 | |
| * | QLogic Corp. | 3,480,777 | | 59,869 | |
| | Xilinx Inc. | 2,229,658 | | 52,219 | |
| * | Juniper Networks Inc. | 1,797,553 | | 48,570 | |
| | Texas Instruments Inc. | 1,994,056 | | 47,239 | |
| * | BMC Software Inc. | 1,255,352 | | 47,113 | |
20
| | | | | |
| Morgan Growth Fund | | | | |
| |
| |
| |
| | | | | Market | |
| | | | | Value• | |
| | | Shares | ($ | 000 | ) |
| | Visa Inc. Class A | 672,286 | | 46,462 | |
| | Mastercard Inc. Class A | 199,090 | | 40,246 | |
| * | Cognizant Technology | | | | |
| | Solutions Corp. Class A | 1,031,830 | | 39,891 | |
| * | Sohu.com Inc. | 479,191 | | 32,959 | |
| | Analog Devices Inc. | 1,108,341 | | 30,568 | |
| * | eBay Inc. | 1,286,652 | | 30,378 | |
| | Western Union Co. | 1,587,368 | | 30,033 | |
| * | Adobe Systems Inc. | 890,100 | | 29,409 | |
| * | Check Point | | | | |
| | Software Technologies | 964,555 | | 27,345 | |
| * | Activision Blizzard Inc. | 2,149,290 | | 26,630 | |
| *,^ | Alliance Data | | | | |
| | Systems Corp. | 426,230 | | 26,034 | |
| * | Emulex Corp. | 2,416,496 | | 24,866 | |
| * | Hewitt Associates Inc. | | | | |
| | Class A | 666,887 | | 24,295 | |
| * | Teradata Corp. | 876,909 | | 24,133 | |
| * | Agilent Technologies Inc. | 814,300 | | 22,662 | |
| * | Western Digital Corp. | 572,600 | | 20,917 | |
| * | Riverbed Technology Inc. | 936,252 | | 20,560 | |
| * | Equinix Inc. | 210,900 | | 19,403 | |
| | Intersil Corp. Class A | 1,207,585 | | 18,488 | |
| * | Marvell Technology | | | | |
| | Group Ltd. | 1,132,000 | | 18,327 | |
| * | Microsemi Corp. | 1,088,400 | | 17,186 | |
| * | Netease.com ADR | 370,012 | | 16,902 | |
| * | Skyworks Solutions Inc. | 1,244,300 | | 16,474 | |
| * | Dell Inc. | 1,054,498 | | 16,092 | |
| | Amphenol Corp. Class A | 422,600 | | 15,924 | |
| * | Baidu Inc. ADR | 39,800 | | 15,564 | |
| *,^ | Shanda Interactive | | | | |
| | Entertainment Ltd. ADR | 298,145 | | 15,265 | |
| * | Longtop Financial | | | | |
| | Technologies Ltd. ADR | 515,728 | | 14,678 | |
| | Automatic Data | | | | |
| | Processing Inc. | 337,600 | | 13,268 | |
| * | McAfee Inc. | 285,400 | | 12,498 | |
| * | F5 Networks Inc. | 307,500 | | 12,186 | |
| * | CommScope Inc. | 400,700 | | 11,993 | |
| | Fidelity National | | | | |
| | Information Services Inc. | 424,980 | | 10,841 | |
| * | NeuStar Inc. Class A | 465,750 | | 10,526 | |
| * | Broadcom Corp. Class A | 306,200 | | 9,397 | |
| * | Rovi Corp. | 266,020 | | 8,938 | |
| | Motorola Inc. | 1,026,012 | | 8,813 | |
| * | Sybase Inc. | 225,100 | | 8,756 | |
| | Applied Materials Inc. | 653,160 | | 8,752 | |
| | Tyco Electronics Ltd. | 386,888 | | 8,620 | |
| * | Amdocs Ltd. | 314,700 | | 8,459 | |
| * | Tellabs Inc. | 1,147,840 | | 7,943 | |
| * | Nuance | | | | |
| | Communications Inc. | 516,040 | | 7,720 | |
| ^ | Giant Interactive | | | | |
| | Group Inc. ADR | 1,009,249 | | 7,640 | |
| * | FLIR Systems Inc. | 271,900 | | 7,605 | |
| * | ANSYS Inc. | 197,700 | | 7,408 | |
| | | | | |
| | | | | Market | |
| | | | | Value• | |
| | | Shares | ($ | 000 | ) |
| * | Concur Technologies Inc. | 183,700 | | 7,304 | |
| | CA Inc. | 328,000 | | 7,213 | |
| | Jabil Circuit Inc. | 528,363 | | 7,085 | |
| * | Symantec Corp. | 406,900 | | 6,702 | |
| * | Intuit Inc. | 217,000 | | 6,184 | |
| | Adtran Inc. | 249,500 | | 6,125 | |
| | Seagate Technology | 401,200 | | 6,102 | |
| | Factset Research | | | | |
| | Systems Inc. | 78,100 | | 5,173 | |
| * | Polycom Inc. | 190,420 | | 5,094 | |
| | Linear Technology Corp. | 183,900 | | 5,081 | |
| | Global Payments Inc. | 83,900 | | 3,918 | |
| | Broadridge Financial | | | | |
| | Solutions Inc. | 178,400 | | 3,586 | |
| * | Accenture PLC Class A | 76,844 | | 2,864 | |
| * | ON Semiconductor Corp. | 341,300 | | 2,816 | |
| * | Dolby Laboratories Inc. | | | | |
| | Class A | 59,400 | | 2,268 | |
| * | Affiliated Computer | | | | |
| | Services Inc. Class A | 26,400 | | 1,430 | |
| * | NCR Corp. | 76,700 | | 1,060 | |
| | | | | 2,884,459 | |
| Materials (3.5%) | | | | |
| | Nucor Corp. | 960,784 | | 45,166 | |
| | Monsanto Co. | 321,357 | | 24,873 | |
| | Celanese Corp. Class A | 965,300 | | 24,133 | |
| * | Crown Holdings Inc. | 832,000 | | 22,630 | |
| | Albemarle Corp. | 643,500 | | 22,265 | |
| | FMC Corp. | 388,192 | | 21,836 | |
| | Praxair Inc. | 251,000 | | 20,504 | |
| | Airgas Inc. | 395,650 | | 19,138 | |
| | Newmont Mining Corp. | 332,100 | | 14,619 | |
| | Barrick Gold Corp. | 380,572 | | 14,424 | |
| | Freeport-McMoRan | | | | |
| | Copper & Gold Inc. | 157,600 | | 10,813 | |
| | Mosaic Co. | 170,679 | | 8,205 | |
| * | Owens-Illinois Inc. | 177,800 | | 6,561 | |
| | Ecolab Inc. | 115,400 | | 5,335 | |
| * | Pactiv Corp. | 107,000 | | 2,787 | |
| | CF Industries Holdings Inc. | 9,200 | | 793 | |
| | | | | 264,082 | |
| Telecommunication Services (0.8%) | | | |
| * | American Tower Corp. | | | | |
| | Class A | 1,230,400 | | 44,787 | |
| | Brasil Telecom SA ADR | 485,428 | | 12,776 | |
| * | MetroPCS | | | | |
| | Communications Inc. | 159,120 | | 1,489 | |
| | | | | 59,052 | |
| Utilities (0.1%) | | | | |
| * | AES Corp. | 483,700 | | 7,168 | |
| * | NRG Energy Inc. | 108,000 | | 3,045 | |
| | | | | 10,213 | |
| Total Common Stocks | | | | |
| (Cost $6,294,267) | | | 7,256,886 | |
21
| | | | | | | |
| Morgan Growth Fund | | | | | | | |
| |
| |
| |
| | | | | | | Market | |
| | | | | | | Value• | |
| | | | Shares | | ($ | 000 | ) |
| Temporary Cash Investments (4.1%)1 | | | | |
| Money Market Fund (3.6%) | | | | |
| 3,4 Vanguard Market | | | | | | | |
| Liquidity Fund, | | | | | | | |
| 0.267 | % | | 267,697,208 | | | 267,697 | |
| |
| | | | Face | | | | |
| | | | Amount | | | | |
| | | ($ | 000 | ) | | | |
| Repurchase Agreement (0.1%) | | | | |
| Banc of America | | | | | | | |
| Securities, LLC | | | | | | | |
| 0.060%, 10/1/09 | | | | | | | |
| (Dated 9/30/09, | | | | | | | |
| Repurchase Value | | | | | | | |
| by Federal National $9,300,000, collateralized | | | | |
| Mortgage Assn. 5.500%,3/1/35) | | | 9,300 | | | 9,300 | |
| | | | | | | |
| | | |
| U.S. Government and Agency Obligations (0.4%) |
| 5,6 | Federal Home Loan Bank | | |
| | Discount Notes 0.220%, | | |
| | 3/26/10 | 15,000 | 14,986 |
| 5,6 | Federal Home Loan Bank | | |
| | Discount Notes | | |
| | 0.275%, 2/19/10 | 8,000 | 7,995 |
| 5,6 | Freddie Mac Discount Notes | | |
| | 0.260%, 12/22/09 | 5,000 | 4,999 |
| 5,6 | Freddie Mac Discount Notes | | |
| | 0.220%, 03/22/10 | 2,000 | 1,998 |
| | | | 29,978 |
| Total Temporary Cash Investments | |
| (Cost $306,967) | | 306,975 |
| | | |
| | | Market | |
| | | Value• | |
| | ($ | 000 | ) |
| Total Investments (101.0%) | | | |
| (Cost $6,601,234) | | 7,563,861 | |
| Other Assets and Liabilities (–1.0%) | | | |
| Other Assets | | 101,293 | |
| Liabilities4 | | (175,171 | ) |
| | | (73,878 | ) |
| Net Assets (100%) | | 7,489,983 | |
At September 30, 2009, net assets consisted of:
| | | |
| | Amount | |
| | ($ | 000 | ) |
| Paid-in Capital | | 8,889,819 | |
| Undistributed Net Investment Income | | 27,851 | |
| Accumulated Net Realized Losses | | (2,395,994 | ) |
| Unrealized Appreciation (Depreciation) | | | |
| Investment Securities | | 962,627 | |
| Futures Contracts | | 5,673 | |
| Foreign Currencies | | 7 | |
| Net Assets | | 7,489,983 | |
| |
| |
| Investor Shares—Net Assets | | | |
| Applicable to 365,935,186 outstanding | | | |
| $.001 par value shares of beneficial | | | |
| interest (unlimited authorization) | | 5,239,183 | |
| Net Asset Value Per Share— | | | |
| Investor Shares | $ | 14.32 | |
| |
| |
| Admiral Shares—Net Assets | | | |
| Applicable to 50,676,215 outstanding | | | |
| $.001 par value shares of beneficial | | | |
| interest (unlimited authorization) | | 2,250,800 | |
| Net Asset Value Per Share— | | | |
| Admiral Shares | $ | 44.42 | |
• See Note A in Notes to Financial Statements.
* Non-income-producing security.
^ Part of security position is on loan to broker-dealers. The total value of securities on loan is $65,964,000.
1 The fund invests a portion of its cash reserves in equity markets through the use of index futures contracts. After giving effect to futures investments, the fund’s effective common stock and temporary cash investment positions represent 99.1% and 1.9%, respectively, of net assets.
2 Considered an affiliated company of the fund as the issuer is another member of The Vanguard Group.
3 Affiliated money market fund available only to Vanguard funds and certain trusts and accounts managed by Vanguard. Rate shown is the 7-day yield.
4 Includes $68,512,000 of collateral received for securities on loan.
5 The issuer operates under a congressional charter; its securities are not backed by the full faith and credit of the U.S. government. 6 Securities with a value of $29,978,000 have been segregated as initial margin for open futures contracts.
ADR—American Depositary Receipt.
See accompanying Notes, which are an integral part of the Financial Statements.
22
| | | |
| Morgan Growth Fund | | | |
| |
| |
| Statement of Operations | | | |
| |
| | | Year Ended | |
| | | September 30, 2009 | |
| | ($ | 000 | ) |
| Investment Income | | | |
| Income | | | |
| Dividends1,2 | | 84,646 | |
| Interest2 | | 2,353 | |
| Security Lending | | 2,257 | |
| Total Income | | 89,256 | |
| Expenses | | | |
| Investment Advisory Fees—Note B | | | |
| Basic Fee | | 9,308 | |
| Performance Adjustment | | 1,224 | |
| The Vanguard Group—Note C | | | |
| Management and Administrative—Investor Shares | | 11,975 | |
| Management and Administrative—Admiral Shares | | 2,106 | |
| Marketing and Distribution—Investor Shares | | 1,335 | |
| Marketing and Distribution—Admiral Shares | | 659 | |
| Custodian Fees | | 113 | |
| Auditing Fees | | 27 | |
| Shareholders’ Reports and Proxies—Investor Shares | | 320 | |
| Shareholders’ Reports and Proxies—Admiral Shares | | 59 | |
| Trustees’ Fees and Expenses | | 14 | |
| Total Expenses | | 27,140 | |
| Expenses Paid Indirectly | | (451 | ) |
| Net Expenses | | 26,689 | |
| Net Investment Income | | 62,567 | |
| Realized Net Gain (Loss) | | | |
| Investment Securities Sold2 | | (1,929,343 | ) |
| Futures Contracts | | (65,841 | ) |
| Foreign Currencies | | (209 | ) |
| Realized Net Gain (Loss) | | (1,995,393 | ) |
| Change in Unrealized Appreciation (Depreciation) | | | |
| Investment Securities | | 1,565,926 | |
| Futures Contracts | | 25,969 | |
| Foreign Currencies | | (6 | ) |
| Change in Unrealized Appreciation (Depreciation) | | 1,591,889 | |
| Net Increase (Decrease) in Net Assets Resulting from Operations | | (340,937 | ) |
| 1 | Dividends are net of foreign withholding taxes of $496,000. |
| 2 | Dividend income, interest income, and realized net gain (loss) from affiliated companies of the fund were $630,000, $1,922,000, and $0, respectively. |
See accompanying Notes, which are an integral part of the Financial Statements.
23
| | | | | | |
| Morgan Growth Fund | | | | | | |
| |
| |
| Statement of Changes in Net Assets | | | | | | |
| |
| | | Year Ended September 30, | |
| | | 2009 | | | 2008 | |
| | ($ | 000 | ) | ($ | 000 | ) |
| Increase (Decrease) in Net Assets | | | | | | |
| Operations | | | | | | |
| Net Investment Income | | 62,567 | | | 78,392 | |
| Realized Net Gain (Loss) | | (1,995,393 | ) | | (302,261 | ) |
| Change in Unrealized Appreciation (Depreciation) | | 1,591,889 | | | (2,160,476 | ) |
| Net Increase (Decrease) in Net Assets Resulting from Operations | | (340,937 | ) | | (2,384,345 | ) |
| Distributions | | | | | | |
| Net Investment Income | | | | | | |
| Investor Shares | | (50,414 | ) | | (54,791 | ) |
| Admiral Shares | | (27,239 | ) | | (27,586 | ) |
| Realized Capital Gain1 | | | | | | |
| Investor Shares | | — | | | (426,117 | ) |
| Admiral Shares | | — | | | (181,607 | ) |
| Total Distributions | | (77,653 | ) | | (690,101 | ) |
| Capital Share Transactions | | | | | | |
| Investor Shares | | 96,224 | | | 949,252 | |
| Admiral Shares | | (117,934 | ) | | 782,658 | |
| Net Increase (Decrease) from Capital Share Transactions | | (21,710 | ) | | 1,731,910 | |
| Total Increase (Decrease) | | (440,300 | ) | | (1,342,536 | ) |
| Net Assets | | | | | | |
| Beginning of Period | | 7,930,283 | | | 9,272,819 | |
| End of Period2 | | 7,489,983 | | | 7,930,283 | |
| 1 | Includes fiscal 2008 short-term gain distributions totaling $172,806,000. Short-term gain distributions are treated as ordinary income dividends for tax purposes. |
| 2 | Net Assets—End of Period includes undistributed net investment income of $27,851,000 and $43,146,000. |
See accompanying Notes, which are an integral part of the Financial Statements.
24
| | | | | | | | | | | | | | | |
| Morgan Growth Fund | | | | | | | | | | | | | | | |
| |
| |
| Financial Highlights | | | | | | | | | | | | | | | |
| |
| |
| Investor Shares | | | | | | | | | | | | | | | |
| |
| For a Share Outstanding | | | | | | | | Year Ended September 30, | |
| Throughout Each Period | | 2009 | | | 2008 | | | 2007 | | | 2006 | | | 2005 | |
| Net Asset Value, Beginning of Period | $ | 15.15 | | $ | 21.45 | | $ | 18.34 | | $ | 17.04 | | $ | 14.77 | |
| Investment Operations | | | | | | | | | | | | | | | |
| Net Investment Income | | .114 | | | .148 | | | .207 | | | .165 | | | .129 | |
| Net Realized and Unrealized Gain (Loss) | | | | | | | | | | | | | | | |
| on Investments | | (.804 | ) | | (4.912 | ) | | 3.604 | | | 1.230 | | | 2.246 | |
| Total from Investment Operations | | (.690 | ) | | (4.764 | ) | | 3.811 | | | 1.395 | | | 2.375 | |
| Distributions | | | | | | | | | | | | | | | |
| Dividends from Net Investment Income | | (.140 | ) | | (.175 | ) | | (.204 | ) | | (.095 | ) | | (.105 | ) |
| Distributions from Realized Capital Gains | | — | | | (1.361 | ) | | (.497 | ) | | — | | | — | |
| Total Distributions | | (.140 | ) | | (1.536 | ) | | (.701 | ) | | (.095 | ) | | (.105 | ) |
| Net Asset Value, End of Period | $ | 14.32 | | $ | 15.15 | | $ | 21.45 | | $ | 18.34 | | $ | 17.04 | |
| |
| Total Return1 | | –4.27 | % | | –23.70 | % | | 21.24 | % | | 8.20 | % | | 16.12 | % |
| |
| Ratios/Supplemental Data�� | | | | | | | | | | | | | | | |
| Net Assets, End of Period (Millions) | $ | 5,239 | | $ | 5,418 | | $ | 6,590 | | $ | 5,171 | | $ | 4,539 | |
| Ratio of Total Expenses to | | | | | | | | | | | | | | | |
| Average Net Assets2 | | 0.48 | % | | 0.38 | % | | 0.37 | % | | 0.42 | % | | 0.41 | % |
| Ratio of Net Investment Income to | | | | | | | | | | | | | | | |
| Average Net Assets | | 0.94 | % | | 0.80 | % | | 1.06 | % | | 0.95 | % | | 0.82 | % |
| Portfolio Turnover Rate | | 87 | % | | 88 | % | | 79 | % | | 90 | % | | 88 | % |
| 1 | Total returns do not include the account service fee that may be applicable to certain accounts with balances below $10,000. |
| 2 | Includes performance-based investment advisory fee increases (decreases) of 0.02%, 0.00%, 0.00%, 0.02%, and 0.00%. |
See accompanying Notes, which are an integral part of the Financial Statements.
25
| | | | | | | | | | | | | | | |
| Morgan Growth Fund | | | | | | | | | | | | | | | |
| |
| |
| Financial Highlights | | | | | | | | | | | | | | | |
| |
| |
| Admiral Shares | | | | | | | | | | | | | | | |
| |
| For a Share Outstanding | | | | | | | | Year Ended September 30, | |
| Throughout Each Period | | 2009 | | | 2008 | | | 2007 | | | 2006 | | | 2005 | |
| Net Asset Value, Beginning of Period | $ | 47.03 | | $ | 66.58 | | $ | 56.94 | | $ | 52.91 | | $ | 45.84 | |
| Investment Operations | | | | | | | | | | | | | | | |
| Net Investment Income | | .414 | | | .555 | | | .742 | | | .620 | | | .500 | |
| Net Realized and Unrealized Gain (Loss) | | | | | | | | | | | | | | | |
| on Investments | | (2.502 | ) | | (15.244 | ) | | 11.184 | | | 3.808 | | | 6.956 | |
| Total from Investment Operations | | (2.088 | ) | | (14.689 | ) | | 11.926 | | | 4.428 | | | 7.456 | |
| Distributions | | | | | | | | | | | | | | | |
| Dividends from Net Investment Income | | (.522 | ) | | (.641 | ) | | (.745 | ) | | (.398 | ) | | (.386 | ) |
| Distributions from Realized Capital Gains | | — | | | (4.220 | ) | | (1.541 | ) | | — | | | — | |
| Total Distributions | | (.522 | ) | | (4.861 | ) | | (2.286 | ) | | (.398 | ) | | (.386 | ) |
| Net Asset Value, End of Period | $ | 44.42 | | $ | 47.03 | | $ | 66.58 | | $ | 56.94 | | $ | 52.91 | |
| |
| Total Return | | –4.09 | % | | –23.57 | % | | 21.43 | % | | 8.39 | % | | 16.32 | % |
| |
| Ratios/Supplemental Data | | | | | | | | | | | | | | | |
| Net Assets, End of Period (Millions) | $ | 2,251 | | $ | 2,512 | | $ | 2,683 | | $ | 1,691 | | $ | 1,110 | |
| Ratio of Total Expenses to | | | | | | | | | | | | | | | |
| Average Net Assets1 | | 0.31 | % | | 0.21 | % | | 0.21 | % | | 0.23 | % | | 0.24 | % |
| Ratio of Net Investment Income to | | | | | | | | | | | | | | | |
| Average Net Assets | | 1.11 | % | | 0.97 | % | | 1.22 | % | | 1.14 | % | | 0.96 | % |
| Portfolio Turnover Rate | | 87 | % | | 88 | % | | 79 | % | | 90 | % | | 88 | % |
| 1 Includes performance-based investment advisory fee increases (decreases) of 0.02%, 0.00%, 0.00%, 0.02%, and 0.00%. | | | | |
See accompanying Notes, which are an integral part of the Financial Statements.
26
Morgan Growth Fund
Notes to Financial Statements
Vanguard Morgan Growth Fund is registered under the Investment Company Act of 1940 as an open-end investment company, or mutual fund. The fund offers two classes of shares, Investor Shares and Admiral Shares. Investor Shares are available to any investor who meets the fund’s minimum purchase requirements. Admiral Shares are designed for investors who meet certain administrative, service, tenure, and account-size criteria.
A. The following significant accounting policies conform to generally accepted accounting principles for U.S. mutual funds. The fund consistently follows such policies in preparing its financial statements.
1. Security Valuation: Securities are valued as of the close of trading on the New York Stock Exchange
(generally 4 p.m., Eastern time) on the valuation date. Equity securities are valued at the latest quoted sales prices or official closing prices taken from the primary market in which each security trades; such securities not traded on the valuation date are valued at the mean of the latest quoted bid and asked prices. Securities for which market quotations are not readily available, or whose values have been affected by events occurring before the fund’s pricing time but after the close of the securities’ primary markets, are valued at their fair values calculated according to procedures adopted by the board of trustees. These procedures include obtaining quotations from an independent pricing service, monitoring news to identify significant market- or security-specific events, and evaluating changes in the values of foreign market proxies (for example, ADRs, futures contracts, or exchange-traded funds), between the time the foreign markets close and the fund’s pricing time. When fair-value pricing is employed, the prices of securities used by a fund to calculate its net asset value may differ from quoted or published prices for the same securities. Investments in Vanguard Market Liquidity Fund are valued at that fund’s net asset value. Temporary cash investments acquired over 60 days to maturity are valued using the latest bid prices or using valuations based on a matrix system (which considers such factors as security prices, yields, maturities, and ratings), both as furnished by independent pricing services. Other temporary cash investments are valued at amortized cost, which approximates market value.
2. Foreign Currency: Securities and other assets and liabilities denominated in foreign currencies are translated into U.S. dollars using exchange rates obtained from an independent third party as of the fund’s pricing time on the valuation date. Realized gains (losses) and unrealized appreciation (depreciation) on investment securities include the effects of changes in exchange rates since the securities were purchased, combined with the effects of changes in security prices. Fluctuations in the value of other assets and liabilities resulting from changes in exchange rates are recorded as unrealized foreign currency gains (losses) until the assets or liabilities are settled in cash, at which time they are recorded as realized foreign currency gains (losses).
3. Futures Contracts: The fund uses index futures contracts to a limited extent, with the objective of maintaining full exposure to the stock market while maintaining liquidity. The fund may purchase or sell futures contracts to achieve a desired level of investment, whether to accommodate portfolio turnover or cash flows from capital share transactions. The primary risks associated with the use of futures contracts are imperfect correlation between changes in market values of stocks held by the fund and the prices of futures contracts, and the possibility of an illiquid market.
Futures contracts are valued at their quoted daily settlement prices. The aggregate principal amounts of the contracts are not recorded in the Statement of Net Assets. Fluctuations in the value of the contracts are recorded in the Statement of Net Assets as an asset (liability) and in the Statement of Operations as unrealized appreciation (depreciation) until the contracts are closed, when they are recorded as realized futures gains (losses).
27
Morgan Growth Fund
4. Repurchase Agreements: The fund may invest in repurchase agreements. Securities pledged as collateral for repurchase agreements are held by a custodian bank until the agreements mature. Each agreement requires that the market value of the collateral be sufficient to cover payments of interest and principal; however, in the event of default or bankruptcy by the other party to the agreement, retention of the collateral may be subject to legal proceedings.
5. Federal Income Taxes: The fund intends to continue to qualify as a regulated investment company and distribute all of its taxable income. Management has analyzed the fund’s tax positions taken for all open federal income tax years (September 30, 2006–2009), and has concluded that no provision for federal income tax is required in the fund’s financial statements.
6. Distributions: Distributions to shareholders are recorded on the ex-dividend date.
7. Security Lending: The fund may lend its securities to qualified institutional borrowers to earn additional income. Security loans are required to be secured at all times by collateral at least equal to the market value of securities loaned. The fund invests cash collateral received in Vanguard Market Liquidity Fund, and records a liability for the return of the collateral, during the period the securities are on loan. Security lending income represents the income earned on investing cash collateral, less expenses associated with the loan.
8. Other: Dividend income is recorded on the ex-dividend date. Interest income includes income distributions received from Vanguard Market Liquidity Fund and is accrued daily. Security transactions are accounted for on the date securities are bought or sold. Costs used to determine realized gains (losses) on the sale of investment securities are those of the specific securities sold.
Each class of shares has equal rights as to assets and earnings, except that each class separately bears certain class-specific expenses related to maintenance of shareholder accounts (included in Management and Administrative expenses), shareholder reporting, and proxies. Marketing and distribution expenses are allocated to each class of shares based on a method approved by the board of trustees. Income, other non-class-specific expenses, and gains and losses on investments are allocated to each class of shares based on its relative net assets.
B. Wellington Management Company, LLP, Jennison Associates LLC, Frontier Capital Management Co., LLC, and Kalmar Investment Advisers each provide investment advisory services to a portion of the fund for a fee calculated at an annual percentage rate of average net assets managed by the advisor. The basic fee of Wellington Management Company, LLP, is subject to quarterly adjustments based on performance for the preceding three years relative to the Russell 3000 Growth Index.
The basic fee of Jennison Associates LLC is subject to quarterly adjustments based on performance since March 31, 2007, relative to the Russell 1000 Growth Index. In accordance with the advisory contracts entered into with Frontier Capital Management Co., LLC, and Kalmar Investment Advisers in November 2008, beginning October 1, 2009, the investment advisory fees will be subject to quarterly adjustments based on performance since December 31, 2008, relative to the Russell Midcap Growth Index. Until November 2008, a portion of the fund was managed by Franklin Portfolio Associates, LLC. The basic fee paid to Franklin Portfolio Associates, LLC, was subject to quarterly adjustments based on performance for the preceding three years relative to the Russell Midcap Growth Index.
The Vanguard Group provides investment advisory services to a portion of the fund on an at-cost basis; the fund paid Vanguard advisory fees of $676,000 for the year ended September 30, 2009.
28
Morgan Growth Fund
For the year ended September 30, 2009, the aggregate investment advisory fee represented an effective annual basic rate of 0.15% of the fund’s average net assets, before an increase of $1,224,000 (0.02%) based on performance.
C. The Vanguard Group furnishes at cost corporate management, administrative, marketing, and distribution services. The costs of such services are allocated to the fund under methods approved by the board of trustees. The fund has committed to provide up to 0.40% of its net assets in capital contributions to Vanguard. At September 30, 2009, the fund had contributed capital of $1,568,000 to Vanguard (included in Other Assets), representing 0.02% of the fund’s net assets and 0.63% of Vanguard’s capitalization. The fund’s trustees and officers are also directors and officers of Vanguard.
D. The fund has asked its investment advisors to direct certain security trades, subject to obtaining the best price and execution, to brokers who have agreed to rebate to the fund part of the commissions generated. Such rebates are used solely to reduce the fund’s management and administrative expenses. The fund’s custodian bank has also agreed to reduce its fees when the fund maintains cash on deposit in the non-interest-bearing custody account. For the year ended September 30, 2009, these arrangements reduced the fund’s management and administrative expenses by $450,000 and custodian fees by $1,000. The total expense reduction represented an effective annual rate of 0.01% of the fund’s average net assets.
E. Various inputs may be used to determine the value of the fund’s investments. These inputs are summarized in three broad levels for financial statement purposes. The inputs or methodologies used to value securities are not necessarily an indication of the risk associated with investing in those securities.
Level 1—Quoted prices in active markets for identical securities.
Level 2—Other significant observable inputs (including quoted prices for similar securities, interest rates, prepayment speeds, credit risk, etc.).
Level 3—Significant unobservable inputs (including the fund’s own assumptions used to determine the fair value of investments).
The following table summarizes the fund’s investments as of September 30, 2009, based on the inputs used to value them:
| | | | | | | | | |
| | | Level 1 | | | Level 2 | | | Level 3 | |
| Investments | ($ | 000 | ) | ($ | 000 | ) | ($ | 000 | ) |
| Common Stocks | | 7,256,886 | | | — | | | — | |
| Temporary Cash Investments | | 267,697 | | | 39,278 | | | — | |
| Futures Contracts—Liabilities1 | | (314 | ) | | — | | | — | |
| Total | | 7,524,269 | | | 39,278 | | | — | |
| 1 | Represents variation margin on the last day of the reporting period. |
29
Morgan Growth Fund
F. At September 30, 2009, the aggregate settlement value of open futures contracts and the related unrealized appreciation (depreciation) were:
| | | | | | |
| | | | | ($ | 000 | ) |
| | | Number of | Aggregate | | Unrealized | |
| | | Long (Short) | Settlement | | Appreciation | |
| Futures Contracts | Expiration | Contracts | Value | | (Depreciation) | |
| S&P 500 Index | December 2009 | 610 | 160,567 | | 5,681 | |
| E-mini S&P 500 Index | December 2009 | 34 | 1,790 | | (8 | ) |
Unrealized appreciation (depreciation) on open futures contracts is required to be treated as realized gain (loss) for tax purposes.
G. Distributions are determined on a tax basis and may differ from net investment income and realized capital gains for financial reporting purposes. Differences may be permanent or temporary. Permanent differences are reclassified among capital accounts in the financial statements to reflect their tax character. Temporary differences arise when certain items of income, expense, gain, or loss are recognized in different periods for financial statement and tax purposes; these differences will reverse at some time in the future. Differences in classification may also result from the treatment of short-term gains as ordinary income for tax purposes.
During the year ended September 30, 2009, the fund realized net foreign currency losses of $209,000, which decreased distributable net income for tax purposes; accordingly, such losses have been reclassified from accumulated net realized losses to undistributed net investment income.
For tax purposes, at September 30, 2009, the fund had $41,768,000 of ordinary income available for distribution. The fund had available capital loss carryforwards totaling $879,082,000 to offset future net capital gains through September 30, 2017. In addition, the fund realized losses of $1,504,330,000 during the period from November 1, 2008, through September 30, 2009, which are deferred and will be treated as realized for tax purposes in fiscal 2010.
At September 30, 2009, the cost of investment securities for tax purposes was $6,607,843,000. Net unrealized appreciation of investment securities for tax purposes was $956,018,000, consisting of unrealized gains of $1,204,453,000 on securities that had risen in value since their purchase and $248,435,000 in unrealized losses on securities that had fallen in value since their purchase.
H. During the year ended September 30, 2009, the fund purchased $5,547,236,000 of investment securities and sold $5,393,105,000 of investment securities, other than temporary cash investments.
30
Morgan Growth Fund
| | | | | | | | | | |
| I. Capital share transactions for each class of shares were: | | | | | | | | |
| | | | | | | | Year Ended September 30, | |
| | | | | 2009 | | | | | 2008 | |
| | | Amount | | Shares | | | Amount | | Shares | |
| | ($ | 000 | ) | (000 | ) | ($ | 000 | ) | (000 | ) |
| Investor Shares | | | | | | | | | | |
| Issued | | 838,795 | | 70,793 | | | 1,538,894 | | 82,992 | |
| Issued in Lieu of Cash Distributions | | 48,928 | | 4,472 | | | 469,940 | | 24,566 | |
| Redeemed | | (791,499 | ) | (67,053 | ) | | (1,059,582 | ) | (57,122 | ) |
| Net Increase (Decrease)—Investor Shares | | 96,224 | | 8,212 | | | 949,252 | | 50,436 | |
| Admiral Shares | | | | | | | | | | |
| Issued | | 371,510 | | 10,237 | | | 1,043,087 | | 17,859 | |
| Issued in Lieu of Cash Distributions | | 22,380 | | 660 | | | 176,658 | | 2,979 | |
| Redeemed | | (511,824 | ) | (13,638 | ) | | (437,087 | ) | (7,717 | ) |
| Net Increase (Decrease)—Admiral Shares | | (117,934 | ) | (2,741 | ) | | 782,658 | | 13,121 | |
J. In preparing the financial statements as of September 30, 2009, management considered the impact of subsequent events occurring through November 10, 2009, for potential recognition or disclosure in these financial statements.
31
Report of Independent Registered Public Accounting Firm
To the Trustees and Shareholders of Vanguard Morgan Growth Fund:
In our opinion, the accompanying statement of net assets and the related statements of operations and of changes in net assets and the financial highlights present fairly, in all material respects, the financial position of Vanguard Morgan Growth Fund (the “Fund”) at September 30, 2009, the results of its operations for the year then ended, the changes in its net assets for each of the two years in the period then ended and the financial highlights for each of the five years in the period then ended, in conformity with accounting principles generally accepted in the United States of America. These financial statements and financial highlights (hereafter referred to as “financial statements”) are the responsibility of the Fund’s management; our responsibility is to express an opinion on these financial statements based on our audits. We conducted our audits of these financial statement s in accordance with the standards of the Public Company Accounting Oversight Board (United States). Those standards require that we plan and perform the audit to obtain reasonable assurance about whether the financial statements are free of material misstatement. An audit includes examining, on a test basis, evidence supporting the amounts and disclosures in the financial statements, assessing the accounting principles used and significant estimates made by management, and evaluating the overall financial statement presentation. We believe that our audits, which included confirmation of securities at September 30, 2009 by correspondence with the custodians and brokers, and by agreement to the underlying ownership records for Vanguard Market Liquidity Fund, provide a reasonable basis for our opinion.
PricewaterhouseCoopers LLP
Philadelphia, Pennsylvania
November 10, 2009
Special 2009 tax information (unaudited) for Vanguard Morgan Growth Fund
This information for the fiscal year ended September 30, 2009, is included pursuant to provisions of the Internal Revenue Code.
The fund distributed $77,653,000 of qualified dividend income to shareholders during the fiscal year.
For corporate shareholders, 100% of investment income (dividend income plus short-term gains, if any) qualifies for the dividends-received deduction.
32
Your Fund’s After-Tax Returns
This table presents returns for your fund both before and after taxes. The after-tax returns are shown in two ways: (1) assuming that an investor owned the fund during the entire period and paid taxes on the fund’s distributions, and (2) assuming that an investor paid taxes on the fund’s distributions and sold all shares at the end of each period.
Calculations are based on the highest individual federal income tax and capital gains tax rates in effect at the times of the distributions and the hypothetical sales. State and local taxes were not considered. After-tax returns reflect any qualified dividend income, using actual prior-year figures and estimates for 2009. (In the example, returns after the sale of fund shares may be higher than those assuming no sale. This occurs when the sale would have produced a capital loss. The calculation assumes that the investor received a tax deduction for the loss.)
The table shows returns for Investor Shares only; returns for other share classes will differ. Please note that your actual after-tax returns will depend on your tax situation and may differ from those shown. Also note that if you own the fund in a tax-deferred account, such as an individual retirement account or a 401(k) plan, this information does not apply to you. Such accounts are not subject to current taxes.
Finally, keep in mind that a fund’s performance—whether before or after taxes—does not guarantee future results.
| | | | | | |
| Average Annual Total Returns: Morgan Growth Fund Investor Shares1 | | | | | |
| Periods Ended September 30, 2009 | | | | | | |
| | One | | Five | | Ten | |
| | Year | | Years | | Years | |
| Returns Before Taxes | –4.27 | % | 2.16 | % | 0.51 | % |
| Returns After Taxes on Distributions | –4.45 | | 1.66 | | –0.49 | |
| Returns After Taxes on Distributions and Sale of Fund Shares | –2.62 | | 1.84 | | 0.12 | |
1 Total returns do not include the account service fee that may be applicable to certain accounts with balances below $10,000.
33
About Your Fund’s Expenses
As a shareholder of the fund, you incur ongoing costs, which include costs for portfolio management, administrative services, and shareholder reports (like this one), among others. Operating expenses, which are deducted from a fund’s gross income, directly reduce the investment return of the fund.
A fund’s expenses are expressed as a percentage of its average net assets. This figure is known as the expense ratio. The following examples are intended to help you understand the ongoing costs (in dollars) of investing in your fund and to compare these costs with those of other mutual funds. The examples are based on an investment of $1,000 made at the beginning of the period shown and held for the entire period.
The accompanying table illustrates your fund’s costs in two ways:
• Based on actual fund return. This section helps you to estimate the actual expenses that you paid over the period. The “Ending Account Value” shown is derived from the fund’s actual return, and the third column shows the dollar amount that would have been paid by an investor who started with $1,000 in the fund. You may use the information here, together with the amount you invested, to estimate the expenses that you paid over the period.
To do so, simply divide your account value by $1,000 (for example, an $8,600 account value divided by $1,000 = 8.6), then multiply the result by the number given for your fund under the heading “Expenses Paid During Period.”
• Based on hypothetical 5% yearly return. This section is intended to help you compare your fund’s costs with those of other mutual funds. It assumes that the fund had a yearly return of 5% before expenses, but that the expense ratio is unchanged. In this case—because the return used is not the fund’s actual return—the results do not apply to your investment. The example is useful in making comparisons because the Securities and Exchange Commission requires all mutual funds to calculate expenses based on a 5% return. You can assess your fund’s costs by comparing this hypothetical example with the hypothetical examples that appear in shareholder reports of other funds.
| | | | | | |
| Six Months Ended September 30, 2009 | | | | | | |
| | | Beginning | | Ending | | Expenses |
| | | Account Value | | Account Value | | Paid During |
| Morgan Growth Fund | | 3/31/2009 | | 9/30/2009 | | Period1 |
| Based on Actual Fund Return | | | | | | |
| Investor Shares | $ | 1,000.00 | $ | 1,325.93 | $ | 2.80 |
| Admiral Shares | | 1,000.00 | | 1,327.16 | | 1.81 |
| Based on Hypothetical 5% Yearly Return | | | | | | |
| Investor Shares | $ | 1,000.00 | $ | 1,022.66 | $ | 2.43 |
| Admiral Shares | | 1,000.00 | | 1,023.51 | | 1.57 |
1 The calculations are based on expenses incurred in the most recent six-month period. The fund’s annualized six-month expense ratios for that period are 0.48% for Investor Shares and 0.31% for Admiral Shares. The dollar amounts shown as “Expenses Paid” are equal to the annualized expense ratio multiplied by the average account value over the period, multiplied by the number of days in the most recent six-month period, then divided by the number of days in the most recent 12-month period.
34
Note that the expenses shown in the table are meant to highlight and help you compare ongoing costs only and do not reflect transaction costs incurred by the fund for buying and selling securities. Further, the expenses do not include the account service fee described in the prospectus. If such a fee were applied to your account, your costs would be higher. Your fund does not charge transaction fees, such as purchase or redemption fees, nor does it carry a “sales load.”
The calculations assume no shares were bought or sold during the period. Your actual costs may have been higher or lower, depending on the amount of your investment and the timing of any purchases or redemptions.
You can find more information about the fund’s expenses, including annual expense ratios, in the Financial Statements section of this report. For additional information on operating expenses and other shareholder costs, please refer to your fund’s current prospectus.
35
Glossary
Beta. A measure of the magnitude of a fund’s past share-price fluctuations in relation to the ups and downs of a given market index. The index is assigned a beta of 1.00. Compared with a given index, a fund with a beta of 1.20 typically would have seen its share price rise or fall by 12% when the index rose or fell by 10%. For this report, beta is based on returns over the past 36 months for both the fund and the index. Note that a fund’s beta should be reviewed in conjunction with its R-squared (see definition). The lower the R-squared, the less correlation there is between the fund and the index, and the less reliable beta is as an indicator of volatility.
Earnings Growth Rate. The average annual rate of growth in earnings over the past five years for the stocks now in a fund.
Equity Exposure. A measure that reflects a fund’s investments in stocks and stock futures. Any holdings in short-term reserves are excluded.
Expense Ratio. The percentage of a fund’s average net assets used to pay its annual administrative and advisory expenses. These expenses directly reduce returns to investors.
Foreign Holdings. The percentage of a fund represented by stocks or depositary receipts of companies based outside the United States.
Inception Date. The date on which the assets of a fund (or one of its share classes) are first invested in accordance with the fund’s investment objective. For funds with a subscription period, the inception date is the day after that period ends. Investment performance is measured from the inception date.
Median Market Cap. An indicator of the size of companies in which a fund invests; the midpoint of market capitalization (market price x shares outstanding) of a fund’s stocks, weighted by the proportion of the fund’s assets invested in each stock. Stocks representing half of the fund’s assets have market capitalizations above the median, and the rest are below it.
Price/Book Ratio. The share price of a stock divided by its net worth, or book value, per share. For a fund, the weighted average price/book ratio of the stocks it holds.
Price/Earnings Ratio. The ratio of a stock’s current price to its per-share earnings over the past year. For a fund, the weighted average P/E of the stocks it holds. P/E is an indicator of market expectations about corporate prospects; the higher the P/E, the greater the expectations for a company’s future growth.
R-Squared. A measure of how much of a fund’s past returns can be explained by the returns from the market in general, as measured by a given index. If a fund’s total returns were precisely synchronized with an index’s returns, its R-squared would be 1.00. If the fund’s returns bore no relationship to the index’s returns, its R-squared would be 0. For this report, R-squared is based on returns over the past 36 months for both the fund and the index.
Return on Equity. The annual average rate of return generated by a company during the past five years for each dollar of shareholder’s equity (net income divided by shareholder’s equity). For a fund, the weighted average return on equity for the companies whose stocks it holds.
Short-Term Reserves. The percentage of a fund invested in highly liquid, short-term securities that can be readily converted to cash.
36
Turnover Rate. An indication of the fund’s trading activity. Funds with high turnover rates incur higher transaction costs and may be more likely to distribute capital gains (which may be taxable to investors). The turnover rate excludes in-kind transactions, which have minimal impact on costs.
Yield. A fund’s 30-day SEC yield is derived using a formula specified by the U.S. Securities and Exchange Commission. Under the formula, data related to the fund’s security holdings in the previous 30 days are used to calculate the fund’s hypothetical net income for that period, which is then annualized and divided by the fund’s estimated average net assets over the calculation period. For the purposes of this calculation, a security’s income is based on its current market yield to maturity (in the case of bonds) or its projected dividend yield (for stocks). Because the SEC yield represents hypothetical annualized income, it will differ—at times significantly—from the fund’s actual experience. As a result, the fund’s income distributions may be higher or lower than implied by the SEC yield.
37
This page intentionally left blank.
This page intentionally left blank.
The People Who Govern Your Fund
The trustees of your mutual fund are there to see that the fund is operated and managed in your best interests since, as a shareholder, you are a part owner of the fund. Your fund’s trustees also serve on the board of directors of The Vanguard Group, Inc., which is owned by the Vanguard funds and provides services to them on an at-cost basis.
A majority of Vanguard’s board members are independent, meaning that they have no affiliation with Vanguard or the funds they oversee, apart from the sizable personal investments they have made as private individuals. The independent board members have distinguished backgrounds in business, academia, and public service. Each of the trustees and executive officers oversees 156 Vanguard funds.
The following table provides information for each trustee and executive officer of the fund. More information about the trustees is in the Statement of Additional Information, which can be obtained, without charge, by contacting Vanguard at 800-662-7447, or online at www.vanguard.com.
Interested Trustees
John J. Brennan1
Born 1954. Trustee Since May 1987. Chairman of the Board. Principal Occupation(s) During the Past Five Years: Chairman of the Board and Director/Trustee of The Vanguard Group, Inc., and of each of the investment companies served by The Vanguard Group; Chief Executive Officer (1996–2008) and President (1989–2008) of The Vanguard Group and of each of the investment companies served by The Vanguard Group; Chairman of the Financial Accounting Foundation; Governor of the Financial Industry Regulatory Authority (FINRA); Director of United Way of Southeastern Pennsylvania.
F. William McNabb III1
Born 1957. Trustee Since July 2009. Principal Occupation(s) During the Past Five Years: Director of The Vanguard Group, Inc., since 2008; Chief Executive Officer and President of The Vanguard Group and of each of the investment companies served by The Vanguard Group since 2008; Director of Vanguard Marketing Corporation; Managing Director of The Vanguard Group (1995–2008).
Independent Trustees
Charles D. Ellis
Born 1937. Trustee Since January 2001. Principal Occupation(s) During the Past Five Years: Applecore Partners (pro bono ventures in education); Senior Advisor to Greenwich Associates (international business strategy consulting); Successor Trustee of Yale University; Overseer of the Stern School of Business at New York University; Trustee of the Whitehead Institute for Biomedical Research.
Emerson U. Fullwood
Born 1948. Trustee Since January 2008. Principal Occupation(s) During the Past Five Years: Executive Chief Staff and Marketing Officer for North America and Corporate Vice President (retired 2008) of Xerox Corporation (photocopiers and printers); Director of SPX Corporation (multi-industry manufacturing), the United Way of Rochester, the Boy Scouts of America, Amerigroup Corporation (direct health and medical insurance carriers), and Monroe Community College Foundation.
Rajiv L. Gupta
Born 1945. Trustee Since December 2001.2 Principal Occupation(s) During the Past Five Years: Chairman and Chief Executive Officer (retired 2009) and President (2006–2008) of Rohm and Haas Co. (chemicals); Board Member of American Chemistry Council; Director of Tyco International, Ltd. (diversified manufacturing and services) and Hewlett-Packard Co. (electronic computer manufacturing); Trustee of The Conference Board.
Amy Gutmann
Born 1949. Trustee Since June 2006. Principal Occupation(s) During the Past Five Years: President of the University of Pennsylvania; Christopher H. Browne Distinguished Professor of Political Science in the School of Arts and Sciences with secondary appointments at the Annenberg School for Communication and the Graduate School of Education of the University of Pennsylvania; Director of Carnegie Corporation of New York, Schuylkill River Development Corporation, and Greater Philadelphia Chamber of Commerce; Trustee of the National Constitution Center.
JoAnn Heffernan Heisen
Born 1950. Trustee Since July 1998. Principal Occupation(s) During the Past Five Years: Corporate Vice President and Chief Global Diversity Officer since 2006 (retired 2008) and Member of the Executive Committee (retired 2008) of Johnson & Johnson (pharmaceuticals/consumer products); Vice President and Chief Information Officer of Johnson & Johnson (1997–2005); Director of the University Medical Center at Princeton and Women’s Research and Education Institute.
André F. Perold
Born 1952. Trustee Since December 2004. Principal Occupation(s) During the Past Five Years: George Gund Professor of Finance and Banking, Harvard Business School; Chairman of UNX, Inc. (equities trading firm); Chair of the Investment Committee of HighVista Strategies LLC (private investment firm).
Alfred M. Rankin, Jr.
Born 1941. Trustee Since January 1993. Principal Occupation(s) During the Past Five Years: Chairman, President, and Chief Executive Officer of NACCO Industries, Inc. (forklift trucks/housewares/lignite); Director of Goodrich Corporation (industrial products/ aircraft systems and services); Deputy Chairman of the Federal Reserve Bank of Cleveland.
Peter F. Volanakis
Born 1955. Trustee Since July 2009. Principal Occupation(s) During the Past Five Years: President since 2007 and Chief Operating Officer since 2005 of Corning Incorporated (communications equipment); President of Corning Technologies (2001–2005); Director of Corning Incorporated and Dow Corning; Trustee of the Corning Incorporated Foundation and the Corning Museum of Glass; Overseer of the Amos Tuck School of Business Administration at Dartmouth College.
Executive Officers
Thomas J. Higgins1
Born 1957. Chief Financial Officer Since September 2008. Principal Occupation(s) During the Past Five Years: Principal of The Vanguard Group, Inc.; Chief Financial Officer of each of the investment companies served by The Vanguard Group since 2008; Treasurer of each of the investment companies served by The Vanguard Group (1998–2008).
Kathryn J. Hyatt1
Born 1955. Treasurer Since November 2008. Principal Occupation(s) During the Past Five Years: Principal of The Vanguard Group, Inc.; Treasurer of each of the investment companies served by The Vanguard Group since 2008; Assistant Treasurer of each of the investment companies served by The Vanguard Group (1988–2008).
Heidi Stam1
Born 1956. Secretary Since July 2005. Principal Occupation(s) During the Past Five Years: Managing Director of The Vanguard Group, Inc., since 2006; General Counsel of The Vanguard Group since 2005; Secretary of The Vanguard Group and of each of the investment companies served by The Vanguard Group since 2005; Director and Senior Vice President of Vanguard Marketing Corporation since 2005; Principal of The Vanguard Group (1997–2006).
| |
| Vanguard Senior Management Team |
| |
| R. Gregory Barton | Michael S. Miller |
| Mortimer J. Buckley | James M. Norris |
| Kathleen C. Gubanich | Glenn W. Reed |
| Paul A. Heller | George U. Sauter |
Founder
John C. Bogle
Chairman and Chief Executive Officer, 1974–1996
1 These individuals are “interested persons” as defined in the Investment Company Act of 1940.
2 December 2002 for Vanguard Equity Income Fund, Vanguard Growth Equity Fund, the Vanguard Municipal Bond Funds, and the Vanguard State Tax-Exempt Funds.

P.O. Box 2600
Valley Forge, PA 19482-2600
Connect with Vanguard® > www.vanguard.com
Fund Information > 800-662-7447
Direct Investor Account Services > 800-662-2739
Institutional Investor Services > 800-523-1036
Text Telephone for People
With Hearing Impairment > 800-952-3335
This material may be used in conjunction with the offering of shares of any Vanguard fund only if preceded or accompanied by the fund’s current prospectus.
CFA® is a trademark owned by CFA Institute.
All comparative mutual fund data are from Lipper Inc. or Morningstar, Inc., unless otherwise noted.
You can obtain a free copy of Vanguard’s proxy voting guidelines by visiting our website, www.vanguard.com, and searching for “proxy voting guidelines,” or by calling Vanguard at 800-662-2739. The guidelines are also available from the SEC’s website, www.sec.gov. In addition, you may obtain a free report on how your fund voted the proxies for securities it owned during the 12 months ended June 30. To get the report, visit either www.vanguard.com or www.sec.gov.
You can review and copy information about your fund at the SEC’s Public Reference Room in Washington, D.C. To find out more about this public service, call the SEC at 202-551-8090. Information about your fund is also available on the SEC’s website, and you can receive copies of this information, for a fee, by sending a request in either of two ways: via e-mail addressed to publicinfo@sec.gov or via regular mail addressed to the Public Reference Section, Securities and Exchange Commission, Washington, DC 20549-0102.
© 2009 The Vanguard Group, Inc. All rights reserved.
Vanguard Marketing Corporation, Distributor.
Q260 112009