
>For the fiscal year ended September 30, 2007, Vanguard Morgan Growth Fund returned slightly more than 21%.
>In a turnaround from patterns of recent years, growth-oriented stocks outperformed their value counterparts during the period.
>Strong results in the energy, industrials, and materials sectors generated a significant share of the fund’s total return. The performance of the fund’s tech holdings, which represented its largest weighting, was somewhat disappointing.
Contents | |
| |
Your Fund’s Total Returns | 1 |
Chairman’s Letter | 2 |
Advisors’ Report | 7 |
Fund Profile | 12 |
Performance Summary | 13 |
Financial Statements | 15 |
Your Fund’s After-Tax Returns | 30 |
About Your Fund’s Expenses | 31 |
Glossary | 33 |
Please note: The opinions expressed in this report are just that—informed opinions. They should not be considered promises or advice. Also, please keep in mind that the information and opinions cover the period through the date on the cover of this report. Of course, the risks of investing in your fund are spelled out in the prospectus.
Your Fund’s Total Returns
Fiscal Year Ended September 30, 2007 | | |
| Ticker | Total |
| Symbol | Returns |
Vanguard Morgan Growth Fund | | |
Investor Shares | VMRGX | 21.2% |
Admiral™ Shares1 | VMRAX | 21.4 |
Russell 3000 Growth Index | | 19.3 |
Average Multi-Cap Growth Fund2 | | 22.9 |
Your Fund’s Performance at a Glance | | |
September 30, 2006–September 30, 2007 | | |
| | | Distributions Per Share |
| Starting | Ending | Income | Capital |
| Share Price | Share Price | Dividends | Gains |
Vanguard Morgan Growth Fund | | | | |
Investor Shares | $18.34 | $21.45 | $0.204 | $0.497 |
Admiral Shares | 56.94 | 66.58 | 0.745 | 1.541 |
1 A lower-cost class of shares available to many longtime shareholders and to those with significant investments in the fund.
2 Derived from data provided by Lipper Inc.
1

Chairman’s Letter
Dear Shareholder,
Vanguard Morgan Growth Fund returned more than 21% during the 12 months ended September 30, 2007. Although the fund’s return surpassed that of its benchmark index, it came up a bit short of the average return of its peers.
The resurgence of interest in growth stocks over the past year led the fund to its solid performance. If you own Vanguard Morgan Growth Fund in a taxable account, you may wish to review our report on the fund’s after-tax returns on page 30.
Strong returns for U.S. stocks; even better for markets abroad
U.S. stocks produced excellent returns for the fiscal year. The gains came despite a midsummer shakeup brought on by problems in the subprime mortgage-loan market. Financials stocks—which represent a sizable share of the U.S. market’s value—were hardest hit, as investment banking and consumer lending businesses throttled back.
The broad U.S. equity market returned 17.1% for the year. Returns from large-capitalization stocks outpaced those of small-caps, and growth-oriented stocks outperformed their value-oriented counterparts. As investors took account of risk, they seemed to exhibit a preference for large-cap growth stocks, which seem better positioned to thrive in a period of economic uncertainty.
2
Although not immune from the effects of the turmoil in U.S. credit markets, international stocks handily surpassed the returns of domestic stocks over the 12 months. The dollar’s ongoing weakness further enhanced foreign market gains for U.S.-based investors.
The bond market was shaken, but regained ground in the end
Turmoil in the corporate bond and subprime lending markets caused a “flight to quality” that drove prices of U.S. Treasury bonds sharply higher, particularly toward the end of the fiscal period. As the bonds’ prices rose, their yields fell. The declines were greatest among Treasury securities with the shortest maturities. The yield of the 3-month Treasury bill, which started the fiscal year at 4.89%, dropped more than a full percentage point to 3.81%.
As short-term yields fell, the yield curve—which illustrates the relationship between short- and long-term bond yields—returned to its usual, upward-sloping pattern. The curve had been mildly inverted at the start of the period, with yields of shorter-term bonds above those of longer-term issues. For the year ended September 30, the broad taxable bond market returned 5.1%. Returns from tax-exempt bonds were lower, as these issues did not benefit from the late-summer rally in Treasuries.
Market Barometer | | | |
| Average Annual Total Returns |
Periods Ended September 30, 2007 |
| One Year | Three Years | Five Years |
Stocks | | | |
Russell 1000 Index (Large-caps) | 16.9% | 13.8% | 16.0% |
Russell 2000 Index (Small-caps) | 12.3 | 13.4 | 18.8 |
Dow Jones Wilshire 5000 Index (Entire market) | 17.1 | 14.0 | 16.5 |
MSCI All Country World Index ex USA (International) | 31.1 | 26.5 | 26.3 |
| | | |
Bonds | | | |
Lehman U.S. Aggregate Bond Index (Broad taxable market) | 5.1% | 3.9% | 4.1% |
Lehman Municipal Bond Index | 3.1 | 3.9 | 4.0 |
Citigroup 3-Month Treasury Bill Index | 5.0 | 4.0 | 2.8 |
| | | |
CPI | | | |
Consumer Price Index | 2.8% | 3.2% | 2.9% |
3
A strong preference for growth drove the fund’s results
Your fund’s advisors guided the Morgan Growth Fund to a strong return of 21.2% for Investor Shares and 21.4% for Admiral Shares for the fiscal period. They were aided by more generous valuations for growth-oriented stocks, which the market had compressed to relatively low levels after the 2000–2002 stock market downturn. The advisors’ stock selection skills were most notable in the energy, industrials, and materials sectors, each of which posted outstanding returns.
In the energy sector, relatively large positions in a number of strongly performing stocks led to an impressive performance, both in absolute terms and in comparison with the benchmark. The advisors’ stock choices were particularly good among oil and gas equipment and service companies, which provide logistical assistance and drilling equipment for oil exploration. Stocks such as Schlumberger and National Oilwell Varco exemplified the strength of some of the companies in that industry. Other leaders in the sector included offshore oil drillers GlobalSantaFe and Transocean.
The strongest industry within the industrials sector was aerospace and defense. Top-ten holding Boeing turned in impressive gains, as did aviation electronics maker Rockwell Collins. The advisors also held numerous strong performers among industrial machinery makers, electrical component manufacturers, and construction
Expense Ratios1 | | | |
Your fund compared with its peer group | | | |
| | | Average |
| Investor | Admiral | Multi-Cap |
| Shares | Shares | Growth Fund |
Morgan Growth Fund | 0.37% | 0.21% | 1.49% |
| 1 | Fund expense ratios reflect the 12 months ended September 30, 2007. Peer-group expense ratio is derived from data provided by Lipper Inc. and captures information through year-end 2006. |
4
companies, which contributed to the fund’s outperformance. Airlines, on the other hand, provided disappointing results.
The materials sector, although a relatively small portion of the fund’s total assets, turned in outstanding results, thanks to a few concentrated positions. The best performers were in the diversified metals and mining subsector, which includes miners of gold and other precious metals. These companies’ stocks were bolstered by rising prices in the commodities markets amid growing global demand for these metals. Among the best performers were Freeport-McMoRan Copper & Gold and Antofagasta, a Chilean copper mining company. Chemical makers, particularly agriculture-related businesses, also made small, but important, contributions to the fund’s return.
On the negative side, the fund received poor performances from its holdings in the information technology sector—its largest, at more than 25% of assets on average. The returns of the fund’s holdings failed to keep pace with those of other stocks in the broader technology sector. The health care and financials sectors also registered below-market returns.
The fund’s relative record is strong over the long term
As you know, it’s best to measure a mutual fund’s investment returns over several years, not months or quarters. Over the past ten years—a period that
Total Returns | |
Ten Years Ended September 30, 2007 | |
| Average |
| Annual Return |
Morgan Growth Fund Investor Shares | 6.7% |
Russell 3000 Growth Index | 4.0 |
Average Multi-Cap Growth Fund1 | 5.9 |
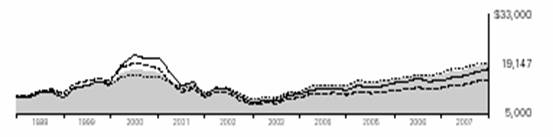
The figures shown represent past performance, which is not a guarantee of future results. (Current performance may be lower or higher than the performance data cited. For performance data current to the most recent month-end, visit our website at www.vanguard.com/performance.) Note, too, that both investment returns and principal value can fluctuate widely, so an investor’s shares, when sold, could be worth more or less than their original cost.
1 | Derived from data provided by Lipper Inc. |
5
began in the midst of the late-1990s stock market boom and included a strong bear market between 2000 and 2002—Morgan Growth’s average annual return was 6.7%. A hypothetical investment of $10,000 made in the fund a decade ago would now be worth $19,147—more than $4,000 better than if the same investment had been made in the fund’s unmanaged benchmark, which does not incur any expenses.
The fund’s success over the long run is a credit to the group of talented advisors who manage it: Wellington Management Company, Franklin Portfolio Associates, Vanguard Quantitative Equity Group, and Jennison Associates, the newest addition to the team. The efforts of the advisors are aided by the fund’s very low expense ratio, which allows a greater portion of its total return to be passed on to shareholders.
Uncertainty is par for the course
After several years of unusual calm, the financial markets experienced a jolt in the third quarter of 2007. Stock market volatility increased sharply, and several other long-established trends seemed to go into reverse. The shift was dramatic, but a long-term perspective suggests that these occasional—and unpredictable—dislocations are an enduring feature of the financial markets.
A prudent response to this uncertainty is diversification both within and across asset classes, which is why we counsel investors to hold a broadly diversified portfolio of stocks and fixed income investments in proportions consistent with their goals, risk tolerance, and time horizon. The Morgan Growth Fund can play a valuable role in the stock portion of such a portfolio.
Thank you for entrusting your assets to Vanguard.
Sincerely,

John J. Brennan
Chairman and Chief Executive Officer
October 12, 2007
6
Advisors’ Report
During the fiscal year ended September 30, 2007, Vanguard Morgan Growth Fund returned 21.2% for Investor Shares and 21.4% for Admiral Shares. This performance reflects the combined efforts of your fund’s four independent advisors. The use of four advisors provides exposure to distinct, yet complementary, investment approaches, enhancing the fund’s diversification.
The advisors, the percentage of fund assets each manages, and a brief description of their investment strategies are presented in the table below. The advisors have also prepared a discussion of the investment environment that existed during the fiscal year and of how their portfolio positioning reflects this assessment. These comments were prepared October 12, 2007.
Wellington Management Company, LLP
Portfolio Manager:
Paul E. Marrkand, CFA, Vice President
Markets were volatile during the 12 months because of concerns surrounding the spillover impact of U.S. housing woes and tightening credit availability. Early signs of trouble in the housing market emerged in February, and were confirmed more broadly in the summer months.
Vanguard Morgan Growth Fund Investment Advisors |
| | | |
| Fund Assets Managed | |
Investment Advisor | % | $ Million | Investment Strategy |
Wellington Management | 36 | 3,323 | Traditional methods of stock selection— |
Company, LLP | | | research and analysis—that identify companies |
| | | believed to have above-average growth |
| | | prospects, particularly those in industries |
| | | undergoing change. Focuses on mid- and |
| | | large-capitalization companies with proven |
| | | records of sales and earnings growth, |
| | | profitability, and cash flow generation. |
Vanguard Quantitative | 25 | 2,355 | Quantitative management using models that |
Equity Group | | | assess valuation, marketplace sentiment, and |
| | | balance-sheet characteristics of companies |
| | | versus their peers. |
Franklin Portfolio | 25 | 2,312 | Quantitative management using a blend of |
Associates, LLC | | | valuation and growth/momentum factors to |
| | | drive stock-selection decisions for a mid-cap |
| | | growth subportfolio. |
Jennison Associates LLC | 10 | 925 | Research-driven fundamental investment |
| | | approach that relies on in-depth company |
| | | knowledge gleaned through meetings with |
| | | management, customers, and suppliers. |
Cash Investments1 | 4 | 358 | — |
1 | These short-term reserves are invested by Vanguard in equity index products to simulate investments in stocks. Each advisor may also maintain a modest cash position. |
7
Investor confidence rebounded toward the end of the period, as the Federal Reserve Board cut several key interest rates. However, concerns over a slowing global economy and high debt levels remain.
Despite the sometimes dour headlines, our subportfolio’s investment returns were strong in absolute terms, led by stocks in the materials, energy, and information technology sectors. We favored the information technology sector over the period, finding companies, such as Google and Cisco Systems, with strong free cash flow, exposure to the international markets, attractive valuations, and high-margin sales growth. The energy sector was another area of focus, particularly deepwater drilling companies, such as Diamond Offshore, that are increasing market share and operating margins.
We seek to invest in undervalued companies that have the ability to innovate, gain market share, and increase sales and free cash flow at an above-average rate. Our purchases over the period were driven by valuation and growth opportunities. New names included Agrium, GameStop, Nintendo, and Roper Industries. We also added to existing positions in Cadence Design Systems and Eli Lilly. We eliminated holdings in AMR, American Tower, AstraZeneca, and CB Richard Ellis Group and trimmed holdings in Walt Disney and ConocoPhillips. At the end of the period, our subportfolio’s largest sector positions were in tech, industrials, and health care.
Vanguard Quantitative Equity Group
Portfolio Manager:
James P. Stetler, Principal
The 2007 fiscal year was an eventful period in the U.S. equity market. Through the first eight months of the fiscal year, value stocks continued to outperform growth issues, as had been the case in most recent years. At that point, the Russell 3000 Value Index was up 17.3%, versus the 16.5% return for the Russell 3000 Growth Index.
Then in June, the tide began to turn as market volatility rose and investors began to worry about a deteriorating housing market, subprime mortgage defaults, rising oil prices, and inflation. For June and July, the Russell 3000 Value Index was off –7.2% while its Growth counterpart was down only –3.3%. A change in market leadership was underway, and it continued through September 30. The market recovered from its summer swoon as the Federal Reserve cut its key interest rate by 0.5 percentage points on September 18. The Russell 3000 Growth Index finished the fiscal year up 19.3%, outpacing the Russell 3000 Value Index by 5.6 percentage points.
To identify attractive investment opportunities, we employ a quantitative assessment of specific fundamental characteristics of companies. This process combines three models (based on valuation, market sentiment, and earnings prospects) to rank companies of similar size and businesses against one another.
8
The higher-ranked stocks are emphasized in the portfolio, while lower-ranked companies are either avoided or underweighted relative to their benchmark weightings.
For this fiscal year, the stock-ranking models, working in concert with one another, were a positive contributor to the portfolio’s overall results. Evaluated individually, the market-sentiment and earnings-prospect models were both positive, while the valuation model was decidedly negative. The change in market preference to growth-oriented issues is, in our opinion, unpredictable, so we do not try to capture this type of occurrence. Our stock-ranking methodology still prefers stocks with attractive valuation characteristics. In strong growth markets, where valuation levels do not seem important, the results from our valuation model can be disappointing.
Because we maintain sector weightings that are essentially the same as those in the benchmark, our results are driven by our success (or lack thereof) in picking the better-performing stocks in each group. During the 12 months, our stock selections in the industrials and telecommunication services sectors were the strongest contributors to our overall results. Examples include McDermott International (+159%), Cummins Engine (+117%), and Telephone and Data Systems (+60%). Those results were partially offset, however, by poor selections in the consumer discretionary and information technology sectors, such as RadioShack (–26% for our holding period) and Micron Technology (–36%).
We continue to believe that the best way to deliver consistent, value-added, long-term investment results is through a highly disciplined, quantitative strategy. The resulting portfolio offers an attractive mix of stocks with high earnings quality, market acceptance, and reasonable valuations.
Franklin Portfolio Associates, LLC
Portfolio Manager: John S. Cone, CFA
The Russell Midcap Growth Index, the benchmark for Franklin’s subportfolio, returned 21.2% for the 12 months ended September 30. Because of our stock selection process, our subportfolio has an emphasis on positive momentum (stocks with near-term price- and earnings-growth momentum) and positive valuation (stocks with lower price-to-earnings ratios) relative to the index. As a generalization, during this period, stocks exhibiting strong earnings and price momentum with poor valuation characteristics outperformed stocks with compelling valuations.
Our results for the last 12 months benefited from strong stock selection in a mix of industries, including specialty retail, hotels, and medical products. Examples include GameStop, which sells electronic games and PC entertainment software, and CDW, a seller of technology products and related services; Wynn Resorts, an operator of casino hotels; and
9
Cytyc, a maker of products for cervical cancer screening, and Dade Behring Holdings, a manufacturer of diagnostic products for clinicians worldwide.
Returns for the fiscal year were hindered by poor stock selection in financials and information technology. Holdings that reduced returns included IndyMac Bancorp, a hybrid thrift/mortgage bank; First Marblehead, which provides outsourcing services for private education lending; Novellus, which makes semiconductor production equipment; and Lexmark, a maker of computer printers and supplies. Our tendency to favor reasonably priced companies was not rewarded during the fiscal year.
Jennison Associates LLC
Portfolio Manager:
Kathleen A. McCarragher,
Managing Director
From our subportfolio’s January inception through September 30, information technology holdings contributed the most to return, as Research In Motion (RIM), Apple, and Juniper Networks posted outsized gains. RIM advanced on the strength of the BlackBerry brand, as new subscribers were added at a solid pace and existing users embraced new product designs. Apple’s growth has been driven by the strength of iPod sales and a resurgence in Macintosh computer sales. The company should continue to benefit from its creativity and innovation in product design and marketing, most recently exhibited in the iPhone. Juniper’s investments in products and in sales force and channel strategy are yielding operating leverage, spurring revenue and earnings-per-share growth at this telecom equipment provider.
The industrials sector provided solid gains as well, thanks in part to the advance of Precision Castparts. The company, which makes complex metal castings and forgings, is benefiting from robust growth in its core aerospace and power-generation markets. Its commitment to efficiency, increasing market share, and ability to extract value from acquisitions should help Precision continue to grow faster than its peers.
In materials, Monsanto’s leading market share position, brand strength, operational performance, and technological innovation are helping the agricultural seed and biotechnology company benefit from a bullish agriculture cycle.
Health care holdings hurt our subportfolio’s relative performance slightly, as unfavorable product and pipeline developments sent shares of drug maker Wyeth down. In the consumer staples sector, Procter & Gamble declined. Given its breadth of product lines and strong distribution networks, the company looks well-positioned to capture the growing demand for household and personal care products in developing countries.
10
Economic activity may cool, particularly into 2008, as the repercussions of the liquidity contraction play out. The potential for a resurgence in inflationary pressures (on the back of rising commodity prices), as well as for a weakening U.S. dollar (in the wake of the Fed’s rate cut), complicates the matter. Although the risk of one is clearly increasing, a recession seems unlikely at this stage, given the positive backdrop against which the credit crunch is unfolding. As the rate of corporate earnings growth slows, the companies in which we invest should generate better-than-average growth in revenues, earnings, and cash flows. The subportfolio is trading at a reasonable premium to the overall market, given its favorable relative earnings outlook.
11
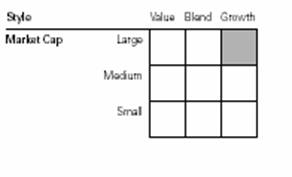
Fund Profile
As of September 30, 2007
Portfolio Characteristics | | |
| | Comparative | Broad |
| Fund | Index1 | Index2 |
Number of Stocks | 352 | 1,927 | 4,887 |
Median Market Cap | $21.6B | $32.0B | $36.1B |
Price/Earnings Ratio | 19.3x | 22.3x | 18.1x |
Price/Book Ratio | 4.0x | 4.4x | 2.8x |
Yield | | 1.0% | 1.7% |
Investor Shares | 0.8% | | |
Admiral Shares | 1.0% | | |
Return on Equity | 20.1% | 20.6% | 18.8% |
Earnings Growth Rate | 26.8% | 22.7% | 21.6% |
Foreign Holdings | 5.9% | 0.0% | 0.0% |
Turnover Rate | 79% | — | — |
Expense Ratio | | — | — |
Investor Shares | 0.37% | | |
Admiral Shares | 0.21% | | |
Short-Term Reserves | 2.8% | — | — |
Sector Diversification (% of equity exposure) |
| | Comparative | Broad |
| Fund | Index1 | Index2 |
Consumer Discretionary | 12.9% | 13.1% | 10.4% |
Consumer Staples | 6.3 | 9.2 | 8.2 |
Energy | 10.0 | 8.2 | 11.2 |
Financials | 6.8 | 7.2 | 20.0 |
Health Care | 16.1 | 16.1 | 11.6 |
Industrials | 14.4 | 13.3 | 11.8 |
Information Technology | 26.8 | 27.2 | 16.0 |
Materials | 3.8 | 3.3 | 3.7 |
Telecommunication | | | |
Services | 1.6 | 0.9 | 3.5 |
Utilities | 1.3 | 1.5 | 3.6 |
Volatility Measures3 | |
| Fund Versus | Fund Versus |
| Comparative Index1 | Broad Index2 |
R-Squared | 0.94 | 0.92 |
Beta | 0.99 | 1.06 |
Ten Largest Holdings4 (% of total net assets) |
| | |
Cisco Systems, Inc. | communications equipment | 2.2% |
The Boeing Co. | aerospace and defense | 2.1 |
Oracle Corp. | systems software | 1.9 |
International Business Machines Corp. | computer hardware | 1.8 |
PepsiCo, Inc. | soft drinks | 1.3 |
Apple Inc. | computer hardware | 1.3 |
National Oilwell Varco Inc. | oil and gas equipment and services | 1.2 |
Google Inc. | internet software and services | 1.2 |
The Walt Disney Co. | movies and entertainment | 1.2 |
Altera Corp. | semiconductors | 1.2 |
Top Ten | | 15.4% |
Investment Focus
1 | Russell 3000 Growth Index. |
2 | Dow Jones Wilshire 5000 Index. |
3 | For an explanation of R-squared, beta, and other terms used here, see the Glossary on page 33. |
4 | “Ten Largest Holdings” excludes any temporary cash investments and equity index products. |
12
Performance Summary
All of the returns in this report represent past performance, which is not a guarantee of future results that may be achieved by the fund. (Current performance may be lower or higher than the performance data cited. For performance data current to the most recent month-end, visit our website at www.vanguard.com/performance.) Note, too, that both investment returns and principal value can fluctuate widely, so an investor’s shares, when sold, could be worth more or less than their original cost. The returns shown do not reflect taxes that a shareholder would pay on fund distributions or on the sale of fund shares.
Cumulative Performance: September 30, 1997–September 30, 2007
Initial Investment of $10,000
| Average Annual Total Returns | Final Value |
Periods Ended September 30, 2007 | of a $10,000 |
| One Year | Five Years | Ten Years | Investment |
Morgan Growth Fund Investor Shares1 | 21.24% | 16.63% | 6.71% | $19,147 |
Dow Jones Wilshire 5000 Index | 17.08 | 16.53 | 6.85 | 19,399 |
Russell 3000 Growth Index | 19.31 | 14.19 | 3.97 | 14,764 |
Average Multi-Cap Growth Fund2 | 22.92 | 16.44 | 5.95 | 17,816 |
| | | | Final Value |
| | | Since | of a $100,000 |
| One Year | Five Years | Inception3 | Investment |
Morgan Growth Fund Admiral Shares | 21.43% | 16.80% | 5.71% | $142,524 |
Dow Jones Wilshire 5000 Index | 17.08 | 16.53 | 6.33 | 147,956 |
Russell 3000 Growth Index | 19.31 | 14.19 | 2.69 | 118,426 |
1 | Total returns do not include the account service fee that may be applicable to certain accounts with balances below $10,000. |
2 | Derived from data provided by Lipper Inc. |
3 | Performance for the fund and its comparative standards is calculated since the fund's inception: May 14, 2001. |
13
Fiscal-Year Total Returns (%): September 30, 1997–September 30, 2007
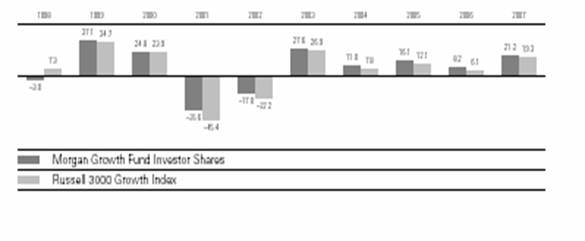
Note: See Financial Highlights tables on pages 23 and 24 for dividend and capital gains information
14
Financial Statements
Statement of Net Assets
As of September 30, 2007
The fund provides a complete list of its holdings four times in each fiscal year, at the quarter-ends. For the second and fourth fiscal quarters, the lists appear in the fund’s semiannual and annual reports to shareholders. For the first and third fiscal quarters, the fund files the lists with the Securities and Exchange Commission on Form N-Q. Shareholders can look up the fund’s Forms N-Q on the SEC’s website at www.sec.gov. Forms N-Q may also be reviewed and copied at the SEC’s Public Reference Room (see the back cover of this report for further information).
| | | Market |
| | | Value• |
| | Shares | ($000) |
Common Stocks (95.2%)1 | | |
Consumer Discretionary (12.3%) | | |
| The Walt Disney Co. | 3,228,800 | 111,038 |
| American Eagle Outfitters, Inc. | 3,603,750 | 94,815 |
| Wynn Resorts Ltd. | 568,600 | 89,589 |
| J.C. Penney Co., Inc. (Holding Co.) | 883,400 | 55,981 |
| TJX Cos., Inc. | 1,869,500 | 54,346 |
| Mattel, Inc. | 1,942,000 | 45,559 |
* | GameStop Corp. Class A | 726,300 | 40,927 |
* | Coach, Inc. | 785,800 | 37,145 |
| Target Corp. | 573,600 | 36,464 |
| Sherwin-Williams Co. | 539,400 | 35,444 |
| Starwood Hotels & Resorts Worldwide, Inc. | 544,400 | 33,072 |
*^ | Nutri/System Inc. | 655,600 | 30,741 |
| News Corp., Class A | 1,371,100 | 30,150 |
| NIKE, Inc. Class B | 435,100 | 25,523 |
| Polo Ralph Lauren Corp. | 288,400 | 22,423 |
^ | Tempur-Pedic International Inc. | 587,000 | 20,985 |
| Honda Motor Co., Ltd. | 596,000 | 19,847 |
| Home Depot, Inc. | 575,100 | 18,656 |
| Yum! Brands, Inc. | 550,200 | 18,613 |
| Darden Restaurants Inc. | 425,200 | 17,799 |
* | Expedia, Inc. | 555,021 | 17,694 |
| Time Warner, Inc. | 885,900 | 16,265 |
* | Amazon.com, Inc. | 171,900 | 16,012 |
| Lowe’s Cos., Inc. | 529,100 | 14,825 |
| Hasbro, Inc. | 505,800 | 14,102 |
* | DreamWorks Animation SKG, Inc. | 410,000 | 13,702 |
| Harley-Davidson, Inc. | 278,500 | 12,869 |
* | Comcast Corp. Class A | 521,926 | 12,620 |
| Meredith Corp. | 198,000 | 11,345 |
* | EchoStar Communications Corp. Class A | 234,900 | 10,996 |
* | Liberty Media Corp.-Capital Series A | 81,200 | 10,136 |
| International Game Technology | 228,000 | 9,827 |
* | Viacom Inc. Class B | 247,500 | 9,645 |
| McDonald’s Corp. | 176,500 | 9,614 |
| Ctrip.com International Ltd. | 176,400 | 9,138 |
| Omnicom Group Inc. | 183,500 | 8,825 |
* | Ford Motor Co. | 1,027,300 | 8,722 |
| Regal Entertainment Group Class A | 395,400 | 8,679 |
| Nordstrom, Inc. | 176,500 | 8,276 |
* | Comcast Corp. Special Class A | 322,034 | 7,716 |
* | Kohl’s Corp. | 128,900 | 7,390 |
| Johnson Controls, Inc. | 61,700 | 7,287 |
| Abercrombie & Fitch Co. | 87,955 | 7,098 |
| Brinker International, Inc. | 211,350 | 5,799 |
| RadioShack Corp. | 248,100 | 5,126 |
* | AutoZone Inc. | 37,000 | 4,297 |
| Ross Stores, Inc. | 159,500 | 4,090 |
* | Starbucks Corp. | 144,200 | 3,778 |
* | Getty Images, Inc. | 134,800 | 3,753 |
| The McGraw-Hill Cos., Inc. | 68,600 | 3,492 |
| Best Buy Co., Inc. | 75,350 | 3,468 |
* | DIRECTV Group, Inc. | 115,826 | 2,812 |
* | The Goodyear Tire & Rubber Co. | 61,000 | 1,855 |
* | Las Vegas Sands Corp. | 13,900 | 1,855 |
| Garmin Ltd. | 13,100 | 1,564 |
* | Sears Holdings Corp. | 9,600 | 1,221 |
* | NVR, Inc. | 2,100 | 988 |
* | Discovery Holding Co. Class A | 29,800 | 860 |
| | | 1,136,858 |
Consumer Staples (5.8%) | | |
| PepsiCo, Inc. | 1,665,100 | 121,985 |
| The Procter & Gamble Co. | 950,275 | 66,842 |
| Altria Group, Inc. | 766,200 | 53,274 |
| The Kroger Co. | 1,657,400 | 47,269 |
15
| | | Market |
| | | Value• |
| | Shares | ($000) |
| Colgate-Palmolive Co. | 504,900 | 36,009 |
| Wal-Mart Stores, Inc. | 823,800 | 35,959 |
| Costco Wholesale Corp. | 406,099 | 24,922 |
| CVS/Caremark Corp. | 547,210 | 21,686 |
| McCormick & Co., Inc. | 597,400 | 21,488 |
| Walgreen Co. | 357,000 | 16,865 |
| The Pepsi Bottling Group, Inc. | 432,900 | 16,091 |
| The Coca-Cola Co. | 265,278 | 15,246 |
| Anheuser-Busch Cos., Inc. | 286,052 | 14,300 |
| UST, Inc. | 248,900 | 12,345 |
| Carolina Group | 123,500 | 10,155 |
| The Estee Lauder Cos. Inc. Class A | 190,000 | 8,067 |
| Alberto-Culver Co. | 272,600 | 6,758 |
| Campbell Soup Co. | 104,000 | 3,848 |
| Archer-Daniels-Midland Co. | 113,367 | 3,750 |
* | Energizer Holdings, Inc. | 10,300 | 1,142 |
| Dean Foods Co. | 35,900 | 918 |
* | Bare Escentuals, Inc. | 29,300 | 729 |
| Safeway, Inc. | 16,100 | 533 |
| | | 540,181 |
Energy (9.4%) | | |
* | National Oilwell Varco Inc. | 787,000 | 113,722 |
| GlobalSantaFe Corp. | 1,152,300 | 87,598 |
| XTO Energy, Inc. | 1,384,262 | 85,603 |
* | Transocean Inc. | 733,300 | 82,900 |
| Diamond Offshore Drilling, Inc. | 612,000 | 69,333 |
| Schlumberger Ltd. | 647,700 | 68,009 |
| Holly Corp. | 998,500 | 59,740 |
| Tesoro Corp. | 1,267,400 | 58,326 |
| Chesapeake Energy Corp. | 1,174,400 | 41,409 |
| Chevron Corp. | 438,000 | 40,988 |
| ConocoPhillips Co. | 461,900 | 40,541 |
| Tidewater Inc. | 357,900 | 22,490 |
| Marathon Oil Corp. | 337,000 | 19,216 |
* | Grant Prideco, Inc. | 280,706 | 15,304 |
| Noble Corp. | 222,606 | 10,919 |
* | Global Industries Ltd. | 408,200 | 10,515 |
* | Cameron International Corp. | 113,000 | 10,429 |
| ENSCO International, Inc. | 162,151 | 9,097 |
| Halliburton Co. | 220,800 | 8,479 |
* | Nabors Industries, Inc. | 254,000 | 7,816 |
| Baker Hughes, Inc. | 71,600 | 6,470 |
| Sunoco, Inc. | 45,800 | 3,242 |
* | Pride International, Inc. | 71,000 | 2,595 |
| | | 874,741 |
Financials (6.0%) | | |
| The Goldman Sachs | | |
| Group, Inc. | 155,000 | 33,595 |
^ | The First Marblehead Corp. | 871,650 | 33,062 |
* | IntercontinentalExchange Inc. | 204,300 | 31,033 |
| Jones Lang LaSalle Inc. | 284,800 | 29,266 |
| Charles Schwab Corp. | 1,167,155 | 25,211 |
| American Express Co. | 373,900 | 22,198 |
| CME Group, Inc. | 37,650 | 22,114 |
| Ameriprise Financial, Inc. | 325,000 | 20,511 |
| NYSE Euronext | 227,400 | 18,003 |
| ACE Ltd. | 289,400 | 17,529 |
| ProLogis REIT | 261,600 | 17,357 |
* | CB Richard Ellis Group, Inc. | 621,100 | 17,291 |
| SL Green Realty Corp. REIT | 131,400 | 15,344 |
| W.R. Berkley Corp. | 517,025 | 15,319 |
| The Principal Financial Group, Inc. | 224,000 | 14,132 |
| People’s United Financial Inc. | 768,000 | 13,271 |
| Hudson City Bancorp, Inc. | 860,400 | 13,233 |
| SEI Investments Co. | 481,900 | 13,146 |
| Lazard Ltd. Class A | 309,400 | 13,119 |
| Weingarten Realty Investors REIT | 303,200 | 12,571 |
* | Berkshire Hathaway Inc. Class B | 3,030 | 11,975 |
| Ambac Financial Group, Inc. | 188,400 | 11,852 |
| HCC Insurance Holdings, Inc. | 399,600 | 11,445 |
| Synovus Financial Corp. | 405,000 | 11,360 |
* | Philadelphia Consolidated Holding Corp. | 261,800 | 10,823 |
| Legg Mason Inc. | 126,800 | 10,688 |
| State Street Corp. | 155,300 | 10,585 |
| Prudential Financial, Inc. | 100,000 | 9,758 |
| Northern Trust Corp. | 145,800 | 9,662 |
| Franklin Resources Corp. | 73,000 | 9,307 |
| AFLAC Inc. | 137,700 | 7,854 |
| Julius Baer Holding, Ltd. | 100,000 | 7,465 |
| Host Hotels & Resorts Inc. REIT | 316,300 | 7,098 |
| General Growth Properties Inc. REIT | 93,500 | 5,013 |
| Simon Property Group, Inc. REIT | 49,900 | 4,990 |
* | AmeriCredit Corp. | 263,200 | 4,627 |
| MGIC Investment Corp. | 130,000 | 4,200 |
| Eaton Vance Corp. | 81,000 | 3,237 |
| Vornado Realty Trust REIT | 20,200 | 2,209 |
| Axis Capital Holdings Ltd. | 32,900 | 1,280 |
* | Nasdaq Stock Market Inc. | 25,160 | 948 |
| SLM Corp. | 17,300 | 859 |
| Forest City Enterprise Class A | 7,000 | 386 |
* | Arch Capital Group Ltd. | 4,838 | 360 |
* | E*TRADE Financial Corp. | 16,700 | 218 |
| | | 555,504 |
Health Care (15.3%) | | |
| Merck & Co., Inc. | 2,078,600 | 107,443 |
| Schering-Plough Corp. | 2,887,020 | 91,316 |
| Abbott Laboratories | 1,578,430 | 84,635 |
| Eli Lilly & Co. | 1,335,000 | 76,002 |
* | Forest Laboratories, Inc. | 1,950,457 | 72,733 |
| McKesson Corp. | 1,139,800 | 67,009 |
* | WellCare Health Plans Inc. | 541,200 | 57,059 |
| Johnson & Johnson | 862,900 | 56,693 |
| Wyeth | 1,187,698 | 52,912 |
| | | | |
16
| | | Market |
| | | Value• |
| | Shares | ($000) |
* | Gilead Sciences, Inc. | 1,143,600 | 46,739 |
| AmerisourceBergen Corp. | 1,008,900 | 45,733 |
* | Coventry Health Care Inc. | 635,775 | 39,552 |
| Bristol-Myers Squibb Co. | 1,345,000 | 38,763 |
| Teva Pharmaceutical Industries Ltd. | | |
| Sponsored ADR | 829,500 | 36,888 |
| Baxter International, Inc. | 649,072 | 36,530 |
| Roche Holdings AG | 141,900 | 25,694 |
| Mylan Inc. | 1,582,100 | 25,250 |
| UnitedHealth Group Inc. | 464,600 | 22,501 |
* | Genentech, Inc. | 281,699 | 21,978 |
| Eisai Co., Ltd. | 418,100 | 19,736 |
* | HLTH Corp. | 1,386,100 | 19,641 |
| Shionogi & Co., Ltd. | 1,241,000 | 19,080 |
* | Amgen, Inc. | 320,900 | 18,153 |
| Medtronic, Inc. | 314,999 | 17,769 |
* | Patterson Cos. | 416,900 | 16,097 |
* | Celgene Corp. | 222,000 | 15,831 |
* | Medco Health Solutions, Inc. | 173,200 | 15,656 |
* | WellPoint Inc. | 187,572 | 14,803 |
| Alcon, Inc. | 102,600 | 14,766 |
* | Lincare Holdings, Inc. | 400,300 | 14,671 |
* | Health Net Inc. | 263,000 | 14,215 |
| Beckman Coulter, Inc. | 188,000 | 13,867 |
* | Humana Inc. | 188,600 | 13,179 |
* | Elan Corp. PLC ADR | 616,200 | 12,965 |
* | Intuitive Surgical, Inc. | 55,200 | 12,696 |
* | Thermo Fisher Scientific, Inc. | 205,800 | 11,879 |
* | Genzyme Corp. | 191,500 | 11,865 |
* | Express Scripts Inc. | 209,800 | 11,711 |
| Aetna Inc. | 208,072 | 11,292 |
* | Biogen Idec Inc. | 160,200 | 10,626 |
* | Laboratory Corp. of America Holdings | 132,200 | 10,342 |
| Novartis AG ADR | 161,300 | 8,865 |
* | Endo Pharmaceuticals Holdings, Inc. | 253,700 | 7,867 |
* | Kinetic Concepts, Inc. | 137,300 | 7,727 |
* | Amylin Pharmaceuticals, Inc. | 154,400 | 7,720 |
* | Cytyc Corp. | 155,100 | 7,391 |
* | Zimmer Holdings, Inc. | 86,900 | 7,038 |
* | Warner Chilcott Ltd. | 389,400 | 6,920 |
| Dade Behring Holdings Inc. | 89,200 | 6,810 |
| Cardinal Health, Inc. | 91,300 | 5,709 |
* | Cephalon, Inc. | 72,980 | 5,332 |
* | Sierra Health Services, Inc. | 122,200 | 5,156 |
| Becton, Dickinson & Co. | 59,400 | 4,874 |
| UCB SA | 80,000 | 4,712 |
* | Techne Corp. | 68,400 | 4,315 |
| Stryker Corp. | 52,700 | 3,624 |
| | | 1,420,330 |
Industrials (13.8%) | | |
| The Boeing Co. | 1,857,700 | 195,040 |
| Parker Hannifin Corp. | 808,000 | 90,359 |
| Rockwell Collins, Inc. | 1,049,800 | 76,677 |
| Emerson Electric Co. | 1,201,700 | 63,954 |
| Raytheon Co. | 873,400 | 55,740 |
| Precision Castparts Corp. | 359,325 | 53,173 |
* | Terex Corp. | 533,000 | 47,448 |
* | Foster Wheeler Ltd. | 356,700 | 46,828 |
| Manpower Inc. | 676,400 | 43,526 |
* | Continental Airlines, Inc. Class B | 1,170,100 | 38,648 |
| The Dun & Bradstreet Corp. | 319,100 | 31,466 |
* | Thomas & Betts Corp. | 514,300 | 30,159 |
| Roper Industries Inc. | 460,000 | 30,130 |
| General Electric Co. | 698,400 | 28,914 |
* | Allied Waste Industries, Inc. | 2,244,000 | 28,611 |
| General Dynamics Corp. | 332,200 | 28,061 |
* | Jacobs Engineering Group Inc. | 344,600 | 26,045 |
^ | Tata Motors Ltd. | 1,355,000 | 25,935 |
| Gamesa Corporacion Tecnologica, SA | 572,000 | 23,281 |
| United Technologies Corp. | 263,700 | 21,223 |
| C.H. Robinson Worldwide Inc. | 387,900 | 21,059 |
| 3M Co. | 211,100 | 19,755 |
| Robert Half International, Inc. | 654,600 | 19,546 |
| W.W. Grainger, Inc. | 199,800 | 18,220 |
| Danaher Corp. | 220,100 | 18,204 |
| United Parcel Service, Inc. | 240,700 | 18,077 |
| Caterpillar, Inc. | 226,600 | 17,772 |
| Lockheed Martin Corp. | 135,300 | 14,679 |
| Textron, Inc. | 200,400 | 12,467 |
* | Gardner Denver Inc. | 314,200 | 12,254 |
| PACCAR, Inc. | 142,500 | 12,148 |
| Cummins Inc. | 90,900 | 11,625 |
| CSX Corp. | 251,500 | 10,747 |
| Waste Management, Inc. | 261,700 | 9,877 |
| Deere & Co. | 63,300 | 9,395 |
| The Manitowoc Co., Inc. | 187,200 | 8,289 |
* | McDermott International, Inc. | 139,600 | 7,550 |
| FedEx Corp. | 69,900 | 7,322 |
* | Hertz Global Holdings Inc. | 321,700 | 7,309 |
* | AMR Corp. | 307,000 | 6,843 |
| Burlington Northern Santa Fe Corp. | 83,500 | 6,778 |
| Illinois Tool Works, Inc. | 104,800 | 6,250 |
| Hubbell Inc. Class B | 85,500 | 4,884 |
| HNI Corp. | 98,900 | 3,560 |
| Pitney Bowes, Inc. | 47,200 | 2,144 |
* | First Solar, Inc. | 12,400 | 1,460 |
| Republic Services, Inc. Class A | 37,300 | 1,220 |
| | | 1,274,652 |
Information Technology (25.7%) | | |
| Communications Equipment (5.0%) | | |
* | Cisco Systems, Inc. | 6,244,200 | 206,745 |
| QUALCOMM Inc. | 1,460,100 | 61,704 |
| Harris Corp. | 642,600 | 37,136 |
17
| | | Market |
| | | Value• |
| | Shares | ($000) |
* | Research In Motion Ltd. | 309,200 | 30,472 |
| Nokia Corp. ADR | 710,000 | 26,930 |
* | Juniper Networks, Inc. | 551,800 | 20,201 |
* | Starent Networks Corp. | 850,000 | 17,944 |
* | F5 Networks, Inc. | 463,000 | 17,219 |
| Corning, Inc. | 583,500 | 14,383 |
* | Ciena Corp. | 346,300 | 13,187 |
| Motorola, Inc. | 614,299 | 11,383 |
* | Arris Group Inc. | 375,000 | 4,631 |
| | |
Computers & Peripherals (5.7%) | | |
| International Business Machines Corp. | 1,388,500 | 163,565 |
* | Apple Inc. | 764,300 | 117,351 |
| Hewlett-Packard Co. | 1,941,300 | 96,657 |
* | NCR Corp. | 844,000 | 42,031 |
* | Network Appliance, Inc. | 1,261,100 | 33,936 |
* | Emulex Corp. | 1,159,200 | 22,222 |
* | Dell Inc. | 665,100 | 18,357 |
* | Western Digital Corp. | 700,400 | 17,734 |
* | EMC Corp. | 560,300 | 11,654 |
* | Sun Microsystems, Inc. | 941,100 | 5,280 |
| | | |
Electronic Equipment & Instruments (1.4%) | | |
* | Avnet, Inc. | 829,400 | 33,060 |
* | Mettler-Toledo International Inc. | 256,700 | 26,183 |
| Amphenol Corp. | 573,000 | 22,782 |
| Hon Hai Precision Industry Co., Ltd. | 1,669,922 | 12,579 |
* | Vishay Intertechnology, Inc. | 751,300 | 9,789 |
* | Agilent Technologies, Inc. | 219,800 | 8,106 |
* | Ingram Micro, Inc. Class A | 402,600 | 7,895 |
* | CDW Corp. | 65,700 | 5,729 |
* | Flextronics International Ltd. | 399,826 | 4,470 |
* | Arrow Electronics, Inc. | 80,400 | 3,419 |
| | | |
Internet Software & Services (1.7%) | | |
* | Google Inc. | 198,700 | 112,717 |
* | eBay Inc. | 966,100 | 37,697 |
* | Yahoo! Inc. | 285,100 | 7,652 |
| | | |
IT Services (1.6%) | | |
| Accenture Ltd. | 1,524,944 | 61,379 |
* | Fiserv, Inc. | 706,600 | 35,938 |
| MasterCard, Inc. Class A | 70,900 | 10,491 |
| Automatic Data Processing, Inc. | 221,600 | 10,178 |
* | Alliance Data Systems Corp. | 127,579 | 9,880 |
* | Convergys Corp. | 487,100 | 8,456 |
| Total System Services, Inc. | 254,600 | 7,073 |
| Electronic Data Systems Corp. | 240,369 | 5,250 |
* | Hewitt Associates, Inc. | 135,600 | 4,753 |
| | | |
Office Electronics (0.5%) | | |
* | Xerox Corp. | 2,575,400 | 44,657 |
Semiconductors & | | |
| Semiconductor Equipment (4.2%) | | |
| Altera Corp. | 4,513,000 | 108,673 |
| Intel Corp. | 2,753,100 | 71,195 |
* | LAM Research Corp. | 899,100 | 47,886 |
* | MEMC Electronic Materials, Inc. | 664,000 | 39,083 |
* | NVIDIA Corp. | 976,350 | 35,383 |
* | Novellus Systems, Inc. | 991,600 | 27,031 |
| Applied Materials, Inc. | 884,499 | 18,309 |
| Texas Instruments, Inc. | 400,600 | 14,658 |
| Xilinx, Inc. | 355,200 | 9,285 |
* | Marvell Technology Group Ltd. | 551,500 | 9,028 |
* | ASML Holding NV (New York) | 180,000 | 5,915 |
* | Teradyne, Inc. | 137,200 | 1,893 |
| National Semiconductor Corp. | 34,700 | 941 |
| | | |
Software (5.6%) | | |
* | Oracle Corp. | 7,952,200 | 172,165 |
| Microsoft Corp. | 3,433,575 | 101,153 |
* | Cadence Design Systems, Inc. | 2,864,600 | 63,565 |
* | BMC Software, Inc. | 1,621,599 | 50,643 |
* | Adobe Systems, Inc. | 1,113,900 | 48,633 |
| Nintendo Co. | 45,000 | 23,234 |
* | Intuit, Inc. | 609,200 | 18,459 |
* | Symantec Corp. | 946,900 | 18,351 |
* | McAfee Inc. | 300,000 | 10,461 |
* | VMware Inc. | 72,000 | 6,120 |
* | NAVTEQ Corp. | 32,800 | 2,557 |
| | | 2,385,476 |
Materials (3.6%) | | |
| Antofagasta PLC | 3,645,000 | 56,862 |
| Monsanto Co. | 584,857 | 50,146 |
| Freeport-McMoRan Copper | | |
| & Gold, Inc. Class B | 435,000 | 45,627 |
* | Pactiv Corp. | 1,387,100 | 39,754 |
| Agrium, Inc. | 702,000 | 38,175 |
* | Crown Holdings, Inc. | 920,900 | 20,960 |
| International Flavors & Fragrances, Inc. | 370,400 | 19,579 |
| Sealed Air Corp. | 587,300 | 15,011 |
| Nucor Corp. | 177,200 | 10,538 |
| Allegheny Technologies Inc. | 94,500 | 10,390 |
* | Owens-Illinois, Inc. | 215,000 | 8,912 |
| Vulcan Materials Co. | 73,800 | 6,579 |
| Potash Corp. of Saskatchewan, Inc. | 50,000 | 5,285 |
| Albemarle Corp. | 97,400 | 4,305 |
| Steel Dynamics, Inc. | 45,400 | 2,120 |
| Ball Corp. | 38,089 | 2,047 |
| Praxair, Inc. | 6,300 | 528 |
* | The Mosaic Co. | 9,400 | 503 |
| | | 337,321 |
18
| | | Market |
| | | Value• |
| | Shares | ($000) |
Telecommunication Services (1.4%) | | |
| Telefonica SA ADR | 497,000 | 41,639 |
| AT&T Inc. | 645,000 | 27,290 |
| Vodafone Group PLC ADR | 595,000 | 21,599 |
| Telephone & Data Systems, Inc. | 266,889 | 17,815 |
* | Qwest Communications International Inc. | 1,222,200 | 11,195 |
* | U.S. Cellular Corp. | 76,400 | 7,502 |
* | NII Holdings Inc. | 58,700 | 4,822 |
| | | 131,862 |
Utilities (1.2%) | | |
* | Mirant Corp. | 1,643,500 | 66,858 |
* | NRG Energy, Inc. | 489,900 | 20,718 |
| TXU Corp. | 106,308 | 7,279 |
| Constellation Energy Group, Inc. | 56,100 | 4,813 |
* | Dynegy, Inc. | 511,200 | 4,723 |
* | Allegheny Energy, Inc. | 40,987 | 2,142 |
| | | 106,533 |
Exchange-Traded Fund (0.7%) | | |
2^ | Vanguard Growth ETF | 1,044,900 | 67,657 |
Total Common Stocks | | |
(Cost $7,299,936) | | 8,831,115 |
Temporary Cash Investments (6.8%)1 | | |
Money Market Fund (4.8%) | | |
3 | Vanguard Market Liquidity Fund, 5.153% | 373,045,595 | 373,046 |
3 | Vanguard Market Liquidity Fund, 5.153%— | | |
| See Note G | 70,972,600 | 70,973 |
| | | 444,019 |
| | Face | Market |
| | Amount | Value• |
| | ($000) | ($000) |
Repurchase Agreement (1.8%) | | |
| Bank of America 5.100%, | | |
| 10/1/07 (Dated 9/28/07, Repurchase Value | | |
| $164,470,000, collateralized by Federal | | |
| National Mortgage Assn. 5.000%, 10/1/35) | 164,400 | 164,400 |
U.S. Agency Obligations (0.2%) | | |
4 | Federal National Mortgage Assn. | | |
5 | 5.204%, 10/3/2007 | 14,000 | 13,996 |
4 | Federal National Mortgage Assn. | | |
5 | 5.208%, 10/3/2007 | 2,000 | 2,000 |
Total Temporary Cash Investments | | |
(Cost $624,415) | | 624,415 |
Total Investments (102.0%) | | |
(Cost $7,924,351) | | 9,455,530 |
Other Assets and Liabilities (–2.0%) | | |
Other Assets—Note C | | 66,523 |
Liabilities—Note G | | (249,234) |
| | | (182,711) |
Net Assets (100%) | | 9,272,819 |
19
At September 30, 2007, net assets consisted of:6 |
| Amount |
| ($000) |
Paid-in Capital | 7,179,619 |
Undistributed Net Investment Income | 47,304 |
Accumulated Net Realized Gains | 509,002 |
Unrealized Appreciation | |
Investment Securities | 1,531,179 |
Futures Contracts | 5,677 |
Foreign Currencies | 38 |
Net Assets | 9,272,819 |
| |
| |
Investor Shares—Net Assets | |
Applicable to 307,286,935 outstanding | |
$.001 par value shares of beneficial | |
interest (unlimited authorization) | 6,590,026 |
Net Asset Value Per Share— | |
Investor Shares | $21.45 |
| |
Admiral Shares—Net Assets | |
Applicable to 40,296,541 outstanding | |
$.001 par value shares of beneficial | |
interest (unlimited authorization) | 2,682,793 |
Net Asset Value Per Share— | |
Admiral Shares | $66.58 |
• See Note A in Notes to Financial Statements.
* Non-income-producing security.
^ Part of security position is on loan to broker-dealers. See Note G in Notes to Financial Statements.
1 The fund invests a portion of its cash reserves in equity markets through the use of index futures contracts. After giving effect to futures investments, the fund’s effective common stock and temporary cash investment positions represent 98.4% and 3.6%, respectively, of net assets. See Note E in Notes to Financial Statements.
2 Considered an affiliated company of the fund as the issuer is another member of The Vanguard Group.
3 Affiliated money market fund available only to Vanguard funds and certain trusts and accounts managed by Vanguard. Rate shown is the 7-day yield.
4 The issuer operates under a congressional charter; its securities are neither issued nor guaranteed by the U.S. government. If needed, access to additional funding from the U.S. Treasury (beyond the issuer’s line of credit) would require congressional action.
5 Securities with a value of $15,996,000 have been segregated as initial margin for open futures contracts.
6 See Note E in Notes to Financial Statements for the tax-basis components of net assets.
ADR—American Depositary Receipt.
REIT—Real Estate Investment Trust.
20
Statement of Operations
| Year Ended |
| September 30, 2007 |
| ($000) |
Investment Income | |
Income | |
Dividends1,2 | 90,087 |
Interest2 | 22,685 |
Security Lending | 2,125 |
Total Income | 114,897 |
Expenses | |
Investment Advisory Fees—Note B | |
Basic Fee | 7,749 |
Performance Adjustment | 320 |
The Vanguard Group—Note C | |
Management and Administrative—Investor Shares | 14,432 |
Management and Administrative—Admiral Shares | 1,815 |
Marketing and Distribution—Investor Shares | 1,187 |
Marketing and Distribution—Admiral Shares | 508 |
Custodian Fees | 107 |
Auditing Fees | 26 |
Shareholders’ Reports—Investor Shares | 140 |
Shareholders’ Reports—Admiral Shares | 23 |
Trustees’ Fees and Expenses | 12 |
Total Expenses | 26,319 |
Expenses Paid Indirectly—Note D | (603) |
Net Expenses | 25,716 |
Net Investment Income | 89,181 |
Realized Net Gain (Loss) | |
Investment Securities Sold2 | 565,309 |
Futures Contracts | 20,478 |
Foreign Currencies | 374 |
Realized Net Gain (Loss) | 586,161 |
Change in Unrealized Appreciation (Depreciation) | |
Investment Securities | 853,794 |
Futures Contracts | 2,558 |
Foreign Currencies | 42 |
Change in Unrealized Appreciation (Depreciation) | 856,394 |
Net Increase (Decrease) in Net Assets Resulting from Operations | 1,531,736 |
1 | Dividends are net of foreign withholding taxes of $699,000. |
2 | Dividend income, interest income, and realized net gain (loss) from affiliated companies of the |
fund were $621,000, $14,074,000, and $0, respectively.
21
Statement of Changes in Net Assets
| Year Ended September 30, |
| 2007 | 2006 |
| ($000) | ($000) |
Increase (Decrease) In Net Assets | | |
Operations | | |
Net Investment Income | 89,181 | 64,002 |
Realized Net Gain (Loss) | 586,161 | 566,551 |
Change in Unrealized Appreciation (Depreciation) | 856,394 | (147,432) |
Net Increase (Decrease) in Net Assets Resulting from Operations | 1,531,736 | 483,121 |
Distributions | | |
Net Investment Income | | |
Investor Shares | (57,770) | (25,348) |
Admiral Shares | (23,226) | (9,445) |
Realized Capital Gain1 | | |
Investor Shares | (140,745) | — |
Admiral Shares | (48,041) | — |
Total Distributions | (269,782) | (34,793) |
Capital Share Transactions—Note H | | |
Investor Shares | 492,866 | 281,742 |
Admiral Shares | 656,214 | 482,819 |
Net Increase (Decrease) from Capital Share Transactions | 1,149,080 | 764,561 |
Total Increase (Decrease) | 2,411,034 | 1,212,889 |
Net Assets | | |
Beginning of Period | 6,861,785 | 5,648,896 |
End of Period2 | 9,272,819 | 6,861,785 |
1 | Includes fiscal 2007 short-term gain distributions totaling $11,775,000. Short-term gain distributions are treated as ordinary income dividends for tax purposes. |
2 | Net Assets—End of Period includes undistributed net investment income of $47,304,000 and $43,399,000. |
22
Financial Highlights
Investor Shares | | | | | |
| | | | | |
| | | | | |
| Year Ended September 30, |
For a Share Outstanding Throughout Each Period | 2007 | 2006 | 2005 | 2004 | 2003 |
Net Asset Value, Beginning of Period | $18.34 | $17.04 | $14.77 | $13.34 | $10.49 |
Investment Operations | | | | | |
Net Investment Income | .207 | .165 | .1291 | .05 | .04 |
Net Realized and Unrealized Gain (Loss) on Investments | 3.604 | 1.230 | 2.246 | 1.42 | 2.85 |
Total from Investment Operations | 3.811 | 1.395 | 2.375 | 1.47 | 2.89 |
Distributions | | | | | |
Dividends from Net Investment Income | (.204) | (.095) | (.105) | (.04) | (.04) |
Distributions from Realized Capital Gains | (.497) | — | — | — | — |
Total Distributions | (.701) | (.095) | (.105) | (.04) | (.04) |
Net Asset Value, End of Period | $21.45 | $18.34 | $17.04 | $14.77 | $13.34 |
| | | | | |
Total Return2 | 21.24% | 8.20% | 16.12% | 11.03% | 27.62% |
| | | | | |
Ratios/Supplemental Data | | | | | |
Net Assets, End of Period (Millions) | $6,590 | $5,171 | $4,539 | $4,115 | $3,329 |
Ratio of Total Expenses to Average Net Assets3 | 0.37% | 0.42% | 0.41% | 0.44% | 0.50% |
Ratio of Net Investment Income to Average Net Assets | 1.06% | 0.95% | 0.82%1 | 0.32% | 0.31% |
Portfolio Turnover Rate | 79% | 90% | 88% | 88% | 91% |
1 | Net investment income per share and the ratio of net investment income to average net assets include $0.044 and 0.28%, respectively, resulting from a special dividend from Microsoft Corp. in November 2004. |
2 | Total returns do not include the account service fee that may be applicable to certain accounts with balances below $10,000. |
3 | Includes performance-based investment advisory fee increases (decreases) of 0.00%, 0.02%, 0.00%, 0.01%, and 0.00%. |
23
Admiral Shares
| Year Ended September 30, |
For a Share Outstanding Throughout Each Period | 2007 | 2006 | 2005 | 2004 | 2003 |
Net Asset Value, Beginning of Period | $56.94 | $52.91 | $45.84 | $41.40 | $32.58 |
Investment Operations | | | | | |
Net Investment Income | .742 | .620 | .5001 | .212 | .17 |
Net Realized and Unrealized Gain (Loss) on Investments | 11.184 | 3.808 | 6.956 | 4.416 | 8.83 |
Total from Investment Operations | 11.926 | 4.428 | 7.456 | 4.628 | 9.00 |
Distributions | | | | | |
Dividends from Net Investment Income | (.745) | (.398) | (.386) | (.188) | (.18) |
Distributions from Realized Capital Gains | (1.541) | — | — | — | — |
Total Distributions | (2.286) | (.398) | (.386) | (.188) | (.18) |
Net Asset Value, End of Period | $66.58 | $56.94 | $52.91 | $45.84 | $41.40 |
| | | | | |
Total Return | 21.43% | 8.39% | 16.32% | 11.19% | 27.73% |
| | | | | |
Ratios/Supplemental Data | | | | | |
Net Assets, End of Period (Millions) | $2,683 | $1,691 | $1,110 | $513 | $390 |
Ratio of Total Expenses to Average Net Assets2 | 0.21% | 0.23% | 0.24% | 0.30% | 0.36% |
Ratio of Net Investment Income to Average Net Assets | 1.22% | 1.14% | 0.96%1 | 0.47% | 0.45% |
Portfolio Turnover Rate | 79% | 90% | 88% | 88% | 91% |
1 | Net investment income per share and the ratio of net investment income to average net assets include |
$0.184 and 0.28%, respectively, resulting from a special dividend from Microsoft Corp. in November 2004.
2 Includes performance-based investment advisory fee increases (decreases) of 0.00%, 0.02%, 0.00%, 0.01%, and 0.00%. See accompanying Notes, which are an integral part of the Financial Statements.
24
Notes to Financial Statements
Vanguard Morgan Growth Fund is registered under the Investment Company Act of 1940 as an open-end investment company, or mutual fund. The fund offers two classes of shares, Investor Shares and Admiral Shares. Investor Shares are available to any investor who meets the fund’s minimum purchase requirements. Admiral Shares are designed for investors who meet certain administrative, service, tenure, and account-size criteria.
A. The following significant accounting policies conform to generally accepted accounting principles for U.S. mutual funds. The fund consistently follows such policies in preparing its financial statements.
1. Security Valuation: Securities are valued as of the close of trading on the New York Stock Exchange (generally 4 p.m., Eastern time) on the valuation date. Equity securities are valued at the latest quoted sales prices or official closing prices taken from the primary market in which each security trades; such securities not traded on the valuation date are valued at the mean of the latest quoted bid and asked prices. Securities for which market quotations are not readily available, or whose values have been affected by events occurring before the fund’s pricing time but after the close of the securities’ primary markets, are valued at their fair values calculated according to procedures adopted by the board of trustees. These procedures include obtaining quotations from an independent pricing service, monitoring news to identify significant market- or security-specific events, and evaluating changes in the values of foreign market proxies (for example, ADRs, futures contracts, or exchange-traded funds), between the time the foreign markets close and the fund’s pricing time. When fair-value pricing is employed, the prices of securities used by a fund to calculate its net asset value may differ from quoted or published prices for the same securities. Investments in Vanguard Market Liquidity Fund are valued at that fund’s net asset value. Temporary cash investments acquired over 60 days to maturity are valued using the latest bid prices or using valuations based on a matrix system (which considers such factors as security prices, yields, maturities, and ratings), both as furnished by independent pricing services. Other temporary cash investments are valued at amortized cost, which approximates market value.
2. Foreign Currency: Securities and other assets and liabilities denominated in foreign currencies are translated into U.S. dollars using exchange rates obtained from an independent third party as of the fund’s pricing time on the valuation date. Realized gains (losses) and unrealized appreciation (depreciation) on investment securities include the effects of changes in exchange rates since the securities were purchased, combined with the effects of changes in security prices. Fluctuations in the value of other assets and liabilities resulting from changes in exchange rates are recorded as unrealized foreign currency gains (losses) until the assets or liabilities are settled in cash, at which time they are recorded as realized foreign currency gains (losses).
Realized gains (losses) and unrealized appreciation (depreciation) on investment securities include the effects of changes in exchange rates since the securities were purchased, combined with the effects of changes in security prices. Fluctuations in the value of other assets and liabilities resulting from changes in exchange rates are recorded as unrealized foreign currency gains (losses) until the asset or liability is settled in cash, when they are recorded as realized foreign currency gains (losses).
3. Futures Contracts: The fund uses index futures contracts to a limited extent, with the objective of maintaining full exposure to the stock market while maintaining liquidity. The fund may purchase or sell futures contracts to achieve a desired level of investment, whether to accommodate portfolio turnover
25
or cash flows from capital share transactions. The primary risks associated with the use of futures contracts are imperfect correlation between changes in market values of stocks held by the fund and the prices of futures contracts, and the possibility of an illiquid market.
Futures contracts are valued at their quoted daily settlement prices. The aggregate principal amounts of the contracts are not recorded in the Statement of Net Assets. Fluctuations in the value of the contracts are recorded in the Statement of Net Assets as an asset (liability) and in the Statement of Operations as unrealized appreciation (depreciation) until the contracts are closed, when they are recorded as realized futures gains (losses).
4. Repurchase Agreements: The fund may invest in repurchase agreements. Securities pledged as collateral for repurchase agreements are held by a custodian bank until the agreements mature. Each agreement requires that the market value of the collateral be sufficient to cover payments of interest and principal; however, in the event of default or bankruptcy by the other party to the agreement, retention of the collateral may be subject to legal proceedings.
5. Federal Income Taxes: The fund intends to continue to qualify as a regulated investment company and distribute all of its taxable income. Accordingly, no provision for federal income taxes is required in the financial statements.
6. Distributions: Distributions to shareholders are recorded on the ex-dividend date.
7. Security Lending: The fund may lend its securities to qualified institutional borrowers to earn additional income. Security loans are required to be secured at all times by collateral at least equal to the market value of securities loaned. The fund invests cash collateral received in Vanguard Market Liquidity Fund, and records a liability for the return of the collateral, during the period the securities are on loan. Security lending income represents the income earned on investing cash collateral, less expenses associated with the loan.
8. Other: Dividend income is recorded on the ex-dividend date. Interest income includes income distributions received from Vanguard Market Liquidity Fund and is accrued daily. Security transactions are accounted for on the date securities are bought or sold. Costs used to determine realized gains (losses) on the sale of investment securities are those of the specific securities sold.
Each class of shares has equal rights as to assets and earnings, except that each class separately bears certain class-specific expenses related to maintenance of shareholder accounts (included in Management and Administrative expenses) and shareholder reporting. Marketing and distribution expenses are allocated to each class of shares based on a method approved by the board of trustees. Income, other non-class-specific expenses, and gains and losses on investments are allocated to each class of shares based on its relative net assets.
B. Wellington Management Company, LLP, Franklin Portfolio Associates, LLC and, beginning January 4, 2007, Jennison Associates LLC, each provide investment advisory services to a portion of the fund for a fee calculated at an annual percentage rate of average net assets managed by the advisor. The basic fee for Wellington Management Company, LLP , is subject to quarterly adjustments based on performance for the preceding three years relative to the Russell 3000 Growth Index; the basic fee of Franklin Portfolio Associates, LLC, is subject to quarterly adjustments based on performance for the preceding three years relative to the Russell Midcap Growth Index. In accordance
26
with the advisory contract entered into with Jennison Associates LLC, in January 2007, the investment advisory fee will be subject to quarterly adjustments based on performance relative to the Russell 1000 Growth Index beginning January 1, 2008.
The Vanguard Group provides investment advisory services to a portion of the fund on an at-cost basis; the fund paid Vanguard advisory fees of $747,000 for the year ended September 30, 2007.
For the year ended September 30, 2007, the aggregate investment advisory fee represented an effective annual basic rate of 0.10% of the fund’s average net assets, before an increase of $320,000 based on performance.
C. The Vanguard Group furnishes at cost corporate management, administrative, marketing, and distribution services. The costs of such services are allocated to the fund under methods approved by the board of trustees. The fund has committed to provide up to 0.40% of its net assets in capital contributions to Vanguard. At September 30, 2007, the fund had contributed capital of $761,000 to Vanguard (included in Other Assets), representing 0.01% of the fund’s net assets and 0.76% of Vanguard’s capitalization. The fund’s trustees and officers are also directors and officers of Vanguard.
D. The fund has asked its investment advisors to direct certain security trades, subject to obtaining the best price and execution, to brokers who have agreed to rebate to the fund part of the commissions generated. Such rebates are used solely to reduce the fund’s management and administrative expenses. The fund’s custodian bank has also agreed to reduce its fees when the fund maintains cash on deposit in the non-interest-bearing custody account. For the year ended September 30, 2007, these arrangements reduced the fund’s management and administrative expenses by $567,000 and custodian fees by $36,000. The total expense reduction represented an effective annual rate of 0.01% of the fund’s average net assets.
E. Distributions are determined on a tax basis and may differ from net investment income and realized capital gains for financial reporting purposes. Differences may be permanent or temporary. Permanent differences are reclassified among capital accounts in the financial statements to reflect their tax character. Temporary differences arise when certain items of income, expense, gain, or loss are recognized in different periods for financial statement and tax purposes; these differences will reverse at some time in the future. Differences in classification may also result from the treatment of short-term gains as ordinary income for tax purposes.
During the year ended September 30, 2007, the fund realized net foreign currency gains of $374,000, which increased distributable net income for tax purposes; accordingly, such gains have been reclassified from accumulated net realized gains to undistributed net investment income.
The fund used a tax accounting practice to treat a portion of the price of capital shares redeemed during the year as distributions from net investment income and realized capital gains. Accordingly, the fund has reclassified $4,654,000 from undistributed net investment income, and $30,601,000 from accumulated net realized gains, to paid-in capital.
For tax purposes, at September 30, 2007, the fund had $218,746,000 of ordinary income and $357,882,000 of long-term capital gains available for distribution.
At September 30, 2007, the cost of investment securities for tax purposes was $7,927,321,000. Net unrealized appreciation of investment securities for tax purposes was $1,528,209,000, consisting of unrealized gains of $1,711,419,000 on securities that had risen in value since their purchase and $183,210,000 in unrealized losses on securities that had fallen in value since their purchase.
27
At September 30, 2007, the aggregate settlement value of open futures contracts expiring in December 2007 and the related unrealized appreciation (depreciation) were:
| | ($000) |
| | Aggregate | Unrealized |
| Number of | Settlement | Appreciation |
Futures Contracts | Long Contracts | Value | (Depreciation) |
S&P 500 Index | 440 | 169,191 | 5,159 |
E-mini S&P 500 Index | 1,542 | 118,588 | 518 |
Unrealized appreciation (depreciation) on open futures contracts is required to be treated as realized gain (loss) for tax purposes.
F. During the year ended September 30, 2007, the fund purchased $6,937,969,000 of investment securities and sold $5,982,760,000 of investment securities, other than temporary cash investments.
G. The market value of securities on loan to broker-dealers at September 30, 2007, was $67,946,000, for which the fund received cash collateral of $70,973,000.
H. Capital share transactions for each class of shares were:
| Year Ended September 30, |
| 2007 | 2006 |
| Amount | Shares | Amount | Shares |
| ($000) | (000) | ($000) | (000) |
Investor Shares | | | | |
Issued | 1,220,304 | 61,572 | 1,021,080 | 57,014 |
Issued in Lieu of Cash Distributions | 193,647 | 10,112 | 24,672 | 1,378 |
Redeemed | (921,085) | (46,368) | (764,010) | (42,825) |
Net Increase (Decrease)—Investor Shares | 492,866 | 25,316 | 281,742 | 15,567 |
Admiral Shares | | | | |
Issued | 915,586 | 14,803 | 680,890 | 12,292 |
Issued in Lieu of Cash Distributions | 58,650 | 988 | 6,969 | 125 |
Redeemed | (318,022) | (5,190) | (205,040) | (3,693) |
Net Increase (Decrease)—Admiral Shares | 656,214 | 10,601 | 482,819 | 8,724 |
I. In June 2006, the Financial Accounting Standards Board issued Interpretation No. 48 (“FIN 48”), “Accounting for Uncertainty in Income Taxes.” FIN 48 establishes the minimum threshold for recognizing, and a system for measuring, the benefits of tax-return positions in financial statements, and is effective for the fund’s fiscal year beginning October 1, 2007. Management has analyzed the fund’s tax positions taken on federal income tax returns for all open tax years (tax years ended September 30, 2004–2007) for purposes of implementing FIN 48, and has concluded that as of September 30, 2007, no provision for income tax would be required in the fund’s financial statements.
28
Report of Independent Registered
Public Accounting Firm
To the Trustees and Shareholders of Vanguard Morgan Growth Fund:
In our opinion, the accompanying statement of net assets and the related statements of operations and of changes in net assets and the financial highlights present fairly, in all material respects, the financial position of Vanguard Morgan Growth Fund (the “Fund”) at September 30, 2007, the results of its operations for the year then ended, the changes in its net assets for each of the two years in the period then ended, and the financial highlights for each of the five years in the period then ended, in conformity with accounting principles generally accepted in the United States of America. These financial statements and financial highlights (hereafter referred to as “financial statements”) are the responsibility of the Fund’s management; our responsibility is to express an opinion on these financial statements based on our audits. We conducted our audits of these financial statements in accordance with the standards of the Public Company Accounting Oversight Board (United States), which require that we plan and perform the audit to obtain reasonable assurance about whether the financial statements are free of material misstatement. An audit includes examining, on a test basis, evidence supporting the amounts and disclosures in the financial statements, assessing the accounting principles used and significant estimates made by management, and evaluating the overall financial statement presentation. We believe that our audits, which included confirmation of securities at September 30, 2007 by correspondence with the custodians and brokers, and by agreement to the underlying ownership records for Vanguard Market Liquidity Fund, provide a reasonable basis for our opinion.
PricewaterhouseCoopers LLP
Philadelphia, Pennsylvania
November 7, 2007
Special 2007 tax information (unaudited) for Vanguard Morgan Growth Fund
This information for the fiscal year ended September 30, 2007, is included pursuant to provisions of the Internal Revenue Code.
The fund distributed $198,164,000 as capital gain dividends (from net long-term capital gains) to shareholders during the fiscal year.
The fund distributed $81,049,000 of qualified dividend income to shareholders during the fiscal year.
For corporate shareholders, 29% of investment income (dividend income plus short-term gains, if any) qualifies for the dividends-received deduction.
29
Your Fund’s After-Tax Returns
This table presents returns for your fund both before and after taxes. The after-tax returns are shown in two ways: (1) assuming that an investor owned the fund during the entire period and paid taxes on the fund’s distributions, and (2) assuming that an investor paid taxes on the fund’s distributions and sold all shares at the end of each period.
Calculations are based on the highest individual federal income tax and capital gains tax rates in effect at the times of the distributions and the hypothetical sales. State and local taxes were not considered. After-tax returns reflect any qualified dividend income, using actual prior-year figures and estimates for 2007. (In the example, returns after the sale of fund shares may be higher than those assuming no sale. This occurs when the sale would have produced a capital loss. The calculation assumes that the investor received a tax deduction for the loss.)
The table shows returns for Investor Shares only; returns for other share classes will differ. Please note that your actual after-tax returns will depend on your tax situation and may differ from those shown. Also note that if you own the fund in a tax-deferred account, such as an individual retirement account or a 401(k) plan, this information does not apply to you. Such accounts are not subject to current taxes.
Finally, keep in mind that a fund’s performance—whether before or after taxes—does not guarantee future results.
Average Annual Total Returns: Morgan Growth Fund Investor Shares1 | |
Periods Ended September 30, 2007 | | | |
| One | Five | Ten |
| Year | Years | Years |
Returns Before Taxes | 21.24% | 16.63% | 6.71% |
Returns After Taxes on Distributions | 20.56 | 16.42 | 5.22 |
Returns After Taxes on Distributions and Sale of Fund Shares | 14.49 | 14.62 | 5.07 |
1 | Total returns do not include the account service fee that may be applicable to certain accounts with balances below $10,000. |
30
About Your Fund’s Expenses
As a shareholder of the fund, you incur ongoing costs, which include costs for portfolio management, administrative services, and shareholder reports (like this one), among others. Operating expenses, which are deducted from a fund’s gross income, directly reduce the investment return of the fund.
A fund’s expenses are expressed as a percentage of its average net assets. This figure is known as the expense ratio. The following examples are intended to help you understand the ongoing costs (in dollars) of investing in your fund and to compare these costs with those of other mutual funds. The examples are based on an investment of $1,000 made at the beginning of the period shown and held for the entire period.
The table below illustrates your fund’s costs in two ways:
• Based on actual fund return. This section helps you to estimate the actual expenses that you paid over the period. The “Ending Account Value” shown is derived from the fund’s actual return, and the third column shows the dollar amount that would have been paid by an investor who started with $1,000 in the fund. You may use the information here, together with the amount you invested, to estimate the expenses that you paid over the period.
To do so, simply divide your account value by $1,000 (for example, an $8,600 account value divided by $1,000 = 8.6), then multiply the result by the number given for your fund under the heading “Expenses Paid During Period.”
• Based on hypothetical 5% yearly return. This section is intended to help you compare your fund’s costs with those of other mutual funds. It assumes that the fund had a yearly return of 5% before expenses, but that the expense ratio is unchanged. In this case—because the return used is not the fund’s actual return—the results do not apply to your investment. The example is useful in making comparisons because the Securities and Exchange Commission requires all mutual funds to calculate expenses based on a 5% return. You can assess your fund’s costs by comparing this hypothetical example with the hypothetical examples that appear in shareholder reports of other funds.
Six Months Ended September 30, 2007 | | | |
| Beginning | Ending | Expenses |
| Account Value | Account Value | Paid During |
Morgan Growth Fund | 3/31/2007 | 9/30/2007 | Period1 |
Based on Actual Fund Return | | | |
Investor Shares | $1,000.00 | $1,114.29 | $1.86 |
Admiral Shares | 1,000.00 | 1,115.06 | 1.11 |
Based on Hypothetical 5% Yearly Return | | | |
Investor Shares | $1,000.00 | $1,023.31 | $1.78 |
Admiral Shares | 1,000.00 | 1,024.02 | 1.07 |
1 | The calculations are based on expenses incurred in the most recent six-month period. The fund’s annualized six-month expense ratios for that period are 0.35% for Investor Shares and 0.21% for Admiral Shares. The dollar amounts shown as “Expenses Paid” are equal to the annualized expense ratio multiplied by the average account value over the period, multiplied by the number of days in the most recent six month period, then divided by the number of days in the most recent 12-month period. |
31
Note that the expenses shown in the table on page 31 are meant to highlight and help you compare ongoing costs only and do not reflect transaction costs incurred by the fund for buying and selling securities. Further, the expenses do not include the account service fee described in the prospectus. If such a fee were applied to your account, your costs would be higher. Your fund does not charge transaction fees, such as purchase or redemption fees, nor does it carry a “sales load.”
The calculations assume no shares were bought or sold during the period. Your actual costs may have been higher or lower, depending on the amount of your investment and the timing of any purchases or redemptions.
You can find more information about the fund’s expenses, including annual expense ratios, in the Financial Statements section of this report. For additional information on operating expenses and other shareholder costs, please refer to your fund’s current prospectus.
32
Glossary
Beta. A measure of the magnitude of a fund’s past share-price fluctuations in relation to the ups and downs of a given market index. The index is assigned a beta of 1.00. Compared with a given index, a fund with a beta of 1.20 typically would have seen its share price rise or fall by 12% when the index rose or fell by 10%. A fund’s beta should be reviewed in conjunction with its R-squared (see definition below). The lower the R-squared, the less correlation there is between the fund and the index, and the less reliable beta is as an indicator of volatility.
Earnings Growth Rate. The average annual rate of growth in earnings over the past five years for the stocks now in a fund.
Equity Exposure. A measure that reflects a fund’s investments in stocks and stock futures. Any holdings in short-term reserves are excluded.
Expense Ratio. The percentage of a fund’s average net assets used to pay its annual administrative and advisory expenses. These expenses directly reduce returns to investors.
Foreign Holdings. The percentage of a fund represented by stocks or depositary receipts of companies based outside the United States.
Inception Date. The date on which the assets of a fund (or one of its share classes) are first invested in accordance with the fund’s investment objective. For funds with a subscription period, the inception date is the day after that period ends. Investment performance is measured from the inception date.
Median Market Cap. An indicator of the size of companies in which a fund invests; the midpoint of market capitalization (market price x shares outstanding) of a fund’s stocks, weighted by the proportion of the fund’s assets invested in each stock. Stocks representing half of the fund’s assets have market capitalizations above the median, and the rest are below it.
Price/Book Ratio. The share price of a stock divided by its net worth, or book value, per share. For a fund, the weighted average price/book ratio of the stocks it holds.
Price/Earnings Ratio. The ratio of a stock’s current price to its per-share earnings over the past year. For a fund, the weighted average P/E of the stocks it holds. P/E is an indicator of market expectations about corporate prospects; the higher the P/E, the greater the expectations for a company’s future growth.
R-Squared. A measure of how much of a fund’s past returns can be explained by the returns from the market in general, as measured by a given index. If a fund’s total returns were precisely synchronized with an index’s returns, its R-squared would be 1.00. If the fund’s returns bore no relationship to the index’s returns, its R-squared would be 0.
Return on Equity. The annual average rate of return generated by a company during the past five years for each dollar of shareholder’s equity (net income divided by shareholder’s equity). For a fund, the weighted average return on equity for the companies whose stocks it holds.
Short-Term Reserves. The percentage of a fund invested in highly liquid, short-term securities that can be readily converted to cash.
Turnover Rate. An indication of the fund’s trading activity. Funds with high turnover rates incur higher transaction costs and may be more likely to distribute capital gains (which may be taxable to investors). The turnover rate excludes in-kind transactions, which have minimal impact on costs.
Yield. A snapshot of a fund’s income from interest and dividends. The yield, expressed as a percentage of the fund’s net asset value, is based on income earned over the past 30 days and is annualized, or projected forward for the coming year. The index yield is based on the current annualized rate of income provided by securities in the index.
33
This page intentionally left blank.
This page intentionally left blank.
The People Who Govern Your Fund
The trustees of your mutual fund are there to see that the fund is operated and managed in your best interests since, as a shareholder, you are a part owner of the fund. Your fund’s trustees also serve on the board of directors of The Vanguard Group, Inc., which is owned by the Vanguard funds and provides services to them on an at-cost basis.
A majority of Vanguard’s board members are independent, meaning that they have no affiliation with Vanguard or the funds they oversee, apart from the sizable personal investments they have made as private individuals.
Our independent board members bring distinguished backgrounds in business, academia, and public service to their task of working with Vanguard officers to establish the policies and oversee the activities of the funds. Among board members’ responsibilities are selecting investment advisors for the funds; monitoring fund operations, performance, and costs; reviewing contracts; nominating and selecting new trustees/directors; and electing Vanguard officers.
Each trustee serves a fund until its termination; or until the trustee’s retirement, resignation, or death; or otherwise as specified in the fund’s organizational documents. Any trustee may be removed at a shareholders’ meeting by a vote representing two-thirds of the net asset value of all shares of the fund together with shares of other Vanguard funds organized within the same trust. The table on these two pages shows information for each trustee and executive officer of the fund. The mailing address of the trustees and officers is P.O. Box 876, Valley Forge, PA 19482.
Chairman of the Board, Chief Executive Officer, and Trustee |
| |
John J. Brennan1 | |
Born 1954 | Principal Occupation(s) During the Past Five Years: |
Trustee since May 1987; | Chairman of the Board, Chief Executive Officer, and |
Chairman of the Board and | Director/Trustee of The Vanguard Group, Inc., and of each |
Chief Executive Officer | of the investment companies served by |
148 Vanguard Funds Overseen | The Vanguard Group. |
| |
Independent Trustees | |
| |
Charles D. Ellis | |
Born 1937 | Principal Occupation(s) During the Past Five Years: |
Trustee since January 2001 | Applecore Partners (pro bono ventures |
148 Vanguard Funds Overseen | in education); Senior Advisor to Greenwich Associates |
| (international business strategy consulting); Successor |
| Trustee of Yale University; Overseer of the Stern School of |
| Business at New York University; Trustee of the Whitehead |
| Institute for Biomedical Research. |
| |
Rajiv L. Gupta | |
Born 1945 | Principal Occupation(s) During the Past Five Years: |
Trustee since December 20012 | Chairman, President, and Chief Executive Officer of Rohm |
148 Vanguard Funds Overseen | and Haas Co. (chemicals); Board Member of the American |
| Chemistry Council; Director of Tyco International, Ltd. |
| (diversified manufacturing and services) since 2005; |
| Trustee of Drexel University and of the Chemical |
| Heritage Foundation. |
| |
| |
| |
Amy Gutmann | |
Born 1949 | Principal Occupation(s) During the Past Five Years: |
Trustee since June 2006 | President of the University of Pennsylvania since 2004; |
148 Vanguard Funds Overseen | Professor in the School of Arts and Sciences, Annenberg |
| School for Communication, and Graduate School of |
| Education of the University of Pennsylvania since 2004; |
| Provost (2001–2004) and Laurance S. Rockefeller Professor |
| of Politics and the University Center for Human Values |
| (1990–2004), Princeton University; Director of Carnegie |
| Corporation of New York since 2005 and of Schuylkill River |
| Development Corporation and Greater Philadelphia |
| Chamber of Commerce since 2004. |
JoAnn Heffernan Heisen | |
Born 1950 | Principal Occupation(s) During the Past Five Years: |
Trustee since July 1998 | Corporate Vice President and Chief Global Diversity |
148 Vanguard Funds Overseen | Officer since 2006, Vice President and Chief Information |
| Officer (1997–2005), and Member of the Executive |
| Committee of Johnson & Johnson (pharmaceuticals/ |
| consumer products); Director of the University Medical |
| Center at Princeton and Women’s Research |
| and Education Institute. |
| |
André F. Perold | |
Born 1952 | Principal Occupation(s) During the Past Five Years: |
Trustee since December 2004 | George Gund Professor of Finance and Banking, Harvard |
148 Vanguard Funds Overseen | Business School; Senior Associate Dean, Director of Faculty |
| Recruiting, and Chair of Finance Faculty, Harvard Business |
| School; Director and Chairman of UNX, Inc. |
| (equities trading firm) since 2003; Chair of the Investment |
| Committee of HighVista Strategies LLC (private |
| investment firm) since 2005. |
| |
Alfred M. Rankin, Jr. | |
Born 1941 | Principal Occupation(s) During the Past Five Years: |
Trustee since January 1993 | Chairman, President, Chief Executive |
148 Vanguard Funds Overseen | Officer, and Director of NACCO Industries, Inc. (forklift |
| trucks/housewares/lignite); Director |
| of Goodrich Corporation (industrial products/ |
| aircraft systems and services). |
| |
J. Lawrence Wilson | |
Born 1936 | Principal Occupation(s) During the Past Five Years: |
Trustee since April 1985 | Retired Chairman and Chief Executive |
148 Vanguard Funds Overseen | Officer of Rohm and Haas Co. (chemicals); Director of |
| Cummins Inc. (diesel engines) and AmerisourceBergen |
| Corp. (pharmaceutical distribution); Trustee of Vanderbilt |
| University and of Culver Educational Foundation. |
| |
Executive Officers1 | |
| |
Thomas J. Higgins | |
Born 1957 | Principal Occupation(s) During the Past Five Years: |
Treasurer since July 1998 | Principal of The Vanguard Group, Inc.; Treasurer of each |
148 Vanguard Funds Overseen | of the investment companies served by The Vanguard |
| Group. |
| |
Heidi Stam | |
Born 1956 | Principal Occupation(s) During the Past Five Years: |
Secretary since July 2005 | Managing Director of The Vanguard |
148 Vanguard Funds Overseen | Group, Inc., since 2006; General Counsel of The Vanguard |
| Group since 2005; Secretary of The Vanguard Group, and |
| of each of the investment companies served by |
| The Vanguard Group, since 2005; Principal of |
| The Vanguard Group (1997–2006). |
| |
| |
Vanguard Senior Management Team |
| |
R. Gregory Barton | Kathleen C. Gubanich | F. William McNabb, III | Ralph K. Packard |
Mortimer J. Buckley | Paul A. Heller | Michael S. Miller | George U. Sauter |
| |
Founder | |
| |
John C. Bogle | |
Chairman and Chief Executive Officer, 1974–1996 |
1 | Officers of the funds are “interested persons” as defined in the Investment Company Act of 1940. |
2 | December 2002 for Vanguard Equity Income Fund, Vanguard Growth Equity Fund, the Vanguard Municipal Bond Funds, and the Vanguard State Tax-Exempt Funds. |
More information about the trustees is in the Statement of Additional Information, available from The Vanguard Group.

P.O. Box 2600
Valley Forge, PA 19482-2600
Connect with Vanguard® > www.vanguard.com
Fund Information > 800-662-7447 | Vanguard, Admiral, Morgan, Connect |
| with Vanguard, and the ship logo are |
Direct Investor Account Services > 800-662-2739 | trademarks of The Vanguard Group, Inc. |
| |
Institutional Investor Services > 800-523-1036 | All other marks are the exclusive property |
| of their respective owners. |
| |
Text Telephone for People | All comparative mutual fund data are from |
With Hearing Impairment > 800-952-3335 | Lipper Inc. or Morningstar, Inc., unless |
| otherwise noted. |
| |
This material may be used in conjunction | You can obtain a free copy of Vanguard’s |
with the offering of shares of any Vanguard | proxy voting guidelines by visiting our website, |
fund only if preceded or accompanied by | www.vanguard.com, and searching for |
the fund’s current prospectus. | “proxy voting guidelines,” or by calling |
| Vanguard at 800-662-2739. The guidelines |
| are also available from the SEC’s website, |
| www.sec.gov. In addition, you may obtain a |
| free report on how your fund voted the |
| proxies for securities it owned during the |
| 12 months ended June 30. To get the report, |
| visit either www.vanguard.com or |
| www.sec.gov. |
| |
| You can review and copy information about |
| your fund at the SEC’s Public Reference |
| Room in Washington, D.C. To find out more |
| about this public service, call the SEC at |
| 202-551-8090. Information about your fund is |
| also available on the SEC’s website, and |
| you can receive copies of this information, |
| for a fee, by sending a request in either |
| of two ways: via e-mail addressed to |
| publicinfo@ sec. gov or via regular mail |
| addressed to the Public Reference Section, |
| Securities and Exchange Commission, |
| Washington, DC 20549-0102. |
| |
| © 2007 The Vanguard Group, Inc. |
| All rights reserved. |
| Vanguard Marketing Corporation, Distributor. |
| |
| Q260 112007 |
Item 2: Code of Ethics. The Registrant has adopted a code of ethics that applies to the Registrant’s principal executive officer, principal financial officer, principal accounting officer or controller or persons performing similar functions. The Code of Ethics was amended during the reporting period covered by this report to make certain technical, non-material changes.
Item 3: Audit Committee Financial Expert. The following members of the Audit Committee have been determined by the Registrant’s Board of Trustees to be Audit Committee Financial Experts serving on its Audit Committee, and to be independent: Charles D. Ellis, Rajiv L. Gupta, JoAnn Heffernan Heisen, André F. Perold, Alfred M. Rankin, Jr., and J. Lawrence Wilson.
Item 4: Principal Accountant Fees and Services.
(a) Audit Fees.
Audit Fees of the Registrant
Fiscal Year Ended September 30, 2007: $26,000
Fiscal Year Ended September 30, 2006: $23,000
Aggregate Audit Fees of Registered Investment Companies in the Vanguard Group.
Fiscal Year Ended September 30, 2007: $2,835,320
Fiscal Year Ended September 30, 2006: $2,347,620
(b) Audit-Related Fees.
Fiscal Year Ended September 30, 2007: $630,400
Fiscal Year Ended September 30, 2006: $530,000
Includes fees billed in connection with assurance and related services provided to the Registrant, The Vanguard Group, Inc., Vanguard Marketing Corporation, and other registered investment companies in the Vanguard Group.
(c) Tax Fees.
Fiscal Year Ended September 30, 2007: $215,900
Fiscal Year Ended September 30, 2006: $101,300
Includes fees billed in connection with tax compliance, planning and advice services provided to the Registrant, The Vanguard Group, Inc., Vanguard Marketing Corporation, and other registered investment companies in the Vanguard Group and related to income and excise taxes.
(d) All Other Fees.
Fiscal Year Ended September 30, 2007: $0
Fiscal Year Ended September 30, 2006: $0
Includes fees billed for services related to risk management and privacy matters. Services were provided to the Registrant, The Vanguard Group, Inc., Vanguard Marketing Corporation, and other registered investment companies in the Vanguard Group.
(e) (1) Pre-Approval Policies. The policy of the Registrant’s Audit Committee is to consider and, if appropriate, approve before the principal accountant is engaged for such services, all specific audit and non-audit services provided to: (1) the Registrant; (2) The Vanguard Group, Inc.; (3) other entities controlled by The Vanguard Group, Inc. that provide ongoing services to the Registrant; and (4) other
registered investment companies in the Vanguard Group. In making a determination, the Audit Committee considers whether the services are consistent with maintaining the principal accountant’s independence.
In the event of a contingency situation in which the principal accountant is needed to provide services in between scheduled Audit Committee meetings, the Chairman of the Audit Committee would be called on to consider and, if appropriate, pre-approve audit or permitted non-audit services in an amount sufficient to complete services through the next Audit Committee meeting, and to determine if such services would be consistent with maintaining the accountant’s independence. At the next scheduled Audit Committee meeting, services and fees would be presented to the Audit Committee for formal consideration, and, if appropriate, approval by the entire Audit Committee. The Audit Committee would again consider whether such services and fees are consistent with maintaining the principal accountant’s independence.
The Registrant’s Audit Committee is informed at least annually of all audit and non-audit services provided by the principal accountant to the Vanguard complex, whether such services are provided to: (1) the Registrant; (2) The Vanguard Group, Inc.; (3) other entities controlled by The Vanguard Group, Inc. that provide ongoing services to the Registrant; or (4) other registered investment companies in the Vanguard Group.
(2) No percentage of the principal accountant’s fees or services were approved pursuant to the waiver provision of paragraph (c)(7)(i)(C) of Rule 2-01 of Regulation S-X.
(f) For the most recent fiscal year, over 50% of the hours worked under the principal accountant’s engagement were not performed by persons other than full-time, permanent employees of the principal accountant.
(g) Aggregate Non-Audit Fees.
Fiscal Year Ended September 30, 2007: $215,900
Fiscal Year Ended September 30, 2006: $101,300
Includes fees billed for non-audit services provided to the Registrant, The Vanguard Group, Inc., Vanguard Marketing Corporation, and other registered investment companies in the Vanguard Group.
(h) For the most recent fiscal year, the Audit Committee has determined that the provision of all non-audit services was consistent with maintaining the principal accountant’s independence.
Item 5: Not Applicable.
Item 6: Not Applicable.
Item 7: Not Applicable.
Item 8: Not Applicable.
Item 9: Not Applicable.
Item 10: Not Applicable.
Item 11: Controls and Procedures.
(a) Disclosure Controls and Procedures. The Principal Executive and Financial Officers concluded that the Registrant's Disclosure Controls and Procedures are effective based on their evaluation of the Disclosure Controls and Procedures as of a date within 90 days of the filing date of this report.
(b) Internal Control Over Financial Reporting. There were no significant changes in Registrant’s Internal Control Over Financial Reporting or in other factors that could significantly affect this control subsequent to the date of the evaluation, including any corrective actions with regard to significant deficiencies and material weaknesses.
Item 12: Exhibits.
Pursuant to the requirements of the Securities Exchange Act of 1934 and the Investment Company Act of 1940, the registrant has duly caused this report to be signed on its behalf by the undersigned, thereunto duly authorized.
| VANGUARD MORGAN GROWTH FUND |
| |
By: | (signature) |
| (HEIDI STAM) |
| JOHN J. BRENNAN* |
| CHIEF EXECUTIVE OFFICER |
| |
Date: November 14, 2007 |
Pursuant to the requirements of the Securities Exchange Act of 1934 and the Investment Company Act of 1940, this report has been signed below by the following persons on behalf of the registrant and in the capacities and on the dates indicated.
| VANGUARD MORGAN GROWTH FUND |
| |
By: | (signature) |
| (HEIDI STAM) |
| JOHN J. BRENNAN* |
| CHIEF EXECUTIVE OFFICER |
| |
Date: November 14, 2007 |
| VANGUARD MORGAN GROWTH FUND |
| |
By: | (signature) |
| (HEIDI STAM) |
| THOMAS J. HIGGINS |
| TREASURER |
| |
Date: November 14, 2007 |
*By Power of Attorney. See File Number 333-145624, filed on August 22, 2007. Incorporated by Reference.