UNITED STATES
SECURITIES AND EXCHANGE COMMISSION
Washington, D.C. 20549
FORM N-CSR
CERTIFIED SHAREHOLDER REPORT
OF
REGISTERED MANAGEMENT INVESTMENT COMPANIES
Investment Company Act file number: 811-01685
Name of Registrant: Vanguard Morgan Growth Fund
Address of Registrant:
P.O. Box 2600
Valley Forge, PA 19482
Name and address of agent for service:
Heidi Stam, Esquire
P.O. Box 876
Valley Forge, PA 19482
Registrant’s telephone number, including area code: (610) 669-1000
Date of fiscal year end: September 30
Date of reporting period: October 1, 2012 – September 30, 2013
Item 1: Reports to Shareholders

|
| Annual Report | September 30, 2013 |
| |
| Vanguard Morgan™ Growth Fund |
| |
 |
Vanguard’s Principles for Investing Success
We want to give you the best chance of investment success. These principles, grounded in Vanguard’s research and experience, can put you on the right path.
Goals. Create clear, appropriate investment goals.
Balance. Develop a suitable asset allocation using broadly diversified funds.
Cost. Minimize cost.
Discipline. Maintain perspective and long-term discipline.
A single theme unites these principles: Focus on the things you can control.
We believe there is no wiser course for any investor.
| |
| Contents | |
| Your Fund’s Total Returns. | 1 |
| Chairman’s Letter. | 2 |
| Advisors’ Report. | 8 |
| Fund Profile. | 12 |
| Performance Summary. | 13 |
| Financial Statements. | 15 |
| Your Fund’s After-Tax Returns. | 31 |
| About Your Fund’s Expenses. | 32 |
| Glossary. | 34 |
Please note: The opinions expressed in this report are just that—informed opinions. They should not be considered promises or advice. Also, please keep in mind that the information and opinions cover the period through the date on the front of this report. Of course, the risks of investing in your fund are spelled out in the prospectus.
See the Glossary for definitions of investment terms used in this report.
About the cover: The ship's wheel represents leadership and guidance, essential qualities in navigating difficult seas. This one is a replica based on an 18th-century British vessel. The HMS Vanguard, another ship of that era, served as the flagship for Admiral Horatio Nelson when he defeated a French fleet at the Battle of the Nile.
Your Fund’s Total Returns
| |
| Fiscal Year Ended September 30, 2013 | |
| |
| | Total |
| | Returns |
| Vanguard Morgan Growth Fund | |
| Investor Shares | 20.69% |
| Admiral™ Shares | 20.86 |
| Russell 3000 Growth Index | 20.30 |
| Multi-Cap Growth Funds Average | 22.55 |
| Multi-Cap Growth Funds Average: Derived from data provided by Lipper, a Thomson Reuters Company. | |
| Admiral Shares carry lower expenses and are available to investors who meet certain account-balance requirements. | |
| | | | |
| Your Fund’s Performance at a Glance | | | | |
| September 30, 2012, Through September 30, 2013 | | | | |
| | | | Distributions Per Share |
| | Starting | Ending | | |
| | Share | Share | Income | Capital |
| | Price | Price | Dividends | Gains |
| Vanguard Morgan Growth Fund | | | | |
| Investor Shares | $20.31 | $24.26 | $0.205 | $0.000 |
| Admiral Shares | 63.02 | 75.26 | 0.735 | 0.000 |
1

Chairman’s Letter
Dear Shareholder,
For the second straight year, the U.S. stock market rose sharply over the 12-month period ended September 30, outpacing its historical long-term average. Vanguard Morgan Growth Fund returned close to 21% for both Investor and Admiral Shares for the period. The fund slightly outperformed its benchmark, the Russell 3000 Growth Index, but its return trailed the average return of its multi-capitalization growth fund peers.
For the period, the fund posted double-digit results in eight of the nine sectors in which it was invested. Stocks in the consumer discretionary, health care, and industrial sectors contributed most to its overall performance.
If you hold shares in a taxable account, you may wish to review the information about after-tax returns, based on the highest federal income tax bracket, that appears later in the report.
Stocks dodged obstacles to produce strong gains
Although their path wasn’t always smooth, U.S. stocks powered to a return of about 22% for the 12 months ended September 30. The U.S. economy delivered only modest growth over the fiscal year, but investors’ appetite for risk seemed to increase faster than companies’ profits.
2
In mid-September, U.S. stocks jumped when the Federal Reserve surprised investors by announcing that it had no immediate plans to unwind its stimulative bond-buying program. But in the waning days of that month, stocks slid ahead of the partial federal government shutdown that began October 1.
It’s natural for investors to be concerned by the situation in Washington. But as Sarah Hammer, a senior analyst in Vanguard Investment Strategy Group, noted in the midst of the temporary shutdown, they shouldn’t be unduly influenced by these events. “Investors are often best served by sticking to their long-term investment plans and avoiding short-term decisions based on the legislative outlook,” Ms. Hammer said. Our recurrent advice to stick to your plan may lack pizzazz, but it’s proven to be sound counsel over the decades.
International stocks generally posted strong results. Emerging-market stocks, however, lagged amid worries about slowing economic growth.
Bond returns were negative despite September’s bounce
Investor concern about the Fed’s potential scaling back of its bond-buying program also affected the performance of bonds, which posted declines for the year. In September, however, bonds trimmed their losses after the Fed said it would continue the purchases.
| | | |
| Market Barometer | | | |
| |
| | | Average Annual Total Returns |
| | Periods Ended September 30, 2013 |
| | One | Three | Five |
| | Year | Years | Years |
| Stocks | | | |
| Russell 1000 Index (Large-caps) | 20.91% | 16.64% | 10.53% |
| Russell 2000 Index (Small-caps) | 30.06 | 18.29 | 11.15 |
| Russell 3000 Index (Broad U.S. market) | 21.60 | 16.76 | 10.58 |
| MSCI All Country World Index ex USA (International) | 16.48 | 5.95 | 6.26 |
| |
| Bonds | | | |
| Barclays U.S. Aggregate Bond Index (Broad taxable market) | -1.68% | 2.86% | 5.41% |
| Barclays Municipal Bond Index (Broad tax-exempt market) | -2.21 | 3.24 | 5.98 |
| Citigroup Three-Month U.S. Treasury Bill Index | 0.07 | 0.07 | 0.14 |
| |
| CPI | | | |
| Consumer Price Index | 1.18% | 2.34% | 1.37% |
3
The broad U.S. taxable bond market returned –1.68% for the fiscal year, and the yield of the 10-year Treasury note closed at 2.63%, down from 2.76% a month earlier. (Bond yields and prices move in opposite directions.) Municipal bonds returned –2.21% after rebounding a bit in September.
Money markets and savings accounts barely budged as the Fed’s target for short-term interest rates remained between 0% and 0.25%.
Strong results across the board powered Morgan Growth’s advance
Vanguard Morgan Growth Fund seeks to outperform the Russell 3000 Growth Index through a multi-manager approach that includes broad exposure to large- and mid-capitalization U.S. growth stocks. The fund’s five investment advisors use different but complementary approaches to manage independent sub-portfolios, providing diversification along with the potential for less volatility than is likely with a single-manager fund.
In the most recent fiscal year, the fund again performed well, returning more than 20%. The most significant contributors were consumer discretionary companies, which make up the fund’s second-largest sector. They returned about 31% as resilient U.S. consumers continued to play their key role in sustaining the nation’s modest recovery.
| | | |
| Expense Ratios | | | |
| Your Fund Compared With Its Peer Group | | | |
| | Investor | Admiral | Peer Group |
| | Shares | Shares | Average |
| Morgan Growth Fund | 0.40% | 0.26% | 1.31% |
The fund expense ratios shown are from the prospectus dated January 28, 2013, and represent estimated costs for the current fiscal year. For the fiscal year ended September 30, 2013, the fund’s expense ratios were 0.39% for Investor Shares and 0.25% for Admiral Shares. The peer-group expense ratio is derived from data provided by Lipper, a Thomson Reuters Company, and captures information through year-end 2012.
Peer group: Multi-Cap Growth Funds.
4
Health care companies—particularly firms in the growing biotechnology field—did especially well for the fund, returning 32%. Industrial stocks posted the highest absolute return, 38%, as the fund’s advisors found strong selections in the aerospace and defense-related corners of the sector.
Information technology stocks, which make up the largest sector in the fund (with a weighting of about 30%, on average), returned a relatively tame 10%. Nonetheless, the fund’s IT holdings outshone those in the benchmark index, largely because of profitable selections among IT service firms, notably data processors.
Materials and energy were the fund’s two notable underperforming sectors. A handful of steel and mining holdings lost value, dragging down the materials sector’s return in the fund to about 6%, compared with nearly 22% in the benchmark. The advisors’ energy selections returned about 17%, but lagged their index counterparts by 10 percentage points.
The fund continues to compile a competitive long-term record
Vanguard Morgan Growth Fund’s long-term results continue to be competitive. For the ten years ended September 30, 2013, the average annual return for Investor Shares was 7.97%, a figure
| |
| Total Returns | |
| Ten Years Ended September 30, 2013 | |
| | Average |
| | Annual Return |
| Morgan Growth Fund Investor Shares | 7.97% |
| Russell 3000 Growth Index | 7.99 |
| Multi-Cap Growth Funds Average | 7.49 |
| Multi-Cap Growth Funds Average: Derived from data provided by Lipper, a Thomson Reuters Company. | |
The figures shown represent past performance, which is not a guarantee of future results. (Current performance may be lower or higher than the performance data cited. For performance data current to the most recent month-end, visit our website at vanguard.com/performance.) Note, too, that both investment returns and principal value can fluctuate widely, so an investor’s shares, when sold, could be worth more or less than their original cost.
5
nearly identical to the return of the fund’s benchmark index and higher than the 7.49% average annual return of its peers.
This period included considerable volatility in the stock market and a painful recession. The multi-manager advisory team steered
the fund through the turbulence to deliver solid long-term results. In addition to the advisors’ skill and perseverance, low investment costs helped the fund’s bottom line. Low costs let investors retain more of a fund’s returns.
|
| Investment insight |
| Don’t let a trick of the calendar alter your course |
| When making investment decisions, it’s important to weigh past returns with caution. |
| That’s because investment returns from any particular period are an unreliable anchor |
| for gauging the future. They can be highly date-dependent. |
| |
| For example, take the five-year average annual return for the broad U.S. stock |
| market. That average just made a startling bounce: from 1.30% for the period |
| ended September 30, 2012, to 10.58% for the period ended September 30, 2013. |
| True, the market returned a hearty 21.60% in the most recent 12 months, but that’s |
| not enough to explain such a big leap in the average. Significantly, the year ended |
| September 30, 2008––when U.S. stocks returned –21.52% during the financial |
| crisis––has now rolled off the five-year calculation. |
| |
| The important thing to remember is that historical returns are just that: historical. |
| Basing investment decisions on such date-dependent snapshots could easily lead |
| you to alter course––possibly in the wrong direction. Instead, Vanguard believes, you |
| should build your asset allocation strategy on long-term risk-and-return relationships, |
| always recognizing that no level of return is guaranteed. |
| |
| Which five-year average should you count on? | |
| (Answer: None of them!) | |
| Average annual returns for U.S. stocks over five-year periods ended September 30 |
| 2007 | 16.18% |
| 2008 | 5.70 |
| 2009 | 1.56 |
| 2010 | 0.92 |
| 2011 | –0.92 |
| 2012 | 1.30 |
| 2013 | 10.58 |
| Note: The U.S. stock market is represented by the Russell 3000 Index. | |
| Source: Vanguard. | |
6
Benefits of combining low costs with diversity of thought
Investors sometimes ask why Vanguard uses a multi-advisor approach for many of its actively managed equity funds. Just as we recommend diversification within and across asset classes for investments overall, we think significant benefits can accrue from using more than one advisory firm for a single fund: diversity of investment process and style, thought, and holdings.
All of these elements can lead to less risk and better results. Because not all investment managers invest the same way, their returns relative to the benchmark don’t move in lockstep.
As with many investment topics, however, there are some misconceptions about the benefits of using a multi-manager approach. For example, it is often suggested that the best ideas of the advisors are diluted when they are combined in one portfolio. Recent Vanguard research has found otherwise.
Conventional wisdom also suggests that multi-manager funds tend to be expensive. At Vanguard, this is not the case: Low costs are a hallmark of all our offerings. And Vanguard research indicates that low costs can contribute greatly to investing success, helping investors keep more of a portfolio’s return. (You can read more in Analyzing Multi-Manager Funds: Does Management Structure Affect Performance? at vanguard.com/research.)
As always, thank you for investing with Vanguard.
Sincerely,

F. William McNabb III
Chairman and Chief Executive Officer
October 14, 2013
7
Advisors’ Report
For the fiscal year ended September 30, 2013, Vanguard Morgan Growth Fund returned 20.69% for Investor Shares and 20.86% for the lower-cost Admiral Shares. Your fund is managed by five independent advisors, a strategy that enhances the
fund’s diversification by providing exposure to distinct yet complementary investment approaches. It’s not uncommon for different advisors to have different views about individual securities or the broader investment environment.
| | | |
| Vanguard Morgan Growth Fund Investment Advisors | |
| |
| | Fund Assets Managed | |
| Investment Advisor | % | $ Million | Investment Strategy |
| Wellington Management | 46 | 4,565 | Uses traditional methods of stock selection— |
| Company, LLP | | | fundamental research and analysis—to identify |
| | | | companies that it believes have above-average growth |
| | | | prospects. Research focuses on mid- and large-cap |
| | | | companies, evaluating and ranking each stock on a |
| | | | consistent set of growth, quality, and valuation criteria. |
| | | | We seek to build a portfolio with diversified sources of |
| | | | return with a balance of growth, quality, and valuation |
| | | | attributes. |
| Jennison Associates LLC | 20 | 1,976 | Uses a research-driven, fundamental investment |
| | | | approach that relies on in-depth company knowledge |
| | | | gleaned through meetings with management, |
| | | | customers, and suppliers. |
| Vanguard Equity Investment | 13 | 1,265 | Employs a quantitative, fundamental management |
| Group | | | approach, using models that assess valuation, growth |
| | | | prospects, management decisions, market sentiment, |
| | | | and earnings quality of companies versus their peers. |
| Kalmar Investment Advisers | 10 | 984 | Employs a “growth-with-value” strategy using creative, |
| | | | bottom-up research to uncover vigorously growing, |
| | | | high-quality businesses whose stocks can also be |
| | | | bought inefficiently valued. The strategy has a dual |
| | | | objective of strong returns with lower risk. |
| Frontier Capital Management Co., | 10 | 975 | Uses a research-driven, fundamental investment |
| LLC | | | approach that seeks companies with above-average |
| | | | growth prospects, reasonable valuations, and |
| | | | competitive advantages. |
| Cash Investments | 1 | 176 | These short-term reserves are invested by Vanguard in |
| | | | equity index products to simulate investments in |
| | | | stocks. Each advisor also may maintain a modest cash |
| | | | position. |
8
The advisors, the percentage of fund assets each manages, and brief descriptions of their investment strategies are presented in the table on page 8. The advisors have also prepared a discussion of the investment environment that existed during the fiscal year and of how portfolio positioning reflects this assessment. (Please note that the Kalmar Investment Advisers and Frontier Capital Management discussions refer to industry sectors as defined by Russell classifications, rather than by the Global Industry Classification Standard used elsewhere in this report.) These comments were prepared on October 17, 2013.
Wellington Management Company, LLP
Portfolio Manager:
Paul E. Marrkand, CFA,
Senior Vice President
Our portion of the fund uses traditional methods of stock selection—fundamental research and analysis —to identify companies that it believes have above-average growth prospects. Research focuses on mid- and large-cap companies, evaluating and ranking each stock on a consistent set of growth, quality, and valuation criteria. We seek to build a portfolio with diversified sources of return with a balance of growth, quality, and valuation attributes.
It was a very strong period for U.S. equities and other developed-market stocks around the world. Emerging-market equities fared less well, finishing roughly where they started. Fixed income investors lost money during the period as most bond markets struggled with rising interest rates.
Stock selection in financials, industrials, and information technology boosted relative results.
Our position in Boeing contributed strongly to performance in both absolute and benchmark-relative terms. The aircraft manufacturer came under pressure as electrical problems surfaced in its 787 model, which delayed deliveries and cash payments from customers. However, the stock rebounded as it became clear that the battery issues were manageable with modest design changes. Demand remained strong; Boeing has an order book of over 800 planes. We increased our position during the period.
Our security selection among stocks in the materials, energy, and consumer discretionary sectors detracted from performance during the period. Eli Lilly’s shares underperformed as investors’ near-term concerns about patent expirations and pipeline developments weighed on the pharmaceutical company’s stock price. We believe Eli Lilly’s robust pipeline of drugs in phase three trials uniquely positions it for success over the next several years, particular in oncology and diabetes. It has a large research-and-development budget relative to similar-sized peers. While Eli Lilly’s ability to innovate is more incremental than transformational, the company could drive
9
higher-than-expected profits over the long haul. We increased our position during the period.
We are very optimistic about the portfolio’s prospects and its favorable risk/reward profile. In particular, we see attractive risk-adjusted potential in the portfolio’s large-cap technology company holdings. Overall, we believe valuations remain attractive, balance sheets are strong, and many technology companies have the potential for high, sustainable free-cash-flow generation. Strong long-term trends, including cloud computing, mobility, security, and data storage, also should help drive sustained growth.
Jennison Associates LLC
Portfolio Manager:
Kathleen A. McCarragher,
Managing Director
Equity markets advanced strongly in the period, but with bouts of volatility. Challenges included Europe’s lingering economic malaise, a slowdown in China, federal spending cuts, and concerns that the Federal Reserve would taper its quantitative easing program. Investors endured these difficulties, however, and focused instead on improving housing and employment data, rising consumer confidence, and persistently strong corporate profits. Having earlier preferred higher-yielding bond substitutes, investors by period-end had ascribed higher valuations to companies with attractive growth potential.
Holdings in consumer discretionary and health care were strong contributors to our portfolio’s return, even though they lagged their counterparts in the benchmark. Overweight positions in both areas helped. In consumer discretionary, Lululemon’s decline tempered strong advances in Nike and TJX. In health care, Express Scripts’ dip moderated strong gains in Gilead Sciences, Biogen Idec, and Vertex Pharmaceuticals.
Our information technology holdings outperformed the benchmark sector’s returns, as triple-digit gains in LinkedIn and Facebook outpaced declines in Apple and VMware.
Vanguard Equity Investment Group
Portfolio Managers:
James P. Stetler, Principal
James D. Troyer, CFA, Principal
Michael R. Roach, CFA
For the 12-month period, our stock selection model had mixed results in identifying the outperformers from the underperformers in each industry group. The sentiment, quality, and growth components of our model helped performance, while the management decisions and valuation components detracted from results.
Our stock selections were positive in six of ten sectors, and were basically neutral in the four others. Our selections had the largest positive impact in industrials, health
10
care, and consumer staples. In industrials, Delta Air Lines, Boeing, and Ingersoll-Rand contributed the most to our relative results. Within health care, Mylan and Cigna led results, while Kroger and Green Mountain Coffee Roasters led in consumer staples.
Kalmar Investment Advisers
Portfolio Manager:
Ford B. Draper, Jr., President and Chief Investment Officer
After the very strong U.S. stock market gains of the last year, driven significantly by a rise in measures of market valuation, it is important that the world economy now benefit from the developing signs of simultaneous expansion and gradually improving growth. In turn, this should enhance the outlook for corporate earnings and the potential for additional market appreciation.
In the last 12 months, our overall returns were good. Our biggest contributing sectors were financial services, technology, and consumer discretionary. Our largest individual contributors included CarMax, B/E Aerospace, LKQ, Cabot Oil & Gas, and Alliance Data Systems.
Our biggest detractors were Sandridge Energy, Nuance Communications, McDermott International, and F5 Networks.
Frontier Capital Management Co., LLC
Portfolio Managers:
Stephen Knightly, CFA, President
Christopher J. Scarpa
Vice President
Equities advanced strongly during the fiscal year. The substantial gains reflect improved economic activity, accommodative monetary policy, low inflation, and reasonable earnings growth.
In a momentum-led market, we saw notable gains in health care and producer durables offset by challenges in energy. Investments in companies helping to lower the cost of drugs, such as Actavis and Covance, benefited our health care holdings. Our focus on the global upturn in aerospace drove producer durables, including investments in B/E Aerospace and United Continental.
Our relative performance was hurt by an underweight position in consumer discretionary, which was one of the best-performing sectors. Small holdings of cash curtailed our portfolio’s return.
11
Morgan Growth Fund
Fund Profile
As of September 30, 2013
| | |
| Share-Class Characteristics | |
| | Investor | Admiral |
| | Shares | Shares |
| Ticker Symbol | VMRGX | VMRAX |
| Expense Ratio1 | 0.40% | 0.26% |
| 30-Day SEC Yield | 0.75% | 0.89% |
| | | |
| Portfolio Characteristics | | |
| | | | DJ U.S. |
| | | Russell | Total |
| | | 3000 | Market |
| | | Growth | FA |
| | Fund | Index | Index |
| Number of Stocks | 340 | 1,727 | 3,636 |
| Median Market Cap | $30.6B | $44.7B | $40.2B |
| Price/Earnings Ratio | 22.8x | 22.8x | 19.5x |
| Price/Book Ratio | 3.7x | 4.7x | 2.5x |
| Return on Equity | 20.7% | 21.7% | 16.5% |
| Earnings Growth | | | |
| Rate | 16.9% | 15.0% | 11.1% |
| Dividend Yield | 1.1% | 1.6% | 1.9% |
| Foreign Holdings | 3.4% | 0.0% | 0.0% |
| Turnover Rate | 53% | — | — |
| Short-Term Reserves | 0.7% | — | — |
| | | |
| Sector Diversification (% of equity exposure) |
| | | Russell | DJ U.S. |
| | | 3000 | Total |
| | | Growth | Market |
| | Fund | Index | FA Index |
| Consumer | | | |
| Discretionary | 21.6% | 19.7% | 13.3% |
| Consumer Staples | 5.4 | 11.7 | 8.7 |
| Energy | 4.7 | 4.8 | 9.6 |
| Financials | 5.3 | 5.5 | 17.3 |
| Health Care | 15.2 | 12.9 | 12.6 |
| Industrials | 13.3 | 12.4 | 11.4 |
| Information | | | |
| Technology | 30.7 | 26.3 | 17.9 |
| Materials | 3.1 | 4.6 | 3.8 |
| Telecommunication | | | |
| Services | 0.7 | 1.9 | 2.2 |
| Utilities | 0.0 | 0.2 | 3.2 |
| | |
| Volatility Measures | | |
| |
| | | DJ U.S. |
| | Russell 3000 | Total Market |
| | Growth Index | FA Index |
| R-Squared | 0.98 | 0.94 |
| Beta | 1.12 | 1.08 |
These measures show the degree and timing of the fund’s fluctuations compared with the indexes over 36 months.
| | |
| Ten Largest Holdings (% of total net assets) |
| Google Inc. | Internet Software & | |
| | Services | 2.5% |
| Apple Inc. | Computer Hardware | 2.4 |
| Cisco Systems Inc. | Communications | |
| | Equipment | 2.0 |
| Microsoft Corp. | Systems Software | 2.0 |
| Gilead Sciences Inc. | Biotechnology | 1.4 |
| Biogen Idec Inc. | Biotechnology | 1.3 |
| Amgen Inc. | Biotechnology | 1.3 |
| Boeing Co. | Aerospace & | |
| | Defense | 1.2 |
| TJX Cos. Inc. | Apparel Retail | 1.2 |
| Home Depot Inc. | Home Improvement | |
| | Retail | 1.2 |
| Top Ten | | 16.5% |
The holdings listed exclude any temporary cash investments and equity index products.
Investment Focus
1 The expense ratios shown are from the prospectus dated January 28, 2013, and represent estimated costs for the current fiscal year. For the fiscal year ended September 30, 2013, the expense ratios were 0.39% for Investor Shares and 0.25% for Admiral Shares.
12
Morgan Growth Fund
Performance Summary
All of the returns in this report represent past performance, which is not a guarantee of future results that may be achieved by the fund. (Current performance may be lower or higher than the performance data cited. For performance data current to the most recent month-end, visit our website at vanguard.com/performance.) Note, too, that both investment returns and principal value can fluctuate widely, so an investor’s shares, when sold, could be worth more or less than their original cost. The returns shown do not reflect taxes that a shareholder would pay on fund distributions or on the sale of fund shares.
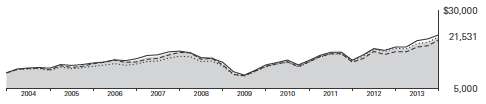
Cumulative Performance: September 30, 2003, Through September 30, 2013
Initial Investment of $10,000
| | | | |
| | | Average Annual Total Returns | |
| | Periods Ended September 30, 2013 | |
| | | | | Final Value |
| | One | Five | Ten | of a $10,000 |
| | Year | Years | Years | Investment |
| Morgan Growth Fund*Investor | | | | |
| Shares | 20.69% | 10.78% | 7.97% | $21,531 |
| Russell 3000 Growth Index | 20.30 | 12.16 | 7.99 | 21,561 |
| Multi-Cap Growth Funds Average | 22.55 | 10.48 | 7.49 | 20,590 |
| Dow Jones U.S. Total Stock Market | | | | |
| Float Adjusted Index | 21.44 | 10.69 | 8.32 | 22,235 |
Multi-Cap Growth Funds Average: Derived from data provided by Lipper, a Thomson Reuters Company.
| | | | |
| | | | | Final Value |
| | One | Five | Ten | of a $50,000 |
| | Year | Years | Years | Investment |
| Morgan Growth Fund Admiral Shares | 20.86% | 10.95% | 8.14% | $109,350 |
| Russell 3000 Growth Index | 20.30 | 12.16 | 7.99 | 107,804 |
| Dow Jones U.S. Total Stock Market Float | | | | |
| Adjusted Index | 21.44 | 10.69 | 8.32 | 111,177 |
See Financial Highlights for dividend and capital gains information.
13
Morgan Growth Fund
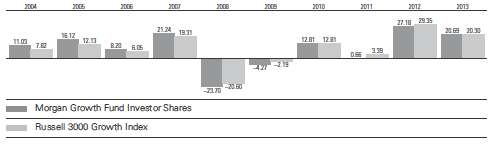
Fiscal-Year Total Returns (%): September 30, 2003, Through September 30, 2013
14
Morgan Growth Fund
Financial Statements
Statement of Net Assets
As of September 30, 2013
The fund reports a complete list of its holdings in regulatory filings four times in each fiscal year, at the quarter-ends. For the second and fourth fiscal quarters, the lists appear in the fund’s semiannual and annual reports to shareholders. For the first and third fiscal quarters, the fund files the lists with the Securities and Exchange Commission on Form N-Q. Shareholders can look up the fund’s Forms N-Q on the SEC’s website at sec.gov. Forms N-Q may also be reviewed and copied at the SEC’s Public Reference Room (see the back cover of this report for further information).
| | | |
| | | | Market |
| | | | Value |
| | | Shares | ($000) |
| Common Stocks (98.7%)1 | | |
| Consumer Discretionary (21.2%) | |
| | TJX Cos. Inc. | 2,125,116 | 119,835 |
| | Home Depot Inc. | 1,512,561 | 114,728 |
| | Lowe’s Cos. Inc. | 2,404,201 | 114,464 |
| | NIKE Inc. Class B | 1,481,906 | 107,646 |
| * | Amazon.com Inc. | 339,841 | 106,248 |
| * | O’Reilly Automotive Inc. | 784,436 | 100,086 |
| | Comcast Corp. Class A | 1,953,777 | 88,213 |
| * | priceline.com Inc. | 80,599 | 81,481 |
| | Starwood Hotels & | | |
| | Resorts Worldwide Inc. | 1,004,608 | 66,756 |
| * | Michael Kors Holdings Ltd. | 769,708 | 57,359 |
| | Omnicom Group Inc. | 771,608 | 48,951 |
| | Twenty-First Century | | |
| | Fox Inc. | 1,449,108 | 48,545 |
| | Wyndham Worldwide | | |
| | Corp. | 763,936 | 46,577 |
| | Inditex SA ADR | 1,474,883 | 45,500 |
| | Ralph Lauren Corp. Class A | 262,198 | 43,192 |
| * | Chipotle Mexican Grill Inc. | | |
| | Class A | 95,988 | 41,150 |
| | PetSmart Inc. | 500,463 | 38,165 |
| | Ford Motor Co. | 2,244,966 | 37,873 |
| | Wynn Resorts Ltd. | 233,707 | 36,928 |
| * | Dollar Tree Inc. | 641,491 | 36,668 |
| | Gap Inc. | 904,595 | 36,437 |
| * | LKQ Corp. | 1,135,543 | 36,178 |
| | Sirius XM Radio Inc. | 9,316,313 | 36,054 |
| | Harley-Davidson Inc. | 457,615 | 29,397 |
| | Luxottica Group SPA ADR | 516,203 | 27,137 |
| | Buckle Inc. | 493,827 | 26,691 |
| | Scripps Networks | | |
| | Interactive Inc. Class A | 335,817 | 26,231 |
| | Starbucks Corp. | 330,063 | 25,405 |
| * | Lululemon Athletica Inc. | 319,778 | 23,373 |
| * | Netflix Inc. | 75,352 | 23,300 |
| * | Discovery | | |
| | Communications Inc. | 298,190 | 23,295 |
| | | |
| | | | Market |
| | | | Value |
| | | Shares | ($000) |
| * | CarMax Inc. | 452,610 | 21,938 |
| | Dick’s Sporting Goods Inc. | 409,475 | 21,858 |
| | GNC Holdings Inc. Class A | 380,980 | 20,813 |
| | Prada SPA | 2,136,159 | 20,749 |
| * | Discovery | | |
| | Communications Inc. | | |
| | Class A | 214,582 | 18,115 |
| * | ASOS plc ADR | 204,691 | 17,299 |
| * | Urban Outfitters Inc. | 457,150 | 16,809 |
| | Tractor Supply Co. | 234,930 | 15,780 |
| * | Jarden Corp. | 315,205 | 15,256 |
| | Delphi Automotive plc | 245,000 | 14,313 |
| * | TRW Automotive | | |
| | Holdings Corp. | 189,400 | 13,506 |
| * | Five Below Inc. | 288,813 | 12,636 |
| | Viacom Inc. Class B | 150,200 | 12,554 |
| *,^ | Imax Corp. | 402,520 | 12,172 |
| | CBS Corp. Class B | 210,300 | 11,600 |
| | Time Warner Cable Inc. | 102,400 | 11,428 |
| * | Ulta Salon Cosmetics | | |
| | & Fragrance Inc. | 93,675 | 11,190 |
| | Las Vegas Sands Corp. | 166,800 | 11,079 |
| | VF Corp. | 55,416 | 11,030 |
| | Burberry Group plc | 396,620 | 10,495 |
| | Walt Disney Co. | 160,300 | 10,338 |
| | PulteGroup Inc. | 562,352 | 9,279 |
| | McDonald’s Corp. | 88,500 | 8,515 |
| * | Goodyear Tire & Rubber Co. | 364,200 | 8,176 |
| * | Bed Bath & Beyond Inc. | 104,441 | 8,079 |
| | Service Corp. International | 424,275 | 7,900 |
| | PVH Corp. | 64,600 | 7,667 |
| | Dunkin’ Brands Group Inc. | 157,573 | 7,132 |
| | Target Corp. | 107,800 | 6,897 |
| | Tupperware Brands Corp. | 79,100 | 6,832 |
| | Tiffany & Co. | 84,800 | 6,497 |
| | Comcast Corp. | 137,900 | 5,981 |
| | Macy’s Inc. | 131,800 | 5,703 |
| | Whirlpool Corp. | 30,900 | 4,525 |
15
Morgan Growth Fund
| | | |
| | | | Market |
| | | | Value |
| | | Shares | ($000) |
| * | ITT Educational | | |
| | Services Inc. | 114,392 | 3,546 |
| * | News Corp. Class A | 146,875 | 2,359 |
| | Gentex Corp. | 47,000 | 1,203 |
| * | Liberty Media Corp. Class A | 1,800 | 265 |
| | | | 2,105,377 |
| Consumer Staples (5.2%) | | |
| | Costco Wholesale Corp. | 987,961 | 113,734 |
| | Whole Foods Market Inc. 1,134,082 | 66,344 |
| | Wal-Mart Stores Inc. | 891,955 | 65,969 |
| | CVS Caremark Corp. | 823,848 | 46,753 |
| | Estee Lauder Cos. Inc. | | |
| | Class A | 551,175 | 38,527 |
| | Anheuser-Busch InBev | | |
| | NV ADR | 370,357 | 36,739 |
| * | Green Mountain Coffee | | |
| | Roasters Inc. | 440,257 | 33,165 |
| | Herbalife Ltd. | 332,960 | 23,231 |
| | Coca-Cola Co. | 439,956 | 16,665 |
| | Philip Morris | | |
| | International Inc. | 171,900 | 14,885 |
| | PepsiCo Inc. | 158,600 | 12,609 |
| | Brown-Forman Corp. | | |
| | Class B | 142,179 | 9,687 |
| | Kimberly-Clark Corp. | 87,200 | 8,216 |
| | Kroger Co. | 201,300 | 8,120 |
| | Kraft Foods Group Inc. | 119,400 | 6,261 |
| | Ingredion Inc. | 87,800 | 5,810 |
| | General Mills Inc. | 96,800 | 4,639 |
| | Altria Group Inc. | 128,800 | 4,424 |
| | Colgate-Palmolive Co. | 36,900 | 2,188 |
| | Hershey Co. | 23,000 | 2,127 |
| * | Sprouts Farmers Market Inc. | 20,247 | 899 |
| | | | 520,992 |
| Energy (4.6%) | | |
| | Noble Energy Inc. | 870,454 | 58,329 |
| | Schlumberger Ltd. | 583,521 | 51,560 |
| | Oceaneering | | |
| | International Inc. | 512,925 | 41,670 |
| | Cabot Oil & Gas Corp. | 1,027,440 | 38,344 |
| | Valero Energy Corp. | 857,264 | 29,276 |
| | National Oilwell Varco Inc. | 292,837 | 22,874 |
| | Transocean Ltd. | 500,876 | 22,289 |
| * | Cameron International Corp. | 357,620 | 20,874 |
| | Core Laboratories NV | 95,185 | 16,106 |
| * | Continental Resources Inc. | 138,700 | 14,877 |
| | EOG Resources Inc. | 82,900 | 14,033 |
| * | Weatherford | | |
| | International Ltd. | 871,890 | 13,366 |
| | Anadarko Petroleum Corp. | 141,900 | 13,195 |
| * | Superior Energy | | |
| | Services Inc. | 495,420 | 12,405 |
| *,^ | InterOil Corp. | 172,100 | 12,272 |
| | | |
| | | | Market |
| | | | Value |
| | | Shares | ($000) |
| * | Concho Resources Inc. | 108,646 | 11,822 |
| * | Southwestern Energy Co. | 300,070 | 10,917 |
| | Chesapeake Energy Corp. | 339,800 | 8,794 |
| | Ensco plc Class A | 152,958 | 8,222 |
| * | Atwood Oceanics Inc. | 129,500 | 7,128 |
| | Helmerich & Payne Inc. | 97,500 | 6,723 |
| * | SandRidge Energy Inc. | 1,140,800 | 6,685 |
| | HollyFrontier Corp. | 129,708 | 5,462 |
| | Marathon Petroleum Corp. | 78,800 | 5,068 |
| | | | 452,291 |
| Exchange-Traded Fund (0.9%) | |
| 2 | Vanguard Growth ETF | 1,044,900 | 88,409 |
| |
| Financials (5.0%) | | |
| | American Express Co. | 957,097 | 72,280 |
| | Bank of America Corp. | 5,184,473 | 71,546 |
| | Goldman Sachs Group Inc. | 285,941 | 45,239 |
| | Morgan Stanley | 1,677,123 | 45,198 |
| | JPMorgan Chase & Co. | 611,878 | 31,628 |
| * | IntercontinentalExchange | | |
| | Inc. | 138,821 | 25,185 |
| | T. Rowe Price Group Inc. | 240,865 | 17,325 |
| * | Affiliated Managers | | |
| | Group Inc. | 83,265 | 15,207 |
| | Allied World Assurance | | |
| | Co. Holdings AG | 148,100 | 14,720 |
| | Citigroup Inc. | 299,200 | 14,514 |
| | American Tower | | |
| | Corporation | 195,345 | 14,481 |
| | Brown & Brown Inc. | 430,115 | 13,807 |
| | Arthur J Gallagher & Co. | 311,680 | 13,605 |
| * | Berkshire Hathaway Inc. | | |
| | Class B | 105,900 | 12,021 |
| | Raymond James | | |
| | Financial Inc. | 274,300 | 11,430 |
| * | Signature Bank | 104,032 | 9,521 |
| | Discover Financial Services | 158,000 | 7,985 |
| | Ameriprise Financial Inc. | 84,100 | 7,660 |
| * | Arch Capital Group Ltd. | 135,000 | 7,308 |
| * | E*TRADE Financial Corp. | 434,200 | 7,164 |
| | Public Storage | 38,300 | 6,149 |
| | Simon Property Group Inc. | 41,200 | 6,107 |
| | American International | | |
| | Group Inc. | 122,400 | 5,952 |
| | McGraw Hill Financial Inc. | 87,400 | 5,733 |
| | Weyerhaeuser Co. | 133,900 | 3,834 |
| | Progressive Corp. | 126,700 | 3,450 |
| | Ventas Inc. | 48,900 | 3,007 |
| | Weingarten Realty | | |
| | Investors | 90,800 | 2,663 |
| | Regency Centers Corp. | 36,300 | 1,755 |
| * | MSCI Inc. Class A | 31,100 | 1,252 |
| | | | 497,726 |
16
Morgan Growth Fund
| | | |
| | | | Market |
| | | | Value |
| | | Shares | ($000) |
| Health Care (14.9%) | | |
| * | Gilead Sciences Inc. | 2,140,967 | 134,538 |
| * | Biogen Idec Inc. | 516,298 | 124,304 |
| | Amgen Inc. | 1,110,305 | 124,288 |
| * | Express Scripts | | |
| | Holding Co. | 1,495,947 | 92,420 |
| * | Celgene Corp. | 594,397 | 91,495 |
| | Medtronic Inc. | 1,167,176 | 62,152 |
| | McKesson Corp. | 471,458 | 60,488 |
| | Eli Lilly & Co. | 1,102,600 | 55,494 |
| | Cooper Cos. Inc. | 352,684 | 45,740 |
| * | Alexion | | |
| | Pharmaceuticals Inc. | 391,617 | 45,490 |
| | Zimmer Holdings Inc. | 551,150 | 45,271 |
| | Merck & Co. Inc. | 875,765 | 41,695 |
| * | Vertex Pharmaceuticals Inc. | 525,683 | 39,857 |
| | Becton Dickinson and Co. | 363,473 | 36,355 |
| | Novo Nordisk A/S ADR | 213,360 | 36,105 |
| | Allergan Inc. | 379,024 | 34,283 |
| * | Actavis Inc. | 235,485 | 33,910 |
| | CR Bard Inc. | 276,964 | 31,906 |
| | Aetna Inc. | 493,875 | 31,618 |
| | Johnson & Johnson | 359,636 | 31,177 |
| * | Covance Inc. | 298,100 | 25,774 |
| ^ | ResMed Inc. | 467,095 | 24,672 |
| * | BioMarin | | |
| | Pharmaceutical Inc. | 289,019 | 20,873 |
| * | Catamaran Corp. | 389,575 | 17,901 |
| | Shire plc ADR | 145,321 | 17,423 |
| | Thermo Fisher | | |
| | Scientific Inc. | 187,035 | 17,235 |
| * | MEDNAX Inc. | 161,996 | 16,264 |
| | Perrigo Co. | 96,600 | 11,918 |
| * | Alkermes plc | 347,470 | 11,682 |
| * | Bruker Corp. | 519,946 | 10,737 |
| * | Mylan Inc. | 245,400 | 9,367 |
| * | Centene Corp. | 144,300 | 9,229 |
| * | Salix Pharmaceuticals Ltd. | 131,950 | 8,825 |
| | AmerisourceBergen Corp. | | |
| | Class A | 142,200 | 8,688 |
| | HCA Holdings Inc. | 193,800 | 8,285 |
| * | Incyte Corp. Ltd. | 202,000 | 7,706 |
| * | Illumina Inc. | 94,848 | 7,667 |
| | Cigna Corp. | 83,700 | 6,433 |
| | AbbVie Inc. | 143,100 | 6,401 |
| | Essilor International SA | 58,109 | 6,250 |
| * | Cerner Corp. | 117,798 | 6,190 |
| * | Edwards Lifesciences Corp. | 68,500 | 4,770 |
| | UnitedHealth Group Inc. | 61,300 | 4,390 |
| | Abbott Laboratories | 131,100 | 4,351 |
| | St. Jude Medical Inc. | 72,900 | 3,910 |
| *,^ | Intrexon Corp. | 142,900 | 3,385 |
| | Zoetis Inc. | 73,800 | 2,297 |
| | | |
| | | | Market |
| | | | Value |
| | | Shares | ($000) |
| * | Charles River Laboratories | | |
| | International Inc. | 42,000 | 1,943 |
| * | Henry Schein Inc. | 11,200 | 1,161 |
| * | Seattle Genetics Inc. | 21,128 | 926 |
| | Universal Health | | |
| | Services Inc. Class B | 5,600 | 420 |
| | HealthSouth Corp. | 3,583 | 124 |
| | | | 1,485,783 |
| Industrials (13.1%) | | |
| | Boeing Co. | 1,035,884 | 121,716 |
| | United Technologies Corp. | 873,168 | 94,145 |
| | 3M Co. | 658,703 | 78,656 |
| | Honeywell | | |
| | International Inc. | 907,749 | 75,379 |
| | Danaher Corp. | 885,027 | 61,350 |
| * | B/E Aerospace Inc. | 815,844 | 60,226 |
| | Parker Hannifin Corp. | 472,095 | 51,326 |
| * | Hertz Global Holdings Inc. | 2,158,844 | 47,840 |
| | Precision Castparts Corp. | 204,329 | 46,432 |
| | AMETEK Inc. | 958,520 | 44,111 |
| | TransDigm Group Inc. | 309,279 | 42,897 |
| | United Parcel Service Inc. | | |
| | Class B | 453,530 | 41,439 |
| | Dover Corp. | 454,825 | 40,857 |
| | Pentair Ltd. | 512,375 | 33,274 |
| ^ | Canadian Pacific | | |
| | Railway Ltd. | 236,977 | 29,219 |
| | Illinois Tool Works Inc. | 346,051 | 26,393 |
| | Flowserve Corp. | 368,400 | 22,984 |
| * | IHS Inc. Class A | 186,170 | 21,257 |
| | Tyco International Ltd. | 570,077 | 19,941 |
| | Fastenal Co. | 362,025 | 18,192 |
| | ADT Corp. | 399,964 | 16,262 |
| | Rockwell Automation Inc. | 148,700 | 15,902 |
| * | United Continental | | |
| | Holdings Inc. | 510,800 | 15,687 |
| | MSC Industrial Direct | | |
| | Co. Inc. Class A | 163,680 | 13,315 |
| | Union Pacific Corp. | 84,400 | 13,111 |
| * | Kirby Corp. | 148,200 | 12,827 |
| * | Stericycle Inc. | 104,925 | 12,108 |
| * | Clean Harbors Inc. | 195,175 | 11,449 |
| * | WESCO International Inc. | 149,344 | 11,429 |
| * | Jacobs Engineering | | |
| | Group Inc. | 193,300 | 11,246 |
| | Pall Corp. | 145,092 | 11,178 |
| * | Chart Industries Inc. | 88,200 | 10,852 |
| * | Genesee & Wyoming Inc. | | |
| | Class A | 114,410 | 10,637 |
| | Chicago Bridge | | |
| | & Iron Co. NV | 154,500 | 10,470 |
| | Delta Air Lines Inc. | 439,200 | 10,361 |
| | Ingersoll-Rand plc | 154,800 | 10,053 |
17
Morgan Growth Fund
| | | |
| | | | Market |
| | | | Value |
| | | Shares | ($000) |
| | KAR Auction Services Inc. | 349,440 | 9,858 |
| | Landstar System Inc. | 167,415 | 9,372 |
| | JB Hunt Transport | | |
| | Services Inc. | 119,770 | 8,735 |
| | Expeditors International | | |
| | of Washington Inc. | 196,245 | 8,647 |
| * | Verisk Analytics Inc. | | |
| | Class A | 128,981 | 8,379 |
| * | United Rentals Inc. | 143,460 | 8,362 |
| * | Armstrong World | | |
| | Industries Inc. | 143,100 | 7,865 |
| | Alaska Air Group Inc. | 125,114 | 7,835 |
| | Southwest Airlines Co. | 518,600 | 7,551 |
| | Wabtec Corp. | 119,400 | 7,507 |
| | Masco Corp. | 333,200 | 7,090 |
| | Lockheed Martin Corp. | 54,800 | 6,990 |
| * | Quanta Services Inc. | 252,975 | 6,959 |
| | Dun & Bradstreet Corp. | 66,600 | 6,916 |
| | IDEX Corp. | 105,300 | 6,871 |
| | Acuity Brands Inc. | 50,360 | 4,634 |
| | Emerson Electric Co. | 45,100 | 2,918 |
| | | | 1,301,010 |
| Information Technology (30.1%) | |
| * | Google Inc. Class A | 284,674 | 249,349 |
| | Apple Inc. | 490,478 | 233,835 |
| | Cisco Systems Inc. | 8,585,953 | 201,083 |
| | Microsoft Corp. | 5,911,140 | 196,900 |
| | Mastercard Inc. Class A | 169,597 | 114,101 |
| | NetApp Inc. | 2,610,572 | 111,263 |
| | Oracle Corp. | 3,324,860 | 110,286 |
| * | Alliance Data | | |
| | Systems Corp. | 494,539 | 104,580 |
| * | LinkedIn Corp. Class A | 412,711 | 101,552 |
| * | Facebook Inc. Class A | 1,929,330 | 96,930 |
| | Xilinx Inc. | 1,730,294 | 81,082 |
| | Visa Inc. Class A | 422,708 | 80,779 |
| * | eBay Inc. | 1,362,266 | 76,001 |
| | Altera Corp. | 1,985,154 | 73,768 |
| * | Salesforce.com Inc. | 1,146,136 | 59,496 |
| * | Check Point Software | | |
| | Technologies Ltd. | 1,017,218 | 57,534 |
| * | Yahoo! Inc. | 1,701,280 | 56,414 |
| | IAC/InterActiveCorp | 1,023,764 | 55,969 |
| | SanDisk Corp. | 708,881 | 42,186 |
| | Microchip Technology Inc. | 1,025,444 | 41,315 |
| | EMC Corp. | 1,429,450 | 36,537 |
| * | VMware Inc. Class A | 441,490 | 35,717 |
| | International Business | | |
| | Machines Corp. | 190,500 | 35,277 |
| | Western Digital Corp. | 548,892 | 34,800 |
| * | Red Hat Inc. | 751,218 | 34,661 |
| | QUALCOMM Inc. | 477,447 | 32,161 |
| | Broadcom Corp. Class A | 1,190,627 | 30,968 |
| * | Akamai Technologies Inc. | 581,492 | 30,063 |
| | | |
| | | | Market |
| | | | Value |
| | | Shares | ($000) |
| * | Informatica Corp. | 748,464 | 29,168 |
| | Amphenol Corp. Class A | 349,760 | 27,064 |
| * | Cognizant Technology | | |
| | Solutions Corp. Class A | 324,110 | 26,616 |
| | Paychex Inc. | 623,561 | 25,342 |
| * | Workday Inc. Class A | 289,598 | 23,437 |
| * | NetSuite Inc. | 200,708 | 21,664 |
| * | Electronic Arts Inc. | 825,100 | 21,081 |
| | Intuit Inc. | 313,793 | 20,808 |
| * | Juniper Networks Inc. | 1,019,552 | 20,248 |
| | Fidelity National | | |
| | Information Services Inc. | 424,580 | 19,717 |
| * | Cadence Design | | |
| | Systems Inc. | 1,300,416 | 17,556 |
| * | NCR Corp. | 439,215 | 17,397 |
| * | Gartner Inc. | 282,329 | 16,940 |
| * | Lam Research Corp. | 313,825 | 16,065 |
| * | WEX Inc. | 175,930 | 15,438 |
| | Jack Henry & | | |
| | Associates Inc. | 279,090 | 14,404 |
| * | Citrix Systems Inc. | 194,250 | 13,716 |
| * | FleetCor Technologies Inc. | 120,641 | 13,290 |
| | Accenture plc Class A | 176,900 | 13,027 |
| * | F5 Networks Inc. | 146,265 | 12,544 |
| * | Trimble Navigation Ltd. | 413,440 | 12,283 |
| | Texas Instruments Inc. | 274,500 | 11,054 |
| | FEI Co. | 125,542 | 11,023 |
| * | Teradata Corp. | 197,678 | 10,959 |
| * | QLogic Corp. | 933,207 | 10,209 |
| * | Atmel Corp. | 1,266,053 | 9,419 |
| * | NXP Semiconductor NV | 248,200 | 9,236 |
| | Symantec Corp. | 365,100 | 9,036 |
| | Motorola Solutions Inc. | 146,257 | 8,685 |
| * | Autodesk Inc. | 205,320 | 8,453 |
| * | Emulex Corp. | 1,070,994 | 8,311 |
| * | Fiserv Inc. | 77,600 | 7,841 |
| * | Equinix Inc. | 41,450 | 7,612 |
| | Avago Technologies Ltd. | | |
| | Class A | 170,860 | 7,367 |
| * | Concur Technologies Inc. | 66,550 | 7,354 |
| * | Vantiv Inc. Class A | 254,500 | 7,111 |
| | LSI Corp. | 888,300 | 6,946 |
| | Computer Sciences Corp. | 123,140 | 6,371 |
| | MAXIMUS Inc. | 118,600 | 5,342 |
| * | Yelp Inc. | 74,300 | 4,917 |
| * | Rovi Corp. | 242,825 | 4,655 |
| | Automatic Data | | |
| | Processing Inc. | 63,800 | 4,618 |
| * | Freescale | | |
| | Semiconductor Ltd. | 269,900 | 4,494 |
| * | Splunk Inc. | 66,092 | 3,968 |
| | NVIDIA Corp. | 55,400 | 862 |
| | | | 2,988,255 |
18
Morgan Growth Fund
| | | |
| | | | Market |
| | | | Value |
| | | Shares | ($000) |
| Materials (3.0%) | | |
| | Monsanto Co. | 943,914 | 98,516 |
| | Sherwin-Williams Co. | 247,204 | 45,036 |
| | FMC Corp. | 537,233 | 38,530 |
| | Ashland Inc. | 222,275 | 20,556 |
| * | WR Grace & Co. | 215,635 | 18,847 |
| | Albemarle Corp. | 267,930 | 16,864 |
| | Eagle Materials Inc. | 162,220 | 11,769 |
| | Celanese Corp. Class A | 180,400 | 9,523 |
| | PPG Industries Inc. | 51,391 | 8,585 |
| | Praxair Inc. | 68,560 | 8,242 |
| | CF Industries Holdings Inc. | 30,700 | 6,472 |
| | Rock Tenn Co. Class A | 61,800 | 6,258 |
| | Cytec Industries Inc. | 72,600 | 5,907 |
| * | Allied Nevada Gold Corp. | 632,142 | 2,642 |
| | Westlake Chemical Corp. | 14,300 | 1,497 |
| | International Paper Co. | 24,900 | 1,116 |
| | | | 300,360 |
| Telecommunication Services (0.7%) | |
| | Verizon | | |
| | Communications Inc. | 804,132 | 37,521 |
| * | SBA Communications | | |
| | Corp. Class A | 363,542 | 29,250 |
| * | T-Mobile US Inc. | 95,800 | 2,488 |
| | | | 69,259 |
| Total Common Stocks | | |
| (Cost $7,069,775) | | 9,809,462 |
| Temporary Cash Investments (2.0%)1 | |
| Money Market Fund (1.8%) | | |
| 3,4 | Vanguard Market Liquidity | | |
| | Fund, 0.112% | 178,343,023 | 178,343 |
| |
| | | Face | |
| | | Amount | |
| | | ($000) | |
| Repurchase Agreement (0.1%) | | |
| | Bank of America Securities, | | |
| | LLC 0.080%, 10/1/13 | | |
| | (Dated 9/30/13, Repurchase | | |
| | Value $12,400,000, | | |
| | collateralized by Federal | | |
| | Home Loan Bank 0.000%, | | |
| | 12/27/13 and Federal Home | | |
| | Loan Mortgage Corp. 6.250%, | |
| | 7/15/32, with a value of | | |
| | $12,648,000) | 12,400 | 12,400 |
| | | |
| | | Face | Market |
| | | Amount | Value |
| | | ($000) | ($000) |
| U.S. Government and Agency Obligations (0.1%) |
| 5,6 | Federal Home Loan | | |
| | Bank Discount Notes, | | |
| | 0.090%, 10/25/13 | 300 | 300 |
| 5,6 | Federal Home Loan | | |
| | Bank Discount Notes, | | |
| | 0.100%, 11/13/13 | 300 | 300 |
| 6,7 | Freddie Mac Discount | | |
| | Notes, 0.120%, 11/5/13 | 1,000 | 1,000 |
| 6,7 | Freddie Mac Discount | | |
| | Notes, 0.073%, 11/12/13 | 3,100 | 3,100 |
| 6,7 | Freddie Mac Discount | | |
| | Notes, 0.075%, 11/18/13 | 2,800 | 2,799 |
| | | | 7,499 |
| Total Temporary Cash Investments | |
| (Cost $198,243) | | 198,242 |
| Total Investments (100.7%) | | |
| (Cost $7,268,018) | | 10,007,704 |
| Other Assets and Liabilities (-0.7%) | |
| Other Assets | | 151,844 |
| Liabilities4 | | (218,356) |
| | | | (66,512) |
| Net Assets (100%) | | 9,941,192 |
19
Morgan Growth Fund
| |
| At September 30, 2013, net assets consisted of: |
| | Amount |
| | ($000) |
| Paid-in Capital | 6,810,996 |
| Undistributed Net Investment Income | 37,964 |
| Accumulated Net Realized Gains | 353,345 |
| Unrealized Appreciation (Depreciation) | |
| Investment Securities | 2,739,686 |
| Futures Contracts | (803) |
| Foreign Currencies | 4 |
| Net Assets | 9,941,192 |
| |
| Investor Shares—Net Assets | |
| Applicable to 202,883,006 outstanding | |
| $.001 par value shares of beneficial | |
| interest (unlimited authorization) | 4,921,730 |
| Net Asset Value Per Share— | |
| Investor Shares | $24.26 |
| |
| Admiral Shares—Net Assets | |
| Applicable to 66,698,413 outstanding | |
| $.001 par value shares of beneficial | |
| interest (unlimited authorization) | 5,019,462 |
| Net Asset Value Per Share— | |
| Admiral Shares | $75.26 |
See Note A in Notes to Financial Statements.
* Non-income-producing security.
^ Part of security position is on loan to broker-dealers. The total value of securities on loan is $35,799,000.
1 The fund invests a portion of its cash reserves in equity markets through the use of index futures contracts. After giving effect to futures investments, the fund’s effective common stock and temporary cash investment positions represent 99.6% and 1.1%, respectively, of net assets.
2 Considered an affiliated company of the fund as the issuer is another member of The Vanguard Group.
3 Affiliated money market fund available only to Vanguard funds and certain trusts and accounts managed by Vanguard. Rate shown is the 7-day yield.
4 Includes $37,061,000 of collateral received for securities on loan.
5 The issuer operates under a congressional charter; its securities are generally neither guaranteed by the U.S. Treasury nor backed by the full faith and credit of the U.S. government.
6 Securities with a value of $5,599,000 have been segregated as initial margin for open futures contracts.
7 The issuer was placed under federal conservatorship in September 2008; since that time, its daily operations have been managed by the Federal Housing Finance Agency and it receives capital from the U.S. Treasury, as needed to maintain a positive net worth, in exchange for senior preferred stock.
ADR—American Depositary Receipt.
See accompanying Notes, which are an integral part of the Financial Statements.
20
Morgan Growth Fund
| |
| Statement of Operations | |
| |
| | Year Ended |
| | September 30, 2013 |
| | ($000) |
| Investment Income | |
| Income | |
| Dividends1,2 | 131,923 |
| Interest2 | 359 |
| Securities Lending | 2,738 |
| Total Income | 135,020 |
| Expenses | |
| Investment Advisory Fees—Note B | |
| Basic Fee | 15,185 |
| Performance Adjustment | (4,412) |
| The Vanguard Group—Note C | |
| Management and Administrative—Investor Shares | 12,724 |
| Management and Administrative—Admiral Shares | 4,698 |
| Marketing and Distribution—Investor Shares | 922 |
| Marketing and Distribution—Admiral Shares | 732 |
| Custodian Fees | 123 |
| Auditing Fees | 31 |
| Shareholders’ Reports—Investor Shares | 68 |
| Shareholders’ Reports—Admiral Shares | 49 |
| Trustees’ Fees and Expenses | 27 |
| Total Expenses | 30,147 |
| Expenses Paid Indirectly | (213) |
| Net Expenses | 29,934 |
| Net Investment Income | 105,086 |
| Realized Net Gain (Loss) | |
| Investment Securities Sold2 | 981,293 |
| Futures Contracts | 17,303 |
| Foreign Currencies | (41) |
| Realized Net Gain (Loss) | 998,555 |
| Change in Unrealized Appreciation (Depreciation) | |
| Investment Securities | 665,324 |
| Futures Contracts | 120 |
| Foreign Currencies | 4 |
| Change in Unrealized Appreciation (Depreciation) | 665,448 |
| Net Increase (Decrease) in Net Assets Resulting from Operations | 1,769,089 |
1 Dividends are net of foreign withholding taxes of $464,000.
2 Dividend income, interest income, and realized net gain (loss) from affiliated companies of the fund were $1,238,000, $243,000, and $0, respectively.
See accompanying Notes, which are an integral part of the Financial Statements.
21
Morgan Growth Fund
| | |
| Statement of Changes in Net Assets | | |
| |
| | Year Ended September 30, |
| | 2013 | 2012 |
| | ($000) | ($000) |
| Increase (Decrease) in Net Assets | | |
| Operations | | |
| Net Investment Income | 105,086 | 69,558 |
| Realized Net Gain (Loss) | 998,555 | 567,311 |
| Change in Unrealized Appreciation (Depreciation) | 665,448 | 1,379,343 |
| Net Increase (Decrease) in Net Assets Resulting from Operations | 1,769,089 | 2,016,212 |
| Distributions | | |
| Net Investment Income | | |
| Investor Shares | (51,062) | (30,342) |
| Admiral Shares | (44,266) | (20,234) |
| Realized Capital Gain | | |
| Investor Shares | — | — |
| Admiral Shares | — | — |
| Total Distributions | (95,328) | (50,576) |
| Capital Share Transactions | | |
| Investor Shares | (1,262,867) | (1,008,677) |
| Admiral Shares | 522,261 | 487,927 |
| Net Increase (Decrease) from Capital Share Transactions | (740,606) | (520,750) |
| Total Increase (Decrease) | 933,155 | 1,444,886 |
| Net Assets | | |
| Beginning of Period | 9,008,037 | 7,563,151 |
| End of Period1 | 9,941,192 | 9,008,037 |
| 1 Net Assets—End of Period includes undistributed net investment income of $37,964,000 and $34,656,000. | |
See accompanying Notes, which are an integral part of the Financial Statements.
22
Morgan Growth Fund
Financial Highlights
| | | | | |
| Investor Shares | | | | | |
| |
| For a Share Outstanding | | | Year Ended September 30, |
| Throughout Each Period | 2013 | 2012 | 2011 | 2010 | 2009 |
| Net Asset Value, Beginning of Period | $20.31 | $16.06 | $16.04 | $14.32 | $15.15 |
| Investment Operations | | | | | |
| Net Investment Income | .230 | .141 | .087 | .097 | .114 |
| Net Realized and Unrealized Gain (Loss) | | | | | |
| on Investments | 3.925 | 4.209 | .029 | 1.733 | (.804) |
| Total from Investment Operations | 4.155 | 4.350 | .116 | 1.830 | (.690) |
| Distributions | | | | | |
| Dividends from Net Investment Income | (.205) | (.100) | (.096) | (.110) | (.140) |
| Distributions from Realized Capital Gains | — | — | — | — | — |
| Total Distributions | (.205) | (.100) | (.096) | (.110) | (.140) |
| Net Asset Value, End of Period | $24.26 | $20.31 | $16.06 | $16.04 | $14.32 |
| |
| Total Return1 | 20.69% | 27.18% | 0.66% | 12.81% | -4.27% |
| |
| Ratios/Supplemental Data | | | | | |
| Net Assets, End of Period (Millions) | $4,922 | $5,283 | $5,009 | $5,432 | $5,239 |
| Ratio of Total Expenses to | | | | | |
| Average Net Assets2 | 0.39% | 0.40% | 0.42% | 0.44% | 0.48% |
| Ratio of Net Investment Income to | | | | | |
| Average Net Assets | 1.06% | 0.74% | 0.47% | 0.62% | 0.94% |
| Portfolio Turnover Rate | 53% | 49% | 55% | 60% | 87% |
1 Total returns do not include account service fees that may have applied in the periods shown. Fund prospectuses provide information about any applicable account service fees.
2 Includes performance-based investment advisory fee increases (decreases) of (0.05%), (0.04%), (0.01%), 0.01%, and 0.02%.
See accompanying Notes, which are an integral part of the Financial Statements.
23
Morgan Growth Fund
Financial Highlights
| | | | | |
| Admiral Shares | | | | | |
| |
| For a Share Outstanding | | | Year Ended September 30, |
| Throughout Each Period | 2013 | 2012 | 2011 | 2010 | 2009 |
| Net Asset Value, Beginning of Period | $63.02 | $49.84 | $49.75 | $44.42 | $47.03 |
| Investment Operations | | | | | |
| Net Investment Income | .831 | .535 | .342 | .372 | .414 |
| Net Realized and Unrealized Gain (Loss) | | | | | |
| on Investments | 12.144 | 13.036 | .110 | 5.364 | (2.502) |
| Total from Investment Operations | 12.975 | 13.571 | .452 | 5.736 | (2.088) |
| Distributions | | | | | |
| Dividends from Net Investment Income | (.735) | (.391) | (.362) | (.406) | (.522) |
| Distributions from Realized Capital Gains | — | — | — | — | — |
| Total Distributions | (.735) | (.391) | (.362) | (.406) | (.522) |
| Net Asset Value, End of Period | $75.26 | $63.02 | $49.84 | $49.75 | $44.42 |
| |
| Total Return | 20.86% | 27.35% | 0.83% | 12.95% | -4.09% |
| |
| Ratios/Supplemental Data | | | | | |
| Net Assets, End of Period (Millions) | $5,019 | $3,725 | $2,554 | $2,445 | $2,251 |
| Ratio of Total Expenses to | | | | | |
| Average Net Assets1 | 0.25% | 0.26% | 0.28% | 0.30% | 0.31% |
| Ratio of Net Investment Income to | | | | | |
| Average Net Assets | 1.20% | 0.88% | 0.61% | 0.76% | 1.11% |
| Portfolio Turnover Rate | 53% | 49% | 55% | 60% | 87% |
| 1 Includes performance-based investment advisory fee increases (decreases) of (0.05%), (0.04%), (0.01%), 0.01%, and 0.02%. | |
See accompanying Notes, which are an integral part of the Financial Statements.
24
Morgan Growth Fund
Notes to Financial Statements
Vanguard Morgan Growth Fund is registered under the Investment Company Act of 1940 as an open-end investment company, or mutual fund. The fund offers two classes of shares: Investor Shares and Admiral Shares. Investor Shares are available to any investor who meets the fund’s minimum purchase requirements. Admiral Shares are designed for investors who meet certain administrative, service, and account-size criteria.
A. The following significant accounting policies conform to generally accepted accounting principles for U.S. mutual funds. The fund consistently follows such policies in preparing its financial statements.
1. Security Valuation: Securities are valued as of the close of trading on the New York Stock Exchange (generally 4 p.m., Eastern time) on the valuation date. Equity securities are valued at the latest quoted sales prices or official closing prices taken from the primary market in which each security trades; such securities not traded on the valuation date are valued at the mean of the latest quoted bid and asked prices. Securities for which market quotations are not readily available, or whose values have been affected by events occurring before the fund’s pricing time but after the close of the securities’ primary markets, are valued at their fair values calculated according to procedures adopted by the board of trustees. These procedures include obtaining quotations from an independent pricing service, monitoring news to identify significant market- or security-specific events, and evaluating changes in the values of foreign market proxies (for example, ADRs, futures contracts, or exchange-traded funds), between the time the foreign markets close and the fund’s pricing time. When fair-value pricing is employed, the prices of securities used by a fund to calculate its net asset value may differ from quoted or published prices for the same securities. Investments in Vanguard Market Liquidity Fund are valued at that fund’s net asset value. Temporary cash investments acquired over 60 days to maturity are valued using the latest bid prices or using valuations based on a matrix system (which considers such factors as security prices, yields, maturities, and ratings), both as furnished by independent pricing services. Other temporary cash investments are valued at amortized cost, which approximates market value.
2. Foreign Currency: Securities and other assets and liabilities denominated in foreign currencies are translated into U.S. dollars using exchange rates obtained from an independent third party as of the fund’s pricing time on the valuation date. Realized gains (losses) and unrealized appreciation (depreciation) on investment securities include the effects of changes in exchange rates since the securities were purchased, combined with the effects of changes in security prices. Fluctuations in the value of other assets and liabilities resulting from changes in exchange rates are recorded as unrealized foreign currency gains (losses) until the assets or liabilities are settled in cash, at which time they are recorded as realized foreign currency gains (losses).
3. Futures Contracts: The fund may use index futures contracts to a limited extent, with the objective of maintaining full exposure to the stock market while maintaining liquidity. The fund may purchase or sell futures contracts to achieve a desired level of investment, whether to accommodate portfolio turnover or cash flows from capital share transactions. The primary risks associated with the use of futures contracts are imperfect correlation between changes in market values of stocks held by the fund and the prices of futures contracts, and the possibility of an illiquid market. Counterparty risk involving futures is mitigated because a regulated clearinghouse is the counterparty instead of the clearing broker. To further mitigate counterparty risk, the fund trades futures contracts on an exchange, monitors the financial strength of its clearing brokers and clearinghouse, and has entered into clearing agreements with its clearing brokers. The clearinghouse imposes initial margin requirements to secure the fund’s performance and requires daily settlement of variation margin representing changes in the market value of each contract.
25
Morgan Growth Fund
Futures contracts are valued at their quoted daily settlement prices. The aggregate notional amounts of the contracts are not recorded in the Statement of Net Assets. Fluctuations in the value of the contracts are recorded in the Statement of Net Assets as an asset (liability) and in the Statement of Operations as unrealized appreciation (depreciation) until the contracts are closed, when they are recorded as realized futures gains (losses).
During the year ended September 30, 2013, the fund’s average investments in long and short futures contracts represented less than 1% and 0% of net assets, respectively, based on quarterly average aggregate settlement values.
4. Repurchase Agreements: The fund may enter into repurchase agreements with institutional counterparties. Securities pledged as collateral to the fund under repurchase agreements are held by a custodian bank until the agreements mature. Each agreement requires that the market value of the collateral be sufficient to cover payments of interest and principal. The fund further mitigates its counterparty risk by entering into repurchase agreements only with a diverse group of pre-qualified counterparties, monitoring their financial strength, and entering into master repurchase agreements with its counterparties. The master repurchase agreements provide that, in the event of a counter-party’s default (including bankruptcy), the fund may terminate any repurchase agreements with that counterparty, determine the net amount owed, and sell or retain the collateral up to the net amount owed to the fund. Such action may be subject to legal proceedings, which may delay or limit the disposition of collateral.
5. Federal Income Taxes: The fund intends to continue to qualify as a regulated investment company and distribute all of its taxable income. Management has analyzed the fund’s tax positions taken for all open federal income tax years (September 30, 2010–2013), and has concluded that no provision for federal income tax is required in the fund’s financial statements.
6. Distributions: Distributions to shareholders are recorded on the ex-dividend date.
7. Securities Lending: To earn additional income, the fund may lend its securities to qualified institutional borrowers. Security loans are required to be secured at all times by collateral in an amount at least equal to the market value of securities loaned. Daily market fluctuations could cause the value of loaned securities to be more or less than the value of the collateral received. When this occurs, the collateral is adjusted and settled on the next business day. The fund further mitigates its counterparty risk by entering into securities lending transactions only with a diverse group of prequalified counterparties, monitoring their financial strength, and entering into master securities lending agreements with its counterparties. The master securities lending agreements provide that, in the event of a counterparty’s default (including bankruptcy), the fund may terminate any loans with that borrower, determine the net amount owed, and sell or retain the collateral up to the net amount owed to the fund; however, such actions may be subject to legal proceedings. While collateral mitigates counterparty risk, in the absence of a default the fund may experience delays and costs in recovering the securities loaned. The fund invests cash collateral received in Vanguard Market Liquidity Fund, and records a liability for the return of the collateral, during the period the securities are on loan. Securities lending income represents fees charged to borrowers plus income earned on invested cash collateral, less expenses associated with the loan.
8. Other: Dividend income is recorded on the ex-dividend date. Interest income includes income distributions received from Vanguard Market Liquidity Fund and is accrued daily. Premiums and discounts on debt securities purchased are amortized and accreted, respectively, to interest income
26
Morgan Growth Fund
over the lives of the respective securities. Security transactions are accounted for on the date securities are bought or sold. Costs used to determine realized gains (losses) on the sale of investment securities are those of the specific securities sold.
Each class of shares has equal rights as to assets and earnings, except that each class separately bears certain class-specific expenses related to maintenance of shareholder accounts (included in Management and Administrative expenses) and shareholder reporting. Marketing and distribution expenses are allocated to each class of shares based on a method approved by the board of trustees. Income, other non-class-specific expenses, and gains and losses on investments are allocated to each class of shares based on its relative net assets.
B. Wellington Management Company, LLP, Jennison Associates LLC, Kalmar Investment Advisers and Frontier Capital Management Co., LLC, each provide investment advisory services to a portion of the fund for a fee calculated at an annual percentage rate of average net assets managed by the advisor. The basic fee of Wellington Management Company, LLP, is subject to quarterly adjustments based on performance for the preceding three years relative to the Russell 3000 Growth Index. The basic fee of Jennison Associates LLC is subject to quarterly adjustments based on performance for the preceding three years relative to the Russell 1000 Growth Index. The basic fees of Kalmar Investment Advisers and Frontier Capital Management Co., LLC, are subject to quarterly adjustments based on performance for the preceding three years relative to the Russell Midcap Growth Index.
The Vanguard Group provides investment advisory services to a portion of the fund on an at-cost basis; the fund paid Vanguard advisory fees of $718,000 for the year ended September 30, 2013.
For the year ended September 30, 2013, the aggregate investment advisory fee represented an effective annual basic rate of 0.16% of the fund’s average net assets, before a decrease of $4,412,000 (0.05%) based on performance.
C. The Vanguard Group furnishes at cost corporate management, administrative, marketing, and distribution services. The costs of such services are allocated to the fund under methods approved by the board of trustees. The fund has committed to provide up to 0.40% of its net assets in capital contributions to Vanguard. At September 30, 2013, the fund had contributed capital of $1,174,000 to Vanguard (included in Other Assets), representing 0.01% of the fund’s net assets and 0.47% of Vanguard’s capitalization. The fund’s trustees and officers are also directors and officers of Vanguard.
D. The fund has asked its investment advisors to direct certain security trades, subject to obtaining the best price and execution, to brokers who have agreed to rebate to the fund part of the commissions generated. Such rebates are used solely to reduce the fund’s management and administrative expenses. For the year ended September 30, 2013, these arrangements reduced the fund’s expenses by $213,000 (an annual rate of 0.00% of average net assets).
E. Various inputs may be used to determine the value of the fund’s investments. These inputs are summarized in three broad levels for financial statement purposes. The inputs or methodologies used to value securities are not necessarily an indication of the risk associated with investing in those securities.
Level 1—Quoted prices in active markets for identical securities.
Level 2—Other significant observable inputs (including quoted prices for similar securities, interest rates, prepayment speeds, credit risk, etc.).
Level 3—Significant unobservable inputs (including the fund’s own assumptions used to determine the fair value of investments).
27
Morgan Growth Fund
The following table summarizes the market value of the fund’s investments as of September 30, 2013, based on the inputs used to value them:
| | | |
| | Level 1 | Level 2 | Level 3 |
| Investments | ($000) | ($000) | ($000) |
| Common Stocks | 9,771,968 | 37,494 | — |
| Temporary Cash Investments | 178,343 | 19,899 | — |
| Futures Contracts—Assets1 | 114 | — | — |
| Futures Contracts—Liabilities1 | (823) | — | — |
| Total | 9,949,602 | 57,393 | — |
| 1 Represents variation margin on the last day of the reporting period. | | | |
F. At September 30, 2013, the aggregate settlement value of open futures contracts and the related unrealized appreciation (depreciation) were:
| | | | |
| | | | | ($000) |
| | | | Aggregate | |
| | | Number of | Settlement | Unrealized |
| | | Long (Short) | Value | Appreciation |
| Futures Contracts | Expiration | Contracts | Long (Short) | (Depreciation) |
| S&P 500 Index | December 2013 | 211 | 88,319 | (797) |
| E-mini S&P 500 Index | December 2013 | 9 | 754 | (6) |
Unrealized appreciation (depreciation) on open futures contracts is required to be treated as realized gain (loss) for tax purposes.
G. Distributions are determined on a tax basis and may differ from net investment income and realized capital gains for financial reporting purposes. Differences may be permanent or temporary. Permanent differences are reclassified among capital accounts in the financial statements to reflect their tax character. Temporary differences arise when certain items of income, expense, gain, or loss are recognized in different periods for financial statement and tax purposes; these differences will reverse at some time in the future. Differences in classification may also result from the treatment of short-term gains as ordinary income for tax purposes.
During the year ended September 30, 2013, the fund realized net foreign currency losses of $41,000, which decreased distributable net income for tax purposes; accordingly, such losses have been reclassified from accumulated net realized gains to undistributed net investment income.
The fund used a tax accounting practice to treat a portion of the price of capital shares redeemed during the year as distributions from net investment income and realized capital gains. Accordingly, the fund has reclassified $6,409,000 from undistributed net investment income, and $22,883,000 from accumulated net realized gains, to paid-in capital.
The fund used capital loss carryforwards of $621,698,000 to offset taxable capital gains realized during the year ended September 30, 2013, reducing the amount of capital gains that would otherwise be available to distribute to shareholders. For tax purposes, at September 30, 2013, the fund had $57,167,000 of ordinary income and $354,112,000 of long-term capital gains available for distribution.
28
Morgan Growth Fund
At September 30, 2013, the cost of investment securities for tax purposes was $7,269,287,000. Net unrealized appreciation of investment securities for tax purposes was $2,738,417,000, consisting of unrealized gains of $2,820,312,000 on securities that had risen in value since their purchase and $81,895,000 in unrealized losses on securities that had fallen in value since their purchase.
H. During the year ended September 30, 2013, the fund purchased $4,796,850,000 of investment securities and sold $5,493,101,000 of investment securities, other than temporary cash investments.
I. Capital share transactions for each class of shares were:
| | | | |
| | | | Year Ended September 30, |
| | | 2013 | | 2012 |
| | Amount | Shares | Amount | Shares |
| | ($000) | (000) | ($000) | (000) |
| Investor Shares | | | | |
| Issued | 268,773 | 12,587 | 640,625 | 33,948 |
| Issued in Lieu of Cash Distributions | 49,772 | 2,519 | 29,253 | 1,660 |
| Redeemed | (1,581,412) | (72,367) | (1,678,555) | (87,305) |
| Net Increase (Decrease)—Investor Shares | (1,262,867) | (57,261) | (1,008,677) | (51,697) |
| Admiral Shares | | | | |
| Issued | 1,256,023 | 18,539 | 1,064,733 | 17,636 |
| Issued in Lieu of Cash Distributions | 39,037 | 638 | 17,720 | 324 |
| Redeemed | (772,799) | (11,580) | (594,526) | (10,104) |
| Net Increase (Decrease) —Admiral Shares | 522,261 | 7,597 | 487,927 | 7,856 |
J. Management has determined that no material events or transactions occurred subsequent to September 30, 2013, that would require recognition or disclosure in these financial statements.
29
Report of Independent Registered Public Accounting Firm
To the Trustees and Shareholders of Vanguard Morgan Growth Fund:
In our opinion, the accompanying statement of net assets and the related statements of operations and of changes in net assets and the financial highlights present fairly, in all material respects, the financial position of Vanguard Morgan Growth Fund (the “Fund”) at September 30, 2013, the results of its operations for the year then ended, the changes in its net assets for each of the two years in the period then ended, and the financial highlights for each of the five years in the period then ended, in conformity with accounting principles generally accepted in the United States of America. These financial statements and financial highlights (hereafter referred to as “financial statements”) are the responsibility of the Fund’s management; our responsibility is to express an opinion on these financial statements based on our audits. We conducted our audits of these financial statements in accordance with the standards of the Public Company Accounting Oversight Board (United States). Those standards require that we plan and perform the audit to obtain reasonable assurance about whether the financial statements are free of material misstatement. An audit includes examining, on a test basis, evidence supporting the amounts and disclosures in the financial statements, assessing the accounting principles used and significant estimates made by management, and evaluating the overall financial statement presentation. We believe that our audits, which included confirmation of securities at September 30, 2013 by correspondence with the custodians and brokers and by agreement to the underlying ownership records of the transfer agent, provide a reasonable basis for our opinion.
/s/PricewaterhouseCoopers LLP
Philadelphia, Pennsylvania
November 7, 2013
Special 2013 tax information (unaudited) for Vanguard Morgan Growth Fund
This information for the fiscal year ended September 30, 2013, is included pursuant to provisions of the Internal Revenue Code.
The fund distributed $22,883,000 as capital gain dividends (from net long-term capital gains) to shareholders during the fiscal year.
The fund distributed $95,328,000 of qualified dividend income to shareholders during the fiscal year.
For corporate shareholders, 100% of investment income (dividend income plus short-term gains, if any) qualifies for the dividends-received deduction.
30
Your Fund’s After-Tax Returns
This table presents returns for your fund both before and after taxes. The after-tax returns are shown in two ways: (1) assuming that an investor owned the fund during the entire period and paid taxes on the fund’s distributions, and (2) assuming that an investor paid taxes on the fund’s distributions and sold all shares at the end of each period.
Calculations are based on the highest individual federal income tax and capital gains tax rates in effect at the times of the distributions and the hypothetical sales. State and local taxes were not considered. After-tax returns reflect any qualified dividend income, using actual prior-year figures and estimates for 2013. (In the example, returns after the sale of fund shares may be higher than those assuming no sale. This occurs when the sale would have produced a capital loss. The calculation assumes that the investor received a tax deduction for the loss.)
The table shows returns for one share class only; returns for other share classes will differ. Please note that your actual after-tax returns will depend on your tax situation and may differ from those shown. Also note that if you own the fund in a tax-deferred account, such as an individual retirement account or a 401(k) plan, this information does not apply to you. Such accounts are not subject to current taxes.
Finally, keep in mind that a fund’s performance—whether before or after taxes—does not guarantee future results.
| | | |
| Average Annual Total Returns: Morgan Growth Fund Investor Shares | | |
| Periods Ended September 30, 2013 | | | |
| | One | Five | Ten |
| | Year | Years | Years |
| Returns Before Taxes | 20.69% | 10.78% | 7.97% |
| Returns After Taxes on Distributions | 20.50 | 10.65 | 7.66 |
| Returns After Taxes on Distributions and Sale of Fund Shares | 11.98 | 8.59 | 6.51 |
31
About Your Fund’s Expenses
As a shareholder of the fund, you incur ongoing costs, which include costs for portfolio management, administrative services, and shareholder reports (like this one), among others. Operating expenses, which are deducted from a fund’s gross income, directly reduce the investment return of the fund.
A fund’s expenses are expressed as a percentage of its average net assets. This figure is known as the expense ratio. The following examples are intended to help you understand the ongoing costs (in dollars) of investing in your fund and to compare these costs with those of other mutual funds. The examples are based on an investment of $1,000 made at the beginning of the period shown and held for the entire period.
The accompanying table illustrates your fund’s costs in two ways:
• Based on actual fund return. This section helps you to estimate the actual expenses that you paid over the period. The ”Ending Account Value“ shown is derived from the fund‘s actual return, and the third column shows the dollar amount that would have been paid by an investor who started with $1,000 in the fund. You may use the information here, together with the amount you invested, to estimate the expenses that you paid over the period.
To do so, simply divide your account value by $1,000 (for example, an $8,600 account value divided by $1,000 = 8.6), then multiply the result by the number given for your fund under the heading ”Expenses Paid During Period.“
• Based on hypothetical 5% yearly return. This section is intended to help you compare your fund‘s costs with those of other mutual funds. It assumes that the fund had a yearly return of 5% before expenses, but that the expense ratio is unchanged. In this case—because the return used is not the fund’s actual return—the results do not apply to your investment. The example is useful in making comparisons because the Securities and Exchange Commission requires all mutual funds to calculate expenses based on a 5% return. You can assess your fund’s costs by comparing this hypothetical example with the hypothetical examples that appear in shareholder reports of other funds.
Note that the expenses shown in the table are meant to highlight and help you compare ongoing costs only and do not reflect transaction costs incurred by the fund for buying and selling securities. Further, the expenses do not include any purchase, redemption, or account service fees described in the fund prospectus. If such fees were applied to your account, your costs would be higher. Your fund does not carry a “sales load.”
The calculations assume no shares were bought or sold during the period. Your actual costs may have been higher or lower, depending on the amount of your investment and the timing of any purchases or redemptions.
You can find more information about the fund’s expenses, including annual expense ratios, in the Financial Statements section of this report. For additional information on operating expenses and other shareholder costs, please refer to your fund’s current prospectus.
32
| | | |
| Six Months Ended September 30, 2013 | | | |
| | Beginning | Ending | Expenses |
| | Account Value | Account Value | Paid During |
| Morgan Growth Fund | 3/31/2013 | 9/30/2013 | Period |
| Based on Actual Fund Return | | | |
| Investor Shares | $1,000.00 | $1,118.49 | $2.02 |
| Admiral Shares | 1,000.00 | 1,119.11 | 1.27 |
| Based on Hypothetical 5% Yearly Return | | | |
| Investor Shares | $1,000.00 | $1,023.16 | $1.93 |
| Admiral Shares | 1,000.00 | 1,023.87 | 1.22 |
The calculations are based on expenses incurred in the most recent six-month period. The fund’s annualized six-month expense ratios for that period are 0.38% for Investor Shares and 0.24% for Admiral Shares. The dollar amounts shown as “Expenses Paid” are equal to the annualized expense ratio multiplied by the average account value over the period, multiplied by the number of days in the most recent six-month period, then divided by the number of days in the most recent 12-month period.
33
Glossary
30-Day SEC Yield. A fund’s 30-day SEC yield is derived using a formula specified by the U.S. Securities and Exchange Commission. Under the formula, data related to the fund’s security holdings in the previous 30 days are used to calculate the fund’s hypothetical net income for that period, which is then annualized and divided by the fund’s estimated average net assets over the calculation period. For the purposes of this calculation, a security’s income is based on its current market yield to maturity (for bonds), its actual income (for asset-backed securities), or its projected dividend yield (for stocks). Because the SEC yield represents hypothetical annualized income, it will differ—at times significantly—from the fund’s actual experience. As a result, the fund’s income distributions may be higher or lower than implied by the SEC yield.
Beta. A measure of the magnitude of a fund’s past share-price fluctuations in relation to the ups and downs of a given market index. The index is assigned a beta of 1.00. Compared with a given index, a fund with a beta of 1.20 typically would have seen its share price rise or fall by 12% when the index rose or fell by 10%. For this report, beta is based on returns over the past 36 months for both the fund and the index. Note that a fund’s beta should be reviewed in conjunction with its R-squared (see definition). The lower the R-squared, the less correlation there is between the fund and the index, and the less reliable beta is as an indicator of volatility.
Dividend Yield. Dividend income earned by stocks, expressed as a percentage of the aggregate market value (or of net asset value, for a fund). The yield is determined by dividing the amount of the annual dividends by the aggregate value (or net asset value) at the end of the period. For a fund, the dividend yield is based solely on stock holdings and does not include any income produced by other investments.
Earnings Growth Rate. The average annual rate of growth in earnings over the past five years for the stocks now in a fund.
Equity Exposure. A measure that reflects a fund’s investments in stocks and stock futures. Any holdings in short-term reserves are excluded.
Expense Ratio. A fund’s total annual operating expenses expressed as a percentage of the fund’s average net assets. The expense ratio includes management and administrative expenses, but does not include the transaction costs of buying and selling portfolio securities.
Foreign Holdings. The percentage of a fund represented by securities or depositary receipts of companies based outside the United States.
Inception Date. The date on which the assets of a fund (or one of its share classes) are first invested in accordance with the fund’s investment objective. For funds with a subscription period, the inception date is the day after that period ends. Investment performance is measured from the inception date.
Median Market Cap. An indicator of the size of companies in which a fund invests; the midpoint of market capitalization (market price x shares outstanding) of a fund’s stocks, weighted by the proportion of the fund’s assets invested in each stock. Stocks representing half of the fund’s assets have market capitalizations above the median, and the rest are below it.
Price/Book Ratio. The share price of a stock divided by its net worth, or book value, per share. For a fund, the weighted average price/book ratio of the stocks it holds.
34
Price/Earnings Ratio. The ratio of a stock’s current price to its per-share earnings over the past year. For a fund, the weighted average P/E of the stocks it holds. P/E is an indicator of market expectations about corporate prospects; the higher the P/E, the greater the expectations for a company’s future growth.
R-Squared. A measure of how much of a fund’s past returns can be explained by the returns from the market in general, as measured by a given index. If a fund’s total returns were precisely synchronized with an index’s returns, its R-squared would be 1.00. If the fund’s returns bore no relationship to the index’s returns, its R-squared would be 0. For this report, R-squared is based on returns over the past 36 months for both the fund and the index.
Return on Equity. The annual average rate of return generated by a company during the past five years for each dollar of shareholder’s equity (net income divided by shareholder’s equity). For a fund, the weighted average return on equity for the companies whose stocks it holds.
Short-Term Reserves. The percentage of a fund invested in highly liquid, short-term securities that can be readily converted to cash.
Turnover Rate. An indication of the fund’s trading activity. Funds with high turnover rates incur higher transaction costs and may be more likely to distribute capital gains (which may be taxable to investors). The turnover rate excludes in-kind transactions, which have minimal impact on costs.
35
The People Who Govern Your Fund
The trustees of your mutual fund are there to see that the fund is operated and managed in your best interests since, as a shareholder, you are a part owner of the fund. Your fund’s trustees also serve on the board of directors of The Vanguard Group, Inc., which is owned by the Vanguard funds and provides services to them on an at-cost basis.
A majority of Vanguard’s board members are independent, meaning that they have no affiliation with Vanguard or the funds they oversee, apart from the sizable personal investments they have made as private individuals. The independent board members have distinguished backgrounds in business, academia, and public service. Each of the trustees and executive officers oversees 181 Vanguard funds.
The following table provides information for each trustee and executive officer of the fund. More information about the trustees is in the Statement of Additional Information, which can be obtained, without charge, by contacting Vanguard at 800-662-7447, or online at vanguard.com.
| |
| InterestedTrustee1 | and Delphi Automotive LLP (automotive components); |
| | Senior Advisor at New Mountain Capital; Trustee of |
| F. William McNabb III | The Conference Board. |
| Born 1957. Trustee Since July 2009. Chairman of the | |
| Board. Principal Occupation(s) During the Past Five | Amy Gutmann |
| Years: Chairman of the Board of The Vanguard Group, | Born 1949. Trustee Since June 2006. Principal |
| Inc., and of each of the investment companies served | Occupation(s) During the Past Five Years: President |
| by The Vanguard Group, since January 2010; Director | of the University of Pennsylvania; Christopher H. |
| of The Vanguard Group since 2008; Chief Executive | Browne Distinguished Professor of Political Science |
| Officer and President of The Vanguard Group and of | in the School of Arts and Sciences with secondary |
| each of the investment companies served by The | appointments at the Annenberg School for |
| Vanguard Group since 2008; Director of Vanguard | Communication and the Graduate School of Education |
| Marketing Corporation; Managing Director of The | of the University of Pennsylvania; Member of the |
| Vanguard Group (1995–2008). | National Commission on the Humanities and Social |
| | Sciences; Trustee of Carnegie Corporation of New |
| York and of the National Constitution Center; Chair |
| IndependentTrustees | of the U. S. Presidential Commission for the Study |
| | of Bioethical Issues. |
| Emerson U. Fullwood | |
| Born 1948. Trustee Since January 2008. Principal | JoAnn Heffernan Heisen |
| Occupation(s) During the Past Five Years: Executive | Born 1950. Trustee Since July 1998. Principal |
| Chief Staff and Marketing Officer for North America | Occupation(s) During the Past Five Years: Corporate |
| and Corporate Vice President (retired 2008) of Xerox | Vice President and Chief Global Diversity Officer |
| Corporation (document management products and | (retired 2008) and Member of the Executive |
| services); Executive in Residence and 2010 | Committee (1997–2008) of Johnson & Johnson |
| Distinguished Minett Professor at the Rochester | (pharmaceuticals/medical devices/consumer |
| Institute of Technology; Director of SPX Corporation | products); Director of Skytop Lodge Corporation |
| (multi-industry manufacturing), the United Way of | (hotels), the University Medical Center at Princeton, |
| Rochester, Amerigroup Corporation (managed health | the Robert Wood Johnson Foundation, and the Center |
| care), the University of Rochester Medical Center, | for Talent Innovation; Member of the Advisory Board |
| Monroe Community College Foundation, and North | of the Maxwell School of Citizenship and Public Affairs |
| Carolina A&T University. | at Syracuse University. |
|
| Rajiv L. Gupta | F. Joseph Loughrey |
| Born 1945. Trustee Since December 2001. 2 | Born 1949. Trustee Since October 2009. Principal |
| Principal Occupation(s) During the Past Five Years: | Occupation(s) During the Past Five Years: President |
| Chairman and Chief Executive Officer (retired 2009) | and Chief Operating Officer (retired 2009) of Cummins |
| and President (2006–2008) of Rohm and Haas Co. | Inc. (industrial machinery); Chairman of the Board of |
| (chemicals); Director of Tyco International, Ltd. | Hillenbrand, Inc. (specialized consumer services) and |
| (diversified manufacturing and services), Hewlett- | of Oxfam America; Director of SKF AB (industrial |
| Packard Co. (electronic computer manufacturing), | |
| | |
| machinery) and the Lumina Foundation for Education; | Executive Officers | |
| Member of the Advisory Council for the College of | | |
| Arts and Letters and of the Advisory Board to the | Glenn Booraem | |
| Kellogg Institute for International Studies, both at | Born 1967. Controller Since July 2010. Principal |
| the University of Notre Dame. | Occupation(s) During the Past Five Years: Principal |
| | of The Vanguard Group, Inc.; Controller of each of |
| Mark Loughridge | the investment companies served by The Vanguard |
| Born 1953. Trustee Since March 2012. Principal | Group; Assistant Controller of each of the investment |
| Occupation(s) During the Past Five Years: Senior Vice | companies served by The Vanguard Group (2001–2010). |
| President and Chief Financial Officer at IBM (information | | |
| technology services); Fiduciary Member of IBM’s | Thomas J. Higgins | |
| Retirement Plan Committee. | Born 1957. Chief Financial Officer Since September |
| | 2008. Principal Occupation(s) During the Past Five |
| Scott C. Malpass | Years: Principal of The Vanguard Group, Inc.; Chief |
| Born 1962. Trustee Since March 2012. Principal | Financial Officer of each of the investment companies |
| Occupation(s) During the Past Five Years: Chief | served by The Vanguard Group; Treasurer of each of |
| Investment Officer and Vice President at the University | the investment companies served by The Vanguard |
| of Notre Dame; Assistant Professor of Finance at the | Group (1998–2008). | |
| Mendoza College of Business at Notre Dame; Member | | |
| of the Notre Dame 403(b) Investment Committee; | Kathryn J. Hyatt | |
| Director of TIFF Advisory Services, Inc. (investment | Born 1955. Treasurer Since November 2008. Principal |
| advisor); Member of the Investment Advisory | Occupation(s) During the Past Five Years: Principal of |
| Committees of the Financial Industry Regulatory | The Vanguard Group, Inc.; Treasurer of each of the |
| Authority (FINRA) and of Major League Baseball. | investment companies served by The Vanguard |
| | Group; Assistant Treasurer of each of the investment |
| André F. Perold | companies served by The Vanguard Group (1988–2008). |
| Born 1952. Trustee Since December 2004. Principal | | |
| Occupation(s) During the Past Five Years: George | Heidi Stam | |
| Gund Professor of Finance and Banking at the Harvard | Born 1956. Secretary Since July 2005. Principal |
| Business School (retired 2011); Chief Investment | Occupation(s) During the Past Five Years: Managing |
| Officer and Managing Partner of HighVista Strategies | Director of The Vanguard Group, Inc.; General Counsel |
| LLC (private investment firm); Director of Rand | of The Vanguard Group; Secretary of The Vanguard |
| Merchant Bank; Overseer of the Museum of Fine | Group and of each of the investment companies |
| Arts Boston. | served by The Vanguard Group; Director and Senior |
| | Vice President of Vanguard Marketing Corporation. |
| Alfred M. Rankin, Jr. | | |
| Born 1941. Trustee Since January 1993. Principal | Vanguard Senior ManagementTeam |
| Occupation(s) During the Past Five Years: Chairman, | | |
| President, and Chief Executive Officer of NACCO | Mortimer J. Buckley | Chris D. McIsaac |
| Industries, Inc. (housewares/lignite) and of Hyster-Yale | Kathleen C. Gubanich | Michael S. Miller |
| Materials Handling, Inc. (forklift trucks); Director of | Paul A. Heller | James M. Norris |
| the National Association of Manufacturers; Chairman | Martha G. King | Glenn W. Reed |
| of the Board of University Hospitals of Cleveland; | John T. Marcante | |
| Advisory Chairman of the Board of The Cleveland | | |
| Museum of Art. | | |
| | Chairman Emeritus and Senior Advisor |
| Peter F. Volanakis | | |
| Born 1955. Trustee Since July 2009. Principal | John J. Brennan | |
| Occupation(s) During the Past Five Years: President | Chairman, 1996–2009 |
| and Chief Operating Officer (retired 2010) of Corning | Chief Executive Officer and President, 1996–2008 |
| Incorporated (communications equipment); Director | | |
| of SPX Corporation (multi-industry manufacturing); | Founder | |
| Overseer of the Amos Tuck School of Business | | |
| Administration at Dartmouth College; Advisor to the | John C. Bogle | |
| Norris Cotton Cancer Center. | Chairman and Chief Executive Officer, 1974–1996 |
| | |
1 Mr. McNabb is considered an “interested person,” as defined in the Investment Company Act of 1940, because he is an officer of the Vanguard funds.
2 December 2002 for Vanguard Equity Income Fund, Vanguard Growth Equity Fund, the Vanguard Municipal Bond Funds, and the Vanguard State Tax-Exempt Funds.
|  |
| P.O. Box 2600 |
| Valley Forge, PA 19482-2600 |
Connect with Vanguard® > vanguard.com | |
| |
| Fund Information > 800-662-7447 | CFA® is a trademark owned by CFA Institute. |
| | |
Direct Investor Account Services > 800-662-2739
Institutional Investor Services > 800-523-1036
Text Telephone for People
With Hearing Impairment > 800-749-7273
This material may be used in conjunction
with the offering of shares of any Vanguard
fund only if preceded or accompanied by
the fund’s current prospectus.
All comparative mutual fund data are from Lipper, a
Thomson Reuters Company, or Morningstar, Inc., unless
otherwise noted.
You can obtain a free copy of Vanguard’s proxy voting
guidelines by visiting vanguard.com/proxyreporting or by
calling Vanguard at 800-662-2739. The guidelines are
also available from the SEC’s website, sec.gov. In
addition, you may obtain a free report on how your fund
voted the proxies for securities it owned during the 12
months ended June 30. To get the report, visit either
vanguard.com/proxyreporting or sec.gov.
You can review and copy information about your fund at
the SEC’s Public Reference Room in Washington, D.C. To
find out more about this public service, call the SEC at
202-551-8090. Information about your fund is also
available on the SEC’s website, and you can receive
copies of this information, for a fee, by sending a
request in either of two ways: via e-mail addressed to
publicinfo@sec.gov or via regular mail addressed to the
Public Reference Section, Securities and Exchange
Commission, Washington, DC 20549-1520. | |
| © 2013 The Vanguard Group, Inc.
All rights reserved.
Vanguard Marketing Corporation, Distributor.
Q260 112013 |
Item 2: Code of Ethics. The Registrant has adopted a code of ethics that applies to the Registrant’s principal executive officer, principal financial officer, principal accounting officer or controller or persons performing similar functions. The Code of Ethics was amended during the reporting period covered by this report to make certain technical, non-material changes.
Item 3: Audit Committee Financial Expert. The following members of the Audit Committee have been determined by the Registrant’s Board of Trustees to be Audit Committee Financial Experts serving on its Audit Committee, and to be independent: Rajiv L. Gupta, Amy Gutmann, JoAnn Heffernan Heisen, F. Joseph Loughrey, Mark Loughridge, Scott C. Malpass, André F. Perold, and Alfred M. Rankin, Jr.
Item 4: Principal Accountant Fees and Services.
(a) Audit Fees.
Audit Fees of the Registrant
Fiscal Year Ended September 30, 2013: $31,000
Fiscal Year Ended September 30, 2012: $31,000
Aggregate Audit Fees of Registered Investment Companies in the Vanguard Group.
Fiscal Year Ended September 30, 2013: $5,714,113
Fiscal Year Ended September 30, 2012: $4,809,780
Includes fees billed in connection with audits of the Registrant and other registered investment companies in the Vanguard complex. Also includes fees billed in connection with audits of The Vanguard Group, Inc. and Vanguard Marketing Corporation for Fiscal Year Ended September 30, 2013.
(b) Audit-Related Fees.
Fiscal Year Ended September 30, 2013: $1,552,950
Fiscal Year Ended September 30, 2012: $1,812,565
Includes fees billed in connection with assurance and related services provided to the Registrant, other registered investment companies in the Vanguard complex, The Vanguard Group, Inc., and Vanguard Marketing Corporation.
(c) Tax Fees.
Fiscal Year Ended September 30, 2013: $110,000
Fiscal Year Ended September 30, 2012: $490,518
Includes fees billed in connection with tax compliance, planning, and advice services provided to the Registrant, other registered investment companies in the Vanguard complex, The Vanguard Group, Inc., and Vanguard Marketing Corporation. Also includes fees billed in connection with certain tax services related to audits of the Registrant and other registered investment companies in the Vanguard complex for Fiscal Year Ended September 30, 2012.
(d) All Other Fees.
Fiscal Year Ended September 30, 2013: $132,000
Fiscal Year Ended September 30, 2012: $16,000
Includes fees billed in connection with tax compliance, planning, and advice services provided to the Registrant, other registered investment companies in the Vanguard complex, The Vanguard Group, Inc., and Vanguard Marketing Corporation.
(e) (1) Pre-Approval Policies. The policy of the Registrant’s Audit Committee is to consider and, if appropriate, approve before the principal accountant is engaged for such services, all specific audit and non-audit services provided to: the Registrant, other registered investment companies in the Vanguard complex, The Vanguard Group, Inc., and entities controlled by The Vanguard Group, Inc. that provide ongoing services to the Registrant. In making a determination, the Audit Committee considers whether the services are consistent with maintaining the principal accountant’s independence.
In the event of a contingency situation in which the principal accountant is needed to provide services in between scheduled Audit Committee meetings, the Chairman of the Audit Committee would be called on to consider and, if appropriate, pre-approve audit or permitted non-audit services in an amount sufficient to complete services through the next Audit Committee meeting, and to determine if such services would be consistent with maintaining the accountant’s independence. At the next scheduled Audit Committee meeting, services and fees would be presented to the Audit Committee for formal consideration, and, if appropriate, approval by the entire Audit Committee. The Audit Committee would again consider whether such services and fees are consistent with maintaining the principal accountant’s independence.
The Registrant’s Audit Committee is informed at least annually of all audit and non-audit services provided by the principal accountant to the Vanguard complex, whether such services are provided to: the Registrant, other registered investment companies in the Vanguard complex, The Vanguard Group, Inc., or other entities controlled by The Vanguard Group, Inc. that provide ongoing services to the Registrant.
(2) No percentage of the principal accountant’s fees or services were approved pursuant to the waiver provision of paragraph (c)(7)(i)(C) of Rule 2-01 of Regulation S-X.
(f) For the most recent fiscal year, over 50% of the hours worked under the principal accountant’s engagement were not performed by persons other than full-time, permanent employees of the principal accountant.
(g) Aggregate Non-Audit Fees.
Fiscal Year Ended September 30, 2013: $242,000
Fiscal Year Ended September 30, 2012: $506,518
Includes fees billed for non-audit services provided to the Registrant, other registered investment companies in the Vanguard complex, The Vanguard Group, Inc., and Vanguard Marketing Corporation.
(h) For the most recent fiscal year, the Audit Committee has determined that the provision of all non-audit services was consistent with maintaining the principal accountant’s independence.
Item 5: Audit Committee of Listed Registrants.
Not Applicable.
Item 6: Investments.
Not Applicable.
Item 7: Disclosure of Proxy Voting Policies and Procedures for Closed-End Management Investment Companies.
Not Applicable.
Item 8: Portfolio Managers of Closed-End Management Investment Companies.
Not Applicable.
Item 9: Purchase of Equity Securities by Closed-End Management Investment Company and Affiliated Purchasers.
Not Applicable.
Item 10: Submission of Matters to a Vote of Security Holders.
Not Applicable.
Item 11: Controls and Procedures.
(a) Disclosure Controls and Procedures. The Principal Executive and Financial Officers concluded that the Registrant’s Disclosure Controls and Procedures are effective based on their evaluation of the Disclosure Controls and Procedures as of a date within 90 days of the filing date of this report.
(b) Internal Control Over Financial Reporting. There were no significant changes in Registrant’s Internal Control Over Financial Reporting or in other factors that could significantly affect this control subsequent to the date of the evaluation, including any corrective actions with regard to significant deficiencies and material weaknesses.
Item 12: Exhibits.
(a) Code of Ethics.
(b) Certifications.
Pursuant to the requirements of the Securities Exchange Act of 1934 and the Investment Company Act of 1940, the registrant has duly caused this report to be signed on its behalf by the undersigned, thereunto duly authorized.
| |
| | VANGUARD MORGAN GROWTH FUND |
| |
| By: | /s/ F. WILLIAM MCNABB III* |
| | F. WILLIAM MCNABB III |
| | CHIEF EXECUTIVE OFFICER |
| |
| Date: November 15, 2013 |
Pursuant to the requirements of the Securities Exchange Act of 1934 and the Investment Company Act of 1940, this report has been signed below by the following persons on behalf of the registrant and in the capacities and on the dates indicated.
| |
| | VANGUARD MORGAN GROWTH FUND |
| |
| By: | /s/ F. WILLIAM MCNABB III* |
| | F. WILLIAM MCNABB III |
| | CHIEF EXECUTIVE OFFICER |
| |
| Date: November 15, 2013 |
| |
| | VANGUARD MORGAN GROWTH FUND |
| |
| By: | /s/ THOMAS J. HIGGINS* |
| | THOMAS J. HIGGINS |
| | CHIEF FINANCIAL OFFICER |
| |
| Date: November 15, 2013 |
* By: /s/ Heidi Stam
Heidi Stam, pursuant to a Power of Attorney filed on March 27, 2012 see file Number 2-11444,
Incorporated by Reference.