UNITED STATES
SECURITIES AND EXCHANGE COMMISSION
Washington, D.C. 20549
FORM N-CSR
CERTIFIED SHAREHOLDER REPORT
OF
REGISTERED MANAGEMENT INVESTMENT COMPANIES
Investment Company Act file number: 811-01685
Name of Registrant: Vanguard Morgan Growth Fund
Address of Registrant:
P.O. Box 2600
Valley Forge, PA 19482
Name and address of agent for service:
Heidi Stam, Esquire
P.O. Box 876
Valley Forge, PA 19482
Registrant’s telephone number, including area code: (610) 669-1000
Date of fiscal year end: September 30
Date of reporting period: October 1, 2011 – September 30, 2012
Item 1: Reports to Shareholders
| 
|
| Annual Report | September 30, 2012 |
| |
| Vanguard MorganTM Growth Fund |
| |
 |
> For the 12 months ended September 30, 2012, Vanguard Morgan Growth Fund returned about 27%.
> The fund lagged its benchmark, the Russell 3000 Growth Index, but outpaced the average return of its peers.
> Stocks in the information technology, consumer discretionary, and health care sectors helped fuel the fund’s performance.
| |
| Contents | |
| Your Fund’s Total Returns. | 1 |
| Chairman’s Letter. | 2 |
| Advisors’ Report. | 7 |
| Fund Profile. | 11 |
| Performance Summary. | 12 |
| Financial Statements. | 14 |
| Your Fund’s After-Tax Returns. | 28 |
| About Your Fund’s Expenses. | 29 |
| Glossary. | 31 |
Please note: The opinions expressed in this report are just that—informed opinions. They should not be considered promises or advice.
Also, please keep in mind that the information and opinions cover the period through the date on the front of this report. Of course, the risks of investing in your fund are spelled out in the prospectus.
See the Glossary for definitions of investment terms used in this report.
About the cover: Our cover photograph shows rigging on the HMSSurprise, a replica of an 18th-century Royal Navy frigate. It was featured in the 2003 movie Master and Commander: The Far Side of the World, which was based on Patrick O’Brian’s sea novels, set amid the Napoleonic Wars. Vanguard was named for another ship of that era, the HMSVanguard, which was the flagship of British Admiral Horatio Nelson at the Battle of the Nile.
Your Fund’s Total Returns
Fiscal Year Ended September 30, 2012
| |
| | Total |
| | Returns |
| Vanguard Morgan Growth Fund | |
| Investor Shares | 27.18% |
| Admiral™ Shares | 27.35 |
| Russell 3000 Growth Index | 29.35 |
| Multi-Cap Growth Funds Average | 25.46 |
Multi-Cap Growth Funds Average: Derived from data provided by Lipper Inc.
Admiral Shares carry lower expenses and are available to investors who meet certain account-balance requirements.
Your Fund’s Performance at a Glance
September 30, 2011, Through September 30, 2012
| | | | |
| | | | Distributions Per Share |
| | Starting | Ending | Income | Capital |
| | Share Price | Share Price | Dividends | Gains |
| Vanguard Morgan Growth Fund | | | | |
| Investor Shares | $16.06 | $20.31 | $0.100 | $0.000 |
| Admiral Shares | 49.84 | 63.02 | 0.391 | 0.000 |
1
developed markets of the Pacific region were the weakest performers but still recorded a modest advance.
In July, the president of the European Central Bank declared that policymakers would do whatever was needed to preserve the euro common currency. That pronouncement was encouraging to investors, but Europe’s financial troubles are by no means resolved. Vanguard economists believe the most likely scenario is that the Eurozone will “muddle through” for several years, with occasional spikes in market volatility, as fiscal tightening continues in the face of weak economic growth.
Bonds produced solid returns; future results may be more muted
Bonds once again advanced; the broad U.S. taxable market returned about 5% for the 12 months. Among U.S. Treasuries, long-term bonds were particularly strong as they benefited from the Federal Reserve’s bond-buying program.
As bond prices rose, the yield of the 10-year U.S. Treasury note fell to a record low in July, closing below 1.5%. (Bond yields and prices move in opposite directions.) By the end of the period, the yield had climbed, but it still remained low by historical standards.
| | | |
| Market Barometer | | | |
| |
| | | Average Annual Total Returns |
| | Periods Ended September 30, 2012 |
| | One | Three | Five |
| | Year | Years | Years |
| Stocks | | | |
| Russell 1000 Index (Large-caps) | 30.06% | 13.27% | 1.22% |
| Russell 2000 Index (Small-caps) | 31.91 | 12.99 | 2.21 |
| Dow Jones U.S. Total Stock Market Index | 30.00 | 13.29 | 1.53 |
| MSCI All Country World Index ex USA (International) | 14.48 | 3.17 | -4.12 |
| |
| Bonds | | | |
| Barclays U.S. Aggregate Bond Index (Broad taxable market) | 5.16% | 6.19% | 6.53% |
| Barclays Municipal Bond Index (Broad tax-exempt market) | 8.32 | 5.99 | 6.06 |
| Citigroup Three-Month U.S. Treasury Bill Index | 0.05 | 0.08 | 0.63 |
| |
| CPI | | | |
| Consumer Price Index | 1.99% | 2.33% | 2.11% |
3
Bondholders have enjoyed years of strong returns. But as Tim Buckley, our incoming chief investment officer, has noted, investors shouldn’t be surprised if future results are much more modest. As yields tumble, the scope for further declines—and price increases—diminishes.
The Federal Reserve announced on September 13 that it would continue to hold its target for short-term interest rates between 0% and 0.25% at least through mid-2015. The exceptionally low rates, in place since late 2008, kept a tight lid on returns from money market funds and savings accounts.
Double-digit results in all sectors boosted Morgan Growth’s returns
Vanguard Morgan Growth Fund seeks to outperform the Russell 3000 Growth Index through a multimanager approach that provides exposure to a broad universe of large- and mid-capitalization U.S. growth stocks. The fund’s five investment advisors use distinct approaches to manage independent subportfolios. We believe this structure provides both broad diversification and the potential for less volatility than a similar single-manager fund might experience. At the same time, it preserves each manager’s opportunity to generate superior returns.
Expense Ratios
Your Fund Compared With Its Peer Group
| | | |
| | Investor | Admiral | Peer Group |
| | Shares | Shares | Average |
| Morgan Growth Fund | 0.42% | 0.28% | 1.34% |
The fund expense ratios shown are from the prospectus dated January 26, 2012, and represent estimated costs for the current fiscal year. For the fiscal year ended September 30, 2012, the fund’s expense ratios were 0.40% for Investor Shares and 0.26% for Admiral Shares. The peer-group expense ratio is derived from data provided by Lipper Inc. and captures information through year-end 2011.
Peer group: Multi-Cap Growth Funds.
4
In the most recent 12 months, as I mentioned previously, the fund failed to outpace the Russell 3000 Growth Index but exceeded the average return of peers by almost 2 percentage points.
The shortfall versus the index was clearest in the tech sector. Tech stocks constituted about 35% of the fund’s holdings on average during the period and returned more than 27%. Compared with the benchmark index, however, this result came up short, as poor selection among manufacturers of computers and peripheral equipment and software companies held back returns.
The story was similar within consumer discretionary and health care. Although both sectors added to the fund’s overall performance, the advisors’ stock selection within these categories tempered results relative to the index.
The fund benefited in comparison with the index from the advisors’ choices in energy and industrials. Within the energy sector, shares of oil and gas companies boosted returns. The fund’s industrial holdings also performed well against the benchmark. A smaller allocation to consumer staples helped as well.
Total Returns
Ten Years Ended September 30, 2012
| |
| | Average |
| | Annual Return |
| Morgan Growth Fund Investor Shares | 8.58% |
| Russell 3000 Growth Index | 8.57 |
| Multi-Cap Growth Funds Average | 7.96 |
| Multi-Cap Growth Funds Average: Derived from data provided by Lipper Inc. | |
The figures shown represent past performance, which is not a guarantee of future results. (Current performance may be lower or higher than the performance data cited. For performance data current to the most recent month-end, visit our website at vanguard.com/performance.) Note, too, that both investment returns and principal value can fluctuate widely, so an investor’s shares, when sold, could be worth more or less than their original cost.
5
Over a turbulent decade, the fund topped the average return of peers
Vanguard Morgan Growth Fund’s long-term results remain competitive. For the ten years ended September 30, 2012, the average annual return for Investor Shares was 8.58%. The fund closely tracked its benchmark index, which returned an average of 8.57%, and was well ahead of the 7.96% average annual return of its peers.
This period included the aftermath of the bursting of the dot-com bubble and, more recently, the trauma of the 2008–2009 financial crisis. It’s a credit to the fund’s multimanager advisory team that Morgan Growth weathered these challenges to deliver solid long-term results. In addition to the advisors’ experience and talent, the fund benefited from its low investment costs, which allow investors to keep a larger proportion of returns.
The lessons of the financial crisis remain relevant four years later
In September, the end of your fund’s fiscal year, we marked the fourth anniversary of Lehman Brothers’ collapse, the start of the 2008–2009 financial crisis. When the Lehman news broke, I was speaking to institutional clients at an event in Washington, D.C., all of three weeks into my new role as Vanguard’s CEO.
In the ensuing months, I was struck both by how fortunate I was to work with a great team of Vanguard “crew” and by the remarkable steadiness demonstrated by our clients. Many clients experienced significant losses, but signs of panic were few. On balance, they remained committed to their long-term investment programs and managed to benefit from the financial markets’ subsequent recovery.
As the crisis recedes further in time, it’s important not to lose sight of the lessons that it illuminated about investing and sound financial practices generally. First among those lessons is that diversification does work. Diversification didn’t immunize investors from the market’s decline, but it certainly helped to insulate them from the worst of it.
Second, saving money and living within your means are critical. Investors are acting on this lesson as they pay off debt, which is a form of saving, and increase their savings rates from the dangerously low levels that prevailed before the crisis.
Third, having the courage to stick with a sound investment plan—as so many of our clients did—is important during volatile, uncertain times. Investors who resisted the urge to bail out of stocks at the depths of the crisis have largely been rewarded in the succeeding years.
I am very optimistic that, if investors embrace these lessons, they can give themselves a better chance of reaching their long-term goals. As always, thank you for investing with Vanguard.
Sincerely,

F. William McNabb III
Chairman and Chief Executive Officer
October 16, 2012
6
Advisors’ Report
For the fiscal year ended September 30, 2012, Vanguard Morgan Growth Fund returned 27.18% for Investor Shares and 27.35% for the lower-cost Admiral Shares. Your fund is managed by five independent advisors, a strategy that enhances the fund’s diversification by providing exposure to distinct yet complementary investment approaches. It’s not uncommon for different advisors to have different views about individual securities or the broader investment environment.
The advisors, the percentage of fund assets each manages, and brief descriptions of their investment strategies are presented in the table below. The advisors have also prepared a discussion
| | | | |
| Vanguard Morgan Growth Fund Investment Advisors | | |
| |
| | Fund Assets Managed | | |
| Investment Advisor | % | $ Million | | Investment Strategy |
| Wellington Management | 45 | 4,098 | | Uses traditional methods of stock selection—research |
| Company, LLP | | | | and analysis—that identify companies believed to have |
| | | | | above-average growth prospects, particularly those in |
| | | | | industries undergoing change. Focuses on mid- and |
| | | | | large-capitalization companies with proven records of |
| | | | | sales and earnings growth, profitability, and cash-flow |
| | | | | generation. |
| Jennison Associates LLC | 19 | 1,725 | | Uses a research-driven, fundamental investment |
| | | | | approach that relies on in-depth company knowledge |
| | | | | gleaned through meetings with management, |
| | | | | customers, and suppliers. |
| Vanguard Equity Investment | 12 | 1,086 | | Employs a quantitative, fundamental management |
| Group | | | | approach, using models that assess valuation, growth |
| | | | | prospects, management decisions, market sentiment, |
| | | | | and earnings quality of companies versus their peers. |
| Frontier Capital Management Co., | 11 | 999 | | Uses a research-driven, fundamental investment |
| LLC | | | | approach that seeks companies with above-average |
| | | | | growth prospects, reasonable valuations, and |
| | | | | competitive advantages. |
| Kalmar Investment Advisers | 11 | 953 | | Employs a “growth-with-value” strategy using creative, |
| | | | | bottom-up research to uncover vigorously growing, |
| | | | | high-quality businesses whose stocks can also be |
| | | | | bought inefficiently valued. The strategy has a dual |
| | | | | objective of strong returns with lower risk. |
| Cash Investments | 2 | 147 | | These short-term reserves are invested by Vanguard in |
| | | | | equity index products to simulate investments in |
| | | | | stocks. Each advisor also may maintain a modest cash |
| | | | | position. |
7
of the investment environment that existed during the fiscal period and of how portfolio positioning reflects this assessment. These comments were prepared on October 17, 2012.
Wellington Management Company, LLP
Portfolio Manager:
Paul E. Marrkand, CFA, Senior Vice President
Our portion of the Morgan Growth Fund utilizes traditional methods of stock selection—research and analysis—to identify companies that we believe have above-average growth prospects, particularly those in industries undergoing change. Research focuses on mid- and large-cap companies with a proven record of sales and earnings growth, profitability, and cash-flow generation.
The fiscal year saw some challenging, sometimes choppy conditions in the markets. The investment environment was characterized by capital flights to safe-haven asset classes, extreme volatility and high correlations among riskier securities, and a fickle sentiment that seemed to reflect tentativeness among market participants collectively. Regardless, we remained true to our process of selecting stocks to construct a portfolio with an attractive balance of favorable growth, quality, and valuation characteristics.
Sector allocation, which tends to be an aggregate result of our individual stock-selection decisions, contributed favorably to results. Our greater-than-benchmark weightings in the information technology and health care sectors helped relative returns, as did our underweight allocations to industrials and consumer staples. Apple was the top individual contributor; our large position in the stock benefited the portfolio as favorable business momentum and operating results pushed the share price up by more than 70% during the year.
On balance, the information technology stocks that we held underperformed relative to their peers. ITT Educational Services was the portfolio’s most substantial detractor. This provider of postsecondary degree programs in the United States has been weak at least in part because of government regulatory uncertainty. Management has taken aggressive action to meet government regulations, and this has negatively affected earnings.
Jennison Associates LLC
Portfolio Manager:
Kathleen A. McCarragher, Managing Director
Equity markets were highly volatile during the fiscal year, up strongly in the first six months, down sharply in May, then back on an upward trajectory beginning in June. The gyrations reflected swings in sentiment concerning European sovereign-debt issues and uncertainty about global growth. U.S. economic growth was subpar, and unemployment remained high.
Our portfolio holdings in the consumer discretionary and health care sectors lagged market returns in these groups. Consumer holdings Amazon.com, Ralph
8
Lauren, and Coach, which coming into the period had performed solidly on strong company-specific fundamentals, rose during the past 12 months but failed to keep pace with the meaningful rebound in economically sensitive specialty retail and media stocks.
In the health care sector, biotechnology stocks, including our holding in Alexion Pharmaceuticals, benefited more than other subsectors from the revival of investors’ appetite for risk. Bristol-Myers Squibb and Shire, which earlier had been rewarded for attractive business opportunities, lagged the biotech surge.
Consumer staples stocks, especially Whole Foods and Estee Lauder, contributed significantly to portfolio performance. Information technology holdings also did well, with Apple, Google, and LinkedIn posting strong advances.
Vanguard Equity Investment Group
Portfolio Managers:
James P. Stetler, Principal
James D. Troyer, CFA, Principal Michael R. Roach, CFA
Over the 12-month period our stock selection models produced mixed results. Our valuation and quality models were effective in distinguishing the outperformers from the underperformers. On the other hand, our models based on management decisions, sentiment, and growth were either neutral or ineffective and detracted from our results.
Our stock selections had a positive impact in seven of ten sectors and a negative effect in three. Choices within the energy and materials sectors added the most to our relative returns. In energy, Tesoro, Williams, and Marathon Petroleum benefited us most in relative terms; in materials, the top contributors were CF Industries, PPG Industries, and Monsanto. Selections were most disappointing in health care and information technology. Humana and Celgene in health care and Advanced Micro Devices and Electronic Arts in technology did not perform as expected and detracted from our results.
Frontier Capital Management Co., LLC
Portfolio Managers:
Stephen Knightly, CFA, President
Christopher J. Scarpa, Vice President
Equities registered strong gains over the fiscal year, with the Russell Midcap Growth Index rising 26.7%. The market advance was driven by the actions of European authorities to prevent a broad financial crisis, by strong corporate earnings, and by signs of recovery in the U.S. housing market.
Relative to our benchmark, we added value through strong selection among energy, consumer discretionary, and financial stocks. In the energy sector, our focus on reliable, high-growth domestic exploration companies proved sound. In the consumer category, niche auto services companies supported results.
9
Our financial holdings did well thanks to an emphasis on processing-oriented providers with recurring business.
Small holdings of cash restrained the portfolio’s returns. A slowdown in European capital spending created challenges for our technology stocks, and the absence of a few biotech winners challenged our relative performance in health care.
Kalmar Investment Advisers
Portfolio Manager:
Ford B. Draper, Jr., President and Chief Investment Officer
Despite substantial uncertainties related to the slowing global economy and the Eurozone sovereign-debt and banking crisis, the U.S. equity market has reached five-year highs. It appears to anticipate significant future improvement in the big picture from unprecedented supportive actions taken by central banks here and abroad, but that improvement is not yet evident. Our earlier optimism about decent returns in calendar 2012 has been borne out so far, but in the face of weakening corporate earnings, we think a concentration on high-quality growth businesses remains essential.
Over the past 12 months, our portfolio’s biggest detractors were technology and health care holdings. These included Rovi and Atmel in IT and Allscripts Healthcare Solutions and Salix Pharmaceuticals.
Our biggest successes came from a variety of sectors and included Alliance Data Systems, W.R. Grace, LKQ, Discovery, Express Scripts, and Tractor Supply.
10
Morgan Growth Fund
Fund Profile
As of September 30, 2012
| | |
| Share-Class Characteristics | |
| | Investor | Admiral |
| | Shares | Shares |
| Ticker Symbol | VMRGX | VMRAX |
| Expense Ratio1 | 0.42% | 0.28% |
| 30-Day SEC Yield | 0.78% | 0.92% |
| | | |
| Portfolio Characteristics | | |
| | | Russell | DJ |
| | | 3000 | U.S. Total |
| | | Growth | Market |
| | Fund | Index | Index |
| Number of Stocks | 318 | 1,679 | 3,638 |
| Median Market Cap $33.2B | $47.1B | $35.6B |
| Price/Earnings Ratio | 19.2x | 19.8x | 17.0x |
| Price/Book Ratio | 3.5x | 4.3x | 2.2x |
| Return on Equity | 22.4% | 23.7% | 18.0% |
| Earnings Growth Rate | 19.3% | 17.9% | 10.4% |
| Dividend Yield | 1.1% | 1.5% | 2.0% |
| Foreign Holdings | 3.4% | 0.0% | 0.0% |
| Turnover Rate | 49% | — | — |
| Short-Term Reserves | 1.0% | — | — |
| | | |
| Sector Diversification (% of equity exposure) |
| | | Russell | DJ |
| | | 3000 | U.S. Total |
| | | Growth | Market |
| | Fund | Index | Index |
| Consumer Discretionary 16.6% | 16.4% | 12.0% |
| Consumer Staples | 8.4 | 12.1 | 9.5 |
| Energy | 6.8 | 4.2 | 10.4 |
| Financials | 4.7 | 4.5 | 16.0 |
| Health Care | 14.3 | 12.6 | 11.9 |
| Industrials | 9.2 | 12.1 | 10.6 |
| Information Technology 34.9 | 31.8 | 19.2 |
| Materials | 3.7 | 3.9 | 3.9 |
| Telecommunication | | | |
| Services | 1.4 | 2.2 | 2.9 |
| Utilities | 0.0 | 0.2 | 3.6 |
| | |
| Volatility Measures | | |
| | | DJ |
| | | U.S. Total |
| | Russell 3000 | Market |
| | Growth Index | Index |
| R-Squared | 0.99 | 0.96 |
| Beta | 1.09 | 1.08 |
These measures show the degree and timing of the fund’s fluctuations compared with the indexes over 36 months.
| | |
| Ten Largest Holdings (% of total net assets) |
| Apple Inc. | Computer Hardware | 6.8% |
| Google Inc. Class A | Internet Software & | |
| | Services | 2.4 |
| Cisco Systems Inc. | Communications | |
| | Equipment | 2.4 |
| International Business | IT Consulting & | |
| Machines Corp. | Other Services | 2.3 |
| Microsoft Corp. | Systems Software | 2.3 |
| Philip Morris | | |
| International Inc. | Tobacco | 1.5 |
| EMC Corp. | Computer Storage & | |
| | Peripherals | 1.5 |
| Coca-Cola Co. | Soft Drinks | 1.4 |
| Amazon.com Inc. | Internet Retail | 1.3 |
| Wal-Mart Stores Inc. | Hypermarkets & | |
| | Super Centers | 1.3 |
| Top Ten | | 23.2% |
The holdings listed exclude any temporary cash investments and equity index products.
Investment Focus
1 The expense ratios shown are from the prospectus dated January 26, 2012, and represent estimated costs for the current fiscal year. For the fiscal year ended September 30, 2012, the expense ratios were 0.40% for Investor Shares and 0.26% for Admiral Shares.
11
Morgan Growth Fund
Performance Summary
All of the returns in this report represent past performance, which is not a guarantee of future results that may be achieved by the fund. (Current performance may be lower or higher than the performance data cited. For performance data current to the most recent month-end, visit our website at vanguard.com/performance.) Note, too, that both investment returns and principal value can fluctuate widely, so an investor’s shares, when sold, could be worth more or less than their original cost. The returns shown do not reflect taxes that a shareholder would pay on fund distributions or on the sale of fund shares.
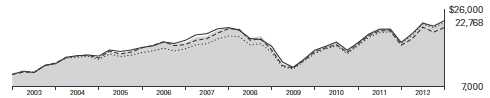
Cumulative Performance: September 30, 2002, Through September 30, 2012
Initial Investment of $10,000
| | | | |
| | | Average Annual Total Returns | |
| | Periods Ended September 30, 2012 | |
| | | | | Final Value |
| | One | Five | Ten | of a $10,000 |
| | Year | Years | Years | Investment |
| Morgan Growth Fund Investor Shares | 27.18% | 1.07% | 8.58% | $22,768 |
| Russell 3000 Growth Index | 29.35 | 3.22 | 8.57 | 22,750 |
| Multi-Cap Growth Funds Average | 25.46 | 0.31 | 7.96 | 21,516 |
| Dow Jones U.S. Total Stock Market | | | | |
| Index | 30.00 | 1.53 | 8.77 | 23,184 |
Multi-Cap Growth Funds Average: Derived from data provided by Lipper Inc.
| | | | |
| | | | | Final Value |
| | One | Five | Ten | of a $50,000 |
| | Year | Years | Years | Investment |
| Morgan Growth Fund Admiral Shares | 27.35% | 1.23% | 8.74% | $115,567 |
| Russell 3000 Growth Index | 29.35 | 3.22 | 8.57 | 113,751 |
| Dow Jones U.S. Total Stock Market Index | 30.00 | 1.53 | 8.77 | 115,920 |
See Financial Highlights for dividend and capital gains information.
12
Morgan Growth Fund
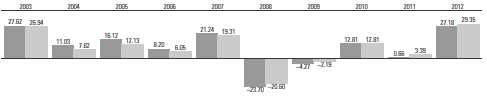
Fiscal-Year Total Returns (%): September 30, 2002, Through September 30, 2012
|
| Morgan Growth Fund Investor Shares |
| Russell 3000 Growth Index |
13
Morgan Growth Fund
Financial Statements
Statement of Net Assets
As of September 30, 2012
The fund reports a complete list of its holdings in regulatory filings four times in each fiscal year, at the quarter-ends. For the second and fourth fiscal quarters, the lists appear in the fund’s semiannual and annual reports to shareholders. For the first and third fiscal quarters, the fund files the lists with the Securities and Exchange Commission on Form N-Q. Shareholders can look up the fund’s Forms N-Q on the SEC’s website at sec.gov. Forms N-Q may also be reviewed and copied at the SEC’s Public Reference Room (see the back cover of this report for further information).
| | | |
| | | | Market |
| | | | Value |
| | | Shares | ($000) |
| Common Stocks (98.5%)1 | | |
| Consumer Discretionary (16.2%) | |
| * | Amazon.com Inc. | 460,606 | 117,141 |
| | Comcast Corp. Class A | 2,066,887 | 73,933 |
| | Coach Inc. | 1,088,770 | 60,993 |
| * | O’Reilly Automotive Inc. | 680,703 | 56,920 |
| | Home Depot Inc. | 899,483 | 54,302 |
| * | Lululemon Athletica Inc. | 690,782 | 51,076 |
| | Lowe’s Cos. Inc. | 1,650,592 | 49,914 |
| * | Bed Bath & Beyond Inc. | 789,708 | 49,752 |
| | Omnicom Group Inc. | 945,470 | 48,748 |
| * | Dollar Tree Inc. | 925,833 | 44,695 |
| | TJX Cos. Inc. | 973,787 | 43,616 |
| | PetSmart Inc. | 625,923 | 43,176 |
| | Ralph Lauren Corp. | | |
| | Class A | 272,195 | 41,164 |
| | News Corp. Class A | 1,595,549 | 39,139 |
| | NIKE Inc. Class B | 406,793 | 38,609 |
| | Yum! Brands Inc. | 553,859 | 36,743 |
| * | Inditex SA ADR | 1,292,283 | 32,158 |
| * | Michael Kors Holdings Ltd. | 591,825 | 31,473 |
| | Ross Stores Inc. | 480,975 | 31,071 |
| * | LKQ Corp. | 1,577,282 | 29,180 |
| | Starwood Hotels & | | |
| | Resorts Worldwide Inc. | 448,300 | 25,983 |
| * | BorgWarner Inc. | 373,697 | 25,826 |
| * | Discovery | | |
| | Communications Inc. | 432,415 | 24,233 |
| * | Urban Outfitters Inc. | 640,730 | 24,066 |
| ^ | Buckle Inc. | 522,063 | 23,717 |
| * | Sirius XM Radio Inc. | 8,817,672 | 22,926 |
| * | CarMax Inc. | 747,025 | 21,141 |
| | Harley-Davidson Inc. | 466,700 | 19,774 |
| * | priceline.com Inc. | 29,008 | 17,948 |
| * | ITT Educational | | |
| | Services Inc. | 547,526 | 17,647 |
| | Tractor Supply Co. | 169,540 | 16,766 |
| | Prada SPA | 2,216,385 | 16,466 |
| *,^ | Tesla Motors Inc. | 552,527 | 16,178 |
| | Gentex Corp. | 893,865 | 15,205 |
| | VF Corp. | 95,216 | 15,174 |
| | | |
| | | | Market |
| | | | Value |
| | | Shares | ($000) |
| * | Discovery | | |
| | Communications Inc. | | |
| | Class A | 244,400 | 14,574 |
| | Wyndham Worldwide Corp. | 276,600 | 14,516 |
| * | DIRECTV | 213,700 | 11,211 |
| | Dick’s Sporting Goods Inc. | 215,800 | 11,189 |
| | Chico’s FAS Inc. | 575,945 | 10,430 |
| * | Steven Madden Ltd. | 231,276 | 10,111 |
| | McDonald’s Corp. | 104,600 | 9,597 |
| | CBS Corp. Class B | 256,800 | 9,330 |
| *,^ | Imax Corp. | 448,720 | 8,934 |
| | Gap Inc. | 213,100 | 7,625 |
| | Family Dollar Stores Inc. | 113,200 | 7,505 |
| | Marriott International Inc. | | |
| | Class A | 185,500 | 7,253 |
| * | Panera Bread Co. Class A | 38,800 | 6,631 |
| | Virgin Media Inc. | 222,200 | 6,542 |
| * | Cabela’s Inc. | 116,100 | 6,348 |
| | Garmin Ltd. | 147,790 | 6,169 |
| | Comcast Corp. | 176,500 | 6,142 |
| | Service Corp. International | 447,920 | 6,029 |
| | Advance Auto Parts Inc. | 85,000 | 5,817 |
| * | AutoZone Inc. | 14,700 | 5,434 |
| | PVH Corp. | 55,800 | 5,230 |
| * | PulteGroup Inc. | 267,000 | 4,138 |
| | Interpublic Group | | |
| | of Cos. Inc. | 135,900 | 1,511 |
| | Wynn Resorts Ltd. | 10,500 | 1,212 |
| | Starbucks Corp. | 16,700 | 847 |
| | Viacom Inc. Class B | 14,400 | 772 |
| | Target Corp. | 7,000 | 444 |
| | | | 1,462,394 |
| Consumer Staples (8.2%) | | |
| | Philip Morris | | |
| | International Inc. | 1,518,923 | 136,612 |
| | Coca-Cola Co. | 3,439,023 | 130,442 |
| | Wal-Mart Stores Inc. | 1,575,632 | 116,282 |
| | Costco Wholesale Corp. | 889,084 | 89,019 |
| | Whole Foods Market Inc. | 619,093 | 60,300 |
| | Mead Johnson | | |
| | Nutrition Co. | 675,038 | 49,467 |
14
| | | |
| Morgan Growth Fund | | |
| |
| |
| |
| | | | Market |
| | | | Value |
| | | Shares | ($000) |
| | CVS Caremark Corp. | 818,347 | 39,624 |
| | Estee Lauder Cos. Inc. | | |
| | Class A | 600,854 | 36,995 |
| | Herbalife Ltd. | 465,955 | 22,086 |
| | Brown-Forman Corp. | | |
| | Class B | 151,479 | 9,884 |
| * | Monster Beverage Corp. | 174,976 | 9,477 |
| *,^ | Green Mountain Coffee | | |
| | Roasters Inc. | 332,552 | 7,898 |
| | Kroger Co. | 327,500 | 7,709 |
| | Beam Inc. | 99,900 | 5,748 |
| | Casey’s General Stores Inc. | 93,634 | 5,350 |
| | Ingredion Inc. | 68,800 | 3,795 |
| | Colgate-Palmolive Co. | 30,000 | 3,217 |
| | Hillshire Brands Co. | 60,000 | 1,607 |
| | General Mills Inc. | 28,400 | 1,132 |
| | PepsiCo Inc. | 12,700 | 899 |
| | | | 737,543 |
| Energy (6.6%) | | |
| | Exxon Mobil Corp. | 882,936 | 80,745 |
| | National Oilwell Varco Inc. | 750,578 | 60,129 |
| * | Concho Resources Inc. | 423,787 | 40,154 |
| | Diamond Offshore | | |
| | Drilling Inc. | 594,760 | 39,141 |
| | Valero Energy Corp. | 1,183,611 | 37,497 |
| | Oceaneering | | |
| | International Inc. | 630,625 | 34,842 |
| | Core Laboratories NV | 281,069 | 34,144 |
| | Noble Energy Inc. | 266,241 | 24,683 |
| | Transocean Ltd. | 548,362 | 24,616 |
| | Cabot Oil & Gas Corp. | 465,175 | 20,886 |
| | Occidental Petroleum Corp. | 242,581 | 20,877 |
| * | McDermott | | |
| | International Inc. | 1,595,166 | 19,493 |
| * | Cameron International Corp. | 333,360 | 18,691 |
| *,^ | InterOil Corp. | 217,000 | 16,765 |
| * | Continental Resources Inc. | 195,200 | 15,011 |
| * | Kodiak Oil & Gas Corp. | 1,295,217 | 12,123 |
| | Ensco plc Class A | 205,063 | 11,188 |
| * | Superior Energy | | |
| | Services Inc. | 523,030 | 10,733 |
| * | SandRidge Energy Inc. | 1,480,760 | 10,321 |
| | Williams Cos. Inc. | 277,500 | 9,704 |
| | Schlumberger Ltd. | 130,100 | 9,410 |
| * | Weatherford | | |
| | International Ltd. | 556,960 | 7,062 |
| | HollyFrontier Corp. | 156,808 | 6,471 |
| | Marathon Petroleum Corp. | 115,400 | 6,300 |
| | Tesoro Corp. | 149,000 | 6,243 |
| * | Southwestern Energy Co. | 178,780 | 6,218 |
| | Helmerich & Payne Inc. | 122,600 | 5,837 |
| * | Plains Exploration & | | |
| | Production Co. | 99,000 | 3,710 |
| | EOG Resources Inc. | 20,300 | 2,275 |
| | | | 595,269 |
| | | |
| | | | Market |
| | | | Value |
| | | Shares | ($000) |
| Exchange-Traded Fund (0.9%) | |
| ^,2 | Vanguard Growth ETF | 1,044,900 | 75,651 |
| |
| Financials (4.5%) | | |
| | American Express Co. | 1,613,160 | 91,724 |
| | American | | |
| | Tower Corporation | 984,254 | 70,266 |
| | Goldman Sachs Group Inc. | 333,050 | 37,861 |
| | T. Rowe Price Group Inc. | 500,990 | 31,713 |
| | Bank of America Corp. | 3,142,901 | 27,752 |
| | Raymond James | | |
| | Financial Inc. | 612,100 | 22,434 |
| * | Affiliated Managers | | |
| | Group Inc. | 168,250 | 20,695 |
| | Fidelity National | | |
| | Financial Inc. Class A | 726,809 | 15,547 |
| | Allied World Assurance | | |
| | Co. Holdings AG | 183,800 | 14,199 |
| | Arthur J Gallagher & Co. | 354,880 | 12,712 |
| | Moody’s Corp. | 248,990 | 10,998 |
| | Simon Property Group Inc. | 63,600 | 9,655 |
| | Jefferies Group Inc. | 606,083 | 8,297 |
| * | American International | | |
| | Group Inc. | 204,800 | 6,715 |
| | Discover Financial Services | 151,200 | 6,007 |
| | US Bancorp | 115,600 | 3,965 |
| | General Growth | | |
| | Properties Inc. | 184,500 | 3,594 |
| | Public Storage | 22,600 | 3,145 |
| | Digital Realty Trust Inc. | 36,900 | 2,578 |
| | Weingarten | | |
| | Realty Investors | 90,800 | 2,552 |
| | Host Hotels & Resorts Inc. | 124,500 | 1,998 |
| * | Arch Capital Group Ltd. | 21,600 | 900 |
| | Equity Residential | 6,300 | 362 |
| | | | 405,669 |
| Health Care (14.0%) | | |
| | Amgen Inc. | 1,331,888 | 112,305 |
| * | Biogen Idec Inc. | 656,049 | 97,902 |
| | UnitedHealth Group Inc. | 1,605,451 | 88,958 |
| * | Gilead Sciences Inc. | 1,179,842 | 78,259 |
| * | Celgene Corp. | 903,955 | 69,062 |
| | Abbott Laboratories | 954,038 | 65,409 |
| * | Express Scripts | | |
| | Holding Co. | 965,455 | 60,505 |
| * | Alexion | | |
| | Pharmaceuticals Inc. | 381,415 | 43,634 |
| | Allergan Inc. | 458,345 | 41,975 |
| | Shire plc ADR | 467,311 | 41,450 |
| * | Watson | | |
| | Pharmaceuticals Inc. | 478,100 | 40,715 |
| * | Edwards Lifesciences Corp. | 370,462 | 39,776 |
| | Cooper Cos. Inc. | 421,027 | 39,770 |
| | Novo Nordisk A/S ADR | 236,578 | 37,334 |
| | Agilent Technologies Inc. | 860,125 | 33,072 |
| * | Vertex Pharmaceuticals Inc. | 581,160 | 32,516 |
15
| | | |
| Morgan Growth Fund | | |
| |
| |
| |
| | | | Market |
| | | | Value |
| | | Shares | ($000) |
| | Zimmer Holdings Inc. | 451,667 | 30,542 |
| | Merck & Co. Inc. | 664,180 | 29,955 |
| * | Hologic Inc. | 1,434,588 | 29,036 |
| * | Catamaran Corp. | 260,223 | 25,494 |
| | ResMed Inc. | 624,180 | 25,261 |
| | Aetna Inc. | 629,945 | 24,946 |
| * | Life Technologies Corp. | 270,864 | 13,240 |
| * | Bruker Corp. | 992,758 | 12,995 |
| * | Salix Pharmaceuticals Ltd. | 290,490 | 12,299 |
| * | MEDNAX Inc. | 157,396 | 11,718 |
| | Baxter International Inc. | 185,100 | 11,154 |
| | Patterson Cos. Inc. | 319,900 | 10,953 |
| * | DaVita Inc. | 99,707 | 10,331 |
| * | Myriad Genetics Inc. | 374,980 | 10,121 |
| * | Intuitive Surgical Inc. | 17,772 | 8,808 |
| | McKesson Corp. | 101,100 | 8,698 |
| * | Centene Corp. | 207,800 | 7,774 |
| | AmerisourceBergen Corp. | | |
| | Class A | 189,300 | 7,328 |
| | Thermo Fisher | | |
| | Scientific Inc. | 121,170 | 7,128 |
| * | Mylan Inc. | 291,800 | 7,120 |
| * | Onyx Pharmaceuticals Inc. | 73,600 | 6,219 |
| | Perrigo Co. | 51,400 | 5,971 |
| * | Seattle Genetics Inc. | 213,600 | 5,757 |
| * | Cerner Corp. | 73,754 | 5,709 |
| | HCA Holdings Inc. | 140,700 | 4,678 |
| | Warner Chilcott plc Class A | 275,300 | 3,717 |
| * | Waters Corp. | 42,429 | 3,536 |
| * | Charles River Laboratories | | |
| | International Inc. | 13,900 | 550 |
| | | | 1,263,680 |
| Industrials (8.9%) | | |
| | Boeing Co. | 1,288,872 | 89,731 |
| | AMETEK Inc. | 1,844,876 | 65,401 |
| | Honeywell | | |
| | International Inc. | 792,225 | 47,335 |
| | Precision Castparts Corp. | 256,616 | 41,916 |
| * | TransDigm Group Inc. | 259,199 | 36,773 |
| | Parker Hannifin Corp. | 427,433 | 35,725 |
| * | B/E Aerospace Inc. | 803,539 | 33,829 |
| | General Electric Co. | 1,472,719 | 33,445 |
| | Caterpillar Inc. | 383,524 | 32,998 |
| | Tyco International Ltd. | 559,651 | 31,486 |
| | Pentair Inc. | 514,920 | 22,919 |
| * | IHS Inc. Class A | 206,120 | 20,066 |
| * | Quanta Services Inc. | 811,723 | 20,050 |
| | Flowserve Corp. | 124,745 | 15,935 |
| * | WESCO International Inc. | 253,609 | 14,506 |
| | Union Pacific Corp. | 122,200 | 14,505 |
| | Pall Corp. | 221,092 | 14,037 |
| ^ | Progressive Waste | | |
| | Solutions Ltd. | 669,080 | 13,763 |
| * | United Continental | | |
| | Holdings Inc. | 654,600 | 12,765 |
| | Fastenal Co. | 278,025 | 11,952 |
| | | |
| | | | Market |
| | | | Value |
| | | Shares | ($000) |
| | United Parcel Service Inc. | | |
| | Class B | 166,500 | 11,916 |
| | MSC Industrial Direct | | |
| | Co. Inc. Class A | 172,800 | 11,657 |
| * | Hertz Global Holdings Inc. | 845,280 | 11,606 |
| | Dover Corp. | 177,640 | 10,568 |
| * | MRC Global Inc. | 403,615 | 9,925 |
| * | Verisk Analytics Inc. | | |
| | Class A | 200,100 | 9,527 |
| | Landstar System Inc. | 176,745 | 8,356 |
| * | Stericycle Inc. | 92,245 | 8,350 |
| | Lockheed Martin Corp. | 85,700 | 8,003 |
| | Ingersoll-Rand plc | 172,800 | 7,745 |
| | Expeditors International | | |
| | of Washington Inc. | 207,180 | 7,533 |
| | Corrections Corp. | | |
| | of America | 206,564 | 6,910 |
| | Textron Inc. | 262,100 | 6,859 |
| | JB Hunt Transport | | |
| | Services Inc. | 126,445 | 6,580 |
| * | Alaska Air Group Inc. | 184,014 | 6,452 |
| | Snap-on Inc. | 89,665 | 6,444 |
| | 3M Co. | 64,800 | 5,989 |
| * | WABCO Holdings Inc. | 100,500 | 5,796 |
| | Dun & Bradstreet Corp. | 66,600 | 5,303 |
| * | Colfax Corp. | 142,920 | 5,241 |
| | UTi Worldwide Inc. | 383,081 | 5,160 |
| | Cummins Inc. | 54,000 | 4,979 |
| * | United Rentals Inc. | 151,455 | 4,954 |
| | WW Grainger Inc. | 23,520 | 4,901 |
| | Norfolk Southern Corp. | 72,200 | 4,594 |
| | FedEx Corp. | 48,800 | 4,129 |
| | Robert Half | | |
| | International Inc. | 73,200 | 1,949 |
| | Illinois Tool Works Inc. | 29,000 | 1,725 |
| | Waste Connections Inc. | 39,928 | 1,208 |
| * | Copart Inc. | 10,800 | 299 |
| | Emerson Electric Co. | 4,600 | 222 |
| | | | 804,017 |
| Information Technology (34.1%) | |
| | Apple Inc. | 916,467 | 611,522 |
| * | Google Inc. Class A | 292,202 | 220,466 |
| | Cisco Systems Inc. | 11,304,221 | 215,798 |
| | International Business | | |
| | Machines Corp. | 997,360 | 206,902 |
| | Microsoft Corp. | 6,842,369 | 203,766 |
| * | EMC Corp. | 4,863,179 | 132,619 |
| | QUALCOMM Inc. | 1,649,938 | 103,105 |
| | Oracle Corp. | 3,209,789 | 101,076 |
| * | Red Hat Inc. | 1,418,381 | 80,763 |
| * | Alliance Data | | |
| | Systems Corp. | 476,585 | 67,651 |
| * | eBay Inc. | 1,310,575 | 63,445 |
| | Altera Corp. | 1,864,141 | 63,353 |
| | IAC/InterActiveCorp | 1,174,035 | 61,120 |
| * | VMware Inc. Class A | 565,268 | 54,684 |
16
| | | |
| Morgan Growth Fund | | |
| |
| |
| |
| | | | Market |
| | | | Value |
| | | Shares | ($000) |
| * | Baidu Inc. ADR | 418,529 | 48,893 |
| * | NetApp Inc. | 1,368,000 | 44,980 |
| * | F5 Networks Inc. | 370,190 | 38,759 |
| | Xilinx Inc. | 1,143,286 | 38,197 |
| * | LinkedIn Corp. Class A | 310,447 | 37,378 |
| | Visa Inc. Class A | 275,095 | 36,940 |
| | Mastercard Inc. Class A | 69,740 | 31,486 |
| * | Salesforce.com Inc. | 204,176 | 31,176 |
| * | Check Point Software | | |
| | Technologies Ltd. | 609,274 | 29,343 |
| * | Citrix Systems Inc. | 329,884 | 25,259 |
| * | Autodesk Inc. | 749,877 | 25,023 |
| | Avago Technologies Ltd. | 703,335 | 24,522 |
| * | QLogic Corp. | 2,145,421 | 24,501 |
| * | Cognizant Technology | | |
| | Solutions Corp. Class A | 304,380 | 21,282 |
| * | Riverbed Technology Inc. | 904,588 | 21,050 |
| * | Gartner Inc. | 448,029 | 20,650 |
| | Fidelity National | | |
| | Information Services Inc. | 594,670 | 18,566 |
| | Total System Services Inc. | 762,500 | 18,071 |
| | KLA-Tencor Corp. | 375,852 | 17,930 |
| | Intuit Inc. | 280,900 | 16,539 |
| * | BMC Software Inc. | 387,595 | 16,081 |
| | Accenture plc Class A | 195,900 | 13,719 |
| * | Trimble Navigation Ltd. | 286,960 | 13,676 |
| * | Emulex Corp. | 1,660,105 | 11,969 |
| | Jack Henry & | | |
| | Associates Inc. | 307,595 | 11,658 |
| * | Symantec Corp. | 640,512 | 11,529 |
| * | Informatica Corp. | 331,155 | 11,527 |
| * | NetSuite Inc. | 176,321 | 11,249 |
| * | NCR Corp. | 463,695 | 10,809 |
| | Amphenol Corp. Class A | 179,315 | 10,558 |
| * | Lam Research Corp. | 331,315 | 10,531 |
| * | NeuStar Inc. Class A | 260,504 | 10,428 |
| * | Cadence Design | | |
| | Systems Inc. | 779,400 | 10,027 |
| * | Nuance | | |
| | Communications Inc. | 396,950 | 9,880 |
| * | Facebook Inc. Class A | 453,595 | 9,820 |
| * | Compuware Corp. | 955,970 | 9,474 |
| * | Wright Express Corp. | 135,530 | 9,449 |
| | Jabil Circuit Inc. | 480,156 | 8,989 |
| * | Akamai Technologies Inc. | 226,700 | 8,674 |
| * | VeriFone Systems Inc. | 301,320 | 8,392 |
| * | Fairchild Semiconductor | | |
| | International Inc. Class A | 628,172 | 8,242 |
| * | Teradata Corp. | 106,678 | 8,045 |
| | Motorola Solutions Inc. | 155,957 | 7,884 |
| * | MICROS Systems Inc. | 155,503 | 7,638 |
| * | Fiserv Inc. | 101,800 | 7,536 |
| * | Teradyne Inc. | 521,870 | 7,421 |
| * | Atmel Corp. | 1,336,613 | 7,031 |
| * | Rovi Corp. | 431,185 | 6,256 |
| | | | |
| | | | | Market |
| | | | | Value |
| | | | Shares | ($000) |
| | Maxim Integrated | | | |
| | Products Inc. | | 230,700 | 6,141 |
| * | LSI Corp. | | 842,300 | 5,820 |
| | Western Digital Corp. | 146,100 | 5,658 |
| * | NVIDIA Corp. | | 345,600 | 4,610 |
| * | Advanced Micro | | | |
| | Devices Inc. | | 1,004,800 | 3,386 |
| | Intel Corp. | | 143,700 | 3,259 |
| * | Polycom Inc. | | 310,900 | 3,069 |
| | FLIR Systems Inc. | | 120,170 | 2,400 |
| * | Flextronics International Ltd. 104,900 | 629 |
| | | | | 3,070,279 |
| Materials (3.7%) | | | |
| | CF Industries Holdings Inc. | 343,705 | 76,385 |
| | Monsanto Co. | | 627,557 | 57,120 |
| | Sherwin-Williams Co. | 347,277 | 51,713 |
| | FMC Corp. | | 600,378 | 33,249 |
| * | WR Grace & Co. | | 434,760 | 25,685 |
| | Cytec Industries Inc. | 192,000 | 12,580 |
| | Albemarle Corp. | | 178,240 | 9,390 |
| * | Crown Holdings Inc. | 236,100 | 8,677 |
| | Ashland Inc. | | 119,934 | 8,587 |
| | Celanese Corp. Class A | 201,000 | 7,620 |
| | Praxair Inc. | | 72,380 | 7,519 |
| | PPG Industries Inc. | | 63,950 | 7,344 |
| | Allegheny Technologies Inc. 216,042 | 6,892 |
| | Ball Corp. | | 154,900 | 6,554 |
| * | Allied Nevada Gold Corp. | 106,800 | 4,171 |
| | EI du Pont de | | | |
| | Nemours & Co. | | 81,300 | 4,087 |
| | | | | 327,573 |
| Telecommunication Services (1.4%) | |
| | Verizon | | | |
| | Communications Inc. | 1,999,065 | 91,098 |
| * | Crown Castle | | | |
| | International Corp. | 544,200 | 34,883 |
| | | | | 125,981 |
| Total Common Stocks | | | |
| (Cost $6,793,693) | | | 8,868,056 |
| Temporary Cash Investments (2.4%)1 | |
| Money Market Fund (2.3%) | | |
| 3,4 | Vanguard Market Liquidity | | |
| | Fund, 0.163% | 207,087,786 | 207,088 |
17
| | | |
| Morgan Growth Fund | | |
| |
| |
| |
| | | Face | Market |
| | | Amount | Value |
| | | ($000) | ($000) |
| Repurchase Agreement (0.0%) | | |
| | Bank of America Securities, | | |
| | LLC 0.170%, 10/1/12 | | |
| | (Dated 9/28/12, Repurchase | | |
| | Value $1,500,000, | | |
| | collateralized by Federal | | |
| | National Mortgage Assn. | | |
| | 4.500%, 1/1/31) | 1,500 | 1,500 |
| |
| U.S. Government and Agency Obligations (0.1%) |
| 5 | Federal Home Loan | | |
| | Bank Discount Notes, | | |
| | 0.130%, 12/26/12 | 2,000 | 1,999 |
| 6 | United States Treasury | | |
| | Note/Bond, | | |
| | 3.875%, 10/31/12 | 6,000 | 6,018 |
| | | | 8,017 |
| Total Temporary Cash Investments | |
| (Cost $216,606) | | 216,605 |
| Total Investments (100.9%) | | |
| (Cost $7,010,299) | | 9,084,661 |
| Other Assets and Liabilities (-0.9%) | |
| Other Assets6 | | 77,224 |
| Liabilities4 | | (153,848) |
| | | | (76,624) |
| Net Assets (100%) | | 9,008,037 |
| |
| At September 30, 2012, net assets consisted of: |
| | Amount |
| | ($000) |
| Paid-in Capital | 7,522,310 |
| Undistributed Net Investment Income | 34,656 |
| Accumulated Net Realized Losses | (622,368) |
| Unrealized Appreciation (Depreciation) | |
| Investment Securities | 2,074,362 |
| Futures Contracts | (923) |
| Net Assets | 9,008,037 |
| |
| |
| Investor Shares—Net Assets | |
| Applicable to 260,143,769 outstanding | |
| $.001 par value shares of beneficial | |
| interest (unlimited authorization) | 5,283,466 |
| Net Asset Value Per Share— | |
| Investor Shares | $20.31 |
| |
| |
| Admiral Shares—Net Assets | |
| Applicable to 59,101,225 outstanding | |
| $.001 par value shares of beneficial | |
| interest (unlimited authorization) | 3,724,571 |
| Net Asset Value Per Share— | |
| Admiral Shares | $63.02 |
See Note A in Notes to Financial Statements.
* Non-income-producing security.
^ Part of security position is on loan to broker-dealers. The total value of securities on loan is $48,150,000.
1 The fund invests a portion of its cash reserves in equity markets through the use of index futures contracts. After giving effect to futures investments, the fund’s effective common stock and temporary cash investment positions represent 99.3% and 1.6%, respectively, of net assets.
2 Considered an affiliated company of the fund as the issuer is another member of The Vanguard Group.
3 Affiliated money market fund available only to Vanguard funds and certain trusts and accounts managed by Vanguard. Rate shown is the 7-day yield.
4 Includes $50,349,000 of collateral received for securities on loan.
5 The issuer operates under a congressional charter; its securities are generally neither guaranteed by the U.S. Treasury nor backed by the full faith and credit of the U.S. government.
6 Securities with a value of $6,018,000 and cash of $300,000 have been segregated as initial margin for open futures contracts.
ADR—American Depositary Receipt.
See accompanying Notes, which are an integral part of the Financial Statements.
18
| |
| Morgan Growth Fund | |
| |
| |
| Statement of Operations | |
| |
| | Year Ended |
| | September 30, 2012 |
| | ($000) |
| Investment Income | |
| Income | |
| Dividends1,2 | 95,843 |
| Interest2 | 386 |
| Security Lending | 3,303 |
| Total Income | 99,532 |
| Expenses | |
| Investment Advisory Fees—Note B | |
| Basic Fee | 14,447 |
| Performance Adjustment | (3,624) |
| The Vanguard Group—Note C | |
| Management and Administrative—Investor Shares | 13,571 |
| Management and Administrative—Admiral Shares | 3,554 |
| Marketing and Distribution—Investor Shares | 1,215 |
| Marketing and Distribution—Admiral Shares | 689 |
| Custodian Fees | 151 |
| Auditing Fees | 31 |
| Shareholders’ Reports—Investor Shares | 126 |
| Shareholders’ Reports—Admiral Shares | 33 |
| Trustees’ Fees and Expenses | 20 |
| Total Expenses | 30,213 |
| Expenses Paid Indirectly | (239) |
| Net Expenses | 29,974 |
| Net Investment Income | 69,558 |
| Realized Net Gain (Loss) | |
| Investment Securities Sold2 | 536,557 |
| Futures Contracts | 30,755 |
| Foreign Currencies | (1) |
| Realized Net Gain (Loss) | 567,311 |
| Change in Unrealized Appreciation (Depreciation) | |
| Investment Securities | 1,375,179 |
| Futures Contracts | 4,164 |
| Change in Unrealized Appreciation (Depreciation) | 1,379,343 |
| Net Increase (Decrease) in Net Assets Resulting from Operations | 2,016,212 |
1 Dividends are net of foreign withholding taxes of $437,000.
2 Dividend income, interest income, and realized net gain (loss) from affiliated companies of the fund were $917,000, $272,000, and $0, respectively.
See accompanying Notes, which are an integral part of the Financial Statements.
19
| | |
| Morgan Growth Fund | | |
| |
| |
| Statement of Changes in Net Assets | | |
| |
| | Year Ended September 30, |
| | 2012 | 2011 |
| | ($000) | ($000) |
| Increase (Decrease) in Net Assets | | |
| Operations | | |
| Net Investment Income | 69,558 | 45,694 |
| Realized Net Gain (Loss) | 567,311 | 793,630 |
| Change in Unrealized Appreciation (Depreciation) | 1,379,343 | (741,826) |
| Net Increase (Decrease) in Net Assets Resulting from Operations | 2,016,212 | 97,498 |
| Distributions | | |
| Net Investment Income | | |
| Investor Shares | (30,342) | (30,610) |
| Admiral Shares | (20,234) | (19,672) |
| Realized Capital Gain | | |
| Investor Shares | — | — |
| Admiral Shares | — | — |
| Total Distributions | (50,576) | (50,282) |
| Capital Share Transactions | | |
| Investor Shares | (1,008,677) | (475,300) |
| Admiral Shares | 487,927 | 114,941 |
| Net Increase (Decrease) from Capital Share Transactions | (520,750) | (360,359) |
| Total Increase (Decrease) | 1,444,886 | (313,143) |
| Net Assets | | |
| Beginning of Period | 7,563,151 | 7,876,294 |
| End of Period1 | 9,008,037 | 7,563,151 |
1 Net Assets—End of Period includes undistributed net investment income of $34,656,000 and $15,675,000.
See accompanying Notes, which are an integral part of the Financial Statements.
20
| | | | | |
| Morgan Growth Fund | | | | | |
| |
| |
| Financial Highlights | | | | | |
| |
| |
| Investor Shares | | | | | |
| |
| |
| For a Share Outstanding | | | Year Ended September 30, |
| Throughout Each Period | 2012 | 2011 | 2010 | 2009 | 2008 |
| Net Asset Value, Beginning of Period | $16.06 | $16.04 | $14.32 | $15.15 | $21.45 |
| Investment Operations | | | | | |
| Net Investment Income | .141 | .087 | .097 | .114 | .148 |
| Net Realized and Unrealized Gain (Loss) | | | | | |
| on Investments | 4.209 | .029 | 1.733 | (.804) | (4.912) |
| Total from Investment Operations | 4.350 | .116 | 1.830 | (.690) | (4.764) |
| Distributions | | | | | |
| Dividends from Net Investment Income | (.100) | (.096) | (.110) | (.140) | (.175) |
| Distributions from Realized Capital Gains | — | — | — | — | (1.361) |
| Total Distributions | (.100) | (.096) | (.110) | (.140) | (1.536) |
| Net Asset Value, End of Period | $20.31 | $16.06 | $16.04 | $14.32 | $15.15 |
| |
| Total Return1 | 27.18% | 0.66% | 12.81% | -4.27% | -23.70% |
| |
| Ratios/Supplemental Data | | | | | |
| Net Assets, End of Period (Millions) | $5,283 | $5,009 | $5,432 | $5,239 | $5,418 |
| Ratio of Total Expenses to | | | | | |
| Average Net Assets2 | 0.40% | 0.42% | 0.44% | 0.48% | 0.38% |
| Ratio of Net Investment Income to | | | | | |
| Average Net Assets | 0.74% | 0.47% | 0.62% | 0.94% | 0.80% |
| Portfolio Turnover Rate | 49% | 55% | 60% | 87% | 88% |
1 Total returns do not include account service fees that may have applied in the periods shown. Fund prospectuses provide information about any applicable account service fees.
2 Includes performance-based investment advisory fee increases (decreases) of (0.04%), (0.01%), 0.01%, 0.02%, and 0.00%.
See accompanying Notes, which are an integral part of the Financial Statements.
21
| | | | | |
| Morgan Growth Fund | | | | | |
| |
| |
| Financial Highlights | | | | | |
| |
| |
| Admiral Shares | | | | | |
| |
| |
| For a Share Outstanding | | | Year Ended September 30, |
| Throughout Each Period | 2012 | 2011 | 2010 | 2009 | 2008 |
| Net Asset Value, Beginning of Period | $49.84 | $49.75 | $44.42 | $47.03 | $66.58 |
| Investment Operations | | | | | |
| Net Investment Income | .535 | .342 | .372 | .414 | .555 |
| Net Realized and Unrealized Gain (Loss) | | | | | |
| on Investments | 13.036 | .110 | 5.364 | (2.502) | (15.244) |
| Total from Investment Operations | 13.571 | .452 | 5.736 | (2.088) | (14.689) |
| Distributions | | | | | |
| Dividends from Net Investment Income | (.391) | (.362) | (.406) | (.522) | (.641) |
| Distributions from Realized Capital Gains | — | — | — | — | (4.220) |
| Total Distributions | (.391) | (.362) | (.406) | (.522) | (4.861) |
| Net Asset Value, End of Period | $63.02 | $49.84 | $49.75 | $44.42 | $47.03 |
| |
| Total Return1 | 27.35% | 0.83% | 12.95% | -4.09% | -23.57% |
| |
| Ratios/Supplemental Data | | | | | |
| Net Assets, End of Period (Millions) | $3,725 | $2,554 | $2,445 | $2,251 | $2,512 |
| Ratio of Total Expenses to | | | | | |
| Average Net Assets2 | 0.26% | 0.28% | 0.30% | 0.31% | 0.21% |
| Ratio of Net Investment Income to | | | | | |
| Average Net Assets | 0.88% | 0.61% | 0.76% | 1.11% | 0.97% |
| Portfolio Turnover Rate | 49% | 55% | 60% | 87% | 88% |
1 Total returns do not include account service fees that may have applied in the periods shown. Fund prospectuses provide information about any applicable account service fees.
2 Includes performance-based investment advisory fee increases (decreases) of (0.04%), (0.01%), 0.01%, 0.02%, and 0.00%.
See accompanying Notes, which are an integral part of the Financial Statements.
22
Morgan Growth Fund
Notes to Financial Statements
Vanguard Morgan Growth Fund is registered under the Investment Company Act of 1940 as an open-end investment company, or mutual fund. The fund offers two classes of shares: Investor Shares and Admiral Shares. Investor Shares are available to any investor who meets the fund’s minimum purchase requirements. Admiral Shares are designed for investors who meet certain administrative, service, and account-size criteria.
A. The following significant accounting policies conform to generally accepted accounting principles for U.S. mutual funds. The fund consistently follows such policies in preparing its financial statements.
1. Security Valuation: Securities are valued as of the close of trading on the New York Stock Exchange (generally 4 p.m., Eastern time) on the valuation date. Equity securities are valued at the latest quoted sales prices or official closing prices taken from the primary market in which each security trades; such securities not traded on the valuation date are valued at the mean of the latest quoted bid and asked prices. Securities for which market quotations are not readily available, or whose values have been affected by events occurring before the fund’s pricing time but after the close of the securities’ primary markets, are valued at their fair values calculated according to procedures adopted by the board of trustees. These procedures include obtaining quotations from an independent pricing service, monitoring news to identify significant market- or security-specific events, and evaluating changes in the values of foreign market proxies (for example, ADRs, futures contracts, or exchange-traded funds), between the time the foreign markets close and the fund’s pricing time. When fair-value pricing is employed, the prices of securities used by a fund to calculate its net asset value may differ from quoted or published prices for the same securities. Investments in Vanguard Market Liquidity Fund are valued at that fund’s net asset value. Temporary cash investments acquired over 60 days to maturity are valued using the latest bid prices or using valuations based on a matrix system (which considers such factors as security prices, yields, maturities, and ratings), both as furnished by independent pricing services. Other temporary cash investments are valued at amortized cost, which approximates market value.
2. Futures Contracts: The fund uses index futures contracts to a limited extent, with the objective of maintaining full exposure to the stock market while maintaining liquidity. The fund may purchase or sell futures contracts to achieve a desired level of investment, whether to accommodate portfolio turnover or cash flows from capital share transactions. The primary risks associated with the use of futures contracts are imperfect correlation between changes in market values of stocks held by the fund and the prices of futures contracts, and the possibility of an illiquid market.
Futures contracts are valued at their quoted daily settlement prices. The aggregate principal amounts of the contracts are not recorded in the Statement of Net Assets. Fluctuations in the value of the contracts are recorded in the Statement of Net Assets as an asset (liability) and in the Statement of Operations as unrealized appreciation (depreciation) until the contracts are closed, when they are recorded as realized futures gains (losses).
During the year ended September 30, 2012, the fund’s average investment in futures contracts represented 1% of net assets, based on quarterly average aggregate settlement values.
3. Repurchase Agreements: The fund may enter into repurchase agreements. Securities pledged as collateral for repurchase agreements are held by a custodian bank until the agreements mature. Each agreement requires that the market value of the collateral be sufficient to cover payments of interest and principal. In the event of default or bankruptcy by the other party to the agreement, the fund may sell or retain the collateral; however, such action may be subject to legal proceedings.
23
Morgan Growth Fund
4. Federal Income Taxes: The fund intends to continue to qualify as a regulated investment company and distribute all of its taxable income. Management has analyzed the fund’s tax positions taken for all open federal income tax years (September 31, 2009–2012), and has concluded that no provision for federal income tax is required in the fund’s financial statements.
5. Distributions: Distributions to shareholders are recorded on the ex-dividend date.
6. Security Lending: The fund may lend its securities to qualified institutional borrowers to earn additional income. Security loans are required to be secured at all times by collateral at least equal to the market value of securities loaned. The fund invests cash collateral received in Vanguard Market Liquidity Fund, and records a liability for the return of the collateral, during the period the securities are on loan. Security lending income represents fees charged to borrowers plus income earned on investing cash collateral, less expenses associated with the loan.
7. Other: Dividend income is recorded on the ex-dividend date. Interest income includes income distributions received from Vanguard Market Liquidity Fund and is accrued daily. Security transactions are accounted for on the date securities are bought or sold. Costs used to determine realized gains (losses) on the sale of investment securities are those of the specific securities sold.
Each class of shares has equal rights as to assets and earnings, except that each class separately bears certain class-specific expenses related to maintenance of shareholder accounts (included in Management and Administrative expenses) and shareholder reporting. Marketing and distribution expenses are allocated to each class of shares based on a method approved by the board of trustees. Income, other non-class-specific expenses, and gains and losses on investments are allocated to each class of shares based on its relative net assets.
B. Wellington Management Company, LLP, Jennison Associates LLC, Frontier Capital Management Co., LLC, and Kalmar Investment Advisers each provide investment advisory services to a portion of the fund for a fee calculated at an annual percentage rate of average net assets managed by the advisor. The basic fee of Wellington Management Company, LLP, is subject to quarterly adjustments based on performance for the preceding three years relative to the Russell 3000 Growth Index. The basic fee of Jennison Associates LLC is subject to quarterly adjustments based on performance for the preceding three years relative to the Russell 1000 Growth Index. The basic fees of Frontier Capital Management Co., LLC, and Kalmar Investment Advisers are subject to quarterly adjustments based on performance for the preceding three years relative to the Russell Midcap Growth Index.
The Vanguard Group provides investment advisory services to a portion of the fund on an at-cost basis; the fund paid Vanguard advisory fees of $547,000 for the year ended September 30, 2012.
For the year ended September 30, 2012, the aggregate investment advisory fee represented an effective annual basic rate of 0.17% of the fund’s average net assets, before a decrease of $3,624,000 (0.04%) based on performance.
C. The Vanguard Group furnishes at cost corporate management, administrative, marketing, and distribution services. The costs of such services are allocated to the fund under methods approved by the board of trustees. The fund has committed to provide up to 0.40% of its net assets in capital contributions to Vanguard. At September 30, 2012, the fund had contributed capital of $1,264,000 to Vanguard (included in Other Assets), representing 0.01% of the fund’s net assets and 0.51% of Vanguard’s capitalization. The fund’s trustees and officers are also directors and officers of Vanguard.
24
Morgan Growth Fund
D. The fund has asked its investment advisors to direct certain security trades, subject to obtaining the best price and execution, to brokers who have agreed to rebate to the fund part of the commissions generated. Such rebates are used solely to reduce the fund’s management and administrative expenses. For the year ended September 30, 2012, these arrangements reduced the fund’s expenses by $239,000 (an annual rate of 0.00% of average net assets).
E. Various inputs may be used to determine the value of the fund’s investments. These inputs are summarized in three broad levels for financial statement purposes. The inputs or methodologies used to value securities are not necessarily an indication of the risk associated with investing in those securities.
Level 1—Quoted prices in active markets for identical securities.
Level 2—Other significant observable inputs (including quoted prices for similar securities, interest rates, prepayment speeds, credit risk, etc.).
Level 3—Significant unobservable inputs (including the fund’s own assumptions used to determine the fair value of investments).
The following table summarizes the market value of the fund’s investments as of September 30, 2012, based on the inputs used to value them:
| | | |
| | Level 1 | Level 2 | Level 3 |
| Investments | ($000) | ($000) | ($000) |
| Common Stocks | 8,851,590 | 16,466 | — |
| Temporary Cash Investments | 207,088 | 9,517 | — |
| Futures Contracts—Assets1 | 129 | — | — |
| Futures Contracts—Liabilities1 | (581) | — | — |
| Total | 9,058,226 | 25,983 | — |
| 1 Represents variation margin on the last day of the reporting period. |
F. At September 30, 2012, the aggregate settlement value of open futures contracts and the related unrealized appreciation (depreciation) were:
| | | | |
| | | | | ($000) |
| | | | Aggregate | |
| | | Number of | Settlement | Unrealized |
| | | Long (Short) | Value | Appreciation |
| Futures Contracts | Expiration | Contracts | Long (Short) | (Depreciation) |
| S&P 500 Index | December 2012 | 176 | 63,105 | (831) |
| E-mini S&P 500 Index | December 2012 | 172 | 12,334 | (92) |
Unrealized appreciation (depreciation) on open futures contracts is required to be treated as realized gain (loss) for tax purposes.
G. Distributions are determined on a tax basis and may differ from net investment income and realized capital gains for financial reporting purposes. Differences may be permanent or temporary. Permanent differences are reclassified among capital accounts in the financial statements to reflect their tax character. Temporary differences arise when certain items of income, expense, gain, or loss are recognized in different periods for financial statement and tax purposes; these differences will reverse at some time in the future. Differences in classification may also result from the treatment of short-term gains as ordinary income for tax purposes.
25
Morgan Growth Fund
For tax purposes, at September 30, 2012, the fund had $53,323,000 of ordinary income available for distribution. The fund used capital loss carryforwards of $611,698,000 to offset taxable capital gains realized during the year ended September 30, 2012. At September 30, 2012, the fund had available capital losses totaling $621,698,000 to offset future net capital gains. Of this amount, $578,633,000 is subject to expiration on September 30, 2018. Capital losses of $43,065,000 realized beginning in fiscal 2012 may be carried forward indefinitely under the Regulated Investment Company Modernization Act of 2010, but must be used before any expiring loss carryforwards.
During the year ended September 30, 2012, the fund realized net foreign currency losses of $1,000, which decreased distributable net income for tax purposes; accordingly, such losses have been reclassified from accumulated net realized losses to undistributed net investment income.
At September 30, 2012, the cost of investment securities for tax purposes was $7,011,591,000. Net unrealized appreciation of investment securities for tax purposes was $2,073,070,000, consisting of unrealized gains of $2,325,177,000 on securities that had risen in value since their purchase and $252,107,000 in unrealized losses on securities that had fallen in value since their purchase.
H. During the year ended September 30, 2012, the fund purchased $4,112,146,000 of investment securities and sold $4,386,168,000 of investment securities, other than temporary cash investments.
I. Capital share transactions for each class of shares were:
| | | | |
| | | | Year Ended September 30, |
| | | 2012 | | 2011 |
| | Amount | Shares | Amount | Shares |
| | ($000) | (000) | ($000) | (000) |
| Investor Shares | | | | |
| Issued | 640,625 | 33,948 | 881,191 | 48,755 |
| Issued in Lieu of Cash Distributions | 29,253 | 1,660 | 29,637 | 1,644 |
| Redeemed | (1,678,555) | (87,305) | (1,386,128) | (77,285) |
| Net Increase (Decrease)—Investor Shares | (1,008,677) | (51,697) | (475,300) | (26,886) |
| Admiral Shares | | | | |
| Issued | 1,064,733 | 17,636 | 800,719 | 14,395 |
| Issued in Lieu of Cash Distributions | 17,720 | 324 | 17,322 | 310 |
| Redeemed | (594,526) | (10,104) | (703,100) | (12,596) |
| Net Increase (Decrease)—Admiral Shares | 487,927 | 7,856 | 114,941 | 2,109 |
J. In preparing the financial statements as of September 30, 2012, management considered the impact of subsequent events for potential recognition or disclosure in these financial statements.
26
Report of Independent Registered
Public Accounting Firm
To the Trustees and Shareholders of Vanguard Morgan Growth Fund:
In our opinion, the accompanying statement of net assets and the related statements of operations and of changes in net assets and the financial highlights present fairly, in all material respects, the financial position of Vanguard Morgan Growth Fund (the “Fund”) at September 30, 2012, the results of its operations for the year then ended, the changes in its net assets for each of the two years in the period then ended and the financial highlights for each of the five years in the period then ended, in conformity with accounting principles generally accepted in the United States of America. These financial statements and financial highlights (hereafter referred to as “financial statements”) are the responsibility of the Fund’s management; our responsibility is to express an opinion on these financial statements based on our audits. We conducted our audits of these financial statements in accordance with the standards of the Public Company Accounting Oversight Board (United States). Those standards require that we plan and perform the audit to obtain reasonable assurance about whether the financial statements are free of material misstatement. An audit includes examining, on a test basis, evidence supporting the amounts and disclosures in the financial statements, assessing the accounting principles used and significant estimates made by management, and evaluating the overall financial statement presentation. We believe that our audits, which included confirmation of securities at September 30, 2012 by correspondence with the custodians and brokers and by agreement to the underlying ownership records of the transfer agent, provide a reasonable basis for our opinion.
PricewaterhouseCoopers LLP
Philadelphia, Pennsylvania
November 12, 2012
| |
| Special 2012 tax information (unaudited) for Vanguard Morgan Growth Fund |
This information for the fiscal year ended September 30, 2012, is included pursuant to provisions of the Internal Revenue Code.
The fund distributed $50,576,000 of qualified dividend income to shareholders during the fiscal year.
For corporate shareholders, 100% of investment income (dividend income plus short-term gains, if any) qualifies for the dividends-received deduction.
27
Your Fund’s After-Tax Returns
This table presents returns for your fund both before and after taxes. The after-tax returns are shown in two ways: (1) assuming that an investor owned the fund during the entire period and paid taxes on the fund’s distributions, and (2) assuming that an investor paid taxes on the fund’s distributions and sold all shares at the end of each period.
Calculations are based on the highest individual federal income tax and capital gains tax rates in effect at the times of the distributions and the hypothetical sales. State and local taxes were not considered. After-tax returns reflect any qualified dividend income , using actual prior-year figures and estimates for 2012. (In the example, returns after the sale of fund shares may be higher than those assuming no sale. This occurs when the sale would have produced a capital loss. The calculation assumes that the investor received a tax deduction for the loss.)
The table shows returns for Investor Shares only; returns for other share classes will differ. Please note that your actual after-tax returns will depend on your tax situation and may differ from those shown. Also note that if you own the fund in a tax-deferred account, such as an individual retirement account or a 401(k) plan, this information does not apply to you. Such accounts are not subject to current taxes.
Finally, keep in mind that a fund’s performance—whether before or after taxes—does not guarantee future results.
Average Annual Total Returns: Morgan Growth Fund Investor Shares
Periods Ended September 30, 2012
| | | |
| | One | Five | Ten |
| | Year | Years | Years |
| Returns Before Taxes | 27.18% | 1.07% | 8.58% |
| Returns After Taxes on Distributions | 27.07 | 0.68 | 8.26 |
| Returns After Taxes on Distributions and Sale of Fund Shares | 17.78 | 0.80 | 7.53 |
28
About Your Fund’s Expenses
As a shareholder of the fund, you incur ongoing costs, which include costs for portfolio management, administrative services, and shareholder reports (like this one), among others. Operating expenses, which are deducted from a fund’s gross income, directly reduce the investment return of the fund.
A typical fund’s expenses are expressed as a percentage of its average net assets. This figure is known as the expense ratio. The following examples are intended to help you understand the ongoing costs (in dollars) of investing in your fund and to compare these costs with those of other mutual funds. The examples are based on an investment of $1,000 made at the beginning of the period shown and held for the entire period.
The accompanying table illustrates your fund’s costs in two ways:
• Based on actual fund return. This section helps you to estimate the actual expenses that you paid over the period. The ”Ending Account Value“ shown is derived from the fund‘s actual return, and the third column shows the dollar amount that would have been paid by an investor who started with $1,000 in the fund. You may use the information here, together with the amount you invested, to estimate the expenses that you paid over the period.
To do so, simply divide your account value by $1,000 (for example, an $8,600 account value divided by $1,000 = 8.6), then multiply the result by the number given for your fund under the heading ”Expenses Paid During Period.“
• Based on hypothetical 5% yearly return. This section is intended to help you compare your fund‘s costs with those of other mutual funds. It assumes that the fund had a yearly return of 5% before expenses, but that the expense ratio is unchanged. In this case—because the return used is not the fund’s actual return—the results do not apply to your investment. The example is useful in making comparisons because the Securities and Exchange Commission requires all mutual funds to calculate expenses based on a 5% return. You can assess your fund’s costs by comparing this hypothetical example with the hypothetical examples that appear in shareholder reports of other funds.
Note that the expenses shown in the table are meant to highlight and help you compare ongoing costs only and do not reflect transaction costs incurred by the fund for buying and selling securities. Further, the expenses do not include any purchase, redemption, or account service fees described in the fund prospectus. If such fees were applied to your account, your costs would be higher. Your fund does not carry a “sales load.”
The calculations assume no shares were bought or sold during the period. Your actual costs may have been higher or lower, depending on the amount of your investment and the timing of any purchases or redemptions.
You can find more information about the fund’s expenses, including annual expense ratios, in the Financial Statements section of this report. For additional information on operating expenses and other shareholder costs, please refer to your fund’s current prospectus.
29
| | | |
| Six Months Ended September 30, 2012 | | | |
| | Beginning | Ending | Expenses |
| | Account Value | Account Value | Paid During |
| Morgan Growth Fund | 3/31/2012 | 9/30/2012 | Period |
| Based on Actual Fund Return | | | |
| Investor Shares | $1,000.00 | $992.18 | $2.00 |
| Admiral Shares | 1,000.00 | 992.75 | 1.30 |
| Based on Hypothetical 5% Yearly Return | | | |
| Investor Shares | $1,000.00 | $1,023.06 | $2.03 |
| Admiral Shares | 1,000.00 | 1,023.76 | 1.32 |
The calculations are based on expenses incurred in the most recent six-month period. The fund’s annualized six-month expense ratios for that period are 0.40% for Investor Shares and 0.26% for Admiral Shares. The dollar amounts shown as “Expenses Paid” are equal to the annualized expense ratio multiplied by the average account value over the period, multiplied by the number of days in the most recent six-month period, then divided by the number of days in the most recent 12-month period.
30
Glossary
30-Day SEC Yield. A fund’s 30-day SEC yield is derived using a formula specified by the U.S. Securities and Exchange Commission. Under the formula, data related to the fund’s security holdings in the previous 30 days are used to calculate the fund’s hypothetical net income for that period, which is then annualized and divided by the fund’s estimated average net assets over the calculation period. For the purposes of this calculation, a security’s income is based on its current market yield to maturity (for bonds), its actual income (for asset-backed securities), or its projected dividend yield (for stocks). Because the SEC yield represents hypothetical annualized income, it will differ—at times significantly—from the fund’s actual experience. As a result, the fund’s income distributions may be higher or lower than implied by the SEC yield.
Beta. A measure of the magnitude of a fund’s past share-price fluctuations in relation to the ups and downs of a given market index. The index is assigned a beta of 1.00. Compared with a given index, a fund with a beta of 1.20 typically would have seen its share price rise or fall by 12% when the index rose or fell by 10%. For this report, beta is based on returns over the past 36 months for both the fund and the index. Note that a fund’s beta should be reviewed in conjunction with its R-squared (see definition). The lower the R-squared, the less correlation there is between the fund and the index, and the less reliable beta is as an indicator of volatility.
Dividend Yield. Dividend income earned by stocks, expressed as a percentage of the aggregate market value (or of net asset value, for a fund). The yield is determined by dividing the amount of the annual dividends by the aggregate value (or net asset value) at the end of the period. For a fund, the dividend yield is based solely on stock holdings and does not include any income produced by other investments.
Earnings Growth Rate. The average annual rate of growth in earnings over the past five years for the stocks now in a fund.
Equity Exposure. A measure that reflects a fund’s investments in stocks and stock futures. Any holdings in short-term reserves are excluded.
Expense Ratio. A fund’s total annual operating expenses expressed as a percentage of the fund’s average net assets. The expense ratio includes management and administrative expenses, but does not include the transaction costs of buying and selling portfolio securities.
Foreign Holdings. The percentage of a fund represented by securities or depositary receipts of companies based outside the United States.
Inception Date. The date on which the assets of a fund (or one of its share classes) are first invested in accordance with the fund’s investment objective. For funds with a subscription period, the inception date is the day after that period ends. Investment performance is measured from the inception date.
Median Market Cap. An indicator of the size of companies in which a fund invests; the midpoint of market capitalization (market price x shares outstanding) of a fund’s stocks, weighted by the proportion of the fund’s assets invested in each stock. Stocks representing half of the fund’s assets have market capitalizations above the median, and the rest are below it.
Price/Book Ratio. The share price of a stock divided by its net worth, or book value, per share. For a fund, the weighted average price/book ratio of the stocks it holds.
31
Price/Earnings Ratio. The ratio of a stock’s current price to its per-share earnings over the past year. For a fund, the weighted average P/E of the stocks it holds. P/E is an indicator of market expectations about corporate prospects; the higher the P/E, the greater the expectations for a company’s future growth.
R-Squared. A measure of how much of a fund’s past returns can be explained by the returns from the market in general, as measured by a given index. If a fund’s total returns were precisely synchronized with an index’s returns, its R-squared would be 1.00. If the fund’s returns bore no relationship to the index’s returns, its R-squared would be 0. For this report, R-squared is based on returns over the past 36 months for both the fund and the index.
Return on Equity. The annual average rate of return generated by a company during the past five years for each dollar of shareholder’s equity (net income divided by shareholder’s equity). For a fund, the weighted average return on equity for the companies whose stocks it holds.
Short-Term Reserves. The percentage of a fund invested in highly liquid, short-term securities that can be readily converted to cash.
Turnover Rate. An indication of the fund’s trading activity. Funds with high turnover rates incur higher transaction costs and may be more likely to distribute capital gains (which may be taxable to investors). The turnover rate excludes in-kind transactions, which have minimal impact on costs.
32
This page intentionally left blank.
This page intentionally left blank.

Chairman’s Letter
Dear Shareholder,
Global stock markets began the fiscal year strongly and, despite volatility in the middle of the period, finished on a high note with four straight monthly gains. In this environment, Vanguard Morgan Growth Fund returned about 27% for both Investor and Admiral Shares. The fund lagged its benchmark, the Russell 3000 Growth Index, but outperformed the average return of its multi-capitalization growth fund peers.
The fund posted strong, double-digit results in all ten market sectors for the 12-month period. Stocks in the information technology, consumer discretionary, and health care sectors contributed most to its overall performance.
If you hold shares in a taxable account, you may wish to review the information about after-tax returns, based on the highest federal income tax bracket, that appears later in the report.
Stocks notched a powerful rally, with help from central bankers
U.S. stocks surged 30% in the 12 monthsended September 30, 2012 outpacing the gains of their international counterparts. The rally came amid moves by U.S. and European central bankers to quiet—at least temporarily—investors’ concerns about the U.S. economy and the finances of European governments and banks.
While U.S. stocks were the standouts, European and emerging markets stocks also posted double-digit results. The
2
The People Who Govern Your Fund
The trustees of your mutual fund are there to see that the fund is operated and managed in your best interests since, as a shareholder, you are a part owner of the fund. Your fund’s trustees also serve on the board of directors of The Vanguard Group, Inc., which is owned by the Vanguard funds and provides services to them on an at-cost basis.
A majority of Vanguard’s board members are independent, meaning that they have no affiliation with Vanguard or the funds they oversee, apart from the sizable personal investments they have made as private individuals. The independent board members have distinguished backgrounds in business, academia, and public service. Each of the trustees and executive officers oversees 179 Vanguard funds.
The following table provides information for each trustee and executive officer of the fund. More information about the trustees is in the Statement of Additional Information, which can be obtained, without charge, by contacting Vanguard at 800-662-7447, or online at vanguard.com.
| |
| InterestedTrustee1 | and Delphi Automotive LLP (automotive components); |
| | Senior Advisor at New Mountain Capital; Trustee of |
| F. William McNabb III | The Conference Board. |
| Born 1957. Trustee Since July 2009. Chairman of the | |
| Board. Principal Occupation(s) During the Past Five | Amy Gutmann |
| Years: Chairman of the Board of The Vanguard Group, | Born 1949. Trustee Since June 2006. Principal |
| Inc., and of each of the investment companies served | Occupation(s) During the Past Five Years: President |
| by The Vanguard Group, since January 2010; Director | of the University of Pennsylvania; Christopher H. |
| of The Vanguard Group since 2008; Chief Executive | Browne Distinguished Professor of Political Science |
| Officer and President of The Vanguard Group and of | in the School of Arts and Sciences with secondary |
| each of the investment companies served by The | appointments at the Annenberg School for |
| Vanguard Group since 2008; Director of Vanguard | Communication and the Graduate School of Education |
| Marketing Corporation; Managing Director of The | of the University of Pennsylvania; Member of the |
| Vanguard Group (1995–2008). | National Commission on the Humanities and Social |
| | Sciences; Trustee of Carnegie Corporation of New |
| | York and of the National Constitution Center; Chair |
| IndependentTrustees | of the U. S. Presidential Commission for the Study |
| | of Bioethical Issues. |
| Emerson U. Fullwood | |
| Born 1948. Trustee Since January 2008. Principal | JoAnn Heffernan Heisen |
| Occupation(s) During the Past Five Years: Executive | Born 1950. Trustee Since July 1998. Principal |
| Chief Staff and Marketing Officer for North America | Occupation(s) During the Past Five Years: Corporate |
| and Corporate Vice President (retired 2008) of Xerox | Vice President and Chief Global Diversity Officer |
| Corporation (document management products and | (retired 2008) and Member of the Executive |
| services); Executive in Residence and 2010 | Committee (1997–2008) of Johnson & Johnson |
| Distinguished Minett Professor at the Rochester | (pharmaceuticals/medical devices/consumer |
| Institute of Technology; Director of SPX Corporation | products); Director of Skytop Lodge Corporation |
| (multi-industry manufacturing), the United Way of | (hotels), the University Medical Center at Princeton, |
| Rochester, Amerigroup Corporation (managed health | the Robert Wood Johnson Foundation, and the Center |
| care), the University of Rochester Medical Center, | for Talent Innovation; Member of the Advisory Board |
| Monroe Community College Foundation, and North | of the Maxwell School of Citizenship and Public Affairs |
| Carolina A&T University. | at Syracuse University. |
| |
| Rajiv L. Gupta | F. Joseph Loughrey |
| Born 1945. Trustee Since December 2001.2 | Born 1949. Trustee Since October 2009. Principal |
| Principal Occupation(s) During the Past Five Years: | Occupation(s) During the Past Five Years: President |
| Chairman and Chief Executive Officer (retired 2009) | and Chief Operating Officer (retired 2009) of Cummins |
| and President (2006–2008) of Rohm and Haas Co. | Inc. (industrial machinery); Director of SKF AB |
| (chemicals); Director of Tyco International, Ltd. | (industrial machinery), Hillenbrand, Inc. (specialized |
| (diversified manufacturing and services), Hewlett- | consumer services), the Lumina Foundation for |
| Packard Co. (electronic computer manufacturing), | |
This page intentionally left blank.
| | |
| Education, and Oxfam America; Chairman of the | Executive Officers | |
| Advisory Council for the College of Arts and Letters | | |
| and Member of the Advisory Board to the Kellogg | Glenn Booraem | |
| Institute for International Studies at the University | Born 1967. Controller Since July 2010. Principal |
| of Notre Dame. | Occupation(s) During the Past Five Years: Principal |
| | of The Vanguard Group, Inc.; Controller of each of |
| Mark Loughridge | the investment companies served by The Vanguard |
| Born 1953. Trustee Since March 2012. Principal | Group; Assistant Controller of each of the investment |
| Occupation(s) During the Past Five Years: Senior Vice | companies served by The Vanguard Group (2001–2010). |
| President and Chief Financial Officer at IBM (information | | |
| technology services); Fiduciary Member of IBM’s | Thomas J. Higgins | |
| Retirement Plan Committee. | Born 1957. Chief Financial Officer Since September |
| | 2008. Principal Occupation(s) During the Past Five |
| Scott C. Malpass | Years: Principal of The Vanguard Group, Inc.; Chief |
| Born 1962. Trustee Since March 2012. Principal | Financial Officer of each of the investment companies |
| Occupation(s) During the Past Five Years: Chief | served by The Vanguard Group; Treasurer of each of |
| Investment Officer and Vice President at the University | the investment companies served by The Vanguard |
| of Notre Dame; Assistant Professor of Finance at the | Group (1998–2008). | |
| Mendoza College of Business at Notre Dame; Member | | |
| of the Notre Dame 403(b) Investment Committee; | Kathryn J. Hyatt | |
| Director of TIFF Advisory Services, Inc. (investment | Born 1955. Treasurer Since November 2008. Principal |
| advisor); Member of the Investment Advisory | Occupation(s) During the Past Five Years: Principal of |
| Committees of the Financial Industry Regulatory | The Vanguard Group, Inc.; Treasurer of each of the |
| Authority (FINRA) and of Major League Baseball. | investment companies served by The Vanguard |
| | Group; Assistant Treasurer of each of the investment |
| André F. Perold | companies served by The Vanguard Group (1988–2008). |
| Born 1952. Trustee Since December 2004. Principal | | |
| Occupation(s) During the Past Five Years: George | Heidi Stam | |
| Gund Professor of Finance and Banking at the Harvard | Born 1956. Secretary Since July 2005. Principal |
| Business School (retired 2011); Chief Investment | Occupation(s) During the Past Five Years: Managing |
| Officer and Managing Partner of HighVista Strategies | Director of The Vanguard Group, Inc.; General Counsel |
| LLC (private investment firm); Director of Rand | of The Vanguard Group; Secretary of The Vanguard |
| Merchant Bank; Overseer of the Museum of Fine | Group and of each of the investment companies |
| Arts Boston. | served by The Vanguard Group; Director and Senior |
| | Vice President of Vanguard Marketing Corporation. |
| Alfred M. Rankin, Jr. | | |
| Born 1941. Trustee Since January 1993. Principal | | |
| Occupation(s) During the Past Five Years: Chairman, | Vanguard Senior ManagementTeam |
| President, and Chief Executive Officer of NACCO | | |
| Industries, Inc. (forklift trucks/housewares/lignite); | Mortimer J. Buckley | Michael S. Miller |
| Director of Goodrich Corporation (industrial products/ | Kathleen C. Gubanich | James M. Norris |
| aircraft systems and services) and the National | Paul A. Heller | Glenn W. Reed |
| Association of Manufacturers; Chairman of the Board | Martha G. King | George U. Sauter |
| of the Federal Reserve Bank of Cleveland and of | Chris D. McIsaac | |
| University Hospitals of Cleveland; Advisory Chairman | | |
| of the Board of The Cleveland Museum of Art. | | |
| Chairman Emeritus and Senior Advisor |
| Peter F. Volanakis | | |
| Born 1955. Trustee Since July 2009. Principal | John J. Brennan | |
| Occupation(s) During the Past Five Years: President | Chairman, 1996–2009 | |
| and Chief Operating Officer (retired 2010) of Corning | Chief Executive Officer and President, 1996–2008 |
| Incorporated (communications equipment); Director | | |
| of SPX Corporation (multi-industry manufacturing); | | |
| Overseer of the Amos Tuck School of Business | Founder | |
| Administration at Dartmouth College; Advisor to the | | |
| Norris Cotton Cancer Center. | John C. Bogle | |
| Chairman and Chief Executive Officer, 1974–1996 | |
| | |
1 Mr. McNabb is considered an “interested person,” as defined in the Investment Company Act of 1940, because he is an officer of the Vanguard funds.
2 December 2002 for Vanguard Equity Income Fund, Vanguard Growth Equity Fund, the Vanguard Municipal Bond Funds, and the Vanguard State Tax-Exempt Funds.
|  |
| P.O. Box 2600 |
| Valley Forge, PA 19482-2600 |
Connect with Vanguard® > vanguard.com
| |
| Fund Information > 800-662-7447 | CFA® is a trademark owned by CFA Institute. |
| Direct Investor Account Services > 800-662-2739 | |
| Institutional Investor Services > 800-523-1036 | |
| Text Telephone for People | |
| With Hearing Impairment > 800-749-7273 | |
| |
| This material may be used in conjunction | |
| with the offering of shares of any Vanguard | |
| fund only if preceded or accompanied by | |
| the fund’s current prospectus. | |
| |
| All comparative mutual fund data are from Lipper Inc. or | |
| Morningstar, Inc., unless otherwise noted. | |
| |
| You can obtain a free copy of Vanguard’s proxy voting | |
| guidelines by visiting vanguard.com/proxyreporting or by | |
| calling Vanguard at 800-662-2739. The guidelines are | |
| also available from the SEC’s website, sec.gov. In | |
| addition, you may obtain a free report on how your fund | |
| voted the proxies for securities it owned during the 12 | |
| months ended June 30. To get the report, visit either | |
| vanguard.com/proxyreporting or sec.gov. | |
| |
| You can review and copy information about your fund at | |
| the SEC’s Public Reference Room in Washington, D.C. To | |
| find out more about this public service, call the SEC at | |
| 202-551-8090. Information about your fund is also | |
| available on the SEC’s website, and you can receive | |
| copies of this information, for a fee, by sending a | |
| request in either of two ways: via e-mail addressed to | |
| publicinfo@sec.gov or via regular mail addressed to the | |
| Public Reference Section, Securities and Exchange | |
| Commission, Washington, DC 20549-1520. | |
| |
| |
| | © 2012 The Vanguard Group, Inc. |
| | All rights reserved. |
| | Vanguard Marketing Corporation, Distributor. |
| |
| | Q260 112012 |
Item 2: Code of Ethics. The Registrant has adopted a code of ethics that applies to the Registrant’s principal executive officer, principal financial officer, principal accounting officer or controller or persons performing similar functions. The Code of Ethics was amended during the reporting period covered by this report to make certain technical, non-material changes.
Item 3: Audit Committee Financial Expert. The following members of the Audit Committee have been determined by the Registrant’s Board of Trustees to be Audit Committee Financial Experts serving on its Audit Committee, and to be independent: Rajiv L. Gupta, Amy Gutmann, JoAnn Heffernan Heisen, F. Joseph Loughrey, Mark Loughridge, Scott C. Malpass, André F. Perold, and Alfred M. Rankin, Jr.
Item 4: Principal Accountant Fees and Services.
(a) Audit Fees.
Audit Fees of the Registrant
Fiscal Year Ended September 30, 2012: $31,000
Fiscal Year Ended September 30, 2011: $31,000
Aggregate Audit Fees of Registered Investment Companies in the Vanguard Group.
Fiscal Year Ended September 30, 2012: $4,809,780
Fiscal Year Ended September 30, 2011: $3,978,540
(b) Audit-Related Fees.
Fiscal Year Ended September 30, 2012: $1,812,565
Fiscal Year Ended September 30, 2011: $1,341,750
Includes fees billed in connection with assurance and related services provided to the Registrant, The Vanguard Group, Inc., Vanguard Marketing Corporation, and other registered investment companies in the Vanguard Group.
(c) Tax Fees.
Fiscal Year Ended September 30, 2012: $490,518
Fiscal Year Ended September 30, 2011: $373,830
Includes fees billed in connection with tax compliance, planning and advice services provided to the Registrant, The Vanguard Group, Inc., Vanguard Marketing Corporation, and other registered investment companies in the Vanguard Group and related to income and excise taxes.
(d) All Other Fees.
Fiscal Year Ended September 30, 2012: $16,000
Fiscal Year Ended September 30, 2011: $16,000
Includes fees billed for services related to risk management and privacy matters. Services were provided to the Registrant, The Vanguard Group, Inc., Vanguard Marketing Corporation, and other registered investment companies in the Vanguard Group.
(e) (1) Pre-Approval Policies. The policy of the Registrant’s Audit Committee is to consider and, if appropriate, approve before the principal accountant is engaged for such services, all specific audit and non-audit services provided to: (1) the Registrant; (2) The Vanguard Group, Inc.; (3) other entities controlled by The Vanguard Group, Inc. that provide ongoing services to the Registrant; and (4) other registered investment
companies in the Vanguard Group. In making a determination, the Audit Committee considers whether the services are consistent with maintaining the principal accountant’s independence.
In the event of a contingency situation in which the principal accountant is needed to provide services in between scheduled Audit Committee meetings, the Chairman of the Audit Committee would be called on to consider and, if appropriate, pre-approve audit or permitted non-audit services in an amount sufficient to complete services through the next Audit Committee meeting, and to determine if such services would be consistent with maintaining the accountant’s independence. At the next scheduled Audit Committee meeting, services and fees would be presented to the Audit Committee for formal consideration, and, if appropriate, approval by the entire Audit Committee. The Audit Committee would again consider whether such services and fees are consistent with maintaining the principal accountant’s independence.
The Registrant’s Audit Committee is informed at least annually of all audit and non-audit services provided by the principal accountant to the Vanguard complex, whether such services are provided to: (1) the Registrant; (2) The Vanguard Group, Inc.; (3) other entities controlled by The Vanguard Group, Inc. that provide ongoing services to the Registrant; or (4) other registered investment companies in the Vanguard Group.
(2) No percentage of the principal accountant’s fees or services were approved pursuant to the waiver provision of paragraph (c)(7)(i)(C) of Rule 2-01 of Regulation S-X.
(f) For the most recent fiscal year, over 50% of the hours worked under the principal accountant’s engagement were not performed by persons other than full-time, permanent employees of the principal accountant.
(g) Aggregate Non-Audit Fees.
Fiscal Year Ended September 30, 2012: $506,518
Fiscal Year Ended September 30, 2011: $389,830
Includes fees billed for non-audit services provided to the Registrant, The Vanguard Group, Inc., Vanguard Marketing Corporation, and other registered investment companies in the Vanguard Group.
(h) For the most recent fiscal year, the Audit Committee has determined that the provision of all non-audit services was consistent with maintaining the principal accountant’s independence.
Item 5: Audit Committee of Listed Registrants.
Not Applicable.
Item 6: Investments.
Not Applicable.
Item 7: Disclosure of Proxy Voting Policies and Procedures for Closed-End Management Investment Companies.
Not Applicable.
Item 8: Portfolio Managers of Closed-End Management Investment Companies.
Not Applicable.
Item 9: Purchase of Equity Securities by Closed-End Management Investment Company and Affiliated Purchasers.
Not Applicable.
Item 10: Submission of Matters to a Vote of Security Holders.
Not Applicable.
Item 11: Controls and Procedures.
(a) Disclosure Controls and Procedures. The Principal Executive and Financial Officers concluded that the Registrant's Disclosure Controls and Procedures are effective based on their evaluation of the Disclosure Controls and Procedures as of a date within 90 days of the filing date of this report.
(b) Internal Control Over Financial Reporting. There were no significant changes in Registrant’s Internal Control Over Financial Reporting or in other factors that could significantly affect this control subsequent to the date of the evaluation, including any corrective actions with regard to significant deficiencies and material weaknesses.
Item 12: Exhibits.
(a) Code of Ethics.
(b) Certifications.
Pursuant to the requirements of the Securities Exchange Act of 1934 and the Investment Company Act of 1940, the registrant has duly caused this report to be signed on its behalf by the undersigned, thereunto duly authorized.
| |
| | VANGUARD MORGAN GROWTH FUND |
| |
| By: | /s/ F. WILLIAM MCNABB III* |
| | F. WILLIAM MCNABB III |
| | CHIEF EXECUTIVE OFFICER |
| |
| Date: November 16, 2012 |
Pursuant to the requirements of the Securities Exchange Act of 1934 and the Investment Company Act of 1940, this report has been signed below by the following persons on behalf of the registrant and in the capacities and on the dates indicated.
| |
| | VANGUARD MORGAN GROWTH FUND |
| |
| By: | /s/ F. WILLIAM MCNABB III* |
| | F. WILLIAM MCNABB III |
| | CHIEF EXECUTIVE OFFICER |
| |
| Date: November 16, 2012 |
| |
| | VANGUARD MORGAN GROWTH FUND |
| |
| By: | /s/ THOMAS J. HIGGINS* |
| | THOMAS J. HIGGINS |
| | CHIEF FINANCIAL OFFICER |
| |
| Date: November 16, 2012 |
* By: /s/ Heidi Stam
Heidi Stam, pursuant to a Power of Attorney filed on March 27, 2012 see file Number 2-11444, Incorporated by Reference.