UNITED STATES
SECURITIES AND EXCHANGE COMMISSION
Washington, D.C. 20549
FORM N-CSR
CERTIFIED SHAREHOLDER REPORT OF REGISTERED
MANAGEMENT INVESTMENT COMPANIES
Investment Company Act file number 811-03445
The Merger Fund
(Exact name of registrant as specified in charter)
100 Summit Lake Drive
Valhalla, New York 10595
(Address of principal executive offices) (Zip code)
Roy Behren and Michael T. Shannon
100 Summit Lake Drive
Valhalla, New York 10595
(Name and address of agent for service)
1-800-343-8959
Registrant's telephone number, including area code
Date of fiscal year end: December 31, 2017
Date of reporting period: December 31, 2017
Item 1. Reports to Stockholders.
December 31, 2017
THE MERGER FUND
WCM ALTERNATIVES:
EVENT-DRIVEN FUND
| STANDARDIZED | Strategy Assets: | |
| PERFORMANCE SUMMARY | Merger Arbitrage1 | $2.5 billion |
| As of December 31, 2017 | Opportunistic Credit | $2.7 million |
| | Multi-Event2 | $346.9 million |
| | | |
| | Average Annual Total Return (%) | |
| Merger Arbitrage | QTD | YTD | 1 YR | 5 YR | 10 YR | Life |
| The Merger Fund | | | | | | |
| (Institutional) | 0.04 | 2.74 | 2.74 | n/a | n/a | 2.03 |
| The Merger Fund | | | | | | |
| (Investor) | -0.04 | 2.39 | 2.39 | 1.83 | 2.38 | 6.05 |
| Insurance | | | | | | |
Dedicated Funds5 | | | | | | |
| The Merger Fund VL | 0.09 | 2.56 | 2.56 | 1.86 | 3.31 | 4.53 |
Opportunistic Credit5 | | | | | | |
| Credit Event Fund | | | | | | |
| (Institutional) | n/a | n/a | n/a | n/a | n/a | n/a |
| Credit Event Fund | | | | | | |
| (Investor) | n/a | n/a | n/a | n/a | n/a | n/a |
Multi-Event5 | | | | | | |
| Event-Driven Fund | | | | | | |
| (Institutional) | 0.52 | 4.72 | 4.72 | n/a | n/a | 2.31 |
| Event-Driven Fund | | | | | | |
| (Investor) | 0.52 | 3.77* | n/a | n/a | n/a | 3.77 |
Annual Operating Expense Ratio (%)3 |
| | | | Net Expenses | | |
| | Gross | Net | excluding | | |
| Merger Arbitrage | Expense | Expense | Investment- | Performance | |
| | Ratio | Ratio3 | Related Expenses4,5 | Inception | Ticker |
| The Merger Fund | | | | | |
| (Institutional) | 1.79% | 1.68% | 1.07% | 08/01/2013 | MERIX |
| The Merger Fund | | | | | |
| (Investor) | 2.12% | 2.01% | 1.40% | 01/31/1989 | MERFX |
| Insurance | | | | | |
Dedicated Funds5 | | | | | |
| The Merger Fund VL | 2.85% | 2.09% | 1.40% | 05/26/2004 | MERVX |
Opportunistic Credit5 | | | | | |
| Credit Event Fund | | | | | |
| (Institutional) | 2.30% | 1.88% | 1.64% | 12/29/2017 | WCFIX |
| Credit Event Fund | | | | | |
| (Investor) | 2.55% | 2.13% | 1.89% | 12/29/2017 | WCFRX |
Multi-Event5 | | | | | |
| Event-Driven Fund | | | | | |
| (Institutional) | 2.54% | 2.53% | 1.74% | 01/02/2014 | WCEIX |
| Event-Driven Fund | | | | | |
| (Investor) | 2.79% | 2.78% | 1.99% | 03/22/2017 | WCERX |
QTD and YTD performance is not annualized. Performance data quoted represent past performance; past performance does not guarantee future results. The performance results portrayed herein reflect the reinvestment of all interest, dividends and distributions. The investment return and principal value of an investment will fluctuate so that an investor’s shares, when redeemed, may be worth more or less than their original cost. Current performance of the Funds may be lower or higher than the performance quoted. Performance data included herein for periods prior to 2011 reflect that of Westchester Capital Management, Inc., the Funds’ prior investment advisor. Messrs. Behren and Shannon, the Funds’ current portfolio managers, have served as co-portfolio managers of the Funds since 2007. Performance data current to the most recent month-end may be obtained by calling (800) 343-8959 or by visiting www.westchestercapitalfunds.com.
1Includes USD 53 million in private funds advised by Westchester Capital Management, LLC’s affiliated investment advisor and USD 132 million in a sub-advised fund. 2Includes USD 247 million in sub- advised funds. 3Net expense ratios are as of a fund's most recent prospectus and were applicable to investors. 4Investment related expenses include expenses related to short sales and interest on any borrowing and acquired fund fees and expenses. 5The Adviser has contractually agreed to waive its investment advisory fee and to reimburse the Fund for other ordinary operating expenses to the extent necessary to limit ordinary operating expenses at the stated levels. See prospectus for additional details.
| MARKET INDICES | QTD | YTD | 1 YR | 5 YR | 10 YR |
| US Fund Market Neutral | 0.81% | 2.48% | 2.48% | 1.48% | 0.33% |
| US Fund Multialternative | 1.74% | 5.68% | 5.68% | 1.71% | 0.62% |
| The Wilshire Liquid | | | | | |
Alternative ED IndexSM | 0.31% | 2.79% | 2.79% | 0.77% | 2.18% |
| S&P 500 Index | 6.64% | 21.83% | 21.83% | 15.79% | 8.50% |
| Bloomberg Barclays | | | | | |
| Aggregate Bond Index | 0.39% | 3.54% | 3.54% | 2.10% | 4.01% |
| The ICE BofA Merrill Lynch | | | | | |
| 3-Month U.S. | | | | | |
| Treasury Bill Index | 0.28% | 0.86% | 0.86% | 0.27% | 0.39% |
Fellow Shareholders,
The Merger Fund® (MERIX) advanced by 0.04% during the fourth quarter, slightly behind the hedge-fund-heavy HFR Merger Arbitrage Index, which was up 0.49% during the period. However, we outperformed the HFR assemblage by over half a percent for the full calendar year, adding 2.74% vs. the index’s 2.23%. The Merger Fund® was quite tax-conscious this year as well. Despite the gains, the Fund paid a taxable distribution of approximately only 1%, all of which qualified for the lower-assessed QDI (qualified dividend income) treatment. Additionally, due to loss harvesting and other factors, we have retained a loss carry-forward of approximately $42.3mm, or about $0.29 per current share count, which as of now should shelter the next 2% of capital gains.
Fixed income comps began to fade later in the year, with the Bloomberg Barclays US Aggregate Bond Index and 3-month Treasury Bills tacking on 3.54% and 0.86% for the year, respectively. The postscript to this paragraph is that as of the writing of this letter, interest rates have moved up and corporate transaction activity has kicked into high gear. This has helped our results and hurt fixed-income investments in general. To wit, through January 31, 2018 The Merger Fund® (MERIX) is up 1.58% and the WCM Alternatives: Event-Driven Fund is up 1.77% vs. the Bloomberg Barclays US Aggregate Bond Index which is down 1.15% while T-Bills are up 0.12%, reflecting the expected negative correlation of absolute return products and interest rates.
Both our correlation and volatility continued to track below that of our peer indices as defined by Morningstar. The Merger Fund® once again exhibited roughly one-fifth the “risk” (volatility) of the S&P 500 Index1 and the beta correlation similarly remained at approximately 0.2 as of December 31.
As mentioned above, fixed income markets have begun to suffer from continued Federal Reserve tapering and rising rates. We have reiterated (ad nauseum) that our funds’ negative correlation with bond prices (our three year beta to the Bloomberg Barclays Aggregate Bond Index is -0.18) should prove helpful when rates rise, which is typically bad for bonds. As a result, Fund inflows have increased according to feedback from fixed income investors repositioning their portfolios to include non-or negatively-correlated investments. Correspondingly, we have observed that many advisers have modified the standard 60/40 portfolio (60% equities, 40% fixed income) to add 20% in liquid alternatives as a diversifier, for a new formulation of 50/30/20.
__________
1 | Three-year trailing standard deviation for The Merger Fund® was 2.65% versus 12.47% for the S&P 500 Index. |
Although many investors questioned the ability of the markets to continue its 7-year rebound from the financial crisis, equities tracked the country’s continued economic recovery and continued to climb on hopes that President Trump’s policies would ignite business activity. All four equity indices closed the year strongly, as the S&P 500, Dow Jones Industrial Average, NASDAQ Composite and the Russell 2000 all finished the year at record or multi-year highs. ETF and passive fund inflow no doubt exacerbated the strength, as more than $465 billion flowed into U.S.-listed ETFs alone, shattering last year’s $287 billion record.
Business Climate
As markets powered ahead globally, merger and acquisition (“M&A”) activity ramped upwards as well. In fact, for a record third year in a row, more than 50,000 M&A deals were announced worldwide, this year totaling $3.54 trillion in value.2 Worldwide composition changed, as a 16% year-over-year drop in domestic M&A was offset by a 16% rise in European M&A and an 11% rise in Asia-Pacific activity. Individual deal values slipped a bit in 2017 as “megadeals” greater than $5 billion in market capitalization dipped but have picked up again to start 2018. Factors such as historically high corporate cash balances, the second-longest bull market on record, readily available debt financing, and now access to repatriated overseas cash all contributed to the conducive environment.
President Trump’s new administration has had a tremendous impact on the financial world. His regulatory appointments have been perceived as pro-free-market, and his spending policies have been clearly stimulative. Most importantly, tax reform has unleashed massive corporate spending capacity.

However, the jury is still out on the Administration’s expected regulatory hands-off policy. Approvals are taking longer than in the past due to increased regulatory complexity and scrutiny. Once again, the excellent work done by Evren Ergin of UBS highlighted that in 2017, deals with Hart Scott-Rodino antitrust approvals took on average almost 260 days to close, more than two standard deviations greater than the historical average of 195 days. This may be partly due to the increased internationalization of transaction activity, with the frequency of required approvals by the Committee on Foreign Investment in the U.S. and China’s Ministry of Competition have risen markedly in the past several years. Additionally,
__________
2 | CEOs go M&A hunting as booming markets unleash deal making spirits, Reuters, December 28, 2017. |
as we wrote in December, the Department of Justice (“DOJ”) injected uncertainty into expectations of the government’s approval posture when it filed a lawsuit to block the AT&T – Time Warner merger, ostensibly a merger of two companies who do not compete with each other in any market. Such transactions, called vertical mergers, have not been challenged by the government since 1977, with the last DOJ victory back in 1962. We would be happy to discuss this suit and its implications in more detail with any interested investor.
The lawsuit was significant for arbitrage, event-driven and even fundamental investors, as its announcement sent ripples through the market, and a government victory could deter other executives from pursuing these types of transactions. Although the suit impacted our portfolios, causing negative marks-to-market in a number of unrelated transactions, arbitrage spreads in general widened as a result and we opportunistically deployed tens of millions of dollars in attractive opportunities. Currently, we are at our highest level of investment in several years. Deal flow is robust and the average risk-reward profile has improved along with modest spread widening due to the early uptick in interest rates. As occasionally occurs, our decision to proactively add to positions has rewarded our investors with enhanced performance. Since our shareholder communication on December 12, when the lawsuit was filed, The Merger Fund® and WCM Alternatives: Event-Driven Fund, Institutional, has returned 1.81% and 2.20% respectively.
The Deloitte M&A trends report, which includes a survey of more than 1,000 executives at corporations and private equity firms regarding the current year and future expectations, points to strong deal activity ahead. According to the report, “nearly 70 percent of executives at US-headquartered corporations and 76 percent of leaders at domestic-based private equity firms expect deal flow to increase over the next 12 months.” Further, there is a virtually unanimous sentiment that average deal size will increase compared to 2017. Of particular note, survey results identified technology acquisition and digital strategy as primary drivers of future merger activity.3
Although uncertainty over tax reform dampened activity in 2017, its passage appears to have greased the skids for a slew of transactions. Just three weeks into 2018, over $152 billion of new deals have been announced, the highest rate since the technology bubble of 20004. Since the dissemination of the GOP tax bill, highlights include Broadcom’s $103 billion hostile offer for Qualcomm; CVS’ $69 billion agreement to buy insurer Aetna; Walt Disney’s $52 billion deal to buy film and TV business
__________
3 | Deloitte 2018 M&A Trends Report. |
4 | Dealmakers Are Off to Hottest Start of the Year Since 2000, Bloomberg, January 23, 2018. |
from 21st Century Fox, and United Technologies’ $30 billion purchase of avionics maker Rockwell Collins. Rounding out the list was AIG’s $6 billion purchase of British reinsurer Validus and Celgene’s 91% premium transaction with cancer researcher Juno Therapeutics Inc. Many of the new transactions will be funded with money held offshore by domestic companies that can now repatriate those funds at a significantly lower tax rate than previously. The new tax code requires corporations to pay a one-time tax of 8%-15.5% on foreign earnings held overseas and it must be paid whether the funds are brought back to the US or not. This effectively eliminates the incentive for companies to keep cash offshore to defer taxes on offshore earnings, explained Manal Corwin of KPMG to the Los Angeles Times5. We expect this influx of cash to continue to fuel deal activity 2018.
Portfolio Highlights
The Merger Fund® held 79 investments during the quarter and experienced no terminated deals. Reflecting a greater than 3:1 ratio of winners to losers, 60 positions posted positive gains while 19 had negative mark-to-market. We invested in 22 new situations during the quarter, and as of the end of December we held 63 positions and were approximately 100% invested.
Winners
| • | The Altaba stub (Altaba’s remaining assets in excess of its significant holdings in Alibaba and Yahoo Japan) was our biggest winner in 4Q. The position was an excellent vehicle to profit from U.S. tax reform. For most of the year, it appeared that the market was putting almost no probability of either a meaningful reduction in the corporate tax rate or a tax-efficient monetization of the company’s Alibaba stake. The remainder, known as the stub, rallied on the tax bill passage, reducing the maximum potential tax liability of a stake sale from a mid-30s percentage tax rate to a low-20s percentage tax rate. The risk-reward still appears attractive as the company can continue to buy back its shares at 25-27% discount to the value of its holdings while pursuing a deal with Alibaba to reduce the discount further. |
| | |
| • | Our Sky PLC position rallied after FOX agreed to make significant assets sales to Disney, including Fox’s stake in Sky. The previously planned Fox purchase of Sky should proceed as planned and is targeted to close sometime mid-year. While it is unclear what impact this asset sale might have on UK regulatory scrutiny of the Fox-Sky deal, Disney’s purchase reassured the market of Sky’s intrinsic value. |
__________
5 | As firms bring back cash to the U.S., some see a fresh wave of mergers , LA Times, January 15, 2018. |
| • | NXP – Qualcomm: NXP shares have been trading above Qualcomm’s offer price, as many NXP shareholders, including hedge fund Elliott Management Corp., have been holding out for a better price. Qualcomm need not decide whether to raise its offer until it receives antitrust clearance from the remaining worldwide regulators reviewing the deal, which is expected in Q1 2018. Meanwhile, Qualcomm is fending off a hostile offer from Broadcom. Broadcom said it was interested in acquiring Qualcomm with or without completion of the NXP deal. |
| | |
| Losers | |
| • | AT&T and Time Warner announced their $85 billion merger last year, but the closing has been dragged out by the government’s antitrust review. The DOJ alleges in its lawsuit that the combination would stifle competition and innovation and raise prices for consumers. AT&T says it sees no reason for its merger to be treated differently than other vertical mergers and decades of antitrust precedent. The Court is expected to rule as soon as the second quarter of 2018 unless there is an earlier settlement among the parties. |
| | |
| • | Monsanto – Bayer: After months of negotiations, St. Louis-based Monsanto Co. accepted an offer from Germany-based Bayer AG in September 2017 in a $66 billion enterprise value transaction. The transaction combines two of the six U.S. and European companies that dominate the agrochemical market and would create a global agricultural and chemical giant with a broad array of products. In early October, European Commission-Competition delayed the January 22, 2018 deadline for approval so that the companies can gather additional requested information. The new deadline for the Commission to decide over the deal is now March 5, 2018. As with NXPI, and arguably Time Warner as well, Monsanto has increased in value during the pendency of the transaction and has also benefited from tax reform, so the downside in the event of deal termination has been reduced significantly. |
Event-Driven Activity
Event-driven funds have a broader mandate than pure merger arbitrage, and the tradeoff is that the risk-reward profile is more magnified. There exists the potential for greater returns with greater volatility. There is a larger range of investments to choose from, but they do not necessarily have the natural market neutrality that a merger arbitrage investment may have. As an economic cycle ages, the variety of investment opportunities will change. If merger activity were to wane, we believe other types of transactions such as corporate restructurings, asset sales, and bankruptcy
reorganizations would take its place. Opportunities in post-bankruptcy emergences and capital structure arbitrage may arise as well. Corporate funding and litigation events may even become more common. However, selective merger arbitrage will continue to be at the core of an uncorrelated market neutral event-driven portfolio. As discussed above, we believe the current economic environment is conducive to merger activity, and both the volume and quality of deals make it appropriate for the WCM Alternatives: Event-Driven Fund to continue to hold significant investments in mergers and acquisitions.
Among 2017’s biggest acquisitions, represented in both our merger arbitrage and event-driven portfolios were U.S. drugstore chain operator CVS Health Corp.’s (CVS.N) $69 billion agreement to buy health insurer Aetna Inc.; Walt Disney Co.’s $52 billion deal to buy film and television businesses from Rupert Murdoch’s Twenty-First Century Fox Inc.; and aerospace supplier United Technologies Corp.’s $30 billion agreement to buy avionics maker Rockwell Collins Inc. Many of these deals had stock as part of the purchase price, with acquirers emboldened to use their own shares as currency given their high stock market valuations, as opposed to offering just cash. However, there were also a number of attractive non-merger related investments which were accretive to the portfolio such as Europe-based Atlas Copco, the bonds of GenOn Energy Inc., and the split up of automobile technology company Delphi.
Following the path of other European and U.S. industrials that have created shareholder value through spin-offs, Atlas Copco announced that it would be spinning off its mining and rock excavation business (Epiroc) in early 2018.
The Epiroc business represents approximately 30% of the Atlas’ sales and is set to capitalize on the global uptick in mining capital expenditure spending. Epiroc and the less cyclical compressor business should be more attractive to investors as separate companies. We believe both companies will be well positioned to return capital to shareholders or use their currencies to consolidate other sector participants.
GenOn Energy Inc. is an independent power producer with multiple power plant assets. It is currently in Chapter 11 and is liquidating its assets in a court-approved auction process. Under the restructuring plan that has been approved by the bankruptcy court, the GenOn bonds that we own are at the highest secured level and will accrue 9% interest (paid monthly) during the liquidation process. We expect the GenOn liquidation to be completed and bond principal returned prior to the summer of 2018. This is an attractive investment with a calculable terminal value, exit strategy, and time frame.
Automotive equipment manager Delphi Technologies spun off its powertrain business on December 5th and renamed the remaining company Aptiv. Aptiv focuses on Electric/Electronic Architecture and Electronics and Safety. The investment thesis rests upon the removal of the parent’s conglomerate discount, and that as a separate listing Aptiv would be valued as a less cyclical yet higher growth company, with additional cache because of its important role in developing the “connected car.”
PORTFOLIO PERFORMANCE SUMMARY
The WCM Alternatives: Event-Driven Fund (WCEIX) returned 0.52% for the quarter, which brought calendar-year 2017 performance to 4.72%. As mentioned above, the Fund is up 1.77% year-to-date through January 31, 2018, and its trailing 1-year performance is 5.61% as of that date. The Fund participated in 121 events throughout the quarter, 92 positions posted gains versus 29 with negative marks-to-market. We entered into 27 new positions and suffered no terminated transactions. As of December 31, the Fund held 100 positions and was fully invested.
OUR COMPANY
WCM manages a total of six SEC-registered mutual funds. Our other vehicles span a spectrum from lower-return, lower-volatility expectations to higher volatility with potentially higher return expectations:
| Account | Vehicle | Strategy | Inception |
The Merger Fund® | SEC ‘40-Act Fund | Merger Arbitrage | 1989 |
| Institutional Share | | | |
| Class (MERIX) | | | 2013 |
| Investor Share | | | |
| Class (MERFX) | | | 1989 |
| The Merger | | | |
| Fund VL (MERVX) | Variable Insurance Trust | Merger Arbitrage | 2004 |
| WCM Alternatives: | | | |
| Credit Event | | | |
Fund New | SEC ‘40-Act Fund | Opportunistic Credit | 2017 |
| Institutional Share | | | |
| Class (WCFIX) | | | 2017 |
| Investor Share | | | |
| Class (WCFRX) | | | 2017 |
| WCM Alternatives: | | | |
| Event-Driven | | | |
| Fund | SEC ‘40-Act Fund | Event-Driven | 2014 |
| Institutional Share | | | |
| Class (WCEIX) | | | 2014 |
| Investor Share | | | |
| Class (WCERX) | | | 2017 |
| JNL/Westchester | | | |
| Capital Event | Sub-advised | | |
| Driven Fund | SEC ‘40-Act Fund | Event-Driven | 2015 |
| Westchester Merger | | | |
| Arbitrage Strategy | | | |
| of the JNL | | | |
| Multi-Manager | Sub-advised | | |
| Alternative Fund | SEC ‘40-Act Fund | Merger Arbitrage | 2016 |
Westchester Capital Management is also pleased to announce the launch of the WCM Alternatives: Credit Event Fund as of December 29, 2017. As noted in prior letters, many investors have requested such a vehicle, which aims to provide a regular income stream in the form of monthly distributions, yet will target an absolute return profile through investment in catalyst-driven fixed income instruments or securities with a similar profile. It will have differentiated exposure but will have higher targeted return and volatility levels than The Merger Fund®. We view this as a natural extension of our business model of providing dependable, liquid, alternative investment products to investors wishing to diversify their portfolio of otherwise correlated investments.
As usual, quarterly statistical summaries for any of our vehicles are provided within two weeks of the end of the quarter – typically one month prior to the release of the quarterly letter. They are available electronically on our website, and we would be happy to provide a scheduled email as soon as the data becomes available. For convenience, investors can arrange for e-alerts of important Fund communications. Through our website at www.westchestercapitalfunds.com, you can check direct account balances, make purchases and sales, and sign up for notification of trade confirmations, statements, and shareholder communications via e-mail.
 |  |
| | |
| Roy Behren | Mike Shannon |
IMPORTANT DISCLOSURES
Before investing in The Merger Fund®, WCM Alternatives: Event-Driven Fund, and/or the WCM Alternatives: Credit Event Fund, carefully consider the investment objectives, risks, charges, and expenses. For a prospectus or summary prospectus containing this and other information, please call (800) 343-8959. Please read the prospectus carefully before investing. The Merger Fund VL is available through variable products offered by third-party insurance companies. For a prospectus containing information for any variable annuity or variable life product that invests in The Merger Fund VL, contact your financial advisor or the offering insurance company for a contract prospectus and prospectus for the underlying funds. Please read it carefully before investing. Shares of JNL/Westchester Capital Event Driven Fund are offered to separate accounts of participating life insurance companies for the purpose of funding variable annuity contracts and variable life insurance policies. Shares of the fund are not offered directly to the public. For a prospectus containing information for any variable annuity or variable life product that invests in the Fund, contact your financial advisor or the offering insurance company for a contract prospectus and prospectus for the underlying funds. Please read it carefully before investing. Variable annuities are long-term, tax-deferred investments designed for retirement, involve investment risks and may lose value. Earnings are taxable as ordinary income when distributed and may be subject to a 10% federal tax penalty if withdrawn before age 59½. Optional benefit costs are added to the ongoing fees and expenses of the variable annuity. A prospectus for WCM Alternatives: Credit Event Fund may be obtained by calling (800) 343-8959.
Variable annuities (VA650, VA660) are issued by Jackson National Life Insurance Company® (Home Office: Lansing, Michigan) and in New York (VA650NY, VA660NY) by Jackson National Life Insurance Company of New York® (Home Office: Purchase, New York). Variable annuities are distributed by Jackson National Life Distributors LLC, member FINRA. May not be available in all states and state variations may apply. These products have limitations and restrictions, including withdrawal charges, recapture charges and excess interest adjustments (interest rate adjustments in New York) where applicable. Jackson® issues other annuities with similar features, benefits, limitations, and charges. Contact Jackson for more information. Jackson is the marketing name for Jackson National Life Insurance Company and Jackson National Life Insurance Company of New York.
Fund holdings and sector allocations are subject to change and should not be considered a recommendation to buy or sell any security. The Ten Largest Positions as a Percent of Net Assets for The Merger Fund® as of December 31, 2017, were: Altaba Inc. (11.74%), Time Warner Inc. (11.07%), NXP Semiconductors NV (8.34%), Worldpay Group PLC (5.69%), DowDuPont Inc. (4.78%), Sky PLC (4.28%), Rockwell Collins Inc. (3.61%), Abertis Infraestructuras S.A. (3.33%), Scripps Networks Interactive Inc. (3.33%), Monsanto Company (2.94%). The Ten Largest Positions as a Percent of Net Assets for The Merger Fund VL as of December 31, 2017, were: Altaba Inc. (11.76%), Time Warner Inc. (10.64%), NXP Semiconductors NV (8.13%), Worldpay Group PLC (5.31%), DowDuPont Inc. (4.76%),
Sky PLC (4.20%), Rockwell Collins, Inc. (3.43%), Scripps Networks Interactive Inc. (3.30%), Abertis Infraestructuras S.A. (3.25%), Monsanto Company (2.82%). The Ten Largest Positions as a Percent of Net Assets for WCM Alternatives: Event-Driven Fund as of December 31, 2017, were: Altaba Inc. (11.52%), Time Warner Inc. (10.89%), DowDuPont Inc. (7.97%), NXP Semiconductors NV (7.83%), Worldpay Group PLC (7.67%), Sky PLC (5.86%), American International Group, Inc. (4.37%), CBS Corporation (4.30%), Monsanto Company (3.95%), GenOn Americas Generation LLC (3.78%). The WCM Alternatives: Credit Event Fund did not hold any of the securities mentioned as of December 31, 2017.
Diversification does not assure a profit, nor does it protect against a loss in a declining market.
Mutual fund investing involves risk. Principal loss is possible. Merger‐arbitrage and event‐driven investing involves the risk that the adviser’s evaluation of the outcome of a proposed event, whether it be a merger, reorganization, regulatory issue or other event, will prove incorrect and that the Funds’ return on the investment will be
negative. Investments in foreign companies may entail political, cultural, regulatory, legal, and tax risks different from those associated with comparable transactions in the United States. The frequency of the Fund’s transactions will vary from year to year, though merger arbitrage portfolios typically have higher turnover rates than portfolios of typical long‐only funds. Increased portfolio turnover may result in higher brokerage commissions, dealer mark‐ups, and other transaction costs. The higher costs associated with increased portfolio turnover may offset gains in the Fund’s performance. The Funds’ may enter into short sale transactions for, among other reasons, purposes of protecting against a decline in the market value of the acquiring company’s shares prior to the acquisition completion. If the price of a security sold short increases between the time of the short sale and the time the Fund covers its short position, the Fund will incur a loss. The amount of a potential loss on an uncovered short sale transaction is theoretically unlimited. Debt securities may fluctuate in value due to, among other things, changes in interest rates, general economic conditions, industry fundamentals, market sentiment and the financial condition of the issuer, including the issuer’s credit rating or financial performance. Derivatives may create leverage which will amplify the effect of the performance of those instruments on the Funds’ and may produce significant losses. The Funds’ hedging strategy will be subject to the Funds’ investment adviser’s ability to assess correctly the degree of correlation between the performance of the instruments used in the hedging strategy and the performance of the investments in the portfolio being hedged. Investments in lower rated and non-rated securities present a great risk of loss to principal and interest than higher rated securities. The WCM Alternatives: Credit Event Fund is non-diversified and therefore has a greater potential to realize losses upon the occurrence of adverse events affecting an issuer in its portfolio.
Any tax or legal information provided is merely a summary of our understanding and interpretation of some of the current income tax regulations and is not exhaustive. Investors must consult their tax advisor or legal counsel for advice and information concerning their particular situation. Neither the Funds’ nor any of their representatives may give legal or tax advice.
The views expressed are as of January 31, 2018, and are a general guide to the views of Westchester Capital Management, are subject to change, are not guaranteed and should not be considered recommendations to buy or sell any security. Distributions are not guaranteed. This document does not replace portfolio and fund-specific materials.
The Morningstar Rating™ for funds, or “star rating”, is calculated for managed products (including mutual funds, variable annuity and variable life subaccounts, exchange-traded funds, closed-end funds, and separate accounts) with at least a three-year history. Exchange-traded funds and open-ended mutual funds are considered a single population for comparative purposes. It is calculated based on a Morningstar Risk-Adjusted Return measure that accounts for variation in a managed product’s monthly excess performance, placing more emphasis on downward variations and rewarding consistent performance. The top 10% of products in each product category receive 5 stars, the next 22.5% receive
4 stars, and the next 35% receive 3 stars, the next 22.5% receive 2 stars, and the bottom 10% receives 1 star. The Overall Morningstar Rating™ for a managed product is derived from a weighted average of the performance figures associated with its three-, five-, and 10-year (if applicable) Morningstar Rating™ metrics.
The weights are 100% three-year rating for 36-59 months of total returns, 60% five-year rating/40% three-year rating for 60-119 months of total returns and 50% 10-year rating/30% five-year rating/20% three-year rating for 120 or more months of total returns. While the 10-year overall star rating formula seems to give the most weight to the 10-year period, the most recent three-year period actually has the greatest impact because it is included in all three rating periods. As of December 31, 2017, The Merger Fund® was rated against the following numbers of U.S.-domiciled Market Neutral funds over the following time periods: 118 funds in the last three years, 83 funds in the last five years, and 33 funds in the last ten
years. With respect to these Market Neutral funds, The Merger Fund® – Investor share class received a Morningstar Rating of 3 stars, 3 stars and 3 stars for the three-, five- and ten-year periods, respectively. The Merger Fund® – Institutional share class received a Morningstar rating of 3 stars, 4 stars and 4 stars for the three-, five- and ten-year periods, respectively. Five- and ten-year ratings are Extended Performance Ratings computed by Morningstar using historical adjusted returns prior to the 8/1/2013 inception date of The Merger Fund® – Institutional share class and reflect the historical performance of the The Merger Fund® – Investor share class, (inception date 1/31/1989), adjusted to reflect the fees and expenses of the Institutional shares. As of December 31, 2017, WCM Alternatives: Event-Driven Fund was rated against the following numbers of U.S.-domiciled Multi Alternative funds over the following time periods: 286 funds in the last three years. With respect to these Market Neutral funds, WCM Alternatives: Event-Driven Fund – Institutional share class received a Morningstar rating of 3 stars for the three-year period. WCM Alternatives: Event-Driven Fund – Investor share class received a Morningstar Rating of 3 stars for the three year period. Three-year ratings are Extended Performance Ratings computed by Morningstar using historical adjusted returns prior to the 3/22/2017 inception date of the WCM Alternatives: Event-Driven Fund – Investor share class and reflect the historical performance of the WCM Alternatives: Event-Driven Fund – Institutional share class, (inception date 1/2/2014), adjusted to reflect the fees and expenses of the Investor shares. © 2017 Morningstar, Inc. All Rights Reserved. The information contained herein: (1) is proprietary to Morningstar; (2) may not be copied or distributed; and (3) is not warranted to be accurate, complete or timely. Neither Morningstar nor its content providers are responsible for any damages or losses arising from any use of this information. Past performance is no guarantee of future results.
Absolute return strategies are not intended to outperform stocks and bonds during strong market rallies. An absolute return fund may not achieve its goals and may underperform during periods of strong positive market performance.
Definitions: The S&P 500 Index is a broad based unmanaged index of 500 stocks, which is widely recognized as representative of the equity market in general; The Bloomberg Barclays Aggregate Bond Index is an intermediate-term index comprised of investment grade bonds. The Morningstar Category: US Fund Market Neutral is comprised of a universe of funds with similar investment objectives. The Morningstar Category: The US Fund Multialternative encompasses funds that have a majority of their assets exposed to alternative strategies and include both funds with static allocations to alternative strategies and funds tactically allocating among alternative strategies and asset classes. The ICE BofA Merrill Lynch 3-Month U.S. Treasury Bill Index is comprised of a single issue purchased at the beginning of the month and held for a full month. The Nasdaq Stock Market Index is an American stock exchange. It is the second-largest exchange in the world by market capitalization, behind only the New York Stock Exchange. The Dow Jones Industrial Average, also called DJIA, is a stock market index that shows how 30 large publicly owned companies based in the United States have traded during a standard trading session. Indices are unavailable for direct investment. The Russell 2000 Index is a market capitalization-weighted benchmark index made up of the 2000 smallest US companies in the Russell 3000. The Wilshire Liquid Alternative Event Driven IndexSM measures the performance of the event-driven strategy component of The Wilshire Liquid Alternative IndexSM. Event-driven strategies predominantly invest in companies involved in corporate transactions such as mergers, restructuring, distressed, buy-backs, or other capital structure changes. The Wilshire Liquid Alternative Event Driven Index (WLIQAED) is designed to provide a broad measure of the liquid alternative event-driven market. Standard Deviation is the degree to which returns vary relative to the average return. The higher the standard deviation, the greater the variability of the investment. Beta is a measure of a portfolio’s sensitivity to market movements. A portfolio with a beta greater than 1 is more volatile than the market and a portfolio with a beta less than 1 is less volatile than the market. Correlation is calculated using R-Squared; which is a measure that represents the
percentage of a fund’s movements that can be explained by movements in a benchmark index. A fund with low R-squared doesn’t act much like the index. The Hart-Scott-Rodino Antitrust Improvements Act of 1976 was adopted to provide the Federal government with the opportunity to review the potential effects on competition of certain mergers, acquisitions or other consolidations that meet the Act’s size and other tests before such transactions are completed. Once all parties to a transaction submit completed filings and pay the filing fee (generally $45,000 per transaction imposed upon the acquiring person), there is a 30-day waiting period before the transaction may be completed. Qualified Dividend Income, as defined by the United States Internal Revenue Code, are ordinary dividends that meet specific criteria to be taxed at the lower long-term capital gains tax rate rather than at higher tax rate for an individual’s ordinary income. The rates on qualified dividends range from 0 to 23.8%. Loss carryforward refers to an accounting technique that applies the current year’s net operating losses to future years’ profits to reduce tax liability and track profits accurately. Tax loss harvesting is the practice of selling a security that has experienced a loss. By realizing, or “harvesting” a loss, investors are able to offset taxes on both gains and income. The sold security is replaced by a similar one, maintaining an optimal asset allocation and expected returns.
The returns shown are based on net asset values calculated for shareholder transactions and may differ from the returns shown in the financial highlights of the annual report, which reflects adjustments made to the net asset values in accordance with accounting principles generally accepted in the United States of America.
The Merger Fund®, WCM Alternatives: Event-Driven Fund and WCM Alternatives: Credit Event Fund are distributed by Quasar Distributors, LLC. The Merger VL is available through variable products offered by third-party insurance companies and is not affiliated with Quasar Distributors, LLC.
DEAL COMPOSITION
The Merger Fund (Unaudited)
| Type of Buyer | | | Deal Terms* | |
| Strategic | 99.2% | | Cash | 39.1% |
| Financial | 0.8% | | Stock and Stub(1) | 20.0% |
| | | | Cash & Stock | 17.5% |
| By Deal Type | | | Stock with Flexible | x |
| Friendly | 99.8% | | Exchange Ratio (Collar) | 17.2% |
| Hostile | 0.2% | | Stock with Fixed Exchange Ratio | 3.6% |
| | | | Undetermined(2) | 2.6% |
| * | Data expressed as a percentage of long common stock, corporate bonds and swap contract positions as of December 31, 2017. |
| 1 | “Stub” includes assets other than cash and stock (e.g., escrow notes). |
| 2 | The compensation is undetermined because the compensation to be received (e.g., stock, cash, escrow notes, other) will be determined at a later date, potentially at the option of the Fund’s investment adviser. |
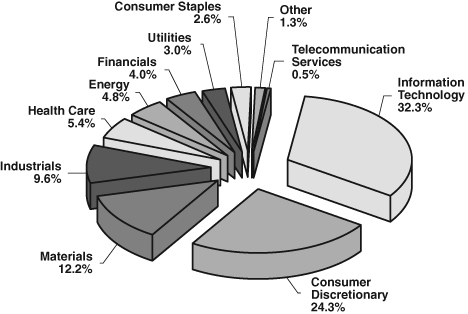
PORTFOLIO COMPOSITION*
The Merger Fund (Unaudited)
��
By Sector
By Region
| * | Data expressed as a percentage of long common stock, corporate bonds and swap contract positions as of December 31, 2017. Data expressed excludes short-term investments, short investments, written options, forward currency exchange contracts and short total return swap contracts. Please refer to the Schedule of Investments, Schedule of Options Written, Schedule of Forward Currency Exchange Contracts and Schedule of Swap Contracts for more details on the Fund’s individual holdings. |
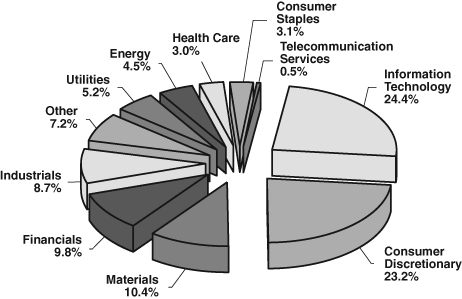
PORTFOLIO COMPOSITION*
WCM Alternatives: Event-Driven Fund (Unaudited)
By Sector
By Region
| * | Data expressed as a percentage of long common stock, corporate bonds and swap contract positions as of December 31, 2017. Data expressed excludes short-term investments, short investments, written options, forward currency exchange contracts and short total return swap contracts. Please refer to the Schedule of Investments, Schedule of Options Written, Schedule of Forward Currency Exchange Contracts and Schedule of Swap Contracts for more details on the Fund’s individual holdings. |
The Global Industry Classification Standard (GICS®) was developed by and/or is the exclusive property of MSCI, Inc. and Standard & Poor’s Financial Services LLC (“S&P”). GICS is a service mark of MSCI and S&P and has been licensed for use by U.S. Bancorp Fund Services, LLC.
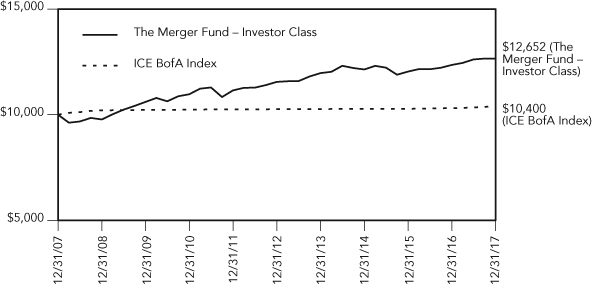
COMPARISON OF CHANGE IN VALUE OF $10,000 INVESTMENT
IN THE MERGER FUND AND THE ICE BofA MERRILL LYNCH
3-MONTH U.S. TREASURY BILL INDEX (Unaudited)
THE MERGER FUND
AVERAGE ANNUAL TOTAL RETURNS
as of December 31, 2017
| | 1 Yr. | 3 Yr. | 5 Yr. | 10 Yr. |
| Investor Class | 2.39% | 1.38% | 1.83% | 2.38% |
| ICE BofA Index | 0.86% | 0.41% | 0.27% | 0.39% |
| | | | Since Inception |
| | 1 Yr. | 3 Yr. | (8/1/2013) |
| Institutional Class | 2.74% | 1.71% | 2.03% |
| ICE BofA Index | 0.86% | 0.41% | 0.29% |
This chart assumes an initial gross investment of $10,000 made on December 31, 2007. Returns shown include the reinvestment of all dividends. Past performance is not predictive of future performance. The graph and table do not reflect the deduction of taxes that a shareholder would pay on fund distributions or upon redemption of fund shares. Investment return and principal value will fluctuate, so that your shares, when redeemed, may be worth more or less than the original cost.
The ICE BofA Merrill Lynch 3-Month U.S. Treasury Bill Index (“ICE BofA Index”) is comprised of a single issue purchased at the beginning of the month and held for a full month. At the end of the month that issue is sold and rolled into a newly selected issue. The issue selected at each month-end rebalancing is the outstanding U.S. Treasury Bill that matures closest to, but not beyond, three months from the rebalancing date. To qualify for selection, an issue must have settled on or before the month-end rebalancing date. The index is unmanaged and does not include any expenses, fees or sales charges. It is not possible to invest directly in an index.
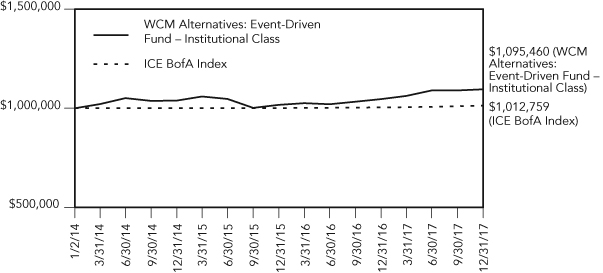
COMPARISON OF CHANGE IN VALUE OF $1,000,000 INVESTMENT
IN THE WCM ALTERNATIVES: EVENT-DRIVEN FUND AND THE ICE BofA
MERRILL LYNCH 3-MONTH U.S. TREASURY BILL INDEX (Unaudited)
WCM ALTERNATIVES: EVENT-DRIVEN FUND
AVERAGE ANNUAL TOTAL RETURNS
as of December 31, 2017
| | | | Since Inception |
| | 1 Yr. | 3 Yr. | (1/2/2014) |
| Institutional Class | 4.72% | 1.79% | 2.31% |
| ICE BofA Index | 0.86% | 0.41% | 0.32% |
| | | Since Inception |
| | | (3/22/2017) |
| Investor Class | | 3.77% |
| ICE BofA Index | | 0.77% |
This chart assumes an initial gross investment of $1,000,000 made on January 2, 2014. Returns shown include the reinvestment of all dividends. Past performance is not predictive of future performance. The graph and table do not reflect the deduction of taxes that a shareholder would pay on fund distributions or upon redemptions of fund shares. Investment return and principal value will fluctuate, so that your shares, when redeemed, may be worth more or less than the original cost.
The ICE BofA Merrill Lynch 3-Month U.S. Treasury Bill Index (“ICE BofA Index”) is comprised of a single issue purchased at the beginning of the month and held for a full month. At the end of the month that issue is sold and rolled into a newly selected issue. The issue selected at each month-end rebalancing is the outstanding U.S. Treasury Bill that matures closest to, but not beyond, three months from the rebalancing date. To qualify for selection, an issue must have settled on or before the month-end rebalancing date. The index is unmanaged and does not include any expenses, fees or sales charges. It is not possible to invest directly in an index.
The Merger Fund and WCM Alternatives: Event-Driven Fund
EXPENSE EXAMPLE
December 31, 2017 (Unaudited)
As a shareholder of The Merger Fund and/or WCM Alternatives: Event-Driven Fund (the “Funds”), you incur two types of costs: (1) transaction costs and (2) ongoing costs, including management fees, and other Fund specific expenses. The expense example is intended to help a shareholder understand ongoing costs (in dollars) of investing in the Fund(s) and to compare these costs with the ongoing costs of investing in other mutual funds. The example is based on an investment of $1,000 invested at the beginning of the period and held for the most recent six-month period.
The Actual Expenses comparison provides information about actual account values and actual expenses. A shareholder may use the information in this line, together with the amount invested, to estimate the expenses paid over the period. A shareholder may divide his/her account value by $1,000 (e.g., an $8,600 account value divided by $1,000 = 8.6), then multiply the result by the number in the first line under the heading entitled “Expenses Paid During Period” to estimate the expenses paid on his/her account during this period. The example below includes, among other fees, management fees, fund accounting, custody and transfer agent fees. However, the example does not include portfolio trading commissions and related expenses or extraordinary expenses.
The Hypothetical Example for Comparison Purposes provides information about hypothetical account values and hypothetical expenses based on each Fund’s actual expense ratios and assumed rates of return of 5% per year before expenses, which are not the Fund’s actual returns. The hypothetical account values and expenses may not be used to estimate the actual ending account balance or expenses paid for the period. A shareholder may use this information to compare the ongoing costs of investing in the Funds and other funds. To do so, a shareholder would compare this 5% hypothetical example with the 5% hypothetical examples that appear in the shareholder reports of other funds.
The expenses shown in the table are meant to highlight your ongoing costs only and do not reflect any transactional costs, such as sales charges (loads), redemptions fees, or exchange fees. Therefore, the Hypothetical Example for Comparison Purposes is useful in comparing ongoing costs only, and will not help to determine the relevant total costs of owning different funds. In addition, if these transactional costs were included, shareholder costs would have been higher.
The Merger Fund and WCM Alternatives: Event-Driven Fund
EXPENSE EXAMPLE (continued)
December 31, 2017 (Unaudited)
| | Annualized | Beginning | Ending | Expenses Paid |
| | Net Expense | Account | Account | During Period |
| | Ratio | Value | Value | 7/1/17- |
| | 12/31/17 | 7/1/17 | 12/31/17 | 12/31/17(1) |
| The Merger Fund | | | | |
| Investor Class | | | | |
Actual Expenses(2)(3) | 1.85% | $1,000.00 | $1,002.70 | $9.34 |
| Hypothetical Example for | | | | |
| Comparison Purposes | | | | |
| (5% return before | | | | |
expenses)(3) | 1.85% | $1,000.00 | $1,015.88 | $9.40 |
| Institutional Class | | | | |
Actual Expenses(2)(3) | 1.53% | $1,000.00 | $1,004.10 | $7.73 |
| Hypothetical Example for | | | | |
| Comparison Purposes | | | | |
| (5% return before | | | | |
expenses)(3) | 1.53% | $1,000.00 | $1,017.49 | $7.78 |
| | | | | |
| | | | | |
| | Annualized | Beginning | Ending | Expenses Paid |
| | Net Expense | Account | Account | During Period |
| | Ratio | Value | Value | 7/1/17- |
| | 12/31/17 | 7/1/17 | 12/31/17 | 12/31/17(1) |
| WCM Alternatives: Event-Driven Fund | | | | |
| Investor Class | | | | |
Actual Expenses(2)(4) | 2.54% | $1,000.00 | $1,005.20 | $12.84 |
| Hypothetical Example for | | | | |
| Comparison Purposes | | | | |
| (5% return before | | | | |
expenses)(4) | 2.54% | $1,000.00 | $1,012.40 | $12.88 |
| Institutional Class | | | | |
Actual Expenses(2)(4) | 2.25% | $1,000.00 | $1,005.20 | $11.37 |
| Hypothetical Example for | | | | |
| Comparison Purposes | | | | |
| (5% return before | | | | |
expenses)(4) | 2.25% | $1,000.00 | $1,013.86 | $11.42 |
The Merger Fund and WCM Alternatives: Event-Driven Fund
EXPENSE EXAMPLE (continued)
December 31, 2017 (Unaudited)
| (1) | Expenses are equal to the Fund’s annualized net expense ratio, multiplied by the average account value over the period, multiplied by 184/365 to reflect the one-half year period. |
| | |
| (2) | Based on the actual returns of 0.27%, 0.41%, 0.52%, and 0.52% for the six-month period ended December 31, 2017 for The Merger Fund Investor and Institutional Classes and WCM Alternatives: Event-Driven Fund Investor and Institutional Classes, respectively. |
| | |
| (3) | Excluding dividends and interest on short positions and borrowing expense on securities sold short, your actual cost of investment and your hypothetical cost of investment would have been $7.32 and $7.37, respectively in the The Merger Fund Investor Class and $5.71 and $5.75, respectively in The Merger Fund Institutional Class. |
| | |
| (4) | Excluding dividends and interest on short positions and borrowing expense on securities sold short, your actual cost of investment and your hypothetical cost of investment would have been $10.06 and $10.11, respectively in WCM Alternatives: Event-Driven Fund Investor Class and $8.79 and $8.84, respectively in WCM Alternatives: Event-Driven Fund Institutional Class. |
The Merger Fund
SCHEDULE OF INVESTMENTS
December 31, 2017
| | | Shares | | | Value | |
| LONG INVESTMENTS — 95.50% | | | | | | |
| | | | | | | |
| COMMON STOCKS — 61.42% | | | | | | |
| | | | | | | |
| AEROSPACE & DEFENSE — 6.50% | | | | | | |
| Orbital ATK, Inc. (e) | | | 507,889 | | | $ | 66,787,404 | |
| Rockwell Collins, Inc. | | | 616,602 | | | | 83,623,563 | |
| | | | | | | | 150,410,967 | |
| | | | | | | | | |
| ALTERNATIVE CARRIERS — 0.16% | | | | | | | | |
| CenturyLink, Inc. (e) | | | 220,138 | | | | 3,671,902 | |
| | | | | | | | | |
| BIOTECHNOLOGY — 0.33% | | | | | | | | |
| Advanced Accelerator | | | | | | | | |
| Applications SA — ADR (a) | | | 93,286 | | | | 7,614,003 | |
| | | | | | | | | |
| BROADCASTING — 3.44% | | | | | | | | |
| Scripps Networks Interactive, Inc. Class A | | | 902,110 | | | | 77,022,152 | |
| Tribune Media Company Class A | | | 61,750 | | | | 2,622,522 | |
| | | | | | | | 79,644,674 | |
| | | | | | | | | |
| CASINOS & GAMING — 0.22% | | | | | | | | |
| Pinnacle Entertainment, Inc. (a) | | | 151,905 | | | | 4,971,851 | |
| | | | | | | | | |
| DATA PROCESSING & | | | | | | | | |
| OUTSOURCED SERVICES — 0.06% | | | | | | | | |
| MoneyGram International, Inc. (a) | | | 112,461 | | | | 1,482,236 | |
| | | | | | | | | |
| DIVERSIFIED CHEMICALS — 6.98% | | | | | | | | |
| DowDuPont, Inc. (e) | | | 1,555,188 | | | | 110,760,489 | |
| Huntsman Corporation | | | 1,526,169 | | | | 50,806,166 | |
| | | | | | | | 161,566,655 | |
| | | | | | | | | |
| DRUG RETAIL — 0.01% | | | | | | | | |
| Rite Aid Corporation (a)(e) | | | 149,016 | | | | 293,561 | |
| | | | | | | | | |
| FERTILIZERS & | | | | | | | | |
| AGRICULTURAL CHEMICALS — 2.94% | | | | | | | | |
| Monsanto Company | | | 583,211 | | | | 68,107,381 | |
| | | | | | | | | |
| HEALTH CARE EQUIPMENT — 2.14% | | | | | | | | |
| Becton, Dickinson and Company | | | 231,871 | | | | 49,634,340 | |
| | | | | | | | | |
| HEALTH CARE SERVICES — 0.34% | | | | | | | | |
| Almost Family, Inc. (a) | | | 141,908 | | | | 7,854,608 | |
| | | | | | | | | |
| HOMEBUILDING — 1.46% | | | | | | | | |
| CalAtlantic Group, Inc. | | | 599,779 | | | | 33,821,538 | |
| | | | | | | | | |
| HOTELS, RESORTS | | | | | | | | |
| & CRUISE LINES — 1.36% | | | | | | | | |
| ILG, Inc. | | | 1,104,992 | | | | 31,470,172 | |
The accompanying notes are an integral part of these financial statements.
The Merger Fund
SCHEDULE OF INVESTMENTS (continued)
December 31, 2017
| | | Shares | | | Value | |
| | | | | | | |
| INDEPENDENT POWER PRODUCERS | | | | | | |
| & ENERGY TRADERS — 2.88% | | | | | | |
| Calpine Corporation (a) | | | 3,670,172 | | | $ | 55,529,702 | |
| Dynegy, Inc. (a) | | | 946,256 | | | | 11,213,134 | |
| | | | | | | | 66,742,836 | |
| | | | | | | | | |
| MANAGED HEALTH CARE — 2.32% | | | | | | | | |
| Aetna, Inc. (e) | | | 298,070 | | | | 53,768,847 | |
| | | | | | | | | |
| MOVIES & ENTERTAINMENT — 13.09% | | | | | | | | |
| Time Warner, Inc. (e) | | | 2,801,674 | | | | 256,269,121 | |
| Twenty-First Century Fox, Inc. Class B | | | 1,368,628 | | | | 46,697,587 | |
| | | | | | | | 302,966,708 | |
| | | | | | | | | |
| MULTI-LINE INSURANCE — 1.40% | | | | | | | | |
| American International Group, Inc. (e) | | | 542,262 | | | | 32,307,970 | |
| | | | | | | | | |
| OIL & GAS STORAGE | | | | | | | | |
| & TRANSPORTATION — 2.55% | | | | | | | | |
| Columbia Pipeline Group, Inc. (a)(d)(g)(j) | | | 2,276,354 | | | | 58,982,517 | |
| | | | | | | | | |
| REGIONAL BANKS — 0.00% | | | | | | | | |
| MainSource Financial Group, Inc. | | | 841 | | | | 30,537 | |
| | | | | | | | | |
| REITs — 2.19% | | | | | | | | |
| GGP, Inc. | | | 1,775,484 | | | | 41,528,571 | |
| Starwood Property Trust, Inc. (e) | | | 424,863 | | | | 9,070,825 | |
| | | | | | | | 50,599,396 | |
| | | | | | | | | |
| SEMICONDUCTORS — 9.80% | | | | | | | | |
| Cavium, Inc. (a) | | | 332,763 | | | | 27,895,522 | |
| NXP Semiconductors NV (a)(b)(e) | | | 1,648,983 | | | | 193,079,420 | |
| QUALCOMM, Inc. | | | 90,900 | | | | 5,819,418 | |
| | | | | | | | 226,794,360 | |
| | | | | | | | | |
| SPECIAL PURPOSE | | | | | | | | |
| ACQUISITION COMPANIES — 1.25% | | | | | | | | |
| Avista Healthcare Public | | | | | | | | |
| Acquisition Corporation Class A (a)(b) | | | 662,154 | | | | 6,568,568 | |
| Black Ridge Acquisition Corporation (a)(f) | | | 286,249 | | | | 2,772,322 | |
| Electrum Special | | | | | | | | |
| Acquisition Corporation (a)(b) | | | 296,519 | | | | 3,060,076 | |
| Federal Street Acquisition Corporation (a) | | | 128,720 | | | | 1,249,871 | |
| Forum Merger Corporation (a) | | | 365,627 | | | | 3,648,957 | |
| Modern Media Acquisition | | | | | | | | |
| Corporation (a)(f) | | | 477,700 | | | | 4,695,791 | |
The accompanying notes are an integral part of these financial statements.
The Merger Fund
SCHEDULE OF INVESTMENTS (continued)
December 31, 2017
| | | Shares | | | Value | |
| Pensare Acquisition Corporation (a)(f) | | | 708,822 | | | $ | 6,857,853 | |
| | | | | | | | 28,853,438 | |
| | | | | | | | | |
| TOTAL COMMON STOCKS | | | | | | | | |
| (Cost $1,392,893,630) | | | | | | | 1,421,590,497 | |
| | | | | | | | | |
| | | | | | | | | |
| CLOSED-END FUNDS — 11.75% (a)(e) | | | | | | | | |
| Altaba, Inc. | | | 3,892,756 | | | | 271,909,007 | |
| TOTAL CLOSED-END FUNDS | | | | | | | | |
| (Cost $188,421,142) | | | | | | | 271,909,007 | |
| | | | | | | | | |
| PREFERRED STOCKS — 0.13% | | | | | | | | |
| NuStar Logistics LP, 8.456% | | | | | | | | |
| (3 Month LIBOR + 6.734%), 1/15/2043 (k) | | | 117,565 | | | | 2,939,125 | |
| TOTAL PREFERRED STOCKS | | | | | | | | |
| (Cost $2,957,936) | | | | | | | 2,939,125 | |
| | | | | | | | | |
| CONTINGENT VALUE | | | | | | | | |
| RIGHTS — 0.04% (a)(e)(g) | | | | | | | | |
| Casa Ley, S.A. de C.V. | | | 1,713,496 | | | | 916,720 | |
| Media General, Inc. | | | 891,153 | | | | 49,013 | |
| Property Development Centers LLC | | | 1,713,496 | | | | 25,703 | |
| TOTAL CONTINGENT VALUE RIGHTS | | | | | | | | |
| (Cost $0) | | | | | | | 991,436 | |
| | | | | | | | | |
| RIGHTS — 0.03% (a)(f) | | | | | | | | |
| Black Ridge Acquisition Corporation | | | 286,249 | | | | 80,150 | |
| Forum Merger Corporation | | | 284,888 | | | | 188,026 | |
| Modern Media Acquisition Corporation | | | 477,700 | | | | 186,303 | |
| Pensare Acquisition Corporation | | | 708,822 | | | | 354,411 | |
| TOTAL RIGHTS (Cost $665,406) | | | | | | | 808,890 | |
| | | | | | | | | |
| WARRANTS — 0.02% (a)(f) | | | | | | | | |
| Black Ridge Acquisition Corporation | | | 286,249 | | | | 94,462 | |
| Federal Street Acquisition Corporation | | | 64,360 | | | | 74,014 | |
| Forum Merger Corporation | | | 142,444 | | | | 96,862 | |
| Modern Media Acquisition Corporation | | | 238,850 | | | | 131,368 | |
| Pensare Acquisition Corporation | | | 354,411 | | | | 194,926 | |
| TOTAL WARRANTS (Cost $477,579) | | | | | | | 591,632 | |
The accompanying notes are an integral part of these financial statements.
The Merger Fund
SCHEDULE OF INVESTMENTS (continued)
December 31, 2017
| | | Principal | | | | |
| | | Amount | | | Value | |
| | | | | | | |
| CONVERTIBLE BONDS — 0.83% (f) | | | | | | |
| Brocade Communications Systems, Inc. | | | | | | |
| 1.375%, 1/1/2020 | | $ | 7,044,000 | | | $ | 7,167,270 | |
| Impax Laboratories, Inc. | | | | | | | | |
| 2.000%, 6/15/2022 | | | 12,277,000 | | | | 11,970,075 | |
| TOTAL CONVERTIBLE BONDS | | | | | | | | |
| (Cost $19,139,081) | | | | | | | 19,137,345 | |
| | | | | | | | | |
| | | | | | | | | |
| CORPORATE BONDS — 4.71% (f) | | | | | | | | |
| Dynegy, Inc. | | | | | | | | |
| 5.875%, 6/1/2023 | | | 15,354,000 | | | | 15,622,695 | |
| Energy Future Intermediate | | | | | | | | |
| Holding Company LLC | | | | | | | | |
| 11.000%, 10/1/2021 (h) | | | 2,012,922 | | | | 2,898,608 | |
| 11.750%, 3/1/2022 (h)(i) | | | 9,065,688 | | | | 13,938,495 | |
| General Cable Corporation | | | | | | | | |
| 5.750%, 10/1/2022 | | | 4,400,000 | | | | 4,581,500 | |
| Rite Aid Corporation | | | | | | | | |
| 9.250%, 3/15/2020 | | | 16,130,000 | | | | 16,388,886 | |
| 6.750%, 6/15/2021 | | | 2,616,000 | | | | 2,616,000 | |
| Terraform Global Operating, LLC | | | | | | | | |
| 9.750%, 8/15/2022 (i) | | | 27,248,000 | | | | 30,279,340 | |
| Time, Inc. | | | | | | | | |
| 5.750%, 4/15/2022 (i) | | | 12,537,000 | | | | 13,132,507 | |
| T-Mobile USA, Inc. | | | | | | | | |
| 6.836%, 4/28/2023 | | | 7,011,000 | | | | 7,361,550 | |
| Tribune Media Company | | | | | | | | |
| 5.875%, 7/15/2022 | | | 2,033,000 | | | | 2,099,073 | |
| TOTAL CORPORATE BONDS | | | | | | | | |
| (Cost $108,189,218) | | | | | | | 108,918,654 | |
| | | Contracts | | | | | | | |
| | | (100 shares per | | | Notional | | | | |
| | | contract) | | | Amount | | | | |
| PURCHASED CALL OPTIONS — 0.00% | | | | | | | | | |
| SPDR S&P 500 ETF Trust | | | | | | | | | |
| Expiration: February 2018, | | | | | | | | | |
| Exercise Price: $275.00 | | | 2,758 | | | $ | 73,599,988 | | | | 96,530 | |
| | | | | | | | | | | | 96,530 | |
The accompanying notes are an integral part of these financial statements.
The Merger Fund
SCHEDULE OF INVESTMENTS (continued)
December 31, 2017
| | | Contracts | | | | | | | |
| | | (100 shares per | | | Notional | | | | |
| | | contract) | | | Amount | | | Value | |
| PURCHASED PUT OPTIONS — 0.08% | | | | | | | | | |
| American International Group, Inc. | | | | | | | | | |
| Expiration: January 2018, | | | | | | | | | |
| Exercise Price: $52.50 | | | 3,847 | | | $ | 22,920,426 | | | $ | 11,541 | |
| DowDuPont, Inc. | | | | | | | | | | | | |
| Expiration: February 2018, | | | | | | | | | | | | |
| Exercise Price: $65.00 | | | 11,006 | | | | 78,384,732 | | | | 451,246 | |
| Huntsman Corporation | | | | | | | | | | | | |
| Expiration: January 2018, | | | | | | | | | | | | |
| Exercise Price: $24.00 | | | 12,540 | | | | 8,455,660 | | | | 6,350 | |
| Expiration: January 2018, | | | | | | | | | | | | |
| Exercise Price: $25.00 | | | 10,171 | | | | 33,859,259 | | | | 25,427 | |
| Expiration: January 2018, | | | | | | | | | | | | |
| Exercise Price: $26.00 | | | 1,596 | | | | 5,313,084 | | | | 3,990 | |
| Marriott Vacations Worldwide Corporation | | | | | | | | | | | | |
| Expiration: January 2018, | | | | | | | | | | | | |
| Exercise Price: $130.00 | | | 816 | | | | 11,033,136 | | | | 99,960 | |
| Materials Select Sector SPDR Trust | | | | | | | | | | | | |
| Expiration: January 2018, | | | | | | | | | | | | |
| Exercise Price: $60.00 | | | 458 | | | | 2,772,274 | | | | 18,320 | |
| QUALCOMM, Inc. | | | | | | | | | | | | |
| Expiration: January 2018, | | | | | | | | | | | | |
| Exercise Price: $62.50 | | | 909 | | | | 5,819,418 | | | | 43,632 | |
| SPDR S&P 500 ETF Trust | | | | | | | | | | | | |
| Expiration: February 2018, | | | | | | | | | | | | |
| Exercise Price: $268.00 | | | 2,970 | | | | 79,257,420 | | | | 1,098,900 | |
| Twenty-First Century Fox, Inc. Class B | | | | | | | | | | | | |
| Expiration: January 2018, | | | | | | | | | | | | |
| Exercise Price: $26.00 | | | 8,188 | | | | 27,937,456 | | | | 20,470 | |
| VanEck Vectors Semiconductor ETF | | | | | | | | | | | | |
| Expiration: January 2018, | | | | | | | | | | | | |
| Exercise Price: $90.00 | | | 2,270 | | | | 22,202,870 | | | | 49,940 | |
| | | | | | | | | | | | 1,829,776 | |
| TOTAL PURCHASED OPTIONS | | | | | | | | | | | | |
| (Cost $3,534,793) | | | | | | | | | | | 1,926,306 | |
| | | Principal | | | | | | | | | |
| | | Amount | | | | | | | | | |
| ESCROW NOTES — 0.09% (a)(d)(g) | | | | | | | | | | | | |
| AMR Corporation | | $ | 1,243,406 | | | | | | | | 1,989,450 | |
| TOTAL ESCROW NOTES | | | | | | | | | | | | |
| (Cost $679,555) | | | | | | | | | | | 1,989,450 | |
The accompanying notes are an integral part of these financial statements.
The Merger Fund
SCHEDULE OF INVESTMENTS (continued)
December 31, 2017
| | | Shares | | | Value | |
| SHORT-TERM INVESTMENTS — 16.40% | | | | | | |
| MONEY MARKET FUNDS — 9.81% (c) | | | | | | |
| The Government & Agency Portfolio, | | | | | | |
| Institutional Share Class, 1.18% | | | 79,403,435 | | | $ | 79,403,435 | |
| JPMorgan Prime Money Market Fund, | | | | | | | | |
| Institutional Share Class, 1.45% | | | 34,585,541 | | | | 34,596,121 | |
| JPMorgan U.S. Government Money Market | | | | | | | | |
| Fund, Institutional Share Class, 1.19% | | | 112,992,000 | | | | 112,992,000 | |
| | | | | | | | 226,991,556 | |
| | | Principal | | | | |
| | | Amount | | | | |
| U.S. TREASURY BILLS — 6.59% (e)(f) | | | | | | |
| United States Treasury Bills | | | | | | |
| 1.06%, 1/11/2018 | | $ | 5,800,000 | | | | 5,798,300 | |
| 1.07%, 1/25/2018 | | | 10,000,000 | | | | 9,992,173 | |
| 1.13%, 2/1/2018 | | | 3,000,000 | | | | 2,996,849 | |
| 1.01%, 2/15/2018 | | | 1,000,000 | | | | 998,494 | |
| 1.05%, 2/22/2018 | | | 3,700,000 | | | | 3,693,395 | |
| 1.08%, 3/1/2018 | | | 10,890,000 | | | | 10,867,762 | |
| 1.09%, 3/8/2018 | | | 1,000,000 | | | | 997,673 | |
| 1.08%, 3/15/2018 | | | 3,400,000 | | | | 3,391,228 | |
| 1.12%, 3/29/2018 | | | 23,100,000 | | | | 23,024,744 | |
| 1.16%, 4/5/2018 | | | 7,000,000 | | | | 6,974,977 | |
| 1.18%, 4/12/2018 | | | 1,000,000 | | | | 996,153 | |
| 1.18%, 4/19/2018 | | | 23,200,000 | | | | 23,104,152 | |
| 1.19%, 4/26/2018 | | | 5,200,000 | | | | 5,177,564 | |
| 1.23%, 5/3/2018 | | | 4,400,000 | | | | 4,379,406 | |
| 1.29%, 5/10/2018 | | | 9,300,000 | | | | 9,253,045 | |
| 1.35%, 5/17/2018 | | | 300,000 | | | | 298,408 | |
| 1.35%, 5/24/2018 | | | 18,500,000 | | | | 18,394,829 | |
| 1.37%, 5/31/2018 | | | 300,000 | | | | 298,203 | |
| 1.37%, 6/7/2018 | | | 6,700,000 | | | | 6,657,539 | |
| 1.40%, 6/14/2018 | | | 5,000,000 | | | | 4,967,060 | |
| 1.45%, 6/21/2018 | | | 4,100,000 | | | | 4,071,055 | |
| 1.45%, 6/28/2018 | | | 6,200,000 | | | | 6,154,199 | |
| | | | | | | | 152,487,208 | |
| TOTAL SHORT-TERM INVESTMENTS | | | | | | | | |
| (Cost $379,540,205) | | | | | | | 379,478,764 | |
| TOTAL LONG INVESTMENTS | | | | | | | | |
| (Cost $2,096,498,545) — 95.50% | | | | | | | 2,210,281,106 | |
The accompanying notes are an integral part of these financial statements.
The Merger Fund
SCHEDULE OF INVESTMENTS (continued)
December 31, 2017
| | | Shares | | | Value | |
| | | | | | | |
| SHORT INVESTMENTS — (27.62)% | | | | | | |
| | | | | | | |
| COMMON STOCKS — (27.62)% | | | | | | |
| | | | | | | |
| AEROSPACE & DEFENSE — (0.90)% | | | | | | |
| United Technologies Corporation | | | (162,373 | ) | | $ | (20,713,924 | ) |
| | | | | | | | | |
| AIRLINES — (0.15)% | | | | | | | | |
| American Airlines Group, Inc. | | | (65,211 | ) | | | (3,392,928 | ) |
| | | | | | | | | |
| BROADCASTING — (0.62)% | | | | | | | | |
| Discovery Communications, Inc. Class C | | | (649,519 | ) | | | (13,750,317 | ) |
| Sinclair Broadcast Group, Inc. Class A | | | (14,203 | ) | | | (537,584 | ) |
| | | | | | | | (14,287,901 | ) |
| | | | | | | | | |
| CASINOS & GAMING — (0.09)% | | | | | | | | |
| Penn National Gaming, Inc. | | | (63,800 | ) | | | (1,998,854 | ) |
| | | | | | | | | |
| DATA PROCESSING & | | | | | | | | |
| OUTSOURCED SERVICES — (4.20)% | | | | | | | | |
| Vantiv, Inc. Class A (f) | | | (1,321,366 | ) | | | (97,292,178 | ) |
| | | | | | | | | |
| DRUG RETAIL — (0.78)% | | | | | | | | |
| CVS Health Corporation | | | (249,702 | ) | | | (18,103,395 | ) |
| | | | | | | | | |
| HEALTH CARE EQUIPMENT — (2.14)% | | | | | | | | |
| Becton, Dickinson and Company | | | (231,863 | ) | | | (49,632,594 | ) |
| | | | | | | | | |
| HEALTH CARE SERVICES — (0.34)% | | | | | | | | |
| LHC Group, Inc. | | | (129,844 | ) | | | (7,952,945 | ) |
| | | | | | | | | |
| HOMEBUILDING — (1.53)% | | | | | | | | |
| Lennar Corporation Class A | | | (551,549 | ) | | | (34,879,959 | ) |
| Lennar Corporation Class B | | | (11,030 | ) | | | (570,030 | ) |
| | | | | | | | (35,449,989 | ) |
| | | | | | | | | |
| HOTELS, RESORTS & CRUISE LINES — (0.04)% | | | | | | | | |
| Marriott Vacations | | | | | | | | |
| Worldwide Corporation | | | (6,829 | ) | | | (923,349 | ) |
| | | | | | | | | |
| INDEPENDENT POWER PRODUCERS | | | | | | | | |
| & ENERGY TRADERS — (0.49)% | | | | | | | | |
| Vistra Energy Corporation | | | (616,685 | ) | | | (11,297,669 | ) |
| | | | | | | | | |
| INDUSTRIAL GASES — (0.04)% | | | | | | | | |
| Praxair, Inc. (f) | | | (6,287 | ) | | | (972,222 | ) |
| | | | | | | | | |
| INTEGRATED TELECOMMUNICATION | | | | | | | | |
| SERVICES — (4.99)% | | | | | | | | |
| AT&T, Inc. | | | (2,970,352 | ) | | | (115,487,286 | ) |
| | | | | | | | | |
| INTERNET SOFTWARE | | | | | | | | |
| & SERVICES — (10.03)% | | | | | | | | |
| Alibaba Group Holding Ltd. — ADR | | | (1,346,739 | ) | | | (232,218,206 | ) |
The accompanying notes are an integral part of these financial statements.
The Merger Fund
SCHEDULE OF INVESTMENTS (continued)
December 31, 2017
| | | Shares | | | Value | |
| MOVIES & ENTERTAINMENT — (0.61)% | | | | | | |
| The Walt Disney Company | | | (131,030 | ) | | $ | (14,087,035 | ) |
| | | | | | | | | |
| REGIONAL BANKS — (0.00)% | | | | | | | | |
| First Financial Bancorp | | | (1,166 | ) | | | (30,724 | ) |
| | | | | | | | | |
| SEMICONDUCTORS — (0.67)% | | | | | | | | |
| Marvell Technology Group Ltd. (b) | | | (724,559 | ) | | | (15,556,282 | ) |
| | | | | | | | | |
| TOTAL COMMON STOCKS | | | | | | | | |
| (Proceeds $504,830,612) | | | | | | | (639,397,481 | ) |
| TOTAL SHORT INVESTMENTS | | | | | | | | |
| (Proceeds $504,830,612) — (27.62)% | | | | | | | (639,397,481 | ) |
| TOTAL NET INVESTMENTS | | | | | | | | |
| (Cost $1,591,667,933) — 67.88% | | | | | | | 1,570,883,625 | |
| OTHER ASSETS IN EXCESS | | | | | | | | |
| OF LIABILITIES — 32.12% | | | | | | | 743,487,975 | |
| TOTAL NET ASSETS — 100.00% | | | | | | $ | 2,314,371,600 | |
ADR – American Depository Receipt
ETF – Exchange-Traded Fund
LIBOR – London Interbank Offered Rate
REITs – Real Estate Investment Trusts
| (a) | Non-income producing security. |
| (b) | Foreign security. |
| (c) | The rate quoted is the annualized seven-day yield as of December 31, 2017. |
| (d) | Security fair valued by the Valuation Group in good faith in accordance with the policies adopted by the Board of Trustees. |
| (e) | All or a portion of the shares have been committed as collateral for open securities sold short, written option contracts, swap contracts, and forward currency exchange contracts. |
| (f) | Level 2 Security. Please see Note 2 in the Notes to the Financial Statements for more information. |
| (g) | Level 3 Security. Please see Note 2 in the Notes to the Financial Statements for more information. |
| (h) | Default or other conditions exist and the security is not presently accruing income. |
| (i) | Security exempt from registration under Rule 144A of the Securities Act of 1933. These securities may be resold in transactions exempt from registration normally to qualified institutional buyers. As of December 31, 2017, these securities represent 2.48% of total net assets. |
| (j) | Restricted security. The Fund may own investment securities that have other legal or contractual limitations, and thus are restricted as to resale. These securities are valued by the Valuation Group under the supervision of the Board of Trustees. As of December 31, 2017, this common stock had a cost of $57,736,820 and its market value represented 2.55% of total net assets. The Fund’s adviser perfected its appraisal rights over this security as of 6/20/2016. Please see Note 2 in the Notes to the Financial Statements for more information. |
| (k) | The coupon rate shown on variable rate securities represents the rate as of December 31, 2017. |
The Global Industry Classification Standard (GICS®) was developed by and/or is the exclusive property of MSCI, Inc. and Standard & Poor’s Financial Services LLC (“S&P”). GICS is a service mark of MSCI and S&P and has been licensed for use by U.S. Bancorp Fund Services, LLC.
The accompanying notes are an integral part of these financial statements.
WCM Alternatives: Event-Driven Fund
SCHEDULE OF INVESTMENTS
December 31, 2017
| | | Shares | | | Value | |
| LONG INVESTMENTS — 102.42% | |
| | |
| COMMON STOCKS — 34.38% | |
| | |
| BIOTECHNOLOGY — 0.55% | |
| Advanced Accelerator | | | | | | |
| Applications SA — ADR (a) | | | 6,729 | | | $ | 549,221 | |
| | |
| BROADCASTING — 0.14% | |
| Tribune Media Company Class A | | | 3,403 | | | | 144,525 | |
| | |
| BUILDING PRODUCTS — 1.34% | |
| Johnson Controls International plc (b)(e) | | | 34,975 | | | | 1,332,897 | |
| | |
| CASINOS & GAMING — 0.31% | |
| Caesars Entertainment Corporation (a)(e) | | | 24,817 | | | | 313,935 | |
| | |
| DATA PROCESSING & | |
| OUTSOURCED SERVICES — 0.45% | |
| MoneyGram International, Inc. (a)(e) | | | 33,872 | | | | 446,433 | |
| | |
| DRUG RETAIL — 0.10% | |
| Rite Aid Corporation (a) | | | 49,002 | | | | 96,534 | |
| | | | | | | | | |
| HOMEBUILDING — 1.90% | | | | | | | | |
| CalAtlantic Group, Inc. (e) | | | 33,338 | | | | 1,879,930 | |
| Lennar Corporation Class B | | | 176 | | | | 9,096 | |
| | | | | | | | 1,889,026 | |
| | |
| HOTELS, RESORTS & CRUISE LINES — 1.16% | |
| ILG, Inc. (e) | | | 40,530 | | | | 1,154,294 | |
| | | | | | |
| INDEPENDENT POWER PRODUCERS | | | | | |
| & ENERGY TRADERS — 2.41% | |
| Calpine Corporation (a)(e) | | | 128,188 | | | | 1,939,485 | |
| Dynegy, Inc. (a)(e) | | | 38,892 | | | | 460,870 | |
| | | | | | | | 2,400,355 | |
| | |
| INDUSTRIAL CONGLOMERATES — 0.58% | |
| General Electric Company (e) | | | 33,400 | | | | 582,830 | |
| | |
| IT CONSULTING & OTHER SERVICES — 1.89% | |
| DXC Technology Company (e) | | | 19,800 | | | | 1,879,020 | |
| | |
| MANAGED HEALTH CARE — 2.99% | |
| Aetna, Inc. (e) | | | 16,536 | | | | 2,982,929 | |
| | |
| MOVIES & ENTERTAINMENT — 1.40% | |
| News Corporation Class A (e) | | | 47,456 | | | | 769,262 | |
| Time Warner, Inc. (e) | | | 6,840 | | | | 625,655 | |
| | | | | | | | 1,394,917 | |
The accompanying notes are an integral part of these financial statements.
WCM Alternatives: Event-Driven Fund
SCHEDULE OF INVESTMENTS (continued)
December 31, 2017
| | | Shares | | | Value | |
| | | | | | | |
| OIL & GAS EXPLORATION | |
| & PRODUCTION — 1.05% | |
| EQT Corporation (e) | | | 18,300 | | | $ | 1,041,636 | |
| | | | | | | | | |
| OIL & GAS STORAGE | |
| & TRANSPORTATION — 1.01% | |
| Columbia Pipeline Group, Inc. (a)(d)(g)(j) | | | 38,718 | | | | 1,003,220 | |
| | | | | | | | | |
| REITs — 3.05% | |
| GGP, Inc. (e) | | | 79,789 | | | | 1,866,265 | |
| New York REIT, Inc. | | | 111,948 | | | | 439,955 | |
| Starwood Property Trust, Inc. (e) | | | 34,314 | | | | 732,604 | |
| | | | | | | | 3,038,824 | |
| | | | | | | | | |
| ROAD & RAIL — 0.75% | |
| CSX Corporation (e) | | | 13,500 | | | | 742,635 | |
| | | | | | | | | |
| SEMICONDUCTORS — 1.79% | |
| Cavium, Inc. (a)(e) | | | 19,372 | | | | 1,623,955 | |
| QUALCOMM, Inc. | | | 2,492 | | | | 159,538 | |
| | | | | | | | 1,783,493 | |
| | | | | | | | | |
| SPECIAL PURPOSE | |
| AQUISITION COMPANIES — 11.49% | |
| Avista Healthcare Public Acquisition | | | | | | | | |
| Corporation Class A (a)(b) | | | 100,214 | | | | 994,123 | |
| Big Rock Partners Acquisition Corporation (a) | | | 45,951 | | | | 470,299 | |
| Bison Capital Acquisition Corporation (a)(b)(f) | | | 35,538 | | | | 351,115 | |
| Black Ridge Acquisition Corporation (a)(f) | | | 40,778 | | | | 394,935 | |
| CM Seven Star Acquisition Corporation (a)(b) | | | 97,424 | | | | 940,142 | |
| Draper Oakwood Technology | | | | | | | | |
| Acquisition, Inc. (a)(f) | | | 47,718 | | | | 466,682 | |
| Federal Street Acquisition Corporation (a) | | | 8,476 | | | | 82,302 | |
| Forum Merger Corporation (a) | | | 148,386 | | | | 1,480,892 | |
| GigCapital, Inc. (a)(e) | | | 122,997 | | | | 1,229,970 | |
| Legacy Acquisition Corporation (a) | | | 144,392 | | | | 1,435,257 | |
| Matlin & Partners Acquisition | | | | | | | | |
| Corporation Class A (a) | | | 25,036 | | | | 244,351 | |
| Modern Media Acquisition Corporation (a)(f) | | | 71,496 | | | | 702,806 | |
| Pensare Acquisition Corporation (a)(f) | | | 56,616 | | | | 547,760 | |
| Regalwood Global Energy Ltd. (a)(b) | | | 97,772 | | | | 972,831 | |
| Silver Run Acquisition | | | | | | | | |
| Corporation II Class A (a) | | | 114,134 | | | | 1,131,068 | |
| | | | | | | | 11,444,533 | |
The accompanying notes are an integral part of these financial statements.
WCM Alternatives: Event-Driven Fund
SCHEDULE OF INVESTMENTS (continued)
December 31, 2017
| | | Shares | | | Value | |
| TECHNOLOGY HARDWARE, | | | | | | |
| STORAGE & PERIPHERALS — 0.02% | | | | | | |
| Borqs Technologies, Inc. (a)(b)(f) | | | 3,537 | | | $ | 18,923 | |
| TOTAL COMMON STOCKS (Cost $34,127,205) | | | | | | | 34,240,180 | |
| | | | | | | | | |
| CLOSED-END FUNDS — 4.92% | | | | | | | | |
| Altaba, Inc. (a) | | | 8,358 | | | | 583,806 | |
| Apollo Senior Floating Rate Fund, Inc. | | | 22,543 | | | | 365,648 | |
| BlackRock Debt Strategies Fund, Inc. (e) | | | 82,764 | | | | 968,339 | |
| BlackRock Floating Rate | | | | | | | | |
| Income Strategies Fund, Inc. | | | 19,222 | | | | 265,071 | |
| Eaton Vance Floating-Rate Income Trust | | | 22,900 | | | | 328,157 | |
| First Trust Senior Floating | | | | | | | | |
| Rate Income Fund II | | | 22,317 | | | | 287,889 | |
| Invesco Dynamic Credit Opportunities Fund | | | 31,842 | | | | 372,870 | |
| Invesco Senior Income Trust | | | 83,915 | | | | 368,387 | |
| Voya Prime Rate Trust | | | 72,022 | | | | 365,152 | |
| Western Asset High Income | | | | | | | | |
| Opportunity Fund, Inc. (e) | | | 195,533 | | | | 991,352 | |
| TOTAL CLOSED-END FUNDS (Cost $4,796,193) | | | | | | | 4,896,671 | |
| | | | | | | | | |
| PREFERRED STOCKS — 3.79% (e) | | | | | | | | |
| Callon Petroleum Company, 10.000%, Series A | | | 21,517 | | | | 1,105,780 | |
| Colony NorthStar, Inc., 8.250%, Series B | | | 13,952 | | | | 354,660 | |
| Colony NorthStar, Inc., 8.750%, Series E | | | 21,830 | | | | 580,023 | |
| Kimco Realty Corporation, 5.250%, Series M | | | 19,802 | | | | 493,862 | |
| NuStar Logistics LP, 8.456% | | | | | | | | |
| (3 Month LIBOR + 6.734%), 1/15/2043 (k) | | | 39,295 | | | | 982,375 | |
| Vornado Realty Trust, 5.250%, Series M | | | 10,025 | | | | 262,254 | |
| TOTAL PREFERRED STOCKS (Cost $3,767,980) | | | | | | | 3,788,954 | |
| | | | | | | | | |
| CONTINGENT VALUE RIGHTS — 0.00% (a)(e)(g) | | | | | | | | |
| Casa Ley, S.A. de C.V. | | | 5,338 | | | | 2,856 | |
| Media General, Inc. | | | 42,852 | | | | 2,357 | |
| Property Development Centers LLC | | | 5,338 | | | | 80 | |
| TOTAL CONTINGENT VALUE RIGHTS (Cost $0) | | | | | | | 5,293 | |
| | | | | | | | | |
| RIGHTS — 0.21% (a)(f) | | | | | | | | |
| Bison Capital Acquisition Corporation (b) | | | 35,538 | | | | 13,469 | |
| Black Ridge Acquisition Corporation | | | 40,778 | | | | 11,418 | |
| CM Seven Star Acquisition Corporation (b) | | | 97,424 | | | | 31,175 | |
| Draper Oakwood Technology Acquisition, Inc. | | | 47,718 | | | | 24,575 | |
The accompanying notes are an integral part of these financial statements.
WCM Alternatives: Event-Driven Fund
SCHEDULE OF INVESTMENTS (continued)
December 31, 2017
| | | Shares | | | Value | |
| Forum Merger Corporation | | | 105,674 | | | $ | 69,745 | |
| Modern Media Acquisition Corporation | | | 71,496 | | | | 27,883 | |
| Pensare Acquisition Corporation | | | 56,616 | | | | 28,308 | |
| TOTAL RIGHTS (Cost $154,474) | | | | | | | 206,573 | |
| | | | | | | | | |
| WARRANTS — 0.13% (a)(f) | | | | | | | | |
| Bison Capital Acquisition Corporation (b) | | | 17,769 | | | | 6,397 | |
| Black Ridge Acquisition Corporation | | | 40,778 | | | | 13,457 | |
| Borqs Technologies, Inc. (b) | | | 35,377 | | | | 6,191 | |
| CM Seven Star Acquisition Corporation (b) | | | 48,712 | | | | 14,127 | |
| Draper Oakwood Technology Acquisition, Inc. | | | 23,859 | | | | 14,554 | |
| Federal Street Acquisition Corporation | | | 4,238 | | | | 4,874 | |
| Forum Merger Corporation | | | 52,837 | | | | 35,929 | |
| Modern Media Acquisition Corporation | | | 35,748 | | | | 19,661 | |
| Pensare Acquisition Corporation | | | 28,308 | | | | 15,569 | |
| TOTAL WARRANTS (Cost $100,184) | | | | | | | 130,759 | |
| | | | | | | | | |
| | | Principal | | | | | |
| | | Amount | | | | | |
| CONVERTIBLE BONDS — 3.10% (f) | | | | | | | | |
| Brocade Communications Systems, Inc. | | | | | | | | |
| 1.375%, 1/1/2020 | | $ | 1,132,000 | | | | 1,151,810 | |
| Caesars Entertainment Corporation | | | | | | | | |
| 5.000%, 10/1/2024 (e) | | | 251,397 | | | | 487,553 | |
| Impax Laboratories, Inc. | | | | | | | | |
| 2.000%, 6/15/2022 | | | 1,486,000 | | | | 1,448,850 | |
| TOTAL CONVERTIBLE BONDS (Cost $2,856,302) | | | | | | | 3,088,213 | |
| | | | | | | | | |
| CORPORATE BONDS — 16.29% (f) | | | | | | | | |
| Dynegy, Inc. | | | | | | | | |
| 5.875%, 6/1/2023 | | | 601,000 | | | | 611,517 | |
| Enbridge, Inc. | | | | | | | | |
| 6.000% (Fixed at 6.000% until 2027), | | | | | | | | |
| 1/15/2077 (b)(e)(k) | | | 1,252,000 | | | | 1,305,210 | |
| Energy Future Intermediate | | | | | | | | |
| Holding Company LLC | | | | | | | | |
| 11.000%, 10/1/2021 (h) | | | 85,690 | | | | 123,394 | |
| 11.750%, 3/1/2022 (h)(i) | | | 1,120,317 | | | | 1,722,487 | |
| General Cable Corporation | | | | | | | | |
| 5.750%, 10/1/2022 (e) | | | 1,429,000 | | | | 1,487,946 | |
| GenOn Americas Generation LLC | | | | | | | | |
| 9.125%, 5/1/2031 (h) | | | 3,903,000 | | | | 3,756,637 | |
The accompanying notes are an integral part of these financial statements.
WCM Alternatives: Event-Driven Fund
SCHEDULE OF INVESTMENTS (continued)
December 31, 2017
| | | Principal | | | | |
| | | Amount | | | Value | |
| Rite Aid Corporation | | | | | | |
| 9.250%, 3/15/2020 (e) | | $ | 1,136,000 | | | $ | 1,154,233 | |
| 6.750%, 6/15/2021 (e) | | | 1,136,000 | | | | 1,136,000 | |
| Sinclair Television Group, Inc. | | | | | | | | |
| 6.125%, 10/1/2022 (e) | | | 1,125,000 | | | | 1,162,969 | |
| Terraform Global Operating, LLC | | | | | | | | |
| 9.750%, 8/15/2022 (e)(i) | | | 1,763,000 | | | | 1,959,134 | |
| Time, Inc. | | | | | | | | |
| 5.750%, 4/15/2022 (i) | | | 894,000 | | | | 936,465 | |
| T-Mobile USA, Inc. | | | | | | | | |
| 6.836%, 4/28/2023 | | | 748,000 | | | | 785,400 | |
| Tribune Media Company | | | | | | | | |
| 5.875%, 7/15/2022 | | | 77,000 | | | | 79,503 | |
| TOTAL CORPORATE BONDS (Cost $16,099,547) | | | | | | | 16,220,895 | |
| | | | | | | | | | |
| | | Contracts | | | | | | | |
| | | (100 shares | | | Notional | | | | |
| | | per contract) | | | Amount | | | | |
| PURCHASED CALL OPTIONS — 0.00% | | | | | | | | | |
| SPDR S&P 500 ETF Trust | | | | | | | | | |
| Expiration: February 2018, | | | | | | | | | |
| Exercise Price: $275.00 | | | 114 | | | $ | 3,042,204 | | | | 3,990 | |
| | | | | | | | | | | | 3,990 | |
| | | | | | | | | | |
| PURCHASED PUT OPTIONS — 0.16% | | | | | | | | | |
| American International Group, Inc. | | | | | | | | | |
| Expiration: January 2018, | | | | | | | | | |
| Exercise Price: $52.50 | | | 633 | | | | 3,771,414 | | | | 1,899 | |
| Expiration: January 2018, | | | | | | | | | | | | |
| Exercise Price: $60.00 | | | 14 | | | | 83,412 | | | | 1,400 | |
| Aptiv plc | | | | | | | | | | | | |
| Expiration: January 2018, | | | | | | | | | | | | |
| Exercise Price: $80.00 (f)(l) | | | 501 | | | | 4,249,983 | | | | 1,252 | |
| Atlas Copco AB Class A | | | | | | | | | | | | |
| Expiration: January 2018, | | | | | | | | | | | | |
| Exercise Price: SEK 310.00 (b)(f) | | | 119 | | | | 513,827 | | | | 435 | |
| Expiration: January 2018, | | | | | | | | | | | | |
| Exercise Price: SEK 320.00 (b)(f) | | | 360 | | | | 1,554,437 | | | | 1,646 | |
| CBS Corporation Class B | | | | | | | | | | | | |
| Expiration: January 2018, | | | | | | | | | | | | |
| Exercise Price: $52.50 | | | 633 | | | | 3,734,700 | | | | 6,963 | |
The accompanying notes are an integral part of these financial statements.
WCM Alternatives: Event-Driven Fund
SCHEDULE OF INVESTMENTS (continued)
December 31, 2017
| | | Contracts | | | | | | | |
| | | (100 shares | | | Notional | | | | |
| | | per contract) | | | Amount | | | Value | |
| CSX Corporation | | | | | | | | | |
| Expiration: January 2018, | | | | | | | | | |
| Exercise Price: $45.00 | | | 540 | | | $ | 2,970,540 | | | $ | 3,780 | |
| Dover Corporation | | | | | | | | | | | | |
| Expiration: January 2018, | | | | | | | | | | | | |
| Exercise Price: $85.00 | | | 100 | | | | 1,009,900 | | | | 500 | |
| DowDuPont, Inc. | | | | | | | | | | | | |
| Expiration: January 2018, | | | | | | | | | | | | |
| Exercise Price: $65.00 | | | 325 | | | | 2,314,650 | | | | 1,950 | |
| Expiration: February 2018, | | | | | | | | | | | | |
| Exercise Price: $65.00 | | | 590 | | | | 4,201,980 | | | | 24,190 | |
| DXC Technology Company | | | | | | | | | | | | |
| Expiration: March 2018, | | | | | | | | | | | | |
| Exercise Price: $80.00 | | | 178 | | | | 1,689,220 | | | | 9,345 | |
| EQT Corporation | | | | | | | | | | | | |
| Expiration: January 2018, | | | | | | | | | | | | |
| Exercise Price: $50.00 | | | 183 | | | | 1,041,636 | | | | 915 | |
| General Electric Company | | | | | | | | | | | | |
| Expiration: January 2018, | | | | | | | | | | | | |
| Exercise Price: $17.00 | | | 334 | | | | 582,830 | | | | 6,346 | |
| Huntsman Corporation | | | | | | | | | | | | |
| Expiration: January 2018, | | | | | | | | | | | | |
| Exercise Price: $23.00 | | | 108 | | | | 359,532 | | | | 270 | |
| Expiration: January 2018, | | | | | | | | | | | | |
| Exercise Price: $25.00 | | | 476 | | | | 1,584,604 | | | | 1,190 | |
| Expiration: January 2018, | | | | | | | | | | | | |
| Exercise Price: $26.00 | | | 798 | | | | 2,656,542 | | | | 1,995 | |
| ILG, Inc. | | | | | | | | | | | | |
| Expiration: March 2018, | | | | | | | | | | | | |
| Exercise Price: $26.00 | | | 326 | | | | 928,448 | | | | 21,353 | |
| Johnson Controls International plc | | | | | | | | | | | | |
| Expiration: January 2018, | | | | | | | | | | | | |
| Exercise Price: $36.00 (b) | | | 813 | | | | 3,098,343 | | | | 12,195 | |
| Marriott Vacations Worldwide Corporation | | | | | | | | | | | | |
| Expiration: January 2018, | | | | | | | | | | | | |
| Exercise Price: $130.00 | | | 70 | | | | 946,470 | | | | 8,575 | |
| Materials Select Sector SPDR Trust | | | | | | | | | | | | |
| Expiration: January 2018, | | | | | | | | | | | | |
| Exercise Price: $60.00 | | | 54 | | | | 326,862 | | | | 2,160 | |
The accompanying notes are an integral part of these financial statements.
WCM Alternatives: Event-Driven Fund
SCHEDULE OF INVESTMENTS (continued)
December 31, 2017
| | | Contracts | | | | | | | |
| | | (100 shares | | | Notional | | | | |
| | | per contract) | | | Amount | | | Value | |
| QUALCOMM, Inc. | | | | | | | | | |
| Expiration: January 2018, | | | | | | | | | |
| Exercise Price: $60.00 | | | 25 | | | $ | 160,050 | | | $ | 375 | |
| SPDR S&P 500 ETF Trust | | | | | | | | | | | | |
| Expiration: February 2018, | | | | | | | | | | | | |
| Exercise Price: $268.00 | | | 123 | | | | 3,282,378 | | | | 45,510 | |
| Twenty-First Century Fox, Inc. Class B | | | | | | | | | | | | |
| Expiration: January 2018, | | | | | | | | | | | | |
| Exercise Price: $26.00 | | | 539 | | | | 1,839,068 | | | | 1,348 | |
| VanEck Vectors Semiconductor ETF | | | | | | | | | | | | |
| Expiration: January 2018, | | | | | | | | | | | | |
| Exercise Price: $90.00 | | | 101 | | | | 987,881 | | | | 2,222 | |
| | | | | | | | | | | | 157,814 | |
| TOTAL PURCHASED OPTIONS (Cost $443,551) | | | | | | | | | | | 161,804 | |
| | | Principal | | | | |
| | | Amount | | | | |
| ESCROW NOTES — 0.22% (a) | | | | | | |
| AMR Corporation (d)(g) | | $ | 28,850 | | | | 46,160 | |
| Impax Laboratories, Inc. (f) | | | 494,000 | | | | 3,132 | |
| Winthrop Realty Trust (d)(e)(g) | | | 26,484 | | | | 172,146 | |
| TOTAL ESCROW NOTES (Cost $254,660) | | | | | | | 221,438 | |
| | | | | | | | | |
| | | Shares | | | | | |
| SHORT-TERM INVESTMENTS — 39.22% | | | | | | | | |
| MONEY MARKET FUNDS — 5.94% (c) | | | | | | | | |
| The Government & Agency Portfolio, | | | | | | | | |
| Institutional Share Class, 1.18% | | | 20,308 | | | | 20,308 | |
| JPMorgan Prime Money Market Fund, | | | | | | | | |
| Institutional Share Class, 1.45% | | | 970,463 | | | | 970,556 | |
| JPMorgan U.S. Government Money Market | | | | | | | | |
| Fund, Institutional Share Class, 1.19% | | | 4,824,000 | | | | 4,824,000 | |
| Morgan Stanley Institutional Liquidity Fund — | | | | | | | | |
| Government Portfolio, | | | | | | | | |
| Institutional Share Class, 1.20% | | | 96,263 | | | | 96,262 | |
| | | | | | | | 5,911,126 | |
The accompanying notes are an integral part of these financial statements.
WCM Alternatives: Event-Driven Fund
SCHEDULE OF INVESTMENTS (continued)
December 31, 2017
| | | Principal | | | | |
| | | Amount | | | Value | |
| U.S. TREASURY BILLS — 33.28% (e)(f) | | | | | | |
| United States Treasury Bills | | | | | | |
| 1.05%, 1/4/2018 | | $ | 100,000 | | | $ | 99,994 | |
| 1.05%, 1/11/2018 | | | 1,900,000 | | | | 1,899,443 | |
| 1.07%, 1/25/2018 | | | 1,000,000 | | | | 999,217 | |
| 1.10%, 2/1/2018 | | | 1,600,000 | | | | 1,598,319 | |
| 1.03%, 2/15/2018 | | | 900,000 | | | | 898,644 | |
| 1.04%, 2/22/2018 | | | 1,000,000 | | | | 998,215 | |
| 1.15%, 3/1/2018 | | | 3,970,000 | | | | 3,961,893 | |
| 1.09%, 3/8/2018 | | | 300,000 | | | | 299,302 | |
| 1.09%, 3/15/2018 | | | 700,000 | | | | 698,194 | |
| 1.11%, 3/22/2018 | | | 300,000 | | | | 299,111 | |
| 1.12%, 3/29/2018 | | | 2,700,000 | | | | 2,691,204 | |
| 1.16%, 4/5/2018 | | | 1,300,000 | | | | 1,295,353 | |
| 1.18%, 4/12/2018 | | | 300,000 | | | | 298,846 | |
| 1.18%, 4/19/2018 | | | 2,600,000 | | | | 2,589,258 | |
| 1.30%, 5/10/2018 | | | 2,900,000 | | | | 2,885,358 | |
| 1.35%, 5/24/2018 | | | 4,500,000 | | | | 4,474,418 | |
| 1.37%, 6/7/2018 | | | 3,200,000 | | | | 3,179,720 | |
| 1.40%, 6/14/2018 | | | 1,200,000 | | | | 1,192,095 | |
| 1.43%, 6/21/2018 | | | 1,800,000 | | | | 1,787,293 | |
| 1.45%, 6/28/2018 | | | 1,000,000 | | | | 992,613 | |
| | | | | | | | 33,138,490 | |
| TOTAL SHORT-TERM INVESTMENTS | | | | | | | | |
| (Cost $39,060,741) | | | | | | | 39,049,616 | |
| TOTAL LONG INVESTMENTS | | | | | | | | |
| (Cost $101,660,837) — 102.42% | | | | | | | 102,000,396 | |
| | | | | | | | | |
| | | Shares | | | | | |
| SHORT INVESTMENTS — (13.50)% | | | | | | | | |
| | | | | | | | | |
| COMMON STOCKS — (13.50)% | | | | | | | | |
| | | | | | | | | |
| AEROSPACE & DEFENSE — (0.93)% | | | | | | | | |
| United Technologies Corporation | | | (7,297 | ) | | | (930,878 | ) |
| | | | | | | | | |
| AIRLINES — (0.08)% | | | | | | | | |
| American Airlines Group, Inc. | | | (1,443 | ) | | | (75,079 | ) |
| | | | | | | | | |
| BROADCASTING — (0.70)% | | | | | | | | |
| Discovery Communications, Inc. Class C | | | (31,468 | ) | | | (666,178 | ) |
| Sinclair Broadcast Group, Inc. Class A | | | (783 | ) | | | (29,636 | ) |
| | | | | | | | (695,814 | ) |
The accompanying notes are an integral part of these financial statements.
WCM Alternatives: Event-Driven Fund
SCHEDULE OF INVESTMENTS (continued)
December 31, 2017
| | | Shares | | | Value | |
| CABLE & SATELLITE — (2.77)% | | | | | | |
| Sirius XM Holdings, Inc. | | | (514,633 | ) | | $ | (2,758,433 | ) |
| | | | | | | | |
| DATA PROCESSING & | | | | | | | |
| OUTSOURCED SERVICES — (0.14)% | | | | | | | |
| Vantiv, Inc. Class A (f) | | | (1,862 | ) | | | (137,099 | ) |
| | | | | | | | | |
| DRUG RETAIL — (1.01)% | | | | | | | | |
| CVS Health Corporation | | | (13,853 | ) | | | (1,004,342 | ) |
| | | | | | | | | |
| HOMEBUILDING — (1.65)% | | | | | | | | |
| Lennar Corporation Class A | | | (25,579 | ) | | | (1,617,616 | ) |
| Lennar Corporation Class B | | | (510 | ) | | | (26,357 | ) |
| | | | | | | | (1,643,973 | ) |
| | | | | | | | | |
| HOTELS, RESORTS & CRUISE LINES — (0.04)% | | | | | | | | |
| Marriott Vacations Worldwide Corporation | | | (282 | ) | | | (38,129 | ) |
| | | | | | | | | |
| INDEPENDENT POWER PRODUCERS | | | | | | | | |
| & ENERGY TRADERS — (0.47)% | | | | | | | | |
| Vistra Energy Corporation | | | (25,344 | ) | | | (464,302 | ) |
| | | | | | | | | |
| INDUSTRIAL GASES — (0.04)% | | | | | | | | |
| Praxair, Inc. (f) | | | (270 | ) | | | (41,753 | ) |
| | | | | | | | | |
| INTEGRATED TELECOMMUNICATION | | | | | | | | |
| SERVICES — (3.14)% | | | | | | | | |
| AT&T, Inc. | | | (80,346 | ) | | | (3,123,852 | ) |
| | | | | | | | | |
| INTERNET SOFTWARE & SERVICES — (0.75)% | | | | | | | | |
| Alibaba Group Holding Ltd. — ADR | | | (4,356 | ) | | | (751,105 | ) |
| | | | | | | | | |
| MOVIES & ENTERTAINMENT — (0.79)% | | | | | | | | |
| News Corporation Class B | | | (47,456 | ) | | | (787,770 | ) |
| | | | | | | | | |
| OIL & GAS DRILLING — (0.08)% | | | | | | | | |
| Transocean, Ltd. (b)(f) | | | (7,809 | ) | | | (82,893 | ) |
| | | | | | | | | |
| SEMICONDUCTORS — (0.91)% | | | | | | | | |
| Marvell Technology Group Ltd. (b) | | | (42,199 | ) | | | (906,013 | ) |
| | | | | | | | | |
| TOTAL COMMON STOCKS | | | | | | | | |
| (Proceeds $11,688,708) | | | | | | | (13,441,435 | ) |
| TOTAL SHORT INVESTMENTS | | | | | | | | |
| (Proceeds $11,688,708) — (13.50)% | | | | | | | (13,441,435 | ) |
| TOTAL NET INVESTMENTS | | | | | | | | |
| (Cost $89,972,129) — 88.92% | | | | | | | 88,558,961 | |
| OTHER ASSETS IN EXCESS | | | | | | | | |
| OF LIABILITIES — 11.08% | | | | | | | 11,030,029 | |
| TOTAL NET ASSETS — 100.00% | | | | | | $ | 99,588,990 | |
The accompanying notes are an integral part of these financial statements.
WCM Alternatives: Event-Driven Fund
SCHEDULE OF INVESTMENTS (continued)
December 31, 2017
ADR – American Depository Receipt
ETF – Exchange-Traded Fund
LIBOR – London Interbank Offered Rate
plc – Public Limited Company
REITs – Real Estate Investment Trusts
SEK – Swedish Krona
| (a) | Non-income producing security. |
| (b) | Foreign security. |
| (c) | The rate quoted is the annualized seven-day yield as of December 31, 2017. |
| (d) | Security fair valued by the Valuation Group in good faith in accordance with the policies adopted by the Board of Trustees. |
| (e) | All or a portion of the shares have been committed as collateral for open securities sold short, written option contracts, swap contracts, and forward currency exchange contracts. |
| (f) | Level 2 Security. Please see Note 2 in the Notes to the Financial Statements for more information. |
| (g) | Level 3 Security. Please see Note 2 in the Notes to the Financial Statements for more information. |
| (h) | Default or other conditions exist and the security is not presently accruing income. |
| (i) | Security exempt from registration under Rule 144A of the Securities Act of 1933. These securities may be resold in transactions exempt from registration normally to qualified institutional buyers. As of December 31, 2017, these securities represent 4.64% of total net assets. |
| (j) | Restricted security. The Fund may own investment securities that have other legal or contractual limitations, and thus are restricted as to resale. These securities are valued by the Valuation Group under the supervision of the Board of Trustees. As of December 31, 2017, this common stock had a cost of $983,662 and its market value represented 1.01% of total net assets. The Fund’s adviser perfected its appraisal rights over this security as of 6/20/2016. Please see Note 2 in the Notes to the Financial Statements for more information. |
| (k) | The coupon rate shown on variable rate securities represents the rate as of December 31, 2017. |
| (l) | As a result of a corporate action on the underlying holding, the option’s underlying security is 100 shares of Aptiv plc, 33 shares of Delphi Technologies plc, and cash in lieu of fractional shares. |
The Global Industry Classification Standard (GICS®) was developed by and/or is the exclusive property of MSCI, Inc. and Standard & Poor’s Financial Services LLC (“S&P”). GICS is a service mark of MSCI and S&P and has been licensed for use by U.S. Bancorp Fund Services, LLC.
The accompanying notes are an integral part of these financial statements.
The Merger Fund
SCHEDULE OF OPTIONS WRITTEN
December 31, 2017
| | | Contracts | | | | | | | |
| | | (100 shares | | | Notional | | | | |
| | | per contract) | | | Amount | | | Value | |
| CALL OPTIONS WRITTEN | | | | | | | | | |
| Advanced Accelerator Applications SA | | | | | | | | | |
| Expiration: January 2018, | | | | | | | | | |
| Exercise Price: $85.00 | | | 776 | | | $ | 6,333,712 | | | $ | 5,820 | |
| American International Group, Inc. | | | | | | | | | | | |
| Expiration: January 2018, | | | | | | | | | | | |
| Exercise Price: $60.00 | | | 3,847 | | | | 22,920,426 | | | | 261,596 | |
| DowDuPont, Inc. | | | | | | | | | | | | |
| Expiration: January 2018, | | | | | | | | | | | | |
| Exercise Price: $72.50 | | | 795 | | | | 5,661,990 | | | | 43,725 | |
| Expiration: February 2018, | | | | | | | | | | | | |
| Exercise Price: $70.00 | | | 12,229 | | | | 87,094,938 | | | | 3,534,181 | |
| GGP, Inc. | | | | | | | | | | | | |
| Expiration: January 2018, | | | | | | | | | | | | |
| Exercise Price: $23.00 | | | 10,126 | | | | 23,684,714 | | | | 880,962 | |
| Huntsman Corporation | | | | | | | | | | | | |
| Expiration: January 2018, | | | | | | | | | | | | |
| Exercise Price: $27.00 | | | 2,162 | | | | 7,197,298 | | | | 1,448,540 | |
| Expiration: January 2018, | | | | | | | | | | | | |
| Exercise Price: $29.00 | | | 11,767 | | | | 39,172,343 | | | | 5,177,480 | |
| QUALCOMM, Inc. | | | | | | | | | | | | |
| Expiration: January 2018, | | | | | | | | | | | | |
| Exercise Price: $67.50 | | | 909 | | | | 5,819,418 | | | | 18,180 | |
| SPDR S&P 500 ETF Trust | | | | | | | | | | | | |
| Expiration: February 2018, | | | | | | | | | | | | |
| Exercise Price: $270.00 | | | 2,758 | | | | 73,599,988 | | | | 478,513 | |
| Twenty-First Century Fox, Inc. Class B | | | | | | | | | | | | |
| Expiration: January 2018, | | | | | | | | | | | | |
| Exercise Price: $31.00 | | | 8,913 | | | | 30,411,156 | | | | 3,164,115 | |
| | | | | | | | | | | | 15,013,112 | |
The accompanying notes are an integral part of these financial statements.
The Merger Fund
SCHEDULE OF OPTIONS WRITTEN (continued)
December 31, 2017
| | | Contracts | | | | | | | |
| | | (100 shares | | | Notional | | | | |
| | | per contract) | | | Amount | | | Value | |
| PUT OPTIONS WRITTEN | | | | | | | | | |
| Lennar Corporation Class A | | | | | | | | | |
| Expiration: February 2018, | | | | | | | | | |
| Exercise Price: $55.00 (a) | | | 1,058 | | | $ | 6,690,792 | | | $ | 10,580 | |
| Marriott Vacations Worldwide Corporation | | | | | | | | | | | | |
| Expiration: January 2018, | | | | | | | | | | | | |
| Exercise Price: $115.00 | | | 816 | | | | 11,033,136 | | | | 8,160 | |
| VanEck Vectors Semiconductor ETF | | | | | | | | | | | | |
| Expiration: January 2018, | | | | | | | | | | | | |
| Exercise Price: $80.00 | | | 2,270 | | | | 22,202,870 | | | | 4,540 | |
| | | | | | | | | | | | 23,280 | |
| TOTAL OPTIONS WRITTEN | | | | | | | | | | | | |
| (Premiums received $10,014,699) | | | | | | | | | | $ | 15,036,392 | |
ETF – Exchange-Traded Fund
| (a) | As a result of a corporate action on the underlying holding, the option’s underlying security is 100 shares of Lennar Corporation Class A and 2 shares of Lennar Corporation Class B. |
The accompanying notes are an integral part of these financial statements.
WCM Alternatives: Event-Driven Fund
SCHEDULE OF OPTIONS WRITTEN
December 31, 2017
| | | Contracts | | | | | | | |
| | | (100 shares | | | Notional | | | | |
| | | per contract) | | | Amount | | | Value | |
| CALL OPTIONS WRITTEN | | | | | | | | | |
| Advanced Accelerator Applications SA | | | | | | | | | |
| Expiration: January 2018, | | | | | | | | | |
| Exercise Price: $85.00 | | | 61 | | | $ | 497,882 | | | $ | 457 | |
| American International Group, Inc. | | | | | | | | | | | | |
| Expiration: January 2018, | | | | | | | | | | | | |
| Exercise Price: $60.00 | | | 545 | | | | 3,247,110 | | | | 37,060 | |
| Expiration: January 2018, | | | | | | | | | | | | |
| Exercise Price: $65.00 | | | 102 | | | | 607,716 | | | | 204 | |
| Atlas Copco AB Class A | | | | | | | | | | | | |
| Expiration: January 2018, | | | | | | | | | | | | |
| Exercise Price: SEK 350.00 (a)(b) | | | 360 | | | | 1,554,437 | | | | 36,425 | |
| CBS Corporation Class B | | | | | | | | | | | | |
| Expiration: January 2018, | | | | | | | | | | | | |
| Exercise Price: $57.50 | | | 391 | | | | 2,306,900 | | | | 90,321 | |
| Expiration: January 2018, | | | | | | | | | | | | |
| Exercise Price: $60.00 | | | 84 | | | | 495,600 | | | | 8,148 | |
| CSX Corporation | | | | | | | | | | | | |
| Expiration: January 2018, | | | | | | | | | | | | |
| Exercise Price: $50.00 | | | 135 | | | | 742,635 | | | | 72,563 | |
| DowDuPont, Inc. | | | | | | | | | | | | |
| Expiration: January 2018, | | | | | | | | | | | | |
| Exercise Price: $70.00 | | | 325 | | | | 2,314,650 | | | | 65,000 | |
| Expiration: January 2018, | | | | | | | | | | | | |
| Exercise Price: $72.50 | | | 31 | | | | 220,782 | | | | 1,705 | |
| Expiration: February 2018, | | | | | | | | | | | | |
| Exercise Price: $70.00 | | | 656 | | | | 4,672,032 | | | | 189,584 | |
| DXC Technology Company | | | �� | | | | | | | | | |
| Expiration: March 2018, | | | | | | | | | | | | |
| Exercise Price: $90.00 | | | 198 | | | | 1,879,020 | | | | 145,530 | |
| EQT Corporation | | | | | | | | | | | | |
| Expiration: January 2018, | | | | | | | | | | | | |
| Exercise Price: $55.00 | | | 183 | | | | 1,041,636 | | | | 51,240 | |
| GGP, Inc. | | | | | | | | | | | | |
| Expiration: January 2018, | | | | | | | | | | | | |
| Exercise Price: $23.00 | | | 418 | | | | 977,702 | | | | 36,366 | |
The accompanying notes are an integral part of these financial statements.
WCM Alternatives: Event-Driven Fund
SCHEDULE OF OPTIONS WRITTEN (continued)
December 31, 2017
| | | Contracts | | | | | | | |
| | | (100 shares | | | Notional | | | | |
| | | per contract) | | | Amount | | | Value | |
| Huntsman Corporation | | | | | | | | | |
| Expiration: January 2018, | | | | | | | | | |
| Exercise Price: $28.00 | | | 97 | | | $ | 322,913 | | | $ | 53,835 | |
| Expiration: January 2018, | | | | | | | | | | | | |
| Exercise Price: $29.00 | | | 541 | | | | 1,800,989 | | | | 238,040 | |
| Expiration: January 2018, | | | | | | | | | | | | |
| Exercise Price: $32.00 | | | 65 | | | | 216,385 | | | | 11,505 | |
| ILG, Inc. | | | | | | | | | | | | |
| Expiration: March 2018, | | | | | | | | | | | | |
| Exercise Price: $29.00 | | | 363 | | | | 1,033,824 | | | | 50,820 | |
| QUALCOMM, Inc. | | | | | | | | | | | | |
| Expiration: January 2018, | | | | | | | | | | | | |
| Exercise Price: $70.00 | | | 25 | | | | 160,050 | | | | 325 | |
| SPDR S&P 500 ETF Trust | | | | | | | | | | | | |
| Expiration: February 2018, | | | | | | | | | | | | |
| Exercise Price: $270.00 | | | 114 | | | | 3,042,204 | | | | 19,779 | |
| | | | | | | | | | | | 1,108,907 | |
| PUT OPTIONS WRITTEN | | | | | | | | | | | | |
| Aptiv plc | | | | | | | | | | | | |
| Expiration: January 2018, | | | | | | | | | | | | |
| Exercise Price: $92.50 (b)(d) | | | 504 | | | | 4,275,432 | | | | 22,680 | |
| Atlas Copco AB Class A | | | | | | | | | | | | |
| Expiration: January 2018, | | | | | | | | | | | | |
| Exercise Price: SEK 340.00 (a)(b) | | | 119 | | | | 513,828 | | | | 2,974 | |
| CSX Corporation | | | | | | | | | | | | |
| Expiration: January 2018, | | | | | | | | | | | | |
| Exercise Price: $50.00 | | | 405 | | | | 2,227,905 | | | | 10,530 | |
| Dover Corporation | | | | | | | | | | | | |
| Expiration: January 2018, | | | | | | | | | | | | |
| Exercise Price: $95.00 | | | 100 | | | | 1,009,900 | | | | 3,500 | |
| Huntsman Corporation | | | | | | | | | | | | |
| Expiration: January 2018, | | | | | | | | | | | | |
| Exercise Price: $29.00 | | | 334 | | | | 1,111,886 | | | | 835 | |
| Expiration: January 2018, | | | | | | | | | | | | |
| Exercise Price: $30.00 | | | 334 | | | | 1,111,886 | | | | 2,505 | |
| Johnson Controls International plc | | | | | | | | | | | | |
| Expiration: January 2018, | | | | | | | | | | | | |
| Exercise Price: $40.00 (a) | | | 638 | | | | 2,431,418 | | | | 127,600 | |
| | | | | | | | | | | | | |
The accompanying notes are an integral part of these financial statements.
WCM Alternatives: Event-Driven Fund
SCHEDULE OF OPTIONS WRITTEN (continued)
December 31, 2017
| | | Contracts | | | | | | | |
| | | (100 shares | | | Notional | | | | |
| | | per contract) | | | Amount | | | Value | |
| Lennar Corporation Class A | | | | | | | | | |
| Expiration: February 2018, | | | | | | | | | |
| Exercise Price: $55.00 (c) | | | 51 | | | $ | 322,524 | | | $ | 510 | |
| Marriott Vacations Worldwide Corporation | | | | | | | | | | | | |
| Expiration: January 2018, | | | | | | | | | | | | |
| Exercise Price: $115.00 | | | 70 | | | | 946,470 | | | | 700 | |
| VanEck Vectors Semiconductor ETF | | | | | | | | | | | | |
| Expiration: January 2018, | | | | | | | | | | | | |
| Exercise Price: $80.00 | | | 101 | | | | 987,881 | | | | 202 | |
| | | | | | | | | | | | 172,036 | |
| TOTAL OPTIONS WRITTEN | | | | | | | | | | | | |
| (Premiums received $1,448,551) | | | | | | | | | | $ | 1,280,943 | |
ETF – Exchange-Traded Fund
SEK – Swedish Krona
| (a) | Foreign security. |
| (b) | Level 2 Security. Please see Note 2 in the Notes to the Financial Statements for more information. |
| (c) | As a result of a corporate action on the underlying holding, the option’s underlying security is 100 shares of Lennar Corporation Class A and 2 shares of Lennar Corporation Class B. |
| (d) | As a result of a corporate action on the underlying holding, the option’s underlying security is 100 shares of Aptiv plc, 33 shares of Delphi Technologies plc, and cash in lieu of fractional shares. |
The accompanying notes are an integral part of these financial statements.
The Merger Fund
SCHEDULE OF FORWARD CURRENCY EXCHANGE CONTRACTS
December 31, 2017
| | | | | | | | USD Value at | | | | | | | USD Value at | | | Unrealized | |
| Settlement | | | Currency to | | December 31, | | | Currency to | | December 31, | | | Appreciation | |
Date | Counterparty | | be Delivered | | 2017 | | | be Received | | 2017 | | | (Depreciation)* | |
| 5/15/18 | JPM | | | 12,809,215 | | AUD | | $ | 9,991,906 | | | | 9,822,618 | | USD | | $ | 9,822,618 | | | $ | (169,288 | ) |
| 2/20/18 | JPM | | | 369,971,580 | | DKK | | | 59,826,393 | | | | 58,941,478 | | USD | | | 58,941,478 | | | | (884,915 | ) |
| 3/20/18 | JPM | | | 52,286,814 | | EUR | | | 63,046,256 | | | | 62,432,547 | | USD | | | 62,432,547 | | | | (613,709 | ) |
| 8/15/18 | JPM | | | 20,469,360 | | EUR | | | 24,935,583 | | | | 24,678,188 | | USD | | | 24,678,188 | | | | (257,395 | ) |
| 1/3/18 | JPM | | | 37,756,282 | | GBP | | | 50,984,650 | | | | 50,367,884 | | USD | | | 50,367,884 | | | | (616,766 | ) |
| 1/24/18 | JPM | | | 13,663,466 | | GBP | | | 18,483,126 | | | | 18,017,163 | | USD | | | 18,017,163 | | | | (465,963 | ) |
| 3/21/18 | JPM | | | 6,265,263 | | GBP | | | 8,482,390 | | | | 8,407,903 | | USD | | | 8,407,903 | | | | (74,487 | ) |
| 6/15/18 | JPM | | | 4,330,729 | | GBP | | | 5,881,690 | | | | 5,843,384 | | USD | | | 5,843,384 | | | | (38,306 | ) |
| 7/13/18 | JPM | | | 78,925,689 | | GBP | | | 107,307,902 | | | | 106,899,762 | | USD | | | 106,899,762 | | | | (408,140 | ) |
| 7/13/18 | JPM | | | 1,183,920 | | USD | | | 1,183,920 | | | | 880,500 | | GBP | | | 1,197,134 | | | | 13,214 | |
| 3/15/18 | JPM | | | 475,832,060 | | JPY | | | 4,239,502 | | | | 4,245,468 | | USD | | | 4,245,468 | | | | 5,966 | |
| 1/22/18 | JPM | | | 19,549,582 | | SGD | | | 14,622,956 | | | | 14,519,137 | | USD | | | 14,519,137 | | | | (103,819 | ) |
| | | | | | | | | $ | 368,986,274 | | | | | | | | $ | 365,372,666 | | | $ | (3,613,608 | ) |
AUD – Australian Dollar
DKK – Danish Krone
EUR – Euro
GBP – British Pound
JPM – JPMorgan Chase & Co., Inc.
JPY – Japanese Yen
SGD – Singapore Dollar
USD – U.S. Dollar
| * | Net unrealized appreciation (depreciation) is a receivable (payable). |
The accompanying notes are an integral part of these financial statements.
WCM Alternatives: Event-Driven Fund
SCHEDULE OF FORWARD CURRENCY EXCHANGE CONTRACTS
December 31, 2017
| | | | | | | | USD Value at | | | | | | | USD Value at | | | Unrealized | |
| Settlement | | | Currency to | | December 31, | | | Currency to | | December 31, | | | Appreciation | |
Date | Counterparty | | be Delivered | | 2017 | | | be Received | | 2017 | | | (Depreciation)* | |
| 5/15/18 | JPM | | | 655,184 | | AUD | | $ | 511,080 | | | | 502,421 | | USD | | $ | 502,421 | | | $ | (8,659 | ) |
| 2/20/18 | JPM | | | 17,076,510 | | DKK | | | 2,761,364 | | | | 2,720,664 | | USD | | | 2,720,664 | | | | (40,700 | ) |
| 3/20/18 | JPM | | | 2,420,192 | | EUR | | | 2,918,213 | | | | 2,889,806 | | USD | | | 2,889,806 | | | | (28,407 | ) |
| 8/15/18 | JPM | | | 1,279,794 | | EUR | | | 1,559,033 | | | | 1,546,235 | | USD | | | 1,546,235 | | | | (12,798 | ) |
| 1/3/18 | JPM | | | 1,738,376 | | GBP | | | 2,347,437 | | | | 2,320,529 | | USD | | | 2,320,529 | | | | (26,908 | ) |
| 1/24/18 | JPM | | | 791,306 | | GBP | | | 1,070,431 | | | | 1,043,353 | | USD | | | 1,043,353 | | | | (27,078 | ) |
| 3/21/18 | JPM | | | 387,834 | | GBP | | | 525,079 | | | | 520,511 | | USD | | | 520,511 | | | | (4,568 | ) |
| 6/15/18 | JPM | | | 178,487 | | GBP | | | 242,408 | | | | 240,828 | | USD | | | 240,828 | | | | (1,580 | ) |
| 7/13/18 | JPM | | | 4,624,773 | | GBP | | | 6,287,873 | | | | 6,263,792 | | USD | | | 6,263,792 | | | | (24,081 | ) |
| 7/13/18 | JPM | | | 49,218 | | USD | | | 49,218 | | | | 36,604 | | GBP | | | 49,767 | | | | 549 | |
| 3/15/18 | JPM | | | 111,791,470 | | JPY | | | 996,024 | | | | 997,426 | | USD | | | 997,426 | | | | 1,402 | |
| 1/25/18 | JPM | | | 12,251,659 | | SEK | | | 1,496,142 | | | | 1,451,961 | | USD | | | 1,451,961 | | | | (44,181 | ) |
| 1/22/18 | JPM | | | 1,648,764 | | SGD | | | 1,233,265 | | | | 1,224,509 | | USD | | | 1,224,509 | | | | (8,756 | ) |
| | | | | | | | | $ | 21,997,567 | | | | | | | | $ | 21,771,802 | | | $ | (225,765 | ) |
AUD – Australian Dollar
DKK – Danish Krone
EUR – Euro
GBP – British Pound
JPM – JPMorgan Chase & Co., Inc.
JPY – Japanese Yen
SEK – Swedish Krona
SGD – Singapore Dollar
USD – U.S. Dollar
| * | Net unrealized appreciation (depreciation) is a receivable (payable). |
The accompanying notes are an integral part of these financial statements.
The Merger Fund
SCHEDULE OF SWAP CONTRACTS
December 31, 2017
| | | Termi- | Pay/Receive | | | | | | | Unrealized | |
| Counter- | | nation | on Financing | | Payment | | | Notional | | Appreciation | |
party | Security | Date | Rate | Financing Rate | Frequency | Shares | | Amount | | (Depreciation)* | |
| LONG TOTAL RETURN SWAP CONTRACTS | | | | | | | |
| JPM | Abertis Infraestructuras SA | 10/18/18 | Pay | 0.400% +3 Month LIBOR | Quarterly | 3,465,457 | | $ | 76,723,044 | | $ | 337,407 | |
| JPM | Aconex Ltd. | 12/18/18 | Pay | 0.400% +3 Month LIBOR | Quarterly | 1,642,207 | | | 9,624,637 | | | 197,226 | |
| JPM | Booker Group plc | 6/21/18 | Pay | 0.300% +3 Month LIBOR | Quarterly | 14,194,576 | | | 36,950,803 | | | 6,905,904 | |
| BAML | Gemalto NV | 12/18/18 | Pay | 0.350% +1 Month LIBOR | Monthly | 81,428 | | | 4,761,463 | | | 71,999 | |
| JPM | Gemalto NV | 12/19/18 | Pay | 0.400% +3 Month LIBOR | Quarterly | 319,932 | | | 18,816,445 | | | 179,951 | |
| JPM | Global Logistic Properties Ltd. | 10/4/18 | Pay | 0.750% +3 Month LIBOR | Quarterly | 5,783,900 | | | 14,029,353 | | | 528,965 | |
| JPM | Hitachi Kokusai Electric, Inc. | 11/10/18 | Pay | 0.400% +3 Month LIBOR | Quarterly | 147,774 | | | 4,109,629 | | | (34,703 | ) |
| JPM | Ladbrokes Coral Group plc | 12/7/18 | Pay | 0.300% +3 Month LIBOR | Quarterly | 9,476,428 | | | 22,101,731 | | | 1,153,150 | |
| BAML | Linde AG | 11/7/18 | Pay | 0.350% +1 Month LIBOR | Monthly | 288,292 | | | 56,793,042 | | | 10,546,833 | |
| JPM | Luxottica Group S.p.A | 5/10/18 | Pay | 0.400% +3 Month LIBOR | Quarterly | 2,804 | | | 163,420 | | | 8,514 | |
| JPM | Nets A/S | 9/27/18 | Pay | 0.796% +3 Month LIBOR | Quarterly | 2,242,252 | | | 57,542,536 | | | 1,370,908 | |
| JPM | Paysafe Group plc | 8/30/18 | Pay | 0.300% +3 Month LIBOR | Quarterly | 6,399,370 | | | 49,634,942 | | | 1,297,676 | |
| JPM | Sky plc | 1/19/18 | Pay | 0.300% +3 Month LIBOR | Quarterly | 7,257,577 | | | 94,812,516 | | | 4,297,387 | |
| JPM | Westfield Corporation | 12/13/18 | Pay | 0.400% +3 Month LIBOR | Quarterly | 88,300 | | | 652,740 | | | 471 | |
| JPM | Worldpay Group plc | 7/7/18 | Pay | 0.300% +3 Month LIBOR | Quarterly | 21,951,522 | | | 113,794,283 | | | 11,466,068 | |
| GS | Worldpay Group plc | 9/11/18 | Pay | 0.500% +3 Month LIBOR | Quarterly | 1,114,544 | | | 6,019,496 | | | 352,568 | |
The accompanying notes are an integral part of these financial statements.
The Merger Fund
SCHEDULE OF SWAP CONTRACTS (continued)
December 31, 2017
| | | Termi- | Pay/Receive | | | | | | | Unrealized | |
| Counter- | | nation | on Financing | | Payment | | | Notional | | Appreciation | |
party | Security | Date | Rate | Financing Rate | Frequency | Shares | | Amount | | (Depreciation)* | |
| SHORT TOTAL RETURN SWAP CONTRACTS | | | | | | | |
| JPM | Essilor International SA | 5/10/18 | Receive | (0.400)% +3 Month LIBOR | Quarterly | (1,292 | ) | $ | (168,251 | ) | $ | (9,851 | ) |
| JPM | GVC Holdings plc | 12/7/18 | Receive | (1.433)% +3 Month LIBOR | Quarterly | (1,296,152 | ) | | (16,309,016 | ) | | 122,378 | |
| JPM | Hochtief AG | 10/18/18 | Pay | (2.166)% +3 Month LIBOR | Quarterly | (12,966 | ) | | (2,300,198 | ) | | 3,327 | |
| BAML | Praxair, Inc. | 10/20/18 | Receive | (0.400)% +1 Month LIBOR | Monthly | (437,683 | ) | | (61,587,787 | ) | | (6,066,389 | ) |
| JPM | Tesco plc | 6/21/18 | Receive | (0.383)% +3 Month LIBOR | Quarterly | (12,218,874 | ) | | (28,951,677 | ) | | (5,553,408 | ) |
| JPM | Unibail-Rodamco SE | 12/13/18 | Receive | (0.700)% +3 Month LIBOR | Quarterly | (1,613 | ) | | (410,987 | ) | | 4,736 | |
| JPM | Vantiv, Inc. Class A | 8/30/18 | Receive | (0.600)% +3 Month LIBOR | Quarterly | (153,777 | ) | | (11,113,002 | ) | | (204,411 | ) |
| GS | Vantiv, Inc. Class A | 9/11/18 | Receive | (0.350)% +3 Month LIBOR | Quarterly | (74,897 | ) | | (5,302,708 | ) | | (224,318 | ) |
| | | | | | | | | | | | $ | 26,752,388 | |
BAML – Bank of America Merrill Lynch & Co., Inc.
GS – Goldman, Sachs & Co.
JPM – JPMorgan Chase & Co., Inc.
LIBOR – London Interbank Offered Rate
plc – Public Limited Company
| * | Based on the net swap value held at each counterparty, unrealized appreciation (depreciation) is a receivable (payable). |
The accompanying notes are an integral part of these financial statements.
WCM Alternatives: Event-Driven Fund
SCHEDULE OF SWAP CONTRACTS
December 31, 2017
| | | Termi- | Pay/Receive | | | | | | | Unrealized | |
| Counter- | | nation | on Financing | | Payment | | | Notional | | Appreciation | |
party | Security | Date | Rate | Financing Rate | Frequency | Shares | | Amount | | (Depreciation)* | |
| LONG TOTAL RETURN SWAP CONTRACTS | | | | | | | |
| JPM | Abertis Infraestructuras SA | 10/13/18 | Pay | 0.400% +3 Month LIBOR | Quarterly | 160,405 | | $ | 3,508,024 | | $ | 58,876 | |
| JPM | Aconex Ltd. | 12/18/18 | Pay | 0.400% +3 Month LIBOR | Quarterly | 83,998 | | | 492,293 | | | 10,062 | |
| JPM | Altaba, Inc. | 6/19/18 | Pay | 0.638% +3 Month LIBOR | Quarterly | 155,601 | | | 10,103,658 | | | 754,508 | |
| JPM | American International | | | | | | | | | | | | |
| | Group, Inc. | 8/29/18 | Pay | 0.322% +3 Month LIBOR | Quarterly | 72,900 | | | 4,372,192 | | | (31,887 | ) |
| JPM | Atlas Copco AB Class A | 10/5/18 | Pay | 0.400% +3 Month LIBOR | Quarterly | 36,037 | | | 1,523,519 | | | 31,085 | |
| JPM | Booker Group plc | 6/21/18 | Pay | 0.300% +3 Month LIBOR | Quarterly | 880,275 | | | 2,308,698 | | | 411,152 | |
| BAML | CBS Corporation Class B | 10/20/18 | Pay | 0.400% +1 Month LIBOR | Monthly | 72,506 | | | 4,183,932 | | | 91,447 | |
| JPM | Colony NorthStar, Inc. Class A | 7/11/18 | Pay | 0.450% +3 Month LIBOR | Quarterly | 109,860 | | | 1,602,577 | | | (350,617 | ) |
| BAML | DowDuPont, Inc. | 10/20/18 | Pay | 0.400% +1 Month LIBOR | Monthly | 111,241 | | | 7,926,589 | | | (8,691 | ) |
| BAML | Gemalto NV | 12/18/18 | Pay | 0.350% +1 Month LIBOR | Monthly | 3,362 | | | 196,591 | | | 2,993 | |
| JPM | Gemalto NV | 12/19/18 | Pay | 0.400% +3 Month LIBOR | Quarterly | 21,732 | | | 1,280,845 | | | 9,605 | |
| JPM | Global Logistic Properties Ltd. | 10/4/18 | Pay | 0.750% +3 Month LIBOR | Quarterly | 487,800 | | | 1,183,201 | | | 44,612 | |
| JPM | Hitachi Kokusai Electric, Inc. | 10/12/18 | Pay | 0.400% +3 Month LIBOR | Quarterly | 34,720 | | | 966,758 | | | (9,341 | ) |
| JPM | Huntsman Corporation | 12/18/18 | Pay | 0.300% +3 Month LIBOR | Quarterly | 73,198 | | | 2,389,761 | | | 45,467 | |
| JPM | ILG, Inc. | 5/24/18 | Pay | 0.300% +3 Month LIBOR | Quarterly | 86,632 | | | 2,400,601 | | | 64,538 | |
| JPM | Ladbrokes Coral Group plc | 12/7/18 | Pay | 0.300% +3 Month LIBOR | Quarterly | 390,563 | | | 910,833 | | | 47,590 | |
| JPM | Liberty Media Corporation- | | | | | | | | | | | | |
| | Liberty SiriusXM Class A | 5/10/18 | Pay | 0.300% +3 Month LIBOR | Quarterly | 55,034 | | | 2,171,267 | | | 9,881 | |
| BAML | Linde AG | 11/7/18 | Pay | 0.350% +1 Month LIBOR | Monthly | 12,092 | | | 2,381,908 | | | 442,568 | |
| JPM | Luxottica Group S.p.A | 5/10/18 | Pay | 0.400% +3 Month LIBOR | Quarterly | 106 | | | 6,178 | | | 322 | |
| JPM | Monsanto Company | 4/5/18 | Pay | 0.300% +3 Month LIBOR | Quarterly | 33,656 | | | 4,029,899 | | | (103,130 | ) |
| JPM | Nets A/S | 9/27/18 | Pay | 0.800% +3 Month LIBOR | Quarterly | 103,494 | | | 2,655,387 | | | 63,783 | |
| BAML | NXP Semiconductors NV | 10/20/18 | Pay | 0.400% +1 Month LIBOR | Monthly | 66,461 | | | 7,675,581 | | | 101,800 | |
| JPM | Orbital ATK, Inc. | 10/4/18 | Pay | 0.300% +3 Month LIBOR | Quarterly | 9,677 | | | 1,279,628 | | | (8,244 | ) |
| JPM | Paysafe Group plc | 8/30/18 | Pay | 0.300% +3 Month LIBOR | Quarterly | 294,640 | | | 2,285,734 | | | 59,291 | |
| JPM | Pinnacle Entertainment, Inc. | 12/18/18 | Pay | 0.300% +3 Month LIBOR | Quarterly | 15,667 | | | 487,029 | | | 25,439 | |
| BAML | Rite Aid Corporation | 10/20/18 | Pay | 0.400% +1 Month LIBOR | Monthly | 28,938 | | | 52,956 | | | 4,020 | |
| BAML | Rockwell Collins, Inc. | 12/11/18 | Pay | 0.400% +1 Month LIBOR | Monthly | 27,598 | | | 3,713,598 | | | 27,047 | |
| JPM | Scripps Networks | | | | | | | | | | | | |
| Interactive, Inc. Class A | 12/8/18 | Pay | 0.300% +3 Month LIBOR | Quarterly | 43,706 | | | 3,597,688 | | | 130,991 | |
The accompanying notes are an integral part of these financial statements.
WCM Alternatives: Event-Driven Fund
SCHEDULE OF SWAP CONTRACTS (continued)
December 31, 2017
| | | Termi- | Pay/Receive | | | | | | | Unrealized | |
| Counter- | | nation | on Financing | | Payment | | | Notional | | Appreciation | |
party | Security | Date | Rate | Financing Rate | Frequency | Shares | | Amount | | (Depreciation)* | |
| LONG TOTAL RETURN SWAP CONTRACTS (continued) | | | | | | | |
| JPM | Sky plc | 1/19/18 | Pay | 0.300% +3 Month LIBOR | Quarterly | 426,602 | | $ | 5,548,743 | | $ | 276,325 | |
| JPM | Songa Offshore SE | 9/8/18 | Pay | 0.400% +3 Month LIBOR | Quarterly | 14,858 | | | 88,105 | | | 20,842 | |
| JPM | Time Warner, Inc. | 9/27/18 | Pay | 0.300% +3 Month LIBOR | Quarterly | 17,013 | | | 1,720,887 | | | (166,242 | ) |
| BAML | Time Warner, Inc. | 10/20/18 | Pay | 0.400% +1 Month LIBOR | Monthly | 94,494 | | | 9,657,287 | | | (1,019,630 | ) |
| JPM | Twenty-First Century | | | | | | | | | | | | |
| | Fox, Inc. Class B | 12/14/18 | Pay | 0.300% +3 Month LIBOR | Quarterly | 14,143 | | | 481,742 | | | 489 | |
| JPM | Westfield Corporation | 9/27/18 | Pay | 0.400% +3 Month LIBOR | Quarterly | 3,640 | | | 26,908 | | | 19 | |
| JPM | Worldpay Group plc | 7/7/18 | Pay | 0.300% +3 Month LIBOR | Quarterly | 1,336,095 | | | 6,976,922 | | | 647,043 | |
| SHORT TOTAL RETURN SWAP CONTRACTS | | | | | | | | | |
| JPM | Alibaba Group | | | | | | | | | | | | |
| | Holding Ltd. — ADR | 1/5/18 | Receive | (0.600)% +3 Month LIBOR | Quarterly | (52,318 | ) | | (6,254,644 | ) | | (2,763,645 | ) |
| JPM | AT&T, Inc. | 9/27/18 | Receive | (0.600)% +3 Month LIBOR | Quarterly | (12,019 | ) | | (455,261 | ) | | (11,825 | ) |
| BAML | AT&T, Inc. | 10/20/18 | Receive | (0.400)% +1 Month LIBOR | Monthly | (11,551 | ) | | (412,255 | ) | | (36,705 | ) |
| JPM | Essilor International SA | 5/10/18 | Receive | (0.400)% +3 Month LIBOR | Quarterly | (49 | ) | | (6,381 | ) | | (374 | ) |
| JPM | GVC Holdings plc | 12/7/18 | Receive | (1.431)% +3 Month LIBOR | Quarterly | (53,428 | ) | | (672,196 | ) | | 4,974 | |
| JPM | Hochtief AG | 10/18/18 | Pay | (2.143)% +3 Month LIBOR | Quarterly | (639 | ) | | (113,371 | ) | | 176 | |
| JPM | Penn National Gaming, Inc. | 12/18/18 | Receive | (0.600)% +3 Month LIBOR | Quarterly | (6,580 | ) | | (187,311 | ) | | (18,776 | ) |
| BAML | Praxair, Inc. | 10/20/18 | Receive | (0.400)% +1 Month LIBOR | Monthly | (18,352 | ) | | (2,582,082 | ) | | (254,976 | ) |
| JPM | Tesco plc | 6/21/18 | Receive | (0.382)% +3 Month LIBOR | Quarterly | (757,762 | ) | | (1,807,154 | ) | | (332,745 | ) |
| JPM | Unibail-Rodamco SE | 12/13/18 | Receive | (0.700)% +3 Month LIBOR | Quarterly | (67 | ) | | (17,071 | ) | | 197 | |
| JPM | Vantiv, Inc. Class A | 8/30/18 | Receive | (0.600)% +3 Month LIBOR | Quarterly | (87,924 | ) | | (6,164,486 | ) | | (306,481 | ) |
| JPM | The Walt Disney Company | 12/14/18 | Receive | (0.600)% +3 Month LIBOR | Quarterly | (3,883 | ) | | (429,973 | ) | | 12,667 | |
| | | | | | | | | | | | $ | (2,023,500 | ) |
| | | | | | | | | | | | | | |
BAML – Bank of America Merrill Lynch & Co., Inc.
JPM – JPMorgan Chase & Co., Inc.
LIBOR – London Interbank Offered Rate
plc – Public Limited Company
| * | Based on the net swap value held at each counterparty, unrealized appreciation (depreciation) is a receivable (payable). |
The accompanying notes are an integral part of these financial statements.
The Merger Fund and WCM Alternatives: Event-Driven Fund
STATEMENTS OF ASSETS AND LIABILITIES
December 31, 2017
| | | | | | WCM Alternatives: | |
| | | The Merger Fund | | | Event-Driven Fund | |
| ASSETS: | | | | | | |
| Investments, at value (Cost $2,096,498,545 and | | | | | | |
| $101,660,837, respectively) | | $ | 2,210,281,106 | | | $ | 102,000,396 | |
| Cash | | | 4,499 | | | | 21,456 | |
| Cash held in foreign currency (Cost $158,613 | | | | | | | | |
| and $31,545, respectively) | | | 158,799 | | | | 31,519 | |
| Receivable from brokers for securities sold short | | | 504,830,612 | | | | 11,688,708 | |
| Deposits at brokers for other investments | | | 128,261,319 | | | | 2,843,285 | |
| Receivable for swap contracts | | | 26,752,388 | | | | — | |
| Receivable for investments sold | | | 119,675,217 | | | | 919,998 | |
| Dividends and interest receivable | | | 6,137,852 | | | | 341,066 | |
| Receivable for fund shares issued | | | 5,286,352 | | | | 313,205 | |
| Prepaid expenses and other receivables | | | 599,542 | | | | 30,750 | |
| Total Assets | | | 3,001,987,686 | | | | 118,190,383 | |
| | | | | | | | | |
| LIABILITIES: | | | | | | | | |
| Securities sold short, at value (Proceeds of | | | | | | | | |
| $504,830,612 and $11,688,708, respectively) | | | 639,397,481 | | | | 13,441,435 | |
| Written option contracts, at value | | | | | | | | |
| (Premiums received $10,014,699 | | | | | | | | |
| and $1,448,551, respectively) | | | 15,036,392 | | | | 1,280,943 | |
| Payable for forward currency exchange contracts | | | 3,613,608 | | | | 225,765 | |
| Payable for swap contracts | | | — | | | | 2,023,500 | |
| Payable for investments purchased | | | 21,524,655 | | | | 1,386,380 | |
| Payable for fund shares redeemed | | | 4,399,695 | | | | 42,381 | |
| Payable to the investment adviser | | | 1,902,614 | | | | 101,023 | |
| Accrued expenses and other liabilities | | | 878,327 | | | | 94,972 | |
| Distribution fees payable | | | 609,198 | | | | 1,199 | |
| Dividends and interest payable | | | 254,116 | | | | 3,795 | |
| Total Liabilities | | | 687,616,086 | | | | 18,601,393 | |
| NET ASSETS | | $ | 2,314,371,600 | | | $ | 99,588,990 | |
The accompanying notes are an integral part of these financial statements.
The Merger Fund and WCM Alternatives: Event-Driven Fund
STATEMENTS OF ASSETS AND LIABILITIES (continued)
December 31, 2017
| | | | | | WCM Alternatives: | |
| | | The Merger Fund | | | Event-Driven Fund | |
| NET ASSETS CONSISTS OF: | | | | | | |
| Accumulated undistributed | | | | | | |
| net investment income (loss) | | $ | (11,805,166 | ) | | $ | 2,151,649 | |
| Accumulated net realized gain (loss) on | | | | | | | | |
| investments, securities sold short, written option | | | | | | | | |
| contracts expired or closed, forward currency | | | | | | | | |
| exchange contracts, swap contracts, and | | | | | | | | |
| foreign currency transactions | | | (68,627,484 | ) | | | 1,511,531 | |
| Net unrealized appreciation (depreciation) on: | | | | | | | | |
| Investments | | | 113,782,561 | | | | 339,559 | |
| Securities sold short | | | (134,566,869 | ) | | | (1,752,727 | ) |
| Written option contracts | | | (5,021,693 | ) | | | 167,608 | |
| Forward currency exchange contracts | | | (3,613,608 | ) | | | (225,765 | ) |
| Swap contracts | | | 26,752,388 | | | | (2,023,500 | ) |
| Foreign currency translation | | | 186 | | | | (26 | ) |
| Net unrealized depreciation | | | (2,667,035 | ) | | | (3,494,851 | ) |
| Paid-in capital | | | 2,397,471,285 | | | | 99,420,661 | |
| Total Net Assets | | $ | 2,314,371,600 | | | $ | 99,588,990 | |
| Investor Class | | | | | | | | |
| Net assets | | $ | 1,161,653,940 | | | $ | 5,558,416 | |
| Shares outstanding | | | 72,854,406 | | | | 547,286 | |
| Net asset value and offering price per share* | | $ | 15.94 | | | $ | 10.16 | |
| Institutional Class | | | | | | | | |
| Net assets | | $ | 1,152,717,660 | | | $ | 94,030,574 | |
| Shares outstanding | | | 72,797,793 | | | | 9,241,934 | |
| Net asset value and offering price per share* | | $ | 15.83 | | | $ | 10.17 | |
| * | The redemption price per share may vary based on the length of time a shareholder holds Fund shares. |
The accompanying notes are an integral part of these financial statements.
The Merger Fund and WCM Alternatives: Event-Driven Fund
STATEMENTS OF OPERATIONS
For the Year Ended December 31, 2017
| | | | | | WCM Alternatives: | |
| | | The Merger Fund | | | Event-Driven Fund | |
| INVESTMENT INCOME: | | | | | | |
| Interest | | $ | 19,500,597 | | | $ | 1,371,691 | |
| Dividend income on long positions (net of | | | | | | | | |
| foreign withholding taxes of $226,053 | | | | | | | | |
| and $810, respectively) | | | 39,322,476 | | | | 1,075,451 | |
| Total investment income | | | 58,823,073 | | | | 2,447,142 | |
| | | | | | | | | |
| EXPENSES: | | | | | | | | |
| Investment advisory fees | | | 27,529,169 | | | | 1,377,430 | |
| Distribution fees (Investor Class) | | | 3,483,210 | | | | 8,584 | |
| Sub transfer agent fees (Investor Class) | | | 1,700,452 | | | | 3,525 | |
| Sub transfer agent fees (Institutional Class) | | | 688,618 | | | | 112,154 | |
| Administration fees | | | 979,564 | | | | 57,659 | |
| Professional fees | | | 705,726 | | | | 138,329 | |
| Transfer agent and shareholder | | | | | | | | |
| servicing agent fees | | | 427,335 | | | | 24,869 | |
| Fund accounting expenses | | | 288,881 | | | | 33,876 | |
| Custody fees | | | 257,546 | | | | 30,475 | |
| Trustees’ fees and expenses | | | 219,929 | | | | 15,885 | |
| Federal and state registration fees | | | 219,430 | | | | 40,797 | |
| Miscellaneous expenses | | | 213,814 | | | | 19,047 | |
| Reports to shareholders | | | 199,005 | | | | 17,347 | |
| Compliance fees | | | 190,449 | | | | 7,468 | |
| Borrowing expenses on securities sold short | | | 4,237,010 | | | | 248,727 | |
| Dividends and interest on securities sold short | | | 5,776,156 | | | | 298,587 | |
| Total expenses before expense | | | | | | | | |
| waiver/recoupment by adviser | | | 47,116,294 | | | | 2,434,759 | |
| Expense recouped (waived) | | | | | | | | |
| by adviser (Note 3) | | | (2,005,834 | ) | | | 38,522 | |
| Net expenses | | | 45,110,460 | | | | 2,473,281 | |
| NET INVESTMENT INCOME (LOSS) | | | 13,712,613 | | | | (26,139 | ) |
The accompanying notes are an integral part of these financial statements.
The Merger Fund and WCM Alternatives: Event-Driven Fund
STATEMENTS OF OPERATIONS (continued)
For the Year Ended December 31, 2017
| | | | | | WCM Alternatives: | |
| | | The Merger Fund | | | Event-Driven Fund | |
| REALIZED AND CHANGE IN UNREALIZED | | | | | | |
| GAIN (LOSS) ON INVESTMENTS: | | | | | | |
| Realized gain (loss) on: | | | | | | |
| Investments | | $ | 142,776,251 | | | $ | 7,016,086 | |
| Securities sold short | | | (56,119,773 | ) | | | (2,274,046 | ) |
| Written option contracts expired or closed | | | 25,360,312 | | | | 3,311,257 | |
| Forward currency exchange contracts | | | (11,179,922 | ) | | | (420,177 | ) |
| Swap contracts | | | (1,117,495 | ) | | | 3,182,774 | |
| Foreign currency transactions | | | 384,013 | | | | 12,838 | |
| Net realized gain | | | 100,103,386 | | | | 10,828,732 | |
| Change in unrealized | | | | | | | | |
| appreciation (depreciation) on: | | | | | | | | |
| Investments | | | 30,580,913 | | | | (5,026,099 | ) |
| Securities sold short | | | (98,803,996 | ) | | | 351,725 | |
| Written option contracts | | | (3,363,607 | ) | | | 345,485 | |
| Forward currency exchange contracts | | | (4,407,382 | ) | | | (284,209 | ) |
| Swap contracts | | | 36,285,532 | | | | (1,056,635 | ) |
| Foreign currency translation | | | 201 | | | | 1,162 | |
| Net change in unrealized depreciation | | | (39,708,339 | ) | | | (5,668,571 | ) |
| NET REALIZED AND CHANGE IN | | | | | | | | |
| UNREALIZED GAIN ON INVESTMENTS | | | 60,395,047 | | | | 5,160,161 | |
| NET INCREASE IN NET ASSETS | | | | | | | | |
| RESULTING FROM OPERATIONS | | $ | 74,107,660 | | | $ | 5,134,022 | |
The accompanying notes are an integral part of these financial statements.
The Merger Fund
STATEMENTS OF CHANGES IN NET ASSETS
| | | Year Ended | | | Year Ended | |
| | | December 31, 2017 | | | December 31, 2016 | |
| Net investment income (loss) | | $ | 13,712,613 | | | $ | (18,503,003 | ) |
| Net realized gain on investments, securities | | | | | | | | |
| sold short, written option contracts | | | | | | | | |
| expired or closed, forward currency | | | | | | | | |
| exchange contracts, swap contracts, | | | | | | | | |
| and foreign currency transactions | | | 100,103,386 | | | | 40,909,822 | |
| Net change in unrealized appreciation | | | | | | | | |
| (depreciation) on investments, securities sold | | | | | | | | |
| short, written option contracts, forward | | | | | | | | |
| currency exchange contracts, swap contracts, | | | | | | | | |
| and foreign currency translation | | | (39,708,339 | ) | | | 73,502,395 | |
| Net increase in net assets | | | | | | | | |
| resulting from operations | | | 74,107,660 | | | | 95,909,214 | |
| | | | | | | | | |
| Investor Class — | | | | | | | | |
| Distributions to shareholders from: (Note 5) | | | | | | | | |
| Net investment income | | | (6,825,795 | ) | | | (4,911,192 | ) |
| Total dividends and distributions — | | | | | | | | |
| Investor Class | | | (6,825,795 | ) | | | (4,911,192 | ) |
| | | | | | | | | |
| Institutional Class — | | | | | | | | |
| Distributions to shareholders from: (Note 5) | | | | | | | | |
| Net investment income | | | (11,286,042 | ) | | | (12,300,844 | ) |
| Total dividends and distributions — | | | | | | | | |
| Institutional Class | | | (11,286,042 | ) | | | (12,300,844 | ) |
| Net decrease in net assets from | | | | | | | | |
| capital share transactions (Note 4) | | | (659,130,663 | ) | | | (1,917,196,942 | ) |
| Net decrease in net assets | | | (603,134,840 | ) | | | (1,838,499,764 | ) |
| | | | | | | | | |
| NET ASSETS: | | | | | | | | |
| Beginning of year | | | 2,917,506,440 | | | | 4,756,006,204 | |
| End of year (including accumulated | | | | | | | | |
| undistributed net investment income (loss) of | | | | | | | | |
| $(11,805,166) and $4,961,867, respectively) | | $ | 2,314,371,600 | | | $ | 2,917,506,440 | |
The accompanying notes are an integral part of these financial statements.
WCM Alternatives: Event-Driven Fund
STATEMENTS OF CHANGES IN NET ASSETS
| | | Year Ended | | | Year Ended | |
| | | December 31, 2017 | | | December 31, 2016 | |
| Net investment loss | | $ | (26,139 | ) | | $ | (513,660 | ) |
| Net realized gain (loss) on investments, | | | | | | | | |
| securities sold short, written option contracts | | | | | | | | |
| expired or closed, forward currency exchange | | | | | | | | |
| contracts, swap contracts, and foreign | | | | | | | | |
| currency transactions | | | 10,828,732 | | | | (676,431 | ) |
| Net change in unrealized appreciation | | | | | | | | |
| (depreciation) on investments, securities sold | | | | | | | | |
| short, written option contracts, forward | | | | | | | | |
| currency exchange contracts, swap contracts, | | | | | | | | |
| and foreign currency translation | | | (5,668,571 | ) | | | 4,630,828 | |
| Net increase in net assets | | | | | | | | |
| resulting from operations | | | 5,134,022 | | | | 3,440,737 | |
| | | | | | | | | |
| Investor Class — | | | | | | | | |
| Distributions to shareholders from: (Note 5) | | | | | | | | |
| Net investment income | | | — | | | | — | |
| Net realized gains | | | (55,388 | ) | | | — | |
| Total dividends and distributions — | | | | | | | | |
| Investor Class | | | (55,388 | ) | | | — | |
| | | | | | | | | |
| Institutional Class — | | | | | | | | |
| Distributions to shareholders from: (Note 5) | | | | | | | | |
| Net investment income | | | — | | | | (968,948 | ) |
| Net realized gains | | | (941,430 | ) | | | — | |
| Total dividends and distributions — | | | | | | | | |
| Institutional Class | | | (941,430 | ) | | | (968,948 | ) |
| Net increase (decrease) in net assets from | | | | | | | | |
| capital share transactions (Note 4) | | | (17,494,919 | ) | | | 13,985,677 | |
| Net increase (decrease) in net assets | | | (13,357,715 | ) | | | 16,457,466 | |
| | | | | | | | | |
| NET ASSETS: | | | | | | | | |
| Beginning of year | | | 112,946,705 | | | | 96,489,239 | |
| End of year (including accumulated | | | | | | | | |
| undistributed net investment income of | | | | | | | | |
| $2,151,649 and $121,596, respectively) | | $ | 99,588,990 | | | $ | 112,946,705 | |
The accompanying notes are an integral part of these financial statements.
The Merger Fund
FINANCIAL HIGHLIGHTS
Selected per share data is based on a share of beneficial interest outstanding throughout each period.
Institutional Class
| | | | | | | | | | | | | | | For the | |
| | | | | | | | | | | | | | | Period from | |
| | | | | | | | | | | | | | | August 1, | |
| | | | | | | | | | | | | | | 2013^ | |
| | | | | | | | | | | | | | | through | |
| | | Year Ended December 31, | | | December 31, | |
| | | 2017 | | | 2016 | | | 2015 | | | 2014 | | | 2013 | |
| Per Share Data: | | | | | | | | | | | | | | | |
| Net asset value, | | | | | | | | | | | | | | | |
| beginning of period | | $ | 15.56 | | | $ | 15.25 | | | $ | 15.58 | | | $ | 15.97 | | | $ | 16.06 | |
| Income from | | | | | | | | | | | | | | | | | | | | |
| investment operations: | | | | | | | | | | | | | | | | | | | | |
| Net investment | | | | | | | | | | | | | | | | | | | | |
income (loss)(1)(2) | | | 0.10 | | | | (0.04 | ) | | | (0.03 | ) | | | 0.37 | | | | 0.03 | |
| Net realized and | | | | | | | | | | | | | | | | | | | | |
| unrealized gain (loss) | | | | | | | | | | | | | | | | | | | | |
| on investments | | | 0.33 | | | | 0.49 | | | | (0.05 | ) | | | (0.10 | ) | | | 0.31 | |
| Total from | | | | | | | | | | | | | | | | | | | | |
| investment operations | | | 0.43 | | | | 0.45 | | | | (0.08 | ) | | | 0.27 | | | | 0.34 | |
| Less distributions: | | | | | | | | | | | | | | | | | | | | |
| From net | | | | | | | | | | | | | | | | | | | | |
| investment income | | | (0.16 | ) | | | (0.14 | ) | | | (0.18 | ) | | | (0.45 | ) | | | (0.35 | ) |
| From net realized gains | | | — | | | | — | | | | (0.07 | ) | | | (0.21 | ) | | | (0.08 | ) |
| Total dividends | | | | | | | | | | | | | | | | | | | | |
| and distributions | | | (0.16 | ) | | | (0.14 | ) | | | (0.25 | ) | | | (0.66 | ) | | | (0.43 | ) |
| Net Asset Value, | | | | | | | | | | | | | | | | | | | | |
| end of period | | $ | 15.83 | | | $ | 15.56 | | | $ | 15.25 | | | $ | 15.58 | | | $ | 15.97 | |
| Total Return | | | 2.74 | % | | | 2.94 | % | | | (0.52 | )% | | | 1.63 | % | | | 2.20 | %(3) |
The accompanying notes are an integral part of these financial statements.
The Merger Fund
FINANCIAL HIGHLIGHTS (continued)
Institutional Class
| | | | | | | | | | | | | | | For the | |
| | | | | | | | | | | | | | | Period from | |
| | | | | | | | | | | | | | | August 1, | |
| | | | | | | | | | | | | | | 2013^ | |
| | | | | | | | | | | | | | | through | |
| | | Year Ended December 31, | | | December 31, | |
| | | 2017 | | | 2016 | | | 2015 | | | 2014 | | | 2013 | |
| Supplemental data and ratios: | | | | | | | | | | | | | | | |
| Net assets, end | | | | | | | | | | | | | | | |
| of period (000’s) | | $ | 1,152,718 | | | $ | 1,377,041 | | | $ | 1,247,332 | | | $ | 1,332,078 | | | $ | 172,247 | |
| Ratio of gross expenses | | | | | | | | | | | | | | | | | | | | |
| to average net assets: | | | | | | | | | | | | | | | | | | | | |
| Before expense waiver | | | 1.55 | % | | | 1.70 | % | | | 1.54 | % | | | 1.44 | % | | | 1.32 | %(4) |
| After expense waiver | | | 1.48 | % | | | 1.59 | % | | | 1.41 | % | | | 1.28 | % | | | 1.19 | %(4) |
| Ratio of dividends and interest | | | | | | | | | | | | | | | | | | | | |
| on short positions and | | | | | | | | | | | | | | | | | | | | |
| borrowing expense on | | | | | | | | | | | | | | | | | | | | |
| securities sold short to | | | | | | | | | | | | | | | | | | | | |
| average net assets | | | 0.37 | % | | | 0.52 | % | | | 0.40 | % | | | 0.29 | % | | | 0.19 | %(4) |
| Ratio of operating expense to | | | | | | | | | | | | | | | | | | | | |
| average net assets excluding | | | | | | | | | | | | | | | | | | | | |
| dividends and interest on | | | | | | | | | | | | | | | | | | | | |
| short positions and borrowing | | | | | | | | | | | | | | | | | | | | |
| expense on securities sold | | | | | | | | | | | | | | | | | | | | |
| short (after expense waiver) | | | 1.11 | % | | | 1.07 | % | | | 1.01 | % | | | 0.99 | % | | | 1.00 | %(4) |
| Ratio of net investment | | | | | | | | | | | | | | | | | | | | |
| income (loss) to average | | | | | | | | | | | | | | | | | | | | |
| net assets | | | 0.66 | % | | | (0.27 | )% | | | (0.21 | )% | | | 2.30 | % | | | 0.42 | %(4) |
Portfolio turnover rate(5) | | | 166 | % | | | 182 | % | | | 157 | % | | | 137 | % | | | 194 | %(3) |
| (1) | Net investment income before dividends and interest on short positions and borrowing expense on securities sold short for the years ended December 31, 2017, 2016, 2015, 2014 and the period ended December 31, 2013 was $0.16, $0.04, $0.03, $0.42, and $0.04, respectively. |
| (2) | Net investment income (loss) per share has been calculated based on average shares outstanding during the period. |
| (3) | Not annualized. |
| (4) | Annualized. |
| (5) | The numerator for the portfolio turnover rate includes the lesser of purchases or sales (excluding short-term investments, short-term options, forward currency contracts, swap contracts and short positions). The denominator includes the average long positions throughout the period. |
| ^ | Commencement of operations. |
The accompanying notes are an integral part of these financial statements.
The Merger Fund
FINANCIAL HIGHLIGHTS
Selected per share data is based on a share of beneficial interest outstanding throughout each year.
Investor Class
| | | Year Ended December 31, | |
| | | 2017 | | | 2016 | | | 2015 | | | 2014 | | | 2013 | |
| Per Share Data: | | | | | | | | | | | | | | | |
| Net asset value, | | | | | | | | | | | | | | | |
| beginning of year | | $ | 15.66 | | | $ | 15.31 | | | $ | 15.63 | | | $ | 16.01 | | | $ | 15.83 | |
| Income from | | | | | | | | | | | | | | | | | | | | |
| investment operations: | | | | | | | | | | | | | | | | | | | | |
| Net investment | | | | | | | | | | | | | | | | | | | | |
income (loss)(1)(2) | | | 0.05 | | | | (0.09 | ) | | | (0.08 | ) | | | 0.33 | | | | 0.04 | |
| Net realized and unrealized | | | | | | | | | | | | | | | | | | | | |
| gain (loss) on investments | | | 0.32 | | | | 0.49 | | | | (0.05 | ) | | | (0.10 | ) | | | 0.53 | |
| Total from | | | | | | | | | | | | | | | | | | | | |
| investment operations | | | 0.37 | | | | 0.40 | | | | (0.13 | ) | | | 0.23 | | | | 0.57 | |
| Less distributions: | | | | | | | | | | | | | | | | | | | | |
| From net investment income | | | (0.09 | ) | | | (0.05 | ) | | | (0.12 | ) | | | (0.40 | ) | | | (0.31 | ) |
| From net realized gains | | | — | | | | — | | | | (0.07 | ) | | | (0.21 | ) | | | (0.08 | ) |
| Total dividends and distributions | | | (0.09 | ) | | | (0.05 | ) | | | (0.19 | ) | | | (0.61 | ) | | | (0.39 | ) |
| Net Asset Value, end of year | | $ | 15.94 | | | $ | 15.66 | | | $ | 15.31 | | | $ | 15.63 | | | $ | 16.01 | |
| Total Return | | | 2.39 | % | | | 2.61 | % | | | (0.82 | )% | | | 1.43 | % | | | 3.61 | % |
The accompanying notes are an integral part of these financial statements.
The Merger Fund
FINANCIAL HIGHLIGHTS (continued)
Investor Class
| | | Year Ended December 31, | |
| | | 2017 | | | 2016 | | | 2015 | | | 2014 | | | 2013 | | |
| Supplemental data and ratios: | | | | | | | | | | | | | | | | |
| Net assets, end of year (in millions) | | $ | 1,162 | | | $ | 1,540 | | | $ | 3,509 | | | $ | 4,069 | | | $ | 4,843 | | |
| Ratio of gross expenses | | | | | | | | | | | | | | | | | | | | | |
| to average net assets: | | | | | | | | | | | | | | | | | | | | | |
| Before expense waiver | | | 1.87 | % | | | 2.03 | % | | | 1.87 | % | | | 1.68 | % | | | 1.61 | % | |
| After expense waiver | | | 1.80 | % | | | 1.92 | % | | | 1.74 | % | | | 1.52 | % | | | 1.48 | % | |
| Ratio of dividends and interest on | | | | | | | | | | | | | | | | | | | | | |
| short positions and borrowing | | | | | | | | | | | | | | | | | | | | | |
| expense on securities sold short | | | | | | | | | | | | | | | | | | | | | |
| to average net assets | | | 0.37 | % | | | 0.52 | % | | | 0.40 | % | | | 0.29 | % | | | 0.22 | % | |
| Ratio of operating expense | | | | | | | | | | | | | | | | | | | | | |
| to average net assets excluding | | | | | | | | | | | | | | | | | | | | | |
| dividends and interest on short | | | | | | | | | | | | | | | | | | | | | |
| positions and borrowing | | | | | | | | | | | | | | | | | | | | | |
| expense on securities sold short | | | | | | | | | | | | | | | | | | | | | |
| (after expense waiver) | | | 1.43 | % | | | 1.40 | % | | | 1.34 | % | | | 1.23 | % | | | 1.26 | % | |
| Ratio of net investment income | | | | | | | | | | | | | | | | | | | | | |
| (loss) to average net assets | | | 0.34 | % | | | (0.60 | )% | | | (0.53 | )% | | | 2.06 | % | | | 0.22 | % | |
Portfolio turnover rate(3) | | | 166 | % | | | 182 | % | | | 157 | % | | | 137 | % | | | 194 | % | |
| (1) | Net investment income (loss) before dividends and interest on short positions and borrowing expense on securities sold short for the years ended December 31, 2017, 2016, 2015, 2014 and 2013 was $0.11, $(0.01), $(0.02), $0.38, and $0.07, respectively. |
| (2) | Net investment income (loss) per share has been calculated based on average shares outstanding during the year. |
| (3) | The numerator for the portfolio turnover rate includes the lesser of purchases or sales (excluding short-term investments, short-term options, forward currency contracts, swap contracts and short positions). The denominator includes the average long positions throughout the year. |
The accompanying notes are an integral part of these financial statements.
WCM Alternatives: Event-Driven Fund
FINANCIAL HIGHLIGHTS
Selected per share data is based on a share of beneficial interest outstanding throughout each period.
Institutional Class
| | | | | | | | | | | | For the | |
| | | | | | | | | | | | Period from | |
| | | | | | | | | | | | January 2, | |
| | | | | | | | | | | | 2014^ | |
| | | | | | through | |
| | | Year Ended December 31, | | | December 31, | |
| | | 2017 | | | 2016 | | | 2015 | | | 2014 | |
| Per Share Data: | | | | | | | | | | | | |
| Net asset value, beginning of period | | $ | 9.81 | | | $ | 9.62 | | | $ | 10.14 | | | $ | 10.00 | |
| Income from investment operations: | | | | | | | | | | | | | | | | |
Net investment income (loss)(1)(2) | | | (0.00 | )(6) | | | (0.04 | ) | | | 0.01 | | | | 0.05 | |
| Net realized and unrealized | | | | | | | | | | | | | | | | |
| gain (loss) on investments | | | 0.46 | | | | 0.31 | | | | (0.22 | ) | | | 0.34 | |
| Total from investment operations | | | 0.46 | | | | 0.27 | | | | (0.21 | ) | | | 0.39 | |
| Less distributions: | | | | | | | | | | | | | | | | |
| From net investment income | | | — | | | | (0.08 | ) | | | (0.09 | ) | | | — | |
| From net realized gains | | | (0.10 | ) | | | — | | | | (0.22 | ) | | | (0.25 | ) |
| Total dividends and distributions | | | (0.10 | ) | | | (0.08 | ) | | | (0.31 | ) | | | (0.25 | ) |
| Net Asset Value, end of period | | $ | 10.17 | | | $ | 9.81 | | | $ | 9.62 | | | $ | 10.14 | |
| Total Return | | | 4.72 | % | | | 2.86 | % | | | (2.08 | )% | | | 3.87 | %(3) |
The accompanying notes are an integral part of these financial statements.
WCM Alternatives: Event-Driven Fund
FINANCIAL HIGHLIGHTS (continued)
Institutional Class
| | | | | | | | | | | | For the | |
| | | | | | | | | | | | Period from | |
| | | | | | | | | | | | January 2, | |
| | | | | | | | | | | | 2014^ | |
| | | | | | through | |
| | | Year Ended December 31, | | | December 31, | |
| | | 2017 | | | 2016 | | | 2015 | | | 2014 | |
| Supplemental data and ratios: | | | | | | | | | | | | |
| Net assets, end of period (in 000’s) | | $ | 94,031 | | | $ | 112,947 | | | $ | 96,489 | | | $ | 12,085 | |
| Ratio of gross expenses | | | | | | | | | | | | | | | | |
| to average net assets: | | | | | | | | | | | | | | | | |
| Before expense reimbursement/ | | | | | | | | | | | | | | | | |
| recoupment | | | 2.20 | % | | | 2.37 | % | | | 2.23 | % | | | 7.95 | %(4) |
| After expense reimbursement/ | | | | | | | | | | | | | | | | |
| recoupment | | | 2.24 | % | | | 2.36 | % | | | 2.09 | % | | | 2.39 | %(4) |
| Ratio of dividends and interest on | | | | | | | | | | | | | | | | |
| short positions and borrowing | | | | | | | | | | | | | | | | |
| expense on securities sold short | | | | | | | | | | | | | | | | |
| to average net assets | | | 0.50 | % | | | 0.62 | % | | | 0.35 | % | | | 0.65 | %(4) |
| Ratio of operating expense to average | | | | | | | | | | | | | | | | |
| net assets excluding dividends and | | | | | | | | | | | | | | | | |
| interest on short positions and | | | | | | | | | | | | | | | | |
| borrowing expense on securities sold | | | | | | | | | | | | | | | | |
| short (after expense reimbursement/ | | | | | | | | | | | | | | | | |
| recoupment) | | | 1.74 | % | | | 1.74 | % | | | 1.74 | % | | | 1.74 | %(4) |
| Ratio of net investment income (loss) | | | | | | | | | | | | | | | | |
| to average net assets | | | (0.02 | )% | | | (0.46 | )% | | | 0.05 | % | | | 0.52 | %(4) |
Portfolio turnover rate(5) | | | 283 | % | | | 217 | % | | | 199 | % | | | 212 | %(3) |
| (1) | Net investment income before dividends and interest on short positions and borrowing expense on securities sold short for the years ended December 31, 2017, 2016, 2015, and the period ended December 31, 2014 was $0.05, $0.02, $0.04, and $0.12, respectively. |
| (2) | Net investment income (loss) per share has been calculated based on average shares outstanding during the period. |
| (3) | Not annualized. |
| (4) | Annualized. |
| (5) | The numerator for the portfolio turnover rate includes the lesser of purchases or sales (excluding short-term investments, short-term options, forward currency contracts, swap contracts and short positions). The denominator includes the average long positions throughout the period. |
| (6) | Amount calculated is less than $(0.005). |
| ^ | Commencement of operations. |
The accompanying notes are an integral part of these financial statements.
WCM Alternatives: Event-Driven Fund
FINANCIAL HIGHLIGHTS
Selected per share data is based on a share of beneficial interest outstanding throughout each period.
Investor Class
| | | For the Period from | |
| | | March 22, 2017^ | |
| | | through | |
| | | December 31, | |
| | | 2017 | |
| Per Share Data: | | | |
| Net asset value, beginning of period | | $ | 9.89 | |
| Income from investment operations: | | | | |
Net investment income (loss) (1)(2) | | | (0.01 | ) |
| Net realized and unrealized gain on investments | | | 0.38 | |
| Total from investment operations | | | 0.37 | |
| Less distributions: | | | | |
| From net investment income | | | — | |
| From net realized gains | | | (0.10 | ) |
| Total dividends and distributions | | | (0.10 | ) |
| Net Asset Value, end of period | | $ | 10.16 | |
| Total Return | | | 3.77 | %(3) |
| | | | | |
| Supplemental data and ratios: | | | | |
| Net assets, end of period (in 000’s) | | $ | 5,558 | |
| Ratio of gross expenses to average net assets: | | | | |
| Before expense recoupment | | | 2.52 | %(4) |
| After expense recoupment | | | 2.54 | %(4) |
| Ratio of dividends and interest on short positions and borrowing | | | | |
| expense on securities sold short to average net assets | | | 0.55 | %(4) |
| Ratio of operating expense to average net assets excluding | | | | |
| dividends and interest on short positions and borrowing | | | | |
| expense on securities sold short (after expense recoupment) | | | 1.99 | %(4) |
| Ratio of net investment income (loss) to average net assets | | | (0.17 | )%(4) |
Portfolio turnover rate(5) | | | 283 | %(3) |
| (1) | Net investment income before dividends and interest on short positions and borrowing expense on securities sold short for the period ended December 31, 2017 was $0.03. |
| (2) | Net investment income (loss) per share has been calculated based on average shares outstanding during the period. |
| (3) | Not annualized. |
| (4) | Annualized. |
| (5) | The numerator for the portfolio turnover rate includes the lesser of purchases or sales (excluding short-term investments, short-term options, forward currency contracts, swap contracts and short positions). The denominator includes the average long positions throughout the period. |
| ^ | Commencement of operations. |
The accompanying notes are an integral part of these financial statements.
The Merger Fund and WCM Alternatives: Event-Driven Fund
NOTES TO THE FINANCIAL STATEMENTS
December 31, 2017
Note 1 — ORGANIZATION
The Merger Fund (“TMF”) is a no-load, open-end, diversified investment company organized as a trust under the laws of the Commonwealth of Massachusetts on April 12, 1982, and registered under the Investment Company Act of 1940, as amended (the “1940 Act”). TMF was formerly known as the Risk Portfolio of The Ayco Fund. In January of 1989, TMF’s fundamental investment policies were amended to permit TMF to engage in merger arbitrage. At the same time, Westchester Capital Management, Inc. became TMF’s investment adviser, and TMF began to do business as The Merger Fund. In a transaction that closed on December 31, 2010, Westchester Capital Management, Inc. transferred substantially all of its business and assets to Westchester Capital Management, LLC (the “Adviser”), which became TMF’s investment adviser. Therefore, the performance information included for periods prior to 2011 reflects the performance of Westchester Capital Management, Inc. Roy Behren and Michael Shannon, TMF’s current portfolio managers, have served as co-portfolio managers of TMF since January 2007. The Investor Class inception date was January 31, 1989, and the Institutional Class inception date was August 1, 2013. The investment objective of TMF is to seek to achieve capital growth by engaging in merger arbitrage. Merger arbitrage is a highly specialized investment approach generally designed to profit from the successful completion of publicly announced mergers, takeovers, tender offers, leveraged buyouts, spin-offs, liquidations and other corporate reorganizations. At December 31, 2017, 85.2% of the shares outstanding of TMF’s Investor Class were owned by 6 omnibus accounts. At December 31, 2017, 84.5% of the shares outstanding of TMF’s Institutional Class were owned by 5 omnibus accounts.
Westchester Capital Funds (“WCF”) is an open-end series management investment company organized under the laws of the Commonwealth of Massachusetts on March 20, 2013, and registered under the 1940 Act. WCM Alternatives: Event-Driven Fund (“EDF”), a series of WCF, is a no-load, open-end, non-diversified investment company with two classes of shares, Investor Class shares and Institutional Class shares. The Institutional Class inception date was January 2, 2014. The Investor Class inception date was March 22, 2017. The investment objective of EDF is to seek to provide attractive risk-adjusted returns with low relative volatility in virtually all market environments. Risk-adjusted return is a concept that considers not only an investment’s return, but also the amount of potential risk involved in producing that return. At December 31, 2017, 98.3% of the shares outstanding of EDF’s Investor Class were owned by 3 omnibus accounts. At December 31, 2017, 98.4% of the shares outstanding of EDF’s Institutional Class were owned by 3 omnibus accounts.
The Merger Fund and WCM Alternatives: Event-Driven Fund
NOTES TO THE FINANCIAL STATEMENTS (continued)
December 31, 2017
Note 1 — ORGANIZATION (continued)
Each class of shares of TMF and EDF (each a “Fund” and together, the “Funds”) has different eligibility and minimum investment requirements. The underlying assets attributable to a class of a Fund are charged with the expenses attributable to that class of the Fund and with a share of the general expenses of the Fund. Any general expenses of a Fund that are not readily identifiable as belonging to a particular class of the Fund are allocated by or under the direction of the Boards of Trustees of the Funds (the “Board of Trustees” or “Trustees”) in such manner as the Trustees determine. Shares of classes may have different voting rights, such as
(i) when required by the 1940 Act, or (ii) when the Trustees determine that such a matter affects only the interests of a particular class. Shares have no preemptive or subscription rights. The Institutional Class shares do not have a distribution fee. Income, expenses (other than expenses attributable to a specific class), and realized and unrealized gains or losses on investments of a Fund are allocated to each class of a Fund based on its relative net assets.
Note 2 — SIGNIFICANT ACCOUNTING POLICIES
The following is a summary of significant accounting policies followed by the Funds in the preparation of their financial statements. These policies are in conformity with U.S. generally accepted accounting principles (“GAAP”). The Funds are investment companies and, accordingly, follow the investment company accounting and reporting guidance of the Financial Accounting Standards Board Accounting Standards Codification Topic 946 – Investment Companies. The presentation of financial statements in conformity with GAAP requires management to make estimates and assumptions that affect the reported amount of assets and liabilities at the date of the financial statements and the reported amounts of revenues and expenses during the reporting period. Actual results could differ from those estimates and assumptions.
The following is a summary of the Funds’ pricing procedures. It is intended to be a general discussion and may not necessarily reflect all pricing procedures followed by the Funds.
Equity securities, including common and preferred stocks, closed-end and exchange traded funds, that trade on an exchange will typically be valued based on the last reported sale price. Securities listed on NASDAQ are typically valued using the NASDAQ Official Closing Price. The securities valued using quoted prices in active markets are classified as Level 1 investments. If, on a particular day, an exchange-listed security does not trade, then the mean between the closing bid and asked prices will typically be used to value the security. These securities are classified as Level 2 than
The Merger Fund and WCM Alternatives: Event-Driven Fund
NOTES TO THE FINANCIAL STATEMENTS (continued)
December 31, 2017
Note 2 — SIGNIFICANT ACCOUNTING POLICIES (continued)
investments. Fixed income securities having a maturity of greater 60 days are typically valued based on evaluations provided by an independent pricing vendor approved by the Board. Investments in United States government securities (other than short-term securities) are valued at the mean between the 4:00 PM New York time bid and asked prices supplied by a third party vendor. Short-term fixed-income securities having a maturity of less than 60 days are valued at market quotations or based on valuations supplied by a third party pricing service. If a reliable price from a third party pricing service is unavailable, amortized cost may be used if it is determined that the instrument’s amortized cost value represents approximately the fair value of the security. These are classified as Level 2 investments.
Investments in Special Purpose Acquisition Companies, including their related units, shares, rights and warrants (each a “SPAC interest”), will typically be valued by reference to the last reported transaction for the composite exchange. The securities valued using quoted prices in active markets are classified as Level 1 investments. If, on a particular day, no reliable market transaction is readily available and reported for the composite exchange, then the mean between the closing bid and asked prices on the composite exchange will be used to value the SPAC interest, or the SPAC interest will be fair valued in accordance with the Fund’s pricing procedures. These securities are classified as Level 2 investments.
Exchange-traded options are typically valued at the higher of the intrinsic value of the option (i.e., what a Fund would pay or can receive upon the option being exercised) or the last reported composite sale price when such sale falls between the bid and asked prices. When the last sale of an exchange-traded option is outside the bid and asked prices, the Funds will typically value the option at the higher of the intrinsic value of the option or the mean between the highest end of day option bid price and the lowest end of day option ask price. Options for which there is an active market are classified as Level 1 investments, but options not listed on an exchange and/or are fair valued in accordance with the Fund’s pricing procedures are classified as Level 2 investments.
Investments in registered open-end investment companies, including money market funds, are typically valued at their reported net asset value (“NAV”) per share. These securities are generally classified as Level 1 investments. Forward currency contracts are valued daily at the prevailing forward exchange rate. These securities are generally classified as Level 2. Total return swap prices are determined using the same methods as would be used to price the underlying security. These securities are generally classified as Level 2 investments.
The Merger Fund and WCM Alternatives: Event-Driven Fund
NOTES TO THE FINANCIAL STATEMENTS (continued)
December 31, 2017
Note 2 — SIGNIFICANT ACCOUNTING POLICIES (continued)
The Funds typically fair value securities and assets for which (a) market quotations are not readily available or (b) market quotations are believed to be unrepresentative of market value. For example, a Fund may fair value a security that primarily trades on an exchange that closes before the New York Stock Exchange (“NYSE”) if a significant event occurs after the close of the exchange on which the security primarily trades but before the NYSE closes. Fair valuations are determined in good faith by the Valuation Group (the “Valuation Group”), a committee comprised of persons who are officers of the Fund or representatives of the Adviser, acting pursuant to procedures adopted by the Board. When fair-value pricing is employed, the prices of securities used by the Funds to calculate their NAV may differ from quoted or published prices for the same securities. In addition, due to the subjective nature of fair-value pricing, it is possible that the value determined for a particular asset may be materially different from the value realized upon such asset’s sale. These securities are generally classified as Level 2 or 3 depending on the inputs as described below.
The Funds have performed analyses of all existing investments to determine the significance and character of all inputs to their fair value determination. Various inputs are used in determining the value of the Funds’ investments. These inputs are summarized in the three broad levels listed below:
| | Level 1 — | Quoted prices in active markets for identical securities. |
| | | |
| | Level 2 — | Other significant observable inputs (including quoted prices for similar securities, interest rates, prepayment speeds, credit risk, etc.). |
| | | |
| | Level 3 — | Significant unobservable inputs are those inputs that reflect the applicable Fund’s own assumptions that market participants would use to price the asset or liability based on the best available information. |
The inputs or methodology used for valuing securities are not an indication of the risk associated with investing in those securities.
The Merger Fund and WCM Alternatives: Event-Driven Fund
NOTES TO THE FINANCIAL STATEMENTS (continued)
December 31, 2017
Note 2 — SIGNIFICANT ACCOUNTING POLICIES (continued)
The following tables provide the fair value measurements of applicable Fund assets and liabilities by level within the fair value hierarchy for the Funds as of December 31, 2017. These assets and liabilities are measured on a recurring basis.
The Merger Fund
Investments at Fair Value | | Level 1 | | | Level 2 | | | Level 3 | | | Total | |
| Assets | | | | | | | | | | | | |
| Common Stocks* | | $ | 1,348,282,014 | | | $ | 14,325,966 | | | $ | 58,982,517 | | | $ | 1,421,590,497 | |
| Closed-End Funds | | | 271,909,007 | | | | — | | | | — | | | | 271,909,007 | |
| Preferred Stock | | | 2,939,125 | | | | — | | | | — | | | | 2,939,125 | |
| Contingent Value Rights | | | — | | | | — | | | | 991,436 | | | | 991,436 | |
| Rights | | | — | | | | 808,890 | | | | — | | | | 808,890 | |
| Warrants | | | — | | | | 591,632 | | | | — | | | | 591,632 | |
| Convertible Bonds | | | — | | | | 19,137,345 | | | | — | | | | 19,137,345 | |
| Corporate Bonds | | | — | | | | 108,918,654 | | | | — | | | | 108,918,654 | |
| Purchased Option Contracts | | | 1,926,306 | | | | — | | | | — | | | | 1,926,306 | |
| Escrow Notes | | | — | | | | — | | | | 1,989,450 | | | | 1,989,450 | |
| Short-Term Investments | | | 226,991,556 | | | | 152,487,208 | | | | — | | | | 379,478,764 | |
| Swap Contracts** | | | — | | | | 26,752,388 | | | | — | | | | 26,752,388 | |
| Total | | $ | 1,852,048,008 | | | $ | 323,022,083 | | | $ | 61,963,403 | | | $ | 2,237,033,494 | |
| | | | | | | | | | | | | | | | | |
| Liabilities | | | | | | | | | | | | | | | | |
| Short Common Stock* | | $ | 541,133,081 | | | $ | 98,264,400 | | | $ | — | | | $ | 639,397,481 | |
| Written Option Contracts | | | 15,036,392 | | | | — | | | | — | | | | 15,036,392 | |
| Forward Currency | | | | | | | | | | | | | | | | |
| Exchange Contracts** | | | — | | | | 3,613,608 | | | | — | | | | 3,613,608 | |
| Total | | $ 556,169,473 | | | $ | 101,878,008 | | | $ | — | | | $ 658,047,481 | |
The Merger Fund and WCM Alternatives: Event-Driven Fund
NOTES TO THE FINANCIAL STATEMENTS (continued)
December 31, 2017
Note 2 — SIGNIFICANT ACCOUNTING POLICIES (continued)
WCM Alternatives: Event-Driven Fund
Investments at Fair Value | | Level 1 | | | Level 2 | | | Level 3 | | | Total | |
| Assets | | | | | | | | | | | | |
| Common Stocks* | | $ | 30,754,739 | | | $ | 2,482,221 | | | $ | 1,003,220 | | | $ 34,240,180 | |
| Closed-End Funds | | | 4,896,671 | | | | — | | | | — | | | | 4,896,671 | |
| Preferred Stock | | | 3,778,954 | | | | — | | | | — | | | | 3,778,954 | |
| Contingent Value Rights | | | — | | | | — | | | | 5,293 | | | | 5,293 | |
| Rights | | | — | | | | 206,573 | | | | — | | | | 206,573 | |
| Warrants | | | — | | | | 130,759 | | | | — | | | | 130,759 | |
| Convertible Bonds | | | — | | | | 3,088,213 | | | | — | | | | 3,088,213 | |
| Corporate Bonds | | | — | | | | 16,220,895 | | | | — | | | | 16,220,895 | |
| Purchased Option Contracts | | | 158,471 | | | | 3,333 | | | | — | | | | 161,804 | |
| Escrow Notes | | | — | | | | 3,132 | | | | 218,306 | | | | 221,438 | |
| Short-Term Investments | | | 5,911,126 | | | | 33,138,490 | | | | — | | | | 39,049,616 | |
| Total | | $ | 45,499,961 | | | $ | 55,273,616 | | | $ | 1,226,819 | | | $ | 102,000,396 | |
| | | | | | | | | | | | | | | | | |
| Liabilities | | | | | | | | | | | | | | | | |
| Short Common Stock* | | $ | 13,179,690 | | | $ | 261,745 | | | $ | — | | | $ 13,441,435 | |
| Written Option Contracts | | | 1,218,864 | | | | 62,079 | | | | — | | | | 1,280,943 | |
| Forward Currency | | | | | | | | | | | | | | | | |
| Exchange Contracts** | | | — | | | | 225,765 | | | | — | | | | 225,765 | |
| Swap Contracts** | | | — | | | | 2,023,500 | | | | — | | | | 2,023,500 | |
| Total | | $ | 14,398,554 | | | $ | 2,573,089 | | | $ | — | | | $ 16,971,643 | |
| * | Please refer to the Schedules of Investments to view long/short common stocks segregated by industry type. |
| ** | Swap contracts and forward currency exchange contracts are valued at the net unrealized appreciation (depreciation) on the instrument by counterparty. |
The Level 2 securities are priced using inputs such as current yields, discount rates, credit quality, yields on comparable securities, trading volume, maturity date, market bid and ask prices, prices on comparable securities and other significant inputs. Level 3 securities are valued by using broker quotes or such other pricing sources or data as are permitted by the Fund’s pricing procedures. At December 31, 2017, the value of these securities held by TMF and EDF were $61,963,403 and $1,226,819, respectively. The inputs for these securities are not readily available or cannot be reasonably estimated and are generally those inputs as described in Note 2 A. The appropriateness of fair values for these securities is monitored by the Valuation Group on an ongoing basis.
There were no transfers between levels during the year ended December 31, 2017. Transfers are recorded at the end of the reporting period.
The Merger Fund and WCM Alternatives: Event-Driven Fund
NOTES TO THE FINANCIAL STATEMENTS (continued)
December 31, 2017
Note 2 — SIGNIFICANT ACCOUNTING POLICIES (continued)
Level 3 Reconciliation Disclosure
The following is a reconciliation of Level 3 assets for which significant unobservable inputs were used to determine fair value.
The Merger Fund
| | | Common | | | Contingent | | | Escrow | | | Total | |
Description | | Stock | | | Value Rights | | | Notes | | | Investment | |
| Balance as of December 31, 2016 | | $ | 185,723,846 | | | $ | 930,150 | | | $ | 1,678,598 | | | $ | 188,332,594 | |
| Purchases on Investments* | | | — | | | | 431,892 | | | | — | | | | 431,892 | |
| (Sales) of Investments | | | (109,986,068 | ) | | | — | | | | — | | | | (109,986,068 | ) |
Realized (Gain) Loss | | | (9,741,042 | ) | | | (264,048 | ) | | | — | | | | (10,005,090 | ) |
| Transfers Into Level 3 | | | — | | | | — | | | | — | | | | — | |
| (Transfer Out) of Level 3 | | | — | | | | — | | | | — | | | | — | |
| Change in Unrealized | | | | | | | | | | | | | | | | |
| Appreciation (Depreciation) | | | (7,014,219 | ) | | | (106,558 | ) | | | 310,852 | | | | (6,809,925 | ) |
| Balance as of December 31, 2017 | | $ | 58,982,517 | | | $ | 991,436 | | | $ | 1,989,450 | | | $ | 61,963,403 | |
| | | | | | | | | | | | | | | | | |
| WCM Alternatives: Event-Driven Fund | | | | | | | | | | | | | | | | |
| | | Common | | | Contingent | | | Escrow | | | Total | |
Description | | Stock | | | Value Rights | | | Notes | | | Investment | |
| Balance as of December 31, 2016 | | $ | 4,868,519 | | | $ | 2,135 | | | $ | 257,440 | | | $ | 5,128,094 | |
| Purchases on Investments* | | | — | | | | 20,805 | | | | — | | | | 20,805 | |
| (Sales) of Investments | | | (3,418,490 | ) | | | — | | | | — | | | | (3,418,490 | ) |
Realized (Gain) Loss | | | (227,266 | ) | | | — | | | | — | | | | (227,266 | ) |
| Transfers Into Level 3 | | | — | | | | — | | | | — | | | | — | |
| (Transfer Out) of Level 3 | | | — | | | | — | | | | — | | | | — | |
| Change in Unrealized Depreciation | | | (219,543 | ) | | | (17,647 | ) | | | (39,134 | ) | | | (276,324 | ) |
| Balance as of December 31, 2017 | | $ | 1,003,220 | | | $ | 5,293 | | | $ | 218,306 | | | $ | 1,226,819 | |
| * | Includes receipts from corporate actions. |
The realized and unrealized gains and losses from Level 3 transactions are included with the net realized gain (loss) on investments and net change in unrealized appreciation (depreciation) on investments on the Statements of Operations. The net change in unrealized appreciation (depreciation) on investments related to Level 3 securities held by TMF and EDF at December 31, 2017 totals $(6,809,925) and $(276,324), respectively.
Significant unobservable valuation inputs monitored by the Valuation Group under the supervision of the Board of Trustees for restricted securities or material Level 3 investments as of December 31, 2017 for both TMF and EDF are as follows:
The Merger Fund and WCM Alternatives: Event-Driven Fund
NOTES TO THE FINANCIAL STATEMENTS (continued)
December 31, 2017
Note 2 — SIGNIFICANT ACCOUNTING POLICIES (continued)
The Merger Fund
| | Fair Value at | Valuation | Unobservable |
Description | December 31, 2017 | Technique | Input |
| Common Stock | $58,982,517 | Discounted Cash | Discount Rates |
| | | Flow Model | Terminal Value |
| | | | Cash Flow Projections |
| | | | |
| WCM Alternatives: Event-Driven Fund | | | |
| | | | |
| | Fair Value at | Valuation | Unobservable |
Description | December 31, 2017 | Technique | Input |
| Common Stock | $1,003,220 | Discounted Cash | Discount Rates |
| | | Flow Model | Terminal Value |
| | | | Cash Flow Projections |
The tables above do not include certain Level 3 investments that are valued by brokers and pricing services. At December 31, 2017, the value of these securities for TMF and EDF were $2,980,886 and $223,599, respectively. The inputs for these investments are not readily available or cannot be reasonably estimated and are generally those inputs described in Note 2.
No provision for federal income taxes has been made since the Funds have complied to date with the provisions of Subchapter M of the Internal Revenue Code applicable to regulated investment companies and intends to continue to so comply in future years and to distribute investment company net taxable income and net capital gains to shareholders. Additionally, the Funds intend to make all required distributions to avoid federal excise tax.
The Funds have reviewed all open tax years in major jurisdictions and concluded that there is no impact on the Funds’ net assets and there is no tax liability resulting from unrecognized tax benefits relating to uncertain income tax positions taken or expected to be taken on a tax return. The Funds are also not aware of any tax positions for which it is reasonably possible that the total amounts of unrecognized tax benefits will significantly change in the next twelve months. As of December 31, 2017, TMF’s and EDF’s open Federal and New York tax years include the tax years ended December 31, 2014 through December 31, 2017. The Funds have no tax examination in progress.
The Merger Fund and WCM Alternatives: Event-Driven Fund
NOTES TO THE FINANCIAL STATEMENTS (continued)
December 31, 2017
Note 2 — SIGNIFICANT ACCOUNTING POLICIES (continued)
| C. | Transactions with Brokers |
The Funds’ receivables from brokers for securities sold short and deposits at brokers for other investments are with two securities dealers. The Funds do not require the brokers to maintain collateral in support of the receivables from the brokers for proceeds on securities sold short. The Funds are required by the brokers to maintain collateral for securities sold short. The receivable from brokers on the Statements of Assets and Liabilities represents the proceeds from securities sold short that is maintained at the broker. The Funds may maintain cash deposits at brokers beyond the receivables for short sales. On the Statement of Assets and Liabilities, these are classified as deposits at brokers for other investments. A Fund may be required by the brokers with which it executes short sales to maintain an additional amount of collateral in a special tri-party custody arrangement for the benefit of the broker.
The Funds’ equity swap contracts’ and forward currency exchange contracts’ cash deposits are monitored daily by the Adviser and counterparty. These transactions may involve market risk in excess of the amounts receivable or payable reflected on the Statements of Assets and Liabilities.
The Funds sell securities or currencies short for economic hedging purposes or any other investment purpose. For financial statement purposes, an amount equal to the settlement amount is initially included in the Statements of Assets and Liabilities as an asset and an equivalent liability. The amount of the liability is subsequently priced to reflect the current value of the short position. Subsequent fluctuations in the market prices of securities or currencies sold, but not yet purchased, may require purchasing the securities or currencies at prices which may differ from the market value reflected on the Statements of Assets and Liabilities. Short sale transactions result in off balance sheet risk because the ultimate obligation may exceed the related amounts shown in the Statements of Assets and Liabilities. The Funds will incur losses if the price of the security increases between the date of the short sale and the date on which the Funds purchase the securities to replace the borrowed securities. The Funds’ losses on short sales are potentially unlimited because there is no upward limit on the price a borrowed security could attain.
The Merger Fund and WCM Alternatives: Event-Driven Fund
NOTES TO THE FINANCIAL STATEMENTS (continued)
December 31, 2017
Note 2 — SIGNIFICANT ACCOUNTING POLICIES (continued)
The Funds are liable for any dividends payable on securities while those securities are sold short. Until the security is replaced, the Funds are required to pay to the lender any income earned, which is recorded as an expense by the Funds. The Funds segregate liquid assets in an amount equal to the market value of securities sold short, which is reflected in the Schedules of Investments. These assets are required to be adjusted daily to reflect changes in the value of the securities or currencies sold short.
| E. | Written Option Contracts |
The Funds are subject to equity price risk in the normal course of pursuing their investment objectives. The Funds write (sell) put or call options for hedging purposes, volatility management purposes, or otherwise to gain, or reduce, long or short exposure to one or more asset classes or issuers. When a Fund writes (sells) an option, an amount equal to the premium received by the Fund is included in the Statement of Assets and Liabilities as an asset and an equivalent liability. The amount of the liability is subsequently priced daily to reflect the current value of the option written. Refer to Note 2 A. for a pricing description. By writing an option, a Fund may become obligated during the term of the option to deliver or purchase the securities underlying the option at the exercise price if the option is exercised. These contracts may involve market risk in excess of the amounts receivable or payable reflected on the Statements of Assets and Liabilities. Refer to Note 2 Q. for further derivative disclosures, and Note 2 O. for further counterparty risk disclosure.
When an option expires on its stipulated expiration date or the Funds enter into a closing purchase transaction, the Funds realize gains or losses if the cost of the closing purchase transaction differs from the premium received when the option was sold without regard to any unrealized appreciation or depreciation on the underlying security, and the liability related to such option is eliminated. When a written call option is exercised, the premium originally received decreases the cost basis of the security and the Funds realize gains or losses from the sale of the underlying security. When a written put option is exercised, the cost of the security acquired is decreased by the premium received for the put.
| F. | Purchased Option Contracts |
The Funds are subject to equity price risk in the normal course of pursuing their investment objectives. The Funds purchase put or call options for hedging purposes, volatility management purposes, or otherwise to gain, or reduce, long or short exposure to one or more asset
The Merger Fund and WCM Alternatives: Event-Driven Fund
NOTES TO THE FINANCIAL STATEMENTS (continued)
December 31, 2017
Note 2 — SIGNIFICANT ACCOUNTING POLICIES (continued)
classes or issuers. When the Funds purchase an option contract, an amount equal to the premiums paid is included in the Statements of Assets and Liabilities as an investment, and is subsequently priced daily to reflect the value of the purchased option. Refer to Note 2 A. for a pricing description. Refer to Note 2 Q. for further derivative disclosures, and Note 2 O. for further counterparty risk disclosure.
When option contracts expire or are closed, realized gains or losses are recognized without regard to any unrealized appreciation or depreciation on the underlying securities that may be held by the Funds. If the Fund exercises a call option, the cost of the security acquired is increased by the premium paid for the call. If the Fund exercises a put option, the premium paid for the put option increases the cost of the underlying security and a gain or loss is realized from the sale of the underlying security.
| G. | Forward Currency Exchange Contracts |
The Funds are subject to foreign currency exchange rate risk in the normal course of pursuing their investment objectives. During the year ended December 31, 2017, the Funds used forward currency exchange contracts to hedge against changes in the value of foreign currencies. The Funds may enter into forward currency exchange contracts obligating the Funds to deliver and receive a currency at a specified future date. Forward contracts are valued daily, and unrealized appreciation or depreciation is recorded daily as the difference between the contract exchange rate and the closing forward rate applied to the face amount of the contract. Refer to Note 2 A. for a pricing description. A realized gain or loss is recorded at the time the forward contract expires. Credit risk may arise as a result of the failure of the counterparty to comply with the terms of the contract. Refer to Note 2 O. for further counterparty risk disclosure.
The use of forward currency exchange contracts does not eliminate fluctuations in the underlying prices of the Funds’ investment securities. The use of forward currency exchange contracts involves the risk that anticipated currency movements will not be accurately predicted. A forward currency exchange contract would limit the risk of loss due to a decline in the value of a particular currency; however, it would also limit any potential gain that might result should the value of the currency increase instead of decrease. These contracts may involve market risk in excess of the amounts receivable or payable reflected on the Statements of Assets and Liabilities. Refer to Note 2 Q. for further derivative disclosures.
The Merger Fund and WCM Alternatives: Event-Driven Fund
NOTES TO THE FINANCIAL STATEMENTS (continued)
December 31, 2017
Note 2 — SIGNIFICANT ACCOUNTING POLICIES (continued)
The Funds are subject to equity price risk and interest rate risk in the normal course of pursuing their investment objectives. During the year ended December 31, 2017, the Funds entered into both long and short equity swap contracts with multiple broker-dealers. A long equity swap contract entitles the Funds to receive from the counterparty any appreciation and dividends paid on an individual security, while obligating the Funds to pay the counterparty any depreciation on the security as well as interest on the notional amount of the contract at a rate equal to LIBOR plus an agreed upon spread (refer to the Schedule of Swap Contracts for further disclosure of the contracts financing rate). A short equity swap contract obligates the Funds to pay the counterparty any appreciation and dividends paid on an individual security, while entitling the Funds to receive from the counterparty any depreciation on the security, and to pay to or receive from the counterparty interest on the notional value of the contract at a rate equal to LIBOR less an agreed upon spread (refer to the Schedule of Swap Contracts for further disclosure of the contracts financing rate). Refer to Note 2 A. for a pricing description.
The Funds may also enter into equity swap contracts whose value may be determined by the spread between a long equity position and a short equity position. This type of swap contract obligates the Funds to pay the counterparty an amount tied to any increase in the spread between the two securities over the term of the contract. The Funds are also obligated to pay the counterparty any dividends paid on the short equity holding as well as any net financing costs. This type of swap contract entitles the Funds to receive from the counterparty any gains based on a decrease in the spread as well as any dividends paid on the long equity holding and any net interest income.
Fluctuations in the value of an open contract are recorded daily as net unrealized appreciation or depreciation. The Funds will realize gains or losses upon termination or reset of the contract. Either party, under certain conditions, may terminate the contract prior to the contract’s expiration date. Equity swap contracts are typically valued based on market quotations or pricing service evaluations for the underlying reference asset. The Valuation Group monitors the credit quality of the Funds’ counterparties and may adjust the valuation of a swap in the Valuation Group’s discretion due to, among other things, changes in a counterparty’s credit quality.
Credit risk may arise as a result of the failure of the counterparty to comply with the terms of the contract. Refer to Note 2 O. for further counterparty risk disclosure. Additionally, risk may arise from unanticipated
The Merger Fund and WCM Alternatives: Event-Driven Fund
NOTES TO THE FINANCIAL STATEMENTS (continued)
December 31, 2017
Note 2 — SIGNIFICANT ACCOUNTING POLICIES (continued)
movements in interest rates or in the value of the underlying securities. Equity swap contracts may involve market risk in excess of the amounts receivable or payable reflected on the Statements of Assets and Liabilities. Refer to Note 2 Q. for further derivative disclosures.
| I. | Distributions to Shareholders |
Dividends from net investment income and net realized capital gains, if any, are declared and paid at least annually. Income and capital gain distributions are determined in accordance with income tax regulations which may differ from GAAP. These differences are due primarily to wash sale-loss deferrals, constructive sales, straddle-loss deferrals, adjustments on swap contracts, and unrealized gains or losses on Section 1256 contracts, which were realized, for tax purposes, at the end of each Fund’s fiscal year.
Investing in securities of foreign companies and foreign governments involves special risks and considerations not typically associated with investing in U.S. companies and the U.S. government. These risks include fluctuations in currency exchange rates and adverse political, cultural, regulatory, legal, tax, and economic developments as well as different custody and/or settlement practices or delayed settlements in some foreign markets. Moreover, securities of many foreign companies and their markets may be less liquid and their prices more volatile than those of securities of comparable U.S. companies and the U.S. government.
| K. | Foreign Currency Transactions |
The books and records of the Funds are maintained in U.S. dollars. Foreign currency transactions are translated into U.S. dollars on the following basis: (i) market value of investment securities, assets and liabilities at the daily rates of exchange, and (ii) purchases and sales of investment securities, dividend and interest income and certain expenses at the rates of exchange prevailing on the respective dates of such transactions. For financial reporting purposes, the Funds do not isolate changes in the exchange rate of investment securities from the fluctuations arising from changes in the market prices of securities. However, for federal income tax purposes, the Funds do isolate and treat as ordinary income the effect of changes in foreign exchange rates on realized gain or loss from the sale of investment securities and payables and receivables arising from trade-date and settlement-date differences. Foreign currency held as cash by the Funds’ custodian is reported separately on the Statements of Assets and Liabilities.
The Merger Fund and WCM Alternatives: Event-Driven Fund
NOTES TO THE FINANCIAL STATEMENTS (continued)
December 31, 2017
Note 2 — SIGNIFICANT ACCOUNTING POLICIES (continued)
| L. | Cash and Cash Equivalents |
The Funds consider highly liquid short-term fixed income investments purchased with an original maturity of less than three months to be cash equivalents. Cash equivalents are included in short-term investments on the Schedule of Investments as well as in investments on the Statements of Assets and Liabilities. Temporary cash overdrafts are reported as payable to custodian.
| M. | Guarantees and Indemnifications |
In the normal course of business, the Funds enter into contracts with service providers that contain general indemnification clauses. The Funds’ maximum exposure under these arrangements is unknown, as this would involve future claims that may be made against the Funds that have not yet occurred. The Funds have not historically incurred material expenses in respect of those provisions.
| N. | Security Transactions, Investment Income and Expenses |
Transactions are recorded for financial statement purposes on the trade date. Realized gains and losses from security transactions are recorded on the identified cost basis. Distributions to shareholders are recorded on the ex-dividend date. Dividend income is recorded on the ex-dividend date, except for certain dividends on foreign securities, which are recorded as soon as the Fund is informed after the ex-dividend date. Interest is accounted for on the accrual basis and includes amortization of premiums and discounts on the effective interest method. At December 31, 2017, expenses include $4,237,010 and $248,727 of borrowing expenses on securities sold short for TMF and EDF, respectively.
The Funds help manage counterparty credit risk by entering into agreements only with counterparties the Adviser believes have the financial resources to honor their obligations. The Adviser considers the creditworthiness of each counterparty to a contract in evaluating potential credit risk. The counterparty risk for forward currency exchange contracts to the Funds includes the amount of any net unrealized appreciation on the contract. The counterparty risk for equity swaps contracts to the Funds includes the risk of loss of the full amount of any net unrealized appreciation on the contract, along with dividends receivable on long equity contracts and interest receivable on short equity contracts. Written and purchased options sold on an exchange expose the Funds to counterparty risk; however, exchange’s clearinghouse guarantees the options against default. Over-the-counter options counterparty risk
The Merger Fund and WCM Alternatives: Event-Driven Fund
NOTES TO THE FINANCIAL STATEMENTS (continued)
December 31, 2017
Note 2 — SIGNIFICANT ACCOUNTING POLICIES (continued)
includes the risk of loss of the full amount of any net unrealized appreciation. Refer to Note 2 H. for further disclosure to counterparty risk related to equity swap contracts.
Financial assets and liabilities, as well as cash collateral received by the Funds’ counterparties and posted are offset by the respective counterparty, and the net amount is reported in the Statements of Assets and Liabilities when the Funds believe there exists a legally enforceable right to offset the recognized amounts.
The Funds may utilize derivative instruments such as options, swaps, futures, forward contracts and other instruments with similar characteristics to the extent that they are consistent with the Funds’ respective investment objectives and limitations. The use of these instruments may involve additional investment risks, including the possibility of illiquid markets or imperfect correlation between the value of the instruments and the underlying securities. Derivatives also may create leverage which will amplify the effect of their performance on the Funds and may produce significant losses.
The Funds have adopted authoritative standards regarding disclosure about derivatives and hedging activities and how they affect the Funds’ Statements of Assets and Liabilities and Statements of Operations. For the year ended December 31, 2017, each Fund’s monthly average quantity and notional value are described below:
The Merger Fund
| | | Monthly Average | | | Monthly Average | |
| | | Quantity | | | Notional Value | |
| Purchased Option Contracts | | | 105,249 | | | $ | 596,812,104 | |
| Written Option Contracts | | | 114,646 | | | $ | 617,988,843 | |
| Forward Currency Exchange Contracts | | | 5 | | | $ | 198,373,148 | |
| Long Total Return Swap Contracts | | | 31,032,015 | | | $ | 333,573,453 | |
| Short Total Return Swap Contracts | | | 5,954,820 | | | $ | 98,598,491 | |
| | | | | | | | | |
| WCM Alternatives: Event-Driven Fund | | | | | | | | |
| | | Monthly Average | | | Monthly Average | |
| | | Quantity | | | Notional Value | |
| Purchased Option Contracts | | | 13,292 | | | $ | 65,639,594 | |
| Written Option Contracts | | | 14,584 | | | $ | 65,134,486 | |
| Forward Currency Exchange Contracts | | | 7 | | | $ | 11,120,227 | |
| Long Total Return Swap Contracts | | | 2,940,740 | | | $ | 71,391,294 | |
| Short Total Return Swap Contracts | | | 437,042 | | | $ | 12,125,026 | |
The Merger Fund and WCM Alternatives: Event-Driven Fund
NOTES TO THE FINANCIAL STATEMENTS (continued)
December 31, 2017
Note 2 — SIGNIFICANT ACCOUNTING POLICIES (continued)
Statements of Assets and Liabilities
Fair values of derivative instruments as of December 31, 2017:
| | Asset Derivatives | |
| | Statements of Assets | | | |
Derivatives | and Liabilities Location | | Fair Value | |
| The Merger Fund | | | | |
| Equity Contracts: | | | | |
| Purchased Option Contracts | Investments | | $ | 1,926,306 | |
| Swap Contracts | Receivables | | | 26,752,388 | |
| Total | | | $ | 28,678,694 | |
| | | | | | |
| WCM Alternatives: Event-Driven Fund | | | | | |
| Equity Contracts: | | | | | |
| Purchased Option Contracts | Investments | | $ | 161,804 | |
| Total | | | $ | 161,804 | |
| | | |
| | Liability Derivatives | |
| | Statements of Assets | | | |
Derivatives | and Liabilities Location | | Fair Value | |
| The Merger Fund | | | | | |
| Equity Contracts: | | | | | |
| Written Option Contracts | Written Option Contracts | | $ | 15,036,392 | |
| Foreign Exchange Contracts: | | | | | |
| Forward Currency Exchange Contracts | Payables | | | 3,613,608 | |
| Total | | | $ | 18,650,000 | |
| | | | | | |
| WCM Alternatives: Event-Driven Fund | | | | | |
| Equity Contracts: | | | | | |
| Written Option Contracts | Written Option Contracts | | $ | 1,280,943 | |
| Swap Contracts | Payables | | | 2,023,500 | |
| Foreign Exchange Contracts: | | | | | |
| Forward Currency Exchange Contracts | Payables | | | 225,765 | |
| Total | | | $ | 3,530,208 | |
The Merger Fund and WCM Alternatives: Event-Driven Fund
NOTES TO THE FINANCIAL STATEMENTS (continued)
December 31, 2017
Note 2 — SIGNIFICANT ACCOUNTING POLICIES (continued)
Statements of Operations
The effect of derivative instruments on the Statements of Operations for the year ended December 31, 2017:
| | | Amount of Realized Gain (Loss) on Derivatives | |
| | | | | | | | | | | | | | | | |
| | | | | | | | | Forward | | | | | | | |
| | | Purchased | | | Written | | | Currency | | | | | | | |
| | | Option | | | Option | | | Exchange | | | Swap | | | | |
Derivatives | | Contracts* | | | Contracts | | | Contracts | | | Contracts | | | Total | |
| The Merger Fund | | | | | | | | | | | | | | | |
| Equity Contracts | | $ | (49,121,145 | ) | | $ | 25,360,312 | | | $ | — | | | $ | (1,117,495 | ) | | $ | (24,878,328 | ) |
| Foreign Exchange | | | | | | | | | | | | | | | | | | | | |
| Contracts | | | — | | | | — | | | | (11,179,922 | ) | | | — | | | | (11,179,922 | ) |
| Total | | $ | (49,121,145 | ) | | $ | 25,360,312 | | | $ | (11,179,922 | ) | | $ | (1,117,495 | ) | | $ | (36,058,250 | ) |
| WCM Alternatives: | | | | | | | | | | | | | | | | | | | | |
| Event-Driven Fund | | | | | | | | | | | | | | | | | | | | |
| Equity Contracts | | $ | (4,193,133 | ) | | $ | 3,311,257 | | | $ | — | | | $ | 3,182,774 | | | $ | 2,300,898 | |
| Foreign Exchange | | | | | | | | | | | | | | | | | | | | |
| Contracts | | | — | | | | — | | | | (420,177 | ) | | | — | | | | (420,177 | ) |
| Total | | $ | (4,193,133 | ) | | $ | 3,311,257 | | | $ | (420,177 | ) | | $ | 3,182,774 | | | $ | 1,880,721 | |
| * | The amounts disclosed are included in the realized gain (loss) on investments. |
| | | Change in Unrealized Appreciation (Depreciation) on Derivatives | |
| | | | |
| | | | | | | | | Forward | | | | | | | |
| | | Purchased | | | Written | | | Currency | | | | | | | |
| | | Option | | | Option | | | Exchange | | | Swap | | | | |
Derivatives | | Contracts* | | | Contracts | | | Contracts | | | Contracts | | | Total | |
| The Merger Fund | | | | | | | | | | | | | | | |
| Equity Contracts | | $ | (342,246 | ) | | $ | (3,363,607 | ) | | $ | — | | | $ | 36,285,532 | | | $ | 32,579,679 | |
| Foreign Exchange | | | | | | | | | | | | | | | | | | | | |
| Contracts | | | — | | | | — | | | | (4,407,382 | ) | | | — | | | | (4,407,382 | ) |
| Total | | $ | (342,246 | ) | | $ | (3,363,607 | ) | | $ | (4,407,382 | ) | | $ | 36,285,532 | | | $ | 28,172,297 | |
| WCM Alternatives: | | | | | | | | | | | | | | | | | | | | |
| Event-Driven Fund | | | | | | | | | | | | | | | | | | | | |
| Equity Contracts | | $ | (98,898 | ) | | $ | 345,485 | | | $ | — | | | $ | (1,056,635 | ) | | $ | (810,048 | ) |
| Foreign Exchange | | | | | | | | | | | | | | | | | | | | |
| Contracts | | | — | | | | — | | | | (284,209 | ) | | | — | | | | (284,209 | ) |
| Total | | $ | (98,898 | ) | | $ | 345,485 | | | $ | (284,209 | ) | | $ | (1,056,635 | ) | | $ | (1,094,257 | ) |
| * | The amounts disclosed are included in the change in unrealized appreciation (depreciation) on investments. |
Note 3 — AGREEMENTS
The Funds’ investment adviser is Westchester Capital Management, LLC pursuant to an investment advisory agreement between TMF and the Adviser dated as of January 1, 2011 (the “TMF Advisory Agreement”) and pursuant to an investment advisory agreement between WCF, with
The Merger Fund and WCM Alternatives: Event-Driven Fund
NOTES TO THE FINANCIAL STATEMENTS (continued)
December 31, 2017
Note 3 — AGREEMENTS (continued)
respect to EDF, and the Adviser dated as of July 30, 2013 (the “EDF Advisory Agreement” and together with the TMF Advisory Agreement, the “Advisory Agreements”).
Under the terms of the TMF Advisory Agreement, the Adviser is entitled to receive a fee, calculated daily and payable monthly, at the annual rate of 1.00% of TMF’s average daily net assets. The Adviser has agreed until April 30, 2018 to reduce its advisory fee so that the advisory fee will be: (i) 1.0% on an annualized basis of the average daily net assets of TMF on net assets below $1.5 billion; (ii) 0.9% on an annualized basis of the average daily net assets of TMF on net assets between $1.5 billion and $2.0 billion; (iii) 0.8% on an annualized basis of the average daily net assets of TMF on net assets between $2.0 billion and $5.0 billion and (iv) 0.75% on an annualized basis of the average daily net assets of TMF on net assets over $5.0 billion (the “TMF Fee Waiver Agreement”). Investment advisory fees waived by the Adviser on behalf of TMF for the year ended December 31, 2017 were $2,005,834. Effective on or about May 1, 2018, the terms of a revised fee waiver agreement will go into effect. Under the terms of that fee waiver agreement, the Adviser has agreed until December 31, 2018 to reduce its advisory fee so that the advisory fee will be: (i) 1.0% of the first $2 billion in average daily net assets of TMF and (ii) 0.93% on average daily net assets above $2.0 billion.
Under the terms of the EDF Advisory Agreement, the Adviser is entitled to receive a fee, calculated daily and payable monthly, at the annual rate of 1.25% of EDF’s average daily net assets. The Adviser has contractually agreed until November 12, 2018 to waive its investment advisory fee and to reimburse EDF for other ordinary operating expenses to the extent necessary to limit ordinary operating expenses to an amount not to exceed 1.74% for Institutional Class shares and 1.99% for Investor Class shares (the “EDF Expense Limitation Agreement”). Ordinary operating expenses exclude taxes, commissions, mark-ups, litigation expenses, indemnification expenses, interest expenses, borrowing expenses, including on securities sold short, dividend expenses on securities sold short, trading or investment expenses, acquired fund fees and expenses, and any extraordinary expenses. To the extent that the Adviser waives its investment advisory fee for EDF and/or reimburses EDF for other ordinary operating expenses, it may seek reimbursement of a portion or all of such amounts at any time within three fiscal years after the fiscal year in which such amounts were waived or reimbursed, subject to the expense limitation in place at the time such amounts were waived or reimbursed. For the year ended December 31, 2017, the Adviser recouped $38,522 of advisory fees to EDF.
The Merger Fund and WCM Alternatives: Event-Driven Fund
NOTES TO THE FINANCIAL STATEMENTS (continued)
December 31, 2017
Note 3 — AGREEMENTS (continued)
Investment advisory fees waived and expenses reimbursed on behalf of EDF that are subject to potential recovery by the Adviser are shown in the following table by year of expiration.
Year of Expiration | Potential Recovery |
| 12/31/2018 | $89,167 |
| 12/31/2019 | $ 5,319 |
Each of the TMF Fee Waiver Agreement and the EDF Expense Limitation Agreement may be terminated at any time by such Fund’s Board of Trustees. Certain officers of the Funds are also officers of the Adviser. Each Advisory Agreement was approved for an initial term of two years and thereafter will remain in effect from year to year provided that such continuance is specifically approved at least annually by the vote of a majority of the relevant Fund’s Trustees who are not interested persons of the Adviser or such Fund or by a vote of a majority of the outstanding voting securities of such Fund.
U.S. Bancorp Fund Services, LLC, a subsidiary of U.S. Bancorp, a publicly held bank holding company, serves as transfer agent, administrator, accountant, dividend paying agent and shareholder servicing agent for the Funds. U.S. Bank, N.A. serves as custodian for the Funds.
Distribution services are performed pursuant to distribution contracts with broker-dealers and other qualified institutions.
Note 4 — SHARES OF BENEFICIAL INTEREST
The Board of Trustees of each Fund has the authority to issue an unlimited amount of shares of beneficial interest without par value.
Changes in shares of beneficial interest were as follows:
| | | Year Ended | | | Year Ended | |
| The Merger Fund | | December 31, 2017 | | | December 31, 2016 | |
| Investor Class | | Shares | | | Amount | | | Shares | | | Amount | |
| Issued | | | 18,119,248 | | | $ | 288,451,286 | | | | 37,333,469 | | | $ | 573,783,416 | |
| Issued as reinvestment | | | | | | | | | | | | | | | | |
| of dividends | | | 369,355 | | | | 5,887,521 | | | | 271,281 | | | | 4,253,698 | |
| Redeemed | | | (44,029,590 | ) | | | (700,623,902 | ) | | | (168,451,278 | ) | | | (2,598,144,269 | ) |
| Net Decrease | | | (25,540,987 | ) | | $ | (406,285,095 | ) | | | (130,846,528 | ) | | $ | (2,020,107,155 | ) |
| | | | | | | |
| | | Year Ended | | | Year Ended | |
| | | December 31, 2017 | | | December 31, 2016 | |
| Institutional Class | | Shares | | | Amount | | | Shares | | | Amount | |
| Issued | | | 29,355,964 | | | $ | 464,973,363 | | | | 37,830,299 | | | $ | 582,506,131 | |
| Issued as reinvestment | | | | | | | | | | | | | | | | |
| of dividends | | | 405,071 | | | | 6,412,277 | | | | 366,625 | | | | 5,712,011 | |
| Redeemed | | | (45,478,115 | ) | | | (724,231,208 | ) | | | (31,496,025 | ) | | | (485,307,929 | ) |
| Net Increase (Decrease) | | | (15,717,080 | ) | | $ | (252,845,568 | ) | | | 6,700,899 | | | $ | 102,910,213 | |
The Merger Fund and WCM Alternatives: Event-Driven Fund
NOTES TO THE FINANCIAL STATEMENTS (continued)
December 31, 2017
Note 4 — SHARES OF BENEFICIAL INTEREST (continued)
| | | For the Period from | | | | | | | |
| | | March 22, 2017^ | | | | | | | |
| | | through | | | Year Ended | |
| WCM Alternatives: | | December 31, 2017 | | | December 31, 2016 | |
| Event-Driven Fund | | Shares | | | Amount | | | Shares | | | Amount | |
| Investor Class | | | | | | | | | | | | |
| Issued | | | 624,205 | | | $ | 6,279,937 | | | | N/A | | | | N/A | |
| Issued as reinvestment | | | | | | | | | | | | | | | | |
| of dividends | | | 5,452 | | | | 55,388 | | | | N/A | | | | N/A | |
| Redeemed | | | (82,371 | ) | | | (840,457 | ) | | | N/A | | | | N/A | |
| Net Increase | | | 547,286 | | | $ | 5,494,868 | | | | N/A | | | | N/A | |
| | | | | | | | | | | | | | | | | |
| | | Year Ended | | | Year Ended | |
| | | December 31, 2017 | | | December 31, 2016 | |
| Institutional Class | | Shares | | | Amount | | | Shares | | | Amount | |
| Issued | | | 3,076,429 | | | $ | 31,012,088 | | | | 3,982,395 | | | $ | 38,316,375 | |
| Issued as reinvestment | | | | | | | | | | | | | | | | |
| of dividends | | | 92,478 | | | | 941,430 | | | | 98,571 | | | | 968,948 | |
| Redeemed | | | (5,434,615 | ) | | | (54,943,305 | ) | | | (2,601,444 | ) | | | (25,299,646 | ) |
| Net Increase (Decrease) | | | (2,265,708 | ) | | $ | (22,989,787 | ) | | | 1,479,522 | | | $ | 13,985,677 | |
^ Commencement of operations.
Note 5 — INVESTMENT TRANSACTIONS AND INCOME TAX INFORMATION
TMF’s purchases and sales of securities for the year ended December 31, 2017 (excluding short-term investments, short-term options, forward currency contracts, swap contracts and short positions) in the aggregate were $3,687,435,023 and $4,105,005,036, respectively. EDF’s purchases and sales of securities for the year ended December 31, 2017 (excluding short-term investments, short-term options, forward currency contracts, swap contracts and short positions) in the aggregate were $240,354,054 and $280,904,558, respectively. There were no purchases or sales of long-term U.S. Government securities for the Funds.
The Merger Fund and WCM Alternatives: Event-Driven Fund
NOTES TO THE FINANCIAL STATEMENTS (continued)
December 31, 2017
Note 5 — INVESTMENT TRANSACTIONS AND INCOME TAX INFORMATION (continued)
At December 31, 2017, the components of accumulated earnings gains (losses) on a tax basis were as follows:
| | | | | | WCM Alternatives: | |
| | | The Merger Fund | | | Event-Driven Fund | |
| Cost of investments* | | $ | 1,621,907,511 | | | $ | 86,523,609 | |
| Gross unrealized appreciation | | | 144,599,151 | | | | 5,533,266 | |
| Gross unrealized depreciation | | | (187,361,850 | ) | | | (6,996,593 | ) |
| Net unrealized depreciation | | $ | (42,762,699 | ) | | $ | (1,463,327 | ) |
| Undistributed ordinary income | | | 12,400,625 | | | | 1,785,492 | |
| Undistributed long-term capital gain | | | — | | | | — | |
| Total distributable earnings | | $ | 12,400,625 | | | $ | 1,785,492 | |
| Other accumulated losses | | | (52,737,611 | ) | | | (153,836 | ) |
| Total accumulated gains (losses) | | $ | (83,099,685 | ) | | $ | 168,329 | |
| * | Represents cost (including derivative contracts) for federal income tax purposes and differs from the cost for financial reporting purposes due to wash sales, constructive sales, PFIC mark to market, and unsettled short losses. |
GAAP requires that certain components of net assets relating to permanent differences be reclassified between financial and tax reporting. Permanent differences are primarily related to foreign currency transactions and swap treatment. These reclassifications have no effect on net assets or net asset value per share. For the year ended December 31, 2017, the following table shows the reclassifications made:
| | | Accumulated Net | |
| | | Realized Gain (Loss) on | |
| | | Investment, Securities | |
| | | Sold Short, Written Option | |
| | | Contracts Expired or | |
| | Accumulated | Closed, Forward Currency | |
| | Undistributed | Exchange Contracts, | |
| | Net Investment | Swap Contracts and | |
| | Income (Loss) | Foreign Currency Transactions | Paid-in Capital |
| The Merger Fund | $(12,367,809) | $ 9,892,235 | $2,475,574 |
| WCM Alternatives: | | | |
| Event Driven Fund | $ 2,056,192 | $(2,898,242) | $ 842,050 |
The Merger Fund and WCM Alternatives: Event-Driven Fund
NOTES TO THE FINANCIAL STATEMENTS (continued)
December 31, 2017
Note 5 — INVESTMENT TRANSACTIONS AND INCOME TAX INFORMATION (continued)
The tax components of dividends paid during the years ended December 31, 2017 and December 31, 2016 were as follows:
| | | | | | | | | WCM Alternatives: | |
| | | The Merger Fund | | | Event-Driven Fund | |
| | | 2017 | | | 2016 | | | 2017 | | | 2016 | |
| Investor Class | | | | | | | | | | | | |
| Ordinary Income | | $ | 6,825,795 | | | $ | 4,911,192 | | | $ | 55,388 | | | | N/A | |
| Long-Term Capital Gains | | | — | | | | — | | | | — | | | | N/A | |
| Total Distributions Paid | | $ | 6,825,795 | | | $ | 4,911,192 | | | $ | 55,388 | | | | N/A | |
| | | | | | | | | | | | | | | | | |
| | | 2017 | | | 2016 | | | 2017 | | | 2016 | |
| Institutional Class | | | | | | | | | | | | | | | | |
| Ordinary Income | | $ | 11,286,042 | | | $ | 12,300,844 | | | $ | 941,430 | | | $ | 968,948 | |
| Long-Term Capital Gains | | | — | | | | — | | | | — | | | | — | |
| Total Distributions Paid | | $ | 11,286,042 | | | $ | 12,300,844 | | | $ | 941,430 | | | $ | 968,948 | |
The Funds designated as long-term capital gain dividend, pursuant to Internal Revenue Case Section 852(b)(3), the amount necessary to reduce the earnings and profits of the Fund related to net capital gain to zero for the tax year ended December 31, 2017.
As of December 31, 2017, TMF and EDF did not have any post-October ordinary losses deferred, on a tax basis. As of December 31, 2017, TMF and EDF had no post-October ordinary losses. As of December 31, 2017, TMF had no short term and $42,349,028 of long term capital loss carryover. As of December 31, 2017, EDF had no short term or long term capital loss carryover.
Note 6 — DISTRIBUTION PLAN
TMF has adopted an Amended and Restated Plan of Distribution (the “TMF Plan”) dated July 30, 2013, pursuant to Rule 12b-1 under the 1940 Act that applies to TMF’s Investor Class shares. EDF has adopted a Plan of Distribution (the “EDF Plan” and together with the TMF Plan, the “Plans”) dated July 30, 2013, pursuant to Rule 12b-1 under the 1940 Act that applies to EDF’s Investor Class shares. Under each Plan, the respective Fund will compensate broker dealers or other qualified institutions with whom the Fund has entered into a contract to distribute the Fund’s Investor Class shares. Under each Plan, the amount of such compensation paid in any one year shall not exceed 0.25% annually of the average daily net assets attributable to the respective Fund’s Investor Class shares, which may be payable as a distribution fee or a service fee for providing permitted recordkeeping, subaccounting, subtransfer agency and/or
The Merger Fund and WCM Alternatives: Event-Driven Fund
NOTES TO THE FINANCIAL STATEMENTS (continued)
December 31, 2017
Note 6 — DISTRIBUTION PLAN (continued)
shareholder liaison services. For the year ended December 31, 2017, TMF incurred $3,483,210 pursuant to the TMF Plan in respect of TMF’s Investor Class shares. For the year ended December 31, 2017, EDF incurred $8,584 pursuant to the EDF Plan in respect of EDF’s Investor Class shares. Each Plan will remain in effect from year to year provided such continuance is approved at least annually by a vote either of a majority of the relevant Fund’s Trustees, including a majority of the non-interested Trustees, or a majority of the relevant Fund’s outstanding Investor Class shares.
Note 7 — OFFSETTING ASSETS AND LIABILITIES
Each Fund is subject to various Master Netting Arrangements, which govern the terms of certain transactions with select counterparties. The Master Netting Arrangements allow each Fund to close out and net its total exposure to a counterparty in the event of a default with respect to all the transactions governed under a single agreement with a counterparty. The Master Netting Arrangements also specify collateral posting arrangements at pre-arranged exposure levels. Under the Master Netting Arrangements, collateral is routinely transferred if the total net exposure to certain transactions (net of existing collateral already in place) governed under the relevant Master Netting Arrangement with a counterparty in a given account exceeds a specified threshold depending on the counterparty and the type of Master Netting Arrangement.
The Merger Fund and WCM Alternatives: Event-Driven Fund
NOTES TO THE FINANCIAL STATEMENTS (continued)
December 31, 2017
Note 7 — OFFSETTING ASSETS AND LIABILITIES (continued)
The Merger Fund
| | | | | | Gross | | | Net | | | | | | | | | | |
| | | | | | Amounts | | | Amounts | | | | | | | | | | |
| | | | | | Offset | | | Presented | | | Gross Amounts not | | | | |
| | | Gross | | | in the | | | in the | | | offset in the Statement | | | | |
| | | Amounts of | | | Statement | | | Statement | | | of Assets and Liabilities | | | | |
| | | Recognized | | | of Assets | | | of Assets | | | | | | Collateral | | | | |
| | | Assets/ | | | and | | | and | | | Financial | | | Received/ | | | Net | |
| | | Liabilities | | | Liabilities | | | Liabilities | | | Instruments | | | Pledged* | | | Amount | |
| Assets: | | | | | | | | | | | | | | | | | | |
| Description | | | | | | | | | | | | | | | | | | |
| Forward | | | | | | | | | | | | | | | | | | |
| Currency | | | | | | | | | | | | | | | | | | |
| Exchange | | | | | | | | | | | | | | | | | | |
| Contracts** | | $ | 19,180 | | | $ | 19,180 | | | $ | — | | | $ | — | | | $ | — | | | $ | — | |
| Swap Contracts — | | | | | | | | | | | | | | | | | | | | | | | | |
| Bank of America | | | | | | | | | | | | | | | | | | | | | | | | |
| Merrill Lynch | | | | | | | | | | | | | | | | | | | | | | | | |
| & Co., Inc. | | | 10,618,832 | | | | 6,066,389 | | | | 4,552,443 | | | | — | | | | — | | | | 4,552,443 | |
| Swap Contracts — | | | | | | | | | | | | | | | | | | | | | | | | |
| JPMorgan | | | | | | | | | | | | | | | | | | | | | | | | |
| Chase & | | | | | | | | | | | | | | | | | | | | | | | | |
| Co., Inc. | | | 27,874,068 | | | | 5,802,373 | | | | 22,071,695 | | | | — | | | | — | | | | 22,071,695 | |
| Swap Contracts — | | | | | | | | | | | | | | | | | | | | | | | | |
| Goldman, | | | | | | | | | | | | | | | | | | | | | | | | |
| Sachs & Co. | | | 352,568 | | | | 224,318 | | | | 128,250 | | | | — | | | | — | | | | 128,250 | |
| | | $ | 38,864,648 | | | $ | 12,112,260 | | | $ | 26,752,388 | | | $ | — | | | $ | — | | | $ | 26,752,388 | |
| Liabilities: | | | | | | | | | | | | | | | | | | | | | | | | |
| Description | | | | | | | | | | | | | | | | | | | | | | | | |
| Written Option | | | | | | | | | | | | | | | | | | | | | | | | |
| Contracts** | | $ | 15,036,392 | | | $ | — | | | $ | 15,036,392 | | | $ | — | | | $ | 15,036,392 | | | $ | — | |
| Forward | | | | | | | | | | | | | | | | | | | | | | | | |
| Currency | | | | | | | | | | | | | | | | | | | | | | | | |
| Exchange | | | | | | | | | | | | | | | | | | | | | | | | |
| Contracts** | | | 3,632,788 | | | | 19,180 | | | | 3,613,608 | | | | — | | | | 3,613,608 | | | | — | |
| Swap Contracts — | | | | | | | | | | | | | | | | | | | | | | | | |
| Bank of America | | | | | | | | | | | | | | | | | | | | | | | | |
| Merrill Lynch | | | | | | | | | | | | | | | | | | | | | | | | |
| & Co., Inc. | | | 6,066,389 | | | | 6,066,389 | | | | — | | | | — | | | | — | | | | — | |
| Swap Contracts — | | | | | | | | | | | | | | | | | | | | | | | | |
| JPMorgan | | | | | | | | | | | | | | | | | | | | | | | | |
| Chase & | | | | | | | | | | | | | | | | | | | | | | | | |
| Co., Inc. | | | 5,802,373 | | | | 5,802,373 | | | | — | | | | — | | | | — | | | | — | |
| Swap Contracts — | | | | | | | | | | | | | | | | | | | | | | | | |
| Goldman, | | | | | | | | | | | | | | | | | | | | | | | | |
| Sachs & Co. | | | 224,318 | | | | 224,318 | | | | — | | | | — | | | | — | | | | — | |
| | | $ | 30,762,260 | | | $ | 12,112,260 | | | $ | 18,650,000 | | | $ | — | | | $ | 18,650,000 | | | $ | — | |
| * | In some instances, the actual collateral received/pledged may be more than amount shown. |
| ** | JPMorgan Chase & Co., Inc. is the counterparty for all open forward currency exchange contracts and prime broker for all written option contracts held by the Funds as of December 31, 2017. |
The Merger Fund and WCM Alternatives: Event-Driven Fund
NOTES TO THE FINANCIAL STATEMENTS (continued)
December 31, 2017
Note 7 — OFFSETTING ASSETS AND LIABILITIES (continued)
WCM Alternatives: Event-Driven Fund
| | | | | | Gross | | | Net | | | | | | | | | | |
| | | | | | Amounts | | | Amounts | | | | | | | | | | |
| | | | | | Offset | | | Presented | | | Gross Amounts not | | | | |
| | | Gross | | | in the | | | in the | | | offset in the Statement | | | | |
| | | Amounts of | | | Statement | | | Statement | | | of Assets and Liabilities | | | | |
| | | Recognized | | | of Assets | | | of Assets | | | | | | Collateral | | | | |
| | | Assets/ | | | and | | | and | | | Financial | | | Received/ | | | Net | |
| | | Liabilities | | | Liabilities | | | Liabilities | | | Instruments | | | Pledged* | | | Amount | |
| Assets: | | | | | | | | | | | | | | | | | | |
| Description | | | | | | | | | | | | | | | | | | |
| Forward | | | | | | | | | | | | | | | | | | |
| Currency | | | | | | | | | | | | | | | | | | |
| Exchange | | | | | | | | | | | | | | | | | | |
| Contracts** | | $ | 1,951 | | | $ | 1,951 | | | $ | — | | | $ | — | | | $ | — | | | $ | — | |
| Swap | | | | | | | | | | | | | | | | | | | | | | | | |
| Contracts — | | | | | | | | | | | | | | | | | | | | | | | | |
| Bank of America | | | | | | | | | | | | | | | | | | | | | | | | |
| Merrill Lynch | | | | | | | | | | | | | | | | | | | | | | | | |
| & Co., Inc. | | | 669,875 | | | | 669,875 | | | | — | | | | — | | | | — | | | | — | |
| Swap | | | | | | | | | | | | | | | | | | | | | | | | |
| Contracts — | | | | | | | | | | | | | | | | | | | | | | | | |
| JPMorgan | | | | | | | | | | | | | | | | | | | | | | | | |
| Chase & | | | | | | | | | | | | | | | | | | | | | | | | |
| Co., Inc. | | | 2,729,934 | | | | 2,729,934 | | | | — | | | | — | | | | — | | | | — | |
| | | $ | 3,401,760 | | | $ | 3,401,760 | | | $ | — | | | $ | — | | | $ | — | | | $ | — | |
| Liabilities: | | | | | | | | | | | | | | | | | | | | | | | | |
| Description | | | | | | | | | | | | | | | | | | | | | | | | |
| Written | | | | | | | | | | | | | | | | | | | | | | | | |
| Option | | | | | | | | | | | | | | | | | | | | | | | | |
| Contracts** | | $ | 1,280,943 | | | $ | — | | | $ | 1,280,943 | | | $ | — | | | $ | 1,280,943 | | | $ | — | |
| Forward | | | | | | | | | | | | | | | | | | | | | | | | |
| Currency | | | | | | | | | | | | | | | | | | | | | | | | |
| Exchange | | | | | | | | | | | | | | | | | | | | | | | | |
| Contracts** | | | 227,716 | | | | 1,951 | | | | 225,765 | | | | — | | | | 225,765 | | | | — | |
| Swap | | | | | | | | | | | | | | | | | | | | | | | | |
| Contracts — | | | | | | | | | | | | | | | | | | | | | | | | |
| Bank of America | | | | | | | | | | | | | | | | | | | | | | | | |
| Merrill Lynch | | | | | | | | | | | | | | | | | | | | | | | | |
| & Co., Inc. | | | 1,320,002 | | | | 669,875 | | | | 650,127 | | | | — | | | | 650,127 | | | | — | |
| Swap | | | | | | | | | | | | | | | | | | | | | | | | |
| Contracts — | | | | | | | | | | | | | | | | | | | | | | | | |
| JPMorgan | | | | | | | | | | | | | | | | | | | | | | | | |
| Chase & | | | | | | | | | | | | | | | | | | | | | | | | |
| Co., Inc. | | | 4,103,307 | | | | 2,729,934 | | | | 1,373,373 | | | | — | | | | 1,373,373 | | | | — | |
| | | $ | 6,931,968 | | | $ | 3,401,760 | | | $ | 3,530,208 | | | $ | — | | | $ | 3,530,208 | | | $ | — | |
| * | In some instances, the actual collateral received/pledged may be more than amount shown. |
| ** | JPMorgan Chase & Co., Inc. is the counterparty for all open forward currency exchange contracts and prime broker for all written option contracts held by the Funds as of December 31, 2017. |
The Merger Fund and WCM Alternatives: Event-Driven Fund
NOTES TO THE FINANCIAL STATEMENTS
December 31, 2017
Note 8 — ACCOUNTING PRONOUNCEMENTS
In March 2017, the Financial Accounting Standards Board (“FASB”) issued Accounting Standards Update (“ASU”) No. 2017-08, Receivables—Nonrefundable Fees and Other Costs (Subtopic 310-20): Premium Amortization on Purchased Callable Debt Securities. The amendments in the ASU shorten the amortization period for certain callable debt securities, held at a premium, to be amortized to the earliest call date. The ASU does not require an accounting change for securities held at a discount; which continues to be amortized to maturity. The ASU is effective for fiscal years and interim periods within those fiscal years beginning after December 15, 2018. Management is currently evaluating the impact, if any, of applying this provision.
Note 9 — SUBSEQUENT EVENTS
Management has evaluated events and transactions occurring after December 31, 2017 through the date that the financial statements were issued, and has determined that no additional disclosure in the financial statements is required.
REPORT OF INDEPENDENT REGISTERED PUBLIC ACCOUNTING FIRM
To the Board of Trustees of The Merger Fund and Westchester Capital Funds
and Shareholders of The Merger Fund and WCM Alternatives: Event-Driven Fund:
Opinion on the Financial Statements
We have audited the accompanying statements of assets and liabilities, including the schedules of investments, of options written, of forward currency exchange contracts, and of swap contracts of The Merger Fund and WCM Alternatives: Event-Driven Fund (the “Funds”) as of December 31, 2017, the related statements of operations for the year ended December 31, 2017, the statements of changes in net assets for each of the two years in the period ended December 31, 2017, including the related notes, and the financial highlights for each of the periods indicated therein (collectively referred to as the “financial statements”). In our opinion, the financial statements present fairly, in all material respects, the financial position of the Funds as of December 31, 2017, the results of each of their operations for the year then ended, the changes in each of their net assets for each of the two years in the period ended December 31, 2017 and the financial highlights for each of the periods indicated therein, in conformity with accounting principles generally accepted in the United States of America.
Basis for Opinion
These financial statements are the responsibility of the Funds’ management. Our responsibility is to express an opinion on the Funds’ financial statements based on our audits. We are a public accounting firm registered with the Public Company Accounting Oversight Board (United States) (“PCAOB”) and are required to be independent with respect to the Funds in accordance with the U.S. federal securities laws and the applicable rules and regulations of the Securities and Exchange Commission and the PCAOB.
We conducted our audits of these financial statements in accordance with the standards of the PCAOB. Those standards require that we plan and perform the audit to obtain reasonable assurance about whether the financial statements are free of material misstatement, whether due to error or fraud.
Our audits included performing procedures to assess the risks of material misstatement of the financial statements, whether due to error or fraud, and performing procedures that respond to those risks. Such procedures included examining, on a test basis, evidence regarding the amounts and disclosures in the financial statements. Our audits also included evaluating the accounting principles used and significant estimates made by management, as well as evaluating the overall presentation of the financial statements. Our procedures included confirmation of securities owned as of December 31, 2017 by correspondence with the custodian and brokers; when replies were not received from brokers, we performed other auditing procedures. We believe that our audits provide a reasonable basis for our opinion.
New York, New York
February 23, 2018
We have served as the auditor of one or more investment companies in Westchester Capital Management (or its predecessor) since 1995.
BOARD APPROVAL OF INVESTMENT ADVISORY AGREEMENT
(Unaudited)
Each year, the Board of Trustees of each of The Merger Fund, The Merger Fund VL, and WCM Alternatives: Event-Driven Fund (together, the “Board”), including a majority of the Trustees who are not interested persons of The Merger Fund, The Merger Fund VL, and WCM Alternatives: Event-Driven Fund (together, the “Independent Trustees”), is required to determine whether to continue the advisory agreements for each of The Merger Fund, The Merger Fund VL, and WCM Alternatives: Event-Driven Fund, respectively. In October 2017, the Board and the Independent Trustees approved the continuation of The Merger Fund’s, The Merger Fund VL’s, and WCM Alternatives: Event-Driven Fund’s (each, a “Fund” and, together, the “Funds”) advisory arrangements with Westchester Capital Management, LLC (the “Adviser”) (collectively, the “Agreements”) for an additional one-year period. A summary of the material factors and conclusions that formed the basis for the approval by the Board and the Independent Trustees are discussed below.
Review Process
The Investment Company Act of 1940, as amended, requires that the Board request and evaluate, and that the Adviser furnish, such information as may reasonably be necessary to evaluate the terms of the Agreements. The Independent Trustees began their formal review process in the summer of 2017 by compiling a request for information that sought a wide range of information the Independent Trustees believed might be necessary to evaluate the terms of the Funds’ Agreements. The Independent Trustees were assisted in compiling that information request by counsel to the Independent Trustees.
Following receipt of the Adviser’s response to their information request, the Independent Trustees evaluated all of the information available to them on a Fund-by-Fund basis, and their deliberations were made separately in respect of each Fund. Throughout the review process, the Independent Trustees were advised by their counsel and they also discussed their obligations with respect to the continuation of the Agreements in private sessions with their counsel. The Independent Trustees and the Board, in determining to approve the continuation of the Agreements, did not identify any particular information that was all-important or controlling, and each Trustee attributed different weights to the various factors. The following summary describes some, but not all, of the factors considered by the Board and the Independent Trustees.
BOARD APPROVAL OF INVESTMENT ADVISORY AGREEMENT
(continued) (Unaudited)
Materials Reviewed
During the course of each year, the Board receives a wide variety of materials relating to the services provided by the Adviser and the Funds’ other service providers, including reports on: each Fund’s investment results; portfolio construction; portfolio composition; portfolio trading practices; and other information relating to the nature, extent and quality of services provided by the Adviser to the Funds. In addition, in connection with its annual consideration of the Agreements, the Board requested and reviewed supplementary information regarding the terms of the Agreements, the Funds’ investment results, advisory fee and total expense comparisons, financial and profitability information regarding the Adviser and its affiliates, descriptions of various functions undertaken by the Adviser, such as compliance monitoring, information about the personnel providing investment management services to the Funds, and information regarding the terms of the Adviser’s other advisory relationships.
The Board also requested and evaluated performance and expense information for other investment companies that was compiled and presented by Morningstar Inc. (“Morningstar”). During the review process, the Board received information regarding the methodology used in compiling Morningstar’s report and the process for how each Fund’s peer group was determined. The Board and the Independent Trustees also considered information regarding so-called “fall-out” benefits to the Adviser and its affiliates due to the Adviser’s relationships with the Funds. After consideration of all of the information presented to it, the Board concluded that it had received all of the information it believed was reasonably necessary to assess the terms of each Agreement and determine whether to renew each Agreement.
Nature, Extent and Quality of Services
Nature and Extent of Services – In considering whether to continue the Agreements for an additional year, the Board and the Independent Trustees evaluated the nature and extent of the services provided by the Adviser. The Board and the Independent Trustees considered information concerning the investment philosophy and investment process used by the Adviser in managing the Funds. In this context, the Board and the Independent Trustees considered the in-house research capabilities of the Adviser as well as other resources available to the Adviser, including research services available to the Adviser as a result of securities transactions effected for the Funds and other investment advisory clients of the Adviser. The Trustees considered the scope and quality of services provided by the Adviser under the Agreements, and noted that the scope of work required of the Adviser
BOARD APPROVAL OF INVESTMENT ADVISORY AGREEMENT
(continued) (Unaudited)
to perform the contracted-for services had expanded over time as a result of regulatory and other developments. In this respect, the Board also considered the oversight functions performed by officers of the Funds who were supplied by and employees of the Adviser and compensated by the Adviser. The Board and the Independent Trustees also considered the managerial and financial resources available to the Adviser.
Quality of Services – The Board and the Independent Trustees considered the quality of the services provided by the Adviser and the quality of the resources of the Adviser available to the Funds. The Board and the Independent Trustees considered the specialized experience, expertise and professional qualifications of the personnel of the Adviser, including that the Adviser was among a limited number of investment advisers with a long track record managing merger arbitrage and event-driven strategies within the context of a registered mutual fund. The Board and the Independent Trustees considered the complexity of managing the Funds’ strategies relative to other types of funds. The Board and the Independent Trustees also received and reviewed information regarding the non-portfolio management services provided to the Funds by the Adviser in support of the Funds’ operations. The Trustees also considered the personnel that had been retained by the Adviser over recent years to maintain and potentially enhance the level of services provided to the Funds. The Board and the Independent Trustees also considered whether the Funds operated within their investment objectives and their record of compliance with their investment restrictions.
In their evaluation of the quality of the services provided by the Adviser, the Board and the Independent Trustees considered the performance of the Funds. The Board and the Independent Trustees reviewed information comparing the Funds’ historical performance to relevant market indices and to performance information for other investment companies with similar investment strategies over the one-, three-, five- and ten-year periods (where applicable) ended August 31, 2017. The Board considered that while The Merger Fund VL ranked in the fourth quartile of its limited peer group for the one- and three-year periods ended August 31, 2017, it ranked in the second and first quartile among its limited number of peers for the five-, and ten-year periods ended August 31, 2017, respectively. The Board also considered that The Merger VL outperformed the HFRX Merger Arbitrage Index over the one-, five-, and ten-year periods ended August 31, 2017, and outperformed its benchmark, the BofA Merrill Lynch 3-Month U.S. Treasury Bill Index, over the one-, five-, and ten-year periods ended August 31, 2017. The Board also considered that while The Merger Fund ranked in the third or fourth quartile of its peer group in Morningstar’s report for each of the one- and three-year periods ended August 31, 2017, it ranked in the second quartile for the five-year period ended August 31, 2017, and it underperformed modestly the only other fund in its peer group over the ten-year period ended August 31, 2017. The Trustees also considered that the Fund outperformed the HFRX Merger Arbitrage Index over the one-, five-, and ten-year periods ended August 31, 2017, and outperformed its benchmark, the BofA Merrill Lynch 3-Month U.S. Treasury Bill Index, over the one-, five-, and ten-year periods ended August 31, 2017. The Board also considered that WCM Alternatives: Event-Driven Fund ranked in the second quartile of its Morningstar peer group for the one- and three-year
BOARD APPROVAL OF INVESTMENT ADVISORY AGREEMENT
(continued) (Unaudited)
periods ended August 31, 2017 and above and at the median of its peers for the one- and three-year periods ended August 31, 2017, respectively. In all of their evaluations of relative performance, the Trustees noted that Morningstar’s report included a relatively small number of peer funds for comparison, especially over longer-term periods, due to the limited number of registered mutual funds pursuing merger-arbitrage and/or event-driven investment strategies. In their evaluation of each Fund’s performance, including each Fund’s relatively lower levels of absolute performance over recent periods, the Trustees also considered, among other things, information the Adviser had provided regarding the market conditions affecting merger-arbitrage strategies generally, the prevailing low interest rate environment generally and the Funds’ historical relationship to interest rates, and that the Adviser had continued to deliver low volatility returns, with relatively low levels of correlation to the equity markets. The Board and the Independent Trustees concluded, within the context of their overall conclusions regarding each of the Agreements, that they were satisfied with the nature, extent and quality of the services provided by the Adviser and that each Fund’s performance record supported the renewal of the Agreements.
Management Fees and Expenses
The Board and the Independent Trustees reviewed information, including comparative information provided by Morningstar, regarding the advisory fees paid to the Adviser and the total expenses borne by the Funds. They considered the Funds’ advisory fees relative to their peer groups. In this regard, the Independent Trustees noted that each Fund’s net advisory fees and net operating expenses, after taking into account any expense limitation arrangements or advisory fee waivers, remained competitive with its peers. The Independent Trustees noted The Merger Fund’s net advisory fees and net operating expenses (Investor Class) were below the median of its peer group. The Independent Trustees also considered the impact of the revised advisory fee waiver for The Merger Fund and noted that the Fund’s net advisory fee, even with the revised fee
BOARD APPROVAL OF INVESTMENT ADVISORY AGREEMENT
(continued) (Unaudited)
waiver in place, would still be expected to be the lowest or near the lowest advisory fee of its peer group. The Independent Trustees also noted that The Merger Fund VL’s net advisory fees were at or near their respective peer group medians and that The Merger Fund VL’s net operating expenses were below its peer group median. The Trustees noted that WCM Alternatives: Event-Driven Fund’s net advisory fees and net operating expenses (Investor Class) were above the median of its peer group, though in line with a number of its peers.
The Board and the Independent Trustees also considered the fees that the Adviser and its affiliates charge other clients with investment strategies similar to the Funds, including where an account is subject to a performance-based fee. The Board and the Independent Trustees considered information provided by the Adviser describing the differences in services provided to these other clients. In this regard, the Adviser noted that the services provided to these other clients typically consist nearly exclusively or primarily of portfolio management services. The Adviser described the additional level of services provided to the Funds under the terms of the Funds’ advisory arrangements or otherwise, such as supplying Fund management, general coordination of the Funds’ other service providers, the provision of middle and back office support functions, provision of certain compliance and regulatory functions, and quarterly preparation and attendance of meetings with the Board, as well as the greater financial obligations and entrepreneurial risks the Adviser undertakes in respect of sponsoring a registered mutual fund. The Board and the Independent Trustees concluded, within the context of their overall conclusions regarding each of the Agreements, that the fees charged under the Agreements represent reasonable compensation to the Adviser in light of the services provided.
Profitability and Possible Economies of Scale
Profitability – The Board and the Independent Trustees reviewed information regarding the cost of services provided by the Adviser and the profitability (before distribution expenses and taxes) of the Adviser’s relationship with each Fund. The Board noted that, in reporting on its profitability, the Adviser had included an estimated expense for compensation of the Funds’ portfolio managers because the Funds’ portfolio managers are principal owners of the Adviser and do not receive a salary or bonus. The Board noted that the Adviser would have incurred significant compensation expense if it instead had to hire equivalently qualified portfolio managers to perform the services performed by the owners, which costs would significantly reduce the Adviser’s profitability.
BOARD APPROVAL OF INVESTMENT ADVISORY AGREEMENT
(continued) (Unaudited)
In evaluating the Adviser’s reported profitability, the Independent Trustees considered that certain of the information provided by the Adviser was necessarily estimated and that preparing the related profitability information involved certain assumptions and allocations that were imprecise. The Board and the Independent Trustees recognized that the probative value of profitability information may be limited because a wide range of comparative information for peer advisers often is not generally available and it can be affected by numerous factors, including the structure of the particular adviser, the types of funds it manages, its business mix, the efficiency of an adviser’s operations, numerous assumptions about allocations and the adviser’s cost of capital. The Independent Trustees concluded that the Adviser’s profitability with respect to The Merger Fund may be relatively high in comparison to other mutual funds, but they noted that the Adviser was among a limited number of investment advisers with an extensive history of providing competitive merger-arbitrage portfolio management services within a registered mutual fund vehicle and that the Fund’s net advisory fees and net operating expenses remained in line with or below its close peers.
In addition, the Board and the Independent Trustees considered information regarding the direct and indirect benefits the Adviser receives as a result of its relationship with the Funds, including research purchased with soft dollar credits earned from portfolio transactions effected on behalf of the Funds (soft dollar arrangements) and reputational benefits.
Economies of Scale – The Board and the Independent Trustees reviewed the extent to which the Adviser may realize economies of scale in managing the Funds. The Board and the Independent Trustees concluded within the context of their overall conclusions regarding each of the Agreements that the Adviser’s level of profitability from its relationship with each Fund was not excessive in light of, among other things, the Funds’ competitive advisory fees and expense ratios. The Trustees also considered that the revised fee waiver to The Merger Fund’s advisory fee would generally have the effect of a breakpoint in the Adviser’s advisory fee and that the Adviser proposed to continue the expense limitation agreements applicable to The Merger Fund VL and WCM Alternatives: Event-Driven Fund, in each case for an additional one-year period. The Independent Trustees concluded that those measures were reasonably designed to result in the sharing of economies of scale realized by the Adviser, if any, with the Funds and their shareholders.
BOARD APPROVAL OF INVESTMENT ADVISORY AGREEMENT
(continued) (Unaudited)
Conclusions
Based on their review, including their consideration of each of the factors referred to above, the Board and the Independent Trustees concluded that the terms of the Agreements, including the fees payable to the Adviser, are fair and reasonable to the Funds and their shareholders given the scope and quality of the services provided to the Funds and such other considerations as the Independent Trustees considered relevant in the exercise of their reasonable business judgment and that the continuation of the Agreements was in the best interests of the Funds and their shareholders. Accordingly, the Board and Independent Trustees unanimously approved the continuation of the Agreements.
INFORMATION ABOUT TRUSTEES AND OFFICERS
The business and affairs of the Funds are managed under the direction of the Funds’ Board of Trustees. Information pertaining to the Funds’ Trustees and Officers is set forth below. The Statement of Additional Information includes additional information about the Fund’s Trustees and Officers and is available, without charge, upon request by calling 1-800-343-8959.
| | | | | # of | Other |
| | | Term of | | Portfolios | Directorships |
| | | Office | | in Fund | Held by |
| | | and | Principal | Complex | Trustee |
| Name, | Position(s) | Length | Occupation(s) | Overseen | During |
| Address and | Held with | of Time | During the | by | the Past |
Year of Birth | the Fund | Served | Past Five Years | Trustee** | Five Years |
| Interested Trustees | | | | | |
| Roy D. Behren* | Co-President, | Indefinite; | Co-Portfolio Manager | 4 | None |
| Westchester Capital | Treasurer and | since 2011 | and Co-President | | |
| Management, LLC | Trustee | for TMF | of Westchester Capital | | |
| 100 Summit Lake Drive | | and | Management, LLC, | | |
| Valhalla, NY 10595 | | since | the Funds’ Adviser, | | |
| Year of Birth: 1960 | | inception | since 2011. | | |
| | | for EDF | | | |
| Michael T. Shannon* | Co-President | Indefinite; | Co-Portfolio Manager | 4 | None |
| Westchester Capital | and | Co- | and Co-President of | | |
| Management, LLC | Trustee | President | Westchester Capital | | |
| 100 Summit Lake Drive | | since 2011 | Management, LLC, the | | |
| Valhalla, NY 10595 | | and | Funds’ Adviser, since | | |
| Year of Birth: 1966 | | Trustee | 2011. | | |
| | | since | | | |
| | | 2014 for | | | |
| | | TMF and | | | |
| | | since | | | |
| | | inception | | | |
| | | for EDF | | | |
| Non-Interested Trustees | | | | | |
| Barry Hamerling | Independent | Indefinite; | Managing Partner of | 4 | None |
| c/o Westchester | Trustee | since | Premium Ice Cream of | | |
| Capital | | 2007 | America since 1995. | | |
| Management, LLC | | for TMF | Managing Partner of | | |
| 100 Summit Lake Drive | | and since | B&J Freeport since 1990. | | |
| Valhalla, NY 10595 | | inception | Managing Partner of | | |
| Year of Birth: 1946 | | for EDF | Let-US Creations from | | |
| | | | 1999 to 2011. | | |
INFORMATION ABOUT TRUSTEES AND OFFICERS (continued)
| | | | | # of | Other |
| | | Term of | | Portfolios | Directorships |
| | | Office | | in Fund | Held by |
| | | and | Principal | Complex | Trustee |
| Name, | Position(s) | Length | Occupation(s) | Overseen | During |
| Address and | Held with | of Time | During the | by | the Past |
Year of Birth | the Fund | Served | Past Five Years | Trustee** | Five Years |
| Richard V. Silver | Independent | Indefinite; | Consultant with AXA | 4 | None |
| c/o Westchester | Trustee | since | Equitable Life Insurance | | |
| Capital | | 2013 | Company from May | | |
| Management, LLC | | for TMF | 2012 to April 2013. | | |
| 100 Summit Lake Drive | | and since | Senior Executive Vice | | |
| Valhalla, NY 10595 | | inception | President, Chief Legal | | |
| Year of Birth: 1955 | | for EDF | Officer and Chief | | |
| | | | Administrative Officer | | |
| | | | of AXA Equitable Life | | |
| | | | Insurance Company from | | |
| | | | February 2010 to April | | |
| | | | 2012. | | |
| | | | | | |
| Christianna Wood | Independent | Indefinite; | Chief Executive Officer | 4 | Director of |
| c/o Westchester | Trustee | since | and President of Gore | | H&R Block |
| Capital | | 2013 | Creek Capital, Ltd. since | | Corporation; |
| Management, LLC | | for TMF | August 2009. | | Director of |
| 100 Summit Lake Drive | | and since | | | International |
| Valhalla, NY 10595 | | inception | | | Securities |
| Year of Birth: 1959 | | for EDF | | | Exchange; |
| | | | | | Director of |
| | | | | | Grange |
| | | | | | Insurance |
| | | | | | |
| Officers | | | | | |
| Bruce Rubin | Vice | One-year | Chief Operating Officer | N/A | N/A |
| Westchester Capital | President, | terms; | of Westchester Capital | | |
| Management, LLC | Chief | since 2010 | Management, LLC, | | |
| 100 Summit Lake Drive | Compliance | for TMF | the Funds’ Adviser, | | |
| Valhalla, NY 10595 | Officer and | and since | since 2010. | | |
| Year of Birth: 1959 | Anti-Money | inception | | | |
| | Laundering | for EDF | | | |
| | Compliance | | | | |
| | Officer | | | | |
INFORMATION ABOUT TRUSTEES AND OFFICERS (continued)
| | | | | # of | Other |
| | | Term of | | Portfolios | Directorships |
| | | Office | | in Fund | Held by |
| | | and | Principal | Complex | Trustee |
| Name, | Position(s) | Length | Occupation(s) | Overseen | During |
| Address and | Held with | of Time | During the | by | the Past |
Year of Birth | the Fund | Served | Past Five Years | Trustee** | Five Years |
| Abraham Cary | Secretary | One-year | Head of Trading of | N/A | N/A |
| Westchester Capital | | terms; | Westchester Capital | | |
| Management, LLC | | since 2012 | Management, LLC, | | |
| 100 Summit Lake Drive | | for TMF | the Funds’ Adviser, | | |
| Valhalla, NY 10595 | | and since | since 2011. | | |
| Year of Birth: 1975 | | inception | | | |
| | | for EDF | | | |
| * | Denotes a trustee who is an “interested person” (as that term is defined in Section 2(a)(19) of the 1940 Act) of the Funds or of the Funds’ investment adviser. Messrs. Behren and Shannon are deemed to be interested persons because of their affiliation with the Funds’ investment adviser, Westchester Capital Management, LLC, and because they are officers of the Funds. |
| ** | The fund complex consists of TMF, The Merger Fund VL, EDF and WCM Alternatives: Credit Event Fund. |
ADDITIONAL INFORMATION (Unaudited)
For the fiscal year ended December 31, 2017, certain dividends paid by TMF may be subject to a maximum tax rate of 15% as provided for by the Jobs and Growth Tax Relief Reconciliation Act of 2003. The percentage of dividends declared from ordinary income designated as qualified dividend income for the fiscal year ended December 31, 2017 was 100.00% for TMF and 25.94% for EDF.
For corporate shareholders, the percent of ordinary income distributions qualifying for the corporate dividends-received deduction for the fiscal year ended December 31, 2017 was 100.00% for TMF and 23.70% for EDF.
The percentage of taxable ordinary income distributions that are designated as short-term capital gain distributions under Internal Revenue Code Section 871(k)(2)(c) for the fiscal year ended December 31, 2017 was 0.00% for TMF and 100.00% for EDF.
AVAILABILITY OF PROXY VOTING INFORMATION
Information regarding how the Funds generally votes proxies relating to portfolio securities may be obtained without charge by calling the Funds’ Transfer Agent at 1-800-343-8959 or by visiting the SEC’s website at www.sec.gov. Information regarding how the Funds voted proxies during the most recent 12-month period ended June 30 is available on the SEC’s website or by calling the toll-free number listed above.
AVAILABILITY OF QUARTERLY PORTFOLIO SCHEDULE
The Funds file their complete schedule of portfolio holdings with the SEC for the first and third quarters of each fiscal year on Form N-Q. The Funds’ Forms N-Q are available on the SEC’s website at www.sec.gov and may be reviewed and copied at the SEC’s Public Reference Room in Washington, DC. Information on the operation of the Public Reference Room may be obtained by calling 1-800-SEC-0330.
The Merger Fund and WCM Alternatives: Event-Driven Fund
PRIVACY POLICY
We collect the following non-public personal information about you:
| | • | Information we receive from you on or in applications or other forms, correspondence, or conversations, including, but not limited to, your name, address, phone number, social security number, assets, income and date of birth; and |
| | | |
| | • | Information about your transactions with us, our affiliates, or others, including, but not limited to, your account number and balance, payments history, parties to transactions, cost basis information, and other financial information. |
We do not disclose any non-public personal information about our current or former shareholders to non-affiliated third parties, except as permitted by law. For example, we are permitted by law to disclose all of the information we collect, as described above, to our transfer agent to process your transactions. Furthermore, we restrict access to your non-public personal information to those persons who require such information to provide products or services to you. We maintain physical, electronic, and procedural safeguards that comply with federal standards to guard your non-public personal information.
In the event that you hold shares of the Fund through a financial intermediary, including, but not limited to, a broker-dealer, bank, or trust company, the privacy policy of your financial intermediary would govern how your non-public personal information would be shared with non-affiliated third parties.
THIS PRIVACY POLICY IS NOT A PART OF THE ANNUAL REPORT.
(This Page Intentionally Left Blank.)
Investment Adviser
Westchester Capital Management, LLC
100 Summit Lake Drive
Valhalla, NY 10595
(914) 741-5600
www.westchestercapitalfunds.com
Administrator, Transfer Agent, Accountant,
Dividend Paying Agent and Shareholder Servicing Agent
U.S. Bancorp Fund Services, LLC
615 East Michigan Street
P.O. Box 701
Milwaukee, WI 53201-0701
(800) 343-8959
Custodian
U.S. Bank, N.A.
1555 North Rivercenter Drive, Suite 302
Milwaukee, WI 53212
(800) 343-8959
Distributor
Quasar Distributors, LLC
777 East Wisconsin Avenue
Milwaukee, WI 53202
Trustees
Roy Behren
Michael T. Shannon
Barry Hamerling
Richard V. Silver
Christianna Wood
Executive Officers
Roy Behren, Co-President and Treasurer
Michael T. Shannon, Co-President
Bruce Rubin, Vice President and
Chief Compliance Officer
Abraham R. Cary, Secretary
Counsel
Ropes & Gray LLP
1211 Avenue of the Americas
New York, NY 10036
Independent Registered
Public Accounting Firm
PricewaterhouseCoopers LLP
300 Madison Avenue
New York, NY 10017
Item 2. Code of Ethics.
The registrant has adopted a code of ethics that applies to the registrant’s principal executive officer and principal financial officer. The registrant has not made any substantive amendments to its code of ethics during the period covered by this report. The registrant has not granted any waivers from any provisions of the code of ethics during the period covered by this report. A copy of the registrant’s Code of Ethics is filed herewith. The registrant also undertakes to provide to any person without charge, upon request, a copy of its code of ethics by mail when they call the registrant at (800) 343-8959.
Item 3. Audit Committee Financial Expert.
The registrant’s board of trustees has determined that there is at least one audit committee financial expert serving on its audit committee. Barry Hamerling and Christianna Wood are the “audit committee financial experts” and are considered to be “independent” as each term is defined in Item 3 of Form N-CSR.
Item 4. Principal Accountant Fees and Services.
The registrant has engaged its principal accountant, PricewaterhouseCoopers LLP, to perform audit services, audit-related services, tax services and other services during the past two fiscal years. “Audit services” refer to performing an audit of the registrant's annual financial statements or services that are normally provided by the accountant in connection with statutory and regulatory filings or engagements for those fiscal years. “Audit-related services” refer to the assurance and related services by the principal accountant that are reasonably related to the performance of the audit. “Tax services” refer to professional services rendered by the principal accountant for tax compliance, tax advice, and tax planning. The following table details the aggregate fees billed or expected to be billed for each of the last two fiscal years for audit fees, audit-related fees, tax fees and other fees by the principal accountant.
| | FYE 12/31/2017 | FYE 12/31/2016 |
| Audit Fees | $107,750 | $104,750 |
| Audit-Related Fees | $ - | $ - |
| Tax Fees | $12,605 | $12,225 |
| All Other Fees | $ - | $ - |
The audit committee has adopted pre-approval policies and procedures that require the audit committee to pre approve all audit and non-audit services of the registrant, including services provided to any entity affiliated with the registrant.
The percentage of fees billed by PricewaterhouseCoopers LLP applicable to non-audit services pursuant to waiver of pre-approval requirement were as follows:
| | FYE 12/31/2017 | FYE 12/31/2016 |
| Audit-Related Fees | 0% | 0% |
| Tax Fees | 0% | 0% |
| All Other Fees | 0% | 0% |
All of the principal accountant’s hours spent on auditing the registrant’s financial statements were attributed to work performed by full time permanent employees of the principal accountant.
The following table indicates the non-audit fees billed or expected to be billed by the registrant’s accountant for services to the registrant and to the registrant’s investment adviser (and any other controlling entity, etc.—not sub-adviser) for the last two years. The audit committee of the board of trustees/directors has considered whether the provision of non-audit services that were rendered to the registrant's investment adviser is compatible with maintaining the principal accountant's independence and has concluded that the provision of such non-audit services by the accountant has not compromised the accountant’s independence.
| Non-Audit Related Fees | FYE 12/31/2017 | FYE 12/31/2016 |
| Registrant | - | - |
| Registrant’s Investment Adviser | - | - |
Item 5. Audit Committee of Listed Registrants.
Not applicable.
Item 6. Investments.
The registrant’s Schedule of Investments is included as part of the report to shareholders filed under Item 1 of this Form.
Item 7. Disclosure of Proxy Voting Policies and Procedures for Closed-End Management Investment Companies.
Not applicable to open-end investment companies.
Item 8. Portfolio Managers of Closed-End Management Investment Companies.
Not applicable to open-end investment companies.
Item 9. Purchases of Equity Securities by Closed‑End Management Investment Company and Affiliated Purchasers.
Not applicable to open-end investment companies.
Item 10. Submission of Matters to a Vote of Security Holders.
There have been no material changes to the procedures by which shareholders may recommend nominees to the registrant’s board of trustees.
Item 11. Controls and Procedures.
| (a) | The registrant’s Co-Presidents/Chief Executive Officers and Treasurer/Chief Financial Officer have reviewed the registrant's disclosure controls and procedures (as defined in Rule 30a-3(c) under the Investment Company Act of 1940 (the “Act”)) as of a date within 90 days of the filing of this report, as required by Rule 30a-3(b) under the Act and Rules 13a-15(b) or 15d‑15(b) under the Securities Exchange Act of 1934. Based on their review, such officers have concluded that the disclosure controls and procedures are effective in ensuring that information required to be disclosed in this report is appropriately recorded, processed, summarized and reported and made known to them by others within the registrant and by the registrant’s service provider. |
| (b) | There were no changes in the registrant's internal control over financial reporting (as defined in Rule 30a-3(d) under the Act) that occurred during the second fiscal quarter of the period covered by this report that has materially affected, or is reasonably likely to materially affect, the registrant's internal control over financial reporting. |
Item 12. Exhibits.
| (a) | (1) Any code of ethics or amendment thereto, that is the subject of the disclosure required by Item 2, to the extent that the registrant intends to satisfy Item 2 requirements through filing an exhibit. Filed herewith. |
(2) A separate certification for each principal executive officer and principal financial officer pursuant to Section 302 of the Sarbanes-Oxley Act of 2002. Filed herewith.
(3) Any written solicitation to purchase securities under Rule 23c‑1 under the Act sent or given during the period covered by the report by or on behalf of the registrant to 10 or more persons. Not applicable to open-end investment companies.
| (b) | Certifications pursuant to Section 906 of the Sarbanes‑Oxley Act of 2002. Furnished herewith. |
SIGNATURES
Pursuant to the requirements of the Securities Exchange Act of 1934 and the Investment Company Act of 1940, the registrant has duly caused this report to be signed on its behalf by the undersigned, thereunto duly authorized.
(Registrant) The Merger Fund
By (Signature and Title)* /s/ Michael T. Shannon
Michael T. Shannon, Co-President
Date 3/1/2018
By (Signature and Title)* /s/Roy Behren
Roy Behren, Co-President and Treasurer
Date 3/1/2018
Pursuant to the requirements of the Securities Exchange Act of 1934 and the Investment Company Act of 1940, this report has been signed below by the following persons on behalf of the registrant and in the capacities and on the dates indicated.
By (Signature and Title)* /s/ Michael T. Shannon
Michael T. Shannon, Co-President
Date 3/1/2018
By (Signature and Title)* /s/ Roy Behren
Roy Behren, Co-President and Treasurer
Date 3/1/2018
* Print the name and title of each signing officer under his or her signature.