UNITED STATES SECURITIES AND EXCHANGE COMMISSION
Washington, D.C. 20549
FORM N-CSR
CERTIFIED SHAREHOLDER REPORT
OF REGISTERED MANAGEMENT INVESTMENT COMPANIES
Investment Company Act file number 811-03462
Meeder Funds Trust
6125 Memorial Drive
Dublin, OH 43017
Bruce McKibben
c/o Meeder Funds Trust
6125 Memorial Drive
Dublin, OH 43017
Registrant’s telephone number, including area code: 800-325-3539
Date of fiscal year end: December 31, 2024
Date of reporting period: June 30, 2024
Item 1. Report to Stockholders.
0000702435mf:SPMidCap4001AdditionalIndexMember2015-09-300000702435mf:MorningstarModeratelyConservativeTargetRiskIndex27AdditionalIndexMember2024-01-012024-06-300000702435mf:Russell3000Index6BroadBasedIndexMember2024-04-300000702435mf:Russell3000Index10BroadBasedIndexMember2021-08-310000702435mf:MorningstarAggressiveTargetRiskIndex11AdditionalIndexMember2022-10-310000702435mf:Russell3000Index12BroadBasedIndexMember2024-06-30
Semi-Annual Shareholder Report
June 30, 2024
This semi-annual shareholder report contains important information about the Muirfield Fund for the period of December 31, 2023, to 6/30/2024, as well as certain changes to the Fund. You can find additional information about the Fund at meederinvestment.com/mutual-funds . You can also request this information by contacting us at 866.633.3371 .
What were the Fund's costs for the period?
(based on a hypothetical $10,000 investment)
| Class Name | Cost of $10K Investment | Cost Paid as % of $10K Investment |
|---|
| Retail Class | $59.90 | 1.13% |
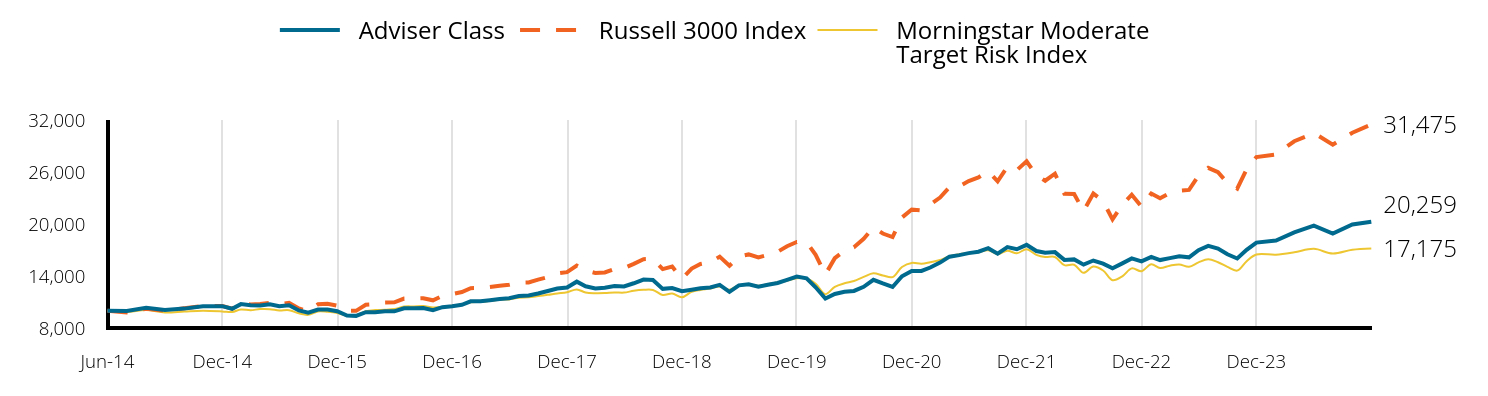
Total Return Based on a $10,000 Investment
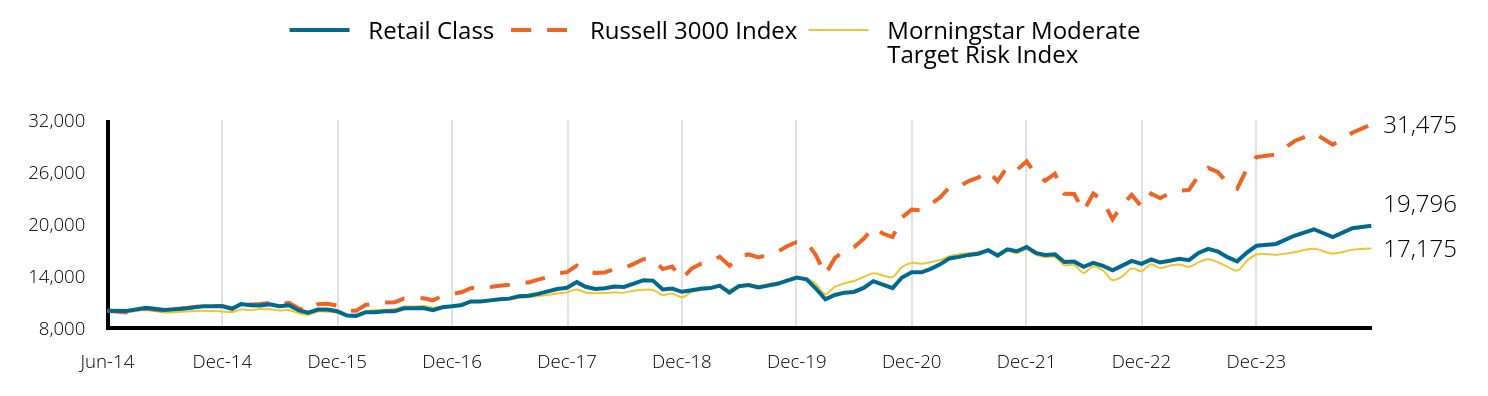
| Retail Class | Russell 3000 Index | Morningstar Moderate Target Risk Index |
|---|
| Jun-14 | 10,000 | 10,000 | 10,000 |
| Jul-14 | 9,960 | 9,803 | 9,861 |
| Aug-14 | 10,337 | 10,214 | 10,063 |
| Sep-14 | 10,070 | 10,001 | 9,801 |
| Oct-14 | 10,236 | 10,276 | 9,909 |
| Nov-14 | 10,512 | 10,525 | 10,002 |
| Dec-14 | 10,516 | 10,525 | 9,915 |
| Jan-15 | 10,217 | 10,232 | 9,841 |
| Feb-15 | 10,756 | 10,825 | 10,129 |
| Mar-15 | 10,621 | 10,715 | 10,051 |
| Apr-15 | 10,606 | 10,763 | 10,184 |
| May-15 | 10,726 | 10,912 | 10,176 |
| Jun-15 | 10,516 | 10,729 | 10,030 |
| Jul-15 | 10,621 | 10,909 | 10,054 |
| Aug-15 | 10,022 | 10,250 | 9,694 |
| Sep-15 | 9,767 | 9,952 | 9,515 |
| Oct-15 | 10,127 | 10,738 | 9,916 |
| Nov-15 | 10,127 | 10,797 | 9,874 |
| Dec-15 | 9,938 | 10,576 | 9,738 |
| Jan-16 | 9,446 | 9,979 | 9,429 |
| Feb-16 | 9,400 | 9,976 | 9,474 |
| Mar-16 | 9,830 | 10,678 | 9,947 |
| Apr-16 | 9,815 | 10,744 | 10,072 |
| May-16 | 9,938 | 10,936 | 10,101 |
| Jun-16 | 9,922 | 10,959 | 10,186 |
| Jul-16 | 10,276 | 11,394 | 10,470 |
| Aug-16 | 10,291 | 11,423 | 10,492 |
| Sep-16 | 10,307 | 11,441 | 10,532 |
| Oct-16 | 10,050 | 11,193 | 10,378 |
| Nov-16 | 10,389 | 11,694 | 10,435 |
| Dec-16 | 10,507 | 11,922 | 10,572 |
| Jan-17 | 10,661 | 12,147 | 10,743 |
| Feb-17 | 11,064 | 12,599 | 10,960 |
| Mar-17 | 11,048 | 12,607 | 11,015 |
| Apr-17 | 11,188 | 12,741 | 11,130 |
| May-17 | 11,312 | 12,871 | 11,258 |
| Jun-17 | 11,389 | 12,987 | 11,301 |
| Jul-17 | 11,652 | 13,232 | 11,494 |
| Aug-17 | 11,714 | 13,258 | 11,551 |
| Sep-17 | 11,931 | 13,581 | 11,685 |
| Oct-17 | 12,226 | 13,877 | 11,831 |
| Nov-17 | 12,505 | 14,299 | 11,991 |
| Dec-17 | 12,638 | 14,442 | 12,122 |
| Jan-18 | 13,292 | 15,203 | 12,451 |
| Feb-18 | 12,756 | 14,642 | 12,094 |
| Mar-18 | 12,504 | 14,349 | 12,016 |
| Apr-18 | 12,588 | 14,403 | 12,029 |
| May-18 | 12,789 | 14,810 | 12,102 |
| Jun-18 | 12,739 | 14,907 | 12,084 |
| Jul-18 | 13,108 | 15,401 | 12,294 |
| Aug-18 | 13,510 | 15,942 | 12,402 |
| Sep-18 | 13,468 | 15,968 | 12,389 |
| Oct-18 | 12,444 | 14,793 | 11,805 |
| Nov-18 | 12,544 | 15,089 | 11,970 |
| Dec-18 | 12,176 | 13,685 | 11,545 |
| Jan-19 | 12,346 | 14,859 | 12,179 |
| Feb-19 | 12,516 | 15,382 | 12,390 |
| Mar-19 | 12,601 | 15,606 | 12,547 |
| Apr-19 | 12,890 | 16,230 | 12,789 |
| May-19 | 12,091 | 15,179 | 12,407 |
| Jun-19 | 12,822 | 16,246 | 12,940 |
| Jul-19 | 12,959 | 16,487 | 12,981 |
| Aug-19 | 12,669 | 16,151 | 12,870 |
| Sep-19 | 12,891 | 16,434 | 13,059 |
| Oct-19 | 13,095 | 16,788 | 13,275 |
| Nov-19 | 13,454 | 17,426 | 13,459 |
| Dec-19 | 13,824 | 17,929 | 13,742 |
| Jan-20 | 13,614 | 17,910 | 13,706 |
| Feb-20 | 12,583 | 16,444 | 13,098 |
| Mar-20 | 11,307 | 14,182 | 11,903 |
| Apr-20 | 11,814 | 16,061 | 12,751 |
| May-20 | 12,076 | 16,919 | 13,159 |
| Jun-20 | 12,163 | 17,306 | 13,419 |
| Jul-20 | 12,619 | 18,289 | 13,896 |
| Aug-20 | 13,408 | 19,614 | 14,312 |
| Sep-20 | 12,999 | 18,900 | 14,063 |
| Oct-20 | 12,595 | 18,492 | 13,875 |
| Nov-20 | 13,826 | 20,741 | 15,043 |
| Dec-20 | 14,426 | 21,675 | 15,504 |
| Jan-21 | 14,426 | 21,578 | 15,409 |
| Feb-21 | 14,795 | 22,253 | 15,596 |
| Mar-21 | 15,341 | 23,050 | 15,840 |
| Apr-21 | 16,027 | 24,238 | 16,296 |
| May-21 | 16,203 | 24,349 | 16,521 |
| Jun-21 | 16,431 | 24,950 | 16,629 |
| Jul-21 | 16,572 | 25,371 | 16,748 |
| Aug-21 | 16,977 | 26,095 | 16,967 |
| Sep-21 | 16,359 | 24,924 | 16,517 |
| Oct-21 | 17,084 | 26,610 | 16,924 |
| Nov-21 | 16,855 | 26,205 | 16,617 |
| Dec-21 | 17,340 | 27,236 | 17,084 |
| Jan-22 | 16,630 | 25,634 | 16,439 |
| Feb-22 | 16,430 | 24,988 | 16,187 |
| Mar-22 | 16,503 | 25,799 | 16,197 |
| Apr-22 | 15,612 | 23,484 | 15,250 |
| May-22 | 15,666 | 23,452 | 15,294 |
| Jun-22 | 15,066 | 21,490 | 14,361 |
| Jul-22 | 15,521 | 23,506 | 15,096 |
| Aug-22 | 15,157 | 22,629 | 14,636 |
| Sep-22 | 14,647 | 20,531 | 13,511 |
| Oct-22 | 15,194 | 22,214 | 13,963 |
| Nov-22 | 15,744 | 23,374 | 14,876 |
| Dec-22 | 15,401 | 22,005 | 14,559 |
| Jan-23 | 15,924 | 23,521 | 15,358 |
| Feb-23 | 15,550 | 22,971 | 14,924 |
| Mar-23 | 15,756 | 23,585 | 15,189 |
| Apr-23 | 15,980 | 23,837 | 15,328 |
| May-23 | 15,831 | 23,929 | 15,059 |
| Jun-23 | 16,655 | 25,563 | 15,566 |
| Jul-23 | 17,125 | 26,480 | 15,938 |
| Aug-23 | 16,824 | 25,968 | 15,584 |
| Sep-23 | 16,166 | 24,731 | 15,055 |
| Oct-23 | 15,695 | 24,076 | 14,625 |
| Nov-23 | 16,675 | 26,321 | 15,703 |
| Dec-23 | 17,486 | 27,717 | 16,485 |
| Jan-24 | 17,698 | 28,024 | 16,464 |
| Feb-24 | 18,641 | 29,541 | 16,731 |
| Mar-24 | 19,391 | 30,494 | 17,130 |
| Apr-24 | 18,485 | 29,152 | 16,592 |
| May-24 | 19,507 | 30,530 | 17,030 |
| Jun-24 | 19,796 | 31,475 | 17,175 |
The Growth of $10,000 chart compares the performance of the Fund over the period shown with dividends and capital gains reinvested to the Fund’s benchmark. Benchmark indices are unmanaged and do not reflect the deduction of expenses associated with a mutual fund, such as investment management and accounting fees.
The performance data shown represents past performance, which does not guarantee future results. The investment return and principal value of an investment will fluctuate so that an investor’s shares, when redeemed, may be worth more or less than their original cost. Current performance may be lower or higher than the performance data quoted. For current month-end performance data, please visit our website at www.meederfunds.com.
| Total Net Assets | $868,805,924 |
| # of Portfolio Holdings | 161 |
| Portfolio Turnover Rate | 150% |
| Advisory Fees and Waivers | 2,543,674 |
Average Annual Total Returns
| . | 1 Year | 5 Year | 10 Year |
|---|
| Retail Class | 18.86% | 9.07% | 7.07% |
| Russell 3000 Index | 23.13% | 14.14% | 12.15% |
| Morningstar Moderate Target Risk Index | 10.34% | 5.83% | 5.56% |
What did the Fund invest in?
| Berkshire Hathaway Inc | 7.2% |
| Microsoft Corp | 5.9% |
| NVIDIA Corp | 4.6% |
| Amazon.com Inc | 4.0% |
| Alphabet Inc | 3.6% |
| Apple Inc | 2.6% |
| Texas Instruments Inc | 2.6% |
| Meta Platforms Inc | 2.4% |
| Johnson & Johnson | 1.9% |
| Merck & Co Inc | 1.9% |
| As a percentage of total net assets. Holdings exclude short-term investments and derivatives. |
| Value | Value |
|---|
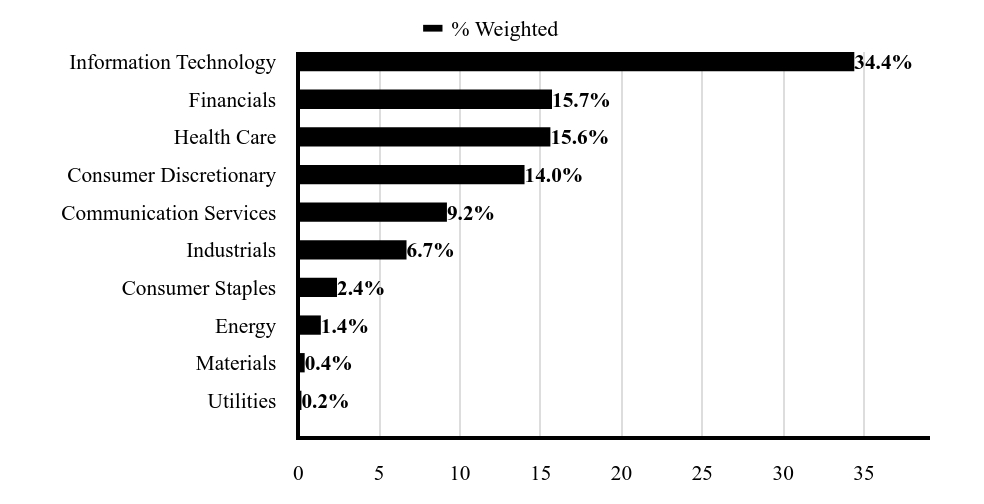
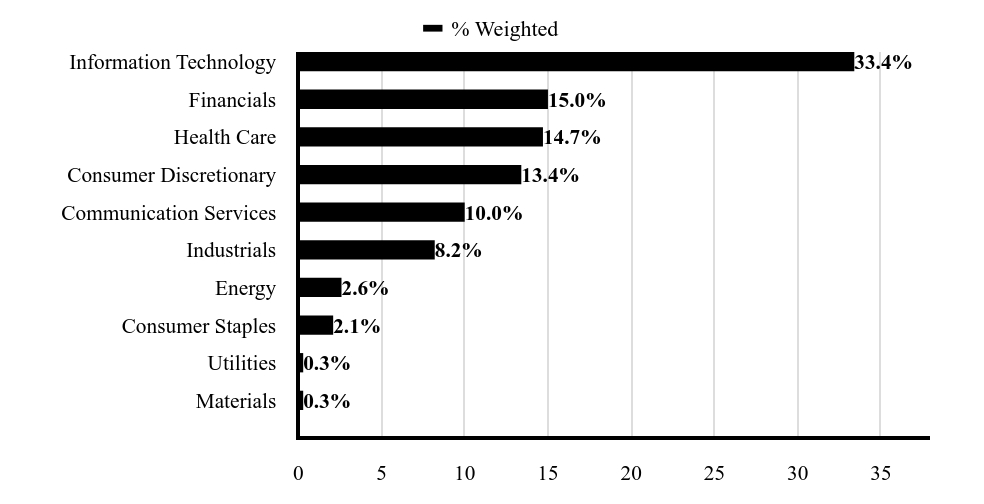
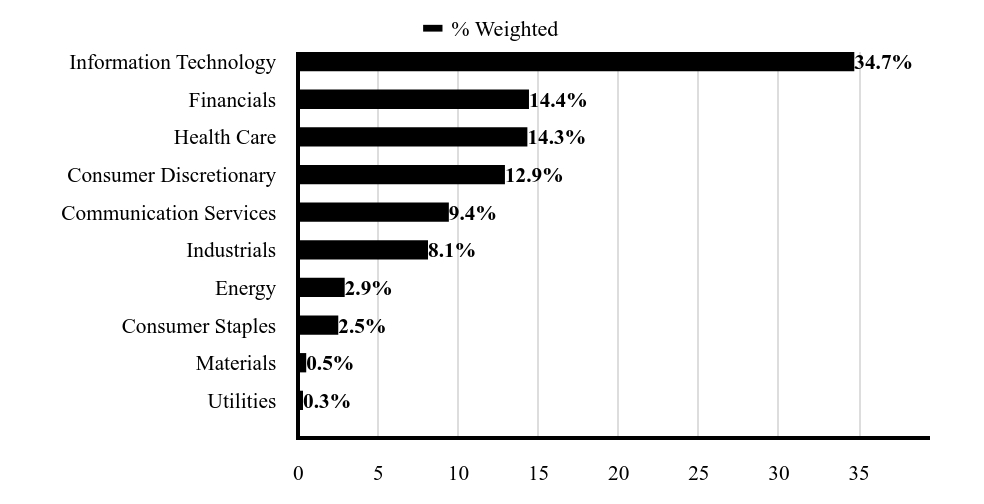
| Utilities | 0.2%Footnote Reference |
| Materials | 0.4%Footnote Reference |
| Energy | 1.4%Footnote Reference |
| Consumer Staples | 2.4%Footnote Reference |
| Industrials | 6.7%Footnote Reference |
| Communication Services | 9.2%Footnote Reference |
| Consumer Discretionary | 14.0%Footnote Reference |
| Health Care | 15.6%Footnote Reference |
| Financials | 15.7%Footnote Reference |
| Information Technology | 34.4%Footnote Reference |
| Footnote | Description |
Footnote | As a percentage of total common stocks. Concentrations are subject to change. |
| Value | Value |
|---|
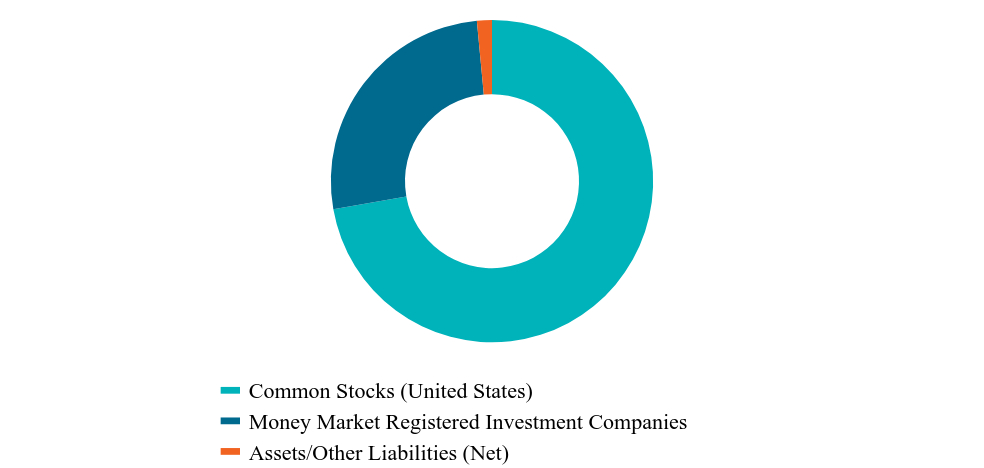
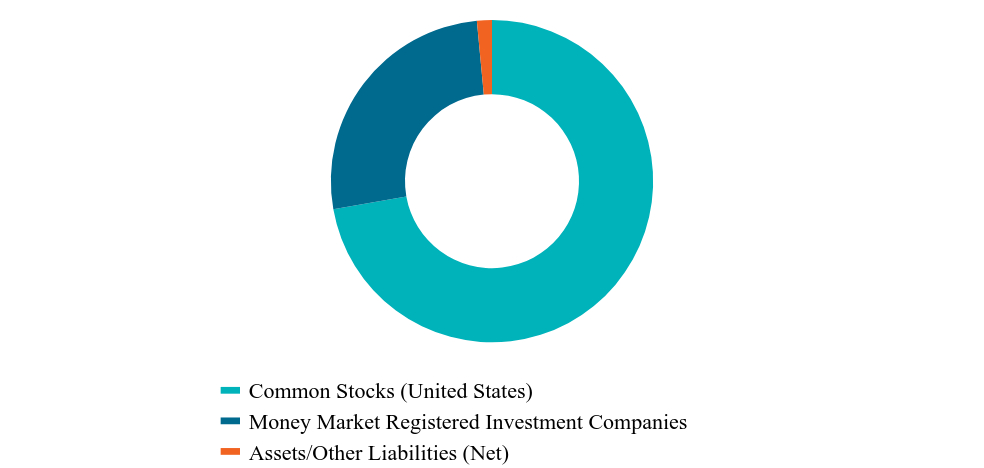
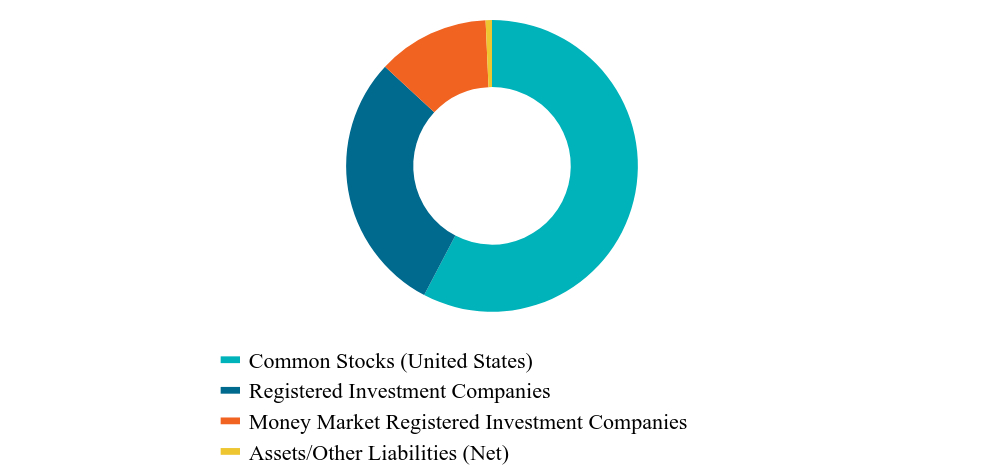
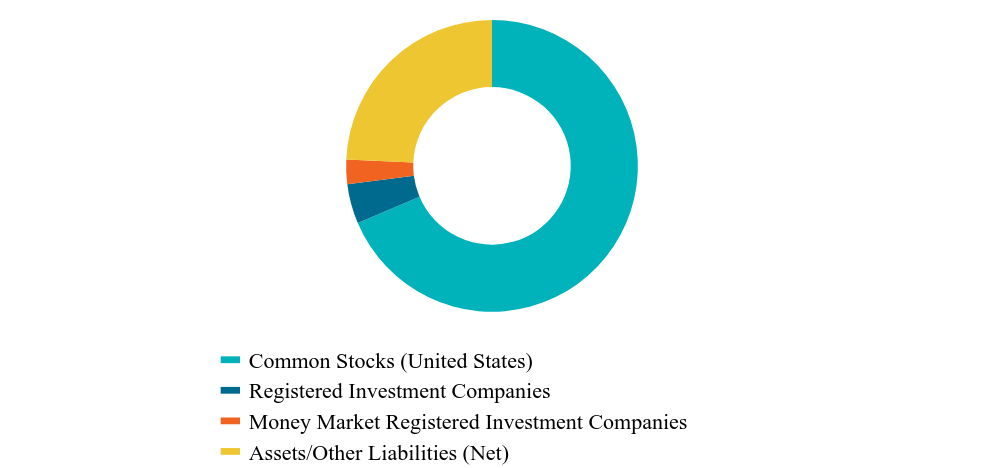
| Common Stocks (United States) | 72.2%Footnote Reference |
| Money Market Registered Investment Companies | 26.3%Footnote Reference |
| Assets/Other Liabilities (Net) | 1.5% |
| Footnote | Description |
Footnote | As a percentage of total net assets. The Fund has invested in stock index futures contracts in order to equitize cash balances it holds in a proprietary money market fund. |
Availability of Additional Information
For additional information about the Fund, including its prospectus, financial information, holdings, proxy voting information and other important materials, scan the QR code or visit www.meederinvestment.com/meeder-funds-resources.
To reduce fund expenses, only one copy of most shareholder documents are delivered to shareholders with multiple accounts at the same address. If you wish to receive copies of this document for each account, please contact the Meeder Funds at 866.633.3371 or contact your financial intermediary.
Semi-Annual Shareholder Report
June 30, 2024
Semi-Annual Shareholder Report
June 30, 2024
This semi-annual shareholder report contains important information about the Global Allocation Fund for the period of December 31, 2023, to 6/30/2024, as well as certain changes to the Fund. You can find additional information about the Fund at meederinvestment.com/mutual-funds . You can also request this information by contacting us at 866.633.3371 .
What were the Fund's costs for the period?
(based on a hypothetical $10,000 investment)
| Class Name | Cost of $10K Investment | Cost Paid as % of $10K Investment |
|---|
| Adviser Class | $72.94 | 1.41% |
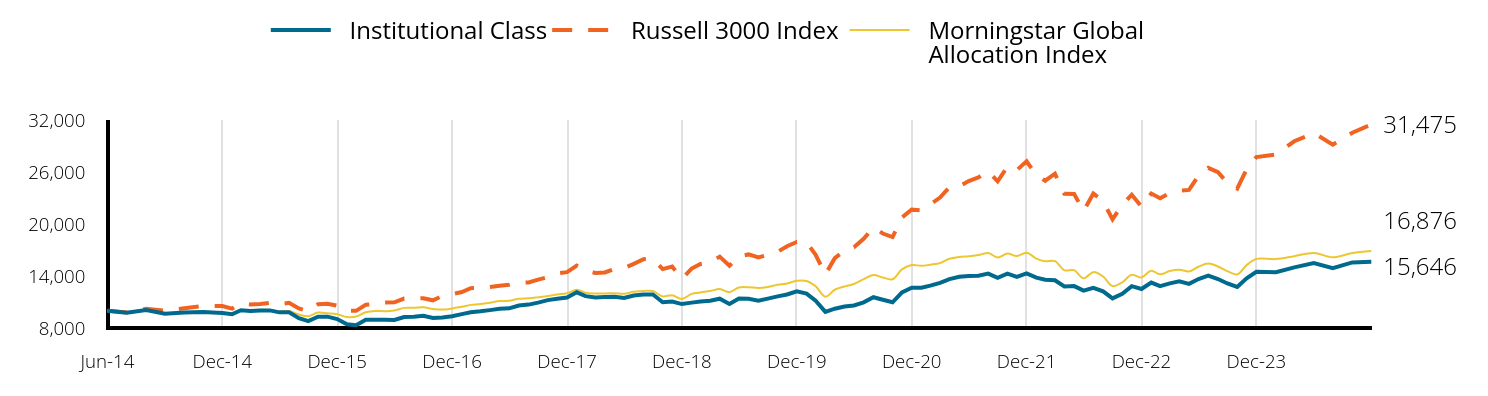
Total Return Based on a $10,000 Investment

| Adviser Class | Russell 3000 Index | Morningstar Global Allocation Index |
|---|
| Jun-14 | 10,000 | 10,000 | 10,000 |
| Jul-14 | 9,757 | 9,803 | 9,872 |
| Aug-14 | 10,073 | 10,214 | 10,046 |
| Sep-14 | 9,655 | 10,001 | 9,734 |
| Oct-14 | 9,793 | 10,276 | 9,803 |
| Nov-14 | 9,834 | 10,525 | 9,890 |
| Dec-14 | 9,731 | 10,525 | 9,778 |
| Jan-15 | 9,590 | 10,232 | 9,722 |
| Feb-15 | 10,049 | 10,825 | 10,021 |
| Mar-15 | 9,956 | 10,715 | 9,947 |
| Apr-15 | 10,012 | 10,763 | 10,113 |
| May-15 | 10,031 | 10,912 | 10,073 |
| Jun-15 | 9,806 | 10,729 | 9,918 |
| Jul-15 | 9,806 | 10,909 | 9,951 |
| Aug-15 | 9,131 | 10,250 | 9,561 |
| Sep-15 | 8,793 | 9,952 | 9,369 |
| Oct-15 | 9,309 | 10,738 | 9,775 |
| Nov-15 | 9,309 | 10,797 | 9,688 |
| Dec-15 | 9,029 | 10,576 | 9,584 |
| Jan-16 | 8,439 | 9,979 | 9,263 |
| Feb-16 | 8,323 | 9,976 | 9,324 |
| Mar-16 | 8,951 | 10,678 | 9,819 |
| Apr-16 | 8,951 | 10,744 | 9,968 |
| May-16 | 8,942 | 10,936 | 9,939 |
| Jun-16 | 8,922 | 10,959 | 10,020 |
| Jul-16 | 9,272 | 11,394 | 10,321 |
| Aug-16 | 9,301 | 11,423 | 10,337 |
| Sep-16 | 9,398 | 11,441 | 10,398 |
| Oct-16 | 9,145 | 11,193 | 10,193 |
| Nov-16 | 9,213 | 11,694 | 10,123 |
| Dec-16 | 9,359 | 11,922 | 10,255 |
| Jan-17 | 9,604 | 12,147 | 10,462 |
| Feb-17 | 9,819 | 12,599 | 10,668 |
| Mar-17 | 9,927 | 12,607 | 10,759 |
| Apr-17 | 10,064 | 12,741 | 10,912 |
| May-17 | 10,210 | 12,871 | 11,106 |
| Jun-17 | 10,269 | 12,987 | 11,139 |
| Jul-17 | 10,602 | 13,232 | 11,369 |
| Aug-17 | 10,700 | 13,258 | 11,434 |
| Sep-17 | 10,925 | 13,581 | 11,555 |
| Oct-17 | 11,210 | 13,877 | 11,690 |
| Nov-17 | 11,366 | 14,299 | 11,872 |
| Dec-17 | 11,497 | 14,442 | 12,005 |
| Jan-18 | 12,095 | 15,203 | 12,424 |
| Feb-18 | 11,657 | 14,642 | 12,072 |
| Mar-18 | 11,487 | 14,349 | 11,984 |
| Apr-18 | 11,557 | 14,403 | 11,991 |
| May-18 | 11,567 | 14,810 | 12,009 |
| Jun-18 | 11,428 | 14,907 | 11,965 |
| Jul-18 | 11,718 | 15,401 | 12,171 |
| Aug-18 | 11,818 | 15,942 | 12,274 |
| Sep-18 | 11,828 | 15,968 | 12,259 |
| Oct-18 | 10,928 | 14,793 | 11,646 |
| Nov-18 | 11,008 | 15,089 | 11,781 |
| Dec-18 | 10,723 | 13,685 | 11,343 |
| Jan-19 | 10,881 | 14,859 | 11,936 |
| Feb-19 | 11,017 | 15,382 | 12,108 |
| Mar-19 | 11,095 | 15,606 | 12,258 |
| Apr-19 | 11,326 | 16,230 | 12,491 |
| May-19 | 10,728 | 15,179 | 12,132 |
| Jun-19 | 11,352 | 16,246 | 12,678 |
| Jul-19 | 11,310 | 16,487 | 12,699 |
| Aug-19 | 11,100 | 16,151 | 12,622 |
| Sep-19 | 11,321 | 16,434 | 12,738 |
| Oct-19 | 11,573 | 16,788 | 12,980 |
| Nov-19 | 11,794 | 17,426 | 13,144 |
| Dec-19 | 12,154 | 17,929 | 13,445 |
| Jan-20 | 11,887 | 17,910 | 13,427 |
| Feb-20 | 11,084 | 16,444 | 12,806 |
| Mar-20 | 9,799 | 14,182 | 11,616 |
| Apr-20 | 10,163 | 16,061 | 12,412 |
| May-20 | 10,420 | 16,919 | 12,797 |
| Jun-20 | 10,537 | 17,306 | 13,078 |
| Jul-20 | 10,891 | 18,289 | 13,629 |
| Aug-20 | 11,480 | 19,614 | 14,116 |
| Sep-20 | 11,191 | 18,900 | 13,831 |
| Oct-20 | 10,900 | 18,492 | 13,628 |
| Nov-20 | 12,030 | 20,741 | 14,763 |
| Dec-20 | 12,571 | 21,675 | 15,266 |
| Jan-21 | 12,548 | 21,578 | 15,169 |
| Feb-21 | 12,791 | 22,253 | 15,303 |
| Mar-21 | 13,110 | 23,050 | 15,482 |
| Apr-21 | 13,539 | 24,238 | 15,991 |
| May-21 | 13,803 | 24,349 | 16,188 |
| Jun-21 | 13,891 | 24,950 | 16,286 |
| Jul-21 | 13,924 | 25,371 | 16,410 |
| Aug-21 | 14,167 | 26,095 | 16,645 |
| Sep-21 | 13,682 | 24,924 | 16,134 |
| Oct-21 | 14,156 | 26,610 | 16,585 |
| Nov-21 | 13,814 | 26,205 | 16,303 |
| Dec-21 | 14,192 | 27,236 | 16,687 |
| Jan-22 | 13,703 | 25,634 | 16,008 |
| Feb-22 | 13,471 | 24,988 | 15,700 |
| Mar-22 | 13,410 | 25,799 | 15,716 |
| Apr-22 | 12,701 | 23,484 | 14,653 |
| May-22 | 12,738 | 23,452 | 14,672 |
| Jun-22 | 12,224 | 21,490 | 13,730 |
| Jul-22 | 12,542 | 23,506 | 14,445 |
| Aug-22 | 12,139 | 22,629 | 13,937 |
| Sep-22 | 11,344 | 20,531 | 12,839 |
| Oct-22 | 11,870 | 22,214 | 13,268 |
| Nov-22 | 12,739 | 23,374 | 14,148 |
| Dec-22 | 12,415 | 22,005 | 13,833 |
| Jan-23 | 13,142 | 23,521 | 14,603 |
| Feb-23 | 12,735 | 22,971 | 14,194 |
| Mar-23 | 13,068 | 23,585 | 14,577 |
| Apr-23 | 13,290 | 23,837 | 14,726 |
| May-23 | 12,994 | 23,929 | 14,530 |
| Jun-23 | 13,561 | 25,563 | 15,062 |
| Jul-23 | 13,946 | 26,480 | 15,429 |
| Aug-23 | 13,548 | 25,968 | 15,096 |
| Sep-23 | 13,039 | 24,731 | 14,553 |
| Oct-23 | 12,665 | 24,076 | 14,187 |
| Nov-23 | 13,651 | 26,321 | 15,251 |
| Dec-23 | 14,379 | 27,717 | 15,971 |
| Jan-24 | 14,341 | 28,024 | 15,949 |
| Feb-24 | 14,883 | 29,541 | 16,288 |
| Mar-24 | 15,386 | 30,494 | 16,653 |
| Apr-24 | 14,805 | 29,152 | 16,152 |
| May-24 | 15,462 | 30,530 | 16,652 |
| Jun-24 | 15,538 | 31,475 | 16,876 |
The Growth of $10,000 chart compares the performance of the Fund over the period shown with dividends and capital gains reinvested to the Fund’s benchmark. Benchmark indices are unmanaged and do not reflect the deduction of expenses associated with a mutual fund, such as investment management and accounting fees.
Investment performance assumes reinvestment of all dividend and capital gain distributions. The results do not reflect the effect of taxes a shareholder would pay on Fund distributions or on the redemption of Fund shares. Historical performance attributed to the Institutional and Adviser Share Classes prior to their inception dates is based on the performance of the Retail Share Class. No adjustment has been made to reflect class-specific distribution or servicing fees. Returns may reflect the effect of voluntary fee waivers or expense reimbursements over the period shown. Without these waivers, performance would have been lower.
The performance data shown represents past performance, which does not guarantee future results. The investment return and principal value of an investment will fluctuate so that an investor’s shares, when redeemed, may be worth more or less than their original cost. Current performance may be lower or higher than the performance data quoted. For current month-end performance data, please visit our website at www.meederfunds.com.
| Total Net Assets | $36,167,888 |
| # of Portfolio Holdings | 146 |
| Portfolio Turnover Rate | 100% |
| Advisory Fees and Waivers | 128,889 |
Average Annual Total Returns
| . | 1 Year | 5 Year | 10 Year |
|---|
| Adviser Class | 14.58% | 6.48% | 4.51% |
| Russell 3000 Index | 23.13% | 14.14% | 12.15% |
| Morningstar Global Allocation Index | 12.04% | 5.89% | 5.37% |
What did the Fund invest in?
| iShares Core MSCI EAFE ETF | 8.5% |
| Berkshire Hathaway Inc | 3.0% |
| Microsoft Corp | 2.9% |
| Fidelity Total Bond Fund - Class Z | 2.5% |
| Baird Core Plus Bond Fund - Class I | 2.2% |
| NVIDIA Corp | 2.1% |
| iShares Core MSCI Emerging Markets ETF | 1.8% |
| Alphabet Inc | 1.7% |
| Amazon.com Inc | 1.6% |
| Frost Total Return Bond Fund - Class I | 1.3% |
| As a percentage of total net assets. Holdings exclude short-term investments and derivatives. |
| Value | Value |
|---|
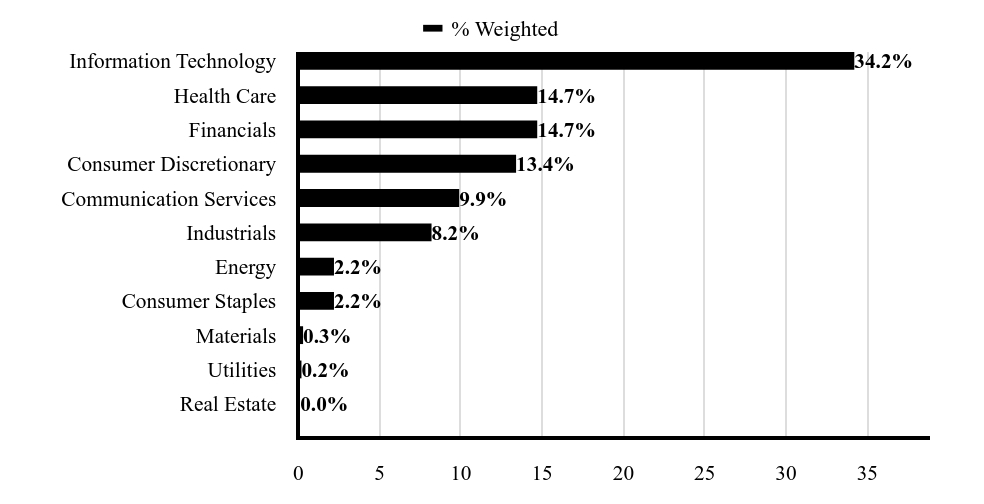
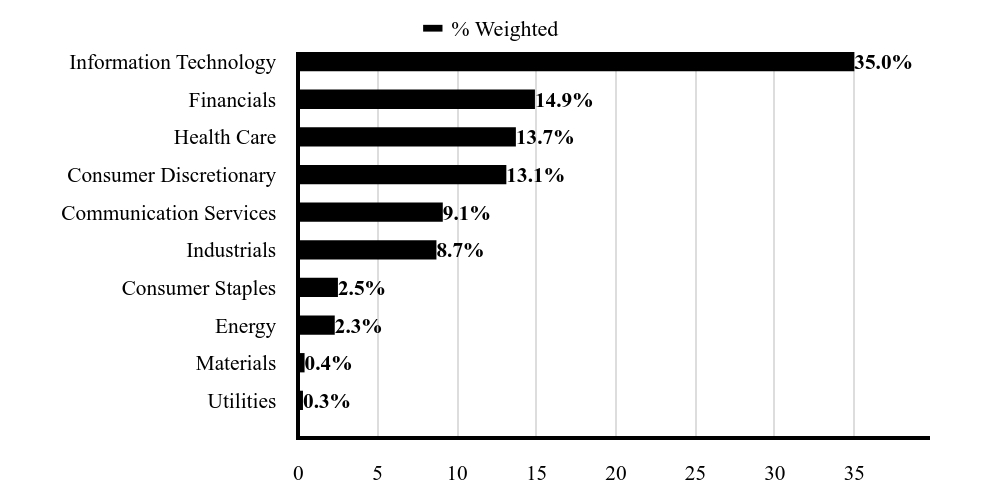
| Utilities | 0.3%Footnote Reference |
| Materials | 0.4%Footnote Reference |
| Energy | 2.3%Footnote Reference |
| Consumer Staples | 2.5%Footnote Reference |
| Industrials | 8.7%Footnote Reference |
| Communication Services | 9.1%Footnote Reference |
| Consumer Discretionary | 13.1%Footnote Reference |
| Health Care | 13.7%Footnote Reference |
| Financials | 14.9%Footnote Reference |
| Information Technology | 35.0%Footnote Reference |
| Footnote | Description |
Footnote | As a percentage of total common stocks. Concentrations are subject to change. |
| Value | Value |
|---|
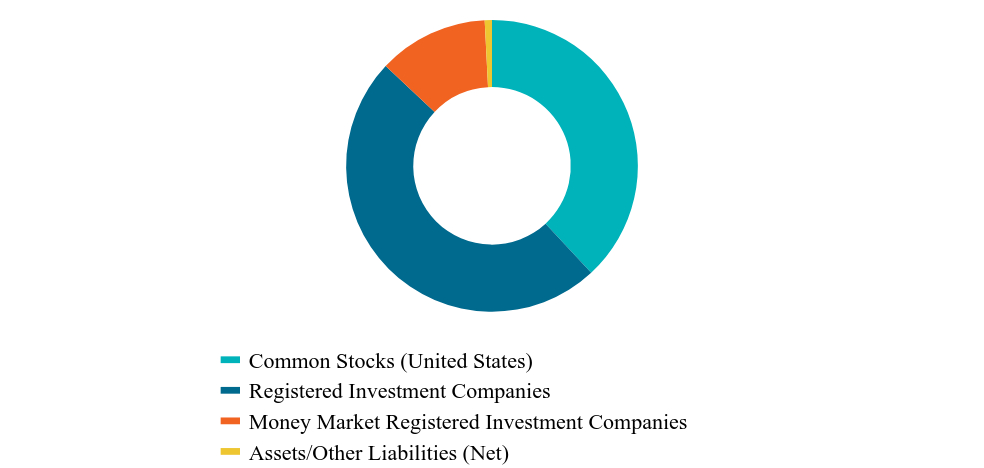
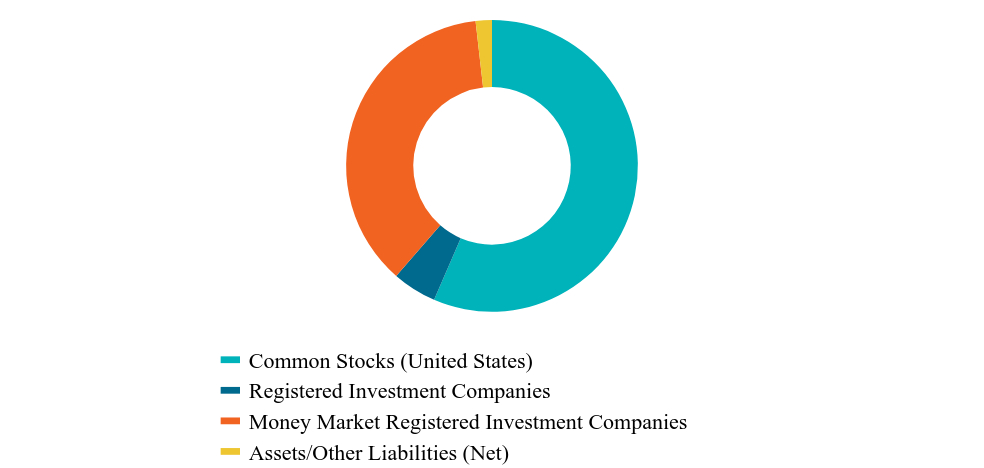
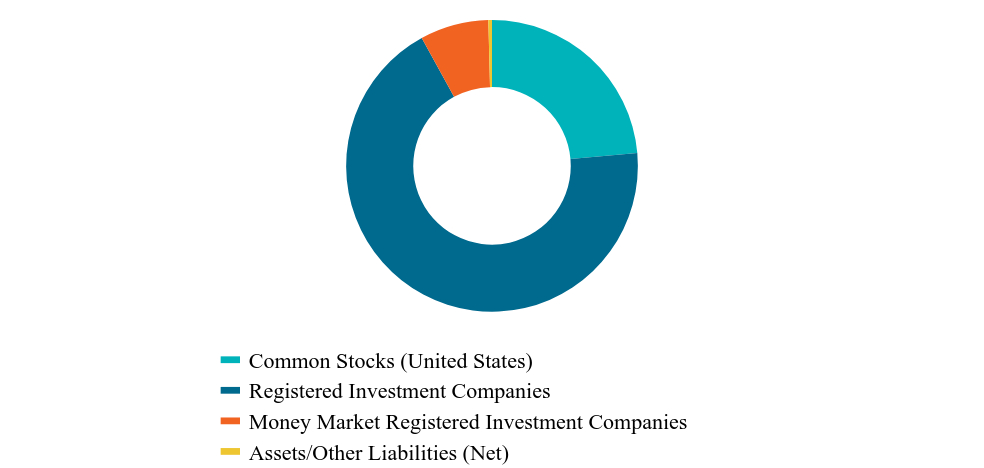
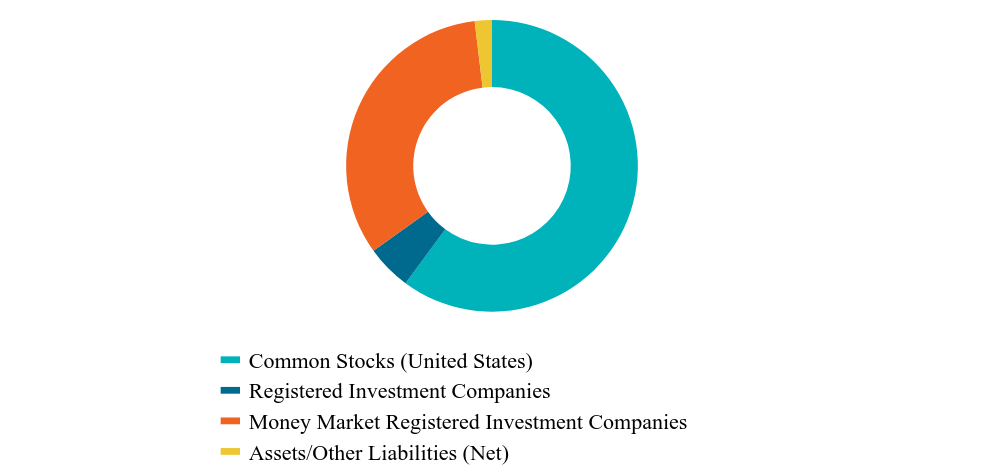
| Common Stocks (United States) | 30.7%Footnote Reference |
| Registered Investment Companies | 20.0%Footnote Reference |
| Money Market Registered Investment Companies | 46.7%Footnote Reference |
| Assets/Other Liabilities (Net) | 2.6% |
| Footnote | Description |
Footnote | As a percentage of total net assets. The Fund has invested in stock index futures contracts in order to equitize cash balances it holds in a proprietary money market fund. |
Availability of Additional Information
For additional information about the Fund, including its prospectus, financial information, holdings, proxy voting information and other important materials, scan the QR code or visit www.meederinvestment.com/meeder-funds-resources.
To reduce fund expenses, only one copy of most shareholder documents are delivered to shareholders with multiple accounts at the same address. If you wish to receive copies of this document for each account, please contact the Meeder Funds at 866.633.3371 or contact your financial intermediary.
Semi-Annual Shareholder Report
June 30, 2024
Institutional Class SRUIX
Semi-Annual Shareholder Report
June 30, 2024
This semi-annual shareholder report contains important information about the Spectrum Fund for the period of December 31, 2023, to 6/30/2024, as well as certain changes to the Fund. You can find additional information about the Fund at meederinvestment.com/mutual-funds . You can also request this information by contacting us at 866.633.3371 .
What were the Fund's costs for the period?
(based on a hypothetical $10,000 investment)
| Class Name | Cost of $10K Investment | Cost Paid as % of $10K Investment |
|---|
| Institutional Class | $47.08 | 0.89% |
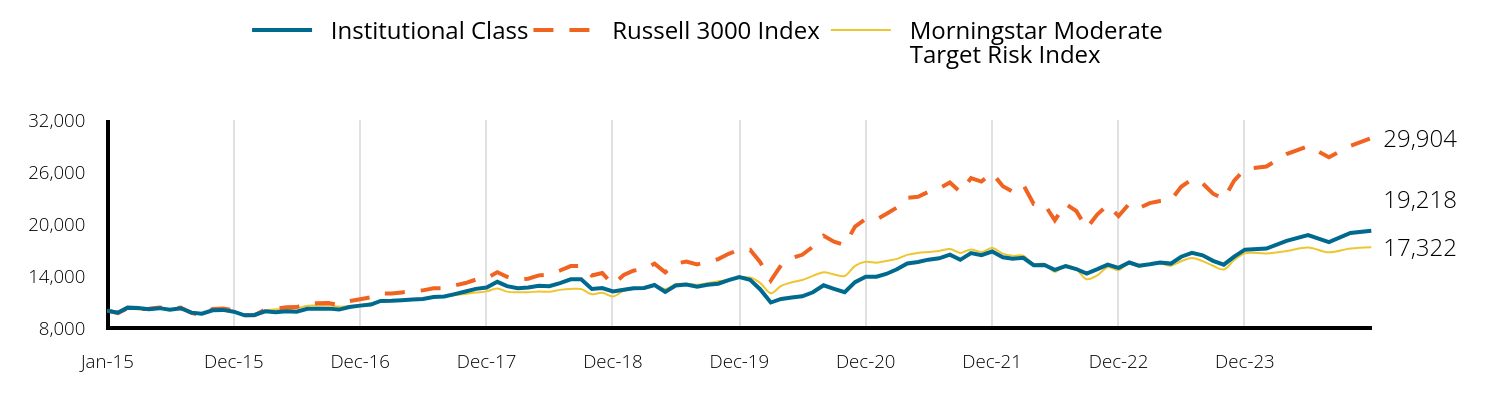
Total Return Based on a $10,000 Investment
| Institutional Class | Russell 3000 Index | Morningstar Moderate Target Risk Index |
|---|
| Jan-15 | 10,000 | 10,000 | 10,000 |
| Jan-15 | 9,770 | 9,722 | 9,925 |
| Feb-15 | 10,350 | 10,285 | 10,216 |
| Mar-15 | 10,310 | 10,180 | 10,137 |
| Apr-15 | 10,170 | 10,226 | 10,271 |
| May-15 | 10,290 | 10,368 | 10,263 |
| Jun-15 | 10,100 | 10,194 | 10,115 |
| Jul-15 | 10,280 | 10,365 | 10,140 |
| Aug-15 | 9,770 | 9,739 | 9,777 |
| Sep-15 | 9,650 | 9,455 | 9,596 |
| Oct-15 | 10,050 | 10,202 | 10,000 |
| Nov-15 | 10,090 | 10,258 | 9,959 |
| Dec-15 | 9,879 | 10,048 | 9,821 |
| Jan-16 | 9,463 | 9,481 | 9,509 |
| Feb-16 | 9,504 | 9,478 | 9,555 |
| Mar-16 | 9,920 | 10,145 | 10,032 |
| Apr-16 | 9,808 | 10,208 | 10,158 |
| May-16 | 9,940 | 10,391 | 10,187 |
| Jun-16 | 9,869 | 10,412 | 10,273 |
| Jul-16 | 10,214 | 10,825 | 10,560 |
| Aug-16 | 10,224 | 10,853 | 10,582 |
| Sep-16 | 10,235 | 10,870 | 10,622 |
| Oct-16 | 10,123 | 10,635 | 10,467 |
| Nov-16 | 10,417 | 11,111 | 10,524 |
| Dec-16 | 10,581 | 11,327 | 10,663 |
| Jan-17 | 10,704 | 11,541 | 10,835 |
| Feb-17 | 11,126 | 11,970 | 11,054 |
| Mar-17 | 11,136 | 11,978 | 11,109 |
| Apr-17 | 11,208 | 12,105 | 11,225 |
| May-17 | 11,290 | 12,229 | 11,355 |
| Jun-17 | 11,342 | 12,339 | 11,398 |
| Jul-17 | 11,578 | 12,572 | 11,592 |
| Aug-17 | 11,630 | 12,596 | 11,650 |
| Sep-17 | 11,907 | 12,903 | 11,785 |
| Oct-17 | 12,206 | 13,185 | 11,932 |
| Nov-17 | 12,514 | 13,585 | 12,094 |
| Dec-17 | 12,670 | 13,721 | 12,225 |
| Jan-18 | 13,329 | 14,444 | 12,558 |
| Feb-18 | 12,835 | 13,912 | 12,197 |
| Mar-18 | 12,583 | 13,633 | 12,119 |
| Apr-18 | 12,681 | 13,684 | 12,132 |
| May-18 | 12,868 | 14,071 | 12,206 |
| Jun-18 | 12,813 | 14,163 | 12,187 |
| Jul-18 | 13,186 | 14,633 | 12,399 |
| Aug-18 | 13,615 | 15,147 | 12,508 |
| Sep-18 | 13,615 | 15,172 | 12,494 |
| Oct-18 | 12,506 | 14,055 | 11,906 |
| Nov-18 | 12,605 | 14,336 | 12,072 |
| Dec-18 | 12,226 | 13,002 | 11,644 |
| Jan-19 | 12,405 | 14,118 | 12,283 |
| Feb-19 | 12,572 | 14,614 | 12,496 |
| Mar-19 | 12,617 | 14,828 | 12,654 |
| Apr-19 | 12,962 | 15,420 | 12,898 |
| May-19 | 12,170 | 14,422 | 12,513 |
| Jun-19 | 12,896 | 15,435 | 13,050 |
| Jul-19 | 13,007 | 15,664 | 13,092 |
| Aug-19 | 12,762 | 15,345 | 12,980 |
| Sep-19 | 12,996 | 15,614 | 13,170 |
| Oct-19 | 13,108 | 15,950 | 13,389 |
| Nov-19 | 13,520 | 16,557 | 13,574 |
| Dec-19 | 13,870 | 17,035 | 13,859 |
| Jan-20 | 13,565 | 17,016 | 13,823 |
| Feb-20 | 12,473 | 15,623 | 13,210 |
| Mar-20 | 10,940 | 13,475 | 12,005 |
| Apr-20 | 11,357 | 15,259 | 12,860 |
| May-20 | 11,526 | 16,075 | 13,272 |
| Jun-20 | 11,650 | 16,443 | 13,534 |
| Jul-20 | 12,123 | 17,376 | 14,014 |
| Aug-20 | 12,923 | 18,635 | 14,435 |
| Sep-20 | 12,519 | 17,957 | 14,184 |
| Oct-20 | 12,121 | 17,569 | 13,993 |
| Nov-20 | 13,293 | 19,707 | 15,172 |
| Dec-20 | 13,904 | 20,593 | 15,636 |
| Jan-21 | 13,916 | 20,501 | 15,541 |
| Feb-21 | 14,234 | 21,142 | 15,729 |
| Mar-21 | 14,769 | 21,900 | 15,975 |
| Apr-21 | 15,440 | 23,029 | 16,435 |
| May-21 | 15,611 | 23,134 | 16,662 |
| Jun-21 | 15,884 | 23,705 | 16,771 |
| Jul-21 | 16,043 | 24,105 | 16,891 |
| Aug-21 | 16,464 | 24,793 | 17,112 |
| Sep-21 | 15,866 | 23,681 | 16,658 |
| Oct-21 | 16,652 | 25,282 | 17,069 |
| Nov-21 | 16,402 | 24,897 | 16,759 |
| Dec-21 | 16,821 | 25,877 | 17,230 |
| Jan-22 | 16,161 | 24,355 | 16,579 |
| Feb-22 | 15,993 | 23,741 | 16,325 |
| Mar-22 | 16,101 | 24,512 | 16,336 |
| Apr-22 | 15,248 | 22,312 | 15,381 |
| May-22 | 15,272 | 22,282 | 15,425 |
| Jun-22 | 14,708 | 20,418 | 14,484 |
| Jul-22 | 15,152 | 22,333 | 15,225 |
| Aug-22 | 14,804 | 21,500 | 14,761 |
| Sep-22 | 14,278 | 19,506 | 13,626 |
| Oct-22 | 14,784 | 21,106 | 14,082 |
| Nov-22 | 15,316 | 22,208 | 15,004 |
| Dec-22 | 14,940 | 20,907 | 14,684 |
| Jan-23 | 15,557 | 22,347 | 15,489 |
| Feb-23 | 15,187 | 21,825 | 15,052 |
| Mar-23 | 15,359 | 22,408 | 15,319 |
| Apr-23 | 15,557 | 22,647 | 15,459 |
| May-23 | 15,433 | 22,735 | 15,187 |
| Jun-23 | 16,224 | 24,288 | 15,699 |
| Jul-23 | 16,671 | 25,158 | 16,074 |
| Aug-23 | 16,386 | 24,673 | 15,717 |
| Sep-23 | 15,752 | 23,497 | 15,183 |
| Oct-23 | 15,303 | 22,875 | 14,750 |
| Nov-23 | 16,239 | 25,008 | 15,837 |
| Dec-23 | 17,041 | 26,334 | 16,626 |
| Jan-24 | 17,162 | 26,626 | 16,604 |
| Feb-24 | 18,048 | 28,067 | 16,874 |
| Mar-24 | 18,707 | 28,973 | 17,276 |
| Apr-24 | 17,901 | 27,698 | 16,734 |
| May-24 | 18,962 | 29,006 | 17,175 |
| Jun-24 | 19,218 | 29,904 | 17,322 |
The Growth of $10,000 chart compares the performance of the Fund over the period shown with dividends and capital gains reinvested to the Fund’s benchmark. Benchmark indices are unmanaged and do not reflect the deduction of expenses associated with a mutual fund, such as investment management and accounting fees.
Investment performance assumes reinvestment of all dividend and capital gain distributions. The results do not reflect the effect of taxes a shareholder would pay on Fund distributions or on the redemption of Fund shares. Historical performance attributed to the Institutional and Adviser Share Classes prior to their inception dates is based on the performance of the Retail Share Class. No adjustment has been made to reflect class-specific distribution or servicing fees. Returns may reflect the effect of voluntary fee waivers or expense reimbursements over the period shown. Without these waivers, performance would have been lower.
The performance data shown represents past performance, which does not guarantee future results. The investment return and principal value of an investment will fluctuate so that an investor’s shares, when redeemed, may be worth more or less than their original cost. Current performance may be lower or higher than the performance data quoted. For current month-end performance data, please visit our website at www.meederfunds.com.
| Total Net Assets | $211,678,626 |
| # of Portfolio Holdings | 496 |
| Portfolio Turnover Rate | 139% |
| Advisory Fees and Waivers | 747,751 |
Average Annual Total Returns
| . | 1 Year | 5 Year | Since Inception |
|---|
| Institutional Class (Inception Date: 1/1/15) | 18.45% | 8.31% | 7.12% |
| Russell 3000 Index | 23.13% | 14.14% | 12.23% |
| Morningstar Moderate Target Risk Index | 10.34% | 5.83% | 5.96% |
What did the Fund invest in?
| Microsoft Corp | 5.1% |
| iShares Short Treasury Bond ETF | 4.4% |
| Berkshire Hathaway Inc | 4.3% |
| NVIDIA Corp | 3.9% |
| Apple Inc | 3.4% |
| Mastercard Inc | 2.7% |
| Alphabet Inc | 2.6% |
| Amazon.com Inc | 2.4% |
| Texas Instruments Inc | 2.3% |
| Exxon Mobil Corp | 2.2% |
| As a percentage of total net assets. Holdings exclude short-term investments and derivatives. |
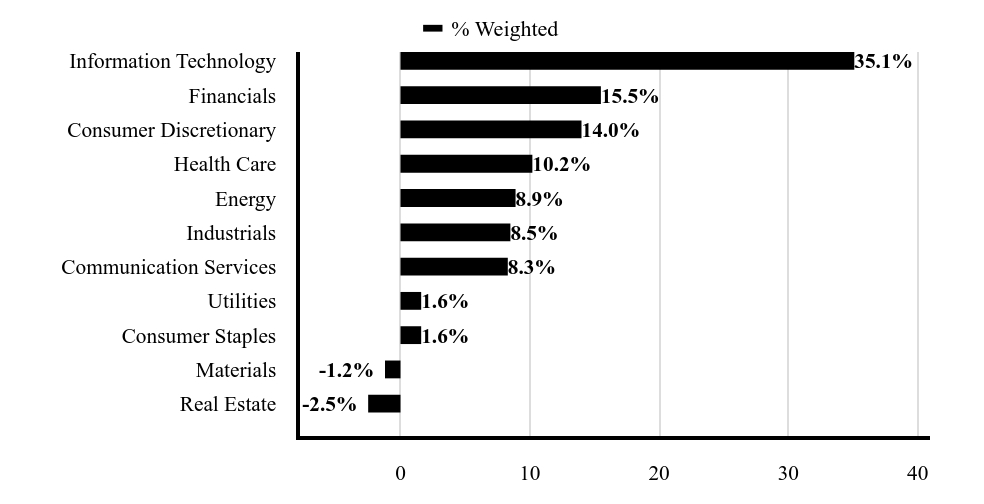
| Value | Value |
|---|
| Real Estate | |
| Materials | |
| Consumer Staples | 1.6%Footnote Reference |
| Utilities | 1.6%Footnote Reference |
| Communication Services | 8.3%Footnote Reference |
| Industrials | 8.5%Footnote Reference |
| Energy | 8.9%Footnote Reference |
| Health Care | 10.2%Footnote Reference |
| Consumer Discretionary | 14.0%Footnote Reference |
| Financials | 15.5%Footnote Reference |
| Information Technology | 35.1%Footnote Reference |
| Footnote | Description |
Footnote | As a percentage of total common stocks. Concentrations are subject to change. |
| Value | Value |
|---|
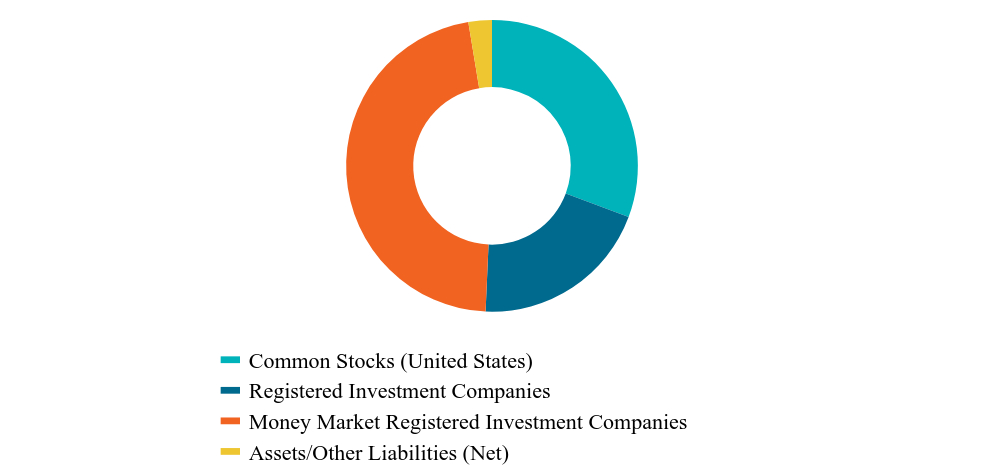
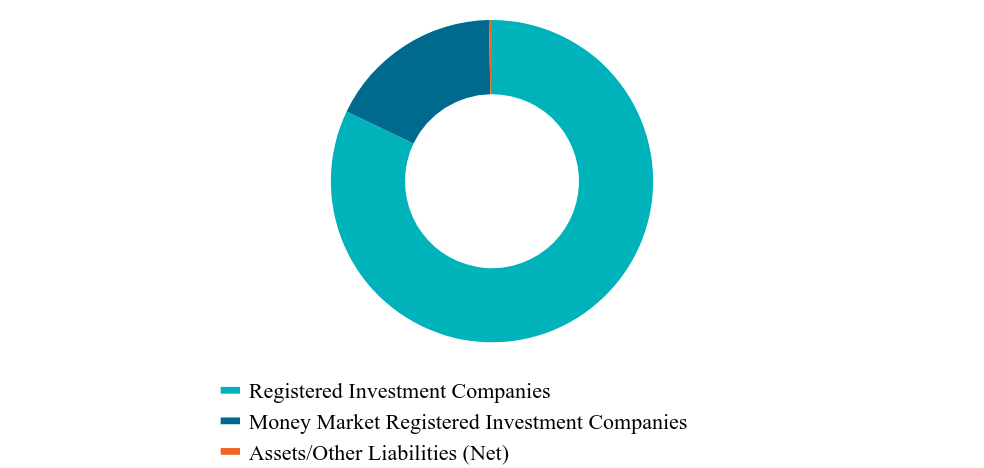
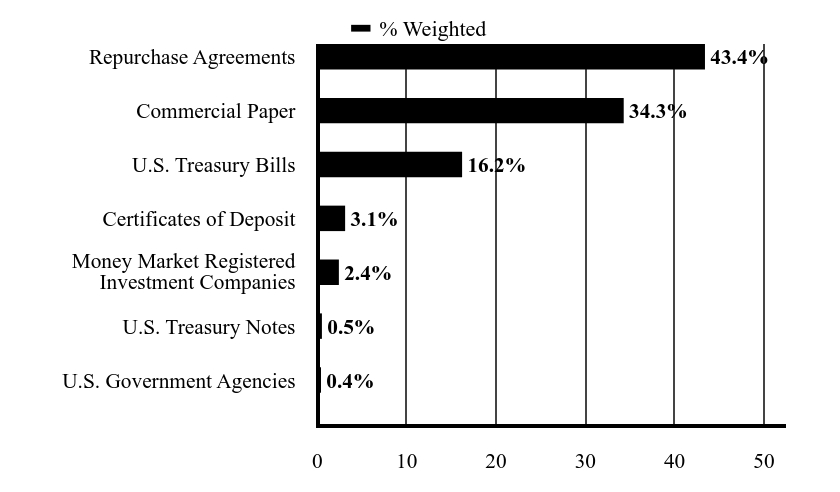
| Common Stocks (United States) | 68.6%Footnote Reference |
| Registered Investment Companies | 4.4%Footnote Reference |
| Money Market Registered Investment Companies | 2.7%Footnote Reference |
| Assets/Other Liabilities (Net) | 24.3% |
| Footnote | Description |
Footnote | As a percentage of total net assets. The Fund has invested in stock index futures contracts in order to equitize cash balances it holds in a proprietary money market fund. |
Availability of Additional Information
For additional information about the Fund, including its prospectus, financial information, holdings, proxy voting information and other important materials, scan the QR code or visit www.meederinvestment.com/meeder-funds-resources.
To reduce fund expenses, only one copy of most shareholder documents are delivered to shareholders with multiple accounts at the same address. If you wish to receive copies of this document for each account, please contact the Meeder Funds at 866.633.3371 or contact your financial intermediary.
Institutional Class SRUIX
Semi-Annual Shareholder Report
June 30, 2024
Semi-Annual Shareholder Report
June 30, 2024
This semi-annual shareholder report contains important information about the Moderate Allocation Fund for the period of December 31, 2023, to 6/30/2024, as well as certain changes to the Fund. You can find additional information about the Fund at meederinvestment.com/mutual-funds . You can also request this information by contacting us at 866.633.3371 .
What were the Fund's costs for the period?
(based on a hypothetical $10,000 investment)
| Class Name | Cost of $10K Investment | Cost Paid as % of $10K Investment |
|---|
| Retail Class | $69.28 | 1.35% |
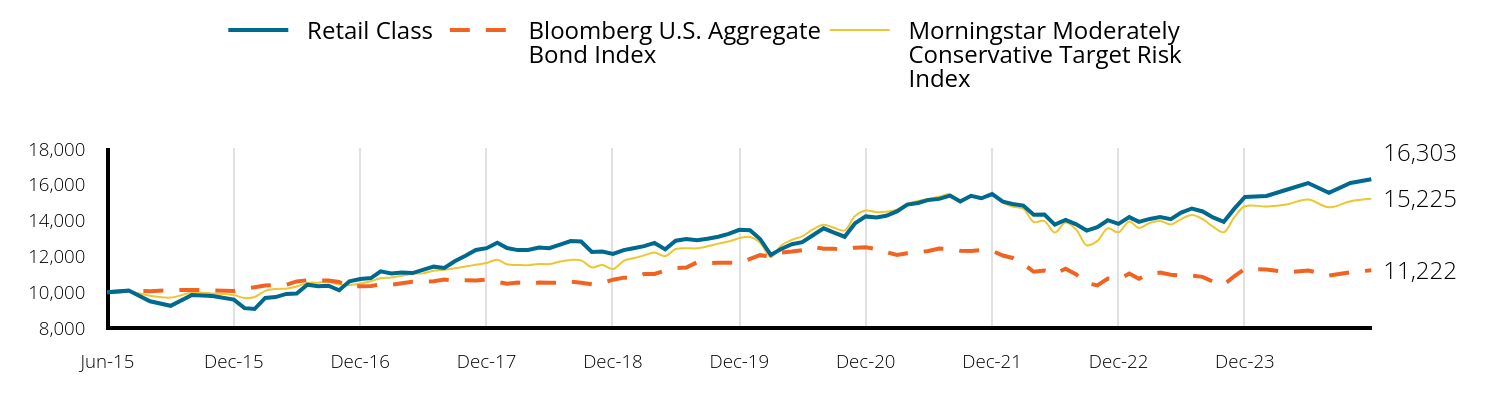
Total Return Based on a $10,000 Investment
| Retail Class | Bloomberg U.S. Aggregate Bond Index | Morningstar Moderately Conservative Target Risk Index |
|---|
| Jun-15 | 10,000 | 10,000 | 10,000 |
| Jul-15 | 10,090 | 10,070 | 10,037 |
| Aug-15 | 9,490 | 10,055 | 9,801 |
| Sep-15 | 9,240 | 10,123 | 9,700 |
| Oct-15 | 9,847 | 10,125 | 9,973 |
| Nov-15 | 9,787 | 10,098 | 9,925 |
| Dec-15 | 9,585 | 10,065 | 9,836 |
| Jan-16 | 9,111 | 10,204 | 9,669 |
| Feb-16 | 9,060 | 10,276 | 9,729 |
| Mar-16 | 9,677 | 10,371 | 10,076 |
| Apr-16 | 9,728 | 10,410 | 10,178 |
| May-16 | 9,905 | 10,413 | 10,195 |
| Jun-16 | 9,930 | 10,600 | 10,313 |
| Jul-16 | 10,420 | 10,667 | 10,520 |
| Aug-16 | 10,333 | 10,655 | 10,530 |
| Sep-16 | 10,364 | 10,649 | 10,566 |
| Oct-16 | 10,110 | 10,567 | 10,436 |
| Nov-16 | 10,607 | 10,317 | 10,396 |
| Dec-16 | 10,740 | 10,332 | 10,491 |
| Jan-17 | 10,787 | 10,352 | 10,615 |
| Feb-17 | 11,162 | 10,422 | 10,778 |
| Mar-17 | 11,043 | 10,416 | 10,816 |
| Apr-17 | 11,105 | 10,497 | 10,918 |
| May-17 | 11,069 | 10,577 | 11,032 |
| Jun-17 | 11,249 | 10,567 | 11,051 |
| Jul-17 | 11,426 | 10,612 | 11,192 |
| Aug-17 | 11,354 | 10,707 | 11,259 |
| Sep-17 | 11,725 | 10,656 | 11,336 |
| Oct-17 | 12,034 | 10,663 | 11,434 |
| Nov-17 | 12,354 | 10,649 | 11,533 |
| Dec-17 | 12,458 | 10,698 | 11,630 |
| Jan-18 | 12,757 | 10,575 | 11,812 |
| Feb-18 | 12,468 | 10,474 | 11,557 |
| Mar-18 | 12,351 | 10,542 | 11,523 |
| Apr-18 | 12,361 | 10,463 | 11,506 |
| May-18 | 12,490 | 10,538 | 11,576 |
| Jun-18 | 12,458 | 10,525 | 11,569 |
| Jul-18 | 12,651 | 10,527 | 11,710 |
| Aug-18 | 12,855 | 10,595 | 11,801 |
| Sep-18 | 12,828 | 10,527 | 11,779 |
| Oct-18 | 12,247 | 10,444 | 11,385 |
| Nov-18 | 12,268 | 10,506 | 11,512 |
| Dec-18 | 12,134 | 10,699 | 11,297 |
| Jan-19 | 12,347 | 10,813 | 11,751 |
| Feb-19 | 12,458 | 10,806 | 11,891 |
| Mar-19 | 12,570 | 11,014 | 12,056 |
| Apr-19 | 12,750 | 11,017 | 12,217 |
| May-19 | 12,391 | 11,212 | 12,022 |
| Jun-19 | 12,873 | 11,353 | 12,410 |
| Jul-19 | 12,964 | 11,378 | 12,451 |
| Aug-19 | 12,896 | 11,673 | 12,451 |
| Sep-19 | 12,986 | 11,611 | 12,561 |
| Oct-19 | 13,099 | 11,646 | 12,713 |
| Nov-19 | 13,257 | 11,640 | 12,831 |
| Dec-19 | 13,484 | 11,632 | 13,020 |
| Jan-20 | 13,461 | 11,855 | 13,081 |
| Feb-20 | 12,972 | 12,069 | 12,760 |
| Mar-20 | 12,084 | 11,998 | 11,958 |
| Apr-20 | 12,415 | 12,211 | 12,606 |
| May-20 | 12,677 | 12,268 | 12,916 |
| Jun-20 | 12,791 | 12,345 | 13,122 |
| Jul-20 | 13,180 | 12,530 | 13,507 |
| Aug-20 | 13,569 | 12,428 | 13,767 |
| Sep-20 | 13,326 | 12,422 | 13,595 |
| Oct-20 | 13,097 | 12,366 | 13,451 |
| Nov-20 | 13,853 | 12,488 | 14,255 |
| Dec-20 | 14,233 | 12,505 | 14,564 |
| Jan-21 | 14,176 | 12,415 | 14,469 |
| Feb-21 | 14,268 | 12,236 | 14,492 |
| Mar-21 | 14,509 | 12,083 | 14,610 |
| Apr-21 | 14,889 | 12,178 | 14,938 |
| May-21 | 14,981 | 12,218 | 15,096 |
| Jun-21 | 15,154 | 12,304 | 15,206 |
| Jul-21 | 15,211 | 12,442 | 15,336 |
| Aug-21 | 15,395 | 12,418 | 15,465 |
| Sep-21 | 15,061 | 12,310 | 15,142 |
| Oct-21 | 15,385 | 12,307 | 15,385 |
| Nov-21 | 15,246 | 12,344 | 15,210 |
| Dec-21 | 15,477 | 12,312 | 15,491 |
| Jan-22 | 15,060 | 12,047 | 14,996 |
| Feb-22 | 14,926 | 11,912 | 14,777 |
| Mar-22 | 14,840 | 11,581 | 14,662 |
| Apr-22 | 14,326 | 11,142 | 13,921 |
| May-22 | 14,338 | 11,214 | 13,970 |
| Jun-22 | 13,775 | 11,038 | 13,328 |
| Jul-22 | 14,032 | 11,307 | 13,895 |
| Aug-22 | 13,787 | 10,988 | 13,494 |
| Sep-22 | 13,443 | 10,513 | 12,619 |
| Oct-22 | 13,629 | 10,377 | 12,866 |
| Nov-22 | 14,019 | 10,759 | 13,564 |
| Dec-22 | 13,814 | 10,710 | 13,345 |
| Jan-23 | 14,191 | 11,040 | 13,950 |
| Feb-23 | 13,927 | 10,754 | 13,588 |
| Mar-23 | 14,091 | 11,027 | 13,865 |
| Apr-23 | 14,192 | 11,094 | 13,978 |
| May-23 | 14,078 | 10,973 | 13,783 |
| Jun-23 | 14,445 | 10,934 | 14,084 |
| Jul-23 | 14,674 | 10,927 | 14,310 |
| Aug-23 | 14,508 | 10,857 | 14,078 |
| Sep-23 | 14,178 | 10,581 | 13,657 |
| Oct-23 | 13,934 | 10,414 | 13,345 |
| Nov-23 | 14,651 | 10,886 | 14,173 |
| Dec-23 | 15,321 | 11,302 | 14,799 |
| Jan-24 | 15,373 | 11,271 | 14,790 |
| Feb-24 | 15,722 | 11,112 | 14,899 |
| Mar-24 | 16,096 | 11,215 | 15,171 |
| Apr-24 | 15,552 | 10,931 | 14,738 |
| May-24 | 16,096 | 11,117 | 15,084 |
| Jun-24 | 16,303 | 11,222 | 15,225 |
The Growth of $10,000 chart compares the performance of the Fund over the period shown with dividends and capital gains reinvested to the Fund’s benchmark. Benchmark indices are unmanaged and do not reflect the deduction of expenses associated with a mutual fund, such as investment management and accounting fees.
The performance data shown represents past performance, which does not guarantee future results. The investment return and principal value of an investment will fluctuate so that an investor’s shares, when redeemed, may be worth more or less than their original cost. Current performance may be lower or higher than the performance data quoted. For current month-end performance data, please visit our website at www.meederfunds.com.
| Total Net Assets | $174,590,060 |
| # of Portfolio Holdings | 150 |
| Portfolio Turnover Rate | 87% |
| Advisory Fees and Waivers | 503,423 |
Average Annual Total Returns
| . | 1 Year | 5 Year | Since Inception |
|---|
| Retail Class (Inception Date: 6/30/15) | 12.86% | 4.84% | 5.58% |
| Bloomberg U.S. Aggregate Bond Index | 2.63% | | 1.29% |
| Morningstar Moderately Conservative Target Risk Index | 8.10% | 4.17% | 4.78% |
What did the Fund invest in?
| Fidelity Total Bond Fund - Class Z | 12.3% |
| Baird Core Plus Bond Fund - Class I | 11.8% |
| Frost Total Return Bond Fund - Class I | 6.6% |
| Dodge & Cox Income Fund - Class I | 3.9% |
| Berkshire Hathaway Inc | 3.8% |
| Microsoft Corp | 3.6% |
| Fidelity Advisor High Income Advantage Fund - Class Z | 3.6% |
| iShares 20+ Year Treasury Bond ETF | 3.6% |
| BrandywineGLOBAL High Yield Fund - Class I | 3.6% |
| NVIDIA Corp | 2.6% |
| As a percentage of total net assets. Holdings exclude short-term investments and derivatives. |
| Value | Value |
|---|
| Utilities | 0.3%Footnote Reference |
| Materials | 0.5%Footnote Reference |
| Consumer Staples | 2.6%Footnote Reference |
| Energy | 2.7%Footnote Reference |
| Industrials | 8.4%Footnote Reference |
| Communication Services | 8.9%Footnote Reference |
| Consumer Discretionary | 13.0%Footnote Reference |
| Financials | 14.6%Footnote Reference |
| Health Care | 14.8%Footnote Reference |
| Information Technology | 34.2%Footnote Reference |
| Footnote | Description |
Footnote | As a percentage of total common stocks. Concentrations are subject to change. |
| Value | Value |
|---|
| Common Stocks (United States) | 38.1%Footnote Reference |
| Registered Investment Companies | 48.9%Footnote Reference |
| Money Market Registered Investment Companies | 12.2%Footnote Reference |
| Assets/Other Liabilities (Net) | 0.8% |
| Footnote | Description |
Footnote | As a percentage of total net assets. The Fund has invested in stock index futures contracts in order to equitize cash balances it holds in a proprietary money market fund. |
Availability of Additional Information
For additional information about the Fund, including its prospectus, financial information, holdings, proxy voting information and other important materials, scan the QR code or visit www.meederinvestment.com/meeder-funds-resources.
To reduce fund expenses, only one copy of most shareholder documents are delivered to shareholders with multiple accounts at the same address. If you wish to receive copies of this document for each account, please contact the Meeder Funds at 866.633.3371 or contact your financial intermediary.
Semi-Annual Shareholder Report
June 30, 2024
Semi-Annual Shareholder Report
June 30, 2024
This semi-annual shareholder report contains important information about the Sector Rotation Fund for the period of December 31, 2023, to 6/30/2024, as well as certain changes to the Fund. You can find additional information about the Fund at meederinvestment.com/mutual-funds . You can also request this information by contacting us at 866.633.3371 .
What were the Fund's costs for the period?
(based on a hypothetical $10,000 investment)
| Class Name | Cost of $10K Investment | Cost Paid as % of $10K Investment |
|---|
| Retail Class | $85.03 | 1.65% |
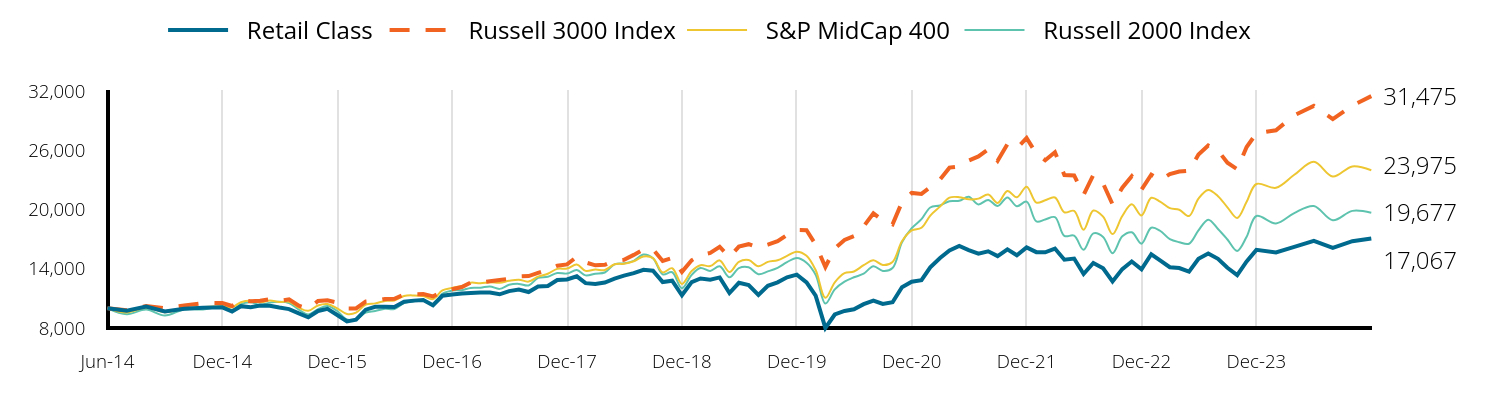
Total Return Based on a $10,000 Investment
| Retail Class | Russell 3000 Index | S&P MidCap 400 | Russell 2000 Index |
|---|
| Jun-14 | 10,000 | 10,000 | 10,000 | 10,000 |
| Jul-14 | 9,750 | 9,803 | 9,573 | 9,395 |
| Aug-14 | 10,182 | 10,214 | 10,059 | 9,861 |
| Sep-14 | 9,675 | 10,001 | 9,602 | 9,264 |
| Oct-14 | 9,945 | 10,276 | 9,944 | 9,875 |
| Nov-14 | 10,054 | 10,525 | 10,128 | 9,884 |
| Dec-14 | 10,095 | 10,525 | 10,211 | 10,165 |
| Jan-15 | 9,673 | 10,232 | 10,097 | 9,838 |
| Feb-15 | 10,210 | 10,825 | 10,614 | 10,422 |
| Mar-15 | 10,109 | 10,715 | 10,754 | 10,604 |
| Apr-15 | 10,267 | 10,763 | 10,594 | 10,333 |
| May-15 | 10,244 | 10,912 | 10,782 | 10,569 |
| Jun-15 | 10,069 | 10,729 | 10,640 | 10,649 |
| Jul-15 | 9,911 | 10,909 | 10,654 | 10,525 |
| Aug-15 | 9,474 | 10,250 | 10,060 | 9,863 |
| Sep-15 | 9,083 | 9,952 | 9,736 | 9,379 |
| Oct-15 | 9,722 | 10,738 | 10,284 | 9,908 |
| Nov-15 | 9,938 | 10,797 | 10,423 | 10,230 |
| Dec-15 | 9,320 | 10,576 | 9,989 | 9,717 |
| Jan-16 | 8,667 | 9,979 | 9,421 | 8,862 |
| Feb-16 | 8,835 | 9,976 | 9,554 | 8,862 |
| Mar-16 | 9,856 | 10,678 | 10,367 | 9,569 |
| Apr-16 | 10,150 | 10,744 | 10,494 | 9,719 |
| May-16 | 10,144 | 10,936 | 10,737 | 9,938 |
| Jun-16 | 10,124 | 10,959 | 10,781 | 9,932 |
| Jul-16 | 10,658 | 11,394 | 11,244 | 10,525 |
| Aug-16 | 10,772 | 11,423 | 11,300 | 10,711 |
| Sep-16 | 10,832 | 11,441 | 11,228 | 10,830 |
| Oct-16 | 10,311 | 11,193 | 10,928 | 10,315 |
| Nov-16 | 11,269 | 11,694 | 11,802 | 11,466 |
| Dec-16 | 11,384 | 11,922 | 12,061 | 11,787 |
| Jan-17 | 11,503 | 12,147 | 12,263 | 11,833 |
| Feb-17 | 11,534 | 12,599 | 12,585 | 12,062 |
| Mar-17 | 11,582 | 12,607 | 12,536 | 12,078 |
| Apr-17 | 11,585 | 12,741 | 12,641 | 12,210 |
| May-17 | 11,414 | 12,871 | 12,579 | 11,962 |
| Jun-17 | 11,739 | 12,987 | 12,783 | 12,375 |
| Jul-17 | 11,896 | 13,232 | 12,896 | 12,467 |
| Aug-17 | 11,640 | 13,258 | 12,698 | 12,308 |
| Sep-17 | 12,209 | 13,581 | 13,195 | 13,077 |
| Oct-17 | 12,257 | 13,877 | 13,493 | 13,188 |
| Nov-17 | 12,865 | 14,299 | 13,989 | 13,568 |
| Dec-17 | 12,911 | 14,442 | 14,020 | 13,513 |
| Jan-18 | 13,234 | 15,203 | 14,423 | 13,867 |
| Feb-18 | 12,542 | 14,642 | 13,784 | 13,330 |
| Mar-18 | 12,448 | 14,349 | 13,912 | 13,502 |
| Apr-18 | 12,609 | 14,403 | 13,876 | 13,619 |
| May-18 | 13,006 | 14,810 | 14,448 | 14,445 |
| Jun-18 | 13,301 | 14,907 | 14,509 | 14,549 |
| Jul-18 | 13,557 | 15,401 | 14,765 | 14,803 |
| Aug-18 | 13,891 | 15,942 | 15,237 | 15,441 |
| Sep-18 | 13,800 | 15,968 | 15,070 | 15,069 |
| Oct-18 | 12,648 | 14,793 | 13,631 | 13,433 |
| Nov-18 | 12,788 | 15,089 | 14,057 | 13,646 |
| Dec-18 | 11,317 | 13,685 | 12,466 | 12,025 |
| Jan-19 | 12,655 | 14,859 | 13,770 | 13,378 |
| Feb-19 | 13,017 | 15,382 | 14,354 | 14,073 |
| Mar-19 | 12,894 | 15,606 | 14,272 | 13,779 |
| Apr-19 | 13,122 | 16,230 | 14,846 | 14,247 |
| May-19 | 11,541 | 15,179 | 13,663 | 13,139 |
| Jun-19 | 12,574 | 16,246 | 14,707 | 14,067 |
| Jul-19 | 12,338 | 16,487 | 14,882 | 14,148 |
| Aug-19 | 11,347 | 16,151 | 14,257 | 13,450 |
| Sep-19 | 12,279 | 16,434 | 14,694 | 13,730 |
| Oct-19 | 12,621 | 16,788 | 14,860 | 14,091 |
| Nov-19 | 13,128 | 17,426 | 15,302 | 14,671 |
| Dec-19 | 13,408 | 17,929 | 15,732 | 15,094 |
| Jan-20 | 12,616 | 17,910 | 15,321 | 14,610 |
| Feb-20 | 11,272 | 16,444 | 13,867 | 13,380 |
| Mar-20 | 8,011 | 14,182 | 11,059 | 10,473 |
| Apr-20 | 9,369 | 16,061 | 12,628 | 11,912 |
| May-20 | 9,726 | 16,919 | 13,552 | 12,687 |
| Jun-20 | 9,892 | 17,306 | 13,722 | 13,135 |
| Jul-20 | 10,414 | 18,289 | 14,355 | 13,499 |
| Aug-20 | 10,783 | 19,614 | 14,859 | 14,260 |
| Sep-20 | 10,432 | 18,900 | 14,377 | 13,783 |
| Oct-20 | 10,603 | 18,492 | 14,689 | 14,072 |
| Nov-20 | 12,137 | 20,741 | 16,786 | 16,666 |
| Dec-20 | 12,689 | 21,675 | 17,881 | 18,107 |
| Jan-21 | 12,842 | 21,578 | 18,150 | 19,019 |
| Feb-21 | 14,138 | 22,253 | 19,384 | 20,204 |
| Mar-21 | 15,085 | 23,050 | 20,289 | 20,407 |
| Apr-21 | 15,847 | 24,238 | 21,203 | 20,835 |
| May-21 | 16,307 | 24,349 | 21,245 | 20,878 |
| Jun-21 | 15,887 | 24,950 | 21,027 | 21,283 |
| Jul-21 | 15,531 | 25,371 | 21,100 | 20,514 |
| Aug-21 | 15,765 | 26,095 | 21,511 | 20,973 |
| Sep-21 | 15,281 | 24,924 | 20,657 | 20,355 |
| Oct-21 | 15,958 | 26,610 | 21,872 | 21,221 |
| Nov-21 | 15,363 | 26,205 | 21,230 | 20,336 |
| Dec-21 | 16,159 | 27,236 | 22,308 | 20,791 |
| Jan-22 | 15,681 | 25,634 | 20,700 | 18,789 |
| Feb-22 | 15,660 | 24,988 | 20,930 | 18,990 |
| Mar-22 | 16,043 | 25,799 | 21,220 | 19,226 |
| Apr-22 | 14,912 | 23,484 | 19,712 | 17,321 |
| May-22 | 15,033 | 23,452 | 19,860 | 17,347 |
| Jun-22 | 13,471 | 21,490 | 17,949 | 15,920 |
| Jul-22 | 14,592 | 23,506 | 19,897 | 17,582 |
| Aug-22 | 14,052 | 22,629 | 19,279 | 17,222 |
| Sep-22 | 12,717 | 20,531 | 17,507 | 15,572 |
| Oct-22 | 13,963 | 22,214 | 19,348 | 17,286 |
| Nov-22 | 14,735 | 23,374 | 20,532 | 17,690 |
| Dec-22 | 13,938 | 22,005 | 19,395 | 16,542 |
| Jan-23 | 15,465 | 23,521 | 21,184 | 18,154 |
| Feb-23 | 14,849 | 22,971 | 20,800 | 17,847 |
| Mar-23 | 14,152 | 23,585 | 20,133 | 16,995 |
| Apr-23 | 14,075 | 23,837 | 19,975 | 16,689 |
| May-23 | 13,702 | 23,929 | 19,338 | 16,535 |
| Jun-23 | 15,009 | 25,563 | 21,110 | 17,879 |
| Jul-23 | 15,546 | 26,480 | 21,980 | 18,973 |
| Aug-23 | 15,000 | 25,968 | 21,345 | 18,024 |
| Sep-23 | 14,102 | 24,731 | 20,223 | 16,962 |
| Oct-23 | 13,360 | 24,076 | 19,143 | 15,806 |
| Nov-23 | 14,745 | 26,321 | 20,772 | 17,236 |
| Dec-23 | 15,910 | 27,717 | 22,583 | 19,342 |
| Jan-24 | 15,646 | 28,024 | 22,196 | 18,590 |
| Feb-24 | 16,209 | 29,541 | 23,514 | 19,641 |
| Mar-24 | 16,820 | 30,494 | 24,830 | 20,344 |
| Apr-24 | 16,108 | 29,152 | 23,336 | 18,912 |
| May-24 | 16,794 | 30,530 | 24,360 | 19,861 |
| Jun-24 | 17,067 | 31,475 | 23,975 | 19,677 |
The Growth of $10,000 chart compares the performance of the Fund over the period shown with dividends and capital gains reinvested to the Fund’s benchmark. Benchmark indices are unmanaged and do not reflect the deduction of expenses associated with a mutual fund, such as investment management and accounting fees.
The performance data shown represents past performance, which does not guarantee future results. The investment return and principal value of an investment will fluctuate so that an investor’s shares, when redeemed, may be worth more or less than their original cost. Current performance may be lower or higher than the performance data quoted. For current month-end performance data, please visit our website at www.meederfunds.com.
| Total Net Assets | $36,570,948 |
| # of Portfolio Holdings | 583 |
| Portfolio Turnover Rate | 164% |
| Advisory Fees and Waivers | 132,883 |
Average Annual Total Returns
| . | 1 Year | 5 Year | 10 Year |
|---|
| Retail Class | 13.72% | 6.30% | 5.49% |
| Russell 3000 Index | 23.13% | 14.14% | 12.15% |
| S&P MidCap 400 | 13.57% | 10.27% | 9.14% |
| Russell 2000 Index | 10.06% | 6.94% | 7.00% |
What did the Fund invest in?
| Amazon.com Inc | 3.9% |
| Microsoft Corp | 3.6% |
| Apple Inc | 3.3% |
| NVIDIA Corp | 3.2% |
| Alphabet Inc | 2.9% |
| Meta Platforms Inc | 1.6% |
| Fidelity Total Bond Fund - Class Z | 1.4% |
| Baird Core Plus Bond Fund - Class I | 1.4% |
| Tesla Inc | 1.2% |
| Home Depot Inc/The | 0.8% |
| As a percentage of total net assets. Holdings exclude short-term investments and derivatives. |
| Value | Value |
|---|
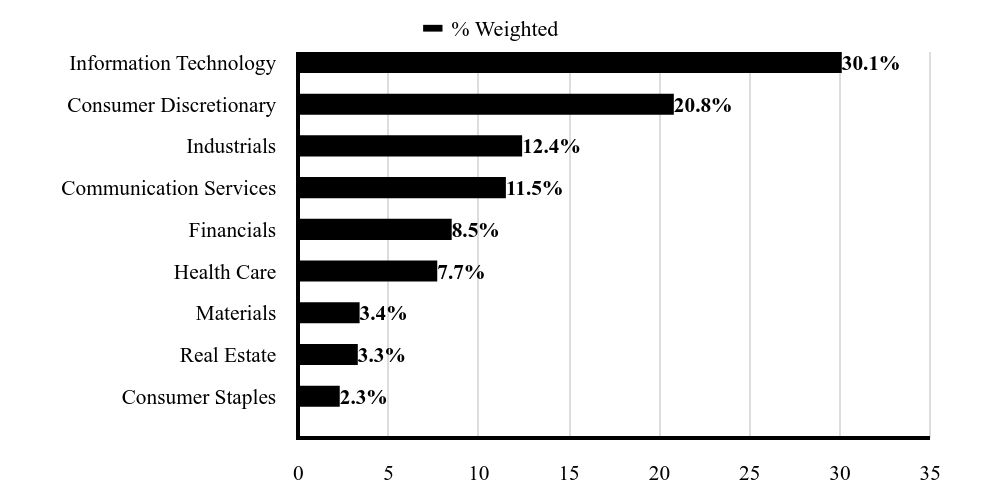
| Consumer Staples | 2.3%Footnote Reference |
| Real Estate | 3.3%Footnote Reference |
| Materials | 3.4%Footnote Reference |
| Health Care | 7.7%Footnote Reference |
| Financials | 8.5%Footnote Reference |
| Communication Services | 11.5%Footnote Reference |
| Industrials | 12.4%Footnote Reference |
| Consumer Discretionary | 20.8%Footnote Reference |
| Information Technology | 30.1%Footnote Reference |
| Footnote | Description |
Footnote | As a percentage of total common stocks. Concentrations are subject to change. |
| Value | Value |
|---|
| Common Stocks (United States) | 56.5%Footnote Reference |
| Registered Investment Companies | 4.9%Footnote Reference |
| Money Market Registered Investment Companies | 36.8%Footnote Reference |
| Assets/Other Liabilities (Net) | 1.8% |
| Footnote | Description |
Footnote | As a percentage of total net assets. The Fund has invested in stock index futures contracts in order to equitize cash balances it holds in a proprietary money market fund. |
Availability of Additional Information
For additional information about the Fund, including its prospectus, financial information, holdings, proxy voting information and other important materials, scan the QR code or visit www.meederinvestment.com/meeder-funds-resources.
To reduce fund expenses, only one copy of most shareholder documents are delivered to shareholders with multiple accounts at the same address. If you wish to receive copies of this document for each account, please contact the Meeder Funds at 866.633.3371 or contact your financial intermediary.
Semi-Annual Shareholder Report
June 30, 2024
Semi-Annual Shareholder Report
June 30, 2024
This semi-annual shareholder report contains important information about the Moderate Allocation Fund for the period of December 31, 2023, to 6/30/2024, as well as certain changes to the Fund. You can find additional information about the Fund at meederinvestment.com/mutual-funds . You can also request this information by contacting us at 866.633.3371 .
What were the Fund's costs for the period?
(based on a hypothetical $10,000 investment)
| Class Name | Cost of $10K Investment | Cost Paid as % of $10K Investment |
|---|
| Adviser Class | $48.27 | 0.94% |
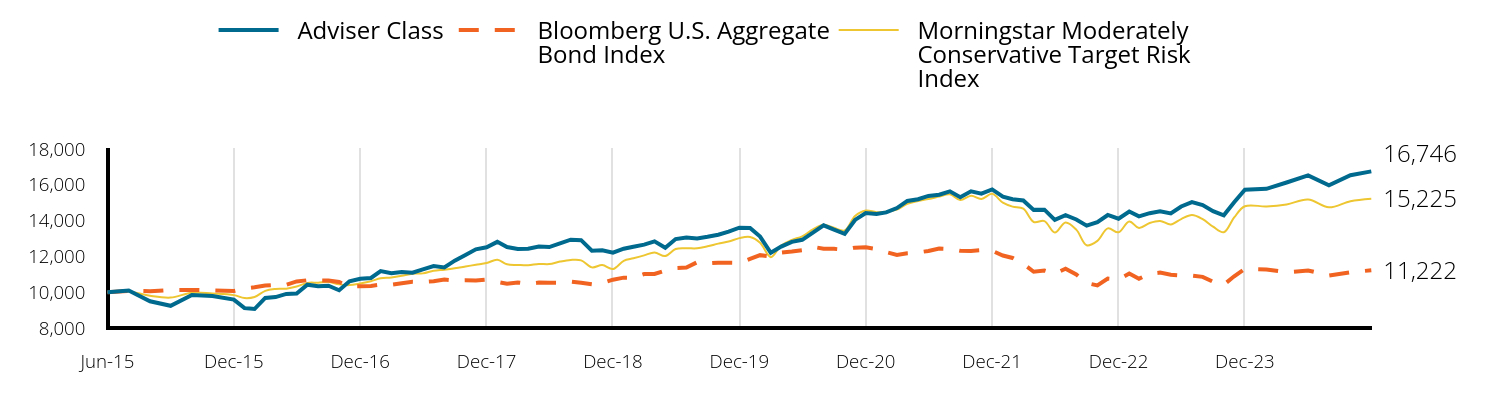
Total Return Based on a $10,000 Investment
| Adviser Class | Bloomberg U.S. Aggregate Bond Index | Morningstar Moderately Conservative Target Risk Index |
|---|
| Jun-15 | 10,000 | 10,000 | 10,000 |
| Jul-15 | 10,090 | 10,070 | 10,037 |
| Aug-15 | 9,490 | 10,055 | 9,801 |
| Sep-15 | 9,240 | 10,123 | 9,700 |
| Oct-15 | 9,847 | 10,125 | 9,973 |
| Nov-15 | 9,787 | 10,098 | 9,925 |
| Dec-15 | 9,585 | 10,065 | 9,836 |
| Jan-16 | 9,111 | 10,204 | 9,669 |
| Feb-16 | 9,060 | 10,276 | 9,729 |
| Mar-16 | 9,677 | 10,371 | 10,076 |
| Apr-16 | 9,728 | 10,410 | 10,178 |
| May-16 | 9,905 | 10,413 | 10,195 |
| Jun-16 | 9,930 | 10,600 | 10,313 |
| Jul-16 | 10,420 | 10,667 | 10,520 |
| Aug-16 | 10,333 | 10,655 | 10,530 |
| Sep-16 | 10,364 | 10,649 | 10,566 |
| Oct-16 | 10,110 | 10,567 | 10,436 |
| Nov-16 | 10,607 | 10,317 | 10,396 |
| Dec-16 | 10,748 | 10,332 | 10,491 |
| Jan-17 | 10,795 | 10,352 | 10,615 |
| Feb-17 | 11,180 | 10,422 | 10,778 |
| Mar-17 | 11,057 | 10,416 | 10,816 |
| Apr-17 | 11,129 | 10,497 | 10,918 |
| May-17 | 11,088 | 10,577 | 11,032 |
| Jun-17 | 11,275 | 10,567 | 11,051 |
| Jul-17 | 11,463 | 10,612 | 11,192 |
| Aug-17 | 11,381 | 10,707 | 11,259 |
| Sep-17 | 11,763 | 10,656 | 11,336 |
| Oct-17 | 12,083 | 10,663 | 11,434 |
| Nov-17 | 12,393 | 10,649 | 11,533 |
| Dec-17 | 12,511 | 10,698 | 11,630 |
| Jan-18 | 12,811 | 10,575 | 11,812 |
| Feb-18 | 12,522 | 10,474 | 11,557 |
| Mar-18 | 12,414 | 10,542 | 11,523 |
| Apr-18 | 12,425 | 10,463 | 11,506 |
| May-18 | 12,554 | 10,538 | 11,576 |
| Jun-18 | 12,522 | 10,525 | 11,569 |
| Jul-18 | 12,727 | 10,527 | 11,710 |
| Aug-18 | 12,932 | 10,595 | 11,801 |
| Sep-18 | 12,905 | 10,527 | 11,779 |
| Oct-18 | 12,321 | 10,444 | 11,385 |
| Nov-18 | 12,342 | 10,506 | 11,512 |
| Dec-18 | 12,203 | 10,699 | 11,297 |
| Jan-19 | 12,428 | 10,813 | 11,751 |
| Feb-19 | 12,540 | 10,806 | 11,891 |
| Mar-19 | 12,658 | 11,014 | 12,056 |
| Apr-19 | 12,839 | 11,017 | 12,217 |
| May-19 | 12,478 | 11,212 | 12,022 |
| Jun-19 | 12,968 | 11,353 | 12,410 |
| Jul-19 | 13,059 | 11,378 | 12,451 |
| Aug-19 | 13,002 | 11,673 | 12,451 |
| Sep-19 | 13,093 | 11,611 | 12,561 |
| Oct-19 | 13,207 | 11,646 | 12,713 |
| Nov-19 | 13,377 | 11,640 | 12,831 |
| Dec-19 | 13,600 | 11,632 | 13,020 |
| Jan-20 | 13,588 | 11,855 | 13,081 |
| Feb-20 | 13,106 | 12,069 | 12,760 |
| Mar-20 | 12,201 | 11,998 | 11,958 |
| Apr-20 | 12,546 | 12,211 | 12,606 |
| May-20 | 12,810 | 12,268 | 12,916 |
| Jun-20 | 12,925 | 12,345 | 13,122 |
| Jul-20 | 13,329 | 12,530 | 13,507 |
| Aug-20 | 13,733 | 12,428 | 13,767 |
| Sep-20 | 13,491 | 12,422 | 13,595 |
| Oct-20 | 13,259 | 12,366 | 13,451 |
| Nov-20 | 14,035 | 12,488 | 14,255 |
| Dec-20 | 14,421 | 12,505 | 14,564 |
| Jan-21 | 14,363 | 12,415 | 14,469 |
| Feb-21 | 14,456 | 12,236 | 14,492 |
| Mar-21 | 14,700 | 12,083 | 14,610 |
| Apr-21 | 15,096 | 12,178 | 14,938 |
| May-21 | 15,189 | 12,218 | 15,096 |
| Jun-21 | 15,376 | 12,304 | 15,206 |
| Jul-21 | 15,445 | 12,442 | 15,336 |
| Aug-21 | 15,632 | 12,418 | 15,465 |
| Sep-21 | 15,306 | 12,310 | 15,142 |
| Oct-21 | 15,634 | 12,307 | 15,385 |
| Nov-21 | 15,505 | 12,344 | 15,210 |
| Dec-21 | 15,741 | 12,312 | 15,491 |
| Jan-22 | 15,330 | 12,047 | 14,996 |
| Feb-22 | 15,194 | 11,912 | 14,777 |
| Mar-22 | 15,119 | 11,581 | 14,662 |
| Apr-22 | 14,597 | 11,142 | 13,921 |
| May-22 | 14,609 | 11,214 | 13,970 |
| Jun-22 | 14,037 | 11,038 | 13,328 |
| Jul-22 | 14,299 | 11,307 | 13,895 |
| Aug-22 | 14,062 | 10,988 | 13,494 |
| Sep-22 | 13,714 | 10,513 | 12,619 |
| Oct-22 | 13,915 | 10,377 | 12,866 |
| Nov-22 | 14,312 | 10,759 | 13,564 |
| Dec-22 | 14,105 | 10,710 | 13,345 |
| Jan-23 | 14,502 | 11,040 | 13,950 |
| Feb-23 | 14,233 | 10,754 | 13,588 |
| Mar-23 | 14,412 | 11,027 | 13,865 |
| Apr-23 | 14,515 | 11,094 | 13,978 |
| May-23 | 14,400 | 10,973 | 13,783 |
| Jun-23 | 14,786 | 10,934 | 14,084 |
| Jul-23 | 15,032 | 10,927 | 14,310 |
| Aug-23 | 14,863 | 10,857 | 14,078 |
| Sep-23 | 14,526 | 10,581 | 13,657 |
| Oct-23 | 14,292 | 10,414 | 13,345 |
| Nov-23 | 15,022 | 10,886 | 14,173 |
| Dec-23 | 15,718 | 11,302 | 14,799 |
| Jan-24 | 15,770 | 11,271 | 14,790 |
| Feb-24 | 16,126 | 11,112 | 14,899 |
| Mar-24 | 16,521 | 11,215 | 15,171 |
| Apr-24 | 15,965 | 10,931 | 14,738 |
| May-24 | 16,535 | 11,117 | 15,084 |
| Jun-24 | 16,746 | 11,222 | 15,225 |
The Growth of $10,000 chart compares the performance of the Fund over the period shown with dividends and capital gains reinvested to the Fund’s benchmark. Benchmark indices are unmanaged and do not reflect the deduction of expenses associated with a mutual fund, such as investment management and accounting fees.
Investment performance assumes reinvestment of all dividend and capital gain distributions. The results do not reflect the effect of taxes a shareholder would pay on Fund distributions or on the redemption of Fund shares. Historical performance attributed to the Institutional and Adviser Share Classes prior to their inception dates is based on the performance of the Retail Share Class. No adjustment has been made to reflect class-specific distribution or servicing fees. Returns may reflect the effect of voluntary fee waivers or expense reimbursements over the period shown. Without these waivers, performance would have been lower.
The performance data shown represents past performance, which does not guarantee future results. The investment return and principal value of an investment will fluctuate so that an investor’s shares, when redeemed, may be worth more or less than their original cost. Current performance may be lower or higher than the performance data quoted. For current month-end performance data, please visit our website at www.meederfunds.com.
| Total Net Assets | $174,590,060 |
| # of Portfolio Holdings | 150 |
| Portfolio Turnover Rate | 87% |
| Advisory Fees and Waivers | 503,423 |
Average Annual Total Returns
| . | 1 Year | 5 Year | Since Inception |
|---|
| Adviser Class (Inception Date: 6/30/15) | 13.26% | 5.25% | 5.90% |
| Bloomberg U.S. Aggregate Bond Index | 2.63% | | 1.29% |
| Morningstar Moderately Conservative Target Risk Index | 8.10% | 4.17% | 4.78% |
What did the Fund invest in?
| Fidelity Total Bond Fund - Class Z | 12.3% |
| Baird Core Plus Bond Fund - Class I | 11.8% |
| Frost Total Return Bond Fund - Class I | 6.6% |
| Dodge & Cox Income Fund - Class I | 3.9% |
| Berkshire Hathaway Inc | 3.8% |
| Microsoft Corp | 3.6% |
| Fidelity Advisor High Income Advantage Fund - Class Z | 3.6% |
| iShares 20+ Year Treasury Bond ETF | 3.6% |
| BrandywineGLOBAL High Yield Fund - Class I | 3.6% |
| NVIDIA Corp | 2.6% |
| As a percentage of total net assets. Holdings exclude short-term investments and derivatives. |
| Value | Value |
|---|
| Utilities | 0.3%Footnote Reference |
| Materials | 0.5%Footnote Reference |
| Consumer Staples | 2.6%Footnote Reference |
| Energy | 2.7%Footnote Reference |
| Industrials | 8.4%Footnote Reference |
| Communication Services | 8.9%Footnote Reference |
| Consumer Discretionary | 13.0%Footnote Reference |
| Financials | 14.6%Footnote Reference |
| Health Care | 14.8%Footnote Reference |
| Information Technology | 34.2%Footnote Reference |
| Footnote | Description |
Footnote | As a percentage of total common stocks. Concentrations are subject to change. |
| Value | Value |
|---|
| Common Stocks (United States) | 38.1%Footnote Reference |
| Registered Investment Companies | 48.9%Footnote Reference |
| Money Market Registered Investment Companies | 12.2%Footnote Reference |
| Assets/Other Liabilities (Net) | 0.8% |
| Footnote | Description |
Footnote | As a percentage of total net assets. The Fund has invested in stock index futures contracts in order to equitize cash balances it holds in a proprietary money market fund. |
Availability of Additional Information
For additional information about the Fund, including its prospectus, financial information, holdings, proxy voting information and other important materials, scan the QR code or visit www.meederinvestment.com/meeder-funds-resources.
To reduce fund expenses, only one copy of most shareholder documents are delivered to shareholders with multiple accounts at the same address. If you wish to receive copies of this document for each account, please contact the Meeder Funds at 866.633.3371 or contact your financial intermediary.
Semi-Annual Shareholder Report
June 30, 2024
Semi-Annual Shareholder Report
June 30, 2024
This semi-annual shareholder report contains important information about the Muirfield Fund for the period of December 31, 2023, to 6/30/2024, as well as certain changes to the Fund. You can find additional information about the Fund at meederinvestment.com/mutual-funds . You can also request this information by contacting us at 866.633.3371 .
What were the Fund's costs for the period?
(based on a hypothetical $10,000 investment)
| Class Name | Cost of $10K Investment | Cost Paid as % of $10K Investment |
|---|
| Adviser Class | $44.58 | 0.84% |
Total Return Based on a $10,000 Investment
| Adviser Class | Russell 3000 Index | Morningstar Moderate Target Risk Index |
|---|
| Jun-14 | 10,000 | 10,000 | 10,000 |
| Jul-14 | 9,960 | 9,803 | 9,861 |
| Aug-14 | 10,337 | 10,214 | 10,063 |
| Sep-14 | 10,070 | 10,001 | 9,801 |
| Oct-14 | 10,236 | 10,276 | 9,909 |
| Nov-14 | 10,512 | 10,525 | 10,002 |
| Dec-14 | 10,516 | 10,525 | 9,915 |
| Jan-15 | 10,217 | 10,232 | 9,841 |
| Feb-15 | 10,756 | 10,825 | 10,129 |
| Mar-15 | 10,621 | 10,715 | 10,051 |
| Apr-15 | 10,606 | 10,763 | 10,184 |
| May-15 | 10,726 | 10,912 | 10,176 |
| Jun-15 | 10,516 | 10,729 | 10,030 |
| Jul-15 | 10,621 | 10,909 | 10,054 |
| Aug-15 | 10,022 | 10,250 | 9,694 |
| Sep-15 | 9,767 | 9,952 | 9,515 |
| Oct-15 | 10,127 | 10,738 | 9,916 |
| Nov-15 | 10,127 | 10,797 | 9,874 |
| Dec-15 | 9,938 | 10,576 | 9,738 |
| Jan-16 | 9,446 | 9,979 | 9,429 |
| Feb-16 | 9,400 | 9,976 | 9,474 |
| Mar-16 | 9,830 | 10,678 | 9,947 |
| Apr-16 | 9,815 | 10,744 | 10,072 |
| May-16 | 9,938 | 10,936 | 10,101 |
| Jun-16 | 9,922 | 10,959 | 10,186 |
| Jul-16 | 10,276 | 11,394 | 10,470 |
| Aug-16 | 10,291 | 11,423 | 10,492 |
| Sep-16 | 10,307 | 11,441 | 10,532 |
| Oct-16 | 10,050 | 11,193 | 10,378 |
| Nov-16 | 10,405 | 11,694 | 10,435 |
| Dec-16 | 10,520 | 11,922 | 10,572 |
| Jan-17 | 10,675 | 12,147 | 10,743 |
| Feb-17 | 11,077 | 12,599 | 10,960 |
| Mar-17 | 11,077 | 12,607 | 11,015 |
| Apr-17 | 11,201 | 12,741 | 11,130 |
| May-17 | 11,340 | 12,871 | 11,258 |
| Jun-17 | 11,433 | 12,987 | 11,301 |
| Jul-17 | 11,681 | 13,232 | 11,494 |
| Aug-17 | 11,743 | 13,258 | 11,551 |
| Sep-17 | 11,976 | 13,581 | 11,685 |
| Oct-17 | 12,270 | 13,877 | 11,831 |
| Nov-17 | 12,549 | 14,299 | 11,991 |
| Dec-17 | 12,676 | 14,442 | 12,122 |
| Jan-18 | 13,346 | 15,203 | 12,451 |
| Feb-18 | 12,810 | 14,642 | 12,094 |
| Mar-18 | 12,559 | 14,349 | 12,016 |
| Apr-18 | 12,643 | 14,403 | 12,029 |
| May-18 | 12,844 | 14,810 | 12,102 |
| Jun-18 | 12,793 | 14,907 | 12,084 |
| Jul-18 | 13,162 | 15,401 | 12,294 |
| Aug-18 | 13,581 | 15,942 | 12,402 |
| Sep-18 | 13,539 | 15,968 | 12,389 |
| Oct-18 | 12,515 | 14,793 | 11,805 |
| Nov-18 | 12,616 | 15,089 | 11,970 |
| Dec-18 | 12,246 | 13,685 | 11,545 |
| Jan-19 | 12,416 | 14,859 | 12,179 |
| Feb-19 | 12,586 | 15,382 | 12,390 |
| Mar-19 | 12,671 | 15,606 | 12,547 |
| Apr-19 | 12,977 | 16,230 | 12,789 |
| May-19 | 12,178 | 15,179 | 12,407 |
| Jun-19 | 12,918 | 16,246 | 12,940 |
| Jul-19 | 13,054 | 16,487 | 12,981 |
| Aug-19 | 12,764 | 16,151 | 12,870 |
| Sep-19 | 12,986 | 16,434 | 13,059 |
| Oct-19 | 13,191 | 16,788 | 13,275 |
| Nov-19 | 13,550 | 17,426 | 13,459 |
| Dec-19 | 13,937 | 17,929 | 13,742 |
| Jan-20 | 13,727 | 17,910 | 13,706 |
| Feb-20 | 12,695 | 16,444 | 13,098 |
| Mar-20 | 11,401 | 14,182 | 11,903 |
| Apr-20 | 11,926 | 16,061 | 12,751 |
| May-20 | 12,188 | 16,919 | 13,159 |
| Jun-20 | 12,276 | 17,306 | 13,419 |
| Jul-20 | 12,750 | 18,289 | 13,896 |
| Aug-20 | 13,558 | 19,614 | 14,312 |
| Sep-20 | 13,137 | 18,900 | 14,063 |
| Oct-20 | 12,731 | 18,492 | 13,875 |
| Nov-20 | 13,967 | 20,741 | 15,043 |
| Dec-20 | 14,588 | 21,675 | 15,504 |
| Jan-21 | 14,588 | 21,578 | 15,409 |
| Feb-21 | 14,977 | 22,253 | 15,596 |
| Mar-21 | 15,542 | 23,050 | 15,840 |
| Apr-21 | 16,231 | 24,238 | 16,296 |
| May-21 | 16,407 | 24,349 | 16,521 |
| Jun-21 | 16,637 | 24,950 | 16,629 |
| Jul-21 | 16,796 | 25,371 | 16,748 |
| Aug-21 | 17,202 | 26,095 | 16,967 |
| Sep-21 | 16,571 | 24,924 | 16,517 |
| Oct-21 | 17,335 | 26,610 | 16,924 |
| Nov-21 | 17,086 | 26,205 | 16,617 |
| Dec-21 | 17,595 | 27,236 | 17,084 |
| Jan-22 | 16,883 | 25,634 | 16,439 |
| Feb-22 | 16,682 | 24,988 | 16,187 |
| Mar-22 | 16,755 | 25,799 | 16,197 |
| Apr-22 | 15,859 | 23,484 | 15,250 |
| May-22 | 15,914 | 23,452 | 15,294 |
| Jun-22 | 15,311 | 21,490 | 14,361 |
| Jul-22 | 15,786 | 23,506 | 15,096 |
| Aug-22 | 15,421 | 22,629 | 14,636 |
| Sep-22 | 14,891 | 20,531 | 13,511 |
| Oct-22 | 15,458 | 22,214 | 13,963 |
| Nov-22 | 16,029 | 23,374 | 14,876 |
| Dec-22 | 15,685 | 22,005 | 14,559 |
| Jan-23 | 16,211 | 23,521 | 15,358 |
| Feb-23 | 15,836 | 22,971 | 14,924 |
| Mar-23 | 16,061 | 23,585 | 15,189 |
| Apr-23 | 16,286 | 23,837 | 15,328 |
| May-23 | 16,155 | 23,929 | 15,059 |
| Jun-23 | 16,982 | 25,563 | 15,566 |
| Jul-23 | 17,473 | 26,480 | 15,938 |
| Aug-23 | 17,171 | 25,968 | 15,584 |
| Sep-23 | 16,510 | 24,731 | 15,055 |
| Oct-23 | 16,017 | 24,076 | 14,625 |
| Nov-23 | 17,022 | 26,321 | 15,703 |
| Dec-23 | 17,856 | 27,717 | 16,485 |
| Jan-24 | 18,089 | 28,024 | 16,464 |
| Feb-24 | 19,038 | 29,541 | 16,731 |
| Mar-24 | 19,812 | 30,494 | 17,130 |
| Apr-24 | 18,900 | 29,152 | 16,592 |
| May-24 | 19,948 | 30,530 | 17,030 |
| Jun-24 | 20,259 | 31,475 | 17,175 |
The Growth of $10,000 chart compares the performance of the Fund over the period shown with dividends and capital gains reinvested to the Fund’s benchmark. Benchmark indices are unmanaged and do not reflect the deduction of expenses associated with a mutual fund, such as investment management and accounting fees.
Investment performance assumes reinvestment of all dividend and capital gain distributions. The results do not reflect the effect of taxes a shareholder would pay on Fund distributions or on the redemption of Fund shares. Historical performance attributed to the Institutional and Adviser Share Classes prior to their inception dates is based on the performance of the Retail Share Class. No adjustment has been made to reflect class-specific distribution or servicing fees. Returns may reflect the effect of voluntary fee waivers or expense reimbursements over the period shown. Without these waivers, performance would have been lower.
The performance data shown represents past performance, which does not guarantee future results. The investment return and principal value of an investment will fluctuate so that an investor’s shares, when redeemed, may be worth more or less than their original cost. Current performance may be lower or higher than the performance data quoted. For current month-end performance data, please visit our website at www.meederfunds.com.
| Total Net Assets | $868,805,924 |
| # of Portfolio Holdings | 161 |
| Portfolio Turnover Rate | 150% |
| Advisory Fees and Waivers | 2,543,674 |
Average Annual Total Returns
| . | 1 Year | 5 Year | 10 Year |
|---|
| Adviser Class | 19.30% | 9.42% | 7.32% |
| Russell 3000 Index | 23.13% | 14.14% | 12.15% |
| Morningstar Moderate Target Risk Index | 10.34% | 5.83% | 5.56% |
What did the Fund invest in?
| Berkshire Hathaway Inc | 7.2% |
| Microsoft Corp | 5.9% |
| NVIDIA Corp | 4.6% |
| Amazon.com Inc | 4.0% |
| Alphabet Inc | 3.6% |
| Apple Inc | 2.6% |
| Texas Instruments Inc | 2.6% |
| Meta Platforms Inc | 2.4% |
| Johnson & Johnson | 1.9% |
| Merck & Co Inc | 1.9% |
| As a percentage of total net assets. Holdings exclude short-term investments and derivatives. |
| Value | Value |
|---|
| Utilities | 0.2%Footnote Reference |
| Materials | 0.4%Footnote Reference |
| Energy | 1.4%Footnote Reference |
| Consumer Staples | 2.4%Footnote Reference |
| Industrials | 6.7%Footnote Reference |
| Communication Services | 9.2%Footnote Reference |
| Consumer Discretionary | 14.0%Footnote Reference |
| Health Care | 15.6%Footnote Reference |
| Financials | 15.7%Footnote Reference |
| Information Technology | 34.4%Footnote Reference |
| Footnote | Description |
Footnote | As a percentage of total common stocks. Concentrations are subject to change. |
| Value | Value |
|---|
| Common Stocks (United States) | 72.2%Footnote Reference |
| Money Market Registered Investment Companies | 26.3%Footnote Reference |
| Assets/Other Liabilities (Net) | 1.5% |
| Footnote | Description |
Footnote | As a percentage of total net assets. The Fund has invested in stock index futures contracts in order to equitize cash balances it holds in a proprietary money market fund. |
Availability of Additional Information
For additional information about the Fund, including its prospectus, financial information, holdings, proxy voting information and other important materials, scan the QR code or visit www.meederinvestment.com/meeder-funds-resources.
To reduce fund expenses, only one copy of most shareholder documents are delivered to shareholders with multiple accounts at the same address. If you wish to receive copies of this document for each account, please contact the Meeder Funds at 866.633.3371 or contact your financial intermediary.
Semi-Annual Shareholder Report
June 30, 2024
Institutional Class GBPIX
Semi-Annual Shareholder Report
June 30, 2024
This semi-annual shareholder report contains important information about the Global Allocation Fund for the period of December 31, 2023, to 6/30/2024, as well as certain changes to the Fund. You can find additional information about the Fund at meederinvestment.com/mutual-funds . You can also request this information by contacting us at 866.633.3371 .
What were the Fund's costs for the period?
(based on a hypothetical $10,000 investment)
| Class Name | Cost of $10K Investment | Cost Paid as % of $10K Investment |
|---|
| Institutional Class | $74.98 | 1.45% |
Total Return Based on a $10,000 Investment
| Institutional Class | Russell 3000 Index | Morningstar Global Allocation Index |
|---|
| Jun-14 | 10,000 | 10,000 | 10,000 |
| Jul-14 | 9,757 | 9,803 | 9,872 |
| Aug-14 | 10,073 | 10,214 | 10,046 |
| Sep-14 | 9,655 | 10,001 | 9,734 |
| Oct-14 | 9,793 | 10,276 | 9,803 |
| Nov-14 | 9,834 | 10,525 | 9,890 |
| Dec-14 | 9,731 | 10,525 | 9,778 |
| Jan-15 | 9,590 | 10,232 | 9,722 |
| Feb-15 | 10,049 | 10,825 | 10,021 |
| Mar-15 | 9,956 | 10,715 | 9,947 |
| Apr-15 | 10,012 | 10,763 | 10,113 |
| May-15 | 10,031 | 10,912 | 10,073 |
| Jun-15 | 9,806 | 10,729 | 9,918 |
| Jul-15 | 9,806 | 10,909 | 9,951 |
| Aug-15 | 9,131 | 10,250 | 9,561 |
| Sep-15 | 8,793 | 9,952 | 9,369 |
| Oct-15 | 9,309 | 10,738 | 9,775 |
| Nov-15 | 9,309 | 10,797 | 9,688 |
| Dec-15 | 9,029 | 10,576 | 9,584 |
| Jan-16 | 8,439 | 9,979 | 9,263 |
| Feb-16 | 8,323 | 9,976 | 9,324 |
| Mar-16 | 8,951 | 10,678 | 9,819 |
| Apr-16 | 8,951 | 10,744 | 9,968 |
| May-16 | 8,942 | 10,936 | 9,939 |
| Jun-16 | 8,922 | 10,959 | 10,020 |
| Jul-16 | 9,272 | 11,394 | 10,321 |
| Aug-16 | 9,301 | 11,423 | 10,337 |
| Sep-16 | 9,398 | 11,441 | 10,398 |
| Oct-16 | 9,145 | 11,193 | 10,193 |
| Nov-16 | 9,213 | 11,694 | 10,123 |
| Dec-16 | 9,359 | 11,922 | 10,255 |
| Jan-17 | 9,603 | 12,147 | 10,462 |
| Feb-17 | 9,818 | 12,599 | 10,668 |
| Mar-17 | 9,926 | 12,607 | 10,759 |
| Apr-17 | 10,062 | 12,741 | 10,912 |
| May-17 | 10,209 | 12,871 | 11,106 |
| Jun-17 | 10,268 | 12,987 | 11,139 |
| Jul-17 | 10,600 | 13,232 | 11,369 |
| Aug-17 | 10,698 | 13,258 | 11,434 |
| Sep-17 | 10,923 | 13,581 | 11,555 |
| Oct-17 | 11,217 | 13,877 | 11,690 |
| Nov-17 | 11,374 | 14,299 | 11,872 |
| Dec-17 | 11,518 | 14,442 | 12,005 |
| Jan-18 | 12,116 | 15,203 | 12,424 |
| Feb-18 | 11,677 | 14,642 | 12,072 |
| Mar-18 | 11,518 | 14,349 | 11,984 |
| Apr-18 | 11,578 | 14,403 | 11,991 |
| May-18 | 11,598 | 14,810 | 12,009 |
| Jun-18 | 11,458 | 14,907 | 11,965 |
| Jul-18 | 11,749 | 15,401 | 12,171 |
| Aug-18 | 11,859 | 15,942 | 12,274 |
| Sep-18 | 11,869 | 15,968 | 12,259 |
| Oct-18 | 10,967 | 14,793 | 11,646 |
| Nov-18 | 11,048 | 15,089 | 11,781 |
| Dec-18 | 10,761 | 13,685 | 11,343 |
| Jan-19 | 10,929 | 14,859 | 11,936 |
| Feb-19 | 11,066 | 15,382 | 12,108 |
| Mar-19 | 11,150 | 15,606 | 12,258 |
| Apr-19 | 11,382 | 16,230 | 12,491 |
| May-19 | 10,781 | 15,179 | 12,132 |
| Jun-19 | 11,413 | 16,246 | 12,678 |
| Jul-19 | 11,381 | 16,487 | 12,699 |
| Aug-19 | 11,160 | 16,151 | 12,622 |
| Sep-19 | 11,392 | 16,434 | 12,738 |
| Oct-19 | 11,646 | 16,788 | 12,980 |
| Nov-19 | 11,868 | 17,426 | 13,144 |
| Dec-19 | 12,231 | 17,929 | 13,445 |
| Jan-20 | 11,961 | 17,910 | 13,427 |
| Feb-20 | 11,143 | 16,444 | 12,806 |
| Mar-20 | 9,862 | 14,182 | 11,616 |
| Apr-20 | 10,228 | 16,061 | 12,412 |
| May-20 | 10,486 | 16,919 | 12,797 |
| Jun-20 | 10,605 | 17,306 | 13,078 |
| Jul-20 | 10,960 | 18,289 | 13,629 |
| Aug-20 | 11,552 | 19,614 | 14,116 |
| Sep-20 | 11,263 | 18,900 | 13,831 |
| Oct-20 | 10,970 | 18,492 | 13,628 |
| Nov-20 | 12,110 | 20,741 | 14,763 |
| Dec-20 | 12,650 | 21,675 | 15,266 |
| Jan-21 | 12,639 | 21,578 | 15,169 |
| Feb-21 | 12,883 | 22,253 | 15,303 |
| Mar-21 | 13,206 | 23,050 | 15,482 |
| Apr-21 | 13,639 | 24,238 | 15,991 |
| May-21 | 13,906 | 24,349 | 16,188 |
| Jun-21 | 13,995 | 24,950 | 16,286 |
| Jul-21 | 14,028 | 25,371 | 16,410 |
| Aug-21 | 14,273 | 26,095 | 16,645 |
| Sep-21 | 13,784 | 24,924 | 16,134 |
| Oct-21 | 14,262 | 26,610 | 16,585 |
| Nov-21 | 13,906 | 26,205 | 16,303 |
| Dec-21 | 14,300 | 27,236 | 16,687 |
| Jan-22 | 13,806 | 25,634 | 16,008 |
| Feb-22 | 13,559 | 24,988 | 15,700 |
| Mar-22 | 13,510 | 25,799 | 15,716 |
| Apr-22 | 12,794 | 23,484 | 14,653 |
| May-22 | 12,831 | 23,452 | 14,672 |
| Jun-22 | 12,312 | 21,490 | 13,730 |
| Jul-22 | 12,633 | 23,506 | 14,445 |
| Aug-22 | 12,226 | 22,629 | 13,937 |
| Sep-22 | 11,423 | 20,531 | 12,839 |
| Oct-22 | 11,954 | 22,214 | 13,268 |
| Nov-22 | 12,832 | 23,374 | 14,148 |
| Dec-22 | 12,504 | 22,005 | 13,833 |
| Jan-23 | 13,238 | 23,521 | 14,603 |
| Feb-23 | 12,827 | 22,971 | 14,194 |
| Mar-23 | 13,151 | 23,585 | 14,577 |
| Apr-23 | 13,387 | 23,837 | 14,726 |
| May-23 | 13,089 | 23,929 | 14,530 |
| Jun-23 | 13,649 | 25,563 | 15,062 |
| Jul-23 | 14,038 | 26,480 | 15,429 |
| Aug-23 | 13,649 | 25,968 | 15,096 |
| Sep-23 | 13,135 | 24,731 | 14,553 |
| Oct-23 | 12,745 | 24,076 | 14,187 |
| Nov-23 | 13,740 | 26,321 | 15,251 |
| Dec-23 | 14,489 | 27,717 | 15,971 |
| Jan-24 | 14,438 | 28,024 | 15,949 |
| Feb-24 | 14,997 | 29,541 | 16,288 |
| Mar-24 | 15,480 | 30,494 | 16,653 |
| Apr-24 | 14,906 | 29,152 | 16,152 |
| May-24 | 15,569 | 30,530 | 16,652 |
| Jun-24 | 15,646 | 31,475 | 16,876 |
The Growth of $10,000 chart compares the performance of the Fund over the period shown with dividends and capital gains reinvested to the Fund’s benchmark. Benchmark indices are unmanaged and do not reflect the deduction of expenses associated with a mutual fund, such as investment management and accounting fees.
Investment performance assumes reinvestment of all dividend and capital gain distributions. The results do not reflect the effect of taxes a shareholder would pay on Fund distributions or on the redemption of Fund shares. Historical performance attributed to the Institutional and Adviser Share Classes prior to their inception dates is based on the performance of the Retail Share Class. No adjustment has been made to reflect class-specific distribution or servicing fees. Returns may reflect the effect of voluntary fee waivers or expense reimbursements over the period shown. Without these waivers, performance would have been lower.
The performance data shown represents past performance, which does not guarantee future results. The investment return and principal value of an investment will fluctuate so that an investor’s shares, when redeemed, may be worth more or less than their original cost. Current performance may be lower or higher than the performance data quoted. For current month-end performance data, please visit our website at www.meederfunds.com.
| Total Net Assets | $36,167,888 |
| # of Portfolio Holdings | 146 |
| Portfolio Turnover Rate | 100% |
| Advisory Fees and Waivers | 128,889 |
Average Annual Total Returns
| . | 1 Year | 5 Year | 10 Year |
|---|
| Institutional Class | 14.63% | 6.51% | 4.58% |
| Russell 3000 Index | 23.13% | 14.14% | 12.15% |
| Morningstar Global Allocation Index | 12.04% | 5.89% | 5.37% |
What did the Fund invest in?
| iShares Core MSCI EAFE ETF | 8.5% |
| Berkshire Hathaway Inc | 3.0% |
| Microsoft Corp | 2.9% |
| Fidelity Total Bond Fund - Class Z | 2.5% |
| Baird Core Plus Bond Fund - Class I | 2.2% |
| NVIDIA Corp | 2.1% |
| iShares Core MSCI Emerging Markets ETF | 1.8% |
| Alphabet Inc | 1.7% |
| Amazon.com Inc | 1.6% |
| Frost Total Return Bond Fund - Class I | 1.3% |
| As a percentage of total net assets. Holdings exclude short-term investments and derivatives. |
| Value | Value |
|---|
| Utilities | 0.3%Footnote Reference |
| Materials | 0.4%Footnote Reference |
| Energy | 2.3%Footnote Reference |
| Consumer Staples | 2.5%Footnote Reference |
| Industrials | 8.7%Footnote Reference |
| Communication Services | 9.1%Footnote Reference |
| Consumer Discretionary | 13.1%Footnote Reference |
| Health Care | 13.7%Footnote Reference |
| Financials | 14.9%Footnote Reference |
| Information Technology | 35.0%Footnote Reference |
| Footnote | Description |
Footnote | As a percentage of total common stocks. Concentrations are subject to change. |
| Value | Value |
|---|
| Common Stocks (United States) | 30.7%Footnote Reference |
| Registered Investment Companies | 20.0%Footnote Reference |
| Money Market Registered Investment Companies | 46.7%Footnote Reference |
| Assets/Other Liabilities (Net) | 2.6% |
| Footnote | Description |
Footnote | As a percentage of total net assets. The Fund has invested in stock index futures contracts in order to equitize cash balances it holds in a proprietary money market fund. |
Availability of Additional Information
For additional information about the Fund, including its prospectus, financial information, holdings, proxy voting information and other important materials, scan the QR code or visit www.meederinvestment.com/meeder-funds-resources.
To reduce fund expenses, only one copy of most shareholder documents are delivered to shareholders with multiple accounts at the same address. If you wish to receive copies of this document for each account, please contact the Meeder Funds at 866.633.3371 or contact your financial intermediary.
Institutional Class GBPIX
Semi-Annual Shareholder Report
June 30, 2024
Institutional Class DVOIX
Semi-Annual Shareholder Report
June 30, 2024
This semi-annual shareholder report contains important information about the Moderate Allocation Fund for the period of December 31, 2023, to 6/30/2024, as well as certain changes to the Fund. You can find additional information about the Fund at meederinvestment.com/mutual-funds . You can also request this information by contacting us at 866.633.3371 .
What were the Fund's costs for the period?
(based on a hypothetical $10,000 investment)
| Class Name | Cost of $10K Investment | Cost Paid as % of $10K Investment |
|---|
| Institutional Class | $52.87 | 1.03% |
Total Return Based on a $10,000 Investment
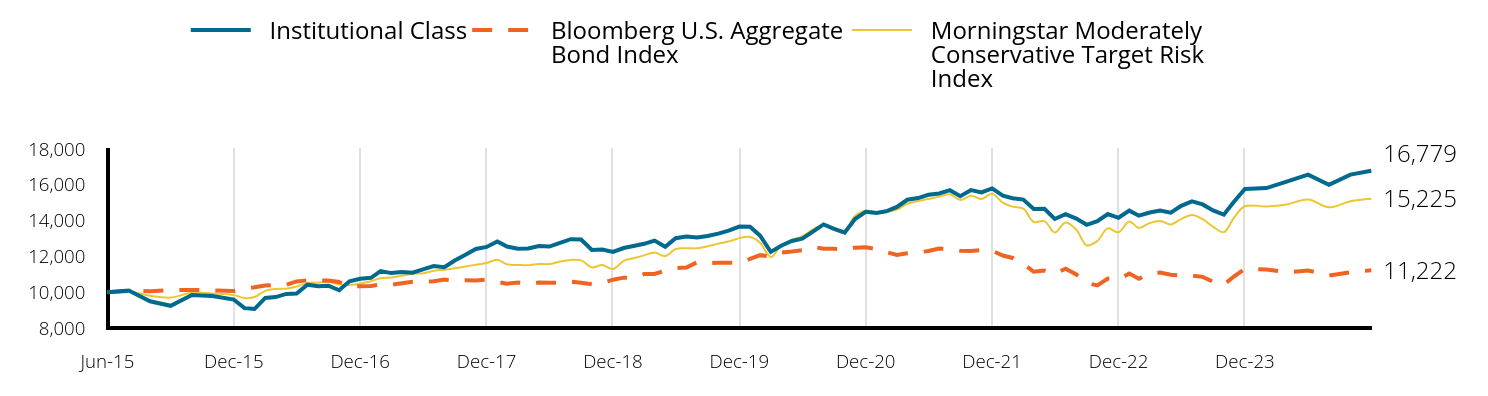
| Institutional Class | Bloomberg U.S. Aggregate Bond Index | Morningstar Moderately Conservative Target Risk Index |
|---|
| Jun-15 | 10,000 | 10,000 | 10,000 |
| Jul-15 | 10,090 | 10,070 | 10,037 |
| Aug-15 | 9,490 | 10,055 | 9,801 |
| Sep-15 | 9,240 | 10,123 | 9,700 |
| Oct-15 | 9,847 | 10,125 | 9,973 |
| Nov-15 | 9,787 | 10,098 | 9,925 |
| Dec-15 | 9,585 | 10,065 | 9,836 |
| Jan-16 | 9,111 | 10,204 | 9,669 |
| Feb-16 | 9,060 | 10,276 | 9,729 |
| Mar-16 | 9,677 | 10,371 | 10,076 |
| Apr-16 | 9,728 | 10,410 | 10,178 |
| May-16 | 9,905 | 10,413 | 10,195 |
| Jun-16 | 9,930 | 10,600 | 10,313 |
| Jul-16 | 10,420 | 10,667 | 10,520 |
| Aug-16 | 10,333 | 10,655 | 10,530 |
| Sep-16 | 10,364 | 10,649 | 10,566 |
| Oct-16 | 10,110 | 10,567 | 10,436 |
| Nov-16 | 10,607 | 10,317 | 10,396 |
| Dec-16 | 10,748 | 10,332 | 10,491 |
| Jan-17 | 10,804 | 10,352 | 10,615 |
| Feb-17 | 11,179 | 10,422 | 10,778 |
| Mar-17 | 11,066 | 10,416 | 10,816 |
| Apr-17 | 11,128 | 10,497 | 10,918 |
| May-17 | 11,092 | 10,577 | 11,032 |
| Jun-17 | 11,275 | 10,567 | 11,051 |
| Jul-17 | 11,463 | 10,612 | 11,192 |
| Aug-17 | 11,391 | 10,707 | 11,259 |
| Sep-17 | 11,772 | 10,656 | 11,336 |
| Oct-17 | 12,092 | 10,663 | 11,434 |
| Nov-17 | 12,412 | 10,649 | 11,533 |
| Dec-17 | 12,526 | 10,698 | 11,630 |
| Jan-18 | 12,827 | 10,575 | 11,812 |
| Feb-18 | 12,548 | 10,474 | 11,557 |
| Mar-18 | 12,430 | 10,542 | 11,523 |
| Apr-18 | 12,441 | 10,463 | 11,506 |
| May-18 | 12,580 | 10,538 | 11,576 |
| Jun-18 | 12,548 | 10,525 | 11,569 |
| Jul-18 | 12,753 | 10,527 | 11,710 |
| Aug-18 | 12,958 | 10,595 | 11,801 |
| Sep-18 | 12,942 | 10,527 | 11,779 |
| Oct-18 | 12,357 | 10,444 | 11,385 |
| Nov-18 | 12,379 | 10,506 | 11,512 |
| Dec-18 | 12,251 | 10,699 | 11,297 |
| Jan-19 | 12,465 | 10,813 | 11,751 |
| Feb-19 | 12,578 | 10,806 | 11,891 |
| Mar-19 | 12,702 | 11,014 | 12,056 |
| Apr-19 | 12,883 | 11,017 | 12,217 |
| May-19 | 12,532 | 11,212 | 12,022 |
| Jun-19 | 13,018 | 11,353 | 12,410 |
| Jul-19 | 13,109 | 11,378 | 12,451 |
| Aug-19 | 13,052 | 11,673 | 12,451 |
| Sep-19 | 13,143 | 11,611 | 12,561 |
| Oct-19 | 13,269 | 11,646 | 12,713 |
| Nov-19 | 13,440 | 11,640 | 12,831 |
| Dec-19 | 13,663 | 11,632 | 13,020 |
| Jan-20 | 13,651 | 11,855 | 13,081 |
| Feb-20 | 13,157 | 12,069 | 12,760 |
| Mar-20 | 12,249 | 11,998 | 11,958 |
| Apr-20 | 12,595 | 12,211 | 12,606 |
| May-20 | 12,860 | 12,268 | 12,916 |
| Jun-20 | 12,987 | 12,345 | 13,122 |
| Jul-20 | 13,380 | 12,530 | 13,507 |
| Aug-20 | 13,785 | 12,428 | 13,767 |
| Sep-20 | 13,542 | 12,422 | 13,595 |
| Oct-20 | 13,321 | 12,366 | 13,451 |
| Nov-20 | 14,087 | 12,488 | 14,255 |
| Dec-20 | 14,485 | 12,505 | 14,564 |
| Jan-21 | 14,427 | 12,415 | 14,469 |
| Feb-21 | 14,520 | 12,236 | 14,492 |
| Mar-21 | 14,765 | 12,083 | 14,610 |
| Apr-21 | 15,162 | 12,178 | 14,938 |
| May-21 | 15,255 | 12,218 | 15,096 |
| Jun-21 | 15,442 | 12,304 | 15,206 |
| Jul-21 | 15,512 | 12,442 | 15,336 |
| Aug-21 | 15,698 | 12,418 | 15,465 |
| Sep-21 | 15,360 | 12,310 | 15,142 |
| Oct-21 | 15,701 | 12,307 | 15,385 |
| Nov-21 | 15,572 | 12,344 | 15,210 |
| Dec-21 | 15,796 | 12,312 | 15,491 |
| Jan-22 | 15,385 | 12,047 | 14,996 |
| Feb-22 | 15,248 | 11,912 | 14,777 |
| Mar-22 | 15,173 | 11,581 | 14,662 |
| Apr-22 | 14,650 | 11,142 | 13,921 |
| May-22 | 14,662 | 11,214 | 13,970 |
| Jun-22 | 14,089 | 11,038 | 13,328 |
| Jul-22 | 14,352 | 11,307 | 13,895 |
| Aug-22 | 14,114 | 10,988 | 13,494 |
| Sep-22 | 13,764 | 10,513 | 12,619 |
| Oct-22 | 13,966 | 10,377 | 12,866 |
| Nov-22 | 14,364 | 10,759 | 13,564 |
| Dec-22 | 14,155 | 10,710 | 13,345 |
| Jan-23 | 14,553 | 11,040 | 13,950 |
| Feb-23 | 14,271 | 10,754 | 13,588 |
| Mar-23 | 14,450 | 11,027 | 13,865 |
| Apr-23 | 14,566 | 11,094 | 13,978 |
| May-23 | 14,437 | 10,973 | 13,783 |
| Jun-23 | 14,824 | 10,934 | 14,084 |
| Jul-23 | 15,071 | 10,927 | 14,310 |
| Aug-23 | 14,902 | 10,857 | 14,078 |
| Sep-23 | 14,564 | 10,581 | 13,657 |
| Oct-23 | 14,329 | 10,414 | 13,345 |
| Nov-23 | 15,061 | 10,886 | 14,173 |
| Dec-23 | 15,763 | 11,302 | 14,799 |
| Jan-24 | 15,815 | 11,271 | 14,790 |
| Feb-24 | 16,172 | 11,112 | 14,899 |
| Mar-24 | 16,567 | 11,215 | 15,171 |
| Apr-24 | 15,997 | 10,931 | 14,738 |
| May-24 | 16,567 | 11,117 | 15,084 |
| Jun-24 | 16,779 | 11,222 | 15,225 |
The Growth of $10,000 chart compares the performance of the Fund over the period shown with dividends and capital gains reinvested to the Fund’s benchmark. Benchmark indices are unmanaged and do not reflect the deduction of expenses associated with a mutual fund, such as investment management and accounting fees.
Investment performance assumes reinvestment of all dividend and capital gain distributions. The results do not reflect the effect of taxes a shareholder would pay on Fund distributions or on the redemption of Fund shares. Historical performance attributed to the Institutional and Adviser Share Classes prior to their inception dates is based on the performance of the Retail Share Class. No adjustment has been made to reflect class-specific distribution or servicing fees. Returns may reflect the effect of voluntary fee waivers or expense reimbursements over the period shown. Without these waivers, performance would have been lower.
The performance data shown represents past performance, which does not guarantee future results. The investment return and principal value of an investment will fluctuate so that an investor’s shares, when redeemed, may be worth more or less than their original cost. Current performance may be lower or higher than the performance data quoted. For current month-end performance data, please visit our website at www.meederfunds.com.
| Total Net Assets | $174,590,060 |
| # of Portfolio Holdings | 150 |
| Portfolio Turnover Rate | 87% |
| Advisory Fees and Waivers | 503,423 |
Average Annual Total Returns
| . | 1 Year | 5 Year | Since Inception |
|---|
| Institutional Class (Inception Date: 6/30/15) | 13.19% | 5.21% | 5.92% |
| Bloomberg U.S. Aggregate Bond Index | 2.63% | | 1.29% |
| Morningstar Moderately Conservative Target Risk Index | 8.10% | 4.17% | 4.78% |
What did the Fund invest in?
| Fidelity Total Bond Fund - Class Z | 12.3% |
| Baird Core Plus Bond Fund - Class I | 11.8% |
| Frost Total Return Bond Fund - Class I | 6.6% |
| Dodge & Cox Income Fund - Class I | 3.9% |
| Berkshire Hathaway Inc | 3.8% |
| Microsoft Corp | 3.6% |
| Fidelity Advisor High Income Advantage Fund - Class Z | 3.6% |
| iShares 20+ Year Treasury Bond ETF | 3.6% |
| BrandywineGLOBAL High Yield Fund - Class I | 3.6% |
| NVIDIA Corp | 2.6% |
| As a percentage of total net assets. Holdings exclude short-term investments and derivatives. |
| Value | Value |
|---|
| Utilities | 0.3%Footnote Reference |
| Materials | 0.5%Footnote Reference |
| Consumer Staples | 2.6%Footnote Reference |
| Energy | 2.7%Footnote Reference |
| Industrials | 8.4%Footnote Reference |
| Communication Services | 8.9%Footnote Reference |
| Consumer Discretionary | 13.0%Footnote Reference |
| Financials | 14.6%Footnote Reference |
| Health Care | 14.8%Footnote Reference |
| Information Technology | 34.2%Footnote Reference |
| Footnote | Description |
Footnote | As a percentage of total common stocks. Concentrations are subject to change. |
| Value | Value |
|---|
| Common Stocks (United States) | 38.1%Footnote Reference |
| Registered Investment Companies | 48.9%Footnote Reference |
| Money Market Registered Investment Companies | 12.2%Footnote Reference |
| Assets/Other Liabilities (Net) | 0.8% |
| Footnote | Description |
Footnote | As a percentage of total net assets. The Fund has invested in stock index futures contracts in order to equitize cash balances it holds in a proprietary money market fund. |
Availability of Additional Information
For additional information about the Fund, including its prospectus, financial information, holdings, proxy voting information and other important materials, scan the QR code or visit www.meederinvestment.com/meeder-funds-resources.
To reduce fund expenses, only one copy of most shareholder documents are delivered to shareholders with multiple accounts at the same address. If you wish to receive copies of this document for each account, please contact the Meeder Funds at 866.633.3371 or contact your financial intermediary.
Institutional Class DVOIX
Semi-Annual Shareholder Report
June 30, 2024
Semi-Annual Shareholder Report
June 30, 2024
This semi-annual shareholder report contains important information about the Sector Rotation Fund for the period of December 31, 2023, to 6/30/2024, as well as certain changes to the Fund. You can find additional information about the Fund at meederinvestment.com/mutual-funds . You can also request this information by contacting us at 866.633.3371 .
What were the Fund's costs for the period?
(based on a hypothetical $10,000 investment)
| Class Name | Cost of $10K Investment | Cost Paid as % of $10K Investment |
|---|
| Adviser Class | $72.71 | 1.41% |
Total Return Based on a $10,000 Investment
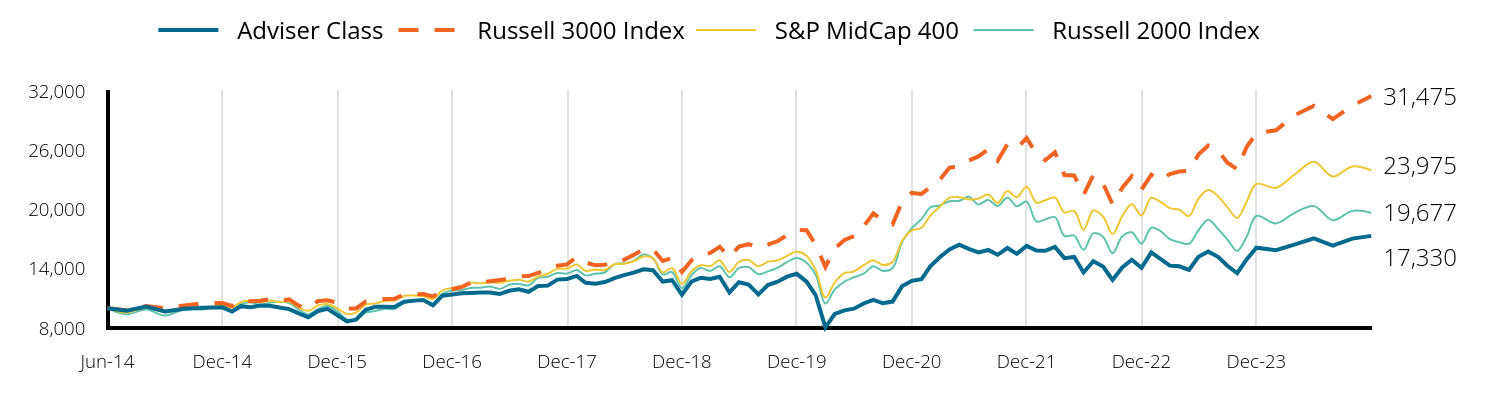
| Adviser Class | Russell 3000 Index | S&P MidCap 400 | Russell 2000 Index |
|---|
| Jun-14 | 10,000 | 10,000 | 10,000 | 10,000 |
| Jul-14 | 9,750 | 9,803 | 9,573 | 9,395 |
| Aug-14 | 10,182 | 10,214 | 10,059 | 9,861 |
| Sep-14 | 9,675 | 10,001 | 9,602 | 9,264 |
| Oct-14 | 9,945 | 10,276 | 9,944 | 9,875 |
| Nov-14 | 10,054 | 10,525 | 10,128 | 9,884 |
| Dec-14 | 10,095 | 10,525 | 10,211 | 10,165 |
| Jan-15 | 9,673 | 10,232 | 10,097 | 9,838 |
| Feb-15 | 10,210 | 10,825 | 10,614 | 10,422 |
| Mar-15 | 10,109 | 10,715 | 10,754 | 10,604 |
| Apr-15 | 10,267 | 10,763 | 10,594 | 10,333 |
| May-15 | 10,244 | 10,912 | 10,782 | 10,569 |
| Jun-15 | 10,069 | 10,729 | 10,640 | 10,649 |
| Jul-15 | 9,911 | 10,909 | 10,654 | 10,525 |
| Aug-15 | 9,474 | 10,250 | 10,060 | 9,863 |
| Sep-15 | 9,083 | 9,952 | 9,736 | 9,379 |
| Oct-15 | 9,722 | 10,738 | 10,284 | 9,908 |
| Nov-15 | 9,938 | 10,797 | 10,423 | 10,230 |
| Dec-15 | 9,320 | 10,576 | 9,989 | 9,717 |
| Jan-16 | 8,667 | 9,979 | 9,421 | 8,862 |
| Feb-16 | 8,835 | 9,976 | 9,554 | 8,862 |
| Mar-16 | 9,856 | 10,678 | 10,367 | 9,569 |
| Apr-16 | 10,150 | 10,744 | 10,494 | 9,719 |
| May-16 | 10,144 | 10,936 | 10,737 | 9,938 |
| Jun-16 | 10,124 | 10,959 | 10,781 | 9,932 |
| Jul-16 | 10,658 | 11,394 | 11,244 | 10,525 |
| Aug-16 | 10,772 | 11,423 | 11,300 | 10,711 |
| Sep-16 | 10,832 | 11,441 | 11,228 | 10,830 |
| Oct-16 | 10,311 | 11,193 | 10,928 | 10,315 |
| Nov-16 | 11,273 | 11,694 | 11,802 | 11,466 |
| Dec-16 | 11,392 | 11,922 | 12,061 | 11,787 |
| Jan-17 | 11,511 | 12,147 | 12,263 | 11,833 |
| Feb-17 | 11,549 | 12,599 | 12,585 | 12,062 |
| Mar-17 | 11,600 | 12,607 | 12,536 | 12,078 |
| Apr-17 | 11,604 | 12,741 | 12,641 | 12,210 |
| May-17 | 11,440 | 12,871 | 12,579 | 11,962 |
| Jun-17 | 11,768 | 12,987 | 12,783 | 12,375 |
| Jul-17 | 11,925 | 13,232 | 12,896 | 12,467 |
| Aug-17 | 11,672 | 13,258 | 12,698 | 12,308 |
| Sep-17 | 12,243 | 13,581 | 13,195 | 13,077 |
| Oct-17 | 12,290 | 13,877 | 13,493 | 13,188 |
| Nov-17 | 12,899 | 14,299 | 13,989 | 13,568 |
| Dec-17 | 12,951 | 14,442 | 14,020 | 13,513 |
| Jan-18 | 13,278 | 15,203 | 14,423 | 13,867 |
| Feb-18 | 12,584 | 14,642 | 13,784 | 13,330 |
| Mar-18 | 12,493 | 14,349 | 13,912 | 13,502 |
| Apr-18 | 12,655 | 14,403 | 13,876 | 13,619 |
| May-18 | 13,056 | 14,810 | 14,448 | 14,445 |
| Jun-18 | 13,352 | 14,907 | 14,509 | 14,549 |
| Jul-18 | 13,613 | 15,401 | 14,765 | 14,803 |
| Aug-18 | 13,947 | 15,942 | 15,237 | 15,441 |
| Sep-18 | 13,859 | 15,968 | 15,070 | 15,069 |
| Oct-18 | 12,704 | 14,793 | 13,631 | 13,433 |
| Nov-18 | 12,845 | 15,089 | 14,057 | 13,646 |
| Dec-18 | 11,367 | 13,685 | 12,466 | 12,025 |
| Jan-19 | 12,716 | 14,859 | 13,770 | 13,378 |
| Feb-19 | 13,079 | 15,382 | 14,354 | 14,073 |
| Mar-19 | 12,956 | 15,606 | 14,272 | 13,779 |
| Apr-19 | 13,188 | 16,230 | 14,846 | 14,247 |
| May-19 | 11,600 | 15,179 | 13,663 | 13,139 |
| Jun-19 | 12,639 | 16,246 | 14,707 | 14,067 |
| Jul-19 | 12,402 | 16,487 | 14,882 | 14,148 |
| Aug-19 | 11,408 | 16,151 | 14,257 | 13,450 |
| Sep-19 | 12,343 | 16,434 | 14,694 | 13,730 |
| Oct-19 | 12,689 | 16,788 | 14,860 | 14,091 |
| Nov-19 | 13,202 | 17,426 | 15,302 | 14,671 |
| Dec-19 | 13,485 | 17,929 | 15,732 | 15,094 |
| Jan-20 | 12,687 | 17,910 | 15,321 | 14,610 |
| Feb-20 | 11,339 | 16,444 | 13,867 | 13,380 |
| Mar-20 | 8,057 | 14,182 | 11,059 | 10,473 |
| Apr-20 | 9,426 | 16,061 | 12,628 | 11,912 |
| May-20 | 9,785 | 16,919 | 13,552 | 12,687 |
| Jun-20 | 9,955 | 17,306 | 13,722 | 13,135 |
| Jul-20 | 10,482 | 18,289 | 14,355 | 13,499 |
| Aug-20 | 10,853 | 19,614 | 14,859 | 14,260 |
| Sep-20 | 10,500 | 18,900 | 14,377 | 13,783 |
| Oct-20 | 10,675 | 18,492 | 14,689 | 14,072 |
| Nov-20 | 12,219 | 20,741 | 16,786 | 16,666 |
| Dec-20 | 12,776 | 21,675 | 17,881 | 18,107 |
| Jan-21 | 12,934 | 21,578 | 18,150 | 19,019 |
| Feb-21 | 14,242 | 22,253 | 19,384 | 20,204 |
| Mar-21 | 15,192 | 23,050 | 20,289 | 20,407 |
| Apr-21 | 15,964 | 24,238 | 21,203 | 20,835 |
| May-21 | 16,429 | 24,349 | 21,245 | 20,878 |
| Jun-21 | 16,011 | 24,950 | 21,027 | 21,283 |
| Jul-21 | 15,657 | 25,371 | 21,100 | 20,514 |
| Aug-21 | 15,900 | 26,095 | 21,511 | 20,973 |
| Sep-21 | 15,414 | 24,924 | 20,657 | 20,355 |
| Oct-21 | 16,100 | 26,610 | 21,872 | 21,221 |
| Nov-21 | 15,507 | 26,205 | 21,230 | 20,336 |
| Dec-21 | 16,313 | 27,236 | 22,308 | 20,791 |
| Jan-22 | 15,838 | 25,634 | 20,700 | 18,789 |
| Feb-22 | 15,821 | 24,988 | 20,930 | 18,990 |
| Mar-22 | 16,213 | 25,799 | 21,220 | 19,226 |
| Apr-22 | 15,075 | 23,484 | 19,712 | 17,321 |
| May-22 | 15,200 | 23,452 | 19,860 | 17,347 |
| Jun-22 | 13,625 | 21,490 | 17,949 | 15,920 |
| Jul-22 | 14,763 | 23,506 | 19,897 | 17,582 |
| Aug-22 | 14,221 | 22,629 | 19,279 | 17,222 |
| Sep-22 | 12,870 | 20,531 | 17,507 | 15,572 |
| Oct-22 | 14,128 | 22,214 | 19,348 | 17,286 |
| Nov-22 | 14,911 | 23,374 | 20,532 | 17,690 |
| Dec-22 | 14,103 | 22,005 | 19,395 | 16,542 |
| Jan-23 | 15,651 | 23,521 | 21,184 | 18,154 |
| Feb-23 | 15,029 | 22,971 | 20,800 | 17,847 |
| Mar-23 | 14,326 | 23,585 | 20,133 | 16,995 |
| Apr-23 | 14,249 | 23,837 | 19,975 | 16,689 |
| May-23 | 13,879 | 23,929 | 19,338 | 16,535 |
| Jun-23 | 15,207 | 25,563 | 21,110 | 17,879 |
| Jul-23 | 15,750 | 26,480 | 21,980 | 18,973 |
| Aug-23 | 15,202 | 25,968 | 21,345 | 18,024 |
| Sep-23 | 14,297 | 24,731 | 20,223 | 16,962 |
| Oct-23 | 13,547 | 24,076 | 19,143 | 15,806 |
| Nov-23 | 14,951 | 26,321 | 20,772 | 17,236 |
| Dec-23 | 16,136 | 27,717 | 22,583 | 19,342 |
| Jan-24 | 15,871 | 28,024 | 22,196 | 18,590 |
| Feb-24 | 16,445 | 29,541 | 23,514 | 19,641 |
| Mar-24 | 17,068 | 30,494 | 24,830 | 20,344 |
| Apr-24 | 16,347 | 29,152 | 23,336 | 18,912 |
| May-24 | 17,050 | 30,530 | 24,360 | 19,861 |
| Jun-24 | 17,330 | 31,475 | 23,975 | 19,677 |
The Growth of $10,000 chart compares the performance of the Fund over the period shown with dividends and capital gains reinvested to the Fund’s benchmark. Benchmark indices are unmanaged and do not reflect the deduction of expenses associated with a mutual fund, such as investment management and accounting fees.
Investment performance assumes reinvestment of all dividend and capital gain distributions. The results do not reflect the effect of taxes a shareholder would pay on Fund distributions or on the redemption of Fund shares. Historical performance attributed to the Institutional and Adviser Share Classes prior to their inception dates is based on the performance of the Retail Share Class. No adjustment has been made to reflect class-specific distribution or servicing fees. Returns may reflect the effect of voluntary fee waivers or expense reimbursements over the period shown. Without these waivers, performance would have been lower.
The performance data shown represents past performance, which does not guarantee future results. The investment return and principal value of an investment will fluctuate so that an investor’s shares, when redeemed, may be worth more or less than their original cost. Current performance may be lower or higher than the performance data quoted. For current month-end performance data, please visit our website at www.meederfunds.com.
| Total Net Assets | $36,570,948 |
| # of Portfolio Holdings | 583 |
| Portfolio Turnover Rate | 164% |
| Advisory Fees and Waivers | 132,883 |
Average Annual Total Returns
| . | 1 Year | 5 Year | 10 Year |
|---|
| Adviser Class | 13.96% | 6.52% | 5.65% |
| Russell 3000 Index | 23.13% | 14.14% | 12.15% |
| S&P MidCap 400 | 13.57% | 10.27% | 9.14% |
| Russell 2000 Index | 10.06% | 6.94% | 7.00% |
What did the Fund invest in?
| Amazon.com Inc | 3.9% |
| Microsoft Corp | 3.6% |
| Apple Inc | 3.3% |
| NVIDIA Corp | 3.2% |
| Alphabet Inc | 2.9% |
| Meta Platforms Inc | 1.6% |
| Fidelity Total Bond Fund - Class Z | 1.4% |
| Baird Core Plus Bond Fund - Class I | 1.4% |
| Tesla Inc | 1.2% |
| Home Depot Inc/The | 0.8% |
| As a percentage of total net assets. Holdings exclude short-term investments and derivatives. |
| Value | Value |
|---|
| Consumer Staples | 2.3%Footnote Reference |
| Real Estate | 3.3%Footnote Reference |
| Materials | 3.4%Footnote Reference |
| Health Care | 7.7%Footnote Reference |
| Financials | 8.5%Footnote Reference |
| Communication Services | 11.5%Footnote Reference |
| Industrials | 12.4%Footnote Reference |
| Consumer Discretionary | 20.8%Footnote Reference |
| Information Technology | 30.1%Footnote Reference |
| Footnote | Description |
Footnote | As a percentage of total common stocks. Concentrations are subject to change. |
| Value | Value |
|---|
| Common Stocks (United States) | 56.5%Footnote Reference |
| Registered Investment Companies | 4.9%Footnote Reference |
| Money Market Registered Investment Companies | 36.8%Footnote Reference |
| Assets/Other Liabilities (Net) | 1.8% |
| Footnote | Description |
Footnote | As a percentage of total net assets. The Fund has invested in stock index futures contracts in order to equitize cash balances it holds in a proprietary money market fund. |
Availability of Additional Information
For additional information about the Fund, including its prospectus, financial information, holdings, proxy voting information and other important materials, scan the QR code or visit www.meederinvestment.com/meeder-funds-resources.
To reduce fund expenses, only one copy of most shareholder documents are delivered to shareholders with multiple accounts at the same address. If you wish to receive copies of this document for each account, please contact the Meeder Funds at 866.633.3371 or contact your financial intermediary.
Semi-Annual Shareholder Report
June 30, 2024
Semi-Annual Shareholder Report
June 30, 2024
This semi-annual shareholder report contains important information about the Balanced Fund for the period of December 31, 2023, to 6/30/2024, as well as certain changes to the Fund. You can find additional information about the Fund at meederinvestment.com/mutual-funds . You can also request this information by contacting us at 866.633.3371 .
What were the Fund's costs for the period?
(based on a hypothetical $10,000 investment)
| Class Name | Cost of $10K Investment | Cost Paid as % of $10K Investment |
|---|
| Retail Class | $69.66 | 1.34% |
Total Return Based on a $10,000 Investment
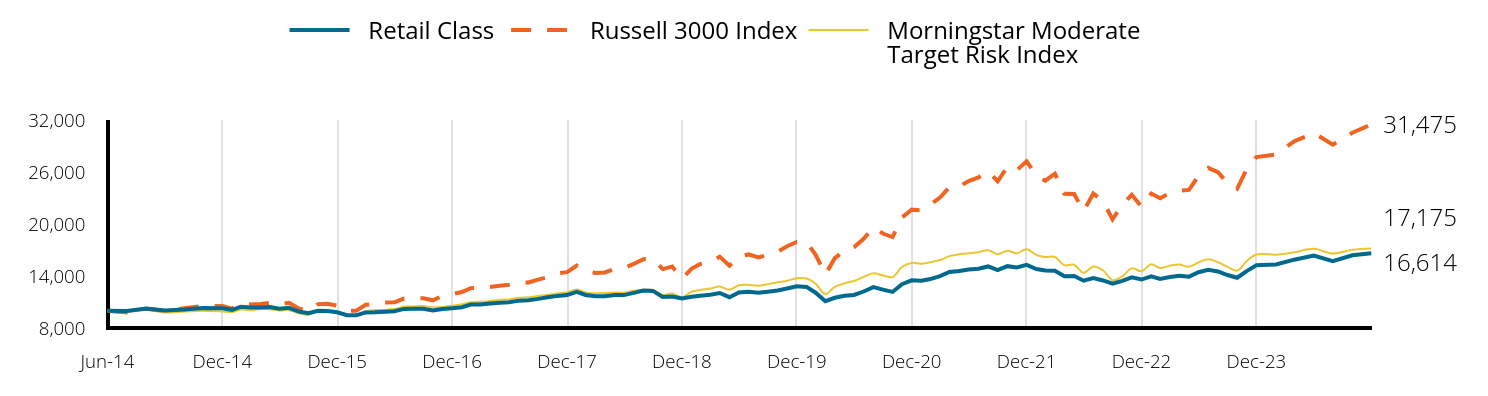
| Retail Class | Russell 3000 Index | Morningstar Moderate Target Risk Index |
|---|
| Jun-14 | 10,000 | 10,000 | 10,000 |
| Jul-14 | 9,966 | 9,803 | 9,861 |
| Aug-14 | 10,239 | 10,214 | 10,063 |
| Sep-14 | 10,009 | 10,001 | 9,801 |
| Oct-14 | 10,121 | 10,276 | 9,909 |
| Nov-14 | 10,295 | 10,525 | 10,002 |
| Dec-14 | 10,273 | 10,525 | 9,915 |
| Jan-15 | 10,095 | 10,232 | 9,841 |
| Feb-15 | 10,460 | 10,825 | 10,129 |
| Mar-15 | 10,376 | 10,715 | 10,051 |
| Apr-15 | 10,357 | 10,763 | 10,184 |
| May-15 | 10,422 | 10,912 | 10,176 |
| Jun-15 | 10,235 | 10,729 | 10,030 |
| Jul-15 | 10,329 | 10,909 | 10,054 |
| Aug-15 | 9,897 | 10,250 | 9,694 |
| Sep-15 | 9,719 | 9,952 | 9,515 |
| Oct-15 | 9,992 | 10,738 | 9,916 |
| Nov-15 | 9,954 | 10,797 | 9,874 |
| Dec-15 | 9,813 | 10,576 | 9,738 |
| Jan-16 | 9,482 | 9,979 | 9,429 |
| Feb-16 | 9,463 | 9,976 | 9,474 |
| Mar-16 | 9,794 | 10,678 | 9,947 |
| Apr-16 | 9,813 | 10,744 | 10,072 |
| May-16 | 9,880 | 10,936 | 10,101 |
| Jun-16 | 9,927 | 10,959 | 10,186 |
| Jul-16 | 10,203 | 11,394 | 10,470 |
| Aug-16 | 10,212 | 11,423 | 10,492 |
| Sep-16 | 10,222 | 11,441 | 10,532 |
| Oct-16 | 10,012 | 11,193 | 10,378 |
| Nov-16 | 10,184 | 11,694 | 10,435 |
| Dec-16 | 10,288 | 11,922 | 10,572 |
| Jan-17 | 10,403 | 12,147 | 10,743 |
| Feb-17 | 10,700 | 12,599 | 10,960 |
| Mar-17 | 10,700 | 12,607 | 11,015 |
| Apr-17 | 10,815 | 12,741 | 11,130 |
| May-17 | 10,921 | 12,871 | 11,258 |
| Jun-17 | 10,964 | 12,987 | 11,301 |
| Jul-17 | 11,156 | 13,232 | 11,494 |
| Aug-17 | 11,214 | 13,258 | 11,551 |
| Sep-17 | 11,358 | 13,581 | 11,685 |
| Oct-17 | 11,541 | 13,877 | 11,831 |
| Nov-17 | 11,704 | 14,299 | 11,991 |
| Dec-17 | 11,804 | 14,442 | 12,122 |
| Jan-18 | 12,180 | 15,203 | 12,451 |
| Feb-18 | 11,814 | 14,642 | 12,094 |
| Mar-18 | 11,662 | 14,349 | 12,016 |
| Apr-18 | 11,672 | 14,403 | 12,029 |
| May-18 | 11,804 | 14,810 | 12,102 |
| Jun-18 | 11,794 | 14,907 | 12,084 |
| Jul-18 | 12,049 | 15,401 | 12,294 |
| Aug-18 | 12,315 | 15,942 | 12,402 |
| Sep-18 | 12,279 | 15,968 | 12,389 |
| Oct-18 | 11,573 | 14,793 | 11,805 |
| Nov-18 | 11,635 | 15,089 | 11,970 |
| Dec-18 | 11,420 | 13,685 | 11,545 |
| Jan-19 | 11,606 | 14,859 | 12,179 |
| Feb-19 | 11,730 | 15,382 | 12,390 |
| Mar-19 | 11,833 | 15,606 | 12,547 |
| Apr-19 | 12,039 | 16,230 | 12,789 |
| May-19 | 11,554 | 15,179 | 12,407 |
| Jun-19 | 12,101 | 16,246 | 12,940 |
| Jul-19 | 12,194 | 16,487 | 12,981 |
| Aug-19 | 12,060 | 16,151 | 12,870 |
| Sep-19 | 12,194 | 16,434 | 13,059 |
| Oct-19 | 12,329 | 16,788 | 13,275 |
| Nov-19 | 12,558 | 17,426 | 13,459 |
| Dec-19 | 12,824 | 17,929 | 13,742 |
| Jan-20 | 12,741 | 17,910 | 13,706 |
| Feb-20 | 12,071 | 16,444 | 13,098 |
| Mar-20 | 11,088 | 14,182 | 11,903 |
| Apr-20 | 11,485 | 16,061 | 12,751 |
| May-20 | 11,715 | 16,919 | 13,159 |
| Jun-20 | 11,810 | 17,306 | 13,419 |
| Jul-20 | 12,209 | 18,289 | 13,896 |
| Aug-20 | 12,723 | 19,614 | 14,312 |
| Sep-20 | 12,434 | 18,900 | 14,063 |
| Oct-20 | 12,160 | 18,492 | 13,875 |
| Nov-20 | 13,055 | 20,741 | 15,043 |
| Dec-20 | 13,500 | 21,675 | 15,504 |
| Jan-21 | 13,457 | 21,578 | 15,409 |
| Feb-21 | 13,647 | 22,253 | 15,596 |
| Mar-21 | 13,994 | 23,050 | 15,840 |
| Apr-21 | 14,458 | 24,238 | 16,296 |
| May-21 | 14,574 | 24,349 | 16,521 |
| Jun-21 | 14,753 | 24,950 | 16,629 |
| Jul-21 | 14,847 | 25,371 | 16,748 |
| Aug-21 | 15,100 | 26,095 | 16,967 |
| Sep-21 | 14,679 | 24,924 | 16,517 |
| Oct-21 | 15,135 | 26,610 | 16,924 |
| Nov-21 | 14,986 | 26,205 | 16,617 |
| Dec-21 | 15,285 | 27,236 | 17,084 |
| Jan-22 | 14,796 | 25,634 | 16,439 |
| Feb-22 | 14,636 | 24,988 | 16,187 |
| Mar-22 | 14,602 | 25,799 | 16,197 |
| Apr-22 | 13,975 | 23,484 | 15,250 |
| May-22 | 13,998 | 23,452 | 15,294 |
| Jun-22 | 13,452 | 21,490 | 14,361 |
| Jul-22 | 13,760 | 23,506 | 15,096 |
| Aug-22 | 13,486 | 22,629 | 14,636 |
| Sep-22 | 13,109 | 20,531 | 13,511 |
| Oct-22 | 13,432 | 22,214 | 13,963 |
| Nov-22 | 13,847 | 23,374 | 14,876 |
| Dec-22 | 13,591 | 22,005 | 14,559 |
| Jan-23 | 13,969 | 23,521 | 15,358 |
| Feb-23 | 13,661 | 22,971 | 14,924 |
| Mar-23 | 13,874 | 23,585 | 15,189 |
| Apr-23 | 14,028 | 23,837 | 15,328 |
| May-23 | 13,922 | 23,929 | 15,059 |
| Jun-23 | 14,432 | 25,563 | 15,566 |
| Jul-23 | 14,705 | 26,480 | 15,938 |
| Aug-23 | 14,527 | 25,968 | 15,584 |
| Sep-23 | 14,110 | 24,731 | 15,055 |
| Oct-23 | 13,800 | 24,076 | 14,625 |
| Nov-23 | 14,564 | 26,321 | 15,703 |
| Dec-23 | 15,232 | 27,717 | 16,485 |
| Jan-24 | 15,328 | 28,024 | 16,464 |
| Feb-24 | 15,881 | 29,541 | 16,731 |
| Mar-24 | 16,361 | 30,494 | 17,130 |
| Apr-24 | 15,711 | 29,152 | 16,592 |
| May-24 | 16,385 | 30,530 | 17,030 |
| Jun-24 | 16,614 | 31,475 | 17,175 |
The Growth of $10,000 chart compares the performance of the Fund over the period shown with dividends and capital gains reinvested to the Fund’s benchmark. Benchmark indices are unmanaged and do not reflect the deduction of expenses associated with a mutual fund, such as investment management and accounting fees.
The performance data shown represents past performance, which does not guarantee future results. The investment return and principal value of an investment will fluctuate so that an investor’s shares, when redeemed, may be worth more or less than their original cost. Current performance may be lower or higher than the performance data quoted. For current month-end performance data, please visit our website at www.meederfunds.com.
| Total Net Assets | $391,853,611 |
| # of Portfolio Holdings | 157 |
| Portfolio Turnover Rate | 113% |
| Advisory Fees and Waivers | 1,275,428 |
Average Annual Total Returns
| . | 1 Year | 5 Year | 10 Year |
|---|
| Retail Class | 15.12% | 6.54% | 5.21% |
| Russell 3000 Index | 23.13% | 14.14% | 12.15% |
| Morningstar Moderate Target Risk Index | 10.34% | 5.83% | 5.56% |
What did the Fund invest in?
| Fidelity Total Bond Fund - Class Z | 7.2% |
| Baird Core Plus Bond Fund - Class I | 6.9% |
| Berkshire Hathaway Inc | 5.7% |
| Microsoft Corp | 5.1% |
| Frost Total Return Bond Fund - Class I | 4.3% |
| NVIDIA Corp | 3.9% |
| Amazon.com Inc | 3.2% |
| Alphabet Inc | 2.7% |
| Dodge & Cox Income Fund - Class I | 2.3% |
| Fidelity Advisor High Income Advantage Fund - Class Z | 2.2% |
| As a percentage of total net assets. Holdings exclude short-term investments and derivatives. |
| Value | Value |
|---|
| Materials | 0.3%Footnote Reference |
| Utilities | 0.3%Footnote Reference |
| Consumer Staples | 2.1%Footnote Reference |
| Energy | 2.6%Footnote Reference |
| Industrials | 8.2%Footnote Reference |
| Communication Services | 10.0%Footnote Reference |
| Consumer Discretionary | 13.4%Footnote Reference |
| Health Care | 14.7%Footnote Reference |
| Financials | 15.0%Footnote Reference |
| Information Technology | 33.4%Footnote Reference |
| Footnote | Description |
Footnote | As a percentage of total common stocks. Concentrations are subject to change. |
| Value | Value |
|---|
| Common Stocks (United States) | 57.7%Footnote Reference |
| Registered Investment Companies | 29.2%Footnote Reference |
| Money Market Registered Investment Companies | 12.4%Footnote Reference |
| Assets/Other Liabilities (Net) | 0.7% |
| Footnote | Description |
Footnote | As a percentage of total net assets. The Fund has invested in stock index futures contracts in order to equitize cash balances it holds in a proprietary money market fund. |
Availability of Additional Information
For additional information about the Fund, including its prospectus, financial information, holdings, proxy voting information and other important materials, scan the QR code or visit www.meederinvestment.com/meeder-funds-resources.
To reduce fund expenses, only one copy of most shareholder documents are delivered to shareholders with multiple accounts at the same address. If you wish to receive copies of this document for each account, please contact the Meeder Funds at 866.633.3371 or contact your financial intermediary.
Semi-Annual Shareholder Report
June 30, 2024
Institutional Class FLMIX
Semi-Annual Shareholder Report
June 30, 2024
This semi-annual shareholder report contains important information about the Muirfield Fund for the period of December 31, 2023, to 6/30/2024, as well as certain changes to the Fund. You can find additional information about the Fund at meederinvestment.com/mutual-funds . You can also request this information by contacting us at 866.633.3371 .
What were the Fund's costs for the period?
(based on a hypothetical $10,000 investment)
| Class Name | Cost of $10K Investment | Cost Paid as % of $10K Investment |
|---|
| Institutional Class | $49.35 | 0.93% |
Total Return Based on a $10,000 Investment
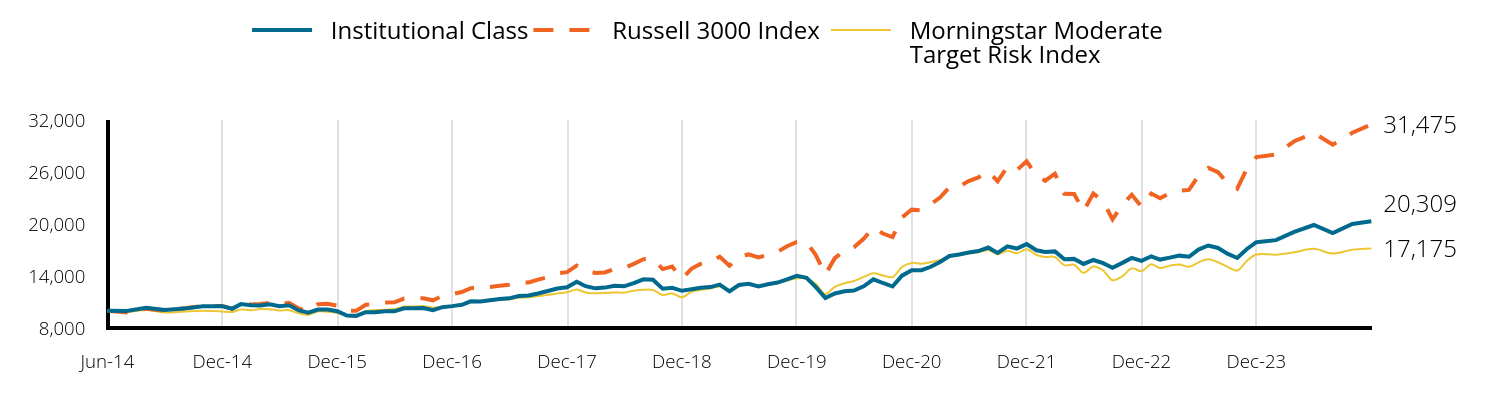
| Institutional Class | Russell 3000 Index | Morningstar Moderate Target Risk Index |
|---|
| Jun-14 | 10,000 | 10,000 | 10,000 |
| Jul-14 | 9,960 | 9,803 | 9,861 |
| Aug-14 | 10,337 | 10,214 | 10,063 |
| Sep-14 | 10,070 | 10,001 | 9,801 |
| Oct-14 | 10,236 | 10,276 | 9,909 |
| Nov-14 | 10,512 | 10,525 | 10,002 |
| Dec-14 | 10,516 | 10,525 | 9,915 |
| Jan-15 | 10,217 | 10,232 | 9,841 |
| Feb-15 | 10,756 | 10,825 | 10,129 |
| Mar-15 | 10,621 | 10,715 | 10,051 |
| Apr-15 | 10,606 | 10,763 | 10,184 |
| May-15 | 10,726 | 10,912 | 10,176 |
| Jun-15 | 10,516 | 10,729 | 10,030 |
| Jul-15 | 10,621 | 10,909 | 10,054 |
| Aug-15 | 10,022 | 10,250 | 9,694 |
| Sep-15 | 9,767 | 9,952 | 9,515 |
| Oct-15 | 10,127 | 10,738 | 9,916 |
| Nov-15 | 10,127 | 10,797 | 9,874 |
| Dec-15 | 9,938 | 10,576 | 9,738 |
| Jan-16 | 9,446 | 9,979 | 9,429 |
| Feb-16 | 9,400 | 9,976 | 9,474 |
| Mar-16 | 9,830 | 10,678 | 9,947 |
| Apr-16 | 9,815 | 10,744 | 10,072 |
| May-16 | 9,938 | 10,936 | 10,101 |
| Jun-16 | 9,922 | 10,959 | 10,186 |
| Jul-16 | 10,276 | 11,394 | 10,470 |
| Aug-16 | 10,291 | 11,423 | 10,492 |
| Sep-16 | 10,307 | 11,441 | 10,532 |
| Oct-16 | 10,050 | 11,193 | 10,378 |
| Nov-16 | 10,405 | 11,694 | 10,435 |
| Dec-16 | 10,524 | 11,922 | 10,572 |
| Jan-17 | 10,679 | 12,147 | 10,743 |
| Feb-17 | 11,081 | 12,599 | 10,960 |
| Mar-17 | 11,066 | 12,607 | 11,015 |
| Apr-17 | 11,205 | 12,741 | 11,130 |
| May-17 | 11,345 | 12,871 | 11,258 |
| Jun-17 | 11,422 | 12,987 | 11,301 |
| Jul-17 | 11,686 | 13,232 | 11,494 |
| Aug-17 | 11,748 | 13,258 | 11,551 |
| Sep-17 | 11,980 | 13,581 | 11,685 |
| Oct-17 | 12,275 | 13,877 | 11,831 |
| Nov-17 | 12,554 | 14,299 | 11,991 |
| Dec-17 | 12,692 | 14,442 | 12,122 |
| Jan-18 | 13,346 | 15,203 | 12,451 |
| Feb-18 | 12,826 | 14,642 | 12,094 |
| Mar-18 | 12,575 | 14,349 | 12,016 |
| Apr-18 | 12,659 | 14,403 | 12,029 |
| May-18 | 12,860 | 14,810 | 12,102 |
| Jun-18 | 12,810 | 14,907 | 12,084 |
| Jul-18 | 13,178 | 15,401 | 12,294 |
| Aug-18 | 13,614 | 15,942 | 12,402 |
| Sep-18 | 13,564 | 15,968 | 12,389 |
| Oct-18 | 12,539 | 14,793 | 11,805 |
| Nov-18 | 12,640 | 15,089 | 11,970 |
| Dec-18 | 12,291 | 13,685 | 11,545 |
| Jan-19 | 12,461 | 14,859 | 12,179 |
| Feb-19 | 12,631 | 15,382 | 12,390 |
| Mar-19 | 12,717 | 15,606 | 12,547 |
| Apr-19 | 13,006 | 16,230 | 12,789 |
| May-19 | 12,222 | 15,179 | 12,407 |
| Jun-19 | 12,955 | 16,246 | 12,940 |
| Jul-19 | 13,092 | 16,487 | 12,981 |
| Aug-19 | 12,802 | 16,151 | 12,870 |
| Sep-19 | 13,041 | 16,434 | 13,059 |
| Oct-19 | 13,246 | 16,788 | 13,275 |
| Nov-19 | 13,606 | 17,426 | 13,459 |
| Dec-19 | 14,012 | 17,929 | 13,742 |
| Jan-20 | 13,784 | 17,910 | 13,706 |
| Feb-20 | 12,749 | 16,444 | 13,098 |
| Mar-20 | 11,452 | 14,182 | 11,903 |
| Apr-20 | 11,978 | 16,061 | 12,751 |
| May-20 | 12,241 | 16,919 | 13,159 |
| Jun-20 | 12,328 | 17,306 | 13,419 |
| Jul-20 | 12,804 | 18,289 | 13,896 |
| Aug-20 | 13,614 | 19,614 | 14,312 |
| Sep-20 | 13,192 | 18,900 | 14,063 |
| Oct-20 | 12,785 | 18,492 | 13,875 |
| Nov-20 | 14,042 | 20,741 | 15,043 |
| Dec-20 | 14,664 | 21,675 | 15,504 |
| Jan-21 | 14,664 | 21,578 | 15,409 |
| Feb-21 | 15,036 | 22,253 | 15,596 |
| Mar-21 | 15,621 | 23,050 | 15,840 |
| Apr-21 | 16,312 | 24,238 | 16,296 |
| May-21 | 16,489 | 24,349 | 16,521 |
| Jun-21 | 16,719 | 24,950 | 16,629 |
| Jul-21 | 16,878 | 25,371 | 16,748 |
| Aug-21 | 17,286 | 26,095 | 16,967 |
| Sep-21 | 16,652 | 24,924 | 16,517 |
| Oct-21 | 17,417 | 26,610 | 16,924 |
| Nov-21 | 17,168 | 26,205 | 16,617 |
| Dec-21 | 17,678 | 27,236 | 17,084 |
| Jan-22 | 16,963 | 25,634 | 16,439 |
| Feb-22 | 16,762 | 24,988 | 16,187 |
| Mar-22 | 16,835 | 25,799 | 16,197 |
| Apr-22 | 15,937 | 23,484 | 15,250 |
| May-22 | 15,974 | 23,452 | 15,294 |
| Jun-22 | 15,388 | 21,490 | 14,361 |
| Jul-22 | 15,846 | 23,506 | 15,096 |
| Aug-22 | 15,479 | 22,629 | 14,636 |
| Sep-22 | 14,948 | 20,531 | 13,511 |
| Oct-22 | 15,517 | 22,214 | 13,963 |
| Nov-22 | 16,089 | 23,374 | 14,876 |
| Dec-22 | 15,745 | 22,005 | 14,559 |
| Jan-23 | 16,272 | 23,521 | 15,358 |
| Feb-23 | 15,895 | 22,971 | 14,924 |
| Mar-23 | 16,121 | 23,585 | 15,189 |
| Apr-23 | 16,347 | 23,837 | 15,328 |
| May-23 | 16,215 | 23,929 | 15,059 |
| Jun-23 | 17,045 | 25,563 | 15,566 |
| Jul-23 | 17,518 | 26,480 | 15,938 |
| Aug-23 | 17,234 | 25,968 | 15,584 |
| Sep-23 | 16,571 | 24,731 | 15,055 |
| Oct-23 | 16,077 | 24,076 | 14,625 |
| Nov-23 | 17,085 | 26,321 | 15,703 |
| Dec-23 | 17,903 | 27,717 | 16,485 |
| Jan-24 | 18,136 | 28,024 | 16,464 |
| Feb-24 | 19,086 | 29,541 | 16,731 |
| Mar-24 | 19,881 | 30,494 | 17,130 |
| Apr-24 | 18,948 | 29,152 | 16,592 |
| May-24 | 19,998 | 30,530 | 17,030 |
| Jun-24 | 20,309 | 31,475 | 17,175 |
The Growth of $10,000 chart compares the performance of the Fund over the period shown with dividends and capital gains reinvested to the Fund’s benchmark. Benchmark indices are unmanaged and do not reflect the deduction of expenses associated with a mutual fund, such as investment management and accounting fees.
Investment performance assumes reinvestment of all dividend and capital gain distributions. The results do not reflect the effect of taxes a shareholder would pay on Fund distributions or on the redemption of Fund shares. Historical performance attributed to the Institutional and Adviser Share Classes prior to their inception dates is based on the performance of the Retail Share Class. No adjustment has been made to reflect class-specific distribution or servicing fees. Returns may reflect the effect of voluntary fee waivers or expense reimbursements over the period shown. Without these waivers, performance would have been lower.
The performance data shown represents past performance, which does not guarantee future results. The investment return and principal value of an investment will fluctuate so that an investor’s shares, when redeemed, may be worth more or less than their original cost. Current performance may be lower or higher than the performance data quoted. For current month-end performance data, please visit our website at www.meederfunds.com.
| Total Net Assets | $868,805,924 |
| # of Portfolio Holdings | 161 |
| Portfolio Turnover Rate | 150% |
| Advisory Fees and Waivers | 2,543,674 |
Average Annual Total Returns
| . | 1 Year | 5 Year | 10 Year |
|---|
| Institutional Class | 19.15% | 9.41% | 7.34% |
| Russell 3000 Index | 23.13% | 14.14% | 12.15% |
| Morningstar Moderate Target Risk Index | 10.34% | 5.83% | 5.56% |
What did the Fund invest in?
| Berkshire Hathaway Inc | 7.2% |
| Microsoft Corp | 5.9% |
| NVIDIA Corp | 4.6% |
| Amazon.com Inc | 4.0% |
| Alphabet Inc | 3.6% |
| Apple Inc | 2.6% |
| Texas Instruments Inc | 2.6% |
| Meta Platforms Inc | 2.4% |
| Johnson & Johnson | 1.9% |
| Merck & Co Inc | 1.9% |
| As a percentage of total net assets. Holdings exclude short-term investments and derivatives. |
| Value | Value |
|---|
| Utilities | 0.2%Footnote Reference |
| Materials | 0.4%Footnote Reference |
| Energy | 1.4%Footnote Reference |
| Consumer Staples | 2.4%Footnote Reference |
| Industrials | 6.7%Footnote Reference |
| Communication Services | 9.2%Footnote Reference |
| Consumer Discretionary | 14.0%Footnote Reference |
| Health Care | 15.6%Footnote Reference |
| Financials | 15.7%Footnote Reference |
| Information Technology | 34.4%Footnote Reference |
| Footnote | Description |
Footnote | As a percentage of total common stocks. Concentrations are subject to change. |
| Value | Value |
|---|
| Common Stocks (United States) | 72.2%Footnote Reference |
| Money Market Registered Investment Companies | 26.3%Footnote Reference |
| Assets/Other Liabilities (Net) | 1.5% |
| Footnote | Description |
Footnote | As a percentage of total net assets. The Fund has invested in stock index futures contracts in order to equitize cash balances it holds in a proprietary money market fund. |
Availability of Additional Information
For additional information about the Fund, including its prospectus, financial information, holdings, proxy voting information and other important materials, scan the QR code or visit www.meederinvestment.com/meeder-funds-resources.
To reduce fund expenses, only one copy of most shareholder documents are delivered to shareholders with multiple accounts at the same address. If you wish to receive copies of this document for each account, please contact the Meeder Funds at 866.633.3371 or contact your financial intermediary.
Institutional Class FLMIX
Semi-Annual Shareholder Report
June 30, 2024
Semi-Annual Shareholder Report
June 30, 2024
This semi-annual shareholder report contains important information about the Tactical Income Fund for the period of December 31, 2023, to 6/30/2024, as well as certain changes to the Fund. You can find additional information about the Fund at meederinvestment.com/mutual-funds . You can also request this information by contacting us at 866.633.3371 .
What were the Fund's costs for the period?
(based on a hypothetical $10,000 investment)
| Class Name | Cost of $10K Investment | Cost Paid as % of $10K Investment |
|---|
| Retail Class | $55.22 | 1.10% |
Total Return Based on a $10,000 Investment
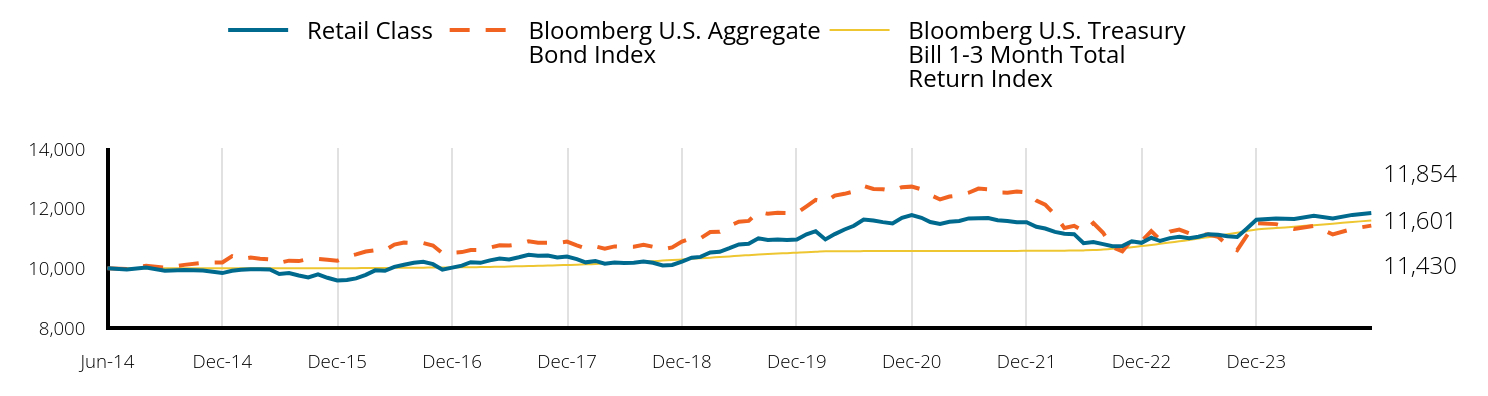
| Retail Class | Bloomberg U.S. Aggregate Bond Index | Bloomberg U.S. Treasury Bill 1-3 Month Total Return Index |
|---|
| Jun-14 | 10,000 | 10,000 | 10,000 |
| Jul-14 | 9,964 | 9,975 | 10,001 |
| Aug-14 | 10,029 | 10,085 | 10,001 |
| Sep-14 | 9,920 | 10,017 | 10,001 |
| Oct-14 | 9,943 | 10,115 | 10,001 |
| Nov-14 | 9,923 | 10,187 | 10,001 |
| Dec-14 | 9,840 | 10,196 | 10,001 |
| Jan-15 | 9,917 | 10,410 | 10,001 |
| Feb-15 | 9,953 | 10,312 | 10,001 |
| Mar-15 | 9,968 | 10,360 | 10,001 |
| Apr-15 | 9,970 | 10,323 | 10,002 |
| May-15 | 9,962 | 10,298 | 10,002 |
| Jun-15 | 9,807 | 10,186 | 10,002 |
| Jul-15 | 9,840 | 10,257 | 10,002 |
| Aug-15 | 9,758 | 10,242 | 10,002 |
| Sep-15 | 9,693 | 10,311 | 10,002 |
| Oct-15 | 9,795 | 10,313 | 10,002 |
| Nov-15 | 9,682 | 10,286 | 10,002 |
| Dec-15 | 9,593 | 10,252 | 10,004 |
| Jan-16 | 9,606 | 10,393 | 10,004 |
| Feb-16 | 9,664 | 10,467 | 10,006 |
| Mar-16 | 9,780 | 10,563 | 10,010 |
| Apr-16 | 9,932 | 10,604 | 10,011 |
| May-16 | 9,917 | 10,606 | 10,012 |
| Jun-16 | 10,049 | 10,797 | 10,015 |
| Jul-16 | 10,118 | 10,865 | 10,017 |
| Aug-16 | 10,185 | 10,853 | 10,020 |
| Sep-16 | 10,219 | 10,847 | 10,023 |
| Oct-16 | 10,139 | 10,764 | 10,025 |
| Nov-16 | 9,952 | 10,509 | 10,027 |
| Dec-16 | 10,024 | 10,524 | 10,030 |
| Jan-17 | 10,091 | 10,544 | 10,034 |
| Feb-17 | 10,205 | 10,615 | 10,038 |
| Mar-17 | 10,183 | 10,610 | 10,040 |
| Apr-17 | 10,265 | 10,692 | 10,046 |
| May-17 | 10,325 | 10,774 | 10,052 |
| Jun-17 | 10,297 | 10,763 | 10,060 |
| Jul-17 | 10,369 | 10,809 | 10,068 |
| Aug-17 | 10,451 | 10,906 | 10,076 |
| Sep-17 | 10,418 | 10,854 | 10,085 |
| Oct-17 | 10,429 | 10,861 | 10,094 |
| Nov-17 | 10,363 | 10,847 | 10,102 |
| Dec-17 | 10,397 | 10,897 | 10,111 |
| Jan-18 | 10,309 | 10,771 | 10,123 |
| Feb-18 | 10,200 | 10,669 | 10,132 |
| Mar-18 | 10,247 | 10,737 | 10,145 |
| Apr-18 | 10,155 | 10,658 | 10,159 |
| May-18 | 10,193 | 10,734 | 10,174 |
| Jun-18 | 10,182 | 10,720 | 10,190 |
| Jul-18 | 10,188 | 10,723 | 10,206 |
| Aug-18 | 10,227 | 10,792 | 10,222 |
| Sep-18 | 10,187 | 10,722 | 10,239 |
| Oct-18 | 10,098 | 10,638 | 10,258 |
| Nov-18 | 10,114 | 10,701 | 10,276 |
| Dec-18 | 10,224 | 10,898 | 10,296 |
| Jan-19 | 10,354 | 11,014 | 10,317 |
| Feb-19 | 10,383 | 11,007 | 10,336 |
| Mar-19 | 10,530 | 11,218 | 10,357 |
| Apr-19 | 10,553 | 11,221 | 10,377 |
| May-19 | 10,673 | 11,421 | 10,399 |
| Jun-19 | 10,799 | 11,564 | 10,421 |
| Jul-19 | 10,821 | 11,589 | 10,440 |
| Aug-19 | 11,007 | 11,890 | 10,459 |
| Sep-19 | 10,950 | 11,826 | 10,477 |
| Oct-19 | 10,965 | 11,862 | 10,495 |
| Nov-19 | 10,946 | 11,856 | 10,508 |
| Dec-19 | 10,964 | 11,848 | 10,524 |
| Jan-20 | 11,139 | 12,076 | 10,537 |
| Feb-20 | 11,245 | 12,293 | 10,551 |
| Mar-20 | 10,968 | 12,221 | 10,572 |
| Apr-20 | 11,146 | 12,438 | 10,573 |
| May-20 | 11,301 | 12,496 | 10,573 |
| Jun-20 | 11,425 | 12,575 | 10,575 |
| Jul-20 | 11,637 | 12,762 | 10,576 |
| Aug-20 | 11,603 | 12,659 | 10,577 |
| Sep-20 | 11,548 | 12,652 | 10,578 |
| Oct-20 | 11,504 | 12,596 | 10,579 |
| Nov-20 | 11,692 | 12,720 | 10,580 |
| Dec-20 | 11,782 | 12,737 | 10,580 |
| Jan-21 | 11,694 | 12,646 | 10,581 |
| Feb-21 | 11,550 | 12,463 | 10,582 |
| Mar-21 | 11,488 | 12,308 | 10,582 |
| Apr-21 | 11,560 | 12,405 | 10,582 |
| May-21 | 11,584 | 12,445 | 10,582 |
| Jun-21 | 11,671 | 12,533 | 10,582 |
| Jul-21 | 11,674 | 12,673 | 10,583 |
| Aug-21 | 11,684 | 12,649 | 10,583 |
| Sep-21 | 11,611 | 12,539 | 10,583 |
| Oct-21 | 11,588 | 12,536 | 10,584 |
| Nov-21 | 11,542 | 12,573 | 10,584 |
| Dec-21 | 11,545 | 12,541 | 10,585 |
| Jan-22 | 11,390 | 12,271 | 10,585 |
| Feb-22 | 11,333 | 12,134 | 10,586 |
| Mar-22 | 11,220 | 11,796 | 10,588 |
| Apr-22 | 11,162 | 11,349 | 10,591 |
| May-22 | 11,144 | 11,422 | 10,596 |
| Jun-22 | 10,842 | 11,243 | 10,601 |
| Jul-22 | 10,884 | 11,518 | 10,610 |
| Aug-22 | 10,812 | 11,192 | 10,630 |
| Sep-22 | 10,742 | 10,709 | 10,652 |
| Oct-22 | 10,748 | 10,570 | 10,674 |
| Nov-22 | 10,905 | 10,959 | 10,708 |
| Dec-22 | 10,854 | 10,909 | 10,746 |
| Jan-23 | 11,024 | 11,245 | 10,782 |
| Feb-23 | 10,915 | 10,954 | 10,820 |
| Mar-23 | 11,012 | 11,232 | 10,863 |
| Apr-23 | 11,055 | 11,300 | 10,905 |
| May-23 | 11,009 | 11,177 | 10,949 |
| Jun-23 | 11,058 | 11,137 | 10,996 |
| Jul-23 | 11,144 | 11,130 | 11,044 |
| Aug-23 | 11,122 | 11,059 | 11,094 |
| Sep-23 | 11,075 | 10,778 | 11,144 |
| Oct-23 | 11,052 | 10,607 | 11,195 |
| Nov-23 | 11,328 | 11,088 | 11,245 |
| Dec-23 | 11,625 | 11,512 | 11,298 |
| Jan-24 | 11,669 | 11,481 | 11,347 |
| Feb-24 | 11,656 | 11,318 | 11,395 |
| Mar-24 | 11,764 | 11,423 | 11,447 |
| Apr-24 | 11,668 | 11,134 | 11,497 |
| May-24 | 11,790 | 11,323 | 11,553 |
| Jun-24 | 11,854 | 11,430 | 11,601 |
The Growth of $10,000 chart compares the performance of the Fund over the period shown with dividends and capital gains reinvested to the Fund’s benchmark. Benchmark indices are unmanaged and do not reflect the deduction of expenses associated with a mutual fund, such as investment management and accounting fees.
The performance data shown represents past performance, which does not guarantee future results. The investment return and principal value of an investment will fluctuate so that an investor’s shares, when redeemed, may be worth more or less than their original cost. Current performance may be lower or higher than the performance data quoted. For current month-end performance data, please visit our website at www.meederfunds.com.
| Total Net Assets | $74,359,352 |
| # of Portfolio Holdings | 14 |
| Portfolio Turnover Rate | 69% |
| Advisory Fees and Waivers | 141,954 |
Average Annual Total Returns
| . | 1 Year | 5 Year | 10 Year |
|---|
| Retail Class | 7.20% | 1.88% | 1.72% |
| Bloomberg U.S. Aggregate Bond Index | 2.63% | | 1.35% |
| Bloomberg U.S. Treasury Bill 1-3 Month Total Return Index | 5.50% | 2.17% | 1.50% |
What did the Fund invest in?
| PIMCO Low Duration Income Fund - Class I | 14.5% |
| Fidelity Advisor High Income Advantage Fund - Class Z | 12.3% |
| BrandywineGLOBAL High Yield Fund - Class I | 12.2% |
| Frost Total Return Bond Fund - Class I | 11.7% |
| Diamond Hill Short Duration Securitized Bond Fund - Class Y | 10.2% |
| Fidelity Total Bond Fund - Class Z | 9.7% |
| iShares J.P. Morgan USD Emerging Markets Bond ETF | 6.7% |
| Eaton Vance Emerging Markets Debt Opportunities Fund - Class R6 | 4.9% |
| As a percentage of total net assets. Holdings exclude short-term investments and derivatives. |
| Value | Value |
|---|
| International Fixed Income | 6.7%Footnote Reference |
| Money Market Registered Investment Companies | 17.6%Footnote Reference |
| U.S. Fixed Income | 75.4%Footnote Reference |
| Footnote | Description |
Footnote | As a percentage of total net assets. Concentrations are subject to change. |
| Value | Value |
|---|
| Registered Investment Companies | 82.1%Footnote Reference |
| Money Market Registered Investment Companies | 17.6%Footnote Reference |
| Assets/Other Liabilities (Net) | 0.3% |
| Footnote | Description |
Footnote | As a percentage of total net assets. The Fund has invested in stock index futures contracts in order to equitize cash balances it holds in a proprietary money market fund. |
Availability of Additional Information
For additional information about the Fund, including its prospectus, financial information, holdings, proxy voting information and other important materials, scan the QR code or visit www.meederinvestment.com/meeder-funds-resources.
To reduce fund expenses, only one copy of most shareholder documents are delivered to shareholders with multiple accounts at the same address. If you wish to receive copies of this document for each account, please contact the Meeder Funds at 866.633.3371 or contact your financial intermediary.
Semi-Annual Shareholder Report
June 30, 2024
Institutional Class QNTIX
Semi-Annual Shareholder Report
June 30, 2024
This semi-annual shareholder report contains important information about the Sector Rotation Fund for the period of December 31, 2023, to 6/30/2024, as well as certain changes to the Fund. You can find additional information about the Fund at meederinvestment.com/mutual-funds . You can also request this information by contacting us at 866.633.3371 .
What were the Fund's costs for the period?
(based on a hypothetical $10,000 investment)
| Class Name | Cost of $10K Investment | Cost Paid as % of $10K Investment |
|---|
| Institutional Class | $74.77 | 1.45% |
Total Return Based on a $10,000 Investment
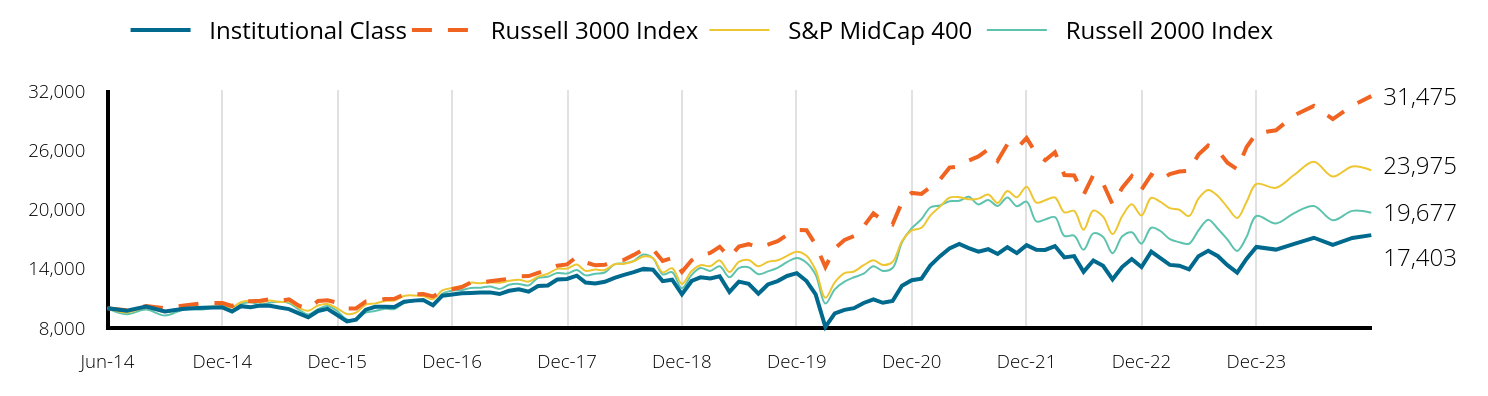
| Institutional Class | Russell 3000 Index | S&P MidCap 400 | Russell 2000 Index |
|---|
| Jun-14 | 10,000 | 10,000 | 10,000 | 10,000 |
| Jul-14 | 9,750 | 9,803 | 9,573 | 9,395 |
| Aug-14 | 10,182 | 10,214 | 10,059 | 9,861 |
| Sep-14 | 9,675 | 10,001 | 9,602 | 9,264 |
| Oct-14 | 9,945 | 10,276 | 9,944 | 9,875 |
| Nov-14 | 10,054 | 10,525 | 10,128 | 9,884 |
| Dec-14 | 10,095 | 10,525 | 10,211 | 10,165 |
| Jan-15 | 9,673 | 10,232 | 10,097 | 9,838 |
| Feb-15 | 10,210 | 10,825 | 10,614 | 10,422 |
| Mar-15 | 10,109 | 10,715 | 10,754 | 10,604 |
| Apr-15 | 10,267 | 10,763 | 10,594 | 10,333 |
| May-15 | 10,244 | 10,912 | 10,782 | 10,569 |
| Jun-15 | 10,069 | 10,729 | 10,640 | 10,649 |
| Jul-15 | 9,911 | 10,909 | 10,654 | 10,525 |
| Aug-15 | 9,474 | 10,250 | 10,060 | 9,863 |
| Sep-15 | 9,083 | 9,952 | 9,736 | 9,379 |
| Oct-15 | 9,722 | 10,738 | 10,284 | 9,908 |
| Nov-15 | 9,938 | 10,797 | 10,423 | 10,230 |
| Dec-15 | 9,320 | 10,576 | 9,989 | 9,717 |
| Jan-16 | 8,667 | 9,979 | 9,421 | 8,862 |
| Feb-16 | 8,835 | 9,976 | 9,554 | 8,862 |
| Mar-16 | 9,856 | 10,678 | 10,367 | 9,569 |
| Apr-16 | 10,150 | 10,744 | 10,494 | 9,719 |
| May-16 | 10,144 | 10,936 | 10,737 | 9,938 |
| Jun-16 | 10,124 | 10,959 | 10,781 | 9,932 |
| Jul-16 | 10,658 | 11,394 | 11,244 | 10,525 |
| Aug-16 | 10,772 | 11,423 | 11,300 | 10,711 |
| Sep-16 | 10,832 | 11,441 | 11,228 | 10,830 |
| Oct-16 | 10,311 | 11,193 | 10,928 | 10,315 |
| Nov-16 | 11,273 | 11,694 | 11,802 | 11,466 |
| Dec-16 | 11,392 | 11,922 | 12,061 | 11,787 |
| Jan-17 | 11,515 | 12,147 | 12,263 | 11,833 |
| Feb-17 | 11,549 | 12,599 | 12,585 | 12,062 |
| Mar-17 | 11,600 | 12,607 | 12,536 | 12,078 |
| Apr-17 | 11,607 | 12,741 | 12,641 | 12,210 |
| May-17 | 11,440 | 12,871 | 12,579 | 11,962 |
| Jun-17 | 11,771 | 12,987 | 12,783 | 12,375 |
| Jul-17 | 11,928 | 13,232 | 12,896 | 12,467 |
| Aug-17 | 11,679 | 13,258 | 12,698 | 12,308 |
| Sep-17 | 12,250 | 13,581 | 13,195 | 13,077 |
| Oct-17 | 12,301 | 13,877 | 13,493 | 13,188 |
| Nov-17 | 12,913 | 14,299 | 13,989 | 13,568 |
| Dec-17 | 12,969 | 14,442 | 14,020 | 13,513 |
| Jan-18 | 13,297 | 15,203 | 14,423 | 13,867 |
| Feb-18 | 12,606 | 14,642 | 13,784 | 13,330 |
| Mar-18 | 12,514 | 14,349 | 13,912 | 13,502 |
| Apr-18 | 12,680 | 14,403 | 13,876 | 13,619 |
| May-18 | 13,085 | 14,810 | 14,448 | 14,445 |
| Jun-18 | 13,385 | 14,907 | 14,509 | 14,549 |
| Jul-18 | 13,650 | 15,401 | 14,765 | 14,803 |
| Aug-18 | 13,985 | 15,942 | 15,237 | 15,441 |
| Sep-18 | 13,900 | 15,968 | 15,070 | 15,069 |
| Oct-18 | 12,745 | 14,793 | 13,631 | 13,433 |
| Nov-18 | 12,890 | 15,089 | 14,057 | 13,646 |
| Dec-18 | 11,407 | 13,685 | 12,466 | 12,025 |
| Jan-19 | 12,760 | 14,859 | 13,770 | 13,378 |
| Feb-19 | 13,127 | 15,382 | 14,354 | 14,073 |
| Mar-19 | 13,007 | 15,606 | 14,272 | 13,779 |
| Apr-19 | 13,244 | 16,230 | 14,846 | 14,247 |
| May-19 | 11,650 | 15,179 | 13,663 | 13,139 |
| Jun-19 | 12,696 | 16,246 | 14,707 | 14,067 |
| Jul-19 | 12,463 | 16,487 | 14,882 | 14,148 |
| Aug-19 | 11,465 | 16,151 | 14,257 | 13,450 |
| Sep-19 | 12,406 | 16,434 | 14,694 | 13,730 |
| Oct-19 | 12,754 | 16,788 | 14,860 | 14,091 |
| Nov-19 | 13,269 | 17,426 | 15,302 | 14,671 |
| Dec-19 | 13,552 | 17,929 | 15,732 | 15,094 |
| Jan-20 | 12,753 | 17,910 | 15,321 | 14,610 |
| Feb-20 | 11,395 | 16,444 | 13,867 | 13,380 |
| Mar-20 | 8,101 | 14,182 | 11,059 | 10,473 |
| Apr-20 | 9,473 | 16,061 | 12,628 | 11,912 |
| May-20 | 9,837 | 16,919 | 13,552 | 12,687 |
| Jun-20 | 10,008 | 17,306 | 13,722 | 13,135 |
| Jul-20 | 10,535 | 18,289 | 14,355 | 13,499 |
| Aug-20 | 10,908 | 19,614 | 14,859 | 14,260 |
| Sep-20 | 10,556 | 18,900 | 14,377 | 13,783 |
| Oct-20 | 10,729 | 18,492 | 14,689 | 14,072 |
| Nov-20 | 12,283 | 20,741 | 16,786 | 16,666 |
| Dec-20 | 12,845 | 21,675 | 17,881 | 18,107 |
| Jan-21 | 12,999 | 21,578 | 18,150 | 19,019 |
| Feb-21 | 14,316 | 22,253 | 19,384 | 20,204 |
| Mar-21 | 15,273 | 23,050 | 20,289 | 20,407 |
| Apr-21 | 16,047 | 24,238 | 21,203 | 20,835 |
| May-21 | 16,515 | 24,349 | 21,245 | 20,878 |
| Jun-21 | 16,094 | 24,950 | 21,027 | 21,283 |
| Jul-21 | 15,734 | 25,371 | 21,100 | 20,514 |
| Aug-21 | 15,979 | 26,095 | 21,511 | 20,973 |
| Sep-21 | 15,493 | 24,924 | 20,657 | 20,355 |
| Oct-21 | 16,180 | 26,610 | 21,872 | 21,221 |
| Nov-21 | 15,583 | 26,205 | 21,230 | 20,336 |
| Dec-21 | 16,394 | 27,236 | 22,308 | 20,791 |
| Jan-22 | 15,915 | 25,634 | 20,700 | 18,789 |
| Feb-22 | 15,903 | 24,988 | 20,930 | 18,990 |
| Mar-22 | 16,297 | 25,799 | 21,220 | 19,226 |
| Apr-22 | 15,152 | 23,484 | 19,712 | 17,321 |
| May-22 | 15,277 | 23,452 | 19,860 | 17,347 |
| Jun-22 | 13,691 | 21,490 | 17,949 | 15,920 |
| Jul-22 | 14,837 | 23,506 | 19,897 | 17,582 |
| Aug-22 | 14,296 | 22,629 | 19,279 | 17,222 |
| Sep-22 | 12,931 | 20,531 | 17,507 | 15,572 |
| Oct-22 | 14,197 | 22,214 | 19,348 | 17,286 |
| Nov-22 | 14,981 | 23,374 | 20,532 | 17,690 |
| Dec-22 | 14,167 | 22,005 | 19,395 | 16,542 |
| Jan-23 | 15,726 | 23,521 | 21,184 | 18,154 |
| Feb-23 | 15,100 | 22,971 | 20,800 | 17,847 |
| Mar-23 | 14,392 | 23,585 | 20,133 | 16,995 |
| Apr-23 | 14,314 | 23,837 | 19,975 | 16,689 |
| May-23 | 13,942 | 23,929 | 19,338 | 16,535 |
| Jun-23 | 15,274 | 25,563 | 21,110 | 17,879 |
| Jul-23 | 15,821 | 26,480 | 21,980 | 18,973 |
| Aug-23 | 15,270 | 25,968 | 21,345 | 18,024 |
| Sep-23 | 14,358 | 24,731 | 20,223 | 16,962 |
| Oct-23 | 13,608 | 24,076 | 19,143 | 15,806 |
| Nov-23 | 15,016 | 26,321 | 20,772 | 17,236 |
| Dec-23 | 16,206 | 27,717 | 22,583 | 19,342 |
| Jan-24 | 15,939 | 28,024 | 22,196 | 18,590 |
| Feb-24 | 16,517 | 29,541 | 23,514 | 19,641 |
| Mar-24 | 17,139 | 30,494 | 24,830 | 20,344 |
| Apr-24 | 16,419 | 29,152 | 23,336 | 18,912 |
| May-24 | 17,122 | 30,530 | 24,360 | 19,861 |
| Jun-24 | 17,403 | 31,475 | 23,975 | 19,677 |
The Growth of $10,000 chart compares the performance of the Fund over the period shown with dividends and capital gains reinvested to the Fund’s benchmark. Benchmark indices are unmanaged and do not reflect the deduction of expenses associated with a mutual fund, such as investment management and accounting fees.
Investment performance assumes reinvestment of all dividend and capital gain distributions. The results do not reflect the effect of taxes a shareholder would pay on Fund distributions or on the redemption of Fund shares. Historical performance attributed to the Institutional and Adviser Share Classes prior to their inception dates is based on the performance of the Retail Share Class. No adjustment has been made to reflect class-specific distribution or servicing fees. Returns may reflect the effect of voluntary fee waivers or expense reimbursements over the period shown. Without these waivers, performance would have been lower.
The performance data shown represents past performance, which does not guarantee future results. The investment return and principal value of an investment will fluctuate so that an investor’s shares, when redeemed, may be worth more or less than their original cost. Current performance may be lower or higher than the performance data quoted. For current month-end performance data, please visit our website at www.meederfunds.com.
| Total Net Assets | $36,570,948 |
| # of Portfolio Holdings | 583 |
| Portfolio Turnover Rate | 164% |
| Advisory Fees and Waivers | 132,883 |
Average Annual Total Returns
| . | 1 Year | 5 Year | 10 Year |
|---|
| Institutional Class | 13.93% | 6.51% | 5.70% |
| Russell 3000 Index | 23.13% | 14.14% | 12.15% |
| S&P MidCap 400 | 13.57% | 10.27% | 9.14% |
| Russell 2000 Index | 10.06% | 6.94% | 7.00% |
What did the Fund invest in?
| Amazon.com Inc | 3.9% |
| Microsoft Corp | 3.6% |
| Apple Inc | 3.3% |
| NVIDIA Corp | 3.2% |
| Alphabet Inc | 2.9% |
| Meta Platforms Inc | 1.6% |
| Fidelity Total Bond Fund - Class Z | 1.4% |
| Baird Core Plus Bond Fund - Class I | 1.4% |
| Tesla Inc | 1.2% |
| Home Depot Inc/The | 0.8% |
| As a percentage of total net assets. Holdings exclude short-term investments and derivatives. |
| Value | Value |
|---|
| Consumer Staples | 2.3%Footnote Reference |
| Real Estate | 3.3%Footnote Reference |
| Materials | 3.4%Footnote Reference |
| Health Care | 7.7%Footnote Reference |
| Financials | 8.5%Footnote Reference |
| Communication Services | 11.5%Footnote Reference |
| Industrials | 12.4%Footnote Reference |
| Consumer Discretionary | 20.8%Footnote Reference |
| Information Technology | 30.1%Footnote Reference |
| Footnote | Description |
Footnote | As a percentage of total common stocks. Concentrations are subject to change. |
| Value | Value |
|---|
| Common Stocks (United States) | 56.5%Footnote Reference |
| Registered Investment Companies | 4.9%Footnote Reference |
| Money Market Registered Investment Companies | 36.8%Footnote Reference |
| Assets/Other Liabilities (Net) | 1.8% |
| Footnote | Description |
Footnote | As a percentage of total net assets. The Fund has invested in stock index futures contracts in order to equitize cash balances it holds in a proprietary money market fund. |
Availability of Additional Information
For additional information about the Fund, including its prospectus, financial information, holdings, proxy voting information and other important materials, scan the QR code or visit www.meederinvestment.com/meeder-funds-resources.
To reduce fund expenses, only one copy of most shareholder documents are delivered to shareholders with multiple accounts at the same address. If you wish to receive copies of this document for each account, please contact the Meeder Funds at 866.633.3371 or contact your financial intermediary.
Institutional Class QNTIX
Semi-Annual Shareholder Report
June 30, 2024
Semi-Annual Shareholder Report
June 30, 2024
This semi-annual shareholder report contains important information about the Balanced Fund for the period of December 31, 2023, to 6/30/2024, as well as certain changes to the Fund. You can find additional information about the Fund at meederinvestment.com/mutual-funds . You can also request this information by contacting us at 866.633.3371 .
What were the Fund's costs for the period?
(based on a hypothetical $10,000 investment)
| Class Name | Cost of $10K Investment | Cost Paid as % of $10K Investment |
|---|
| Adviser Class | $49.96 | 0.96% |
Total Return Based on a $10,000 Investment

| Adviser Class | Russell 3000 Index | Morningstar Moderate Target Risk Index |
|---|
| Jun-14 | 10,000 | 10,000 | 10,000 |
| Jul-14 | 9,966 | 9,803 | 9,861 |
| Aug-14 | 10,239 | 10,214 | 10,063 |
| Sep-14 | 10,009 | 10,001 | 9,801 |
| Oct-14 | 10,121 | 10,276 | 9,909 |
| Nov-14 | 10,295 | 10,525 | 10,002 |
| Dec-14 | 10,273 | 10,525 | 9,915 |
| Jan-15 | 10,095 | 10,232 | 9,841 |
| Feb-15 | 10,460 | 10,825 | 10,129 |
| Mar-15 | 10,376 | 10,715 | 10,051 |
| Apr-15 | 10,357 | 10,763 | 10,184 |
| May-15 | 10,422 | 10,912 | 10,176 |
| Jun-15 | 10,235 | 10,729 | 10,030 |
| Jul-15 | 10,329 | 10,909 | 10,054 |
| Aug-15 | 9,897 | 10,250 | 9,694 |
| Sep-15 | 9,719 | 9,952 | 9,515 |
| Oct-15 | 9,992 | 10,738 | 9,916 |
| Nov-15 | 9,954 | 10,797 | 9,874 |
| Dec-15 | 9,813 | 10,576 | 9,738 |
| Jan-16 | 9,482 | 9,979 | 9,429 |
| Feb-16 | 9,463 | 9,976 | 9,474 |
| Mar-16 | 9,794 | 10,678 | 9,947 |
| Apr-16 | 9,813 | 10,744 | 10,072 |
| May-16 | 9,880 | 10,936 | 10,101 |
| Jun-16 | 9,927 | 10,959 | 10,186 |
| Jul-16 | 10,203 | 11,394 | 10,470 |
| Aug-16 | 10,212 | 11,423 | 10,492 |
| Sep-16 | 10,222 | 11,441 | 10,532 |
| Oct-16 | 10,012 | 11,193 | 10,378 |
| Nov-16 | 10,184 | 11,694 | 10,435 |
| Dec-16 | 10,289 | 11,922 | 10,572 |
| Jan-17 | 10,414 | 12,147 | 10,743 |
| Feb-17 | 10,721 | 12,599 | 10,960 |
| Mar-17 | 10,721 | 12,607 | 11,015 |
| Apr-17 | 10,836 | 12,741 | 11,130 |
| May-17 | 10,941 | 12,871 | 11,258 |
| Jun-17 | 10,999 | 12,987 | 11,301 |
| Jul-17 | 11,191 | 13,232 | 11,494 |
| Aug-17 | 11,258 | 13,258 | 11,551 |
| Sep-17 | 11,392 | 13,581 | 11,685 |
| Oct-17 | 11,585 | 13,877 | 11,831 |
| Nov-17 | 11,748 | 14,299 | 11,991 |
| Dec-17 | 11,855 | 14,442 | 12,122 |
| Jan-18 | 12,251 | 15,203 | 12,451 |
| Feb-18 | 11,875 | 14,642 | 12,094 |
| Mar-18 | 11,723 | 14,349 | 12,016 |
| Apr-18 | 11,743 | 14,403 | 12,029 |
| May-18 | 11,875 | 14,810 | 12,102 |
| Jun-18 | 11,865 | 14,907 | 12,084 |
| Jul-18 | 12,120 | 15,401 | 12,294 |
| Aug-18 | 12,395 | 15,942 | 12,402 |
| Sep-18 | 12,360 | 15,968 | 12,389 |
| Oct-18 | 11,655 | 14,793 | 11,805 |
| Nov-18 | 11,716 | 15,089 | 11,970 |
| Dec-18 | 11,501 | 13,685 | 11,545 |
| Jan-19 | 11,686 | 14,859 | 12,179 |
| Feb-19 | 11,820 | 15,382 | 12,390 |
| Mar-19 | 11,929 | 15,606 | 12,547 |
| Apr-19 | 12,136 | 16,230 | 12,789 |
| May-19 | 11,639 | 15,179 | 12,407 |
| Jun-19 | 12,192 | 16,246 | 12,940 |
| Jul-19 | 12,296 | 16,487 | 12,981 |
| Aug-19 | 12,161 | 16,151 | 12,870 |
| Sep-19 | 12,296 | 16,434 | 13,059 |
| Oct-19 | 12,442 | 16,788 | 13,275 |
| Nov-19 | 12,681 | 17,426 | 13,459 |
| Dec-19 | 12,948 | 17,929 | 13,742 |
| Jan-20 | 12,864 | 17,910 | 13,706 |
| Feb-20 | 12,193 | 16,444 | 13,098 |
| Mar-20 | 11,208 | 14,182 | 11,903 |
| Apr-20 | 11,606 | 16,061 | 12,751 |
| May-20 | 11,847 | 16,919 | 13,159 |
| Jun-20 | 11,952 | 17,306 | 13,419 |
| Jul-20 | 12,353 | 18,289 | 13,896 |
| Aug-20 | 12,880 | 19,614 | 14,312 |
| Sep-20 | 12,598 | 18,900 | 14,063 |
| Oct-20 | 12,312 | 18,492 | 13,875 |
| Nov-20 | 13,222 | 20,741 | 15,043 |
| Dec-20 | 13,681 | 21,675 | 15,504 |
| Jan-21 | 13,639 | 21,578 | 15,409 |
| Feb-21 | 13,840 | 22,253 | 15,596 |
| Mar-21 | 14,190 | 23,050 | 15,840 |
| Apr-21 | 14,666 | 24,238 | 16,296 |
| May-21 | 14,793 | 24,349 | 16,521 |
| Jun-21 | 14,984 | 24,950 | 16,629 |
| Jul-21 | 15,079 | 25,371 | 16,748 |
| Aug-21 | 15,333 | 26,095 | 16,967 |
| Sep-21 | 14,917 | 24,924 | 16,517 |
| Oct-21 | 15,387 | 26,610 | 16,924 |
| Nov-21 | 15,238 | 26,205 | 16,617 |
| Dec-21 | 15,557 | 27,236 | 17,084 |
| Jan-22 | 15,051 | 25,634 | 16,439 |
| Feb-22 | 14,890 | 24,988 | 16,187 |
| Mar-22 | 14,867 | 25,799 | 16,197 |
| Apr-22 | 14,234 | 23,484 | 15,250 |
| May-22 | 14,257 | 23,452 | 15,294 |
| Jun-22 | 13,706 | 21,490 | 14,361 |
| Jul-22 | 14,029 | 23,506 | 15,096 |
| Aug-22 | 13,752 | 22,629 | 14,636 |
| Sep-22 | 13,370 | 20,531 | 13,511 |
| Oct-22 | 13,696 | 22,214 | 13,963 |
| Nov-22 | 14,140 | 23,374 | 14,876 |
| Dec-22 | 13,882 | 22,005 | 14,559 |
| Jan-23 | 14,276 | 23,521 | 15,358 |
| Feb-23 | 13,953 | 22,971 | 14,924 |
| Mar-23 | 14,180 | 23,585 | 15,189 |
| Apr-23 | 14,348 | 23,837 | 15,328 |
| May-23 | 14,240 | 23,929 | 15,059 |
| Jun-23 | 14,768 | 25,563 | 15,566 |
| Jul-23 | 15,057 | 26,480 | 15,938 |
| Aug-23 | 14,876 | 25,968 | 15,584 |
| Sep-23 | 14,454 | 24,731 | 15,055 |
| Oct-23 | 14,152 | 24,076 | 14,625 |
| Nov-23 | 14,927 | 26,321 | 15,703 |
| Dec-23 | 15,614 | 27,717 | 16,485 |
| Jan-24 | 15,724 | 28,024 | 16,464 |
| Feb-24 | 16,297 | 29,541 | 16,731 |
| Mar-24 | 16,785 | 30,494 | 17,130 |
| Apr-24 | 16,124 | 29,152 | 16,592 |
| May-24 | 16,822 | 30,530 | 17,030 |
| Jun-24 | 17,066 | 31,475 | 17,175 |
The Growth of $10,000 chart compares the performance of the Fund over the period shown with dividends and capital gains reinvested to the Fund’s benchmark. Benchmark indices are unmanaged and do not reflect the deduction of expenses associated with a mutual fund, such as investment management and accounting fees.
Investment performance assumes reinvestment of all dividend and capital gain distributions. The results do not reflect the effect of taxes a shareholder would pay on Fund distributions or on the redemption of Fund shares. Historical performance attributed to the Institutional and Adviser Share Classes prior to their inception dates is based on the performance of the Retail Share Class. No adjustment has been made to reflect class-specific distribution or servicing fees. Returns may reflect the effect of voluntary fee waivers or expense reimbursements over the period shown. Without these waivers, performance would have been lower.
The performance data shown represents past performance, which does not guarantee future results. The investment return and principal value of an investment will fluctuate so that an investor’s shares, when redeemed, may be worth more or less than their original cost. Current performance may be lower or higher than the performance data quoted. For current month-end performance data, please visit our website at www.meederfunds.com.
| Total Net Assets | $391,853,611 |
| # of Portfolio Holdings | 157 |
| Portfolio Turnover Rate | 113% |
| Advisory Fees and Waivers | 1,275,428 |
Average Annual Total Returns
| . | 1 Year | 5 Year | 10 Year |
|---|
| Adviser Class | 15.57% | 6.96% | 5.49% |
| Russell 3000 Index | 23.13% | 14.14% | 12.15% |
| Morningstar Moderate Target Risk Index | 10.34% | 5.83% | 5.56% |
What did the Fund invest in?
| Fidelity Total Bond Fund - Class Z | 7.2% |
| Baird Core Plus Bond Fund - Class I | 6.9% |
| Berkshire Hathaway Inc | 5.7% |
| Microsoft Corp | 5.1% |
| Frost Total Return Bond Fund - Class I | 4.3% |
| NVIDIA Corp | 3.9% |
| Amazon.com Inc | 3.2% |
| Alphabet Inc | 2.7% |
| Dodge & Cox Income Fund - Class I | 2.3% |
| Fidelity Advisor High Income Advantage Fund - Class Z | 2.2% |
| As a percentage of total net assets. Holdings exclude short-term investments and derivatives. |
| Value | Value |
|---|
| Materials | 0.3%Footnote Reference |
| Utilities | 0.3%Footnote Reference |
| Consumer Staples | 2.1%Footnote Reference |
| Energy | 2.6%Footnote Reference |
| Industrials | 8.2%Footnote Reference |
| Communication Services | 10.0%Footnote Reference |
| Consumer Discretionary | 13.4%Footnote Reference |
| Health Care | 14.7%Footnote Reference |
| Financials | 15.0%Footnote Reference |
| Information Technology | 33.4%Footnote Reference |
| Footnote | Description |
Footnote | As a percentage of total common stocks. Concentrations are subject to change. |
| Value | Value |
|---|
| Common Stocks (United States) | 57.7%Footnote Reference |
| Registered Investment Companies | 29.2%Footnote Reference |
| Money Market Registered Investment Companies | 12.4%Footnote Reference |
| Assets/Other Liabilities (Net) | 0.7% |
| Footnote | Description |
Footnote | As a percentage of total net assets. The Fund has invested in stock index futures contracts in order to equitize cash balances it holds in a proprietary money market fund. |
Availability of Additional Information
For additional information about the Fund, including its prospectus, financial information, holdings, proxy voting information and other important materials, scan the QR code or visit www.meederinvestment.com/meeder-funds-resources.
To reduce fund expenses, only one copy of most shareholder documents are delivered to shareholders with multiple accounts at the same address. If you wish to receive copies of this document for each account, please contact the Meeder Funds at 866.633.3371 or contact your financial intermediary.
Semi-Annual Shareholder Report
June 30, 2024
Semi-Annual Shareholder Report
June 30, 2024
This semi-annual shareholder report contains important information about the Dynamic Allocation Fund for the period of December 31, 2023, to 6/30/2024, as well as certain changes to the Fund. You can find additional information about the Fund at meederinvestment.com/mutual-funds . You can also request this information by contacting us at 866.633.3371 .
What were the Fund's costs for the period?
(based on a hypothetical $10,000 investment)
| Class Name | Cost of $10K Investment | Cost Paid as % of $10K Investment |
|---|
| Retail Class | $66.43 | 1.26% |
Total Return Based on a $10,000 Investment
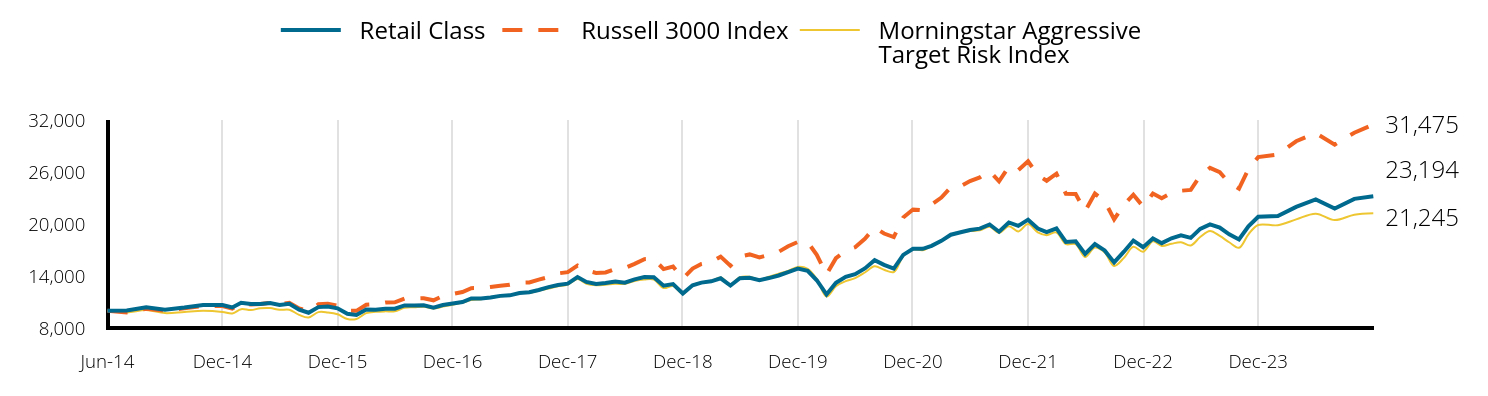
| Retail Class | Russell 3000 Index | Morningstar Aggressive Target Risk Index |
|---|
| Jun-14 | 10,000 | 10,000 | 10,000 |
| Jul-14 | 10,018 | 9,803 | 9,802 |
| Aug-14 | 10,392 | 10,214 | 10,073 |
| Sep-14 | 10,114 | 10,001 | 9,718 |
| Oct-14 | 10,357 | 10,276 | 9,855 |
| Nov-14 | 10,656 | 10,525 | 9,977 |
| Dec-14 | 10,642 | 10,525 | 9,849 |
| Jan-15 | 10,366 | 10,232 | 9,675 |
| Feb-15 | 10,908 | 10,825 | 10,174 |
| Mar-15 | 10,759 | 10,715 | 10,064 |
| Apr-15 | 10,770 | 10,763 | 10,278 |
| May-15 | 10,876 | 10,912 | 10,299 |
| Jun-15 | 10,653 | 10,729 | 10,098 |
| Jul-15 | 10,791 | 10,909 | 10,112 |
| Aug-15 | 10,111 | 10,250 | 9,517 |
| Sep-15 | 9,760 | 9,952 | 9,205 |
| Oct-15 | 10,410 | 10,738 | 9,829 |
| Nov-15 | 10,474 | 10,797 | 9,792 |
| Dec-15 | 10,274 | 10,576 | 9,586 |
| Jan-16 | 9,648 | 9,979 | 9,036 |
| Feb-16 | 9,506 | 9,976 | 9,037 |
| Mar-16 | 10,142 | 10,678 | 9,710 |
| Apr-16 | 10,109 | 10,744 | 9,870 |
| May-16 | 10,230 | 10,936 | 9,920 |
| Jun-16 | 10,219 | 10,959 | 9,926 |
| Jul-16 | 10,604 | 11,394 | 10,346 |
| Aug-16 | 10,593 | 11,423 | 10,392 |
| Sep-16 | 10,627 | 11,441 | 10,448 |
| Oct-16 | 10,333 | 11,193 | 10,247 |
| Nov-16 | 10,654 | 11,694 | 10,465 |
| Dec-16 | 10,826 | 11,922 | 10,673 |
| Jan-17 | 10,993 | 12,147 | 10,931 |
| Feb-17 | 11,416 | 12,599 | 11,235 |
| Mar-17 | 11,394 | 12,607 | 11,330 |
| Apr-17 | 11,517 | 12,741 | 11,477 |
| May-17 | 11,706 | 12,871 | 11,648 |
| Jun-17 | 11,767 | 12,987 | 11,736 |
| Jul-17 | 12,035 | 13,232 | 12,017 |
| Aug-17 | 12,125 | 13,258 | 12,051 |
| Sep-17 | 12,381 | 13,581 | 12,307 |
| Oct-17 | 12,716 | 13,877 | 12,544 |
| Nov-17 | 12,962 | 14,299 | 12,823 |
| Dec-17 | 13,121 | 14,442 | 13,015 |
| Jan-18 | 13,871 | 15,203 | 13,644 |
| Feb-18 | 13,315 | 14,642 | 13,101 |
| Mar-18 | 13,073 | 14,349 | 12,928 |
| Apr-18 | 13,182 | 14,403 | 13,003 |
| May-18 | 13,375 | 14,810 | 13,105 |
| Jun-18 | 13,230 | 14,907 | 13,076 |
| Jul-18 | 13,618 | 15,401 | 13,424 |
| Aug-18 | 13,885 | 15,942 | 13,585 |
| Sep-18 | 13,860 | 15,968 | 13,587 |
| Oct-18 | 12,878 | 14,793 | 12,610 |
| Nov-18 | 13,060 | 15,089 | 12,846 |
| Dec-18 | 11,986 | 13,685 | 11,952 |
| Jan-19 | 12,928 | 14,859 | 12,927 |
| Feb-19 | 13,234 | 15,382 | 13,285 |
| Mar-19 | 13,381 | 15,606 | 13,414 |
| Apr-19 | 13,737 | 16,230 | 13,821 |
| May-19 | 12,903 | 15,179 | 13,057 |
| Jun-19 | 13,737 | 16,246 | 13,870 |
| Jul-19 | 13,798 | 16,487 | 13,919 |
| Aug-19 | 13,528 | 16,151 | 13,596 |
| Sep-19 | 13,761 | 16,434 | 13,918 |
| Oct-19 | 14,056 | 16,788 | 14,257 |
| Nov-19 | 14,450 | 17,426 | 14,581 |
| Dec-19 | 14,862 | 17,929 | 15,049 |
| Jan-20 | 14,599 | 17,910 | 14,833 |
| Feb-20 | 13,510 | 16,444 | 13,658 |
| Mar-20 | 11,869 | 14,182 | 11,630 |
| Apr-20 | 13,209 | 16,061 | 12,831 |
| May-20 | 13,910 | 16,919 | 13,413 |
| Jun-20 | 14,211 | 17,306 | 13,758 |
| Jul-20 | 14,875 | 18,289 | 14,404 |
| Aug-20 | 15,829 | 19,614 | 15,120 |
| Sep-20 | 15,287 | 18,900 | 14,722 |
| Oct-20 | 14,860 | 18,492 | 14,464 |
| Nov-20 | 16,429 | 20,741 | 16,297 |
| Dec-20 | 17,147 | 21,675 | 17,044 |
| Jan-21 | 17,134 | 21,578 | 16,972 |
| Feb-21 | 17,479 | 22,253 | 17,499 |
| Mar-21 | 18,056 | 23,050 | 18,003 |
| Apr-21 | 18,760 | 24,238 | 18,723 |
| May-21 | 19,042 | 24,349 | 19,052 |
| Jun-21 | 19,298 | 24,950 | 19,181 |
| Jul-21 | 19,464 | 25,371 | 19,264 |
| Aug-21 | 19,938 | 26,095 | 19,678 |
| Sep-21 | 19,107 | 24,924 | 18,980 |
| Oct-21 | 20,174 | 26,610 | 19,741 |
| Nov-21 | 19,788 | 26,205 | 19,143 |
| Dec-21 | 20,498 | 27,236 | 19,993 |
| Jan-22 | 19,482 | 25,634 | 19,026 |
| Feb-22 | 19,055 | 24,988 | 18,712 |
| Mar-22 | 19,482 | 25,799 | 19,022 |
| Apr-22 | 17,922 | 23,484 | 17,671 |
| May-22 | 18,011 | 23,452 | 17,690 |
| Jun-22 | 16,539 | 21,490 | 16,188 |
| Jul-22 | 17,687 | 23,506 | 17,273 |
| Aug-22 | 16,951 | 22,629 | 16,714 |
| Sep-22 | 15,568 | 20,531 | 15,163 |
| Oct-22 | 16,805 | 22,214 | 16,088 |
| Nov-22 | 18,087 | 23,374 | 17,363 |
| Dec-22 | 17,315 | 22,005 | 16,808 |
| Jan-23 | 18,336 | 23,521 | 18,006 |
| Feb-23 | 17,787 | 22,971 | 17,472 |
| Mar-23 | 18,351 | 23,585 | 17,717 |
| Apr-23 | 18,687 | 23,837 | 17,897 |
| May-23 | 18,397 | 23,929 | 17,522 |
| Jun-23 | 19,434 | 25,563 | 18,494 |
| Jul-23 | 19,954 | 26,480 | 19,195 |
| Aug-23 | 19,587 | 25,968 | 18,615 |
| Sep-23 | 18,808 | 24,731 | 17,892 |
| Oct-23 | 18,210 | 24,076 | 17,252 |
| Nov-23 | 19,727 | 26,321 | 18,808 |
| Dec-23 | 20,837 | 27,717 | 19,884 |
| Jan-24 | 20,914 | 28,024 | 19,856 |
| Feb-24 | 21,977 | 29,541 | 20,532 |
| Mar-24 | 22,824 | 30,494 | 21,190 |
| Apr-24 | 21,789 | 29,152 | 20,446 |
| May-24 | 22,901 | 30,530 | 21,076 |
| Jun-24 | 23,194 | 31,475 | 21,245 |
The Growth of $10,000 chart compares the performance of the Fund over the period shown with dividends and capital gains reinvested to the Fund’s benchmark. Benchmark indices are unmanaged and do not reflect the deduction of expenses associated with a mutual fund, such as investment management and accounting fees.
The performance data shown represents past performance, which does not guarantee future results. The investment return and principal value of an investment will fluctuate so that an investor’s shares, when redeemed, may be worth more or less than their original cost. Current performance may be lower or higher than the performance data quoted. For current month-end performance data, please visit our website at www.meederfunds.com.
| Total Net Assets | $337,595,208 |
| # of Portfolio Holdings | 145 |
| Portfolio Turnover Rate | 148% |
| Advisory Fees and Waivers | 1,060,409 |
Average Annual Total Returns
| . | 1 Year | 5 Year | 10 Year |
|---|
| Retail Class | 19.35% | 11.04% | 8.78% |
| Russell 3000 Index | 23.13% | 14.14% | 12.15% |
| Morningstar Aggressive Target Risk Index | 14.87% | 8.90% | 7.83% |
What did the Fund invest in?
| Berkshire Hathaway Inc | 5.9% |
| Microsoft Corp | 5.4% |
| NVIDIA Corp | 4.1% |
| Amazon.com Inc | 3.2% |
| Alphabet Inc | 3.1% |
| Meta Platforms Inc | 2.0% |
| Apple Inc | 2.0% |
| Texas Instruments Inc | 1.9% |
| Johnson & Johnson | 1.8% |
| Merck & Co Inc | 1.5% |
| As a percentage of total net assets. Holdings exclude short-term investments and derivatives. |
| Value | Value |
|---|
| Real Estate | 0.0%Footnote Reference |
| Utilities | 0.2%Footnote Reference |
| Materials | 0.3%Footnote Reference |
| Consumer Staples | 2.2%Footnote Reference |
| Energy | 2.2%Footnote Reference |
| Industrials | 8.2%Footnote Reference |
| Communication Services | 9.9%Footnote Reference |
| Consumer Discretionary | 13.4%Footnote Reference |
| Financials | 14.7%Footnote Reference |
| Health Care | 14.7%Footnote Reference |
| Information Technology | 34.2%Footnote Reference |
| Footnote | Description |
Footnote | As a percentage of total common stocks. Concentrations are subject to change. |
| Value | Value |
|---|
| Common Stocks (United States) | 60.1%Footnote Reference |
| Registered Investment Companies | 5.0%Footnote Reference |
| Money Market Registered Investment Companies | 33.0%Footnote Reference |
| Assets/Other Liabilities (Net) | 1.9% |
| Footnote | Description |
Footnote | As a percentage of total net assets. The Fund has invested in stock index futures contracts in order to equitize cash balances it holds in a proprietary money market fund. |
Availability of Additional Information
For additional information about the Fund, including its prospectus, financial information, holdings, proxy voting information and other important materials, scan the QR code or visit www.meederinvestment.com/meeder-funds-resources.
To reduce fund expenses, only one copy of most shareholder documents are delivered to shareholders with multiple accounts at the same address. If you wish to receive copies of this document for each account, please contact the Meeder Funds at 866.633.3371 or contact your financial intermediary.
Semi-Annual Shareholder Report
June 30, 2024
Conservative Allocation Fund
Semi-Annual Shareholder Report
June 30, 2024
This semi-annual shareholder report contains important information about the Conservative Allocation Fund for the period of December 31, 2023, to 6/30/2024, as well as certain changes to the Fund. You can find additional information about the Fund at meederinvestment.com/mutual-funds . You can also request this information by contacting us at 866.633.3371 .
What were the Fund's costs for the period?
(based on a hypothetical $10,000 investment)
| Class Name | Cost of $10K Investment | Cost Paid as % of $10K Investment |
|---|
| Retail Class | $61.84 | 1.22% |
Total Return Based on a $10,000 Investment
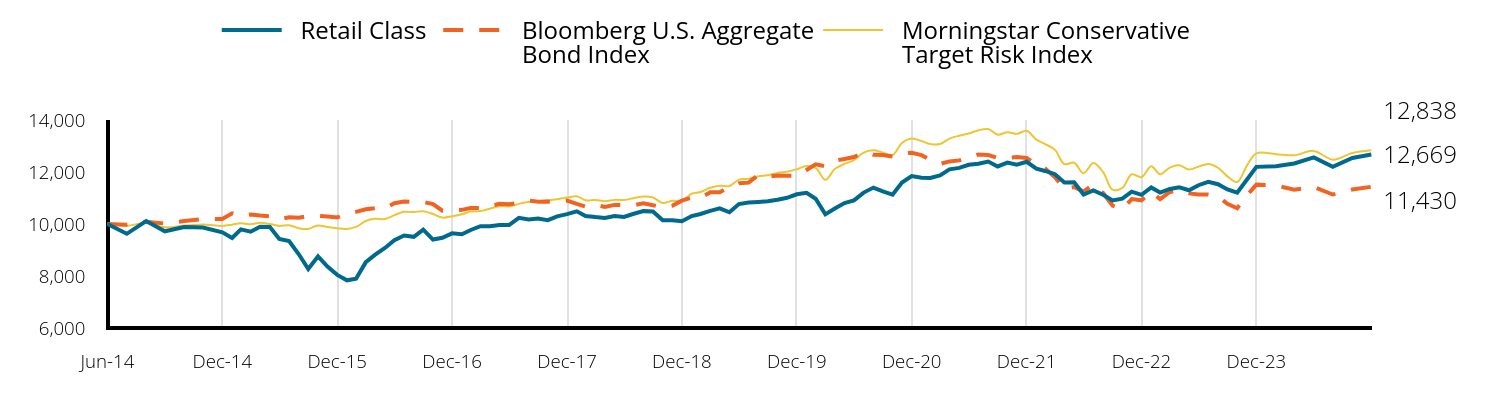
| Retail Class | Bloomberg U.S. Aggregate Bond Index | Morningstar Conservative Target Risk Index |
|---|
| Jun-14 | 10,000 | 10,000 | 10,000 |
| Jul-14 | 9,622 | 9,975 | 9,931 |
| Aug-14 | 10,111 | 10,085 | 10,037 |
| Sep-14 | 9,718 | 10,017 | 9,874 |
| Oct-14 | 9,880 | 10,115 | 9,937 |
| Nov-14 | 9,865 | 10,187 | 9,983 |
| Dec-14 | 9,681 | 10,196 | 9,927 |
| Jan-15 | 9,463 | 10,410 | 9,974 |
| Feb-15 | 9,793 | 10,312 | 10,027 |
| Mar-15 | 9,703 | 10,360 | 9,987 |
| Apr-15 | 9,892 | 10,323 | 10,045 |
| May-15 | 9,883 | 10,298 | 10,001 |
| Jun-15 | 9,426 | 10,186 | 9,926 |
| Jul-15 | 9,343 | 10,257 | 9,953 |
| Aug-15 | 8,835 | 10,242 | 9,839 |
| Sep-15 | 8,267 | 10,311 | 9,810 |
| Oct-15 | 8,754 | 10,313 | 9,944 |
| Nov-15 | 8,360 | 10,286 | 9,885 |
| Dec-15 | 8,043 | 10,252 | 9,836 |
| Jan-16 | 7,833 | 10,393 | 9,810 |
| Feb-16 | 7,893 | 10,467 | 9,886 |
| Mar-16 | 8,531 | 10,563 | 10,114 |
| Apr-16 | 8,822 | 10,604 | 10,197 |
| May-16 | 9,077 | 10,606 | 10,188 |
| Jun-16 | 9,372 | 10,797 | 10,340 |
| Jul-16 | 9,557 | 10,865 | 10,466 |
| Aug-16 | 9,506 | 10,853 | 10,459 |
| Sep-16 | 9,780 | 10,847 | 10,489 |
| Oct-16 | 9,401 | 10,764 | 10,383 |
| Nov-16 | 9,468 | 10,509 | 10,245 |
| Dec-16 | 9,641 | 10,524 | 10,296 |
| Jan-17 | 9,605 | 10,544 | 10,374 |
| Feb-17 | 9,768 | 10,615 | 10,479 |
| Mar-17 | 9,917 | 10,610 | 10,501 |
| Apr-17 | 9,917 | 10,692 | 10,588 |
| May-17 | 9,962 | 10,774 | 10,680 |
| Jun-17 | 9,958 | 10,763 | 10,675 |
| Jul-17 | 10,238 | 10,809 | 10,774 |
| Aug-17 | 10,170 | 10,906 | 10,848 |
| Sep-17 | 10,211 | 10,854 | 10,862 |
| Oct-17 | 10,148 | 10,861 | 10,909 |
| Nov-17 | 10,292 | 10,847 | 10,955 |
| Dec-17 | 10,378 | 10,897 | 11,017 |
| Jan-18 | 10,488 | 10,771 | 11,068 |
| Feb-18 | 10,309 | 10,669 | 10,911 |
| Mar-18 | 10,267 | 10,737 | 10,923 |
| Apr-18 | 10,235 | 10,658 | 10,877 |
| May-18 | 10,304 | 10,734 | 10,927 |
| Jun-18 | 10,272 | 10,720 | 10,923 |
| Jul-18 | 10,392 | 10,723 | 10,993 |
| Aug-18 | 10,494 | 10,792 | 11,055 |
| Sep-18 | 10,480 | 10,722 | 11,021 |
| Oct-18 | 10,140 | 10,638 | 10,807 |
| Nov-18 | 10,145 | 10,701 | 10,895 |
| Dec-18 | 10,106 | 10,898 | 10,885 |
| Jan-19 | 10,306 | 11,014 | 11,165 |
| Feb-19 | 10,383 | 11,007 | 11,228 |
| Mar-19 | 10,502 | 11,218 | 11,393 |
| Apr-19 | 10,603 | 11,221 | 11,469 |
| May-19 | 10,449 | 11,421 | 11,459 |
| Jun-19 | 10,765 | 11,564 | 11,707 |
| Jul-19 | 10,823 | 11,589 | 11,738 |
| Aug-19 | 10,847 | 11,890 | 11,832 |
| Sep-19 | 10,871 | 11,826 | 11,873 |
| Oct-19 | 10,934 | 11,862 | 11,965 |
| Nov-19 | 11,007 | 11,856 | 12,007 |
| Dec-19 | 11,142 | 11,848 | 12,106 |
| Jan-20 | 11,200 | 12,076 | 12,230 |
| Feb-20 | 10,971 | 12,293 | 12,159 |
| Mar-20 | 10,371 | 12,221 | 11,698 |
| Apr-20 | 10,596 | 12,438 | 12,114 |
| May-20 | 10,806 | 12,496 | 12,312 |
| Jun-20 | 10,909 | 12,575 | 12,456 |
| Jul-20 | 11,208 | 12,762 | 12,742 |
| Aug-20 | 11,400 | 12,659 | 12,833 |
| Sep-20 | 11,253 | 12,652 | 12,745 |
| Oct-20 | 11,125 | 12,596 | 12,652 |
| Nov-20 | 11,597 | 12,720 | 13,112 |
| Dec-20 | 11,841 | 12,737 | 13,286 |
| Jan-21 | 11,777 | 12,646 | 13,191 |
| Feb-21 | 11,772 | 12,463 | 13,074 |
| Mar-21 | 11,871 | 12,308 | 13,073 |
| Apr-21 | 12,099 | 12,405 | 13,282 |
| May-21 | 12,158 | 12,445 | 13,395 |
| Jun-21 | 12,277 | 12,533 | 13,476 |
| Jul-21 | 12,317 | 12,673 | 13,604 |
| Aug-21 | 12,402 | 12,649 | 13,651 |
| Sep-21 | 12,213 | 12,539 | 13,435 |
| Oct-21 | 12,363 | 12,536 | 13,529 |
| Nov-21 | 12,278 | 12,573 | 13,465 |
| Dec-21 | 12,391 | 12,541 | 13,586 |
| Jan-22 | 12,129 | 12,271 | 13,243 |
| Feb-22 | 12,039 | 12,134 | 13,071 |
| Mar-22 | 11,914 | 11,796 | 12,850 |
| Apr-22 | 11,594 | 11,349 | 12,303 |
| May-22 | 11,604 | 11,422 | 12,356 |
| Jun-22 | 11,133 | 11,243 | 11,953 |
| Jul-22 | 11,290 | 11,518 | 12,342 |
| Aug-22 | 11,127 | 11,192 | 11,994 |
| Sep-22 | 10,907 | 10,709 | 11,318 |
| Oct-22 | 10,975 | 10,570 | 11,385 |
| Nov-22 | 11,245 | 10,959 | 11,910 |
| Dec-22 | 11,122 | 10,909 | 11,800 |
| Jan-23 | 11,404 | 11,245 | 12,221 |
| Feb-23 | 11,207 | 10,954 | 11,912 |
| Mar-23 | 11,346 | 11,232 | 12,169 |
| Apr-23 | 11,410 | 11,300 | 12,257 |
| May-23 | 11,297 | 11,177 | 12,093 |
| Jun-23 | 11,490 | 11,137 | 12,206 |
| Jul-23 | 11,620 | 11,130 | 12,311 |
| Aug-23 | 11,528 | 11,059 | 12,163 |
| Sep-23 | 11,328 | 10,778 | 11,832 |
| Oct-23 | 11,204 | 10,607 | 11,615 |
| Nov-23 | 11,693 | 11,088 | 12,223 |
| Dec-23 | 12,197 | 11,512 | 12,713 |
| Jan-24 | 12,219 | 11,481 | 12,686 |
| Feb-24 | 12,328 | 11,318 | 12,642 |
| Mar-24 | 12,559 | 11,423 | 12,810 |
| Apr-24 | 12,200 | 11,134 | 12,474 |
| May-24 | 12,537 | 11,323 | 12,729 |
| Jun-24 | 12,669 | 11,430 | 12,838 |
The Growth of $10,000 chart compares the performance of the Fund over the period shown with dividends and capital gains reinvested to the Fund’s benchmark. Benchmark indices are unmanaged and do not reflect the deduction of expenses associated with a mutual fund, such as investment management and accounting fees.
The performance data shown represents past performance, which does not guarantee future results. The investment return and principal value of an investment will fluctuate so that an investor’s shares, when redeemed, may be worth more or less than their original cost. Current performance may be lower or higher than the performance data quoted. For current month-end performance data, please visit our website at www.meederfunds.com.
| Total Net Assets | $133,249,326 |
| # of Portfolio Holdings | 136 |
| Portfolio Turnover Rate | 72% |
| Advisory Fees and Waivers | 321,819 |
Average Annual Total Returns
| . | 1 Year | 5 Year | 10 Year |
|---|
| Retail Class | 10.26% | 3.31% | 2.39% |
| Bloomberg U.S. Aggregate Bond Index | 2.63% | | 1.35% |
| Morningstar Conservative Target Risk Index | 5.18% | 1.86% | 2.53% |
What did the Fund invest in?
| Fidelity Total Bond Fund - Class Z | 17.3% |
| Baird Core Plus Bond Fund - Class I | 16.7% |
| Frost Total Return Bond Fund - Class I | 8.7% |
| Dodge & Cox Income Fund - Class I | 5.5% |
| Fidelity Advisor High Income Advantage Fund - Class Z | 5.2% |
| BrandywineGLOBAL High Yield Fund - Class I | 5.2% |
| iShares 20+ Year Treasury Bond ETF | 5.1% |
| Eaton Vance Emerging Markets Debt Opportunities Fund - Class R6 | 3.4% |
| Berkshire Hathaway Inc | 2.3% |
| Microsoft Corp | 2.2% |
| As a percentage of total net assets. Holdings exclude short-term investments and derivatives. |
| Value | Value |
|---|
| Utilities | 0.3%Footnote Reference |
| Materials | 0.5%Footnote Reference |
| Consumer Staples | 2.5%Footnote Reference |
| Energy | 2.9%Footnote Reference |
| Industrials | 8.1%Footnote Reference |
| Communication Services | 9.4%Footnote Reference |
| Consumer Discretionary | 12.9%Footnote Reference |
| Health Care | 14.3%Footnote Reference |
| Financials | 14.4%Footnote Reference |
| Information Technology | 34.7%Footnote Reference |
| Footnote | Description |
Footnote | As a percentage of total common stocks. Concentrations are subject to change. |
| Value | Value |
|---|
| Common Stocks (United States) | 23.6%Footnote Reference |
| Registered Investment Companies | 68.4%Footnote Reference |
| Money Market Registered Investment Companies | 7.6%Footnote Reference |
| Assets/Other Liabilities (Net) | 0.4% |
| Footnote | Description |
Footnote | As a percentage of total net assets. The Fund has invested in stock index futures contracts in order to equitize cash balances it holds in a proprietary money market fund. |
Availability of Additional Information
For additional information about the Fund, including its prospectus, financial information, holdings, proxy voting information and other important materials, scan the QR code or visit www.meederinvestment.com/meeder-funds-resources.
To reduce fund expenses, only one copy of most shareholder documents are delivered to shareholders with multiple accounts at the same address. If you wish to receive copies of this document for each account, please contact the Meeder Funds at 866.633.3371 or contact your financial intermediary.
Conservative Allocation Fund
Semi-Annual Shareholder Report
June 30, 2024
Institutional Class BLNIX
Semi-Annual Shareholder Report
June 30, 2024
This semi-annual shareholder report contains important information about the Balanced Fund for the period of December 31, 2023, to 6/30/2024, as well as certain changes to the Fund. You can find additional information about the Fund at meederinvestment.com/mutual-funds . You can also request this information by contacting us at 866.633.3371 .
What were the Fund's costs for the period?
(based on a hypothetical $10,000 investment)
| Class Name | Cost of $10K Investment | Cost Paid as % of $10K Investment |
|---|
| Institutional Class | $55.14 | 1.06% |
Total Return Based on a $10,000 Investment
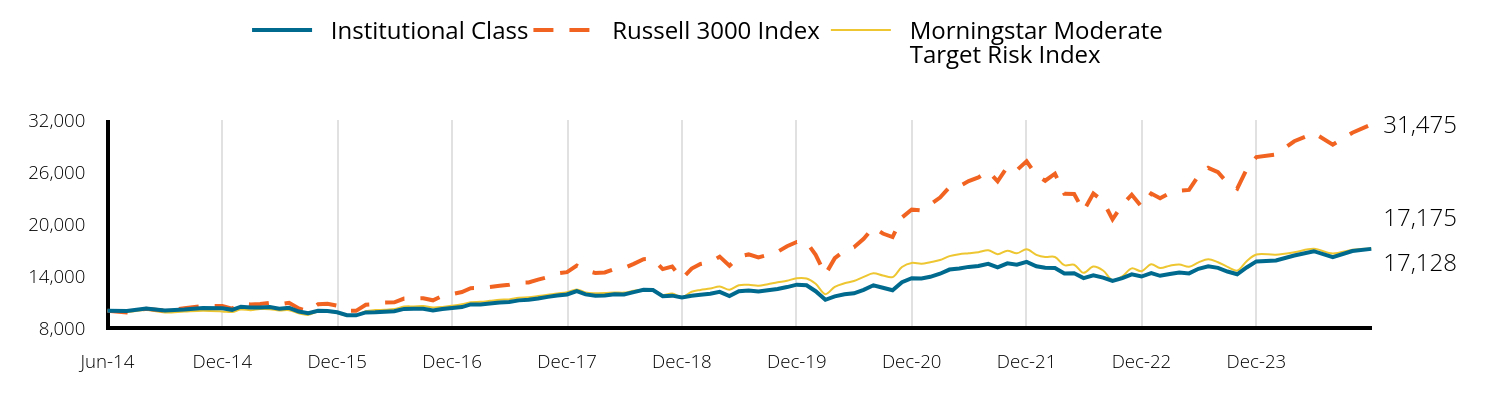
| Institutional Class | Russell 3000 Index | Morningstar Moderate Target Risk Index |
|---|
| Jun-14 | 10,000 | 10,000 | 10,000 |
| Jul-14 | 9,966 | 9,803 | 9,861 |
| Aug-14 | 10,239 | 10,214 | 10,063 |
| Sep-14 | 10,009 | 10,001 | 9,801 |
| Oct-14 | 10,121 | 10,276 | 9,909 |
| Nov-14 | 10,295 | 10,525 | 10,002 |
| Dec-14 | 10,273 | 10,525 | 9,915 |
| Jan-15 | 10,095 | 10,232 | 9,841 |
| Feb-15 | 10,460 | 10,825 | 10,129 |
| Mar-15 | 10,376 | 10,715 | 10,051 |
| Apr-15 | 10,357 | 10,763 | 10,184 |
| May-15 | 10,422 | 10,912 | 10,176 |
| Jun-15 | 10,235 | 10,729 | 10,030 |
| Jul-15 | 10,329 | 10,909 | 10,054 |
| Aug-15 | 9,897 | 10,250 | 9,694 |
| Sep-15 | 9,719 | 9,952 | 9,515 |
| Oct-15 | 9,992 | 10,738 | 9,916 |
| Nov-15 | 9,954 | 10,797 | 9,874 |
| Dec-15 | 9,813 | 10,576 | 9,738 |
| Jan-16 | 9,482 | 9,979 | 9,429 |
| Feb-16 | 9,463 | 9,976 | 9,474 |
| Mar-16 | 9,794 | 10,678 | 9,947 |
| Apr-16 | 9,813 | 10,744 | 10,072 |
| May-16 | 9,880 | 10,936 | 10,101 |
| Jun-16 | 9,927 | 10,959 | 10,186 |
| Jul-16 | 10,203 | 11,394 | 10,470 |
| Aug-16 | 10,212 | 11,423 | 10,492 |
| Sep-16 | 10,222 | 11,441 | 10,532 |
| Oct-16 | 10,012 | 11,193 | 10,378 |
| Nov-16 | 10,184 | 11,694 | 10,435 |
| Dec-16 | 10,296 | 11,922 | 10,572 |
| Jan-17 | 10,411 | 12,147 | 10,743 |
| Feb-17 | 10,717 | 12,599 | 10,960 |
| Mar-17 | 10,717 | 12,607 | 11,015 |
| Apr-17 | 10,832 | 12,741 | 11,130 |
| May-17 | 10,938 | 12,871 | 11,258 |
| Jun-17 | 10,995 | 12,987 | 11,301 |
| Jul-17 | 11,188 | 13,232 | 11,494 |
| Aug-17 | 11,255 | 13,258 | 11,551 |
| Sep-17 | 11,399 | 13,581 | 11,685 |
| Oct-17 | 11,592 | 13,877 | 11,831 |
| Nov-17 | 11,755 | 14,299 | 11,991 |
| Dec-17 | 11,866 | 14,442 | 12,122 |
| Jan-18 | 12,252 | 15,203 | 12,451 |
| Feb-18 | 11,876 | 14,642 | 12,094 |
| Mar-18 | 11,734 | 14,349 | 12,016 |
| Apr-18 | 11,754 | 14,403 | 12,029 |
| May-18 | 11,887 | 14,810 | 12,102 |
| Jun-18 | 11,876 | 14,907 | 12,084 |
| Jul-18 | 12,142 | 15,401 | 12,294 |
| Aug-18 | 12,407 | 15,942 | 12,402 |
| Sep-18 | 12,376 | 15,968 | 12,389 |
| Oct-18 | 11,671 | 14,793 | 11,805 |
| Nov-18 | 11,732 | 15,089 | 11,970 |
| Dec-18 | 11,528 | 13,685 | 11,545 |
| Jan-19 | 11,714 | 14,859 | 12,179 |
| Feb-19 | 11,848 | 15,382 | 12,390 |
| Mar-19 | 11,962 | 15,606 | 12,547 |
| Apr-19 | 12,169 | 16,230 | 12,789 |
| May-19 | 11,682 | 15,179 | 12,407 |
| Jun-19 | 12,231 | 16,246 | 12,940 |
| Jul-19 | 12,335 | 16,487 | 12,981 |
| Aug-19 | 12,200 | 16,151 | 12,870 |
| Sep-19 | 12,346 | 16,434 | 13,059 |
| Oct-19 | 12,492 | 16,788 | 13,275 |
| Nov-19 | 12,722 | 17,426 | 13,459 |
| Dec-19 | 13,000 | 17,929 | 13,742 |
| Jan-20 | 12,926 | 17,910 | 13,706 |
| Feb-20 | 12,243 | 16,444 | 13,098 |
| Mar-20 | 11,254 | 14,182 | 11,903 |
| Apr-20 | 11,654 | 16,061 | 12,751 |
| May-20 | 11,896 | 16,919 | 13,159 |
| Jun-20 | 12,001 | 17,306 | 13,419 |
| Jul-20 | 12,403 | 18,289 | 13,896 |
| Aug-20 | 12,931 | 19,614 | 14,312 |
| Sep-20 | 12,645 | 18,900 | 14,063 |
| Oct-20 | 12,358 | 18,492 | 13,875 |
| Nov-20 | 13,282 | 20,741 | 15,043 |
| Dec-20 | 13,742 | 21,675 | 15,504 |
| Jan-21 | 13,710 | 21,578 | 15,409 |
| Feb-21 | 13,902 | 22,253 | 15,596 |
| Mar-21 | 14,263 | 23,050 | 15,840 |
| Apr-21 | 14,741 | 24,238 | 16,296 |
| May-21 | 14,868 | 24,349 | 16,521 |
| Jun-21 | 15,049 | 24,950 | 16,629 |
| Jul-21 | 15,155 | 25,371 | 16,748 |
| Aug-21 | 15,410 | 26,095 | 16,967 |
| Sep-21 | 14,988 | 24,924 | 16,517 |
| Oct-21 | 15,459 | 26,610 | 16,924 |
| Nov-21 | 15,299 | 26,205 | 16,617 |
| Dec-21 | 15,626 | 27,236 | 17,084 |
| Jan-22 | 15,119 | 25,634 | 16,439 |
| Feb-22 | 14,958 | 24,988 | 16,187 |
| Mar-22 | 14,924 | 25,799 | 16,197 |
| Apr-22 | 14,290 | 23,484 | 15,250 |
| May-22 | 14,313 | 23,452 | 15,294 |
| Jun-22 | 13,760 | 21,490 | 14,361 |
| Jul-22 | 14,084 | 23,506 | 15,096 |
| Aug-22 | 13,806 | 22,629 | 14,636 |
| Sep-22 | 13,424 | 20,531 | 13,511 |
| Oct-22 | 13,751 | 22,214 | 13,963 |
| Nov-22 | 14,195 | 23,374 | 14,876 |
| Dec-22 | 13,939 | 22,005 | 14,559 |
| Jan-23 | 14,334 | 23,521 | 15,358 |
| Feb-23 | 14,023 | 22,971 | 14,924 |
| Mar-23 | 14,238 | 23,585 | 15,189 |
| Apr-23 | 14,407 | 23,837 | 15,328 |
| May-23 | 14,298 | 23,929 | 15,059 |
| Jun-23 | 14,827 | 25,563 | 15,566 |
| Jul-23 | 15,117 | 26,480 | 15,938 |
| Aug-23 | 14,936 | 25,968 | 15,584 |
| Sep-23 | 14,513 | 24,731 | 15,055 |
| Oct-23 | 14,198 | 24,076 | 14,625 |
| Nov-23 | 14,986 | 26,321 | 15,703 |
| Dec-23 | 15,685 | 27,717 | 16,485 |
| Jan-24 | 15,783 | 28,024 | 16,464 |
| Feb-24 | 16,357 | 29,541 | 16,731 |
| Mar-24 | 16,859 | 30,494 | 17,130 |
| Apr-24 | 16,184 | 29,152 | 16,592 |
| May-24 | 16,883 | 30,530 | 17,030 |
| Jun-24 | 17,128 | 31,475 | 17,175 |
The Growth of $10,000 chart compares the performance of the Fund over the period shown with dividends and capital gains reinvested to the Fund’s benchmark. Benchmark indices are unmanaged and do not reflect the deduction of expenses associated with a mutual fund, such as investment management and accounting fees.
Investment performance assumes reinvestment of all dividend and capital gain distributions. The results do not reflect the effect of taxes a shareholder would pay on Fund distributions or on the redemption of Fund shares. Historical performance attributed to the Institutional and Adviser Share Classes prior to their inception dates is based on the performance of the Retail Share Class. No adjustment has been made to reflect class-specific distribution or servicing fees. Returns may reflect the effect of voluntary fee waivers or expense reimbursements over the period shown. Without these waivers, performance would have been lower.
The performance data shown represents past performance, which does not guarantee future results. The investment return and principal value of an investment will fluctuate so that an investor’s shares, when redeemed, may be worth more or less than their original cost. Current performance may be lower or higher than the performance data quoted. For current month-end performance data, please visit our website at www.meederfunds.com.
| Total Net Assets | $391,853,611 |
| # of Portfolio Holdings | 157 |
| Portfolio Turnover Rate | 113% |
| Advisory Fees and Waivers | 1,275,428 |
Average Annual Total Returns
| . | 1 Year | 5 Year | 10 Year |
|---|
| Institutional Class | 15.52% | 6.97% | 5.53% |
| Russell 3000 Index | 23.13% | 14.14% | 12.15% |
| Morningstar Moderate Target Risk Index | 10.34% | 5.83% | 5.56% |
What did the Fund invest in?
| Fidelity Total Bond Fund - Class Z | 7.2% |
| Baird Core Plus Bond Fund - Class I | 6.9% |
| Berkshire Hathaway Inc | 5.7% |
| Microsoft Corp | 5.1% |
| Frost Total Return Bond Fund - Class I | 4.3% |
| NVIDIA Corp | 3.9% |
| Amazon.com Inc | 3.2% |
| Alphabet Inc | 2.7% |
| Dodge & Cox Income Fund - Class I | 2.3% |
| Fidelity Advisor High Income Advantage Fund - Class Z | 2.2% |
| As a percentage of total net assets. Holdings exclude short-term investments and derivatives. |
| Value | Value |
|---|
| Materials | 0.3%Footnote Reference |
| Utilities | 0.3%Footnote Reference |
| Consumer Staples | 2.1%Footnote Reference |
| Energy | 2.6%Footnote Reference |
| Industrials | 8.2%Footnote Reference |
| Communication Services | 10.0%Footnote Reference |
| Consumer Discretionary | 13.4%Footnote Reference |
| Health Care | 14.7%Footnote Reference |
| Financials | 15.0%Footnote Reference |
| Information Technology | 33.4%Footnote Reference |
| Footnote | Description |
Footnote | As a percentage of total common stocks. Concentrations are subject to change. |
| Value | Value |
|---|
| Common Stocks (United States) | 57.7%Footnote Reference |
| Registered Investment Companies | 29.2%Footnote Reference |
| Money Market Registered Investment Companies | 12.4%Footnote Reference |
| Assets/Other Liabilities (Net) | 0.7% |
| Footnote | Description |
Footnote | As a percentage of total net assets. The Fund has invested in stock index futures contracts in order to equitize cash balances it holds in a proprietary money market fund. |
Availability of Additional Information
For additional information about the Fund, including its prospectus, financial information, holdings, proxy voting information and other important materials, scan the QR code or visit www.meederinvestment.com/meeder-funds-resources.
To reduce fund expenses, only one copy of most shareholder documents are delivered to shareholders with multiple accounts at the same address. If you wish to receive copies of this document for each account, please contact the Meeder Funds at 866.633.3371 or contact your financial intermediary.
Institutional Class BLNIX
Semi-Annual Shareholder Report
June 30, 2024
Semi-Annual Shareholder Report
June 30, 2024
This semi-annual shareholder report contains important information about the Tactical Income Fund for the period of December 31, 2023, to 6/30/2024, as well as certain changes to the Fund. You can find additional information about the Fund at meederinvestment.com/mutual-funds . You can also request this information by contacting us at 866.633.3371 .
What were the Fund's costs for the period?
(based on a hypothetical $10,000 investment)
| Class Name | Cost of $10K Investment | Cost Paid as % of $10K Investment |
|---|
| Adviser Class | $35.69 | 0.71% |
Total Return Based on a $10,000 Investment
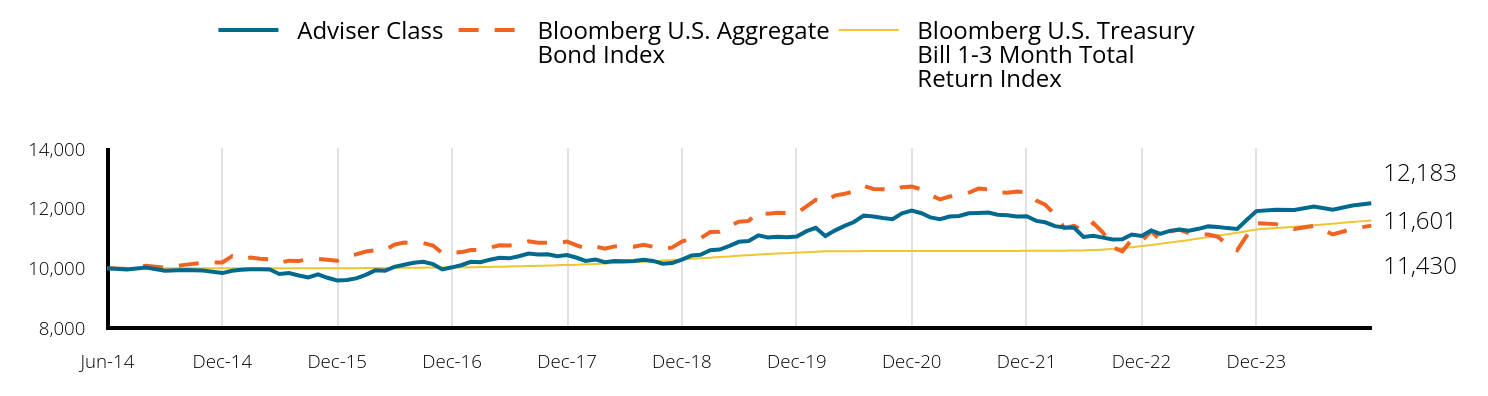
| Adviser Class | Bloomberg U.S. Aggregate Bond Index | Bloomberg U.S. Treasury Bill 1-3 Month Total Return Index |
|---|
| Jun-14 | 10,000 | 10,000 | 10,000 |
| Jul-14 | 9,964 | 9,975 | 10,001 |
| Aug-14 | 10,029 | 10,085 | 10,001 |
| Sep-14 | 9,920 | 10,017 | 10,001 |
| Oct-14 | 9,943 | 10,115 | 10,001 |
| Nov-14 | 9,923 | 10,187 | 10,001 |
| Dec-14 | 9,840 | 10,196 | 10,001 |
| Jan-15 | 9,917 | 10,410 | 10,001 |
| Feb-15 | 9,953 | 10,312 | 10,001 |
| Mar-15 | 9,968 | 10,360 | 10,001 |
| Apr-15 | 9,970 | 10,323 | 10,002 |
| May-15 | 9,962 | 10,298 | 10,002 |
| Jun-15 | 9,807 | 10,186 | 10,002 |
| Jul-15 | 9,840 | 10,257 | 10,002 |
| Aug-15 | 9,758 | 10,242 | 10,002 |
| Sep-15 | 9,693 | 10,311 | 10,002 |
| Oct-15 | 9,795 | 10,313 | 10,002 |
| Nov-15 | 9,682 | 10,286 | 10,002 |
| Dec-15 | 9,593 | 10,252 | 10,004 |
| Jan-16 | 9,606 | 10,393 | 10,004 |
| Feb-16 | 9,664 | 10,467 | 10,006 |
| Mar-16 | 9,780 | 10,563 | 10,010 |
| Apr-16 | 9,932 | 10,604 | 10,011 |
| May-16 | 9,917 | 10,606 | 10,012 |
| Jun-16 | 10,049 | 10,797 | 10,015 |
| Jul-16 | 10,118 | 10,865 | 10,017 |
| Aug-16 | 10,185 | 10,853 | 10,020 |
| Sep-16 | 10,219 | 10,847 | 10,023 |
| Oct-16 | 10,139 | 10,764 | 10,025 |
| Nov-16 | 9,963 | 10,509 | 10,027 |
| Dec-16 | 10,033 | 10,524 | 10,030 |
| Jan-17 | 10,111 | 10,544 | 10,034 |
| Feb-17 | 10,219 | 10,615 | 10,038 |
| Mar-17 | 10,203 | 10,610 | 10,040 |
| Apr-17 | 10,290 | 10,692 | 10,046 |
| May-17 | 10,350 | 10,774 | 10,052 |
| Jun-17 | 10,334 | 10,763 | 10,060 |
| Jul-17 | 10,405 | 10,809 | 10,068 |
| Aug-17 | 10,493 | 10,906 | 10,076 |
| Sep-17 | 10,460 | 10,854 | 10,085 |
| Oct-17 | 10,471 | 10,861 | 10,094 |
| Nov-17 | 10,405 | 10,847 | 10,102 |
| Dec-17 | 10,442 | 10,897 | 10,111 |
| Jan-18 | 10,353 | 10,771 | 10,123 |
| Feb-18 | 10,247 | 10,669 | 10,132 |
| Mar-18 | 10,297 | 10,737 | 10,145 |
| Apr-18 | 10,205 | 10,658 | 10,159 |
| May-18 | 10,247 | 10,734 | 10,174 |
| Jun-18 | 10,235 | 10,720 | 10,190 |
| Jul-18 | 10,247 | 10,723 | 10,206 |
| Aug-18 | 10,286 | 10,792 | 10,222 |
| Sep-18 | 10,247 | 10,722 | 10,239 |
| Oct-18 | 10,156 | 10,638 | 10,258 |
| Nov-18 | 10,177 | 10,701 | 10,276 |
| Dec-18 | 10,290 | 10,898 | 10,296 |
| Jan-19 | 10,433 | 11,014 | 10,317 |
| Feb-19 | 10,455 | 11,007 | 10,336 |
| Mar-19 | 10,604 | 11,218 | 10,357 |
| Apr-19 | 10,629 | 11,221 | 10,377 |
| May-19 | 10,750 | 11,421 | 10,399 |
| Jun-19 | 10,888 | 11,564 | 10,421 |
| Jul-19 | 10,913 | 11,589 | 10,440 |
| Aug-19 | 11,104 | 11,890 | 10,459 |
| Sep-19 | 11,034 | 11,826 | 10,477 |
| Oct-19 | 11,054 | 11,862 | 10,495 |
| Nov-19 | 11,039 | 11,856 | 10,508 |
| Dec-19 | 11,067 | 11,848 | 10,524 |
| Jan-20 | 11,245 | 12,076 | 10,537 |
| Feb-20 | 11,356 | 12,293 | 10,551 |
| Mar-20 | 11,081 | 12,221 | 10,572 |
| Apr-20 | 11,263 | 12,438 | 10,573 |
| May-20 | 11,423 | 12,496 | 10,573 |
| Jun-20 | 11,551 | 12,575 | 10,575 |
| Jul-20 | 11,770 | 12,762 | 10,576 |
| Aug-20 | 11,738 | 12,659 | 10,577 |
| Sep-20 | 11,687 | 12,652 | 10,578 |
| Oct-20 | 11,645 | 12,596 | 10,579 |
| Nov-20 | 11,841 | 12,720 | 10,580 |
| Dec-20 | 11,936 | 12,737 | 10,580 |
| Jan-21 | 11,846 | 12,646 | 10,581 |
| Feb-21 | 11,706 | 12,463 | 10,582 |
| Mar-21 | 11,647 | 12,308 | 10,582 |
| Apr-21 | 11,737 | 12,405 | 10,582 |
| May-21 | 11,752 | 12,445 | 10,582 |
| Jun-21 | 11,845 | 12,533 | 10,582 |
| Jul-21 | 11,854 | 12,673 | 10,583 |
| Aug-21 | 11,867 | 12,649 | 10,583 |
| Sep-21 | 11,798 | 12,539 | 10,583 |
| Oct-21 | 11,775 | 12,536 | 10,584 |
| Nov-21 | 11,739 | 12,573 | 10,584 |
| Dec-21 | 11,745 | 12,541 | 10,585 |
| Jan-22 | 11,588 | 12,271 | 10,585 |
| Feb-22 | 11,542 | 12,134 | 10,586 |
| Mar-22 | 11,414 | 11,796 | 10,588 |
| Apr-22 | 11,371 | 11,349 | 10,591 |
| May-22 | 11,359 | 11,422 | 10,596 |
| Jun-22 | 11,053 | 11,243 | 10,601 |
| Jul-22 | 11,090 | 11,518 | 10,610 |
| Aug-22 | 11,029 | 11,192 | 10,630 |
| Sep-22 | 10,963 | 10,709 | 10,652 |
| Oct-22 | 10,971 | 10,570 | 10,674 |
| Nov-22 | 11,131 | 10,959 | 10,708 |
| Dec-22 | 11,082 | 10,909 | 10,746 |
| Jan-23 | 11,268 | 11,245 | 10,782 |
| Feb-23 | 11,156 | 10,954 | 10,820 |
| Mar-23 | 11,255 | 11,232 | 10,863 |
| Apr-23 | 11,299 | 11,300 | 10,905 |
| May-23 | 11,260 | 11,177 | 10,949 |
| Jun-23 | 11,323 | 11,137 | 10,996 |
| Jul-23 | 11,405 | 11,130 | 11,044 |
| Aug-23 | 11,382 | 11,059 | 11,094 |
| Sep-23 | 11,347 | 10,778 | 11,144 |
| Oct-23 | 11,321 | 10,607 | 11,195 |
| Nov-23 | 11,616 | 11,088 | 11,245 |
| Dec-23 | 11,917 | 11,512 | 11,298 |
| Jan-24 | 11,962 | 11,481 | 11,347 |
| Feb-24 | 11,955 | 11,318 | 11,395 |
| Mar-24 | 12,072 | 11,423 | 11,447 |
| Apr-24 | 11,964 | 11,134 | 11,497 |
| May-24 | 12,104 | 11,323 | 11,553 |
| Jun-24 | 12,183 | 11,430 | 11,601 |
The Growth of $10,000 chart compares the performance of the Fund over the period shown with dividends and capital gains reinvested to the Fund’s benchmark. Benchmark indices are unmanaged and do not reflect the deduction of expenses associated with a mutual fund, such as investment management and accounting fees.
Investment performance assumes reinvestment of all dividend and capital gain distributions. The results do not reflect the effect of taxes a shareholder would pay on Fund distributions or on the redemption of Fund shares. Historical performance attributed to the Institutional and Adviser Share Classes prior to their inception dates is based on the performance of the Retail Share Class. No adjustment has been made to reflect class-specific distribution or servicing fees. Returns may reflect the effect of voluntary fee waivers or expense reimbursements over the period shown. Without these waivers, performance would have been lower.
The performance data shown represents past performance, which does not guarantee future results. The investment return and principal value of an investment will fluctuate so that an investor’s shares, when redeemed, may be worth more or less than their original cost. Current performance may be lower or higher than the performance data quoted. For current month-end performance data, please visit our website at www.meederfunds.com.
| Total Net Assets | $74,359,352 |
| # of Portfolio Holdings | 14 |
| Portfolio Turnover Rate | 69% |
| Advisory Fees and Waivers | 141,954 |
Average Annual Total Returns
| . | 1 Year | 5 Year | 10 Year |
|---|
| Adviser Class | 7.60% | 2.27% | 1.99% |
| Bloomberg U.S. Aggregate Bond Index | 2.63% | | 1.35% |
| Bloomberg U.S. Treasury Bill 1-3 Month Total Return Index | 5.50% | 2.17% | 1.50% |
What did the Fund invest in?
| PIMCO Low Duration Income Fund - Class I | 14.5% |
| Fidelity Advisor High Income Advantage Fund - Class Z | 12.3% |
| BrandywineGLOBAL High Yield Fund - Class I | 12.2% |
| Frost Total Return Bond Fund - Class I | 11.7% |
| Diamond Hill Short Duration Securitized Bond Fund - Class Y | 10.2% |
| Fidelity Total Bond Fund - Class Z | 9.7% |
| iShares J.P. Morgan USD Emerging Markets Bond ETF | 6.7% |
| Eaton Vance Emerging Markets Debt Opportunities Fund - Class R6 | 4.9% |
| As a percentage of total net assets. Holdings exclude short-term investments and derivatives. |
| Value | Value |
|---|
| International Fixed Income | 6.7%Footnote Reference |
| Money Market Registered Investment Companies | 17.6%Footnote Reference |
| U.S. Fixed Income | 75.4%Footnote Reference |
| Footnote | Description |
Footnote | As a percentage of total net assets. Concentrations are subject to change. |
| Value | Value |
|---|
| Registered Investment Companies | 82.1%Footnote Reference |
| Money Market Registered Investment Companies | 17.6%Footnote Reference |
| Assets/Other Liabilities (Net) | 0.3% |
| Footnote | Description |
Footnote | As a percentage of total net assets. The Fund has invested in stock index futures contracts in order to equitize cash balances it holds in a proprietary money market fund. |
Availability of Additional Information
For additional information about the Fund, including its prospectus, financial information, holdings, proxy voting information and other important materials, scan the QR code or visit www.meederinvestment.com/meeder-funds-resources.
To reduce fund expenses, only one copy of most shareholder documents are delivered to shareholders with multiple accounts at the same address. If you wish to receive copies of this document for each account, please contact the Meeder Funds at 866.633.3371 or contact your financial intermediary.
Semi-Annual Shareholder Report
June 30, 2024
Semi-Annual Shareholder Report
June 30, 2024
This semi-annual shareholder report contains important information about the Dynamic Allocation Fund for the period of December 31, 2023, to 6/30/2024, as well as certain changes to the Fund. You can find additional information about the Fund at meederinvestment.com/mutual-funds . You can also request this information by contacting us at 866.633.3371 .
What were the Fund's costs for the period?
(based on a hypothetical $10,000 investment)
| Class Name | Cost of $10K Investment | Cost Paid as % of $10K Investment |
|---|
| Adviser Class | $48.62 | 0.92% |
Total Return Based on a $10,000 Investment
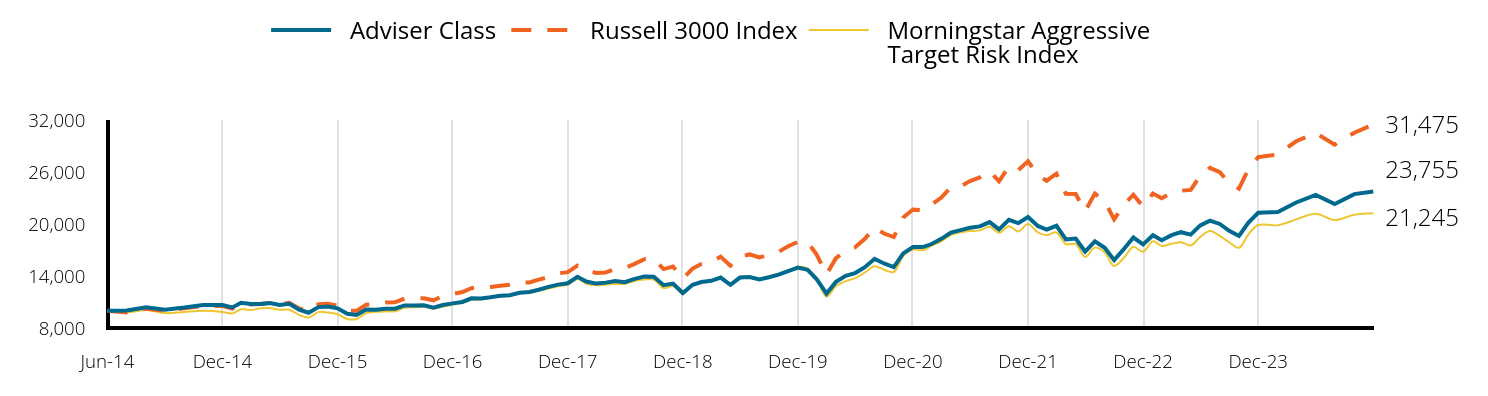
| Adviser Class | Russell 3000 Index | Morningstar Aggressive Target Risk Index |
|---|
| Jun-14 | 10,000 | 10,000 | 10,000 |
| Jul-14 | 10,018 | 9,803 | 9,802 |
| Aug-14 | 10,392 | 10,214 | 10,073 |
| Sep-14 | 10,114 | 10,001 | 9,718 |
| Oct-14 | 10,357 | 10,276 | 9,855 |
| Nov-14 | 10,656 | 10,525 | 9,977 |
| Dec-14 | 10,642 | 10,525 | 9,849 |
| Jan-15 | 10,366 | 10,232 | 9,675 |
| Feb-15 | 10,908 | 10,825 | 10,174 |
| Mar-15 | 10,759 | 10,715 | 10,064 |
| Apr-15 | 10,770 | 10,763 | 10,278 |
| May-15 | 10,876 | 10,912 | 10,299 |
| Jun-15 | 10,653 | 10,729 | 10,098 |
| Jul-15 | 10,791 | 10,909 | 10,112 |
| Aug-15 | 10,111 | 10,250 | 9,517 |
| Sep-15 | 9,760 | 9,952 | 9,205 |
| Oct-15 | 10,410 | 10,738 | 9,829 |
| Nov-15 | 10,474 | 10,797 | 9,792 |
| Dec-15 | 10,274 | 10,576 | 9,586 |
| Jan-16 | 9,648 | 9,979 | 9,036 |
| Feb-16 | 9,506 | 9,976 | 9,037 |
| Mar-16 | 10,142 | 10,678 | 9,710 |
| Apr-16 | 10,109 | 10,744 | 9,870 |
| May-16 | 10,230 | 10,936 | 9,920 |
| Jun-16 | 10,219 | 10,959 | 9,926 |
| Jul-16 | 10,604 | 11,394 | 10,346 |
| Aug-16 | 10,593 | 11,423 | 10,392 |
| Sep-16 | 10,627 | 11,441 | 10,448 |
| Oct-16 | 10,333 | 11,193 | 10,247 |
| Nov-16 | 10,654 | 11,694 | 10,465 |
| Dec-16 | 10,838 | 11,922 | 10,673 |
| Jan-17 | 11,005 | 12,147 | 10,931 |
| Feb-17 | 11,428 | 12,599 | 11,235 |
| Mar-17 | 11,406 | 12,607 | 11,330 |
| Apr-17 | 11,540 | 12,741 | 11,477 |
| May-17 | 11,730 | 12,871 | 11,648 |
| Jun-17 | 11,786 | 12,987 | 11,736 |
| Jul-17 | 12,065 | 13,232 | 12,017 |
| Aug-17 | 12,154 | 13,258 | 12,051 |
| Sep-17 | 12,411 | 13,581 | 12,307 |
| Oct-17 | 12,746 | 13,877 | 12,544 |
| Nov-17 | 13,003 | 14,299 | 12,823 |
| Dec-17 | 13,160 | 14,442 | 13,015 |
| Jan-18 | 13,910 | 15,203 | 13,644 |
| Feb-18 | 13,366 | 14,642 | 13,101 |
| Mar-18 | 13,124 | 14,349 | 12,928 |
| Apr-18 | 13,233 | 14,403 | 13,003 |
| May-18 | 13,426 | 14,810 | 13,105 |
| Jun-18 | 13,281 | 14,907 | 13,076 |
| Jul-18 | 13,669 | 15,401 | 13,424 |
| Aug-18 | 13,936 | 15,942 | 13,585 |
| Sep-18 | 13,924 | 15,968 | 13,587 |
| Oct-18 | 12,941 | 14,793 | 12,610 |
| Nov-18 | 13,123 | 15,089 | 12,846 |
| Dec-18 | 12,042 | 13,685 | 11,952 |
| Jan-19 | 12,986 | 14,859 | 12,927 |
| Feb-19 | 13,305 | 15,382 | 13,285 |
| Mar-19 | 13,446 | 15,606 | 13,414 |
| Apr-19 | 13,815 | 16,230 | 13,821 |
| May-19 | 12,980 | 15,179 | 13,057 |
| Jun-19 | 13,821 | 16,246 | 13,870 |
| Jul-19 | 13,882 | 16,487 | 13,919 |
| Aug-19 | 13,612 | 16,151 | 13,596 |
| Sep-19 | 13,858 | 16,434 | 13,918 |
| Oct-19 | 14,154 | 16,788 | 14,257 |
| Nov-19 | 14,548 | 17,426 | 14,581 |
| Dec-19 | 14,967 | 17,929 | 15,049 |
| Jan-20 | 14,716 | 17,910 | 14,833 |
| Feb-20 | 13,623 | 16,444 | 13,658 |
| Mar-20 | 11,976 | 14,182 | 11,630 |
| Apr-20 | 13,321 | 16,061 | 12,831 |
| May-20 | 14,025 | 16,919 | 13,413 |
| Jun-20 | 14,339 | 17,306 | 13,758 |
| Jul-20 | 15,020 | 18,289 | 14,404 |
| Aug-20 | 15,979 | 19,614 | 15,120 |
| Sep-20 | 15,444 | 18,900 | 14,722 |
| Oct-20 | 15,015 | 18,492 | 14,464 |
| Nov-20 | 16,606 | 20,741 | 16,297 |
| Dec-20 | 17,340 | 21,675 | 17,044 |
| Jan-21 | 17,340 | 21,578 | 16,972 |
| Feb-21 | 17,688 | 22,253 | 17,499 |
| Mar-21 | 18,281 | 23,050 | 18,003 |
| Apr-21 | 19,002 | 24,238 | 18,723 |
| May-21 | 19,286 | 24,349 | 19,052 |
| Jun-21 | 19,556 | 24,950 | 19,181 |
| Jul-21 | 19,724 | 25,371 | 19,264 |
| Aug-21 | 20,213 | 26,095 | 19,678 |
| Sep-21 | 19,384 | 24,924 | 18,980 |
| Oct-21 | 20,470 | 26,610 | 19,741 |
| Nov-21 | 20,095 | 26,205 | 19,143 |
| Dec-21 | 20,812 | 27,236 | 19,993 |
| Jan-22 | 19,777 | 25,634 | 19,026 |
| Feb-22 | 19,363 | 24,988 | 18,712 |
| Mar-22 | 19,792 | 25,799 | 19,022 |
| Apr-22 | 18,224 | 23,484 | 17,671 |
| May-22 | 18,313 | 23,452 | 17,690 |
| Jun-22 | 16,819 | 21,490 | 16,188 |
| Jul-22 | 18,002 | 23,506 | 17,273 |
| Aug-22 | 17,247 | 22,629 | 16,714 |
| Sep-22 | 15,842 | 20,531 | 15,163 |
| Oct-22 | 17,116 | 22,214 | 16,088 |
| Nov-22 | 18,434 | 23,374 | 17,363 |
| Dec-22 | 17,643 | 22,005 | 16,808 |
| Jan-23 | 18,700 | 23,521 | 18,006 |
| Feb-23 | 18,133 | 22,971 | 17,472 |
| Mar-23 | 18,715 | 23,585 | 17,717 |
| Apr-23 | 19,052 | 23,837 | 17,897 |
| May-23 | 18,776 | 23,929 | 17,522 |
| Jun-23 | 19,834 | 25,563 | 18,494 |
| Jul-23 | 20,388 | 26,480 | 19,195 |
| Aug-23 | 20,003 | 25,968 | 18,615 |
| Sep-23 | 19,219 | 24,731 | 17,892 |
| Oct-23 | 18,617 | 24,076 | 17,252 |
| Nov-23 | 20,161 | 26,321 | 18,808 |
| Dec-23 | 21,299 | 27,717 | 19,884 |
| Jan-24 | 21,393 | 28,024 | 19,856 |
| Feb-24 | 22,480 | 29,541 | 20,532 |
| Mar-24 | 23,350 | 30,494 | 21,190 |
| Apr-24 | 22,306 | 29,152 | 20,446 |
| May-24 | 23,444 | 30,530 | 21,076 |
| Jun-24 | 23,755 | 31,475 | 21,245 |
The Growth of $10,000 chart compares the performance of the Fund over the period shown with dividends and capital gains reinvested to the Fund’s benchmark. Benchmark indices are unmanaged and do not reflect the deduction of expenses associated with a mutual fund, such as investment management and accounting fees.
Investment performance assumes reinvestment of all dividend and capital gain distributions. The results do not reflect the effect of taxes a shareholder would pay on Fund distributions or on the redemption of Fund shares. Historical performance attributed to the Institutional and Adviser Share Classes prior to their inception dates is based on the performance of the Retail Share Class. No adjustment has been made to reflect class-specific distribution or servicing fees. Returns may reflect the effect of voluntary fee waivers or expense reimbursements over the period shown. Without these waivers, performance would have been lower.
The performance data shown represents past performance, which does not guarantee future results. The investment return and principal value of an investment will fluctuate so that an investor’s shares, when redeemed, may be worth more or less than their original cost. Current performance may be lower or higher than the performance data quoted. For current month-end performance data, please visit our website at www.meederfunds.com.
| Total Net Assets | $337,595,208 |
| # of Portfolio Holdings | 145 |
| Portfolio Turnover Rate | 148% |
| Advisory Fees and Waivers | 1,060,409 |
Average Annual Total Returns
| . | 1 Year | 5 Year | 10 Year |
|---|
| Adviser Class | 19.77% | 11.44% | 9.04% |
| Russell 3000 Index | 23.13% | 14.14% | 12.15% |
| Morningstar Aggressive Target Risk Index | 14.87% | 8.90% | 7.83% |
What did the Fund invest in?
| Berkshire Hathaway Inc | 5.9% |
| Microsoft Corp | 5.4% |
| NVIDIA Corp | 4.1% |
| Amazon.com Inc | 3.2% |
| Alphabet Inc | 3.1% |
| Meta Platforms Inc | 2.0% |
| Apple Inc | 2.0% |
| Texas Instruments Inc | 1.9% |
| Johnson & Johnson | 1.8% |
| Merck & Co Inc | 1.5% |
| As a percentage of total net assets. Holdings exclude short-term investments and derivatives. |
| Value | Value |
|---|
| Real Estate | 0.0%Footnote Reference |
| Utilities | 0.2%Footnote Reference |
| Materials | 0.3%Footnote Reference |
| Consumer Staples | 2.2%Footnote Reference |
| Energy | 2.2%Footnote Reference |
| Industrials | 8.2%Footnote Reference |
| Communication Services | 9.9%Footnote Reference |
| Consumer Discretionary | 13.4%Footnote Reference |
| Financials | 14.7%Footnote Reference |
| Health Care | 14.7%Footnote Reference |
| Information Technology | 34.2%Footnote Reference |
| Footnote | Description |
Footnote | As a percentage of total common stocks. Concentrations are subject to change. |
| Value | Value |
|---|
| Common Stocks (United States) | 60.1%Footnote Reference |
| Registered Investment Companies | 5.0%Footnote Reference |
| Money Market Registered Investment Companies | 33.0%Footnote Reference |
| Assets/Other Liabilities (Net) | 1.9% |
| Footnote | Description |
Footnote | As a percentage of total net assets. The Fund has invested in stock index futures contracts in order to equitize cash balances it holds in a proprietary money market fund. |
Availability of Additional Information
For additional information about the Fund, including its prospectus, financial information, holdings, proxy voting information and other important materials, scan the QR code or visit www.meederinvestment.com/meeder-funds-resources.
To reduce fund expenses, only one copy of most shareholder documents are delivered to shareholders with multiple accounts at the same address. If you wish to receive copies of this document for each account, please contact the Meeder Funds at 866.633.3371 or contact your financial intermediary.
Semi-Annual Shareholder Report
June 30, 2024
Semi-Annual Shareholder Report
June 30, 2024
This semi-annual shareholder report contains important information about the Spectrum Fund for the period of December 31, 2023, to 6/30/2024, as well as certain changes to the Fund. You can find additional information about the Fund at meederinvestment.com/mutual-funds . You can also request this information by contacting us at 866.633.3371 .
What were the Fund's costs for the period?
(based on a hypothetical $10,000 investment)
| Class Name | Cost of $10K Investment | Cost Paid as % of $10K Investment |
|---|
| Retail Class | $65.53 | 1.24% |
Total Return Based on a $10,000 Investment

| Retail Class | Russell 3000 Index | Morningstar Moderate Target Risk Index |
|---|
| Jan-15 | 10,000 | 10,000 | 10,000 |
| Jan-15 | 9,770 | 9,722 | 9,925 |
| Feb-15 | 10,350 | 10,285 | 10,216 |
| Mar-15 | 10,310 | 10,180 | 10,137 |
| Apr-15 | 10,170 | 10,226 | 10,271 |
| May-15 | 10,290 | 10,368 | 10,263 |
| Jun-15 | 10,100 | 10,194 | 10,115 |
| Jul-15 | 10,280 | 10,365 | 10,140 |
| Aug-15 | 9,770 | 9,739 | 9,777 |
| Sep-15 | 9,650 | 9,455 | 9,596 |
| Oct-15 | 10,050 | 10,202 | 10,000 |
| Nov-15 | 10,090 | 10,258 | 9,959 |
| Dec-15 | 9,879 | 10,048 | 9,821 |
| Jan-16 | 9,463 | 9,481 | 9,509 |
| Feb-16 | 9,504 | 9,478 | 9,555 |
| Mar-16 | 9,920 | 10,145 | 10,032 |
| Apr-16 | 9,808 | 10,208 | 10,158 |
| May-16 | 9,940 | 10,391 | 10,187 |
| Jun-16 | 9,869 | 10,412 | 10,273 |
| Jul-16 | 10,214 | 10,825 | 10,560 |
| Aug-16 | 10,224 | 10,853 | 10,582 |
| Sep-16 | 10,235 | 10,870 | 10,622 |
| Oct-16 | 10,123 | 10,635 | 10,467 |
| Nov-16 | 10,417 | 11,111 | 10,524 |
| Dec-16 | 10,568 | 11,327 | 10,663 |
| Jan-17 | 10,702 | 11,541 | 10,835 |
| Feb-17 | 11,113 | 11,970 | 11,054 |
| Mar-17 | 11,113 | 11,978 | 11,109 |
| Apr-17 | 11,185 | 12,105 | 11,225 |
| May-17 | 11,267 | 12,229 | 11,355 |
| Jun-17 | 11,318 | 12,339 | 11,398 |
| Jul-17 | 11,534 | 12,572 | 11,592 |
| Aug-17 | 11,586 | 12,596 | 11,650 |
| Sep-17 | 11,853 | 12,903 | 11,785 |
| Oct-17 | 12,151 | 13,185 | 11,932 |
| Nov-17 | 12,449 | 13,585 | 12,094 |
| Dec-17 | 12,605 | 13,721 | 12,225 |
| Jan-18 | 13,242 | 14,444 | 12,558 |
| Feb-18 | 12,759 | 13,912 | 12,197 |
| Mar-18 | 12,496 | 13,633 | 12,119 |
| Apr-18 | 12,595 | 13,684 | 12,132 |
| May-18 | 12,770 | 14,071 | 12,206 |
| Jun-18 | 12,715 | 14,163 | 12,187 |
| Jul-18 | 13,089 | 14,633 | 12,399 |
| Aug-18 | 13,495 | 15,147 | 12,508 |
| Sep-18 | 13,495 | 15,172 | 12,494 |
| Oct-18 | 12,386 | 14,055 | 11,906 |
| Nov-18 | 12,485 | 14,336 | 12,072 |
| Dec-18 | 12,106 | 13,002 | 11,644 |
| Jan-19 | 12,284 | 14,118 | 12,283 |
| Feb-19 | 12,439 | 14,614 | 12,496 |
| Mar-19 | 12,484 | 14,828 | 12,654 |
| Apr-19 | 12,828 | 15,420 | 12,898 |
| May-19 | 12,028 | 14,422 | 12,513 |
| Jun-19 | 12,750 | 15,435 | 13,050 |
| Jul-19 | 12,850 | 15,664 | 13,092 |
| Aug-19 | 12,606 | 15,345 | 12,980 |
| Sep-19 | 12,828 | 15,614 | 13,170 |
| Oct-19 | 12,939 | 15,950 | 13,389 |
| Nov-19 | 13,340 | 16,557 | 13,574 |
| Dec-19 | 13,683 | 17,035 | 13,859 |
| Jan-20 | 13,380 | 17,016 | 13,823 |
| Feb-20 | 12,303 | 15,623 | 13,210 |
| Mar-20 | 10,787 | 13,475 | 12,005 |
| Apr-20 | 11,191 | 15,259 | 12,860 |
| May-20 | 11,348 | 16,075 | 13,272 |
| Jun-20 | 11,472 | 16,443 | 13,534 |
| Jul-20 | 11,932 | 17,376 | 14,014 |
| Aug-20 | 12,707 | 18,635 | 14,435 |
| Sep-20 | 12,314 | 17,957 | 14,184 |
| Oct-20 | 11,921 | 17,569 | 13,993 |
| Nov-20 | 13,067 | 19,707 | 15,172 |
| Dec-20 | 13,652 | 20,593 | 15,636 |
| Jan-21 | 13,663 | 20,501 | 15,541 |
| Feb-21 | 13,978 | 21,142 | 15,729 |
| Mar-21 | 14,494 | 21,900 | 15,975 |
| Apr-21 | 15,146 | 23,029 | 16,435 |
| May-21 | 15,315 | 23,134 | 16,662 |
| Jun-21 | 15,573 | 23,705 | 16,771 |
| Jul-21 | 15,730 | 24,105 | 16,891 |
| Aug-21 | 16,135 | 24,793 | 17,112 |
| Sep-21 | 15,542 | 23,681 | 16,658 |
| Oct-21 | 16,307 | 25,282 | 17,069 |
| Nov-21 | 16,059 | 24,897 | 16,759 |
| Dec-21 | 16,461 | 25,877 | 17,230 |
| Jan-22 | 15,809 | 24,355 | 16,579 |
| Feb-22 | 15,643 | 23,741 | 16,325 |
| Mar-22 | 15,738 | 24,512 | 16,336 |
| Apr-22 | 14,908 | 22,312 | 15,381 |
| May-22 | 14,920 | 22,282 | 15,425 |
| Jun-22 | 14,374 | 20,418 | 14,484 |
| Jul-22 | 14,801 | 22,333 | 15,225 |
| Aug-22 | 14,457 | 21,500 | 14,761 |
| Sep-22 | 13,937 | 19,506 | 13,626 |
| Oct-22 | 14,424 | 21,106 | 14,082 |
| Nov-22 | 14,938 | 22,208 | 15,004 |
| Dec-22 | 14,564 | 20,907 | 14,684 |
| Jan-23 | 15,162 | 22,347 | 15,489 |
| Feb-23 | 14,796 | 21,825 | 15,052 |
| Mar-23 | 14,967 | 22,408 | 15,319 |
| Apr-23 | 15,150 | 22,647 | 15,459 |
| May-23 | 15,028 | 22,735 | 15,187 |
| Jun-23 | 15,784 | 24,288 | 15,699 |
| Jul-23 | 16,225 | 25,158 | 16,074 |
| Aug-23 | 15,931 | 24,673 | 15,717 |
| Sep-23 | 15,319 | 23,497 | 15,183 |
| Oct-23 | 14,865 | 22,875 | 14,750 |
| Nov-23 | 15,786 | 25,008 | 15,837 |
| Dec-23 | 16,554 | 26,334 | 16,626 |
| Jan-24 | 16,660 | 26,626 | 16,604 |
| Feb-24 | 17,520 | 28,067 | 16,874 |
| Mar-24 | 18,169 | 28,973 | 17,276 |
| Apr-24 | 17,361 | 27,698 | 16,734 |
| May-24 | 18,394 | 29,006 | 17,175 |
| Jun-24 | 18,632 | 29,904 | 17,322 |
The Growth of $10,000 chart compares the performance of the Fund over the period shown with dividends and capital gains reinvested to the Fund’s benchmark. Benchmark indices are unmanaged and do not reflect the deduction of expenses associated with a mutual fund, such as investment management and accounting fees.
The performance data shown represents past performance, which does not guarantee future results. The investment return and principal value of an investment will fluctuate so that an investor’s shares, when redeemed, may be worth more or less than their original cost. Current performance may be lower or higher than the performance data quoted. For current month-end performance data, please visit our website at www.meederfunds.com.
| Total Net Assets | $211,678,626 |
| # of Portfolio Holdings | 496 |
| Portfolio Turnover Rate | 139% |
| Advisory Fees and Waivers | 747,751 |
Average Annual Total Returns
| . | 1 Year | 5 Year | Since Inception |
|---|
| Retail Class (Inception Date: 1/1/15) | 18.04% | 7.88% | 6.77% |
| Russell 3000 Index | 23.13% | 14.14% | 12.23% |
| Morningstar Moderate Target Risk Index | 10.34% | 5.83% | 5.96% |
What did the Fund invest in?
| Microsoft Corp | 5.1% |
| iShares Short Treasury Bond ETF | 4.4% |
| Berkshire Hathaway Inc | 4.3% |
| NVIDIA Corp | 3.9% |
| Apple Inc | 3.4% |
| Mastercard Inc | 2.7% |
| Alphabet Inc | 2.6% |
| Amazon.com Inc | 2.4% |
| Texas Instruments Inc | 2.3% |
| Exxon Mobil Corp | 2.2% |
| As a percentage of total net assets. Holdings exclude short-term investments and derivatives. |
| Value | Value |
|---|
| Real Estate | |
| Materials | |
| Consumer Staples | 1.6%Footnote Reference |
| Utilities | 1.6%Footnote Reference |
| Communication Services | 8.3%Footnote Reference |
| Industrials | 8.5%Footnote Reference |
| Energy | 8.9%Footnote Reference |
| Health Care | 10.2%Footnote Reference |
| Consumer Discretionary | 14.0%Footnote Reference |
| Financials | 15.5%Footnote Reference |
| Information Technology | 35.1%Footnote Reference |
| Footnote | Description |
Footnote | As a percentage of total common stocks. Concentrations are subject to change. |
| Value | Value |
|---|
| Common Stocks (United States) | 68.6%Footnote Reference |
| Registered Investment Companies | 4.4%Footnote Reference |
| Money Market Registered Investment Companies | 2.7%Footnote Reference |
| Assets/Other Liabilities (Net) | 24.3% |
| Footnote | Description |
Footnote | As a percentage of total net assets. The Fund has invested in stock index futures contracts in order to equitize cash balances it holds in a proprietary money market fund. |
Availability of Additional Information
For additional information about the Fund, including its prospectus, financial information, holdings, proxy voting information and other important materials, scan the QR code or visit www.meederinvestment.com/meeder-funds-resources.
To reduce fund expenses, only one copy of most shareholder documents are delivered to shareholders with multiple accounts at the same address. If you wish to receive copies of this document for each account, please contact the Meeder Funds at 866.633.3371 or contact your financial intermediary.
Semi-Annual Shareholder Report
June 30, 2024
Institutional Class BNDIX
Semi-Annual Shareholder Report
June 30, 2024
This semi-annual shareholder report contains important information about the Tactical Income Fund for the period of December 31, 2023, to 6/30/2024, as well as certain changes to the Fund. You can find additional information about the Fund at meederinvestment.com/mutual-funds . You can also request this information by contacting us at 866.633.3371 .
What were the Fund's costs for the period?
(based on a hypothetical $10,000 investment)
| Class Name | Cost of $10K Investment | Cost Paid as % of $10K Investment |
|---|
| Institutional Class | $40.18 | 0.80% |
Total Return Based on a $10,000 Investment
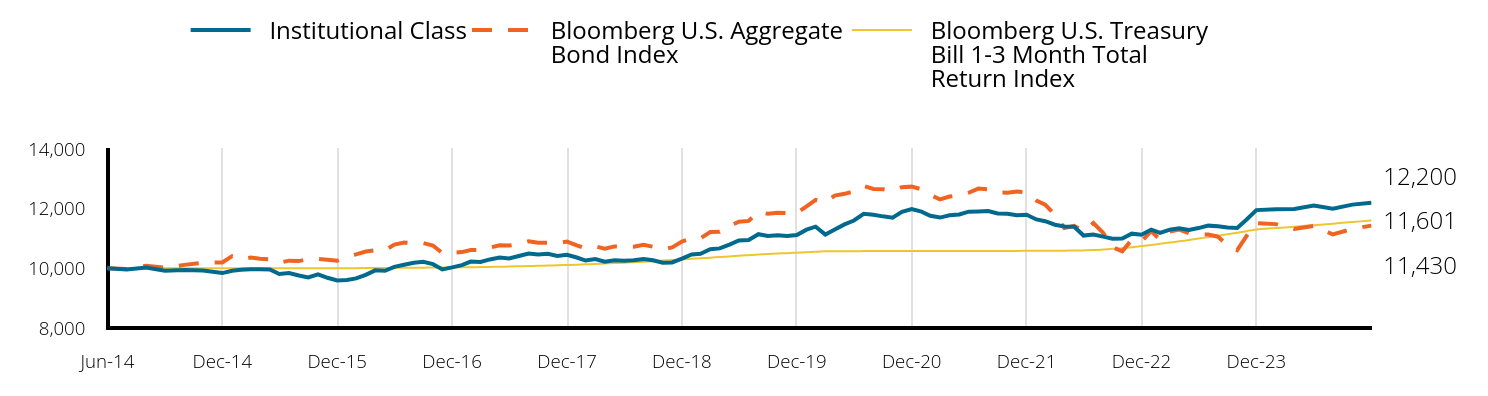
| Institutional Class | Bloomberg U.S. Aggregate Bond Index | Bloomberg U.S. Treasury Bill 1-3 Month Total Return Index |
|---|
| Jun-14 | 10,000 | 10,000 | 10,000 |
| Jul-14 | 9,964 | 9,975 | 10,001 |
| Aug-14 | 10,029 | 10,085 | 10,001 |
| Sep-14 | 9,920 | 10,017 | 10,001 |
| Oct-14 | 9,943 | 10,115 | 10,001 |
| Nov-14 | 9,923 | 10,187 | 10,001 |
| Dec-14 | 9,840 | 10,196 | 10,001 |
| Jan-15 | 9,917 | 10,410 | 10,001 |
| Feb-15 | 9,953 | 10,312 | 10,001 |
| Mar-15 | 9,968 | 10,360 | 10,001 |
| Apr-15 | 9,970 | 10,323 | 10,002 |
| May-15 | 9,962 | 10,298 | 10,002 |
| Jun-15 | 9,807 | 10,186 | 10,002 |
| Jul-15 | 9,840 | 10,257 | 10,002 |
| Aug-15 | 9,758 | 10,242 | 10,002 |
| Sep-15 | 9,693 | 10,311 | 10,002 |
| Oct-15 | 9,795 | 10,313 | 10,002 |
| Nov-15 | 9,682 | 10,286 | 10,002 |
| Dec-15 | 9,593 | 10,252 | 10,004 |
| Jan-16 | 9,606 | 10,393 | 10,004 |
| Feb-16 | 9,664 | 10,467 | 10,006 |
| Mar-16 | 9,780 | 10,563 | 10,010 |
| Apr-16 | 9,932 | 10,604 | 10,011 |
| May-16 | 9,917 | 10,606 | 10,012 |
| Jun-16 | 10,049 | 10,797 | 10,015 |
| Jul-16 | 10,118 | 10,865 | 10,017 |
| Aug-16 | 10,185 | 10,853 | 10,020 |
| Sep-16 | 10,219 | 10,847 | 10,023 |
| Oct-16 | 10,139 | 10,764 | 10,025 |
| Nov-16 | 9,963 | 10,509 | 10,027 |
| Dec-16 | 10,030 | 10,524 | 10,030 |
| Jan-17 | 10,108 | 10,544 | 10,034 |
| Feb-17 | 10,227 | 10,615 | 10,038 |
| Mar-17 | 10,211 | 10,610 | 10,040 |
| Apr-17 | 10,298 | 10,692 | 10,046 |
| May-17 | 10,358 | 10,774 | 10,052 |
| Jun-17 | 10,331 | 10,763 | 10,060 |
| Jul-17 | 10,413 | 10,809 | 10,068 |
| Aug-17 | 10,496 | 10,906 | 10,076 |
| Sep-17 | 10,463 | 10,854 | 10,085 |
| Oct-17 | 10,485 | 10,861 | 10,094 |
| Nov-17 | 10,413 | 10,847 | 10,102 |
| Dec-17 | 10,451 | 10,897 | 10,111 |
| Jan-18 | 10,362 | 10,771 | 10,123 |
| Feb-18 | 10,260 | 10,669 | 10,132 |
| Mar-18 | 10,313 | 10,737 | 10,145 |
| Apr-18 | 10,221 | 10,658 | 10,159 |
| May-18 | 10,266 | 10,734 | 10,174 |
| Jun-18 | 10,255 | 10,720 | 10,190 |
| Jul-18 | 10,271 | 10,723 | 10,206 |
| Aug-18 | 10,310 | 10,792 | 10,222 |
| Sep-18 | 10,271 | 10,722 | 10,239 |
| Oct-18 | 10,186 | 10,638 | 10,258 |
| Nov-18 | 10,197 | 10,701 | 10,276 |
| Dec-18 | 10,324 | 10,898 | 10,296 |
| Jan-19 | 10,466 | 11,014 | 10,317 |
| Feb-19 | 10,489 | 11,007 | 10,336 |
| Mar-19 | 10,638 | 11,218 | 10,357 |
| Apr-19 | 10,667 | 11,221 | 10,377 |
| May-19 | 10,794 | 11,421 | 10,399 |
| Jun-19 | 10,932 | 11,564 | 10,421 |
| Jul-19 | 10,950 | 11,589 | 10,440 |
| Aug-19 | 11,143 | 11,890 | 10,459 |
| Sep-19 | 11,085 | 11,826 | 10,477 |
| Oct-19 | 11,107 | 11,862 | 10,495 |
| Nov-19 | 11,080 | 11,856 | 10,508 |
| Dec-19 | 11,115 | 11,848 | 10,524 |
| Jan-20 | 11,296 | 12,076 | 10,537 |
| Feb-20 | 11,396 | 12,293 | 10,551 |
| Mar-20 | 11,131 | 12,221 | 10,572 |
| Apr-20 | 11,302 | 12,438 | 10,573 |
| May-20 | 11,473 | 12,496 | 10,573 |
| Jun-20 | 11,602 | 12,575 | 10,575 |
| Jul-20 | 11,824 | 12,762 | 10,576 |
| Aug-20 | 11,792 | 12,659 | 10,577 |
| Sep-20 | 11,741 | 12,652 | 10,578 |
| Oct-20 | 11,699 | 12,596 | 10,579 |
| Nov-20 | 11,896 | 12,720 | 10,580 |
| Dec-20 | 11,989 | 12,737 | 10,580 |
| Jan-21 | 11,899 | 12,646 | 10,581 |
| Feb-21 | 11,760 | 12,463 | 10,582 |
| Mar-21 | 11,700 | 12,308 | 10,582 |
| Apr-21 | 11,778 | 12,405 | 10,582 |
| May-21 | 11,806 | 12,445 | 10,582 |
| Jun-21 | 11,898 | 12,533 | 10,582 |
| Jul-21 | 11,905 | 12,673 | 10,583 |
| Aug-21 | 11,919 | 12,649 | 10,583 |
| Sep-21 | 11,836 | 12,539 | 10,583 |
| Oct-21 | 11,825 | 12,536 | 10,584 |
| Nov-21 | 11,777 | 12,573 | 10,584 |
| Dec-21 | 11,795 | 12,541 | 10,585 |
| Jan-22 | 11,638 | 12,271 | 10,585 |
| Feb-22 | 11,579 | 12,134 | 10,586 |
| Mar-22 | 11,460 | 11,796 | 10,588 |
| Apr-22 | 11,405 | 11,349 | 10,591 |
| May-22 | 11,393 | 11,422 | 10,596 |
| Jun-22 | 11,098 | 11,243 | 10,601 |
| Jul-22 | 11,135 | 11,518 | 10,610 |
| Aug-22 | 11,061 | 11,192 | 10,630 |
| Sep-22 | 10,992 | 10,709 | 10,652 |
| Oct-22 | 11,001 | 10,570 | 10,674 |
| Nov-22 | 11,161 | 10,959 | 10,708 |
| Dec-22 | 11,123 | 10,909 | 10,746 |
| Jan-23 | 11,297 | 11,245 | 10,782 |
| Feb-23 | 11,185 | 10,954 | 10,820 |
| Mar-23 | 11,297 | 11,232 | 10,863 |
| Apr-23 | 11,341 | 11,300 | 10,905 |
| May-23 | 11,285 | 11,177 | 10,949 |
| Jun-23 | 11,348 | 11,137 | 10,996 |
| Jul-23 | 11,430 | 11,130 | 11,044 |
| Aug-23 | 11,407 | 11,059 | 11,094 |
| Sep-23 | 11,371 | 10,778 | 11,144 |
| Oct-23 | 11,355 | 10,607 | 11,195 |
| Nov-23 | 11,638 | 11,088 | 11,245 |
| Dec-23 | 11,950 | 11,512 | 11,298 |
| Jan-24 | 11,982 | 11,481 | 11,347 |
| Feb-24 | 11,989 | 11,318 | 11,395 |
| Mar-24 | 12,102 | 11,423 | 11,447 |
| Apr-24 | 11,994 | 11,134 | 11,497 |
| May-24 | 12,134 | 11,323 | 11,553 |
| Jun-24 | 12,200 | 11,430 | 11,601 |
The Growth of $10,000 chart compares the performance of the Fund over the period shown with dividends and capital gains reinvested to the Fund’s benchmark. Benchmark indices are unmanaged and do not reflect the deduction of expenses associated with a mutual fund, such as investment management and accounting fees.
Investment performance assumes reinvestment of all dividend and capital gain distributions. The results do not reflect the effect of taxes a shareholder would pay on Fund distributions or on the redemption of Fund shares. Historical performance attributed to the Institutional and Adviser Share Classes prior to their inception dates is based on the performance of the Retail Share Class. No adjustment has been made to reflect class-specific distribution or servicing fees. Returns may reflect the effect of voluntary fee waivers or expense reimbursements over the period shown. Without these waivers, performance would have been lower.
The performance data shown represents past performance, which does not guarantee future results. The investment return and principal value of an investment will fluctuate so that an investor’s shares, when redeemed, may be worth more or less than their original cost. Current performance may be lower or higher than the performance data quoted. For current month-end performance data, please visit our website at www.meederfunds.com.
| Total Net Assets | $74,359,352 |
| # of Portfolio Holdings | 14 |
| Portfolio Turnover Rate | 69% |
| Advisory Fees and Waivers | 141,954 |
Average Annual Total Returns
| . | 1 Year | 5 Year | 10 Year |
|---|
| Institutional Class | 7.51% | 2.22% | 2.01% |
| Bloomberg U.S. Aggregate Bond Index | 2.63% | | 1.35% |
| Bloomberg U.S. Treasury Bill 1-3 Month Total Return Index | 5.50% | 2.17% | 1.50% |
What did the Fund invest in?
| PIMCO Low Duration Income Fund - Class I | 14.5% |
| Fidelity Advisor High Income Advantage Fund - Class Z | 12.3% |
| BrandywineGLOBAL High Yield Fund - Class I | 12.2% |
| Frost Total Return Bond Fund - Class I | 11.7% |
| Diamond Hill Short Duration Securitized Bond Fund - Class Y | 10.2% |
| Fidelity Total Bond Fund - Class Z | 9.7% |
| iShares J.P. Morgan USD Emerging Markets Bond ETF | 6.7% |
| Eaton Vance Emerging Markets Debt Opportunities Fund - Class R6 | 4.9% |
| As a percentage of total net assets. Holdings exclude short-term investments and derivatives. |
| Value | Value |
|---|
| International Fixed Income | 6.7%Footnote Reference |
| Money Market Registered Investment Companies | 17.6%Footnote Reference |
| U.S. Fixed Income | 75.4%Footnote Reference |
| Footnote | Description |
Footnote | As a percentage of total net assets. Concentrations are subject to change. |
| Value | Value |
|---|
| Registered Investment Companies | 82.1%Footnote Reference |
| Money Market Registered Investment Companies | 17.6%Footnote Reference |
| Assets/Other Liabilities (Net) | 0.3% |
| Footnote | Description |
Footnote | As a percentage of total net assets. The Fund has invested in stock index futures contracts in order to equitize cash balances it holds in a proprietary money market fund. |
Availability of Additional Information
For additional information about the Fund, including its prospectus, financial information, holdings, proxy voting information and other important materials, scan the QR code or visit www.meederinvestment.com/meeder-funds-resources.
To reduce fund expenses, only one copy of most shareholder documents are delivered to shareholders with multiple accounts at the same address. If you wish to receive copies of this document for each account, please contact the Meeder Funds at 866.633.3371 or contact your financial intermediary.
Institutional Class BNDIX
Semi-Annual Shareholder Report
June 30, 2024
Conservative Allocation Fund
Semi-Annual Shareholder Report
June 30, 2024
This semi-annual shareholder report contains important information about the Conservative Allocation Fund for the period of December 31, 2023, to 6/30/2024, as well as certain changes to the Fund. You can find additional information about the Fund at meederinvestment.com/mutual-funds . You can also request this information by contacting us at 866.633.3371 .
What were the Fund's costs for the period?
(based on a hypothetical $10,000 investment)
| Class Name | Cost of $10K Investment | Cost Paid as % of $10K Investment |
|---|
| Adviser Class | $44.13 | 0.87% |
Total Return Based on a $10,000 Investment
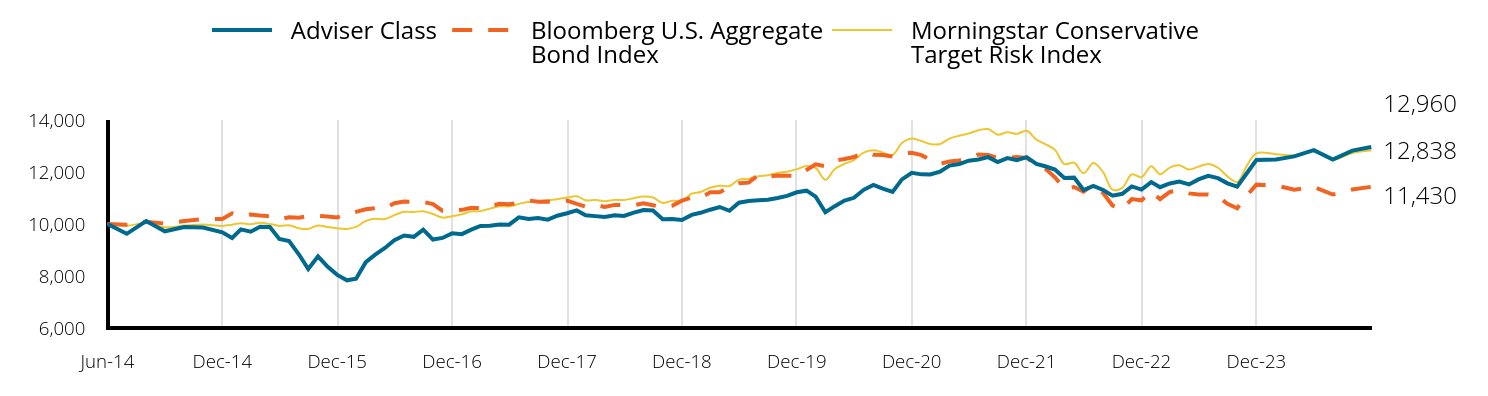
| Adviser Class | Bloomberg U.S. Aggregate Bond Index | Morningstar Conservative Target Risk Index |
|---|
| Jun-14 | 10,000 | 10,000 | 10,000 |
| Jul-14 | 9,622 | 9,975 | 9,931 |
| Aug-14 | 10,111 | 10,085 | 10,037 |
| Sep-14 | 9,718 | 10,017 | 9,874 |
| Oct-14 | 9,880 | 10,115 | 9,937 |
| Nov-14 | 9,865 | 10,187 | 9,983 |
| Dec-14 | 9,681 | 10,196 | 9,927 |
| Jan-15 | 9,463 | 10,410 | 9,974 |
| Feb-15 | 9,793 | 10,312 | 10,027 |
| Mar-15 | 9,703 | 10,360 | 9,987 |
| Apr-15 | 9,892 | 10,323 | 10,045 |
| May-15 | 9,883 | 10,298 | 10,001 |
| Jun-15 | 9,426 | 10,186 | 9,926 |
| Jul-15 | 9,343 | 10,257 | 9,953 |
| Aug-15 | 8,835 | 10,242 | 9,839 |
| Sep-15 | 8,267 | 10,311 | 9,810 |
| Oct-15 | 8,754 | 10,313 | 9,944 |
| Nov-15 | 8,360 | 10,286 | 9,885 |
| Dec-15 | 8,043 | 10,252 | 9,836 |
| Jan-16 | 7,833 | 10,393 | 9,810 |
| Feb-16 | 7,893 | 10,467 | 9,886 |
| Mar-16 | 8,531 | 10,563 | 10,114 |
| Apr-16 | 8,822 | 10,604 | 10,197 |
| May-16 | 9,077 | 10,606 | 10,188 |
| Jun-16 | 9,372 | 10,797 | 10,340 |
| Jul-16 | 9,557 | 10,865 | 10,466 |
| Aug-16 | 9,506 | 10,853 | 10,459 |
| Sep-16 | 9,780 | 10,847 | 10,489 |
| Oct-16 | 9,401 | 10,764 | 10,383 |
| Nov-16 | 9,463 | 10,509 | 10,245 |
| Dec-16 | 9,640 | 10,524 | 10,296 |
| Jan-17 | 9,608 | 10,544 | 10,374 |
| Feb-17 | 9,771 | 10,615 | 10,479 |
| Mar-17 | 9,924 | 10,610 | 10,501 |
| Apr-17 | 9,929 | 10,692 | 10,588 |
| May-17 | 9,978 | 10,774 | 10,680 |
| Jun-17 | 9,974 | 10,763 | 10,675 |
| Jul-17 | 10,254 | 10,809 | 10,774 |
| Aug-17 | 10,191 | 10,906 | 10,848 |
| Sep-17 | 10,231 | 10,854 | 10,862 |
| Oct-17 | 10,168 | 10,861 | 10,909 |
| Nov-17 | 10,317 | 10,847 | 10,955 |
| Dec-17 | 10,411 | 10,897 | 11,017 |
| Jan-18 | 10,521 | 10,771 | 11,068 |
| Feb-18 | 10,338 | 10,669 | 10,911 |
| Mar-18 | 10,302 | 10,737 | 10,923 |
| Apr-18 | 10,270 | 10,658 | 10,877 |
| May-18 | 10,338 | 10,734 | 10,927 |
| Jun-18 | 10,311 | 10,720 | 10,923 |
| Jul-18 | 10,435 | 10,723 | 10,993 |
| Aug-18 | 10,536 | 10,792 | 11,055 |
| Sep-18 | 10,522 | 10,722 | 11,021 |
| Oct-18 | 10,181 | 10,638 | 10,807 |
| Nov-18 | 10,190 | 10,701 | 10,895 |
| Dec-18 | 10,151 | 10,898 | 10,885 |
| Jan-19 | 10,350 | 11,014 | 11,165 |
| Feb-19 | 10,430 | 11,007 | 11,228 |
| Mar-19 | 10,549 | 11,218 | 11,393 |
| Apr-19 | 10,653 | 11,221 | 11,469 |
| May-19 | 10,506 | 11,421 | 11,459 |
| Jun-19 | 10,820 | 11,564 | 11,707 |
| Jul-19 | 10,882 | 11,589 | 11,738 |
| Aug-19 | 10,910 | 11,890 | 11,832 |
| Sep-19 | 10,934 | 11,826 | 11,873 |
| Oct-19 | 11,002 | 11,862 | 11,965 |
| Nov-19 | 11,078 | 11,856 | 12,007 |
| Dec-19 | 11,218 | 11,848 | 12,106 |
| Jan-20 | 11,281 | 12,076 | 12,230 |
| Feb-20 | 11,053 | 12,293 | 12,159 |
| Mar-20 | 10,451 | 12,221 | 11,698 |
| Apr-20 | 10,685 | 12,438 | 12,114 |
| May-20 | 10,899 | 12,496 | 12,312 |
| Jun-20 | 11,006 | 12,575 | 12,456 |
| Jul-20 | 11,314 | 12,762 | 12,742 |
| Aug-20 | 11,504 | 12,659 | 12,833 |
| Sep-20 | 11,363 | 12,652 | 12,745 |
| Oct-20 | 11,235 | 12,596 | 12,652 |
| Nov-20 | 11,716 | 12,720 | 13,112 |
| Dec-20 | 11,968 | 12,737 | 13,286 |
| Jan-21 | 11,908 | 12,646 | 13,191 |
| Feb-21 | 11,904 | 12,463 | 13,074 |
| Mar-21 | 12,012 | 12,308 | 13,073 |
| Apr-21 | 12,245 | 12,405 | 13,282 |
| May-21 | 12,305 | 12,445 | 13,395 |
| Jun-21 | 12,434 | 12,533 | 13,476 |
| Jul-21 | 12,479 | 12,673 | 13,604 |
| Aug-21 | 12,569 | 12,649 | 13,651 |
| Sep-21 | 12,379 | 12,539 | 13,435 |
| Oct-21 | 12,534 | 12,536 | 13,529 |
| Nov-21 | 12,454 | 12,573 | 13,465 |
| Dec-21 | 12,571 | 12,541 | 13,586 |
| Jan-22 | 12,308 | 12,271 | 13,243 |
| Feb-22 | 12,219 | 12,134 | 13,071 |
| Mar-22 | 12,092 | 11,796 | 12,850 |
| Apr-22 | 11,772 | 11,349 | 12,303 |
| May-22 | 11,782 | 11,422 | 12,356 |
| Jun-22 | 11,304 | 11,243 | 11,953 |
| Jul-22 | 11,467 | 11,518 | 12,342 |
| Aug-22 | 11,309 | 11,192 | 11,994 |
| Sep-22 | 11,088 | 10,709 | 11,318 |
| Oct-22 | 11,162 | 10,570 | 11,385 |
| Nov-22 | 11,444 | 10,959 | 11,910 |
| Dec-22 | 11,322 | 10,909 | 11,800 |
| Jan-23 | 11,611 | 11,245 | 12,221 |
| Feb-23 | 11,413 | 10,954 | 11,912 |
| Mar-23 | 11,558 | 11,232 | 12,169 |
| Apr-23 | 11,628 | 11,300 | 12,257 |
| May-23 | 11,520 | 11,177 | 12,093 |
| Jun-23 | 11,714 | 11,137 | 12,206 |
| Jul-23 | 11,850 | 11,130 | 12,311 |
| Aug-23 | 11,763 | 11,059 | 12,163 |
| Sep-23 | 11,562 | 10,778 | 11,832 |
| Oct-23 | 11,436 | 10,607 | 11,615 |
| Nov-23 | 11,940 | 11,088 | 12,223 |
| Dec-23 | 12,461 | 11,512 | 12,713 |
| Jan-24 | 12,483 | 11,481 | 12,686 |
| Feb-24 | 12,599 | 11,318 | 12,642 |
| Mar-24 | 12,837 | 11,423 | 12,810 |
| Apr-24 | 12,475 | 11,134 | 12,474 |
| May-24 | 12,821 | 11,323 | 12,729 |
| Jun-24 | 12,960 | 11,430 | 12,838 |
The Growth of $10,000 chart compares the performance of the Fund over the period shown with dividends and capital gains reinvested to the Fund’s benchmark. Benchmark indices are unmanaged and do not reflect the deduction of expenses associated with a mutual fund, such as investment management and accounting fees.
Investment performance assumes reinvestment of all dividend and capital gain distributions. The results do not reflect the effect of taxes a shareholder would pay on Fund distributions or on the redemption of Fund shares. Historical performance attributed to the Institutional and Adviser Share Classes prior to their inception dates is based on the performance of the Retail Share Class. No adjustment has been made to reflect class-specific distribution or servicing fees. Returns may reflect the effect of voluntary fee waivers or expense reimbursements over the period shown. Without these waivers, performance would have been lower.
The performance data shown represents past performance, which does not guarantee future results. The investment return and principal value of an investment will fluctuate so that an investor’s shares, when redeemed, may be worth more or less than their original cost. Current performance may be lower or higher than the performance data quoted. For current month-end performance data, please visit our website at www.meederfunds.com.
| Total Net Assets | $133,249,326 |
| # of Portfolio Holdings | 136 |
| Portfolio Turnover Rate | 72% |
| Advisory Fees and Waivers | 321,819 |
Average Annual Total Returns
| . | 1 Year | 5 Year | 10 Year |
|---|
| Adviser Class | 10.63% | 3.68% | 2.63% |
| Bloomberg U.S. Aggregate Bond Index | 2.63% | | 1.35% |
| Morningstar Conservative Target Risk Index | 5.18% | 1.86% | 2.53% |
What did the Fund invest in?
| Fidelity Total Bond Fund - Class Z | 17.3% |
| Baird Core Plus Bond Fund - Class I | 16.7% |
| Frost Total Return Bond Fund - Class I | 8.7% |
| Dodge & Cox Income Fund - Class I | 5.5% |
| Fidelity Advisor High Income Advantage Fund - Class Z | 5.2% |
| BrandywineGLOBAL High Yield Fund - Class I | 5.2% |
| iShares 20+ Year Treasury Bond ETF | 5.1% |
| Eaton Vance Emerging Markets Debt Opportunities Fund - Class R6 | 3.4% |
| Berkshire Hathaway Inc | 2.3% |
| Microsoft Corp | 2.2% |
| As a percentage of total net assets. Holdings exclude short-term investments and derivatives. |
| Value | Value |
|---|
| Utilities | 0.3%Footnote Reference |
| Materials | 0.5%Footnote Reference |
| Consumer Staples | 2.5%Footnote Reference |
| Energy | 2.9%Footnote Reference |
| Industrials | 8.1%Footnote Reference |
| Communication Services | 9.4%Footnote Reference |
| Consumer Discretionary | 12.9%Footnote Reference |
| Health Care | 14.3%Footnote Reference |
| Financials | 14.4%Footnote Reference |
| Information Technology | 34.7%Footnote Reference |
| Footnote | Description |
Footnote | As a percentage of total common stocks. Concentrations are subject to change. |
| Value | Value |
|---|
| Common Stocks (United States) | 23.6%Footnote Reference |
| Registered Investment Companies | 68.4%Footnote Reference |
| Money Market Registered Investment Companies | 7.6%Footnote Reference |
| Assets/Other Liabilities (Net) | 0.4% |
| Footnote | Description |
Footnote | As a percentage of total net assets. The Fund has invested in stock index futures contracts in order to equitize cash balances it holds in a proprietary money market fund. |
Availability of Additional Information
For additional information about the Fund, including its prospectus, financial information, holdings, proxy voting information and other important materials, scan the QR code or visit www.meederinvestment.com/meeder-funds-resources.
To reduce fund expenses, only one copy of most shareholder documents are delivered to shareholders with multiple accounts at the same address. If you wish to receive copies of this document for each account, please contact the Meeder Funds at 866.633.3371 or contact your financial intermediary.
Conservative Allocation Fund
Semi-Annual Shareholder Report
June 30, 2024
Institutional Class DYGIX
Semi-Annual Shareholder Report
June 30, 2024
This semi-annual shareholder report contains important information about the Dynamic Allocation Fund for the period of December 31, 2023, to 6/30/2024, as well as certain changes to the Fund. You can find additional information about the Fund at meederinvestment.com/mutual-funds . You can also request this information by contacting us at 866.633.3371 .
What were the Fund's costs for the period?
(based on a hypothetical $10,000 investment)
| Class Name | Cost of $10K Investment | Cost Paid as % of $10K Investment |
|---|
| Institutional Class | $52.79 | 1.00% |
Total Return Based on a $10,000 Investment
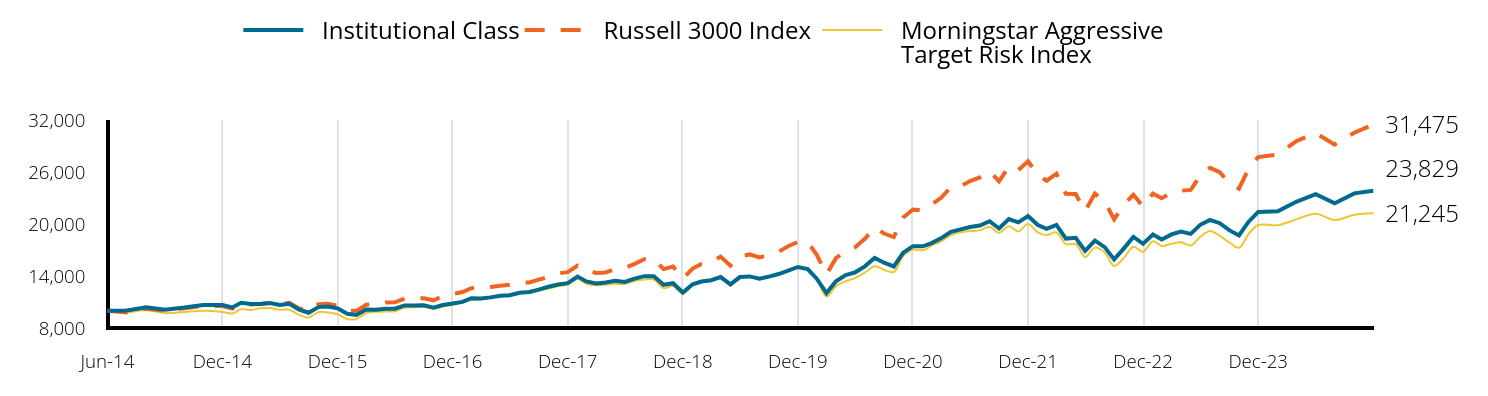
| Institutional Class | Russell 3000 Index | Morningstar Aggressive Target Risk Index |
|---|
| Jun-14 | 10,000 | 10,000 | 10,000 |
| Jul-14 | 10,018 | 9,803 | 9,802 |
| Aug-14 | 10,392 | 10,214 | 10,073 |
| Sep-14 | 10,114 | 10,001 | 9,718 |
| Oct-14 | 10,357 | 10,276 | 9,855 |
| Nov-14 | 10,656 | 10,525 | 9,977 |
| Dec-14 | 10,642 | 10,525 | 9,849 |
| Jan-15 | 10,366 | 10,232 | 9,675 |
| Feb-15 | 10,908 | 10,825 | 10,174 |
| Mar-15 | 10,759 | 10,715 | 10,064 |
| Apr-15 | 10,770 | 10,763 | 10,278 |
| May-15 | 10,876 | 10,912 | 10,299 |
| Jun-15 | 10,653 | 10,729 | 10,098 |
| Jul-15 | 10,791 | 10,909 | 10,112 |
| Aug-15 | 10,111 | 10,250 | 9,517 |
| Sep-15 | 9,760 | 9,952 | 9,205 |
| Oct-15 | 10,410 | 10,738 | 9,829 |
| Nov-15 | 10,474 | 10,797 | 9,792 |
| Dec-15 | 10,274 | 10,576 | 9,586 |
| Jan-16 | 9,648 | 9,979 | 9,036 |
| Feb-16 | 9,506 | 9,976 | 9,037 |
| Mar-16 | 10,142 | 10,678 | 9,710 |
| Apr-16 | 10,109 | 10,744 | 9,870 |
| May-16 | 10,230 | 10,936 | 9,920 |
| Jun-16 | 10,219 | 10,959 | 9,926 |
| Jul-16 | 10,604 | 11,394 | 10,346 |
| Aug-16 | 10,593 | 11,423 | 10,392 |
| Sep-16 | 10,627 | 11,441 | 10,448 |
| Oct-16 | 10,333 | 11,193 | 10,247 |
| Nov-16 | 10,654 | 11,694 | 10,465 |
| Dec-16 | 10,829 | 11,922 | 10,673 |
| Jan-17 | 11,007 | 12,147 | 10,931 |
| Feb-17 | 11,430 | 12,599 | 11,235 |
| Mar-17 | 11,408 | 12,607 | 11,330 |
| Apr-17 | 11,531 | 12,741 | 11,477 |
| May-17 | 11,720 | 12,871 | 11,648 |
| Jun-17 | 11,787 | 12,987 | 11,736 |
| Jul-17 | 12,067 | 13,232 | 12,017 |
| Aug-17 | 12,157 | 13,258 | 12,051 |
| Sep-17 | 12,425 | 13,581 | 12,307 |
| Oct-17 | 12,760 | 13,877 | 12,544 |
| Nov-17 | 13,018 | 14,299 | 12,823 |
| Dec-17 | 13,168 | 14,442 | 13,015 |
| Jan-18 | 13,932 | 15,203 | 13,644 |
| Feb-18 | 13,374 | 14,642 | 13,101 |
| Mar-18 | 13,144 | 14,349 | 12,928 |
| Apr-18 | 13,253 | 14,403 | 13,003 |
| May-18 | 13,447 | 14,810 | 13,105 |
| Jun-18 | 13,314 | 14,907 | 13,076 |
| Jul-18 | 13,703 | 15,401 | 13,424 |
| Aug-18 | 13,983 | 15,942 | 13,585 |
| Sep-18 | 13,971 | 15,968 | 13,587 |
| Oct-18 | 12,985 | 14,793 | 12,610 |
| Nov-18 | 13,167 | 15,089 | 12,846 |
| Dec-18 | 12,091 | 13,685 | 11,952 |
| Jan-19 | 13,039 | 14,859 | 12,927 |
| Feb-19 | 13,359 | 15,382 | 13,285 |
| Mar-19 | 13,507 | 15,606 | 13,414 |
| Apr-19 | 13,877 | 16,230 | 13,821 |
| May-19 | 13,026 | 15,179 | 13,057 |
| Jun-19 | 13,877 | 16,246 | 13,870 |
| Jul-19 | 13,951 | 16,487 | 13,919 |
| Aug-19 | 13,679 | 16,151 | 13,596 |
| Sep-19 | 13,926 | 16,434 | 13,918 |
| Oct-19 | 14,224 | 16,788 | 14,257 |
| Nov-19 | 14,621 | 17,426 | 14,581 |
| Dec-19 | 15,041 | 17,929 | 15,049 |
| Jan-20 | 14,788 | 17,910 | 14,833 |
| Feb-20 | 13,689 | 16,444 | 13,658 |
| Mar-20 | 12,033 | 14,182 | 11,630 |
| Apr-20 | 13,398 | 16,061 | 12,831 |
| May-20 | 14,106 | 16,919 | 13,413 |
| Jun-20 | 14,426 | 17,306 | 13,758 |
| Jul-20 | 15,111 | 18,289 | 14,404 |
| Aug-20 | 16,075 | 19,614 | 15,120 |
| Sep-20 | 15,531 | 18,900 | 14,722 |
| Oct-20 | 15,098 | 18,492 | 14,464 |
| Nov-20 | 16,700 | 20,741 | 16,297 |
| Dec-20 | 17,439 | 21,675 | 17,044 |
| Jan-21 | 17,426 | 21,578 | 16,972 |
| Feb-21 | 17,789 | 22,253 | 17,499 |
| Mar-21 | 18,373 | 23,050 | 18,003 |
| Apr-21 | 19,099 | 24,238 | 18,723 |
| May-21 | 19,384 | 24,349 | 19,052 |
| Jun-21 | 19,656 | 24,950 | 19,181 |
| Jul-21 | 19,825 | 25,371 | 19,264 |
| Aug-21 | 20,318 | 26,095 | 19,678 |
| Sep-21 | 19,481 | 24,924 | 18,980 |
| Oct-21 | 20,574 | 26,610 | 19,741 |
| Nov-21 | 20,184 | 26,205 | 19,143 |
| Dec-21 | 20,905 | 27,236 | 19,993 |
| Jan-22 | 19,878 | 25,634 | 19,026 |
| Feb-22 | 19,446 | 24,988 | 18,712 |
| Mar-22 | 19,893 | 25,799 | 19,022 |
| Apr-22 | 18,315 | 23,484 | 17,671 |
| May-22 | 18,404 | 23,452 | 17,690 |
| Jun-22 | 16,900 | 21,490 | 16,188 |
| Jul-22 | 18,091 | 23,506 | 17,273 |
| Aug-22 | 17,332 | 22,629 | 16,714 |
| Sep-22 | 15,917 | 20,531 | 15,163 |
| Oct-22 | 17,184 | 22,214 | 16,088 |
| Nov-22 | 18,511 | 23,374 | 17,363 |
| Dec-22 | 17,715 | 22,005 | 16,808 |
| Jan-23 | 18,779 | 23,521 | 18,006 |
| Feb-23 | 18,209 | 22,971 | 17,472 |
| Mar-23 | 18,795 | 23,585 | 17,717 |
| Apr-23 | 19,134 | 23,837 | 17,897 |
| May-23 | 18,856 | 23,929 | 17,522 |
| Jun-23 | 19,906 | 25,563 | 18,494 |
| Jul-23 | 20,463 | 26,480 | 19,195 |
| Aug-23 | 20,092 | 25,968 | 18,615 |
| Sep-23 | 19,287 | 24,731 | 17,892 |
| Oct-23 | 18,681 | 24,076 | 17,252 |
| Nov-23 | 20,234 | 26,321 | 18,808 |
| Dec-23 | 21,390 | 27,717 | 19,884 |
| Jan-24 | 21,468 | 28,024 | 19,856 |
| Feb-24 | 22,562 | 29,541 | 20,532 |
| Mar-24 | 23,437 | 30,494 | 21,190 |
| Apr-24 | 22,387 | 29,152 | 20,446 |
| May-24 | 23,531 | 30,530 | 21,076 |
| Jun-24 | 23,829 | 31,475 | 21,245 |
The Growth of $10,000 chart compares the performance of the Fund over the period shown with dividends and capital gains reinvested to the Fund’s benchmark. Benchmark indices are unmanaged and do not reflect the deduction of expenses associated with a mutual fund, such as investment management and accounting fees.
Investment performance assumes reinvestment of all dividend and capital gain distributions. The results do not reflect the effect of taxes a shareholder would pay on Fund distributions or on the redemption of Fund shares. Historical performance attributed to the Institutional and Adviser Share Classes prior to their inception dates is based on the performance of the Retail Share Class. No adjustment has been made to reflect class-specific distribution or servicing fees. Returns may reflect the effect of voluntary fee waivers or expense reimbursements over the period shown. Without these waivers, performance would have been lower.
The performance data shown represents past performance, which does not guarantee future results. The investment return and principal value of an investment will fluctuate so that an investor’s shares, when redeemed, may be worth more or less than their original cost. Current performance may be lower or higher than the performance data quoted. For current month-end performance data, please visit our website at www.meederfunds.com.
| Total Net Assets | $337,595,208 |
| # of Portfolio Holdings | 145 |
| Portfolio Turnover Rate | 148% |
| Advisory Fees and Waivers | 1,060,409 |
Average Annual Total Returns
| . | 1 Year | 5 Year | 10 Year |
|---|
| Institutional Class | 19.71% | 11.42% | 9.07% |
| Russell 3000 Index | 23.13% | 14.14% | 12.15% |
| Morningstar Aggressive Target Risk Index | 14.87% | 8.90% | 7.83% |
What did the Fund invest in?
| Berkshire Hathaway Inc | 5.9% |
| Microsoft Corp | 5.4% |
| NVIDIA Corp | 4.1% |
| Amazon.com Inc | 3.2% |
| Alphabet Inc | 3.1% |
| Meta Platforms Inc | 2.0% |
| Apple Inc | 2.0% |
| Texas Instruments Inc | 1.9% |
| Johnson & Johnson | 1.8% |
| Merck & Co Inc | 1.5% |
| As a percentage of total net assets. Holdings exclude short-term investments and derivatives. |
| Value | Value |
|---|
| Real Estate | 0.0%Footnote Reference |
| Utilities | 0.2%Footnote Reference |
| Materials | 0.3%Footnote Reference |
| Consumer Staples | 2.2%Footnote Reference |
| Energy | 2.2%Footnote Reference |
| Industrials | 8.2%Footnote Reference |
| Communication Services | 9.9%Footnote Reference |
| Consumer Discretionary | 13.4%Footnote Reference |
| Financials | 14.7%Footnote Reference |
| Health Care | 14.7%Footnote Reference |
| Information Technology | 34.2%Footnote Reference |
| Footnote | Description |
Footnote | As a percentage of total common stocks. Concentrations are subject to change. |
| Value | Value |
|---|
| Common Stocks (United States) | 60.1%Footnote Reference |
| Registered Investment Companies | 5.0%Footnote Reference |
| Money Market Registered Investment Companies | 33.0%Footnote Reference |
| Assets/Other Liabilities (Net) | 1.9% |
| Footnote | Description |
Footnote | As a percentage of total net assets. The Fund has invested in stock index futures contracts in order to equitize cash balances it holds in a proprietary money market fund. |
Availability of Additional Information
For additional information about the Fund, including its prospectus, financial information, holdings, proxy voting information and other important materials, scan the QR code or visit www.meederinvestment.com/meeder-funds-resources.
To reduce fund expenses, only one copy of most shareholder documents are delivered to shareholders with multiple accounts at the same address. If you wish to receive copies of this document for each account, please contact the Meeder Funds at 866.633.3371 or contact your financial intermediary.
Institutional Class DYGIX
Semi-Annual Shareholder Report
June 30, 2024
Semi-Annual Shareholder Report
June 30, 2024
This semi-annual shareholder report contains important information about the Spectrum Fund for the period of December 31, 2023, to 6/30/2024, as well as certain changes to the Fund. You can find additional information about the Fund at meederinvestment.com/mutual-funds . You can also request this information by contacting us at 866.633.3371 .
What were the Fund's costs for the period?
(based on a hypothetical $10,000 investment)
| Class Name | Cost of $10K Investment | Cost Paid as % of $10K Investment |
|---|
| Adviser Class | $41.82 | 0.79% |
Total Return Based on a $10,000 Investment
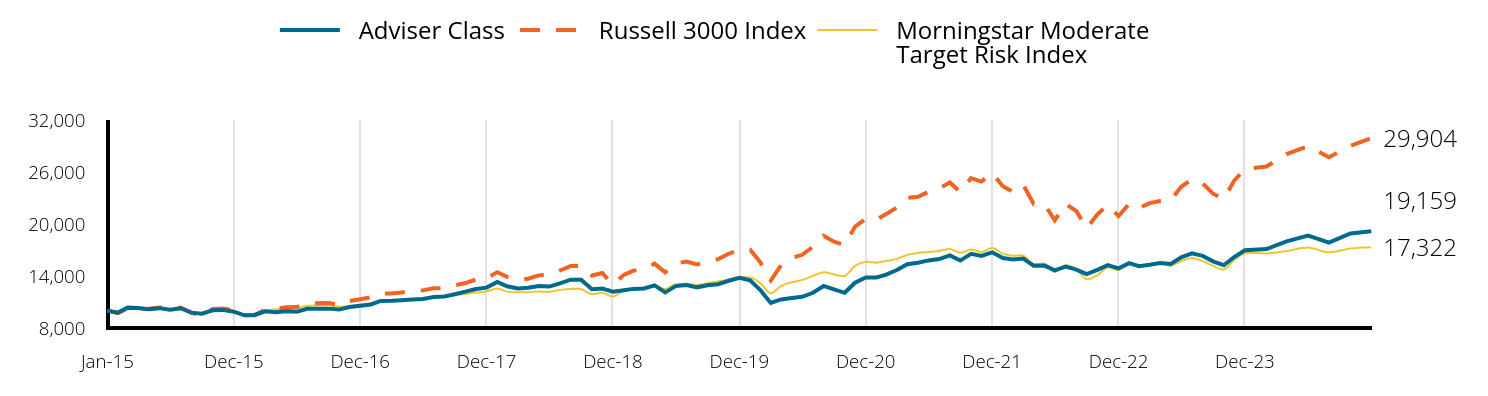
| Adviser Class | Russell 3000 Index | Morningstar Moderate Target Risk Index |
|---|
| Jan-15 | 10,000 | 10,000 | 10,000 |
| Jan-15 | 9,770 | 9,722 | 9,925 |
| Feb-15 | 10,350 | 10,285 | 10,216 |
| Mar-15 | 10,310 | 10,180 | 10,137 |
| Apr-15 | 10,170 | 10,226 | 10,271 |
| May-15 | 10,290 | 10,368 | 10,263 |
| Jun-15 | 10,100 | 10,194 | 10,115 |
| Jul-15 | 10,280 | 10,365 | 10,140 |
| Aug-15 | 9,770 | 9,739 | 9,777 |
| Sep-15 | 9,650 | 9,455 | 9,596 |
| Oct-15 | 10,050 | 10,202 | 10,000 |
| Nov-15 | 10,090 | 10,258 | 9,959 |
| Dec-15 | 9,879 | 10,048 | 9,821 |
| Jan-16 | 9,463 | 9,481 | 9,509 |
| Feb-16 | 9,504 | 9,478 | 9,555 |
| Mar-16 | 9,920 | 10,145 | 10,032 |
| Apr-16 | 9,808 | 10,208 | 10,158 |
| May-16 | 9,940 | 10,391 | 10,187 |
| Jun-16 | 9,869 | 10,412 | 10,273 |
| Jul-16 | 10,214 | 10,825 | 10,560 |
| Aug-16 | 10,224 | 10,853 | 10,582 |
| Sep-16 | 10,235 | 10,870 | 10,622 |
| Oct-16 | 10,123 | 10,635 | 10,467 |
| Nov-16 | 10,417 | 11,111 | 10,524 |
| Dec-16 | 10,577 | 11,327 | 10,663 |
| Jan-17 | 10,711 | 11,541 | 10,835 |
| Feb-17 | 11,122 | 11,970 | 11,054 |
| Mar-17 | 11,132 | 11,978 | 11,109 |
| Apr-17 | 11,204 | 12,105 | 11,225 |
| May-17 | 11,297 | 12,229 | 11,355 |
| Jun-17 | 11,338 | 12,339 | 11,398 |
| Jul-17 | 11,564 | 12,572 | 11,592 |
| Aug-17 | 11,626 | 12,596 | 11,650 |
| Sep-17 | 11,893 | 12,903 | 11,785 |
| Oct-17 | 12,191 | 13,185 | 11,932 |
| Nov-17 | 12,489 | 13,585 | 12,094 |
| Dec-17 | 12,656 | 13,721 | 12,225 |
| Jan-18 | 13,303 | 14,444 | 12,558 |
| Feb-18 | 12,809 | 13,912 | 12,197 |
| Mar-18 | 12,557 | 13,633 | 12,119 |
| Apr-18 | 12,656 | 13,684 | 12,132 |
| May-18 | 12,831 | 14,071 | 12,206 |
| Jun-18 | 12,776 | 14,163 | 12,187 |
| Jul-18 | 13,149 | 14,633 | 12,399 |
| Aug-18 | 13,577 | 15,147 | 12,508 |
| Sep-18 | 13,577 | 15,172 | 12,494 |
| Oct-18 | 12,469 | 14,055 | 11,906 |
| Nov-18 | 12,557 | 14,336 | 12,072 |
| Dec-18 | 12,190 | 13,002 | 11,644 |
| Jan-19 | 12,357 | 14,118 | 12,283 |
| Feb-19 | 12,513 | 14,614 | 12,496 |
| Mar-19 | 12,569 | 14,828 | 12,654 |
| Apr-19 | 12,914 | 15,420 | 12,898 |
| May-19 | 12,113 | 14,422 | 12,513 |
| Jun-19 | 12,836 | 15,435 | 13,050 |
| Jul-19 | 12,947 | 15,664 | 13,092 |
| Aug-19 | 12,691 | 15,345 | 12,980 |
| Sep-19 | 12,925 | 15,614 | 13,170 |
| Oct-19 | 13,048 | 15,950 | 13,389 |
| Nov-19 | 13,448 | 16,557 | 13,574 |
| Dec-19 | 13,796 | 17,035 | 13,859 |
| Jan-20 | 13,504 | 17,016 | 13,823 |
| Feb-20 | 12,413 | 15,623 | 13,210 |
| Mar-20 | 10,884 | 13,475 | 12,005 |
| Apr-20 | 11,300 | 15,259 | 12,860 |
| May-20 | 11,468 | 16,075 | 13,272 |
| Jun-20 | 11,592 | 16,443 | 13,534 |
| Jul-20 | 12,064 | 17,376 | 14,014 |
| Aug-20 | 12,851 | 18,635 | 14,435 |
| Sep-20 | 12,461 | 17,957 | 14,184 |
| Oct-20 | 12,063 | 17,569 | 13,993 |
| Nov-20 | 13,221 | 19,707 | 15,172 |
| Dec-20 | 13,820 | 20,593 | 15,636 |
| Jan-21 | 13,832 | 20,501 | 15,541 |
| Feb-21 | 14,150 | 21,142 | 15,729 |
| Mar-21 | 14,683 | 21,900 | 15,975 |
| Apr-21 | 15,353 | 23,029 | 16,435 |
| May-21 | 15,524 | 23,134 | 16,662 |
| Jun-21 | 15,796 | 23,705 | 16,771 |
| Jul-21 | 15,955 | 24,105 | 16,891 |
| Aug-21 | 16,375 | 24,793 | 17,112 |
| Sep-21 | 15,778 | 23,681 | 16,658 |
| Oct-21 | 16,563 | 25,282 | 17,069 |
| Nov-21 | 16,313 | 24,897 | 16,759 |
| Dec-21 | 16,732 | 25,877 | 17,230 |
| Jan-22 | 16,073 | 24,355 | 16,579 |
| Feb-22 | 15,917 | 23,741 | 16,325 |
| Mar-22 | 16,013 | 24,512 | 16,336 |
| Apr-22 | 15,174 | 22,312 | 15,381 |
| May-22 | 15,198 | 22,282 | 15,425 |
| Jun-22 | 14,646 | 20,418 | 14,484 |
| Jul-22 | 15,090 | 22,333 | 15,225 |
| Aug-22 | 14,742 | 21,500 | 14,761 |
| Sep-22 | 14,217 | 19,506 | 13,626 |
| Oct-22 | 14,710 | 21,106 | 14,082 |
| Nov-22 | 15,253 | 22,208 | 15,004 |
| Dec-22 | 14,877 | 20,907 | 14,684 |
| Jan-23 | 15,481 | 22,347 | 15,489 |
| Feb-23 | 15,124 | 21,825 | 15,052 |
| Mar-23 | 15,296 | 22,408 | 15,319 |
| Apr-23 | 15,493 | 22,647 | 15,459 |
| May-23 | 15,382 | 22,735 | 15,187 |
| Jun-23 | 16,159 | 24,288 | 15,699 |
| Jul-23 | 16,606 | 25,158 | 16,074 |
| Aug-23 | 16,321 | 24,673 | 15,717 |
| Sep-23 | 15,688 | 23,497 | 15,183 |
| Oct-23 | 15,240 | 22,875 | 14,750 |
| Nov-23 | 16,187 | 25,008 | 15,837 |
| Dec-23 | 16,971 | 26,334 | 16,626 |
| Jan-24 | 17,105 | 26,626 | 16,604 |
| Feb-24 | 17,991 | 28,067 | 16,874 |
| Mar-24 | 18,649 | 28,973 | 17,276 |
| Apr-24 | 17,843 | 27,698 | 16,734 |
| May-24 | 18,904 | 29,006 | 17,175 |
| Jun-24 | 19,159 | 29,904 | 17,322 |
The Growth of $10,000 chart compares the performance of the Fund over the period shown with dividends and capital gains reinvested to the Fund’s benchmark. Benchmark indices are unmanaged and do not reflect the deduction of expenses associated with a mutual fund, such as investment management and accounting fees.
Investment performance assumes reinvestment of all dividend and capital gain distributions. The results do not reflect the effect of taxes a shareholder would pay on Fund distributions or on the redemption of Fund shares. Historical performance attributed to the Institutional and Adviser Share Classes prior to their inception dates is based on the performance of the Retail Share Class. No adjustment has been made to reflect class-specific distribution or servicing fees. Returns may reflect the effect of voluntary fee waivers or expense reimbursements over the period shown. Without these waivers, performance would have been lower.
The performance data shown represents past performance, which does not guarantee future results. The investment return and principal value of an investment will fluctuate so that an investor’s shares, when redeemed, may be worth more or less than their original cost. Current performance may be lower or higher than the performance data quoted. For current month-end performance data, please visit our website at www.meederfunds.com.
| Total Net Assets | $211,678,626 |
| # of Portfolio Holdings | 496 |
| Portfolio Turnover Rate | 139% |
| Advisory Fees and Waivers | 747,751 |
Average Annual Total Returns
| . | 1 Year | 5 Year | Since Inception |
|---|
| Adviser Class (Inception Date: 1/1/15) | 18.56% | 8.34% | 7.09% |
| Russell 3000 Index | 23.13% | 14.14% | 12.23% |
| Morningstar Moderate Target Risk Index | 10.34% | 5.83% | 5.96% |
What did the Fund invest in?
| Microsoft Corp | 5.1% |
| iShares Short Treasury Bond ETF | 4.4% |
| Berkshire Hathaway Inc | 4.3% |
| NVIDIA Corp | 3.9% |
| Apple Inc | 3.4% |
| Mastercard Inc | 2.7% |
| Alphabet Inc | 2.6% |
| Amazon.com Inc | 2.4% |
| Texas Instruments Inc | 2.3% |
| Exxon Mobil Corp | 2.2% |
| As a percentage of total net assets. Holdings exclude short-term investments and derivatives. |
| Value | Value |
|---|
| Real Estate | |
| Materials | |
| Consumer Staples | 1.6%Footnote Reference |
| Utilities | 1.6%Footnote Reference |
| Communication Services | 8.3%Footnote Reference |
| Industrials | 8.5%Footnote Reference |
| Energy | 8.9%Footnote Reference |
| Health Care | 10.2%Footnote Reference |
| Consumer Discretionary | 14.0%Footnote Reference |
| Financials | 15.5%Footnote Reference |
| Information Technology | 35.1%Footnote Reference |
| Footnote | Description |
Footnote | As a percentage of total common stocks. Concentrations are subject to change. |
| Value | Value |
|---|
| Common Stocks (United States) | 68.6%Footnote Reference |
| Registered Investment Companies | 4.4%Footnote Reference |
| Money Market Registered Investment Companies | 2.7%Footnote Reference |
| Assets/Other Liabilities (Net) | 24.3% |
| Footnote | Description |
Footnote | As a percentage of total net assets. The Fund has invested in stock index futures contracts in order to equitize cash balances it holds in a proprietary money market fund. |
Availability of Additional Information
For additional information about the Fund, including its prospectus, financial information, holdings, proxy voting information and other important materials, scan the QR code or visit www.meederinvestment.com/meeder-funds-resources.
To reduce fund expenses, only one copy of most shareholder documents are delivered to shareholders with multiple accounts at the same address. If you wish to receive copies of this document for each account, please contact the Meeder Funds at 866.633.3371 or contact your financial intermediary.
Semi-Annual Shareholder Report
June 30, 2024
Institutional Class IFAIX
Conservative Allocation Fund
Semi-Annual Shareholder Report
June 30, 2024
This semi-annual shareholder report contains important information about the Conservative Allocation Fund for the period of December 31, 2023, to 6/30/2024, as well as certain changes to the Fund. You can find additional information about the Fund at meederinvestment.com/mutual-funds . You can also request this information by contacting us at 866.633.3371 .
What were the Fund's costs for the period?
(based on a hypothetical $10,000 investment)
| Class Name | Cost of $10K Investment | Cost Paid as % of $10K Investment |
|---|
| Institutional Class | $48.68 | 0.96% |
Total Return Based on a $10,000 Investment

| Institutional Class | Bloomberg U.S. Aggregate Bond Index | Morningstar Conservative Target Risk Index |
|---|
| Jun-14 | 10,000 | 10,000 | 10,000 |
| Jul-14 | 9,622 | 9,975 | 9,931 |
| Aug-14 | 10,111 | 10,085 | 10,037 |
| Sep-14 | 9,718 | 10,017 | 9,874 |
| Oct-14 | 9,880 | 10,115 | 9,937 |
| Nov-14 | 9,865 | 10,187 | 9,983 |
| Dec-14 | 9,681 | 10,196 | 9,927 |
| Jan-15 | 9,463 | 10,410 | 9,974 |
| Feb-15 | 9,793 | 10,312 | 10,027 |
| Mar-15 | 9,703 | 10,360 | 9,987 |
| Apr-15 | 9,892 | 10,323 | 10,045 |
| May-15 | 9,883 | 10,298 | 10,001 |
| Jun-15 | 9,426 | 10,186 | 9,926 |
| Jul-15 | 9,343 | 10,257 | 9,953 |
| Aug-15 | 8,835 | 10,242 | 9,839 |
| Sep-15 | 8,267 | 10,311 | 9,810 |
| Oct-15 | 8,754 | 10,313 | 9,944 |
| Nov-15 | 8,360 | 10,286 | 9,885 |
| Dec-15 | 8,043 | 10,252 | 9,836 |
| Jan-16 | 7,833 | 10,393 | 9,810 |
| Feb-16 | 7,893 | 10,467 | 9,886 |
| Mar-16 | 8,531 | 10,563 | 10,114 |
| Apr-16 | 8,822 | 10,604 | 10,197 |
| May-16 | 9,077 | 10,606 | 10,188 |
| Jun-16 | 9,372 | 10,797 | 10,340 |
| Jul-16 | 9,557 | 10,865 | 10,466 |
| Aug-16 | 9,506 | 10,853 | 10,459 |
| Sep-16 | 9,780 | 10,847 | 10,489 |
| Oct-16 | 9,401 | 10,764 | 10,383 |
| Nov-16 | 9,463 | 10,509 | 10,245 |
| Dec-16 | 9,638 | 10,524 | 10,296 |
| Jan-17 | 9,607 | 10,544 | 10,374 |
| Feb-17 | 9,774 | 10,615 | 10,479 |
| Mar-17 | 9,923 | 10,610 | 10,501 |
| Apr-17 | 9,927 | 10,692 | 10,588 |
| May-17 | 9,977 | 10,774 | 10,680 |
| Jun-17 | 9,977 | 10,763 | 10,675 |
| Jul-17 | 10,257 | 10,809 | 10,774 |
| Aug-17 | 10,194 | 10,906 | 10,848 |
| Sep-17 | 10,235 | 10,854 | 10,862 |
| Oct-17 | 10,180 | 10,861 | 10,909 |
| Nov-17 | 10,325 | 10,847 | 10,955 |
| Dec-17 | 10,419 | 10,897 | 11,017 |
| Jan-18 | 10,533 | 10,771 | 11,068 |
| Feb-18 | 10,351 | 10,669 | 10,911 |
| Mar-18 | 10,319 | 10,737 | 10,923 |
| Apr-18 | 10,287 | 10,658 | 10,877 |
| May-18 | 10,360 | 10,734 | 10,927 |
| Jun-18 | 10,333 | 10,720 | 10,923 |
| Jul-18 | 10,457 | 10,723 | 10,993 |
| Aug-18 | 10,558 | 10,792 | 11,055 |
| Sep-18 | 10,549 | 10,722 | 11,021 |
| Oct-18 | 10,207 | 10,638 | 10,807 |
| Nov-18 | 10,216 | 10,701 | 10,895 |
| Dec-18 | 10,182 | 10,898 | 10,885 |
| Jan-19 | 10,381 | 11,014 | 11,165 |
| Feb-19 | 10,466 | 11,007 | 11,228 |
| Mar-19 | 10,585 | 11,218 | 11,393 |
| Apr-19 | 10,689 | 11,221 | 11,469 |
| May-19 | 10,542 | 11,421 | 11,459 |
| Jun-19 | 10,861 | 11,564 | 11,707 |
| Jul-19 | 10,923 | 11,589 | 11,738 |
| Aug-19 | 10,956 | 11,890 | 11,832 |
| Sep-19 | 10,980 | 11,826 | 11,873 |
| Oct-19 | 11,048 | 11,862 | 11,965 |
| Nov-19 | 11,125 | 11,856 | 12,007 |
| Dec-19 | 11,263 | 11,848 | 12,106 |
| Jan-20 | 11,321 | 12,076 | 12,230 |
| Feb-20 | 11,098 | 12,293 | 12,159 |
| Mar-20 | 10,495 | 12,221 | 11,698 |
| Apr-20 | 10,724 | 12,438 | 12,114 |
| May-20 | 10,939 | 12,496 | 12,312 |
| Jun-20 | 11,046 | 12,575 | 12,456 |
| Jul-20 | 11,355 | 12,762 | 12,742 |
| Aug-20 | 11,551 | 12,659 | 12,833 |
| Sep-20 | 11,409 | 12,652 | 12,745 |
| Oct-20 | 11,281 | 12,596 | 12,652 |
| Nov-20 | 11,763 | 12,720 | 13,112 |
| Dec-20 | 12,015 | 12,737 | 13,286 |
| Jan-21 | 11,951 | 12,646 | 13,191 |
| Feb-21 | 11,946 | 12,463 | 13,074 |
| Mar-21 | 12,055 | 12,308 | 13,073 |
| Apr-21 | 12,289 | 12,405 | 13,282 |
| May-21 | 12,353 | 12,445 | 13,395 |
| Jun-21 | 12,482 | 12,533 | 13,476 |
| Jul-21 | 12,522 | 12,673 | 13,604 |
| Aug-21 | 12,612 | 12,649 | 13,651 |
| Sep-21 | 12,422 | 12,539 | 13,435 |
| Oct-21 | 12,573 | 12,536 | 13,529 |
| Nov-21 | 12,493 | 12,573 | 13,465 |
| Dec-21 | 12,609 | 12,541 | 13,586 |
| Jan-22 | 12,346 | 12,271 | 13,243 |
| Feb-22 | 12,256 | 12,134 | 13,071 |
| Mar-22 | 12,130 | 11,796 | 12,850 |
| Apr-22 | 11,804 | 11,349 | 12,303 |
| May-22 | 11,814 | 11,422 | 12,356 |
| Jun-22 | 11,335 | 11,243 | 11,953 |
| Jul-22 | 11,499 | 11,518 | 12,342 |
| Aug-22 | 11,335 | 11,192 | 11,994 |
| Sep-22 | 11,114 | 10,709 | 11,318 |
| Oct-22 | 11,188 | 10,570 | 11,385 |
| Nov-22 | 11,475 | 10,959 | 11,910 |
| Dec-22 | 11,348 | 10,909 | 11,800 |
| Jan-23 | 11,638 | 11,245 | 12,221 |
| Feb-23 | 11,439 | 10,954 | 11,912 |
| Mar-23 | 11,589 | 11,232 | 12,169 |
| Apr-23 | 11,654 | 11,300 | 12,257 |
| May-23 | 11,546 | 11,177 | 12,093 |
| Jun-23 | 11,740 | 11,137 | 12,206 |
| Jul-23 | 11,876 | 11,130 | 12,311 |
| Aug-23 | 11,784 | 11,059 | 12,163 |
| Sep-23 | 11,588 | 10,778 | 11,832 |
| Oct-23 | 11,457 | 10,607 | 11,615 |
| Nov-23 | 11,961 | 11,088 | 12,223 |
| Dec-23 | 12,486 | 11,512 | 12,713 |
| Jan-24 | 12,508 | 11,481 | 12,686 |
| Feb-24 | 12,624 | 11,318 | 12,642 |
| Mar-24 | 12,857 | 11,423 | 12,810 |
| Apr-24 | 12,494 | 11,134 | 12,474 |
| May-24 | 12,840 | 11,323 | 12,729 |
| Jun-24 | 12,979 | 11,430 | 12,838 |
The Growth of $10,000 chart compares the performance of the Fund over the period shown with dividends and capital gains reinvested to the Fund’s benchmark. Benchmark indices are unmanaged and do not reflect the deduction of expenses associated with a mutual fund, such as investment management and accounting fees.
Investment performance assumes reinvestment of all dividend and capital gain distributions. The results do not reflect the effect of taxes a shareholder would pay on Fund distributions or on the redemption of Fund shares. Historical performance attributed to the Institutional and Adviser Share Classes prior to their inception dates is based on the performance of the Retail Share Class. No adjustment has been made to reflect class-specific distribution or servicing fees. Returns may reflect the effect of voluntary fee waivers or expense reimbursements over the period shown. Without these waivers, performance would have been lower.
The performance data shown represents past performance, which does not guarantee future results. The investment return and principal value of an investment will fluctuate so that an investor’s shares, when redeemed, may be worth more or less than their original cost. Current performance may be lower or higher than the performance data quoted. For current month-end performance data, please visit our website at www.meederfunds.com.
| Total Net Assets | $133,249,326 |
| # of Portfolio Holdings | 136 |
| Portfolio Turnover Rate | 72% |
| Advisory Fees and Waivers | 321,819 |
Average Annual Total Returns
| . | 1 Year | 5 Year | 10 Year |
|---|
| Institutional Class | 10.55% | 3.63% | 2.64% |
| Bloomberg U.S. Aggregate Bond Index | 2.63% | | 1.35% |
| Morningstar Conservative Target Risk Index | 5.18% | 1.86% | 2.53% |
What did the Fund invest in?
| Fidelity Total Bond Fund - Class Z | 17.3% |
| Baird Core Plus Bond Fund - Class I | 16.7% |
| Frost Total Return Bond Fund - Class I | 8.7% |
| Dodge & Cox Income Fund - Class I | 5.5% |
| Fidelity Advisor High Income Advantage Fund - Class Z | 5.2% |
| BrandywineGLOBAL High Yield Fund - Class I | 5.2% |
| iShares 20+ Year Treasury Bond ETF | 5.1% |
| Eaton Vance Emerging Markets Debt Opportunities Fund - Class R6 | 3.4% |
| Berkshire Hathaway Inc | 2.3% |
| Microsoft Corp | 2.2% |
| As a percentage of total net assets. Holdings exclude short-term investments and derivatives. |
| Value | Value |
|---|
| Utilities | 0.3%Footnote Reference |
| Materials | 0.5%Footnote Reference |
| Consumer Staples | 2.5%Footnote Reference |
| Energy | 2.9%Footnote Reference |
| Industrials | 8.1%Footnote Reference |
| Communication Services | 9.4%Footnote Reference |
| Consumer Discretionary | 12.9%Footnote Reference |
| Health Care | 14.3%Footnote Reference |
| Financials | 14.4%Footnote Reference |
| Information Technology | 34.7%Footnote Reference |
| Footnote | Description |
Footnote | As a percentage of total common stocks. Concentrations are subject to change. |
| Value | Value |
|---|
| Common Stocks (United States) | 23.6%Footnote Reference |
| Registered Investment Companies | 68.4%Footnote Reference |
| Money Market Registered Investment Companies | 7.6%Footnote Reference |
| Assets/Other Liabilities (Net) | 0.4% |
| Footnote | Description |
Footnote | As a percentage of total net assets. The Fund has invested in stock index futures contracts in order to equitize cash balances it holds in a proprietary money market fund. |
Availability of Additional Information
For additional information about the Fund, including its prospectus, financial information, holdings, proxy voting information and other important materials, scan the QR code or visit www.meederinvestment.com/meeder-funds-resources.
To reduce fund expenses, only one copy of most shareholder documents are delivered to shareholders with multiple accounts at the same address. If you wish to receive copies of this document for each account, please contact the Meeder Funds at 866.633.3371 or contact your financial intermediary.
Institutional Class IFAIX
Conservative Allocation Fund
Semi-Annual Shareholder Report
June 30, 2024
Institutional Prime Money Market Fund
Semi-Annual Shareholder Report
June 30, 2024
This semi-annual shareholder report contains important information about the Institutional Prime Money Market Fund for the period of December 31, 2023, to 6/30/2024, as well as certain changes to the Fund. You can find additional information about the Fund at meederinvestment.com/mutual-funds . You can also request this information by contacting us at 866.633.3371 .
What were the Fund's costs for the period?
(based on a hypothetical $10,000 investment)
| Class Name | Cost of $10K Investment | Cost Paid as % of $10K Investment |
|---|
| Institutional Prime Money Market Fund | $10.59 | 0.21% |
- Total Net Assets$507,375,001
- # of Portfolio Holdings65
- Portfolio Turnover RateN/A
- Advisory Fees and Waivers713,851
Average Annual Total Returns
| . | 1 Year | 5 Year | 10 Year |
|---|
| Institutional Prime Money Market Fund (Inception Date: 10/7/16) | 5.47% | 2.22% | 1.57% |
| . | 7-Day Subsidized Yield | 7-Day Unsubsidized Yield |
|---|
| Institutional Prime Money Market Fund | 5.28% | 5.00% |
Investment performance assumes reinvestment of all dividend and capital gain distributions. The results do not reflect the effect of taxes a shareholder would pay on Fund distributions or on the redemption of Fund shares. The Fund’s performance prior to October 7, 2016 reflects the performance of a predecessor fund, the Institutional Class of the Meeder Prime Money Market Fund, which was distributed and transferred to the Institutional Prime Money Market Fund upon its inception. The subsidized 7-day current yield is the current annualized net yield of the Fund. The unsubsidized 7-day current yield does not reflect the effect of any fee waivers or expense reimbursements made by the Fund’s investment adviser. The 7-day current yield more closely reflects the current earnings of the Fund than total return.
You could lose money by investing in the Fund. Because the share price of the Fund will fluctuate, when you sell your shares they may be worth more or less than what you originally paid for them. The Fund may impose a fee upon sale of your shares or may temporarily suspend your ability to sell shares if the Fund’s liquidity falls below required minimums because of market conditions or other factors. An investment in the Fund is not insured or guaranteed by the Federal Deposit Insurance Corporation or any other government agency. The Fund’s sponsor has no legal obligation to provide financial support to the Fund, and you should not expect that the sponsor will provide financial support to the Fund at any time.
| StoneX (Collateralized by $184,240,744 various Asset Backed Securities, Corporate Bonds, FMACs, GNMAs, FNMAs, SBAs, Mid-Term Notes and Municipal Bonds, 0.00% - 7.92%, due 7/1/24 - 2/25/67, fair value $77,551,147) (proceeds $75,035,125) purch date 6/28/24 | 14.8% |
| South Street (Collateralized by $52,179,490 various FCSBs, FHLBs, FMACs, FNMAs, GNMAs, and U.S. Treasuries, 1.00% - 6.50%, due 7/24/25 - 6/1/54, fair value $51,000,029)(proceeds $50,022,583), purchase date 6/28/24 | 9.9% |
| South Street (Collateralized by $51,962,649 various FCSBs, FHLBs, FMACs, FNMAs, GNMAs, and U.S. Treasuries, 0.38% - 6.00%, due 9/29/25 - 6/1/54, fair value $51,000,055) (proceeds $50,022,667), purchase date 6/28/24 | 9.9% |
| Loop Capital (Collateralized by $47,852,627 FNMAs, 4.50%, due 7/1/52, fair value $45,900,000) (proceeds $45,020,063), purchase date 6/28/24 | 8.9% |
| Anglesea Funding | 2.4% |
| Bedford Row Funding (Secured Overnight Financing Rate + 0.17%) | 2.0% |
| US Treasury Bill | 2.0% |
| Old Line Funding LLC | 2.0% |
| American Honda Finance | 2.0% |
| US Treasury Bill | 2.0% |
| As a percentage of total net assets. |
| Value | Value |
|---|
| U.S. Government Agencies | 0.4%Footnote Reference |
| U.S. Treasury Notes | 0.5%Footnote Reference |
| Money Market Registered Investment Companies | 2.4%Footnote Reference |
| Certificates of Deposit | 3.1%Footnote Reference |
| U.S. Treasury Bills | 16.2%Footnote Reference |
| Commercial Paper | 34.3%Footnote Reference |
| Repurchase Agreements | 43.4%Footnote Reference |
| Footnote | Description |
Footnote | As a percentage of total net assets. Concentrations are subject to change. |
Availability of Additional Information
For additional information about the Fund, including its prospectus, financial information, holdings, proxy voting information and other important materials, scan the QR code or visit www.meederinvestment.com/meeder-funds-resources.
To reduce fund expenses, only one copy of most shareholder documents are delivered to shareholders with multiple accounts at the same address. If you wish to receive copies of this document for each account, please contact the Meeder Funds at 866.633.3371 or contact your financial intermediary.
Institutional Prime Money Market Fund
Semi-Annual Shareholder Report
June 30, 2024
Semi-Annual Shareholder Report
June 30, 2024
This semi-annual shareholder report contains important information about the Global Allocation Fund for the period of December 31, 2023, to 6/30/2024, as well as certain changes to the Fund. You can find additional information about the Fund at meederinvestment.com/mutual-funds . You can also request this information by contacting us at 866.633.3371 .
What were the Fund's costs for the period?
(based on a hypothetical $10,000 investment)
| Class Name | Cost of $10K Investment | Cost Paid as % of $10K Investment |
|---|
| Retail Class | $94.06 | 1.82% |
Total Return Based on a $10,000 Investment

| Retail Class | Russell 3000 Index | Morningstar Global Allocation Index |
|---|
| Jun-14 | 10,000 | 10,000 | 10,000 |
| Jul-14 | 9,757 | 9,803 | 9,872 |
| Aug-14 | 10,073 | 10,214 | 10,046 |
| Sep-14 | 9,655 | 10,001 | 9,734 |
| Oct-14 | 9,793 | 10,276 | 9,803 |
| Nov-14 | 9,834 | 10,525 | 9,890 |
| Dec-14 | 9,731 | 10,525 | 9,778 |
| Jan-15 | 9,590 | 10,232 | 9,722 |
| Feb-15 | 10,049 | 10,825 | 10,021 |
| Mar-15 | 9,956 | 10,715 | 9,947 |
| Apr-15 | 10,012 | 10,763 | 10,113 |
| May-15 | 10,031 | 10,912 | 10,073 |
| Jun-15 | 9,806 | 10,729 | 9,918 |
| Jul-15 | 9,806 | 10,909 | 9,951 |
| Aug-15 | 9,131 | 10,250 | 9,561 |
| Sep-15 | 8,793 | 9,952 | 9,369 |
| Oct-15 | 9,309 | 10,738 | 9,775 |
| Nov-15 | 9,309 | 10,797 | 9,688 |
| Dec-15 | 9,029 | 10,576 | 9,584 |
| Jan-16 | 8,439 | 9,979 | 9,263 |
| Feb-16 | 8,323 | 9,976 | 9,324 |
| Mar-16 | 8,951 | 10,678 | 9,819 |
| Apr-16 | 8,951 | 10,744 | 9,968 |
| May-16 | 8,942 | 10,936 | 9,939 |
| Jun-16 | 8,922 | 10,959 | 10,020 |
| Jul-16 | 9,272 | 11,394 | 10,321 |
| Aug-16 | 9,301 | 11,423 | 10,337 |
| Sep-16 | 9,398 | 11,441 | 10,398 |
| Oct-16 | 9,145 | 11,193 | 10,193 |
| Nov-16 | 9,213 | 11,694 | 10,123 |
| Dec-16 | 9,348 | 11,922 | 10,255 |
| Jan-17 | 9,583 | 12,147 | 10,462 |
| Feb-17 | 9,798 | 12,599 | 10,668 |
| Mar-17 | 9,906 | 12,607 | 10,759 |
| Apr-17 | 10,033 | 12,741 | 10,912 |
| May-17 | 10,180 | 12,871 | 11,106 |
| Jun-17 | 10,233 | 12,987 | 11,139 |
| Jul-17 | 10,566 | 13,232 | 11,369 |
| Aug-17 | 10,654 | 13,258 | 11,434 |
| Sep-17 | 10,879 | 13,581 | 11,555 |
| Oct-17 | 11,163 | 13,877 | 11,690 |
| Nov-17 | 11,310 | 14,299 | 11,872 |
| Dec-17 | 11,436 | 14,442 | 12,005 |
| Jan-18 | 12,031 | 15,203 | 12,424 |
| Feb-18 | 11,595 | 14,642 | 12,072 |
| Mar-18 | 11,426 | 14,349 | 11,984 |
| Apr-18 | 11,486 | 14,403 | 11,991 |
| May-18 | 11,496 | 14,810 | 12,009 |
| Jun-18 | 11,352 | 14,907 | 11,965 |
| Jul-18 | 11,640 | 15,401 | 12,171 |
| Aug-18 | 11,740 | 15,942 | 12,274 |
| Sep-18 | 11,750 | 15,968 | 12,259 |
| Oct-18 | 10,855 | 14,793 | 11,646 |
| Nov-18 | 10,925 | 15,089 | 11,781 |
| Dec-18 | 10,643 | 13,685 | 11,343 |
| Jan-19 | 10,810 | 14,859 | 11,936 |
| Feb-19 | 10,935 | 15,382 | 12,108 |
| Mar-19 | 11,007 | 15,606 | 12,258 |
| Apr-19 | 11,237 | 16,230 | 12,491 |
| May-19 | 10,643 | 15,179 | 12,132 |
| Jun-19 | 11,258 | 16,246 | 12,678 |
| Jul-19 | 11,216 | 16,487 | 12,699 |
| Aug-19 | 11,007 | 16,151 | 12,622 |
| Sep-19 | 11,226 | 16,434 | 12,738 |
| Oct-19 | 11,467 | 16,788 | 12,980 |
| Nov-19 | 11,686 | 17,426 | 13,144 |
| Dec-19 | 12,044 | 17,929 | 13,445 |
| Jan-20 | 11,768 | 17,910 | 13,427 |
| Feb-20 | 10,970 | 16,444 | 12,806 |
| Mar-20 | 9,704 | 14,182 | 11,616 |
| Apr-20 | 10,055 | 16,061 | 12,412 |
| May-20 | 10,299 | 16,919 | 12,797 |
| Jun-20 | 10,427 | 17,306 | 13,078 |
| Jul-20 | 10,768 | 18,289 | 13,629 |
| Aug-20 | 11,342 | 19,614 | 14,116 |
| Sep-20 | 11,055 | 18,900 | 13,831 |
| Oct-20 | 10,768 | 18,492 | 13,628 |
| Nov-20 | 11,885 | 20,741 | 14,763 |
| Dec-20 | 12,402 | 21,675 | 15,266 |
| Jan-21 | 12,391 | 21,578 | 15,169 |
| Feb-21 | 12,619 | 22,253 | 15,303 |
| Mar-21 | 12,935 | 23,050 | 15,482 |
| Apr-21 | 13,359 | 24,238 | 15,991 |
| May-21 | 13,609 | 24,349 | 16,188 |
| Jun-21 | 13,696 | 24,950 | 16,286 |
| Jul-21 | 13,718 | 25,371 | 16,410 |
| Aug-21 | 13,957 | 26,095 | 16,645 |
| Sep-21 | 13,478 | 24,924 | 16,134 |
| Oct-21 | 13,935 | 26,610 | 16,585 |
| Nov-21 | 13,587 | 26,205 | 16,303 |
| Dec-21 | 13,962 | 27,236 | 16,687 |
| Jan-22 | 13,466 | 25,634 | 16,008 |
| Feb-22 | 13,237 | 24,988 | 15,700 |
| Mar-22 | 13,164 | 25,799 | 15,716 |
| Apr-22 | 12,475 | 23,484 | 14,653 |
| May-22 | 12,499 | 23,452 | 14,672 |
| Jun-22 | 11,992 | 21,490 | 13,730 |
| Jul-22 | 12,294 | 23,506 | 14,445 |
| Aug-22 | 11,895 | 22,629 | 13,937 |
| Sep-22 | 11,109 | 20,531 | 12,839 |
| Oct-22 | 11,629 | 22,214 | 13,268 |
| Nov-22 | 12,476 | 23,374 | 14,148 |
| Dec-22 | 12,155 | 22,005 | 13,833 |
| Jan-23 | 12,862 | 23,521 | 14,603 |
| Feb-23 | 12,460 | 22,971 | 14,194 |
| Mar-23 | 12,776 | 23,585 | 14,577 |
| Apr-23 | 12,996 | 23,837 | 14,726 |
| May-23 | 12,703 | 23,929 | 14,530 |
| Jun-23 | 13,240 | 25,563 | 15,062 |
| Jul-23 | 13,619 | 26,480 | 15,429 |
| Aug-23 | 13,228 | 25,968 | 15,096 |
| Sep-23 | 12,725 | 24,731 | 14,553 |
| Oct-23 | 12,357 | 24,076 | 14,187 |
| Nov-23 | 13,303 | 26,321 | 15,251 |
| Dec-23 | 14,024 | 27,717 | 15,971 |
| Jan-24 | 13,974 | 28,024 | 15,949 |
| Feb-24 | 14,507 | 29,541 | 16,288 |
| Mar-24 | 14,978 | 30,494 | 16,653 |
| Apr-24 | 14,418 | 29,152 | 16,152 |
| May-24 | 15,052 | 30,530 | 16,652 |
| Jun-24 | 15,127 | 31,475 | 16,876 |
The Growth of $10,000 chart compares the performance of the Fund over the period shown with dividends and capital gains reinvested to the Fund’s benchmark. Benchmark indices are unmanaged and do not reflect the deduction of expenses associated with a mutual fund, such as investment management and accounting fees.
The performance data shown represents past performance, which does not guarantee future results. The investment return and principal value of an investment will fluctuate so that an investor’s shares, when redeemed, may be worth more or less than their original cost. Current performance may be lower or higher than the performance data quoted. For current month-end performance data, please visit our website at www.meederfunds.com.
| Total Net Assets | $36,167,888 |
| # of Portfolio Holdings | 146 |
| Portfolio Turnover Rate | 100% |
| Advisory Fees and Waivers | 128,889 |
Average Annual Total Returns
| . | 1 Year | 5 Year | 10 Year |
|---|
| Retail Class | 14.25% | 6.09% | 4.23% |
| Russell 3000 Index | 23.13% | 14.14% | 12.15% |
| Morningstar Global Allocation Index | 12.04% | 5.89% | 5.37% |
What did the Fund invest in?
| iShares Core MSCI EAFE ETF | 8.5% |
| Berkshire Hathaway Inc | 3.0% |
| Microsoft Corp | 2.9% |
| Fidelity Total Bond Fund - Class Z | 2.5% |
| Baird Core Plus Bond Fund - Class I | 2.2% |
| NVIDIA Corp | 2.1% |
| iShares Core MSCI Emerging Markets ETF | 1.8% |
| Alphabet Inc | 1.7% |
| Amazon.com Inc | 1.6% |
| Frost Total Return Bond Fund - Class I | 1.3% |
| As a percentage of total net assets. Holdings exclude short-term investments and derivatives. |
| Value | Value |
|---|
| Utilities | 0.3%Footnote Reference |
| Materials | 0.4%Footnote Reference |
| Energy | 2.3%Footnote Reference |
| Consumer Staples | 2.5%Footnote Reference |
| Industrials | 8.7%Footnote Reference |
| Communication Services | 9.1%Footnote Reference |
| Consumer Discretionary | 13.1%Footnote Reference |
| Health Care | 13.7%Footnote Reference |
| Financials | 14.9%Footnote Reference |
| Information Technology | 35.0%Footnote Reference |
| Footnote | Description |
Footnote | As a percentage of total common stocks. Concentrations are subject to change. |
| Value | Value |
|---|
| Common Stocks (United States) | 30.7%Footnote Reference |
| Registered Investment Companies | 20.0%Footnote Reference |
| Money Market Registered Investment Companies | 46.7%Footnote Reference |
| Assets/Other Liabilities (Net) | 2.6% |
| Footnote | Description |
Footnote | As a percentage of total net assets. The Fund has invested in stock index futures contracts in order to equitize cash balances it holds in a proprietary money market fund. |
Availability of Additional Information
For additional information about the Fund, including its prospectus, financial information, holdings, proxy voting information and other important materials, scan the QR code or visit www.meederinvestment.com/meeder-funds-resources.
To reduce fund expenses, only one copy of most shareholder documents are delivered to shareholders with multiple accounts at the same address. If you wish to receive copies of this document for each account, please contact the Meeder Funds at 866.633.3371 or contact your financial intermediary.
Semi-Annual Shareholder Report
June 30, 2024
Item 2. Code of Ethics.
The registrant has adopted a code of ethics that applies to the registrant’s principal executive officer, principal financial officer, comptroller or principal accounting officer, and any person who performs a similar function. There were no amendments made to, or waivers granted from, the code of ethics during the fiscal year.
Item 3. Audit Committee Financial Expert.
The Board of Trustees of the Trust has determined that Jeffrey R. Provence is an audit committee financial expert, as defined in Item 3 of Form N-CSR. Mr. Provence is independent for purposes of Item 3 of Form N-CSR.
Item 4. Principal Accountant Fees and Services.
(a) – (d) Aggregate fees billed to the registrant for the last two fiscal years for professional services rendered by the registrant’s principal accountant were as follows:
2024 2023
Audit Fees $120,000 $120,000
Audit-Related Fees 0 0
Tax Fees 44,000 38,000
All Other Fees 1,500 1,500
Audit fees include amounts related to the audit of the registrant’s annual financial statements and services normally provided by the accountant in connection with statutory and regulatory filings. Audit-related fees include amounts reasonably related to the performance of the audit of the registrant’s financial statements, including, but not limited to, mileage, lodging, and meals. Tax fees include amounts related to tax compliance, tax planning, and tax advice, including the review and preparation of the Funds’ income tax returns, the review and preparation of the Funds’ excise tax returns, the review of supporting schedules and documentation provided by management, the review and recalculation of the Funds’ estimated distribution calculations, and the review of wash sales for reasonableness. All other fees include amounts related to the registrant’s annual filing of Form N1A.
(e)(1) A purpose of the Audit Committee is to approve the engagement of the registrant’s independent auditors (i) to render audit and non-audit services for the registrant in accordance with Rule 2-01(c)(7)(i) of Regulation S-X, subject to the waiver provisions set forth in Rule 2-01(c)(7)(i)(C) of Regulation S-X, and (ii) to render non-audit services for the registrant’s investment advisors (other than a sub-advisor whose role is primarily portfolio management and is subcontracted or overseen by another investment advisor) and any other entity controlling by, or under common control with the investment advisor that provides ongoing services to the registrant, in each case under (ii) if the engagement relates directly to the operations and financial reporting of the registrant, in accordance with Rule 2-01(c)(7)(ii) of Regulation S-X, subject to waiver provisions set forth in Rule 2-01(c)(7)(ii) of Regulation S-X.
(e)(2) 0% of services included in (b) – (d) above were approved pursuant to Rule 2-01(c)(7)(i)(C) of Regulation S-X.
(f) Not applicable.
(g) The aggregate fees billed for the most recent fiscal year and the preceding fiscal year by the registrant’s principal accountant for non-audit services rendered to the registrant, its investment advisor, and any entity controlling, controlled by, or under common control with the investment advisor that provides ongoing services to the registrant were $26,500 and $92,175, respectively.
(h) The registrant’s audit committee of the board of directors has considered whether the provision of non-audit services that were rendered to the registrant’s investment adviser (not including any sub-adviser whose role is primarily portfolio management and is subcontracted with or overseen by another investment adviser), and any entity controlling, controlled by, or under common control with the investment adviser that provides ongoing services to the registrant that were not pre-approved pursuant to paragraph (c)(7)(ii) of Rule 2-01 of Regulation S-X is compatible with maintaining the principal accountant’s independence.
(i) Not applicable.
(j) Not applicable.
Items 5. Audit Committee of Listed Registrants.
Not applicable.
Item 6. Investments.
(a) The schedule of investments is included as part of the report to stockholders filed under Item 7 of this Form.
(b) Not applicable.
Item 7. Financial Statements and Financial Highlights for Open-End Management Investment Companies.
June
30,
2024
(unaudited)
Meeder
Funds
Semi-Annual
Report
This
Semi-Annual
Report
is
prepared
and
distributed
for
the
general
information
of
the
shareholders
of
the
Funds.
This
material
is
not
authorized
for
distribution
to
prospective
investors
unless
preceded
or
accompanied
by
a
prospectus.
Investors
are
advised
to
consider
carefully
the
investment
objectives,
risks,
charges
and
expenses
of
the
Fund
before
investing.
The
prospectus
contains
this
and
other
information
about
the
Funds.
Meeder
Funds
are
distributed
by
Meeder
Distribution
Services,
Inc.
(Member
FINRA),
an
affiliate
of
Meeder
Investment
Management.
An
affiliated
registered
investment
adviser,
Meeder
Asset
Management,
Inc.,
serves
as
the
investment
adviser
to
Meeder
Funds
and
is
paid
a
fee
for
its
services.
Schedules
of
Investments
....................................................................................................................................................
2
Statements
of
Assets
and
Liabilities
.....................................................................................................................................
38
Statements
of
Operations
....................................................................................................................................................
40
Statements
of
Changes
in
Net
Assets
...................................................................................................................................
42
Financial
Highlights
..............................................................................................................................................................
46
Notes
to
Financial
Statements
..............................................................................................................................................
56
Shareholder
Expense
Analysis
..............................................................................................................................................
73
Other
Items
..........................................................................................................................................................................
75
2024
Semi-Annual
Report
Fund
Holdings
&
Financial
Statements
2024
Semi-Annual
Report
|
June
30,
2024
The
accompanying
notes
are
an
integral
part
of
these
financial
statements.
Schedules
of
Investments
June
30,
2024
(unaudited)
Muirfield
Fund
Security
Description
Shares,
Contracts
or
Principal
Amount
($)
Fair
Value
($)
Common
Stocks
(United
States)
—
72
.2
%
Communication
Services
—
6.6%
Alphabet
Inc
.......................
171,380
31,434,520
Comcast
Corp
......................
15,625
611,875
Meta
Platforms
Inc
...................
40,671
20,507,132
Netflix
Inc
(1)
........................
7,212
4,867,234
Telephone
and
Data
Systems
Inc
.........
11,045
228,963
57,649,724
Consumer
Discretionary
—
10.1%
Amazon.com
Inc
(1)
...................
177,487
34,299,363
Aptiv
PLC
(1)
........................
1,012
71,265
Best
Buy
Co
Inc
.....................
16,860
1,421,129
Burlington
Stores
Inc
(1)
................
4,932
1,183,680
Frontdoor
Inc
(1)
......................
4,185
141,411
Helen
of
Troy
Ltd
(1)
...................
1,455
134,937
Hibbett
Inc
........................
14,389
1,254,865
Hovnanian
Enterprises
Inc
(1)
.............
1,080
153,274
Las
Vegas
Sands
Corp
.................
26,029
1,151,783
Leggett
&
Platt
Inc
...................
26,366
302,154
Lennar
Corp
.......................
67,128
10,060,473
Lululemon
Athletica
Inc
(1)
...............
6,843
2,044,004
Meritage
Homes
Corp
.................
5,355
866,707
Mohawk
Industries
Inc
(1)
...............
37,773
4,290,635
NVR
Inc
(1)
.........................
118
895,450
ONE
Group
Hospitality
Inc/The
(1)
..........
4,708
20,009
O'Reilly
Automotive
Inc
(1)
...............
4,440
4,688,906
PVH
Corp
.........................
4,865
515,058
Ross
Stores
Inc
.....................
61,957
9,003,591
Texas
Roadhouse
Inc
.................
5,462
937,880
TJX
Cos
Inc/The
.....................
119,599
13,167,850
Ulta
Beauty
Inc
(1)
....................
1,802
695,338
Valvoline
Inc
(1)
......................
10,354
447,293
87,747,055
Consumer
Staples
—
1.7%
Andersons
Inc/The
...................
959
47,566
Bunge
Global
SA
....................
42,692
4,558,225
Cal-Maine
Foods
Inc
..................
2,244
137,131
Casey's
General
Stores
Inc
.............
3,998
1,525,477
Kroger
Co/The
......................
74,004
3,695,020
PriceSmart
Inc
......................
493
40,032
Target
Corp
........................
24,774
3,667,543
Walmart
Inc
.......................
21,302
1,442,358
15,113,352
Muirfield
Fund
Security
Description
Shares,
Contracts
or
Principal
Amount
($)
Fair
Value
($)
Common
Stocks
(United
States)
—
continued
Energy
—
1.1%
Berry
Corp
........................
4,345
28,069
Civitas
Resources
Inc
.................
5,455
376,395
ConocoPhillips
......................
4,010
458,664
Devon
Energy
Corp
...................
3,717
176,186
Diamondback
Energy
Inc
...............
18,671
3,737,748
EOG
Resources
Inc
...................
24,105
3,034,096
Exxon
Mobil
Corp
....................
9,804
1,128,636
Scorpio
Tankers
Inc
..................
1,852
150,549
Teekay
Corp
(1)
......................
3,592
32,220
9,122,563
Financials
—
11.3%
Ally
Financial
Inc
....................
78,808
3,126,313
Ameriprise
Financial
Inc
...............
22,685
9,690,805
Associated
Banc-Corp
.................
1,722
36,420
Banco
Latinoamericano
de
Comercio
Exterior
SA
969
28,750
Bank
of
New
York
Mellon
Corp/The
........
123,043
7,369,045
Berkshire
Hathaway
Inc
(1)
..............
154,421
62,818,463
Block
Inc
(1)
........................
18,485
1,192,098
Commerce
Bancshares
Inc/MO
...........
12,959
722,853
Cullen/Frost
Bankers
Inc
...............
13,263
1,347,919
Fifth
Third
Bancorp
...................
4,791
174,824
First
American
Financial
Corp
............
6,698
361,357
Hanmi
Financial
Corp
.................
1,894
31,668
Medley
Management
Inc
(1)
(2)
.............
235
0
NerdWallet
Inc
(1)
.....................
6,004
87,658
Northern
Trust
Corp
..................
54,193
4,551,128
Popular
Inc
........................
547
48,371
PROG
Holdings
Inc
...................
3,633
125,992
State
Street
Corp
....................
88,513
6,549,962
WaFd
Inc
.........................
2,825
80,739
98,344,365
Health
Care
—
11.3%
AbbVie
Inc
........................
57,224
9,815,061
Amgen
Inc
........................
28,387
8,869,518
Bristol-Myers
Squibb
Co
...............
10,283
427,053
Cardinal
Health
Inc
...................
14,488
1,424,460
Centene
Corp
(1)
.....................
28,637
1,898,633
Elevance
Health
Inc
..................
26,168
14,179,392
Eli
Lilly
&
Co
.......................
17,124
15,503,727
Encompass
Health
Corp
...............
23,100
1,981,749
Gilead
Sciences
Inc
..................
80,640
5,532,710
HCA
Healthcare
Inc
...................
3,963
1,273,233
Johnson
&
Johnson
..................
115,348
16,859,264
2024
Semi-Annual
Report
|
June
30,
2024
The
accompanying
notes
are
an
integral
part
of
these
financial
statements.
Schedules
of
Investments
June
30,
2024
(unaudited)
Muirfield
Fund
Security
Description
Shares,
Contracts
or
Principal
Amount
($)
Fair
Value
($)
Common
Stocks
(United
States)
—
continued
Merck
&
Co
Inc
.....................
130,586
16,166,547
Organon
&
Co
......................
6,786
140,470
Universal
Health
Services
Inc
............
3,661
677,029
Viatris
Inc
.........................
12,586
133,789
West
Pharmaceutical
Services
Inc
.........
82
27,010
Zoetis
Inc
.........................
16,770
2,907,247
97,816,892
Industrials
—
4.8%
A
O
Smith
Corp
.....................
21,051
1,721,551
Alaska
Air
Group
Inc
(1)
.................
18,588
750,955
Allegion
plc
........................
11,664
1,378,101
Applied
Industrial
Technologies
Inc
........
2,496
484,224
Boise
Cascade
Co
...................
11,244
1,340,510
Broadridge
Financial
Solutions
Inc
.........
21,799
4,294,403
BWX
Technologies
Inc
.................
13,169
1,251,055
Delta
Air
Lines
Inc
...................
51,328
2,435,000
EMCOR
Group
Inc
....................
10,720
3,913,658
Encore
Wire
Corp
....................
3,749
1,086,573
FedEx
Corp
........................
515
154,418
Graco
Inc
.........................
24,612
1,951,239
Huntington
Ingalls
Industries
Inc
..........
10,928
2,691,894
Johnson
Controls
International
plc
.........
9,468
629,338
Kirby
Corp
(1)
.......................
5,762
689,884
Leidos
Holdings
Inc
..................
42,206
6,157,011
Matson
Inc
........................
2,988
391,338
MSC
Industrial
Direct
Co
Inc
.............
42,990
3,409,537
Owens
Corning
.....................
8,479
1,472,972
Ryder
System
Inc
....................
5,902
731,140
Sterling
Infrastructure
Inc
(1)
.............
1,749
206,977
UFP
Industries
Inc
...................
3,947
442,064
United
Airlines
Holdings
Inc
(1)
............
72,083
3,507,559
Vertiv
Holdings
Co
...................
2,553
221,013
Waste
Management
Inc
................
3,545
756,290
42,068,704
Information
Technology
—
24.8%
Advanced
Micro
Devices
Inc
(1)
...........
13,873
2,250,339
Amkor
Technology
Inc
.................
6,316
252,766
Analog
Devices
Inc
...................
66,305
15,134,779
Apple
Inc
.........................
107,490
22,639,544
Applied
Materials
Inc
.................
22,723
5,362,401
Broadcom
Inc
......................
5,498
8,827,204
Cirrus
Logic
Inc
(1)
....................
9,400
1,200,004
Consensus
Cloud
Solutions
Inc
(1)
..........
4,103
70,490
Enphase
Energy
Inc
(1)
.................
12,110
1,207,488
Muirfield
Fund
Security
Description
Shares,
Contracts
or
Principal
Amount
($)
Fair
Value
($)
Common
Stocks
(United
States)
—
continued
First
Solar
Inc
(1)
.....................
5,632
1,269,791
GLOBALFOUNDRIES
Inc
(1)
...............
3,493
176,606
Ichor
Holdings
Ltd
(1)
..................
2,914
112,335
Intel
Corp
.........................
85,671
2,653,231
Jabil
Inc
..........................
4,837
526,217
KLA
Corp
.........................
675
556,544
Lattice
Semiconductor
Corp
(1)
............
2,431
140,974
Marvell
Technology
Inc
................
5,248
366,835
Microchip
Technology
Inc
..............
34,845
3,188,318
Micron
Technology
Inc
................
9,585
1,260,715
Microsoft
Corp
......................
114,594
51,217,788
NVIDIA
Corp
.......................
322,310
39,818,177
ON
Semiconductor
Corp
(1)
..............
10,800
740,340
Oracle
Corp
........................
38,134
5,384,521
Palantir
Technologies
Inc
(1)
..............
20,950
530,664
Photronics
Inc
(1)
.....................
16,119
397,656
Qorvo
Inc
(1)
........................
4,954
574,862
QUALCOMM
Inc
.....................
80,485
16,031,002
Sapiens
International
Corp
NV
...........
881
29,892
Skyworks
Solutions
Inc
................
65,238
6,953,066
Smartsheet
Inc
(1)
....................
14,686
647,359
TD
SYNNEX
Corp
....................
9,115
1,051,871
Teradyne
Inc
.......................
15,513
2,300,423
Texas
Instruments
Inc
.................
115,549
22,477,747
Ultra
Clean
Holdings
Inc
(1)
..............
852
41,748
215,393,697
Materials
—
0.3%
Ball
Corp
.........................
10,596
635,972
Clearwater
Paper
Corp
(1)
...............
1,327
64,320
RPM
International
Inc
.................
5,230
563,166
Sylvamo
Corp
......................
14,284
979,882
Warrior
Met
Coal
Inc
..................
1,708
107,211
2,350,551
Utilities
—
0.2%
Clearway
Energy
Inc
..................
2,062
50,911
Ormat
Technologies
Inc
................
7,194
515,810
Vistra
Corp
........................
8,137
699,619
1,266,340
Total
Common
Stocks
(United
States)
(Cost
$
505,151,081
)
................
626,873,243
2024
Semi-Annual
Report
|
June
30,
2024
The
accompanying
notes
are
an
integral
part
of
these
financial
statements.
Schedules
of
Investments
June
30,
2024
(unaudited)
Muirfield
Fund
Security
Description
Shares,
Contracts
or
Principal
Amount
($)
Fair
Value
($)
Preferred
Stock
(United
States)
—
0
.0
%
WESCO
International
Inc
Series
A
Variable
Pfd,
9.7%
..........................
2,612
67,729
Total
Preferred
Stock
(United
States)
(Cost
$
65,288
)
....................
67,729
Warrants
(United
States)
—
0
.0
%
Chaparral
Energy
Inc
A
Warrants
,
Expiration
Date
10/14/2024
(1)
(2)
.........
7
0
Chaparral
Energy
Inc
B
Warrants
,
Expiration
Date
10/14/2025
(1)
(2)
.........
7
0
Chord
Energy
Corp
,
Expiration
Date
11/19/2024
(1)
(2)
.........
23
0
Civitas
Resources
Inc
,
Expiration
Date
1/20/2025
(1)
(2)
..........
57
0
Civitas
Resources
Inc
,
Expiration
Date
1/20/2026
(1)
(2)
..........
28
0
Total
Warrants
(United
States)
(Cost
$
7,167
)
.....................
0
Money
Market
Registered
Investment
Companies
—
26
.3
%
Meeder
Institutional
Prime
Money
Market
Fund
,
5.27
%
(3)
........................
228,608,173
228,631,034
Total
Money
Market
Registered
Investment
Companies
(Cost
$
228,512,594
)
................
228,631,034
Total
Investments
—
98
.5
%
(Cost
$
733,736,130
)
................
855,572,006
Other
Assets
less
Liabilities
—
1
.5
%
.......
13,233,918
Total
Net
Assets
—
100
.0
%
.............
868,805,924
Trustee
Deferred
Compensation
(4)
Meeder
Balanced
Fund
-
Retail
Class
.......
6,090
83,738
Meeder
Conservative
Allocation
Fund
-
Retail
Class
..........................
1,852
42,226
Meeder
Dynamic
Allocation
Fund
-
Retail
Class
15,871
237,589
Meeder
Muirfield
Fund
-
Retail
Class
.......
12,364
126,607
Total
Trustee
Deferred
Compensation
(Cost
$
390,512
)
...................
490,160
Muirfield
Fund
Long
(Short)
Contracts
Expiration
Date
Notional
Value
of
Contracts
($)
Value
and
Unrealized
Appreciation
(Depreciation)
($)
Futures
Contracts
Index
Futures
Mini
MSCI
EAFE
Futures
-
Sept
2024
.........
693
9/20/24
81,191,880
(
191,992
)
Mini
MSCI
Emg
Mkt
Futures
-
Sept
2024
........
390
9/20/24
21,219,900
(
173,403
)
Russell
2000
Futures
Mini
September
2024
.....
660
9/20/24
68,145,000
603,064
S&P
500
Mini
Futures
September
2024
.....
7
9/20/24
1,932,525
(
559
)
S&P
Mid
Cap
Futures
EMini
September
2024
.....
94
9/20/24
27,806,140
64,409
Total
Futures
Contracts
..
1,844
200,295,445
301,519
(1)
Represents
non-income
producing
securities.
(2)
Fair
valued
security
deemed
a
Level
3
security.
Security
is
not
part
of
the
investment
strategy
of
the
Fund.
(3)
Investment
in
affiliate.
The
yield
shown
represents
the
7-day
yield
in
effect
at
June
30,
2024.
(4)
Assets
of
affiliates
to
the
Muirfield
Fund
held
for
the
benefit
of
the
Fund’s
Trustees
in
connection
with
the
Trustee
Deferred
Compensation
Plan.
2024
Semi-Annual
Report
|
June
30,
2024
The
accompanying
notes
are
an
integral
part
of
these
financial
statements.
Schedules
of
Investments
June
30,
2024
(unaudited)
Spectrum
Fund
Long
Positions
Security
Description
Shares,
Contracts
or
Principal
Amount
($)
Fair
Value
($)
Common
Stocks
(United
States)
—
89
.7
%
Communication
Services
—
5.9%
Alphabet
Inc
.......................
30,258
5,549,922
Alphabet
Inc
.......................
7,045
1,283,247
AMC
Networks
Inc
(1)
..................
2,109
20,373
AT&T
Inc
..........................
2,806
53,623
ATN
International
Inc
..................
5,723
130,484
Bumble
Inc
(1)
.......................
7,808
82,062
EverQuote
Inc
(1)
.....................
3,642
75,972
Meta
Platforms
Inc
...................
7,933
3,999,977
Netflix
Inc
(1)
........................
1,588
1,071,709
Telephone
and
Data
Systems
Inc
.........
3,770
78,152
Townsquare
Media
Inc
................
5,189
56,871
TripAdvisor
Inc
(1)
.....................
2,205
39,271
Yelp
Inc
(1)
.........................
690
25,496
Ziff
Davis
Inc
(1)
......................
2,411
132,726
12,599,885
Consumer
Discretionary
—
13.2%
Aaron's
Co
Inc/The
...................
2,050
20,459
Abercrombie
&
Fitch
Co
(1)
...............
1,044
185,665
Adient
PLC
(1)
.......................
259
6,400
Amazon.com
Inc
(1)
...................
26,022
5,028,751
Best
Buy
Co
Inc
.....................
4,074
343,397
Beyond
Inc
(1)
.......................
5,749
75,197
Big
Lots
Inc
(1)
.......................
3,156
5,460
BJ's
Restaurants
Inc
(1)
.................
1,155
40,078
Burlington
Stores
Inc
(1)
................
3,481
835,440
Crocs
Inc
(1)
........................
3,469
506,266
DR
Horton
Inc
......................
8,665
1,221,158
eBay
Inc
..........................
17,638
947,513
Ethan
Allen
Interiors
Inc
................
5,080
141,681
Everi
Holdings
Inc
(1)
..................
14,071
118,196
Five
Below
Inc
(1)
.....................
3,446
375,511
Frontdoor
Inc
(1)
......................
1,128
38,115
Garmin
Ltd
........................
8,288
1,350,281
Genesco
Inc
(1)
......................
4,352
112,543
Helen
of
Troy
Ltd
(1)
...................
3,572
331,267
Hibbett
Inc
........................
2,049
178,693
Home
Depot
Inc/The
..................
8,084
2,782,836
Hovnanian
Enterprises
Inc
(1)
.............
63
8,941
Installed
Building
Products
Inc
...........
38
7,816
J
Jill
Inc
..........................
960
33,571
JAKKS
Pacific
Inc
(1)
...................
3,331
59,658
La-Z-Boy
Inc
.......................
10,301
384,021
Leggett
&
Platt
Inc
...................
30,072
344,625
Lennar
Corp
.......................
26,879
4,028,356
Spectrum
Fund
Security
Description
Shares,
Contracts
or
Principal
Amount
($)
Fair
Value
($)
Common
Stocks
(United
States)
—
continued
Lovesac
Co/The
(1)
....................
1,923
43,421
Lowe's
Cos
Inc
.....................
2,495
550,048
Lululemon
Athletica
Inc
(1)
...............
508
151,740
Meritage
Homes
Corp
.................
1,468
237,596
Mohawk
Industries
Inc
(1)
...............
11,557
1,312,760
Monarch
Casino
&
Resort
Inc
............
784
53,414
National
Vision
Holdings
Inc
(1)
............
2,443
31,979
NVR
Inc
(1)
.........................
27
204,891
Ollie's
Bargain
Outlet
Holdings
Inc
(1)
........
323
31,709
Phinia
Inc
.........................
1,919
75,532
Potbelly
Corp
(1)
......................
3,100
24,893
PulteGroup
Inc
......................
6,849
754,075
PVH
Corp
.........................
410
43,407
Rent
the
Runway
Inc
(1)
.................
1,893
33,260
Ross
Stores
Inc
.....................
17,154
2,492,819
Sally
Beauty
Holdings
Inc
(1)
.............
10,909
117,054
Sonos
Inc
(1)
........................
12,973
191,481
Strategic
Education
Inc
................
322
35,633
Tempur
Sealy
International
Inc
...........
1,892
89,567
Texas
Roadhouse
Inc
.................
602
103,369
TJX
Cos
Inc/The
.....................
4,893
538,719
Toll
Brothers
Inc
.....................
3,563
410,386
TopBuild
Corp
(1)
.....................
21
8,091
Ulta
Beauty
Inc
(1)
....................
326
125,794
Universal
Technical
Institute
Inc
(1)
.........
1,514
23,815
Upbound
Group
Inc
...................
1,381
42,397
Urban
Outfitters
Inc
(1)
.................
1,161
47,659
Valvoline
Inc
(1)
......................
1,618
69,898
Warby
Parker
Inc
(1)
...................
420
6,745
Whirlpool
Corp
......................
9,965
1,018,423
Worthington
Enterprises
Inc
.............
840
39,757
Zumiez
Inc
(1)
.......................
1,223
23,824
28,446,051
Consumer
Staples
—
3.0%
Andersons
Inc/The
...................
959
47,566
Casey's
General
Stores
Inc
.............
59
22,512
Costco
Wholesale
Corp
................
3,175
2,698,718
Kroger
Co/The
......................
11,788
588,575
Target
Corp
........................
4,892
724,212
Walgreens
Boots
Alliance
Inc
............
20,093
243,025
Walmart
Inc
.......................
28,960
1,960,882
6,285,490
Energy
—
6.3%
Berry
Corp
........................
842
5,439
2024
Semi-Annual
Report
|
June
30,
2024
The
accompanying
notes
are
an
integral
part
of
these
financial
statements.
Schedules
of
Investments
June
30,
2024
(unaudited)
Spectrum
Fund
Security
Description
Shares,
Contracts
or
Principal
Amount
($)
Fair
Value
($)
Common
Stocks
(United
States)
—
continued
Cheniere
Energy
Inc
..................
4,310
753,517
Chevron
Corp
......................
10,685
1,671,348
ConocoPhillips
......................
4,387
501,785
Diamondback
Energy
Inc
...............
6,342
1,269,605
DMC
Global
Inc
(1)
....................
1,704
24,572
DT
Midstream
Inc
....................
8,241
585,358
EOG
Resources
Inc
...................
5,811
731,431
Exxon
Mobil
Corp
....................
41,135
4,735,461
FLEX
LNG
Ltd
......................
1,387
37,504
Kinder
Morgan
Inc
...................
21,246
422,158
KLX
Energy
Services
Holdings
Inc
(1)
........
1,247
6,173
Matador
Resources
Co
................
2,029
120,928
ONEOK
Inc
........................
6,551
534,234
Par
Pacific
Holdings
Inc
(1)
...............
1,710
43,178
Scorpio
Tankers
Inc
..................
438
35,605
SilverBow
Resources
Inc
(1)
..............
3,542
133,994
Teekay
Corp
(1)
......................
1,555
13,948
Valero
Energy
Corp
...................
5,401
846,661
Williams
Cos
Inc/The
.................
20,880
887,400
13,360,299
Financials
—
12.7%
Ally
Financial
Inc
....................
19,445
771,383
American
Express
Co
.................
1,593
368,859
American
International
Group
Inc
.........
531
39,421
Artisan
Partners
Asset
Management
Inc
.....
2,539
104,785
Associated
Banc-Corp
.................
6,500
137,475
Bank
of
New
York
Mellon
Corp/The
........
8,973
537,393
Bank
of
NT
Butterfield
&
Son
Ltd/The
.......
1,607
56,438
BankUnited
Inc
.....................
2,528
73,995
Berkshire
Hathaway
Inc
(1)
..............
22,287
9,066,352
Berkshire
Hills
Bancorp
Inc
.............
4,545
103,626
Block
Inc
(1)
........................
10,826
698,169
Bread
Financial
Holdings
Inc
............
3,024
134,749
C&F
Financial
Corp
...................
163
7,857
Capital
One
Financial
Corp
..............
6,090
843,160
Chubb
Ltd
.........................
266
67,851
Citizens
Financial
Group
Inc
.............
18,466
665,330
Cohen
&
Steers
Inc
...................
2,220
161,083
Commerce
Bancshares
Inc/MO
...........
6,086
339,477
Compass
Diversified
Holdings
...........
850
18,606
Cullen/Frost
Bankers
Inc
...............
3,268
332,127
Eagle
Bancorp
Inc
...................
4,685
88,547
Encore
Capital
Group
Inc
(1)
..............
780
32,549
Enova
International
Inc
(1)
...............
347
21,601
Equity
Bancshares
Inc
.................
488
17,178
Esquire
Financial
Holdings
Inc
...........
1,249
59,452
Spectrum
Fund
Security
Description
Shares,
Contracts
or
Principal
Amount
($)
Fair
Value
($)
Common
Stocks
(United
States)
—
continued
Essent
Group
Ltd
....................
2,896
162,726
Euronet
Worldwide
Inc
(1)
...............
4,149
429,422
First
American
Financial
Corp
............
7,692
414,983
First
Financial
Bancorp
................
655
14,554
Fiserv
Inc
(1)
........................
1,107
164,987
Hancock
Whitney
Corp
................
1,314
62,849
Heritage
Financial
Corp/WA
.............
1,713
30,885
Hippo
Holdings
Inc
(1)
..................
318
5,466
International
Money
Express
Inc
(1)
.........
5,621
117,142
Investors
Title
Co
....................
43
7,746
Jack
Henry
&
Associates
Inc
............
2,109
350,136
LendingTree
Inc
(1)
....................
3,347
139,202
Mastercard
Inc
.....................
12,868
5,676,847
National
Bank
Holdings
Corp
............
1,327
51,819
NerdWallet
Inc
(1)
.....................
9,401
137,255
Northern
Trust
Corp
..................
11,952
1,003,729
Northfield
Bancorp
Inc
................
1,351
12,807
OceanFirst
Financial
Corp
..............
3,902
62,003
Origin
Bancorp
Inc
...................
2,876
91,227
PennyMac
Mortgage
Investment
Trust
......
1,775
24,406
PNC
Financial
Services
Group
Inc/The
......
895
139,155
PROG
Holdings
Inc
...................
1,578
54,725
Prosperity
Bancshares
Inc
..............
1,866
114,087
Renasant
Corp
......................
1,268
38,725
Sandy
Spring
Bancorp
Inc
..............
4,784
116,538
State
Street
Corp
....................
17,025
1,259,850
Stewart
Information
Services
Corp
........
1,250
77,600
Synchrony
Financial
..................
1,954
92,209
T
Rowe
Price
Group
Inc
................
2,465
284,239
Toast
Inc
(1)
........................
309
7,963
TPG
RE
Finance
Trust
Inc
...............
3,105
26,827
TrustCo
Bank
Corp
NY
.................
2,942
84,641
Veritex
Holdings
Inc
..................
1,165
24,570
WaFd
Inc
.........................
40,566
1,159,376
27,188,159
Health
Care
—
8.4%
AbbVie
Inc
........................
3,088
529,654
Alnylam
Pharmaceuticals
Inc
(1)
...........
276
67,068
Amgen
Inc
........................
271
84,674
Arrowhead
Pharmaceuticals
Inc
(1)
.........
3,405
88,496
Avid
Bioservices
Inc
(1)
.................
5,315
37,949
Biogen
Inc
(1)
.......................
1,224
283,748
Bristol-Myers
Squibb
Co
...............
5,486
227,834
CareDx
Inc
(1)
.......................
9,127
141,742
CareMax
Inc
(1)
......................
2,329
6,498
Catalyst
Pharmaceuticals
Inc
(1)
...........
4,497
69,658
2024
Semi-Annual
Report
|
June
30,
2024
The
accompanying
notes
are
an
integral
part
of
these
financial
statements.
Schedules
of
Investments
June
30,
2024
(unaudited)
Spectrum
Fund
Security
Description
Shares,
Contracts
or
Principal
Amount
($)
Fair
Value
($)
Common
Stocks
(United
States)
—
continued
Centene
Corp
(1)
.....................
5,447
361,136
Cigna
Group/The
....................
2,529
836,011
Edgewise
Therapeutics
Inc
(1)
............
1,946
35,047
Elevance
Health
Inc
..................
2,204
1,194,259
Eli
Lilly
&
Co
.......................
2,112
1,912,163
Emergent
BioSolutions
Inc
(1)
.............
6,051
41,268
Enliven
Therapeutics
Inc
(1)
..............
447
10,446
Fulgent
Genetics
Inc
(1)
.................
1,658
32,530
Gilead
Sciences
Inc
..................
4,847
332,553
Hims
&
Hers
Health
Inc
(1)
...............
7,588
153,202
Inogen
Inc
(1)
........................
3,679
29,910
Inozyme
Pharma
Inc
(1)
.................
15,210
67,837
iRadimed
Corp
......................
453
19,905
Johnson
&
Johnson
..................
19,571
2,860,497
Joint
Corp/The
(1)
.....................
1,026
14,426
Kodiak
Sciences
Inc
(1)
.................
15,137
35,572
Labcorp
Holdings
Inc
.................
1,551
315,644
MannKind
Corp
(1)
....................
10,472
54,664
McKesson
Corp
.....................
4,092
2,389,892
Merck
&
Co
Inc
.....................
11,624
1,439,051
Mesa
Laboratories
Inc
.................
116
10,065
Molina
Healthcare
Inc
(1)
................
587
174,515
Monte
Rosa
Therapeutics
Inc
(1)
...........
10,050
37,587
Myriad
Genetics
Inc
(1)
.................
715
17,489
Nkarta
Inc
(1)
........................
4,465
26,388
Novocure
Ltd
(1)
......................
4,721
80,871
Nurix
Therapeutics
Inc
(1)
...............
931
19,430
Organon
&
Co
......................
1,563
32,354
Owens
&
Minor
Inc
(1)
..................
955
12,892
Patterson
Cos
Inc
....................
1,865
44,984
Premier
Inc
........................
2,502
46,712
Quest
Diagnostics
Inc
.................
1,621
221,882
Sagimet
Biosciences
Inc
(1)
..............
5,591
19,121
Sarepta
Therapeutics
Inc
(1)
..............
493
77,894
Savara
Inc
(1)
.......................
2,119
8,540
Semler
Scientific
Inc
(1)
.................
1,961
67,458
Supernus
Pharmaceuticals
Inc
(1)
..........
1,774
47,454
Sutro
Biopharma
Inc
(1)
.................
2,822
8,268
Tandem
Diabetes
Care
Inc
(1)
.............
6,637
267,405
Terns
Pharmaceuticals
Inc
(1)
.............
772
5,257
UnitedHealth
Group
Inc
................
4,453
2,267,735
Universal
Health
Services
Inc
............
26
4,808
Vanda
Pharmaceuticals
Inc
(1)
............
6,852
38,714
Viatris
Inc
.........................
664
7,058
Viking
Therapeutics
Inc
(1)
...............
768
40,712
West
Pharmaceutical
Services
Inc
.........
197
64,890
Spectrum
Fund
Security
Description
Shares,
Contracts
or
Principal
Amount
($)
Fair
Value
($)
Common
Stocks
(United
States)
—
continued
Zoetis
Inc
.........................
3,497
606,240
17,930,057
Industrials
—
9.9%
A
O
Smith
Corp
.....................
8,992
735,366
AECOM
...........................
16,608
1,463,829
Air
Transport
Services
Group
Inc
(1)
.........
3,273
45,397
Alaska
Air
Group
Inc
(1)
.................
13,369
540,108
Allegiant
Travel
Co
...................
6,184
310,622
Allegion
plc
........................
699
82,587
American
Woodmark
Corp
(1)
.............
3,672
288,619
Applied
Industrial
Technologies
Inc
........
130
25,220
Arcosa
Inc
........................
372
31,029
Armstrong
World
Industries
Inc
...........
377
42,691
Asure
Software
Inc
(1)
..................
2,241
18,824
Blue
Bird
Corp
(1)
.....................
1,499
80,721
BlueLinx
Holdings
Inc
(1)
................
756
70,376
Boise
Cascade
Co
...................
2,911
347,049
Broadridge
Financial
Solutions
Inc
.........
2,575
507,275
BWX
Technologies
Inc
.................
1,811
172,045
Delta
Air
Lines
Inc
...................
11,055
524,449
Driven
Brands
Holdings
Inc
(1)
............
27,688
352,468
EMCOR
Group
Inc
....................
1,800
657,144
Fastenal
Co
........................
27,043
1,699,382
Ferguson
PLC
......................
7,647
1,480,842
Genco
Shipping
&
Trading
Ltd
............
989
21,076
Generac
Holdings
Inc
(1)
................
1,576
208,379
Graco
Inc
.........................
5,439
431,204
Greenbrier
Cos
Inc/The
................
1,360
67,388
H&E
Equipment
Services
Inc
............
1,461
64,532
Heidrick
&
Struggles
International
Inc
......
1,829
57,760
Hudson
Technologies
Inc
(1)
..............
2,565
22,546
IBEX
Holdings
Ltd
(1)
...................
2,348
37,991
Johnson
Controls
International
plc
.........
788
52,378
Karat
Packaging
Inc
..................
287
8,489
Kelly
Services
Inc
....................
2,394
51,256
Kirby
Corp
(1)
.......................
13,037
1,560,920
Landstar
System
Inc
..................
728
134,301
Leidos
Holdings
Inc
..................
2,045
298,325
Limbach
Holdings
Inc
(1)
................
2,702
153,825
Masco
Corp
.......................
676
45,069
MasTec
Inc
(1)
.......................
53
5,670
Matson
Inc
........................
2,292
300,183
MDU
Resources
Group
Inc
..............
53,003
1,330,375
MSC
Industrial
Direct
Co
Inc
.............
9,056
718,231
Norfolk
Southern
Corp
.................
4,022
863,483
Owens
Corning
.....................
2,183
379,231
2024
Semi-Annual
Report
|
June
30,
2024
The
accompanying
notes
are
an
integral
part
of
these
financial
statements.
Schedules
of
Investments
June
30,
2024
(unaudited)
Spectrum
Fund
Security
Description
Shares,
Contracts
or
Principal
Amount
($)
Fair
Value
($)
Common
Stocks
(United
States)
—
continued
Paycom
Software
Inc
.................
4,162
595,332
Powell
Industries
Inc
..................
53
7,600
Proto
Labs
Inc
(1)
.....................
2,592
80,067
Quanta
Services
Inc
..................
265
67,334
Southwest
Airlines
Co
.................
4,159
118,989
Sterling
Infrastructure
Inc
(1)
.............
321
37,987
Sun
Country
Airlines
Holdings
Inc
(1)
........
9,883
124,130
Thermon
Group
Holdings
Inc
(1)
...........
1,939
59,644
Trane
Technologies
PLC
................
168
55,260
UFP
Industries
Inc
...................
3,963
443,856
Union
Pacific
Corp
...................
5,897
1,334,255
United
Airlines
Holdings
Inc
(1)
............
11,575
563,240
Valmont
Industries
Inc
.................
287
78,767
Waste
Management
Inc
................
3,091
659,434
WESCO
International
Inc
...............
1,620
256,802
WW
Grainger
Inc
....................
844
761,491
21,532,843
Information
Technology
—
26.2%
A10
Networks
Inc
....................
9,905
137,184
Advanced
Micro
Devices
Inc
(1)
...........
4,255
690,204
Ambarella
Inc
(1)
.....................
483
26,058
American
Software
Inc/GA
..............
6,568
59,966
Amkor
Technology
Inc
.................
1,710
68,434
Analog
Devices
Inc
...................
14,112
3,221,205
Apple
Inc
.........................
34,526
7,271,866
Applied
Materials
Inc
.................
7,795
1,839,542
Arlo
Technologies
Inc
(1)
................
4,784
62,383
Axcelis
Technologies
Inc
(1)
..............
483
68,678
Broadcom
Inc
......................
1,416
2,273,430
Calix
Inc
(1)
.........................
6,434
227,957
CEVA
Inc
(1)
.........................
956
18,441
CommVault
Systems
Inc
(1)
..............
827
100,538
Consensus
Cloud
Solutions
Inc
(1)
..........
14,856
255,226
CS
Disco
Inc
(1)
......................
6,253
37,268
Digital
Turbine
Inc
(1)
..................
4,282
7,108
Dolby
Laboratories
Inc
................
466
36,921
Enphase
Energy
Inc
(1)
.................
4,935
492,069
EPAM
Systems
Inc
(1)
..................
1,352
254,325
First
Solar
Inc
(1)
.....................
2,885
650,452
HubSpot
Inc
(1)
......................
134
79,032
Ichor
Holdings
Ltd
(1)
..................
952
36,700
Intel
Corp
.........................
17,050
528,038
Intuit
Inc
..........................
3,090
2,030,779
KLA
Corp
.........................
2,259
1,862,568
Marathon
Digital
Holdings
Inc
(1)
...........
11,215
222,618
Marvell
Technology
Inc
................
245
17,125
Spectrum
Fund
Security
Description
Shares,
Contracts
or
Principal
Amount
($)
Fair
Value
($)
Common
Stocks
(United
States)
—
continued
Maxeon
Solar
Technologies
Ltd
(1)
..........
12,825
10,940
Microchip
Technology
Inc
..............
7,920
724,680
Micron
Technology
Inc
................
1,279
168,227
Microsoft
Corp
......................
24,146
10,792,055
MKS
Instruments
Inc
.................
326
42,569
NetScout
Systems
Inc
(1)
................
2,086
38,153
Nutanix
Inc
(1)
.......................
4,967
282,374
NVIDIA
Corp
.......................
66,640
8,232,706
ON
Semiconductor
Corp
(1)
..............
6,497
445,369
OneSpan
Inc
(1)
......................
12,983
166,442
Oracle
Corp
........................
4,897
691,456
Palantir
Technologies
Inc
(1)
..............
13,470
341,195
Photronics
Inc
(1)
.....................
4,672
115,258
Qorvo
Inc
(1)
........................
1,308
151,780
QUALCOMM
Inc
.....................
14,327
2,853,652
Rambus
Inc
(1)
.......................
2,716
159,592
Silicon
Laboratories
Inc
(1)
...............
1,069
118,263
Skyworks
Solutions
Inc
................
13,512
1,440,109
SMART
Global
Holdings
Inc
(1)
............
740
16,924
Smartsheet
Inc
(1)
....................
19,285
850,083
Teradyne
Inc
.......................
2,875
426,334
Texas
Instruments
Inc
.................
24,717
4,808,198
Twilio
Inc
(1)
........................
7,444
422,894
55,875,368
Materials
—
0.9%
Ball
Corp
.........................
2,964
177,899
Clearwater
Paper
Corp
(1)
...............
3,492
169,257
Core
Molding
Technologies
Inc
(1)
..........
1,201
19,144
Kaiser
Aluminum
Corp
.................
722
63,464
Louisiana-Pacific
Corp
................
3,593
295,812
Orion
SA
..........................
12,241
268,567
PPG
Industries
Inc
...................
1,112
139,990
Sylvamo
Corp
......................
2,550
174,930
Trinseo
PLC
........................
16,116
37,228
Vulcan
Materials
Co
..................
2,653
659,748
2,006,039
Real
Estate
—
1.4%
BRT
Apartments
Corp
.................
1,608
28,092
CBL
&
Associates
Properties
Inc
..........
4,868
113,814
Chatham
Lodging
Trust
................
5,401
46,016
City
Office
REIT
Inc
...................
7,005
34,885
Compass
Inc
(1)
......................
1,264
4,550
CoStar
Group
Inc
(1)
...................
8,261
612,471
Cousins
Properties
Inc
................
10,060
232,889
2024
Semi-Annual
Report
|
June
30,
2024
The
accompanying
notes
are
an
integral
part
of
these
financial
statements.
Schedules
of
Investments
June
30,
2024
(unaudited)
Spectrum
Fund
Security
Description
Shares,
Contracts
or
Principal
Amount
($)
Fair
Value
($)
Common
Stocks
(United
States)
—
continued
Easterly
Government
Properties
Inc
........
19,905
246,225
eXp
World
Holdings
Inc
................
2,581
29,127
Forestar
Group
Inc
(1)
..................
4,622
147,858
Office
Properties
Income
Trust
...........
2,881
5,877
Orion
Office
REIT
Inc
..................
39,876
143,155
Peakstone
Realty
Trust
................
481
5,099
Piedmont
Office
Realty
Trust
Inc
..........
10,475
75,944
Plymouth
Industrial
REIT
Inc
.............
50,417
1,077,915
RE/MAX
Holdings
Inc
.................
18,943
153,438
Retail
Opportunity
Investments
Corp
.......
6,557
81,503
RMR
Group
Inc/The
..................
2,677
60,500
Xenia
Hotels
&
Resorts
Inc
..............
1,744
24,992
3,124,350
Utilities
—
1.8%
AES
Corp/The
......................
25,540
448,738
ALLETE
Inc
........................
2,730
170,215
Brookfield
Renewable
Corp
.............
10,278
291,690
Clearway
Energy
Inc
..................
28,678
708,060
Entergy
Corp
.......................
12,687
1,357,509
Montauk
Renewables
Inc
(1)
..............
2,484
14,159
Ormat
Technologies
Inc
................
7,661
549,294
Xcel
Energy
Inc
.....................
3,163
168,936
3,708,601
Total
Common
Stocks
–
Long
(United
States)
(Cost
$
158,402,711
)
................
192,057,142
Preferred
Stock
(United
States)
—
0
.0
%
WESCO
International
Inc
Series
A
Variable
Pfd,
9.7%
..........................
198
5,134
Total
Preferred
Stock
–
Long
(United
States)
(Cost
$
4,949
)
.....................
5,134
Warrants
(United
States)
—
0
.0
%
Chaparral
Energy
Inc
A
Warrants
,
Expiration
Date
10/14/2024
(1)
(2)
.........
1
0
Chaparral
Energy
Inc
B
Warrants
,
Expiration
Date
10/14/2025
(1)
(2)
.........
1
0
Chord
Energy
Corp
,
Expiration
Date
11/19/2024
(1)
(2)
.........
7
0
Civitas
Resources
Inc
,
Expiration
Date
1/20/2025
(1)
(2)
..........
13
0
Spectrum
Fund
Security
Description
Shares,
Contracts
or
Principal
Amount
($)
Fair
Value
($)
Warrants
(United
States)
—
continued
Civitas
Resources
Inc
,
Expiration
Date
1/20/2026
(1)
(2)
..........
6
0
Total
Warrants
–
Long
(United
States)
(Cost
$
2,181
)
.....................
0
Registered
Investment
Companies
—
4
.4
%
U.S.
Fixed
Income
—
4.4%
iShares
Short
Treasury
Bond
ETF
(3)
........
84,445
9,331,172
9,331,172
Total
Registered
Investment
Companies
–
Long
(Cost
$
9,313,221
)
..................
9,331,172
Money
Market
Registered
Investment
Companies
—
2
.7
%
Meeder
Institutional
Prime
Money
Market
Fund
,
5.27
%
(4)
........................
5,657,265
5,657,831
Total
Money
Market
Registered
Investment
Companies
–
Long
(Cost
$
5,657,345
)
..................
5,657,831
Short
Positions
Common
Stocks
(United
States)
—
-
21
.1
%
Communication
Services
—
-0.2%
EchoStar
Corp
(1)
.....................
(12,809)
(228,128)
Gogo
Inc
(1)
.........................
(25,507)
(245,377)
TechTarget
Inc
(1)
.....................
(602)
(18,764)
(492,269)
Consumer
Discretionary
—
-3.6%
America's
Car-Mart
Inc/TX
(1)
.............
(2,595)
(156,245)
Birkenstock
Holding
Plc
(1)
...............
(1,728)
(94,020)
Booking
Holdings
Inc
.................
(284)
(1,125,066)
Bowlero
Corp
......................
(6,226)
(90,215)
Camping
World
Holdings
Inc
.............
(5,811)
(103,784)
Choice
Hotels
International
Inc
...........
(3,822)
(454,818)
Duolingo
Inc
(1)
......................
(3,317)
(692,158)
Empire
Resorts
Inc
C
(1)
(2)
...............
(245)
0
Fox
Factory
Holding
Corp
(1)
..............
(4,886)
(235,456)
Hilton
Grand
Vacations
Inc
(1)
.............
(27,736)
(1,121,366)
LGI
Homes
Inc
(1)
.....................
(11,044)
(988,328)
Lithia
Motors
Inc
....................
(2,716)
(685,654)
MarineMax
Inc
(1)
.....................
(1,654)
(53,540)
Marriott
International
Inc/MD
............
(1,723)
(416,570)
Penn
Entertainment
Inc
(1)
...............
(8,485)
(164,227)
PlayAGS
Inc
(1)
......................
(785)
(9,028)
Pool
Corp
.........................
(3,281)
(1,008,350)
2024
Semi-Annual
Report
|
June
30,
2024
The
accompanying
notes
are
an
integral
part
of
these
financial
statements.
Schedules
of
Investments
June
30,
2024
(unaudited)
Spectrum
Fund
Security
Description
Shares,
Contracts
or
Principal
Amount
($)
Fair
Value
($)
Common
Stocks
(United
States)
—
continued
Rivian
Automotive
Inc
(1)
................
(4,994)
(67,019)
Rush
Street
Interactive
Inc
(1)
.............
(9,175)
(87,988)
Tesla
Inc
(1)
.........................
(2,491)
(492,919)
Vizio
Holding
Corp
(1)
..................
(4,851)
(52,391)
(8,099,142)
Consumer
Staples
—
-1.9%
Celsius
Holdings
Inc
(1)
.................
(4,353)
(248,513)
Chefs'
Warehouse
Inc/The
(1)
.............
(3,979)
(155,619)
elf
Beauty
Inc
(1)
.....................
(3,942)
(830,658)
MGP
Ingredients
Inc
..................
(13,692)
(1,018,685)
Monster
Beverage
Corp
(1)
...............
(10,980)
(548,451)
United
Natural
Foods
Inc
(1)
..............
(6,475)
(84,823)
WD-40
Co
.........................
(4,930)
(1,082,825)
Westrock
Coffee
Co
(1)
.................
(3,200)
(32,736)
(4,002,310)
Energy
—
-0.2%
Core
Laboratories
Inc
.................
(3,893)
(78,989)
Energy
Fuels
Inc/Canada
(1)
..............
(4,457)
(27,009)
NextDecade
Corp
(1)
...................
(19,996)
(158,768)
Uranium
Energy
Corp
(1)
................
(28,380)
(170,564)
(435,330)
Financials
—
-2.1%
Brookfield
Asset
Management
Ltd
.........
(8,309)
(316,157)
Coinbase
Global
Inc
(1)
.................
(1,194)
(265,343)
Columbia
Financial
Inc
(1)
...............
(8,505)
(127,320)
Dynex
Capital
Inc
....................
(93,483)
(1,116,187)
KKR
Real
Estate
Finance
Trust
Inc
.........
(7,682)
(69,522)
NU
Holdings
Ltd/Cayman
Islands
(1)
........
(12,317)
(158,766)
Patria
Investments
Ltd
................
(70,406)
(849,096)
PJT
Partners
Inc
.....................
(10,485)
(1,131,436)
Remitly
Global
Inc
(1)
..................
(15,169)
(183,848)
ServisFirst
Bancshares
Inc
..............
(5,570)
(351,968)
Upstart
Holdings
Inc
(1)
.................
(4,250)
(100,258)
(4,669,901)
Health
Care
—
-1.4%
Agios
Pharmaceuticals
Inc
(1)
.............
(769)
(33,159)
Artivion
Inc
(1)
.......................
(5,697)
(146,128)
Azenta
Inc
(1)
.......................
(6,891)
(362,604)
Fortrea
Holdings
Inc
(1)
.................
(7,077)
(165,177)
Kiniksa
Pharmaceuticals
International
Plc
....
(14,544)
(271,537)
Mirum
Pharmaceuticals
Inc
(1)
............
(5,754)
(196,729)
NeoGenomics
Inc
(1)
...................
(1,645)
(22,816)
Spectrum
Fund
Security
Description
Shares,
Contracts
or
Principal
Amount
($)
Fair
Value
($)
Common
Stocks
(United
States)
—
continued
OrthoPediatrics
Corp
(1)
.................
(232)
(6,672)
Rhythm
Pharmaceuticals
Inc
(1)
...........
(4,954)
(203,411)
Solventum
Corp
(1)
....................
(21,544)
(1,139,247)
Tarsus
Pharmaceuticals
Inc
(1)
............
(1,412)
(38,378)
TG
Therapeutics
Inc
(1)
.................
(3,472)
(61,767)
Theravance
Biopharma
Inc
(1)
............
(2,011)
(17,053)
TransMedics
Group
Inc
(1)
...............
(3,127)
(470,989)
Veracyte
Inc
(1)
......................
(2,314)
(50,144)
(3,185,811)
Industrials
—
-4.1%
ACV
Auctions
Inc
(1)
...................
(21,295)
(388,634)
Ameresco
Inc
(1)
.....................
(2,783)
(80,178)
Atmus
Filtration
Technologies
Inc
(1)
........
(34,316)
(987,614)
Carrier
Global
Corp
...................
(17,900)
(1,129,132)
Dayforce
Inc
(1)
......................
(19,454)
(964,918)
Energy
Recovery
Inc
(1)
.................
(7,747)
(102,958)
Exponent
Inc
.......................
(1,502)
(142,870)
Forward
Air
Corp
....................
(2,289)
(43,583)
Hayward
Holdings
Inc
(1)
................
(83,074)
(1,021,810)
Honeywell
International
Inc
.............
(5,154)
(1,100,585)
Mercury
Systems
Inc
(1)
................
(19,902)
(537,155)
NV5
Global
Inc
(1)
.....................
(4,853)
(451,183)
Parsons
Corp
(1)
......................
(14,208)
(1,162,356)
Spirit
AeroSystems
Holdings
Inc
(1)
.........
(1,599)
(52,559)
SPX
Technologies
Inc
(1)
................
(2,832)
(402,540)
U-Haul
Holding
Co
(1)
..................
(10,215)
(630,572)
(9,198,647)
Information
Technology
—
-2.1%
Aviat
Networks
Inc
(1)
..................
(5,092)
(146,089)
Braze
Inc
(1)
........................
(15,489)
(601,593)
C3.ai
Inc
(1)
.........................
(8,188)
(237,124)
Clearfield
Inc
(1)
......................
(7,662)
(295,447)
Confluent
Inc
(1)
......................
(37,288)
(1,101,115)
Couchbase
Inc
(1)
.....................
(7,956)
(145,277)
Intevac
Inc
(1)
.......................
(1,548)
(5,975)
Knowles
Corp
(1)
.....................
(14,316)
(247,094)
MicroStrategy
Inc
(1)
...................
(227)
(312,688)
NextNav
Inc
(1)
......................
(1,299)
(10,535)
PAR
Technology
Corp
(1)
................
(5,158)
(242,890)
Perficient
Inc
(1)
......................
(1,033)
(77,258)
Qualys
Inc
(1)
........................
(8,064)
(1,149,926)
Sprout
Social
Inc
(1)
...................
(8,512)
(303,708)
Turtle
Beach
Corp
(1)
..................
(2,247)
(32,222)
2024
Semi-Annual
Report
|
June
30,
2024
The
accompanying
notes
are
an
integral
part
of
these
financial
statements.
Schedules
of
Investments
June
30,
2024
(unaudited)
Spectrum
Fund
Security
Description
Shares,
Contracts
or
Principal
Amount
($)
Fair
Value
($)
Common
Stocks
(United
States)
—
continued
Western
Digital
Corp
(1)
.................
(233)
(17,654)
(4,926,595)
Materials
—
-1.7%
Albemarle
Corp
.....................
(9,166)
(875,536)
Alcoa
Corp
........................
(15,742)
(626,217)
American
Vanguard
Corp
...............
(1,309)
(11,257)
FMC
Corp
.........................
(19,558)
(1,125,563)
Summit
Materials
Inc
(1)
................
(30,958)
(1,133,372)
TriMas
Corp
.......................
(335)
(8,563)
(3,780,508)
Real
Estate
—
-3.1%
Apartment
Investment
and
Management
Co
(1)
.
(3,702)
(30,690)
Extra
Space
Storage
Inc
...............
(6,999)
(1,087,715)
First
Industrial
Realty
Trust
Inc
...........
(2,291)
(108,845)
Getty
Realty
Corp
....................
(38,568)
(1,028,223)
Howard
Hughes
Holdings
Inc
(1)
...........
(17,237)
(1,117,302)
NETSTREIT
Corp
....................
(66,466)
(1,070,103)
Realty
Income
Corp
..................
(10,701)
(565,227)
Rexford
Industrial
Realty
Inc
.............
(24,898)
(1,110,202)
Safehold
Inc
.......................
(4,553)
(87,827)
Veris
Residential
Inc
..................
(32,099)
(481,485)
(6,687,619)
Utilities
—
-0.7%
Brookfield
Infrastructure
Corp
............
(13,682)
(460,536)
Chesapeake
Utilities
Corp
..............
(7,778)
(826,024)
Hawaiian
Electric
Industries
Inc
..........
(13,882)
(125,216)
Pure
Cycle
Corp
(1)
....................
(824)
(7,869)
(1,419,645)
Total
Common
Stocks
–
Short
–
-
21
.1
%
(United
States)
(Proceeds
Received
$
(
48,618,132
)
)
......
(46,897,777)
Total
Investments
—
Long
—
96
.8
%
(Cost
$
173,380,407
)
................
207,051,279
Other
Assets
less
Liabilities
—
24
.3
%
......
51,525,121
Total
Net
Assets
—
100
.0
%
.............
211,678,623
Spectrum
Fund
Security
Description
Shares,
Contracts
or
Principal
Amount
($)
Fair
Value
($)
Trustee
Deferred
Compensation
(5)
Meeder
Balanced
Fund
-
Retail
Class
.......
1,003
13,791
Meeder
Conservative
Allocation
Fund
-
Retail
Class
..........................
322
7,342
Meeder
Dynamic
Allocation
Fund
-
Retail
Class
2,436
36,467
Meeder
Muirfield
Fund
-
Retail
Class
.......
3,034
31,068
Total
Trustee
Deferred
Compensation
(Cost
$
74,303
)
....................
88,668
Long
(Short)
Contracts
Expiration
Date
Notional
Value
of
Contracts
($)
Value
and
Unrealized
Appreciation
(Depreciation)
($)
Futures
Contracts
Index
Futures
Mini
MSCI
EAFE
Futures
-
Sept
2024
.........
168
9/20/24
19,682,880
(
46,676
)
Mini
MSCI
Emg
Mkt
Futures
-
Sept
2024
........
94
9/20/24
5,114,540
(
43,201
)
Russell
2000
Futures
Mini
September
2024
.....
195
9/20/24
20,133,750
176,896
S&P
500
Mini
Futures
September
2024
.....
(7)
9/20/24
(1,932,525)
9,769
S&P
Mid
Cap
Futures
EMini
September
2024
.....
45
9/20/24
13,311,450
12,352
Total
Futures
Contracts
..
495
56,310,095
109,140
(1)
Represents
non-income
producing
securities.
(2)
Fair
valued
security
deemed
a
Level
3
security.
Security
is
not
part
of
the
investment
strategy
of
the
Fund.
(3)
Exchange-traded
fund.
(4)
Investment
in
affiliate.
The
yield
shown
represents
the
7-day
yield
in
effect
at
June
30,
2024.
(5)
Assets
of
affiliates
to
the
Spectrum
Fund
held
for
the
benefit
of
the
Fund’s
Trustees
in
connection
with
the
Trustee
Deferred
Compensation
Plan.
2024
Semi-Annual
Report
|
June
30,
2024
The
accompanying
notes
are
an
integral
part
of
these
financial
statements.
Schedules
of
Investments
June
30,
2024
(unaudited)
Global
Allocation
Fund
Security
Description
Shares,
Contracts
or
Principal
Amount
($)
Fair
Value
($)
Common
Stocks
(United
States)
—
30
.7
%
Communication
Services
—
2.8%
Alphabet
Inc
.......................
3,328
610,422
Meta
Platforms
Inc
...................
661
333,289
Netflix
Inc
(1)
........................
69
46,567
Telephone
and
Data
Systems
Inc
.........
267
5,535
Verizon
Communications
Inc
............
454
18,723
1,014,536
Consumer
Discretionary
—
4.0%
Amazon.com
Inc
(1)
...................
2,975
574,919
Best
Buy
Co
Inc
.....................
355
29,923
Burlington
Stores
Inc
(1)
................
100
24,000
Hibbett
Inc
........................
374
32,617
Las
Vegas
Sands
Corp
.................
228
10,089
Leggett
&
Platt
Inc
...................
2,134
24,456
Lennar
Corp
.......................
807
120,945
Lululemon
Athletica
Inc
(1)
...............
96
28,675
Mohawk
Industries
Inc
(1)
...............
469
53,274
O'Reilly
Automotive
Inc
(1)
...............
19
20,065
Ross
Stores
Inc
.....................
1,128
163,921
Texas
Roadhouse
Inc
.................
127
21,807
TJX
Cos
Inc/The
.....................
2,810
309,381
Ulta
Beauty
Inc
(1)
....................
104
40,130
1,454,202
Consumer
Staples
—
0.8%
Bunge
Global
SA
....................
620
66,197
Casey's
General
Stores
Inc
.............
8
3,053
Kroger
Co/The
......................
1,619
80,837
Target
Corp
........................
305
45,152
Walmart
Inc
.......................
1,202
81,387
276,626
Energy
—
0.7%
Berry
Corp
........................
67
433
Civitas
Resources
Inc
.................
834
57,546
ConocoPhillips
......................
367
41,978
Devon
Energy
Corp
...................
9
427
EOG
Resources
Inc
...................
382
48,082
Exxon
Mobil
Corp
....................
732
84,268
Liberty
Energy
Inc
...................
109
2,277
Matador
Resources
Co
................
97
5,781
SilverBow
Resources
Inc
(1)
..............
199
7,528
Sitio
Royalties
Corp
..................
18
425
Global
Allocation
Fund
Security
Description
Shares,
Contracts
or
Principal
Amount
($)
Fair
Value
($)
Common
Stocks
(United
States)
—
continued
Teekay
Corp
(1)
......................
121
1,085
249,830
Financials
—
4.6%
Ally
Financial
Inc
....................
1,123
44,550
American
Express
Co
.................
57
13,198
Ameriprise
Financial
Inc
...............
156
66,642
Bank
of
New
York
Mellon
Corp/The
........
1,946
116,546
Berkshire
Hathaway
Inc
(1)
..............
2,684
1,091,851
Block
Inc
(1)
........................
271
17,477
Capital
One
Financial
Corp
..............
111
15,368
Commerce
Bancshares
Inc/MO
...........
376
20,973
Cullen/Frost
Bankers
Inc
...............
173
17,582
Fifth
Third
Bancorp
...................
912
33,279
First
American
Financial
Corp
............
172
9,279
Medley
Management
Inc
(1)
(2)
.............
21
0
Northern
Trust
Corp
..................
820
68,864
RAIT
Financial
Trust
(1)
(2)
................
287
0
State
Street
Corp
....................
1,223
90,502
Synchrony
Financial
..................
265
12,505
Visa
Inc
..........................
104
27,297
WaFd
Inc
.........................
85
2,429
1,648,342
Health
Care
—
4.2%
AbbVie
Inc
........................
801
137,387
Amgen
Inc
........................
309
96,547
Cardinal
Health
Inc
...................
293
28,808
Centene
Corp
(1)
.....................
546
36,200
Elevance
Health
Inc
..................
293
158,765
Eli
Lilly
&
Co
.......................
258
233,588
Encompass
Health
Corp
...............
361
30,970
Gilead
Sciences
Inc
..................
1,190
81,646
HCA
Healthcare
Inc
...................
124
39,839
Johnson
&
Johnson
..................
2,465
360,284
Merck
&
Co
Inc
.....................
2,302
284,988
Universal
Health
Services
Inc
............
16
2,959
Zoetis
Inc
.........................
179
31,031
1,523,012
Industrials
—
2.7%
A
O
Smith
Corp
.....................
563
46,042
AECOM
...........................
1,080
95,191
Alaska
Air
Group
Inc
(1)
.................
300
12,120
Allegion
plc
........................
28
3,308
Applied
Industrial
Technologies
Inc
........
29
5,626
2024
Semi-Annual
Report
|
June
30,
2024
The
accompanying
notes
are
an
integral
part
of
these
financial
statements.
Schedules
of
Investments
June
30,
2024
(unaudited)
Global
Allocation
Fund
Security
Description
Shares,
Contracts
or
Principal
Amount
($)
Fair
Value
($)
Common
Stocks
(United
States)
—
continued
Boise
Cascade
Co
...................
13
1,550
Broadridge
Financial
Solutions
Inc
.........
287
56,539
BWX
Technologies
Inc
.................
205
19,475
Delta
Air
Lines
Inc
...................
642
30,457
EMCOR
Group
Inc
....................
152
55,492
Encore
Wire
Corp
....................
310
89,847
Fastenal
Co
........................
1,335
83,891
Graco
Inc
.........................
510
40,433
Huntington
Ingalls
Industries
Inc
..........
120
29,560
Johnson
Controls
International
plc
.........
384
25,525
Karat
Packaging
Inc
..................
15
444
Kirby
Corp
(1)
.......................
25
2,993
Leidos
Holdings
Inc
..................
492
71,773
MDU
Resources
Group
Inc
..............
923
23,167
MSC
Industrial
Direct
Co
Inc
.............
772
61,227
Owens
Corning
.....................
307
53,332
Trane
Technologies
PLC
................
250
82,233
UFP
Industries
Inc
...................
134
15,008
United
Airlines
Holdings
Inc
(1)
............
485
23,600
Waste
Management
Inc
................
160
34,134
962,967
Information
Technology
—
10.7%
Advanced
Micro
Devices
Inc
(1)
...........
290
47,041
Amkor
Technology
Inc
.................
107
4,282
Analog
Devices
Inc
...................
1,120
255,651
Apple
Inc
.........................
2,182
459,573
Applied
Materials
Inc
.................
365
86,136
Broadcom
Inc
......................
70
112,387
Enphase
Energy
Inc
(1)
.................
198
19,743
First
Solar
Inc
(1)
.....................
114
25,702
GLOBALFOUNDRIES
Inc
(1)
...............
35
1,770
Intel
Corp
.........................
1,601
49,583
KLA
Corp
.........................
36
29,682
Marvell
Technology
Inc
................
33
2,307
Microchip
Technology
Inc
..............
1,065
97,447
Micron
Technology
Inc
................
149
19,598
Microsoft
Corp
......................
2,352
1,051,226
Nutanix
Inc
(1)
.......................
37
2,103
NVIDIA
Corp
.......................
6,090
752,359
ON
Semiconductor
Corp
(1)
..............
234
16,041
Oracle
Corp
........................
785
110,842
Palantir
Technologies
Inc
(1)
..............
230
5,826
Qorvo
Inc
(1)
........................
242
28,082
QUALCOMM
Inc
.....................
1,129
224,874
Skyworks
Solutions
Inc
................
1,154
122,993
Smartsheet
Inc
(1)
....................
125
5,510
Global
Allocation
Fund
Security
Description
Shares,
Contracts
or
Principal
Amount
($)
Fair
Value
($)
Common
Stocks
(United
States)
—
continued
TD
SYNNEX
Corp
....................
7
808
Teradyne
Inc
.......................
75
11,122
Texas
Instruments
Inc
.................
1,751
340,622
3,883,310
Materials
—
0.1%
Ball
Corp
.........................
441
26,469
Silgan
Holdings
Inc
...................
138
5,842
Sylvamo
Corp
......................
164
11,250
43,561
Utilities
—
0.1%
Clearway
Energy
Inc
..................
192
4,741
Ormat
Technologies
Inc
................
432
30,974
35,715
Total
Common
Stocks
(United
States)
(Cost
$
9,183,191
)
..................
11,092,101
Preferred
Stock
(United
States)
—
0
.0
%
WESCO
International
Inc
Series
A
Variable
Pfd,
9.7%
..........................
81
2,100
Total
Preferred
Stock
(United
States)
(Cost
$
2,024
)
.....................
2,100
Warrants
(United
States)
—
0
.0
%
Civitas
Resources
Inc
,
Expiration
Date
1/20/2025
(1)
(2)
..........
2
0
Civitas
Resources
Inc
,
Expiration
Date
1/20/2026
(1)
(2)
..........
1
0
Total
Warrants
(United
States)
(Cost
$
–
)
........................
0
Registered
Investment
Companies
—
20
.0
%
U.S.
Fixed
Income
—
7.3%
BrandywineGLOBAL
High
Yield
Fund
-
Class
I
.
24,069
243,822
Dodge
&
Cox
Income
Fund
-
Class
I
........
27,604
341,734
Eaton
Vance
Emerging
Markets
Debt
Opportunities
Fund
-
Class
R6
..........
21,893
170,327
Fidelity
Advisor
High
Income
Advantage
Fund
-
Class
Z
.........................
22,774
246,189
Fidelity
Total
Bond
Fund
-
Class
Z
.........
96,254
903,821
Frost
Total
Return
Bond
Fund
-
Class
I
......
49,385
479,531
iShares
20+
Year
Treasury
Bond
ETF
(3)
......
2,947
270,476
2,655,900
2024
Semi-Annual
Report
|
June
30,
2024
The
accompanying
notes
are
an
integral
part
of
these
financial
statements.
Schedules
of
Investments
June
30,
2024
(unaudited)
Global
Allocation
Fund
Security
Description
Shares,
Contracts
or
Principal
Amount
($)
Fair
Value
($)
Registered
Investment
Companies
—
continued
International
Fixed
Income
—
0.2%
iShares
J.P.
Morgan
USD
Emerging
Markets
Bond
ETF
(3)
..........................
922
81,579
81,579
International
Equity
—
12.5%
Baird
Core
Plus
Bond
Fund
-
Class
I
.......
78,549
784,703
iShares
Core
MSCI
EAFE
ETF
(3)
...........
42,298
3,072,527
iShares
Core
MSCI
Emerging
Markets
ETF
(3)
..
12,312
659,061
4,516,291
Total
Registered
Investment
Companies
(Cost
$
6,171,442
)
..................
7,253,770
Money
Market
Registered
Investment
Companies
—
46
.7
%
Meeder
Institutional
Prime
Money
Market
Fund
,
5.27
%
(4)
........................
16,880,762
16,882,450
Total
Money
Market
Registered
Investment
Companies
(Cost
$
16,875,360
)
.................
16,882,450
Total
Investments
—
97
.4
%
(Cost
$
32,232,017
)
.................
35,230,421
Other
Assets
less
Liabilities
—
2
.6
%
.......
937,467
Total
Net
Assets
—
100
.0
%
.............
36,167,888
Trustee
Deferred
Compensation
(5)
Meeder
Balanced
Fund
-
Retail
Class
.......
2,119
29,136
Meeder
Conservative
Allocation
Fund
-
Retail
Class
..........................
605
13,794
Meeder
Dynamic
Allocation
Fund
-
Retail
Class
5,707
85,434
Meeder
Muirfield
Fund
-
Retail
Class
.......
2,566
26,276
Total
Trustee
Deferred
Compensation
(Cost
$
117,848
)
...................
154,640
Global
Allocation
Fund
Long
(Short)
Contracts
Expiration
Date
Notional
Value
of
Contracts
($)
Value
and
Unrealized
Appreciation
(Depreciation)
($)
Futures
Contracts
Index
Futures
Mini
MSCI
EAFE
Futures
-
Sept
2024
.........
78
9/20/24
9,138,480
(
23,736
)
Mini
MSCI
Emg
Mkt
Futures
-
Sept
2024
........
45
9/20/24
2,448,450
(
22,080
)
Russell
2000
Futures
Mini
September
2024
.....
17
9/20/24
1,755,250
15,383
S&P
500
Mini
Futures
September
2024
.....
11
9/20/24
3,036,825
(
14,092
)
S&P
Mid
Cap
Futures
EMini
September
2024
.....
4
9/20/24
1,183,240
(
828
)
Total
Futures
Contracts
..
155
17,562,245
(
45,353
)
(1)
Represents
non-income
producing
securities.
(2)
Fair
valued
security
deemed
a
Level
3
security.
Security
is
not
part
of
the
investment
strategy
of
the
Fund.
(3)
Exchange-traded
fund.
(4)
Investment
in
affiliate.
The
yield
shown
represents
the
7-day
yield
in
effect
at
June
30,
2024.
(5)
Assets
of
affiliates
to
the
Global
Allocation
Fund
held
for
the
benefit
of
the
Fund’s
Trustees
in
connection
with
the
Trustee
Deferred
Compensation
Plan.
2024
Semi-Annual
Report
|
June
30,
2024
The
accompanying
notes
are
an
integral
part
of
these
financial
statements.
Schedules
of
Investments
June
30,
2024
(unaudited)
Balanced
Fund
Security
Description
Shares,
Contracts
or
Principal
Amount
($)
Fair
Value
($)
Common
Stocks
(United
States)
—
57
.7
%
Communication
Services
—
5.7%
Alphabet
Inc
.......................
58,372
10,706,592
Alphabet
Inc
.......................
6,134
1,117,308
Meta
Platforms
Inc
...................
15,594
7,862,807
Netflix
Inc
(1)
........................
3,449
2,327,661
Telephone
and
Data
Systems
Inc
.........
5,113
105,992
Verizon
Communications
Inc
............
8,986
370,583
22,490,943
Consumer
Discretionary
—
7.8%
Amazon.com
Inc
(1)
...................
63,788
12,327,031
Best
Buy
Co
Inc
.....................
8,629
727,338
Burlington
Stores
Inc
(1)
................
1,422
341,280
Hibbett
Inc
........................
6,355
554,220
Hovnanian
Enterprises
Inc
(1)
.............
1,080
153,274
Las
Vegas
Sands
Corp
.................
9,226
408,250
Leggett
&
Platt
Inc
...................
18,391
210,761
Lennar
Corp
.......................
14,942
2,239,358
Lululemon
Athletica
Inc
(1)
...............
1,476
440,881
Mohawk
Industries
Inc
(1)
...............
14,232
1,616,613
NVR
Inc
(1)
.........................
64
485,668
O'Reilly
Automotive
Inc
(1)
...............
684
722,345
PVH
Corp
.........................
545
57,699
Ross
Stores
Inc
.....................
23,366
3,395,547
Texas
Roadhouse
Inc
.................
4,214
723,586
TJX
Cos
Inc/The
.....................
44,565
4,906,607
Ulta
Beauty
Inc
(1)
....................
2,582
996,316
Valvoline
Inc
(1)
......................
1,941
83,851
30,390,625
Consumer
Staples
—
1.2%
Bunge
Global
SA
....................
17,488
1,867,194
Casey's
General
Stores
Inc
.............
2,166
826,459
Kroger
Co/The
......................
17,552
876,371
Target
Corp
........................
5,631
833,613
Walmart
Inc
.......................
6,119
414,318
4,817,955
Energy
—
1.5%
Civitas
Resources
Inc
.................
3,066
211,554
ConocoPhillips
......................
6,957
795,742
Devon
Energy
Corp
...................
1,759
83,377
Diamondback
Energy
Inc
...............
12,085
2,419,296
EOG
Resources
Inc
...................
10,623
1,337,117
Exxon
Mobil
Corp
....................
7,075
814,474
Marathon
Oil
Corp
...................
482
13,819
Balanced
Fund
Security
Description
Shares,
Contracts
or
Principal
Amount
($)
Fair
Value
($)
Common
Stocks
(United
States)
—
continued
Ovintiv
Inc
.........................
2,633
123,409
Scorpio
Tankers
Inc
..................
338
27,476
Teekay
Corp
(1)
......................
1,515
13,589
5,839,853
Financials
—
8.6%
Ally
Financial
Inc
....................
29,145
1,156,182
Ameriprise
Financial
Inc
...............
6,129
2,618,247
Bank
of
New
York
Mellon
Corp/The
........
38,116
2,282,767
Berkshire
Hathaway
Inc
(1)
..............
54,707
22,254,808
Block
Inc
(1)
........................
4,025
259,572
Commerce
Bancshares
Inc/MO
...........
9,896
551,999
Cullen/Frost
Bankers
Inc
...............
4,492
456,522
Essent
Group
Ltd
....................
3,983
223,805
Fifth
Third
Bancorp
...................
3,020
110,200
First
American
Financial
Corp
............
5,081
274,120
International
Money
Express
Inc
(1)
.........
440
9,170
Medley
Management
Inc
(1)
(2)
.............
101
0
NerdWallet
Inc
(1)
.....................
1,436
20,966
Northern
Trust
Corp
..................
19,811
1,663,728
PROG
Holdings
Inc
...................
1,589
55,106
State
Street
Corp
....................
22,024
1,629,776
Stewart
Information
Services
Corp
........
4,329
268,744
WaFd
Inc
.........................
1,910
54,588
33,890,300
Health
Care
—
8.5%
AbbVie
Inc
........................
21,550
3,696,256
Amgen
Inc
........................
7,681
2,399,928
Cardinal
Health
Inc
...................
6,499
638,982
Centene
Corp
(1)
.....................
14,911
988,599
Elevance
Health
Inc
..................
7,356
3,985,922
Eli
Lilly
&
Co
.......................
5,516
4,994,076
Encompass
Health
Corp
...............
10,903
935,368
Gilead
Sciences
Inc
..................
27,021
1,853,911
HCA
Healthcare
Inc
...................
1,227
394,211
Johnson
&
Johnson
..................
45,137
6,597,224
Merck
&
Co
Inc
.....................
45,808
5,671,030
Universal
Health
Services
Inc
............
1,728
319,559
Viatris
Inc
.........................
5,057
53,756
Zoetis
Inc
.........................
4,397
762,264
33,291,086
Industrials
—
4.8%
A
O
Smith
Corp
.....................
8,407
687,524
AECOM
...........................
10,852
956,495
2024
Semi-Annual
Report
|
June
30,
2024
The
accompanying
notes
are
an
integral
part
of
these
financial
statements.
Schedules
of
Investments
June
30,
2024
(unaudited)
Balanced
Fund
Security
Description
Shares,
Contracts
or
Principal
Amount
($)
Fair
Value
($)
Common
Stocks
(United
States)
—
continued
Alaska
Air
Group
Inc
(1)
.................
7,997
323,079
Allegion
plc
........................
7,815
923,342
Applied
Industrial
Technologies
Inc
........
442
85,748
Boise
Cascade
Co
...................
2,273
270,987
Broadridge
Financial
Solutions
Inc
.........
7,626
1,502,322
BWX
Technologies
Inc
.................
4,470
424,650
Delta
Air
Lines
Inc
...................
21,171
1,004,352
EMCOR
Group
Inc
....................
2,846
1,039,018
Encore
Wire
Corp
....................
1,409
408,370
Fastenal
Co
........................
15,467
971,946
Graco
Inc
.........................
8,226
652,157
Huntington
Ingalls
Industries
Inc
..........
3,358
827,176
Johnson
Controls
International
plc
.........
6,293
418,296
Kirby
Corp
(1)
.......................
2,438
291,902
Leidos
Holdings
Inc
..................
13,211
1,927,221
Limbach
Holdings
Inc
(1)
................
1,370
77,994
MSC
Industrial
Direct
Co
Inc
.............
12,715
1,008,427
Owens
Corning
.....................
2,622
455,494
Ryder
System
Inc
....................
145
17,963
Trane
Technologies
PLC
................
4,833
1,589,719
UFP
Industries
Inc
...................
3,325
372,400
United
Airlines
Holdings
Inc
(1)
............
17,818
867,024
Waste
Management
Inc
................
7,082
1,510,874
18,614,480
Information
Technology
—
19.3%
Advanced
Micro
Devices
Inc
(1)
...........
5,738
930,761
Amkor
Technology
Inc
.................
871
34,857
Analog
Devices
Inc
...................
21,563
4,921,970
Apple
Inc
.........................
31,758
6,688,870
Applied
Materials
Inc
.................
5,417
1,278,358
Broadcom
Inc
......................
1,680
2,697,290
Cirrus
Logic
Inc
(1)
....................
4,921
628,215
Consensus
Cloud
Solutions
Inc
(1)
..........
1,598
27,454
Digital
Turbine
Inc
(1)
..................
17,787
29,526
Enphase
Energy
Inc
(1)
.................
4,019
400,735
Entegris
Inc
........................
1,337
181,030
First
Solar
Inc
(1)
.....................
3,072
692,613
GLOBALFOUNDRIES
Inc
(1)
...............
2,274
114,974
Ichor
Holdings
Ltd
(1)
..................
1,508
58,133
Intel
Corp
.........................
36,554
1,132,077
inTEST
Corp
(1)
......................
1,075
10,621
KLA
Corp
.........................
581
479,040
Marvell
Technology
Inc
................
1,329
92,897
Microchip
Technology
Inc
..............
11,222
1,026,813
Micron
Technology
Inc
................
4,923
647,522
Microsoft
Corp
......................
44,984
20,105,599
Balanced
Fund
Security
Description
Shares,
Contracts
or
Principal
Amount
($)
Fair
Value
($)
Common
Stocks
(United
States)
—
continued
NVIDIA
Corp
.......................
124,840
15,422,734
ON
Semiconductor
Corp
(1)
..............
5,119
350,908
Oracle
Corp
........................
13,939
1,968,187
Palantir
Technologies
Inc
(1)
..............
4,060
102,840
Photronics
Inc
(1)
.....................
5,757
142,025
Qorvo
Inc
(1)
........................
6,353
737,202
QUALCOMM
Inc
.....................
22,779
4,537,121
Skyworks
Solutions
Inc
................
19,294
2,056,355
Smartsheet
Inc
(1)
....................
2,775
122,322
TD
SYNNEX
Corp
....................
2,498
288,269
Teradyne
Inc
.......................
4,818
714,461
Texas
Instruments
Inc
.................
35,190
6,845,511
75,467,290
Materials
—
0.2%
Ball
Corp
.........................
8,152
489,283
Sylvamo
Corp
......................
3,695
253,477
742,760
Utilities
—
0.1%
Clearway
Energy
Inc
..................
1,486
36,689
Ormat
Technologies
Inc
................
4,953
355,130
Vistra
Corp
........................
1,948
167,489
559,308
Total
Common
Stocks
(United
States)
(Cost
$
180,151,673
)
................
226,104,600
Preferred
Stock
(United
States)
—
0
.0
%
WESCO
International
Inc
Series
A
Variable
Pfd,
9.7%
..........................
994
25,774
Total
Preferred
Stock
(United
States)
(Cost
$
24,846
)
....................
25,774
Warrants
(United
States)
—
0
.0
%
Chaparral
Energy
Inc
A
Warrants
,
Expiration
Date
10/14/2024
(1)
(2)
.........
3
0
Chaparral
Energy
Inc
B
Warrants
,
Expiration
Date
10/14/2025
(1)
(2)
.........
3
0
Chord
Energy
Corp
,
Expiration
Date
11/19/2024
(1)
(2)
.........
9
0
Civitas
Resources
Inc
,
Expiration
Date
1/20/2025
(1)
(2)
..........
22
0
2024
Semi-Annual
Report
|
June
30,
2024
The
accompanying
notes
are
an
integral
part
of
these
financial
statements.
Schedules
of
Investments
June
30,
2024
(unaudited)
Balanced
Fund
Security
Description
Shares,
Contracts
or
Principal
Amount
($)
Fair
Value
($)
Warrants
(United
States)
—
continued
Civitas
Resources
Inc
,
Expiration
Date
1/20/2026
(1)
(2)
..........
12
0
Total
Warrants
(United
States)
(Cost
$
2,804
)
.....................
0
Registered
Investment
Companies
—
29
.2
%
U.S.
Fixed
Income
—
21.7%
BrandywineGLOBAL
High
Yield
Fund
-
Class
I
.
830,640
8,414,382
Dodge
&
Cox
Income
Fund
-
Class
I
........
734,254
9,090,063
Eaton
Vance
Emerging
Markets
Debt
Opportunities
Fund
-
Class
R6
..........
729,380
5,674,580
Fidelity
Advisor
High
Income
Advantage
Fund
-
Class
Z
.........................
785,949
8,496,113
Fidelity
Total
Bond
Fund
-
Class
Z
.........
2,985,213
28,031,152
Frost
Total
Return
Bond
Fund
-
Class
I
......
1,737,449
16,870,632
iShares
20+
Year
Treasury
Bond
ETF
(3)
......
92,135
8,456,150
85,033,072
International
Fixed
Income
—
0.6%
iShares
J.P.
Morgan
USD
Emerging
Markets
Bond
ETF
(3)
..........................
25,585
2,263,761
2,263,761
International
Equity
—
6.9%
Baird
Core
Plus
Bond
Fund
-
Class
I
.......
2,722,200
27,194,775
27,194,775
Total
Registered
Investment
Companies
(Cost
$
111,647,619
)
................
114,491,608
Money
Market
Registered
Investment
Companies
—
12
.4
%
Meeder
Institutional
Prime
Money
Market
Fund
,
5.27
%
(4)
........................
48,611,979
48,616,840
Total
Money
Market
Registered
Investment
Companies
(Cost
$
48,584,478
)
.................
48,616,840
Total
Investments
—
99
.3
%
(Cost
$
340,411,420
)
................
389,238,822
Other
Assets
less
Liabilities
—
0
.7
%
.......
2,614,789
Total
Net
Assets
—
100
.0
%
.............
391,853,611
Balanced
Fund
Security
Description
Shares,
Contracts
or
Principal
Amount
($)
Fair
Value
($)
Trustee
Deferred
Compensation
(5)
Meeder
Balanced
Fund
-
Retail
Class
.......
3,885
53,419
Meeder
Conservative
Allocation
Fund
-
Retail
Class
..........................
1,164
26,539
Meeder
Dynamic
Allocation
Fund
-
Retail
Class
10,086
150,987
Meeder
Muirfield
Fund
-
Retail
Class
.......
7,525
77,056
Total
Trustee
Deferred
Compensation
(Cost
$
244,884
)
...................
308,001
Long
(Short)
Contracts
Expiration
Date
Notional
Value
of
Contracts
($)
Value
and
Unrealized
Appreciation
(Depreciation)
($)
Futures
Contracts
Index
Futures
Mini
MSCI
EAFE
Futures
-
Sept
2024
.........
218
9/20/24
25,540,880
(
60,721
)
Mini
MSCI
Emg
Mkt
Futures
-
Sept
2024
........
122
9/20/24
6,638,020
(
54,200
)
Russell
2000
Futures
Mini
September
2024
.....
205
9/20/24
21,166,250
188,421
S&P
500
Mini
Futures
September
2024
.....
(78)
9/20/24
(21,533,850)
103,727
S&P
Mid
Cap
Futures
EMini
September
2024
.....
9
9/20/24
2,662,290
14,283
Total
Futures
Contracts
..
476
34,473,590
191,510
(1)
Represents
non-income
producing
securities.
(2)
Fair
valued
security
deemed
a
Level
3
security.
Security
is
not
part
of
the
investment
strategy
of
the
Fund.
(3)
Exchange-traded
fund.
(4)
Investment
in
affiliate.
The
yield
shown
represents
the
7-day
yield
in
effect
at
June
30,
2024.
(5)
Assets
of
affiliates
to
the
Balanced
Fund
held
for
the
benefit
of
the
Fund’s
Trustees
in
connection
with
the
Trustee
Deferred
Compensation
Plan.
2024
Semi-Annual
Report
|
June
30,
2024
The
accompanying
notes
are
an
integral
part
of
these
financial
statements.
Schedules
of
Investments
June
30,
2024
(unaudited)
Moderate
Allocation
Fund
Security
Description
Shares,
Contracts
or
Principal
Amount
($)
Fair
Value
($)
Common
Stocks
(United
States)
—
38
.1
%
Communication
Services
—
3.4%
Alphabet
Inc
.......................
17,897
3,282,668
Alphabet
Inc
.......................
839
152,824
Meta
Platforms
Inc
...................
4,232
2,133,859
Netflix
Inc
(1)
........................
507
342,164
Telephone
and
Data
Systems
Inc
.........
1,355
28,089
5,939,604
Consumer
Discretionary
—
5.0%
Amazon.com
Inc
(1)
...................
19,682
3,803,546
Best
Buy
Co
Inc
.....................
2,393
201,706
Burlington
Stores
Inc
(1)
................
333
79,920
Hibbett
Inc
........................
2,074
180,874
Las
Vegas
Sands
Corp
.................
1,556
68,853
Leggett
&
Platt
Inc
...................
9,166
105,042
Lennar
Corp
.......................
4,794
718,477
Mohawk
Industries
Inc
(1)
...............
2,869
325,890
NVR
Inc
(1)
.........................
13
98,651
O'Reilly
Automotive
Inc
(1)
...............
93
98,214
Ross
Stores
Inc
.....................
7,360
1,069,555
Texas
Roadhouse
Inc
.................
1,050
180,295
TJX
Cos
Inc/The
.....................
13,280
1,462,128
Ulta
Beauty
Inc
(1)
....................
695
268,180
8,661,331
Consumer
Staples
—
1.0%
Bunge
Global
SA
....................
4,489
479,290
Casey's
General
Stores
Inc
.............
618
235,804
Kroger
Co/The
......................
5,792
289,195
Target
Corp
........................
1,617
239,381
Walmart
Inc
.......................
7,490
507,148
1,750,818
Energy
—
1.0%
Berry
Corp
........................
510
3,295
Civitas
Resources
Inc
.................
2,674
184,506
ConocoPhillips
......................
2,192
250,721
Devon
Energy
Corp
...................
61
2,891
Diamondback
Energy
Inc
...............
3,993
799,359
EOG
Resources
Inc
...................
1,619
203,784
Exxon
Mobil
Corp
....................
2,272
261,553
HF
Sinclair
Corp
.....................
123
6,561
International
Seaways
Inc
..............
56
3,311
Marathon
Oil
Corp
...................
114
3,268
Ovintiv
Inc
.........................
898
42,089
Peabody
Energy
Corp
.................
112
2,477
Moderate
Allocation
Fund
Security
Description
Shares,
Contracts
or
Principal
Amount
($)
Fair
Value
($)
Common
Stocks
(United
States)
—
continued
Scorpio
Tankers
Inc
..................
337
27,395
Teekay
Corp
(1)
......................
502
4,503
1,795,713
Financials
—
5.6%
Ally
Financial
Inc
....................
7,070
280,467
American
Express
Co
.................
476
110,218
Ameriprise
Financial
Inc
...............
1,086
463,928
Bank
of
New
York
Mellon
Corp/The
........
11,431
684,602
Berkshire
Hathaway
Inc
(1)
..............
16,113
6,554,768
Block
Inc
(1)
........................
1,632
105,248
Capital
One
Financial
Corp
..............
417
57,734
Commerce
Bancshares
Inc/MO
...........
1,701
94,882
Cullen/Frost
Bankers
Inc
...............
1,263
128,359
Fifth
Third
Bancorp
...................
2,717
99,143
First
American
Financial
Corp
............
287
15,484
Medley
Management
Inc
(1)
(2)
.............
27
0
Northern
Trust
Corp
..................
5,000
419,900
PROG
Holdings
Inc
...................
150
5,202
RAIT
Financial
Trust
(1)
(2)
................
751
0
State
Street
Corp
....................
8,071
597,254
Synchrony
Financial
..................
1,590
75,032
WaFd
Inc
.........................
1,359
38,840
9,731,061
Health
Care
—
5.6%
AbbVie
Inc
........................
6,647
1,140,093
Amgen
Inc
........................
2,013
628,962
Cardinal
Health
Inc
...................
1,520
149,446
Centene
Corp
(1)
.....................
3,254
215,740
Elevance
Health
Inc
..................
1,893
1,025,741
Eli
Lilly
&
Co
.......................
1,521
1,377,083
Encompass
Health
Corp
...............
2,862
245,531
Gilead
Sciences
Inc
..................
7,373
505,862
HCA
Healthcare
Inc
...................
781
250,920
Johnson
&
Johnson
..................
14,923
2,181,146
Merck
&
Co
Inc
.....................
13,029
1,612,990
Organon
&
Co
......................
146
3,022
Pfizer
Inc
.........................
3,577
100,084
Universal
Health
Services
Inc
............
241
44,568
Viatris
Inc
.........................
3,418
36,333
Zoetis
Inc
.........................
1,857
321,930
9,839,451
Industrials
—
3.2%
A
O
Smith
Corp
.....................
2,280
186,458
2024
Semi-Annual
Report
|
June
30,
2024
The
accompanying
notes
are
an
integral
part
of
these
financial
statements.
Schedules
of
Investments
June
30,
2024
(unaudited)
Moderate
Allocation
Fund
Security
Description
Shares,
Contracts
or
Principal
Amount
($)
Fair
Value
($)
Common
Stocks
(United
States)
—
continued
AECOM
...........................
7,388
651,178
Alaska
Air
Group
Inc
(1)
.................
1,828
73,851
Allegion
plc
........................
1,944
229,684
Applied
Industrial
Technologies
Inc
........
46
8,924
Boise
Cascade
Co
...................
147
17,525
Broadridge
Financial
Solutions
Inc
.........
1,758
346,326
BWX
Technologies
Inc
.................
977
92,815
Delta
Air
Lines
Inc
...................
3,631
172,255
EMCOR
Group
Inc
....................
1,027
374,937
Encore
Wire
Corp
....................
774
224,328
Fastenal
Co
........................
10,493
659,380
Graco
Inc
.........................
3,353
265,826
Huntington
Ingalls
Industries
Inc
..........
849
209,134
Johnson
Controls
International
plc
.........
1,850
122,970
Kirby
Corp
(1)
.......................
160
19,157
Leidos
Holdings
Inc
..................
3,100
452,228
MSC
Industrial
Direct
Co
Inc
.............
3,787
300,347
Owens
Corning
.....................
1,793
311,480
Ryder
System
Inc
....................
25
3,097
Trane
Technologies
PLC
................
1,272
418,399
UFP
Industries
Inc
...................
41
4,592
United
Airlines
Holdings
Inc
(1)
............
4,922
239,505
Waste
Management
Inc
................
1,014
216,327
5,600,723
Information
Technology
—
13.0%
Advanced
Micro
Devices
Inc
(1)
...........
1,938
314,363
Analog
Devices
Inc
...................
6,864
1,566,777
Apple
Inc
.........................
12,009
2,529,336
Applied
Materials
Inc
.................
1,022
241,182
Broadcom
Inc
......................
474
761,021
Consensus
Cloud
Solutions
Inc
(1)
..........
1,761
30,254
Enphase
Energy
Inc
(1)
.................
1,108
110,479
First
Solar
Inc
(1)
.....................
809
182,397
GLOBALFOUNDRIES
Inc
(1)
...............
601
30,386
Intel
Corp
.........................
10,434
323,141
KLA
Corp
.........................
133
109,660
Marvell
Technology
Inc
................
267
18,663
Microchip
Technology
Inc
..............
2,217
202,855
Micron
Technology
Inc
................
1,414
185,983
Microsoft
Corp
......................
14,233
6,361,439
Nutanix
Inc
(1)
.......................
115
6,538
NVIDIA
Corp
.......................
36,450
4,503,033
ON
Semiconductor
Corp
(1)
..............
2,236
153,278
Oracle
Corp
........................
4,105
579,626
Palantir
Technologies
Inc
(1)
..............
821
20,796
Qorvo
Inc
(1)
........................
1,268
147,139
Moderate
Allocation
Fund
Security
Description
Shares,
Contracts
or
Principal
Amount
($)
Fair
Value
($)
Common
Stocks
(United
States)
—
continued
QUALCOMM
Inc
.....................
7,636
1,520,938
Skyworks
Solutions
Inc
................
7,684
818,961
Smartsheet
Inc
(1)
....................
448
19,748
TD
SYNNEX
Corp
....................
104
12,002
Teradyne
Inc
.......................
752
111,514
Texas
Instruments
Inc
.................
9,933
1,932,266
22,793,775
Materials
—
0.2%
Ball
Corp
.........................
2,763
165,835
Silgan
Holdings
Inc
...................
1,585
67,093
Sylvamo
Corp
......................
1,014
69,561
302,489
Utilities
—
0.1%
Clearway
Energy
Inc
..................
453
11,185
Ormat
Technologies
Inc
................
2,329
166,989
178,174
Total
Common
Stocks
(United
States)
(Cost
$
54,214,031
)
.................
66,593,139
Preferred
Stock
(United
States)
—
0
.0
%
WESCO
International
Inc
Series
A
Variable
Pfd,
9.7%
..........................
252
6,534
Total
Preferred
Stock
(United
States)
(Cost
$
6,299
)
.....................
6,534
Warrants
(United
States)
—
0
.0
%
Chaparral
Energy
Inc
A
Warrants
,
Expiration
Date
10/14/2024
(1)
(2)
.........
1
0
Chaparral
Energy
Inc
B
Warrants
,
Expiration
Date
10/14/2025
(1)
(2)
.........
1
0
Chord
Energy
Corp
,
Expiration
Date
11/19/2024
(1)
(2)
.........
3
0
Civitas
Resources
Inc
,
Expiration
Date
1/20/2025
(1)
(2)
..........
7
0
Civitas
Resources
Inc
,
Expiration
Date
1/20/2026
(1)
(2)
..........
3
0
Total
Warrants
(United
States)
(Cost
$
656
)
......................
0
Registered
Investment
Companies
—
48
.9
%
U.S.
Fixed
Income
—
36.1%
BrandywineGLOBAL
High
Yield
Fund
-
Class
I
.
621,286
6,293,626
Dodge
&
Cox
Income
Fund
-
Class
I
........
550,168
6,811,076
2024
Semi-Annual
Report
|
June
30,
2024
The
accompanying
notes
are
an
integral
part
of
these
financial
statements.
Schedules
of
Investments
June
30,
2024
(unaudited)
Moderate
Allocation
Fund
Security
Description
Shares,
Contracts
or
Principal
Amount
($)
Fair
Value
($)
Registered
Investment
Companies
—
continued
Eaton
Vance
Emerging
Markets
Debt
Opportunities
Fund
-
Class
R6
..........
544,847
4,238,910
Fidelity
Advisor
High
Income
Advantage
Fund
-
Class
Z
.........................
587,853
6,354,696
Fidelity
Total
Bond
Fund
-
Class
Z
.........
2,288,944
21,493,180
Frost
Total
Return
Bond
Fund
-
Class
I
......
1,180,358
11,461,279
iShares
20+
Year
Treasury
Bond
ETF
(3)
......
69,121
6,343,925
62,996,692
International
Fixed
Income
—
1.0%
iShares
J.P.
Morgan
USD
Emerging
Markets
Bond
ETF
(3)
..........................
19,121
1,691,826
1,691,826
International
Equity
—
11.8%
Baird
Core
Plus
Bond
Fund
-
Class
I
.......
2,066,511
20,644,440
20,644,440
Total
Registered
Investment
Companies
(Cost
$
83,210,421
)
.................
85,332,958
Money
Market
Registered
Investment
Companies
—
12
.2
%
Meeder
Institutional
Prime
Money
Market
Fund
,
5.27
%
(4)
........................
21,256,496
21,258,622
Total
Money
Market
Registered
Investment
Companies
(Cost
$
21,244,245
)
.................
21,258,622
Total
Investments
—
99
.2
%
(Cost
$
158,675,652
)
................
173,191,253
Other
Assets
less
Liabilities
—
0
.8
%
.......
1,398,807
Total
Net
Assets
—
100
.0
%
.............
174,590,060
Trustee
Deferred
Compensation
(5)
Meeder
Balanced
Fund
-
Retail
Class
.......
738
10,148
Meeder
Conservative
Allocation
Fund
-
Retail
Class
..........................
241
5,495
Meeder
Dynamic
Allocation
Fund
-
Retail
Class
1,784
26,706
Meeder
Muirfield
Fund
-
Retail
Class
.......
2,509
25,692
Total
Trustee
Deferred
Compensation
(Cost
$
57,374
)
....................
68,041
Moderate
Allocation
Fund
Long
(Short)
Contracts
Expiration
Date
Notional
Value
of
Contracts
($)
Value
and
Unrealized
Appreciation
(Depreciation)
($)
Futures
Contracts
Index
Futures
Mini
MSCI
EAFE
Futures
-
Sept
2024
.........
69
9/20/24
8,084,040
(
18,944
)
Mini
MSCI
Emg
Mkt
Futures
-
Sept
2024
........
39
9/20/24
2,121,990
(
16,107
)
Russell
2000
Futures
Mini
September
2024
.....
66
9/20/24
6,814,500
60,890
S&P
500
Mini
Futures
September
2024
.....
(11)
9/20/24
(3,036,825)
15,352
S&P
Mid
Cap
Futures
EMini
September
2024
.....
7
9/20/24
2,070,670
13,692
Total
Futures
Contracts
..
170
16,054,375
54,883
(1)
Represents
non-income
producing
securities.
(2)
Fair
valued
security
deemed
a
Level
3
security.
Security
is
not
part
of
the
investment
strategy
of
the
Fund.
(3)
Exchange-traded
fund.
(4)
Investment
in
affiliate.
The
yield
shown
represents
the
7-day
yield
in
effect
at
June
30,
2024.
(5)
Assets
of
affiliates
to
the
Moderate
Allocation
Fund
held
for
the
benefit
of
the
Fund’s
Trustees
in
connection
with
the
Trustee
Deferred
Compensation
Plan.
2024
Semi-Annual
Report
|
June
30,
2024
The
accompanying
notes
are
an
integral
part
of
these
financial
statements.
Schedules
of
Investments
June
30,
2024
(unaudited)
Conservative
Allocation
Fund
Security
Description
Shares,
Contracts
or
Principal
Amount
($)
Fair
Value
($)
Common
Stocks
(United
States)
—
23
.6
%
Communication
Services
—
2.2%
Alphabet
Inc
.......................
9,664
1,772,571
Meta
Platforms
Inc
...................
1,900
958,018
Netflix
Inc
(1)
........................
219
147,799
Telephone
and
Data
Systems
Inc
.........
971
20,129
Verizon
Communications
Inc
............
1,511
62,313
2,960,830
Consumer
Discretionary
—
3.0%
Amazon.com
Inc
(1)
...................
8,440
1,631,030
Aptiv
PLC
(1)
........................
22
1,549
Best
Buy
Co
Inc
.....................
1,000
84,290
Burlington
Stores
Inc
(1)
................
144
34,560
Hibbett
Inc
........................
1,080
94,187
JAKKS
Pacific
Inc
(1)
...................
206
3,689
Las
Vegas
Sands
Corp
.................
685
30,311
Leggett
&
Platt
Inc
...................
6,995
80,163
Lennar
Corp
.......................
2,334
349,797
Mohawk
Industries
Inc
(1)
...............
1,842
209,233
O'Reilly
Automotive
Inc
(1)
...............
51
53,859
Ross
Stores
Inc
.....................
3,264
474,325
Texas
Roadhouse
Inc
.................
448
76,926
TJX
Cos
Inc/The
.....................
7,294
803,069
Ulta
Beauty
Inc
(1)
....................
288
111,131
Valvoline
Inc
(1)
......................
152
6,566
4,044,685
Consumer
Staples
—
0.6%
Bunge
Global
SA
....................
1,974
210,764
Casey's
General
Stores
Inc
.............
200
76,312
Kroger
Co/The
......................
3,346
167,066
Target
Corp
........................
820
121,393
Walmart
Inc
.......................
3,277
221,885
797,420
Energy
—
0.7%
Civitas
Resources
Inc
.................
1,711
118,059
ConocoPhillips
......................
2,237
255,868
Devon
Energy
Corp
...................
1,689
80,058
EOG
Resources
Inc
...................
1,741
219,140
Exxon
Mobil
Corp
....................
2,007
231,046
HF
Sinclair
Corp
.....................
73
3,894
Teekay
Corp
(1)
......................
129
1,157
909,222
Conservative
Allocation
Fund
Security
Description
Shares,
Contracts
or
Principal
Amount
($)
Fair
Value
($)
Common
Stocks
(United
States)
—
continued
Financials
—
3.4%
Ally
Financial
Inc
....................
3,216
127,579
American
Express
Co
.................
201
46,541
Ameriprise
Financial
Inc
...............
516
220,430
Bank
of
New
York
Mellon
Corp/The
........
5,792
346,883
Berkshire
Hathaway
Inc
(1)
..............
7,616
3,098,189
Block
Inc
(1)
........................
785
50,625
Commerce
Bancshares
Inc/MO
...........
1,215
67,773
Cullen/Frost
Bankers
Inc
...............
408
41,465
Fifth
Third
Bancorp
...................
1,615
58,931
First
American
Financial
Corp
............
377
20,339
Medley
Management
Inc
(1)
(2)
.............
25
0
Northern
Trust
Corp
..................
2,136
179,381
PROG
Holdings
Inc
...................
110
3,815
RAIT
Financial
Trust
(1)
(2)
................
368
0
State
Street
Corp
....................
3,665
271,210
Synchrony
Financial
..................
174
8,211
WaFd
Inc
.........................
118
3,372
4,544,744
Health
Care
—
3.4%
AbbVie
Inc
........................
2,667
457,444
Amgen
Inc
........................
985
307,763
Amneal
Pharmaceuticals
Inc
(1)
...........
442
2,807
Cardinal
Health
Inc
...................
972
95,567
Centene
Corp
(1)
.....................
1,858
123,185
Elevance
Health
Inc
..................
829
449,202
Eli
Lilly
&
Co
.......................
733
663,644
Encompass
Health
Corp
...............
1,213
104,063
Gilead
Sciences
Inc
..................
3,379
231,833
HCA
Healthcare
Inc
...................
589
189,234
Johnson
&
Johnson
..................
6,781
991,111
Merck
&
Co
Inc
.....................
6,310
781,178
Universal
Health
Services
Inc
............
94
17,384
Zoetis
Inc
.........................
565
97,948
4,512,363
Industrials
—
1.9%
A
O
Smith
Corp
.....................
1,548
126,595
AECOM
...........................
2,961
260,983
Alaska
Air
Group
Inc
(1)
.................
824
33,290
Applied
Industrial
Technologies
Inc
........
203
39,382
Boise
Cascade
Co
...................
47
5,603
Broadridge
Financial
Solutions
Inc
.........
906
178,482
BWX
Technologies
Inc
.................
673
63,935
Delta
Air
Lines
Inc
...................
1,467
69,594
2024
Semi-Annual
Report
|
June
30,
2024
The
accompanying
notes
are
an
integral
part
of
these
financial
statements.
Schedules
of
Investments
June
30,
2024
(unaudited)
Conservative
Allocation
Fund
Security
Description
Shares,
Contracts
or
Principal
Amount
($)
Fair
Value
($)
Common
Stocks
(United
States)
—
continued
EMCOR
Group
Inc
....................
253
92,365
Encore
Wire
Corp
....................
587
170,130
Fastenal
Co
........................
2,645
166,212
Graco
Inc
.........................
1,568
124,311
Huntington
Ingalls
Industries
Inc
..........
385
94,837
Johnson
Controls
International
plc
.........
933
62,017
Kirby
Corp
(1)
.......................
138
16,523
Leidos
Holdings
Inc
..................
1,512
220,571
MDU
Resources
Group
Inc
..............
185
4,643
MSC
Industrial
Direct
Co
Inc
.............
2,483
196,927
Owens
Corning
.....................
1,799
312,522
Trane
Technologies
PLC
................
492
161,834
UFP
Industries
Inc
...................
761
85,232
United
Airlines
Holdings
Inc
(1)
............
1,606
78,148
2,564,136
Information
Technology
—
8.2%
Advanced
Micro
Devices
Inc
(1)
...........
857
139,014
Analog
Devices
Inc
...................
3,046
695,280
Apple
Inc
.........................
6,237
1,313,637
Applied
Materials
Inc
.................
920
217,111
Broadcom
Inc
......................
201
322,712
Consensus
Cloud
Solutions
Inc
(1)
..........
477
8,195
Enphase
Energy
Inc
(1)
.................
498
49,656
First
Solar
Inc
(1)
.....................
326
73,500
Intel
Corp
.........................
4,561
141,254
Marvell
Technology
Inc
................
160
11,184
Microchip
Technology
Inc
..............
3,522
322,263
Micron
Technology
Inc
................
545
71,684
Microsoft
Corp
......................
6,470
2,891,766
NVIDIA
Corp
.......................
16,940
2,092,768
ON
Semiconductor
Corp
(1)
..............
413
28,311
Oracle
Corp
........................
2,186
308,663
Palantir
Technologies
Inc
(1)
..............
640
16,211
Qorvo
Inc
(1)
........................
432
50,129
QUALCOMM
Inc
.....................
4,530
902,285
Skyworks
Solutions
Inc
................
2,746
292,669
Smartsheet
Inc
(1)
....................
647
28,520
TD
SYNNEX
Corp
....................
57
6,578
Teradyne
Inc
.......................
177
26,247
Texas
Instruments
Inc
.................
4,653
905,148
10,914,785
Materials
—
0.1%
Ball
Corp
.........................
1,266
75,985
Silgan
Holdings
Inc
...................
738
31,240
Conservative
Allocation
Fund
Security
Description
Shares,
Contracts
or
Principal
Amount
($)
Fair
Value
($)
Common
Stocks
(United
States)
—
continued
Sylvamo
Corp
......................
494
33,888
141,113
Utilities
—
0.1%
Ormat
Technologies
Inc
................
1,197
85,825
85,825
Total
Common
Stocks
(United
States)
(Cost
$
26,516,433
)
.................
31,475,123
Preferred
Stock
(United
States)
—
0
.0
%
WESCO
International
Inc
Series
A
Variable
Pfd,
9.7%
..........................
153
3,967
Total
Preferred
Stock
(United
States)
(Cost
$
3,824
)
.....................
3,967
Warrants
(United
States)
—
0
.0
%
Chord
Energy
Corp
,
Expiration
Date
11/19/2024
(1)
(2)
.........
1
0
Civitas
Resources
Inc
,
Expiration
Date
1/20/2026
(1)
(2)
..........
1
0
Civitas
Resources
Inc
,
Expiration
Date
1/20/2025
(1)
(2)
..........
4
0
Total
Warrants
(United
States)
(Cost
$
312
)
......................
0
Registered
Investment
Companies
—
68
.4
%
U.S.
Fixed
Income
—
50.3%
BrandywineGLOBAL
High
Yield
Fund
-
Class
I
.
676,918
6,857,176
Dodge
&
Cox
Income
Fund
-
Class
I
........
586,740
7,263,845
Eaton
Vance
Emerging
Markets
Debt
Opportunities
Fund
-
Class
R6
..........
581,835
4,526,675
Fidelity
Advisor
High
Income
Advantage
Fund
-
Class
Z
.........................
640,494
6,923,739
Fidelity
Total
Bond
Fund
-
Class
Z
.........
2,456,464
23,066,198
Frost
Total
Return
Bond
Fund
-
Class
I
......
1,195,983
11,612,999
iShares
20+
Year
Treasury
Bond
ETF
(3)
......
74,061
6,797,319
67,047,951
International
Fixed
Income
—
1.4%
iShares
J.P.
Morgan
USD
Emerging
Markets
Bond
ETF
(3)
..........................
20,433
1,807,912
1,807,912
2024
Semi-Annual
Report
|
June
30,
2024
The
accompanying
notes
are
an
integral
part
of
these
financial
statements.
Schedules
of
Investments
June
30,
2024
(unaudited)
Conservative
Allocation
Fund
Security
Description
Shares,
Contracts
or
Principal
Amount
($)
Fair
Value
($)
Registered
Investment
Companies
—
continued
International
Equity
—
16.7%
Baird
Core
Plus
Bond
Fund
-
Class
I
.......
2,227,330
22,251,023
22,251,023
Total
Registered
Investment
Companies
(Cost
$
88,831,644
)
.................
91,106,886
Money
Market
Registered
Investment
Companies
—
7
.6
%
Meeder
Institutional
Prime
Money
Market
Fund
,
5.27
%
(4)
........................
10,136,840
10,137,854
Total
Money
Market
Registered
Investment
Companies
(Cost
$
10,130,454
)
.................
10,137,854
Total
Investments
—
99
.6
%
(Cost
$
125,482,667
)
................
132,723,830
Other
Assets
less
Liabilities
—
0
.4
%
.......
525,496
Total
Net
Assets
—
100
.0
%
.............
133,249,326
Trustee
Deferred
Compensation
(5)
Meeder
Balanced
Fund
-
Retail
Class
.......
1,553
21,354
Meeder
Conservative
Allocation
Fund
-
Retail
Class
..........................
462
10,534
Meeder
Dynamic
Allocation
Fund
-
Retail
Class
4,100
61,377
Meeder
Muirfield
Fund
-
Retail
Class
.......
2,873
29,420
Total
Trustee
Deferred
Compensation
(Cost
$
96,160
)
....................
122,685
Conservative
Allocation
Fund
Long
(Short)
Contracts
Expiration
Date
Notional
Value
of
Contracts
($)
Value
and
Unrealized
Appreciation
(Depreciation)
($)
Futures
Contracts
Index
Futures
Mini
MSCI
EAFE
Futures
-
Sept
2024
.........
31
9/20/24
3,631,960
(
8,979
)
Mini
MSCI
Emg
Mkt
Futures
-
Sept
2024
........
17
9/20/24
924,970
(
7,657
)
Russell
2000
Futures
Mini
September
2024
.....
30
9/20/24
3,097,500
27,730
S&P
500
Mini
Futures
September
2024
.....
(9)
9/20/24
(2,484,675)
12,320
S&P
Mid
Cap
Futures
EMini
September
2024
.....
3
9/20/24
887,430
3,913
Total
Futures
Contracts
..
72
6,057,185
27,327
(1)
Represents
non-income
producing
securities.
(2)
Fair
valued
security
deemed
a
Level
3
security.
Security
is
not
part
of
the
investment
strategy
of
the
Fund.
(3)
Exchange-traded
fund.
(4)
Investment
in
affiliate.
The
yield
shown
represents
the
7-day
yield
in
effect
at
June
30,
2024.
(5)
Assets
of
affiliates
to
the
Conservative
Allocation
Fund
held
for
the
benefit
of
the
Fund’s
Trustees
in
connection
with
the
Trustee
Deferred
Compensation
Plan.
2024
Semi-Annual
Report
|
June
30,
2024
The
accompanying
notes
are
an
integral
part
of
these
financial
statements.
Schedules
of
Investments
June
30,
2024
(unaudited)
Dynamic
Allocation
Fund
Security
Description
Shares,
Contracts
or
Principal
Amount
($)
Fair
Value
($)
Common
Stocks
(United
States)
—
60
.1
%
Communication
Services
—
5.9%
Alphabet
Inc
.......................
56,936
10,443,201
Alphabet
Inc
.......................
1,068
194,536
Meta
Platforms
Inc
...................
13,487
6,800,415
Netflix
Inc
(1)
........................
3,012
2,032,739
Telephone
and
Data
Systems
Inc
.........
4,089
84,765
Verizon
Communications
Inc
............
10,297
424,648
19,980,304
Consumer
Discretionary
—
8.1%
Amazon.com
Inc
(1)
...................
56,200
10,860,650
Best
Buy
Co
Inc
.....................
8,215
692,442
Burlington
Stores
Inc
(1)
................
1,295
310,800
Hibbett
Inc
........................
5,955
519,336
Las
Vegas
Sands
Corp
.................
7,390
327,007
Leggett
&
Platt
Inc
...................
26,456
303,186
Lennar
Corp
.......................
16,521
2,476,002
Lululemon
Athletica
Inc
(1)
...............
1,074
320,804
Mohawk
Industries
Inc
(1)
...............
8,930
1,014,359
NVR
Inc
(1)
.........................
84
637,439
O'Reilly
Automotive
Inc
(1)
...............
552
582,945
PVH
Corp
.........................
458
48,488
Ross
Stores
Inc
.....................
20,255
2,943,457
Texas
Roadhouse
Inc
.................
3,492
599,611
TJX
Cos
Inc/The
.....................
41,438
4,562,324
Tupperware
Brands
Corp
(1)
..............
13,119
18,367
Ulta
Beauty
Inc
(1)
....................
2,391
922,615
Valvoline
Inc
(1)
......................
1,933
83,506
27,223,338
Consumer
Staples
—
1.3%
Bunge
Global
SA
....................
16,219
1,731,703
Casey's
General
Stores
Inc
.............
2,036
776,856
Kroger
Co/The
......................
18,235
910,473
Target
Corp
........................
5,573
825,027
Walmart
Inc
.......................
2,173
147,134
4,391,193
Energy
—
1.3%
Berry
Corp
........................
1,448
9,354
Civitas
Resources
Inc
.................
3,118
215,142
ConocoPhillips
......................
7,105
812,670
Devon
Energy
Corp
...................
4,369
207,091
Diamondback
Energy
Inc
...............
6,714
1,344,076
EOG
Resources
Inc
...................
7,899
994,247
Exxon
Mobil
Corp
....................
6,335
729,285
Dynamic
Allocation
Fund
Security
Description
Shares,
Contracts
or
Principal
Amount
($)
Fair
Value
($)
Common
Stocks
(United
States)
—
continued
Marathon
Oil
Corp
...................
331
9,490
Scorpio
Tankers
Inc
..................
579
47,067
SilverBow
Resources
Inc
(1)
..............
381
14,413
Teekay
Corp
(1)
......................
1,128
10,118
4,392,953
Financials
—
8.9%
Ally
Financial
Inc
....................
21,583
856,198
Ameriprise
Financial
Inc
...............
5,435
2,321,778
Bank
of
New
York
Mellon
Corp/The
........
35,165
2,106,032
Berkshire
Hathaway
Inc
(1)
..............
49,133
19,987,304
Block
Inc
(1)
........................
3,915
252,478
Commerce
Bancshares
Inc/MO
...........
8,629
481,326
Cullen/Frost
Bankers
Inc
...............
4,488
456,115
Fifth
Third
Bancorp
...................
2,355
85,934
First
American
Financial
Corp
............
3,530
190,444
Northern
Trust
Corp
..................
15,992
1,343,008
State
Street
Corp
....................
24,540
1,815,960
WaFd
Inc
.........................
1,109
31,695
29,928,272
Health
Care
—
8.9%
AbbVie
Inc
........................
20,187
3,462,474
Amgen
Inc
........................
6,821
2,131,221
Cardinal
Health
Inc
...................
6,186
608,208
Centene
Corp
(1)
.....................
13,188
874,364
Elevance
Health
Inc
..................
6,224
3,372,537
Eli
Lilly
&
Co
.......................
4,939
4,471,672
Encompass
Health
Corp
...............
7,724
662,642
Gilead
Sciences
Inc
..................
22,813
1,565,200
HCA
Healthcare
Inc
...................
1,819
584,408
Johnson
&
Johnson
..................
42,039
6,144,420
Merck
&
Co
Inc
.....................
40,491
5,012,786
Organon
&
Co
......................
348
7,204
Universal
Health
Services
Inc
............
1,431
264,635
Viatris
Inc
.........................
7,721
82,074
Zoetis
Inc
.........................
3,770
653,567
29,897,412
Industrials
—
4.9%
A
O
Smith
Corp
.....................
7,157
585,299
AECOM
...........................
12,614
1,111,798
Alaska
Air
Group
Inc
(1)
.................
6,963
281,305
Allegion
plc
........................
6,542
772,937
Applied
Industrial
Technologies
Inc
........
589
114,266
Boise
Cascade
Co
...................
1,198
142,826
2024
Semi-Annual
Report
|
June
30,
2024
The
accompanying
notes
are
an
integral
part
of
these
financial
statements.
Schedules
of
Investments
June
30,
2024
(unaudited)
Dynamic
Allocation
Fund
Security
Description
Shares,
Contracts
or
Principal
Amount
($)
Fair
Value
($)
Common
Stocks
(United
States)
—
continued
Broadridge
Financial
Solutions
Inc
.........
6,358
1,252,526
BWX
Technologies
Inc
.................
3,768
357,960
Delta
Air
Lines
Inc
...................
13,113
622,081
EMCOR
Group
Inc
....................
1,844
673,208
Encore
Wire
Corp
....................
1,399
405,472
Fastenal
Co
........................
18,257
1,147,270
Graco
Inc
.........................
7,566
599,832
Huntington
Ingalls
Industries
Inc
..........
2,682
660,657
Johnson
Controls
International
plc
.........
6,672
443,488
Karat
Packaging
Inc
..................
223
6,596
Kirby
Corp
(1)
.......................
2,216
265,322
Leidos
Holdings
Inc
..................
12,077
1,761,793
MSC
Industrial
Direct
Co
Inc
.............
11,571
917,696
Owens
Corning
.....................
4,398
764,021
Trane
Technologies
PLC
................
4,272
1,405,189
UFP
Industries
Inc
...................
2,280
255,360
United
Airlines
Holdings
Inc
(1)
............
17,505
851,793
Waste
Management
Inc
................
5,956
1,270,653
16,669,348
Information
Technology
—
20.5%
Advanced
Micro
Devices
Inc
(1)
...........
5,293
858,577
Analog
Devices
Inc
...................
20,519
4,683,667
Apple
Inc
.........................
31,917
6,722,359
Applied
Materials
Inc
.................
6,638
1,566,502
Broadcom
Inc
......................
1,476
2,369,762
Cirrus
Logic
Inc
(1)
....................
2,538
324,001
Consensus
Cloud
Solutions
Inc
(1)
..........
4,011
68,909
Enphase
Energy
Inc
(1)
.................
3,808
379,696
First
Solar
Inc
(1)
.....................
2,561
577,403
GLOBALFOUNDRIES
Inc
(1)
...............
875
44,240
Intel
Corp
.........................
31,678
981,068
Jabil
Inc
..........................
170
18,494
KLA
Corp
.........................
239
197,058
Microchip
Technology
Inc
..............
10,272
939,888
Micron
Technology
Inc
................
4,274
562,159
Microsoft
Corp
......................
40,945
18,300,368
NVIDIA
Corp
.......................
111,070
13,721,588
ON
Semiconductor
Corp
(1)
..............
3,247
222,582
Oracle
Corp
........................
12,389
1,749,327
Palantir
Technologies
Inc
(1)
..............
2,683
67,960
Qorvo
Inc
(1)
........................
4,885
566,855
QUALCOMM
Inc
.....................
23,562
4,693,079
Skyworks
Solutions
Inc
................
25,726
2,741,877
Smartsheet
Inc
(1)
....................
2,519
111,037
TD
SYNNEX
Corp
....................
2,059
237,609
Teradyne
Inc
.......................
2,994
443,980
Dynamic
Allocation
Fund
Security
Description
Shares,
Contracts
or
Principal
Amount
($)
Fair
Value
($)
Common
Stocks
(United
States)
—
continued
Texas
Instruments
Inc
.................
32,062
6,237,021
69,387,066
Materials
—
0.2%
Ball
Corp
.........................
6,142
368,643
Sylvamo
Corp
......................
3,599
246,891
615,534
Real
Estate
—
0.0%
CoStar
Group
Inc
(1)
...................
1,097
81,331
81,331
Utilities
—
0.1%
Clearway
Energy
Inc
..................
1,543
38,097
Ormat
Technologies
Inc
................
4,311
309,099
Vistra
Corp
........................
1,425
122,521
469,717
Total
Common
Stocks
(United
States)
(Cost
$
163,217,845
)
................
203,036,468
Preferred
Stock
(United
States)
—
0
.0
%
WESCO
International
Inc
Series
A
Variable
Pfd,
9.7%
..........................
610
15,817
Total
Preferred
Stock
(United
States)
(Cost
$
15,247
)
....................
15,817
Warrants
(United
States)
—
0
.0
%
Chaparral
Energy
Inc
A
Warrants
,
Expiration
Date
10/14/2024
(1)
(2)
.........
2
0
Chaparral
Energy
Inc
B
Warrants
,
Expiration
Date
10/14/2025
(1)
(2)
.........
2
0
Chord
Energy
Corp
,
Expiration
Date
11/19/2024
(1)
(2)
.........
7
0
Civitas
Resources
Inc
,
Expiration
Date
1/20/2025
(1)
(2)
..........
15
0
Civitas
Resources
Inc
,
Expiration
Date
1/20/2026
(1)
(2)
..........
8
0
Total
Warrants
(United
States)
(Cost
$
2,167
)
.....................
0
Registered
Investment
Companies
—
5
.0
%
U.S.
Fixed
Income
—
3.2%
BrandywineGLOBAL
High
Yield
Fund
-
Class
I
.
111,222
1,126,683
Dodge
&
Cox
Income
Fund
-
Class
I
........
93,580
1,158,525
2024
Semi-Annual
Report
|
June
30,
2024
The
accompanying
notes
are
an
integral
part
of
these
financial
statements.
Schedules
of
Investments
June
30,
2024
(unaudited)
Dynamic
Allocation
Fund
Security
Description
Shares,
Contracts
or
Principal
Amount
($)
Fair
Value
($)
Registered
Investment
Companies
—
continued
Eaton
Vance
Emerging
Markets
Debt
Opportunities
Fund
-
Class
R6
..........
93,686
728,880
Fidelity
Advisor
High
Income
Advantage
Fund
-
Class
Z
.........................
105,362
1,138,960
Fidelity
Total
Bond
Fund
-
Class
Z
.........
461,438
4,332,900
Frost
Total
Return
Bond
Fund
-
Class
I
......
115,100
1,117,624
iShares
20+
Year
Treasury
Bond
ETF
(3)
......
13,486
1,237,745
10,841,317
International
Fixed
Income
—
0.1%
iShares
J.P.
Morgan
USD
Emerging
Markets
Bond
ETF
(3)
..........................
4,263
377,190
377,190
International
Equity
—
1.7%
Baird
Core
Plus
Bond
Fund
-
Class
I
.......
441,031
4,405,898
iShares
Core
MSCI
EAFE
ETF
(3)
...........
15,725
1,142,264
5,548,162
Total
Registered
Investment
Companies
(Cost
$
16,659,537
)
.................
16,766,669
Money
Market
Registered
Investment
Companies
—
33
.0
%
Meeder
Institutional
Prime
Money
Market
Fund
,
5.27
%
(4)
........................
111,336,461
111,347,595
Total
Money
Market
Registered
Investment
Companies
(Cost
$
111,321,196
)
................
111,347,595
Total
Investments
—
98
.1
%
(Cost
$
291,215,992
)
................
331,166,549
Other
Assets
less
Liabilities
—
1
.9
%
.......
6,428,659
Total
Net
Assets
—
100
.0
%
.............
337,595,208
Trustee
Deferred
Compensation
(5)
Meeder
Balanced
Fund
-
Retail
Class
.......
4,441
61,064
Meeder
Conservative
Allocation
Fund
-
Retail
Class
..........................
1,305
29,754
Meeder
Dynamic
Allocation
Fund
-
Retail
Class
12,007
179,745
Meeder
Muirfield
Fund
-
Retail
Class
.......
6,378
65,311
Total
Trustee
Deferred
Compensation
(Cost
$
257,539
)
...................
335,874
Dynamic
Allocation
Fund
Long
(Short)
Contracts
Expiration
Date
Notional
Value
of
Contracts
($)
Value
and
Unrealized
Appreciation
(Depreciation)
($)
Futures
Contracts
Index
Futures
Mini
MSCI
EAFE
Futures
-
Sept
2024
.........
524
9/20/24
61,391,840
(
156,092
)
Mini
MSCI
Emg
Mkt
Futures
-
Sept
2024
........
205
9/20/24
11,154,050
(
100,588
)
Russell
2000
Futures
Mini
September
2024
.....
229
9/20/24
23,644,250
207,220
S&P
500
Mini
Futures
September
2024
.....
33
9/20/24
9,110,475
(
42,277
)
S&P
Mid
Cap
Futures
EMini
September
2024
.....
33
9/20/24
9,761,730
(
15,489
)
Total
Futures
Contracts
..
1,024
115,062,345
(
107,226
)
(1)
Represents
non-income
producing
securities.
(2)
Fair
valued
security
deemed
a
Level
3
security.
Security
is
not
part
of
the
investment
strategy
of
the
Fund.
(3)
Exchange-traded
fund.
(4)
Investment
in
affiliate.
The
yield
shown
represents
the
7-day
yield
in
effect
at
June
30,
2024.
(5)
Assets
of
affiliates
to
the
Dynamic
Allocation
Fund
held
for
the
benefit
of
the
Fund’s
Trustees
in
connection
with
the
Trustee
Deferred
Compensation
Plan.
2024
Semi-Annual
Report
|
June
30,
2024
The
accompanying
notes
are
an
integral
part
of
these
financial
statements.
Schedules
of
Investments
June
30,
2024
(unaudited)
Sector
Rotation
Fund
Security
Description
Shares,
Contracts
or
Principal
Amount
($)
Fair
Value
($)
Common
Stocks
(United
States)
—
56
.5
%
Communication
Services
—
6.5%
Alphabet
Inc
.......................
5,731
1,043,902
AT&T
Inc
..........................
4,096
78,275
Charter
Communications
Inc
(1)
...........
69
20,628
Comcast
Corp
......................
2,243
87,836
Electronic
Arts
Inc
...................
168
23,407
Live
Nation
Entertainment
Inc
(1)
...........
143
13,405
Meta
Platforms
Inc
...................
1,154
581,870
Netflix
Inc
(1)
........................
226
152,523
Omnicom
Group
Inc
..................
217
19,465
Paramount
Global
....................
267
4,907
Pinterest
Inc
(1)
......................
343
15,116
ROBLOX
Corp
(1)
.....................
311
11,572
Roku
Inc
(1)
.........................
104
6,233
Spotify
Technology
SA
(1)
................
82
25,731
Take-Two
Interactive
Software
Inc
(1)
........
107
16,637
T-Mobile
US
Inc
.....................
261
45,983
Trade
Desk
Inc/The
(1)
.................
263
25,687
Verizon
Communications
Inc
............
2,321
95,718
Walt
Disney
Co/The
..................
985
97,801
Warner
Bros
Discovery
Inc
(1)
.............
1,808
13,451
2,380,147
Consumer
Discretionary
—
11.7%
Abercrombie
&
Fitch
Co
(1)
...............
51
9,070
Airbnb
Inc
(1)
........................
375
56,861
Amazon.com
Inc
(1)
...................
7,288
1,408,406
Aptiv
PLC
(1)
........................
329
23,168
AutoZone
Inc
(1)
......................
15
44,461
Bath
&
Body
Works
Inc
................
299
11,676
Best
Buy
Co
Inc
.....................
210
17,701
Booking
Holdings
Inc
.................
29
114,883
BorgWarner
Inc
.....................
576
18,570
Brunswick
Corp/DE
..................
295
21,467
Burlington
Stores
Inc
(1)
................
65
15,600
CarMax
Inc
(1)
.......................
266
19,508
Carnival
Corp
(1)
.....................
1,091
20,424
Carvana
Co
(1)
.......................
96
12,357
Chipotle
Mexican
Grill
Inc
(1)
.............
1,200
75,180
Coupang
Inc
(1)
......................
1,000
20,950
Crocs
Inc
(1)
........................
83
12,113
Darden
Restaurants
Inc
................
176
26,632
Deckers
Outdoor
Corp
(1)
................
24
23,231
Dick's
Sporting
Goods
Inc
..............
58
12,461
Domino's
Pizza
Inc
...................
39
20,137
DoorDash
Inc
(1)
.....................
293
31,873
DR
Horton
Inc
......................
327
46,084
Sector
Rotation
Fund
Security
Description
Shares,
Contracts
or
Principal
Amount
($)
Fair
Value
($)
Common
Stocks
(United
States)
—
continued
DraftKings
Inc
(1)
.....................
476
18,169
Duolingo
Inc
(1)
......................
37
7,721
eBay
Inc
..........................
538
28,901
Etsy
Inc
(1)
.........................
157
9,260
Expedia
Group
Inc
(1)
..................
127
16,001
Floor
&
Decor
Holdings
Inc
(1)
.............
181
17,993
Ford
Motor
Co
......................
3,680
46,147
GameStop
Corp
(1)
....................
233
5,753
Garmin
Ltd
........................
128
20,854
General
Motors
Co
...................
1,019
47,343
Genuine
Parts
Co
....................
161
22,270
Graham
Holdings
Co
..................
34
23,785
Hilton
Worldwide
Holdings
Inc
...........
262
57,168
Home
Depot
Inc/The
..................
823
283,310
Las
Vegas
Sands
Corp
.................
406
17,965
Lear
Corp
.........................
217
24,784
Lennar
Corp
(1)
......................
523
72,922
Liberty
Media
Corp-Liberty
Formula
One
....
195
12,525
Lowe's
Cos
Inc
.....................
508
111,994
Lululemon
Athletica
Inc
(1)
...............
111
33,156
Marriott
International
Inc/MD
............
239
57,783
McDonald's
Corp
....................
594
151,375
MGM
Resorts
International
(1)
.............
478
21,242
NIKE
Inc
..........................
1,009
76,048
Norwegian
Cruise
Line
Holdings
Ltd
(1)
......
520
9,771
O'Reilly
Automotive
Inc
(1)
...............
52
54,915
Pool
Corp
.........................
70
21,513
PulteGroup
Inc
......................
370
40,737
Rivian
Automotive
Inc
(1)
................
818
10,978
Ross
Stores
Inc
.....................
326
47,374
Royal
Caribbean
Cruises
Ltd
(1)
...........
233
37,147
Starbucks
Corp
.....................
929
72,323
Tapestry
Inc
.......................
435
18,614
Taylor
Morrison
Home
Corp
(1)
............
555
30,769
Tesla
Inc
(1)
.........................
2,246
444,438
TJX
Cos
Inc/The
.....................
966
106,357
Toll
Brothers
Inc
.....................
240
27,643
Tractor
Supply
Co
....................
107
28,890
Ulta
Beauty
Inc
(1)
....................
54
20,837
VF
Corp
..........................
760
10,260
Wayfair
Inc
(1)
.......................
143
7,540
Williams-Sonoma
Inc
.................
64
18,072
Yum!
Brands
Inc
.....................
270
35,764
4,291,224
Consumer
Staples
—
1.3%
Altria
Group
Inc
.....................
338
15,396
2024
Semi-Annual
Report
|
June
30,
2024
The
accompanying
notes
are
an
integral
part
of
these
financial
statements.
Schedules
of
Investments
June
30,
2024
(unaudited)
Sector
Rotation
Fund
Security
Description
Shares,
Contracts
or
Principal
Amount
($)
Fair
Value
($)
Common
Stocks
(United
States)
—
continued
Archer-Daniels-Midland
Co
.............
103
6,226
BJ's
Wholesale
Club
Holdings
Inc
(1)
........
36
3,162
Bunge
Global
SA
....................
37
3,951
Celsius
Holdings
Inc
(1)
.................
30
1,713
Clorox
Co/The
......................
30
4,094
Coca-Cola
Co/The
...................
662
42,136
Colgate-Palmolive
Co
.................
164
15,915
Constellation
Brands
Inc
...............
38
9,777
Costco
Wholesale
Corp
................
77
65,449
Dollar
General
Corp
..................
42
5,554
Dollar
Tree
Inc
(1)
.....................
41
4,378
elf
Beauty
Inc
(1)
.....................
12
2,529
Estee
Lauder
Cos
Inc/The
..............
46
4,894
General
Mills
Inc
....................
143
9,046
Hershey
Co/The
.....................
36
6,618
Kenvue
Inc
........................
371
6,745
Keurig
Dr
Pepper
Inc
..................
196
6,546
Kimberly-Clark
Corp
..................
71
9,812
Kraft
Heinz
Co/The
...................
192
6,186
Kroger
Co/The
......................
127
6,341
Lamb
Weston
Holdings
Inc
..............
34
2,859
McCormick
&
Co
Inc/MD
...............
65
4,611
Mondelez
International
Inc
..............
272
17,800
Monster
Beverage
Corp
(1)
...............
169
8,442
PepsiCo
Inc
........................
237
39,088
Philip
Morris
International
Inc
............
286
28,980
Procter
&
Gamble
Co/The
..............
406
66,958
Sysco
Corp
........................
101
7,210
Target
Corp
........................
82
12,139
US
Foods
Holding
Corp
(1)
...............
77
4,079
Walgreens
Boots
Alliance
Inc
............
176
2,129
Walmart
Inc
.......................
729
49,361
480,124
Financials
—
4.8%
Affirm
Holdings
Inc
(1)
..................
101
3,051
Aflac
Inc
..........................
169
15,093
Allstate
Corp/The
....................
80
12,773
American
Express
Co
.................
155
35,890
American
International
Group
Inc
.........
237
17,595
Ameriprise
Financial
Inc
...............
36
15,379
Aon
PLC
..........................
57
16,734
Apollo
Global
Management
Inc
...........
161
19,009
Arch
Capital
Group
Ltd
(1)
...............
115
11,602
Ares
Management
Corp
................
60
7,997
Arthur
J
Gallagher
&
Co
................
67
17,374
Bank
of
America
Corp
.................
1,784
70,950
Sector
Rotation
Fund
Security
Description
Shares,
Contracts
or
Principal
Amount
($)
Fair
Value
($)
Common
Stocks
(United
States)
—
continued
Bank
of
New
York
Mellon
Corp/The
........
262
15,691
Berkshire
Hathaway
Inc
(1)
..............
467
189,976
BlackRock
Inc
......................
44
34,642
Blackstone
Inc
......................
205
25,379
Block
Inc
(1)
........................
169
10,899
Capital
One
Financial
Corp
..............
126
17,445
Charles
Schwab
Corp/The
..............
398
29,329
Chubb
Ltd
.........................
109
27,804
Citigroup
Inc
.......................
510
32,365
Citizens
Financial
Group
Inc
.............
354
12,755
CME
Group
Inc
......................
99
19,463
CNO
Financial
Group
Inc
...............
369
10,229
Coinbase
Global
Inc
(1)
.................
48
10,667
Comerica
Inc
.......................
203
10,361
Corpay
Inc
(1)
.......................
27
7,193
Discover
Financial
Services
.............
74
9,680
Equitable
Holdings
Inc
.................
207
8,458
FactSet
Research
Systems
Inc
...........
17
6,941
Fidelity
National
Financial
Inc
............
125
6,177
Fidelity
National
Information
Services
Inc
....
196
14,770
Fifth
Third
Bancorp
...................
302
11,020
First
Busey
Corp
....................
562
13,606
First
Citizens
BancShares
Inc/NC
.........
3
5,051
First
Commonwealth
Financial
Corp
........
1,147
15,840
First
Mid
Bancshares
Inc
...............
392
12,889
Fiserv
Inc
(1)
........................
181
26,976
Global
Payments
Inc
..................
89
8,606
Goldman
Sachs
Group
Inc/The
...........
90
40,709
Hartford
Financial
Services
Group
Inc/The
...
139
13,975
Intercontinental
Exchange
Inc
............
167
22,861
JPMorgan
Chase
&
Co
................
736
148,863
Kinsale
Capital
Group
Inc
...............
7
2,697
KKR
&
Co
Inc
.......................
199
20,943
Loews
Corp
........................
207
15,471
LPL
Financial
Holdings
Inc
..............
26
7,262
Markel
Group
Inc
(1)
...................
5
7,878
Marsh
&
McLennan
Cos
Inc
.............
130
27,394
Mastercard
Inc
.....................
212
93,526
MetLife
Inc
........................
220
15,442
Moody's
Corp
......................
48
20,205
Morgan
Stanley
.....................
317
30,809
MSCI
Inc
..........................
23
11,080
Nasdaq
Inc
........................
145
8,738
Northern
Trust
Corp
..................
99
8,314
NU
Holdings
Ltd/Cayman
Islands
(1)
........
675
8,701
PayPal
Holdings
Inc
(1)
.................
304
17,641
PNC
Financial
Services
Group
Inc/The
......
118
18,347
2024
Semi-Annual
Report
|
June
30,
2024
The
accompanying
notes
are
an
integral
part
of
these
financial
statements.
Schedules
of
Investments
June
30,
2024
(unaudited)
Sector
Rotation
Fund
Security
Description
Shares,
Contracts
or
Principal
Amount
($)
Fair
Value
($)
Common
Stocks
(United
States)
—
continued
Progressive
Corp/The
.................
153
31,780
Prudential
Financial
Inc
................
126
14,766
Regions
Financial
Corp
................
514
10,300
Robinhood
Markets
Inc
(1)
...............
214
4,860
S&P
Global
Inc
......................
84
37,464
SoFi
Technologies
Inc
(1)
................
472
3,120
SouthState
Corp
.....................
157
11,998
Starwood
Property
Trust
Inc
.............
534
10,114
SVB
Financial
Group
(1)
.................
798
24
Synchrony
Financial
..................
229
10,806
T
Rowe
Price
Group
Inc
................
93
10,724
Toast
Inc
(1)
........................
141
3,633
Travelers
Cos
Inc/The
.................
69
14,030
Truist
Financial
Corp
..................
446
17,327
US
Bancorp
........................
483
19,175
Visa
Inc
..........................
404
106,038
Wells
Fargo
&
Co
....................
921
54,698
WesBanco
Inc
......................
483
13,480
Willis
Towers
Watson
PLC
..............
35
9,175
1,762,027
Health
Care
—
4.4%
Abbott
Laboratories
..................
435
45,201
AbbVie
Inc
........................
453
77,699
Agilent
Technologies
Inc
...............
90
11,667
Align
Technology
Inc
(1)
.................
29
7,002
Alnylam
Pharmaceuticals
Inc
(1)
...........
45
10,935
American
Well
Corp
(1)
.................
5,716
1,857
Amgen
Inc
........................
141
44,056
Avantor
Inc
(1)
.......................
251
5,321
Axsome
Therapeutics
Inc
(1)
..............
47
3,784
Baxter
International
Inc
................
176
5,887
Becton
Dickinson
&
Co
................
77
17,996
Biogen
Inc
(1)
.......................
49
11,359
BioMarin
Pharmaceutical
Inc
(1)
...........
72
5,928
Bio-Techne
Corp
....................
60
4,299
Blueprint
Medicines
Corp
(1)
..............
30
3,233
Boston
Scientific
Corp
(1)
................
376
28,956
Bristol-Myers
Squibb
Co
...............
574
23,838
Cardinal
Health
Inc
...................
75
7,374
Cencora
Inc
........................
41
9,237
Centene
Corp
(1)
.....................
167
11,072
Charles
River
Laboratories
International
Inc
(1)
.
31
6,404
Cigna
Group/The
....................
73
24,132
Cooper
Cos
Inc/The
..................
80
6,984
CVS
Health
Corp
....................
340
20,080
Cytokinetics
Inc
(1)
....................
43
2,330
Sector
Rotation
Fund
Security
Description
Shares,
Contracts
or
Principal
Amount
($)
Fair
Value
($)
Common
Stocks
(United
States)
—
continued
Danaher
Corp
......................
164
40,975
Dexcom
Inc
(1)
.......................
111
12,585
Edwards
Lifesciences
Corp
(1)
............
176
16,257
Elanco
Animal
Health
Inc
(1)
..............
205
2,958
Elevance
Health
Inc
..................
63
34,137
Eli
Lilly
&
Co
.......................
217
196,468
Exact
Sciences
Corp
(1)
.................
80
3,380
GE
HealthCare
Technologies
Inc
..........
127
9,896
Gilead
Sciences
Inc
..................
328
22,504
GRAIL
Inc
(1)
........................
10
154
Guardant
Health
Inc
(1)
.................
80
2,310
HCA
Healthcare
Inc
...................
58
18,634
Humana
Inc
.......................
34
12,704
ICON
PLC
(1)
........................
28
8,777
Ideaya
Biosciences
Inc
(1)
...............
98
3,441
IDEXX
Laboratories
Inc
(1)
...............
25
12,180
Illumina
Inc
........................
64
6,680
Insmed
Inc
(1)
.......................
47
3,149
Insulet
Corp
(1)
......................
29
5,852
Intellia
Therapeutics
Inc
(1)
..............
149
3,335
Intra-Cellular
Therapies
Inc
(1)
............
47
3,219
Intuitive
Surgical
Inc
(1)
.................
96
42,706
IQVIA
Holdings
Inc
(1)
..................
54
11,418
Johnson
&
Johnson
..................
614
89,742
Labcorp
Holdings
Inc
.................
44
8,954
McKesson
Corp
.....................
35
20,441
Medtronic
PLC
......................
351
27,627
Merck
&
Co
Inc
.....................
645
79,851
Mettler-Toledo
International
Inc
(1)
.........
7
9,783
Moderna
Inc
(1)
......................
92
10,925
Molina
Healthcare
Inc
(1)
................
21
6,243
Natera
Inc
(1)
........................
41
4,440
Neurocrine
Biosciences
Inc
(1)
............
48
6,608
Penumbra
Inc
(1)
.....................
21
3,779
Pfizer
Inc
.........................
1,484
41,522
Quest
Diagnostics
Inc
.................
55
7,528
Regeneron
Pharmaceuticals
Inc
(1)
.........
27
28,378
Repligen
Corp
(1)
.....................
35
4,412
ResMed
Inc
........................
43
8,231
REVOLUTION
Medicines
Inc
(1)
............
72
2,794
Rocket
Pharmaceuticals
Inc
(1)
............
178
3,832
Sarepta
Therapeutics
Inc
(1)
..............
32
5,056
Solventum
Corp
(1)
....................
52
2,750
STERIS
PLC
........................
37
8,123
Stryker
Corp
.......................
92
31,303
Syndax
Pharmaceuticals
Inc
(1)
...........
213
4,373
Tandem
Diabetes
Care
Inc
(1)
.............
37
1,491
2024
Semi-Annual
Report
|
June
30,
2024
The
accompanying
notes
are
an
integral
part
of
these
financial
statements.
Schedules
of
Investments
June
30,
2024
(unaudited)
Sector
Rotation
Fund
Security
Description
Shares,
Contracts
or
Principal
Amount
($)
Fair
Value
($)
Common
Stocks
(United
States)
—
continued
Teleflex
Inc
........................
28
5,889
Tenet
Healthcare
Corp
(1)
................
37
4,922
Thermo
Fisher
Scientific
Inc
.............
94
51,982
Ultragenyx
Pharmaceutical
Inc
(1)
..........
90
3,699
United
Therapeutics
Corp
(1)
.............
18
5,734
UnitedHealth
Group
Inc
................
239
121,713
Universal
Health
Services
Inc
............
34
6,288
Vaxcyte
Inc
(1)
.......................
63
4,757
Veeva
Systems
Inc
(1)
..................
50
9,151
Vertex
Pharmaceuticals
Inc
(1)
............
68
31,873
Viatris
Inc
.........................
563
5,985
Viking
Therapeutics
Inc
(1)
...............
34
1,802
Waters
Corp
(1)
......................
29
8,414
West
Pharmaceutical
Services
Inc
.........
21
6,917
Zimmer
Biomet
Holdings
Inc
............
77
8,357
Zoetis
Inc
.........................
135
23,404
1,589,423
Industrials
—
7.0%
3M
Co
...........................
308
31,475
Advanced
Drainage
Systems
Inc
..........
53
8,501
AECOM
...........................
132
11,634
AMETEK
Inc
.......................
134
22,339
Arcosa
Inc
........................
105
8,758
Automatic
Data
Processing
Inc
...........
224
53,467
Axon
Enterprise
Inc
(1)
.................
46
13,535
Boeing
Co/The
(1)
.....................
302
54,967
Booz
Allen
Hamilton
Holding
Corp
.........
90
13,851
Broadridge
Financial
Solutions
Inc
.........
98
19,306
Builders
FirstSource
Inc
(1)
..............
77
10,658
Carlisle
Cos
Inc
.....................
31
12,562
Carrier
Global
Corp
...................
465
29,332
Caterpillar
Inc
......................
270
89,937
CH
Robinson
Worldwide
Inc
.............
84
7,402
Chart
Industries
Inc
(1)
.................
38
5,485
Cintas
Corp
........................
49
34,313
Clean
Harbors
Inc
(1)
...................
53
11,986
CNH
Industrial
NV
(1)
...................
827
8,378
Comfort
Systems
USA
Inc
..............
25
7,603
Copart
Inc
(1)
........................
575
31,142
CSX
Corp
.........................
1,176
39,337
Cummins
Inc
.......................
82
22,708
Curtiss-Wright
Corp
..................
61
16,530
Dayforce
Inc
(1)
......................
139
6,894
Deere
&
Co
........................
139
51,935
Delta
Air
Lines
Inc
...................
419
19,877
Dover
Corp
........................
97
17,504
Sector
Rotation
Fund
Security
Description
Shares,
Contracts
or
Principal
Amount
($)
Fair
Value
($)
Common
Stocks
(United
States)
—
continued
Eaton
Corp
PLC
.....................
211
66,159
EMCOR
Group
Inc
....................
30
10,952
Emerson
Electric
Co
..................
300
33,048
Equifax
Inc
........................
89
21,579
Expeditors
International
of
Washington
Inc
...
113
14,101
Fastenal
Co
........................
337
21,177
FedEx
Corp
........................
131
39,279
Ferguson
PLC
......................
125
24,206
Fortive
Corp
.......................
239
17,710
Fortune
Brands
Innovations
Inc
...........
190
12,339
FTAI
Aviation
Ltd
....................
82
8,465
GE
Vernova
Inc
(1)
....................
148
25,383
Generac
Holdings
Inc
(1)
................
47
6,214
General
Dynamics
Corp
................
131
38,008
General
Electric
Co
...................
576
91,567
Graco
Inc
.........................
170
13,478
HEICO
Corp
(1)
.......................
125
22,190
Honeywell
International
Inc
.............
381
81,359
Howmet
Aerospace
Inc
................
228
17,700
Hubbell
Inc
........................
37
13,523
Illinois
Tool
Works
Inc
.................
159
37,677
Ingersoll
Rand
Inc
...................
245
22,256
ITT
Inc
...........................
102
13,176
Jacobs
Solutions
Inc
..................
97
13,552
JB
Hunt
Transport
Services
Inc
...........
79
12,640
Johnson
Controls
International
plc
.........
364
24,195
Kennametal
Inc
.....................
462
10,875
L3Harris
Technologies
Inc
..............
119
26,725
Leidos
Holdings
Inc
..................
86
12,546
Lennox
International
Inc
...............
24
12,840
Lincoln
Electric
Holdings
Inc
.............
48
9,055
Lockheed
Martin
Corp
.................
107
49,980
Lyft
Inc
(1)
..........................
245
3,454
Masco
Corp
.......................
194
12,934
MasTec
Inc
(1)
.......................
51
5,456
NEXTracker
Inc
(1)
....................
86
4,032
Nordson
Corp
......................
48
11,133
Norfolk
Southern
Corp
.................
138
29,627
Northrop
Grumman
Corp
...............
76
33,132
nVent
Electric
PLC
...................
150
11,492
Old
Dominion
Freight
Line
Inc
............
122
21,545
Otis
Worldwide
Corp
..................
270
25,990
Owens
Corning
.....................
67
11,639
PACCAR
Inc
........................
281
28,926
Parker-Hannifin
Corp
.................
72
36,418
Paychex
Inc
.......................
220
26,083
Paycom
Software
Inc
.................
43
6,151
2024
Semi-Annual
Report
|
June
30,
2024
The
accompanying
notes
are
an
integral
part
of
these
financial
statements.
Schedules
of
Investments
June
30,
2024
(unaudited)
Sector
Rotation
Fund
Security
Description
Shares,
Contracts
or
Principal
Amount
($)
Fair
Value
($)
Common
Stocks
(United
States)
—
continued
Pentair
PLC
........................
180
13,801
Quanta
Services
Inc
..................
90
22,868
RB
Global
Inc
.......................
122
9,316
Regal
Rexnord
Corp
..................
56
7,572
Resources
Connection
Inc
..............
961
10,609
Rockwell
Automation
Inc
...............
72
19,820
Rollins
Inc
.........................
223
10,880
RTX
Corp
.........................
743
74,590
Saia
Inc
(1)
.........................
18
8,537
SiteOne
Landscape
Supply
Inc
(1)
..........
54
6,556
Snap-on
Inc
.......................
43
11,240
Southwest
Airlines
Co
.................
376
10,757
Stanley
Black
&
Decker
Inc
.............
129
10,306
Sunrun
Inc
(1)
.......................
245
2,906
Tetra
Tech
Inc
......................
53
10,837
Textron
Inc
........................
143
12,278
Toro
Co/The
.......................
97
9,070
Trane
Technologies
PLC
................
118
38,814
TransDigm
Group
Inc
.................
30
38,328
TransUnion
........................
145
10,753
Trex
Co
Inc
(1)
.......................
119
8,820
Uber
Technologies
Inc
(1)
................
1,048
76,169
UFP
Industries
Inc
...................
105
11,760
Union
Pacific
Corp
...................
324
73,308
United
Airlines
Holdings
Inc
(1)
............
208
10,121
United
Parcel
Service
Inc
...............
394
53,919
United
Rentals
Inc
...................
41
26,516
Veralto
Corp
.......................
152
14,511
Verisk
Analytics
Inc
...................
89
23,990
Vertiv
Holdings
Co
...................
194
16,795
Waste
Management
Inc
................
212
45,228
Watsco
Inc
........................
26
12,044
WESCO
International
Inc
...............
44
6,975
Westinghouse
Air
Brake
Technologies
Corp
...
110
17,386
WillScot
Mobile
Mini
Holdings
Corp
(1)
.......
185
6,963
Woodward
Inc
......................
50
8,719
WW
Grainger
Inc
....................
28
25,263
XPO
Inc
(1)
.........................
78
8,280
Xylem
Inc/NY
.......................
151
20,480
2,560,467
Information
Technology
—
17.0%
Accenture
PLC
......................
303
91,933
Adobe
Inc
(1)
........................
195
108,330
Advanced
Energy
Industries
Inc
..........
272
29,583
Advanced
Micro
Devices
Inc
(1)
...........
664
107,707
Amphenol
Corp
.....................
848
57,130
Sector
Rotation
Fund
Security
Description
Shares,
Contracts
or
Principal
Amount
($)
Fair
Value
($)
Common
Stocks
(United
States)
—
continued
Analog
Devices
Inc
...................
223
50,902
Apple
Inc
.........................
5,759
1,212,961
Applied
Materials
Inc
.................
359
84,720
Arista
Networks
Inc
(1)
.................
120
42,058
Atlassian
Corp
(1)
.....................
97
17,157
Autodesk
Inc
(1)
......................
152
37,612
Broadcom
Inc
......................
173
277,757
Cadence
Design
Systems
Inc
(1)
...........
155
47,701
Cisco
Systems
Inc
...................
1,716
81,527
Cloudflare
Inc
(1)
.....................
190
15,738
Cognizant
Technology
Solutions
Corp
.......
593
40,324
Crowdstrike
Holdings
Inc
(1)
..............
108
41,385
Datadog
Inc
(1)
......................
173
22,436
Fair
Isaac
Corp
(1)
....................
16
23,819
First
Solar
Inc
(1)
.....................
49
11,048
Fortinet
Inc
(1)
.......................
357
21,516
HubSpot
Inc
(1)
......................
33
19,463
Intel
Corp
.........................
1,802
55,808
International
Business
Machines
Corp
......
406
70,218
Intuit
Inc
..........................
131
86,095
Keysight
Technologies
Inc
(1)
.............
194
26,529
KLA
Corp
.........................
68
56,067
Lam
Research
Corp
..................
65
69,215
Marvell
Technology
Inc
................
422
29,498
Microchip
Technology
Inc
..............
373
34,130
Micron
Technology
Inc
................
455
59,846
Microsoft
Corp
......................
2,933
1,310,904
MicroStrategy
Inc
(1)
...................
7
9,642
Monolithic
Power
Systems
Inc
...........
30
24,650
Motorola
Solutions
Inc
.................
90
34,745
NVIDIA
Corp
.......................
9,353
1,155,470
ON
Semiconductor
Corp
(1)
..............
284
19,468
Oracle
Corp
........................
642
90,650
Palantir
Technologies
Inc
(1)
..............
940
23,810
Palo
Alto
Networks
Inc
(1)
...............
129
43,732
QUALCOMM
Inc
.....................
455
90,627
Roper
Technologies
Inc
................
78
43,965
Salesforce
Inc
......................
398
102,326
ServiceNow
Inc
(1)
....................
97
76,307
Snowflake
Inc
(1)
.....................
182
24,586
Super
Micro
Computer
Inc
(1)
.............
22
18,026
Synopsys
Inc
(1)
......................
79
47,010
Texas
Instruments
Inc
.................
403
78,396
Vishay
Intertechnology
Inc
..............
1,469
32,759
Western
Digital
Corp
(1)
.................
285
21,594
2024
Semi-Annual
Report
|
June
30,
2024
The
accompanying
notes
are
an
integral
part
of
these
financial
statements.
Schedules
of
Investments
June
30,
2024
(unaudited)
Sector
Rotation
Fund
Security
Description
Shares,
Contracts
or
Principal
Amount
($)
Fair
Value
($)
Common
Stocks
(United
States)
—
continued
Workday
Inc
(1)
......................
102
22,803
6,201,683
Materials
—
1.9%
Air
Products
and
Chemicals
Inc
..........
123
31,740
Albemarle
Corp
.....................
73
6,973
Alcoa
Corp
........................
117
4,654
Alpha
Metallurgical
Resources
Inc
.........
7
1,964
Amcor
PLC
........................
864
8,450
Arcadium
Lithium
PLC
(1)
...............
765
2,570
ATI
Inc
(1)
..........................
76
4,214
Avery
Dennison
Corp
.................
53
11,588
Avient
Corp
........................
159
6,940
Axalta
Coating
Systems
Ltd
(1)
............
152
5,194
Ball
Corp
.........................
191
11,464
Berry
Global
Group
Inc
................
80
4,708
Carpenter
Technology
Corp
.............
31
3,397
Celanese
Corp
......................
72
9,712
CF
Industries
Holdings
Inc
..............
112
8,301
Chemours
Co/The
...................
105
2,370
Cleveland-Cliffs
Inc
(1)
.................
323
4,971
Coeur
Mining
Inc
(1)
...................
306
1,720
Commercial
Metals
Co
................
81
4,454
Corteva
Inc
........................
404
21,792
Crown
Holdings
Inc
..................
68
5,059
Dow
Inc
..........................
421
22,334
DuPont
de
Nemours
Inc
................
245
19,720
Eagle
Materials
Inc
...................
32
6,959
Eastman
Chemical
Co
.................
92
9,013
Ecolab
Inc
.........................
138
32,844
Element
Solutions
Inc
.................
283
7,675
FMC
Corp
.........................
82
4,719
Freeport-McMoRan
Inc
................
800
38,880
Graphic
Packaging
Holding
Co
...........
231
6,055
Hecla
Mining
Co
.....................
465
2,255
International
Flavors
&
Fragrances
Inc
......
151
14,377
International
Paper
Co
.................
202
8,716
Linde
PLC
.........................
264
115,846
Louisiana-Pacific
Corp
................
46
3,787
LyondellBasell
Industries
NV
.............
158
15,114
Martin
Marietta
Materials
Inc
............
37
20,047
Mosaic
Co/The
.....................
209
6,040
Newmont
Corp
.....................
643
26,922
Nucor
Corp
........................
137
21,657
Olin
Corp
.........................
104
4,904
Packaging
Corp
of
America
.............
57
10,406
PPG
Industries
Inc
...................
147
18,506
Sector
Rotation
Fund
Security
Description
Shares,
Contracts
or
Principal
Amount
($)
Fair
Value
($)
Common
Stocks
(United
States)
—
continued
Reliance
Inc
.......................
33
9,425
Royal
Gold
Inc
......................
48
6,008
RPM
International
Inc
.................
91
9,799
Sealed
Air
Corp
.....................
112
3,896
Sherwin-Williams
Co/The
..............
138
41,183
Southern
Copper
Corp
.................
53
5,710
Steel
Dynamics
Inc
...................
91
11,785
United
States
Steel
Corp
...............
131
4,952
Vulcan
Materials
Co
..................
83
20,640
Warrior
Met
Coal
Inc
..................
34
2,134
Westrock
Co
.......................
152
7,640
702,183
Real
Estate
—
1.9%
Alexandria
Real
Estate
Equities
Inc
........
104
12,165
American
Homes
4
Rent
...............
195
7,246
American
Tower
Corp
.................
237
46,068
Americold
Realty
Trust
Inc
..............
162
4,138
AvalonBay
Communities
Inc
.............
80
16,551
BXP
Inc
..........................
97
5,971
Camden
Property
Trust
................
62
6,765
CBRE
Group
Inc
(1)
....................
176
15,683
CoStar
Group
Inc
(1)
...................
214
15,866
Cousins
Properties
Inc
................
251
5,811
Crown
Castle
Inc
....................
225
21,983
CubeSmart
........................
140
6,324
Digital
Realty
Trust
Inc
.................
162
24,632
Easterly
Government
Properties
Inc
........
484
5,987
EastGroup
Properties
Inc
...............
30
5,103
Equinix
Inc
........................
47
35,560
Equity
LifeStyle
Properties
Inc
...........
100
6,513
Equity
Residential
....................
214
14,839
Essex
Property
Trust
Inc
...............
37
10,071
Extra
Space
Storage
Inc
...............
110
17,095
Federal
Realty
Investment
Trust
..........
58
5,856
First
Industrial
Realty
Trust
Inc
...........
89
4,228
Gaming
and
Leisure
Properties
Inc
........
164
7,414
Healthcare
Realty
Trust
Inc
..............
260
4,285
Healthpeak
Properties
Inc
..............
407
7,977
Host
Hotels
&
Resorts
Inc
..............
400
7,192
Howard
Hughes
Holdings
Inc
(1)
...........
54
3,500
Independence
Realty
Trust
Inc
...........
213
3,992
Invitation
Homes
Inc
..................
364
13,064
Iron
Mountain
Inc
....................
155
13,891
Jones
Lang
LaSalle
Inc
(1)
...............
31
6,364
Kilroy
Realty
Corp
....................
115
3,585
Kimco
Realty
Corp
...................
412
8,018
2024
Semi-Annual
Report
|
June
30,
2024
The
accompanying
notes
are
an
integral
part
of
these
financial
statements.
Schedules
of
Investments
June
30,
2024
(unaudited)
Sector
Rotation
Fund
Security
Description
Shares,
Contracts
or
Principal
Amount
($)
Fair
Value
($)
Common
Stocks
(United
States)
—
continued
Lamar
Advertising
Co
.................
50
5,977
LXP
Industrial
Trust
...................
541
4,934
Macerich
Co/The
....................
146
2,254
Medical
Properties
Trust
Inc
.............
340
1,465
Mid-America
Apartment
Communities
Inc
....
67
9,555
NNN
REIT
Inc
.......................
148
6,305
Omega
Healthcare
Investors
Inc
..........
145
4,966
Park
Hotels
&
Resorts
Inc
..............
195
2,921
Prologis
Inc
........................
471
52,898
Public
Storage
......................
83
23,875
Realty
Income
Corp
..................
443
23,399
Regency
Centers
Corp
.................
120
7,464
Rexford
Industrial
Realty
Inc
.............
133
5,930
Ryman
Hospitality
Properties
Inc
..........
37
3,695
SBA
Communications
Corp
.............
57
11,189
Simon
Property
Group
Inc
..............
169
25,654
SL
Green
Realty
Corp
.................
53
3,002
STAG
Industrial
Inc
...................
159
5,734
Sun
Communities
Inc
.................
69
8,303
UDR
Inc
..........................
197
8,107
Ventas
Inc
.........................
218
11,175
VICI
Properties
Inc
...................
571
16,353
Vornado
Realty
Trust
..................
115
3,023
Welltower
Inc
......................
283
29,503
Weyerhaeuser
Co
....................
417
11,839
WP
Carey
Inc
.......................
129
7,101
Zillow
Group
Inc
(1)
....................
124
5,585
675,943
Total
Common
Stocks
(United
States)
(Cost
$
19,593,616
)
.................
20,643,221
Preferred
Stock
(United
States)
—
0
.0
%
Wells
Fargo
&
Co
....................
1
1
Total
Preferred
Stock
(United
States)
(Cost
$
–
)
........................
1
Registered
Investment
Companies
—
4
.9
%
U.S.
Fixed
Income
—
3.4%
BrandywineGLOBAL
High
Yield
Fund
-
Class
I
.
12,998
131,665
Dodge
&
Cox
Income
Fund
-
Class
I
........
10,281
127,277
Eaton
Vance
Emerging
Markets
Debt
Opportunities
Fund
-
Class
R6
..........
11,673
90,817
Fidelity
Advisor
High
Income
Advantage
Fund
-
Class
Z
.........................
12,170
131,553
Fidelity
Total
Bond
Fund
-
Class
Z
.........
54,000
507,057
Frost
Total
Return
Bond
Fund
-
Class
I
......
14,810
143,809
Sector
Rotation
Fund
Security
Description
Shares,
Contracts
or
Principal
Amount
($)
Fair
Value
($)
Registered
Investment
Companies
—
continued
iShares
20+
Year
Treasury
Bond
ETF
(2)
......
1,466
134,549
1,266,727
International
Fixed
Income
—
0.1%
iShares
J.P.
Morgan
USD
Emerging
Markets
Bond
ETF
(2)
..........................
410
36,277
36,277
International
Equity
—
1.4%
Baird
Core
Plus
Bond
Fund
-
Class
I
.......
50,519
504,684
504,684
Total
Registered
Investment
Companies
(Cost
$
1,810,161
)
..................
1,807,688
Money
Market
Registered
Investment
Companies
—
36
.8
%
Meeder
Institutional
Prime
Money
Market
Fund
,
5.27
%
(3)
........................
13,472,483
13,473,830
Total
Money
Market
Registered
Investment
Companies
(Cost
$
13,473,631
)
.................
13,473,830
Total
Investments
—
98
.2
%
(Cost
$
34,877,408
)
.................
35,924,740
Other
Assets
less
Liabilities
—
1
.8
%
.......
646,208
Total
Net
Assets
—
100
.0
%
.............
36,570,948
Trustee
Deferred
Compensation
(4)
Meeder
Balanced
Fund
-
Retail
Class
.......
1,273
17,504
Meeder
Conservative
Allocation
Fund
-
Retail
Class
..........................
371
8,459
Meeder
Dynamic
Allocation
Fund
-
Retail
Class
3,393
50,793
Meeder
Muirfield
Fund
-
Retail
Class
.......
1,834
18,780
Total
Trustee
Deferred
Compensation
(Cost
$
73,747
)
....................
95,536
2024
Semi-Annual
Report
|
June
30,
2024
The
accompanying
notes
are
an
integral
part
of
these
financial
statements.
Schedules
of
Investments
June
30,
2024
(unaudited)
Sector
Rotation
Fund
Long
(Short)
Contracts
Expiration
Date
Notional
Value
of
Contracts
($)
Value
and
Unrealized
Appreciation
(Depreciation)
($)
Futures
Contracts
Index
Futures
Mini
MSCI
EAFE
Futures
-
Sept
2024
.........
61
9/20/24
7,146,760
(
18,588
)
Mini
MSCI
Emg
Mkt
Futures
-
Sept
2024
........
23
9/20/24
1,251,430
(
11,286
)
S&P
500
Mini
Futures
September
2024
.....
14
9/20/24
3,865,050
(
7,418
)
S&P
Mid
Cap
Futures
EMini
September
2024
.....
6
9/20/24
1,774,860
4
Total
Futures
Contracts
..
104
14,038,100
(
37,288
)
(1)
Represents
non-income
producing
securities.
(2)
Exchange-traded
fund.
(3)
Investment
in
affiliate.
The
yield
shown
represents
the
7-day
yield
in
effect
at
June
30,
2024.
(4)
Assets
of
affiliates
to
the
Sector
Rotation
Fund
held
for
the
benefit
of
the
Fund’s
Trustees
in
connection
with
the
Trustee
Deferred
Compensation
Plan.
2024
Semi-Annual
Report
|
June
30,
2024
The
accompanying
notes
are
an
integral
part
of
these
financial
statements.
Schedules
of
Investments
June
30,
2024
(unaudited)
Tactical
Income
Fund
Security
Description
Shares,
Contracts
or
Principal
Amount
($)
Fair
Value
($)
Registered
Investment
Companies
—
82
.1
%
U.S.
Fixed
Income
—
75.4%
BrandywineGLOBAL
High
Yield
Fund
-
Class
I
.
891,989
9,035,854
Diamond
Hill
Short
Duration
Securitized
Bond
Fund
-
Class
Y
....................
771,007
7,571,285
Eaton
Vance
Emerging
Markets
Debt
Opportunities
Fund
-
Class
R6
..........
464,244
3,611,819
Fidelity
Advisor
High
Income
Advantage
Fund
-
Class
Z
.........................
844,133
9,125,081
Fidelity
Total
Bond
Fund
-
Class
Z
.........
767,673
7,208,453
Frost
Total
Return
Bond
Fund
-
Class
I
......
897,219
8,711,995
PIMCO
Low
Duration
Income
Fund
-
Class
I
..
1,349,114
10,792,910
56,057,397
International
Fixed
Income
—
6.7%
iShares
J.P.
Morgan
USD
Emerging
Markets
Bond
ETF
(1)
..........................
56,370
4,987,617
4,987,617
Total
Registered
Investment
Companies
(Cost
$
60,032,934
)
.................
61,045,014
Money
Market
Registered
Investment
Companies
—
17
.6
%
Meeder
Institutional
Prime
Money
Market
Fund
,
5.27
%
(2)
........................
13,073,389
13,074,697
Total
Money
Market
Registered
Investment
Companies
(Cost
$
13,070,279
)
.................
13,074,697
Total
Investments
—
99
.7
%
(Cost
$
73,103,213
)
.................
74,119,711
Other
Assets
less
Liabilities
—
0
.3
%
.......
239,641
Total
Net
Assets
—
100
.0
%
.............
74,359,352
Trustee
Deferred
Compensation
(3)
Meeder
Balanced
Fund
-
Retail
Class
.......
1,481
20,364
Meeder
Conservative
Allocation
Fund
-
Retail
Class
..........................
441
10,055
Meeder
Dynamic
Allocation
Fund
-
Retail
Class
3,838
57,455
Meeder
Muirfield
Fund
-
Retail
Class
.......
2,291
23,460
Total
Trustee
Deferred
Compensation
(Cost
$
89,401
)
....................
111,334
(1)
Exchange-traded
fund.
(2)
Investment
in
affiliate.
The
yield
shown
represents
the
7-day
yield
in
effect
at
June
30,
2024.
(3)
Assets
of
affiliates
to
the
Tactical
Income
Fund
held
for
the
benefit
of
the
Fund’s
Trustees
in
connection
with
the
Trustee
Deferred
Compensation
Plan.
2024
Semi-Annual
Report
|
June
30,
2024
The
accompanying
notes
are
an
integral
part
of
these
financial
statements.
Schedules
of
Investments
June
30,
2024
(unaudited)
Institutional
Prime
Money
Market
Fund
Security
Description
Coupon/
Yield
Maturity/
Demand
Date
Principal
Amount
($)
or
Shares
Fair
Value
($)
Certificates
of
Deposit
—
3
.1
%
Bank
of
Nova
Scotia
(Secured
Overnight
Financing
Rate
+
0.64%)
.............
5
.98
%
(1)
7/8/24
1,000,000
1,000,135
Mizuho
Bank
(Secured
Overnight
Financing
Rate
+
0.18%)
.............
5
.52
%
(1)
7/25/24
5,000,000
5,000,340
Nordea
Bank
ABP
(Secured
Overnight
Financing
Rate
+
0.29%)
.............
5
.63
%
(1)
2/5/25
5,000,000
5,001,360
Sumitomo
Mitsui
Bank
(Secured
Overnight
Financing
Rate
+
0.19%)
.
5
.53
%
(1)
7/26/24
5,000,000
5,000,420
Total
Certificates
of
Deposit
(Cost
$
16,000,097
)
...................
16,002,255
Commercial
Paper
—
34
.3
%
Alinghi
Funding
Co
LLC
....
5
.51
%
10/22/24
7,960,000
7,822,746
American
Honda
Finance
...
5
.53
%
8/21/24
5,000,000
4,958,210
American
Honda
Finance
...
5
.56
%
8/26/24
10,000,000
9,908,570
Anglesea
Funding
.......
5
.33
%
7/1/24
12,000,000
11,994,660
Aquitaine
Funding
Co
LLC
..
5
.47
%
8/1/24
5,000,000
4,974,305
Australia
&
New
Zealand
Banking
Group
Ltd
.....
5
.86
%
7/16/24
2,500,000
2,493,337
Australia
&
New
Zealand
Banking
Group
Ltd
.....
5
.29
%
11/13/24
5,000,000
4,898,225
Bank
of
Montreal
........
5
.40
%
7/30/24
7,500,000
7,464,188
Bank
of
Nova
Scotia
(Secured
Overnight
Financing
Rate
+
0.23%)
.............
5
.55
%
(1)
11/5/24
6,000,000
6,000,900
Barclays
Bank
..........
5
.46
%
8/12/24
1,300,000
1,291,229
Barclays
Bank
PLC
.......
5
.48
%
10/9/24
3,820,000
3,761,501
Barclays
Bank
PLC
.......
5
.41
%
7/3/24
2,500,000
2,498,152
Bedford
Row
Funding
(Secured
Overnight
Financing
Rate
+
0.17%)
.............
5
.48
%
8/5/24
10,000,000
10,000,314
BofA
Securities
Inc
.......
5
.43
%
9/26/24
5,000,000
4,932,000
Canadian
Imperial
Bank
of
Commerce
...........
5
.85
%
7/1/24
7,500,000
7,496,670
Canadian
Imperial
Holdings
Inc
5
.28
%
7/26/24
1,800,000
1,792,555
Columbia
Funding
Co
LLC
..
5
.44
%
7/18/24
6,634,000
6,614,237
Columbia
Funding
Co
LLC
..
5
.41
%
9/4/24
6,000,000
5,938,314
HSBC
USA
Inc
..........
5
.55
%
7/3/24
1,000,000
999,256
HSBC
USA
Inc
..........
5
.51
%
7/26/24
5,250,000
5,227,819
HSBC
USA
Inc
..........
5
.39
%
7/5/24
6,500,000
6,493,227
Longship
Funding
LLC
.....
5
.34
%
7/3/24
2,500,000
2,498,153
Mackinac
Funding
Co
.....
5
.42
%
8/2/24
5,000,000
4,973,775
Mackinac
Funding
Co
LLC
..
5
.45
%
8/20/24
3,500,000
3,472,164
Macquarie
Bank
Ltd
......
5
.37
%
8/12/24
2,500,000
2,483,100
Macquarie
Bank
Ltd
......
5
.38
%
11/20/24
1,400,000
1,369,320
Institutional
Prime
Money
Market
Fund
Security
Description
Coupon/
Yield
Maturity/
Demand
Date
Principal
Amount
($)
or
Shares
Fair
Value
($)
Commercial
Paper
—
continued
Macquarie
International
Finance
Ltd
..........
5
.43
%
9/3/24
3,000,000
2,969,544
Macquarie
International
Finance
Ltd
..........
5
.66
%
8/16/24
2,200,000
2,183,784
MUFG
Bank
Ltd/New
York
NY
5
.41
%
8/16/24
2,500,000
2,481,918
MUFG
Bank
Ltd/New
York
NY
5
.73
%
8/9/24
1,060,000
1,053,450
MUFG
Bank
Ltd/New
York
NY
5
.43
%
7/29/24
2,000,000
1,990,924
Old
Line
Funding
LLC
.....
5
.38
%
8/19/24
10,000,000
9,921,890
Pacific
Life
Short
Term
Funding
LLC
...............
5
.47
%
8/22/24
3,000,000
2,975,394
Royal
Bank
of
Canada/New
York
NY
.............
5
.88
%
7/3/24
1,500,000
1,498,893
Sumitomo
Mitsui
Trust
Bank
Ltd/Singapore
........
5
.45
%
8/8/24
8,250,000
8,200,112
Svenska
Handelsbanken
AB
.
5
.31
%
9/6/24
6,000,000
5,938,278
Westpac
Bank
Corp
(Secured
Overnight
Financing
Rate
+
0.47%)
.............
5
.36
%
(1)
7/22/24
2,500,000
2,500,633
Total
Commercial
Paper
(Cost
$
174,155,826
)
..................
174,071,747
Repurchase
Agreements
—
43
.4
%
Loop
Capital
(Collateralized
by
$47,852,627
FNMAs,
4.50%,
due
7/1/52,
fair
value
$45,900,000)
(proceeds
$45,020,063),
purchase
date
6/28/24
............
5
.35
%
7/1/24
45,000,000
45,000,000
South
Street
(Collateralized
by
$51,962,649
various
FCSBs,
FHLBs,
FMACs,
FNMAs,
GNMAs,
and
U.S.
Treasuries,
0.38%
-
6.00%,
due
9/29/25
-
6/1/54,
fair
value
$51,000,055)
(proceeds
$50,022,667),
purchase
date
6/28/24
............
5
.44
%
7/1/24
50,000,000
50,000,000
South
Street
(Collateralized
by
$52,179,490
various
FCSBs,
FHLBs,
FMACs,
FNMAs,
GNMAs,
and
U.S.
Treasuries,
1.00%
-
6.50%,
due
7/24/25
-
6/1/54,
fair
value
$51,000,029)(proceeds
$50,022,583),
purchase
date
6/28/24
............
5
.42
%
7/1/24
50,000,000
50,000,000
2024
Semi-Annual
Report
|
June
30,
2024
The
accompanying
notes
are
an
integral
part
of
these
financial
statements.
Schedules
of
Investments
June
30,
2024
(unaudited)
Institutional
Prime
Money
Market
Fund
Security
Description
Coupon/
Yield
Maturity/
Demand
Date
Principal
Amount
($)
or
Shares
Fair
Value
($)
Repurchase
Agreements
—
continued
StoneX
(Collateralized
by
$184,240,744
various
Asset
Backed
Securities,
Corporate
Bonds,
FMACs,
GNMAs,
FNMAs,
SBAs,
Mid-
Term
Notes
and
Municipal
Bonds,
0.00%
-
7.92%,
due
7/1/24
-
2/25/67,
fair
value
$77,551,147)
(proceeds
$75,035,125)
purch
date
6/28/24
............
5
.62
%
7/1/24
75,000,000
75,000,000
Total
Repurchase
Agreements
(Cost
$
220,000,000
)
..................
220,000,000
U.S.
Government
Agencies
—
0
.4
%
Freddie
Mac
...........
5
.30
%
2/12/25
2,105,000
2,056,633
Total
U.S.
Government
Agencies
(Cost
$
2,056,846
)
....................
2,056,633
U.S.
Treasury
Bills
—
16
.2
%
US
Treasury
Bill
.........
5
.34
%
10/31/24
10,000,000
9,824,790
US
Treasury
Bill
.........
5
.35
%
11/29/24
5,000,000
4,892,665
US
Treasury
Bill
.........
5
.35
%
8/22/24
10,000,000
9,924,520
US
Treasury
Bill
.........
5
.14
%
4/17/25
2,500,000
2,401,255
US
Treasury
Bill
.........
5
.36
%
8/20/24
3,600,000
3,573,774
US
Treasury
Bill
.........
5
.35
%
9/3/24
5,000,000
4,953,510
US
Treasury
Bill
.........
5
.37
%
9/17/24
10,000,000
9,886,950
US
Treasury
Bill
.........
5
.21
%
5/15/25
3,000,000
2,870,613
US
Treasury
Bill
.........
5
.35
%
9/5/24
7,500,000
7,428,217
US
Treasury
Bill
.........
5
.38
%
10/1/24
7,500,000
7,400,303
US
Treasury
Bill
.........
5
.38
%
10/8/24
5,000,000
4,928,310
US
Treasury
Bill
.........
5
.34
%
12/19/24
8,000,000
7,805,488
US
Treasury
Bill
.........
5
.32
%
12/26/24
6,500,000
6,335,609
Total
U.S.
Treasury
Bills
(Cost
$
82,223,092
)
...................
82,226,004
U.S.
Treasury
Notes
—
0
.5
%
US
Treasury
Note
........
5
.28
%
2/15/25
2,500,000
2,449,560
Total
U.S.
Treasury
Notes
(Cost
$
2,450,304
)
....................
2,449,560
Institutional
Prime
Money
Market
Fund
Security
Description
Principal
Amount
($)
or
Shares
Fair
Value
($)
Money
Market
Registered
Investment
Companies
—
2
.4
%
Federated
Hermes
Government
Obligations
Fund
(2)
12,332,493
12,332,493
Total
Money
Market
Registered
Investment
Companies
(Cost
$
12,332,493
)
...................
12,332,493
Total
Investments
—
100
.3
%
(Cost
$
509,218,658
)
..................
509,138,692
Liabilities
less
Other
Assets
—
(
0
.3
%
)
........
(1,763,691)
Total
Net
Assets
—
100
.0
%
...............
507,375,001
Trustee
Deferred
Compensation
(3)
Meeder
Balanced
Fund
-
Retail
Class
.........
116
1,595
Meeder
Conservative
Allocation
Fund
-
Retail
Class
38
866
Meeder
Dynamic
Allocation
Fund
-
Retail
Class
..
280
4,192
Meeder
Muirfield
Fund
-
Retail
Class
.........
395
4,045
Total
Trustee
Deferred
Compensation
(Cost
$
9,029
)
.......................
10,698
(1)
Floating
rate
security.
Interest
rates
reset
periodically.
The
reference
rate
and
spread
are
indicated
in
the
description
above.
The
rate
shown
represents
the
rate
in
effect
at
June
30,
2024.
The
maturity
date
shown
reflects
the
earlier
of
the
next
demand
date
or
stated
maturity
date.
(2)
7-day
yield
as
of
June
30,
2024.
The
Fund
may
invest
a
significant
portion
of
its
assets
in
shares
of
one
or
more
investment
companies,
including
money
market
mutual
funds.
The
Fund
will
incur
additional
indirect
expenses
(acquired
fund
fees
and
expenses)
to
the
extent
it
invests
in
shares
of
other
investment
companies.
(3)
Assets
of
affiliates
to
the
Institutional
Prime
Money
Market
Fund
held
for
the
benefit
of
the
Fund’s
Trustees
in
connection
with
the
Trustee
Deferred
Compensation
Plan.
2024
Semi-Annual
Report
|
June
30,
2024
The
accompanying
notes
are
an
integral
part
of
these
financial
statements.
Statements
of
Assets
and
Liabilities
June
30,
2024
(unaudited)
Muirfield
Fund
Spectrum
Fund
Assets
Investments,
at
fair
value
(1)(2)
.............................................................
$
626,940,972
$
203,113,803
Repurchase
agreements,
at
fair
value
(1)
......................................................
—
—
Investments
in
affiliates,
at
fair
value
(1)
......................................................
228,631,034
5,657,831
Trustee
deferred
compensation
investments,
at
fair
value
...........................................
490,160
88,668
Deposits
at
broker
for
futures
contracts
(3)
.....................................................
12,359,768
4,055,231
Cash
held
at
broker
for
collateral
on
securities
sold
short
...........................................
—
47,388,370
Receivable
for
securities
sold
..............................................................
7,853,140
1,822,790
Receivable
for
capital
stock
issued
..........................................................
657,174
139,382
Interest
and
dividend
receivable
............................................................
1,065,136
98,594
Prepaid
expenses/other
assets
.............................................................
42,430
208,008
Total
Assets
..........................................................................
878,039,814
262,572,677
Liabilities
Securities
sold
short
at
fair
value
(Proceeds
Received
$
48,618,131
)
....................................
—
48,618,131
Payable
for
securities
purchased
............................................................
7,883,047
1,830,749
Payable
for
Trustee
Deferred
Compensation
Plan
.................................................
490,160
88,668
Payable
for
capital
stock
redeemed
.........................................................
194,522
76,225
Dividends
payable
.....................................................................
—
—
Dividend
expense
payable
on
short
positions
...................................................
—
66,094
Payable
to
investment
adviser
.............................................................
435,747
125,425
Accrued
distribution
plan
(12b-1)
and
shareholder
service
plan
fees
....................................
75,188
17,691
Accrued
transfer
agent,
fund
accounting,
CCO,
and
administration
fees
and
expenses
........................
110,151
41,001
Accrued
trustee
fees
....................................................................
2,665
1,069
Other
accrued
liabilities
..................................................................
42,410
28,998
Total
Liabilities
........................................................................
9,233,890
50,894,051
Net
Assets
..........................................................................
$
868,805,924
$
211,678,626
Net
Assets
Capital
.............................................................................
$
644,036,997
$
159,168,206
Distributable
Earnings
(Accumulated
Deficit)
....................................................
224,768,927
52,510,420
Total
Net
Assets
.......................................................................
$
868,805,924
$
211,678,626
Net
Asset
Value
Per
Share
Retail
Class
Net
Assets
.......................................................................
$
47,112,884
$
1,899,556
Shares
Outstanding
.................................................................
4,599,371
135,194
Net
Asset
Value,
Offering
and
Redemption
Price
Per
Share
.......................................
$
10
.24
$
14
.05
Adviser
Class
Net
Assets
.......................................................................
$
113,753,448
$
39,893,089
Shares
Outstanding
.................................................................
10,941,127
2,806,117
Net
Asset
Value,
Offering
and
Redemption
Price
Per
Share
.......................................
$
10
.40
$
14
.22
Institutional
Class
Net
Assets
.......................................................................
$
707,939,592
$
169,885,981
Shares
Outstanding
.................................................................
68,015,360
11,916,103
Net
Asset
Value,
Offering
and
Redemption
Price
Per
Share
.......................................
$
10
.41
$
14
.26
Net
Asset
Value
Per
Share
-
Institutional
Prime
Money
Market
Fund
Net
Assets
.......................................................................
Shares
Outstanding
.................................................................
Net
Asset
Value,
Offering
and
Redemption
Price
Per
Share
(1)
Investments
and
affiliated
investments
at
cost
(See
Note
#4)
.......................................
$
733,736,130
$
124,762,275
(2)
Fair
value
of
securities
loaned
included
in
investments
at
fair
value
(See
Note
#2
Note
#3,
and
Note
#5)
..........
$
—
$
—
(3)
Required
margin
held
as
collateral
for
futures
contracts
..........................................
$
8,953,456
$
2,654,163
2024
Semi-Annual
Report
|
June
30,
2024
The
accompanying
notes
are
an
integral
part
of
these
financial
statements.
Global
Allocation
Fund
Balanced
Fund
Moderate
Allocation
Fund
Conservative
Allocation
Fund
Dynamic
Allocation
Fund
Sector
Rotation
Fund
Tactical
Income
Fund
Institutional
Prime
Money
Market
Fund
$
18,347,971
$
340,621,982
$
151,932,631
$
122,585,976
$
219,818,954
$
22,450,910
$
61,045,014
$
289,138,692
—
—
—
—
—
—
—
220,000,000
16,882,450
48,616,840
21,258,622
10,137,854
111,347,595
13,473,830
13,074,697
—
154,640
308,001
68,041
122,685
335,874
95,536
111,334
10,698
891,689
2,519,414
1,245,787
391,471
5,878,972
620,475
—
—
—
—
—
—
—
—
—
—
140,659
2,837,493
846,344
400,878
2,571,721
3,403
—
—
21,337
176,909
80,702
74,318
359,641
6,130
66,668
—
76,883
431,331
234,616
190,648
515,281
67,111
215,976
290,455
25,944
33,062
34,653
32,535
25,394
31,506
31,575
17,966
36,541,573
395,545,032
175,701,396
133,936,365
340,853,432
36,748,901
74,545,264
509,457,811
—
—
—
—
—
—
—
—
139,953
2,843,548
839,136
397,072
2,556,372
—
—
—
154,640
308,001
68,041
122,685
335,874
95,536
111,334
10,698
26,280
185,151
44,615
47,201
93,064
27,080
14,415
—
—
—
—
—
—
—
—
1,976,193
—
—
—
—
—
—
—
—
21,775
212,661
84,017
53,447
167,934
22,063
17,174
—
4,554
36,185
14,581
13,874
19,879
7,103
8,313
53
10,996
71,448
34,885
27,927
61,434
11,089
15,494
73,040
304
1,637
843
625
610
323
383
238
15,183
32,790
25,218
24,208
23,057
14,759
18,799
22,588
373,685
3,691,421
1,111,336
687,039
3,258,224
177,953
185,912
2,082,810
$
36,167,888
$
391,853,611
$
174,590,060
$
133,249,326
$
337,595,208
$
36,570,948
$
74,359,352
$
507,375,001
$
29,917,825
$
309,236,817
$
155,082,342
$
129,189,675
$
257,836,889
$
28,783,330
$
86,620,430
$
507,447,592
6,250,063
82,616,794
19,507,718
4,059,651
79,758,319
7,787,618
(
12,261,078
)
(
72,591
)
$
36,167,888
$
391,853,611
$
174,590,060
$
133,249,326
$
337,595,208
$
36,570,948
$
74,359,352
$
507,375,001
$
3,020,836
$
9,413,074
$
909,743
$
6,194,670
$
11,955,273
$
12,590,110
$
2,589,848
249,275
684,670
72,690
271,733
798,790
321,352
281,450
$
12
.12
$
13
.75
$
12
.52
$
22
.80
$
14
.97
$
39
.18
$
9
.20
$
4,041,050
$
75,107,649
$
33,887,492
$
23,114,760
$
28,812,733
$
4,106,718
$
9,985,320
330,291
5,411,239
2,695,041
1,001,758
1,898,567
103,858
1,083,578
$
12
.23
$
13
.88
$
12
.57
$
23
.07
$
15
.18
$
39
.54
$
9
.22
$
29,106,002
$
307,332,888
$
139,792,825
$
103,939,896
$
296,827,202
$
19,874,120
$
61,784,184
2,385,253
22,094,090
11,100,523
4,495,379
19,591,824
503,536
6,708,792
$
12
.20
$
13
.91
$
12
.59
$
23
.12
$
15
.15
$
39
.47
$
9
.21
$
507,375,001
507,394,296
$
1
.0001
$
32,232,017
$
340,411,420
$
158,675,652
$
125,482,667
$
291,215,992
$
34,877,408
$
73,103,213
$
509,218,658
$
—
$
—
$
—
$
—
$
—
$
—
$
—
$
—
$
657,804
$
1,917,553
$
763,847
$
315,285
$
4,663,858
$
521,128
$
—
$
—
2024
Semi-Annual
Report
|
June
30,
2024
The
accompanying
notes
are
an
integral
part
of
these
financial
statements.
Statements
of
Operations
For
the
Six
Months
Ended
June
30,
2024
(unaudited)
Muirfield
Fund
Spectrum
Fund
Investment
Income
Interest
............................................................................
$
—
$
—
Income
from
affiliates
...................................................................
5,596,907
747,425
Dividends
..........................................................................
3,553,055
1,315,327
Total
Investment
Income
.................................................................
9,149,962
2,062,752
Fund
Expenses
Investment
advisory
fees
.................................................................
2,543,674
747,751
Transfer
agent
fees
and
expenses
-
Retail
Class
.................................................
19,112
1,121
Transfer
agent
fees
and
expenses
-
Adviser
Class
................................................
46,027
22,609
Transfer
agent
fees
and
expenses
-
Institutional
Class
.............................................
278,978
96,329
Transfer
agent
fees
and
expenses
-
Money
Market
Fund
............................................
—
—
Fund
accounting
fees
...................................................................
58,514
28,404
Administration
fees
....................................................................
249,636
85,013
Trustee
fees
.........................................................................
16,103
4,293
Audit
fees
...........................................................................
8,930
8,930
Legal
fees
...........................................................................
3,754
3,754
Custody
fees
.........................................................................
34,847
9,339
Printing
expenses
......................................................................
9,139
3,784
Distribution
plan
(12b-1)
fees
-
Retail
Class
(1)
...................................................
44,572
2,336
Shareholder
service
plan
fees
-
Retail
Class
....................................................
20,195
1,869
Shareholder
service
plan
fees
-
Adviser
Class
...................................................
1,548
364
Shareholder
service
plan
fees
-
Institutional
Class
................................................
312,648
75,113
Postage
expenses
.....................................................................
13,073
7,174
Registration
fees
......................................................................
33,363
23,572
Insurance
expenses
....................................................................
19,003
5,191
Chief
Compliance
Officer
fees
.............................................................
4,625
4,625
Excise
tax
expense
.....................................................................
—
227,286
Other
expenses
.......................................................................
27,053
16,987
Total
Expenses
Before
Reductions
...........................................................
3,744,794
1,375,844
Expenses
voluntarily
reimbursed/waived
by
investment
adviser
(See
Note
#5)
.............................
—
—
Short
sales
credit
......................................................................
—
(
502,984
)
Net
Expenses
........................................................................
3,744,794
872,860
Net
Investment
Income
(Loss)
.............................................................
5,405,168
1,189,892
Realized
and
Unrealized
Gain
(Loss)
from
Investments
–
–
Net
realized
gains
from
unaffiliated
investments
.................................................
49,288,097
6,178,031
Net
realized
gains
(losses)
from
affiliated
investments
.............................................
18,758
39,061
Net
realized
losses
from
closed
short
positions
..................................................
—
(
1,405,115
)
Net
realized
gains
from
futures
contracts
......................................................
14,887,383
3,770,532
Net
Realized
Gains
from
Investment
Transactions,
Futures
Contracts,
and
Distributions
of
Long-term
Realized
Gains
by
Other
Investment
Companies
............................................................
64,194,238
8,582,509
Net
change
in
unrealized
appreciation
(depreciation)
of
unaffiliated
investments
............................
41,236,761
15,642,353
Net
change
in
unrealized
appreciation
(depreciation)
of
affiliated
investments
..............................
(
56,982
)
(
49,817
)
Net
change
in
unrealized
appreciation
(depreciation)
of
short
positions
..................................
—
1,720,347
Net
change
in
unrealized
appreciation
(depreciation)
of
futures
contracts
.................................
(
10,306,969
)
(
2,884,995
)
Net
Change
in
Unrealized
Appreciation
(Depreciation)
of
Investment
Transactions
and
Futures
Contracts
............
30,872,810
14,427,888
Net
Realized
and
Unrealized
Gain
(Loss)
from
Investments
..........................................
95,067,048
23,010,397
Net
Change
in
Net
Assets
Resulting
from
Operations
..............................................
$
100,472,216
$
24,200,289
(1)
Only
the
Retail
Class
of
shares
has
adopted
a
Rule
12b-1
Plan.
See
#5
of
the
Notes
to
Financial
Statements.
2024
Semi-Annual
Report
|
June
30,
2024
The
accompanying
notes
are
an
integral
part
of
these
financial
statements.
Global
Allocation
Fund
Balanced
Fund
Moderate
Allocation
Fund
Conservative
Allocation
Fund
Dynamic
Allocation
Fund
Sector
Rotation
Fund
Tactical
Income
Fund
Institutional
Prime
Money
Market
Fund
$
—
$
—
$
—
$
—
$
—
$
40
$
16
$
14,175,453
427,940
1,421,542
620,852
322,512
2,492,590
304,231
488,434
—
205,599
3,768,362
2,213,906
2,129,854
1,547,744
217,108
1,419,774
—
633,539
5,189,904
2,834,758
2,452,366
4,040,334
521,379
1,908,224
14,175,453
128,889
1,275,428
503,423
321,819
1,060,409
132,883
141,954
713,851
1,785
5,374
562
3,523
7,131
7,520
1,017
—
2,361
43,066
19,838
13,457
16,455
2,440
3,793
—
16,476
176,810
80,284
60,256
158,605
11,301
23,556
—
—
—
—
—
—
—
—
199,709
17,858
37,170
26,789
24,835
33,582
17,964
21,512
43,969
17,185
155,139
72,096
56,464
126,433
17,718
33,339
204,682
961
7,961
3,771
2,952
6,097
979
1,747
586
8,930
8,929
8,827
8,827
8,930
8,931
8,389
7,847
3,754
3,754
3,754
3,754
3,754
3,754
3,754
3,843
1,583
17,483
7,999
6,051
12,406
1,665
3,440
24,190
357
5,478
2,715
2,566
4,230
586
1,157
—
3,719
11,173
1,171
7,337
14,865
12,539
3,177
—
2,342
5,936
787
3,069
5,753
2,545
1,738
—
1
619
173
846
489
74
221
—
4,959
138,882
62,469
46,892
105,887
3,951
26,630
—
551
9,003
4,683
4,762
6,534
1,019
1,999
148
23,101
27,100
24,302
24,546
29,356
23,535
23,983
4,079
873
9,748
4,348
3,311
6,798
961
1,791
15,259
4,625
4,625
4,625
4,625
4,625
4,625
4,625
4,625
—
—
—
—
—
—
—
—
13,643
20,511
16,407
15,595
17,620
13,674
14,404
34,492
253,953
1,964,189
849,023
615,487
1,629,959
268,664
322,226
1,257,280
—
—
—
—
(
99,726
)
—
(
39,126
)
(
713,851
)
—
—
—
—
—
—
—
—
253,953
1,964,189
849,023
615,487
1,530,233
268,664
283,100
543,429
379,586
3,225,715
1,985,735
1,836,879
2,510,101
252,715
1,625,124
13,632,024
–
–
–
–
–
–
–
–
662,114
20,698,570
5,892,910
2,615,181
16,949,544
3,908,571
536,993
740
87
4,191
2,340
4,424
(
1,689
)
4,256
(
2,856
)
—
—
—
—
—
—
—
—
—
1,471,322
2,763,795
1,517,806
616,069
7,154,756
1,288,498
—
—
2,133,523
23,466,556
7,413,056
3,235,674
24,102,611
5,201,325
534,137
740
923,163
9,165,506
2,172,448
479,036
10,641,334
(
2,453,580
)
(
669,130
)
(
199,571
)
(
3,136
)
(
16,210
)
(
7,484
)
(
7,180
)
(
14,337
)
(
6,807
)
(
2,186
)
—
—
—
—
—
—
—
—
—
(
779,855
)
(
2,421,006
)
(
964,732
)
(
450,610
)
(
4,331,722
)
(
455,922
)
—
—
140,172
6,728,290
1,200,232
21,246
6,295,275
(
2,916,309
)
(
671,316
)
(
199,571
)
2,273,695
30,194,846
8,613,288
3,256,920
30,397,886
2,285,016
(
137,179
)
(
198,831
)
$
2,653,281
$
33,420,561
$
10,599,023
$
5,093,799
$
32,907,987
$
2,537,731
$
1,487,945
$
13,433,193
2024
Semi-Annual
Report
|
June
30,
2024
The
accompanying
notes
are
an
integral
part
of
these
financial
statements.
Statements
of
Changes
in
Net
Assets
For
the
Six
Months
Ended
June
30,
2024
(unaudited)
and
the
Year
Ended
December
31,
2023
Muirfield
Fund
2024
2023
Operations
Net
investment
income
(loss)
..............................................................
$
5,405,168
$
12,558,225
Net
realized
gains
(losses)
from
investment
transactions,
futures
contracts,
and
distributions
of
long-term
realized
gains
by
other
investment
companies
.......................................................
64,194,238
48,724,709
Net
change
in
unrealized
appreciation
(depreciation)
of
investment
transactions
and
futures
contracts
.............
30,872,810
28,170,783
Net
change
in
net
assets
resulting
from
operations
...............................................
100,472,216
89,453,717
Distributions
to
Shareholders
Retail
Class
........................................................................
(
229,402
)
(
1,205,639
)
Adviser
Class
.......................................................................
(
650,186
)
(
3,157,387
)
Institutional
Class
....................................................................
(
4,006,424
)
(
17,709,992
)
Change
in
net
assets
resulting
from
distributions
.................................................
(
4,886,012
)
(
22,073,018
)
Capital
Transactions:
Issued
.............................................................................
98,607,347
174,493,246
Reinvested
..........................................................................
4,866,726
21,969,316
Redeemed
..........................................................................
(
78,718,934
)
(
151,455,846
)
Net
change
in
net
assets
resulting
from
capital
transactions
.........................................
24,755,139
45,006,716
Total
Change
in
Net
Assets
................................................................
120,341,343
112,387,415
Net
Assets
-
Beginning
of
Year
.............................................................
748,464,581
636,077,166
Net
Assets
-
End
of
Period/
Year
.............................................................
$
868,805,924
$
748,464,581
Share
Transactions:
Issued
.............................................................................
9,897,304
19,897,337
Reinvested
..........................................................................
471,494
2,430,047
Redeemed
..........................................................................
(
7,982,586
)
(
17,251,613
)
Net
change
in
shares
...................................................................
2,386,212
5,075,771
2024
Semi-Annual
Report
|
June
30,
2024
The
accompanying
notes
are
an
integral
part
of
these
financial
statements.
Spectrum
Fund
Global
Allocation
Fund
Balanced
Fund
Moderate
Allocation
Fund
2024
2023
2024
2023
2024
2023
2024
2023
$
1,189,892
$
3,400,146
$
379,586
$
679,569
$
3,225,715
$
7,346,247
$
1,985,735
$
4,448,806
8,582,509
17,894,261
2,133,523
2,675,613
23,466,556
17,312,404
7,413,056
2,873,586
14,427,888
3,230,554
140,172
1,398,831
6,728,290
16,813,099
1,200,232
10,011,240
24,200,289
24,524,961
2,653,281
4,754,013
33,420,561
41,471,750
10,599,023
17,333,632
(
4,047
)
(
143,420
)
(
22,690
)
(
45,751
)
(
55,101
)
(
120,544
)
(
8,405
)
(
22,551
)
(
139,794
)
(
2,994,063
)
(
36,558
)
(
83,531
)
(
590,951
)
(
1,413,683
)
(
377,435
)
(
890,185
)
(
475,202
)
(
12,687,685
)
(
257,668
)
(
548,265
)
(
2,193,334
)
(
5,759,540
)
(
1,429,304
)
(
3,515,203
)
(
619,043
)
(
15,825,168
)
(
316,916
)
(
677,547
)
(
2,839,386
)
(
7,293,767
)
(
1,815,144
)
(
4,427,939
)
16,466,422
24,602,506
3,887,903
6,063,691
37,457,943
54,784,178
14,860,877
22,471,031
618,988
15,823,894
316,914
677,451
2,838,574
7,283,027
1,812,768
4,418,359
(
20,378,911
)
(
41,893,797
)
(
3,485,185
)
(
9,367,236
)
(
43,395,330
)
(
77,587,419
)
(
16,891,720
)
(
32,292,987
)
(
3,293,501
)
(
1,467,397
)
719,632
(
2,626,094
)
(
3,098,813
)
(
15,520,214
)
(
218,075
)
(
5,403,597
)
20,287,745
7,232,396
3,055,997
1,450,372
27,482,362
18,657,769
8,565,804
7,502,096
191,390,881
184,158,485
33,111,891
31,661,518
364,371,249
345,713,480
166,024,256
158,522,168
$
211,678,626
$
191,390,881
$
36,167,888
$
33,111,890
$
391,853,611
$
364,371,249
$
174,590,060
$
166,024,260
1,214,042
1,941,171
328,505
567,612
2,793,387
4,544,169
1,205,629
1,984,834
43,439
1,252,424
26,024
61,622
205,066
590,633
144,377
384,616
(
1,505,916
)
(
3,300,768
)
(
296,099
)
(
875,138
)
(
3,232,508
)
(
6,429,085
)
(
1,381,329
)
(
2,849,736
)
(
248,435
)
(
107,173
)
58,430
(
245,904
)
(
234,055
)
(
1,294,283
)
(
31,323
)
(
480,286
)
2024
Semi-Annual
Report
|
June
30,
2024
The
accompanying
notes
are
an
integral
part
of
these
financial
statements.
Statements
of
Changes
in
Net
Assets
For
the
Six
Months
Ended
June
30,
2024
(unaudited)
and
the
Year
Ended
December
31,
2023
Conservative
Allocation
Fund
2024
2023
Operations
Net
investment
income
(loss)
..............................................................
$
1,836,879
$
3,862,459
Net
realized
gains
(losses)
from
investment
transactions,
futures
contracts,
and
distributions
of
long-term
realized
gains
by
other
investment
companies
.......................................................
3,235,674
(
1,504,124
)
Net
change
in
unrealized
appreciation
(depreciation)
of
investment
transactions
and
futures
contracts
.............
21,246
9,276,072
Net
change
in
net
assets
resulting
from
operations
...............................................
5,093,799
11,634,407
Distributions
to
Shareholders
Retail
Class
........................................................................
(
74,679
)
(
158,729
)
Adviser
Class
.......................................................................
(
318,384
)
(
681,745
)
Institutional
Class
....................................................................
(
1,407,594
)
(
2,991,746
)
Money
Market
Fund
..................................................................
–
–
Change
in
net
assets
resulting
from
distributions
.................................................
(
1,800,657
)
(
3,832,220
)
Capital
Transactions:
Issued
.............................................................................
18,042,695
26,767,993
Reinvested
..........................................................................
1,799,235
3,826,126
Redeemed
..........................................................................
(
18,203,210
)
(
30,485,167
)
Net
change
in
net
assets
resulting
from
capital
transactions
.........................................
1,638,720
108,952
Total
Change
in
Net
Assets
................................................................
4,931,862
7,911,139
Net
Assets
-
Beginning
of
Year
.............................................................
128,317,464
120,406,323
Net
Assets
-
End
of
Period/
Year
.............................................................
$
133,249,326
$
128,317,462
Share
Transactions:
Issued
.............................................................................
790,559
1,239,400
Reinvested
..........................................................................
77,844
175,640
Redeemed
..........................................................................
(
797,156
)
(
1,415,831
)
Net
change
in
shares
...................................................................
71,247
(
791
)
2024
Semi-Annual
Report
|
June
30,
2024
The
accompanying
notes
are
an
integral
part
of
these
financial
statements.
Dynamic
Allocation
Fund
Sector
Rotation
Fund
Tactical
Income
Fund
Institutional
Prime
Money
Market
Fund
2024
2023
2024
2023
2024
2023
2024
2023
$
2,510,101
$
3,444,368
$
252,715
$
472,796
$
1,625,124
$
2,722,534
$
13,632,024
$
33,483,599
24,102,611
26,238,057
5,201,325
2,872,529
534,137
(
867,969
)
740
7,501
6,295,275
16,149,773
(
2,916,309
)
1,167,788
(
671,316
)
3,063,972
(
199,571
)
247,127
32,907,987
45,832,198
2,537,731
4,513,113
1,487,945
4,918,537
13,433,193
33,738,227
(
73,958
)
(
109,810
)
(
71,506
)
(
156,043
)
(
55,694
)
(
86,407
)
–
–
(
207,588
)
(
362,615
)
(
28,492
)
(
56,129
)
(
223,114
)
(
393,163
)
–
–
(
1,881,011
)
(
2,954,145
)
(
124,920
)
(
247,905
)
(
1,359,169
)
(
2,242,155
)
–
–
–
–
–
–
–
–
(
13,632,024
)
(
33,483,600
)
(
2,162,557
)
(
3,426,570
)
(
224,918
)
(
460,077
)
(
1,637,977
)
(
2,721,725
)
(
13,632,024
)
(
33,483,600
)
54,522,798
69,012,333
2,677,422
4,220,236
13,506,476
16,044,423
270,232,820
879,526,395
2,153,713
3,413,268
220,918
445,218
1,636,633
2,718,207
1,067,355
2,089,602
(
26,050,882
)
(
53,623,273
)
(
3,679,602
)
(
5,846,392
)
(
10,734,673
)
(
18,185,104
)
(
401,477,052
)
(
937,202,461
)
30,625,629
18,802,328
(
781,262
)
(
1,180,938
)
4,408,436
577,526
(
130,176,877
)
(
55,586,464
)
61,371,059
61,207,956
1,531,551
2,872,098
4,258,404
2,774,338
(
130,375,708
)
(
55,331,837
)
276,224,149
215,016,195
35,039,397
32,167,299
70,100,948
67,326,611
637,750,709
693,082,546
$
337,595,208
$
276,224,151
$
36,570,948
$
35,039,397
$
74,359,352
$
70,100,948
$
507,375,001
$
637,750,709
3,749,290
5,498,590
70,756
125,067
1,465,035
1,783,172
270,159,046
879,463,522
142,855
260,063
5,630
12,731
177,787
302,411
1,067,232
2,089,371
(
1,791,888
)
(
4,287,105
)
(
97,131
)
(
171,257
)
(
1,163,645
)
(
2,024,943
)
(
401,417,825
)
(
937,133,579
)
2,100,257
1,471,548
(
20,745
)
(
33,459
)
479,177
60,640
(
130,191,547
)
(
55,580,686
)
2024
Semi-Annual
Report
|
June
30,
2024
The
accompanying
notes
are
an
integral
part
of
these
financial
statements.
Financial
Highlights
For
the
Six
Months
Ended
June
30,
2024
(unaudited)
and
the
Years
Ended
December
31,
[?]
See
footnotes
on
pages
54
and
55
.
Income
from
Investment
Operations
Less
Distributions
Net
Asset
Value,
Beginning
of
Period
Net
Investment
Income
(Loss)
(1)
Net
gains
(losses)
on
securities
and
futures
(both
realized
and
unrealized)
Total
from
Investment
Operations
From
Net
Investment
Income
From
Net
Capital
Gains
From
Return
of
Capital
Total
Distributions
Muirfield
Fund
-
Retail
Class
(4)
(5)
(6)
(7)
2024
........
$
9
.09
0
.06
1
.14
1
.20
(
0
.05
)
0
.00
0
.00
(
0
.05
)
2023
........
$
8
.24
0
.14
0
.97
1
.11
(
0
.14
)
(
0
.12
)
0
.00
(
0
.26
)
2022
........
$
9
.53
0
.03
(
1
.09
)
(
1
.06
)
(
0
.06
)
(
0
.17
)
0
.00
(
0
.23
)
2021
........
$
8
.20
(
0
.01
)
1
.66
1
.65
(
0
.07
)
(
0
.25
)
0
.00
(
0
.32
)
2020
........
$
7
.91
0
.03
0
.31
0
.34
(
0
.05
)
0
.00
0
.00
(
0
.05
)
2019
........
$
7
.16
0
.07
0
.89
0
.96
(
0
.03
)
(
0
.18
)
0
.00
(
0
.21
)
Muirfield
Fund
-
Adviser
Class
(4)
(5)
(6)
(7)
2024
........
$
9
.22
0
.07
1
.17
1
.24
(
0
.06
)
0
.00
0
.00
(
0
.06
)
2023
........
$
8
.36
0
.17
0
.98
1
.15
(
0
.17
)
(
0
.12
)
0
.00
(
0
.29
)
2022
........
$
9
.63
0
.06
(
1
.10
)
(
1
.04
)
(
0
.06
)
(
0
.17
)
0
.00
(
0
.23
)
2021
........
$
8
.26
0
.03
1
.67
1
.70
(
0
.08
)
(
0
.25
)
0
.00
(
0
.33
)
2020
........
$
7
.97
0
.05
0
.31
0
.36
(
0
.07
)
0
.00
0
.00
(
0
.07
)
2019
........
$
7
.20
0
.09
0
.90
0
.99
(
0
.04
)
(
0
.18
)
0
.00
(
0
.22
)
Muirfield
Fund
-
Institutional
Class
(4)
(5)
(6)
(7)
2024
........
$
9
.23
0
.07
1
.17
1
.24
(
0
.06
)
0
.00
0
.00
(
0
.06
)
2023
........
$
8
.37
0
.16
0
.98
1
.14
(
0
.16
)
(
0
.12
)
0
.00
(
0
.28
)
2022
........
$
9
.65
0
.06
(
1
.11
)
(
1
.05
)
(
0
.06
)
(
0
.17
)
0
.00
(
0
.23
)
2021
........
$
8
.28
0
.03
1
.66
1
.69
(
0
.07
)
(
0
.25
)
0
.00
(
0
.32
)
2020
........
$
7
.99
0
.05
0
.31
0
.36
(
0
.07
)
0
.00
0
.00
(
0
.07
)
2019
........
$
7
.21
0
.10
0
.90
1
.00
(
0
.04
)
(
0
.18
)
0
.00
(
0
.22
)
Spectrum
Fund
-
Retail
Class
(4)
(5)
(6)
(7)
2024
........
$
12
.51
0
.05
1
.52
1
.57
(
0
.03
)
0
.00
0
.00
(
0
.03
)
2023
........
$
11
.95
0
.18
1
.43
1
.61
(
0
.17
)
(
0
.88
)
0
.00
(
1
.05
)
2022
........
$
13
.88
0
.01
(
1
.61
)
(
1
.60
)
(
0
.09
)
(
0
.24
)
0
.00
(
0
.33
)
2021
........
$
12
.15
(
0
.06
)
2
.56
2
.50
(
0
.03
)
(
0
.74
)
0
.00
(
0
.77
)
2020
........
$
12
.19
0
.00
(
0
.03
)
(
0
.03
)
(
0
.01
)
0
.00
0
.00
(
0
.01
)
2019
........
$
10
.89
0
.04
1
.38
1
.42
(
0
.01
)
(
0
.11
)
0
.00
(
0
.12
)
Spectrum
Fund
-
Adviser
Class
(4)
(5)
(6)
(7)
2024
........
$
12
.64
0
.08
1
.55
1
.63
(
0
.05
)
0
.00
0
.00
(
0
.05
)
2023
........
$
12
.08
0
.24
1
.44
1
.68
(
0
.24
)
(
0
.88
)
0
.00
(
1
.12
)
2022
........
$
13
.96
0
.07
(
1
.62
)
(
1
.55
)
(
0
.09
)
(
0
.24
)
0
.00
(
0
.33
)
2021
........
$
12
.17
0
.02
2
.54
2
.56
(
0
.03
)
(
0
.74
)
0
.00
(
0
.77
)
2020
........
$
12
.27
0
.03
(
0
.02
)
0
.01
(
0
.11
)
0
.00
0
.00
(
0
.11
)
2019
........
$
10
.95
0
.07
1
.37
1
.44
(
0
.01
)
(
0
.11
)
0
.00
(
0
.12
)
Spectrum
Fund
-
Institutional
Class
(4)
(5)
(6)
(7)
2024
........
$
12
.68
0
.08
1
.54
1
.62
(
0
.04
)
0
.00
0
.00
(
0
.04
)
2023
........
$
12
.11
0
.23
1
.45
1
.68
(
0
.23
)
(
0
.88
)
0
.00
(
1
.11
)
2022
........
$
14
.01
0
.06
(
1
.62
)
(
1
.56
)
(
0
.10
)
(
0
.24
)
0
.00
(
0
.34
)
2021
........
$
12
.22
0
.01
2
.55
2
.56
(
0
.03
)
(
0
.74
)
0
.00
(
0
.77
)
2020
........
$
12
.31
0
.04
(
0
.02
)
0
.02
(
0
.11
)
0
.00
0
.00
(
0
.11
)
2019
........
$
10
.96
0
.09
1
.38
1
.47
(
0
.01
)
(
0
.11
)
0
.00
(
0
.12
)
2024
Semi-Annual
Report
|
June
30,
2024
The
accompanying
notes
are
an
integral
part
of
these
financial
statements.
Ratios/Supplemental
Data
Net
Asset
Value,
End
of
Period
Total
Return
(Assumes
Reinvestment
of
Distributions)
Net
Assets,
End
of
Period
($000)
Ratio
of
Net
Investment
Income
(Loss)
to
Average
Net
Assets
Ratio
of
Expenses
to
Average
Net
Assets
After
Fee
Reductions
(2)
Ratio
of
Expenses
to
Average
Net
Assets
Before
Fee
Reductions
(3)
Portfolio
Turnover
Rate
$
10
.24
13
.21
%
$
47,113
1
.15
%
1
.13
%
1
.13
%
150%
$
9
.09
13
.55
%
$
42,667
1
.60
%
1
.18
%
1
.18
%
316%
$
8
.24
(
11
.19
%
)
$
38,206
0
.37
%
1
.20
%
1
.20
%
267%
$
9
.53
20
.20
%
$
43,353
(
0
.06
)
%
1
.21
%
1
.21
%
197%
$
8
.20
4
.36
%
$
134,240
0
.35
%
1
.28
%
1
.28
%
225%
$
7
.91
13
.53
%
$
189,105
0
.94
%
1
.28
%
1
.28
%
222%
$
10
.40
13
.46
%
$
113,753
1
.44
%
0
.84
%
0
.84
%
150%
$
9
.22
13
.84
%
$
102,117
1
.91
%
0
.87
%
0
.87
%
316%
$
8
.36
(
10
.85
%
)
$
94,282
0
.71
%
0
.87
%
0
.87
%
267%
$
9
.63
20
.61
%
$
104,300
0
.33
%
0
.90
%
0
.90
%
197%
$
8
.26
4
.67
%
$
48,953
0
.64
%
0
.98
%
0
.98
%
225%
$
7
.97
13
.81
%
$
60,024
1
.14
%
1
.09
%
1
.09
%
222%
$
10
.41
13
.44
%
$
707,940
1
.34
%
0
.93
%
0
.93
%
150%
$
9
.23
13
.70
%
$
603,681
1
.84
%
0
.94
%
0
.95
%
316%
$
8
.37
(
10
.93
%
)
$
503,589
0
.63
%
0
.94
%
0
.95
%
267%
$
9
.65
20
.55
%
$
572,819
0
.27
%
0
.94
%
0
.95
%
197%
$
8
.28
4
.66
%
$
390,632
0
.73
%
0
.88
%
0
.97
%
225%
$
7
.99
14
.01
%
$
432,299
1
.35
%
0
.87
%
0
.98
%
222%
$
14
.05
12
.55
%
$
1,900
0
.82
%
1
.24
%
1
.24
%
139%
$
12
.51
13
.66
%
$
1,789
1
.43
%
1
.53
%
1
.53
%
334%
$
11
.95
(
11
.52
%
)
$
1,715
0
.08
%
1
.52
%
1
.52
%
289%
$
13
.88
20
.58
%
$
2,526
(
0
.43
)
%
1
.49
%
1
.49
%
200%
$
12
.15
(
0
.23
%
)
$
36,604
(
0
.04
)
%
1
.73
%
1
.73
%
182%
$
12
.19
13
.03
%
$
51,060
0
.37
%
1
.77
%
1
.77
%
74%
$
14
.22
12
.90
%
$
39,893
1
.27
%
0
.79
%
0
.79
%
139%
$
12
.64
14
.07
%
$
36,059
1
.88
%
1
.08
%
1
.08
%
334%
$
12
.08
(
11
.08
%
)
$
33,536
0
.56
%
1
.08
%
1
.08
%
289%
$
13
.96
21
.07
%
$
38,190
0
.11
%
1
.09
%
1
.09
%
200%
$
12
.17
0
.18
%
$
12,475
0
.32
%
1
.36
%
1
.36
%
182%
$
12
.27
13
.17
%
$
15,564
0
.63
%
1
.51
%
1
.51
%
74%
$
14
.26
12
.78
%
$
169,886
1
.17
%
0
.89
%
0
.89
%
139%
$
12
.68
14
.06
%
$
153,543
1
.80
%
1
.16
%
1
.16
%
334%
$
12
.11
(
11
.19
%
)
$
148,907
0
.49
%
1
.15
%
1
.15
%
289%
$
14
.01
20
.98
%
$
170,388
0
.05
%
1
.13
%
1
.13
%
200%
$
12
.22
0
.25
%
$
136,200
0
.33
%
1
.32
%
1
.33
%
182%
$
12
.31
13
.44
%
$
146,433
0
.77
%
1
.38
%
1
.40
%
74%
2024
Semi-Annual
Report
|
June
30,
2024
The
accompanying
notes
are
an
integral
part
of
these
financial
statements.
Financial
Highlights
For
the
Six
Months
Ended
June
30,
2024
(unaudited)
and
the
Years
Ended
December
31,
[?]
See
footnotes
on
pages
54
and
55
.
Income
from
Investment
Operations
Less
Distributions
Net
Asset
Value,
Beginning
of
Period
Net
Investment
Income
(Loss)
(1)
Net
gains
(losses)
on
securities
and
futures
(both
realized
and
unrealized)
Total
from
Investment
Operations
From
Net
Investment
Income
From
Net
Capital
Gains
From
Return
of
Capital
Total
Distributions
Global
Allocation
Fund
-
Retail
Class
(4)
(5)
(6)
(7)
2024
........
$
11
.32
0
.11
0
.78
0
.89
(
0
.09
)
0
.00
0
.00
(
0
.09
)
2023
........
$
9
.98
0
.19
1
.34
1
.53
(
0
.19
)
0
.00
0
.00
(
0
.19
)
2022
........
$
11
.55
(
0
.02
)
(
1
.47
)
(
1
.49
)
(
0
.03
)
(
0
.05
)
0
.00
(
0
.08
)
2021
........
$
11
.40
(
0
.08
)
1
.52
1
.44
0
.00
(
1
.29
)
0
.00
(
1
.29
)
2020
........
$
11
.32
(
0
.02
)
0
.35
0
.33
0
.00
(
0
.25
)
0
.00
(
0
.25
)
2019
........
$
10
.22
0
.08
1
.26
1
.34
(
0
.04
)
(
0
.20
)
0
.00
(
0
.24
)
Global
Allocation
Fund
-
Adviser
Class
(4)
(5)
(6)
(7)
2024
........
$
11
.42
0
.13
0
.79
0
.92
(
0
.11
)
0
.00
0
.00
(
0
.11
)
2023
........
$
10
.08
0
.23
1
.35
1
.58
(
0
.24
)
0
.00
0
.00
(
0
.24
)
2022
........
$
11
.61
0
.03
(
1
.48
)
(
1
.45
)
(
0
.03
)
(
0
.05
)
0
.00
(
0
.08
)
2021
........
$
11
.42
(
0
.02
)
1
.50
1
.48
0
.00
(
1
.29
)
0
.00
(
1
.29
)
2020
........
$
11
.35
0
.01
0
.37
0
.38
(
0
.06
)
(
0
.25
)
0
.00
(
0
.31
)
2019
........
$
10
.24
0
.11
1
.25
1
.36
(
0
.05
)
(
0
.20
)
0
.00
(
0
.25
)
Global
Allocation
Fund
-
Institutional
Class
(4)
(5)
(6)
(7)
2024
........
$
11
.40
0
.13
0
.78
0
.91
(
0
.11
)
0
.00
0
.00
(
0
.11
)
2023
........
$
10
.05
0
.23
1
.36
1
.59
(
0
.24
)
0
.00
0
.00
(
0
.24
)
2022
........
$
11
.58
0
.03
(
1
.48
)
(
1
.45
)
(
0
.03
)
(
0
.05
)
0
.00
(
0
.08
)
2021
........
$
11
.38
(
0
.02
)
1
.51
1
.49
0
.00
(
1
.29
)
0
.00
(
1
.29
)
2020
........
$
11
.36
0
.02
0
.35
0
.37
(
0
.10
)
(
0
.25
)
0
.00
(
0
.35
)
2019
........
$
10
.24
0
.13
1
.26
1
.39
(
0
.07
)
(
0
.20
)
0
.00
(
0
.27
)
Balanced
Fund
-
Retail
Class
(4)
(5)
(6)
(7)
2024
........
$
12
.68
0
.09
1
.06
1
.15
(
0
.08
)
0
.00
0
.00
(
0
.08
)
2023
........
$
11
.50
0
.21
1
.17
1
.38
(
0
.20
)
0
.00
0
.00
(
0
.20
)
2022
........
$
13
.42
0
.06
(
1
.55
)
(
1
.49
)
(
0
.23
)
(
0
.20
)
0
.00
(
0
.43
)
2021
........
$
12
.82
(
0
.01
)
1
.71
1
.70
(
0
.16
)
(
0
.94
)
0
.00
(
1
.10
)
2020
........
$
12
.26
0
.08
0
.56
0
.64
(
0
.08
)
0
.00
0
.00
(
0
.08
)
2019
........
$
11
.08
0
.16
1
.20
1
.36
(
0
.09
)
(
0
.09
)
0
.00
(
0
.18
)
Balanced
Fund
-
Adviser
Class
(4)
(5)
(6)
(7)
2024
........
$
12
.80
0
.12
1
.07
1
.19
(
0
.11
)
0
.00
0
.00
(
0
.11
)
2023
........
$
11
.62
0
.26
1
.18
1
.44
(
0
.26
)
0
.00
0
.00
(
0
.26
)
2022
........
$
13
.53
0
.11
(
1
.57
)
(
1
.46
)
(
0
.25
)
(
0
.20
)
0
.00
(
0
.45
)
2021
........
$
12
.92
0
.11
1
.66
1
.77
(
0
.22
)
(
0
.94
)
0
.00
(
1
.16
)
2020
........
$
12
.35
0
.13
0
.56
0
.69
(
0
.12
)
0
.00
0
.00
(
0
.12
)
2019
........
$
11
.15
0
.19
1
.21
1
.40
(
0
.11
)
(
0
.09
)
0
.00
(
0
.20
)
Balanced
Fund
-
Institutional
Class
(4)
(5)
(6)
(7)
2024
........
$
12
.83
0
.11
1
.07
1
.18
(
0
.10
)
0
.00
0
.00
(
0
.10
)
2023
........
$
11
.64
0
.25
1
.20
1
.45
(
0
.26
)
0
.00
0
.00
(
0
.26
)
2022
........
$
13
.56
0
.11
(
1
.58
)
(
1
.47
)
(
0
.25
)
(
0
.20
)
0
.00
(
0
.45
)
2021
........
$
12
.94
0
.10
1
.67
1
.77
(
0
.21
)
(
0
.94
)
0
.00
(
1
.15
)
2020
........
$
12
.36
0
.14
0
.55
0
.69
(
0
.11
)
0
.00
0
.00
(
0
.11
)
2019
........
$
11
.15
0
.21
1
.21
1
.42
(
0
.12
)
(
0
.09
)
0
.00
(
0
.21
)
2024
Semi-Annual
Report
|
June
30,
2024
The
accompanying
notes
are
an
integral
part
of
these
financial
statements.
Ratios/Supplemental
Data
Net
Asset
Value,
End
of
Period
Total
Return
(Assumes
Reinvestment
of
Distributions)
Net
Assets,
End
of
Period
($000)
Ratio
of
Net
Investment
Income
(Loss)
to
Average
Net
Assets
Ratio
of
Expenses
to
Average
Net
Assets
After
Fee
Reductions
(2)
Ratio
of
Expenses
to
Average
Net
Assets
Before
Fee
Reductions
(3)
Portfolio
Turnover
Rate
$
12
.12
7
.86
%
$
3,021
1
.86
%
1
.82
%
1
.82
%
100%
$
11
.32
15
.37
%
$
2,880
1
.79
%
1
.89
%
1
.89
%
262%
$
9
.98
(
12
.94
%
)
$
2,399
(
0
.18
)
%
1
.81
%
1
.81
%
243%
$
11
.55
12
.58
%
$
3,567
(
0
.63
)
%
1
.72
%
1
.72
%
173%
$
11
.40
2
.96
%
$
9,001
(
0
.25
)
%
1
.74
%
1
.74
%
179%
$
11
.32
13
.17
%
$
11,154
0
.76
%
1
.68
%
1
.68
%
185%
$
12
.23
8
.06
%
$
4,041
2
.27
%
1
.41
%
1
.41
%
100%
$
11
.42
15
.82
%
$
3,838
2
.15
%
1
.47
%
1
.47
%
262%
$
10
.08
(
12
.52
%
)
$
4,088
0
.28
%
1
.37
%
1
.37
%
243%
$
11
.61
12
.90
%
$
5,099
(
0
.14
)
%
1
.31
%
1
.31
%
173%
$
11
.42
3
.42
%
$
1,740
0
.09
%
1
.40
%
1
.40
%
179%
$
11
.35
13
.34
%
$
1,772
1
.01
%
1
.45
%
1
.45
%
185%
$
12
.20
7
.99
%
$
29,106
2
.24
%
1
.45
%
1
.45
%
100%
$
11
.40
15
.87
%
$
26,394
2
.17
%
1
.49
%
1
.49
%
262%
$
10
.05
(
12
.56
%
)
$
25,175
0
.25
%
1
.37
%
1
.37
%
243%
$
11
.58
13
.05
%
$
36,590
(
0
.16
)
%
1
.30
%
1
.30
%
173%
$
11
.38
3
.43
%
$
34,841
0
.17
%
1
.31
%
1
.31
%
179%
$
11
.36
13
.66
%
$
38,497
1
.19
%
1
.25
%
1
.25
%
185%
$
13
.75
9
.07
%
$
9,413
1
.42
%
1
.34
%
1
.34
%
113%
$
12
.68
12
.08
%
$
7,742
1
.73
%
1
.37
%
1
.37
%
273%
$
11
.50
(
11
.09
%
)
$
6,117
0
.48
%
1
.39
%
1
.39
%
365%
$
13
.42
13
.23
%
$
7,086
(
0
.09
)
%
1
.36
%
1
.36
%
205%
$
12
.82
5
.27
%
$
75,449
0
.65
%
1
.41
%
1
.41
%
189%
$
12
.26
12
.29
%
$
92,815
1
.34
%
1
.41
%
1
.41
%
180%
$
13
.88
9
.30
%
$
75,108
1
.80
%
0
.96
%
0
.96
%
113%
$
12
.80
12
.48
%
$
69,697
2
.13
%
0
.98
%
0
.98
%
273%
$
11
.62
(
10
.77
%
)
$
65,668
0
.89
%
0
.97
%
0
.97
%
365%
$
13
.53
13
.71
%
$
71,034
0
.78
%
0
.97
%
0
.97
%
205%
$
12
.92
5
.66
%
$
18,699
1
.03
%
1
.04
%
1
.04
%
189%
$
12
.35
12
.59
%
$
20,182
1
.61
%
1
.14
%
1
.14
%
180%
$
13
.91
9
.20
%
$
307,333
1
.71
%
1
.06
%
1
.06
%
113%
$
12
.83
12
.53
%
$
286,932
2
.10
%
1
.00
%
1
.05
%
273%
$
11
.64
(
10
.80
%
)
$
273,928
0
.86
%
1
.00
%
1
.05
%
365%
$
13
.56
13
.71
%
$
309,130
0
.69
%
1
.00
%
1
.02
%
205%
$
12
.94
5
.71
%
$
302,350
1
.09
%
0
.98
%
1
.03
%
189%
$
12
.36
12
.77
%
$
295,200
1
.79
%
0
.96
%
1
.04
%
180%
2024
Semi-Annual
Report
|
June
30,
2024
The
accompanying
notes
are
an
integral
part
of
these
financial
statements.
Financial
Highlights
For
the
Six
Months
Ended
June
30,
2024
(unaudited)
and
the
Years
Ended
December
31,
[?]
See
footnotes
on
pages
54
and
55
.
Income
from
Investment
Operations
Less
Distributions
Net
Asset
Value,
Beginning
of
Period
Net
Investment
Income
(Loss)
(1)
Net
gains
(losses)
on
securities
and
futures
(both
realized
and
unrealized)
Total
from
Investment
Operations
From
Net
Investment
Income
From
Net
Capital
Gains
From
Return
of
Capital
Total
Distributions
Moderate
Allocation
Fund
-
Retail
Class
(4)
(5)
(6)
(7)
2024
........
$
11
.87
0
.12
0
.64
0
.76
(
0
.11
)
0
.00
0
.00
(
0
.11
)
2023
........
$
10
.97
0
.27
0
.91
1
.18
(
0
.28
)
0
.00
0
.00
(
0
.28
)
2022
........
$
12
.64
0
.08
(
1
.43
)
(
1
.35
)
(
0
.24
)
(
0
.08
)
0
.00
(
0
.32
)
2021
........
$
12
.37
(
0
.02
)
1
.10
1
.08
(
0
.05
)
(
0
.76
)
0
.00
(
0
.81
)
2020
........
$
11
.85
0
.13
0
.52
0
.65
(
0
.13
)
0
.00
0
.00
(
0
.13
)
2019
........
$
10
.84
0
.20
1
.00
1
.20
(
0
.19
)
0
.00
0
.00
(
0
.19
)
Moderate
Allocation
Fund
-
Adviser
Class
(4)
(5)
(6)
(7)
2024
........
$
11
.93
0
.15
0
.63
0
.78
(
0
.14
)
0
.00
0
.00
(
0
.14
)
2023
........
$
11
.01
0
.32
0
.92
1
.24
(
0
.32
)
0
.00
0
.00
(
0
.32
)
2022
........
$
12
.66
0
.14
(
1
.45
)
(
1
.31
)
(
0
.26
)
(
0
.08
)
0
.00
(
0
.34
)
2021
........
$
12
.39
0
.16
0
.97
1
.13
(
0
.10
)
(
0
.76
)
0
.00
(
0
.86
)
2020
........
$
11
.86
0
.17
0
.53
0
.70
(
0
.17
)
0
.00
0
.00
(
0
.17
)
2019
........
$
10
.85
0
.24
1
.00
1
.24
(
0
.23
)
0
.00
0
.00
(
0
.23
)
Moderate
Allocation
Fund
-
Institutional
Class
(4)
(5)
(6)
(7)
2024
........
$
11
.95
0
.14
0
.63
0
.77
(
0
.13
)
0
.00
0
.00
(
0
.13
)
2023
........
$
11
.03
0
.31
0
.93
1
.24
(
0
.32
)
0
.00
0
.00
(
0
.32
)
2022
........
$
12
.68
0
.13
(
1
.44
)
(
1
.31
)
(
0
.26
)
(
0
.08
)
0
.00
(
0
.34
)
2021
........
$
12
.42
0
.14
0
.98
1
.12
(
0
.10
)
(
0
.76
)
0
.00
(
0
.86
)
2020
........
$
11
.89
0
.17
0
.53
0
.70
(
0
.17
)
0
.00
0
.00
(
0
.17
)
2019
........
$
10
.88
0
.25
1
.00
1
.25
(
0
.24
)
0
.00
0
.00
(
0
.24
)
Conservative
Allocation
Fund
-
Retail
Class
(4)
(5)
(6)
(7)
2024
........
$
22
.22
0
.29
0
.57
0
.86
(
0
.28
)
0
.00
0
.00
(
0
.28
)
2023
........
$
20
.85
0
.62
1
.37
1
.99
(
0
.62
)
0
.00
0
.00
(
0
.62
)
2022
........
$
23
.64
0
.22
(
2
.64
)
(
2
.42
)
(
0
.25
)
(
0
.12
)
0
.00
(
0
.37
)
2021
........
$
23
.91
0
.22
0
.89
1
.11
(
0
.24
)
(
1
.14
)
0
.00
(
1
.38
)
2020
........
$
22
.85
0
.37
1
.04
1
.41
(
0
.35
)
0
.00
0
.00
(
0
.35
)
2019
........
$
21
.18
0
.51
1
.65
2
.16
(
0
.49
)
0
.00
0
.00
(
0
.49
)
Conservative
Allocation
Fund
-
Adviser
Class
(4)
(5)
(6)
(7)
2024
........
$
22
.49
0
.33
0
.57
0
.90
(
0
.32
)
0
.00
0
.00
(
0
.32
)
2023
........
$
21
.11
0
.71
1
.38
2
.09
(
0
.71
)
0
.00
0
.00
(
0
.71
)
2022
........
$
23
.91
0
.31
(
2
.69
)
(
2
.38
)
(
0
.30
)
(
0
.12
)
0
.00
(
0
.42
)
2021
........
$
24
.21
0
.41
0
.81
1
.22
(
0
.38
)
(
1
.14
)
0
.00
(
1
.52
)
2020
........
$
23
.13
0
.46
1
.06
1
.52
(
0
.44
)
0
.00
0
.00
(
0
.44
)
2019
........
$
21
.44
0
.57
1
.67
2
.24
(
0
.55
)
0
.00
0
.00
(
0
.55
)
Conservative
Allocation
Fund
-
Institutional
Class
(4)
(5)
(6)
(7)
2024
........
$
22
.55
0
.32
0
.57
0
.89
(
0
.32
)
0
.00
0
.00
(
0
.32
)
2023
........
$
21
.15
0
.69
1
.40
2
.09
(
0
.69
)
0
.00
0
.00
(
0
.69
)
2022
........
$
23
.96
0
.29
(
2
.69
)
(
2
.40
)
(
0
.29
)
(
0
.12
)
0
.00
(
0
.41
)
2021
........
$
24
.26
0
.38
0
.81
1
.19
(
0
.35
)
(
1
.14
)
0
.00
(
1
.49
)
2020
........
$
23
.18
0
.46
1
.06
1
.52
(
0
.44
)
0
.00
0
.00
(
0
.44
)
2019
........
$
21
.49
0
.59
1
.68
2
.27
(
0
.58
)
0
.00
0
.00
(
0
.58
)
2024
Semi-Annual
Report
|
June
30,
2024
The
accompanying
notes
are
an
integral
part
of
these
financial
statements.
Ratios/Supplemental
Data
Net
Asset
Value,
End
of
Period
Total
Return
(Assumes
Reinvestment
of
Distributions)
Net
Assets,
End
of
Period
($000)
Ratio
of
Net
Investment
Income
(Loss)
to
Average
Net
Assets
Ratio
of
Expenses
to
Average
Net
Assets
After
Fee
Reductions
(2)
Ratio
of
Expenses
to
Average
Net
Assets
Before
Fee
Reductions
(3)
Portfolio
Turnover
Rate
$
12
.52
6
.41
%
$
910
2
.02
%
1
.35
%
1
.35
%
87%
$
11
.87
10
.92
%
$
932
2
.42
%
1
.37
%
1
.37
%
246%
$
10
.97
(
10
.75
%
)
$
1,033
0
.73
%
1
.36
%
1
.36
%
446%
$
12
.64
8
.74
%
$
1,190
(
0
.22
)
%
1
.34
%
1
.34
%
211%
$
12
.37
5
.55
%
$
30,930
1
.00
%
1
.38
%
1
.38
%
160%
$
11
.85
11
.13
%
$
35,460
1
.73
%
1
.38
%
1
.38
%
155%
$
12
.57
6
.54
%
$
33,887
2
.44
%
0
.94
%
0
.94
%
87%
$
11
.93
11
.43
%
$
32,881
2
.85
%
0
.94
%
0
.94
%
246%
$
11
.01
(
10
.39
%
)
$
30,879
1
.18
%
0
.94
%
0
.94
%
446%
$
12
.66
9
.15
%
$
29,781
1
.13
%
0
.94
%
0
.94
%
211%
$
12
.39
6
.04
%
$
9,823
1
.39
%
1
.00
%
1
.00
%
160%
$
11
.86
11
.45
%
$
10,080
2
.00
%
1
.11
%
1
.11
%
155%
$
12
.59
6
.45
%
$
139,793
2
.35
%
1
.03
%
1
.03
%
87%
$
11
.95
11
.36
%
$
132,211
2
.77
%
1
.02
%
1
.02
%
246%
$
11
.03
(
10
.39
%
)
$
126,610
1
.09
%
1
.00
%
1
.00
%
446%
$
12
.68
9
.05
%
$
142,788
1
.01
%
0
.99
%
0
.99
%
211%
$
12
.42
6
.02
%
$
135,512
1
.40
%
0
.99
%
0
.99
%
160%
$
11
.89
11
.52
%
$
132,500
2
.10
%
1
.01
%
1
.01
%
155%
$
22
.80
3
.87
%
$
6,195
2
.59
%
1
.22
%
1
.22
%
72%
$
22
.22
9
.67
%
$
5,675
2
.92
%
1
.24
%
1
.24
%
277%
$
20
.85
(
10
.24
%
)
$
5,328
1
.01
%
1
.21
%
1
.21
%
543%
$
23
.64
4
.64
%
$
6,879
0
.78
%
1
.22
%
1
.23
%
210%
$
23
.91
6
.28
%
$
29,034
1
.46
%
1
.28
%
1
.28
%
139%
$
22
.85
10
.25
%
$
31,688
2
.19
%
1
.28
%
1
.28
%
136%
$
23
.07
4
.00
%
$
23,115
2
.94
%
0
.87
%
0
.87
%
72%
$
22
.49
10
.06
%
$
22,207
3
.28
%
0
.88
%
0
.88
%
277%
$
21
.11
(
9
.94
%
)
$
21,189
1
.40
%
0
.87
%
0
.87
%
543%
$
23
.91
5
.04
%
$
22,283
1
.56
%
0
.87
%
0
.88
%
210%
$
24
.21
6
.69
%
$
7,082
1
.85
%
0
.92
%
0
.92
%
139%
$
23
.13
10
.51
%
$
6,787
2
.44
%
1
.04
%
1
.04
%
136%
$
23
.12
3
.95
%
$
103,940
2
.85
%
0
.96
%
0
.96
%
72%
$
22
.55
10
.03
%
$
100,435
3
.21
%
0
.96
%
0
.96
%
277%
$
21
.15
(
10
.00
%
)
$
93,889
1
.33
%
0
.94
%
0
.94
%
543%
$
23
.96
4
.94
%
$
105,307
1
.42
%
0
.92
%
0
.93
%
210%
$
24
.26
6
.68
%
$
105,403
1
.87
%
0
.92
%
0
.92
%
139%
$
23
.18
10
.61
%
$
99,456
2
.54
%
0
.94
%
0
.94
%
136%
2024
Semi-Annual
Report
|
June
30,
2024
The
accompanying
notes
are
an
integral
part
of
these
financial
statements.
Financial
Highlights
For
the
Six
Months
Ended
June
30,
2024
(unaudited)
and
the
Years
Ended
December
31,
[?]
See
footnotes
on
pages
54
and
55
.
Income
from
Investment
Operations
Less
Distributions
Net
Asset
Value,
Beginning
of
Period
Net
Investment
Income
(Loss)
(1)
Net
gains
(losses)
on
securities
and
futures
(both
realized
and
unrealized)
Total
from
Investment
Operations
From
Net
Investment
Income
From
Net
Capital
Gains
From
Return
of
Capital
Total
Distributions
Dynamic
Allocation
Fund
-
Retail
Class
(4)
(5)
(6)
(7)
2024
........
$
13
.53
0
.10
1
.43
1
.53
(
0
.09
)
0
.00
0
.00
(
0
.09
)
2023
........
$
11
.36
0
.14
2
.17
2
.31
(
0
.14
)
0
.00
0
.00
(
0
.14
)
2022
........
$
13
.93
0
.03
(
2
.18
)
(
2
.15
)
(
0
.06
)
(
0
.36
)
0
.00
(
0
.42
)
2021
........
$
13
.39
(
0
.03
)
2
.65
2
.62
(
0
.08
)
(
2
.00
)
0
.00
(
2
.08
)
2020
........
$
11
.87
0
.03
1
.79
1
.82
(
0
.03
)
(
0
.27
)
0
.00
(
0
.30
)
2019
........
$
9
.79
0
.11
2
.23
2
.34
(
0
.08
)
(
0
.18
)
0
.00
(
0
.26
)
Dynamic
Allocation
Fund
-
Adviser
Class
(4)
(5)
(6)
(7)
2024
........
$
13
.71
0
.13
1
.45
1
.58
(
0
.11
)
0
.00
0
.00
(
0
.11
)
2023
........
$
11
.52
0
.19
2
.19
2
.38
(
0
.19
)
0
.00
0
.00
(
0
.19
)
2022
........
$
14
.07
0
.07
(
2
.20
)
(
2
.13
)
(
0
.06
)
(
0
.36
)
0
.00
(
0
.42
)
2021
........
$
13
.46
0
.04
2
.65
2
.69
(
0
.08
)
(
2
.00
)
0
.00
(
2
.08
)
2020
........
$
11
.91
0
.07
1
.81
1
.88
(
0
.06
)
(
0
.27
)
0
.00
(
0
.33
)
2019
........
$
9
.82
0
.13
2
.24
2
.37
(
0
.10
)
(
0
.18
)
0
.00
(
0
.28
)
Dynamic
Allocation
Fund
-
Institutional
Class
(4)
(5)
(6)
(7)
2024
........
$
13
.69
0
.12
1
.44
1
.56
(
0
.10
)
0
.00
0
.00
(
0
.10
)
2023
........
$
11
.49
0
.18
2
.19
2
.37
(
0
.17
)
0
.00
0
.00
(
0
.17
)
2022
........
$
14
.04
0
.06
(
2
.19
)
(
2
.13
)
(
0
.06
)
(
0
.36
)
0
.00
(
0
.42
)
2021
........
$
13
.45
0
.03
2
.64
2
.67
(
0
.08
)
(
2
.00
)
0
.00
(
2
.08
)
2020
........
$
11
.90
0
.08
1
.80
1
.88
(
0
.06
)
(
0
.27
)
0
.00
(
0
.33
)
2019
........
$
9
.82
0
.15
2
.23
2
.38
(
0
.12
)
(
0
.18
)
0
.00
(
0
.30
)
Sector
Rotation
Fund
-
Retail
Class
(4)
(5)
(6)
(7)
2024
........
$
36
.73
0
.24
2
.43
2
.67
(
0
.22
)
0
.00
0
.00
(
0
.22
)
2023
........
$
32
.58
0
.44
4
.14
4
.58
(
0
.43
)
0
.00
0
.00
(
0
.43
)
2022
........
$
38
.89
0
.05
(
5
.47
)
(
5
.42
)
(
0
.89
)
0
.00
0
.00
(
0
.89
)
2021
........
$
35
.64
(
0
.02
)
9
.77
9
.75
(
0
.02
)
(
6
.48
)
0
.00
(
6
.50
)
2020
........
$
37
.91
0
.20
(
2
.28
)
(
2
.08
)
(
0
.19
)
0
.00
0
.00
(
0
.19
)
2019
........
$
32
.22
0
.19
5
.75
5
.94
(
0
.25
)
0
.00
0
.00
(
0
.25
)
Sector
Rotation
Fund
-
Adviser
Class
(4)
(5)
(6)
(7)
2024
........
$
37
.07
0
.29
2
.45
2
.74
(
0
.27
)
0
.00
0
.00
(
0
.27
)
2023
........
$
32
.88
0
.53
4
.18
4
.71
(
0
.52
)
0
.00
0
.00
(
0
.52
)
2022
........
$
39
.15
0
.13
(
5
.51
)
(
5
.38
)
(
0
.89
)
0
.00
0
.00
(
0
.89
)
2021
........
$
35
.75
0
.13
9
.77
9
.90
(
0
.02
)
(
6
.48
)
0
.00
(
6
.50
)
2020
........
$
38
.01
0
.23
(
2
.28
)
(
2
.05
)
(
0
.21
)
0
.00
0
.00
(
0
.21
)
2019
........
$
32
.28
0
.24
5
.76
6
.00
(
0
.27
)
0
.00
0
.00
(
0
.27
)
Sector
Rotation
Fund
-
Institutional
Class
(4)
(5)
(6)
(7)
2024
........
$
36
.99
0
.28
2
.45
2
.73
(
0
.25
)
0
.00
0
.00
(
0
.25
)
2023
........
$
32
.80
0
.51
4
.18
4
.69
(
0
.50
)
0
.00
0
.00
(
0
.50
)
2022
........
$
39
.07
0
.12
(
5
.50
)
(
5
.38
)
(
0
.89
)
0
.00
0
.00
(
0
.89
)
2021
........
$
35
.70
0
.09
9
.78
9
.87
(
0
.02
)
(
6
.48
)
0
.00
(
6
.50
)
2020
........
$
38
.01
0
.26
(
2
.31
)
(
2
.05
)
(
0
.26
)
0
.00
0
.00
(
0
.26
)
2019
........
$
32
.29
0
.29
5
.77
6
.06
(
0
.34
)
0
.00
0
.00
(
0
.34
)
2024
Semi-Annual
Report
|
June
30,
2024
The
accompanying
notes
are
an
integral
part
of
these
financial
statements.
Ratios/Supplemental
Data
Net
Asset
Value,
End
of
Period
Total
Return
(Assumes
Reinvestment
of
Distributions)
Net
Assets,
End
of
Period
($000)
Ratio
of
Net
Investment
Income
(Loss)
to
Average
Net
Assets
Ratio
of
Expenses
to
Average
Net
Assets
After
Fee
Reductions
(2)
Ratio
of
Expenses
to
Average
Net
Assets
Before
Fee
Reductions
(3)
Portfolio
Turnover
Rate
$
14
.97
11
.31
%
$
11,955
1
.39
%
1
.26
%
1
.33
%
148%
$
13
.53
20
.34
%
$
11,135
1
.15
%
1
.31
%
1
.39
%
279%
$
11
.36
(
15
.53
%
)
$
7,767
0
.22
%
1
.32
%
1
.41
%
295%
$
13
.93
19
.54
%
$
9,850
(
0
.21
)
%
1
.34
%
1
.43
%
213%
$
13
.39
15
.37
%
$
37,392
0
.27
%
1
.41
%
1
.51
%
236%
$
11
.87
24
.00
%
$
40,977
0
.97
%
1
.41
%
1
.51
%
265%
$
15
.18
11
.53
%
$
28,813
1
.73
%
0
.92
%
0
.99
%
148%
$
13
.71
20
.72
%
$
26,252
1
.48
%
0
.96
%
1
.04
%
279%
$
11
.52
(
15
.23
%
)
$
23,048
0
.57
%
0
.96
%
1
.05
%
295%
$
14
.07
20
.02
%
$
28,129
0
.25
%
0
.98
%
1
.07
%
213%
$
13
.46
15
.85
%
$
13,322
0
.61
%
1
.06
%
1
.16
%
236%
$
11
.91
24
.29
%
$
13,137
1
.20
%
1
.18
%
1
.28
%
265%
$
15
.15
11
.40
%
$
296,828
1
.65
%
1
.00
%
1
.07
%
148%
$
13
.69
20
.74
%
$
238,838
1
.44
%
1
.01
%
1
.09
%
279%
$
11
.49
(
15
.26
%
)
$
184,201
0
.53
%
1
.02
%
1
.11
%
295%
$
14
.04
19
.88
%
$
199,753
0
.21
%
1
.00
%
1
.09
%
213%
$
13
.45
15
.94
%
$
148,566
0
.67
%
1
.01
%
1
.11
%
236%
$
11
.90
24
.40
%
$
146,119
1
.38
%
1
.00
%
1
.10
%
265%
$
39
.18
7
.27
%
$
12,590
1
.29
%
1
.65
%
1
.65
%
164%
$
36
.73
14
.15
%
$
12,956
1
.30
%
1
.70
%
1
.70
%
38%
$
32
.58
(
13
.75
%
)
$
12,477
0
.15
%
1
.60
%
1
.60
%
56%
$
38
.89
27
.34
%
$
16,406
(
0
.05
)
%
1
.60
%
1
.60
%
64%
$
35
.64
(
5
.36
%
)
$
18,352
0
.65
%
1
.53
%
1
.53
%
88%
$
37
.91
18
.48
%
$
24,979
0
.52
%
1
.53
%
1
.53
%
82%
$
39
.54
7
.39
%
$
4,107
1
.53
%
1
.41
%
1
.41
%
164%
$
37
.07
14
.42
%
$
3,950
1
.55
%
1
.46
%
1
.46
%
38%
$
32
.88
(
13
.55
%
)
$
3,646
0
.36
%
1
.38
%
1
.38
%
56%
$
39
.15
27
.68
%
$
4,575
0
.31
%
1
.33
%
1
.33
%
64%
$
35
.75
(
5
.25
%
)
$
986
0
.77
%
1
.41
%
1
.41
%
88%
$
38
.01
18
.63
%
$
1,113
0
.67
%
1
.41
%
1
.41
%
82%
$
39
.47
7
.38
%
$
19,874
1
.49
%
1
.45
%
1
.45
%
164%
$
36
.99
14
.40
%
$
18,133
1
.51
%
1
.50
%
1
.50
%
38%
$
32
.80
(
13
.58
%
)
$
16,045
0
.34
%
1
.40
%
1
.40
%
56%
$
39
.07
27
.63
%
$
21,046
0
.20
%
1
.36
%
1
.36
%
64%
$
35
.70
(
5
.22
%
)
$
20,756
0
.85
%
1
.37
%
1
.37
%
88%
$
38
.01
18
.81
%
$
36,646
0
.82
%
1
.25
%
1
.25
%
82%
2024
Semi-Annual
Report
|
June
30,
2024
The
accompanying
notes
are
an
integral
part
of
these
financial
statements.
Financial
Highlights
For
the
Six
Months
Ended
June
30,
2024
(unaudited)
and
the
Years
Ended
December
31,
PageReference
Income
from
Investment
Operations
Less
Distributions
Net
Asset
Value,
Beginning
of
Period
Net
Investment
Income
(Loss)
(1)
Net
gains
(losses)
on
securities
and
futures
(both
realized
and
unrealized)
Total
from
Investment
Operations
From
Net
Investment
Income
From
Net
Capital
Gains
From
Return
of
Capital
Total
Distributions
Tactical
Income
Fund
-
Retail
Class
(4)
(5)
(6)
(7)
2024
........
$
9
.22
0
.20
(
0
.02
)
0
.18
(
0
.20
)
0
.00
0
.00
(
0
.20
)
2023
........
$
8
.93
0
.33
0
.29
0
.62
(
0
.33
)
0
.00
0
.00
(
0
.33
)
2022
........
$
9
.63
0
.12
(
0
.70
)
(
0
.58
)
(
0
.12
)
0
.00
0
.00
(
0
.12
)
2021
........
$
9
.98
0
.13
(
0
.33
)
(
0
.20
)
(
0
.15
)
0
.00
0
.00
(
0
.15
)
2020
........
$
9
.46
0
.21
0
.49
0
.70
(
0
.18
)
0
.00
0
.00
(
0
.18
)
2019
........
$
9
.03
0
.23
0
.42
0
.65
(
0
.22
)
0
.00
0
.00
(
0
.22
)
Tactical
Income
Fund
-
Adviser
Class
(4)
(5)
(6)
(7)
2024
........
$
9
.23
0
.21
(
0
.01
)
0
.20
(
0
.21
)
0
.00
0
.00
(
0
.21
)
2023
........
$
8
.94
0
.36
0
.30
0
.66
(
0
.37
)
0
.00
0
.00
(
0
.37
)
2022
........
$
9
.64
0
.16
(
0
.70
)
(
0
.54
)
(
0
.16
)
0
.00
0
.00
(
0
.16
)
2021
........
$
9
.99
0
.21
(
0
.37
)
(
0
.16
)
(
0
.19
)
0
.00
0
.00
(
0
.19
)
2020
........
$
9
.47
0
.25
0
.49
0
.74
(
0
.22
)
0
.00
0
.00
(
0
.22
)
2019
........
$
9
.04
0
.26
0
.42
0
.68
(
0
.25
)
0
.00
0
.00
(
0
.25
)
Tactical
Income
Fund
-
Institutional
Class
(4)
(5)
(6)
(7)
2024
........
$
9
.23
0
.21
(
0
.02
)
0
.19
(
0
.21
)
0
.00
0
.00
(
0
.21
)
2023
........
$
8
.94
0
.36
0
.29
0
.65
(
0
.36
)
0
.00
0
.00
(
0
.36
)
2022
........
$
9
.64
0
.15
(
0
.70
)
(
0
.55
)
(
0
.15
)
0
.00
0
.00
(
0
.15
)
2021
........
$
9
.99
0
.20
(
0
.36
)
(
0
.16
)
(
0
.19
)
0
.00
0
.00
(
0
.19
)
2020
........
$
9
.47
0
.24
0
.50
0
.74
(
0
.22
)
0
.00
0
.00
(
0
.22
)
2019
........
$
9
.04
0
.27
0
.42
0
.69
(
0
.26
)
0
.00
0
.00
(
0
.26
)
Money
Market
Fund
(4)
(5)
(6)
(7)
2024
........
$
1
.0003
$
0
.0266
$
(
0
.0002
)
$
0
.0264
$
(
0
.0266
)
$
0
.0000
$
0
.0000
$
(
0
.0266
)
2023
........
$
1
.0000
$
0
.0508
$
0
.0005
$
0
.0513
$
(
0
.0510
)
$
0
.0000
$
0
.0000
$
(
0
.0510
)
2022
........
$
1
.0001
$
0
.0167
$
(
0
.0008
)
$
0
.0159
$
(
0
.0160
)
$
0
.0000
$
0
.0000
$
(
0
.0160
)
2021
........
$
1
.0003
$
0
.0005
$
0
.0003
$
0
.0008
$
(
0
.0010
)
$
0
.0000
$
0
.0000
$
(
0
.0010
)
2020
........
$
1
.0000
$
0
.0058
$
(
0
.0005
)
$
0
.0053
$
(
0
.0050
)
$
0
.0000
$
0
.0000
$
(
0
.0050
)
2019
........
$
0
.9999
$
0
.0231
$
–
$
0
.0231
$
(
0
.0230
)
$
0
.0000
$
0
.0000
$
(
0
.0230
)
(1)
Except
for
the
Money
Market
Fund,
net
investment
income
per
share
is
based
on
average
shares
outstanding
during
the
period.
(2)
Ratio
of
expenses
to
average
net
assets
after
fee
reductions
reflects
contractual
or
voluntary
waivers
and
reimbursements
of
expenses
by
the
investment
adviser
and
transfer
agent.
(3)
Ratio
of
expenses
to
average
net
assets
before
fee
reductions
reflects
the
total
expenses
before
reductions
reported
in
the
statements
of
operations.
(4)
Ratio
of
net
investment
income
(loss)
to
average
net
assets,
ratio
of
expenses
to
average
net
assets
after
fee
reductions,
and
ratio
of
expenses
to
average
net
assets
before
fee
reductions
do
not
include
impact
of
expenses
of
the
underlying
security
holdings
as
represented
in
the
schedule
of
investments.
2024
Semi-Annual
Report
|
June
30,
2024
The
accompanying
notes
are
an
integral
part
of
these
financial
statements.
Ratios/Supplemental
Data
Net
Asset
Value,
End
of
Period
Total
Return
(Assumes
Reinvestment
of
Distributions)
Net
Assets,
End
of
Period
($000)
Ratio
of
Net
Investment
Income
(Loss)
to
Average
Net
Assets
Ratio
of
Expenses
to
Average
Net
Assets
After
Fee
Reductions
(2)
Ratio
of
Expenses
to
Average
Net
Assets
Before
Fee
Reductions
(3)
Portfolio
Turnover
Rate
$
9
.20
1
.97
%
$
2,590
4
.28
%
1
.10
%
1
.21
%
69%
$
9
.22
7
.10
%
$
2,476
3
.67
%
1
.12
%
1
.23
%
262%
$
8
.93
(
5
.99
%
)
$
2,247
1
.27
%
1
.11
%
1
.22
%
514%
$
9
.63
(
2
.01
%
)
$
2,721
1
.10
%
1
.14
%
1
.25
%
250%
$
9
.98
7
.46
%
$
12,231
1
.87
%
1
.15
%
1
.26
%
69%
$
9
.46
7
.24
%
$
11,137
2
.27
%
1
.14
%
1
.25
%
95%
$
9
.22
2
.24
%
$
9,985
4
.67
%
0
.71
%
0
.82
%
69%
$
9
.23
7
.54
%
$
9,359
4
.06
%
0
.73
%
0
.84
%
262%
$
8
.94
(
5
.65
%
)
$
10,625
1
.77
%
0
.71
%
0
.82
%
514%
$
9
.64
(
1
.60
%
)
$
8,982
1
.98
%
0
.75
%
0
.86
%
250%
$
9
.99
7
.86
%
$
5,463
2
.28
%
0
.79
%
0
.90
%
69%
$
9
.47
7
.54
%
$
4,205
2
.64
%
0
.88
%
0
.99
%
95%
$
9
.21
2
.09
%
$
61,784
4
.58
%
0
.80
%
0
.91
%
69%
$
9
.23
7
.44
%
$
58,266
3
.99
%
0
.80
%
0
.91
%
262%
$
8
.94
(
5
.70
%
)
$
54,455
1
.65
%
0
.78
%
0
.89
%
514%
$
9
.64
(
1
.62
%
)
$
57,638
1
.90
%
0
.79
%
0
.90
%
250%
$
9
.99
7
.86
%
$
50,410
2
.25
%
0
.77
%
0
.88
%
69%
$
9
.47
7
.67
%
$
46,490
2
.72
%
0
.76
%
0
.87
%
95%
$
1
.0001
2
.67
%
$
507,375
5
.34
%
0
.21
%
0
.49
%
N/A
$
1
.0003
5
.20
%
$
637,751
5
.08
%
0
.19
%
0
.46
%
N/A
$
1
.0000
1
.63
%
$
693,083
1
.67
%
0
.17
%
0
.45
%
N/A
$
1
.0001
0
.03
%
$
626,993
0
.05
%
0
.11
%
0
.50
%
N/A
$
1
.0003
0
.57
%
$
336,445
0
.57
%
0
.15
%
0
.52
%
N/A
$
1
.0000
2
.31
%
$
370,120
2
.30
%
0
.13
%
0
.50
%
N/A
(5)
Recognition
of
net
investment
income
by
the
Fund
is
affected
by
the
timing
of
the
declaration
of
dividends
by
the
underlying
investment
companies
in
which
the
Fund
invests.
(6)
Total
return
and
portfolio
turnover
rate
are
not
annualized
for
periods
of
less
than
one
full
year.
(7)
Ratio
of
net
investment
income
(loss)
to
average
net
assets,
ratio
of
expenses
to
average
net
assets
after
fee
reductions,
and
ratio
of
expenses
to
average
net
assets
before
fee
reductions
are
annualized
for
periods
of
less
than
one
full
year.
2024
Semi-Annual
Report
|
June
30,
2024
Notes
to
Financial
Statements
June
30,
2024
(unaudited)
1.
Organization
Meeder
Funds
(the
Trust)
is
organized
as
a
Massachusetts
business
trust
and
is
registered
under
the
Investment
Company
Act
of
1940,
as
amended
(the
1940
Act),
as
a
diversified,
open-end
management
investment
company.
The
Trust
offers
ten
separate
series,
all
of
which
are
included
in
this
report:
Muirfield
Fund
(Muirfield),
Spectrum
Fund
(Spectrum),
Global
Allocation
Fund
(Global),
Balanced
Fund
(Balanced),
Moderate
Allocation
Fund
(Moderate),
Conservative
Allocation
Fund
(Conservative),
Dynamic
Allocation
Fund
(Dynamic),
Sector
Allocation
Fund
(f.k.a.
Quantex
Fund)(Sector
Rotation),
Tactical
Income
Fund
(Income),
and
Institutional
Prime
Money
Market
Fund
(Money
Market)(the
Funds).
Each
Fund,
except
Money
Market,
offers
three
classes
of
shares:
Retail
Class,
Adviser
Class,
and
Institutional
Class.
Money
Market
offers
only
one
class
of
shares.
The
share
classes
differ
with
respect
to
distribution
fees,
service
fees,
and
other
expenses
allocated
to
each
class.
Eligibility
to
purchase
Adviser
and
Institutional
Class
shares
is
generally
limited
to
customers
of
financial
intermediaries
who
enter
into
special
arrangements
with
the
Funds
or
who
meet
certain
initial
investment
minimums.
Money
Market
operates
as
an
institutional
money
market
fund
open
to
all
forms
of
investors.
Its
net
asset
value
fluctuates
based
upon
changes
in
the
value
of
its
investments
and
the
value
of
its
shares
is
calculated
daily
to
four
decimal
places.
Money
Market
has
adopted
policies
and
procedures
to
impose
liquidity
fees
on
redemptions
or
temporary
redemption
gates
in
the
event
that
the
Fund’s
weekly
liquid
assets
fall
below
designated
thresholds
and
the
Board
of
Trustees
determines
that
such
liquidity
fees
or
redemption
gates
are
in
the
best
interests
of
the
Fund.
Effective
April
1,
2024,
Quantex
Fund
changed
its
name
to
Sector
Rotation
Fund
and
changed
its
principal
investment
strategy
from
one
focused
on
investments
in
mid-capitalization
companies
to
one
focused
on
rotation
of
fund
assets
between
and
among
investments
in
securities
market
sectors
considered
most
promising.
For
more
information
regarding
the
Funds’
objectives,
strategies,
and
differences
in
share
classes,
please
refer
to
the
Funds’
prospectus.
2.
Significant
Accounting
Policies
The
Funds’
financial
statements
are
prepared
in
conformity
with
accounting
principles
generally
accepted
in
the
United
States
of
America
(GAAP),
which
require
management
to
make
certain
estimates
and
assumptions
that
affect
the
reported
amounts
of
assets
and
liabilities
and
disclosure
of
contingent
assets
and
liabilities
at
the
date
of
the
financial
statements.
The
Trust
is
an
investment
company
and
applies
the
accounting
and
reporting
guidance
of
the
Financial
Accounting
Standards
Board
(FASB)
Accounting
Standards
Codification
Topic
946
Financial
Services
Companies.
The
following
summarizes
the
significant
accounting
policies
of
the
Trust
and
the
Funds:
Securities
valuation.
All
investments
in
securities
are
recorded
at
their
estimated
fair
value,
as
described
in
Note
#3.
Repurchase
agreements.
Each
Fund
may
engage
in
repurchase
agreement
transactions
whereby
the
Fund
takes
possession
of
an
underlying
debt
instrument
subject
to
an
obligation
of
the
seller
to
repurchase
the
instrument
from
the
Fund
and
an
obligation
of
the
Fund
to
resell
the
instrument
at
an
agreed
upon
price
and
term.
At
all
times,
the
Fund
maintains
the
fair
value
of
collateral,
including
accrued
interest,
of
at
least
100%
of
the
amount
of
the
repurchase
agreement,
plus
accrued
interest.
If
the
seller
defaults
or
the
fair
value
of
the
collateral
declines,
realization
of
the
collateral
by
the
Fund
may
be
delayed
or
limited.
Short
sales.
Spectrum
may
enter
into
short
sales
as
part
of
its
overall
portfolio
management
strategy
or
to
offset
a
potential
decline
in
value
of
a
security.
The
Fund
may
engage
in
short
sales
with
respect
to
various
types
of
securities,
including
ETFs.
A
short
sale
involves
the
sale
of
a
security
that
is
borrowed
from
a
broker
or
other
institution
to
complete
the
sale.
The
Fund
may
engage
in
short
sales
with
respect
to
securities
it
owns,
as
well
as
securities
that
it
does
not
own.
Short
sales
expose
the
Fund
to
the
risk
that
it
will
be
required
to
acquire,
convert,
or
exchange
securities
to
replace
the
borrowed
securities
(also
known
as
“covering”
the
short
position)
at
a
time
when
the
securities
sold
short
have
appreciated
in
value,
thus
resulting
in
a
loss
to
the
Fund.
The
Fund’s
investment
performance
may
also
suffer
if
the
Fund
is
required
to
close
out
a
short
position
earlier
than
it
had
intended.
The
Fund
must
segregate
assets
determined
to
be
liquid
in
accordance
with
procedures
established
by
the
Board,
or
otherwise
cover
its
position
in
a
permissible
manner.
The
Fund
will
be
required
to
pledge
its
liquid
assets
to
the
broker
in
order
to
secure
its
performance
on
short
sales.
As
a
result,
the
assets
pledged
may
not
be
available
to
meet
the
Fund’s
needs
for
immediate
cash
or
other
liquidity.
In
addition,
the
Fund
may
be
subject
to
expenses
related
to
short
sales
that
are
not
typically
associated
with
investing
in
securities
directly,
such
as
costs
of
borrowing
and
margin
account
maintenance
costs
associated
with
the
Fund’s
open
short
positions.
These
types
of
short
sales
expenses
are
sometimes
referred
to
as
the
“negative
cost
of
carry,”
and
will
tend
to
cause
the
Fund
to
lose
money
on
a
short
sale
even
in
instances
where
the
price
of
the
underlying
security
sold
short
does
not
change
over
the
duration
of
the
short
sale.
Dividend
expenses
on
securities
sold
short
and
borrowing
costs
will
be
borne
by
the
Fund
and
are
reflected
in
the
Statements
of
Operations.
2024
Semi-Annual
Report
|
June
30,
2024
Futures
&
options.
Each
Fund,
except
Money
Market,
may
engage
in
transactions
in
financial
futures
contracts
and
options
contracts
in
order
to
manage
the
risk
of
unanticipated
changes
in
market
values
of
securities
held
in
the
Fund,
or
which
it
intends
to
purchase.
The
futures
and
options
contracts
are
adjusted
by
the
daily
exchange
rate
of
the
underlying
currency,
or
index,
and
any
gains
or
losses
are
recorded
for
financial
statement
purposes
as
unrealized
gains
or
losses
in
the
Statements
of
Assets
and
Liabilities
and
the
Statements
of
Operations
until
the
contract
settlement
date,
at
which
time
amounts
are
reflected
as
realized
gains
and
losses
in
the
Statements
of
Operations.
To
the
extent
that
a
Fund
enters
into
futures
contracts
on
an
index
or
group
of
securities,
the
Fund
exposes
itself
to
an
indeterminate
liability
and
will
be
required
to
pay
or
receive
a
sum
of
money
measured
by
the
change
in
the
fair
value
of
the
index.
Upon
entering
into
a
futures
contract,
the
Fund
is
required
to
deposit
an
initial
margin,
which
is
either
cash
or
securities
(disclosed
as
pledged
as
collateral
on
the
Schedules
of
Investments)
in
an
amount
equal
to
a
certain
percentage
of
the
contract
value.
Subsequently,
margin
movements,
which
are
equal
to
changes
in
the
daily
price
or
last
sale
price
on
the
exchanges
where
futures
contracts
trade,
are
recorded
as
unrealized
gains
or
losses
until
the
contract
is
closed.
When
the
contract
is
closed,
the
Fund
records
a
realized
gain
or
loss
equal
to
the
difference
between
the
proceeds
from
(or
cost
of)
the
closing
transaction
and
the
Fund’s
basis
in
the
contract.
Should
market
conditions
move
unexpectedly,
the
Fund
may
not
achieve
the
anticipated
benefits
of
the
futures
contract
and
may
realize
a
loss.
The
use
of
futures
transactions
involves
the
risk
of
imperfect
correlation
in
movements
in
the
price
of
futures
contracts,
interest
rates,
and
the
underlying
hedged
assets.
With
futures,
there
is
minimal
counterparty
credit
risk
to
the
Fund
since
futures
are
exchange
traded
and
the
exchange’s
clearinghouse,
as
counterparty
to
all
exchange
traded
futures,
guarantees
the
futures
against
default.
Except
for
Money
Market,
it
is
normal
practice
for
each
Fund
to
invest
in
futures
contracts
on
a
daily
basis.
The
Funds,
except
for
Income
and
Money
Market,
typically
utilize
equity
index
futures
contracts
to
equitize
cash
positions
or
adjust
targeted
stock
market
exposure.
Except
for
Money
Market,
the
fixed
income
portion
of
any
Fund
can
utilize
Treasury
futures
contracts
in
order
to
adjust
duration.
Call
and
put
option
contracts
involve
the
payment
of
a
premium
for
the
right
to
purchase
or
sell
an
individual
security
or
index
aggregate
at
a
specified
price
until
the
expiration
of
the
contract.
Such
transactions
expose
the
Fund
to
the
loss
of
the
premium
paid
if
the
Fund
does
not
sell
or
exercise
the
contract
prior
to
the
expiration
date.
In
the
case
of
a
call
option,
sufficient
cash
or
money
market
instruments
will
be
segregated
to
complete
the
purchase.
Options
are
fair
valued
on
the
basis
of
the
daily
settlement
price
or
last
sale
on
the
exchanges
where
they
trade
and
the
changes
in
fair
value
are
recorded
as
unrealized
appreciation
or
depreciation
until
closed,
exercised
or
expired.
For
the
six
months
ended
June
30,
2024
,
there
were
no
call
or
put
options
transacted
for
any
of
the
Funds.
The
Funds
may
write
covered
call
or
put
options
for
which
premiums
received
are
recorded
as
liabilities
and
are
subsequently
adjusted
to
the
current
value
of
the
options
written.
When
written
options
are
closed
or
exercised,
premiums
received
are
offset
against
the
proceeds
paid,
and
the
Fund
records
realized
gains
or
losses
for
the
difference.
When
written
options
expire,
the
liability
is
eliminated,
and
the
Fund
records
realized
gains
for
the
entire
amount
of
premiums
received.
Although
permitted,
it
is
currently
not
normal
practice
for
the
Funds
to
write
call
and
put
options
and
none
were
written
during
the
six
months
ended
June
30,
2024
.
The
fair
value
of
derivative
instruments,
not
accounted
for
as
hedging
instruments,
as
reported
within
the
Statements
of
Assets
and
Liabilities
as
of
June
30,
2024
was
as
follows:
Amount
of
Deposits
at
Broker
and
Unrealized
Appreciation
(Depreciation)
on
Derivatives
Type
of
Derivative/
Risk
Statements
of
Assets
&
Liabilities
Location
Fair
Value
of
Deposits
at
Broker
for
Futures
Contracts
Value
of
Unrealized
Appreciation
(Depreciation)
Muirfield
.............
Equity
Contracts
Assets,
Deposits
at
broker
for
futures
contracts;
Net
Assets,
Distributable
Earnings
(Accumulated
Deficit)
$
12,359,768
$
301,519
Spectrum
............
Equity
Contracts
Assets,
Deposits
at
broker
for
futures
contracts;
Net
Assets,
Distributable
Earnings
(Accumulated
Deficit)
4,055,231
109,140
Global
..............
Equity
Contracts
Assets,
Deposits
at
broker
for
futures
contracts;
Net
Assets,
Distributable
Earnings
(Accumulated
Deficit)
891,689
(45,353)
Balanced
............
Equity
Contracts
Assets,
Deposits
at
broker
for
futures
contracts;
Net
Assets,
Distributable
Earnings
(Accumulated
Deficit)
2,519,414
191,510
Moderate
............
Equity
Contracts
Assets,
Deposits
at
broker
for
futures
contracts;
Net
Assets,
Distributable
Earnings
(Accumulated
Deficit)
1,245,787
54,883
Conservative
..........
Equity
Contracts
Assets,
Deposits
at
broker
for
futures
contracts;
Net
Assets,
Distributable
Earnings
(Accumulated
Deficit)
391,471
27,327
Dynamic
.............
Equity
Contracts
Assets,
Deposits
at
broker
for
futures
contracts;
Net
Assets,
Distributable
Earnings
(Accumulated
Deficit)
5,878,972
(107,226)
Sector
Rotation
........
Equity
Contracts
Assets,
Deposits
at
broker
for
futures
contracts;
Net
Assets,
Distributable
Earnings
(Accumulated
Deficit)
620,476
(37,288)
2024
Semi-Annual
Report
|
June
30,
2024
The
effect
of
derivative
instruments
on
the
Statements
of
Operations
for
the
six
months
ended
June
30,
2024
and
related
activity
was
as
follows:
Amount
of
Realized
Gain
(Loss)
on
Derivatives
Recognized
in
Income
Change
in
Unrealized
Gain
or
(Loss)
on
Derivatives
Recognized
in
Income
05
Federal
income
taxes.
It
is
each
Fund’s
policy
to
continue
to
comply
with
the
requirements
of
Subchapter
M
of
the
Internal
Revenue
Code
applicable
to
regulated
investment
companies
and
to
distribute
substantially
all
of
its
taxable
income
and
net
capital
gains
to
its
shareholders.
Therefore,
no
federal
income
tax
provision
is
required.
The
Funds
recognize
the
tax
benefits
or
expenses
of
uncertain
tax
positions
only
where
the
position
is
“more
likely
than
not”
to
be
sustained
assuming
examination
by
tax
authorities.
Management
has
reviewed
tax
positions
taken
on
Federal
income
tax
returns
for
all
open
tax
years
(tax
years
ended
December
31,
2020
through
December
31,
2024
)
and
has
concluded
that
no
provision
for
unrecognized
tax
benefits
or
expenses
is
required
in
these
financial
statements.
Each
Fund
identifies
its
major
tax
jurisdictions
as
U.S.
Federal
and
certain
State
tax
authorities;
however
the
Funds
are
not
aware
of
any
tax
positions
for
which
it
is
reasonably
possible
that
the
total
amounts
of
unrecognized
tax
benefits
will
change
materially
in
the
next
twelve
months.
The
Funds
recognize
interest
and
penalties,
if
any,
related
to
unrecognized
tax
benefits
as
income
tax
expense
in
the
Statements
of
Operations
as
incurred.
During
the
six
months
ended
June
30,
2024
,
the
Funds
did
not
incur
any
material
interest
or
penalties.
Distributions
to
shareholders.
Distributions
to
shareholders
are
recorded
on
the
ex-dividend
date.
Muirfield,
Spectrum,
Global,
Balanced,
Moderate,
Conservative,
Dynamic,
and
Sector
declare
and
pay
dividends
from
net
investment
income,
if
any,
on
a
quarterly
basis.
Income
declares
and
pays
dividends
from
net
investment
income
on
a
monthly
basis.
Money
Market
declares
dividends
from
net
investment
income
on
a
daily
basis
and
pays
such
dividends
on
a
monthly
basis.
Each
Fund
distributes
net
capital
gains,
if
any,
on
an
annual
basis.
Type
of
Derivative/
Risk
Net
Long
Contracts
as
of
December
31,
2023
Long
and
Short
Contracts
Opened
During
the
Period
Long
and
Short
Contracts
Closed/
Expired
During
the
Period
Net
Long
Contracts
as
of
June
30,
2024
Statement
of
Operations
Location
For
the
Six
Months
Ended
June
30,
2024
Muirfield
.............
Equity
Contracts
1,957
4,974
5,087
1,844
Net
realized
gains
(losses)
from
futures
contracts
$
14,887,383
Spectrum
............
Equity
Contracts
527
1,400
1,432
495
Net
realized
gains
(losses)
from
futures
contracts
3,770,532
Global
..............
Equity
Contracts
159
364
368
155
Net
realized
gains
(losses)
from
futures
contracts
1,471,322
Balanced
............
Equity
Contracts
519
1,684
1,727
476
Net
realized
gains
(losses)
from
futures
contracts
2,763,795
Moderate
............
Equity
Contracts
194
503
527
170
Net
realized
gains
(losses)
from
futures
contracts
1,517,806
Conservative
..........
Equity
Contracts
94
250
272
72
Net
realized
gains
(losses)
from
futures
contracts
616,069
Dynamic
.............
Equity
Contracts
880
2,584
2,440
1,024
Net
realized
gains
(losses)
from
futures
contracts
7,154,756
Sector
Rotation
........
Equity
Contracts
58
302
256
104
Net
realized
gains
(losses)
from
futures
contracts
1,288,498
Type
of
Derivative/
Risk
Statement
of
Operations
Location
For
the
Six
Months
Ended
June
30,
2024
Muirfield
.............
Equity
Contracts
Net
change
in
unrealized
appreciation
(depreciation)
of
futures
contracts
$
(10,306,969)
Spectrum
............
Equity
Contracts
Net
change
in
unrealized
appreciation
(depreciation)
of
futures
contracts
(2,884,995)
Global
..............
Equity
Contracts
Net
change
in
unrealized
appreciation
(depreciation)
of
futures
contracts
(779,855)
Balanced
............
Equity
Contracts
Net
change
in
unrealized
appreciation
(depreciation)
of
futures
contracts
(2,421,006)
Moderate
............
Equity
Contracts
Net
change
in
unrealized
appreciation
(depreciation)
of
futures
contracts
(964,732)
Conservative
..........
Equity
Contracts
Net
change
in
unrealized
appreciation
(depreciation)
of
futures
contracts
(450,610)
Dynamic
.............
Equity
Contracts
Net
change
in
unrealized
appreciation
(depreciation)
of
futures
contracts
(4,331,722)
Sector
Rotation
........
Equity
Contracts
Net
change
in
unrealized
appreciation
(depreciation)
of
futures
contracts
(455,922)
2024
Semi-Annual
Report
|
June
30,
2024
Distributions
from
net
investment
income
and
from
net
capital
gains
are
determined
in
accordance
with
income
tax
regulations,
which
may
differ
from
GAAP.
Permanent
differences
relate
to
redemptions
treated
as
distributions
for
tax
purposes
(i.e.
equalization).
Accordingly,
timing
differences
relating
to
shareholder
distributions
are
reflected
in
the
components
of
net
assets
and
permanent
book
and
tax
differences
have
been
reclassified
within
the
components
of
net
assets
based
on
their
ultimate
characterization
for
federal
income
tax
purposes.
For
the
year
ended
December
31,
2023
,
the
Funds
made
the
following
reclassifications
to
increase/(decrease)
the
components
of
net
assets:
Investment
income
&
expenses
allocation.
For
all
Funds,
except
Money
Market,
income
and
expenses
(other
than
expenses
attributable
to
a
specific
class)
are
allocated
to
each
class
of
shares
based
on
its
relative
net
assets.
Expenses
incurred
by
the
Trust
that
do
not
specifically
relate
to
an
individual
Fund
of
the
Trust
are
allocated
to
the
Funds
based
on
each
Fund’s
relative
net
assets
or
other
appropriate
basis.
Capital
Share
Transactions.
All
Funds
are
authorized
to
issue
an
unlimited
number
of
shares.
Transactions
in
the
capital
shares
of
the
Funds
for
the
six
months
ended
June
30,
2024
and
the
year
ended
December
31,
2023
were
as
follows:
Capital
Distributable
Earnings
(Accumulated
Deficit)
Muirfield
.................................................................
$
4,122,212
$
(4,122,212)
Spectrum
................................................................
1,677,928
(1,677,928)
Global
..................................................................
142,916
(142,916)
Balanced
................................................................
499,064
(499,064)
Dynamic
.................................................................
983,313
(983,313)
Sector
Rotation
............................................................
219,006
(219,006)
Issued
Reinvested
Share
Class
Amount
Shares
Amount
Shares
For
the
Six
Months
Ended
June
30,
2024
Muirfield
-
Retail
Class
.
.
.
.
.
.
.
.
.
.
.
.
.
.
.
.
.
.
.
.
.
.
.
.
.
.
.
.
.
.
.
.
.
.
.
.
$
4,604,168
469,503
$
214,482
21,046
Muirfield
-
Adviser
Class
.
.
.
.
.
.
.
.
.
.
.
.
.
.
.
.
.
.
.
.
.
.
.
.
.
.
.
.
.
.
.
.
.
.
6,913,291
690,028
650,186
63,036
Muirfield
-
Institutional
Class
.
.
.
.
.
.
.
.
.
.
.
.
.
.
.
.
.
.
.
.
.
.
.
.
.
.
.
.
.
.
.
87,089,888
8,737,773
4,002,058
387,412
Spectrum
-
Retail
Class
.
.
.
.
.
.
.
.
.
.
.
.
.
.
.
.
.
.
.
.
.
.
.
.
.
.
.
.
.
.
.
.
.
.
.
142,493
10,752
4,047
288
Spectrum
-
Adviser
Class
.
.
.
.
.
.
.
.
.
.
.
.
.
.
.
.
.
.
.
.
.
.
.
.
.
.
.
.
.
.
.
.
.
.
2,185,222
160,308
139,795
9,831
Spectrum
-
Institutional
Class
.
.
.
.
.
.
.
.
.
.
.
.
.
.
.
.
.
.
.
.
.
.
.
.
.
.
.
.
.
.
14,138,707
1,042,982
475,146
33,320
Global
-
Retail
Class
.
.
.
.
.
.
.
.
.
.
.
.
.
.
.
.
.
.
.
.
.
.
.
.
.
.
.
.
.
.
.
.
.
.
.
.
.
.
206,731
17,692
22,689
1,875
Global
-
Adviser
Class
.
.
.
.
.
.
.
.
.
.
.
.
.
.
.
.
.
.
.
.
.
.
.
.
.
.
.
.
.
.
.
.
.
.
.
.
220,892
18,426
36,558
2,993
Global
-
Institutional
Class
.
.
.
.
.
.
.
.
.
.
.
.
.
.
.
.
.
.
.
.
.
.
.
.
.
.
.
.
.
.
.
.
.
3,460,280
292,387
257,667
21,156
Balanced
-
Retail
Class
.
.
.
.
.
.
.
.
.
.
.
.
.
.
.
.
.
.
.
.
.
.
.
.
.
.
.
.
.
.
.
.
.
.
.
1,519,429
118,203
54,895
4,010
Balanced
-
Adviser
Class
.
.
.
.
.
.
.
.
.
.
.
.
.
.
.
.
.
.
.
.
.
.
.
.
.
.
.
.
.
.
.
.
.
.
4,859,978
361,158
590,951
42,731
Balanced
-
Institutional
Class
.
.
.
.
.
.
.
.
.
.
.
.
.
.
.
.
.
.
.
.
.
.
.
.
.
.
.
.
.
.
.
31,078,536
2,314,026
2,192,728
158,325
Moderate
-
Retail
Class
.
.
.
.
.
.
.
.
.
.
.
.
.
.
.
.
.
.
.
.
.
.
.
.
.
.
.
.
.
.
.
.
.
.
.
169,663
13,931
8,126
650
Moderate
-
Adviser
Class
.
.
.
.
.
.
.
.
.
.
.
.
.
.
.
.
.
.
.
.
.
.
.
.
.
.
.
.
.
.
.
.
.
.
1,706,794
138,796
377,435
30,088
Moderate
-
Institutional
Class
.
.
.
.
.
.
.
.
.
.
.
.
.
.
.
.
.
.
.
.
.
.
.
.
.
.
.
.
.
.
.
12,984,420
1,052,902
1,427,207
113,639
Conservative
-
Retail
Class
.
.
.
.
.
.
.
.
.
.
.
.
.
.
.
.
.
.
.
.
.
.
.
.
.
.
.
.
.
.
.
.
.
737,264
32,732
74,667
3,273
Conservative
-
Adviser
Class
.
.
.
.
.
.
.
.
.
.
.
.
.
.
.
.
.
.
.
.
.
.
.
.
.
.
.
.
.
.
.
1,894,604
83,030
318,384
13,792
Conservative
-
Institutional
Class
.
.
.
.
.
.
.
.
.
.
.
.
.
.
.
.
.
.
.
.
.
.
.
.
.
.
.
.
15,410,827
674,797
1,406,184
60,779
Dynamic
-
Retail
Class
.
.
.
.
.
.
.
.
.
.
.
.
.
.
.
.
.
.
.
.
.
.
.
.
.
.
.
.
.
.
.
.
.
.
.
.
1,175,305
82,070
65,114
4,369
Dynamic
-
Adviser
Class
.
.
.
.
.
.
.
.
.
.
.
.
.
.
.
.
.
.
.
.
.
.
.
.
.
.
.
.
.
.
.
.
.
.
2,214,465
152,752
207,588
13,738
Dynamic
-
Institutional
Class
.
.
.
.
.
.
.
.
.
.
.
.
.
.
.
.
.
.
.
.
.
.
.
.
.
.
.
.
.
.
.
51,133,028
3,514,468
1,881,011
124,748
Sector
Rotation
-
Retail
Class
.
.
.
.
.
.
.
.
.
.
.
.
.
.
.
.
.
.
.
.
.
.
.
.
.
.
.
.
.
.
.
93,470
2,494
67,506
1,729
Sector
Rotation
-
Adviser
Class
.
.
.
.
.
.
.
.
.
.
.
.
.
.
.
.
.
.
.
.
.
.
.
.
.
.
.
.
.
344,571
9,292
28,492
723
Sector
Rotation
-
Institutional
Class
.
.
.
.
.
.
.
.
.
.
.
.
.
.
.
.
.
.
.
.
.
.
.
.
.
.
2,239,381
58,970
124,920
3,178
Income
-
Retail
Class
.
.
.
.
.
.
.
.
.
.
.
.
.
.
.
.
.
.
.
.
.
.
.
.
.
.
.
.
.
.
.
.
.
.
.
.
.
178,216
19,331
55,502
6,035
Income
-
Adviser
Class
.
.
.
.
.
.
.
.
.
.
.
.
.
.
.
.
.
.
.
.
.
.
.
.
.
.
.
.
.
.
.
.
.
.
.
.
1,875,988
203,644
223,114
24,229
Income
-
Institutional
Class
.
.
.
.
.
.
.
.
.
.
.
.
.
.
.
.
.
.
.
.
.
.
.
.
.
.
.
.
.
.
.
.
11,452,272
1,242,060
1,358,017
147,523
Money
Market
.
.
.
.
.
.
.
.
.
.
.
.
.
.
.
.
.
.
.
.
.
.
.
.
.
.
.
.
.
.
.
.
.
.
.
.
.
.
.
.
.
.
270,232,820
270,208,781
1,067,355
1,067,232
For
the
Year
Ended
December
31,
2023
Muirfield
-
Retail
Class
.
.
.
.
.
.
.
.
.
.
.
.
.
.
.
.
.
.
.
.
.
.
.
.
.
.
.
.
.
.
.
.
.
.
.
.
6,260,913
723,203
1,145,792
128,512
Muirfield
-
Adviser
Class
.
.
.
.
.
.
.
.
.
.
.
.
.
.
.
.
.
.
.
.
.
.
.
.
.
.
.
.
.
.
.
.
.
.
8,445,825
967,481
3,156,217
349,064
Muirfield
-
Institutional
Class
.
.
.
.
.
.
.
.
.
.
.
.
.
.
.
.
.
.
.
.
.
.
.
.
.
.
.
.
.
.
.
159,786,508
18,206,653
17,667,307
1,952,471
Spectrum
-
Retail
Class
.
.
.
.
.
.
.
.
.
.
.
.
.
.
.
.
.
.
.
.
.
.
.
.
.
.
.
.
.
.
.
.
.
.
.
533,752
42,415
143,420
11,513
2024
Semi-Annual
Report
|
June
30,
2024
Issued
Reinvested
Share
Class
Amount
Shares
Amount
Shares
Spectrum
-
Adviser
Class
.
.
.
.
.
.
.
.
.
.
.
.
.
.
.
.
.
.
.
.
.
.
.
.
.
.
.
.
.
.
.
.
.
.
$
2,476,972
195,518
$
2,993,790
237,348
Spectrum
-
Institutional
Class
.
.
.
.
.
.
.
.
.
.
.
.
.
.
.
.
.
.
.
.
.
.
.
.
.
.
.
.
.
.
21,591,782
1,703,238
12,686,684
1,003,563
Global
-
Retail
Class
.
.
.
.
.
.
.
.
.
.
.
.
.
.
.
.
.
.
.
.
.
.
.
.
.
.
.
.
.
.
.
.
.
.
.
.
.
.
400,717
37,382
45,746
4,186
Global
-
Adviser
Class
.
.
.
.
.
.
.
.
.
.
.
.
.
.
.
.
.
.
.
.
.
.
.
.
.
.
.
.
.
.
.
.
.
.
.
.
278,425
25,690
83,611
7,597
Global
-
Institutional
Class
.
.
.
.
.
.
.
.
.
.
.
.
.
.
.
.
.
.
.
.
.
.
.
.
.
.
.
.
.
.
.
.
.
5,384,549
504,540
548,094
49,839
Balanced
-
Retail
Class
.
.
.
.
.
.
.
.
.
.
.
.
.
.
.
.
.
.
.
.
.
.
.
.
.
.
.
.
.
.
.
.
.
.
.
1,621,690
136,523
119,996
9,833
Balanced
-
Adviser
Class
.
.
.
.
.
.
.
.
.
.
.
.
.
.
.
.
.
.
.
.
.
.
.
.
.
.
.
.
.
.
.
.
.
.
6,893,820
573,672
1,412,658
114,687
Balanced
-
Institutional
Class
.
.
.
.
.
.
.
.
.
.
.
.
.
.
.
.
.
.
.
.
.
.
.
.
.
.
.
.
.
.
.
46,268,668
3,833,974
5,750,373
466,113
Moderate
-
Retail
Class
.
.
.
.
.
.
.
.
.
.
.
.
.
.
.
.
.
.
.
.
.
.
.
.
.
.
.
.
.
.
.
.
.
.
.
305,775
26,964
21,761
1,907
Moderate
-
Adviser
Class
.
.
.
.
.
.
.
.
.
.
.
.
.
.
.
.
.
.
.
.
.
.
.
.
.
.
.
.
.
.
.
.
.
.
2,869,840
254,261
889,846
77,457
Moderate
-
Institutional
Class
.
.
.
.
.
.
.
.
.
.
.
.
.
.
.
.
.
.
.
.
.
.
.
.
.
.
.
.
.
.
.
19,295,416
1,703,609
3,506,752
305,252
Conservative
-
Retail
Class
.
.
.
.
.
.
.
.
.
.
.
.
.
.
.
.
.
.
.
.
.
.
.
.
.
.
.
.
.
.
.
.
.
519,210
24,434
158,648
7,378
Conservative
-
Adviser
Class
.
.
.
.
.
.
.
.
.
.
.
.
.
.
.
.
.
.
.
.
.
.
.
.
.
.
.
.
.
.
.
3,979,481
184,320
681,434
31,308
Conservative
-
Institutional
Class
.
.
.
.
.
.
.
.
.
.
.
.
.
.
.
.
.
.
.
.
.
.
.
.
.
.
.
.
22,269,302
1,030,646
2,986,044
136,954
Dynamic
-
Retail
Class
.
.
.
.
.
.
.
.
.
.
.
.
.
.
.
.
.
.
.
.
.
.
.
.
.
.
.
.
.
.
.
.
.
.
.
.
2,759,014
224,363
96,800
7,431
Dynamic
-
Adviser
Class
.
.
.
.
.
.
.
.
.
.
.
.
.
.
.
.
.
.
.
.
.
.
.
.
.
.
.
.
.
.
.
.
.
.
2,066,877
163,257
362,568
27,668
Dynamic
-
Institutional
Class
.
.
.
.
.
.
.
.
.
.
.
.
.
.
.
.
.
.
.
.
.
.
.
.
.
.
.
.
.
.
.
64,186,442
5,110,970
2,953,900
224,964
Sector
Rotation
-
Retail
Class
.
.
.
.
.
.
.
.
.
.
.
.
.
.
.
.
.
.
.
.
.
.
.
.
.
.
.
.
.
.
.
182,690
5,376
141,273
4,066
Sector
Rotation
-
Adviser
Class
.
.
.
.
.
.
.
.
.
.
.
.
.
.
.
.
.
.
.
.
.
.
.
.
.
.
.
.
.
426,888
12,676
56,056
1,597
Sector
Rotation
-
Institutional
Class
.
.
.
.
.
.
.
.
.
.
.
.
.
.
.
.
.
.
.
.
.
.
.
.
.
.
3,610,658
107,015
247,889
7,068
Income
-
Retail
Class
.
.
.
.
.
.
.
.
.
.
.
.
.
.
.
.
.
.
.
.
.
.
.
.
.
.
.
.
.
.
.
.
.
.
.
.
.
255,186
28,295
86,071
9,586
Income
-
Adviser
Class
.
.
.
.
.
.
.
.
.
.
.
.
.
.
.
.
.
.
.
.
.
.
.
.
.
.
.
.
.
.
.
.
.
.
.
.
607,231
67,548
393,077
43,704
Income
-
Institutional
Class
.
.
.
.
.
.
.
.
.
.
.
.
.
.
.
.
.
.
.
.
.
.
.
.
.
.
.
.
.
.
.
.
15,182,006
1,687,329
2,239,059
249,121
Money
Market
.
.
.
.
.
.
.
.
.
.
.
.
.
.
.
.
.
.
.
.
.
.
.
.
.
.
.
.
.
.
.
.
.
.
.
.
.
.
.
.
.
.
879,526,395
879,463,522
2,089,602
2,089,371
Redeemed
Net
Increase
(Decrease)
Share
Class
Amount
Shares
Amount
Shares
For
the
Six
Months
Ended
June
30,
2024
Muirfield
-
Retail
Class
.
.
.
.
.
.
.
.
.
.
.
.
.
.
.
.
.
.
.
.
.
.
.
.
.
.
.
.
.
.
.
.
.
.
.
.
$
(5,658,243)
(587,346)
$
(839,593)
(96,797)
Muirfield
-
Adviser
Class
.
.
.
.
.
.
.
.
.
.
.
.
.
.
.
.
.
.
.
.
.
.
.
.
.
.
.
.
.
.
.
.
.
.
(8,881,457)
(891,182)
(1,317,980)
(138,118)
Muirfield
-
Institutional
Class
.
.
.
.
.
.
.
.
.
.
.
.
.
.
.
.
.
.
.
.
.
.
.
.
.
.
.
.
.
.
.
(64,179,234)
(6,504,058)
26,912,712
2,621,127
Spectrum
-
Retail
Class
.
.
.
.
.
.
.
.
.
.
.
.
.
.
.
.
.
.
.
.
.
.
.
.
.
.
.
.
.
.
.
.
.
.
.
(255,809)
(18,881)
(109,269)
(7,841)
Spectrum
-
Adviser
Class
.
.
.
.
.
.
.
.
.
.
.
.
.
.
.
.
.
.
.
.
.
.
.
.
.
.
.
.
.
.
.
.
.
.
(2,919,677)
(215,666)
(594,660)
(45,527)
Spectrum
-
Institutional
Class
.
.
.
.
.
.
.
.
.
.
.
.
.
.
.
.
.
.
.
.
.
.
.
.
.
.
.
.
.
.
(17,203,425)
(1,271,369)
(2,589,572)
(195,067)
Global
-
Retail
Class
.
.
.
.
.
.
.
.
.
.
.
.
.
.
.
.
.
.
.
.
.
.
.
.
.
.
.
.
.
.
.
.
.
.
.
.
.
.
(291,896)
(24,683)
(62,476)
(5,116)
Global
-
Adviser
Class
.
.
.
.
.
.
.
.
.
.
.
.
.
.
.
.
.
.
.
.
.
.
.
.
.
.
.
.
.
.
.
.
.
.
.
.
(321,614)
(27,091)
(64,164)
(5,672)
Global
-
Institutional
Class
.
.
.
.
.
.
.
.
.
.
.
.
.
.
.
.
.
.
.
.
.
.
.
.
.
.
.
.
.
.
.
.
.
(2,871,675)
(244,325)
846,272
69,218
Balanced
-
Retail
Class
.
.
.
.
.
.
.
.
.
.
.
.
.
.
.
.
.
.
.
.
.
.
.
.
.
.
.
.
.
.
.
.
.
.
.
(638,481)
(48,220)
935,843
73,993
Balanced
-
Adviser
Class
.
.
.
.
.
.
.
.
.
.
.
.
.
.
.
.
.
.
.
.
.
.
.
.
.
.
.
.
.
.
.
.
.
.
(5,850,212)
(436,589)
(399,283)
(32,700)
Balanced
-
Institutional
Class
.
.
.
.
.
.
.
.
.
.
.
.
.
.
.
.
.
.
.
.
.
.
.
.
.
.
.
.
.
.
.
(36,906,637)
(2,747,699)
(3,635,373)
(275,348)
Moderate
-
Retail
Class
.
.
.
.
.
.
.
.
.
.
.
.
.
.
.
.
.
.
.
.
.
.
.
.
.
.
.
.
.
.
.
.
.
.
.
(248,800)
(20,386)
(71,011)
(5,805)
Moderate
-
Adviser
Class
.
.
.
.
.
.
.
.
.
.
.
.
.
.
.
.
.
.
.
.
.
.
.
.
.
.
.
.
.
.
.
.
.
.
(2,808,236)
(229,207)
(724,007)
(60,323)
Moderate
-
Institutional
Class
.
.
.
.
.
.
.
.
.
.
.
.
.
.
.
.
.
.
.
.
.
.
.
.
.
.
.
.
.
.
.
(13,834,684)
(1,131,736)
576,943
34,805
Conservative
-
Retail
Class
.
.
.
.
.
.
.
.
.
.
.
.
.
.
.
.
.
.
.
.
.
.
.
.
.
.
.
.
.
.
.
.
.
(441,719)
(19,627)
370,212
16,378
Conservative
-
Adviser
Class
.
.
.
.
.
.
.
.
.
.
.
.
.
.
.
.
.
.
.
.
.
.
.
.
.
.
.
.
.
.
.
(1,874,745)
(82,502)
338,243
14,320
Conservative
-
Institutional
Class
.
.
.
.
.
.
.
.
.
.
.
.
.
.
.
.
.
.
.
.
.
.
.
.
.
.
.
.
(15,886,746)
(695,027)
930,265
40,549
Dynamic
-
Retail
Class
.
.
.
.
.
.
.
.
.
.
.
.
.
.
.
.
.
.
.
.
.
.
.
.
.
.
.
.
.
.
.
.
.
.
.
.
(1,619,101)
(110,642)
(378,682)
(24,203)
Dynamic
-
Adviser
Class
.
.
.
.
.
.
.
.
.
.
.
.
.
.
.
.
.
.
.
.
.
.
.
.
.
.
.
.
.
.
.
.
.
.
(2,666,037)
(182,367)
(243,984)
(15,877)
Dynamic
-
Institutional
Class
.
.
.
.
.
.
.
.
.
.
.
.
.
.
.
.
.
.
.
.
.
.
.
.
.
.
.
.
.
.
.
(21,765,744)
(1,498,879)
31,248,295
2,140,337
Sector
Rotation
-
Retail
Class
.
.
.
.
.
.
.
.
.
.
.
.
.
.
.
.
.
.
.
.
.
.
.
.
.
.
.
.
.
.
.
(1,335,912)
(35,625)
(1,174,936)
(31,402)
Sector
Rotation
-
Adviser
Class
.
.
.
.
.
.
.
.
.
.
.
.
.
.
.
.
.
.
.
.
.
.
.
.
.
.
.
.
.
(487,262)
(12,700)
(114,199)
(2,685)
Sector
Rotation
-
Institutional
Class
.
.
.
.
.
.
.
.
.
.
.
.
.
.
.
.
.
.
.
.
.
.
.
.
.
.
(1,856,428)
(48,806)
507,873
13,342
Income
-
Retail
Class
.
.
.
.
.
.
.
.
.
.
.
.
.
.
.
.
.
.
.
.
.
.
.
.
.
.
.
.
.
.
.
.
.
.
.
.
.
(113,374)
(12,285)
120,344
13,081
Income
-
Adviser
Class
.
.
.
.
.
.
.
.
.
.
.
.
.
.
.
.
.
.
.
.
.
.
.
.
.
.
.
.
.
.
.
.
.
.
.
.
(1,456,225)
(157,758)
642,877
70,115
2024
Semi-Annual
Report
|
June
30,
2024
Redeemed
Net
Increase
(Decrease)
Share
Class
Amount
Shares
Amount
Shares
Income
-
Institutional
Class
.
.
.
.
.
.
.
.
.
.
.
.
.
.
.
.
.
.
.
.
.
.
.
.
.
.
.
.
.
.
.
.
$
(9,165,074)
(993,602)
$
3,645,215
395,981
Money
Market
.
.
.
.
.
.
.
.
.
.
.
.
.
.
.
.
.
.
.
.
.
.
.
.
.
.
.
.
.
.
.
.
.
.
.
.
.
.
.
.
.
.
(401,477,052)
(401,417,825)
(130,176,877)
(130,141,812)
For
the
Year
Ended
December
31,
2023
Muirfield
-
Retail
Class
.
.
.
.
.
.
.
.
.
.
.
.
.
.
.
.
.
.
.
.
.
.
.
.
.
.
.
.
.
.
.
.
.
.
.
.
(6,865,499)
(791,884)
541,206
59,831
Muirfield
-
Adviser
Class
.
.
.
.
.
.
.
.
.
.
.
.
.
.
.
.
.
.
.
.
.
.
.
.
.
.
.
.
.
.
.
.
.
.
(13,270,548)
(1,517,650)
(1,668,506)
(201,105)
Muirfield
-
Institutional
Class
.
.
.
.
.
.
.
.
.
.
.
.
.
.
.
.
.
.
.
.
.
.
.
.
.
.
.
.
.
.
.
(131,319,799)
(14,942,079)
46,134,016
5,217,045
Spectrum
-
Retail
Class
.
.
.
.
.
.
.
.
.
.
.
.
.
.
.
.
.
.
.
.
.
.
.
.
.
.
.
.
.
.
.
.
.
.
.
(684,014)
(54,364)
(6,842)
(436)
Spectrum
-
Adviser
Class
.
.
.
.
.
.
.
.
.
.
.
.
.
.
.
.
.
.
.
.
.
.
.
.
.
.
.
.
.
.
.
.
.
.
(4,512,426)
(357,067)
958,336
75,799
Spectrum
-
Institutional
Class
.
.
.
.
.
.
.
.
.
.
.
.
.
.
.
.
.
.
.
.
.
.
.
.
.
.
.
.
.
.
(36,697,357)
(2,889,337)
(2,418,892)
(182,536)
Global
-
Retail
Class
.
.
.
.
.
.
.
.
.
.
.
.
.
.
.
.
.
.
.
.
.
.
.
.
.
.
.
.
.
.
.
.
.
.
.
.
.
.
(293,358)
(27,612)
153,105
13,956
Global
-
Adviser
Class
.
.
.
.
.
.
.
.
.
.
.
.
.
.
.
.
.
.
.
.
.
.
.
.
.
.
.
.
.
.
.
.
.
.
.
.
(1,105,214)
(103,099)
(743,178)
(69,812)
Global
-
Institutional
Class
.
.
.
.
.
.
.
.
.
.
.
.
.
.
.
.
.
.
.
.
.
.
.
.
.
.
.
.
.
.
.
.
.
(7,968,664)
(744,427)
(2,036,021)
(190,048)
Balanced
-
Retail
Class
.
.
.
.
.
.
.
.
.
.
.
.
.
.
.
.
.
.
.
.
.
.
.
.
.
.
.
.
.
.
.
.
.
.
.
(811,824)
(67,723)
929,862
78,633
Balanced
-
Adviser
Class
.
.
.
.
.
.
.
.
.
.
.
.
.
.
.
.
.
.
.
.
.
.
.
.
.
.
.
.
.
.
.
.
.
.
(10,812,861)
(897,190)
(2,506,383)
(208,831)
Balanced
-
Institutional
Class
.
.
.
.
.
.
.
.
.
.
.
.
.
.
.
.
.
.
.
.
.
.
.
.
.
.
.
.
.
.
.
(65,962,734)
(5,464,172)
(13,943,692)
(1,164,085)
Moderate
-
Retail
Class
.
.
.
.
.
.
.
.
.
.
.
.
.
.
.
.
.
.
.
.
.
.
.
.
.
.
.
.
.
.
.
.
.
.
.
(503,245)
(44,592)
(175,709)
(15,721)
Moderate
-
Adviser
Class
.
.
.
.
.
.
.
.
.
.
.
.
.
.
.
.
.
.
.
.
.
.
.
.
.
.
.
.
.
.
.
.
.
.
(4,305,869)
(380,618)
(546,183)
(48,900)
Moderate
-
Institutional
Class
.
.
.
.
.
.
.
.
.
.
.
.
.
.
.
.
.
.
.
.
.
.
.
.
.
.
.
.
.
.
.
(27,483,873)
(2,424,526)
(4,681,708)
(415,665)
Conservative
-
Retail
Class
.
.
.
.
.
.
.
.
.
.
.
.
.
.
.
.
.
.
.
.
.
.
.
.
.
.
.
.
.
.
.
.
.
(678,119)
(32,024)
(261)
(212)
Conservative
-
Adviser
Class
.
.
.
.
.
.
.
.
.
.
.
.
.
.
.
.
.
.
.
.
.
.
.
.
.
.
.
.
.
.
.
(4,989,313)
(232,087)
(328,398)
(16,459)
Conservative
-
Institutional
Class
.
.
.
.
.
.
.
.
.
.
.
.
.
.
.
.
.
.
.
.
.
.
.
.
.
.
.
.
(24,817,735)
(1,151,720)
437,611
15,878
Dynamic
-
Retail
Class
.
.
.
.
.
.
.
.
.
.
.
.
.
.
.
.
.
.
.
.
.
.
.
.
.
.
.
.
.
.
.
.
.
.
.
.
(1,149,999)
(92,664)
1,705,815
139,130
Dynamic
-
Adviser
Class
.
.
.
.
.
.
.
.
.
.
.
.
.
.
.
.
.
.
.
.
.
.
.
.
.
.
.
.
.
.
.
.
.
.
(3,468,054)
(277,878)
(1,038,609)
(86,953)
Dynamic
-
Institutional
Class
.
.
.
.
.
.
.
.
.
.
.
.
.
.
.
.
.
.
.
.
.
.
.
.
.
.
.
.
.
.
.
(49,005,220)
(3,916,563)
18,135,123
1,419,371
Sector
Rotation
-
Retail
Class
.
.
.
.
.
.
.
.
.
.
.
.
.
.
.
.
.
.
.
.
.
.
.
.
.
.
.
.
.
.
.
(1,335,284)
(39,639)
(1,011,321)
(30,197)
Sector
Rotation
-
Adviser
Class
.
.
.
.
.
.
.
.
.
.
.
.
.
.
.
.
.
.
.
.
.
.
.
.
.
.
.
.
.
(628,731)
(18,623)
(145,787)
(4,350)
Sector
Rotation
-
Institutional
Class
.
.
.
.
.
.
.
.
.
.
.
.
.
.
.
.
.
.
.
.
.
.
.
.
.
.
(3,882,377)
(112,995)
(23,831)
1,088
Income
-
Retail
Class
.
.
.
.
.
.
.
.
.
.
.
.
.
.
.
.
.
.
.
.
.
.
.
.
.
.
.
.
.
.
.
.
.
.
.
.
.
(188,929)
(21,104)
152,328
16,777
Income
-
Adviser
Class
.
.
.
.
.
.
.
.
.
.
.
.
.
.
.
.
.
.
.
.
.
.
.
.
.
.
.
.
.
.
.
.
.
.
.
.
(2,570,552)
(285,979)
(1,570,244)
(174,727)
Income
-
Institutional
Class
.
.
.
.
.
.
.
.
.
.
.
.
.
.
.
.
.
.
.
.
.
.
.
.
.
.
.
.
.
.
.
.
(15,425,623)
(1,717,860)
1,995,442
218,590
Money
Market
.
.
.
.
.
.
.
.
.
.
.
.
.
.
.
.
.
.
.
.
.
.
.
.
.
.
.
.
.
.
.
.
.
.
.
.
.
.
.
.
.
.
(937,202,461)
(937,133,579)
(55,586,464)
(55,580,686)
2024
Semi-Annual
Report
|
June
30,
2024
Offsetting
Assets
&
Liabilities.
The
Funds
are
party
to
enforceable
master
netting
arrangements
between
counter
parties,
such
as
the
securities
lending
agreement,
which
provides
for
the
right
of
offset
under
certain
circumstances,
such
as
the
event
of
default.
The
securities
lending
transactions
have
an
overnight
and
continuous
contractual
maturity.
Risks
arise
from
the
possible
inability
of
counterparties
to
meet
the
terms
of
their
contracts.
The
table
below
reflects
the
offsetting
assets
and
liabilities
relating
to
securities
lending,
futures
contracts,
and
repurchase
agreements
shown
on
the
Statements
of
Assets
and
Liabilities
at
June
30,
2024
.
Other.
The
Funds
record
security
transactions
on
the
trade
date.
Securities
purchased
or
sold
on
a
when-issued
or
delayed-delivery
basis
may
be
settled
15
days
or
more
after
the
trade
date.
Gains
and
losses
realized
from
the
sale
of
securities
are
determined
on
the
specific
identification
basis.
Dividend
income
and
dividend
expenses
are
recognized
on
the
ex-dividend
date
and
interest
income
(including
amortization
of
premium
and
accretion
of
discount)
is
recognized
as
earned.
Short-term
capital
gain
distributions
from
underlying
funds
are
classified
as
dividend
income
for
financial
reporting
purposes.
Long-term
capital
gains
distributions
are
separately
stated.
Discounts
and
premiums
are
amortized
using
the
effective
yield
over
the
lives
of
the
respective
securities.
Distributions
received
from
partnerships
are
recorded
as
return
of
capital
distributions.
Withholding
taxes
on
foreign
dividends,
if
applicable,
have
been
provided
for
in
accordance
with
the
Funds’
understanding
of
the
applicable
country’s
tax
rules
and
rates.
A
Fund
may
purchase
securities
on
a
forward
commitment
or
when-issued
basis.
A
Fund
records
a
when-issued
transaction
on
the
trade
date
and
will
segregate
assets
in
an
amount
at
least
equal
in
value
to
the
Fund’s
commitment
to
purchase
when-issued
securities.
Securities
purchased
on
a
when-issued
basis
are
marked-to-market
daily
and
the
Fund
begins
earning
interest
on
the
settlement
date.
Losses
may
arise
due
to
changes
in
the
market
value
of
the
underlying
securities
or
if
the
counterparty
does
not
perform
under
the
contract.
Certain
Funds
may
purchase
or
sell
securities
on
a
delayed-delivery
basis.
These
transactions
involve
a
commitment
by
a
Fund
to
purchase
or
sell
securities
for
a
predetermined
price
or
yield,
with
payment
and
delivery
taking
place
beyond
the
customary
settlement
period.
When
delayed-
delivery
transactions
are
outstanding,
a
Fund
will
designate
or
receive
as
collateral
liquid
assets
in
an
amount
sufficient
to
meet
the
purchase
price
or
respective
obligations.
When
purchasing
a
security
on
a
delayed-delivery
basis,
a
Fund
assumes
the
rights
and
risks
of
ownership
of
the
security,
including
the
risk
of
price
and
yield
fluctuations,
and
takes
such
fluctuations
into
account
when
determining
its
NAV.
A
Fund
may
dispose
of
or
renegotiate
a
delayed-delivery
transaction
after
it
is
entered
into
which
may
result
in
a
realized
gain
or
loss.
When
a
Fund
has
sold
a
security
on
a
delayed-delivery
basis,
the
Fund
does
not
participate
in
future
gains
and
losses
with
respect
to
the
security.
Distributions
received
from
the
Funds’
investments
in
real
estate
investment
trusts
(“REITs”)
may
be
characterized
as
ordinary
income,
net
capital
gain,
or
return
of
capital.
The
proper
characterization
of
REIT
distributions
is
generally
not
known
until
after
the
end
of
each
calendar
year.
As
such,
the
Funds
must
use
estimates
in
reporting
the
character
of
their
income
and
distributions
for
financial
statement
purposes.
The
actual
character
of
distributions
to
the
Funds’
shareholders
will
be
reflected
on
the
Form
1099
received
by
shareholders
after
the
end
of
the
calendar
year.
Due
to
the
nature
of
REIT
investments,
a
portion
of
the
distributions
received
by
the
Funds’
shareholders
may
represent
a
return
of
capital.
Gross
Amounts
Not
Offset
in
the
Statements
of
Assets
and
Liabilities
Description/Fund (1)
Gross
Amounts
of
Recognized
Assets/
Liabilities
Gross
Amounts
Offset
in
the
Statements
of
Assets
and
Liabilities
Net
Amounts
Presented
in
the
Statements
of
Assets
and
Liabilities
Financial
Instruments (2)
Collateral
Pledged
(Received) (2)
Net
Amount
Assets:
Futures
Contracts
Muirfield
....................
$
667,473
$
(365,954)
$
301,519
$
–
$
–
$
301,519
Spectrum
...................
199,017
(89,877)
109,140
–
–
109,140
Balanced
...................
306,431
(114,921)
191,510
–
–
191,510
Moderate
...................
89,934
(35,051)
54,883
–
–
54,883
Conservative
.................
43,963
(16,636)
27,327
–
–
27,327
Repurchase
Agreements
Money
Market
................
–
220,000,000
220,000,000
(220,000,000)
–
–
Liabilities:
Futures
Contracts
Sector
Rotation
...............
(37,292)
4
(37,288)
–
37,288
–
Global
.....................
(60,736)
15,383
(45,353)
–
45,353
–
Dynamic
....................
(314,446)
207,220
(107,226)
–
107,226
–
(1)
There
were
no
securities
on
loan
as
of
June
30,
2024.
(2)
The
amount
is
limited
to
the
net
amounts
of
financial
assets
and
liabilities
and
accordingly
does
not
include
excess
collateral
pledged.
2024
Semi-Annual
Report
|
June
30,
2024
3.
Securities
Valuations
The
Funds
utilize
various
methods
to
measure
the
fair
value
of
their
investments
on
a
recurring
basis.
GAAP
establishes
a
hierarchy
that
prioritizes
inputs
to
valuation
methods.
The
three
levels
of
inputs
are
as
follows:
Level
1
–
Unadjusted
quoted
prices
in
active
markets
for
identical
assets
or
liabilities
that
the
Funds
have
the
ability
to
access.
Level
2
–
Observable
inputs
other
than
quoted
prices
included
in
level
1
that
are
observable
for
the
asset
or
liability,
either
directly
or
indirectly.
These
inputs
may
include
quoted
prices
for
the
identical
instrument
on
an
inactive
market,
prices
for
similar
instruments,
interest
rates,
prepayment
speeds,
credit
risk,
yield
curves,
default
rates
and
similar
data.
Level
3
–
Significant
unobservable
inputs
for
the
asset
or
liability,
to
the
extent
relevant
observable
inputs
are
not
available,
representing
the
Funds’
own
assumptions
about
the
assumptions
a
market
participant
would
use
in
valuing
the
asset
or
liability,
and
would
be
based
on
the
best
information
available.
The
availability
of
observable
inputs
can
vary
from
security
to
security
and
is
affected
by
a
wide
variety
of
factors,
including,
for
example,
the
type
of
security,
whether
the
security
is
new
and
not
yet
established
in
the
marketplace,
the
liquidity
of
markets,
and
other
characteristics
particular
to
the
security.
To
the
extent
that
valuation
is
based
on
models
or
inputs
that
are
less
observable
or
unobservable
in
the
market,
the
determination
of
fair
value
requires
more
judgment.
Accordingly,
the
degree
of
judgment
exercised
in
determining
fair
value
is
greatest
for
instruments
categorized
in
level
3.
The
inputs
used
to
measure
fair
value
may
fall
into
different
levels
of
the
fair
value
hierarchy.
In
such
cases,
for
disclosure
purposes,
the
level
in
the
fair
value
hierarchy
within
which
the
fair
value
measurement
falls
in
its
entirety,
is
determined
based
on
the
lowest
level
input
that
is
significant
to
the
fair
value
measurement
in
its
entirety.
A
description
of
the
valuation
techniques
applied
to
the
Funds’
major
categories
of
assets
and
liabilities
measured
at
fair
value
on
a
recurring
basis
follows.
Equity
securities
(including
publicly
traded
partnerships,
real
estate
investment
trusts,
American
depositary
receipts,
exchange
traded
funds,
and
common
stock).
Securities
traded
on
a
national
securities
exchange
(or
reported
on
the
NASDAQ
national
market)
are
stated
at
the
last
reported
sales
price
on
the
day
of
valuation
and
are
categorized
in
level
1
of
the
fair
value
hierarchy.
Investments
in
registered
open-end
investment
companies,
including
money
market
funds,
are
valued
at
the
daily
redemption
net
asset
value
as
reported
by
the
underlying
fund
and
are
categorized
in
level
1
of
the
fair
value
hierarchy.
Short-term
notes
(including
bank
obligations,
commercial
paper,
corporate
obligations,
repurchase
agreements,
U.S.
government
agency
obligations,
and
floating
rate
demand
notes)
.
Short-term
notes
held
in
the
Funds
maturing
more
than
sixty
days
after
the
valuation
date,
are
valued
at
the
last
sales
price
as
of
the
close
of
business
on
the
day
of
valuation,
or,
lacking
any
sales,
at
the
most
recent
bid
price
or
yield
equivalent
as
obtained
from
dealers
that
make
markets
in
such
securities.
When
valued
at
the
last
sales
price,
the
securities
will
be
categorized
as
level
1.
When
using
bid
prices
or
yield
equivalents,
they
will
be
categorized
as
level
2.
When
such
securities
are
valued
within
sixty
days
or
less
to
maturity,
the
difference
between
the
valuation
existing
on
the
sixty-first
day
before
maturity
and
maturity
value
is
amortized
on
a
straight-line
basis
to
maturity,
which
approximates
fair
value,
and
will
be
categorized
as
level
2.
Certificates
of
deposit.
Except
for
Money
Market,
certificates
of
deposit
are
valued
at
acquisition
cost,
which
approximates
fair
value,
and
will
be
categorized
as
level
2.
For
Money
Market,
certificates
of
deposit
are
normally
valued
using
a
model
that
incorporates
market
observable
data
such
as
reported
sales
of
similar
securities,
broker
quotes,
yields,
bids,
offers,
and
reference
data,
and
will
be
categorized
as
level
2.
U.S.
government
obligations.
U.S.
government
obligations
are
normally
valued
using
a
model
that
incorporates
market
observable
data
such
as
reported
sales
of
similar
securities,
broker
quotes,
yields,
bids,
offers,
and
reference
data.
Certain
securities
are
valued
principally
using
dealer
quotations.
In
either
case,
these
securities
will
be
categorized
as
level
2.
Restricted
securities
(equity
and
debt).
Restricted
securities
for
which
quotations
are
not
readily
available
are
valued
at
fair
value
as
determined
by
the
Trustees.
Depending
on
the
relative
significance
of
valuation
inputs,
these
instruments
may
be
classified
in
either
level
2
or
level
3
of
the
fair
value
hierarchy.
Derivative
instruments
(futures
contracts).
Listed
derivative
instruments
that
are
actively
traded,
including
futures
contracts,
are
valued
based
on
quoted
prices
from
the
exchange
and
are
categorized
in
level
1
of
the
fair
value
hierarchy.
In
the
event
market
quotations
or
evaluated
prices
obtained
from
a
pricing
service
are
not
readily
available
when
the
NAV
is
calculated,
the
Funds
will
utilize
the
fair
value
of
the
investment.
This
may
occur
in
the
event
the
Funds
cannot
obtain
current
market
quotations
for
a
security,
cannot
obtain
current
evaluated
prices
from
a
pricing
service,
or
the
price
furnished
is
not
deemed
reliable
and
representative
of
the
fair
value
of
the
security.
In
these
cases,
the
Valuation
&
Pricing
Committee,
established
and
designated
by
the
Board
of
Trustees
as
its
valuation
designee
pursuant
to
Rule
2a-5
under
the
1940
Act,
determines
the
fair
value
of
the
security
in
accordance
with
procedures
adopted
by
the
Adviser.
Depending
on
the
method
used
to
determine
fair
value,
valuations
for
these
securities
may
be
classified
as
Level
2
or
Level
3
as
appropriate
in
the
fair
value
hierarchy.
2024
Semi-Annual
Report
|
June
30,
2024
The
Valuation
&
Pricing
Committee
is
responsible
for
determining
the
fair
value
of
investments
for
which
market
quotations
are
not
readily
available.
The
Valuation
&
Pricing
Committee
is
also
authorized
to
select
and
retain
pricing
services
to
provide
fair
value
evaluations
of
the
current
value
of
certain
investments
for
which
market
quotations
are
not
readily
available.
The
Valuation
&
Pricing
Committee
supervises
various
methods
used
to
review
market
quotations
and
evaluated
prices
for
reliability,
including
the
resolution
of
price
challenges
by
the
Adviser
to
evaluated
prices
for
a
given
security.
In
the
event
market
quotations
or
evaluated
prices
are
not
readily
available
for
an
investment,
the
Valuation
&
Pricing
Committee
will
determine
the
fair
value
of
the
investment
in
accordance
with
its
procedures.
Fair
valuations
are
periodically
reviewed
by
the
Board
of
Trustees,
which
maintains
oversight
of
the
Adviser’s
fair
valuation
policy
and
procedures.
For
the
six
months
ended
June
30,
2024
,
the
Funds
did
not
hold
any
assets
at
any
time
in
which
significant
unobservable
inputs
were
used
in
determining
fair
value.
Therefore,
no
reconciliation
of
level
3
securities
is
provided.
However,
the
Funds
have
disclosed
holding
level
3
securities
with
fair
valuations
of
zero.
The
following
table
summarizes
the
inputs
used
to
value
the
Funds’
assets
and
liabilities
measured
at
fair
value
as
of
June
30,
2024
.
Muirfield
-
Assets/(Liabilities)
Level
1
Level
2
Level
3
Total
Common
Stocks*
................................
$
626,873,243
$
—
$
—
$
626,873,243
Preferred
Stock
.................................
67,729
—
—
67,729
Warrants
.....................................
—
—
—
—
Money
Market
Registered
Investment
Companies
..........
228,631,034
—
—
228,631,034
Total
........................................
$
855,572,006
$
—
$
—
$
855,572,006
Trustee
Deferred
Compensation**
.....................
$
490,160
$
—
$
—
$
490,160
Futures
Contracts***
..............................
$
301,519
$
—
$
—
$
301,519
Spectrum
-
Assets/(Liabilities)
Level
1
Level
2
Level
3
Total
Common
Stocks*
................................
$
145,159,365
$
—
$
—
$
145,159,365
Preferred
Stock
.................................
5,134
—
—
5,134
Warrants
.....................................
—
—
—
—
Registered
Investment
Companies
....................
9,331,172
—
—
9,331,172
Money
Market
Registered
Investment
Companies
..........
5,657,831
—
—
5,657,831
Total
........................................
$
160,153,502
$
—
$
—
$
160,153,502
Trustee
Deferred
Compensation**
.....................
$
88,668
$
—
$
—
$
88,668
Futures
Contracts***
..............................
$
109,140
$
—
$
—
$
109,140
Global
-
Assets/(Liabilities)
Level
1
Level
2
Level
3
Total
Common
Stocks*
................................
$
11,092,101
$
—
$
—
$
11,092,101
Preferred
Stock
.................................
2,100
—
—
2,100
Warrants
.....................................
—
—
—
—
Registered
Investment
Companies
....................
7,253,770
—
—
7,253,770
Money
Market
Registered
Investment
Companies
..........
16,882,450
—
—
16,882,450
Total
........................................
$
35,230,421
$
—
$
—
$
35,230,421
Trustee
Deferred
Compensation**
.....................
$
154,640
$
—
$
—
$
154,640
Futures
Contracts***
..............................
$
(45,353)
$
—
$
—
$
(45,353)
Balanced
-
Assets/(Liabilities)
Level
1
Level
2
Level
3
Total
Common
Stocks*
................................
$
226,104,600
$
—
$
—
$
226,104,600
Preferred
Stock
.................................
25,774
—
—
25,774
Warrants
.....................................
—
—
—
—
Registered
Investment
Companies
....................
114,491,608
—
—
114,491,608
Money
Market
Registered
Investment
Companies
..........
48,616,840
—
—
48,616,840
Total
........................................
$
389,238,822
$
—
$
—
$
389,238,822
Trustee
Deferred
Compensation**
.....................
$
308,001
$
—
$
—
$
308,001
Futures
Contracts***
..............................
$
191,510
$
—
$
—
$
191,510
2024
Semi-Annual
Report
|
June
30,
2024
Moderate
-
Assets/(Liabilities)
Level
1
Level
2
Level
3
Total
Common
Stocks*
................................
$
66,593,139
$
—
$
—
$
66,593,139
Preferred
Stock
.................................
6,534
—
—
6,534
Warrants
.....................................
—
—
—
—
Registered
Investment
Companies
....................
85,332,958
—
—
85,332,958
Money
Market
Registered
Investment
Companies
..........
21,258,622
—
—
21,258,622
Total
........................................
$
173,191,253
$
—
$
—
$
173,191,253
Trustee
Deferred
Compensation**
.....................
$
68,041
$
—
$
—
$
68,041
Futures
Contracts***
..............................
$
54,883
$
—
$
—
$
54,883
Conservative
-
Assets/(Liabilities)
Level
1
Level
2
Level
3
Total
Common
Stocks*
................................
$
31,475,123
$
—
$
—
$
31,475,123
Preferred
Stock
.................................
3,967
—
—
3,967
Warrants
.....................................
—
—
—
—
Registered
Investment
Companies
....................
91,106,886
—
—
91,106,886
Money
Market
Registered
Investment
Companies
..........
10,137,854
—
—
10,137,854
Total
........................................
$
132,723,830
$
—
$
—
$
132,723,830
Trustee
Deferred
Compensation**
.....................
$
122,685
$
—
$
—
$
122,685
Futures
Contracts***
..............................
$
27,327
$
—
$
—
$
27,327
Dynamic
-
Assets/(Liabilities)
Level
1
Level
2
Level
3
Total
Common
Stocks*
................................
$
203,036,468
$
—
$
—
$
203,036,468
Preferred
Stock
.................................
15,817
—
—
15,817
Warrants
.....................................
—
—
—
—
Registered
Investment
Companies
....................
16,766,669
—
—
16,766,669
Money
Market
Registered
Investment
Companies
..........
111,347,595
—
—
111,347,595
Total
........................................
$
331,166,549
$
—
$
—
$
331,166,549
Trustee
Deferred
Compensation**
.....................
$
335,874
$
—
$
—
$
335,874
Futures
Contracts***
..............................
$
(107,226)
$
—
$
—
$
(107,226)
Sector
Rotation
-
Assets/(Liabilities)
Level
1
Level
2
Level
3
Total
Common
Stocks*
................................
$
20,643,221
$
—
$
—
$
20,643,221
Preferred
Stock
.................................
1
—
—
1
Registered
Investment
Companies
....................
1,807,688
—
—
1,807,688
Money
Market
Registered
Investment
Companies
..........
13,473,830
—
—
13,473,830
Total
........................................
$
35,924,740
$
—
$
—
$
35,924,740
Trustee
Deferred
Compensation**
.....................
$
95,536
$
—
$
—
$
95,536
Futures
Contracts***
..............................
$
(37,288)
$
—
$
—
$
(37,288)
Income
-
Assets/(Liabilities)
Level
1
Level
2
Level
3
Total
Registered
Investment
Companies
....................
$
61,045,014
$
—
$
—
$
61,045,014
Money
Market
Registered
Investment
Companies
..........
13,074,697
—
—
13,074,697
Total
........................................
$
74,119,711
$
—
$
—
$
74,119,711
Trustee
Deferred
Compensation**
.....................
$
111,334
$
—
$
—
$
111,334
2024
Semi-Annual
Report
|
June
30,
2024
4.
Investment
Transactions
For
the
six
months
ended
June
30,
2024
,
the
cost
of
purchases
and
proceeds
from
sales
or
maturities
of
long-term
investments
for
the
Funds,
excluding
U.S.
Government
investments
and
short
positions,
were
as
follows:
For
the
six
months
ended
June
30,
2024
,
the
cost
of
purchases
and
proceeds
from
sales
or
maturities
of
long-term
U.S.
Government
investments
for
the
Funds
are
as
follows:
Money
Market
-
Assets/(Liabilities)
Level
1
Level
2
Level
3
Total
Certificates
of
Deposit
.............................
$
—
$
16,002,255
$
—
$
16,002,255
Commercial
Paper
...............................
—
174,071,747
—
174,071,747
Repurchase
Agreements
...........................
—
220,000,000
—
220,000,000
U.S.
Government
Agencies
..........................
—
2,056,633
—
2,056,633
U.S.
Treasury
Bills
...............................
—
82,226,004
—
82,226,004
U.S.
Treasury
Notes
..............................
—
2,449,560
—
2,449,560
Money
Market
Registered
Investment
Companies
..........
12,332,493
—
—
12,332,493
Total
........................................
$
12,332,493
$
496,806,199
$
—
$
509,138,692
Trustee
Deferred
Compensation**
.....................
$
10,698
$
—
$
—
$
10,698
*
See
schedules
of
investments
for
industry
classifications.
**
A
corresponding
liability
exists
that
is
marked
to
market
and
is
considered
Level
1
in
the
fair
value
hierarchy.
***
Futures
contracts
include
unrealized
gain/loss
on
contracts
open
at
June
30,
2024.
Purchases
Sales
Muirfield
.....................................................................
$
930,239,947
$
860,585,118
Spectrum
....................................................................
252,754,075
232,564,619
Global
......................................................................
19,469,712
17,062,649
Balanced
....................................................................
370,892,312
360,862,843
Moderate
....................................................................
130,253,963
124,490,024
Conservative
..................................................................
92,514,446
83,690,612
Dynamic
.....................................................................
311,683,852
299,452,847
Sector
Rotation
................................................................
35,102,176
35,061,194
Income
......................................................................
51,134,964
36,356,243
Purchases
Sales
Income
......................................................................
$
359
$
68,565
2024
Semi-Annual
Report
|
June
30,
2024
5.
Investment
Advisory
Fees
and
Other
Transactions
with
Affiliates
and
Non-Affiliates
Meeder
Asset
Management,
Inc.
(“MAM”),
a
wholly-owned
subsidiary
of
Meeder
Investment
Management,
Inc.
(“Meeder”),
provides
the
Funds
with
investment
management,
research,
statistical
and
advisory
services
pursuant
to
the
terms
of
an
Investment
Advisory
Agreement.
The
services
of
MAM
will
terminate
automatically
if
assigned
and
may
be
terminated
without
penalty
at
any
time
upon
60
days
prior
written
notice
by
majority
vote
of
the
Fund,
by
the
Trustees
of
the
Fund,
or
by
MAM.
For
such
services
the
Funds
pay
a
monthly
fee
at
the
following
annual
rates:
Fee
Waivers
&
Expense
Limitation
Agreements.
MAM
can
contractually
agree
to
reduce
its
advisory
fees
or
limit
total
annual
ordinary
fund
operating
expenses
for
certain
Funds
pursuant
to
written
agreements
that
may
only
be
amended
or
terminated
with
the
approval
of
the
Board.
The
sums
waived
or
reimbursed
under
these
agreements
would
not
be
subject
to
recoupment.
During
the
six
months
ended
June
30,
2024
,
there
were
no
fees
contractually
waived
or
reimbursed
for
any
of
the
Funds.
Mutual
Funds
Service
Co.
(“MFSCo”),
a
wholly-owned
subsidiary
of
Meeder,
serves
as
stock
transfer,
dividend
disbursing
and
shareholder
services
agent
for
each
Fund.
In
compensation
for
such
services,
each
Fund
pays
MFSCo
a
monthly
fee
at
an
annual
rate
equal
to
the
greater
of
the
following:
Percentage
of
Average
Daily
Net
Assets
up
to
$50
Million
Percentage
of
Average
Daily
Net
Assets
Exceeding
$50
Million
up
to
$100
Million
Percentage
of
Average
Daily
Net
Assets
Exceeding
$100
Million
up
to
$200
Million
Percentage
of
Average
Daily
Net
Assets
Exceeding
$200
Million
Muirfield
.....................................................
1.00%
0.75%
0.60%
0.60%
Spectrum
....................................................
0.75%
0.75%
0.75%
0.60%
Global
.........................................................
0.75%
0.75%
0.75%
0.60%
Balanced
....................................................
0.75%
0.75%
0.75%
0.60%
Moderate
....................................................
0.60%
0.60%
0.60%
0.60%
Conservative
...............................................
0.50%
0.50%
0.50%
0.50%
Dynamic
.....................................................
0.75%
0.75%
0.75%
0.60%
Sector
Rotation
...........................................
0.75%
0.75%
0.60%
0.60%
Income
.......................................................
0.40%
0.40%
0.20%
0.20%
Money
Market
.............................................
0.40%
0.40%
0.25%
0.25%
Minimum
Fee
Percentage
of
Average
Daily
Net
Assets
up
to
$500
Million
Percentage
of
Average
Daily
Net
Assets
Exceeding
$500
Million
Muirfield
............................................................................................................
$
4,000
0.12%
0.03%
Spectrum
...........................................................................................................
4,000
0.12%
0.03%
Global
................................................................................................................
4,000
0.12%
0.03%
Balanced
...........................................................................................................
4,000
0.12%
0.03%
Moderate
...........................................................................................................
4,000
0.12%
0.03%
Conservative
......................................................................................................
4,000
0.12%
0.03%
Dynamic
............................................................................................................
4,000
0.12%
0.03%
Sector
Rotation
..................................................................................................
4,000
0.12%
0.03%
Income
..............................................................................................................
4,000
0.08%
0.03%
Money
Market
....................................................................................................
4,000
0.08%
0.03%
2024
Semi-Annual
Report
|
June
30,
2024
Management
may
voluntarily
waive
fees
for
any
Fund.
During
the
six
months
ended
June
30,
2024
,
there
were
no
transfer
agent
fees
waived.
MFSCo
provides
the
Trust
with
certain
administrative
services.
In
compensation
for
such
services,
each
Fund
pays
MFSCo
a
monthly
fee
at
the
following
annual
rates:
MFSCo
serves
as
accounting
services
agent
for
each
Fund.
In
compensation
for
such
services,
each
Fund
pays
MFSCo
a
monthly
fee
at
an
annual
rate
equal
to
the
greater
of
a
minimum
fee
or
at
a
rate
based
on
the
percentage
of
average
daily
net
assets.
The
annual
rates
are
as
follows:
Voluntary
Transfer
Agent
Fees
Reimbursements
0
Impact
of
Voluntary
Transfer
Agent
Fees
Reimbursements
to
Average
Net
Assets
1
Impact
of
Voluntary
Transfer
Agent
Fees
Reimbursements
to
Average
Net
Assets
-
Retail
Class
2
Impact
of
Voluntary
Transfer
Agent
Fees
Reimbursements
to
Average
Net
Assets
-
Adviser
Class
3
Impact
of
Voluntary
Transfer
Agent
Fees
Reimbursements
to
Average
Net
Assets
-
Institutional
Class
Muirfield
................
$
—
N/A
N/A
N/A
N/A
Spectrum
...............
—
N/A
N/A
N/A
N/A
Global
.................
—
N/A
N/A
N/A
N/A
Balanced
...............
—
N/A
N/A
N/A
N/A
Moderate
...............
—
N/A
N/A
N/A
N/A
Conservative
.............
—
N/A
N/A
N/A
N/A
Dynamic
................
—
N/A
N/A
N/A
N/A
Sector
Rotation
...........
—
N/A
N/A
N/A
N/A
Income
.................
—
N/A
N/A
N/A
N/A
Money
Market
............
—
N/A
N/A
N/A
N/A
Percentage
of
Average
Daily
Net
Assets
up
to
$50
Million
Percentage
of
Average
Daily
Net
Assets
Exceeding
$50
Million
up
to
$500
Million
Percentage
of
Average
Daily
Net
Assets
Exceeding
$500
Million
Muirfield
.............................................................................................................................
0.10%
0.08%
0.03%
Spectrum
............................................................................................................................
0.10%
0.08%
0.03%
Global
.................................................................................................................................
0.10%
0.08%
0.03%
Balanced
............................................................................................................................
0.10%
0.08%
0.03%
Moderate
............................................................................................................................
0.10%
0.08%
0.03%
Conservative
.......................................................................................................................
0.10%
0.08%
0.03%
Dynamic
.............................................................................................................................
0.10%
0.08%
0.03%
Sector
Rotation
...................................................................................................................
0.10%
0.08%
0.03%
Income
...............................................................................................................................
0.10%
0.08%
0.03%
Money
Market
.....................................................................................................................
0.10%
0.08%
0.03%
Minimum
Fee
Percentage
of
Average
Daily
Net
Assets
up
to
$10
Million
Percentage
of
Average
Daily
Net
Assets
Exceeding
$10
Million
up
to
$30
Million
Percentage
of
Average
Daily
Net
Assets
Exceeding
$30
Million
up
to
$80
Million
Percentage
of
Average
Daily
Net
Assets
Exceeding
$80
Million
Muirfield
...........................................................
$
7,500
0.15%
0.10%
0.02%
0.01%
Spectrum
..........................................................
7,500
0.15%
0.10%
0.02%
0.01%
Global
...............................................................
7,500
0.15%
0.10%
0.02%
0.01%
Balanced
..........................................................
7,500
0.15%
0.10%
0.02%
0.01%
Moderate
..........................................................
7,500
0.15%
0.10%
0.02%
0.01%
Conservative
.....................................................
7,500
0.15%
0.10%
0.02%
0.01%
Dynamic
...........................................................
7,500
0.15%
0.10%
0.02%
0.01%
Sector
Rotation
.................................................
7,500
0.15%
0.10%
0.02%
0.01%
Income
.............................................................
7,500
0.15%
0.10%
0.02%
0.01%
Money
Market
...................................................
30,000
0.15%
0.10%
0.02%
0.01%
2024
Semi-Annual
Report
|
June
30,
2024
For
the
six
months
ended
June
30,
2024
,
MAM
agreed
to
voluntarily
waive
and/or
reimburse
investment
advisory
fees.
The
amounts
voluntarily
waived
and/or
reimbursed
and
the
impact
to
the
net
expense
ratio
(excluding
brokerage
fees
and
commissions,
taxes,
interest,
and
extraordinary
or
non-recurring
expenses)
for
each
Fund
are
as
follows:
Certain
Funds
have
entered
into
securities
lending
arrangements
with
Huntington
National
Bank
(“HNB”).
Under
the
terms
of
the
agreement,
HNB
is
authorized
to
loan
securities
on
behalf
of
the
Funds
to
approved
brokers.
In
exchange,
under
normal
market
conditions,
the
Funds
receive
cash
collateral
in
the
amount
of
at
least
102%
of
the
value
of
securities
loaned.
The
cash
collateral
is
invested
in
short
term
instruments
as
disclosed
in
the
Schedules
of
Investments.
Although
risk
is
mitigated
by
the
collateral,
the
Funds
could
experience
a
delay
in
recovering
their
securities
and
possible
loss
of
income
or
value
if
the
borrower
fails
to
return
the
borrowed
securities.
In
addition,
the
Funds
bear
the
risk
of
loss
associated
with
the
investment
of
cash
collateral
received.
After
predetermined
rebates
to
brokers,
a
percentage
of
the
net
securities
lending
revenue
is
credited
to
the
Funds
to
be
used
as
an
offset
against
charges
incurred
by
the
Funds.
HNB
is
paid
a
fee
for
administering
the
securities
lending
program
for
the
Funds,
equal
to
the
remaining
percentage
of
the
net
securities
lending
revenues
generated
under
the
agreement.
As
of
June
30,
2024
,
no
Funds
were
loaning
any
securities.
Any
cash
collateral
received
is
invested
in
securities
as
listed
in
each
Fund’s
Schedule
of
Investments.
During
the
six
months
ended
June
30,
2024
,
there
were
no
securities
lent.
The
Funds
have
adopted
a
written
plan
pursuant
to
Rule
12b-1
of
the
1940
Act
that
allows
the
Funds
to
pay
fees
for
the
sale
and
distribution
of
Fund
shares
and
for
services
provided
to
Fund
shareholders.
12b-1
fees
are
paid
by
the
Funds
to
financial
intermediaries,
securities
brokers,
investment
advisers,
and
other
persons,
including
affiliates
of
MAM.
For
the
six
months
ended
June
30,
2024
,
total
12b-1
plan
expense
payments
made
to
the
Funds’
affiliated
distributor
was
$35,990
.
The
Funds’
affiliated
distributor
did
not
receive
any
brokerage
commissions
from
executed
trades
from
the
Funds.
The
annual
adopted
12b-1
plan
maximum
limitations
for
the
six
months
ended
June
30,
2024
,
are
as
follows:
Voluntary
Investment
Advisory
Fee
Waivers
and/or
Reimbursements
0
Impact
of
Voluntary
Investment
Advisory
Fee
Waivers
and/or
Reimbursements
to
Average
Net
Assets
1
Impact
of
Voluntary
Investment
Advisory
Fee
Waivers
and/or
Reimbursements
to
Average
Net
Assets
-
Retail
Class
2
Impact
of
Voluntary
Investment
Advisory
Fee
Waivers
and/or
Reimbursements
to
Average
Net
Assets
-
Adviser
Class
3
Impact
of
Voluntary
Investment
Advisory
Fee
Waivers
and/or
Reimbursements
to
Average
Net
Assets
-
Institutional
Class
Muirfield
...................
$
–
N/A
N/A
N/A
N/A
Spectrum
..................
–
N/A
N/A
N/A
N/A
Global
....................
–
N/A
N/A
N/A
N/A
Balanced
..................
–
N/A
N/A
N/A
N/A
Moderate
..................
–
N/A
N/A
N/A
N/A
Conservative
................
–
N/A
N/A
N/A
N/A
Dynamic
...................
99,726
N/A
0.07%
0.07%
0.07%
Sector
Rotation
..............
–
N/A
N/A
N/A
N/A
Income
....................
39,126
N/A
0.11%
0.11%
0.11%
Money
Market
...............
713,851
0.28%
N/A
N/A
N/A
Maximum
Annual
12b-1
Plan
Expense
as
a
Percentage
of
Average
Daily
Net
Assets
Maximum
Annual
12b-1
Plan
Expense
as
a
Percentage
of
Average
Daily
Net
Assets
-
Retail
Class
Maximum
Annual
12b-1
Plan
Expense
as
a
Percentage
of
Average
Daily
Net
Assets
-
Adviser
Class
Maximum
Annual
12b-1
Plan
Expense
as
a
Percentage
of
Average
Daily
Net
Assets
-
Institutional
Class
12b-1
Plan
Expense
Payments
Made
to
Affiliates
Muirfield
...............................
N/A
0.20%
N/A
N/A
$
14,894
Spectrum
..............................
N/A
0.25%
N/A
N/A
388
Global
.................................
N/A
0.25%
N/A
N/A
760
Balanced
..............................
N/A
0.25%
N/A
N/A
2,065
Moderate
..............................
N/A
0.25%
N/A
N/A
231
Conservative
..........................
N/A
0.25%
N/A
N/A
2,997
Dynamic
...............................
N/A
0.25%
N/A
N/A
5,540
Sector
Rotation
........................
N/A
0.20%
N/A
N/A
8,225
Income
................................
N/A
0.25%
N/A
N/A
890
Money
Market
.........................
0.20%
N/A
N/A
N/A
N/A
2024
Semi-Annual
Report
|
June
30,
2024
The
Funds
(other
than
Money
Market)
have
adopted
a
shareholder
services
plan
that
allows
the
Funds
to
pay
financial
intermediaries
and
other
persons,
including
“platforms,”
for
providing
shareholder
and
administrative
services
to
Fund
shareholders
and
maintaining
shareholder
accounts.
The
annual
adopted
shareholder
services
plan
maximum
limitations
for
the
six
months
ended
June
30,
2024
are
as
follows:
The
Funds
have
adopted
a
Deferred
Compensation
Plan
(the
“Plan”)
for
the
independent
Trustees.
Under
the
Plan,
each
eligible
Trustee
is
permitted
to
defer
all
or
a
portion
of
the
trustees
fees
payable
by
any
of
the
Funds
as
an
investment
into
any
combination
of
Funds
until
a
specified
point
of
time.
The
investment
into
the
Funds
is
recorded
as
an
asset
however
an
offsetting
liability
is
also
recorded
for
the
deferred
payment.
Amounts
deferred
under
the
Plan
may
be
distributed
in
a
lump
sum
or
generally
equal
annual
installments
over
a
period
of
up
to
ten
(10)
years
to
the
eligible
Trustee(s).
The
Funds
may
terminate
this
Plan
at
any
time.
Certain
Trustees
and
officers
of
the
Funds
are
also
officers
or
directors
of
Meeder,
MAM,
and
MFSCo.
During
the
six
months
ended
June
30,
2024
,
several
of
the
Funds
invested
in
the
Institutional
Prime
Money
Market
Fund,
an
affiliate,
as
described
in
Section
2(a)(3)
of
the
Investment
Company
Act
of
1940.
The
purchases/sales
amounts
in
the
following
table
are
presented
on
a
gross
basis,
while
the
statement
of
changes
in
net
assets
shows
subscriptions
and
redemptions
into
and
out
of
the
Institutional
Prime
Money
Market
Fund
on
a
net
basis.
The
Funds’
investments
in
the
Institutional
Prime
Money
Market
Fund,
which
had
a
7-day
yield
of
5.28%
on
June
30,
2024
,
were
as
follows:
Maximum
Annual
Shareholder
Services
Plan
Expense
as
a
Percentage
of
Average
Daily
Net
Assets
-
Retail
Class
Maximum
Annual
Shareholder
Services
Plan
Expense
as
a
Percentage
of
Average
Daily
Net
Assets
-
Adviser
Class
Maximum
Annual
Shareholder
Services
Plan
Expense
as
a
Percentage
of
Average
Daily
Net
Assets
-
Institutional
Class
Muirfield
...................................................................................................
0.20%
0.25%
0.10%
Spectrum
..................................................................................................
0.20%
0.25%
0.10%
Global
.......................................................................................................
0.20%
0.25%
0.10%
Balanced
..................................................................................................
0.20%
0.25%
0.10%
Moderate
..................................................................................................
0.20%
0.25%
0.10%
Conservative
.............................................................................................
0.20%
0.25%
0.10%
Dynamic
...................................................................................................
0.20%
0.25%
0.10%
Sector
Rotation
.........................................................................................
0.20%
0.25%
0.10%
Income
.....................................................................................................
0.20%
0.25%
0.10%
12/31/23
Fair
Value
Purchases
Sales
Realized
Gains
(Losses)
6/30/24
Cost
Change
in
Unrealized
Income
6/30/24
Fair
Value
Muirfield
...........
$
269,785,737
$
59,200,719
$
(100,317,199)
$
18,758
$
228,512,594
$
(56,982)
$
5,596,907
$
228,631,034
Spectrum
..........
75,328,289
14,664,324
(84,324,026)
39,061
5,657,345
(49,817)
747,425
5,657,831
Global
............
17,873,873
5,059,491
(6,047,865)
87
16,875,360
(3,136)
427,940
16,882,450
Balanced
..........
60,576,374
33,014,578
(44,962,093)
4,191
48,584,478
(16,210)
1,421,543
48,616,840
Moderate
..........
26,724,067
21,606,791
(27,067,092)
2,340
21,244,245
(7,484)
620,852
21,258,622
Conservative
........
16,708,431
22,193,047
(28,760,868)
4,424
10,130,454
(7,180)
322,512
10,137,854
Dynamic
...........
92,058,669
44,116,574
(24,811,623)
(1,689)
111,321,196
(14,337)
2,492,590
111,347,595
Sector
Rotation
......
13,338,879
18,521,428
(18,383,926)
4,256
13,473,631
(6,807)
304,231
13,473,830
Income
............
23,429,407
13,928,110
(24,277,778)
(2,856)
13,070,279
(2,186)
488,434
13,074,697
2024
Semi-Annual
Report
|
June
30,
2024
6.
Federal
Tax
Information
The
following
information
is
computed
on
a
tax
basis
for
each
item
as
of
December
31,
2023
:
The
tax
characteristics
of
dividends
paid
by
the
Funds
during
the
year
ended
December
31,
2023
were
as
follows:
The
tax
characteristics
of
dividends
paid
by
the
Funds
during
the
year
ended
December
31,
2022
were
as
follows:
Tax
Cost
of
Portfolio
Investments
Gross
Unrealized
Appreciation
Gross
Unrealized
Depreciation
Net
Unrealized
Appreciation/
Depreciation
Muirfield
..........................................
$
659,776,281
$
82,465,586
$
(5,690,661)
$
76,774,925
Spectrum
.........................................
170,652,864
18,456,158
(1,316,754)
17,139,404
Global
...........................................
30,211,677
2,125,048
(107,076)
2,017,972
Balanced
.........................................
323,048,267
40,893,613
(2,634,968)
38,258,645
Moderate
.........................................
152,999,962
12,827,631
(999,804)
11,827,827
Conservative
.......................................
121,080,791
6,958,622
(662,852)
6,295,770
Dynamic
..........................................
244,335,888
30,231,055
(2,510,206)
27,720,849
Sector
Rotation
.....................................
30,881,943
4,735,118
(1,323,247)
3,411,871
Income
...........................................
68,228,050
1,767,652
(99,662)
1,667,990
Money
Market
......................................
639,732,721
203,386
(83,780)
119,606
Ordinary
Income
Net
Short-Term
Capital
Gains
Net
Long-Term
Capital
Gains
Total
Dividends
Paid
Muirfield
..........................................
$
12,493,900
$
—
$
9,579,118
$
22,073,018
Spectrum
.........................................
3,388,080
—
12,437,088
15,825,168
Global
...........................................
677,547
—
—
677,547
Balanced
.........................................
7,293,767
—
—
7,293,767
Moderate
.........................................
4,427,939
—
—
4,427,939
Conservative
.......................................
3,832,220
—
—
3,832,220
Dynamic
..........................................
3,426,570
—
—
3,426,570
Sector
Rotation
.....................................
460,077
—
—
460,077
Income
...........................................
2,721,725
—
—
2,721,725
Money
Market
......................................
33,483,600
—
—
33,483,600
Total
dividends
paid
may
differ
from
the
amount
reported
in
the
Statements
of
Changes
in
Net
Assets
because
for
tax
purposes
dividends
are
recognized
when
actually
paid.
Short-term
capital
gains
distributions
are
taxed
as
ordinary
income.
Ordinary
Income
Net
Short-Term
Capital
Gains
Net
Long-Term
Capital
Gains
Total
Dividends
Paid
Muirfield
..........................................
$
4,249,878
$
—
$
12,812,219
$
17,062,097
Spectrum
.........................................
958,594
471,996
3,611,331
5,041,921
Global
...........................................
82,102
—
158,351
240,453
Balanced
.........................................
3,501,995
3,906,305
5,840,278
13,248,578
Moderate
.........................................
2,235,676
1,370,093
1,071,618
4,677,387
Conservative
.......................................
1,641,226
—
693,917
2,335,143
Dynamic
..........................................
1,144,644
—
6,501,337
7,645,981
Sector
Rotation
.....................................
132,707
745,313
—
878,020
Income
...........................................
1,124,771
—
—
1,124,771
Money
Market
......................................
11,475,492
—
—
11,475,492
Total
dividends
paid
may
differ
from
the
amount
reported
in
the
Statements
of
Changes
in
Net
Assets
because
for
tax
purposes
dividends
are
recognized
when
actually
paid.
Short-term
capital
gains
distributions
are
taxed
as
ordinary
income.
2024
Semi-Annual
Report
|
June
30,
2024
As
of
December
31,
2023
,
the
components
of
distributable
earnings/(accumulated
deficit)
on
a
tax
basis
for
the
Funds
were
as
follows:
For
federal
income
tax
purposes,
the
following
Funds
have
capital
loss
carryforwards
as
of
December
31,
2023
,
which
are
not
subject
to
expiration
and
are
available
to
offset
future
capital
gains,
if
any.
To
the
extent
that
these
carryforwards
are
used
to
offset
future
capital
gains,
it
is
probable
that
the
gains
that
are
offset
will
not
be
distributed
to
shareholders:
7.
Control
Ownership
The
beneficial
ownership,
either
directly
or
indirectly,
of
more
than
25%
of
the
voting
securities
of
a
fund
creates
a
presumption
of
control
of
the
fund
under
Section
2(a)(9)
of
the
1940
Act.
As
of
June
30,
2024
,
beneficial
owners
that
held
more
than
25%
of
the
voting
securities
of
the
Funds
and
may
be
deemed
to
control
the
Funds
are
as
follows:
8.
Contingencies
and
Commitments
The
Funds
indemnify
the
Trust’s
officers
and
Trustees
for
certain
liabilities
that
might
arise
from
their
performance
of
their
duties
to
the
Funds.
Additionally,
in
the
normal
course
of
business
the
Funds
enter
into
contracts
that
contain
a
variety
of
representations
and
warranties
and
which
provide
general
indemnifications.
The
Funds’
maximum
exposure
under
these
arrangements
is
unknown,
as
this
would
involve
future
claims
that
may
be
made
against
the
Funds
that
have
not
yet
occurred.
However,
based
on
experience,
the
Funds
expect
the
risk
of
loss
to
be
remote.
9.
Subsequent
Events
On
June
18,
2024,
the
Meeder
Funds
filed
a
Post-Effective
Amendment
to
the
Registration
Statement
for
the
Meeder
Funds
that
will
change
the
name
of
the
Institutional
Prime
Money
Market
Fund
to
the
Government
Money
Market
Fund
and
change
its
principal
investment
strategy
to
one
in
which
at
least
99.5%
of
the
Fund's
assets
are
invested
in
cash,
securities
issued
by
the
U.S.
government
and
its
agencies
and
instrumentalities
and
repurchase
agreements
that
are
collateralized
fully
by
securities
issued
by
the
U.S.
government
and
its
agencies
and
instrumentalities
or
cash.
The
change
is
expected
to
become
effective
on
September
1,
2024.
Undistributed
Ordinary
Income
Undistributed
Long-Term
Capital
Gain
Accumulated
Capital
and
Other
Gains
and
(Losses)
Unrealized
Appreciation/
(Depreciation)
Total
Distributable
Earnings/
(Accumulated
Deficit)
Muirfield
.........................
$
1,310,329
$
51,473,349
$
(375,880)
$
76,774,925
$
129,182,723
Spectrum
........................
1,921,354
9,939,175
(70,759)
17,139,404
28,929,174
Global
..........................
11,190
2,000,758
(116,223)
2,017,972
3,913,697
Balanced
........................
82,742
13,931,740
(237,507)
38,258,645
52,035,620
Moderate
........................
38,634
—
(1,142,618)
11,827,827
10,723,843
Conservative
......................
54,219
—
(5,583,482)
6,295,770
766,507
Dynamic
.........................
41,473
21,501,462
(250,894)
27,720,849
49,012,890
Sector
Rotation
....................
14,775
2,120,645
(72,486)
3,411,871
5,474,805
Income
..........................
11,990
—
(13,791,026)
1,667,990
(12,111,046)
Money
Market
.....................
15,233
—
(8,597)
119,606
126,242
The
differences
between
book-
and
tax-basis
unrealized
appreciation/(depreciation)
are
attributable
primarily
to:
wash
sales
and
the
realization
for
tax
purposes
of
unrealized
gains/(losses)
on
certain
derivative
instruments.
Short-Term
Capital
Loss
Carryforward
Long-Term
Capital
Loss
Carryforward
Capital
Loss
Carryforward
Utilized
Muirfield
...................................................
$
—
$
—
$
—
Spectrum
..................................................
—
—
—
Global
....................................................
—
—
1,639,070
Balanced
..................................................
—
—
3,576,181
Moderate
..................................................
1,088,162
—
3,475,122
Conservative
................................................
4,700,609
789,444
—
Dynamic
...................................................
—
—
9,440,863
Sector
Rotation
..............................................
—
—
1,337,582
Income
....................................................
12,310,635
1,392,843
—
Money
Market
...............................................
—
—
1,721
Fund
Beneficial
Owner
Percent
of
Voting
Securities
Money
Market
Muirfield
45%
2024
Semi-Annual
Report
|
June
30,
2024
Shareholder
Expense
Analysis
(unaudited)
Shareholders
of
mutual
funds
pay
ongoing
expenses,
such
as
advisory
fees,
distribution
and
service
fees
and
other
fund
operating
expenses.
The
following
examples
are
intended
to
help
you
understand
your
ongoing
costs
(in
dollars)
of
investing
in
the
Funds
and
to
compare
these
costs
with
the
ongoing
costs
of
investing
in
other
mutual
funds.
The
examples
are
based
on
an
investment
of
$1,000
invested
for
the
period
of
time
indicated
in
the
table
below.
The
Actual
Expense
example
provides
information
about
actual
account
values
and
actual
expenses.
You
may
use
the
information
in
this
line,
together
with
the
amount
you
invested,
to
estimate
the
expenses
that
you
paid
over
the
period.
Simply
divide
your
account
value
by
$1,000
(e.g.:
an
$8,600
account
value
divided
by
$1,000
=
8.6),
then
multiply
the
result
by
the
number
in
the
line
under
the
heading
“Expenses
Paid
During
the
Period”
to
estimate
the
expenses
you
paid
on
your
account
during
this
period.
The
Hypothetical
Expense
example
provides
information
about
hypothetical
account
values
and
hypothetical
expenses
based
on
each
Fund’s
actual
expense
ratio
and
an
assumed
rate
of
return
of
5%
per
year
before
expenses,
which
is
not
the
actual
return
of
any
Fund.
The
hypothetical
account
values
and
expenses
may
not
be
used
to
estimate
the
actual
ending
account
balance
or
expenses
you
paid
for
the
period.
You
may
use
this
information
to
compare
the
ongoing
costs
of
investing
in
the
Funds
to
other
funds.
To
do
so,
compare
this
5%
hypothetical
example
with
the
5%
hypothetical
examples
that
appear
in
the
shareholder
reports
of
the
other
funds.
Beginning
Account
Value
January
1,
2024
Ending
Account
Value
June
30,
2024
Expenses
Paid
During
Period
1
Net
Expense
Ratio
2
Actual
Hypothetical
Actual
Hypothetical
Actual
Hypothetical
Actual
0
Muirfield
Fund
Retail
Class
$
1,000.00
$
1,000.00
$
1,132.10
$
1,019.24
$
5.99
$
5.67
1.13%
Adviser
Class
1,000.00
1,000.00
1,134.60
1,020.69
4.46
4.22
0.84%
Institutional
Class
1,000.00
1,000.00
1,134.40
1,020.24
4.94
4.67
0.93%
1
Spectrum
Fund
Retail
Class
1,000.00
1,000.00
1,125.50
1,018.70
6.55
6.22
1.24%
Adviser
Class
1,000.00
1,000.00
1,129.00
1,020.93
4.18
3.97
0.79%
Institutional
Class
1,000.00
1,000.00
1,127.80
1,020.44
4.71
4.47
0.89%
2
Global
Allocation
Fund
Retail
Class
1,000.00
1,000.00
1,078.60
1,015.81
9.41
9.12
1.82%
Adviser
Class
1,000.00
1,000.00
1,080.60
1,017.85
7.29
7.07
1.41%
Institutional
Class
1,000.00
1,000.00
1,079.90
1,017.65
7.50
7.27
1.45%
3
Balanced
Fund
Retail
Class
1,000.00
1,000.00
1,090.70
1,018.20
6.97
6.72
1.34%
Adviser
Class
1,000.00
1,000.00
1,093.00
1,020.09
5.00
4.82
0.96%
Institutional
Class
1,000.00
1,000.00
1,092.00
1,019.59
5.51
5.32
1.06%
4
Moderate
Allocation
Fund
Retail
Class
1,000.00
1,000.00
1,064.10
1,018.15
6.93
6.77
1.35%
Adviser
Class
1,000.00
1,000.00
1,065.40
1,020.19
4.83
4.72
0.94%
Institutional
Class
1,000.00
1,000.00
1,064.50
1,019.74
5.29
5.17
1.03%
5
Conservative
Allocation
Fund
Retail
Class
1,000.00
1,000.00
1,038.70
1,018.80
6.18
6.12
1.22%
Adviser
Class
1,000.00
1,000.00
1,040.00
1,020.54
4.41
4.37
0.87%
Institutional
Class
1,000.00
1,000.00
1,039.50
1,020.09
4.87
4.82
0.96%
6
Dynamic
Allocation
Fund
Retail
Class
1,000.00
1,000.00
1,113.10
1,018.60
6.62
6.32
1.26%
Adviser
Class
1,000.00
1,000
.00
1,115.30
1,020.29
4.84
4.62
0.92%
Institutional
Class
1,000.00
1,000.00
1,114.00
1,019.89
5.26
5.02
1.00%
2024
Semi-Annual
Report
|
June
30,
2024
Please
note
that
the
expenses
shown
in
the
tables
are
meant
to
highlight
your
ongoing
costs
only
and
do
not
reflect
any
transactional
costs,
such
as
redemption
fees
or
exchange
fees.
Therefore,
hypothetical
information
is
useful
in
comparing
ongoing
costs
only,
and
will
not
help
you
determine
the
relative
total
costs
of
owning
different
funds.
In
addition,
if
any
transactional
costs
were
included,
your
costs
would
have
been
higher.
Beginning
Account
Value
January
1,
2024
Ending
Account
Value
June
30,
2024
Expenses
Paid
During
Period
1
Net
Expense
Ratio
2
Actual
Hypothetical
Actual
Hypothetical
Actual
Hypothetical
Actual
7
Sector
Rotation
Fund
Retail
Class
$
1,000.00
$
1,000.00
$
1,072.70
$
1,016.66
$
8.50
$
8
.27
1.65%
Adviser
Class
1,000.00
1,000.00
1,073.90
1,017.85
7.27
7.07
1.41%
Institutional
Class
1,000.00
1,000.00
1,073.80
1,017.65
7.48
7.27
1.45%
8
Tactical
Income
Fund
Retail
Class
1,000.00
1,000.00
1,019.70
1,019.39
5.52
5.52
1.10%
Adviser
Class
1,000.00
1,000.00
1,022.40
1,021.33
3.57
3.57
0.71%
Institutional
Class
1,000.00
1,000.00
1,020.90
1,020.89
4.02
4.02
0.80%
Institutional
Prime
Money
Market
Fund
1,000.00
1,000.00
1,026.70
1,023.82
1.06
1.06
0.21%
1
Expenses
are
equal
to
each
Fund’s
annualized
net
expense
ratio,
multiplied
by
the
average
account
value
over
the
period,
multiplied
by
182/366
(to
reflect
the
total
number
of
days
in
the
six-month
period).
2
Annualized
net
expense
ratio
reflects
contractual
or
voluntary
waivers
and
reimbursements
of
expenses
by
the
investment
adviser
and
transfer
agent.
2024
Semi-Annual
Report
|
June
30,
2024
Other
Information
(unaudited)
The
Trust
files
a
complete
schedule
of
portfolio
holdings
for
the
first
and
third
quarters
of
each
fiscal
year
on
Form
N-PORT.
In
addition,
Money
Market
files
its
complete
schedule
of
portfolio
holdings
with
the
SEC
each
month
on
Form
N-MFP.
Forms
N-PORT
and
N-MFP
are
available
on
the
SEC’s
website
at
www.sec.gov.
Information
regarding
Fund
holdings
is
also
available
at
www.meederinvestment.com.
The
investment
adviser
is
responsible
for
exercising
the
voting
rights
associated
with
the
securities
purchased
or
held
by
the
Funds.
A
description
of
the
policies
and
procedures
that
the
adviser
uses
in
fulfilling
this
responsibility
and
information
regarding
how
those
proxies
were
voted
during
the
most
recent
12-month
period
ending
June
30
are
available,
without
charge,
by
calling
1-800-325-3539
or
on
the
SEC’s
website
at
www.sec.gov.
Privacy
Policy
–
MIM
001
(4/21/22)
Privacy
Policy
Meeder
Investment
Management
and
the
Meeder
Funds
are
committed
to
maintaining
the
financial
privacy
of
our
current,
former
and
prospective
customers.
This
policy
explains
how
we
protect
the
security
and
confidentiality
of
our
customer’s
information.
PERSONAL
INFORMATION
WE
COLLECT
We
may
collect
information
about
Meeder
customers
from
a
variety
of
sources,
including:
Information
provided
by
you
or
your
representative
on
applications
or
forms,
such
as
your
name,
address,
date
of
birth,
social
security
number
and
investment
objectives;
Information
about
the
transactions
in
your
account,
such
as
your
account
balance
and
transaction
history;
and
Information
we
obtain
from
third
parties
regarding
you,
to
verify
your
identity
or
transfer
your
account.
INFORMATION
WE
SHARE
WITH
OUR
AFFILIATES
Our
affiliates
are
financial
service
providers
that
offer
transfer
agency,
customer
accounting,
customer
servicing,
investment
advisory,
and
other
financial
services.
We
share
information
with
our
affiliates
to
service
your
account.
In
addition,
we
may
also
share
information
with
our
affiliates
to
alert
you
to
other
products
or
services
offered
by
Meeder
to
the
extent
provided
by
law.
Information
collected
from
customers
whose
accounts
are
opened
through
investment
professionals
is
not
shared
with
Meeder
affiliates
for
marketing
purposes.
INFORMATION
WE
SHARE
WITH
THIRD
PARTIES
On
occasion,
we
share
information
we
collect
about
you
with
unaffiliated
third
parties
to
perform
services
in
connection
with
your
account,
such
as
processing
transactions,
preparing
and
mailing
account
statements,
and
other
forms
of
customer
servicing.
Information
provided
to
third
parties
may
not
be
used
for
any
other
purpose
and
Meeder
does
not
permit
unaffiliated
third
parties
to
use
customer
information
to
market
their
products
or
services.
HOW
WE
PROTECT
INFORMATION
ABOUT
YOU
We
maintain
policies,
and
require
all
unaffiliated
third
parties
to
maintain
policies,
to
safeguard
customer
information.
We
restrict
access
to
nonpublic
personal
information
about
you
to
those
persons
who
need
to
know
that
information
in
order
to
provide
products
and
services
to
you.
We
also
maintain
physical,
electronic,
and
procedural
safeguards
to
guard
your
nonpublic
personal
information.
WHO
THIS
POLICY
APPLIES
TO
This
policy
applies
to
customers
who
open
relationships
directly
with
Meeder.
It
applies
to
Meeder
Funds
and
Meeder’s
affiliated
companies,
including
Meeder
Asset
Management,
Meeder
Advisory
Services,
Meeder
Public
Funds,
Meeder
Distribution
Services
and
Mutual
Funds
Service
Company.
QUESTIONS
Contact
us
at
800-325-3539
or
visit
us
online
at
www.meederinvestment.com
Manager
and
Investment
Adviser
Meeder
Asset
Management,
Inc.
6125
Memorial
Drive
P.O.
Box
7177
Dublin,
Ohio
43017
Board
of
Trustees
Stuart
M.
Allen
Anthony
V.
D’Angelo
Robert
S.
Meeder,
Jr.
Jeffrey
R.
Provence
Custodian
The
Huntington
National
Bank
Columbus,
Ohio
43215
Transfer
Agent
&
Dividend
Disbursing
Agent
Mutual
Funds
Service
Co.
6125
Memorial
Drive
Dublin,
Ohio
43017
Distributor
Meeder
Distribution
Services,
Inc.
6125
Memorial
Drive
Dublin,
Ohio
43017
Independent
Registered
Public
Accounting
Firm
Cohen
&
Company,
Ltd.
342
North
Water
Street,
Suite
830
Milwaukee,
Wisconsin
53202
6125
Memorial
Drive,
Dublin,
Ohio
43017
866.633.3371
|
meeder
investment.com
©
2024
Meeder
Investment
Management
Go
Paperless
Looking
for
ways
to
help
the
environment
Sign
up
to
view
reports
online
at
meederinvestment.com
Item 8. Changes in and Disagreements with Accountants for Open-End Management Investment Companies.
None.
Item 9. Proxy Disclosures for Open-End Management Investment Companies.
A special meeting of the shareholders of the Institutional Prime Money Market Fund was held on December 7, 2023, to approve a change to the fundamental investment policy of the fund regarding investment concentration. The change was approved by a vote of 23,855,046.855 shares in favor of the proposal, 150,537.088 shares against the proposal, 37,582.344 abstentions, and 0 broker non-votes.
Item 10. Remuneration Paid to Directors, Officers, and Others of Open-End Management Investment Companies.
The remuneration paid to directors, officers and others is included as part of the report to stockholders filed under Item 7 of this Form.
Item 11. Statement Regarding Basis for Approval of Investment Advisory Contract.
None.
Item 12. Disclosure of Proxy Voting Policies and Procedures for Closed-End Management Investment Companies.
Not applicable.
Item 13. Portfolio Managers of Closed-End Management Investment Companies.
Not applicable.
Item 14. Purchases of Equity Securities by Closed-End Management Investment Company and Affiliated Purchasers.
Not applicable.
Item 15. Submission of Matters to a Vote of Security Holders.
During the reporting period, there were no material changes to the procedures by which shareholders may recommend nominees to the registrant’s board.
Item 16. Controls and Procedures.
(a) The registrant’s principal executive officer and principal financial officer have evaluated the registrant's disclosure controls and procedures within 90 days of the filing date of this report and have concluded that these disclosure controls and procedures are adequately designed and are operating effectively to ensure that information required to be disclosed by the registrant in this Form N-CSR was recorded, processed, summarized, and reported timely.
(b) There were no changes in the registrant’s internal control over financial reporting (as defined in Rule 30a-3(d) under the Investment Company Act of 1940) that occurred during the period covered by this report that have materially affected, or are reasonably likely to materially affect, the registrant’s internal control over financial reporting.
Item 17. Disclosure of Securities Lending Activities for Closed-End Management Investment Companies.
Not applicable.
Item 18. Recovery of Erroneously Awarded Compensation.
(a) Not applicable.
(b) Not applicable.
Item 19. Exhibits.
(a)(1) Code of Ethics filed herewith as EX-99.CODE ETH.
(a)(2) Not applicable.
(a)(3) A separate certification for each principal executive and principal financial officer of the registrant as required by Rule 30a-2(a) under the Act(17 CFR270.30a-2(a)). Filed herewith as EX-99.CERT.
(a)(4) Not applicable.
(a)(5) Not applicable.
(b) Certifications of principal executive officer and principal financial officer, under Section 906 of the Sarbanes-Oxley Act of 2002, and 18 U.S.C. ss.1350. Filed herewith as EX-99.906 CERT.
SIGNATURES
Pursuant to the requirements of the Securities Exchange Act of 1934 and the Investment Company Act of 1940, the registrant has duly caused this report to be signed on its behalf by the undersigned, thereunto duly authorized.
Meeder Funds
By: /s/ Bruce E. McKibben
Bruce E. McKibben, Principal Financial Officer
Date: August 29, 2024
Pursuant to the requirements of the Securities Exchange Act of 1934 and the Investment Company Act of 1940, this report has been signed below by the following persons on behalf of the registrant and in the capacities and on the dates indicated.
By: /s/ Bruce E. McKibben
Bruce E. McKibben, Principal Financial Officer
Date: August 29, 2024
By: /s/ Robert S. Meeder, Jr.
Robert S. Meeder, Jr., Principal Executive Officer
Date: August 29, 2024