UNITED STATES SECURITIES AND EXCHANGE COMMISSION
Washington, D.C. 20549
FORM N-CSR
CERTIFIED SHAREHOLDER REPORT
OF REGISTERED MANAGEMENT INVESTMENT COMPANIES
Investment Company Act file number 811-03462
Meeder Funds Trust
6125 Memorial Drive
Dublin, OH 43017
Bruce McKibben
c/o Meeder Funds Trust
6125 Memorial Drive
Dublin, OH 43017
Registrant's telephone number, including area code: 800-325-3539
Date of fiscal year end: December 31, 2022
Date of reporting period: June 30, 2022
Item 1. Report to Stockholders.
TABLE OF CONTENTS
Letter to Shareholders | 1 |
Portfolio Composition | 4 |
Schedules of Investments | 11 |
Statements of Assets and Liabilities | 54 |
Statements of Operations | 56 |
Statements of Changes in Net Assets | 58 |
Financial Highlights | 62 |
Notes to Financial Statements | 72 |
Shareholder Expense Analysis | 90 |
This Semi-Annual Report is prepared and distributed for the general information of the shareholders of the Funds. This material is not authorized for distribution to prospective investors unless preceded or accompanied by a prospectus. Investors are advised to consider carefully the investment objectives, risks, charges and expenses of the Fund before investing. The prospectus contains this and other information about the Funds.
Meeder Funds are distributed by Meeder Distribution Services, Inc. (Member FINRA), an affiliate of Meeder Investment Management. An affiliated registered investment adviser, Meeder Asset Management, Inc., serves as the investment adviser to Meeder Funds and is paid a fee for its services.
Letter to Shareholders June 30, 2022
A Bear Market is Here
MARKET UPDATE
The S&P 500 Index officially reached bear market territory after finishing the second quarter down more than -20% from its all-time high set on January 3rd. It was the worst first-half performance for the S&P 500 since 1970. Bonds, represented by the Bloomberg Aggregate Index could not escape the carnage either as they also finished June down more than -10% YTD. This was just the third time since 1981 that stocks and bonds experienced two consecutive quarters of negative performance. Prior to that, the most recent occurrence was during the Financial Crisis of 2008.
The second quarter was a continuation of many of the same themes as the first quarter this year, as illustrated in Figure 1. Value stocks outperformed their Growth peers and Large- caps generally outperformed Small-caps. When looking at the 9 style boxes, the performance of each of Russell’s 9 equity style indexes were negative. S&P sectors only had Energy produce positive performance year-to-date, up more than 30%. Utilities, Consumer Staples, and Health Care sectors each had single-digit losses year-to-date. The remaining sectors have experienced negative performance year-to-date, down anywhere from 16-32%. International markets suffered too, just as the global supply chain issues continue to struggle to meet demand.
FIGURE 1
YTD PERFORMANCE THROUGH JUNE 30, 2022
| | VALUE | BLEND | GROWTH |
Large-Cap | -12.9% | -19.9% | -28.1% |
Mid-Cap | -10.0% | -21.6% | -31.0% |
Small-Cap | -17.3% | -23.4% | -29.5% |
INVESTMENT | RETURN |
Developed International ex-USA Index | -21.6% |
Emerging Markets Index | -14.4% |
Bloomberg U.S Aggregate Bond Index | -10.4% |
SOURCE: Morningstar Direct; Bloomberg; Large Value: Russell 1000 Value TR Index, Large Blend: S&P 500 Index TR, Large Growth: Russell 1000 Growth Index TR, Mid Value: Russell Midcap Value Index TR, Mid Blend: Russell Midcap Index TR, Mid Growth: Russell Midcap Growth Index TR, Small Value: Russell 2000 Value Index TR, Small Blend: Russell 2000 Index TR, Small Growth: Russell 2000 Growth Index TR. Developed International: STOXX Global 1800 ex-USA Index TR, Emerging Markets: STOXX Emerging Markets 1500 Index TR
FEDERAL RESERVE
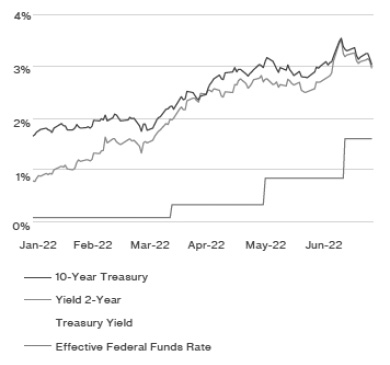
The Fed is trying to restore credibility with the marketplace after dismissing inflationary trends as just being transitory for nearly a year. The Fed took bold action after seeing inflation reach a 40-year high and increased the federal funds rate by 0.75% on June 15, making it the largest single rate increase since 1994. This brought the overnight lending rate between banks to a range of 1.50%-1.75%. The committee is currently telegraphing that they will likely increase rates by an additional 0.75% at their July meeting. The Fed is predicting that the federal funds target rate at the end of 2022 will be between 3.25% and 3.50%, which remains much higher than where rates currently sit. In June, the 10-Year Treasury yield closed above 3.49% for the first time since July 2011. It has also caused the spread between the 2 and 10-year Treasury maturities to invert. This occurs when the economic forecast looks unsteady and investors favor purchasing longer-term debt over short-term debt. They do this to try and lock in long-term bond yields to reduce risk. Historically, this has been a precursor to an economic recession.
FIGURE 2
TREASURY YIELDS AND FEDERAL FUNDS RATE
SOURCE: FRED
2022 Semi-Annual Report | June 30, 2022 | Page 1 |
RECESSION AROUND THE CORNER?
Now that the Fed has committed to “do-whatever-it-takes to control inflation” and will be aggressively raising rates for the foreseeable future, investors are questioning if the economy has what it takes to rebound this time. As the Fed continues to tighten, the question remains, will the economy be able to continue to grow despite the dampening demand caused by an increase in interest rates? The first quarter of 2022 saw the U.S. economy unexpectedly contract by -1.6%. While the National Bureau of Economic Research is responsible for determining the official declaration of a recession, many investors follow the old methodology of two consecutive quarters of negative GDP growth as the definition of a recession. As interest rate increases continue to work their way into the economy, there are signs that some of the demand is already declining rapidly. For example, according to the U.S. Census Bureau, new housing starts declined by -14.4% from April to May.
SENTIMENT AT HISTORIC LOW
Consumers are feeling different about this bear market from others that have occurred in recent years. The University of Michigan Index of Consumer Sentiment survey for June reported a level of 50.0, making it an all-time low in the survey’s history since 1978. It was a substantial drop of more than -14% from May. Previously, investors knew that the Federal Reserve was ultimately backing up the stock market which is why some analysts believe that we had the V-shaped recoveries after the significant drawdowns we experienced in 2019 and 2020.
RUSSIA AND UKRAINE WAR
As the war between Russia and Ukraine continues to drag on, Ukraine is defending itself on several fronts better than many expected. This unprovoked Russian attack led many countries, including the European Union, to ban the purchase of Russian oil exports. This sent the price of crude oil higher as demand already outweighed supply. Russia is the world’s second- largest oil producer behind the U.S. and produces more than 9.4 million barrels per day. This shortage and continued supply chain issues were primary drivers in pushing inflation to reach 40-year highs.
HOW IS THIS IMPACTING PORTFOLIOS?
At Meeder, we manage investment solutions across different risk profiles and time horizons. Meeder manages strategies using a systematic approach that guides us in the allocation of our portfolios. Many of these solutions employ one or more of our core investment strategies: Growth, Defensive Equity, and Fixed Income.
GROWTH
Investment portfolios comprised of the Growth Strategy maintain a more aggressive objective and typically remain invested in the stock market. In the second quarter, equity markets experienced significant volatility as the Russia and Ukraine War continued. This led many countries to ban the purchase of Russian oil exports, sending the price of crude oil higher and exacerbating supply chain disruptions. The Fed took bold action after seeing inflation reach a 40-year high and increased the federal funds rate by 0.75% on June 15 making it the largest single rate increase since 1994. This volatility caused the performance of nearly all equity markets to struggle. Investors that remained in the Growth Strategy experienced more volatility than our Defensive Equity strategies but achieved performance similar to the equity market as represented by the S&P 500 Index.
DEFENSIVE EQUITY
Portfolios that utilize the Defensive Equity Strategy follow a rules-based and data-driven approach using the Meeder Investment Positioning System (IPS) model. This investment model is used to determine the risk relative to the reward available in the marketplace and identify when we should be increasing or decreasing the portfolio’s equity exposure. At the beginning of the quarter, the strategy had a 70% allocation to equities. By the end of April, credit risk continued to rise, and inflation, interest rates, and geopolitical uncertainty weighed on the model score. The IPS model guided us to reduce our allocation to equities to 51%. In the middle of May, the long-term trends and momentum were very weak. Valuations remained elevated, causing us to reduce our equity allocation to as low as 32%. In early June our intermediate and short-term models became a little more positive due to the extreme number of flows into inverse bearish ETFs. We view this from a contrarian perspective and increased our equity exposure to 41%. For the remainder of the quarter, any improvement in the IPS model scores were essentially negated by the heightened volatility present in the marketplace. The defensive equity positioning throughout the quarter substantially reduced the market volatility experienced by investors relative to the equity market as measured by the S&P 500 Index.
FIXED INCOME
The Meeder Fixed Income Strategy tactically shifts portfolio exposure utilizing our proprietary investment models. These models are designed to actively monitor factors to guide us in determining the credit quality, emerging market debt exposure, and the portfolio’s U.S. Treasury duration.
Meeder Fixed Income portfolios started the second quarter with exposure to high yield bonds, investment-grade bonds, short-term U.S. Treasuries, and cash. As market volatility increased early in the quarter, momentum and volatility factors in our credit model signaled risk-off sentiment and we reduced high yield positions in our portfolios, moving the proceeds to cash. We also extended portfolio duration from mid-May through mid-June, as momentum factors in our duration model indicated relative strength in longer duration Treasuries. As volatility subsided towards the end of May, macroeconomic, momentum and volatility factors in our credit and emerging markets led us to increase high yield and emerging market exposure briefly.
However, rate volatility in the fixed income markets continued to rise during the quarter and the Federal Reserve surprised the markets with a higher-than- expected, 0.75% rate hike on the federal funds rate in June. Our models ultimately guided us to exit high yield and
Page 2 | 2022 Semi-Annual Report | June 30, 2022 |
emerging market positions in mid- June, increasing the cash position in our portfolios. Higher cash exposure helped our portfolios’ relative performance against market benchmarks on the downside during the quarter.
One-third of the portfolio remained invested in U.S. Investment grade securities throughout the quarter. At the end of the second quarter, we reduced High Yield and Emerging Market exposure and shortened the duration by raising cash.
LOOKING AHEAD
Inflation will remain a very important issue for the global economy in the foreseeable future. This presents a unique and challenging environment that we have not seen for more than 40 years. The good news is that we have seen inflationary times worse than this and have built our models with everything we learned since that time. While no two economic periods are the same, we will continue to make our investment decisions based on economic data and factors that remove emotion from the decision- making process. We will continue to follow our disciplined process and rules-based approach to managing money and, as always, we thank you for trusting us to help you reach your financial goals.
Sincerely,

Robert S. Meeder
President and CEO
2022 Semi-Annual Report | June 30, 2022 | Page 3 |
Portfolio Composition
June 30, 2022
Muirfield Fund
Common Stock Sector
Concentration
as of June 30, 2022 | % of total
common
stocks |
Information Technology | 29.4% |
Healthcare | 19.9% |
Financials | 11.3% |
Industrials | 9.4% |
Consumer Discretionary | 9.1% |
Communication Services | 6.4% |
Energy | 6.2% |
Consumer Staples | 4.5% |
Materials | 2.3% |
Utilities | 1.3% |
Real Estate Investment Trust | 0.2% |
Total | 100.0% |
As a percentage of total common stocks. Concentrations are subject to change.
Top 10 Holdings
as of June 30, 2022 |
% of total
net assets
|
Microsoft Corp. | 4.6% |
Apple, Inc. | 3.8% |
Berkshire Hathaway, Inc. - Class B | 2.6% |
Johnson & Johnson | 1.8% |
Alphabet, Inc. - Class C | 1.8% |
Costco Wholesale Corp. | 1.1% |
Amazon.com, Inc. | 1.1% |
Lockheed Martin Corp. | 1.0% |
UnitedHealth Group, Inc. | 0.9% |
Northrop Grumman Systems Corp. | 0.9% |
As a percentage of total net assets. Holdings exclude short-term investments and derivatives.
Asset Allocation
as of June 30, 2022 |
% of total
net assets
|
Common Stocks (United States) | 52.3% |
Money Market Registered Investment Companies | 42.6% |
Bank Obligations | 0.1% |
Other Assets/Liabilities (Net) | 5.0% |
Total | 100.0% |
As a percentage of total net assets. The Fund has invested in stock index futures contracts in order to equitize cash balances it holds in a proprietary money market fund.
Spectrum Fund
Common Stock Sector
Concentration
as of June 30, 2022 | % of total
common
stocks |
Information Technology | 28.4% |
Healthcare | 20.7% |
Financials | 11.9% |
Consumer Discretionary | 9.2% |
Industrials | 7.8% |
Energy | 7.4% |
Communication Services | 6.6% |
Consumer Staples | 4.9% |
Materials | 1.9% |
Utilities | 1.1% |
Real Estate Investment Trust | 0.1% |
Total | 100.0% |
As a percentage of total common stocks. Concentrations are subject to change.
Top 10 Holdings
as of June 30, 2022 |
% of total
net assets
|
Microsoft Corp. | 5.7% |
Apple, Inc. | 4.8% |
Berkshire Hathaway, Inc. - Class B | 3.0% |
Alphabet, Inc. - Class C | 2.4% |
UnitedHealth Group, Inc. | 2.1% |
Amazon.com, Inc. | 1.6% |
Amgen USA, Inc. | 1.4% |
Costco Wholesale Corp. | 1.4% |
Johnson & Johnson | 1.3% |
Chevron Corp. | 1.2% |
As a percentage of total net assets. Holdings exclude short-term investments and derivatives.
Asset Allocation
as of June 30, 2022 |
% of total
net assets
|
Common Stocks (United States) | 66.5% |
Money Market Registered Investment Companies | 25.4% |
Other Assets/Liabilities (Net) | 8.1% |
Total | 100.0% |
As a percentage of total net assets. The Fund has invested in stock index futures contracts in order to equitize cash balances it holds in a proprietary money market fund.
2022 Semi-Annual Report | June 30, 2022 | Page 5 |
Global Allocation Fund
Common Stock Sector
Concentration
as of June 30, 2022 | % of total
common
stocks |
Information Technology | 28.7% |
Healthcare | 19.4% |
Financials | 14.0% |
Consumer Discretionary | 8.7% |
Industrials | 8.3% |
Energy | 6.7% |
Communication Services | 6.5% |
Consumer Staples | 5.2% |
Materials | 1.4% |
Utilities | 1.0% |
Real Estate Investment Trust | 0.1% |
Total | 100.0% |
As a percentage of total common stocks. Concentrations are subject to change.
Registered Investment Company
Geographic Concentration
as of June 30, 2022 | % of total
common
stocks |
U.S. Fixed Income | 24.7% |
International Equity | 75.3% |
Total | 100.0% |
As a percentage of total registered investment companies. Concentrations are subject to change.
Top 10 Holdings
as of June 30, 2022 |
% of total
net assets
|
iShares Core MSCI EAFE ETF | 6.7% |
Microsoft Corp. | 1.7% |
iShares Core MSCI Emerging Markets ETF | 1.6% |
Apple, Inc. | 1.6% |
Berkshire Hathaway, Inc. - Class B | 1.3% |
Alphabet, Inc. - Class C | 0.8% |
Johnson & Johnson | 0.6% |
Marsh & McLennan Cos., Inc. | 0.5% |
Amazon.com, Inc. | 0.5% |
UnitedHealth Group, Inc. | 0.5% |
As a percentage of total net assets. Holdings exclude short-term investments and derivatives.
Asset Allocation
as of June 30, 2022 |
% of total
net assets
|
Common Stocks (United States) | 21.7% |
Equity Registered Investment Companies | 8.4% |
Fixed Income Registered Investment Companies | 2.7% |
Money Market Registered Investment Companies | 62.7% |
Bank Obligations | 1.3% |
Other Assets/Liabilities (Net) | 3.2% |
Total | 100.0% |
As a percentage of total net assets. The Fund has invested in stock index futures contracts in order to equitize cash balances it holds in a proprietary money market fund.
Balanced Fund
Common Stock Sector
Concentration
as of June 30, 2022 | % of total
common
stocks |
Information Technology | 28.7% |
Healthcare | 19.9% |
Financials | 12.8% |
Consumer Discretionary | 8.6% |
Industrials | 8.4% |
Energy | 7.2% |
Communication Services | 6.4% |
Consumer Staples | 4.7% |
Materials | 1.9% |
Utilities | 1.3% |
Real Estate Investment Trust | 0.1% |
Total | 100.0% |
As a percentage of total common stocks. Concentrations are subject to change.
Registered Investment Company
Geographic Concentration
as of June 30, 2022 | % of total
common
stocks |
U.S. Fixed Income | 100.0% |
Total | 100.0% |
As a percentage of total registered investment companies. Concentrations are subject to change.
Top 10 Holdings
as of June 30, 2022 |
% of total
net assets
|
Microsoft Corp. | 3.0% |
Apple, Inc. | 2.6% |
Berkshire Hathaway, Inc. - Class B | 2.0% |
PGIM Short-Term Corporate Bond Fund - Class R6 | 1.5% |
Diamond Hill Short Duration Securitized Bond Fund - Class Y | 1.5% |
Alphabet, Inc. - Class C | 1.3% |
Segall Bryant & Hamill Plus Bond Fund Institutional | 1.1% |
DoubleLine Total Return Bond Fund - Class I | 1.1% |
UnitedHealth Group Inc. | 1.0% |
Baird Core Plus Bond Fund Class Institutional | 0.9% |
As a percentage of total net assets. Holdings exclude short-term investments and derivatives.
Asset Allocation
as of June 30, 2022 |
% of total
net assets
|
Common Stocks (United States) | 36.2% |
Fixed Income Registered Investment Companies | 8.5% |
Money Market Registered Investment Companies | 50.7% |
Bank Obligations | 0.1% |
Other Assets/Liabilities (Net) | 4.5% |
Total | 100.0% |
As a percentage of total net assets. The Fund has invested in stock index futures contracts in order to equitize cash balances it holds in a proprietary money market fund.
Page 6 | 2022 Semi-Annual Report | June 30, 2022 |
Moderate Allocation Fund
Common Stock Sector
Concentration
as of June 30, 2022 | % of total
common
stocks |
Information Technology | 28.4% |
Healthcare | 19.5% |
Financials | 14.6% |
Consumer Discretionary | 8.6% |
Industrials | 8.4% |
Communication Services | 6.7% |
Energy | 6.6% |
Consumer Staples | 4.7% |
Materials | 1.4% |
Utilities | 1.0% |
Real Estate Investment Trust | 0.1% |
Total | 100.0% |
As a percentage of total common stocks. Concentrations are subject to change.
Registered Investment Company
Geographic Concentration
as of June 30, 2022 | % of total
common
stocks |
U.S. Fixed Income | 100.0% |
Total | 100.0% |
As a percentage of total registered investment companies. Concentrations are subject to change.
Top 10 Holdings
as of June 30, 2022 |
% of total
net assets
|
PGIM Short-Term Corporate Bond Fund - Class R6 | 2.4% |
Diamond Hill Short Duration Securitized Bond Fund - Class Y | 2.4% |
Segall Bryant & Hamill Plus Bond Fund Institutional | 1.8% |
DoubleLine Total Return Bond Fund - Class I | 1.8% |
Baird Core Plus Bond Fund Class Institutional | 1.5% |
Microsoft Corp. | 1.4% |
Apple, Inc. | 1.3% |
Pioneer Bond Fund - Class K | 1.0% |
Frost Total Return Bond Fund Class Institutional | 1.0% |
Berkshire Hathaway, Inc. - Class B | 1.0% |
As a percentage of total net assets. Holdings exclude short-term investments and derivatives.
Asset Allocation
as of June 30, 2022 |
% of total
net assets
|
Common Stocks (United States) | 17.2% |
Fixed Income Registered Investment Companies | 14.2% |
Money Market Registered Investment Companies | 66.0% |
Bank Obligations | 0.2% |
Other Assets/Liabilities (Net) | 2.4% |
Total | 100.0% |
As a percentage of total net assets. The Fund has invested in stock index futures contracts in order to equitize cash balances it holds in a proprietary money market fund.
Conservative Allocation Fund
Common Stock Sector
Concentration
as of June 30, 2022 | % of total
common
stocks |
Information Technology | 27.6% |
Healthcare | 18.6% |
Financials | 12.0% |
Consumer Discretionary | 7.9% |
Communication Services | 7.1% |
Energy | 6.6% |
Utilities | 6.6% |
Industrials | 6.3% |
Consumer Staples | 4.1% |
Materials | 3.2% |
Real Estate Investment Trust | 0.0% |
Total | 100.0% |
As a percentage of total common stocks. Concentrations are subject to change.
Registered Investment Company
Geographic Concentration
as of June 30, 2022 | % of total
common
stocks |
U.S. Fixed Income | 100.0% |
Total | 100.0% |
As a percentage of total registered investment companies. Concentrations are subject to change.
Top 10 Holdings
as of June 30, 2022 |
% of total
net assets
|
PGIM Short-Term Corporate Bond Fund - Class R6 | 3.4% |
Diamond Hill Short Duration Securitized Bond Fund - Class Y | 3.4% |
Segall Bryant & Hamill Plus Bond Fund Institutional | 2.5% |
DoubleLine Total Return Bond Fund - Class I | 2.5% |
Baird Core Plus Bond Fund Class Institutional | 2.1% |
Pioneer Bond Fund - Class K | 1.4% |
Frost Total Return Bond Fund Class Institutional | 1.4% |
Guggenheim Total Return Bond Fund Institutional Class | 1.1% |
iShares Core US Aggregate Bond ETF | 1.0% |
BBH Limited Duration Fund Class Institutional | 0.9% |
As a percentage of total net assets. Holdings exclude short-term investments and derivatives.
Asset Allocation
as of June 30, 2022 |
% of total
net assets
|
Common Stocks (United States) | 1.2% |
Fixed Income Registered Investment Companies | 19.8% |
Money Market Registered Investment Companies | 77.7% |
Other Assets/Liabilities (Net) | 1.3% |
Total | 100.0% |
As a percentage of total net assets. The Fund has invested in stock index futures contracts in order to equitize cash balances it holds in a proprietary money market fund.
2022 Semi-Annual Report | June 30, 2022 | Page 7 |
Dynamic Allocation Fund
Common Stock Sector
Concentration
as of June 30, 2022 | % of total
common
stocks |
Information Technology | 28.6% |
Healthcare | 19.9% |
Financials | 12.4% |
Consumer Discretionary | 9.2% |
Industrials | 8.2% |
Energy | 7.0% |
Communication Services | 6.4% |
Consumer Staples | 5.2% |
Materials | 1.8% |
Utilities | 1.3% |
Real Estate Investment Trust | 0.0% |
Total | 100.0% |
As a percentage of total common stocks. Concentrations are subject to change.
Registered Investment Company
Geographic Concentration
as of June 30, 2022 | % of total
common
stocks |
U.S. Fixed Income | 91.1% |
International Equity | 8.9% |
Total | 100.0% |
As a percentage of total registered investment companies. Concentrations are subject to change.
Top 10 Holdings
as of June 30, 2022 |
% of total
net assets
|
Microsoft Corp. | 5.4% |
Apple, Inc. | 4.5% |
Berkshire Hathaway, Inc. - Class B | 3.1% |
Alphabet, Inc. - Class C | 2.2% |
UnitedHealth Group, Inc. | 1.8% |
Amazon.com, Inc. | 1.5% |
Johnson & Johnson | 1.5% |
Costco Wholesale Corp. | 1.4% |
ExxonMobil Oil Corp. | 1.1% |
Chevron Corp. | 1.1% |
As a percentage of total net assets. Holdings exclude short-term investments and derivatives.
Asset Allocation
as of June 30, 2022 |
% of total
net assets
|
Common Stocks (United States) | 62.1% |
Fixed Income Registered Investment Companies | 4.6% |
Equity Registered Investment Companies | 0.5% |
Money Market Registered Investment Companies | 29.6% |
Bank Obligations | 0.2% |
Other Assets/Liabilities (Net) | 3.0% |
Total | 100.0% |
As a percentage of total net assets. The Fund has invested in stock index futures contracts in order to equitize cash balances it holds in a proprietary money market fund.
Quantex Fund
Common Stock Sector
Concentration
as of June 30, 2022 | % of total
common
stocks |
Industrials | 18.7% |
Consumer Discretionary | 12.7% |
Financials | 12.0% |
Information Technology | 9.8% |
Healthcare | 9.5% |
Utilities | 8.7% |
Materials | 8.5% |
Real Estate Investment Trust | 6.3% |
Communication Services | 5.5% |
Consumer Staples | 4.8% |
Energy | 3.5% |
Total | 100.0% |
As a percentage of total common stocks. Concentrations are subject to change.
Top 10 Holdings
as of June 30, 2022 |
% of total
net assets
|
Mosaic Co. Foundation/The | 0.9% |
Leidos Holdings, Inc. | 0.9% |
Nielsen Holdings PLC | 0.8% |
Quanta Services, Inc. | 0.8% |
Huntington Ingalls Industries, Inc. | 0.8% |
Atmos Energy Corp. | 0.8% |
Rollins, Inc. | 0.8% |
CF Industries Holdings, Inc. | 0.8% |
SolarEdge Technologies, Inc. | 0.8% |
Alliant Energy Corp. | 0.7% |
As a percentage of total net assets. Holdings exclude short-term investments and derivatives.
Asset Allocation
as of June 30, 2022 |
% of total
net assets
|
Common Stocks (United States) | 58.6% |
Money Market Registered Investment Companies | 37.4% |
Other Assets/Liabilities (Net) | 4.0% |
Total | 100.0% |
As a percentage of total net assets. The Fund has invested in stock index futures contracts in order to equitize cash balances it holds in a proprietary money market fund.
Page 8 | 2022 Semi-Annual Report | June 30, 2022 |
Tactical Income Fund
Fixed Income Sector Concentration
as of June 30, 2022 | % of total
fixed
income
securities |
Investment Grade | 29.0% |
Cash & Equivalents | 71.0% |
Total | 100.0% |
As a percentage of total fixed income securities. Concentrations are subject to change.
Top 10 Holdings
as of June 30, 2022 |
% of total
net assets
|
iShares Core 1-5 Year USD Bond ETF | 14.2% |
BBH Limited Duration Fund Class Institutional | 7.5% |
Diamond Hill Short Duration Securitized Bond Fund - Class Y | 3.1% |
Frost Total Return Bond Fund Class Institutional | 2.5% |
PGIM Short-Term Corporate Bond Fund - Class R6 | 1.4% |
Government National Mortgage Association, 6.50%, 7/20/2038 | 0.1% |
As a percentage of total net assets. Holdings exclude short-term investments and derivatives.
Institutional Prime Money Market Fund
Sector Concentration
as of June 30, 2022 |
% of total
net assets
|
Commercial Paper | 40.7% |
Certificates of Deposit | 27.4% |
Repurchase Agreements | 23.5% |
Money Market Registered Investment Companies | 4.6% |
Variable Rate Demand Notes | 3.2% |
Corporate Obligations | 2.1% |
Other Assets/Liabilities (Net) | -1.5% |
Total | 100.0% |
As a percentage of total net assets. Concentrations are subject to change.
Top 10 Holdings
as of June 30, 2022 |
% of total
net assets
|
South Street Repo, 1.50%, due 7/1/2022 | 8.6% |
South Street Repo, 1.55%, due 7/1/2022 | 7.8% |
StoneX Repo, 1.70%, due 7/1/2022 | 7.1% |
Federated Hermes Government Obligations Fund, 1.41% | 4.6% |
Great Bear Funding, 1.60%, 7/1/2022 | 2.1% |
Great Bear Funding, 1.58%, 7/5/2022 | 2.1% |
Halkin Finance, LLC, 1.11%, 7/1/2022 | 1.9% |
Natixis SA/New York, NY, 1.88%, 12/2/2022 | 1.4% |
Standard Chartered Bank NY, 0.66%, 11/1/2022 | 1.4% |
Bank of Montreal Chicago, 2.03%, 1/3/2023 | 1.4% |
As a percentage of total net assets.
2022 Semi-Annual Report | June 30, 2022 | Page 9 |
2022 Semi-Annual Report
Fund Holdings & Financial Statements
Schedules of Investments
June 30, 2022 (unaudited)
Muirfield Fund |
Security Description | | Shares,
Contracts
or Principal
Amount ($) | | | Fair
Value ($) | |
Common Stocks (United States) — 52.3% |
Communication Services — 3.4% | | | | | | | | |
Alphabet, Inc. (1) | | | 5,193 | | | | 11,359,428 | |
AT&T, Inc. | | | 29,147 | | | | 610,921 | |
Cogent Communications Holdings, Inc. | | | 2,264 | | | | 137,561 | |
Comcast Corp. | | | 81,067 | | | | 3,181,069 | |
Emerald Holding, Inc. (1) | | | 8 | | | | 33 | |
Entravision Communications Corp. | | | 1,883 | | | | 8,586 | |
IDT Corp. (1) | | | 15,505 | | | | 389,951 | |
Interpublic Group of Cos., Inc./The | | | 49,688 | | | | 1,367,911 | |
Liberty TripAdvisor Holdings, Inc. (1) | | | 8,364 | | | | 6,328 | |
Lions Gate Entertainment Corp. (1) | | | 688 | | | | 6,075 | |
Lumen Technologies, Inc. | | | 7,466 | | | | 81,454 | |
Meta Platforms, Inc. (1) | | | 16,153 | | | | 2,604,671 | |
News Corp. | | | 1,172 | | | | 18,260 | |
Nexstar Media Group, Inc. | | | 3,686 | | | | 600,376 | |
Omnicom Group, Inc. | | | 19,418 | | | | 1,235,179 | |
Telephone and Data Systems, Inc. | | | 410 | | | | 6,474 | |
Verizon Communications, Inc. | | | 802 | | | | 40,702 | |
| | | | | | | | 21,654,979 | |
| | | | | | | | | |
Consumer Discretionary — 4.7% | | | | | | | | |
Abercrombie & Fitch Co. (1) | | | 192 | | | | 3,249 | |
Academy Sports & Outdoors, Inc. | | | 53,605 | | | | 1,905,122 | |
Amazon.com, Inc. (1) | | | 64,824 | | | | 6,884,957 | |
AutoZone, Inc. (1) | | | 547 | | | | 1,175,569 | |
Booking Holdings, Inc. (1) | | | 921 | | | | 1,610,820 | |
Cavco Industries, Inc. (1) | | | 694 | | | | 136,017 | |
Dana, Inc. | | | 3,684 | | | | 51,834 | |
Dillard’s, Inc. | | | 68 | | | | 14,999 | |
Everi Holdings, Inc. (1) | | | 1,466 | | | | 23,910 | |
Fisker, Inc. (1) | | | 3 | | | | 26 | |
Ford Motor Co. | | | 45,012 | | | | 500,984 | |
Frontdoor, Inc. (1) | | | 2,948 | | | | 70,988 | |
Garmin, Ltd. | | | 72 | | | | 7,074 | |
Genesco, Inc. (1) | | | 1,423 | | | | 71,022 | |
Gentex Corp. | | | 476 | | | | 13,314 | |
Gentherm, Inc. (1) | | | 1,770 | | | | 110,466 | |
Genuine Parts Co. | | | 94 | | | | 12,502 | |
Grand Canyon Education, Inc. (1) | | | 17,367 | | | | 1,635,798 | |
H&R Block, Inc. | | | 11,137 | | | | 393,359 | |
Hibbett, Inc. | | | 2,837 | | | | 124,005 | |
Home Depot, Inc./The | | | 2,383 | | | | 653,585 | |
Hovnanian Enterprises, Inc. (1) | | | 10 | | | | 428 | |
Kohl’s Corp. | | | 14,402 | | | | 514,007 | |
La-Z-Boy, Inc. | | | 315 | | | | 7,469 | |
Lear Corp. | | | 55 | | | | 6,924 | |
Muirfield Fund |
Security Description | | Shares,
Contracts
or Principal
Amount ($) | | | Fair
Value ($) | |
Common Stocks (United States) — continued |
LKQ Corp. | | | 69 | | | | 3,387 | |
Lowe’s Cos., Inc. | | | 20 | | | | 3,493 | |
Lululemon Athletica, Inc. (1) | | | 9,068 | | | | 2,472,027 | |
M/I Homes, Inc. (1) | | | 7,987 | | | | 316,764 | |
Macy’s, Inc. | | | 86,196 | | | | 1,579,111 | |
Mohawk Industries, Inc. (1) | | | 6,873 | | | | 852,871 | |
Monarch Casino & Resort, Inc. (1) | | | 582 | | | | 34,146 | |
Murphy USA, Inc. | | | 280 | | | | 65,204 | |
Nordstrom, Inc. | | | 3,925 | | | | 82,935 | |
ONE Group Hospitality, Inc./The (1) | | | 3,356 | | | | 24,734 | |
O’Reilly Automotive, Inc. (1) | | | 2,508 | | | | 1,584,454 | |
PVH Corp. | | | 12,348 | | | | 702,601 | |
Qurate Retail, Inc. | | | 7,934 | | | | 22,771 | |
Rent-A-Center, Inc./TX | | | 281 | | | | 5,465 | |
Ross Stores, Inc. | | | 3,156 | | | | 221,646 | |
Skyline Champion Corp. (1) | | | 20,917 | | | | 991,884 | |
Smith & Wesson Brands, Inc. | | | 10,263 | | | | 134,753 | |
Sonos, Inc. (1) | | | 37,511 | | | | 676,698 | |
Sturm Ruger & Co., Inc. | | | 283 | | | | 18,013 | |
Tapestry, Inc. | | | 6,717 | | | | 205,003 | |
Target Corp. | | | 2,938 | | | | 414,934 | |
Terminix Global Holdings, Inc. (1) | | | 2 | | | | 81 | |
Tesla, Inc. (1) | | | 575 | | | | 387,217 | |
Thor Industries, Inc. | | | 3,534 | | | | 264,096 | |
TJX Cos., Inc./The | | | 10,052 | | | | 561,404 | |
Town Sports International Holdings, Inc. (1) | | | 4,613 | | | | 1 | |
Tractor Supply Co. | | | 2,516 | | | | 487,727 | |
Tupperware Brands Corp. (1) | | | 645 | | | | 4,089 | |
Ulta Beauty, Inc. (1) | | | 5,150 | | | | 1,985,222 | |
Yum! Brands, Inc. | | | 4,033 | | | | 457,786 | |
| | | | | | | | 30,488,945 | |
| | | | | | | | | |
Consumer Staples — 2.4% | | | | | | | | |
Albertsons Cos., Inc. | | | 22,234 | | | | 594,092 | |
Archer-Daniels-Midland Co. | | | 26,248 | | | | 2,036,845 | |
Bunge, Ltd. | | | 11,487 | | | | 1,041,756 | |
Coca-Cola Co./The | | | 3,709 | | | | 233,333 | |
Costco Wholesale Corp. | | | 15,244 | | | | 7,306,144 | |
Darling Ingredients, Inc. (1) | | | 2,457 | | | | 146,929 | |
Flowers Foods, Inc. | | | 750 | | | | 19,740 | |
General Mills, Inc. | | | 19,764 | | | | 1,491,194 | |
Hostess Brands, Inc. (1) | | | 8,446 | | | | 179,140 | |
Ingredion, Inc. | | | 3,551 | | | | 313,056 | |
Kroger Co./The | | | 166 | | | | 7,857 | |
Mondelez International, Inc. | | | 4,967 | | | | 308,401 | |
NewAge, Inc. (1) | | | 14 | | | | 3 | |
The accompanying notes are an integral part of these financial statements.
2022 Semi-Annual Report | June 30, 2022 | Page 11 |
Schedules of Investments
June 30, 2022 (unaudited)
Muirfield Fund |
Security Description | | Shares,
Contracts
or Principal
Amount ($) | | | Fair
Value ($) | |
Common Stocks (United States) — continued |
PepsiCo, Inc. | | | 868 | | | | 144,661 | |
Simply Good Foods Co./The (1) | | | 11,593 | | | | 437,868 | |
Sysco Corp. | | | 40 | | | | 3,388 | |
Tyson Foods, Inc. | | | 10,693 | | | | 920,240 | |
| | | | | | | | 15,184,647 | |
| | | | | | | | | |
Energy — 3.2% | | | | | | | | |
Alto Ingredients, Inc. (1) | | | 1,605 | | | | 5,955 | |
APA Corp. | | | 7,673 | | | | 267,788 | |
Arch Resources, Inc. | | | 67 | | | | 9,587 | |
Baker Hughes Co. | | | 204 | | | | 5,889 | |
Berry Corp. | | | 2,368 | | | | 18,044 | |
Brigham Minerals, Inc. | | | 266 | | | | 6,552 | |
Bristow Group, Inc. (1) | | | 2,574 | | | | 60,232 | |
California Resources Corp. | | | 1,723 | | | | 66,336 | |
Centennial Resource Development, Inc./DE (1) | | | 580 | | | | 3,468 | |
Centrus Energy Corp. (1) | | | 2,426 | | | | 60,044 | |
ChampionX Corp. | | | 337 | | | | 6,689 | |
Cheniere Energy, Inc. | | | 4,803 | | | | 638,943 | |
Chevron Corp. | | | 35,561 | | | | 5,148,522 | |
Chord Energy Corp. | | | 47 | | | | 5,718 | |
Civitas Resources, Inc. | | | 327 | | | | 17,099 | |
ConocoPhillips | | | 6,796 | | | | 610,349 | |
Continental Resources, Inc./OK | | | 113 | | | | 7,385 | |
Coterra Energy, Inc. | | | 244 | | | | 6,293 | |
CVR Energy, Inc. | | | 438 | | | | 14,673 | |
Delek US Holdings, Inc. | | | 376 | | | | 9,716 | |
Devon Energy Corp. | | | 3,257 | | | | 179,493 | |
Diamondback Energy, Inc. | | | 2,487 | | | | 301,300 | |
DT Midstream, Inc. | | | 5,259 | | | | 257,796 | |
EOG Resources, Inc. | | | 5,707 | | | | 630,281 | |
EQT Corp. | | | 6,023 | | | | 207,191 | |
Exxon Mobil Corp. | | | 44,061 | | | | 3,773,384 | |
Halliburton Co. | | | 183 | | | | 5,739 | |
Hess Corp. | | | 1,994 | | | | 211,244 | |
HF Sinclair Corp. | | | 720 | | | | 32,515 | |
Laredo Petroleum, Inc. (1) | | | 218 | | | | 15,029 | |
Magnolia Oil & Gas Corp. | | | 275 | | | | 5,772 | |
Marathon Petroleum Corp. | | | 36,385 | | | | 2,991,211 | |
Matador Resources Co. | | | 1,875 | | | | 87,356 | |
Murphy Oil Corp. | | | 184 | | | | 5,555 | |
Nine Energy Service, Inc. (1) | | | 7,505 | | | | 19,888 | |
Occidental Petroleum Corp. | | | 498 | | | | 29,322 | |
ONEOK, Inc. | | | 19,525 | | | | 1,083,638 | |
Ovintiv, Inc. | | | 5,060 | | | | 223,601 | |
Muirfield Fund |
Security Description | | Shares,
Contracts
or Principal
Amount ($) | | | Fair
Value ($) | |
Common Stocks (United States) — continued |
PBF Energy, Inc. (1) | | | 216 | | | | 6,268 | |
PDC Energy, Inc. | | | 953 | | | | 58,714 | |
Phillips 66 | | | 9,887 | | | | 810,635 | |
Pioneer Natural Resources Co. | | | 1,755 | | | | 391,505 | |
ProPetro Holding Corp. (1) | | | 369 | | | | 3,690 | |
REX American Resources Corp. (1) | | | 51 | | | | 4,325 | |
Schlumberger NV | | | 23,752 | | | | 849,372 | |
SM Energy Co. | | | 1,208 | | | | 41,302 | |
Targa Resources Corp. | | | 6,362 | | | | 379,621 | |
Teekay Corp. (1) | | | 3,592 | | | | 10,345 | |
Valero Energy Corp. | | | 10,631 | | | | 1,129,863 | |
Whiting Petroleum Corp. | | | 122 | | | | 8,300 | |
Williams Cos., Inc./The | | | 502 | | | | 15,667 | |
World Fuel Services Corp. | | | 2,314 | | | | 47,344 | |
| | | | | | | | 20,786,548 | |
| | | | | | | | | |
Financials — 5.9% | | | | | | | | |
American Equity Investment Life Holding Co. | | | 10,002 | | | | 365,773 | |
American Financial Group, Inc./OH | | | 2,518 | | | | 349,524 | |
American International Group, Inc. | | | 63,115 | | | | 3,227,070 | |
Aon PLC | | | 14 | | | | 3,776 | |
Atlanticus Holdings Corp. (1) | | | 129 | | | | 4,537 | |
Axis Capital Holdings, Ltd. | | | 385 | | | | 21,980 | |
Bank of New York Mellon Corp./The | | | 24,075 | | | | 1,004,168 | |
Berkshire Hathaway, Inc. (1) | | | 61,253 | | | | 16,723,294 | |
Capital Bancorp, Inc. | | | 246 | | | | 5,338 | |
Carlyle Group, Inc./The | | | 23 | | | | 728 | |
Charles Schwab Corp./The | | | 15,661 | | | | 989,462 | |
Chubb, Ltd. | | | 3,118 | | | | 612,936 | |
Enact Holdings, Inc. | | | 309 | | | | 6,637 | |
Erie Indemnity Co. | | | 45 | | | | 8,649 | |
Essent Group, Ltd. | | | 10,298 | | | | 400,592 | |
Fidelity National Financial, Inc. | | | 16,823 | | | | 621,778 | |
Hartford Financial Services Group, Inc./The | | | 5,375 | | | | 351,686 | |
Markel Corp. (1) | | | 210 | | | | 271,583 | |
Marsh & McLennan Cos., Inc. | | | 25,477 | | | | 3,955,304 | |
Medley Management, Inc. (1)(5) | | | 235 | | | | 0 | |
Moelis & Co. | | | 4,017 | | | | 158,069 | |
Mr Cooper Group, Inc. (1) | | | 1,667 | | | | 61,246 | |
New Residential Investment Corp. | | | 1,068 | | | | 9,954 | |
NMI Holdings, Inc. (1) | | | 424 | | | | 7,060 | |
Northrim BanCorp, Inc. | | | 2,779 | | | | 111,883 | |
OFG Bancorp | | | 257 | | | | 6,528 | |
Old Republic International Corp. | | | 978 | | | | 21,868 | |
OneMain Holdings, Inc. | | | 30,367 | | | | 1,135,118 | |
The accompanying notes are an integral part of these financial statements.
Page 12 | 2022 Semi-Annual Report | June 30, 2022 |
Schedules of Investments
June 30, 2022 (unaudited)
Muirfield Fund |
Security Description | | Shares,
Contracts
or Principal
Amount ($) | | | Fair
Value ($) | |
Common Stocks (United States) — continued |
Pathward Financial, Inc. | | | 3,673 | | | | 142,035 | |
Popular, Inc. | | | 90 | | | | 6,924 | |
Prudential Financial, Inc. | | | 11,769 | | | | 1,126,058 | |
Pzena Investment Management, Inc. | | | 7,429 | | | | 48,957 | |
Regions Financial Corp. | | | 33,360 | | | | 625,500 | |
Rocket Cos., Inc. | | | 3 | | | | 22 | |
State Street Corp. | | | 6,373 | | | | 392,895 | |
Stewart Information Services Corp. | | | 14,949 | | | | 743,713 | |
Synchrony Financial | | | 9,858 | | | | 272,278 | |
Unum Group | | | 201 | | | | 6,838 | |
W R Berkley Corp. | | | 8,168 | | | | 557,548 | |
Walker & Dunlop, Inc. | | | 4,498 | | | | 433,337 | |
Westamerica BanCorp | | | 318 | | | | 17,700 | |
Willis Towers Watson PLC | | | 16,007 | | | | 3,159,622 | |
Zions Bancorp NA | | | 3,255 | | | | 165,680 | |
| | | | | | | | 38,135,648 | |
| | | | | | | | | |
Healthcare — 10.4% | | | | | | | | |
Abbott Laboratories | | | 11,797 | | | | 1,281,744 | |
AbbVie, Inc. | | | 36,570 | | | | 5,601,061 | |
Agilent Technologies, Inc. | | | 89 | | | | 10,571 | |
Align Technology, Inc. (1) | | | 14 | | | | 3,313 | |
Amgen, Inc. | | | 21,249 | | | | 5,169,882 | |
Amneal Pharmaceuticals, Inc. (1) | | | 7,487 | | | | 23,809 | |
Assertio Holdings, Inc. (1) | | | 3,562 | | | | 10,508 | |
Avalo Therapeutics, Inc. (1) | | | 17,337 | | | | 8,669 | |
Avid Bioservices, Inc. (1) | | | 246 | | | | 3,754 | |
Bio-Techne Corp. | | | 21 | | | | 7,279 | |
Bristol-Myers Squibb Co. | | | 51,154 | | | | 3,938,858 | |
Brooklyn ImmunoTherapeutics, Inc. (1) | | | 5 | | | | 3 | |
Cardinal Health, Inc. | | | 36,005 | | | | 1,881,981 | |
Catalent, Inc. (1) | | | 13,756 | | | | 1,475,881 | |
Celldex Therapeutics, Inc. (1) | | | 32 | | | | 863 | |
Centene Corp. (1) | | | 5,425 | | | | 459,009 | |
Centogene NV (1) | | | 2,360 | | | | 5,593 | |
Cigna Corp. | | | 5,727 | | | | 1,509,179 | |
Cyteir Therapeutics, Inc. (1) | | | 3 | | | | 9 | |
Danaher Corp. | | | 2,716 | | | | 688,560 | |
Dyne Therapeutics, Inc. (1) | | | 4 | | | | 27 | |
Eli Lilly & Co. | | | 12,720 | | | | 4,124,206 | |
Eloxx Pharmaceuticals, Inc. (1) | | | 14,948 | | | | 4,036 | |
Endo International PLC (1) | | | 21,615 | | | | 10,066 | |
Fulgent Genetics, Inc. (1) | | | 6,797 | | | | 370,640 | |
Galectin Therapeutics, Inc. (1) | | | 3,817 | | | | 5,000 | |
Genprex, Inc. (1) | | | 4,483 | | | | 6,231 | |
Gilead Sciences, Inc. | | | 42,865 | | | | 2,649,486 | |
Muirfield Fund |
Security Description | | Shares,
Contracts
or Principal
Amount ($) | | | Fair
Value ($) | |
Common Stocks (United States) — continued |
Humana, Inc. | | | 1,140 | | | | 533,600 | |
IDEXX Laboratories, Inc. (1) | | | 1,790 | | | | 627,807 | |
Illumina, Inc. (1) | | | 3,660 | | | | 674,758 | |
ImmunityBio, Inc. (1) | | | 14,061 | | | | 52,307 | |
Incyte Corp. (1) | | | 3,850 | | | | 292,485 | |
Intra-Cellular Therapies, Inc. (1) | | | 356 | | | | 20,320 | |
Johnson & Johnson | | | 64,271 | | | | 11,408,745 | |
Kronos Bio, Inc. (1) | | | 3 | | | | 11 | |
La Jolla Pharmaceutical Co. (1) | | | 1,666 | | | | 5,315 | |
Laboratory Corp. of America Holdings | | | 278 | | | | 65,152 | |
McKesson Corp. | | | 8,991 | | | | 2,932,954 | |
Merck & Co., Inc. | | | 49,542 | | | | 4,516,744 | |
Moderna, Inc. (1) | | | 11,479 | | | | 1,639,775 | |
Molina Healthcare, Inc. (1) | | | 26 | | | | 7,270 | |
Oak Street Health, Inc. (1) | | | 1 | | | | 16 | |
Palatin Technologies, Inc. (1) | | | 15,677 | | | | 4,399 | |
Pfizer, Inc. | | | 62,691 | | | | 3,286,889 | |
Premier, Inc. | | | 2,907 | | | | 103,722 | |
QuidelOrtho Corp. (1) | | | 4,151 | | | | 403,394 | |
Regeneron Pharmaceuticals, Inc. (1) | | | 2,877 | | | | 1,700,681 | |
UnitedHealth Group, Inc. | | | 11,212 | | | | 5,758,820 | |
Universal Health Services, Inc. | | | 1,326 | | | | 133,541 | |
Veeva Systems, Inc. (1) | | | 867 | | | | 171,701 | |
Veracyte, Inc. (1) | | | 4,212 | | | | 83,819 | |
Vertex Pharmaceuticals, Inc. (1) | | | 3,044 | | | | 857,769 | |
Viatris, Inc. | | | 29,587 | | | | 309,776 | |
West Pharmaceutical Services, Inc. | | | 4,491 | | | | 1,357,944 | |
Zoetis, Inc. | | | 3,233 | | | | 555,720 | |
| | | | | | | | 66,755,652 | |
| | | | | | | | | |
Industrials — 4.9% | | | | | | | | |
AECOM | | | 208 | | | | 13,566 | |
Allison Transmission Holdings, Inc. | | | 187 | | | | 7,190 | |
Atkore, Inc. (1) | | | 9,025 | | | | 749,165 | |
Axon Enterprise, Inc. (1) | | | 7,443 | | | | 693,464 | |
Babcock & Wilcox Enterprises, Inc. (1) | | | 14 | | | | 84 | |
BlueLinx Holdings, Inc. (1) | | | 131 | | | | 8,752 | |
Boise Cascade Co. | | | 10,341 | | | | 615,186 | |
Builders FirstSource, Inc. (1) | | | 56,707 | | | | 3,045,166 | |
Cintas Corp. | | | 10 | | | | 3,735 | |
Copart, Inc. (1) | | | 14,086 | | | | 1,530,585 | |
Costamare, Inc. | | | 524 | | | | 6,340 | |
CoStar Group, Inc. (1) | | | 5,624 | | | | 339,746 | |
Eagle Bulk Shipping, Inc. | | | 144 | | | | 7,471 | |
EMCOR Group, Inc. | | | 8,293 | | | | 853,847 | |
Emerson Electric Co. | | | 1,156 | | | | 91,948 | |
The accompanying notes are an integral part of these financial statements.
2022 Semi-Annual Report | June 30, 2022 | Page 13 |
Schedules of Investments
June 30, 2022 (unaudited)
Muirfield Fund |
Security Description | | Shares,
Contracts
or Principal
Amount ($) | | | Fair
Value ($) | |
Common Stocks (United States) — continued |
Encore Wire Corp. | | | 3,243 | | | | 337,013 | |
FedEx Corp. | | | 15 | | | | 3,401 | |
Genco Shipping & Trading, Ltd. | | | 2,685 | | | | 51,874 | |
General Dynamics Corp. | | | 18,049 | | | | 3,993,341 | |
Graco, Inc. | | | 3,462 | | | | 205,677 | |
Heidrick & Struggles International, Inc. | | | 1,132 | | | | 36,632 | |
Heritage-Crystal Clean, Inc. (1) | | | 140 | | | | 3,774 | |
Hillenbrand, Inc. | | | 5,410 | | | | 221,594 | |
Hubbell, Inc. | | | 1,440 | | | | 257,155 | |
Infrastructure and Energy Alternatives, Inc. (1) | | | 3,588 | | | | 28,812 | |
Karat Packaging, Inc. (1) | | | 307 | | | | 5,237 | |
Kforce, Inc. | | | 117 | | | | 7,177 | |
Lockheed Martin Corp. | | | 15,199 | | | | 6,534,962 | |
ManpowerGroup, Inc. | | | 3,617 | | | | 276,375 | |
Matson, Inc. | | | 4,056 | | | | 295,601 | |
Montrose Environmental Group, Inc. (1) | | | 1 | | | | 34 | |
Mueller Industries, Inc. | | | 4,931 | | | | 262,773 | |
MYR Group, Inc. (1) | | | 755 | | | | 66,538 | |
Northrop Grumman Corp. | | | 11,911 | | | | 5,700,247 | |
nVent Electric PLC | | | 2,601 | | | | 81,489 | |
Raytheon Technologies Corp. | | | 28,380 | | | | 2,727,602 | |
Regal Rexnord Corp. | | | 2,651 | | | | 300,942 | |
Republic Services, Inc. | | | 282 | | | | 36,905 | |
Sterling Infrastructure, Inc. (1) | | | 316 | | | | 6,927 | |
Textron, Inc. | | | 6,577 | | | | 401,657 | |
Titan Machinery, Inc. (1) | | | 156 | | | | 3,496 | |
TrueBlue, Inc. (1) | | | 323 | | | | 5,782 | |
United Parcel Service, Inc. | | | 20 | | | | 3,651 | |
Univar Solutions, Inc. (1) | | | 258 | | | | 6,416 | |
V2X, Inc. (1) | | | 1,245 | | | | 41,658 | |
Waste Management, Inc. | | | 8,623 | | | | 1,319,147 | |
WillScot Mobile Mini Holdings Corp. (1) | | | 3 | | | | 97 | |
WW Grainger, Inc. | | | 677 | | | | 307,649 | |
| | | | | | | | 31,497,880 | |
| | | | | | | | | |
Information Technology — 15.4% | | | | | | | | |
ACI Worldwide, Inc. (1) | | | 3,129 | | | | 81,010 | |
Advanced Micro Devices, Inc. (1) | | | 4,045 | | | | 309,321 | |
Affirm Holdings, Inc. (1) | | | 2,649 | | | | 47,841 | |
Alpha & Omega Semiconductor, Ltd. (1) | | | 32,281 | | | | 1,076,249 | |
Amdocs, Ltd. | | | 44 | | | | 3,666 | |
American Software, Inc./GA | | | 713 | | | | 11,522 | |
Amkor Technology, Inc. | | | 35,568 | | | | 602,878 | |
Apple, Inc. | | | 176,678 | | | | 24,155,416 | |
Arrow Electronics, Inc. (1) | | | 9,145 | | | | 1,025,063 | |
Muirfield Fund |
Security Description | | Shares,
Contracts
or Principal
Amount ($) | | | Fair
Value ($) | |
Common Stocks (United States) — continued |
Avid Technology, Inc. (1) | | | 5,155 | | | | 133,772 | |
Avnet, Inc. | | | 8,301 | | | | 355,947 | |
Axcelis Technologies, Inc. (1) | | | 11,450 | | | | 627,918 | |
Belden, Inc. | | | 1,085 | | | | 57,798 | |
Broadcom, Inc. | | | 756 | | | | 367,272 | |
Cadence Design Systems, Inc. (1) | | | 11,915 | | | | 1,787,607 | |
Cass Information Systems, Inc. | | | 112 | | | | 3,786 | |
Cisco Systems, Inc. | | | 22,031 | | | | 939,402 | |
Cognizant Technology Solutions Corp. | | | 4,563 | | | | 307,957 | |
CommVault Systems, Inc. (1) | | | 1,060 | | | | 66,674 | |
Concentrix Corp. | | | 2,744 | | | | 372,196 | |
Corning, Inc. | | | 2,534 | | | | 79,846 | |
Dell Technologies, Inc. | | | 429 | | | | 19,824 | |
Diodes, Inc. (1) | | | 7,041 | | | | 454,637 | |
Dolby Laboratories, Inc. | | | 6,270 | | | | 448,681 | |
Duck Creek Technologies, Inc. (1) | | | 1 | | | | 15 | |
DXC Technology Co. (1) | | | 6,664 | | | | 201,986 | |
DZS, Inc. (1) | | | 3 | | | | 49 | |
EPAM Systems, Inc. (1) | | | 2,193 | | | | 646,453 | |
Euronet Worldwide, Inc. (1) | | | 2,449 | | | | 246,345 | |
Extreme Networks, Inc. (1) | | | 1,770 | | | | 15,788 | |
Fabrinet (1) | | | 305 | | | | 24,736 | |
Intel Corp. | | | 80,484 | | | | 3,010,906 | |
International Money Express, Inc. (1) | | | 562 | | | | 11,504 | |
Intuit, Inc. | | | 8,519 | | | | 3,283,563 | |
Jabil, Inc. | | | 57,095 | | | | 2,923,835 | |
Juniper Networks, Inc. | | | 367 | | | | 10,460 | |
Manhattan Associates, Inc. (1) | | | 43,576 | | | | 4,993,810 | |
Mastercard, Inc. | | | 6,986 | | | | 2,203,943 | |
Microchip Technology, Inc. | | | 14,690 | | | | 853,195 | |
Micron Technology, Inc. | | | 78,374 | | | | 4,332,515 | |
Microsoft Corp. | | | 114,877 | | | | 29,503,860 | |
Monolithic Power Systems, Inc. | | | 411 | | | | 157,840 | |
New Relic, Inc. (1) | | | 4,260 | | | | 213,213 | |
NortonLifeLock, Inc. | | | 13,979 | | | | 306,979 | |
Oracle Corp. | | | 34,448 | | | | 2,406,882 | |
Photronics, Inc. (1) | | | 4,920 | | | | 95,842 | |
Power Integrations, Inc. | | | 6,692 | | | | 501,967 | |
Pure Storage, Inc. (1) | | | 14,303 | | | | 367,730 | |
QUALCOMM, Inc. | | | 44,230 | | | | 5,649,940 | |
Qualys, Inc. (1) | | | 1,823 | | | | 229,953 | |
StarTek, Inc. (1) | | | 2,934 | | | | 8,479 | |
Synopsys, Inc. (1) | | | 1,034 | | | | 314,026 | |
Tenable Holdings, Inc. (1) | | | 10,008 | | | | 454,463 | |
WEX, Inc. (1) | | | 898 | | | | 139,693 | |
Xperi Holding Corp. | | | 4,260 | | | | 61,472 | |
The accompanying notes are an integral part of these financial statements.
Page 14 | 2022 Semi-Annual Report | June 30, 2022 |
Schedules of Investments
June 30, 2022 (unaudited)
Muirfield Fund |
Security Description | | Shares,
Contracts
or Principal
Amount ($) | | | Fair
Value ($) | |
Common Stocks (United States)— continued |
Zebra Technologies Corp. (1) | | | 1,479 | | | | 434,752 | |
Zoom Video Communications, Inc. (1) | | | 15,849 | | | | 1,711,217 | |
| | | | | | | | 98,653,694 | |
| | | | | | | | | |
Materials — 1.2% | | | | | | | | |
AdvanSix, Inc. | | | 1,277 | | | | 42,703 | |
Air Products and Chemicals, Inc. | | | 31 | | | | 7,455 | |
Alcoa Corp. | | | 3,649 | | | | 166,321 | |
CF Industries Holdings, Inc. | | | 545 | | | | 46,723 | |
Clearwater Paper Corp. (1) | | | 113 | | | | 3,800 | |
Cleveland-Cliffs, Inc. (1) | | | 1,040 | | | | 15,985 | |
Dow, Inc. | | | 17,824 | | | | 919,897 | |
Eagle Materials, Inc. | | | 3,389 | | | | 372,587 | |
Freeport-McMoRan, Inc. | | | 32,031 | | | | 937,227 | |
Huntsman Corp. | | | 354 | | | | 10,036 | |
International Paper Co. | | | 11,412 | | | | 477,364 | |
Louisiana-Pacific Corp. | | | 25,240 | | | | 1,322,828 | |
LyondellBasell Industries NV | | | 14,522 | | | | 1,270,094 | |
Newmont Corp. | | | 268 | | | | 15,992 | |
Nucor Corp. | | | 7,026 | | | | 733,585 | |
Olin Corp. | | | 1,864 | | | | 86,266 | |
Packaging Corp. of America | | | 2,937 | | | | 403,838 | |
PPG Industries, Inc. | | | 29 | | | | 3,316 | |
Reliance Steel & Aluminum Co. | | | 40 | | | | 6,794 | |
Royal Gold, Inc. | | | 5,076 | | | | 542,015 | |
Ryerson Holding Corp. | | | 760 | | | | 16,180 | |
Schnitzer Steel Industries, Inc. | | | 830 | | | | 27,257 | |
Southern Copper Corp. | | | 3,414 | | | | 170,051 | |
Steel Dynamics, Inc. | | | 1,109 | | | | 73,360 | |
Sylvamo Corp. | | | 1,618 | | | | 52,876 | |
Trinseo PLC | | | 475 | | | | 18,269 | |
Tronox Holdings PLC | | | 453 | | | | 7,610 | |
United States Steel Corp. | | | 4,660 | | | | 83,461 | |
Westrock Co. | | | 155 | | | | 6,175 | |
| | | | | | | | 7,840,065 | |
| | | | | | | | | |
Real Estate Investment Trust — 0.1% | | | | | | | | |
Altisource Portfolio Solutions SA (1) | | | 3,399 | | | | 36,505 | |
Brixmor Property Group, Inc. | | | 901 | | | | 18,209 | |
Broadstone Net Lease, Inc. | | | 5 | | | | 103 | |
CareTrust REIT, Inc. | | | 11,988 | | | | 221,059 | |
CatchMark Timber Trust, Inc. | | | 1,594 | | | | 16,036 | |
CorEnergy Infrastructure Trust, Inc. | | | 13,458 | | | | 33,914 | |
Corporate Office Properties Trust | | | 11,293 | | | | 295,764 | |
Essex Property Trust, Inc. | | | 26 | | | | 6,799 | |
Kilroy Realty Corp. | | | 280 | | | | 14,652 | |
Muirfield Fund |
Security Description | | Shares,
Contracts
or Principal
Amount ($) | | | Fair
Value ($) | |
Common Stocks (United States) — continued |
Lamar Advertising Co. | | | 40 | | | | 3,519 | |
PotlatchDeltic Corp. | | | 2,682 | | | | 118,518 | |
SITE Centers Corp. | | | 605 | | | | 8,149 | |
Spirit MTA REIT Liquidating Trust (1)(5) | | | 9,151 | | | | 0 | |
| | | | | | | | 773,227 | |
| | | | | | | | | |
Utilities — 0.7% | | | | | | | | |
AES Corp./The | | | 333 | | | | 6,996 | |
CenterPoint Energy, Inc. | | | 6,493 | | | | 192,063 | |
Constellation Energy Corp. | | | 22,699 | | | | 1,299,736 | |
Evergy, Inc. | | | 321 | | | | 20,945 | |
National Fuel Gas Co. | | | 1,234 | | | | 81,506 | |
NRG Energy, Inc. | | | 23,835 | | | | 909,782 | |
SJW Group | | | 481 | | | | 30,019 | |
UGI Corp. | | | 36,952 | | | | 1,426,717 | |
Vistra Corp. | | | 12,555 | | | | 286,882 | |
| | | | | | | | 4,254,646 | |
| | | | | | | | | |
Total Common Stocks (United States) (Cost $293,356,560) | | | | | | | 336,025,931 | |
| | | | | | | | | |
Preferred Stock (United States) — 0.0% |
WESCO International, Inc. Series A Variable Preferred (6) | | | 2,612 | | | | 71,621 | |
Total Preferred Stock (United States) (Cost $65,288) | | | | | | | 71,621 | |
| | | | | | | | | |
Warrants (United States) — 0.0% |
Chaparral Energy, Inc. A Warrants, Expiration Date 10/14/2024 (1)(5) | | | 7 | | | | 0 | |
Chaparral Energy, Inc. B Warrants, Expiration Date 10/14/2025 (1)(5) | | | 7 | | | | 0 | |
Civitas Solutions, Inc. A Warrants, Expiration Date 1/20/2025 (1)(5) | | | 57 | | | | 0 | |
Civitas Solutions, Inc. B Warrants, Expiration Date 1/20/2026 (1)(5) | | | 28 | | | | 0 | |
Hertz Global Holdings, Inc. Warrants, Expiration Date 6/30/2051 (1) | | | 349 | | | | 3,417 | |
Nabors Industries, Ltd. Warrants, Expiration Date 6/11/2026 (1) | | | 122 | | | | 3,902 | |
Oasis Petroleum, Inc. Warrants, Expiration Date 11/19/2024 (1)(5) | | | 23 | | | | 0 | |
Whiting Petroleum Corp. A Warrants, Expiration Date 9/1/2024 (1) | | | 128 | | | | 1,715 | |
The accompanying notes are an integral part of these financial statements.
2022 Semi-Annual Report | June 30, 2022 | Page 15 |
Schedules of Investments
June 30, 2022 (unaudited)
Muirfield Fund |
Security Description | | Shares,
Contracts
or Principal
Amount ($) | | | Fair
Value ($) | |
Warrants (United States) — continued |
Whiting Petroleum Corp. B Warrants, Expiration Date 9/1/2025 (1) | | | 63 | | | | 662 | |
Total Warrants (United States) (Cost $8,512) | | | | | | | 9,696 | |
| | | | | | | | | |
Money Market Registered Investment Companies — 42.6% |
Meeder Institutional Prime Money Market Fund, 1.42% (2) | | | 273,689,073 | | | | 273,579,597 | |
Total Money Market Registered Investment Companies (Cost $273,624,584) | | | | | | | 273,579,597 | |
| | | | | | | | | |
Bank Obligations — 0.1% |
First Merchants Bank Deposit Account, 0.55%, 7/1/2022 (3) | | | 249,644 | | | | 249,644 | |
Metro City Bank Deposit Account, 0.05%, 7/1/2022 (3) | | | 248,529 | | | | 248,529 | |
Total Bank Obligations (Cost $498,173) | | | | | | | 498,173 | |
Total Investments — 95.0% (Cost $567,553,117) | | | | | | | 610,185,018 | |
Other Assets less Liabilities — 5.0% | | | | | | | 32,434,083 | |
Total Net Assets — 100.0% | | | | | | | 642,619,101 | |
| | | | | | | | | |
Trustee Deferred Compensation (4) |
Meeder Balanced Fund - Retail Class | | | 5,216 | | | | 61,392 | |
Meeder Dynamic Allocation Fund - Retail Class | | | 13,845 | | | | 155,618 | |
Meeder Muirfield Fund - Retail Class | | | 9,385 | | | | 77,708 | |
Meeder Conservative Allocation Fund - Retail Class | | | 1,544 | | | | 32,748 | |
Total Trustee Deferred Compensation (Cost $321,238) | | | | | | | 327,466 | |
| | | | | | | | | |
| | | Long
(Short)
Contracts | | | Expiration
Date | | | Notional
Value of
Contracts
($) | | | Value and
Unrealized
Appreciation
(Depreciation)
($) | |
Futures Contracts |
Index Futures | | | | | | | | | | | | | | | | |
E-mini Standard & Poors MidCap 400 Futures | | | (182 | ) | | | 9/16/2022 | | | | (41,277,600 | ) | | | 302,148 | |
Mini MSCI EAFE Index Futures | | | 405 | | | | 9/16/2022 | | | | 37,596,150 | | | | 39,960 | |
Mini MSCI Emerging Markets Index Futures | | | 141 | | | | 9/16/2022 | | | | 7,069,035 | | | | (15,982 | ) |
Russell 2000 Mini Index Futures | | | 196 | | | | 9/16/2022 | | | | 16,738,400 | | | | (167,143 | ) |
Standard & Poors 500 Mini Futures | | | (491 | ) | | | 9/16/2022 | | | | (93,032,225 | ) | | | (1,526,652 | ) |
Total Futures Contracts | | | 69 | | | | | | | | (72,906,240 | ) | | | (1,367,669 | ) |
(1) | Represents non-income producing securities. |
(2) | Investment in affiliate. The yield shown represents the 7-day yield in effect at June 30, 2022. |
(3) | Variable rate security. Securities payable at par including accrued interest (usually within seven days notice) and unconditionally secured as to principal and interest by letters of credit or other credit support agreements from major banks. The interest rates are adjustable and are not based on a published reference rate and spread but are determined by the issuer or agent and are based on current market conditions. These securities do not indicate a reference rate and spread in their description above. The rate shown represents the rate in effect at June 30, 2022. The maturity date shown, if applicable, reflects the earlier of the next demand date or stated maturity date. |
(4) | Assets of affiliates to the Muirfield Fund held for the benefit of the Fund’s Trustees in connection with the Trustee Deferred Compensation Plan. |
(5) | Fair valued security deemed a Level 3 security. Security is not part of the investment strategy of the Fund. |
The accompanying notes are an integral part of these financial statements.
Page 16 | 2022 Semi-Annual Report | June 30, 2022 |
Schedules of Investments
June 30, 2022 (unaudited)
Spectrum Fund |
Security Description | | Shares or
Principal
Amount ($) | | | Fair
Value ($) | |
Common Stocks (United States) - Long — 66.5% |
Communication Services — 4.4% | | | | | | | | |
Alphabet, Inc. (1) | | | 2,048 | | | | 4,479,898 | |
AT&T, Inc. | | | 7,528 | | | | 157,787 | |
Cogent Communications Holdings, Inc. | | | 2,317 | | | | 140,781 | |
Comcast Corp. | | | 28,990 | | | | 1,137,568 | |
Entravision Communications Corp. | | | 1,225 | | | | 5,586 | |
IDT Corp. (1) | | | 5,190 | | | | 130,529 | |
Interpublic Group of Cos., Inc./The | | | 16,266 | | | | 447,803 | |
Liberty TripAdvisor Holdings, Inc. (1) | | | 2,709 | | | | 2,050 | |
Meta Platforms, Inc. (1) | | | 5,332 | | | | 859,785 | |
Nexstar Media Group, Inc. | | | 1,175 | | | | 191,384 | |
Omnicom Group, Inc. | | | 7,569 | | | | 481,464 | |
| | | | | | | | 8,034,635 | |
| | | | | | | | | |
Consumer Discretionary — 6.1% | | | | | | | | |
Academy Sports & Outdoors, Inc. | | | 13,700 | | | | 486,898 | |
Amazon.com, Inc. (1) | | | 27,747 | | | | 2,947,009 | |
AutoZone, Inc. (1) | | | 159 | | | | 341,710 | |
Booking Holdings, Inc. (1) | | | 288 | | | | 503,709 | |
Caleres, Inc. | | | 285 | | | | 7,478 | |
Chico’s FAS, Inc. (1) | | | 382 | | | | 1,899 | |
Ethan Allen Interiors, Inc. | | | 206 | | | | 4,163 | |
Everi Holdings, Inc. (1) | | | 1,238 | | | | 20,192 | |
Ford Motor Co. | | | 15,097 | | | | 168,030 | |
Frontdoor, Inc. (1) | | | 1,128 | | | | 27,162 | |
Gentex Corp. | | | 265 | | | | 7,412 | |
Gentherm, Inc. (1) | | | 1,237 | | | | 77,201 | |
Grand Canyon Education, Inc. (1) | | | 6,858 | | | | 645,955 | |
H&R Block, Inc. | | | 4,966 | | | | 175,399 | |
Hibbett, Inc. | | | 2,700 | | | | 118,017 | |
Home Depot, Inc./The | | | 248 | | | | 68,019 | |
Kohl’s Corp. | | | 4,212 | | | | 150,326 | |
Lowe’s Cos., Inc. | | | 1,895 | | | | 331,000 | |
Lululemon Athletica, Inc. (1) | | | 2,701 | | | | 736,320 | |
M/I Homes, Inc. (1) | | | 5,276 | | | | 209,246 | |
Macy’s, Inc. | | | 24,116 | | | | 441,805 | |
Mohawk Industries, Inc. (1) | | | 3,870 | | | | 480,228 | |
Nordstrom, Inc. | | | 1,973 | | | | 41,689 | |
O’Reilly Automotive, Inc. (1) | | | 639 | | | | 403,695 | |
PVH Corp. | | | 6,450 | | | | 367,005 | |
Qurate Retail, Inc. | | | 2,482 | | | | 7,123 | |
Skyline Champion Corp. (1) | | | 6,640 | | | | 314,869 | |
Smith & Wesson Brands, Inc. | | | 5,227 | | | | 68,631 | |
Sonos, Inc. (1) | | | 17,098 | | | | 308,448 | |
Tapestry, Inc. | | | 2,247 | | | | 68,578 | |
Target Corp. | | | 690 | | | | 97,449 | |
Thor Industries, Inc. | | | 2,491 | | | | 186,152 | |
Spectrum Fund |
Security Description | | Shares or
Principal
Amount ($) | | | Fair
Value ($) | |
Common Stocks (United States) - Long — continued |
TJX Cos., Inc./The | | | 6,585 | | | | 367,772 | |
Tractor Supply Co. | | | 297 | | | | 57,573 | |
Ulta Beauty, Inc. (1) | | | 1,993 | | | | 768,262 | |
Yum! Brands, Inc. | | | 2,153 | | | | 244,387 | |
| | | | | | | | 11,250,811 | |
| | | | | | | | | |
Consumer Staples — 3.3% | | | | | | | | |
Albertsons Cos., Inc. | | | 4,897 | | | | 130,848 | |
Archer-Daniels-Midland Co. | | | 7,038 | | | | 546,149 | |
Bunge, Ltd. | | | 3,331 | | | | 302,088 | |
Costco Wholesale Corp. | | | 5,228 | | | | 2,505,676 | |
Darling Ingredients, Inc. (1) | | | 1,050 | | | | 62,790 | |
General Mills, Inc. | | | 11,179 | | | | 843,456 | |
Kroger Co./The | | | 1,605 | | | | 75,965 | |
Mondelez International, Inc. | | | 9,418 | | | | 584,764 | |
PepsiCo, Inc. | | | 787 | | | | 131,161 | |
Simply Good Foods Co./The (1) | | | 6,380 | | | | 240,973 | |
Tyson Foods, Inc. | | | 7,280 | | | | 626,517 | |
| | | | | | | | 6,050,387 | |
| | | | | | | | | |
Energy — 4.9% | | | | | | | | |
APA Corp. | | | 3,444 | | | | 120,196 | |
Berry Corp. | | | 842 | | | | 6,416 | |
Bristow Group, Inc. (1) | | | 676 | | | | 15,818 | |
Centrus Energy Corp. (1) | | | 679 | | | | 16,805 | |
Cheniere Energy, Inc. | | | 537 | | | | 71,437 | |
Chevron Corp. | | | 14,979 | | | | 2,168,660 | |
Civitas Resources, Inc. | | | 117 | | | | 6,118 | |
ConocoPhillips | | | 5,174 | | | | 464,677 | |
Devon Energy Corp. | | | 1,435 | | | | 79,083 | |
Diamondback Energy, Inc. | | | 666 | | | | 80,686 | |
DT Midstream, Inc. | | | 2,203 | | | | 107,991 | |
EOG Resources, Inc. | | | 2,444 | | | | 269,915 | |
Exxon Mobil Corp. | | | 23,862 | | | | 2,043,542 | |
Hess Corp. | | | 561 | | | | 59,432 | |
Laredo Petroleum, Inc. (1) | | | 54 | | | | 3,723 | |
Marathon Oil Corp. | | | 3,999 | | | | 89,898 | |
Marathon Petroleum Corp. | | | 24,088 | | | | 1,980,274 | |
Nine Energy Service, Inc. (1) | | | 1,635 | | | | 4,333 | |
ONEOK, Inc. | | | 6,383 | | | | 354,257 | |
Overseas Shipholding Group, Inc. (1) | | | 808 | | | | 1,656 | |
Ovintiv, Inc. | | | 1,774 | | | | 78,393 | |
Phillips 66 | | | 2,135 | | | | 175,049 | |
Pioneer Natural Resources Co. | | | 980 | | | | 218,618 | |
Schlumberger NV | | | 6,838 | | | | 244,527 | |
SM Energy Co. | | | 274 | | | | 9,368 | |
Targa Resources Corp. | | | 1,808 | | | | 107,883 | |
The accompanying notes are an integral part of these financial statements.
2022 Semi-Annual Report | June 30, 2022 | Page 17 |
Schedules of Investments
June 30, 2022 (unaudited)
Spectrum Fund |
Security Description | | Shares or
Principal
Amount ($) | | | Fair
Value ($) | |
Common Stocks (United States) - Long — continued |
Teekay Corp. (1) | | | 1,555 | | | | 4,478 | |
Valero Energy Corp. | | | 2,660 | | | | 282,705 | |
World Fuel Services Corp. | | | 312 | | | | 6,384 | |
| | | | | | | | 9,072,322 | |
| | | | | | | | | |
Financials — 7.9% | | | | | | | | |
American Equity Investment Life Holding Co. | | | 3,778 | | | | 138,161 | |
American International Group, Inc. | | | 29,095 | | | | 1,487,627 | |
Argo Group International Holdings, Ltd. | | | 392 | | | | 14,449 | |
Bank of New York Mellon Corp./The | | | 8,561 | | | | 357,079 | |
Berkshire Hathaway, Inc. (1) | | | 20,363 | | | | 5,559,506 | |
Capital BanCorp., Inc. | | | 1,243 | | | | 26,973 | |
Charles Schwab Corp./The | | | 7,614 | | | | 481,053 | |
Chubb, Ltd. | | | 4,139 | | | | 813,645 | |
Erie Indemnity Co. | | | 120 | | | | 23,063 | |
Essent Group, Ltd. | | | 4,593 | | | | 178,668 | |
Fidelity National Financial, Inc. | | | 13,530 | | | | 500,069 | |
Hartford Financial Services Group, Inc./The | | | 1,798 | | | | 117,643 | |
Investors Title Co. | | | 43 | | | | 6,746 | |
Markel Corp. (1) | | | 159 | | | | 205,627 | |
Marsh & McLennan Cos., Inc. | | | 10,768 | | | | 1,671,732 | |
Moelis & Co. | | | 445 | | | | 17,511 | |
Mr Cooper Group, Inc. (1) | | | 629 | | | | 23,109 | |
Northrim BanCorp., Inc. | | | 1,218 | | | | 49,037 | |
OneMain Holdings, Inc. | | | 12,199 | | | | 455,999 | |
Pathward Financial, Inc. | | | 1,123 | | | | 43,426 | |
Prudential Financial, Inc. | | | 2,389 | | | | 228,580 | |
Pzena Investment Management, Inc. | | | 2,467 | | | | 16,258 | |
Regions Financial Corp. | | | 10,374 | | | | 194,513 | |
State Street Corp. | | | 3,490 | | | | 215,159 | |
Stewart Information Services Corp. | | | 2,427 | | | | 120,743 | |
Synchrony Financial | | | 3,449 | | | | 95,261 | |
W R Berkley Corp. | | | 2,045 | | | | 139,592 | |
Walker & Dunlop, Inc. | | | 1,022 | | | | 98,459 | |
Willis Towers Watson PLC | | | 6,501 | | | | 1,283,232 | |
| | | | | | | | 14,562,920 | |
| | | | | | | | | |
Healthcare — 13.8% | | | | | | | | |
AbbVie, Inc. | | | 13,362 | | | | 2,046,524 | |
Alaunos Therapeutics, Inc. (1) | | | 3,984 | | | | 4,940 | |
Amgen, Inc. | | | 10,473 | | | | 2,548,081 | |
Amneal Pharmaceuticals, Inc. (1) | | | 1,938 | | | | 6,163 | |
Avid Bioservices, Inc. (1) | | | 1,826 | | | | 27,865 | |
Bristol-Myers Squibb Co. | | | 16,628 | | | | 1,280,356 | |
Cardinal Health, Inc. | | | 22,075 | | | | 1,153,860 | |
Catalent, Inc. (1) | | | 5,348 | | | | 573,787 | |
Spectrum Fund |
Security Description | | Shares or
Principal
Amount ($) | | | Fair
Value ($) | |
Common Stocks (United States) - Long — continued |
Centene Corp. (1) | | | 1,840 | | | | 155,682 | |
Centogene NV (1) | | | 664 | | | | 1,574 | |
Cigna Corp. | | | 3,246 | | | | 855,386 | |
Corvus Pharmaceuticals, Inc. (1) | | | 1,984 | | | | 1,964 | |
CVS Health Corp. | | | 8,589 | | | | 795,857 | |
Danaher Corp. | | | 2,638 | | | | 668,786 | |
Eli Lilly & Co. | | | 5,823 | | | | 1,887,991 | |
Eloxx Pharmaceuticals, Inc. (1) | | | 7,574 | | | | 2,045 | |
Endo International PLC (1) | | | 7,100 | | | | 3,306 | |
Fulgent Genetics, Inc. (1) | | | 6,036 | | | | 329,143 | |
Genprex, Inc. (1) | | | 1,467 | | | | 2,039 | |
Gilead Sciences, Inc. | | | 9,026 | | | | 557,897 | |
Humana, Inc. | | | 944 | | | | 441,858 | |
IDEXX Laboratories, Inc. (1) | | | 864 | | | | 303,031 | |
Illumina, Inc. (1) | | | 1,345 | | | | 247,964 | |
ImmunityBio, Inc. (1) | | | 9,360 | | | | 34,819 | |
Incyte Corp. (1) | | | 1,929 | | | | 146,546 | |
Johnson & Johnson | | | 13,348 | | | | 2,369,403 | |
La Jolla Pharmaceutical Co. (1) | | | 873 | | | | 2,785 | |
McKesson Corp. | | | 2,596 | | | | 846,841 | |
Merck & Co., Inc. | | | 10,689 | | | | 974,516 | |
Moderna, Inc. (1) | | | 4,090 | | | | 584,257 | |
Molina Healthcare, Inc. (1) | | | 101 | | | | 28,241 | |
Otonomy, Inc. (1) | | | 2,774 | | | | 5,770 | |
Pfizer, Inc. | | | 16,502 | | | | 865,200 | |
QuidelOrtho Corp. (1) | | | 3,217 | | | | 312,628 | |
Regeneron Pharmaceuticals, Inc. (1) | | | 736 | | | | 435,072 | |
UnitedHealth Group, Inc. | | | 7,365 | | | | 3,782,885 | |
Universal Health Services, Inc. | | | 2,015 | | | | 202,931 | |
Veracyte, Inc. (1) | | | 151 | | | | 3,005 | |
Viatris, Inc. | | | 9,003 | | | | 94,261 | |
West Pharmaceutical Services, Inc. | | | 2,147 | | | | 649,188 | |
Zoetis, Inc. | | | 682 | | | | 117,229 | |
| | | | | | | | 25,351,676 | |
| | | | | | | | | |
Industrials — 5.2% | | | | | | | | |
Atkore, Inc. (1) | | | 2,840 | | | | 235,748 | |
Axon Enterprise, Inc. (1) | | | 4,171 | | | | 388,612 | |
Boise Cascade Co. | | | 1,218 | | | | 72,459 | |
Builders FirstSource, Inc. (1) | | | 20,331 | | | | 1,091,775 | |
BWX Technologies, Inc. | | | 3,995 | | | | 220,085 | |
Copart, Inc. (1) | | | 9,256 | | | | 1,005,757 | |
CoStar Group, Inc. (1) | | | 9,234 | | | | 557,826 | |
EMCOR Group, Inc. | | | 1,800 | | | | 185,328 | |
Encore Wire Corp. | | | 1,086 | | | | 112,857 | |
General Dynamics Corp. | | | 6,525 | | | | 1,443,656 | |
Graco, Inc. | | | 2,304 | | | | 136,881 | |
The accompanying notes are an integral part of these financial statements.
Page 18 | 2022 Semi-Annual Report | June 30, 2022 |
Schedules of Investments
June 30, 2022 (unaudited)
Spectrum Fund |
Security Description | | Shares or
Principal
Amount ($) | | | Fair
Value ($) | |
Common Stocks (United States) - Long — continued |
Hillenbrand, Inc. | | | 789 | | | | 32,317 | |
Hubbell, Inc. | | | 250 | | | | 44,645 | |
Karat Packaging, Inc. (1) | | | 140 | | | | 2,388 | |
Lockheed Martin Corp. | | | 2,747 | | | | 1,181,100 | |
ManpowerGroup, Inc. | | | 1,584 | | | | 121,033 | |
Matson, Inc. | | | 1,704 | | | | 124,188 | |
Mueller Industries, Inc. | | | 3,073 | | | | 163,760 | |
MYR Group, Inc. (1) | | | 138 | | | | 12,162 | |
Northrop Grumman Corp. | | | 3,404 | | | | 1,629,052 | |
Raytheon Technologies Corp. | | | 1,073 | | | | 103,126 | |
United Parcel Service, Inc. | | | 365 | | | | 66,627 | |
V2X, Inc. (1) | | | 888 | | | | 29,712 | |
Waste Management, Inc. | | | 3,326 | | | | 508,811 | |
WW Grainger, Inc. | | | 200 | | | | 90,886 | |
| | | | | | | | 9,560,791 | |
| | | | | | | | | |
Information Technology — 18.9% | | | | | | | | |
A10 Networks, Inc. | | | 6,963 | | | | 100,128 | |
ACI Worldwide, Inc. (1) | | | 2,755 | | | | 71,327 | |
Advanced Micro Devices, Inc. (1) | | | 2,137 | | | | 163,416 | |
Affirm Holdings, Inc. (1) | | | 670 | | | | 12,100 | |
Alpha & Omega Semiconductor, Ltd. (1) | | | 14,207 | | | | 473,661 | |
American Software, Inc./GA | | | 713 | | | | 11,522 | |
Amkor Technology, Inc. | | | 15,193 | | | | 257,521 | |
Apple, Inc. | | | 64,610 | | | | 8,833,479 | |
Arrow Electronics, Inc. (1) | | | 1,361 | | | | 152,554 | |
Avid Technology, Inc. (1) | | | 1,479 | | | | 38,380 | |
Avnet, Inc. | | | 4,145 | | | | 177,738 | |
Axcelis Technologies, Inc. (1) | | | 3,558 | | | | 195,121 | |
Broadcom, Inc. | | | 142 | | | | 68,985 | |
Cadence Design Systems, Inc. (1) | | | 3,831 | | | | 574,765 | |
Cisco Systems, Inc. | | | 8,900 | | | | 379,496 | |
Cognizant Technology Solutions Corp. | | | 2,014 | | | | 135,925 | |
Concentrix Corp. | | | 570 | | | | 77,315 | |
Dell Technologies, Inc. | | | 644 | | | | 29,759 | |
Diodes, Inc. (1) | | | 2,792 | | | | 180,279 | |
Dolby Laboratories, Inc. | | | 1,730 | | | | 123,799 | |
DXC Technology Co. (1) | | | 965 | | | | 29,249 | |
EPAM Systems, Inc. (1) | | | 852 | | | | 251,153 | |
Intel Corp. | | | 33,422 | | | | 1,250,317 | |
Intuit, Inc. | | | 2,339 | | | | 901,544 | |
Jabil, Inc. | | | 18,556 | | | | 950,253 | |
Manhattan Associates, Inc. (1) | | | 17,562 | | | | 2,012,605 | |
Mastercard, Inc. | | | 2,431 | | | | 766,932 | |
Microchip Technology, Inc. | | | 4,382 | | | | 254,507 | |
Micron Technology, Inc. | | | 28,928 | | | | 1,599,140 | |
Microsoft Corp. | | | 41,108 | | | | 10,557,766 | |
Spectrum Fund |
Security Description | | Shares or
Principal
Amount ($) | | | Fair
Value ($) | |
Common Stocks (United States) - Long — continued |
NortonLifeLock, Inc. | | | 985 | | | | 21,631 | |
Oracle Corp. | | | 11,866 | | | | 829,077 | |
Photronics, Inc. (1) | | | 377 | | | | 7,344 | |
Power Integrations, Inc. | | | 3,351 | | | | 251,359 | |
Pure Storage, Inc. (1) | | | 7,504 | | | | 192,928 | |
QUALCOMM, Inc. | | | 15,298 | | | | 1,954,167 | |
Qualys, Inc. (1) | | | 1,400 | | | | 176,596 | |
StarTek, Inc. (1) | | | 2,176 | | | | 6,289 | |
Tenable Holdings, Inc. (1) | | | 2,524 | | | | 114,615 | |
Wolfspeed, Inc. (1) | | | 104 | | | | 6,599 | |
Zebra Technologies Corp. (1) | | | 13 | | | | 3,821 | |
Zoom Video Communications, Inc. (1) | | | 5,220 | | | | 563,603 | |
| | | | | | | | 34,758,765 | |
| | | | | | | | | |
Materials — 1.3% | | | | | | | | |
AdvanSix, Inc. | | | 118 | | | | 3,946 | |
Alcoa Corp. | | | 583 | | | | 26,573 | |
Dow, Inc. | | | 8,054 | | | | 415,667 | |
Eagle Materials, Inc. | | | 1,533 | | | | 168,538 | |
Ferroglobe PLC Contingent Value Rights (1)(6) | | | (2,326 | ) | | | 0 | |
Freeport-McMoRan, Inc. | | | 9,117 | | | | 266,763 | |
Louisiana-Pacific Corp. | | | 5,527 | | | | 289,670 | |
LyondellBasell Industries NV | | | 3,881 | | | | 339,432 | |
Nucor Corp. | | | 1,392 | | | | 145,339 | |
Packaging Corp. of America | | | 1,702 | | | | 234,025 | |
Reliance Steel & Aluminum Co. | | | 168 | | | | 28,536 | |
Royal Gold, Inc. | | | 2,495 | | | | 266,416 | |
Schnitzer Steel Industries, Inc. | | | 316 | | | | 10,377 | |
Steel Dynamics, Inc. | | | 765 | | | | 50,605 | |
Sylvamo Corp. | | | 905 | | | | 29,575 | |
United States Steel Corp. | | | 1,345 | | | | 24,089 | |
Valvoline, Inc. | | | 877 | | | | 25,284 | |
| | | | | | | | 2,324,835 | |
| | | | | | | | | |
Real Estate Investment Trust — 0.0% | | | | | | | | |
Altisource Portfolio Solutions SA (1) | | | 967 | | | | 10,386 | |
CorEnergy Infrastructure Trust, Inc. | | | 4,564 | | | | 11,501 | |
Maui Land & Pineapple Co., Inc. (1) | | | 314 | | | | 2,974 | |
Trinity Place Holdings, Inc. (1) | | | 3,358 | | | | 3,392 | |
| | | | | | | | 28,253 | |
| | | | | | | | | |
Utilities — 0.7% | | | | | | | | |
Constellation Energy Corp. | | | 9,362 | | | | 536,069 | |
Evergy, Inc. | | | 188 | | | | 12,267 | |
NRG Energy, Inc. | | | 8,155 | | | | 311,276 | |
UGI Corp. | | | 10,129 | | | | 391,081 | |
Vistra Corp. | | | 1,796 | | | | 41,039 | |
The accompanying notes are an integral part of these financial statements.
2022 Semi-Annual Report | June 30, 2022 | Page 19 |
Schedules of Investments
June 30, 2022 (unaudited)
Spectrum Fund |
Security Description | | Shares or
Principal
Amount ($) | | | Fair
Value ($) | |
Common Stocks (United States) - Long — continued |
Xcel Energy, Inc. | | | 483 | | | | 34,177 | |
| | | | | | | | 1,325,909 | |
| | | | | | | | | |
Total Common Stocks (United States) - Long (Cost $110,862,002) | | | | | | | 122,321,304 | |
| | | | | | | | | |
Preferred Stock (United States) — 0.0% |
WESCO International, Inc. Series A Variable Preferred (5) | | | 198 | | | | 5,429 | |
Total Preferred Stock (United States) (Cost $4,949) | | | | | | | 5,429 | |
| | | | | | | | | |
Warrants (United States) — 0.0% |
Chaparral Energy, Inc. A Warrants, Expiration Date 10/14/2024 (1)(4) | | | 1 | | | | 0 | |
Chaparral Energy, Inc. B Warrants, Expiration Date 10/14/2025 (1)(4) | | | 1 | | | | 0 | |
Civitas Solutions, Inc. A Warrants, Expiration Date 1/20/2025 (1)(4) | | | 13 | | | | 0 | |
Civitas Solutions, Inc. B Warrants, Expiration Date 1/20/2026 (1)(4) | | | 6 | | | | 0 | |
Hertz Global Holdings, Inc. Warrants, Expiration Date 6/30/2051 (1) | | | 86 | | | | 842 | |
Nabors Industries, Ltd. Warrants, Expiration Date 6/11/2026 (1) | | | 29 | | | | 927 | |
Oasis Petroleum, Inc. Warrants, Expiration Date 11/19/2024 (1)(4) | | | 7 | | | | 0 | |
Whiting Petroleum Corp. A Warrants, Expiration Date 9/1/2024 (1) | | | 47 | | | | 630 | |
Whiting Petroleum Corp. B Warrants, Expiration Date 9/1/2025 (1) | | | 23 | | | | 242 | |
Total Warrants (United States) (Cost $2,899) | | | | | | | 2,641 | |
| | | | | | | | | |
Money Market Registered Investment Companies — 25.4% |
Meeder Institutional Prime Money Market Fund, 1.42% (2) | | | 46,816,397 | | | | 46,797,670 | |
Total Money Market Registered Investment Companies (Cost 46,795,802) | | | | | | | 46,797,670 | |
Total Investments — Long - 91.9% (Cost $157,665,652) | | | | | | | 169,127,044 | |
Other Assets less Liabilities — 8.1% | | | | | | | 14,819,188 | |
Total Net Assets — 100.0% | | | | | | | 183,946,232 | |
| | | | | | | | | |
Spectrum Fund |
Security Description | | Shares or
Principal
Amount ($) | | | Fair
Value ($) | |
Trustee Deferred Compensation (3) |
Meeder Balanced Fund - Retail Class | | | 794 | | | | 9,345 | |
Meeder Dynamic Allocation Fund - Retail Class | | | 1,964 | | | | 22,075 | |
Meeder Muirfield Fund - Retail Class | | | 2,218 | | | | 18,365 | |
Meeder Conservative Allocation Fund - Retail Class | | | 246 | | | | 5,218 | |
Total Trustee Deferred Compensation (Cost $56,967) | | | | | | | 55,003 | |
| | | | | | | | | |
| | | Long
(Short)
Contracts | | | Expiration
Date | | | Notional
Value of
Contracts
($) | | | Value and
Unrealized
Appreciation
(Depreciation)
($) | |
Futures Contracts |
Index Futures | | | | | | | | | | | | | | | | |
E-mini Standard & Poors MidCap 400 Futures | | | (80 | ) | | | 9/16/2022 | | | | (18,144,000 | ) | | | 176,174 | |
Mini MSCI EAFE Index Futures | | | 116 | | | | 9/16/2022 | | | | 10,768,280 | | | | 12,853 | |
Mini MSCI Emerging Markets Index Futures | | | 40 | | | | 9/16/2022 | | | | 2,005,400 | | | | (3,933 | ) |
Russell 2000 Mini Index Futures | | | 50 | | | | 9/16/2022 | | | | 4,270,000 | | | | (32,724 | ) |
Standard & Poors 500 Mini Futures | | | (241 | ) | | | 9/16/2022 | | | | (45,663,475 | ) | | | (676,110 | ) |
Total Futures Contracts | | | (115 | ) | | | | | | | (46,763,795 | ) | | | (523,740 | ) |
(1) | Represents non-income producing securities. |
(2) | Investment in affiliate. The yield shown represents the 7-day yield in effect at June 30, 2022. |
(3) | Assets of affiliates to the Spectrum Fund held for the benefit of the Fund’s Trustees in connection with the Trustee Deferred Compensation Plan. |
(4) | Fair valued security deemed a Level 3 security. Security is not part of the investment strategy of the Fund. |
The accompanying notes are an integral part of these financial statements.
Page 20 | 2022 Semi-Annual Report | June 30, 2022 |
Schedules of Investments
June 30, 2022 (unaudited)
Global Allocation Fund |
Security Description | | Shares or
Principal
Amount ($) | | | Fair
Value ($) | |
Common Stocks (United States) — 21.7% |
Communication Services — 1.4% | | | | | | | | |
Alphabet, Inc. (1) | | | 139 | | | | 304,056 | |
AT&T, Inc. | | | 50 | | | | 1,048 | |
Cogent Communications Holdings, Inc. | | | 377 | | | | 22,907 | |
Comcast Corp. | | | 1,784 | | | | 70,004 | |
Entravision Communications Corp. | | | 144 | | | | 657 | |
IDT Corp. (1) | | | 437 | | | | 10,991 | |
Interpublic Group of Cos., Inc./The | | | 822 | | | | 22,630 | |
Liberty TripAdvisor Holdings, Inc. (1) | | | 262 | | | | 198 | |
Lumen Technologies, Inc. | | | 337 | | | | 3,677 | |
Meta Platforms, Inc. (1) | | | 372 | | | | 59,985 | |
Nexstar Media Group, Inc. | | | 12 | | | | 1,955 | |
Omnicom Group, Inc. | | | 274 | | | | 17,429 | |
| | | | | | | | 515,537 | |
| | | | | | | | | |
Consumer Discretionary — 1.9% | | | | | | | | |
Academy Sports & Outdoors, Inc. | | | 1,020 | | | | 36,251 | |
Amazon.com, Inc. (1) | | | 1,835 | | | | 194,895 | |
AutoZone, Inc. (1) | | | 11 | | | | 23,640 | |
Booking Holdings, Inc. (1) | | | 13 | | | | 22,737 | |
Chico’s FAS, Inc. (1) | | | 42 | | | | 209 | |
Ethan Allen Interiors, Inc. | | | 10 | | | | 202 | |
Ford Motor Co. | | | 1,534 | | | | 17,073 | |
Frontdoor, Inc. (1) | | | 38 | | | | 915 | |
Gentherm, Inc. (1) | | | 67 | | | | 4,181 | |
Genuine Parts Co. | | | 1 | | | | 133 | |
Grand Canyon Education, Inc. (1) | | | 358 | | | | 33,720 | |
H&R Block, Inc. | | | 31 | | | | 1,095 | |
Hibbett, Inc. | | | 316 | | | | 13,812 | |
Kohl’s Corp. | | | 330 | | | | 11,778 | |
Lennar Corp. | | | 75 | | | | 5,293 | |
Lowe’s Cos., Inc. | | | 8 | | | | 1,397 | |
Lululemon Athletica, Inc. (1) | | | 170 | | | | 46,344 | |
M/I Homes, Inc. (1) | | | 246 | | | | 9,756 | |
Macy’s, Inc. | | | 1,909 | | | | 34,973 | |
MasterCraft Boat Holdings, Inc. (1) | | | 6 | | | | 126 | |
Mohawk Industries, Inc. (1) | | | 244 | | | | 30,278 | |
O’Reilly Automotive, Inc. (1) | | | 34 | | | | 21,480 | |
PVH Corp. | | | 188 | | | | 10,697 | |
Qurate Retail, Inc. | | | 315 | | | | 904 | |
Skyline Champion Corp. (1) | | | 341 | | | | 16,170 | |
Smith & Wesson Brands, Inc. | | | 111 | | | | 1,457 | |
Sonos, Inc. (1) | | | 1,287 | | | | 23,217 | |
Sturm Ruger & Co., Inc. | | | 2 | | | | 127 | |
Tapestry, Inc. | | | 235 | | | | 7,172 | |
Target Corp. | | | 50 | | | | 7,062 | |
Tesla, Inc. (1) | | | 3 | | | | 2,020 | |
Global Allocation Fund |
Security Description | | Shares or
Principal
Amount ($) | | | Fair
Value ($) | |
Common Stocks (United States) — continued |
Thor Industries, Inc. | | | 199 | | | | 14,871 | |
TJX Cos., Inc./The | | | 373 | | | | 20,832 | |
Town Sports International Holdings, Inc. (1)(5) | | | 378 | | | | 0 | |
Tractor Supply Co. | | | 105 | | | | 20,354 | |
Ulta Beauty, Inc. (1) | | | 134 | | | | 51,654 | |
| | | | | | | | 686,825 | |
| | | | | | | | | |
Consumer Staples — 1.1% | | | | | | | | |
Albertsons Cos., Inc. | | | 430 | | | | 11,490 | |
Archer-Daniels-Midland Co. | | | 857 | | | | 66,503 | |
Bunge, Ltd. | | | 30 | | | | 2,721 | |
Costco Wholesale Corp. | | | 293 | | | | 140,429 | |
General Mills, Inc. | | | 1,271 | | | | 95,897 | |
Ingredion, Inc. | | | 18 | | | | 1,587 | |
Kroger Co./The | | | 53 | | | | 2,508 | |
PepsiCo, Inc. | | | 336 | | | | 55,998 | |
Simply Good Foods Co./The (1) | | | 328 | | | | 12,389 | |
Tyson Foods, Inc. | | | 322 | | | | 27,711 | |
| | | | | | | | 417,233 | |
| | | | | | | | | |
Energy — 1.5% | | | | | | | | |
APA Corp. | | | 334 | | | | 11,657 | |
Berry Corp. | | | 67 | | | | 511 | |
Bristow Group, Inc. (1) | | | 60 | | | | 1,404 | |
Centrus Energy Corp. (1) | | | 28 | | | | 693 | |
Cheniere Energy, Inc. | | | 8 | | | | 1,064 | |
Chevron Corp. | | | 807 | | | | 116,837 | |
ConocoPhillips | | | 363 | | | | 32,601 | |
Diamondback Energy, Inc. | | | 39 | | | | 4,725 | |
EOG Resources, Inc. | | | 162 | | | | 17,891 | |
Exxon Mobil Corp. | | | 1,517 | | | | 129,916 | |
Halliburton Co. | | | 444 | | | | 13,924 | |
Hess Corp. | | | 46 | | | | 4,873 | |
Marathon Petroleum Corp. | | | 1,098 | | | | 90,267 | |
ONEOK, Inc. | | | 128 | | | | 7,104 | |
Ovintiv, Inc. | | | 260 | | | | 11,489 | |
PDC Energy, Inc. | | | 32 | | | | 1,972 | |
Phillips 66 | | | 169 | | | | 13,856 | |
Pioneer Natural Resources Co. | | | 51 | | | | 11,377 | |
Range Resources Corp. (1) | | | 4 | | | | 99 | |
Schlumberger NV | | | 653 | | | | 23,351 | |
Targa Resources Corp. | | | 166 | | | | 9,905 | |
Teekay Corp. (1) | | | 121 | | | | 348 | |
Valero Energy Corp. | | | 279 | | | | 29,652 | |
Westmoreland Coal Co. (1)(5) | | | 539 | | | | 0 | |
World Fuel Services Corp. | | | 20 | | | | 409 | |
| | | | | | | | 535,925 | |
| | | | | | | | | |
The accompanying notes are an integral part of these financial statements.
2022 Semi-Annual Report | June 30, 2022 | Page 21 |
Schedules of Investments
June 30, 2022 (unaudited)
Global Allocation Fund |
Security Description | | Shares or
Principal
Amount ($) | | | Fair
Value ($) | |
Common Stocks (United States) — continued |
Financials — 3.0% | | | | | | | | |
American Equity Investment Life Holding Co. | | | 4 | | | | 146 | |
American Financial Group, Inc./OH | | | 69 | | | | 9,578 | |
American International Group, Inc. | | | 2,036 | | | | 104,101 | |
Argo Group International Holdings, Ltd. | | | 68 | | | | 2,506 | |
Axis Capital Holdings, Ltd. | | | 3 | | | | 171 | |
Bank of New York Mellon Corp./The | | | 1,036 | | | | 43,212 | |
Berkshire Hathaway, Inc. (1) | | | 1,703 | | | | 464,953 | |
Charles Schwab Corp./The | | | 195 | | | | 12,320 | |
Chubb, Ltd. | | | 139 | | | | 27,325 | |
Essent Group, Ltd. | | | 36 | | | | 1,400 | |
Fidelity National Financial, Inc. | | | 267 | | | | 9,868 | |
First American Financial Corp. | | | 27 | | | | 1,429 | |
Hartford Financial Services Group, Inc./The | | | 189 | | | | 12,366 | |
Markel Corp. (1) | | | 11 | | | | 14,226 | |
Marsh & McLennan Cos., Inc. | | | 1,307 | | | | 202,912 | |
Medley Management, Inc. (1)(5) | | | 21 | | | | 0 | |
Moelis & Co. | | | 145 | | | | 5,706 | |
Northrim BanCorp., Inc. | | | 110 | | | | 4,429 | |
OneMain Holdings, Inc. | | | 369 | | | | 13,793 | |
Pathward Financial, Inc. | | | 120 | | | | 4,640 | |
Prudential Financial, Inc. | | | 394 | | | | 37,698 | |
Pzena Investment Management, Inc. | | | 196 | | | | 1,292 | |
Regions Financial Corp. | | | 1,003 | | | | 18,806 | |
Siebert Financial Corp. (1) | | | 74 | | | | 115 | |
State Street Corp. | | | 199 | | | | 12,268 | |
Stewart Information Services Corp. | | | 407 | | | | 20,248 | |
W R Berkley Corp. | | | 94 | | | | 6,416 | |
Walker & Dunlop, Inc. | | | 9 | | | | 867 | |
Willis Towers Watson PLC | | | 411 | | | | 81,127 | |
| | | | | | | | 1,113,918 | |
| | | | | | | | | |
Healthcare — 4.2% | | | | | | | | |
AbbVie, Inc. | | | 670 | | | | 102,617 | |
Alaunos Therapeutics, Inc. (1) | | | 620 | | | | 769 | |
Amgen, Inc. | | | 560 | | | | 136,248 | |
Amneal Pharmaceuticals, Inc. (1) | | | 233 | | | | 741 | |
Assertio Holdings, Inc. (1) | | | 132 | | | | 389 | |
Bristol-Myers Squibb Co. | | | 1,219 | | | | 93,863 | |
Calyxt, Inc. (1) | | | 455 | | | | 110 | |
Cardinal Health, Inc. | | | 1,058 | | | | 55,302 | |
Catalent, Inc. (1) | | | 102 | | | | 10,944 | |
Centene Corp. (1) | | | 176 | | | | 14,891 | |
Centogene NV (1) | | | 74 | | | | 175 | |
Cigna Corp. | | | 143 | | | | 37,683 | |
CVS Health Corp. | | | 182 | | | | 16,864 | |
Global Allocation Fund |
Security Description | | Shares or
Principal
Amount ($) | | | Fair
Value ($) | |
Common Stocks (United States) — continued |
Eli Lilly & Co. | | | 292 | | | | 94,675 | |
Eloxx Pharmaceuticals, Inc. (1) | | | 481 | | | | 130 | |
Endo International PLC (1) | | | 1,889 | | | | 880 | |
Fulgent Genetics, Inc. (1) | | | 820 | | | | 44,715 | |
Genprex, Inc. (1) | | | 180 | | | | 250 | |
Gilead Sciences, Inc. | | | 1,319 | | | | 81,527 | |
Humana, Inc. | | | 33 | | | | 15,446 | |
Illumina, Inc. (1) | | | 7 | | | | 1,291 | |
Johnson & Johnson | | | 1,198 | | | | 212,657 | |
La Jolla Pharmaceutical Co. (1) | | | 56 | | | | 179 | |
Laboratory Corp. of America Holdings | | | 26 | | | | 6,093 | |
McKesson Corp. | | | 97 | | | | 31,642 | |
Merck & Co., Inc. | | | 1,160 | | | | 105,757 | |
Moderna, Inc. (1) | | | 323 | | | | 46,141 | |
Organogenesis Holdings, Inc. (1) | | | 21 | | | | 102 | |
Palatin Technologies, Inc. (1) | | | 689 | | | | 193 | |
Pfizer, Inc. | | | 1,192 | | | | 62,497 | |
QuidelOrtho Corp. (1) | | | 154 | | | | 14,966 | |
Regeneron Pharmaceuticals, Inc. (1) | | | 64 | | | | 37,832 | |
REGENXBIO, Inc. (1) | | | 82 | | | | 2,025 | |
UnitedHealth Group, Inc. | | | 350 | | | | 179,771 | |
Vertex Pharmaceuticals, Inc. (1) | | | 75 | | | | 21,134 | |
Viatris, Inc. | | | 1,031 | | | | 10,795 | |
West Pharmaceutical Services, Inc. | | | 119 | | | | 35,982 | |
Zoetis, Inc. | | | 413 | | | | 70,991 | |
| | | | | | | | 1,548,267 | |
| | | | | | | | | |
Industrials — 1.8% | | | | | | | | |
Atkore, Inc. (1) | | | 92 | | | | 7,637 | |
Axon Enterprise, Inc. (1) | | | 341 | | | | 31,771 | |
Builders FirstSource, Inc. (1) | | | 2,192 | | | | 117,710 | |
BWX Technologies, Inc. | | | 418 | | | | 23,028 | |
Copart, Inc. (1) | | | 773 | | | | 83,994 | |
EMCOR Group, Inc. | | | 269 | | | | 27,696 | |
Emerson Electric Co. | | | 136 | | | | 10,817 | |
Encore Wire Corp. | | | 10 | | | | 1,039 | |
General Dynamics Corp. | | | 593 | | | | 131,201 | |
Graco, Inc. | | | 224 | | | | 13,308 | |
Hillenbrand, Inc. | | | 103 | | | | 4,219 | |
Hubbell, Inc. | | | 1 | | | | 179 | |
Karat Packaging, Inc. (1) | | | 15 | | | | 256 | |
Lockheed Martin Corp. | | | 92 | | | | 39,556 | |
ManpowerGroup, Inc. | | | 3 | | | | 229 | |
Matson, Inc. | | | 23 | | | | 1,676 | |
Mueller Industries, Inc. | | | 229 | | | | 12,203 | |
MYR Group, Inc. (1) | | | 10 | | | | 881 | |
Northrop Grumman Corp. | | | 170 | | | | 81,357 | |
The accompanying notes are an integral part of these financial statements.
Page 22 | 2022 Semi-Annual Report | June 30, 2022 |
Schedules of Investments
June 30, 2022 (unaudited)
Global Allocation Fund |
Security Description | | Shares or
Principal
Amount ($) | | | Fair
Value ($) | |
Common Stocks (United States) — continued |
nVent Electric PLC | | | 215 | | | | 6,736 | |
Pitney Bowes, Inc. | | | 26 | | | | 94 | |
Regal Rexnord Corp. | | | 1 | | | | 114 | |
United Parcel Service, Inc. | | | 100 | | | | 18,254 | |
V2X, Inc. (1) | | | 46 | | | | 1,539 | |
Waste Management, Inc. | | | 301 | | | | 46,047 | |
| | | | | | | | 661,541 | |
| | | | | | | | | |
Information Technology — 6.3% | | | | | | | | |
Advanced Micro Devices, Inc. (1) | | | 386 | | | | 29,517 | |
Alpha & Omega Semiconductor, Ltd. (1) | | | 1,111 | | | | 37,041 | |
Amkor Technology, Inc. | | | 1,916 | | | | 32,476 | |
Apple, Inc. | | | 4,401 | | | | 601,705 | |
Arrow Electronics, Inc. (1) | | | 349 | | | | 39,119 | |
Avnet, Inc. | | | 503 | | | | 21,569 | |
Axcelis Technologies, Inc. (1) | | | 367 | | | | 20,126 | |
Cadence Design Systems, Inc. (1) | | | 176 | | | | 26,405 | |
Cisco Systems, Inc. | | | 748 | | | | 31,895 | |
Cognizant Technology Solutions Corp. | | | 257 | | | | 17,345 | |
Concentrix Corp. | | | 35 | | | | 4,747 | |
Diodes, Inc. (1) | | | 382 | | | | 24,666 | |
Dolby Laboratories, Inc. | | | 13 | | | | 930 | |
EPAM Systems, Inc. (1) | | | 52 | | | | 15,329 | |
Euronet Worldwide, Inc. (1) | | | 33 | | | | 3,319 | |
Extreme Networks, Inc. (1) | | | 16 | | | | 143 | |
Intel Corp. | | | 1,407 | | | | 52,636 | |
Intuit, Inc. | | | 146 | | | | 56,274 | |
Jabil, Inc. | | | 1,085 | | | | 55,563 | |
Manhattan Associates, Inc. (1) | | | 1,267 | | | | 145,198 | |
Mastercard, Inc. | | | 153 | | | | 48,268 | |
Micron Technology, Inc. | | | 2,259 | | | | 124,878 | |
Microsoft Corp. | | | 2,432 | | | | 624,615 | |
NortonLifeLock, Inc. | | | 530 | | | | 11,639 | |
Oracle Corp. | | | 524 | | | | 36,612 | |
PTC, Inc. (1) | | | 116 | | | | 12,335 | |
QUALCOMM, Inc. | | | 1,061 | | | | 135,532 | |
Qualys, Inc. (1) | | | 291 | | | | 36,707 | |
Rimini Street, Inc. (1) | | | 68 | | | | 409 | |
StarTek, Inc. (1) | | | 131 | | | | 379 | |
Tenable Holdings, Inc. (1) | | | 191 | | | | 8,673 | |
TESSCO Technologies, Inc. (1) | | | 27 | | | | 160 | |
Visa, Inc. | | | 1 | | | | 197 | |
Zoom Video Communications, Inc. (1) | | | 294 | | | | 31,743 | |
| | | | | | | | 2,288,150 | |
| | | | | | | | | |
Global Allocation Fund |
Security Description | | Shares or
Principal
Amount ($) | | | Fair
Value ($) | |
Common Stocks (United States) — continued |
Materials — 0.3% | | | | | | | | |
Alcoa Corp. | | | 34 | | | | 1,550 | |
Constellium SE (1) | | | 8 | | | | 106 | |
Dow, Inc. | | | 309 | | | | 15,947 | |
Eagle Materials, Inc. | | | 5 | | | | 550 | |
Flotek Industries, Inc. (1) | | | 208 | | | | 206 | |
Freeport-McMoRan, Inc. | | | 137 | | | | 4,009 | |
Huntsman Corp. | | | 158 | | | | 4,479 | |
Louisiana-Pacific Corp. | | | 584 | | | | 30,607 | |
LyondellBasell Industries NV | | | 181 | | | | 15,830 | |
Nucor Corp. | | | 148 | | | | 15,453 | |
Olin Corp. | | | 84 | | | | 3,888 | |
Royal Gold, Inc. | | | 33 | | | | 3,524 | |
Ryerson Holding Corp. | | | 34 | | | | 724 | |
Schnitzer Steel Industries, Inc. | | | 52 | | | | 1,708 | |
Southern Copper Corp. | | | 109 | | | | 5,429 | |
Steel Dynamics, Inc. | | | 75 | | | | 4,961 | |
United States Steel Corp. | | | 132 | | | | 2,364 | |
| | | | | | | | 111,335 | |
| | | | | | | | | |
Real Estate Investment Trust — 0.0% | | | | | | | | |
Altisource Portfolio Solutions SA (1) | | | 115 | | | | 1,235 | |
CorEnergy Infrastructure Trust, Inc. | | | 583 | | | | 1,469 | |
Kilroy Realty Corp. | | | 2 | | | | 105 | |
Lamar Advertising Co. | | | 2 | | | | 176 | |
RAIT Financial Trust (1)(5) | | | 287 | | | | 0 | |
Spirit MTA REIT Liquidating Trust (1)(5) | | | 385 | | | | 0 | |
Trinity Place Holdings, Inc. (1) | | | 331 | | | | 334 | |
| | | | | | | | 3,319 | |
| | | | | | | | | |
Utilities — 0.2% | | | | | | | | |
AES Corp./The | | | 7 | | | | 147 | |
Constellation Energy Corp. | | | 738 | | | | 42,258 | |
NRG Energy, Inc. | | | 254 | | | | 9,695 | |
UGI Corp. | | | 681 | | | | 26,293 | |
| | | | | | | | 78,393 | |
| | | | | | | | | |
Total Common Stocks (United States) (Cost $6,650,109) | | | | | | | 7,960,443 | |
| | | | | | | | | |
Preferred Stock (United States) — 0.0% |
WESCO International, Inc. Series A Variable Preferred (6) | | | 81 | | | | 2,221 | |
Total Preferred Stock (United States) (Cost $2,025) | | | | | | | 2,221 | |
| | | | | | | | | |
The accompanying notes are an integral part of these financial statements.
2022 Semi-Annual Report | June 30, 2022 | Page 23 |
Schedules of Investments
June 30, 2022 (unaudited)
Global Allocation Fund |
Security Description | | Shares or
Principal
Amount ($) | | | Fair
Value ($) | |
Warrants (United States) — 0.0% |
Civitas Solutions, Inc. A Warrants, Expiration Date 1/20/2025 (1)(5) | | | 2 | | | | 0 | |
Civitas Solutions, Inc. B Warrants, Expiration Date 1/20/2026 (1)(5) | | | 1 | | | | 0 | |
Hertz Global Holdings, Inc. Warrants, Expiration Date 6/30/2051 (1) | | | 11 | | | | 108 | |
Nabors Industries, Ltd. Warrants, Expiration Date 6/11/2026 (1) | | | 4 | | | | 128 | |
Whiting Petroleum Corp. A Warrants, Expiration Date 9/1/2024 (1) | | | 12 | | | | 161 | |
Whiting Petroleum Corp. B Warrants, Expiration Date 9/1/2025 (1) | | | 9 | | | | 95 | |
Total Warrants (United States) (Cost $93) | | | | | | | 492 | |
| | | | | | | | | |
Registered Investment Companies — 11.1% |
U.S. Fixed Income — 2.7% | | | | | | | | |
Baird Core Plus Bond Fund - Class I | | | 10,515 | | | | 107,777 | |
BBH Limited Duration Fund - Class I | | | 5,015 | | | | 49,950 | |
Diamond Hill Short Duration Securitized Bond Fund - Class Y | | | 17,653 | | | | 170,000 | |
DoubleLine Total Return Bond Fund - Class I | | | 13,795 | | | | 128,984 | |
Frost Total Return Bond Fund - Class I | | | 7,587 | | | | 72,603 | |
Guggenheim- Total Return Bond Fund - Class I | | | 2,159 | | | | 52,608 | |
iShares Core U.S. Aggregate Bond ETF (7) | | | 531 | | | | 53,992 | |
PGIM Short-Term Corporate Bond Fund - Class Q | | | 16,489 | | | | 170,494 | |
Pioneer Bond Fund - Class K | | | 8,689 | | | | 74,726 | |
Segall Bryant & Hamill Plus Bond Fund - Class I | | | 14,065 | | | | 132,214 | |
| | | | | | | | 1,013,348 | |
| | | | | | | | | |
International Equity — 8.4% | | | | | | | | |
iShares Core MSCI EAFE ETF (7) | | | 42,298 | | | | 2,489,237 | |
iShares Core MSCI Emerging Markets ETF (7) | | | 12,312 | | | | 604,027 | |
| | | | | | | | 3,093,264 | |
| | | | | | | | | |
Total Registered Investment Companies (Cost $3,775,991) | | | | | | | 4,106,612 | |
| | | | | | | | | |
Global Allocation Fund |
Security Description | | Shares or
Principal
Amount ($) | | | Fair
Value ($) | |
Money Market Registered Investment Companies — 62.7% |
Federated Hermes Government Obligations Fund, 1.41% | | | 1,864,000 | | | | 1,864,000 | |
Meeder Institutional Prime Money Market Fund, 1.42% (2) | | | 21,307,273 | | | | 21,298,750 | |
Total Money Market Registered Investment Companies (Cost $23,166,219) | | | | | | | 23,162,750 | |
| | | | | | | | | |
Bank Obligations — 1.3% |
First Merchants Bank Deposit Account, 0.55%, 7/1/2022 (3) | | | 249,644 | | | | 249,644 | |
Metro City Bank Deposit Account, 0.05%, 7/1/2022 (3) | | | 248,529 | | | | 248,529 | |
Total Bank Obligations (Cost $498,173) | | | | | | | 498,173 | |
Total Investments — 96.8% (Cost $34,092,610) | | | | | | | 35,730,691 | |
Other Assets less Liabilities — 3.2% | | | | | | | 1,192,236 | |
Total Net Assets — 100.0% | | | | | | | 36,922,927 | |
| | | | | | | | | |
Trustee Deferred Compensation (4) |
Meeder Balanced Fund - Retail Class | | | 1,970 | | | | 23,187 | |
Meeder Dynamic Allocation Fund - Retail Class | | | 5,344 | | | | 60,067 | |
Meeder Muirfield Fund - Retail Class | | | 2,276 | | | | 18,845 | |
Meeder Conservative Allocation Fund - Retail Class | | | 558 | | | | 11,835 | |
Total Trustee Deferred Compensation (Cost $107,974) | | | | | | | 113,934 | |
| | | | | | | | | |
The accompanying notes are an integral part of these financial statements.
Page 24 | 2022 Semi-Annual Report | June 30, 2022 |
Schedules of Investments
June 30, 2022 (unaudited)
Global Allocation Fund |
| | | Long
(Short)
Contracts | | | Expiration
Date | | | Notional
Value of
Contracts
($) | | | Value and
Unrealized
Appreciation
(Depreciation)
($) | |
Futures Contracts |
Index Futures | | | | | | | | | | | | | | | | |
E-mini Standard & Poors MidCap 400 Futures | | | (2 | ) | | | 9/16/2022 | | | | (453,600 | ) | | | (8,018 | ) |
Mini MSCI EAFE Index Futures | | | 47 | | | | 9/16/2022 | | | | 4,363,010 | | | | 8,900 | |
Mini MSCI Emerging Markets Index Futures | | | 18 | | | | 9/16/2022 | | | | 902,430 | | | | (238 | ) |
Russell 2000 Mini Index Futures | | | 5 | | | | 9/16/2022 | | | | 427,000 | | | | (1,759 | ) |
Standard & Poors 500 Mini Futures | | | (6 | ) | | | 9/16/2022 | | | | (1,136,850 | ) | | | (27,891 | ) |
Total Futures Contracts | | | 62 | | | | | | | | 4,101,990 | | | | (29,006 | ) |
(1) | Represents non-income producing securities. |
(2) | Investment in affiliate. The yield shown represents the 7-day yield in effect at June 30, 2022. |
(3) | Variable rate security. Securities payable at par including accrued interest (usually within seven days notice) and unconditionally secured as to principal and interest by letters of credit or other credit support agreements from major banks. The interest rates are adjustable and are not based on a published reference rate and spread but are determined by the issuer or agent and are based on current market conditions. These securities do not indicate a reference rate and spread in their description above. The rate shown represents the rate in effect at June 30, 2022. The maturity date shown, if applicable, reflects the earlier of the next demand date or stated maturity date. |
(4) | Assets of affiliates to the Global Allocation Fund held for the benefit of the Fund’s Trustees in connection with the Trustee Deferred Compensation Plan. |
(5) | Fair valued security deemed a Level 3 security. Security is not part of the investment strategy of the Fund. |
The accompanying notes are an integral part of these financial statements.
2022 Semi-Annual Report | June 30, 2022 | Page 25 |
Schedules of Investments
June 30, 2022 (unaudited)
Balanced Fund |
Security Description | | Shares,
Contracts
or Principal
Amount ($) | | | Fair
Value ($) | |
Common Stocks (United States) — 36.2% |
Communication Services — 2.3% | | | | | | | | |
Alphabet, Inc. (1) | | | 2,060 | | | | 4,506,147 | |
AT&T, Inc. | | | 6,328 | | | | 132,635 | |
Cogent Communications Holdings, Inc. | | | 2,397 | | | | 145,642 | |
Comcast Corp. | | | 27,714 | | | | 1,087,497 | |
Emerald Holding, Inc. (1) | | | 1 | | | | 4 | |
Entravision Communications Corp. | | | 1,386 | | | | 6,320 | |
IDT Corp. (1) | | | 5,617 | | | | 141,268 | |
Interpublic Group of Cos., Inc./The | | | 16,900 | | | | 465,257 | |
Liberty TripAdvisor Holdings, Inc. (1) | | | 4,043 | | | | 3,059 | |
Lumen Technologies, Inc. | | | 3,384 | | | | 36,919 | |
Meta Platforms, Inc. (1) | | | 5,133 | | | | 827,696 | |
Nexstar Media Group, Inc. | | | 965 | | | | 157,179 | |
Omnicom Group, Inc. | | | 7,229 | | | | 459,837 | |
Verizon Communications, Inc. | | | 198 | | | | 10,049 | |
| | | | | | | | 7,979,509 | |
| | | | | | | | | |
Consumer Discretionary — 3.1% | | | | | | | | |
Academy Sports & Outdoors, Inc. | | | 16,176 | | | | 574,895 | |
Amazon.com, Inc. (1) | | | 26,337 | | | | 2,797,253 | |
AutoZone, Inc. (1) | | | 8 | | | | 17,193 | |
Booking Holdings, Inc. (1) | | | 247 | | | | 432,001 | |
Chico’s FAS, Inc. (1) | | | 439 | | | | 2,182 | |
Dillard’s, Inc. | | | 22 | | | | 4,853 | |
Ethan Allen Interiors, Inc. | | | 151 | | | | 3,052 | |
Everi Holdings, Inc. (1) | | | 80 | | | | 1,305 | |
Ford Motor Co. | | | 20,271 | | | | 225,616 | |
Frontdoor, Inc. (1) | | | 398 | | | | 9,584 | |
Gentex Corp. | | | 145 | | | | 4,056 | |
Gentherm, Inc. (1) | | | 1,216 | | | | 75,891 | |
Genuine Parts Co. | | | 22 | | | | 2,926 | |
Grand Canyon Education, Inc. (1) | | | 7,210 | | | | 679,110 | |
H&R Block, Inc. | | | 2,945 | | | | 104,017 | |
Hibbett, Inc. | | | 3,085 | | | | 134,845 | |
Home Depot, Inc./The | | | 46 | | | | 12,616 | |
Kohl’s Corp. | | | 6,416 | | | | 228,987 | |
La-Z-Boy, Inc. | | | 62 | | | | 1,470 | |
LKQ Corp. | | | 26 | | | | 1,276 | |
Lowe’s Cos., Inc. | | | 443 | | | | 77,379 | |
Lululemon Athletica, Inc. (1) | | | 2,998 | | | | 817,285 | |
M/I Homes, Inc. (1) | | | 3,943 | | | | 156,379 | |
Macy’s, Inc. | | | 32,760 | | | | 600,163 | |
Mohawk Industries, Inc. (1) | | | 3,665 | | | | 454,790 | |
Nordstrom, Inc. | | | 1,972 | | | | 41,668 | |
ONE Group Hospitality, Inc./The (1) | | | 1,514 | | | | 11,158 | |
O’Reilly Automotive, Inc. (1) | | | 756 | | | | 477,611 | |
Balanced Fund |
Security Description | | Shares,
Contracts
or Principal
Amount ($) | | | Fair
Value ($) | |
Common Stocks (United States) — continued |
PVH Corp. | | | 5,226 | | | | 297,359 | |
Qurate Retail, Inc. | | | 4,274 | | | | 12,266 | |
Rent-A-Center, Inc./TX | | | 107 | | | | 2,081 | |
Ross Stores, Inc. | | | 18 | | | | 1,264 | |
Skyline Champion Corp. (1) | | | 6,317 | | | | 299,552 | |
Smith & Wesson Brands, Inc. | | | 5,346 | | | | 70,193 | |
Sonos, Inc. (1) | | | 14,307 | | | | 258,098 | |
Sturm Ruger & Co., Inc. | | | 64 | | | | 4,074 | |
Tapestry, Inc. | | | 2,980 | | | | 90,950 | |
Target Corp. | | | 709 | | | | 100,132 | |
Tesla, Inc. (1) | | | 255 | | | | 171,722 | |
Thor Industries, Inc. | | | 2,309 | | | | 172,552 | |
TJX Cos., Inc./The | | | 5,398 | | | | 301,478 | |
Town Sports International Holdings, Inc. (1)(5) | | | 1,777 | | | | 0 | |
Tractor Supply Co. | | | 1,565 | | | | 303,375 | |
TravelCenters of America, Inc. (1) | | | 1 | | | | 34 | |
Ulta Beauty, Inc. (1) | | | 1,999 | | | | 770,575 | |
XL Fleet Corp. (1) | | | 1 | | | | 1 | |
Yum! Brands, Inc. | | | 12 | | | | 1,362 | |
| | | | | | | | 10,806,629 | |
| | | | | | | | | |
Consumer Staples — 1.7% | | | | | | | | |
Albertsons Cos., Inc. | | | 5,438 | | | | 145,303 | |
Archer-Daniels-Midland Co. | | | 9,443 | | | | 732,777 | |
Bunge, Ltd. | | | 2,201 | | | | 199,609 | |
Coca-Cola Co./The | | | 441 | | | | 27,743 | |
Costco Wholesale Corp. | | | 5,723 | | | | 2,742,919 | |
Darling Ingredients, Inc. (1) | | | 1,342 | | | | 80,252 | |
Flowers Foods, Inc. | | | 144 | | | | 3,790 | |
General Mills, Inc. | | | 8,293 | | | | 625,707 | |
Hostess Brands, Inc. (1) | | | 2,741 | | | | 58,137 | |
Ingredion, Inc. | | | 1,260 | | | | 111,082 | |
Mondelez International, Inc. | | | 3,086 | | | | 191,610 | |
NewAge, Inc. (1)(5) | | | 1 | | | | 0 | |
PepsiCo, Inc. | | | 1,075 | | | | 179,160 | |
Simply Good Foods Co./The (1) | | | 6,706 | | | | 253,286 | |
Sysco Corp. | | | 15 | | | | 1,271 | |
Tyson Foods, Inc. | | | 6,635 | | | | 571,008 | |
| | | | | | | | 5,923,654 | |
| | | | | | | | | |
Energy — 2.6% | | | | | | | | |
Alto Ingredients, Inc. (1) | | | 663 | | | | 2,460 | |
APA Corp. | | | 3,532 | | | | 123,267 | |
Berry Corp. | | | 190 | | | | 1,448 | |
Bristow Group, Inc. (1) | | | 747 | | | | 17,480 | |
California Resources Corp. | | | 67 | | | | 2,580 | |
The accompanying notes are an integral part of these financial statements.
Page 26 | 2022 Semi-Annual Report | June 30, 2022 |
Schedules of Investments
June 30, 2022 (unaudited)
Balanced Fund |
Security Description | | Shares,
Contracts
or Principal
Amount ($) | | | Fair
Value ($) | |
Common Stocks (United States) — continued |
Cheniere Energy, Inc. | | | 500 | | | | 66,515 | |
Chevron Corp. | | | 17,691 | | | | 2,561,303 | |
Civitas Resources, Inc. | | | 394 | | | | 20,602 | |
ConocoPhillips | | | 7,809 | | | | 701,326 | |
Coterra Energy, Inc. | | | 79 | | | | 2,037 | |
Devon Energy Corp. | | | 1,739 | | | | 95,836 | |
Diamondback Energy, Inc. | | | 706 | | | | 85,532 | |
DT Midstream, Inc. | | | 76 | | | | 3,726 | |
EOG Resources, Inc. | | | 2,225 | | | | 245,729 | |
Exxon Mobil Corp. | | | 28,231 | | | | 2,417,703 | |
Hess Corp. | | | 800 | | | | 84,752 | |
HF Sinclair Corp. | | | 295 | | | | 13,322 | |
Marathon Oil Corp. | | | 482 | | | | 10,835 | |
Marathon Petroleum Corp. | | | 14,382 | | | | 1,182,344 | |
Matador Resources Co. | | | 28 | | | | 1,305 | |
Nine Energy Service, Inc. (1) | | | 1,808 | | | | 4,791 | |
ONEOK, Inc. | | | 1,086 | | | | 60,273 | |
Ovintiv, Inc. | | | 2,463 | | | | 108,840 | |
Phillips 66 | | | 2,562 | | | | 210,058 | |
Pioneer Natural Resources Co. | | | 688 | | | | 153,479 | |
Schlumberger NV | | | 8,695 | | | | 310,933 | |
Targa Resources Corp. | | | 1,871 | | | | 111,643 | |
Teekay Corp. (1) | | | 1,515 | | | | 4,363 | |
Valero Energy Corp. | | | 3,723 | | | | 395,680 | |
World Fuel Services Corp. | | | 482 | | | | 9,862 | |
| | | | | | | | 9,010,024 | |
| | | | | | | | | |
Financials — 4.6% | | | | | | | | |
American Equity Investment Life Holding Co. | | | 3,141 | | | | 114,866 | |
American Express Co. | | | 10 | | | | 1,386 | |
American Financial Group, Inc./OH | | | 1,117 | | | | 155,051 | |
American International Group, Inc. | | | 25,452 | | | | 1,301,361 | |
Atlanticus Holdings Corp. (1) | | | 52 | | | | 1,829 | |
Axis Capital Holdings, Ltd. | | | 51 | | | | 2,912 | |
Bank of New York Mellon Corp./The | | | 10,086 | | | | 420,687 | |
Berkshire Hathaway, Inc. (1) | | | 25,193 | | | | 6,878,193 | |
Capital BanCorp., Inc. | | | 132 | | | | 2,864 | |
Carlyle Group, Inc./The | | | 1 | | | | 32 | |
Charles Schwab Corp./The | | | 4,282 | | | | 270,537 | |
Chubb, Ltd. | | | 4,612 | | | | 906,627 | |
Cincinnati Financial Corp. | | | 11 | | | | 1,309 | |
Erie Indemnity Co. | | | 9 | | | | 1,730 | |
Essent Group, Ltd. | | | 3,927 | | | | 152,760 | |
Fidelity National Financial, Inc. | | | 7,735 | | | | 285,886 | |
Hartford Financial Services Group, Inc./The | | | 2,606 | | | | 170,511 | |
Balanced Fund |
Security Description | | Shares,
Contracts
or Principal
Amount ($) | | | Fair
Value ($) | |
Common Stocks (United States) — continued |
Markel Corp. (1) | | | 160 | | | | 206,920 | |
Marsh & McLennan Cos., Inc. | | | 11,012 | | | | 1,709,613 | |
Medley Management, Inc. (1)(5) | | | 101 | | | | 0 | |
Moelis & Co. | | | 427 | | | | 16,802 | |
Mr Cooper Group, Inc. (1) | | | 1,503 | | | | 55,220 | |
Northrim BanCorp., Inc. | | | 1,156 | | | | 46,541 | |
Old Republic International Corp. | | | 122 | | | | 2,728 | |
OneMain Holdings, Inc. | | | 11,499 | | | | 429,833 | |
Pathward Financial, Inc. | | | 1,680 | | | | 64,966 | |
PennyMac Financial Services, Inc. | | | 62 | | | | 2,710 | |
Prudential Financial, Inc. | | | 4,153 | | | | 397,359 | |
Pzena Investment Management, Inc. | | | 2,756 | | | | 18,162 | |
Regions Financial Corp. | | | 13,426 | | | | 251,738 | |
State Street Corp. | | | 2,915 | | | | 179,710 | |
Stewart Information Services Corp. | | | 6,018 | | | | 299,396 | |
Synchrony Financial | | | 1,444 | | | | 39,883 | |
UMB Financial Corp. | | | 15 | | | | 1,292 | |
W R Berkley Corp. | | | 1,903 | | | | 129,899 | |
Walker & Dunlop, Inc. | | | 967 | | | | 93,161 | |
Westamerica BanCorp. | | | 72 | | | | 4,008 | |
Willis Towers Watson PLC | | | 7,005 | | | | 1,382,717 | |
| | | | | | | | 16,001,199 | |
| | | | | | | | | |
Healthcare — 7.2% | | | | | | | | |
Abbott Laboratories | | | 1,233 | | | | 133,965 | |
AbbVie, Inc. | | | 12,995 | | | | 1,990,314 | |
Acadia Healthcare Co., Inc. (1) | | | 18 | | | | 1,217 | |
Alaunos Therapeutics, Inc. (1) | | | 5,102 | | | | 6,326 | |
Align Technology, Inc. (1) | | | 6 | | | | 1,420 | |
Amgen, Inc. | | | 7,834 | | | | 1,906,012 | |
Amneal Pharmaceuticals, Inc. (1) | | | 1,894 | | | | 6,023 | |
Avid Bioservices, Inc. (1) | | | 1,110 | | | | 16,939 | |
Bristol-Myers Squibb Co. | | | 18,965 | | | | 1,460,305 | |
Cardinal Health, Inc. | | | 13,422 | | | | 701,568 | |
Catalent, Inc. (1) | | | 3,275 | | | | 351,375 | |
Celldex Therapeutics, Inc. (1) | | | 1 | | | | 27 | |
Centene Corp. (1) | | | 3,364 | | | | 284,628 | |
Centogene NV (1) | | | 1,080 | | | | 2,560 | |
Cigna Corp. | | | 3,081 | | | | 811,905 | |
CVS Health Corp. | | | 7,511 | | | | 695,969 | |
Danaher Corp. | | | 1,580 | | | | 400,562 | |
Eli Lilly & Co. | | | 4,212 | | | | 1,365,657 | |
Eloxx Pharmaceuticals, Inc. (1) | | | 6,436 | | | | 1,738 | |
Fulgent Genetics, Inc. (1) | | | 8,321 | | | | 453,744 | |
Galectin Therapeutics, Inc. (1) | | | 1,818 | | | | 2,382 | |
Genprex, Inc. (1) | | | 2,209 | | | | 3,071 | |
The accompanying notes are an integral part of these financial statements.
2022 Semi-Annual Report | June 30, 2022 | Page 27 |
Schedules of Investments
June 30, 2022 (unaudited)
Balanced Fund |
Security Description | | Shares,
Contracts
or Principal
Amount ($) | | | Fair
Value ($) | |
Common Stocks (United States) — continued |
Gilead Sciences, Inc. | | | 17,886 | | | | 1,105,534 | |
Humana, Inc. | | | 101 | | | | 47,275 | |
IDEXX Laboratories, Inc. (1) | | | 982 | | | | 344,417 | |
Illumina, Inc. (1) | | | 757 | | | | 139,561 | |
ImmunityBio, Inc. (1) | | | 9,627 | | | | 35,812 | |
Incyte Corp. (1) | | | 249 | | | | 18,917 | |
Johnson & Johnson | | | 13,420 | | | | 2,382,184 | |
La Jolla Pharmaceutical Co. (1) | | | 705 | | | | 2,249 | |
Laboratory Corp. of America Holdings | | | 75 | | | | 17,577 | |
McKesson Corp. | | | 2,777 | | | | 905,885 | |
Merck & Co., Inc. | | | 15,600 | | | | 1,422,252 | |
Moderna, Inc. (1) | | | 4,494 | | | | 641,968 | |
Molina Healthcare, Inc. (1) | | | 5 | | | | 1,398 | |
National HealthCare Corp. | | | 42 | | | | 2,936 | |
Palatin Technologies, Inc. (1) | | | 4,739 | | | | 1,330 | |
Pfizer, Inc. | | | 21,408 | | | | 1,122,421 | |
Premier, Inc. | | | 2,106 | | | | 75,142 | |
Quest Diagnostics, Inc. | | | 10 | | | | 1,330 | |
QuidelOrtho Corp. (1) | | | 1,792 | | | | 174,147 | |
Regeneron Pharmaceuticals, Inc. (1) | | | 860 | | | | 508,372 | |
ResMed, Inc. | | | 6 | | | | 1,258 | |
Twist Bioscience Corp. (1) | | | 37 | | | | 1,294 | |
United Therapeutics Corp. (1) | | | 6 | | | | 1,414 | |
UnitedHealth Group, Inc. | | | 6,538 | | | | 3,358,113 | |
Universal Health Services, Inc. | | | 45 | | | | 4,532 | |
Veeva Systems, Inc. (1) | | | 232 | | | | 45,945 | |
Veracyte, Inc. (1) | | | 2,415 | | | | 48,059 | |
Vertex Pharmaceuticals, Inc. (1) | | | 1,683 | | | | 474,253 | |
Viatris, Inc. | | | 5,057 | | | | 52,947 | |
West Pharmaceutical Services, Inc. | | | 1,479 | | | | 447,205 | |
Zoetis, Inc. | | | 5,249 | | | | 902,251 | |
| | | | | | | | 24,885,685 | |
| | | | | | | | | |
Industrials — 3.0% | | | | | | | | |
ASGN, Inc. (1) | | | 15 | | | | 1,354 | |
Atkore, Inc. (1) | | | 2,880 | | | | 239,069 | |
Axon Enterprise, Inc. (1) | | | 4,316 | | | | 402,122 | |
Babcock & Wilcox Enterprises, Inc. (1) | | | 1 | | | | 6 | |
BlueLinx Holdings, Inc. (1) | | | 31 | | | | 2,071 | |
Boise Cascade Co. | | | 1,888 | | | | 112,317 | |
Builders FirstSource, Inc. (1) | | | 21,121 | | | | 1,134,198 | |
BWX Technologies, Inc. | | | 1,747 | | | | 96,242 | |
Cintas Corp. | | | 4 | | | | 1,494 | |
Copart, Inc. (1) | | | 8,382 | | | | 910,788 | |
CoStar Group, Inc. (1) | | | 6,177 | | | | 373,153 | |
EMCOR Group, Inc. | | | 2,548 | | | | 262,342 | |
Balanced Fund |
Security Description | | Shares,
Contracts
or Principal
Amount ($) | | | Fair
Value ($) | |
Common Stocks (United States) — continued |
Encore Wire Corp. | | | 1,048 | | | | 108,908 | |
General Dynamics Corp. | | | 7,299 | | | | 1,614,904 | |
Graco, Inc. | | | 2,760 | | | | 163,972 | |
Heidrick & Struggles International, Inc. | | | 43 | | | | 1,391 | |
Hillenbrand, Inc. | | | 2,531 | | | | 103,670 | |
Hubbell, Inc. | | | 22 | | | | 3,929 | |
Karat Packaging, Inc. (1) | | | 183 | | | | 3,122 | |
Lockheed Martin Corp. | | | 4,840 | | | | 2,081,006 | |
ManpowerGroup, Inc. | | | 2,177 | | | | 166,345 | |
Matson, Inc. | | | 1,408 | | | | 102,615 | |
MDU Resources Group, Inc. | | | 102 | | | | 2,753 | |
Mueller Industries, Inc. | | | 2,526 | | | | 134,611 | |
MYR Group, Inc. (1) | | | 438 | | | | 38,601 | |
Northrop Grumman Corp. | | | 3,759 | | | | 1,798,945 | |
nVent Electric PLC | | | 1,696 | | | | 53,136 | |
Raytheon Technologies Corp. | | | 40 | | | | 3,844 | |
Regal Rexnord Corp. | | | 227 | | | | 25,769 | |
Republic Services, Inc. | | | 53 | | | | 6,936 | |
Safe Bulkers, Inc. | | | 448 | | | | 1,711 | |
United Parcel Service, Inc. | | | 564 | | | | 102,953 | |
Univar Solutions, Inc. (1) | | | 103 | | | | 2,562 | |
V2X, Inc. (1) | | | 629 | | | | 21,046 | |
Waste Management, Inc. | | | 2,869 | | | | 438,900 | |
WW Grainger, Inc. | | | 6 | | | | 2,727 | |
| | | | | | | | 10,519,512 | |
| | | | | | | | | |
Information Technology — 10.5% | | | | | | | | |
A10 Networks, Inc. | | | 1,730 | | | | 24,877 | |
Advanced Micro Devices, Inc. (1) | | | 4,377 | | | | 334,709 | |
Affirm Holdings, Inc. (1) | | | 1,121 | | | | 20,245 | |
Alpha & Omega Semiconductor, Ltd. (1) | | | 10,475 | | | | 349,237 | |
American Software, Inc./GA | | | 713 | | | | 11,522 | |
Amkor Technology, Inc. | | | 11,445 | | | | 193,993 | |
Apple, Inc. | | | 66,260 | | | | 9,059,067 | |
Arrow Electronics, Inc. (1) | | | 3,762 | | | | 421,683 | |
Avid Technology, Inc. (1) | | | 1,191 | | | | 30,906 | |
Avnet, Inc. | | | 7,482 | | | | 320,828 | |
Axcelis Technologies, Inc. (1) | | | 5,440 | | | | 298,330 | |
Broadcom, Inc. | | | 316 | | | | 153,516 | |
Cadence Design Systems, Inc. (1) | | | 5,034 | | | | 755,251 | |
Cisco Systems, Inc. | | | 10,492 | | | | 447,379 | |
Cognizant Technology Solutions Corp. | | | 2,376 | | | | 160,356 | |
CommVault Systems, Inc. (1) | | | 46 | | | | 2,893 | |
Concentrix Corp. | | | 801 | | | | 108,648 | |
Dell Technologies, Inc. | | | 139 | | | | 6,423 | |
Diodes, Inc. (1) | | | 3,196 | | | | 206,366 | |
The accompanying notes are an integral part of these financial statements.
Page 28 | 2022 Semi-Annual Report | June 30, 2022 |
Schedules of Investments
June 30, 2022 (unaudited)
Balanced Fund |
Security Description | | Shares,
Contracts
or Principal
Amount ($) | | | Fair
Value ($) | |
Common Stocks (United States) — continued |
Dolby Laboratories, Inc. | | | 1,956 | | | | 139,971 | |
DXC Technology Co. (1) | | | 1,053 | | | | 31,916 | |
EPAM Systems, Inc. (1) | | | 956 | | | | 281,810 | |
Euronet Worldwide, Inc. (1) | | | 692 | | | | 69,608 | |
Fabrinet (1) | | | 35 | | | | 2,839 | |
Intel Corp. | | | 26,134 | | | | 977,673 | |
International Money Express, Inc. (1) | | | 216 | | | | 4,422 | |
Intuit, Inc. | | | 885 | | | | 341,114 | |
Jabil, Inc. | | | 22,197 | | | | 1,136,708 | |
Juniper Networks, Inc. | | | 46 | | | | 1,311 | |
Manhattan Associates, Inc. (1) | | | 19,786 | | | | 2,267,476 | |
Mastercard, Inc. | | | 2,685 | | | | 847,064 | |
Microchip Technology, Inc. | | | 3,584 | | | | 208,159 | |
Micron Technology, Inc. | | | 32,443 | | | | 1,793,449 | |
Microsoft Corp. | | | 40,833 | | | | 10,487,124 | |
Monolithic Power Systems, Inc. | | | 4 | | | | 1,536 | |
New Relic, Inc. (1) | | | 2,182 | | | | 109,209 | |
NortonLifeLock, Inc. | | | 5,104 | | | | 112,084 | |
Oracle Corp. | | | 11,964 | | | | 835,925 | |
Photronics, Inc. (1) | | | 1,342 | | | | 26,142 | |
Power Integrations, Inc. | | | 1,737 | | | | 130,292 | |
PTC, Inc. (1) | | | 12 | | | | 1,276 | |
Pure Storage, Inc. (1) | | | 4,406 | | | | 113,278 | |
QUALCOMM, Inc. | | | 15,575 | | | | 1,989,551 | |
Qualys, Inc. (1) | | | 1,647 | | | | 207,753 | |
Rimini Street, Inc. (1) | | | 937 | | | | 5,631 | |
SS&C Technologies Holdings, Inc. | | | 22 | | | | 1,278 | |
StarTek, Inc. (1) | | | 1,281 | | | | 3,702 | |
Synopsys, Inc. (1) | | | 441 | | | | 133,932 | |
Tenable Holdings, Inc. (1) | | | 3,229 | | | | 146,629 | |
WEX, Inc. (1) | | | 45 | | | | 7,000 | |
Xperi Holding Corp. | | | 2,456 | | | | 35,440 | |
Zebra Technologies Corp. (1) | | | 5 | | | | 1,470 | |
Zoom Video Communications, Inc. (1) | | | 5,066 | | | | 546,976 | |
| | | | | | | | 35,905,977 | |
| | | | | | | | | |
Materials — 0.7% | | | | | | | | |
Air Products and Chemicals, Inc. | | | 13 | | | | 3,126 | |
Alcoa Corp. | | | 611 | | | | 27,849 | |
Dow, Inc. | | | 5,423 | | | | 279,881 | |
Eagle Materials, Inc. | | | 3,239 | | | | 356,096 | |
Freeport-McMoRan, Inc. | | | 8,135 | | | | 238,030 | |
Hecla Mining Co. | | | 591 | | | | 2,317 | |
Louisiana-Pacific Corp. | | | 11,572 | | | | 606,489 | |
LyondellBasell Industries NV | | | 2,233 | | | | 195,298 | |
Newmont Corp. | | | 51 | | | | 3,043 | |
Balanced Fund |
Security Description | | Shares,
Contracts
or Principal
Amount ($) | | | Fair
Value ($) | |
Common Stocks (United States) — continued |
Nucor Corp. | | | 1,552 | | | | 162,044 | |
Packaging Corp. of America | | | 711 | | | | 97,763 | |
PPG Industries, Inc. | | | 11 | | | | 1,258 | |
Reliance Steel & Aluminum Co. | | | 11 | | | | 1,868 | |
Royal Gold, Inc. | | | 2,375 | | | | 253,603 | |
Ryerson Holding Corp. | | | 462 | | | | 9,836 | |
Schnitzer Steel Industries, Inc. | | | 640 | | | | 21,018 | |
Southern Copper Corp. | | | 1,343 | | | | 66,895 | |
Steel Dynamics, Inc. | | | 835 | | | | 55,235 | |
Sylvamo Corp. | | | 78 | | | | 2,549 | |
Trinseo PLC | | | 96 | | | | 3,692 | |
United States Steel Corp. | | | 1,964 | | | | 35,175 | |
| | | | | | | | 2,423,065 | |
| | | | | | | | | |
Real Estate Investment Trust — 0.0% | | | | | | | | |
Altisource Portfolio Solutions SA (1) | | | 1,498 | | | | 16,089 | |
Brixmor Property Group, Inc. | | | 75 | | | | 1,516 | |
CorEnergy Infrastructure Trust, Inc. | | | 5,403 | | | | 13,616 | |
Kilroy Realty Corp. | | | 1,623 | | | | 84,932 | |
SITE Centers Corp. | | | 121 | | | | 1,630 | |
Spirit MTA REIT Liquidating Trust (1)(5) | | | 3,461 | | | | 0 | |
| | | | | | | | 117,783 | |
| | | | | | | | | |
Utilities — 0.5% | | | | | | | | |
CenterPoint Energy, Inc. | | | 2,737 | | | | 80,960 | |
Constellation Energy Corp. | | | 9,110 | | | | 521,639 | |
NRG Energy, Inc. | | | 9,499 | | | | 362,577 | |
SJW Group | | | 482 | | | | 30,082 | |
UGI Corp. | | | 13,915 | | | | 537,156 | |
Vistra Corp. | | | 3,327 | | | | 76,022 | |
Xcel Energy, Inc. | | | 312 | | | | 22,077 | |
| | | | | | | | 1,630,513 | |
| | | | | | | | | |
Total Common Stocks (United States) (Cost $105,500,179) | | | | | | | 125,203,550 | |
| | | | | | | | | |
Preferred Stock (United States) — 0.0% |
WESCO International, Inc. Series A Variable Preferred (6) | | | 994 | | | | 27,255 | |
Total Preferred Stock (United States) (Cost $24,845) | | | | | | | 27,255 | |
| | | | | | | | | |
The accompanying notes are an integral part of these financial statements.
2022 Semi-Annual Report | June 30, 2022 | Page 29 |
Schedules of Investments
June 30, 2022 (unaudited)
Balanced Fund |
Security Description | | Shares,
Contracts
or Principal
Amount ($) | | | Fair
Value ($) | |
Warrants (United States) — 0.0% |
Chaparral Energy, Inc. A Warrants, Expiration Date 10/14/2024 (1)(5) | | | 3 | | | | 0 | |
Chaparral Energy, Inc. B Warrants, Expiration Date 10/14/2025 (1)(5) | | | 3 | | | | 0 | |
Civitas Solutions, Inc. A Warrants, Expiration Date 1/20/2025 (1)(5) | | | 22 | | | | 0 | |
Civitas Solutions, Inc. B Warrants, Expiration Date 1/20/2026 (1)(5) | | | 12 | | | | 0 | |
Hertz Global Holdings, Inc. Warrants, Expiration Date 6/30/2051 (1) | | | 157 | | | | 1,537 | |
Nabors Industries, Ltd. Warrants, Expiration Date 6/11/2026 (1) | | | 57 | | | | 1,823 | |
Oasis Petroleum, Inc. Warrants, Expiration Date 11/19/2024 (1)(5) | | | 9 | | | | 0 | |
Whiting Petroleum Corp. A Warrants, Expiration Date 9/1/2024 (1) | | | 56 | | | | 750 | |
Whiting Petroleum Corp. B Warrants, Expiration Date 9/1/2025 (1) | | | 28 | | | | 294 | |
Total Warrants (United States) (Cost $3,304) | | | | | | | 4,404 | |
| | | | | | | | | |
Registered Investment Companies — 8.5% |
U.S. Fixed Income — 8.5% | | | | | | | | |
Baird Core Plus Bond Fund - Class I | | | 309,538 | | | | 3,172,766 | |
BBH Limited Duration Fund - Class I | | | 150,451 | | | | 1,498,495 | |
Diamond Hill Short Duration Securitized Bond Fund - Class Y | | | 519,211 | | | | 5,000,000 | |
DoubleLine Total Return Bond Fund - Class I | | | 392,047 | | | | 3,665,643 | |
Frost Total Return Bond Fund - Class I | | | 220,086 | | | | 2,106,219 | |
Guggenheim- Total Return Bond Fund - Class I | | | 63,690 | | | | 1,552,127 | |
iShares Core U.S. Aggregate Bond ETF (7) | | | 15,331 | | | | 1,558,856 | |
PGIM Short-Term Corporate Bond Fund - Class Q | | | 484,966 | | | | 5,014,549 | |
Pioneer Bond Fund - Class K | | | 247,387 | | | | 2,127,531 | |
Segall Bryant & Hamill Plus Bond Fund - Class I | | | 396,265 | | | | 3,724,892 | |
Total Registered Investment Companies (Cost $30,166,872) | | | | | | | 29,421,078 | |
| | | | | | | | | |
Balanced Fund |
Security Description | | Shares,
Contracts
or Principal
Amount ($) | | | Fair
Value ($) | |
Money Market Registered Investment Companies — 50.7% |
Federated Hermes Government Obligations Fund, 1.41% | | | 54,170,000 | | | | 54,170,000 | |
Meeder Institutional Prime Money Market Fund, 1.42% (2) | | | 121,352,709 | | | | 121,304,168 | |
Total Money Market Registered Investment Companies (Cost $175,472,242) | | | | | | | 175,474,168 | |
| | | | | | | | | |
Bank Obligations — 0.1% |
First Merchants Bank Deposit Account, 0.55%, 7/1/2022 (3) | | | 249,644 | | | | 249,644 | |
Metro City Bank Deposit Account, 0.05%, 7/1/2022 (3) | | | 248,529 | | | | 248,529 | |
Total Bank Obligations (Cost $498,173) | | | | | | | 498,173 | |
Total Investments — 95.5% (Cost $311,665,615) | | | | | | | 330,628,628 | |
Other Assets less Liabilities — 4.5% | | | | | | | 15,426,123 | |
Total Net Assets — 100.0% | | | | | | | 346,054,751 | |
| | | | | | | | | |
Trustee Deferred Compensation (4) |
Meeder Balanced Fund - Retail Class | | | 3,393 | | | | 39,936 | |
Meeder Dynamic Allocation Fund - Retail Class | | | 8,942 | | | | 100,508 | |
Meeder Muirfield Fund - Retail Class | | | 5,920 | | | | 49,018 | |
Meeder Conservative Allocation Fund - Retail Class | | | 994 | | | | 21,083 | |
Total Trustee Deferred Compensation (Cost $206,686) | | | | | | | 210,545 | |
The accompanying notes are an integral part of these financial statements.
Page 30 | 2022 Semi-Annual Report | June 30, 2022 |
Schedules of Investments
June 30, 2022 (unaudited)
Balanced Fund |
| | | Net Long
(Short)
Contracts | | | Expiration
Date | | | Notional
Value of
Contracts
($) | | | Value and
Unrealized
Appreciation
(Depreciation)
($) | |
Futures Contracts |
Index Futures | | | | | | | | | | | | | | | | |
E-mini Standard & Poors MidCap 400 Futures | | | (63 | ) | | | 9/16/2022 | | | | (14,288,400 | ) | | | 91,209 | |
Mini MSCI EAFE Index Futures | | | 153 | | | | 9/16/2022 | | | | 14,202,990 | | | | 15,067 | |
Mini MSCI Emerging Markets Index Futures | | | 53 | | | | 9/16/2022 | | | | 2,657,155 | | | | (6,008 | ) |
Russell 2000 Mini Index Futures | | | 72 | | | | 9/16/2022 | | | | 6,148,800 | | | | (62,499 | ) |
Standard & Poors 500 Mini Futures | | | (183 | ) | | | 9/16/2022 | | | | (34,673,925 | ) | | | (535,187 | ) |
Total Futures Contracts | | | 32 | | | | | | | | (25,953,380 | ) | | | (497,418 | ) |
(1) | Represents non-income producing securities. |
(2) | Investment in affiliate. The yield shown represents the 7-day yield in effect at June 30, 2022. |
(3) | Variable rate security. Securities payable at par including accrued interest (usually within seven days notice) and unconditionally secured as to principal and interest by letters of credit or other credit support agreements from major banks. The interest rates are adjustable and are not based on a published reference rate and spread but are determined by the issuer or agent and are based on current market conditions. These securities do not indicate a reference rate and spread in their description above. The rate shown represents the rate in effect at June 30, 2022. The maturity date shown, if applicable, reflects the earlier of the next demand date or stated maturity date. |
(4) | Assets of affiliates to the Balanced Fund held for the benefit of the Fund’s Trustees in connection with the Trustee Deferred Compensation Plan. |
(5) | Fair valued security deemed a Level 3 security. Security is not part of the investment strategy of the Fund. |
The accompanying notes are an integral part of these financial statements.
2022 Semi-Annual Report | June 30, 2022 | Page 31 |
Schedules of Investments
June 30, 2022 (unaudited)
Moderate Allocation Fund |
Security Description | | Shares or
Principal
Amount ($) | | | Fair
Value ($) | |
Common Stocks (United States) — 17.2% |
Communication Services — 1.2% | | | | | | | | |
Alphabet, Inc. (1) | | | 472 | | | | 1,032,476 | |
AT&T, Inc. | | | 18 | | | | 377 | |
Cogent Communications Holdings, Inc. | | | 1,066 | | | | 64,770 | |
Comcast Corp. | | | 6,878 | | | | 269,893 | |
Entravision Communications Corp. | | | 537 | | | | 2,449 | |
IDT Corp. (1) | | | 1,454 | | | | 36,568 | |
Interpublic Group of Cos., Inc./The | | | 2,856 | | | | 78,626 | |
Liberty TripAdvisor Holdings, Inc. (1) | | | 971 | | | | 735 | |
Lumen Technologies, Inc. | | | 1,221 | | | | 13,321 | |
Meta Platforms, Inc. (1) | | | 1,316 | | | | 212,205 | |
Nexstar Media Group, Inc. | | | 96 | | | | 15,636 | |
Omnicom Group, Inc. | | | 1,168 | | | | 74,296 | |
Verizon Communications, Inc. | | | 20 | | | | 1,015 | |
| | | | | | | | 1,802,367 | |
| | | | | | | | | |
Consumer Discretionary — 1.5% | | | | | | | | |
Academy Sports & Outdoors, Inc. | | | 3,961 | | | | 140,774 | |
Amazon.com, Inc. (1) | | | 6,007 | | | | 638,003 | |
AutoZone, Inc. (1) | | | 29 | | | | 62,324 | |
Booking Holdings, Inc. (1) | | | 30 | | | | 52,470 | |
Cavco Industries, Inc. (1) | | | 2 | | | | 392 | |
Chico’s FAS, Inc. (1) | | | 134 | | | | 666 | |
Dillard’s, Inc. | | | 2 | | | | 441 | |
Ford Motor Co. | | | 5,706 | | | | 63,508 | |
Frontdoor, Inc. (1) | | | 27 | | | | 650 | |
Garmin, Ltd. | | | 4 | | | | 393 | |
Gentherm, Inc. (1) | | | 235 | | | | 14,666 | |
Grand Canyon Education, Inc. (1) | | | 1,149 | | | | 108,224 | |
H&R Block, Inc. | | | 58 | | | | 2,049 | |
Hibbett, Inc. | | | 836 | | | | 36,542 | |
Kohl’s Corp. | | | 1,123 | | | | 40,080 | |
La-Z-Boy, Inc. | | | 16 | | | | 379 | |
Lowe’s Cos., Inc. | | | 2 | | | | 349 | |
Lululemon Athletica, Inc. (1) | | | 543 | | | | 148,027 | |
M/I Homes, Inc. (1) | | | 626 | | | | 24,827 | |
Macy’s, Inc. | | | 7,590 | | | | 139,049 | |
Mohawk Industries, Inc. (1) | | | 851 | | | | 105,601 | |
Murphy USA, Inc. | | | 2 | | | | 466 | |
O’Reilly Automotive, Inc. (1) | | | 249 | | | | 157,308 | |
PVH Corp. | | | 773 | | | | 43,984 | |
Qurate Retail, Inc. | | | 1,113 | | | | 3,194 | |
Skyline Champion Corp. (1) | | | 1,003 | | | | 47,562 | |
Smith & Wesson Brands, Inc. | | | 771 | | | | 10,123 | |
Sonos, Inc. (1) | | | 3,098 | | | | 55,888 | |
Sturm Ruger & Co., Inc. | | | 11 | | | | 700 | |
Tapestry, Inc. | | | 846 | | | | 25,820 | |
Moderate Allocation Fund |
Security Description | | Shares or
Principal
Amount ($) | | | Fair
Value ($) | |
Common Stocks (United States) — continued |
Target Corp. | | | 183 | | | | 25,845 | |
Tesla, Inc. (1) | | | 1 | | | | 673 | |
Thor Industries, Inc. | | | 550 | | | | 41,102 | |
TJX Cos., Inc./The | | | 1,253 | | | | 69,980 | |
Town Sports International Holdings, Inc. (1)(5) | | | 961 | | | | 0 | |
Tractor Supply Co. | | | 366 | | | | 70,949 | |
Ulta Beauty, Inc. (1) | | | 501 | | | | 193,125 | |
| | | | | | | | 2,326,133 | |
| | | | | | | | | |
Consumer Staples — 0.8% | | | | | | | | |
Albertsons Cos., Inc. | | | 2,273 | | | | 60,735 | |
Archer-Daniels-Midland Co. | | | 2,026 | | | | 157,218 | |
Costco Wholesale Corp. | | | 912 | | | | 437,103 | |
Flowers Foods, Inc. | | | 22 | | | | 579 | |
General Mills, Inc. | | | 3,345 | | | | 252,380 | |
Hostess Brands, Inc. (1) | | | 152 | | | | 3,224 | |
Ingredion, Inc. | | | 39 | | | | 3,438 | |
Kroger Co./The | | | 114 | | | | 5,396 | |
PepsiCo, Inc. | | | 1,175 | | | | 195,826 | |
Simply Good Foods Co./The (1) | | | 1,212 | | | | 45,777 | |
Tyson Foods, Inc. | | | 1,127 | | | | 96,990 | |
| | | | | | | | 1,258,666 | |
| | | | | | | | | |
Energy — 1.1% | | | | | | | | |
APA Corp. | | | 1,171 | | | | 40,868 | |
Berry Corp. | | | 301 | | | | 2,294 | |
Bristow Group, Inc. (1) | | | 305 | | | | 7,137 | |
California Resources Corp. | | | 9 | | | | 347 | |
ChampionX Corp. | | | 156 | | | | 3,097 | |
Cheniere Energy, Inc. | | | 59 | | | | 7,849 | |
Chevron Corp. | | | 2,665 | | | | 385,839 | |
Civitas Resources, Inc. | | | 40 | | | | 2,092 | |
Comstock Resources, Inc. (1) | | | 78 | | | | 942 | |
ConocoPhillips | | | 1,065 | | | | 95,648 | |
Diamondback Energy, Inc. | | | 37 | | | | 4,483 | |
DT Midstream, Inc. | | | 7 | | | | 343 | |
EOG Resources, Inc. | | | 621 | | | | 68,583 | |
Exxon Mobil Corp. | | | 5,193 | | | | 444,729 | |
Halliburton Co. | | | 943 | | | | 29,572 | |
Hess Corp. | | | 221 | | | | 23,413 | |
HF Sinclair Corp. | | | 8 | | | | 361 | |
Laredo Petroleum, Inc. (1) | | | 4 | | | | 276 | |
Marathon Petroleum Corp. | | | 3,217 | | | | 264,470 | |
ONEOK, Inc. | | | 770 | | | | 42,735 | |
Ovintiv, Inc. | | | 792 | | | | 34,998 | |
Phillips 66 | | | 589 | | | | 48,292 | |
Pioneer Natural Resources Co. | | | 164 | | | | 36,585 | |
The accompanying notes are an integral part of these financial statements.
Page 32 | 2022 Semi-Annual Report | June 30, 2022 |
Schedules of Investments
June 30, 2022 (unaudited)
Moderate Allocation Fund |
Security Description | | Shares or
Principal
Amount ($) | | | Fair
Value ($) | |
Common Stocks (United States) — continued |
Schlumberger NV | | | 2,464 | | | | 88,113 | |
Targa Resources Corp. | | | 1,093 | | | | 65,219 | |
Teekay Corp. (1) | | | 502 | | | | 1,446 | |
Valero Energy Corp. | | | 781 | | | | 83,005 | |
Westmoreland Coal Co. (1)(5) | | | 773 | | | | 0 | |
Williams Cos., Inc./The | | | 11 | | | | 343 | |
World Fuel Services Corp. | | | 74 | | | | 1,514 | |
| | | | | | | | 1,784,593 | |
| | | | | | | | | |
Financials — 2.5% | | | | | | | | |
American Equity Investment Life Holding Co. | | | 10 | | | | 366 | |
American Financial Group, Inc./OH | | | 281 | | | | 39,006 | |
American International Group, Inc. | | | 7,123 | | | | 364,199 | |
Argo Group International Holdings, Ltd. | | | 180 | | | | 6,635 | |
Atlanticus Holdings Corp. (1) | | | 42 | | | | 1,477 | |
Axis Capital Holdings, Ltd. | | | 6 | | | | 343 | |
Bank of New York Mellon Corp./The | | | 3,890 | | | | 162,252 | |
Berkshire Hathaway, Inc. (1) | | | 5,570 | | | | 1,520,721 | |
Charles Schwab Corp./The | | | 839 | | | | 53,008 | |
Chubb, Ltd. | | | 365 | | | | 71,752 | |
Erie Indemnity Co. | | | 3 | | | | 577 | |
Essent Group, Ltd. | | | 220 | | | | 8,558 | |
Fidelity National Financial, Inc. | | | 1,095 | | | | 40,471 | |
Hartford Financial Services Group, Inc./The | | | 778 | | | | 50,905 | |
Markel Corp. (1) | | | 19 | | | | 24,572 | |
Marsh & McLennan Cos., Inc. | | | 5,174 | | | | 803,264 | |
Medley Management, Inc. (1)(5) | | | 27 | | | | 0 | |
Moelis & Co. | | | 597 | | | | 23,492 | |
Mr Cooper Group, Inc. (1) | | | 199 | | | | 7,311 | |
Northrim BanCorp., Inc. | | | 343 | | | | 13,809 | |
OneMain Holdings, Inc. | | | 1,706 | | | | 63,770 | |
Pathward Financial, Inc. | | | 407 | | | | 15,739 | |
Prudential Financial, Inc. | | | 1,276 | | | | 122,088 | |
Pzena Investment Management, Inc. | | | 698 | | | | 4,600 | |
Regions Financial Corp. | | | 3,729 | | | | 69,919 | |
Siebert Financial Corp. (1) | | | 277 | | | | 429 | |
State Street Corp. | | | 752 | | | | 46,361 | |
Stewart Information Services Corp. | | | 1,873 | | | | 93,182 | |
Synchrony Financial | | | 36 | | | | 994 | |
W R Berkley Corp. | | | 296 | | | | 20,205 | |
Walker & Dunlop, Inc. | | | 10 | | | | 963 | |
Westamerica BanCorp. | | | 12 | | | | 668 | |
Willis Towers Watson PLC | | | 1,535 | | | | 302,994 | |
| | | | | | | | 3,934,630 | |
| | | | | | | | | |
Moderate Allocation Fund |
Security Description | | Shares or
Principal
Amount ($) | | | Fair
Value ($) | |
Common Stocks (United States) — continued |
Healthcare — 3.4% | | | | | | | | |
AbbVie, Inc. | | | 2,178 | | | | 333,582 | |
Agilent Technologies, Inc. | | | 3 | | | | 356 | |
Amgen, Inc. | | | 1,662 | | | | 404,365 | |
Amneal Pharmaceuticals, Inc. (1) | | | 960 | | | | 3,053 | |
Assertio Holdings, Inc. (1) | | | 263 | | | | 776 | |
Bio-Techne Corp. | | | 35 | | | | 12,132 | |
Bristol-Myers Squibb Co. | | | 4,051 | | | | 311,927 | |
Cardinal Health, Inc. | | | 3,475 | | | | 181,638 | |
Catalent, Inc. (1) | | | 432 | | | | 46,349 | |
Centene Corp. (1) | | | 645 | | | | 54,573 | |
Centogene NV (1) | | | 308 | | | | 730 | |
Cigna Corp. | | | 432 | | | | 113,841 | |
CVS Health Corp. | | | 388 | | | | 35,952 | |
Danaher Corp. | | | 41 | | | | 10,394 | |
Eli Lilly & Co. | | | 948 | | | | 307,370 | |
Eloxx Pharmaceuticals, Inc. (1) | | | 1,526 | | | | 412 | |
Endo International PLC (1) | | | 1,122 | | | | 523 | |
Fulgent Genetics, Inc. (1) | | | 2,599 | | | | 141,723 | |
Galectin Therapeutics, Inc. (1) | | | 322 | | | | 422 | |
Genprex, Inc. (1) | | | 631 | | | | 877 | |
Gilead Sciences, Inc. | | | 5,080 | | | | 313,995 | |
Humana, Inc. | | | 145 | | | | 67,870 | |
Illumina, Inc. (1) | | | 59 | | | | 10,877 | |
Intra-Cellular Therapies, Inc. (1) | | | 11 | | | | 628 | |
Johnson & Johnson | | | 3,685 | | | | 654,124 | |
La Jolla Pharmaceutical Co. (1) | | | 292 | | | | 931 | |
Laboratory Corp. of America Holdings | | | 138 | | | | 32,342 | |
McKesson Corp. | | | 289 | | | | 94,275 | |
Merck & Co., Inc. | | | 3,769 | | | | 343,620 | |
Moderna, Inc. (1) | | | 1,137 | | | | 162,420 | |
Molina Healthcare, Inc. (1) | | | 51 | | | | 14,260 | |
National HealthCare Corp. | | | 27 | | | | 1,887 | |
Neurocrine Biosciences, Inc. (1) | | | 75 | | | | 7,311 | |
Oncocyte Corp. (1) | | | 447 | | | | 402 | |
Palatin Technologies, Inc. (1) | | | 1,854 | | | | 520 | |
Pfizer, Inc. | | | 3,928 | | | | 205,945 | |
Premier, Inc. | | | 16 | | | | 571 | |
QuidelOrtho Corp. (1) | | | 521 | | | | 50,631 | |
Regeneron Pharmaceuticals, Inc. (1) | | | 214 | | | | 126,502 | |
UnitedHealth Group, Inc. | | | 1,176 | | | | 604,029 | |
Universal Health Services, Inc. | | | 77 | | | | 7,755 | |
Veracyte, Inc. (1) | | | 47 | | | | 935 | |
Vertex Pharmaceuticals, Inc. (1) | | | 302 | | | | 85,101 | |
Viatris, Inc. | | | 3,418 | | | | 35,786 | |
West Pharmaceutical Services, Inc. | | | 683 | | | | 206,519 | |
Zoetis, Inc. | | | 1,611 | | | | 276,915 | |
| | | | | | | | 5,267,146 | |
The accompanying notes are an integral part of these financial statements.
2022 Semi-Annual Report | June 30, 2022 | Page 33 |
Schedules of Investments
June 30, 2022 (unaudited)
Moderate Allocation Fund |
Security Description | | Shares or
Principal
Amount ($) | | | Fair
Value ($) | |
Common Stocks (United States) — continued |
Industrials — 1.5% | | | | | | | | |
AECOM | | | 5 | | | | 326 | |
Atkore, Inc. (1) | | | 386 | | | | 32,042 | |
Atlas Air Worldwide Holdings, Inc. (1) | | | 5 | | | | 309 | |
Axon Enterprise, Inc. (1) | | | 946 | | | | 88,139 | |
Builders FirstSource, Inc. (1) | | | 5,982 | | | | 321,233 | |
BWX Technologies, Inc. | | | 758 | | | | 41,758 | |
Copart, Inc. (1) | | | 2,257 | | | | 245,246 | |
EMCOR Group, Inc. | | | 966 | | | | 99,459 | |
Emerson Electric Co. | | | 482 | | | | 38,338 | |
Encore Wire Corp. | | | 36 | | | | 3,741 | |
General Dynamics Corp. | | | 2,037 | | | | 450,686 | |
Graco, Inc. | | | 454 | | | | 26,972 | |
Heidrick & Struggles International, Inc. | | | 10 | | | | 324 | |
Hillenbrand, Inc. | | | 781 | | | | 31,990 | |
Hubbell, Inc. | | | 2 | | | | 357 | |
Karat Packaging, Inc. (1) | | | 58 | | | | 989 | |
Lockheed Martin Corp. | | | 709 | | | | 304,842 | |
ManpowerGroup, Inc. | | | 159 | | | | 12,149 | |
Matson, Inc. | | | 107 | | | | 7,798 | |
MDU Resources Group, Inc. | | | 14 | | | | 378 | |
Mueller Industries, Inc. | | | 531 | | | | 28,297 | |
MYR Group, Inc. (1) | | | 136 | | | | 11,986 | |
Northrop Grumman Corp. | | | 499 | | | | 238,806 | |
nVent Electric PLC | | | 1,021 | | | | 31,988 | |
Otis Worldwide Corp. | | | 5 | | | | 353 | |
Republic Services, Inc. | | | 7 | | | | 916 | |
United Parcel Service, Inc. | | | 325 | | | | 59,326 | |
V2X, Inc. (1) | | | 159 | | | | 5,320 | |
Waste Management, Inc. | | | 1,258 | | | | 192,449 | |
| | | | | | | | 2,276,517 | |
| | | | | | | | | |
Information Technology — 4.8% | | | | | | | | |
A10 Networks, Inc. | | | 21 | | | | 302 | |
Advanced Micro Devices, Inc. (1) | | | 1,390 | | | | 106,293 | |
Alpha & Omega Semiconductor, Ltd. (1) | | | 4,611 | | | | 153,731 | |
Amkor Technology, Inc. | | | 4,908 | | | | 83,191 | |
Apple, Inc. | | | 14,944 | | | | 2,043,144 | |
Arrow Electronics, Inc. (1) | | | 1,130 | | | | 126,662 | |
Avnet, Inc. | | | 2,163 | | | | 92,749 | |
Axcelis Technologies, Inc. (1) | | | 1,248 | | | | 68,440 | |
Cadence Design Systems, Inc. (1) | | | 352 | | | | 52,811 | |
Cisco Systems, Inc. | | | 2,812 | | | | 119,904 | |
Cognizant Technology Solutions Corp. | | | 522 | | | | 35,230 | |
CommVault Systems, Inc. (1) | | | 6 | | | | 377 | |
Concentrix Corp. | | | 92 | | | | 12,479 | |
Dell Technologies, Inc. | | | 9 | | | | 416 | |
Moderate Allocation Fund |
Security Description | | Shares or
Principal
Amount ($) | | | Fair
Value ($) | |
Common Stocks (United States) — continued |
Diodes, Inc. (1) | | | 545 | | | | 35,191 | |
Dolby Laboratories, Inc. | | | 443 | | | | 31,701 | |
EPAM Systems, Inc. (1) | | | 176 | | | | 51,881 | |
Euronet Worldwide, Inc. (1) | | | 254 | | | | 25,550 | |
Extreme Networks, Inc. (1) | | | 266 | | | | 2,373 | |
Fabrinet (1) | | | 4 | | | | 324 | |
Intel Corp. | | | 5,134 | | | | 192,063 | |
International Money Express, Inc. (1) | | | 35 | | | | 716 | |
Intuit, Inc. | | | 555 | | | | 213,919 | |
Jabil, Inc. | | | 4,358 | | | | 223,173 | |
Manhattan Associates, Inc. (1) | | | 4,182 | | | | 479,257 | |
Mastercard, Inc. | | | 544 | | | | 171,621 | |
Micron Technology, Inc. | | | 7,366 | | | | 407,192 | |
Microsoft Corp. | | | 8,222 | | | | 2,111,652 | |
NortonLifeLock, Inc. | | | 1,430 | | | | 31,403 | |
Oracle Corp. | | | 1,471 | | | | 102,779 | |
Photronics, Inc. (1) | | | 24 | | | | 468 | |
QUALCOMM, Inc. | | | 3,391 | | | | 433,166 | |
Qualys, Inc. (1) | | | 871 | | | | 109,868 | |
Rimini Street, Inc. (1) | | | 372 | | | | 2,236 | |
StarTek, Inc. (1) | | | 631 | | | | 1,824 | |
Tenable Holdings, Inc. (1) | | | 442 | | | | 20,071 | |
TESSCO Technologies, Inc. (1) | | | 101 | | | | 597 | |
Visa, Inc. | | | 2 | | | | 394 | |
Wolfspeed, Inc. (1) | | | 5 | | | | 317 | |
Zoom Video Communications, Inc. (1) | | | 915 | | | | 98,793 | |
| | | | | | | | 7,644,258 | |
| | | | | | | | | |
Materials — 0.2% | | | | | | | | |
AdvanSix, Inc. | | | 33 | | | | 1,104 | |
Air Products and Chemicals, Inc. | | | 3 | | | | 721 | |
Alcoa Corp. | | | 134 | | | | 6,108 | |
Dow, Inc. | | | 1,212 | | | | 62,551 | |
Eagle Materials, Inc. | | | 5 | | | | 550 | |
Flotek Industries, Inc. (1) | | | 676 | | | | 671 | |
Huntsman Corp. | | | 644 | | | | 18,257 | |
Louisiana-Pacific Corp. | | | 2,254 | | | | 118,132 | |
LyondellBasell Industries NV | | | 695 | | | | 60,785 | |
Newmont Corp. | | | 21 | | | | 1,253 | |
Nucor Corp. | | | 534 | | | | 55,755 | |
Packaging Corp. of America | | | 5 | | | | 688 | |
Royal Gold, Inc. | | | 7 | | | | 747 | |
Ryerson Holding Corp. | | | 23 | | | | 490 | |
Schnitzer Steel Industries, Inc. | | | 131 | | | | 4,302 | |
Southern Copper Corp. | | | 421 | | | | 20,970 | |
Steel Dynamics, Inc. | | | 287 | | | | 18,985 | |
Tronox Holdings PLC | | | 25 | | | | 420 | |
The accompanying notes are an integral part of these financial statements.
Page 34 | 2022 Semi-Annual Report | June 30, 2022 |
Schedules of Investments
June 30, 2022 (unaudited)
Moderate Allocation Fund |
Security Description | | Shares or
Principal
Amount ($) | | | Fair
Value ($) | |
Common Stocks (United States) — continued |
United States Steel Corp. | | | 573 | | | | 10,262 | |
| | | | | | | | 382,751 | |
| | | | | | | | | |
Real Estate Investment Trust — 0.0% | | | | | | | | |
Altisource Portfolio Solutions SA (1) | | | 467 | | | | 5,016 | |
CorEnergy Infrastructure Trust, Inc. | | | 2,011 | | | | 5,068 | |
Rafael Holdings, Inc. (1) | | | 530 | | | | 991 | |
RAIT Financial Trust (1)(5) | | | 751 | | | | 0 | |
Spirit MTA REIT Liquidating Trust (1)(5) | | | 1,024 | | | | 0 | |
Trinity Place Holdings, Inc. (1) | | | 645 | | | | 651 | |
| | | | | | | | 11,726 | |
| | | | | | | | | |
Utilities — 0.2% | | | | | | | | |
CenterPoint Energy, Inc. | | | 32 | | | | 947 | |
Constellation Energy Corp. | | | 2,810 | | | | 160,900 | |
NRG Energy, Inc. | | | 502 | | | | 19,161 | |
UGI Corp. | | | 2,358 | | | | 91,042 | |
Vistra Corp. | | | 39 | | | | 891 | |
| | | | | | | | 272,941 | |
| | | | | | | | | |
Total Common Stocks (United States) (Cost $22,732,971) | | | | | | | 26,961,728 | |
| | | | | | | | | |
Preferred Stock (United States) — 0.0% |
WESCO International, Inc. Series A Variable Preferred (6) | | | 252 | | | | 6,910 | |
Total Preferred Stock (United States) (Cost $6,299) | | | | | | | 6,910 | |
| | | | | | | | | |
Warrants (United States) — 0.0% |
Chaparral Energy, Inc. A Warrants, Expiration Date 10/14/2024 (1)(5) | | | 1 | | | | 0 | |
Chaparral Energy, Inc. B Warrants, Expiration Date 10/14/2025 (1)(5) | | | 1 | | | | 0 | |
Civitas Solutions, Inc. A Warrants, Expiration Date 1/20/2025 (1)(5) | | | 7 | | | | 0 | |
Civitas Solutions, Inc. B Warrants, Expiration Date 1/20/2026 (1)(5) | | | 3 | | | | 0 | |
Hertz Global Holdings, Inc. Warrants, Expiration Date 6/30/2051 (1) | | | 48 | | | | 470 | |
Nabors Industries, Ltd. Warrants, Expiration Date 6/11/2026 (1) | | | 15 | | | | 480 | |
Oasis Petroleum, Inc. Warrants, Expiration Date 11/19/2024 (1)(5) | | | 3 | | | | 0 | |
Whiting Petroleum Corp. A Warrants, Expiration Date 9/1/2024 (1) | | | 26 | | | | 348 | |
Moderate Allocation Fund |
Security Description | | Shares or
Principal
Amount ($) | | | Fair
Value ($) | |
Warrants (United States) — continued |
Whiting Petroleum Corp. B Warrants, Expiration Date 9/1/2025 (1) | | | 13 | | | | 137 | |
Total Warrants (United States) (Cost $941) | | | | | | | 1,435 | |
| | | | | | | | | |
Registered Investment Companies — 14.2% |
U.S. Fixed Income — 14.2% | | | | | | | | |
Baird Core Plus Bond Fund - Class I | | | 233,110 | | | | 2,389,382 | |
BBH Limited Duration Fund - Class I | | | 110,331 | | | | 1,098,897 | |
Diamond Hill Short Duration Securitized Bond Fund - Class Y | | | 384,216 | | | | 3,700,000 | |
DoubleLine Total Return Bond Fund - Class I | | | 297,603 | | | | 2,782,592 | |
Frost Total Return Bond Fund - Class I | | | 165,131 | | | | 1,580,299 | |
Guggenheim- Total Return Bond Fund - Class I | | | 48,510 | | | | 1,182,195 | |
iShares Core U.S. Aggregate Bond ETF (7) | | | 11,587 | | | | 1,178,166 | |
PGIM Short-Term Corporate Bond Fund - Class Q | | | 367,604 | | | | 3,801,028 | |
Pioneer Bond Fund - Class K | | | 185,550 | | | | 1,595,730 | |
Segall Bryant & Hamill Plus Bond Fund - Class I | | | 302,395 | | | | 2,842,510 | |
Total Registered Investment Companies (Cost $22,744,183) | | | | | | | 22,150,799 | |
| | | | | | | | | |
Money Market Registered Investment Companies — 66.0% |
Federated Hermes Government Obligations Fund, 1.41% | | | 40,950,000 | | | | 40,950,000 | |
Meeder Institutional Prime Money Market Fund, 1.42% (2) | | | 62,156,528 | | | | 62,131,665 | |
Total Money Market Registered Investment Companies (Cost $103,078,980) | | | | | | | 103,081,665 | |
| | | | | | | | | |
Bank Obligations — 0.2% |
Metro City Bank Deposit Account, 0.05%, 7/1/2022 (3) | | | 248,529 | | | | 248,529 | |
Total Bank Obligations (Cost 248,529) | | | | | | | 248,529 | |
Total Investments — 97.6% (Cost $148,811,903) | | | | | | | 152,451,066 | |
Other Assets less Liabilities — 2.4% | | | | | | | 3,791,244 | |
Total Net Assets — 100.0% | | | | | | | 156,242,310 | |
| | | | | | | | | |
The accompanying notes are an integral part of these financial statements.
2022 Semi-Annual Report | June 30, 2022 | Page 35 |
Schedules of Investments
June 30, 2022 (unaudited)
Moderate Allocation Fund |
Security Description | | Shares or
Principal
Amount ($) | | | Fair
Value ($) | |
Trustee Deferred Compensation (4) |
Meeder Balanced Fund - Retail Class | | | 565 | | | | 6,650 | |
Meeder Dynamic Allocation Fund - Retail Class | | | 1,394 | | | | 15,669 | |
Meeder Muirfield Fund - Retail Class | | | 1,813 | | | | 15,012 | |
Meeder Conservative Allocation Fund - Retail Class | | | 177 | | | | 3,754 | |
Total Trustee Deferred Compensation (Cost $42,851) | | | | | | | 41,085 | |
| | | | | | | | | |
| | | Long
(Short)
Contracts | | | Expiration
Date | | | Notional
Value of
Contracts
($) | | | Value and
Unrealized
Appreciation
(Depreciation)
($) | |
Futures Contracts |
Index Futures | | | | | | | | | | | | | | | | |
E-mini Standard & Poors MidCap 400 Futures | | | (7 | ) | | | 9/16/2022 | | | | (1,587,600 | ) | | | (27,878 | ) |
Mini MSCI EAFE Index Futures | | | 49 | | | | 9/16/2022 | | | | 4,548,670 | | | | 4,837 | |
Mini MSCI Emerging Markets Index Futures | | | 17 | | | | 9/16/2022 | | | | 852,295 | | | | (1,927 | ) |
Russell 2000 Mini Index Futures | | | 25 | | | | 9/16/2022 | | | | 2,135,000 | | | | (19,751 | ) |
Standard & Poors 500 Mini Futures | | | (6 | ) | | | 9/16/2022 | | | | (1,136,850 | ) | | | (13,014 | ) |
Total Futures Contracts | | | 78 | | | | | | | | 4,811,515 | | | | (57,733 | ) |
(1) | Represents non-income producing securities. |
(2) | Investment in affiliate. The yield shown represents the 7-day yield in effect at June 30, 2022. |
(3) | Variable rate security. Securities payable at par including accrued interest (usually within seven days notice) and unconditionally secured as to principal and interest by letters of credit or other credit support agreements from major banks. The interest rates are adjustable and are not based on a published reference rate and spread but are determined by the issuer or agent and are based on current market conditions. These securities do not indicate a reference rate and spread in their description above. The rate shown represents the rate in effect at June 30, 2022. The maturity date shown, if applicable, reflects the earlier of the next demand date or stated maturity date. |
(4) | Assets of affiliates to the Moderate Allocation Fund held for the benefit of the Fund’s Trustees in connection with the Trustee Deferred Compensation Plan. |
(5) | Fair valued security deemed a Level 3 security. Security is not part of the investment strategy of the Fund. |
The accompanying notes are an integral part of these financial statements.
Page 36 | 2022 Semi-Annual Report | June 30, 2022 |
Schedules of Investments
June 30, 2022 (unaudited)
Conservative Allocation |
Security Description | | Shares or
Principal
Amount ($) | | | Fair
Value ($) | |
Common Stocks (United States) — 1.2% |
Communication Services — 0.1% | | | | | | | | |
Alphabet, Inc. - Class C (1) | | | 1 | | | | 2,187 | |
Alphabet, Inc. - Class A (1) | | | 15 | | | | 32,689 | |
AT&T, Inc. | | | 4 | | | | 84 | |
Comcast Corp. | | | 708 | | | | 27,782 | |
Entravision Communications Corp. | | | 172 | | | | 784 | |
IDT Corp. (1) | | | 8 | | | | 201 | |
Interpublic Group of Cos., Inc./The | | | 582 | | | | 16,022 | |
Meta Platforms, Inc. (1) | | | 74 | | | | 11,933 | |
Omnicom Group, Inc. | | | 142 | | | | 9,033 | |
Verizon Communications, Inc. | | | 6 | | | | 305 | |
| | | | | | | | 101,020 | |
| | | | | | | | | |
Consumer Discretionary — 0.0% | | | | | | | | |
Academy Sports & Outdoors, Inc. | | | 49 | | | | 1,741 | |
Amazon.com, Inc. (1) | | | 358 | | | | 38,023 | |
AutoZone, Inc. (1) | | | 7 | | | | 15,044 | |
Booking Holdings, Inc. (1) | | | 1 | | | | 1,749 | |
Chico’s FAS, Inc. (1) | | | 62 | | | | 308 | |
Frontdoor, Inc. (1) | | | 2 | | | | 48 | |
Grand Canyon Education, Inc. (1) | | | 77 | | | | 7,253 | |
Kohl’s Corp. | | | 84 | | | | 2,998 | |
Macy’s, Inc. | | | 585 | | | | 10,717 | |
O’Reilly Automotive, Inc. (1) | | | 10 | | | | 6,318 | |
Qurate Retail, Inc. | | | 409 | | | | 1,174 | |
Tesla, Inc. (1) | | | 24 | | | | 16,162 | |
Town Sports International Holdings, Inc. (1)(4) | | | 464 | | | | 0 | |
Tractor Supply Co. | | | 1 | | | | 194 | |
Ulta Beauty, Inc. (1) | | | 22 | | | | 8,481 | |
Yum! Brands, Inc. | | | 22 | | | | 2,497 | |
| | | | | | | | 112,707 | |
| | | | | | | | | |
Consumer Staples — 0.0% | | | | | | | | |
Albertsons Cos., Inc. | | | 162 | | | | 4,329 | |
Altria Group, Inc. | | | 2 | | | | 84 | |
Archer-Daniels-Midland Co. | | | 10 | | | | 776 | |
Coca-Cola Co./The | | | 97 | | | | 6,102 | |
Costco Wholesale Corp. | | | 37 | | | | 17,733 | |
Flowers Foods, Inc. | | | 10 | | | | 263 | |
Kroger Co./The | | | 67 | | | | 3,171 | |
Mondelez International, Inc. | | | 1 | | | | 62 | |
PepsiCo, Inc. | | | 68 | | | | 11,333 | |
Tyson Foods, Inc. | | | 161 | | | | 13,856 | |
| | | | | | | | 57,709 | |
| | | | | | | | | |
Conservative Allocation |
Security Description | | Shares or
Principal
Amount ($) | | | Fair
Value ($) | |
Common Stocks (United States) — continued |
Energy — 0.1% | | | | | | | | |
APA Corp. | | | 23 | | | | 803 | |
California Resources Corp. | | | 3 | | | | 116 | |
ChampionX Corp. | | | 26 | | | | 516 | |
Cheniere Energy, Inc. | | | 29 | | | | 3,858 | |
Chevron Corp. | | | 82 | | | | 11,872 | |
Civitas Resources, Inc. | | | 19 | | | | 994 | |
ConocoPhillips | | | 43 | | | | 3,862 | |
DT Midstream, Inc. | | | 2 | | | | 98 | |
EOG Resources, Inc. | | | 45 | | | | 4,970 | |
EQT Corp. | | | 3 | | | | 103 | |
Exxon Mobil Corp. | | | 265 | | | | 22,695 | |
Hess Corp. | | | 9 | | | | 953 | |
HF Sinclair Corp. | | | 2 | | | | 90 | |
Marathon Petroleum Corp. | | | 108 | | | | 8,879 | |
Matador Resources Co. | | | 2 | | | | 93 | |
ONEOK, Inc. | | | 104 | | | | 5,772 | |
Ovintiv, Inc. | | | 31 | | | | 1,370 | |
Phillips 66 | | | 62 | | | | 5,083 | |
Pioneer Natural Resources Co. | | | 4 | | | | 892 | |
Schlumberger NV | | | 66 | | | | 2,360 | |
Targa Resources Corp. | | | 275 | | | | 16,409 | |
Teekay Corp. (1) | | | 65 | | | | 187 | |
Valero Energy Corp. | | | 17 | | | | 1,807 | |
Westmoreland Coal Co. (1)(4) | | | 410 | | | | 0 | |
| | | | | | | | 93,782 | |
| | | | | | | | | |
Financials — 0.1% | | | | | | | | |
American Equity Investment Life Holding Co. | | | 5 | | | | 183 | |
American Financial Group, Inc./OH | | | 11 | | | | 1,527 | |
American International Group, Inc. | | | 260 | | | | 13,294 | |
Argo Group International Holdings, Ltd. | | | 33 | | | | 1,216 | |
Axis Capital Holdings, Ltd. | | | 2 | | | | 114 | |
Berkshire Hathaway, Inc. (1) | | | 132 | | | | 36,039 | |
Charles Schwab Corp./The | | | 126 | | | | 7,961 | |
Chubb, Ltd. | | | 80 | | | | 15,726 | |
Essent Group, Ltd. | | | 6 | | | | 233 | |
Hartford Financial Services Group, Inc./The | | | 354 | | | | 23,162 | |
Markel Corp. (1) | | | 4 | | | | 5,173 | |
Marsh & McLennan Cos., Inc. | | | 216 | | | | 33,534 | |
Medley Management, Inc. (1)(4) | | | 25 | | | | 0 | |
Old Republic International Corp. | | | 5 | | | | 112 | |
OneMain Holdings, Inc. | | | 31 | | | | 1,159 | |
Pzena Investment Management, Inc. | | | 173 | | | | 1,140 | |
Stewart Information Services Corp. | | | 213 | | | | 10,597 | |
W R Berkley Corp. | | | 3 | | | | 205 | |
The accompanying notes are an integral part of these financial statements.
2022 Semi-Annual Report | June 30, 2022 | Page 37 |
Schedules of Investments
June 30, 2022 (unaudited)
Conservative Allocation |
Security Description | | Shares or
Principal
Amount ($) | | | Fair
Value ($) | |
Common Stocks (United States) — continued |
Walker & Dunlop, Inc. | | | 2 | | | | 193 | |
Willis Towers Watson PLC | | | 100 | | | | 19,739 | |
| | | | | | | | 171,307 | |
| | | | | | | | | |
Healthcare — 0.3% | | | | | | | | |
AbbVie, Inc. | | | 49 | | | | 7,505 | |
Amgen, Inc. | | | 69 | | | | 16,788 | |
Amneal Pharmaceuticals, Inc. (1) | | | 442 | | | | 1,406 | |
Avalo Therapeutics, Inc. (1) | | | 745 | | | | 373 | |
Bristol-Myers Squibb Co. | | | 136 | | | | 10,472 | |
Cardinal Health, Inc. | | | 69 | | | | 3,607 | |
Centene Corp. (1) | | | 27 | | | | 2,284 | |
Centogene NV (1) | | | 138 | | | | 327 | |
Cigna Corp. | | | 7 | | | | 1,845 | |
Danaher Corp. | | | 22 | | | | 5,577 | |
Elevance Health, Inc. | | | 21 | | | | 10,134 | |
Eli Lilly & Co. | | | 56 | | | | 18,157 | |
Eloxx Pharmaceuticals, Inc. (1) | | | 627 | | | | 169 | |
Fulgent Genetics, Inc. (1) | | | 32 | | | | 1,745 | |
Genprex, Inc. (1) | | | 271 | | | | 377 | |
Gilead Sciences, Inc. | | | 497 | | | | 30,720 | |
Humana, Inc. | | | 15 | | | | 7,021 | |
Illumina, Inc. (1) | | | 13 | | | | 2,397 | |
Johnson & Johnson | | | 102 | | | | 18,106 | |
McKesson Corp. | | | 1 | | | | 326 | |
Merck & Co., Inc. | | | 88 | | | | 8,023 | |
Moderna, Inc. (1) | | | 38 | | | | 5,428 | |
Oncocyte Corp. (1) | | | 195 | | | | 175 | |
Palatin Technologies, Inc. (1) | | | 859 | | | | 241 | |
Pfizer, Inc. | | | 113 | | | | 5,925 | |
Premier, Inc. | | | 7 | | | | 250 | |
QuidelOrtho Corp. (1) | | | 117 | | | | 11,370 | |
Regeneron Pharmaceuticals, Inc. (1) | | | 25 | | | | 14,778 | |
UnitedHealth Group, Inc. | | | 35 | | | | 17,977 | |
Vertex Pharmaceuticals, Inc. (1) | | | 29 | | | | 8,172 | |
Viatris, Inc. | | | 1,051 | | | | 11,004 | |
West Pharmaceutical Services, Inc. | | | 66 | | | | 19,956 | |
Zoetis, Inc. | | | 128 | | | | 22,002 | |
| | | | | | | | 264,637 | |
| | | | | | | | | |
Industrials — 0.1% | | | | | | | | |
Axon Enterprise, Inc. (1) | | | 22 | | | | 2,050 | |
Copart, Inc. (1) | | | 212 | | | | 23,036 | |
CoStar Group, Inc. (1) | | | 51 | | | | 3,081 | |
EMCOR Group, Inc. | | | 244 | | | | 25,122 | |
Heidrick & Struggles International, Inc. | | | 4 | | | | 129 | |
Lockheed Martin Corp. | | | 32 | | | | 13,759 | |
Conservative Allocation |
Security Description | | Shares or
Principal
Amount ($) | | | Fair
Value ($) | |
Common Stocks (United States) — continued |
Matson, Inc. | | | 29 | | | | 2,114 | |
Mueller Industries, Inc. | | | 2 | | | | 107 | |
Northrop Grumman Corp. | | | 13 | | | | 6,221 | |
Owens Corning | | | 18 | | | | 1,338 | |
Republic Services, Inc. | | | 2 | | | | 262 | |
Univar Solutions, Inc. (1) | | | 4 | | | | 99 | |
V2X, Inc. (1) | | | 40 | | | | 1,338 | |
Waste Management, Inc. | | | 68 | | | | 10,403 | |
| | | | | | | | 89,059 | |
| | | | | | | | | |
Information Technology — 0.4% | | | | | | | | |
Amkor Technology, Inc. | | | 906 | | | | 15,357 | |
Apple, Inc. | | | 697 | | | | 95,294 | |
Dell Technologies, Inc. | | | 3 | | | | 139 | |
DXC Technology Co. (1) | | | 3 | | | | 91 | |
EPAM Systems, Inc. (1) | | | 9 | | | | 2,653 | |
Intel Corp. | | | 1,023 | | | | 38,270 | |
International Money Express, Inc. (1) | | | 5 | | | | 102 | |
Intuit, Inc. | | | 21 | | | | 8,094 | |
Jabil, Inc. | | | 597 | | | | 30,572 | |
Manhattan Associates, Inc. (1) | | | 492 | | | | 56,383 | |
Mastercard, Inc. | | | 63 | | | | 19,875 | |
Micron Technology, Inc. | | | 254 | | | | 14,041 | |
Microsoft Corp. | | | 324 | | | | 83,211 | |
NVIDIA Corp. | | | 28 | | | | 4,245 | |
Oracle Corp. | | | 128 | | | | 8,943 | |
Pure Storage, Inc. (1) | | | 1 | | | | 26 | |
QUALCOMM, Inc. | | | 66 | | | | 8,431 | |
Tenable Holdings, Inc. (1) | | | 20 | | | | 908 | |
TESSCO Technologies, Inc. (1) | | | 44 | | | | 260 | |
Zoom Video Communications, Inc. (1) | | | 49 | | | | 5,291 | |
| | | | | | | | 392,186 | |
| | | | | | | | | |
Materials — 0.0% | | | | | | | | |
AdvanSix, Inc. | | | 12 | | | | 401 | |
Alcoa Corp. | | | 11 | | | | 501 | |
Cleveland-Cliffs, Inc. (1) | | | 5 | | | | 77 | |
Dow, Inc. | | | 318 | | | | 16,412 | |
Freeport-McMoRan, Inc. | | | 1 | | | | 29 | |
International Paper Co. | | | 2 | | | | 84 | |
Louisiana-Pacific Corp. | | | 78 | | | | 4,088 | |
LyondellBasell Industries NV | | | 70 | | | | 6,122 | |
Newmont Corp. | | | 4 | | | | 239 | |
Nucor Corp. | | | 30 | | | | 3,132 | |
Packaging Corp. of America | | | 36 | | | | 4,950 | |
Royal Gold, Inc. | | | 14 | | | | 1,495 | |
Southern Copper Corp. | | | 120 | | | | 5,977 | |
The accompanying notes are an integral part of these financial statements.
Page 38 | 2022 Semi-Annual Report | June 30, 2022 |
Schedules of Investments
June 30, 2022 (unaudited)
Conservative Allocation |
Security Description | | Shares or
Principal
Amount ($) | | | Fair
Value ($) | |
Common Stocks (United States) — continued |
United States Steel Corp. | | | 97 | | | | 1,737 | |
| | | | | | | | 45,244 | |
| | | | | | | | | |
Real Estate Investment Trust — 0.0% | | | | | | | | |
RAIT Financial Trust (1)(4) | | | 368 | | | | 0 | |
Spirit MTA REIT Liquidating Trust (1)(4) | | | 477 | | | | 0 | |
| | | | | | | | 0 | |
| | | | | | | | | |
Utilities — 0.1% | | | | | | | | |
CenterPoint Energy, Inc. | | | 8 | | | | 237 | |
Constellation Energy Corp. | | | 1,220 | | | | 69,856 | |
National Fuel Gas Co. | | | 3 | | | | 198 | |
UGI Corp. | | | 622 | | | | 24,015 | |
Vistra Corp. | | | 6 | | | | 137 | |
| | | | | | | | 94,443 | |
| | | | | | | | | |
Total Common Stocks (United States) (Cost $1,202,751) | | | | | | | 1,422,094 | |
| | | | | | | | | |
Preferred Stock (United States) — 0.0% |
WESCO International, Inc. Series A Variable Preferred (5) | | | 153 | | | | 4,195 | |
Total Preferred Stock (United States) (Cost $3,824) | | | | | | | 4,195 | |
| | | | | | | | | |
Warrants (United States) — 0.0% |
Civitas Solutions, Inc. A Warrants, Expiration Date 1/20/2025 (1)(4) | | | 4 | | | | 0 | |
Civitas Solutions, Inc. B Warrants, Expiration Date 1/20/2026 (1)(4) | | | 1 | | | | 0 | |
Hertz Global Holdings, Inc. Warrants, Expiration Date 6/30/2051 (1) | | | 21 | | | | 206 | |
Nabors Industries, Ltd. Warrants, Expiration Date 6/11/2026 (1) | | | 6 | | | | 192 | |
Oasis Petroleum, Inc. Warrants, Expiration Date 11/19/2024 (1)(4) | | | 1 | | | | 0 | |
Whiting Petroleum Corp. A Warrants, Expiration Date 9/1/2024 (1) | | | 8 | | | | 107 | |
Whiting Petroleum Corp. B Warrants, Expiration Date 9/1/2025 (1) | | | 2 | | | | 21 | |
Total Warrants (United States) (Cost $374) | | | | | | | 526 | |
| | | | | | | | | |
Conservative Allocation |
Security Description | | Shares or
Principal
Amount ($) | | | Fair
Value ($) | |
Registered Investment Companies — 19.8% |
U.S. Fixed Income — 19.8% | | | | | | | | |
Baird Core Plus Bond Fund - Class I | | | 251,776 | | | | 2,580,703 | |
BBH Limited Duration Fund - Class I | | | 110,331 | | | | 1,098,897 | |
Diamond Hill Short Duration Securitized Bond Fund - Class Y | | | 425,753 | | | | 4,100,000 | |
DoubleLine Total Return Bond Fund - Class I | | | 321,031 | | | | 3,001,644 | |
Frost Total Return Bond Fund - Class I | | | 178,077 | | | | 1,704,198 | |
Guggenheim- Total Return Bond Fund - Class I | | | 52,292 | | | | 1,274,344 | |
iShares Core U.S. Aggregate Bond ETF (6) | | | 12,310 | | | | 1,251,681 | |
PGIM Short-Term Corporate Bond Fund - Class Q | | | 397,672 | | | | 4,111,930 | |
Pioneer Bond Fund - Class K | | | 199,844 | | | | 1,718,655 | |
Segall Bryant & Hamill Plus Bond Fund - Class I | | | 326,020 | | | | 3,064,590 | |
Total Registered Investment Companies (Cost $24,523,363) | | | | | | | 23,906,642 | |
| | | | | | | | | |
Money Market Registered Investment Companies — 77.7% |
Federated Hermes Government Obligations Fund, 1.41% | | | 44,200,000 | | | | 44,200,000 | |
Meeder Institutional Prime Money Market Fund, 1.42% (2) | | | 49,474,956 | | | | 49,455,166 | |
Total Money Market Registered Investment Companies (Cost $93,651,598) | | | | | | | 93,655,166 | |
Total Investments — 98.7% (Cost $119,381,910) | | | | | | | 118,988,623 | |
Other Assets less Liabilities — 1.3% | | | | | | | 1,518,698 | |
Total Net Assets — 100.0% | | | | | | | 120,507,321 | |
| | | | | | | | | |
Trustee Deferred Compensation (3) |
Meeder Balanced Fund - Retail Class | | | 1,365 | | | | 16,066 | |
Meeder Dynamic Allocation Fund - Retail Class | | | 3,660 | | | | 41,138 | |
Meeder Muirfield Fund - Retail Class | | | 2,277 | | | | 18,854 | |
Meeder Conservative Allocation Fund - Retail Class | | | 398 | | | | 8,442 | |
Total Trustee Deferred Compensation (Cost $81,723) | | | | | | | 84,500 | |
| | | | | | | | | |
The accompanying notes are an integral part of these financial statements.
2022 Semi-Annual Report | June 30, 2022 | Page 39 |
Schedules of Investments
June 30, 2022 (unaudited)
Conservative Allocation |
| | | Long
(Short)
Contracts | | | Expiration
Date | | | Notional
Value of
Contracts
($) | | | Value and
Unrealized
Appreciation
(Depreciation)
($) | |
Futures Contracts |
Index Futures | | | | | | | | | | | | | | | | |
E-mini Standard & Poors MidCap 400 Futures | | | 8 | | | | 9/16/2022 | | | | 1,814,400 | | | | 9,431 | |
Mini MSCI EAFE Index Futures | | | 23 | | | | 9/16/2022 | | | | 2,135,090 | | | | 2,252 | |
Mini MSCI Emerging Markets Index Futures | | | 8 | | | | 9/16/2022 | | | | 401,080 | | | | (306 | ) |
Russell 2000 Mini Index Futures | | | 14 | | | | 9/16/2022 | | | | 1,195,600 | | | | (8,573 | ) |
Standard & Poors 500 Mini Futures | | | 41 | | | | 9/16/2022 | | | | 7,768,475 | | | | 93,144 | |
Total Futures Contracts | | | 94 | | | | | | | | 13,314,645 | | | | 95,948 | |
(1) | Represents non-income producing securities. |
(2) | Investment in affiliate. The yield shown represents the 7-day yield in effect at June 30, 2022. |
(3) | Assets of affiliates to the Conservative Allocation Fund held for the benefit of the Fund’s Trustees in connection with the Trustees Deferred Compensation Plan. |
(4) | Fair valued security deemed a Level 3 security. Security is not part of the investment strategy of the Fund. |
The accompanying notes are an integral part of these financial statements.
Page 40 | 2022 Semi-Annual Report | June 30, 2022 |
Schedules of Investments
June 30, 2022 (unaudited)
Dynamic Allocation Fund |
Security Description | | Shares or
Principal
Amount ($) | | | Fair
Value ($) | |
Common Stocks (United States) — 62.1% |
Communication Services — 4.0% | | | | | | | | |
Alphabet, Inc. (1) | | | 2,070 | | | | 4,528,022 | |
AT&T, Inc. | | | 5,912 | | | | 123,916 | |
Cogent Communications Holdings, Inc. | | | 1,500 | | | | 91,140 | |
Comcast Corp. | | | 29,237 | | | | 1,147,260 | |
Entravision Communications Corp. | | | 1,214 | | | | 5,536 | |
IDT Corp. (1) | | | 5,644 | | | | 141,947 | |
Interpublic Group of Cos., Inc./The | | | 18,256 | | | | 502,588 | |
Liberty TripAdvisor Holdings, Inc. (1) | | | 2,078 | | | | 1,572 | |
Lumen Technologies, Inc. | | | 3,936 | | | | 42,942 | |
Meta Platforms, Inc. (1) | | | 5,228 | | | | 843,015 | |
News Corp. | | | 572 | | | | 8,912 | |
Nexstar Media Group, Inc. | | | 1,263 | | | | 205,717 | |
Omnicom Group, Inc. | | | 8,630 | | | | 548,954 | |
Verizon Communications, Inc. | | | 524 | | | | 26,593 | |
| | | | | | | | 8,218,114 | |
| | | | | | | | | |
Consumer Discretionary — 5.7% | | | | | | | | |
Academy Sports & Outdoors, Inc. | | | 14,042 | | | | 499,053 | |
Amazon.com, Inc. (1) | | | 29,815 | | | | 3,166,651 | |
AutoZone, Inc. (1) | | | 51 | | | | 109,605 | |
Booking Holdings, Inc. (1) | | | 291 | | | | 508,956 | |
Chico’s FAS, Inc. (1) | | | 743 | | | | 3,693 | |
Everi Holdings, Inc. (1) | | | 1,238 | | | | 20,192 | |
Ford Motor Co. | | | 15,497 | | | | 172,482 | |
Frontdoor, Inc. (1) | | | 1,100 | | | | 26,488 | |
Gentex Corp. | | | 1,847 | | | | 51,661 | |
Gentherm, Inc. (1) | | | 1,288 | | | | 80,384 | |
Grand Canyon Education, Inc. (1) | | | 7,871 | | | | 741,369 | |
H&R Block, Inc. | | | 5,380 | | | | 190,022 | |
Hibbett, Inc. | | | 3,554 | | | | 155,345 | |
Home Depot, Inc./The | | | 345 | | | | 94,623 | |
Kohl’s Corp. | | | 4,774 | | | | 170,384 | |
Lennar Corp. | | | 35 | | | | 2,055 | |
Lululemon Athletica, Inc. (1) | | | 2,825 | | | | 770,123 | |
M/I Homes, Inc. (1) | | | 5,251 | | | | 208,255 | |
Macy’s, Inc. | | | 26,609 | | | | 487,477 | |
Mohawk Industries, Inc. (1) | | | 4,762 | | | | 590,917 | |
Nordstrom, Inc. | | | 1,973 | | | | 41,689 | |
O’Reilly Automotive, Inc. (1) | | | 982 | | | | 620,388 | |
PVH Corp. | | | 6,506 | | | | 370,191 | |
Qurate Retail, Inc. | | | 2,330 | | | | 6,687 | |
Skyline Champion Corp. (1) | | | 6,976 | | | | 330,802 | |
Smith & Wesson Brands, Inc. | | | 5,264 | | | | 69,116 | |
Sonos, Inc. (1) | | | 15,438 | | | | 278,502 | |
Tapestry, Inc. | | | 2,344 | | | | 71,539 | |
Target Corp. | | | 660 | | | | 93,212 | |
Dynamic Allocation Fund |
Security Description | | Shares or
Principal
Amount ($) | | | Fair
Value ($) | |
Common Stocks (United States) — continued |
Thor Industries, Inc. | | | 2,323 | | | | 173,598 | |
TJX Cos., Inc./The | | | 6,148 | | | | 343,366 | |
Town Sports International Holdings, Inc. (1)(5) | | | 2,090 | | | | 0 | |
Tractor Supply Co. | | | 1,069 | | | | 207,226 | |
Ulta Beauty, Inc. (1) | | | 2,153 | | | | 829,938 | |
Yum! Brands, Inc. | | | 2,098 | | | | 238,144 | |
| | | | | | | | 11,724,133 | |
| | | | | | | | | |
Consumer Staples — 3.2% | | | | | | | | |
Albertsons Cos., Inc. | | | 9,774 | | | | 261,161 | |
Archer-Daniels-Midland Co. | | | 11,486 | | | | 891,314 | |
Bunge, Ltd. | | | 5,318 | | | | 482,289 | |
Costco Wholesale Corp. | | | 5,992 | | | | 2,871,846 | |
Darling Ingredients, Inc. (1) | | | 1,919 | | | | 114,756 | |
Flowers Foods, Inc. | | | 107 | | | | 2,816 | |
General Mills, Inc. | | | 12,711 | | | | 959,045 | |
Hostess Brands, Inc. (1) | | | 1,618 | | | | 34,318 | |
Ingredion, Inc. | | | 153 | | | | 13,488 | |
Kroger Co./The | | | 295 | | | | 13,962 | |
Mondelez International, Inc. | | | 2,284 | | | | 141,814 | |
PepsiCo, Inc. | | | 660 | | | | 109,996 | |
Simply Good Foods Co./The (1) | | | 7,082 | | | | 267,487 | |
Tyson Foods, Inc. | | | 4,938 | | | | 424,964 | |
| | | | | | | | 6,589,256 | |
| | | | | | | | | |
Energy — 4.3% | | | | | | | | |
APA Corp. | | | 3,465 | | | | 120,929 | |
Berry Corp. | | | 1,448 | | | | 11,034 | |
Bristow Group, Inc. (1) | | | 778 | | | | 18,205 | |
Centrus Energy Corp. (1) | | | 976 | | | | 24,156 | |
ChampionX Corp. | | | 616 | | | | 12,228 | |
Cheniere Energy, Inc. | | | 259 | | | | 34,455 | |
Chevron Corp. | | | 15,999 | | | | 2,316,335 | |
Civitas Resources, Inc. | | | 84 | | | | 4,392 | |
Comstock Resources, Inc. (1) | | | 272 | | | | 3,286 | |
ConocoPhillips | | | 5,705 | | | | 512,366 | |
Coterra Energy, Inc. | | | 75 | | | | 1,934 | |
Devon Energy Corp. | | | 1,994 | | | | 109,889 | |
Diamondback Energy, Inc. | | | 786 | | | | 95,224 | |
DT Midstream, Inc. | | | 2,018 | | | | 98,922 | |
EOG Resources, Inc. | | | 1,660 | | | | 183,330 | |
Exxon Mobil Corp. | | | 27,122 | | | | 2,322,728 | |
Halliburton Co. | | | 2,664 | | | | 83,543 | |
Hess Corp. | | | 624 | | | | 66,107 | |
Laredo Petroleum, Inc. (1) | | | 55 | | | | 3,792 | |
Marathon Oil Corp. | | | 331 | | | | 7,441 | |
Marathon Petroleum Corp. | | | 17,444 | | | | 1,434,071 | |
The accompanying notes are an integral part of these financial statements.
2022 Semi-Annual Report | June 30, 2022 | Page 41 |
Schedules of Investments
June 30, 2022 (unaudited)
Dynamic Allocation Fund |
Security Description | | Shares or
Principal
Amount ($) | | | Fair
Value ($) | |
Common Stocks (United States) — continued |
Nine Energy Service, Inc. (1) | | | 2,396 | | | | 6,349 | |
ONEOK, Inc. | | | 5,048 | | | | 280,164 | |
Ovintiv, Inc. | | | 1,655 | | | | 73,134 | |
Phillips 66 | | | 2,019 | | | | 165,538 | |
Pioneer Natural Resources Co. | | | 519 | | | | 115,779 | |
Ranger Oil Corp. | | | 53 | | | | 1,742 | |
Schlumberger NV | | | 7,782 | | | | 278,284 | |
SM Energy Co. | | | 465 | | | | 15,898 | |
Targa Resources Corp. | | | 2,436 | | | | 145,356 | |
Teekay Corp. (1) | | | 1,128 | | | | 3,249 | |
Valero Energy Corp. | | | 3,397 | | | | 361,033 | |
World Fuel Services Corp. | | | 258 | | | | 5,279 | |
| | | | | | | | 8,916,172 | |
| | | | | | | | | |
Financials — 7.7% | | | | | | | | |
American Equity Investment Life Holding Co. | | | 4,141 | | | | 151,436 | |
American Financial Group, Inc./OH | | | 577 | | | | 80,093 | |
American International Group, Inc. | | | 21,477 | | | | 1,098,119 | |
Argo Group International Holdings, Ltd. | | | 521 | | | | 19,204 | |
Atlanticus Holdings Corp. (1) | | | 141 | | | | 4,959 | |
Bank of New York Mellon Corp./The | | | 9,711 | | | | 405,046 | |
Berkshire Hathaway, Inc. (1) | | | 23,669 | | | | 6,462,110 | |
Charles Schwab Corp./The | | | 8,554 | | | | 540,442 | |
Chubb, Ltd. | | | 4,940 | | | | 971,105 | |
Essent Group, Ltd. | | | 6,116 | | | | 237,912 | |
Fidelity National Financial, Inc. | | | 5,005 | | | | 184,985 | |
Hartford Financial Services Group, Inc./The | | | 1,450 | | | | 94,874 | |
Markel Corp. (1) | | | 189 | | | | 244,424 | |
Marsh & McLennan Cos., Inc. | | | 11,553 | | | | 1,793,603 | |
MetLife, Inc. | | | 2,304 | | | | 144,668 | |
Moelis & Co. | | | 187 | | | | 7,358 | |
Mr Cooper Group, Inc. (1) | | | 1,322 | | | | 48,570 | |
Northrim BanCorp., Inc. | | | 795 | | | | 32,007 | |
Old Republic International Corp. | | | 241 | | | | 5,389 | |
OneMain Holdings, Inc. | | | 13,820 | | | | 516,592 | |
Pathward Financial, Inc. | | | 1,175 | | | | 45,437 | |
Prudential Financial, Inc. | | | 3,366 | | | | 322,059 | |
Pzena Investment Management, Inc. | | | 1,983 | | | | 13,068 | |
Regions Financial Corp. | | | 11,137 | | | | 208,819 | |
State Street Corp. | | | 2,125 | | | | 131,006 | |
Stewart Information Services Corp. | | | 4,581 | | | | 227,905 | |
Synchrony Financial | | | 4,480 | | | | 123,738 | |
W R Berkley Corp. | | | 4,738 | | | | 323,416 | |
Walker & Dunlop, Inc. | | | 1,453 | | | | 139,982 | |
Willis Towers Watson PLC | | | 6,377 | | | | 1,258,756 | |
| | | | | | | | 15,837,082 | |
| | | | | | | | | |
Dynamic Allocation Fund |
Security Description | | Shares or
Principal
Amount ($) | | | Fair
Value ($) | |
Common Stocks (United States) — continued |
Healthcare — 12.3% | | | | | | | | |
AbbVie, Inc. | | | 12,940 | | | | 1,981,890 | |
Agilent Technologies, Inc. | | | 224 | | | | 26,604 | |
Alaunos Therapeutics, Inc. (1) | | | 4,281 | | | | 5,308 | |
Amgen, Inc. | | | 6,855 | | | | 1,667,822 | |
Amneal Pharmaceuticals, Inc. (1) | | | 1,969 | | | | 6,261 | |
Bristol-Myers Squibb Co. | | | 13,027 | | | | 1,003,079 | |
Cardinal Health, Inc. | | | 19,469 | | | | 1,017,645 | |
Catalent, Inc. (1) | | | 4,684 | | | | 502,546 | |
Centene Corp. (1) | | | 2,538 | | | | 214,740 | |
Centogene NV (1) | | | 647 | | | | 1,533 | |
Cigna Corp. | | | 2,398 | | | | 631,921 | |
CVS Health Corp. | | | 9,000 | | | | 833,940 | |
Danaher Corp. | | | 1,972 | | | | 499,941 | |
Elevance Health, Inc. | | | 954 | | | | 460,381 | |
Eli Lilly & Co. | | | 3,844 | | | | 1,246,340 | |
Eloxx Pharmaceuticals, Inc. (1) | | | 8,083 | | | | 2,182 | |
Endo International PLC (1) | | | 7,278 | | | | 3,389 | |
Fulgent Genetics, Inc. (1) | | | 7,681 | | | | 418,845 | |
Genprex, Inc. (1) | | | 1,400 | | | | 1,946 | |
Gilead Sciences, Inc. | | | 15,566 | | | | 962,134 | |
Humana, Inc. | | | 134 | | | | 62,721 | |
Illumina, Inc. (1) | | | 1,143 | | | | 210,723 | |
ImmunityBio, Inc. (1) | | | 6,193 | | | | 23,038 | |
Incyte Corp. (1) | | | 1,663 | | | | 126,338 | |
Johnson & Johnson | | | 16,827 | | | | 2,986,961 | |
Joint Corp./The (1) | | | 200 | | | | 3,062 | |
La Jolla Pharmaceutical Co. (1) | | | 567 | | | | 1,809 | |
Laboratory Corp. of America Holdings | | | 266 | | | | 62,340 | |
McKesson Corp. | | | 3,132 | | | | 1,021,690 | |
Merck & Co., Inc. | | | 14,056 | | | | 1,281,486 | |
Moderna, Inc. (1) | | | 4,155 | | | | 593,542 | |
Molina Healthcare, Inc. (1) | | | 97 | | | | 27,122 | |
Pfizer, Inc. | | | 16,915 | | | | 886,853 | |
Premier, Inc. | | | 44 | | | | 1,570 | |
Quest Diagnostics, Inc. | | | 221 | | | | 29,389 | |
QuidelOrtho Corp. (1) | | | 1,799 | | | | 174,827 | |
Regeneron Pharmaceuticals, Inc. (1) | | | 1,150 | | | | 679,800 | |
UnitedHealth Group, Inc. | | | 7,366 | | | | 3,783,399 | |
Universal Health Services, Inc. | | | 335 | | | | 33,738 | |
Vertex Pharmaceuticals, Inc. (1) | | | 1,062 | | | | 299,261 | |
Viatris, Inc. | | | 7,721 | | | | 80,839 | |
West Pharmaceutical Services, Inc. | | | 2,814 | | | | 850,869 | |
Zoetis, Inc. | | | 4,235 | | | | 727,954 | |
| | | | | | | | 25,437,778 | |
| | | | | | | | | |
The accompanying notes are an integral part of these financial statements.
Page 42 | 2022 Semi-Annual Report | June 30, 2022 |
Schedules of Investments
June 30, 2022 (unaudited)
Dynamic Allocation Fund |
Security Description | | Shares or
Principal
Amount ($) | | | Fair
Value ($) | |
Common Stocks (United States) — continued |
Industrials — 5.1% | | | | | | | | |
Atkore, Inc. (1) | | | 2,879 | | | | 238,986 | |
Axon Enterprise, Inc. (1) | | | 4,195 | | | | 390,848 | |
Boise Cascade Co. | | | 1,198 | | | | 71,269 | |
Builders FirstSource, Inc. (1) | | | 19,833 | | | | 1,065,032 | |
BWX Technologies, Inc. | | | 1,804 | | | | 99,382 | |
Copart, Inc. (1) | | | 9,675 | | | | 1,051,286 | |
CoStar Group, Inc. (1) | | | 10,232 | | | | 618,115 | |
EMCOR Group, Inc. | | | 1,844 | | | | 189,858 | |
Emerson Electric Co. | | | 488 | | | | 38,816 | |
Encore Wire Corp. | | | 1,041 | | | | 108,181 | |
General Dynamics Corp. | | | 6,201 | | | | 1,371,971 | |
Graco, Inc. | | | 2,539 | | | | 150,842 | |
Hillenbrand, Inc. | | | 2,161 | | | | 88,515 | |
Hubbell, Inc. | | | 45 | | | | 8,036 | |
Karat Packaging, Inc. (1) | | | 111 | | | | 1,894 | |
Lockheed Martin Corp. | | | 4,680 | | | | 2,012,213 | |
ManpowerGroup, Inc. | | | 1,994 | | | | 152,362 | |
Matson, Inc. | | | 1,013 | | | | 73,827 | |
Mueller Industries, Inc. | | | 2,910 | | | | 155,074 | |
MYR Group, Inc. (1) | | | 289 | | | | 25,470 | |
Northrop Grumman Corp. | | | 3,463 | | | | 1,657,288 | |
nVent Electric PLC | | | 338 | | | | 10,590 | |
United Parcel Service, Inc. | | | 442 | | | | 80,683 | |
V2X, Inc. (1) | | | 211 | | | | 7,060 | |
Waste Management, Inc. | | | 4,448 | | | | 680,455 | |
WW Grainger, Inc. | | | 259 | | | | 117,697 | |
| | | | | | | | 10,465,750 | |
| | | | | | | | | |
Information Technology — 17.7% | | | | | | | | |
A10 Networks, Inc. | | | 4,742 | | | | 68,190 | |
ACI Worldwide, Inc. (1) | | | 3,146 | | | | 81,450 | |
Advanced Micro Devices, Inc. (1) | | | 2,969 | | | | 227,039 | |
Affirm Holdings, Inc. (1) | | | 357 | | | | 6,447 | |
Alpha & Omega Semiconductor, Ltd. (1) | | | 12,836 | | | | 427,952 | |
American Software, Inc./GA | | | 713 | | | | 11,522 | |
Amkor Technology, Inc. | | | 13,290 | | | | 225,266 | |
Apple, Inc. | | | 67,104 | | | | 9,174,459 | |
Arrow Electronics, Inc. (1) | | | 2,707 | | | | 303,428 | |
Avid Technology, Inc. (1) | | | 2,178 | | | | 56,519 | |
Avnet, Inc. | | | 4,923 | | | | 211,098 | |
Axcelis Technologies, Inc. (1) | | | 6,740 | | | | 369,622 | |
Broadcom, Inc. | | | 226 | | | | 109,793 | |
Cadence Design Systems, Inc. (1) | | | 4,163 | | | | 624,575 | |
Cisco Systems, Inc. | | | 10,299 | | | | 439,149 | |
Cognizant Technology Solutions Corp. | | | 1,877 | | | | 126,679 | |
Concentrix Corp. | | | 944 | | | | 128,044 | |
Dynamic Allocation Fund |
Security Description | | Shares or
Principal
Amount ($) | | | Fair
Value ($) | |
Common Stocks (United States) — continued |
Diodes, Inc. (1) | | | 2,237 | | | | 144,443 | |
Dolby Laboratories, Inc. | | | 1,739 | | | | 124,443 | |
DXC Technology Co. (1) | | | 2,194 | | | | 66,500 | |
EPAM Systems, Inc. (1) | | | 907 | | | | 267,365 | |
Euronet Worldwide, Inc. (1) | | | 695 | | | | 69,910 | |
Extreme Networks, Inc. (1) | | | 748 | | | | 6,672 | |
Intel Corp. | | | 26,855 | | | | 1,004,646 | |
Intuit, Inc. | | | 1,130 | | | | 435,547 | |
Jabil, Inc. | | | 18,417 | | | | 943,135 | |
Manhattan Associates, Inc. (1) | | | 18,656 | | | | 2,137,978 | |
Mastercard, Inc. | | | 2,969 | | | | 936,660 | |
Microchip Technology, Inc. | | | 3,082 | | | | 179,003 | |
Micron Technology, Inc. | | | 30,623 | | | | 1,692,839 | |
Microsoft Corp. | | | 43,441 | | | | 11,156,953 | |
NortonLifeLock, Inc. | | | 4,820 | | | | 105,847 | |
Oracle Corp. | | | 13,761 | | | | 961,481 | |
Photronics, Inc. (1) | | | 1,258 | | | | 24,506 | |
Power Integrations, Inc. | | | 3,835 | | | | 287,663 | |
Pure Storage, Inc. (1) | | | 7,658 | | | | 196,887 | |
QUALCOMM, Inc. | | | 15,715 | | | | 2,007,434 | |
Qualys, Inc. (1) | | | 1,501 | | | | 189,336 | |
Rimini Street, Inc. (1) | | | 1,066 | | | | 6,407 | |
SS&C Technologies Holdings, Inc. | | | 2,410 | | | | 139,949 | |
StarTek, Inc. (1) | | | 1,629 | | | | 4,708 | |
Synopsys, Inc. (1) | | | 341 | | | | 103,562 | |
Tenable Holdings, Inc. (1) | | | 2,849 | | | | 129,373 | |
Xperi Holding Corp. | | | 2,934 | | | | 42,338 | |
Zebra Technologies Corp. (1) | | | 42 | | | | 12,346 | |
Zoom Video Communications, Inc. (1) | | | 5,742 | | | | 619,964 | |
| | | | | | | | 36,589,127 | |
| | | | | | | | | |
Materials — 1.1% | | | | | | | | |
AdvanSix, Inc. | | | 88 | | | | 2,943 | |
Alcoa Corp. | | | 349 | | | | 15,907 | |
Dow, Inc. | | | 5,102 | | | | 263,314 | |
Eagle Materials, Inc. | | | 2,223 | | | | 244,397 | |
Freeport-McMoRan, Inc. | | | 8,579 | | | | 251,022 | |
Huntsman Corp. | | | 482 | | | | 13,665 | |
Louisiana-Pacific Corp. | | | 9,487 | | | | 497,214 | |
LyondellBasell Industries NV | | | 1,914 | | | | 167,398 | |
Newmont Corp. | | | 43 | | | | 2,566 | |
Nucor Corp. | | | 1,345 | | | | 140,431 | |
Packaging Corp. of America | | | 1,673 | | | | 230,038 | |
Royal Gold, Inc. | | | 2,585 | | | | 276,026 | |
Ryerson Holding Corp. | | | 140 | | | | 2,981 | |
Schnitzer Steel Industries, Inc. | | | 386 | | | | 12,676 | |
Southern Copper Corp. | | | 1,298 | | | | 64,653 | |
The accompanying notes are an integral part of these financial statements.
2022 Semi-Annual Report | June 30, 2022 | Page 43 |
Schedules of Investments
June 30, 2022 (unaudited)
Dynamic Allocation Fund |
Security Description | | Shares or
Principal
Amount ($) | | | Fair
Value ($) | |
Common Stocks (United States) — continued |
Steel Dynamics, Inc. | | | 902 | | | | 59,667 | |
United States Steel Corp. | | | 1,655 | | | | 29,641 | |
Valvoline, Inc. | | | 2,007 | | | | 57,862 | |
| | | | | | | | 2,332,401 | |
| | | | | | | | | |
Real Estate Investment Trust — 0.0% | | | | | | | | |
Altisource Portfolio Solutions SA (1) | | | 1,047 | | | | 11,245 | |
CorEnergy Infrastructure Trust, Inc. | | | 5,320 | | | | 13,406 | |
Kilroy Realty Corp. | | | 109 | | | | 5,704 | |
Rafael Holdings, Inc. (1) | | | 1,612 | | | | 3,014 | |
SITE Centers Corp. | | | 255 | | | | 3,435 | |
Spirit MTA REIT Liquidating Trust (1)(5) | | | 3,134 | | | | 0 | |
| | | | | | | | 36,804 | |
| | | | | | | | | |
Utilities — 0.8% | | | | | | | | |
CenterPoint Energy, Inc. | | | 3,857 | | | | 114,090 | |
Constellation Energy Corp. | | | 7,739 | | | | 443,135 | |
Evergy, Inc. | | | 188 | | | | 12,267 | |
NRG Energy, Inc. | | | 8,744 | | | | 333,758 | |
UGI Corp. | | | 14,131 | | | | 545,596 | |
Vistra Corp. | | | 5,087 | | | | 116,238 | |
Xcel Energy, Inc. | | | 491 | | | | 34,743 | |
| | | | | | | | 1,599,827 | |
| | | | | | | | | |
Total Common Stocks (United States) (Cost $114,791,966) | | | | | | | 127,746,444 | |
| | | | | | | | | |
Preferred Stock (United States) — 0.0% |
WESCO International, Inc. Series A Variable Preferred (6) | | | 610 | | | | 16,726 | |
Total Preferred Stock (United States) (Cost $15,247) | | | | | | | 16,726 | |
| | | | | | | | | |
Warrants (United States) — 0.0% |
Chaparral Energy, Inc. A Warrants, Expiration Date 10/14/2024 (1)(5) | | | 2 | | | | 0 | |
Chaparral Energy, Inc. B Warrants, Expiration Date 10/14/2025 (1)(5) | | | 2 | | | | 0 | |
Civitas Solutions, Inc. A Warrants, Expiration Date 1/20/2025 (1)(5) | | | 15 | | | | 0 | |
Civitas Solutions, Inc. B Warrants, Expiration Date 1/20/2026 (1)(5) | | | 8 | | | | 0 | |
Hertz Global Holdings Inc. Warrants, Expiration Date 6/30/2051 (1) | | | 89 | | | | 871 | |
Nabors Industries, Ltd. Warrants, Expiration Date 6/11/2026 (1) | | | 27 | | | | 863 | |
Dynamic Allocation Fund |
Security Description | | Shares or
Principal
Amount ($) | | | Fair
Value ($) | |
Warrants (United States) — continued |
Oasis Petroleum, Inc. Warrants, Expiration Date 11/19/2024 (1)(5) | | | 7 | | | | 0 | |
Whiting Petroleum Corp. A Warrants, Expiration Date 9/1/2024 (1) | | | 45 | | | | 603 | |
Whiting Petroleum Corp. B Warrants, Expiration Date 9/1/2025 (1) | | | 22 | | | | 231 | |
Total Warrants (United States) (Cost $2,715) | | | | | | | 2,568 | |
| | | | | | | | | |
Registered Investment Companies — 5.1% |
U.S. Fixed Income — 4.6% | | | | | | | | |
Vanguard Short-Term Bond ETF (7) | | | 123,505 | | | | 9,483,949 | |
| | | | | | | | 9,483,949 | |
| | | | | | | | | |
International Equity — 0.5% | | | | | | | | |
iShares Core MSCI EAFE ETF (7) | | | 15,725 | | | | 925,416 | |
| | | | | | | | 925,416 | |
| | | | | | | | | |
Total Registered Investment Companies (Cost $10,345,629) | | | | | | | 10,409,365 | |
| | | | | | | | | |
Money Market Registered Investment Companies — 29.6% |
Meeder Institutional Prime Money Market Fund, 1.42% (2) | | | 60,683,741 | | | | 60,659,468 | |
Total Money Market Registered Investment Companies (Cost $60,660,912) | | | | | | | 60,659,468 | |
| | | | | | | | | |
Bank Obligations — 0.2% |
First Merchants Bank Deposit Account, 0.55%, 7/1/2022 (3) | | | 249,644 | | | | 249,644 | |
Metro City Bank Deposit Account, 0.05%, 7/1/2022 (3) | | | 248,529 | | | | 248,529 | |
Total Bank Obligations (Cost $498,173) | | | | | | | 498,173 | |
Total Investments — 97.0% (Cost $186,314,642) | | | | | | | 199,332,744 | |
Other Assets less Liabilities — 3.0% | | | | | | | 5,912,011 | |
Total Net Assets — 100.0% | | | | | | | 205,244,755 | |
| | | | | | | | | |
The accompanying notes are an integral part of these financial statements.
Page 44 | 2022 Semi-Annual Report | June 30, 2022 |
Schedules of Investments
June 30, 2022 (unaudited)
Dynamic Allocation Fund |
Security Description | | Shares or
Principal
Amount ($) | | | Fair
Value ($) | |
Trustee Deferred Compensation (4) |
Meeder Balanced Fund - Retail Class | | | 4,005 | | | | 47,139 | |
Meeder Dynamic Allocation Fund - Retail Class | | | 10,961 | | | | 123,202 | |
Meeder Muirfield Fund - Retail Class | | | 5,189 | | | | 42,965 | |
Meeder Conservative Allocation Fund - Retail Class | | | 1,158 | | | | 24,561 | |
Total Trustee Deferred Compensation (Cost $225,317) | | | | | | | 237,867 | |
| | | | | | | | | |
| | | Long
(Short)
Contracts | | | Expiration
Date | | | Notional
Value of
Contracts
($) | | | Value and
Unrealized
Appreciation
(Depreciation)
($) | |
Futures Contracts |
Index Futures | | | | | | | | | | | | | | | | |
E-mini Standard & Poors MidCap 400 Futures | | | (24 | ) | | | 9/16/2022 | | | | (5,443,200 | ) | | | 40,542 | |
Mini MSCI EAFE Index Futures | | | 479 | | | | 9/16/2022 | | | | 44,465,570 | | | | 38,365 | |
Mini MSCI Emerging Markets Index Futures | | | 172 | | | | 9/16/2022 | | | | 8,623,220 | | | | (14,194 | ) |
Russell 2000 Mini Index Futures | | | 141 | | | | 9/16/2022 | | | | 12,041,400 | | | | (144,195 | ) |
Standard & Poors 500 Mini Futures | | | 38 | | | | 9/16/2022 | | | | 7,200,050 | | | | (58,399 | ) |
Total Futures Contracts | | | 806 | | | | | | | | 66,887,040 | | | | (137,881 | ) |
(1) | Represents non-income producing securities. |
(2) | Investment in affiliate. The yield shown represents the 7-day yield in effect at June 30, 2022. |
(3) | Variable rate security. Securities payable at par including accrued interest (usually within seven days notice) and unconditionally secured as to principal and interest by letters of credit or other credit support agreements from major banks. The interest rates are adjustable and are not based on a published reference rate and spread but are determined by the issuer or agent and are based on current market conditions. These securities do not indicate a reference rate and spread in their description above. The rate shown represents the rate in effect at June 30, 2022. The maturity date shown, if applicable, reflects the earlier of the next demand date or stated maturity date. |
(4) | Assets of affiliates to the Dynamic Allocation Fund held for the benefit of the Fund’s Trustees in connection with the Trustee Deferred Compensation Plan. |
(5) | Fair valued security deemed a Level 3 security. Security is not part of the investment strategy of the Fund. |
The accompanying notes are an integral part of these financial statements.
2022 Semi-Annual Report | June 30, 2022 | Page 45 |
Schedules of Investments
June 30, 2022 (unaudited)
Quantex Fund |
Security Description | | Shares or
Principal
Amount ($) | | | Fair
Value ($) | |
Common Stocks (United States) — 58.6% |
Communication Services — 3.2% | | | | | | | | |
Interpublic Group of Cos., Inc./The | | | 6,654 | | | | 183,185 | |
Lumen Technologies, Inc. | | | 18,357 | | | | 200,275 | |
News Corp. | | | 10,626 | | | | 168,847 | |
News Corp. | | | 10,760 | | | | 167,641 | |
Omnicom Group, Inc. | | | 2,771 | | | | 176,263 | |
Warner Bros Discovery, Inc. (1) | | | 11,687 | | | | 156,840 | |
| | | | | | | | 1,053,051 | |
| | | | | | | | | |
Consumer Discretionary — 7.4% | | | | | | | | |
Advance Auto Parts, Inc. | | | 1,009 | | | | 174,648 | |
BorgWarner, Inc. | | | 5,333 | | | | 177,962 | |
Gap, Inc./The | | | 13,704 | | | | 112,921 | |
Hasbro, Inc. | | | 2,325 | | | | 190,371 | |
Mohawk Industries, Inc. (1) | | | 1,358 | | | | 168,514 | |
Newell Brands, Inc. | | | 9,393 | | | | 178,843 | |
Norwegian Cruise Line Holdings, Ltd. (1) | | | 10,736 | | | | 119,384 | |
Penn National Gaming, Inc. (1) | | | 4,847 | | | | 147,446 | |
PulteGroup, Inc. | | | 4,492 | | | | 178,018 | |
PVH Corp. | | | 2,292 | | | | 130,415 | |
Ralph Lauren Corp. | | | 1,810 | | | | 162,267 | |
Tapestry, Inc. | | | 5,967 | | | | 182,113 | |
Under Armour, Inc. (1) | | | 14,020 | | | | 106,272 | |
Under Armour, Inc. (1) | | | 11,900 | | | | 99,127 | |
Whirlpool Corp. | | | 1,068 | | | | 165,401 | |
Wynn Resorts, Ltd. (1) | | | 2,580 | | | | 147,008 | |
| | | | | | | | 2,440,710 | |
| | | | | | | | | |
Consumer Staples — 2.8% | | | | | | | | |
Campbell Soup Co. | | | 4,209 | | | | 202,242 | |
Conagra Brands, Inc. | | | 5,942 | | | | 203,454 | |
J M Smucker Co./The | | | 578 | | | | 73,990 | |
Lamb Weston Holdings, Inc. | | | 3,358 | | | | 239,963 | |
Molson Coors Beverage Co. | | | 3,793 | | | | 206,756 | |
| | | | | | | | 926,405 | |
| | | | | | | | | |
Energy — 2.0% | | | | | | | | |
APA Corp. | | | 4,699 | | | | 163,995 | |
ConocoPhillips | | | 2,083 | | | | 187,074 | |
Coterra Energy, Inc. | | | 6,434 | | | | 165,933 | |
Marathon Oil Corp. | | | 7,027 | | | | 157,967 | |
| | | | | | | | 674,969 | |
| | | | | | | | | |
Financials — 7.1% | | | | | | | | |
Assurant, Inc. | | | 1,165 | | | | 201,370 | |
Cboe Global Markets, Inc. | | | 1,943 | | | | 219,928 | |
Comerica, Inc. | | | 2,449 | | | | 179,708 | |
Quantex Fund |
Security Description | | Shares or
Principal
Amount ($) | | | Fair
Value ($) | |
Common Stocks (United States) — continued |
Everest Re Group, Ltd. | | | 780 | | | | 218,618 | |
Globe Life, Inc. | | | 2,253 | | | | 219,600 | |
Invesco, Ltd. | | | 10,515 | | | | 169,607 | |
Lincoln National Corp. | | | 3,404 | | | | 159,205 | |
Loews Corp. | | | 3,641 | | | | 215,766 | |
M&T Bank Corp. | | | 1,228 | | | | 195,731 | |
MarketAxess Holdings, Inc. | | | 628 | | | | 160,774 | |
W R Berkley Corp. | | | 3,161 | | | | 215,770 | |
Wells Fargo & Co. (1)(5) | | | 1 | | | | 0 | |
Zions BanCorp. NA | | | 3,305 | | | | 168,225 | |
| | | | | | | | 2,324,302 | |
| | | | | | | | | |
Healthcare — 5.6% | | | | | | | | |
ABIOMED, Inc. (1) | | | 706 | | | | 174,742 | |
Cardinal Health, Inc. | | | 3,698 | | | | 193,294 | |
DaVita, Inc. (1) | | | 2,043 | | | | 163,358 | |
DENTSPLY SIRONA, Inc. | | | 4,471 | | | | 159,749 | |
Henry Schein, Inc. (1) | | | 2,540 | | | | 194,920 | |
Incyte Corp. (1) | | | 2,854 | | | | 216,818 | |
Organon & Co. | | | 6,512 | | | | 219,780 | |
Teleflex, Inc. | | | 761 | | | | 187,092 | |
Universal Health Services, Inc. | | | 1,716 | | | | 172,818 | |
Viatris, Inc. | | | 15,811 | | | | 165,541 | |
| | | | | | | | 1,848,112 | |
| | | | | | | | | |
Industrials — 10.9% | | | | | | | | |
A O Smith Corp. | | | 3,009 | | | | 164,532 | |
Alaska Air Group, Inc. (1) | | | 4,152 | | | | 166,288 | |
Allegion plc | | | 1,930 | | | | 188,947 | |
American Airlines Group, Inc. (1) | | | 13,439 | | | | 170,407 | |
CH Robinson Worldwide, Inc. | | | 2,316 | | | | 234,773 | |
Fortune Brands Home & Security, Inc. | | | 2,382 | | | | 142,634 | |
Howmet Aerospace, Inc. | | | 7,623 | | | | 239,743 | |
Huntington Ingalls Industries, Inc. | | | 1,243 | | | | 270,750 | |
Leidos Holdings, Inc. | | | 2,781 | | | | 280,075 | |
Masco Corp. | | | 3,640 | | | | 184,184 | |
Nielsen Holdings PLC | | | 11,950 | | | | 277,479 | |
Pentair PLC | | | 3,556 | | | | 162,758 | |
Quanta Services, Inc. | | | 2,201 | | | | 275,873 | |
Robert Half International, Inc. | | | 2,103 | | | | 157,494 | |
Rollins, Inc. | | | 7,605 | | | | 265,567 | |
Snap-on, Inc. | | | 1,158 | | | | 228,161 | |
United Airlines Holdings, Inc. (1) | | | 5,527 | | | | 195,766 | |
| | | | | | | | 3,605,431 | |
| | | | | | | | | |
The accompanying notes are an integral part of these financial statements.
Page 46 | 2022 Semi-Annual Report | June 30, 2022 |
Schedules of Investments
June 30, 2022 (unaudited)
Quantex Fund |
Security Description | | Shares or
Principal
Amount ($) | | | Fair
Value ($) | |
Common Stocks (United States) — continued |
Information Technology — 5.8% | | | | | | | | |
Ceridian HCM Holding, Inc. (1) | | | 2,541 | | | | 119,630 | |
Citrix Systems, Inc. | | | 2,153 | | | | 209,207 | |
DXC Technology Co. (1) | | | 7,190 | | | | 217,929 | |
F5, Inc. (1) | | | 1,066 | | | | 163,141 | |
IPG Photonics Corp. (1) | | | 1,465 | | | | 137,900 | |
Jack Henry & Associates, Inc. | | | 1,179 | | | | 212,244 | |
Juniper Networks, Inc. | | | 6,685 | | | | 190,523 | |
NortonLifeLock, Inc. | | | 8,850 | | | | 194,341 | |
PTC, Inc. (1) | | | 1,953 | | | | 207,682 | |
SolarEdge Technologies, Inc. (1) | | | 927 | | | | 253,701 | |
| | | | | | | | 1,906,298 | |
| | | | | | | | | |
Materials — 5.0% | | | | | | | | |
CF Industries Holdings, Inc. | | | 2,985 | | | | 255,904 | |
Eastman Chemical Co. | | | 2,092 | | | | 187,799 | |
FMC Corp. | | | 2,298 | | | | 245,909 | |
Mosaic Co./The | | | 6,312 | | | | 298,116 | |
Packaging Corp. of America | | | 1,608 | | | | 221,100 | |
Sealed Air Corp. | | | 3,466 | | | | 200,058 | |
Westrock Co. | | | 5,584 | | | | 222,467 | |
| | | | | | | | 1,631,353 | |
| | | | | | | | | |
Real Estate Investment Trust — 3.7% | | | | | | | | |
Federal Realty OP LP | | | 1,834 | | | | 175,587 | |
Host Hotels & Resorts, Inc. | | | 14,395 | | | | 225,714 | |
Iron Mountain, Inc. | | | 5,037 | | | | 245,252 | |
Kimco Realty Corp. | | | 10,131 | | | | 200,290 | |
Regency Centers Corp. | | | 3,283 | | | | 194,715 | |
SL Green Realty Corp. | | | 128 | | | | 5,907 | |
Vornado Realty Trust | | | 5,642 | | | | 161,305 | |
| | | | | | | | 1,208,770 | |
| | | | | | | | | |
Utilities — 5.1% | | | | | | | | |
AES Corp./The | | | 10,453 | | | | 219,618 | |
Alliant Energy Corp. | | | 4,210 | | | | 246,748 | |
Atmos Energy Corp. | | | 2,406 | | | | 269,713 | |
Evergy, Inc. | | | 3,706 | | | | 241,817 | |
NiSource, Inc. | | | 8,248 | | | | 243,233 | |
NRG Energy, Inc. | | | 5,997 | | | | 228,905 | |
Pinnacle West Capital Corp. | | | 3,063 | | | | 223,967 | |
| | | | | | | | 1,674,001 | |
| | | | | | | | | |
Total Common Stocks (United States) (Cost $18,635,721) | | | | | | | 19,293,402 | |
| | | | | | | | | |
Quantex Fund |
Security Description | | Shares or
Principal
Amount ($) | | | Fair
Value ($) | |
Money Market Registered Investment Companies — 37.4% |
Meeder Institutional Prime Money Market Fund, 1.42% (2) | | | 12,328,436 | | | | 12,323,505 | |
Total Money Market Registered Investment Companies (Cost $12,329,587) | | | | | | | 12,323,505 | |
| | | | | | | | | |
Bank Obligations — 0.0% |
First Merchants Bank Deposit Account, 0.55%, 7/1/2022 (3) | | | 8,199 | | | | 8,199 | |
Metro City Bank Deposit Account, 0.05%, 7/1/2022 (3) | | | 19 | | | | 19 | |
Total Bank Obligations (Cost $8,218) | | | | | | | 8,218 | |
Total Investments — 96.0% (Cost $30,973,526) | | | | | | | 31,625,125 | |
Other Assets less Liabilities — 4.0% | | | | | | | 1,313,311 | |
Total Net Assets — 100.0% | | | | | | | 32,938,436 | |
| | | | | | | | | |
Trustee Deferred Compensation (4) |
Meeder Balanced Fund - Retail Class | | | 1,170 | | | | 13,771 | |
Meeder Dynamic Allocation Fund - Retail Class | | | 3,145 | | | | 35,350 | |
Meeder Muirfield Fund - Retail Class | | | 1,585 | | | | 13,124 | |
Meeder Conservative Allocation Fund - Retail Class | | | 337 | | | | 7,148 | |
Total Trustee Deferred Compensation (Cost $66,472) | | | | | | | 69,393 | |
| | | | | | | | | |
The accompanying notes are an integral part of these financial statements.
2022 Semi-Annual Report | June 30, 2022 | Page 47 |
Schedules of Investments
June 30, 2022 (unaudited)
Quantex Fund |
| | | Long
(Short)
Contracts | | | Expiration
Date | | | Notional
Value of
Contracts
($) | | | Value and
Unrealized
Appreciation
(Depreciation)
($) | |
Futures Contracts |
Index Futures | | | | | | | | | | | | | | | | |
E-mini Standard & Poors MidCap 400 Futures | | | 31 | | | | 9/16/2022 | | | | 7,030,800 | | | | (28,124 | ) |
Standard & Poors 500 Mini Futures | | | 35 | | | | 9/16/2022 | | | | 6,631,625 | | | | 100,601 | |
Total Futures Contracts | | | 66 | | | | | | | | 13,662,425 | | | | 72,477 | |
(1) | Represents non-income producing securities. |
(2) | Investment in affiliate. The yield shown represents the 7-day yield in effect at June 30, 2022. |
(3) | Variable rate security. Securities payable at par including accrued interest (usually within seven days notice) and unconditionally secured as to principal and interest by letters of credit or other credit support agreements from major banks. The interest rates are adjustable and are not based on a published reference rate and spread but are determined by the issuer or agent and are based on current market conditions. These securities do not indicate a reference rate and spread in their description above. The rate shown represents the rate in effect at June 30, 2022. The maturity date shown, if applicable, reflects the earlier of the next demand date or stated maturity date. |
(4) | Assets of affiliates to the Quantex Fund held for the benefit of the Fund’s Trustees in connection with the Trustee Deferred Compensation Plan. |
(5) | Fair valued security deemed a Level 3 security. Security is not part of the investment strategy of the Fund. |
The accompanying notes are an integral part of these financial statements.
Page 48 | 2022 Semi-Annual Report | June 30, 2022 |
Schedules of Investments
June 30, 2022 (unaudited)
Tactical Income Fund |
Security Description | | Shares or
Principal
Amount ($) | | | Fair
Value ($) | |
Registered Investment Companies (U.S. Fixed Income) — 28.7% |
BBH Limited Duration Fund - Class I | | | 497,264 | | | | 4,952,746 | |
Diamond Hill Short Duration Securitized Bond Fund - Class Y | | | 213,030 | | | | 2,051,482 | |
Frost Total Return Bond Fund - Class I | | | 175,434 | | | | 1,678,905 | |
iShares Core 1-5 Year USD Bond ETF (3) | | | 198,740 | | | | 9,420,274 | |
PGIM Short-Term Corporate Bond Fund - Class Q | | | 90,664 | | | | 937,466 | |
Total Registered Investment Companies (U.S. Fixed Income) (Cost $19,913,200) | | | | | | | 19,040,873 | |
| | | | | | | | | |
Money Market Registered Investment Companies — 71.1% |
Federated Hermes Government Obligations Fund, 1.41% | | | 35,000,000 | | | | 35,000,000 | |
Meeder Institutional Prime Money Market Fund, 1.42% (1) | | | 12,237,114 | | | | 12,232,219 | |
Total Money Market Registered Investment Companies (Cost $47,231,568) | | | | | | | 47,232,219 | |
| | | | | | | | | |
U.S. Government Obligations — 0.1% |
Government National Mortgage Association, 6.50%, due 7/20/2038 | | | 59,751 | | | | 68,372 | |
Total U.S. Government Obligations (Cost $63,701) | | | | | | | 68,372 | |
Total Investments — 99.9% (Cost $67,208,469) | | | | | | | 66,341,464 | |
Other Assets less Liabilities — 0.1% | | | | | | | 56,038 | |
Total Net Assets — 100.0% | | | | | | | 66,397,502 | |
| | | | | | | | | |
Trustee Deferred Compensation (2) |
Meeder Balanced Fund - Retail Class | | | 1,338 | | | | 15,748 | |
Meeder Dynamic Allocation Fund - Retail Class | | | 3,505 | | | | 39,396 | |
Meeder Muirfield Fund - Retail Class | | | 1,900 | | | | 15,732 | |
Meeder Conservative Allocation Fund - Retail Class | | | 393 | | | | 8,336 | |
Total Trustee Deferred Compensation (Cost $79,034) | | | | | | | 79,212 | |
| | | | | | | | | |
(1) | Investment in affiliate. The yield shown represents the 7-day yield in effect at June 30, 2022. |
(2) | Assets of affiliates to the Tactical Income Fund held for the benefit of the Fund’s Trustees in connection with the Trustee Deferred Compensation Plan. |
The accompanying notes are an integral part of these financial statements.
2022 Semi-Annual Report | June 30, 2022 | Page 49 |
Schedules of Investments
June 30, 2022 (unaudited)
Institutional Prime Money Market Fund |
Security Description | | Coupon/
Yield | | | Maturity/
Demand
Date | | | Principal
Amount ($)
or Shares | | | Fair
Value ($) | |
Certificates of Deposit — 27.4% |
Banco Santander Yankee CD | | | 0.20 | % | | | 08/19/22 | | | | 1,500,000 | | | | 1,496,544 | |
Bank of Montreal Chicago (Secured Overnight Financing Rate + 0.24%) | | | 1.75 | %(2) | | | 12/01/22 | | | | 5,000,000 | | | | 4,994,455 | |
Bank of Montreal Chicago (Secured Overnight Financing Rate + 0.61%) | | | 2.12 | %(2) | | | 07/21/23 | | | | 10,000,000 | | | | 9,995,001 | |
Bank of Montreal Chicago (Secured Overnight Financing Rate + 0.20%) | | | 1.71 | %(2) | | | 11/03/22 | | | | 5,000,000 | | | | 4,996,155 | |
Barclays Bank PLC NY (Secured Overnight Financing Rate + 0.30%) | | | 1.81 | %(2) | | | 02/02/23 | | | | 5,000,000 | | | | 4,990,510 | |
Barclays Bank PLC NY (Secured Overnight Financing Rate + 0.29%) | | | 1.80 | %(2) | | | 02/16/23 | | | | 5,000,000 | | | | 4,989,140 | |
Canadian Imperial Holdings, Inc. (Secured Overnight Financing Rate + 0.30%) | | | 1.81 | %(2) | | | 01/06/23 | | | | 5,000,000 | | | | 4,996,405 | |
Canadian Imperial Holdings, Inc. (Secured Overnight Financing Rate + 0.25%) | | | 1.76 | %(2) | | | 02/10/23 | | | | 6,000,000 | | | | 5,990,688 | |
Canadian Imperial Holdings, Inc. (Secured Overnight Financing Rate + 0.25%) | | | 1.76 | %(2) | | | 02/17/23 | | | | 5,000,000 | | | | 4,991,555 | |
Canadian Imperial Holdings, Inc. (Secured Overnight Financing Rate + 0.21%) | | | 1.72 | %(2) | | | 12/01/22 | | | | 5,000,000 | | | | 4,997,000 | |
Cooperatieve Rabobank UA/NY (Secured Overnight Financing Rate + 0.49%) | | | 2.00 | %(2) | | | 03/10/23 | | | | 10,000,000 | | | | 9,999,195 | |
Credit Agricole Yankee CD | | | 1.96 | % | | | 09/21/22 | | | | 5,000,000 | | | | 4,992,350 | |
Lloyds Bank Corp. Mkts/NY Yankee CD | | | 0.23 | % | | | 08/17/22 | | | | 400,000 | | | | 399,168 | |
Lloyds Bank Corp. Mkts/NY (Secured Overnight Financing Rate + 0.28%) | | | 1.79 | %(2) | | | 02/13/23 | | | | 5,000,000 | | | | 4,992,135 | |
Institutional Prime Money Market Fund |
Security Description | | Coupon/
Yield | | | Maturity/
Demand
Date | | | Principal
Amount ($)
or Shares | | | Fair
Value ($) | |
Certificates of Deposit — continued |
Mitsubishi UFJ Trust & Banking Corp. (Secured Overnight Financing Rate + 0.19%) | | | 1.70 | %(2) | | | 07/27/22 | | | | 5,000,000 | | | | 4,999,915 | |
Mizuho Bank, Ltd./NY Yankee CD | | | 0.33 | % | | | 07/15/22 | | | | 5,000,000 | | | | 4,997,320 | |
Mizuho Bank, Ltd./NY (Secured Overnight Financing Rate + 0.18%) | | | 1.63 | %(2) | | | 08/10/22 | | | | 5,000,000 | | | | 4,999,665 | |
MUFG Bank, Ltd./New York, NY Yankee CD | | | 0.23 | % | | | 07/15/22 | | | | 2,000,000 | | | | 1,998,880 | |
MUFG Bank, Ltd./New York, NY Yankee CD | | | 0.32 | % | | | 08/08/22 | | | | 3,000,000 | | | | 2,995,533 | |
MUFG Bank, Ltd./New York, NY Yankee CD | | | 0.21 | % | | | 09/20/22 | | | | 2,000,000 | | | | 1,991,298 | |
Natixis SA/New York, NY Yankee CD | | | 0.30 | % | | | 10/21/22 | | | | 5,000,000 | | | | 4,965,490 | |
Natixis SA/New York, NY (Secured Overnight Financing Rate + 0.41%) | | | 1.92 | %(2) | | | 12/02/22 | | | | 10,000,000 | | | | 10,001,500 | |
Nordea Bank ABP/New York, NY (Secured Overnight Financing Rate + 0.29%) | | | 1.80 | %(2) | | | 08/26/22 | | | | 5,000,000 | | | | 5,000,460 | |
Nordea Bank ABP/New York, NY (Secured Overnight Financing Rate + 0.34%) | | | 1.85 | %(2) | | | 10/21/22 | | | | 5,000,000 | | | | 5,000,365 | |
Nordea Bank ABP/New York, NY (Secured Overnight Financing Rate + 0.19%) | | | 1.70 | %(2) | | | 10/24/22 | | | | 5,000,000 | | | | 4,997,870 | |
Royal Bank of Canada (Secured Overnight Financing Rate + 0.15%) | | | 1.66 | %(2) | | | 08/09/22 | | | | 5,000,000 | | | | 4,999,595 | |
Royal Bank of Canada Yankee CD | | | 0.27 | % | | | 10/20/22 | | | | 5,000,000 | | | | 4,967,195 | |
Standard Chartered Bank NY (Secured Overnight Financing Rate + 0.21%) | | | 1.72 | %(2) | | | 11/07/22 | | | | 5,000,000 | | | | 4,996,760 | |
Standard Chartered Bank NY (Secured Overnight Financing Rate + 0.40%) | | | 1.91 | %(2) | | | 11/01/22 | | | | 10,000,000 | | | | 10,000,520 | |
Sumitomo Mitsui Banking Corp./NY Yankee CD | | | 1.65 | % | | | 07/21/22 | | | | 5,000,000 | | | | 5,000,135 | |
The accompanying notes are an integral part of these financial statements.
Page 50 | 2022 Semi-Annual Report | June 30, 2022 |
Schedules of Investments
June 30, 2022 (unaudited)
Institutional Prime Money Market Fund |
Security Description | | Coupon/
Yield | | | Maturity/
Demand
Date | | | Principal
Amount ($)
or Shares | | | Fair
Value ($) | |
Certificates of Deposit — continued |
Sumitomo Mitsui Banking Corp./NY (Secured Overnight Financing Rate + 0.45%) | | | 1.96 | %(2) | | | 11/23/22 | | | | 5,000,000 | | | | 4,999,855 | |
Sumitomo Mitsui Banking Corp./NY (Secured Overnight Financing Rate + 0.60%) | | | 2.11 | %(2) | | | 05/03/23 | | | | 10,000,000 | | | | 9,997,040 | |
Svenska Handelsbanken (Secured Overnight Financing Rate + 0.15%) | | | 1.66 | %(2) | | | 08/01/22 | | | | 1,000,000 | | | | 999,954 | |
Toronto Dominion Bank/New York, NY (Secured Overnight Financing Rate + 0.23%) | | | 1.74 | %(2) | | | 02/08/23 | | | | 5,000,000 | | | | 5,000,000 | |
Toronto Dominion Bank/New York, NY Yankee CD | | | 2.40 | % | | | 05/11/23 | | | | 5,000,000 | | | | 5,000,000 | |
Toronto Dominion Bank/New York, NY Yankee CD | | | 3.02 | % | | | 07/03/23 | | | | 5,000,000 | | | | 4,963,535 | |
Toronto Dominion Bank/New York, NY Yankee CD | | | 0.27 | % | | | 10/20/22 | | | | 1,000,000 | | | | 993,639 | |
Toronto Dominion Bank/New York, NY (US Federal Funds Effective Rate + 0.49%) | | | 2.07 | %(2) | | | 12/23/22 | | | | 5,000,000 | | | | 5,000,000 | |
Total Certificates of Deposit (Cost $191,839,652) | | | 191,686,825 | |
| | | | | |
Commercial Paper — 40.7% |
American Honda Finance Corp. | | | 1.90 | % | | | 07/21/22 | | | | 10,000,000 | | | | 9,987,649 | |
American Honda Finance Corp. | | | 1.98 | % | | | 07/25/22 | | | | 1,500,000 | | | | 1,497,778 | |
American Honda Finance Corp. | | | 2.18 | % | | | 08/23/22 | | | | 10,000,000 | | | | 9,966,850 | |
Anglesea Funding | | | 1.62 | % | | | 07/01/22 | | | | 800,000 | | | | 799,966 | |
Anglesea Funding | | | 1.62 | % | | | 07/05/22 | | | | 10,000,000 | | | | 9,997,373 | |
Bank of Montreal | | | 1.62 | % | | | 07/08/22 | | | | 3,700,000 | | | | 3,698,701 | |
Bank of Nova Scotia/The | | | 0.12 | % | | | 07/27/22 | | | | 2,000,000 | | | | 1,997,616 | |
Bank of Nova Scotia/The | | | 0.12 | % | | | 07/29/22 | | | | 2,000,000 | | | | 1,997,438 | |
Bank of Nova Scotia/The | | | 0.22 | % | | | 10/03/22 | | | | 1,450,000 | | | | 1,441,861 | |
Institutional Prime Money Market Fund |
Security Description | | Coupon/
Yield | | | Maturity/
Demand
Date | | | Principal
Amount ($)
or Shares | | | Fair
Value ($) | |
Commercial Paper — continued |
Barclays Capital, Inc. | | | 2.53 | % | | | 01/05/23 | | | | 5,000,000 | | | | 4,919,831 | |
Barclays Capital, Inc. | | | 0.17 | % | | | 08/08/22 | | | | 3,750,000 | | | | 3,741,926 | |
Bedford Row Funding | | | 3.05 | % | | | 01/03/23 | | | | 10,000,000 | | | | 9,842,560 | |
Bedford Row Funding | | | 0.33 | % | | | 08/18/22 | | | | 3,000,000 | | | | 2,992,140 | |
Bedford Row Funding (Secured Overnight Financing Rate + 0.40%) | | | 1.91 | %(2) | | | 12/12/22 | | | | 5,000,000 | | | | 4,999,500 | |
BNP Paribas SA/New York, NY | | | 1.57 | % | | | 07/01/22 | | | | 8,443,000 | | | | 8,443,000 | |
Chesham Finance, LLC | | | 1.22 | % | | | 07/01/22 | | | | 1,000,000 | | | | 999,957 | |
Chesham Finance, LLC | | | 1.61 | % | | | 07/06/22 | | | | 10,000,000 | | | | 9,996,928 | |
Chesham Finance, LLC | | | 1.60 | % | | | 07/11/22 | | | | 10,000,000 | | | | 9,995,130 | |
Collateralized Commercial Paper V Co. | | | 2.70 | % | | | 02/24/23 | | | | 2,700,000 | | | | 2,641,691 | |
Collateralized Commercial Paper V Co. | | | 1.62 | % | | | 07/05/22 | | | | 1,700,000 | | | | 1,699,629 | |
Collateralized Commercial Paper V Co. | | | 1.67 | % | | | 07/11/22 | | | | 1,955,000 | | | | 1,954,048 | |
Collateralized Commercial Paper V Co. | | | 1.73 | % | | | 07/14/22 | | | | 310,000 | | | | 309,807 | |
Collateralized Commercial Paper V Co. | | | 2.27 | % | | | 11/30/22 | | | | 5,000,000 | | | | 4,940,970 | |
Collateralized Commercial Paper V Co. | | | 1.62 | % | | | 07/05/22 | | | | 500,000 | | | | 499,891 | |
Collateralized Commercial Paper FLEX Co., LLC (Secured Overnight Financing Rate + 0.17%) | | | 1.68 | %(2) | | | 07/21/22 | | | | 5,000,000 | | | | 4,999,970 | |
CommonWealth Bank | | | 0.25 | % | | | 07/15/22 | | | | 2,000,000 | | | | 1,998,692 | |
CommonWealth Bank | | | 2.00 | % | | | 11/07/22 | | | | 1,500,000 | | | | 1,486,551 | |
CommonWealth Bank (Secured Overnight Financing Rate + 0.20%) | | | 1.71 | %(2) | | | 08/24/22 | | | | 5,000,000 | | | | 4,999,290 | |
Crown Point Capital | | | 0.60 | % | | | 08/02/22 | | | | 5,000,000 | | | | 4,991,965 | |
Crown Point Capital | | | 2.39 | % | | | 12/06/22 | | | | 10,000,000 | | | | 9,870,810 | |
Crown Point Capital | | | 1.03 | % | | | 12/19/22 | | | | 1,000,000 | | | | 985,538 | |
DZ Bank AG | | | 1.63 | % | | | 07/08/22 | | | | 750,000 | | | | 749,736 | |
DZ Bank AG | | | 1.32 | % | | | 08/02/22 | | | | 5,000,000 | | | | 4,992,085 | |
Ebury Finance, LLC | | | 1.61 | % | | | 07/07/22 | | | | 10,000,000 | | | | 9,996,930 | |
Ebury Finance, LLC | | | 1.60 | % | | | 07/12/22 | | | | 10,000,000 | | | | 9,994,670 | |
Ebury Finance, LLC | | | 1.52 | % | | | 08/01/22 | | | | 3,000,000 | | | | 2,995,365 | |
The accompanying notes are an integral part of these financial statements.
2022 Semi-Annual Report | June 30, 2022 | Page 51 |
Schedules of Investments
June 30, 2022 (unaudited)
Institutional Prime Money Market Fund |
Security Description | | Coupon/
Yield | | | Maturity/
Demand
Date | | | Principal
Amount ($)
or Shares | | | Fair
Value ($) | |
Commercial Paper — continued |
Glencove Funding, LLC | | | 1.66 | % | | | 07/08/22 | | | | 900,000 | | | | 899,683 | |
Glencove Funding, LLC | | | 2.05 | % | | | 11/07/22 | | | | 1,000,000 | | | | 990,626 | |
Great Bear Funding | | | 1.62 | % | | | 07/01/22 | | | | 15,000,000 | | | | 14,999,355 | |
Great Bear Funding | | | 1.60 | % | | | 07/05/22 | | | | 15,000,000 | | | | 14,996,730 | |
Halkin Finance, LLC | | | 1.15 | % | | | 07/01/22 | | | | 13,000,000 | | | | 12,999,441 | |
Lloyds Bank Corp. Mkts./NY | | | 2.08 | % | | | 11/21/22 | | | | 5,000,000 | | | | 4,946,080 | |
Macquarie Bank, Ltd./Australia | | | 0.60 | % | | | 08/02/22 | | | | 5,000,000 | | | | 4,991,885 | |
National Australia Bank, Ltd. | | | 2.05 | % | | | 11/01/22 | | | | 900,000 | | | | 892,399 | |
Natixis SA/New York, NY | | | 0.40 | % | | | 08/15/22 | | | | 5,000,000 | | | | 4,987,470 | |
Nordea Bank ABP | | | 0.33 | % | | | 07/01/22 | | | | 10,000,000 | | | | 9,999,570 | |
Ridgefield Funding Co. | | | 1.45 | % | | | 08/11/22 | | | | 1,500,000 | | | | 1,496,801 | |
Ridgefield Funding Co. | | | 2.04 | % | | | 10/03/22 | | | | 5,000,000 | | | | 4,968,850 | |
Royal Bank of Canada (Secured Overnight Financing Rate + 0.25%) | | | 1.76 | %(2) | | | 02/24/23 | | | | 5,000,000 | | | | 4,989,815 | |
Royal Bank of Canada | | | 0.13 | % | | | 07/06/22 | | | | 2,000,000 | | | | 1,999,478 | |
Royal Bank of Canada | | | 0.28 | % | | | 10/04/22 | | | | 2,650,000 | | | | 2,633,061 | |
Royal Bank of Canada | | | 0.21 | % | | | 10/12/22 | | | | 2,000,000 | | | | 1,985,706 | |
Royal Bank of Canada | | | 0.38 | % | | | 11/14/22 | | | | 1,000,000 | | | | 989,428 | |
Standard Chartered Bank NY | | | 0.14 | % | | | 07/27/22 | | | | 2,700,000 | | | | 2,696,782 | |
Standard Chartered Bank NY | | | 0.39 | % | | | 10/14/22 | | | | 900,000 | | | | 893,939 | |
Toronto Dominion Bank/New York, NY | | | 1.62 | % | | | 07/07/22 | | | | 1,000,000 | | | | 999,697 | |
Westpac Banking Corp. (Secured Overnight Financing Rate + 0.45%) | | | 1.96 | %(2) | | | 02/21/23 | | | | 10,000,000 | | | | 9,995,670 | |
Westpac Banking Corp. (Secured Overnight Financing Rate + 0.44%) | | | 1.95 | %(2) | | | 09/22/22 | | | | 5,000,000 | | | | 5,001,385 | |
Westpac Banking Corp. (Secured Overnight Financing Rate + 0.36%) | | | 1.87 | %(2) | | | 11/14/22 | | | | 5,000,000 | | | | 4,999,505 | |
Westpac Securities, Ltd. | | | 0.29 | % | | | 08/18/22 | | | | 2,500,000 | | | | 2,494,025 | |
Westpac Securities, Ltd. | | | 1.99 | % | | | 11/01/22 | | | | 500,000 | | | | 495,867 | |
Total Commercial Paper (Cost $284,997,911) | | | 284,767,089 | |
| | | | | |
Institutional Prime Money Market Fund |
Security Description | | Coupon/
Yield | | | Maturity/
Demand
Date | | | Principal
Amount ($)
or Shares | | | Fair
Value ($) | |
Corporate Obligations — 2.1% |
Bank of Montreal (Bloomberg 1Month Short Term Bank Yield Index (USD) + 0.42%) | | | 2.03 | %(2) | | | 01/03/23 | | | | 10,000,000 | | | | 10,000,000 | |
Citigroup Global Markets, Inc. | | | 3.80 | % | | | 07/30/23 | | | | 5,000,000 | | | | 5,000,000 | |
Total Corporate Obligations (Cost $15,000,000) | | | 15,000,000 | |
| | | | | |
Repurchase Agreements — 23.5% |
StoneX (Collateralized by $66,211,211 various Corporate Bonds, FMACs, GNMAs, and FNMAs, 0.52% - 6.95%, due 8/2/22 - 1/1/99, fair value $51,240,485)(proceeds $50,002,361) purchase date 6/30/22 | | | 1.70 | % | | | 07/01/22 | | | | 50,000,000 | | | | 50,000,000 | |
South Street (Collateralized by $90,589,161 various FMACs, FHLBs, SBAs, FNMAs, FCSBs, GNMAs, and U.S. Treasuries, 3.00% - 6.50%, due 1/1/26 - 6/1/52, fair value $61,248,890)(proceeds $60,002,500), purchase date 6/30/22 | | | 1.50 | % | | | 07/01/22 | | | | 60,000,000 | | | | 60,000,000 | |
South Street (Collateralized by $116,943,827 various FMACs, GNMAs, FNMAs, FHLBs, SBAs, and Corporate Bonds, 1.38% - 6.50%, due 10/11/22 - 5/1/52, fair value $56,163,672)(proceeds $55,002,368), purchase date 6/30/22 | | | 1.55 | % | | | 07/01/22 | | | | 55,000,000 | | | | 55,000,000 | |
Total Repurchase Agreements (Cost $165,000,000) | | | 165,000,000 | |
The accompanying notes are an integral part of these financial statements.
Page 52 | 2022 Semi-Annual Report | June 30, 2022 |
Schedules of Investments
June 30, 2022 (unaudited)
Institutional Prime Money Market Fund |
Security Description | | Coupon/
Yield | | | Maturity/
Demand
Date | | | Principal
Amount ($)
or Shares | | | Fair
Value ($) | |
Variable Rate Demand Notes — 3.2% |
Metro Transport Authority NY Revenue | | | 1.20 | %(1) | | | 07/07/22 | | | | 5,000,000 | | | | 5,000,000 | |
Michigan State Finance Authority Revenue | | | 1.56 | %(1) | | | 07/07/22 | | | | 4,500,000 | | | | 4,500,000 | |
Ohio State Special Obligation | | | 1.20 | %(1) | | | 07/06/22 | | | | 3,000,000 | | | | 3,000,000 | |
Pittsburgh & Allegheny County PA Sports & Exhibition Authority | | | 1.60 | %(1) | | | 07/07/22 | | | | 1,715,000 | | | | 1,715,000 | |
Triborough NY Bridge & Tunnel Authority Revenues | | | 1.19 | %(1) | | | 07/06/22 | | | | 2,400,000 | | | | 2,400,000 | |
Triborough NY Bridge & Tunnel Authority Revenues | | | 0.75 | %(1) | | | 07/07/22 | | | | 6,000,000 | | | | 6,000,000 | |
Total Variable Rate Demand Notes (Cost $22,615,000) | | | 22,615,000 | |
| | | | | |
Money Market Registered Investment Companies — 4.6% |
Federated Hermes Government Obligations Fund, 1.41% (3) | | | 31,958,602 | | | | 31,958,602 | |
Total Money Market Registered Investment Companies (Cost $31,958,602) | | | 31,958,602 | |
Total Investments — 101.5% (Cost $711,411,165) | | | 711,027,516 | |
Liabilities less Other Assets — (1.5%) | | | (10,182,157 | ) |
Total Net Assets — 100.0% | | | 700,845,359 | |
| | | | | |
Institutional Prime Money Market Fund |
Security Description | Principal
Amount ($)
or Shares | Fair
Value ($) |
Trustee Deferred Compensation (4) |
Meeder Balanced Fund - Retail Class | 89 | 1,048 |
Meeder Dynamic Allocation Fund - Retail Class | 220 | 2,473 |
Meeder Muirfield Fund - Retail Class | 287 | 2,376 |
Meeder Conservative Allocation Fund - Retail Class | 28 | 594 |
Total Trustee Deferred Compensation (Cost $6,772) | 6,491 |
(1) | Variable rate security. Securities payable at par including accrued interest (usually within seven days notice) and unconditionally secured as to principal and interest by letters of credit or other credit support agreements from major banks. The interest rates are adjustable and are not based on a published reference rate and spread but are determined by the issuer or agent and are based on current market conditions. These securities do not indicate a reference rate and spread in their description above. The rate shown represents the rate in effect at June 30, 2022. The maturity date shown, if applicable, reflects the earlier of the next demand date or stated maturity date. |
(2) | Floating rate security. Interest rates reset periodically. The reference rate and spread are indicated in the description above. The rate shown represents the rate in effect at June 30, 2022. The maturity date shown reflects the earlier of the next demand date or stated maturity date. |
(3) | 7-day yield as of June 30, 2022. The Fund may invest a significant portion of its assets in shares of one or more investment companies, including money market mutual funds. The Fund will incur additional indirect expenses (acquired fund fees and expenses) to the extent it invests in shares of other investment companies. |
(4) | Assets of affiliates to the Institutional Prime Money Market Fund held for the benefit of the Fund’s Trustees in connection with the Trustee Deferred Compensation Plan. |
The accompanying notes are an integral part of these financial statements.
2022 Semi-Annual Report | June 30, 2022 | Page 53 |
Statements of Assets and Liabilities
June 30, 2022 (unaudited) | |
| | | Muirfield
Fund | | | Spectrum
Fund | |
Assets | | | | | | | | |
Investments, at fair value (1)(2) | | $ | 336,605,421 | | | $ | 122,329,374 | |
Repurchase agreements, at fair value (1) | | | — | | | | — | |
Investments in affiliates, at fair value (1) | | | 273,579,597 | | | | 46,797,670 | |
Trustee deferred compensation investments, at fair value | | | 327,466 | | | | 55,003 | |
Deposits at broker for futures contracts (3) | | | 28,537,973 | | | | 13,515,252 | |
Cash held at broker for collateral on securities sold short | | | — | | | | 994 | |
Receivable for securities sold | | | 7,109,159 | | | | 2,669,117 | |
Receivable for capital stock issued | | | 390,500 | | | | 64,805 | |
Interest and dividend receivable | | | 468,695 | | | | 126,608 | |
Prepaid expenses/other assets | | | 52,693 | | | | 28,686 | |
Total Assets | | | 647,071,504 | | | | 185,587,509 | |
| | | | | | | | | |
Liabilities | | | | | | | | |
Payable for securities purchased | | | 3,276,875 | | | | 1,340,601 | |
Payable for Trustee Deferred Compensation Plan | | | 327,466 | | | | 55,003 | |
Payable for capital stock redeemed | | | 236,168 | | | | 34,056 | |
Dividends payable | | | — | | | | — | |
Payable to investment adviser | | | 334,409 | | | | 110,336 | |
Accrued distribution plan (12b-1) and shareholder service plan fees | | | 126,607 | | | | 23,377 | |
Accrued transfer agent, fund accounting, CCO, and administrative fees | | | 97,549 | | | | 36,533 | |
Accrued trustee fees | | | 8,537 | | | | 3,133 | |
Other accrued liabilities | | | 44,792 | | | | 38,238 | |
Total Liabilities | | | 4,452,403 | | | | 1,641,277 | |
| | | | | | | | | |
Net Assets | | $ | 642,619,101 | | | $ | 183,946,232 | |
| | | | | | | | | |
Net Assets | | | | | | | | |
Capital | | $ | 570,844,432 | | | $ | 159,313,166 | |
Distributable Earnings (Accumulated Deficit) | | | 71,774,669 | | | | 24,633,066 | |
Total Net Assets | | $ | 642,619,101 | | | $ | 183,946,232 | |
| | | | | | | | | |
Net Asset Value Per Share | | | | | | | | |
Retail Class | | | | | | | | |
Net Assets | | $ | 39,947,463 | | | $ | 1,817,869 | |
Shares Outstanding | | | 4,821,808 | | | | 150,037 | |
Net Asset Value, Offering and Redemption Price Per Share | | $ | 8.28 | | | $ | 12.12 | |
| | | | | | | | | |
Adviser Class | | | | | | | | |
Net Assets | | $ | 90,080,372 | | | $ | 32,467,273 | |
Shares Outstanding | | | 10,743,958 | | | | 2,657,919 | |
Net Asset Value, Offering and Redemption Price Per Share | | $ | 8.38 | | | $ | 12.22 | |
| | | | | | | | | |
Institutional Class | | | | | | | | |
Net Assets | | $ | 512,591,266 | | | $ | 149,661,090 | |
Shares Outstanding | | | 61,049,093 | | | | 12,216,602 | |
Net Asset Value, Offering and Redemption Price Per Share | | $ | 8.40 | | | $ | 12.25 | |
| | | | | | | | | |
Net Asset Value Per Share - Money Market Fund | | | | | | | | |
Net Assets | | | | | | | | |
Shares Outstanding | | | | | | | | |
Net Asset Value, Offering and Redemption Price Per Share | | | | | | | | |
| | | | | | | | | |
(1) Investments and affiliated investments at cost | | $ | 567,553,117 | | | $ | 157,665,652 | |
(2) Fair value of securities loaned included in investments at fair value (See Note #2, Note #3, and Note #5) | | $ | — | | | $ | — | |
(3) Required margin held as collateral for futures contracts | | $ | 9,625,394 | | | $ | 4,198,406 | |
The accompanying notes are an integral part of these financial statements.
Page 54 | 2022 Semi-Annual Report | June 30, 2022 |
| | Global
Allocation
Fund | | | Balanced
Fund | | | Moderate
Allocation
Fund | | | Conservative
Allocation
Fund | | | Dynamic
Allocation
Fund | | | Quantex
Fund | | | Tactical
Income Fund | | | Institutional
Prime Money
Market Fund | |
| | | | | | | | | | | | | | | | | | | | | | | | | | | | | | | | |
| | $ | 14,431,941 | | | $ | 209,324,460 | | | $ | 90,319,401 | | | $ | 69,533,457 | | | $ | 138,673,276 | | | $ | 19,301,620 | | | $ | 54,109,245 | | | $ | 546,027,516 | |
| | | — | | | | — | | | | — | | | | — | | | | — | | | | — | | | | — | | | | 165,000,000 | |
| | | 21,298,750 | | | | 121,304,168 | | | | 62,131,665 | | | | 49,455,166 | | | | 60,659,468 | | | | 12,323,505 | | | | 12,232,219 | | | | — | |
| | | 113,934 | | | | 210,545 | | | | 41,085 | | | | 84,500 | | | | 237,867 | | | | 69,393 | | | | 79,212 | | | | 6,491 | |
| | | 927,097 | | | | 13,278,480 | | | | 2,752,980 | | | | 1,253,108 | | | | 5,500,799 | | | | 1,297,564 | | | | — | | | | — | |
| | | — | | | | — | | | | — | | | | — | | | | — | | | | — | | | | — | | | | — | |
| | | 288,002 | | | | 3,210,282 | | | | 1,088,855 | | | | 353,171 | | | | 2,314,540 | | | | 19 | | | | 38 | | | | — | |
| | | 9,416 | | | | 123,768 | | | | 37,560 | | | | 41,337 | | | | 143,760 | | | | 18,282 | | | | 92,496 | | | | — | |
| | | 25,840 | | | | 268,254 | | | | 127,581 | | | | 105,613 | | | | 137,309 | | | | 37,460 | | | | 48,126 | | | | 344,043 | |
| | | 23,474 | | | | 35,135 | | | | 35,702 | | | | 31,963 | | | | 34,828 | | | | 30,860 | | | | 31,821 | | | | — | |
| | | 37,118,454 | | | | 347,755,092 | | | | 156,534,829 | | | | 120,858,315 | | | | 207,701,847 | | | | 33,078,703 | | | | 66,593,157 | | | | 711,378,050 | |
| | | | | | | | | | | | | | | | | | | | | | | | | | | | | | | | |
| | | | | | | | | | | | | | | | | | | | | | | | | | | | | | | | |
| | | 40 | | | | 878,030 | | | | 1,019 | | | | 60,921 | | | | 1,930,754 | | | | — | | | | — | | | | 9,845,000 | |
| | | 113,934 | | | | 210,545 | | | | 41,085 | | | | 84,500 | | | | 237,867 | | | | 69,393 | | | | 79,212 | | | | 6,491 | |
| | | 26,294 | | | | 220,876 | | | | 74,769 | | | | 71,522 | | | | 110,531 | | | | 392 | | | | 49,617 | | | | — | |
| | | — | | | | 12,895 | | | | 2,983 | | | | 1,669 | | | | — | | | | — | | | | 125 | | | | 562,035 | |
| | | 22,250 | | | | 189,865 | | | | 74,956 | | | | 48,194 | | | | 107,912 | | | | 20,337 | | | | 15,341 | | | | — | |
| | | 3,997 | | | | 73,779 | | | | 32,830 | | | | 25,573 | | | | — | | | | 21,207 | | | | 9,495 | | | | 53 | |
| | | 11,322 | | | | 63,765 | | | | 31,861 | | | | 25,871 | | | | 40,622 | | | | 10,705 | | | | 14,522 | | | | 84,259 | |
| | | 846 | | | | 6,923 | | | | 2,617 | | | | 2,096 | | | | 2,786 | | | | 747 | | | | 820 | | | | 215 | |
| | | 16,844 | | | | 43,663 | | | | 30,399 | | | | 30,648 | | | | 26,620 | | | | 17,486 | | | | 26,523 | | | | 34,638 | |
| | | 195,527 | | | | 1,700,341 | | | | 292,519 | | | | 350,994 | | | | 2,457,092 | | | | 140,267 | | | | 195,655 | | | | 10,532,691 | |
| | | | | | | | | | | | | | | | | | | | | | | | | | | | | | | | |
| | $ | 36,922,927 | | | $ | 346,054,751 | | | $ | 156,242,310 | | | $ | 120,507,321 | | | $ | 205,244,755 | | | $ | 32,938,436 | | | $ | 66,397,502 | | | $ | 700,845,359 | |
| | | | | | | | | | | | | | | | | | | | | | | | | | | | | | | | |
| | | | | | | | | | | | | | | | | | | | | | | | | | | | | | | | |
| | $ | 37,607,813 | | | $ | 321,506,261 | | | $ | 155,586,588 | | | $ | 125,931,017 | | | $ | 203,695,788 | | | $ | 32,949,113 | | | $ | 80,028,864 | | | $ | 701,231,585 | |
| | | (684,886 | ) | | | 24,548,490 | | | | 655,722 | | | | (5,423,696 | ) | | | 1,548,967 | | | | (10,677 | ) | | | (13,631,362 | ) | | | (386,226 | ) |
| | $ | 36,922,927 | | | $ | 346,054,751 | | | $ | 156,242,310 | | | $ | 120,507,321 | | | $ | 205,244,755 | | | $ | 32,938,436 | | | $ | 66,397,502 | | | $ | 700,845,359 | |
| | | | | | | | | | | | | | | | | | | | | | | | | | | | | | | | |
| | | | | | | | | | | | | | | | | | | | | | | | | | | | | | | | |
| | | | | | | | | | | | | | | | | | | | | | | | | | | | | | | | |
| | $ | 2,650,892 | | | $ | 7,270,291 | | | $ | 1,097,031 | | | $ | 5,835,520 | | | $ | 7,090,053 | | | $ | 13,186,178 | | | $ | 2,404,811 | | | | | |
| | | 267,202 | | | | 617,621 | | | | 97,716 | | | | 275,124 | | | | 630,827 | | | | 406,743 | | | | 266,478 | | | | | |
| | $ | 9.92 | | | $ | 11.77 | | | $ | 11.23 | | | $ | 21.21 | | | $ | 11.24 | | | $ | 32.42 | | | $ | 9.02 | | | | | |
| | | | | | | | | | | | | | | | | | | | | | | | | | | | | | | | |
| | | | | | | | | | | | | | | | | | | | | | | | | | | | | | | | |
| | $ | 4,153,839 | | | $ | 62,903,433 | | | $ | 29,473,501 | | | $ | 20,682,308 | | | $ | 21,734,084 | | | $ | 3,607,774 | | | $ | 9,302,778 | | | | | |
| | | 415,409 | | | | 5,303,156 | | | | 2,619,826 | | | | 964,503 | | | | 1,911,451 | | | | 110,328 | | | | 1,029,862 | | | | | |
| | $ | 10.00 | | | $ | 11.86 | | | $ | 11.25 | | | $ | 21.44 | | | $ | 11.37 | | | $ | 32.70 | | | $ | 9.03 | | | | | |
| | | | | | | | | | | | | | | | | | | | | | | | | | | | | | | | |
| | | | | | | | | | | | | | | | | | | | | | | | | | | | | | | | |
| | $ | 30,118,196 | | | $ | 275,881,027 | | | $ | 125,671,778 | | | $ | 93,989,493 | | | $ | 176,420,618 | | | $ | 16,144,484 | | | $ | 54,689,913 | | | | | |
| | | 3,020,785 | | | | 23,214,431 | | | | 11,153,902 | | | | 4,373,021 | | | | 15,543,359 | | | | 494,706 | | | | 6,058,923 | | | | | |
| | $ | 9.97 | | | $ | 11.88 | | | $ | 11.27 | | | $ | 21.49 | | | $ | 11.35 | | | $ | 32.63 | | | $ | 9.03 | | | | | |
| | | | | | | | | | | | | | | | | | | | | | | | | | | | | | | | |
| | | | | | | | | | | | | | | | | | | | | | | | | | | | | | | | |
| | | | | | | | | | | | | | | | | | | | | | | | | | | | | | $ | 700,845,359 | |
| | | | | | | | | | | | | | | | | | | | | | | | | | | | | | | 701,143,877 | |
| | | | | | | | | | | | | | | | | | | | | | | | | | | | | | $ | 0.9996 | |
| | | | | | | | | | | | | | | | | | | | | | | | | | | | | | | | |
| | $ | 34,092,610 | | | $ | 311,665,615 | | | $ | 148,811,903 | | | $ | 119,381,910 | | | $ | 186,314,642 | | | $ | 30,973,526 | | | $ | 67,208,469 | | | $ | 711,411,165 | |
| | $ | — | | | $ | — | | | $ | — | | | $ | — | | | $ | — | | | $ | — | | | $ | — | | | $ | — | |
| | $ | 364,022 | | | $ | 3,535,836 | | | $ | 411,074 | | | $ | 752,333 | | | $ | 3,789,594 | | | $ | 786,000 | | | $ | — | | | $ | — | |
The accompanying notes are an integral part of these financial statements.
2022 Semi-Annual Report | June 30, 2022 | Page 55 |
Statements of Operations
For the Six Months Ended June 30, 2022 (unaudited) | |
| | | Muirfield
Fund | | | Spectrum
Fund | |
Investment Income | | | | | | | | |
Interest | | $ | 7,089 | | | $ | 2,640 | |
Income from affiliates | | | 474,355 | | | | 83,317 | |
Dividends | | | 3,308,578 | | | | 1,122,801 | |
Total Investment Income | | | 3,790,022 | | | | 1,208,758 | |
| | | | | | | | | |
Fund Expenses | | | | | | | | |
Investment adviser | | | 2,191,833 | | | | 733,579 | |
Transfer agent - Retail Class | | | 19,755 | | | | 1,270 | |
Transfer agent - Adviser Class | | | 46,445 | | | | 21,422 | |
Transfer agent - Institutional Class | | | 259,724 | | | | 94,919 | |
Transfer agent - Money Market Fund | | | | | | | | |
Fund accounting | | | 52,606 | | | | 28,149 | |
Administrative | | | 231,705 | | | | 83,366 | |
Trustee | | | 15,826 | | | | 4,954 | |
Audit and tax services | | | 8,389 | | | | 8,392 | |
Legal | | | 1,280 | | | | 1,275 | |
Custody | | | 34,891 | | | | 10,922 | |
Printing | | | 2,483 | | | | 3,160 | |
Distribution plan (12b-1) - Retail Class (1) | | | 41,529 | | | | 2,646 | |
Distribution plan (12b-1) - Money Market Fund | | | | | | | | |
Shareholder service plan - Retail Class | | | 18,065 | | | | 2,117 | |
Shareholder service plan - Adviser Class | | | — | | | | — | |
Shareholder service plan - Institutional Class | | | 248,425 | | | | 56,951 | |
Postage | | | 15,994 | | | | 11,765 | |
Registration and filing | | | 32,579 | | | | 29,744 | |
Insurance | | | 17,282 | | | | 5,542 | |
Chief Compliance Officer | | | 3,534 | | | | 3,537 | |
Other | | | 25,977 | | | | 18,145 | |
Total Expenses Before Reductions | | | 3,268,322 | | | | 1,121,855 | |
| | | | | | | | | |
Expenses voluntarily reimbursed/waived by investment adviser (See Note #5) | | | — | | | | — | |
Expenses contractually reimbursed/waived by investment adviser (See Note #5) | | | — | | | | — | |
Securities lending credit (See Note #5) | | | (234 | ) | | | — | |
| | | | | | | | |
Net Expenses | | | 3,268,088 | | | | 1,121,855 | |
| | | | | | | | | |
Net Investment Income (Loss) | | | 521,934 | | | | 86,903 | |
| | | | | | | | | |
Net Realized and Unrealized Gain (Loss) from Investments | | | | | | | | |
Net realized gains (losses) from unaffiliated investments | | | 25,932,986 | | | | 8,468,442 | |
Net realized gains (losses) from affiliated investments | | | (55,653 | ) | | | (23,764 | ) |
Net realized gains (losses) from futures contracts | | | (3,805,402 | ) | | | 2,593,938 | |
Net Realized Gains (Losses) from Investment Transactions, Futures Contracts, and Distributions of Long-term Realized Gains by Other Investment Companies | | | 22,071,931 | | | | 11,038,616 | |
| | | | | | | | | |
Net change in unrealized appreciation (depreciation) of unaffiliated investments | | | (116,848,497 | ) | | | (37,244,025 | ) |
Net change in unrealized appreciation (depreciation) of affiliated investments | | | (44,732 | ) | | | (375 | ) |
Net change in unrealized appreciation (depreciation) of futures contracts | | | (1,756,569 | ) | | | (346,268 | ) |
Net Change in Unrealized Appreciation (Depreciation) of Investment Transactions and Futures Contracts | | | (118,649,798 | ) | | | (37,590,668 | ) |
| | | | | | | | | |
Net Realized and Unrealized Gain (Loss) from Investments | | | (96,577,867 | ) | | | (26,552,052 | ) |
| | | | | | | | | |
Net Change in Net Assets Resulting from Operations | | $ | (96,055,933 | ) | | $ | (26,465,149 | ) |
(1) | Only the Retail Class of shares has adopted a Rule 12b-1 Plan. See #5 of the Notes to Financial Statements. |
The accompanying notes are an integral part of these financial statements.
Page 56 | 2022 Semi-Annual Report | June 30, 2022 |
| | Global
Allocation
Fund | | | Balanced
Fund | | | Moderate
Allocation
Fund | | | Conservative
Allocation
Fund | | | Dynamic
Allocation
Fund | | | Quantex
Fund | | | Tactical
Income Fund | | | Institutional
Prime Money
Market Fund | |
| | | | | | | | | | | | | | | | | | | | | | | | | | | | | | | | |
| | $ | 6,575 | | | $ | 167,311 | | | $ | 124,862 | | | $ | 135,326 | | | $ | 2,869 | | | $ | 21 | | | $ | 110,712 | | | $ | 1,736,158 | |
| | | 34,750 | | | | 186,038 | | | | 90,190 | | | | 68,710 | | | | 106,083 | | | | 22,275 | | | | 15,781 | | | | — | |
| | | 185,703 | | | | 2,097,600 | | | | 967,570 | | | | 786,059 | | | | 1,260,863 | | | | 209,538 | | | | 446,297 | | | | — | |
| | | 227,028 | | | | 2,450,949 | | | | 1,182,622 | | | | 990,095 | | | | 1,369,815 | | | | 231,834 | | | | 572,790 | | | | 1,736,158 | |
| | | | | | | | | | | | | | | | | | | | | | | | | | | | | | | | |
| | | | | | | | | | | | | | | | | | | | | | | | | | | | | | | | |
| | | 151,949 | | | | 1,243,644 | | | | 496,073 | | | | 318,563 | | | | 816,471 | | | | 142,412 | | | | 136,206 | | | | 899,585 | |
| | | 1,834 | | | | 3,940 | | | | 660 | | | | 3,815 | | | | 5,033 | | | | 9,047 | | | | 1,024 | | | | | |
| | | 2,838 | | | | 40,743 | | | | 18,627 | | | | 13,157 | | | | 15,324 | | | | 2,543 | | | | 3,802 | | | | | |
| | | 19,640 | | | | 174,292 | | | | 79,928 | | | | 59,483 | | | | 113,184 | | | | 11,195 | | | | 22,415 | | | | | |
| | | | | | | | | | | | | | | | | | | | | | | | | | | | | | | 222,997 | |
| | | 18,433 | | | | 36,596 | | | | 26,616 | | | | 24,719 | | | | 29,476 | | | | 18,178 | | | | 21,191 | | | | 51,356 | |
| | | 20,260 | | | | 150,943 | | | | 71,102 | | | | 55,929 | | | | 93,986 | | | | 18,988 | | | | 32,200 | | | | 227,956 | |
| | | 1,272 | | | | 9,414 | | | | 4,129 | | | | 3,236 | | | | 5,286 | | | | 1,189 | | | | 1,675 | | | | 546 | |
| | | 8,389 | | | | 8,392 | | | | 9,393 | | | | 9,393 | | | | 9,427 | | | | 8,389 | | | | 7,291 | | | | 6,820 | |
| | | 1,274 | | | | 1,278 | | | | 1,275 | | | | 1,275 | | | | 1,275 | | | | 1,274 | | | | 1,275 | | | | 1,333 | |
| | | 2,127 | | | | 21,515 | | | | 9,238 | | | | 7,237 | | | | 11,110 | | | | 1,663 | | | | 3,236 | | | | 22,691 | |
| | | 87 | | | | 1,409 | | | | 713 | | | | 799 | | | | 991 | | | | 112 | | | | 303 | | | | 533 | |
| | | 3,821 | | | | 8,207 | | | | 1,376 | | | | 7,947 | | | | 10,486 | | | | 15,079 | | | | 3,199 | | | | — | |
| | | | | | | | | | | | | | | | | | | | | | | | | | | | | | | | |
| | | 3,516 | | | | 3,316 | | | | 1,101 | | | | — | | | | 4,110 | | | | 12,742 | | | | 2,303 | | | | | |
| | | — | | | | — | | | | — | | | | — | | | | — | | | | — | | | | — | | | | | |
| | | 1,800 | | | | 133,624 | | | | 59,946 | | | | 45,604 | | | | 26,410 | | | | — | | | | 18,493 | | | | | |
| | | 2 | | | | 14,231 | | | | 7,810 | | | | 8,217 | | | | 9,812 | | | | 747 | | | | 6,001 | | | | 195 | |
| | | 25,437 | | | | 32,301 | | | | 24,788 | | | | 24,434 | | | | 26,045 | | | | 21,869 | | | | 25,141 | | | | 5,163 | |
| | | 1,318 | | | | 11,589 | | | | 4,930 | | | | 3,942 | | | | 5,843 | | | | 1,187 | | | | 1,904 | | | | 9,410 | |
| | | 3,532 | | | | 3,532 | | | | 3,533 | | | | 3,532 | | | | 3,533 | | | | 3,534 | | | | 3,532 | | | | 3,517 | |
| | | 15,136 | | | | 21,556 | | | | 17,639 | | | | 17,101 | | | | 18,141 | | | | 15,434 | | | | 20,147 | | | | 43,116 | |
| | | 282,665 | | | | 1,920,522 | | | | 838,877 | | | | 608,383 | | | | 1,205,943 | | | | 285,583 | | | | 311,338 | | | | 1,495,218 | |
| | | | | | | | | | | | | | | | | | | | | | | | | | | | | | | | |
| | | — | | | | — | | | | — | | | | — | | | | (33,973 | ) | | | — | | | | (12,638 | ) | | | (938,521 | ) |
| | | — | | | | — | | | | — | | | | — | | | | (65,205 | ) | | | — | | | | (24,819 | ) | | | — | |
| | | (150 | ) | | | (4,838 | ) | | | (3,247 | ) | | | (690 | ) | | | — | | | | — | | | | — | | | | — | |
| | | | | | | | | | | | | | | | | | | | | | | | | | | | | | | | |
| | | 282,515 | | | | 1,915,684 | | | | 835,630 | | | | 607,693 | | | | 1,106,765 | | | | 285,583 | | | | 273,881 | | | | 556,697 | |
| | | | | | | | | | | | | | | | | | | | | | | | | | | | | | | | |
| | | (55,487 | ) | | | 535,265 | | | | 346,992 | | | | 382,402 | | | | 263,050 | | | | (53,749 | ) | | | 298,909 | | | | 1,179,461 | |
| | | | | | | | | | | | | | | | | | | | | | | | | | | | | | | | |
| | | | | | | | | | | | | | | | | | | | | | | | | | | | | | | | |
| | | 516,801 | | | | (714,614 | ) | | | (3,132,475 | ) | | | (3,283,390 | ) | | | 741,955 | | | | 3,492,429 | | | | (3,247,603 | ) | | | (200 | ) |
| | | (4,114 | ) | | | (50,771 | ) | | | (31,482 | ) | | | (29,805 | ) | | | (21,350 | ) | | | (2,393 | ) | | | (10,464 | ) | | | — | |
| | | (1,864,270 | ) | | | 491,269 | | | | (1,275,740 | ) | | | (1,829,812 | ) | | | (12,334,652 | ) | | | (3,243,323 | ) | | | — | | | | — | |
| | | (1,351,583 | ) | | | (274,116 | ) | | | (4,439,697 | ) | | | (5,143,007 | ) | | | (11,614,047 | ) | | | 246,713 | | | | (3,258,067 | ) | | | (200 | ) |
| | | | | | | | | | | | | | | | | | | | | | | | | | | | | | | | |
| | | (4,395,994 | ) | | | (46,271,180 | ) | | | (14,847,426 | ) | | | (8,830,546 | ) | | | (34,528,885 | ) | | | (6,658,496 | ) | | | (1,196,562 | ) | | | (350,105 | ) |
| | | (5,973 | ) | | | (11,433 | ) | | | (3,117 | ) | | | 412 | | | | (1,797 | ) | | | (4,784 | ) | | | 135 | | | | — | |
| | | (303,472 | ) | | | (499,325 | ) | | | (97,364 | ) | | | 19,519 | | | | (1,357,000 | ) | | | (160,337 | ) | | | — | | | | — | |
| | | (4,705,439 | ) | | | (46,781,938 | ) | | | (14,947,907 | ) | | | (8,810,615 | ) | | | (35,887,682 | ) | | | (6,823,617 | ) | | | (1,196,427 | ) | | | (350,105 | ) |
| | | | | | | | | | | | | | | | | | | | | | | | | | | | | | | | |
| | | (6,057,022 | ) | | | (47,056,054 | ) | | | (19,387,604 | ) | | | (13,953,622 | ) | | | (47,501,729 | ) | | | (6,576,904 | ) | | | (4,454,494 | ) | | | (350,305 | ) |
| | | | | | | | | | | | | | | | | | | | | | | | | | | | | | | | |
| | $ | (6,112,509 | ) | | $ | (46,520,789 | ) | | $ | (19,040,612 | ) | | $ | (13,571,220 | ) | | $ | (47,238,679 | ) | | $ | (6,630,653 | ) | | $ | (4,155,585 | ) | | $ | 829,156 | |
The accompanying notes are an integral part of these financial statements.
2022 Semi-Annual Report | June 30, 2022 | Page 57 |
Statements of Changes in Net Assets
For the Six Months Ended June 30, 2022 (unaudited) and the Year Ended December 31, 2021 | |
| | | Muirfield Fund | | | Spectrum Fund | |
| | | 2022 | | | 2021 | | | 2022 | | | 2021 | |
Operations | | | | | | | | | | | | | | | | |
Net investment income (loss) | | $ | 521,934 | | | $ | 1,595,623 | | | $ | 86,903 | | | $ | 94,333 | |
Net realized gain (loss) from investment transactions, futures contracts, and distributions of long-term realized gains by other investment companies | | | 22,071,931 | | | | 89,463,110 | | | | 11,038,616 | | | | 32,449,569 | |
Net change in unrealized appreciation (depreciation) of investment transactions and futures contracts | | | (118,649,798 | ) | | | 22,186,089 | | | | (37,590,668 | ) | | | 4,551,153 | |
Net change in net assets resulting from operations | | | (96,055,933 | ) | | | 113,244,822 | | | | (26,465,149 | ) | | | 37,095,055 | |
| | | | | | | | | | | | | | | | | |
Distributions to Shareholders | | | | | | | | | | | | | | | | |
Retail Class | | | — | | | | (1,428,738 | ) | | | — | | | | (133,412 | ) |
Adviser Class | | | — | | | | (3,472,675 | ) | | | — | | | | (2,008,809 | ) |
Institutional Class | | | — | | | | (18,608,096 | ) | | | — | | | | (8,934,801 | ) |
Money Market Fund | | | | | | | | | | | | | | | | |
Change in net assets resulting from distributions | | | — | | | | (23,509,509 | ) | | | — | | | | (11,077,022 | ) |
| | | | | | | | | | | | | | | | | |
Capital Transactions: | | | | | | | | | | | | | | | | |
Issued | | | 104,658,200 | | | | 317,995,936 | | | | 21,814,173 | | | | 81,698,993 | |
Reinvested | | | (1 | ) | | | 22,813,672 | | | | — | | | | 11,042,182 | |
Redeemed | | | (86,454,731 | ) | | | (283,898,369 | ) | | | (22,506,546 | ) | | | (92,934,007 | ) |
Net change in net assets resulting from capital transactions | | | 18,203,468 | | | | 56,911,239 | | | | (692,373 | ) | | | (192,832 | ) |
| | | | | | | | | | | | | | | | | |
Total Change in Net Assets | | | (77,852,465 | ) | | | 146,646,552 | | | | (27,157,522 | ) | | | 25,825,201 | |
| | | | | | | | | | | | | | | | | |
Net Assets - Beginning of Year | | | 720,471,566 | | | | 573,825,014 | | | | 211,103,754 | | | | 185,278,553 | |
| | | | | | | | | | | | | | | | | |
Net Assets - End of Period/Year | | $ | 642,619,101 | | | $ | 720,471,566 | | | $ | 183,946,232 | | | $ | 211,103,754 | |
| | | | | | | | | | | | | | | | | |
Share Transactions: | | | | | | | | | | | | | | | | |
Issued | | | 11,636,798 | | | | 35,009,621 | | | | 1,660,745 | | | | 6,207,988 | |
Reinvested | | | — | | | | 2,375,480 | | | | — | | | | 787,831 | |
Redeemed | | | (9,792,250 | ) | | | (32,086,333 | ) | | | (1,720,363 | ) | | | (7,098,087 | ) |
Net change in shares | | | 1,844,548 | | | | 5,298,768 | | | | (59,618 | ) | | | (102,268 | ) |
The accompanying notes are an integral part of these financial statements.
Page 58 | 2022 Semi-Annual Report | June 30, 2022 |
| | Global
Allocation Fund | | | Balanced Fund | | | Moderate
Allocation Fund | | | Conservative
Allocation Fund | |
| | 2022 | | | 2021 | | | 2022 | | | 2021 | | | 2022 | | | 2021 | | | 2022 | | | 2021 | |
| | | | | | | | | | | | | | | | | | | | | | | | | | | | | | | | |
| | $ | (55,487 | ) | | $ | (91,989 | ) | | $ | 535,265 | | | $ | 2,769,005 | | | $ | 346,992 | | | $ | 1,760,910 | | | $ | 382,402 | | | $ | 1,975,878 | |
| | | (1,351,583 | ) | | | 6,197,305 | | | | (274,116 | ) | | | 57,143,370 | | | | (4,439,697 | ) | | | 18,503,263 | | | | (5,143,007 | ) | | | 11,326,073 | |
| | | (4,705,439 | ) | | | (425,582 | ) | | | (46,781,938 | ) | | | (7,453,233 | ) | | | (14,947,907 | ) | | | (4,917,333 | ) | | | (8,810,615 | ) | | | (6,463,745 | ) |
| | | (6,112,509 | ) | | | 5,679,734 | | | | (46,520,789 | ) | | | 52,459,142 | | | | (19,040,612 | ) | | | 15,346,840 | | | | (13,571,220 | ) | | | 6,838,206 | |
| | | | | | | | | | | | | | | | | | | | | | | | | | | | | | | | |
| | | | | | | | | | | | | | | | | | | | | | | | | | | | | | | | |
| | | — | | | | (355,386 | ) | | | (24,624 | ) | | | (539,513 | ) | | | (1,952 | ) | | | (71,385 | ) | | | (8,243 | ) | | | (378,811 | ) |
| | | — | | | | (507,971 | ) | | | (316,556 | ) | | | (5,644,094 | ) | | | (104,519 | ) | | | (1,909,611 | ) | | | (57,717 | ) | | | (1,342,034 | ) |
| | | — | | | | (3,659,013 | ) | | | (1,386,447 | ) | | | (24,757,476 | ) | | | (444,621 | ) | | | (9,206,005 | ) | | | (218,209 | ) | | | (6,369,177 | ) |
| | | | | | | | | | | | | | | | | | | | | | | | | | | | | | | | |
| | | — | | | | (4,522,370 | ) | | | (1,727,627 | ) | | | (30,941,083 | ) | | | (551,092 | ) | | | (11,187,001 | ) | | | (284,169 | ) | | | (8,090,022 | ) |
| | | | | | | | | | | | | | | | | | | | | | | | | | | | | | | | |
| | | | | | | | | | | | | | | | | | | | | | | | | | | | | | | | |
| | | 3,118,944 | | | | 11,805,911 | | | | 45,194,548 | | | | 153,194,019 | | | | 18,568,989 | | | | 66,121,514 | | | | 15,990,633 | | | | 54,257,997 | |
| | | — | | | | 4,521,300 | | | | 1,714,704 | | | | 30,784,411 | | | | 548,109 | | | | 11,120,325 | | | | 282,499 | | | | 8,047,628 | |
| | | (5,339,307 | ) | | | (17,810,709 | ) | | | (39,855,909 | ) | | | (214,744,638 | ) | | | (17,041,328 | ) | | | (83,908,176 | ) | | | (16,380,005 | ) | | | (68,102,776 | ) |
| | | (2,220,363 | ) | | | (1,483,498 | ) | | | 7,053,343 | | | | (30,766,208 | ) | | | 2,075,770 | | | | (6,666,337 | ) | | | (106,873 | ) | | | (5,797,151 | ) |
| | | | | | | | | | | | | | | | | | | | | | | | | | | | | | | | |
| | | (8,332,872 | ) | | | (326,134 | ) | | | (41,195,073 | ) | | | (9,248,149 | ) | | | (17,515,934 | ) | | | (2,506,498 | ) | | | (13,962,262 | ) | | | (7,048,967 | ) |
| | | | | | | | | | | | | | | | | | | | | | | | | | | | | | | | |
| | | 45,255,799 | | | | 45,581,933 | | | | 387,249,824 | | | | 396,497,973 | | | | 173,758,244 | | | | 176,264,742 | | | | 134,469,583 | | | | 141,518,550 | |
| | | | | | | | | | | | | | | | | | | | | | | | | | | | | | | | |
| | $ | 36,922,927 | | | $ | 45,255,799 | | | $ | 346,054,751 | | | $ | 387,249,824 | | | $ | 156,242,310 | | | $ | 173,758,244 | | | $ | 120,507,321 | | | $ | 134,469,583 | |
| | | | | | | | | | | | | | | | | | | | | | | | | | | | | | | | |
| | | | | | | | | | | | | | | | | | | | | | | | | | | | | | | | |
| | | 292,928 | | | | 982,056 | | | | 3,544,577 | | | | 11,296,376 | | | | 1,537,306 | | | | 5,159,224 | | | | 701,399 | | | | 2,206,952 | |
| | | — | | | | 390,033 | | | | 144,399 | | | | 2,261,914 | | | | 48,651 | | | | 873,520 | | | | 13,158 | | | | 333,814 | |
| | | (497,405 | ) | | | (1,467,025 | ) | | | (3,135,069 | ) | | | (15,681,027 | ) | | | (1,420,743 | ) | | | (6,532,488 | ) | | | (719,913 | ) | | | (2,774,610 | ) |
| | | (204,477 | ) | | | (94,936 | ) | | | 553,907 | | | | (2,122,737 | ) | | | 165,214 | | | | (499,744 | ) | | | (5,356 | ) | | | (233,844 | ) |
The accompanying notes are an integral part of these financial statements.
2022 Semi-Annual Report | June 30, 2022 | Page 59 |
Statements of Changes in Net Assets
For the Six Months Ended June 30, 2022 (unaudited) and the Year Ended December 31, 2021 | |
| | | Dynamic
Allocation Fund | |
| | | 2022 | | | 2021 | |
Operations | | | | | | | | |
Net investment income (loss) | | $ | 263,050 | | | $ | 405,885 | |
Net realized gain (loss) from investment transactions, futures contracts, and distributions of long-term realized gains by other investment companies | | | (11,614,047 | ) | | | 33,126,774 | |
Net change in unrealized appreciation (depreciation) of investment transactions and futures contracts | | | (35,887,682 | ) | | | 4,297,387 | |
Net change in net assets resulting from operations | | | (47,238,679 | ) | | | 37,830,046 | |
| | | | | | | | | |
Distributions to Shareholders | | | | | | | | |
Retail Class | | | — | | | | (1,288,985 | ) |
Adviser Class | | | — | | | | (3,644,420 | ) |
Institutional Class | | | — | | | | (25,897,027 | ) |
Money Market Fund | | | | | | | | |
Change in net assets resulting from distributions | | | — | | | | (30,830,432 | ) |
| | | | | | | | | |
Capital Transactions: | | | | | | | | |
Issued | | | 39,644,847 | | | | 108,187,090 | |
Reinvested | | | — | | | | 30,789,232 | |
Redeemed | | | (24,892,828 | ) | | | (107,524,267 | ) |
Net change in net assets resulting from capital transactions | | | 14,752,019 | | | | 31,452,055 | |
| | | | | | | | | |
Total Change in Net Assets | | | (32,486,660 | ) | | | 38,451,669 | |
| | | | | | | | | |
Net Assets - Beginning of Year | | | 237,731,415 | | | | 199,279,746 | |
| | | | | | | | | |
Net Assets - End of Period/Year | | $ | 205,244,755 | | | $ | 237,731,415 | |
| | | | | | | | | |
Share Transactions: | | | | | | | | |
Issued | | | 3,102,252 | | | | 7,360,966 | |
Reinvested | | | — | | | | 2,185,338 | |
Redeemed | | | (1,945,666 | ) | | | (7,446,963 | ) |
Net change in shares | | | 1,156,586 | | | | 2,099,341 | |
The accompanying notes are an integral part of these financial statements.
Page 60 | 2022 Semi-Annual Report | June 30, 2022 |
| | Quantex Fund | | | Tactical
Income Fund | | | Institutional
Prime
Money Market
Fund | |
| | 2022 | | | 2021 | | | 2022 | | | 2021 | | | 2022 | | | 2021 | |
| | | | | | | | | | | | | | | | | | | | | | | | |
| | $ | (53,749 | ) | | $ | 49,174 | | | $ | 298,909 | | | $ | 1,269,628 | | | $ | 1,179,461 | | | $ | 193,476 | |
| | | 246,713 | | | | 10,644,111 | | | | (3,258,067 | ) | | | 2,061,332 | | | | (200 | ) | | | 229 | |
| | | (6,823,617 | ) | | | (213,812 | ) | | | (1,196,427 | ) | | | (4,500,178 | ) | | | (350,105 | ) | | | (67,755 | ) |
| | | (6,630,653 | ) | | | 10,479,473 | | | | (4,155,585 | ) | | | (1,169,218 | ) | | | 829,156 | | | | 125,950 | |
| | | | | | | | | | | | | | | | | | | | | | | | |
| | | | | | | | | | | | | | | | | | | | | | | | |
| | | — | | | | (2,350,162 | ) | | | (6,535 | ) | | | (40,103 | ) | | | | | | | | |
| | | — | | | | (649,230 | ) | | | (44,284 | ) | | | (185,140 | ) | | | | | | | | |
| | | — | | | | (3,059,421 | ) | | | (248,797 | ) | | | (1,070,555 | ) | | | | | | | | |
| | | | | | | | | | | | | | | | | | | (1,179,462 | ) | | | (193,478 | ) |
| | | — | | | | (6,058,813 | ) | | | (299,616 | ) | | | (1,295,798 | ) | | | (1,179,462 | ) | | | (193,478 | ) |
| | | | | | | | | | | | | | | | | | | | | | | | |
| | | | | | | | | | | | | | | | | | | | | | | | |
| | | 1,831,987 | | | | 16,768,435 | | | | 11,331,035 | | | | 36,170,527 | | | | 708,125,113 | | | | 1,011,642,367 | |
| | | — | | | | 6,046,958 | | | | 299,029 | | | | 1,288,487 | | | | 71,387 | | | | 35,042 | |
| | | (4,289,790 | ) | | | (25,302,418 | ) | | | (10,118,477 | ) | | | (33,757,101 | ) | | | (633,994,246 | ) | | | (721,061,508 | ) |
| | | (2,457,803 | ) | | | (2,487,025 | ) | | | 1,511,587 | | | | 3,701,913 | | | | 74,202,254 | | | | 290,615,901 | |
| | | | | | | | | | | | | | | | | | | | | | | | |
| | | (9,088,456 | ) | | | 1,933,635 | | | | (2,943,614 | ) | | | 1,236,897 | | | | 73,851,948 | | | | 290,548,373 | |
| | | | | | | | | | | | | | | | | | | | | | | | |
| | | 42,026,892 | | | | 40,093,257 | | | | 69,341,116 | | | | 68,104,219 | | | | 626,993,411 | | | | 336,445,038 | |
| | | | | | | | | | | | | | | | | | | | | | | | |
| | $ | 32,938,436 | | | $ | 42,026,892 | | | $ | 66,397,502 | | | $ | 69,341,116 | | | $ | 700,845,359 | | | $ | 626,993,411 | |
| | | | | | | | | | | | | | | | | | | | | | | | |
| | | | | | | | | | | | | | | | | | | | | | | | |
| | | 49,724 | | | | 415,083 | | | | 1,210,976 | | | | 3,681,061 | | | | 708,313,030 | | | | 1,011,455,624 | |
| | | — | | | | 154,992 | | | | 32,302 | | | | 132,173 | | | | 71,475 | | | | 35,036 | |
| | | (115,279 | ) | | | (616,603 | ) | | | (1,084,237 | ) | | | (3,434,958 | ) | | | (634,163,596 | ) | | | (720,922,007 | ) |
| | | (65,555 | ) | | | (46,528 | ) | | | 159,041 | | | | 378,276 | | | | 74,220,909 | | | | 290,568,653 | |
The accompanying notes are an integral part of these financial statements.
2022 Semi-Annual Report | June 30, 2022 | Page 61 |
Financial Highlights
For the Six Months Ended June 30, 2022 (unaudited) and the Years Ended December 31, | |
| | | | | | | Income
from
Investment Operations | | | Less
Distributions | |
| | Net Asset
Value,
Beginning
of Period | | | Net
Investment
Income
(Loss) (5) | | | Net gains (losses)
on securities and
futures (both realized
and unrealized) | | | Total from
Investment
Operations | | | From Net
Investment
Income | | | From Net
Capital
Gains | | | From
Return of
Capital | | | Total
Distributions | |
Muirfield Fund - Retail Class (1)(2)(3)(4) |
2022 | | $ | 9.53 | | | | (0.00 | ) | | | (1.25 | ) | | | (1.25 | ) | | | 0.00 | | | | 0.00 | | | | 0.00 | | | | 0.00 | |
2021 | | $ | 8.20 | | | | (0.01 | ) | | | 1.66 | | | | 1.65 | | | | (0.07 | ) | | | (0.25 | ) | | | 0.00 | | | | (0.32 | ) |
2020 | | $ | 7.91 | | | | 0.03 | | | | 0.31 | | | | 0.34 | | | | (0.05 | ) | | | 0.00 | | | | 0.00 | | | | (0.05 | ) |
2019 | | $ | 7.16 | | | | 0.07 | | | | 0.89 | | | | 0.96 | | | | (0.03 | ) | | | (0.18 | ) | | | 0.00 | | | | (0.21 | ) |
2018 | | $ | 7.54 | | | | 0.04 | | | | (0.31 | ) | | | (0.27 | ) | | | (0.04 | ) | | | (0.07 | ) | | | 0.00 | | | | (0.11 | ) |
2017 | | $ | 6.79 | | | | 0.04 | | | | 1.34 | | | | 1.38 | | | | (0.04 | ) | | | (0.59 | ) | | | 0.00 | | | | (0.63 | ) |
Muirfield Fund - Adviser Class (1)(2)(3)(4) |
2022 | | $ | 9.63 | | | | 0.01 | | | | (1.26 | ) | | | (1.25 | ) | | | 0.00 | | | | 0.00 | | | | 0.00 | | | | 0.00 | |
2021 | | $ | 8.26 | | | | 0.03 | | | | 1.67 | | | | 1.70 | | | | (0.08 | ) | | | (0.25 | ) | | | 0.00 | | | | (0.33 | ) |
2020 | | $ | 7.97 | | | | 0.05 | | | | 0.31 | | | | 0.36 | | | | (0.07 | ) | | | 0.00 | | | | 0.00 | | | | (0.07 | ) |
2019 | | $ | 7.20 | | | | 0.09 | | | | 0.90 | | | | 0.99 | | | | (0.04 | ) | | | (0.18 | ) | | | 0.00 | | | | (0.22 | ) |
2018 | | $ | 7.57 | | | | 0.06 | | | | (0.31 | ) | | | (0.25 | ) | | | (0.05 | ) | | | (0.07 | ) | | | 0.00 | | | | (0.12 | ) |
2017 | | $ | 6.80 | | | | 0.05 | | | | 1.34 | | | | 1.39 | | | | (0.03 | ) | | | (0.59 | ) | | | 0.00 | | | | (0.62 | ) |
Muirfield Fund - Institutional Class (1)(2)(3)(4) |
2022 | | $ | 9.65 | | | | 0.01 | | | | (1.26 | ) | | | (1.25 | ) | | | 0.00 | | | | 0.00 | | | | 0.00 | | | | 0.00 | |
2021 | | $ | 8.28 | | | | 0.03 | | | | 1.66 | | | | 1.69 | | | | (0.07 | ) | | | (0.25 | ) | | | 0.00 | | | | (0.32 | ) |
2020 | | $ | 7.99 | | | | 0.05 | | | | 0.31 | | | | 0.36 | | | | (0.07 | ) | | | 0.00 | | | | 0.00 | | | | (0.07 | ) |
2019 | | $ | 7.21 | | | | 0.10 | | | | 0.90 | | | | 1.00 | | | | (0.04 | ) | | | (0.18 | ) | | | 0.00 | | | | (0.22 | ) |
2018 | | $ | 7.57 | | | | 0.08 | | | | (0.31 | ) | | | (0.23 | ) | | | (0.06 | ) | | | (0.07 | ) | | | 0.00 | | | | (0.13 | ) |
2017 | | $ | 6.80 | | | | 0.07 | | | | 1.33 | | | | 1.40 | | | | (0.04 | ) | | | (0.59 | ) | | | 0.00 | | | | (0.63 | ) |
Spectrum Fund - Retail Class (1)(2)(3)(4) |
2022 | | $ | 13.88 | | | | (0.02 | ) | | | (1.74 | ) | | | (1.76 | ) | | | 0.00 | | | | 0.00 | | | | 0.00 | | | | 0.00 | |
2021 | | $ | 12.15 | | | | (0.06 | ) | | | 2.56 | | | | 2.50 | | | | (0.03 | ) | | | (0.74 | ) | | | 0.00 | | | | (0.77 | ) |
2020 | | $ | 12.19 | | | | (0.00 | ) | | | (0.03 | ) | | | (0.03 | ) | | | (0.01 | ) | | | 0.00 | | | | 0.00 | | | | (0.01 | ) |
2019 | | $ | 10.89 | | | | 0.04 | | | | 1.38 | | | | 1.42 | | | | (0.01 | ) | | | (0.11 | ) | | | 0.00 | | | | (0.12 | ) |
2018 | | $ | 11.48 | | | | 0.03 | | | | (0.49 | ) | | | (0.46 | ) | | | 0.00 | | | | (0.13 | ) | | | 0.00 | | | | (0.13 | ) |
2017 | | $ | 10.28 | | | | (0.01 | ) | | | 1.99 | | | | 1.98 | | | | 0.00 | | | | (0.78 | ) | | | 0.00 | | | | (0.78 | ) |
Spectrum Fund - Adviser Class (1)(2)(3)(4) |
2022 | | $ | 13.96 | | | | 0.01 | | | | (1.75 | ) | | | (1.74 | ) | | | 0.00 | | | | 0.00 | | | | 0.00 | | | | 0.00 | |
2021 | | $ | 12.17 | | | | 0.02 | | | | 2.54 | | | | 2.56 | | | | (0.03 | ) | | | (0.74 | ) | | | 0.00 | | | | (0.77 | ) |
2020 | | $ | 12.27 | | | | 0.03 | | | | (0.02 | ) | | | 0.01 | | | | (0.11 | ) | | | 0.00 | | | | 0.00 | | | | (0.11 | ) |
2019 | | $ | 10.95 | | | | 0.07 | | | | 1.37 | | | | 1.44 | | | | (0.01 | ) | | | (0.11 | ) | | | 0.00 | | | | (0.12 | ) |
2018 | | $ | 11.53 | | | | 0.06 | | | | (0.48 | ) | | | (0.42 | ) | | | (0.03 | ) | | | (0.13 | ) | | | 0.00 | | | | (0.16 | ) |
2017 | | $ | 10.29 | | | | 0.02 | | | | 2.00 | | | | 2.02 | | | | 0.00 | | | | (0.78 | ) | | | 0.00 | | | | (0.78 | ) |
Spectrum Fund - Institutional Class (1)(2)(3)(4) |
2022 | | $ | 14.01 | | | | 0.01 | | | | (1.77 | ) | | | (1.76 | ) | | | 0.00 | | | | 0.00 | | | | 0.00 | | | | 0.00 | |
2021 | | $ | 12.22 | | | | 0.01 | | | | 2.55 | | | | 2.56 | | | | (0.03 | ) | | | (0.74 | ) | | | 0.00 | | | | (0.77 | ) |
2020 | | $ | 12.31 | | | | 0.04 | | | | (0.02 | ) | | | 0.02 | | | | (0.11 | ) | | | 0.00 | | | | 0.00 | | | | (0.11 | ) |
2019 | | $ | 10.96 | | | | 0.09 | | | | 1.38 | | | | 1.47 | | | | (0.01 | ) | | | (0.11 | ) | | | 0.00 | | | | (0.12 | ) |
2018 | | $ | 11.54 | | | | 0.08 | | | | (0.49 | ) | | | (0.41 | ) | | | (0.04 | ) | | | (0.13 | ) | | | 0.00 | | | | (0.17 | ) |
2017 | | $ | 10.29 | | | | 0.05 | | | | 1.98 | | | | 2.03 | | | | 0.00 | | | | (0.78 | ) | | | 0.00 | | | | (0.78 | ) |
|
See footnotes on pages 70 and 71.
The accompanying notes are an integral part of these financial statements.
Page 62 | 2022 Semi-Annual Report | June 30, 2022 |
| | | | | | | | | | Ratios/
Supplemental
Data | |
| | Net Asset
Value, End
of Period | | | Total Return
(Assumes
Reinvestment of
Distributions) | | | Net Assets,
End of Period
($000) | | | Ratio of Net
Investment
Income (Loss)
to Average
Net Assets | | | Ratio of Expenses to
Average Net Assets
After Fee Reductions (6) | | | Ratio of Expenses
to Average Net
Assets Before Fee
Reductions (7) | | | Portfolio
Turnover
Rate | |
| | | | |
| | $ | 8.28 | | | | (13.12 | %) | | $ | 39,947 | | | | (0.05 | %) | | | 1.15 | % | | | 1.15 | % | | | 144 | % |
| | $ | 9.53 | | | | 20.20 | % | | $ | 43,353 | | | | (0.06 | %) | | | 1.21 | % | | | 1.21 | % | | | 197 | % |
| | $ | 8.20 | | | | 4.36 | % | | $ | 134,240 | | | | 0.35 | % | | | 1.28 | % | | | 1.28 | % | | | 225 | % |
| | $ | 7.91 | | | | 13.53 | % | | $ | 189,105 | | | | 0.94 | % | | | 1.28 | % | | | 1.28 | % | | | 222 | % |
| | $ | 7.16 | | | | (3.66 | %) | | $ | 203,287 | | | | 0.54 | % | | | 1.32 | % | | | 1.32 | % | | | 225 | % |
| | $ | 7.54 | | | | 20.29 | % | | $ | 250,322 | | | | 0.49 | % | | | 1.33 | % | | | 1.33 | % | | | 276 | % |
| | | |
| | $ | 8.38 | | | | (12.98 | %) | | $ | 90,080 | | | | 0.24 | % | | | 0.86 | % | | | 0.86 | % | | | 144 | % |
| | $ | 9.63 | | | | 20.61 | % | | $ | 104,300 | | | | 0.33 | % | | | 0.90 | % | | | 0.90 | % | | | 197 | % |
| | $ | 8.26 | | | | 4.67 | % | | $ | 48,953 | | | | 0.64 | % | | | 0.98 | % | | | 0.98 | % | | | 225 | % |
| | $ | 7.97 | | | | 13.81 | % | | $ | 60,024 | | | | 1.14 | % | | | 1.09 | % | | | 1.09 | % | | | 222 | % |
| | $ | 7.20 | | | | (3.39 | %) | | $ | 61,159 | | | | 0.79 | % | | | 1.10 | % | | | 1.17 | % | | | 225 | % |
| | $ | 7.57 | | | | 20.50 | % | | $ | 41,440 | | | | 0.71 | % | | | 1.11 | % | | | 1.20 | % | | | 276 | % |
| | | |
| | $ | 8.40 | | | | (12.95 | %) | | $ | 512,591 | | | | 0.15 | % | | | 0.95 | % | | | 0.95 | % | | | 144 | % |
| | $ | 9.65 | | | | 20.55 | % | | $ | 572,819 | | | | 0.27 | % | | | 0.94 | % | | | 0.95 | % | | | 197 | % |
| | $ | 8.28 | | | | 4.66 | % | | $ | 390,632 | | | | 0.73 | % | | | 0.88 | % | | | 0.97 | % | | | 225 | % |
| | $ | 7.99 | | | | 14.01 | % | | $ | 432,299 | | | | 1.35 | % | | | 0.87 | % | | | 0.98 | % | | | 222 | % |
| | $ | 7.21 | | | | (3.17 | %) | | $ | 346,563 | | | | 1.00 | % | | | 0.90 | % | | | 0.98 | % | | | 225 | % |
| | $ | 7.57 | | | | 20.60 | % | | $ | 186,200 | | | | 0.88 | % | | | 0.91 | % | | | 1.00 | % | | | 276 | % |
| | | |
| | $ | 12.12 | | | | (12.68 | %) | | $ | 1,818 | | | | (0.31 | %) | | | 1.53 | % | | | 1.53 | % | | | 167 | % |
| | $ | 13.88 | | | | 20.58 | % | | $ | 2,526 | | | | (0.43 | %) | | | 1.49 | % | | | 1.49 | % | | | 200 | % |
| | $ | 12.15 | | | | (0.23 | %) | | $ | 36,604 | | | | (0.04 | %) | | | 1.73 | % | | | 1.73 | % | | | 182 | % |
| | $ | 12.19 | | | | 13.03 | % | | $ | 51,060 | | | | 0.37 | % | | | 1.77 | % | | | 1.77 | % | | | 74 | % |
| | $ | 10.89 | | | | (3.97 | %) | | $ | 51,083 | | | | 0.26 | % | | | 1.89 | % | | | 1.89 | % | | | 97 | % |
| | $ | 11.48 | | | | 19.28 | % | | $ | 59,441 | | | | (0.08 | %) | | | 2.16 | % | | | 2.16 | % | | | 120 | % |
| | | |
| | $ | 12.22 | | | | (12.46 | %) | | $ | 32,467 | | | | 0.15 | % | | | 1.08 | % | | | 1.08 | % | | | 167 | % |
| | $ | 13.96 | | | | 21.07 | % | | $ | 38,190 | | | | 0.11 | % | | | 1.09 | % | | | 1.09 | % | | | 200 | % |
| | $ | 12.17 | | | | 0.18 | % | | $ | 12,475 | | | | 0.32 | % | | | 1.36 | % | | | 1.36 | % | | | 182 | % |
| | $ | 12.27 | | | | 13.17 | % | | $ | 15,564 | | | | 0.63 | % | | | 1.51 | % | | | 1.51 | % | | | 74 | % |
| | $ | 10.95 | | | | (3.67 | %) | | $ | 14,486 | | | | 0.49 | % | | | 1.70 | % | | | 1.70 | % | | | 97 | % |
| | $ | 11.53 | | | | 19.65 | % | | $ | 12,921 | | | | 0.21 | % | | | 1.89 | % | | | 2.01 | % | | | 120 | % |
| | | |
| | $ | 12.25 | | | | (12.56 | %) | | $ | 149,661 | | | | 0.08 | % | | | 1.15 | % | | | 1.15 | % | | | 167 | % |
| | $ | 14.01 | | | | 20.98 | % | | $ | 170,388 | | | | 0.05 | % | | | 1.13 | % | | | 1.13 | % | | | 200 | % |
| | $ | 12.22 | | | | 0.25 | % | | $ | 136,200 | | | | 0.33 | % | | | 1.32 | % | | | 1.33 | % | | | 182 | % |
| | $ | 12.31 | | | | 13.44 | % | | $ | 146,443 | | | | 0.77 | % | | | 1.38 | % | | | 1.40 | % | | | 74 | % |
| | $ | 10.96 | | | | (3.51 | %) | | $ | 117,166 | | | | 0.71 | % | | | 1.50 | % | | | 1.50 | % | | | 97 | % |
| | $ | 11.54 | | | | 19.75 | % | | $ | 82,513 | | | | 0.45 | % | | | 1.70 | % | | | 1.82 | % | | | 120 | % |
| | | |
See footnotes on pages 70 and 71.
The accompanying notes are an integral part of these financial statements.
2022 Semi-Annual Report | June 30, 2022 | Page 63 |
Financial Highlights
For the Six Months Ended June 30, 2022 (unaudited) and the Years Ended December 31, | |
| | | | | | | Income
from
Investment Operations | | | Less
Distributions | |
| | Net Asset
Value,
Beginning
of Period | | | Net
Investment
Income
(Loss) (5) | | | Net gains (losses)
on securities and
futures (both realized
and unrealized) | | | Total from
Investment
Operations | | | From Net
Investment
Income | | | From Net
Capital
Gains | | | From
Return of
Capital | | | Total
Distributions | |
Global Allocation Fund - Retail Class (1)(2)(3)(4) |
2022 | | $ | 11.55 | | | | (0.04 | ) | | | (1.59 | ) | | | (1.63 | ) | | | 0.00 | | | | 0.00 | | | | 0.00 | | | | 0.00 | |
2021 | | $ | 11.40 | | | | (0.08 | ) | | | 1.52 | | | | 1.44 | | | | 0.00 | | | | (1.29 | ) | | | 0.00 | | | | (1.29 | ) |
2020 | | $ | 11.32 | | | | (0.02 | ) | | | 0.35 | | | | 0.33 | | | | 0.00 | | | | (0.25 | ) | | | 0.00 | | | | (0.25 | ) |
2019 | | $ | 10.22 | | | | 0.08 | | | | 1.26 | | | | 1.34 | | | | (0.04 | ) | | | (0.20 | ) | | | 0.00 | | | | (0.24 | ) |
2018 | | $ | 11.53 | | | | 0.05 | | | | (0.85 | ) | | | (0.80 | ) | | | (0.06 | ) | | | (0.45 | ) | | | 0.00 | | | | (0.51 | ) |
2017 | | $ | 9.56 | | | | 0.04 | | | | 2.09 | | | | 2.13 | | | | (0.03 | ) | | | (0.13 | ) | | | 0.00 | | | | (0.16 | ) |
Global Allocation Fund - Adviser Class (1)(2)(3)(4) |
2022 | | $ | 11.61 | | | | (0.01 | ) | | | (1.60 | ) | | | (1.61 | ) | | | 0.00 | | | | 0.00 | | | | 0.00 | | | | 0.00 | |
2021 | | $ | 11.42 | | | | (0.02 | ) | | | 1.50 | | | | 1.48 | | | | 0.00 | | | | (1.29 | ) | | | 0.00 | | | | (1.29 | ) |
2020 | | $ | 11.35 | | | | 0.01 | | | | 0.37 | | | | 0.38 | | | | (0.06 | ) | | | (0.25 | ) | | | 0.00 | | | | (0.31 | ) |
2019 | | $ | 10.24 | | | | 0.11 | | | | 1.25 | | | | 1.36 | | | | (0.05 | ) | | | (0.20 | ) | | | 0.00 | | | | (0.25 | ) |
2018 | | $ | 11.54 | | | | 0.09 | | | | (0.86 | ) | | | (0.77 | ) | | | (0.08 | ) | | | (0.45 | ) | | | 0.00 | | | | (0.53 | ) |
2017 | | $ | 9.57 | | | | 0.15 | | | | 2.03 | | | | 2.18 | | | | (0.08 | ) | | | (0.13 | ) | | | 0.00 | | | | (0.21 | ) |
Global Allocation Fund - Institutional Class (1)(2)(3)(4) |
2022 | | $ | 11.58 | | | | (0.01 | ) | | | (1.60 | ) | | | (1.61 | ) | | | 0.00 | | | | 0.00 | | | | 0.00 | | | | 0.00 | |
2021 | | $ | 11.38 | | | | (0.02 | ) | | | 1.51 | | | | 1.49 | | | | 0.00 | | | | (1.29 | ) | | | 0.00 | | | | (1.29 | ) |
2020 | | $ | 11.36 | | | | 0.02 | | | | 0.35 | | | | 0.37 | | | | (0.10 | ) | | | (0.25 | ) | | | 0.00 | | | | (0.35 | ) |
2019 | | $ | 10.24 | | | | 0.13 | | | | 1.26 | | | | 1.39 | | | | (0.07 | ) | | | (0.20 | ) | | | 0.00 | | | | (0.27 | ) |
2018 | | $ | 11.55 | | | | 0.11 | | | | (0.86 | ) | | | (0.75 | ) | | | (0.11 | ) | | | (0.45 | ) | | | 0.00 | | | | (0.56 | ) |
2017 | | $ | 9.58 | | | | 0.12 | | | | 2.09 | | | | 2.21 | | | | (0.11 | ) | | | (0.13 | ) | | | 0.00 | | | | (0.24 | ) |
Balanced Fund - Retail Class (1)(2)(3)(4) |
2022 | | $ | 13.42 | | | | 0.00 | | | | (1.61 | ) | | | (1.61 | ) | | | (0.04 | ) | | | 0.00 | | | | 0.00 | | | | (0.04 | ) |
2021 | | $ | 12.82 | | | | (0.01 | ) | | | 1.71 | | | | 1.70 | | | | (0.16 | ) | | | (0.94 | ) | | | 0.00 | | | | (1.10 | ) |
2020 | | $ | 12.26 | | | | 0.08 | | | | 0.56 | | | | 0.64 | | | | (0.08 | ) | | | 0.00 | | | | 0.00 | | | | (0.08 | ) |
2019 | | $ | 11.08 | | | | 0.16 | | | | 1.20 | | | | 1.36 | | | | (0.09 | ) | | | (0.09 | ) | | | 0.00 | | | | (0.18 | ) |
2018 | | $ | 11.61 | | | | 0.12 | | | | (0.49 | ) | | | (0.37 | ) | | | (0.10 | ) | | | (0.06 | ) | | | 0.00 | | | | (0.16 | ) |
2017 | | $ | 10.74 | | | | 0.09 | | | | 1.49 | | | | 1.58 | | | | (0.11 | ) | | | (0.60 | ) | | | 0.00 | | | | (0.71 | ) |
Balanced Fund - Adviser Class (1)(2)(3)(4) |
2022 | | $ | 13.53 | | | | 0.02 | | | | (1.63 | ) | | | (1.61 | ) | | | (0.06 | ) | | | 0.00 | | | | 0.00 | | | | (0.06 | ) |
2021 | | $ | 12.92 | | | | 0.11 | | | | 1.66 | | | | 1.77 | | | | (0.22 | ) | | | (0.94 | ) | | | 0.00 | | | | (1.16 | ) |
2020 | | $ | 12.35 | | | | 0.13 | | | | 0.56 | | | | 0.69 | | | | (0.12 | ) | | | 0.00 | | | | 0.00 | | | | (0.12 | ) |
2019 | | $ | 11.15 | | | | 0.19 | | | | 1.21 | | | | 1.40 | | | | (0.11 | ) | | | (0.09 | ) | | | 0.00 | | | | (0.20 | ) |
2018 | | $ | 11.68 | | | | 0.15 | | | | (0.49 | ) | | | (0.34 | ) | | | (0.13 | ) | | | (0.06 | ) | | | 0.00 | | | | (0.19 | ) |
2017 | | $ | 10.74 | | | | 0.13 | | | | 1.50 | | | | 1.63 | | | | (0.09 | ) | | | (0.60 | ) | | | 0.00 | | | | (0.69 | ) |
Balanced Fund - Institutional Class (1)(2)(3)(4) |
2022 | | $ | 13.56 | | | | 0.02 | | | | (1.64 | ) | | | (1.62 | ) | | | (0.06 | ) | | | 0.00 | | | | 0.00 | | | | (0.06 | ) |
2021 | | $ | 12.94 | | | | 0.10 | | | | 1.67 | | | | 1.77 | | | | (0.21 | ) | | | (0.94 | ) | | | 0.00 | | | | (1.15 | ) |
2020 | | $ | 12.36 | | | | 0.14 | | | | 0.55 | | | | 0.69 | | | | (0.11 | ) | | | 0.00 | | | | 0.00 | | | | (0.11 | ) |
2019 | | $ | 11.15 | | | | 0.21 | | | | 1.21 | | | | 1.42 | | | | (0.12 | ) | | | (0.09 | ) | | | 0.00 | | | | (0.21 | ) |
2018 | | $ | 11.68 | | | | 0.18 | | | | (0.51 | ) | | | (0.33 | ) | | | (0.14 | ) | | | (0.06 | ) | | | 0.00 | | | | (0.20 | ) |
2017 | | $ | 10.75 | | | | 0.16 | | | | 1.47 | | | | 1.63 | | | | (0.10 | ) | | | (0.60 | ) | | | 0.00 | | | | (0.70 | ) |
|
See footnotes on pages 70 and 71.
The accompanying notes are an integral part of these financial statements.
Page 64 | 2022 Semi-Annual Report | June 30, 2022 |
| | | | | | | | | | Ratios/
Supplemental
Data | |
| | Net Asset
Value, End
of Period | | | Total Return
(Assumes
Reinvestment of
Distributions) | | | Net Assets,
End of Period
($000) | | | Ratio of Net
Investment
Income (Loss)
to Average
Net Assets | | | Ratio of Expenses to
Average Net Assets
After Fee Reductions (6) | | | Ratio of Expenses
to Average Net
Assets Before Fee
Reductions (7) | | | Portfolio
Turnover
Rate | |
| | | |
| | $ | 9.92 | | | | (14.11 | %) | | $ | 2,651 | | | | (0.72 | %) | | | 1.83 | % | | | 1.83 | % | | | 147 | % |
| | $ | 11.55 | | | | 12.58 | % | | $ | 3,567 | | | | (0.63 | %) | | | 1.72 | % | | | 1.72 | % | | | 173 | % |
| | $ | 11.40 | | | | 2.96 | % | | $ | 9,001 | | | | (0.25 | %) | | | 1.74 | % | | | 1.74 | % | | | 179 | % |
| | $ | 11.32 | | | | 13.17 | % | | $ | 11,154 | | | | 0.76 | % | | | 1.68 | % | | | 1.68 | % | | | 185 | % |
| | $ | 10.22 | | | | (6.94 | %) | | $ | 13,810 | | | | 0.47 | % | | | 1.63 | % | | | 1.63 | % | | | 163 | % |
| | $ | 11.53 | | | | 22.33 | % | | $ | 35,512 | | | | 0.35 | % | | | 1.63 | % | | | 1.63 | % | | | 179 | % |
| | | |
| | $ | 10.00 | | | | (13.87 | %) | | $ | 4,154 | | | | (0.24 | %) | | | 1.35 | % | | | 1.35 | % | | | 147 | % |
| | $ | 11.61 | | | | 12.90 | % | | $ | 5,099 | | | | (0.14 | %) | | | 1.31 | % | | | 1.31 | % | | | 173 | % |
| | $ | 11.42 | | | | 3.42 | % | | $ | 1,740 | | | | 0.09 | % | | | 1.40 | % | | | 1.40 | % | | | 179 | % |
| | $ | 11.35 | | | | 13.34 | % | | $ | 1,772 | | | | 1.01 | % | | | 1.45 | % | | | 1.45 | % | | | 185 | % |
| | $ | 10.24 | | | | (6.73 | %) | | $ | 1,624 | | | | 0.75 | % | | | 1.44 | % | | | 1.44 | % | | | 163 | % |
| | $ | 11.54 | | | | 22.84 | % | | $ | 1,057 | | | | 1.38 | % | | | 1.33 | % | | | 1.44 | % | | | 179 | % |
| | | |
| | $ | 9.97 | | | | (13.90 | %) | | $ | 30,118 | | | | (0.24 | %) | | | 1.36 | % | | | 1.36 | % | | | 147 | % |
| | $ | 11.58 | | | | 13.05 | % | | $ | 36,590 | | | | (0.16 | %) | | | 1.30 | % | | | 1.30 | % | | | 173 | % |
| | $ | 11.38 | | | | 3.43 | % | | $ | 34,841 | | | | 0.17 | % | | | 1.31 | % | | | 1.31 | % | | | 179 | % |
| | $ | 11.36 | | | | 13.66 | % | | $ | 38,497 | | | | 1.19 | % | | | 1.25 | % | | | 1.25 | % | | | 185 | % |
| | $ | 10.24 | | | | (6.57 | %) | | $ | 42,976 | | | | 0.94 | % | | | 1.20 | % | | | 1.20 | % | | | 163 | % |
| | $ | 11.55 | | | | 23.07 | % | | $ | 37,369 | | | | 1.13 | % | | | 1.10 | % | | | 1.21 | % | | | 179 | % |
| | | |
| | $ | 11.77 | | | | (12.00 | %) | | $ | 7,270 | | | | 0.03 | % | | | 1.33 | % | | | 1.33 | % | | | 231 | % |
| | $ | 13.42 | | | | 13.23 | % | | $ | 7,086 | | | | (0.09 | %) | | | 1.36 | % | | | 1.36 | % | | | 205 | % |
| | $ | 12.82 | | | | 5.27 | % | | $ | 75,449 | | | | 0.65 | % | | | 1.41 | % | | | 1.41 | % | | | 189 | % |
| | $ | 12.26 | | | | 12.29 | % | | $ | 92,815 | | | | 1.34 | % | | | 1.41 | % | | | 1.41 | % | | | 180 | % |
| | $ | 11.08 | | | | (3.25 | %) | | $ | 90,133 | | | | 1.06 | % | | | 1.43 | % | | | 1.43 | % | | | 218 | % |
| | $ | 11.61 | | | | 14.74 | % | | $ | 97,116 | | | | 0.81 | % | | | 1.49 | % | | | 1.49 | % | | | 226 | % |
| | | |
| | $ | 11.86 | | | | (11.90 | %) | | $ | 62,903 | | | | 0.37 | % | | | 0.97 | % | | | 0.97 | % | | | 231 | % |
| | $ | 13.53 | | | | 13.71 | % | | $ | 71,034 | | | | 0.78 | % | | | 0.97 | % | | | 0.97 | % | | | 205 | % |
| | $ | 12.92 | | | | 5.66 | % | | $ | 18,699 | | | | 1.03 | % | | | 1.04 | % | | | 1.04 | % | | | 189 | % |
| | $ | 12.35 | | | | 12.59 | % | | $ | 20,182 | | | | 1.61 | % | | | 1.14 | % | | | 1.14 | % | | | 180 | % |
| | $ | 11.15 | | | | (2.99 | %) | | $ | 19,301 | | | | 1.31 | % | | | 1.21 | % | | | 1.23 | % | | | 218 | % |
| | $ | 11.68 | | | | 15.21 | % | | $ | 12,137 | | | | 1.13 | % | | | 1.21 | % | | | 1.30 | % | | | 226 | % |
| | | |
| | $ | 11.88 | | | | (11.95 | %) | | $ | 275,881 | | | | 0.28 | % | | | 1.06 | % | | | 1.06 | % | | | 231 | % |
| | $ | 13.56 | | | | 13.71 | % | | $ | 309,130 | | | | 0.69 | % | | | 1.00 | % | | | 1.02 | % | | | 205 | % |
| | $ | 12.94 | | | | 5.71 | % | | $ | 302,350 | | | | 1.09 | % | | | 0.98 | % | | | 1.03 | % | | | 189 | % |
| | $ | 12.36 | | | | 12.77 | % | | $ | 295,200 | | | | 1.79 | % | | | 0.96 | % | | | 1.04 | % | | | 180 | % |
| | $ | 11.15 | | | | (2.85 | %) | | $ | 239,375 | | | | 1.51 | % | | | 1.02 | % | | | 1.05 | % | | | 218 | % |
| | $ | 11.68 | | | | 15.25 | % | | $ | 169,586 | | | | 1.35 | % | | | 1.02 | % | | | 1.11 | % | | | 226 | % |
| | | |
See footnotes on pages 70 and 71.
The accompanying notes are an integral part of these financial statements.
2022 Semi-Annual Report | June 30, 2022 | Page 65 |
Financial Highlights
For the Six Months Ended June 30, 2022 (unaudited) and the Years Ended December 31, | |
| | | | | | | Income
from
Investment Operations | | | Less
Distributions | |
| | Net Asset
Value,
Beginning
of Period | | | Net
Investment
Income
(Loss) (5) | | | Net gains (losses)
on securities and
futures (both realized
and unrealized) | | | Total from
Investment
Operations | | | From Net
Investment
Income | | | From Net
Capital
Gains | | | From
Return of
Capital | | | Total
Distributions | |
Moderate Allocation Fund - Retail Class (1)(2)(3)(4) |
2022 | | $ | 12.64 | | | | 0.00 | | | | (1.39 | ) | | | (1.39 | ) | | | (0.02 | ) | | | 0.00 | | | | 0.00 | | | | (0.02 | ) |
2021 | | $ | 12.37 | | | | (0.02 | ) | | | 1.10 | | | | 1.08 | | | | (0.05 | ) | | | (0.76 | ) | | | 0.00 | | | | (0.81 | ) |
2020 | | $ | 11.85 | | | | 0.13 | | | | 0.52 | | | | 0.65 | | | | (0.13 | ) | | | 0.00 | | | | 0.00 | | | | (0.13 | ) |
2019 | | $ | 10.84 | | | | 0.20 | | | | 1.00 | | | | 1.20 | | | | (0.19 | ) | | | 0.00 | | | | 0.00 | | | | (0.19 | ) |
2018 | | $ | 11.66 | | | | 0.18 | | | | (0.48 | ) | | | (0.30 | ) | | | (0.16 | ) | | | (0.36 | ) | | | 0.00 | | | | (0.52 | ) |
2017 | | $ | 10.46 | | | | 0.07 | | | | 1.60 | | | | 1.67 | | | | (0.05 | ) | | | (0.42 | ) | | | 0.00 | | | | (0.47 | ) |
Moderate Allocation Fund - Adviser Class (1)(2)(3)(4) |
2022 | | $ | 12.66 | | | | 0.03 | | | | (1.40 | ) | | | (1.37 | ) | | | (0.04 | ) | | | 0.00 | | | | 0.00 | | | | (0.04 | ) |
2021 | | $ | 12.39 | | | | 0.16 | | | | 0.97 | | | | 1.13 | | | | (0.10 | ) | | | (0.76 | ) | | | 0.00 | | | | (0.86 | ) |
2020 | | $ | 11.86 | | | | 0.17 | | | | 0.53 | | | | 0.70 | | | | (0.17 | ) | | | 0.00 | | | | 0.00 | | | | (0.17 | ) |
2019 | | $ | 10.85 | | | | 0.24 | | | | 1.00 | | | | 1.24 | | | | (0.23 | ) | | | 0.00 | | | | 0.00 | | | | (0.23 | ) |
2018 | | $ | 11.66 | | | | 0.21 | | | | (0.49 | ) | | | (0.28 | ) | | | (0.17 | ) | | | (0.36 | ) | | | 0.00 | | | | (0.53 | ) |
2017 | | $ | 10.46 | | | | 0.12 | | | | 1.59 | | | | 1.71 | | | | (0.09 | ) | | | (0.42 | ) | | | 0.00 | | | | (0.51 | ) |
Moderate Allocation Fund - Institutional Class (1)(2)(3)(4) |
2022 | | $ | 12.68 | | | | 0.02 | | | | (1.39 | ) | | | (1.37 | ) | | | (0.04 | ) | | | 0.00 | | | | 0.00 | | | | (0.04 | ) |
2021 | | $ | 12.42 | | | | 0.14 | | | | 0.98 | | | | 1.12 | | | | (0.10 | ) | | | (0.76 | ) | | | 0.00 | | | | (0.86 | ) |
2020 | | $ | 11.89 | | | | 0.17 | | | | 0.53 | | | | 0.70 | | | | (0.17 | ) | | | 0.00 | | | | 0.00 | | | | (0.17 | ) |
2019 | | $ | 10.88 | | | | 0.25 | | | | 1.00 | | | | 1.25 | | | | (0.24 | ) | | | 0.00 | | | | 0.00 | | | | (0.24 | ) |
2018 | | $ | 11.68 | | | | 0.23 | | | | (0.48 | ) | | | (0.25 | ) | | | (0.19 | ) | | | (0.36 | ) | | | 0.00 | | | | (0.55 | ) |
2017 | | $ | 10.47 | | | | 0.14 | | | | 1.59 | | | | 1.73 | | | | (0.10 | ) | | | (0.42 | ) | | | 0.00 | | | | (0.52 | ) |
Conservative Allocation Fund - Retail Class (1)(2)(3)(4) |
2022 | | $ | 23.64 | | | | 0.05 | | | | (2.45 | ) | | | (2.40 | ) | | | (0.03 | ) | | | 0.00 | | | | 0.00 | | | | (0.03 | ) |
2021 | | $ | 23.91 | | | | 0.22 | | | | 0.89 | | | | 1.11 | | | | (0.24 | ) | | | (1.14 | ) | | | 0.00 | | | | (1.38 | ) |
2020 | | $ | 22.85 | | | | 0.37 | | | | 1.04 | | | | 1.41 | | | | (0.35 | ) | | | 0.00 | | | | 0.00 | | | | (0.35 | ) |
2019 | | $ | 21.18 | | | | 0.51 | | | | 1.65 | | | | 2.16 | | | | (0.49 | ) | | | 0.00 | | | | 0.00 | | | | (0.49 | ) |
2018 | | $ | 22.54 | | | | 0.46 | | | | (1.04 | ) | | | (0.58 | ) | | | (0.40 | ) | | | (0.38 | ) | | | 0.00 | | | | (0.78 | ) |
2017 | | $ | 21.32 | | | | 0.27 | | | | 1.36 | | | | 1.63 | | | | (0.41 | ) | | | 0.00 | | | | 0.00 | | | | (0.41 | ) |
Conservative Allocation Fund - Adviser Class (1)(2)(3)(4) |
2022 | �� | $ | 23.91 | | | | 0.08 | | | | (2.49 | ) | | | (2.41 | ) | | | (0.06 | ) | | | 0.00 | | | | 0.00 | | | | (0.06 | ) |
2021 | | $ | 24.21 | | | | 0.41 | | | | 0.81 | | | | 1.22 | | | | (0.38 | ) | | | (1.14 | ) | | | 0.00 | | | | (1.52 | ) |
2020 | | $ | 23.13 | | | | 0.46 | | | | 1.06 | | | | 1.52 | | | | (0.44 | ) | | | 0.00 | | | | 0.00 | | | | (0.44 | ) |
2019 | | $ | 21.44 | | | | 0.57 | | | | 1.67 | | | | 2.24 | | | | (0.55 | ) | | | 0.00 | | | | 0.00 | | | | (0.55 | ) |
2018 | | $ | 22.82 | | | | 0.52 | | | | (1.08 | ) | | | (0.56 | ) | | | (0.44 | ) | | | (0.38 | ) | | | 0.00 | | | | (0.82 | ) |
2017 | | $ | 21.34 | | | | 0.36 | | | | 1.35 | | | | 1.71 | | | | (0.23 | ) | | | 0.00 | | | | 0.00 | | | | (0.23 | ) |
Conservative Allocation Fund - Institutional Class (1)(2)(3)(4) |
2022 | | $ | 23.96 | | | | 0.07 | | | | (2.49 | ) | | | (2.42 | ) | | | (0.05 | ) | | | 0.00 | | | | 0.00 | | | | (0.05 | ) |
2021 | | $ | 24.26 | | | | 0.38 | | | | 0.81 | | | | 1.19 | | | | (0.35 | ) | | | (1.14 | ) | | | 0.00 | | | | (1.49 | ) |
2020 | | $ | 23.18 | | | | 0.46 | | | | 1.06 | | | | 1.52 | | | | (0.44 | ) | | | 0.00 | | | | 0.00 | | | | (0.44 | ) |
2019 | | $ | 21.49 | | | | 0.59 | | | | 1.68 | | | | 2.27 | | | | (0.58 | ) | | | 0.00 | | | | 0.00 | | | | (0.58 | ) |
2018 | | $ | 22.85 | | | | 0.56 | | | | (1.07 | ) | | | (0.51 | ) | | | (0.47 | ) | | | (0.38 | ) | | | 0.00 | | | | (0.85 | ) |
2017 | | $ | 21.34 | | | | 0.59 | | | | 1.14 | | | | 1.73 | | | | (0.22 | ) | | | 0.00 | | | | 0.00 | | | | (0.22 | ) |
|
See footnotes on pages 70 and 71.
The accompanying notes are an integral part of these financial statements.
Page 66 | 2022 Semi-Annual Report | June 30, 2022 |
| | | | | | | | | | Ratios/
Supplemental
Data | |
| | Net Asset
Value, End
of Period | | | Total Return
(Assumes
Reinvestment of
Distributions) | | | Net Assets,
End of Period
($000) | | | Ratio of Net
Investment
Income (Loss)
to Average
Net Assets | | | Ratio of Expenses to
Average Net Assets
After Fee Reductions (6) | | | Ratio of Expenses
to Average Net
Assets Before Fee
Reductions (7) | | | Portfolio
Turnover
Rate | |
| | | |
| | $ | 11.23 | | | | (11.00 | %) | | $ | 1,097 | | | | 0.04 | % | | | 1.39 | % | | | 1.39 | % | | | 292 | % |
| | $ | 12.64 | | | | 8.74 | % | | $ | 1,190 | | | | (0.22 | %) | | | 1.34 | % | | | 1.34 | % | | | 211 | % |
| | $ | 12.37 | | | | 5.55 | % | | $ | 30,930 | | | | 1.00 | % | | | 1.38 | % | | | 1.38 | % | | | 160 | % |
| | $ | 11.85 | | | | 11.13 | % | | $ | 35,460 | | | | 1.73 | % | | | 1.38 | % | | | 1.38 | % | | | 155 | % |
| | $ | 10.84 | | | | (2.60 | %) | | $ | 32,502 | | | | 1.51 | % | | | 1.39 | % | | | 1.44 | % | | | 213 | % |
| | $ | 11.66 | | | | 15.99 | % | | $ | 24,635 | | | | 0.61 | % | | | 1.67 | % | | | 1.73 | % | | | 349 | % |
| | | |
| | $ | 11.25 | | | | (10.82 | %) | | $ | 29,474 | | | | 0.50 | % | | | 0.94 | % | | | 0.94 | % | | | 292 | % |
| | $ | 12.66 | | | | 9.15 | % | | $ | 29,781 | | | | 1.13 | % | | | 0.94 | % | | | 0.94 | % | | | 211 | % |
| | $ | 12.39 | | | | 6.04 | % | | $ | 9,823 | | | | 1.39 | % | | | 1.00 | % | | | 1.00 | % | | | 160 | % |
| | $ | 11.86 | | | | 11.45 | % | | $ | 10,080 | | | | 2.00 | % | | | 1.11 | % | | | 1.11 | % | | | 155 | % |
| | $ | 10.85 | | | | (2.47 | %) | | $ | 9,480 | | | | 1.78 | % | | | 1.19 | % | | | 1.24 | % | | | 213 | % |
| | $ | 11.66 | | | | 16.40 | % | | $ | 3,538 | | | | 1.03 | % | | | 1.35 | % | | | 1.50 | % | | | 349 | % |
| | | |
| | $ | 11.27 | | | | (10.80 | %) | | $ | 125,672 | | | | 0.40 | % | | | 1.03 | % | | | 1.03 | % | | | 292 | % |
| | $ | 12.68 | | | | 9.05 | % | | $ | 142,788 | | | | 1.01 | % | | | 0.99 | % | | | 0.99 | % | | | 211 | % |
| | $ | 12.42 | | | | 6.02 | % | | $ | 135,512 | | | | 1.40 | % | | | 0.99 | % | | | 0.99 | % | | | 160 | % |
| | $ | 11.89 | | | | 11.52 | % | | $ | 132,500 | | | | 2.10 | % | | | 1.01 | % | | | 1.01 | % | | | 155 | % |
| | $ | 10.88 | | | | (2.20 | %) | | $ | 119,881 | | | | 1.97 | % | | | 1.01 | % | | | 1.05 | % | | | 213 | % |
| | $ | 11.68 | | | | 16.55 | % | | $ | 37,945 | | | | 1.29 | % | | | 1.13 | % | | | 1.28 | % | | | 349 | % |
| | | |
| | $ | 21.21 | | | | (10.15 | %) | | $ | 5,836 | | | | 0.42 | % | | | 1.12 | % | | | 1.12 | % | | | 363 | % |
| | $ | 23.64 | | | | 4.64 | % | | $ | 6,879 | | | | 0.78 | % | | | 1.22 | % | | | 1.23 | % | | | 210 | % |
| | $ | 23.91 | | | | 6.28 | % | | $ | 29,034 | | | | 1.46 | % | | | 1.28 | % | | | 1.28 | % | | | 139 | % |
| | $ | 22.85 | | | | 10.25 | % | | $ | 31,688 | | | | 2.19 | % | | | 1.28 | % | | | 1.28 | % | | | 136 | % |
| | $ | 21.18 | | | | (2.62 | %) | | $ | 30,759 | | | | 2.09 | % | | | 1.27 | % | | | 1.38 | % | | | 185 | % |
| | $ | 22.54 | | | | 7.64 | % | | $ | 12,545 | | | | 1.24 | % | | | 1.70 | % | | | 2.57 | % | | | 135 | % |
| | | |
| | $ | 21.44 | | | | (10.08 | %) | | $ | 20,682 | | | | 0.69 | % | | | 0.87 | % | | | 0.87 | % | | | 363 | % |
| | $ | 23.91 | | | | 5.04 | % | | $ | 22,283 | | | | 1.56 | % | | | 0.87 | % | | | 0.88 | % | | | 210 | % |
| | $ | 24.21 | | | | 6.69 | % | | $ | 7,082 | | | | 1.85 | % | | | 0.92 | % | | | 0.92 | % | | | 139 | % |
| | $ | 23.13 | | | | 10.51 | % | | $ | 6,787 | | | | 2.44 | % | | | 1.04 | % | | | 1.04 | % | | | 136 | % |
| | $ | 21.44 | | | | (2.50 | %) | | $ | 6,110 | | | | 2.29 | % | | | 1.12 | % | | | 1.22 | % | | | 185 | % |
| | $ | 22.82 | | | | 8.01 | % | | $ | 682 | | | | 1.63 | % | | | 1.07 | % | | | 1.97 | % | | | 135 | % |
| | | |
| | $ | 21.49 | | | | (10.10 | %) | | $ | 93,989 | | | | 0.59 | % | | | 0.96 | % | | | 0.96 | % | | | 363 | % |
| | $ | 23.96 | | | | 4.94 | % | | $ | 105,307 | | | | 1.42 | % | | | 0.92 | % | | | 0.93 | % | | | 210 | % |
| | $ | 24.26 | | | | 6.68 | % | | $ | 105,403 | | | | 1.87 | % | | | 0.92 | % | | | 0.92 | % | | | 139 | % |
| | $ | 23.18 | | | | 10.61 | % | | $ | 99,456 | | | | 2.54 | % | | | 0.94 | % | | | 0.94 | % | | | 136 | % |
| | $ | 21.49 | | | | (2.28 | %) | | $ | 92,412 | | | | 2.50 | % | | | 0.92 | % | | | 1.04 | % | | | 185 | % |
| | $ | 22.85 | | | | 8.10 | % | | $ | 11,739 | | | | 2.65 | % | | | 0.49 | % | | | 1.39 | % | | | 135 | % |
| | | |
See footnotes on pages 70 and 71.
The accompanying notes are an integral part of these financial statements.
2022 Semi-Annual Report | June 30, 2022 | Page 67 |
Financial Highlights
For the Six Months Ended June 30, 2022 (unaudited) and the Years Ended December 31, | |
| | | | | | | Income
from
Investment Operations | | | Less
Distributions | |
| | Net Asset
Value,
Beginning
of Period | | | Net
Investment
Income
(Loss) (5) | | | Net gains (losses)
on securities and
futures (both realized
and unrealized) | | | Total from
Investment
Operations | | | From Net
Investment
Income | | | From Net
Capital
Gains | | | From
Return of
Capital | | | Total
Distributions | |
Dynamic Allocation Fund - Retail Class (1)(2)(3)(4) |
2022 | | $ | 13.93 | | | | (0.01 | ) | | | (2.68 | ) | | | (2.69 | ) | | | 0.00 | | | | 0.00 | | | | 0.00 | | | | 0.00 | |
2021 | | $ | 13.39 | | | | (0.03 | ) | | | 2.65 | | | | 2.62 | | | | (0.08 | ) | | | (2.00 | ) | | | 0.00 | | | | (2.08 | ) |
2020 | | $ | 11.87 | | | | 0.03 | | | | 1.79 | | | | 1.82 | | | | (0.03 | ) | | | (0.27 | ) | | | 0.00 | | | | (0.30 | ) |
2019 | | $ | 9.79 | | | | 0.11 | | | | 2.23 | | | | 2.34 | | | | (0.08 | ) | | | (0.18 | ) | | | 0.00 | | | | (0.26 | ) |
2018 | | $ | 10.85 | | | | 0.07 | | | | (1.00 | ) | | | (0.93 | ) | | | (0.06 | ) | | | (0.07 | ) | | | 0.00 | | | | (0.13 | ) |
2017 | | $ | 9.72 | | | | 0.06 | | | | 1.99 | | | | 2.05 | | | | (0.07 | ) | | | (0.85 | ) | | | 0.00 | | | | (0.92 | ) |
Dynamic Allocation Fund - Adviser Class (1)(2)(3)(4) |
2022 | | $ | 14.07 | | | | 0.02 | | | | (2.72 | ) | | | (2.70 | ) | | | 0.00 | | | | 0.00 | | | | 0.00 | | | | 0.00 | |
2021 | | $ | 13.46 | | | | 0.04 | | | | 2.65 | | | | 2.69 | | | | (0.08 | ) | | | (2.00 | ) | | | 0.00 | | | | (2.08 | ) |
2020 | | $ | 11.91 | | | | 0.07 | | | | 1.81 | | | | 1.88 | | | | (0.06 | ) | | | (0.27 | ) | | | 0.00 | | | | (0.33 | ) |
2019 | | $ | 9.82 | | | | 0.13 | | | | 2.24 | | | | 2.37 | | | | (0.10 | ) | | | (0.18 | ) | | | 0.00 | | | | (0.28 | ) |
2018 | | $ | 10.88 | | | | 0.09 | | | | (1.00 | ) | | | (0.91 | ) | | | (0.08 | ) | | | (0.07 | ) | | | 0.00 | | | | (0.15 | ) |
2017 | | $ | 9.73 | | | | 0.10 | | | | 1.97 | | | | 2.07 | | | | (0.07 | ) | | | (0.85 | ) | | | 0.00 | | | | (0.92 | ) |
Dynamic Allocation Fund - Institutional Class (1)(2)(3)(4) |
2022 | | $ | 14.04 | | | | 0.02 | | | | (2.71 | ) | | | (2.69 | ) | | | 0.00 | | | | 0.00 | | | | 0.00 | | | | 0.00 | |
2021 | | $ | 13.45 | | | | 0.03 | | | | 2.64 | | | | 2.67 | | | | (0.08 | ) | | | (2.00 | ) | | | 0.00 | | | | (2.08 | ) |
2020 | | $ | 11.90 | | | | 0.08 | | | | 1.80 | | | | 1.88 | | | | (0.06 | ) | | | (0.27 | ) | | | 0.00 | | | | (0.33 | ) |
2019 | | $ | 9.82 | | | | 0.15 | | | | 2.23 | | | | 2.38 | | | | (0.12 | ) | | | (0.18 | ) | | | 0.00 | | | | (0.30 | ) |
2018 | | $ | 10.86 | | | | 0.12 | | | | (1.00 | ) | | | (0.88 | ) | | | (0.09 | ) | | | (0.07 | ) | | | 0.00 | | | | (0.16 | ) |
2017 | | $ | 9.72 | | | | 0.12 | | | | 1.97 | | | | 2.09 | | | | (0.10 | ) | | | (0.85 | ) | | | 0.00 | | | | (0.95 | ) |
Quantex Fund - Retail Class (1)(2)(3)(4) |
2022 | | $ | 38.89 | | | | (0.09 | ) | | | (6.38 | ) | | | (6.47 | ) | | | 0.00 | | | | 0.00 | | | | 0.00 | | | | 0.00 | |
2021 | | $ | 35.64 | | | | (0.02 | ) | | | 9.77 | | | | 9.75 | | | | (0.02 | ) | | | (6.48 | ) | | | 0.00 | | | | (6.50 | ) |
2020 | | $ | 37.91 | | | | 0.20 | | | | (2.28 | ) | | | (2.08 | ) | | | (0.19 | ) | | | 0.00 | | | | 0.00 | | | | (0.19 | ) |
2019 | | $ | 32.22 | | | | 0.19 | | | | 5.75 | | | | 5.94 | | | | (0.25 | ) | | | 0.00 | | | | 0.00 | | | | (0.25 | ) |
2018 | | $ | 36.76 | | | | (0.01 | ) | | | (4.53 | ) | | | (4.54 | ) | | | 0.00 | | | | 0.00 | | | | 0.00 | | | | 0.00 | |
2017 | | $ | 33.36 | | | | 0.09 | | | | 4.38 | | | | 4.47 | | | | (0.06 | ) | | | (1.01 | ) | | | 0.00 | | | | (1.07 | ) |
Quantex Fund - Adviser Class (1)(2)(3)(4) |
2022 | | $ | 39.15 | | | | (0.03 | ) | | | (6.42 | ) | | | (6.45 | ) | | | 0.00 | | | | 0.00 | | | | 0.00 | | | | 0.00 | |
2021 | | $ | 35.75 | | | | 0.13 | | | | 9.77 | | | | 9.90 | | | | (0.02 | ) | | | (6.48 | ) | | | 0.00 | | | | (6.50 | ) |
2020 | | $ | 38.01 | | | | 0.23 | | | | (2.28 | ) | | | (2.05 | ) | | | (0.21 | ) | | | 0.00 | | | | 0.00 | | | | (0.21 | ) |
2019 | | $ | 32.28 | | | | 0.24 | | | | 5.76 | | | | 6.00 | | | | (0.27 | ) | | | 0.00 | | | | 0.00 | | | | (0.27 | ) |
2018 | | $ | 36.78 | | | | 0.10 | | | | (4.60 | ) | | | (4.50 | ) | | | 0.00 | | | | 0.00 | | | | 0.00 | | | | 0.00 | |
2017 | | $ | 33.37 | | | | 0.21 | | | | 4.35 | | | | 4.56 | | | | (0.14 | ) | | | (1.01 | ) | | | 0.00 | | | | (1.15 | ) |
Quantex - Institutional Class (1)(2)(3)(4) |
2022 | | $ | 39.07 | | | | (0.03 | ) | | | (6.41 | ) | | | (6.44 | ) | | | 0.00 | | | | 0.00 | | | | 0.00 | | | | 0.00 | |
2021 | | $ | 35.70 | | | | 0.09 | | | | 9.78 | | | | 9.87 | | | | (0.02 | ) | | | (6.48 | ) | | | 0.00 | | | | (6.50 | ) |
2020 | | $ | 38.01 | | | | 0.26 | | | | (2.31 | ) | | | (2.05 | ) | | | (0.26 | ) | | | 0.00 | | | | 0.00 | | | | (0.26 | ) |
2019 | | $ | 32.29 | | | | 0.29 | | | | 5.77 | | | | 6.06 | | | | (0.34 | ) | | | 0.00 | | | | 0.00 | | | | (0.34 | ) |
2018 | | $ | 36.77 | | | | 0.20 | | | | (4.62 | ) | | | (4.42 | ) | | | (0.06 | ) | | | 0.00 | | | | 0.00 | | | | (0.06 | ) |
2017 | | $ | 33.37 | | | | 0.26 | | | | 4.35 | | | | 4.61 | | | | (0.20 | ) | | | (1.01 | ) | | | 0.00 | | | | (1.21 | ) |
|
See footnotes on pages 70 and 71.
The accompanying notes are an integral part of these financial statements.
Page 68 | 2022 Semi-Annual Report | June 30, 2022 |
| | | | | | | | | | Ratios/
Supplemental
Data | |
| | Net Asset
Value, End
of Period | | | Total Return
(Assumes
Reinvestment of
Distributions) | | | Net Assets,
End of Period
($000) | | | Ratio of Net
Investment
Income (Loss)
to Average
Net Assets | | | Ratio of Expenses to
Average Net Assets
After Fee Reductions (6) | | | Ratio of Expenses
to Average Net
Assets Before Fee
Reductions (7) | | | Portfolio
Turnover
Rate | |
| | | | |
| | $ | 11.24 | | | | (19.31 | %) | | $ | 7,090 | | | | (0.08 | %) | | | 1.30 | % | | | 1.39 | % | | | 172 | % |
| | $ | 13.93 | | | | 19.54 | % | | $ | 9,850 | | | | (0.21 | %) | | | 1.34 | % | | | 1.43 | % | | | 213 | % |
| | $ | 13.39 | | | | 15.37 | % | | $ | 37,392 | | | | 0.27 | % | | | 1.41 | % | | | 1.51 | % | | | 236 | % |
| | $ | 11.87 | | | | 24.00 | % | | $ | 40,977 | | | | 0.97 | % | | | 1.41 | % | | | 1.51 | % | | | 265 | % |
| | $ | 9.79 | | | | (8.66 | %) | | $ | 40,732 | | | | 0.62 | % | | | 1.45 | % | | | 1.55 | % | | | 273 | % |
| | $ | 10.85 | | | | 21.20 | % | | $ | 50,570 | | | | 0.59 | % | | | 1.51 | % | | | 1.58 | % | | | 252 | % |
| | | |
| | $ | 11.37 | | | | (19.19 | %) | | $ | 21,734 | | | | 0.26 | % | | | 0.96 | % | | | 1.05 | % | | | 172 | % |
| | $ | 14.07 | | | | 20.02 | % | | $ | 28,129 | | | | 0.25 | % | | | 0.98 | % | | | 1.07 | % | | | 213 | % |
| | $ | 13.46 | | | | 15.85 | % | | $ | 13,322 | | | | 0.61 | % | | | 1.06 | % | | | 1.16 | % | | | 236 | % |
| | $ | 11.91 | | | | 24.29 | % | | $ | 13,137 | | | | 1.20 | % | | | 1.18 | % | | | 1.28 | % | | | 265 | % |
| | $ | 9.82 | | | | (8.49 | %) | | $ | 11,198 | | | | 0.84 | % | | | 1.23 | % | | | 1.33 | % | | | 273 | % |
| | $ | 10.88 | | | | 21.42 | % | | $ | 10,140 | | | | 0.87 | % | | | 1.27 | % | | | 1.34 | % | | | 252 | % |
| | | |
| | $ | 11.35 | | | | (19.16 | %) | | $ | 176,421 | | | | 0.25 | % | | | 0.99 | % | | | 1.08 | % | | | 172 | % |
| | $ | 14.04 | | | | 19.88 | % | | $ | 199,753 | | | | 0.21 | % | | | 1.00 | % | | | 1.09 | % | | | 213 | % |
| | $ | 13.45 | | | | 15.94 | % | | $ | 148,566 | | | | 0.67 | % | | | 1.01 | % | | | 1.11 | % | | | 236 | % |
| | $ | 11.90 | | | | 24.40 | % | | $ | 146,119 | | | | 1.38 | % | | | 1.00 | % | | | 1.10 | % | | | 265 | % |
| | $ | 9.82 | | | | (8.18 | %) | | $ | 121,965 | | | | 1.08 | % | | | 1.01 | % | | | 1.11 | % | | | 273 | % |
| | $ | 10.86 | | | | 21.61 | % | | $ | 70,187 | | | | 1.10 | % | | | 1.05 | % | | | 1.12 | % | | | 252 | % |
| | | |
| | $ | 32.42 | | | | (16.64 | %) | | $ | 13,186 | | | | (0.50 | %) | | | 1.73 | % | | | 1.73 | % | | | 24 | % |
| | $ | 38.89 | | | | 27.34 | % | | $ | 16,406 | | | | (0.05 | %) | | | 1.60 | % | | | 1.60 | % | | | 64 | % |
| | $ | 35.64 | | | | (5.36 | %) | | $ | 18,352 | | | | 0.65 | % | | | 1.53 | % | | | 1.53 | % | | | 88 | % |
| | $ | 37.91 | | | | 18.48 | % | | $ | 24,979 | | | | 0.52 | % | | | 1.53 | % | | | 1.53 | % | | | 82 | % |
| | $ | 32.22 | | | | (12.35 | %) | | $ | 28,319 | | | | (0.03 | %) | | | 1.57 | % | | | 1.62 | % | | | 116 | % |
| | $ | 36.76 | | | | 13.42 | % | | $ | 60,161 | | | | 0.27 | % | | | 1.52 | % | | | 1.66 | % | | | 72 | % |
| | | |
| | $ | 32.70 | | | | (16.48 | %) | | $ | 3,608 | | | | (0.14 | %) | | | 1.36 | % | | | 1.36 | % | | | 24 | % |
| | $ | 39.15 | | | | 27.68 | % | | $ | 4,575 | | | | 0.31 | % | | | 1.33 | % | | | 1.33 | % | | | 64 | % |
| | $ | 35.75 | | | | (5.25 | %) | | $ | 986 | | | | 0.77 | % | | | 1.41 | % | | | 1.41 | % | | | 88 | % |
| | $ | 38.01 | | | | 18.63 | % | | $ | 1,113 | | | | 0.67 | % | | | 1.41 | % | | | 1.41 | % | | | 82 | % |
| | $ | 32.28 | | | | (12.22 | %) | | $ | 923 | | | | 0.28 | % | | | 1.42 | % | | | 1.47 | % | | | 116 | % |
| | $ | 36.78 | | | | 13.68 | % | | $ | 2,114 | | | | 0.59 | % | | | 1.39 | % | | | 1.56 | % | | | 72 | % |
| | | |
| | $ | 32.63 | | | | (16.48 | %) | | $ | 16,144 | | | | (0.14 | %) | | | 1.36 | % | | | 1.36 | % | | | 24 | % |
| | $ | 39.07 | | | | 27.63 | % | | $ | 21,046 | | | | 0.20 | % | | | 1.36 | % | | | 1.36 | % | | | 64 | % |
| | $ | 35.70 | | | | (5.22 | %) | | $ | 20,756 | | | | 0.85 | % | | | 1.37 | % | | | 1.37 | % | | | 88 | % |
| | $ | 38.01 | | | | 18.81 | % | | $ | 36,646 | | | | 0.82 | % | | | 1.25 | % | | | 1.25 | % | | | 82 | % |
| | $ | 32.29 | | | | (12.05 | %) | | $ | 35,414 | | | | 0.54 | % | | | 1.21 | % | | | 1.26 | % | | | 116 | % |
| | $ | 36.77 | | | | 13.84 | % | | $ | 32,489 | | | | 0.75 | % | | | 1.18 | % | | | 1.35 | % | | | 72 | % |
| | | |
See footnotes on pages 70 and 71.
The accompanying notes are an integral part of these financial statements.
2022 Semi-Annual Report | June 30, 2022 | Page 69 |
Financial Highlights
For the Six Months Ended June 30, 2022 (unaudited) and the Years Ended December 31, | |
| | | | | | | Income
from
Investment Operations | | | Less
Distributions | |
| | Net Asset
Value,
Beginning
of Period | | | Net
Investment
Income
(Loss) (5) | | | Net gains (losses)
on securities and
futures (both realized
and unrealized) | | | Total from
Investment
Operations | | | From Net
Investment
Income | | | From Net
Capital
Gains | | | From
Return of
Capital | | | Total
Distributions | |
Tactical Income Fund - Retail Class (1)(2)(3)(4) |
2022 | | $ | 9.63 | | | | 0.02 | | | | (0.61 | ) | | | (0.59 | ) | | | (0.02 | ) | | | 0.00 | | | | 0.00 | | | | (0.02 | ) |
2021 | | $ | 9.98 | | | | 0.13 | | | | (0.33 | ) | | | (0.20 | ) | | | (0.15 | ) | | | 0.00 | | | | 0.00 | | | | (0.15 | ) |
2020 | | $ | 9.46 | | | | 0.21 | | | | 0.49 | | | | 0.70 | | | | (0.18 | ) | | | 0.00 | | | | 0.00 | | | | (0.18 | ) |
2019 | | $ | 9.03 | | | | 0.23 | | | | 0.42 | | | | 0.65 | | | | (0.22 | ) | | | 0.00 | | | | 0.00 | | | | (0.22 | ) |
2018 | | $ | 9.37 | | | | 0.17 | | | | (0.33 | ) | | | (0.16 | ) | | | (0.18 | ) | | | 0.00 | | | | 0.00 | | | | (0.18 | ) |
2017 | | $ | 9.28 | | | | 0.24 | | | | 0.10 | | | | 0.34 | | | | (0.25 | ) | | | 0.00 | | | | 0.00 | | | | (0.25 | ) |
Tactical Income Fund - Adviser Class (1)(2)(3)(4) |
2022 | | $ | 9.64 | | | | 0.04 | | | | (0.61 | ) | | | (0.57 | ) | | | (0.04 | ) | | | 0.00 | | | | 0.00 | | | | (0.04 | ) |
2021 | | $ | 9.99 | | | | 0.21 | | | | (0.37 | ) | | | (0.16 | ) | | | (0.19 | ) | | | 0.00 | | | | 0.00 | | | | (0.19 | ) |
2020 | | $ | 9.47 | | | | 0.25 | | | | 0.49 | | | | 0.74 | | | | (0.22 | ) | | | 0.00 | | | | 0.00 | | | | (0.22 | ) |
2019 | | $ | 9.04 | | | | 0.26 | | | | 0.42 | | | | 0.68 | | | | (0.25 | ) | | | 0.00 | | | | 0.00 | | | | (0.25 | ) |
2018 | | $ | 9.38 | | | | 0.21 | | | | (0.35 | ) | | | (0.14 | ) | | | (0.20 | ) | | | 0.00 | | | | 0.00 | | | | (0.20 | ) |
2017 | | $ | 9.28 | | | | 0.28 | | | | 0.10 | | | | 0.38 | | | | (0.28 | ) | | | 0.00 | | | | 0.00 | | | | (0.28 | ) |
Tactical Income Fund - Institutional Class (1)(2)(3)(4) |
2022 | | $ | 9.64 | | | | 0.04 | | | | (0.61 | ) | | | (0.57 | ) | | | (0.04 | ) | | | 0.00 | | | | 0.00 | | | | (0.04 | ) |
2021 | | $ | 9.99 | | | | 0.20 | | | | (0.36 | ) | | | (0.16 | ) | | | (0.19 | ) | | | 0.00 | | | | 0.00 | | | | (0.19 | ) |
2020 | | $ | 9.47 | | | | 0.24 | | | | 0.50 | | | | 0.74 | | | | (0.22 | ) | | | 0.00 | | | | 0.00 | | | | (0.22 | ) |
2019 | | $ | 9.04 | | | | 0.27 | | | | 0.42 | | | | 0.69 | | | | (0.26 | ) | | | 0.00 | | | | 0.00 | | | | (0.26 | ) |
2018 | | $ | 9.38 | | | | 0.23 | | | | (0.35 | ) | | | (0.12 | ) | | | (0.22 | ) | | | 0.00 | | | | 0.00 | | | | (0.22 | ) |
2017 | | $ | 9.28 | | | | 0.31 | | | | 0.08 | | | | 0.39 | | | | (0.29 | ) | | | 0.00 | | | | 0.00 | | | | (0.29 | ) |
Institutional Prime Money Market Fund (1)(2)(3)(4) |
2022 | | $ | 1.0001 | | | | 0.0018 | | | | (0.0003 | ) | | | 0.0015 | | | | (0.0020 | ) | | | 0.0000 | | | | 0.0000 | | | | (0.0020 | ) |
2021 | | $ | 1.0003 | | | | 0.0005 | | | | 0.0003 | | | | 0.0008 | | | | (0.0010 | ) | | | 0.0000 | | | | 0.0000 | | | | (0.0010 | ) |
2020 | | $ | 1.0000 | | | | 0.0058 | | | | (0.0005 | ) | | | 0.0053 | | | | (0.0050 | ) | | | 0.0000 | | | | 0.0000 | | | | (0.0050 | ) |
2019 | | $ | 0.9999 | | | | 0.0231 | | | | 0.0000 | | | | 0.0231 | | | | (0.0230 | ) | | | 0.0000 | | | | 0.0000 | | | | (0.0230 | ) |
2018 | | $ | 0.9999 | | | | 0.0190 | | | | 0.0000 | | | | 0.0190 | | | | (0.0190 | ) | | | 0.0000 | | | | 0.0000 | | | | (0.0190 | ) |
2017 | | $ | 1.0001 | | | | 0.0101 | | | | (0.0003 | ) | | | 0.0098 | | | | (0.0100 | ) | | | 0.0000 | | | | 0.0000 | | | | (0.0100 | ) |
|
1 | Ratio of net investment income (loss) to average net assets, ratio of expenses to average net assets after fee reductions, and ratio of expenses to average net assets before fee reductions do not include impact of expenses of the underlying security holdings as represented in the schedule of investments. |
2 | Recognition of net investment income by the Fund is affected by the timing of the declaration of dividends by the underlying investment companies in which the Fund invests. |
3 | Total return and portfolio turnover rate are not annualized for periods of less than one full year. |
4 | Ratio of net investment income (loss) to average net assets, ratio of expenses to average net assets after fee reductions, and ratio of expenses to average net assets before fee reductions are annualized for periods of less than one full year. |
5 | Except for the Money Market Fund, net investment income per share is based on average shares outstanding during the period. |
The accompanying notes are an integral part of these financial statements.
Page 70 | 2022 Semi-Annual Report | June 30, 2022 |
| | | | | | | | | | Ratios/
Supplemental
Data | |
| | Net Asset
Value, End
of Period | | | Total Return
(Assumes
Reinvestment of
Distributions) | | | Net Assets,
End of Period
($000) | | | Ratio of Net
Investment
Income (Loss)
to Average
Net Assets | | | Ratio of Expenses to
Average Net Assets
After Fee Reductions (6) | | | Ratio of Expenses
to Average Net
Assets Before Fee
Reductions (7) | | | Portfolio
Turnover
Rate | |
| | | | |
| | $ | 9.02 | | | | (6.09 | %) | | $ | 2,405 | | | | 0.50 | % | | | 1.16 | % | | | 1.27 | % | | | 350 | % |
| | $ | 9.63 | | | | (2.01 | %) | | $ | 2,721 | | | | 1.10 | % | | | 1.14 | % | | | 1.25 | % | | | 250 | % |
| | $ | 9.98 | | | | 7.46 | % | | $ | 12,231 | | | | 1.87 | % | | | 1.15 | % | | | 1.26 | % | | | 69 | % |
| | $ | 9.46 | | | | 7.24 | % | | $ | 11,137 | | | | 2.27 | % | | | 1.14 | % | | | 1.25 | % | | | 95 | % |
| | $ | 9.03 | | | | (1.67 | %) | | $ | 14,932 | | | | 1.88 | % | | | 1.15 | % | | | 1.26 | % | | | 102 | % |
| | $ | 9.37 | | | | 3.72 | % | | $ | 67,986 | | | | 2.59 | % | | | 1.02 | % | | | 1.03 | % | | | 133 | % |
| | | |
| | $ | 9.03 | | | | (5.89 | %) | | $ | 9,303 | | | | 0.96 | % | | | 0.73 | % | | | 0.84 | % | | | 350 | % |
| | $ | 9.64 | | | | (1.60 | %) | | $ | 8,982 | | | | 1.98 | % | | | 0.75 | % | | | 0.86 | % | | | 250 | % |
| | $ | 9.99 | | | | 7.86 | % | | $ | 5,463 | | | | 2.28 | % | | | 0.79 | % | | | 0.90 | % | | | 69 | % |
| | $ | 9.47 | | | | 7.54 | % | | $ | 4,205 | | | | 2.64 | % | | | 0.88 | % | | | 0.99 | % | | | 95 | % |
| | $ | 9.04 | | | | (1.45 | %) | | $ | 3,570 | | | | 2.33 | % | | | 0.95 | % | | | 1.06 | % | | | 102 | % |
| | $ | 9.38 | | | | 4.07 | % | | $ | 9,896 | | | | 2.95 | % | | | 0.83 | % | | | 0.84 | % | | | 133 | % |
| | | |
| | $ | 9.03 | | | | (5.91 | %) | | $ | 54,690 | | | | 0.88 | % | | | 0.80 | % | | | 0.91 | % | | | 350 | % |
| | $ | 9.64 | | | | (1.62 | %) | | $ | 57,638 | | | | 1.90 | % | | | 0.79 | % | | | 0.90 | % | | | 250 | % |
| | $ | 9.99 | | | | 7.86 | % | | $ | 50,410 | | | | 2.25 | % | | | 0.77 | % | | | 0.88 | % | | | 69 | % |
| | $ | 9.47 | | | | 7.67 | % | | $ | 46,490 | | | | 2.72 | % | | | 0.76 | % | | | 0.87 | % | | | 95 | % |
| | $ | 9.04 | | | | (1.22 | %) | | $ | 48,437 | | | | 2.50 | % | | | 0.76 | % | | | 0.87 | % | | | 102 | % |
| | $ | 9.38 | | | | 4.20 | % | | $ | 110,674 | | | | 3.27 | % | | | 0.64 | % | | | 0.65 | % | | | 133 | % |
| | | |
| | $ | 0.9996 | | | | 0.13 | % | | $ | 700,845 | | | | 0.36 | % | | | 0.17 | % | | | 0.46 | % | | | N/A | |
| | $ | 1.0001 | | | | 0.03 | % | | $ | 626,993 | | | | 0.05 | % | | | 0.11 | % | | | 0.50 | % | | | N/A | |
| | $ | 1.0003 | | | | 0.57 | % | | $ | 336,445 | | | | 0.57 | % | | | 0.15 | % | | | 0.52 | % | | | N/A | |
| | $ | 1.0000 | | | | 2.31 | % | | $ | 370,120 | | | | 2.30 | % | | | 0.13 | % | | | 0.50 | % | | | N/A | |
| | $ | 0.9999 | | | | 1.90 | % | | $ | 471,603 | | | | 1.90 | % | | | 0.16 | % | | | 0.51 | % | | | N/A | |
| | $ | 0.9999 | | | | 0.96 | % | | $ | 296,547 | | | | 1.01 | % | | | 0.17 | % | | | 0.56 | % | | | N/A | |
| | | |
6 | Ratio of expenses to average net assets after fee reductions reflects contractual or voluntary waivers and reimbursements of expenses by the investment adviser and transfer agent. |
7 | Ratio of expenses to average net assets before fee reductions reflects the total expenses before reductions reported in the statements of operations. |
* | Actual amounts were less than one-half of a cent per share |
The accompanying notes are an integral part of these financial statements.
2022 Semi-Annual Report | June 30, 2022 | Page 71 |
Notes to Financial Statements
June 30, 2022 (unaudited)
1. Organization
Meeder Funds (the Trust) is organized as a Massachusetts business trust and is registered under the Investment Company Act of 1940, as amended (the 1940 Act), as a diversified, open-end management investment company. The Trust offers ten separate series, all of which are included in this report: Muirfield Fund (Muirfield), Spectrum Fund (Spectrum), Global Allocation Fund (Global), Balanced Fund (Balanced), Moderate Allocation Fund (Moderate), Conservative Allocation Fund (Conservative), Dynamic Allocation Fund (Dynamic), Quantex Fund (Quantex), Tactical Income Fund (Income), and Institutional Prime Money Market Fund (Money Market)(the Funds).
Each Fund, except Money Market, offers three classes of shares: Retail Class, Adviser Class, and Institutional Class. Money Market offers only one class of shares. The share classes differ with respect to distribution fees, service fees, and other expenses allocated to each class. Eligibility to purchase Adviser and Institutional Class shares is generally limited to customers of financial intermediaries who enter into special arrangements with the Funds or who meet certain initial investment minimums.
Money Market operates as an institutional money market fund open to all forms of investors. Its net asset value fluctuates based upon changes in the value of its investments and the value of its shares is calculated daily to four decimal places. Money Market has adopted policies and procedures to impose liquidity fees on redemptions or temporary redemption gates in the event that the Fund’s weekly liquid assets fall below designated thresholds and the Board of Trustees determines that such liquidity fees or redemption gates are in the best interests of the Fund.
On November 2, 2021, the Board of Trustees of the Meeder Funds determined that it was in the best interest of shareholders to liquidate the Prime Money Market Fund, a former series of the Trust, pursuant to a plan of liquidation approved by the Board. The liquidation payment to shareholders took place on December 28, 2021.
For more information regarding the Funds’ objectives, strategies, and differences in share classes, please refer to the Funds’ prospectus.
2. Significant Accounting Policies
The Funds’ financial statements are prepared in conformity with accounting principles generally accepted in the United States of America (GAAP), which require management to make certain estimates and assumptions that affect the reported amounts of assets and liabilities and disclosure of contingent assets and liabilities at the date of the financial statements. The Trust is an investment company and applies the accounting and reporting guidance of the Financial Accounting Standards Board (FASB) Accounting Standards Codification Topic 946 Financial Services Companies. The following summarizes the significant accounting policies of the Trust and the Funds:
Securities valuation. All investments in securities are recorded at their estimated fair value, as described in Note #3.
Repurchase agreements. Each Fund may engage in repurchase agreement transactions whereby the Fund takes possession of an underlying debt instrument subject to an obligation of the seller to repurchase the instrument from the Fund and an obligation of the Fund to resell the instrument at an agreed upon price and term. At all times, the Fund maintains the fair value of collateral, including accrued interest, of at least 100% of the amount of the repurchase agreement, plus accrued interest. If the seller defaults or the fair value of the collateral declines, realization of the collateral by the Fund may be delayed or limited.
Short sales. Spectrum may enter into short sales as part of its overall portfolio management strategy or to offset a potential decline in value of a security. The Fund may engage in short sales with respect to various types of securities, including ETFs. A short sale involves the sale of a security that is borrowed from a broker or other institution to complete the sale. The Fund may engage in short sales with respect to securities it owns, as well as securities that it does not own. Short sales expose the Fund to the risk that it will be required to acquire, convert, or exchange securities to replace the borrowed securities (also known as “covering” the short position) at a time when the securities sold short have appreciated in value, thus resulting in a loss to the Fund. The Fund’s investment performance may also suffer if the Fund is required to close out a short position earlier than it had intended. The Fund must segregate assets determined to be liquid in accordance with procedures established by the Board, or otherwise cover its position in a permissible manner. The Fund will be required to pledge its liquid assets to the broker in order to secure its performance on short sales. As a result, the assets pledged may not be available to meet the Fund’s needs for immediate cash or other liquidity. In addition, the Fund may be subject to expenses related to short sales that are not typically associated with investing in securities directly, such as costs of borrowing and margin account maintenance costs associated with the Fund’s open short positions. These types of short sales expenses are sometimes referred to as the “negative cost of carry,” and will tend to cause the Fund to lose money on a short sale even in instances where the price of the underlying security sold short does not change over the duration of the short sale. Dividend expenses on securities sold short and borrowing costs will be borne by the Fund and are reflected in the Statements of Operations.
Futures & options. Each Fund, except Money Market, may engage in transactions in financial futures contracts and options contracts in order to manage the risk of unanticipated changes in market values of securities held in the Fund, or which it intends to purchase. The futures and options contracts are adjusted by the daily exchange rate of the underlying currency, or index, and any gains or losses are recorded for financial statement purposes as unrealized gains or losses in the Statements of Assets and Liabilities and the Statements of Operations until the contract settlement date, at which time amounts are reflected as realized gains and losses in the Statements of Operations.
Page 72 | 2022 Semi-Annual Report | June 30, 2022 |
To the extent that a Fund enters into futures contracts on an index or group of securities, the Fund exposes itself to an indeterminate liability and will be required to pay or receive a sum of money measured by the change in the fair value of the index. Upon entering into a futures contract, the Fund is required to deposit an initial margin, which is either cash or securities (disclosed as pledged as collateral on the Schedules of Investments) in an amount equal to a certain percentage of the contract value. Subsequently, margin movements, which are equal to changes in the daily price or last sale price on the exchanges where futures contracts trade, are recorded as unrealized gains or losses until the contract is closed. When the contract is closed, the Fund records a realized gain or loss equal to the difference between the proceeds from (or cost of) the closing transaction and the Fund’s basis in the contract. Should market conditions move unexpectedly, the Fund may not achieve the anticipated benefits of the futures contract and may realize a loss. The use of futures transactions involves the risk of imperfect correlation in movements in the price of futures contracts, interest rates, and the underlying hedged assets. With futures, there is minimal counterparty credit risk to the Fund since futures are exchange traded and the exchange’s clearinghouse, as counterparty to all exchange traded futures, guarantees the futures against default. Except for Money Market, it is normal practice for each Fund to invest in futures contracts on a daily basis. The Funds, except for Income and Money Market, typically utilize equity index futures contracts to equitize cash positions or adjust targeted stock market exposure. Except for Money Market, the fixed income portion of any Fund can utilize Treasury futures contracts in order to adjust duration.
Call and put option contracts involve the payment of a premium for the right to purchase or sell an individual security or index aggregate at a specified price until the expiration of the contract. Such transactions expose the Fund to the loss of the premium paid if the Fund does not sell or exercise the contract prior to the expiration date. In the case of a call option, sufficient cash or money market instruments will be segregated to complete the purchase. Options are fair valued on the basis of the daily settlement price or last sale on the exchanges where they trade and the changes in fair value are recorded as unrealized appreciation or depreciation until closed, exercised or expired. For the six months ended June 30, 2022, there were no call or put options transacted for any of the Funds.
The Funds may write covered call or put options for which premiums received are recorded as liabilities and are subsequently adjusted to the current value of the options written. When written options are closed or exercised, premiums received are offset against the proceeds paid, and the Fund records realized gains or losses for the difference. When written options expire, the liability is eliminated, and the Fund records realized gains for the entire amount of premiums received. Although permitted, it is currently not normal practice for the Funds to write call and put options and none were written during the six months ended June 30, 2022.
The fair value of derivative instruments, not accounted for as hedging instruments, as reported within the Statements of Assets and Liabilities as of June 30, 2022 was as follows:
Amount of Deposits at Broker and Unrealized Appreciation (Depreciation) on Derivatives |
| | Type of
Derivative/
Risk | Statements of Assets & Liabilities Location | | Fair Value of
Deposits at
Broker for Futures
Contracts | | | Value of
Unrealized
Appreciation
(Depreciation) | |
Muirfield | Equity contracts | Assets, Deposits at broker for futures contracts; Net Assets, Distributable Earnings (Accumulated Deficit) | | $ | 28,086,272 | | | $ | (1,367,670 | ) |
Spectrum | Equity contracts | Assets, Deposits at broker for futures contracts; Net Assets, Distributable Earnings (Accumulated Deficit) | | | 12,844,987 | | | | (523,741 | ) |
Global | Equity contracts | Assets, Deposits at broker for futures contracts; Net Assets, Distributable Earnings (Accumulated Deficit) | | | 1,063,190 | | | | (29,005 | ) |
Balanced | Equity contracts | Assets, Deposits at broker for futures contracts; Net Assets, Distributable Earnings (Accumulated Deficit) | | | 13,120,398 | | | | (497,418 | ) |
Moderate | Equity contracts | Assets, Deposits at broker for futures contracts; Net Assets, Distributable Earnings (Accumulated Deficit) | | | 2,944,790 | | | | (57,733 | ) |
Conservative | Equity contracts | Assets, Deposits at broker for futures contracts; Net Assets, Distributable Earnings (Accumulated Deficit) | | | 1,569,415 | | | | 95,948 | |
Dynamic | Equity contracts | Assets, Deposits at broker for futures contracts; Net Assets, Distributable Earnings (Accumulated Deficit) | | | 6,547,618 | | | | (137,881 | ) |
Quantex | Equity contracts | Assets, Deposits at broker for futures contracts; Net Assets, Distributable Earnings (Accumulated Deficit) | | | 1,573,624 | | | | 72,478 | |
2022 Semi-Annual Report | June 30, 2022 | Page 73 |
The effect of derivative instruments on the Statements of Operations for the six months ended June 30, 2022 and related activity was as follows:
Amount of Realized Gain (Loss) on Derivatives Recognized in Income |
| | Type of
Derivative/
Risk | | Net Long
Contracts as of
December 31,
2021 | | | Long and
Short
Contracts
Opened
During the
Period | | | Long and
Short
Contracts
Closed/
Expired
During the
Period | | | Net Long
(Short)
Contracts as of
June 30, 2022 | | Statement of Operations
Location | | For the
Six Months
Ended June 30,
2022 | |
Muirfield | Equity contracts | | | 361 | | | | 7,338 | | | | 7,630 | | | | 69 | | Net realized gains (losses) from futures contracts | | $ | (3,805,402 | ) |
Spectrum | Equity contracts | | | 63 | | | | 2,345 | | | | 2,523 | | | | (115 | ) | Net realized gains (losses) from futures contracts | | | 2,593,938 | |
Global | Equity contracts | | | 110 | | | | 538 | | | | 586 | | | | 62 | | Net realized gains (losses) from futures contracts | | | (1,864,270 | ) |
Balanced | Equity contracts | | | 117 | | | | 2,825 | | | | 2,910 | | | | 32 | | Net realized gains (losses) from futures contracts | | | 491,269 | |
Moderate | Equity contracts | | | 39 | | | | 863 | | | | 824 | | | | 78 | | Net realized gains (losses) from futures contracts | | | (1,275,740 | ) |
Conservative | Equity contracts | | | 29 | | | | 484 | | | | 419 | | | | 94 | | Net realized gains (losses) from futures contracts | | | (1,829,812 | ) |
Dynamic | Equity contracts | | | 448 | | | | 3,287 | | | | 2,929 | | | | 806 | | Net realized gains (losses) from futures contracts | | | (12,334,652 | ) |
Quantex | Equity contracts | | | 43 | | | | 329 | | | | 306 | | | | 66 | | Net realized gains (losses) from futures contracts | | | (3,243,323 | ) |
Change in Unrealized Gain or (Loss) on Derivatives Recognized in Income |
| | Type of
Derivative/ Risk | Statement of Operations Location | | For the
Six Months Ended
June 30, 2022 | |
Muirfield | Equity contracts | Net change in unrealized appreciation (depreciation) of futures contracts | | $ | (1,756,568 | ) |
Spectrum | Equity contracts | Net change in unrealized appreciation (depreciation) of futures contracts | | | (346,269 | ) |
Global | Equity contracts | Net change in unrealized appreciation (depreciation) of futures contracts | | | (303,471 | ) |
Balanced | Equity contracts | Net change in unrealized appreciation (depreciation) of futures contracts | | | (499,325 | ) |
Moderate | Equity contracts | Net change in unrealized appreciation (depreciation) of futures contracts | | | (97,364 | ) |
Conservative | Equity contracts | Net change in unrealized appreciation (depreciation) of futures contracts | | | 19,520 | |
Dynamic | Equity contracts | Net change in unrealized appreciation (depreciation) of futures contracts | | | (1,356,999 | ) |
Quantex | Equity contracts | Net change in unrealized appreciation (depreciation) of futures contracts | | | (160,337 | ) |
Federal income taxes. It is each Fund’s policy to continue to comply with the requirements of Subchapter M of the Internal Revenue Code applicable to regulated investment companies and to distribute substantially all of its taxable income and net capital gains to its shareholders. Therefore, no federal income tax provision is required. The Funds recognize the tax benefits or expenses of uncertain tax positions only where the position is “more likely than not” to be sustained assuming examination by tax authorities. Management has reviewed tax positions taken on Federal income tax returns for all open tax years (tax years ended December 31, 2018 through December 31, 2021) and has concluded that no provision for unrecognized tax benefits or expenses is required in these financial statements. Each Fund identifies its major tax jurisdictions as U.S. Federal and certain State tax authorities; however the Funds are not aware of any tax positions for which it is reasonably possible that the total amounts of unrecognized tax benefits will change materially in the next twelve months. The Funds recognize interest and penalties, if any, related to unrecognized tax benefits as income tax expense in the Statements of Operations as incurred. During the six months ended June 30, 2022, the Funds did not incur any material interest or penalties.
Distributions to shareholders. Distributions to shareholders are recorded on the ex-dividend date. Muirfield, Spectrum, Global, Balanced, Moderate, Conservative, Dynamic, and Quantex declare and pay dividends from net investment income, if any, on a quarterly basis. Income declares and pays dividends from net investment income on a monthly basis. Money Market declares dividends from net investment income on a daily basis and pays such dividends on a monthly basis. Each Fund distributes net capital gains, if any, on an annual basis.
Page 74 | 2022 Semi-Annual Report | June 30, 2022 |
Distributions from net investment income and from net capital gains are determined in accordance with income tax regulations, which may differ from GAAP. Permanent differences relate to redemptions treated as distributions for tax purposes (i.e. equalization). Accordingly, timing differences relating to shareholder distributions are reflected in the components of net assets and permanent book and tax differences have been reclassified within the components of net assets based on their ultimate characterization for federal income tax purposes. For the year ended December 31, 2021, the Funds made the following reclassifications to increase/(decrease) the components of net assets:
| | | Capital | | | Distributable Earnings
(Accumulated Deficit) | |
Muirfield | | $ | 749,141 | | | $ | (749,141 | ) |
Spectrum | | | 506,238 | | | | (506,238 | ) |
Global | | | 521,611 | | | | (521,611 | ) |
Balanced | | | 1,002,057 | | | | (1,002,057 | ) |
Moderate | | | 540,869 | | | | (540,869 | ) |
Conservative | | | 315,068 | | | | (315,068 | ) |
Dynamic | | | 3,831,331 | | | | (3,831,331 | ) |
Quantex | | | 1,397,895 | | | | (1,397,895 | ) |
Investment income & expenses allocation. For all Funds, except Money Market, income and expenses (other than expenses attributable to a specific class) are allocated to each class of shares based on its relative net assets. Expenses incurred by the Trust that do not specifically relate to an individual Fund of the Trust are allocated to the Funds based on each Fund’s relative net assets or other appropriate basis.
Capital Share Transactions. All Funds are authorized to issue an unlimited number of shares. Transactions in the capital shares of the Funds for the six months ended June 30, 2022 and the year ended December 31, 2021 were as follows:
| | | Issued | | | Reinvested | |
Share Class | | Amount | | | Shares | | | Amount | | | Shares | |
Six Months Ended June 30, 2022 | | | | | | | | | | | | | | | | |
Muirfield - Retail | | $ | 6,510,174 | | | | 734,727 | | | $ | — | | | | — | |
Muirfield - Adviser | | | 8,765,073 | | | | 950,351 | | | | (1 | ) | | | — | |
Muirfield - Institutional | | | 89,382,953 | | | | 9,951,720 | | | | — | | | | — | |
Spectrum - Retail | | | 227,982 | | | | 17,553 | | | | — | | | | — | |
Spectrum - Adviser | | | 2,839,771 | | | | 210,835 | | | | — | | | | — | |
Spectrum - Institutional | | | 18,746,420 | | | | 1,432,357 | | | | — | | | | — | |
Global - Retail | | | 209,796 | | | | 19,689 | | | | — | | | | — | |
Global - Adviser | | | 445,713 | | | | 39,767 | | | | — | | | | — | |
Global - Institutional | | | 2,463,435 | | | | 233,472 | | | | — | | | | — | |
Balanced - Retail | | | 1,812,428 | | | | 150,061 | | | | 24,504 | | | | 2,082 | |
Balanced - Adviser | | | 6,982,011 | | | | 534,194 | | | | 316,190 | | | | 26,660 | |
Balanced - Institutional | | | 36,400,109 | | | | 2,860,322 | | | | 1,374,010 | | | | 115,657 | |
Moderate - Retail | | | 279,790 | | | | 24,205 | | | | 1,884 | | | | 168 | |
Moderate - Adviser | | | 5,710,663 | | | | 462,640 | | | | 104,450 | | | | 9,284 | |
Moderate - Institutional | | | 12,578,536 | | | | 1,050,461 | | | | 441,775 | | | | 39,199 | |
Conservative - Retail | | | 225,662 | | | | 10,068 | | | | 8,221 | | | | 388 | |
Conservative - Adviser | | | 2,600,576 | | | | 111,774 | | | | 57,667 | | | | 2,690 | |
Conservative - Institutional | | | 13,164,395 | | | | 579,557 | | | | 216,611 | | | | 10,080 | |
Dynamic - Retail | | | 216,741 | | | | 17,173 | | | | — | | | | — | |
Dynamic - Adviser | | | 2,039,159 | | | | 151,442 | | | | — | | | | — | |
Dynamic - Institutional | | | 37,388,947 | | | | 2,933,637 | | | | — | | | | — | |
Quantex - Retail | | | 127,238 | | | | 3,424 | | | | — | | | | — | |
Quantex - Adviser | | | 262,582 | | | | 6,830 | | | | — | | | | — | |
Quantex - Institutional | | | 1,442,167 | | | | 39,470 | | | | — | | | | — | |
Income - Retail | | | 200,325 | | | | 21,401 | | | | 6,536 | | | | 707 | |
Income - Adviser | | | 1,612,943 | | | | 170,033 | | | | 44,283 | | | | 4,780 | |
Income - Institutional | | | 9,517,767 | | | | 1,019,542 | | | | 248,210 | | | | 26,815 | |
Money Market | | | 708,125,113 | | | | 708,313,030 | | | | 71,387 | | | | 71,475 | |
| | | | | | | | | | | | | | | | | |
2022 Semi-Annual Report | June 30, 2022 | Page 75 |
| | | Issued | | | Reinvested | |
Share Class | | Amount | | | Shares | | | Amount | | | Shares | |
Year Ended December 31, 2021 | | | | | | | | | | | | | | | | |
Muirfield - Retail | | $ | 6,469,284 | | | | 694,953 | | | $ | 1,389,369 | | | | 146,318 | |
Muirfield - Adviser | | | 105,372,752 | | | | 12,157,906 | | | | 3,472,316 | | | | 362,120 | |
Muirfield - Institutional | | | 206,153,900 | | | | 22,156,762 | | | | 17,951,987 | | | | 1,867,042 | |
Spectrum - Retail | | | 812,426 | | | | 62,421 | | | | 133,412 | | | | 9,600 | |
Spectrum - Adviser | | | 38,585,700 | | | | 3,016,241 | | | | 2,008,738 | | | | 143,722 | |
Spectrum - Institutional | | | 42,300,867 | | | | 3,129,326 | | | | 8,900,032 | | | | 634,509 | |
Global - Retail | | | 464,829 | | | | 37,814 | | | | 355,386 | | | | 30,743 | |
Global - Adviser | | | 5,718,573 | | | | 480,145 | | | | 507,971 | | | | 43,678 | |
Global - Institutional | | | 5,622,509 | | | | 464,097 | | | | 3,657,943 | | | | 315,612 | |
Balanced - Retail | | | 1,419,522 | | | | 103,666 | | | | 536,279 | | | | 39,803 | |
Balanced - Adviser | | | 75,167,324 | | | | 5,639,400 | | | | 5,644,455 | | | | 415,494 | |
Balanced - Institutional | | | 76,607,173 | | | | 5,553,310 | | | | 24,603,677 | | | | 1,806,617 | |
Moderate - Retail | | | 243,792 | | | | 19,203 | | | | 68,964 | | | | 5,442 | |
Moderate - Adviser | | | 32,545,012 | | | | 2,569,740 | | | | 1,909,210 | | | | 150,181 | |
Moderate - Institutional | | | 33,332,710 | | | | 2,570,281 | | | | 9,142,151 | | | | 717,897 | |
Conservative - Retail | | | 834,351 | | | | 34,357 | | | | 373,133 | | | | 15,690 | |
Conservative - Adviser | | | 24,966,663 | | | | 1,019,612 | | | | 1,341,555 | | | | 55,711 | |
Conservative - Institutional | | | 28,456,983 | | | | 1,152,983 | | | | 6,332,940 | | | | 262,413 | |
Dynamic - Retail | | | 826,784 | | | | 56,185 | | | | 1,280,969 | | | | 91,616 | |
Dynamic - Adviser | | | 30,927,011 | | | | 2,198,166 | | | | 3,644,409 | | | | 258,053 | |
Dynamic - Institutional | | | 76,433,295 | | | | 5,106,615 | | | | 25,863,854 | | | | 1,835,669 | |
Quantex - Retail | | | 4,529,307 | | | | 104,989 | | | | 2,342,181 | | | | 60,226 | |
Quantex - Adviser | | | 4,794,010 | | | | 125,606 | | | | 649,231 | | | | 16,579 | |
Quantex - Institutional | | | 7,445,118 | | | | 184,488 | | | | 3,055,546 | | | | 78,187 | |
Income - Retail | | | 573,050 | | | | 58,803 | | | | 39,594 | | | | 4,065 | |
Income - Adviser | | | 10,993,038 | | | | 1,108,656 | | | | 185,116 | | | | 18,972 | |
Income - Institutional | | | 24,604,439 | | | | 2,513,602 | | | | 1,063,777 | | | | 109,136 | |
Money Market | | | 1,011,642,367 | | | | 1,011,455,624 | | | | 35,042 | | | | 35,036 | |
| | | Redeemed | | | Net Increase (Decrease) | |
Share Class | | Amount | | | Shares | | | Amount | | | Shares | |
Six Months Ended June 30, 2022 | | | | | | | | | | | | | | | | |
Muirfield - Retail | | $ | (4,068,376 | ) | | | (463,561 | ) | | $ | 2,441,798 | | | | 271,166 | |
Muirfield - Adviser | | | (9,345,597 | ) | | | (1,040,786 | ) | | | (580,525 | ) | | | (90,435 | ) |
Muirfield - Institutional | | | (73,040,758 | ) | | | (8,287,903 | ) | | | 16,342,195 | | | | 1,663,817 | |
Spectrum - Retail | | | (637,508 | ) | | | (49,505 | ) | | | (409,526 | ) | | | (31,952 | ) |
Spectrum - Adviser | | | (3,770,152 | ) | | | (288,953 | ) | | | (930,381 | ) | | | (78,118 | ) |
Spectrum - Institutional | | | (18,098,886 | ) | | | (1,381,905 | ) | | | 647,534 | | | | 50,452 | |
Global - Retail | | | (656,371 | ) | | | (61,324 | ) | | | (446,575 | ) | | | (41,635 | ) |
Global - Adviser | | | (675,890 | ) | | | (63,423 | ) | | | (230,177 | ) | | | (23,656 | ) |
Global - Institutional | | | (4,007,046 | ) | | | (372,658 | ) | | | (1,543,611 | ) | | | (139,186 | ) |
Balanced - Retail | | | (777,786 | ) | | | (62,362 | ) | | | 1,059,146 | | | | 89,781 | |
Balanced - Adviser | | | (6,491,925 | ) | | | (509,496 | ) | | | 806,276 | | | | 51,358 | |
Balanced - Institutional | | | (32,586,198 | ) | | | (2,563,211 | ) | | | 5,187,921 | | | | 412,768 | |
Moderate - Retail | | | (243,994 | ) | | | (20,814 | ) | | | 37,680 | | | | 3,559 | |
Moderate - Adviser | | | (2,459,783 | ) | | | (204,889 | ) | | | 3,355,330 | | | | 267,035 | |
Moderate - Institutional | | | (14,337,551 | ) | | | (1,195,040 | ) | | | (1,317,240 | ) | | | (105,380 | ) |
Conservative - Retail | | | (589,381 | ) | | | (26,299 | ) | | | (355,498 | ) | | | (15,843 | ) |
Conservative - Adviser | | | (1,874,672 | ) | | | (82,059 | ) | | | 783,571 | | | | 32,405 | |
Conservative - Institutional | | | (13,915,952 | ) | | | (611,555 | ) | | | (534,946 | ) | | | (21,918 | ) |
Dynamic - Retail | | | (1,173,315 | ) | | | (93,407 | ) | | | (956,574 | ) | | | (76,234 | ) |
Dynamic - Adviser | | | (3,050,605 | ) | | | (239,550 | ) | | | (1,011,446 | ) | | | (88,108 | ) |
Dynamic - Institutional | | | (20,668,908 | ) | | | (1,612,709 | ) | | | 16,720,039 | | | | 1,320,928 | |
Page 76 | 2022 Semi-Annual Report | June 30, 2022 |
| | | Redeemed | | | Net Increase (Decrease) | |
Share Class | | Amount | | | Shares | | | Amount | | | Shares | |
Quantex - Retail | | $ | (688,580 | ) | | | (18,545 | ) | | $ | (561,342 | ) | | | (15,121 | ) |
Quantex - Adviser | | | (501,821 | ) | | | (13,343 | ) | | | (239,239 | ) | | | (6,513 | ) |
Quantex - Institutional | | | (3,099,389 | ) | | | (83,391 | ) | | | (1,657,222 | ) | | | (43,921 | ) |
Income - Retail | | | (356,334 | ) | | | (38,055 | ) | | | (149,473 | ) | | | (15,947 | ) |
Income - Adviser | | | (718,025 | ) | | | (76,641 | ) | | | 939,201 | | | | 98,172 | |
Income - Institutional | | | (9,044,118 | ) | | | (969,541 | ) | | | 721,859 | | | | 76,816 | |
Money Market | | | (633,994,246 | ) | | | (634,163,596 | ) | | | 74,202,254 | | | | 74,220,909 | |
| | | | | | | | | | | | | | | | | |
Year Ended December 31, 2021 | | | | | | | | | | | | | | | | |
Muirfield - Retail | | $ | (108,680,649 | ) | | | (12,662,814 | ) | | $ | (100,821,996 | ) | | | (11,821,543 | ) |
Muirfield - Adviser | | | (66,608,139 | ) | | | (7,612,443 | ) | | | 42,236,929 | | | | 4,907,583 | |
Muirfield - Institutional | | | (108,609,581 | ) | | | (11,811,076 | ) | | | 115,496,306 | | | | 12,212,728 | |
Spectrum - Retail | | | (36,841,554 | ) | | | (2,901,721 | ) | | | (35,895,716 | ) | | | (2,829,700 | ) |
Spectrum - Adviser | | | (18,737,374 | ) | | | (1,448,581 | ) | | | 21,857,064 | | | | 1,711,382 | |
Spectrum - Institutional | | | (37,355,079 | ) | | | (2,747,785 | ) | | | 13,845,820 | | | | 1,016,050 | |
Global - Retail | | | (6,568,484 | ) | | | (548,993 | ) | | | (5,748,269 | ) | | | (480,436 | ) |
Global - Adviser | | | (2,862,018 | ) | | | (237,195 | ) | | | 3,364,526 | | | | 286,628 | |
Global - Institutional | | | (8,380,207 | ) | | | (680,837 | ) | | | 900,245 | | | | 98,872 | |
Balanced - Retail | | | (72,534,298 | ) | | | (5,502,556 | ) | | | (70,578,497 | ) | | | (5,359,087 | ) |
Balanced - Adviser | | | (30,358,104 | ) | | | (2,250,733 | ) | | | 50,453,675 | | | | 3,804,161 | |
Balanced - Institutional | | | (111,852,236 | ) | | | (7,927,738 | ) | | | (10,641,386 | ) | | | (567,811 | ) |
Moderate - Retail | | | (30,629,325 | ) | | | (2,430,279 | ) | | | (30,316,569 | ) | | | (2,405,634 | ) |
Moderate - Adviser | | | (14,748,469 | ) | | | (1,159,942 | ) | | | 19,705,753 | | | | 1,559,979 | |
Moderate - Institutional | | | (38,530,382 | ) | | | (2,942,267 | ) | | | 3,944,479 | | | | 345,911 | |
Conservative - Retail | | | (23,494,226 | ) | | | (973,256 | ) | | | (22,286,742 | ) | | | (923,209 | ) |
Conservative - Adviser | | | (10,649,934 | ) | | | (435,766 | ) | | | 15,658,284 | | | | 639,557 | |
Conservative - Institutional | | | (33,958,616 | ) | | | (1,365,588 | ) | | | 831,307 | | | | 49,808 | |
Dynamic - Retail | | | (31,238,886 | ) | | | (2,232,902 | ) | | | (29,131,133 | ) | | | (2,085,101 | ) |
Dynamic - Adviser | | | (20,640,401 | ) | | | (1,446,686 | ) | | | 13,931,019 | | | | 1,009,533 | |
Dynamic - Institutional | | | (55,644,980 | ) | | | (3,767,375 | ) | | | 46,652,169 | | | | 3,174,909 | |
Quantex - Retail | | | (10,498,344 | ) | | | (258,266 | ) | | | (3,626,856 | ) | | | (93,051 | ) |
Quantex - Adviser | | | (2,204,605 | ) | | | (52,908 | ) | | | 3,238,636 | | | | 89,277 | |
Quantex - Institutional | | | (12,599,469 | ) | | | (305,429 | ) | | | (2,098,805 | ) | | | (42,754 | ) |
Income - Retail | | | (9,978,652 | ) | | | (1,005,571 | ) | | | (9,366,008 | ) | | | (942,703 | ) |
Income - Adviser | | | (7,285,187 | ) | | | (742,788 | ) | | | 3,892,967 | | | | 384,840 | |
Income - Institutional | | | (16,493,262 | ) | | | (1,686,599 | ) | | | 9,174,954 | | | | 936,139 | |
Money Market | | | (721,061,508 | ) | | | (720,922,007 | ) | | | 290,615,901 | | | | 290,568,653 | |
2022 Semi-Annual Report | June 30, 2022 | Page 77 |
Offsetting Assets & Liabilities. The Funds are party to enforceable master netting arrangements between counter parties, such as the securities lending agreement, which provides for the right of offset under certain circumstances, such as the event of default. The securities lending transactions have an overnight and continuous contractual maturity. Risks arise from the possible inability of counterparties to meet the terms of their contracts. The table below reflects the offsetting assets and liabilities relating to securities lending, futures contracts, and repurchase agreements shown on the Statements of Assets and Liabilities at June 30, 2022.
| | | | | | | | | | | | | | | Gross Amounts Not Offset in the
Statements of Assets and Liabilities | | | | | |
Description/ Fund | | Gross Amounts
of Recognized
Assets/
Liabilities | | | Gross Amounts
Offset in the
Statements
of Assets and
Liabilities | | | Net Amounts
Presented in
the Statements
of Assets and
Liabilities | | | Financial
Instruments* | | | Collateral
Pledged
(Received)* | | | Net Amount | |
Assets: | | | | | | | | | | | | | | | | | | | | | | | | |
Futures Contracts | | | | | | | | | | | | | | | | | | | | | | | | |
Conservative | | $ | 110,999 | | | $ | (15,051 | ) | | $ | 95,948 | | | $ | — | | | $ | — | | | $ | 95,948 | |
Quantex | | | 114,092 | | | | (41,614 | ) | | | 72,478 | | | | — | | | | — | | | | 72,478 | |
| | | | | | | | | | | | | | | | | | | | | | | | | |
Repurchase Agreements | | | | | | | | | | | | | | | | | | | | | | | | |
Money Market | | $ | 165,000,000 | | | $ | — | | | $ | 165,000,000 | | | $ | (165,000,000 | ) | | $ | — | | | $ | — | |
| | | | | | | | | | | | | | | | | | | | | | | | | |
Liabilities: | | | | | | | | | | | | | | | | | | | | | | | | |
Futures Contracts | | | | | | | | | | | | | | | | | | | | | | | | |
Muirfield | | $ | (1,938,842 | ) | | $ | 571,172 | | | $ | (1,367,670 | ) | | $ | — | | | $ | 1,367,670 | | | $ | — | |
Spectrum | | | (787,389 | ) | | | 263,648 | | | | (523,741 | ) | | | — | | | | 523,741 | | | | — | |
Global | | | (40,213 | ) | | | 11,208 | | | | (29,005 | ) | | | — | | | | 29,005 | | | | — | |
Balanced | | | (678,563 | ) | | | 181,145 | | | | (497,418 | ) | | | — | | | | 497,418 | | | | — | |
Moderate | | | (74,847 | ) | | | 17,114 | | | | (57,733 | ) | | | — | | | | 57,733 | | | | — | |
Dynamic | | | (319,700 | ) | | | 181,819 | | | | (137,881 | ) | | | — | | | | 137,881 | | | | — | |
| | | | | | | | | | | | | | | | | | | | | | | | | |
* The amount is limited to the net amounts of financial assets and liabilities and accordingly does not include excess collateral pledged.
Other. The Funds record security transactions on the trade date. Securities purchased or sold on a when-issued or delayed-delivery basis may be settled 15 days or more after the trade date. Gains and losses realized from the sale of securities are determined on the specific identification basis. Dividend income and dividend expenses are recognized on the ex-dividend date and interest income (including amortization of premium and accretion of discount) is recognized as earned. Short-term capital gain distributions from underlying funds are classified as dividend income for financial reporting purposes. Long-term capital gains distributions are separately stated. Discounts and premiums are amortized using the effective yield over the lives of the respective securities. Distributions received from partnerships are recorded as return of capital distributions. Withholding taxes on foreign dividends, if applicable, have been provided for in accordance with the Funds’ understanding of the applicable country’s tax rules and rates.
A Fund may purchase securities on a forward commitment or when-issued basis. A Fund records a when-issued transaction on the trade date and will segregate assets in an amount at least equal in value to the Fund’s commitment to purchase when-issued securities. Securities purchased on a when-issued basis are marked-to-market daily and the Fund begins earning interest on the settlement date. Losses may arise due to changes in the market value of the underlying securities or if the counterparty does not perform under the contract.
Certain Funds may purchase or sell securities on a delayed-delivery basis. These transactions involve a commitment by a Fund to purchase or sell securities for a predetermined price or yield, with payment and delivery taking place beyond the customary settlement period. When delayed-delivery transactions are outstanding, a Fund will designate or receive as collateral liquid assets in an amount sufficient to meet the purchase price or respective obligations. When purchasing a security on a delayed-delivery basis, a Fund assumes the rights and risks of ownership of the security, including the risk of price and yield fluctuations, and takes such fluctuations into account when determining its NAV. A Fund may dispose of or renegotiate a delayed-delivery transaction after it is entered into which may result in a realized gain or loss. When a Fund has sold a security on a delayed-delivery basis, the Fund does not participate in future gains and losses with respect to the security.
Distributions received from the Funds’ investments in real estate investment trusts (“REITs”) may be characterized as ordinary income, net capital gain, or return of capital. The proper characterization of REIT distributions is generally not known until after the end of each calendar year. As such, the Funds must use estimates in reporting the character of their income and distributions for financial statement purposes. The actual character of distributions to the Funds’ shareholders will be reflected on the Form 1099 received by shareholders after the end of the calendar year. Due to the nature of REIT investments, a portion of the distributions received by the Funds’ shareholders may represent a return of capital.
Page 78 | 2022 Semi-Annual Report | June 30, 2022 |
3. Securities Valuations
The Funds utilize various methods to measure the fair value of their investments on a recurring basis. GAAP establishes a hierarchy that prioritizes inputs to valuation methods. The three levels of inputs are as follows:
Level 1 – Unadjusted quoted prices in active markets for identical assets or liabilities that the Funds have the ability to access.
Level 2 – Observable inputs other than quoted prices included in level 1 that are observable for the asset or liability, either directly or indirectly. These inputs may include quoted prices for the identical instrument on an inactive market, prices for similar instruments, interest rates, prepayment speeds, credit risk, yield curves, default rates and similar data.
Level 3 – Significant unobservable inputs for the asset or liability, to the extent relevant observable inputs are not available, representing the Funds’ own assumptions about the assumptions a market participant would use in valuing the asset or liability, and would be based on the best information available.
The availability of observable inputs can vary from security to security and is affected by a wide variety of factors, including, for example, the type of security, whether the security is new and not yet established in the marketplace, the liquidity of markets, and other characteristics particular to the security. To the extent that valuation is based on models or inputs that are less observable or unobservable in the market, the determination of fair value requires more judgment. Accordingly, the degree of judgment exercised in determining fair value is greatest for instruments categorized in level 3.
The inputs used to measure fair value may fall into different levels of the fair value hierarchy. In such cases, for disclosure purposes, the level in the fair value hierarchy within which the fair value measurement falls in its entirety, is determined based on the lowest level input that is significant to the fair value measurement in its entirety.
A description of the valuation techniques applied to the Funds’ major categories of assets and liabilities measured at fair value on a recurring basis follows.
Equity securities (including publicly traded partnerships, real estate investment trusts, American depositary receipts, exchange traded funds, and common stock). Securities traded on a national securities exchange (or reported on the NASDAQ national market) are stated at the last reported sales price on the day of valuation and are categorized in level 1 of the fair value hierarchy.
Investments in registered open-end investment companies, including money market funds, are valued at the daily redemption net asset value as reported by the underlying fund and are categorized in level 1 of the fair value hierarchy.
Short-term notes (including bank obligations, commercial paper, corporate obligations, repurchase agreements, U.S. government agency obligations, and floating rate demand notes). Short-term notes held in the Funds maturing more than sixty days after the valuation date, are valued at the last sales price as of the close of business on the day of valuation, or, lacking any sales, at the most recent bid price or yield equivalent as obtained from dealers that make markets in such securities. When valued at last sales price, the securities will be categorized as level 1. When using bid prices or yield equivalents, they will be categorized as level 2. When such securities are valued within sixty days or less to maturity, the difference between the valuation existing on the sixty-first day before maturity and maturity value is amortized on a straight-line basis to maturity and will be categorized as level 2.
Certificates of deposit. Except for Money Market, certificates of deposit are valued at acquisition cost, which approximates fair value, and will be categorized as level 2. For Money Market, certificates of deposit are normally valued using a model that incorporates market observable data such as reported sales of similar securities, broker quotes, yields, bids, offers, and reference data, and will be categorized as level 2.
U.S. government obligations. U.S. government obligations are normally valued using a model that incorporates market observable data such as reported sales of similar securities, broker quotes, yields, bids, offers, and reference data. Certain securities are valued principally using dealer quotations. In either case, these securities will be categorized as level 2.
Restricted securities (equity and debt). Restricted securities for which quotations are not readily available are valued at fair value as determined by the Trustees. Depending on the relative significance of valuation inputs, these instruments may be classified in either level 2 or level 3 of the fair value hierarchy.
Derivative instruments (futures contracts). Listed derivative instruments that are actively traded, including futures contracts, are valued based on quoted prices from the exchange and are categorized in level 1 of the fair value hierarchy.
2022 Semi-Annual Report | June 30, 2022 | Page 79 |
For the six months ended June 30, 2022, the Funds did not hold any assets at any time in which significant unobservable inputs were used in determining fair value. Therefore, no reconciliation of level 3 securities is provided. However, the Funds have disclosed holding level 3 securities with fair valuations of zero. The following table summarizes the inputs used to value the Funds’ assets and liabilities measured at fair value as of June 30, 2022.
Muirfield - Assets/(Liabilities) | | Level 1 | | | Level 2 | | | Level 3 | | | Total | |
Common stocks* | | $ | 336,025,931 | | | $ | — | | | $ | — | | | $ | 336,025,931 | |
Preferred stocks | | | 71,621 | | | | — | | | | — | | | | 71,621 | |
Warrants | | | 9,696 | | | | — | | | | — | | | | 9,696 | |
Money market registered investment companies | | | 273,579,597 | | | | — | | | | — | | | | 273,579,597 | |
Bank obligations | | | — | | | | 498,173 | | | | — | | | | 498,173 | |
Total | | $ | 609,686,845 | | | $ | 498,173 | | | $ | — | | | $ | 610,185,018 | |
Trustee deferred compensation*** | | $ | 327,466 | | | $ | — | | | $ | — | | | $ | 327,466 | |
Futures contracts** | | $ | (1,367,669 | ) | | $ | — | | | $ | — | | | $ | (1,367,669 | ) |
Spectrum - Assets/(Liabilities) | | Level 1 | | | Level 2 | | | Level 3 | | | Total | |
Common stocks* | | $ | 122,321,304 | | | $ | — | | | $ | — | | | $ | 122,321,304 | |
Preferred stocks | | | 5,429 | | | | — | | | | — | | | | 5,429 | |
Warrants | | | 2,641 | | | | — | | | | — | | | | 2,641 | |
Money market registered investment companies | | | 46,797,670 | | | | — | | | | — | | | | 46,797,670 | |
Total | | $ | 169,127,044 | | | $ | — | | | $ | — | | | $ | 169,127,044 | |
Trustee deferred compensation*** | | $ | 55,003 | | | $ | — | | | $ | — | | | $ | 55,003 | |
Futures contracts** | | $ | (523,740 | ) | | $ | — | | | $ | — | | | $ | (523,740 | ) |
Global - Assets/(Liabilities) | | Level 1 | | | Level 2 | | | Level 3 | | | Total | |
Common stocks* | | $ | 7,960,443 | | | $ | — | | | $ | — | | | $ | 7,960,443 | |
Preferred stocks | | | 2,221 | | | | — | | | | — | | | | 2,221 | |
Warrants | | | 492 | | | | — | | | | — | | | | 492 | |
Registered investment companies | | | 4,106,612 | | | | — | | | | — | | | | 4,106,612 | |
Money market registered investment companies | | | 23,162,750 | | | | — | | | | — | | | | 23,162,750 | |
Bank obligations | | | — | | | | 498,173 | | | | — | | | | 498,173 | |
Total | | $ | 35,232,518 | | | $ | 498,173 | | | $ | — | | | $ | 35,730,691 | |
Trustee deferred compensation*** | | $ | 113,934 | | | $ | — | | | $ | — | | | $ | 113,934 | |
Futures contracts** | | $ | (29,006 | ) | | $ | — | | | $ | — | | | $ | (29,006 | ) |
Balanced - Assets/(Liabilities) | | Level 1 | | | Level 2 | | | Level 3 | | | Total | |
Common stocks* | | $ | 125,203,550 | | | $ | — | | | $ | — | | | $ | 125,203,550 | |
Preferred stocks | | | 27,255 | | | | — | | | | — | | | | 27,255 | |
Warrants | | | 4,404 | | | | — | | | | — | | | | 4,404 | |
Registered investment companies | | | 29,421,078 | | | | — | | | | — | | | | 29,421,078 | |
Money market registered investment companies | | | 175,474,168 | | | | — | | | | — | | | | 175,474,168 | |
Bank obligations | | | — | | | | 498,173 | | | | — | | | | 498,173 | |
Total | | $ | 330,130,455 | | | $ | 498,173 | | | $ | — | | | $ | 330,628,628 | |
Trustee deferred compensation*** | | $ | 210,545 | | | $ | — | | | $ | — | | | $ | 210,545 | |
Futures contracts** | | $ | (497,418 | ) | | $ | — | | | $ | — | | | $ | (497,418 | ) |
Page 80 | 2022 Semi-Annual Report | June 30, 2022 |
Moderate - Assets/(Liabilities) | | Level 1 | | | Level 2 | | | Level 3 | | | Total | |
Common stocks* | | $ | 26,961,728 | | | $ | — | | | $ | — | | | $ | 26,961,728 | |
Preferred stocks | | | 6,910 | | | | — | | | | — | | | | 6,910 | |
Warrants | | | 1,435 | | | | — | | | | — | | | | 1,435 | |
Registered investment companies | | | 22,150,799 | | | | — | | | | — | | | | 22,150,799 | |
Money market registered investment companies | | | 103,081,665 | | | | — | | | | — | | | | 103,081,665 | |
Bank obligations | | | — | | | | 248,529 | | | | — | | | | 248,529 | |
Total | | $ | 152,202,537 | | | $ | 248,529 | | | $ | — | | | $ | 152,451,066 | |
Trustee deferred compensation*** | | $ | 41,085 | | | $ | — | | | $ | — | | | $ | 41,085 | |
Futures contracts** | | $ | (57,733 | ) | | $ | — | | | $ | — | | | $ | (57,733 | ) |
Conservative - Assets/(Liabilities) | | Level 1 | | | Level 2 | | | Level 3 | | | Total | |
Common stocks* | | $ | 1,422,094 | | | $ | — | | | $ | — | | | $ | 1,422,094 | |
Preferred stocks | | | 4,195 | | | | — | | | | — | | | | 4,195 | |
Warrants | | | 526 | | | | — | | | | — | | | | 526 | |
Registered investment companies | | | 23,906,642 | | | | — | | | | — | | | | 23,906,642 | |
Money market registered investment companies | | | 93,655,166 | | | | — | | | | — | | | | 93,655,166 | |
Total | | $ | 118,988,623 | | | $ | — | | | $ | — | | | $ | 118,988,623 | |
Trustee deferred compensation*** | | $ | 84,500 | | | $ | — | | | $ | — | | | $ | 84,500 | |
Futures contracts** | | $ | 95,948 | | | $ | — | | | $ | — | | | $ | 95,948 | |
Dynamic - Assets/(Liabilities) | | Level 1 | | | Level 2 | | | Level 3 | | | Total | |
Common stocks* | | $ | 127,746,444 | | | $ | — | | | $ | — | | | $ | 127,746,444 | |
Preferred stocks | | | 16,726 | | | | — | | | | — | | | | 16,726 | |
Warrants | | | 2,568 | | | | — | | | | — | | | | 2,568 | |
Registered investment companies | | | 10,409,365 | | | | — | | | | — | | | | 10,409,365 | |
Money market registered investment companies | | | 60,659,468 | | | | — | | | | — | | | | 60,659,468 | |
Bank obligations | | | — | | | | 498,173 | | | | — | | | | 498,173 | |
Total | | $ | 198,834,571 | | | $ | 498,173 | | | $ | — | | | $ | 199,332,744 | |
Trustee deferred compensation*** | | $ | 237,867 | | | $ | — | | | $ | — | | | $ | 237,867 | |
Futures contracts** | | $ | (137,881 | ) | | $ | — | | | $ | — | | | $ | (137,881 | ) |
Quantex - Assets/(Liabilities) | | Level 1 | | | Level 2 | | | Level 3 | | | Total | |
Common stocks* | | $ | 19,293,402 | | | $ | — | | | $ | — | | | $ | 19,293,402 | |
Money market registered investment companies | | | 12,323,505 | | | | — | | | | — | | | | 12,323,505 | |
Bank obligations | | | — | | | | 8,218 | | | | — | | | | 8,218 | |
Total | | $ | 31,616,907 | | | $ | 8,218 | | | $ | — | | | $ | 31,625,125 | |
Trustee deferred compensation*** | | $ | 69,393 | | | $ | — | | | $ | — | | | $ | 69,393 | |
Futures contracts** | | $ | 72,477 | | | $ | — | | | $ | — | | | $ | 72,477 | |
Income - Assets/(Liabilities) | | Level 1 | | | Level 2 | | | Level 3 | | | Total | |
Registered investment companies | | $ | 19,040,873 | | | $ | — | | | $ | — | | | $ | 19,040,873 | |
Money market registered investment companies | | | 47,232,219 | | | | — | | | | — | | | | 47,232,219 | |
U.S. government obligations | | | — | | | | 68,372 | | | | — | | | | 68,372 | |
Total | | $ | 66,273,092 | | | $ | 68,372 | | | $ | — | | | $ | 66,341,464 | |
Trustee deferred compensation*** | | $ | 79,212 | | | $ | — | | | $ | — | | | $ | 79,212 | |
2022 Semi-Annual Report | June 30, 2022 | Page 81 |
Money Market - Assets/(Liabilities) | | Level 1 | | | Level 2 | | | Level 3 | | | Total | |
Certificates of deposit | | $ | — | | | $ | 191,686,825 | | | $ | — | | | $ | 191,686,825 | |
Commercial paper | | | — | | | | 284,767,089 | | | | — | | | | 284,767,089 | |
Corporate obligations | | | — | | | | 15,000,000 | | | | — | | | | 15,000,000 | |
Repurchase agreements | | | — | | | | 165,000,000 | | | | — | | | | 165,000,000 | |
Variable rate demand notes | | | — | | | | 22,615,000 | | | | — | | | | 22,615,000 | |
Money market registered investment companies | | | 31,958,602 | | | | — | | | | — | | | | 31,958,602 | |
Total | | $ | 31,958,602 | | | $ | 679,068,914 | | | $ | — | | | $ | 711,027,516 | |
Trustee deferred compensation*** | | $ | 6,491 | | | $ | — | | | $ | — | | | $ | 6,491 | |
* | See schedules of investments for industry classifications. |
** | Futures contracts include unrealized gain/loss on contracts open at June 30, 2022. |
*** | A corresponding liability exists that is marked to market and is considered Level 1 in the fair value hierarchy. |
4. Investment Transactions
For the six months ended June 30, 2022, the cost of purchases and proceeds from sales or maturities of long-term investments for the Funds, excluding U.S. Government investments and short positions, were as follows:
| | | Purchases | | | Sales | |
Muirfield | | $ | 604,927,548 | | | $ | 659,309,230 | |
Spectrum | | | 234,251,646 | | | | 236,047,092 | |
Global | | | 21,890,690 | | | | 29,049,889 | |
Balanced | | | 385,605,358 | | | | 469,784,264 | |
Moderate | | | 173,368,740 | | | | 238,410,222 | |
Conservative | | | 143,542,285 | | | | 211,112,250 | |
Dynamic | | | 273,747,094 | | | | 272,895,358 | |
Quantex | | | 5,437,219 | | | | 9,844,807 | |
Income | | | 72,243,580 | | | | 104,977,666 | |
For the six months ended June 30, 2022, the cost of purchases and proceeds from sales or maturities of long-term U.S. Government investments for the Funds are as follows:
| | | Purchases | | | Sales | |
Global | | $ | 6,250,142 | | | $ | 6,178,983 | |
Balanced | | | 175,494,852 | | | | 173,503,690 | |
Moderate | | | 133,121,858 | | | | 131,606,539 | |
Conservative | | | 144,193,945 | | | | 142,551,691 | |
Income | | | 94,862,741 | | | | 94,335,015 | |
Page 82 | 2022 Semi-Annual Report | June 30, 2022 |
5. Investment Advisory Fees and Other Transactions with Affiliates and Non-Affiliates
Meeder Asset Management, Inc. (“MAM”), a wholly-owned subsidiary of Meeder Investment Management, Inc. (“Meeder”), provides the Funds with investment management, research, statistical and advisory services pursuant to the terms of an Investment Advisory Agreement. The services of MAM will terminate automatically if assigned and may be terminated without penalty at any time upon 60 days prior written notice by majority vote of the Fund, by the Trustees of the Fund, or by MAM. For such services the Funds pay a monthly fee at the following annual rates:
| | Percentage of Average
Daily Net Assets up to
$50 Million | Percentage of Average
Daily Net Assets
Exceeding $50 Million up
to $100 Million | Percentage of Average
Daily Net Assets
Exceeding $100 Million
up to $200 Million | Percentage of Average
Daily Net Assets
Exceeding $200 Million |
Muirfield | 1.00% | 0.75% | 0.60% | 0.60% |
Spectrum | 0.75% | 0.75% | 0.75% | 0.60% |
Global | 0.75% | 0.75% | 0.75% | 0.60% |
Balanced | 0.75% | 0.75% | 0.75% | 0.60% |
Moderate | 0.60% | 0.60% | 0.60% | 0.60% |
Conservative | 0.50% | 0.50% | 0.50% | 0.50% |
Dynamic | 0.75% | 0.75% | 0.75% | 0.60% |
Quantex | 0.75% | 0.75% | 0.60% | 0.60% |
Income | 0.40% | 0.40% | 0.20% | 0.20% |
Money Market | 0.40% | 0.40% | 0.25% | 0.25% |
Fee Waivers & Expense Limitation Agreements. MAM can contractually agree to reduce its advisory fees or limit total annual ordinary fund operating expenses for certain Funds pursuant to written agreements that may only be amended or terminated with the approval of the board. The sums waived or reimbursed under these agreements would not be subject to recoupment.
For the period January 1, 2022 through April 29, 2022, MAM contractually agreed to reduce its investment advisory fee by 0.10% for Dynamic for average daily net assets up to $200 million. Effective April 30, 2022, MAM voluntarily agreed to reduce this fee by 0.10% for average daily net assets up to $200 million. During the six months ended June 30, 2022, $65,205 of investment advisory fees were contractually waived in Dynamic, while $33,973 of investment advisory fees were voluntarily waived.
For the period January 1, 2022 through April 29, 2022, MAM contractually agreed to reduce its investment advisory fee by 0.11% for Income for average daily net assets up to $100 million. Effective April 30, 2022, MAM voluntarily agreed to reduce this fee by 0.11% for average daily net assets up to $100 million. During the six months ended June 30, 2022, $24,819 of investment advisory fees were contractually waived in Income, while $12,638 of investment advisory fees were voluntarily waived.
Mutual Funds Service Co. (“MFSCo”), a wholly-owned subsidiary of Meeder, serves as stock transfer, dividend disbursing and shareholder services agent for each Fund. In compensation for such services, each Fund pays MFSCo a monthly fee at an annual rate equal to the greater of the following:
| | | Minimum Fee | | | Percentage of Average
Daily Net Assets up to
$500 Million | | | Percentage of Average
Daily Net Assets
Exceeding $500
Million | |
Muirfield | | $ | 4,000 | | | | 0.12 | % | | | 0.03 | % |
Spectrum | | | 4,000 | | | | 0.12 | % | | | 0.03 | % |
Global | | | 4,000 | | | | 0.12 | % | | | 0.03 | % |
Balanced | | | 4,000 | | | | 0.12 | % | | | 0.03 | % |
Moderate | | | 4,000 | | | | 0.12 | % | | | 0.03 | % |
Conservative | | | 4,000 | | | | 0.12 | % | | | 0.03 | % |
Dynamic | | | 4,000 | | | | 0.12 | % | | | 0.03 | % |
Quantex | | | 4,000 | | | | 0.12 | % | | | 0.03 | % |
Income | | | 4,000 | | | | 0.08 | % | | | 0.03 | % |
Money Market | | | 4,000 | | | | 0.08 | % | | | 0.03 | % |
2022 Semi-Annual Report | June 30, 2022 | Page 83 |
Management may voluntarily waive fees for any Fund. During the six months ended June 30, 2022, there were no transfer agent fees waived.MFSCo provides the Trust with certain administrative services. In compensation for such services, each Fund pays MFSCo a monthly fee at the following annual rates:
| | | Percentage of
Average Daily Net
Assets up to $50
Million | | | Percentage of
Average Daily Net
Assets Exceeding
$50 Million up to
$500 Million | | | Percentage of
Average Daily Net
Assets Exceeding
$500 Million | |
Muirfield | | | 0.10 | % | | | 0.08 | % | | | 0.03 | % |
Spectrum | | | 0.10 | % | | | 0.08 | % | | | 0.03 | % |
Global | | | 0.10 | % | | | 0.08 | % | | | 0.03 | % |
Balanced | | | 0.10 | % | | | 0.08 | % | | | 0.03 | % |
Moderate | | | 0.10 | % | | | 0.08 | % | | | 0.03 | % |
Conservative | | | 0.10 | % | | | 0.08 | % | | | 0.03 | % |
Dynamic | | | 0.10 | % | | | 0.08 | % | | | 0.03 | % |
Quantex | | | 0.10 | % | | | 0.08 | % | | | 0.03 | % |
Income | | | 0.10 | % | | | 0.08 | % | | | 0.03 | % |
Money Market | | | 0.10 | % | | | 0.08 | % | | | 0.03 | % |
MFSCo serves as accounting services agent for each Fund. In compensation for such services, each Fund pays MFSCo a monthly fee at an annual rate equal to the greater of a minimum fee or at a rate based on the percentage of average daily net assets. The annual rates are as follows:
| | | Minimum Fee | | | Percentage of
Average Daily Net
Assets up to $10
Million | | | Percentage of
Average Daily Net
Assets Exceeding
$10 Million up to
$30 Million | | | Percentage of
Average Daily Net
Assets Exceeding
$30 Million up to
$80 Million | | | Percentage of
Average Daily Net
Assets Exceeding
$80 Million | |
Muirfield | | $ | 7,500 | | | | 0.15 | % | | | 0.10 | % | | | 0.02 | % | | | 0.01 | % |
Spectrum | | | 7,500 | | | | 0.15 | % | | | 0.10 | % | | | 0.02 | % | | | 0.01 | % |
Global | | | 7,500 | | | | 0.15 | % | | | 0.10 | % | | | 0.02 | % | | | 0.01 | % |
Balanced | | | 7,500 | | | | 0.15 | % | | | 0.10 | % | | | 0.02 | % | | | 0.01 | % |
Moderate | | | 7,500 | | | | 0.15 | % | | | 0.10 | % | | | 0.02 | % | | | 0.01 | % |
Conservative | | | 7,500 | | | | 0.15 | % | | | 0.10 | % | | | 0.02 | % | | | 0.01 | % |
Dynamic | | | 7,500 | | | | 0.15 | % | | | 0.10 | % | | | 0.02 | % | | | 0.01 | % |
Quantex | | | 7,500 | | | | 0.15 | % | | | 0.10 | % | | | 0.02 | % | | | 0.01 | % |
Income | | | 7,500 | | | | 0.15 | % | | | 0.10 | % | | | 0.02 | % | | | 0.01 | % |
Money Market | | | 30,000 | | | | 0.15 | % | | | 0.10 | % | | | 0.02 | % | | | 0.01 | % |
Page 84 | 2022 Semi-Annual Report | June 30, 2022 |
For the six months ended June 30, 2022, MAM agreed to voluntarily waive and/or reimburse investment advisory fees. The amounts voluntarily waived and/or reimbursed and the impact to the net expense ratio (excluding brokerage fees and commissions, taxes, interest, and extraordinary or non-recurring expenses) for each Fund are as follows:
| | | Voluntary
Investment
Advisory Fee
Waivers and/or
Reimbursements | | | Impact of Voluntary
Investment
Advisory Fee
Waivers and/or
Reimbursements to
Average Net Assets | | | Impact of Voluntary
Investment
Advisory Fee
Waivers and/or
Reimbursements to
Average Net Assets
- Retail Class | | | Impact of Voluntary
Investment
Advisory Fee
Waivers and/or
Reimbursements to
Average Net Assets
- Adviser Class | | | Impact of Voluntary
Investment
Advisory Fee
Waivers and/or
Reimbursements to
Average Net Assets
- Institutional Class | |
Muirfield | | $ | — | | | | N/A | | | | N/A | | | | N/A | | | | N/A | |
Spectrum | | | — | | | | N/A | | | | N/A | | | | N/A | | | | N/A | |
Global | | | — | | | | N/A | | | | N/A | | | | N/A | | | | N/A | |
Balanced | | | — | | | | N/A | | | | N/A | | | | N/A | | | | N/A | |
Moderate | | | — | | | | N/A | | | | N/A | | | | N/A | | | | N/A | |
Conservative | | | — | | | | N/A | | | | N/A | | | | N/A | | | | N/A | |
Dynamic | | | — | | | | N/A | | | | N/A | | | | N/A | | | | N/A | |
Quantex | | | — | | | | N/A | | | | N/A | | | | N/A | | | | N/A | |
Income | | | — | | | | N/A | | | | N/A | | | | N/A | | | | N/A | |
Money Market | | | 938,521 | | | | 0.28 | % | | | N/A | | | | N/A | | | | N/A | |
Certain Funds have entered into securities lending arrangements with Huntington National Bank (“HNB”). Under the terms of the agreement, HNB is authorized to loan securities on behalf of the Funds to approved brokers. In exchange, under normal market conditions, the Funds receive cash collateral in the amount of at least 102% of the value of securities loaned. The cash collateral is invested in short term instruments as noted in the Schedules of Investments. Although risk is mitigated by the collateral, the Funds could experience a delay in recovering their securities and possible loss of income or value if the borrower fails to return the borrowed securities. In addition, the Funds bear the risk of loss associated with the investment of cash collateral received. After predetermined rebates to brokers, a percentage of the net securities lending revenue is credited to the Funds to be used as an offset against charges incurred by the Funds. HNB is paid a fee for administering the securities lending program for the Funds, equal to the remaining percentage of the net securities lending revenues generated under the agreement. As of June 30, 2022, Moderate had loaned securities that were collateralized by cash. The cash collateral received was invested in securities as listed in each Fund’s Schedule of Investments. For the six months ended June 30, 2022, income earned through securities lending arrangements was as follows:
| | | Amount Received
to Reduce Gross
Expenses | |
Muirfield | | $ | 234 | |
Global | | | 150 | |
Balanced | | | 4,838 | |
Moderate | | | 3,247 | |
Conservative | | | 690 | |
2022 Semi-Annual Report | June 30, 2022 | Page 85 |
The Funds have adopted a written plan pursuant to Rule 12b-1 of the 1940 Act that allows the Funds to pay fees for the sale and distribution of Fund shares and for services provided to Fund shareholders. 12b-1 fees are paid by the Funds to financial intermediaries, securities brokers, investment advisers, and other persons, including affiliates of MAM. For the six months ended June 30, 2022, total 12b-1 plan expense payments made to the Funds’ affiliated distributor was $41,902. The annual adopted 12b-1 plan maximum limitations for the six months ended June 30, 2022, are as follows:
| | Maximum Annual
12b-1 Plan Expense
as a Percentage of
Average Daily Net
Assets | Maximum Annual
12b-1 Plan Expense
as a Percentage of
Average Daily Net
Assets - Retail Class | Maximum Annual
12b-1 Plan Expense
as a Percentage of
Average Daily Net
Assets - Adviser
Class | Maximum Annual
12b-1 Plan Expense
as a Percentage of
Average Daily Net
Assets - Institutional
Class | 12b-1 Plan Expense
Payments Made to
Affiliates |
Muirfield | N/A | 0.20% | N/A | N/A | $ 17,868 |
Spectrum | N/A | 0.25% | N/A | N/A | 595 |
Global | N/A | 0.25% | N/A | N/A | 877 |
Balanced | N/A | 0.25% | N/A | N/A | 2,316 |
Moderate | N/A | 0.25% | N/A | N/A | 298 |
Conservative | N/A | 0.25% | N/A | N/A | 3,995 |
Dynamic | N/A | 0.25% | N/A | N/A | 5,121 |
Quantex | N/A | 0.20% | N/A | N/A | 9,944 |
Income | N/A | 0.25% | N/A | N/A | 888 |
Money Market | 0.20% | N/A | N/A | N/A | N/A |
The Funds (other than Money Market) have adopted a shareholder services plan that allows the Funds to pay financial intermediaries and other persons, including “platforms,” for providing shareholder and administrative services to Fund shareholders and maintaining shareholder accounts. The annual adopted shareholder services plan maximum limitations for the six months ended June 30, 2022 are as follows:
| | Maximum Annual
Shareholder Services
Plan Expense as a
Percentage of Average
Daily Net Assets - Retail
Class | Maximum Annual
Shareholder Services
Plan Expense as a
Percentage of Average
Daily Net Assets -
Adviser Class | Maximum Annual
Shareholder Services
Plan Expense as a
Percentage of Average
Daily Net Assets -
Institutional Class |
Muirfield | 0.20% | 0.25% | 0.10% |
Spectrum | 0.20% | 0.25% | 0.10% |
Global | 0.20% | 0.25% | 0.10% |
Balanced | 0.20% | 0.25% | 0.10% |
Moderate | 0.20% | 0.25% | 0.10% |
Conservative | 0.20% | 0.25% | 0.10% |
Dynamic | 0.20% | 0.25% | 0.10% |
Quantex | 0.20% | 0.25% | 0.10% |
Income | 0.20% | 0.25% | 0.10% |
Page 86 | 2022 Semi-Annual Report | June 30, 2022 |
The Funds have adopted a Deferred Compensation Plan (the “Plan”) for the independent Trustees. Under the Plan, each eligible Trustee is permitted to defer all or a portion of the trustees fees payable by any of the Funds as an investment into any combination of Funds until a specified point of time. The investment into the Funds is recorded as an asset however an offsetting liability is also recorded for the deferred payment. Amounts deferred under the Plan may be distributed in a lump sum or generally equal annual installments over a period of up to ten (10) years to the eligible Trustee(s). The Funds may terminate this Plan at any time.
Certain Trustees and officers of the Funds are also officers or directors of Meeder, MAM, and MFSCo.
During the six months ended June 30, 2022, several of the Funds invested in the Institutional Prime Money Market Fund, an affiliate, as described in Section 2(a)(3) of the Investment Company Act of 1940. The purchases/sales amounts in the following table are presented on a gross basis, while the statement of changes in net assets shows subscriptions and redemptions into and out of the Institutional Prime Money Market Fund on a net basis. The Funds’ investments in the Institutional Prime Money Market Fund, which had a 7-day yield of 1.42% on June 30, 2022, were as follows:
| | | 12/31/21
Fair Value | | | Purchases | | | Sales | | | Realized
Gains
(Losses) | | | 6/30/22 Cost | | | Change in
Unrealized | | | Income | | | 6/30/22
Fair Value | |
Muirfield | | $ | 227,883,637 | | | $ | 158,480,246 | | | $ | (112,683,900 | ) | | $ | (55,653 | ) | | $ | 273,624,584 | | | $ | (44,733 | ) | | $ | 474,355 | | | $ | 273,579,597 | |
Spectrum | | | 54,068,333 | | | | 47,661,082 | | | | (54,907,607 | ) | | | (23,764 | ) | | | 46,795,802 | | | | (374 | ) | | | 83,317 | | | | 46,797,670 | |
Global | | | 19,823,051 | | | | 11,569,206 | | | | (10,083,420 | ) | | | (4,114 | ) | | | 21,302,219 | | | | (5,973 | ) | | | 34,750 | | | | 21,298,750 | |
Balanced | | | 98,243,827 | | | | 165,563,447 | | | | (142,440,902 | ) | | | (50,771 | ) | | | 121,302,242 | | | | (11,433 | ) | | | 186,038 | | | | 121,304,168 | |
Moderate | | | 41,085,154 | | | | 108,413,250 | | | | (87,332,140 | ) | | | (31,482 | ) | | | 62,128,980 | | | | (3,117 | ) | | | 90,190 | | | | 62,131,665 | |
Conservative | | | 30,120,101 | | | | 110,611,996 | | | | (91,247,540 | ) | | | (29,805 | ) | | | 49,451,598 | | | | 414 | | | | 68,710 | | | | 49,455,166 | |
Dynamic | | | 58,149,681 | | | | 56,818,700 | | | | (54,285,766 | ) | | | (21,350 | ) | | | 60,660,912 | | | | (1,797 | ) | | | 106,083 | | | | 60,659,468 | |
Quantex | | | 13,687,909 | | | | 5,109,304 | | | | (6,466,531 | ) | | | (2,393 | ) | | | 12,329,587 | | | | (4,784 | ) | | | 22,275 | | | | 12,323,505 | |
Income | | | 13,584,663 | | | | 76,734,510 | | | | (78,076,626 | ) | | | (10,464 | ) | | | 12,231,568 | | | | 136 | | | | 15,781 | | | | 12,232,219 | |
6. Federal Tax Information
The following information is computed on a tax basis for each item as of December 31, 2021:
| | | Tax Cost of
Portfolio
Investments | | | Gross Unrealized
Appreciation | | | Gross Unrealized
Depreciation | | | Net Unrealized
Appreciation/
Depreciation | |
| | | | | | | | | | | | | | | | | |
Muirfield | | $ | 554,010,792 | | | $ | 165,987,127 | | | $ | (9,937,425 | ) | | $ | 156,049,702 | |
Spectrum | | | 159,796,545 | | | | 51,267,244 | | | | (3,696,820 | ) | | | 47,570,424 | |
Global | | | 37,705,672 | | | | 6,274,282 | | | | (376,927 | ) | | | 5,897,355 | |
Balanced | | | 318,963,323 | | | | 68,355,601 | | | | (4,539,044 | ) | | | 63,816,557 | |
Moderate | | | 153,988,537 | | | | 19,746,150 | | | | (1,804,997 | ) | | | 17,941,153 | |
Conservative | | | 125,329,635 | | | | 9,208,270 | | | | (1,077,468 | ) | | | 8,130,802 | |
Dynamic | | | 183,669,427 | | | | 49,646,392 | | | | (3,309,824 | ) | | | 46,336,568 | |
Quantex | | | 33,293,229 | | | | 7,446,328 | | | | (149,971 | ) | | | 7,296,357 | |
Income | | | 69,014,811 | | | | 582,989 | | | | (287,878 | ) | | | 295,111 | |
Money Market | | | 622,482,031 | | | | 11,886 | | | | (45,430 | ) | | | (33,544 | ) |
2022 Semi-Annual Report | June 30, 2022 | Page 87 |
The tax characteristics of dividends paid by the Funds during the year ended December 31, 2021 were as follows:
| | | Ordinary Income | | | Net Short-Term
Capital Gains | | | Net Long-Term
Capital Gains | | | Total Dividends
Paid* | |
Muirfield | | $ | 5,065,877 | | | $ | — | | | $ | 18,443,632 | | | $ | 23,509,509 | |
Spectrum | | | 452,969 | | | | 4,113,237 | | | | 6,510,816 | | | | 11,077,022 | |
Global | | | — | | | | 1,360,991 | | | | 3,161,379 | | | | 4,522,370 | |
Balanced | | | 6,001,952 | | | | 1,250,419 | | | | 23,688,712 | | | | 30,941,083 | |
Moderate | | | 1,372,700 | | | | — | | | | 9,814,301 | | | | 11,187,001 | |
Conservative | | | 2,100,379 | | | | — | | | | 5,989,643 | | | | 8,090,022 | |
Dynamic | | | 1,183,701 | | | | 13,748,460 | | | | 15,898,271 | | | | 30,830,432 | |
Quantex | | | 18,344 | | | | 449,273 | | | | 5,591,196 | | | | 6,058,813 | |
Income | | | 1,295,798 | | | | — | | | | — | | | | 1,295,798 | |
Money Market | | | 193,478 | | | | — | | | | — | | | | 193,478 | |
The tax characteristics of dividends paid by the Funds during the year ended December 31, 2020 were as follows:
| | | Ordinary Income | | | Net Short Term
Capital Gains | | | Net Long Term
Capital Gains | | | Total Dividends
Paid* | |
Muirfield | | $ | 4,943,111 | | | $ | — | | | $ | — | | | $ | 4,943,111 | |
Spectrum | | | 1,441,970 | | | | — | | | | — | | | | 1,441,970 | |
Global | | | 318,203 | | | | 303,373 | | | | 689,457 | | | | 1,311,033 | |
Balanced | | | 3,364,824 | | | | — | | | | — | | | | 3,364,824 | |
Moderate | | | 2,369,151 | | | | — | | | | — | | | | 2,369,151 | |
Conservative | | | 2,480,581 | | | | — | | | | — | | | | 2,480,581 | |
Dynamic | | | 835,596 | | | | 639,520 | | | | 3,370,600 | | | | 4,845,716 | |
Quantex | | | 292,663 | | | | — | | | | — | | | | 292,663 | |
Income | | | 1,403,955 | | | | — | | | | — | | | | 1,403,955 | |
Money Market | | | 2,275,825 | | | | — | | | | — | | | | 2,275,825 | |
As of December 31, 2021, the components of distributable earnings/(accumulated deficit) on a tax basis for the Funds were as follows:
| | | Undistributed
Ordinary Income | | | Undistributed
Long-Term
Capital Gain | | | Accumulated
Capital and Other
Gains and (Losses) | | | Unrealized
Appreciation/
(Depreciation)** | | | Total Distributable
Earnings/
(Accumulated
Deficit) | |
Muirfield | | $ | 34,575 | | | $ | 12,812,237 | | | $ | (316,771 | ) | | $ | 156,049,702 | | | $ | 168,579,743 | |
Spectrum | | | 474,159 | | | | 3,611,330 | | | | (51,460 | ) | | | 47,570,424 | | | | 51,604,453 | |
Global | | | — | | | | 158,351 | | | | (106,472 | ) | | | 5,897,355 | | | | 5,949,234 | |
Balanced | | | 4,338,740 | | | | 5,840,278 | | | | (196,612 | ) | | | 63,816,557 | | | | 73,798,963 | |
Moderate | | | 1,813,657 | | | | 1,071,618 | | | | (38,133 | ) | | | 17,941,153 | | | | 20,788,295 | |
Conservative | | | — | | | | 693,917 | | | | (77,958 | ) | | | 8,130,802 | | | | 8,746,761 | |
Dynamic | | | — | | | | 6,501,337 | | | | (218,928 | ) | | | 46,336,568 | | | | 52,618,977 | |
Quantex | | | 787,611 | | | | — | | | | (66,097 | ) | | | 7,296,357 | | | | 8,017,871 | |
Income | | | 4,205 | | | | — | | | | (9,475,477 | ) | | | 295,111 | | | | (9,176,161 | ) |
Money Market | | | 6,135 | | | | — | | | | (8,511 | ) | | | (33,544 | ) | | | (35,920 | ) |
* | Total dividends paid may differ from the amount reported in the Statements of Changes in Net Assets because for tax purposes dividends are recognized when actually paid. Short-term capital gains distributions are taxed as ordinary income. |
** | The differences between book- and tax-basis unrealized appreciation/(depreciation) are attributable primarily to: wash sales, return of capital adjustments, and the realization for tax purposes of unrealized gains/(losses) on certain derivative instruments. |
Page 88 | 2022 Semi-Annual Report | June 30, 2022 |
For federal income tax purposes, the following Funds have capital loss carryforwards as of December 31, 2021, which are not subject to expiration and are available to offset future capital gains, if any. To the extent that these carryforwards are used to offset future capital gains, it is probable that the gains that are offset will not be distributed to shareholders:
| | | Short-Term Capital
Loss Carryforward | | | Long-Term Capital
Loss Carryforward | | | Capital Loss
Carryforward Utilized | |
Muirfield | | $ | — | | | $ | — | | | $ | 51,457,537 | |
Spectrum | | | — | | | | — | | | | 15,741,644 | |
Global | | | — | | | | — | | | | 723,513 | |
Balanced | | | — | | | | — | | | | 17,867,307 | |
Moderate | | | — | | | | — | | | | 4,583,845 | |
Conservative | | | — | | | | — | | | | 3,692,056 | |
Quantex | | | — | | | | — | | | | 2,671,091 | |
Income | | | 8,808,448 | | | | 590,194 | | | | 1,906,735 | |
Money Market | | | 974 | | | | 1,504 | | | | 229 | |
7. Control Ownership
The beneficial ownership, either directly or indirectly, of more than 25% of the voting securities of a fund creates a presumption of control of the fund under Section 2(a)(9) of the 1940 Act. As of June 30, 2022, beneficial owners that held more than 25% of the voting securities of the Funds and may be deemed to control the Funds are as follows:
Fund | Beneficial Owner | Percent of Voting
Securities |
Money Market | Muirfield | 39% |
8. Contingencies and Commitments
The Funds indemnify the Trust’s officers and Trustees for certain liabilities that might arise from their performance of their duties to the Funds. Additionally, in the normal course of business the Funds enter into contracts that contain a variety of representations and warranties and which provide general indemnifications. The Funds’ maximum exposure under these arrangements is unknown, as this would involve future claims that may be made against the Funds that have not yet occurred. However, based on experience, the Funds expect the risk of loss to be remote.
9. Subsequent Events
Management evaluated subsequent events through the date these financial statements were issued and concluded no subsequent events required recognition or disclosure in these financial statements.
Other Information (unaudited)
The Trust files a complete schedule of portfolio holdings for the first and third quarters of each fiscal year on Form N-PORT. In addition, Institutional Prime Money Market Fund files its complete schedule of portfolio holdings with the SEC each month on Form N-MFP. Forms N-PORT and N-MFP are available on the SEC’s website at www.sec.gov. Information regarding Fund holdings is also available at www.meederinvestment.com.
The investment adviser is responsible for exercising the voting rights associated with the securities purchased or held by the Funds. A description of the policies and procedures that the adviser uses in fulfilling this responsibility and information regarding how those proxies were voted during the most recent 12-month period ending June 30 are available, without charge, by calling 1-800-325-3539 or on the SEC’s website at www.sec.gov.
2022 Semi-Annual Report | June 30, 2022 | Page 89 |
Shareholder Expense Analysis (unaudited)
Shareholders of mutual funds pay ongoing expenses, such as advisory fees, distribution and service fees and other fund operating expenses. The following examples are intended to help you understand your ongoing costs (in dollars) of investing in the Funds and to compare these costs with the ongoing costs of investing in other mutual funds. The examples are based on an investment of $1,000 invested for the period of time indicated in the table below.
The Actual Expense example provides information about actual account values and actual expenses. You may use the information in this line, together with the amount you invested, to estimate the expenses that you paid over the period. Simply divide your account value by $1,000 (e.g.: an $8,600 account value divided by $1,000 = 8.6), then multiply the result by the number in the line under the heading “Expenses Paid During the Period” to estimate the expenses you paid on your account during this period.
The Hypothetical Expense example provides information about hypothetical account values and hypothetical expenses based on each Fund’s actual expense ratio and an assumed rate of return of 5% per year before expenses, which is not the actual return of any Fund. The hypothetical account values and expenses may not be used to estimate the actual ending account balance or expenses you paid for the period. You may use this information to compare the ongoing costs of investing in the Funds to other funds. To do so, compare this 5% hypothetical example with the 5% hypothetical examples that appear in the shareholder reports of the other funds.
| | Beginning Account Value
December 31, 2021 | | | Ending Account Value
June 30, 2022 | | | Expenses Paid
During Period1 | | | Net Expense
Ratio2 | |
| | | Actual | | | Hypothetical | | | Actual | | | Hypothetical | | | Actual | | | Hypothetical | | | Actual | |
Muirfield Fund | | | | | | | | | | | | | | | | | | | | | | | | | | | | |
Retail Class | | $ | 1,000.00 | | | $ | 1,000.00 | | | $ | 868.80 | | | $ | 1,019.09 | | | $ | 5.33 | | | $ | 5.76 | | | | 1.15 | % |
Adviser Class | | | 1,000.00 | | | | 1,000.00 | | | | 870.20 | | | | 1,020.53 | | | | 3.99 | | | | 4.31 | | | | 0.86 | % |
Institutional Class | | | 1,000.00 | | | | 1,000.00 | | | | 870.50 | | | | 1,020.03 | | | | 4.45 | | | | 4.81 | | | | 0.96 | % |
Spectrum Fund | | | | | | | | | | | | | | | | | | | | | | | | | | | | |
Retail Class | | | 1,000.00 | | | | 1,000.00 | | | | 873.20 | | | | 1,017.21 | | | | 7.11 | | | | 7.65 | | | | 1.53 | % |
Adviser Class | | | 1,000.00 | | | | 1,000.00 | | | | 875.40 | | | | 1,019.44 | | | | 5.02 | | | | 5.41 | | | | 1.08 | % |
Institutional Class | | | 1,000.00 | | | | 1,000.00 | | | | 874.40 | | | | 1,019.09 | | | | 5.34 | | | | 5.76 | | | | 1.15 | % |
Global Allocation Fund | | | | | | | | | | | | | | | | | | | | | | | | | | | | |
Retail Class | | | 1,000.00 | | | | 1,000.00 | | | | 858.90 | | | | 1,015.72 | | | | 8.43 | | | | 9.15 | | | | 1.83 | % |
Adviser Class | | | 1,000.00 | | | | 1,000.00 | | | | 861.30 | | | | 1,018.10 | | | | 6.23 | | | | 6.76 | | | | 1.35 | % |
Institutional Class | | | 1,000.00 | | | | 1,000.00 | | | | 861.00 | | | | 1,018.05 | | | | 6.28 | | | | 6.80 | | | | 1.36 | % |
Balanced Fund | | | | | | | | | | | | | | | | | | | | | | | | | | | | |
Retail Class | | | 1,000.00 | | | | 1,000.00 | | | | 880.00 | | | | 1,018.20 | | | | 6.20 | | | | 6.66 | | | | 1.33 | % |
Adviser Class | | | 1,000.00 | | | | 1,000.00 | | | | 881.00 | | | | 1,019.98 | | | | 4.52 | | | | 4.86 | | | | 0.97 | % |
Institutional Class | | | 1,000.00 | | | | 1,000.00 | | | | 880.50 | | | | 1,019.54 | | | | 4.94 | | | | 5.31 | | | | 1.06 | % |
Moderate Allocation Fund | | | | | | | | | | | | | | | | | | | | | | | | | | | | |
Retail Class | | | 1,000.00 | | | | 1,000.00 | | | | 890.00 | | | | 1,017.90 | | | | 6.51 | | | | 6.95 | | | | 1.39 | % |
Adviser Class | | | 1,000.00 | | | | 1,000.00 | | | | 891.80 | | | | 1,020.13 | | | | 4.41 | | | | 4.71 | | | | 0.94 | % |
Institutional Class | | | 1,000.00 | | | | 1,000.00 | | | | 892.00 | | | | 1,019.69 | | | | 4.83 | | | | 5.16 | | | | 1.03 | % |
Conservative Allocation Fund | | | | | | | | | | | | | | | | | | | | | | | | | | | | |
Retail Class | | | 1,000.00 | | | | 1,000.00 | | | | 898.50 | | | | 1,019.24 | | | | 5.27 | | | | 5.61 | | | | 1.12 | % |
Adviser Class | | | 1,000.00 | | | | 1,000.00 | | | | 899.20 | | | | 1,020.48 | | | | 4.10 | | | | 4.36 | | | | 0.87 | % |
Institutional Class | | | 1,000.00 | | | | 1,000.00 | | | | 899.00 | | | | 1,020.03 | | | | 4.52 | | | | 4.81 | | | | 0.96 | % |
Dynamic Allocation Fund | | | | | | | | | | | | | | | | | | | | | | | | | | | | |
Retail Class | | | 1,000.00 | | | | 1,000.00 | | | | 806.90 | | | | 1,018.35 | | | | 5.82 | | | | 6.51 | | | | 1.30 | % |
Adviser Class | | | 1,000.00 | | | | 1,000.00 | | | | 808.10 | | | | 1,020.03 | | | | 4.30 | | | | 4.81 | | | | 0.96 | % |
Institutional Class | | | 1,000.00 | | | | 1,000.00 | | | | 808.40 | | | | 1,019.89 | | | | 4.44 | | | | 4.96 | | | | 0.99 | % |
Page 90 | 2022 Semi-Annual Report | June 30, 2022 |
| | Beginning Account Value
December 31, 2021 | | | Ending Account Value
June 30, 2022 | | | Expenses Paid
During Period1 | | | Net Expense
Ratio2 | |
| | | Actual | | | Hypothetical | | | Actual | | | Hypothetical | | | Actual | | | Hypothetical | | | Actual | |
Quantex Fund | | | | | | | | | | | | | | | | | | | | | | | | | | | | |
Retail Class | | $ | 1,000.00 | | | $ | 1,000.00 | | | $ | 833.60 | | | $ | 1,016.22 | | | $ | 7.87 | | | $ | 8.65 | | | | 1.73 | % |
Adviser Class | | | 1,000.00 | | | | 1,000.00 | | | | 835.20 | | | | 1,018.05 | | | | 6.19 | | | | 6.80 | | | | 1.36 | % |
Institutional Class | | | 1,000.00 | | | | 1,000.00 | | | | 835.20 | | | | 1,018.05 | | | | 6.19 | | | | 6.80 | | | | 1.36 | % |
Tactical Income Fund | | | | | | | | | | | | | | | | | | | | | | | | | | | | |
Retail Class | | | 1,000.00 | | | | 1,000.00 | | | | 939.10 | | | | 1,019.04 | | | | 5.58 | | | | 5.81 | | | | 1.16 | % |
Adviser Class | | | 1,000.00 | | | | 1,000.00 | | | | 941.10 | | | | 1,021.17 | | | | 3.51 | | | | 3.66 | | | | 0.73 | % |
Institutional Class | | | 1,000.00 | | | | 1,000.00 | | | | 940.90 | | | | 1,020.83 | | | | 3.85 | | | | 4.01 | | | | 0.80 | % |
Institutional Prime Money Market Fund | | | 1,000.00 | | | | 1,000.00 | | | | 1,001.30 | | | | 1,023.95 | | | | 0.84 | | | | 0.85 | | | | 0.17 | % |
Please note that the expenses shown in the tables are meant to highlight your ongoing costs only and do not reflect any transactional costs, such as redemption fees or exchange fees. Therefore, hypothetical information is useful in comparing ongoing costs only, and will not help you determine the relative total costs of owning different funds. In addition, if any transactional costs were included, your costs would have been higher.
1 | Expenses are equal to each Fund’s annualized net expense ratio, multiplied by the average account value over the period, multiplied by 181/365 (to reflect the total number of days in the six-month period). |
2 | Annualized net expense ratio reflects contractual or voluntary waivers and reimbursements of expenses by the investment adviser and transfer agent. |
2022 Semi-Annual Report | June 30, 2022 | Page 91 |

Privacy Policy
Meeder Investment Management and the Meeder Funds are committed to maintaining the financial privacy of our current, former and prospective customers. This policy explains how we protect the security and confidentiality of our customer’s information.
PERSONAL INFORMATION WE COLLECT
We may collect information about Meeder customers from a variety of sources, including:
| | ● | Information provided by you or your representative on applications or forms, such as your name, address, date of birth, social security number and investment objectives; |
| | ● | Information about the transactions in your account, such as your account balance and transaction history; and |
| | ● | Information we obtain from third parties regarding you, to verify your identity or transfer your account. |
INFORMATION WE SHARE WITH OUR AFFILIATES
Our affiliates are financial service providers that offer transfer agency, customer accounting, customer servicing, investment advisory, and other financial services. We share information with our affiliates to service your account. In addition, we may also share information with our affiliates to alert you to other products or services offered by Meeder to the extent provided by law. Information collected from customers whose accounts are opened through investment professionals is not shared with Meeder affiliates for marketing purposes.
INFORMATION WE SHARE WITH THIRD PARTIES
On occasion, we share information we collect about you with unaffiliated third parties to perform services in connection with your account, such as processing transactions, preparing and mailing account statements, and other forms of customer servicing. Information provided to third parties may not be used for any other purpose and Meeder does not permit unaffiliated third parties to use customer information to market their products or services.
HOW WE PROTECT INFORMATION ABOUT YOU
We maintain policies, and require all unaffiliated third parties to maintain policies, to safeguard customer information. We restrict access to nonpublic personal information about you to those persons who need to know that information in order to provide products and services to you. We also maintain physical, electronic, and procedural safeguards to guard your nonpublic personal information.
WHO THIS POLICY APPLIES TO
This policy applies to customers who open relationships directly with Meeder. It applies to Meeder Funds and Meeder’s affiliated companies, including Meeder Asset Management, Meeder Advisory Services, Meeder Public Funds, Meeder Distribution Services, Inc. and Mutual Funds Service Company.
QUESTIONS
Contact us at 800-325-3539 or visit us online at www.meederinvestment.com
Page 92 | 2022 Semi-Annual Report | June 30, 2022 |
Manager and Investment Adviser
Meeder Asset Management, Inc.
6125 Memorial Drive
P.O. Box 7177
Dublin, Ohio 43017
Board of Trustees
Stuart M. Allen
Anthony V. D’Angelo
Robert S. Meeder, Jr.
Jeffrey R. Provence
Custodian
The Huntington National Bank
Columbus, Ohio 43215
Transfer Agent & Dividend Disbursing Agent
Mutual Funds Service Co.
6125 Memorial Drive
Dublin, Ohio 43017
Distributor
Meeder Distribution Services, Inc.
6125 Memorial Drive
Dublin, Ohio 43017
Independent Registered Public Accounting Firm
Cohen & Company, Ltd.
1350 Euclid Ave., Suite 800
Cleveland, Ohio 44115

Item 2. Code of Ethics.
The registrant has adopted a code of ethics that applies to the registrant's principal executive officer, principal financial officer, comptroller or principal accounting officer, and any person who performs a similar function. There were no amendments made to, or waivers granted from, the code of ethics during the fiscal year.
Item 3. Audit Committee Financial Expert.
The Board of Trustees of the Trust has determined that Jeffrey R. Provence is an audit committee financial expert, as defined in Item 3 of Form N-CSR. Mr. Provence is independent for purposes of Item 3 of Form N-CSR.
Item 4. Principal Accountant Fees and Services.
(a) – (d) Aggregate fees billed to the registrant for the last two fiscal years for professional services rendered by the registrant's principal accountant were as follows:
| | | 2022 | | | 2021 | |
| Audit Fees | | $ | 108,000 | | | $ | 119,400 | |
| Audit-Related Fees | | | 0 | | | | 0 | |
| Tax Fees | | | 50,500 | | | | 41,000 | |
| All Other Fees | | | 2,250 | | | | 2,250 | |
Audit fees include amounts related to the audit of the registrant's annual financial statements and services normally provided by the accountant in connection with statutory and regulatory filings. Audit-related fees include amounts reasonably related to the performance of the audit of the registrant's financial statements, including, but not limited to, mileage, lodging, and meals. Tax fees include amounts related to tax compliance, tax planning, and tax advice, including the review and preparation of the Funds' income tax returns, the review and preparation of the Funds' excise tax returns, the review of supporting schedules and documentation provided by management, the review and recalculation of the Funds' estimated distribution calculations, and the review of wash sales for reasonableness. All other fees include amounts related to the registrant's annual filing of Form N1A.
(e)(1) A purpose of the Audit Committee is to approve the engagement of the registrant's independent auditors (i) to render audit and non-audit services for the registrant in accordance with Rule 2-01(c)(7)(i) of Regulation S-X, subject to the waiver provisions set forth in Rule 2-01(c)(7)(i)(C) of Regulation S-X, and (ii) to render non-audit services for the registrant's investment advisors (other than a sub-advisor whose role is primarily portfolio management and is subcontracted or overseen by another investment advisor) and any other entity controlling by, or under common control with the investment advisor that provides ongoing services to the registrant, in each case under (ii) if the engagement relates directly to the operations and financial reporting of the registrant, in accordance with Rule 2-01(c)(7)(ii) of Regulation S-X, subject to waiver provisions set forth in Rule 2-01(c)(7)(ii) of Regulation S-X.
(e)(2) 0% of services included in (b) – (d) above were approved pursuant to Rule 2-01(c)(7)(i)(C) of Regulation S-X.
(f) Not applicable.
(g) The aggregate fees billed for the most recent fiscal year and the preceding fiscal year by the registrant's principal accountant for non-audit services rendered to the registrant, its investment advisor, and any entity controlling, controlled by, or under common control with the investment advisor that provides ongoing services to the registrant were $51,600 and $40,600 respectively.
(h) The registrant's audit committee of the board of directors has considered whether the provision of non-audit services that were rendered to the registrant's investment adviser (not including any sub-adviser whose role is primarily portfolio management and is subcontracted with or overseen by another investment adviser), and any entity controlling, controlled by, or under common control with the investment adviser that provides ongoing services to the registrant that were not pre-approved pursuant to paragraph (c)(7)(ii) of Rule 2-01 of Regulation S-X is compatible with maintaining the principal accountant's independence.
Items 5. Audit Committee of Listed Registrants.
Not applicable.
Item 6. Schedule of Investments.
Not applicable.
Item 7. Disclosure of Proxy Voting Policies and Procedures for Closed-End Management Investment Companies.
Not applicable.
Item 8. Portfolio Managers of Closed-End Management Investment Companies.
Not applicable.
Item 9. Purchases of Equity Securities by Closed-End Management Investment Company and Affiliated Purchasers.
Not applicable.
Item 10. Submission of Matters to a Vote of Security Holders.
Not applicable.
Item 11. Controls and Procedures.
(a) Based on our evaluation conducted within 90 days of the filing date, hereof, the design and operation of the registrant's disclosure controls and procedures are effective to ensure that material information relating to the registrant is made known to the certifying officers by others within the appropriate entities, particularly during the period in which Forms N-CSR are being prepared, and the registrant's disclosure controls and procedures allow timely preparation and review of the information for the registrant's Form N-CSR and the officer certifications of such Form N-CSR.
(b) There were no significant changes in the registrant's internal controls or in other factors that could significantly affect these controls subsequent to the date of their evaluation, including any corrective actions with regard to significant deficiencies and material weaknesses.
Item 12. Disclosure of Securities Lending Activities for Closed-End Management Investment Companies.
Not applicable.
Item 13. Exhibits.
(a)(1) Code of Ethics filed herewith as EX-99.CODE ETH.
(a)(2) A separate certification for each principal executive and principal financial officer of the registrant as required by Rule 30a-2(a) under the Act(17 CFR270.30a-2(a)). Filed herewith as EX-99.CERT.
(b) Certifications of principal executive officer and principal financial officer, under Section 906 of the Sarbanes-Oxley Act of 2002, and 18 U.S.C. ss.1350. Filed herewith as EX-99.906 CERT.
SIGNATURES
Pursuant to the requirements of the Securities Exchange Act of 1934 and the Investment Company Act of 1940, the registrant has duly caused this report to be signed on its behalf by the undersigned, thereunto duly authorized.
Meeder Funds
| By: | /s/ Bruce E. McKibben | |
| | Bruce E. McKibben, Treasurer | |
Pursuant to the requirements of the Securities Exchange Act of 1934 and the Investment Company Act of 1940, this report has been signed below by the following persons on behalf of the registrant and in the capacities and on the dates indicated.
| By: | /s/ Bruce E. McKibben | |
| | Bruce E. McKibben, Treasurer | |
| By: | /s/ Robert S. Meeder, Jr. | |
| | Robert S. Meeder, Jr., President | |