As filed with the Securities and Exchange Commission on March 6, 2012
UNITED STATES
SECURITIES AND EXCHANGE COMMISSION
WASHINGTON, D.C. 20549
FORM N-CSR
CERTIFIED SHAREHOLDER REPORT OF REGISTERED MANAGEMENT
INVESTMENT COMPANIES
Investment Company Act file number 811-3489
THE WRIGHT MANAGED EQUITY TRUST
440 Wheelers Farms Road
Milford, Connecticut 06461
Christopher A. Madden
Three Canal Plaza, Suite 600
Portland, ME 04101
207-347-2000
Date of fiscal year end: December 31
Date of reporting period: January 1, 2011 – December 31, 2011
ITEM 1. REPORT TO STOCKHOLDERS.
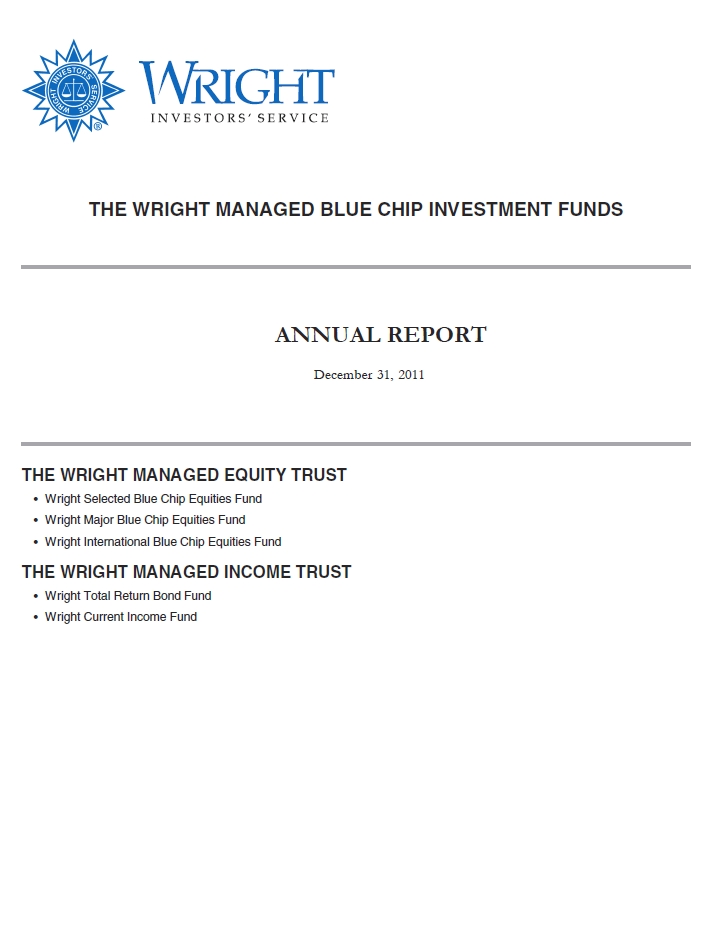
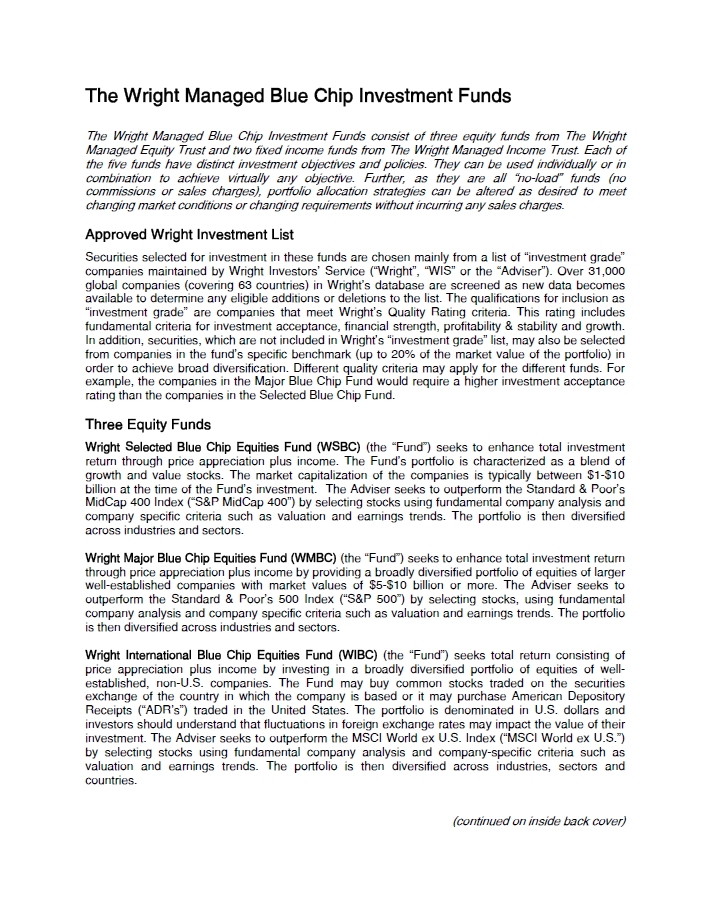
Table of Contents
| Investment Objectives | inside front cover | |||
| Letter to Shareholders (Unaudited) | 2 | |||
| Management Discussion (Unaudited) | 4 | |||
| Performance Summaries (Unaudited) | 10 | |||
| Fund Expenses (Unaudited) | 20 | |||
| Management and Organization (Unaudited) | 71 | |||
| Board of Trustees Annual Approval of the Investment Advisory Agreement (Unaudited) | 72 | |||
| Important Notices Regarding Privacy, Delivery of Shareholder Documents, Portfolio Holdings and Proxy Voting (Unaudited) | 73 | |||
| FINANCIAL STATEMENTS | ||||
| The Wright Managed Equity Trust | The Wright Managed Income Trust | |||
| Wright Selected Blue Chip Equities Fund | Wright Total Return Bond Fund | |||
| Portfolio of Investments | 22 | Portfolio of Investments | 47 | |
| Statement of Assets and Liabilities | 24 | Statement of Assets and Liabilities | 52 | |
| Statement of Operations | 24 | Statement of Operations | 52 | |
| Statements of Changes in Net Assets | 25 | Statements of Changes in Net Assets | 53 | |
| Financial Highlights | 26 | Financial Highlights | 54 | |
| Wright Major Blue Chip Equities Fund | Wright Current Income Fund | |||
| Portfolio of Investments | 27 | Portfolio of Investments | 55 | |
| Statement of Assets and Liabilities | 28 | Statement of Assets and Liabilities | 59 | |
| Statement of Operations | 28 | Statement of Operations | 59 | |
| Statements of Changes in Net Assets | 29 | Statements of Changes in Net Assets | 60 | |
| Financial Highlights | 30 | Financial Highlights | 61 | |
| Wright International Blue Chip Equities Fund | Notes to Financial Statements | 62 | ||
| Portfolio of Investments | 31 | |||
| Statement of Assets and Liabilities | 33 | Report of Independent Registered Public Accounting Firm | 69 | |
| Statement of Operations | 33 | |||
| Statements of Changes in Net Assets | 34 | Federal Tax Information (Unaudited) | 70 | |
| Financial Highlights | 35 | |||
| Notes to Financial Statements | 36 | |||
| Report of Independent Registered Public Accounting Firm | 45 | |||
| Federal Tax Information (Unaudited) | 46 | |||
Letter to Shareholders (Unaudited)
Dear Shareholder:
U.S. stock prices were either up modestly (Dow Jones Industrials), flat (S&P 500) or down slightly (NASDAQ) in 2011, as Europe’s debt crisis dominated financial headlines, more or less offsetting the generally strong corporate profits showing. After double-digit percentage declines in the stock market averages during the third quarter, the fourth quarter rally rescued the year 2011 from the bear market that looked to be developing in September. The year saw a strong move to quality stocks as investors shied away from risk; the dollar and U.S. Treasury bonds were also sought as safe havens, and gold glittered as an alternative bet on economic calamity. 2011 was remarkable for the Arab Spring, which unseated long-entrenched rulers, and for an intensification of pressures on Europe’s bourses and on the euro itself, which also ended up costing a number of European leaders their jobs. As 2012 begins, difficult elections lie ahead for three G-7 leaders, U.S. President Barack Obama, French President Nicolas Sarkozy and German Chancellor Angela Merkel. The incumbents will no doubt do all they can to promote a stronger economic climate; the question is: given today’s many obstacles to growth and countervailing forces in government, how much will they be able to do to jump-start the most sluggish economic recovery in modern times?
After three downbeat quarters, U.S. economic data generally exceeded expectations during the fourth quarter, with Q4 GDP growth shaping up to be the best quarterly showing for the U.S. economy – on the order of 3% – since 2010’s second quarter. Considering that a good portion of the year-end improvement in economic activity represents a favorable swing in business inventories (Q3 GDP growth was reduced around 1.3% by inventory liquidation), sustainable growth in the 3% range does not yet look to be anywhere on the horizon. Instead, about the best one can realistically project is a muddling along in the 1%-2% growth range, and even that will become problematic in the event recession in Europe were to combine with more slowing in China than the soft landing now anticipated. The long-awaited reduction in inflation pressures finally began to show up as 2011 was coming to a close, perhaps a little later than the Federal Reserve had been projecting. Commodities prices mostly went lower in 2011 with the notable exceptions of crude oil and gold, but the core rate of consumer price inflation was stubbornly above 2% as the year was ending.
This past year was also notable for the Occupy Wall Street protest movement, a product of the nation’s high unemployment and a widespread sense that financial industry leaders and government policy makers were conspiring in markets against ordinary investors and wage earners. As we have noted previously, this dissatisfaction and cynicism may be a logical result of the worst recession in the postwar period and what to date has been the shallowest recovery. Congress has drawn the scorn of constituents who believe partisanship has increased to such a degree that compromise is all but impossible, crippling the ability of government to respond to swiftly changing economic conditions. That has led to the nation’s many “kicking-the-can-down-the-road” fiscal policies, ranging from TARP to the acrimonious two-month extension of payroll tax cuts that closed out this past legislative year. Happily, while Washington does not seem to be able to kick its spending/debt habit, the private sector (i.e., households and businesses) continued to repair their balance sheets in 2011, although much more needs to be done.
Corporate profits have been the redeeming feature of our otherwise sub-par economic expansion. The U.S. economy returned to its peak 2007 fourth quarter output level in Q3 2011, 15 quarters after the recession began. That is roughly twice as long as the recoveries following the deep recessions of 1957-58, 1973-75, and 1981-82. In real terms, personal incomes have yet to return to their previous peak level. What stands out about the current recovery is the return of corporate profits to record levels; corporate profits before taxes surpassed the previous peak in the second quarter of 2010, and by this measure Q3 2011 profits were more than 120% higher than at the cycle low in Q4 2008. By contrast, at its December 2011 close, the S&P 500 stock price level was 86% above its 2009 low (but
2
| Letter to Shareholders (Unaudited) | |||
still 20% below its all-time high hit in October 2007). Where the U.S. had a stock market bubble in 2000 and was about to experience the bursting of the real estate bubble at the market peak in 2007, today stock prices are priced at attractive levels relative to earnings. On the basis of forecast year-ahead earnings, the S&P 500’s year-end 2011 price/earnings multiple of 12.3 is three P/E points below its average over the past quarter century.
While the Federal Reserve has had some “success” in reflating the U.S. economy, there remain downward pressures on product prices and interest rates. We continue to believe that interest rates will gradually move higher in 2012. The Fed has effectively anchored rates at the short end of the yield curve by indicating it will keep the fed funds rates close to zero through at least mid-2013. Economic activity continues to run well below the world’s productive capacity, undermining pricing power for businesses to the benefit of consumers. But consumers, still shaken by the economic and financial vicissitudes of 2008-09, have been somewhat more cautious in their spending, boosting the personal savings rate since 2007 by a factor of two relative to the 2005-07 average rate (5% vs 2.2%). That is for the good; indeed, the debt and dissaving excesses of the 1990s and 2000s probably require an extended period of more prudent financial behavior before the imbalances of the bubble years are completely washed out of the nation’s economic system. As this is occurring, we should be prepared for economic growth to remain somewhat constrained compared with long-term growth norms.
The financial turmoil of the past five years has reduced stock prices to comparatively cheap levels, as will become clear once financial conditions begin to normalize. For the most part, U.S. stock returns failed to keep pace with inflation in 2011, and outside the U.S., equities fared far worse. But the growth of corporate fundamentals (sales, assets, earnings, dividends and equity) has continued to create value for stockholders in a way that real estate and fixed-income investments are unlikely to match. Volatility may be elevated from time to time in the near term, but we retain our confidence in the longer-term ability of equities to produce significant positive real rates of return. If you have any questions or suggestions on how we can better serve your investment and wealth management needs, please let me know.
| Sincerely, | ||

| Peter M. Donovan | ||
| Chairman & CEO | ||
3
Management Discussion (Unaudited)
WRIGHT EQUITY FUNDS
In the fourth quarter of 2011, the S&P 500 gained enough to offset its loss for the first nine months of the year. Stocks were up in the first half of the year, but gave it all back and then some in the third quarter as the European debt crisis reemerged as a major risk to the global economy. While news about the European debt crisis was a major mover of the stock market for most of 2011, the protracted wrangling in Washington last summer over the U.S. government’s debt ceiling also contributed to reduced confidence on the part of investors, as well as to a downgrade of U.S. government debt to AA+ by Standard & Poor’s. The stock market’s positive fourth quarter was largely due to a strong October as investors anticipated the announcement, which finally came on October 27, of a tentative plan to resolve Europe’s debt crisis and recapitalize its banks. After the first rush of enthusiasm for the new plan, however, the markets were again besieged with doubts that Europe’s key players France and Germany would have the political will to implement any plan that would be able to keep countries such as Greece and Italy from defaulting and hold the euro together. There was also more political gridlock in Washington. In November, the Congressional Super Committee appointed as part of the debt ceiling deal couldn’t come up with an agreement on tax increases and spending cuts to reduce the budget deficits; in December, Congress could not reach an agreement on extension of supplemental unemployment benefits and 2011’s payroll tax cut for a year – even though both sides wanted to accomplish this. Instead a two-month fix once again kicked the can down the road. Given the uncertainty permeating the investment environment in the last two months of the year, it may be surprising that the market managed to hang on to most of October’s gains; the credit for this goes to steady growth in corporate profits, which have been healthy throughout 2011, and some better-than-expected U.S. economic reports suggesting that the domestic economy picked up late in the year.
The fact that the S&P 500 started and ended the year at essentially the same price belies the market volatility over the course of 2011. From its starting point in 2011, the S&P 500 had gained more than 8% by its April high, and then plunged almost 20% over the next five months before clawing its way back to even. In addition to these major swings, what is striking about 2011 is the way that good days followed bad (and vice versa) and sector performance vacillated with little conviction or staying power. In the fourth quarter, the good days outweighed the bad, with the S&P 500 returning close to 12%; the S&P 500’s 2.1% return for the year was entirely due to dividend income. The Dow Jones Industrials edged out the S&P 500 for the quarter with a 13% return; for the year, the Dow returned 8.4%. Nasdaq lagged the S&P 500 for both the quarter (8.2%) and the year (-0.8%). The better tone to news about the U.S. economy led to relatively strong showings by cyclical groups – consumer discretionary, industrials, materials – in the fourth quarter; for the year, defensive sectors such as consumer staples, health care and utilities outperformed. Financial stocks lagged for both periods as worries about Europe’s debt crisis focused attention on banks’ financial health. The S&P MidCap 400 and SmallCap 600 both outperformed the S&P 500 for the fourth quarter but lagged for the year.
In the aggregate, both developed and developing international stock markets lagged the U.S. market for the quarter and the year. The MSCI World ex U.S. index of developed markets returned 3.5% for the fourth quarter and lost 12.2% for all of 2011 in dollar terms. Dollar appreciation cut into the returns, particularly in the fourth quarter and particularly compared to the euro. (For the year, the dollar lost ground compared to the Japanese yen.) In the fourth quarter, the euro currency markets returned 2.2%. The Japanese market lost 3.9% in dollars in the fourth quarter, while the rest of the Pacific region returned 6.0%. For all of 2011, markets in the EMU lost nearly 18% while the Pacific region lost 14%. Emerging markets returned 4.4% in dollar terms in the fourth quarter, led by healthy gains in Latin America. For the year, however, the MSCI Emerging Markets index lost more than 18%.
4
Management Discussion (Unaudited)
SELECTED BLUE CHIP FUND
The S&P MidCap 400 lagged the S&P 500 in 2011 with a loss of 1.7%, despite a good showing compared to the S&P 500 in the fourth quarter with a return of 13%. The Wright Selected Blue Chip Fund (WSBC), which is a mid-cap blend fund, lost 1.2% in 2011, outperforming the MidCap benchmark by 0.5%. For fourth quarter, WSBC also outperformed with a 13.3% return.
In the first quarter, strong stock selection, particularly in the financial sector, accounting for essentially all of the Fund’s outperformance compared to the S&P MidCap 400, while in the second quarter, stock selection accounted for the Fund’s underperformance, mostly due to lagging results in the technology and energy sectors. In the third quarter, when investors showed a preference for larger stocks, the Fund had a smaller loss than the benchmark as its larger median and weighted-average market cap compared to the S&P 400 worked in its favor. Underweight positions in the lagging energy and industrial sectors also helped in Q3. In the fourth quarter, strong stock selection in consumer staples, consumer discretionary and financial sectors were key to the Fund’s strong relative showing. Looking at the year as a whole, sector weighting decisions overall had little impact on relative performance, with superior stock selection within the sectors accounting for the Fund’s outperformance compared to the S&P Midcap 400. Relative performance was particularly strong in the consumer discretionary, utility, financial and materials sectors. Among the issues that made positive contributions for the year were retailer Ross Stores, which contributed a positive 1.1%; Kinetic Concepts +0.6% and Lubrizol +0.6%, both of which were acquired; REIT Rayonier +0.6%; and software company Alliance Data Systems +0.6%. Detracting from relative performance were energy companies Arch Coal -0.9% and HollyFrontier -0.7%; technology companies Lam Research and Vishay Intertechnologies, each -0.9%; and real estate developer Jones Lang LaSalle, also with a negative contribution of 0.9%.
In the face of an uncertain economic environment, WSBC is positioned in the mid-cap universe to take advantage of a preference for quality. WSBC continues to be biased to the larger companies in the S&P MidCap 400 index with larger median and weighted-average market caps compared to the S&P 400; its holdings have better historic earnings growth than the index constituents. In the aggregate, WSBC companies had lower current and forward P/E multiples than those in the MidCap 400. WIS continues to advise diversity in investment portfolios as the best way to navigate difficult economic times.
MAJOR BLUE CHIP FUND
The Wright Major Blue Chip Fund (WMBC) is managed as a blend of the large-cap growth and value stocks in the S&P 500 Composite, selected with a bias toward the higher-quality issues in the index. The WMBC Fund returned 0.1% in 2011 compared to 2.1% for the S&P 500. WMBC outperformed its benchmark in the first quarter of the year, lagged in the middle two quarters, and once again outperformed in Q4 with a 12.9% return compared to 11.8% for the S&P 500.
In the first quarter of 2011, investors favored the smaller stocks in the S&P 500. WMBC was able to overcome its higher median market cap relative to the benchmark by favorable sector allocation and stock selection. In the second and third quarters, a major factor in the Fund’s underperformance compared to the benchmark was its underweight positions in consumer staples and utility stocks, two of the S&P 500’s strongest sectors for both quarters; in the fourth quarter this underweight was a positive for performance as investors favored more cyclical groups. The fourth
5
Management Discussion (Unaudited)
quarter also benefited from strong showings by some of the Fund’s energy holdings (Helmerich & Payne, which contributed +1.0% to performance, National-Oilwell +0.8%, Murphy Oil +0.8) bouncing back from declines that detracted from third quarter performance. For the year as a whole, the underweights in defensive groups, particularly utilities and consumer staples, hurt Fund performance compared to the benchmark, as did the lagging performance of the Fund’s energy, health care and technology holdings relative to those sectors of the S&P 500. Partially offsetting these negatives were relatively strong showings by the Fund’s holdings in the financial and consumer discretionary sectors compared to the S&P 500. Among the issues that made the most positive contributions to the Fund’s performance for the year were consumer discretionary issues Fossil +1.2%; Ralph Lauren +1.0%; and Tiffany +0.6%. Also contributing were marine shipper Kirby Corp. +1.2% and insurer Arch Capital +0.7%. Among the detractors from full-year performance were miner Freeport McMoRan, Murphy Oil and electronics retailer Best Buy, each -0.9%; engineering company Fluor -0.7%; and financial company CME Group -0.8%.
Going into 2012, the economic environment is uncertain. WIS expects that corporate profits will continue to grow, but at a slower pace than in 2011. WMBC is well positioned for such an environment, with its bias toward the higher-quality and more substantial issues in the S&P 500. At year end, WMBC had a higher median market cap and a substantially better earnings growth record over the previous five years than the S&P 500, while offering an attractive valuation with its P/E multiples based on current and forward earnings lower than the S&P 500’s comparable multiples.
INTERNATIONAL BLUE CHIP FUND
In the aggregate, international stocks lagged U.S. stocks in the 2011. The Wright International Blue Chip Fund (WIBC) lost 13.7% in 2011 compared to the MSCI World ex U.S index’s 12.2% loss. In the first quarter of 2011, WIBC was ahead of the benchmark, but lagged in the middle two quarters of the year, particularly the third. In the fourth quarter of 2011, WIBC returned to outperformance with a 5.6% return, ahead of the benchmark’s 3.5%.
Both sector allocation and stock selection contributed positively to WIBC’s performance in the first quarter, with an underweight in the lagging consumer staples group having the most significant effect on relative performance. In the second quarter, stock selection was a negative contributor to performance, particularly in materials and industrials. The Fund’s performance was negatively affected by its position in Sino-Forest, a Canadian company with lumber interests in China, which fell sharply when its accounting practices came into question. The position was sold before the end of the second quarter. In the third quarter, the biggest factor in underperformance was a sell-off in some high-quality companies in the materials sector on concerns about an economic slowdown in China, one of their most important customers. Among the biggest decliners in Q3 were miners Rio Tinto, Teck Resources and BHP Billiton, all of which made positive contributions to performance in the fourth quarter, when stock selection in the materials sector was a major contributor to the Fund’s outperformance compared to its benchmark. For the year as a whole, the Fund’s relative performance benefited from its underweight position in the financial sector, one of the laggard sectors in the MSCI World ex U.S index last year because of growing concerns about the European debt crisis. In addition, the Fund’s financial stock selection also contributed positively. The biggest detractor from WIBC’s relative performance was the aforementioned weakness in materials stocks. Looking at individual issues, for the year positive contributions came from consumer discretionary company Jardine Cycle & Carriage, with a positive contribution of 0.4%; and real estate company Daito Trust Construction, telecom company Vodaphone, and oil company Royal Dutch Shell, which each contributed +0.2%. The list of detractors is laden with materials stocks: Sino Forest -1.0%; Rio Tinto -0.7%; Eurasian Natural Resources -0.6%. Also detracting were European banks BNP
6
Management Discussion (Unaudited)
Paribas -0.8% and Société Generale -0.5%.
Moving into 2012, WIBC remains overweight in Asia, which reflects our view that emerging markets such as China will be the global growth engines going forward. WIBC is underweight in financial stocks and overweight in the consumer discretionary and industrial sectors. In the aggregate, WIBC holdings are priced at significant discounts to the MSCI World ex U.S. index in terms of current price/earnings ratio. We continue to see the inclusion of international stocks as likely to enhance returns in diversified investment portfolios.
WRIGHT FIXED INCOME FUNDS
Treasury bonds yields declined over the course of 2011. Good news on the economy sent investors out of bonds and into stocks in the first quarter. For most of the rest of 2011, however, Treasury bonds rallied as investors looked for safety amidst concerns about the European debt crisis and political gridlock in the U.S. Standard & Poor’s decision to downgrade U. S. government debt to AA+ seemed to contribute to stock market anxiety but had little effect on Treasury bonds, which rallied after the downgrade. Early in the fourth quarter the rally reversed for a while as investors anticipated the announcement, which finally came on October 27, of a tentative plan to resolve Europe’s debt crisis and recapitalize its banks. After the first rush of enthusiasm for the new plan, however, the markets were again besieged with doubts that Europe’s key players France and Germany would have the political will to implement any plan that would be able to keep countries such as Greece and Italy from defaulting and hold the euro-region together. Before year end, Treasury bonds had resumed their rally. Treasury bond yields at the shortest maturities held at extremely low levels, pegged by the Fed’s stated intention to keep the fed funds rate near zero well into 2013. The Fed’s “operation twist,” whereby it is swapping out of short-term Treasuries into longer-dated issues probably put downward pressure on longer Treasury yields in Q4. Additionally, the inflation fears that popped up early in 2011 appear to have subsided for the time being. The 10-year T-bond yield closed 2011 at 1.88%, down from 3.30% at the beginning of the year and from 1.92% at the end of September (which was up from a record low of 1.72% reached earlier that month). The two-year Treasury yield closed the year at about 0.25%, down from near 0.60% at the end of 2010.
The Barclays U.S. Aggregate bond index’s 7.8% return compared favorably with the S&P 500’s 2.1% return for 2011. Bonds lagged stocks in the fourth quarter with a 1.1% return. All major sectors of the Barclays U.S. Aggregate had positive returns for the year and for the fourth quarter. In keeping with the rally in stocks, spreads on corporate bonds tightened a bit in the fourth quarter of 2011. Over the full year, however, spreads on corporate bonds widened, especially in the financial sector, as investors worried about problems in Europe, U.S. budget deficits and, at times, the risk of recession. Investment-grade corporate bonds returned 1.9% in the fourth quarter, more than doubling the 0.9% return on Treasury bonds. For the year, Treasury bonds were the best-performing sector in the Barclay’s Aggregate with a 9.8% return, followed by corporate bonds, which returned 8.2%. Mortgage-backed securities returned 6.2% for the year, commercial mortgage-backed issues 6.0%, asset-backed 5.1% and Agency bonds 4.9%. High-yield bonds outperformed investment grade corporate bonds in the fourth quarter, but for the year they lagged with a 5.0% return. International investment grade bonds had a loss for the fourth quarter and lagged U.S. bonds for the year with a 4.4% return in dollars, with appreciation of the dollar having a negative effect on dollar-based returns.
7
Management Discussion (Unaudited)
TOTAL RETURN BOND FUND
The Wright Total Return Bond Fund (WTRB), a diversified bond fund, returned 6.7% in 2011 compared to 7.8% for the Barclays U.S. Aggregate Bond index. WTRB outperformed the benchmark in the first quarter with a 0.8% return which doubled the 0.4% return for the Barclays Aggregate. In subsequent quarters, however, it lagged its benchmark, closing the year with a 1.0% return in the fourth quarter compared to 1.1% for the Barclays Aggregate. WTRB had a yield of 2.5% for December 2011 calculated according to SEC guidelines. Dividends paid by this Fund may be more or less than implied by this yield.
WTRB started the year with essentially a neutral duration compared to the Barclays U.S. Aggregate. In the first quarter, the duration position was shortened by a quarter-year compared to the benchmark, reflecting WIS’s expectation that interest rates would move higher. Late in August, with yields near record lows, duration was further shortened to about half a year short compared to the benchmark. Duration positioning had little effect on first-quarter performance but being short compared to the benchmark detracted from the Fund’s relative performance for the rest of 2011 as interest rates declined. The Fund’s duration position was maintained at almost half a year shorter than the benchmark as 2012 began. This positioning reflects our view that, given the uncertainty in the current economic environment, limiting potential losses from rising interest rates is an appropriate strategy even if it would dampen returns should interest rates fall further.
For all of 2011, sector allocation detracted from WTRB’s performance relative to the Barclays U.S. Aggregate benchmark. Throughout the year, WIS maintained overweight positions in corporate bonds, commercial mortgages and asset-backed securities compared to the Barclays Aggregate benchmark, while being significantly underweight in Treasury bonds. Spread tightening accounted for the Fund’s outperformance relative to the benchmark in the first quarter and made a positive contribution in the fourth quarter, but for all of 2011, spreads on non-Treasury sectors widened and Treasury bonds, which were underweighted in WTRB, was the best-performing sector of the Barclays Aggregate. At the end of 2011, the Fund’s sector weightings were: Treasury bonds 14% vs. 36% for the benchmark; agency bonds 0% vs. 6%; corporate 47% vs. 26%; mortgages 28% vs. 31%; asset-backed securities 2% vs. 0%; and commercial mortgages 8% vs. 2%, with 1% in cash.
CURRENT INCOME FUND
For 2011, the mortgage-backed sector of the bond market returned 6.2%, lagging both Treasury bonds, which returned 9.8%, and the Barclays U.S. Aggregate Bond index, which returned 7.8%. The Wright Current Income Fund (WCIF) is managed to be invested in GNMA issues (mortgage-based securities, known as Ginnie Maes, guaranteed by the full faith and credit of the U.S. government) and other mortgage-based securities. WCIF is actively managed to maximize income and minimize principal fluctuation. WCIF returned 6.2% in 2011 compared to 7.9% for the Barclays GNMA Bond index, coming in ahead of the index in the first quarter, but lagging for the rest of the year. In the fourth quarter of 2011, WCIF returned 0.9% compared to 1.3% for the Barclays GNMA benchmark. WCIF had a yield of 2.4% for December calculated according to SEC guidelines. Dividends paid by this Fund may be more or less than implied by this yield.
In addition to its holdings in GNMA-backed mortgage issues, WCIF also held issues backed by Fannie Mae (FNMA), and Freddie Mac (FHLMC), which returned less than GNMA-backed bonds in the 2011 and the fourth quarter. The Fund was 100% in Agency-backed mortgages at the end of 2011. Throughout the year the Fund had a higher average coupon than the GNMA benchmark,
8
Management Discussion (Unaudited)
reflecting the Fund’s mandate to maximize income. At the end of 2011, WCIF’s average coupon was 6.0%, compared to 4.7% for the GNMA benchmark. The emphasis on well-seasoned higher-coupon issues contributes to the Fund’s lower negative convexity compared to the GNMA benchmark, which results in a more stable performance when interest rates are volatile. However, in 2011, the overweight in high-coupon bonds detracted from the Fund’s relative performance. The low level of mortgage rates in the quarter raised prepayment concerns that limited high-coupon issues’ price performance compared to low-coupon issues. WCIF had a longer duration than the GNMA benchmark, but the favorable impact of the duration positioning was not enough to offset the factors that detracted from relative performance.
9
Performance Summaries (Unaudited)
Important
The Total Investment Return is the percent return of an initial $10,000 investment made at the beginning of the period to the ending redeemable value assuming all dividends and distributions are reinvested. After-tax returns are calculated using the historical highest individual federal marginal income tax rates, and do not reflect the impact of state and local taxes. Actual after-tax returns depend on the investor's tax situation and may differ from those shown. After-tax returns are not relevant to investors who hold their fund shares through tax-deferred arrangements such as 401(k) plans or individual retirement accounts. Past performance is not predictive of future performance.
| WRIGHT SELECTED BLUE CHIP EQUITIES FUND | ||||||||||||||||||
| Growth of $10,000 Invested 1/1/02 Through 12/31/11 | ||||||||||||||||||
| Average Annual Total Return | ||||||||||||||||||
| Last 1 Yr | Last 5 Yrs | Last 10 Yrs | ||||||||||||||||
| — WSBC | ||||||||||||||||||
| - Return before taxes | -1.15 | % | 2.66 | % | 5.09 | % | ||||||||||||
| - Return after taxes on distributions | -1.15 | % | 1.76 | % | 4.13 | % | ||||||||||||
| - Return after taxes on distributions and sales of fund shares | -0.75 | % | 2.22 | % | 4.31 | % | ||||||||||||
| — S&P MidCap 400* | -1.73 | % | 3.31 | % | 7.03 | % | ||||||||||||
| ----Average of Morningstar Mid Cap Value/Blend Funds** | -4.12 | % | 0.38 | % | 4.82 | % | ||||||||||||
| Investment Value as of 12/31/11 (in thousands $) | ||||||||||||||||||
| — WSBC | $ | 16.43 | ||||||||||||||||
| — S&P MidCap 400* | $ | 19.74 | ||||||||||||||||
| ----Average of Morningstar Mid Cap Value/Blend Funds** | $ | 16.01 | ||||||||||||||||
* The Fund’s average annual return is compared with that of the S&P MidCap 400, an unmanaged index of stocks in a broad range of industries with market capitalizations of a few billion or less. The performance of the S&P MidCap 400, unlike that of the Fund, reflects no deductions for fees, expense or taxes. As stated in the current prospectus, the Fund’s annual operating expense ratio (gross) is 1.79%. However, Wright and WISDI have contractually agreed to waive a portion of its fees and/or reimburse certain expenses to limit total operating expense to 1.40%, which is in effect until April 30, 2012. During the period, certain fees were waived and/or expenses reimbursed; otherwise, returns would have been lower. Returns greater than one year are annualized.
** Morningstar Mid Cap Funds represent the average return of 44 funds with a Mid Cap Value equity style prior to 12/31/99 and 177 current funds ex multi-share classes in the Mid Cap Blend category since 12/31/99 reported in the Morningstar, Inc. database. © 2012 Morningstar, Inc. All Rights Reserved. The information contained herein: (1) is proprietary to Morningstar and/or its content providers; (2) may not be copied or distributed; and (3) is not warranted to be accurate, complete or timely. Neither Morningstar nor its content providers are responsible for any damages or losses arising from any use of this information. Past performance is no guarantee of future results.
10
Performance Summaries (Unaudited)
| WRIGHT SELECTED BLUE CHIP EQUITIES FUND | |||||||||||||
| Industry Weightings | Ten Largest Stock Holdings | ||||||||||||
| % of net assets @ 12/31/11 | % of net assets @ 12/31/11 | ||||||||||||
| Retailing | 13.4 | % | Food, Beverage & Tobacco | 4.1 | % | Ross Stores, Inc. | 3.5 | % | |||||
| Capital Goods | 12.1 | % | Consumer Services | 4.0 | % | Corn Products International, Inc. | 3.4 | % | |||||
| Technology Hardware & Equipment | 7.7 | % | Utilities | 3.8 | % | Rayonier, Inc. | 3.0 | % | |||||
| Insurance | 7.2 | % | Semiconductors & Semiconductor Equipment | 3.7 | % | Endo Pharmaceutical Holdings, Inc. | 3.0 | % | |||||
| Health Care Equipment & Services | 6.9 | % | Transportation | 1.8 | % | Advance Auto Parts, Inc. | 3.0 | % | |||||
| Real Estate | 6.2 | % | Commercial & Professional Services | 1.0 | % | Alliance Data Systems Corp. | 2.9 | % | |||||
| Banks | 5.3 | % | Diversified Financials | 0.8 | % | AGCO Corp. | 2.6 | % | |||||
| Software & Services | 5.0 | % | Household & Personal Products | 0.7 | % | Jones Lang LaSalle, Inc. | 2.5 | % | |||||
| Energy | 4.9 | % | Media | 0.5 | % | KBR, Inc. | 2.5 | % | |||||
| Pharmaceuticals & Biotechnology | 4.7 | % | Telecommunication Services | 0.4 | % | East West Bancorp, Inc. | 2.2 | % | |||||
| Materials | 4.6 | % | Automobiles & Components | 0.4 | % | ||||||||
11
Performance Summaries (Unaudited)
| WRIGHT MAJOR BLUE CHIP EQUITIES FUND | ||||||||||||||||||
| Growth of $10,000 Invested 1/1/02 Through 12/31/11 | ||||||||||||||||||
| Average Annual Total Return | ||||||||||||||||||
| Last 1 Yr | Last 5 Yrs | Last 10 Yrs | ||||||||||||||||
| — WMBC | ||||||||||||||||||
| - Return before taxes | 0.08 | % | -1.62 | % | 1.33 | % | ||||||||||||
| - Return after taxes on distributions | 0.08 | % | -1.73 | % | 1.21 | % | ||||||||||||
| - Return after taxes on distributions and sales of fund shares | 0.05 | % | -1.38 | % | 1.09 | % | ||||||||||||
| — S&P 500* | 2.11 | % | -0.25 | % | 2.92 | % | ||||||||||||
| ----Average of Morningstar Large Cap Value/Blend Funds** | -1.40 | % | -1.02 | % | 2.06 | % | ||||||||||||
| Investment Value on 12/31/11 (in thousands $) | ||||||||||||||||||
| — WMBC | $ | 11.41 | ||||||||||||||||
| — S&P 500* | $ | 13.34 | ||||||||||||||||
| ----Average of Morningstar Large Cap Value/Blend Funds** | $ | 12.27 | ||||||||||||||||
* The Fund’s average annual return is compared with that of the S&P 500, an unmanaged index of 500 widely held common stocks that generally indicates the performance of the market. The performance of the S&P 500, unlike that of the Fund, reflects no deductions for fees, expenses or taxes. As stated in the current prospectus, the Fund’s annual operating expense ratio (gross) is 1.68%. However, Wright and WISDI have contractually agreed to waive a portion of its fees and/or reimburse certain expenses to limit total operating expense to 1.40%, which is in effect until April 30, 2012. During the period, certain fees were waived and/or expenses reimbursed; otherwise, returns would have been lower. Returns greater than one year are annualized.
** Morningstar Large Cap Funds represent the average return of 229 funds with a Large Cap Value equity style prior to 12/31/99 and 650 current funds ex multi-share classes in the Large Cap Blend category since 12/31/99 reported in the Morningstar, Inc. database. © 2012 Morningstar, Inc. All Rights Reserved. The information contained herein: (1) is proprietary to Morningstar and/or its content providers; (2) may not be copied or distributed; and (3) is not warranted to be accurate, complete or timely. Neither Morningstar nor its content providers are responsible for any damages or losses arising from any use of this information. Past performance is no guarantee of future results.
12
Performance Summaries (Unaudited)
| WRIGHT MAJOR BLUE CHIP EQUITIES FUND | |||||||||||||
| Industry Weightings | Ten Largest Stock Holdings | ||||||||||||
| % of net assets @ 12/31/11 | % of net assets @ 12/31/11 | ||||||||||||
| Energy | 16.3 | % | Materials | 3.8 | % | Microsoft Corp. | 4.4 | % | |||||
| Capital Goods | 11.7 | % | Retailing | 3.8 | % | Johnson & Johnson | 4.1 | % | |||||
| Software & Services | 11.7 | % | Food & Staples Retailing | 3.2 | % | Google, Inc., Class A | 4.0 | % | |||||
| Pharmaceuticals & Biotechnology | 11.2 | % | Transportation | 3.0 | % | Cisco Systems, Inc. | 3.9 | % | |||||
| Insurance | 10.8 | % | Semiconductors & Semiconductor Equipment | 2.5 | % | Amgen, Inc. | 3.7 | % | |||||
| Technology Hardware & Equipment | 7.9 | % | Food, Beverage & Tobacco | 2.0 | % | Walgreen Co. | 3.2 | % | |||||
| Health Care Equipment & Services | 5.2 | % | Consumer Durables & Apparel | 0.8 | % | General Dynamics Corp. | 3.2 | % | |||||
| Diversified Financials | 4.0 | % | Consumer Services | 0.5 | % | Humana, Inc. | 3.2 | % | |||||
| National Oilwell Varco, Inc. | 3.1 | % | |||||||||||
| Aflac, Inc. | 3.1 | % | |||||||||||
13
Performance Summaries (Unaudited)
| WRIGHT INTERNATIONAL BLUE CHIP EQUITIES FUND | ||||||||||||||||||
| Growth of $10,000 Invested 1/1/02 Through 12/31/11 | ||||||||||||||||||
| Average Annual Total Return | ||||||||||||||||||
| Last 1 Yr | Last 5 Yrs | Last 10 Yrs | ||||||||||||||||
| — WIBC | ||||||||||||||||||
| - Return before taxes | -13.65 | % | -7.60 | % | 3.36 | % | ||||||||||||
| - Return after taxes on distributions | -13.56 | % | -8.17 | % | 2.94 | % | ||||||||||||
| - Return after taxes on distributions and sales of fund shares | -8.20 | % | -6.22 | % | 2.93 | % | ||||||||||||
| — MSCI World ex U.S. Index* | -12.21 | % | -4.09 | % | 5.14 | % | ||||||||||||
| ----Average of Morningstar Foreign Large Blend Funds** | -13.91 | % | -4.50 | % | 4.10 | % | ||||||||||||
| Investment Value as of 12/31/11 (in thousands $) | ||||||||||||||||||
| — WIBC | $ | 13.92 | ||||||||||||||||
| — MSCI World ex U.S. Index* | $ | 16.50 | ||||||||||||||||
| ----Average of Morningstar Foreign Large Blend Funds** | $ | 14.95 | ||||||||||||||||
* The Fund’s average annual return is compared with that of the MSCI World ex U.S. Index. While the Fund does not seek to match the returns of this index, this unmanaged index generally indicates foreign stock market performance. The performance of the MSCI World ex U.S. Index, unlike that of the Fund, reflects no deductions for fees, expenses or taxes. As stated in the current prospectus, the Fund’s annual operating expense ratio (gross) is 1.77%. However, Wright and WISDI have contractually agreed to waive a portion of its fees and/or reimburse certain expenses to limit total operating expense to 1.85%, which is in effect until April 30, 2012. Returns greater than one year are annualized. Shares held less than 90 days will be subject to a 2.00% redemption fee.
** Morningstar International Equity Funds represent the average of 205 current funds ex multi-share classes in the Foreign Large Blend category reported in the Morningstar, Inc. database. © 2012 Morningstar, Inc. All Rights Reserved. The information contained herein: (1) is proprietary to Morningstar and/or its content providers; (2) may not be copied or distributed; and (3) is not warranted to be accurate, complete or timely. Neither Morningstar nor its content providers are responsible for any damages or losses arising from any use of this information. Past performance is no guarantee of future results.
14
Performance Summaries (Unaudited)
| WRIGHT INTERNATIONAL BLUE CHIP EQUITIES FUND | |||||||||||||
| Country Weightings | Ten Largest Stock Holdings | ||||||||||||
| % of net assets @ 12/31/11 | % of net assets @ 12/31/11 | ||||||||||||
| United Kingdom | 21.3 | % | Spain | 3.0 | % | Nestle SA | 4.9 | % | |||||
| Japan | 15.1 | % | Netherlands | 2.2 | % | AstraZeneca PLC | 3.1 | % | |||||
| Switzerland | 8.7 | % | Norway | 1.7 | % | BASF SE | 2.9 | % | |||||
| France | 8.6 | % | Sweden | 1.7 | % | Toronto-Dominion Bank | 2.6 | % | |||||
| Canada | 8.4 | % | Belgium | 1.4 | % | Sumitomo Corp. | 2.6 | % | |||||
| Germany | 7.7 | % | Brazil | 1.0 | % | Sanofi | 2.5 | % | |||||
| Australia | 5.2 | % | Singapore | 1.0 | % | Yamada Denki Co., Ltd. | 2.4 | % | |||||
| Hong Kong | 4.1 | % | Finland | 0.7 | % | Legal & General Group PLC | 2.2 | % | |||||
| China | 3.7 | % | United States | 0.7 | % | Vodafone Group PLC | 2.2 | % | |||||
| Italy | 3.0 | % | Denmark | 0.5 | % | Rio Tinto, Ltd. | 2.1 | % | |||||
15
Performance Summaries (Unaudited)
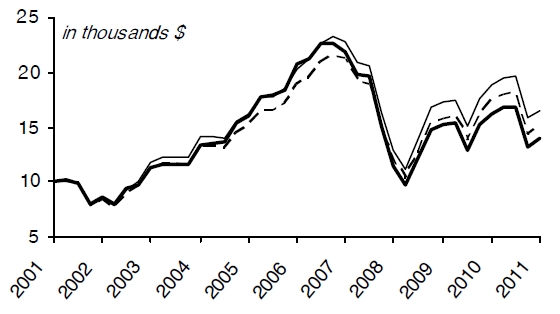
| WRIGHT TOTAL RETURN BOND FUND | ||||||||||||||||||
| Growth of $10,000 Invested 1/1/02 Through 12/31/11 | ||||||||||||||||||
| Average Annual Total Return | ||||||||||||||||||
| Last 1 Yr | Last 5 Yrs | Last 10 Yrs | ||||||||||||||||
| — WTRB | ||||||||||||||||||
| - Return before taxes | 6.68 | % | 6.11 | % | 5.10 | % | ||||||||||||
| - Return after taxes on distributions | 5.22 | % | 4.46 | % | 3.46 | % | ||||||||||||
| - Return after taxes on distributions and sales of fund shares | 4.31 | % | 4.24 | % | 3.38 | % | ||||||||||||
| — Barclays Capital U.S. Aggregate Bond Index* | 7.84 | % | 6.50 | % | 5.78 | % | ||||||||||||
| ----Average of Morningstar Intermediate Term Bond Funds** | 5.77 | % | 5.09 | % | 4.71 | % | ||||||||||||
| Investment Value as of 12/31/11 (in thousands $) | ||||||||||||||||||
| — WTRB | $ | 16.45 | ||||||||||||||||
| — Barclays Capital U.S. Aggregate Bond Index* | $ | 17.54 | ||||||||||||||||
| ----Average of Morningstar Intermediate Term Bond Funds** | $ | 15.85 | ||||||||||||||||

* The Fund’s average annual return is compared with that of the Barclays Capital U.S. Aggregate Bond Index, an unmanaged index that is a broad representation of the investment-grade fixed income market in the U.S. The Barclays Capital U.S. Aggregate Bond Index, unlike the Fund, reflects no deductions for fees, expenses or taxes. As stated in the current prospectus, the Fund’s annual operating expense ratio (gross) is 1.43%. However, Wright and WISDI have contractually agreed to waive a portion of its fees and/or reimburse certain expenses to limit total operating expense to 0.95%, which is in effect until April 30, 2012. During the period, certain fees were waived and/or expenses reimbursed; otherwise, returns would have been lower. Returns greater than one year are annualized.
** Morningstar average represents the return of 334 current funds ex multi-share classes in the Intermediate Term Bond category in the Morningstar, Inc. database. © 2012 Morningstar, Inc. All Rights Reserved. The information contained herein: (1) is proprietary to Morningstar and/or its content providers; (2) may not be copied or distributed; and (3) is not warranted to be accurate, complete or timely. Neither Morningstar nor its content providers are responsible for any damages or losses arising from any use of this information. Past performance is no guarantee of future results.
16
Performance Summaries (Unaudited)
| WRIGHT TOTAL RETURN BOND FUND | ||||||||||||||||||
| Holdings by Security Type | Five Largest Bond Holdings | |||||||||||||||||
| % of net assets @ 12/31/11 | % of net assets @ 12/31/11 | |||||||||||||||||
| Asset-Backed Securities | 2.3 | % | GNMA, Series 2010-44, Class NK | 4.00% | 10/20/37 | 3.2 | % | |||||||||||
| Corporate Bonds | 46.8 | % | U.S. Treasury Note | 3.25% | 06/30/16 | 2.7 | % | |||||||||||
| Mortgage-Backed Securities | 36.2 | % | U.S. Treasury Bond | 6.13% | 11/15/27 | 2.7 | % | |||||||||||
| U.S. Treasuries | 13.6 | % | U.S. Treasury Note | 4.50% | 05/15/17 | 2.7 | % | |||||||||||
| FNMA Pool #888366 | 7.00% | 04/01/37 | 2.3 | % | ||||||||||||||
| Holdings by Credit Quality | ||||||||||||||||||
| % of net assets @ 12/31/11 | ||||||||||||||||||
| A | 21 | % | ||||||||||||||||
| Aa | 5 | % | ||||||||||||||||
| Aaa | 52 | % | ||||||||||||||||
| Baa | 20 | % | ||||||||||||||||
| <Baa | 2 | % | ||||||||||||||||
| U.S. Government Agencies | 0 | % | ||||||||||||||||
| U.S. Treasuries | 0 | % | ||||||||||||||||
17
Performance Summaries (Unaudited)
| WRIGHT CURRENT INCOME FUND | ||||||||||||||||||
| Growth of $10,000 Invested 1/1/02 Through 12/31/11 | ||||||||||||||||||
| Average Annual Total Return | ||||||||||||||||||
| Last 1 Yr | Last 5 Yrs | Last 10 Yrs | ||||||||||||||||
| — WCIF | ||||||||||||||||||
| - Return before taxes | 6.22 | % | 6.00 | % | 4.82 | % | ||||||||||||
| - Return after taxes on distributions | 4.69 | % | 4.30 | % | 3.03 | % | ||||||||||||
| - Return after taxes on distributions and sales of fund shares | 4.01 | % | 4.13 | % | 3.07 | % | ||||||||||||
| — Barclays Capital GNMA Backed Bond Index* | 7.89 | % | 6.96 | % | 5.84 | % | ||||||||||||
| ----Average of Morningstar Government Mortgage Funds** | 6.51 | % | 5.58 | % | 4.68 | % | ||||||||||||
| Investment Value as of 12/31/11 (in thousands $) | ||||||||||||||||||
| — WCIF | $ | 16.02 | ||||||||||||||||
| — Barclays Capital GNMA Backed Bond Index* | $ | 17.64 | ||||||||||||||||
| ----Average of Morningstar Government Mortgage Funds** | $ | 15.80 | ||||||||||||||||
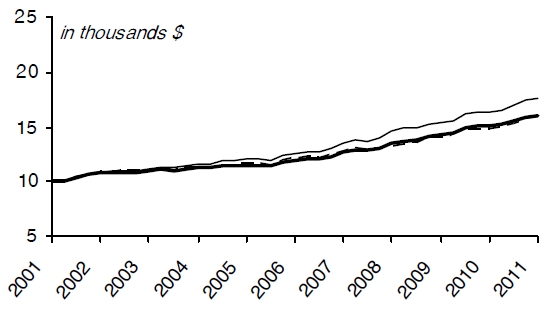
* The Fund’s average annual return is compared with that of the Barclays Capital GNMA Backed Bond Index. While the Fund does not seek to match the returns of the Barclays Capital GNMA Backed Bond Index, Wright believes that this unmanaged index generally indicates the performance of government and corporate mortgage-backed bond markets. The Barclays Capital GNMA Backed Bond Index, unlike the Fund, reflects no deductions for fees, expenses or taxes. As stated in the current prospectus, the Fund’s annual operating expense ratio (gross) is 1.33%. However, Wright and WISDI have contractually agreed to waive a portion of its fees and/or reimburse certain expenses to limit total operating expense to 1.00%, which is in effect until April 30, 2012. During the period, certain fees were waived and/or expenses reimbursed; otherwise, returns would have been lower. Returns greater than one year are annualized.
** The Morningstar Government Mortgage Fund Average represents the average return of all 107 current funds ex multi-share classes with a government mortgage investment objective reported in the Morningstar, Inc. database. © 2012 Morningstar, Inc. All Rights Reserved. The information contained herein: (1) is proprietary to Morningstar and/or its content providers; (2) may not be copied or distributed; and (3) is not warranted to be accurate, complete or timely. Neither Morningstar nor its content providers are responsible for any damages or losses arising from any use of this information. Past performance is no guarantee of future results.
18
Performance Summaries (Unaudited)
| WRIGHT CURRENT INCOME FUND | ||||||||||||
| Holdings by Security Type | Five Largest Bond Holdings | |||||||||||
| % of net assets @ 12/31/11 | % of net assets @ 12/31/11 | |||||||||||
| FNMA Pool #995149 | 6.50% | 10/01/38 | 3.7 | % | ||||||||
| Agency Mortgage-Backed Securities | 98.1 | % | GNMA, Series 2010-116, Class PB | 5.00% | 06/16/40 | 3.7 | % | |||||
| FNMA Pool #889307 | 5.00% | 07/01/37 | 2.7 | % | ||||||||
| FHLMC Gold Pool #G08081 | 6.00% | 09/01/35 | 2.5 | % | ||||||||
| FNMA Pool #256182 | 6.00% | 03/01/36 | 2.5 | % | ||||||||
| Weighted Average Maturity | ||||||||||||
| @ 12/31/11 | 5.4 | Years | ||||||||||
19
Fund Expenses (Unaudited)
Example:
As a shareholder of a fund, you incur two types of costs: (1) transaction costs, including redemption fees (if applicable); and (2) ongoing costs including management fees; distribution or service fees; and other fund expenses. This example is intended to help you understand your ongoing costs (in dollars) of investing in a fund and to compare these costs with the ongoing costs of investing in other mutual funds. The example is based on an investment of $1,000 invested at the beginning of the period and held for the entire period (July 1, 2011 – December 31, 2011).
Actual Expenses:
The first line of the tables shown on the following page provides information about actual account values and actual expenses. You may use the information in this line, together with the amount you invested, to estimate the expenses that you paid over the period. Simply divide your account value by $1,000 (for example, an $8,600 account value divided by $1,000 = 8.6), then multiply the result by the number in the first line under the heading entitled “Expenses Paid During Period” to estimate the expenses you paid on your account during this period.
Hypothetical Example for Comparison Purposes:
The second line of the tables provides information about hypothetical account values and hypothetical expenses based on the actual Fund expense ratio and an assumed rate of return of 5% per year (before expenses), which is not the actual return of the Fund. The hypothetical account values and expenses may not be used to estimate the actual ending account balance or expenses you paid for the period. You may use this information to compare the ongoing costs of investing in your Fund and other funds. To do so, compare this 5% hypothetical example with the 5% hypothetical examples that appear in the shareholder reports of the other funds.
Please note that the expenses shown in the tables are meant to highlight your ongoing costs only and do not reflect any transactional costs, such as redemption fees (if applicable). Therefore, the second line of the tables is useful in comparing ongoing costs only, and will not help you determine the relative total costs of owning different funds. In addition, if these transactional costs were included, your costs would have been higher.
20
| EQUITY FUNDS | FIXED INCOME FUNDS | |||||||
| Wright Selected Blue Chip Equities Fund | Wright Total Return Bond Fund | |||||||
| Beginning | Ending | Expenses Paid | Beginning | Ending | Expenses Paid | |||
| Account Value (7/1/11) | Account Value (12/31/11) | During Period* | Account Value (7/1/11) | Account Value (12/31/11) | During Period* | |||
| (7/1/11-12/31/11) | (7/1/11-12/31/11) | |||||||
| Actual Fund Shares | $1,000.00 | $912.15 | $6.75 | Actual Fund Shares | $1,000.00 | $1,038.11 | $4.88 | |
| Hypothetical (5% return per year before expenses) | Hypothetical (5% return per year before expenses) | |||||||
| Fund Shares | $1,000.00 | $1,018.15 | $7.12 | Fund Shares | $1,000.00 | $1,020.42 | $4.84 | |
| *Expenses are equal to the Fund’s annualized expense ratio of 1.40% multiplied by the average account value over the period, multiplied by 184/365 (to reflect the one-half year period). The example assumes that the $1,000 was invested at the net asset value per share determined at the close of business on June 30, 2011. | *Expenses are equal to the Fund’s annualized expense ratio of 0.95% multiplied by the average account value over the period, multiplied by 184/365 (to reflect the one-half year period). The example assumes that the $1,000 was invested at the net asset value per share determined at the close of business on June 30, 2011. | |||||||
| Wright Major Blue Chip Equities Fund | Wright Current Income Fund | |||||||
| Beginning | Ending | Expenses Paid | Beginning | Ending | Expenses Paid | |||
| Account Value (7/1/11) | Account Value (12/31/11) | During Period* | Account Value (7/1/11) | Account Value (12/31/11) | During Period* | |||
| (7/1/11-12/31/11) | (7/1/11-12/31/11) | |||||||
| Actual Fund Shares | $1,000.00 | $ 932.32 | $6.82 | Actual Fund Shares | $1,000.00 | $1,031.31 | $4.61 | |
| Hypothetical (5% return per year before expenses) | Hypothetical (5% return per year before expenses) | |||||||
| Fund Shares | $1,000.00 | $1,018.15 | $7.12 | Fund Shares | $1,000.00 | $1,020.67 | $4.58 | |
| *Expenses are equal to the Fund’s annualized expense ratio of 1.40% multiplied by the average account value over the period, multiplied by 184/365 (to reflect the one-half year period). The example assumes that the $1,000 was invested at the net asset value per share determined at the close of business on June 30, 2011. | *Expenses are equal to the Fund’s annualized expense ratio of 0.90% multiplied by the average account value over the period, multiplied by 184/365 (to reflect the one-half year period). The example assumes that the $1,000 was invested at the net asset value per share determined at the close of business on June 30, 2011. | |||||||
| Wright International Blue Chip Equities Fund | ||||||||
| Beginning | Ending | Expenses Paid | ||||||
| Account Value (7/1/11) | Account Value (12/31/11) | During Period* | ||||||
| (7/1/11-12/31/11) | ||||||||
| Actual Fund Shares | $1,000.00 | $ 825.41 | $8.24 | |||||
| Hypothetical (5% return per year before expenses) | ||||||||
| Fund Shares | $1,000.00 | $1,016.18 | $9.10 | |||||
| *Expenses are equal to the Fund’s annualized expense ratio of 1.79% multiplied by the average account value over the period, multiplied by 184/365 (to reflect the one-half year period). The example assumes that the $1,000 was invested at the net asset value per share determined at the close of business on June 30, 2011. | ||||||||
21
Wright Selected Blue Chip Equities Fund (WSBC)
Portfolio of Investments – As of December 31, 2011
| Shares | Value | Shares | Value | |||||||||
| HOUSEHOLD & PERSONAL PRODUCTS - 0.7% | ||||||||||||
| Energizer Holdings, Inc.* | 2,925 | $ | 226,629 | |||||||||
| AUTOMOBILES & COMPONENTS - 0.4% | ||||||||||||
| BorgWarner, Inc.* | 2,225 | $ | 141,821 | INSURANCE - 7.2% | ||||||||
| American Financial Group, Inc. | 11,445 | $ | 422,206 | |||||||||
| BANKS - 5.3% | Arthur J. Gallagher & Co. | 5,650 | 188,936 | |||||||||
| Commerce Bancshares, Inc. | 8,175 | $ | 311,631 | Everest Re Group, Ltd. | 2,625 | 220,736 | ||||||
| East West Bancorp, Inc. | 35,930 | 709,618 | HCC Insurance Holdings, Inc. | 21,495 | 591,113 | |||||||
| Fulton Financial Corp. | 69,640 | 683,168 | Reinsurance Group of America, Inc. | 5,855 | 305,924 | |||||||
| $ | 1,704,417 | WR Berkley Corp. | 17,257 | 593,468 | ||||||||
| $ | 2,322,383 | |||||||||||
| CAPITAL GOODS - 12.1% | ||||||||||||
| AGCO Corp.* | 19,880 | $ | 854,244 | MATERIALS - 4.6% | ||||||||
| BE Aerospace, Inc.* | 14,230 | 550,843 | Albemarle Corp. | 3,030 | $ | 156,075 | ||||||
| Hubbell, Inc. - Class B | 4,035 | 269,780 | Ashland, Inc. | 5,250 | 300,090 | |||||||
| KBR, Inc. | 28,965 | 807,255 | Rock-Tenn Co. - Class A | 11,405 | 658,069 | |||||||
| SPX Corp. | 5,045 | 304,062 | Valspar Corp. | 9,285 | 361,836 | |||||||
| Thomas & Betts Corp.* | 9,590 | 523,614 | $ | 1,476,070 | ||||||||
| Timken Co. | 5,350 | 207,098 | ||||||||||
| URS Corp.* | 11,405 | 400,544 | MEDIA - 0.5% | |||||||||
| $ | 3,917,440 | John Wiley & Sons, Inc. - Class A | 3,330 | $ | 147,852 | |||||||
| COMMERCIAL AND PROFESSIONAL SERVICES - 1.0% | PHARMACEUTICALS & BIOTECHNOLOGY - 4.7% | |||||||||||
| Towers Watson & Co. - Class A | 5,550 | $ | 332,611 | Endo Pharmaceuticals Holdings, Inc.* | 28,055 | $ | 968,739 | |||||
| Medicis Pharmaceutical Corp. - Class A | 16,250 | 540,313 | ||||||||||
| CONSUMER SERVICES - 4.0% | $ | 1,509,052 | ||||||||||
| Brinker International, Inc. | 26,245 | $ | 702,316 | |||||||||
| Cheesecake Factory, Inc. (The)* | 10,705 | 314,192 | REAL ESTATE - 6.2% | |||||||||
| ITT Educational Services, Inc.* | 4,745 | 269,943 | Hospitality Properties Trust (REIT) | 10,395 | $ | 238,877 | ||||||
| $ | 1,286,451 | Jones Lang LaSalle, Inc. | 13,220 | 809,857 | ||||||||
| Rayonier, Inc. (REIT) | 21,737 | 970,123 | ||||||||||
| DIVERSIFIED FINANCIALS - 0.8% | $ | 2,018,857 | ||||||||||
| Affiliated Managers Group, Inc.* | 805 | $ | 77,240 | |||||||||
| Raymond James Financial, Inc. | 6,255 | 193,655 | RETAILING - 13.4% | |||||||||
| $ | 270,895 | Advance Auto Parts, Inc. | 13,830 | $ | 962,983 | |||||||
| Ascena Retail Group, Inc.* | 4,245 | 126,161 | ||||||||||
| ENERGY - 4.9% | Dick's Sporting Goods, Inc. | 2,930 | 108,058 | |||||||||
| Arch Coal, Inc. | 28,665 | $ | 415,929 | Dollar Tree, Inc.* | 7,172 | 596,065 | ||||||
| HollyFrontier Corp. | 13,789 | 322,663 | Foot Locker, Inc. | 8,280 | 197,395 | |||||||
| Oceaneering International, Inc. | 8,680 | 400,408 | PetSmart, Inc. | 4,340 | 222,599 | |||||||
| Southern Union Co. | 8,480 | 357,093 | PVH Corp. | 7,270 | 512,462 | |||||||
| Superior Energy Services, Inc.* | 3,030 | 86,173 | Rent-A-Center, Inc. | 10,295 | 380,915 | |||||||
| $ | 1,582,266 | Ross Stores, Inc. | 23,820 | 1,132,165 | ||||||||
| Williams-Sonoma, Inc. | 2,725 | 104,913 | ||||||||||
| FOOD, BEVERAGE & TOBACCO - 4.1% | $ | 4,343,716 | ||||||||||
| Corn Products International, Inc. | 20,890 | $ | 1,098,605 | |||||||||
| Ralcorp Holdings, Inc.* | 2,525 | �� | 215,888 | SEMICONDUCTORS & SEMICONDUCTOR EQUIPMENT - 3.7% | ||||||||
| $ | 1,314,493 | Atmel Corp.* | 13,425 | $ | 108,743 | |||||||
| Fairchild Semiconductor International, Inc.* | 22,710 | 273,428 | ||||||||||
| HEALTH CARE EQUIPMENT & SERVICES - 6.9% | Lam Research Corp.* | 18,370 | 680,057 | |||||||||
| Health Management Associates, Inc. - Class A* | 41,480 | $ | 305,708 | RF Micro Devices, Inc.* | 12,920 | 69,768 | ||||||
| LifePoint Hospitals, Inc.* | 10,395 | 386,174 | Skyworks Solutions, Inc.* | 3,530 | 57,257 | |||||||
| Lincare Holdings, Inc. | 10,595 | 272,397 | $ | 1,189,253 | ||||||||
| Mednax, Inc.* | 1,715 | 123,497 | ||||||||||
| Omnicare, Inc. | 6,965 | 239,944 | SOFTWARE & SERVICES - 5.0% | |||||||||
| Universal Health Services, Inc. - Class B | 16,045 | 623,509 | Alliance Data Systems Corp.* | 8,980 | $ | 932,483 | ||||||
| WellCare Health Plans, Inc.* | 5,145 | 270,113 | Synopsys, Inc.* | 7,470 | 203,184 | |||||||
| $ | 2,221,342 | ValueClick, Inc.* | 30,580 | 498,148 | ||||||||
| $ | 1,633,815 | |||||||||||
| See Notes to Financial Statements. | 22 | |
Wright Selected Blue Chip Equities Fund (WSBC)
Portfolio of Investments – As of December 31, 2011
| Shares | Value | |||||||||||
| TECHNOLOGY HARDWARE & EQUIPMENT - 7.7% | ||||||||||||
| Arrow Electronics, Inc.* | 10,195 | $ | 381,395 | |||||||||
| Avnet, Inc.* | 19,175 | 596,151 | ||||||||||
| DST Systems, Inc. | 5,855 | 266,519 | ||||||||||
| Ingram Micro, Inc. - Class A* | 7,670 | 139,517 | ||||||||||
| Jack Henry & Associates, Inc. | 10,195 | 342,654 | ||||||||||
| MICROS Systems, Inc.* | 1,920 | 89,434 | ||||||||||
| QLogic Corp.* | 11,810 | 177,150 | ||||||||||
| Tech Data Corp.* | 5,650 | 279,166 | ||||||||||
| Vishay Intertechnology, Inc.* | 25,030 | 225,020 | ||||||||||
| $ | 2,497,006 | |||||||||||
| TELECOMMUNICATION SERVICES - 0.4% | ||||||||||||
| Telephone & Data Systems, Inc. | 5,650 | $ | 146,278 | |||||||||
| TRANSPORTATION - 1.8% | ||||||||||||
| Kansas City Southern* | 8,780 | $ | 597,128 | |||||||||
| UTILITIES - 3.8% | ||||||||||||
| NV Energy, Inc. | 20,790 | $ | 339,916 | |||||||||
| ONEOK, Inc. | 5,755 | 498,901 | ||||||||||
| UGI Corp. | 12,920 | 379,848 | ||||||||||
| $ | 1,218,665 | |||||||||||
| TOTAL EQUITY INTERESTS - 99.2% | ||||||||||||
| (identified cost, $29,259,854) | $ | 32,098,440 | ||||||||||
| SHORT-TERM INVESTMENTS - 2.0% | ||||||||||||
| Fidelity Government Money Market Fund, 0.01% (1) | $ | 665,583 | ||||||||||
| TOTAL SHORT-TERM INVESTMENTS - 2.0% | ||||||||||||
| (identified cost, $665,583) | $ | 665,583 | ||||||||||
| TOTAL INVESTMENTS — 101.2% | ||||||||||||
| (identified cost, $29,925,437) | $ | 32,764,023 | ||||||||||
| LIABILITIES, IN EXCESS OF OTHER ASSETS — (1.2)% | (402,264 | ) | ||||||||||
| NET ASSETS — 100.0% | $ | 32,361,759 | ||||||||||
REIT — Real Estate Investment Trust
| * | Non-income producing security. |
| (1) | Variable rate security. Rate presented is as of December 31, 2011. |
| See Notes to Financial Statements. | 23 | |
Wright Selected Blue Chip Equities Fund (WSBC)
| As of December 31, 2011 | For the Year Ended December 31, 2011 | |||||||||||||
| ASSETS: | INVESTMENT INCOME (Note 1C) | |||||||||||||
| Investments, at value | 0 | Dividend income | $ | 376,367 | ||||||||||
| (identified cost $29,925,437) (Note 1A) | $ | 32,764,023 | Total investment income | $ | 376,367 | |||||||||
| Receivable for fund shares sold | 86,626 | |||||||||||||
| Dividends receivable | 31,467 | Expenses – | ||||||||||||
| Prepaid expenses and other assets | 15,622 | Investment adviser fee (Note 3) | $ | 182,636 | ||||||||||
| Total assets | $ | 32,897,738 | Administrator fee (Note 3) | 36,527 | ||||||||||
| Trustee expense (Note 3) | 14,523 | |||||||||||||
| LIABILITIES: | Custodian fee | 3,142 | ||||||||||||
| Payable for fund shares reacquired | $ | 20,538 | Accountant fee | 38,408 | ||||||||||
| Payable for investment securities purchased | 501,834 | Distribution expenses (Note 4) | 76,098 | |||||||||||
| Accrued expenses and other liabilities | 13,607 | Transfer agent fee | 33,776 | |||||||||||
| Total liabilities | $ | 535,979 | Printing | 137 | ||||||||||
| NET ASSETS | $ | 32,361,759 | Shareholder communications | 7,045 | ||||||||||
| Audit services | 17,317 | |||||||||||||
| NET ASSETS CONSIST OF: | Legal services | 2,465 | ||||||||||||
| Paid-in capital | $ | 28,737,960 | Compliance services | 870 | ||||||||||
| Accumulated net realized gain on investments | 785,213 | Registration costs | 19,069 | |||||||||||
| Unrealized appreciation on investments | 2,838,586 | Interest expense (Note 8) | 664 | |||||||||||
| Net assets applicable to outstanding shares | $ | 32,361,759 | Miscellaneous | 12,114 | ||||||||||
| Total expenses | $ | 444,791 | ||||||||||||
| SHARES OF BENEFICIAL INTEREST OUTSTANDING AT $0.000 PAR VALUE (UNLIMITED SHARES AUTHORIZED) | 3,148,022 | |||||||||||||
| Deduct – | ||||||||||||||
| NET ASSET VALUE, OFFERING PRICE, AND REDEMPTION PRICE PER SHARE OF BENEFICIAL INTEREST | $ | 10.28 | Waiver and/or reimbursement by the principal underwriter and/or investment adviser (Note 4) | $ | (17,976 | ) | ||||||||
| Net expenses | $ | 426,815 | ||||||||||||
| Net investment loss | $ | (50,448 | ) | |||||||||||
| REALIZED AND UNREALIZED GAIN (LOSS) ON INVESTMENTS: | ||||||||||||||
| Net realized gain on investment transactions | $ | 1,748,539 | ||||||||||||
| Net change in unrealized appreciation (depreciation) on investments | (2,203,596 | ) | ||||||||||||
| Net realized and unrealized loss on investments | $ | (455,057 | ) | |||||||||||
| Net decrease in net assets from operations | $ | (505,505 | ) | |||||||||||
| See Notes to Financial Statements. | 24 | |
Wright Selected Blue Chip Equities Fund (WSBC)
| Years Ended | ||||||||||
| STATEMENTS OF CHANGES IN NET ASSETS | December 31, 2011 | December 31, 2010 | ||||||||
| INCREASE (DECREASE) IN NET ASSETS: | ||||||||||
From operations – | ||||||||||
| Net investment loss | $ | (50,448 | ) | $ | (45,144 | ) | ||||
| 0 | Net realized gain on investment transactions | 1,748,539 | 1,233,621 | |||||||
| Net change in unrealized appreciation (depreciation) on investments | (2,203,596 | ) | 2,909,492 | |||||||
| Net increase (decrease) in net assets from operations | $ | (505,505 | ) | $ | 4,097,969 | |||||
| Distributions to shareholders (Note 2) | ||||||||||
| From net investment income | $ | - | $ | (17,380 | ) | |||||
| Total distributions | $ | - | $ | (17,380 | ) | |||||
| Net increase in net assets resulting from fund share transactions (Note 6) | $ | 4,496,809 | $ | 7,526,879 | ||||||
| Net increase in net assets | $ | 3,991,304 | $ | 11,607,468 | ||||||
| NET ASSETS: | ||||||||||
| At beginning of year | 28,370,455 | 16,762,987 | ||||||||
| At end of year | $ | 32,361,759 | $ | 28,370,455 | ||||||
| See Notes to Financial Statements. | 25 | |
| These financial highlights reflect selected data for a share outstanding throughout each year. | |||||||||||||||||||
| Years Ended December 31, | |||||||||||||||||||
| 2011 | 2010 | 2009 | 2008 | 2007 | |||||||||||||||
| Net asset value, beginning of year | $ | 10.400 | $ | 8.400 | $ | 6.060 | $ | 11.100 | $ | 12.270 | |||||||||
| Income (loss) from investment operations: | |||||||||||||||||||
Net investment income (loss) (1) | (0.018 | ) | (0.022 | ) | 0.011 | (0.013 | ) | (0.013 | ) | ||||||||||
| Net realized and unrealized gain (loss) | (0.102 | ) | 2.030 | 2.329 | (4.121 | ) | 1.340 | ||||||||||||
| Total income (loss) from investment operations | (0.120 | ) | 2.008 | 2.340 | (4.134 | ) | 1.327 | ||||||||||||
| Less distributions: | |||||||||||||||||||
| From net investment income | — | (0.008 | ) | — | — | (0.016 | ) | ||||||||||||
| From net realized gains | — | — | — | (0.906 | ) | (2.481 | ) | ||||||||||||
| Total distributions | — | (0.008 | ) | — | (0.906 | ) | (2.497 | ) | |||||||||||
| Net asset value, end of year | $ | 10.280 | $ | 10.400 | $ | 8.400 | $ | 6.060 | $ | 11.100 | |||||||||
Total Return(2) | (1.15 | )% | 23.93 | % | 38.61 | % | (39.81 | )% | 11.59 | % | |||||||||
Ratios/Supplemental Data(3): | |||||||||||||||||||
| Net assets, end of year (000 omitted) | $32,362 | $28,370 | $16,763 | $13,364 | $23,923 | ||||||||||||||
| Ratios (As a percentage of average daily net assets): | |||||||||||||||||||
| Net expenses | 1.40 | % | 1.40 | % | 1.36 | % | 1.26 | % | 1.26 | % | |||||||||
| Net expenses after custodian fee reduction | N/A | N/A | 1.36 | % | 1.25 | % | 1.25 | % | |||||||||||
| Net investment income (loss) | (0.17 | )% | (0.24 | )% | 0.15 | % | (0.15 | )% | (0.10 | )% | |||||||||
| Portfolio turnover rate | 82 | % | 60 | % | 41 | % | 72 | % | 67 | % | |||||||||
| (1) | Computed using average shares outstanding. | ||||||||||||||||||
| (2) | Total return is calculated assuming a purchase at the net asset value on the first day and a sale at the net asset value on the last day of each year reported. Dividends and distributions, if any, are assumed to be reinvested at the net asset value on the reinvestment date. | ||||||||||||||||||
| (3) | For each of the years presented, the operating expenses of the Fund were reduced by a waiver of fees and/or allocation of expenses to the principal underwriter and/or investment adviser. Had such action not been undertaken, expenses and net investment loss ratios would have been as follows: | ||||||||||||||||||
| 2011 | 2010 | 2009 | 2008 | 2007 | |||||||||||||||
| Ratios (As a percentage of average daily net assets): | |||||||||||||||||||
| Expenses | 1.46 | % | 1.79 | % | 2.15 | % | 1.90 | % | 1.66 | % | |||||||||
| Expenses after custodian fee reduction | N/A | N/A | 2.15 | % | 1.89 | % | 1.66 | % | |||||||||||
| Net investment loss | (0.23 | )% | (0.63 | )% | (0.64 | )% | (0.79 | )% | (0.51 | )% | |||||||||
| See Notes to Financial Statements. | 26 | |
Wright Major Blue Chip Equities Fund (WMBC)
Portfolio of Investments – As of December 31, 2011
| Shares | Value | Shares | Value | |||||||||
| PHARMACEUTICALS & BIOTECHNOLOGY - 11.2% | ||||||||||||
| Amgen, Inc. | 10,940 | $ | 702,457 | |||||||||
| CAPITAL GOODS - 11.7% | Endo Pharmaceuticals Holdings, Inc.* | 14,020 | 484,111 | |||||||||
| Cummins, Inc. | 5,360 | $ | 471,787 | Forest Laboratories, Inc.* | 4,920 | 148,879 | ||||||
| Fastenal Co. | 2,275 | 99,213 | Johnson & Johnson | 11,890 | 779,746 | |||||||
| Fluor Corp. | 7,635 | 383,659 | $ | 2,115,193 | ||||||||
| General Dynamics Corp. | 9,175 | 609,312 | ||||||||||
| Precision Castparts Corp. | 3,375 | 556,166 | RETAILING - 3.8% | |||||||||
| WW Grainger, Inc. | 515 | 96,403 | Bed Bath & Beyond, Inc.* | 1,835 | $ | 106,375 | ||||||
| $ | 2,216,540 | Best Buy Co., Inc. | 21,875 | 511,219 | ||||||||
| Ross Stores, Inc. | 2,060 | 97,912 | ||||||||||
| CONSUMER DURABLES & APPAREL - 0.8% | $ | 715,506 | ||||||||||
| Garmin, Ltd. | 3,745 | $ | 149,088 | |||||||||
| SEMICONDUCTORS & SEMICONDUCTOR EQUIPMENT - 2.5% | ||||||||||||
| CONSUMER SERVICES - 0.5% | Analog Devices, Inc. | 2,715 | $ | 97,142 | ||||||||
| WMS Industries, Inc.* | 4,700 | $ | 96,444 | Intel Corp. | 15,195 | 368,479 | ||||||
| $ | 465,621 | |||||||||||
| DIVERSIFIED FINANCIALS - 4.0% | ||||||||||||
| CME Group, Inc. | 2,275 | $ | 554,349 | SOFTWARE & SERVICES - 11.7% | ||||||||
| IntercontinentalExchange, Inc.* | 805 | 97,043 | Accenture PLC - Class A | 2,130 | $ | 113,380 | ||||||
| T. Rowe Price Group, Inc. | 1,690 | 96,246 | Akamai Technologies, Inc.* | 3,085 | 99,584 | |||||||
| $ | 747,638 | Google, Inc. - Class A* | 1,175 | 758,932 | ||||||||
| Microsoft Corp. | 31,935 | 829,033 | ||||||||||
| ENERGY - 16.3% | Oracle Corp. | 15,855 | 406,681 | |||||||||
| Atwood Oceanics, Inc.* | 12,480 | $ | 496,579 | $ | 2,207,610 | |||||||
| Cameron International Corp.* | 5,065 | 249,147 | ||||||||||
| Diamond Offshore Drilling, Inc. | 1,395 | 77,088 | TECHNOLOGY HARDWARE & EQUIPMENT - 7.9% | |||||||||
| Helmerich & Payne, Inc. | 8,955 | 522,614 | Apple, Inc.* | 240 | $ | 97,200 | ||||||
| Murphy Oil Corp. | 10,425 | 581,089 | Cisco Systems, Inc. | 40,450 | 731,336 | |||||||
| National Oilwell Varco, Inc. | 8,735 | 593,893 | Cognizant Technology Solutions Corp. - Class A* | 1,395 | 89,712 | |||||||
| Noble Corp.* | 15,930 | 481,405 | Western Digital Corp.* | 18,865 | 583,872 | |||||||
| Schlumberger, Ltd. | 1,250 | 85,387 | $ | 1,502,120 | ||||||||
| $ | 3,087,202 | |||||||||||
| TRANSPORTATION - 3.0% | ||||||||||||
| FOOD & STAPLES RETAILING - 3.2% | Kirby Corp.* | 8,660 | $ | 570,174 | ||||||||
| Walgreen Co. | 18,500 | $ | 611,610 | |||||||||
| TOTAL EQUITY INTERESTS - 98.4% | ||||||||||||
| FOOD, BEVERAGE & TOBACCO - 2.0% | (identified cost, $19,546,427) | $ | 18,612,791 | |||||||||
| Brown-Forman Corp. - Class B | 1,180 | $ | 95,002 | |||||||||
| Coca-Cola Co. (The) | 3,965 | 277,431 | SHORT-TERM INVESTMENTS - 1.5% | |||||||||
| $ | 372,433 | Fidelity Government Money Market Fund, 0.01% (1) | 292,858 | $ | 292,858 | |||||||
| HEALTH CARE EQUIPMENT & SERVICES - 5.2% | TOTAL SHORT-TERM INVESTMENTS - 1.5% | |||||||||||
| Humana, Inc. | 6,825 | $ | 597,938 | (identified cost, $292,858) | $ | 292,858 | ||||||
| Stryker Corp. | 7,930 | 394,201 | ||||||||||
| $ | 992,139 | TOTAL INVESTMENTS — 99.9% | ||||||||||
| (identified cost, $19,839,285) | $ | 18,905,649 | ||||||||||
| INSURANCE - 10.8% | ||||||||||||
| Aflac, Inc. | 13,580 | $ | 587,471 | OTHER ASSETS, IN EXCESS OF LIABILITIES — 0.1% | 15,314 | |||||||
| Arch Capital Group, Ltd.* | 14,975 | 557,519 | ||||||||||
| PartnerRe, Ltd. | 6,825 | 438,233 | NET ASSETS — 100.0% | $ | 18,920,963 | |||||||
| RenaissanceRe Holdings, Ltd. | 6,315 | 469,647 | ||||||||||
| $ | 2,052,870 | PLC — Public Limited Company | ||||||||||
| * Non-income producing security. | ||||||||||||
| MATERIALS - 3.8% | (1) Variable rate security. Rate presented is as of December 31, 2011. | |||||||||||
| CF Industries Holdings, Inc. | 1,400 | $ | 202,972 | |||||||||
| Freeport-McMoRan Copper & Gold, Inc. | 10,865 | 399,723 | ||||||||||
| Monsanto Co. | 1,540 | 107,908 | ||||||||||
| $ | 710,603 | |||||||||||
| See Notes to Financial Statements. | 27 | |
Wright Major Blue Chip Equities Fund (WMBC)
| STATEMENT OF OPERATIONS | ||||||||||||||
| As of December 31, 2011 | For the Year Ended December 31, 2011 | |||||||||||||
| ASSETS: | INVESTMENT INCOME (Note 1C) | |||||||||||||
| Investments, at value | 0 | Dividend income | $ | 258,102 | ||||||||||
| (identified cost $19,839,285) (Note 1A) | $ | 18,905,649 | Total investment income | $ | 258,102 | |||||||||
| Receivable for fund shares sold | 2,334 | |||||||||||||
| Dividends receivable | 10,116 | Expenses – | ||||||||||||
| Prepaid expenses and other assets | 14,815 | Investment adviser fee (Note 3) | $ | 117,907 | ||||||||||
| Total assets | $ | 18,932,914 | Administrator fee (Note 3) | 23,582 | ||||||||||
| Trustee expense (Note 3) | 14,523 | |||||||||||||
| LIABILITIES: | Custodian fee | 5,000 | ||||||||||||
| Accrued expenses and other liabilities | $ | 11,951 | Accountant fee | 37,554 | ||||||||||
| Total liabilities | $ | 11,951 | Distribution expenses (Note 4) | 49,128 | ||||||||||
| NET ASSETS | $ | 18,920,963 | Transfer agent fee | 31,434 | ||||||||||
| Printing | 88 | |||||||||||||
| NET ASSETS CONSIST OF: | Shareholder communications | 6,157 | ||||||||||||
| Paid-in capital | $ | 25,078,622 | Audit services | 17,252 | ||||||||||
| Accumulated net realized loss on investments | (5,224,023 | ) | Legal services | 682 | ||||||||||
| Unrealized depreciation on investments | (933,636 | ) | Compliance services | 812 | ||||||||||
| Net assets applicable to outstanding shares | $ | 18,920,963 | Registration costs | 19,172 | ||||||||||
| Interest expense (Note 8) | 1,164 | |||||||||||||
| SHARES OF BENEFICIAL INTEREST OUTSTANDING AT $0.000 PAR VALUE (UNLIMITED SHARES AUTHORIZED) | 1,543,767 | Miscellaneous | 9,633 | |||||||||||
| Total expenses | $ | 334,088 | ||||||||||||
| NET ASSET VALUE, OFFERING PRICE, AND REDEMPTION PRICE PER SHARE OF BENEFICIAL INTEREST | $ | 12.26 | ||||||||||||
| Deduct – | ||||||||||||||
| Waiver and/or reimbursement by the principal underwriter and/or investment adviser (Note 4) | $ | (57,809 | ) | |||||||||||
| Net expenses | $ | 276,279 | ||||||||||||
| Net investment loss | $ | (18,177 | ) | |||||||||||
| REALIZED AND UNREALIZED GAIN (LOSS) ON INVESTMENTS: | ||||||||||||||
| Net realized gain on investment transactions | $ | 2,830,519 | ||||||||||||
| Net change in unrealized appreciation (depreciation) on investments | (2,666,829 | ) | ||||||||||||
| Net realized and unrealized gain on investments | $ | 163,690 | ||||||||||||
| Net increase in net assets from operations | $ | 145,513 | ||||||||||||
| See Notes to Financial Statements. | 28 | |
Wright Major Blue Chip Equities Fund (WMBC)
| Years Ended | ||||||||||
| STATEMENTS OF CHANGES IN NET ASSETS | December 31, 2011 | December 31, 2010 | ||||||||
| INCREASE (DECREASE) IN NET ASSETS: | ||||||||||
From operations – | ||||||||||
| Net investment income (loss) | $ | (18,177 | ) | $ | 92,781 | |||||
| 0 | Net realized gain on investment transactions | 2,830,519 | 1,024,058 | |||||||
| Net change in unrealized appreciation (depreciation) on investments | (2,666,829 | ) | 1,503,779 | |||||||
| Net increase in net assets from operations | $ | 145,513 | $ | 2,620,618 | ||||||
| Distributions to shareholders (Note 2) | ||||||||||
| From net investment income | $ | - | $ | (94,651 | ) | |||||
| Total distributions | $ | - | $ | (94,651 | ) | |||||
| Net decrease in net assets resulting from fund share transactions (Note 6) | $ | (2,900,561 | ) | $ | (8,187,311 | ) | ||||
| Net decrease in net assets | $ | (2,755,048 | ) | $ | (5,661,344 | ) | ||||
| NET ASSETS: | ||||||||||
| At beginning of year | 21,676,011 | 27,337,355 | ||||||||
| At end of year | $ | 18,920,963 | $ | 21,676,011 | ||||||
| See Notes to Financial Statements. | 29 | |
Wright Major Blue Chip Equities Fund (WMBC)
| These financial highlights reflect selected data for a share outstanding throughout each year. | ||||||||||||||||||
| Years Ended December 31, | ||||||||||||||||||
| 2011 | 2010 | 2009 | 2008 | 2007 | ||||||||||||||
| Net asset value, beginning of year | $ | 12.250 | $ | 10.870 | $ | 9.340 | $ | 14.520 | $ | 13.790 | ||||||||
| Income (loss) from investment operations: | ||||||||||||||||||
Net investment income (loss) (1) | (0.012 | ) | 0.044 | 0.099 | 0.104 | 0.091 | ||||||||||||
| Net realized and unrealized gain (loss) | 0.022 | 1.389 | 1.564 | (5.169 | ) | 0.728 | ||||||||||||
| Total income (loss) from investment operations | 0.010 | 1.433 | 1.663 | (5.065 | ) | 0.819 | ||||||||||||
| Less distributions: | ||||||||||||||||||
| From net investment income | — | (0.053 | ) | (0.133 | ) | (0.115 | ) | (0.089 | ) | |||||||||
| Net asset value, end of year | $ | 12.260 | $ | 12.250 | $ | 10.870 | $ | 9.340 | $ | 14.520 | ||||||||
Total Return(2) | 0.08 | % | 13.19 | % | 17.83 | % | (34.85 | )% | 5.96 | % | ||||||||
Ratios/Supplemental Data(3): | ||||||||||||||||||
| Net assets, end of year (000 omitted) | $18,921 | $21,676 | $27,337 | $32,484 | $57,750 | |||||||||||||
| Ratios (As a percentage of average daily net assets): | ||||||||||||||||||
| Net expenses | 1.40 | % | 1.41 | % | 1.36 | % | 1.26 | % | 1.26 | % | ||||||||
| Net expenses after custodian fee reduction | N/A | N/A | 1.36 | % | 1.25 | % | 1.25 | % | ||||||||||
| Net investment income (loss) | (0.09 | )% | 0.39 | % | 1.06 | % | 0.86 | % | 0.63 | % | ||||||||
| Portfolio turnover rate | 154 | % | 68 | % | 69 | % | 58 | % | 55 | % | ||||||||
| (1) | Computed using average shares outstanding. | |||||||||||||||||
| (2) | Total return is calculated assuming a purchase at the net asset value on the first day and a sale at the net asset value on the last day of each year reported. Dividends and distributions, if any, are assumed to be reinvested at the net asset value on the reinvestment date. | |||||||||||||||||
| (3) | For each of the years presented, the operating expenses of the Fund were reduced by a waiver of fees and/or allocation of expenses to the principal underwriter and/or investment adviser. Had such action not been undertaken, expenses and net investment income (loss) ratios would have been as follows: | |||||||||||||||||
| 2011 | 2010 | 2009 | 2008 | 2007 | ||||||||||||||
| Ratios (As a percentage of average daily net assets): | ||||||||||||||||||
| Expenses | 1.70 | % | 1.68 | % | 1.55 | % | 1.37 | % | 1.28 | % | ||||||||
| Expenses after custodian fee reduction | N/A | N/A | 1.55 | % | 1.36 | % | 1.27 | % | ||||||||||
| Net investment income (loss) | (0.39 | )% | 0.13 | % | 0.86 | % | 0.75 | % | 0.61 | % | ||||||||
| See Notes to Financial Statements. | 30 | |
Wright International Blue Chip Equities Fund (WIBC)
Portfolio of Investments – As of December 31, 2011
| Shares | Value | Shares | Value | |||||||||
| GERMANY - 7.7% | ||||||||||||
| Adidas AG | 3,023 | $ | 197,801 | |||||||||
| AUSTRALIA - 5.2% | Allianz SE | 1,481 | 142,096 | |||||||||
| Australia & New Zealand Banking Group, Ltd. | 7,702 | $ | 162,107 | BASF SE | 14,303 | 995,865 | ||||||
| Commonwealth Bank of Australia | 10,549 | 532,306 | Bayer AG | 4,335 | 277,997 | |||||||
| Incitec Pivot, Ltd. | 75,548 | 240,875 | Bayerische Motoren Werke AG | 1,771 | 118,503 | |||||||
| Rio Tinto, Ltd. | 11,353 | 701,838 | Henkel AG & Co. KGaA (Preferred Stock), 0.72% | 2,466 | 142,839 | |||||||
| Westpac Banking Corp. | 6,507 | 133,420 | Infineon Technologies AG | 25,491 | 191,929 | |||||||
| $ | 1,770,546 | Muenchener Rueckversicherungs AG - Class R | 1,124 | 138,024 | ||||||||
| Siemens AG | 1,739 | 166,679 | ||||||||||
| BELGIUM - 1.4% | Volkswagen AG | 2,108 | 282,596 | |||||||||
| Delhaize Group SA | 8,290 | $ | 467,110 | $ | 2,654,329 | |||||||
| BRAZIL - 1.0% | HONG KONG - 4.1% | |||||||||||
| Cia de Bebidas das Americas, ADR | 9,319 | $ | 336,323 | ASM Pacific Technology, Ltd. | 10,300 | $ | 115,578 | |||||
| Cheung Kong Holdings, Ltd. | 45,000 | 535,369 | ||||||||||
| CANADA - 8.4% | Guangdong Investment, Ltd. | 167,500 | 101,579 | |||||||||
| Agrium, Inc. | 5,932 | $ | 398,360 | Techtronic Industries Co. | 84,000 | 86,416 | ||||||
| Bank of Nova Scotia | 6,671 | 333,010 | Yue Yuen Industrial Holdings, Ltd. | 174,000 | 550,009 | |||||||
| Canadian National Railway Co. | 3,248 | 255,661 | $ | 1,388,951 | ||||||||
| Canadian Natural Resources, Ltd. | 5,486 | 205,012 | ||||||||||
| CGI Group, Inc. - Class A* | 17,916 | 337,822 | ITALY - 3.0% | |||||||||
| First Quantum Minerals, Ltd. | 10,783 | 212,324 | Enel SpA | 108,355 | $ | 442,238 | ||||||
| Teck Resources, Ltd. - Class B | 6,609 | 233,076 | ENI SpA (Azioni Ordinarie) | 27,741 | 576,552 | |||||||
| Toronto-Dominion Bank (The) | 11,968 | 896,674 | $ | 1,018,790 | ||||||||
| $ | 2,871,939 | |||||||||||
| JAPAN - 15.1% | ||||||||||||
| CHINA - 3.7% | Brother Industries, Ltd. | 13,200 | $ | 162,126 | ||||||||
| Baidu, Inc., ADR* | 4,302 | $ | 501,054 | Daito Trust Construction Co., Ltd. | 6,300 | 540,421 | ||||||
| China Petroleum & Chemical Corp., ADR | 2,079 | 218,399 | Fast Retailing Co., Ltd. | 600 | 109,176 | |||||||
| China Railway Construction Corp., Ltd. - Class H | 261,500 | 144,107 | ITOCHU Corp. | 68,800 | 699,267 | |||||||
| CNOOC, Ltd., ADR | 1,029 | 179,746 | KDDI Corp. | 47 | 302,379 | |||||||
| ENN Energy Holdings, Ltd. | 34,000 | 109,005 | Marubeni Corp. | 14,000 | 85,339 | |||||||
| Xinyi Glass Holdings, Ltd. | 222,000 | 127,484 | Mitsubishi Corp. | 23,000 | 464,843 | |||||||
| $ | 1,279,795 | Mitsui & Co., Ltd. | 23,700 | 368,715 | ||||||||
| Nippon Electric Glass Co., Ltd. | 24,000 | 237,692 | ||||||||||
| DENMARK - 0.5% | Nippon Telegraph & Telephone Corp. | 7,500 | 383,578 | |||||||||
| AP Moeller - Maersk A/S - Class B | 27 | $ | 178,826 | ORIX Corp. | 1,330 | 109,940 | ||||||
| Sumitomo Corp. | 65,900 | 892,485 | ||||||||||
| FINLAND - 0.7% | Yamada Denki Co., Ltd. | 11,810 | 804,320 | |||||||||
| Nokian Renkaat OYJ | 4,134 | $ | 133,520 | $ | 5,160,281 | |||||||
| Sampo OYJ - Class A | 4,051 | 100,811 | ||||||||||
| $ | 234,331 | NETHERLANDS - 2.2% | ||||||||||
| Aegon NV* | 25,562 | $ | 102,902 | |||||||||
| FRANCE - 8.6% | Fugro NV, ADR | 4,772 | 278,114 | |||||||||
| Alstom SA | 5,512 | $ | 167,651 | Koninklijke Boskalis Westminster NV | 10,528 | 388,004 | ||||||
| BNP Paribas SA | 12,262 | 483,109 | $ | 769,020 | ||||||||
| Cie Generale des Etablissements Michelin - Class B | 4,890 | 289,943 | ||||||||||
| France Telecom SA | 7,704 | 121,361 | NORWAY - 1.7% | |||||||||
| PPR | 1,441 | 206,986 | Telenor ASA | 30,095 | $ | 494,696 | ||||||
| Sanofi | 11,660 | 858,992 | Yara International ASA | 2,332 | 93,781 | |||||||
| Schneider Electric SA | 1,911 | 100,918 | $ | 588,477 | ||||||||
| Societe Generale SA | 5,550 | 123,957 | ||||||||||
| Technip SA | 1,345 | 126,795 | SINGAPORE - 1.0% | |||||||||
| Total SA | 9,348 | 479,337 | Jardine Cycle & Carriage, Ltd. | 9,000 | $ | 333,999 | ||||||
| $ | 2,959,049 | |||||||||||
| See Notes to Financial Statements. | 31 | |
Wright International Blue Chip Equities Fund (WIBC)
Portfolio of Investments – As of December 31, 2011
Wright International Blue Chip Equities Fund (WIBC)
Wright International Blue Chip Equities Fund (WIBC)
Wright International Blue Chip Equities Fund (WIBC)
36
| Shares | Value | ADR — American Depository Receipt | ||||||||||
| PLC — Public Limited Company | ||||||||||||
| SPAIN - 3.0% | ||||||||||||
| Banco Santander SA | 59,034 | $ | 449,847 | * | Non-income producing security. | |||||||
| Repsol YPF SA | 6,110 | 188,259 | (1) | Security fair valued in accordance with procedures adopted by the Board of Trustees. At year end, the value of these securities amounted | ||||||||
| Telefonica SA | 21,914 | 380,772 | to $16,120 or 0.0% of net assets. | |||||||||
| $ | 1,018,878 | |||||||||||
| SWEDEN - 1.7% | ||||||||||||
| Getinge AB - Class B | 11,048 | $ | 281,063 | |||||||||
| Skanska AB - Class B | 7,414 | 123,291 | ||||||||||
| Tele2 AB - Class B | 9,334 | 182,315 | ||||||||||
| $ | 586,669 | |||||||||||
| SWITZERLAND - 8.7% | ||||||||||||
| Nestle SA | 28,792 | $ | 1,662,676 | |||||||||
| Novartis AG | 7,197 | 413,302 | ||||||||||
| Swatch Group AG (The) | 1,190 | 447,316 | ||||||||||
| Zurich Financial Services AG (Inhaberktie)* | 2,067 | 469,722 | ||||||||||
| $ | 2,993,016 | |||||||||||
| UNITED KINGDOM - 21.3% | ||||||||||||
| Anglo American PLC | 4,873 | $ | 180,165 | |||||||||
| AstraZeneca PLC | 23,187 | 1,072,039 | ||||||||||
| Aviva PLC | 31,267 | 146,165 | ||||||||||
| Balfour Beatty PLC | 32,705 | 134,590 | ||||||||||
| Barclays PLC (Ordinary) | 84,173 | 230,297 | ||||||||||
| BG Group PLC | 25,527 | 546,079 | ||||||||||
| BHP Billiton PLC | 22,194 | 647,582 | ||||||||||
| BP PLC | 85,349 | 610,811 | ||||||||||
| Centrica PLC | 62,009 | 278,793 | ||||||||||
| Ensco PLC, ADR | 3,940 | 184,865 | ||||||||||
| Eurasian Natural Resources Corp. PLC | 37,041 | 365,828 | ||||||||||
| GlaxoSmithKline PLC | 8,248 | 188,620 | ||||||||||
| Legal & General Group PLC | 477,360 | 762,638 | ||||||||||
| Rio Tinto PLC | 3,667 | 178,090 | ||||||||||
| Rolls-Royce Holdings PLC* | 23,720 | 275,184 | ||||||||||
| Rolls-Royce Holdings PLC – Class C* (1) | 1,673,043 | 16,120 | ||||||||||
| Royal Dutch Shell PLC - Class B | 7,484 | 285,422 | ||||||||||
| Standard Chartered PLC | 5,393 | 118,092 | ||||||||||
| Vodafone Group PLC | 268,932 | 747,708 | ||||||||||
| WPP PLC | 12,495 | 131,172 | ||||||||||
| Xstrata PLC | 12,402 | 188,499 | ||||||||||
| $ | 7,288,759 | |||||||||||
| UNITED STATES - 0.7% | ||||||||||||
| BlackRock, Inc. | 814 | $ | 145,087 | |||||||||
| Cognizant Technology Solutions Corp. - Class A* | 1,764 | 113,443 | ||||||||||
| $ | 258,530 | |||||||||||
| TOTAL EQUITY INTERESTS - 99.7% | ||||||||||||
| (identified cost, $33,263,847) | $ | 34,157,618 | ||||||||||
| TOTAL INVESTMENTS — 99.7% | ||||||||||||
| (identified cost, $33,263,847) | $ | 34,157,618 | ||||||||||
| OTHER ASSETS, IN EXCESS OF LIABILITIES — 0.3% | 91,979 | |||||||||||
| NET ASSETS — 100.0% | $ | 34,249,597 | ||||||||||
| See Notes to Financial Statements. | 32 | |
Wright International Blue Chip Equities Fund (WIBC)
| As of December 31, 2011 | For the Year Ended December 31, 2011 | |||||||||||||
| ASSETS: | INVESTMENT INCOME (Note 1C) | |||||||||||||
| Investments, at value | 0 | Dividend income (net of foreign taxes $193,976) | $ | 1,378,227 | ||||||||||
| (identified cost $33,263,847) (Note 1A) | $ | 34,157,618 | Income from securities lending (net) | 36,130 | ||||||||||
| Foreign currency, at value | Total investment income | $ | 1,414,357 | |||||||||||
| (identified cost $789) (Note 1A) | 789 | |||||||||||||
| Receivable for fund shares sold | 27,439 | Expenses – | ||||||||||||
| Dividends receivable | 36,113 | Investment adviser fee (Note 3) | $ | 338,656 | ||||||||||
| Tax reclaims receivable | 92,498 | Administrator fee (Note 3) | 71,964 | |||||||||||
| Prepaid expenses and other assets | 16,745 | Trustee expense (Note 3) | 14,671 | |||||||||||
| Total assets | $ | 34,331,202 | Custodian fee | 39,082 | ||||||||||
| Accountant fee | 63,350 | |||||||||||||
| LIABILITIES: | Distribution expenses (Note 4) | 105,829 | ||||||||||||
| Outstanding line of credit (Note 8) | $ | 51,727 | Transfer agent fee | 53,957 | ||||||||||
| Payable for fund shares reacquired | 8,164 | Printing | 191 | |||||||||||
| Accrued expenses and other liabilities | 21,714 | Shareholder communications | 7,754 | |||||||||||
| Total liabilities | $ | 81,605 | Audit services | 17,570 | ||||||||||
| NET ASSETS | $ | 34,249,597 | Legal services | 1,496 | ||||||||||
| Compliance services | 891 | |||||||||||||
| NET ASSETS CONSIST OF: | Registration costs | 19,000 | ||||||||||||
| Paid-in capital | $ | 86,191,554 | Interest expense (Note 8) | 2,159 | ||||||||||
| Accumulated net realized loss on investments and foreign currency | (52,876,311 | ) | Miscellaneous | 18,731 | ||||||||||
| Undistributed net investment income | 37,004 | Total expenses | $ | 755,301 | ||||||||||
| Unrealized appreciation on investments and foreign currency | 897,350 | |||||||||||||
| Net assets applicable to outstanding shares | $ | 34,249,597 | Net investment income | $ | 659,056 | |||||||||
| SHARES OF BENEFICIAL INTEREST OUTSTANDING AT $0.000 PAR VALUE (UNLIMITED SHARES AUTHORIZED) | 2,722,816 | REALIZED AND UNREALIZED GAIN (LOSS) ON INVESTMENTS AND FOREIGN CURRENCY: | ||||||||||||
| Net realized gain (loss) – | ||||||||||||||
| NET ASSET VALUE, OFFERING PRICE, AND REDEMPTION PRICE PER SHARE OF BENEFICIAL INTEREST | $ | 12.58 | Investment transactions | $ | 1,683,976 | |||||||||
| Foreign currency transactions | (20,918 | ) | ||||||||||||
| Net realized gain | $ | 1,663,058 | ||||||||||||
| Change in unrealized appreciation (depreciation) – | ||||||||||||||
| Investments | $ | (7,908,777 | ) | |||||||||||
| Foreign currency translations | (17,730 | ) | ||||||||||||
| Net change in unrealized appreciation (depreciation) on investments | $ | (7,926,507 | ) | |||||||||||
| Net realized and unrealized loss on investments and foreign currency translations | $ | (6,263,449 | ) | |||||||||||
| Net decrease in net assets from operations | $ | (5,604,393 | ) | |||||||||||
| See Notes to Financial Statements. | 33 | |
| Years Ended | |||||||||||
| STATEMENTS OF CHANGES IN NET ASSETS | December 31, 2011 | December 31, 2010 | |||||||||
| INCREASE (DECREASE) IN NET ASSETS: | |||||||||||
From operations – | |||||||||||
| Net investment income | $ | 659,056 | $ | 697,013 | |||||||
| Net realized gain on investment and foreign currency transactions | 1,663,058 | 1,142,339 | |||||||||
| Net change in unrealized appreciation (depreciation) on investments and foreign currency translations | (7,926,507 | ) | (507,476 | ) | |||||||
| Net increase (decrease) in net assets from operations | $ | (5,604,393 | ) | $ | 1,331,876 | ||||||
| Distributions to shareholders (Note 2) | |||||||||||
| From net investment income | $ | (683,131 | ) | $ | (1,672,543 | ) | |||||
| Total distributions | $ | (683,131 | ) | $ | (1,672,543 | ) | |||||
| Net decrease in net assets resulting from fund share transactions (Note 6) | $ | (9,456,804 | ) | $ | (18,504,338 | ) | |||||
| Net decrease in net assets | $ | (15,744,328 | ) | $ | (18,845,005 | ) | |||||
| NET ASSETS: | |||||||||||
| At beginning of year | 49,993,925 | 68,838,930 | |||||||||
| At end of year | $ | 34,249,597 | $ | 49,993,925 | |||||||
| UNDISTRIBUTED NET INVESTMENT INCOME INCLUDED IN NET ASSETS AT END OF YEAR | $ | 37,004 | $ | 1,556 | |||||||
| See Notes to Financial Statements. | 34 | |
| These financial highlights reflect selected data for a share outstanding throughout each year. | |||||||||||||||||||
| Years Ended December 31, | |||||||||||||||||||
| 2011 | 2010 | 2009 | 2008 | 2007 | |||||||||||||||
| Net asset value, beginning of year | $ | 14.860 | $ | 14.460 | $ | 10.810 | $ | 22.470 | $ | 22.830 | |||||||||
| Income (loss) from investment operations: | |||||||||||||||||||
Net investment income (1) | 0.224 | 0.170 | 0.208 | 0.483 | 0.434 | ||||||||||||||
| Net realized and unrealized gain (loss) | (2.256 | ) | 0.640 | 3.442 | (11.002 | ) | 0.755 | ||||||||||||
| Total income (loss) from investment operations | (2.032 | ) | 0.810 | 3.650 | (10.519 | ) | 1.189 | ||||||||||||
| Less distributions: | |||||||||||||||||||
| From net investment income | (0.248 | ) | (0.410 | ) | — | (0.575 | ) | (0.491 | ) | ||||||||||
| From net realized gains | — | — | — | (0.558 | ) | (1.058 | ) | ||||||||||||
| Tax return of capital | — | — | — | (0.008 | ) | — | |||||||||||||
| Total distributions | (0.248 | ) | (0.410 | ) | — | (1.141 | ) | (1.549 | ) | ||||||||||
Redemption Fees(1) | — | (2) | — | (2) | — | — | — | ||||||||||||
| # | |||||||||||||||||||
| Net asset value, end of year | $ | 12.580 | $ | 14.860 | $ | 14.460 | $ | 10.810 | $ | 22.470 | |||||||||
Total Return(3) | 13.65 | )% | 5.76 | % | 33.77 | % | (47.74 | )% | 5.50 | % | |||||||||
Ratios/Supplemental Data(4): | |||||||||||||||||||
| Net assets, end of year (000 omitted) | $34,250 | $49,994 | $68,839 | $67,146 | $183,608 | ||||||||||||||
| Ratios (As a percentage of average daily net assets): | |||||||||||||||||||
| Net expenses | 1.78 | % | 1.74 | % | 1.63 | % | 1.54 | % | 1.49 | % | |||||||||
| Net expenses after custodian fee reduction | N/A | N/A | 1.63 | % | 1.53 | % | 1.47 | % | |||||||||||
| Net investment income | 1.56 | % | 1.23 | % | 1.75 | % | 2.71 | % | 1.82 | % | |||||||||
| Portfolio turnover rate | 50 | % | 2 | % | 63 | % | 82 | % | 138 | % | |||||||||
| (1) | Computed using average shares outstanding. | ||||||||||||||||||
| (2) | Less than $0.001 per share. | ||||||||||||||||||
| (3) | Total return is calculated assuming a purchase at the net asset value on the first day and a sale at the net asset value on the last day of each year reported. Dividends and distributions, if any, are assumed to be reinvested at the net asset value on the reinvestment date. | ||||||||||||||||||
| (4) | For the year ended December 31, 2010, the operating expenses of the Fund were reduced by a waiver of fees and/or allocation of expenses to the principal underwriter and/or investment adviser. Had such action not been undertaken, expenses and net investment income ratios would have been as follows: | ||||||||||||||||||
| 2010 | |||||||||||||||||||
| Ratios (As a percentage of average daily net assets): | |||||||||||||||||||
| Gross expenses | 1.76 | % | |||||||||||||||||
| Net investment income | 1.22 | % | |||||||||||||||||
| See Notes to Financial Statements. | 35 | |
The Wright Managed Equity Trust
Notes to Financial Statements
1. Significant Accounting Policies
Wright Selected Blue Chip Equities Fund (“WSBC”), Wright Major Blue Chip Equities Fund (“WMBC”), and Wright International Blue Chip Equities Fund (“WIBC”) (each a “Fund” and collectively, the “Funds”) (the Funds constituting Wright Managed Equity Trust (the “Trust”)), is registered under the Investment Company Act of 1940, as amended (the “1940 Act”), as a diversified, open-end management investment company. The Funds seek to provide total return consisting of price appreciation and current income.
The following is a summary of significant accounting policies consistently followed by the Trust in the preparation of its financial statements. The policies are in conformity with accounting principles generally accepted in the United States of America (“GAAP”).
A. Investment Valuations – Equity securities listed on a U.S. securities exchange generally are valued at the last sale price on the day of valuation or, if no sales took place on such date, at the mean between the closing bid and asked prices therefore on the exchange where such securities are principally traded. Equity securities listed on the NASDAQ Global or Global Select Market generally are valued at the NASDAQ official closing price. Unlisted or listed securities for which closing sales prices or closing quotations are not available are valued at the mean between the latest available bid and asked prices or, in the case of preferred equity securities that are not listed or traded in the over-the-counter market, by a third party pricing service. Investments in open-end mutual funds are valued at net asset value. Short-term debt securities with a remaining maturity of sixty days or less are generally valued at amortized cost, which approximates market value. If short-term debt securities are acquired with a remaining maturity of more than sixty days, they will be valued by a third party pricing service. Foreign securities and currencies are valued in U.S. dollars, based on foreign currency exchange rate quotations supplied by a third party pricing service. The daily valuation of exchange-traded foreign securities generally is determined as of the close of trading on the principal exchange on which such securities trade. Events occurring after the close of trading on foreign exchanges are monitored by the investment adviser and may result in adjustments to the valuation of foreign securities to more accurately reflect their fair value as of the close of regular trading on the New York Stock Exchange. Investments for which valuations or market quotations are not readily available or are deemed unreliable are valued at fair value using methods determined in good faith by or at the direction of the Trustees of the Funds in a manner that most fairly reflects the security’s value, or the amount that the Funds might reasonably expect to receive for the security upon its current sale in the ordinary course. Each such determination is based on a consideration of all relevant factors, which are likely to vary from one pricing context to another. These factors may include, but are not limited to, the type of security, the existence of any contractual restrictions on the security’s disposition, the price and extent of public trading in similar securities of the issuer or of comparable companies, quotations or relevant information obtained from broker-dealers or other market participants, information obtained from the issuer, analysts, and/or the appropriate stock exchange (for exchange-traded securities), an analysis of the company’s financial condition, and an evaluation of the forces that influence the issuer and the market(s) in which the security is purchased and sold.
B. Investment Transactions – Investment transactions for financial statement purposes are accounted for on a trade date basis. Realized gains and losses on investments sold are determined on the basis of identified cost.
C. Income – Dividend income is recorded on the ex-dividend date. However, if the ex-dividend date has passed, certain dividends from foreign securities are recorded as the Funds are informed of the ex-dividend date. Withholding taxes on foreign dividends and capital gains have been provided for in accordance with the Funds’ understanding of applicable countries’ tax rules and rates. Interest income is recorded on the basis of interest accrued, adjusted for amortization of premium and accretion of discount.
D. Federal Taxes – Each Fund’s policy is to comply with the provisions of the Internal Revenue Code (the “Code”) applicable to regulated investment companies and to distribute to shareholders each year substantially all of its taxable income and all or substantially all of its net realized capital gains. Accordingly, no provision for federal income or excise tax is necessary. Foreign taxes are provided for based on WIBC’s understanding of the tax rules and rates that exist in the foreign markets in which it invests. At December 31,
36
The Wright Managed Equity Trust
Notes to Financial Statements
2011, WMBC and WIBC, for federal income tax purposes, had capital loss carryforwards of $5,140,711 and $52,085,864, respectively, which will reduce each Fund’s taxable income arising from future net realized gain on investment transactions, if any, to the extent permitted by the Code, and thus will reduce the amount of the distributions to shareholders, which would otherwise be necessary to relieve the Funds of any liability for federal income or excise tax. Pursuant to the Code, such capital loss carryovers will expire as follows:
2011, WMBC and WIBC, for federal income tax purposes, had capital loss carryforwards of $5,140,711 and $52,085,864, respectively, which will reduce each Fund’s taxable income arising from future net realized gain on investment transactions, if any, to the extent permitted by the Code, and thus will reduce the amount of the distributions to shareholders, which would otherwise be necessary to relieve the Funds of any liability for federal income or excise tax. Pursuant to the Code, such capital loss carryovers will expire as follows:
| December 31, | WMBC | WIBC | |
| 2016 | $ 203,325 | $17,388,448 | |
| 2017 | 4,937,386 | 34,697,416 | |
As of December 31, 2011, the Funds had no uncertain tax positions that would require financial statement recognition, de-recognition, or disclosure. Each of the Funds’ federal tax returns filed in the 3-year period ended December 31, 2011, remains subject to examination by the Internal Revenue Service.
E. Expenses – The majority of expenses of the Trust are directly identifiable to an individual Fund. Expenses which are not readily identifiable to a specific Fund are allocated taking into consideration, among other things, the nature and type of expense and the relative size of the Funds.
F. Redemption Fees – A shareholder who redeems or exchanges shares of WIBC within 90 days of purchase will incur a redemption fee of 2.00% of the current net asset value of shares redeemed, subject to certain limitations. The fee is charged for the benefit of the remaining shareholders and will be paid to WIBC to help offset transaction costs. The fee is accounted for as an addition to paid-in capital. The Fund reserves the right to modify the terms of or terminate the fee at any time. There are limited exceptions to the imposition of the redemption fee.
G. Foreign Currency Translation – Investment valuations, other assets, and liabilities initially expressed in foreign currencies are translated each business day into U.S. dollars based upon current exchange rates. Purchases and sales of foreign investment securities and income and expenses denominated in foreign currencies are translated into U.S. dollars based upon currency exchange rates in effect on the respective dates of such transactions. Reported net realized foreign exchange gains or losses arise from sales of foreign currencies, currency gains or losses realized between the trade and settlement dates on securities transactions, and the difference between the amounts of dividends, interest and foreign withholding taxes recorded on the Funds’ books and the U.S. dollar equivalent of the amounts actually received or paid. That portion of unrealized gains and losses on investments that results from fluctuations in foreign currency exchange rates is not separately disclosed.
H. Use of Estimates – The preparation of financial statements in conformity with GAAP requires management to make estimates and assumptions that affect the reported amounts of assets and liabilities and disclosure of contingent assets and liabilities at the date of the financial statements and the reported amounts of income and expense during the reporting period. Actual results could differ from those estimates.
I. Indemnifications – Under each Fund’s organizational documents, its officers and Trustees may be indemnified against certain liabilities and expenses arising out of the performance of their duties to the Funds, and shareholders are indemnified against personal liability for the obligations of the Funds. Additionally, in the normal course of business, the Funds enter into agreements with service providers that may contain indemnification clauses. Each Fund’s maximum exposure under these arrangements is unknown as this would involve future claims that may be made against the Funds that have not yet occurred.
2. Distributions to Shareholders
It is the present policy of the Trust to make annual distributions of all or substantially all of the net investment income of the Funds and to distribute annually all or substantially all of the net realized capital gains (reduced by available capital loss carryforwards from prior years, if any) of the Funds. Distributions to shareholders are recorded on the ex-dividend date. Shareholders may reinvest income and capital gain distributions in additional shares of the same Fund at the net asset value as of the reinvestment date or, at the election of the
37
The Wright Managed Equity Trust
Notes to Financial Statements
shareholder, receive distributions in cash. The Funds distinguish between distributions on a tax basis and a financial reporting basis. GAAP requires that only distributions in excess of tax basis earnings and profits be reported in the financial statements as a return of capital. Permanent differences between book and tax accounting relating to distributions are reclassified to paid-in capital. For tax purposes, distributions from short-term capital gains are considered to be from ordinary income.
shareholder, receive distributions in cash. The Funds distinguish between distributions on a tax basis and a financial reporting basis. GAAP requires that only distributions in excess of tax basis earnings and profits be reported in the financial statements as a return of capital. Permanent differences between book and tax accounting relating to distributions are reclassified to paid-in capital. For tax purposes, distributions from short-term capital gains are considered to be from ordinary income.
The tax character of distributions paid for the year ended December 31, 2011, and December 31, 2010, was as follows:
| Year Ended 12/31/11 | WSBC | WMBC | WIBC | ||||||
| Distributions declared from: | |||||||||
| Ordinary income | $ | - | $ | - | $ | 683,131 |
| Year Ended 12/31/10 | WSBC | WMBC | WIBC | ||||||
| Distributions declared from: | |||||||||
| Ordinary income | $ | 17,380 | $ | 94,651 | $ | 1,672,543 |
During the year ended December 31, 2011, the following amounts were reclassified due to differences between book and tax accounting, primarily for net operating losses, foreign currency gain (loss), distributions from real estate investment trusts and passive foreign investment company transactions.
| Increase (decrease): | WSBC | WMBC | WIBC | |||||||||
| Paid-in capital | $ | (82,230 | ) | $ | (18,177 | ) | $ | - | ||||
| Accumulated net realized gain (loss) | 31,782 | - | (59,523 | ) | ||||||||
| Accumulated undistributed net investment income (loss) | 50,448 | 18,177 | 59,523 |
These reclassifications had no effect on the net assets or net asset value per share of the Funds.
As of December 31, 2011, the components of distributable earnings (accumulated losses) on a tax basis were as follows:
| WSBC | WMBC | WIBC | ||||||||||
| Undistributed ordinary income | $ | - | $ | - | $ | 42,290 | ||||||
| Undistributed long-term gain | 1,149,464 | - | - | |||||||||
| Capital loss carryforward and post October losses | - | (5,140,711 | ) | (52,085,864 | ) | |||||||
| Net unrealized appreciation (depreciation) | 2,474,335 | (1,016,948 | ) | 101,617 | ||||||||
| Total | $ | 3,623,799 | $ | (6,157,659 | ) | $ | (51,941,957 | ) |
The difference between components of distributable earnings (accumulated losses) on a tax basis and the amounts reflected in the Statements of Assets and Liabilities are primarily due to wash sales and passive foreign investment company transactions.
3. Investment Adviser Fee and Other Transactions with Affiliates
The investment adviser fee is earned by Wright Investor Services, Inc. (“Wright”) as compensation for investment advisory services rendered to the Funds. The fees are computed at annual rates of the Funds' average daily net assets as noted below, and are payable monthly.
38
The Wright Managed Equity Trust
Notes to Financial Statements
| Annual Advisory Fee Rates | |||||
| Fund | Under $100 Million | $100 Million to $250 Million | $250 Million to $500 Million | $500 Million to $1 Billion | Over $1 Billion |
| WSBC | 0.60% | 0.57% | 0.54% | 0.50% | 0.45% |
| WMBC | 0.60% | 0.57% | 0.54% | 0.50% | 0.45% |
| WIBC | 0.80% | 0.78% | 0.76% | 0.72% | 0.67% |
For the year ended December 31, 2011, the fee and the effective annual rate, as a percentage of average daily net assets for each of the Funds were as follows:
| Fund | Investment Adviser Fee | Effective Annual Rate |
| WSBC | $182,636 | 0.60% |
| WMBC | $117,907 | 0.60% |
| WIBC | $338,656 | 0.80% |
The administrator fee is earned by Wright for administering the business affairs of each Fund. The fee is computed at an annual rate of 0.17% of WIBC’s average daily net assets up to $100 million and 0.07% of average daily net assets over $100 million. The fee is computed at an annual rate of 0.12% of WSBC’s and WMBC’s average daily net assets up to $100 million and 0.07% of average daily net assets over $100 million. Atlantic Fund Administration, LLC (d/b/a Atlantic Fund Services) (“Atlantic”) serves as sub-administrator of the Funds to perform certain services of the administrator as may be agreed upon between the administrator and sub-administrator. The sub-administration fee is paid by Wright.
For the year ended December 31, 2011, the administrator fee for WSBC, WMBC and WIBC amounted to $36,527, $23,582 and $71,964, respectively.
Certain Trustees and officers of the Trust are Trustees or officers of the above organizations and/or of the Funds’ principal underwriter. Except as to Trustees of the Trust who are not employees of Atlantic or Wright, Trustees and officers receive remuneration for their services to the Trust out of the fees paid to Atlantic and Wright. The Trustees are compensated by the Trust in conjunction with the Wright Managed Income Trust, rather than on a per Trust or per Fund basis. Quarterly retainer fees are paid in the amount of $4,000 to the Lead Trustee, $3,500 to the Secretary of Independent Trustees, and $3,000 each to the remaining Trustees. In addition, each Trustee will be paid a fee of $1,500 for each regular Board meeting attended. Each Trustee is also reimbursed for all reasonable out-of-pocket expenses incurred in connection with his duties as a Trustee, including travel and related expenses incurred in attending Board meetings. The amount of Trustees’ fees attributable to each Fund is disclosed in each Fund’s Statement of Operations.
4. Distribution and Service Plans
The Trust has in effect a Distribution Plan (the “Plan”) pursuant to Rule 12b-1 of the 1940 Act. The Plan provides that each Fund will pay Wright Investors’ Service Distributors, Inc. (“WISDI”), the principal underwriter, a wholly-owned subsidiary of The Winthrop Corporation and an affiliate of Wright, a distribution fee of 0.25% of the average daily net assets of each Fund for distribution services and facilities provided to the Funds by WISDI. Distribution fees paid or accrued to WISDI for the year ended December 31, 2011, for WSBC, WMBC and WIBC were $76,098, $49,128 and $105,829, respectively. In addition, the Trustees have adopted a service plan (the “Service Plan”) which allows the Funds to reimburse the principal underwriter for payments to intermediaries for providing account administration and personal and account maintenance services to their customers who are beneficial owners of each Fund’s shares. The combined amount of service fees payable under the Service Plan and Rule 12b-1 distribution fees may not exceed 0.25% annually of each Fund’s average daily net assets. For the year ended December 31, 2011, the Funds did not accrue or pay any service fees.
Pursuant to an Expense Limitation Agreement, Wright and WISDI have agreed to waive all or a portion of
39
The Wright Managed Equity Trust
Notes to Financial Statements
their fees and reimburse expenses to the extent that total annual operating expenses exceed 1.40% of the average daily net assets of each of WSBC and WMBC and 1.85% of the average daily net assets of WIBC through April 30, 2012 (excluding interest, taxes, brokerage commissions, other expenditures which are capitalized in accordance with GAAP, and other extraordinary expenses not incurred in the ordinary course of the Fund’s business). Thereafter, the waiver and reimbursement may be changed or terminated at any time. Pursuant to this agreement, Wright waived and/or reimbursed investment adviser fees of $8,681 for WMBC. WISDI waived distribution fees of $17,976 and $49,128 for WSBC and WMBC, respectively.
5. Investment Transactions
Purchases and sales of investments, other than short-term obligations, were as follows:
| Year Ended December 31, 2011 | |||
| WSBC | WMBC | WIBC | |
| Purchases | $28,971,327 | $30,725,840 | $21,430,118 |
| Sales | $24,691,709 | $33,813,634 | $30,564,663 |
6. Shares of Beneficial Interest
The Declaration of Trust permits the Trustees to issue an unlimited number of full and fractional shares of beneficial interest (without par value). Transactions in Fund shares were as follows:
| Year Ended December 31, 2011 | Year Ended December 31, 2010 | ||||||||||||||||
| Shares | Amount | Shares | Amount | ||||||||||||||
| WSBC | |||||||||||||||||
| Sold | 1,217,920 | $ | 12,601,664 | 1,241,263 | $ | 12,152,747 | |||||||||||
| Issued to shareholders in payment of distributions declared | - | - | 1,655 | 14,572 | |||||||||||||
| Redemptions | (797,792 | ) | (8,104,855 | ) | (510,109 | ) | (4,640,440 | ) | |||||||||
| Net increase | 420,128 | $ | 4,496,809 | 732,809 | $ | 7,526,879 | |||||||||||
| 40543 | |||||||||||||||||
| Year Ended December 31, 2011 | Year Ended December 31, 2010 | ||||||||||||||||
| Shares | Amount | Shares | Amount | ||||||||||||||
| WMBC | |||||||||||||||||
| Sold | 265,696 | $ | 3,265,816 | 203,955 | $ | 2,262,037 | |||||||||||
| Issued to shareholders in payment of distributions declared | - | - | 6,975 | 84,020 | |||||||||||||
| Redemptions | (491,607 | ) | (6,166,377 | ) | (956,638 | ) | (10,533,368 | ) | |||||||||
| Net decrease | (225,911 | ) | $ | (2,900,561 | ) | (745,708 | ) | $ | (8,187,311 | ) | |||||||
40
The Wright Managed Equity Trust
Notes to Financial Statements
| Year Ended December 31, 2011 | Year Ended December 31, 2010 | ||||||||||||||
| Shares | Amount | Shares | Amount | ||||||||||||
| WIBC | |||||||||||||||
| Sold | 366,751 | $ | 5,165,522 | 444,936 | $ | 6,282,185 | |||||||||
| Issued to shareholders in payment of distributions declared | 48,799 | 606,608 | 89,482 | 1,264,509 | |||||||||||
| Redemptions | (1,056,710 | ) | (15,228,963 | ) | (1,930,614 | ) | (26,052,262 | ) | |||||||
| Redemption fees | - | 29 | - | 1,230 | |||||||||||
| Net decrease | (641,160 | ) | $ | (9,456,804 | ) | (1,396,196 | ) | $ | (18,504,338 | ) | |||||
7. Federal Income Tax Basis of Investments
The cost and unrealized appreciation (depreciation) of the investment securities owned at December 31, 2011, as computed on a federal income tax basis, were as follows:
| Year Ended December 31, 2011 | |||||||||
| WSBC | WMBC | WIBC | |||||||
| Aggregate cost | $ | 30,289,688 | $ | 19,922,597 | $ | 34,059,580 | |||
| Gross unrealized appreciation | $ | 4,459,668 | $ | 921,191 | $ | 4,174,972 | |||
| Gross unrealized depreciation | (1,985,333 | ) | (1,938,139 | ) | (4,076,934 | ) | |||
| Net unrealized appreciation (depreciation) | $ | 2,474,335 | $ | (1,016,948 | ) | $ | 98,038 | ||
8. Line of Credit
The Funds participate with other funds managed by Wright in a committed $10 million unsecured line of credit agreement with Union Bank of California, N.A. (“Union Bank”). The Funds may temporarily borrow from the line of credit to satisfy redemption requests or settle investment transactions. Interest is charged to each Fund based on its borrowings at an amount above the LIBOR rate. Because the line of credit is not available exclusively to each Fund, they may be unable to borrow some or all of the Funds’ requested amounts at any particular time. At December 31, 2011, WIBC had a balance outstanding pursuant to this line of credit of $51,727 at an interest rate of 1.30%.
The average borrowings and average interest rate (based on days with outstanding balances) for the year ended December 31, 2011, were as follows:
| WSBC | WMBC | WIBC | |
| Average borrowings | $685,047 | $202,248 | $350,155 |
| Average interest rate | 1.26% | 1.23% | 1.24% |
9. Risks Associated with Foreign Investments
Investing in securities issued by companies whose principal business activities are outside the United States may involve significant risks not present in domestic investments. For example, there is generally less publicly available information about foreign companies, particularly those not subject to the disclosure and reporting requirements of the U.S. securities laws. Certain foreign issuers are generally not bound by uniform accounting, auditing, and financial reporting requirements and standards of practice comparable to those applicable to domestic issuers. Investments in foreign securities also involve the risk of possible adverse
41
The Wright Managed Equity Trust
Notes to Financial Statements
changes in investment or exchange control regulations, expropriation or confiscatory taxation, limitation on the removal of funds or other assets of the Funds, political or financial instability or diplomatic and other developments which could affect such investments. Foreign stock markets, while growing in volume and sophistication, are generally not as developed as those in the United States, and securities of some foreign issuers (particularly those located in developing countries) may be less liquid and more volatile than securities of comparable U.S. companies. In general, there is less overall governmental supervision and regulation of foreign securities markets, broker-dealers and issuers than in the United States.
10. Securities Lending Agreement
WIBC has established a securities lending arrangement with Union Bank as securities lending agent in which WIBC lends portfolio securities to a broker in exchange for collateral consisting of cash in an amount at least equal to the market value of the securities on loan. Cash collateral may be invested in government securities. WIBC earns interest on the amount invested in the portfolio, but it must pay to or receive from a broker a rebate fee, depending on the securities loaned, computed as a varying percentage of the collateral received. The broker fee and interest income earned is offset by the broker rebate fees paid of $50,354 for the year ended December 31, 2011. In the event of counterparty default, WIBC is subject to potential loss if it is delayed or prevented from exercising its right to dispose of the collateral. WIBC bears risk in the event that invested collateral is not sufficient to meet obligations due on loans. WIBC has the right under the securities lending agreement to recover the securities from the borrower on demand. As of December 31, 2011, WIBC had no securities on loan.
11. Fair Value Measurements
Under GAAP for fair value measurements, a three-tier hierarchy to prioritize the assumptions, referred to as inputs, is used in valuation techniques to measure fair value. The three-tier hierarchy of inputs is summarized in the three broad levels listed below.
• Level 1 – quoted prices in active markets for identical investments
• Level 2 – other significant observable inputs (including quoted prices for similar investments, interest rates, prepayment speeds, credit risk, etc.)
• Level 3 – significant unobservable inputs (including a fund’s own assumptions in determining the fair value of investments)
The inputs or methodology used for valuing securities are not necessarily an indication of the risk associated with investing in those securities.
At December 31, 2011, the inputs used in valuing each Fund’s investments, which are carried at value, were as follows:
WSBC
| Asset Description | Quoted Prices in Active Markets for Identical Assets (Level 1) | Significant Other Observable Inputs (Level 2) | Significant Unobservable Inputs (Level 3) | Total | ||||
| Equity Interests | $ | 32,098,440 | $ | - | $ | - | $ | 32,098,440 |
| Short-Term Investments | - | 665,583 | - | 665,583 | ||||
| Total Investments | $ | 32,098,440 | $ | 665,583 | $ | - | $ | 32,764,023 |
42
The Wright Managed Equity Trust
Notes to Financial Statements
WMBC
Asset Description | Quoted Prices in Active Markets for Identical Assets (Level 1) | Significant Other Observable Inputs (Level 2) | Significant Unobservable Inputs (Level 3) | Total | ||||
| Equity Interests | $ | 18,612,791 | $ | - | $ | - | $ | 18,612,791 |
| Short-Term Investments | - | 292,858 | - | 292,858 | ||||
| Total Investments | $ | 18,612,791 | $ | 292,858 | $ | - | $ | 18,905,649 |
WIBC
Asset Description | Quoted Prices in Active Markets for Identical Assets (Level 1) | Significant Other Observable Inputs (Level 2) | Significant Unobservable Inputs (Level 3) | Total | ||||
| Equity Interests | $ | 34,141,498 | $ | - | $ | 16,120 | $ | 34,157,618 |
| Total Investments | $ | 34,141,498 | $ | - | $ | 16,120 | $ | 34,157,618 |
The Level 1 inputs displayed in these tables under Equity Interests are Common Stock and Preferred Stock. Refer to each Fund’s Portfolio of Investments for a further breakout of each security by type.
There were no significant transfers between Level 1 and Level 2 for the year ended December 31, 2011. The security identified below as a transfer into Level 3 represents shares that were received as a result of a corporate action.
The following is a reconciliation of Level 3 assets (at either the beginning or ending of the period) for WIBC for which significant unobservable inputs were used to determine fair value.
| Equity Interests | ||||||||
| Balance as of 12/31/10 | $ | - | ||||||
| Transfers In | 16,120 | |||||||
| Balance as of 12/31/11 | $ | 16,120 | ||||||
| Net change in unrealized appreciation from investments held as of 12/31/11 * | $ | 16,120 |
* The change in unrealized appreciation (depreciation) is included in net change in unrealized appreciation (depreciation) of investments in the accompanying Statement of Operations.
12. New Accounting Pronouncement
In May 2011, FASB issued ASU No. 2011-04 “Amendments to Achieve Common Fair Value Measurement and Disclosure Requirements in U.S. GAAP and IFRSs.” ASU No. 2011-04 establishes common requirements for measuring fair value and for disclosing information about fair value measurements in accordance with U.S. GAAP and International Financial Reporting Standards (“IFRSs”). ASU No. 2011-04 is effective for interim and annual periods beginning after December 15, 2011. Management is currently evaluating the impact ASU No. 2011-04 may have on financial statement disclosures.
13. Regulated Investment Company Modernization Act
The Regulated Investment Company Modernization Act of 2010 (the “Modernization Act”) was enacted on December 22, 2010. The Modernization Act makes changes to several of the federal income and excise tax
43

The Wright Managed Equity Trust
Notes to Financial Statements
provisions impacting each Fund. In general, the provisions of the Modernization Act are effective for the Funds' fiscal year ending December 31, 2011. The Modernization Act provides several benefits, including unlimited carryover on future capital losses, simplification provisions on asset diversification and/or qualifying income tests, and several provisions aimed at preserving the character of distributions made by a fiscal year regulated investment company.
14. Review for Subsequent Events
In connection with the preparation of the financial statements of the Funds as of and for the year ended December 31, 2011, events and transactions subsequent to December 31, 2011, have been evaluated by the Funds’ management for possible adjustment and/or disclosure. Management has not identified any subsequent events requiring financial statement disclosure as of the date these financial statements were issued.
44
The Wright Managed Equity Trust
Report of Independent Registered Public Accounting Firm
To the Board of Trustees of The Wright Managed Equity Trust
and the Shareholders of Wright Selected Blue Chip Equities Fund, Wright Major Blue Chip Equities Fund, and Wright International Blue Chip Equities Fund:
We have audited the accompanying statements of assets and liabilities of Wright Selected Blue Chip Equities Fund, Wright Major Blue Chip Equities Fund, and Wright International Blue Chip Equities Fund (the “Funds”), each a series of shares of beneficial interest in The Wright Managed Equity Trust, including the portfolios of investments, as of December 31, 2011, and the related statements of operations for the year then ended, and the statements of changes in net assets and the financial highlights for each of the years in the two-year period then ended. These financial statements and financial highlights are the responsibility of the Funds’ management. Our responsibility is to express an opinion on these financial statements and financial highlights based on our audits. The financial highlights for each of the years in the three-year period ended December 31, 2009 were audited by other auditors whose report dated February 23, 2010, expressed an unqualified opinion on such financial highlights.
We conducted our audits in accordance with the standards of the Public Company Accounting Oversight Board (United States). Those standards require that we plan and perform the audits to obtain reasonable assurance about whether the financial statements and financial highlights are free of material misstatement. An audit includes examining, on a test basis, evidence supporting the amounts and disclosures in the financial statements. Our procedures included confirmation of securities owned as of December 31, 2011 by correspondence with the custodian and brokers. An audit also includes assessing the accounting principles used and significant estimates made by management, as well as evaluating the overall financial statement presentation. We believe that our audits provide a reasonable basis for our opinion.
In our opinion, the financial statements and financial highlights referred to above present fairly, in all material respects, the financial position of Wright Selected Blue Chip Equities Fund, Wright Major Blue Chip Equities Fund, and Wright International Blue Chip Equities Fund as of December 31, 2011, the results of their operations for the year then ended, and the changes in their net assets and their financial highlights for each of the years in the two-year period then ended, in conformity with accounting principles generally accepted in the United States of America.
BBD, LLP
Philadelphia, Pennsylvania
February 17, 2012
45
The Wright Managed Equity Trust
Federal Tax Information (Unaudited)
The Form 1099-DIV you received in January 2012 showed the tax status of all distributions paid to your account in calendar year 2011. Shareholders are advised to consult their own tax adviser with respect to the tax consequences of their investment in the Funds. As required by the Internal Revenue Code regulations, shareholders must be notified within 60 days of a Fund’s fiscal year end regarding capital gain dividends, and the status of qualified dividend income for individuals, the dividends received deduction for corporations and the foreign tax credit.
Qualified Dividend Income – Wright International Blue Chip Equities Fund designates 100.00% for the qualified dividend rate (QDI) as defined in Section 1(h)(11) of the Internal Revenue Code.
46
Wright Total Return Bond Fund (WTRB)
Portfolio of Investments – As of December 31, 2011
| Face Amount | Description | Coupon Rate | Maturity Date | Value | |||||||||
| ASSET-BACKED SECURITIES - 2.3% | |||||||||||||
| $ | 310,000 | Citibank Credit Card Issuance Trust, Series 2009-A1, Class A1 | 2.028 | % | (1) | 03/17/14 | $ | 311,087 | |||||
| 170,000 | Harley-Davidson Motorcycle Trust, Series 2009-1, Class A4 | 4.550 | % | 01/15/17 | 172,653 | ||||||||
| 195,000 | PSE&G Transition Funding LLC, Series 2001-1, Class A7 | 6.750 | % | 06/15/16 | 218,526 | ||||||||
| Total Asset-Backed Securities (identified cost, $687,007) | $ | 702,266 | |||||||||||
| COMMERCIAL MORTGAGE-BACKED SECURITIES - 8.2% | |||||||||||||
| $ | 275,000 | Citigroup Commercial Mortgage Trust, Series 2004-C2, Class A5 | 4.733 | % | 10/15/41 | $ | 293,653 | ||||||
| 330,000 | Credit Suisse First Boston Mortgage Securities Corp., Series 2003-C3, Class A5 | 3.936 | % | 05/15/38 | 337,587 | ||||||||
| 346,003 | Credit Suisse First Boston Mortgage Securities Corp., Series 2005-C1, Class A3 | 4.813 | % | 02/15/38 | 357,289 | ||||||||
| 435,000 | JPMorgan Chase Commercial Mortgage Securities Corp., Series 2004-C3, Class A5 | 4.878 | % | 01/15/42 | 466,617 | ||||||||
| 300,000 | LB-UBS Commercial Mortgage Trust, Series 2006-C6, Class A4 | 5.372 | % | 09/15/39 | 334,081 | ||||||||
| 315,000 | Merrill Lynch Mortgage Trust, Series 2005-LC1, Class A4 | 5.291 | % | (1) | 01/12/44 | 349,892 | |||||||
| 310,000 | Merrill Lynch/Countrywide Commercial Mortgage Trust, Series 2006-2, Class A4 | 5.906 | % | (1) | 06/12/46 | 347,191 | |||||||
| 23,897 | Salomon Brothers Mortgage Securities VII, Inc., Series 2002-KEY2, Class A2 | 4.467 | % | 03/18/36 | 23,933 | ||||||||
| Total Commercial Mortgage-Backed Securities (identified cost, $2,336,550) | $ | 2,510,243 | |||||||||||
| RESIDENTIAL MORTGAGE-BACKED SECURITIES - 0.2% | |||||||||||||
| $ | 51,948 | Wells Fargo Mortgage Backed Securities Trust, Series 2004-K, Class 1A2 | 2.740 | % | (1) | 07/25/34 | $ | 51,962 | |||||
| Total Residential Mortgage-Backed Securities (identified cost, $43,669) | $ | 51,962 | |||||||||||
| CORPORATE BONDS - 46.8% | |||||||||||||
| AUTO MANUFACTURERS - 0.4% | |||||||||||||
| $ | 110,000 | Daimler Finance North America, LLC | 6.500 | % | 11/15/13 | $ | 119,865 | ||||||
| CAPITAL GOODS - 0.4% | |||||||||||||
| $ | 110,000 | PACCAR, Inc. | 6.875 | % | 02/15/14 | $ | 123,295 | ||||||
| CONSUMER DURABLES & APPAREL - 0.4% | |||||||||||||
| $ | 115,000 | Hasbro, Inc. | 6.125 | % | 05/15/14 | $ | 125,525 | ||||||
| CONSUMER SERVICES - 0.2% | |||||||||||||
| $ | 60,000 | Brinker International, Inc. | 5.750 | % | 06/01/14 | $ | 63,322 | ||||||
| DIVERSIFIED FINANCIALS - 12.7% | |||||||||||||
| $ | 135,000 | American Express Credit Corp., Series C | 7.300 | % | 08/20/13 | $ | 146,567 | ||||||
| 55,000 | Ameriprise Financial, Inc. | 5.650 | % | 11/15/15 | 62,180 | ||||||||
| 135,000 | Bank of America Corp., MTN | 5.000 | % | 05/13/21 | 123,186 | ||||||||
| 140,000 | Bear Stearns Cos., LLC (The) | 5.700 | % | 11/15/14 | 152,356 | ||||||||
| 65,000 | BlackRock, Inc. | 3.500 | % | 12/10/14 | 69,458 | ||||||||
| 55,000 | Capital One Financial Corp. | 7.375 | % | 05/23/14 | 60,463 | ||||||||
| 260,000 | Citigroup, Inc. | 6.500 | % | 08/19/13 | 270,755 | ||||||||
| 160,000 | Cooperatieve Centrale Raiffeisen-Boerenleenbank BA/Netherlands | 2.125 | % | 10/13/15 | 156,925 | ||||||||
| 130,000 | Credit Suisse USA, Inc. | 0.644 | % | (1) | 04/12/13 | 127,826 | |||||||
| 260,000 | Eaton Vance Corp. | 6.500 | % | 10/02/17 | 292,152 | ||||||||
| 135,000 | Equifax, Inc. | 4.450 | % | 12/01/14 | 142,388 | ||||||||
| 225,000 | General Electric Capital Corp., MTN, Series A | 6.750 | % | 03/15/32 | 264,233 | ||||||||
| 100,000 | Goldman Sachs Group, Inc. (The) | 1.176 | % | (1) | 09/29/14 | 90,839 | |||||||
| 115,000 | Goldman Sachs Group, Inc. (The) | 6.150 | % | 04/01/18 | 118,843 | ||||||||
| 110,000 | JPMorgan Chase & Co. | 6.300 | % | 04/23/19 | 124,775 | ||||||||
| 125,000 | Merrill Lynch & Co., Inc. | 6.050 | % | 05/16/16 | 117,930 | ||||||||
| 150,000 | Moody's Corp. | 5.500 | % | 09/01/20 | 155,229 | ||||||||
| 150,000 | Morgan Stanley | 5.500 | % | 07/28/21 | 138,946 | ||||||||
| 120,000 | Nomura Holdings, Inc. | 5.000 | % | 03/04/15 | 120,924 | ||||||||
| 135,000 | PNC Funding Corp. | 4.250 | % | 09/21/15 | 144,849 | ||||||||
| 55,000 | SunTrust Banks, Inc. | 6.000 | % | 09/11/17 | 60,503 | ||||||||
| 130,000 | TD Ameritrade Holding Corp. | 4.150 | % | 12/01/14 | 137,490 | ||||||||
| See Notes to Financial Statements. | 47 | |
Wright Total Return Bond Fund (WTRB)
Portfolio of Investments – As of December 31, 2011
| Face Amount | Description | Coupon Rate | Maturity Date | Value | |||||||||
| DIVERSIFIED FINANCIALS (CONTINUED) | |||||||||||||
| $ | 220,000 | US Bancorp, MTN | 3.150 | % | 03/04/15 | $ | 230,117 | ||||||
| 280,000 | Wells Fargo & Co. | 3.625 | % | 04/15/15 | 293,344 | ||||||||
| 280,000 | Westpac Banking Corp. | 4.200 | % | 02/27/15 | 292,040 | ||||||||
| ENERGY - 2.2% | |||||||||||||
| $ | 205,000 | Baker Hughes, Inc. | 6.875 | % | 01/15/29 | $ | 279,781 | ||||||
| 70,000 | Cimarex Energy Co. | 7.125 | % | 05/01/17 | 73,325 | ||||||||
| 50,000 | Newfield Exploration Co. | 6.625 | % | 04/15/16 | 51,750 | ||||||||
| 50,000 | ONEOK Partners LP | 6.850 | % | 10/15/37 | 60,910 | ||||||||
| 60,000 | Oneok, Inc. | 5.200 | % | 06/15/15 | 65,812 | ||||||||
| 70,000 | Peabody Energy Corp. | 7.375 | % | 11/01/16 | 77,350 | ||||||||
| 55,000 | Valero Energy Corp. | 9.375 | % | 03/15/19 | 70,626 | ||||||||
| FOOD, BEVERAGE & TOBACCO - 2.3% | |||||||||||||
| $ | 60,000 | Altria Group, Inc. | 8.500 | % | 11/10/13 | $ | 67,766 | ||||||
| 55,000 | Altria Group, Inc. | 9.700 | % | 11/10/18 | 74,096 | ||||||||
| 140,000 | ConAgra Foods, Inc. | 5.875 | % | 04/15/14 | 153,721 | ||||||||
| 150,000 | Corn Products International, Inc. | 4.625 | % | 11/01/20 | 159,800 | ||||||||
| 100,000 | PepsiCo, Inc. | 7.900 | % | 11/01/18 | 135,195 | ||||||||
| 105,000 | Philip Morris International, Inc. | 6.875 | % | 03/17/14 | 118,191 | ||||||||
| HEALTH CARE EQUIPMENT & SERVICES - 3.1% | |||||||||||||
| $ | 115,000 | Biogen Idec, Inc. | 6.000 | % | 03/01/13 | $ | 120,951 | ||||||
| 155,000 | Cigna Corp. | 2.750 | % | 11/15/16 | 154,835 | ||||||||
| 135,000 | Hospira, Inc. | 5.900 | % | 06/15/14 | 146,350 | ||||||||
| 75,000 | Laboratory Corp. of America Holdings | 3.125 | % | 05/15/16 | 77,988 | ||||||||
| 40,000 | McKesson Corp. | 6.500 | % | 02/15/14 | 44,289 | ||||||||
| 100,000 | Medtronic, Inc. | 4.500 | % | 03/15/14 | 107,775 | ||||||||
| 130,000 | UnitedHealth Group, Inc. | 6.000 | % | 02/15/18 | 154,767 | ||||||||
| 145,000 | WellPoint, Inc. | 4.350 | % | 08/15/20 | 156,918 | ||||||||
| HOUSEHOLD & PERSONAL PRODUCTS - 0.7% | |||||||||||||
| $ | 115,000 | Avon Products, Inc. | 5.625 | % | 03/01/14 | $ | 122,408 | ||||||
| 60,000 | Estee Lauder Cos., Inc. (The) | 6.000 | % | 05/15/37 | 77,430 | ||||||||
| INDUSTRIAL - 0.2% | |||||||||||||
| $ | 70,000 | Greif, Inc. | 6.750 | % | 02/01/17 | $ | 73,500 | ||||||
| INSURANCE - 4.7% | |||||||||||||
| $ | 100,000 | ACE INA Holdings, Inc. | 5.875 | % | 06/15/14 | $ | 110,379 | ||||||
| 275,000 | Loews Corp. | 5.250 | % | 03/15/16 | 303,064 | ||||||||
| 125,000 | MetLife, Inc. | 5.000 | % | 06/15/15 | 136,283 | ||||||||
| 46,000 | OneBeacon US Holdings, Inc. | 5.875 | % | 05/15/13 | 47,290 | ||||||||
| 255,000 | PartnerRe Finance B, LLC | 5.500 | % | 06/01/20 | 257,584 | ||||||||
| 55,000 | Principal Financial Group, Inc. | 8.875 | % | 05/15/19 | 68,574 | ||||||||
| 130,000 | Principal Life Income Funding Trusts, MTN | 0.618 | % | 11/08/13 | 127,741 | ||||||||
| 90,000 | Prudential Financial, Inc., MTN | 4.500 | % | 11/15/20 | 90,663 | ||||||||
| 50,000 | Prudential Financial, Inc., MTN, Series D | 7.375 | % | 06/15/19 | 59,190 | ||||||||
| 200,000 | Travelers Cos., Inc. (The) | 5.500 | % | 12/01/15 | 224,559 | ||||||||
| MATERIALS - 1.6% | |||||||||||||
| $ | 145,000 | Airgas, Inc. | 4.500 | % | 09/15/14 | $ | 153,734 | ||||||
| 120,000 | Dow Chemical Co. (The) | 7.375 | % | 03/01/23 | 147,864 | ||||||||
| 100,000 | Lubrizol Corp. | 8.875 | % | 02/01/19 | 137,596 | ||||||||
| 55,000 | Steel Dynamics, Inc. | 7.375 | % | 11/01/12 | 57,406 | ||||||||
| MEDIA - 2.4% | |||||||||||||
| $ | 90,000 | Comcast Cable Communications Holdings, Inc. | 9.455 | % | 11/15/22 | $ | 128,482 | ||||||
| 150,000 | DIRECTV Holdings, LLC / DIRECTV Financing Co, Inc. | 5.000 | % | 03/01/21 | 160,829 | ||||||||
| 95,000 | McGraw-Hill Cos., Inc. (The) | 5.900 | % | 11/15/17 | 103,504 | ||||||||
| 50,000 | Time Warner Cable, Inc. | 8.250 | % | 04/01/19 | 62,890 | ||||||||
| 115,000 | Time Warner Cos., Inc. | 6.950 | % | 01/15/28 | 139,255 | ||||||||
| 120,000 | Viacom, Inc. | 4.375 | % | 09/15/14 | 128,632 | ||||||||
| See Notes to Financial Statements. | 48 | |
Wright Total Return Bond Fund (WTRB)
Portfolio of Investments – As of December 31, 2011
| Face Amount | Description | Coupon Rate | Maturity Date | Value | |||||||||
| MINING - 0.5% | |||||||||||||
| $ | 80,000 | Barrick Gold Financeco, LLC | 6.125 | % | 09/15/13 | $ | 86,491 | ||||||
| 50,000 | Rio Tinto Finance USA, Ltd. | 8.950 | % | 05/01/14 | 58,507 | ||||||||
| MISCELLANEOUS MANUFACTURING - 0.2% | |||||||||||||
| $ | 55,000 | Tyco International Finance SA | 8.500 | % | 01/15/19 | $ | 70,942 | ||||||
| PHARMACEUTICALS, BIOTECHNOLOGY & LIFE SCIENCES - 0.4% | |||||||||||||
| $ | 115,000 | Wyeth | 5.500 | % | 02/01/14 | $ | 126,132 | ||||||
| PIPELINES - 0.9% | |||||||||||||
| $ | 60,000 | Spectra Energy Capital, LLC | 5.650 | % | 03/01/20 | $ | 66,706 | ||||||
| 170,000 | TransCanada PipeLines, Ltd. | 6.500 | % | 08/15/18 | 208,328 | ||||||||
| RETAILING - 2.0% | |||||||||||||
| $ | 55,000 | AutoZone, Inc. | 5.750 | % | 01/15/15 | $ | 60,927 | ||||||
| 135,000 | Best Buy Co., Inc. | 6.750 | % | 07/15/13 | 143,192 | ||||||||
| 145,000 | Kohl's Corp. | 4.000 | % | 11/01/21 | 148,854 | ||||||||
| 72,000 | Ltd. Brands, Inc. | 5.250 | % | 11/01/14 | 75,240 | ||||||||
| 55,000 | Netflix, Inc. | 8.500 | % | 11/15/17 | 56,788 | ||||||||
| 120,000 | Safeway, Inc. | 5.000 | % | 08/15/19 | 128,227 | ||||||||
| SEMICONDUCTORS & SEMICONDUCTOR EQUIPMENT - 0.7% | |||||||||||||
| $ | 165,000 | Applied Materials, Inc. | 7.125 | % | 10/15/17 | $ | 200,250 | ||||||
| SOFTWARE & SERVICES - 2.9% | |||||||||||||
| $ | 140,000 | Adobe Systems, Inc. | 4.750 | % | 02/01/20 | $ | 152,235 | ||||||
| 140,000 | Computer Sciences Corp. | 5.500 | % | 03/15/13 | 139,335 | ||||||||
| 140,000 | Dun & Bradstreet Corp. (The) | 6.000 | % | 04/01/13 | 147,671 | ||||||||
| 145,000 | Ingram Micro, Inc. | 5.250 | % | 09/01/17 | 149,545 | ||||||||
| 105,000 | International Business Machines Corp. | 7.625 | % | 10/15/18 | 141,102 | ||||||||
| 150,000 | Symantec Corp. | 4.200 | % | 09/15/20 | 151,102 | ||||||||
| TECHNOLOGY HARDWARE & EQUIPMENT - 1.1% | |||||||||||||
| $ | 30,000 | Dell, Inc. | 5.625 | % | 04/15/14 | $ | 32,915 | ||||||
| 140,000 | Harris Corp. | 5.000 | % | 10/01/15 | 152,093 | ||||||||
| 140,000 | Pitney Bowes, Inc., MTN | 5.250 | % | 01/15/37 | 143,168 | ||||||||
| TELECOMMUNICATIONS - 2.4% | |||||||||||||
| $ | 155,000 | BellSouth Corp. | 6.000 | % | 11/15/34 | $ | 176,449 | ||||||
| 70,000 | British Telecommunications PLC | 9.625 | % | 12/15/30 | 98,904 | ||||||||
| 105,000 | Cellco Partnership / Verizon Wireless Capital, LLC | 5.550 | % | 02/01/14 | 114,135 | ||||||||
| 145,000 | Telefonica Emisiones SAU | 4.949 | % | 01/15/15 | 144,337 | ||||||||
| 150,000 | Verizon Global Funding Corp. | 7.750 | % | 12/01/30 | 209,499 | ||||||||
| TRANSPORTATION - 0.5% | |||||||||||||
| $ | 120,000 | Burlington Northern Santa Fe, LLC | 6.200 | % | 08/15/36 | $ | 153,999 | ||||||
| UTILITIES - 3.9% | |||||||||||||
| $ | 115,000 | American Electric Power Co., Inc. | 5.250 | % | 06/01/15 | $ | 126,006 | ||||||
| 110,000 | Consolidated Edison Co. of New York, Inc. | 7.125 | % | 12/01/18 | 141,704 | ||||||||
| 90,000 | Dominion Resources, Inc., Series E | 6.300 | % | 03/15/33 | 112,847 | ||||||||
| 115,000 | Duke Energy Indiana, Inc. | 5.000 | % | 09/15/13 | 121,765 | ||||||||
| 80,000 | Exelon Generation Co., LLC | 5.200 | % | 10/01/19 | 88,021 | ||||||||
| 115,000 | NextEra Energy Capital Holdings, Inc., Series D | 7.300 | % | (1) | 09/01/67 | 119,738 | |||||||
| 50,000 | Pacific Gas & Electric Co. | 8.250 | % | 10/15/18 | 66,001 | ||||||||
| 138,000 | PPL Energy Supply, LLC | 6.300 | % | 07/15/13 | 147,493 | ||||||||
| 60,000 | Public Service Electric & Gas Co., MTN | 5.300 | % | 05/01/18 | 71,127 | ||||||||
| 125,000 | Sempra Energy | 6.500 | % | 06/01/16 | 145,955 | ||||||||
| 55,000 | TransAlta Corp. | 4.750 | % | 01/15/15 | 59,118 | ||||||||
| Total Corporate Bonds (identified cost, $13,473,550) | $ | 14,334,226 | |||||||||||
| See Notes to Financial Statements. | 49 | |
Wright Total Return Bond Fund (WTRB)
Portfolio of Investments – As of December 31, 2011
| Face Amount | Description | Coupon Rate | Maturity Date | Value | |||||||||
| U.S. GOVERNMENT INTERESTS - 41.4% | |||||||||||||
| AGENCY MORTGAGE-BACKED SECURITIES - 27.8% | |||||||||||||
| $ | 141,754 | FHLMC Gold Pool #A32600 | 5.500 | % | 05/01/35 | $ | 155,013 | ||||||
| 31,267 | FHLMC Gold Pool #C01646 | 6.000 | % | 09/01/33 | 34,834 | ||||||||
| 21,343 | FHLMC Gold Pool #C27663 | 7.000 | % | 06/01/29 | 24,898 | ||||||||
| 102,971 | FHLMC Gold Pool #C47318 | 7.000 | % | 09/01/29 | 121,685 | ||||||||
| 150,189 | FHLMC Gold Pool #C66878 | 6.500 | % | 05/01/32 | 170,986 | ||||||||
| 121,605 | FHLMC Gold Pool #C91046 | 6.500 | % | 05/01/27 | 135,727 | ||||||||
| 22,292 | FHLMC Gold Pool #D66753 | 6.000 | % | 10/01/23 | 24,626 | ||||||||
| 5,337 | FHLMC Gold Pool #E00903 | 7.000 | % | 10/01/15 | 5,752 | ||||||||
| 165,035 | FHLMC Gold Pool #G01035 | 6.000 | % | 05/01/29 | 183,865 | ||||||||
| 82,767 | FHLMC Gold Pool #G02478 | 5.500 | % | 12/01/36 | 90,025 | ||||||||
| 100,807 | FHLMC Gold Pool #H19018 | 6.500 | % | 08/01/37 | 111,915 | ||||||||
| 90,234 | FHLMC Gold Pool #N30514 | 5.500 | % | 11/01/28 | 97,399 | ||||||||
| 253,415 | FHLMC Gold Pool #P00024 | 7.000 | % | 09/01/32 | 285,035 | ||||||||
| 13,863 | FHLMC Gold Pool #P50031 | 7.000 | % | 08/01/18 | 14,588 | ||||||||
| 44,556 | FHLMC Gold Pool #P50064 | 7.000 | % | 09/01/30 | 50,361 | ||||||||
| 65,656 | FHLMC Pool #1B1291 | 2.500 | % | (1) | 11/01/33 | 69,126 | |||||||
| 183,774 | FHLMC Pool #1G0233 | 2.511 | % | (1) | 05/01/35 | 194,034 | |||||||
| 29,857 | FHLMC Pool #781071 | 5.220 | % | (1) | 11/01/33 | 31,991 | |||||||
| 25,782 | FHLMC Pool #781804 | 5.076 | % | (1) | 07/01/34 | 27,602 | |||||||
| 13,621 | FHLMC Pool #781884 | 5.152 | % | (1) | 08/01/34 | 14,597 | |||||||
| 40,723 | FHLMC Pool #782862 | 5.036 | % | (1) | 11/01/34 | 43,762 | |||||||
| 197,628 | FHLMC, Series 1983, Class Z | 6.500 | % | 12/15/23 | 224,605 | ||||||||
| 142,404 | FHLMC, Series 2044, Class PE | 6.500 | % | 04/15/28 | 164,849 | ||||||||
| 550,000 | FHLMC, Series 2627, Class MW | 5.000 | % | 06/15/23 | 616,620 | ||||||||
| 95,110 | FNMA Pool #253057 | 8.000 | % | 12/01/29 | 113,420 | ||||||||
| 6,481 | FNMA Pool #254845 | 4.000 | % | 07/01/13 | 6,833 | ||||||||
| 6,988 | FNMA Pool #254863 | 4.000 | % | 08/01/13 | 7,365 | ||||||||
| 13,394 | FNMA Pool #479477 | 6.000 | % | 01/01/29 | 14,933 | ||||||||
| 12,883 | FNMA Pool #489357 | 6.500 | % | 03/01/29 | 14,729 | ||||||||
| 14,516 | FNMA Pool #535332 | 8.500 | % | 04/01/30 | 17,776 | ||||||||
| 28,922 | FNMA Pool #545782 | 7.000 | % | 07/01/32 | 33,690 | ||||||||
| 12,954 | FNMA Pool #597396 | 6.500 | % | 09/01/31 | 14,746 | ||||||||
| 77,894 | FNMA Pool #621284 | 6.500 | % | 12/01/31 | 88,668 | ||||||||
| 33,750 | FNMA Pool #725866 | 4.500 | % | 09/01/34 | 36,016 | ||||||||
| 90,186 | FNMA Pool #738630 | 5.500 | % | 11/01/33 | 98,602 | ||||||||
| 252,268 | FNMA Pool #745001 | 6.500 | % | 09/01/35 | 284,953 | ||||||||
| 141,494 | FNMA Pool #745467 | 5.580 | % | (1) | 04/01/36 | 151,483 | |||||||
| 269,319 | FNMA Pool #745755 | 5.000 | % | 12/01/35 | 291,295 | ||||||||
| 116,381 | FNMA Pool #747529 | 4.500 | % | 10/01/33 | 124,234 | ||||||||
| 481,531 | FNMA Pool #781893 | 4.500 | % | 11/01/31 | 517,516 | ||||||||
| 40,430 | FNMA Pool #809888 | 4.500 | % | 03/01/35 | 43,120 | ||||||||
| 613,366 | FNMA Pool #888366 | 7.000 | % | 04/01/37 | 701,005 | ||||||||
| 550,278 | FNMA Pool #888367 | 7.000 | % | 03/01/37 | 628,903 | ||||||||
| 276,277 | FNMA Pool #888417 | 6.500 | % | 01/01/36 | 315,873 | ||||||||
| 46,437 | FNMA Pool #906455 | 6.010 | % | (1) | 01/01/37 | 50,194 | |||||||
| 48,282 | GNMA I Pool #374892 | 7.000 | % | 02/15/24 | 55,928 | ||||||||
| 26,446 | GNMA I Pool #376400 | 6.500 | % | 02/15/24 | 30,217 | ||||||||
| 36,039 | GNMA I Pool #379982 | 7.000 | % | 02/15/24 | 41,746 | ||||||||
| 140,086 | GNMA I Pool #393347 | 7.500 | % | 02/15/27 | 165,467 | ||||||||
| 53,999 | GNMA I Pool #410081 | 8.000 | % | 08/15/25 | 64,276 | ||||||||
| 32,703 | GNMA I Pool #427199 | 7.000 | % | 12/15/27 | 38,050 | ||||||||
| 1,519 | GNMA I Pool #436214 | 6.500 | % | 02/15/13 | 1,667 | ||||||||
| 36,124 | GNMA I Pool #448490 | 7.500 | % | 03/15/27 | 39,797 | ||||||||
| See Notes to Financial Statements. | 50 | |
Wright Total Return Bond Fund (WTRB)
Portfolio of Investments – As of December 31, 2011
| Face Amount | Description | Coupon Rate | Maturity Date | Value | |||||||||
| AGENCY MORTGAGE-BACKED SECURITIES (CONTINUED) | |||||||||||||
| $ | 45,210 | GNMA I Pool #458762 | 6.500 | % | 01/15/28 | $ | 52,422 | ||||||
| 34,363 | GNMA I Pool #460726 | 6.500 | % | 12/15/27 | 39,844 | ||||||||
| 14,723 | GNMA I Pool #488924 | 6.500 | % | 11/15/28 | 17,072 | ||||||||
| 12,256 | GNMA I Pool #510706 | 8.000 | % | 11/15/29 | 14,816 | ||||||||
| 30,585 | GNMA I Pool #581536 | 5.500 | % | 06/15/33 | 34,532 | ||||||||
| 88,890 | GNMA II Pool #002630 | 6.500 | % | 08/20/28 | 101,704 | ||||||||
| 4,358 | GNMA II Pool #002909 | 8.000 | % | 04/20/30 | 5,277 | ||||||||
| 11,238 | GNMA II Pool #002972 | 7.500 | % | 09/20/30 | 13,450 | ||||||||
| 4,086 | GNMA II Pool #002973 | 8.000 | % | 09/20/30 | 4,949 | ||||||||
| 39,908 | GNMA II Pool #003095 | 6.500 | % | 06/20/31 | 45,661 | ||||||||
| 286,336 | GNMA II Pool #004841 | 8.000 | % | 08/20/31 | 342,760 | ||||||||
| 915,610 | GNMA, Series 2010-44, Class NK | 4.000 | % | 10/20/37 | 974,602 | ||||||||
| U.S. TREASURIES - 13.6% | |||||||||||||
| $ | 550,000 | U.S. Treasury Bond | 6.125 | % | 11/15/27 | $ | 817,523 | ||||||
| 40,000 | U.S. Treasury Note | 1.375 | % | 04/15/12 | 40,158 | ||||||||
| 350,000 | U.S. Treasury Note | 3.875 | % | 02/15/13 | 364,465 | ||||||||
| 745,000 | U.S. Treasury Note | 3.250 | % | 06/30/16 | 827,474 | ||||||||
| 245,000 | U.S. Treasury Note | 2.750 | % | 11/30/16 | 267,528 | ||||||||
| 685,000 | U.S. Treasury Note | 4.500 | % | 05/15/17 | 812,528 | ||||||||
| 175,000 | U.S. Treasury Note | 3.125 | % | 05/15/19 | 196,246 | ||||||||
| 685,000 | U.S. Treasury Strip | 3.530-4.845 | % | (2) | 11/15/30 | 398,207 | |||||||
| 995,000 | U.S. Treasury Strip | 4.696-5.045 | % | (2) | 08/15/39 | 435,207 | |||||||
| Total U.S. Government Interests (identified cost, $11,815,464) | $ | 12,692,822 | |||||||||||
| TOTAL FIXED INCOME INVESTMENTS (identified cost, $28,356,240) — 98.9% | $ | 30,291,519 | |||||||||||
| SHORT-TERM INVESTMENTS - 0.0% | |||||||||||||
| $ | 244 | Fidelity Government Money Market Fund, 0.01% (1) | $ | 244 | |||||||||
| TOTAL SHORT-TERM INVESTMENTS (identified cost, $244) — 0.0% | $ | 244 | |||||||||||
| TOTAL INVESTMENTS (identified cost, $28,356,484) — 98.9% | $ | 30,291,763 | |||||||||||
| OTHER ASSETS, IN EXCESS OF LIABILITIES — 1.1% | 331,561 | ||||||||||||
| NET ASSETS — 100.0% | $ | 30,623,324 | |||||||||||
FHLMC — Federal Home Loan Mortgage Corporation
FNMA — Federal National Mortgage Association
GNMA — Government National Mortgage Association
LLC — Limited Liability Company
LP — Limited Partnership
MTN — Medium Term Note
PLC — Public Limited Company
| (1) | Variable rate security. Rate presented is as of December 31, 2011. |
| (2) | Rate presented is yield to maturity. |
| See Notes to Financial Statements. | 51 | |
Wright Total Return Bond Fund (WTRB)
| As of December 31, 2011 | For the Year Ended December 31, 2011 | |||||||||||||
| ASSETS: | INVESTMENT INCOME (Note 1C) | |||||||||||||
| Investments, at value | 0 | Dividend income | $ | 35 | ||||||||||
| (identified cost $28,356,484) (Note 1A) | $ | 30,291,763 | Interest income | 1,282,550 | ||||||||||
| Receivable for fund shares sold | 10,000 | Total investment income | $ | 1,282,585 | ||||||||||
| Receivable for investment securities sold | 111,683 | |||||||||||||
| Dividends and interest receivable | 262,471 | Expenses – | ||||||||||||
| Prepaid expenses and other assets | 18,546 | Investment adviser fee (Note 3) | $ | 138,549 | ||||||||||
| Total assets | $ | 30,694,463 | Administrator fee (Note 3) | 21,552 | ||||||||||
| Trustee expense (Note 3) | 21,023 | |||||||||||||
| LIABILITIES: | Custodian fee | 3,031 | ||||||||||||
| Outstanding line of credit (Note 8) | $ | 4,399 | Accountant fee | 38,436 | ||||||||||
| Payable for fund shares reacquired | 4,912 | Pricing | 29,377 | |||||||||||
| Distributions payable | 43,979 | Distribution expenses (Note 4) | 76,971 | |||||||||||
| Accrued expenses and other liabilities | 17,849 | Transfer agent fee | 30,037 | |||||||||||
| Total liabilities | $ | 71,139 | Printing | 144 | ||||||||||
| NET ASSETS | $ | 30,623,324 | Shareholder communications | 6,716 | ||||||||||
| Audit services | 20,370 | |||||||||||||
| NET ASSETS CONSIST OF: | Legal services | 1,111 | ||||||||||||
| Paid-in capital | $ | 30,717,874 | Compliance services | 871 | ||||||||||
| Accumulated net realized loss on investments | (2,029,829 | ) | Registration costs | 18,949 | ||||||||||
| Unrealized appreciation on investments | 1,935,279 | Interest expense (Note 8) | 188 | |||||||||||
| Net assets applicable to outstanding shares | $ | 30,623,324 | Miscellaneous | 13,319 | ||||||||||
| Total expenses | $ | 420,644 | ||||||||||||
| SHARES OF BENEFICIAL INTEREST OUTSTANDING AT $0.000 PAR VALUE (UNLIMITED SHARES AUTHORIZED) | 2,317,269 | |||||||||||||
| Deduct – | ||||||||||||||
| NET ASSET VALUE, OFFERING PRICE, AND REDEMPTION PRICE PER SHARE OF BENEFICIAL INTEREST | $ | 13.22 | Waiver and/or reimbursement by the principal underwriter and/or investment adviser (Note 4) | $ | (127,959 | ) | ||||||||
| Net expenses | $ | 292,685 | ||||||||||||
| Net investment income | $ | 989,900 | ||||||||||||
| REALIZED AND UNREALIZED GAIN ON INVESTMENTS: | ||||||||||||||
| Net realized gain on investment transactions | $ | 211,660 | ||||||||||||
| Net change in unrealized appreciation (depreciation) on investments | 788,844 | |||||||||||||
| Net realized and unrealized gain on investments | $ | 1,000,504 | ||||||||||||
| Net increase in net assets from operations | $ | 1,990,404 | ||||||||||||
| See Notes to Financial Statements. | 52 | |
Wright Total Return Bond Fund (WTRB)
| Years Ended | ||||||||||
| STATEMENTS OF CHANGES IN NET ASSETS | December 31, 2011 | December 31, 2010 | ||||||||
| INCREASE (DECREASE) IN NET ASSETS: | ||||||||||
From operations – | ||||||||||
| Net investment income | $ | 989,900 | $ | 968,730 | ||||||
| 0 | Net realized gain on investment transactions | 211,660 | 254,200 | |||||||
| Net change in unrealized appreciation (depreciation) on investments | 788,844 | 369,046 | ||||||||
| Net increase in net assets from operations | $ | 1,990,404 | $ | 1,591,976 | ||||||
| Distributions to shareholders (Note 2) | ||||||||||
| From net investment income | $ | (1,214,917 | ) | $ | (1,108,572 | ) | ||||
| Total distributions | $ | (1,214,917 | ) | $ | (1,108,572 | ) | ||||
| Net increase (decrease) in net assets resulting from fund share transactions (Note 6) | $ | (1,682,358 | ) | $ | 6,490,580 | |||||
| Net increase (decrease) in net assets | $ | (906,871 | ) | $ | 6,973,984 | |||||
| NET ASSETS: | ||||||||||
| At beginning of year | 31,530,195 | 24,556,211 | ||||||||
| At end of year | $ | 30,623,324 | $ | 31,530,195 | ||||||
| See Notes to Financial Statements. | 53 | |
Wright Total Return Bond Fund (WTRB)
These financial highlights reflect selected data for a share outstanding throughout each year.
| Years Ended December 31, | ||||||||||||||||||
| 2011 | 2010 | 2009 | 2008 | 2007 | ||||||||||||||
| Net asset value, beginning of year | $ | 12.890 | $ | 12.620 | $ | 11.990 | $ | 12.390 | $ | 12.290 | ||||||||
| Income (loss) from investment operations: | ||||||||||||||||||
Net investment income (1) | 0.420 | 0.437 | 0.558 | 0.573 | 0.558 | |||||||||||||
| Net realized and unrealized gain (loss) | 0.425 | 0.336 | 0.676 | (0.373 | ) | 0.115 | ||||||||||||
| Total income from investment operations | 0.845 | 0.773 | 1.234 | 0.200 | 0.673 | |||||||||||||
| Less distributions: | ||||||||||||||||||
| From net investment income | (0.515 | ) | (0.503 | ) | (0.604 | ) | (0.600 | ) | (0.573 | ) | ||||||||
| Net asset value, end of year | $ | 13.220 | $ | 12.890 | $ | 12.620 | $ | 11.990 | $ | 12.390 | ||||||||
Total Return(2) | 6.68 | % | 6.18 | % | 10.53 | % | 1.69 | % | 5.64 | % | ||||||||
Ratios/Supplemental Data(3): | ||||||||||||||||||
| Net assets, end of year (000 omitted) | $30,623 | $31,530 | $24,556 | $23,262 | $24,989 | |||||||||||||
| Ratios (As a percentage of average daily net assets): | ||||||||||||||||||
| Net expenses | 0.95 | % | 0.83 | % | 0.70 | % | 0.71 | % | 0.87 | % | ||||||||
| Net expenses after custodian fee reduction | N/A | N/A | 0.70 | % | 0.70 | % | 0.85 | % | ||||||||||
| Net investment income | 3.22 | % | 3.38 | % | 4.53 | % | 4.73 | % | 4.56 | % | ||||||||
| Portfolio turnover rate | 55 | % | 119 | % | 61 | % | 125 | % | 119 | % | ||||||||
| (1) | Computed using average shares outstanding. | |||||||||||||||||
| (2) | Total return is calculated assuming a purchase at the net asset value on the first day and a sale at the net asset value on the last day of each year reported. Dividends and distributions, if any, are assumed to be reinvested at the net asset value on the reinvestment date. | |||||||||||||||||
| (3) | For each of the years presented, the operating expenses of the Fund were reduced by a waiver of fees and/or allocation of expenses to the principal underwriter and/or investment adviser. Had such action not been undertaken, expenses and net investment income ratios would have been as follows: | |||||||||||||||||
| 2011 | 2010 | 2009 | 2008 | 2007 | ||||||||||||||
| Ratios (As a percentage of average daily net assets): | ||||||||||||||||||
| Expenses | 1.37 | % | 1.43 | % | 1.55 | % | 1.52 | % | 1.41 | % | ||||||||
| Expenses after custodian fee reduction | N/A | N/A | 1.55 | % | 1.51 | % | 1.38 | % | ||||||||||
| Net investment income | 2.80 | % | 2.78 | % | 3.68 | % | 3.93 | % | 4.03 | % | ||||||||
| See Notes to Financial Statements. | 54 | |
Wright Current Income Fund (WCIF)
Portfolio of Investments – As of December 31, 2011
| Face Amount | Description | Coupon Rate | Maturity Date | Value | |||||||||
| AGENCY MORTGAGE-BACKED SECURITIES - 98.1% | |||||||||||||
| $ | 21,688 | FHLMC Gold Pool #C00548 | 7.000 | % | 08/01/27 | $ | 25,188 | ||||||
| 63,432 | FHLMC Gold Pool #C00778 | 7.000 | % | 06/01/29 | 73,996 | ||||||||
| 139,825 | FHLMC Gold Pool #C01375 | 6.500 | % | 07/01/32 | 159,187 | ||||||||
| 267,179 | FHLMC Gold Pool #C91034 | 6.000 | % | 06/01/27 | 293,614 | ||||||||
| 50,498 | FHLMC Gold Pool #D81642 | 7.500 | % | 08/01/27 | 59,951 | ||||||||
| 75,789 | FHLMC Gold Pool #D82572 | 7.000 | % | 09/01/27 | 88,021 | ||||||||
| 23,492 | FHLMC Gold Pool #E00678 | 6.500 | % | 06/01/14 | 24,760 | ||||||||
| 24,483 | FHLMC Gold Pool #E00721 | 6.500 | % | 07/01/14 | 25,833 | ||||||||
| 36,755 | FHLMC Gold Pool #E81704 | 8.500 | % | 05/01/15 | 39,825 | ||||||||
| 772,259 | FHLMC Gold Pool #G02791 | 5.500 | % | 04/01/37 | 839,135 | ||||||||
| 231,767 | FHLMC Gold Pool #G02809 | 6.500 | % | 05/01/36 | 262,219 | ||||||||
| 179,807 | FHLMC Gold Pool #G08012 | 6.500 | % | 09/01/34 | 203,581 | ||||||||
| 1,372,022 | FHLMC Gold Pool #G08081 | 6.000 | % | 09/01/35 | 1,515,275 | ||||||||
| 915,383 | FHLMC Gold Pool #G08378 | 6.000 | % | 10/01/39 | 1,005,809 | ||||||||
| 293,113 | FHLMC Gold Pool #H09054 | 4.500 | % | 03/01/37 | 307,474 | ||||||||
| 149,907 | FHLMC Gold Pool #H09098 | 6.500 | % | 10/01/37 | 166,098 | ||||||||
| 253,415 | FHLMC Gold Pool #P00024 | 7.000 | % | 09/01/32 | 285,035 | ||||||||
| 230,871 | FHLMC Gold Pool #P50019 | 7.000 | % | 07/01/24 | 258,197 | ||||||||
| 94,253 | FHLMC, Series 2176, Class OJ | 7.000 | % | 08/15/29 | 107,749 | ||||||||
| 66,191 | FHLMC, Series 2201, Class C | 8.000 | % | 11/15/29 | 79,365 | ||||||||
| 356,390 | FHLMC, Series 2218, Class ZB | 6.000 | % | 03/15/30 | 401,080 | ||||||||
| 143,920 | FHLMC, Series 2259, Class ZM | 7.000 | % | 10/15/30 | 167,458 | ||||||||
| 785,000 | FHLMC, Series 3004, Class HK | 5.500 | % | 07/15/35 | 847,135 | ||||||||
| 200,000 | FHLMC, Series 3072, Class DL | 6.000 | % | 02/15/35 | 238,847 | ||||||||
| 135,000 | FHLMC, Series 3217, Class PD | 6.000 | % | 11/15/34 | 143,956 | ||||||||
| 565,000 | FHLMC, Series 3605, Class NC | 5.500 | % | 06/15/37 | 673,730 | ||||||||
| 1,000,000 | FHLMC, Series 3662, Class PJ | 5.000 | % | 04/15/40 | 1,130,540 | ||||||||
| 196,908 | FHLMC-GNMA, Series 15, Class L | 7.000 | % | 07/25/23 | 204,121 | ||||||||
| 69,043 | FHLMC-GNMA, Series 23, Class KZ | 6.500 | % | 11/25/23 | 77,781 | ||||||||
| 123,317 | FHLMC-GNMA, Series 4, Class D | 8.000 | % | 12/25/22 | 139,932 | ||||||||
| 515,386 | FNMA Pool #252034 | 7.000 | % | 09/01/28 | 601,368 | ||||||||
| 1,380,452 | FNMA Pool #256182 | 6.000 | % | 03/01/36 | 1,511,643 | ||||||||
| 271,208 | FNMA Pool #256972 | 6.000 | % | 11/01/37 | 297,491 | ||||||||
| 1,031,628 | FNMA Pool #257138 | 5.000 | % | 03/01/38 | 1,105,006 | ||||||||
| 36,491 | FNMA Pool #535131 | 6.000 | % | 03/01/29 | 40,683 | ||||||||
| 152,886 | FNMA Pool #594207 | 6.500 | % | 02/01/31 | 177,059 | ||||||||
| 144,795 | FNMA Pool #673315 | 5.500 | % | 11/01/32 | 158,307 | ||||||||
| 645,097 | FNMA Pool #721255 | 5.500 | % | 07/01/33 | 705,296 | ||||||||
| 59,072 | FNMA Pool #733750 | 6.310 | % | 10/01/32 | 66,625 | ||||||||
| 944,499 | FNMA Pool #735415 | 6.500 | % | 12/01/32 | 1,075,138 | ||||||||
| 284,849 | FNMA Pool #735861 | 6.500 | % | 09/01/33 | 325,672 | ||||||||
| 505,498 | FNMA Pool #745001 | 6.500 | % | 09/01/35 | 570,994 | ||||||||
| 979,255 | FNMA Pool #745318 | 5.000 | % | 12/01/34 | 1,059,925 | ||||||||
| 112,070 | FNMA Pool #745630 | 5.500 | % | 01/01/29 | 123,229 | ||||||||
| 140,450 | FNMA Pool #801357 | 5.500 | % | 08/01/34 | 153,556 | ||||||||
| 160,139 | FNMA Pool #813839 | 6.000 | % | 11/01/34 | 178,536 | ||||||||
| 936,533 | FNMA Pool #851655 | 6.000 | % | 12/01/35 | 1,040,901 | ||||||||
| 125,564 | FNMA Pool #871394 | 7.000 | % | 04/01/21 | 137,748 | ||||||||
| 399,548 | FNMA Pool #879922 | 5.000 | % | 11/01/35 | 430,090 | ||||||||
| 307,405 | FNMA Pool #888211 | 7.000 | % | 08/01/36 | 361,789 | ||||||||
| 123,990 | FNMA Pool #888367 | 7.000 | % | 03/01/37 | 141,706 | ||||||||
| 252,762 | FNMA Pool #888534 | 5.000 | % | 08/01/37 | 270,740 | ||||||||
| 1,531,667 | FNMA Pool #889307 | 5.000 | % | 07/01/37 | 1,656,647 | ||||||||
| See Notes to Financial Statements. | 55 | |
Wright Current Income Fund (WCIF)
Portfolio of Investments – As of December 31, 2011
Wright Current Income Fund (WCIF)
| Face Amount | Description | Coupon Rate | Maturity Date | Value | |||||||||
| AGENCY MORTGAGE-BACKED SECURITIES (CONTINUED) | |||||||||||||
| $ | 348,803 | FNMA Pool #889649 | 6.500 | % | 08/01/37 | $ | 378,026 | ||||||
| 113,432 | FNMA Pool #954957 | 6.000 | % | 10/01/37 | 124,425 | ||||||||
| 2,038,800 | FNMA Pool #995149 | 6.500 | % | 10/01/38 | 2,290,218 | ||||||||
| 257,795 | FNMA Pool #995346 | 6.500 | % | 09/01/36 | 291,197 | ||||||||
| 468,925 | FNMA Pool #995656 | 7.000 | % | 06/01/33 | 547,297 | ||||||||
| 1,085,253 | FNMA Pool #AB3223 | 4.000 | % | 07/01/41 | 1,166,274 | ||||||||
| 125,000 | FNMA, Series 2002-15, Class QH | 6.000 | % | 04/25/32 | 145,375 | ||||||||
| 166,000 | FNMA, Series 2004-25, Class LC | 5.500 | % | 04/25/34 | 187,132 | ||||||||
| 256,000 | FNMA, Series 2004-25, Class UC | 5.500 | % | 04/25/34 | 288,378 | ||||||||
| 339,858 | FNMA, Series 2004-90, Class D | 4.000 | % | 11/25/34 | 364,179 | ||||||||
| 205,000 | FNMA, Series 2005-106, Class UK | 5.500 | % | 12/25/35 | 223,093 | ||||||||
| 226,000 | FNMA, Series 2007-76, Class PE | 6.000 | % | 08/25/37 | 263,992 | ||||||||
| 800,000 | FNMA, Series 2007-81, Class GE | 6.000 | % | 08/25/37 | 948,455 | ||||||||
| 170,000 | FNMA, Series 2008-46, Class JN | 5.500 | % | 06/25/38 | 190,154 | ||||||||
| 155,000 | FNMA, Series 2008-86, Class GD | 6.000 | % | 03/25/36 | 165,329 | ||||||||
| 390,000 | FNMA, Series 2009-96, Class DB | 4.000 | % | 11/25/29 | 422,455 | ||||||||
| 393,361 | FNMA, Series G92-43, Class Z | 7.500 | % | 07/25/22 | 461,633 | ||||||||
| 245,656 | FNMA, Series G93-5, Class Z | 6.500 | % | 02/25/23 | 270,493 | ||||||||
| 139 | GNMA I Pool #176992 | 8.000 | % | 11/15/16 | 140 | ||||||||
| 845 | GNMA I Pool #177784 | 8.000 | % | 10/15/16 | 849 | ||||||||
| 7,455 | GNMA I Pool #192357 | 8.000 | % | 04/15/17 | 7,494 | ||||||||
| 1,644 | GNMA I Pool #194287 | 9.500 | % | 03/15/17 | 1,654 | ||||||||
| 655 | GNMA I Pool #196063 | 8.500 | % | 03/15/17 | 736 | ||||||||
| 874 | GNMA I Pool #212601 | 8.500 | % | 06/15/17 | 879 | ||||||||
| 1,204 | GNMA I Pool #220917 | 8.500 | % | 04/15/17 | 1,273 | ||||||||
| 2,715 | GNMA I Pool #223348 | 10.000 | % | 08/15/18 | 2,733 | ||||||||
| 2,004 | GNMA I Pool #230223 | 9.500 | % | 04/15/18 | 2,016 | ||||||||
| 2,896 | GNMA I Pool #260999 | 9.500 | % | 09/15/18 | 3,064 | ||||||||
| 4,232 | GNMA I Pool #263439 | 10.000 | % | 02/15/19 | 4,261 | ||||||||
| 1,150 | GNMA I Pool #265267 | 9.500 | % | 08/15/20 | 1,157 | ||||||||
| 611 | GNMA I Pool #266983 | 10.000 | % | 02/15/19 | 615 | ||||||||
| 637 | GNMA I Pool #286556 | 9.000 | % | 03/15/20 | 641 | ||||||||
| 776 | GNMA I Pool #301366 | 8.500 | % | 06/15/21 | 815 | ||||||||
| 3,773 | GNMA I Pool #302933 | 8.500 | % | 06/15/21 | 4,462 | ||||||||
| 9,081 | GNMA I Pool #308792 | 9.000 | % | 07/15/21 | 9,604 | ||||||||
| 1,581 | GNMA I Pool #314222 | 8.500 | % | 04/15/22 | 1,603 | ||||||||
| 1,477 | GNMA I Pool #315187 | 8.000 | % | 06/15/22 | 1,484 | ||||||||
| 20,348 | GNMA I Pool #319441 | 8.500 | % | 04/15/22 | 20,791 | ||||||||
| 5,458 | GNMA I Pool #325165 | 8.000 | % | 06/15/22 | 6,409 | ||||||||
| 6,440 | GNMA I Pool #335950 | 8.000 | % | 10/15/22 | 6,474 | ||||||||
| 96,821 | GNMA I Pool #346987 | 7.000 | % | 12/15/23 | 111,817 | ||||||||
| 41,414 | GNMA I Pool #352001 | 6.500 | % | 12/15/23 | 47,172 | ||||||||
| 13,636 | GNMA I Pool #352110 | 7.000 | % | 08/15/23 | 15,748 | ||||||||
| 42,824 | GNMA I Pool #368238 | 7.000 | % | 12/15/23 | 49,456 | ||||||||
| 23,011 | GNMA I Pool #372379 | 8.000 | % | 10/15/26 | 24,471 | ||||||||
| 39,175 | GNMA I Pool #399726 | 7.490 | % | 05/15/25 | 45,728 | ||||||||
| 94,049 | GNMA I Pool #399788 | 7.490 | % | 09/15/25 | 109,778 | ||||||||
| 26,705 | GNMA I Pool #399958 | 7.490 | % | 02/15/27 | 31,267 | ||||||||
| 25,238 | GNMA I Pool #399964 | 7.490 | % | 04/15/26 | 29,488 | ||||||||
| 44,302 | GNMA I Pool #410215 | 7.500 | % | 12/15/25 | 52,170 | ||||||||
| 3,630 | GNMA I Pool #414736 | 7.500 | % | 11/15/25 | 4,281 | ||||||||
| 15,959 | GNMA I Pool #420707 | 7.000 | % | 02/15/26 | 18,522 | ||||||||
| 12,403 | GNMA I Pool #421829 | 7.500 | % | 04/15/26 | 14,600 | ||||||||
| 3,444 | GNMA I Pool #431036 | 8.000 | % | 07/15/26 | 3,631 | ||||||||
| 13,431 | GNMA I Pool #431612 | 8.000 | % | 11/15/26 | 13,802 | ||||||||
| 4,436 | GNMA I Pool #442190 | 8.000 | % | 12/15/26 | 5,097 | ||||||||
| See Notes to Financial Statements. | 56 | |
Wright Current Income Fund (WCIF)
Portfolio of Investments – As of December 31, 2011
| Face Amount | Description | Coupon Rate | Maturity Date | Value | |||||||||
| AGENCY MORTGAGE-BACKED SECURITIES (CONTINUED) | |||||||||||||
| $ | 44,942 | GNMA I Pool #448970 | 8.000 | % | 08/15/27 | $ | 53,845 | ||||||
| 8,037 | GNMA I Pool #449176 | 6.500 | % | 07/15/28 | 9,319 | ||||||||
| 20,713 | GNMA I Pool #462623 | 6.500 | % | 03/15/28 | 24,016 | ||||||||
| 84,174 | GNMA I Pool #471369 | 5.500 | % | 05/15/33 | 95,099 | ||||||||
| 238,797 | GNMA I Pool #487108 | 6.000 | % | 04/15/29 | 272,512 | ||||||||
| 127,905 | GNMA I Pool #489377 | 6.375 | % | 03/15/29 | 145,964 | ||||||||
| 335,584 | GNMA I Pool #503405 | 6.500 | % | 04/15/29 | 389,110 | ||||||||
| 131,109 | GNMA I Pool #509930 | 5.500 | % | 06/15/29 | 148,317 | ||||||||
| 231,737 | GNMA I Pool #509965 | 5.500 | % | 06/15/29 | 262,659 | ||||||||
| 14,397 | GNMA I Pool #538314 | 7.000 | % | 02/15/32 | 16,899 | ||||||||
| 52,122 | GNMA I Pool #595606 | 6.000 | % | 11/15/32 | 59,326 | ||||||||
| 9,708 | GNMA I Pool #602377 | 4.500 | % | 06/15/18 | 10,561 | ||||||||
| 17,651 | GNMA I Pool #603377 | 4.500 | % | 01/15/18 | 19,242 | ||||||||
| 159,075 | GNMA I Pool #615403 | 4.500 | % | 08/15/33 | 175,018 | ||||||||
| 85,211 | GNMA I Pool #616829 | 5.500 | % | 01/15/25 | 95,889 | ||||||||
| 101,493 | GNMA I Pool #623190 | 6.000 | % | 12/15/23 | 115,617 | ||||||||
| 348,018 | GNMA I Pool #624600 | 6.150 | % | 01/15/34 | 396,120 | ||||||||
| 68,954 | GNMA I Pool #640940 | 5.500 | % | 05/15/35 | 78,305 | ||||||||
| 30,001 | GNMA I Pool #658267 | 6.500 | % | 02/15/22 | 33,056 | ||||||||
| 836,442 | GNMA I Pool #711286 | 6.500 | % | 10/15/32 | 969,855 | ||||||||
| 31,650 | GNMA I Pool #780429 | 7.500 | % | 09/15/26 | 36,952 | ||||||||
| 185,532 | GNMA I Pool #780492 | 7.000 | % | 09/15/24 | 213,003 | ||||||||
| 92,588 | GNMA I Pool #780685 | 6.500 | % | 12/15/27 | 105,582 | ||||||||
| 109,221 | GNMA I Pool #780977 | 7.500 | % | 12/15/28 | 131,099 | ||||||||
| 272,865 | GNMA I Pool #781120 | 7.000 | % | 12/15/29 | 318,070 | ||||||||
| 1,275,400 | GNMA I Pool #781804 | 6.000 | % | 09/15/34 | 1,451,684 | ||||||||
| 21,120 | GNMA II Pool #000723 | 7.500 | % | 01/20/23 | 24,486 | ||||||||
| 1,714 | GNMA II Pool #001596 | 9.000 | % | 04/20/21 | 2,040 | ||||||||
| 23,543 | GNMA II Pool #002268 | 7.500 | % | 08/20/26 | 27,806 | ||||||||
| 65,889 | GNMA II Pool #002442 | 6.500 | % | 06/20/27 | 75,418 | ||||||||
| 3,606 | GNMA II Pool #002855 | 8.500 | % | 12/20/29 | 4,411 | ||||||||
| 110,008 | GNMA II Pool #003284 | 5.500 | % | 09/20/32 | 124,333 | ||||||||
| 71,917 | GNMA II Pool #003401 | 4.500 | % | 06/20/33 | 79,125 | ||||||||
| 414,569 | GNMA II Pool #003403 | 5.500 | % | 06/20/33 | 468,295 | ||||||||
| 111,200 | GNMA II Pool #003554 | 4.500 | % | 05/20/34 | 122,090 | ||||||||
| 289,934 | GNMA II Pool #003689 | 4.500 | % | 03/20/35 | 318,058 | ||||||||
| 716,343 | GNMA II Pool #003931 | 6.000 | % | 12/20/36 | 812,289 | ||||||||
| 38,049 | GNMA II Pool #004149 | 7.500 | % | 05/20/38 | 45,647 | ||||||||
| 1,129,977 | GNMA II Pool #004260 | 6.000 | % | 10/20/38 | 1,247,142 | ||||||||
| 162,957 | GNMA II Pool #004284 | 5.500 | % | 11/20/38 | 178,515 | ||||||||
| 629,512 | GNMA II Pool #004291 | 6.000 | % | 11/20/38 | 711,860 | ||||||||
| 404,032 | GNMA II Pool #004308 | 5.000 | % | 12/20/38 | 436,746 | ||||||||
| 359,900 | GNMA II Pool #004412 | 5.000 | % | 04/20/39 | 395,114 | ||||||||
| 707,512 | GNMA II Pool #004561 | 6.000 | % | 10/20/39 | 801,762 | ||||||||
| 637,578 | GNMA II Pool #004751 | 7.000 | % | 12/20/38 | 741,491 | ||||||||
| 164,553 | GNMA II Pool #004752 | 7.500 | % | 11/20/38 | 197,207 | ||||||||
| 477,366 | GNMA II Pool #004753 | 8.000 | % | 08/20/30 | 574,424 | ||||||||
| 512,898 | GNMA II Pool #004805 | 6.500 | % | 09/20/40 | 586,354 | ||||||||
| 174,219 | GNMA II Pool #004808 | 8.000 | % | 01/20/31 | 210,841 | ||||||||
| 977,995 | GNMA II Pool #004838 | 6.500 | % | 10/20/40 | 1,118,521 | ||||||||
| 1,173,532 | GNMA II Pool #004848 | 3.500 | % | 11/20/40 | 1,210,352 | ||||||||
| 344,612 | GNMA II Pool #004993 | 7.000 | % | 03/20/41 | 400,698 | ||||||||
| 500,000 | GNMA II Pool #005257 | 4.000 | % | 12/20/41 | 528,266 | ||||||||
| 94,769 | GNMA II Pool #575787 | 5.760 | % | 03/20/33 | 106,991 | ||||||||
| 102,295 | GNMA II Pool #608120 | 6.310 | % | 01/20/33 | 116,188 | ||||||||
| 290,488 | GNMA II Pool #610116 | 5.760 | % | 04/20/33 | 328,269 | ||||||||
| See Notes to Financial Statements. | 57 | |
Wright Current Income Fund (WCIF)
Portfolio of Investments – As of December 31, 2011
Wright Current Income Fund (WCIF)
| Face Amount | Description | Coupon Rate | Maturity Date | Value | |||||||||
| AGENCY MORTGAGE-BACKED SECURITIES (CONTINUED) | |||||||||||||
| $ | 68,248 | GNMA II Pool #610143 | 5.760 | % | 06/20/33 | $ | 77,050 | ||||||
| 230,544 | GNMA II Pool #612121 | 5.760 | % | 07/20/33 | 260,277 | ||||||||
| 219,904 | GNMA II Pool #648541 | 6.000 | % | 10/20/35 | 249,037 | ||||||||
| 1,075,525 | GNMA II Pool #719213 | 6.500 | % | 02/20/33 | 1,230,401 | ||||||||
| 781,191 | GNMA, Series 1998-21, Class ZB | 6.500 | % | 09/20/28 | 904,863 | ||||||||
| 176,165 | GNMA, Series 1999-25, Class TB | 7.500 | % | 07/16/29 | 210,209 | ||||||||
| 672,328 | GNMA, Series 1999-4, Class ZB | 6.000 | % | 02/20/29 | 763,743 | ||||||||
| 258,870 | GNMA, Series 2000-14, Class PD | 7.000 | % | 02/16/30 | 306,703 | ||||||||
| 201,970 | GNMA, Series 2001-4, Class PM | 6.500 | % | 03/20/31 | 235,712 | ||||||||
| 254,983 | GNMA, Series 2002-22, Class GF | 6.500 | % | 03/20/32 | 294,049 | ||||||||
| 173,528 | GNMA, Series 2002-40, Class UK | 6.500 | % | 06/20/32 | 201,763 | ||||||||
| 137,977 | GNMA, Series 2002-45, Class QE | 6.500 | % | 06/20/32 | 158,546 | ||||||||
| 223,317 | GNMA, Series 2002-6, Class GE | 6.500 | % | 01/20/32 | 251,503 | ||||||||
| 112,374 | GNMA, Series 2002-7, Class PG | 6.500 | % | 01/20/32 | 130,672 | ||||||||
| 214,000 | GNMA, Series 2003-103, Class PC | 5.500 | % | 11/20/33 | 248,415 | ||||||||
| 154,000 | GNMA, Series 2003-46, Class HA | 4.500 | % | 06/20/33 | 174,671 | ||||||||
| 179,000 | GNMA, Series 2003-46, Class MA | 5.000 | % | 05/20/33 | 204,712 | ||||||||
| 575,000 | GNMA, Series 2003-57, Class C | 4.500 | % | 04/20/33 | 646,960 | ||||||||
| 117,000 | GNMA, Series 2004-16, Class GB | 5.500 | % | 06/20/33 | 128,015 | ||||||||
| 125,000 | GNMA, Series 2004-63, Class AG | 6.000 | % | 07/20/32 | 146,025 | ||||||||
| 294,248 | GNMA, Series 2005-17, Class GE | 5.000 | % | 02/20/35 | 319,255 | ||||||||
| 100,000 | GNMA, Series 2005-93, Class BH | 5.500 | % | 06/20/35 | 116,971 | ||||||||
| 179,000 | GNMA, Series 2006-17, Class TW | 6.000 | % | 04/20/36 | 216,675 | ||||||||
| 120,000 | GNMA, Series 2007-18, Class B | 5.500 | % | 05/20/35 | 130,023 | ||||||||
| 300,000 | GNMA, Series 2008-35, Class EH | 5.500 | % | 03/20/38 | 362,476 | ||||||||
| 157,000 | GNMA, Series 2009-47, Class LT | 5.000 | % | 06/20/39 | 181,242 | ||||||||
| 2,000,000 | GNMA, Series 2010-116, Class PB | 5.000 | % | 06/16/40 | 2,276,729 | ||||||||
| 321,595 | Vendee Mortgage Trust, Series 1996-1, Class 1Z | 6.750 | % | 02/15/26 | 377,125 | ||||||||
| 264,348 | Vendee Mortgage Trust, Series 1998-1, Class 2E | 7.000 | % | 03/15/28 | 309,444 | ||||||||
| Total Agency Mortgage-Backed Securities (identified cost, $57,511,943) | $ | 60,154,452 | |||||||||||
| TOTAL FIXED INCOME INVESTMENTS (identified cost, $57,511,943) — 98.1% | $ | 60,154,452 | |||||||||||
| SHORT-TERM INVESTMENTS - 4.4% | |||||||||||||
| $ | 2,732,046 | Fidelity Government Money Market Fund, 0.01% (1) | $ | 2,732,046 | |||||||||
| TOTAL SHORT-TERM INVESTMENTS (identified cost, $2,732,046) — 4.4% | $ | 2,732,046 | |||||||||||
| TOTAL INVESTMENTS (identified cost, $60,243,989) — 102.5% | $ | 62,886,498 | |||||||||||
| LIABILITIES, IN EXCESS OF OTHER ASSETS — (2.5)% | (1,561,082 | ) | |||||||||||
| NET ASSETS — 100.0% | $ | 61,325,416 | |||||||||||
FHLMC — Federal Home Loan Mortgage Corporation
FNMA — Federal National Mortgage Association
GNMA — Government National Mortgage Association
| (1) | Variable rate security. Rate presented is as of December 31, 2011. |
| See Notes to Financial Statements. | 58 | |
Wright Current Income Fund (WCIF)
| As of December 31, 2011 | For the Year Ended December 31, 2011 | |||||||||||||
| ASSETS: | INVESTMENT INCOME (Note 1C) | |||||||||||||
| Investments, at value | 0 | Dividend income | $ | 328 | ||||||||||
| (identified cost $60,243,989) (Note 1A) | $ | 62,886,498 | Interest income | 1,910,335 | ||||||||||
| Receivable for fund shares sold | 11,676 | Total investment income | $ | 1,910,663 | ||||||||||
| Receivable for investment securities sold | 24,582 | |||||||||||||
| Dividends and interest receivable | 258,066 | Expenses – | ||||||||||||
| Prepaid expenses and other assets | 20,182 | Investment adviser fee (Note 3) | $ | 218,859 | ||||||||||
| Total assets | $ | 63,201,004 | Administrator fee (Note 3) | 43,773 | ||||||||||
| Trustee expense (Note 3) | 21,023 | |||||||||||||
| LIABILITIES: | Custodian fee | 4,933 | ||||||||||||
| Payable for fund shares reacquired | $ | 50,279 | Accountant fee | 39,847 | ||||||||||
| Payable for investment securities purchased | 1,706,896 | Distribution expenses (Note 4) | 121,588 | |||||||||||
| Distributions payable | 96,372 | Transfer agent fee | 35,946 | |||||||||||
| Accrued expenses and other liabilities | 22,041 | Printing | 231 | |||||||||||
| Total liabilities | $ | 1,875,588 | Shareholder communications | 8,372 | ||||||||||
| NET ASSETS | $ | 61,325,416 | Audit services | 20,492 | ||||||||||
| Legal services | 3,157 | |||||||||||||
| NET ASSETS CONSIST OF: | Compliance services | 1,026 | ||||||||||||
| Paid-in capital | $ | 59,618,742 | Registration costs | 19,160 | ||||||||||
| Undistributed net investment income | 22 | Miscellaneous | 39,622 | |||||||||||
| Accumulated net realized loss on investments | (935,857 | ) | Total expenses | $ | 578,029 | |||||||||
| Unrealized appreciation on investments | 2,642,509 | |||||||||||||
| Net assets applicable to outstanding shares | $ | 61,325,416 | Deduct – | |||||||||||
| Waiver and/or reimbursement by the principal underwriter and/or investment adviser (Note 4) | $ | (140,390 | ) | |||||||||||
| SHARES OF BENEFICIAL INTEREST OUTSTANDING AT $0.000 PAR VALUE (UNLIMITED SHARES AUTHORIZED) | 6,069,799 | Net expenses | $ | 437,639 | ||||||||||
| Net investment income | $ | 1,473,024 | ||||||||||||
| NET ASSET VALUE, OFFERING PRICE, AND REDEMPTION PRICE PER SHARE OF BENEFICIAL INTEREST | $ | 10.10 | ||||||||||||
| REALIZED AND UNREALIZED GAIN ON INVESTMENTS: | ||||||||||||||
| Net realized gain on investment transactions | $ | 251,314 | ||||||||||||
| Net change in unrealized appreciation (depreciation) on investments | 1,174,061 | |||||||||||||
| Net realized and unrealized gain on investments | $ | 1,425,375 | ||||||||||||
| Net increase in net assets from operations | $ | 2,898,399 | ||||||||||||
| See Notes to Financial Statements. | 59 | |
Wright Current Income Fund (WCIF)
| Years Ended | ||||||||||
| STATEMENTS OF CHANGES IN NET ASSETS | December 31, 2011 | December 31, 2010 | ||||||||
| INCREASE (DECREASE) IN NET ASSETS: | ||||||||||
From operations – | ||||||||||
| Net investment income | $ | 1,473,024 | $ | 1,368,857 | ||||||
| 0 | Net realized gain on investment transactions | 251,314 | 244,084 | |||||||
| Net change in unrealized appreciation (depreciation) on investments | 1,174,061 | 261,790 | ||||||||
| Net increase in net assets from operations | $ | 2,898,399 | $ | 1,874,731 | ||||||
| Distributions to shareholders (Note 2) | ||||||||||
| From net investment income | $ | (1,997,208 | ) | $ | (1,698,180 | ) | ||||
| Total distributions | $ | (1,997,208 | ) | $ | (1,698,180 | ) | ||||
| Net increase in net assets resulting from fund share transactions (Note 6) | $ | 19,839,935 | $ | 7,378,534 | ||||||
| Net increase in net assets | $ | 20,741,126 | $ | 7,555,085 | ||||||
| NET ASSETS: | ||||||||||
| At beginning of year | 40,584,290 | 33,029,205 | ||||||||
| At end of year | $ | 61,325,416 | $ | 40,584,290 | ||||||
| UNDISTRIBUTED NET INVESTMENT INCOME INCLUDED IN NET ASSETS AT END OF YEAR | $ | 22 | $ | 1,499 | ||||||
| See Notes to Financial Statements. | 60 | |
Wright Current Income Fund (WCIF)
These financial highlights reflect selected data for a share outstanding throughout each year.
| Years Ended December 31, | ||||||||||||||||||
| 2011 | 2010 | 2009 | 2008 | 2007 | ||||||||||||||
| Net asset value, beginning of year | $ | 9.910 | $ | 9.830 | $ | 9.700 | $ | 9.590 | $ | 9.510 | ||||||||
| Income (loss) from investment operations: | ||||||||||||||||||
Net investment income (1) | 0.303 | 0.377 | 0.472 | 0.447 | 0.455 | |||||||||||||
| Net realized and unrealized gain | 0.302 | 0.175 | 0.118 | 0.122 | 0.078 | |||||||||||||
| Total income from investment operations | 0.605 | 0.552 | 0.590 | 0.569 | 0.533 | |||||||||||||
| Less distributions: | ||||||||||||||||||
| From net investment income | (0.415 | ) | (0.472 | ) | (0.460 | ) | (0.459 | ) | (0.444 | ) | ||||||||
| From net realized gains | — | — | — | — | (0.009 | ) | ||||||||||||
| Total distributions | (0.415 | ) | (0.472 | ) | (0.460 | ) | (0.459 | ) | (0.453 | ) | ||||||||
| Net asset value, end of year | $ | 10.100 | $ | 9.910 | $ | 9.830 | $ | 9.700 | $ | 9.590 | ||||||||
Total Return(2) | 6.22 | % | 5.70 | % | 6.20 | % | 6.10 | % | 5.77 | % | ||||||||
Ratios/Supplemental Data(3): | ||||||||||||||||||
| Net assets, end of year (000 omitted) | $61,325 | $40,584 | $33,029 | $38,806 | $39,699 | |||||||||||||
| Ratios (As a percentage of average daily net assets): | ||||||||||||||||||
| Net expenses | 0.90 | % | 0.90 | % | 0.92 | % | 0.96 | % | 0.96 | % | ||||||||
| Net expenses after custodian fee reduction | N/A | N/A | 0.92 | % | 0.95 | % | 0.95 | % | ||||||||||
| Net investment income | 3.03 | % | 3.79 | % | 4.81 | % | 4.66 | % | 4.80 | % | ||||||||
| Portfolio turnover rate | 50 | % | 54 | % | 57 | % | 57 | % | 47 | % | ||||||||
| (1) | Computed using average shares outstanding. | |||||||||||||||||
| (2) | Total return is calculated assuming a purchase at the net asset value on the first day and a sale at the net asset value on the last day of each year reported. Dividends and distributions, if any, are assumed to be reinvested at the net asset value on the reinvestment date. | |||||||||||||||||
| (3) | For each of the years presented, the operating expenses of the Fund were reduced by a waiver of fees and/or allocation of expenses to the principal underwriter and/or investment adviser. Had such action not been undertaken, expenses and net investment income ratios would have been as follows: | |||||||||||||||||
| 2011 | 2010 | 2009 | 2008 | 2007 | ||||||||||||||
| Ratios (As a percentage of average daily net assets): | ||||||||||||||||||
| Expenses | 1.19 | % | 1.33 | % | 1.32 | % | 1.24 | % | 1.23 | % | ||||||||
| Expenses after custodian fee reduction | N/A | N/A | 1.32 | % | 1.23 | % | 1.22 | % | ||||||||||
| Net investment income | 2.74 | % | 3.36 | % | 4.41 | % | 4.38 | % | 4.52 | % | ||||||||
| See Notes to Financial Statements. | 61 | |
The Wright Managed Income Trust
Notes to Financial Statements
1. Significant Accounting Policies
Wright Total Return Bond Fund (“WTRB”) and Wright Current Income Fund (“WCIF”) (each a “Fund” and collectively, the “Funds”) (the Funds constituting Wright Managed Income Trust (the “Trust”)), is registered under the Investment Company Act of 1940, as amended (the “1940 Act”), as a diversified, open-end management investment company. WTRB seeks a superior rate of total return, consisting of a high level of income plus price appreciation. WCIF seeks a high level of current income consistent with moderate fluctuations of principal.
The following is a summary of significant accounting policies consistently followed by the Trust in the preparation of its financial statements. The policies are in conformity with accounting principles generally accepted in the United States of America (“GAAP”).
A. Investment Valuations – Debt obligations, including listed securities and securities for which quotations are readily available, will normally be valued on the basis of reported trades or market quotations provided by third party pricing services, when these prices are representative of the securities’ market values. For debt securities where market quotations are not readily available, the pricing services will use various techniques that consider factors including, but not limited to, prices or yields of securities with similar characteristics, benchmark yields, broker/dealer quotes, issuer spreads, as well as industry and economic events. Short-term debt securities with a remaining maturity of sixty days or less are generally valued at amortized cost, which approximates market value. If short-term debt securities are acquired with a remaining maturity of more than sixty days, they will be valued by a pricing service as described above. Investments for which valuations or market quotations are not readily available or are deemed unreliable are valued at fair value using methods determined in good faith by or at the direction of the Trustees of the Funds in a manner that most fairly reflects the security’s value, or the amount that the Funds might reasonably expect to receive for the security upon its current sale in the ordinary course. Each such determination is based on a consideration of all relevant factors, which are likely to vary from one pricing context to another. These factors may include, but are not limited to, the type of security, the existence of any contractual restrictions on the security’s disposition, the price and extent of public trading in similar securities of the issuer or of comparable companies, quotations or relevant information obtained from broker-dealers or other market participants, information obtained from the issuer, analysts, and/or the appropriate stock exchange (for exchange-traded securities), an analysis of the company’s financial condition, and an evaluation of the forces that influence the issuer and the market(s) in which the security is purchased and sold.
B. Investment Transactions – Investment transactions for financial statement purposes are accounted for on a trade date basis. Realized gains and losses on investments sold are determined on the basis of identified cost.
C. Income – Dividend income is recorded on the ex-dividend date. However, if the ex-dividend date has passed, certain dividends from foreign securities are recorded as the Funds are informed of the ex-dividend date. Withholding taxes on foreign dividends and capital gains have been provided for in accordance with the Funds’ understanding of applicable countries’ tax rules and rates. Interest income is recorded on the basis of interest accrued, adjusted for amortization of premium and accretion of discount. Paydown gains and losses are included in interest income.
D. Federal Taxes – Each Fund’s policy is to comply with the provisions of the Internal Revenue Code (the “Code”) applicable to regulated investment companies and to distribute to shareholders each year substantially all of its net investment income and all or substantially all of its net realized capital gains. Accordingly, no provision for federal income or excise tax is necessary. At December 31, 2011, WTRB and WCIF, for federal income tax purposes, had capital loss carryovers of $1,798,213 and $851,407, respectively, which will reduce each Fund’s taxable income arising from future net realized gain on investment transactions, if any, to the extent permitted by the Code, and thus will reduce the amount of the distributions to shareholders, which would otherwise be necessary to relieve the Funds of any liability for federal income or excise tax. Pursuant to the Code, such capital loss carryovers will expire as follows:
62
The Wright Managed Income Trust
Notes to Financial Statements
| December 31, | WTRB | WCIF | ||
| 2012 | $ - | $248,470 | ||
| 2013 | 211,311 | 196,117 | ||
| 2014 | 1,088,772 | - | ||
| 2015 | 199,047 | 160,341 | ||
| 2017 | 299,083 | - | ||
As a result of the Regulated Investment Company Modernization Act of 2010, net capital losses realized on or after January 1, 2011 (effective date) may be carried forward indefinitely to offset future realized capital gains; however, post-effective losses must be used before pre-effective capital loss carry overs with expiration dates. Therefore, it is possible that all or a portion of a fund’s pre-effective capital loss carry overs could expire unused. In addition to the amounts noted in the table above, WCIF has $246,479 available capital loss carry overs that have no expiration date.
A capital loss carryover of $444,587, included in WCIF’s amount in the table above, is available to the Fund as a result of the reorganization of Wright U.S. Government Near Term Fund on December 9, 2006. Utilization of this capital loss carryover may be limited in accordance with certain income tax regulations.
As of December 31, 2011, the Funds had no uncertain tax positions that would require financial statement recognition, de-recognition, or disclosure. Each of the Funds’ federal tax returns filed in the 3-year period ended December 31, 2011, remains subject to examination by the Internal Revenue Service.
E. Expenses – The majority of expenses of the Trust are directly identifiable to an individual Fund. Expenses which are not readily identifiable to a specific Fund are allocated taking into consideration, among other things, the nature and type of expense and the relative size of the Funds.
F. Use of Estimates – The preparation of financial statements in conformity with GAAP requires management to make estimates and assumptions that affect the reported amounts of assets and liabilities and disclosure of contingent assets and liabilities at the date of the financial statements and the reported amounts of income and expense during the reporting period. Actual results could differ from those estimates.
G. Indemnifications – Under each Fund’s organizational documents, its officers and Trustees may be indemnified against certain liabilities and expenses arising out of the performance of their duties to the Funds, and shareholders are indemnified against personal liability for the obligations of the Funds. Additionally, in the normal course of business, the Funds enter into agreements with service providers that may contain indemnification clauses. Each Fund’s maximum exposure under these arrangements is unknown as this would involve future claims that may be made against the Funds that have not yet occurred.
2. Distributions to Shareholders
The net investment income of each Fund is determined daily, and substantially all of the net investment income so determined is declared daily as a dividend to shareholders of record at the time of declaration. Distributions are generally paid monthly. Distributions of net realized capital gains (reduced by available capital loss carryforwards from prior years, if any) are made at least annually. Shareholders may reinvest income and capital gain distributions in additional shares of the same Fund at the net asset value as of the reinvestment date or, at the election of the shareholder, receive distributions in cash. The Funds distinguish between distributions on a tax basis and a financial reporting basis. GAAP requires that only distributions in excess of tax basis earnings and profits be reported in the financial statements as a return of capital. Permanent differences between book and tax accounting relating to distributions are reclassified to paid-in capital.
63
The Wright Managed Income Trust
Notes to Financial Statements
The tax character of distributions paid for the year ended December 31, 2011, and December 31, 2010, was as follows:
| Year Ended 12/31/11 | WTRB | WCIF | |||||
| Distributions declared from: | |||||||
| Ordinary income | $ | 1,214,917 | $ | 1,997,208 | |||
| Year Ended 12/31/10 | |||||||
| Distributions declared from: | |||||||
| Ordinary income | $ | 1,108,572 | $ | 1,698,180 |
During the year ended December 31, 2011, the following amounts were reclassified due to differences between book and tax accounting, primarily for premium amortization and paydown gain (loss).
| Increase (decrease): | WTRB | WCIF | |||||||
| Paid-in capital | $ | (112 | ) | $ | - | ||||
| Accumulated net realized gain (loss) | (224,905 | ) | (522,707 | ) | |||||
| Accumulated undistributed net investment income (loss) | 225,017 | 522,707 |
These reclassifications had no effect on the net assets or net asset value per share of the Funds.
As of December 31, 2011, the components of distributable earnings (accumulated losses) on a tax basis were as follows:
| WTRB | WCIF | |||||||
| Undistributed ordinary income | $ | - | $ | 22 | ||||
| Capital loss carryforward and post October losses | (1,798,213 | ) | (851,407 | ) | ||||
| Unrealized appreciation | 1,703,663 | 2,558,059 | ||||||
| Total | $ | (94,550 | ) | $ | 1,706,674 |
The difference between components of distributable earnings (accumulated losses) on a tax basis and the amounts reflected in the Statements of Assets and Liabilities are primarily due to wash sales, premium amortization and paydown gain (loss).
3. Investment Adviser Fee and Other Transactions with Affiliates
The investment adviser fee is earned by Wright Investor Services, Inc. (“Wright”) as compensation for investment advisory services rendered to the Funds. The fees are computed at annual rates of the Funds' average daily net assets as noted below, and are payable monthly.
| Annual Advisory Fee Rates | |||||
| Fund | Under $100 Million | $100 Million to $250 Million | $250 Million to $500 Million | $500 Million to $1 Billion | Over $1 Billion |
| WTRB | 0.45% | 0.44% | 0.42% | 0.40% | 0.35% |
| WCIF | 0.45% | 0.44% | 0.42% | 0.40% | 0.35% |
For the year ended December 31, 2011, the fee and the effective annual rate, as a percentage of average daily net assets for each of the Funds were as follows:
| Fund | Investment Adviser Fee | Effective Annual Rate |
| WTRB | $138,549 | 0.45% |
| WCIF | $218,859 | 0.45% |
64
The Wright Managed Income Trust
Notes to Financial Statements
The administrator fee is earned by Wright for administering the business affairs of each Fund. The fee is computed at an annual rate of 0.07% of the average daily net assets up to $100 million for WTRB and an annual rate of 0.09% of the average daily net assets up to $100 million for WCIF, and 0.05% of average daily net assets over $100 million. Atlantic Fund Administration, LLC (d/b/a Atlantic Fund Services) (“Atlantic”) serves as sub-administrator of the Funds to perform certain services of the administrator as may be agreed upon between the administrator and sub-administrator. The sub-administration fee is paid by Wright.
For the year ended December 31, 2011, the administrator fee for WTRB and WCIF amounted to $21,552 and $43,773, respectively.
Certain Trustees and officers of the Trust are Trustees or officers of the above organizations and/or of the Funds’ principal underwriter. Except as to Trustees of the Trust who are not employees of Atlantic or Wright, Trustees and officers receive remuneration for their services to the Trust out of the fees paid to Atlantic and Wright. The Trustees are compensated by the Trust in conjunction with the Wright Managed Equity Trust, rather than on a per Trust or per Fund basis. Quarterly retainer fees are paid in the amount of $4,000 to the Lead Trustee, $3,500 to the Secretary of Independent Trustees, and $3,000 each to the remaining Trustees. In addition, each Trustee will be paid a fee of $1,500 for each regular Board meeting attended. Each Trustee is also reimbursed for all reasonable out-of-pocket expenses incurred in connection with his duties as a Trustee, including travel and related expenses incurred in attending Board meetings. The amount of Trustees’ fees attributable to each Fund is disclosed in each Fund’s Statement of Operations.
4. Distribution and Service Plans
The Trust has in effect a Distribution Plan (the “Plan”) pursuant to Rule 12b-1 of the 1940 Act. The Plan provides that each Fund will pay Wright Investors’ Service Distributors, Inc. (“WISDI”), the principal underwriter, a wholly-owned subsidiary of The Winthrop Corporation and an affiliate of Wright, a distribution fee of 0.25% of the average daily net assets of each Fund for distribution services and facilities provided to the Funds by WISDI. Distribution fees paid or accrued to WISDI for the year ended December 31, 2011, for WTRB and WCIF were $76,971 and $121,588, respectively. In addition, the Trustees have adopted a service plan (the “Service Plan”) which allows the Funds to reimburse the principal underwriter for payments to intermediaries for providing account administration and personal and account maintenance services to their customers who are beneficial owners of each Fund’s shares. The combined amount of service fees payable under the Service Plan and Rule 12b-1 distribution fees may not exceed 0.25% annually of each Fund’s average daily net assets. For the year ended December 31, 2011, the Funds did not accrue or pay any service fees.
Pursuant to an Expense Limitation Agreement, Wright and WISDI have agreed to waive all or a portion of their fees and reimburse expenses to the extent that total annual operating expenses exceed 0.95% and 1.00% of the average daily net assets of WTRB and WCIF, respectively, through April 30, 2012 (excluding interest, taxes, brokerage commissions, other expenditures which are capitalized in accordance with GAAP, and other extraordinary expenses not incurred in the ordinary course of the Fund’s business). Thereafter, the waiver and reimbursement may be changed or terminated at any time. In addition, Wright and WISDI have voluntarily agreed to further limit the total annual expenses of WCIF to 0.90% of its average daily net assets. Such voluntary limitation may be terminated at any time. Pursuant to these agreements and voluntary limitation, Wright waived and/or reimbursed investment adviser fees of $50,988 and $18,802 for WTRB and WCIF, respectively. WISDI waived distribution fees of $76,971 and $121,588 for WTRB and WCIF, respectively.
5. Investment Transactions
Purchases and sales (including maturities and paydowns) of investments, other than short-term obligations, were as follows:
65
The Wright Managed Income Trust
Notes to Financial Statements
| Year Ended December 31, 2011 | ||||
| WTRB | WCIF | |||
| Purchases - | ||||
| Non-U.S. Government & Agency Obligations | $4,033,899 | $ - | ||
| U.S. Government & Agency Obligations | $12,412,706 | $43,651,310 | ||
| Sales - | ||||
| Non-U.S. Government & Agency Obligations | $3,452,785 | $66,510 | ||
| U.S. Government & Agency Obligations | $14,592,251 | $23,697,035 | ||
6. Shares of Beneficial Interest
The Declaration of Trust permits the Trustees to issue an unlimited number of full and fractional shares of beneficial interest (without par value). Transactions in Fund shares were as follows:
| Year Ended December 31, 2011 | Year Ended December 31, 2010 | |||||||||||||||
| Shares | Amount | Shares | Amount | |||||||||||||
| WTRB | ||||||||||||||||
| Sold | 620,725 | $ | 8,102,660 | 969,280 | $ | 12,544,600 | ||||||||||
| Issued to shareholders in payment of distributions declared | 56,493 | 737,603 | 61,226 | 792,638 | ||||||||||||
| Redemptions | (806,155 | ) | (10,522,621 | ) | (530,770 | ) | (6,846,658 | ) | ||||||||
| Net increase (decrease) | (128,937 | ) | $ | (1,682,358 | ) | 499,736 | $ | 6,490,580 | ||||||||
| Year Ended December 31, 2011 | Year Ended December 31, 2010 | |||||||||||||||
| Shares | Amount | Shares | Amount | |||||||||||||
| WCIF | ||||||||||||||||
| Sold | 4,106,579 | $ | 41,203,680 | 2,147,771 | $ | 21,431,508 | ||||||||||
| Issued to shareholders in payment of distributions declared | 108,804 | 1,090,141 | 110,447 | 1,099,985 | ||||||||||||
| Redemptions | (2,239,228 | ) | (22,453,886 | ) | (1,524,435 | ) | (15,152,959 | ) | ||||||||
| Net increase | 1,976,155 | $ | 19,839,935 | 733,783 | $ | 7,378,534 | ||||||||||
7. Federal Income Tax Basis of Investments
The cost and unrealized appreciation (depreciation) of the investment securities owned at December 31, 2011, as computed on a federal income tax basis, were as follows:
| Year Ended December 31, 2011 | ||||||||
| WTRB | WCIF | |||||||
| Aggregate cost | $ | 28,588,100 | $ | 60,328,439 | ||||
| Gross unrealized appreciation | $ | 1,864,045 | $ | 2,583,048 | ||||
| Gross unrealized depreciation | (160,382 | ) | (24,989 | ) | ||||
| Net unrealized appreciation | $ | 1,703,663 | $ | 2,558,059 | ||||
66
The Wright Managed Income Trust
Notes to Financial Statements
68
The Wright Managed Income Trust
8. Line of Credit
The Funds participate with other funds managed by Wright in a committed $10 million unsecured line of credit agreement with Union Bank of California, N.A. (“Union Bank”). The Funds may temporarily borrow from the line of credit to satisfy redemption requests or settle investment transactions. Interest is charged to each Fund based on its borrowings at an amount above the LIBOR rate. Because the line of credit is not available exclusively to each Fund, they may be unable to borrow some or all of the Funds’ requested amounts at any particular time. At December 31, 2011, WTRB had a balance outstanding pursuant to this line of credit of $4,399 at an interest rate of 1.30%.
The average borrowings and average interest rate (based on days with outstanding balances) for the year ended December 31, 2011, were as follows:
| WTRB | WCIF | |||
| Average borrowings | $217,323 | $4,405,760 | ||
| Average interest rate | 1.24% | 1.27% | ||
9. Fair Value Measurements
Under GAAP for fair value measurements, a three-tier hierarchy to prioritize the assumptions, referred to as inputs, is used in valuation techniques to measure fair value. The three-tier hierarchy of inputs is summarized in the three broad levels listed below.
• Level 1 – quoted prices in active markets for identical investments
• Level 2 – other significant observable inputs (including quoted prices for similar investments, interest rates, prepayment speeds, credit risk, etc.)
• Level 3 – significant unobservable inputs (including a fund’s own assumptions in determining the fair value of investments)
The inputs or methodology used for valuing securities are not necessarily an indication of the risk associated with investing in those securities.
At December 31, 2011, the inputs used in valuing each Fund’s investments, which are carried at value, were as follows:
WTRB
| Asset Description | Quoted Prices in Active Markets for Identical Assets (Level 1) | Significant Other Observable Inputs (Level 2) | Significant Unobservable Inputs (Level 3) | Total | ||||||
| Asset-Backed Securities | $ | - | $ | 702,266 | $ | - | $ | 702,266 | ||
| Commerical Mortgage-Backed Securities | - | 2,510,243 | - | 2,510,243 | ||||||
| Residential Mortgage-Backed Securities | - | 51,962 | - | 51,962 | ||||||
| Corporate Bonds | - | 14,334,226 | - | 14,334,226 | ||||||
| U.S. Government Interests | - | 12,692,822 | - | 12,692,822 | ||||||
| Short-Term Investments | - | 244 | - | 244 | ||||||
| Total Investments | $ | - | $ | 30,291,763 | $ | - | $ | 30,291,763 | ||
67
The Wright Managed Income Trust
Notes to Financial Statements
WCIF
WCIF
| Asset Description | Quoted Prices in Active Markets for Identical Assets (Level 1) | Significant Other Observable Inputs (Level 2) | Significant Unobservable Inputs (Level 3) | Total | ||||||
| Agency Mortgage-Backed Securities | $ | - | $ | 60,154,452 | $ | - | $ | 60,154,452 | ||
| Short-Term Investments | - | 2,732,046 | - | 2,732,046 | ||||||
| Total Investments | $ | - | $ | 62,886,498 | $ | - | $ | 62,886,498 | ||
The level classification by major category of investments is the same as the category presentation in each Fund’s Portfolio of Investments.
There were no significant transfers between Level 1 and Level 2 for the year ended December 31, 2011.
10. New Accounting Pronouncement
In May 2011, FASB issued ASU No. 2011-04 “Amendments to Achieve Common Fair Value Measurement and Disclosure Requirements in U.S. GAAP and IFRSs.” ASU No. 2011-04 establishes common requirements for measuring fair value and for disclosing information about fair value measurements in accordance with U.S. GAAP and International Financial Reporting Standards (“IFRSs”). ASU No. 2011-04 is effective for interim and annual periods beginning after December 15, 2011. Management is currently evaluating the impact ASU No. 2011-04 may have on financial statement disclosures.
11. Regulated Investment Company Modernization Act
The Regulated Investment Company Modernization Act of 2010 (the “Modernization Act”) was enacted on December 22, 2010. The Modernization Act makes changes to several of the federal income and excise tax provisions impacting each Fund. In general, the provisions of the Modernization Act are effective for the Funds' fiscal year ending December 31, 2011. The Modernization Act provides several benefits, including unlimited carryover on future capital losses, simplification provisions on asset diversification and/or qualifying income tests, and several provisions aimed at preserving the character of distributions made by a fiscal year regulated investment company.
12. Review for Subsequent Events
In connection with the preparation of the financial statements of the Funds as of and for the year ended December 31, 2011, events and transactions subsequent to December 31, 2011, have been evaluated by the Funds’ management for possible adjustment and/or disclosure. Management has not identified any subsequent events requiring financial statement disclosure as of the date these financial statements were issued.
68
The Wright Managed Income Trust
Report of Independent Registered Public Accounting Firm
To the Board of Trustees of The Wright Managed Income Trust
and the Shareholders of Wright Total Return Bond Fund and Wright Current Income Fund:
We have audited the accompanying statements of assets and liabilities of Wright Total Return Bond Fund and Wright Current Income Fund, each a series of shares of beneficial interest in The Wright Managed Income Trust (the “Funds”), including the portfolios of investments, as of December 31, 2011, and the related statements of operations for the year then ended, and the statements of changes in net assets and the financial highlights for each of the years in the two-year period then ended. These financial statements and financial highlights are the responsibility of the Funds’ management. Our responsibility is to express an opinion on these financial statements and financial highlights based on our audits. The financial highlights for each of the years in the three-year period ended December 31, 2009 were audited by other auditors whose report dated February 23, 2010, expressed an unqualified opinion on such financial highlights.
We conducted our audits in accordance with the standards of the Public Company Accounting Oversight Board (United States). Those standards require that we plan and perform the audits to obtain reasonable assurance about whether the financial statements and financial highlights are free of material misstatement. An audit includes examining, on a test basis, evidence supporting the amounts and disclosures in the financial statements. Our procedures included confirmation of securities owned as of December 31, 2011 by correspondence with the custodian and brokers. An audit also includes assessing the accounting principles used and significant estimates made by management, as well as evaluating the overall financial statement presentation. We believe that our audits provide a reasonable basis for our opinion.
In our opinion, the financial statements and financial highlights referred to above present fairly, in all material respects, the financial position of Wright Total Return Bond Fund and Wright Current Income Fund as of December 31, 2011, the results of their operations for the year then ended, and the changes in their net assets and their financial highlights for each of the years in the two-year period then ended, in conformity with accounting principles generally accepted in the United States of America.

BBD, LLP
Philadelphia, Pennsylvania
February 17, 2012
69
The Wright Managed Income Trust
Federal Tax Information (Unaudited)
The Form 1099-DIV you received in January 2012 showed the tax status of all distributions paid to your account in calendar year 2011. Shareholders are advised to consult their own tax adviser with respect to the tax consequences of their investment in the Funds.
Qualified Interest Income – Wright Total Return Bond Fund and Wright Current Income Fund designate 94.86% and 99.99%, respectively, as qualified interest income exempt from U.S. tax for foreign shareholders (QII).
70
Management and Organization (Unaudited)
_____________________________________________________________________
Fund Management. The Trustees of the Trust are responsible for the overall management and supervision of the affairs of the Trust. The Trustees and principal officers of the Trusts are listed below. Except as indicated, each individual has held the office shown or other offices in the same company for the last five years. The business address of each Trustee and principal officer is 440 Wheelers Farms Road, Milford, Connecticut 06461.
Definitions:
“WISDI” means Wright Investors’ Service Distributors, Inc., the principal underwriter of the Funds.
“Winthrop” means The Winthrop Corporation, a holding company which owns all of the shares of Wright and WISDI.
| Name, Address and Age | Position(s) with the Trust | Term* of Office and Length of Service | Principal Occupation(s) During Past Five Years | Number of Funds in Fund Complex Overseen by Trustee | Other Trustee/ Director/ Partnership/Employment Positions Held | |
| Interested Trustee | ||||||
Peter M. Donovan** Age 69 | President and Trustee | President and Trustee since Inception | Chairman, Chief Executive Officer, President and Director of Wright and Winthrop; Chief Investment Officer and Chairman of the Investment committee; a director of WISDI; President of 5 funds managed by Wright | 5 | None | |
A.M. Moody, III*** Age 75 | Vice President and Trustee | Vice President of the Trusts since December, 1990; Trustee of the Trusts since January, 1990 | President, AM Moody Consulting LLC (compliance and administrative services to the mutual fund industry) since July 1, 2003; President of WISDI since 2005; Vice President of 5 funds managed by Wright; Retired Senior Vice President of Wright and Winthrop; Retired President of WISDI June 30, 2003 to May 2005 | 5 | None | |
| Independent Trustees | ||||||
James J. Clarke Age 70 | Trustee | Trustee since December, 2002 | President, Clarke Consulting (bank consultant - financial management and strategic planning); Director - Reliance Bank, Altoona, PA since August 1995; Director - Quaint Oak Bank, Southampton, PA since March 2007; Associate Professor of Finance at Villanova University, 1972-2002. | 5 | None | |
Dorcas R. Hardy Age 65 | Trustee | Trustee since December, 1998 | President, Dorcas R. Hardy & Associates ( a public policy and government relations firm) Spotsylvania, VA; Director, The Options Clearing Corporation 1997-2005; Director, First Coast Service Options since 1998. | 5 | None | |
Richard E. Taber Age 63 | Trustee | Trustee since March, 1997 | Chairman and Chief Executive Officer of First Country Bank, Stamford, CT | 5 | None | |
| Principal Officers who are not Trustees | ||||||
Michael J. McKeen Age 40 | Treasurer | Treasurer since December, 2010 | Senior Vice President, Atlantic Fund Services, LLC 2008 to present; 2004 to 2008 Citigroup Fund Services, LLC; Officer of 5 funds managed by Wright | |||
Christopher A. Madden Age 44 | Secretary | Secretary since December 1, 2009 | Counsel at Atlantic Fund Services, LLC 2009 to present; 2005 to 2009 Citigroup Fund Services, LLC; 1997 to 2005 State Street Bank and Trust Company; Officer of 5 funds managed by Wright | |||
| * | Trustees serve an indefinite term. Officers are elected annually. | |||||
| ** | Mr. Donovan is an interested person of the Trusts because of his positions as President of the Trusts, Chairman, Chief Executive Officer and Director of Wright and Winthrop and Director of WISDI. | |||||
| *** | Mr. Moody is an interested person of the Trusts because his position as Vice President of the Trusts, President and Director of WISDI, and his affiliation as a consultant to Wright. | |||||
71
Board of Trustees
Annual Approval of the Investment Advisory Agreement (Unaudited)
In evaluating the Investment Advisory Contracts, the Independent Trustees met separately from the Interested Trustees and reviewed and considered materials furnished by Wright, including information regarding Wright, its affiliates and personnel, operations and financial condition. The Independent Trustees discussed with representatives of Wright the portfolio management and operations of the funds and the capabilities of Wright to provide advisory and other services to each fund. The Independent Trustees considered, among other things, the following:
1. Performance and Quality of Services. The Trustees considered the quality of services provided by Wright as well as Wright’s oversight of vendors. They noted that the vendor transitions during 2009 and 2010 have gone smoothly and the quality of customer service does not appear to be a concern. The Trustees also considered the resources devoted to Wright’s compliance efforts and the record of compliance. The Trustees concluded that the services being provided by Wright are as agreed to in the Advisory Contracts and that the quality of service is good.
The Trustees relied on market comparisons and Morningstar data to assess the performance of each Fund over one, three, five and ten year periods. The Trustees noted that Wright Selected Blue Chip Equities Fund (WSBC) underperformed its benchmark and outperformed its peer group in 2010. They also observed that, in the three to ten year time frames, WSBC had comparable performance to its peer group but lower performance relative to its benchmark.
The Trustees saw that Wright Major Blue Chip Equities Fund (WMBC) performed comparably to its benchmark and its peer group in 2010. While recognizing that the large market decline in the third quarter of 2008 distorted the longer term references, they noted that WMBC generally underperformed its peer group and benchmark in all time periods.
The Trustees observed that Wright International Blue Chip Equities Fund (WIBC) underperformed its benchmark and its peer group in 2010. They noted that WIBC underperformed its peer group and benchmark in all other time periods, although much of the longer term underperformance was tied to a large decline in 2008.
The Trustees noted Wright Total Return Bond Fund (WTRB) performed comparably to its benchmark in 2010, but fell behind its peer group during that period. They also noted that in prior periods WTRB performed comparably to the index while outperforming its peer group.
The Trustees observed that Wright Current Income Fund (WCIF) outperformed its peer group and was comparable to its benchmark in 2010, noting that WCIF has consistently outperformed its peer group across all time periods.
2. Fees and expense ratios. The Trustees noted that the Funds’ expense ratios exceed those of some of their peers, but are reasonably similar. The Trustees specifically noted that the WIBC’s net expense ratio exceeded its peer group average, although WIBC’s gross expense ratio and management fee were commensurate with the peer group average. They also considered the contractual expense limitations in place for each Fund. The Trustees concluded that, based upon the information provided by Wright, the compensation paid by the funds to Wright is in the average range of compensation charged by other advisers for similar services and appear fair, and also that the Funds’ expenses do not appear excessive.
3. Relationship of fees and performance. The Trustees recognized the impact of the decline in the equity market in 2008, noting that the equity Funds rebounded nicely in 2009 and 2010. They observed that performance in 2010 was slightly below average for the Funds generally, with the exception of WIBC which underperformed. The Trustees assessed each Fund’s fee structure against those of its peer group, as well as in comparison to the fee structure for private accounts. The Trustees concluded that, based on the overall short-term and long-term performance of the Funds, the fee structure appears to be fair and reasonable.
4. Profitability and Economies of Scale. The Trustees assessed the level of profitability to Wright as adviser to each Fund and concluded that such was reasonable and not excessive. The Trustees also considered Wright’s financial condition, and noted that a subsidy by Wright to any Fund limits overall profitability of that Fund to Wright. The Trustee observed that the Funds have breakpoints which appear to be typical and serve to limit concerns over economies of scale. The Trustees concluded that economies of scale are not a major concern at the Funds’ current asset levels.
72
Important Notices Regarding Privacy, Delivery of Shareholder
Documents, Portfolio Holdings and Proxy Voting (Unaudited)
73
The Wright Managed Blue Chip Investment Funds
Wright Investors’ Service, Inc.
Wright Investors’ Service Distributors, Inc.
Privacy Policy
Wright is committed to ensuring your financial privacy. Each of the above financial institutions has the following policy in effect with respect to nonpublic personal information about its customers:
| • The only such information we collect is information received from customers, through application forms or otherwise, and information which we necessarily receive in connection with your Wright fund transactions. |
| • We will not disclose this information to anyone except as required or permitted by law. Such disclosure includes that made to other companies such as transfer agents and their employees and to our employees, in each case as necessary to service your account. |
| • We have adopted polices and procedures (including physical, electronic and procedural safeguards) that are designed to protect the confidentiality of this information. |
For more information about Wright’s privacy policies please feel free to call (800) 888-9471.
Important Notice Regarding Delivery of Shareholders Documents
The Securities and Exchange Commission (the “SEC”) permits funds to deliver only one copy of shareholder documents, including prospectuses, proxy statements and shareholder reports, to fund investors with multiple accounts at the same residential or post office box address. This practice is often called “householding” and it helps eliminate duplicate mailings to shareholders.
Wright, or your financial adviser, may household the mailing of your documents indefinitely unless you instruct Wright, or your financial adviser, otherwise.
If you would prefer that your Wright documents not be householded, please contact Wright at (800) 888-9471, or your financial adviser.
Your instructions that householding not apply to delivery of your Wright documents will be effective within 30 days of receipt by Wright or your financial adviser.
Portfolio Holdings
In accordance with rules established by the SEC, the Funds send semi-annual and annual reports to shareholders that contain a complete list of portfolio holdings as of the end of the second and fourth quarters, respectively, within 60 days of quarter-end and after filing with the SEC. The Funds also disclose complete portfolio holdings as of the end of the first and third fiscal quarters on Form N-Q, which is filed with the SEC within 60 days of quarter-end. The Funds’ complete portfolio holdings as reported in annual and semi-annual reports and on Form N-Q are available for viewing on the SEC website at http://www.sec.gov and may be reviewed and copied at the SEC’s public reference room (information on the operation and terms of usage of the SEC public reference room is available at http://sec.gov/info/edgar/prrules.htm or by calling (800) SEC-0330). After filing, the Funds’ portfolio holdings as reported in annual and semi-annual reports are also available on Wright’s website at www.wisi.com and are available upon request at no additional cost by contacting Wright at (800) 888-9471.
Important Notices Regarding Privacy, Delivery of Shareholder
Documents, Portfolio Holdings and Proxy Voting (Unaudited)
Important Notices Regarding Privacy, Delivery of Shareholder
Documents, Portfolio Holdings and Proxy Voting (Unaudited)
Proxy Voting Policies and Procedures
From time to time funds are required to vote proxies related to the securities held by the funds. The Wright Managed Blue Chip Investment Funds vote proxies according to a set of policies and procedures approved by the Funds’ Board. You may obtain a description of these policies and procedures and information on how the Funds voted proxies relating to portfolio securities during the most recent 12-month period ended June 30 without charge, upon request, by calling (800) 888-9471. This description is also available on the SEC website at http://www.sec.gov.
74
This page intentionally left blank.
75
This page intentionally left blank.
76
ITEM 2. CODE OF ETHICS.
| (a) | As of the end of the period covered by this report, The Wright Managed Equity Trust (the “Registrant”) has adopted a code of ethics, which applies to its Principal Executive Officer and Principal Financial Officer (the “Code of Ethics”). |
| (c) | There have been no amendments to the Registrant’s Code of Ethics during the period covered by this report. |
| (d) | There have been no waivers to the Registrant’s Code of Ethics during the period covered by this report. |
| (e) | Not applicable. |
(f) (3) The registrant undertakes to provide a copy of such code of ethics to any person upon request, without charge, by calling 1-800-888-9471.
ITEM 3. AUDIT COMMITTEE FINANCIAL EXPERT.
The registrant’s Board has designate James J. Clarke, an independent trustee, as its audit committee financial expert. Mr. Clarke is the Principal of Clarke Consulting, a financial management and strategic planning firm.
ITEM 4. PRINCIPAL ACCOUNTANT FEES AND SERVICES.
(a) Audit Fees
The aggregate fees billed for each of the last two fiscal years for professional services rendered by the principal accountant for the audit of the registrant’s annual financial statements or services that are normally provided by the principal accountant in connection with the statutory and filings or engagements for those fiscal years were, $88,992 in 2010 and $42,000 in 2011.
(b) Audit-Related Fees
None.
(c) Tax Fees
The aggregate fees billed in each of the last two fiscal years for professional services rendered by the principal accountant for tax compliance, tax advice and tax planning were $17,110 in 2010 and $9,000 in 2011. The nature of the services comprising these fees were tax compliance, tax advice and tax planning including fees for tax return preparation.
(d) All Other Fees
None.
(e) (1) The registrant’s audit committee has adopted an Audit Committee Charter which contains policies and procedures relating to the pre-approval of services provided by the registrant’s principal accountant (the “Pre-Approval Policies”). The Pre-Approval Policies establish a framework intended to assist the audit committee in the proper discharge of its pre-approval responsibilities. As a general matter, the Pre-Approval Policies (i) specify certain types of audit, audit-related, tax, and other services determined to be pre-approved by the audit committee, and (ii) delineate specific procedures governing the mechanics of the pre-approval process, including the approval and monitoring of audit and non-audit service fees with the exception of any de minimus engagement meeting applicable requirements. Unless a service is specifically pre-approved under the Pre-Approval Policies, it must be separately pre-approved by the registrant’s audit committee. The Pre-Approval Policies and the types of audit and non-audit services pre-approved therein must be reviewed and ratified by the registrant’s audit committee at least annually. The registrant’s audit committee maintains full responsibility for the appointment, compensation and oversight of the registrant’s principal accountant.
(2) Not applicable.
(f) Not applicable
(g) Not applicable.
(h) Not applicable.
ITEM 5. AUDIT COMMITTEE OF LISTED REGISTRANTS.
Not applicable.
ITEM 6. INVESTMENTS.
| (a) | Included as part of report to stockholders under Item 1. |
| (b) | Not applicable. |
ITEM 7. DISCLOSURE OF PROXY VOTING POLICIES AND PROCEDURES FOR CLOSED-END
MANAGEMENT INVESTMENT COMPANIES.
Not applicable.
ITEM 8. PORTFOLIO MANAGERS OF CLOSED-END MANAGEMENT INVESTMENT COMPANIES.
Not applicable.
ITEM 9. PURCHASES OF EQUITY SECURITIES BY CLOSED-END MANAGEMENT INVESTMENT COMPANY AND AFFILIATED PURCHASERS.
Not applicable.
ITEM 10. SUBMISSION OF MATTERS TO A VOTE OF SECURITY HOLDERS
There have been no material changes to the procedures by which a Fund’s shareholder may recommend nominees to the registrant’s board of Trustees, where those changes were implemented after the registrant last provided disclosure in response to the requirements of Item 7(d)(2)(ii)(G) of Schedule 14A(17 CFR240 14a-101), or this item.
ITEM 11. CONTROLS AND PROCEDURES
(a) It is the conclusion of the registrant’s principal executive officer and principal financial officer that the effectiveness of the registrant’s current disclosure controls and procedures (such disclosure controls and procedures having been evaluated within 90 days of the date of this filing) provide reasonable assurance that the information required to be disclosed by the registrant has been recorded, processed, summarized and reported within the time period specified to the Commission’s rules and forms and that the information required to be disclosed by the registrant has been accumulated and communicated to the registrant’s principal executive officer and principal financial officer in order to allow timely decisions regarding required disclosure.
(b) There have been no significant changes in the registrant’s internal controls or in other factors that could significantly affect these controls subsequent to the date of their evaluation, including any corrective actions with regard to significant deficiencies and material weaknesses.
ITEM 12. EXHIBITS.
(a)(1) Registrant��s Code of Ethics – Not applicable (please see Item 2)
(a)(2) Treasurer’s and President’s Section 302 certification
(a)(3) Not applicable.
(b) Combined 906 certification
SIGNATURES
Pursuant to the requirements of the Securities Exchange Act of 1934 and the Investment Company Act of 1940, the registrant has duly caused this report to be signed on its behalf by the undersigned, thereunto duly authorized.
Registrant The Wright Managed Equity Trust (On behalf of Wright Selected Blue Chip Equities Fund, Wright Major Blue Chip Equities Fund and Wright International Blue Chip Equities Fund)
| By: | /s/ Peter M. Donovan | ||
| Peter M. Donovan | |||
| President | |||
| Date: | February 29, 2012 | ||
Pursuant to the requirements of the Securities Exchange Act of 1934 and the Investment Company Act of 1940, this report has been signed below by the following persons on behalf of the Registrant and in the capacities and on the dates indicated.
| By: | /s/ Peter M. Donovan | ||
| Peter M. Donovan | |||
| President | |||
| Date: | February 29, 2012 | ||
| By: | /s/ Michael J. McKeen | ||
| Michael J. McKeen | |||
| Treasurer | |||
| Date: | February 29, 2012 | ||