As filed with the Securities and Exchange Commission on March 5, 2018
UNITED STATES
SECURITIES AND EXCHANGE COMMISSION
WASHINGTON, D.C. 20549
FORM N-CSR
CERTIFIED SHAREHOLDER REPORT OF REGISTERED MANAGEMENT
INVESTMENT COMPANIES
Investment Company Act file number 811-3489
THE WRIGHT MANAGED EQUITY TRUST
177 West Putnam Ave.
Greenwich, Connecticut 06830
Michael J. McKeen, Principal Financial Officer
Three Canal Plaza, Suite 600
Portland, ME 04101
207-347-2000
Date of fiscal year end: December 31
Date of reporting period: January 1, 2017 – December 31, 2017
ITEM 1. REPORT TO STOCKHOLDERS.
The Wright Managed Blue Chip Investment Funds
The Wright Managed Blue Chip Investment Funds consist of three equity funds from The Wright Managed Equity Trust and one fixed-income fund from The Wright Managed Income Trust. Each of the four funds have distinct investment objectives and policies. They can be used individually or in combination to achieve virtually any objective. Further, as they are all "no-load" funds (no commissions or sales charges), portfolio allocation strategies can be altered as desired to meet changing market conditions or changing requirements without incurring any sales charges.
Approved Wright Investment List
Securities selected for investment in these funds are chosen mainly from a list of "investment grade" companies maintained by Wright Investors' Service ("Wright", "WIS" or the "Adviser"). Over 39,000 global companies (covering 85 countries) in Wright's database are screened as new data becomes available to determine any eligible additions or deletions to the list. The qualifications for inclusion as "investment grade" are companies that meet Wright's Quality Rating criteria. This rating includes fundamental criteria for investment acceptance, financial strength, profitability & stability and growth. In addition, securities, which are not included in Wright's "investment grade" list, may also be selected from companies in the fund's specific benchmark (up to 20% of the market value of the portfolio) in order to achieve broad diversification.
Three Equity Funds
Wright Selected Blue Chip Equities Fund (WSBC) (the "Fund") seeks to enhance total investment return through price appreciation plus income. The Fund's portfolio is characterized as a blend of growth and value stocks. The market capitalization of the companies is typically between $1-$10 billion at the time of the Fund's investment. The Adviser seeks to outperform the Standard & Poor's MidCap 400 Index ("S&P MidCap 400") by selecting stocks using fundamental company analysis and company specific criteria such as valuation and earnings trends. The portfolio is then diversified across industries and sectors.
Wright Major Blue Chip Equities Fund (WMBC) (the "Fund") seeks to enhance total investment return through price appreciation plus income by providing a broadly diversified portfolio of equities of larger well-established companies with market values of $5 billion or more. The Adviser seeks to outperform the Standard & Poor's 500 Index ("S&P 500") by selecting stocks, using fundamental company analysis and company specific criteria such as valuation and earnings trends. The portfolio is then diversified across industries and sectors.
Wright International Blue Chip Equities Fund (WIBC) (the "Fund") seeks total return consisting of price appreciation plus income by investing in a broadly diversified portfolio of equities of well-established, non-U.S. companies. The Fund may buy common stocks traded on the securities exchange of the country in which the company is based or it may purchase American Depositary Receipts ("ADR's") traded in the United States. The portfolio is denominated in U.S. dollars and investors should understand that fluctuations in foreign exchange rates may impact the value of their investment. The Adviser seeks to outperform the MSCI World ex U.S. Index ("MSCI World ex U.S.") by selecting stocks using fundamental company analysis and company-specific criteria such as valuation and earnings trends. The portfolio is then diversified across industries, sectors and countries.
One Fixed-Income Fund
Wright Current Income Fund (WCIF) (the "Fund") may be invested in a variety of securities and may use a number of strategies, including GNMAs, to produce a high level of income with reasonable stability of principal. The Fund reinvests all principal payments. Dividends are accrued daily and paid monthly. The Fund's benchmark is the Bloomberg Barclays GNMA Index.
.
| Investment Objectives | inside front | ||
| Letter to Shareholders (Unaudited) | 2 | ||
| Management Discussion (Unaudited) | 4 | ||
| Performance Summaries (Unaudited) | 8 | ||
| Fund Expenses (Unaudited) | 16 | ||
| Management and Organization (Unaudited) | 56 | ||
| Important Notices Regarding Delivery of Shareholder Documents, Portfolio Holdings and Proxy Voting (Unaudited) | 58 | ||
| FINANCIAL STATEMENTS | |||
| The Wright Managed Equity Trust | The Wright Managed Income Trust | ||
| Wright Selected Blue Chip Equities Fund | Wright Current Income Fund | ||
| Portfolio of Investments | 18 | Portfolio of Investments | 41 |
| Statement of Assets and Liabilities | 20 | Statement of Assets and Liabilities | 45 |
| Statement of Operations | 20 | Statement of Operations | 45 |
| Statements of Changes in Net Assets | 21 | Statements of Changes in Net Assets | 46 |
| Financial Highlights | 22 | Financial Highlights | 47 |
| Wright Major Blue Chip Equities Fund | Notes to Financial Statements | 48 | |
| Portfolio of Investments | 23 | ||
| Statement of Assets and Liabilities | 24 | Report of Independent Registered Public Accounting Firm | 54 |
| Statement of Operations | 24 | ||
| Statements of Changes in Net Assets | 25 | Federal Tax Information (Unaudited) | 55 |
| Financial Highlights | 26 | ||
| Wright International Blue Chip Equities Fund | |||
| Portfolio of Investments | 27 | ||
| Statement of Assets and Liabilities | 29 | ||
| Statement of Operations | 29 | ||
| Statements of Changes in Net Assets | 30 | ||
| Financial Highlights | 31 | ||
| Notes to Financial Statements | 32 | ||
| Report of Independent Registered Public Accounting Firm | 39 | ||
| Federal Tax Information (Unaudited) | 40 | ||
Letter to Shareholders (Unaudited)
Dear Shareholder:
SUMMARY: Global stocks had a terrific year in 2017 as the worldwide economy finally started to pull itself out of its nearly decade-long lethargy. U.S. equities had their best performance since 2013, with all three of the major indexes returning well over 20%, much of it in anticipation of a major corporate tax cut that takes effect this year. Foreign stocks also did well, in many cases outperforming their American counterparts, with some additional help from a weak dollar. Bonds had modestly positive returns as short-term interest rates rose sharply but long-term yields fell or held steady. The outlook for 2018 remains positive, as lower tax rates promise to continue to boost the economy and improve corporate earnings results.
It was a banner year for stocks in 2017, with the major equity averages around the world boasting returns of 20% or more and in many cases closing at or near record highs. In the U.S., NASDAQ was the top performer, finishing with a 29.6% return, including dividends. But the Dow Jones Industrial Average nearly caught up to it at the end, finishing with a 28.1% return. The S&P 500 gained 21.8%. The catalyst for the advances was an improving economy and the potential of further gains from President Trump's big tax reform legislation cutting corporate income taxes to 21%.
Foreign stocks met or surpassed the gains in U.S. equities, with some of the increases coming from the weaker dollar overseas. The best-performing market was China, where stocks returned 54.1% in U.S. dollar terms. Emerging markets also outpaced the U.S., returning 37.3%. Japanese stocks gained an even 24%, while Pacific-area stocks outside Japan rose nearly 26%. Eurozone stocks increased 26.8% in dollar terms, with much of the gain coming from the dollar's 12.4% decline against the euro.
Bonds also had positive returns, but they paled in comparison to equities. In the U.S., the Bloomberg Barclays U.S. Bond Market Aggregate, which is heavily weighted with U.S. government securities, returned 3.5% in 2017, as short-term interest rates jumped sharply while long-term rates held steady or actually fell. Corporate and high-yield bonds did better, returning 6.2% and 7.5%, respectively. Still, returns on U.S. fixed-income instruments trailed foreign bonds, again because of the weak dollar, which boosted their returns.
One of the reasons for the big jump in stock prices, of course, was U.S. economic performance, which continued to exceed expectations, even before the tax package kicked in. GDP grew by more than 3% on an annualized basis in both the second and third quarters, and the Federal Reserve Bank of Atlanta's GDPNow forecaster is predicting 3.2% growth in the fourth quarter; if that happens, it would mark the first time since 2004 that GDP has grown by more than 3% in three straight quarters. Retail sales jumped an unexpectedly sharp 0.8% in November while consumer spending, a broader category, rose a better-than-expected 0.6%. Auto sales fell 1.7% last year, the first annual decline since the financial crisis, but sales still made it over the 17 million mark for the third straight year, the first time that's happened in the industry's history. The Conference Board's consumer confidence index climbed to 17-year highs in both October and November before easing a bit in December. Certainly, a big reason for the optimism is the jobs market. Nonfarm payrolls increased by a stronger-than-expected 228,000 in November while the unemployment rate held steady at a 17-year low of 4.1%.
The bar was set pretty high in 2017, so even approaching last year's stock market returns will be difficult to do. Nevertheless, we're optimistic that 2018 will be another good year for stocks. Chief among the reasons is the Tax Cuts and Jobs Act, which President Trump signed into law at the end of December. The centerpiece of the act is a reduction in corporate income taxes to 21% from 35%, which should boost profits and therefore equity prices. But as we saw in 2017, the economy started to surge long before tax reform became reality, not just in anticipation of it becoming law but also due to the many actions taken by the administration to ease the regulatory burdens on businesses. Clearly, they have had a major positive effect already, as evidenced by the economic data, and can be expected to deliver more dividends going forward.
2 |
Letter to Shareholders (Unaudited)
So, as we enter 2018, there are many reasons to remain upbeat. The U.S. economy finally appears to be firing on all cylinders after nearly a decade of subpar growth. The same thing is going on in Europe and to a lesser extent in Japan. We can expect the momentum to continue this year. Of course, investors must always be wary of the unexpected. That's why we believe holding a well-diversified portfolio of high-quality domestic and foreign financial assets remains the best investment approach.
Sincerely,

Amit S. Khandwala
Co-Chief Executive Officer
3 |
After mostly falling during the first eight months of 2017, interest rates rose sharply in the last four months of the year, mainly due to a strengthening U.S. economy. In response, the Federal Reserve raised the federal funds rate three times and signaled at least three more rate hikes in 2018. It also announced its intention to begin unwinding its $4.5 trillion bond portfolio, allowing it to gradually run off as the securities mature. The December passage of the Tax Cuts and Jobs Act promises to add to federal deficit spending, which puts further upward pressure on interest rates, especially if the Fed reduces or eliminates its purchases of new government debt issues. At the end of December 2017, the yield on the benchmark 10-year Treasury note – on which long-term mortgage rates are based – was at 2.41%, nearly 40 basis points higher than where it was in early September, its low point of the year. Higher rates on mortgages discourage homeowners from refinancing, which means existing mortgages can be expected to stay on lenders' books longer than historical norms.
7 |
Performance Summaries (Unaudited)
Important
The Total Investment Return is the percent return of an initial $10,000 investment made at the beginning of the period to the ending redeemable value assuming all dividends and distributions are reinvested. After-tax returns are calculated using the historical highest individual federal marginal income tax rates, and do not reflect the impact of state and local taxes. Actual after-tax returns depend on the investor's tax situation and may differ from those shown. After-tax returns are not relevant to investors who hold their fund shares through tax-deferred arrangements such as 401(k) plans or individual retirement accounts. Past performance is not predictive of future performance.
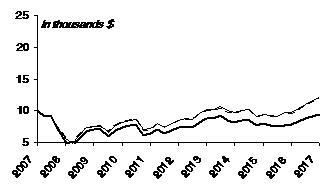
| WRIGHT SELECTED BLUE CHIP EQUITIES FUND | ||||||||||||||||||
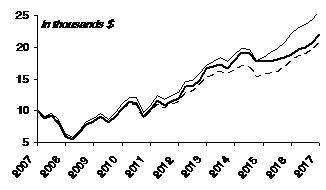
| Growth of $10,000 Invested 1/1/08 Through 12/31/17 | ||||||||||||||||||
| Average Annual Total Return | ||||||||||||||||||
| Last 1 Yr | Last 5 Yrs | Last 10 Yrs | ||||||||||||||||
| — WSBC | ||||||||||||||||||
| - Return before taxes | 16.46 | % | 13.21 | % | 8.23 | % | ||||||||||||
| - Return after taxes on distributions | 14.20 | % | 10.45 | % | 6.69 | % | ||||||||||||
| - Return after taxes on distributions and sales of fund shares | 11.08 | % | 10.13 | % | 6.46 | % | ||||||||||||
| — S&P MidCap 400* | 16.26 | % | 15.01 | % | 9.97 | % | ||||||||||||
| ----Average of Morningstar Mid Cap Value/Blend Funds** | 15.85 | % | 12.74 | % | 7.48 | % | ||||||||||||
| Investment Value as of 12/31/17 (in thousands $) | ||||||||||||||||||
| — WSBC | $ | 22.05 | ||||||||||||||||
| — S&P MidCap 400* | $ | 25.86 | ||||||||||||||||
| ----Average of Morningstar Mid Cap Value/Blend Funds** | $ | 20.58 | ||||||||||||||||
* The Fund's average annual return is compared with that of the S&P MidCap 400, an unmanaged index of stocks in a broad range of industries with market capitalizations of a few billion or less. The performance of the S&P MidCap 400, unlike that of the Fund, reflects no deductions for fees, expense or taxes. As stated in the current prospectus, the Fund's total annual operating expense ratio is 1.17%. The expense information in the Fund's current prospectus has been restated to reflect current fees after the elimination of the Fund's Rule 12b-1 Plan and shareholder services fee, effective October 1, 2017. If not restated, the Fund's total annual operating expenses would be higher. Wright has contractually agreed to waive a portion of its advisory fees and/or assume certain expenses to the extent total operating expenses exceed 1.40%, which is in effect until April 30, 2018. During the year, certain fees were waived and/or expenses reimbursed; otherwise, returns would have been lower. Returns greater than one year are annualized.
** Morningstar Mid Cap Value/Blend Funds represent the average return of 220 current funds ex multi-share classes in the Mid Cap Blend category reported in the Morningstar, Inc. database. © 2017 Morningstar, Inc. All Rights Reserved. The information contained herein: (1) is proprietary to Morningstar and/or its content providers; (2) may not be copied or distributed; and (3) is not warranted to be accurate, complete or timely. Neither Morningstar nor its content providers are responsible for any damages or losses arising from any use of this information. Past performance is no guarantee of future results.
8 |
| WRIGHT SELECTED BLUE CHIP EQUITIES FUND | |||||||||||||
| Industry Weightings | Ten Largest Stock Holdings | ||||||||||||
| % of net assets @ 12/31/17 | % of net assets @ 12/31/17 | ||||||||||||
Capital Goods Materials | 11.1 10.0 | % % | Technology Hardware & Equipment Automobiles & Components | 5.0 4.4 | % % | UGI Corp. ManpowerGroup, Inc. | 3.4 3.3 | % % | |||||
| Real Estate | 8.8 | % | Health Care Equipment & Services | 4.0 | % | WellCare Health Plans, Inc. | 3.0 | % | |||||
Insurance Software & Services | 7.8 7.3 | % % | Energy Pharmaceuticals & Biotechnology | 3.8 3.7 | % % | Primerica, Inc. Thor Industries, Inc. | 2.7 2.7 | % % | |||||
| Banks | 6.0 | % | Retailing | 3.3 | % | Charles River Laboratories International, Inc. | 2.3 | % | |||||
Utilities Semiconductors & Semiconductor | 5.8 5.8 | % % | Diversified Financials Food, Beverage & Tobacco | 2.7 2.5 | % % | Deluxe Corp. AECOM | 2.2 2.1 | % % | |||||
Equipment Commercial & Professional Services | 5.5 | % | Consumer Services Consumer Durables & Apparel | 1.4 0.9 | % % | HollyFrontier Corp. Great Plains Energy, Inc. | 2.1 2.1 | % % | |||||
9 |
Performance Summaries (Unaudited)
| WRIGHT MAJOR BLUE CHIP EQUITIES FUND | ||||||||||||||||||
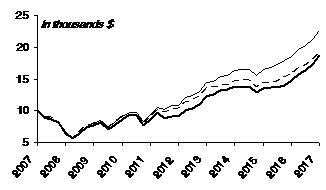
| Growth of $10,000 Invested 1/1/08 Through 12/31/17 | ||||||||||||||||||
| Average Annual Total Return | ||||||||||||||||||
| Last 1 Yr | Last 5 Yrs | Last 10 Yrs | ||||||||||||||||
| — WMBC | ||||||||||||||||||
| - Return before taxes | 27.66 | % | 15.67 | % | 6.50 | % | ||||||||||||
| - Return after taxes on distributions | 27.55 | % | 15.05 | % | 6.15 | % | ||||||||||||
| - Return after taxes on distributions and sales of fund shares | 15.75 | % | 12.53 | % | 5.17 | % | ||||||||||||
| — S&P 500* | 21.84 | % | 15.80 | % | 8.50 | % | ||||||||||||
| ----Average of Morningstar Large Cap Value/Blend Funds** | 20.47 | % | 13.06 | % | 6.63 | % | ||||||||||||
| Investment Value on 12/31/17 (in thousands $) | ||||||||||||||||||
| — WMBC | $ | 18.77 | ||||||||||||||||
| — S&P 500* | $ | 22.61 | ||||||||||||||||
| ----Average of Morningstar Large Cap Value/Blend Funds** | $ | 19.01 | ||||||||||||||||
* The Fund's average annual return is compared with that of the S&P 500, an unmanaged index of 500 widely held common stocks that generally indicates the performance of the market. The performance of the S&P 500, unlike that of the Fund, reflects no deductions for fees, expenses or taxes. As stated in the current prospectus, the Fund's total annual operating expense ratio is 1.95%. The expense information in the Fund's current prospectus has been restated to reflect current fees after the elimination of the Fund's Rule 12b-1 Plan and shareholder services fee, effective October 1, 2017. If not restated, the Fund's total annual fund operating expenses would be higher. Wright has contractually agreed to waive a portion of its fees and/or assume certain expenses to the extent total operating expenses exceed 1.40%, which is in effect until April 30, 2018. During the year, certain fees were waived and/or expenses reimbursed; otherwise, returns would have been lower. Returns greater than one year are annualized.
** Morningstar Large Cap Value/Blend Funds represent the average return of 800 current funds ex multi-share classes in the Large Cap Blend category reported in the Morningstar, Inc. database. © 2017 Morningstar, Inc. All Rights Reserved. The information contained herein: (1) is proprietary to Morningstar and/or its content providers; (2) may not be copied or distributed; and (3) is not warranted to be accurate, complete or timely. Neither Morningstar nor its content providers are responsible for any damages or losses arising from any use of this information. Past performance is no guarantee of future results.
10 |
Performance Summaries (Unaudited)
| WRIGHT MAJOR BLUE CHIP EQUITIES FUND | |||||||||||||
| Industry Weightings | Ten Largest Stock Holdings | ||||||||||||
| % of net assets @ 12/31/17 | % of net assets @ 12/31/17 | ||||||||||||
Software & Services Health Care Equipment & Services | 14.5 11.2 | % % | Energy Semiconductor Equipment & Products | 3.9 3.3 | % % | Microsoft Corp. Apple, Inc. | 5.2 5.0 | % % | |||||
| Capital Goods | 10.8 | % | Media | 2.8 | % | Progressive Corp. (The) | 4.2 | % | |||||
| Insurance | 8.9 | % | Materials | 2.5 | % | Amazon.com, Inc. | 4.1 | % | |||||
| Banks | 8.8 | % | Transportation | 2.1 | % | Anthem, Inc. | 3.9 | % | |||||
| Retailing | 7.1 | % | Telecommunication Services | 1.9 | % | Aetna, Inc. | 3.3 | % | |||||
| Pharmaceuticals & Biotechnology | 6.0 | % | Utilities | 1.8 | % | JPMorgan Chase & Co. | 3.2 | % | |||||
Food, Beverage & Tobacco Technology Hardware & Equipment | 5.4 5.0 | % % | Diversified Financials Food & Staples Retailing | 1.1 1.1 | % % | UnitedHealth Group, Inc. Boeing Co. (The) | 3.1 3.1 | % % | |||||
| MasterCard, Inc. - Class A | 2.8 | % | |||||||||||
11 |
Performance Summaries (Unaudited)
| WRIGHT INTERNATIONAL BLUE CHIP EQUITIES FUND | ||||||||||||||||||
| Growth of $10,000 Invested 1/1/08 Through 12/31/17 | ||||||||||||||||||
| Average Annual Total Return | ||||||||||||||||||
| Last 1 Yr | Last 5 Yrs | Last 10 Yrs | ||||||||||||||||
| — WIBC | ||||||||||||||||||
| - Return before taxes | 19.53 | % | 5.30 | % | -0.56 | % | ||||||||||||
| - Return after taxes on distributions | 19.14 | % | 5.09 | % | -0.88 | % | ||||||||||||
| - Return after taxes on distributions and sales of fund shares | 11.36 | % | 4.37 | % | -0.28 | % | ||||||||||||
| — MSCI World ex U.S. Index* | 24.21 | % | 7.46 | % | 1.87 | % | ||||||||||||
| ----Average of Morningstar Foreign Large Blend Funds** | 25.42 | % | 7.05 | % | 1.60 | % | ||||||||||||
| Investment Value as of 12/31/17 (in thousands $) | ||||||||||||||||||
| — WIBC | $ | 9.46 | ||||||||||||||||
| — MSCI World ex U.S. Index* | $ | 12.04 | ||||||||||||||||
| ----Average of Morningstar Foreign Large Blend Funds** | $ | 11.72 | ||||||||||||||||
* The Fund's average annual return is compared with that of the MSCI World ex U.S. Index. While the Fund does not seek to match the returns of this index, this unmanaged index generally indicates foreign stock market performance. The performance of the MSCI World ex U.S. Index, unlike that of the Fund, reflects no deductions for fees, expenses or taxes. As stated in the current prospectus, the Fund's total annual operating expense ratio is 1.98%. The expense information in the Fund's current prospectus has been restated to reflect current fees after the elimination of the Fund's Rule 12b-1 Plan and shareholder services fee, effective October 1, 2017. If not restated, the Fund's total annual fund operating expenses would be higher. Wright contractually agreed to waive a portion of its advisory fees and/or assume certain expenses to the extent total operating expenses exceed 1.85%, which is in effect until April 30, 2018. Returns greater than one year are annualized. Shares held less than 90 days will be subject to a 2.00% redemption fee.
** Morningstar Foreign Large Blend Funds represent the average of 347 current funds ex multi-share classes in the Foreign Large Blend category reported in the Morningstar, Inc. database. © 2017 Morningstar, Inc. All Rights Reserved. The information contained herein: (1) is proprietary to Morningstar and/or its content providers; (2) may not be copied or distributed; and (3) is not warranted to be accurate, complete or timely. Neither Morningstar nor its content providers are responsible for any damages or losses arising from any use of this information. Past performance is no guarantee of future results.
12 |
Performance Summaries (Unaudited)
| WRIGHT INTERNATIONAL BLUE CHIP EQUITIES FUND | |||||||||||||
| Country Weightings | Ten Largest Stock Holdings | ||||||||||||
| % of net assets @ 12/31/17 | % of net assets @ 12/31/17 | ||||||||||||
| Japan | 21.9 | % | Spain | 3.9 | % | Nestle SA | 3.4 | % | |||||
| Canada | 13.2 | % | Hong Kong | 2.8 | % | TOTAL SA | 2.7 | % | |||||
| Germany | 12.7 | % | Sweden | 1.7 | % | ITOCHU Corp. | 2.6 | % | |||||
| United Kingdom | 11.7 | % | Finland | 1.3 | % | Daiwa House Industry Co., Ltd. | 2.6 | % | |||||
France Switzerland Australia | 7.5 6.4 5.6 | % % % | Ireland South Africa Denmark | 1.0 0.3 0.3 | % % % | Airbus SE Muenchener Rueckversicherungs- Gesellschaft AG in Muenchen – Class R | 2.4 2.3 | % % | |||||
| Netherlands | 5.2 | % | Toronto-Dominion Bank (The) | 2.0 | % | ||||||||
| BASF SE | 1.9 | % | |||||||||||
| Manulife FInancial Corp. | 1.8 | % | |||||||||||
| KDDI Corp. | 1.7 | % | |||||||||||
13 |
Performance Summaries (Unaudited)
| WRIGHT CURRENT INCOME FUND | ||||||||||||||||||
| Growth of $10,000 Invested 1/1/08 Through 12/31/17 | ||||||||||||||||||
| Average Annual Total Return | ||||||||||||||||||
| Last 1 Yr | Last 5 Yrs | Last 10 Yrs | ||||||||||||||||
| — WCIF | ||||||||||||||||||
| - Return before taxes | 1.00 | % | 1.11 | % | 3.25 | % | ||||||||||||
| - Return after taxes on distributions | -0.55 | % | -0.47 | % | 1.65 | % | ||||||||||||
| - Return after taxes on distributions and sales of fund shares | 0.57 | % | 0.13 | % | 1.87 | % | ||||||||||||
| — Bloomberg Barclays GNMA Index* | 1.86 | % | 1.70 | % | 3.84 | % | ||||||||||||
| ----Average of Morningstar Intermediate Government Funds** | 1.51 | % | 0.94 | % | 2.89 | % | ||||||||||||
| Investment Value as of 12/31/17 (in thousands $) | ||||||||||||||||||
| — WCIF | $ | 13.78 | ||||||||||||||||
| — Bloomberg Barclays GNMA Index* | $ | 14.58 | ||||||||||||||||
| ----Average of Morningstar Intermediate Government Funds** | $ | 13.29 | ||||||||||||||||
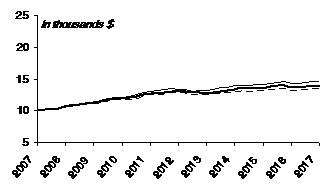
* The Fund's average annual return is compared with that of the Bloomberg Barclays GNMA Index. While the Fund does not seek to match the returns of the Bloomberg Barclays GNMA Index, Wright believes that this unmanaged index generally indicates the performance of government and corporate mortgage-backed bond markets. The Bloomberg Barclays GNMA Index, unlike the Fund, reflects no deductions for fees, expenses or taxes. As stated in the current prospectus, the Fund's total annual operating expense ratio is 0.89%. The expense information in the Fund's current prospectus has been restated to reflect current fees after the elimination of the Fund's Rule 12b-1 Plan and shareholder services fee, effective October 1, 2017. If not restated, the Fund's total annual fund operating expenses would be higher. Wright has contractually agreed to waive a portion of its advisory fees and/or assume certain expenses to the extent total operating expenses exceed 1.00%, which is in effect until April 30, 2018. During the year, certain fees were waived and/or expenses reimbursed; otherwise, returns would have been lower. Returns greater than one year are annualized.
** The Morningstar Intermediate Government Fund Average represents the average return of all 167 current funds ex multi-share classes in the Intermediate Government category reported in the Morningstar, Inc. database. © 2016 Morningstar, Inc. All Rights Reserved. The information contained herein: (1) is proprietary to Morningstar and/or its content providers; (2) may not be copied or distributed; and (3) is not warranted to be accurate, complete or timely. Neither Morningstar nor its content providers are responsible for any damages or losses arising from any use of this information. Past performance is no guarantee of future results.
14 |
| WRIGHT CURRENT INCOME FUND | ||||||||||||
| Holdings by Security Type | Five Largest Bond Holdings | |||||||||||
| % of net assets @ 12/31/17 | % of net assets @ 12/31/17 | |||||||||||
| Agency Mortgage-Backed Securities | 93.2 | % | GNMA, Series 2011-2 Class DP | 5.46% | 03/20/39 | 3.8 | % | |||||
| Other U.S. Government Guaranteed | 3.4 | % | FNMA, Series 2003-18, Class XD | 5.00% | 03/25/33 | 3.7 | % | |||||
| GNMA, Series 2010-116, Class JB | 5.00% | 06/16/40 | 3.6 | % | ||||||||
| Weighted Average Maturity | FHLMC Gold Pool #U80611 | 4.50% | 11/01/33 | 3.6 | % | |||||||
| @ 12/31/17 | 9.4 | Years | Vessel Management Services, Inc. | 5.13% | 04/16/35 | 3.4 | % | |||||
15 |
Fund Expenses (Unaudited)
Example:
As a shareholder of a fund, you incur two types of costs: (1) transaction costs, including redemption fees (if applicable); and (2) ongoing costs including management fees; distribution or service fees; and other fund expenses. This example is intended to help you understand your ongoing costs (in dollars) of investing in a fund and to compare these costs with the ongoing costs of investing in other mutual funds. The example is based on an investment of $1,000 invested at the beginning of the period and held for the entire period (July 1, 2017 – December 31, 2017).
Actual Expenses:
The first line of the tables shown on the following page provides information about actual account values and actual expenses. You may use the information in this line, together with the amount you invested, to estimate the expenses that you paid over the period. Simply divide your account value by $1,000 (for example, an $8,600 account value divided by $1,000 = 8.6), then multiply the result by the number in the first line under the heading entitled "Expenses Paid During Period" to estimate the expenses you paid on your account during this period.
Hypothetical Example for Comparison Purposes:
The second line of the tables provides information about hypothetical account values and hypothetical expenses based on the actual Fund expense ratio and an assumed rate of return of 5% per year (before expenses), which is not the actual return of the Fund. The hypothetical account values and expenses may not be used to estimate the actual ending account balance or expenses you paid for the period. You may use this information to compare the ongoing costs of investing in your Fund and other funds. To do so, compare this 5% hypothetical example with the 5% hypothetical examples that appear in the shareholder reports of the other funds.
Please note that the expenses shown in the tables are meant to highlight your ongoing costs only and do not reflect any transactional costs, such as redemption fees (if applicable). Therefore, the second line of the tables is useful in comparing ongoing costs only, and will not help you determine the relative total costs of owning different funds. In addition, if these transactional costs were included, your costs would have been higher.
16 |
EQUITY FUNDS
Wright Selected Blue Chip Equities Fund
Beginning Account Value (7/1/17) | Ending Account Value (12/31/17) | Expenses Paid During Period* (7/1/17-12/31/17) | |
| Actual Fund Shares | $1,000.00 | $1,101.16 | $7.36 |
| Hypothetical (5% return per year before expenses) | |||
| Fund Shares | $1,000.00 | $1,018.20 | $7.07 |
*Expenses are equal to the Fund's annualized expense ratio of 1.39% multiplied by the average account value over the period, multiplied by 184/365 (to reflect the one-half year period). The example assumes that the $1,000 was invested at the net asset value per share determined at the close of business on June 30, 2017.
Wright Major Blue Chip Equities Fund
Beginning Account Value (7/1/17) | Ending Account Value (12/31/17) | Expenses Paid During Period* (7/1/17-12/31/17) | |
| Actual Fund Shares | $1,000.00 | $1,152.17 | $7.59 |
| Hypothetical (5% return per year before expenses) | |||
| Fund Shares | $1,000.00 | $1,018.15 | $7.12 |
*Expenses are equal to the Fund's annualized expense ratio of 1.40% multiplied by the average account value over the period, multiplied by 184/365 (to reflect the one-half year period). The example assumes that the $1,000 was invested at the net asset value per share determined at the close of business on June 30, 2017.
Wright International Blue Chip Equities Fund
Beginning Account Value (7/1/17) | Ending Account Value (12/31/17) | Expenses Paid During Period* (7/1/17-12/31/17) | |
| Actual Fund Shares | $1,000.00 | $1,086.08 | $9.73 |
| Hypothetical (5% return per year before expenses) | |||
| Fund Shares | $1,000.00 | $1,015.88 | $9.40 |
*Expenses are equal to the Fund's annualized expense ratio of 1.85% multiplied by the average account value over the period, multiplied by 184/365 (to reflect the one-half year period). The example assumes that the $1,000 was invested at the net asset value per share determined at the close of business on June 30, 2017.
FIXED-INCOME FUNDS
Wright Current Income Fund
Beginning Account Value (7/1/17) | Ending Account Value (12/31/17) | Expenses Paid During Period* (7/1/17-12/31/17) | |
| Actual Fund Shares | $1,000.00 | $999.76 | $4.54 |
| Hypothetical (5% return per year before expenses) | |||
| Fund Shares | $1,000.00 | $1,020.67 | $4.58 |
*Expenses are equal to the Fund's annualized expense ratio of 0.90% multiplied by the average account value over the period, multiplied by 184/365 (to reflect the one-half year period). The example assumes that the $1,000 was invested at the net asset value per share determined at the close of business on June 30, 2017.
17 |
| Shares | Value |
| EQUITY INTERESTS - 99.8% |
| AUTOMOBILES & COMPONENTS - 4.4% | |||||
| Gentex Corp. | 24,786 | $ | 519,267 | ||
| Thor Industries, Inc. | 5,395 | 813,134 | |||
| $ | 1,332,401 | ||||
| BANKS - 6.0% | |||||
| Cullen/Frost Bankers, Inc. | 2,281 | $ | 215,897 | ||
| East West Bancorp, Inc. | 6,536 | 397,585 | |||
| Fulton Financial Corp. | 6,916 | 123,796 | |||
| Prosperity Bancshares, Inc. | 6,681 | 468,138 | |||
| Sterling Bancorp | 9,089 | 223,589 | |||
| Webster Financial Corp. | 7,151 | 401,600 | |||
| $ | 1,830,605 | ||||
| CAPITAL GOODS - 11.1% | |||||
| AECOM* | 17,091 | $ | 634,931 | ||
| Carlisle Cos., Inc. | 2,897 | 329,244 | |||
| Curtiss-Wright Corp. | 652 | 79,446 | |||
| EMCOR Group, Inc. | 2,734 | 223,505 | |||
| Granite Construction, Inc. | 1,521 | 96,477 | |||
| Huntington Ingalls Industries, Inc. | 2,173 | 512,176 | |||
| Oshkosh Corp. | 6,644 | 603,873 | |||
| Regal Beloit Corp. | 1,177 | 90,158 | |||
| Rockwell Collins, Inc. | 2,299 | 311,791 | |||
| Terex Corp. | 3,368 | 162,405 | |||
| Trinity Industries, Inc. | 3,168 | 118,673 | |||
| Triumph Group, Inc. | 8,346 | 227,011 | |||
| $ | 3,389,690 | ||||
| COMMERCIAL & PROFESSIONAL SERVICES - 5.5% | |||||
| Deluxe Corp. | 8,727 | $ | 670,583 | ||
| ManpowerGroup, Inc. | 7,912 | 997,782 | |||
| $ | 1,668,365 | ||||
| CONSUMER DURABLES & APPAREL - 0.9% | |||||
| Tupperware Brands Corp. | 4,363 | $ | 273,560 | ||
| CONSUMER SERVICES - 1.4% | |||||
| Service Corp. International | 5,450 | $ | 203,394 | ||
| Sotheby's* | 4,273 | 220,487 | |||
| $ | 423,881 | ||||
| DIVERSIFIED FINANCIALS - 2.7% | |||||
| Eaton Vance Corp. | 2,897 | $ | 163,362 | ||
| Legg Mason, Inc. | 3,349 | 140,591 | |||
| MSCI, Inc. | 1,195 | 151,215 | |||
| Raymond James Financial, Inc. | 4,037 | 360,504 | |||
| $ | 815,672 | ||||
| ENERGY - 3.8% | |||||
| Diamond Offshore Drilling, Inc.* | 10,428 | $ | 193,856 | ||
| Ensco PLC, Class A | 26,216 | 154,937 | |||
| HollyFrontier Corp. | 12,329 | 631,491 | |||
| Murphy Oil Corp. | 3,096 | 96,131 | |||
| QEP Resources, Inc.* | 9,270 | 88,714 | |||
| $ | 1,165,129 | ||||
| Shares | Value |
| FOOD, BEVERAGE & TOBACCO - 2.5% | |||||
| Ingredion, Inc. | 2,317 | $ | 323,917 | ||
| Lamb Weston Holdings, Inc. | 7,930 | 447,648 | |||
| $ | 771,565 | ||||
| HEALTH CARE EQUIPMENT & SERVICES - 4.0% | |||||
| HealthSouth Corp. | 6,192 | $ | 305,947 | ||
| WellCare Health Plans, Inc.* | 4,526 | 910,224 | |||
| $ | 1,216,171 | ||||
| INSURANCE - 7.8% | |||||
| American Financial Group, Inc. | 4,562 | $ | 495,160 | ||
| Primerica, Inc. | 8,220 | 834,741 | |||
| Reinsurance Group of America, Inc. | 3,096 | 482,759 | |||
| WR Berkley Corp. | 7,713 | 552,636 | |||
| $ | 2,365,296 | ||||
| MATERIALS - 10.0% | |||||
| Albemarle Corp. | 2,806 | $ | 358,859 | ||
| Cabot Corp. | 5,450 | 335,666 | |||
| Ingevity Corp.* | 2,372 | 167,155 | |||
| Louisiana-Pacific Corp.* | 3,530 | 92,698 | |||
| Owens-Illinois, Inc.* | 13,017 | 288,587 | |||
| Packaging Corp. of America | 3,368 | 406,012 | |||
| Steel Dynamics, Inc. | 12,148 | 523,943 | |||
| The Chemours Co. | 7,115 | 356,177 | |||
| United States Steel Corp. | 4,454 | 156,736 | |||
| WestRock Co. | 5,450 | 344,495 | |||
| $ | 3,030,328 | ||||
| PHARMACEUTICALS & BIOTECHNOLOGY - 3.7% | |||||
| Bioverativ, Inc.* | 7,876 | $ | 424,674 | ||
| Charles River Laboratories International, Inc.* | 6,427 | 703,435 | |||
| $ | 1,128,109 | ||||
| REAL ESTATE - 8.8% | |||||
| Cousins Properties, Inc. REIT | 9,089 | $ | 84,073 | ||
| Duke Realty Corp. REIT | 19,771 | 537,969 | |||
| First Industrial Realty Trust, Inc. REIT | 13,126 | 413,075 | |||
| Jones Lang LaSalle, Inc. | 3,567 | 531,234 | |||
| Medical Properties Trust, Inc. REIT | 44,176 | 608,745 | |||
| Uniti Group, Inc. REIT | 29,095 | 517,600 | |||
| $ | 2,692,696 | ||||
| RETAILING - 3.3% | |||||
| Aaron's, Inc. | 9,306 | $ | 370,844 | ||
| AutoNation, Inc.* | 5,033 | 258,344 | |||
| Big Lots, Inc. | 6,807 | 382,213 | |||
| $ | 1,011,401 | ||||
| SEMICONDUCTORS & SEMICONDUCTOR EQUIPMENT - 5.8% | |||||
| Advanced Micro Devices, Inc.* | 19,354 | $ | 198,959 | ||
| Cirrus Logic, Inc.* | 9,885 | 512,636 | |||
| Cypress Semiconductor Corp. | 16,041 | 244,465 | |||
| MKS Instruments, Inc. | 2,444 | 230,958 | |||
| Teradyne, Inc. | 13,452 | 563,235 | |||
| $ | 1,750,253 | ||||
See Notes to Financial Statements. | 18 |
| Shares | Value |
| SOFTWARE & SERVICES - 7.3% | |||||
| Cadence Design Systems, Inc.* | 12,420 | $ | 519,404 | ||
| Convergys Corp. | 9,451 | 222,098 | |||
| Fortinet, Inc.* | 8,727 | 381,283 | |||
| Leidos Holdings, Inc. | 7,821 | 505,002 | |||
| PTC, Inc.* | 9,722 | 590,806 | |||
| $ | 2,218,593 | ||||
| TECHNOLOGY HARDWARE & EQUIPMENT - 5.0% | |||||
| Arrow Electronics, Inc.* | 4,363 | $ | 350,829 | ||
| Cognex Corp. | 5,087 | 311,121 | |||
| Coherent, Inc.* | 815 | 230,009 | |||
| SYNNEX Corp. | 2,372 | 322,473 | |||
| Vishay Intertechnology, Inc. | 14,158 | 293,779 | |||
| $ | 1,508,211 | ||||
| UTILITIES - 5.8% | |||||
| Great Plains Energy, Inc. | 19,336 | $ | 623,393 | ||
| MDU Resources Group, Inc. | 4,146 | 111,445 | |||
| UGI Corp. | 22,233 | 1,043,839 | |||
| $ | 1,778,677 | ||||
TOTAL EQUITY INTERESTS - 99.8% (identified cost, $22,372,989) | $ | 30,370,603 |
| SHORT-TERM INVESTMENTS - 0.0% | |||||
| Fidelity Investments Money Market Government Portfolio - Class I, 1.16% (1) | 10,614 | $ | 10,614 | ||
TOTAL SHORT-TERM INVESTMENTS - 0.0% (identified cost, $10,614) | $ | 10,614 |
INVESTMENTS, AT VALUE — 99.8% (identified cost, $22,383,603) | $ | 30,381,217 |
| OTHER ASSETS, IN EXCESS OF LIABILITIES — 0.2% | 60,307 |
| NET ASSETS — 100.0% | $ | 30,441,524 |
PLC — Public Limited Company
REIT — Real Estate Investment Trust
| * | Non-income producing security. |
| (1) | Dividend yield changes daily to reflect current market |
conditions. Rate was the quoted yield as of December 31,
2017.
See Notes to Financial Statements. | 19 |
| STATEMENT OF ASSETS AND LIABILITIES | ||||||||||||||
| As of December 31, 2017 | STATEMENT OF OPERATIONS | |||||||||||||
| For the Year Ended December 31, 2017 | ||||||||||||||
| ASSETS: | TRUE | |||||||||||||
| Investments, at value | INVESTMENT INCOME (Note 1C) | TRUE | ||||||||||||
| (identified cost $22,383,603) (Note 1A) | $ | 30,381,217 | ###### | 2.00E+07 | Dividend income (net of foreign taxes $5) | $ | 517,243 | |||||||
| Receivable for fund shares sold | 815 | Total investment income | $ | 517,243 | ||||||||||
| Dividends receivable | 59,105 | |||||||||||||
| Prepaid expenses and other assets | 12,162 | Expenses – | ||||||||||||
| Total assets | $ | 30,453,299 | Investment adviser fee (Note 3) | $ | 190,511 | |||||||||
| Administrator fee (Note 3) | 38,102 | |||||||||||||
| LIABILITIES: | Trustee expense (Note 3) | 12,450 | ||||||||||||
| Payable for fund shares reacquired | $ | 547 | Custodian fee | 5,000 | ||||||||||
| Accrued expenses and other liabilities | Accountant fee | 39,061 | ||||||||||||
| Transfer agent fee | 2,239 | Distribution expenses (Note 4) | 59,720 | �� | ||||||||||
| Trustee expenses | 150 | Transfer agent fee | 29,402 | |||||||||||
| Other expenses and liabilities | 8,839 | Printing | 364 | |||||||||||
| Total liabilities | $ | 11,775 | Shareholder communications | 6,698 | ||||||||||
| NET ASSETS | $ | 30,441,524 | Audit services | 17,500 | ||||||||||
| Legal services | 17,214 | |||||||||||||
| NET ASSETS CONSIST OF: | Compliance services | 6,474 | ||||||||||||
| Paid-in capital | $ | 20,145,723 | Registration costs | 20,554 | ||||||||||
| Accumulated net realized gain on investments | 2,298,187 | Interest expense (Note 8) | 974 | |||||||||||
| Unrealized appreciation on investments | 7,997,614 | Miscellaneous | 27,082 | |||||||||||
| Net assets applicable to outstanding shares | $ | 30,441,524 | Total expenses | $ | 471,106 | |||||||||
| SHARES OF BENEFICIAL INTEREST OUTSTANDING AT $0.000 PAR VALUE (UNLIMITED SHARES AUTHORIZED) | 2,405,936 | Deduct – | ||||||||||||
| Waiver and/or reimbursement by the principal underwriter and/or investment adviser (Note 4) | $ | (27,183 | ) | |||||||||||
| NET ASSET VALUE, OFFERING PRICE, AND REDEMPTION PRICE PER SHARE OF BENEFICIAL INTEREST | $ | 12.65 | Net expenses | $ | 443,923 | |||||||||
| Net investment income | $ | 73,320 | ||||||||||||
| REALIZED AND UNREALIZED GAIN (LOSS) ON INVESTMENTS: | ||||||||||||||
| Net realized gain on investment transactions | $ | 4,239,188 | ||||||||||||
| Net change in unrealized appreciation (depreciation) on investments | 533,260 | |||||||||||||
| Net realized and unrealized gain on investments | $ | 4,772,448 | ||||||||||||
| Net increase in net assets from operations | $ | 4,845,768 | ||||||||||||
See Notes to Financial Statements. | 20 |
| Years Ended | ||||||||||
| STATEMENTS OF CHANGES IN NET ASSETS | December 31, 2017 | December 31, 2016 | ||||||||
| INCREASE (DECREASE) IN NET ASSETS: | ||||||||||
From operations – | ||||||||||
| Net investment income | $ | 73,320 | $ | 156,374 | ||||||
| 0 | Net realized gain on investment transactions | 4,239,188 | 671,319 | |||||||
| Net change in unrealized appreciation (depreciation) on investments | 533,260 | 1,398,751 | ||||||||
| Net increase in net assets from operations | $ | 4,845,768 | $ | 2,226,444 | ||||||
| Distributions to shareholders (Note 2) | ||||||||||
| From net investment income | $ | (73,664 | ) | $ | (152,168 | ) | ||||
| From net realized capital gains | (2,560,355 | ) | (831,095 | ) | ||||||
| Total distributions | $ | (2,634,019 | ) | $ | (983,263 | ) | ||||
| Net decrease in net assets resulting from fund share transactions (Note 6) | $ | (5,715,462 | ) | $ | (5,804,590 | ) | ||||
| Net decrease in net assets | $ | (3,503,713 | ) | $ | (4,561,409 | ) | ||||
| ## | ||||||||||
| NET ASSETS: | ||||||||||
| At beginning of year | 33,945,237 | 38,506,646 | ||||||||
| At end of year | $ | 30,441,524 | $ | 33,945,237 | ||||||
| These financial highlights reflect selected data for a share outstanding throughout each year. | |||||||||||||||||
| Years Ended December 31, | |||||||||||||||||
| FINANCIAL HIGHLIGHTS | 2017 | 2016 | 2015 | 2014 | 2013 | ||||||||||||
| Net asset value, beginning of year | $ | 11.810 | $ | 11.430 | $ | 12.740 | $ | 14.160 | $ | 11.530 | |||||||
| Income (loss) from investment operations: | |||||||||||||||||
Net investment income (loss) (1) | 0.029 | 0.046 | 0.032 | 0.027 | (0.007 | ) | |||||||||||
| Net realized and unrealized gain (loss) | 1.883 | 0.620 | (0.030 | ) | 1.043 | 4.412 | |||||||||||
| Total income from investment operations | 1.912 | 0.666 | 0.002 | 1.070 | 4.405 | ||||||||||||
| Less distributions: | |||||||||||||||||
| From net investment income | (0.031 | ) | (0.053 | ) | (0.019 | ) | (0.036 | ) | — | (2) | |||||||
| From net realized gains | (1.041 | ) | (0.233 | ) | (1.293 | ) | (2.454 | ) | (1.775 | ) | |||||||
| Total distributions | (1.072 | ) | (0.286 | ) | (1.312 | ) | (2.490 | ) | (1.775 | ) | |||||||
| Net asset value, end of year | $ | 12.650 | $ | 11.810 | $ | 11.430 | $ | 12.740 | $ | 14.160 | |||||||
Total Return(3) | 16.46 | % | 5.98 | % | (0.22 | )% | 7.99 | % | 39.82 | % | |||||||
Ratios/Supplemental Data(4): | |||||||||||||||||
| Net assets, end of year (000 omitted) | $30,442 | $33,945 | $38,507 | $37,610 | $40,204 | ||||||||||||
| Ratios (As a percentage of average daily net assets): | |||||||||||||||||
| Net expenses | 1.40 | % | 1.40 | % | 1.40 | % | 1.45 | % | 1.40 | % | |||||||
| Net investment income (loss) | 0.23 | % | 0.41 | % | 0.25 | % | 0.19 | % | (0.06 | )% | |||||||
| Portfolio turnover rate | 52 | % | 77 | % | 55 | % | 66 | % | 76 | % | |||||||
| For the years ended December 31, 2017, 2016, 2015, 2014 and 2013 | For the years ended December 31, 2017, 2016, 2015, 2014 and 2013 | ||||||||||||||||
| (1) | Computed using average shares outstanding. | ||||||||||||||||
| (2) | Less than $0.001 per share. | ||||||||||||||||
| (3) | Total return is calculated assuming a purchase at the net asset value on the first day and a sale at the net asset value on the last day of each year reported. Dividends and distributions, if any, are assumed to be reinvested at the net asset value on the reinvestment date. | ||||||||||||||||
| (4) | For each of the years presented, the operating expenses of the Fund were reduced by a waiver of fees and/or allocation of expenses to the principal underwriter and/or investment adviser. Had such action not been undertaken, expenses and net investment income (loss) ratios would have been as follows: | ||||||||||||||||
| 2017 | 2016 | 2015 | 2014 | 2013 | |||||||||||||
| Ratios (As a percentage of average daily net assets): | |||||||||||||||||
| Expenses | 1.48 | % | 1.42 | % | 1.44 | % | 1.51 | % | 1.43 | % | |||||||
| Net investment income (loss) | 0.15 | % | 0.39 | % | 0.21 | % | 0.13 | % | (0.09 | )% | |||||||
See Notes to Financial Statements. | 22 |
Wright Major Blue Chip Equities Fund (WMBC)
Portfolio of Investments - As of December 31, 2017
| Shares | Value |
| EQUITY INTERESTS - 98.2% |
| BANKS - 8.8% | |||||
| Bank of America Corp. | 10,737 | $ | 316,956 | ||
| Citigroup, Inc. | 5,166 | 384,402 | |||
| JPMorgan Chase & Co. | 4,041 | 432,145 | |||
| U.S. Bancorp | 1,255 | 67,243 | |||
| $ | 1,200,746 | ||||
| CAPITAL GOODS - 10.8% | |||||
| Boeing Co. (The) | 1,414 | $ | 417,003 | ||
| General Dynamics Corp. | 1,212 | 246,581 | |||
| Huntington Ingalls Industries, Inc. | 707 | 166,640 | |||
| Lockheed Martin Corp. | 794 | 254,914 | |||
| Northrop Grumman Corp. | 866 | 265,784 | |||
| Raytheon Co. | 664 | 124,732 | |||
| $ | 1,475,654 | ||||
| DIVERSIFIED FINANCIALS - 1.1% | |||||
| Bank of New York Mellon Corp. (The) | 2,843 | $ | 153,124 | ||
| ENERGY - 3.9% | |||||
| Anadarko Petroleum Corp. | 3,550 | $ | 190,422 | ||
| Exxon Mobil Corp. | 1,342 | 112,245 | |||
| Marathon Oil Corp. | 7,504 | 127,043 | |||
| Schlumberger, Ltd. | 1,414 | 95,289 | |||
| $ | 524,999 | ||||
| FOOD & STAPLES RETAILING - 1.1% | |||||
| CVS Health Corp. | 2,092 | $ | 151,670 | ||
| FOOD, BEVERAGE & TOBACCO - 5.4% | |||||
| Constellation Brands, Inc. - Class A | 1,255 | $ | 286,855 | ||
| PepsiCo, Inc. | 1,559 | 186,955 | |||
| Philip Morris International, Inc. | 2,410 | 254,617 | |||
| $ | 728,427 | ||||
| HEALTH CARE EQUIPMENT & SERVICES - 11.2% | |||||
| Aetna, Inc. | 2,453 | $ | 442,497 | ||
| Anthem, Inc. | 2,338 | 526,073 | |||
| Centene Corp.* | 1,299 | 131,043 | |||
| UnitedHealth Group, Inc. | 1,905 | 419,976 | |||
| $ | 1,519,589 | ||||
| INSURANCE - 8.9% | |||||
| Allstate Corp. (The) | 3,665 | $ | 383,762 | ||
| Brighthouse Financial, Inc.* | 1 | 59 | |||
| MetLife, Inc. | 5,195 | 262,659 | |||
| Progressive Corp. (The) | 10,102 | 568,945 | |||
| $ | 1,215,425 | ||||
| MATERIALS - 2.5% | |||||
| DowDuPont, Inc. | 3,608 | $ | 256,962 | ||
| FMC Corp. | 790 | 74,781 | |||
| $ | 331,743 | ||||
| MEDIA - 2.8% | |||||
| Comcast Corp. - Class A | 9,640 | $ | 386,082 | ||
| Shares | Value |
| PHARMACEUTICALS & BIOTECHNOLOGY - 6.0% | |||||
| AbbVie, Inc. | 2,944 | $ | 284,714 | ||
| Amgen, Inc. | 1,140 | 198,246 | |||
| Celgene Corp.* | 936 | 97,681 | |||
| Gilead Sciences, Inc. | 3,334 | 238,848 | |||
| $ | 819,489 | ||||
| RETAILING - 7.1% | |||||
| Amazon.com, Inc.* | 476 | $ | 556,668 | ||
| Dollar Tree, Inc.* | 731 | 78,444 | |||
| Home Depot, Inc. (The) | 1,761 | 333,762 | |||
| $ | 968,874 | ||||
| SEMICONDUCTOR EQUIPMENT & PRODUCTS - 3.3% | |||||
| Cirrus Logic, Inc.* | 1,235 | $ | 64,047 | ||
| Intel Corp. | 8,283 | 382,343 | |||
| $ | 446,390 | ||||
| SOFTWARE & SERVICES - 14.5% | |||||
| Activision Blizzard, Inc. | 4,531 | $ | 286,903 | ||
| Alphabet, Inc. - Class C* | 361 | 377,750 | |||
| Facebook, Inc.- Class A* | 1,212 | 213,870 | |||
| MasterCard, Inc. - Class A | 2,554 | 386,573 | |||
| Microsoft Corp. | 8,298 | 709,811 | |||
| $ | 1,974,907 | ||||
| TECHNOLOGY HARDWARE & EQUIPMENT - 5.0% | |||||
| Apple, Inc. | 4,026 | $ | 681,320 | ||
| TELECOMMUNICATION SERVICES - 1.9% | |||||
| AT&T, Inc. | 6,436 | $ | 250,232 | ||
| TRANSPORTATION - 2.1% | |||||
| Southwest Airlines Co. | 4,416 | $ | 289,027 | ||
| UTILITIES - 1.8% | |||||
| NextEra Energy, Inc. | 1,587 | $ | 247,874 | ||
TOTAL EQUITY INTERESTS - 98.2% (identified cost, $9,960,244) | $ | 13,365,572 |
| SHORT-TERM INVESTMENTS - 1.6% | |||||
| Fidelity Investments Money Market Government Portfolio - Class I, 1.16% (1) | 220,646 | $ | 220,646 | ||
TOTAL SHORT-TERM INVESTMENTS - 1.6% (identified cost, $220,646) | $ | 220,646 |
INVESTMENTS, AT VALUE — 99.8% (identified cost, $10,180,890) | $ | 13,586,218 |
| OTHER ASSETS, IN EXCESS OF LIABILITIES — 0.2% | 33,057 |
| NET ASSETS — 100.0% | $ | 13,619,275 |
* — Non-income producing security.
| (1) | Dividend yield changes daily to reflect current market |
conditions. Rate was the quoted yield as of December 31,
2017.
See Notes to Financial Statements. | 23 |
| Years Ended | ||||||||||
| STATEMENTS OF CHANGES IN NET ASSETS | December 31, 2017 | December 31, 2016 | ||||||||
| INCREASE (DECREASE) IN NET ASSETS: | ||||||||||
From operations – | ||||||||||
| Net investment income | $ | 49,624 | $ | 105,738 | ||||||
| 0 | Net realized gain (loss) on investment transactions | 664,664 | (170,985 | ) | ||||||
| Net change in unrealized appreciation (depreciation) on investments | 2,372,516 | 1,120,300 | ||||||||
| Net increase in net assets from operations | $ | 3,086,804 | $ | 1,055,053 | ||||||
| Distributions to shareholders (Note 2) | ||||||||||
| From net investment income | $ | (49,691 | ) | $ | (108,099 | ) | ||||
| From net realized capital gains | - | (939,427 | ) | |||||||
| Total distributions | $ | (49,691 | ) | $ | (1,047,526 | ) | ||||
| Net decrease in net assets resulting from fund share transactions (Note 6) | $ | (1,034,115 | ) | $ | (1,188,235 | ) | ||||
| Net increase (decrease) in net assets | $ | 2,002,998 | $ | (1,180,708 | ) | |||||
| ## | ||||||||||
| NET ASSETS: | ||||||||||
| At beginning of year | 11,616,277 | 12,796,985 | ||||||||
| At end of year | $ | 13,619,275 | $ | 11,616,277 | ||||||
See Notes to Financial Statements. | 25 |
Wright Major Blue Chip Equities Fund (WMBC)
| These financial highlights reflect selected data for a share outstanding throughout each year. | ||||||||||||||||||
| Years Ended December 31, | ||||||||||||||||||
| FINANCIAL HIGHLIGHTS | 2017 | 2016 | 2015 | 2014 | 2013 | |||||||||||||
| Net asset value, beginning of year | $ | 18.420 | $ | 18.360 | $ | 19.100 | $ | 17.030 | $ | 12.690 | ||||||||
| Income (loss) from investment operations: | ||||||||||||||||||
Net investment income (1) | 0.082 | 0.154 | 0.168 | 0.127 | 0.096 | |||||||||||||
| Net realized and unrealized gain (loss) | 5.014 | 1.464 | (0.727 | ) | 2.095 | 4.344 | ||||||||||||
| Total income (loss) from investment operations | 5.096 | 1.618 | (0.559 | ) | 2.222 | 4.440 | ||||||||||||
| Less distributions: | ||||||||||||||||||
| From net investment income | (0.086 | ) | (0.172 | ) | (0.181 | ) | (0.152 | ) | (0.100 | ) | ||||||||
| From net realized gains | — | (1.386 | ) | — | — | — | ||||||||||||
| Total distributions | (0.086 | ) | (1.558 | ) | (0.181 | ) | (0.152 | ) | (0.100 | ) | ||||||||
| Net asset value, end of year | $ | 23.430 | $ | 18.420 | $ | 18.360 | $ | 19.100 | $ | 17.030 | ||||||||
Total Return(2) | 27.66 | % | 9.43 | % | (2.91 | )% | 13.04 | % | 35.03 | % | ||||||||
Ratios/Supplemental Data(3): | ||||||||||||||||||
| Net assets, end of year (000 omitted) | $13,619 | $11,616 | $12,797 | $15,925 | $17,692 | |||||||||||||
| Ratios (As a percentage of average daily net assets): | ||||||||||||||||||
| Net expenses | 1.40 | % | 1.40 | % | 1.40 | % | 1.40 | % | 1.40 | % | ||||||||
| Net investment income | 0.39 | % | 0.88 | % | 0.89 | % | 0.71 | % | 0.65 | % | ||||||||
| Portfolio turnover rate | 26 | % | 44 | % | 118 | % | 62 | % | 64 | % | ||||||||
| For the years ended December 31, 2017, 2016, 2015, 2014 and 2013 | For the years ended December 31, 2017, 2016, 2015, 2014 and 2013 | |||||||||||||||||
| (1) | Computed using average shares outstanding. | |||||||||||||||||
| (2) | Total return is calculated assuming a purchase at the net asset value on the first day and a sale at the net asset value on the last day of each year reported. Dividends and distributions, if any, are assumed to be reinvested at the net asset value on the reinvestment date. | |||||||||||||||||
| (3) | For each of the years presented, the operating expenses of the Fund were reduced by a waiver of fees and/or allocation of expenses to the principal underwriter and/or investment adviser. Had such action not been undertaken, expenses and net investment income (loss) ratios would have been as follows: | |||||||||||||||||
| 2017 | 2016 | 2015 | 2014 | 2013 | ||||||||||||||
| Ratios (As a percentage of average daily net assets): | ||||||||||||||||||
| Expenses | 2.10 | % | 2.20 | % | 2.05 | % | 1.86 | % | 1.87 | % | ||||||||
| Net investment income (loss) | (0.31 | )% | 0.08 | % | 0.24 | % | 0.25 | % | 0.17 | % | ||||||||
See Notes to Financial Statements. | 26 |
Wright International Blue Chip Equities Fund (WIBC)
Portfolio of Investments - As of December 31, 2017
| Shares | Value |
| EQUITY INTERESTS - 95.5% |
| AUSTRALIA - 5.6% | |||||
| Australia & New Zealand Banking Group, Ltd. | 3,845 | $ | 86,432 | ||
| BHP Billiton, Ltd. | 5,272 | 121,932 | |||
| CIMIC Group, Ltd. | 3,165 | 127,365 | |||
| Crown Resorts, Ltd. | 2,731 | 27,811 | |||
| CSL, Ltd. | 1,309 | 144,668 | |||
| Dexus REIT | 7,183 | 54,777 | |||
| Fortescue Metals Group, Ltd. | 11,506 | 43,917 | |||
| $ | 606,902 | ||||
| CANADA - 13.2% | |||||
| Alimentation Couche-Tard, Inc. - Class B | 2,848 | $ | 149,088 | ||
| Canadian National Railway Co. | 951 | 78,671 | |||
| Canadian Tire Corp., Ltd. - Class A | 1,072 | 140,230 | |||
| CCL Industries, Inc. - Class B | 2,935 | 136,051 | |||
| CGI Group, Inc. - Class A* | 3,369 | 183,649 | |||
| Enbridge, Inc. | 482 | 18,911 | |||
| Magna International, Inc. | 1,808 | 102,799 | |||
| Manulife Financial Corp. | 9,461 | 197,987 | |||
| Metro, Inc. | 2,998 | 96,308 | |||
| Open Text Corp. | 1,390 | 49,601 | |||
| Royal Bank of Canada | 774 | 63,411 | |||
| Toronto-Dominion Bank (The) | 3,769 | 221,547 | |||
| $ | 1,438,253 | ||||
| DENMARK - 0.3% | |||||
| Pandora A/S | 289 | $ | 31,485 | ||
| FINLAND - 1.3% | |||||
| Sampo OYJ - Class A | 2,584 | $ | 142,111 | ||
| FRANCE - 7.5% | |||||
| Alstom SA | 1,399 | $ | 58,134 | ||
| AXA SA | 4,174 | 123,975 | |||
| Capgemini SE | 547 | 64,955 | |||
| Orange SA | 2,871 | 49,902 | |||
| Societe Generale SA | 2,048 | 105,870 | |||
| TOTAL SA | 5,267 | 291,217 | |||
| Vivendi SA | 4,460 | 120,072 | |||
| $ | 814,125 | ||||
| GERMANY - 12.7% | |||||
| adidas AG | 280 | $ | 56,200 | ||
| Allianz SE | 655 | 150,619 | |||
| BASF SE | 1,864 | 205,341 | |||
| Bayer AG | 394 | 49,204 | |||
| Bayerische Motoren Werke AG | 371 | 38,682 | |||
| Continental AG | 280 | 75,667 | |||
| Daimler AG | 347 | 29,501 | |||
| Hannover Rueck SE | 1,121 | 141,206 | |||
| Merck KGaA | 541 | 58,305 | |||
| Muenchener Rueckversicherungs-Gesellschaft AG in Muenchen - Class R | 1,129 | 245,043 | |||
| SAP SE | 1,120 | 125,681 | |||
| Siemens AG | 1,291 | 180,060 | |||
| Shares | Value |
| Volkswagen AG | 119 | $ | 24,106 | ||
| $ | 1,379,615 |
| HONG KONG - 2.8% | |||||
| BOC Hong Kong Holdings, Ltd. | 26,500 | $ | 134,241 | ||
| CK Hutchison Holdings, Ltd. | 11,500 | 144,314 | |||
| Henderson Land Development Co., Ltd. | 3,520 | 23,190 | |||
| $ | 301,745 | ||||
| IRELAND - 1.0% | |||||
| Ryanair Holdings PLC* | 5,850 | $ | 106,213 | ||
| JAPAN - 21.9% | |||||
| Asahi Kasei Corp. | 13,000 | $ | 167,737 | ||
| Central Japan Railway Co. | 841 | 150,656 | |||
| Daito Trust Construction Co., Ltd. | 200 | 40,790 | |||
| Daiwa House Industry Co., Ltd. | 7,226 | 277,558 | |||
| FUJIFILM Holdings Corp. | 700 | 28,615 | |||
| Hitachi High-Technologies Corp. | 700 | 29,516 | |||
| Hitachi Metals, Ltd. | 1,400 | 20,108 | |||
| Hoya Corp. | 1,119 | 55,905 | |||
| ITOCHU Corp. | 15,200 | 283,760 | |||
| KDDI Corp. | 7,600 | 189,207 | |||
| Kose Corp. | 300 | 46,844 | |||
| Mitsubishi Corp. | 2,100 | 58,032 | |||
| Mitsubishi Electric Corp. | 2,500 | 41,534 | |||
| Mitsubishi UFJ Financial Group, Inc. | 6,000 | 44,016 | |||
| Nippon Telegraph & Telephone Corp. | 3,900 | 183,523 | |||
| Nomura Real Estate Holdings, Inc. | 5,200 | 116,602 | |||
| Omron Corp. | 600 | 35,792 | |||
| ORIX Corp. | 3,161 | 53,441 | |||
| Rohm Co. Ltd, | 500 | 55,393 | |||
| Sekisui Chemical Co., Ltd. | 3,100 | 62,248 | |||
| Shimadzu Corp. | 3,200 | 72,778 | |||
| SoftBank Corp. | 1,300 | 102,938 | |||
| Subaru Corp. | 500 | 15,903 | |||
| Taisei Corp. | 1,000 | 49,800 | |||
| Tokio Marine Holdings, Inc. | 900 | 41,073 | |||
| Tokyo Electron, Ltd. | 200 | 36,219 | |||
| Toyota Motor Corp. | 1,900 | 121,658 | |||
| $ | 2,381,646 | ||||
| NETHERLANDS - 5.2% | |||||
| AerCap Holdings NV* | 1,695 | $ | 89,174 | ||
| Airbus SE | 2,635 | 262,621 | |||
| ASML Holding NV | 274 | 47,757 | |||
| ING Groep NV | 9,287 | 170,902 | |||
| $ | 570,454 | ||||
| SOUTH AFRICA - 0.3% | |||||
| Foschini Group, Ltd. (The) | 2,376 | $ | 37,872 | ||
| SPAIN - 3.9% | |||||
| Enagas SA | 2,196 | $ | 62,944 | ||
| Gas Natural SDG SA | 4,559 | 105,383 | |||
| Iberdrola SA | 17,575 | 136,332 | |||
| Red Electrica Corp. SA | 5,576 | 125,276 | |||
| $ | 429,935 | ||||
See Notes to Financial Statements. | 27 |
Wright International Blue Chip Equities Fund (WIBC)
Portfolio of Investments - As of December 31, 2017
| Shares | Value |
| SWEDEN - 1.7% | |||||
| Nordea Bank AB | 5,413 | $ | 65,650 | ||
| Skanska AB - Class B | 5,834 | 121,134 | |||
| $ | 186,784 | ||||
| SWITZERLAND - 6.4% | |||||
| ABB, Ltd. | 2,660 | $ | 71,297 | ||
| Idorsia, Ltd.* | 1,772 | 46,277 | |||
| Nestle SA | 4,293 | 369,167 | |||
| Novartis AG | 886 | 74,917 | |||
| Swiss Re AG | 1,412 | 132,217 | |||
| $ | 693,875 | ||||
| UNITED KINGDOM - 11.7% | |||||
| Bellway PLC | 1,564 | $ | 75,382 | ||
| BHP Billiton PLC | 6,869 | 141,471 | |||
| BP PLC | 16,391 | 115,898 | |||
| British American Tobacco PLC | 1,502 | 101,957 | |||
| BT Group PLC | 23,367 | 85,884 | |||
| National Grid PLC | 7,095 | 83,990 | |||
| Reckitt Benckiser Group PLC | 1,050 | 98,277 | |||
| Rio Tinto PLC | 2,031 | 108,304 | |||
| Royal Dutch Shell PLC - Class A | 3,216 | 107,891 | |||
| Royal Dutch Shell PLC - Class B | 3,499 | 118,734 | |||
| Shire PLC | 1,232 | 64,997 | |||
| Taylor Wimpey PLC | 21,118 | 58,963 | |||
| WPP PLC | 6,419 | 116,443 | |||
| $ | 1,278,191 | ||||
TOTAL EQUITY INTERESTS - 95.5% (identified cost, $7,026,409) | $ | 10,399,206 |
| SHORT-TERM INVESTMENTS - 4.1% | |||||
| Fidelity Investments Money Market Government Portfolio - Class I, 1.16% (1) | 443,688 | $ | 443,688 | ||
TOTAL SHORT-TERM INVESTMENTS - 4.1% (identified cost, $443,688) | $ | 443,688 |
INVESTMENTS, AT VALUE — 99.6% (identified cost, $7,470,097) | $ | 10,842,894 |
| OTHER ASSETS, IN EXCESS OF LIABILITIES — 0.4% | 41,230 |
| NET ASSETS — 100.0% | $ | 10,884,124 |
PLC — Public Limited Company
REIT — Real Estate Investment Trust
| * | Non-income producing security. |
| (1) | Dividend yield changes daily to reflect current market conditions. Rate was the quoted yield as of December 31, 2017. |
See Notes to Financial Statements. | 28 |
Wright International Blue Chip Equities Fund (WIBC)
| STATEMENT OF ASSETS AND LIABILITIES | STATEMENT OF OPERATIONS | ||||||||||||||
| As of December 31, 2017 | For the Year Ended December 31, 2017 | ||||||||||||||
| ASSETS: | TRUE | INVESTMENT INCOME (Note 1C) | TRUE | ||||||||||||
| Investments, at value | 7.00E+06 | Dividend income (net of foreign taxes $57,230) | $ | 312,847 | |||||||||||
| (identified cost $7,470,097) (Note 1A) | $ | 10,842,894 | ###### | Total investment income | $ | 312,847 | |||||||||
| Foreign currency, at value | |||||||||||||||
| (identified cost $353) (Notes 1A, 1G) | 354 | Expenses – | |||||||||||||
| Receivable for fund shares sold | 23,891 | Investment adviser fee (Note 3) | $ | 94,322 | |||||||||||
| Dividends receivable | 9,693 | Administrator fee (Note 3) | 20,043 | ||||||||||||
| Tax reclaims receivable | 20,411 | Trustee expense (Note 3) | 12,450 | ||||||||||||
| Prepaid expenses and other assets | 9,438 | Custodian fee | 16,686 | ||||||||||||
| Total assets | $ | 10,906,681 | Accountant fee | 61,132 | |||||||||||
| Distribution expenses (Note 4) | 22,718 | ||||||||||||||
| LIABILITIES: | Transfer agent fee | 42,448 | |||||||||||||
| Payable for fund shares reacquired | $ | 8,022 | Printing | 133 | |||||||||||
| Accrued expenses and other liabilities | Shareholder communications | 5,695 | |||||||||||||
| Transfer agent fee | 3,336 | Audit services | 17,500 | ||||||||||||
| Trustee expenses | 150 | Legal services | 6,045 | ||||||||||||
| Other expenses and liabilities | 11,049 | Compliance services | 5,543 | ||||||||||||
| Total liabilities | $ | 22,557 | Registration costs | 20,411 | |||||||||||
| NET ASSETS | $ | 10,884,124 | Interest expense (Note 8) | 160 | |||||||||||
| Miscellaneous | 21,672 | ||||||||||||||
| NET ASSETS CONSIST OF: | Total expenses | $ | 346,958 | ||||||||||||
| Paid-in capital | $ | 7,741,092 | |||||||||||||
| Distributions in excess of net investment income | (91,806 | ) | Deduct – | ||||||||||||
| Accumulated net realized loss on investments and foreign currency | (139,555 | ) | Waiver and/or reimbursement by the principal underwriter and/or investment adviser (Note 4) | $ | (128,578 | ) | |||||||||
| Unrealized appreciation on investments and foreign currency | 3,374,393 | Net expenses | $ | 218,380 | |||||||||||
| Net assets applicable to outstanding shares | $ | 10,884,124 | Net investment income | $ | 94,467 | ||||||||||
| SHARES OF BENEFICIAL INTEREST OUTSTANDING AT $0.000 PAR VALUE (UNLIMITED SHARES AUTHORIZED) | 657,867 | REALIZED AND UNREALIZED GAIN (LOSS) ON INVESTMENTS AND FOREIGN CURRENCY: | |||||||||||||
| Net realized gain (loss) – | |||||||||||||||
| NET ASSET VALUE, OFFERING PRICE, AND REDEMPTION PRICE PER SHARE OF BENEFICIAL INTEREST (Note 1F) | $ | 16.54 | Investment transactions | $ | 2,321,340 | ||||||||||
| Foreign currency transactions | (26,771 | ) | |||||||||||||
| Net realized gain | $ | 2,294,569 | |||||||||||||
| Change in unrealized appreciation (depreciation) – | |||||||||||||||
| Investments | $ | (327,953 | ) | ||||||||||||
| Foreign currency translations | 7,186 | ||||||||||||||
| Net change in unrealized appreciation (depreciation) on investments | $ | (320,767 | ) | ||||||||||||
| Net realized and unrealized gain on investments and foreign currency translations | $ | 1,973,802 | |||||||||||||
| Net increase in net assets from operations | $ | 2,068,269 | |||||||||||||
See Notes to Financial Statements. | 29 |
Wright International Blue Chip Equities Fund (WIBC)
| Years Ended | |||||||||||
| STATEMENTS OF CHANGES IN NET ASSETS | December 31, 2017 | December 31, 2016 | |||||||||
| INCREASE (DECREASE) IN NET ASSETS: | |||||||||||
From operations – | |||||||||||
| Net investment income | $ | 94,467 | $ | 257,891 | |||||||
| -37534 | Net realized gain (loss) on investment and foreign currency transactions | 2,294,569 | (382,347 | ) | |||||||
| Net change in unrealized appreciation (depreciation) on investments and foreign currency translations | (320,767 | ) | (146,885 | ) | |||||||
| Net increase (decrease) in net assets from operations | $ | 2,068,269 | $ | (271,341 | ) | ||||||
| Distributions to shareholders (Note 2) | |||||||||||
| From net investment income | $ | (145,868 | ) | $ | (308,333 | ) | |||||
| Total distributions | $ | (145,868 | ) | $ | (308,333 | ) | |||||
| Net decrease in net assets resulting from fund share transactions (Note 6) | $ | (8,378,566 | ) | $ | (7,416,846 | ) | |||||
| Net decrease in net assets | $ | (6,456,165 | ) | $ | (7,996,520 | ) | |||||
| ## | |||||||||||
| NET ASSETS: | |||||||||||
| At beginning of year | 17,340,289 | 25,336,809 | |||||||||
| At end of year | $ | 10,884,124 | $ | 17,340,289 | |||||||
| DISTRIBUTIONS IN EXCESS OF NET INVESTMENT INCOME INCLUDED IN NET ASSETS AT END OF YEAR | $ | (91,806 | ) | $ | (59,032 | ) | |||||
See Notes to Financial Statements. | 30 |
Wright International Blue Chip Equities Fund (WIBC)
| These financial highlights reflect selected data for a share outstanding throughout each year. | |||||||||||||||||
| Years Ended December 31, | |||||||||||||||||
| FINANCIAL HIGHLIGHTS | 2017 | 2016 | 2015 | 2014 | 2013 | ||||||||||||
| Net asset value, beginning of year | $ | 14.030 | $ | 14.400 | $ | 14.900 | $ | 16.280 | $ | 14.120 | |||||||
| Income (loss) from investment operations: | |||||||||||||||||
Net investment income (1) | 0.123 | 0.161 | 0.169 | 0.382 | 0.236 | ||||||||||||
| Net realized and unrealized gain (loss) | 2.609 | (0.300 | ) | (0.486 | ) | (1.439 | ) | 2.480 | |||||||||
| Total income (loss) from investment operations | 2.732 | (0.139 | ) | (0.317 | ) | (1.057 | ) | 2.716 | |||||||||
| Less distributions: | |||||||||||||||||
| From net investment income | (0.222 | ) | (0.231 | ) | (0.185 | ) | (0.323 | ) | (0.556 | ) | |||||||
Redemption Fees(1) | — | (2) | — | (2) | 0.002 | — | (2) | — | (2) | ||||||||
| # | |||||||||||||||||
| Net asset value, end of year | $ | 16.540 | $ | 14.030 | $ | 14.400 | $ | 14.900 | $ | 16.280 | |||||||
Total Return(3) | 19.53 | % | (0.94 | )% | (2.11 | )% | (6.51 | )% | 19.46 | % | |||||||
Ratios/Supplemental Data(4): | |||||||||||||||||
| Net assets, end of year (000 omitted) | $10,884 | $17,340 | $25,337 | $27,992 | $32,067 | ||||||||||||
| Ratios (As a percentage of average daily net assets): | |||||||||||||||||
| Net expenses | 1.85 | % | 1.85 | % | 1.85 | % | 1.85 | % | 1.85 | % | |||||||
| Net investment income | 0.80 | % | 1.17 | % | 1.11 | % | 2.37 | % | 1.57 | % | |||||||
| Portfolio turnover rate | 19 | % | 49 | % | 33 | % | 57 | % | 45 | % | |||||||
| For the years ended December 31, 2017, 2016, 2015, 2014 and 2013 | For the years ended December 31, 2017, 2016, 2015, 2014 and 2013 | ||||||||||||||||
| (1) | Computed using average shares outstanding. | ||||||||||||||||
| (2) | Less than $0.001 per share. | ||||||||||||||||
| (3) | Total return is calculated assuming a purchase at the net asset value on the first day and a sale at the net asset value on the last day of each year reported. Dividends and distributions, if any, are assumed to be reinvested at the net asset value on the reinvestment date. | ||||||||||||||||
| (4) | For each of the years presented, the operating expenses of the Fund were reduced by a waiver of fees and/or allocation of expenses to the principal underwriter and/or investment adviser. Had such action not been undertaken, expenses and net investment income (loss) ratios would have been as follows: | ||||||||||||||||
| 2017 | 2016 | 2015 | 2014 | 2013 | |||||||||||||
| Ratios (As a percentage of average daily net assets): | |||||||||||||||||
| Expenses | 2.94 | % | 2.23 | % | 2.04 | % | 2.01 | % | 2.01 | % | |||||||
| Net investment income (loss) | (0.29 | )% | 0.79 | % | 0.92 | % | 2.21 | % | 1.41 | % | |||||||
See Notes to Financial Statements. | 31 |
Wright Managed Equity Trust
Notes to Financial Statements
1. Significant Accounting Policies
Wright Selected Blue Chip Equities Fund ("WSBC"), Wright Major Blue Chip Equities Fund ("WMBC"), and Wright International Blue Chip Equities Fund ("WIBC") (each a "Fund" and collectively, the "Funds") (the Funds constituting The Wright Managed Equity Trust (the "Trust")), are registered under the Investment Company Act of 1940, as amended (the "1940 Act"), as diversified, open-end management investment companies. The Funds seek to provide total return consisting of price appreciation and current income.
The Funds are investment companies and follow accounting and reporting guidance under Financial Accounting Standards Board("FASB") Accounting Standards Codification ("ASC") Topic 946, "Financial Services-Investment Companies". The following is a summary of significant accounting policies consistently followed by the Trust in the preparation of their financial statements. The policies are in conformity with accounting principles generally accepted in the United States of America ("GAAP").
A. Investment Valuations – Equity securities listed on a U.S. securities exchange generally are valued at the last sale price on the day of valuation or, if no sales took place on such date, at the mean between the closing bid and asked prices therefore on the exchange where such securities are principally traded. Equity securities listed on the NASDAQ Global or Global Select Market generally are valued at the NASDAQ official closing price. Unlisted or listed securities for which closing sales prices or closing quotations are not available are valued at the mean between the latest available bid and asked prices or, in the case of preferred equity securities that are not listed or traded in the over-the-counter market, by a third party pricing service. Investments in open-end mutual funds are valued at net asset value. Short-term debt securities with a remaining maturity of sixty days or less may be valued at amortized cost, which approximates market value. If short-term debt securities are acquired with a remaining maturity of more than sixty days, they will be valued by a third party pricing service. Foreign securities and currencies are valued in U.S. dollars, based on foreign currency exchange rate quotations supplied by a third party pricing service. The daily valuation of exchange-traded foreign securities generally is determined as of the close of trading on the principal exchange on which such securities trade. Events occurring after the close of trading on foreign exchanges are monitored by the investment adviser and may result in adjustments to the valuation of foreign securities to more accurately reflect their fair value as of the close of regular trading on the New York Stock Exchange. Investments for which valuations or market quotations are not readily available or are deemed unreliable are valued at fair value using methods determined in good faith by or at the direction of the Trustees of the Funds in a manner that most fairly reflects the security's value, or the amount that the Funds might reasonably expect to receive for the security upon its current sale in the ordinary course. Each such determination is based on a consideration of all relevant factors, which are likely to vary from one pricing context to another. These factors may include, but are not limited to, the type of security, the existence of any contractual restrictions on the security's disposition, the price and extent of public trading in similar securities of the issuer or of comparable companies, quotations or relevant information obtained from broker-dealers or other market participants, information obtained from the issuer, analysts, and/or the appropriate stock exchange (for exchange-traded securities), an analysis of the company's financial condition, and an evaluation of the forces that influence the issuer and the market(s) in which the security is purchased and sold.
B. Investment Transactions – Investment transactions for financial statement purposes are accounted for on a trade date basis. Realized gains and losses on investments sold are determined on the basis of identified cost.
C. Income – Dividend income is recorded on the ex-dividend date. However, if the ex-dividend date has passed, certain dividends from foreign securities are recorded as the Funds are informed of the ex-dividend date. Withholding taxes on foreign dividends and capital gains have been provided for in accordance with the Funds' understanding of applicable countries' tax rules and rates. Interest income is recorded on the basis of interest accrued, adjusted for amortization of premium and accretion of discount.
D. Federal Taxes – Each Fund's policy is to comply with the provisions of the Internal Revenue Code (the "Code") applicable to regulated investment companies and to distribute to shareholders each year substantially all of its taxable income and all or substantially all of its net realized capital gains. Accordingly,
32 |
no provision for federal income or excise tax is necessary. Foreign taxes are provided for based on WIBC's understanding of the tax rules and rates that exist in the foreign markets in which it invests. As of December 31, 2017, the Funds had no uncertain tax positions that would require financial statement recognition, de-recognition, or disclosure. Each of the Funds' federal tax returns filed in the 3-year period ended December 31, 2017, remains subject to examination by the Internal Revenue Service.
E. Expenses – The majority of expenses of the Trust are directly identifiable to an individual Fund. Expenses which are not readily identifiable to a specific Fund are allocated taking into consideration, among other things, the nature and type of expense and the relative size of the Funds.
F. Redemption Fees – A shareholder who redeems or exchanges shares of WIBC within three months of purchase will incur a redemption fee of 2.00% of the current net asset value of shares redeemed, subject to certain limitations. The fee is charged for the benefit of the remaining shareholders and will be paid to WIBC to help offset transaction costs. The fee is accounted for as an addition to paid-in capital. The Fund reserves the right to modify the terms of or terminate the fee at any time. There are limited exceptions to the imposition of the redemption fee.
G. Foreign Currency Translation – Investment valuations, other assets, and liabilities initially expressed in foreign currencies are translated each business day into U.S. dollars based upon current exchange rates. Purchases and sales of foreign investment securities and income and expenses denominated in foreign currencies are translated into U.S. dollars based upon currency exchange rates in effect on the respective dates of such transactions. Reported net realized foreign exchange gains or losses arise from sales of foreign currencies, currency gains or losses realized between the trade and settlement dates on securities transactions, and the difference between the amounts of dividends, interest and foreign withholding taxes recorded on the Funds' books and the U.S. dollar equivalent of the amounts actually received or paid. The portion of unrealized gains and losses on investments that results from fluctuations in foreign currency exchange rates is not separately disclosed.
H. Use of Estimates – The preparation of financial statements in conformity with GAAP requires management to make estimates and assumptions that affect the reported amounts of assets and liabilities and disclosure of contingent assets and liabilities at the date of the financial statements and the reported amounts of income and expense during the reporting period. Actual results could differ from those estimates.
I. Indemnifications – Under each Fund's organizational documents, its officers and Trustees may be indemnified against certain liabilities and expenses arising out of the performance of their duties to the Funds, and shareholders are indemnified against personal liability for the obligations of the Funds. Additionally, in the normal course of business, the Funds enter into agreements with service providers that may contain indemnification clauses. Each Fund's maximum exposure under these arrangements is unknown as this would involve future claims that may be made against the Funds that have not yet occurred.
2. Distributions to Shareholders
It is the present policy of the Trust to make annual distributions of all or substantially all of the net investment income of the Funds and to distribute annually all or substantially all of the net realized capital gains (reduced by available capital loss carryforwards from prior years, if any) of the Funds. Distributions to shareholders are recorded on the ex-dividend date. Shareholders may reinvest income and capital gain distributions in additional shares of the same Fund at the net asset value as of the reinvestment date or, at the election of the shareholder, receive distributions in cash. The Funds distinguish between distributions on a tax basis and a financial reporting basis. GAAP requires that only distributions in excess of tax basis earnings and profits be reported in the financial statements as a return of capital. Permanent differences between book and tax accounting relating to distributions are reclassified to paid-in capital.
For tax purposes, distributions from short-term capital gains are considered to be from ordinary income.
The tax character of distributions paid for the years ended December 31, 2017, and December 31, 2016, was
33 |
as follows:
| Year Ended 12/31/17 | WSBC | WMBC | WIBC | ||||||
| Distributions declared from: | |||||||||
| Ordinary income | $ | 73,664 | $ | 49,624 | $ | 145,868 | |||
| Long-term capital gain | 2,560,355 | 67 | - |
| Year Ended 12/31/16 | WSBC | WMBC | WIBC | ||||||
| Distributions declared from: | |||||||||
| Ordinary income | $ | 136,834 | $ | 108,099 | $ | 308,333 | |||
| Long-term capital gain | 846,429 | 939,427 | - |
During the year ended December 31, 2017, the following amounts were reclassified due to real estate investment trusts, recharacterization of distributions, foreign currency gain (loss), expiring capital loss carryforwards and passive foreign investment company transactions.
| Increase (decrease): | WSBC | WMBC | WIBC | ||||||||
| Accumulated net realized gain (loss) | $ | (342 | ) | $ | (67) | $ | 33,125,101 | ||||
| Accumulated net investment income (loss) | 344 | 67 | 18,627 | ||||||||
| Paid in Capital | (2 | ) | - | (33,143,728 | ) | ||||||
These reclassifications had no effect on the net assets or net asset value per share of the Funds.
As of December 31, 2017, the components of distributable earnings on a tax basis were as follows:
| WSBC | WMBC | WIBC | ||||||||||
| Undistributed ordinary income | $ | 65,199 | $ | - | $ | 84,149 | ||||||
| Undistributed long-term gain | 2,357,983 | 493,135 | - | |||||||||
| Net unrealized appreciation | 7,872,619 | 3,404,848 | 3,058,883 | |||||||||
| Total | $ | 10,295,801 | $ | 3,897,983 | $ | 3,143,032 |
The difference between components of distributable earnings on a tax basis and the amounts reflected in the Statements of Assets and Liabilities are primarily due to wash sales, passive foreign investment company transactions and real estate investment trust transactions.
3. Investment Adviser Fee and Other Transactions with Affiliates
The investment adviser fee is earned by Wright Investor Services, Inc. ("Wright") as compensation for investment advisory services rendered to the Funds. The fees are computed at annual rates of the Funds' average daily net assets as noted below, and are payable monthly.
| Annual Advisory Fee Rates | |||||
| Fund | Under $100 Million | $100 Million to $250 Million | $250 Million to $500 Million | $500 Million to $1 Billion | Over $1 Billion |
| WSBC | 0.60% | 0.57% | 0.54% | 0.50% | 0.45% |
| WMBC | 0.60% | 0.57% | 0.54% | 0.50% | 0.45% |
| WIBC | 0.80% | 0.78% | 0.76% | 0.72% | 0.67% |
34 |
For the year ended December 31, 2017, the fee and the effective annual rate, as a percentage of average daily net assets for each of the Funds were as follows:
| Fund | Investment Adviser Fee | Effective Annual Rate |
| WSBC | $ 190,511 | 0.60% |
| WMBC | $ 75,630 | 0.60% |
| WIBC | $ 94,322 | 0.80% |
The administrator fee is earned by Wright for administering the business affairs of each Fund. The fee is computed at an annual rate of 0.12% of WSBC's and WMBC's average daily net assets up to $100 million and 0.07% of average daily net assets over $100 million. The fee is computed at an annual rate of 0.17% of WIBC's average daily net assets up to $100 million and 0.07% of average daily net assets over $100 million. Atlantic Fund Administration, LLC (d/b/a Atlantic Fund Services) ("Atlantic") serves as sub-administrator of the Funds to perform certain services of the administrator as may be agreed upon between the administrator and sub-administrator. The sub-administration fee is paid by Wright.
For the year ended December 31, 2017, the administrator fee for WSBC, WMBC and WIBC amounted to $38,102, $15,126 and $20,043, respectively.
Certain Trustees and officers of the Trust are Trustees or officers of the above organizations and/or of the Funds' principal underwriter. Except as to Trustees of the Trust who are not employees of Atlantic or Wright, Trustees and officers receive remuneration for their services to the Trust out of the fees paid to Atlantic and Wright. The Trustees are compensated by the Trust in conjunction with the Wright Managed Income Trust, rather than on a per Trust or per Fund basis. Quarterly retainer fees are paid in the amount of $4,000 to the Lead Trustee, $3,500 to the Secretary of Independent Trustees, and $3,000 each to the remaining Trustees. In addition, each Trustee will be paid a fee of $1,500 for each regular Board meeting attended. Each Trustee is also reimbursed for all reasonable out-of-pocket expenses incurred in connection with his duties as a Trustee, including travel and related expenses incurred in attending Board meetings. The amount of Trustees' fees attributable to each Fund is disclosed in each Fund's Statement of Operations.
4. Distribution and Service Plans
The Trust had in effect a Distribution Plan (the "Plan") pursuant to Rule 12b-1 of the 1940 Act. The Plan provided that each Fund would pay Wright Investors' Service Distributors, Inc. ("WISDI"), the principal underwriter, a wholly-owned subsidiary of The Winthrop Corporation and an affiliate of Wright, a distribution fee of 0.25% of the average daily net assets of each Fund for distribution services and facilities provided to the Funds by WISDI. The Plan was terminated on October 1, 2017. Distribution fees paid to WISDI for the year ended December 31, 2017, for WSBC, WMBC and WIBC were $59,720, $23,124 and $22,718, respectively. In addition, the Trustees have adopted a service plan (the "Service Plan") which allows the Funds to reimburse the principal underwriter for payments to intermediaries for providing account administration and personal and account maintenance services to their customers who are beneficial owners of each Fund's shares. The combined amount of service fees payable under the Service Plan and Rule 12b-1 distribution fees may not exceed 0.25% annually of each Fund's average daily net assets. For the year ended December 31, 2017, the Funds did not accrue or pay any service fees.
Pursuant to an Expense Limitation Agreement, Wright has agreed to waive all or a portion of their advisory fees and/or assume certain expenses to the extent total annual operating expenses exceed 1.40% of the average daily net assets of each of WSBC and WMBC and 1.85% of the average daily net assets of WIBC through April 30, 2018 (excluding interest, taxes, brokerage commissions, other expenditures which are capitalized in accordance with GAAP, and other extraordinary expenses not incurred in the ordinary course of the Fund's business). Thereafter, the waiver and reimbursement may be changed or terminated at any time. Pursuant to this agreement, Wright waived and/or reimbursed investment adviser fees and expenses of $1,068, $65,515 and $105,860 for WSBC, WMBC and WIBC, respectively. WISDI waived distribution fees of
35 |
$26,115, $23,124 and $22,718 for WSBC, WMBC and WIBC, respectively. Effective October 1, 2017, WISDI no longer waives fees.
5. Investment Transactions
Purchases and sales of investments, other than short-term obligations, were as follows:
| Year Ended December 31, 2017 | |||
| WSBC | WMBC | WIBC | |
| Purchases | $16,605,992 | $3,230,804 | $2,242,772 |
| Sales | $24,967,267 | $4,349,465 | $10,902,854 |
6. Shares of Beneficial Interest
The Declaration of Trust permits the Trustees to issue an unlimited number of full and fractional shares of beneficial interest (without par value). Transactions in Fund shares were as follows:
| December 31, 2018 | 36525 | 43100 | # | # | 42735 | ||||||||||
| Year Ended December 31, 2017 | Year Ended December 31, 2016 | ||||||||||||||
| Shares | Amount | Shares | Amount | ||||||||||||
| WSBC | |||||||||||||||
| Sold | 161,392 | $ | 2,001,471 | 744,147 | $ | 8,152,464 | |||||||||
| Issued to shareholders in payment of distributions declared | 144,367 | 1,803,973 | 63,181 | 701,757 | |||||||||||
| Redemptions | (774,301 | ) | (9,520,906 | ) | (1,302,233 | ) | (14,658,811 | ) | |||||||
| Net decrease | (468,542 | ) | $ | (5,715,462 | ) | (494,905 | ) | $ | (5,804,590 | ) | |||||
| December 31, 2018 | 36525 | 43100 | # | # | 42735 | ||||||||||
| Year Ended December 31, 2017 | Year Ended December 31, 2016 | ||||||||||||||
| Shares | Amount | Shares | Amount | ||||||||||||
| WMBC | |||||||||||||||
| Sold | 39,772 | $ | 809,287 | 38,375 | $ | 675,147 | |||||||||
| Issued to shareholders in payment of distributions declared | 2,007 | 47,179 | 58,106 | 1,004,419 | |||||||||||
| Redemptions | (91,185 | ) | (1,890,581 | ) | (162,847 | ) | (2,867,801 | ) | |||||||
| Net decrease | (49,406 | ) | $ | (1,034,115 | ) | (66,366 | ) | $ | (1,188,235 | ) | |||||
| December 31, 2018 | 36525 | 43100 | # | # | 42735 | ||||||||||
| Year Ended December 31, 2017 | Year Ended December 31, 2016 | ||||||||||||||
| Shares | Amount | Shares | Amount | ||||||||||||
| WIBC | |||||||||||||||
| Sold | 19,981 | $ | 310,545 | 130,220 | $ | 1,726,027 | |||||||||
| Issued to shareholders in payment of distributions declared | 8,580 | 137,177 | 21,453 | 298,088 | |||||||||||
| Redemptions | (606,554 | ) | (8,826,310 | ) | (675,398 | ) | (9,441,303 | ) | |||||||
| Redemption fees | - | 22 | - | 342 | |||||||||||
| Net decrease | (577,993 | ) | $ | (8,378,566 | ) | (523,725 | ) | $ | (7,416,846 | ) | |||||
36 |
7. Federal Income Tax Basis of Investments
The cost and unrealized appreciation (depreciation) of the investment securities owned at December 31, 2017, as computed on a federal income tax basis, were as follows:
| Year Ended December 31, 2017 | |||||||||
| WSBC | WMBC | WIBC | |||||||
| Aggregate cost | $ | 22,508,598 | $ | 10,181,370 | $ | 7,785,607 | |||
| Gross unrealized appreciation | $ | 8,209,484 | $ | 3,642,373 | $ | 3,150,598 | |||
| Gross unrealized depreciation | (336,865 | ) | (237,525 | ) | (93,311 | ) | |||
| Net unrealized appreciation | $ | 7,872,619 | $ | 3,404,848 | $ | 3,057,287 | |||
8. Line of Credit
The Funds participate with other funds managed by Wright in a committed $10 million unsecured line of credit agreement with MUFG Union Bank, N.A. ("Union Bank"). The Funds may temporarily borrow from the line of credit to satisfy redemption requests or settle investment transactions. Interest is charged to each Fund based on its borrowings at an amount above the LIBOR rate. Because the line of credit is not available exclusively to each Fund, they may be unable to borrow some or all of the Funds' requested amounts at any particular time. As of December 31, 2017, the Funds had no outstanding balances pursuant to this line of credit.The average borrowings and average interest rate (based on days with outstanding balances) for the year ended December 31, 2017, were as follows:
| WSBC | WMBC | WIBC | |
| Average borrowings | $166,171 | $51,967 | $74,010 |
| Average interest rate | 2.07% | 2.30% | 2.08% |
9. Risks Associated with Foreign Investments
Investing in securities issued by companies whose principal business activities are outside the United States may involve significant risks not present in domestic investments. For example, there is generally less publicly available information about foreign companies, particularly those not subject to the disclosure and reporting requirements of the U.S. securities laws. Certain foreign issuers are generally not bound by uniform accounting, auditing, and financial reporting requirements and standards of practice comparable to those applicable to domestic issuers. Investments in foreign securities also involve the risk of possible adverse changes in investment or exchange control regulations, expropriation or confiscatory taxation, limitation on the removal of funds or other assets of the Funds, political or financial instability or diplomatic and other developments which could affect such investments. Foreign stock markets, while growing in volume and sophistication, are generally not as developed as those in the United States, and securities of some foreign issuers (particularly those located in developing countries) may be less liquid and more volatile than securities of comparable U.S. companies. In general, there is less overall governmental supervision and regulation of foreign securities markets, broker-dealers and issuers than in the United States.
37 |
10. Fair Value Measurements
Under GAAP for fair value measurements, a three-tier hierarchy to prioritize the assumptions, referred to as inputs, is used in valuation techniques to measure fair value. The three-tier hierarchy of inputs is summarized in the three broad levels listed below.
• Level 1 – quoted prices in active markets for identical investments
• Level 2 – other significant observable inputs (including quoted prices for similar investments, interest rates, prepayment speeds, credit risk, etc.)
• Level 3 – significant unobservable inputs (including a fund's own assumptions in determining the fair value of investments)
The inputs or methodology used for valuing securities are not necessarily an indication of the risk associated with investing in those securities.
At December 31, 2017, the inputs used in valuing each Fund's investments, which are carried at value, were as follows:
WSBC
| Asset Description | Level 1 | Level 2 | Level 3 | Total | ||||
| Equity Interests | $ | 30,370,603 | $ | - | $ | - | $ | 30,370,603 |
| Short-Term Investments | - | 10,614 | - | 10,614 | ||||
| Total Investments | $ | 30,370,603 | $ | 10,614 | $ | - | $ | 30,381,217 |
WMBC
| Asset Description | Level 1 | Level 2 | Level 3 | Total | |||||
| Equity Interests | $ | 13,365,572 | $ | - | $ | - | $ | 13,365,572 | |
| Short-Term Investments | - | 220,646 | - | 220,646 | |||||
| Total Investments | $ | 13,365,575 | $ | 220,646 | $ | - | $ | 13,586,218 | |
WIBC
| Asset Description | Level 1 | Level 2 | Level 3 | Total | |||||
| Equity Interests | $ | 10,399,206 | $ | - | $ | - | $ | 10,399,206 | |
| Short-Term Investments | - | 443,688 | - | 443,688 | |||||
| Total Investments | $ | 10,399,206 | $ | 443,688 | $ | - | $ | 10,842,894 | |
The Level 1 values displayed in these tables under Equity Interests are Common Stock. Refer to each Fund's Portfolio of Investments for a further breakout of each security by industry or country.
The Funds utilize the end of period methodology when determining transfers. There were no transfers among Level 1, Level 2 and Level 3 for the year ended December 31, 2017.
11. Review for Subsequent Events
In connection with the preparation of the financial statements of the Funds as of and for the year ended December 31, 2017, events and transactions subsequent to December 31, 2017, have been evaluated by the Funds' management for possible adjustment and/or disclosure. Management has not identified any subsequent events requiring financial statement disclosure as of the date these financial statements were issued.
38 |
To the Board of Trustees of The Wright Managed Equity Trust
and the Shareholders of Wright Selected Blue Chip Equities Fund, Wright Major Blue Chip Equities Fund and Wright International Blue Chip Equities Fund
Opinion on the Financial Statements
We have audited the accompanying statements of assets and liabilities of Wright Selected Blue Chip Equities Fund, Wright Major Blue Chip Equities Fund and Wright International Blue Chip Equities Fund, each a series of shares of beneficial interest in The Wright Managed Equity Trust (the "Funds"), including the portfolios of investments, as of December 31, 2017, and the related statements of operations for the year then ended, the statements of changes in net assets for each of the years in the two-year period then ended and the financial highlights for each of the years in the five-year period then ended, and the related notes (collectively referred to as the "financial statements"). In our opinion, the financial statements present fairly, in all material respects, the financial position of the Funds as of December 31, 2017, and the results of their operations for the year then ended, the changes in their net assets for each of the years in the two-year period then ended and their financial highlights for each of the years in the five-year period then ended, in conformity with accounting principles generally accepted in the United States of America ("GAAP").
Basis for Opinion
These financial statements are the responsibility of the Funds' management. Our responsibility is to express an opinion on the Funds' financial statements based on our audits. We are a public accounting firm registered with the Public Company Accounting Oversight Board (United States) ("PCAOB") and are required to be independent with respect to the Funds in accordance with the U.S. federal securities law and the applicable rules and regulations of the Securities and Exchange Commission and the PCAOB.
We conducted our audits in accordance with the standards of the PCAOB. Those standards require that we plan and perform the audits to obtain reasonable assurance about whether the financial statements are free of material misstatement, whether due to error or fraud. The Funds are not required to have, nor were we engaged to perform, an audit of their internal control over financial reporting. As part of our audits we are required to obtain an understanding of internal control over financial reporting but not for the purpose of expressing an opinion on the effectiveness of the Funds' internal control over financial reporting. Accordingly, we express no such opinion.
Our audits included performing procedures to assess the risk of material misstatement of those financial statements, whether due to error or fraud, and performing procedures that respond to those risks. Such procedures included examining, on a test basis, evidence regarding the amounts and disclosures in the financial statements. Our procedures included confirmation of securities owned as of December 31, 2017 by correspondence with the custodian. Our audits also included evaluating the accounting principles used and significant estimates made by management, as well as evaluating the overall presentation of the financial statements. We believe that our audits provide a reasonable basis for our opinion.

BBD, LLP
We have served as the auditor of one or more of the Funds in The Wright Managed Equity Trust since 2010.
Philadelphia, Pennsylvania
February 28, 2018
39 |
The Form 1099-DIV you received in January 2018 showed the tax status of all distributions paid to your account in calendar year 2017. Shareholders are advised to consult their own tax adviser with respect to the tax consequences of their investment in the Funds. As required by the Internal Revenue Code regulations, shareholders must be notified within 60 days of a Fund's fiscal year end regarding capital gain dividends, and the status of qualified dividend income for individuals, the dividends received deduction for corporations and the foreign tax credit.
Qualified Dividend Income – Wright Selected Blue Chip Equities Fund and Wright Major Blue Chip Equities Fund designate 100.00% and 100.00%, respectively, of its income dividend distributed as qualifying for the corporate dividends-received deduction (DRD). Wright Selected Blue Chip Equities Fund, Wright Major Blue Chip Equities Fund and Wright International Blue Chip Equities Fund designate 100.00%, 100.00% and 100.00%, respectively, for the qualified dividend rate (QDI) as defined in Section 1(h)(11) of the Internal Revenue Code. Also, Wright Selected Blue Chip Equities Fund designates 72.18% of its income dividends as qualified short-term gain exempt from U.S. tax for foreign shareholders (QSD).
40 |
AFA
| Face Amount | Description | Coupon Rate | Maturity Date | Value |
| FIXED INCOME INVESTMENTS - 96.6% |
| AGENCY MORTGAGE-BACKED SECURITIES - 93.2% | |||||||||||||
| $ | 112,725 | FHLMC Gold Pool #A37619 | 4.500 | % | 09/01/35 | $ | 120,348 | ||||||
| 181,716 | FHLMC Gold Pool #A39555 | 5.500 | % | 11/01/35 | 203,383 | ||||||||
| 409,631 | FHLMC Gold Pool #A88945 | 4.000 | % | 08/01/39 | 433,069 | ||||||||
| 383,123 | FHLMC Gold Pool #A92435 | 5.000 | % | 06/01/40 | 417,677 | ||||||||
| 16,082 | FHLMC Gold Pool #C00778 | 7.000 | % | 06/01/29 | 18,187 | ||||||||
| 1,173,592 | FHLMC Gold Pool #C91303 | 5.000 | % | 05/01/30 | 1,263,757 | ||||||||
| 234,163 | FHLMC Gold Pool #G07025 | 5.000 | % | 02/01/42 | 256,812 | ||||||||
| 86,404 | FHLMC Gold Pool #G08022 | 6.000 | % | 11/01/34 | 97,421 | ||||||||
| 81,747 | FHLMC Gold Pool #G08047 | 6.000 | % | 03/01/35 | 92,339 | ||||||||
| 452,318 | FHLMC Gold Pool #G08378 | 6.000 | % | 10/01/39 | 506,303 | ||||||||
| 227,077 | FHLMC Gold Pool #G30285 | 6.000 | % | 02/01/26 | 253,859 | ||||||||
| 52,395 | FHLMC Gold Pool #G80111 | 7.300 | % | 12/17/22 | 55,215 | ||||||||
| 7,926 | FHLMC Gold Pool #H09098 | 6.500 | % | 10/01/37 | 8,543 | ||||||||
| 84,372 | FHLMC Gold Pool #P00024 | 7.000 | % | 09/01/32 | 92,035 | ||||||||
| 292,811 | FHLMC Gold Pool #P50079 | 5.000 | % | 07/01/33 | 308,711 | ||||||||
| 23,156 | FHLMC Gold Pool #T30126 | 5.550 | % | 07/01/37 | 23,319 | ||||||||
| 310,372 | FHLMC Gold Pool #T60798 | 3.500 | % | 07/01/42 | 316,133 | ||||||||
| 1,456,961 | FHLMC Gold Pool #U80611 | 4.500 | % | 11/01/33 | 1,582,581 | ||||||||
| 167,172 | FHLMC, Series 2097, Class PZ | 6.000 | % | 11/15/28 | 188,473 | ||||||||
| 30,765 | FHLMC, Series 2176, Class OJ | 7.000 | % | 08/15/29 | 34,897 | ||||||||
| 20,380 | FHLMC, Series 2201, Class C | 8.000 | % | 11/15/29 | 23,165 | ||||||||
| 78,459 | FHLMC, Series 2218, Class ZB | 6.000 | % | 03/15/30 | 85,259 | ||||||||
| 19,296 | FHLMC, Series 2576, Class HC | 5.500 | % | 03/15/33 | 21,149 | ||||||||
| 56,320 | FHLMC, Series 2802, Class OH | 6.000 | % | 05/15/34 | 61,000 | ||||||||
| 201,432 | FHLMC, Series 3033, Class WY | 5.500 | % | 09/15/35 | 223,898 | ||||||||
| 71,823 | FHLMC, Series 3072, Class DL | 6.000 | % | 02/15/35 | 78,014 | ||||||||
| 241,228 | FHLMC, Series 3143, Class BC | 5.500 | % | 02/15/36 | 262,999 | ||||||||
| 34,742 | FHLMC, Series 3255, Class QE | 5.500 | % | 12/15/36 | 38,213 | ||||||||
| 312,244 | FHLMC, Series 3613, Class HJ | 5.500 | % | 12/15/39 | 345,645 | ||||||||
| 228,936 | FHLMC, Series 3677, Class PB | 4.500 | % | 05/15/40 | 241,344 | ||||||||
| 439,592 | FHLMC, Series 3926, Class OP | 6.000 | % | 08/15/25 | 455,000 | ||||||||
| 405,326 | FHLMC, Series 3960, Class BM | 3.000 | % | 02/15/30 | 410,885 | ||||||||
| 121,565 | FHLMC, Series 4050, Class NK | 4.500 | % | 09/15/41 | 128,585 | ||||||||
| 1,000,000 | FHLMC, Series 4299, Class JY | 4.000 | % | 01/15/44 | 1,111,681 | ||||||||
| 18,800 | FHLMC-GNMA, Series 23, Class KZ | 6.500 | % | 11/25/23 | 20,216 | ||||||||
| 168,623 | FNMA Pool #252034 | 7.000 | % | 09/01/28 | 189,890 | ||||||||
| 12,684 | FNMA Pool #252215 | 6.000 | % | 11/01/28 | 14,199 | ||||||||
| 163,528 | FNMA Pool #256182 | 6.000 | % | 03/01/36 | 178,598 | ||||||||
| 15,151 | FNMA Pool #256972 | 6.000 | % | 11/01/37 | 15,850 | ||||||||
| 77,118 | FNMA Pool #257138 | 5.000 | % | 03/01/38 | 80,173 | ||||||||
| 41,505 | FNMA Pool #594207 | 6.500 | % | 02/01/31 | 45,700 | ||||||||
| 137,908 | FNMA Pool #687887 | 5.500 | % | 03/01/33 | 154,625 | ||||||||
| 258,592 | FNMA Pool #694795 | 5.500 | % | 04/01/33 | 292,313 | ||||||||
| 91,201 | FNMA Pool #724888 | 5.500 | % | 06/01/33 | 99,053 | ||||||||
| 123,667 | FNMA Pool #735861 | 6.500 | % | 09/01/33 | 138,768 | ||||||||
| 188,126 | FNMA Pool #745318 | 5.000 | % | 12/01/34 | 200,027 | ||||||||
| 76,289 | FNMA Pool #813839 | 6.000 | % | 11/01/34 | 82,932 | ||||||||
| 136,978 | FNMA Pool #831927 | 6.000 | % | 12/01/36 | 154,870 | ||||||||
| 324,839 | FNMA Pool #883281 | 7.000 | % | 07/01/36 | 356,128 | ||||||||
| 17,826 | FNMA Pool #888534 | 5.000 | % | 08/01/37 | 18,486 | ||||||||
See Notes to Financial Statements. | 41 |
| Face Amount | Description | Coupon Rate | Maturity Date | Value |
| $ | 561,227 | FNMA Pool #896838 | 5.450 | % | 07/01/36 | $ | 618,023 | ||||||
| 8,698 | FNMA Pool #908160 | 5.500 | % | 12/01/36 | 8,931 | ||||||||
| 105,266 | FNMA Pool #930504 | 5.000 | % | 02/01/39 | 113,686 | ||||||||
| 37,946 | FNMA Pool #930664 | 6.500 | % | 03/01/39 | 42,388 | ||||||||
| 115,751 | FNMA Pool #954633 | 5.500 | % | 02/01/37 | 125,399 | ||||||||
| 10,622 | FNMA Pool #954957 | 6.000 | % | 10/01/37 | 11,125 | ||||||||
| 124,466 | FNMA Pool #995656 | 7.000 | % | 06/01/33 | 145,595 | ||||||||
| 232,897 | FNMA Pool #AC5445 | 5.000 | % | 11/01/39 | 254,526 | ||||||||
| 304,390 | FNMA Pool #AC9581 | 5.500 | % | 01/01/40 | 338,130 | ||||||||
| 213,097 | FNMA Pool #AL6860 | 4.500 | % | 03/01/44 | 230,158 | ||||||||
| 1,079,216 | FNMA Pool #AL9105 | 4.500 | % | 10/01/46 | 1,149,606 | ||||||||
| 216,085 | FNMA Pool #AM4671 | 5.320 | % | 10/01/43 | 257,430 | ||||||||
| 803,554 | FNMA Pool #AM5015 | 4.940 | % | 12/01/43 | 916,512 | ||||||||
| 160,370 | FNMA Pool #AS5235 | 3.500 | % | 06/01/45 | 164,121 | ||||||||
| 132,652 | FNMA Whole Loan, Series 2003-W17, Class 1A7 | 5.750 | % | 08/25/33 | 146,812 | ||||||||
| 209,176 | FNMA Whole Loan, Series 2004-W11, Class 1A1 | 6.000 | % | 05/25/44 | 240,562 | ||||||||
| 111,051 | FNMA, Series 2001-52, Class XZ | 6.500 | % | 10/25/31 | 125,847 | ||||||||
| 1,558,124 | FNMA, Series 2003-18, Class XD | 5.000 | % | 03/25/33 | 1,653,774 | ||||||||
| 39,812 | FNMA, Series 2003-30, Class JQ | 5.500 | % | 04/25/33 | 43,358 | ||||||||
| 202,489 | FNMA, Series 2003-32, Class BZ | 6.000 | % | 11/25/32 | 225,379 | ||||||||
| 142,127 | FNMA, Series 2004-17, Class H | 5.500 | % | 04/25/34 | 156,889 | ||||||||
| 222,514 | FNMA, Series 2004-18, Class EZ | 6.000 | % | 04/25/34 | 245,716 | ||||||||
| 90,974 | FNMA, Series 2005-106, Class UK | 5.500 | % | 12/25/35 | 102,223 | ||||||||
| 172,000 | FNMA, Series 2005-120, Class PB | 6.000 | % | 01/25/36 | 196,410 | ||||||||
| 87,560 | FNMA, Series 2005-58, Class BC | 5.500 | % | 07/25/25 | 94,802 | ||||||||
| 520,357 | FNMA, Series 2006-24, Class Z | 5.500 | % | 04/25/36 | 577,335 | ||||||||
| 157,569 | FNMA, Series 2007-71, Class GB | 6.000 | % | 07/25/37 | 175,423 | ||||||||
| 143,896 | FNMA, Series 2007-76, Class PE | 6.000 | % | 08/25/37 | 161,416 | ||||||||
| 270,578 | FNMA, Series 2007-81, Class GE | 6.000 | % | 08/25/37 | 293,022 | ||||||||
| 388,253 | FNMA, Series 2008-60, Class JC | 5.000 | % | 07/25/38 | 419,045 | ||||||||
| 150,000 | FNMA, Series 2009-50, Class AX | 5.000 | % | 07/25/39 | 170,452 | ||||||||
| 290,000 | FNMA, Series 2010-136, Class CY | 4.000 | % | 12/25/40 | 310,516 | ||||||||
| 591,137 | FNMA, Series 2012-133, Class PB | 6.500 | % | 04/25/42 | 663,066 | ||||||||
| 87,207 | FNMA, Series 2012-51, Class B | 7.000 | % | 05/25/42 | 102,253 | ||||||||
| 523,327 | FNMA, Series 2013-17, Class YM | 4.000 | % | 03/25/33 | 549,028 | ||||||||
| 62,834 | FNMA, Series G93-5, Class Z | 6.500 | % | 02/25/23 | 66,660 | ||||||||
| 152,333 | GNMA I Pool #615272 | 4.500 | % | 07/15/33 | 164,299 | ||||||||
| 81,195 | GNMA I Pool #626755 | 5.000 | % | 03/15/35 | 87,489 | ||||||||
| 124,154 | GNMA I Pool #644970 | 5.000 | % | 06/15/35 | 134,733 | ||||||||
| 77,739 | GNMA I Pool #647406 | 5.000 | % | 09/15/35 | 84,385 | ||||||||
| 111,411 | GNMA I Pool #650493 | 5.000 | % | 01/15/36 | 120,961 | ||||||||
| 86,131 | GNMA I Pool #675477 | 5.000 | % | 06/15/38 | 93,368 | ||||||||
| 318,035 | GNMA I Pool #678649 | 4.000 | % | 12/15/39 | 337,093 | ||||||||
| 70,416 | GNMA I Pool #697999 | 4.500 | % | 02/15/24 | 72,891 | ||||||||
| 248,520 | GNMA I Pool #711286 | 6.500 | % | 10/15/32 | 275,915 | ||||||||
| 304,492 | GNMA I Pool #737844 | 3.500 | % | 01/15/26 | 315,537 | ||||||||
| 472,324 | GNMA I Pool #752112 | 3.500 | % | 01/15/33 | 495,118 | ||||||||
| 199,625 | GNMA I Pool #781341 | 6.000 | % | 10/15/31 | 225,839 | ||||||||
| 340,930 | GNMA I Pool #781886 | 5.500 | % | 03/15/35 | 378,765 | ||||||||
| 70,774 | GNMA I Pool #782771 | 4.500 | % | 09/15/24 | 75,040 | ||||||||
| 535,570 | GNMA II Pool #003066 | 5.500 | % | 04/20/31 | 583,004 | ||||||||
| 24,473 | GNMA II Pool #003284 | 5.500 | % | 09/20/32 | 27,202 | ||||||||
| 117,608 | GNMA II Pool #003403 | 5.500 | % | 06/20/33 | 130,433 | ||||||||
| 244,617 | GNMA II Pool #003638 | 6.000 | % | 11/20/34 | 277,708 | ||||||||
| 64,693 | GNMA II Pool #003689 | 4.500 | % | 03/20/35 | 68,440 | ||||||||
| 226,247 | GNMA II Pool #003909 | 5.500 | % | 10/20/36 | 247,576 |
See Notes to Financial Statements. | 42 |
| Face Amount | Description | Coupon Rate | Maturity Date | Value |
| $ | 7,257 | GNMA II Pool #004284 | 5.500 | % | 11/20/38 | $ | 7,558 | ||||||
| 90,433 | GNMA II Pool #004291 | 6.000 | % | 11/20/38 | 102,234 | ||||||||
| 22,795 | GNMA II Pool #004412 | 5.000 | % | 04/20/39 | 23,669 | ||||||||
| 132,249 | GNMA II Pool #004561 | 6.000 | % | 10/20/39 | 150,483 | ||||||||
| 98,131 | GNMA II Pool #004702 | 3.500 | % | 06/20/25 | 101,071 | ||||||||
| 87,879 | GNMA II Pool #004753 | 8.000 | % | 08/20/30 | 95,271 | ||||||||
| 431,122 | GNMA II Pool #004838 | 6.500 | % | 10/20/40 | 490,289 | ||||||||
| 987,054 | GNMA II Pool #442324 | 4.500 | % | 08/20/41 | 1,047,865 | ||||||||
| 190,275 | GNMA II Pool #648541 | 6.000 | % | 10/20/35 | 199,602 | ||||||||
| 490,647 | GNMA II Pool #781642 | 5.500 | % | 08/20/33 | 552,126 | ||||||||
| 384,450 | GNMA II Pool #AG0467 | 4.000 | % | 04/20/44 | 401,505 | ||||||||
| 69,115 | GNMA II Pool #MA2295 | 4.500 | % | 10/20/44 | 71,677 | ||||||||
| 127,083 | GNMA, Series 2002-33, Class ZD | 6.000 | % | 05/16/32 | 142,173 | ||||||||
| 42,701 | GNMA, Series 2002-45, Class QE | 6.500 | % | 06/20/32 | 48,172 | ||||||||
| 39,560 | GNMA, Series 2002-7, Class PG | 6.500 | % | 01/20/32 | 45,338 | ||||||||
| 92,080 | GNMA, Series 2003-103, Class PC | 5.500 | % | 11/20/33 | 102,426 | ||||||||
| 48,144 | GNMA, Series 2003-26, Class MA | 5.500 | % | 03/20/33 | 49,844 | ||||||||
| 135,737 | GNMA, Series 2003-46, Class HA | 4.500 | % | 06/20/33 | 144,567 | ||||||||
| 93,713 | GNMA, Series 2003-46, Class MA | 5.000 | % | 05/20/33 | 95,403 | ||||||||
| 293,382 | GNMA, Series 2003-46, Class ND | 5.000 | % | 06/20/33 | 319,124 | ||||||||
| 248,533 | GNMA, Series 2003-57, Class C | 4.500 | % | 04/20/33 | 266,103 | ||||||||
| 81,879 | GNMA, Series 2003-84, Class PC | 5.500 | % | 10/20/33 | 89,510 | ||||||||
| 150,422 | GNMA, Series 2005-13, Class BE | 5.000 | % | 09/20/34 | 155,393 | ||||||||
| 495,112 | GNMA, Series 2005-17, Class GE | 5.000 | % | 02/20/35 | 535,604 | ||||||||
| 161,958 | GNMA, Series 2005-49, Class B | 5.500 | % | 06/20/35 | 181,645 | ||||||||
| 134,384 | GNMA, Series 2005-51, Class DC | 5.000 | % | 07/20/35 | 147,261 | ||||||||
| 48,210 | GNMA, Series 2005-93, Class BH | 5.500 | % | 06/20/35 | 53,389 | ||||||||
| 770,014 | GNMA, Series 2007-14, Class PB | 5.400 | % | 03/20/37 | 833,761 | ||||||||
| 43,190 | GNMA, Series 2007-18, Class B | 5.500 | % | 05/20/35 | 48,940 | ||||||||
| 268,524 | GNMA, Series 2007-59, Class ZT | 5.500 | % | 10/20/37 | 294,919 | ||||||||
| 66,358 | GNMA, Series 2007-68, Class NA | 5.000 | % | 11/20/37 | 71,506 | ||||||||
| 36,882 | GNMA, Series 2007-70, Class PE | 5.500 | % | 11/20/37 | 41,258 | ||||||||
| 204,630 | GNMA, Series 2008-26, Class JP | 5.250 | % | 03/20/38 | 223,886 | ||||||||
| 306,062 | GNMA, Series 2008-35, Class NF | 5.000 | % | 04/20/38 | 327,927 | ||||||||
| 311,922 | GNMA, Series 2008-38, Class PL | 5.500 | % | 05/20/38 | 343,646 | ||||||||
| 272,548 | GNMA, Series 2008-65, Class CM | 5.000 | % | 08/20/38 | 296,157 | ||||||||
| 1,288,846 | GNMA, Series 2008-65, Class PG | 6.000 | % | 08/20/38 | 1,460,479 | ||||||||
| 157,000 | GNMA, Series 2009-47, Class LT | 5.000 | % | 06/20/39 | 173,513 | ||||||||
| 360,690 | GNMA, Series 2009-93, Class AY | 5.000 | % | 10/20/39 | 392,879 | ||||||||
| 1,422,703 | GNMA, Series 2010-116, Class JB | 5.000 | % | 06/16/40 | 1,592,653 | ||||||||
| 239,979 | GNMA, Series 2010-129, Class NK | 4.000 | % | 06/20/39 | 247,966 | ||||||||
| 1,527,548 | GNMA, Series 2011-2, Class DP | 5.458 | % | (1) | 03/20/39 | 1,703,495 | |||||||
| 500,000 | GNMA, Series 2011-42, Class ME | 4.000 | % | 06/20/44 | 523,680 | ||||||||
| 320,960 | GNMA, Series 2012-124, Class NE | 2.000 | % | 10/20/42 | 267,292 |
| Total Agency Mortgage-Backed Securities (identified cost, $41,824,319) | $ | 41,556,400 |
See Notes to Financial Statements. | 43 |
| Face Amount | Description | Coupon Rate | Maturity Date | Value |
| OTHER U.S GOVERNMENT GUARANTEED- 3.4% |
INDUSTRIALS - 3.4% | |||||||||||||
| $ | 1,345,000 | Vessel Management Services, Inc. | 5.125 | % | 04/16/35 | $ | 1,519,331 | ||||||
| Total Other U.S. Government Guaranteed (identified cost, $1,529,136) | $ | 1,519,331 |
| TOTAL FIXED INCOME INVESTMENTS (identified cost, $43,353,455) — 96.6% | $ | 43,075,731 |
| Shares | Description | Value |
| SHORT-TERM INVESTMENTS - 3.3% |
| 1,501,431 | Fidelity Investments Money Market Government Portfolio - Class I, 1.16%(1) | $ | 1,501,431 |
| TOTAL SHORT-TERM INVESTMENTS (identified cost, $1,501,431) — 3.3% | $ | 1,501,431 |
| INVESTMENTS, AT VALUE (identified cost, $44,854,886) — 99.9% | $ | 44,577,162 |
| OTHER ASSETS, IN EXCESS OF LIABILITIES — 0.1% | 29,506 |
| NET ASSETS — 100.0% | $ | 44,606,668 |
FHLMC — Federal Home Loan Mortgage Corporation
FNMA — Federal National Mortgage Association
GNMA — Government National Mortgage Association
| (1) | Dividend yield changes daily to reflect current market conditions. Rate was the quoted yield as of December 31, 2017. |
See Notes to Financial Statements. | 44 |
| STATEMENT OF ASSETS AND LIABILITIES | STATEMENT OF OPERATIONS | ||||||||||||||
| As of December 31, 2017 | For the Year Ended December 31, 2017 | ||||||||||||||
| ASSETS: | TRUE | INVESTMENT INCOME (Note 1C) | TRUE | ||||||||||||
| Investments, at value | Interest income | $ | 1,231,859 | ||||||||||||
| (identified cost $44,854,886) (Note 1A) | $ | 44,577,162 | ###### | 4.00E+07 | Dividend income | 16,211 | |||||||||
| Receivable for fund shares sold | 6,206 | Total investment income | $ | 1,248,070 | |||||||||||
| Dividends and interest receivable | 179,384 | ||||||||||||||
| Prepaid expenses and other assets | 18,406 | Expenses – | |||||||||||||
| Total assets | $ | 44,781,158 | Investment adviser fee (Note 3) | $ | 232,672 | ||||||||||
| Administrator fee (Note 3) | 46,535 | ||||||||||||||
| LIABILITIES: | Trustee expense (Note 3) | 12,450 | |||||||||||||
| Payable for fund shares reacquired | $ | 77,800 | Custodian fee | 5,906 | |||||||||||
| Distributions payable | 84,163 | Accountant fee | 40,981 | ||||||||||||
| Accrued expenses and other liabilities | Distribution expenses (Note 4) | 99,458 | |||||||||||||
| Transfer agent fee | 2,309 | Transfer agent fee | 30,609 | ||||||||||||
| Trustee expenses | 150 | Printing | 599 | ||||||||||||
| Other expenses and liabilities | 10,068 | Shareholder communications | 9,198 | ||||||||||||
| Total liabilities | $ | 174,490 | Audit services | 21,000 | |||||||||||
| NET ASSETS | $ | 44,606,668 | Legal services | 27,717 | |||||||||||
| Compliance services | 7,396 | ||||||||||||||
| NET ASSETS CONSIST OF: | Registration costs | 28,690 | |||||||||||||
| Paid-in capital | $ | 51,396,769 | Interest expense (Note 8) | 142 | |||||||||||
| Accumulated net realized loss on investments | (6,512,377 | ) | Miscellaneous | 59,773 | |||||||||||
| Unrealized depreciation on investments | (277,724 | ) | Total expenses | $ | 623,126 | ||||||||||
| Net assets applicable to outstanding shares | $ | 44,606,668 | |||||||||||||
| Deduct – | |||||||||||||||
| SHARES OF BENEFICIAL INTEREST OUTSTANDING AT $0.000 PAR VALUE (UNLIMITED SHARES AUTHORIZED) | 5,060,211 | Waiver and/or reimbursement by the principal underwriter and/or investment adviser (Note 4) | $ | (157,419 | ) | ||||||||||
| Net expenses | $ | 465,707 | |||||||||||||
| NET ASSET VALUE, OFFERING PRICE, AND REDEMPTION PRICE PER SHARE OF BENEFICIAL INTEREST | $ | 8.82 | Net investment income | $ | 782,363 | ||||||||||
| REALIZED AND UNREALIZED GAIN (LOSS) ON INVESTMENTS: | |||||||||||||||
| Net realized loss on investment transactions | $ | (172,019 | ) | ||||||||||||
| Net change in unrealized appreciation (depreciation) on investments | (101,635 | ) | |||||||||||||
| Net realized and unrealized loss on investments | $ | (273,654 | ) | ||||||||||||
| Net increase in net assets from operations | $ | 508,709 | |||||||||||||
See Notes to Financial Statements. | 45 |
1. Significant Accounting Policies
Wright Current Income Fund ("WCIF") (the "Fund") is a diversified portfolio of The Wright Managed Income Trust (the "Trust"), an open-end, management investment company that is registered under the Investment Company Act of 1940, as amended (the "1940 Act"). WCIF seeks a high level of current income consistent with moderate fluctuations of principal.
The Fund is an investment company and follows accounting and reporting guidance under Financial Accounting Standards Board("FASB") Accounting Standards Codification ("ASC") Topic 946, "Financial Services-Investment Companies". The following is a summary of significant accounting policies consistently followed by the Trust in the preparation of their financial statements. The policies are in conformity with accounting principles generally accepted in the United States of America ("GAAP").
A. Investment Valuations – Debt obligations, including listed securities and securities for which quotations are readily available, will normally be valued on the basis of reported trades or market quotations provided by third party pricing services, when these prices are representative of the securities' market values. For debt securities where market quotations are not readily available, the pricing services will use various techniques that consider factors including, but not limited to, prices or yields of securities with similar characteristics, benchmark yields, broker/dealer quotes, issuer spreads, as well as industry and economic events. Short-term debt securities with a remaining maturity of sixty days or less are generally valued at amortized cost, which approximates market value. If short-term debt securities are acquired with a remaining maturity of more than sixty days, they will be valued by a pricing service as described above. Investments for which valuations or market quotations are not readily available or are deemed unreliable are valued at fair value using methods determined in good faith by or at the direction of the Trustees of the Fund in a manner that most fairly reflects the security's value, or the amount that the Fund might reasonably expect to receive for the security upon its current sale in the ordinary course. Each such determination is based on a consideration of all relevant factors, which are likely to vary from one pricing context to another. These factors may include, but are not limited to, the type of security, the existence of any contractual restrictions on the security's disposition, the price and extent of public trading in similar securities of the issuer or of comparable companies, quotations or relevant information obtained from broker-dealers or other market participants, information obtained from the issuer, analysts, and/or the appropriate stock exchange (for exchange-traded securities), an analysis of the company's financial condition, and an evaluation of the forces that influence the issuer and the market(s) in which the security is purchased and sold.
B. Investment Transactions – Investment transactions for financial statement purposes are accounted for on a trade date basis. Realized gains and losses on investments sold are determined on the basis of identified cost.
C. Income – Dividend income is recorded on the ex-dividend date. However, if the ex-dividend date has passed, certain dividends from foreign securities are recorded as the Fund is informed of the ex-dividend date. Interest income is recorded on the basis of interest accrued, adjusted for amortization of premium and accretion of discount.
Paydown gains and losses are included in interest income.
D. Federal Taxes – The Fund's policy is to comply with the provisions of the Internal Revenue Code (the "Code") applicable to regulated investment companies and to distribute to shareholders each year substantially all of its net investment income and all or substantially all of its net realized capital gains. Accordingly, no provision for federal income or excise tax is necessary. At December 31, 2017, WCIF, for federal income tax purposes, had $2,761,461 available short term capital loss carryforwards and $3,350,416 available long term capital loss carryforwards that have no expiration date which will reduce the Fund's taxable income arising from future net realized gain on investment transactions, if any, to the extent permitted by the Code, and thus will reduce the amount of the distributions to shareholders, which would otherwise be necessary to relieve the Fund of any liability for federal income or excise tax.
As of December 31, 2017, the Fund had no uncertain tax positions that would require financial statement recognition, de-recognition, or disclosure. The Fund's federal tax returns filed in the 3-year period ended December 31, 2017, remain subject to examination by the Internal Revenue Service.
E. Expenses – The majority of expenses of the Trust are directly identifiable to the Fund. Expenses which are not readily identifiable to a specific Fund are allocated taking into consideration, among other things, the nature and type of expense and the relative size of the Funds.
F. Use of Estimates – The preparation of financial statements in conformity with GAAP requires management to make estimates and assumptions that affect the reported amounts of assets and liabilities and disclosure of contingent assets and liabilities at the date of the financial statements and the reported amounts of income and expense during the reporting period. Actual results could differ from those estimates.
G. Indemnifications – Under the Fund's organizational documents, its officers and Trustees may be indemnified against certain liabilities and expenses arising out of the performance of their duties to the Fund, and shareholders are indemnified against personal liability for the obligations of the Fund. Additionally, in the normal course of business, the Fund enters into agreements with service providers that may contain indemnification clauses. The Fund's maximum exposure under these arrangements is unknown as this would involve future claims that may be made against the Fund that have not yet occurred.
2. Distributions to Shareholders
The net investment income of the Fund is determined daily, and substantially all of the net investment income so determined is declared daily as a dividend to shareholders of record at the time of declaration. Distributions are generally paid monthly. Distributions of net realized capital gains (reduced by available capital loss carryforwards from prior years, if any) are made at least annually. Shareholders may reinvest income and capital gain distributions in additional shares of the same Fund at the net asset value as of the reinvestment date or, at the election of the shareholder, receive distributions in cash. The Fund distinguishes between distributions on a tax basis and a financial reporting basis. GAAP requires that only distributions in excess of tax basis earnings and profits be reported in the financial statements as a return of capital. Permanent differences between book and tax accounting relating to distributions are reclassified to paid-in capital.
The tax character of distributions paid for the years ended December 31, 2017, and December 31, 2016, was as follows:
| Year Ended 12/31/17 | WCIF | |||
| Distributions declared from: | ||||
| Ordinary income | $ | 1,845,285 | ||
| Year Ended 12/31/16 | WCIF | |||
| Distributions declared from: | ||||
| Ordinary income | $ | 2,315,168 |
During the year ended December 31, 2017, the following amounts were reclassified due to premium amortization and paydown gain (loss).
| Increase (decrease): | WCIF | ||||
| Paid-in capital | $ | (124 | ) | ||
| Accumulated net realized gain (loss) | (1,062,798 | ) | |||
| Accumulated net investment income (loss) | 1,062,922 |
As of December 31, 2017, the components of distributable earnings on a tax basis were as follows:
| WCIF | ||||
| Capital loss carryforward | $ | (6,111,877 | ) | |
| Unrealized (depreciation) | (678,224 | ) | ||
| Total | $ | (6,790,101 | ) |
The difference between components of distributable earnings (accumulated losses) on a tax basis and the amounts reflected in the Statement of Assets and Liabilities are primarily due to premium amortization and paydown gain (loss).
3. Investment Adviser Fee and Other Transactions with Affiliates
The investment adviser fee is earned by Wright Investor Services, Inc. ("Wright") as compensation for investment advisory services rendered to the Fund. The fees are computed at annual rates of the Fund's average daily net assets as noted below, and are payable monthly.
| Annual Advisory Fee Rates | |||||
| Fund | Under $100 Million | $100 Million to $250 Million | $250 Million to $500 Million | $500 Million to $1 Billion | Over $1 Billion |
| WCIF | 0.45% | 0.44% | 0.42% | 0.40% | 0.35% |
For the year ended December 31, 2017, the fee and the effective annual rate, as a percentage of average daily net assets for each of the Funds were as follows:
| Fund | Investment Adviser Fee | Effective Annual Rate |
| WCIF | $232,672 | 0.45% |
The administrator fee is earned by Wright for administering the business affairs of the Fund. The fee is computed at an annual rate of 0.09% of the average daily net assets up to $100 million for WCIF, and 0.05% of average daily net assets over $100 million. Atlantic Fund Administration, LLC (d/b/a Atlantic Fund Services) ("Atlantic") serves as sub-administrator of the Fund to perform certain services of the administrator as may be agreed upon between the administrator and sub-administrator. The sub-administration fee is paid by Wright.
For the year ended December 31, 2017, the administrator fee for WCIF amounted to $46,535.
Certain Trustees and officers of the Trust are Trustees or officers of the above organizations and/or of the Fund's principal underwriter. Except as to Trustees of the Trust who are not employees of Atlantic or Wright, Trustees and officers receive remuneration for their services to the Trust out of the fees paid to Atlantic and Wright. The Trustees are compensated by the Trust in conjunction with the Wright Managed Equity Trust, rather than on a per Trust or per Fund basis. Quarterly retainer fees are paid in the amount of $4,000 to the Lead Trustee, $3,500 to the Secretary of Independent Trustees, and $3,000 each to the remaining Trustees. In addition, each Trustee will be paid a fee of $1,500 for each regular Board meeting attended. Each Trustee is also reimbursed for all reasonable out-of-pocket expenses incurred in connection with his duties as a Trustee, including travel and related expenses incurred in attending Board meetings. The amount of Trustees' fees attributable to the Fund is disclosed in the Fund's Statement of Operations.
4. Distribution and Service Plans
The Trust had in effect a Distribution Plan (the "Plan") pursuant to Rule 12b-1 of the 1940 Act. The Plan provided that the Fund would pay Wright Investors' Service Distributors, Inc. ("WISDI"), the principal underwriter, a wholly-owned subsidiary of The Winthrop Corporation and an affiliate of Wright, a distribution fee of 0.25% of the average daily net assets of the Fund for distribution services and facilities provided to the
Fund by WISDI. The plan was terminated on October 1, 2017. Distribution fees paid or accrued to WISDI for the year ended December 31, 2017, for WCIF were $99,458.
In addition, the Trustees have adopted a service plan (the "Service Plan") which allows the Fund to reimburse the principal underwriter for payments to intermediaries for providing account administration and personal and account maintenance services to their customers who are beneficial owners of the Fund's shares. The combined amount of service fees payable under the Service Plan and Rule 12b-1 distribution fees may not exceed 0.25% annually of the Fund's average daily net assets. For the year ended December 31, 2017, the Fund did not accrue or pay any service fees.
Pursuant to an Expense Limitation Agreement, Wright has agreed to waive all or a portion of their advisory fees and/or assume expenses to the extent that total annual operating expenses exceed 1.00% of the average daily net assets of WCIF, through April 30, 2018 (excluding interest, taxes, brokerage commissions, other expenditures which are capitalized in accordance with GAAP, and other extraordinary expenses not incurred in the ordinary course of the Fund's business). Thereafter, the waiver and reimbursement may be changed or terminated at any time. In addition, Wright and WISDI have voluntarily agreed to further limit the total annual expenses of WCIF to 0.90% of its average daily net assets. Such voluntary limitation may be terminated at any time. Pursuant to these agreements and voluntary limitation, Wright waived investment adviser fees of $57,961 for WCIF. WISDI waived distribution fees of $99,458 for WCIF. Effective October 21, 2017, WISDI no longer waives fees.
5. Investment Transactions
Purchases and sales (including maturities and paydowns) of investments, other than short-term obligations, were as follows:
| Year Ended December 31, 2017 | |
| WCIF | |
| Purchases - | |
| Non-U.S. Government & Agency Obligations | $ - |
| U.S. Government & Agency Obligations | 5,485,357 |
| Sales - | |
| Non-U.S. Government & Agency Obligations | $ 76,000 |
| U.S. Government & Agency Obligations | 17,934,523 |
6. Shares of Beneficial Interest
The Declaration of Trust permits the Trustees to issue an unlimited number of full and fractional shares of beneficial interest (without par value). Transactions in Fund shares were as follows:
| December 31, 2018 | 36525 | 43100 | # | # | 42735 | ||||||||||
| Year Ended December 31, 2017 | Year Ended December 31, 2016 | ||||||||||||||
| Shares | Amount | Shares | Amount | ||||||||||||
| WCIF | |||||||||||||||
| Sold | 684,728 | $ | 6,152,276 | 1,648,494 | $ | 15,446,094 | |||||||||
| Issued to shareholders in payment of distributions declared | 79,045 | 708,790 | 96,715 | 903,089 | |||||||||||
| Redemptions | (2,186,967 | ) | (19,622,992 | ) | (2,447,720 | ) | (22,741,935 | ) | |||||||
| Net decrease | (1,423,194 | ) | $ | (12,761,926 | ) | (702,511 | ) | $ | (6,392,752 | ) | |||||
51 |
7. Federal Income Tax Basis of Investments
The cost and unrealized appreciation (depreciation) of the investment securities owned at December 31, 2017, as computed on a federal income tax basis, were as follows:
| Year Ended December 31, 2017 | |||||
| WCIF | |||||
| Aggregate cost | $ | 45,255,386 | |||
| Gross unrealized appreciation | $ | 188,502 | |||
| Gross unrealized depreciation | (866,726 | ) | |||
| Net unrealized depreciation | $ | (678,224 | ) | ||
8. Line of Credit
The Fund participates with other funds managed by Wright in a committed $10 million unsecured line of credit agreement with Union Bank of California, N.A. ("Union Bank"). The Fund may temporarily borrow from the line of credit to satisfy redemption requests or settle investment transactions. Interest is charged to the Fund based on its borrowings at an amount above the LIBOR rate. Because the line of credit is not available exclusively to the Fund, it may be unable to borrow some or all of the Fund's requested amounts at any particular time. As of December 31, 2017, the Fund had no outstanding balance pursuant to this line of credit. The average borrowings and average interest rate (based on days with outstanding balances) for the year ended December 31, 2017, were as follows:
| WCIF | |
| Average borrowings | $405,608 |
| Average interest rate | 1.78% |
9. Risks Associated with Government Issuers
The Fund invests in securities issued or guaranteed by the U.S. government or its agencies and instrumentalities (such as Ginnie Mae, Fannie Mae, or Freddie Mac securities). Unlike Ginnie Mae securities, securities issued or guaranteed by U.S. government-related organizations such as Fannie Mae and Freddie Mac are not backed by the full faith and credit of the U.S. government and no assurance can be given that the U.S. government would provide financial support. Therefore, U.S. government-related organizations such as Fannie Mae or Freddie Mac may not have the funds to meet their payment obligations.
10. Fair Value Measurements
Under GAAP for fair value measurements, a three-tier hierarchy to prioritize the assumptions, referred to as inputs, is used in valuation techniques to measure fair value. The three-tier hierarchy of inputs is summarized in the three broad levels listed below.
• Level 1 – quoted prices in active markets for identical investments
• Level 2 – other significant observable inputs (including quoted prices for similar investments, interest rates, prepayment speeds, credit risk, etc.)
• Level 3 – significant unobservable inputs (including a fund's own assumptions in determining the fair value of investments)
The inputs or methodology used for valuing securities are not necessarily an indication of the risk associated with investing in those securities.
52 |
At December 31, 2017, the inputs used in valuing the Fund's investments, which are carried at value, were as follows:
WCIF Asset Description | Quoted Prices in Active Markets for Identical Assets (Level 1) | Significant Other Observable Inputs (Level 2) | Significant Unobservable Inputs (Level 3) | Total | ||||
| Agency Mortgage-Backed Securities | $ | - | $ | 41,556,400 | $ | - | $ | 41,556,400 |
| Other U.S. Government Guaranteed | - | 1,519,331 | - | 1,519,331 | ||||
| Short-Term Investments | - | 1,501,431 | - | 1,501,431 | ||||
| Total Investments | $ | - | $ | 44,577,162 | $ | - | $ | 44,577,162 |
The level classification by major category of investments is the same as the category presentation in the Fund's Portfolio of Investments.
There were no transfers among Level 1, Level 2 and Level 3 for the year ended December 31, 2017.
11. New Accounting Pronouncement
In March 2017, the Financial Accounting Standards Board (FASB} issued Accounting Standards Update (ASU) No. 2017-08, Receivables -Nonrefundable Fees and Other Costs (Subtopic 310-20): Premium Amortization on Purchased Callable Debt Securities. The amendments in the ASU shorten the amortization period for certain callable debt securities, held at a premium, to be amortized to the earliest call date. The ASU does not require an accounting change for securities held at a discount; which continues to be amortized to maturity. The ASU is effective for fiscal years and interim periods within those fiscal years beginning after December 15, 2018. Management is currently evaluating the impact, if any, of applying this provision.
12. Review for Subsequent Events
In connection with the preparation of the financial statements of the Fund as of and for the year ended December 31, 2017, events and transactions subsequent to December 31, 2017, have been evaluated by the Fund's management for possible adjustment and/or disclosure. Management has not identified any subsequent events requiring financial statement disclosure as of the date these financial statements were issued.
53 |
To the Board of Trustees of The Wright Managed Income Trust
and the Shareholders of Wright Current Income Fund
Opinion on the Financial Statements
We have audited the accompanying statement of assets and liabilities of Wright Current Income Fund, a series of shares of beneficial interest in The Wright Managed Income Trust (the "Fund"), including the portfolio of investments, as of December 31, 2017, and the related statement of operations for the year then ended, the statements of changes in net assets for each of the years in the two-year period then ended and the financial highlights for each of the years in the five-year period then ended, and the related notes (collectively referred to as the "financial statements"). In our opinion, the financial statements present fairly, in all material respects, the financial position of the Fund as of December 31, 2017, and the results of its operations for the year then ended, the changes in its net assets for each of the years in the two-year period then ended and its financial highlights for each of the years in the five-year period then ended, in conformity with accounting principles generally accepted in the United States of America ("GAAP").
Basis for Opinion
These financial statements are the responsibility of the Fund's management. Our responsibility is to express an opinion on the Fund's financial statements based on our audits. We are a public accounting firm registered with the Public Company Accounting Oversight Board (United States) ("PCAOB") and are required to be independent with respect to the Fund in accordance with the U.S. federal securities law and the applicable rules and regulations of the Securities and Exchange Commission and the PCAOB.
We conducted our audit in accordance with the standards of the PCAOB. Those standards require that we plan and perform the audits to obtain reasonable assurance about whether the financial statements are free of material misstatement, whether due to error or fraud. The Fund is not required to have, nor were we engaged to perform, an audit of its internal control over financial reporting. As part of our audits we are required to obtain an understanding of internal control over financial reporting but not for the purpose of expressing an opinion on the effectiveness of the Fund's internal control over financial reporting. Accordingly, we express no such opinion.
Our audit included performing procedures to assess the risk of material misstatement of the financial statements, whether due to error or fraud, and performing procedures that respond to those risks. Such procedures include examining, on a test basis, evidence regarding the amounts and disclosures in the financial statements. Our procedures included confirmation of securities owned as of December 31, 2017 by correspondence with the custodian. Our audits also included evaluating the accounting principles used and significant estimates made by management, as well as evaluating the overall presentation of the financial statements. We believe that our audits provide a reasonable basis for our opinion.
BBD, LLP
We have served as the auditor of one or more of the Funds in The Wright Managed Income Trust since 2010.
Philadelphia, Pennsylvania
February 28, 2018
54 |
The Form 1099-DIV you received in January 2018 showed the tax status of all distributions paid to your account in calendar year 2017. Shareholders are advised to consult their own tax adviser with respect to the tax consequences of their investment in the Fund.
Qualified Interest Income –Wright Current Income Fund designates 99.30%, as qualified interest income exempt from U.S. tax for foreign shareholders (QII).
Management and Organization (Unaudited)
_____________________________________________________________________
Fund Management. The Trustees of the Trusts are responsible for the overall management and supervision of the affairs of the Trusts. The Trustees and principal officers of the Trusts are listed below. Except as indicated, each individual has held the office shown or other offices in the same company for the last five years. The business address of each Trustee and principal officer is 177 West Putnam Avenue, Greenwich, Connecticut 06830.
Definitions:
"WISDI" means Wright Investors' Service Distributors, Inc., the principal underwriter of the Funds.
"Winthrop" means The Winthrop Corporation, a holding company which owns all of the shares of Wright and WISDI.
| Name, Address and Age | Position(s) with the Trust | Term* of Office and Length of Service | Principal Occupation(s) During Past Five Years | Number of Funds in Fund Complex Overseen by Trustee | Other Trustee/Director/Partnership/Employment Positions Held |
| Interested Trustee | |||||
Peter M. Donovan** Born: 1943 | President and Trustee | President and Trustee since Inception | Retired. Executive Chairman of Wright Investors' Services, Inc. and The Winthrop Corporation, December 2015-December 2017. Director of Wright Investors' Service, Inc.and The Winthrop Corp.1984-December 2017, Director, WISDI 1988-December 2017. CEO and President of Wright Investors' Service, Inc and The Winthrop Corp. 1996-December 2015; Director, Wright Investors' Service Holdings, Inc.; Authorized Representative of Wright Private Asset Management; Chairman of The Winthrop Corp. November 2002-December 2012; President of 4 funds managed by Wright. | 4 | None |
| Independent Trustees | |||||
James J. Clarke, Ph.D. Born: 1941 | Trustee and Chairman of the Audit Committee, Independent Trustees' Committee and Governance Committee | Trustee since December, 2002 | Principal, Clarke Consulting (bank consultant - financial management and strategic planning); Director, Reliance Bank, Altoona PA since August 1995; Director, Quaint Oak Bank, Southampton, PA since 2007; Director, Phoenixville Federal Bank & Trust, Phoenixville, PA since 2011. | 4 | None |
Richard E. Taber Born: 1948 | Trustee | Trustee since March, 1997 | Retired; Chairman and Chief Executive Officer of First County Bank, Stamford, CT through 2011; Director, First County Bank since 2011. | 4 | None |
| * | Trustees serve an indefinite term. Officers are elected annually. | ||||
| ** | Mr. Donovan is an interested person of the Trusts because of his positions as President of the Trusts, Executive Chairman and Director of Wright and Winthrop, and Director of WISDI. | ||||
Management and Organization (Unaudited)
| Name, Address and Age | Position(s) with the Trust | Term* of Office and Length of Service | Principal Occupation(s) During Past Five Years | Number of Funds in Fund Complex Overseen by Trustee | Other Trustee/Director/Partnership/Employment Positions Held |
| Principal Officers who are not Trustees | |||||
Michael J. McKeen Born: 1971 | Treasurer | Treasurer of the Trusts since March 2011 | Senior Vice President, Atlantic Fund Services, LLC since 2008; Officer of 4 funds managed by Wright. | N/A | N/A |
Gino Malaspina Born: 1968 | Secretary | Secretary of the Trusts since November, 2016 | Senior Counsel, Atlantic since June 2014; Senior Counsel and Managing Director, Cipperman & Company/Cipperman Compliance Services LLC, 2010-2014; and Associate, Stradley Ronon Stevens & Young, LLP, 2009-2010. | N/A | N/A |
Carlyn Edgar Born: 1963 | Chief Compliance Officer | Chief Compliance Officer of the Trusts since September, 2011. | Senior Vice President, Atlantic Fund Services, LLC since 2008. | N/A | N/A |
Important Notices Regarding Delivery of Shareholder
Documents, Portfolio Holdings and Proxy Voting (Unaudited)
The Wright Managed Blue Chip Investment Funds
Wright Investors' Service, Inc.
Wright Investors' Service Distributors, Inc.
Important Notice Regarding Delivery of Shareholders Documents
The Securities and Exchange Commission (the "SEC") permits funds to deliver only one copy of shareholder documents, including prospectuses, proxy statements and shareholder reports, to fund investors with multiple accounts at the same residential or post office box address. This practice is often called "householding" and it helps eliminate duplicate mailings to shareholders.
Wright, or your financial adviser, may household the mailing of your documents indefinitely unless you instruct Wright, or your financial adviser, otherwise.
If you would prefer that your Wright documents not be householded, please contact Wright at (800) 555-0644, or your financial adviser.
Your instructions that householding not apply to delivery of your Wright documents will be effective within 30 days of receipt by Wright or your financial adviser.
Portfolio Holdings
In accordance with rules established by the SEC, the Funds send semi-annual and annual reports to shareholders that contain a complete list of portfolio holdings as of the end of the second and fourth quarters, respectively, within 60 days of quarter-end and after filing with the SEC. The Funds also disclose complete portfolio holdings as of the end of the first and third fiscal quarters on Form N-Q, which is filed with the SEC within 60 days of quarter-end. The Funds' complete portfolio holdings as reported in annual and semi-annual reports and on Form N-Q are available for viewing on the SEC website at http://www.sec.gov and may be reviewed and copied at the SEC's public reference room (information on the operation and terms of usage of the SEC public reference room is available at http://sec.gov/info/edgar/prrules.htm or by calling (800) SEC-0330). After filing, the Funds' portfolio holdings as reported in annual and semi-annual reports are also available on Wright's website at www.wrightinvestors.com and are available upon request at no additional cost by contacting Wright at (800) 555-0644.
Proxy Voting Policies and Procedures
From time to time funds are required to vote proxies related to the securities held by the funds. The Wright Managed Blue Chip Investment Funds vote proxies according to a set of policies and procedures approved by the Funds' Board. You may obtain a description of these policies and procedures and information on how the Funds voted proxies relating to portfolio securities during the most recent 12-month period ended June 30 without charge, upon request, by calling (800) 555-0644. This description is also available on the SEC website at http://www.sec.gov.
58 |