UNITED STATES
SECURITIES AND EXCHANGE COMMISSION
Washington, D.C. 20549
FORM N-CSR
CERTIFIED SHAREHOLDER REPORT OF REGISTERED
MANAGEMENT INVESTMENT COMPANIES
Investment Company Act file number 811-03541
Asset Management Fund
(Exact name of registrant as specified in charter)
230 West Monroe Street, Chicago, IL 60606
(Address of principal executive offices) (Zip code)
Beacon Hill Fund Services, Inc., 4041 North High Street, Suite 402, Columbus, Ohio 43214
(Name and address of agent for service)
Registrant’s telephone number, including area code: (800) 527-3713
Date of fiscal year end: 10/31
Date of reporting period: 10/31/11
Form N-CSR is to be used by management investment companies to file reports with the Commission not later than 10 days after the transmission to stockholders of any report that is required to be transmitted to stockholders under Rule 30e-1 under the Investment Company Act of 1940 (17 CFR 270.30e-1). The Commission may use the information provided on Form N-CSR in its regulatory, disclosure review, inspection and policymaking roles.
A registrant is required to disclose the information specified by Form N-CSR, and the Commission will make this information public. A registrant is not required to respond to the collection of information contained in Form N-CSR unless the Form displays a currently valid Office of Management and Budget (“OMB”) control number. Please direct comments concerning the accuracy of the information collection burden estimate and any suggestions for reducing the burden to Secretary, Securities and Exchange Commission, 450 Fifth Street, NW, Washington, DC 20549-0609. The OMB has reviewed this collection of information under the clearance requirements of 44 U.S.C. § 3507.
Item 1. Reports to Stockholders.

Managed By:
Shay Assets Management, Inc.
ANNUAL REPORT
October 31, 2011

ASSET MANAGEMENT FUND
230 West Monroe Street
Chicago, IL 60606
CHAIRMAN’S LETTER
The Asset Management Fund (“AMF” and each series, a “Fund”) family of no load institutional mutual Funds is pleased to present shareholders the 2011 Annual Report.
Many of the trends we focused on in last year’s Market Overview remained at work in 2011 as another year of economic and political uncertainty unfolded. Investors continue to be challenged by events that have little precedent in the sphere of the G-20 world: sovereign debt defaults, political system breakdown, and economic stagnation. Seismic shifts in the distribution of economic and political power are rapidly changing the ability of countries to respond to these problems to assuage the markets. And when investors are faced with situations outside of their comfort zone, they typically react cautiously. Risk-on one day, risk-off the next.
While the U.S. is starting to emerge from its economic malaise, the crisis engulfing Europe is without precedent. In our view, there’s little doubt that Europe is headed for recession; the impact on the U.S. will be a function of how far EC leaders are willing to go to salvage the Euro by enforcing fiscal discipline on the weaker members. And with the economic outlook in China growing more uncertain, the U.S. has to look internally for ways to spur growth. New home construction, typically a catalyst to growth in recoveries, will help in 2012 but is unlikely to be the cure. More than ever, we need leadership out of Washington to put policies in place to spur economic growth. Unfortunately, the upcoming election cycle may limit meaningful action from Congress and the Administration, leaving the Fed with its blunt force tools to do the heavy lifting.
With the U.S. likely still several years away from a robust recovery, we expect that interest rates on direct government debt will remain at relatively low rates for the foreseeable future. However, financial company deleveraging means yields on government mortgage-backed securities should remain relatively attractive. With the AMF fixed income Funds increasing their focus on these securities, we continue to look to maximize shareholder value while vigilantly managing risk exposures.

Rodger D. Shay
Chairman
Asset Management Fund
The report has been prepared to provide information to the shareholders of the Funds and must be proceeded or accompanied by a prospectus. It is not to be construed as an offering to sell or buy any shares of the Funds. Such an offering is made only by the prospectus. You may obtain a current copy of the Prospectus by calling 1-800-527-3713 or at AMF’s website (www.amffunds.com). Investors should consider the investment objectives, risks, and expenses of the Funds before investing. Read the prospectus carefully before you invest. Like all Mutual Funds, the Funds are not FDIC insured, may lose value and have no bank guarantee.
1
MARKET OVERVIEW
October 31, 2011
After an energy cost-induced economic growth slowdown to start the year in the U.S., the economy has been accelerating all year, albeit at a slow pace. Large U.S. financial institutions, while still “Too Big To Fail”, are profitable, leverage is down, and credit is (slowly) expanding. Many have made great headway to the Basel II-induced deleveraging, so a “Lehman event” (i.e., the insolvency of a single firm generating massive negative feedback into the financial system) seems unlikely. However, headwinds from Europe give us pause in declaring a broad recovery, and the lack of employment growth remains a significant concern for the U.S.
The engineering by the Fed of multi-generational lows in interest rates is undoubtedly helping housing as well as corporations and state and municipal governments (we think households, in the aggregate, would probably prefer higher rates at this point to generate more income from savings). While many prognosticators point to the still historic highs in nominal debt relative to GDP and income, we counter those concerns with the fact that much of this debt is now longer term, fixed rate debt, and that the carrying costs of household debt is at a twenty year low. While high nominal debt balances was certainly a key cause of the massive de-leveraging in 2008-09, equally critical was the staggering mismatch between asset quality, liquidity, and maturity relative to liabilities.
Alas, given the preference of investors to own short term debt, someone has to be exposed to higher rates. Today, that entity is the Federal Reserve System and the U.S. Government. The Fed’s $2.8 trillion balance sheet holds a staggering amount of interest rate risk. The same goes for the U.S. federal government. When interest rates rise, the finances of both these entities will deteriorate rapidly. In some ways, all we’ve done over the past four years is move the credit problem from corporations and households up to federal government. We believe the Fed is facing the “mother-of-all conflicts of interest:” once they start to raise rates, they will be reducing the carry imbedded in their portfolio (the current annualized earnings of nearly $100 billion are used to reduce the federal budget deficit, by the way). The Fed’s portfolio will also experience mark-to-market losses; while that’s not economically important, it will be politically crucial, and once they hike rates above the coupon on their holdings, they will be generating real losses. The federal deficit is benefitting from near zero interest rates, but once rates are normalized the burden to the government will be all too real. Getting the U.S. national debt problems under control has never been more critical. Given the low level of interest rates, the AMF funds have generally been positioned towards the lower end of their interest rate risk targets; with hindsight, the funds would have earned some additional income had we taken on more interest rate exposure.
Of course, Congress can’t complain too much about potential losses at the Fed given the staggering losses coming out of FHLMC and FNMA (and GNMA may be next). Cumulative losses at these institutions will eventually exceed $200 billion. We are surprised at the slow pace that GSE reform is moving through Congress; this lack of clarity is slowing the recovery of the mortgage securitization market. The Home Affordable Refinance Program (HARP), the administration’s program to help underwater and credit-impaired borrowers access lower mortgage rates, has been only moderately successful. Even with all of the government effort to assist homeowners with weak credit to refinance their mortgage debt, our research tells us that prepayment rates will continue to be below historic norms for the foreseeable future. The funds, which benefitted in 2011 from exposure to higher coupons, should continue to focus on these assets in 2012.
Portfolio composition is subject to change.
Past performance does not guarantee future results. Investment return and net asset value will fluctuate so that an investor’s shares, when redeemed, may be worth more or less than the original cost.
2
MARKET OVERVIEW
October 31, 2011
Some important changes have been made to the AMF fixed income funds over the past year. The funds are much more focused on government and government agency securities. For example, the Ultra Short Mortgage Fund, the largest fund in the AMF family, will no longer invest in private label mortgage-backed securities. Most of the fund’s private label MBS holdings were sold in late 2010; while prices continued to climb in early 2011, they’ve declined sharply since then. Nonetheless, we believe that government and government agency MBS are attractive assets to own given their high credit quality and attractive yields.
The report has been prepared to provide information to the shareholders of the Funds and must be proceeded or accompanied by a prospectus. It is not to be construed as an offering to sell or buy any shares of the Funds. Such an offering is made only by the prospectus. You may obtain a current copy of the Prospectus by calling 1-800-527-3713 or at AMF’s website (www.amffunds.com). Investors should consider the investment objectives, risks, and expenses of the Funds before investing. Read the prospectus carefully before you invest. Like all Mutual Funds, the Funds are not FDIC insured, may lose value and have no bank guarantee.
Portfolio composition is subject to change.
Past performance does not guarantee future results. Investment return and net asset value will fluctuate so that an investor’s shares, when redeemed, may be worth more or less than the original cost.
3
ASSET MANAGEMENT FUND REVIEW
October 31, 2011
Ultra Short Mortgage Fund
The investment guidelines of the fund were changed in 2011 such that the only securities eligible for purchase by the Fund are government and government agency securities with a focus on mortgage-backed securities. With the Fed on hold throughout the year, interest rate volatility for shorter maturity U.S. government securities was relatively muted. As such, the fund focused on purchasing fixed rate securities backed by fixed rate loans. These securities generated slightly more yield than securities backed by adjustable rate mortgages. Also, the fund purchased securities backed by loans which are expected to have lower prepayment rates given their inability to refinance. Many homeowners with older, higher coupon mortgage loans are unable to refinance due to high current loan-to-values or other credit problems. This is true even though the federal government has initiated a number of programs to assist borrowers to overcome these issues. We expect that these securities will continue to have attractive yields relative to their interest rate risk. The Fund was ranked in the 11th percentile and the 16th percentile of the Morningstar Ultra Short Bond category for the one year periods ended October 31, 2010 and October 31, 2011, respectively.*
Portfolio composition is subject to change.
Past performance does not guarantee future results. Investment return and net asset value will fluctuate so that an investor’s shares, when redeemed, may be worth more or less than the original cost.
| * | The Morningstar category is assigned based on the underlying securities in each portfolio. Morningstar places funds in a given category based on their portfolio statistics and compositions over the past three years. When necessary, Morningstar may change a category assignment based on recent changes to the portfolio. Morningstar has classified the Ultra Short Mortgage Fund in the Ultrashort Bond category. The Morningstar percentile rankings were based on 95 funds and 105 funds on 10/31/10 and 10/31/11, respectively. The one, three, five and ten year percentile rankings for the Ultra Short Fund in the Morningstar Ultrashort Bond category as of 10/31/10 and 10/31/11 were as follows: |
| | | | | | | | |
| | | One year
Percentile | | Three year
Percentile | | Five year
Percentile | | Ten year
Percentile |
10/31/10 | | 11th | | 100th | | 100th | | 100th |
10/31/11 | | 16th | | 57th | | 92nd | | 100th |
| | The percentile rankings shown reflect any expenses that were voluntarily reduced during the periods presented. In such instances, and without this activity, the percentile rankings may have been higher. |
4
ASSET MANAGEMENT FUND REVIEW
October 31, 2011
Ultra Short Fund
The credit quality of the fund was maintained at extremely high levels during the year, with assets held mainly in government and government agency mortgage-backed securities. The overall interest rate risk of the fund was maintained at relatively low levels. Also, the fund purchased securities backed by loans which are expected to have lower prepayment rates given their inability to refinance. Many homeowners with older, higher coupon mortgage loans are unable to refinance due to high current loan-to-values or other credit problems. This is true even though the federal government has initiated a number of programs to assist borrowers to overcome these issues. We expect that these securities will continue to have attractive yields relative to their interest rate risk. The Fund was ranked in the 100th percentile and the 60th percentile of the Morningstar Ultra Short Bond category for the one year periods ended October 31, 2010 and October 31, 2011, respectively.*
Portfolio composition is subject to change.
Past performance does not guarantee future results. Investment return and net asset value will fluctuate so that an investor’s shares, when redeemed, may be worth more or less than the original cost.
| * | The Morningstar category is assigned based on the underlying securities in each portfolio. Morningstar places funds in a given category based on their portfolio statistics and compositions over the past three years. When necessary, Morningstar may change a category assignment based on recent changes to the portfolio. Morningstar has classified the Ultra Short Fund in the Ultrashort Bond category. The Morningstar percentile rankings were based on 95 funds and 105 funds on 10/31/10 and 10/31/11, respectively. The one, three and five year percentile rankings for the Ultra Short Fund in the Morningstar Ultrashort Bond category as of 10/31/10 and 10/31/11 were as follows: |
| | | | | | |
| | | One year
Percentile | | Three year
Percentile | | Five year
Percentile |
10/31/10 | | 100th | | 100th | | 100th |
10/31/11 | | 60th | | 100th | | 100th |
| | The percentile rankings shown reflect any expenses that were voluntarily reduced during the periods presented. In such instances, and without this activity, the percentile rankings may have been higher. |
5
ASSET MANAGEMENT FUND REVIEW
October 31, 2011
Short U.S. Government Fund
The investment guidelines of the fund were changed in 2011 such that the only securities eligible for purchase by the Fund are government and government agency securities with a focus on mortgage-backed securities. The overall interest rate risk of the fund was maintained at relatively low levels. Also, the fund purchased securities backed by loans which are expected to have lower prepayment rates given their inability to refinance. Many homeowners with older, higher coupon mortgage loans are unable to refinance due to high current loan-to-values or other credit problems. This is true even though the federal government has initiated a number of programs to assist borrowers to overcome these issues. We expect that these securities will continue to have attractive yields relative to their interest rate risk. The fund also made greater use of fixed rate agency passthrough securities given their high level of liquidity and enhanced disclosures. The Fund was ranked in the 76th percentile and the 77th percentile of the Morningstar Short Government Bond category for the one year periods ended October 31, 2010 and October 31, 2011, respectively.*
Portfolio composition is subject to change.
Past performance does not guarantee future results. Investment return and net asset value will fluctuate so that an investor’s shares, when redeemed, may be worth more or less than the original cost.
| * | The Morningstar category is assigned based on the underlying securities in each portfolio. Morningstar places funds in a given category based on their portfolio statistics and compositions over the past three years. When necessary, Morningstar may change a category assignment based on recent changes to the portfolio. Morningstar has classified the Short U.S. Government Fund in the Short Government Bond category. The Morningstar percentile rankings were based on 177 funds and 161 funds on 10/31/10 and 10/31/11, respectively. The one, three, five and ten year percentile rankings for the Short U.S. Government Fund in the Morningstar Short Government Bond category as of 10/31/10 and 10/31/11 were as follows: |
| | | | | | | | |
| | | One year
Percentile | | Three year
Percentile | | Five year
Percentile | | Ten year
Percentile |
10/31/10 | | 76th | | 99th | | 99th | | 96th |
10/31/11 | | 77th | | 62nd | | 99th | | 91st |
| | The percentile rankings shown reflect any expenses that were voluntarily reduced during the periods presented. In such instances, and without this activity, the percentile rankings may have been higher. |
6
ASSET MANAGEMENT FUND REVIEW
October 31, 2011
Intermediate Mortgage Fund
The overall interest rate risk of the fund was maintained at relatively low levels. Also, the fund purchased securities backed by loans which are expected to have lower prepayment rates given their inability to refinance. Many homeowners with older, higher coupon mortgage loans are unable to refinance due to high current loan-to-values or other credit problems. This is true even though the federal government has initiated a number of programs to assist borrowers to overcome these issues. We expect that these securities will continue to have attractive yields relative to their interest rate risk. The fund also made greater use of fixed rate agency passthrough securities given their high level of liquidity and enhanced disclosures. The Fund was ranked in the 100th percentile and the 42nd percentile of the Morningstar Short Term Bond category for the one year periods ended October 31, 2010 and October 31, 2011, respectively.*
Portfolio composition is subject to change.
Past performance does not guarantee future results. Investment return and net asset value will fluctuate so that an investor’s shares, when redeemed, may be worth more or less than the original cost.
| * | The Morningstar category is assigned based on the underlying securities in each portfolio. Morningstar places funds in a given category based on their portfolio statistics and compositions over the past three years. When necessary, Morningstar may change a category assignment based on recent changes to the portfolio. Morningstar has classified the Intermediate Mortgage Fund in the Short Term Bond category. The Morningstar percentile rankings were based on 474 funds and 440 funds on 10/31/10 and 10/31/11, respectively. The one, three, five and ten year percentile rankings for the Intermediate Mortgage Fund in the Morningstar Short Term Bond category as of 10/31/10 and 10/31/11 were as follows: |
| | | | | | | | |
| | | One year
Percentile | | Three year
Percentile | | Five year
Percentile | | Ten year
Percentile |
10/31/10 | | 100th | | 100th | | 100th | | 100th |
10/31/11 | | 42nd | | 100th | | 100th | | 100th |
| | The percentile rankings shown reflect any expenses that were voluntarily reduced during the periods presented. In such instances, and without this activity, the percentile rankings may have been higher. |
7
ASSET MANAGEMENT FUND REVIEW
October 31, 2011
U.S. Government Mortgage Fund
The overall interest rate risk of the fund was maintained at relatively low levels, particularly relative to its peers. The fund purchased securities backed by loans which are expected to have lower prepayment rates given their inability to refinance. Many homeowners with older, higher coupon mortgage loans are unable to refinance due to high current loan-to-values or other credit problems. This is true even though the federal government has initiated a number of programs to assist borrowers to overcome these issues. We expect that these securities will continue to have attractive yields relative to their interest rate risk. The fund also made greater use of fixed rate agency passthrough securities given their high level of liquidity and enhanced disclosures. The Fund was ranked in the 98th percentile and the 98th percentile of the Morningstar Intermediate Government Bond category for the one year periods ended October 31, 2010 and October 31, 2011, respectively.*
Portfolio composition is subject to change.
Past performance does not guarantee future results. Investment return and net asset value will fluctuate so that an investor’s shares, when redeemed, may be worth more or less than the original cost.
| * | The Morningstar category is assigned based on the underlying securities in each portfolio. Morningstar places funds in a given category based on their portfolio statistics and compositions over the past three years. When necessary, Morningstar may change a category assignment based on recent changes to the portfolio. Morningstar has classified the U.S. Government Mortgage Fund in the Intermediate Government Bond category. The Morningstar percentile rankings were based on 373 funds and 359 funds on 10/31/10 and 10/31/11, respectively. The one, three, five and ten year percentile rankings for the U.S. Government Mortgage Fund in the Morningstar Intermediate Government Bond category as of 10/31/10 and 10/31/11 were as follows: |
| | | | | | | | |
| | | One year
Percentile | | Three year
Percentile | | Five year
Percentile | | Ten year
Percentile |
10/31/10 | | 98th | | 95th | | 95th | | 92nd |
10/31/11 | | 98th | | 99th | | 100th | | 100th |
| | The percentile rankings shown reflect any expenses that were voluntarily reduced during the periods presented. In such instances, and without this activity, the percentile rankings may have been higher. |
8
AMF LARGE CAP EQUITY FUND REVIEW
October 31, 2011
During the one-year period ending October 31, 2011, the AMF Large Cap Equity Fund (Class AMF) produced a total return of 8.66%. Total return figures for the benchmark indices were 5.33% for the Morningstar Large Blend category and 8.09% for the Standard & Poor’s 500 Index for the same period. This performance placed the Fund in the top 13th percentile ranking of the Morningstar Large Cap Blend category for the one-year period ending 10/31/11.* Total return assumes the reinvestment of all dividends and capital gains and the deduction of all applicable fees and expenses.
During the past twelve months, the domestic economy continued to make progress following the “Great Recession” of 2008-2009, however, the pace of growth deteriorated from the prior year period. Throughout the year, especially in the second half, the risk of a double dip recession intensified, although one has been avoided thus far. Gross Domestic Product (GDP) growth was barely positive at 0.4% for the first quarter of 2011. It subsequently improved to 1.3% in the second quarter and 2.0% in the third, although the rate of growth was not enough to make a dent in the high unemployment rate which remained above 9%. Consequently, consumer confidence declined in the latter half of the year, nearing its 2009 recession lows, due to the continued poor employment environment, weak income growth, increased inflationary pressures, and the absence of any housing recovery. Consumer confidence was also negatively affected by the lack of progress by congressional members on a deficit reduction plan during the summer which ultimately led to a downgrade of the U.S. credit rating from AAA by Standard & Poor’s ratings agency.
Further compounding issues were continuing concerns regarding Europe’s debt crisis, which led to a weakening of the European banking sector and caused an economic slowdown in Europe which may ultimately evolve into a recession. Economic growth worldwide will likely feel repercussions from the contentious European situation. Headlines out of Europe directly affected our stock market in the form of significant volatility especially during the late summer months. Swings of 1-3% were not uncommon on a daily basis during the past three
Portfolio composition is subject to change.
Past performance does not guarantee future results. Investment return and net asset value will fluctuate so that an investor’s shares, when redeemed, may be worth more or less than the original cost.
| * | The Morningstar category is assigned based on the underlying securities in each portfolio. Morningstar categories help investors and investment professionals make meaningful comparisons between funds. Morningstar places funds in a given category based on their portfolio statistics and compositions over the past three years. When necessary, Morningstar may change a category assignment based on recent changes to the portfolio. Morningstar has classified the Large Cap Equity Fund in the Large Cap Blend category. The Morningstar percentile rankings were based on 1,840 funds on 10/31/11. The one, three and five year percentile rankings for the Large Cap Equity Fund in the Morningstar Large Cap Blend category as of 10/31/11 were as follows: |
| | | | | | | | |
| | | One year
Percentile | | Three year
Percentile | | Five year
Percentile | | Ten year
Percentile |
10/31/11 | | 13th | | 72nd | | 21st | | 77th |
| | The percentile rankings shown reflect any expenses that were voluntarily or contractually reduced during the periods presented. In such instances, and without this activity, the percentile rankings may have been higher. |
9
AMF LARGE CAP EQUITY FUND REVIEW
October 31, 2011
months. In order to address the weakening domestic economy, and likely some of the financial market volatility, the Federal Reserve maintained its accommodative stance keeping interest rates at near zero. It also announced that it will keep rates this low through mid-2013. Additionally, the Fed began purchasing government and mortgage securities with longer durations in an attempt to lower long-term interest rates. As a result, the 10-year Treasury yield dropped below 2% in September and October.
Even as economic growth stalled and stock market volatility increased, corporate profit growth remained strong throughout the year. After reducing cost structures during the 2008 - 2009 recession, business profits expanded as revenue growth slowly resumed. Corporate managers remained cautious due to elevated consumer uncertainty, increased government regulation and a lack of clarity regarding future taxation. As a result, capital expenditures were tepid and hiring was limited, meanwhile, productivity continued to improve. This led to strong cash flow generation which has resulted in significant growth of corporate cash balances as well as increased dividend growth and shareholder repurchases. High quality corporate credits have also been actively refinancing their liabilities at these historically low interest rates, further improving their balance sheets.
The AMF Large Cap Equity Fund’s investment philosophy focuses on investing in high quality, large capitalization common stocks. These companies typically have lower risk attributes due to their consistency of earnings and dividends. This investment approach results in the Fund having a higher concentration in industry sectors that are less sensitive to the economy and a lower concentration in sectors more sensitive to the economy. During rapidly rising markets, industry sectors most sensitive to the economy often outperform, while during falling markets, sectors least sensitive to the economy tend to outperform. Additionally, during periods of excessive volatility, such as those experienced during this past August and September, the Fund’s lower risk attributes typically have a dampening effect on the volatility. The relative performance of the Fund throughout the past year was consistent with these correlations.
Equity investment return can ultimately be defined as the fundamental growth in a company’s intrinsic value per share combined with any change in the discount or premium associated with that value. Over the short-term, stock price movements are largely determined by changes in the discount or premium associated with intrinsic value, which is largely influenced by investor sentiment. However, over the long-term, business fundamentals tend to have the largest impact on investment performance. The role of the Fund’s portfolio management team is to identify businesses that offer attractive long-term fundamental growth prospects that are available at attractive valuations. The portfolio is managed from a business-like perspective. The Fund’s capital is invested in portions of public companies, each of which generates cash flow and earnings for its shareholders. A vast majority of our ownership stakes pay out a portion of earnings in the form of dividends. Many of our companies also actively repurchase their own shares, which directly increases our ownership percentage.
The portfolio management team carefully monitors fundamental progress of the portfolio utilizing “owner earnings” much like an individual business owner would in his or her own company. Owner earnings are simply the earnings per share times the number of shares owned for each of the portfolio holdings. Since the AMF Fund is an open-ended mutual fund, the owner earnings must be converted into owner earnings per AMF share to be comparable over time periods. As of 10/31/11, owner earnings per AMF share increased by 19% versus
Portfolio composition is subject to change.
Past performance does not guarantee future results. Investment return and net asset value will fluctuate so that an investor’s shares, when redeemed, may be worth more or less than the original cost.
10
AMF LARGE CAP EQUITY FUND REVIEW
October 31, 2011
the prior year ending 10/31/10. This fundamental return was significantly higher than the total return of the Fund during the period. This was primarily due to a contraction in the collective price-to-earnings multiple for our portfolio holdings over the 12-month period. Cash dividends from portfolio companies were also received throughout the year and are an integral part of total return. The weighted average dividend yield of our portfolio holdings has increased over the past year.
In keeping with our focus on long-term ownership of high quality businesses, our portfolio turnover was quite low this past year at 7%. This was lower than our average of 14% during the prior three years. We will consider eliminating holdings in the portfolio if we believe current market value exceeds our estimate of intrinsic value, if fundamentals deteriorate measurably such that intrinsic value becomes permanently impaired, or if better opportunities exist for alternative investment. During the year, our businesses delivered favorable fundamental performance without attracting overly optimistic valuations. We did not see a compelling reason to eliminate any of our portfolio holdings during the year. However, we did add a new holding to the portfolio during early 2011. General Mills, the food products company best known for its Big G cereals, Progresso soup, Green Giant, Pillsbury and Yoplait brands, is our most recent addition to the portfolio. The company’s consistent earnings growth, attractive dividend, wide profit margins and high returns on capital and equity make this company a solid addition to the AMF Large Cap Equity Fund.
After nearly 20 years of managing this equity fund, your portfolio management team remains committed to the investment philosophy of investing in high quality, large capitalization companies for long-term wealth creation. Given current valuations associated with common stocks in general and high quality dividend paying companies in particular, we believe it is an opportune time to be a long-term investor, especially if one agrees with our outlook for continued slow economic growth and given the historically low interest rate environment.
Portfolio composition is subject to change.
Past performance does not guarantee future results. Investment return and net asset value will fluctuate so that an investor’s shares, when redeemed, may be worth more or less than the original cost.
11
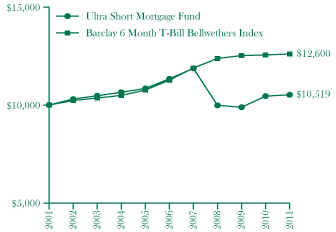
Investment Comparison (Unaudited)
Comparison of change in value of a hypothetical $10,000 investment for the years ended October 31
Ultra Short Mortgage Fund
| | | | | | | | | | | | | | | | |
 | | Gross Expense Ratio 0.87% |
| | The above expense ratios are from the Funds’ prospectus dated March 1, 2011. Additional information pertaining to the Funds’ expense ratios as of October 31, 2011 can be found in the Financial Highlights. |
| | Average Annual Total Return Periods Ending October 31, 2011 |
| | | |
| One
Year |
| |
| Five
Year |
| |
| Ten
Year |
| | |
| | | | | 0.97% | | | | (1.42% | ) | | | 0.55% | | | |
| | | | | | | | | | | | | | | | |
| | | | | | | | | | | | | | | | |
| | | | | | | | | | | | | | | | |
Ultra Short Fund
| | | | | | | | | | | | | | |
 | | Gross Expense Ratio 0.93% |
| | The above expense ratios are from the Funds’ prospectus dated March 1, 2011. Additional information pertaining to the Funds’ expense ratios as of October 31, 2011 can be found in the Financial Highlights. |
| | Average Annual Total Return Periods Ending October 31, 2011 |
| | | |
| One
Year |
| |
| Five
Year |
| |
Since Inception
(Nov 14, 2001) | | |
| | | | | 0.10% | | | | (7.65% | ) | | (2.67%) | | |
| | | | | | | | | | | | | | |
| | | | | | | | | | | | | | |
| | | | | | | | | | | | | | |
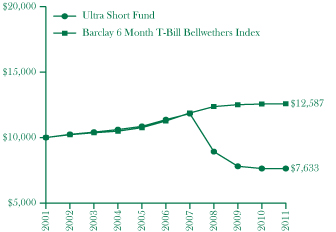
Past performance does not guarantee future results. The performance data quoted represents past performance and current returns may be lower or higher. Performance figures in the table and graph do not reflect the deduction of taxes that a shareholder would pay on the Fund distributions or the redemption of Fund shares. The Barclay 6 Month T-Bill Bellwethers Index is an unmanaged index comprised of U.S. Government Treasury Bonds with an average maturity of six months. The index represents unmanaged groups of bonds that differ from the composition of each AMF Fund. The index does not include a reduction in return for expenses. Investors cannot invest directly in an index, although they can invest in its underlying securities. To obtain current month-end performance information for any of the AMF Funds, please call 1-800-527-3713.
12
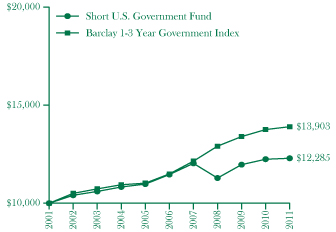
Investment Comparison (Unaudited)
Comparison of change in value of a hypothetical $10,000 investment for the years ended October 31
Short U.S. Government Fund
| | | | | | | | | | | | | | | | |
 | | Gross Expense Ratio 0.63% |
| | The above expense ratios are from the Funds’ prospectus dated March 1, 2011. Additional information pertaining to the Funds’ expense ratios as of October 31, 2011 can be found in the Financial Highlights. |
| | Average Annual Total Return Periods Ending October 31, 2011 |
| | | |
| One
Year |
| |
| Five
Year |
| |
| Ten
Year |
| | |
| | | | | 0.43% | | | | 1.40% | | | | 2.08% | | | |
| | | | | | | | | | | | | | | | |
| | | | | | | | | | | | | | | | |
| | | | | | | | | | | | | | | | |
| | | | | | | | | | | | | | | | |
| | | | | | | | | | | | | | | | |
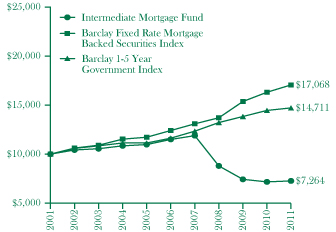
Intermediate Mortgage Fund
| | | | | | | | | | | | | | | | |
 | | Gross Expense Ratio 0.67% |
| | The above expense ratios are from the Funds’ prospectus dated March 1, 2011. Additional information pertaining to the Funds’ expense ratios as of October 31, 2011 can be found in the Financial Highlights. |
| | Average Annual Total Return Periods Ending October 31, 2011 |
| | | |
| One
Year |
| |
| Five
Year |
| |
| Ten
Year |
| | |
| | | | | 1.09% | | | | (8.79% | ) | | | (3.14% | ) | | |
| | | | | | | | | | | | | | | | |
| | | | | | | | | | | | | | | | |
| | | | | | | | | | | | | | | | |
| | | | | | | | | | | | | | | | |
| | | | | | | | | | | | | | | | |
Past performance does not guarantee future results. The performance data quoted represents past performance and current returns may be lower or higher. Performance figures in the table and graph do not reflect the deduction of taxes that a shareholder would pay on the Fund distributions or the redemption of Fund shares. The Barclay 1-3 Year Government Index is an unmanaged index generally representative of government securities with maturities of one to three years. The Barclay Fixed Rate Mortgage Backed Securities Index is a broad-based unmanaged index that represents the general performance of fixed rate mortgage bonds. The Barclay 1-5 Year Government Index is an unmanaged index generally representative of government securities with maturities of one to five years. The indices represent unmanaged groups of bonds that differ from the composition of each AMF Fund. The indices do not include a reduction in return for expenses. Investors cannot invest directly in an index, although they can invest in its underlying securities. To obtain current month-end performance information for any of the AMF Funds, please call 1-800-527-3713.
13
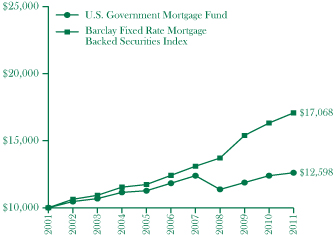
Investment Comparison (Unaudited)
Comparison of change in value of a hypothetical $10,000 investment for the years ended October 31
U.S. Government Mortgage Fund
| | | | | | | | | | | | | | | | |
 | | Gross Expense Ratio 0.60% |
| | The above expense ratios are from the Funds’ prospectus dated March 1, 2011. Additional information pertaining to the Funds’ expense ratios as of October 31, 2011 can be found in the Financial Highlights. |
| | Average Annual Total Return Periods Ending October 31, 2011 |
| | | |
| One
Year |
| |
| Five
Year |
| |
| Ten
Year |
| | |
| | | | | 1.68% | | | | 1.28% | | | | 2.34% | | | |
| | | | | | | | | | | | | | | | |
| | | | | | | | | | | | | | | | |
| | | | | | | | | | | | | | | | |
| | | | | | | | | | | | | | | | |
| | | | | | | | | | | | | | | | |
Past performance does not guarantee future results. The performance data quoted represents past performance and current returns may be lower or higher. Performance figures in the table and graph do not reflect the deduction of taxes that a shareholder would pay on the Fund distributions or the redemption of Fund shares. The Barclay Fixed Rate Mortgage Backed Securities Index is a broad-based unmanaged index that represents the general performance of fixed rate mortgage bonds. The index represents unmanaged groups of bonds that differ from the composition of each AMF Fund. The index does not include a reduction in return for expenses. Investors cannot invest directly in an index, although they can invest in its underlying securities. To obtain current month-end performance information for any of the AMF Funds, please call 1-800-527-3713.
14
Investment Comparison (Unaudited)
Comparison of change in value of a hypothetical $10,000 investment for the years ended October 31
Large Cap Equity Fund
| | | | | | | | | | | | | | | | | | | | |
The following graph shows that an investment of $10,000 in the Class AMF of the Fund on October 31, 2001 would have been worth $12,787 on October 31, 2011, assuming all dividends and distributions had been reinvested. A similar investment in the S&P 500, over the same period, would have been to $14,368. A similar investment in the Morningstar Large Cap Blend, over the same period, would have worth to $13,511. 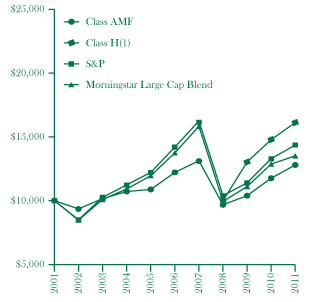
| | Gross Expense Ratio Class AMF 1.15% Class H 0.90% |
| | The above expense ratios are from the Funds’ prospectus dated March 1, 2011. Additional information pertaining to the Funds’ expense ratios as of October 31, 2011 can be found in the Financial Highlights. |
| | Average Annual Total Return Periods Ending October 31, 2011* |
| | | | | One Year | | |
| Five
Year |
| |
| Ten
Year |
| |
| Since
Inception |
| | |
| | Class AMF | | | 8.66% | | | | 0.94% | | | | 2.49% | | | | | | | |
| | Class H(1) | | | 8.83% | | | | N/A | | | | N/A | | | | 19.34% | | | |
| | Morningstar Large Cap Blend | | | 5.33% | | | | (0.31% | ) | | | 3.46% | | | | | | | |
| | S&P 500 | | | 8.09% | | | | 0.25% | | | | 3.69% | | | | | | | |
| | * Assumes reinvestment of all dividends and distributions and the deduction of all applicable fees and expenses. Average annual returns are stated for periods greater than one year. The S&P 500 does not include a reduction in total return for expenses. |
| | |
| | |
| | |
| | |
| | |
| | |
| (1) | Class H of the Fund commenced operations on February 20, 2009. An investment of $10,000 in Class H on February 20, 2009 would have been worth $16,098 on October 31, 2011. |
Past performance does not guarantee future results. The performance data quoted represents past performance and current returns may be lower or higher. Performance figures in the table and graph do not reflect the deduction of taxes that a shareholder would pay on the Fund distributions or the redemption of Fund shares. The Morningstar Large Cap Blend Average consists of funds that, by portfolio practice, invest at least 70% of assets in domestic stocks in the top 70% of the capitalization of the U.S. equity market. These portfolios tend to invest across the spectrum of U.S. industries, and owing to their broad exposure, the portfolios’ returns are often similar to those of the S&P 500 Index. The Standard & Poors 500 Index is an unmanaged index, generally representative of the U.S. stock market as a whole. Each of these indices represents an unmanaged group of securities that differ from the composition of each AMF Fund. Investors cannot invest directly in an index, although they can invest in its underlying securities. To obtain current month-end performance information for any of the AMF Funds, please call 1-800-527-3713.
15
ASSET MANAGEMENT FUND
MONEY MARKET FUND
SCHEDULE OF INVESTMENTS
October 31, 2011
| | | | | | | | | | | | |
| | | Percentage
of Net
Assets | | | Shares | | | Value | |
INVESTMENT COMPANIES | | | 0.0% | | | | | | | | | |
Northern Institutional Treasury Portfolio | | | | | | | 615 | | | $ | 615 | |
| | | | | | | | | | | | |
TOTAL INVESTMENT COMPANIES | | | | | | | | | | | 615 | |
| | | | | | | | | | | | |
| | | | | | | | | | | | | |
| | | Percentage
of Net
Assets | | | Principal
Amount | | | Value | |
REPURCHASE AGREEMENTS | | | 100.0% | | | | | | | | | |
Bank of America, 0.09%, (Agreement dated 10/31/11 to be repurchased at $19,650,049 on 11/1/11. Collateralized by Adjustable Rate U.S. Government Mortgage-Backed Securities, 1.69% - 2.65%, with a value of $20,043,000, due at 8/20/61) | | | | | | $ | 19,650,000 | | | $ | 19,650,000 | |
| | | | | | | | | | | | |
TOTAL REPURCHASE AGREEMENTS | | | | | | | | | | | 19,650,000 | |
| | | | | | | | | | | | |
TOTAL INVESTMENTS
(Cost $19,650,615)(a) | | | 100.0% | | | | | | | | 19,650,615 | |
NET OTHER ASSETS (LIABILITIES) | | | 0.0% | | | | | | | | 574 | |
| | | | | | | | | | | | |
NET ASSETS | | | 100.0% | | | | | | | $ | 19,651,189 | |
| | | | | | | | | | | | |
| | | | | | | | | | | | | |
| | (a) | Represents cost for financial reporting purposes. |
See notes to financial statements.
16
ASSET MANAGEMENT FUND
ULTRA SHORT MORTGAGE FUND
SCHEDULE OF INVESTMENTS
October 31, 2011
| | | | | | | | | | | | | | | | |
| | | Percentage of Net Assets | | | Maturity
Date | | | Principal
Amount | | | Value | |
| | | | | | | | | | | | | | | | |
ADJUSTABLE RATE MORTGAGE-RELATED SECURITIES* | | | 53.3% | | | | | | | | | | | | | |
1 Yr. Constant Maturity Treasury Based ARMS | | | 38.8% | | | | | | | | | | | | | |
Fannie Mae | | | | | | | | | | | | | | | | |
2.55% | | | | | | | 7/1/28 | | | $ | 2,209,570 | | | $ | 2,307,750 | |
2.16% | | | | | | | 8/1/29 | | | | 1,759,558 | | | | 1,807,247 | |
2.95% | | | | | | | 3/1/30 | | | | 247,520 | | | | 256,264 | |
2.46% | | | | | | | 5/1/33 | | | | 853,637 | | | | 879,798 | |
2.54% | | | | | | | 9/1/33 | | | | 2,895,985 | | | | 3,019,605 | |
2.46% | | | | | | | 1/1/35 | | | | 5,798,408 | | | | 6,113,179 | |
2.37% | | | | | | | 1/1/35 | | | | 7,539,892 | | | | 7,871,789 | |
2.50% | | | | | | | 9/1/36 | | | | 15,324,713 | | | | 16,162,178 | |
2.55% | | | | | | | 6/1/37 | | | | 20,244,109 | | | | 21,399,237 | |
2.74% | | | | | | | 9/1/38 | | | | 22,295,197 | | | | 23,628,204 | |
2.46% | | | | | | | 9/1/38 | | | | 9,609,703 | | | | 10,136,987 | |
3.34% | | | | | | | 5/25/42 | | | | 6,136,555 | | | | 6,371,321 | |
Fannie Mae Grantor Trust | | | | | | | | | | | | | | | | |
3.77% | | | | | | | 5/25/42 | | | | 8,206,000 | | | | 8,378,129 | |
3.17% | | | | | | | 8/25/43 | | | | 9,756,355 | | | | 10,384,420 | |
Fannie Mae Whole Loan | | | | | | | | | | | | | | | | |
4.05% | | | | | | | 8/25/42 | | | | 3,407,439 | | | | 3,665,382 | |
3.48% | | | | | | | 8/25/42 | | | | 9,524,983 | | | | 10,249,786 | |
3.28% | | | | | | | 4/25/45 | | | | 17,646,773 | | | | 18,945,415 | |
FHLMC Structured Pass-Through Securities | | | | | | | | | | | | | | | | |
3.70% | | | | | | | 3/25/44 | | | | 2,386,370 | | | | 2,408,833 | |
Freddie Mac | | | | | | | | | | | | | | | | |
3.02% | | | | | | | 10/1/22 | | | | 779,083 | | | | 798,092 | |
2.36% | | | | | | | 9/1/27 | | | | 1,170,658 | | | | 1,207,288 | |
2.34% | | | | | | | 9/1/28 | | | | 7,948,514 | | | | 8,208,007 | |
2.33% | | | | | | | 9/1/30 | | | | 701,651 | | | | 718,396 | |
2.43% | | | | | | | 7/1/31 | | | | 4,407,361 | | | | 4,534,442 | |
| | | | | | | | | | | | | | | | |
| | | | | | | | | | | | | | | 169,451,749 | |
| | | | | | | | | | | | | | | | |
6 Mo. Certificate of Deposit Based ARMS | | | 0.8% | | | | | | | | | | | | | |
Fannie Mae | | | | | | | | | | | | | | | | |
1.32% | | | | | | | 6/1/21 | | | | 980,019 | | | | 983,650 | |
1.81% | | | | | | | 12/1/24 | | | | 1,604,360 | | | | 1,632,988 | |
Freddie Mac | | | | | | | | | | | | | | | | |
1.98% | | | | | | | 1/1/26 | | | | 675,367 | | | | 690,054 | |
| | | | | | | | | | | | | | | | |
| | | | | | | | | | | | | | | 3,306,692 | |
| | | | | | | | | | | | | | | | |
|
See notes to financial statements. | |
17
ASSET MANAGEMENT FUND
ULTRA SHORT MORTGAGE FUND (continued)
SCHEDULE OF INVESTMENTS
October 31, 2011
| | | | | | | | | | | | | | | | |
| | | Percentage of Net Assets | | | Maturity
Date | | | Principal
Amount | | | Value | |
| | | | | | | | | | | | | | | | |
6 Mo. London Interbank Offering Rate (LIBOR) | | | 3.3% | | | | | | | | | | | | | |
Fannie Mae | | | | | | | | | | | | | | | | |
1.65% | | | | | | | 9/1/27 | | | $ | 3,231,768 | | | $ | 3,305,063 | |
1.71% | | | | | | | 3/1/28 | | | | 2,882,417 | | | | 2,943,405 | |
2.19% | | | | | | | 6/1/28 | | | | 411,508 | | | | 428,395 | |
1.60% | | | | | | | 9/1/33 | | | | 1,353,320 | | | | 1,382,051 | |
1.71% | | | | | | | 11/1/33 | | | | 2,265,652 | | | | 2,318,090 | |
1.77% | | | | | | | 11/1/33 | | | | 1,117,245 | | | | 1,145,919 | |
Freddie Mac | | | | | | | | | | | | | | | | |
2.52% | | | | | | | 9/1/30 | | | | 2,734,399 | | | | 2,897,727 | |
| | | | | | | | | | | | | | | | |
| | | | | | | | | | | | | | | 14,420,650 | |
| | | | | | | | | | | | | | | | |
Cost of Funds Index Based ARMS | | | 8.8% | | | | | | | | | | | | | |
Fannie Mae | | | | | | | | | | | | | | | | |
3.57% | | | | | | | 2/1/28 | | | | 13,170,817 | | | | 13,914,911 | |
2.59% | | | | | | | 8/1/33 | | | | 7,853,388 | | | | 8,138,786 | |
3.01% | | | | | | | 11/1/36 | | | | 8,949,251 | | | | 9,440,348 | |
2.60% | | | | | | | 6/1/38 | | | | 6,814,162 | | | | 7,066,482 | |
| | | | | | | | | | | | | | | | |
| | | | | | | | | | | | | | | 38,560,527 | |
| | | | | | | | | | | | | | | | |
HYBRID ARMS | | | 1.6% | | | | | | | | | | | | | |
Freddie Mac | | | | | | | | | | | | | | | | |
5.65% | | | | | | | 11/1/36 | | | | 6,655,469 | | | | 6,960,336 | |
| | | | | | | | | | | | | | | | |
TOTAL ADJUSTABLE RATE MORTGAGE-RELATED SECURITIES | | | | | | | | | | | | | | | 232,699,954 | |
| | | | | | | | | | | | | | | | |
FIXED RATE MORTGAGE-RELATED SECURITIES | | | 39.4% | | | | | | | | | | | | | |
15 Yr. Securities | | | 5.5% | | | | | | | | | | | | | |
Fannie Mae | | | | | | | | | | | | | | | | |
3.00%(a) | | | | | | | 10/14/16 | | | | 19,500,000 | | | | 19,969,229 | |
Freddie Mac | | | | | | | | | | | | | | | | |
4.00% | | | | | | | 12/1/25 | | | | 3,723,714 | | | | 3,907,457 | |
| | | | | | | | | | | | | | | | |
| | | | | | | | | | | | | | | 23,876,686 | |
| | | | | | | | | | | | | | | | |
30 Yr. Securities | | | 3.1% | | | | | | | | | | | | | |
Fannie Mae | | | | | | | | | | | | | | | | |
6.00% | | | | | | | 5/1/39 | | | | 12,491,195 | | | | 13,804,582 | |
| | | | | | | | | | | | | | | | |
|
See notes to financial statements. | |
18
ASSET MANAGEMENT FUND
ULTRA SHORT MORTGAGE FUND (continued)
SCHEDULE OF INVESTMENTS
October 31, 2011
| | | | | | | | | | | | | | | | |
| | | Percentage of Net Assets | | | Maturity
Date | | | Principal
Amount | | | Value | |
| | | | | | | | | | | | | | | | |
Collateralized Mortgage Obligations | | | 30.8% | | | | | | | | | | | | | |
Fannie Mae | | | | | | | | | | | | | | | | |
5.00%(b) | | | | | | | 2/25/18 | | | $ | 5,076,515 | | | $ | 5,434,367 | |
4.00% | | | | | | | 10/25/23 | | | | 3,024,269 | | | | 3,140,849 | |
5.00% | | | | | | | 3/25/24 | | | | 6,542,932 | | | | 7,054,359 | |
6.00% | | | | | | | 1/25/32 | | | | 9,500,000 | | | | 10,056,700 | |
5.50%(b) | | | | | | | 9/25/33 | | | | 16,060,983 | | | | 16,390,827 | |
5.50% | | | | | | | 9/25/34 | | | | 7,583,815 | | | | 7,736,318 | |
5.50% | | | | | | | 2/25/38 | | | | 15,690,134 | | | | 16,160,210 | |
Freddie Mac | | | | | | | | | | | | | | | | |
4.50% | | | | | | | 12/15/13 | | | | 1,390,944 | | | | 1,396,446 | |
5.00% | | | | | | | 7/15/32 | | | | 9,205,539 | | | | 9,386,132 | |
6.00% | | | | | | | 2/15/33 | | | | 12,545,000 | | | | 13,199,096 | |
5.50% | | | | | | | 2/15/33 | | | | 11,610,302 | | | | 12,142,132 | |
Government National Mortgage Association | | | | | | | | | | | | | | | | |
4.49% | | | | | | | 10/16/25 | | | | 105,162 | | | | 105,302 | |
4.77% | | | | | | | 8/16/27 | | | | 14,319,882 | | | | 14,625,325 | |
5.08% | | | | | | | 1/16/30 | | | | 357,619 | | | | 364,189 | |
5.00% | | | | | | | 8/20/35 | | | | 11,143,814 | | | | 11,531,412 | |
4.50% | | | | | | | 11/20/36 | | | | 5,550,824 | | | | 5,647,237 | |
| | | | | | | | | | | | | | | | |
| | | | | | | | | | | | | | | 134,370,901 | |
| | | | | | | | | | | | | | | | |
TOTAL FIXED RATE MORTGAGE-RELATED SECURITIES | | | | | | | | | | | | | | | 172,052,169 | |
| | | | | | | | | | | | | | | | |
U.S. GOVERNMENT AGENCIES | | | 3.1% | | | | | | | | | | | | | |
FDIC Structured Sale Guaranteed Notes | | | | | | | | | | | | | | | | |
1.68%(c) | | | | | | | 1/7/13 | | | | 2,500,000 | | | | 2,484,325 | |
3.00%(c) | | | | | | | 9/30/19 | | | | 2,197,673 | | | | 2,209,936 | |
| | | | | | | | | | | | | | | | |
| | | | | | | | | | | | | | | 4,694,261 | |
| | | | | | | | | | | | | | | | |
FDIC Trust | | | | | | | | | | | | | | | | |
2.18%(c) | | | | | | | 5/25/50 | | | | 8,806,450 | | | | 8,795,671 | |
| | | | | | | | | | | | | | | | |
TOTAL U.S. GOVERNMENT AGENCIES | | | | | | | | | | | | | | | 13,489,932 | |
| | | | | | | | | | | | | | | | |
| | | | | | | | | | | | | | | | | |
| | | Percentage
of Net
Assets | | | | | | Shares | | | Value | |
INVESTMENT COMPANIES | | | 0.0% | | | | | | | | | | | | | |
Northern Institutional Treasury Portfolio | | | | | | | | | | | 544 | | | $ | 544 | |
| | | | | | | | | | | | | | | | |
TOTAL INVESTMENT COMPANIES | | | | | | | | | | | | | | | 544 | |
| | | | | | | | | | | | | | | | |
|
See notes to financial statements. | |
19
ASSET MANAGEMENT FUND
ULTRA SHORT MORTGAGE FUND (concluded)
SCHEDULE OF INVESTMENTS
October 31, 2011
| | | | | | | | | | | | | | |
| | | Percentage of Net Assets | | | | | Principal
Amount | | | Value | |
| | | | | | | | | | | | | | |
REPURCHASE AGREEMENTS | | | 9.6% | | | | | | | | | | | |
Bank of America, 0.09%, (Agreement dated 10/31/11 to be repurchased at $41,634,104 on 11/1/11. Collateralized by Adjustable and Fixed Rate U.S. Government Mortgage-Backed Securities, 1.99% - 5.30%, with a value of $42,466,681, due at 8/20/60 - 8/20/61) | | | | | | | | $ | 41,634,000 | | | $ | 41,634,000 | |
| | | | | | | | | | | | | | |
TOTAL REPURCHASE AGREEMENTS | | | | | | | | | | | | | 41,634,000 | |
| | | | | | | | | | | | | | |
TOTAL INVESTMENTS
(Cost $452,099,122)(d) | | | 105.4% | | | | | | | | | | 459,876,599 | |
NET OTHER ASSETS (LIABILITIES) | | | (5.4)% | | | | | | | | | | (23,392,012 | ) |
| | | | | | | | | | | | | | |
NET ASSETS | | | 100.0% | | | | | | | | | $ | 436,484,587 | |
| | | | | | | | | | | | | | |
| | | | | | | | | | | | | | | |
| * | The rates presented are the rates in effect at October 31, 2011. |
| (a) | TBA and When-Issued Security. |
| (b) | Security held as collateral for When-Issued Security. |
| (c) | Securities purchased in a transaction exempt from registration under Rule 144A of the Securities Act of 1933. These securities may not be publicly sold without registration under the Securities Act of 1933. The value of these securities is determined by valuations supplied by a pricing service or brokers. |
| (d) | Represents cost for financial reporting purposes. |
FHLMC Federal Home Loan Mortgage Corporation.
FDIC Federal Deposit Insurance Corporation.
See notes to financial statements.
20
ASSET MANAGEMENT FUND
ULTRA SHORT FUND
SCHEDULE OF INVESTMENTS
October 31, 2011
| | | | | | | | | | | | | | | | |
| | | Percentage of Net Assets | | | Maturity
Date | | | Principal
Amount | | | Value | |
| | | | | | | | | | | | | | | | |
ADJUSTABLE RATE MORTGAGE-RELATED SECURITIES* | | | 65.6% | | | | | | | | | | | | | |
1 Yr. Constant Maturity Treasury Based ARMS | | | 65.6% | | | | | | | | | | | | | |
Fannie Mae | | | | | | | | | | | | | | | | |
2.34% | | | | | | | 10/1/28 | | | $ | 158,433 | | | $ | 164,333 | |
2.77% | | | | | | | 12/1/30 | | | | 465,695 | | | | 488,933 | |
2.34% | | | | | | | 7/1/33 | | | | 630,938 | | | | 653,646 | |
2.74% | | | | | | | 9/1/38 | | | | 969,468 | | | | 1,027,432 | |
Freddie Mac | | | | | | | | | | | | | | | | |
2.46% | | | | | | | 11/1/28 | | | | 165,914 | | | | 173,657 | |
2.97% | | | | | | | 1/1/29 | | | | 588,128 | | | | 619,178 | |
2.37% | | | | | | | 7/1/30 | | | | 426,930 | | | | 439,724 | |
2.43% | | | | | | | 9/1/30 | | | | 80,724 | | | | 84,516 | |
2.60% | | | | | | | 8/1/31 | | | | 967,700 | | | | 1,006,080 | |
| | | | | | | | | | | | | | | | |
| | | | | | | | | | | | | | | 4,657,499 | |
| | | | | | | | | | | | | | | | |
TOTAL ADJUSTABLE RATE MORTGAGE-RELATED SECURITIES | | | | | | | | | | | | | | | 4,657,499 | |
| | | | | | | | | | | | | | | | |
FIXED RATE MORTGAGE-RELATED SECURITIES | | | 29.7% | | | | | | | | | | | | | |
Collateralized Mortgage Obligations | | | 29.7% | | | | | | | | | | | | | |
Fannie Mae | | | | | | | | | | | | | | | | |
6.00% | | | | | | | 1/25/32 | | | | 500,000 | | | | 529,300 | |
Freddie Mac | | | | | | | | | | | | | | | | |
6.00% | | | | | | | 2/15/33 | | | | 1,500,000 | | | | 1,578,210 | |
| | | | | | | | | | | | | | | | |
| | | | | | | | | | | | | | | 2,107,510 | |
| | | | | | | | | | | | | | | | |
TOTAL FIXED RATE MORTGAGE-RELATED SECURITIES | | | | | | | | | | | | | | | 2,107,510 | |
| | | | | | | | | | | | | | | | |
| | | | | | | | | | | | | | | | | |
| | | Percentage of Net Assets | | | | | | Shares | | | Value | |
INVESTMENT COMPANIES | | | 4.2% | | | | | | | | | | | | | |
Northern Institutional Treasury Portfolio | | | | | | | | | | | 295,738 | | | $ | 295,738 | |
| | | | | | | | | | | | | | | | |
TOTAL INVESTMENT COMPANIES | | | | | | | | | | | | | | | 295,738 | |
| | | | | | | | | | | | | | | | |
TOTAL INVESTMENTS
(Cost $6,994,333)(a) | | | 99.5% | | | | | | | | | | | | 7,060,747 | |
OTHER NET ASSETS (LIABILITIES) | | | 0.5% | | | | | | | | | | | | 32,800 | |
| | | | | | | | | | | | | | | | |
NET ASSETS | | | 100.0% | | | | | | | | | | | $ | 7,093,547 | |
| | | | | | | | | | | | | | | | |
| | | | | | | | | | | | | | | | | |
| * | The rates presented are the rates in effect at October 31, 2011. |
| (a) | Represents cost for financial reporting purposes. |
See notes to financial statements.
21
ASSET MANAGEMENT FUND
SHORT U.S. GOVERNMENT FUND
SCHEDULE OF INVESTMENTS
October 31, 2011
| | | | | | | | | | | | | | | | |
| | | Percentage of Net Assets | | | Maturity
Date | | | Principal
Amount | | | Value | |
| | | | | | | | | | | | | | | | |
ADJUSTABLE RATE MORTGAGE-RELATED SECURITIES* | | | 34.4% | | | | | | | | | | | | | |
1 Yr. Constant Maturity Treasury Based ARMS | | | 34.4% | | | | | | | | | | | | | |
Fannie Mae | | | | | | | | | | | | | | | | |
2.66% | | | | | | | 5/1/31 | | | $ | 581,347 | | | $ | 609,118 | |
2.46% | | | | | | | 1/1/35 | | | | 495,926 | | | | 522,848 | |
2.50% | | | | | | | 9/1/36 | | | | 712,777 | | | | 751,729 | |
2.74% | | | | | | | 9/1/38 | | | | 1,736,964 | | | | 1,840,816 | |
Fannie Mae Grantor Trust | | | | | | | | | | | | | | | | |
3.77% | | | | | | | 5/25/42 | | | | 928,898 | | | | 948,383 | |
3.17% | | | | | | | 8/25/43 | | | | 1,905,241 | | | | 2,027,891 | |
Freddie Mac | | | | | | | | | | | | | | | | |
2.44% | | | | | | | 3/1/27 | | | | 319,815 | | | | 332,322 | |
2.60% | | | | | | | 8/1/31 | | | | 1,411,394 | | | | 1,467,373 | |
| | | | | | | | | | | | | | | | |
| | | | | | | | | | | | | | | 8,500,480 | |
| | | | | | | | | | | | | | | | |
TOTAL ADJUSTABLE RATE MORTGAGE-RELATED SECURITIES | | | | | | | | | | | | | | | 8,500,480 | |
| | | | | | | | | | | | | | | | |
FIXED RATE MORTGAGE-RELATED SECURITIES | | | 62.0% | | | | | | | | | | | | | |
15 Yr. Securities | | | 22.8% | | | | | | | | | | | | | |
Fannie Mae | | | | | | | | | | | | | | | | |
3.50% | | | | | | | 7/1/21 | | | | 2,361,946 | | | | 2,476,181 | |
2.50% | | | | | | | 2/1/26 | | | | 480,514 | | | | 485,612 | |
3.00%(a) | | | | | | | 10/14/26 | | | | 2,600,000 | | | | 2,662,564 | |
Freddie Mac | | | | | | | | | | | | | | | | |
8.00% | | | | | | | 12/17/15 | | | | 18,490 | | | | 19,442 | |
| | | | | | | | | | | | | | | | |
| | | | | | | | | | | | | | | 5,643,799 | |
| | | | | | | | | | | | | | | | |
Collateralized Mortgage Obligations | | | 39.2% | | | | | | | | | | | | | |
Freddie Mac | | | | | | | | | | | | | | | | |
4.50%(b) | | | | | | | 4/15/19 | | | | 2,918,904 | | | | 3,137,323 | |
6.00% | | | | | | | 2/15/33 | | | | 4,300,000 | | | | 4,524,202 | |
Government National Mortgage Association | | | | | | | | | | | | | | | | |
4.77% | | | | | | | 8/16/27 | | | | 622,604 | | | | 635,884 | |
3.83% | | | | | | | 6/16/31 | | | | 735,897 | | | | 751,213 | |
4.50% | | | | | | | 11/20/36 | | | | 646,133 | | | | 657,356 | |
| | | | | | | | | | | | | | | | |
| | | | | | | | | | | | | | | 9,705,978 | |
| | | | | | | | | | | | | | | | |
TOTAL FIXED RATE MORTGAGE-RELATED SECURITIES | | | | | | | | | | | | | | | 15,349,777 | |
| | | | | | | | | | | | | | | | |
|
See notes to financial statements. | |
22
ASSET MANAGEMENT FUND
SHORT U.S. GOVERNMENT FUND (concluded)
SCHEDULE OF INVESTMENTS
October 31, 2011
| | | | | | | | | | | | | | | | |
| | | Percentage of Net Assets | | | Maturity
Date | | | Principal
Amount | | | Value | |
| | | | | | | | | | | | | | | | |
U.S. GOVERNMENT AGENCIES | | | 2.0% | | | | | | | | | | | | | |
FDIC Structured Sale Guaranteed Notes | | | | | | | | | | | | | | | | |
1.68%(c) | | | | | | | 1/7/13 | | | $ | 500,000 | | | $ | 496,865 | |
| | | | | | | | | | | | | | | | |
TOTAL U.S. GOVERNMENT AGENCIES | | | | | | | | | | | | | | | 496,865 | |
| | | | | | | | | | | | | | | | |
| | | | | | | | | | | | | | | | | |
| | | Percentage of Net Assets | | | | | | Shares | | | Value | |
INVESTMENT COMPANIES | | | 0.0% | | | | | | | | | | | | | |
Northern Institutional Treasury Portfolio | | | | | | | | | | | 537 | | | $ | 537 | |
| | | | | | | | | | | | | | | | |
TOTAL INVESTMENT COMPANIES | | | | | | | | | | | | | | | 537 | |
| | | | | | | | | | | | | | | | |
| | | | | | | | | | | | | | | | | |
| | | Percentage of Net Assets | | | | | | Principal
Amount | | | Value | |
REPURCHASE AGREEMENTS | | | 12.1% | | | | | | | | | | | | | |
Bank of America, 0.09%, (Agreement dated 10/31/11 to be repurchased at $2,992,007 on 11/1/11 Collateralized by Adjustable Rate U.S. Government Mortgage-Backed Security, 1.69%, with a value of $3,051,841, due at 8/20/61) | | | | | | | | | | $ | 2,992,000 | | | $ | 2,992,000 | |
| | | | | | | | | | | | | | | | |
TOTAL REPURCHASE AGREEMENTS | | | | | | | | | | | | | | | 2,992,000 | |
| | | | | | | | | | | | | | | | |
TOTAL INVESTMENTS
(Cost $26,940,176)(d) | | | 110.5% | | | | | | | | | | | | 27,339,659 | |
NET OTHER ASSETS (LIABILITIES) | | | (10.5)% | | | | | | | | | | | | (2,601,379 | ) |
| | | | | | | | | | | | | | | | |
NET ASSETS | | | 100.0% | | | | | | | | | | | $ | 24,738,280 | |
| | | | | | | | | | | | | | | | |
| | | | | | | | | | | | | | | | | |
| * | The rates presented are the rates in effect at October 31, 2011. |
| (a) | TBA and When-Issued Security. |
| (b) | Security held as collateral for When-Issued Security. |
| (c) | Securities purchased in a transaction exempt from registration under Rule 144A of the Securities Act of 1933. These securities may not be publicly sold without registration under the Securities Act of 1933. The value of these securities is determined by valuations supplied by a pricing service or brokers. |
| (d) | Represents cost for financial reporting purposes. |
FDIC Federal Deposit Insurance Corporation.
See notes to financial statements.
23
ASSET MANAGEMENT FUND
INTERMEDIATE MORTGAGE FUND
SCHEDULE OF INVESTMENTS
October 31, 2011
| | | | | | | | | | | | | | | | |
| | | Percentage of Net Assets | | | Maturity
Date | | | Principal
Amount | | | Value | |
| | | | | | | | | | | | | | | | |
ADJUSTABLE RATE MORTGAGE-RELATED SECURITIES* | | | 13.0% | | | | | | | | | | | | | |
1 Yr. Constant Maturity Treasury Based ARMS | | | 13.0% | | | | | | | | | | | | | |
Fannie Mae | | | | | | | | | | | | | | | | |
2.65% | | | | | | | 7/1/37 | | | $ | 1,805,178 | | | $ | 1,909,861 | |
2.74% | | | | | | | 9/1/38 | | | | 1,333,019 | | | | 1,412,719 | |
| | | | | | | | | | | | | | | | |
| | | | | | | | | | | | | | | 3,322,580 | |
| | | | | | | | | | | | | | | | |
TOTAL ADJUSTABLE RATE MORTGAGE-RELATED SECURITIES | | | | | | | | | | | | | | | 3,322,580 | |
| | | | | | | | | | | | | | | | |
FIXED RATE MORTGAGE-RELATED SECURITIES | | | 79.2% | | | | | | | | | | | | | |
15 Yr. Securities | | | 70.6% | | | | | | | | | | | | | |
Fannie Mae | | | | | | | | | | | | | | | | |
7.00% | | | | | | | 3/1/15 | | | | 40,386 | | | | 42,732 | |
7.00% | | | | | | | 3/1/15 | | | | 35,674 | | | | 37,746 | |
7.00% | | | | | | | 3/1/15 | | | | 73,338 | | | | 77,599 | |
7.50% | | | | | | | 11/1/15 | | | | 63,273 | | | | 67,982 | |
6.50% | | | | | | | 1/1/16 | | | | 56,218 | | | | 59,679 | |
6.00% | | | | | | | 6/1/16 | | | | 183,371 | | | | 198,241 | |
3.00%(a) | | | | | | | 10/14/16 | | | | 8,000,000 | | | | 8,192,504 | |
6.00% | | | | | | | 7/1/17 | | | | 213,231 | | | | 230,522 | |
6.00% | | | | | | | 7/1/17 | | | | 117,214 | | | | 126,720 | |
3.50%(b) | | | | | | | 7/1/21 | | | | 1,889,557 | | | | 1,980,945 | |
2.50% | | | | | | | 2/1/26 | | | | 720,771 | | | | 728,418 | |
3.00%(b) | | | | | | | 9/1/26 | | | | 5,917,748 | | | | 6,078,267 | |
Freddie Mac | | | | | | | | | | | | | | | | |
6.00% | | | | | | | 6/1/17 | | | | 233,702 | | | | 251,804 | |
| | | | | | | | | | | | | | | | |
| | | | | | | | | | | | | | | 18,073,159 | |
| | | | | | | | | | | | | | | | |
Collateralized Mortgage Obligations | | | 8.6% | | | | | | | | | | | | | |
Fannie Mae | | | | | | | | | | | | | | | | |
4.00%(b) | | | | | | | 10/25/32 | | | | 783,241 | | | | 816,361 | |
Government National Mortgage Association | | | | | | | | | | | | | | | | |
4.77% | | | | | | | 8/16/27 | | | | 622,604 | | | | 635,884 | |
4.50% | | | | | | | 11/20/36 | | | | 734,194 | | | | 746,946 | |
| | | | | | | | | | | | | | | | |
| | | | | | | | | | | | | | | 2,199,191 | |
| | | | | | | | | | | | | | | | |
TOTAL FIXED RATE MORTGAGE-RELATED SECURITIES | | | | | | | | | | | | | | | 20,272,350 | |
| | | | | | | | | | | | | | | | |
U.S. GOVERNMENT AGENCIES | | | 8.5% | | | | | | | | | | | | | |
FDIC Structured Sale Guaranteed Notes | | | | | | | | | | | | | | | | |
3.00%(c) | | | | | | | 9/30/19 | | | | 274,709 | | | | 276,242 | |
|
See notes to financial statements. | |
24
ASSET MANAGEMENT FUND
INTERMEDIATE MORTGAGE FUND (concluded)
SCHEDULE OF INVESTMENTS
October 31, 2011
| | | | | | | | | | | | | | | | |
| | | Percentage of Net Assets | | | Maturity
Date | | | Principal
Amount | | | Value | |
| | | | | | | | | | | | | | | | |
FDIC Trust | | | | | | | | | | | | | | | | |
2.18%(c) | | | | | | | 5/25/50 | | | $ | 1,914,446 | | | $ | 1,912,102 | |
| | | | | | | | | | | | | | | | |
TOTAL U.S. GOVERNMENT AGENCIES | | | | | | | | | | | | | | | 2,188,344 | |
| | | | | | | | | | | | | | | | |
| | | | | | | | | | | | | | | | | |
| | | Percentage of Net Assets | | | | | | Shares | | | Value | |
INVESTMENT COMPANIES | | | 0.0% | | | | | | | | | | | | | |
Northern Institutional Treasury Portfolio | | | | | | | | | | | 995 | | | $ | 995 | |
| | | | | | | | | | | | | | | | |
TOTAL INVESTMENT COMPANIES | | | | | | | | | | | | | | | 995 | |
| | | | | | | | | | | | | | | | |
| | | | | | | | | | | | | | | | | |
| | | Percentage of Net Assets | | | | | | Principal
Amount | | | Value | |
REPURCHASE AGREEMENTS | | | 31.1% | | | | | | | | | | | | | |
Bank of America, 0.09%, (Agreement dated 10/31/11 to be repurchased at $7,968,020 on 11/1/11. Collateralized by Adjustable Rate U.S. Government Mortgage-Backed Securities, 1.69%, with a value of $8,127,361, due at 8/20/61) | | | | | | | | | | $ | 7,968,000 | | | $ | 7,968,000 | |
| | | | | | | | | | | | | | | | |
TOTAL REPURCHASE AGREEMENTS | | | | | | | | | | | | | | | 7,968,000 | |
| | | | | | | | | | | | | | | | |
TOTAL INVESTMENTS
(Cost $33,376,279)(d) | | | 131.8% | | | | | | | | | | | | 33,752,269 | |
NET OTHER ASSETS (LIABILITIES) | | | (31.8)% | | | | | | | | | | | | (8,147,497 | ) |
| | | | | | | | | | | | | | | | |
NET ASSETS | | | 100.0% | | | | | | | | | | | $ | 25,604,772 | |
| | | | | | | | | | | | | | | | |
| | | | | | | | | | | | | | | | | |
| * | The rates presented are the rates in effect at October 31, 2011. |
| (a) | TBA and When-Issued Security. |
| (b) | Security held as collateral for When-Issued Security. |
| (c) | Securities purchased in a transaction exempt from registration under Rule 144A of the Securities Act of 1933. These securities may not be publicly sold without registration under the Securities Act of 1933. The value of these securities is determined by valuations supplied by a pricing service or brokers. |
| (d) | Represents cost for financial reporting purposes. |
FDIC Federal Deposit Insurance Corporation.
See notes to financial statements.
25
ASSET MANAGEMENT FUND
U.S. GOVERNMENT MORTGAGE FUND
SCHEDULE OF INVESTMENTS
October 31, 2011
| | | | | | | | | | | | | | | | |
| | | Percentage of Net Assets | | | Maturity
Date | | | Principal
Amount | | | Value | |
| | | | | | | | | | | | | | | | |
ADJUSTABLE RATE MORTGAGE-RELATED SECURITIES* | | | 35.0% | | | | | | | | | | | | | |
1 Yr. Constant Maturity Treasury Based ARMS | | | 22.0% | | | | | | | | | | | | | |
Fannie Mae | | | | | | | | | | | | | | | | |
2.65% | | | | | | | 7/1/37 | | | $ | 2,818,772 | | | $ | 2,982,236 | |
2.74% | | | | | | | 9/1/38 | | | | 1,938,937 | | | | 2,054,864 | |
| | | | | | | | | | | | | | | | |
| | | | | | | | | | | | | | | 5,037,100 | |
| | | | | | | | | | | | | | | | |
HYBRID ARMS | | | 3.5% | | | | | | | | | | | | | |
Freddie Mac | | | | | | | | | | | | | | | | |
5.65% | | | | | | | 11/1/36 | | | | 763,742 | | | | 798,727 | |
| | | | | | | | | | | | | | | | |
MONTHLY London Interbank Offering Rate (LIBOR) Collateralized Mortgage Obligations | | | 9.5% | | | | | | | | | | | | | |
Fannie Mae | | | | | | | | | | | | | | | | |
0.66% | | | | | | | 2/25/37 | | | | 2,171,146 | | | | 2,165,176 | |
| | | | | | | | | | | | | | | | |
TOTAL ADJUSTABLE RATE MORTGAGE-RELATED SECURITIES | | | | | | | | | | | | | | | 8,001,003 | |
| | | | | | | | | | | | | | | | |
FIXED RATE MORTGAGE-RELATED SECURITIES | | | 57.8% | | | | | | | | | | | | | |
15 Yr. Securities | | | 21.1% | | | | | | | | | | | | | |
Fannie Mae | | | | | | | | | | | | | | | | |
7.00% | | | | | | | 3/1/15 | | | | 49,070 | | | | 51,921 | |
3.50% | | | | | | | 7/1/21 | | | | 472,389 | | | | 495,236 | |
2.50% | | | | | | | 2/1/26 | | | | 720,771 | | | | 728,418 | |
3.00%(a) | | | | | | | 9/1/26 | | | | 2,958,874 | | | | 3,039,134 | |
3.00%(b) | | | | | | | 10/14/26 | | | | 500,000 | | | | 512,031 | |
| | | | | | | | | | | | | | | | |
| | | | | | | | | | | | | | | 4,826,740 | |
| | | | | | | | | | | | | | | | |
30 Yr. Securities | | | 3.5% | | | | | | | | | | | | | |
Fannie Mae | | | | | | | | | | | | | | | | |
5.00% | | | | | | | 3/1/38 | | | | 416,929 | | | | 448,150 | |
Government National Mortgage Association | | | | | | | | | | | | | | | | |
7.50% | | | | | | | 2/15/24 | | | | 77,645 | | | | 88,451 | |
7.00% | | | | | | | 4/15/27 | | | | 88,849 | | | | 101,095 | |
6.00% | | | | | | | 1/15/29 | | | | 137,609 | | | | 153,923 | |
| | | | | | | | | | | | | | | | |
| | | | | | | | | | | | | | | 791,619 | |
| | | | | | | | | | | | | | | | |
Collateralized Mortgage Obligations | | | 33.2% | | | | | | | | | | | | | |
Fannie Mae | | | | | | | | | | | | | | | | |
4.00% | | | | | | | 1/25/33 | | | | 83,185 | | | | 86,133 | |
5.50% | | | | | | | 12/25/36 | | | | 3,138,481 | | | | 3,593,253 | |
Freddie Mac | | | | | | | | | | | | | | | | |
4.50% | | | | | | | 4/15/19 | | | | 2,928,712 | | | | 3,147,865 | |
4.00% | | | | | | | 3/15/33 | | | | 134,121 | | | | 142,680 | |
|
See notes to financial statements. | |
26
ASSET MANAGEMENT FUND
U.S. GOVERNMENT MORTGAGE FUND (concluded)
SCHEDULE OF INVESTMENTS
October 31, 2011
| | | | | | | | | | | | | | | | |
| | | Percentage of Net Assets | | | Maturity
Date | | | Principal
Amount | | | Value | |
| | | | | | | | | | | | | | | | |
Government National Mortgage Association | | | | | | | | | | | | | | | | |
4.77% | | | | | | | 8/16/27 | | | $ | 622,603 | | | $ | 635,884 | |
| | | | | | | | | | | | | | | | |
| | | | | | | | | | | | | | | 7,605,815 | |
| | | | | | | | | | | | | | | | |
TOTAL FIXED RATE MORTGAGE-RELATED SECURITIES | | | | | | | | | | | | | | | 13,224,174 | |
| | | | | | | | | | | | | | | | |
U.S. GOVERNMENT AGENCIES | | | 4.5% | | | | | | | | | | | | | |
FDIC Structured Sale Guaranteed Note | | | | | | | | | | | | | | | | |
3.00%(c) | | | | | | | 9/30/19 | | | | 274,709 | | | | 276,242 | |
FDIC Trust | | | | | | | | | | | | | | | | |
2.18%(c) | | | | | | | 5/25/50 | | | | 765,778 | | | | 764,841 | |
| | | | | | | | | | | | | | | | |
TOTAL U.S. GOVERNMENT AGENCIES | | | | | | | | | | | | | | | 1,041,083 | |
| | | | | | | | | | | | | | | | |
| | | | | | | | | | | | | | | | | |
| | | Percentage of Net Assets | | | | | | Shares | | | Value | |
INVESTMENT COMPANIES | | | 0.0% | | | | | | | | | | | | | |
Northern Institutional Treasury Portfolio | | | | | | | | | | | 553 | | | $ | 553 | |
| | | | | | | | | | | | | | | | |
TOTAL INVESTMENT COMPANIES | | | | | | | | | | | | | | | 553 | |
| | | | | | | | | | | | | | | | |
| | | | | | | | | | | | | | | | | |
| | | Percentage of Net Assets | | | | | | Principal
Amount | | | Value | |
REPURCHASE AGREEMENTS | | | 4.7% | | | | | | | | | | | | | |
Bank of America, 0.09%, (Agreement dated 10/31/11 to be repurchased at $1,076,003 on 11/1/11. Collateralized by Adjustable and Fixed Rate U.S. Government Mortgage-Backed Securities, 1.69% - 4.65%, with a value of $1,097,520, due at 2/20/61 - 8/20/61) | | | | | | | | | | $ | 1,076,000 | | | $ | 1,076,000 | |
| | | | | | | | | | | | | | | | |
TOTAL REPURCHASE AGREEMENTS | | | | | | | | | | | | | | | 1,076,000 | |
| | | | | | | | | | | | | | | | |
TOTAL INVESTMENTS
(Cost $22,389,309)(d) | | | 102.0% | | | | | | | | | | | | 23,342,813 | |
NET OTHER ASSETS (LIABILITIES) | | | (2.0)% | | | | | | | | | | | | (467,382 | ) |
| | | | | | | | | | | | | | | | |
NET ASSETS | | | 100.0% | | | | | | | | | | | $ | 22,875,431 | |
| | | | | | | | | | | | | | | | |
| | | | | | | | | | | | | | | | | |
| * | The rates presented are the rates in effect at October 31, 2011. |
| (a) | Security held as collateral for When-Issued Security. |
| (b) | TBA and When-Issued Security. |
| (c) | Securities purchased in a transaction exempt from registration under Rule 144A of the Securities Act of 1933. These securities may not be publicly sold without registration under the Securities Act of 1933. The value of these securities is determined by valuations supplied by a pricing service or brokers. |
| (d) | Represents cost for financial reporting purposes. |
See notes to financial statements.
27
ASSET MANAGEMENT FUND
LARGE CAP EQUITY FUND
SCHEDULE OF INVESTMENTS
October 31, 2011
| | | | | | | | | | | | |
| | | Percentage of Net Assets | | | Shares | | | Value | |
| | | | | | | | | | | | |
COMMON STOCKS | | | 96.4% | | | | | | | | | |
Aerospace & Defense | | | 6.4% | | | | | | | | | |
General Dynamics Corp. | | | | | | | 32,000 | | | $ | 2,054,080 | |
United Technologies Corp. | | | | | | | 40,000 | | | | 3,119,200 | |
| | | | | | | | | | | | |
| | | | | | | | | | | 5,173,280 | |
| | | | | | | | | | | | |
Air Freight & Logistics | | | 3.1% | | | | | | | | | |
United Parcel Service, Inc. | | | | | | | 35,000 | | | | 2,458,400 | |
| | | | | | | | | | | | |
Beverages | | | 8.9% | | | | | | | | | |
Coca-Cola Co. | | | | | | | 52,000 | | | | 3,552,640 | |
PepsiCo, Inc. | | | | | | | 57,000 | | | | 3,588,150 | |
| | | | | | | | | | | | |
| | | | | | | | | | | 7,140,790 | |
| | | | | | | | | | | | |
Chemicals | | | 1.9% | | | | | | | | | |
Praxair, Inc. | | | | | | | 15,000 | | | | 1,525,050 | |
| | | | | | | | | | | | |
Commercial Banks | | | 4.0% | | | | | | | | | |
Wells Fargo & Co. | | | | | | | 125,000 | | | | 3,238,750 | |
| | | | | | | | | | | | |
Communications Equipment | | | 2.1% | | | | | | | | | |
Cisco Systems, Inc. | | | | | | | 90,000 | | | | 1,667,700 | |
| | | | | | | | | | | | |
Computers & Peripherals | | | 4.6% | | | | | | | | | |
International Business Machines Corp. | | | | | | | 20,000 | | | | 3,692,600 | |
| | | | | | | | | | | | |
Diversified Financial Services | | | 3.5% | | | | | | | | | |
American Express Co. | | | | | | | 55,000 | | | | 2,784,100 | |
| | | | | | | | | | | | |
Food & Staples Retailing | | | 6.2% | | | | | | | | | |
Sysco Corp. | | | | | | | 50,000 | | | | 1,386,000 | |
Wal-Mart Stores, Inc. | | | | | | | 64,000 | | | | 3,630,080 | |
| | | | | | | | | | | | |
| | | | | | | | | | | 5,016,080 | |
| | | | | | | | | | | | |
Food Products | | | 2.4% | | | | | | | | | |
General Mills, Inc. | | | | | | | 50,000 | | | | 1,926,500 | |
| | | | | | | | | | | | |
Health Care Equipment & Supplies | | | 5.5% | | | | | | | | | |
Becton, Dickinson & Co. | | | | | | | 30,000 | | | | 2,346,900 | |
Medtronic, Inc. | | | | | | | 60,000 | | | | 2,084,400 | |
| | | | | | | | | | | | |
| | | | | | | | | | | 4,431,300 | |
| | | | | | | | | | | | |
Hotels, Restaurants & Leisure | | | 4.6% | | | | | | | | | |
McDonald’s Corp. | | | | | | | 40,000 | | | | 3,714,000 | |
| | | | | | | | | | | | |
Household Products | | | 4.4% | | | | | | | | | |
Procter & Gamble | | | | | | | 55,000 | | | | 3,519,450 | |
| | | | | | | | | | | | |
| | | | | | | | | | | | | |
See notes to financial statements.
28
ASSET MANAGEMENT FUND
LARGE CAP EQUITY FUND (concluded)
SCHEDULE OF INVESTMENTS
October 31, 2011
| | | | | | | | | | | | |
| | | Percentage of Net Assets | | | Shares | | | Value | |
| | | | | | | | | | | | |
Industrial Conglomerates | | | 6.3% | | | | | | | | | |
3M Company | | | | | | | 32,000 | | | $ | 2,528,640 | |
General Electric Co. | | | | | | | 150,000 | | | | 2,506,500 | |
| | | | | | | | | | | | |
| | | | | | | | | | | 5,035,140 | |
| | | | | | | | | | | | |
Insurance | | | 4.4% | | | | | | | | | |
Berkshire Hathaway, Inc.(a) | | | | | | | 30 | | | | 3,508,500 | |
| | | | | | | | | | | | |
IT Services | | | 1.9% | | | | | | | | | |
Automatic Data Processing | | | | | | | 30,000 | | | | 1,569,900 | |
| | | | | | | | | | | | |
Oil & Gas Consumable Fuels | | | 8.3% | | | | | | | | | |
Chevron Corp. | | | | | | | 30,000 | | | | 3,151,500 | |
Exxon Mobil Corp. | | | | | | | 45,000 | | | | 3,514,050 | |
| | | | | | | | | | | | |
| | | | | | | | | | | 6,665,550 | |
| | | | | | | | | | | | |
Pharmaceuticals | | | 8.4% | | | | | | | | | |
Abbott Laboratories | | | | | | | 60,000 | | | | 3,232,200 | |
Johnson & Johnson | | | | | | | 55,000 | | | | 3,541,450 | |
| | | | | | | | | | | | |
| | | | | | | | | | | 6,773,650 | |
| | | | | | | | | | | | |
Software | | | 4.3% | | | | | | | | | |
Microsoft Corp. | | | | | | | 130,000 | | | | 3,461,900 | |
| | | | | | | | | | | | |
Specialty Retail | | | 5.2% | | | | | | | | | |
Home Depot | | | | | | | 50,000 | | | | 1,790,000 | |
TJX Companies | | | | | | | 40,000 | | | | 2,357,200 | |
| | | | | | | | | | | | |
| | | | | | | | | | | 4,147,200 | |
| | | | | | | | | | | | |
TOTAL COMMON STOCKS | | | | | | | | | | | 77,449,840 | |
| | | | | | | | | | | | |
INVESTMENT COMPANIES | | | 3.6% | | | | | | | | | |
Northern Institutional Treasury Portfolio | | | | | | | 2,889,435 | | | | 2,889,435 | |
| | | | | | | | | | | | |
TOTAL INVESTMENT COMPANIES | | | | | | | | | | | 2,889,435 | |
| | | | | | | | | | | | |
TOTAL INVESTMENTS
(Cost $58,585,147)(b) | | | 100.0% | | | | | | | | 80,339,275 | |
NET OTHER ASSETS (LIABILITIES) | | | 0.0% | | | | | | | | 5,406 | |
| | | | | | | | | | | | |
NET ASSETS | | | 100.0% | | | | | | | $ | 80,344,681 | |
| | | | | | | | | | | | |
| | | | | | | | | | | | | |
| (a) | Non-income producing security. |
| (b) | Represents cost for financial reporting purposes. |
See notes to financial statements.
29
ASSET MANAGEMENT FUND
STATEMENTS OF ASSETS & LIABILITIES
October 31, 2011
| | | | | | | | | | | | | | | | | | | | | | | | | | | | |
| | | Money Market Fund | | | Ultra
Short
Mortgage
Fund | | | Ultra
Short
Fund | | | Short
U.S.
Government
Fund | | | Intermediate
Mortgage
Fund | | | U.S.
Government
Mortgage
Fund | | | Large
Cap
Equity
Fund | |
Assets | | | | | | | | | | | | | | | | | | | | | | | | | | | | |
Investments, at cost | | $ | 19,650,615 | | | $ | 452,099,122 | | | $ | 6,994,333 | | | $ | 26,940,176 | | | $ | 33,376,279 | | | $ | 22,389,309 | | | $ | 58,585,147 | |
Investments, at value | | $ | 19,650,615 | | | $ | 459,876,599 | | | $ | 7,060,747 | | | $ | 27,339,659 | | | $ | 33,752,269 | | | $ | 23,342,813 | | | $ | 80,339,275 | |
Receivable for dividends and interest | | | 55 | | | | 1,298,245 | | | | 24,685 | | | | 74,371 | | | | 56,952 | | | | 63,671 | | | | 98,412 | |
Receivable for investments sold | | | — | | | | 634,600 | | | | 22,776 | | | | 24,470 | | | | — | | | | 39,858 | | | | 139,862 | |
Receivable for capital shares sold | | | 9,214 | | | | — | | | | — | | | | — | | | | — | | | | — | | | | 1,750 | |
Receivable from Adviser/
Distributor | | | 4,400 | | | | 112,673 | | | | 1,807 | | | | — | | | | 2,173 | | | | — | | | | 6,370 | |
| | | | | | | | | | | | | | | | | | | | | | | | | | | | |
Total Assets | | | 19,664,284 | | | | 461,922,117 | | | | 7,110,015 | | | | 27,438,500 | | | | 33,811,394 | | | | 23,446,342 | | | | 80,585,669 | |
Liabilities | | | | | | | | | | | | | | | | | | | | | | | | | | | | |
Income distribution payable | | $ | 61 | | | $ | 728,540 | | | $ | 8,802 | | | $ | 30,090 | | | $ | 31,781 | | | $ | 41,544 | | | $ | — | |
Investment advisory fees payable | | | 2,530 | | | | 169,011 | | | | 2,712 | | | | 5,249 | | | | 7,605 | | | | 4,864 | | | | 43,247 | |
Administration fees payable | | | 1,023 | | | | 41,157 | | | | 659 | | | | 2,305 | | | | 2,392 | | | | 2,137 | | | | 6,995 | |
Distribution fees payable | | | 2,531 | | | | 93,894 | | | | 1,506 | | | | 3,149 | | | | 3,259 | | | | 2,919 | | | | 15,924 | |
Securities purchased payable | | | — | | | | — | | | | — | | | | — | | | | — | | | | — | | | | 126,298 | |
When issued securities payable | | | — | | | | 19,867,250 | | | | — | | | | 2,648,967 | | | | 8,150,667 | | | | 509,417 | | | | — | |
Capital shares redeemed payable | | | — | | | | 4,349,978 | | | | — | | | | — | | | | — | | | | — | | | | 15,044 | |
Accrued expenses and other payable | | | 6,950 | | | | 187,700 | | | | 2,789 | | | | 10,460 | | | | 10,918 | | | | 10,030 | | | | 33,480 | |
| | | | | | | | | | | | | | | | | | | | | | | | | | | | |
Total Liabilities | | | 13,095 | | | | 25,437,530 | | | | 16,468 | | | | 2,700,220 | | | | 8,206,622 | | | | 570,911 | | | | 240,988 | |
| | | | | | | | | | | | | | | | | | | | | | | | | | | | |
Net Assets | | $ | 19,651,189 | | | $ | 436,484,587 | | | $ | 7,093,547 | | | $ | 24,738,280 | | | $ | 25,604,772 | | | $ | 22,875,431 | | | $ | 80,344,681 | |
| | | | | | | | | | | | | | | | | | | | | | | | | | | | |
Class I | | | | | | | | | | | | | | | | | | | | | | | | | | | | |
Net assets | | $ | 19,651,189 | | | $ | 436,484,587 | | | $ | 7,093,547 | | | $ | 24,738,280 | | | $ | 25,604,772 | | | $ | 22,875,431 | | | $ | — | |
Share of common stock outstanding | | | 19,665,460 | | | | 59,096,612 | | | | 1,393,470 | | | | 2,659,898 | | | | 5,737,203 | | | | 2,595,193 | | | | — | |
Net asset value per share | | $ | 1.00 | | | $ | 7.39 | | | $ | 5.09 | | | $ | 9.30 | | | $ | 4.46 | | | $ | 8.82 | | | $ | — | |
| | | | | | | | | | | | | | | | | | | | | | | | | | | | |
Class AMF | | | | | | | | | | | | | | | | | | | | | | | | | | | | |
Net assets | | $ | — | | | $ | — | | | $ | — | | | $ | — | | | $ | — | | | $ | — | | | $ | 76,904,863 | |
Share of common stock outstanding | | | — | | | | — | | | | — | | | | — | | | | — | | | | — | | | | 9,017,003 | |
Net asset value per share | | $ | — | | | $ | — | | | $ | — | | | $ | — | | | $ | — | | | $ | — | | | $ | 8.53 | |
| | | | | | | | | | | | | | | | | | | | | | | | | | | | |
Class H | | | | | | | | | | | | | | | | | | | | | | | | | | | | |
Net assets | | $ | — | | | $ | — | | | $ | — | | | $ | — | | | $ | — | | | $ | — | | | $ | 3,439,818 | |
Share of common stock outstanding | | | — | | | | — | | | | — | | | | — | | | | — | | | | — | | | | 403,334 | |
Net asset value per share | | $ | — | | | $ | — | | | $ | — | | | $ | — | | | $ | — | | | $ | — | | | $ | 8.53 | |
| | | | | | | | | | | | | | | | | | | | | | | | | | | | |
Net Assets | | | | | | | | | | | | | | | | | | | | | | | | | | | | |
Paid in capital | | $ | 19,652,003 | | | $ | 797,353,721 | | | $ | 36,882,840 | | | $ | 33,697,703 | | | $ | 80,356,128 | | | $ | 32,747,683 | | | $ | 56,793,610 | |
Accumulated net investment income (loss) | | | — | | | | 44,175 | | | | 3,601 | | | | 2,419 | | | | (50 | ) | | | 1,869 | | | | 50,190 | |
Accumulated net realized gains (losses) | | | (814 | ) | | | (368,690,786 | ) | | | (29,859,308 | ) | | | (9,361,325 | ) | | | (55,127,296 | ) | | | (10,827,625 | ) | | | 1,746,753 | |
Unrealized appreciation (depreciation) on investments | | | — | | | | 7,777,477 | | | | 66,414 | | | | 399,483 | | | | 375,990 | | | | 953,504 | | | | 21,754,128 | |
| | | | | | | | | | | | | | | | | | | | | | | | | | | | |
Net assets | | $ | 19,651,189 | | | $ | 436,484,587 | | | $ | 7,093,547 | | | $ | 24,738,280 | | | $ | 25,604,772 | | | $ | 22,875,431 | | | $ | 80,344,681 | |
| | | | | | | | | | | | | | | | | | | | | | | | | | | | |
| | | | | | | | | | | | | | | | | | | | | | | | | | | | | |
See notes to financial statements
30
ASSET MANAGEMENT FUND
STATEMENTS OF OPERATIONS
For the Year Ended October 31, 2011
| | | | | | | | | | | | | | | | | | | | | | | | | | | | |
| | | Money
Market
Fund | | | Ultra
Short
Mortgage
Fund | | | Ultra
Short
Fund | | | Short
U.S.
Government
Fund | | | Intermediate
Mortgage
Fund | | | U.S.
Government
Mortgage
Fund | | | Large
Cap
Equity
Fund | |
INVESTMENT INCOME: | | | | | | | | | | | | | | | | | | | | | | | | | | | | |
Interest income | | $ | 18,322 | | | $ | 11,957,016 | | | $ | 178,310 | | | $ | 608,735 | | | $ | 724,290 | | | $ | 623,410 | | | $ | — | |
Dividend income | | | — | | | | — | | | | — | | | | — | | | | — | | | | — | | | | 2,031,494 | |
| | | | | | | | | | | | | | | | | | | | | | | | | | | | |
Total investment income | | | 18,322 | | | | 11,957,016 | | | | 178,310 | | | | 608,735 | | | | 724,290 | | | | 623,410 | | | | 2,031,494 | |
| | | | | | | | | | | | | | | | | | | | | | | | | | | | |
Operating expenses: | | | | | | | | | | | | | | | | | | | | | | | | | | | | |
Investment advisory | | | 28,644 | | | | 2,264,507 | | | | 43,407 | | | | 62,284 | | | | 92,199 | | | | 56,785 | | | | 550,818 | |
Distribution — Class AMF Shares | | | — | | | | — | | | | — | | | | — | | | | — | | | | — | | | | 203,603 | |
Distribution — Class I Shares | | | 28,644 | | | | 1,258,053 | | | | 24,115 | | | | 37,371 | | | | 39,514 | | | | 34,071 | | | | — | |
Administration | | | 17,962 | | | | 494,276 | | | | 9,411 | | | | 24,885 | | | | 26,100 | | | | 22,753 | | | | 84,614 | |
Legal | | | 5,250 | | | | 120,597 | | | | 2,208 | | | | 7,628 | | | | 7,688 | | | | 7,366 | | | | 26,938 | |
Registration | | | 14,388 | | | | 20,924 | | | | 10,958 | | | | 11,845 | | | | 11,991 | | | | 10,907 | | | | 39,008 | |
Trustees | | | 3,622 | | | | 118,039 | | | | 2,286 | | | | 5,391 | | | | 5,748 | | | | 4,588 | | | | 16,618 | |
Other | | | 22,514 | | | | 618,031 | | | | 12,470 | | | | 31,845 | | | | 33,444 | | | | 28,666 | | | | 120,197 | |
| | | | | | | | | | | | | | | | | | | | | | | | | | | | |
Total expenses before fee reductions | | | 121,024 | | | | 4,894,427 | | | | 104,855 | | | | 181,249 | | | | 216,684 | | | | 165,136 | | | | 1,041,796 | |
| | | | | | | | | | | | | | | | | | | | | | | | | | | | |
Expenses reduced by Investment Adviser | | | (94,368 | ) | | | (1,006,454 | ) | | | (19,292 | ) | | | — | | | | (26,342 | ) | | | — | | | | — | |
Expenses reduced by Distributor | | | (19,096 | ) | | | (503,218 | ) | | | (9,646 | ) | | | — | | | | — | | | | — | | | | (81,440 | ) |
| | | | | | | | | | | | | | | | | | | | | | | | | | | | |
Net expenses | | | 7,560 | | | | 3,384,755 | | | | 75,917 | | | | 181,249 | | | | 190,342 | | | | 165,136 | | | | 960,356 | |
| | | | | | | | | | | | | | | | | | | | | | | | | | | | |
Net investment income | | | 10,762 | | | | 8,572,261 | | | | 102,393 | | | | 427,486 | | | | 533,948 | | | | 458,274 | | | | 1,071,138 | |
| | | | | | | | | | | | | | | | | | | | | | | | | | | | |
REALIZED AND UNREALIZED
GAINS (LOSSES) FROM
INVESTMENT ACTIVITIES: | | | | | | | | | | | | | | | | | | | | | | | | | | | | |
Realized gains (losses) from investment transactions | | | — | | | | 1,771,063 | | | | 15,342 | | | | 126,773 | | | | (254,091 | ) | | | (101,029 | ) | | | 4,779,643 | |
Change in unrealized appreciation (depreciation) on investments | | | — | | | | (6,774,077 | ) | | | (114,056 | ) | | | (445,991 | ) | | | (54,794 | ) | | | 41,502 | | | | 1,645,315 | |
| | | | | | | | | | | | | | | | | | | | | | | | | | | | |
Net realized and unrealized gains (losses) from investment activities | | | — | | | | (5,003,014 | ) | | | (98,714 | ) | | | (319,218 | ) | | | (308,885 | ) | | | (59,527 | ) | | | 6,424,958 | |
| | | | | | | | | | | | | | | | | | | | | | | | | | | | |
CHANGE IN NET ASSETS RESULTING
FROM OPERATIONS | | $ | 10,762 | | | $ | 3,569,247 | | | $ | 3,679 | | | $ | 108,268 | | | $ | 225,063 | | | $ | 398,747 | | | $ | 7,496,096 | |
| | | | | | | | | | | | | | | | | | | | | | | | | | | | |
| | | | | | | | | | | | | | | | | | | | | | | | | | | | | |
See notes to financial statements.
31
(This page intentionally left blank)
ASSET MANAGEMENT FUND
STATEMENTS OF CHANGES IN NET ASSETS
| | | | | | | | |
| | | Money Market Fund | |
| | | Year Ended
October 31, 2011 | | | Year Ended
October 31, 2010 | |
Increase (decrease) in net assets: | | | | | | | | |
Operations: | | | | | | | | |
Net investment income | | $ | 10,762 | | | $ | 18,930 | |
| | | | | | | | |
Change in net assets resulting from operations | | | 10,762 | | | | 18,930 | |
| | | | | | | | |
Dividends paid to stockholders: | | | | | | | | |
From net investment income: | | | | | | | | |
Class I Stockholders | | | (10,762 | ) | | | (18,837 | ) |
Class D Stockholders | | | — | | | | (93 | ) |
| | | | | | | | |
Total dividends paid to stockholders | | | (10,762 | ) | | | (18,930 | ) |
| | | | | | | | |
Capital Transactions: | | | | | | | | |
Class I Shares: | | | | | | | | |
Proceeds from sale of shares | | | 88,924,266 | | | | 111,342,638 | |
Value of shares issued to stockholders in reinvestment of dividends | | | 9,972 | | | | 17,242 | |
Cost of shares repurchased | | | (88,586,168 | ) | | | (113,398,431 | ) |
Class D Shares: | | | | | | | | |
Proceeds from sale of shares | | | — | | | | 547,890 | |
Value of shares issued to stockholders in reinvestment of dividends | | | — | | | | 89 | |
Cost of shares repurchased | | | — | | | | (1,549,226 | ) |
| | | | | | | | |
Change in net assets from capital transactions | | | 348,070 | | | | (3,039,798 | ) |
| | | | | | | | |
Change in net assets | | | 348,070 | | | | (3,039,798 | ) |
Net Assets: | | | | | | | | |
Beginning of year | | | 19,303,119 | | | | 22,342,917 | |
| | | | | | | | |
End of year | | $ | 19,651,189 | | | $ | 19,303,119 | |
| | | | | | | | |
Accumulated net investment income (losses) | | $ | — | | | $ | — | |
See notes to financial statements.
33
ASSET MANAGEMENT FUND
STATEMENTS OF CHANGES IN NET ASSETS (continued)
| | | | | | | | | | | | | | | | |
| | | Ultra Short Mortgage Fund | | | Ultra Short Fund | |
| | | Year Ended October 31, 2011 | | | Year Ended October 31, 2010 | | | Year Ended October 31, 2011 | | | Year Ended October 31, 2010 | |
Increase (decrease) in net assets: | | | | | | | | | | | | | | | | |
Operations: | | | | | | | | | | | | | | | | |
Net investment income | | $ | 8,572,261 | | | $ | 24,844,502 | | | $ | 102,393 | | | $ | 957,798 | |
Net realized gains (losses) from investment transactions | | | 1,771,063 | | | | (287,155,424 | ) | | | 15,342 | | | | (19,988,019 | ) |
Change in unrealized appreciation (depreciation) on investments | | | (6,774,077 | ) | | | 310,257,569 | | | | (114,056 | ) | | | 18,608,697 | |
| | | | | | | | | | | | | | | | |
Change in net assets resulting from operations | | | 3,569,247 | | | | 47,946,647 | | | | 3,679 | | | | (421,524 | ) |
| | | | | | | | | | | | | | | | |
Dividends paid to stockholders: | | | | | | | | | | | | | | | | |
From net investment income | | | (12,393,077 | ) | | | (28,484,326 | ) | | | (144,365 | ) | | | (1,077,269 | ) |
| | | | | | | | | | | | | | | | |
Total dividends paid to stockholders | | | (12,393,077 | ) | | | (28,484,326 | ) | | | (144,365 | ) | | | (1,077,269 | ) |
| | | | | | | | | | | | | | | | |
Capital Transactions: | | | | | | | | | | | | | | | | |
Proceeds from sale of shares | | | 17,090,829 | | | | — | | | | — | | | | — | |
Value of shares issued to stockholders in reinvestment of dividends | | | 1,099,895 | | | | 1,770,618 | | | | 9,720 | | | | 25,546 | |
Value of shares redeemed | | | (254,997,532 | ) | | | (230,862,089 | ) | | | (7,171,509 | ) | | | (5,245,409 | ) |
| | | | | | | | | | | | | | | | |
Change in net assets from capital transactions | | | (236,806,808 | ) | | | (229,091,471 | ) | | | (7,161,789 | ) | | | (5,219,863 | ) |
| | | | | | | | | | | | | | | | |
Change in net assets | | | (245,630,638 | ) | | | (209,629,150 | ) | | | (7,302,475 | ) | | | (6,718,656 | ) |
Net Assets: | | | | | | | | | | | | | | | | |
Beginning of year | | | 682,115,225 | | | | 891,744,375 | | | | 14,396,022 | | | | 21,114,678 | |
| | | | | | | | | | | | | | | | |
End of year | | $ | 436,484,587 | | | $ | 682,115,225 | | | $ | 7,093,547 | | | $ | 14,396,022 | |
| | | | | | | | | | | | | | | | |
Accumulated undistributed net investment income (losses) (distributions in excess of income) | | $ | 44,175 | | | $ | 51,568 | | | $ | 3,601 | | | $ | 2,779 | |
See notes to financial statements.
34
| | | | | | | | | | | | | | | | | | | | | | |
| Short U.S. Government Fund | | | Intermediate Mortgage Fund | | | U.S. Government Mortgage Fund | |
Year Ended
October 31, 2011 | | | Year Ended October 31, 2010 | | | Year Ended October 31, 2011 | | | Year Ended October 31, 2010 | | | Year Ended October 31, 2011 | | | Year Ended
October 31, 2010 | |
| | | | | | | | | | | | | | | | | | | | | | |
| | | | | | | | | | | | | | | | | | | | | | |
| $ | 427,486 | | | $ | 785,747 | | | $ | 533,948 | | | $ | 2,434,653 | | | $ | 458,274 | | | $ | 847,308 | |
|
126,773 |
| | | (5,085,539 | ) | | | (254,091 | ) | | | (38,832,643 | ) | | | (101,029 | ) | | | (4,836,822 | ) |
| | (445,991 | ) | |
|
4,926,020 |
| | | (54,794 | ) | | | 35,301,206 | | | | 41,502 | | | | 4,958,853 | |
| | | | | | | | | | | | | | | | | | | | | | |
| | 108,268 | | |
|
626,228 |
| | | 225,063 | | | | (1,096,784 | ) | | | 398,747 | | | | 969,339 | |
| | | | | | | | | | | | | | | | | | | | | | |
| | | | | | | | | | | | | | | | | | | | | | |
| | (505,687 | ) | | | (867,842 | ) | | | (638,976 | ) | | | (2,499,209 | ) | | | (558,229 | ) | | | (847,537 | ) |
| | | | | | | | | | | | | | | | | | | | | | |
| | (505,687 | ) | | | (867,842 | ) | | | (638,976 | ) | | | (2,499,209 | ) | | | (558,229 | ) | | | (847,537 | ) |
| | | | | | | | | | | | | | | | | | | | | | |
| | | | | | | | | | | | | | | | | | | | | | |
| | 12,026 | | | | 61,516 | | | | 10,000 | | | | — | | | | 10,000 | | | | — | |
|
45,437 |
| | | 76,817 | | | | 7,843 | | | | 59,680 | | | | 27,340 | | | | 43,648 | |
| | (928,218 | ) | | | (10,520,608 | ) | | | (3,586,621 | ) | | | (7,985,626 | ) | | | (25,167 | ) | | | (1,769,483 | ) |
| | | | | | | | | | | | | | | | | | | | | | |
| (870,755 | ) | | | (10,382,275 | ) | | | (3,568,778 | ) | | | (7,925,946 | ) | | | 12,173 | | | | (1,725,835 | ) |
| | | | | | | | | | | | | | | | | | | | | | |
| | (1,268,174 | ) | | | (10,623,889 | ) | | | (3,982,691 | ) | | | (11,521,939 | ) | | | (147,309 | ) | | | (1,604,033 | ) |
| | | | | | | | | | | | | | | | | | | | | | |
| | 26,006,454 | | | | 36,630,343 | | | | 29,587,463 | | | | 41,109,402 | | | | 23,022,740 | | | | 24,626,773 | |
| | | | | | | | | | | | | | | | | | | | | | |
| $ | 24,738,280 | | | $ | 26,006,454 | | | $ | 25,604,772 | | | $ | 29,587,463 | | | $ | 22,875,431 | | | $ | 23,022,740 | |
| | | | | | | | | | | | | | | | | | | | | | |
$ | 2,419 | | | $ | (14,312 | ) | | $ | (50 | ) | | $ | 7,233 | | | $ | 1,869 | | | $ | 1,843 | |
35
ASSET MANAGEMENT FUND
STATEMENTS OF CHANGES IN NET ASSETS (concluded)
| | | | | | | | |
| | | Large Cap Equity Fund | |
| | | Year Ended
October 31, 2011 | | | Year Ended
October 31, 2010 | |
Increase (decrease) in net assets: | | | | | | | | |
Operations: | | | | | | | | |
Net investment income | | $ | 1,071,138 | | | $ | 1,042,688 | |
Net realized gains from investment transactions | | | 4,779,643 | | | | 552,483 | |
Change in unrealized appreciation (depreciation) on investments | | | 1,645,315 | | | | 9,313,253 | |
| | | | | | | | |
Change in net assets resulting from operations | | | 7,496,096 | | | | 10,908,424 | |
| | | | | | | | |
Dividends paid to stockholders: | | | | | | | | |
From net investment income: | | | | | | | | |
Class AMF Stockholders | | | (997,347 | ) | | | (1,118,313 | ) |
Class H Stockholders | | | (46,516 | ) | | | (43,869 | ) |
| | | | | | | | |
Total dividends paid to stockholders | | | (1,043,863 | ) | | | (1,162,182 | ) |
| | | | | | | | |
Capital Transactions: | | | | | | | | |
Class AMF Shares: | | | | | | | | |
Proceeds from sale of shares | | | 1,378,284 | | | | 10,966,491 | |
Value of shares issued to stockholders in reinvestment of dividends | | | 711,408 | | | | 802,483 | |
Cost of shares repurchased | | | (19,790,834 | ) | | | (9,505,526 | ) |
Class H Shares: | | | | | | | | |
Proceeds from sale of shares | | | 438,432 | | | | 186,857 | |
Value of shares issued to stockholders in reinvestment of dividends | | | 46,516 | | | | 43,772 | |
Cost of shares repurchased | | | (197,091 | ) | | | (187,145 | ) |
| | | | | | | | |
Change in net assets from capital transactions | | | (17,413,285 | ) | | | 2,306,932 | |
| | | | | | | | |
Change in net assets | | | (10,961,052 | ) | | | 12,053,174 | |
Net Assets: | | | | | | | | |
Beginning of year | | | 91,305,733 | | | | 79,252,559 | |
| | | | | | | | |
End of year | | $ | 80,344,681 | | | $ | 91,305,733 | |
| | | | | | | | |
Accumulated net investment income | | $ | 50,190 | | | $ | 22,915 | |
See notes to financial statements.
36
ASSET MANAGEMENT FUND
MONEY MARKET FUND
FINANCIAL HIGHLIGHTS
Selected data for a share outstanding throughout the period indicated.
| | | | | | | | | | | | | | | | | | | | |
| | | Year Ended October 31, | |
| | | 2011 | | | 2010 | | | 2009 | | | 2008 | | | 2007 | |
Net asset value, beginning of year | | $ | 1.00 | | | $ | 1.00 | | | $ | 1.00 | | | $ | 1.00 | | | $ | 1.00 | |
| | | | | | | | | | | | | | | | | | | | |
Income from investment operations: | | | | | | | | | | | | | | | | | | | | |
Net investment income | | | 0.0006 | | | | 0.0009 | | | | 0.0009 | | | | 0.0250 | | | | 0.0512 | |
Net realized losses from investments | | | — | | | | — | | | | — | | | | — | | | | — | (a) |
| | | | | | | | | | | | | | | | | | | | |
Total from investment operations | | | 0.0006 | | | | 0.0009 | | | | 0.0009 | | | | 0.0250 | | | | 0.0512 | |
| | | | | | | | | | | | | | | | | | | | |
Less distributions: | | | | | | | | | | | | | | | | | | | | |
Dividends paid to stockholders: | | | | | | | | | | | | | | | | | | | | |
From net investment income | | | (0.0006 | ) | | | (0.0009 | ) | | | (0.0009 | ) | | | (0.0250 | ) | | | (0.0512 | ) |
| | | | | | | | | | | | | | | | | | | | |
Net asset value, end of year | | $ | 1.00 | | | $ | 1.00 | | | $ | 1.00 | | | $ | 1.00 | | | $ | 1.00 | |
| | | | | | | | | | | | | | | | | | | | |
Total return | | | 0.06% | | | | 0.09% | | | | 0.09% | | | | 2.53% | | | | 5.24% | |
Ratios/Supplemental data: | | | | | | | | | | | | | | | | | | | | |
Net assets, end of year (in 000’s) | | $ | 19,651 | | | $ | 19,303 | | | $ | 21,342 | | | $ | 32,568 | | | $ | 131,720 | |
Ratio of net expenses to average net assets | | | 0.04% | | | | 0.06% | | | | 0.16% | | | | 0.20% | | | | 0.14% | |
Ratio of net investment income to average net assets | | | 0.06% | | | | 0.09% | | | | 0.09% | | | | 2.82% | | | | 5.12% | |
Ratio of gross expenses to average net assets* | | | 0.63% | | | | 0.51% | | | | 0.61% | | | | 0.43% | | | | 0.40% | |
| * | | During the periods shown, certain fees were voluntarily reduced. If such voluntary fee reductions had not occurred, the ratios would have been as indicated. |
| (a) | | Net realized losses per share were less than $0.00005. |
See notes to financial statements.
37
ASSET MANAGEMENT FUND
ULTRA SHORT MORTGAGE FUND
FINANCIAL HIGHLIGHTS
Selected data for a share outstanding throughout the period indicated.
| | | | | | | | | | | | | | | | | | | | |
| | | Year Ended October 31, | |
| | | 2011 | | | 2010 | | | 2009 | | | 2008 | | | 2007 | |
Net asset value, beginning of year | | $ | 7.50 | | | $ | 7.33 | | | $ | 7.72 | | | $ | 9.62 | | | $ | 9.68 | |
| | | | | | | | | | | | | | | | | | | | |
Income from investment operations: | | | | | | | | | | | | | | | | | | | | |
Net investment income | | | 0.1166 | | | | 0.2054 | | | | 0.3058 | | | | 0.4290 | | | | 0.5107 | |
Net realized and unrealized gains (losses) from investments | | | (0.0457 | ) | | | 0.2082 | | | | (0.3855 | ) | | | (1.9116 | ) | | | (0.0686 | ) |
| | | | | | | | | | | | | | | | | | | | |
Total from investment operations | | | 0.0709 | | | | 0.4136 | | | | (0.0797 | ) | | | (1.4826 | ) | | | 0.4421 | |
| | | | | | | | | | | | | | | | | | | | |
Less distributions: | | | | | | | | | | | | | | | | | | | | |
Dividends paid to stockholders: | | | | | | | | | | | | | | | | | | | | |
From net investment income | | | (0.1809 | ) | | | (0.2436 | ) | | | (0.3109 | ) | | | (0.4174 | ) | | | (0.5021 | ) |
| | | | | | | | | | | | | | | | | | | | |
Change in net asset value | | | (0.1100 | ) | | | 0.1700 | | | | (0.3900 | ) | | | (1.9000 | ) | | | (0.0600 | ) |
| | | | | | | | | | | | | | | | | | | | |
Net asset value, end of year | | $ | 7.39 | | | $ | 7.50 | | | $ | 7.33 | | | $ | 7.72 | | | $ | 9.62 | |
| | | | | | | | | | | | | | | | | | | | |
Total return | | | 0.97% | | | | 5.75% | | | | (0.88)% | | | | (15.95)% | | | | 4.67% | |
Ratios/Supplemental data: | | | | | | | | | | | | | | | | | | | | |
Net assets, end of year (in 000’s) | | $ | 436,485 | | | $ | 682,115 | | | $ | 891,744 | | | $ | 1,044,580 | | | $ | 2,131,889 | |
Ratio of net expenses to average net assets | | | 0.67% | | | | 0.57% | | | | 0.60% | | | | 0.50% | | | | 0.46% | |
Ratio of net investment income to average net assets | | | 1.71% | | | | 2.88% | | | | 4.24% | | | | 4.71% | | | | 5.28% | |
Ratio of gross expenses to average net assets* | | | 0.97% | | | | 0.87% | | | | 0.90% | | | | 0.80% | | | | 0.76% | |
Portfolio turnover rate | | | 57% | | | | 74% | | | | 56% | | | | 35% | | | | 59% | |
| * | | During the periods shown, certain fees were voluntarily reduced. If such voluntary fee reductions had not occurred, the ratios would have been as indicated. |
See notes to financial statements.
38
ASSET MANAGEMENT FUND
ULTRA SHORT FUND
FINANCIAL HIGHLIGHTS
Selected data for a share outstanding throughout the period indicated.
| | | | | | | | | | | | | | | | | | | | |
| | | Year Ended October, 31 | |
| | | 2011 | | | 2010 | | | 2009 | | | 2008 | | | 2007 | |
Net asset value, beginning of year | | $ | 5.16 | | | $ | 5.59 | | | $ | 6.86 | | | $ | 9.61 | | | $ | 9.74 | |
| | | | | | | | | | | | | | | | | | | | |
Income from investment operations: | | | | | | | | | | | | | | | | | | | | |
Net investment income | | | 0.0458 | | | | 0.2737 | | | | 0.4179 | | | | 0.4667 | | | | 0.5137 | |
Net realized and unrealized gains (losses) from investments | | | (0.0409 | ) | | | (0.3939 | ) | | | (1.2717 | ) | | | (2.7462 | ) | | | (0.1249 | ) |
| | | | | | | | | | | | | | | | | | | | |
Total from investment operations | | | 0.0049 | | | | (0.1202 | ) | | | (0.8538 | ) | | | (2.2795 | ) | | | 0.3888 | |
| | | | | | | | | | | | | | | | | | | | |
Less distributions: | | | | | | | | | | | | | | | | | | | | |
Dividends paid to stockholders: | | | | | | | | | | | | | | | | | | | | |
From net investment income | | | (0.0749 | ) | | | (0.3098 | ) | | | (0.4162 | ) | | | (0.4705 | ) | | | (0.5188 | ) |
| | | | | | | | | | | | | | | | | | | | |
Change in net asset value | | | (0.0700 | ) | | | (0.4300 | ) | | | (1.2700 | ) | | | (2.7500 | ) | | | (0.1300 | ) |
| | | | | | | | | | | | | | | | | | | | |
Net asset value, end of year | | $ | 5.09 | | | $ | 5.16 | | | $ | 5.59 | | | $ | 6.86 | | | $ | 9.61 | |
| | | | | | | | | | | | | | | | | | | | |
Total return | | | 0.10% | | | | (2.25)% | | | | (12.45)% | | | | (24.99)% | | | | 4.07% | |
Ratios/Supplemental data: | | | | | | | | | | | | | | | | | | | | |
Net assets, end of year (in 000’s) | | $ | 7,094 | | | $ | 14,396 | | | $ | 21,115 | | | $ | 39,750 | | | $ | 195,161 | |
Ratio of net expenses to average net assets | | | 0.79% | | | | 0.63% | | | | 0.67% | | | | 0.54% | | | | 0.48% | |
Ratio of net investment income to average net assets | | | 1.06% | | | | 5.23% | | | | 7.07% | | | | 5.16% | | | | 5.29% | |
Ratio of gross expenses to average net assets* | | | 1.09% | | | | 0.93% | | | | 0.97% | | | | 0.84% | | | | 0.78% | |
Portfolio turnover rate | | | 83% | | | | 66% | | | | 10% | | | | 32% | | | | 36% | |
| * | | During the periods shown, certain fees were voluntarily reduced. If such voluntary fee reductions had not occurred, the ratios would have been as indicated. |
See notes to financial statements.
39
ASSET MANAGEMENT FUND
SHORT U.S. GOVERNMENT FUND
FINANCIAL HIGHLIGHTS
Selected data for a share outstanding throughout the period indicated.
| | | | | | | | | | | | | | | | | | | | |
| | | Year Ended October 31, | |
| | | 2011 | | | 2010 | | | 2009 | | | 2008 | | | 2007 | |
Net asset value, beginning of year | | $ | 9.45 | | | $ | 9.49 | | | $ | 9.28 | | | $ | 10.35 | | | $ | 10.37 | |
| | | | | | | | | | | | | | | | | | | | |
Income from investment operations: | | | | | | | | | | | | | | | | | | | | |
Net investment income | | | 0.1592 | | | | 0.2236 | | | | 0.3548 | | | | 0.4301 | | | | 0.5222 | |
Net realized and unrealized gains (losses) from investments | | | (0.1204 | ) | | | (0.0115 | ) | | | 0.2069 | | | | (1.0594 | ) | | | (0.0232 | ) |
| | | | | | | | | | | | | | | | | | | | |
Total from investment operations | | | 0.0388 | | | | 0.2121 | | | | 0.5617 | | | | (0.6293 | ) | | | 0.4990 | |
| | | | | | | | | | | | | | | | | | | | |
Less distributions: | | | | | | | | | | | | | | | | | | | | |
Dividends paid to stockholders: | | | | | | | | | | | | | | | | | | | | |
From net investment income | | | (0.1888 | ) | | | (0.2521 | ) | | | (0.3517 | ) | | | (0.4407 | ) | | | (0.5190 | ) |
| | | | | | | | | | | | | | | | | | | | |
Change in net asset value | | | (0.1500 | ) | | | (0.0400 | ) | | | 0.2100 | | | | (1.0700 | ) | | | (0.0200 | ) |
| | | | | | | | | | | | | | | | | | | | |
Net asset value, end of year | | $ | 9.30 | | | $ | 9.45 | | | $ | 9.49 | | | $ | 9.28 | | | $ | 10.35 | |
| | | | | | | | | | | | | | | | | | | | |
Total return | | | 0.43% | | | | 2.28% | | | | 6.17% | | | | (6.71)% | | | | 4.93% | |
Ratios/Supplemental data: | | | | | | | | | | | | | | | | | | | | |
Net assets, end of year (in 000’s) | | $ | 24,738 | | | $ | 26,006 | | | $ | 36,630 | | | $ | 60,534 | | | $ | 132,727 | |
Ratio of net expenses to average net assets | | | 0.73% | | | | 0.63% | | | | 0.59% | | | | 0.53% | | | | 0.48% | |
Ratio of net investment income to average net assets | | | 1.71% | | | | 2.44% | | | | 3.92% | | | | 4.33% | | | | 5.04% | |
Ratio of gross expenses to average net assets* | | | 0.73% | | | | 0.63% | | | | 0.62% | | | | 0.53% | | | | 0.48% | |
Portfolio turnover rate | | | 114% | | | | 44% | | | | 59% | | | | 58% | | | | 42% | |
| * | | During the periods shown, certain fees were voluntarily reduced. If such voluntary fee reductions had not occurred, the ratios would have been as indicated. |
See notes to financial statements.
40
ASSET MANAGEMENT FUND
INTERMEDIATE MORTGAGE FUND
FINANCIAL HIGHLIGHTS
Selected data for a share outstanding throughout the period indicated.
| | | | | | | | | | | | | | | | | | | | |
| | | Year Ended October 31, | |
| | | 2011 | | | 2010 | | | 2009 | | | 2008 | | | 2007 | |
Net asset value, beginning of year | | $ | 4.52 | | | $ | 5.00 | | | $ | 6.39 | | | $ | 9.12 | | | $ | 9.29 | |
| | | | | | | | | | | | | | | | | | | | |
Income from investment operations: | | | | | | | | | | | | | | | | | | | | |
Net investment income | | | 0.0895 | | | | 0.3162 | | | | 0.4028 | | | | 0.4504 | | | | 0.4810 | |
Net realized and unrealized gains (losses) from investments | | | (0.0418 | ) | | | (0.4711 | ) | | | (1.3925 | ) | | | (2.7388 | ) | | | (0.1774 | ) |
| | | | | | | | | | | | | | | | | | | | |
Total from investment operations | | | 0.0477 | | | | (0.1549 | ) | | | (0.9897 | ) | | | (2.2884 | ) | | | 0.3036 | |
| | | | | | | | | | | | | | | | | | | | |
Less distributions: | | | | | | | | | | | | | | | | | | | | |
Dividends paid to stockholders: | | | | | | | | | | | | | | | | | | | | |
From net investment income | | | (0.1077 | ) | | | (0.3251 | ) | | | (0.4003 | ) | | | (0.4416 | ) | | | (0.4736 | ) |
| | | | | | | | | | | | | | | | | | | | |
Change in net asset value | | | (0.0600 | ) | | | (0.4800 | ) | | | (1.3900 | ) | | | (2.7300 | ) | | | (0.1700 | ) |
| | | | | | | | | | | | | | | | | | | | |
Net asset value, end of year | | $ | 4.46 | | | $ | 4.52 | | | $ | 5.00 | | | $ | 6.39 | | | $ | 9.12 | |
| | | | | | | | | | | | | | | | | | | | |
Total return | | | 1.09% | | | | (3.27)% | | | | (15.65)% | | | | (25.94)% | | | | 3.31% | |
Ratios/Supplemental data: | | | | | | | | | | | | | | | | | | | | |
Net assets, end of year (in 000’s) | | $ | 25,605 | | | $ | 29,587 | | | $ | 41,109 | | | $ | 80,239 | | | $ | 230,076 | |
Ratio of net expenses to average net assets | | | 0.72% | | | | 0.57% | | | | 0.70% | | | | 0.51% | | | | 0.48% | |
Ratio of net investment income to average net assets | | | 2.03% | | | | 6.76% | | | | 7.41% | | | | 5.42% | | | | 5.19% | |
Ratio of gross expenses to average net assets* | | | 0.82% | | | | 0.67% | | | | 0.80% | | | | 0.61% | | | | 0.58% | |
Portfolio turnover rate | | | 174% | | | | 115% | | | | 32% | | | | 18% | | | | 39% | |
| * | | During the periods shown, certain fees were voluntarily reduced. If such voluntary fee reductions had not occurred, the ratios would have been as indicated. |
See notes to financial statements.
41
ASSET MANAGEMENT FUND
U.S. GOVERNMENT MORTGAGE FUND
FINANCIAL HIGHLIGHTS
Selected data for a share outstanding throughout the period indicated.
| | | | | | | | | | | | | | | | | | | | |
| | | Year Ended October 31, | |
| | | 2011 | | | 2010 | | | 2009 | | | 2008 | | | 2007 | |
Net asset value, beginning of year | | $ | 8.88 | | | $ | 8.82 | | | $ | 8.86 | | | $ | 10.13 | | | $ | 10.18 | |
| | | | | | | | | | | | | | | | | | | | |
Income from investment operations: | | | | | | | | | | | | | | | | | | | | |
Net investment income | | | 0.1767 | | | | 0.3169 | | | | 0.4225 | | | | 0.4898 | | | | 0.5287 | |
Net realized and unrealized gains (losses) on investments | | | (0.0215 | ) | | | 0.0603 | | | | (0.0399 | ) | | | (1.2772 | ) | | | (0.0631 | ) |
| | | | | | | | | | | | | | | | | | | | |
Total from investment operations | | | 0.1552 | | | | 0.3772 | | | | 0.3826 | | | | (0.7874 | ) | | | 0.4656 | |
| | | | | | | | | | | | | | | | | | | | |
Less distributions: | | | | | | | | | | | | | | | | | | | | |
Dividends paid to stockholders: | | | | | | | | | | | | | | | | | | | | |
From net investment income | | | (0.2152 | ) | | | (0.3172 | ) | | | (0.4226 | ) | | | (0.4826 | ) | | | (0.5156 | ) |
| | | | | | | | | | | | | | | | | | | | |
Change in net asset value | | | (0.0600 | ) | | | 0.0600 | | | | (0.0400 | ) | | | (1.2700 | ) | | | (0.0500 | ) |
| | | | | | | | | | | | | | | | | | | | |
Net asset value, end of year | | $ | 8.82 | | | $ | 8.88 | | | $ | 8.82 | | | $ | 8.86 | | | $ | 10.13 | |
| | | | | | | | | | | | | | | | | | | | |
Total return | | | 1.68% | | | | 4.37% | | | | 4.41% | | | | (8.11)% | | | | 4.69% | |
Ratios/Supplemental data: | | | | | | | | | | | | | | | | | | | | |
Net assets, end of year (in 000’s) | | $ | 22,875 | | | $ | 23,023 | | | $ | 24,627 | | | $ | 59,835 | | | $ | 131,070 | |
Ratio of net expenses to average net assets | | | 0.73% | | | | 0.60% | | | | 0.68% | | | | 0.52% | | | | 0.49% | |
Ratio of net investment income to average net assets | | | 2.01% | | | | 3.63% | | | | 4.83% | | | | 4.96% | | | | 5.20% | |
Portfolio turnover rate | | | 93% | | | | 104% | | | | 36% | | | | 28% | | | | 39% | |
See notes to financial statements.
42
ASSET MANAGEMENT FUND
LARGE CAP EQUITY FUND — CLASS AMF SHARES
FINANCIAL HIGHLIGHTS
Selected data for a share outstanding throughout the period indicated.
| | | | | | | | | | | | | | | | | | | | | | | | |
| | | Year Ended October 31, | | | Ten Months
Ended
October 31,
2007* | | | Year
Ended
December 31,
2006 | |
| | | 2011 | | | 2010 | | | 2009 | | | 2008 | | | |
Net asset value, beginning of period | | $ | 7.95 | | | $ | 7.11 | | | $ | 6.89 | | | $ | 10.47 | | | $ | 10.01 | | | $ | 9.77 | |
| | | | | | | | | | | | | | | | | | | | | | | | |
Income (Loss) from operations: | | | | | | | | | | | | | | | | | | | | | | | | |
Net investment income | | | 0.11 | | | | 0.09 | | | | 0.09 | | | | 0.09 | | | | 0.05 | | | | 0.01 | |
Net realized and unrealized gains (losses) from investments | | | 0.58 | | | | 0.85 | | | | 0.37 | | | | (2.57 | ) | | | 0.46 | | | | 1.35 | |
| | | | | | | | | | | | | | | | | | | | | | | | |
Total from investment operations | | | 0.69 | | | | 0.94 | | | | 0.46 | | | | (2.48 | ) | | | 0.51 | | | | 1.36 | |
| | | | | | | | | | | | | | | | | | | | | | | | |
Less distributions: | | | | | | | | | | | | | | | | | | | | | | | | |
Dividends paid to stockholders: | | | | | | | | | | | | | | | | | | | | | | | | |
From net investment income | | | (0.11 | ) | | | (0.10 | ) | | | (0.10 | ) | | | (0.12 | ) | | | (0.05 | ) | | | (0.02 | ) |
From net realized gains on investments | | | — | | | | — | | | | (0.14 | ) | | | (0.98 | ) | | | — | | | | (1.10 | ) |
Tax return of capital | | | — | | | | — | | | | — | | | | — | | | | — | | | | — | (a) |
| | | | | | | | | | | | | | | | | | | | | | | | |
Total distributions | | | (0.11 | ) | | | (0.10 | ) | | | (0.24 | ) | | | (1.10 | ) | | | (0.05 | ) | | | (1.12 | ) |
| | | | | | | | | | | | | | | | | | | | | | | | |
Change in net asset value | | | 0.58 | | | | 0.84 | | | | 0.22 | | | | (3.58 | ) | | | 0.46 | | | | 0.24 | |
| | | | | | | | | | | | | | | | | | | | | | | | |
Net asset value, end of period | | $ | 8.53 | | | $ | 7.95 | | | $ | 7.11 | | | $ | 6.89 | | | $ | 10.47 | | | $ | 10.01 | |
| | | | | | | | | | | | | | | | | | | | | | | | |
Total return | | | 8.66% | | | | 13.35% | | | | 7.16% | | | | (26.23)% | | | | 5.11% | (b) | | | 13.83% | |
Ratios/Supplemental data: | | | | | | | | | | | | | | | | | | | | | | | | |
Net assets, end of period (000’s) | | $ | 76,905 | | | $ | 88,368 | | | $ | 76,669 | | | $ | 39,428 | | | $ | 57,461 | | | $ | 66,161 | |
Ratio of net expenses to average net assets | | | 1.14% | | | | 1.04% | | | | 1.24% | | | | 0.97% | | | | 1.18% | (c) | | | 1.68% | |
Ratio of net investment income to average net assets | | | 1.25% | | | | 1.23% | | | | 1.39% | | | | 1.08% | | | | 0.60% | (c) | | | 0.09% | |
Ratio of gross expenses to average net assets** | | | 1.24% | | | | 1.15% | | | | 1.45% | | | | 1.07% | | | | 1.27% | (c) | | | — | |
Portfolio turnover rate | | | 7% | | | | 14% | | | | 14% | | | | 14% | | | | 13% | | | | 10% | |
| * | | In connection with the reorganization of the AMF Large Cap Equity Institutional Fund, Inc. (the Predecessor Fund) into the Large Cap Equity Fund on January 8, 2007, the Net Asset Value (NAV) of the Predecessor Fund changed to $10.00 per share. Shareholders received the number of shares of Large Cap Equity Fund equal in value to the number of shares held in the Predecessor Fund. The amounts presented prior to this date have been restated to reflect the change in NAV during the reorganization. |
| ** | | During the periods shown, certain fees were voluntarily reduced. If such voluntary fee reductions had not occurred, the ratios would have been as indicated. |
| (a) | | Distributions per share were less than $0.005. |
See notes to financial statements.
43
ASSET MANAGEMENT FUND
LARGE CAP EQUITY FUND — CLASS H SHARES
FINANCIAL HIGHLIGHTS
Selected data for a share outstanding throughout the period indicated.
| | | | | | | | | | | | |
| | | Year Ended
October 31, | | | Period
Ended
October 31,
2009(a) | |
| | | 2011 | | | 2010 | | |
Net asset value, beginning of period | | $ | 7.95 | | | $ | 7.11 | | | $ | 5.52 | |
| | | | | | | | | | | | |
Income (Loss) from operations: | | | | | | | | | | | | |
Net investment income | | | 0.12 | | | | 0.11 | | | | 0.07 | |
Net realized and unrealized gains (losses) from investments | | | 0.58 | | | | 0.85 | | | | 1.59 | |
| | | | | | | | | | | | |
Total from investment operations | | | 0.70 | | | | 0.96 | | | | 1.66 | |
| | | | | | | | | | | | |
Less distributions: | | | | | | | | | | | | |
Dividends paid to stockholders: | | | | | | | | | | | | |
From net investment income | | | (0.12 | ) | | | (0.12 | ) | | | (0.07 | ) |
| | | | | | | | | | | | |
Change in net asset value | | | 0.58 | | | | 0.84 | | | | 1.59 | |
| | | | | | | | | | | | |
Net asset value, end of period | | $ | 8.53 | | | $ | 7.95 | | | $ | 7.11 | |
| | | | | | | | | | | | |
Total return | | | 8.83% | | | | 13.59% | | | | 30.22% | (b) |
Ratios/Supplemental data: | | | | | | | | | | | | |
Net assets, end of period (000’s) | | $ | 3,440 | | | $ | 2,937 | | | $ | 2,584 | |
Ratio of net expenses to average net assets | | | 0.99% | | | | 0.85% | | | | 0.90% | (c) |
Ratio of net investment income to average net assets | | | 1.39% | | | | 1.41% | | | | 1.56% | (c) |
Ratio of gross expenses to average net assets* | | | 0.99% | | | | 0.90% | | | | 1.05% | (c) |
Portfolio turnover rate | | | 7% | | | | 14% | | | | 14% | (d) |
| * | | During the periods shown, certain fees were voluntarily reduced. If such voluntary fee reductions had not occurred, the ratios would have been as indicated. |
| (a) | | For the period February 20, 2009 (commencement of operations) through October 31, 2009. |
| (d) | | The portfolio turnover rate represents the full year period of November 1, 2008 through October 31, 2009. |
See notes to financial statements.
44
ASSET MANAGEMENT FUND
NOTES TO FINANCIAL STATEMENTS
OCTOBER 31, 2011
Asset Management Fund (the “Trust”) was reorganized as a Delaware statutory trust on September 30, 1999, and is registered under the Investment Company Act of 1940, as amended (the “1940 Act”), as a diversified open-end management company. As of October 31, 2011, the Trust is authorized to issue an unlimited number of shares in seven separate series: the Money Market Fund, the Ultra Short Mortgage Fund, the Ultra Short Fund, the Short U.S. Government Fund, the Intermediate Mortgage Fund, the U.S. Government Mortgage Fund and the Large Cap Equity Fund (referred to individually as a “Fund” and collectively as the “Funds”). Each of the Funds, except the Large Cap Equity Fund, offer a single class of shares. The Large Cap Equity Fund is authorized to sell two classes of shares: Class AMF Shares and Class H Shares. Class AMF and Class H Shares of the Large Cap Equity Fund have the same rights and obligations except: (i) Class AMF Shares bear a distribution fee, while Class H Shares do not have any distribution fee, which will cause Class AMF Shares to have a higher expense ratio and to pay lower dividends than those related to Class H Shares; (ii) other expenses, which are determined to properly apply to one class of shares upon approval by the Board of Trustees, will be borne solely by the class to which such expenses are attributable; and (iii) each class will have exclusive voting rights with respect to the matters relating to its own distribution arrangements.
Under the Trust’s organizational documents, its officers and trustees are indemnified against certain liabilities arising out of the performance of their duties to the Trust. In addition, in the normal course of business, the Trust enters into contracts with its vendors and others that provide general indemnification. Each Fund’s maximum exposure under these arrangements is unknown, as this would involve future claims that may be made against a Fund. The Trust maintains an insurance policy that insures its officers and trustees against certain liabilities.
A. Significant accounting policies are as follows:
SECURITY VALUATION
Money Market Fund:
Fund securities are valued under the amortized cost method as allowed by Rule 2a-7 under the 1940 Act, which approximates current market value. Under this method, securities are valued at cost when purchased and thereafter a constant accretion/amortization rate of any discount or premium is recorded until maturity of the security as long as the calculation approximates fair value. Open-end mutual fund investments are valued at their most recently calculated net asset value. The Fund seeks to maintain a net asset value per share (“NAV”) at $1.00.
Ultra Short Mortgage Fund, Ultra Short Fund, Short U.S. Government Fund, Intermediate Mortgage Fund and U.S. Government Mortgage Fund:
The Funds’ debt securities (except short-term debt instruments maturing within 60 days, which are valued at amortized cost which approximates fair value) are valued at market quotations or values obtained from independent pricing services approved by the Board of Trustees of the Trust (“Board”). Pricing services may use various techniques to value securities which take into account a variety of factors including yield, quality, coupon rate, maturity date, type of issue, trading characteristics and other data, including broker quotes. If a pricing service is unable to provide valuations for a particular security or securities, or the Adviser has determined that such valuations are unreliable, the Funds will fair value the security or securities pursuant to the Board approved fair valuation methodology of the Adviser.
Within the fair value pricing methodology used by the Adviser, among the more specific factors that are considered in determining the fair value of investments in debt instruments are: (1) information obtained with respect to market transactions in such securities or comparable securities; (2) the price and extent of public trading in similar securities of the issuer or comparable securities; (3) the fundamental analytical data relating to the investment;
45
ASSET MANAGEMENT FUND
NOTES TO FINANCIAL STATEMENTS (continued)
OCTOBER 31, 2011
(4) quotations from broker/dealers, yields, maturities, ratings and various relationships between securities; and (5) evaluation of the forces which influence the market in which these securities are purchased and sold. The fair valuation process also takes into consideration factors such as interest rate changes, movements in credit spreads, default rate assumptions, prepayment assumptions, type and quality of collateral, and security seasoning. Imprecision in estimating fair value can impact the amount of unrealized appreciation or depreciation recorded for a particular security, and differences in the assumptions used could result in a different determination of fair value, and those differences could be material.
Fair value pricing, including prices obtained from pricing services, is inherently a process of estimates and judgments. Fair value prices may fluctuate less than market prices due to technical issues which may impact the prices at which the Funds can purchase or sell securities. Market prices can be impacted by technical factors such as short term changes in market liquidity and volatility which may not directly impact fair value prices. There can be no assurance that a Fund could purchase or sell a portfolio of investments at the fair value price used to calculate the Fund’s NAV. In addition, changes in the value of portfolio investments priced at fair value may be less frequent and of greater magnitude than changes in the price of securities that trade frequently in the marketplace, resulting in potentially greater NAV volatility.
While the Trust’s policy is intended to result in a calculation of a Fund’s NAV that fairly reflects security values at the time of pricing, the Trust cannot ensure that fair value prices would accurately reflect the price that a Fund could obtain for a security if it were to dispose of that security, particularly in a forced or distressed sale.
Open-end mutual fund investments are valued at their most recently calculated net asset value. Short-term instruments of sufficient credit quality
maturing within 60 days of the valuation date will be valued at amortized cost, which approximates market value.
Large Cap Equity Fund:
Securities traded on the NASDAQ National Market System are valued at the official closing price as reported by NASDAQ. Securities traded on national exchanges are valued at the last reported sale price on the exchange where the security is principally traded. In the case of over-the-counter securities, securities are valued at the mean between closing bid and asked prices as of the close of regular trading on the New York Stock Exchange (normally 4:00 PM Eastern time). Open-end mutual fund investments are valued at their most recently calculated net asset value. Short-term instruments of sufficient credit quality maturing within 60 days of the valuation date are valued at amortized cost, which approximates market value. Securities for which (i) quotations are not readily available, or (ii) are determined by the Adviser not to reflect their fair market value are valued at fair value as determined in good faith by the Valuation Committee under the direction of the Board.
The Funds use a three tier fair value hierarchy that is dependent upon the various “inputs” used to determine the value of the Funds’ investments. These inputs are summarized in the three broad levels listed below:
| | • | | Level 1 — quoted prices in active markets for identical assets |
| | • | | Level 2 — other significant inputs (including quoted prices of similar securities, interest rates, prepayment speeds, credit risk, etc.) |
| | • | | Level 3 — significant unobservable inputs (including the Fund’s own assumptions in determining the fair value of investments.) |
The inputs or methodology used for valuing securities are not necessarily an indication of the risk associated with investing in those securities. For example, short-term debt securities of sufficient credit quality
46
ASSET MANAGEMENT FUND
NOTES TO FINANCIAL STATEMENTS (continued)
OCTOBER 31, 2011
maturing within 60 days are valued using amortized cost, in accordance with rules under the 1940 Act. Generally, amortized cost approximates the current
fair value of a security, but since this valuation is not obtained from a quoted price in an active market, such securities are reflected as Level 2.
The following is a summary of the inputs used to value the Funds’ investments as of October 31, 2011:
| | | | | | | | | | | | | | | | |
| Portfolio | | Level 1 -
Quoted
Prices | | | Level 2 -
Other Significant
Observable Inputs | | | Level 3 -
Significant
Unobservable Inputs | | | Total | |
Money Market Fund | | | | | | | | | | | | | | | | |
Repurchase Agreements | | $ | — | | | $ | 19,650,000 | | | $ | — | | | $ | 19,650,000 | |
Investment Companies | | | 615 | | | | — | | | | — | | | | 615 | |
| | | | | | | | | | | | | | | | |
Total Investments | | | | | | | | | | | | | | | 19,650,615 | |
Ultra Short Mortgage Fund | | | | | | | | | | | | | | | | |
U.S. Government Agency Mortgages | | | — | | | | 404,752,123 | | | | — | | | | 404,752,123 | |
U.S. Government Agencies | | | — | | | | 13,489,932 | | | | — | | | | 13,489,932 | |
Repurchase Agreements | | | — | | | | 41,634,000 | | | | — | | | | 41,634,000 | |
Investment Companies | | | 544 | | | | — | | | | — | | | | 544 | |
| | | | | | | | | | | | | | | | |
Total Investments | | | | | | | | | | | | | | | 459,876,599 | |
Ultra Short Fund | | | | | | | | | | | | | | | | |
U.S. Government Agency Mortgages | | | — | | | | 6,765,009 | | | | — | | | | 6,765,009 | |
Investment Companies | | | 295,738 | | | | — | | | | — | | | | 295,738 | |
| | | | | | | | | | | | | | | | |
Total Investments | | | | | | | | | | | | | | | 7,060,747 | |
Short U.S. Government Fund | | | | | | | | | | | | | | | | |
U.S. Government Agency Mortgages | | | — | | | | 23,850,257 | | | | — | | | | 23,850,257 | |
U.S. Government Agencies | | | | | | | 496,865 | | | | — | | | | 496,865 | |
Repurchase Agreements | | | | | | | 2,992,000 | | | | | | | | 2,992,000 | |
Investment Companies | | | 537 | | | | — | | | | — | | | | 537 | |
| | | | | | | | | | | | | | | | |
Total Investments | | | | | | | | | | | | | | | 27,339,659 | |
Intermediate Mortgage Fund | | | | | | | | | | | | | | | | |
U.S. Government Agency Mortgages | | | — | | | | 23,594,930 | | | | — | | | | 23,594,930 | |
U.S. Government Agencies | | | — | | | | 2,188,344 | | | | — | | | | 2,188,344 | |
Repurchase Agreements | | | — | | | | 7,968,000 | | | | — | | | | 7,968,000 | |
Investment Companies | | | 995 | | | | — | | | | — | | | | 995 | |
| | | | | | | | | | | | | | | | |
Total Investments | | | | | | | | | | | | | | | 33,752,269 | |
U.S. Government Mortgage Fund | | | | | | | | | | | | | | | | |
U.S. Government Agency Mortgages | | | — | | | | 21,225,177 | | | | — | | | | 21,225,177 | |
U.S. Government Agencies | | | — | | | | 1,041,083 | | | | — | | | | 1,041,083 | |
Repurchase Agreements | | | | | | | 1,076,000 | | | | | | | | 1,076,000 | |
Investment Companies | | | 553 | | | | — | | | | — | | | | 553 | |
| | | | | | | | | | | | | | | | |
Total Investments | | | | | | | | | | | | | | | 23,342,813 | |
Large Cap Equity Fund | | | | | | | | | | | | | | | | |
Common Stocks | | | 77,449,840 | | | | — | | | | — | | | | 77,449,840 | |
Investment Companies | | | 2,889,435 | | | | — | | | | — | | | | 2,889,435 | |
| | | | | | | | | | | | | | | | |
Total Investments | | | | | | | | | | | | | | $ | 80,339,275 | |
47
ASSET MANAGEMENT FUND
NOTES TO FINANCIAL STATEMENTS (continued)
OCTOBER 31, 2011
As of October 31, 2011, there were no level 3 securities held by the Funds.
The Trust’s policy is to disclose significant transfers between levels based on valuations at the end of the reporting period. There were no significant transfers between Level 1 or 2 as of October 31, 2011, based on levels assigned to securities on October 31, 2010.
LIQUIDITY AND VALUATION OF CERTAIN SECURITIES
While liquidity for government securities remains quite strong, the involvement of the federal government in the mortgage and real estate markets continues to create uncertainty for investors by reducing market liquidity. Additionally, changes in the securitization process, and changes in the mandate of the government sponsored mortgage entities (GNMA, FHLMC, and FNMA, or the “GSEs”) could impact the Fund’s future performance. For example, the federal government continues to evaluate novel strategies for modifying loan principal balances for many classes of residential mortgage-backed securities, and these strategies could negatively impact the valuation of certain holdings of the Funds. Weaker than expected economic growth or further increases in unemployment could result in an increase in loan delinquencies and home foreclosures and reduce home prices. This may also lead to accelerated loan buyouts by the GSEs, which could negatively impact fund performance. In general, these shifts in government housing and mortgage policy, particularly if they are unanticipated, could reduce market liquidity which would likely lead to lower prices for the securities held by the Funds. Illiquid securities generally are those that cannot be sold or disposed of in an orderly fashion within seven calendar days at approximately the price at which they are valued. Because the market price of illiquid securities generally is more difficult to estimate than that of more liquid securities, illiquid securities may be sold at prices that differ from the value assigned to them. This illiquidity of portfolio securities may
result in the Funds incurring greater losses on the sale of some portfolio securities than under more stable market conditions. Such losses could adversely impact a Fund’s net asset value.
REPURCHASE AGREEMENTS
Obligations of the U.S. Government or other obligations that are not subject to any investment limitation on the part of national banks may be purchased from government securities dealers or the custodian bank, subject to the seller’s agreement to repurchase them at an agreed upon date and price. The value of collateral underlying the repurchase agreement will always be at least equal to the repurchase price, including any accrued interest earned on the repurchase agreement. If the counterparty defaults, and the fair value of the collateral declines, realization of the collateral by Funds may be delayed or limited.
SECURITIES PURCHASED ON A WHEN-ISSUED OR DELAYED-DELIVERY BASIS
Each Fund, except the Money Market Fund, may purchase securities on a when-issued or delayed-delivery basis. In when-issued transactions, securities are bought or sold during the period between the announcement of an offering and the issuance and payment date of the securities. When securities are purchased on a delayed-delivery basis, the price of the securities is fixed at the time the commitment to purchase is made, but settlement may take place at a future date. By the time of delivery, securities purchased on a when-issued or delayed-delivery basis may be valued at less than the purchase price. At the time when-issued or delayed-delivery securities are purchased, the Fund must set aside funds in a segregated account to pay for the purchase, and until acquisition, the Fund will not earn any income on the securities that it purchased.
DIVIDENDS TO SHAREHOLDERS
Money Market Fund, Ultra Short Mortgage Fund, Ultra Short Fund, Short U.S. Government Fund,
48
ASSET MANAGEMENT FUND
NOTES TO FINANCIAL STATEMENTS (continued)
OCTOBER 31, 2011
Intermediate Mortgage Fund and U.S. Government Mortgage Fund:
Dividends from net investment income are declared daily and paid monthly. Net short-term and long-term capital gains, if any, are declared and paid annually.
Large Cap Equity Fund:
Dividends from net investment income are declared and paid at least quarterly. Net short-term and long-term capital gains, if any, are declared and paid annually.
For all Funds, distributions from net investment income and from net realized capital gains are determined in accordance with Federal income tax regulations, which may differ from accounting principles generally accepted in the United States of America. These “book/tax” differences are either considered temporary or permanent in nature. To the extent these differences are permanent in nature (e.g. reclass of dividend distribution and return of capital), such amounts are reclassified within the composition of net assets based on their federal tax-basis treatment; temporary differences do not require reclassification. Distributions to shareholders that exceed net investment income and net realized capital gains for tax purposes are reported as distributions of capital.
FEDERAL TAXES
No provision is made for Federal income taxes as it is the policy of each Fund to continue to qualify as a regulated investment company by complying with the provisions available to certain investment companies, as defined in applicable sections of the Internal Revenue Code, and to make distributions of net investment income and net realized capital gains sufficient to relieve it from all, or substantially all, federal income taxes.
For all open tax years and all major taxing jurisdictions, management of the Funds has concluded that there are no significant uncertain tax positions that would require recognition in the financial statements. Open tax years are those that are open for examination by taxing authorities (i.e., generally the
last four tax year ends and the interim tax period since then). Furthermore, management of the Funds is also not aware of any tax positions for which it is reasonably possible that the total amounts of unrecognized tax benefits will significantly change in the next twelve months.
MANAGEMENT ESTIMATES
The preparation of financial statements in conformity with accounting principles generally accepted in the United States of America requires management to make estimates and assumptions that affect the reported amounts of assets and liabilities at the date of the financial statements and the reported amounts of revenues and expenses during the reporting period. Actual results could differ from these estimates.
OTHER
Investment transactions are accounted for no later than one business day after the trade date. However, for financial reporting purposes, investment transactions are reported on the trade date. Interest income is recorded on the accrual basis, amortization and accretion is recognized based on the anticipated effective maturity date, and the cost of investments sold is determined by use of the specific identification method for both financial reporting and income tax purposes. Paydown gains and losses on mortgage- and asset-backed securities are recorded as adjustments to interest income in the Statement of Operations.
B. Fees and transactions with affiliates were as follows:
Shay Assets Management, Inc. “SAMI” serves the Trust as investment adviser (the “Adviser”). Robert Schweitzer is the current President of SAMI. The Adviser is a wholly-owned subsidiary of Shay Investment Services, Inc. “SISI”. SISI is controlled by Rodger D. Shay, Chairman of the Board and Rodger D. Shay, Jr., a member of the Board and President of Shay Financial Services, Inc. “SFSI”, also a wholly-owned subsidiary of SISI.
49
ASSET MANAGEMENT FUND
NOTES TO FINANCIAL STATEMENTS (continued)
OCTOBER 31, 2011
As compensation for investment advisory services, the Funds pay an investment advisory fee monthly based upon an annual percentage of the average daily net assets of each Fund as follows:
The investment advisory fee rate for the Money Market Fund is 0.15% of the first $500 million, 0.125% of the next $500 million, and 0.10% of net assets in excess of $1 billion. The Adviser voluntarily waived a portion of its fee so that the Fund paid 0.05% of average daily net assets for the period ended October 31, 2011. The Adviser also voluntarily reimbursed expenses of $75,272 during the period ended October 31, 2011.
The investment advisory fee rate for the Ultra Short Mortgage Fund is 0.45% of the first $3 billion, 0.35% of the next $2 billion, and 0.25% of net assets in excess of $5 billion. The Adviser voluntarily waived a portion of its fee so that the Fund paid 0.25% of average daily net assets for the period ended October 31, 2011.
The investment advisory fee rate for the Ultra Short Fund is 0.45% of the average daily net assets. The Adviser voluntarily waived a portion of its fee so that the Fund paid 0.25% of average daily net assets for the period ended October 31, 2011.
The investment advisory fee rate for each of the Short U.S. Government Fund and the U.S. Government Mortgage Fund, computed separately, is 0.25% of the first $500 million, 0.175% of the next $500 million, 0.125% of the next $500 million, and 0.10% of net assets in excess of $1.5 billion.
The investment advisory fee rate for the Intermediate Mortgage Fund is 0.35% of the first $500 million, 0.275% of the next $500 million, 0.20% of the next $500 million, and 0.10% of net assets in excess of $1.5 billion. The Adviser voluntarily waived a portion of its fee so that the Fund paid 0.25% of average daily net assets for the period ended October 31, 2011.
The investment advisory fee rate for the Large Cap Equity Fund is 0.65% of the first $250 million and 0.55% for assets over $250 million.
The Adviser has contractually agreed to reduce its advisory fees charged to the Money Market Fund, the Short U.S. Government Fund, the Intermediate Mortgage Fund and the U.S. Government Mortgage Fund, to the extent that the daily ratio of operating expenses to average daily net assets of each Fund exceeds 0.75% through February 29, 2012.
Amounts of advisory fees contractually or voluntarily waived for the Funds during the fiscal period ended October 31, 2011 are not subject to recoupment.
SFSI serves the Trust as distributor (the “Distributor”). The Distributor is a wholly-owned subsidiary of SISI, which is controlled by Rodger D. Shay, Chairman of the Board and Rodger D. Shay, Jr., a member of the Board of and the President of SFSI.
As compensation for distribution services, the Trust pays the Distributor a distribution fee monthly in accordance with the distribution plan adopted by the Trust, pursuant to Rule 12b-1 under the 1940 Act, based upon an annual percentage of the average daily net assets of each Fund as follows:
The distribution fee rate for each of the Money Market Fund and the Short U.S. Government Fund is based upon an annual percentage of the combined average daily net assets of both funds and is as follows: 0.15% of the first $500 million, 0.125% of the next $500 million, 0.10% of the next $1 billion, and 0.075% of combined net assets in excess of $2 billion. The fee is allocated between the two Funds based on their relative average net assets. The Distributor voluntarily waived a portion of its 12b-1 fee so that the Money Market Fund paid 0.05% of average daily net assets for the period ended October 31, 2011.
The distribution fee rate for each of the Ultra Short Mortgage Fund and the Ultra Short Fund, computed separately, is 0.25% of average daily net assets. The Distributor voluntarily waived a portion of its fee so that the Ultra Short Mortgage Fund and the Ultra Short Fund paid an amount equal to 0.15% of average daily net assets for the period ended October 31, 2011.
50
ASSET MANAGEMENT FUND
NOTES TO FINANCIAL STATEMENTS (continued)
OCTOBER 31, 2011
The distribution fee rate for each of the Intermediate Mortgage Fund and the U.S. Government Mortgage Fund, computed separately, is as follows: 0.15% of the first $500 million, 0.125% of the next $500 million, 0.10% of the next $500 million, and 0.075% of net assets in excess of $1.5 billion.
The distribution fee rate for the Large Cap Equity Fund Class AMF Shares is 0.25% of average daily net assets. The Distributor waived a portion of its fee so that the Large Cap Equity Fund Class AMF Shares paid an amount equal to 0.15% of average daily net assets for the period ended October 31, 2011. The Large Cap Equity Fund Class H Shares does not have a distribution fee.
The Northern Trust Company (“Northern Trust”) and the Trust have entered into a Custody Agreement, Fund Administration and Accounting Services Agreement, and Transfer Agency Service Agreement (collectively the “Services Agreements”). As compensation for its services under the Service Agreements, the Trust has agreed to pay Northern Trust an annual fee of $680,000 for the aggregate services.
The Trust has entered into a Compliance Services Agreement with Beacon Hill Fund Services, Inc. (“Beacon Hill”). Pursuant to the terms of the Compliance Services Agreement, Beacon Hill makes available an individual to serve as the Trust’s chief compliance officer. The chief compliance officer is responsible for administering the Trust’s compliance policies and procedures and, at least annually reviewing, the compliance policies and procedures of the Trust and the Trust’s service providers in accordance with Rule 38a-1 under the 1940 Act. As compensation
for the services to each Fund rendered by Beacon Hill under the Compliance Services Agreement, the Trust pays Beacon Hill an annual fee of $115,000, plus reasonable out-of-pocket expenses.
The Trust has entered into a Financial Services Agreement with Beacon Hill. Pursuant to the terms of the Financial Services Agreement, Beacon Hill makes available an individual to serve as the Trust’s chief financial officer. The chief financial officer is responsible for administering the Trust’s accounting policies and procedures. As compensation for the services to each Fund rendered by Beacon Hill under the Financial Services Agreement, the Trust has agreed to pay Beacon Hill an annual fee of $90,000 plus reasonable out-of-pocket expenses.
The Trust has entered into an agreement with Beacon Hill to provide governance and regulatory oversight services to the Trust. Under the terms of this agreement, Beacon Hill performs and coordinates fund governance and regulatory oversight activities of the Trust, including but not limited to, monitoring activities of its third party service providers, coordinating and filing amendments to the Trust’s registration statement and financial filings, preparing and distributing material for board meetings and maintaining all books and records as required by the federal securities laws. As compensation for its services under the agreement, the Trust pays Beacon Hill a fee at an annual rate of 0.02% of the average daily assets of the Trust for the first $1 billion and 0.015% of the average daily assets for assets in excess of $1 billion, with a minimum annual fee of $150,000 plus reasonable out-of-pocket expenses.
51
ASSET MANAGEMENT FUND
NOTES TO FINANCIAL STATEMENTS (continued)
OCTOBER 31, 2011
C. Transactions in shares of the Funds for the years ended October 31, 2011 and year ended October 31, 2010 were as follows:
| | | | | | | | |
| | | Money Market Fund | |
| | | Year Ended
October 31, 2011 | | | Year Ended
October 31, 2010 | |
Share transactions Class I: | | | | | | | | |
Sale of shares | | | 88,924,266 | | | | 111,344,959 | |
Shares issued to stockholders in reinvestment of dividends | | | 9,971 | | | | 17,242 | |
Shares repurchased | | | (88,586,168 | ) | | | (113,398,431 | ) |
| | | | | | | | |
Net increase (decrease) | | | 348,069 | | | | (2,036,230 | ) |
Shares Outstanding | | | | | | | | |
Beginning of year | | | 19,317,391 | | | | 21,353,621 | |
| | | | | | | | |
End of year | | | 19,665,460 | | | | 19,317,391 | |
| | | | | | | | |
Share transactions Class D: | | | | | | | | |
Sale of shares | | | — | | | | 547,890 | |
Shares issued to stockholders in reinvestment of dividends | | | — | | | | 89 | |
Shares repurchased | | | — | | | | (1,549,226 | ) |
| | | | | | | | |
Net (decrease) | | | — | | | | (1,001,247 | ) |
Shares Outstanding | | | | | | | | |
Beginning of year | | | — | | | | 1,001,247 | |
| | | | | | | | |
End of year | | | — | | | | — | |
| | | | | | | | |
| | | | | | | | | |
| | | | | | | | | | | | | | | | |
| | | Ultra Short Mortgage Fund | | | Ultra Short Fund | |
| | | Year Ended
October 31, 2011 | | | Year Ended
October 31, 2010 | | | Year Ended
October 31, 2011 | | | Year Ended
October 31, 2010 | |
Share transactions: | | | | | | | | | | | | | | | | |
Sale of shares | | | 2,306,828 | | | | — | | | | — | | | | — | |
Shares issued to stockholders in reinvestment of dividends | | | 148,245 | | | | 239,831 | | | | 1,900 | | | | 4,746 | |
Shares repurchased | | | (34,330,753 | ) | | | (30,928,375 | ) | | | (1,400,915 | ) | | | (988,643 | ) |
| | | | | | | | | | | | | | | | |
Net increase (decrease) | | | (31,875,680 | ) | | | (30,688,544 | ) | | | (1,399,015 | ) | | | (983,897 | ) |
Shares Outstanding | | | | | | | | | | | | | | | | |
Beginning of year | | | 90,972,292 | | | | 121,660,836 | | | | 2,792,485 | | | | 3,776,382 | |
| | | | | | | | | | | | | | | | |
End of year | | | 59,096,612 | | | | 90,972,292 | | | | 1,393,470 | | | | 2,792,485 | |
| | | | | | | | | | | | | | | | |
| | | | | | | | | | | | | | | | | |
52
ASSET MANAGEMENT FUND
NOTES TO FINANCIAL STATEMENTS (continued)
OCTOBER 31, 2011
| | | | | | | | | | | | | | | | |
| | | Short U.S. Government Fund | | | Intermediate Mortgage Fund | |
| | | Year Ended
October 31, 2011 | | | Year Ended
October 31, 2010 | | | Year Ended
October 31, 2011 | | | Year Ended
October 31, 2010 | |
Share transactions: | | | | | | | | | | | | | | | | |
Sale of shares | | | 1,285 | | | | 6,523 | | | | 2,232 | | | | — | |
Shares issued to stockholders in reinvestment of dividends | | | 4,883 | | | | 8,159 | | | | 1,762 | | | | 12,497 | |
Shares repurchased | | | (99,785 | ) | | | (1,120,280 | ) | | | (808,674 | ) | | | (1,700,702 | ) |
| | | | | | | | | | | | | | | | |
Net increase (decrease) | | | (93,617 | ) | | | (1,105,598 | ) | | | (804,680 | ) | | | (1,688,205 | ) |
Shares Outstanding | | | | | | | | | | | | | | | | |
Beginning of year | | | 2,753,515 | | | | 3,859,113 | | | | 6,541,883 | | | | 8,230,088 | |
| | | | | | | | | | | | | | | | |
End of year | | | 2,659,898 | | | | 2,753,515 | | | | 5,737,203 | | | | 6,541,883 | |
| | | | | | | | | | | | | | | | |
| | | | | | | | | | | | | | | | | |
| | | | | | | | |
| | | U.S. Government Mortgage Fund | |
| | | Year Ended
October 31, 2011 | | | Year Ended
October 31, 2010 | |
Share transactions: | | | | | | | | |
Sale of shares | | | 1,160 | | | | — | |
Shares issued to stockholders in reinvestment of dividends | | | 3,123 | | | | 4,963 | |
Shares repurchased | | | (2,916 | ) | | | (203,184 | ) |
| | | | | | | | |
Net increase (decrease) | | | 1,367 | | | | (198,221 | ) |
Shares Outstanding | | | | | | | | |
Beginning of year | | | 2,593,826 | | | | 2,792,047 | |
| | | | | | | | |
End of year | | | 2,595,193 | | | | 2,593,826 | |
| | | | | | | | |
| | | | | | | | | |
53
ASSET MANAGEMENT FUND
NOTES TO FINANCIAL STATEMENTS (continued)
OCTOBER 31, 2011
| | | | | | | | |
| | | Large Cap Equity Fund | |
| | | Year Ended
October 31, 2011 | | | Year Ended
October 31, 2010 | |
Share transactions Class AMF: | | | | | | | | |
Sale of shares | | | 164,076 | | | | 1,356,290 | |
Shares issued to stockholders in reinvestment of dividends | | | 85,795 | | | | 104,311 | |
Shares repurchased | | | (2,342,733 | ) | | | (1,134,197 | ) |
| | | | | | | | |
Net increase (decrease) | | | (2,092,862 | ) | | | 326,404 | |
Shares Outstanding | | | | | | | | |
Beginning of year | | | 11,109,865 | | | | 10,783,461 | |
| | | | | | | | |
End of year | | | 9,017,003 | | | | 11,109,865 | |
| | | | | | | | |
Share transactions Class H: | | | | | | | | |
Sale of shares | | | 52,269 | | | | 21,203 | |
Shares issued to stockholders in reinvestment of dividends | | | 5,607 | | | | 5,690 | |
Shares repurchased | | | (23,825 | ) | | | (20,952 | ) |
| | | | | | | | |
Net increase (decrease) | | | 34,051 | | | | 5,941 | |
Shares Outstanding | | | | | | | | |
Beginning of pd | | | 369,283 | | | | 363,342 | |
| | | | | | | | |
End of year | | | 403,334 | | | | 369,283 | |
| | | | | | | | |
| | | | | | | | | |
D. For the year ended October 31, 2011, purchases and sales of securities, other than short-term investments and U.S. Government securities, were as follows:
| | | | | | | | | | | | | | | | | | | | | | | | |
| | | Ultra Short Mortgage Fund | | | Ultra Short Fund | | | Short U.S. Government Fund | | | Intermediate Mortgage Fund | | | U.S. Government Mortgage Fund | | | Large Cap Equity Fund | |
Purchases | | $ | — | | | $ | — | | | $ | — | | | $ | — | | | $ | — | | | $ | 5,467,759 | |
Sales | | | 31,260,154 | | | | 194,004 | | | | — | | | | — | | | | — | | | | 20,535,870 | |
For the year ended October 31, 2011, purchases and sales of U.S. Government securities, other than short-term investments, were as follows:
| | | | | | | | | | | | | | | | | | | | |
| | | Ultra Short Mortgage Fund | | | Ultra Short Fund | | | Short U.S. Government Fund | | | Intermediate Mortgage Fund | | | U.S. Government Mortgage Fund | |
Purchases | | $ | 281,155,849 | | | $ | 7,460,547 | | | $ | 27,382,812 | | | $ | 44,570,534 | | | $ | 20,488,164 | |
Sales | | | 514,999,905 | | | | 14,272,330 | | | | 28,117,973 | | | | 47,792,642 | | | | 20,987,214 | |
54
ASSET MANAGEMENT FUND
NOTES TO FINANCIAL STATEMENTS (continued)
OCTOBER 31, 2011
E. FEDERAL INCOME TAX INFORMATION:
The tax characteristics of distributions paid to shareholders during the fiscal years ended October 31, 2011, and 2010 were as follows:
| | | | | | | | | | | | |
| Fund Name | | Distributions paid from Ordinary Income | | | Total Taxable Distributions | | | Total Distributions Paid* | |
Money Market Fund | | $ | 10,875 | | | $ | 10,875 | | | $ | 10,875 | |
Ultra Short Mortgage Fund | | | 13,217,584 | | | | 13,217,584 | | | | 13,217,584 | |
Ultra Short Fund | | | 158,068 | | | | 158,068 | | | | 158,068 | |
Short U.S. Government Fund | | | 527,590 | | | | 527,590 | | | | 527,590 | |
Intermediate Mortgage Fund | | | 655,601 | | | | 655,601 | | | | 655,601 | |
U.S. Government Mortgage Fund | | | 562,800 | | | | 562,800 | | | | 562,800 | |
| | | | | | | | | | | | |
| 2010 | | Distributions paid from
Ordinary Income | | | Total Taxable
Distributions | | | Total Distributions
Paid* | |
Money Market Fund | | $ | 19,005 | | | $ | 19,005 | | | $ | 19,005 | |
Ultra Short Mortgage Fund | | | 29,551,205 | | | | 29,551,205 | | | | 29,551,205 | |
Ultra Short Fund | | | 1,182,936 | | | | 1,182,936 | | | | 1,182,936 | |
Short U.S. Government Fund | | | 904,883 | | | | 904,883 | | | | 904,883 | |
Intermediate Mortgage Fund | | | 2,724,267 | | | | 2,724,267 | | | | 2,724,267 | |
U.S. Government Mortgage Fund | | | 894,265 | | | | 894,265 | | | | 894,265 | |
| * | Total distributions paid differ from the Statement of Changes in Net Assets because dividends are recognized when actually paid for federal income tax purposes. |
The tax characteristics of distributions paid to shareholders during the years ended October 31, 2011 and 2010 for the Large Cap Equity Fund were as follows:
| | | | | | | | | | | | | | | | | | | | |
| 2011 | | Distributions paid from
Ordinary Income | | | Net Long
Term Gains | | | Total Taxable
Distributions | | | Tax Return
of Capital | | | Total Distributions
Paid | |
Large Cap Equity Fund | | $ | 1,043,863 | | | $ | — | | | $ | 1,043,863 | | | $ | — | | | $ | 1,043,863 | |
| | | | | | | | | | | | | | | | | | | | |
| 2010 | | Distributions paid from
Ordinary Income | | | Net Long
Term Gains | | | Total Taxable
Distributions | | | Tax Return
of Capital | | | Total Distributions
Paid | |
Large Cap Equity Fund | | $ | 1,162,182 | | | $ | — | | | $ | 1,162,182 | | | $ | — | | | $ | 1,162,182 | |
At October 31, 2011, the cost, gross unrealized appreciation and gross unrealized depreciation on securities, for federal income tax purposes, were as follows:
| | | | | | | | | | | | | | | | |
| | | Tax Cost | | | Tax
Unrealized
Appreciation | | | Tax Unrealized
(Depreciation) | | | Net Unrealized
Appreciation
(Depreciation) | |
AMF Money Market Fund | | $ | 19,650,615 | | | $ | — | | | $ | — | | | $ | — | |
AMF Ultra Short Mortgage Fund | | | 452,128,296 | | | | 8,996,835 | | | | (1,248,532 | ) | | | 7,748,303 | |
AMF Ultra Short Fund | | | 6,994,333 | | | | 94,175 | | | | (27,761 | ) | | | 66,414 | |
AMF Short U.S. Government Fund | | | 26,941,140 | | | | 505,446 | | | | (106,927 | ) | | | 398,519 | |
AMF Intermediate Mortgage Fund | | | 33,377,050 | | | | 378,918 | | | | (3,699 | ) | | | 375,219 | |
AMF U.S. Government Mortgage Fund | | | 22,389,309 | | | | 971,930 | | | | (18,426 | ) | | | 953,504 | |
AMF Large Cap Equity Fund | | | 58,585,146 | | | | 25,788,859 | | | | (4,034,730 | ) | | | 21,754,129 | |
55
ASSET MANAGEMENT FUND
NOTES TO FINANCIAL STATEMENTS (continued)
OCTOBER 31, 2011
As of October 31, 2011, the components of accumulated earnings/(deficit) on a tax basis were as follows:
| | | | | | | | | | | | | | | | | | | | | | | | | | | | |
| | | Undistributed Ordinary Income | | | Undistributed Long Term Capital Gains | | | Accumulated Earnings | | | Distributions Payable | | | Accumulated Capital and Other Losses | | | Unrealized Appreciation/ (Depreciation) | | | Total Accumulated Earnings (Deficit) | |
Money Market Fund | | $ | 61 | | | $ | — | | | $ | 61 | | | $ | (61 | ) | | $ | (814 | ) | | $ | — | | | $ | (814 | ) |
Ultra Short Mortgage Fund | | | 772,716 | | | | — | | | | 772,716 | | | | (728,540 | ) | | | (368,690,786 | ) | | | 7,748,303 | | | | (360,898,307 | ) |
Ultra Short Fund | | | 12,404 | | | | — | | | | 12,404 | | | | (8,802 | ) | | | (29,859,308 | ) | | | 66,414 | | | | (29,789,292 | ) |
Short U.S. Government Fund | | | 32,506 | | | | — | | | | 32,506 | | | | (30,090 | ) | | | (9,361,325 | ) | | | 398,519 | | | | (8,960,390 | ) |
Intermediate Mortgage Fund | | | 31,729 | | | | — | | | | 31,729 | | | | (31,781 | ) | | | (55,127,296 | ) | | | 375,219 | | | | (54,752,129 | ) |
U.S. Government Mortgage
Fund | | | 43,412 | | | | — | | | | 43,412 | | | | (41,544 | ) | | | (10,827,625 | ) | | | 953,504 | | | | (9,872,253 | ) |
Large Cap Equity Fund | | | 50,190 | | | | 1,746,753 | | | | 1,796,943 | | | | — | | | | — | | | | 21,754,129 | | | | 23,551,072 | |
The tax character of current year distributions paid and the tax basis of the current components of accumulated earnings (deficit) and any net capital loss carryforwards will be determined at end of the current tax year.
At October 31, 2011, the following Funds had capital loss carry-forwards available to offset future net capital gains through the indicated expiration dates:
| | | | | | | | | | | | | | | | |
| Fund | | Amount | | | Expires | | | Amount | | | Expires | |
Money Market Fund | | $ | 407 | | | | 2013 | | | $ | 407 | | | | 2015 | |
| | | | |
Ultra Short Mortgage Fund | | | 24,633,492 | | | | 2012 | | | | 7,491,105 | | | | 2016 | |
Ultra Short Mortgage Fund | | | 19,172,685 | | | | 2013 | | | | 9,348,253 | | | | 2017 | |
Ultra Short Mortgage Fund | | | 13,969,341 | | | | 2014 | | | | 290,225,068 | | | | 2018 | |
Ultra Short Mortgage Fund | | | 1,808,482 | | | | 2015 | | | | 2,013,187 | | | | 2019 | |
| | | | |
Ultra Short Fund | | | 1,616,100 | | | | 2012 | | | | 3,451,774 | | | | 2016 | |
Ultra Short Fund | | | 1,507,357 | | | | 2013 | | | | 307,673 | | | | 2017 | |
Ultra Short Fund | | | 1,784,218 | | | | 2014 | | | | 20,036,732 | | | | 2018 | |
Ultra Short Fund | | | 1,128,003 | | | | 2015 | | | | 27,453 | | | | 2019 | |
| | | | |
Short U.S. Government Fund | | | 104,641 | | | | 2012 | | | | 357,577 | | | | 2015 | |
Short U.S. Government Fund | | | 1,805,629 | | | | 2013 | | | | 1,071,031 | | | | 2016 | |
Short U.S. Government Fund | | | 880,563 | | | | 2014 | | | | 5,140,920 | | | | 2017 | |
| | | | |
Intermediate Mortgage Fund | | | 2,261,965 | | | | 2012 | | | | 2,299,353 | | | | 2016 | |
Intermediate Mortgage Fund | | | 1,821,864 | | | | 2013 | | | | 5,641,899 | | | | 2017 | |
Intermediate Mortgage Fund | | | 2,863,116 | | | | 2014 | | | | 38,873,400 | | | | 2018 | |
Intermediate Mortgage Fund | | | 1,013,863 | | | | 2015 | | | | 351,065 | | | | 2019 | |
| | | | |
U.S. Government Mortgage Fund | | | 2,721,813 | | | | 2012 | | | | 4,846,874 | | | | 2018 | |
U.S. Government Mortgage Fund | | | 3,057,928 | | | | 2014 | | | | 201,009 | | | | 2019 | |
| * | A portion of the capital loss carry-forwards may be subject to limitations under Section 382 of the Internal Revenue Code, and is available to the extent allowed by tax law to offset future net capital gain, if any. |
During the fiscal year ended October 31, 2011, Money Market Fund, Ultra Short Mortgage Fund, Ultra Short Fund, Intermediate Mortgage Fund, and U.S. Government Mortgage Fund had net capital loss
carry-forward amounts expire of $181,035, $33,378,700, $1,849,300, $3,013,622, and $1,808,782, respectively.
56
ASSET MANAGEMENT FUND
NOTES TO FINANCIAL STATEMENTS (continued)
OCTOBER 31, 2011
The Regulated Investment Company Modernization Act of 2010 (the “Act”) was enacted on December 22, 2010. The Act makes changes to several tax rules impacting the Fund. In general, the provisions of the Act will be effective for the Fund’s fiscal year ending October, 31, 2012. Although the Act provides several benefits, including the unlimited carry- forward of future capital losses, there may be a greater likelihood that all or a portion of the fund’s pre-enactment capital loss carry-forward may expire without being utilized due to the fact that post-enactment capital losses get utilized before pre-enactment capital loss carry-forward. Relevant information regarding the impact of the Act on the Fund, if any, will be contained within the “Federal Tax Information” section of the notes to financial statements beginning in 2012 reporting periods.
Dividends and distributions are determined in accordance with federal income tax regulations and may differ from accounting principles generally accepted in the United States of America. These differences are primarily due to differing treatments for deferral of losses on wash sales. To the extent these differences are permanent, adjustments are made to the appropriate components of net assets in the period that these differences arise.
F. NEW ACCOUNTING PRONOUNCEMENTS
On May 12, 2011, the Financial Accounting Standards Board (“FASB”) issued Accounting Standards Update (“ASU”) No. 2011-04, Fair Value Measurement: Amendments to Achieve Common Fair Value Measurement and Disclosure Requirements in U.S. GAAP and IFRSs (“ASU 2011-04”), modifying Accounting Standards Codification (“ASC”) 820. At the same time, the International Accounting Standards Board (“IASB”) issued International Financial Reporting Standard (“IFRS”) 13, Fair Value Measurement. The objective of the FASB and IASB is convergence of their guidance on fair value measurements and disclosures. Specifically, ASU 2011-04 requires reporting entities to disclose 1) the amounts of and reasons for any transfers between Level 1 and Level 2, and 2) for Level 3 fair
value measurements: a) quantitative information about significant unobservable inputs used, b) a description of the valuation procedures used by the reporting entity, and c) a narrative description of the sensitivity of the fair value measurement to changes in unobservable inputs if a change in those inputs might result in a significantly higher or lower fair value measurement. The effective date of ASU 2011-04 is for annual periods beginning after December 15, 2011. At this time, management is evaluating the implications of this requirement and the impact it will have on the Funds’ financial statement disclosures.
G. DISTRIBUTOR LEGAL PROCEEDINGS
On December 28, 2010, West Texas National Bank (“WTNB”) commenced a FINRA arbitration proceeding against Shay Financial. WTNB alleges violation of state securities laws, negligent misrepresentation, breach of fiduciary duty, and other theories, and seeks damages in excess of approximately $27.6 million relating to alleged losses from investments in mortgage-backed securities.
On August 18, 2011, Citizens Community Federal (“CCF”) commenced a FINRA arbitration proceeding against Shay Financial. CCF alleges breach of fiduciary duties, negligent misrepresentation, and seeks damages in excess of approximately $14 million relating to alleged losses from investments in mortgage-backed securities.
On September 12, 2011, El Dorado Savings Bank (“EDSB”) commenced a FINRA arbitration proceeding against Shay Financial, Rodger D. Shay, and Rodger D. Shay Jr. EDSB alleges violations of federal and state securities laws, and other theories, seeking damages in excess of approximately $3-$5 million for alleged losses on investments in AMF Funds.
On November 11, 2011, Town North Bank, N.A. (“TNB”) commenced a civil action in the U.S. District Court, Northern District of Texas, against Shay Financial and others. TNB alleges violations of federal securities law, fraud, and breach of fiduciary duty, and seeks approximately $64 million in damages from Shay Financial relating to alleged losses from invest-
57
ASSET MANAGEMENT FUND
NOTES TO FINANCIAL STATEMENTS (concluded)
OCTOBER 31, 2011
ments in mortgage-backed securities and collateralized debt obligations.
There is no assurance that additional legal actions arising out of these circumstances will not be filed against Shay Assets Management, Inc., Shay Financial Services Inc., Rodger D. Shay and/or Rodger D. Shay, Jr. The Distributor is unable to predict the potential range of monetary exposure, if any, but believe that claims asserted in each of the above-referenced actions are without merit and each
intends to vigorously defend itself against all actions. However, an unfavorable result could have a material adverse effect on the Distributor.
H. SUBSEQUENT EVENTS
The Funds evaluated subsequent events from October 31, 2011, through the date these financial statements were issued and available. There were no subsequent events to report that would have a material impact on the Funds’ financial statements.
58
REPORT OF INDEPENDENT REGISTERED PUBLIC ACCOUNTING FIRM
To the Trustees and Shareholders of
the Asset Management Fund
In our opinion, the accompanying statements of assets and liabilities, including the schedules of investments, and the related statements of operations and of changes in net assets and the financial highlights present fairly, in all material respects, the financial position of the Money Market Fund, Ultra Short Mortgage Fund, Ultra Short Fund, Short U.S. Government Fund, Intermediate Mortgage Fund, U.S. Government Mortgage Fund, and Large Cap Equity Fund (collectively referred to as the “Funds’’) at October 31, 2011, the results of each of their operations for the year then ended, the changes in each of their net assets for each of the two years in the period then ended and the financial highlights for each of the periods presented, in conformity with accounting principles generally accepted in the United States of America. These financial statements and financial highlights (hereafter referred to as “financial statements’’) are the responsibility of the Funds’ management; our responsibility is to express an opinion on these financial statements based on our audits. We conducted our audits of these financial statements in accordance with the standards of the Public Company Accounting Oversight Board (United States). Those standards require that we plan and perform the audit to obtain reasonable assurance about whether the financial statements are free of material misstatement. An audit includes examining, on a test basis, evidence supporting the amounts and disclosures in the financial statements, assessing the accounting principles used and significant estimates made by management, and evaluating the overall financial statement presentation. We believe that our audits, which included confirmation of securities at October 31, 2011 by correspondence with the custodian and brokers, provide a reasonable basis for our opinion. The financial highlights of the Large Cap Equity Fund for the year ended December 31, 2006 were audited by other auditors, whose report, dated February 20, 2007, expressed an unqualified opinion on those statements.
PricewaterhouseCoopers LLP
Chicago, Illinois
December 23, 2011
59
ASSET MANAGEMENT FUND
ADDITIONAL INFORMATION
OCTOBER 31, 2011 (Unaudited)
Other Federal Income Tax Information
For the year ended October 31, 2011, certain distributions paid by the Funds may be subject to a maximum tax rate of 15% as provided by the Jobs and Growth Relief Reconciliation Act of 2003. The Funds intend to designate the maximum amount allowable as taxed at a maximum rate of 15%. Complete information will be reported in conjunction with your 2011 Form 1099-DIV.
For corporate shareholders, the following percentage of the total ordinary income distributions paid during the fiscal year ended October 31, 2011, qualify for corporate dividends received deduction for the following Fund:
| | | | |
| Fund | | Percentage | |
Large Cap Equity Fund | | | 100% | |
For the year ended October 31, 2011, the following Funds paid qualified dividend income for purposes of reduced individual federal income tax rates of:
| | | | |
| Fund | | Percentage | |
Large Cap Equity Fund | | | 100% | |
60
ASSET MANAGEMENT FUND
ADDITIONAL INFORMATION (continued)
OCTOBER 31, 2011 (Unaudited)
Trustees and Officers of Asset Management Fund
| | | | | | | | |
| Name, Address and Age | | Position(s) Held with Trust,
Length of Time Served
and Term of Office | | Principal Occupation(s)
During Past 5 Years | | Number of
Portfolios in
Fund
Complex
Overseen | | Other
Directorships
Held |
| Independent Trustees | | | | | | | | |
| | | | |
David F. Holland 17 Ledgewood Circle Topsfield, MA 01983 Age: 69 | | Trustee since 1993 and from 1988 to 1989. Indefinite Term of Office | | Retired; Chairman of the Board, Chief Executive Officer and President, BostonFed Bancorp Inc. from 1995 to 2005; Chairman of the Board from 1989 to 2005 and Chief Executive Officer from 1986 to 2005, Boston Federal Savings Bank. | | 7 | | |
| | | | |
Gerald J. Levy 4000 W. Brown Deer Road Milwaukee, WI 53209 Age: 79 | | Lead Independent Trustee, Vice Chairman of the Board since 1997 and Trustee since 1982. Indefinite Term of Office | | Chairman since 1984 and Director since 1963, Guaranty Bank, F.S.B. | | 7 | | FISERV, Inc.; Guaranty Financial; Federal Home Loan Bank of Chicago |
| | | | |
William A. McKenna, Jr. 42 Dorothy Grace Road Saugerties, NY 12477 Age: 74 | | Trustee since 2002. Indefinite Term of Office | | Retired; Chairman and Chief Executive Officer from 1992 to 2004 and President from 1985 to 2001, Ridgewood Savings Bank. | | 7 | | RSGroup Trust Company; RetirementSystem Group, Inc.; Irish Educational Development Foundation, Inc.; The Catholic University of America; RSI Retirement Trust; St. Vincent’s Services; Boys Hope Girls Hope; Calvary Hospital Fund; St. Aloysius School; American Institute of Certified Public Accountants; TransVideo Communications, Inc. |
| | | | |
Maria F. Ramirez 675 3rd Avenue, 11th Floor New York, NY 10017 Age: 63 | | Trustee since 2005. Indefinite Term of Office | | President and Chief Executive Officer, Maria Fiorini Ramirez Inc. (a global economic and financial consulting firm) since 1992. | | 7 | | Schroder Hedge Funds Bermuda; Pace University; Sovereign Bank; Security Mutual Insurance Company |
61
ASSET MANAGEMENT FUND
ADDITIONAL INFORMATION (continued)
OCTOBER 31, 2011 (Unaudited)
Trustees and Officers of Asset Management Fund (continued)
| | | | | | | | |
| Name, Address and Age | | Position(s) Held with Trust,
Length of Time Served
and Term of Office | | Principal Occupation(s)
During Past 5 Years | | Number of
Portfolios in
Fund
Complex
Overseen | | Other
Directorships
Held |
| Interested Trustees1 | | | | | | | | |
| | | | |
Rodger D. Shay2 1000 Brickell Avenue Miami, FL 33131 Age: 75 | | Chairman of the Board since 1997 and Trustee since 1993 and from 1985 to 1990. Indefinite Term of Office | | Chairman and Director of Shay Investment Services, Inc. and Shay Financial Services, Inc. since 1997. | | 7 | | Shay Assets Management, Inc. |
| | | | |
Rodger D. Shay, Jr.2 230 West Monroe Street Suite 2810 Chicago, IL 60606 Age: 52 | | Trustee since 2002. Indefinite Term of Office President since 2005. Term of Office Expires 2011 | | President and Chief Executive Officer of Shay Financial Services, Inc. since 1997; President, Shay Assets Management, Inc. from 2005 to 2008. | | 7 | | Family Financial Holdings, LLC; First Financial Bank and Trust |
| | | | |
| Officers | | | | | | | | |
| | | | |
Robert T. Podraza 1000 Brickell Avenue Miami, FL 33131 Age: 67 | | Vice President and Assistant Treasurer since 1998. Term of Office Expires 2011 | | Chief Compliance Officer, Shay Assets Management since 2010, Vice President, Shay Investment Services, Inc. since 1990; Vice President and Chief Compliance Officer, Shay Financial Services, Inc. since 1990 and 1997, respectively; Vice President, Shay Assets Management, Inc. since 1990. | | N/A | | None |
| | | | |
Trent M. Statczar 4041 N. High Street Suite 402 Columbus, OH 43214 Age: 40 | | Treasurer since 2009. Term of Office Expires 2011 | | Director, Beacon Hill Fund Services, Inc. 2008 to present; Senior Vice President of Citi Fund Services Ohio, Inc. from 2007 to 2008; Vice President Citi Fund Services Ohio, Inc. from 2004 to 2007. | | N/A | | None |
| | | | |
Rodney L. Ruehle 4041 N. High Street Suite 402 Columbus, OH 43214 Age: 43 | | Chief Compliance Officer since 2009. Term of Office Expires 2011 | | Director, Beacon Hill Fund Services, Inc. 2008 to present; Vice President, CCO Services, Citi Fund Services, Inc. from 2004 to 2008; Director, Fund Administration, Citi Fund Services, Inc. from 1995 to 2004. | | N/A | | None |
| | | | |
Christine A. Cwik 230 West Monroe Street Suite 2810 Chicago, IL 60606 Age: 62 | | Assistant Secretary since 1999. Term of Office Expires 2011 | | Executive Secretary, Shay Assets Management, Inc. since 1999. | | N/A | | None |
62
ASSET MANAGEMENT FUND
ADDITIONAL INFORMATION (continued)
OCTOBER 31, 2011 (Unaudited)
Trustees and Officers of Asset Management Fund (concluded)
| | | | | | | | |
| Name, Address and Age | | Position(s) Held with Trust,
Length of Time Served
and Term of Office | | Principal Occupation(s)
During Past 5 Years | | Number of
Portfolios in
Fund
Complex
Overseen | | Other
Directorships
Held |
Eimile J. Moore 4041 N. High Street Suite 402 Columbus, OH 43214 Age: 42 | | Assistant Secretary since 2011. Term of Office Expires 2012 | | Director, Business Management and Governance Services at Beacon Hill Fund Services, Inc. September 2011 to present; Vice President, JP Morgan Distribution Services, Inc. from 2006 - 2011. | | N/A | | None |
| 1 | A trustee is an “interested person” of the Trust under the 1940 Act because he holds certain positions with the Trust’s Distributor and/or Investment Adviser and because of his financial interest in Shay Investment Services, Inc., parent company of the Trust’s Investment Adviser, Shay Assets Management, Inc., and Distributor, Shay Financial Services, Inc. |
| 2 | Rodger D. Shay, Jr., Trustee, is the son of Rodger D. Shay, Chairman of the Board of Trustees and Trustee. |
63
ASSET MANAGEMENT FUND
ADDITIONAL INFORMATION (continued)
OCTOBER 31, 2011 (Unaudited)
A. SECURITY ALLOCATION:
MONEY MARKET FUND
| | | | |
| Security Allocation | | Percentage of
Net Assets | |
Repurchase Agreements | | | 100.0% | |
Investment Companies | | | 0.0% | |
| | | | |
Total | | | 100.0% | |
| | | | |
| | | | | |
ULTRA SHORT MORTGAGE FUND
| | | | |
| Security Allocation | | Percentage of
Net Assets | |
Adjustable Rate Mortgage-Related Securities | | | 53.3% | |
Fixed Rate Mortgage-Related Securities | | | 39.4% | |
U.S. Government Agency Securities | | | 3.1% | |
Investment Companies | | | 0.0% | |
Repurchase Agreements | | | 9.6% | |
| | | | |
Total | | | 105.4% | |
| | | | |
| | | | | |
ULTRA SHORT FUND
| | | | |
| Security Allocation | | Percentage of
Net Assets | |
Adjustable Rate Mortgage-Related Securities | | | 65.6% | |
Fixed Rate Mortgage Related Securities | | | 29.7% | |
Investment Companies | | | 4.2% | |
| | | | |
Total | | | 99.5% | |
| | | | |
| | | | | |
SHORT U.S. GOVERNMENT FUND
| | | | |
| Security Allocation | | Percentage of
Net Assets | |
Adjustable Rate Mortgage-Related Securities | | | 34.4% | |
Fixed Rate Mortgage-Related Securities | | | 62.0% | |
U.S. Government Agency Securities | | | 2.0% | |
Investment Companies | | | 0.0% | |
Repurchase Agreements | | | 12.1% | |
| | | | |
Total | | | 110.5% | |
| | | | |
| | | | | |
64
ASSET MANAGEMENT FUND
ADDITIONAL INFORMATION (continued)
OCTOBER 31, 2011 (Unaudited)
INTERMEDIATE MORTGAGE FUND
| | | | |
| Security Allocation | | Percentage of
Net Assets | |
Adjustable Rate Mortgage-Related Securities | | | 13.0% | |
Fixed Rate Mortgage-Related Securities | | | 79.2% | |
U.S. Government Agency Securities | | | 8.5% | |
Investment Companies | | | 0.0% | |
Repurchase Agreements | | | 31.1% | |
| | | | |
Total | | | 131.8% | |
| | | | |
| | | | | |
U.S. GOVERNMENT MORTGAGE FUND
| | | | |
| Security Allocation | | Percentage of
Net Assets | |
Adjustable Rate Mortgage-Related Securities | | | 35.0% | |
Fixed Rate Mortgage-Related Securities | | | 57.8% | |
U.S. Government Agency Securities | | | 4.5% | |
Investment Companies | | | 0.0% | |
Repurchase Agreements | | | 4.7% | |
| | | | |
Total | | | 102.0% | |
| | | | |
| | | | | |
LARGE CAP EQUITY FUND
| | | | |
| Security Allocation | | Percentage of
Net Assets | |
Common Stocks | | | 96.4% | |
Investment Companies | | | 3.6% | |
| | | | |
Total | | | 100.0% | |
| | | | |
| | | | | |
B. EXPENSE COMPARISON:
As a shareholder of the Funds, you incur ongoing costs, including management fees; distribution (12b-1) fees; and other Fund expenses. This example is intended to help you understand your ongoing costs (in dollars) of investing in the Funds and to compare these costs with the ongoing costs of investing in other mutual funds.
The Example is based on an investment of $1,000 invested at the beginning of the period and held for the entire period from May 1, 2011 through October 31, 2011.
ACTUAL EXPENSES
The table below provides information about actual account values and actual expenses. You may use the information below, together with the amount you invested, to estimate the expenses that you paid over the period. Simply divide your account value by $1,000 (for example, an $8,600 account value divided by $1,000 = 8.6), then multiply the result by the number in the table under the heading entitled “Expenses Paid During Period” to estimate the expenses you paid on your account during this period.
65
ASSET MANAGEMENT FUND
ADDITIONAL INFORMATION (continued)
OCTOBER 31, 2011 (Unaudited)
| | | | | | | | | | | | | | | | | | | | |
| | | | | | Beginning
Account Value
5/1/11 | | | Ending
Account Value
10/31/11 | | | Expense Paid
During Period*
5/1/11 - 10/31/11 | | | Expense Ratio
During Period**
5/1/11 - 10/31/11 | |
Money Market Fund | | | | | | $ | 1,000.00 | | | $ | 1,000.20 | | | $ | 0.05 | | | | 0.01 | % |
Ultra Short Mortgage Fund | | | | | | | 1,000.00 | | | | 1,008.80 | | | | 3.44 | | | | 0.68 | % |
Ultra Short Fund | | | | | | | 1,000.00 | | | | 1,002.90 | | | | 4.44 | | | | 0.88 | % |
Short U.S. Government Fund | | | | | | | 1,000.00 | | | | 1,010.30 | | | | 3.80 | | | | 0.75 | % |
Intermediate Mortgage Fund | | | | | | | 1,000.00 | | | | 1,018.20 | | | | 3.82 | | | | 0.75 | % |
U.S. Government Mortgage Fund | | | | | | | 1,000.00 | | | | 1,024.90 | | | | 3.83 | | | | 0.75 | % |
Large Cap Equity Fund | | | Class AMF | | | | 1,000.00 | | | | 975.80 | | | | 5.63 | | | | 1.13 | % |
| | | | Class H | | | | 1,000.00 | | | | 976.50 | | | | 4.88 | | | | 0.98 | % |
| * | | Expenses are equal to the average account value times the Fund’s annualized expense ratio multiplied by the number of days in the most recent fiscal half-year divided by the number of days in the fiscal year. |
HYPOTHETICAL EXAMPLE FOR COMPARISON PURPOSES
The table below provides information about hypothetical account values and hypothetical expenses based on each Fund’s actual expense ratio and an assumed rate of return of 5% per year before expenses, which is not the Fund’s actual return. The hypothetical account values and expenses may not be used to estimate the actual ending account balance or expenses you paid for the period. You may use this information to compare this 5% hypothetical example
with the 5% hypothetical examples that appear in the shareholder reports of other funds.
Please note that the expenses shown in the table are meant to highlight your ongoing costs only and do not reflect any transactional costs, such as sales charges (loads), redemption fees, or exchange fees. Therefore, the table is useful in comparing ongoing costs only, and will not help you determine the relative total costs of owning different funds. In addition, if these transactional costs were included, your costs would have been higher.
| | | | | | | | | | | | | | | | | | | | |
| | | | | | Beginning
Account Value
5/1/11 | | | Ending
Account Value
10/31/11 | | | Expense Paid
During Period*
5/1/11 - 10/31/11 | | | Expense Ratio
During Period**
5/1/11 - 10/31/11 | |
Money Market Fund | | | | | | $ | 1,000.00 | | | $ | 1,025.16 | | | $ | 0.05 | | | | 0.01 | % |
Ultra Short Mortgage Fund | | | | | | | 1,000.00 | | | | 1,021.78 | | | | 3.47 | | | | 0.68 | % |
Ultra Short Fund | | | | | | | 1,000.00 | | | | 1,020.77 | | | | 4.48 | | | | 0.88 | % |
Short U.S. Government Fund | | | | | | | 1,000.00 | | | | 1,021.42 | | | | 3.82 | | | | 0.75 | % |
Intermediate Mortgage Fund | | | | | | | 1,000.00 | | | | 1,021.42 | | | | 3.82 | | | | 0.75 | % |
U.S. Government Mortgage Fund | | | | | | | 1,000.00 | | | | 1,021.42 | | | | 3.82 | | | | 0.75 | % |
Large Cap Equity Fund | | | Class AMF | | | | 1,000.00 | | | | 1,019.51 | | | | 5.75 | | | | 1.13 | % |
| | | | Class H | | | | 1,000.00 | | | | 1,020.27 | | | | 4.99 | | | | 0.98 | % |
| * | | Expenses are equal to the average account value times the Fund’s annualized expense ratio multiplied by the number of days in the most recent fiscal half-year divided by the number of days in the fiscal year. |
66
ASSET MANAGEMENT FUND
ADDITIONAL INFORMATION (concluded)
OCTOBER 31, 2011 (Unaudited)
C. OTHER INFORMATION:
A description of the policies and procedures that the Funds use to determine how to vote proxies relating to portfolio securities is available (i) without charge, upon request, by calling 800-527-3713; and (ii) on the Securities and Exchange Commission’s website at http://www.sec.gov.
Information regarding how the Funds voted proxies relating to portfolio securities is available (i) without charge, upon request, by calling 800-527-3713; and (ii) on the Securities and Exchange Commission’s website at http://www.sec.gov.
A complete schedule of each Fund’s portfolio holdings for the first and third fiscal quarter of each fiscal year is filed with the Securities and Exchange Commission on Form N-Q and is available on the Securities and Exchange Commission’s website at http://www.sec.gov. In addition, the schedules may be reviewed and copied at the Securities and Exchange Commission’s Public Reference Room in Washington, D.C. Information on the operation of the Public Reference Room may be obtained by calling 1-800-SEC-0330.
The Statement of Additional Information includes additional information about Trustees and is available, without charge, upon request, by calling 800-527-3713.
67
DISTRIBUTOR
Shay Financial Services, Inc.
230 West Monroe Street, Suite 2810
Chicago, IL 60606
INVESTMENT ADVISER
Shay Assets Management, Inc.
230 West Monroe Street, Suite 2810
Chicago, IL 60606
GOVERNANCE AND REGULATORY SERVICES
Beacon Hill Fund Services, Inc.
4041 N. High St.
Columbus, OH 43214
ADMINISTRATOR, TRANSFER AGENT, AND DIVIDEND AGENT
Northern Trust Company
50 South LaSalle Street
Chicago, Illinois 60603
LEGAL COUNSEL
Vedder Price, P.C.
222 North LaSalle Street
Chicago, IL 60601
CUSTODIAN
Northern Trust Company
50 South LaSalle Street
Chicago, Illinois 60603
INDEPENDENT REGISTERED PUBLIC ACCOUNTING FIRM
PricewaterhouseCoopers LLP
One North Wacker Drive
Chicago, IL 60606
AMF-ANN-1011
Item 2. Code of Ethics.
The registrant has adopted a code of ethics that applies to the registrant’s principal executive officer, principal financial officer, principal accounting officer or controller, or persons performing similar functions. This code of ethics is included as Exhibit 12(a)(1).
During the period covered by the report, with respect to the registrant’s code of ethics that applies to its principal executive officer, principal financial officer, principal accounting officer or controller, or persons performing similar functions; there have been no amendments to, nor any waivers granted from, a provision that relates to any element of the code of ethics definition enumerated in paragraph (b) of this Item 2.
Item 3. Audit Committee Financial Expert.
3(a)(1) The registrant’s board of directors has determined that the registrant has at least one audit committee financial expert serving on its audit committee.
3(a)(2) The audit committee financial expert is David F. Holland, who is “independent” for purposes of this Item 3 of Form N-CSR.
Item 4. Principal Accountant Fees and Services.
(a) Audit Fees. Audit fees totaled $159,500 and $156,250 in fiscal years 2011 and 2010 respectively, including fees associated with the annual audit and filings of the registrant’s Form N-1A and Form N-SAR.
(b) Audit-Related Fees. There were no audit related fees billed in fiscal years 2011 and 2010.
(c) Tax Fees. Fees for tax compliance and review services totaled $27,500 and $26,925 in fiscal years 2011 and 2010, respectively.
(d) All Other Fees. There were no other fees in fiscal years 2011 and 2010.
(e)(1) Except as permitted by rule 2-01(c)(7)(i)(C) of regulation S-X the trust’s audit committee must pre-approve all audit and non-audit services provided by the independent accountants relating to the operations or financial reporting of the funds. Prior to the commencement of any audit or non-audit services to the fund, the audit committee reviews the services to determine whether they are appropriate and permissible under applicable law.
(e)(2) None of the services summarized in (b)–(d), above, were approved by the audit committee pursuant to rule 2-01(c)(7)(i)(C) of regulation S-X.
(f) Not applicable
(g) There were no aggregate non-audit fees for services to the registrant, its investment adviser and any entity controlling, controlled by, or under common control with the adviser that provides ongoing services to the registrant in fiscal years 2011 or 2010.
(h) There were no non-audit services billed for fiscal years 2011 or 2010.
Item 5. Audit Committee of Listed Companies.
Not applicable.
Item 6. Schedule of Investments.
(a) The Schedule of Investments in securities of unaffiliated issuers is included in the report to shareholders filed under Item 1 of this Form.
(b) Not applicable.
Item 7. Disclosure of Proxy Voting Policies and Procedures for Closed-End Management Investment Companies.
Not applicable.
Item 8. Portfolio Managers of Closed-End Management Investment Companies.
Not applicable.
Item 9. Purchases of Equity Securities by Closed-End Management Investment Company and Affiliated Purchasers.
Not applicable.
Item 10. Submission of Matters to a Vote of Security Holders.
Not applicable.
Item 11. Controls and Procedures.
(a) The registrant’s principal executive officer and principal financial officer have concluded, based on their evaluation of the registrant’s disclosure controls and procedures as conducted within 90 days of the filing date of this report, that these disclosure controls and procedures are adequately designed and are operating effectively to ensure that information required to be disclosed by the registrant on Form N-CSR is recorded, processed, summarized and reported within the time periods specified in the Securities and Exchange Commission’s rules and forms.
(b) There were no changes in the registrant’s internal control over financial reporting (as defined in Rule 30a-3(d) under the Investment Company Act of 1940) that occurred during the second fiscal quarter of the period covered by this report that have materially affected or are reasonably likely to materially affect, the registrant’s internal control over financial reporting.
Item 12. Exhibits.
(a)(1) Code of Ethics for Senior Financial Officers is filed herewith
(a)(2) Certifications required by Item 12(a) of Form N-CSR are filed herewith.
(a)(3) Not applicable.
(b) Certification required by Item 12(b) of Form N-CSR is furnished herewith
SIGNATURES
Pursuant to the requirements of the Securities Exchange Act of 1934 and the Investment Company Act of 1940, the registrant has duly caused this report to be signed on its behalf by the undersigned, thereunto duly authorized.
|
| (Registrant) Asset Management Fund |
|
| By (Signature and Title) |
|
| /s/ Trent M. Statczar |
| Trent M. Statczar |
| Treasurer |
|
| Date: January 4, 2012 |
Pursuant to the requirements of the Securities Exchange Act of 1934 and the Investment Company Act of 1940, this report has been signed below by the following persons on behalf of the registrant and in the capacities and on the dates indicated.
|
| By (Signature and Title) |
|
| /s/ Rodger D. Shay, Jr. |
| Rodger D. Shay, Jr. |
| President |
|
| Date: January 4, 2012 |
|
| By (Signature and Title) |
|
| /s/ Trent M. Statczar |
| Trent M. Statczar |
| Treasurer |
|
| Date: January 4, 2012 |