United States
Securities and Exchange Commission
Washington, D.C. 20549
FORM N-CSR
CERTIFIED SHAREHOLDER REPORT OF REGISTERED MANAGEMENT
INVESTMENT COMPANIES
Investment Company Act file number 811-03541
Asset Management Fund
(Exact name of registrant as specified in charter)
1000 Brickell Avenue, Suite 500, Miami, FL 33131
(Address of principal executive offices) (Zip code)
Beacon Hill Fund Services, Inc., 4041 North High Street, Suite 402, Columbus, Ohio 43214
(Name and address of agent for service)
Registrant's telephone number, including area code: (800) 247-9780
Date of fiscal year end: 10/31
Date of reporting period: 10/31/13
Form N-CSR is to be used by management investment companies to file reports with the Commission not later than 10 days after the transmission to stockholders of any report that is required to be transmitted to stockholders under Rule 30e-1 under the Investment Company Act of 1940 (17 CFR 270.30e-1). The Commission may use the information provided on Form N-CSR in its regulatory, disclosure review, inspection and policymaking roles.
A registrant is required to disclose the information specified by Form N-CSR, and the Commission will make this information public. A registrant is not required to respond to the collection of information contained in Form N-CSR unless the Form displays a currently valid Office of Management and Budget ("OMB") control number. Please direct comments concerning the accuracy of the information collection burden estimate and any suggestions for reducing the burden to Secretary, Securities and Exchange Commission, 450 Fifth Street, NW, Washington, DC 20549-0609. The OMB has reviewed this collection of information under the clearance requirements of 44 U.S.C. § 3507.
Item 1. Reports to Stockholders.
Managed By:
Shay Assets Management, Inc.
ANNUAL REPORT
October 31, 2013
CHAIRMAN’S LETTER
The Asset Management Fund (“AMF” and each series, a “Fund”) family of no load institutional mutual funds is pleased to present to shareholders the 2013 Annual Report.
The global economy is now finishing up a fifth year of difficult adjustment and restructuring. Central banks remain on center stage and are the dominant drivers of financial market trends as politicians continue to stumble towards policies to contain the fiscal imbalances which are the greatest source of systematic risk in the western economic system. Our fellow citizens understand these risks; rarely have Washington politicians been held in lower regard by voters and this pessimism is likely holding back our recovery. After all, how can Washington expect consumers and investors to regain their “animal spirits” while observing Congress flail through the Fiscal Cliff, sequestration, the government shutdown and the rollout of ObamaCare? Unfortunately, we do not expect our leaders to fix this toxic environment in the near future.
Meanwhile, the Federal Reserve continues to do the heavy lifting for the U.S. economy. Quantitative Easing (“QE”) has undoubtedly been a success, if success is measured as negative real government yields and private and corporate sectors that have the lowest debt service costs in decades. But another key objective of QE is to encourage private sector risk-taking and generate healthy nominal economic growth to pay back the accumulated government debt. While the buoyant equity markets would suggest that QE is working, achieving acceptable GDP and inflation targets has been more difficult. The temptation, therefore, is to keep QE and “financial repression” in place longer than what might seem reasonable. And while the new Fed Chairperson-to-be, Janet Yellen, is clearly a dove in regards to these issues, she will be faced with a much more hawkish and vocal Open Market Committee lineup in 2014. Plan on more Fed-generated volatility over the next few years.
The evil twin of financial repression that doesn’t get nearly as much play as it’s sibling but is equally important is “regulatory repression”. Most financial market participants think of Dodd-Frank as a financial market overhaul; however, it also keeps the risk-taking activities encouraged by financial repression out of the depository system. In a fractional banking system, this is exactly where those risks, properly capitalized and managed, need to reside; they encourage investment and economic growth. Unfortunately, these opportunities are migrating back into the unregulated shadow banking and securitization systems. We don’t believe that these non-depository markets have been properly restructured, and therefore remain a future source of unsupervised risk. Depositories, meanwhile, are still de-leveraging, de-risking and being forced to improve liquidity, which is just another way of saying to bulk up on government securities. We fear that if the Washington politicians can’t control spending, the next stage of regulatory repression is far worse: capital and foreign exchange controls, caps on deposit rates, and mandated investment in government securities for non-depositories, such as pension funds. Sound impossible in the U.S.? Perhaps, but examples of this happening in Europe over the past few years are too numerous for this letter.
Given these themes, we continue to focus on staying long liquidity and transparency and under weighting our duration benchmarks. The restructuring of our fixed income funds has proven beneficial for shareholders, and the recent performance of our short duration fixed income funds has been particularly strong. As always, we are grateful for your continuing support and continue to seek the best investment strategies for achieving our shareholder’s investment objectives.
Rodger D. Shay, Sr.
Chairman
Asset Management Fund
This report has been prepared to provide information to the shareholders of the Funds and must be preceded or accompanied by the Prospectus. It should not be construed as an offering to sell or buy any shares of the Funds. Such an offering is made only by the Prospectus. You may obtain a current copy of the Prospectus by calling 1-800-247-9780 or at AMF’s website (www.amffunds.com). Investors should consider the investment objectives, risks and expenses of the Funds before investing. Read the Prospectus carefully before you invest. Like all Mutual Funds, the AMF Funds are not FDIC insured, may lose value and have no bank guarantee.
MARKET OVERVIEW
October 31, 2013
Last year, we expressed some concern that investor complacency could lead to some surprises in the bond markets due to what we called the “Interest Rate Gap”, or the difference between the price the Fed will pay for fixed income securities and price that brings in real economic buyers. We also forecasted a steeper yield curve in 2013. In fact, the sharp increase in interest rates which we experienced in 2013 was the direct result of the Federal Reserve opening the discussion to a “Tapering” of their Quantitative Easing (“QE”) program. While Treasury Bill rates fell 5-10 bps during the funds’ fiscal year, short Treasury Note rates rose 5-20 bps and intermediate and long Treasury Notes and Bonds rose 60-90 bps.
Of course, the catalyst to the Fed opening the discussion of higher rates was the continued firming in economic conditions. While GDP growth remains below potential, it is encouraging that GDP has been accelerating all year given the headwinds caused by the Fiscal Cliff, sequestration, higher taxes, and weak growth in government employment. The housing market has begun what many to believe to be a long, steady improvement, and the rise in home and equity prices mean that household net worth has never been higher. Private employment continues to improve, and indicators hint at an acceleration in job growth into 2014.
And even though employment and industrial activity aren’t back to 2008 levels, the Fed’s QE policy has allowed consumer and corporation balance sheets to heal dramatically. While nominal debt levels remain historically high, most consumer debt has been termed out at very low interest rates. Households are currently spending just over 15% of disposable income to service fixed debt and other payments (such as property taxes), which is the lowest level in over thirty years. The federal government’s HARP (“Home Affordable Refinance Program”) program for underwater mortgagors certainly helped to lower mortgage payments, and the Fed’s QE policy allowed healthy homeowners to lock in the lowest mortgage rates since the 1960’s. While that made owning higher coupon mortgage-backed securities somewhat uncomfortable for a good part of 2013, we believe the mortgage-backed securities market is entering a period of tremendous prepayment stability now that the generational lows in mortgage rates have been achieved. Since Q 2 2009, over 18 million GSE loans (about 75% of the total) have been refinanced, with 2.9 million coming through HARP alone. As such, the pool of eligible loans that are refinanceable has declined sharply. With mortgage rates up 100 bps since late last year, principal prepayment rates have fallen by 60%.
By our estimates, U.S. economic growth looks primed for a surprise on the upside. We say that with some real trepidation; actual GDP has come in below both the Fed’s forecast and private economist survey’s since 2008. For the record, the Fed’s September 2013 forecast is for 2014 GDP of 2.9% - 3.1%, down slightly from their June 2013 forecast. The private sector is forecasting 2.6%. We’re leaning towards the Fed, and as the unemployment rate prepares to drop below 7% early next year - a level not breached since the end of 2008 – we expect that QE will be dialed down throughout 2014. Janet Yellen will be faced with an Open Market Committee with almost as many hawks as doves. She will face some contentious new members, and we expect Fed risk will add to volatility in 2014. As such, we’ve focused our investments on shorter duration, floating rate securities.
As we stated last year, the rebound in home prices caught some by surprise. In 2013, the continued rebound impacted economic and political events on a number of fronts. First, after several tweaks to the HARP program, the Obama administration got the desired results in mortgage modifications. At the same time, the political imperative to do something dramatic to cure the underwater homeowner problem has declined significantly. At one point, nearly 25% of all homes with mortgages were underwater. Currently, that number is less than 15%, and only 6% are significantly underwater. With home prices forecast to continue to rise modestly, the underwater homeowner is being cured naturally. The one caveat: the improvement in the housing market has also returned the GSEs to reasonable health, and FHLMC and FNMA have nearly completely repaid the government’s initial investment from 2008 when they were placed into receivership. For the foreseeable future, the GSEs will be net cash generators for the federal government. The Obama Administration could use some of these profits for more aggressive loan modifications. All said, what this certainly means is that housing reform is likely to take a back seat once again, as Congress faces more pressing problems with debt and entitlement reforms.
| |
| Portfolio composition is subject to change. |
| |
Past performance does not guarantee future results. Investments returns and net asset values will fluctuate so that an investor’s shares, when redeemed, may be worth more or less than original cost. |
MARKET OVERVIEW
October 31, 2013
As for 2014, we expect a year of increased volatility. After several years of growth hovering around 2% in the U.S., a number of headwinds have been removed. QE is nearing its end; investors should start to think hard about what they believe to be market based levels on nominal, long term interest rates because, in our view, the Fed will wind down its QE program throughout 2014 and U.S. Treasury and mortgage rates will, for the first time in several years, be solely dominated by the forces of inflation and real GDP. We thank all of our shareholders for allowing us to assist them with their investment needs, and look forward to serving you in the future.
This report has been prepared to provide information to the shareholders of the Funds and must be preceded or accompanied by the Prospectus. It should not be construed as an offering to sell or buy any shares of the Funds. Such an offering is made only by the Prospectus. You may obtain a current copy of the Prospectus by calling 1-800-247-9780 or at AMF’s website (www.amffunds.com). Investors should consider the investment objectives, risks and expenses of the Funds before investing. Read the Prospectus carefully before you invest. Like all Mutual Funds, the AMF Funds are not FDIC insured, may lose value and have no bank guarantee.
| |
| Portfolio composition is subject to change. |
| |
Past performance does not guarantee future results. Investments returns and net asset values will fluctuate so that an investor’s shares, when redeemed, may be worth more or less than original cost. |
ASSET MANAGEMENT FUND REVIEW
October 31, 2013
Ultra Short Mortgage Fund
With nearly zero interest rate volatility on the front part of the yield curve, the Fund focused on securities that we believed would provide stable, prepayment protected yields. The Fund’s holdings are mainly seasoned government agency hybrid ARMs. Many of the loans backing these pools provide the borrower with a monthly mortgage payment below that available from fixed mortgage rates, which helps to keep their refinancing risk relatively low. However, the federal government’s enhancements to the HARP Program (“Home Affordable Refinance Program”) in late 2012 did raise prepayments rates on most government mortgage securities, negatively impacting the returns of the Fund. Once interest rates rose in the second half of the fiscal year, prepayment rates declined markedly, allowing the Fund to retain more of its coupon income and positively impacted performance. The Fund’s focus continues to be on seasoned loans which have a variety of impediments to refinancing. This strategy allows the Fund to maintain a relatively attractive yield compared to newly issued securities. The Fund benefitted substantially from a number of litigation recoveries associated with private label mortgage-backed securities. The Fund was ranked in the 55th percentile and the 5th percentile of the Morningstar Ultrashort Bond category* for the one-year periods ended October 31, 2012 and October 31, 2013, respectively.
Portfolio composition is subject to change.
Past performance does not guarantee future results. Investments returns and net asset values will fluctuate so that an investor’s shares, when redeemed, may be worth more or less than original cost.
| | * | The Morningstar category is assigned based on the underlying securities in each portfolio. Morningstar places funds in a given category based on their portfolio statistics and compositions over the past three years. When necessary, Morningstar may change a category assignment based on recent changes to the portfolio. Morningstar has classified the Ultra Short Mortgage Fund in the Ultrashort Bond category. The Morningstar percentile rankings were based on 111 funds and 130 funds on 10/31/12 and 10/31/13, respectively. The one, three, five and ten year percentile rankings for the Ultra Short Fund in the Morningstar Ultrashort Bond category as of 10/31/12 and 10/31/13 were as follows: |
| | 1yr | 3yr | 5yr | 10yr |
| 10/31/12 | 55th | 16th | 98th | 96th |
| 10/31/13 | 5th | 18th | 91st | 92nd |
| | | The percentile rankings shown reflect any expenses that were voluntarily reduced during the periods presented and litigation recoveries received in the current fiscal year associated with private label mortgage-backed securities. In such instances, and without this activity, the percentile rankings would have been less favorable. |
ASSET MANAGEMENT FUND REVIEW
October 31, 2013
Ultra Short Fund
With nearly zero interest rate volatility on the front part of the yield curve, the Fund focused on securities that we believed would provide stable, prepayment protected yields. The Fund’s holdings are mainly seasoned government agency hybrid ARMs. Many of the loans backing these pools provide the borrower with a monthly mortgage payment below that available from fixed mortgage rates, which helps to keep their refinancing risk relatively low. However, the federal government’s enhancements to the HARP Program (“Home Affordable Refinance Program”) in late 2012 did raise prepayments rates on most government mortgage securities, negatively impacting the returns of the Fund. Once interest rates rose in the second half of the fiscal year, prepayment rates declined markedly, allowing the Fund to retain more of its coupon income and positively impacted performance. The Fund’s focus continues to be on seasoned loans which have a variety of impediments to refinancing. This strategy allows the Fund to maintain a relatively attractive yield compared to newly issued securities. The Fund benefitted substantially from a number of litigation recoveries associated with private label mortgage-backed securities. The Fund was ranked in the 46th percentile and the 2nd percentile of the Morningstar Ultrashort Bond category* for the one-year periods ended October 31, 2012 and October 31, 2013, respectively.
Portfolio composition is subject to change.
Past performance does not guarantee future results. Investments returns and net asset values will fluctuate so that an investor’s shares, when redeemed, may be worth more or less than original cost.
| | * | The Morningstar category is assigned based on the underlying securities in each portfolio. Morningstar places funds in a given category based on their portfolio statistics and compositions over the past three years. When necessary, Morningstar may change a category assignment based on recent changes to the portfolio. Morningstar has classified the Ultra Short Fund in the Ultrashort Bond category. The Morningstar percentile rankings were based on 111 funds and 130 funds on 10/31/12 and 10/31/13, respectively. The one, three, five and ten year percentile rankings for the Ultra Short Fund in the Morningstar Ultrashort Bond category as of 10/31/12 and 10/31/13 were as follows: |
| | 1yr | 3yr | 5yr | 10yr |
| 10/31/12 | 46th | 97th | 100th | 100th |
| 10/31/13 | 2nd | 21st | 100th | 100th |
| | | The percentile rankings shown reflect any expenses that were voluntarily reduced during the periods presented and litigation recoveries received in the current fiscal year associated with private label mortgage-backed securities. In such instances, and without this activity, the percentile rankings would have been less favorable. |
ASSET MANAGEMENT FUND REVIEW
October 31, 2013
Short U.S. Government Fund
With nearly zero interest rate volatility on the front part of the yield curve, the Fund focused on securities that we believed would provide stable, prepayment protected yields. The Fund increased its exposure to seasoned government agency hybrid ARMs throughout the year as a defensive strategy against rising interest rates. From the beginning of 2013 until October, the percentage of floating rate and adjustable rate securities increased from 40% to 63%. Mortgage spreads also widened during the initial increase in interest rates, and since the Fund maintained its spread duration during this period the net asset value has improved as spreads tightened in the last few months of the fiscal year. Also, prepayment rates have declined markedly since interest rates rose this summer, allowing the Fund to retain more of its coupon income and positively impacted performance. The Fund’s focus continues to be on seasoned loans which have a variety of impediments to refinancing. The Fund benefitted slightly from a number of litigation recoveries associated with private label mortgage-backed securities. The Fund was ranked in the 33rd percentile and the 24th percentile of the Morningstar Short Government Bond category* for the one year periods ended October 31, 2012 and October 31, 2013, respectively.
Portfolio composition is subject to change.
Past performance does not guarantee future results. Investments returns and net asset values will fluctuate so that an investor’s shares, when redeemed, may be worth more or less than original cost.
| | * | The Morningstar category is assigned based on the underlying securities in each portfolio. Morningstar places funds in a given category based on their portfolio statistics and compositions over the past three years. When necessary, Morningstar may change a category assignment based on recent changes to the portfolio. Morningstar has classified the Short U. S. Government Fund in the Short Government Bond category. The Morningstar percentile rankings were based on 145 funds and 151 funds on 10/31/12 and 10/31/13, respectively. The one, three, five and ten year percentile rankings for the Short U.S. Government Fund in the Morningstar Short Government Bond category as of 10/31/12 and 10/31/13 were as follows: |
| | 1yr | 3yr | 5yr | 10yr |
| 10/31/12 | 33rd | 63rd | 97th | 91st |
| 10/31/13 | 24th | 44th | 50th | 92nd |
| | | The percentile rankings shown reflect any expenses that were voluntarily or contractually reduced during the periods presented and litigation recoveries received in the current fiscal year associated with private label mortgage-backed securities. In such instances, and without this activity, the percentile rankings would have been less favorable. |
ASSET MANAGEMENT FUND REVIEW
October 31, 2013
Intermediate Mortgage Fund
With nearly zero interest rate volatility on the front part of the yield curve, the Fund focused on securities that we believed would provide stable, prepayment protected yields. The Fund increased its exposure to seasoned government agency hybrid ARMs throughout the year as a defensive strategy against rising interest rates. Mortgage spreads also widened during the initial increase in interest rates, and since the Fund maintained its spread duration during this period the net asset value has improved as spreads tightened in the last few months of the fiscal year. Also, prepayment rates have declined markedly since interest rates rose this summer, allowing the Fund to retain more of its coupon income and positively impacted performance. The Fund’s focus continues to be on seasoned or refinancing-impaired loans which have a variety of impediments to refinancing. For example, the Fund purchased GNMA securities backed by home loans from residences in Puerto Rico. Even though these securities were refinanceable for much of 2013, they have experienced no prepayments. The Fund benefitted substantially from a number of litigation recoveries associated with private label mortgage-backed securities. The Fund was ranked in the 42nd percentile and the 97th percentile of the Morningstar Short-Term Bond category* for the one year periods ended October 31, 2012 and October 31, 2013, respectively.
| |
| Portfolio composition is subject to change. |
Past performance does not guarantee future results. Investments returns and net asset values will fluctuate so that an investor’s shares, when redeemed, may be worth more or less than original cost.
| | | |
| | * | The Morningstar category is assigned based on the underlying securities in each portfolio. Morningstar places funds in a given category based on their portfolio statistics and compositions over the past three years. When necessary, Morningstar may change a category assignment based on recent changes to the portfolio. Morningstar has classified the Intermediate Mortgage Fund in the Short Term Bond category. The Morningstar percentile rankings were based on 436 funds and 465 funds on 10/31/12 and 10/31/13, respectively. The one, three, five and ten year percentile rankings for the Intermediate Mortgage Fund in the Morningstar Short-Term Bond category as of 10/31/12 and 10/31/13 were as follows: |
| | | | | | |
| | | 1yr | 3yr | 5yr | 10yr |
| 10/31/12 | | 42nd | 98th | 100th | 100th |
| 10/31/13 | | 97th | 74th | 100th | 100th |
| | | |
| | | The percentile rankings shown reflect any expenses that were voluntarily or contractually reduced during the periods presented and litigation recoveries received in the current fiscal year associated with private label mortgage-backed securities. In such instances, and without this activity, the percentile rankings would have been less favorable. |
ASSET MANAGEMENT FUND REVIEW
October 31, 2013
U.S. Government Mortgage Fund
The fund sought to maintain a lower than normal interest rate exposure throughout the year due to our expectation that interest rate would rise. While this strategy was beneficial to the Fund as rates rose in the summer, the defensive nature of funds’ holdings also reduced net interest income. The Fund’s holdings are mainly higher coupon, fixed rate securities and refinancing-impaired securities. This strategy has allowed the Fund to maintain a relatively attractive yield compared to newly issued securities. For example, the Fund purchased GNMA securities backed by home loans from residences in Puerto Rico. Even though these securities were refinanceable for much of 2013, they have experienced no prepayments. The Fund also used fixed rate MBS to manage interest rate exposure, and the Fund was generally positioned toward the lower end of its targeted duration range. The Fund was ranked in the 44th percentile and the 76th percentile of the Morningstar Intermediate Government Bond category* for the one year periods ended October 31, 2012 and October 31, 2013, respectively.
On December 11, 2013, the Board of Trustees determined that it is in the best interest of the Shareholders of the U.S. Government Mortgage Fund to liquidate the Fund. The liquidation will commence on January 10, 2014.
| |
| Portfolio composition is subject to change. |
Past performance does not guarantee future results. Investments returns and net asset values will fluctuate so that an investor’s shares, when redeemed, may be worth more or less than original cost.
| | | |
| | * | The Morningstar category is assigned based on the underlying securities in each portfolio. Morningstar places funds in a given category based on their portfolio statistics and compositions over the past three years. When necessary, Morningstar may change a category assignment based on recent changes to the portfolio. Morningstar has classified the U.S. Government Mortgage Fund in the Intermediate Government Bond category. The Morningstar percentile rankings were based on 351 funds and 307 funds on 10/31/12 and 10/31/13, respectively. The one, three, five and ten year percentile rankings for the U.S. Government Mortgage Fund in the Morningstar Intermediate Government Bond category as of 10/31/12 and 10/31/13 were as follows: |
| | | | | | |
| | | 1yr | 3yr | 5yr | 10yr |
| 10/31/12 | | 44th | 97th | 100th | 100th |
| 10/31/13 | | 76th | 88th | 99th | 100th |
| | | |
| | | The percentile rankings shown reflect any expenses that were voluntarily or contractually reduced during the periods presented. In such instances, and without this activity, the percentile rankings would have been less favorable. |
AMF LARGE CAP EQUITY FUND REVIEW
October 31, 2013
During the one-year period ending October 31, 2013, the AMF Large Cap Equity Fund (Class AMF) produced a total return of 23.55%. Total return figures for the Fund’s peer group and benchmark index were 27.16% for the Morningstar Large Blend Category and 27.18% for the Standard & Poor’s 500 Index for the same period. Total return assumes the reinvestment of all dividends and capital gains and the deduction of all applicable fees and expenses. Individual security performance, relative market sector weightings, cash balances and fund expense ratio are the primary drivers of the Fund’s investment return relative to its peer group and index benchmarks.
The Fund contains 28 high quality, large capitalization common stock investments. With its focus on companies that have demonstrated an ability to achieve long-term sustainable earnings and dividend growth, the Fund is more heavily weighted toward sectors of the market that are less cyclical in nature. As such, the Fund tends to be less volatile than the broad market, rising less in a bull market but declining less in a bear market.
We are happy to report that the Fund just celebrated its sixtieth anniversary, making it one of the oldest mutual funds in the country. The Fund’s 23.55% total return this year is the best October 31st 1-year return since 1998, 15 years ago. As of October 31, 2013, the Fund’s annualized total return since inception on June 30, 1953 is 10.51%, more than 700 basis points above inflation. A $10,000 investment at inception would be worth $4,164,563 as of October 31, 2013 assuming the reinvestment of all dividends and capital gains. To put these figures into some perspective, in 1953 $10,000 was equivalent to about half of the cost of a typical new home. Today $4.1 million is equivalent to approximately 16 new homes. The power of long-term compounding is an amazing investment tool.
The domestic economy produced positive growth during this past year, however the overall pace remains sluggish. Gross Domestic Product (GDP) growth made progress throughout the past four quarters rising from 0.1% to 2.8%, although the year-over-year figure amounted to a relatively modest 1.6%. The employment landscape continues to show signs of improvement with the unemployment rate dipping to 7.3% recently. The underemployment rate however, which includes people marginally attached to the labor force and those working part-time but who would prefer full-time employment, remains elevated at 13.8%. The labor participation rate of 62.8% is the lowest it’s been since the 1970’s.
Due to the slow economic progress and the challenging labor market, the Federal Reserve continued its accommodative monetary policy throughout the past year. However, there have been signs that the Fed may begin to reduce its Quantitative Easing policy in the near future. This strategy of purchasing bonds in the open market has kept both short and long-term interest rates at historically low levels. As the market has anticipated the Fed “tapering” its Quantitative Easing program, long-term interest rates have begun to move up from their extremely low levels. This has produced a slight headwind for the recovering housing market as mortgage rates have risen.
From a corporate performance perspective, during the past year S&P 500 revenues grew 4% while profit margins expanded from 8.9% to 9.6%, resulting in operating earnings growth of 5%. This is an improvement over the prior year’s 3% operating earnings growth rate. The stock market’s strong return during the past year was largely attributable to an expansion in the price-to-earnings ratio. Investors were more willing to pay a higher price for each dollar of earnings as recent economic data supported the outlook for further economic improvement. The Fed added to this economic optimism flashing signs of “tapering” its Quantitative Easing program.
The Fund’s investment philosophy focuses on investing in high quality, large capitalization common stocks. We specifically seek to acquire equity stakes in established companies that we believe have the ability to produce long-term sustainable earnings and dividend growth at favorable valuations for long-term ownership. We believe that this is a prudent way for investors to accumulate wealth over the long-term and benefit from the mathematical merits of compounding. As of October 31, 2013, the portfolio’s 28 holdings had a weighted average earnings yield of 6.08% (12-month trailing earnings divided by the closing stock price on 10/31/13). The weighted average 5-year historical earnings growth rate for these holdings was 7.10%. The weighted average dividend yield of our current portfolio holdings was 2.34%. Over the previous 5-year period, the growth rate of these dividends has been 8.07% on a weighted average basis. The return on equity for our portfolio holdings on a weighted average basis was 25.16% as of October 31, 2013. The current earnings and dividend yields available in the equity market are attractive relative to the “risk-free” alternatives available in the U.S. Treasury market. While price-to-earnings ratios have expanded during the past few years, they remain in line with the 60-year historical average.
Our portfolio turnover of 5% during the past year is evidence of our long-term investment horizon. There are three primary reasons why we will choose to make changes in portfolio composition: valuations, fundamentals and relative opportunities. In late
| |
| Portfolio composition is subject to change. |
Past performance does not guarantee future results. Investment return and net asset value will fluctuate so that an investor’s shares, when redeemed, may be worth more or less than the original cost.
AMF LARGE CAP EQUITY FUND REVIEW
October 31, 2013
2012, we eliminated Cisco Systems and Home Depot from the portfolio. Cisco was eliminated primarily for fundamental reasons and secondarily for valuation. Its revenue and earnings growth were continuing to decelerate as its core server and switch markets have matured. New competitors have been entering the market with alternative software solutions that risk diminishing the value of Cisco’s core hardware product lines. Management has attempted to diversify the company’s business although success has been limited. For these reasons, along with the fact that its stock price reflected our estimate of fair market value, we chose to eliminate the position. Home Depot’s valuation exceeded our estimated fair value as its stock price had risen significantly over the prior 18 months. In our opinion, this lofty valuation discounted a significant portion of its future return potential.
During the past year, long-term holding Abbott Labs spun off its research-based pharmaceutical business into a new company called AbbVie. The “new” Abbott Labs consists of the remaining business units, including Nutritionals, Diabetes Care, Vascular and other medical devices and products. AbbVie is highly reliant on its blockbuster drug Humira for a majority of its revenues and profits. With so much riding on the success of one product, we felt it was best for the Fund to eliminate AbbVie from the portfolio after the spinoff and realize the capital appreciation accumulated over the Fund’s 15+ year holding period. Shares of the remaining Abbott Labs company were retained in the portfolio as this business is more reflective of the type of high quality, stable investment the Fund seeks.
In the relative opportunities category, early in 2013 we eliminated General Dynamics in exchange for Emerson Electric, both in the Industrial sector of the portfolio. General Dynamics is a major defense contractor as well as the manufacturer of Gulf-stream business jets. With so much of its revenue dependent on the Department of Defense and subject to cuts by the U.S. government, its projected revenue growth has been on the decline. It will be difficult for the Gulfstream business to offset these large potential headwinds. Given its weakening business environment and fair valuation, the position was used as a source of funds to purchase Emerson Electric. Emerson is a high quality company that has demonstrated an ability to deliver long-term sustainable earnings and dividend growth. It is a well diversified industrial company with multiple business units including Process Management, Industrial Automation, Network Power, Climate Technologies and Commercial and Residential Solutions. At the time of purchase, the shares were favorably valued and offered an attractive dividend yield.
A second opportunistic transaction occurred toward the end the period when we eliminated Sysco (the food distribution company) in the Consumer Staples sector and purchased Schlumberger in the Energy sector. Sysco had been in the Fund for over 17 years. It was a model of consistent earnings and dividend growth over a majority of that period, up until the past few years. The recession injured their client base, many of which are restaurants. Moreover, it has also been conducting a business transformation project for an extensive period of time that has not met objectives. Management recently announced that next year’s earnings would fall below expectations. We chose to realize our large capital gains in this long-term holding, which had the added effect of reducing our large market overweighting in the Consumer Staples sector. Schlumberger is an oilfield services company that has a worldwide footprint and dominates its industry. It is involved in all aspects of exploration and production for the oil and natural gas industry including reservoir characterization, drilling and servicing, along with reservoir production. This company compliments our other energy sector holdings which include Chevron and Exxon Mobil. As new oil and gas reserves become harder to locate and extract, demand for Schlumberger’s technology and service capabilities continues to increase.
In addition to the companies mentioned above, a number of other holdings were reduced during the year due to rising valuations after strong performance and/or due to their large weighting in the portfolio. Some of the larger reductions included Berkshire Hathaway, American Express, Microsoft, Procter & Gamble, Johnson & Johnson and United Technologies. All of these companies, however, continue to be core holdings in the portfolio.
As always, the Fund’s portfolio management team continues its focus on common stock investments that offer the opportunity for long-term sustainable earnings and dividend growth, making additions to the portfolio when valuations are attractive, in pursuit of long-term wealth creation with subdued volatility.
| |
| Portfolio composition is subject to change. |
Past performance does not guarantee future results. Investment return and net asset value will fluctuate so that an investor’s shares, when redeemed, may be worth more or less than the original cost.
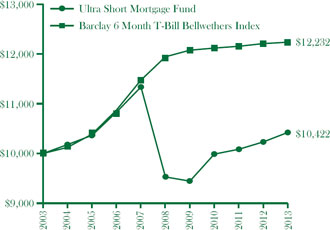
Investment Comparison (Unaudited)
Comparison of change in value of a hypothetical $10,000 investment for the years ended October 31
| | | | | | | |
| | | | | | |
| Ultra Short Mortgage Fund | | | |
| | | | |
 | | Gross Expense Ratio | Net Expense Ratio |
| | 1.03% | 0.73% |
| | | | | |
| | The above expense ratios are from the Fund’s prospectus dated March 1, 2013. As indicated in the difference between the gross and net expense ratio, voluntary fee waivers were in effect from November 1, 2012 through October 31, 2013. Additional information pertaining to the Fund’s expense ratios as of October 31, 2013 can be found in the Financial Highlights. |
| | | | | |
| | Average Annual Total Return |
| | Periods Ending October 31, 2013 |
| | | | | |
| | | One | Five | Ten |
| | | Year | Year | Year |
| | Ultra Short Mortgage Fund(1) | 1.86% | 1.81% | 0.41% |
| | Barclay 6 Month T-Bill | | | |
| | Bellwethers Index | 0.20% | 0.42% | 2.06% |
| | | | | |
| | | | | | |
| | (1) During the fiscal year ended October, 31, 2013, the Ultra Short Mortgage Fund received monies related to certain nonrecurring litigation settlements. If these monies were not received, the One Year return would have been –0.20%. The Five Year and Ten Year returns would also have been lower. See Notes to the Financial Statements for more information. |
| | | | | | |
| | | | | | |
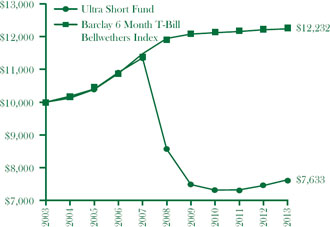
| Ultra Short Fund | | | | | |
| | | | |
 | | Gross Expense Ratio | Net Expense Ratio |
| | 1.19% | 0.89% |
| | | | | |
| | The above expense ratios are from the Fund’s prospectus dated March 1, 2013. As indicated in the difference between the gross and net expense ratio, voluntary fee waivers were in effect from November 1, 2012 through October 31, 2013. Additional information pertaining to the Fund’s expense ratios as of October 31, 2013 can be found in the Financial Highlights. |
| | | | | |
| | Average Annual Total Return |
| | Periods Ending October 31, 2013 |
| | | | | |
| | | One | Five | Ten |
| | | Year | Year | Year |
| | Ultra Short Fund(2) | 2.37% | –2.28% | –2.67% |
| | Barclay 6 Month T-Bill | | | |
| | Bellwethers Index | 0.20% | 0.42% | 2.06% |
| | | | | | |
| | (2) During the fiscal year ended October, 31, 2013, the Ultra Short Fund received monies related to certain nonrecurring litigation settlements. If these monies were not received, the One Year, Five Year returns would have been –0.98% and –2.92%, respectively. The Ten Year return would also have been lower. See Notes to the Financial Statements for more information. |
| | | | | | | |
| | | | | | | |
Past performance does not guarantee future results. The performance data quoted represents past performance and current returns may be lower or higher. Performance figures in the table and graph do not reflect the deduction of taxes that a shareholder would pay on the Fund distributions or the redemption of Fund shares. The Barclay 6 Month T-Bill Bellwethers Index is an unmanaged index comprised of U.S. Government Treasury Bonds with an average maturity of six months. The index represents unmanaged groups of bonds that differ from the composition of each AMF Fund. The index does not include a reduction in return for expenses. Investors cannot invest directly in an index, although they can invest in its underlying securities. To obtain current month-end performance information for any of the AMF Funds, please call 1-800-247-9780. |
Investment Comparison (Unaudited)
Comparison of change in value of a hypothetical $10,000 investment for the years ended October 31
| | | | | | | |
| | | | | | | |
| Short U.S. Government Fund | | | | | |
| | | | |
 | | Gross Expense Ratio | Net Expense Ratio |
| | 0.78% | 0.75% |
| | | | | |
| | The above expense ratios are from the Fund’s prospectus dated March 1, 2013. As indicated in the difference between the gross and net expense ratio, voluntary and contractual fee waivers are in effect from March 1, 2013 through February 28th, 2014. Additional information pertaining to the Fund’s expense ratios as of October 31, 2013 can be found in the Financial Highlights. |
| | | | | |
| | Average Annual Total Return |
| | Periods Ending October 31, 2013 |
| | | | | |
| | | One | Five | Ten |
| | | Year | Year | Year |
| | Short U.S. Government Fund(1) | –0.14% | 2.08% | 1.66% |
| | Barclay 1-3 Year U.S. Government | | | |
| | Bond Index | 0.53% | 1.48% | 2.63% |
| | | | | | |
| | (1) During the fiscal year ended October, 31, 2013, the Short U.S. Government Fund received monies related to certain nonrecurring litigation settlements. If these monies were not received, the returns presented would have been lower. See Notes to the Financial Statements for more information. |
| | | | | | |
| | | | | | |
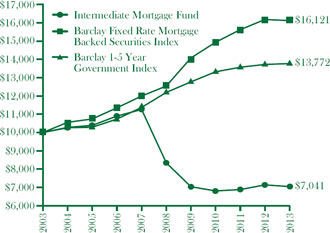
| Intermediate Mortgage Fund | | | | | |
| | | | |
 | | Gross Expense Ratio | Net Expense Ratio |
| | 0.89% | 0.75% |
| | | | | |
| | The above expense ratios are from the Fund’s prospectus dated March 1, 2013. As indicated in the difference between the gross and net expense ratio, voluntary and contractual fee waivers are in effect from March 1, 2013 through February 28th, 2014. Additional information pertaining to the Fund’s expense ratios as of October 31, 2013 can be found in the Financial Highlights. |
| | | | | |
| | Average Annual Total Return |
| | Periods Ending October 31, 2013 |
| | | | | |
| | | One | Five | Ten |
| | | Year | Year | Year |
| | Intermediate Mortgage Fund(2) | –1.31% | –3.33% | –3.45% |
| | Barclay Fixed Rate Mortgage | | | |
| | Backed Securities Index | –0.38% | 5.15% | 4.89% |
| | Barclay 1-5 Year Government Index | 0.35% | 2.28% | 3.20% |
| | | | | | |
| | (2) During the fiscal year ended October, 31, 2013, the Intermediate Mortgage Fund received monies related to certain nonrecurring litigation settlements. If these monies were not received, the One Year, Five Year returns would have been –2.65% and –3.59%, respectively. The Ten Year return would also have been lower. See Notes to the Financial Statements for more information. |
| | | |
| | | |
Past performance does not guarantee future results. The performance data quoted represents past performance and current returns may be lower or higher. Performance figures in the table and graph do not reflect the deduction of taxes that a shareholder would pay on the Fund distributions or the redemption of Fund shares. The Barclay 1-3 Year U.S. Government Bond Index is an unmanaged index generally representative of government securities with maturities of one to three years. The Barclay Fixed Rate Mortgage Backed Securities Index is a broad-based unmanaged index that represents the general performance of fixed rate mortgage bonds. The Barclay 1-5 Year Government Index is an unmanaged index generally representative of government securities with maturities of one to five years. The indices represent unmanaged groups of bonds that differ from the composition of each AMF Fund. The indices do not include a reduction in return for expenses. Investors cannot invest directly in an index, although they can invest in its underlying securities. To obtain current month-end performance information for any of the AMF Funds, please call 1-800-247-9780. |
Investment Comparison (Unaudited)
Comparison of change in value of a hypothetical $10,000 investment for the years ended October 31
| | | | | | | |
| | | | | | | |
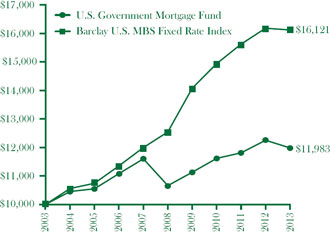
| U.S. Government Mortgage Fund | | | | | |
| | | | | | |
 | | Gross Expense Ratio | Net Expense Ratio |
| | 0.78% | 0.75% |
| | | | | |
| | The above expense ratios are from the Fund’s prospectus dated March 1, 2013. As indicated in the difference between the gross and net expense ratio, voluntary and contractual fee waivers are in effect from March 1, 2013 through February 28th, 2014. Additional information pertaining to the Fund’s expense ratios as of October 31, 2013 can be found in the Financial Highlights. |
| | | | | |
| | Average Annual Total Return |
| | Periods Ending October 31, 2013 |
| | | | | |
| | | One | Five | Ten |
| | | Year | Year | Year |
| | U.S. Government Mortgage Fund | –2.19% | 2.37% | 1.82% |
| | Barclay Fixed Rate Mortgage | | | |
| | Backed Securities Index | –0.38% | 5.15% | 4.89% |
| | | | | | | |
| | | | | | | |
Past performance does not guarantee future results. The performance data quoted represents past performance and current returns may be lower or higher. Performance figures in the table and graph do not reflect the deduction of taxes that a shareholder would pay on the Fund distributions or the redemption of Fund shares. The Barclay Fixed Rate Mortgage Backed Securities Index is a broad-based unmanaged index that represents the general performance of fixed rate mortgage bonds. The index represents unmanaged groups of bonds that differ from the composition of each AMF Fund. The index does not include a reduction in return for expenses. Investors cannot invest directly in an index, although they can invest in its underlying securities. To obtain current month-end performance information for any of the AMF Funds, please call 1-800-247-9780. |
Investment Comparison (Unaudited)
Comparison of change in value of a hypothetical $10,000 investment for the years ended October 31
| | | | | | | |
| | | | | | |
| Large Cap Equity Fund | | | | | |
| | | | | | |
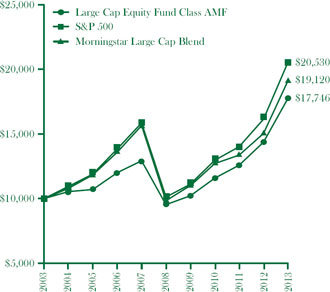
| The following graph shows that an investment of $10,000 in the Class AMF of the Fund on October 31, 2003 would have been worth $17,746 on October 31, 2013, assuming all dividends and distributions had been reinvested. A similar investment in the S&P 500, over the same period, would have been to $20,530. A similar investment in the Morningstar Large Cap Blend, over the same period, would have worth to $19,120. | | Gross Expense Ratio Class AMF 1.30% Class H 1.05% | Net Expense Ratio Class AMF 1.20% Class H 1.05% |
| | | | |
 | | The above expense ratios are from the Fund’s prospectus dated March 1, 2013. As indicated in the difference between the gross and net expense ratio for Class AMF, voluntary fee waivers were in effect from November 1, 2012 through October 31, 2013. Additional information pertaining to the Fund’s expense ratios as of October 31, 2013 can be found in the Financial Highlights. |
| | | | | | |
| | Average Annual Total Return |
| | Periods Ending October 31, 2013* |
| | | | | | |
| | | One | Five | Ten | Since |
| | | Year | Year | Year | Inception |
| | Class AMF(1) | 23.55% | 13.23% | 5.90% | 10.51% |
| | Class H(2) | 23.74% | N/A | N/A | 19.17% |
| | Morningstar Large Cap Blend | 27.16% | 14.24% | 6.69% | |
| | S&P 500 | 27.18% | 15.17% | 7.46% | 21.75%(3) |
| | | | | | | |
| | * Assumes reinvestment of all dividends and distributions and the deduction of all applicable fees and expenses. Average annual returns are stated for periods greater than one year. The S&P 500 does not include a reduction in total return for expenses. |
| | (1) Class AMF of the Fund commenced operations on June 30, 1953. |
| | (2) Class H of the Fund commenced operations on February 20, 2009. |
| | (3) Return presented is for the period from February 20, 2009 to October 31, 2013. |
| | | | | | | |
| | | | | | | |
Past performance does not guarantee future results. The performance data quoted represents past performance and current returns may be lower or higher. Performance figures in the table and graph do not reflect the deduction of taxes that a shareholder would pay on the Fund distributions or the redemption of Fund shares. The Morningstar Large Cap Blend Average consists of funds that, by portfolio practice, invest at least 70% of assets in domestic stocks in the top 70% of the capitalization of the U.S. equity market. These portfolios tend to invest across the spectrum of U.S. industries, and owing to their broad exposure, the portfolios’ returns are often similar to those of the S&P 500 Index. The Standard & Poors 500 Index is an unmanaged index, generally representative of the U.S. stock market as a whole. Each of these indices represents an unmanaged group of securities that differ from the composition of each AMF Fund. Investors cannot invest directly in an index, although they can invest in its underlying securities. To obtain current month-end performance information for any of the AMF Funds, please call 1-800-247-9780. |
ASSET MANAGEMENT FUND
ULTRA SHORT MORTGAGE FUND
SCHEDULE OF INVESTMENTS
October 31, 2013
| | |
Percentage | | | | | | | | |
| | | of Net | | Maturity | | Principal | | | | |
| | | Assets | | Date | | Amount | | | Value | |
| ADJUSTABLE RATE MORTGAGE-RELATED SECURITIES* | | | 88.3 | % | | | | | | | | |
| 1 Yr. Constant Maturity Treasury Based ARMS | | | 45.6 | % | | | | | | | | |
| Fannie Mae | | | | | | | | | | | | |
| 2.49% | | | | | | 7/1/28 | | $ | 1,586,373 | | | $ | 1,659,069 | |
| 2.07% | | | | | | 8/1/29 | | | 1,130,101 | | | | 1,166,157 | |
| 2.30% | | | | | | 3/1/30 | | | 190,853 | | | | 199,301 | |
| 2.37% | | | | | | 5/1/33 | | | 609,207 | | | | 641,001 | |
| 2.47% | | | | | | 9/1/33 | | | 2,107,241 | | | | 2,205,702 | |
| 2.30% | | | | | | 1/1/35 | | | 5,179,078 | | | | 5,464,046 | |
| 2.37% | | | | | | 1/1/35 | | | 4,079,019 | | | | 4,315,847 | |
| 2.50% | | | | | | 9/1/36 | | | 10,618,502 | | | | 11,286,077 | |
| 2.60% | | | | | | 6/1/37 | | | 16,341,064 | | | | 17,402,220 | |
| 2.29% | | | | | | 9/1/38 | | | 7,122,328 | | | | 7,559,226 | |
| 2.36% | | | | | | 9/1/38 | | | 20,754,003 | | | | 22,066,257 | |
| Fannie Mae Grantor Trust | | | | | | | | | | | | | | |
| 3.54% | | | | | | 5/25/42 | | | 6,839,431 | | | | 7,318,192 | |
| 2.86% | | | | | | 8/25/43 | | | 8,292,179 | | | | 8,684,730 | |
| Fannie Mae Whole Loan | | | | | | | | | | | | | | |
| 3.06% | | | | | | 8/25/42 | | | 7,575,811 | | | | 7,992,345 | |
| 3.63% | | | | | | 8/25/42 | | | 3,051,806 | | | | 3,259,176 | |
| 2.69% | | | | | | 4/25/45 | | | 13,186,765 | | | | 13,996,830 | |
| Freddie Mac | | | | | | | | | | | | | | |
| 2.24% | | | | | | 10/1/22 | | | 394,242 | | | | 404,194 | |
| 2.28% | | | | | | 9/1/27 | | | 758,851 | | | | 782,723 | |
| 2.24% | | | | | | 9/1/28 | | | 5,585,496 | | | | 5,792,534 | |
| 2.26% | | | | | | 9/1/30 | | | 411,246 | | | | 421,478 | |
| 2.39% | | | | | | 7/1/31 | | | 2,714,710 | | | | 2,801,500 | |
| | | | | | | | | | | | | | 125,418,605 | |
| 12 Mo. London Interbank Offering Rate (LIBOR) | | | 25.9 | % | | | | | | | | | | |
| Fannie Mae | | | | | | | | | | | | | | |
| 2.59% | | | | | | 8/1/37 | | | 25,199,559 | | | | 26,905,519 | |
| 2.27% | | | | | | 9/1/37 | | | 6,559,308 | | | | 6,970,229 | |
| 2.71% | | | | | | 10/1/37 | | | 3,654,038 | | | | 3,907,536 | |
| 2.44% | | | | | | 7/1/38 | | | 7,867,713 | | | | 8,413,536 | |
| 4.35% | | | | | | 5/1/39 | | | 10,910,008 | | | | 11,625,715 | |
| Freddie Mac | | | | | | | | | | | | | | |
| 2.54% | | | | | | 5/1/39 | | | 12,503,580 | | | | 13,371,015 | |
| | | | | | | | | | | | | | 71,193,550 | |
| 6 Mo. Certificate of Deposit Based ARMS | | | 0.8 | % | | | | | | | | | | |
| Fannie Mae | | | | | | | | | | | | | | |
| 1.25% | | | | | | 6/1/21 | | | 538,979 | | | | 542,099 | |
| 1.72% | | | | | | 12/1/24 | | | 1,138,622 | | | | 1,164,247 | |
| Freddie Mac | | | | | | | | | | | | | | |
| 1.94% | | | | | | 1/1/26 | | | 510,926 | | | | 525,807 | |
| | | | | | | | | | | | | | 2,232,153 | |
| 6 Mo. London Interbank Offering Rate (LIBOR) | | | 3.9 | % | | | | | | | | | | |
| Fannie Mae | | | | | | | | | | | | | | |
| 1.66% | | | | | | 9/1/27 | | | 2,239,154 | | | | 2,292,956 | |
| 1.71% | | | | | | 3/1/28 | | | 1,938,557 | | | | 1,974,954 | |
| 2.25% | | | | | | 6/1/28 | | | 284,805 | | | | 295,032 | |
| 1.57% | | | | | | 9/1/33 | | | 1,180,522 | | | | 1,206,208 | |
| 1.73% | | | | | | 11/1/33 | | | 948,135 | | | | 972,271 | |
| 1.75% | | | | | | 11/1/33 | | | 1,898,847 | | | | 1,947,885 | |
| | | | | | | | | | | | | | | |
See notes to financial statements.
ASSET MANAGEMENT FUND
ULTRA SHORT MORTGAGE FUND
SCHEDULE OF INVESTMENTS
October 31, 2013
| | |
Percentage | | | | | | | |
| | | of Net | | Maturity | | Principal | | | |
| | | Assets | | Date | | Amount | | Value | |
| Freddie Mac | | | | | | | | | | | |
| 2.55% | | | | | | 9/1/30 | | $ | 1,936,207 | | $ | 2,069,420 | |
| | | | | | | | | | | | | 10,758,726 | |
| Cost of Funds Index Based ARMS | | | 10.0 | % | | | | | | | | | |
| Fannie Mae | | | | | | | | | | | | | |
| 3.16% | | | | | | 2/1/28 | | | 9,094,559 | | | 9,581,764 | |
| 2.20% | | | | | | 8/1/33 | | | 5,586,830 | | | 5,798,794 | |
| 2.94% | | | | | | 11/1/36 | | | 6,192,219 | | | 6,604,199 | |
| 2.20% | | | | | | 6/1/38 | | | 5,207,521 | | | 5,405,475 | |
| | | | | | | | | | | | | 27,390,232 | |
| SBA Pool Floaters | | | 2.1 | % | | | | | | | | | |
| Small Business Administration Pool | | | | | | | | | | | | | |
| 3.36% | | | | | | 10/25/38 | | | 4,989,341 | | | 5,709,647 | |
TOTAL ADJUSTABLE RATE MORTGAGE-RELATED SECURITIES | | | | | | | | | | | | 242,702,913 | |
| FIXED RATE MORTGAGE-RELATED SECURITIES | | | 5.6 | % | | | | | | | | | |
| 15 Yr. Securities | | | 0.9 | % | | | | | | | | | |
| Fannie Mae | | | | | | | | | | | | | |
| 2.50% | | | | | | 10/1/27 | | | 2,548,774 | | | 2,539,784 | |
| Collateralized Mortgage Obligations | | | 4.7 | % | | | | | | | | | |
| Fannie Mae | | | | | | | | | | | | | |
| 5.00% | | | | | | 2/25/18 | | | 2,024,477 | | | 2,138,985 | |
| 4.00% | | | | | | 10/25/23 | | | 989,549 | | | 1,016,907 | |
| 5.00% | | | | | | 3/25/24 | | | 2,861,929 | | | 3,047,016 | |
| Freddie Mac | | | | | | | | | | | | | |
| 4.00% | | | | | | 6/15/36 | | | 6,473,388 | | | 6,758,463 | |
| | | | | | | | | | | | | 12,961,371 | |
| TOTAL FIXED RATE MORTGAGE-RELATED SECURITIES | | | | | | | | | | | | 15,501,155 | |
| | | | | | | | | | | | | | |
| | | Percentage | | | | | | | | | |
| | | of Net | | | | | | | | | |
| | | Assets | | | | Shares | | Value | |
| INVESTMENT COMPANIES | | | 0.0 | % | | | | | | | | | |
| Northern Institutional Treasury Portfolio, 0.01% | | | | | | | | | 823 | | $ | 823 | |
| TOTAL INVESTMENT COMPANIES | | | | | | | | | | | | 823 | |
| | | | | | | | | | | | | | |
| | | | | | | | | | | | | | |
| See notes to financial statements. | | | | | | | | | | | | | |
ASSET MANAGEMENT FUND
ULTRA SHORT MORTGAGE FUND (concluded)
SCHEDULE OF INVESTMENTS
October 31, 2013
| | | | | | | | | |
| | |
Percentage | | | | | | |
| | | of Net | | Principal | | | | |
| | | Assets | | Amount | | | Value | |
| REPURCHASE AGREEMENTS | | | 5.9 | % | | | | | | |
Bank of America, 0.08%, (Agreement dated 10/31/13 to be repurchased at $16,167, 036 on 11/1/13 | | | | | | $ | 16,167,000 | | | $ | 16,167,000 | |
| TOTAL REPURCHASE AGREEMENTS | | | | | | | | | | | 16,167,000 | |
| TOTAL INVESTMENTS | | | | | | | | | | | | |
| (Cost $268,948,008) | | | 99.8 | % | | | | | | | 274,371,891 | |
| NET OTHER ASSETS (LIABILITIES) | | | 0.2 | % | | | | | | | 490,083 | |
| NET ASSETS | | | 100.0 | % | | | | | | $ | 274,861,974 | |
| | | | | | | | | | | | | |
* The rates presented are the rates in effect at October 31, 2013.
See notes to financial statements.
ASSET MANAGEMENT FUND
ULTRA SHORT FUND
SCHEDULE OF INVESTMENTS
October 31, 2013
| | |
Percentage | | | | | | | | |
| | | of Net | | Maturity | | Principal | | | | |
| | | Assets | | Date | | Amount | | | Value | |
| ADJUSTABLE RATE MORTGAGE-RELATED SECURITIES* | | | 88.0 | % | | | | | | | | |
| 1 Yr. Constant Maturity Treasury Based ARMS | | | 47.0 | % | | | | | | | | |
| Fannie Mae | | | | | | | | | | | | |
| 2.28% | | | | | | 10/1/28 | | $ | 100,268 | | | $ | 104,639 | |
| 2.66% | | | | | | 12/1/30 | | | 328,540 | | | | 347,049 | |
| 2.27% | | | | | | 7/1/33 | | | 409,671 | | | | 423,245 | |
| 2.36% | | | | | | 9/1/38 | | | 830,248 | | | | 882,744 | |
| Freddie Mac | | | | | | | | | | | | | | |
| 2.37% | | | | | | 11/1/28 | | | 103,139 | | | | 108,386 | |
| 2.89% | | | | | | 1/1/29 | | | 441,167 | | | | 468,076 | |
| 2.28% | | | | | | 7/1/30 | | | 283,754 | | | | 294,326 | |
| 2.38% | | | | | | 9/1/30 | | | 55,091 | | | | 57,917 | |
| 2.53% | | | | | | 8/1/31 | | | 654,888 | | | | 683,781 | |
| | | | | | | | | | | | | | 3,370,163 | |
| 12 Mo. London Interbank Offering Rate (LIBOR) | | | 41.0 | % | | | | | | | | | | |
| Fannie Mae | | | | | | | | | | | | | | |
| 2.59% | | | | | | 8/1/37 | | | 1,296,690 | | | | 1,384,474 | |
| 2.27% | | | | | | 9/1/37 | | | 470,290 | | | | 499,752 | |
| 2.71% | | | | | | 10/1/37 | | | 935,587 | | | | 1,000,493 | |
| 4.35% | | | | | | 5/1/39 | | | 52,180 | | �� | | 55,603 | |
| | | | | | | | | | | | | | 2,940,322 | |
| TOTAL ADJUSTABLE RATE MORTGAGE-RELATED SECURITIES | | | | | | | | | | | | | 6,310,485 | |
| | | | | | | | | | | | | | | |
| | | Percentage | | | | | | | | | | |
| | | of Net | | | | | | | | | | |
| | | Assets | | | | Shares | | | Value | |
| INVESTMENT COMPANIES | | | 11.6 | % | | | | | | | | | | |
| Northern Institutional Treasury Portfolio, 0.01% | | | | | | | | | 830,641 | | | $ | 830,641 | |
| TOTAL INVESTMENT COMPANIES | | | | | | | | | | | | | 830,641 | |
| TOTAL INVESTMENTS | | | | | | | | | | | | | | |
| (Cost $7,053,906) | | | 99.6 | % | | | | | | | | | 7,141,126 | |
| OTHER NET ASSETS (LIABILITIES) | | | 0.4 | % | | | | | | | | | 27,522 | |
| NET ASSETS | | | 100.0 | % | | | | | | | | $ | 7,168,648 | |
| | | | | | | | | | | | | | | |
* The rates presented are the rates in effect at October 31, 2013.
See notes to financial statements.
ASSET MANAGEMENT FUND
SHORT U.S. GOVERNMENT FUND
SCHEDULE OF INVESTMENTS
October 31, 2013
| | |
Percentage | | | | | | | | |
| | | of Net | | Maturity | | Principal | | | | |
| | | Assets | | Date | | Amount | | | Value | |
| ADJUSTABLE RATE MORTGAGE-RELATED SECURITIES* | | | 62.8 | % | | | | | | | | |
| 1 Yr. Constant Maturity Treasury Based ARMS | | | 25.7 | % | | | | | | | | |
| Fannie Mae | | | | | | | | | | | | |
| 2.56% | | | | | | 5/1/31 | | $ | 476,535 | | | $ | 502,741 | |
| 2.37% | | | | | | 1/1/35 | | | 348,870 | | | | 369,126 | |
| 2.50% | | | | | | 9/1/36 | | | 493,884 | | | | 524,934 | |
| Fannie Mae Grantor Trust | | | | | | | | | | | | | | |
| 3.54% | | | | | | 5/25/42 | | | 774,206 | | | | 828,400 | |
| 2.86% | | | | | | 8/25/43 | | | 1,619,314 | | | | 1,695,972 | |
| Freddie Mac | | | | | | | | | | | | | | |
| 2.36% | | | | | | 3/1/27 | | | 234,528 | | | | 243,776 | |
| 2.53% | | | | | | 8/1/31 | | | 955,157 | | | | 997,297 | |
| | | | | | | | | | | | | | 5,162,246 | |
| 12 Mo. London Interbank Offering Rate (LIBOR) | | | 37.1 | % | | | | | | | | | | |
| Fannie Mae | | | | | | | | | | | | | | |
| 2.27% | | | | | | 9/1/37 | | | 940,580 | | | | 999,504 | |
| 2.71% | | | | | | 10/1/37 | | | 1,590,498 | | | | 1,700,839 | |
| 2.36% | | | | | | 9/1/38 | | | 1,487,528 | | | | 1,581,583 | |
| 4.35% | | | | | | 5/1/39 | | | 391,346 | | | | 417,019 | |
| Freddie Mac | | | | | | | | | | | | | | |
| 2.54% | | | | | | 5/1/39 | | | 2,568,596 | | | | 2,746,793 | |
| | | | | | | | | | | | | | 7,445,738 | |
TOTAL ADJUSTABLE RATE MORTGAGE-RELATED SECURITIES | | | | | | | | | | | | | 12,607,984 | |
| FIXED RATE MORTGAGE-RELATED SECURITIES | | | 27.5 | % | | | | | | | | | | |
| 10 Yr. Securities | | | 6.8 | % | | | | | | | | | | |
| Fannie Mae | | | | | | | | | | | | | | |
| 3.50% | | | | | | 7/1/21 | | | 1,286,372 | | | | 1,362,312 | |
| 15 Yr. Securities | | | 14.1 | % | | | | | | | | | | |
| Fannie Mae | | | | | | | | | | | | | | |
| 3.00% | | | | | | 1/1/27 | | | 2,711,357 | | | | 2,818,944 | |
| Freddie Mac | | | | | | | | | | | | | | |
| 8.00% | | | | | | 12/17/15 | | | 7,412 | | | | 7,872 | |
| | | | | | | | | | | | | | 2,826,816 | |
| 30 Yr. Securities | | | 6.6 | % | | | | | | | | | | |
| Government National Mortgage Association | | | | | | | | | | | | | | |
| 3.50% | | | | | | 9/15/42 | | | 1,273,740 | | | | 1,324,640 | |
| Collateralized Mortgage Obligations | | | 0.0 | % | | | | | | | | | | |
| Government National Mortgage Association | | | | | | | | | | | | | | |
| 3.96% | | | | | | 6/16/31 | | | 9,954 | | | | 9,960 | |
| TOTAL FIXED RATE MORTGAGE-RELATED SECURITIES | | | | | | | | | | | | | 5,523,728 | |
| | | | | | | | | | | | | | | |
| | | Percentage | | | | | | | | | | |
| | | of Net | | | | | | | | | | |
| | | Assets | | | | Shares | | | Value | |
| INVESTMENT COMPANIES | | | 0.0 | % | | | | | | | | | | |
| Northern Institutional Treasury Portfolio, 0.01% | | | | | | | | | 521 | | | $ | 521 | |
| TOTAL INVESTMENT COMPANIES | | | | | | | | | | | | | 521 | |
| | | | | | | | | | | | | | | |
| | | | | | | | | | | | | | | |
| See notes to financial statements. | | |
ASSET MANAGEMENT FUND
SHORT U.S. GOVERNMENT FUND (concluded)
SCHEDULE OF INVESTMENTS
October 31, 2013
| | | | | | | | | |
| | |
Percentage | | | | | | |
| | | of Net | | Principal | | | | |
| | | Assets | | Amount | | | Value | |
| REPURCHASE AGREEMENTS | | | 9.4 | % | | | | | | |
| Bank of America, 0.08%, (Agreement dated 10/31/13 | | | | | | | | | | |
| to be repurchased at $1,879,004 on 11/1/13 | | | | | | | | | | |
| Collateralized by Fixed Rate U.S. Government | | | | | | | | | | |
| Mortgage-Backed Security. 2.50%, with a value of | | | | | | | | | | |
| $1,916,581, due at 10/16/43) | | | | | | $ | 1,879,000 | | | $ | 1,879,000 | |
| TOTAL REPURCHASE AGREEMENTS | | | | | | | | | | | 1,879,000 | |
| TOTAL INVESTMENTS | | | | | | | | | | | | |
| (Cost $19,861,719) | | | 99.7 | % | | | | | | | 20,011,233 | |
| NET OTHER ASSETS (LIABILITIES) | | | 0.3 | % | | | | | | | 57,912 | |
| NET ASSETS | | | 100.0 | % | | | | | | $ | 20,069,145 | |
| | | | | | | | | | | | | |
* The rates presented are the rates in effect at October 31, 2013.
See notes to financial statements.
ASSET MANAGEMENT FUND
INTERMEDIATE MORTGAGE FUND
SCHEDULE OF INVESTMENTS
October 31, 2013
| | | | | | | | | | | | | |
| | | Percentage | | | | | | | | | | |
| | | of Net | | | Maturity | | | Principal | | | | |
| | | Assets | | | Date | | | Amount | | | Value | |
| ADJUSTABLE RATE MORTGAGE-RELATED SECURITIES* | | | 33.5% | | | | | | | | | | |
| 1 Yr. Constant Maturity Treasury Based ARMS | | | 6.2% | | | | | | | | | | |
| Fannie Mae | | | | | | | | | | | | | |
| 2.54% | | | | | | 7/1/37 | | | $ | 1,414,446 | | | $ | 1,511,346 | |
| 12 Mo. London Interbank Offering Rate (LIBOR) | | | 27.3% | | | | | | | | | | | | |
| Fannie Mae | | | | | | | | | | | | | | | |
| 2.27% | | | | | | 9/1/37 | | | | 4,702,900 | | | | 4,997,523 | |
| 2.36% | | | | | | 9/1/38 | | | | 1,141,592 | | | | 1,213,773 | |
| 4.35% | | | | | | 5/1/39 | | | | 391,346 | | | | 417,019 | |
| | | | | | | | | | | | | | | 6,628,315 | |
| TOTAL ADJUSTABLE RATE MORTGAGE-RELATED SECURITIES | | | | | | | | | | | | | | 8,139,661 | |
| FIXED RATE MORTGAGE-RELATED SECURITIES. | | | 55.0% | | | | | | | | | | | | |
| 10 Yr. Securities | | | 4.5% | | | | | | | | | | | | |
| Fannie Mae | | | | | | | | | | | | | | | |
| 3.50% | | | | | | 7/1/21 | | | | 1,029,098 | | | | 1,089,850 | |
| 15 Yr. Securities | | | 3.6% | | | | | | | | | | | | |
| Fannie Mae | | | | | | | | | | | | | | | |
| 7.00% | | | | | | 3/1/15 | | | | 7,349 | | | | 7,549 | |
| 7.00% | | | | | | 3/1/15 | | | | 8,111 | | | | 8,348 | |
| 7.00% | | | | | | 3/1/15 | | | | 14,033 | | | | 14,383 | |
| 7.50% | | | | | | 11/1/15 | | | | 19,746 | | | | 20,582 | |
| 6.50% | | | | | | 1/1/16 | | | | 11,434 | | | | 11,855 | |
| 6.00% | | | | | | 6/1/16 | | | | 69,668 | | | | 72,954 | |
| 6.00% | | | | | | 7/1/17 | | | | 59,475 | | | | 63,121 | |
| 6.00% | | | | | | 7/1/17 | | | | 87,093 | | | | 92,333 | |
| 2.50% | | | | | | 2/1/26 | | | | 466,339 | | | | 471,660 | |
| Freddie Mac | | | | | | | | | | | | | | | |
| 6.00% | | | | | | 6/1/17 | | | | 109,472 | | | | 116,467 | |
| | | | | | | | | | | | | | | 879,252 | |
| 30 Yr. Securities | | | 19.7% | | | | | | | | | | | | |
| Freddie Mac | | | | | | | | | | | | | | | |
| 3.50% | | | | | | 11/1/41 | | | | 2,109,752 | | | | 2,158,242 | |
| 3.00% | | | | | | 8/1/42 | | | | 86,820 | | | | 85,367 | |
| Government National Mortgage Association | | | | | | | | | | | | | | | |
| 3.50% | | | | | | 8/15/42 | | | | 2,448,912 | | | | 2,546,773 | |
| | | | | | | | | | | | | | | 4,790,382 | |
| Collateralized Mortgage Obligations | | | 27.2% | | | | | | | | | | | | |
| Fannie Mae | | | | | | | | | | | | | | | |
| 4.00% | | | | | | 10/25/32 | | | | 211,783 | | | | 216,528 | |
| Freddie Mac | | | | | | | | | | | | | | | |
| 5.50% | | | | | | 9/15/33 | | | | 5,852,041 | | | | 6,405,837 | |
| | | | | | | | | | | | | | | 6,622,365 | |
| TOTAL FIXED RATE MORTGAGE-RELATED SECURITIES | | | | | | | | | | | | | | 13,381,849 | |
| | | | | | | | | | | | | |
| | | Percentage | | | | | | | | | | |
| | | of Net | | | | | | | | | | |
| | | Assets | | | | | | Shares | | | Value | |
| INVESTMENT COMPANIES | | | 0.0% | | | | | | | | | | |
| Northern Institutional Treasury Portfolio, 0.01% | | | | | | | | | | 665 | | | $ | 665 | |
| TOTAL INVESTMENT COMPANIES | | | | | | | | | | | | | | 665 | |
| | | | | | | | | | | | | | | | |
See notes to financial statements.
ASSET MANAGEMENT FUND
INTERMEDIATE MORTGAGE FUND (concluded)
SCHEDULE OF INVESTMENTS
October 31, 2013
| | | | | | | | | | | | | |
| | | Percentage | | | | | | | | | | |
| | | of Net | | | | | | Principal | | | | |
| | | Assets | | | | | | Amount | | | Value | |
| REPURCHASE AGREEMENTS | | | 11.7% | | | | | | | | | | |
| Bank of America, 0.08%, (Agreement dated 10/31/13 | | | | | | | | | | | | | |
| to be repurchased at $2,854,006 on 11/1/13. | | | | | | | | | | | | | |
| Collateralized by Fixed Rate U.S. Government | | | | | | | | | | | | | |
| Mortgage-Backed Security, 2.50%, with a value of | | | | | | | | | | | | | |
| $2,911,080, due at 10/16/43) | | | | | | | | | $ | 2,854,000 | | | $ | 2,854,000 | |
| TOTAL REPURCHASE AGREEMENTS | | | | | | | | | | | | | | 2,854,000 | |
| TOTAL INVESTMENTS | | | | | | | | | | | | | | | |
| (Cost $24,383,414) | | | 100.2% | | | | | | | | | | | 24,376,175 | |
| NET OTHER ASSETS (LIABILITIES) | | | (0.2)% | | | | | | | | | | | (46,380 | ) |
| NET ASSETS | | | 100.0% | | | | | | | | | | $ | 24,329,795 | |
| | | | | | | | | | | | | | | | |
| * | The rates presented are the rates in effect at October 31, 2013. |
See notes to financial statements.
ASSET MANAGEMENT FUND
U.S. GOVERNMENT MORTGAGE FUND
SCHEDULE OF INVESTMENTS
October 31, 2013
| | | | | | | | | | | | | |
| | | Percentage | | | | | | | | | | |
| | | of Net | | | Maturity | | | Principal | | | | |
| | | Assets | | | Date | | | Amount | | | Value | |
| ADJUSTABLE RATE MORTGAGE-RELATED SECURITIES* | | | 73.9% | | | | | | | | | | |
| 1 Yr. Constant Maturity Treasury Based ARMS | | | 22.1% | | | | | | | | | | |
| Fannie Mae | | | | | | | | | | | | | |
| 2.54% | | | | | | 7/1/37 | | | $ | 2,208,649 | | | $ | 2,359,956 | |
| 12 Mo. London Interbank Offering Rate (LIBOR) | | | 46.9% | | | | | | | | | | | | |
| Fannie Mae | | | | | | | | | | | | | | | |
| 2.27% | | | | | | 9/1/37 | | | | 1,673,723 | | | | 1,778,577 | |
| Freddie Mac | | | | | | | | | | | | | | | |
| 2.54% | | | | | | 5/1/39 | | | | 3,015,309 | | | | 3,224,495 | |
| | | | | | | | | | | | | | | 5,003,072 | |
| HYBRID ARMS | | | 4.9% | | | | | | | | | | | | |
| Freddie Mac | | | | | | | | | | | | | | | |
| 2.64% | | | | | | 11/1/36 | | | | 504,004 | | | | 524,014 | |
| TOTAL ADJUSTABLE RATE MORTGAGE-RELATED SECURITIES | | | | | | | | | | | | | | 7,887,042 | |
| FIXED RATE MORTGAGE-RELATED SECURITIES | | | 23.1% | | | | | | | | | | | | |
| 10 Yr. Securities | | | 2.6% | | | | | | | | | | | | |
| Fannie Mae | | | | | | | | | | | | | | | |
| 3.50% | | | | | | 7/1/21 | | | | 257,274 | | | | 272,462 | |
| 15 Yr. Securities | | | 4.5% | | | | | | | | | | | | |
| Fannie Mae | | | | | | | | | | | | | | | |
| 7.00% | | | | | | 3/1/15 | | | | 10,109 | | | | 10,383 | |
| 2.50% | | | | | | 2/1/26 | | | | 466,339 | | | | 471,661 | |
| | | | | | | | | | | | | | | 482,044 | |
| 30 Yr. Securities | | | 15.3% | | | | | | | | | | | | |
| Fannie Mae | | | | | | | | | | | | | | | |
| 5.00% | | | | | | 3/1/38 | | | | 142,672 | | | | 155,055 | |
| Government National Mortgage Association | | | | | | | | | | | | | | | |
| 7.50% | | | | | | 2/15/24 | | | | 58,520 | | | | 68,731 | |
| 7.00% | | | | | | 4/15/27 | | | | 81,801 | | | | 96,363 | |
| 6.00% | | | | | | 1/15/29 | | | | 75,322 | | | | 84,713 | |
| 3.50% | | | | | | 8/15/42 | | | | 490,718 | | | | 510,328 | |
| 3.50% | | | | | | 9/15/42 | | | | 685,751 | | | | 713,155 | |
| | | | | | | | | | | | | | | 1,628,345 | |
| Collateralized Mortgage Obligations | | | 0.7% | | | | | | | | | | | | |
| Fannie Mae | | | | | | | | | | | | | | | |
| 4.00% | | | | | | 1/25/33 | | | | 12,283 | | | | 12,369 | |
| Freddie Mac | | | | | | | | | | | | | | | |
| 4.00% | | | | | | 3/15/33 | | | | 61,169 | | | | 65,305 | |
| | | | | | | | | | | | | | | 77,674 | |
| TOTAL FIXED RATE MORTGAGE-RELATED SECURITIES | | | | | | | | | | | | | | 2,460,525 | |
| | | | | | | | | | | | | |
| | | Percentage | | | | | | | | | | |
| | | of Net | | | | | | | | | | |
| | | Assets | | | | | | Shares | | | Value | |
| INVESTMENT COMPANIES | | | 2.9% | | | | | | | | | | |
| Northern Institutional Treasury Portfolio, 0.01% | | | | | | | | | | 309,608 | | | $ | 309,608 | |
| TOTAL INVESTMENT COMPANIES | | | | | | | | | | | | | | 309,608 | |
| TOTAL INVESTMENTS | | | | | | | | | | | | | | | |
| (Cost $10,596,748) | | | 99.9% | | | | | | | | | | | 10,657,175 | |
| NET OTHER ASSETS (LIABILITIES) | | | 0.1% | | | | | | | | | | | 9,692 | |
| NET ASSETS | | | 100.0% | | | | | | | | | | $ | 10,666,867 | |
| | | | | | | | | | | | | | | | |
| * | The rates presented are the rates in effect at October 31, 2013. |
See notes to financial statements.
ASSET MANAGEMENT FUND
LARGE CAP EQUITY FUND
SCHEDULE OF INVESTMENTS
October 31, 2013
| | | | | | | | | | | | | |
| | | Percentage | | | | | | | | | | |
| | | of Net | | | | | | | | | | |
| | | Assets | | | | | | Shares | | | Value | |
| COMMON STOCKS | | | 94.9% | | | | | | | | | | |
| Aerospace & Defense | | | 4.1% | | | | | | | | | | |
United Technologies Corp. | | | | | | | | | | 36,800 | | | $ | 3,910,000 | |
| Air Freight & Logistics | | | 4.1% | | | | | | | | | | | | |
| United Parcel Service, Inc. | | | | | | | | | | 40,000 | | | | 3,929,600 | |
| Beverages | | | 8.6% | | | | | | | | | | | | |
| Coca-Cola Co. | | | | | | | | | | 100,000 | | | | 3,957,000 | |
| PepsiCo, Inc. | | | | | | | | | | 50,000 | | | | 4,204,500 | |
| | | | | | | | | | | | | | | 8,161,500 | |
| Chemicals | | | 4.1% | | | | | | | | | | | | |
| Du Pont (E.I.) De Nemours | | | | | | | | | | 40,000 | | | | 2,448,000 | |
| Praxair, Inc. | | | | | | | | | | 12,000 | | | | 1,496,520 | |
| | | | | | | | | | | | | | | 3,944,520 | |
| Commercial Banks | | | 4.5% | | | | | | | | | | | | |
| Wells Fargo & Co. | | | | | | | | | | 100,000 | | | | 4,269,000 | |
| Diversified Financial Services | | | 3.4% | | | | | | | | | | | | |
| American Express Co. | | | | | | | | | | 40,000 | | | | 3,272,000 | |
| Electrical Equipment | | | 2.8% | | | | | | | | | | | | |
| Emerson Electric Co. | | | | | | | | | | 40,000 | | | | 2,678,800 | |
| Energy Equipment & Services | | | 1.0% | | | | | | | | | | | | |
| Schlumberger Ltd | | | | | | | | | | 10,000 | | | | 937,200 | |
| Food & Staples Retailing | | | 4.0% | | | | | | | | | | | | |
| Wal-Mart Stores, Inc. | | | | | | | | | | 50,000 | | | | 3,837,500 | |
| Food Products | | | 2.7% | | | | | | | | | | | | |
| General Mills, Inc. | | | | | | | | | | 50,000 | | | | 2,521,000 | |
| Health Care Equipment & Supplies | | | 5.5% | | | | | | | | | | | | |
| Becton, Dickinson & Co. | | | | | | | | | | 25,000 | | | | 2,628,250 | |
| Medtronic, Inc. | | | | | | | | | | 45,000 | | | | 2,583,000 | |
| | | | | | | | | | | | | | | 5,211,250 | |
| Hotels, Restaurants & Leisure | | | 4.1% | | | | | | | | | | | | |
| McDonald’s Corp. | | | | | | | | | | 40,000 | | | | 3,860,800 | |
| Household Products | | | 3.4% | | | | | | | | | | | | |
| Procter & Gamble | | | | | | | | | | 40,000 | | | | 3,230,000 | |
| Industrial Conglomerates | | | 8.3% | | | | | | | | | | | | |
| 3M Company | | | | | | | | | | 32,000 | | | | 4,027,200 | |
| General Electric Co. | | | | | | | | | | 150,000 | | | | 3,921,000 | |
| | | | | | | | | | | | | | | 7,948,200 | |
| Insurance | | | 4.5% | | | | | | | | | | | | |
Berkshire Hathaway, Inc. (Class A)(a) | | | | | | | | | | 25 | | | | 4,324,870 | |
| IT Services | | | 5.7% | | | | | | | | | | | | |
| Automatic Data Processing | | | | | | | | | | 25,000 | | | | 1,874,250 | |
| International Business Machines Corp. | | | | | | | | | | 20,000 | | | | 3,584,200 | |
| | | | | | | | | | | | | | | 5,458,450 | |
| Media | | | 4.0% | | | | | | | | | | | | |
| The Walt Disney Company | | | | | | | | | | 55,000 | | | | 3,772,450 | |
| Oil & Gas Consumable Fuels | | | 7.5% | | | | | | | | | | | | |
| Chevron Corp. | | | | | | | | | | 30,000 | | | | 3,598,800 | |
| Exxon Mobil Corp. | | | | | | | | | | 40,000 | | | | 3,584,800 | |
| | | | | | | | | | | | | | | 7,183,600 | |
| |
| See notes to financial statements. |
LARGE CAP EQUITY FUND (concluded)
SCHEDULE OF INVESTMENTS
October 31, 2013
| | | | | | | | | | | | | |
| | | Percentage | | | | | | | | | | |
| | | of Net | | | | | | | | | | |
| | | Assets | | | | | | Shares | | | Value | |
| Pharmaceuticals | | | 6.3% | | | | | | | | | | |
| Abbott Laboratories | | | | | | | | | | 50,000 | | | $ | 1,827,500 | |
| Johnson & Johnson | | | | | | | | | | 45,000 | | | | 4,167,450 | |
| | | | | | | | | | | | | | | 5,994,950 | |
| Software | | | 3.7% | | | | | | | | | | | | |
| Microsoft Corp. | | | | | | | | | | 100,000 | | | | 3,535,000 | |
| Specialty Retail | | | 2.6% | | | | | | | | | | | | |
| TJX Companies | | | | | | | | | | 40,000 | | | | 2,431,600 | |
| TOTAL COMMON STOCKS | | | | | | | | | | | | | | 90,412,290 | |
| INVESTMENT COMPANIES | | | 5.2% | | | | | | | | | | | | |
| Northern Institutional Treasury Portfolio, 0.01% | | | | | | | | | | 4,970,457 | | | | 4,970,457 | |
| TOTAL INVESTMENT COMPANIES | | | | | | | | | | | | | | 4,970,457 | |
| TOTAL INVESTMENTS | | | | | | | | | | | | | | | |
| (Cost $54,588,096) | | | 100.1% | | | | | | | | | | | 95,382,747 | |
| NET OTHER ASSETS (LIABILITIES) | | | (0.1)% | | | | | | | | | | | (66,162 | ) |
| NET ASSETS | | | 100.0% | | | | | | | | | | $ | 95,316,585 | |
| | | | | | | | | | | | | | | | |
| (a) | Non-income producing security. |
See notes to financial statements.
STATEMENTS OF ASSETS & LIABILITIES
October 31, 2013
| | | | | | | | | | | | | | | | | | | |
| | | | | | | | | Short U.S. | | | | | | U.S. | | | | |
| | | Ultra Short | | | Ultra | | | Government | | | Intermediate | | | Government | | | Large Cap | |
| | | Mortgage Fund | | | Short Fund | | | Fund | | | Mortgage Fund | | | Mortgage Fund | | | Equity Fund | |
| Assets | | | | | | | | | | | | | | | | | | |
| Investments, at cost | | $ | 252,781,008 | | | $ | 7,053,906 | | | $ | 17,982,719 | | | $ | 21,529,414 | | | $ | 10,596,748 | | | $ | 54,588,096 | |
| Investments, at value | | $ | 258,204,891 | | | $ | 7,141,126 | | | $ | 18,132,233 | | | $ | 21,522,175 | | | $ | 10,657,175 | | | $ | 95,382,747 | |
| Repurchase agreements, cost equals fair value | | | 16,167,000 | | | | — | | | | 1,879,000 | | | | 2,854,000 | | | | — | | | | — | |
| Receivable for dividends and interest | | | 608,187 | | | | 15,966 | | | | 48,802 | | | | 62,565 | | | | 30,096 | | | | 59,762 | |
| Receivable for investments sold | | | 199,785 | | | | 38,914 | | | | 54,398 | | | | — | | | | 5,378 | | | | — | |
| Receivable for capital shares sold | | | 228,766 | | | | — | | | | — | | | | — | | | | — | | | | 7,069 | |
| Prepaid and other assets | | | 90,990 | | | | 2,544 | | | | 3,519 | | | | 3,286 | | | | 2,819 | | | | 5,930 | |
| Receivable from Adviser / Distributor | | | 70,334 | | | | 1,829 | | | | 633 | | | | 2,069 | | | | 638 | | | | 7,431 | |
| Total Assets | | | 275,569,953 | | | | 7,200,379 | | | | 20,118,585 | | | | 24,444,095 | | | | 10,696,106 | | | | 95,462,939 | |
| Liabilities | | | | | | | | | | | | | | | | | | | | | | | | |
| Income distribution payable | | $ | 308,778 | | | $ | 5,358 | | | $ | 21,484 | | | $ | 20,426 | | | $ | 11,170 | | | $ | — | |
| Investment advisory fees payable | | | 105,502 | | | | 2,744 | | | | 4,291 | | | | 7,241 | | | | 3,271 | | | | 51,317 | |
| Administration fees payable | | | 33,883 | | | | 879 | | | | 2,501 | | | | 2,988 | | | | 2,119 | | | | 11,463 | |
| Distribution fees payable | | | 58,612 | | | | 1,524 | | | | 2,575 | | | | 3,103 | | | | 1,962 | | | | 18,577 | |
| Capital shares redeemed payable | | | 28,613 | | | | — | | | | 102 | | | | 5 | | | | — | | | | 4,011 | |
| Accrued expenses and other payable | | | 172,591 | | | | 21,226 | | | | 18,487 | | | | 80,537 | | | | 10,717 | | | | 60,986 | |
| Total Liabilities | | | 707,979 | | | | 31,731 | | | | 49,440 | | | | 114,300 | | | | 29,239 | | | | 146,354 | |
| Net Assets | | $ | 274,861,974 | | | $ | 7,168,648 | | | $ | 20,069,145 | | | $ | 24,329,795 | | | $ | 10,666,867 | | | $ | 95,316,585 | |
| | | | | | | | | | | | | | | | | | | | | | | | | |
| Class I | | | | | | | | | | | | | | | | | | | | | | | | |
| Net assets | | $ | 274,861,974 | | | $ | 7,168,648 | | | $ | 20,069,145 | | | $ | 24,329,795 | | | $ | 10,666,867 | | | $ | — | |
| Share of common stock outstanding | | | 37,290,722 | | | | 1,384,422 | | | | 2,200,235 | | | | 5,546,730 | | | | 1,242,346 | | | | — | |
| Net asset value per share | | $ | 7.37 | | | $ | 5.18 | | | $ | 9.12 | | | $ | 4.39 | | | $ | 8.59 | | | $ | — | |
| | | | | | | | | | | | | | | | | | | | | | | | | |
| Class AMF | | | | | | | | | | | | | | | | | | | | | | | | |
| Net assets | | $ | — | | | $ | — | | | $ | — | | | $ | — | | | $ | — | | | $ | 89,561,730 | |
| Share of common stock outstanding | | | — | | | | — | | | | — | | | | — | | | | — | | | | 8,066,349 | |
| Net asset value per share | | $ | — | | | $ | — | | | $ | — | | | $ | — | | | $ | — | | | $ | 11.10 | |
| | | | | | | | | | | | | | | | | | | | | | | | | |
| Class H | | | | | | | | | | | | | | | | | | | | | | | | |
| Net assets | | $ | — | | | $ | — | | | $ | — | | | $ | — | | | $ | — | | | $ | 5,754,855 | |
| Share of common stock outstanding | | | — | | | | — | | | | — | | | | — | | | | — | | | | 518,343 | |
| Net asset value per share | | $ | — | | | $ | — | | | $ | — | | | $ | — | | | $ | — | | | $ | 11.10 | |
| | | | | | | | | | | | | | | | | | | | | | | | | |
| Net Assets | | | | | | | | | | | | | | | | | | | | | | | | |
| Paid in capital | | $ | 594,316,819 | | | $ | 33,818,584 | | | $ | 27,558,605 | | | $ | 75,540,876 | | | $ | 18,955,312 | | | $ | 48,146,142 | |
| Accumulated net investment income (loss) | | | (22,182 | ) | | | (1,305 | ) | | | (5,058 | ) | | | (2,152 | ) | | | (2,552 | ) | | | (1 | ) |
| Accumulated net realized gains (losses) | | | (324,856,546 | ) | | | (26,735,851 | ) | | | (7,633,916 | ) | | | (51,201,690 | ) | | | (8,346,320 | ) | | | 6,375,793 | |
| Unrealized appreciation (depreciation) on | | | | | | | | | | | | | | | | | | | | | | | | |
| investments | | | 5,423,883 | | | | 87,220 | | | | 149,514 | | | | (7,239 | ) | | | 60,427 | | | | 40,794,651 | |
| Net assets | | $ | 274,861,974 | | | $ | 7,168,648 | | | $ | 20,069,145 | | | $ | 24,329,795 | | | $ | 10,666,867 | | | $ | 95,316,585 | |
| |
| See notes to financial statements. |
ASSET MANAGEMENT FUND
STATEMENTS OF OPERATIONS
For the Year Ended October 31, 2013
| | | | | | | | | | | | | | | | | | | |
| | | Ultra Short | | | | | | Short U.S. | | | Intermediate | | | U.S. | | | | |
| | | Mortgage | | | Ultra | | | Government | | | Mortgage | | | Government | | | Large Cap | |
| | | Fund | | | Short Fund | | | Fund | | | Fund | | | Mortgage Fund | | | Equity Fund | |
| INVESTMENT INCOME: | | | | | | | | | | | | | | | | | | |
| Interest income | | $ | 5,596,469 | | | $ | 104,783 | | | $ | 366,198 | | | $ | 484,382 | | | $ | 413,075 | | | $ | — | |
| Dividend income | | | 6 | | | | 81 | | | | 16 | | | | 37 | | | | 39 | | | | 2,110,949 | |
| Total investment income | | | 5,596,475 | | | | 104,864 | | | | 366,214 | | | | 484,419 | | | | 413,114 | | | | 2,110,949 | |
| Operating expenses: | | | | | | | | | | | | | | | | | | | | | | | | |
| Investment advisory | | | 1,416,095 | | | | 31,768 | | | | 54,129 | | | | 86,458 | | | | 49,011 | | | | 589,109 | |
| Distribution — Class AMF Shares | | | — | | | | — | | | | — | | | | — | | | | — | | | | 214,378 | |
| Distribution — Class I Shares | | | 786,716 | | | | 17,649 | | | | 32,478 | | | | 37,054 | | | | 29,407 | | | | — | |
| Administration | | | 423,695 | | | | 9,591 | | | | 29,358 | | | | 33,495 | | | | 26,722 | | | | 123,139 | |
| Legal | | | 279,915 | | | | 6,351 | | | | 12,495 | | | | 14,183 | | | | 11,112 | | | | 50,808 | |
| Registration | | | 19,511 | | | | 10,219 | | | | 11,869 | | | | 13,019 | | | | 10,719 | | | | 32,754 | |
| Trustees | | | 91,452 | | | | 1,971 | | | | 6,073 | | | | 6,911 | | | | 5,567 | | | | 24,690 | |
| Other | | | 513,511 | | | | 11,945 | | | | 35,357 | | | | 40,275 | | | | 31,985 | | | | 151,314 | |
| Total expenses before fee reductions | | | 3,530,895 | | | | 89,494 | | | | 181,759 | | | | 231,395 | | | | 164,523 | | | | 1,186,192 | |
| Fees reduced by waivers/reimbursements | | | (1,047,837 | ) | | | (23,507 | ) | | | (19,372 | ) | | | (46,150 | ) | | | (17,488 | ) | | | (85,750 | ) |
| Net expenses | | | 2,483,058 | | | | 65,987 | | | | 162,387 | | | | 185,245 | | | | 147,035 | | | | 1,100,442 | |
| Net investment income | | | 3,113,417 | | | | 38,877 | | | | 203,827 | | | | 299,174 | | | | 266,079 | | | | 1,010,507 | |
REALIZED AND UNREALIZED GAINS (LOSSES) FROM INVESTMENT ACTIVITIES: | | | | | | | | | | | | | | | | | | | | | | | | |
Realized gains (losses) from investment transactions | | | 4,699,577 | | | | 165,686 | | | | 126,085 | | | | (62,466 | ) | | | (154,366 | ) | | | 6,407,124 | |
Change in unrealized appreciation (depreciation) on investments | | | (2,896,853 | ) | | | (48,837 | ) | | | (358,205 | ) | | | (645,605 | ) | | | (582,313 | ) | | | 11,728,080 | |
Net realized and unrealized gains (losses) from investment activities | | | 1,802,724 | | | | 116,849 | | | | (232,120 | ) | | | (708,071 | ) | | | (736,679 | ) | | | 18,135,204 | |
CHANGE IN NET ASSETS RESULTING FROM OPERATIONS | | $ | 4,916,141 | | | $ | 155,726 | | | $ | (28,293 | ) | | $ | (408,897 | ) | | $ | (470,600 | ) | | $ | 19,145,711 | |
| | | | | | | | | | | | | | | | | | | | | | | | | |
See notes to financial statements.
STATEMENTS OF CHANGES IN NET ASSETS
| | | | | | | | | | |
| | | Ultra Short Mortgage Fund | | | Ultra Short Fund | |
| | | Year Ended | | | Year Ended | | | Year Ended | | | Year Ended | |
| | | October 31, 2013 | | | October 31, 2012 | | | October 31, 2013 | | | October 31, 2012 | |
| Increase (decrease) in net assets: | | | | | | | | | | | | |
| Operations: | | | | | | | | | | | | |
| Net investment income | | $ | 3,113,417 | | | $ | 5,109,008 | | | $ | 38,877 | | | $ | 63,900 | |
Net realized gains (losses) from investment transactions | | | 4,699,577 | | | | 636,422 | | | | 165,686 | | | | (14,830 | ) |
Change in unrealized appreciation (depreciation) on investments | | | (2,896,853 | ) | | | 543,259 | | | | (48,837 | ) | | | 69,643 | |
Change in net assets resulting from operations | | | 4,916,141 | | | | 6,288,689 | | | | 155,726 | | | | 118,713 | |
| Dividends paid to stockholders: | | | | | | | | | | | | | | | | |
| From net investment income | | | (5,422,747 | ) | | | (7,593,989 | ) | | | (69,537 | ) | | | (83,675 | ) |
| Total dividends paid to stockholders | | | (5,422,747 | ) | | | (7,593,989 | ) | | | (69,537 | ) | | | (83,675 | ) |
| Capital Transactions: | | | | | | | | | | | | | | | | |
| Proceeds from sale of shares | | | 15,300,491 | | | | 13,305,515 | | | | — | | | | — | |
Value of shares issued to stockholders in reinvestment of dividends | | | 709,751 | | | | 650,222 | | | | 2,300 | | | | 3,091 | |
| Value of shares redeemed | | | (135,031,316 | ) | | | (54,745,370 | ) | | | (15,559 | ) | | | (35,958 | ) |
Change in net assets from capital transactions | | | (119,021,074 | ) | | | (40,789,633 | ) | | | (13,259 | ) | | | (32,867 | ) |
| Change in net assets | | | (119,527,680 | ) | | | (42,094,933 | ) | | | 72,930 | | | | 2,171 | |
| Net Assets: | | | | | | | | | | | | | | | | |
| Beginning of year | | | 394,389,654 | | | | 436,484,587 | | | | 7,095,718 | | | | 7,093,547 | |
| End of year | | $ | 274,861,974 | | | $ | 394,389,654 | | | $ | 7,168,648 | | | $ | 7,095,718 | |
| | | | | | | | | | | | | | | | | |
Accumulated undistributed net investment (losses) (distributions in excess of income) | | $ | (22,182 | ) | | $ | (65,753 | ) | | $ | (1,305 | ) | | $ | (1,150 | ) |
| | | | | | | | | | | | | | | | | |
See notes to financial statements.
| | | | | | | | | |
| | Short U.S. Government Fund | | | Intermediate Mortgage Fund | | | U.S. Government Mortgage Fund | |
| | Year Ended | | | Year Ended | | | Year Ended | | | Year Ended | | | Year Ended | | | Year Ended | |
| | October 31, 2013 | | | October 31, 2012 | | | October 31, 2013 | | | October 31, 2012 | | | October 31, 2013 | | | October 31, 2012 | |
| | | | | | | | | | | | | | | | | | |
| $ | 203,827 | | | $ | 351,295 | | | $ | 299,174 | | | $ | 453,767 | | | $ | 266,079 | | | $ | 434,322 | |
| | | | | | | | | | | | | | | | | | | | | | | |
| | 126,085 | | | | (28,372 | ) | | | (62,466 | ) | | | 207,412 | | | | (154,366 | ) | | | 705,825 | |
| | | | | | | | | | | | | | | | | | | | | | | |
| | (358,205 | ) | | | 108,236 | | | | (645,605 | ) | | | 262,376 | | | | (582,313 | ) | | | (310,764 | ) |
| | | | | | | | | | | | | | | | | | | | | | | |
| | (28,293 | ) | | | 431,159 | | | | (408,897 | ) | | | 923,555 | | | | (470,600 | ) | | | 829,383 | |
| | | | | | | | | | | | | | | | | | | | | | | |
| | (370,485 | ) | | | (472,688 | ) | | | (394,777 | ) | | | (539,884 | ) | | | (352,315 | ) | | | (505,365 | ) |
| | (370,485 | ) | | | (472,688 | ) | | | (394,777 | ) | | | (539,884 | ) | | | (352,315 | ) | | | (505,365 | ) |
| | | | | | | | | | | | | | | | | | | | | | | |
| | 24,376 | | | | 111,297 | | | | 16 | | | | 500 | | | | 2,010,756 | | | | 20 | |
| | | | | | | | | | | | | | | | | | | | | | | |
| | 35,765 | | | | 37,058 | | | | 1,356 | | | | 1,956 | | | | 54,318 | | | | 23,779 | |
| | (3,199,350 | ) | | | (1,237,974 | ) | | | (469,498 | ) | | | (389,304 | ) | | | (13,718,313 | ) | | | (80,227 | ) |
| | | | | | | | | | | | | | | | | | | | | | | |
| | (3,139,209 | ) | | | (1,089,619 | ) | | | (468,126 | ) | | | (386,848 | ) | | | (11,653,239 | ) | | | (56,428 | ) |
| | (3,537,987 | ) | | | (1,131,148 | ) | | | (1,271,800 | ) | | | (3,177 | ) | | | (12,476,154 | ) | | | 267,590 | |
| | | | | | | | | | | | | | | | | | | | | | | |
| | | | | | | | | | | | | | | | | | | | | | | |
| | 23,607,132 | | | | 24,738,280 | | | | 25,601,595 | | | | 25,604,772 | | | | 23,143,021 | | | | 22,875,431 | |
| $ | 20,069,145 | | | $ | 23,607,132 | | | $ | 24,329,795 | | | $ | 25,601,595 | | | $ | 10,666,867 | | | $ | 23,143,021 | |
| | | | | | | | | | | | | | | | | | | | | | | |
| $ | (5,058 | ) | | $ | (5,486 | ) | | $ | (2,152 | ) | | $ | (2,306 | ) | | $ | (2,552 | ) | | $ | (2,459 | ) |
| | | | | | | | | | | | | | | | | | | | | | | |
STATEMENTS OF CHANGES IN NET ASSETS
| | | Large Cap Equity Fund | |
| | | Year Ended October 31, 2013 | | | Year Ended October 31, 2012 | |
| Increase (decrease) in net assets: | | | | | | |
| Operations: | | | | | | |
| Net investment income | | $ | 1,010,507 | | | $ | 1,091,945 | |
| Net realized gains from investment transactions | | | 6,407,124 | | | | 2,871,029 | |
| Change in unrealized appreciation (depreciation) on investments | | | 11,728,080 | | | | 7,312,443 | |
| Change in net assets resulting from operations | | | 19,145,711 | | | | 11,275,417 | |
| Dividends paid to stockholders: | | | | | | | | |
| From net investment income: | | | | | | | | |
| Class AMF Stockholders | | | (988,675 | ) | | | (1,073,283 | ) |
| Class H Stockholders | | | (63,311 | ) | | | (58,705 | ) |
| From net realized gains: | | | | | | | | |
| Class AMF Shares | | | (2,724,584 | ) | | | (1,671,892 | ) |
| Class H Shares | | | (146,445 | ) | | | (74,861 | ) |
| Total dividends paid to stockholders | | | (3,923,015 | ) | | | (2,878,741 | ) |
| Capital Transactions: | | | | | | | | |
| Class AMF Shares: | | | | | | | | |
| Proceeds from sale of shares | | | 1,976,728 | | | | 2,396,055 | |
| Value of shares issued to stockholders in reinvestment of dividends | | | 2,763,030 | | | | 1,968,621 | |
| Cost of shares repurchased | | | (11,956,198 | ) | | | (6,914,380 | ) |
| Class H Shares: | | | | | | | | |
| Proceeds from sale of shares | | | 649,634 | | | | 549,854 | |
| Value of shares issued to stockholders in reinvestment of dividends | | | 209,756 | | | | 133,566 | |
| Cost of shares repurchased | | | (335,019 | ) | | | (89,115 | ) |
| Change in net assets from capital transactions | | | (6,692,069 | ) | | | (1,955,399 | ) |
| Change in net assets | | | 8,530,627 | | | | 6,441,277 | |
| Net Assets: | | | | | | | | |
| Beginning of year | | | 86,785,958 | | | | 80,344,681 | |
| End of year | | $ | 95,316,585 | | | $ | 86,785,958 | |
| | | | | | | | | |
| Accumulated net investment income (losses) | | $ | (1 | ) | | $ | 10,147 | |
| | | | | | | | | |
See notes to financial statements.
ULTRA SHORT MORTGAGE FUND
FINANCIAL HIGHLIGHTS
Selected data for a share outstanding throughout the period indicated.
| | | Year Ended October 31, | |
| | | 2013 | | | 2012 | | | 2011 | | | 2010 | | | 2009 | |
| Net asset value, beginning of year | | $ | 7.36 | | | $ | 7.39 | | | $ | 7.50 | | | $ | 7.33 | | | $ | 7.72 | |
| Income (Loss) from investment operations: | | | | | | | | | | | | | | | | | | | | |
| Net investment income | | | 0.0626 | | | | 0.0906 | | | | 0.1166 | | | | 0.2054 | | | | 0.3058 | |
| Net realized and unrealized gains (losses) from investments | | | 0.0725 | | | | 0.0163 | | | | (0.0457 | ) | | | 0.2082 | | | | (0.3855 | ) |
| Total from investment operations | | | 0.1351 | | | | 0.1069 | | | | 0.0709 | | | | 0.4136 | | | | (0.0797 | ) |
| Less distributions: | | | | | | | | | | | | | | | | | | | | |
| Dividends paid to stockholders: | | | | | | | | | | | | | | | | | | | | |
| From net investment income | | | (0.1251 | ) | | | (0.1369 | ) | | | (0.1809 | ) | | | (0.2436 | ) | | | (0.3109 | ) |
| Change in net asset value | | | 0.01 | | | | (0.03 | ) | | | (0.11 | ) | | | 0.17 | | | | (0.39 | ) |
| Net asset value, end of year | | $ | 7.37 | | | $ | 7.36 | | | $ | 7.39 | | | $ | 7.50 | | | $ | 7.33 | |
| Total return | | | 1.86% | * | | | 1.46% | | | | 0.97% | | | | 5.75% | | | | (0.88)% | |
| Ratios/Supplemental data: | | | | | | | | | | | | | | | | | | | | |
| Net assets, end of year (in 000’s) | | $ | 274,862 | | | $ | 394,390 | | | $ | 436,485 | | | $ | 682,115 | | | $ | 891,744 | |
| Ratio of net expenses to average net assets | | | 0.79% | | | | 0.73% | | | | 0.67% | | | | 0.57% | | | | 0.60% | |
| Ratio of net investment income to average net assets | | | 0.99% | | | | 1.26% | | | | 1.71% | | | | 2.88% | | | | 4.24% | |
| Ratio of gross expenses to average net assets** | | | 1.12% | | | | 1.05% | | | | 0.97% | | | | 0.87% | | | | 0.90% | |
| Portfolio turnover rate | | | 30% | | | | 77% | | | | 57% | | | | 74% | | | | 56% | |
| | | | | | | | | | | | | | | | | | | | | |
| * | During the fiscal year ended October 31, 2013, the Ultra Short Mortgage Fund received monies related to certain nonrecurring litigation settlements. If these monies were not received, the One Year return would have been (0.20)%. |
| ** | During the periods shown, certain fees were voluntarily reduced. If such voluntary fee reductions had not occurred, the ratios would have been as indicated. |
See notes to financial statements.
ASSET MANAGEMENT FUND
ULTRA SHORT FUND
FINANCIAL HIGHLIGHTS
Selected data for a share outstanding throughout the period indicated.
| | | | | | | | | | | | | | | | |
| | | Year Ended October 31, | |
| | | 2013 | | | 2012 | | | 2011 | | | 2010 | | | 2009 | |
| Net asset value, beginning of year | | $ | 5.12 | | | $ | 5.09 | | | $ | 5.16 | | | $ | 5.59 | | | $ | 6.86 | |
| Income (Loss) from investment operations: | | | | | | | | | | | | | | | | | | | | |
| Net investment income | | | 0.0280 | | | | 0.0459 | | | | 0.0458 | | | | 0.2737 | | | | 0.4179 | |
| Net realized and unrealized gains (losses) from investments | | | 0.0822 | | | | 0.0442 | | | | (0.0409 | ) | | | (0.3939 | ) | | | (1.2717 | ) |
| Total from investment operations | | | 0.1102 | | | | 0.0901 | | | | 0.0049 | | | | (0.1202 | ) | | | (0.8538 | ) |
| Less distributions: | | | | | | | | | | | | | | | | | | | | |
| Dividends paid to stockholders: | | | | | | | | | | | | | | | | | | | | |
| From net investment income | | | (0.0502 | ) | | | (0.0601 | ) | | | (0.0749 | ) | | | (0.3098 | ) | | | (0.4162 | ) |
| Change in net asset value | | | 0.06 | | | | 0.03 | | | | (0.07 | ) | | | (0.43 | ) | | | (1.27 | ) |
| Net asset value, end of year | | $ | 5.18 | | | $ | 5.12 | | | $ | 5.09 | | | $ | 5.16 | | | $ | 5.59 | |
| Total return | | | 2.37% | * | | | 1.78% | | | | 0.10% | | | | (2.25)% | | | | (12.45)% | |
| Ratios/Supplemental data: | | | | | | | | | | | | | | | | | | | | |
| Net assets, end of year (in 000’s) | | $ | 7,169 | | | $ | 7,096 | | | $ | 7,094 | | | $ | 14,396 | | | $ | 21,115 | |
| Ratio of net expenses to average net assets | | | 0.93% | | | | 0.89% | | | | 0.79% | | | | 0.63% | | | | 0.67% | |
| Ratio of net investment income to average net assets | | | 0.56% | | | | 0.90% | | | | 1.06% | | | | 5.23% | | | | 7.07% | |
| Ratio of gross expenses to average net assets** | | | 1.27% | | | | 1.21% | | | | 1.09% | | | | 0.93% | | | | 0.97% | |
| Portfolio turnover rate | | | 25% | | | | 111% | | | | 83% | | | | 66% | | | | 10% | |
| | | | | | | | | | | | | | | | | | | | | |
| * | During the fiscal year ended October 31, 2013, the Ultra Short Fund received monies related to certain nonrecurring litigation settlements. If these monies were not received, the One Year return would have been (0.98)%. |
| ** | During the periods shown, certain fees were voluntarily reduced. If such voluntary fee reductions had not occurred, the ratios would have been as indicated. |
See notes to financial statements.
ASSET MANAGEMENT FUND
SHORT U.S. GOVERNMENT FUND
FINANCIAL HIGHLIGHTS
Selected data for a share outstanding throughout the period indicated.
| | | | |
| | | Year Ended October 31, | |
| | | 2013 | | | 2012 | | | 2011 | | | 2010 | | | 2009 | |
| Net asset value, beginning of year | | $ | 9.29 | | | $ | 9.30 | | | $ | 9.45 | | | $ | 9.49 | | | $ | 9.28 | |
| Income (Loss) from investment operations: | | | | | | | | | | | | | | | | | | | | |
| Net investment income | | | 0.0803 | | | | 0.1377 | | | | 0.1592 | | | | 0.2236 | | | | 0.3548 | |
| Net realized and unrealized gains (losses) from investments | | | (0.0939 | ) | | | 0.0377 | | | | (0.1204 | ) | | | (0.0115 | ) | | | 0.2069 | |
| Total from investment operations | | | (0.0136 | ) | | | 0.1754 | | | | 0.0388 | | | | 0.2121 | | | | 0.5617 | |
| Less distributions: | | | | | | | | | | | | | | | | | | | | |
| Dividends paid to stockholders: | | | | | | | | | | | | | | | | | | | | |
| From net investment income | | | (0.1564 | ) | | | (0.1854 | ) | | | (0.1888 | ) | | | (0.2521 | ) | | | (0.3517 | ) |
| Change in net asset value | | | (0.17 | ) | | | (0.01 | ) | | | (0.15 | ) | | | (0.04 | ) | | | 0.21 | |
| Net asset value, end of year | | $ | 9.12 | | | $ | 9.29 | | | $ | 9.30 | | | $ | 9.45 | | | $ | 9.49 | |
| Total return | | | (0.14)% | * | | | 1.91% | | | | 0.43% | | | | 2.28% | | | | 6.17% | |
| Ratios/Supplemental data: | | | | | | | | | | | | | | | | | | | | |
| Net assets, end of year (in 000’s) | | $ | 20,069 | | | $ | 23,607 | | | $ | 24,738 | | | $ | 26,006 | | | $ | 36,630 | |
| Ratio of net expenses to average net assets | | | 0.75% | | | | 0.75% | | | | 0.73% | | | | 0.63% | | | | 0.59% | |
| Ratio of net investment income to average net assets | | | 0.95% | | | | 1.48% | | | | 1.71% | | | | 2.44% | | | | 3.92% | |
| Ratio of gross expenses to average net assets** | | | 0.84% | | | | 0.78% | | | | 0.73% | | | | 0.63% | | | | 0.62% | |
| Portfolio turnover rate | | | 43% | | | | 44% | | | | 114% | | | | 44% | | | | 59% | |
| | | | | | | | | | | | | | | | | | | | | |
| * | During the fiscal year ended October 31, 2013, the Short U.S. Government Fund received monies related to certain nonrecurring litigation settlements. If these monies were not received, the one year return would have been (0.47)%. |
| ** | During the periods shown, certain fees were voluntarily and contractually reduced. If such voluntary and contractual fee reductions had not occurred, the ratios would have been as indicated. |
See notes to financial statements.
INTERMEDIATE MORTGAGE FUND
FINANCIAL HIGHLIGHTS
Selected data for a share outstanding throughout the period indicated.
| | | | |
| | | Year Ended October 31, | |
| | | 2013 | | | 2012 | | | 2011 | | | 2010 | | | 2009 | |
| Net asset value, beginning of year | | $ | 4.53 | | | $ | 4.46 | | | $ | 4.52 | | | $ | 5.00 | | | $ | 6.39 | |
| Income (Loss) from investment operations: | | | | | | | | | | | | | | | | | | | | |
| Net investment income | | | 0.0534 | | | | 0.0794 | | | | 0.0895 | | | | 0.3162 | | | | 0.4028 | |
| Net realized and unrealized gains (losses) from investments | | | (0.1228 | ) | | | 0.0853 | | | | (0.0418 | ) | | | (0.4711 | ) | | | (1.3925 | ) |
| Total from investment operations | | | (0.0694 | ) | | | 0.1647 | | | | 0.0477 | | | | (0.1549 | ) | | | (0.9897 | ) |
| Less distributions: | | | | | | | | | | | | | | | | | | | | |
| Dividends paid to stockholders: | | | | | | | | | | | | | | | | | | | | |
| From net investment income | | | (0.0706 | ) | | | (0.0947 | ) | | | (0.1077 | ) | | | (0.3251 | ) | | | (0.4003 | ) |
| Change in net asset value | | | (0.14 | ) | | | 0.07 | | | | (0.06 | ) | | | (0.48 | ) | | | (1.39 | ) |
| Net asset value, end of year | | $ | 4.39 | | | $ | 4.53 | | | $ | 4.46 | | | $ | 4.52 | | | $ | 5.00 | |
| Total return | | | (1.31)% | * | | | 3.72 % | | | | 1.09 % | | | | (3.27)% | | | | (15.65)% | |
| Ratios/Supplemental data: | | | | | | | | | | | | | | | | | | | | |
| Net assets, end of year (in 000’s) | | $ | 24,330 | | | $ | 25,602 | | | $ | 25,605 | | | $ | 29,587 | | | $ | 41,109 | |
| Ratio of net expenses to average net assets | | | 0.75% | | | | 0.75% | | | | 0.72% | | | | 0.57% | | | | 0.70% | |
| Ratio of net investment income to average net assets | | | 1.22% | | | | 1.77% | | | | 2.03% | | | | 6.76% | | | | 7.41% | |
| Ratio of gross expenses to average net assets** | | | 0.94% | | | | 0.89% | | | | 0.82% | | | | 0.67% | | | | 0.80% | |
| Portfolio turnover rate | | | 77% | | | | 72% | | | | 174% | | | | 115% | | | | 32% | |
| | |
| | |
| * | During the fiscal year ended October 31, 2013, the Intermediate Mortgage Fund received monies related to certain nonrecurring litigation settlements. If these monies were not received, the One Year return would have been (2.65)%. |
| ** | During the periods shown, certain fees were voluntarily and contractually reduced. If such voluntary and contractual fee reductions had not occurred, the ratios would have been as indicated. |
See notes to financial statements.
U.S. GOVERNMENT MORTGAGE FUND
FINANCIAL HIGHLIGHTS
Selected data for a share outstanding throughout the period indicated.
| | | | |
| | | Year Ended October 31, | |
| | | 2013 | | | 2012 | | | 2011 | | | 2010 | | | 2009 | |
| Net asset value, beginning of year | | $ | 8.94 | | | $ | 8.82 | | | $ | 8.88 | | | $ | 8.82 | | | $ | 8.86 | |
| Income (Loss) from investment operations: | | | | | | | | | | | | | | | | | | | | |
| Net investment income | | | 0.0850 | | | | 0.1678 | | | | 0.1767 | | | | 0.3169 | | | | 0.4225 | |
| Net realized and unrealized gains (losses) on investments | | | (0.2796 | ) | | | 0.1474 | | | | (0.0215 | ) | | | 0.0603 | | | | (0.0399 | ) |
| Total from investment operations | | | (0.1946 | ) | | | 0.3152 | | | | 0.1552 | | | | 0.3772 | | | | 0.3826 | |
| Less distributions: | | | | | | | | | | | | | | | | | | | | |
| Dividends paid to stockholders: | | | | | | | | | | | | | | | | | | | | |
| From net investment income | | | (0.1554 | ) | | | (0.1952 | ) | | | (0.2152 | ) | | | (0.3172 | ) | | | (0.4226 | ) |
| Change in net asset value | | | (0.35 | ) | | | 0.12 | | | | (0.06 | ) | | | 0.06 | | | | (0.04 | ) |
| Net asset value, end of year | | $ | 8.59 | | | $ | 8.94 | | | $ | 8.82 | | | $ | 8.88 | | | $ | 8.82 | |
| Total return | | | (2.19)% | | | | 3.73 % | | | | 1.68% | | | | 4.37% | | | | 4.41% | |
| Ratios/Supplemental data: | | | | | | | | | | | | | | | | | | | | |
| Net assets, end of year (in 000’s) | | $ | 10,667 | | | $ | 23,143 | | | $ | 22,875 | | | $ | 23,023 | | | $ | 24,627 | |
| Ratio of net expenses to average net assets | | | 0.75% | | | | 0.75% | | | | 0.73% | | | | 0.60% | | | | 0.68% | |
| Ratio of net investment income to average net assets | | | 1.36% | | | | 1.89% | | | | 2.01% | | | | 3.63% | | | | 4.83% | |
| Ratio of gross expenses to average net assets* | | | 0.84% | | | | 0.78% | | | | 0.73% | | | | 0.60% | | | | 0.68% | |
| Portfolio turnover rate | | | 38% | | | | 65% | | | | 93% | | | | 104% | | | | 36% | |
| | |
| | |
| * | During the periods shown, certain fees were voluntarily and contractually reduced. If such voluntary and contractual fee reductions had not occurred, the ratios would have been as indicated. |
See notes to financial statements.
LARGE CAP EQUITY FUND — CLASS AMF SHARES
FINANCIAL HIGHLIGHTS
Selected data for a share outstanding throughout the period indicated.
| | | | | | | | | | | | | | | | |
| | | Year Ended October 31, | |
| | | 2013 | | | 2012 | | | 2011 | | | 2010 | | | 2009 | |
| Net asset value, beginning of year | | $ | 9.41 | | | $ | 8.53 | | | $ | 7.95 | | | $ | 7.11 | | | $ | 6.89 | |
| Income from operations: | | | | | | | | | | | | | | | | | | | | |
| Net investment income | | | 0.11 | | | | 0.12 | | | | 0.11 | | | | 0.09 | | | | 0.09 | |
| Net realized and unrealized gains (losses) from investments | | | 2.02 | | | | 1.07 | | | | 0.58 | | | | 0.85 | | | | 0.37 | |
| Total from investment operations | | | 2.13 | | | | 1.19 | | | | 0.69 | | | | 0.94 | | | | 0.46 | |
| Less Distributions: | | | | | | | | | | | | | | | | | | | | |
| Dividends paid to stockholders: | | | | | | | | | | | | | | | | | | | | |
| From net investment income | | | (0.12 | ) | | | (0.12 | ) | | | (0.11 | ) | | | (0.10 | ) | | | (0.10 | ) |
| From net realized gains on investments | | | (0.32 | ) | | | (0.19 | ) | | | — | | | | — | | | | (0.14 | ) |
| Total distributions | | | (0.44 | ) | | | (0.31 | ) | | | (0.11 | ) | | | (0.10 | ) | | | (0.24 | ) |
| Change in net asset value | | | 1.69 | | | | 0.88 | | | | 0.58 | | | | 0.84 | | | | 0.22 | |
| Net asset value, end of year | | $ | 11.10 | | | $ | 9.41 | | | $ | 8.53 | | | $ | 7.95 | | | $ | 7.11 | |
| Total return | | | 23.55% | | | | 14.16% | | | | 8.66% | | | | 13.35% | | | | 7.16% | |
| Ratios/Supplemental data: | | | | | | | | | | | | | | | | | | | | |
| Net assets, end of year (000’s) | | $ | 89,562 | | | $ | 82,373 | | | $ | 76,905 | | | $ | 88,368 | | | $ | 76,669 | |
| Ratio of net expenses to average net assets | | | 1.22% | | | | 1.20% | | | | 1.14% | | | | 1.04% | | | | 1.24% | |
| Ratio of net investment income to average net assets | | | 1.11% | | | | 1.25% | | | | 1.25% | | | | 1.23% | | | | 1.39% | |
| Ratio of gross expenses to average net assets* | | | 1.32% | | | | 1.30% | | | | 1.24% | | | | 1.15% | | | | 1.45% | |
| Portfolio turnover rate | | | 5% | | | | 8% | | | | 7% | | | | 14% | | | | 14% | |
| | | | | | | | | | | | | | | | | | | | | |
| * | During the periods shown, certain fees were voluntarily reduced. If such voluntary fee reductions had not occurred, the ratios would have been as indicated. |
See notes to financial statements.
ASSET MANAGEMENT FUND
LARGE CAP EQUITY FUND — CLASS H SHARES
FINANCIAL HIGHLIGHTS
Selected data for a share outstanding throughout the period indicated.
| | | | | | | | | | | | | | | | |
| | | Year Ended October 31, | | | Period Ended October 31, 2009(a) | |
| | | 2013 | | | 2012 | | | 2011 | | | 2010 | |
| | | | | | | | | | | | | | | | |
| Net asset value, beginning of period | | $ | 9.41 | | | $ | 8.53 | | | $ | 7.95 | | | $ | 7.11 | | | $ | 5.52 | |
| Income from operations: | | | | | | | | | | | | | | | | | | | | |
| Net investment income | | | 0.13 | | | | 0.13 | | | | 0.12 | | | | 0.11 | | | | 0.07 | |
| Net realized and unrealized gains (losses) from investments | | | 2.01 | | | | 1.07 | | | | 0.58 | | | | 0.85 | | | | 1.59 | |
| Total from investment operations | | | 2.14 | | | | 1.20 | | | | 0.70 | | | | 0.96 | | | | 1.66 | |
| Less Distributions: | | | | | | | | | | | | | | | | | | | | |
| Dividends paid to stockholders: | | | | | | | | | | | | | | | | | | | | |
| From net investment income | | | (0.13 | ) | | | (0.13 | ) | | | (0.12 | ) | | | (0.12 | ) | | | (0.07 | ) |
| From net realized gains on investments | | | (0.32 | ) | | | (0.19 | ) | | | — | | | | — | | | | — | |
| Total distributions | | | (0.45 | ) | | | (0.32 | ) | | | (0.12 | ) | | | (0.12 | ) | | | (0.07 | ) |
| Change in net asset value | | | 1.69 | | | | 0.88 | | | | 0.58 | | | | 0.84 | | | | 1.59 | |
| Net asset value, end of period | | $ | 11.10 | | | $ | 9.41 | | | $ | 8.53 | | | $ | 7.95 | | | $ | 7.11 | |
| Total return | | | 23.74% | | | | 14.33% | | | | 8.83% | | | | 13.59% | | | | 32.22% | (b) |
| Ratios/Supplemental data: | | | | | | | | | | | | | | | | | | | | |
| Net assets, end of period (000’s) | | $ | 5,755 | | | $ | 4,413 | | | $ | 3,440 | | | $ | 2,937 | | | $ | 2,584 | |
| Ratio of net expenses to average net assets | | | 1.07% | | | | 1.05% | | | | 0.99% | | | | 0.85% | | | | 0.90% | (c) |
| Ratio of net investment income to average net assets | | | 1.24% | | | | 1.39% | | | | 1.39% | | | | 1.41% | | | | 1.56% | (c) |
| Ratio of gross expenses to average net assets* | | | 1.07% | | | | 1.05% | | | | 0.99% | | | | 0.90% | | | | 1.05% | (c) |
| Portfolio turnover rate | | | 5% | | | | 8% | | | | 7% | | | | 14% | | | | 14% | (d) |
| | | | | | | | | | | | | | | | | | | | | |
| * | During the periods shown, certain fees were voluntarily reduced. If such voluntary fee reductions had not occurred, the ratios would have been as indicated. |
| (a) | For the period February 20, 2009 (commencement of operations) through October 31, 2009. |
| (b) | Not annualized. |
| (c) | Annualized. |
| (d) | The portfolio turnover rate represents the full year period of November 1, 2008 through October 31, 2009. |
See notes to financial statements.
ASSET MANAGEMENT FUND
NOTES TO FINANCIAL STATEMENTS
October 31, 2013
| | | | | |
| | | | | |
Asset Management Fund (the “Trust”) was reorganized as a Delaware statutory trust on September 30, 1999, and is registered under the Investment Company Act of 1940, as amended (the “1940 Act”), as a diversified open-end management company. As of October 31, 2013, the Trust is authorized to issue an unlimited number of shares in six separate series: the Ultra Short Mortgage Fund, the Ultra Short Fund, the Short U.S. Government Fund, the Intermediate Mortgage Fund, the U.S. Government Mortgage Fund and the Large Cap Equity Fund (referred to individually as a “Fund” and collectively as the “Funds”). Each of the Funds, except the Large Cap Equity Fund, offer a single class of shares. The Large Cap Equity Fund is authorized to issue two classes of shares: Class AMF Shares and Class H Shares. Class AMF and Class H Shares of the Large Cap Equity Fund have the same rights and obligations except: (i) Class AMF Shares bear a distribution fee, while Class H Shares do not have any distribution fee, which will cause Class AMF Shares to have a higher expense ratio and to pay lower dividends than those related to Class H Shares; (ii) other expenses, which are determined to properly apply to one class of shares upon approval by the Board of Trustees of the Trust (“Board”), will be borne solely by the class to which such expenses are attributable; and (iii) each class will have exclusive voting rights with respect to the matters relating to its own distribution arrangements. Under the Trust’s organizational documents, its officers and trustees are indemnified against certain liabilities arising out of the performance of their duties to the Trust. In addition, in the normal course of business, the Trust enters into contracts with its vendors and others that provide general indemnification. Each Fund’s maximum exposure under these arrangements is unknown, as this would involve future claims that may be made against a Fund. The Trust maintains an insurance policy that insures its officers and trustees against certain liabilities. A. Significant accounting policies are as follows: SECURITY VALUATION Investments are recorded at fair value. Fair value is defined as the price that would be received to sell an asset or paid to transfer a liability in an orderly transaction between market participants at the measurement date. The valuation techniques employed by the Funds, as described below, maximize the use of observable inputs and minimize the use of unobservable inputs in determining fair value. These inputs are summarized in the following three broad levels: | | The inputs or methodology used for valuing securities are not necessarily an indication of the risk associated with investing in those securities. For example, certain short-term debt securities are valued using amortized cost. Generally, amortized cost approximates the current value of a security, but since this valuation is not obtained from a quoted price in an active market, such securities would be reflected as Level 2 in the fair value hierarchy. The Funds’ prices for equity securities are generally provided by an independent third party pricing service approved by the Board as of the close of the regular trading session of the New York Stock Exchange, normally at 4:00 pm EST, each business day on which the share price of each Fund is calculated. Equity securities listed or traded on a primary exchange are valued at the closing price, if available, or the last sales price on the primary exchange. If no sale occurred on the valuation date, the securities will be valued at the mean of the latest bid and ask quotations as of the close of the primary exchange. Investments in other open-end registered investment companies are valued at their respective net asset value as reported by such companies. In these types of situations, valuations are typically categorized as Level 1 in the fair value hierarchy. The Funds’ debt and other fixed income securities are generally valued at an evaluated bid price provided by an independent pricing source approved by the Board. To value debt securities, pricing services may use various pricing techniques which take into account appropriate factors such as market activity, yield, quality, coupon rate, maturity, type of issue, trading characteristics, call features, credit ratings and other data, as well as broker quotes. Short-term debt securities of sufficient credit quality that mature within sixty days are valued at amortized cost, which approximates fair value. In each of these situations, valuations are typically categorized as Level 2 in the fair value hierarchy. If a pricing service is unable to provide valuations for a particular security or securities, or the Adviser has determined that such valuations are unreliable, the Funds will fair value the security or securities pursuant to the fair valuation methodology of the Adviser approved by the Board. Within the fair value pricing methodology used by the Adviser, among the more specific factors that are considered in determining the fair value of investments in debt instruments are: (1) information obtained with respect to market transactions in such securities or comparable securities; (2) the price and extent of public trading in similar securities of the issuer or comparable securities; (3) the fundamental analytical data relating to the investment; (4) quotations from broker/dealers, yields, maturities, ratings and various relationships between securities; and (5) evaluation of the forces which influence the market in which these securities are purchased and sold. The fair valuation process also takes into consideration factors such as interest rate changes, movements in credit spreads, default rate assumptions, repayment assumptions, type and quality of collateral, and security seasoning. Imprecision in estimating fair value can impact the amount of unrealized appreciation or |
| | | | |
| | ● | Level 1 — quoted prices in active markets for identical assets | |
| | | | |
| | ● | Level 2 — other significant observable inputs (including quoted prices of similar securities, interest rates, prepayment speeds, credit risk, etc.) | |
| | | | |
| | ● | Level 3 — significant unobservable inputs (including the Fund’s own assumptions in determining the fair value of investments) | |
| | | | |
ASSET MANAGEMENT FUND
NOTES TO FINANCIAL STATEMENTS (continued)
October 31, 2013
depreciation recorded for a particular security, and differences in the assumptions used could result in a different determination of fair value, and those differences could be material. Depending on the source and relative significance of the valuation inputs in these instances, the instruments may be classified as Level 2 or Level 3 in the fair value hierarchy. Fair value pricing, including evaluated prices obtained from pricing services, is inherently a process of estimates and judgments. Fair value prices may fluctuate less than market prices due to technical issues which may impact the prices at which the Funds can purchase or sell securities. Market prices can be impacted by technical factors such as short term changes in market liquidity and volatility which may not directly impact | | fair value prices. There can be no assurance that a Fund could purchase or sell a portfolio of investments at the fair value price used to calculate the Fund’s NAV. In addition, changes in the value of portfolio investments priced at fair value may be less frequent and of greater magnitude than changes in the price of securities that trade frequently in the marketplace, resulting in potentially greater NAV volatility. While the Trust’s policy is intended to result in a calculation of a Fund’s NAV that fairly reflects security values at the time of pricing, the Trust cannot ensure that fair value prices would accurately reflect the price that a Fund could obtain for a security if it were to dispose of that security, particularly in a forced or distressed sale. |
The following is a summary of the inputs used to value the Funds’ investments as of October 31, 2013:
| | | | | | Level 2 - | | | Level 3 - | | | | |
| | | Level 1 - | | | Other Significant | | | Significant | | | | |
| Portfolio | | Quoted Prices | | | Observable Inputs | | | Unobservable Inputs | | | Total | |
| Ultra Short Mortgage Fund | | | | | | | | | | | | |
| U.S. Government Agency Mortgages | | $ | — | | | $ | 252,494,421 | | | $ | — | | | $ | 252,494,421 | |
| U.S. Government Agency | | | — | | | | 5,709,647 | | | | — | | | | 5,709,647 | |
| Repurchase Agreements | | | — | | | | 16,167,000 | | | | — | | | | 16,167,000 | |
| Investment Companies | | | 823 | | | | — | | | | — | | | | 823 | |
| Total Investments | | | | | | | | | | | | | | | 274,371,891 | |
| Ultra Short Fund | | | | | | | | | | | | | | | | |
| U.S. Government Agency Mortgages | | | — | | | | 6,310,485 | | | | — | | | | 6,310,485 | |
| Investment Companies | | | 830,641 | | | | — | | | | — | | | | 830,641 | |
| Total Investments | | | | | | | | | | | | | | | 7,141,126 | |
| Short U.S. Government Fund | | | | | | | | | | | | | | | | |
| U.S. Government Agency Mortgages | | | — | | | | 18,131,712 | | | | — | | | | 18,131,712 | |
| Repurchase Agreements | | | — | | | | 1,879,000 | | | | — | | | | 1,879,000 | |
| Investment Companies | | | 521 | | | | — | | | | — | | | | 521 | |
| Total Investments | | | | | | | | | | | | | | | 20,011,233 | |
| Intermediate Mortgage Fund | | | | | | | | | | | | | | | | |
| U.S. Government Agency Mortgages | | | — | | | | 21,521,510 | | | | — | | | | 21,521,510 | |
| Repurchase Agreements | | | — | | | | 2,854,000 | | | | — | | | | 2,854,000 | |
| Investment Companies | | | 665 | | | | — | | | | — | | | | 665 | |
| Total Investments | | | | | | | | | | | | | | | 24,376,175 | |
| U.S. Government Mortgage Fund | | | | | | | | | | | | | | | | |
| U.S. Government Agency Mortgages | | | — | | | | 10,347,567 | | | | — | | | | 10,347,567 | |
| Investment Companies | | | 309,608 | | | | — | | | | — | | | | 309,608 | |
| Total Investments | | | | | | | | | | | | | | | 10,657,175 | |
| Large Cap Equity Fund | | | | | | | | | | | | | | | | |
| Common Stocks | | | 90,412,290 | | | | — | | | | — | | | | 90,412,290 | |
| Investment Companies | | | 4,970,457 | | | | — | | | | — | | | | 4,970,457 | |
| Total Investments | | | | | | | | | | | | | | $ | 95,382,747 | |
| | | | | | | | | | | | | | | | | |
As of October 31, 2013, there were no Level 3 securities held by the Funds. The Trust’s policy is to disclose transfers between levels based on valuations at the end of the reporting period. There were no transfers between Level 1, 2 or 3 as of October 31, 2013, based on levels assigned to securities as of October 31, 2012. REPURCHASE AGREEMENTS With the exception of the Ultra Short Fund and Large Cap Equity Fund, obligations of the U.S. Government or other | | obligations that are not subject to any investment limitation on the part of national banks may be purchased from government securities dealers or the custodian bank, subject to the seller’s agreement to repurchase them at an agreed upon date and price. The value of collateral underlying the repurchase agreement will always be at least equal to the repurchase price, including any accrued interest earned on the repurchase agreement. If the counterparty defaults, and the fair value of the collateral declines, realization of the collateral by Funds may be delayed or limited. |
NOTES TO FINANCIAL STATEMENTS (continued)
October 31, 2013
| | | |
SECURITIES PURCHASED ON A WHEN-ISSUED OR DELAYED-DELIVERY BASIS Each Fund may purchase securities on a when-issued or delayed-delivery basis. In when-issued transactions, securities are bought or sold during the period between the announcement of an offering and the issuance and payment date of the securities. When securities are purchased on a delayed-delivery basis, the price of the securities is fixed at the time the commitment to purchase is made, but settlement may take place at a future date. By the time of delivery, securities purchased on a when-issued or delayed-delivery basis may be valued at less than the purchase price. At the time when-issued or delayed-delivery securities are purchased, the Fund must set aside funds in a segregated account to pay for the purchase, and until acquisition, the Fund will not earn any income on the securities that it purchased. There were no when-issued securities held in the Funds as of October 31, 2013. DIVIDENDS TO SHAREHOLDERS Ultra Short Mortgage Fund, Ultra Short Fund, Short U.S. Government Fund, Intermediate Mortgage Fund and U.S. Government Mortgage Fund: Dividends from net investment income are declared daily and paid monthly. Net short-term and long-term capital gains, if any, are declared and paid annually. Large Cap Equity Fund: Dividends from net investment income are declared and paid at least quarterly. Net short-term and long-term capital gains, if any, are declared and paid annually. For all Funds, distributions from net investment income and from net realized capital gains are determined in accordance with Federal income tax regulations, which may differ from accounting principles generally accepted in the United States of America. These “book/tax” differences are either considered temporary or permanent in nature. To the extent these differences are permanent in nature (e.g. reclass of dividend distribution and return of capital), such amounts are reclassified within the composition of net assets based on their federal tax-basis treatment; temporary differences do not require reclassification. Distributions to shareholders that exceed net investment income and net realized capital gains for tax purposes are reported as distributions of capital. FEDERAL TAXES No provision is made for Federal income taxes as it is the policy of each Fund to continue to qualify as a regulated investment company by complying with the provisions available to certain investment companies, as defined in applicable sections of the Internal Revenue Code, and to make distributions of net investment income and net realized capital gains sufficient to relieve it from all, or substantially all, federal income taxes. | | For all open tax years and all major taxing jurisdictions, management of the Funds has concluded that there are no significant uncertain tax positions that would require recognition in the financial statements. Open tax years are those that are open for examination by taxing authorities (i.e., generally the last four tax year ends and the interim tax period since then). Furthermore, management of the Funds is also not aware of any tax positions for which it is reasonably possible that the total amounts of unrecognized tax benefits will significantly change in the next twelve months. MANAGEMENT ESTIMATES The preparation of financial statements in conformity with accounting principles generally accepted in the United States of America requires management to make estimates and assumptions that affect the reported amounts of assets and liabilities at the date of the financial statements and the reported amounts of revenues and expenses during the reporting period. Actual results could differ from these estimates. OTHER Investment transactions are accounted for no later than one business day after the trade date. However, for financial reporting purposes, investment transactions are reported on the trade date. Interest income is recorded on the accrual basis, amortization and accretion is recognized based on the anticipated effective maturity date, and the cost of investments sold is determined by use of the specific identification method for both financial reporting and income tax purposes. Paydown gains and losses on mortgage- and asset-backed securities are recorded as adjustments to interest income in the Statement of Operations. B. Fees and transactions with affiliates were as follows: Shay Assets Management, Inc. “SAMI” serves the Trust as investment adviser (the “Adviser”). Sean Kelleher is the current President of SAMI. The Adviser is a wholly-owned subsidiary of Shay Investment Services, Inc. “SISI”. SISI is controlled by Rodger D. Shay, Chairman of the Board and Rodger D. Shay, Jr., a member of the Board and President of Shay Financial Services, Inc. “SFSI”, also a wholly-owned subsidiary of SISI. As compensation for investment advisory services, the Funds pay an investment advisory fee monthly based upon an annual percentage of the average daily net assets of each Fund as follows: The investment advisory fee rate for the Ultra Short Mortgage Fund is 0.45% of the first $3 billion, 0.35% of the next $2 billion, and 0.25% of net assets in excess of $5 billion. The Adviser voluntarily waived a portion of its fee so that the Fund paid 0.25% of average daily net assets for the year ended October 31, 2013. The investment advisory fee rate for the Ultra Short Fund is 0.45% of the average daily net assets. The Adviser voluntarily |
ASSET MANAGEMENT FUND
NOTES TO FINANCIAL STATEMENTS (continued)
October 31, 2013
| | | |
waived a portion of its fee so that the Fund paid 0.25% of average daily net assets for the year ended October 31, 2013. The investment advisory fee rate for each of the Short U.S. Government Fund and the U.S. Government Mortgage Fund, computed separately, is 0.25% of the first $500 million, 0.175% of the next $500 million, 0.125% of the next $500 million, and 0.10% of net assets in excess of $1.5 billion. The investment advisory fee rate for the Intermediate Mortgage Fund is 0.35% of the first $500 million, 0.275% of the next $500 million, 0.20% of the next $500 million, and 0.10% of net assets in excess of $1.5 billion. The Adviser voluntarily waived a portion of its fee so that the Fund paid 0.25% of average daily net assets for the year ended October 31, 2013. The investment advisory fee rate for the Large Cap Equity Fund is 0.65% of the first $250 million and 0.55% for assets over $250 million. The Adviser has contractually agreed to reduce its advisory fees charged to the Short U.S. Government Fund, the Intermediate Mortgage Fund and the U.S. Government Mortgage Fund, to the extent that the daily ratio of operating expenses to average daily net assets of each Fund exceeds 0.75% through February 28, 2014. As a result of the contractual expense limit, the Adviser reduced its adviser fees charged for the Short U.S Government Fund, the Intermediate Mortgage Fund and the U.S Government Fund for the following amounts; $19,372, $21,448 and $17,488, respectively, for the year ended October 31, 2013. SFSI serves the Trust as distributor (the “Distributor”). The Distributor is a wholly-owned subsidiary of SISI, which is controlled by Rodger D. Shay, Chairman of the Board and Rodger D. Shay, Jr., a member of the Board of and the President of SFSI. As compensation for distribution services, the Trust pays the Distributor a distribution fee monthly in accordance with the distribution plan adopted by the Trust, pursuant to Rule 12b-1 under the 1940 Act, based upon an annual percentage of the average daily net assets of each Fund as follows: The distribution fee rate for the Short U.S. Government Fund is based upon an annual percentage of the average daily net assets of the funds and is as follows: 0.15% of the first $500 million, 0.125% of the next $500 million, 0.10% of the next $1 billion, and 0.075% of combined net assets in excess of $2 billion. The distribution fee rate for each of the Ultra Short Mortgage Fund and the Ultra Short Fund, computed separately, is 0.25% of average daily net assets. The Distributor voluntarily waived a portion of its fee so that the Ultra Short Mortgage Fund and the Ultra Short Fund paid an amount equal to 0.15% of average daily net assets for the year ended October 31, 2013. The distribution fee rate for each of the Intermediate Mortgage Fund and the U.S. Government Mortgage Fund, computed separately, is as follows: 0.15% of the first $500 mil- | | lion, 0.125% of the next $500 million, 0.10% of the next $500 million, and 0.075% of net assets in excess of $1.5 billion. The distribution fee rate for the Large Cap Equity Fund Class AMF Shares is 0.25% of average daily net assets. The Distributor waived a portion of its fee so that the Large Cap Equity Fund Class AMF Shares paid an amount equal to 0.15% of average daily net assets for the year ended October 31, 2013. The Large Cap Equity Fund Class H Shares do not have a distribution fee. The Northern Trust Company (“Northern Trust”) and the Trust have entered into a Custody Agreement, Fund Administration and Accounting Services Agreement, and Transfer Agency Service Agreement (collectively the “Services Agreements”). As compensation for its services under the Service Agreements, the Trust has agreed to pay Northern Trust an annual fee of $646,000 for the aggregate services, plus out-of-pocket expenses exceeding $200,000. The Trust has entered into a Compliance Services Agreement with Beacon Hill Fund Services, Inc. (“Beacon Hill”). Pursuant to the terms of the Compliance Services Agreement, Beacon Hill makes available an individual to serve as the Trust’s chief compliance officer. The chief compliance officer is responsible for administering the Trust’s compliance policies and procedures and, at least annually, reviewing, the compliance policies and procedures of the Trust and the Trust’s service providers in accordance with Rule 38a-1 under the 1940 Act. As compensation for the services to each Fund rendered by Beacon Hill under the Compliance Services Agreement, the Trust pays Beacon Hill an annual fee of $115,000, plus reasonable out-of-pocket expenses. The Trust has entered into a Financial Services Agreement with Beacon Hill. Pursuant to the terms of the Financial Services Agreement, Beacon Hill makes available an individual to serve as the Trust’s chief financial officer. The chief financial officer is responsible for administering the Trust’s accounting policies and procedures. As compensation for the services to each Fund rendered by Beacon Hill under the Financial Services Agreement, the Trust has agreed to pay Beacon Hill an annual fee of $90,000 plus reasonable out-of-pocket expenses. The Trust has entered into an agreement with Beacon Hill to provide governance and regulatory oversight services to the Trust. Under the terms of this agreement, Beacon Hill performs and coordinates fund governance and regulatory oversight activities of the Trust, including but not limited to, monitoring activities of its third party service providers, coordinating and filing amendments to the Trust’s registration statement and financial filings, preparing and distributing material for board meetings and maintaining all books and records as required by the federal securities laws. As compensation for its services under the agreement, the Trust pays Beacon Hill a fee at an annual rate of 0.02% of the average daily assets of the Trust for the first $1 billion and 0.015% of the average daily assets for assets in excess of $1 billion, with a minimum annual fee of $150,000 plus reasonable out-of-pocket expenses. |
| |
| ASSET MANAGEMENT FUND |
| NOTES TO FINANCIAL STATEMENTS (continued) |
| October 31, 2013 |
| |
| On April 24, 2012 Watertown Savings Bank commenced a civil action in the Circuit Court of Cook County against Asset Management Fund, specifically the Ultra Short and Ultra Short Mortgage Funds. As a result of the civil action, the Ultra Short Mortgage and Ultra Short Fund incurred legal expenses of $103,775 and $2,328 respectively, during the period covered by the report. These legal expenses have been included in the Statements of Operations under legal | | expenses for each Fund. In addition to the legal expense incurred, a corresponding legal expense reimbursement from the Funds’ insurance carrier has also been included in the Statements of Operations under expenses reduced for each Fund. As of October 31, 2013, this civil action is no longer pending. The legal fees and corresponding expense reimbursement incurred in connection with this civil action resulted in no net asset value impact to either Fund. |
C. Transactions in shares of the Funds for the year ended October 31, 2013 and year ended October 31, 2012 were as follows:
| | | | | | | |
| | | Ultra Short Mortgage Fund | | | Ultra Short Fund | |
| | | Year Ended | | | Year Ended | | | Year Ended | | | Year Ended | |
| | | October 31, 2013 | | | October 31, 2012 | | | October 31, 2013 | | | October 31, 2012 | |
| Share transactions: | | | | | | | | | | | | |
| Sale of shares | | | 2,083,790 | | | | 1,805,230 | | | | — | | | | — | |
| Shares issued to stockholders in reinvestment of dividends | | | 96,969 | | | | 88,189 | | | | 451 | | | | 606 | |
| Shares repurchased | | | (18,454,695 | ) | | | (7,425,373 | ) | | | (3,069 | ) | | | (7,036 | ) |
| Net (decrease) | | | (16,273,936 | ) | | | (5,531,954 | ) | | | (2,618 | ) | | | (6,430 | ) |
| Shares Outstanding | | | | | | | | | | | | | | | | |
| Beginning of year | | | 53,564,658 | | | | 59,096,612 | | | | 1,387,040 | | | | 1,393,470 | |
| End of year | | | 37,290,722 | | | | 53,564,658 | | | | 1,384,422 | | | | 1,387,040 | |
| | | | | | | | | | | | | | | | | |
| | | | | | | | | | | | | | | | | |
| | | Short U.S. Government Fund | | | Intermediate Mortgage Fund | |
| | | Year Ended | | | Year Ended | | | Year Ended | | | Year Ended | |
| | | October 31, 2013 | | | October 31, 2012 | | | October 31, 2013 | | | October 31, 2012 | |
| Share transactions: | | | | | | | | | | | | | | | | |
| Sale of shares | | | 2,658 | | | | 12,005 | | | | 4 | | | | 111 | |
| Shares issued to stockholders in reinvestment of dividends | | | 3,898 | | | | 3,993 | | | | 305 | | | | 433 | |
| Shares repurchased | | | (348,328 | ) | | | (133,889 | ) | | | (105,012 | ) | | | (86,314 | ) |
| Net (decrease) | | | (341,772 | ) | | | (117,891 | ) | | | (104,703 | ) | | | (85,770 | ) |
| Shares Outstanding | | | | | | | | | | | | | | | | |
| Beginning of year | | | 2,542,007 | | | | 2,659,898 | | | | 5,651,433 | | | | 5,737,203 | |
| End of year | | | 2,200,235 | | | | 2,542,007 | | | | 5,546,730 | | | | 5,651,433 | |
| | | | | | | | | | | | | | | | | |
| | | | | | | | | | | | | | | | | |
| | | | | | | | | | | U.S. Government Mortgage Fund | |
| | | | | | | | | | | Year Ended | | | Year Ended | |
| | | | | | | | | | | October 31, 2013 | | | October 31, 2012 | |
| Share transactions: | | | | | | | | | | | | | | | | |
| Sale of shares | | | | 225,177 | | | | 2 | |
| Shares issued to stockholders in reinvestment of dividends | | | | | 6,197 | | | | 2,675 | |
| Shares repurchased | | | | | | | | | | | (1,577,833 | ) | | | (9,065 | ) |
| Net (decrease) | | | | (1,346,459 | ) | | | (6,388 | ) |
| Shares Outstanding | | | | | | | | | | | | | | | | |
| Beginning of year | | | | | | | | | | | 2,588,805 | | | | 2,595,193 | |
| End of year | | | | | | | | | | | 1,242,346 | | | | 2,588,805 | |
| | | | | | | | | | | | | | | | | |
| |
| ASSET MANAGEMENT FUND |
| NOTES TO FINANCIAL STATEMENTS (continued) |
| October 31, 2013 |
| |
| | | Large Cap Equity Fund | |
| | | Year Ended | | | Year Ended | |
| | | October 31, 2013 | | | October 31, 2012 | |
| Share transactions Class AMF: | | | | | | |
| Sale of shares | | | 192,410 | | | | 261,613 | |
| Shares issued to stockholders in reinvestment of dividends | | | 299,468 | | | | 222,599 | |
| Shares repurchased | | | (1,179,879 | ) | | | (746,865 | ) |
| Net decrease | | | (688,001 | ) | | | (262,653 | ) |
| Shares Outstanding | | | | | | | | |
| Beginning of year | | | 8,754,350 | | | | 9,017,003 | |
| End of year | | | 8,066,349 | | | | 8,754,350 | |
| | | | | | | | | |
| Share transactions Class H: | | | | | | | | |
| Sale of shares | | | 60,795 | | | | 60,740 | |
| Shares issued to stockholders in reinvestment of dividends | | | 22,660 | | | | 15,061 | |
| Shares repurchased | | | (34,136 | ) | | | (10,111 | ) |
| Net increase | | | 49,319 | | | | 65,690 | |
| Shares Outstanding | | | | | | | | |
| Beginning of year | | | 469,024 | | | | 403,334 | |
| End of year | | | 518,343 | | | | 469,024 | |
| | | | | | | | | |
D. For the year ended October 31, 2013, purchases and sales of securities, other than short-term investments and U.S. Government securities, were as follows:
| | | | | | | | | | | | | | | | | | | |
| | | Ultra Short | | | | | | Short U.S. | | | Intermediate | | | U.S. Government | | | Large Cap | |
| | | Mortgage | | | Ultra Short | | | Government | | | Mortgage | | | Mortgage | | | Equity | |
| | | Fund | | | Fund | | | Fund | | | Fund | | | Fund | | | Fund | |
| Purchases | | $ | — | | | $ | — | | | $ | — | | | $ | — | | | $ | — | | | $ | 4,364,790 | |
| Sales | | | — | | | | — | | | | — | | | | — | | | | — | | | | 15,879,590 | |
For the year ended October 31, 2013, purchases and sales of U.S. Government securities, other than short-term investments, were as follows:
| | | | | | | | | | | | | | | | |
| | | Ultra Short | | | | | | Short U.S. | | | Intermediate | | | U.S. Government | |
| | | Mortgage | | | Ultra Short | | | Government | | | Mortgage | | | Mortgage | |
| | | Fund | | | Fund | | | Fund | | | Fund | | | Fund | |
| Purchases | | $ | 91,318,984 | | | $ | 1,588,301 | | | $ | 8,592,602 | | | $ | 16,379,523 | | | $ | 6,825,072 | |
| Sales | | | 198,259,382 | | | | 1,805,655 | | | | 12,430,964 | | | | 18,299,165 | | | | 18,258,572 | |
E. FEDERAL INCOME TAX INFORMATION:
The tax characteristics of distributions paid to shareholders during the fiscal years ended October 31, 2013, and 2012 were as follows:
| | | | | | | | | | |
| | | Distributions paid from | | | Total Taxable | | | Total Distributions | |
| 2013 | | Ordinary Income | | | Distributions | | | Paid* | |
| Ultra Short Mortgage Fund | | $ | 5,656,633 | | | $ | 5,656,633 | | | $ | 5,656,633 | |
| Ultra Short Fund | | | 69,829 | | | | 69,829 | | | | 69,829 | |
| Short U.S. Government Fund | | | 384,438 | | | | 384,438 | | | | 384,438 | |
| Intermediate Mortgage Fund | | | 417,732 | | | | 417,732 | | | | 417,732 | |
| U.S. Government Mortgage Fund | | | 381,671 | | | | 381,671 | | | | 381,671 | |
ASSET MANAGEMENT FUND NOTES TO FINANCIAL STATEMENTS (continued) October 31, 2013 |
| | | | | | | | | | | | | |
| | | Distributions paid from | | | Total Taxable | | | Total Distributions | |
| 2012 | | Ordinary Income | | | Distributions | | | Paid* | |
| Ultra Short Mortgage Fund | | $ | 7,779,865 | | | $ | 7,779,865 | | | $ | 7,779,865 | |
| Ultra Short Fund | | | 86,828 | | | | 86,828 | | | | 86,828 | |
| Short U.S. Government Fund | | | 467,341 | | | | 467,341 | | | | 467,341 | |
| Intermediate Mortgage Fund | | | 528,284 | | | | 528,284 | | | | 528,284 | |
| U.S. Government Mortgage Fund | | | 506,383 | | | | 506,383 | | | | 506,383 | |
| * | Total distributions paid differ from the Statement of Changes in Net Assets because dividends are recognized when actually paid for federal income tax purposes. |
The tax characteristics of distributions paid to shareholders during the years ended October 31, 2013 and 2012 for the Large Cap Equity Fund were as follows:
| | | | | | | | | | | | | | | | | |
| | | Distributions paid from | | | Net Long | | | Tax Return | | | Total Distributions | |
| 2013 | | Ordinary Income | | | Term Gains | | | of Capital | | | Paid | |
| Large Cap Equity Fund | | $ | 1,075,179 | | | $ | 2,847,836 | | | $ | — | | | $ | 3,923,015 | |
| | | | | | | | | | | | | | | | | |
| | | Distributions paid from | | | Net Long | | | Tax Return | | | Total Distributions | |
| 2012 | | Ordinary Income | | | Term Gains | | | of Capital | | | Paid | |
| Large Cap Equity Fund | | $ | 1,131,987 | | | $ | 1,746,753 | | | $ | — | | | $ | 2,878,740 | |
At October 31, 2013, the cost, gross unrealized appreciation and gross unrealized depreciation on securities, for federal income tax purposes, were as follows:
| | | | | | | | | | | | | | | | | |
| | | | | | Tax | | | | | | Net Unrealized | |
| | | | | | Unrealized | | | Tax Unrealized | | | Appreciation | |
| | | Tax Cost | | | Appreciation | | | (Depreciation) | | | (Depreciation) | |
| Ultra Short Mortgage Fund | | $ | 268,949,119 | | | $ | 5,796,393 | | | $ | (373,621 | ) | | $ | 5,422,772 | |
| Ultra Short Fund | | | 7,053,906 | | | | 95,175 | | | | (7,955 | ) | | | 87,220 | |
| Short U.S. Government Fund | | | 19,862,683 | | | | 221,495 | | | | (72,945 | ) | | | 148,550 | |
| Intermediate Mortgage Fund | | | 24,384,185 | | | | 139,256 | | | | (147,266 | ) | | | (8,010 | ) |
| U.S. Government Mortgage Fund | | | 10,596,748 | | | | 133,477 | | | | (73,050 | ) | | | 60,427 | |
| Large Cap Equity Fund | | | 54,588,096 | | | | 41,655,328 | | | | (860,677 | ) | | | 40,794,651 | |
As of October 31, 2013, the components of accumulated earnings/(deficit) on a tax basis were as follows:
| | | | | | | | | | | | | | | | | | | | | | | | | | | | | |
| | | | | | Undistributed | | | | | | | | | | | | | | | Total | |
| | | Undistributed | | | Long Term | | | | | | | | | Accumulated | | | Unrealized | | | Accumulated | |
| | | Ordinary | | | Capital | | | Accumulated | | | Distributions | | | Capital and | | | Appreciation/ | | | Earnings | |
| | | Income | | | Gains | | | Earnings | | | Payable | | | Other Losses | | | (Depreciation) | | | (Deficit) | |
| Ultra Short Mortgage Fund | | $ | 286,597 | | | $ | — | | | $ | 286,597 | | | $ | (308,778 | ) | | $ | (324,855,436 | ) | | $ | 5,422,772 | | | $ | (319,454,845 | ) |
| Ultra Short Fund | | | 4,055 | | | | — | | | | 4,055 | | | | (5,358 | ) | | | (26,735,853 | ) | | | 87,220 | | | | (26,649,936 | ) |
| Short U.S. Government Fund | | | 16,426 | | | | — | | | | 16,426 | | | | (21,484 | ) | | | (7,632,952 | ) | | | 148,550 | | | | (7,489,460 | ) |
| Intermediate Mortgage Fund | | | 18,274 | | | | — | | | | 18,274 | | | | (20,426 | ) | | | (51,200,919 | ) | | | (8,010 | ) | | | (51,211,081 | ) |
| U.S. Government Mortgage Fund | | | 8,618 | | | | — | | | | 8,618 | | | | (11,170 | ) | | | (8,346,320 | ) | | | 60,427 | | | | (8,288,445 | ) |
| Large Cap Equity Fund | | | 168,940 | | | | 6,206,852 | | | | 6,375,792 | | | | — | | | | — | | | | 40,794,651 | | | | 47,170,443 | |
The tax character of current year distributions paid and the tax basis of the current components of accumulated earnings (deficit) and any net capital loss carryforwards will be determined at end of the current tax year.
| |
| ASSET MANAGEMENT FUND |
| NOTES TO FINANCIAL STATEMENTS (continued) |
October 31, 2013 |
At October 31, 2013, the following Funds had capital loss carry-forwards available to offset future net capital gains through the indicated expiration dates:
| | | | | | | | | | | | | | | | |
| Fund | | Amount | | | Expires | | | Amount | | | Expires | |
| Ultra Short Mortgage Fund | | $ | 13,969,341 | | | | 2014 | | | $ | 290,225,068 | | | | 2018 | |
| Ultra Short Mortgage Fund | | | 1,808,482 | | | | 2015 | | | | 2,013,187 | | | | 2019 | |
| Ultra Short Mortgage Fund | | | 7,491,105 | | | | 2016 | | | | | | | | | |
| Ultra Short Mortgage Fund | | | 9,348,253 | | | | 2017 | | | | | | | | | |
| Ultra Short Fund | | | 1,784,218 | * | | | 2014 | | | | 20,036,732 | * | | | 2018 | |
| Ultra Short Fund | | | 1,128,003 | * | | | 2015 | | | | 27,453 | * | | | 2019 | |
| Ultra Short Fund | | | 3,451,774 | * | | | 2016 | | | | | | | | | |
| Ultra Short Fund | | | 307,673 | * | | | 2017 | | | | | | | | | |
| Short U.S. Government Fund | | | 880,563 | * | | | 2014 | | | | 5,140,920 | * | | | 2018 | |
| Short U.S. Government Fund | | | 357,577 | * | | | 2015 | | | | | | | | | |
| Short U.S. Government Fund | | | 1,071,031 | * | | | 2016 | | | | | | | | | |
| Intermediate Mortgage Fund | | | 2,863,116 | * | | | 2014 | | | | 38,873,400 | * | | | 2018 | |
| Intermediate Mortgage Fund | | | 1,013,863 | * | | | 2015 | | | | 351,065 | | | | 2019 | |
| Intermediate Mortgage Fund | | | 2,299,353 | * | | | 2016 | | | | | | | | | |
| Intermediate Mortgage Fund | | | 5,641,899 | * | | | 2017 | | | | | | | | | |
| U.S. Government Mortgage Fund | | | 3,057,928 | * | | | 2014 | | | | 201,009 | * | | | 2019 | |
| U.S. Government Mortgage Fund | | | 4,846,874 | * | | | 2018 | | | | | | | | | |
| | | | | | | | | | | | | | | | | |
| * | A portion of the capital loss carry-forwards may be subject to limitations under Section 382 of the Internal Revenue Code, and is available to the extent allowed by tax law to offset future net capital gain, if any. |
| | | |
During the fiscal year ended October 31, 2013, Ultra Short Mortgage Fund, Ultra Short Fund, Intermediate Mortgage Fund and Short U.S. Government Fund had net capital loss carry-forward amounts expire of 18,592,703, 1,402,014, 1,821,864 and 1,805,629 respectively. The Regulated Investment Company Modernization Act of 2010 (the “Act”) eliminated the eight year limit on the use of capital loss carryforwards that arise in taxable years beginning after its enactment date of December 22, 2010. The changes became effective for the Funds for the fiscal year ended October 31, 2012. Consequently, capital losses incurred by the Funds in taxable years beginning with the taxable year ended October 31, 2012 can be carried forward for an unlimited period. However, capital losses | | incurred by the Funds in taxable years beginning before the taxable year ended October 31, 2012 with an expiration date may not be used to offset capital gains until all net capital losses incurred in taxable years beginning with the taxable year ended October 31, 2012 without an expiration date have been utilized. As a result, pre-enactment capital loss carryforwards may be more likely to expire unused. Additionally, post-enactment capital loss carryforwards will retain their character as either short-term or long-term capital losses instead of as short-term capital losses as under prior law. The Funds’ ability to utilize capital loss carryforwards in the future may be limited under the Internal Revenue Code and related regulations based on the results of future transactions. |
| Capital losses incurred that will be carried forward under the provisions of the Act are as follows: | | | | | | | | |
| Fund | | | | | Long Term
Capital Loss
Carryforward | |
| Short U.S. Government Fund | | $ | 182,861 | | | $ | — | |
| Intermediate Mortgage Fund | | | 158,223 | | | | — | |
| U.S. Government Mortgage Fund | | | 240,509 | * | | | — | |
| | | | | | | | | |
| * | A portion of the capital loss carry-forwards may be subject to limitations under Section 382 of the Internal Revenue Code, and is available to the extent allowed by tax law to offset future net capital gain, if any. |
ASSET MANAGEMENT FUND
NOTES TO FINANCIAL STATEMENTS (concluded)
October 31, 2013
| | | |
| | | |
Dividends and distributions are determined in accordance with federal income tax regulations and may differ from accounting principles generally accepted in the United States of America. These differences are primarily due to differing treatments for deferral of losses on wash sales. To the extent these differences are permanent, adjustments are made to the appropriate components of net assets in the period that these differences arise. F. LITIGATION PROCEEDS During the year ended October 31, the Ultra Short Mortgage, Ultra Short, Short U.S. Government and Intermediate Mortgage Funds received proceeds of approximately $5,639,985, $215,769, $66,921 and $278,545, respectively, relating to settlements of litigation. In addition, the Ultra Short Mortgage and Intermediate Mortgage Funds received proceeds of approximately $333,144 and $42,221, respectively, relating to class action settlements. The proceeds have been included in “Realized gains (losses) from investment transactions” on the Statement of Operations and Statement of Changes in Net Assets. | | G. SHAREHOLDER CONCENTRATION At October 31, 2013, the Ultra Short Fund, Short U.S. Government Fund, Intermediate Fund and U.S. Government Mortgage Fund have a concentrated number of shareholders invested in the Funds. Investment activities of these concentrated investors could have a material effect on the Funds. H. SUBSEQUENT EVENTS The Funds have evaluated events from October 31, 2013 through the date that these financial statements were issued. On December 11th, 2013, the Board of Trustees determined that it is in the best interest of the shareholders of the U.S. Government Mortgage fund to liquidate the fund, which is expected to commence on January 10, 2014. Effective immediately, the U.S. Government Mortgage Fund is closed to new investors. There are no additional subsequent events to report that would have a material impact on the Funds’ financial statements. |
REPORT OF INDEPENDENT REGISTERED PUBLIC ACCOUNTING FIRM
To the Board of Trustees and Shareholders of
Asset Management Fund:
In our opinion, the accompanying statements of assets and liabilities, including the schedules of investments, and the related statements of operations and of changes in net assets and the financial highlights present fairly, in all material respects, the financial position of Ultra Short Mortgage Fund, Ultra Short Fund, Short U.S. Government Fund, Intermediate Mortgage Fund, U.S. Government Mortgage Fund, and Large Cap Equity Fund (collectively referred to as the “Funds”) at October 31, 2013, the results of each of their operations for the year then ended, the changes in each of their net assets for each of the two years in the period then ended and the financial highlights for each of the periods presented, in conformity with accounting principles generally accepted in the United States of America. These financial statements and financial highlights (hereafter referred to as “financial statements”) are the responsibility of the Funds’ management; our responsibility is to express an opinion on these financial statements based on our audits. We conducted our audits of these financial statements in accordance with the standards of the Public Company Accounting Oversight Board (United States). Those standards require that we plan and perform the audit to obtain reasonable assurance about whether the financial statements are free of material misstatement. An audit includes examining, on a test basis, evidence supporting the amounts and disclosures in the financial statements, assessing the accounting principles used and significant estimates made by management, and evaluating the overall financial statement presentation. We believe that our audits, which included confirmation of securities at October 31, 2013 by correspondence with the custodian and brokers, provide a reasonable basis for our opinion.
As disclosed in Note H of the Notes to Financial Statements, the U.S. Government Mortgage Fund will liquidate after the close of business on January 10, 2014.
| /s/ PricewaterhouseCoopers LLP |
| Chicago, Illinois |
| December 23, 2013 |
ADDITIONAL INFORMATION
October 31, 2013 (Unaudited)
Other Federal Income Tax Information
For the year ended October 31, 2013, certain distributions paid by the Funds may be subject to a maximum tax rate of 15% as provided by the Jobs and Growth Relief Reconciliation Act of 2003. The Funds intend to designate the maximum amount allowable as taxed at a maximum rate of 15%. Complete information will be reported in conjunction with your 2013 Form 1099-DIV.
For corporate shareholders, the following percentage of the total ordinary income distributions paid during the fiscal year ended October 31, 2013, qualify for corporate dividends received deduction for the following Fund:
| Fund | Percentage |
| Large Cap Equity Fund | 94.9% |
For the year ended October 31, 2013, the following Funds paid qualified dividend income for purposes of reduced individual federal income tax rates of:
| Fund | Percentage |
| Large Cap Equity Fund | 94.9% |
| ASSET MANAGEMENT FUND |
| ADDITIONAL INFORMATION |
| October 31, 2013 (Unaudited) |
| | | | | | | | | |
| Trustees and Officers of Asset Management Fund |
| | | | | | | | | |
| Name, Address and Age | | Position(s) Held with Trust,
Length of Time Served
and Term of Office | | Principal Occupation(s)
During Past 5 Years | | Number of
Portfolios
in Fund
Complex Overseen | | |
| Independent Trustees | | | | | | | | |
| | | | | | | | | |
David F. Holland 4041 N. High Street Suite 402 Columbus, OH 43214 Age: 71 | | Trustee since 1993 and from 1988 to 1989. Indefinite Term of Office | | Retired; Chairman of the Board, Chief Executive Officer and President, BostonFed Bancorp Inc. from 1995 to 2005; Chairman of the Board from 1989 to 2005 and Chief Executive Officer from 1986 to 2005, Boston Federal Savings Bank. | | 6 | | Preferred Community Bank |
| | | | | | | | | |
Gerald J. Levy 4041 N. High Street Suite 402 Columbus, OH 43214 Age: 81 | | Lead Independent Trustee, Vice Chairman of the Board since 1997 and Trustee since 1982. Indefinite Term of Office | | Chairman since 1984 and Director since 1963, Guaranty Bank, F.S.B. | | 6 | | FISERV, Inc.; Guaranty Financial; Federal Home Loan Bank of Chicago |
| | | | | | | | | |
William A. McKenna, Jr 4041 N. High Street Suite 402 Columbus, OH 43214 Age: 76 | | Trustee since 2002. Indefinite Term of Office | | Retired; Chairman and Chief Executive Officer from 1992 to 2004 and President from 1985 to 2001, Ridgewood Savings Bank. | | 6 | | Irish Educational Development Foundation, Inc.; The Catholic University of America; St. Vincent’s Services; Boys Hope Girls Hope; DeSales Media Group |
| | | | | | | | | |
Maria F. Ramirez 4041 N. High Street Suite 402 Columbus, OH 43214 Age: 65 | | Trustee since 2005. Indefinite Term of Office | | President and Chief Executive Officer, Maria Fiorini Ramirez Inc. (a global economic and financial consulting firm) since 1992. | | 6 | | Pace University; Security Mutual Insurance Company; Brooklyn Hospital; MonaVie; Edward Jones Advisory Board |
| | | | | | | | | |
Interested Trustees1 | | | | | | | | |
| | | | | | | | | |
Rodger D. Shay2 1000 Brickell Avenue Miami, FL 33131 Age: 77 | | Chairman of the Board since 1997 and Trustee since 1993 and from 1985 to 1990. Indefinite Term of Office | | Chairman and Director of Shay Investment Services, Inc. and Shay Financial Services, Inc. since 1997. | | 6 | | Shay Assets Management, Inc. |
| | | | | | | | | |
Rodger D. Shay, Jr.2 1000 Brickell Avenue Miami, FL 33131 Age: 54 | | Trustee since 2002. Indefinite Term of Office President since 2005. Term of Office Expires 2014 | | President and Chief Executive Officer of Shay Financial Services, Inc. since 1997; President, Shay Assets Management, Inc. from 2005 to 2008. | | 6 | | Family Financial Holdings, LLC; Anthem Bank |
| ASSET MANAGEMENT FUND |
| ADDITIONAL INFORMATION (continued) |
| October 31, 2013 (Unaudited) |
| | | | | |
| Trustees and Officers of Asset Management Fund (continued) |
| | | | | |
| Name, Address and Age | | Position(s) Held with Trust, Length of Time Served
and Term of Office | | Principal Occupation(s)
During Past 5 Years |
| Officers | | | | |
| | | | | |
Trent M. Statczar 4041 N. High Street Suite 402 Columbus, OH 43214 Age: 42 | | Treasurer since 2009. Term of Office Expires 2014 | | Director, Beacon Hill Fund Services, Inc. 2008 to present; Senior Vice President of Citi Fund Services Ohio, Inc. from 2007 to 2008; Vice President Citi Fund Services Ohio, Inc. from 2004 to 2007. |
| | | | | |
Rodney L. Ruehle 4041 N. High Street Suite 402 Columbus, OH 43214 Age: 45 | | Chief Compliance Officer since 2009. Term of Office Expires 2014 | | Director, Beacon Hill Fund Services, Inc. 2008 to present; Vice President, CCO Services, Citi Fund Services, Inc. from 2004 to 2008; Director, Fund Administration, Citi Fund Services, Inc. from 1995 to 2004. |
| | | | | |
Eimile J. Moore 4041 N. High Street Suite 402 Columbus, OH 43214 Age: 44 | | Assistant Secretary since 2011. Term of Office Expires 2014 | | Director, Business Management and Governance Services at Beacon Hill Fund Services, Inc. September 2011 to present; Vice President, JP Morgan Distribution Services, Inc. from 2006 to 2011. |
| 1 | A trustee is an “interested person” of the Trust under the 1940 Act because he holds certain positions with the Trust’s Distributor and/or Investment Adviser and because of his financial interest in Shay Investment Services, Inc., parent company of the Trust’s Investment Adviser, Shay Assets Management, Inc., and Distributor, Shay Financial Services, Inc. |
| 2 | Rodger D. Shay, Jr., Trustee, is the son of Rodger D. Shay, Chairman of the Board of Trustees and Trustee. |
ASSET MANAGEMENT FUND
ADDITIONAL INFORMATION (continued)
October 31, 2013 (Unaudited)
ULTRA SHORT MORTGAGE FUND |
| | | | |
| Security Allocation | | Percentage of Net Assets | |
Adjustable Rate Mortgage-Related Securities | | | 88.3 | % | |
| Fixed Rate Mortgage-Related Securities | | | 5.6 | % | |
| U.S. Government Agency Securities | | | 0.0 | % | |
| U.S. Government Obligations | | | 0.0 | % | |
| Investment Companies | | | 0.0 | % | |
| Repurchase Agreements | | | 5.9 | % | |
| Total | | | 99.8 | % | |
| | | | | | |
ULTRA SHORT FUND | | | | | |
| Security Allocation | | Percentage of Net Assets | |
Adjustable Rate Mortgage-Related Securities | | | 88.0 | % | |
| Fixed Rate Mortgage-Related Securities | | | 0.00 | % | |
| Investment Companies | | | 11.6 | % | |
| U.S. Government Obligations | | | 0.0 | % | |
| Repurchase Agreements | | | 0.0 | % | |
| Total | | | 99.6 | % | |
| | | | | | |
SHORT U.S. GOVERNMENT FUND | | | | | |
| Security Allocation | | Percentage of Net Assets | |
Adjustable Rate Mortgage-Related Securities | | | 62.8 | % | |
| Fixed Rate Mortgage-Related Securities | | | 27.5 | % | |
| U.S. Government Agency Securities | | | 0.0 | % | |
| U.S. Government Obligations | | | 0.0 | % | |
| Investment Companies | | | 0.0 | % | |
| Repurchase Agreements | | | 9.4 | % | |
| Total | | | 99.7 | % | |
| | | | | | |
INTERMEDIATE MORTGAGE FUND | | | | | |
| Security Allocation | | Percentage of Net Assets | |
| Adjustable Rate Mortgage-Related Securities | | | 33.5 | % | |
| Fixed Rate Mortgage-Related Securities | | | 55.0 | % | |
| U.S. Government Agency Securities | | | 0.0 | % | |
| Investment Companies | | | 0.0 | % | |
| Repurchase Agreements | | | 11.7 | % | |
| Total | | | 100.2 | % | |
| | | | | | |
| | | | | | |
U.S. GOVERNMENT MORTGAGE FUND | | | | | |
| Security Allocation | | Percentage of Net Assets | |
| Adjustable Rate Mortgage-Related Securities | | | 73.9 | % | |
| Fixed Rate Mortgage-Related Securities | | | 23.1 | % | |
| U.S. Government Agency Securities | | | 0.0 | % | |
| Investment Companies | | | 0.0 | % | |
| Repurchase Agreements | | | 2.9 | % | |
| Total | | | 99.9 | % | |
| | | | | | |
| ASSET MANAGEMENT FUND |
| ADDITIONAL INFORMATION (continued) |
| October 31, 2013 (Unaudited) |
| |
| | | | | | |
| | | Percentage of | |
| Security Allocation | | Net Assets | |
| | | | | | |
Common Stocks | | | 94.9 | % | |
| Investment Companies | | | 5.2 | % | |
| Total | | | 100.1 | % | |
| | | | | | |
| B. EXPENSE COMPARISON: | | ACTUAL EXPENSES |
| | | |
| As a shareholder of the Funds, you incur ongoing costs, including management fees; distribution (12b-1) fees; and other Fund expenses. This example is intended to help you understand your ongoing costs (in dollars) of investing in the Funds and to compare these costs with the ongoing costs of investing in other mutual funds. | | The table below provides information about actual account values and actual expenses. You may use the information below, together with the amount you invested, to estimate the expenses that you paid over the period. Simply divide your account value by $1,000 (for example, an $8,600 account value divided by $1,000 = 8.6), then multiply the result by the number in the table under the heading entitled “Expenses Paid During Period” to estimate the expenses you paid on your account during this period. |
| | |
| The Example is based on an investment of $1,000 invested at the beginning of the period and held for the entire period from May 1, 2013 through October 31, 2013. | |
| | | | | | | | | | | | | | | | | | | | | |
| | | | | Beginning | | | Ending | | | Expense Paid | | | Expense Ratio | |
| | | | | Account Value | | | Account Value | | | During Period* | | | During Period** | |
| | | | | 5/1/13 | | | 10/31/13 | | | 5/1/13 - 10/31/13 | | | 5/1/13 - 10/31/13 | |
Ultra Short Mortgage Fund | | | | $ | 1,000.00 | | | | $ | 1,017.80 | | | | $ | 4.07 | | | | 0.80% | |
| Ultra Short Fund | | | | | 1,000.00 | | | | | 1,026.30 | | | | | 4.85 | | | | 0.95% | |
| Short U.S Government Fund | | | | | 1,000.00 | | | | | 994.60 | | | | | 3.77 | | | | 0.75% | |
| Intermediate Mortgage Fund | | | | | 1,000.00 | | | | | 986.50 | | | | | 3.76 | | | | 0.75% | |
| U.S Government Mortgage Fund | | | | | 1,000.00 | | | | | 977.20 | | | | | 3.74 | | | | 0.75% | |
| Large Cap Equity Fund | Class AMF | | | | 1,000.00 | | | | | 1,074.80 | | | | | 6.38 | | | | 1.22% | |
| | Class H | | | | 1,000.00 | | | | | 1,075.70 | | | | | 5.60 | | | | 1.07% | |
| * | Expenses are equal to the average account value times the Fund’s annualized expense ratio multiplied by the number of days in the most recent fiscal half-year (184) divided by the number of days in the fiscal year (365). |
| | | |
| HYPOTHETICAL EXAMPLE FOR COMPARISON PURPOSES | | Please note that the expenses shown in the table are meant to highlight your ongoing costs only and do not reflect any transactional costs, such as sales charges (loads), redemption fees, or exchange fees. Therefore, the table is useful in comparing ongoing costs only, and will not help you determine the relative total costs of owning different funds. In addition, if these transactional costs were included, your costs would have been higher. |
| | |
| The table below provides information about hypothetical account values and hypothetical expenses based on each Fund’s actual expense ratio and an assumed rate of return of 5% per year before expenses, which is not the Fund’s actual return. The hypothetical account values and expenses may not be used to estimate the actual ending account balance or expenses you paid for the period. You may use this information to compare this 5% hypothetical example with the 5% hypothetical examples that appear in the shareholder reports of other funds. | |
| | | | | | | | | | | | | | | | | | | | | |
| | | | | Beginning | | | Ending | | | Expense Paid | | | Expense Ratio | |
| | | | | Account Value | | | Account Value | | | During Period* | | | During Period** | |
| | | | | 5/1/13 | | | 10/31/13 | | | 5/1/13 - 10/31/13 | | | 5/1/13 - 10/31/13 | |
| Ultra Short Mortgage Fund | | | | $ | 1,000.00 | | | | $ | 1,021.17 | | | | $ | 4.08 | | | | 0.80% | |
| Ultra Short Fund | | | | | 1,000.00 | | | | | 1,020.42 | | | | | 4.84 | | | | 0.95% | |
| Short U.S Government Fund | | | | | 1,000.00 | | | | | 1,021.42 | | | | | 3.82 | | | | 0.75% | |
| Intermediate Mortgage Fund | | | | | 1,000.00 | | | | | 1,021.42 | | | | | 3.82 | | | | 0.75% | |
| U.S Government Mortgage Fund | | | | | 1,000.00 | | | | | 1,021.42 | | | | | 3.82 | | | | 0.75% | |
| Large Cap Equity Fund | Class AMF | | | | 1,000.00 | | | | | 1,019.06 | | | | | 6.21 | | | | 1.22% | |
| | Class H | | | | 1,000.00 | | | | | 1,019.81 | | | | | 5.45 | | | | 1.07% | |
| * | Expenses are equal to the average account value times the Fund’s annualized expense ratio multiplied by the number of days in the most recent fiscal half-year (184) divided by the number of days in the fiscal year (365). |
ASSET MANAGEMENT FUND
ADDITIONAL INFORMATION (concluded)
October 31, 2013 (Unaudited)
| | | |
| C. OTHER INFORMATION: | | is available on the Securities and Exchange Commission’s website at http://www.sec.gov. In addition, the schedules may be reviewed and copied at the Securities and Exchange Commission’s Public Reference Room in Washington, D.C. Information on the operation of the Public Reference Room may be obtained by calling 1-800-SEC-0330. |
A description of the policies and procedures that the Funds use to determine how to vote proxies relating to portfolio securities is available (i) without charge, upon request, by calling 800-527-3713; and (ii) on the Securities and Exchange Commission’s website at http://www.sec.gov. | |
| | | |
| Information regarding how the Funds voted proxies relating to portfolio securities is available (i) without charge, upon request, by calling 800-527-3713; and (ii) on the Securities and Exchange Commission’s website at http://www.sec.gov. | | The Statement of Additional Information includes additional information about Trustees and is available, without charge, upon request, by calling 800-527-3713. |
| | | |
| A complete schedule of each Fund’s portfolio holdings for the first and third fiscal quarter of each fiscal year is filed with the Securities and Exchange Commission on Form N-Q and | | |
(This page intentionally left blank)
(This page intentionally left blank)
(This page intentionally left blank)
| |
|
| |
| DISTRIBUTOR |
| Shay Financial Services, Inc. |
| 1000 Brickell Avenue, Suite 500 |
| Miami, FL 33131 |
| |
| INVESTMENT ADVISER |
| Shay Assets Management, Inc. |
| 1000 Brickell Avenue, Suite 500 |
| Miami, FL 33131 |
| |
| GOVERNANCE AND REGULATORY SERVICES |
| Beacon Hill Fund Services, Inc. |
| 4041 N. High St. |
| Columbus, OH 43214 |
| |
| ADMINISTRATOR, TRANSFER AGENT, AND DIVIDEND AGENT |
| Northern Trust Company |
| 50 South LaSalle Street |
| Chicago, Illinois 60603 |
| |
| LEGAL COUNSEL |
| Vedder Price, P.C. |
| 222 North LaSalle Street |
| Chicago, IL 60601 |
| |
| CUSTODIAN |
| Northern Trust Company |
| 50 South LaSalle Street |
| Chicago, Illinois 60603 |
| |
| INDEPENDENT REGISTERED PUBLIC ACCOUNTING FIRM |
| PricewaterhouseCoopers LLP |
| One North Wacker Drive |
| Chicago, IL 60606 |
AMF-ANN-1013
Item 2. Code of Ethics.
(a) The registrant has adopted a code of ethics that applies to the registrant’s principal executive officer, principal financial officer, principal accounting officer or controller, or persons performing similar functions. This code of ethics is included as an Exhibit.
(b) During the period covered by the report, with respect to the registrant’s code of ethics that applies to its principal executive officer, principal financial officer, principal accounting officer or controller, or persons performing similar functions; there have been no amendments to, nor any waivers granted from, a provision that relates to any element of the code of ethics definition enumerated in paragraph (b) of this Item 2.
Item 3. Audit Committee Financial Expert.
3(a)(1) The registrant’s board of directors has determined that the registrant has at least one audit committee financial expert serving on its audit committee.
3(a)(2) The audit committee financial expert is David F. Holland, who is “independent” for purposes of this Item 3 of Form N-CSR.
Item 4. Principal Accountant Fees and Services.
(a) Audit Fees. Audit fees totaled $150,000 and $145,785 in fiscal years 2013 and 2012 respectively, including fees associated with the annual audit and filings of the registrant’s Form N-1A and Form N-SAR.
(b) Audit-Related Fees. There were no audit related fees billed in fiscal years 2012 and 2011.
(c) Tax Fees. Fees for tax compliance and review services totaled $25,020 and $29,850 in fiscal years 2013 and 2012, respectively.
(d) All Other Fees. There were no other fees in fiscal years 2013 and 2012.
(e)(1) Except as permitted by rule 2-01(c)(7)(i)(C) of regulation S-X the trust’s audit committee must pre-approve all audit and non-audit services provided by the independent accountants relating to the operations or financial reporting of the funds. Prior to the commencement of any audit or non-audit services to the fund, the audit committee reviews the services to determine whether they are appropriate and permissible under applicable law.
(e)(2) 2012 0%
2011 0%
(f) Not applicable
(g) 2012 $25,020
2011 $29,850
(h) The Audit Committee considered the non-audit services rendered to the registrant’s investment adviser and believes the services are compatible with the principal accountant’s independence.
Item 5. Audit Committee of Listed Companies.
Not applicable.
Item 6. Schedule of Investments.
| (a) | | The Schedule of Investments in securities of unaffiliated issuers is included in the report to shareholders filed under Item 1 of this Form. |
Item 7. Disclosure of Proxy Voting Policies and Procedures for Closed-End Management Investment Companies.
Not applicable.
Item 8. Portfolio Managers of Closed-End Management Investment Companies.
Not applicable.
Item 9. Purchases of Equity Securities by Closed-End Management Investment Company and Affiliated Purchasers.
Not applicable.
Item 10. Submission of Matters to a Vote of Security Holders.
Not applicable.
Item 11. Controls and Procedures.
(a) The registrant’s principal executive officer and principal financial officer have concluded, based on their evaluation of the registrant’s disclosure controls and procedures as conducted within 90 days of the filing date of this report, that these disclosure controls and procedures are adequately designed and are operating effectively to ensure that information required to be disclosed by the registrant on this report is recorded, processed, summarized and reported within the time periods specified in the Securities and Exchange Commission’s rules and forms.
(b) There were no changes in the registrant’s internal control over financial reporting (as defined in Rule 30a-3(d) under the Investment Company Act of 1940) that occurred during the second fiscal quarter of the period covered by this report that have materially affected or are reasonably likely to materially affect, the registrant’s internal control over financial reporting.
Item 12. Exhibits.
| (a)(1) | | Code of Ethics for Senior Financial Officers is filed herewith |
| (a)(2) | | Certifications required by Item 12(a) of Form N-CSR are attached hereto. |
| (b) | | Certification required by Item 12(b) of Form N-CSR is furnished hereto. |
SIGNATURES
Pursuant to the requirements of the Securities Exchange Act of 1934 and the Investment Company Act of 1940, the registrant has duly caused this report to be signed on its behalf by the undersigned, thereunto duly authorized.
(Registrant) Asset Management Fund
By (Signature and Title)
Trent M. Statczar
Treasurer
Date: January 3, 2014
Pursuant to the requirements of the Securities Exchange Act of 1934 and the Investment Company Act of 1940, this report has been signed below by the following persons on behalf of the registrant and in the capacities and on the dates indicated.
By (Signature and Title)
Rodger D. Shay, Jr.
President
Date: January 3, 2014
By (Signature and Title)
Trent M. Statczar
Treasurer
Date: January 3, 2014