United States
Securities and Exchange Commission
Washington, D.C. 20549
FORM N-CSR
CERTIFIED SHAREHOLDER REPORT OF REGISTERED MANAGEMENT
INVESTMENT COMPANIES
Investment Company Act file number 811-03541
Asset Management Fund
(Exact name of registrant as specified in charter)
690 Taylor Road, Suite 210 Gahanna, OH 43230
(Address of principal executive offices) (Zip code)
Foreside Management Services, LLC, 690 Taylor Road, Suite 210 Gahanna, OH 43230
(Name and address of agent for service)
Registrant’s telephone number, including area code: (800) 247-9780
Date of fiscal year end: 10/31
Date of reporting period: 10/31/17
Form N-CSR is to be used by management investment companies to file reports with the Commission not later than 10 days after the transmission to stockholders of any report that is required to be transmitted to stockholders under Rule 30e-1 under the Investment Company Act of 1940 (17 CFR 270.30e-1). The Commission may use the information provided on Form N-CSR in its regulatory, disclosure review, inspection and policymaking roles.
A registrant is required to disclose the information specified by Form N-CSR, and the Commission will make this information public. A registrant is not required to respond to the collection of information contained in Form N-CSR unless the Form displays a currently valid Office of Management and Budget (“OMB”) control number. Please direct comments concerning the accuracy of the information collection burden estimate and any suggestions for reducing the burden to Secretary, Securities and Exchange Commission, 450 Fifth Street, NW, Washington, DC 20549-0609. The OMB has reviewed this collection of information under the clearance requirements of 44 U.S.C. § 3507.
Item 1. Reports to Stockholders.

ANNUAL REPORT
October 31, 2017
2017 SHAREHOLDER LETTER
The Asset Management Fund (“AMF” and each series, a “Fund”) family of no load institutional mutual funds is pleased to present to shareholders the 2017 Annual Report for the Funds advised by Austin Atlantic Asset Management Company.
In 2017, financial markets focused on the potential for faster economic growth and higher corporate profits driven by a more markets-focused government administration. Less regulation and lower taxes should benefit corporate earnings in the future, so forward-looking, equity markets rewarded investors with the 21st Century’s second best 12 month (October/October) performance: a total return of 23.6%, second only to 2013’s 27.2%. While last year’s letter suggested that this economy would respond positively to these policies, we did not expect to see such a buoyant equity market. However, our bearish interest rate forecast was on the mark: in October of 2016, the money market was expecting only one or two 25 basis point rate hikes in 2017, but we felt four was more appropriate. To date, we’ve had three, and the market is expecting the fourth at the December 2017 meeting.
Since our interest rate crystal ball appears to be more transparent than our equity crystal ball, let’s stay there for a moment. For the past several years, we’ve viewed the Fed’s deliberate process of gradual rate hikes as the removal of easy money as opposed to as true monetary tightening. Framing Fed policy in this manner is important; as long as short term rates remain below inflation, monetary policy is historically viewed as accommodative and should be supportive of asset prices. In the 37 years leading up to the 2008-09 financial crisis (i.e., the post-Bretton Woods period), the Fed Funds rate averaged 100 basis points above the Consumer Price Index (ex-food and energy). Currently, Fed Funds is roughly 50 basis points below inflation. Consensus for 2018 is that the Fed will raise the Fed Funds rate to approximately 1.75%, which would put it right on top of current inflation. We’d consider that to be an appropriate place to pause, assuming that inflation remains benign.
Assuming that neutrality is a reasonable place for monetary policy to pause, it’s instructive to look at some key economic indicators today relative to late 2006, when the Fed Funds rate was 5.25%, which was more than 200 basis points above trailing inflation:
| | October | October | |
| | 2006 | 2017 | Comment |
| | | | |
| Unemployment Rate: | 4.4% | 4.1% | [Close to 17 year low of 3.8%] |
| Underemployment Rate: | 8.2% | 7.9% | [11 year low] |
| 4 Quarter Trailing GDP: | 2.2% | 2.4% | [Annual Average since 2000 is 2.1%] |
| GDP Deflator: | 3.1% | 1.8% | [since 2000, peak was 3.4%, average is 2.0%] |
| ISM Manufacturing Index: | 52.2% | 58.7% | [Close to 13 year peak of 60.8%] |
| Fed Funds Rate: | 5.25% | 1.25% | |
Many of the major economic indicators describe an economy that is on firm footing and provide the Fed with a solid rationale for raising rates to the 1.75% - 2.25% range. Inflation scares remain the key, and the wildcards here are wages and cost of goods. The U.S. economy has had a long run of soft labor costs, so the elasticity of labor costs has not been tested in a full employment environment in a long time. Likewise, U.S. consumers have experienced flat or declining costs for many consumer products such as clothing, electronics, and automobiles. Weakness in these markets has largely offset the acceleration in housing and medical services. So any reversal in the former categories – which are mainly imports – could lead to a spike in inflation. Another wild-card will be the reversal of the quantitative easing policies of the Fed (and potentially the other major central banks). The Fed has been absorbing a substantial percentage of the net supply in U.S. Treasuries and agency mortgage-backed securities for the past few years. As their longer maturity bond balances run off, and the housing market continues to improve, we expect longer interest rates to underperform short rates – not the typical scenario when the Fed is hiking rates.
This report has been prepared to provide information to the shareholders of the Funds and must be preceded or accompanied by the Prospectus. It should not be construed as an offering to sell or buy any shares of the Funds. Such an offering is made only by the Prospectus. You may obtain a current copy of the Prospectus by calling 1-800-247-9780 or at the Funds’ website (www.amffunds.com). Investors should consider the investment objectives, risks and expenses of the Funds before investing. Read the Prospectus carefully before you invest. Like all mutual funds, the Funds are not FDIC insured, may lose value and have no bank guarantee.
In the meantime, our equity fund had another strong year. The Fund provides an attractive vehicle for investors that believe a steady improvement in corporate earnings will support equity prices but seek to provide downside protection as well. The new (as of 2016) portfolio management team’s investment process – a blend of fundamental analysis with quantitative models – helps the fund to broaden the investable universe while still maintaining a bias to large cap securities. The fund has been achieving attractive nominal returns but taking less risk than the average equity fund – an admirable combination and one that is in the tradition of this fund.
At the other end of the spectrum, our new fixed income offering, the AAAMCO Ultrashort Financing Fund, is an appropriate vehicle to express the view that the Fed is behind the curve and will need to raise rates faster than the market is assuming. In that scenario, equity valuations may suffer, but the Ultrashort Financing Fund is designed to minimize capital losses while still outperforming short term interest rates.
Regardless, of your desired risk exposure, we are grateful for your continuing support and continue to seek the best investment strategies for achieving our shareholders’ investment objectives.
 |  |
| Sean Kelleher | David Holland |
| President | Chairman |
| Austin Atlantic Asset Management Company | Asset Management Fund |
This report has been prepared to provide information to the shareholders of the Funds and must be preceded or accompanied by the Prospectus. It should not be construed as an offering to sell or buy any shares of the Funds. Such an offering is made only by the Prospectus. You may obtain a current copy of the Prospectus by calling 1-800-247-9780 or at the Funds’ website (www.amffunds.com). Investors should consider the investment objectives, risks and expenses of the Funds before investing. Read the Prospectus carefully before you invest. Like all mutual funds, the Funds are not FDIC insured, may lose value and have no bank guarantee.
AAAMCO ULTRA SHORT FINANCING FUND REVIEW
October 31, 2017
One of the key factors that has slowed the economic recovery from the financial crisis is regulatory-driven, de-risking of the financial system. While much of this was certainly necessary, there are always unintended consequences. We’ve observed numerous examples of global banks reducing their exposures to creditworthy clients simply because the services required by these clients no longer met the bank’s required return on capital. So banks have rejected these clients not because of changes in credit quality but simply due to regulatory shifts. When we see regulatory-driven capital re-allocations, our job as money managers is to determine if we can create a pool of capital that provides an attractive risk-adjusted return for an investor base with a return target more consistent with the financial asset in question. Our newest fixed income fund, the Ultrashort Financing Fund, is a good example of this process. The Fund commenced operations on June 6, 2017 and focuses on investments in repurchase agreements (“repos”) backed by government and government agency securities. Repos are short term borrowings over-collateralized by a variety of securities. While repos have been around for many years, particularly as a core asset for money market funds, we are not aware of any bond funds that use repos as a core asset. While the borrowers for most funds are the large, well-known global investment banks, the borrowers in our Fund are the counterparties that can no longer access financing from the global banks. These are the borrowers that have been disintermediated by the global banks as a result of the new bank capital rules. Since the inception of the Fund (June 6, 2017), the Fund has earned an annualized, weighted average yield of 1.42%, which is 0.49% higher than one month T-bills. The Fund’s net asset value has been $10.00 since inception even though short interest rates increased approximately 0.30%, reflecting the short maturities of the repurchase agreements.
We believe this strategy has an exciting future, and thank all of our shareholders for allowing us to assist them with their investment needs, and look forward to serving them in the future.
This report has been prepared to provide information to the shareholders of the Funds and must be preceded or accompanied by the Prospectus. It should not be construed as an offering to sell or buy any shares of the Funds. Such an offering is made only by the Prospectus. You may obtain a current copy of the Prospectus by calling 1-800-247-9780 or at the Funds’ website (www.amffunds.com). Investors should consider the investment objectives, risks and expenses of the Funds before investing. Read the Prospectus carefully before you invest. Like all mutual funds, the Funds are not FDIC insured, may lose value and have no bank guarantee.
Portfolio composition is subject to change.
Past performance does not guarantee future results. Investment return and net asset value will fluctuate so that an investor’s shares, when redeemed, may be worth more or less than the original cost.
ULTRA SHORT MORTGAGE FUND REVIEW
October 31, 2017
For the year ending October 31, 2017, the Ultra Short Mortgage Fund’s return was -0.61% as compared to the Bloomberg Barclays 6 Month T-Bill Bellwethers Index return of 0.85%. Faster than expected principal prepayments on our mortgage-backed securities positions and low interest rates relative to the expense load of the Fund contributed to most of the underperformance for the year.
For the first time since 2006, the Fed engaged in a steady but slow program of interest rate hikes. The Fed Funds rate was increased from 0.50% to 1.25%, and the market consensus is that several more rate hikes are baked into Fed policy for 2018. These rate hikes allowed for a steady increase in the coupons on the Fund’s portfolio of adjustable rate mortgages. At the other end of the yield curve, interest rates on thirty year fixed rate mortgages did not increase as much, reflecting the continued benign inflation environment. The result was that mortgage prepayments stayed unusually high for a rising mortgage rate environment, reflecting the willingness of adjustable rate mortgagors to lock in historically low fixed rates. Combine this fact with rising home prices and improving borrower credit and the result is the unlocking of many borrowers that were unable to refinance over the past decade. Some factors offset this propensity for faster prepayments, such as increased government insurance fees on GNMA loans. So while the yield on the Fund’s assets increased, principal payoffs due to faster than expected prepayments negatively impacted performance. While our investment strategy remains consistent - we invest in higher coupon government and government agency MBS that we believe will prepay more slowly than market consensus – we’ve further reduced the Fund’s exposure to interest rate risk and have lowered the Fund’s average dollar price investment.
We thank all of our shareholders for allowing us to assist them with their investment needs, and look forward to serving them in the future.
This report has been prepared to provide information to the shareholders of the Funds and must be preceded or accompanied by the Prospectus. It should not be construed as an offering to sell or buy any shares of the Funds. Such an offering is made only by the Prospectus. You may obtain a current copy of the Prospectus by calling 1-800-247-9780 or at the Funds’ website (www.amffunds.com). Investors should consider the investment objectives, risks and expenses of the Funds before investing. Read the Prospectus carefully before you invest. Like all mutual funds, the Funds are not FDIC insured, may lose value and have no bank guarantee.
Portfolio composition is subject to change.
Past performance does not guarantee future results. Investment return and net asset value will fluctuate so that an investor’s shares, when redeemed, may be worth more or less than the original cost.
ULTRA SHORT MORTGAGE FUND REVIEW
October 31, 2017
Ultra Short Mortgage Fund
Gross Expense Ratio
1.26%
The gross expense ratio above is from the Fund’s prospectus dated March 1, 2017. Additional information pertaining to the Fund’s expense ratios as of October 31, 2017, can be found in the Financial Highlights.
Average Annual Total Return
Periods Ending October 31, 2017*
| | | One
Year | Five
Year | Ten
Year |
| Ultra Short Mortgage Fund(1) | | -0.61% | 0.53% | -0.76% |
| Bloomberg Barclays 6 Month T-Bill Bellwethers Index | | 0.85% | 0.41% | 0.80% |
| * | Assumes reinvestment of all dividends and distributions and the deduction of all applicable fees and expenses. Average annual returns are stated for periods greater than one year. The Bloomberg Barclays 6 Month T-Bill Bellwethers Index does not include a reduction in total return for expenses. |
| (1) | During the fiscal year ended October, 31, 2013, the Ultra Short Mortgage Fund received monies related to certain nonrecurring litigation settlements. If these monies were not received, the Five Year and Ten Year returns would have been lower. |
Comparison of change in value of a hypothetical $10,000 investment for the years ended October 31
The following graph shows that an investment of $10,000 in the Fund on October 31, 2007, would have been worth $9,263 on October 31, 2017, assuming all dividends and distributions had been reinvested. A similar investment in the Bloomberg Barclays 6 Month T-Bill Bellwethers Index, over the same period, would have been worth $10,862.
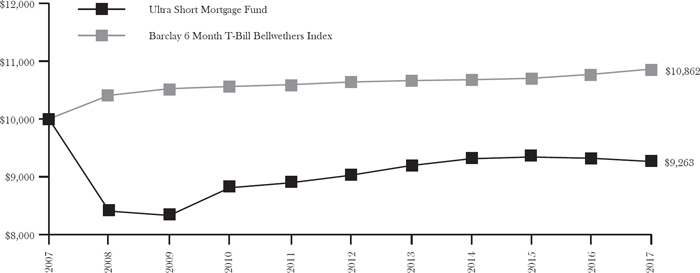
Past performance does not guarantee future results. Investments returns and net asset values will fluctuate so that an investor’s shares, when redeemed, may be worth more or less than original cost. The performance data quoted represents past performance and current returns may be lower or higher. Performance figures in the table and graph do not reflect the deduction of taxes that a shareholder would pay on the Fund distributions or the redemption of Fund shares. The Bloomberg Barclays 6 Month T-Bill Bellwethers Index is an unmanaged index comprised of U.S. Government Treasury Bonds with an average maturity of six months. The index represents unmanaged groups of bonds that differ from the composition of the Fund. The index does not include a reduction in return for expenses. Investors cannot invest directly in an index, although they can invest in its underlying securities. To obtain current month-end performance information for the Fund, please call 1-800-247-9780.
LARGE CAP EQUITY FUND REVIEW
October 31, 2017
For the year ending October 31, 2017, Class AMF of the Large Cap Equity Fund earned 24.63% return for shareholders. Total returns for the Morningstar Large Cap Blend Fund Category and the Fund’s benchmark index (the S&P 500) were 22.34% and 23.63%, respectively. Total return assumes the reinvestment of all capital gains and dividends and the deduction of all applicable fund expenses and fees. While the Large Cap Equity Fund is one of the oldest mutual funds in the country, tracing its track record back to 1953, it’s investment process (implemented in 2016) represents some of the latest thinking and research in equity investment management techniques. While our 2016 results were terrific, we believe the performance in 2017 has been outstanding. The Fund has always been managed with a focus on megacap stocks, which tends to limit volatility relative to the overall market. One way to measure the risk of the Fund relative to the index is known as “Beta”, and is defined as the quotient of the historical price risk of the Fund relative to the historical risk of the S&P 500 Index. For example, the Fund’s Beta is historically in the range of 80%-90% of the market, meaning it tends to be 10%-20% less volatile than the S&P 500. While this protects investors in years like 2008 (S&P 500 was down 38.42% while the Fund was only down 28.57%), it also limits performance in a rallying market. What we’ve seen from the new investment process is that the Fund is still less volatile than the overall market, but is able to capture more upside performance. For example, the Fund’s Beta this year was 86%, or 14% less volatile than the S&P 500 – right in line with its historical trends. An 86% Beta implies that the Fund should have been up 21.16% (86% of the S&P 500’s 23.63% increase). But the Fund actually increased by 24.63%, 3.47% more than what the Fund’s Beta implies. While there have been periods in time when the Fund outperformed its index in a rallying market, the Fund has never outperformed the index for a rally of this magnitude.
How did we do that? First, the scalability of the process allows the investment team to efficiently analyze the full set of eligible companies. While the Fund still focuses on megacap stocks, the investment process allows the Fund to more readily reach into the secondary issues in the S&P 500 to source attractive returns. Simply having a larger universe from which to source investments provides greater opportunity to outperform. So while the Fund’s holdings are more diversified than historically, our largest holdings are still megacap companies: UnitedHealth Group, Oracle, Alphabet, Broadcom, and Bank of America make up 20.6% of the Fund. In summary, the investment philosophy and investment objectives of the Fund have not changed. The new process allows portfolio management to source a broader opportunity set and more objectively analyze the relevant investment variables that drive performance.
We sincerely thank the shareholders of the Fund for their patience and trust as we re-position the Fund, and look forward to serving your investment needs in the future.
This report has been prepared to provide information to the shareholders of the Funds and must be preceded or accompanied by the Prospectus. It should not be construed as an offering to sell or buy any shares of the Funds. Such an offering is made only by the Prospectus. You may obtain a current copy of the Prospectus by calling 1-800-247-9780 or at the Funds’ website (www.amffunds.com). Investors should consider the investment objectives, risks and expenses of the Funds before investing. Read the Prospectus carefully before you invest. Like all mutual funds, the Funds are not FDIC insured, may lose value and have no bank guarantee.
Portfolio composition is subject to change.
Past performance does not guarantee future results. Investment return and net asset value will fluctuate so that an investor’s shares, when redeemed, may be worth more or less than the original cost.
LARGE CAP EQUITY FUND REVIEW
October 31, 2017
Large Cap Equity Fund
Gross Expense Ratio
Class AMF 1.46%
Class H 1.21%
The gross expense ratio above is from the Fund’s prospectus dated March 1, 2017. Additional information pertaining to the Fund’s expense ratios as of October 31, 2017, can be found in the Financial Highlights.
Average Annual Total Return
Periods Ending October 31, 2017*
| | | One
Year | Five
Year | Ten
Year | Since
Inception |
| Class AMF(1) | 24.63% | 12.63% | 7.25% | |
| Class H(2) | | 24.76% | 12.80% | — | 14.96% |
| S&P 500 | | 23.63% | 15.18% | 7.51% | 17.34%(3) |
| * | Assumes reinvestment of all dividends and distributions and the deduction of all applicable fees and expenses. Average annual returns are stated for periods greater than one year. The S&P 500 does not include a reduction in total return for expenses. |
| (1) | Class AMF of the Fund commenced operations on June 30, 1953. |
| (2) | Class H of the Fund commenced operations on February 20, 2009. |
| (3) | Return presented is for the period from February 20, 2009 to October 31, 2017. |
Comparison of change in value of a hypothetical $10,000 investment for the years ended October 31
The following graph shows that an investment of $10,000 in Class AMF of the Fund on October 31, 2007, would have been worth $20,140 on October 31, 2017, assuming all dividends and distributions had been reinvested. A similar investment in the S&P 500, over the same period, would have been worth $20,645.
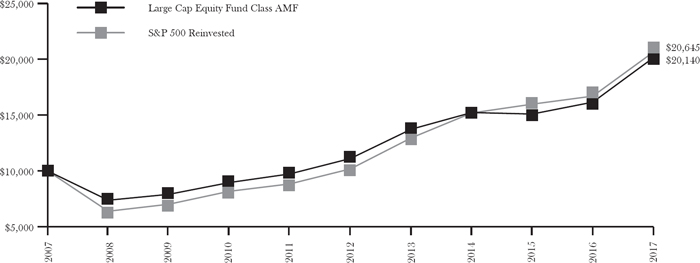
Past performance does not guarantee future results. The performance data quoted represents past performance and current returns may be lower or higher. Performance figures in the table and graph do not reflect the deduction of taxes that a shareholder would pay on the Fund distributions or the redemption of Fund shares. The Standard & Poors 500 Index is an unmanaged index, generally representative of the U.S. stock market as a whole. The index differs from the composition of the Fund. The index does not include a reduction in return for expenses. Investors cannot invest directly in an index, although they can invest in its underlying securities. To obtain current month-end performance information for the Fund, please call 1-800-247-9780.
AAAMCO ULTRASHORT FINANCING FUND
SCHEDULE OF INVESTMENTS
October 31, 2017
| | | | | | | | | | | | | | |
| | | | Percentage
of Net
Assets | | Maturity
Date | Principal
Amount | | Value | |
| | | | | | | | | | | | | | |
| ADJUSTABLE RATE MORTGAGE-RELATED SECURITIES | | | 13.5 | % | | | | | | | | | |
| 1 Mo. London Interbank Offering Rate (LIBOR) | | | 13.5 | % | | | | | | | | | |
| Freddie Mac | | | | | | | | | | | | | |
| (Floating, LIBOR USD 1M + 0.37%), 1.60%(1) | | | | | | 5/25/24 | | $ | 7,999,316 | | $ | 8,001,803 | |
TOTAL ADJUSTABLE RATE MORTGAGE-RELATED SECURITIES
(Cost $8,011,783) | | | | | | | | | | | | 8,001,803 | |
| | | | | | | | | | | | | | |
| | | | Percentage
of Net
Assets | | | Principal
Amount /
Shares | | Value | |
| | | | | | | | | | | | | | |
| INVESTMENT COMPANIES | | | 0.0 | % | | | | | | | | | |
| Northern Institutional Treasury Portfolio, 0.88%* | | | | | | | | | 35,691 | | $ | 35,691 | |
TOTAL INVESTMENT COMPANIES
(Cost $35,691) | | | | | | | | | | | | 35,691 | |
| | | | | | | | | | | | | | |
| REPURCHASE AGREEMENTS | | | 86.4 | % | | | | | | | | | |
| Amherst Pierpont Securities LLC, 1.15%, (Agreement dated 10/31/17 to be repurchased at $6,000,192 on 11/1/17. Collateralized by Fixed Rate U.S. Government Mortgage-Backed Securities, 3.50% - 6.00%, with a value of $6,120,002, due at 5/1/41 - 5/1/42) | | | | | | | | | 6,000,000 | | | 6,000,000 | |
| Amherst Pierpont Securities LLC, 1.54%, (Agreement dated 10/25/17 to be repurchased at $12,003,593 on 11/1/17. Collateralized by Fixed and Adjustable Rate U.S. Government Mortgage-Backed Securities, 2.00% - 4.50%, with a value of $12,867,883, due at 3/1/44 - 10/15/47) | | | | | | | | | 12,000,000 | | | 12,000,000 | |
| BCM High Income Fund, LP, 1.80%, (Open repurchase agreement which the Fund can initiate closure at any time. Collateralized by SBA Pools 3.50% - 4.84%, with a value of $19,639,824, due at 7/25/42 - 12/25/42, and cash equivalents of $1,298,986) | | | | | | | | | 19,743,218 | | | 19,743,218 | |
| JVB Financial Group, LLC, 2.24%, (Agreement dated 10/11/17 to be repurchased at $8,685,179 on 11/14/17. Collateralized by VIC Master Trust Series 2017-VI Certificates, 4.50%, with a value of $9,184,147 due at 3/20/2042)(2) | | | | | | | | | 8,673,845 | | | 8,673,845 | |
| Vining-Sparks IBG, L.P., 1.89%, (Open repurchase agreement which the Fund can initiate closure at any time. Collateralized by SBA Loans, 4.55% - 5.33% with a value of $5,383,564 due at 9/15/27 - 4/15/42) | | | | | | | | | 4,824,616 | | | 4,824,616 | |
TOTAL REPURCHASE AGREEMENTS
(Cost $51,241,679) | | | | | | | | | | | | 51,241,679 | |
| | | | | | | | | | | | | | |
TOTAL INVESTMENTS
(Cost $59,289,153) | | | 99.9 | % | | | | | | | | 59,279,173 | |
| NET OTHER ASSETS (LIABILITIES) | | | 0.1 | % | | | | | | | | 50,241 | |
| NET ASSETS | | | 100.0 | % | | | | | | | $ | 59,329,414 | |
| | | | | | | | | | | | | | |
| * | The rates presented are the rates in effect at October 31, 2017. |
| (1) | Variable rate security. The rate presented is the rate in effect at October 31, 2017. |
| (2) | Illiquid security, maturity date is greater than 7 days. |
See notes to financial statements.
ULTRA SHORT MORTGAGE FUND
SCHEDULE OF INVESTMENTS
October 31, 2017
| | | Percentage
of Net
Assets | | Maturity
Date | | Principal
Amount | | | Value | |
| | | | | | | | | | |
| ADJUSTABLE RATE MORTGAGE-RELATED SECURITIES | | 54.7 | % | | | | | | | | | |
| 1 Yr. Constant Maturity Treasury Based ARMS | | 28.7 | % | | | | | | | | | |
| Fannie Mae Grantor Trust | | | | | | | | | | | | |
| 4.13%(1) | | | | | 5/25/42 | | $ | 4,949,479 | | $ | 5,172,894 | |
| 3.29%(1) | | | | | 8/25/43 | | | 6,568,517 | | | 6,710,587 | |
| Fannie Mae Whole Loan | | | | | | | | | | | | |
| 3.88%(1) | | | | | 8/25/42 | | | 1,374,826 | | | 1,477,736 | |
| 3.55%(1) | | | | | 8/25/42 | | | 4,272,548 | | | 4,440,387 | |
| 3.21%(1) | | | | | 4/25/45 | | | 7,106,697 | | | 7,319,916 | |
| | | | | | | | | | | | 25,121,520 | |
| 12 Mo. London Interbank Offering Rate (LIBOR) | | 21.4 | % | | | | | | | | | |
| Fannie Mae | | | | | | | | | | | | |
| (Floating, ICE LIBOR USD 1Y + 1.72%), 3.45%(2), (3) | | | | | 9/1/36 | | | 156,435 | | | 164,512 | |
| (Floating, ICE LIBOR USD 1Y + 1.73%), 3.53%(2), (3) | | | | | 6/1/37 | | | 6,572,566 | | | 6,882,752 | |
| (Floating, ICE LIBOR USD 1Y + 1.57%), 3.32%(2), (3) | | | | | 9/1/38 | | | 11,162,479 | | | 11,632,743 | |
| | | | | | | | | | | | 18,680,007 | |
| 6 Mo. Certificate of Deposit Based ARMS | | 0.9 | % | | | | | | | | | |
| Fannie Mae | | | | | | | | | | | | |
| (Floating, ICE LIBOR USD 6M + 1.00%), 2.40%(2), (3) | | | | | 6/1/21 | | | 66,062 | | | 66,264 | |
| (Floating, ICE LIBOR USD 6M + 1.48%), 2.87%(2), (3) | | | | | 12/1/24 | | | 466,204 | | | 480,561 | |
| Freddie Mac | | | | | | | | | | | | |
| (Floating, ICE LIBOR USD 6M + 1.85%), 3.23%(2), (3) | | | | | 1/1/26 | | | 190,153 | | | 194,203 | |
| | | | | | | | | | | | 741,028 | |
| SBA Pool Floaters | | 3.7 | % | | | | | | | | | |
| Small Business Administration Pool | | | | | | | | | | | | |
| (Variable, Prime Rate U.S. + 0.09%), 4.34%(2) | | | | | 10/25/38 | | | 2,943,288 | | | 3,256,012 | |
| TOTAL ADJUSTABLE RATE MORTGAGE-RELATED SECURITIES | | | | | | | | | | | | |
| (Cost $47,250,750) | | | | | | | | | | | 47,798,567 | |
| FIXED RATE MORTGAGE-RELATED SECURITIES | | 32.2 | % | | | | | | | | | |
| 30 Yr. Securities | | 7.8 | % | | | | | | | | | |
| Fannie Mae | | | | | | | | | | | | |
| 5.00% | | | | | 6/1/41 | | | 487,524 | | | 536,886 | |
| 5.00% | | | | | 6/1/41 | | | 898,260 | | | 989,209 | |
| 5.00% | | | | | 6/1/41 | | | 3,478,002 | | | 3,830,150 | |
| Freddie Mac | | | | | | | | | | | | |
| 6.00% | | | | | 6/16/37 | | | 1,352,230 | | | 1,479,279 | |
| | | | | | | | | | | | 6,835,524 | |
| Collateralized Mortgage Obligations | | 24.4 | % | | | | | | | | | |
| Fannie Mae | | | | | | | | | | | | |
| 5.00% | | | | | 2/25/18 | | | 27,117 | | | 27,178 | |
| Freddie Mac | | | | | | | | | | | | |
| 2.00% | | | | | 9/15/44 | | | 14,848,527 | | | 14,829,027 | |
| Government National Mortgage Association | | | | | | | | | | | | |
| 1.35% | | | | | 6/16/37 | | | 6,657,266 | | | 6,506,512 | |
| | | | | | | | | | | | 21,362,717 | |
| TOTAL FIXED RATE MORTGAGE-RELATED SECURITIES | | | | | | | | | | | | |
| (Cost $28,451,757) | | | | | | | | | | | 28,198,241 | |
See notes to financial statements.
ULTRA SHORT MORTGAGE FUND (concluded)
SCHEDULE OF INVESTMENTS
October 31, 2017
| | | Percentage
of Net
Assets | | | | Shares | | Principal
Amount/
Value | |
| | | | | | | | | | | |
| INVESTMENT COMPANIES | | 13.0 | % | | | | | | | | | |
| Northern Institutional Treasury Portfolio, 0.88%* | | | | | | | | 7,321,671 | | $ | 7,321,671 | |
| AAAMCO Ultrashort Financing Fund (4) | | | | | | | | 401,312 | | | 4,013,121 | |
| | | | | | | | | | | | | |
| TOTAL INVESTMENT COMPANIES | | | | | | | | | | | | |
| (Cost $11,334,792) | | | | | | | | | | | 11,334,792 | |
| | | | | | | | | | | | | |
| TOTAL INVESTMENTS | | | | | | | | | | | | |
| (Cost $87,037,299) | | 99.9 | % | | | | | | | | 87,331,600 | |
| NET OTHER ASSETS (LIABILITIES) | | 0.1 | % | | | | | | | | 54,818 | |
| NET ASSETS | | 100.0 | % | | | | | | | $ | 87,386,418 | |
| | | | | | | | | | | | | |
| * | The rates presented are the rates in effect at October 31, 2017. |
| (1) | Variable or floating rate security, the interest rate of which adjusts periodically based on changes in current interest rates and prepayments on the underlying pool of assets. |
| (2) | Variable rate security. The rate presented is the rate in effect at October 31, 2017. |
| (3) | ICE LIBOR is a benchmark rate produced from the average of interest rates that some of the world’s leading banks charge each other for short-term loans. |
| (4) | Affiliated fund, see Note E. |
See notes to financial statements.
LARGE CAP EQUITY FUND
SCHEDULE OF INVESTMENTS
October 31, 2017
| | | Percentage
of Net
Assets | | | | Shares | | Value | |
| | | | | | | | | | |
| COMMON STOCKS | | 98.0 | % | | | | | | | | | |
| Automobiles & Components | | 1.3 | % | | | | | | | | | |
| General Motors Co. | | | | | | | | 14,000 | | $ | 601,720 | |
| | | | | | | | | | | | | |
| Banks | | 5.9 | % | | | | | | | | | |
| Bank of America Corp. | | | | | | | | 66,975 | | | 1,834,445 | |
| PNC Financial Services Group | | | | | | | | | | | | |
| (The), Inc. | | | | | | | | 6,500 | | | 889,135 | |
| | | | | | | | | | | | 2,723,580 | |
| Capital Goods | | 9.9 | % | | | | | | | | | |
| Caterpillar, Inc. | | | | | | | | 3,500 | | | 475,300 | |
| Cummins, Inc. | | | | | | | | 10,000 | | | 1,768,800 | |
| Eaton Corp. PLC | | | | | | | | 20,678 | | | 1,654,654 | |
| Ingersoll-Rand PLC | | | | | | | | 7,689 | | | 681,245 | |
| | | | | | | | | | | | 4,579,999 | |
| Consumer Services | | 8.1 | % | | | | | | | | | |
| Carnival Corp. | | | | | | | | 8,396 | | | 557,411 | |
| McDonald’s Corp. | | | | | | | | 10,365 | | | 1,730,022 | |
| Starbucks Corp. | | | | | | | | 27,000 | | | 1,480,680 | |
| | | | | | | | | | | | 3,768,113 | |
| Diversified Financials | | 1.9 | % | | | | | | | | | |
| Discover Financial Services | | | | | | | | 12,942 | | | 861,031 | |
| Energy | | 3.6 | % | | | | | | | | | |
| Valero Energy Corp. | | | | | | | | 21,335 | | | 1,683,118 | |
| Energy Equipment & Services | | 1.7 | % | | | | | | | | | |
| Schlumberger Ltd. | | | | | | | | 12,000 | | | 768,000 | |
| Food Beverage & Tobacco | | 4.4 | % | | | | | | | | | |
| PepsiCo, Inc. | | | | | | | | 14,154 | | | 1,560,196 | |
| Philip Morris International, Inc. | | | | | | | | 4,500 | | | 470,880 | |
| | | | | | | | | | | | 2,031,076 | |
| Health Care Equipment & Services | | 7.0 | % | | | | | | | | | |
| Aetna, Inc. | | | | | | | | 6,642 | | | 1,129,340 | |
| UnitedHealth Group, Inc. | | | | | | | | 10,060 | | | 2,114,813 | |
| | | | | | | | | | | | 3,244,153 | |
| Household & Personal Products | | 1.7 | % | | | | | | | | | |
| Kimberly-Clark Corp. | | | | | | | | 6,900 | | | 776,319 | |
| Insurance | | 8.0 | % | | | | | | | | | |
| Aflac, Inc. | | | | | | | | 17,975 | | | 1,507,923 | |
| Progressive (The) Corp. | | | | | | | | 24,000 | | | 1,167,600 | |
| Prudential Financial, Inc. | | | | | | | | 9,188 | | | 1,014,906 | |
| | | | | | | | | | | | 3,690,429 | |
| Materials | | 6.2 | % | | | | | | | | | |
| LyondellBasell Industries NV | | | | | | | | 15,753 | | | 1,630,908 | |
| Sherwin-Williams (The) Co. | | | | | | | | 3,125 | | | 1,234,844 | |
| | | | | | | | | | | | 2,865,752 | |
| Pharmaceuticals & Biotechnology | | 7.8 | % | | | | | | | | | |
| AbbVie, Inc. | | | | | | | | 15,000 | | | 1,353,750 | |
| Amgen, Inc. | | | | | | | | 6,570 | | | 1,151,195 | |
| Bristol-Myers Squibb Co. | | | | | | | | 9,700 | | | 598,102 | |
| Eli Lilly & Co. | | | | | | | | 6,400 | | | 524,416 | |
| | | | | | | | | | | | 3,627,463 | |
See notes to financial statements.
LARGE CAP EQUITY FUND (concluded)
SCHEDULE OF INVESTMENTS
October 31, 2017
| | | Percentage
of Net
Assets | | | | | Shares | | Value | |
| Real Estate | | 2.1 | % | | | | | | | | | |
| Simon Property Group, Inc. | | | | | | | | 6,137 | | $ | 953,260 | |
| Retailing | | 3.5 | % | | | | | | | | | |
| Home Depot (The), Inc. | | | | | | | | 5,176 | | | 858,078 | |
| Lowe’s Cos., Inc. | | | | | | | | 9,576 | | | 765,601 | |
| | | | | | | | | | | | 1,623,679 | |
| Semiconductors & Semiconductor | | 4.0 | % | | | | | | | | | |
| Broadcom Ltd. | | | | | | | | 7,000 | | | 1,847,370 | |
| Software & Services | | 14.1 | % | | | | | | | | | |
| Alphabet, Inc.(a) | | | | | | | | 1,800 | | | 1,859,472 | |
| Facebook, Inc.(a) | | | | | | | | 10,200 | | | 1,836,612 | |
| Intuit, Inc. | | | | | | | | 6,250 | | | 943,875 | |
| Oracle Corp. | | | | | | | | 37,237 | | | 1,895,363 | |
| | | | | | | | | | | | 6,535,322 | |
| Technology Hardware & Equipment | | 1.9 | % | | | | | | | | | |
| Western Digital Corp. | | | | | | | | 10,000 | | | 892,700 | |
| Utilities | | 4.9 | % | | | | | | | | | |
| American Electric Power Co., Inc. | | | | | | | | 18,000 | | | 1,339,380 | |
| Edison International | | | | | | | | 11,762 | | | 940,372 | |
| | | | | | | | | | | | 2,279,752 | |
| TOTAL COMMON STOCKS | | | | | | | | | | | | |
| (Cost $35,091,683) | | | | | | | | | | | 45,352,836 | |
| | | Percentage
of Net
Assets | | | | | Shares | | | Value | |
| INVESTMENT COMPANIES | | 2.2 | % | | | | | | | | | |
| Northern Institutional Treasury Portfolio, 0.88%* | | | | | | | | 1,023,416 | | $ | 1,023,416 | |
| TOTAL INVESTMENT COMPANIES | | | | | | | | | | | | |
| (Cost $1,023,416) | | | | | | | | | | | 1,023,416 | |
| | | | | | | | | | | | | |
| TOTAL INVESTMENTS | | | | | | | | | | | | |
| (Cost $36,115,099) | | 100.2 | % | | | | | | | | 46,376,252 | |
| NET OTHER ASSETS (LIABILITIES) | | (0.2 | )% | | | | | | | | (76,687 | ) |
| NET ASSETS | | 100.0 | % | | | | | | | $ | 46,299,565 | |
| | | | | | | | | | | | | |
| * | The rates presented are the rates in effect at October 31, 2017. |
| (a) | Non-income producing security. |
See notes to financial statements.
STATEMENTS OF ASSETS & LIABILITIES
October 31, 2017
| | | AAAMCO Ultrashort Financing Fund | | | Ultra Short Mortgage Fund | | | Large Cap Equity Fund | |
| Assets: | | | | | | | | | | | | |
| Investments, at cost | | $ | 8,047,474 | | | $ | 83,024,178 | | | $ | 36,115,099 | |
| Investments, at value | | | 8,037,494 | | | | 83,318,479 | | | | 46,376,252 | |
| Investments in affiliates, at value (Cost $0, $4,013,121 and $0, respectively) | | | — | | | | 4,013,121 | | | | — | |
| Repurchase agreements, cost equals fair value | | | 51,241,679 | | | | — | | | | — | |
| Receivable for dividends and interest | | | 53,352 | | | | 208,671 | | | | 31,363 | |
| Receivable for paydowns on mortgage-backed securities | | | — | | | | 9,719 | | | | — | |
| Receivable from Adviser/Distributor | | | 36,090 | | | | 20,378 | | | | 3,375 | |
| Total Assets | | | 59,368,615 | | | | 87,570,368 | | | | 46,410,990 | |
| | | | | | | | | | | | | |
| Liabilities: | | | | | | | | | | | | |
| Income distribution payable | | | — | | | | 82,252 | | | | — | |
| Investment advisory fees payable | | | 15,099 | | | | 33,501 | | | | 25,357 | |
| Distribution fees payable | | | 768 | | | | 18,611 | | | | 8,437 | |
| Unitary fees payable | | | 23,334 | | | | 49,586 | | | | 25,830 | |
| Capital shares redeemed payable | | | — | | | | — | | | | 51,801 | |
| Total Liabilities | | | 39,201 | | | | 183,950 | | | | 111,425 | |
| Net Assets | | $ | 59,329,414 | | | $ | 87,386,418 | | | $ | 46,299,565 | |
| | | | | | | | | | | | | |
| Class I | | | | | | | | | | | | |
| Net assets | | $ | 9,048,793 | | | $ | 87,386,418 | | | $ | — | |
| Shares of common stock outstanding | | | 905,078 | | | | 12,481,525 | | | | — | |
| Net asset value per share | | $ | 10.00 | | | $ | 7.00 | | | $ | — | |
| | | | | | | | | | | | | |
| Class Y | | | | | | | | | | | | |
| Net assets | | $ | 50,280,621 | | | $ | — | | | $ | — | |
| Shares of common stock outstanding | | | 5,029,607 | | | | — | | | | — | |
| Net asset value per share | | $ | 10.00 | | | $ | — | | | $ | — | |
| | | | | | | | | | | | | |
| Class AMF | | | | | | | | | | | | |
| Net assets | | $ | — | | | $ | — | | | $ | 40,103,888 | |
| Shares of common stock outstanding | | | — | | | | — | | | | 4,074,026 | |
| Net asset value per share | | $ | — | | | $ | — | | | $ | 9.84 | |
| | | | | | | | | | | | | |
| Class H | | | | | | | | | | | | |
| Net assets | | $ | — | | | $ | — | | | $ | 6,195,677 | |
| Shares of common stock outstanding | | | — | | | | — | | | | 630,679 | |
| Net asset value per share | | $ | — | | | $ | — | | | $ | 9.82 | |
| | | | | | | | | | | | | |
| Net Assets | | | | | | | | | | | | |
| Paid in capital | | $ | 59,359,352 | | | $ | 382,120,332 | | | $ | 27,911,066 | |
| Accumulated undistributed net investment income (loss) | | | 999 | | | | 85,505 | | | | (1 | ) |
| Accumulated undistributed net realized gains (losses) | | | (20,957 | ) | | | (295,113,720 | ) | | | 8,127,347 | |
| Unrealized appreciation (depreciation) on investments | | | (9,980 | ) | | | 294,301 | | | | 10,261,153 | |
| Net assets | | $ | 59,329,414 | | | $ | 87,386,418 | | | $ | 46,299,565 | |
| | | | | | | | | | | | | |
See notes to financial statements.
STATEMENTS OF OPERATIONS
For the Year or Period Ended October 31, 2017
| | | AAAMCO Ultrashort Financing Fund* | | | Ultra Short Mortgage Fund | | | Large Cap Equity Fund | |
| INVESTMENT INCOME: | | | | | | | | | | | | |
| Interest income | | $ | 377,300 | | | $ | 1,637,675 | | | $ | — | |
| Dividend income | | | 5,166 | | | | 29,001 | | | | 1,099,503 | |
| Dividend income from investment in affiliates | | | — | | | | 13,127 | | | | — | |
| Total investment income | | | 382,466 | | | | 1,679,803 | | | | 1,099,503 | |
| | | | | | | | | | | | | |
| Operating expenses: | | | | | | | | | | | | |
| Investment advisory | | | 68,953 | | | | 483,200 | | | | 286,487 | |
| Distribution — Class AMF Shares | | | — | | | | — | | | | 95,728 | |
| Distribution — Class I Shares | | | 2,940 | | | | 268,444 | | | | — | |
| Unitary | | | 151,219 | | | | 642,090 | | | | 262,910 | |
| Total expenses before reductions | | | 223,112 | | | | 1,393,734 | | | | 645,125 | |
| Expenses reduced by Investment Adviser | | | (117,397 | ) | | | (174,636 | ) | | | — | |
| Expenses reduced by Distributor | | | — | | | | (107,376 | ) | | | (38,291 | ) |
| Unitary Fee Waiver | | | (39,794 | ) | | | — | | | | — | |
| Net expenses | | | 65,921 | | | | 1,111,722 | | | | 606,834 | |
| Net investment income | | | 316,545 | | | | 568,081 | | | | 492,669 | |
| | | | | | | | | | | | | |
| REALIZED AND UNREALIZED GAINS (LOSSES) | | | | | | | | | | | | |
| FROM INVESTMENT ACTIVITIES: | | | | | | | | | | | | |
| Net realized gains (loss) from investment transactions | | | (9,652 | ) | | | (572,466 | ) | | | 9,094,101 | |
| Net increase from payment by affiliates | | | 12,500 | | | | — | | | | — | |
| Change in unrealized appreciation (depreciation) on investments | | | (9,980 | ) | | | (578,941 | ) | | | 86,114 | |
| Net realized and unrealized gains (losses) from investment activities | | | (7,132 | ) | | | (1,151,407 | ) | | | 9,180,215 | |
| CHANGE IN NET ASSETS RESULTING FROM OPERATIONS | | $ | 309,413 | | | $ | (583,326 | ) | | $ | 9,672,884 | |
| | | | | | | | | | | | | |
| * | For the period from June 6, 2017, commencement of operations, to October 31, 2017. |
See notes to financial statements.
STATEMENTS OF CHANGES IN NET ASSETS
| | | AAAMCO
Ultrashort
Financing Fund |
| | | Since Inception to
October 31, 2017* |
| | | | | |
| Increase (decrease) in net assets: | | | | |
| Operations: | | | | |
| Net investment income | | $ | 316,545 | |
| Net realized losses from investment transactions | | | (9,652 | ) |
| Net increase from payment by affiliates | | | 12,500 | |
| Change in unrealized depreciation on investments | | | (9,980 | ) |
| Change in net assets resulting from operations | | | 309,413 | |
| Dividends paid to shareholders: | | | | |
| From net investment income: | | | | |
| Class I Stockholders | | | (40,777 | ) |
| Class Y Stockholders | | | (286,074 | ) |
| Total dividends paid to stockholders | | | (326,851 | ) |
| Capital Transactions: | | | | |
| Class I Shares: | | | | |
| Proceeds from sale of shares | | | 9,010,000 | |
| Value of shares issued to shareholders in reinvestment of dividends | | | 40,777 | |
| Class Y Shares: | | | | |
| Proceeds from sale of shares | | | 50,010,000 | |
| Value of shares issued to shareholders in reinvestment of dividends | | | 286,075 | |
| Change in net assets from capital transactions | | | 59,346,852 | |
| Change in net assets | | | 59,329,414 | |
| Net Assets: | | | | |
| Beginning of period | | | — | |
| End of period | | $ | 59,329,414 | |
| Accumulated undistributed net investment income | | $ | 999 | |
| * | For the period from June 6, 2017, commencement of operations, to October 31, 2017. |
See notes to financial statements.
STATEMENTS OF CHANGES IN NET ASSETS (continued)
| | | Ultra Short Mortgage Fund | |
| | | Year Ended
October 31,
2017 | | | Year Ended
October 31,
2016 | |
| Increase (decrease) in net assets: | | | | | | | | |
| Operations: | | | | | | | | |
| Net investment income | | $ | 568,081 | | | $ | 1,087,396 | |
| Net realized gains (losses) from investment transactions | | | (572,466 | ) | | | 531,340 | |
| Change in unrealized depreciation on investments | | | (578,941 | ) | | | (2,138,000 | ) |
| Change in net assets resulting from operations | | | (583,326 | ) | | | (519,264 | ) |
| Dividends paid to stockholders: | | | | | | | | |
| From net investment income | | | (1,780,575 | ) | | | (2,263,353 | ) |
| Total dividends paid to stockholders | | | (1,780,575 | ) | | | (2,263,353 | ) |
| Capital Transactions: | | | | | | | | |
| Proceeds from sale of shares | | | 2,000,059 | | | | 19,481,854 | |
| Value of shares issued to shareholders in reinvestment of dividends | | | 432,767 | | | | 500,577 | |
| Cost of shares redeemed | | | (32,577,526 | ) | | | (71,682,538 | ) |
| Change in net assets from capital transactions | | | (30,144,700 | ) | | | (51,700,107 | ) |
| Change in net assets | | | (32,508,601 | ) | | | (54,482,724 | ) |
| Net Assets: | | | | | | | | |
| Beginning of year | | | 119,895,019 | | | | 174,377,743 | |
| End of year | | $ | 87,386,418 | | | $ | 119,895,019 | |
| Accumulated undistributed net investment income | | $ | 85,505 | | | $ | 36,479 | |
See notes to financial statements.
STATEMENTS OF CHANGES IN NET ASSETS (concluded)
| | | Large Cap Equity Fund | |
| | | Year Ended
October 31,
2017 | | | Year Ended
October 31,
2016 | |
| Increase (decrease) in net assets: | | | | | | | | |
| Operations: | | | | | | | | |
| Net investment income | | $ | 492,669 | | | $ | 505,894 | |
| Net realized gains from investment transactions | | | 9,094,101 | | | | 10,417,303 | |
| Change in unrealized appreciation (depreciation) on investments | | | 86,114 | | | | (8,053,698 | ) |
| Change in net assets resulting from operations | | | 9,672,884 | | | | 2,869,499 | |
| Dividends paid to shareholders: | | | | | | | | |
| From net investment income: | | | | | | | | |
| Class AMF Stockholders | | | (449,507 | ) | | | (446,355 | ) |
| Class H Stockholders | | | (82,031 | ) | | | (71,839 | ) |
| From net realized gains: | | | | | | | | |
| Class AMF Shares | | | (8,615,460 | ) | | | (2,362,365 | ) |
| Class H Shares | | | (1,243,999 | ) | | | (349,126 | ) |
| Total dividends paid to stockholders | | | (10,390,997 | ) | | | (3,229,685 | ) |
| Capital Transactions: | | | | | | | | |
| Class AMF Shares: | | | | | | | | |
| Proceeds from sale of shares | | | 815,172 | | | | 598,431 | |
| Value of shares issued to shareholders in reinvestment of dividends | | | 8,349,483 | | | | 2,511,047 | |
| Cost of shares redeemed | | | (5,056,728 | ) | | | (5,182,189 | ) |
| Class H Shares: | | | | | | | | |
| Proceeds from sale of shares | | | 1,446,466 | | | | 611,561 | |
| Value of shares issued to shareholders in reinvestment of dividends | | | 23,809 | | | | 6,596 | |
| Cost of shares redeemed | | | (541,444 | ) | | | (1,781,351 | ) |
| Change in net assets from capital transactions | | | 5,036,758 | | | | (3,235,905 | ) |
| Change in net assets | | | 4,318,645 | | | | (3,596,091 | ) |
| Net Assets: | | | | | | | | |
| Beginning of year | | | 41,980,920 | | | | 45,577,011 | |
| End of year | | $ | 46,299,565 | | | $ | 41,980,920 | |
| Accumulated net investment loss | | $ | (1 | ) | | $ | (1 | ) |
See notes to financial statements.
AAAMCO ULTRASHORT FINANCING FUND — CLASS I SHARES
FINANCIAL HIGHLIGHTS
Selected data for a share outstanding throughout the period indicated.
| | | Period ended
October 31,
2017* | |
| Net asset value, beginning of period | | $ | 10.00 | |
| Income from investment operations: | | | | |
| Net investment income | | | 0.0533 | |
| Net realized and unrealized gains from investments | | | 0.0018 | (a) |
| Total from investment operations | | | 0.0551 | |
| Less distributions: | | | | |
| Dividends paid to stockholders: | | | | |
| From net investment income | | | (0.0551 | ) |
| Change in net asset value | | | — | |
| Net asset value, end of period | | $ | 10.00 | |
| Total return | | | 0.55 | %(b) |
| Ratios/Supplemental data: | | | | |
| Net assets, end of period (in 000’s) | | $ | 9,049 | |
| Ratio of net expenses to average net assets | | | 0.34 | %(c) |
| Ratio of net investment income to average net assets | | | 1.32 | %(c) |
| Ratio of gross expenses to average net assets | | | 1.05 | %(c) |
| Portfolio turnover rate | | | 389 | %(b) |
| * | For the period from June 6, 2017, commencement of operations, to October 31, 2017. |
| (a) | Realized and unrealized gains and losses per share in this caption are balancing amounts necessary to reconcile the change in net asset value per share for the period, and may not reconcile with the aggregate gains and losses in the Statement of Operations due to share transactions for the period. |
| (b) | Not annualized for periods less than one year. |
| (c) | Annualized for periods less than one year. |
See notes to financial statements.
AAAMCO ULTRASHORT FINANCING FUND — CLASS Y SHARES
FINANCIAL HIGHLIGHTS
Selected data for a share outstanding throughout the period indicated.
| | | Period ended
October 31,
2017* | |
| Net asset value, beginning of period | | $ | 10.00 | |
| Income from investment operations: | | | | |
| Net investment income | | | 0.0553 | |
| Net realized and unrealized gains from investments | | | 0.0018 | (a) |
| Total from investment operations | | | 0.0571 | |
| Less distributions: | | | | |
| Dividends paid to stockholders: | | | | |
| From net investment income | | | (0.0571 | ) |
| Change in net asset value | | | — | |
| Net asset value, end of period | | $ | 10.00 | |
| Total return | | | 0.57 | %(b),(c) |
| Ratios/Supplemental data: | | | | |
| Net assets, end of period (in 000’s) | | $ | 50,281 | |
| Ratio of net expenses to average net assets | | | 0.29 | %(d) |
| Ratio of net investment income to average net assets | | | 1.37 | %(d) |
| Ratio of gross expenses to average net assets | | | 0.96 | %(d) |
| Portfolio turnover rate | | | 389 | %(c) |
| * | For the period from June 6, 2017, commencement of operations, to October 31, 2017. |
| | |
| (a) | Realized and unrealized gains and losses per share in this caption are balancing amounts necessary to reconcile the change in net asset value per share for the period, and may not reconcile with the aggregate gains and losses in the Statement of Operations due to share transactions for the period. |
| | |
| (b) | During the period ended October 31, 2017, the AAAMCO UltraShort Financing Fund received monies from the Adviser. |
If these monies were not received, the return for the period would have been 0.47%.
| (c) | Not annualized for periods less than one year. |
| | |
| (d) | Annualized for periods less than one year. |
See notes to financial statements.
ULTRA SHORT MORTGAGE FUND
FINANCIAL HIGHLIGHTS
Selected data for a share outstanding throughout the period indicated. |
| |
| | | Year Ended October 31, |
| | | 2017 | | | 2016 | | | 2015 | | | 2014 | | | 2013 | |
| Net asset value, beginning of year | | $ | 7.16 | | | $ | 7.29 | | | $ | 7.36 | | | $ | 7.37 | | | $ | 7.36 | |
| Income (loss) from investment operations: | | | | | | | | | | | | | | | | | | | | |
| Net investment income | | | 0.0205 | | | | 0.0439 | | | | 0.0575 | | | | 0.0722 | | | | 0.0626 | |
| Net realized and unrealized gains (losses) from investments | | | (0.0636 | ) | | | (0.0603 | ) | | | (0.0339 | ) | | | 0.0225 | | | | 0.0725 | |
| Total from investment operations | | | (0.0431 | ) | | | (0.0164 | ) | | | 0.0236 | | | | 0.0947 | | | | 0.1351 | |
| | | | | | | | | | | | | | | | | | | | | |
| Less distributions: | | | | | | | | | | | | | | | | | | | | |
| Dividends paid to stockholders: | | | | | | | | | | | | | | | | | | | | |
| From net investment income | | | (0.1169 | ) | | | (0.1136 | ) | | | (0.0936 | ) | | | (0.1047 | ) | | | (0.1251 | ) |
| Change in net asset value | | | (0.16 | ) | | | (0.13 | ) | | | (0.07 | ) | | | (0.01 | ) | | | 0.01 | |
| Net asset value, end of year | | $ | 7.00 | | | $ | 7.16 | | | $ | 7.29 | | | $ | 7.36 | | | $ | 7.37 | |
| Total return | | | (0.61) % | | | | (0.22) % | | | | 0.32% | | | | 1.30% | | | | 1.86%* | |
| Ratios/Supplemental data: | | | | | | | | | | | | | | | | | | | | |
| Net assets, end of year (in 000’s) | | $ | 87,386 | | | $ | 119,895 | | | $ | 174,378 | | | $ | 197,512 | | | $ | 274,862 | |
| Ratio of net expenses to average net assets | | | 1.03% | | | | 0.96% | | | | 0.92% | | | | 0.80% | | | | 0.79% | |
| Ratio of net investment income to average net assets | | | 0.53% | | | | 0.75% | | | | 0.85% | | | | 1.08% | | | | 0.99% | |
| Ratio of gross expenses to average net assets** | | | 1.30% | | | | 1.22% | | | | 1.18% | | | | 1.09% | | | | 1.12% | |
| Portfolio turnover rate | | | 26% | | | | 26% | | | | 22% | | | | 3% | | | | 30% | |
| * | During the fiscal year ended October 31, 2013, the Ultra Short Mortgage Fund received monies related to certain nonrecurring litigation settlements. If these monies were not received, the One Year return would have been (0.20)%. |
| ** | During the periods shown, certain fees were voluntarily reduced. If such voluntary fee reductions had not occurred, the ratios would have been as indicated. |
See notes to financial statements.
LARGE CAP EQUITY FUND — CLASS AMF SHARES
FINANCIAL HIGHLIGHTS
Selected data for a share outstanding throughout the period indicated. |
| |
| | | Year Ended October 31, | |
| | | 2017 | | | 2016 | | | 2015 | | | 2014 | | | 2013 | |
| Net asset value, beginning of year | | $ | 10.34 | | | $ | 10.43 | | | $ | 11.37 | | | $ | 11.10 | | | $ | 9.41 | |
| | | | | | | | | | | | | | | | | | | | | |
| Income (loss) from investment operations: | | | | | | | | | | | | | | | | | | | | |
| Net investment income | | | 0.11 | | | | 0.12 | | | | 0.13 | | | | 0.13 | | | | 0.11 | |
| Net realized and unrealized gains (losses) from investments | | | 2.02 | | | | 0.57 | | | | (0.20 | ) | | | 1.03 | | | | 2.02 | |
| Total from investment operations | | | 2.13 | | | | 0.69 | | | | (0.07 | ) | | | 1.16 | | | | 2.13 | |
| | | | | | | | | | | | | | | | | | | | | |
| Less distributions: | | | | | | | | | | | | | | | | | | | | |
| Dividends paid to stockholders: | | | | | | | | | | | | | | | | | | | | |
| From net investment income | | | (0.11 | ) | | | (0.12 | ) | | | (0.14 | ) | | | (0.14 | ) | | | (0.12 | ) |
| From net realized gains | | | (2.52 | ) | | | (0.66 | ) | | | (0.73 | ) | | | (0.75 | ) | | | (0.32 | ) |
| Total distributions | | | (2.63 | ) | | | (0.78 | ) | | | (0.87 | ) | | | (0.89 | ) | | | (0.44 | ) |
| Change in net asset value | | | (0.50 | ) | | | (0.09 | ) | | | (0.94 | ) | | | 0.27 | | | | 1.69 | |
| Net asset value, end of year | | $ | 9.84 | | | $ | 10.34 | | | $ | 10.43 | | | $ | 11.37 | | | $ | 11.10 | |
| Total return | | | 24.63% | | | | 7.06% | | | | (0.87)% | | | | 10.90% | | | | 23.55 | % |
| Ratios/Supplemental data: | | | | | | | | | | | | | | | | | | | | |
| Net assets, end of year (in 000’s) | | $ | 40,104 | | | $ | 36,668 | | | $ | 39,017 | | | $ | 54,780 | | | $ | 89,562 | |
| Ratio of net expenses to average net assets | | | 1.40% | | | | 1.32% | | | | 1.28% | | | | 1.24% | | | | 1.22% | |
| Ratio of net investment income to average net assets | | | 1.09% | | | | 1.18% | | | | 1.22% | | | | 1.13% | | | | 1.11% | |
| Ratio of gross expenses to average net assets** | | | 1.50% | | | | 1.42% | | | | 1.38% | | | | 1.34% | | | | 1.32% | |
| Portfolio turnover rate | | | 112% | | | | 76% | | | | 9% | | | | 7% | | | | 5% | |
| ** | During the periods shown, certain fees were voluntarily reduced. If such voluntary fee reductions had not occurred, the ratios would have been as indicated. |
See notes to financial statements.
LARGE CAP EQUITY FUND — CLASS H SHARES
FINANCIAL HIGHLIGHTS
Selected data for a share outstanding throughout the period indicated. |
| |
| | | Year Ended October 31, | |
| | | 2017 | | | 2016 | | | 2015 | | | 2014 | | | 2013 | |
| Net asset value, beginning of year | | $ | 10.34 | | | $ | 10.43 | | | $ | 11.36 | | | $ | 11.10 | | | $ | 9.41 | |
| Income (loss) from investment operations: | | | | | | | | | | | | | | | | | | | | |
| Net investment income | | | 0.12 | | | | 0.15 | | | | 0.14 | | | | 0.13 | | | | 0.13 | |
| Net realized and unrealized gains (losses) from investments | | | 2.02 | | | | 0.56 | | | | (0.19 | ) | | | 1.04 | | | | 2.01 | |
| Total from investment operations | | | 2.14 | | | | 0.71 | | | | (0.05 | ) | | | 1.17 | | | | 2.14 | |
| | | | | | | | | | | | | | | | | | | | | |
| Less distributions: | | | | | | | | | | | | | | | | | | | | |
| Dividends paid to stockholders: | | | | | | | | | | | | | | | | | | | | |
| From net investment income | | | (0.14 | ) | | | (0.14 | ) | | | (0.15 | ) | | | (0.16 | ) | | | (0.13 | ) |
| From net realized gains | | | (2.52 | ) | | | (0.66 | ) | | | (0.73 | ) | | | (0.75 | ) | | | (0.32 | ) |
| Total distributions | | | (2.66 | ) | | | (0.80 | ) | | | (0.88 | ) | | | (0.91 | ) | | | (0.45 | ) |
| Change in net asset value | | | (0.52 | ) | | | (0.09 | ) | | | (0.93 | ) | | | 0.26 | | | | 1.69 | |
| Net asset value, end of year | | $ | 9.82 | | | $ | 10.34 | | | $ | 10.43 | | | $ | 11.36 | | | $ | 11.10 | |
| Total return | | | 24.76 | % | | | 7.23 | % | | | (0.62 | )% | | | 10.99 | % | | | 23.74 | % |
| Ratios/Supplemental data: | | | | | | | | | | | | | | | | | | | | |
| Net assets, end of year (in 000’s) | | $ | 6,196 | | | $ | 5,313 | | | $ | 6,560 | | | $ | 6,864 | | | $ | 5,755 | |
| Ratio of net expenses to average net assets | | | 1.25 | % | | | 1.16 | % | | | 1.13 | % | | | 1.09 | % | | | 1.07 | % |
| Ratio of net investment income to average net assets | | | 1.24 | % | | | 1.38 | % | | | 1.33 | % | | | 1.15 | % | | | 1.24 | % |
| Ratio of gross expenses to average net assets | | | 1.25 | % | | | 1.16 | % | | | 1.13 | % | | | 1.09 | % | | | 1.07 | % |
| Portfolio turnover rate | | | 112 | % | | | 76 | % | | | 9 | % | | | 7 | % | | | 5 | % |
See notes to financial statements.
NOTES TO FINANCIAL STATEMENTS
October 31, 2017
Asset Management Fund (the “Trust”) was reorganized as a Delaware statutory trust on September 30, 1999, and is registered under the Investment Company Act of 1940, as amended (the “1940 Act”), as a diversified open-end management company. As an investment company, as defined in Financial Accounting Standards Board (“FASB”) Accounting Standards Update 2013-08, the Trust follows accounting and reporting guidance under FASB Accounting Standards Codification Topic 946, “Financial Services-Investment Companies.” As of October 31, 2017, the Trust is authorized to issue an unlimited number of shares, at no par value, in three separate series: the AAAMCO Ultrashort Financing Fund, the Ultra Short Mortgage Fund and the Large Cap Equity Fund (referred to individually as a “Fund” and collectively as the “Funds”). The AAAMCO Ultrashort Financing Fund is authorized to issue two classes of shares: Class I Shares and Class Y Shares. Class I and Class Y Shares of the AAAMCO Ultrashort Financing Fund have the same rights and obligations except: (i) Class I Shares bear a distribution fee, while Class Y Shares do not have any distribution fee, which will cause Class I Shares to have a higher expense ratio and to pay lower dividends than those related to Class Y Shares; (ii) other expenses, which are determined to properly apply to one class of shares upon approval by the Board of Trustees of the Trust (“Board”), will be borne solely by the class to which such expenses are attributable; and (iii) each class will have exclusive voting rights with respect to the matters relating to its own distribution arrangements. The AAAMCO Ultrashort Financing Fund commenced operations on June 6, 2017. The Ultra Short Mortgage Fund offers a single class of shares. The Large Cap Equity Fund is authorized to issue two classes of shares: Class AMF Shares and Class H Shares. Class AMF and Class H Shares of the Large Cap Equity Fund have the same rights and obligations except: (i) Class AMF Shares bear a distribution fee, while Class H Shares do not have any distribution fee, which will cause Class AMF Shares to have a higher expense ratio and to pay lower dividend rates than those related to Class H Shares; (ii) other expenses, which are determined to properly apply to one class of shares upon approval by the Board of Trustees of the Trust (“Board”), will be borne solely by the class to which such expenses are attributable; and (iii) each class will have exclusive voting rights with respect to the matters relating to its own distribution arrangements.
The Trust maintains an insurance policy that insures its officers and trustees against certain liabilities. Under the Trust’s organizational documents, its officers and trustees are indemnified against certain liabilities arising out of the performance of their duties to the Trust. In addition, in the normal course of business, the Trust enters into contracts with its vendors and others that provide general indemnification. Each Fund’s maximum exposure under these arrangements is unknown, as this would involve future claims that may be made against a Fund.
A. Significant accounting policies are as follows:
SECURITY VALUATION
Investments are recorded at fair value. Fair value is defined as the price that would be received to sell an asset or paid to transfer a liability in an orderly transaction between market participants at the measurement date. The valuation techniques employed by the Funds, as described below, maximize the use of observable inputs and minimize the use of unobservable inputs in determining fair value. These inputs are summarized in the following three broad levels:
| ● | Level 1 — quoted prices in active markets for identical assets |
| ● | Level 2 — other significant observable inputs (including quoted prices of similar securities, interest rates, prepayment speeds, credit risk, etc.) |
| ● | Level 3 — significant unobservable inputs (including a Fund’s own assumptions in determining the fair value of investments) |
The inputs or methodology used for valuing securities are not necessarily an indication of the risk associated with investing in those securities. For example, certain short-term debt securities may be valued using amortized cost. Generally, amortized cost approximates the fair value of a security, but since this valuation is not obtained from a quoted price in an active market, such securities would be reflected as Level 2 in the fair value hierarchy.
The Funds’ prices for equity securities are generally provided by an independent third party pricing service approved by the Board as of the close of the regular trading session of the New York Stock Exchange, normally at 4:00 pm EST, each business day on which the share price of each Fund is calculated. Equity securities listed or traded on a primary exchange are valued at the closing price, if available, or the last sales price on the primary exchange. If no sale occurred on the valuation date, the securities will be valued at the mean of the latest bid and ask quotations as of the close of the primary exchange. Investments in other open-end registered investment companies are valued at their respective net asset value (“NAV”) as reported by such companies. In these types of situations, valuations are typically categorized as Level 1 in the fair value hierarchy.
The Funds’ debt and other fixed income securities are generally valued at an evaluated bid price provided by an independent pricing source approved by the Board. To value debt securities, pricing services may use various pricing techniques which take into account appropriate factors such as market activity, yield, quality, coupon rate, maturity, type of issue, trading characteristics, call features, credit ratings and other data, as well as broker quotes. Short-term debt securities of sufficient credit quality that mature within sixty days may be valued at amortized cost, which may approximate fair value. Repurchase agreements are valued at par daily, as long as the
NOTES TO FINANCIAL STATEMENTS (continued)
October 31, 2017
market value of collateral is sufficient to support this valuation. In each of these situations, valuations are typically categorized as Level 2 in the fair value hierarchy. If a pricing service is unable to provide valuations for a particular security or securities, or the Trust’s Pricing Committee has determined that such valuations are unreliable, the Board has approved the use of a fair valuation methodology implemented by the Trust’s Pricing Committee to fair value the security or securities.
Within the fair value pricing methodology implemented by the Pricing Committee, among the more specific factors that are considered in determining the fair value of investments in debt instruments are: (1) information obtained with respect to market transactions in such securities or comparable securities; (2) the price and extent of public trading in similar securities of the issuer or comparable securities; (3) the fundamental analytical data relating to the investment; (4) quotations from broker/ dealers, yields, maturities, ratings and various relationships between securities; and (5) evaluation of the forces which influence the market in which these securities are purchased and sold. The fair valuation process also takes into consideration factors such as interest rate changes, movements in credit spreads, default rate assumptions, repayment assumptions, type and quality of collateral, and security seasoning. Imprecision in estimating fair value can impact the
amount of unrealized appreciation or depreciation recorded for a particular security, and differences in the assumptions used could result in a different determination of fair value, and those differences could be material. Depending on the source and relative significance of the valuation inputs in these instances, the instruments may be classified as Level 2 or Level 3 in the fair value hierarchy.
Fair value pricing, including evaluated prices obtained from pricing services, is inherently a process of estimates and judgments. Fair value prices may fluctuate less than market prices due to technical issues which may impact the prices at which the Funds can purchase or sell securities. Market prices can be impacted by technical factors such as short term changes in market liquidity and volatility which may not directly impact fair value prices. In addition, changes in the value of portfolio investments priced at fair value may be less frequent and of greater magnitude than changes in the price of securities that trade frequently in the marketplace, resulting in potentially greater NAV volatility.
While the Trust’s policy is intended to result in a calculation of a Fund’s NAV that fairly reflects security values at the time of pricing, the Trust cannot ensure that fair value prices would accurately reflect the price that a Fund could obtain for a security if it were to dispose of that security, particularly in a forced or distressed sale.
The following is a summary of the inputs used to value the Funds’ investments as of October 31, 2017:
| Portfolio | | Level 1-
Quoted Prices | | | Level 2 -
Other Significant
Observable Inputs | | | Level 3 -
Significant
Unobservable Inputs | | | Total | |
| AAAMCO Ultrashort Financing Fund | | | | | | | | | | | | | | | | |
| Adjustable Rate Mortgage-Related Securities | | $ | — | | | $ | 8,001,803 | | | $ | — | | | $ | 8,001,803 | |
| Investment Companies | | | 35,691 | | | | — | | | | — | | | | 35,691 | |
| Repurchase Agreements | | | — | | | | 51,241,679 | | | | — | | | | 51,241,679 | |
| Total Investments | | | 35,691 | | | | 59,243,482 | | | | — | | | | 59,279,173 | |
| Ultra Short Mortgage Fund | | | | | | | | | | | | | | | | |
| Adjustable Rate Mortgage-Related Securities | | | — | | | | 47,798,567 | | | | — | | | | 47,798,567 | |
| Fixed Rate Mortgage-Related Securities | | | — | | | | 28,198,241 | | | | — | | | | 28,198,241 | |
| Investment Companies | | | 11,334,792 | | | | — | | | | — | | | | 11,334,792 | |
| Total Investments | | | 11,334,792 | | | | 75,996,808 | | | | — | | | | 87,331,600 | |
| Large Cap Equity Fund | | | | | | | | | | | | | | | | |
| Common Stocks | | | 45,352,836 | | | | — | | | | — | | | | 45,352,836 | |
| Investment Companies | | | 1,023,416 | | | | — | | | | — | | | | 1,023,416 | |
| Total Investments | | | 46,376,252 | | | | — | | | | — | | | | 46,376,252 | |
| | | | | | | | | | | | | | | | | |
As of October 31, 2017, there were no Level 3 securities held by the Funds. The Trust’s policy is to disclose transfers between levels based on valuations at the end of the reporting period. There were no transfers between Level 1, 2 or 3 as of October 31, 2017, based on levels assigned to securities as of October 31, 2016.
REPURCHASE AGREEMENTS
The AAAMCO Ultrashort Financing Fund and the Ultra Short Mortgage Fund may invest in obligations of the U.S. Government or other obligations that are not subject to any investment limitation on the part of national banks that may
NOTES TO FINANCIAL STATEMENTS (continued)
October 31, 2017
be purchased from government securities dealers or the custodian bank, subject to the seller’s agreement to repurchase them at an agreed upon date and price. The Funds, through the custodian, receives delivery of the underlying collateral for each repurchase agreement. The Funds require the custodian to take possession of all collateral for repurchase agreements. The Fund’s require the fair value of collateral underlying the repurchase agreement to be at least 102% of the repurchase price, including any accrued interest earned on the repurchase agreement. If the counterparty defaults, and the fair value of the collateral declines, realization of the collateral by a Fund may be delayed or limited. There were no repurchase agreements held by the Ultra Short Mortgage Fund as of October 31, 2017.
The Funds may enter into transactions subject to enforceable netting arrangements (“netting arrangements”) under a repurchase agreement. Generally, netting arrangements allow the Funds to offset any exposure to a specific counterparty with any collateral received or delivered to that counterparty. In addition, netting arrangements provide the right for the non-defaulting party to liquidate the collateral and calculate the net exposure to the defaulting party or request additional collateral. Generally, the Funds manage their cash collateral and securities collateral on a counterparty basis. As of October 31, 2017, the AAAMCO Ultrashort Financing Fund has invested in the repurchase agreements described below, with gross exposures on the Statement of Assets and Liabilities, that could be netted subject to netting agreements.
The following table presents the repurchase agreements, which are subject to netting arrangements, as well as the collateral received related to those repurchase agreements.
| | | | | | | | Gross Amounts Not Offset in the
Statement of Assets and Liabilities |
| Fund Name | | Counterparty | | Gross Amounts of Assets
Presented in Statement of
Assets and Liabilities | Financial
Instruments | | Net
Amount |
| AAAMCO Ultrashort Financing Fund | | Amherst Pierpont Securities LLC | | | $ | 18,000,000 | | | | $ | (18,000,000 | ) | | | $ | — |
| | | BCM High Income Fund, LP | | | | 19,743,218 | | | | | (19,743,218 | ) | | | | — |
| | | JVB Financial Group, LLC | | | | 8,673,845 | | | | | (8,673,845 | ) | | | | — |
| | | Vining-Sparks IBG, L.P. | | | | 4,824,616 | | | | | (4,824,616 | ) | | | | — |
| | | Total | | | $ | 51,241,679 | | | | $ | (51,241,679 | ) | | | $ | — |
SECURITIES PURCHASED OR SOLD ON A WHEN-ISSUED OR DELAYED DELIVERY BASIS
Each Fund may purchase or sell securities on a when-issued basis or delayed-delivery basis. With when-issued transactions, securities are bought or sold during the periods between the announcement of an offering and the issuance and payment date of the securities. When securities are purchased or sold on a delayed-delivery basis, the price of the securities is fixed at the time of the commitment to purchase or sell is made, but settlement may take place at a future date. By the time of delivery, securities purchased or sold on a when-issued or delayed-delivery basis may be valued at less than the purchase or sell price. At the time when-issued or delayed-delivery securities are purchased or sold, a Fund must set aside funds or securities in a segregated account to pay for the purchase or as collateral for the sale. There were no securities purchased or sold on a when-issued or delayed-delivery basis held by the Funds as of October 31, 2017.
MORTGAGE-BACKED TO-BE-ANNOUNCED TRANSACTIONS
A Mortgage-Backed To-Be-Announced (“TBA”) trade represents a forward contract for the purchase or sale of single-
family mortgage-related securities to be delivered on a specified future date. In a typical TBA trade, the specific pool of mortgages that will be delivered to fulfill the forward contract are unknown at the time of the trade. The parties to a TBA trade agree upon the issuer, coupon, price, product type, amount of securities and settlement date for delivery. Settlement for TBA trades is standardized to occur on one specific day each month. The mortgage-related securities that ultimately will be delivered, and the loans backing those mortgage-related securities, frequently have not been created or originated at the time of the TBA trade, even though a price for the securities is agreed to at that time.
The Ultra Short Mortgage Fund may engage in TBA transactions to manage cash positions as well as to manage interest rate and prepayment risks. The Fund may engage in forward sales of TBA trades only when the Fund has identified the actual mortgage pool held in position to be delivered in fulfillment of the TBA trade obligation(specifying the pool or CUSIP number). These pools must be deliverable into the sold TBA position. At October 31, 2017, there were no mortgage-backed TBA positions held in the Ultra Short Mortgage Fund.
NOTES TO FINANCIAL STATEMENTS (continued)
October 31, 2017
DIVIDENDS TO SHAREHOLDERS
AAAMCO Ultrashort Financing Fund and Ultra Short Mortgage Fund:
Dividends from net investment income are declared daily and paid monthly. Net short-term and long-term capital gains, if any, are declared and paid annually.
Large Cap Equity Fund:
Dividends from net investment income are declared and paid at least quarterly. Net short-term and long-term capital gains, if any, are declared and paid annually.
For all Funds, distributions from net investment income and from net realized capital gains are determined in accordance with Federal income tax regulations, which may differ from accounting principles generally accepted in the United States of America. These “book/tax” differences are either considered temporary or permanent in nature. To the extent these differences are permanent in nature (e.g. reclass of dividend distribution and return of capital), such amounts are reclassified within the composition of net assets based on their federal tax-basis treatment; temporary differences do not require reclassification. Distributions to shareholders that exceed net investment income and net realized capital gains for tax purposes are reported as distributions of capital.
FEDERAL TAXES
No provision is made for Federal income taxes as it is the policy of each Fund to continue to qualify as a regulated investment company by complying with the provisions available to certain investment companies, as defined in applicable sections of the Internal Revenue Code, and to make distributions of net investment income and net realized capital gains sufficient to relieve it from all, or substantially all, federal income taxes.
For all open tax years and all major taxing jurisdictions, management of the Funds has concluded that there are no significant uncertain tax positions that would require recognition in the financial statements. Open tax years are those that are open for examination by taxing authorities (i.e., generally the last three tax year ends as well as the most recent fiscal year end which has yet to be filed). Furthermore, management of the Funds is also not aware of any tax positions for which it is reasonably possible that the total amounts of unrecognized tax benefits will significantly change in the next twelve months.
MANAGEMENT ESTIMATES
The preparation of financial statements in conformity with accounting principles generally accepted in the United States of America requires management to make estimates and assumptions that affect the reported amounts of assets and
liabilities at the date of the financial statements and the reported amounts of revenues and expenses during the reporting period. Actual results could differ from these estimates.
EXPENSE ALLOCATION
Each Fund is charged for those expenses that are directly attributable to that Fund. Certain expenses that arise in connection with a class of shares are charged to that class of shares. Expenses incurred which do not specifically relate to an individual Fund are allocated among all Funds in the Trust in proportion to each Fund’s relative net assets or other reasonable basis.
OTHER
Investment transactions are accounted for no later than one business day after the trade date. However, for financial reporting purposes, investment transactions are reported on the trade date. Interest income is recorded on the accrual basis, amortization and accretion is recognized on a scientific basis and based on the anticipated effective maturity date, and the cost of investments sold is determined by use of the specific identification method for both financial reporting and income tax purposes. Paydown gains and losses on mortgage and asset-backed securities are recorded as adjustments to interest income in the Statements of Operations.
B. Fees and transactions with affiliates were as follows:
FEES AND TRANSACTIONS WITH AFFILIATES
Austin Atlantic Asset Management Company “AAAMCO” serves the Funds as investment adviser (the “Adviser”). The Adviser is a wholly-owned subsidiary of Austin Atlantic Inc. “AAI”. AAI is controlled by Rodger D. Shay, Jr., President of Austin Atlantic Capital Inc. “AACI”, also a wholly-owned subsidiary of AAI.
As compensation for investment advisory services, the Funds pay an investment advisory fee monthly based upon an annual percentage of the average daily net assets of each Fund as follows:
The investment advisory fee rate for the AAAMCO Ultra-short Financing Fund is 0.30% of average daily net assets. The Adviser voluntarily waived $5,898 of the investment advisory fee for the period ended October 31, 2017. The Adviser has contractually agreed to waive fees and reimburse expenses to the extent that Total Annual Operating Expenses (excluding brokerage costs, interest, taxes, dividend expense on short positions, litigation and indemnification expenses, expenses associated with the investments in underlying investment companies and extraordinary expenses(as determined under generally accepted principles)) exceed 0.30% for Class Y shares and 0.35% for Class I shares through
NOTES TO FINANCIAL STATEMENTS (continued)
October 31, 2017
February 28, 2018. If it becomes unnecessary for the Adviser to waive fees or make reimbursements, the Adviser may recapture any of its prior waivers or reimbursements for a period not to exceed three years from the fiscal year in which the waiver or reimbursement was made to the extent that such a recapture does not cause the Total Annual Fund Operating Expenses (excluding brokerage costs, interest, taxes, dividend expense on short positions, litigation and indemnification expenses, expenses associated with the investments in underlying investment companies and extraordinary expenses (as determined under generally accepted principles)) to exceed the applicable expense limitation in effect at time of recoupment or that was in effect at the time of the waiver or reimbursement, whichever is lower. The Adviser can terminate this agreement with 60 days notice before renewal. The agreement to waive fees and reimburse expenses may also be terminated by the Board of Trustees at any time and will terminate automatically upon termination of the investment advisory agreement. From the inception date of the Fund (June 6, 2017) through October 31, 2017, the Adviser contractually reduced investment advisory fees and/or reimbursed other operating expenses of the Fund in the amount of $111,499.
As of October 31, 2017, the AAAMCO Ultrashort Financing Fund had the following amounts and year of expiration subject to repayment to the Adviser:
| Year Waived | Year Repayment Expires | Balance |
| 2017 | 2020 | $111,499 |
The investment advisory fee rate for the Ultra Short Mortgage Fund is 0.45% of the first $3 billion, 0.35% of the next $2 billion, and 0.25% of net assets in excess of $5 billion. The Adviser voluntarily waived a portion of its fee so that the Fund paid 0.29% of average daily net assets for the year ended October 31, 2017.
The investment advisory fee rate for the Large Cap Equity Fund is 0.65% of the first $250 million and 0.55% for assets over $250 million.
The Ultra Short Mortgage Fund invests in the AAAMCO Ultrashort Financing Fund. The Fund’s adviser has contractually agreed to waive fees in the pro-rata amount of the management fee charged by the underlying AAAMCO Ultra short Financing Fund on the Ultra Short Mortgage Fund’s investment in the AAAMCO Ultrashort Financing Fund. This fee waiver is accrued daily and settled monthly. During the fiscal year ended October 31, 2017, the Ultra Short Mortgage Fund reduced investment advisory fees for this contractual fee waiver by $2,830.
AACI serves the Trust as distributor (the “Distributor”). The Distributor is a wholly-owned subsidiary of AAI.
As compensation for distribution services, the Trust pays the Distributor a distribution fee monthly in accordance with the distribution plan adopted by the Trust, pursuant to Rule 12b-1
under the 1940 Act, based upon an annual percentage of the average daily net assets of each Fund as follows:
The distribution fee rate for the AAAMCO Ultrashort Financing Fund Class I Shares is 0.10% of average daily net assets. The AAAMCO Ultrashort Financing Fund Class Y Shares do not have a distribution fee.
The distribution fee rate for the Ultra Short Mortgage Fund is 0.25% of average daily net assets. The Distributor voluntarily waived a portion of its fee so that the Ultra Short Mortgage Fund paid an amount equal to 0.15% of average daily net assets for the year ended October 31, 2017.
The distribution fee rate for the Large Cap Equity Fund Class AMF Shares is 0.25% of average daily net assets. The Distributor voluntarily waived a portion of its fee so that the Large Cap Equity Fund Class AMF Shares paid an amount equal to 0.15% of average daily net assets for the year ended October 31, 2017. The Large Cap Equity Fund Class H Shares do not have a distribution fee.
There were no brokerage commissions paid to the Distributor during the year ended October 31, 2017.
BUSINESS MANAGER AND ADMINISTRATOR
The Trust has Management and Administration Agreement with Foreside Management Services, LLC (“Foreside”), who serves as business manager and administrator for the Trust on behalf of the Funds. Pursuant to the terms of the Agreement, Foreside performs and coordinates all management and administration services for the Funds either directly or through working with the Funds service providers. Services provided under the Agreements by Foreside include, but are not limited to, coordinating and monitoring activities of the third party service providers to the Funds; serving as officers of the Trust, including but not limited to President, Secretary, Chief Compliance Officer, Anti-Money Laundering Officer, Treasurer and others as deemed necessary and appropriate; performing compliance services for the Trust, including maintaining the Trust compliance program as required under the 1940 Act; managing the process of filing amendments to the Trust’s registration statement and other reports to shareholders; coordinating the Board meeting preparation process; reviewing financial filings and filing with the Securities and Exchange Commission; and maintaining books and records in accordance with applicable laws and regulations.
Pursuant to the Agreement, Foreside pays all operating expenses of the Funds not specifically assumed by the Trust, unless the Trust and the Funds’ Adviser otherwise agree to pay, including without limitation the compensation and expenses of any employees and officers of the Trust and of any other persons rendering any services to the Trust or the Funds; clerical and shareholder service staff salaries; office space and other office expenses; fees and expenses incurred by the Trust in connection with membership in investment company organizations; legal, auditing and accounting
NOTES TO FINANCIAL STATEMENTS (continued)
October 31, 2017
expenses; expenses of registering shares under federal and state securities laws; insurance expenses; fees and expenses of the transfer agent, dividend disbursing agent, shareholder service agent, custodian, fund accounting agent and financial administrator (excluding fees and expenses payable to Foreside) and accounting and pricing services agent; expenses, including clerical expenses, of issue, sale, redemption or repurchase of shares of the Funds; the cost of preparing and distributing reports and notices to shareholders; the cost of printing or preparing prospectuses and statements of additional information for delivery to each Fund’s current shareholders; the cost of printing or preparing any documents, statements or reports to shareholders unless otherwise noted; fees and expenses of trustees of the Trust who are not interested persons of the Trust, as defined in the 1940 Act; and all other operating expenses not spe-
cifically assumed by the Trust or the Funds. In paying expenses that would otherwise be obligations of the Trust or the Funds, Foreside is expressly acting as an agent on behalf of the Trust or the Funds. For Services under the Agreement and expenses assumed by Foreside, the Ultra Short Mortgage Fund and the Large Cap Equity Funds pay Foreside an annual fee of 0.35% of average daily net assets of the Funds; subject to an aggregate minimum annual fee of $905,000 for these Funds. The AAAMCO Ultrashort Financing Fund pays Foreside an annual fee of 0.08% of average daily net assets on the first $500 million, 0.06% of average daily net assets on the next $500 million and 0.04% of average daily net assets over $1 billion; subject to an aggregate minimum annual fee of $380,000. With respect to the AAAMCO Ultrashort Financing Fund, Foreside has voluntarily agreed to waive $100,000 for a period of one year or until such time as the Ultrashort Fund’s net assets reach $175 million, whichever comes sooner.
C. Transactions in shares of the Funds for the year ended October 31, 2017, and year ended October 31, 2016, were as follows:
| | | AAAMCO
Ultrashort
Financing Fund | |
| | | Period Ended | |
| | | October 31, 2017* | |
| Share transactions Class I: | | | |
| Sale of shares | | 901,000 | |
Shares issued to stockholders in reinvestment of dividends | | 4,078 | |
| Net Increase | | 905,078 | |
| Shares Outstanding | | | |
| Beginning of period | | — | |
| End of period | | 905,078 | |
| Share transactions Class Y: | | | |
| Sale of shares | | 5,001,000 | |
| Shares issued to stockholders in reinvestment of dividends | | 28,607 | |
| Net Increase | | 5,029,607 | |
| Shares Outstanding | | | |
| Beginning of period | | — | |
| End of period | | 5,029,607 | |
| | | | |
| * | For the period from June 6, 2017, commencement of operations, to October 31, 2017. |
| | | Ultra Short Mortgage Fund | |
| | | Year Ended
October 31,
2017 | | Year Ended
October 31,
2016 | |
| Share transactions: | | | | | |
| Sale of shares | | 280,513 | | 2,694,379 | |
| Shares issued to stockholders in reinvestment of dividends | | 61,151 | | 69,459 | |
| Shares redeemed | | (4,611,108 | ) | (9,924,428 | ) |
| Net (decrease) | | (4,269,444 | ) | (7,160,590 | ) |
| Shares Outstanding | | | | | |
| Beginning of year | | 16,750,969 | | 23,911,559 | |
| End of year | | 12,481,525 | | 16,750,969 | |
| | | | | | |
NOTES TO FINANCIAL STATEMENTS (continued)
October 31, 2017
| | | Large Cap Equity Fund | |
| | | | Year Ended | | | Year Ended | |
| | | | October 31,
2017 | | | October 31,
2016 | |
| Share transactions Class AMF: | | | | | | | | |
| Sale of shares | | | 87,663 | | | | 58,579 | |
| Shares issued to stockholders in reinvestment of dividends | | | 971,840 | | | | 253,863 | |
| Shares redeemed | | | (530,253 | ) | | | (507,756 | ) |
| Net increase (decrease) | | | 529,250 | | | | (195,314 | ) |
| Shares Outstanding | | | | | | | | |
| Beginning of year | | | 3,544,776 | | | | 3,740,090 | |
| End of year | | | 4,074,026 | | | | 3,544,776 | |
| | | | | | | | | |
| Share transactions Class H: | | | | | | | | |
| Sale of shares | | | 166,864 | | | | 61,581 | |
| Shares issued to stockholders in reinvestment of dividends | | | 2,776 | | | | 667 | |
| Shares redeemed | | | (52,891 | ) | | | (177,472 | ) |
| Net increase (decrease) | | | 116,749 | | | | (115,224 | ) |
| Shares Outstanding | | | | | | | | |
| Beginning of year | | | 513,930 | | | | 629,154 | |
| End of year | | | 630,679 | | | | 513,930 | |
| | | | | | | | | |
D. For the period ended October 31, 2017, purchases and sales of securities, other than short-term investments and U.S. Government securities, were as follows:
| | | | AAAMCO | | | | | |
| | | | Ultrashort | | Ultra Short | | Large Cap | |
| | | | Financing | | Mortgage | | Equity | |
| | | | Fund | | Fund | | Fund | |
| Purchases | | | $ | — | | | $ | 4,013,121 | | | $ | 47,408,096 | |
| Sales | | | | — | | | | — | | | | 49,476,234 | |
For the period ended October 31, 2017, purchases and sales of U.S. Government securities, other than short-term investments, were as follows:
| | | | AAAMCO | | | | | |
| | | | Ultrashort | | Ultra Short | | Large Cap | |
| | | | Financing | | Mortgage | | Equity | |
| | | | Fund | | Fund | | Fund | |
| Purchases | | | $ | 40,224,751 | | | $ | 21,980,798 | | | $ | — | |
| Sales | | | | 32,171,952 | | | | 61,536,566 | | | | — | |
E. INVESTMENTS IN AFFILIATES
Transactions in affiliated investments for the fiscal year ended October 31, 2017, were as follows:
| | | Affiliate | | | Value, Beginning
of Year | | | Purchases | | | Sales
Proceeds | | | Net Change
In Unrealized
Appreciation
(Depreciation) | | | Net
Realized
Gains
(Losses) | | | Dividend
Income | | | Value, End of Year | |
| Ultra Short Mortgage Fund | | | AAAMCO Ultrashort.Financing Fund | | | $ | — | | | $ | 4,013,121 | | | $ | — | | | $ | — | | | $ | — | | | $ | 13,127 | | | $ | 4,013,121 | |
NOTES TO FINANCIAL STATEMENTS (continued)
October 31, 2017
F. FEDERAL INCOME TAX INFORMATION:
The tax characteristics of distributions paid to shareholders during the fiscal periods ended October 31, 2017 and 2016 for the Ultra Short Mortgage Fund and AAAMCO Ultrashort Financing Fund, were as follows:
| | | Distributions paid from | | Total Taxable | | Total Distributions | |
| 2017 | | Ordinary Income | | Distributions | | Paid* | |
| AAAMCO Ultrashort Financing Fund | | $ | 326,851 | | | $ | 326,851 | | | $ | 326,851 | |
| Ultra Short Mortgage Fund | | | 1,836,453 | | | | 1,836,453 | | | | 1,836,453 | |
| | | | Distributions paid from | | Total Taxable | | Total Distributions | |
| 2016 | | | Ordinary Income | | Distributions | | Paid* | |
| Ultra Short Mortgage Fund | | $ | 2,299,318 | | | $ | 2,299,318 | | | $ | 2,299,318 | |
| * | Total distributions paid differ from the Statements of Changes in Net Assets because dividends are recognized when actually paid for federal income tax purposes. |
The tax characteristics of distributions paid to shareholders during the years ended October 31, 2017 and 2016, for the Large Cap Equity Fund were as follows:
| | | Distributions paid from | | Net Long | | Total Taxable | | | Total Distributions |
| | | Ordinary Income | | Term Gains | | Distributions | | | Paid |
| 2017 | | | | | | | | | | | | | | | | | |
| Large Cap Equity Fund | | $ | 1,333,244 | | | $ | 9,057,753 | | | $ | 10,390,997 | | | | $ | 10,390,997 | |
| 2016 | | | | | | | | | | | | | | | | | |
| Large Cap Equity Fund | | $ | 518,194 | | | $ | 2,711,491 | | | $ | 3,229,685 | | | | $ | 3,229,685 | |
At October 31, 2017, the cost, gross unrealized appreciation and gross unrealized depreciation on securities, for federal income tax purposes, were as follows:
| Fund | | Tax Cost | | | Tax
Unrealized
Appreciation | | | Tax Unrealized
(Depreciation) | | | Net Unrealized
Appreciation
(Depreciation) | |
| AAAMCO Ultrashort Financing Fund | | $ | 59,289,153 | | | $ | — | | | $ | (9,980 | ) | | $ | (9,980 | ) |
| Ultra Short Mortgage Fund | | | 87,033,601 | | | | 651,248 | | | | (358,058 | ) | | | 293,190 | |
| Large Cap Equity Fund | | | 36,115,099 | | | | 10,641,632 | | | | (380,479 | ) | | | 10,261,153 | |
As of October 31, 2017, the components of accumulated earnings/(deficit) on a tax basis were as follows:
| Fund | | Undistributed
Ordinary
Income | | | Undistributed
Long Term
Capital
Gains | | | Accumulated
Earnings | | | Distributions
Payable | | | Accumulated
Capital and
Other Losses | | | Unrealized
Appreciation/
(Depreciation) | | | Total
Accumulated
Earnings
(Deficit) | |
| AAAMCO Ultrashort Financing Fund | | $ | 999 | | | $ | — | | | $ | 999 | | | $ | — | | | $ | (20,957 | ) | | $ | (9,980 | ) | | $ | (29,938 | ) |
| Ultra Short Mortgage Fund | | | 167,758 | | | | — | | | | 167,758 | | | | (82,252 | ) | | | (295,112,610 | ) | | | 293,190 | | | | (294,733,914 | ) |
| Large Cap Equity Fund | | | 1,705,469 | | | | 6,421,878 | | | | 8,127,347 | | | | — | | | | — | | | | 10,261,153 | | | | 18,388,500 | |
The tax character of current year distributions paid and the tax basis of the current components of accumulated earnings (deficit) and any net capital loss carry-forwards will be determined at end of the current tax year.
At October 31, 2017, the following Fund had capital loss carry-forwards available to offset future net capital gains through the indicated expiration dates:
| Fund | | Amount | | | Expires | |
| Ultra Short Mortgage Fund | | $ | 290,225,068 | | | | 2018 | |
| Ultra Short Mortgage Fund | | | 2,013,187 | | | | 2019 | |
| * | A portion of the capital loss carry-forwards may be subject to limitations under Section 382 of the Internal Revenue Code, and is available to the extent allowed by tax law to offset future net capital gain, if any. |
NOTES TO FINANCIAL STATEMENTS (continued)
October 31, 2017
The Regulated Investment Company Modernization Act of 2010 (the “Act”) eliminated the eight year limit on the use of capital loss carry-forwards that arise in taxable years beginning after its enactment date of December 22, 2010. The changes became effective for the Funds for the fiscal year ended October 31, 2012. Consequently, capital losses incurred by the Funds in taxable years beginning with the taxable year ended October 31, 2012, can be carried forward for an unlimited period. However, capital losses incurred by the Funds in taxable years beginning before the taxable year ended October 31, 2012, with an expiration date may not be used to offset capital gains until all net capital losses incurred in taxable years beginning with the taxable year ended October 31, 2012,
without an expiration date have been utilized. As a result, pre-enactment capital loss carry-forwards may be more likely to expire unused. Additionally, post-enactment capital loss carry-forwards will retain their character as either short-term or long-term capital losses instead of as short-term capital losses as under prior law. The Funds’ ability to utilize capital loss carry-forwards in the future may be limited under the Internal Revenue Code and related regulations based on the results of future transactions.
During the tax year ended October 31, 2017, Ultra Short Mortgage Fund had net capital loss carry-forward amounts that expired of $9,348,253.
Capital losses incurred that will be carried forward under the provisions of the Act are as follows:
| | | Short Term | | | Long Term | |
| | | Capital Loss | | | Capital Loss | |
| Fund | | Carry-forward | | | Carry-forward | |
| AAAMCO Ultrashort Financing Fund | | $ | 20,957 | | | $ | — | |
| Ultra Short Mortgage Fund | | | 592,762 | | | | 2,281,593 | |
Dividends and distributions are determined in accordance with federal income tax regulations and may differ from accounting principles generally accepted in the United States of America. These differences are primarily due to differing treatments for deferral of losses on wash sales. To the extent these differences are permanent, adjustments are made to the appropriate components of net assets in the period that these differences arise.
Income dividends and capital gains distributions are determined in accordance with federal income tax regulations. Such amounts may differ from income and capital gains recorded in accordance with U.S. GAAP. Accordingly, the Funds may periodically make reclassifications among certain of their capital accounts to reflect differences between financial reporting and federal income tax basis distributions. These reclassifications are reported in order to reflect the tax treatment for certain permanent differences that exist between income tax regulations and U.S. GAAP. These reclassifications may relate to paydowns, tax equalization, expiration of capital loss carry-forwards and changes in tax characterization. These reclassifications have no impact on the total net assets or the net asset values per share of the Funds. At October 31, 2017, the following reclassifications were recorded:
| Fund | | Accumulated
Undistributed Net
Investment Income (Loss) | | | Accumulated
Undistributed Net
Realized Gains (Losses) | | | Paid in Capital | |
| AAAMCO Ultrashort Financing Fund | | $ | 11,305 | | | $ | (23,805 | ) | | $ | 12,500 | |
| Ultra Short Mortgage Fund | | | 1,261,520 | | | | 8,086,733 | | | | (9,348,253 | ) |
| Large Cap Equity Fund | | | 38,869 | | | | (966,754 | ) | | | 927,885 | |
G. SUBSEQUENT EVENTS
The Funds have evaluated events from October 31, 2017 through the date that these financial statements were issued. There are no subsequent events to report that would have a material impact on the Funds’ financial statements.
H. BENEFICIAL SHARE TRANSACTIONS
The beneficial ownership, either directly or indirectly, of more than 25% of the voting securities of a fund creates a presumption of control of the Fund, under Section 2(a)(9) of the 1940 Act. As of October 31, 2017, the following entities owned beneficially 25% or greater of the Fund’s outstanding shares. The shares are held under omnibus accounts (whereby the transactions of two or more shareholders are combined and carried in the name of the originating broker rather than designated separately).
| Fund | | Record Owner | | %
Ownership |
| AAAMCO Ultrashort Financing Fund | | Peoples Bank | | 84.7% |
NOTES TO FINANCIAL STATEMENTS (concluded)
October 31, 2017
I. SPECIAL MEETING OF SHAREHOLDERS
A Special Meeting of Shareholders of the Trust was held on May 10, 2017, for the purpose of voting to approve a new investment advisory agreement between the Trust, on behalf of the Ultra Short Mortgage Fund, the Large Cap Equity Fund, and Austin Atlantic Asset Management Company. At the meeting, the proposal set forth in the shareholder proxy statement was approved. The voting results for the proposal was as follows:
| Fund | | For | | | Against | |
| Ultra Short Mortgage Fund | | | 9,352,968 | | | | 165,641 | |
| Large Cap Equity Fund | | | 2,420,305 | | | | 66,883 | |
J. CONCENTRATION OF OWNERSHIP
A significant portion of the AAAMCO Ultrashort Financing Fund’s shares may be held in a limited number of shareholder accounts, including in certain omnibus or institutional accounts which typically hold shares for the benefit of other underlying investors. To the extent that a shareholder or group of shareholders redeem a significant portion of the shares issued by a Fund, this could have a disruptive impact on the efficient implementation of the Funds’ investment strategy.
REPORT OF INDEPENDENT REGISTERED PUBLIC ACCOUNTING FIRM
To the Shareholders of Austin Atlantic Funds and
Board of Trustees of Asset Management Fund
We have audited the accompanying statements of assets and liabilities, including the schedules of investments, of AAAMCO Ultrashort Financing Fund, Ultra Short Mortgage Fund, and Large Cap Equity Fund (the “Austin Atlantic Funds” or “Funds”), each a series of Asset Management Fund, as of October 31, 2017, and the related statements of operations and changes in net assets and the financial highlights for the period June 6, 2017 (commencement of operations) through October 31, 2017, for AAAMCO Ultrashort Financing Fund, and the related statements of operations for the year then ended, the statements of changes in net assets for each of the two years in the period then ended, and the financial highlights for each of the four years in the period then ended for Ultra Short Mortgage Fund and Large Cap Equity Fund. These financial statements and financial highlights are the responsibility of the Funds’ management. Our responsibility is to express an opinion on these financial statements and financial highlights based on our audits. The Funds’ financial highlights for the year ended October 31, 2013, were audited by other auditors whose report dated December 23, 2013, expressed an unqualified opinion on those financial highlights.
We conducted our audits in accordance with the standards of the Public Company Accounting Oversight Board (United States). Those standards require that we plan and perform the audit to obtain reasonable assurance about whether the financial statements and financial highlights are free of material misstatement. An audit includes examining, on a test basis, evidence supporting the amounts and disclosures in the financial statements. Our procedures included confirmation of securities owned as of October 31, 2017, by correspondence with the custodian and counterparties. An audit also includes assessing the accounting principles used and significant estimates made by management, as well as evaluating the overall financial statement presentation. We believe that our audits provide a reasonable basis for our opinion.
In our opinion, the financial statements and financial highlights referred to above present fairly, in all material respects, the financial position of each of the Funds constituting Austin Atlantic Funds as of October 31, 2017, the results of their operations, the changes in their net assets, and the financial highlights for each of the periods indicated above, in conformity with accounting principles generally accepted in the United States of America.
COHEN & COMPANY, LTD.
Cleveland, Ohio
December 22, 2017
ADDITIONAL INFORMATION
October 31, 2017 (Unaudited)
Other Federal Income Tax Information
For the year ended October 31, 2017, certain distributions paid by the Funds may be subject to a maximum tax rate of 15% as provided by the Jobs and Growth Relief Reconciliation Act of 2003. The Funds intend to designate the maximum amount allowable as taxed at a maximum rate of 15%. Complete information will be reported in conjunction with your 2016, Form 1099-DIV.
For corporate shareholders, the following percentage of the total ordinary income distributions paid during the fiscal year ended October 31, 2017, qualify for corporate dividends received deduction for the following Fund:
| Fund | Percentage |
| Large Cap Equity Fund | 100% |
For the year ended October 31, 2017, the following Fund paid qualified dividend income for purposes of reduced individual federal income tax rates of:
| Fund | Percentage |
| Large Cap Equity Fund | 100% |
Pursuant to Section 852 of the Internal Revenue Code, Large Cap Equity designates $6,421,878 as a long-term capital gain for October 31, 2017.
ADDITIONAL INFORMATION (continued)
October 31, 2017 (Unaudited)
| | Trustees and Officers of Asset Management Fund | |
| Name, Address and Age1 | Position(s) Held with Trust,
Length of Time
and Term of Office | Principal Occupation(s) During
Past 5 years, Prior Relevant Experience and
Other Directorships During the Past Five Years | Number of Portfolio
in Fund Complex
Overseen | Other
Directorships
Held |
| Independent Trustees | | | | |
David F. Holland
Age: 75 | Chairman of the Board since 2015. Trustee since 1993 and from 1988 to 1989. Indefinite Term of Office. | Chairman of the Board, Chief Executive Officer and President, BostonFed Bancorp Inc. from 1995 to 2005; Chairman of the Board from 1989 to 2005 and Chief Executive Officer from 1986 to 2005, Boston Federal Savings Bank; Consultant, TD Banknorth 2005-2007; Director, TD Banknorth – Massachusetts 2005-2007. | 5 | Preferred Community Bank Since 2013 |
| | | | | |
Carla Carstens
Age: 66 | Nominating and Governance Committee Chair. Trustee since 2015. Indefinite Term of Office. | Prior to 2009, Principal of Tatum LLC. (performance improvement consulting firm); President of Carstens Associates (strategic and operational consulting firm); and Vice President Strategic Planning of Amoco Oil Company. Advisory Board of Directors of AIT Worldwide Logistics, 2013 to 2015; Trustee and Audit Committee Chair of Lou Holland Trust mutual fund, 2005-2010. | 5 | Board member and Chairman of Strategic Planning and Diversity Initiatives of Financial Executives International Chicago, 2009-present; Board of Directors and Audit Committee Chairperson of Chicago Yacht Club Foundation, 2015 to present. |
| | | | | |
David Gruber
Age: 54 | Audit Committee Chair. Trustee since 2015. Indefinite Term of Office. | Director of Risk Advisory Services for Holbrook and Manter, CPAs from January 2016 to present; President of DJG Financial Consulting, LLC (financial consulting firm), 2007 to 2015. Board member of Fifth Third Funds, 2003-2012, Board member and Treasurer of CASA of Delaware County, 2009-2010. | 5 | Board member of Cross Shore Discovery Fund, 2014 to present. Board member of Monteagle Funds, 2015 to present. |
1 The mailing address of each Independent Trustee is 690 Taylor Road, Suite 210, Gahanna, OH 43230.
ADDITIONAL INFORMATION (continued)
October 31, 2017 (Unaudited)
| | Trustees and Officers of Asset Management Fund (continued) | |
| Name, Address and Age1 | Position(s) Held with Trust,
Length of Time
and Term of Office2 | Principal Occupation(s) During
Past 5 years, Prior Relevant Experience and
Other Directorships During the Past Five Years | Number of Portfolio in
Fund Complex Overseen |
Interested Trustees and Officers | | | |
Dana Gentile3
Age: 55 | Trustee since 2014; Indefinite Term of Office. President since 2014. | Director, Foreside Management Services, LLC (formerly Beacon Hill Fund Services, Inc.), 2013 to present. Senior Vice President, Product Management, Citi Fund Services Ohio, Inc., 2012 to 2013; Senior Vice President, Compliance Services, Citi Fund Services Ohio, Inc., 2007 to 2012. | 5 |
| | | | |
Trent Statczar
Age: 46 | Treasurer since 2009. | Fund Principal Financial Officer, Foreside Management Services, LLC (formerly Beacon Hill Fund Services, Inc.), 2008 to present; Senior Vice President of Citi Fund Services Ohio, Inc., from 2007 to 2008. | N/A |
| | | | |
Jennifer Gorham
Age: 36 | Secretary since 2016. | Director, Foreside Management Services, LLC (formerly Beacon Hill Fund Services, Inc.), 2015 to present; Paralegal, Red Capital Group, LLC, from 2011 to 2015. | N/A |
| | | | |
Eimile Moore
Age: 48 | Chief Compliance Officer since 2016. AML Officer since 2016. | Fund Chief Compliance Officer, Foreside Management Services, LLC (formerly Beacon Hill Fund Services, Inc.), 2011 to present; Vice President JP Morgan Distribution Services, Inc. 2006 to 2011. | N/A |
| | | | |
C. David Bunstine
Age: 52 | Assistant Secretary since 2016. | Director, Foreside Management Services, LLC (formerly Beacon Hill Fund Services, Inc.), since November 2013 to present; Director Citi Fund Services Ohio, Inc., from 2007 to 2013. | N/A |
| | | | |
| 1 | The mailing address of each Interested Trustee and Officer is 690 Taylor Road, Suite 210, Gahanna, OH 43230. |
| 2 | The Trust’s officers, except the Chief Compliance Officer, are elected annually by the Board of Trustees. The Trust’s Chief Compliance Officer is designated by the Board of Trustees and may only be removed by action of the Board of Trustees, including a majority of Independent Trustees. |
| 3 | The Trustee is an “interested person” of the Trust under the 1940 Act because she is the President of the Trust. She also holds certain positions with the Trust’s business manager and administrator, Foreside Management Services, LLC, (formerly Beacon Hill Fund Services, Inc.). |
ADDITIONAL INFORMATION (continued)
October 31, 2017 (Unaudited) |
| |
A. SECURITY ALLOCATION
AAAMCO ULTRA SHORT FINANCING FUND
| | | Percentage of |
| Security Allocation | | Net Assets |
| Assets: | | | | |
| Adjustable Rate Mortgage-Related Securities | | | 13.5% | |
| Repurchase Agreements | | | 86.4 | |
| Total | | | 99.9% | |
| | | | | |
ULTRA SHORT MORTGAGE FUND
| | | Percentage of |
| Security Allocation | | Net Assets |
| Assets: | | | | |
| Adjustable Rate Mortgage-Related Securities | | | 54.7% | |
| Fixed Rate Mortgage-Related Securities | | | 32.2 | |
| Investment Companies | | | 13.0 | |
| Total | | | 99.9% | |
| | | | | |
LARGE CAP EQUITY FUND
| | | Percentage of |
| Security Allocation | | Net Assets |
| Assets: | | | | |
| Common Stocks | | | 98.0% | |
| Investment Companies | | | 2.2 | |
| Total | | | 100.2% | |
| | | | | |
B. EXPENSE COMPARISON:
As a shareholder of the Funds, you incur ongoing costs, including management fees; distribution (12b-1) fees; and other Fund expenses. This example is intended to help you understand your ongoing costs (in dollars) of investing in the Funds and to compare these costs with the ongoing costs of investing in other mutual funds.
The Example is based on an investment of $1,000 invested at the beginning of the period and held for the entire period from May 1, 2016 through October 31, 2017.
ACTUAL EXPENSES
The table below provides information about actual account values and actual expenses. You may use the information below, together with the amount you invested, to estimate the expenses that you paid over the period. Simply divide your account value by$1,000 (for example,an $8,600 account value divided by $1,000 = 8.6), then multiply the result by the number in the table under the heading entitled “Expenses Paid During Period” to estimate the expenses you paid on your account during this period.
| | | Beginning | | Ending | | Expense Paid | | Expense Ratio |
| | | Account Value | | Account Value | | During Period* | | During Period** |
| | | 5/1/17 | | 10/31/17 | | 5/1/17 - 10/31/17 | | 5/1/17 - 10/31/17 |
| AAAMCO Ultrashort Financing Fund - Class I*** | | | $1,000.00 | | | | $1,005.50 | | | | $1.36 | | | | 0.34 | % |
| AAAMCO Ultrashort Financing Fund - Class Y*** | | | 1,000.00 | | | | 1,005.70 | | | | 1.13 | | | | 0.28 | % |
| Ultra Short Mortgage Fund | | | 1,000.00 | | | | 995.40 | | | | 5.33 | | | | 1.06 | % |
| Large Cap Equity Fund - Class AMF | | | 1,000.00 | | | | 1,094.50 | | | | 7.67 | | | | 1.45 | % |
| Large Cap Equity Fund - Class H | | | 1,000.00 | | | | 1,095.50 | | | | 6.89 | | | | 1.30 | % |
| * | Expenses are equal to the Funds’ annualized expenses ratio multiplied by the average account value over the period, multiplied by the number of days in the most recent half fiscal year (184) divided by the number of days in the current year (365) |
| *** | For the period from June 6, 2017, commencement of operations, to October 31, 2017. |
ADDITIONAL INFORMATION (continued)
October 31, 2017 (Unaudited) |
| |
HYPOTHETICAL EXAMPLE FOR COMPARISON PURPOSES
The table below provides information about hypothetical account values and hypothetical expenses based on each Fund’s actual expense ratio and an assumed rate of return of 5% per year before expenses, which is not the Fund’s actual return. The hypothetical account values and expenses may not be used to estimate the actual ending account balance or expenses you paid for the period. You may use this information to compare this 5%
hypothetical example with the 5% hypothetical examples that appear in the shareholder reports of other funds.
Please note that the expenses shown in the table are meant to highlight your ongoing costs only and do not reflect any transactional costs, such as sales charges (loads), redemption fees, or exchange fees. Therefore, the table is useful in comparing ongoing costs only, and will not help you determine the relative total costs of owning different funds. In addition, if these transactional costs were included, your costs would have been higher.
| | | Beginning | | Ending | | Expense Paid | | Expense Ratio |
| | | Account Value | | Account Value | | During Period* | | During Period** |
| | | 5/1/16 | | 10/31/17 | | 5/1/17 - 10/31/17 | | 5/1/17 - 10/31/17 |
| AAAMCO Ultrashort Financing Fund - Class I*** | | | $ 1,000.00 | | | | $ 1,023.49 | | | | $1.73 | | | | 0.34 | % |
| AAAMCO Ultrashort Financing Fund - Class Y*** | | | 1,000.00 | | | | 1,023.79 | | | | 1.44 | | | | 0.28 | % |
| Ultra Short Mortgage Fund | | | 1,000.00 | | | | 1,019.87 | | | | 5.39 | | | | 1.06 | % |
| Large Cap Equity Fund - Class AMF | | | 1,000.00 | | | | 1,017.88 | | | | 7.39 | | | | 1.45 | % |
| Large Cap Equity Fund - Class H | | | 1,000.00 | | | | 1,018.63 | | | | 6.64 | | | | 1.30 | % |
| * | Expenses are equal to the Funds’ annualized expenses ratio multiplied by the average account value over the period, multiplied by the number of days in the most recent half fiscal year (184) divided by the number of days in the current year (365) |
| *** | For the period June 6, 2017, commencement of operations, to October 31, 2017. |
C. BOARD OF APPROVAL OF INVESTMENT ADVISORY AGREEMENT
At a meeting held on October 26-27, 2016, the Board of Trustees (the “Board”) of Asset Management Fund (the “Trust”) approved an Investment Advisory Agreement (the “Advisory Agreement”) between the Trust, on behalf of the AAAMCO Ultrashort Financing Fund (the “Fund”), and Austin Atlantic Asset Management Company (the “Investment Adviser”) and an Investment Sub-Advisory Agreement (the “Sub-Advisory Agreement” and, together with the Advisory Agreement, the “Agreements”) between the Investment Adviser and Treesdale Partners, LLC (the “Sub-Adviser”).
In reviewing the Agreements, the Board considered its duties under the Investment Company Act of 1940, as amended (the “1940 Act”), as well as under the general principles of state law in reviewing and approving advisory contracts; the requirements of the 1940 Act in such matters; the fiduciary duty of investment advisors with respect to advisory agreements and compensation; the standards used by courts in determining whether investment company boards have fulfilled their duties; and the factors to be considered by the Board in voting on such agreements. The Board received separate reports from the Investment Adviser and the Sub-Adviser in advance of the Board meeting that, among other things, outlined the services to be provided by the Investment Adviser and the Sub-Adviser to the Fund (including the relevant personnel responsible for these services and their experience); the proposed advisory fee for the Fund as compared to fees charged by investment advisors to comparable funds; estimated expenses of the Fund as compared to expense ratios of comparable funds; the potential for economies of scale, if
any; financial data on the Investment Adviser and the Sub-Adviser; any fall out benefits to the Investment Adviser and its affiliates and to the Sub-Adviser; and the Investment Adviser’s and the Sub-Adviser’s compliance program. In considering approval of the Agreements, the Independent Trustees also met independently of management and of the interested Trustee to review and discuss materials received from the Investment Adviser, the Sub-Adviser, Foreside Financial Group (“Foreside”) and Trust counsel. In making its determination to approve the Agreements, the Board considered the factors discussed below, but did not identify any single factor or group of factors as all important or controlling and considered all factors together. Subsequent to the Board’s approval of the Agreements, but prior to the execution and effectiveness of the Agreements, both the Investment Adviser and the Sub-Adviser experienced ownership changes. Both the Investment Adviser and the Sub-Adviser informed the Board that the information provided at the October 2016 meeting remained accurate, except for the ownership changes, and that the Board could continue to rely of the information provided at the October 2016 meeting.
Nature, Quality and Extent of Services. The Board considered the nature, quality and extent of services expected to be provided by the Investment Adviser and the Sub-Adviser to the Fund under the Agreements. With respect to the Advisory Agreement, the Board noted that the Investment Adviser would be responsible for managing the Fund’s investments, which would be done through its portfolio management team and the separate Credit Committee, and discussed the investment process with a representative of the Investment Adviser. The Board reviewed the experience and skills of the Investment
ADDITIONAL INFORMATION (concluded)
October 31, 2017 (Unaudited) |
| |
Adviser’s portfolio management team and the chairman of the Investment Adviser’s Credit Committee. With respect to the Sub-Advisory Agreement, the Board noted that the Sub-Adviser would be primarily focused on developing and implementing quantitative analytics for overseeing the risk management of the Fund’s investment exposures. The Board considered the background and experience of the personnel at the Sub-Adviser that would be providing the services under the Sub-Advisory Agreement. The Board also received a presentation from a representative of the Sub-Adviser regarding the services it will provide to the Fund and were able to ask questions. Since the Fund had yet to commence investment operations, the Board could not consider the historical investment performance of the Fund. Based upon all relevant factors, the Board concluded that the nature, quality and extent of the services to be provided by the Investment Adviser and the Sub-Adviser to the Fund under the Agreements were expected to be satisfactory.
Fees and Expenses. The Board reviewed the proposed advisory fee and sub-advisory fee for the Fund. The Board considered that the sub-advisory fee would be paid by the Investment Adviser from its advisory fee. The Board reviewed information comparing the advisory fee to peers in the Morningstar Ultra-short Bond category. The Board noted the Investment Adviser’s statements about differences between the Fund and peer funds in the Morningstar category and took these differences into account in reviewing the peer information relating to the proposed advisory fee. In considering the information provided, the Board noted that the Fund’s proposed advisory fee was above the median advisory fee of the Morningstar category and at the average advisory fee of the Morningstar category. The Board also considered that the Investment Adviser had proposed to limit total operating expenses, including waiving advisory fees, if necessary, and that, with the effect of the expense limitation, the Fund’s net expense ratio (Class I shares) was expected to be lower than the median and average net expense ratio of the Morningstar category. The Board considered information provided by the Investment Adviser and Sub-Adviser regarding fees charged to other similar clients, noting that the Sub-Adviser stated that it does not have any other clients similar to the Fund. The Board noted that Investment Adviser indicated that its provides advisory services to a private fund that invests in repurchase agreements and considered statements from the Investment Adviser regarding differences between the management of the private fund and the Fund, including additional regulatory requirements associated with managing a registered investment company. On the basis of the information provided, the Board concluded that the proposed advisory and sub-advisory fees were reasonable in light of the nature, quality and extent of services expected to be provided by the Investment Adviser and the Sub-Adviser.
Profitability. With respect to the estimated profitability of the Advisory Agreement to the Investment Adviser, the Board considered estimated net income projections provided by the Investment Adviser at various Fund asset levels. The Board also considered information on estimated profitability of the
Sub-Adviser. The Board considered the proposed advisory and sub-advisory fees, that the Fund was newly organized and had no assets, and the Investment Adviser’s agreement to limit total expenses. The Board concluded that any profits to be realized by the Investment Adviser and the Sub-Adviser were not expected to be unreasonable.
Economies of Scale. The Board considered the extent to which economies of scale may be realized as the Fund grows and whether fee levels reflect these potential economies of scale. In considering whether fee levels reflect potential economies of scale for the benefit of Fund investors, the Board reviewed the Fund’s proposed advisory fee compared to peer funds and the Fund’s estimated expense ratio giving effect to the Investment Adviser’s agreement to limit total expenses, and concluded that the advisory fee was reasonable.
Other Benefits to the Investment Adviser and Sub-Adviser. The Board considered benefits expected to be derived by the Investment Adviser and its affiliate, Austin Atlantic Capital Inc., which will act as the Fund’s Distributor, as a result of the Investment Adviser’s relationship with the Fund. The Board considered that Class I shares of the Fund will make payments under the Fund’s Rule 12b-1 Plan to the Distributor. The Board noted that the Distributor will not execute portfolio transactions on behalf of the Funds and that the Investment Adviser will not use brokerage of the Fund to obtain third party research. The Board noted the Sub-Adviser’s statement that it does not expect any material fall-out benefits from its relationship with the Fund.
Conclusion. Based upon all of the information considered and the conclusions reached, the Board determined that the terms of the Agreements are fair and reasonable and that the approval of the Agreements is in the best interests of the Fund.
D. OTHER INFORMATION:
The Adviser is responsible for exercising the voting rights associated with the securities purchased and held by the Funds. A description of the policies and procedures that the Adviser uses in fulfilling this responsibility and information regarding how those proxies were voted during the twelve month period ended June 30 are available without charge by calling toll free 1-800-247-9780 or on the Securities and Exchange Commission’s website at www.sec.gov.
A complete schedule of each Fund’s portfolio holdings for the first and third fiscal quarter of each fiscal year is filed with the Securities and Exchange Commission on Form N-Q and is available on the Securities and Exchange Commission’s website at http://www.sec.gov. In addition, the schedules may be reviewed and copied at the Securities and Exchange Commission’s Public Reference Room in Washington, D.C. Information on the operation of the Public Reference Room may be obtained by calling 1-800-SEC-0330.
The Statement of Additional Information includes additional information about Trustees and is available, without charge, upon request, by calling 800-247-9780.
DISTRIBUTOR
Austin Atlantic Capital Inc.
1 Alhambra Plaza, Suite 100
Coral Gables, FL 33134
INVESTMENT ADVISER
Austin Atlantic Asset Management Company
1 Alhambra Plaza, Suite 100
Coral Gables, FL 33134
GOVERNANCE AND REGULATORY SERVICES
Foreside Management Services, LLC
690 Taylor Road, Suite 210
Gahanna, OH 43230
ADMINISTRATOR, TRANSFER AGENT, AND DIVIDEND AGENT
Northern Trust Company
50 South LaSalle Street
Chicago, Illinois 60603
LEGAL COUNSEL
Vedder Price P.C.
222 North LaSalle Street
Chicago, IL 60601
CUSTODIAN
Northern Trust Company
50 South LaSalle Street
Chicago, Illinois 60603
INDEPENDENT REGISTERED PUBLIC ACCOUNTING FIRM
Cohen & Company, Ltd.
1350 Euclid Ave., Suite 800
Cleveland, OH 44115
AMF-ANN-1017
Item 2. Code of Ethics.
(a) The registrant has adopted a code of ethics that applies to the registrant’s principal executive officer, principal financial officer, principal accounting officer or controller, or persons performing similar functions. This code of ethics is included as an Exhibit.
(b) During the period covered by the report, with respect to the registrant’s code of ethics that applies to its principal executive officer, principal financial officer, principal accounting officer or controller, or persons performing similar functions; there have been no amendments to, nor any waivers granted from, a provision that relates to any element of the code of ethics definition enumerated in paragraph (b) of this Item 2.
Item 3. Audit Committee Financial Expert.
3(a)(1) The registrant’s board of directors has determined that the registrant has at least one audit committee financial expert serving on its audit committee.
3(a)(2) The audit committee financial expert is David Gruber, who is “independent” for purposes of this Item 3 of Form N-CSR.
Item 4. Principal Accountant Fees and Services.
(a) Audit Fees. Audit fees totaled $54,500 and $28,000 in fiscal years 2017 and 2016 respectively, including fees associated with the annual audit and filings of the registrant’s Form N-1A and Form N-SAR.
(b) Audit-Related Fees. There were no audit related fees billed in fiscal years 2017 and 2016.
(c) Tax Fees. Fees for tax compliance and review services totaled $9,000 and $11,500 in fiscal years 2017 and 2016, respectively.
(d) All Other Fees. There were no other fees in fiscal years 2017 and 2016.
(e)(1) Except as permitted by rule 2-01(c)(7)(i)(C) of regulation S-X the trust’s audit committee must pre-approve all audit and non-audit services provided by the independent accountants relating to the operations or financial reporting of the funds. Prior to the commencement of any audit or non-audit services to the fund, the audit committee reviews the services to determine whether they are appropriate and permissible under applicable law.
| (g) | 2017 $9,000
2016 $11,500 |
(h) The Audit Committee considered the non-audit services rendered to the registrant’s investment adviser and believes the services are compatible with the principal accountant’s independence.
Item 5. Audit Committee of Listed Companies.
Not applicable.
Item 6. Schedule of Investments.
(a) The Schedule of Investments in securities of unaffiliated issuers is included in the report to shareholders filed under Item 1 of this Form.
(b) Not applicable.
Item 7. Disclosure of Proxy Voting Policies and Procedures for Closed-End Management Investment Companies.
Not applicable.
Item 8. Portfolio Managers of Closed-End Management Investment Companies.
Not applicable.
Item 9. Purchases of Equity Securities by Closed-End Management Investment Company and Affiliated Purchasers.
Not applicable.
Item 10. Submission of Matters to a Vote of Security Holders.
Not applicable.
Item 11. Controls and Procedures.
(a) The registrant’s principal executive officer and principal financial officer have concluded, based on their evaluation of the registrant’s disclosure controls and procedures as conducted within 90 days of the filing date of this report, that these disclosure controls and procedures are adequately designed and are operating effectively to ensure that information required to be disclosed by the registrant on this report is recorded, processed, summarized and reported within the time periods specified in the Securities and Exchange Commission’s rules and forms.
(b) There were no changes in the registrant’s internal control over financial reporting (as defined in Rule 30a-3(d) under the Investment Company Act of 1940) that occurred during the second fiscal quarter of the period covered by this report that have materially affected or are reasonably likely to materially affect, the registrant’s internal control over financial reporting.
Item 12. Disclosure of Securities Lending Activities for Closed-End Management Investment Companies.
Not applicable.
Item 13. Exhibits.
| (a)(1) | Code of Ethics for Senior Financial Officers is filed herewith |
| (a)(2) | Certifications required by Item 12(a) of Form N-CSR are attached hereto. |
| (b) | Certification required by Item 12(b) of Form N-CSR is furnished hereto. |
SIGNATURES
Pursuant to the requirements of the Securities Exchange Act of 1934 and the Investment Company Act of 1940, the registrant has duly caused this report to be signed on its behalf by the undersigned, thereunto duly authorized.
(Registrant) Asset Management Fund
By (Signature and Title)
| /s/ Trent Statczar | |
| Trent Statczar | |
| Treasurer | |
| | |
Date: January 8, 2018
Pursuant to the requirements of the Securities Exchange Act of 1934 and the Investment Company Act of 1940, this report has been signed below by the following persons on behalf of the registrant and in the capacities and on the dates indicated.
By (Signature and Title)
| /s/ Dana Gentile | |
| Dana Gentile | |
| President | |
| | |
Date: January 8, 2018
By (Signature and Title)
| /s/ Trent Statczar | |
| Trent Statczar | |
| Treasurer | |
| | |
Date: January 8, 2018