United States
Securities and Exchange Commission
Washington, D.C. 20549
FORM N-CSR
CERTIFIED SHAREHOLDER REPORT OF REGISTERED MANAGEMENT
INVESTMENT COMPANIES
Investment Company Act file number 811-03541
Asset Management Fund
(Exact name of registrant as specified in charter)
690 Taylor Road, Suite 210 Gahanna, OH 43230
(Address of principal executive offices) (Zip code)
Foreside Management Services, LLC, 690 Taylor Road, Suite 210 Gahanna, OH 43230
(Name and address of agent for service)
| Registrant’s telephone number, including area code: | (800) 247-9780 – Austin Atlantic Funds (800) 701-9502 – AAMA Funds |
Date of fiscal year end: 6/30
Date of reporting period: 6/30/18
Form N-CSR is to be used by management investment companies to file reports with the Commission not later than 10 days after the transmission to stockholders of any report that is required to be transmitted to stockholders under Rule 30e-1 under the Investment Company Act of 1940 (17 CFR 270.30e-1). The Commission may use the information provided on Form N-CSR in its regulatory, disclosure review, inspection and policymaking roles.
A registrant is required to disclose the information specified by Form N-CSR, and the Commission will make this information public. A registrant is not required to respond to the collection of information contained in Form N-CSR unless the Form displays a currently valid Office of Management and Budget (“OMB”) control number. Please direct comments concerning the accuracy of the information collection burden estimate and any suggestions for reducing the burden to Secretary, Securities and Exchange Commission, 450 Fifth Street, NW, Washington, DC 20549-0609. The OMB has reviewed this collection of information under the clearance requirements of 44 U.S.C. § 3507.
Item 1. Reports to Stockholders.

AAMA Equity Fund
Ticker: AMFEX
AAMA Income Fund
Ticker: AMFIX
Annual Report
June 30, 2018
| AAMA Funds | |
| Letter To Shareholders | June 30, 2018 |
Dear Fellow Shareholder,
Thank you for investing in the AAMA Funds. In this report you will find the audited financial statements and management reviews for the AAMA Equity Fund and the AAMA Income Fund for the year ending June 30, 2018.
During the twelve months ending June 30, 2018, the US equity markets provided low double digit returns while the US fixed income markets provided small to negative total returns. Concerns regarding the sustainability of economic growth, higher equity valuations and rising interest rates drove the equity market into a correction in February, after posting all-time closing highs in late January 2018. Since the end of February, the equity markets have begun to re-cover as reported corporate earnings have continued the rising trend which began during the fourth quarter of 2016. The portfolio management reviews for The Equity Fund and The Income Fund provide a detailed explanation of our holdings and allocations to various segments of the markets.
We encourage you to maintain a strong relationship with your financial advisor. They will assist you in maintaining a portfolio structure that proactively considers both the opportunities and the uncertainty in the markets. As always, we appreciate your investment and look forward to continuing to assist you in meeting your investment goals and objectives.
Sincerely,
 |  | |
| Robert D. Baker | Phil A. Voelker | |
| Co-Portfolio Managers |
Past performance of the Funds, markets or securities mentioned herein should not be considered to be indicative of future results. Investing involves risk, including the potential loss of principal. Allocations are subject to change.
AAMA Funds are distributed by Foreside Financial Services, LLC. Advanced Asset Management Advisors, Inc. is the investment adviser to the Funds.
This report is not authorized for distribution to prospective investors unless preceded or accompanied by a current prospectus. For additional information about the Funds, including fees, expenses, and risks, view our prospectus online at www.aamafunds.com or call 800-701-9502. Read the prospectus carefully before you invest or send money.
1
AAMA Funds
Management Discussion of Fund Performance
June 30, 2018 (Unaudited)
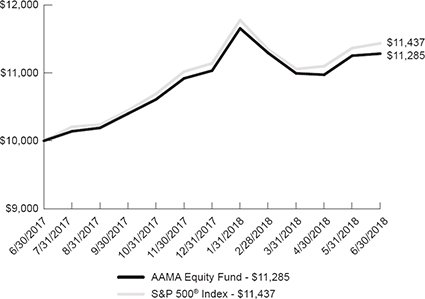
The AAMA Equity Fund (the “Equity Fund”) commenced operations on July 3, 2017. Since inception, the Equity Fund returned 12.85% which may be compared to the S&P 500 index return of 14.37%.
Over the last 12 months, the U.S. equity market was characterized by generally rising prices with increasing volatility. Volatility increased markedly in January/ February 2018. Prices rose across all market capitalization ranges. Economic sector performance was widely divergent ranging from a 28.7% gain in the Technology sector to a 3.7% loss in the Consumer Staples sector. Other notable performance results include the Consumer Discretionary and Energy sectors with returns of 23.5% and 20.9% respectively. All other sectors experienced single digit returns.
For the year, the Equity Fund maintained a cash position between 3 and 6% with the balance of the portfolio exposed to U.S. equities. Small and mid cap issues each represented between 5 and 6% of the portfolio for the entire year. Our exposure to small cap companies contributed positive relative performance while the mid cap exposure performed largely in line with the S&P 500 for the year.
Our sector allocation discipline provided mixed contributions towards the relative performance of the Equity Fund. The most significant positive contribution resulted from our over-weighted position in the technology sector. Our relative over-weighting ranged between 4 and 7% for the year, taking advantage of the S&P 500 Technology sector return of 28.7%. Detracting from performance was our positioning within the Consumer sectors. We were underweighted by 2 to 3% in the relatively strong Discretionary sector (up 23.5% for the year) and equal weighted in the underperforming Staples sector (down 3.6%). Portfolio allocations to the Industrial and Health Care sectors resulted in small negative contributions to overall results.
The small and mid-capitalization companies the Fund invest in may be more vulnerable to adverse business or economic events than larger, more established companies. Small and mid-capitalization companies may have limited product lines, markets and management groups.
The S&P 500 Index is an unmanaged index, generally representative of the U.S. Stock Market as a whole. Indexes that are unmanaged, do not reflect fees or expenses and an investor cannot invest directly in an index.
Sectors and allocations are subject to change. Past performance does not guarantee future results.
2
AAMA Funds
Management Discussion of Fund Performance
(Continued)
Comparison of the Change in Value of a $10,000 Investment in
AAMA Equity Fund versus the S&P 500® Index*
| Total Returns (for the period ended June 30, 2018) | ||
| Since Inception(c) | ||
| AAMA Equity Fund(a)(b) | 12.85% | |
| S&P 500® Index * | 14.37% |
| (a) | The Fund’s total return does not reflect the deduction of taxes a shareholder would pay on Fund distributions or the redemption of Fund shares. |
| (b) | The gross and net expense ratios as disclosed in the June 19, 2017 prospectus were 1.27% and 0.97%, respectively. The Adviser has contractually agreed to waive fees and reimburse expenses through February 28, 2019. Without fee waivers, the Fund’s returns would have been lower. |
| (c) | Inception date of the Fund is June 30, 2017. The Fund commenced operations on July 3, 2017. |
| * | The S&P 500 Index is an unmanaged index generally representative of the U.S. Stock Market as a whole. |
The Fund and S&P 500 Index returns presented include the reinvestment of dividends and interest.
The performance data quoted represents past performance and is no guarantee of future results. Investment return and principal value of an investment will fluctuate so that an investor’s shares, when redeemed, may be worth more or less than their original cost. Current performance may be lower or higher than the performance quoted. For the most recent month-end performance, please call 1-800-701-9502.
3
AAMA Equity Fund
Schedule of Portfolio Investments
June 30, 2018
| COMMON STOCKS — 40.3% | Shares | Fair Value | ||||||
| AEROSPACE & DEFENSE — 2.1% | ||||||||
| Boeing Company (The) | 13,200 | $ | 4,428,732 | |||||
| Rockwell Collins, Inc. | 4,900 | 659,932 | ||||||
| Spirit AeroSystems Holdings, Inc. - Class A | 8,900 | 764,599 | ||||||
| TransDigm Group, Inc. | 2,000 | 690,280 | ||||||
| 6,543,543 | ||||||||
| AIR FREIGHT & LOGISTICS — 0.4% | ||||||||
| FedEx Corporation | 6,000 | 1,362,360 | ||||||
| AIRLINES — 0.2% | ||||||||
| Southwest Airlines Company | 15,200 | 773,376 | ||||||
| BANKS — 6.7% | ||||||||
| Bank of America Corporation | 137,800 | 3,884,582 | ||||||
| BB&T Corporation | 36,800 | 1,856,192 | ||||||
| Commerce Bancshares, Inc. | 9,300 | 601,803 | ||||||
| JPMorgan Chase & Company | 37,400 | 3,897,080 | ||||||
| KeyCorp | 59,400 | 1,160,676 | ||||||
| PNC Financial Services Group, Inc. (The) | 8,100 | 1,094,310 | ||||||
| SunTrust Banks, Inc. | 11,000 | 726,220 | ||||||
| U.S. Bancorp | 42,900 | 2,145,858 | ||||||
| Wells Fargo & Company | 59,800 | 3,315,312 | ||||||
| Zions Bancorporation | 37,400 | 1,970,606 | ||||||
| 20,652,639 | ||||||||
| BEVERAGES — 0.6% | ||||||||
| PepsiCo, Inc. | 16,400 | 1,785,468 | ||||||
| BIOTECHNOLOGY — 2.1% | ||||||||
| Alexion Pharmaceuticals, Inc. (a) | 7,000 | 869,050 | ||||||
| Amgen, Inc. | 8,400 | 1,550,556 | ||||||
| Biogen, Inc. (a) | 6,700 | 1,944,608 | ||||||
| Celgene Corporation (a) | 11,100 | 881,562 | ||||||
| Regeneron Pharmaceuticals, Inc. (a) | 3,400 | 1,172,966 | ||||||
| 6,418,742 | ||||||||
| BUILDING PRODUCTS — 0.2% | ||||||||
| Masco Corporation | 13,200 | 493,944 | ||||||
| CAPITAL MARKETS — 0.3% | ||||||||
| Affiliated Managers Group, Inc. | 5,600 | 832,552 | ||||||
4
AAMA Equity Fund
Schedule of Portfolio Investments
(Continued)
| COMMON STOCKS — 40.3% (Continued) | Shares | Fair Value | ||||||
| CHEMICALS — 0.2% | ||||||||
| Huntsman Corporation | 25,500 | $ | 744,600 | |||||
| COMMUNICATIONS EQUIPMENT — 1.4% | ||||||||
| Cisco Systems, Inc. | 71,600 | 3,080,948 | ||||||
| F5 Networks, Inc. (a) | 4,500 | 776,025 | ||||||
| Juniper Networks, Inc. | 15,400 | 422,268 | ||||||
| 4,279,241 | ||||||||
| CONSTRUCTION & ENGINEERING — 0.5% | ||||||||
| Fluor Corporation | 18,000 | 878,040 | ||||||
| Quanta Services, Inc. (a) | 16,100 | 537,740 | ||||||
| 1,415,780 | ||||||||
| CONSUMER FINANCE — 0.8% | ||||||||
| Capital One Financial Corporation | 26,500 | 2,435,350 | ||||||
| DIVERSIFIED TELECOMMUNICATION SERVICES — 0.8% | ||||||||
| AT&T, Inc. | 34,500 | 1,107,795 | ||||||
| Verizon Communications, Inc. | 25,100 | 1,262,781 | ||||||
| 2,370,576 | ||||||||
| ELECTRICAL EQUIPMENT — 0.1% | ||||||||
| Acuity Brands, Inc. | 2,900 | 336,023 | ||||||
| ELECTRONIC EQUIPMENT, INSTRUMENTS & COMPONENTS — 0.4% | ||||||||
| Cognex Corporation | 12,800 | 571,008 | ||||||
| FLIR Systems, Inc. | 10,400 | 540,488 | ||||||
| 1,111,496 | ||||||||
| FOOD & STAPLES RETAILING — 1.5% | ||||||||
| Kroger Company (The) | 37,500 | 1,066,875 | ||||||
| Walgreen Boots Alliance, Inc. | 19,700 | 1,182,296 | ||||||
| Walmart, Inc. | 29,100 | 2,492,415 | ||||||
| 4,741,586 | ||||||||
| FOOD PRODUCTS — 1.4% | ||||||||
| Archer-Daniels-Midland Company | 31,200 | 1,429,896 | ||||||
| General Mills, Inc. | 18,300 | 809,958 | ||||||
| Ingredion, Inc. | 7,100 | 785,970 | ||||||
| Kraft Heinz Company (The) | 5,000 | 314,100 | ||||||
| McCormick & Company, Inc. | 7,300 | 847,457 | ||||||
| 4,187,381 | ||||||||
5
AAMA Equity Fund
Schedule of Portfolio Investments
(Continued)
| COMMON STOCKS — 40.3% (Continued) | Shares | Fair Value | ||||||
| HEALTH CARE EQUIPMENT & SUPPLIES — 0.7% | ||||||||
| Edwards Lifesciences Corporation (a) | 6,700 | $ | 975,319 | |||||
| Medtronic plc | 15,100 | 1,292,711 | ||||||
| 2,268,030 | ||||||||
| HEALTH CARE PROVIDERS & SERVICES — 2.6% | ||||||||
| Centene Corporation (a) | 10,800 | 1,330,668 | ||||||
| CVS Health Corporation | 15,300 | 984,555 | ||||||
| Express Scripts Holding Company (a) | 19,100 | 1,474,711 | ||||||
| Humana, Inc. | 4,700 | 1,398,861 | ||||||
| UnitedHealth Group, Inc. | 7,400 | 1,815,516 | ||||||
| Universal Health Services, Inc. - Class B | 8,100 | 902,664 | ||||||
| 7,906,975 | ||||||||
| HEALTH CARE TECHNOLOGY — 0.4% | ||||||||
| Cerner Corporation (a) | 20,800 | 1,243,632 | ||||||
| HOTELS, RESTAURANTS & LEISURE — 0.2% | ||||||||
| Norwegian Cruise Line Holdings Ltd. (a) | 13,000 | 614,250 | ||||||
| HOUSEHOLD DURABLES — 0.2% | ||||||||
| Newell Brands, Inc. | 23,000 | 593,170 | ||||||
| HOUSEHOLD PRODUCTS — 0.6% | ||||||||
| Procter & Gamble Company (The) | 21,900 | 1,709,514 | ||||||
| INDUSTRIAL CONGLOMERATES — 1.2% | ||||||||
| 3M Company | 12,100 | 2,380,312 | ||||||
| General Electric Company | 88,800 | 1,208,568 | ||||||
| 3,588,880 | ||||||||
| INTERNET SOFTWARE & SERVICES — 0.2% | ||||||||
| Akamai Technologies, Inc. (a) | 7,000 | 512,610 | ||||||
| IT SERVICES — 2.1% | ||||||||
| Cognizant Technology Solutions Corporation - Class A | 10,400 | 821,496 | ||||||
| International Business Machines Corporation | 15,100 | 2,109,470 | ||||||
| MasterCard, Inc. - Class A | 11,100 | 2,181,372 | ||||||
| Visa, Inc. - Class A | 9,400 | 1,245,030 | ||||||
| 6,357,368 | ||||||||
6
AAMA Equity Fund
Schedule of Portfolio Investments
(Continued)
| COMMON STOCKS — 40.3% (Continued) | Shares | Fair Value | ||||||
| LIFE SCIENCES TOOLS & SERVICES — 0.2% | ||||||||
| Bio-Rad Laboratories, Inc. - Class A (a) | 2,300 | $ | 663,642 | |||||
| MACHINERY — 0.4% | ||||||||
| Cummins, Inc. | 4,900 | 651,700 | ||||||
| ITT, Inc. | 12,900 | 674,283 | ||||||
| 1,325,983 | ||||||||
| OIL, GAS & CONSUMABLE FUELS — 1.4% | ||||||||
| Cimarex Energy Company | 6,100 | 620,614 | ||||||
| Diamondback Energy, Inc. | 4,600 | 605,222 | ||||||
| EOG Resources, Inc. | 6,300 | 783,909 | ||||||
| Occidental Petroleum Corporation | 18,700 | 1,564,816 | ||||||
| Pioneer Natural Resources Company | 4,400 | 832,656 | ||||||
| 4,407,217 | ||||||||
| PHARMACEUTICALS — 1.9% | ||||||||
| Bristol-Myers Squibb Company | 29,200 | 1,615,928 | ||||||
| Johnson & Johnson | 16,000 | 1,941,440 | ||||||
| Pfizer, Inc. | 61,500 | 2,231,220 | ||||||
| 5,788,588 | ||||||||
| ROAD & RAIL — 1.3% | ||||||||
| Norfolk Southern Corporation | 7,200 | 1,086,264 | ||||||
| Union Pacific Corporation | 19,800 | 2,805,264 | ||||||
| 3,891,528 | ||||||||
| SEMICONDUCTORS & SEMICONDUCTOR EQUIPMENT — 3.0% | ||||||||
| Applied Materials, Inc. | 42,800 | 1,976,932 | ||||||
| Intel Corporation | 64,300 | 3,196,353 | ||||||
| QUALCOMM, Inc. | 20,100 | 1,128,012 | ||||||
| Skyworks Solutions, Inc. | 9,000 | 869,850 | ||||||
| Texas Instruments, Inc. | 19,700 | 2,171,925 | ||||||
| 9,343,072 | ||||||||
| SOFTWARE — 2.6% | ||||||||
| Adobe Systems, Inc. (a) | 10,000 | 2,438,100 | ||||||
| Microsoft Corporation | 32,500 | 3,204,825 | ||||||
| Red Hat, Inc. (a) | 7,000 | 940,590 | ||||||
| VMware, Inc. - Class A (a) | 10,400 | 1,528,488 | ||||||
| 8,112,003 | ||||||||
7
AAMA Equity Fund
Schedule of Portfolio Investments
(Continued)
| COMMON STOCKS — 40.3% (Continued) | Shares | Fair Value | ||||||
| SPECIALTY RETAIL — 0.8% | ||||||||
| Advance Auto Parts, Inc. | 7,000 | $ | 949,900 | |||||
| Home Depot, Inc. (The) | 4,000 | 780,400 | ||||||
| Lowe’s Companies, Inc. | 9,000 | 860,130 | ||||||
| 2,590,430 | ||||||||
| TOBACCO — 0.1% | ||||||||
| Philip Morris International, Inc. | 5,100 | 411,774 | ||||||
| TRADING COMPANIES & DISTRIBUTORS — 0.5% | ||||||||
| Fastenal Company | 15,000 | 721,950 | ||||||
| W.W. Grainger, Inc. | 2,900 | 894,360 | ||||||
| 1,616,310 | ||||||||
| WIRELESS TELECOMMUNICATION SERVICES — 0.2% | ||||||||
| T-Mobile US, Inc. (a) | 12,300 | 734,925 | ||||||
| TOTAL COMMON STOCKS (Cost $114,086,358) | $ | 124,164,558 | ||||||
| EXCHANGE-TRADED FUNDS — 53.9% | Shares | Fair Value | ||||||
| Invesco QQQ Trust Series 1 | 109,600 | $ | 18,812,840 | |||||
| iShares Core S&P 500 ETF | 101,200 | 27,632,660 | ||||||
| iShares Core S&P U.S. Growth ETF | 239,600 | 13,705,120 | ||||||
| Schwab U.S. Large-Cap ETF | 401,700 | 26,106,483 | ||||||
| Vanguard Growth ETF | 112,500 | 16,853,625 | ||||||
| Vanguard Mid-Cap ETF | 49,000 | 7,724,360 | ||||||
| Vanguard Mid-Cap Growth ETF | 63,500 | 8,535,035 | ||||||
| Vanguard S&P 500 ETF | 115,600 | 28,843,356 | ||||||
| Vanguard Small-Cap ETF | 52,100 | 8,110,407 | ||||||
| Vanguard Small-Cap Growth ETF | 55,000 | 9,669,000 | ||||||
| TOTAL EXCHANGE-TRADED FUNDS (Cost $143,927,158) | $ | 165,992,886 | ||||||
8
AAMA Equity Fund
Schedule of Portfolio Investments
(Continued)
| U.S. TREASURY OBLIGATIONS — 3.6% | Coupon | Maturity | Principal Amount | Fair Value | ||||||||||||
| U.S. Treasury Bills — 3.6 %(b) | ||||||||||||||||
| U.S. Treasury Bills (Cost $10,990,540) | 1.732 | % | 07/19/18 | $ | 11,000,000 | $ | 10,991,046 | |||||||||
| MONEY MARKET FUNDS — 2.2% | Shares | Fair Value | ||||||
| Morgan Stanley Institutional Liquidity Funds - Treasury Securities Portfolio - Advisory Class, 1.46% (c) (Cost $6,721,649) | 6,721,649 | $ | 6,721,649 | |||||
| TOTAL INVESTMENTS (Cost $275,725,705) — 100.0% | $ | 307,870,139 | ||||||
| OTHER ASSETS IN EXCESS OF LIABILITIES — 0.0% (d) | 157,656 | |||||||
| NET ASSETS — 100.0% | $ | 308,027,795 | ||||||
| (a) | Non-income producing security. |
| (b) | Rate shown is the annualized yield at time of purchase, not a coupon rate. |
| (c) | The rate shown is the 7-day effective yield as of June 30, 2018. |
| (d) | Percentage rounds to less than 0.1% |
plc - Public Liability Company
See accompanying notes to financial statements.
| Security Allocation (Percentage of Net Assets) | |||
| Common Stocks | 40.3% | ||
| Exchange-Traded Funds (holding Common Stocks) | 53.9% | ||
| U.S. Treasury Obligations | 3.6% | ||
| Cash Equivalents* | 2.2% | ||
| Total | 100.0% | ||
| * | Includes Other Assets in Excess of Liabilities. |
9
AAMA Funds
Management Discussion of Fund Performance
June 30, 2018 (Unaudited)
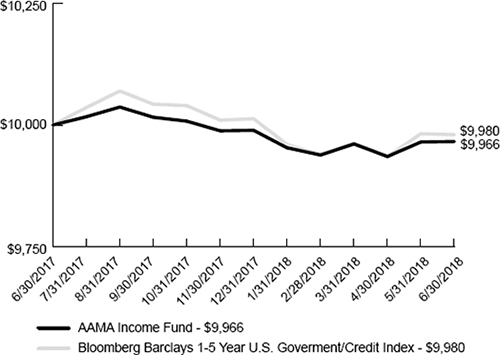
The AAMA Income Fund (the “Income Fund”) commenced operations on July 3, 2017. Since inception, the Income Fund returned -0.34% which may be compared to the Bloomberg Barclays 1-5 Year U.S. Government/Credit Index return of -0.20%.
Over the last 12 months, credit markets were driven by rising short term interest rates in the United States while Japan and the European central banks maintained low or negative interest rate policies. Credit spreads remained relatively low while selective emerging countries experienced falling currency values and dramatically higher interest rates.
For the entire year, the Income Fund maintained a conservative position with approximately 95% of the portfolio dedicated to a laddered portfolio of U.S. Government and Agency debt with an average maturity of approximately 1.5 years. From mid-July, 2017 thru late April, 2018 the Income Fund held positions in short-term, high yield debt and variable rate preferred stocks. These positions comprised a total of approximately 5% of the portfolio assets and were not a significant contributor to relative performance. These positions were eliminated in late April as credit spreads narrowed. Based on our risk management discipline, the additional yield available in low quality credit issues no longer justified the risk of exposure to this sector of the credit market.
A short maturity schedule was maintained as we expected a general rise in interest rates across the entire yield curve. Over the last 12 months, 2 year Treasury yields rose 1.14% (from 1.38% to 2.52%) while 10 year yields rose only 0.54% (from 2.31% to 2.85%). Even though short term rates increased more than long term rates, the marked to market losses over the last year favored shorter maturity holdings. A generic 2 year Treasury Bond would have experienced a principal loss of 1.12% versus a 4.26% loss to the holder of a generic 10 year Treasury Bond over the last 12 months. Both bonds would return 100% of principal at maturity; however, our risk management discipline favored the shorter-term issues for two reasons. First, the volatility of the principal value is less. And second, the return of principal at face value occurs sooner, affording the opportunity to re-invest the maturing value at prevailing interest rates.
When the Fund invests in fixed income securities including corporate bonds, the value of the Fund will fluctuate with changes in interest rates. When interest rates rise, fixed income securities (i.e. debt obligations) generally will decline in value.
Sectors and allocations are subject to change. Past performance does not guarantee future results.
10
AAMA Funds
Management Discussion of Fund Performance
(Continued)
Comparison of the Change in Value of a $10,000 Investment in AAMA Income Fund versus the Bloomberg Barclays 1-5 Year U.S. Government/Credit Index*
| Total Returns | ||
| (for the period ended June 30, 2018) | ||
| Since Inception(c) | ||
| AAMA Income Fund(a)(b) | - 0.34% | |
| Bloomberg Barclays 1-5 Year U.S. Government/Credit Index * | - 0.20% | |
| (a) | The Fund’s total return does not reflect the deduction of taxes a shareholder would pay on Fund distributions or the redemption of Fund shares. |
| (b) | The gross and net expense ratios as disclosed in the June 19, 2017 prospectus were 1.03% and 0.71%, respectively. The Adviser has contractually agreed to waive fees and reimburse expenses through February 28, 2019. Without fee waivers, the Fund returns would have been lower. |
| (c) | Inception date of the Fund is June 30, 2017. The Fund commenced operations on July 3, 2017. |
| * | The Bloomberg Barclays 1-5 Year U.S. Government/Credit Index is a broad-based benchmark that measures the non-securitized component of the Barclays U.S. Aggregate Index. It includes investment grade, U.S. dollar-denominated, fixed-rate Treasuries, government-related and corporate securities that have a remaining maturity of greater than or equal to one year and less than five years. Indexes that are unmanaged, do not reflect fees or expenses and an investor cannot invest directly in an index. |
The Fund and Barclays 1-5 Year U.S. Government/Credit Index returns presented include the reinvestment of dividends and interest.
The performance data quoted represents past performance and is no guarantee of future results. Investment return and principal value of an investment will fluctuate so that an investor’s shares, when redeemed, may be worth more or less than their original cost. Current performance may be lower or higher than the performance quoted. For the most recent month-end performance, please call 1-800-701-9502.
11
AAMA Income Fund
Schedule of Portfolio Investments
June 30, 2018
| U.S. GOVERNMENT AGENCIES — 2.1% | Coupon | Maturity | Principal Amount | Fair Value | ||||||||||||
| Federal Home Loan Mortgage Corporation — 2.1% | ||||||||||||||||
| Federal Home Loan Mortgage Corporation (Cost $2,996,933) | 2.500 | % | 04/23/20 | $ | 3,000,000 | $ | 2,994,759 | |||||||||
| U.S. TREASURY OBLIGATIONS — 89.2% | Coupon | Maturity | Principal Amount | Fair Value | ||||||||||||
| U.S. Treasury Bonds — 1.4% | ||||||||||||||||
| U.S. Treasury Bonds | 1.500 | % | 05/15/20 | $ | 2,000,000 | $ | 1,962,656 | |||||||||
| U.S. Treasury Notes — 87.8% | ||||||||||||||||
| U.S. Treasury Notes | 0.875 | % | 07/15/18 | 2,000,000 | 1,999,338 | |||||||||||
| U.S. Treasury Notes | 1.500 | % | 08/31/18 | 12,000,000 | 11,991,840 | |||||||||||
| U.S. Treasury Notes | 1.375 | % | 11/30/18 | 3,500,000 | 3,489,609 | |||||||||||
| U.S. Treasury Notes | 1.500 | % | 01/31/19 | 12,000,000 | 11,950,313 | |||||||||||
| U.S. Treasury Notes | 1.500 | % | 05/31/19 | 6,500,000 | 6,450,235 | |||||||||||
| U.S. Treasury Notes | 1.625 | % | 08/31/19 | 10,000,000 | 9,909,375 | |||||||||||
| U.S. Treasury Notes | 3.375 | % | 11/15/19 | 7,000,000 | 7,083,945 | |||||||||||
| U.S. Treasury Notes | 1.375 | % | 01/15/20 | 12,000,000 | 11,797,500 | |||||||||||
| U.S. Treasury Notes | 1.625 | % | 07/31/20 | 10,000,000 | 9,811,719 | |||||||||||
| U.S. Treasury Notes | 1.375 | % | 09/15/20 | 3,000,000 | 2,923,945 | |||||||||||
| U.S. Treasury Notes | 3.625 | % | 02/15/21 | 7,000,000 | 7,178,281 | |||||||||||
| U.S. Treasury Notes | 2.250 | % | 04/30/21 | 10,000,000 | 9,900,000 | |||||||||||
| U.S. Treasury Notes | 2.000 | % | 08/31/21 | 10,000,000 | 9,804,297 | |||||||||||
| U.S. Treasury Notes | 1.875 | % | 01/31/22 | 5,000,000 | 4,862,891 | |||||||||||
| U.S. Treasury Notes | 1.875 | % | 05/31/22 | 5,000,000 | 4,848,047 | |||||||||||
| U.S. Treasury Notes | 1.875 | % | 07/31/22 | 2,000,000 | 1,935,703 | |||||||||||
| U.S. Treasury Notes | 2.000 | % | 11/30/22 | 10,000,000 | 9,703,906 | |||||||||||
| 125,640,944 | ||||||||||||||||
| Total U.S. Treasury Obligations (Cost $129,169,907) | $ | 127,603,600 | ||||||||||||||
12
AAMA Income Fund
Schedule of Portfolio Investments
(Continued)
| MONEY MARKET FUNDS — 8.3% | Shares | Fair Value | ||||||
| Morgan Stanley Institutional Liquidity Funds - Treasury Securities Portfolio - Advisory Class, 1.46% (a) (Cost $11,903,441) | 11,903,441 | $ | 11,903,441 | |||||
| TOTAL INVESTMENTS (Cost $144,070,281) — 99.6% | $ | 142,501,800 | ||||||
| OTHER ASSETS IN EXCESS OF LIABILITIES — 0.4% | 548,498 | |||||||
| NET ASSETS — 100.0% | $ | 143,050,298 | ||||||
| (a) | The rate shown is the 7-day effective yield as of June 30, 2018. |
See accompanying notes to financial statements.
| Security Allocation (Percentage of Net Assets) | ||||
| U.S. Government Agencies | 2.1% | |||
| U.S. Treasury Obligations | 89.2% | |||
| Cash Equivalents* | 8.7% | |||
| Total | 100.0% | |||
| * | Includes Other Assets in Excess of Liabilities. |
13
AAMA Funds
Statements of Assets and Liabilities
June 30, 2018
| AAMA Equity Fund | AAMA Income Fund | |||||||
| ASSETS | ||||||||
| Investments in securities: | ||||||||
| At cost | $ | 275,725,705 | $ | 144,070,281 | ||||
| At value | $ | 307,870,139 | $ | 142,501,800 | ||||
| Cash | 120,229 | — | ||||||
| Receivable for capital shares sold | 32,696 | 22,693 | ||||||
| Dividends and interest receivable | 413,858 | 701,599 | ||||||
| TOTAL ASSETS | 308,436,922 | 143,226,092 | ||||||
| LIABILITIES | ||||||||
| Payable for capital shares redeemed | 177,837 | 102,636 | ||||||
| Payable to Adviser | 187,048 | 53,137 | ||||||
| Payable to administrator | 44,242 | 20,021 | ||||||
| TOTAL LIABILITIES | 409,127 | 175,794 | ||||||
| NET ASSETS | $ | 308,027,795 | $ | 143,050,298 | ||||
| Net assets consist of: | ||||||||
| Paid-in capital | $ | 275,027,308 | $ | 144,871,703 | ||||
| Accumulated net investment income | 1,020,580 | 4,313 | ||||||
| Accumulated net realized losses from investment transactions | (164,527 | ) | (257,237 | ) | ||||
| Net unrealized appreciation (depreciation) on investments | 32,144,434 | (1,568,481 | ) | |||||
| Net assets | $ | 308,027,795 | $ | 143,050,298 | ||||
| Shares of beneficial interest outstanding (unlimited number of shares authorized, $0.01 par value) | 27,399,581 | 5,799,943 | ||||||
| Net asset value, offering price and redemption price per share | $ | 11.24 | $ | 24.66 | ||||
See accompanying notes to financial statements.
14
AAMA Funds
Statements of Operations
Year Ended June 30, 2018 (a)
| AAMA Equity Fund | AAMA Income Fund | |||||||
| INVESTMENT INCOME | ||||||||
| Dividends | $ | 4,493,427 | $ | 261,598 | ||||
| Interest | 168,933 | 1,976,841 | ||||||
| TOTAL INVESTMENT INCOME | 4,662,360 | 2,238,439 | ||||||
| EXPENSES | ||||||||
| Investment advisory fees | 2,775,385 | 994,719 | ||||||
| Administration fees | 536,632 | 257,391 | ||||||
| TOTAL EXPENSES | 3,312,017 | 1,252,110 | ||||||
| Less fee reductions by the Adviser | (804,697 | ) | (411,771 | ) | ||||
| Less fee waivers by the administrator | (9,471 | ) | (4,774 | ) | ||||
| NET EXPENSES | 2,497,849 | 835,565 | ||||||
| NET INVESTMENT INCOME | 2,164,511 | 1,402,874 | ||||||
| REALIZED AND UNREALIZED GAINS (LOSSES) ON INVESTMENTS | ||||||||
| Net realized losses on investment transactions | (164,527 | ) | (257,237 | ) | ||||
| Net change in unrealized appreciation (depreciation) on investments | 32,144,434 | (1,568,481 | ) | |||||
| NET REALIZED AND UNREALIZED GAINS (LOSSES) ON INVESTMENTS | 31,979,907 | (1,825,718 | ) | |||||
| NET INCREASE (DECREASE) IN NET ASSETS FROM OPERATIONS | $ | 34,144,418 | $ | (422,844 | ) | |||
| (a) | Inception date of each Fund is June 30, 2017. The Funds commenced operations on July 3, 2017. |
See accompanying notes to financial statements.
15
AAMA Equity Fund
Statement of Changes in Net Assets
| Year Ended June 30, 2018 (a) | ||||
| FROM OPERATIONS | ||||
| Net investment income | $ | 2,164,511 | ||
| Net realized losses on investment transactions | (164,527 | ) | ||
| Net change in unrealized appreciation (depreciation) on investments | 32,144,434 | |||
| Net increase in net assets from operations | 34,144,418 | |||
| DISTRIBUTIONS TO SHAREHOLDERS | ||||
| From net investment income | (1,143,931 | ) | ||
| FROM CAPITAL SHARE TRANSACTIONS | ||||
| Proceeds from shares sold | 337,121,845 | |||
| Net asset value of shares issued in reinvestment of distributions to shareholders | 1,143,931 | |||
| Payments for shares redeemed | (63,238,468 | ) | ||
| Net increase in net assets from capital share transactions | 275,027,308 | |||
| TOTAL INCREASE IN NET ASSETS | 308,027,795 | |||
| NET ASSETS | ||||
| Beginning of year | — | |||
| End of year | $ | 308,027,795 | ||
| ACCUMULATED NET INVESTMENT INCOME | $ | 1,020,580 | ||
| CAPITAL SHARE ACTIVITY | ||||
| Shares sold | 33,090,449 | |||
| Shares reinvested | 103,523 | |||
| Shares redeemed | (5,794,391 | ) | ||
| Net increase in shares outstanding | 27,399,581 | |||
| Shares outstanding, beginning of year | — | |||
| Shares outstanding, end of year | 27,399,581 | |||
| (a) | Inception date of the Fund is June 30, 2017. The Fund commenced operations on July 3, 2017. |
See accompanying notes to financial statements.
16
AAMA Income Fund
Statement of Changes in Net Assets
| Year Ended June 30, 2018 (a) | ||||
| FROM OPERATIONS | ||||
| Net investment income | $ | 1,402,874 | ||
| Net realized losses on investment transactions | (257,237 | ) | ||
| Net change in unrealized appreciation (depreciation) on investments | (1,568,481 | ) | ||
| Net decrease in net assets from operations | (422,844 | ) | ||
| DISTRIBUTIONS TO SHAREHOLDERS | ||||
| From net investment income | (1,398,561 | ) | ||
| FROM CAPITAL SHARE TRANSACTIONS | ||||
| Proceeds from shares sold | 174,182,651 | |||
| Net asset value of shares issued in reinvestment of distributions to shareholders | 1,398,303 | |||
| Payments for shares redeemed | (30,709,251 | ) | ||
| Net increase in net assets from capital share transactions | 144,871,703 | |||
| TOTAL INCREASE IN NET ASSETS | 143,050,298 | |||
| NET ASSETS | ||||
| Beginning of year | — | |||
| End of year | $ | 143,050,298 | ||
| ACCUMULATED NET INVESTMENT INCOME | $ | 4,313 | ||
| CAPITAL SHARE ACTIVITY | ||||
| Shares sold | 6,979,639 | |||
| Shares reinvested | 56,376 | |||
| Shares redeemed | (1,236,072 | ) | ||
| Net increase in shares outstanding | 5,799,943 | |||
| Shares outstanding, beginning of year | — | |||
| Shares outstanding, end of year | 5,799,943 | |||
| (a) | Inception date of the Fund is June 30, 2017. The Fund commenced operations on July 3, 2017. |
See accompanying notes to financial statements.
17
AAMA Equity Fund
Financial Highlights
Per Share Data for a Share Outstanding Throughout the Year
| Year Ended June 30, 2018 (a) | ||||
| Net asset value at beginning of year | $ | 10.00 | ||
| Income from investment operations: | ||||
| Net investment income | 0.08 | |||
| Net realized and unrealized gains on investments | 1.20 | |||
| Total from investment operations | 1.28 | |||
| Less distributions from: | ||||
| Net investment income | (0.04 | ) | ||
| Net asset value at end of year | $ | 11.24 | ||
| Total return (b) | 12.85 | %(c) | ||
| Net assets at end of year (000’s) | $ | 308,028 | ||
| Ratio of total expenses to average net assets (d) | 1.19 | %(e) | ||
| Ratio of net expenses to average net assets (d)(f) | 0.90 | %(e) | ||
| Ratio of net investment income to average net assets (f)(g) | 0.78 | %(e) | ||
| Portfolio turnover rate | 5 | %(c) | ||
| (a) | Inception date of the Fund is June 30, 2017. The Fund commenced operations on July 3, 2017. |
| (b) | Total return is a measure of the change in value of an investment in the Fund over the period covered, which assumes any dividends or realized capital gains distributions are reinvested in shares of the Fund. The return shown does not reflect the deduction of taxes a shareholder would pay on Fund distributions or the redemption of Fund shares. The total return would be lower if the Adviser and administrator had not reduced fees. |
| (c) | Not annualized. |
| (d) | The ratios of expenses to average net assets do not reflect the Fund’s proportionate share of expenses of the underlying investment companies in which the Fund invests. |
| (e) | Annualized. |
| (f) | Ratio was determined after fee reductions. |
| (g) | Recognition of net investment income by the Fund is affected by the timing of the declaration of dividends and distributions by the underlying investment companies in which the Fund invests. |
See accompanying notes to financial statements.
18
AAMA Income Fund
Financial Highlights
Per Share Data for a Share Outstanding Throughout the Year
| Year Ended June 30, 2018 (a) | ||||
| Net asset value at beginning of year | $ | 25.00 | ||
| Income (loss) from investment operations: | ||||
| Net investment income | 0.26 | |||
| Net realized and unrealized losses on investments | (0.35 | ) | ||
| Total from investment operations | (0.09 | ) | ||
| Less distributions from: | ||||
| Net investment income | (0.25 | ) | ||
| Net asset value at end of year | $ | 24.66 | ||
| Total return (b) | (0.34 | %)(c) | ||
| Net assets at end of year (000’s) | $ | 143,050 | ||
| Ratio of total expenses to average net assets | 0.94 | %(d) | ||
| Ratio of net expenses to average net assets (e) | 0.63 | %(d) | ||
| Ratio of net investment income to average net assets (e) | 1.05 | %(d) | ||
| Portfolio turnover rate | 6 | %(c) | ||
| (a) | Inception date of the Fund is June 30, 2017. The Fund commenced operations on July 3, 2017. |
| (b) | Total return is a measure of the change in value of an investment in the Fund over the period covered, which assumes any dividends or realized capital gains distributions are reinvested in shares of the Fund. The return shown does not reflect the deduction of taxes a shareholder would pay on Fund distributions or the redemption of Fund shares. The total return would be lower if the Adviser and administrator had not reduced fees. |
| (c) | Not annualized. |
| (d) | Annualized. |
| (e) | Ratio was determined after fee reductions. |
See accompanying notes to financial statements.
19
AAMA Funds
Notes to Financial Statements
June 30, 2018
1. Organization
AAMA Equity Fund and AAMA Income Fund (individually, a “Fund,” and, collectively, the “Funds” or “AAMA Funds”) are each a separate series of Asset Management Fund (the “Trust”), a professionally managed, diversified, open-end investment company registered under the Investment Company Act of 1940, as amended (the “1940 Act”). The Trust is organized as a Delaware statutory trust operating under a First Amended and Restated Declaration of Trust dated September 22, 2006. Other series of the Trust are not included in this report. The inception date of the Funds was June 30, 2017. The Funds commenced operations on July 3, 2018, when they began to execute their investment objectives, which included purchasing investments.
AAMA Equity Fund’s investment objective is long-term capital appreciation.
AAMA Income Fund’s investment objective is current income with a secondary objective of preservation of capital.
2. Significant Accounting Policies
Each Fund follows accounting and reporting guidance under Financial Accounting Standards Board (“FASB”) Accounting Standards Codification Topic 946, “Financial Services – Investment Companies.” The following is a summary of the Funds’ significant accounting policies used in the preparation of their financial statements. These policies are in conformity with accounting principles generally accepted in the United States of America (“GAAP”).
Securities valuation — The Funds record their investments at fair value. Fair value is defined as the price that would be received to sell an asset or paid to transfer a liability in an orderly transaction between market participants at the measurement date. The valuation techniques used by the Funds maximize the use of observable inputs and minimize the use of unobservable inputs in determining fair value. These inputs are summarized in the three broad levels listed below:
| ● | Level 1 — quoted prices in active markets for identical securities |
| ● | Level 2 — other significant observable inputs (including quoted prices for similar securities, interest rates, prepayment speeds, credit risk, etc.) |
| ● | Level 3 — significant unobservable inputs (including the Funds’ own assumptions in determining the fair value of investments) |
Portfolio securities are valued as of the close of regular trading on the New York Stock Exchange (“NYSE”) (normally, 4:00p.m., Eastern time) on each day the NYSE is open. Listed securities, including common stocks and exchange-traded funds, for which market quotations are readily available are valued at the closing prices on the primary exchange where the securities are normally traded. Securities which are quoted by NASDAQ are valued at the NASDAQ Official Closing Price. Investments in other investment companies, including money market funds, are valued at their reported net asset value (“NAV”). In each of these situations, valuations are typically categorized as Level 1 in the fair value hierarchy.
20
AAMA Funds
Notes to Financial Statements (Continued)
Debt securities are typically valued on the basis of valuations provided by dealers or by an independent pricing service approved by the Board of Trustees (the “Board”) that determines valuations based upon market transactions for normal, institutional-size trading units of similar securities. Short-term debt investments of sufficient credit quality maturing in less than 61 days may be valued at amortized cost if it is determined that amortized cost approximates fair value. In each of these situations, valuations are typically categorized as Level 2 in the fair value hierarchy.
Securities for which market quotations are not readily available (e.g., an approved pricing service does not provide a price, a price has become stale, or an event occurs that materially affects the furnished price) are valued by the Pricing Committee. In these cases, the Pricing Committee determines in good faith, subject to procedures adopted by the Board for the Funds, the fair value of such securities (“good faith fair valuation”). When a good faith fair valuation of a security is required, consideration is generally given to a number of factors, including, but not limited to the following: type of security, nature and duration of any restrictions on disposition of the security, forces that influence the market in which the security is purchased or sold, existence of merger proposals or tender offers, expectation of additional news about the company and volume and depth of public trading in similar securities of the issuer or similar companies. Depending on the source and relative significance of the valuation inputs in these instances, the valuations for these securities will be classified as Level 2 or Level 3 in the fair value hierarchy.
The inputs or methodology used for valuing securities are not necessarily an indication of the risks associated with investing in those securities. The inputs used to measure the fair value may fall into different levels of the fair value hierarchy. In such cases, for disclosure purposes, the level in the fair value hierarchy within which the fair value measurement falls in its entirety is determined based on the lowest level input that is significant to the fair value measurement.
21
AAMA Funds
Notes to Financial Statements (Continued)
The following is a summary of the inputs used to value each Fund’s investments as of June 30, 2018, by security type:
| AAMA Equity Fund | Level 1 | Level 2 | Level 3 | Total | ||||||||||||
| Common Stocks | $ | 124,164,558 | $ | — | $ | — | $ | 124,164,558 | ||||||||
| Exchange-Traded Funds | 165,992,886 | — | — | 165,992,886 | ||||||||||||
| U.S. Treasury Obligations | — | 10,991,046 | — | 10,991,046 | ||||||||||||
| Money Market Funds | 6,721,649 | — | — | 6,721,649 | ||||||||||||
| Total | $ | 296,879,093 | $ | 10,991,046 | $ | — | $ | 307,870,139 | ||||||||
| AAMA Income Fund | Level 1 | Level 2 | Level 3 | Total | ||||||||||||
| U.S. Government Agencies | $ | — | $ | 2,994,759 | $ | — | $ | 2,994,759 | ||||||||
| U.S. Treasury Obligations | — | 127,603,600 | — | 127,603,600 | ||||||||||||
| Money Market Funds | 11,903,441 | — | — | 11,903,441 | ||||||||||||
| Total | $ | 11,903,441 | $ | 130,598,359 | — | $ | 142,501,800 | |||||||||
Refer to each Fund’s Schedule of Portfolio Investments for a listing of the securities by security type and industry type. As of June 30, 2018, the Funds did not have any transfers into or out of any Level. There were no Level 3 securities or derivative instruments held by the Funds as of June 30, 2018. It is the Funds’ policy to recognize transfers into or out of any Level at the end of the reporting period.
Share valuation — The NAV per share of each Fund is calculated daily by dividing the total value of its assets, less liabilities, by the number of shares outstanding. The offering price and redemption price per share of each Fund is equal to the NAV per share.
Investment income — Interest income is accrued as earned. Dividend income is recorded on the ex-dividend date. Discounts and premiums on fixed income securities are amortized using the interest method. Withholding taxes on foreign dividends, if any, have been recorded in accordance with the Trust’s understanding of the applicable country’s rules and tax rates.
Distributions to shareholders — Dividends arising from net investment income, if any, are declared and paid annually to shareholders of the AAMA Equity Fund. Dividends arising from net investment income are declared and paid monthly to shareholders of the AAMA Income Fund. Net realized capital gains, if any, are distributed at least once each year. The amount of distributions from net investment income and net realized capital gains are determined in accordance with federal income tax regulations, which may differ from GAAP. These “book/tax” differences are permanent in nature and are primarily due to differing treatments of net short-term capital gains. Dividends and distributions are recorded on the ex-dividend date.
22
AAMA Funds
Notes to Financial Statements (Continued)
The tax character of distributions paid by each Fund during the year ended June 30, 2018 was ordinary income in the amounts of $1,143,931 paid to the shareholders of AAMA Equity Fund and $1,398,561 paid to the shareholders of AAMA Income Fund.
Investment transactions — Investment transactions are accounted for on trade date. Realized gains and losses on investments sold are determined on a specific identification basis.
Estimates — The preparation of financial statements in conformity with GAAP requires management to make estimates and assumptions that affect the reported amounts of assets and liabilities and the disclosure of contingent assets and liabilities as of the date of the financial statements and the reported amounts of income and expenses during the reporting period. Actual results could differ from those estimates.
Federal income tax — Each Fund has qualified and intends to continue to qualify as a regulated investment company under the Internal Revenue Code of 1986, as amended (the “Code”). Qualification generally will relieve the Funds of liability for federal income taxes to the extent 100% of their net investment income and net realized capital gains are distributed in accordance with the Code.
In order to avoid imposition of the excise tax applicable to regulated investment companies, it is also each Fund’s intention to declare as dividends in each calendar year at least 98% of its net investment income (earned during the calendar year) and 98.2% of its net realized capital gains (earned during the twelve months ended October 31) plus undistributed amounts from prior years.
The tax character of distributable earnings (deficit) as of June 30, 2018, was as follows:
| AAMA Equity Fund | AAMA Income Fund | |||||||
| Tax cost of portfolio investments | $ | 275,725,705 | $ | 144,070,281 | ||||
| Gross unrealized appreciation | $ | 37,538,918 | $ | 642 | ||||
| Gross unrealized depreciation | (5,394,484 | ) | (1,569,123 | ) | ||||
| Net unrealized appreciation (depreciation) | 32,144,434 | (1,568,481 | ) | |||||
| Undistributed ordinary income | 1,020,580 | 4,313 | ||||||
| Accumulated capital and other losses | (164,527 | ) | (257,237 | ) | ||||
| Accumulated earnings (deficit) | $ | 33,000,487 | $ | (1,821,405 | ) | |||
23
AAMA Funds
Notes to Financial Statements (Continued)
As of June 30, 2018, AAMA Equity Fund and AAMA Income Fund had short-term capital loss carryforwards of $164,527 and $257,237, respectively, for income tax purposes. These capital loss carryforwards, which do not expire, may be utilized in future years to offset net realized capital gains, if any, prior to distributing such gains to shareholders.
The Funds recognize the tax benefits or expenses of uncertain tax positions only when the position is “more likely than not” to be sustained assuming examination by tax authorities. Management has reviewed each Fund’s tax positions for the tax year ended June 30, 2018 and has concluded that no provision for unrecognized tax benefits or expenses is required in these financial statements. The Funds identify their major tax jurisdiction as U.S. Federal.
3. Investment Transactions
Investment transactions, other than short-term investments and U.S. Government securities, were as follows for the year ended June 30, 2018:
| AAMA Equity Fund | AAMA Income Fund | |||||||
| Purchase of investment securities | $ | 272,457,298 | $ | 6,790,410 | ||||
| Proceeds from sales and maturities of investment securities | $ | 14,268,518 | $ | 6,534,438 | ||||
Investment transactions in long-term U.S. Government securities were as follows for the year ended June 30, 2018:
| AAMA Equity Fund | AAMA Income Fund | |||||||
| Purchase of U.S. Government securities | $ | — | $ | 130,210,298 | ||||
| Proceeds from sales and maturities of U.S. Government securities | $ | — | $ | — | ||||
4. Transactions with Related Parties
INVESTMENT ADVISORY AGREEMENTS
Each Fund’s investments are managed by Advanced Asset Management Advisors, Inc. (the “Adviser”) under the terms of an Investment Advisory Agreement. AAMA Equity Fund pays the Adviser a fee, which is computed and accrued daily and paid monthly, at an annual rate of 1.00% of its average daily net assets. AAMA Income Fund pays the Adviser a fee, which is computed and accrued daily and paid monthly, at an annual rate of 0.75% of its average daily net assets.
24
AAMA Funds
Notes to Financial Statements (Continued)
The Adviser has entered into an Expense Limitation Agreement (“ELA”) under which it has contractually agreed, until February 28, 2019, to reduce its investment advisory fees and to reimburse other expenses to the extent necessary so that total annual operating expenses (excluding brokerage costs, interest, taxes, dividend expense on short positions, litigation and indemnification expenses, acquired fund fees and expenses, and extraordinary expenses (as determined under GAAP)) do not exceed 0.90% for AAMA Equity Fund and 0.63% for AAMA Income Fund. Accordingly, during the year ended June 30, 2018, the Adviser reduced its advisory fees in the amount of $804,697 and $411,771 with respect to AAMA Equity Fund and AAMA Income Fund, respectively.
Under the terms of the ELA, investment advisory fee reductions and expense reimbursement by the Adviser are subject to repayment by each Fund for a period of three years after the fiscal year that such fees and expenses were incurred, provided the repayments do not cause total annual operating expenses to exceed the lesser of (i) the expense limitation then in effect, if any, and (ii) the expense limitation in effect at the time the expenses to be repaid were incurred. As of June 30, 2018, the Adviser may seek repayment of investment advisory fee reductions totaling $804,697 and $411,771 with respect to AAMA Equity Fund and AAMA Income Fund, respectively, no later than June 30, 2021.
BUSINESS MANAGER AND ADMINISTRATOR
Foreside Management Services, LLC (“Foreside”) serves as the Trust’s business manager and administrator. Pursuant to the terms of a Management and Administration Agreement (the “Agreement”) between the Trust and Foreside, Foreside performs and coordinates all management and administration services for the Trust either directly or through working with the Trust’s service providers. Services provided under the Agreement by Foreside include, but are not limited to, coordinating and monitoring activities of the third party service providers to the Funds; serving as officers of the Trust, including but not limited to, President, Secretary, Chief Compliance Officer, Anti-Money Laundering Officer, Treasurer and others as are deemed necessary and appropriate; performing compliance services for the Trust, including maintaining the Trust’s compliance program as required under the 1940 Act; managing the process of filing amendments to the Trust’s registration statement and other reports to shareholders; coordinating the Board meeting preparation process; reviewing financial reports and filing them with the SEC; and maintaining books and records in accordance with applicable laws and regulations.
25
AAMA Funds
Notes to Financial Statements (Continued)
Pursuant to the Agreement, Foreside pays all operating expenses of the Trust and the Funds not specifically assumed by the Trust, unless the Trust or the Adviser otherwise agree to pay, including without limitation the compensation and expenses of any employees and officers of the Trust and of any other persons rendering any services to the Trust; clerical and shareholder service staff salaries; office space and other office expenses; fees and expenses incurred by the Trust in connection with membership in investment company organizations; legal, auditing and accounting expenses; expenses registering shares under federal and state securities laws; insurance expenses; fees and expenses of the transfer agent, dividend disbursing agent, shareholder service agent, custodian, fund accounting agent and financial administrator (excluding fees and expenses payable to Foreside) and accounting and pricing services agent; expenses, including clerical expenses, of issue, sale, redemption or repurchase of shares of the Funds; the cost of preparing and distributing reports and notices to shareholders; the cost of printing or preparing prospectuses and statements of additional information for delivery to each Fund’s current shareholders; the cost of printing or preparing any documents, statements or reports to shareholders; fees and expenses of Trustees of the Trust who are not interested persons of the Trust, as defined by the 1940 Act; and all other operating expenses not specifically assumed by the Trust. In paying expenses that would otherwise be obligations of the Trust, Foreside is expressly acting as an agent on behalf of the Trust. Foreside Financial Services, LLC (the Distributor) is an affiliate of Foreside. For the services under the Agreement and expenses assumed by Foreside, the Trust, on behalf of the Funds, pays Foreside an annual fee equal to 0.20% of the average daily net assets of the Funds up to $250,000,000 and 0.15% of the average daily net assets of the Funds greater than $250,000,000; subject, however, to an aggregate minimum annual fee of $795,000. During the year ended June 30, 2018, Foreside voluntarily waived fees in the amount of $9,471 and $4,774 with respect to AAMA Equity Fund and AAMA Income Fund, respectively.
OTHER SERVICE PROVIDER
Ultimus Fund Solutions, LLC (“Ultimus”) serves as the transfer agent, fund accountant and financial administrator for the Funds. The transfer agent services provided by Ultimus to the Funds include, but are not limited to (i) processing shareholder purchase and redemption requests; (ii) processing dividend payments; and (iii) maintaining shareholder account records. The administrative and fund accounting services provided by Ultimus to the Funds include (i) computing each Fund’s NAV for purposes of the sale and redemption of its shares; (ii) computing the dividends payable by each Fund; (iii) preparing certain periodic reports and statements; and (iv) maintaining the general ledger and other accounting records for the Funds.
26
AAMA Funds
Notes to Financial Statements (Continued)
PRINCIPAL HOLDERS OF FUND SHARES
As of June 30, 2018, the following account holders owned of record 5% or more of the outstanding shares of each Fund:
| NAME OF RECORD OWNER | % Ownership | ||
| AAMA Equity Fund | |||
| TD Ameritrade, Inc. (for the benefit of its clients) | 74% | ||
| TD Ameritrade Trust Company (for the benefit of its clients) | 19% | ||
| AAMA Income Fund | |||
| TD Ameritrade, Inc. (for the benefit of its clients) | 78% | ||
| TD Ameritrade Trust Company (for the benefit of its clients) | 16% |
5. Investment in Other Investment Companies
The Funds may invest a significant portion of their assets in shares of one or more investment companies, including Exchange-Traded Funds (“ETFs”). ETFs issue their shares to authorized participants in return for a specific basket of securities. The authorized participants then sell the ETF’s shares on the secondary market. In other words, ETF shares are traded on a securities exchange based on their fair value. There are certain risks associated with investments in ETFs. Investments in ETFs are subject to the risk that the ETF’s shares may trade at a premium (creating the risk that the Fund pays more than NAV for an ETF when making a purchase) or discount (creating the risk that a Fund receives less than NAV when selling an ETF) to the ETF’s NAV. Investments in ETFs are also subject to index-tracking risk because the total return generated by the securities will be reduced by transaction costs and expenses not incurred by the indices. Certain securities comprising the index tracked by an ETF may temporarily be unavailable, which may further impede the ETF’s ability to track its applicable index or match the index’s performance. Finally, ETF shares are also subject to the risks applicable to the underlying basket of securities. As of June 30, 2018, AAMA Equity Fund had 53.9% of the value of its net assets invested in ETFs.
6. Contingencies and Commitments
The Funds indemnify the Trust’s officers and Trustees for certain liabilities that might arise from their performance of their duties to the Funds. Additionally, in the normal course of business the Funds enter into contracts that contain a variety of representations and warranties and which provide general indemnifications. The Funds’ maximum exposure under these arrangements is unknown, as this would involve future claims that may be made against the Funds that have not yet occurred. However, based on experience, the Trust expects the risk of loss to be remote.
27
AAMA Funds
Notes to Financial Statements (Continued)
7. Trustee Compensation
The Independent Trustees are compensated for their services to the Trust by Foreside as part of the Management and Administration agreements. Each Trustee receives an annual retainer of $14,000, an in person meeting fee of $4,000 for board meetings and $1,000 for committee meetings. For each telephonic meeting, the attendance fee is $1,000. Collectively, the Independent Trustees were paid $112,000 in fees during the fiscal year ended June 30, 2018. In addition, Foreside reimburses Trustees for out-of-pocket expenses incurred in conjunction with attendance of meetings.
8. Subsequent Events
The Funds are required to recognize in the financial statements the effects of all subsequent events that provide additional evidence about conditions that existed as of the date of the Statements of Assets and Liabilities. For non-recognized subsequent events that must be disclosed to keep the financial statements from being misleading, the Funds are required to disclose the nature of the event as well as an estimate of its financial effect, or a statement that such an estimate cannot be made. Management has evaluated subsequent events through the issuance of these financial statements and has noted no such events.
28
AAMA Funds
Report of Independent Registered
Public Accounting Firm
To the Shareholders of AAMA Funds and
Board of Trustees of Asset Management Fund
Opinion on the Financial Statements
We have audited the accompanying statements of assets and liabilities, including the schedules of portfolio investments, of AAMA Equity Fund and AAMA Income Fund (the “AAMA Funds” or “Funds”), each a series of Asset Management Fund, as of June 30, 2018, and the related statements of operations and changes in net assets, including the related notes, and the financial highlights for the year then ended (collectively referred to as the “financial statements”). In our opinion, the financial statements present fairly, in all material respects, the financial position of each of the Funds as of June 30, 2018, the results of their operations, the changes in their net assets, and the financial highlights for the year ended June 30, 2018, in conformity with accounting principles generally accepted in the United States of America.
Basis for Opinion
These financial statements are the responsibility of the Funds’ management. Our responsibility is to express an opinion on the Funds’ financial statements based on our audit. We are a public accounting firm registered with the Public Company Accounting Oversight Board (United States) (“PCAOB”) and are required to be independent with respect to the Funds in accordance with the U.S. federal securities laws and the applicable rules and regulations of the Securities and Exchange Commission and the PCAOB.
We conducted our audit in accordance with the standards of the PCAOB. Those standards require that we plan and perform the audit to obtain reasonable assurance about whether the financial statements are free of material misstatement, whether due to error or fraud.
Our audit includes performing procedures to assess the risks of material misstatement of the financial statements, whether due to error or fraud, and performing procedures that respond to those risks. Such procedures include examining, on a test basis, evidence regarding the amounts and disclosures in the financial statements and confirmation of securities owned as of June 30, 2018, by correspondence with the custodian. Our audit also included evaluating the accounting principles used and significant estimates made by management, as well as evaluating the overall presentation of the financial statements. We believe that our audit provides a reasonable basis for our opinion.
We have served as the Funds’ auditor since 2017.
COHEN & COMPANY, LTD.
Cleveland, Ohio
August 27, 2018
29
AAMA Funds
About Your Fund’s Expenses (Unaudited)
We believe it is important for you to understand the impact of costs on your investment. All mutual funds have operating expenses. As a shareholder of the Funds, you incur ongoing costs, including management fees and other expenses. The following examples are intended to help you understand your ongoing costs (in dollars) of investing in the Funds and to compare these costs with the ongoing costs of investing in other mutual funds.
A mutual fund’s ongoing costs are expressed as a percentage of its average net assets. This figure is known as the expense ratio. The expenses in the table below are based on an investment of $1,000 made at the beginning of the period shown and held for the entire period (January 1, 2018 through June 30, 2018).
The table below illustrates each Fund’s costs in two ways:
Actual fund return – This section helps you to estimate the actual expenses that you paid over the period. The “Ending Account Value” shown is derived from each Fund’s actual return, and the fourth column shows the dollar amount of operating expenses that would have been paid by an investor who started with $1,000 in the Funds. You may use the information here, together with the amount you invested, to estimate the expenses that you paid over the period.
To do so, simply divide your account value by $1,000 (for example, an $8,600 account value divided by $1,000 = 8.6), then multiply the result by the number given for the Funds under the heading “Expenses Paid During Period.”
Hypothetical 5% return – This section is intended to help you compare each Fund’s ongoing costs with those of other mutual funds. It assumes that each Fund had an annual return of 5% before expenses during the period shown, but that the expense ratio is unchanged. In this case, because the returns used are not the Funds’ actual returns, the results do not apply to your investment. The example is useful in making comparisons because the SEC requires all mutual funds to calculate expenses based on a 5% return. You can assess each Fund’s ongoing costs by comparing this hypothetical example with the hypothetical examples that appear in shareholder reports of other funds.
Note that expenses shown in the table are meant to highlight and help you compare ongoing costs only. The Funds do not charge sales loads or redemption fees.
The calculations assume no shares were bought or sold during the period. Your actual costs may have been higher or lower, depending on the amount of your investment and the timing of any purchases or redemptions.
30
AAMA Funds
About Your Fund’s Expenses (Unaudited)
More information about the Funds’ expenses can be found in this report. For additional information on operating expenses and other shareholder costs, please refer to the Funds’ prospectus.
| Beginning Account Value January 1, 2018 | Ending Account Value June 30, 2018 | Net Expense Ratio(a) | Expenses Paid During Period(b) | |||||
| AAMA Equity Fund | ||||||||
| Based on Actual Fund Return | $ 1,000.00 | $ 1,022.70 | 0.90% | $ 4.51 | ||||
| Based on Hypothetical 5% Return (before expenses) | $ 1,000.00 | $ 1,020.33 | 0.90% | $ 4.51 | ||||
| AAMA Income Fund | ||||||||
| Based on Actual Fund Return | $ 1,000.00 | $ 997.70 | 0.63% | $ 3.12 | ||||
| Based on Hypothetical 5% Return (before expenses) | $ 1,000.00 | $ 1,021.67 | 0.63% | $ 3.16 |
| (a) | Annualized, based on the Fund’s most recent one-half year expenses. |
| (b) | Expenses are equal to each Fund’s annualized net expense ratio multiplied by the average account value over the period, muliplied by 181/365 (to reflect the one-half year period). |
31
AAMA Funds
Other Information (Unaudited)
A description of the policies and procedures that the Funds use to vote proxies relating to portfolio securities is available without charge upon request by calling toll-free 1-800-701-9502, or on the SEC’s website at http://www.sec.gov. Information regarding how the Funds voted proxies relating to portfolio securities during the most recent 12-month period ended June 30 is available without charge upon request by calling toll-free 1-800-701-9502, or on the SEC’s website at http://www.sec.gov.
The Trust files a complete listing of portfolio holdings of the Funds with the SEC as of the end of the first and third quarters of each fiscal year on Form N-Q. The filings are available upon request, by calling 1-800-701-9502. Furthermore, you may obtain a copy of these filings on the SEC’s website at http://www.sec.gov. The Trust’s Forms N-Q may also be reviewed and copied at the SEC’s Public Reference Room in Washington, DC, and information on the operation of the Public Reference Room may be obtained by calling 1-800-SEC-0330.
Federal Tax Information (Unaudited)
Qualified Dividend Income – For the fiscal year ended June 30, 2018, AAMA Equity Fund and AAMA Income Fund have designated 100% and 4.59%, respectively, of ordinary income distributions, or up to the maximum amount of such dividends allowable pursuant to the Internal Revenue Code, as qualified dividend income eligible for the reduced tax rate of 15%.
Dividends Received Deduction – Corporate shareholders are generally entitled to take the dividends received deduction on the portion of a Fund’s dividends that qualify under tax law. For the fiscal year ended June 30, 2018, 100% and 3.63%, of ordinary income dividends paid by AAMA Equity Fund and AAMA Income Fund, respectively, qualify for the corporate dividends received deduction.
32
AAMA Funds
Board of Trustees and Executive Officers
(Unaudited)
Listed below is basic information regarding the Trustee and executive officers of the Trust. The Trust’s Statement of Additional Information includes additional information about Trustees and is available, without charge, upon request by calling 1-800-701-9502.
| Name, Year of Birth and Address1 | Position(s) Held With Trust, Length of Time Served and Term of Office | Principal Occupation(s) During Past Five Years, Prior Relevant Experience and Other Directorships During the Past Five Years | No. of Portfolios in Trust Overseen |
| Independent Trustees | |||
David F. Holland Year of Birth: 1941 | Chairman of the Board since 2015. Trustee since 1993 and from 1988 to 1989. Indefinite Term of Office | Retired; Director, Preferred Community Bank since 2013. | 5 |
Carla S. Carstens Year of Birth: 1951 | Trustee since 2015. Indefinite Term of Office | Advisory Board of Directors of AIT Worldwide Logistics, 2013 to 2015; Board member and Treasurer of Athena International, 2010 to 2016; Board member and Chairman of Strategic Planning and Women and Inclusion Initiatives of Financial Executives International Chicago, 2009 to present; Board of Directors and Audit Committee Chair of Chicago Yacht Club Foundation, 2015 to 2017. | 5 |
David J. Gruber Year of Birth: 1963 | Trustee since 2015. Indefinite Term of Office | Director of Risk Advisory Services for Holbrook and Manter, CPAs from January 2016 to present; President of DJG Financial Consulting, LLC (financial consulting firm), 2007 to 2015; Independent Trustee for Monteagle Funds (6 Funds), Audit Committee Chair, Valuation Committee member from 2015 to present; Board member of Cross Shore Discovery Fund, 2014 to present; Board member of Fifth Third Funds, 2003 to 2012. | 5 |
James A. Simpson Year of Birth: 1970 | Trustee since 2018. Indefinite Term of Office | President, ETP Resources, LLC, a financial services consulting company, 2009 to present. Trustee of Virtus ETF Trust II, 2015 to present and Trustee of ETFis Series Trust I, 2014 to present. | 5 |
| 1 | The mailing address of each Independent Trustee is 690 Taylor Road, Suite 210, Gahanna, Ohio 43230. |
33
AAMA Funds
Board of Trustees and Executive Officers
(Unaudited) (Continued)
The following table provides information regarding each officer of the Trust.
| Name, Age and Address1 | Position(s) Held With Trust, Length of Time Served and Term of Office | Principal Occupation(s) During Past Five Years, Prior Relevant Experience and Other Directorships During the Past Five Years | No. of Portfolios in Trust Overseen |
| Officers | |||
C. David Bunstine Year of Birth: 1965 | President since 2018. | Managing Director, Foreside Financial Group, LLC (formerly Beacon Hill Fund Services, Inc.), 2013 to present. Director, Citi Fund Services Ohio, Inc., 2007 to 2013. | N/A |
Trent M. Statczar Year of Birth: 1971 | Treasurer since 2009. | Director, Foreside Financial Group, LLC (formerly Beacon Hill Fund Services, Inc.), 2008 to present. | N/A |
Eimile J. Moore Year of Birth: 1969 | Chief Compliance Officer since 2016. AML Officer since 2016. | Director, Foreside Financial Group, LLC (formerly Beacon Hill Fund Services, Inc.), 2011 to present; Chief Compliance Officer of Diamond Hill Funds 2014 to 2018. | N/A |
Jennifer Gorham Year of Birth: 1981 | Secretary since 2016. | Director, Foreside Financial Group, LLC (formerly Beacon Hill Fund Services, Inc.), 2015 to present; Paralegal, Red Capital Group, LLC, from 2011 to 2015. | N/A |
| 1 | The mailing address of each Independent Trustee is 690 Taylor Road, Suite 210, Gahanna, Ohio 43230. |
34
This page intentionally left blank.
This page intentionally left blank.
This page intentionally left blank.
Investment Advisor
Advanced Asset Management Advisors, Inc.
4995 Bradenton Avenue, Suite 210
Dublin, Ohio 43017
Business Manager and Administrator
Foreside Management Services, LLC
Three Canal Plaza, Suite 100
Portland, Maine 04101
Financial Administrator and Transfer and Dividend Agent
Ultimus Fund Solutions
225 Pictoria Drive, Suite 450
Cincinnati, Ohio 45246
Distributor
Foreside Financial Services, LLC
Three Canal Plaza, Suite 100
Portland, Maine 04101
Legal Counsel
Vedder Price P.C.
222 N. LaSalle Street
Chicago, Illinois 60601
Custodian
MUFG Union Bank, N.A.
350 California Street
San Francisco, California 94104
Independent Registered Public Accounting Firm
Cohen & Company, Ltd.
1350 Euclid Avenue, Suite 800
Cleveland, Ohio 44115

ANNUAL REPORT
June 30, 2018
2018 SHAREHOLDER LETTER
The Austin Atlantic Funds (“AAF” and each series, a “Fund”) family of no load mutual funds is pleased to present to shareholders the 2018 Annual Report for the Funds advised by Austin Atlantic Asset Management Company. Since we have revamped our year-end to conclude each June, instead of October, this report summarizes an abbreviated, eight month period. All market returns shown in this letter are for the October 31, 2017 – June 30, 2018 time period and are not annualized, unless otherwise noted.
Through June 2018, the financial markets have calmly dealt with a number of variables that have not driven investor uncertainty for many years: rising interest rates, increasing trade and tariff tension, and geo-political uncertainty. Typically, financial markets react poorly when there is a shock to the system for which it lacks recent historical precedent; instead, market volatility has remained low, albeit with a brief surge in February. With corporate tax cuts driving earnings growth and a generally positive economic backdrop, the S&P 500 Index was able to generate a total return of 6.97% (10.51% annualized) which is close to long term trends. The underlying strength of corporate earnings and optimism for further growth is undoubtedly supportive of market valuations.
That said, equity market valuations are towards the high end of their long term averages. While some internal measures of corporate performance, such as gross and profit margins, remain strong, others, such as free cash flow have weakened recently. Debt is corporate America has been on an upward trajectory, which could be of issue given the weakening in free cash flow, but most of this debt is termed out. Continued growth in corporate earnings and an environment of contained political and legislative uncertainty, will be important to sustain current valuations.
At the same time, the underlying strength of the economy, coupled with tight labor markets and rising trade tariffs, are likely to support a continued firming of inflationary trends, another economic variable that has been missing from Wall Street’s “Wall of Worry” for many years. We note that the annualized GDP Price Deflator reached a 10 year high for the second quarter of 2018 at 3.1%, still above Fed Funds and rising just as fast. Therefore, even after 175 bps of rate hikes by the Fed, we continue to characterize current monetary policy as accommodative, just as we did last year. In fact, we’d argue that the Fed has made little headway with bringing policy even back to a neutral position, and believe that the Fed will increase rates more than the market is currently forecasting.
We are grateful for your continued support and continue to seek the best investment strategies for achieving our shareholder’s investment objectives.
 |  | |
| Sean Kelleher | David Holland | |
| President | Chairman | |
| Austin Atlantic Asset Management Company | Asset Management Fund |
This report has been prepared to provide information to the shareholders of the Funds and must be preceded or accompanied by the Prospectus. It should not be construed as an offering to sell or buy any shares of the Funds. Such an offering is made only by the Prospectus. You may obtain a current copy of the Prospectus by calling 1-800-247-9780 or at AAF’s website (www.amffunds.com). Investors should consider the investment objectives, risks and expenses of the Funds before investing. Read the Prospectus carefully before you invest. Like all Mutual Funds, the Austin Atlantic Funds are not FDIC insured, may lose value and have no bank guarantee.
1
AAAMCO ULTRASHORT FINANCING FUND REVIEW
June 30, 2018
For the eight months ending June 30, 2018, the AAAMCO Ultrashort Financing Fund outperformed our benchmark returns. The Class I Shares of the Fund returned 1.24% (unannualized) while the Bloomberg Barclays 1 Month Libor Index returned 1.14% and the Morningstar Ultrashort Bond Fund Index earned 0.90%. The strong performance is attributable to the lack of repo credit for credit-worthy borrowers, which allows the Fund to earn an attractive financing rate. The Fund has just past its one year anniversary and has performed as expected. The opportunity to provide repurchase agreement financing (“repos”) backed by government securities remains attractive, and this strategy remains the source of the fund’s performance. Cash investing is starting to gain more attention, particularly now that the Fed has abandoned their “Zero Interest Rate Policy”. Many short bond funds – including ours – now have dividend yields that exceed the dividend yield of the S&P 500 Index. The Fund is designed to minimize capital losses while still outperforming other short term investment options, such as money market funds. In the face of rising interest rates, it’s net asset value has been steady at $10.00 share while it’s yield has moved up steadily with interest rates. As of June 30th, the Fund had a 2.28% yield, 53 basis points above one month U.S. Treasury bills.
We believe this strategy, as well as our equity investment process and team, has an exciting future, and thank all of our shareholders for allowing us to assist them with their investment needs. We look forward to serving them in the future.
This report has been prepared to provide information to the shareholders of the Funds and must be preceded or accompanied by the Prospectus. It should not be construed as an offering to sell or buy any shares of the Funds. Such an offering is made only by the Prospectus. You may obtain a current copy of the Prospectus by calling 1-800-247-9780 or at the Funds’ website (www.amffunds.com). Investors should consider the investment objectives, risks and expenses of the Funds before investing. Read the Prospectus carefully before you invest. Like all mutual funds, the Funds are not FDIC insured, may lose value and have no bank guarantee.
Portfolio composition is subject to change.
Past performance does not guarantee future results. Investment return and net asset value will fluctuate so that an investor’s shares, when redeemed, may be worth more or less than the original cost.
2
AAAMCO ULTRASHORT FINANCING FUND REVIEW
June 30, 2018
| AAAMCO Ultrashort Financing Fund |
| Class I |
| Gross 1.04% Net 0.35% |
| Class Y |
| Gross 0.94% Net 0.30% |
The gross expense ratios above is from the Fund’s prospectus dated February 28, 2018. Additional information pertaining to the Fund’s expense ratios as of June 30, 2018, can be found in the Financial Highlights.
| Average Annual Total Return Periods Ending June 30, 2018* | ||||||
| Eight Months Ended June 30, 2018 | One Year | Since Inception | ||||
| AAAMCO Ultrashort Financing Fund(1) | ||||||
| Class I | 1.24% | 1.72% | 1.69% | |||
| Class Y | 1.28% | 1.77% | 1.74% | |||
| Bloomberg Barclays 1 Month | ||||||
| Libor Index | 1.14% | 1.57% | 1.55% | |||
| * | Assumes reinvestment of all dividends and distributions and the deduction of all applicable fees and expenses. Average annual returns are stated for periods greater than one year. The eight months ended return as of June 30, 2018 is not annualized. The Bloomberg Barclays 1 Month Libor Index does not include a reduction in total return for expenses. |
| (1) | Inception date of the Fund was 6/7/2017. |
Comparison of change in value of a hypothetical $25,000 investment for the year ended June 30
The following graph shows that an investment of $25,000 in Class I of the Fund on June 6, 2017, would have been worth $25,454 on June 30, 2018, assuming all dividends and distributions had been reinvested. A similar investment in the Bloomberg Barclays 1 Month Libor Index, over the same period, would have been worth $25,411.
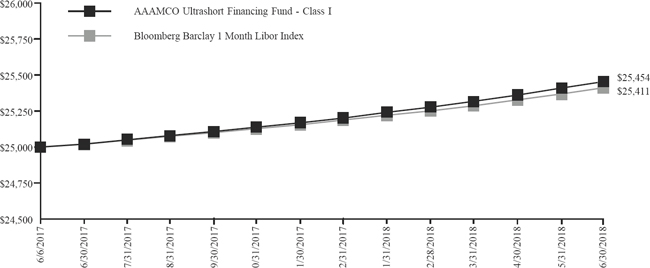
Past performance does not guarantee future results. Investments returns and net asset values will fluctuate so that an investor’s shares, when redeemed, may be worth more or less than original cost. The performance data quoted represents past performance and current returns may be lower or higher. Performance figures in the table and graph do not reflect the deduction of taxes that a shareholder would pay on the Fund distributions or the redemption of Fund shares. The Bloomberg Barclays 1 Month Libor Index is an index tracking the London Interbank Offered Rate (“LIBOR”), which is the interest rate offered by a specific group of London banks for U.S. dollar deposits with a one-month maturity. The index does not include a reduction in return for expenses. Investors cannot invest directly in an index, although they can invest in its underlying securities. To obtain current month-end performance information for the Fund, please call 1-800-247-9780.
3
ULTRA SHORT MORTGAGE FUND REVIEW
June 30, 2018
For the eight months ending June 30, 2018, the Ultra Short Mortgage Fund’s return was -0.87% (unannualized) as compared to the Bloomberg Barclays 6 Month T-Bill Bellwethers Index return of 1.04% and the Morningstar Ultrashort Bond Fund Index return of 0.90%. Faster than expected principal prepayments on our mortgage-backed securities positions and low interest rates relative to the expense load of the Fund contributed to most of the underperformance for the period. Fed rate hikes allowed for a steady increase in the coupons on the Fund’s portfolio of adjustable rate mortgages; however mortgage prepayments remained strong as borrowers swapped out of their adjustable rate mortgages into fixed rates. Continued strength in employment, consumer credit, and home prices supported refinancing activity.
We thank all of our shareholders for allowing us to assist them with their investment needs, and look forward to serving them in the future.
This report has been prepared to provide information to the shareholders of the Funds and must be preceded or accompanied by the Prospectus. It should not be construed as an offering to sell or buy any shares of the Funds. Such an offering is made only by the Prospectus. You may obtain a current copy of the Prospectus by calling 1-800-247-9780 or at the Funds’ website (www.amffunds.com). Investors should consider the investment objectives, risks and expenses of the Funds before investing. Read the Prospectus carefully before you invest. Like all mutual funds, the Funds are not FDIC insured, may lose value and have no bank guarantee.
Portfolio composition is subject to change.
Past performance does not guarantee future results. Investment return and net asset value will fluctuate so that an investor’s shares, when redeemed, may be worth more or less than the original cost.
4
ULTRA SHORT MORTGAGE FUND REVIEW
June 30, 2018
| Ultra Short Mortgage Fund |
| Gross Expense Ratio |
| 1.34% |
The gross expense ratio above is from the Fund’s prospectus dated February 28, 2018. Additional information pertaining to the Fund’s expense ratios as of June 30, 2018, can be found in the Financial Highlights.
| Average Annual Total Return Periods Ending June 30, 2018* | ||||||||
| Eight Months Ended June 30, 2018 | One Year | Five Year | Ten Year | |||||
| Ultra Short Mortgage Fund | -0.87% | -1.19% | 0.44% | -0.39%(1) | ||||
| Bloomberg Barclays 6 Month T-Bill Bellwethers Index | 1.04% | 1.44% | 0.59% | 0.65% | ||||
| * | Assumes reinvestment of all dividends and distributions and the deduction of all applicable fees and expenses. The eight month period return as of June 30, 2018 is not annualized. Average annual returns are stated for periods greater than one year. The Bloomberg Barclays 6 Month T-Bill Bellwethers Index does not include a reduction in total return for expenses. |
| (1) | During the fiscal year ended October, 31, 2013, the Ultra Short Mortgage Fund received monies related to certain nonrecurring litigation settlements. If these monies were not received, the Ten Year return would have been lower. |
Comparison of change in value of a hypothetical $10,000 investment for the years ended June 30
The following graph shows that an investment of $10,000 in the Fund on June 30, 2008, would have been worth $9,613 on June 30, 2018, assuming all dividends and distributions had been reinvested. A similar investment in the Bloomberg Barclays 6 Month T-Bill Bellwethers Index, over the same period, would have been worth $10,668.
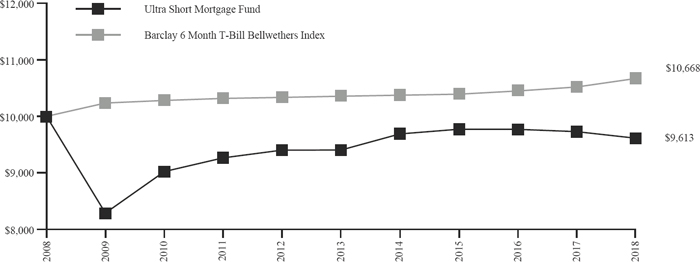
Past performance does not guarantee future results. Investments returns and net asset values will fluctuate so that an investor’s shares, when redeemed, may be worth more or less than original cost. The performance data quoted represents past performance and current returns may be lower or higher. Performance figures in the table and graph do not reflect the deduction of taxes that a shareholder would pay on the Fund distributions or the redemption of Fund shares. The Bloomberg Barclays 6 Month T-Bill Bellwethers Index is an unmanaged index comprised of U.S. Government Treasury Bonds with an average maturity of six months. The index represents unmanaged groups of bonds that differ from the composition of the Fund. The index does not include a reduction in return for expenses. Investors cannot invest directly in an index, although they can invest in its underlying securities. To obtain current month-end performance information for the Fund, please call 1-800-247-9780.
5
LARGE CAP EQUITY FUND REVIEW
June 30, 2018
For the eight months ending June 30, 2018, the Large Cap Equity Fund lagged the market and other equity funds with a similar strategy. The Class AMF Shares of the Fund returned 3.41% (unannualized) while the S&P 500 generated 6.97% and the Morningstar Large Blend Index earned 5.99%. The underperformance of the Large Cap Equity Fund over the 10/31/17 - 6/30/18 period was mainly driven by weak performance in the Consumer Discretionary and Industrials sectors. In the Consumer Discretionary sector the underperformance was due to an overweight position in Starbucks Corp. and Carnival Corp., while having no exposure to the Internet & Direct Marketing Retail industry (which had strong results over the same period). The weak results in the Industrials sector was due to an overweight position in Cummins, Inc. However, since the new investment management team came on board in 2016, performance has been quite strong. In fact, Morningstar recently gave the fund a “5 Star” ranking for the most recent three year period (which includes six months under the previous investment team and process), something we have not achieved in many years. The fact that the Fund has been able to keep up with the surging equity market with less volatility than the S&P 500 and its Large Blend fund peers is an important trait to keep in mind as we enter what we believe to be a financial environment with greater uncertainty.
We thank all of our shareholders for allowing us to assist them with their investment needs, and look forward to serving them in the future.
This report has been prepared to provide information to the shareholders of the Funds and must be preceded or accompanied by the Prospectus. It should not be construed as an offering to sell or buy any shares of the Funds. Such an offering is made only by the Prospectus. You may obtain a current copy of the Prospectus by calling 1-800-247-9780 or at the Funds’ website (www.amffunds.com). Investors should consider the investment objectives, risks and expenses of the Funds before investing. Read the Prospectus carefully before you invest. Like all mutual funds, the Funds are not FDIC insured, may lose value and have no bank guarantee.
Portfolio composition is subject to change.
Past performance does not guarantee future results. Investment return and net asset value will fluctuate so that an investor’s shares, when redeemed, may be worth more or less than the original cost.
6
LARGE CAP EQUITY FUND REVIEW
June 30, 2018
| Large Cap Equity Fund |
| Gross Expense Ratio |
| Class AMF 1.54% |
| Class H 1.29% |
The gross expense ratio above is from the Fund’s prospectus dated February 28, 2018. Additional information pertaining to the Fund’s expense ratios as of June 30, 2018, can be found in the Financial Highlights.
| Average Annual Total Return Periods Ending June 30, 2018* | ||||||||||
| Eight Months Ended June 30, 2018 | One Year | Five Year | Ten Year | Since Incesption | ||||||
| Class AMF(1) | 3.41% | 11.00% | 10.00% | 9.45% | ||||||
| Class H(2) | 3.54% | 11.20% | 10.19% | — | 14.26% | |||||
| S&P 500 | 6.97% | 14.37% | 13.42% | 10.17% | 16.87%(3) | |||||
| * | Assumes reinvestment of all dividends and distributions and the deduction of all applicable fees and expenses. The eight month period return as of June 30, 2018 is not annualized. Average annual returns are stated for periods greater than one year. The S&P 500 does not include a reduction in total return for expenses. |
| (1) | Class AMF of the Fund commenced operations on June 30, 1953. |
| (2) | Class H of the Fund commenced operations on February 20, 2009. |
| (3) | Return presented is for the period from February 20, 2009 to June 30, 2018. |
Comparison of change in value of a hypothetical $10,000 investment for the years ended June 30
The following graph shows that an investment of $10,000 in Class AMF of the Fund on June 30, 2008, would have been worth $24,680 on June 30, 2018, assuming all dividends and distributions had been reinvested. A similar investment in the S&P 500, over the same period, would have been worth $26,341.
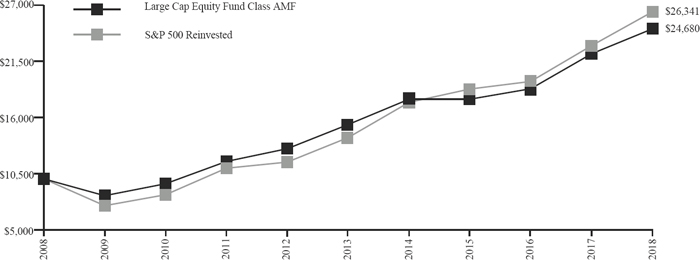
Past performance does not guarantee future results. The performance data quoted represents past performance and current returns may be lower or higher. Performance figures in the table and graph do not reflect the deduction of taxes that a shareholder would pay on the Fund distributions or the redemption of Fund shares. The Standard & Poors 500 Index is an unmanaged index, generally representative of the U.S. stock market as a whole. The index differs from the composition of the Fund. The index does not include a reduction in return for expenses. Investors cannot invest directly in an index, although they can invest in its underlying securities. To obtain current month-end performance information for the Fund, please call 1-800-247-9780.
7
AAAMCO ULTRASHORT FINANCING FUND
SCHEDULE OF INVESTMENTS
June 30, 2018
| Percentage of Net Assets | Principal Amount/ Shares | Value | ||||||||||
| INVESTMENT COMPANIES | 3.2 | % | ||||||||||
| Northern Institutional Treasury Portfolio, 1.70%* | 1,943,289 | $ | 1,943,289 | |||||||||
| TOTAL INVESTMENT COMPANIES (Cost $1,943,289) | 1,943,289 | |||||||||||
| REPURCHASE AGREEMENTS | 96.7 | % | ||||||||||
| Amherst Pierpont Securities LLC, 2.45%, (Agreement dated 6/26/18 to be repurchased at $10,004,764 on 7/3/18. Collateralized by U.S. Government Mortgage-Backed Securities, 3.00% - 6.50%, with a value of $10,797,347, due at 4/15/39 - 6/25/48) | 10,000,000 | 10,000,000 | ||||||||||
| BCM High Income Fund, L.P., 2.85%, (Open repurchase agreement which the Fund can initiate closure at any time. Collateralized by SBA Loans, 4.33% - 6.07% with a value of $17,475,214, due at 4/15/42 - 12/15/42 and cash equivalents of $2,251,814) | 18,017,756 | 18,017,756 | ||||||||||
| JVB Financial Group, LLC, 3.09%, (Agreement dated 6/25/18 to be repurchased at $8,479,158 on 7/25/18. Collateralized by VIC Master Trust Series 2017-V1 Certificates, 2.75% - 5.00%, with a value of $9,012,114, due at 5/1/38 - 6/1/48)(1)(2) | 8,457,381 | 8,457,381 | ||||||||||
| KGS - ALPHA Financial Services LLC, 2.12%, (Agreement dated 6/27/18 to be repurchased at $14,006,595 on 7/5/18. Collateralized by U.S. Government Mortgage-Backed Securities and a U.S. Government Agency, 2.10% - 5.64%, with a value of $14,698,668, due at 4/25/25 - 7/1/48) | 14,000,000 | 14,000,000 | ||||||||||
| Vining-Sparks IBG, L.P., 2.74%, (Open repurchase agreement which the Fund can initiate closure at any time. Collateralized by SBA Loans, 5.08% - 6.08%, with a value of $7,958,145, due at 4/15/25 - 5/15/43) | 7,089,989 | 7,089,989 | ||||||||||
| TOTAL REPURCHASE AGREEMENTS (Cost $57,565,126) | 57,565,126 | |||||||||||
| TOTAL INVESTMENTS (Cost $59,508,415) | 99.9 | % | 59,508,415 | |||||||||
| NET OTHER ASSETS (LIABILITIES) | 0.1 | % | 42,817 | |||||||||
| NET ASSETS | 100.0 | % | $ | 59,551,232 | ||||||||
| * | The rates presented are the rates in effect at June 30, 2018. |
| (1) | Illiquid security, maturity date is greater than 7 days. |
| (2) | The rates and maturity dates disclosed represent those of the underlying mortgage loans which are used to securitize the VIC Mast Trust Series 2017-VI Certificates. |
See notes to financial statements.
8
ULTRA SHORT MORTGAGE FUND
SCHEDULE OF INVESTMENTS
June 30, 2018
| Percentage of Net Assets | Maturity Date | Principal Amount | Value | |||||||||||||
| ADJUSTABLE RATE MORTGAGE-RELATED SECURITIES | 61.5 | % | ||||||||||||||
| 1 Mo. London Interbank Offering Rate (LIBOR) | 7.3 | % | ||||||||||||||
| Freddie Mac | ||||||||||||||||
| (Floating, LIBOR USD 1M + 0.16%, 0.16% Floor), 2.16%(1)(3) | 9/25/22 | $ | 3,384,490 | $ | 3,387,087 | |||||||||||
| 1 Yr. Constant Maturity Treasury Based ARMS | 21.3 | % | ||||||||||||||
| Fannie Mae Grantor Trust | ||||||||||||||||
| 4.45%(2)(3) | 5/25/42 | 4,562,568 | 4,664,086 | |||||||||||||
| Fannie Mae Whole Loan | ||||||||||||||||
| 4.15%(2)(3) | 8/24/42 | 1,205,878 | 1,234,700 | |||||||||||||
| 3.95%(2)(3) | 8/25/42 | 3,887,752 | 3,971,875 | |||||||||||||
| 9,870,661 | ||||||||||||||||
| 12 Mo. London Interbank Offering Rate (LIBOR) | 25.3 | % | ||||||||||||||
| Fannie Mae | ||||||||||||||||
| (Floating, ICE LIBOR USD 1Y + 1.72%, 10.21% Cap), 3.62%(1)(3) | 9/1/36 | 122,937 | 129,276 | |||||||||||||
| (Floating, ICE LIBOR USD 1Y + 1.76%, 11.31% Cap), 4.00%(1)(3) | 6/1/37 | 4,135,421 | 4,330,071 | |||||||||||||
| (Floating, ICE LIBOR USD 1Y + 1.58%, 10.65% Cap), 3.65%(1)(3) | 9/1/38 | 6,956,932 | 7,222,840 | |||||||||||||
| 11,682,187 | ||||||||||||||||
| 6 Mo. Certificate of Deposit Based ARMS | 1.3 | % | ||||||||||||||
| Fannie Mae | ||||||||||||||||
| (Floating, ICE LIBOR USD 6M + 1.00%, 12.24% Cap), 2.97%(1)(3) | 6/1/21 | 35,378 | 35,373 | |||||||||||||
| (Floating, ICE LIBOR USD 6M + 1.48%, 10.50% Cap), 3.36%(1)(3) | 12/1/24 | 360,631 | 370,814 | |||||||||||||
| Freddie Mac | ||||||||||||||||
| (Floating, ICE LIBOR USD 6M + 1.85%, 9.74% Cap), 3.76%(1)(3) | 1/1/26 | 173,339 | 177,030 | |||||||||||||
| 583,217 | ||||||||||||||||
| SBA Pool Floaters | 6.3 | % | ||||||||||||||
| Small Business Administration Pool | ||||||||||||||||
| (Variable, Prime Rate U.S. + 0.09%), 4.84%(3) | 10/25/38 | 2,733,229 | 2,931,358 | |||||||||||||
| TOTAL ADJUSTABLE RATE MORTGAGE-RELATED SECURITIES (Cost $28,570,995) | 28,454,510 | |||||||||||||||
| FIXED RATE MORTGAGE-RELATED SECURITIES | 26.6 | % | ||||||||||||||
| 30 Yr. Securities | 2.4 | % | ||||||||||||||
| Freddie Mac | ||||||||||||||||
| 6.00% | 6/16/37 | 1,066,997 | 1,126,420 | |||||||||||||
| Collateralized Mortgage Obligations | 24.2 | % | ||||||||||||||
| Freddie Mac | ||||||||||||||||
| 3.25% | 4/25/23 | 5,000,000 | 5,034,740 | |||||||||||||
| Government National Mortgage Association | ||||||||||||||||
| 1.35% | 6/16/37 | 6,374,388 | 6,171,421 | |||||||||||||
| 11,206,161 | ||||||||||||||||
| TOTAL FIXED RATE MORTGAGE-RELATED SECURITIES (Cost $12,587,208) | 12,332,581 | |||||||||||||||
See notes to financial statements.
9
ULTRA SHORT MORTGAGE FUND (concluded)
SCHEDULE OF INVESTMENTS
June 30, 2018
| Percentage of Net Assets | Shares | Value | ||||||||||
| INVESTMENT COMPANIES | 13.8 | % | ||||||||||
| Northern Institutional Treasury Portfolio, 1.70%* | 4,112,574 | $ | 4,112,574 | |||||||||
| AAAMCO Ultrashort Financing Fund(4) | 227,151 | 2,271,514 | ||||||||||
| TOTAL INVESTMENT COMPANIES (Cost $6,384,088) | 6,384,088 | |||||||||||
| TOTAL INVESTMENTS (Cost $47,542,291) | 101.9 | % | 47,171,179 | |||||||||
| NET OTHER ASSETS (LIABILITIES) | (1.9 | )% | (893,269 | ) | ||||||||
| NET ASSETS | 100.0 | % | $ | 46,277,910 | ||||||||
| * | The rate presented is the rate in effect at June 30, 2018. |
| (1) | ICE LIBOR is a benchmark rate produced from the average of interest rates that some of the world’s leading banks charge each other for short-term loans. |
| (2) | Variable or floating rate security, the interest rate of which adjusts periodically based on changes in current interest rates and prepayments on the underlying pool of assets. The rate presented is the rate in effect at June 30, 2018. |
| (3) | Variable rate security. The rate presented is the rate in effect at June 30, 2018. |
| (4) | Affiliated fund, see Note E. |
See notes to financial statements.
10
LARGE CAP EQUITY FUND
SCHEDULE OF INVESTMENTS
June 30, 2018
| Percentage of Net Assets | Shares | Value | ||||||||||
| COMMON STOCKS | 95.4 | % | ||||||||||
| Automobiles & Components | 1.3 | % | ||||||||||
| General Motors Co. | 14,000 | $ | 551,600 | |||||||||
| Banks | 3.5 | % | ||||||||||
| M&T Bank Corp. | 3,500 | 595,525 | ||||||||||
| PNC Financial Services Group | ||||||||||||
| (The), Inc. | 6,500 | 878,150 | ||||||||||
| 1,473,675 | ||||||||||||
| Capital Goods | 7.8 | % | ||||||||||
| Caterpillar, Inc. | 3,500 | 474,845 | ||||||||||
| Cummins, Inc. | 10,000 | 1,330,000 | ||||||||||
| Honeywell International, Inc. | 5,500 | 792,275 | ||||||||||
| Ingersoll-Rand PLC | 7,689 | 689,934 | ||||||||||
| 3,287,054 | ||||||||||||
| Consumer Services | 4.3 | % | ||||||||||
| Carnival Corp. | 8,396 | 481,175 | ||||||||||
| Starbucks Corp. | 27,000 | 1,318,950 | ||||||||||
| 1,800,125 | ||||||||||||
| Diversified Financials | 3.6 | % | ||||||||||
| Discover Financial Services | 12,942 | 911,246 | ||||||||||
| S&P Global, Inc. | 3,000 | 611,670 | ||||||||||
| 1,522,916 | ||||||||||||
| Energy | 6.1 | % | ||||||||||
| ConocoPhillips | 10,000 | 696,200 | ||||||||||
| EOG Resources, Inc. | 1,500 | 186,645 | ||||||||||
| Valero Energy Corp. | 15,257 | 1,690,933 | ||||||||||
| 2,573,778 | ||||||||||||
| Food & Staples Retailing | 3.3 | % | ||||||||||
| CVS Health Corp. | 5,000 | 321,750 | ||||||||||
| Walgreens Boots Alliance, Inc. | 18,000 | 1,080,270 | ||||||||||
| 1,402,020 | ||||||||||||
| Food Beverage & Tobacco | 2.4 | % | ||||||||||
| PepsiCo, Inc. | 9,154 | 996,596 | ||||||||||
| Health Care Equipment & Services | 4.2 | % | ||||||||||
| UnitedHealth Group, Inc. | 7,192 | 1,764,485 | ||||||||||
| Household & Personal Products | 0.5 | % | ||||||||||
| Estee Lauder Cos (The), Inc. | 1,500 | 214,035 | ||||||||||
| Insurance | 7.5 | % | ||||||||||
| Aflac, Inc. | 35,950 | 1,546,569 | ||||||||||
| Progressive (The) Corp. | 24,000 | 1,419,600 | ||||||||||
| Prudential Financial, Inc. | 2,188 | 204,600 | ||||||||||
| 3,170,769 | ||||||||||||
| Materials | 4.1 | % | ||||||||||
| LyondellBasell Industries NV | 15,753 | 1,730,467 | ||||||||||
| Media | 0.5 | % | ||||||||||
| Comcast Corp. | 7,000 | 229,670 | ||||||||||
| Pharmaceuticals & Biotechnology | 10.8 | % | ||||||||||
| AbbVie, Inc. | 15,000 | 1,389,750 | ||||||||||
See notes to financial statements.
11
LARGE CAP EQUITY FUND (concluded)
SCHEDULE OF INVESTMENTS
June 30, 2018
| Percentage of Net Assets | Shares | Value | ||||||||||
| Pharmaceuticals & Biotechnology (continued) | 10.8 | % | ||||||||||
| Amgen, Inc. | 6,570 | $ | 1,212,756 | |||||||||
| Bristol-Myers Squibb Co. | 9,700 | 536,798 | ||||||||||
| Eli Lilly & Co. | 16,400 | 1,399,412 | ||||||||||
| 4,538,716 | ||||||||||||
| Real Estate | 2.5 | % | ||||||||||
| Simon Property Group, Inc. | 6,137 | 1,044,456 | ||||||||||
| Retailing | 4.8 | % | ||||||||||
| Dollar General Corp. | 1,000 | 98,600 | ||||||||||
| Home Depot (The), Inc. | 5,176 | 1,009,838 | ||||||||||
| Lowe’s Cos., Inc. | 9,576 | 5,178 | ||||||||||
| 2,023,616 | ||||||||||||
| Semiconductors & Semiconductor | 4.8 | % | ||||||||||
| Broadcom, Inc. | 7,000 | 1,698,480 | ||||||||||
| Intel Corp. | 6,500 | 323,115 | ||||||||||
| 2,021,595 | ||||||||||||
| Software & Services | 18.7 | % | ||||||||||
| Alphabet, Inc.(a) | 1,650 | 1,863,164 | ||||||||||
| Facebook, Inc.(a) | 10,200 | 1,982,064 | ||||||||||
| Intuit, Inc. | 6,250 | 1,276,906 | ||||||||||
| Mastercard, Inc. | 5,000 | 982,600 | ||||||||||
| Microsoft Corp. | 18,200 | 1,794,702 | ||||||||||
| 7,899,436 | ||||||||||||
| Technology Hardware & Equipment | 2.4 | % | ||||||||||
| Western Digital Corp. | 13,000 | 1,006,330 | ||||||||||
| Utilities | 2.3 | % | ||||||||||
| American Electric Power Co., Inc. | 3,000 | 207,750 | ||||||||||
| Edison International | 11,762 | 744,182 | ||||||||||
| 951,932 | ||||||||||||
| TOTAL COMMON STOCKS (Cost $33,166,399) | 40,203,271 | |||||||||||
| Percentage of Net Assets | Shares | Value | ||||||||||
| INVESTMENT COMPANIES | 4.7 | % | ||||||||||
| Northern Institutional Treasury Portfolio, 1.70%* | 1,986,910 | $ | 1,986,910 | |||||||||
| TOTAL INVESTMENT COMPANIES (Cost $1,986,910) | 1,986,910 | |||||||||||
| TOTAL INVESTMENTS (Cost $35,153,309) | 42,190,181 | |||||||||||
| NET OTHER ASSETS (LIABILITIES) | (0.1 | )% | (38,549 | ) | ||||||||
| NET ASSETS | 100.0 | % | $ | 42,151,632 | ||||||||
| * | The rate presented is the rate in effect at June 30, 2018. |
| (a) | Non-income producing security. |
See notes to financial statements.
12
STATEMENTS OF ASSETS & LIABILITIES
June 30, 2018
AAAMCO Ultrashort Financing Fund | Ultra Short Mortgage Fund | Large Cap Equity Fund | ||||||||||
| Assets: | ||||||||||||
| Investments, at cost | $ | 1,943,289 | $ | 45,270,777 | $ | 35,153,309 | ||||||
| Investments, at value | 1,943,289 | 44,899,665 | 42,190,181 | |||||||||
| Investments in affiliates, at value (Cost $0, $2,271,514 and $0, respectively) | — | 2,271,514 | — | |||||||||
| Repurchase agreements, cost equals fair value | 57,565,126 | — | — | |||||||||
| Receivable for dividends and interest | 54,634 | 125,102 | 16,173 | |||||||||
| Receivable for paydowns on mortgage-backed securities | — | 9,696 | — | |||||||||
| Receivable for capital shares sold | — | — | 3,287 | |||||||||
| Receivable from Adviser/Distributor | 26,770 | 10,773 | 3,049 | |||||||||
| Total Assets | 59,589,819 | 47,316,750 | 42,212,690 | |||||||||
| Liabilities: | ||||||||||||
| Income distribution payable | — | 70,649 | — | |||||||||
| Investment advisory fees payable | 14,610 | 17,679 | 23,302 | |||||||||
| Distribution fees payable | 693 | 9,821 | 7,624 | |||||||||
| Unitary fees payable | 23,284 | 33,661 | 29,256 | |||||||||
| Capital shares redeemed payable | — | 907,030 | 876 | |||||||||
| Total Liabilities | 38,587 | 1,038,840 | 61,058 | |||||||||
| Net Assets | $ | 59,551,232 | $ | 46,277,910 | $ | 42,151,632 | ||||||
| Class I | ||||||||||||
| Net assets | $ | 8,632,442 | $ | 46,277,910 | $ | — | ||||||
| Shares of common stock outstanding | 863,384 | 6,745,690 | — | |||||||||
| Net asset value per share | $ | 10.00 | $ | 6.86 | $ | — | ||||||
| Class Y | ||||||||||||
| Net assets | $ | 50,918,790 | $ | — | $ | — | ||||||
| Shares of common stock outstanding | 5,093,095 | — | — | |||||||||
| Net asset value per share | $ | 10.00 | $ | — | $ | — | ||||||
| Class AMF | ||||||||||||
| Net assets | $ | — | $ | — | $ | 35,818,585 | ||||||
| Shares of common stock outstanding | — | — | 4,270,914 | |||||||||
| Net asset value per share | $ | — | $ | — | $ | 8.39 | ||||||
| Class H | ||||||||||||
| Net assets | $ | — | $ | — | $ | 6,333,047 | ||||||
| Shares of common stock outstanding | — | — | 757,832 | |||||||||
| Net asset value per share | $ | — | $ | — | $ | 8.36 | ||||||
| Net Assets | ||||||||||||
| Paid in capital | $ | 59,577,292 | $ | 52,238,655 | $ | 30,854,095 | ||||||
| Accumulated undistributed net investment income | 14,169 | 103,602 | — | |||||||||
| Accumulated undistributed net realized gains (losses) | (40,229 | ) | (5,693,235 | ) | 4,260,665 | |||||||
| Unrealized appreciation (depreciation) on investments | — | (371,112 | ) | 7,036,872 | ||||||||
| Net assets | $ | 59,551,232 | $ | 46,277,910 | $ | 42,151,632 | ||||||
See notes to financial statements.
13
STATEMENTS OF OPERATIONS
AAAMCO Ultrashort Financing Fund | Ultra Short Mortgage Fund | Large Cap Equity Fund | ||||||||||||||||||||||
Eight Months Ended June 30, 2018 | Since Inception to October 31, 2017* | Eight Months Ended June 30, 2018 | Year Ended October 31, 2017 | Eight Months Ended June 30, 2018 | Year Ended October 31, 2017 | |||||||||||||||||||
| INVESTMENT INCOME: | ||||||||||||||||||||||||
| Interest income | $ | 843,638 | $ | 377,300 | $ | 767,582 | $ | 1,637,675 | $ | — | $ | — | ||||||||||||
| Dividend income | 10,159 | 5,166 | 29,200 | 29,001 | 653,033 | 1,099,503 | ||||||||||||||||||
| Dividend income from investment in affiliates | — | — | 38,387 | 13,127 | — | — | ||||||||||||||||||
| Total investment income | 853,797 | 382,466 | 835,169 | 1,679,803 | 653,033 | 1,099,503 | ||||||||||||||||||
| Operating expenses: | ||||||||||||||||||||||||
| Investment advisory | 116,566 | 68,953 | 196,191 | 483,200 | 194,540 | 286,487 | ||||||||||||||||||
| Distribution — Class AMF Shares | — | — | — | — | 64,236 | 95,728 | ||||||||||||||||||
| Distribution — Class I Shares | 5,707 | 2,940 | 108,995 | 268,444 | — | — | ||||||||||||||||||
| Unitary | 253,268 | 151,219 | 295,579 | 642,090 | 207,754 | 262,910 | ||||||||||||||||||
| Total expenses before reductions | 375,541 | 223,112 | 600,765 | 1,393,734 | 466,530 | 645,125 | ||||||||||||||||||
| Expenses reduced by Investment | ||||||||||||||||||||||||
| Adviser | (209,052 | ) | (117,397 | ) | (76,117 | ) | (174,636 | ) | — | — | ||||||||||||||
| Expenses reduced by Distributor | — | — | (43,598 | ) | (107,376 | ) | (25,694 | ) | (38,291 | ) | ||||||||||||||
| Unitary Fee Waiver | (66,649 | ) | (39,794 | ) | — | — | — | — | ||||||||||||||||
| Net expenses | 99,840 | 65,921 | 481,050 | 1,111,722 | 440,836 | 606,834 | ||||||||||||||||||
| Net investment income | 753,957 | 316,545 | 354,119 | 568,081 | 212,197 | 492,669 | ||||||||||||||||||
| REALIZED AND UNREALIZED GAINS | ||||||||||||||||||||||||
| (LOSSES) FROM INVESTMENT ACTIVITIES: | ||||||||||||||||||||||||
| Net realized gains (loss) from investment transactions | (19,274 | ) | (9,652 | ) | (391,663 | ) | (572,466 | ) | 4,595,624 | 9,094,101 | ||||||||||||||
| Net increase from payment by affiliates | — | 12,500 | — | — | — | — | ||||||||||||||||||
| Change in unrealized appreciation (depreciation) on investments | 9,980 | (9,980 | ) | (665,413 | ) | (578,941 | ) | (3,224,281 | ) | 86,114 | ||||||||||||||
| Net realized and unrealized gains (losses) from investment activities | (9,294 | ) | (7,132 | ) | (1,057,076 | ) | (1,151,407 | ) | 1,371,343 | 9,180,215 | ||||||||||||||
| CHANGE IN NET ASSETS RESULTING FROM OPERATIONS | $ | 744,663 | $ | 309,413 | $ | (702,957 | ) | $ | (583,326 | ) | $ | 1,583,540 | $ | 9,672,884 | ||||||||||
| * | For the period from June 6, 2017, inception date and commencement of operations, to October 31, 2017. |
See notes to financial statements.
14
STATEMENTS OF CHANGES IN NET ASSETS
| AAAMCO Ultrashort Financing Fund | ||||||||
| Eight Months Ended June 30, 2018 | Since Inception 2017* | |||||||
| Increase (decrease) in net assets: | ||||||||
| Operations: | ||||||||
| Net investment income | $ | 753,957 | $ | 316,545 | ||||
| Net realized losses from investment transactions | (19,274 | ) | (9,652 | ) | ||||
| Net increase from payment by affiliates | — | 12,500 | ||||||
| Change in unrealized appreciation (depreciation) on investments | 9,980 | (9,980 | ) | |||||
| Change in net assets resulting from operations | 744,663 | 309,413 | ||||||
| Dividends paid to shareholders: | ||||||||
| From net investment income: | ||||||||
| Class I Stockholders | (105,908 | ) | (40,777 | ) | ||||
| Class Y Stockholders | (634,877 | ) | (286,074 | ) | ||||
| Total dividends paid to shareholders | (740,785 | ) | (326,851 | ) | ||||
| Capital Transactions: | ||||||||
| Class I Shares: | ||||||||
| Proceeds from sale of shares | 1,258,156 | 9,010,000 | ||||||
| Value of shares issued to shareholders in reinvestment of dividends | 105,907 | 40,777 | ||||||
| Cost of shares redeemed | (1,781,001 | ) | — | |||||
| Class Y Shares: | ||||||||
| Proceeds from sale of shares | 5,000,000 | 50,010,000 | ||||||
| Value of shares issued to shareholders in reinvestment of dividends | 634,878 | 286,075 | ||||||
| Cost of shares redeemed | (5,000,000 | ) | — | |||||
| Change in net assets from capital transactions | 217,940 | 59,346,852 | ||||||
| Change in net assets | 221,818 | 59,329,414 | ||||||
| Net Assets: | ||||||||
| Beginning of period | 59,329,414 | — | ||||||
| End of period | $ | 59,551,232 | $ | 59,329,414 | ||||
| Accumulated undistributed net investment income | $ | 14,169 | $ | 999 | ||||
| * | For the period from June 6, 2017, inception date and commencement of operations, to October 31, 2017. |
See notes to financial statements.
15
STATEMENTS OF CHANGES IN NET ASSETS (continued)
| Ultra Short Mortgage Fund | ||||||||||||
| Eight Months Ended June 30, 2018 | Year Ended | Year Ended | ||||||||||
| Increase (decrease) in net assets: | ||||||||||||
| Operations: | ||||||||||||
| Net investment income | $ | 354,119 | $ | 568,081 | $ | 1,087,396 | ||||||
| Net realized gains (losses) from investment transactions | (391,663 | ) | (572,466 | ) | 531,340 | |||||||
| Change in unrealized depreciation on investments | (665,413 | ) | (578,941 | ) | (2,138,000 | ) | ||||||
| Change in net assets resulting from operations | (702,957 | ) | (583,326 | ) | (519,264 | ) | ||||||
| Dividends paid to stockholders: | ||||||||||||
| From net investment income | (748,942 | ) | (1,780,575 | ) | (2,263,353 | ) | ||||||
| Total dividends paid to stockholders | (748,942 | ) | (1,780,575 | ) | (2,263,353 | ) | ||||||
| Capital Transactions: | ||||||||||||
| Proceeds from sale of shares | — | 2,000,059 | 19,481,854 | |||||||||
| Value of shares issued to shareholders in reinvestment of dividends | 139,153 | 432,767 | 500,577 | |||||||||
| Cost of shares redeemed | (39,795,762 | ) | (32,577,526 | ) | (71,682,538 | ) | ||||||
| Change in net assets from capital transactions | (39,656,609 | ) | (30,144,700 | ) | (51,700,107 | ) | ||||||
| Change in net assets | (41,108,508 | ) | (32,508,601 | ) | (54,482,724 | ) | ||||||
| Net Assets: | ||||||||||||
| Beginning of period | 87,386,418 | 119,895,019 | 174,377,743 | |||||||||
| End of period | $ | 46,277,910 | $ | 87,386,418 | $ | 119,895,019 | ||||||
| Accumulated undistributed net investment income | $ | 103,602 | $ | 85,505 | $ | 36,479 | ||||||
See notes to financial statements.
16
STATEMENTS OF CHANGES IN NET ASSETS (concluded)
| Large Cap Equity Fund | ||||||||||||
| Eight Months Ended June 30, 2018 | Year Ended October 31, | Year Ended | ||||||||||
| Increase (decrease) in net assets: | ||||||||||||
| Operations: | ||||||||||||
| Net investment income | $ | 212,197 | $ | 492,669 | $ | 505,894 | ||||||
| Net realized gains from investment transactions | 4,595,624 | 9,094,101 | 10,417,303 | |||||||||
| Change in unrealized appreciation (depreciation) on investments | (3,224,281 | ) | 86,114 | (8,053,698 | ) | |||||||
| Change in net assets resulting from operations | 1,583,540 | 9,672,884 | 2,869,499 | |||||||||
| Dividends paid to shareholders: | ||||||||||||
| From net investment income: | ||||||||||||
| Class AMF Stockholders | (223,611 | ) | (449,507 | ) | (446,355 | ) | ||||||
| Class H Stockholders | (51,270 | ) | (82,031 | ) | (71,839 | ) | ||||||
| From net realized gains: | ||||||||||||
| Class AMF Shares | (7,040,958 | ) | (8,615,460 | ) | (2,362,365 | ) | ||||||
| Class H Shares | (1,086,385 | ) | (1,243,999 | ) | (349,126 | ) | ||||||
| Total dividends paid to shareholders | (8,402,224 | ) | (10,390,997 | ) | (3,229,685 | ) | ||||||
| Capital Transactions: | ||||||||||||
| Class AMF Shares: | ||||||||||||
| Proceeds from sale of shares | 260,103 | 815,172 | 598,431 | |||||||||
| Value of shares issued to shareholders in reinvestment of dividends | 6,478,073 | 8,349,483 | 2,511,047 | |||||||||
| Cost of shares redeemed | (5,127,919 | ) | (5,056,728 | ) | (5,182,189 | ) | ||||||
| Class H Shares: | ||||||||||||
| Proceeds from sale of shares | 1,171,224 | 1,446,466 | 611,561 | |||||||||
| Value of shares issued to shareholders in reinvestment of dividends | 22,169 | 23,809 | 6,596 | |||||||||
| Cost of shares redeemed | (132,899 | ) | (541,444 | ) | (1,781,351 | ) | ||||||
| Change in net assets from capital transactions | 2,670,751 | 5,036,758 | (3,235,905 | ) | ||||||||
| Change in net assets | (4,147,933 | ) | 4,318,645 | (3,596,091 | ) | |||||||
| Net Assets: | ||||||||||||
| Beginning of period | 46,299,565 | 41,980,920 | 45,577,011 | |||||||||
| End of period | $ | 42,151,632 | $ | 46,299,565 | $ | 41,980,920 | ||||||
| Accumulated undistributed net investment loss | $ | — | $ | (1 | ) | $ | (1 | ) | ||||
See notes to financial statements.
17
AAAMCO ULTRASHORT FINANCING FUND — CLASS I SHARES
FINANCIAL HIGHLIGHTS
Selected data for a share outstanding throughout the period indicated.
| Eight Months Ended June 30, 2018 | Period Ended October 31, 2017* | |||||||
| Net asset value, beginning of period | $ | 10.00 | $ | 10.00 | ||||
| Income (loss) from investment operations: | ||||||||
| Net investment income | 0.1260 | 0.0533 | ||||||
| Net realized and unrealized gains (losses) from investments | (0.0025 | ) | 0.0018 | (a) | ||||
| Total from investment operations | 0.1235 | 0.0551 | ||||||
| Less distributions: | ||||||||
| Dividends paid to stockholders: | ||||||||
| From net investment income | (0.1235 | ) | (0.0551 | ) | ||||
| Change in net asset value | — | — | ||||||
| Net asset value, end of period | $ | 10.00 | $ | 10.00 | ||||
| Total return | 1.24 | %(b) | 0.55 | %(b) | ||||
| Ratios/Supplemental data: | ||||||||
| Net assets, end of period (in 000’s) | $ | 8,632 | $ | 9,049 | ||||
| Ratio of net expenses to average net assets | 0.30 | %(c) | 0.34 | %(c) | ||||
| Ratio of net investment income to average net assets | 1.89 | %(c) | 1.32 | %(c) | ||||
| Ratio of gross expenses to average net assets | 1.05 | %(c) | 1.05 | %(c) | ||||
| Portfolio turnover rate | 706 | %(b) | 389 | %(b) | ||||
| * | For the period from June 6, 2017, inception date and commencement of operations, to October 31, 2017. |
| (a) | Realized and unrealized gains and losses per share in this caption are balancing amounts necessary to reconcile the change in net asset value per share for the period, and may not reconcile with the aggregate gains and losses in the Statement of Operations due to share transactions for the period. |
| (b) | Not annualized for periods less than one year. |
| (c) | Annualized for periods less than one year. |
See notes to financial statements.
18
AAAMCO ULTRASHORT FINANCING FUND — CLASS Y SHARES
FINANCIAL HIGHLIGHTS
Selected data for a share outstanding throughout the period indicated.
| Eight Months Ended June 30, 2018 | Period Ended October 31, 2017* | |||||||
| Net asset value, beginning of period | $ | 10.00 | $ | 10.00 | ||||
| Income (loss) from investment operations: | ||||||||
| Net investment income | 0.1290 | 0.0553 | ||||||
| Net realized and unrealized gains (losses) from investments | (0.0021 | ) | 0.0018 | (a) | ||||
| Total from investment operations | 0.1269 | 0.0571 | ||||||
| Less distributions: | ||||||||
| Dividends paid to stockholders: | ||||||||
| From net investment income | (0.1269 | ) | (0.0571 | ) | ||||
| Change in net asset value | — | — | ||||||
| Net asset value, end of period | $ | 10.00 | $ | 10.00 | ||||
| Total return | 1.28 | %(b) | 0.57 | %(b),(c) | ||||
| Ratios/Supplemental data: | ||||||||
| Net assets, end of period (in 000’s) | $ | 50,919 | $ | 50,281 | ||||
| Ratio of net expenses to average net assets | 0.25 | %(d) | 0.29 | %(d) | ||||
| Ratio of net investment income to average net assets | 1.95 | %(d) | 1.37 | %(d) | ||||
| Ratio of gross expenses to average net assets | 0.95 | %(d) | 0.96 | %(d) | ||||
| Portfolio turnover rate | 706 | %(b) | 389 | %(b) | ||||
| * | For the period from June 6, 2017, inception date and commencement of operations, to October 31, 2017. |
| (a) | Realized and unrealized gains and losses per share in this caption are balancing amounts necessary to reconcile the change in net asset value per share for the period, and may not reconcile with the aggregate gains and losses in the Statement of Operations due to share transactions for the period. |
| (b) | Not annualized for periods less than one year. |
| (c) | During the period ended October 31, 2017, the AAAMCO Ultrashort Financing Fund received monies from the Adviser. If these monies were not received, the return for the period would have been 0.47%. |
| (d) | Annualized for periods less than one year. |
See notes to financial statements.
19
ULTRA SHORT MORTGAGE FUND
FINANCIAL HIGHLIGHTS
Selected data for a share outstanding throughout the period indicated.
| Eight Months Ended June 30, | Year Ended October 31, | |||||||||||||||||||||||
| 2018 | 2017 | 2016 | 2015 | 2014 | 2013 | |||||||||||||||||||
| Net asset value, beginning of period | $ | 7.00 | $ | 7.16 | $ | 7.29 | $ | 7.36 | $ | 7.37 | $ | 7.36 | ||||||||||||
| Income (loss) from investment operations: | ||||||||||||||||||||||||
| Net investment income | 0.0268 | 0.0205 | 0.0439 | 0.0575 | 0.0722 | 0.0626 | ||||||||||||||||||
| Net realized and unrealized gains (losses) from investments | (0.0873 | ) | (0.0636 | ) | (0.0603 | ) | (0.0339 | ) | 0.0225 | 0.0725 | ||||||||||||||
| Total from investment operations | (0.0605 | ) | (0.0431 | ) | (0.0164 | ) | 0.0236 | 0.0947 | 0.1351 | |||||||||||||||
| Less distributions: | ||||||||||||||||||||||||
| Dividends paid to stockholders: | ||||||||||||||||||||||||
| From net investment income | (0.0795 | ) | (0.1169 | ) | (0.1136 | ) | (0.0936 | ) | (0.1047 | ) | (0.1251 | ) | ||||||||||||
| Change in net asset value | (0.14 | ) | (0.16 | ) | (0.13 | ) | (0.07 | ) | (0.01 | ) | 0.01 | |||||||||||||
| Net asset value, end of period | $ | 6.86 | $ | 7.00 | $ | 7.16 | $ | 7.29 | $ | 7.36 | $ | 7.37 | ||||||||||||
| Total return | (0.87 | )%(a) | (0.61 | )% | (0.22 | )% | 0.32 | % | 1.30 | % | 1.86 | %* | ||||||||||||
| Ratios/Supplemental data: | ||||||||||||||||||||||||
| Net assets, end of period (000’s) | $ | 46,278 | $ | 87,386 | $ | 119,895 | $ | 174,378 | $ | 197,512 | $ | 274,862 | ||||||||||||
| Ratio of net expenses to average net assets | 1.10 | %(b) | 1.03 | % | 0.96 | % | 0.92 | % | 0.80 | % | 0.79 | % | ||||||||||||
| Ratio of net investment income to average net assets | 0.82 | %(b) | 0.53 | % | 0.75 | % | 0.85 | % | 1.08 | % | 0.99 | % | ||||||||||||
| Ratio of gross expenses to average net assets** | 1.38 | %(b) | 1.30 | % | 1.22 | % | 1.18 | % | 1.09 | % | 1.12 | % | ||||||||||||
| Portfolio turnover rate | 32 | %(a) | 26 | % | 26 | % | 22 | % | 3 | % | 30 | % | ||||||||||||
| (a) | Not annualized for periods less than one year. |
| (b) | Annualized for periods less than one year. |
| * | During the fiscal year ended October 31, 2013, the Ultra Short Mortgage Fund received monies related to certain nonrecurring litigation settlements. If these monies were not received, the One Year return would have been (0.20)%. |
| ** | During the periods shown, certain fees were voluntarily reduced. If such voluntary fee reductions had not occurred, the ratios would have been as indicated. |
See notes to financial statements.
20
LARGE CAP EQUITY FUND — CLASS AMF SHARES
FINANCIAL HIGHLIGHTS
Selected data for a share outstanding throughout the period indicated.
| Eight Months Ended June 30, | Year Ended October 31, | |||||||||||||||||||||||
| 2018 | 2017 | 2016 | 2015 | 2014 | 2013 | |||||||||||||||||||
| Net asset value, beginning of period | $ | 9.84 | $ | 10.34 | $ | 10.43 | $ | 11.37 | $ | 11.10 | $ | 9.41 | ||||||||||||
| Income (loss) from investment operations: | ||||||||||||||||||||||||
| Net investment income | 0.04 | 0.11 | 0.12 | 0.13 | 0.13 | 0.11 | ||||||||||||||||||
| Net realized and unrealized gains (losses) from investments | 0.30 | 2.02 | 0.57 | (0.20 | ) | 1.03 | 2.02 | |||||||||||||||||
| Total from investment operations | 0.34 | 2.13 | 0.69 | (0.07 | ) | 1.16 | 2.13 | |||||||||||||||||
| Less distributions: | ||||||||||||||||||||||||
| Dividends paid to stockholders: | ||||||||||||||||||||||||
| From net investment income | (0.05 | ) | (0.11 | ) | (0.12 | ) | (0.14 | ) | (0.14 | ) | (0.12 | ) | ||||||||||||
| From net realized gains | (1.74 | ) | (2.52 | ) | (0.66 | ) | (0.73 | ) | (0.75 | ) | (0.32 | ) | ||||||||||||
| Total distributions | (1.79 | ) | (2.63 | ) | (0.78 | ) | (0.87 | ) | (0.89 | ) | (0.44 | ) | ||||||||||||
| Change in net asset value | (1.45 | ) | (0.50 | ) | (0.09 | ) | (0.94 | ) | 0.27 | 1.69 | ||||||||||||||
| Net asset value, end of period | $ | 8.39 | $ | 9.84 | $ | 10.34 | $ | 10.43 | $ | 11.37 | $ | 11.10 | ||||||||||||
| Total return | 3.41 | %(a) | 24.63 | % | 7.06 | % | (0.87 | )% | 10.90 | % | 23.55 | % | ||||||||||||
| Ratios/Supplemental data: | ||||||||||||||||||||||||
| Net assets, end of period (in 000’s) | $ | 35,819 | $ | 40,104 | $ | 36,668 | $ | 39,017 | $ | 54,780 | $ | 89,562 | ||||||||||||
| Ratio of net expenses to average net assets | 1.49 | %(b) | 1.40 | % | 1.32 | % | 1.28 | % | 1.24 | % | 1.22 | % | ||||||||||||
| Ratio of net investment income to average net assets | 0.69 | %(b) | 1.09 | % | 1.18 | % | 1.22 | % | 1.13 | % | 1.11 | % | ||||||||||||
| Ratio of gross expenses to average net assets** | 1.59 | %(b) | 1.50 | % | 1.42 | % | 1.38 | % | 1.34 | % | 1.32 | % | ||||||||||||
| Portfolio turnover rate | 21 | %(a) | 112 | % | 76 | % | 9 | % | 7 | % | 5 | % | ||||||||||||
| ** | During the periods shown, certain fees were voluntarily reduced. If such voluntary fee reductions had not occurred, the ratios would have been as indicated. |
| (a) | Not annualized for periods less than one year. |
| (b) | Annualized for periods less than one year. |
See notes to financial statements.
21
LARGE CAP EQUITY FUND — CLASS H SHARES
FINANCIAL HIGHLIGHTS
Selected data for a share outstanding throughout the period indicated.
| Eight Months Ended June 30, | Year Ended October 31, | |||||||||||||||||||||||
| 2018 | 2017 | 2016 | 2015 | 2014 | 2013 | |||||||||||||||||||
| Net asset value, beginning of period | $ | 9.82 | $ | 10.34 | $ | 10.43 | $ | 11.36 | $ | 11.10 | $ | 9.41 | ||||||||||||
| Income (loss) from investment operations: | ||||||||||||||||||||||||
| Net investment income | 0.05 | 0.12 | 0.15 | 0.14 | 0.13 | 0.13 | ||||||||||||||||||
| Net realized and unrealized gains (losses) from investments | 0.30 | 2.02 | 0.56 | (0.19 | ) | 1.04 | 2.01 | |||||||||||||||||
| Total from investment operations | 0.35 | 2.14 | 0.71 | (0.05 | ) | 1.17 | 2.14 | |||||||||||||||||
| Less distributions: | ||||||||||||||||||||||||
| Dividends paid to stockholders: | ||||||||||||||||||||||||
| From net investment income | (0.07 | ) | (0.14 | ) | (0.14 | ) | (0.15 | ) | (0.16 | ) | (0.13 | ) | ||||||||||||
| From net realized gains | (1.74 | ) | (2.52 | ) | (0.66 | ) | (0.73 | ) | (0.75 | ) | (0.32 | ) | ||||||||||||
| Total distributions | (1.81 | ) | (2.66 | ) | (0.80 | ) | (0.88 | ) | (0.91 | ) | (0.45 | ) | ||||||||||||
| Change in net asset value | (1.46 | ) | (0.52 | ) | (0.09 | ) | (0.93 | ) | 0.26 | 1.69 | ||||||||||||||
| Net asset value, end of period | $ | 8.36 | $ | 9.82 | $ | 10.34 | $ | 10.43 | $ | 11.36 | $ | 11.10 | ||||||||||||
| Total return | 3.54 | %(a) | 24.76 | % | 7.23 | % | (0.62 | )% | 10.99 | % | 23.74 | % | ||||||||||||
| Ratios/Supplemental data: | ||||||||||||||||||||||||
| Net assets, end of period (in 000’s) | $ | 6,333 | $ | 6,196 | $ | 5,313 | $ | 6,560 | $ | 6,864 | $ | 5,755 | ||||||||||||
| Ratio of net expenses to average net assets | 1.35 | %(b) | 1.25 | % | 1.16 | % | 1.13 | % | 1.09 | % | 1.07 | % | ||||||||||||
| Ratio of net investment income to average net assets | 0.82 | %(b) | 1.24 | % | 1.38 | % | 1.33 | % | 1.15 | % | 1.24 | % | ||||||||||||
| Ratio of gross expenses to average net assets | 1.35 | %(b) | 1.25 | % | 1.16 | % | 1.13 | % | 1.09 | % | 1.07 | % | ||||||||||||
| Portfolio turnover rate | 21 | %(a) | 112 | % | 76 | % | 9 | % | 7 | % | 5 | % | ||||||||||||
| (a) | Not annualized for periods less than one year. |
| (b) | Annualized for periods less than one year. |
See notes to financial statements.
22
NOTES TO FINANCIAL STATEMENTS
June 30, 2018
Asset Management Fund (the “Trust”) was reorganized as a Delaware statutory trust on September 30, 1999, and is registered under the Investment Company Act of 1940, as amended (the “1940 Act”), as a diversified open-end management company. As an investment company, as defined in Financial Accounting Standards Board (“FASB”) Accounting Standards Update 2013-08, the Trust follows accounting and reporting guidance under FASB Accounting Standards Codification Topic 946, “Financial Services- Investment Companies.” As of June 30, 2018, the Trust is authorized to issue an unlimited number of shares, at no par value, in three separate series: the AAAMCO Ultrashort Financing Fund, the Ultra Short Mortgage Fund and the Large Cap Equity Fund (referred to individually as a “Fund” and collectively as the “Funds”). The AAAMCO Ultrashort Financing Fund is authorized to issue two classes of shares: Class I Shares and Class Y Shares. Class I and Class Y Shares of the AAAMCO Ultrashort Financing Fund have the same rights and obligations except: (i) Class I Shares bear a distribution fee, while Class Y Shares do not have any distribution fee, which will cause Class I Shares to have a higher expense ratio and to pay lower dividends than those related to Class Y Shares; (ii) other expenses, which are determined to properly apply to one class of shares upon approval by the Board of Trustees of the Trust (“Board”), will be borne solely by the class to which such expenses are attributable; and (iii) each class will have exclusive voting rights with respect to the matters relating to its own distribution arrangements. The AAAMCO Ultrashort Financing Fund commenced operations on June 6, 2017. The Ultra Short Mortgage Fund offers a single class of shares. The Large Cap Equity Fund is authorized to issue two classes of shares: Class AMF Shares and Class H Shares. Class AMF and Class H Shares of the Large Cap Equity Fund have the same rights and obligations except: (i) Class AMF Shares bear a distribution fee, while Class H Shares do not have any distribution fee, which will cause Class AMF Shares to have a higher expense ratio and to pay lower dividend rates than those related to Class H Shares; (ii) other expenses, which are determined to properly apply to one class of shares upon approval by the (“Board”), will be borne solely by the class to which such expenses are attributable; and (iii) each class will have exclusive voting rights with respect to the matters relating to its own distribution arrangements. The Funds’ fiscal year-end changed from October 31 to June 30.
The Trust maintains an insurance policy that insures its officers and trustees against certain liabilities. Under the Trust’s organizational documents, its officers and trustees are indemnified against certain liabilities arising out of the performance of their duties to the Trust. In addition, in the normal course of business, the Trust enters into contracts with its vendors and others that provide general indemnification. Each Fund’s maximum exposure under these arrangements is unknown, as this would involve future claims that may be made against a Fund.
A. Significant accounting policies are as follows:
SECURITY VALUATION
Investments are recorded at fair value. Fair value is defined as the price that would be received to sell an asset or paid to transfer a liability in an orderly transaction between market participants at the measurement date. The valuation techniques employed by the Funds, as described below, maximize the use of observable inputs and minimize the use of unobservable inputs in determining fair value. These inputs are summarized in the following three broad levels:
| ● | Level 1 — quoted prices in active markets for identical assets |
| ● | Level 2 — other significant observable inputs (including quoted prices of similar securities, interest rates, prepayment speeds, credit risk, etc.) |
| ● | Level 3 — significant unobservable inputs (including a Fund’s own assumptions in determining the fair value of investments) |
The inputs or methodology used for valuing securities are not necessarily an indication of the risk associated with investing in those securities. For example, certain short-term debt securities may be valued using amortized cost. Generally, amortized cost approximates the fair value of a security, but since this valuation is not obtained from a quoted price in an active market, such securities would be reflected as Level 2 in the fair value hierarchy.
The Funds’ prices for equity securities are generally provided by an independent third party pricing service approved by the Board as of the close of the regular trading session of the New York Stock Exchange, normally at 4:00 pm EST, each business day on which the share price of each Fund is calculated. Equity securities listed or traded on a primary exchange are valued at the closing price, if available, or the last sales price on the primary exchange. If no sale occurred on the valuation date, the securities will be valued at the mean of the latest bid and ask quotations as of the close of the primary exchange. Investments in other open-end registered investment companies are valued at their respective net asset value (“NAV”) as reported by such companies. In these types of situations, valuations are typically categorized as Level 1 in the fair value hierarchy.
The Funds’ debt and other fixed income securities are generally valued at an evaluated bid price provided by an independent pricing source approved by the Board. To value debt securities, pricing services may use various pricing techniques which take into account appropriate factors such as market activity, yield, quality, coupon rate, maturity, type of issue, trading characteristics, call features, credit ratings and other data, as well as broker quotes. Short-term debt securities of sufficient credit quality that mature within sixty days may be valued at amortized cost, which may approximate fair value. Repurchase agreements are valued at
23
NOTES TO FINANCIAL STATEMENTS (continued)
June 30, 2018
par daily, as long as the market value of collateral is sufficient to support this valuation. In each of these situations, valuations are typically categorized as Level 2 in the fair value hierarchy. If a pricing service is unable to provide valuations for a particular security or securities, or the Pricing Committee has determined that such valuations are unreliable, the Board has approved the use of a fair valuation methodology implemented by the Pricing Committee to fair value the security or securities.
Within the fair value pricing methodology implemented by the Pricing Committee, among the more specific factors that are considered in determining the fair value of investments in debt instruments are: (1) information obtained with respect to market transactions in such securities or comparable securities; (2) the price and extent of public trading in similar securities of the issuer or comparable securities; (3) the fundamental analytical data relating to the investment; (4) quotations from broker/ dealers, yields, maturities, ratings and various relationships between securities; and (5) evaluation of the forces which influence the market in which these securities are purchased and sold. The fair valuation process also takes into consideration factors such as interest rate changes, movements in credit spreads, default rate assumptions, repayment assumptions, type and quality of collateral, and security seasoning. Imprecision in estimating fair value can impact the amount
of unrealized appreciation or depreciation recorded for a particular security, and differences in the assumptions used could result in a different determination of fair value, and those differences could be material. Depending on the source and relative significance of the valuation inputs in these instances, the instruments may be classified as Level 2 or Level 3 in the fair value hierarchy.
Fair value pricing, including evaluated prices obtained from pricing services, is inherently a process of estimates and judgments. Fair value prices may fluctuate less than market prices due to technical issues which may impact the prices at which the Funds can purchase or sell securities. Market prices can be impacted by technical factors such as short term changes in market liquidity and volatility which may not directly impact fair value prices. In addition, changes in the value of portfolio investments priced at fair value may be less frequent and of greater magnitude than changes in the price of securities that trade frequently in the marketplace, resulting in potentially greater NAV volatility.
While the Trust’s policy is intended to result in a calculation of a Fund’s NAV that fairly reflects security values at the time of pricing, the Trust cannot ensure that fair value prices would accurately reflect the price that a Fund could obtain for a security if it were to dispose of that security, particularly in a forced or distressed sale.
The following is a summary of the inputs used to value the Funds’ investments as of June 30, 2018:
| Portfolio | Level 1 - Quoted Prices | Level 2 - Other Significant Observable Inputs | Level 3 - Significant Unobservable Inputs | Total | ||||||||||||
| AAAMCO Ultrashort Financing Fund | ||||||||||||||||
| Investment Companies | $ | 1,943,289 | $ | — | $ | — | $ | 1,943,289 | ||||||||
| Repurchase Agreements | — | 57,565,126 | — | 57,565,126 | ||||||||||||
| Total Investments | 1,943,289 | 57,565,126 | — | 59,508,415 | ||||||||||||
| Ultra Short Mortgage Fund | ||||||||||||||||
| Adjustable Rate Mortgage-Related Securities | — | 28,454,510 | — | 28,454,510 | ||||||||||||
| Fixed Rate Mortgage-Related Securities | — | 12,332,581 | — | 12,332,581 | ||||||||||||
| Investment Companies | 6,384,088 | — | — | 6,384,088 | ||||||||||||
| Total Investments | 6,384,088 | 40,787,091 | — | 47,171,179 | ||||||||||||
| Large Cap Equity Fund | ||||||||||||||||
| Common Stocks | 40,203,271 | — | — | 40,203,271 | ||||||||||||
| Investment Companies | 1,986,910 | — | — | 1,986,910 | ||||||||||||
| Total Investments | 42,190,181 | — | — | 42,190,181 | ||||||||||||
As of June 30, 2018, there were no Level 3 securities held by the Funds. The Trust’s policy is to disclose transfers between levels based on valuations at the end of the reporting period. There were no transfers between Level 1, 2 or 3 as of June 30, 2018, based on levels assigned to securities as of October 31, 2017.
REPURCHASE AGREEMENTS
The AAAMCO Ultrashort Financing Fund and the Ultra Short Mortgage Fund may invest in obligations of the U.S. Government or other obligations that are not subject to any investment limitation on the part of national banks
24
NOTES TO FINANCIAL STATEMENTS (continued)
June 30, 2018
that may be purchased from government securities dealers or the custodian bank, subject to the seller’s agreement to repurchase them at an agreed upon date and price. The Funds, through the custodian, receives delivery of the underlying collateral for each repurchase agreement. The Funds require the custodian to take possession of all collateral for repurchase agreements. The Funds require the fair value of collateral underlying the repurchase agreement to be at least 102% of the repurchase price, including any accrued interest earned on the repurchase agreement. If the counterparty defaults, and the fair value of the collateral declines, realization of the collateral by a Fund may be delayed or limited. There were no repurchase agreements held by the Ultra Short Mortgage Fund as of June 30, 2018.
The Funds may enter into transactions subject to enforceable netting arrangements (“netting arrangements”)
under a repurchase agreement. Generally, netting arrangements allow the Funds to offset any exposure to a specific counterparty with any collateral received or delivered to that counterparty. In addition, netting arrangements provide the right for the non-defaulting party to liquidate the collateral and calculate the net exposure to the defaulting party or request additional collateral. Generally, the Funds manage their cash collateral and securities collateral on a counterparty basis. As of June 30, 2018, the AAAMCO Ultrashort Financing Fund has invested in the repurchase agreements described below, with gross exposures on the Statement of Assets and Liabilities, that could be netted subject to netting agreements.
The following table presents the repurchase agreements, which are subject to netting arrangements, as well as the collateral received related to those repurchase agreements. Actual collateral is in excess of the collateral presented.
| Gross Amounts Not Offset in the Statements of Assets and Liabilities | ||||||||||||||
| Fund Name | Counterparty | Gross Amounts of Assets Presented In Statements of Assets and Liabilities | Financial Instruments | Net Amount | ||||||||||
| AAAMCO Ultrashort Financing | ||||||||||||||
| Fund | Amherst Pierpont Securities LLC | $ | 10,000,000 | $ | (10,000,000 | ) | $ | — | ||||||
| BCM High Income Fund, LP | 18,017,756 | (18,017,756 | ) | — | ||||||||||
| JVB Financial Group, LLC | 8,457,381 | (8,457,381 | ) | — | ||||||||||
| KGS-ALPHA Financial Services LLC | 14,000,000 | (14,000,000 | ) | — | ||||||||||
| Vining-Sparks IBG, L.P. | 7,089,989 | $ | (7,089,989 | ) | — | |||||||||
| Total | $ | 57,565,126 | (57,565,126 | ) | $ | — | ||||||||
SECURITIES PURCHASED OR SOLD ON A WHEN-ISSUED OR DELAYED DELIVERY BASIS
Each Fund may purchase or sell securities on a when-issued basis or delayed-delivery basis. With when-issued transactions, securities are bought or sold during the periods between the announcement of an offering and the issuance and payment date of the securities. When securities are purchased or sold on a delayed-delivery basis, the price of the securities is fixed at the time of the commitment to purchase or sell is made, but settlement may take place at a future date. By the time of delivery, securities purchased or sold on a when-issued or delayed-delivery basis may be valued at less than the purchase or sale price. At the time when-issued or delayed-delivery securities are purchased or sold, a Fund must set aside funds or securities in a segregated account to pay for the purchase or as collateral for the sale. There were no securities purchased or sold on a when-issued or delayed-delivery basis held by the Funds as of June 30, 2018.
MORTGAGE-BACKED TO-BE-ANNOUNCED TRANSACTIONS
A Mortgage-Backed To-Be-Announced (“TBA”) trade represents a forward contract for the purchase or sale of
single-family mortgage-related securities to be delivered on a specified future date. In a typical TBA trade, the specific pool of mortgages that will be delivered to fulfill the forward contract are unknown at the time of the trade. The parties to a TBA trade agree upon the issuer, coupon, price, product type, amount of securities and settlement date for delivery. Settlement for TBA trades is standardized to occur on one specific day each month. The mortgage-related securities that ultimately will be delivered, and the loans backing those mortgage-related securities, frequently have not been created or originated at the time of the TBA trade, even though a price for the securities is agreed to at that time.
The Ultra Short Mortgage Fund may engage in TBA transactions to manage cash positions as well as to manage interest rate and prepayment risks. The Fund may engage in forward sales of TBA trades only when the Fund has identified the actual mortgage pool held in position to be delivered in fulfillment of the TBA trade obligation(specifying the pool or CUSIP number). These pools must be deliverable into the sold TBA position. At June 30, 2018, there were no mortgage-backed TBA positions held in the Ultra Short Mortgage Fund.
25
NOTES TO FINANCIAL STATEMENTS (continued)
June 30, 2018
DIVIDENDS TO SHAREHOLDERS
AAAMCO Ultrashort Financing Fund and Ultra Short Mortgage Fund:
Dividends from net investment income are declared daily and paid monthly. Net short-term and long-term capital gains, if any, are declared and paid annually.
Large Cap Equity Fund:
Dividends from net investment income are declared and paid at least quarterly. Net short-term and long-term capital gains, if any, are declared and paid annually.
For all Funds, distributions from net investment income and from net realized capital gains are determined in accordance with Federal income tax regulations, which may differ from accounting principles generally accepted in the United States of America. These “book/tax” differences are either considered temporary or permanent in nature. To the extent these differences are permanent in nature (e.g. reclass of dividend distribution and return of capital), such amounts are reclassified within the composition of net assets based on their federal tax-basis treatment; temporary differences do not require reclassification. Distributions to shareholders that exceed net investment income and net realized capital gains for tax purposes are reported as distributions of capital.
FEDERAL TAXES
No provision is made for Federal income taxes as it is the policy of each Fund to continue to qualify as a regulated investment company by complying with the provisions available to certain investment companies, as defined in applicable sections of the Internal Revenue Code, and to make distributions of net investment income and net realized capital gains sufficient to relieve it from all, or substantially all, federal income taxes.
For all open tax years and all major taxing jurisdictions, management of the Funds has concluded that there are no significant uncertain tax positions that would require recognition in the financial statements. Open tax years are those that are open for examination by taxing authorities (i.e., generally the last three tax year ends as well as the most recent fiscal year end which has yet to be filed). Furthermore, management of the Funds is also not aware of any tax positions for which it is reasonably possible that the total amounts of unrecognized tax benefits will significantly change in the next twelve months.
MANAGEMENT ESTIMATES
The preparation of financial statements in conformity with accounting principles generally accepted in the United States of America requires management to make estimates and assumptions that affect the reported amounts of assets and liabilities at the date of the financial statements and
the reported amounts of revenues and expenses during the reporting period. Actual results could differ from these estimates.
EXPENSE ALLOCATION
Each Fund is charged for those expenses that are directly attributable to that Fund. Certain expenses that arise in connection with a class of shares are charged to that class of shares. Expenses incurred which do not specifically relate to an individual Fund are allocated among all Funds in the Trust in proportion to each Fund’s relative net assets or other reasonable basis.
OTHER
Investment transactions are accounted for no later than one business day after the trade date. However, for financial reporting purposes, investment transactions are reported on the trade date. Interest income is recorded on the accrual basis, amortization and accretion is recognized on a scientific basis and based on the anticipated effective maturity date, and the cost of investments sold is determined by use of the specific identification method for both financial reporting and income tax purposes. Pay-down gains and losses on mortgage- and asset-backed securities are recorded as adjustments to interest income in the Statements of Operations.
B. Fees and transactions with affiliates were as follows:
FEES AND TRANSACTIONS WITH AFFILIATES
Austin Atlantic Asset Management Company “AAAMCO” serves the Funds as investment adviser (the “Adviser”). The Adviser is a wholly-owned subsidiary of Austin Atlantic Inc. “AAI”. AAI is controlled by Rodger D. Shay, Jr., President of Austin Atlantic Capital Inc. “AACI”, also a wholly-owned subsidiary of AAI.
As compensation for investment advisory services, the Funds pay an investment advisory fee monthly based upon an annual percentage of the average daily net assets of each Fund as follows:
The investment advisory fee rate for the AAAMCO Ultrashort Financing Fund is 0.30% of average daily net assets. The Adviser voluntarily waived $19,580 and $5,898 of the investment advisory fee for the periods ended June 30, 2018 and October 31, 2017, respectively. The Adviser has contractually agreed to waive fees and reimburse expenses to the extent that Total Annual Operating Expenses (excluding brokerage costs, interest, taxes, dividend expense on short positions, litigation and indemnification expenses, expenses associated with the investments in underlying investment companies and extraordinary expenses (as determined under generally accepted principles)) exceed 0.30% for Class Y shares and 0.35% for Class I shares through
26
NOTES TO FINANCIAL STATEMENTS (continued)
June 30, 2018
November 1, 2018. If it becomes unnecessary for the Adviser to waive fees or make reimbursements, the Adviser may recapture any of its prior waivers or reimbursements for a period not to exceed three years from the fiscal year in which the waiver or reimbursement was made to the extent that such a recapture does not cause the Total Annual Fund Operating Expenses (excluding brokerage costs, interest, taxes, dividend expense on short positions, litigation and indemnification expenses, expenses associated with the investments in underlying investment companies and extraordinary expenses (as determined under generally accepted principles)) to exceed the applicable expense limitation in effect at time of recoupment or that was in effect at the time of the waiver or reimbursement, whichever is lower. The Adviser can terminate this agreement with 60 days notice before renewal. The agreement to waive fees and reimburse expenses may be terminated by the Board of Trustees at any time and will also terminate automatically upon termination of the investment advisory agreement. For the eight months ended June 30, 2018, and from the inception date of the Fund (June 6, 2017) through October 31, 2017, the Adviser contractually reduced investment advisory fees and/or reimbursed other operating expenses of the Fund in the amounts of $189,472 and $111,499, respectively.
As of June 30, 2018, the AAAMCO Ultrashort Financing Fund had the following amounts (and year of expiration subject to repayment to the Adviser):
| Year Waived | Year Repayment Expires | Balance |
| 2017 | 2020 | $111,499 |
| 2018 | 2021 | $189,472 |
The investment advisory fee rate for the Ultra Short Mortgage Fund is 0.45% of the first $3 billion, 0.35% of the next $2 billion, and 0.25% of net assets in excess of $5 billion. The Adviser voluntarily waived $69,757 so that the Fund paid 0.29% of average daily net assets for the periods ended June 30, 2018 and October 31, 2017.
The investment advisory fee rate for the Large Cap Equity Fund is 0.65% of the first $250 million and 0.55% for assets over $250 million.
The Ultra Short Mortgage Fund invests in the AAAMCO Ultrashort Financing Fund. The Fund’s Adviser has contractually agreed to waive fees in the pro-rata amount of the management fee charged by the underlying AAAMCO Ultrashort Financing Fund on the Ultra Short Mortgage Fund’s investment in the AAAMCO Ultrashort Financing Fund. This fee waiver is accrued daily and settled monthly. During the periods ended June 30, 2018 and October 31, 2017, the Ultra Short Mortgage Fund reduced investment advisory fees for this contractual fee waiver by $6,360 and $2,830, respectively.
AACI serves the Trust as distributor (the “Distributor”). The Distributor is a wholly-owned subsidiary of AAI.
As compensation for distribution services, the Trust pays the Distributor a distribution fee monthly in accordance with the distribution plan adopted by the Trust, pursuant to Rule 12b-1 under the 1940 Act, based upon an annual percentage of the average daily net assets of each Fund as follows:
The distribution fee rate for the AAAMCO Ultrashort Financing Fund Class I Shares is up to 0.10% of average daily net assets. The AAAMCO Ultrashort Financing Fund Class Y Shares do not have a distribution fee.
The distribution fee rate for the Ultra Short Mortgage Fund is 0.25% of average daily net assets. The Distributor voluntarily waived a portion of its fee so that the Ultra Short Mortgage Fund paid an amount equal to 0.15% of average daily net assets for the periods ended June 30, 2018, and October 31, 2017.
The distribution fee rate for the Large Cap Equity Fund Class AMF Shares is 0.25% of average daily net assets. The Distributor voluntarily waived a portion of its fee so that the Large Cap Equity Fund Class AMF Shares paid an amount equal to 0.15% of average daily net assets for the periods ended June 30, 2018, and October 31, 2017. The Large Cap Equity Fund Class H Shares do not have a distribution fee.
There were no brokerage commissions paid to the Distributor during the periods ended June 30, 2018 and October 31, 2017.
BUSINESS MANAGER AND ADMINISTRATOR
The Trust has Management and Administration Agreement with Foreside Management Services, LLC (“Foreside”), who serves as business manager and administrator for the Trust on behalf of the Funds. Pursuant to the terms of the Agreement, Foreside performs and coordinates all management and administration services for the Funds either directly or through working with the Funds’ service providers. Services provided under the Agreement by Foreside include, but are not limited to, coordinating and monitoring activities of the third party service providers to the Funds; serving as officers of the Trust, including but not limited to President, Secretary, Chief Compliance Officer, Anti-Money Laundering Officer, Treasurer and others as deemed necessary and appropriate; performing compliance services for the Trust, including maintaining the Trust compliance program as required under the 1940 Act; managing the process of filing amendments to the Trust’s registration statement and other reports to shareholders; coordinating the Board meeting preparation process; reviewing financial filings and filing with the Securities and Exchange Commission; and maintaining books and records in accordance with applicable laws and regulations.
27
NOTES TO FINANCIAL STATEMENTS (continued)
June 30, 2018
Pursuant to the Agreement, Foreside pays all operating expenses of the Funds not specifically assumed by the Trust, unless the Trust and the Funds’ Adviser otherwise agree to pay, including without limitation the compensation and expenses of any employees and officers of the Trust and of any other persons rendering any services to the Trust or the Funds; clerical and shareholder service staff salaries; office space and other office expenses; fees and expenses incurred by the Trust in connection with membership in investment company organizations; legal, auditing and accounting expenses; expenses of registering shares under federal and state securities laws; insurance expenses; fees and expenses of the transfer agent, dividend disbursing agent, shareholder service agent, custodian, fund accounting agent and financial administrator (excluding fees and expenses payable to Foreside) and accounting and pricing services agent; expenses, including clerical expenses, of issue, sale, redemption or repurchase of shares of the Funds; the cost of preparing and distributing reports and notices to shareholders; the cost of printing or preparing prospectuses and statements of additional information for delivery to each Fund’s current shareholders; the cost of printing or preparing any documents,
statements or reports to shareholders unless otherwise noted; fees and expenses of trustees of the Trust who are not interested persons of the Trust, as defined in the 1940 Act; and all other operating expenses not specifically assumed by the Trust or the Funds. In paying expenses that would otherwise be obligations of the Trust, Foreside is expressly acting as an agent on behalf of the Trust or the Funds. For services under the Agreement and expenses assumed by Foreside, the Ultra Short Mortgage Fund and the Large Cap Equity Funds pay Foreside an annual fee of 0.35% of average daily net assets of the Funds; subject to an aggregate minimum annual fee of $755,000 for these Funds. The AAAMCO Ultrashort Financing Fund pays Foreside an annual fee of 0.08% of average daily net assets on the first $500 million, 0.06% of average daily net assets on the next $500 million and 0.04% of average daily net assets over $1 billion; subject to an aggregate minimum annual fee of $380,000. Such expenses are disclosed on the Statements of Operations as “Unitary.” With respect to the AAAMCO Ultrashort Financing Fund, Foreside has voluntarily agreed to waive a portion of its fee. For the eight month period ending June 30, 2018, Foreside waived $66,649 in fees.
C. Transactions in shares of the Funds for the eight months ended June 30, 2018, and years ended October 31, 2017 and October 31, 2016, were as follows:
| AAAMCO Ultrashort Financing Fund | ||||||||
| Eight Months Ended June 30, 2018 | Period Ended October 31, 2017* | |||||||
| Share transactions Class I: | ||||||||
| Sale of shares | 125,815 | 901,000 | ||||||
| Shares issued to stockholders in reinvestment of dividends | 10,591 | 4,078 | ||||||
| Shares redeemed | (178,100 | ) | — | |||||
| Net increase (decrease) | (41,694 | ) | 905,078 | |||||
| Shares outstanding | ||||||||
| Beginning of period | 905,078 | — | ||||||
| End of period | 863,384 | 905,078 | ||||||
| Share transactions Class Y: | ||||||||
| Sale of shares | 500,000 | 5,001,000 | ||||||
| Shares issued to stockholders in reinvestment of dividends | 63,488 | 28,607 | ||||||
| Shares redeemed | (500,000 | ) | — | |||||
| Net increase | 63,488 | 5,029,607 | ||||||
| Shares outstanding | ||||||||
| Beginning of period | 5,029,607 | — | ||||||
| End of period | 5,093,095 | 5,029,607 | ||||||
* For the period from June 6, 2017, commencement of operations, to October 31, 2017.
28
NOTES TO FINANCIAL STATEMENTS (continued)
June 30, 2018
| Ultra Short Mortgage Fund | ||||||||||||
| Eight Months Ended June 30, 2018 | Year Ended October 31, 2017 | Year Ended October 31, 2016 | ||||||||||
| Share transactions: | ||||||||||||
| Sale of shares | — | 280,513 | 2,694,379 | |||||||||
| Shares issued to stockholders in reinvestment of dividends | 20,092 | 61,151 | 69,459 | |||||||||
| Shares redeemed | (5,755,927 | ) | (4,611,108 | ) | (9,924,428 | ) | ||||||
| Net decrease | (5,735,835 | ) | (4,269,444 | ) | (7,160,590 | ) | ||||||
| Shares outstanding | ||||||||||||
| Beginning of period | 12,481,525 | 16,750,969 | 23,911,559 | |||||||||
| End of period | 6,745,690 | 12,481,525 | 16,750,969 | |||||||||
| Large Cap Equity Fund | ||||||||||||
| Eight Months Ended June 30, 2018 | Year Ended October 31, 2017 | Year Ended October 31, 2016 | ||||||||||
| Share transactions Class AMF: | ||||||||||||
| Sale of shares | 29,094 | 87,663 | 58,579 | |||||||||
| Shares issued to stockholders in reinvestment of dividends | 766,217 | 971,840 | 253,863 | |||||||||
| Shares redeemed | (598,423 | ) | (530,253 | ) | (507,756 | ) | ||||||
| Net increase (decrease) | 196,888 | 529,250 | (195,314 | ) | ||||||||
| Shares outstanding | ||||||||||||
| Beginning of period | 4,074,026 | 3,544,776 | 3,740,090 | |||||||||
| End of period | 4,270,914 | 4,074,026 | 3,544,776 | |||||||||
| Share transactions Class H: | ||||||||||||
| Sale of shares | 138,886 | 166,864 | 61,581 | |||||||||
| Shares issued to stockholders in reinvestment of dividends | 2,632 | 2,776 | 667 | |||||||||
| Shares redeemed | (14,365 | ) | (52,891 | ) | (177,472 | ) | ||||||
| Net increase (decrease) | 127,153 | 116,749 | (115,224 | ) | ||||||||
| Shares outstanding | ||||||||||||
| Beginning of period | 630,679 | 513,930 | 629,154 | |||||||||
| End of period | 757,832 | 630,679 | 513,930 | |||||||||
D. For the eight months ended June 30, 2018, purchases and sales of securities, other than short-term investments and U.S. Government securities, were as follows:
| AAAMCO Ultrashort Financing Fund | Ultra Short Mortgage Fund | Large Cap Equity Fund | ||||||||||
| Purchases | $ | — | $ | 43,202 | $ | 8,979,733 | ||||||
| Sales | — | 1,780,000 | 15,424,894 | |||||||||
For the eight months ended June 30, 2018, purchases and sales of U.S. Government securities, other than short-term investments, were as follows:
| AAAMCO Ultrashort Financing Fund | Ultra Short Mortgage Fund | Large Cap Equity Fund | ||||||||||
| Purchases | $ | 10,998,752 | $ | 19,563,461 | $ | — | ||||||
| Sales | 18,991,720 | 53,263,851 | — | |||||||||
29
NOTES TO FINANCIAL STATEMENTS (continued)
June 30, 2018
E. INVESTMENTS IN AFFILIATES
Transactions in affiliated investments for the eight months ended June 30, 2018, were as follows:
| Affiliate | Value, Beginning of Period | Purchases | Sales Proceeds | Net Change In Unrealized Appreciation (Depreciation) | Net Realized Gains (Losses) | Dividend Income | Value, End of Period | |||||||||||||||||||||||
| Ultra Short Mortgage Fund | AAAMCO Ultrashort Financing Fund | $ | 4,013,121 | $ | 38,393 | $ | (1,780,000 | ) | $ | — | $ | — | $ | 38,387 | $ | 2,271,514 | ||||||||||||||
F. FEDERAL INCOME TAX INFORMATION:
The tax characteristics of distributions paid to shareholders during the fiscal periods ended June 30, 2018 and October 31, 2017 and 2016, for the Ultra Short Mortgage Fund and AAAMCO Ultrashort Financing Fund, were as follows:
| 2018 | Distributions paid from Ordinary Income | Total Taxable Distributions | Total Distributions Paid | |||||||||
| AAAMCO Ultrashort Financing Fund | $ | 740,785 | $ | 740,785 | $ | 740,785 | ||||||
| Ultra Short Mortgage Fund | 760,545 | 760,545 | 760,545 | |||||||||
| 2017 | Distributions paid from Ordinary Income | Total Taxable Distributions | Total Distributions Paid* | |||||||||
| AAAMCO Ultrashort Financing Fund | $ | 326,851 | $ | 326,851 | $ | 326,851 | ||||||
| Ultra Short Mortgage Fund | 1,836,453 | 1,836,453 | 1,836,453 | |||||||||
| 2016 | Distributions paid from Ordinary Income | Total Taxable Distributions | Total Distributions Paid* | |||||||||
| Ultra Short Mortgage Fund | $ | 2,299,318 | $ | 2,299,318 | $ | 2,299,318 | ||||||
| * | Total distributions paid differ from the Statements of Changes in Net Assets because dividends are recognized when actually paid for federal income tax purposes. |
The tax characteristics of distributions paid to shareholders during the fiscal periods ended June 30, 2018 and October 31, 2017 and 2016, for the Large Cap Equity Fund were as follows:
| Distributions paid from Ordinary Income | Net Long Term Gains | Total Taxable Distributions | Total Distributions Paid | ||||||||||||||
| 2018 | |||||||||||||||||
| Large Cap Equity Fund | $ | 1,920,081 | $ | 6,482,143 | $ | 8,402,224 | $ | 8,402,224 | |||||||||
| 2017 | |||||||||||||||||
| Large Cap Equity Fund | $ | 1,333,244 | $ | 9,057,753 | $ | 10,390,997 | $ | 10,390,997 | |||||||||
| 2016 | |||||||||||||||||
| Large Cap Equity Fund | $ | 518,194 | $ | 2,711,491 | $ | 3,229,685 | $ | 3,229,685 | |||||||||
At June 30, 2018, the cost, gross unrealized appreciation and gross unrealized depreciation on securities, for federal income tax purposes, were as follows:
| Fund | Tax Cost | Tax Unrealized Appreciaiton | Tax Unrealized (Depreciation) | Net Unrealized Appreciaiton (Depreciation) | ||||||||||||
| AAAMCO Ultrashort Financing Fund | $ | 59,508,415 | $ | — | $ | — | $ | — | ||||||||
| Ultra Short Mortgage Fund | 47,543,402 | 159,447 | (531,670 | ) | (372,223 | ) | ||||||||||
| Large Cap Equity Fund | 35,153,309 | 7,896,272 | (859,400 | ) | 7,036,872 | |||||||||||
30
NOTES TO FINANCIAL STATEMENTS (continued)
June 30, 2018
As of June 30, 2018, the components of accumulated earnings/(deficit) on a tax basis were as follows:
| Fund | Undistributed Ordinary Income | Undistributed Long Term Capital Gains | Accumulated Earnings | Distributions Payable | Accumulated Capital and Other Losses | Unrealized Appreciation/ (Depreciation) | Total Accumulated Earnings (Deficit) | |||||||||||||||||||||
| AAAMCO Ultrashort Financing Fund | $ | 14,169 | $ | — | $ | 14,169 | $ | — | $ | (40,229 | ) | $ | — | $ | (26,060 | ) | ||||||||||||
| Ultra Short Mortgage Fund | 174,252 | — | 174,252 | (70,649 | ) | (5,692,125 | ) | (372,223 | ) | (5,960,745 | ) | |||||||||||||||||
| Large Cap Equity Fund | — | 4,260,665 | 4,260,665 | — | — | 7,036,872 | 11,297,537 | |||||||||||||||||||||
The tax character of current year distributions paid and the tax basis of the current components of accumulated earnings (deficit) and any net capital loss carryforwards will be determined at end of the current tax year.
At June 30, 2018, the following Fund had capital loss carry-forwards available to offset future net capital gains through the indicated expiration dates:
| Fund | Amount | Expires | ||||
| Ultra Short Mortgage Fund | 2,013,187 | 2019 |
| * | A portion of the capital loss carry-forwards may be subject to limitations under Section 382 of the Internal Revenue Code, and is available to the extent allowed by tax law to offset future net capital gain, if any. |
The Regulated Investment Company Modernization Act of 2010 (the “Act”) eliminated the eight year limit on the use of capital loss carry-forwards that arise in taxable years beginning after its enactment date of December 22, 2010. The changes became effective for the Funds for the fiscal year ended October 31, 2012. Consequently, capital losses incurred by the Funds in taxable years beginning with the taxable year ended October 31, 2012, can be carried forward for an unlimited period. However, capital losses incurred by the Funds in taxable years beginning before the taxable year ended October 31, 2012, with an expiration date may not be used to offset capital gains until all net capital losses incurred in taxable years beginning with the taxable year ended October 31, 2012,
without an expiration date have been utilized. As a result, pre-enactment capital loss carry-forwards may be more likely to expire unused. Additionally, post-enactment capital loss carry-forwards will retain their character as either short-term or long-term capital losses instead of as short-term capital losses as under prior law. The Funds’ ability to utilize capital loss carry-forwards in the future may be limited under the Internal Revenue Code and related regulations based on the results of future transactions.
During the tax period ended June 30, 2018, Ultra Short Mortgage Fund had net capital loss carry-forward amounts that expired of $290,225,068.
Capital losses incurred that will be carried forward under the provisions of the Act are as follows:
| Fund | Short Term Capital Loss Carryforward | Long Term Capital Loss Carryforward | ||||||
| AAAMCO Ultrashort Financing Fund | $ | 40,229 | $ | — | ||||
| Ultra Short Mortgage Fund | 993,221 | 2,685,717 | ||||||
Dividends and distributions are determined in accordance with federal income tax regulations and may differ from accounting principles generally accepted in the United States of America. These differences are primarily due to differing treatments for deferral of losses on wash sales. To the extent these differences are permanent, adjustments are made to the appropriate components of net assets in the period that these differences arise.
Income dividends and capital gains distributions are determined in accordance with federal income tax regulations. Such amounts may differ from income and capital gains recorded in accordance with U.S. GAAP. Accordingly, the Funds may periodically make reclassifications among certain of their capital accounts to reflect differences between financial reporting and federal income tax basis distributions. These reclassifications are reported in order to reflect the tax treatment for certain permanent differences that exist between income tax regulations and U.S. GAAP. These reclassifications may relate to paydowns, tax equalization, expiration of capital loss carry-forwards and changes in tax characterization. These reclassifications have no
31
NOTES TO FINANCIAL STATEMENTS (concluded)
June 30, 2018
impact on the total net assets or the net asset values per share of the Funds. At June 30, 2018, the following reclassifications were recorded:
| Fund | Accumulated Net Investment Income (Loss) | Accumulated Undistributed Net Realized Gains (Losses) | Paid in Capital | |||||||||
| AAAMCO Ultrashort Financing Fund | $ | (2 | ) | $ | 2 | $ | — | |||||
| Ultra Short Mortgage Fund | 412,920 | 289,812,148 | (290,225,068 | ) | ||||||||
| Large Cap Equity Fund | 62,685 | (334,963 | ) | 272,278 | ||||||||
G. SUBSEQUENT EVENTS
The Funds have evaluated events from June 30, 2018, through the date that these financial statements were issued. There are no subsequent events to report that would have a material impact on the Funds’ financial statements.
H. BENEFICIAL SHARE TRANSACTIONS
The beneficial ownership, either directly or indirectly, of more than 25% of the voting securities of a fund creates a presumption of control of the Fund, under Section 2(a)(9) of the 1940 Act. As of June 30, 2018, the following entities owned beneficially 25% or greater of the Fund’s outstanding shares. The shares are held under omnibus accounts (whereby the transactions of two or more shareholders are combined and carried in the name of the originating broker rather than designated separately).
| Fund | Record Owner | % Ownership | ||||
| AAAMCO Ultrashort Financing Fund | Peoples Bank | 85.5 | % | |||
I. CONCENTRATION OF OWNERSHIP
A significant portion of the AAAMCO Ultrashort Financing Fund’s shares may be held in a limited number of shareholder accounts, including in certain omnibus or institutional accounts which typically hold shares for the benefit of other underlying investors. To the extent that a shareholder or group of shareholders redeem a significant portion of the shares issued by a Fund, this could have a disruptive impact on the efficient implementation of the Funds’ investment strategy.
32
REPORT OF INDEPENDENT REGISTERED PUBLIC ACCOUNTING FIRM
To the Shareholders of Austin Atlantic Funds and
Board of Trustees of Asset Management Fund
Opinion on the Financial Statements
We have audited the accompanying statements of assets and liabilities, including the schedules of investments, of AAAMCO Ultrashort Financing Fund, Ultra Short Mortgage Fund, and Large Cap Equity Fund (the “Funds”), each a series of Asset Management Fund, as of June 30, 2018, and the related statements of operations and changes in net assets and the financial highlights for each of the two periods in the period then ended, including the related notes, for AAAMCO Ultrashort Financing Fund, and the related statements of operations for the two periods in the period then ended, the statements of changes in net assets for each of the three periods in the period then ended, including the related notes, and the financial highlights for each of the five periods in the period then ended for Ultra Short Mortgage Fund and Large Cap Equity Fund (collectively referred to as the “financial statements”). In our opinion, the financial statements present fairly, in all material respects, the financial position of each of the Funds as of June 30, 2018, the results of their operations, the changes in their net assets, and the financial highlights for each of the periods indicated above, in conformity with accounting principles generally accepted in the United States of America.
The Funds’ financial highlights for the year ended October 31, 2013, were audited by other auditors whose report dated December 23, 2013, expressed an unqualified opinion on those financial statements and financial highlights.
Basis for Opinion
These financial statements are the responsibility of the Funds’ management. Our responsibility is to express an opinion on the Funds’ financial statements based on our audits. We are a public accounting firm registered with the Public Company Accounting Oversight Board (United States) (“PCAOB”) and are required to be independent with respect to the Funds in accordance with the U.S. federal securities laws and the applicable rules and regulations of the Securities and Exchange Commission and the PCAOB.
We conducted our audits in accordance with the standards of the PCAOB. Those standards require that we plan and perform the audit to obtain reasonable assurance about whether the financial statements are free of material misstatement, whether due to error or fraud.
Our audits include performing procedures to assess the risks of material misstatement of the financial statements, whether due to error or fraud, and performing procedures that respond to those risks. Such procedures include examining, on a test basis, evidence regarding the amounts and disclosures in the financial statements and confirmation of securities owned as of June 30, 2018, by correspondence with the custodian and counterparties. Our audits also included evaluating the accounting principles used and significant estimates made by management, as well as evaluating the overall presentation of the financial statements. We believe that our audits provide a reasonable basis for our opinion.
We have served as the Funds’ auditor since 2014.
COHEN & COMPANY, LTD.
Cleveland, Ohio
August 27, 2018
33
ADDITIONAL INFORMATION
June 30, 2018 (Unaudited)
Other Federal Income Tax Information
For the eight months ended June 30, 2018, certain distributions paid by the Funds may be subject to a maximum tax rate of 15% as provided by the Jobs and Growth Relief Reconciliation Act of 2003. The Funds intend to designate the maximum amount allowable as taxed at a maximum rate of 15%. Complete information will be reported in conjunction with your 2016, Form 1099-DIV.
For corporate shareholders, the following percentage of the total ordinary income distributions paid during the fiscal year ended June 30, 2018, qualify for corporate dividends received deduction for the following Fund:
| Fund | Percentage | |||
| Large Cap Equity Fund | 12 | % | ||
For the eight months ended June 30, 2018, the following Fund paid qualified dividend income for purposes of reduced individual federal income tax rates of:
| Fund | Percentage | |||
| Large Cap Equity Fund | 12 | % | ||
Pursuant to Section 852 of the Internal Revenue Code, Large Cap Equity designates $4,260,665 as a long-term capital gain for June 30, 2018.
In addition to the long term capital gain distributions, during 2018 the Fund utilized equalization accounting for tax purposes whereby a portion of redemption payments were treated as distributions of long term capital gains of $272,279.
34
ADDITIONAL INFORMATION (continued)
June 30, 2018 (Unaudited)
| Trustees and Officers of Asset Management Fund | ||||||
| Name, Year of Birth and Address1 | Position(s) Held With Trust, Length of Time Served and Term of Office | Principal Occupation(s) During Past Five Years, Prior Relevant Experience and Other Directorships During the Past Five Years | No. of Portfolios in Trust Overseen | |||
| Independent Trustees | ||||||
| David F. Holland Year of Birth: 1941 | Chairman of the Board since 2015. Trustee since 1993 and from 1988 to 1989. Indefinite Term of Office | Retired; Director, Preferred Community Bank since 2013. | 5 | |||
| Carla S. Carstens Year of Birth: 1951 | Trustee since 2015. Indefinite Term of Office | Advisory Board of Directors of AIT Worldwide Logistics, 2013 to 2015; Board member and Treasurer of Athena International, 2010 to 2016; Board member and Chairman of Strategic Planning and Women and Inclusion Initiatives of Financial Executives International Chicago, 2009 to present; Board of Directors and Audit Committee Chair of Chicago Yacht Club Foundation, 2015 to 2017. | 5 | |||
| David J. Gruber Year of Birth: 1963 | Trustee since 2015. Indefinite Term of Office | Director of Risk Advisory Services for Holbrook and Manter, CPAs from January 2016 to present; President of DJG Financial Consulting, LLC (financial consulting firm), 2007 to 2015; Independent Trustee for Monteagle Funds (6 Funds), Audit Committee Chair, Valuation Committee member from 2015 to present; Board member of Cross Shore Discovery Fund, 2014 to present; Board member of Fifth Third Funds, 2003 to 2012. | 5 | |||
| James A. Simpson Year of Birth: 1970 | Trustee since 2018. Indefinite Term of Office | President, ETP Resources, LLC, a financial services consulting company, 2009 to present. Trustee of Virtus ETF Trust II, 2015 to present and Trustee of ETFis Series Trust I, 2014 to present. | 5 | |||
| 1 | The mailing address of each Independent Trustee is 690 Taylor Road, Suite 210, Gahanna, Ohio 43230. |
35
ADDITIONAL INFORMATION (continued)
June 30, 2018 (Unaudited)
The following table provides information regarding each officer of the Trust.
| Trustees and Officers of Asset Management Fund (continued) | ||||||
| Name, Age and Address1 | Position(s) Held With Trust, Length of Time Served and Term of Office | Principal Occupation(s) During Past Five Years, Prior Relevant Experience and Other Directorships During the Past Five Years | No. of Portfolios in Trust Overseen | |||
| Officers | ||||||
| C. David Bunstine Year of Birth: 1965 | President since 2018. | Managing Director, Foreside Financial Group, LLC (formerly Beacon Hill Fund Services, Inc.), 2013 to present. Director, Citi Fund Services Ohio, Inc., 2007 to 2013. | N/A | |||
| Trent M. Statczar Year of Birth: 1971 | Treasurer since 2009. | Director, Foreside Financial Group, LLC (formerly Beacon Hill Fund Services, Inc.), 2008 to present. | N/A | |||
| Eimile J. Moore Year of Birth: 1969 | Chief Compliance Officer since 2016. AML Officer since 2016. | Director, Foreside Financial Group, LLC (formerly Beacon Hill Fund Services, Inc.), 2011 to present; Chief Compliance Officer of Diamond Hill Funds 2014 to 2018. | N/A | |||
| Jennifer Gorham Year of Birth: 1981 | Secretary since 2016. | Director, Foreside Financial Group, LLC (formerly Beacon Hill Fund Services, Inc.), 2015 to present; Paralegal, Red Capital Group, LLC, from 2011 to 2015. | N/A | |||
| 1 | The mailing address of each Independent Trustee is 690 Taylor Road, Suite 210, Gahanna, Ohio 43230. |
36
ADDITIONAL INFORMATION (continued)
June 30, 2018 (Unaudited)
| A. SECURITY ALLOCATION | ||||
| AAAMCO ULTRASHORT FINANCING FUND | ||||
| Security Allocation | Percentage of Net Assets | |||
| Assets: | ||||
| Repurchase Agreements | 96.7 | % | ||
| Investment Companies | 3.2 | |||
| Total | 99.9 | % | ||
| ULTRA SHORT MORTGAGE FUND | ||||
| Security Allocation | Percentage of Net Assets | |||
| Assets: | ||||
| Adjustable Rate Mortgage-Related Securities | 61.5 | % | ||
| Fixed Rate Mortgage-Related Securities | 26.6 | |||
| Investment Companies | 13.8 | |||
| Total | 101.9 | % | ||
| LARGE CAP EQUITY FUND | ||||
| Security Allocation | Percentage of Net Assets | |||
| Assets: | ||||
| Common Stocks | 95.4 | % | ||
| Investment Companies | 4.7 | |||
| Total | 100.1 | % | ||
B. EXPENSE COMPARISON:
As a shareholder of the Funds, you incur ongoing costs, including management fees; distribution (12b-1) fees; and other Fund expenses. This example is intended to help you understand your ongoing costs (in dollars) of investing in the Funds and to compare these costs with the ongoing costs of investing in other mutual funds.
The Example is based on an investment of $1,000 invested at the beginning of the period and held for the entire period from January 1, 2018 through June 30, 2018.
ACTUAL EXPENSES
The table below provides information about actual account values and actual expenses. You may use the information below, together with the amount you invested, to estimate the expenses that you paid over the period. Simply divide your account value by $1,000 (for example, an $8,600 account value divided by $1,000 = 8.6), then multiply the result by the number in the table under the heading entitled “Expenses Paid During Period” to estimate the expenses you paid on your account during this period.
| Beginning Account Value 1/1/18 | Ending Account Value 6/30/18 | Expense Paid During Period* 1/1/18 – 6/30/18 | Expense Ratio During Period** 1/1/18 – 6/30/18 | ||||||||||||
| AAAMCO Ultrashort Financing Fund - Class I | $ | 1,000.00 | $ | 1,009.90 | $ | 1.45 | 0.29% | ||||||||
| AAAMCO Ultrashort Financing Fund - Class Y | 1,000.00 | 1,010.20 | 1.20 | 0.24% | |||||||||||
| Ultra Short Mortgage Fund | 1,000.00 | 992.80 | 5.58 | 1.13% | |||||||||||
| Large Cap Equity Fund - Class AMF | 1,000.00 | 997.20 | 7.53 | 1.52% | |||||||||||
| Large Cap Equity Fund - Class H | 1,000.00 | 999.10 | 6.84 | 1.38% | |||||||||||
| * | Expenses are equal to the Funds’ annualized expenses ratio multiplied by the average account value over the period, multi-plied by the number of days in the most recent half fiscal year (181) divided by the number of days in the current year (365) |
| ** | Annualized. |
37
ADDITIONAL INFORMATION (concluded)
June 30, 2018 (Unaudited)
HYPOTHETICAL EXAMPLE FOR COMPARISON PURPOSES
The table below provides information about hypothetical account values and hypothetical expenses based on each Fund’s actual expense ratio and an assumed rate of return of 5% per year before expenses, which is not the Fund’s actual return. The hypothetical account values and expenses may not be used to estimate the actual ending account balance or expenses you paid for the period. You may use this information to compare this 5% hypothetical example with
the 5% hypothetical examples that appear in the shareholder reports of other funds.
Please note that the expenses shown in the table are meant to highlight your ongoing costs only and do not reflect any transactional costs, such as sales charges (loads), redemption fees, or exchange fees. Therefore, the table is useful in comparing ongoing costs only, and will not help you determine the relative total costs of owning different funds. In addition, if these transactional costs were included, your costs would have been higher.
| Beginning Account Value 1/1/18 | Ending Account Value 6/30/18 | Expense Paid During Period* 1/1/18 – 6/30/18 | Expense Ratio During Period** 1/1/18 – 6/30/18 | ||||||||||||
| AAAMCO Ultrashort Financing Fund - Class I | $ | 1,000.00 | $ | 1,023.36 | $ | 1.45 | 0.29% | ||||||||
| AAAMCO Ultrashort Financing Fund - Class Y | 1,000.00 | 1,023.60 | 1.20 | 0.24% | |||||||||||
| Ultra Short Mortgage Fund | 1,000.00 | 1,019.19 | 5.66 | 1.13% | |||||||||||
| Large Cap Equtiy Fund - Class AMF | 1,000.00 | 1,017.26 | 7.60 | 1.52% | |||||||||||
| Large Cap Equtiy - Class H | 1,000.00 | 1,017.95 | 6.90 | 1.38% | |||||||||||
| * | Expenses are equal to the Funds’ annualized expenses ratio multiplied by the average account value over the period, multiplied by the number of days in the most recent half fiscal year (181) divided by the number of days in the current year (365) |
| ** | Annualized. |
OTHER INFORMATION:
The Adviser is responsible for exercising the voting rights associated with the securities purchased and held by the Funds. A description of the policies and procedures that the Adviser uses in fulfilling this responsibility and information regarding how those proxies were voted during the twelve month period ended June 30 are available without charge by calling toll free 1-800-247-9780 or on the Securities and Exchange Commission’s website at www.sec.gov.
A complete schedule of each Fund’s portfolio holdings for the first and third fiscal quarter of each fiscal year is filed with the Securities and Exchange Commission on Form N-Q and is available on the Securities and Exchange Commission’s website at http://www.sec.gov. In addition, the schedules may be reviewed and copied at the Securities and Exchange Commission’s Public Reference Room in Washington, D.C.
Information on the operation of the Public Reference Room may be obtained by calling 1-800-SEC-0330.
The Independent Trustees are compensated for their services to the Funds by Foreside as part of the Management and Administration agreements. Each Trustee receives an annual retainer of $14,000, an in person meeting fee of $4,000 for board meetings and $1,000 for committee meetings. For each telephonic meeting, the attendance fee is $1,000. Collectively, the Independent Trustees were paid $112,000 in fees during the fiscal year ended June 30, 2018. In addition, Foreside reimburses Trustees for out-of-pocket expenses incurred in conjunction with attendance of meetings.
The Statement of Additional Information includes additional information about Trustees and is available, without charge, upon request, by calling 800-247-9780.
38
DISTRIBUTOR
Austin Atlantic Capital Inc.
1 Alhambra Plaza, Suite 100
Coral Gables, FL 33134
INVESTMENT ADVISER
Austin Atlantic Asset Management Company
1 Alhambra Plaza, Suite 100
Coral Gables, FL 33134
GOVERNANCE AND REGULATORY SERVICES
Foreside Management Services, LLC
690 Taylor Road, Suite 210
Gahanna, OH 43230
ADMINISTRATOR, TRANSFER AGENT, AND DIVIDEND AGENT
Northern Trust Company
50 South LaSalle Street
Chicago, IL 60603
LEGAL COUNSEL
Vedder Price P.C.
222 North LaSalle Street
Chicago, IL 60601
CUSTODIAN
Northern Trust Company
50 South LaSalle Street
Chicago, IL 60603
INDEPENDENT REGISTERED PUBLIC ACCOUNTING FIRM
Cohen & Company, Ltd.
1350 Euclid Ave., Suite 800
Cleveland, OH 44115
AMF-ANN-0618
Item 2. Code of Ethics.
(a) The registrant has adopted a code of ethics that applies to the registrant’s principal executive officer, principal financial officer, principal accounting officer or controller, or persons performing similar functions. This code of ethics is included as an Exhibit.
(b) During the period covered by the report, with respect to the registrant’s code of ethics that applies to its principal executive officer, principal financial officer, principal accounting officer or controller, or persons performing similar functions; there have been no amendments to, nor any waivers granted from, a provision that relates to any element of the code of ethics definition enumerated in paragraph (b) of this Item 2.
Item 3. Audit Committee Financial Expert.
3(a)(1) The registrant’s board of directors has determined that the registrant has at least one audit committee financial expert serving on its audit committee.
3(a)(2) The audit committee financial expert is David Gruber, who is “independent” for purposes of this Item 3 of Form N-CSR.
Item 4. Principal Accountant Fees and Services.
(a) Audit Fees. Audit fees totaled $83,000 and $54,500 in fiscal years 2018 and 2017 respectively, including fees associated with the annual audit and filings of the registrant’s Form N-1A, Form N-SAR and Form N-CEN.
(b) Audit-Related Fees. There were no audit related fees billed in fiscal years 2018 and 2017.
(c) Tax Fees. Fees for tax compliance and review services totaled $15,000 and $9,000 in fiscal years 2018 and 2017, respectively.
(d) All Other Fees. There were no other fees in fiscal years 2018 and 2017.
(e)(1) Except as permitted by rule 2-01(c)(7)(i)(C) of regulation S-X the trust’s audit committee must pre-approve all audit and non-audit services provided by the independent accountants relating to the operations or financial reporting of the funds. Prior to the commencement of any audit or non-audit services to the fund, the audit committee reviews the services to determine whether they are appropriate and permissible under applicable law.
| (e)(2) | 2018 0% 2017 0% |
| (f) | Not applicable |
| (g) | 2018 $15,000 2017 $9,000 |
(h) The Audit Committee considered the non-audit services rendered to the registrant’s investment adviser and believes the services are compatible with the principal accountant’s independence.
Item 5. Audit Committee of Listed Companies.
Not applicable.
Item 6. Schedule of Investments.
(a) The Schedule of Investments in securities of unaffiliated issuers is included in the report to shareholders filed under Item 1 of this Form.
(b) Not applicable.
Item 7. Disclosure of Proxy Voting Policies and Procedures for Closed-End Management Investment Companies.
Not applicable.
Item 8. Portfolio Managers of Closed-End Management Investment Companies.
Not applicable.
Item 9. Purchases of Equity Securities by Closed-End Management Investment Company and Affiliated Purchasers.
Not applicable.
Item 10. Submission of Matters to a Vote of Security Holders.
Not applicable.
Item 11. Controls and Procedures.
(a) The registrant’s principal executive officer and principal financial officer have concluded, based on their evaluation of the registrant’s disclosure controls and procedures as conducted within 90 days of the filing date of this report, that these disclosure controls and procedures are adequately designed and are operating effectively to ensure that information required to be disclosed by the registrant on this report is recorded, processed, summarized and reported within the time periods specified in the Securities and Exchange Commission’s rules and forms.
(b) There were no changes in the registrant’s internal control over financial reporting (as defined in Rule 30a-3(d) under the Investment Company Act of 1940) that occurred during the second fiscal quarter of the period covered by this report that have materially affected or are reasonably likely to materially affect, the registrant’s internal control over financial reporting.
Item 12. Disclosure of Securities Lending Activities for Closed-End Management Investment Companies.
Not applicable.
Item 13. Exhibits.
| (a)(1) | Code of Ethics for Senior Financial Officers is filed herewith |
| (a)(2) | Certifications required by Item 12(a) of Form N-CSR are attached hereto. |
| (a)(3) | Not applicable. |
| (a)(4) | Not applicable. |
| (b) | Certification required by Item 12(b) of Form N-CSR is furnished hereto. |
SIGNATURES
Pursuant to the requirements of the Securities Exchange Act of 1934 and the Investment Company Act of 1940, the registrant has duly caused this report to be signed on its behalf by the undersigned, thereunto duly authorized.
(Registrant) Asset Management Fund
By (Signature and Title)
| /s/ Trent Statczar | |
| Trent Statczar | |
| Treasurer | |
Date: September 7, 2018
Pursuant to the requirements of the Securities Exchange Act of 1934 and the Investment Company Act of 1940, this report has been signed below by the following persons on behalf of the registrant and in the capacities and on the dates indicated.
By (Signature and Title)
| /s/ David Bunstine | |
| David Bunstine | |
| President | |
Date: September 7, 2018
By (Signature and Title)
| /s/ Trent Statczar | |
| Trent Statczar | |
| Treasurer | |
Date: September 7, 2018