Searchable text section of graphics shown above
Project Heron
Update for the Board of Directors
PRELIMINARY | SUBJECT TO FURTHER REVIEW AND EVALUATION
October 18, 2005
THESE MATERIALS MAY NOT BE USED OR RELIED UPON FOR ANY PURPOSE OTHER THAN AS SPECIFICALLY CONTEMPLATED BY A WRITTEN AGREEMENT WITH CREDIT SUISSE FIRST BOSTON AND MORGAN STANLEY.
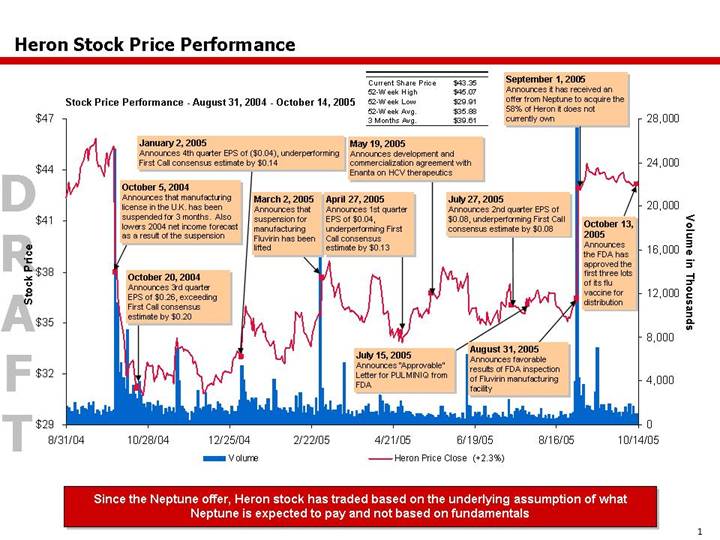
Heron Stock Price Performance
Stock Price Performance - August 31, 2004 - October 14, 2005
Current Share Price | | $ | 43.35 | |
52-Week High | | $ | 45.07 | |
52-Week Low | | $ | 29.91 | |
52-Week Avg. | | $ | 35.88 | |
3 Months Avg. | | $ | 39.61 | |
[CHART]
Since the Neptune offer, Heron stock has traded based on the underlying assumption of what Neptune is expected to pay and not based on fundamentals
1
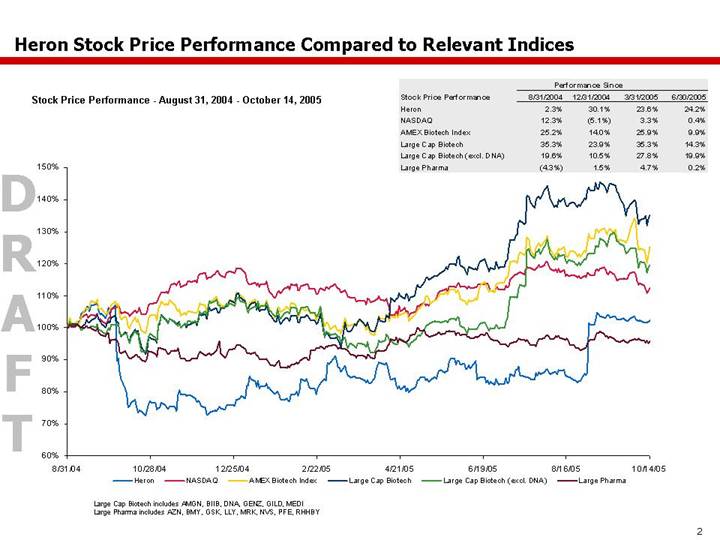
Heron Stock Price Performance Compared to Relevant Indices
Stock Price Performance - August 31, 2004 - October 14, 2005
| | Performance Since | |
Stock Price Performance | | 8/31/2004 | | 12/31/2004 | | 3/31/2005 | | 6/30/2005 | |
Heron | | 2.3 | % | 30.1 | % | 23.6 | % | 24.2 | % |
NASDAQ | | 12.3 | % | (5.1 | )% | 3.3 | % | 0.4 | % |
AMEX Biotech Index | | 25.2 | % | 14.0 | % | 25.9 | % | 9.9 | % |
Large Cap Biotech | | 35.3 | % | 23.9 | % | 35.3 | % | 14.3 | % |
Large Cap Biotech (excl. DNA) | | 19.6 | % | 10.5 | % | 27.8 | % | 19.9 | % |
Large Pharma | | (4.3 | )% | 1.5 | % | 4.7 | % | 0.2 | % |
[CHART]
Large Cap Biotech includes AMGN, BIIB, DNA, GENZ, GILD, MEDI
Large Pharma includes AZN, BMY, GSK, LLY, MRK, NVS, PFE, RHHBY
2
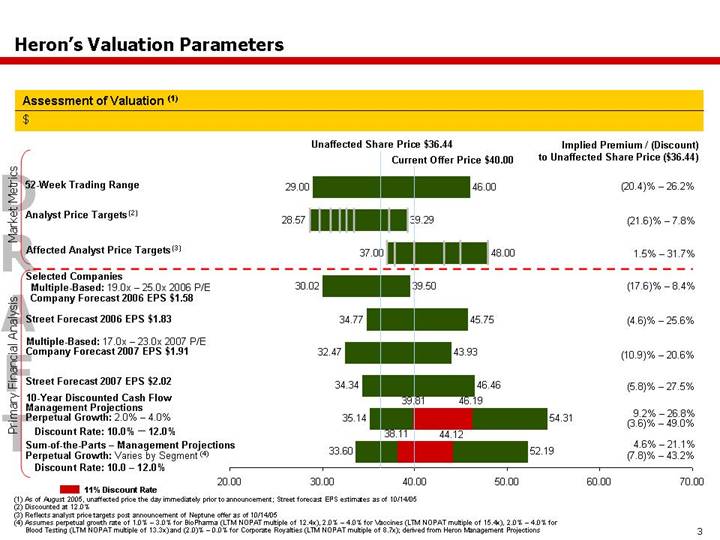
Heron’s Valuation Parameters
Assessment of Valuation (1)
$
[CHART]
(1) As of August 2005, unaffected price the day immediately prior to announcement; Street forecast EPS estimates as of 10/14/05
(2) Discounted at 12.0%
(3) Reflects analyst price targets post announcement of Neptune offer as of 10/14/05
(4) Assumes perpetual growth rate of 1.0% – 3.0% for BioPharma (LTM NOPAT multiple of 12.4x), 2.0% – 4.0% for Vaccines (LTM NOPAT multiple of 15.4x), 2.0% – 4.0% for Blood Testing (LTM NOPAT multiple of 13.3x) and (2.0)% – 0.0% for Corporate Royalties (LTM NOPAT multiple of 8.7x); derived from Heron Management Projections
3
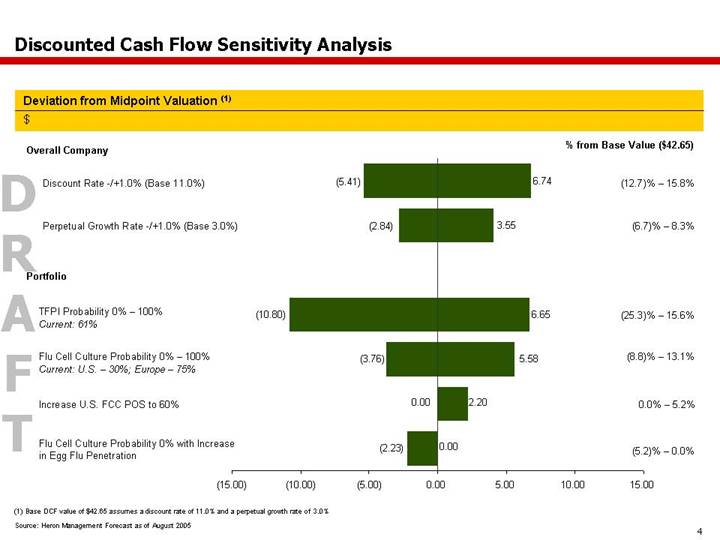
Discounted Cash Flow Sensitivity Analysis
Deviation from Midpoint Valuation (1)
$
[CHART]
(1) Base DCF value of $42.65 assumes a discount rate of 11.0% and a perpetual growth rate of 3.0%
Source: Heron Management Forecast as of August 2005
4
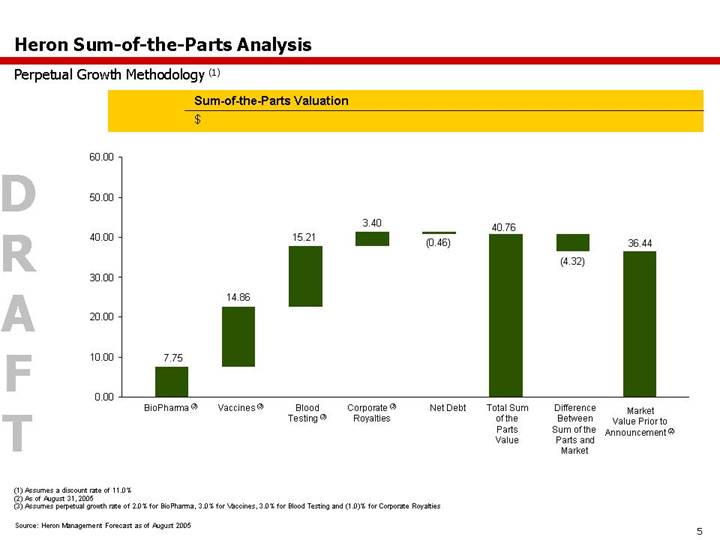
Heron Sum-of-the-Parts Analysis
Perpetual Growth Methodology (1)
Sum-of-the-Parts Valuation
$
[CHART]
(1) Assumes a discount rate of 11.0%
(2) As of August 31, 2005
(3) Assumes perpetual growth rate of 2.0% for BioPharma, 3.0% for Vaccines, 3.0% for Blood Testing and (1.0)% for Corporate Royalties
Source: Heron Management Forecast as of August 2005
5
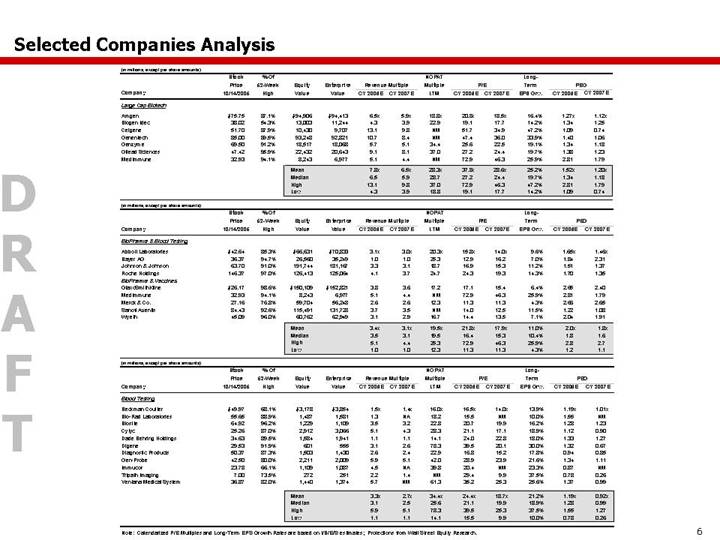
Selected Companies Analysis
(in millions, except per share amounts)
| | Stock | | % Of | | | | | | | | | | NOPAT | | | | | | Long- | | | | | |
| | Price | | 52-Week | | Equity | | Enterprise | | Revenue Multiple | | Multiple | | P/E | | Term | | PEG | |
Company | | 10/14/2005 | | High | | Value | | Value | | CY 2006E | | CY 2007E | | LTM | | CY 2006E | | CY 2007E | | EPS Grw. | | CY 2006E | | CY 2007E | |
Large Cap Biotech | | | | | | | | | | | | | | | | | | | | | | | | | |
Amgen | | $ | 75.75 | | 87.1 | % | $ | 94,906 | | $ | 94,413 | | 6.5 | x | 5.9 | x | 18.8 | x | 20.8 | x | 18.5 | x | 16.4 | % | 1.27 | x | 1.12 | x |
Biogen Idec | | 38.02 | | 54.3 | % | 13,003 | | 11,244 | | 4.3 | | 3.9 | | 22.9 | | 19.1 | | 17.7 | | 14.2 | % | 1.34 | | 1.25 | |
Celgene | | 51.70 | | 87.9 | % | 10,430 | | 9,707 | | 13.1 | | 9.8 | | NM | | 51.7 | | 34.9 | | 47.2 | % | 1.09 | | 0.74 | |
Genentech | | 85.00 | | 89.5 | % | 93,248 | | 92,821 | | 10.7 | | 8.4 | | NM | | 47.4 | | 36.0 | | 33.9 | % | 1.40 | | 1.06 | |
Genzyme | | 69.50 | | 91.2 | % | 18,517 | | 18,068 | | 5.7 | | 5.1 | | 34.4 | | 25.6 | | 22.5 | | 19.1 | % | 1.34 | | 1.18 | |
Gilead Sciences | | 47.42 | | 95.9 | % | 22,432 | | 20,643 | | 9.1 | | 8.1 | | 37.0 | | 27.2 | | 24.4 | | 19.7 | % | 1.38 | | 1.23 | |
MedImmune | | 32.93 | | 94.1 | % | 8,243 | | 6,977 | | 5.1 | | 4.4 | | NM | | 72.9 | | 46.3 | | 25.9 | % | 2.81 | | 1.79 | |
| | | | | | | | | | | | | | | | | | | | | | | | | |
| | | | | | Mean | | | | 7.8 | x | 6.5 | x | 28.3 | x | 37.8 | x | 28.6 | x | 25.2 | % | 1.52 | x | 1.20 | x |
| | | | | | Median | | | | 6.5 | | 5.9 | | 28.7 | | 27.2 | | 24.4 | | 19.7 | % | 1.34 | | 1.18 | |
| | | | | | High | | | | 13.1 | | 9.8 | | 37.0 | | 72.9 | | 46.3 | | 47.2 | % | 2.81 | | 1.79 | |
| | | | | | Low | | | | 4.3 | | 3.9 | | 18.8 | | 19.1 | | 17.7 | | 14.2 | % | 1.09 | | 0.74 | |
| | | | | | | | | | | | | | | | | | | | | | | | | | | | |
(in millions, except per share amounts)
| | Stock | | % Of | | | | | | | | | | NOPAT | | | | | | Long- | | | | | |
| | Price | | 52-Week | | Equity | | Enterprise | | Revenue Multiple | | Multiple | | P/E | | Term | | PEG | |
Company | | 10/14/2005 | | High | | Value | | Value | | CY 2006E | | CY 2007E | | LTM | | CY 2006E | | CY 2007E | | EPS Grw. | | CY 2006E | | CY 2007E | |
BioPharma & Blood Testing | | | | | | | | | | | | | | | | | | | | | | | | | |
Abbott Laboratories | | $ | 42.64 | | 85.3 | % | $ | 66,631 | | $ | 70,833 | | 3.1 | x | 3.0 | x | 20.3 | x | 15.8 | x | 14.0 | x | 9.6 | % | 1.65 | x | 1.46 | x |
Bayer AG | | 36.37 | | 94.7 | % | 26,560 | | 35,249 | | 1.0 | | 1.0 | | 25.3 | | 12.9 | | 16.2 | | 7.0 | % | 1.84 | | 2.31 | |
Johnson & Johnson | | 63.70 | | 91.0 | % | 191,744 | | 181,167 | | 3.3 | | 3.1 | | 18.7 | | 16.9 | | 15.3 | | 11.2 | % | 1.51 | | 1.37 | |
Roche Holdings | | 146.37 | | 97.0 | % | 126,413 | | 125,064 | | 4.1 | | 3.7 | | 24.7 | | 24.3 | | 19.3 | | 14.3 | % | 1.70 | | 1.35 | |
BioPharma & Vaccines | | | | | | | | | | | | | | | | | | | | | | | | | |
GlaxoSmithKline | | $ | 26.17 | | 98.6 | % | $ | 150,109 | | $ | 152,821 | | 3.8 | | 3.6 | | 17.2 | | 17.1 | | 15.4 | | 6.4 | % | 2.65 | | 2.40 | |
MedImmune | | 32.93 | | 94.1 | % | 8,243 | | 6,977 | | 5.1 | | 4.4 | | NM | | 72.9 | | 46.3 | | 25.9 | % | 2.81 | | 1.79 | |
Merck & Co. | | 27.16 | | 76.8 | % | 59,704 | | 56,248 | | 2.6 | | 2.6 | | 12.3 | | 11.3 | | 11.3 | | 4.3 | % | 2.66 | | 2.65 | |
Sanofi Aventis | | 84.43 | | 92.6 | % | 115,491 | | 131,728 | | 3.7 | | 3.5 | | NM | | 14.0 | | 12.5 | | 11.5 | % | 1.22 | | 1.08 | |
Wyeth | | 45.09 | | 96.0 | % | 60,762 | | 62,949 | | 3.1 | | 2.9 | | 16.7 | | 14.4 | | 13.5 | | 7.1 | % | 2.04 | | 1.91 | |
| | | | | | | | | | | | | | | | | | | | | | | | | |
| | | | | | Mean | | | | 3.4 | x | 3.1 | x | 19.5 | x | 21.8 | x | 17.9 | x | 11.0 | % | 2.0 | x | 1.8 | x |
| | | | | | Median | | | | 3.5 | | 3.1 | | 19.5 | | 16.4 | | 15.3 | | 10.4 | % | 1.8 | | 1.6 | |
| | | | | | High | | | | 5.1 | | 4.4 | | 25.3 | | 72.9 | | 46.3 | | 25.9 | % | 2.8 | | 2.7 | |
| | | | | | Low | | | | 1.0 | | 1.0 | | 12.3 | | 11.3 | | 11.3 | | 4.3 | % | 1.2 | | 1.1 | |
(in millions, except per share amounts)
| | Stock | | % Of | | | | | | | | | | NOPAT | | | | | | Long- | | | | | |
| | Price | | 52-Week | | Equity | | Enterprise | | Revenue Multiple | | Multiple | | P/E | | Term | | PEG | |
Company | | 10/14/2005 | | High | | Value | | Value | | CY 2006E | | CY 2007E | | LTM | | CY 2006E | | CY 2007E | | EPS Grw. | | CY 2006E | | CY 2007E | |
Blood Testing | | | | | | | | | | | | | | | | | | | | | | | | | |
Beckman Coulter | | $ | 49.97 | | 68.1 | % | $ | 3,178 | | $ | 3,854 | | 1.5 | x | 1.4 | x | 16.0 | x | 16.5 | x | 14.0 | x | 13.9 | % | 1.19 | x | 1.01 | x |
Bio-Rad Laboratories | | 55.65 | | 88.9 | % | 1,487 | | 1,581 | | 1.3 | | NA | | 18.2 | | 15.5 | | NM | | 10.0 | % | 1.55 | | NM | |
Biosite | | 64.92 | | 96.2 | % | 1,229 | | 1,109 | | 3.5 | | 3.2 | | 22.8 | | 20.7 | | 19.9 | | 16.2 | % | 1.28 | | 1.23 | |
Cytyc | | 25.26 | | 87.0 | % | 2,912 | | 3,066 | | 5.1 | | 4.3 | | 28.3 | | 21.1 | | 17.1 | | 18.9 | % | 1.12 | | 0.90 | |
Dade Behring Holdings | | 34.63 | | 89.5 | % | 1,584 | | 1,941 | | 1.1 | | 1.1 | | 14.1 | | 24.0 | | 22.8 | | 18.0 | % | 1.33 | | 1.27 | |
Digene | | 29.53 | | 91.9 | % | 601 | | 555 | | 3.1 | | 2.6 | | 78.3 | | 39.5 | | 20.1 | | 30.0 | % | 1.32 | | 0.67 | |
Diagnostic Products | | 50.37 | | 87.3 | % | 1,503 | | 1,430 | | 2.6 | | 2.4 | | 22.9 | | 16.8 | | 15.2 | | 17.8 | % | 0.94 | | 0.85 | |
Gen-Probe | | 42.50 | | 80.0 | % | 2,211 | | 2,009 | | 5.9 | | 5.1 | | 42.0 | | 28.9 | | 23.9 | | 21.6 | % | 1.34 | | 1.11 | |
Immucor | | 23.78 | | 66.1 | % | 1,109 | | 1,087 | | 4.5 | | NA | | 39.8 | | 20.4 | | NM | | 23.3 | % | 0.87 | | NM | |
Tripath Imaging | | 7.00 | | 73.5 | % | 272 | | 251 | | 2.2 | | 1.4 | | NM | | 29.4 | | 9.9 | | 37.5 | % | 0.78 | | 0.26 | |
Ventana Medical System | | 36.87 | | 82.0 | % | 1,440 | | 1,374 | | 5.7 | | NM | | 61.3 | | 35.2 | | 25.3 | | 25.6 | % | 1.37 | | 0.99 | |
| | | | | | | | | | | | | | | | | | | | | | | | | |
| | | | | | Mean | | | | 3.3 | x | 2.7 | x | 34.4 | x | 24.4 | x | 18.7 | x | 21.2 | % | 1.19 | x | 0.92 | x |
| | | | | | Median | | | | 3.1 | | 2.5 | | 25.6 | | 21.1 | | 19.9 | | 18.9 | % | 1.28 | | 0.99 | |
| | | | | | High | | | | 5.9 | | 5.1 | | 78.3 | | 39.5 | | 25.3 | | 37.5 | % | 1.55 | | 1.27 | |
| | | | | | Low | | | | 1.1 | | 1.1 | | 14.1 | | 15.5 | | 9.9 | | 10.0 | % | 0.78 | | 0.26 | |
| | | | | | | | | | | | | | | | | | | | | | | | | | | | |
Note: Calendarized P/E Multiples and Long-Term EPS Growth Rates are based on I/B/E/S estimates; Projections from Wall Street Equity Research.
6
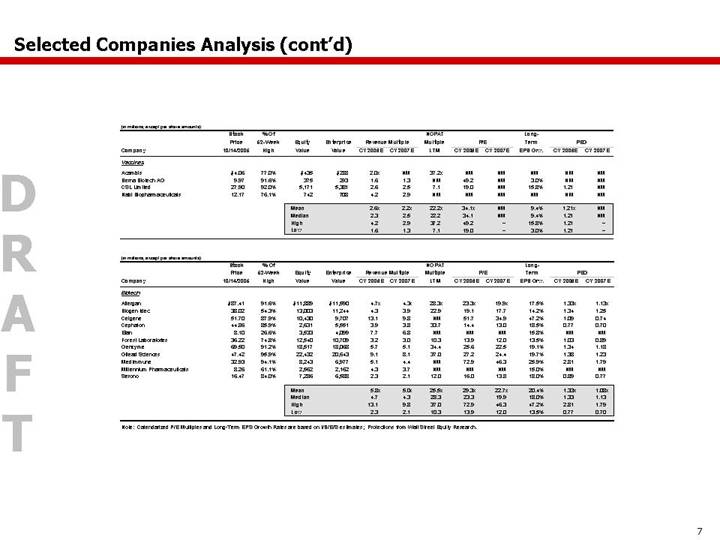
(in millions, except per share amounts)
| | Stock | | % Of | | | | | | | | | | NOPAT | | | | | | Long- | | | | | |
| | Price | | 52-Week | | Equity | | Enterprise | | Revenue Multiple | | Multiple | | P/E | | Term | | PEG | |
Company | | 10/14/2005 | | High | | Value | | Value | | CY 2006E | | CY 2007E | | LTM | | CY 2006E | | CY 2007E | | EPS Grw. | | CY 2006E | | CY 2007E | |
Vaccines | | | | | | | | | | | | | | | | | | | | | | | | | |
Acambis | | $ | 4.06 | | 77.0 | % | $ | 435 | | $ | 288 | | 2.0 | x | NM | | 37.2 | x | NM | | NM | | NM | | NM | | NM | |
Berna Biotech AG | | 9.97 | | 91.6 | % | 375 | | 293 | | 1.6 | | 1.3 | | NM | | 49.2 | | NM | | 3.0 | % | NM | | NM | |
CSL Limited | | 27.90 | | 92.0 | % | 5,171 | | 5,381 | | 2.6 | | 2.5 | | 7.1 | | 19.0 | | NM | | 15.8 | % | 1.21 | | NM | |
Nabi Biopharmaceuticals | | 12.17 | | 76.1 | % | 742 | | 708 | | 4.2 | | 2.9 | | NM | | NM | | NM | | NM | | NM | | NM | |
| | | | | | | | | | | | | | | | | | | | | | | | | |
| | | | | | Mean | | | | 2.6 | x | 2.2 | x | 22.2 | x | 34.1 | x | NM | | 9.4 | % | 1.21 | x | NM | |
| | | | | | Median | | | | 2.3 | | 2.5 | | 22.2 | | 34.1 | | NM | | 9.4 | % | 1.21 | | NM | |
| | | | | | High | | | | 4.2 | | 2.9 | | 37.2 | | 49.2 | | — | | 15.8 | % | 1.21 | | — | |
| | | | | | Low | | | | 1.6 | | 1.3 | | 7.1 | | 19.0 | | — | | 3.0 | % | 1.21 | | — | |
| | | | | | | | | | | | | | | | | | | | | | | | | | | | |
(in millions, except per share amounts)
| | Stock | | % Of | | | | | | | | | | NOPAT | | | | | | Long- | | | | | |
| | Price | | 52-Week | | Equity | | Enterprise | | Revenue Multiple | | Multiple | | P/E | | Term | | PEG | |
Company | | 10/14/2005 | | High | | Value | | Value | | CY 2006E | | CY 2007E | | LTM | | CY 2006E | | CY 2007E | | EPS Grw. | | CY 2006E | | CY 2007E | |
Biotech | | | | | | | | | | | | | | | | | | | | | | | | | |
Allergan | | $ | 87.41 | | 91.6 | % | $ | 11,889 | | $ | 11,590 | | 4.7 | x | 4.3 | x | 28.3 | x | 23.3 | x | 19.9 | x | 17.5 | % | 1.33 | x | 1.13 | x |
Biogen Idec | | 38.02 | | 54.3 | % | 13,003 | | 11,244 | | 4.3 | | 3.9 | | 22.9 | | 19.1 | | 17.7 | | 14.2 | % | 1.34 | | 1.25 | |
Celgene | | 51.70 | | 87.9 | % | 10,430 | | 9,707 | | 13.1 | | 9.8 | | NM | | 51.7 | | 34.9 | | 47.2 | % | 1.09 | | 0.74 | |
Cephalon | | 44.86 | | 85.9 | % | 2,631 | | 5,551 | | 3.9 | | 3.8 | | 33.7 | | 14.4 | | 13.0 | | 18.5 | % | 0.77 | | 0.70 | |
Elan | | 8.10 | | 26.6 | % | 3,533 | | 4,099 | | 7.7 | | 6.8 | | NM | | NM | | NM | | 15.8 | % | NM | | NM | |
Forest Laboratories | | 36.22 | | 74.8 | % | 12,540 | | 10,709 | | 3.2 | | 3.0 | | 10.3 | | 13.9 | | 12.0 | | 13.5 | % | 1.03 | | 0.89 | |
Genzyme | | 69.50 | | 91.2 | % | 18,517 | | 18,068 | | 5.7 | | 5.1 | | 34.4 | | 25.6 | | 22.5 | | 19.1 | % | 1.34 | | 1.18 | |
Gilead Sciences | | 47.42 | | 95.9 | % | 22,432 | | 20,643 | | 9.1 | | 8.1 | | 37.0 | | 27.2 | | 24.4 | | 19.7 | % | 1.38 | | 1.23 | |
MedImmune | | 32.93 | | 94.1 | % | 8,243 | | 6,977 | | 5.1 | | 4.4 | | NM | | 72.9 | | 46.3 | | 25.9 | % | 2.81 | | 1.79 | |
Millennium Pharmaceuticals | | 8.26 | | 61.1 | % | 2,562 | | 2,162 | | 4.3 | | 3.7 | | NM | | NM | | NM | | 15.0 | % | NM | | NM | |
Serono | | 16.47 | | 84.0 | % | 7,286 | | 6,588 | | 2.3 | | 2.1 | | 12.0 | | 16.0 | | 13.8 | | 18.0 | % | 0.89 | | 0.77 | |
| | | | | | | | | | | | | | | | | | | | | | | | | |
| | | | | | Mean | | | | 5.8 | x | 5.0 | x | 25.5 | x | 29.3 | x | 22.7 | x | 20.4 | % | 1.33 | x | 1.08 | x |
| | | | | | Median | | | | 4.7 | | 4.3 | | 28.3 | | 23.3 | | 19.9 | | 18.0 | % | 1.33 | | 1.13 | |
| | | | | | High | | | | 13.1 | | 9.8 | | 37.0 | | 72.9 | | 46.3 | | 47.2 | % | 2.81 | | 1.79 | |
| | | | | | Low | | | | 2.3 | | 2.1 | | 10.3 | | 13.9 | | 12.0 | | 13.5 | % | 0.77 | | 0.70 | |
| | | | | | | | | | | | | | | | | | | | | | | | | | | | |
Note: Calendarized P/E Multiples and Long-Term EPS Growth Rates are based on I/B/E/S estimates; Projections from Wall Street Equity Research.
7
Credit Suisse First Boston (“CSFB”) and Morgan Stanley do not provide any tax advice. Any tax statement herein regarding any US federal tax is not intended or written to be used, and cannot be used, by any taxpayer for the purpose of avoiding any penalties. Any such statement herein was written to support the marketing or promotion of the transaction(s) or matter(s) to which the statement relates. Each taxpayer should seek advice based on the taxpayer’s particular circumstances from an independent tax advisor.
These materials have been provided to you by CSFB and Morgan Stanley in connection with an actual or potential mandate or engagement and may not be used or relied upon for any purpose other than as specifically contemplated by a written agreement with CSFB and Morgan Stanley. In addition, these materials may not be disclosed, in whole or in part, or summarized or otherwise referred to except as agreed in writing by CSFB and Morgan Stanley. The information used in preparing these materials was obtained from or through you or your representatives or from public sources. CSFB and Morgan Stanley assume no responsibility for independent verification of such information and has relied on such information being complete and accurate in all material respects. To the extent such information includes estimates and forecasts of future financial performance (including estimates of potential cost savings and synergies) prepared by or reviewed or discussed with the managements of your company and/or other potential transaction participants or obtained from public sources, we have assumed that such estimates and forecasts have been reasonably prepared on bases reflecting the best currently available estimates and judgments of such managements (or, with respect to estimates and forecasts obtained from public sources, represent reasonable estimates). These materials were designed for use by specific persons familiar with the business and the affairs of your company and CSFB and Morgan Stanley assume no obligation to update or otherwise revise these materials. Nothing contained herein should be construed as tax, accounting or legal advice. You (and each of your employees, representatives or other agents) may disclose to any and all persons, without limitation of any kind, the tax treatment and tax structure of the transactions contemplated by these materials and all materials of any kind (including opinions or other tax analyses) that are provided to you relating to such tax treatment and structure. For this purpose, the tax treatment of a transaction is the purported or claimed U.S. federal income tax treatment of the transaction and the tax structure of a transaction is any fact that may be relevant to understanding the purported or claimed U.S. federal income tax treatment of the transaction.
CSFB and Morgan Stanley have adopted policies and guidelines designed to preserve the independence of its research analysts. CSFB’s and Morgan Stanley’s policies prohibit employees from directly or indirectly offering a favorable research rating or specific price target, or offering to change a research rating or price target, as consideration for or an inducement to obtain business or other compensation. CSFB’s and Morgan Stanley’s policies prohibit research analysts from being compensated for their involvement in investment banking transactions except to the extent such participation is intended to benefit investor clients.
Credit Suisse First Boston or CSFB is the trade name for the investment banking business of Credit Suisse, a Swiss bank, and references to Credit Suisse First Boston or CSFB herein include all of the subsidiaries and affiliates of Credit Suisse operating under the Credit Suisse First Boston division of Credit Suisse Group. For more information on our structure, please follow the below link: http://www.creditsuisse.com/en/who_we_are/ourstructure.html.
8