Searchable text section of graphics shown above
Project Heron
Supplementary Discussion Materials
PRELIMINARY | SUBJECT TO FURTHER REVIEW AND EVALUATION
September 2005
DRAFT
THESE MATERIALS MAY NOT BE USED OR RELIED UPON FOR ANY PURPOSE OTHER THAN AS SPECIFICALLY CONTEMPLATED BY A WRITTEN AGREEMENT WITH CREDIT SUISSE FIRST BOSTON AND MORGAN STANLEY.
Neptune Process to Date
In pursuing an acquisition of Heron, Neptune has followed the procedures outlined in the Governance Agreement
• Neptune has proposed a “Buyout Transaction”, which under the Governance Agreement can be done “only in accordance with . . . [specified] procedures”
• Neptune made its initial $40 offer publicly
• Heron publicly rejected Neptune’s offer
• Neptune, through its bankers and attorneys, has initiated a confidential negotiating process in an effort to arrive at a transaction
• Neptune’s actions to date have been influenced by its disclosure obligations under Section 13 of the securities laws
• Under the Governance Agreement, if a majority of the Independent Directors do not approve the buyout offer within four months of its first being proposed, Novartis can withdraw or seek arbitration of the Third Party Sale Value
1
Project Heron - Potential Further Neptune Actions
Neptune’s bankers suggested a process in a call on 9/9:
• Neptune’s objective is to engage in confidential discussions to reach an agreement or conclude that no agreement can be reached
• Process would result in either the public announcement of a transaction or that the offer has been withdrawn
Alternatively, Neptune could consider a range of other actions:
• Publicly disclose that Neptune is pursuing discussions with Heron
• Publicly disclose a new offer
• Attempt to pursue confidential discussions directly with one or more Heron board members
• Slow down the process and determine to wait and do nothing
• Withdraw offer publicly and terminate discussions completely at this time
• Withdraw offer publicly and announce intention to sell its 42% interest in Heron
• Withdraw offer publicly and pursue confidential discussions at the Heron board level regarding restructuring of Heron including spin-off and/or sale of individual businesses or Heron in total
• Withdraw offer publicly and pursue discussions regarding purchase of vaccines business
• Breach the Governance Agreement and commence a tender offer for Heron
Note: Pursuant to the Governance Agreement, if Neptune withdraws the offer it would be unable to make another offer for twelve months
2
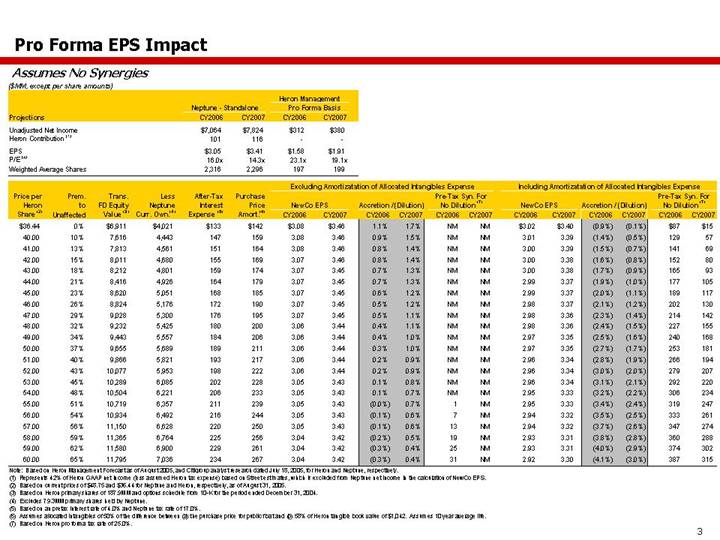
Pro Forma EPS Impact
Assumes No Synergies
($MM, except per share amounts)
| | | | | | Heron Management | |
| | Neptune - Standalone | | Pro Forma Basis | |
Projections | | CY2006 | | CY2007 | | CY2006 | | CY2007 | |
Unadjusted Net Income | | $ | 7,064 | | $ | 7,824 | | $ | 312 | | $ | 380 | |
Heron Contribution (1) | | 101 | | 116 | | — | | — | |
| | | | | | | | | |
EPS | | $ | 3.05 | | $ | 3.41 | | $ | 1.58 | | $ | 1.91 | |
P/E (2) | | 16.0 | x | 14.3 | x | 23.1 | x | 19.1 | x |
Weighted Average Shares | | 2,316 | | 2,296 | | 197 | | 199 | |
| | | | | | | | | | | | | | | | | | | | | | | | | | | | | | | | | | | | | | | | | | | | | | |
Price | | | | Trans. | | | | | After- | | | | | | | | | | | | | | | | | | | | | | | | | | | | | | | | | | |
per | | | | FD | | Less | | Tax | | Purchase | | Excluding Amortizatation of Allocated Intangibles Expense | | Including Amortizatation of Allocated Intangibles Expense | |
Heron | | Prem. | | Equity | | Neptune | | Interest | | Price | | | | | | | | | | Pre-Tax Syn. For | | | | | | | | | | Pre-Tax Syn. For | |
Share | | to | | Value | | Curr. | | Expense | | Amort. | | NewCo EPS | | Accretion / (Dilution) | | No Dilution (7) | | NewCo EPS | | Accretion / (Dilution) | | No Dilution (7) | |
(2) | | Unaffected | | (3) | | Own.(4) | | (5) | | (6) | | CY2006 | | CY2007 | | CY2006 | | CY2007 | | CY2006 | | CY2007 | | CY2006 | | CY2007 | | CY2006 | | CY2007 | | CY2006 | | CY2007 | |
$ | 36.44 | | 0 | % | $ | 6,911 | | $ | 4,021 | | $ | 133 | | $ | 142 | | $ | 3.08 | | $ | 3.46 | | 1.1 | % | 1.7 | % | NM | | NM | | $ | 3.02 | | $ | 3.40 | | (0.9 | )% | (0.1 | )% | $ | 87 | | $ | 15 | |
40.00 | | 10 | % | 7,616 | | 4,443 | | 147 | | 159 | | 3.08 | | 3.46 | | 0.9 | % | 1.5 | % | NM | | NM | | 3.01 | | 3.39 | | (1.4 | )% | (0.5 | )% | 129 | | 57 | |
41.00 | | 13 | % | 7,813 | | 4,561 | | 151 | | 164 | | 3.08 | | 3.46 | | 0.8 | % | 1.4 | % | NM | | NM | | 3.00 | | 3.39 | | (1.5 | )% | (0.7 | )% | 141 | | 69 | |
42.00 | | 15 | % | 8,011 | | 4,680 | | 155 | | 169 | | 3.07 | | 3.46 | | 0.8 | % | 1.4 | % | NM | | NM | | 3.00 | | 3.38 | | (1.6 | )% | (0.8 | )% | 152 | | 80 | |
43.00 | | 18 | % | 8,212 | | 4,801 | | 159 | | 174 | | 3.07 | | 3.45 | | 0.7 | % | 1.3 | % | NM | | NM | | 3.00 | | 3.38 | | (1.7 | )% | (0.9 | )% | 165 | | 93 | |
44.00 | | 21 | % | 8,416 | | 4,926 | | 164 | | 179 | | 3.07 | | 3.45 | | 0.7 | % | 1.3 | % | NM | | NM | | 2.99 | | 3.37 | | (1.9 | )% | (1.0 | )% | 177 | | 105 | |
45.00 | | 23 | % | 8,620 | | 5,051 | | 168 | | 185 | | 3.07 | | 3.45 | | 0.6 | % | 1.2 | % | NM | | NM | | 2.99 | | 3.37 | | (2.0 | )% | (1.1 | )% | 189 | | 117 | |
46.00 | | 26 | % | 8,824 | | 5,176 | | 172 | | 190 | | 3.07 | | 3.45 | | 0.5 | % | 1.2 | % | NM | | NM | | 2.98 | | 3.37 | | (2.1 | )% | (1.2 | )% | 202 | | 130 | |
47.00 | | 29 | % | 9,028 | | 5,300 | | 176 | | 195 | | 3.07 | | 3.45 | | 0.5 | % | 1.1 | % | NM | | NM | | 2.98 | | 3.36 | | (2.3 | )% | (1.4 | )% | 214 | | 142 | |
48.00 | | 32 | % | 9,232 | | 5,425 | | 180 | | 200 | | 3.06 | | 3.44 | | 0.4 | % | 1.1 | % | NM | | NM | | 2.98 | | 3.36 | | (2.4 | )% | (1.5 | )% | 227 | | 155 | |
49.00 | | 34 | % | 9,443 | | 5,557 | | 184 | | 206 | | 3.06 | | 3.44 | | 0.4 | % | 1.0 | % | NM | | NM | | 2.97 | | 3.35 | | (2.5 | )% | (1.6 | )% | 240 | | 168 | |
50.00 | | 37 | % | 9,655 | | 5,689 | | 189 | | 211 | | 3.06 | | 3.44 | | 0.3 | % | 1.0 | % | NM | | NM | | 2.97 | | 3.35 | | (2.7 | )% | (1.7 | )% | 253 | | 181 | |
51.00 | | 40 | % | 9,866 | | 5,821 | | 193 | | 217 | | 3.06 | | 3.44 | | 0.2 | % | 0.9 | % | NM | | NM | | 2.96 | | 3.34 | | (2.8 | )% | (1.9 | )% | 266 | | 194 | |
52.00 | | 43 | % | 10,077 | | 5,953 | | 198 | | 222 | | 3.06 | | 3.44 | | 0.2 | % | 0.9 | % | NM | | NM | | 2.96 | | 3.34 | | (3.0 | )% | (2.0 | )% | 279 | | 207 | |
53.00 | | 45 | % | 10,289 | | 6,085 | | 202 | | 228 | | 3.05 | | 3.43 | | 0.1 | % | 0.8 | % | NM | | NM | | 2.96 | | 3.34 | | (3.1 | )% | (2.1 | )% | 292 | | 220 | |
54.00 | | 48 | % | 10,504 | | 6,221 | | 206 | | 233 | | 3.05 | | 3.43 | | 0.1 | % | 0.7 | % | NM | | NM | | 2.95 | | 3.33 | | (3.2 | )% | (2.2 | )% | 306 | | 234 | |
55.00 | | 51 | % | 10,719 | | 6,357 | | 211 | | 239 | | 3.05 | | 3.43 | | (0.0 | )% | 0.7 | % | 1 | | NM | | 2.95 | | 3.33 | | (3.4 | )% | (2.4 | )% | 319 | | 247 | |
56.00 | | 54 | % | 10,934 | | 6,492 | | 216 | | 244 | | 3.05 | | 3.43 | | (0.1 | )% | 0.6 | % | 7 | | NM | | 2.94 | | 3.32 | | (3.5 | )% | (2.5 | )% | 333 | | 261 | |
57.00 | | 56 | % | 11,150 | | 6,628 | | 220 | | 250 | | 3.05 | | 3.43 | | (0.1 | )% | 0.6 | % | 13 | | NM | | 2.94 | | 3.32 | | (3.7 | )% | (2.6 | )% | 347 | | 274 | |
58.00 | | 59 | % | 11,365 | | 6,764 | | 225 | | 256 | | 3.04 | | 3.42 | | (0.2 | )% | 0.5 | % | 19 | | NM | | 2.93 | | 3.31 | | (3.8 | )% | (2.8 | )% | 360 | | 288 | |
59.00 | | 62 | % | 11,580 | | 6,900 | | 229 | | 261 | | 3.04 | | 3.42 | | (0.3 | )% | 0.4 | % | 25 | | NM | | 2.93 | | 3.31 | | (4.0 | )% | (2.9 | )% | 374 | | 302 | |
60.00 | | 65 | % | 11,795 | | 7,036 | | 234 | | 267 | | 3.04 | | 3.42 | | (0.3 | )% | 0.4 | % | 31 | | NM | | 2.92 | | 3.30 | | (4.1 | )% | (3.0 | )% | 387 | | 315 | |
Note: Based on Heron Management Forecast as of August 2005, and Citigroup analyst research dated July 18, 2005, for Heron and Neptune, respectively.
(1) Represents 42% of Heron GAAP net income (less assumed Heron tax expense) based on Street estimates, which is excluded from Neptune net income in the calculation of NewCo EPS.
(2) Based on current prices of $48.75 and $36.44 for Neptune and Heron, respectively, as of August 31, 2005.
(3) Based on Heron primary shares of 187.9MM and options schedule from 10-K for the period ended December 31, 2004.
(4) Excludes 79.3MM primary shares held by Neptune.
(5) Based on an pretax interest rate of 4.0% and Neptune tax rate of 17.0%.
(6) Assumes allocated intangibles of 50% of the difference between (a) the purchase price for public float and (b) 58% of Heron tangible book value of $1,042. Assumes 10 year average life.
(7) Based on Heron pro forma tax rate of 25.0%.
3
Framing the Synergy Potential: Heron Expense Breakout by Division
($MM) | | | | | | | | | | | | | | | | | | | | | |
| | | | | | | | | | | | | | | | | | | | | |
| | Heron Calendar Year Projections | |
| | Biopharma | | Vaccines | | Blood Testing | | Corporate | | Total | |
| | 2006E | | 2007E | | 2006E | | 2007E | | 2006E | | 2007E | | 2006E | | 2007E | | 2006E | | 2007E | |
| | | | | | | | | | | | | | | | | | | | | |
Revenue | | $ | 612 | | $ | 652 | | $ | 921 | | $ | 998 | | $ | 609 | | $ | 701 | | $ | 81 | | $ | 86 | | $ | 2,222 | | $ | 2,437 | |
| | | | | | | | | | | | | | | | | | | | | | | | | | | | | | | |
COGS | | 159 | | 177 | | 450 | | 451 | | 225 | | 264 | | 0 | | 0 | | 834 | | 892 | |
% Margin | | 26 | % | 27 | % | 49 | % | 45 | % | 37 | % | 38 | % | 0 | % | 0 | % | 38 | % | 37 | % |
| | | | | | | | | | | | | | | | | | | | | |
Operating Expenses | | | | | | | | | | | | | | | | | | | | | |
| | | | | | | | | | | | | | | | | | | | | |
R&D | | 297 | * | 305 | * | 150 | * | 151 | * | 32 | | 45 | | 3 | | 3 | | 482 | | 504 | |
% Margin | | 49 | % | 47 | % | 16 | % | 15 | % | 5 | % | 6 | % | 3 | % | 3 | % | 22 | % | 21 | % |
| | | | | | | | | | | | | | | | | | | | | |
S&M | | 145 | * | 163 | * | 111 | | 115 | | 45 | | 49 | | 0 | | 0 | | 301 | | 326 | |
% Margin | | 24 | % | 25 | % | 12 | % | 11 | % | 7 | % | 7 | % | 0 | % | 0 | % | 14 | % | 13 | % |
| | | | | | | | | | | | | | | | | | | | | |
G&A | | 31 | | 32 | | 50 | | 54 | | 5 | | 5 | | 115 | | 119 | | 202 | * | 210 | * |
% Margin | | 5 | % | 5 | % | 5 | % | 5 | % | 1 | % | 1 | % | 142 | % | 140 | % | 9 | % | 9 | % |
| | | | | | | | | | | | | | | | | | | | | |
Other Operating Expenses | | 13 | | 13 | | 0 | | 0 | | 0 | | 0 | | 1 | | 1 | | 14 | | 14 | |
| | | | | | | | | | | | | | | | | | | | | |
Total OpEx | | 486 | | 513 | | 311 | | 320 | | 82 | | 98 | | 119 | | 123 | | 999 | | 1,055 | |
% Margin | | 79 | % | 79 | % | 34 | % | 32 | % | 14 | % | 14 | % | 147 | % | 144 | % | 45 | % | 43 | % |
| | | | | | | | | | | | | | | | | | | | | |
EBIT | | (33 | ) | (39 | ) | 159 | | 227 | | 301 | | 339 | | (38 | ) | (38 | ) | 389 | | 490 | |
% Margin | | (5 | )% | (6 | )% | 17 | % | 23 | % | 49 | % | 48 | % | (47 | )% | (44 | )% | 18 | % | 20 | % |
Source: Heron management forecast as of August 2005.
* Potential cost savings areas include: R&D investment, R&D efficiencies, S&M overlap with certain Neptune products and general G&A redundancies
Selected cost buckets represent ~$800MM of addressable cost structure in 2006
4
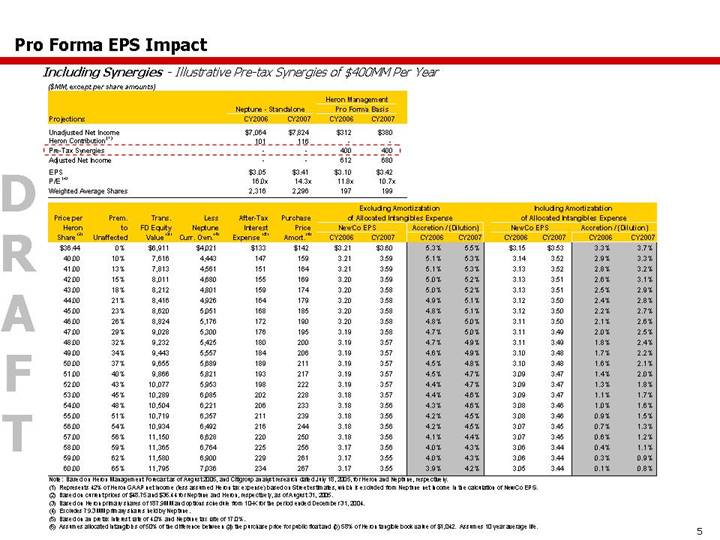
Including Synergies - Illustrative Pre-tax Synergies of $400MM Per Year
($MM, except per share amounts)
| | | | | | Heron Management | |
| | Neptune - Standalone | | Pro Forma Basis | |
Projections | | CY2006 | | CY2007 | | CY2006 | | CY2007 | |
Unadjusted Net Income | | $ | 7,064 | | $ | 7,824 | | $ | 312 | | $ | 380 | |
Heron Contribution (1) | | 101 | | 116 | | — | | — | |
Pre-Tax Synergies | | — | | — | | 400 | | 400 | |
Adjusted Net Income | | — | | — | | 612 | | 680 | |
| | | | | | | | | |
EPS | | $ | 3.05 | | $ | 3.41 | | $ | 3.10 | | $ | 3.42 | |
P/E (2) | | 16.0 | x | 14.3 | x | 11.8 | x | 10.7 | x |
Weighted Average Shares | | 2,316 | | 2,296 | | 197 | | 199 | |
| | | | | | | | | | | | | | | | | | | | | | | | | | | | | | | | | | | | |
Price per | | | | | | Less | | | | | | Excluding Amortizatation | | Including Amortizatation | |
Heron | | Prem. | | Trans. | | Neptune | | After-Tax | | Purchase | | of Allocated Intangibles Expense | | of Allocated Intangibles Expense | |
Share | | to | | FD Equity | | Curr. | | Interest | | Price | | NewCo EPS | | Accretion / (Dilution) | | NewCo EPS | | Accretion / (Dilution) | |
(2) | | Unaffected | | Value (3) | | Own.(4) | | Expense (5) | | Amort.(6) | | CY2006 | | CY2007 | | CY2006 | | CY2007 | | CY2006 | | CY2007 | | CY2006 | | CY2007 | |
$ | 36.44 | | 0 | % | $ | 6,911 | | $ | 4,021 | | $ | 133 | | $ | 142 | | $ | 3.21 | | $ | 3.60 | | 5.3 | % | 5.5 | % | $ | 3.15 | | $ | 3.53 | | 3.3 | % | 3.7 | % |
40.00 | | 10 | % | 7,616 | | 4,443 | | 147 | | 159 | | 3.21 | | 3.59 | | 5.1 | % | 5.3 | % | 3.14 | | 3.52 | | 2.9 | % | 3.3 | % |
41.00 | | 13 | % | 7,813 | | 4,561 | | 151 | | 164 | | 3.21 | | 3.59 | | 5.1 | % | 5.3 | % | 3.13 | | 3.52 | | 2.8 | % | 3.2 | % |
42.00 | | 15 | % | 8,011 | | 4,680 | | 155 | | 169 | | 3.20 | | 3.59 | | 5.0 | % | 5.2 | % | 3.13 | | 3.51 | | 2.6 | % | 3.1 | % |
43.00 | | 18 | % | 8,212 | | 4,801 | | 159 | | 174 | | 3.20 | | 3.58 | | 5.0 | % | 5.2 | % | 3.13 | | 3.51 | | 2.5 | % | 2.9 | % |
44.00 | | 21 | % | 8,416 | | 4,926 | | 164 | | 179 | | 3.20 | | 3.58 | | 4.9 | % | 5.1 | % | 3.12 | | 3.50 | | 2.4 | % | 2.8 | % |
45.00 | | 23 | % | 8,620 | | 5,051 | | 168 | | 185 | | 3.20 | | 3.58 | | 4.8 | % | 5.1 | % | 3.12 | | 3.50 | | 2.2 | % | 2.7 | % |
46.00 | | 26 | % | 8,824 | | 5,176 | | 172 | | 190 | | 3.20 | | 3.58 | | 4.8 | % | 5.0 | % | 3.11 | | 3.50 | | 2.1 | % | 2.6 | % |
47.00 | | 29 | % | 9,028 | | 5,300 | | 176 | | 195 | | 3.19 | | 3.58 | | 4.7 | % | 5.0 | % | 3.11 | | 3.49 | | 2.0 | % | 2.5 | % |
48.00 | | 32 | % | 9,232 | | 5,425 | | 180 | | 200 | | 3.19 | | 3.57 | | 4.7 | % | 4.9 | % | 3.11 | | 3.49 | | 1.8 | % | 2.4 | % |
49.00 | | 34 | % | 9,443 | | 5,557 | | 184 | | 206 | | 3.19 | | 3.57 | | 4.6 | % | 4.9 | % | 3.10 | | 3.48 | | 1.7 | % | 2.2 | % |
50.00 | | 37 | % | 9,655 | | 5,689 | | 189 | | 211 | | 3.19 | | 3.57 | | 4.5 | % | 4.8 | % | 3.10 | | 3.48 | | 1.6 | % | 2.1 | % |
51.00 | | 40 | % | 9,866 | | 5,821 | | 193 | | 217 | | 3.19 | | 3.57 | | 4.5 | % | 4.7 | % | 3.09 | | 3.47 | | 1.4 | % | 2.0 | % |
52.00 | | 43 | % | 10,077 | | 5,953 | | 198 | | 222 | | 3.19 | | 3.57 | | 4.4 | % | 4.7 | % | 3.09 | | 3.47 | | 1.3 | % | 1.8 | % |
53.00 | | 45 | % | 10,289 | | 6,085 | | 202 | | 228 | | 3.18 | | 3.57 | | 4.4 | % | 4.6 | % | 3.09 | | 3.47 | | 1.1 | % | 1.7 | % |
54.00 | | 48 | % | 10,504 | | 6,221 | | 206 | | 233 | | 3.18 | | 3.56 | | 4.3 | % | 4.6 | % | 3.08 | | 3.46 | | 1.0 | % | 1.6 | % |
55.00 | | 51 | % | 10,719 | | 6,357 | | 211 | | 239 | | 3.18 | | 3.56 | | 4.2 | % | 4.5 | % | 3.08 | | 3.46 | | 0.9 | % | 1.5 | % |
56.00 | | 54 | % | 10,934 | | 6,492 | | 216 | | 244 | | 3.18 | | 3.56 | | 4.2 | % | 4.5 | % | 3.07 | | 3.45 | | 0.7 | % | 1.3 | % |
57.00 | | 56 | % | 11,150 | | 6,628 | | 220 | | 250 | | 3.18 | | 3.56 | | 4.1 | % | 4.4 | % | 3.07 | | 3.45 | | 0.6 | % | 1.2 | % |
58.00 | | 59 | % | 11,365 | | 6,764 | | 225 | | 256 | | 3.17 | | 3.56 | | 4.0 | % | 4.3 | % | 3.06 | | 3.44 | | 0.4 | % | 1.1 | % |
59.00 | | 62 | % | 11,580 | | 6,900 | | 229 | | 261 | | 3.17 | | 3.55 | | 4.0 | % | 4.3 | % | 3.06 | | 3.44 | | 0.3 | % | 0.9 | % |
60.00 | | 65 | % | 11,795 | | 7,036 | | 234 | | 267 | | 3.17 | | 3.55 | | 3.9 | % | 4.2 | % | 3.05 | | 3.44 | | 0.1 | % | 0.8 | % |
Note: Based on Heron Management Forecast as of August 2005, and Citigroup analyst research dated July 18, 2005, for Heron and Neptune, respectively.
(1) Represents 42% of Heron GAAP net income (less assumed Heron tax expense) based on Street estimates, which is excluded from Neptune net income in the calculation of NewCo EPS.
(2) Based on current prices of $48.75 and $36.44 for Neptune and Heron, respectively, as of August 31, 2005.
(3) Based on Heron primary shares of 187.9MM and options schedule from 10-K for the period ended December 31, 2004.
(4) Excludes 79.3MM primary shares held by Neptune.
(5) Based on an pretax interest rate of 4.0% and Neptune tax rate of 17.0%.
(6) Assumes allocated intangibles of 50% of the difference between (a) the purchase price for public float and (b) 58% of Heron tangible book value of $1,042. Assumes 10 year average life.
5
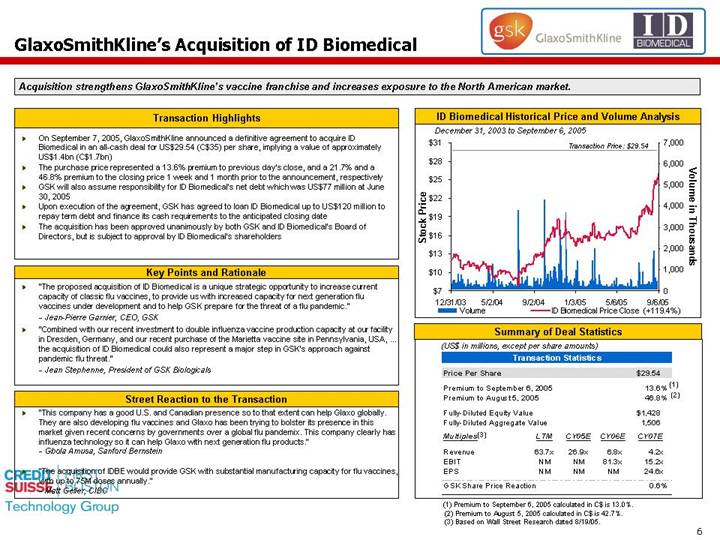
GlaxoSmithKline’s Acquisition of ID Biomedical | [LOGO] |
Acquisition strengthens GlaxoSmithKline’s vaccine franchise and increases exposure to the North American market.
Transaction Highlights
• On September 7, 2005, GlaxoSmithKline announced a definitive agreement to acquire ID Biomedical in an all-cash deal for US$29.54 (C$35) per share, implying a value of approximately US$1.4bn (C$1.7bn)
• The purchase price represented a 13.6% premium to previous day’s close, and a 21.7% and a 46.8% premium to the closing price 1 week and 1 month prior to the announcement, respectively
• GSK will also assume responsibility for ID Biomedical’s net debt which was US$77 million at June 30, 2005
• Upon execution of the agreement, GSK has agreed to loan ID Biomedical up to US$120 million to repay term debt and finance its cash requirements to the anticipated closing date
• The acquisition has been approved unanimously by both GSK and ID Biomedical’s Board of Directors, but is subject to approval by ID Biomedical’s shareholders
Key Points and Rationale
• “The proposed acquisition of ID Biomedical is a unique strategic opportunity to increase current capacity of classic flu vaccines, to provide us with increased capacity for next generation flu vaccines under development and to help GSK prepare for the threat of a flu pandemic.”
- Jean-Pierre Garnier, CEO, GSK
• “Combined with our recent investment to double influenza vaccine production capacity at our facility in Dresden, Germany, and our recent purchase of the Marietta vaccine site in Pennsylvania, USA, … the acquisition of ID Biomedical could also represent a major step in GSK’s approach against pandemic flu threat.”
- Jean Stephenne, President of GSK Biologicals
Street Reaction to the Transaction
• “This company has a good U.S. and Canadian presence so to that extent can help Glaxo globally. They are also developing flu vaccines and Glaxo has been trying to bolster its presence in this market given recent concerns by governments over a global flu pandemix. This company clearly has influenza technology so it can help Glaxo with next generation flu products.”
- Gbola Amusa, Sanford Bernstein
• “The acquisition of IDBE would provide GSK with substantial manufacturing capacity for flu vaccines, with up to 75M doses annually.”
- Matt Geller, CIBC
ID Biomedical Historical Price and Volume Analysis
[CHART]
Summary of Deal Statistics
(US$ in millions, except per share amounts)
Transaction Statistics
Price Per Share | | | | | | | | $ | 29.54 | |
| | | | | | | | | |
Premium to September 6, 2005 | | | | | | | | 13.6 | %(1) |
Premium to August 5, 2005 | | | | | | | | 46.8 | %(2) |
| | | | | | | | | |
Fully-Diluted Equity Value | | | | | | | | $ | 1,428 | |
Fully-Diluted Aggregate Value | | | | | | | | 1,506 | |
| | | | | | | | | |
Multiples(3) | | LTM | | CY05E | | CY06E | | CY07E | |
Revenue | | 63.7 | x | 26.9 | x | 6.8 | x | 4.2 | x |
EBIT | | NM | | NM | | 81.3 | x | 15.2 | x |
EPS | | NM | | NM | | NM | | 24.6 | x |
| | | | | | | | | |
GSK Share Price Reaction | | | | | | | | 0.6 | % |
(1) Premium to September 6, 2005 calculated in C$ is 13.0%.
(2) Premium to August 5, 2005 calculated in C$ is 42.7%.
(3) Based on Wall Street Research dated 8/19/05.
6
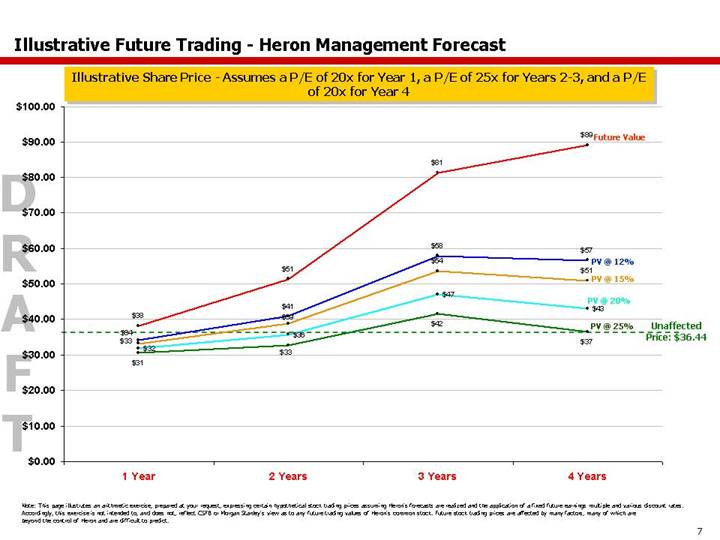
Illustrative Future Trading - Heron Management Forecast
Illustrative Share Price - Assumes a P/E of 20x for Year 1, a P/E of 25x for Years 2-3, and a P/E of 20x for Year 4
[CHART]
Note: This page illustrates an arithmetic exercise, prepared at your request, expressing certain hypothetical stock trading prices assuming Heron’s forecasts are realized and the application of a fixed future earnings multiple and various discount rates. Accordingly, this exercise is not intended to, and does not, reflect CSFB or Morgan Stanley’s view as to any future trading values of Heron’s common stock. Future stock trading prices are affected by many factors, many of which are beyond the control of Heron and are difficult to predict.
7
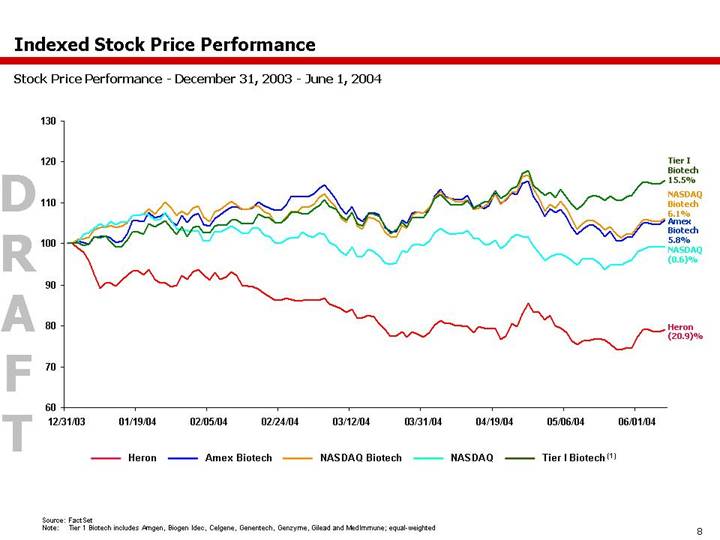
Indexed Stock Price Performance
Stock Price Performance - December 31, 2003 - June 1, 2004
[CHART]
Source: FactSet
Note: Tier 1 Biotech includes Amgen, Biogen Idec, Celgene, Genentech, Genzyme, Gilead and MedImmune; equal-weighted
8
Heron Stock Price Performance
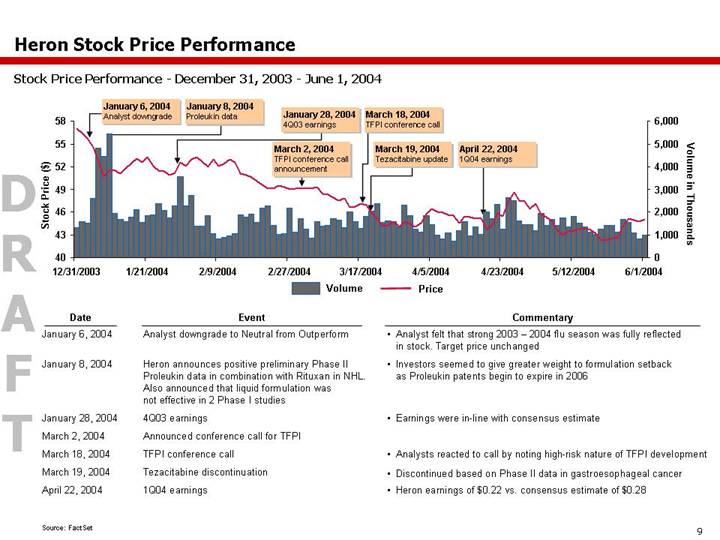
Stock Price Performance - December 31, 2003 - June 1, 2004
[CHART]
Date | | Event | | Commentary |
January 6, 2004 | | Analyst downgrade to Neutral from Outperform | | • Analyst felt that strong 2003 – 2004 flu season was fully reflected in stock. Target price unchanged |
| | | | |
January 8, 2004 | | Heron announces positive preliminary Phase II Proleukin data in combination with Rituxan in NHL.
Also announced that liquid formulation was
not effective in 2 Phase I studies | | • Investors seemed to give greater weight to formulation setback as Proleukin patents begin to expire in 2006 |
| | | | |
January 28, 2004 | | 4Q03 earnings | | • Earnings were in-line with consensus estimate |
| | | | |
March 2, 2004 | | Announced conference call for TFPI | | |
| | | | |
March 18, 2004 | | TFPI conference call | | • Analysts reacted to call by noting high-risk nature of TFPI development |
| | | | |
March 19, 2004 | | Tezacitabine discontinuation | | • Discontinued based on Phase II data in gastroesophageal cancer |
| | | | |
April 22, 2004 | | 1Q04 earnings | | • Heron earnings of $0.22 vs. consensus estimate of $0.28 |
Source: FactSet
9
Credit Suisse First Boston (“CSFB”) and Morgan Stanley do not provide any tax advice. Any tax statement herein regarding any US federal tax is not intended or written to be used, and cannot be used, by any taxpayer for the purpose of avoiding any penalties. Any such statement herein was written to support the marketing or promotion of the transaction(s) or matter(s) to which the statement relates. Each taxpayer should seek advice based on the taxpayer’s particular circumstances from an independent tax advisor.
These materials have been provided to you by CSFB and Morgan Stanley in connection with an actual or potential mandate or engagement and may not be used or relied upon for any purpose other than as specifically contemplated by a written agreement with CSFB and Morgan Stanley. In addition, these materials may not be disclosed, in whole or in part, or summarized or otherwise referred to except as agreed in writing by CSFB and Morgan Stanley. The information used in preparing these materials was obtained from or through you or your representatives or from public sources. CSFB and Morgan Stanley assume no responsibility for independent verification of such information and has relied on such information being complete and accurate in all material respects. To the extent such information includes estimates and forecasts of future financial performance (including estimates of potential cost savings and synergies) prepared by or reviewed or discussed with the managements of your company and/or other potential transaction participants or obtained from public sources, we have assumed that such estimates and forecasts have been reasonably prepared on bases reflecting the best currently available estimates and judgments of such managements (or, with respect to estimates and forecasts obtained from public sources, represent reasonable estimates). These materials were designed for use by specific persons familiar with the business and the affairs of your company and CSFB and Morgan Stanley assume no obligation to update or otherwise revise these materials. Nothing contained herein should be construed as tax, accounting or legal advice. You (and each of your employees, representatives or other agents) may disclose to any and all persons, without limitation of any kind, the tax treatment and tax structure of the transactions contemplated by these materials and all materials of any kind (including opinions or other tax analyses) that are provided to you relating to such tax treatment and structure. For this purpose, the tax treatment of a transaction is the purported or claimed U.S. federal income tax treatment of the transaction and the tax structure of a transaction is any fact that may be relevant to understanding the purported or claimed U.S. federal income tax treatment of the transaction.
CSFB and Morgan Stanley have adopted policies and guidelines designed to preserve the independence of its research analysts. CSFB’s and Morgan Stanley’s policies prohibit employees from directly or indirectly offering a favorable research rating or specific price target, or offering to change a research rating or price target, as consideration for or an inducement to obtain business or other compensation. CSFB’s and Morgan Stanley’s policies prohibit research analysts from being compensated for their involvement in investment banking transactions except to the extent such participation is intended to benefit investor clients.
Credit Suisse First Boston or CSFB is the trade name for the investment banking business of Credit Suisse, a Swiss bank, and references to Credit Suisse First Boston or CSFB herein include all of the subsidiaries and affiliates of Credit Suisse operating under the Credit Suisse First Boston division of Credit Suisse Group. For more information on our structure, please follow the below link: http://www.creditsuisse.com/en/who_we_are/ourstructure.html.
10