Searchable text section of graphics shown above
Project Heron
Presentation to the Board of Directors
PRELIMINARY | SUBJECT TO FURTHER REVIEW AND EVALUATION
September 4, 2005
THESE MATERIALS MAY NOT BE USED OR RELIED UPON FOR ANY PURPOSE OTHER THAN AS SPECIFICALLY CONTEMPLATED BY A WRITTEN AGREEMENT WITH CREDIT SUISSE FIRST BOSTON AND MORGAN STANLEY.
Transaction Summary
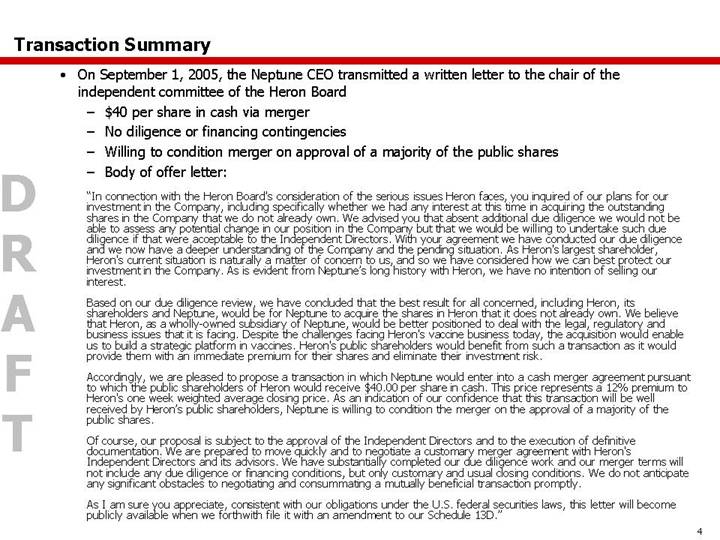
• On September 1, 2005, the Neptune CEO transmitted a written letter to the chair of the independent committee of the Heron Board
• $40 per share in cash via merger
• No diligence or financing contingencies
• Willing to condition merger on approval of a majority of the public shares
• Body of offer letter:
“In connection with the Heron Board's consideration of the serious issues Heron faces, you inquired of our plans for our investment in the Company, including specifically whether we had any interest at this time in acquiring the outstanding shares in the Company that we do not already own. We advised you that absent additional due diligence we would not be able to assess any potential change in our position in the Company but that we would be willing to undertake such due diligence if that were acceptable to the Independent Directors. With your agreement we have conducted our due diligence and we now have a deeper understanding of the Company and the pending situation. As Heron's largest shareholder, Heron's current situation is naturally a matter of concern to us, and so we have considered how we can best protect our investment in the Company. As is evident from Neptune's long history with Heron, we have no intention of selling our interest.
Based on our due diligence review, we have concluded that the best result for all concerned, including Heron, its shareholders and Neptune, would be for Neptune to acquire the shares in Heron that it does not already own. We believe that Heron, as a wholly-owned subsidiary of Neptune, would be better positioned to deal with the legal, regulatory and business issues that it is facing. Despite the challenges facing Heron's vaccine business today, the acquisition would enable us to build a strategic platform in vaccines. Heron's public shareholders would benefit from such a transaction as it would provide them with an immediate premium for their shares and eliminate their investment risk.
Accordingly, we are pleased to propose a transaction in which Neptune would enter into a cash merger agreement pursuant to which the public shareholders of Heron would receive $40.00 per share in cash. This price represents a 12% premium to Heron's one week weighted average closing price. As an indication of our confidence that this transaction will be well received by Heron's public shareholders, Neptune is willing to condition the merger on the approval of a majority of the public shares.
Of course, our proposal is subject to the approval of the Independent Directors and to the execution of definitive documentation. We are prepared to move quickly and to negotiate a customary merger agreement with Heron's Independent Directors and its advisors. We have substantially completed our due diligence work and our merger terms will not include any due diligence or financing conditions, but only customary and usual closing conditions. We do not anticipate any significant obstacles to negotiating and consummating a mutually beneficial transaction promptly.
As I am sure you appreciate, consistent with our obligations under the U.S. federal securities laws, this letter will become publicly available when we forthwith file it with an amendment to our Schedule 13D.”
4
Key Terms of Offer
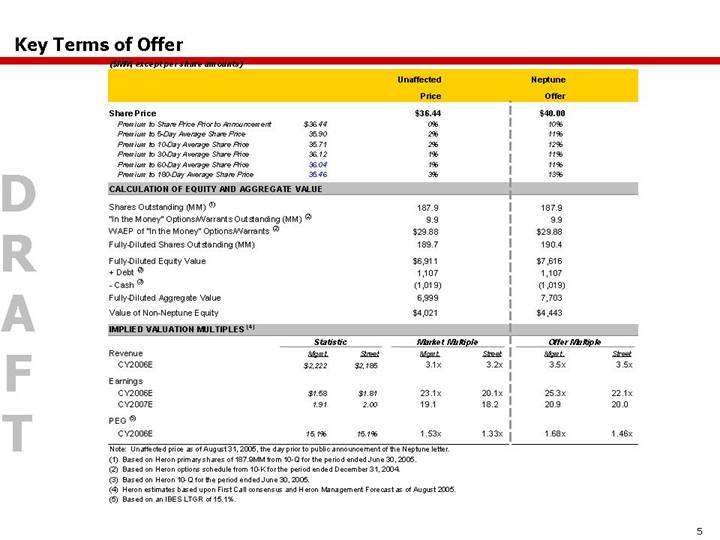
($MM, except per share amounts)
| | | | Unaffected | | Neptune | |
| | | | Price | | Offer | |
| | | | | | | |
Share Price | | | | $ | 36.44 | | $ | 40.00 | |
Premium to Share Price Prior to Announcement | | $ | 36.44 | | 0 | % | 10 | % |
Premium to 5-Day Average Share Price | | 35.90 | | 2 | % | 11 | % |
Premium to 10-Day Average Share Price | | 35.71 | | 2 | % | 12 | % |
Premium to 30-Day Average Share Price | | 36.12 | | 1 | % | 11 | % |
Premium to 60-Day Average Share Price | | 36.04 | | 1 | % | 11 | % |
Premium to 180-Day Average Share Price | | 35.46 | | 3 | % | 13 | % |
| | | | | | | | | | |
CALCULATION OF EQUITY AND AGGREGATE VALUE
Shares Outstanding (MM) (1) | | 187.9 | | 187.9 | |
“In the Money” Options/Warrants Outstanding (MM) (2) | | 9.9 | | 9.9 | |
WAEP of “In the Money” Options/Warrants (2) | | $ | 29.88 | | $ | 29.88 | |
Fully-Diluted Shares Outstanding (MM) | | 189.7 | | 190.4 | |
| | | | | |
Fully-Diluted Equity Value | | $ | 6,911 | | $ | 7,616 | |
+ Debt (3) | | 1,107 | | 1,107 | |
- Cash (3) | | (1,019 | ) | (1,019 | ) |
Fully-Diluted Aggregate Value | | 6,999 | | 7,703 | |
| | | | | |
Value of Non-Neptune Equity | | $ | 4,021 | | $ | 4,443 | |
IMPLIED VALUATION MULTIPLES (4)
| | Statistic | | Market Multiple | | Offer Multiple | |
| | Mgmt. | | Street | | Mgmt. | | Street | | Mgmt. | | Street | |
Revenue | | | | | | | | | | | | | |
CY2006E | | $ | 2,222 | | $ | 2,185 | | 3.1 | x | 3.2 | x | 3.5 | x | 3.5 | x |
| | | | | | | | | | | | | |
Earnings | | | | | | | | | | | | | |
CY2006E | | $ | 1.58 | | $ | 1.81 | | 23.1 | x | 20.1 | x | 25.3 | x | 22.1 | x |
CY2007E | | 1.91 | | 2.00 | | 19.1 | | 18.2 | | 20.9 | | 20.0 | |
| | | | | | | | | | | | | |
PEG (5) | | | | | | | | | | | | | |
CY2006E | | 15.1 | % | 15.1 | % | 1.53 | x | 1.33 | x | 1.68 | x | 1.46 | x |
Note: Unaffected price as of August 31, 2005, the day prior to public announcement of the Neptune letter.
(1) Based on Heron primary shares of 187.9MM from 10-Q for the period ended June 30, 2005.
(2) Based on Heron options schedule from 10-K for the period ended December 31, 2004.
(3) Based on Heron 10-Q for the period ended June 30, 2005.
(4) Heron estimates based upon First Call consensus and Heron Management Forecast as of August 2005.
(5) Based on an IBES LTGR of 15.1%.
5
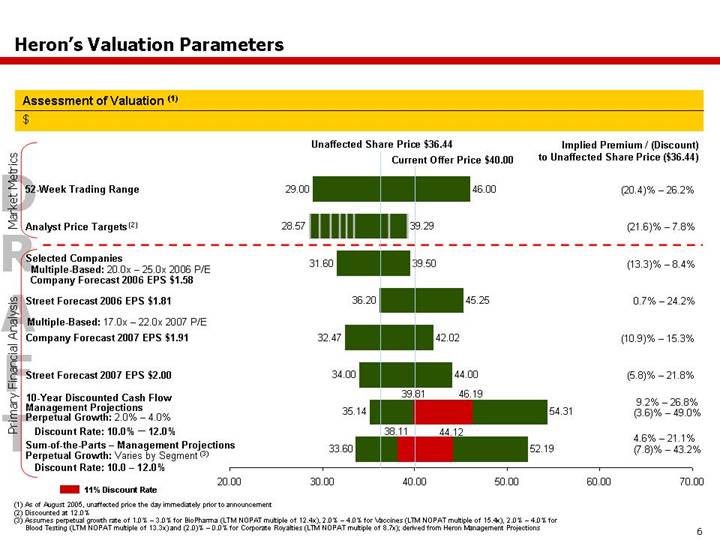
Heron's Valuation Parameters
Assessment of Valuation (1)
$
[CHART]
(1) As of August 2005, unaffected price the day immediately prior to announcement
(2) Discounted at 12.0%
(3) Assumes perpetual growth rate of 1.0% – 3.0% for BioPharma (LTM NOPAT multiple of 12.4x), 2.0% – 4.0% for Vaccines (LTM NOPAT multiple of 15.4x), 2.0% – 4.0% for Blood Testing (LTM NOPAT multiple of 13.3x) and (2.0)% – 0.0% for Corporate Royalties (LTM NOPAT multiple of 8.7x); derived from Heron Management Projections
6
2. Overview of Heron
A. Update on Heron Business Situation
7
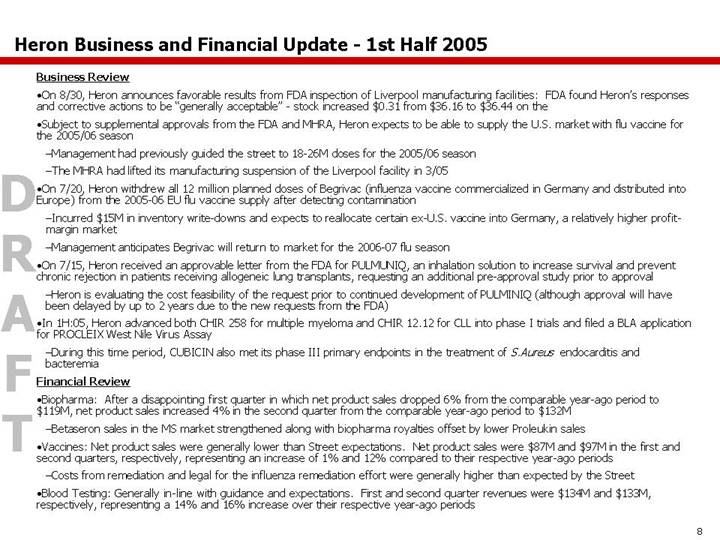
Heron Business and Financial Update - 1st Half 2005
Business Review
• On 8/30, Heron announces favorable results from FDA inspection of Liverpool manufacturing facilities: FDA found Heron's responses and corrective actions to be “generally acceptable” - stock increased $0.31 from $36.16 to $36.44 on the
• Subject to supplemental approvals from the FDA and MHRA, Heron expects to be able to supply the U.S. market with flu vaccine for the 2005/06 season
• Management had previously guided the street to 18-26M doses for the 2005/06 season
• The MHRA had lifted its manufacturing suspension of the Liverpool facility in 3/05
• On 7/20, Heron withdrew all 12 million planned doses of Begrivac (influenza vaccine commercialized in Germany and distributed into Europe) from the 2005-06 EU flu vaccine supply after detecting contamination
• Incurred $15M in inventory write-downs and expects to reallocate certain ex-U.S. vaccine into Germany, a relatively higher profit-margin market
• Management anticipates Begrivac will return to market for the 2006-07 flu season
• On 7/15, Heron received an approvable letter from the FDA for PULMUNIQ, an inhalation solution to increase survival and prevent chronic rejection in patients receiving allogeneic lung transplants, requesting an additional pre-approval study prior to approval
• Heron is evaluating the cost feasibility of the request prior to continued development of PULMINIQ (although approval will have been delayed by up to 2 years due to the new requests from the FDA)
• In 1H:05, Heron advanced both CHIR 258 for multiple myeloma and CHIR 12.12 for CLL into phase I trials and filed a BLA application for PROCLEIX West Nile Virus Assay
• During this time period, CUBICIN also met its phase III primary endpoints in the treatment of S.Aureus endocarditis and bacteremia
Financial Review
• Biopharma: After a disappointing first quarter in which net product sales dropped 6% from the comparable year-ago period to $119M, net product sales increased 4% in the second quarter from the comparable year-ago period to $132M
• Betaseron sales in the MS market strengthened along with biopharma royalties offset by lower Proleukin sales
• Vaccines: Net product sales were generally lower than Street expectations. Net product sales were $87M and $97M in the first and second quarters, respectively, representing an increase of 1% and 12% compared to their respective year-ago periods
• Costs from remediation and legal for the influenza remediation effort were generally higher than expected by the Street
• Blood Testing: Generally in-line with guidance and expectations. First and second quarter revenues were $134M and $133M, respectively, representing a 14% and 16% increase over their respective year-ago periods
8
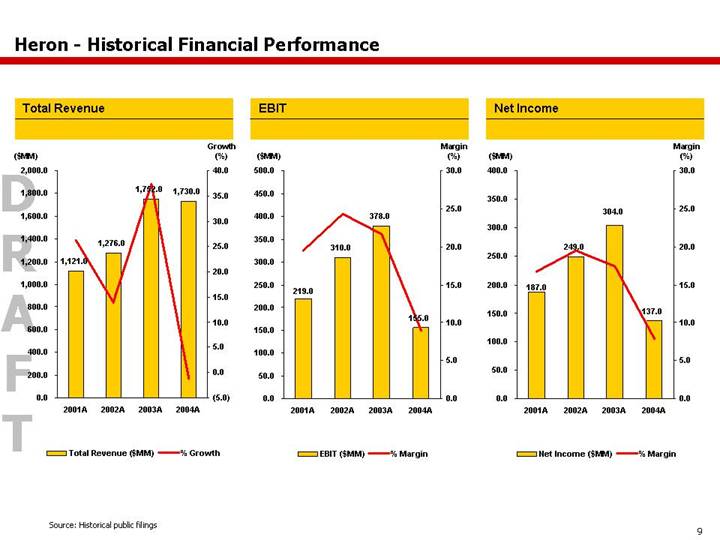
Heron - Historical Financial Performance
Total Revenue
[CHART]
EBIT
[CHART]
Net Income
[CHART]
Source: Historical public filings
9
Financial Projection Overview
• Heron management's forecast methodology is based on customary biotechnology financial analysis providing for probabilities of success based on stage of development of individual product candidates
• Only product candidates in clinical development were modeled
• In 1H:05, CSFB and Morgan Stanley conducted a series of meetings with Heron management to review projections for Heron and its major lines of business
• The assumptions underlying the management forecast were challenged and stress tested with management in numerous meetings
• The forecast was approved by Heron management and presented to the Board of Heron
• Since then, Heron's business forecast has changed and accordingly additional changes to the management forecast were provided to CSFB and Morgan Stanley
• Revenues from the vaccines business were further reduced due to Begrivac vaccine contamination issues in the summer 2005
• Overall forecast for biopharma were further reduced due to PULMUNIQ setback and increased competition against Proleukin
10
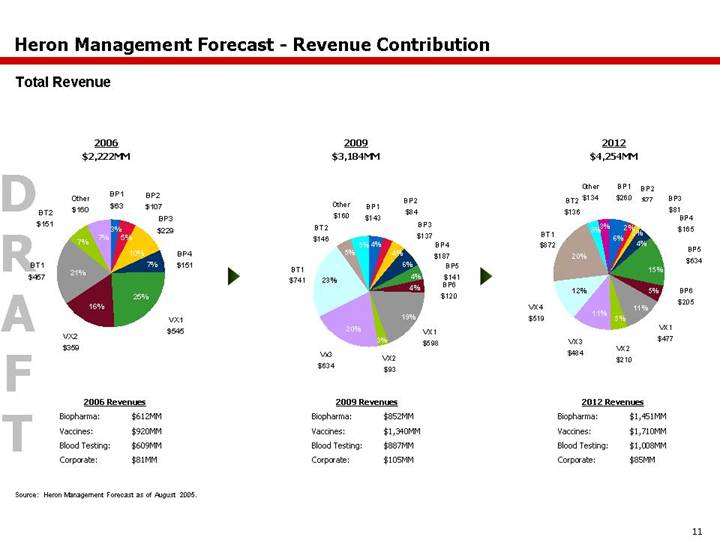
Heron Management Forecast - Revenue Contribution
Total Revenue
2006
$2,222MM
[CHART]
2006 Revenues
Biopharma: | | $ | 612 | MM |
Vaccines: | | $ | 920 | MM |
Blood Testing: | | $ | 609 | MM |
Corporate: | | $ | 81 | MM |
2009
$3,184MM
[CHART]
2009 Revenues
Biopharma: | | $ | 852 | MM |
Vaccines: | | $ | 1,340 | MM |
Blood Testing: | | $ | 887 | MM |
Corporate: | | $ | 105 | MM |
2012
$4,254MM
[CHART]
2012 Revenues
Biopharma: | | $ | 1,451 | MM |
Vaccines: | | $ | 1,710 | MM |
Blood Testing: | | $ | 1,008 | MM |
Corporate: | | $ | 85 | MM |
Source: Heron Management Forecast as of August 2005.
11
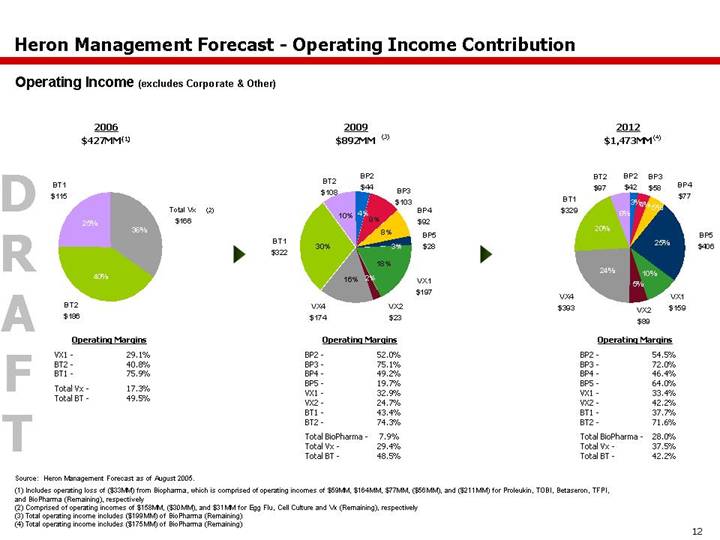
Heron Management Forecast - Operating Income Contribution
Operating Income (excludes Corporate & Other)
2006
$427MM(1)
[CHART]
Operating Margins
VX1 - | | 29.1 | % |
BT2 - | | 40.8 | % |
BT1 - | | 75.9 | % |
| | | |
Total Vx - | | 17.3 | % |
Total BT - | | 49.5 | % |
2009
$892MM (3)
[CHART]
Operating Margins
BP2 - | | 52.0 | % |
BP3 - | | 75.1 | % |
BP4 - | | 49.2 | % |
BP5 - | | 19.7 | % |
VX1 - | | 32.9 | % |
VX2 - | | 24.7 | % |
BT1 - | | 43.4 | % |
BT2 - | | 74.3 | % |
| | | |
Total BioPharma - | | 7.9 | % |
Total Vx - | | 29.4 | % |
Total BT - | | 48.5 | % |
2012
$1,473MM (4)
[CHART]
Operating Margins
BP2 - | | 54.5 | % |
BP3 - | | 72.0 | % |
BP4 - | | 46.4 | % |
BP5 - | | 64.0 | % |
VX1 - | | 33.4 | % |
VX2 - | | 42.2 | % |
BT1 - | | 37.7 | % |
BT2 - | | 71.6 | % |
| | | |
Total BioPharma - | | 28.0 | % |
Total Vx - | | 37.5 | % |
Total BT - | | 42.2 | % |
Source: Heron Management Forecast as of August 2005.
(1) Includes operating loss of ($33MM) from Biopharma, which is comprised of operating incomes of $59MM, $164MM, $77MM, ($56MM), and ($211MM) for Proleukin, TOBI, Betaseron, TFPI, and BioPharma (Remaining), respectively
(2) Comprised of operating incomes of $158MM, ($30MM), and $31MM for Egg Flu, Cell Culture and Vx (Remaining), respectively
(3) Total operating income includes ($199MM) of BioPharma (Remaining)
(4) Total operating income includes ($175MM) of BioPharma (Remaining)
12
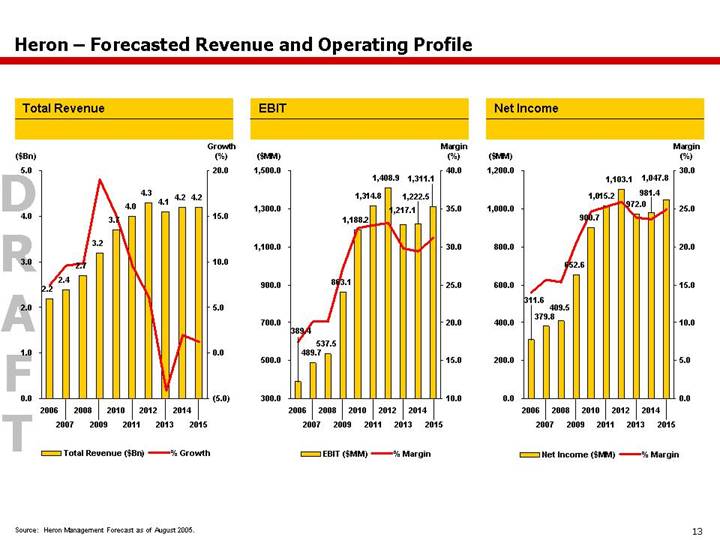
Heron – Forecasted Revenue and Operating Profile
Total Revenue
[CHART]
EBIT
[CHART]
Net Income
[CHART]
Source: Heron Management Forecast as of August 2005.
13
Heron Management Forecast - Consolidated Income Statement
Heron Income Statement
| | Fiscal Year Ending December 31 | |
| | 2006E | | 2007E | | 2008E | | 2009E | | 2010E | | 2011E | | 2012E | | 2013E | | 2014E | | 2015E | |
Total Revenue | | $ | 2,222.2 | | $ | 2,436.6 | | $ | 2,675.3 | | $ | 3,183.9 | | $ | 3,663.4 | | $ | 4,010.1 | | $ | 4,254.1 | | $ | 4,080.7 | | $ | 4,161.4 | | $ | 4,211.1 | |
% Growth | | 11.9 | % | 9.6 | % | 9.8 | % | 19.0 | % | 15.1 | % | 9.5 | % | 6.1 | % | -4.1 | % | 2.0 | % | 1.2 | % |
| | | | | | | | | | | | | | | | | | | | | |
COGS | | 833.8 | | 891.9 | | 971.4 | | 1,132.4 | | 1,221.6 | | 1,345.5 | | 1,417.5 | | 1,446.4 | | 1,483.7 | | 1,405.2 | |
% Growth | | 15.2 | % | 7.0 | % | 8.9 | % | 16.6 | % | 7.9 | % | 10.1 | % | 5.3 | % | 2.0 | % | 2.6 | % | -5.3 | % |
| | | | | | | | | | | | | | | | | | | | | |
Gross Profit | | 1,388.5 | | 1,544.7 | | 1,703.9 | | 2,051.5 | | 2,441.8 | | 2,664.5 | | 2,836.6 | | 2,634.4 | | 2,677.7 | | 2,805.9 | |
% Margin | | 62.5 | % | 63.4 | % | 63.7 | % | 64.4 | % | 66.7 | % | 66.4 | % | 66.7 | % | 64.6 | % | 64.3 | % | 66.6 | % |
| | | | | | | | | | | | | | | | | | | | | |
R&D | | 482.2 | | 503.9 | | 537.7 | | 502.9 | | 514.2 | | 556.1 | | 601.4 | | 603.2 | | 613.7 | | 627.8 | |
% Margin | | 21.7 | % | 20.7 | % | 20.1 | % | 15.8 | % | 14.0 | % | 13.9 | % | 14.1 | % | 14.8 | % | 14.7 | % | 14.9 | % |
% Growth | | 11.0 | % | 4.5 | % | 6.7 | % | -6.5 | % | 2.2 | % | 8.1 | % | 8.2 | % | 0.3 | % | 1.7 | % | 2.3 | % |
| | | | | | | | | | | | | | | | | | | | | |
S&M | | 300.8 | | 326.1 | | 395.8 | | 439.4 | | 471.8 | | 502.8 | | 509.6 | | 498.0 | | 512.6 | | 526.8 | |
% Margin | | 13.5 | % | 13.4 | % | 14.8 | % | 13.8 | % | 12.9 | % | 12.5 | % | 12.0 | % | 12.2 | % | 12.3 | % | 12.5 | % |
% Growth | | 6.0 | % | 8.4 | % | 21.4 | % | 11.0 | % | 7.4 | % | 6.6 | % | 1.3 | % | -2.3 | % | 2.9 | % | 2.8 | % |
| | | | | | | | | | | | | | | | | | | | | |
G&A | | 202.0 | | 210.5 | | 223.3 | | 244.9 | | 267.2 | | 290.4 | | 316.2 | | 315.7 | | 328.4 | | 339.7 | |
% Margin | | 9.1 | % | 8.6 | % | 8.3 | % | 7.7 | % | 7.3 | % | 7.2 | % | 7.4 | % | 7.7 | % | 7.9 | % | 8.1 | % |
% Growth | | -9.7 | % | 4.2 | % | 6.1 | % | 9.7 | % | 9.1 | % | 8.7 | % | 8.9 | % | -0.2 | % | 4.0 | % | 3.5 | % |
| | | | | | | | | | | | | | | | | | | | | |
Other Expenses | | 14.1 | | 14.5 | | 9.6 | | 1.3 | | 0.4 | | 0.4 | | 0.4 | | 0.4 | | 0.4 | | 0.4 | |
% Growth | | 40.7 | % | 2.5 | % | -33.5 | % | -86.7 | % | -66.5 | % | -0.6 | % | 0.0 | % | 0.0 | % | 0.0 | % | 0.0 | % |
| | | | | | | | | | | | | | | | | | | | | |
EBITDA | | 546.8 | | 649.0 | | 701.9 | | 1,048.5 | | 1,367.7 | | 1,515.8 | | 1,621.4 | | 1,435.5 | | 1,432.6 | | 1,535.5 | |
% Margin | | 24.6 | % | 26.6 | % | 26.2 | % | 32.9 | % | 37.3 | % | 37.8 | % | 38.1 | % | 35.2 | % | 34.4 | % | 36.5 | % |
Depreciation | | 127.2 | | 129.8 | | 136.6 | | 159.7 | | 167.0 | | 190.8 | | 205.3 | | 212.1 | | 205.5 | | 220.3 | |
Amortization | | 30.2 | | 29.5 | | 27.8 | | 25.8 | | 12.4 | | 10.3 | | 7.2 | | 6.3 | | 4.5 | | 4.1 | |
| | | | | | | | | | | | | | | | | | | | | |
Operating Income | | 389.4 | | 489.7 | | 537.5 | | 863.1 | | 1,188.2 | | 1,314.8 | | 1,408.9 | | 1,217.1 | | 1,222.5 | | 1,311.1 | |
% Margin | | 17.5 | % | 20.1 | % | 20.1 | % | 27.1 | % | 32.4 | % | 32.8 | % | 33.1 | % | 29.8 | % | 29.4 | % | 31.1 | % |
% Growth | | 25.3 | % | 25.8 | % | 9.7 | % | 60.6 | % | 37.7 | % | 10.7 | % | 7.2 | % | -13.6 | % | 0.4 | % | 7.2 | % |
| | | | | | | | | | | | | | | | | | | | | |
Net Other Income (Expense) | | 29.1 | | 19.6 | | 11.6 | | 10.1 | | 15.7 | | 41.8 | | 64.8 | | 81.9 | | 89.0 | | 89.0 | |
Minority Interest | | (3.0 | ) | (3.0 | ) | (3.0 | ) | (3.0 | ) | (3.0 | ) | (3.0 | ) | (3.0 | ) | (3.0 | ) | (3.0 | ) | (3.0 | ) |
| | | | | | | | | | | | | | | | | | | | | |
Pre-tax Income | | 415.5 | | 506.3 | | 546.0 | | 870.1 | | 1,200.9 | | 1,353.6 | | 1,470.7 | | 1,296.0 | | 1,308.6 | | 1,397.1 | |
% Margin | | 18.7 | % | 20.8 | % | 20.4 | % | 27.3 | % | 32.8 | % | 33.8 | % | 34.6 | % | 31.8 | % | 31.4 | % | 33.2 | % |
| | | | | | | | | | | | | | | | | | | | | |
Income Tax Expense | | (103.9 | ) | (126.6 | ) | (136.5 | ) | (217.5 | ) | (300.2 | ) | (338.4 | ) | (367.7 | ) | (324.0 | ) | (327.1 | ) | (349.3 | ) |
Effective Tax Rate | | 25.0 | % | 25.0 | % | 25.0 | % | 25.0 | % | 25.0 | % | 25.0 | % | 25.0 | % | 25.0 | % | 25.0 | % | 25.0 | % |
| | | | | | | | | | | | | | | | | | | | | |
Net Income | | 311.6 | | 379.8 | | 409.5 | | 652.6 | | 900.7 | | 1,015.2 | | 1,103.1 | | 972.0 | | 981.4 | | 1,047.8 | |
Share Outstanding | | 197.5 | | 198.7 | | 199.5 | | 200.4 | | 202.1 | | 203.5 | | 204.5 | | 205.5 | | 206.4 | | 207.4 | |
EPS | | $ | 1.58 | | $ | 1.91 | | $ | 2.05 | | $ | 3.26 | | $ | 4.46 | | $ | 4.99 | | $ | 5.39 | | $ | 4.73 | | $ | 4.75 | | $ | 5.05 | |
Note: Heron consolidated income statement includes corporate royalties and expenses
Source: Heron Management Forecast as of August 2005.
14
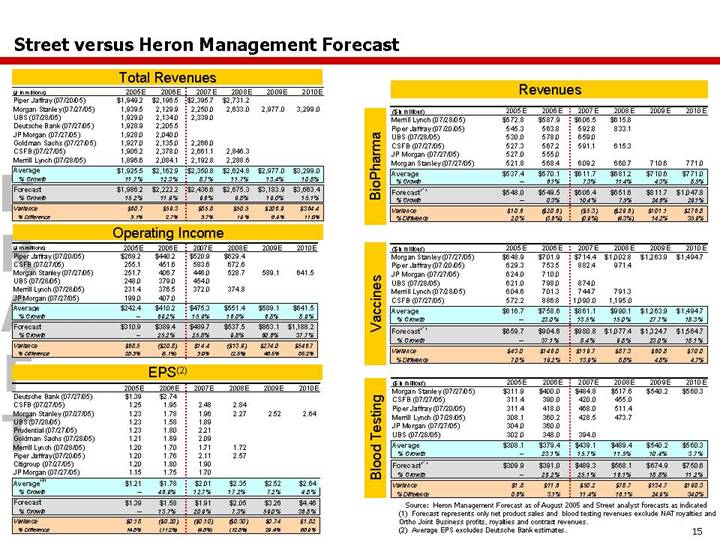
Street versus Heron Management Forecast
Total Revenues
($ in millions) | | 2005E | | 2006E | | 2007E | | 2008E | | 2009E | | 2010E | |
Piper Jaffray (07/20/05) | | $ | 1,949.2 | | $ | 2,196.5 | | $ | 2,395.7 | | $ | 2,731.2 | | | | | |
Morgan Stanley (07/27/05) | | 1,939.5 | | 2,129.9 | | 2,250.0 | | 2,633.0 | | 2,977.0 | | 3,299.0 | |
UBS (07/28/05) | | 1,929.0 | | 2,134.0 | | 2,339.0 | | | | | | | |
Deutsche Bank (07/27/05) | | 1,928.9 | | 2,205.5 | | | | | | | | | |
JP Morgan (07/27/05) | | 1,928.0 | | 2,040.0 | | | | | | | | | |
Goldman Sachs (07/27/05) | | 1,927.0 | | 2,135.0 | | 2,266.0 | | | | | | | |
CSFB (07/27/05) | | 1,906.2 | | 2,378.0 | | 2,661.1 | | 2,846.3 | | | | | |
Merrill Lynch (07/28/05) | | 1,896.6 | | 2,084.1 | | 2,192.8 | | 2,288.6 | | | | | |
| | | | | | | | | | | | | |
Average | | $ | 1,925.5 | | $ | 2,162.9 | | $ | 2,350.8 | | $ | 2,624.8 | | $ | 2,977.0 | | $ | 3,299.0 | |
% Growth | | 11.7 | % | 12.3 | % | 8.7 | % | 11.7 | % | 13.4 | % | 10.8 | % |
| | | | | | | | | | | | | |
Forecast | | $ | 1,986.2 | | $ | 2,222.2 | | $ | 2,436.6 | | $ | 2,675.3 | | $ | 3,183.9 | | $ | 3,663.4 | |
% Growth | | 15.2 | % | 11.9 | % | 9.6 | % | 9.8 | % | 19.0 | % | 15.1 | % |
| | | | | | | | | | | | | |
Variance | | $ | 60.7 | | $ | 59.3 | | $ | 85.8 | | $ | 50.5 | | $ | 206.9 | | $ | 364.4 | |
% Difference | | 3.1 | % | 2.7 | % | 3.7 | % | 1.9 | % | 6.9 | % | 11.0 | % |
| | | | | | | | | | | | | | | | | | | | | | | | |
Operating Income
($ in millions) | | 2005E | | 2006E | | 2007E | | 2008E | | 2009E | | 2010E | |
Piper Jaffray (07/20/05) | | $ | 269.2 | | $ | 440.2 | | $ | 520.9 | | $ | 629.4 | | | | | |
CSFB (07/27/05) | | 255.1 | | 451.6 | | 583.6 | | 672.6 | | | | | |
Morgan Stanley (07/27/05) | | 251.7 | | 406.7 | | 446.0 | | 528.7 | | 589.1 | | 641.5 | |
UBS (07/28/05) | | 248.0 | | 379.0 | | 454.0 | | | | | | | |
Merrill Lynch (07/28/05) | | 231.4 | | 376.5 | | 372.0 | | 374.8 | | | | | |
JP Morgan (07/27/05) | | 199.0 | | 407.0 | | | | | | | | | |
| | | | | | | | | | | | | |
Average | | $ | 242.4 | | $ | 410.2 | | $ | 475.3 | | $ | 551.4 | | $ | 589.1 | | $ | 641.5 | |
% Growth | | — | | 69.2 | % | 15.9 | % | 16.0 | % | 6.8 | % | 8.9 | % |
| | | | | | | | | | | | | |
Forecast | | $ | 310.9 | | $ | 389.4 | | $ | 489.7 | | $ | 537.5 | | $ | 863.1 | | $ | 1,188.2 | |
% Growth | | — | | 25.2 | % | 25.8 | % | 9.8 | % | 60.6 | % | 37.7 | % |
| | | | | | | | | | | | | |
Variance | | $ | 68.5 | | $ | (20.8 | ) | $ | 14.4 | | $ | (13.9 | ) | $ | 274.0 | | $ | 546.7 | |
% Difference | | 28.3 | % | (5.1 | )% | 3.0 | % | (2.5 | )% | 46.5 | % | 85.2 | % |
EPS(2)
| | 2005E | | 2006E | | 2007E | | 2008E | | 2009E | | 2010E | |
Deutsche Bank (07/27/05) | | $ | 1.39 | | $ | 2.74 | | | | | | | | | |
CSFB (07/27/05) | | 1.25 | | 1.95 | | 2.48 | | 2.84 | | | | | |
Morgan Stanley (07/27/05) | | 1.23 | | 1.78 | | 1.96 | | 2.27 | | 2.52 | | 2.64 | |
UBS (07/28/05) | | 1.23 | | 1.58 | | 1.89 | | | | | | | |
Prudential (07/27/05) | | 1.23 | | 1.80 | | 2.21 | | | | | | | |
Goldman Sachs (07/28/05) | | 1.21 | | 1.89 | | 2.09 | | | | | | | |
Merrill Lynch (07/28/05) | | 1.20 | | 1.70 | | 1.71 | | 1.72 | | | | | |
Piper Jaffray (07/20/05) | | 1.20 | | 1.76 | | 2.11 | | 2.57 | | | | | |
Citigroup (07/27/05) | | 1.20 | | 1.80 | | 1.90 | | | | | | | |
JP Morgan (07/27/05) | | 1.15 | | 1.75 | | 1.70 | | | | | | | |
| | | | | | | | | | | | | |
Average (2) | | $ | 1.21 | | $ | 1.78 | | $ | 2.01 | | $ | 2.35 | | $ | 2.52 | | $ | 2.64 | |
% Growth | | — | | 46.9 | % | 12.7 | % | 17.2 | % | 7.2 | % | 4.8 | % |
| | | | | | | | | | | | | |
Forecast (1) | | $ | 1.39 | | $ | 1.58 | | $ | 1.91 | | $ | 2.05 | | $ | 3.26 | | $ | 4.46 | |
% Growth | | — | | 13.7 | % | 20.9 | % | 7.3 | % | 59.0 | % | 36.8 | % |
| | | | | | | | | | | | | |
Variance | | $ | 0.18 | | $ | (0.20 | ) | $ | (0.10 | ) | $ | (0.30 | ) | $ | 0.74 | | $ | 1.82 | |
% Difference | | 14.8 | % | (11.2 | )% | (4.8 | )% | (12.8 | )% | 29.4 | % | 68.9 | % |
Revenues
BioPharma
($ in millions) | | 2005E | | 2006E | | 2007E | | 2008E | | 2009E | | 2010E | |
Merrill Lynch (07/28/05) | | $ | 572.8 | | $ | 587.9 | | $ | 606.5 | | $ | 615.8 | | | | | |
Piper Jaffray (07/20/05) | | 545.3 | | 563.8 | | 592.8 | | 833.1 | | | | | |
UBS (07/28/05) | | 530.0 | | 578.0 | | 659.0 | | | | | | | |
CSFB (07/27/05) | | 527.3 | | 567.2 | | 591.1 | | 615.3 | | | | | |
JP Morgan (07/27/05) | | 527.0 | | 555.0 | | | | | | | | | |
Morgan Stanley (07/27/05) | | 521.8 | | 568.4 | | 609.2 | | 660.7 | | 710.6 | | 771.0 | |
| | | | | | | | | | | | | |
Average | | $ | 537.4 | | $ | 570.1 | | $ | 611.7 | | $ | 681.2 | | $ | 710.6 | | $ | 771.0 | % |
% Growth | | — | | 6.1 | % | 7.3 | % | 11.4 | % | 4.3 | % | 8.5 | % |
| | | | | | | | | | | | | |
Forecast(1) | | $ | 548.0 | | $ | 549.5 | | $ | 606.4 | | $ | 651.6 | | $ | 811.7 | | $ | 1,047.8 | |
% Growth | | — | | 0.3 | % | 10.4 | % | 7.5 | % | 24.6 | % | 29.1 | % |
| | | | | | | | | | | | | |
Variance | | $ | 10.6 | | $ | (20.6 | ) | $ | (5.3 | ) | $ | (29.6 | ) | $ | 101.1 | | $ | 276.8 | |
% Difference | | 2.0 | % | (3.6 | )% | (0.9 | )% | (4.3 | )% | 14.2 | % | 35.9 | % |
Vaccines
($ in millions) | | 2005E | | 2006E | | 2007E | | 2008E | | 2009E | | 2010E | |
Morgan Stanley (07/27/05) | | $ | 648.9 | | $ | 701.9 | | $ | 714.4 | | $ | 1,002.8 | | $ | 1,263.9 | | $ | 1,494.7 | |
Piper Jaffray (07/20/05) | | 629.3 | | 753.5 | | 882.4 | | 971.4 | | | | | |
JP Morgan (07/27/05) | | 624.0 | | 710.0 | | | | | | | | | |
UBS (07/28/05) | | 621.0 | | 798.0 | | 874.0 | | | | | | | |
Merrill Lynch (07/28/05) | | 604.6 | | 701.3 | | 744.7 | | 791.3 | | | | | |
CSFB (07/27/05) | | 572.2 | | 886.8 | | 1,090.0 | | 1,195.0 | | | | | |
| | | | | | | | | | | | | |
Average | | $ | 616.7 | | $ | 758.6 | | $ | 861.1 | | $ | 990.1 | | $ | 1,263.9 | | $ | 1,494.7 | |
% Growth | | — | | 23.0 | % | 13.5 | % | 15.0 | % | 27.7 | % | 18.3 | % |
| | | | | | | | | | | | | |
Forecast(1) | | $ | 659.7 | | $ | 904.6 | | $ | 980.8 | | $ | 1,077.4 | | $ | 1,324.7 | | $ | 1,564.7 | |
% Growth | | — | | 37.1 | % | 8.4 | % | 9.8 | % | 23.0 | % | 18.1 | % |
| | | | | | | | | | | | | |
Variance | | $ | 43.0 | | $ | 146.0 | | $ | 119.7 | | $ | 87.3 | | $ | 60.8 | | $ | 70.0 | |
% Difference | | 7.0 | % | 19.2 | % | 13.9 | % | 8.8 | % | 4.8 | % | 4.7 | % |
Blood Testing
($ in millions) | | 2005E | | 2006E | | 2007E | | 2008E | | 2009E | | 2010E | |
Morgan Stanley (07/27/05) | | $ | 311.9 | | $ | 400.0 | | $ | 484.8 | | $ | 517.6 | | $ | 540.2 | | $ | 560.3 | |
CSFB (07/27/05) | | 311.4 | | 390.0 | | 420.0 | | 455.0 | | | | | |
Piper Jaffray (07/20/05) | | 311.4 | | 418.0 | | 468.0 | | 511.4 | | | | | |
Merrill Lynch (07/28/05) | | 308.1 | | 360.2 | | 428.5 | | 473.7 | | | | | |
JP Morgan (07/27/05) | | 304.0 | | 360.0 | | | | | | | | | |
UBS (07/28/05) | | 302.0 | | 348.0 | | 394.0 | | | | | | | |
| | | | | | | | | | | | | |
Average | | $ | 308.1 | | $ | 379.4 | | $ | 439.1 | | $ | 489.4 | | $ | 540.2 | | $ | 560.3 | |
% Growth | | — | | 23.1 | % | 15.7 | % | 11.5 | % | 10.4 | % | 3.7 | % |
| | | | | | | | | | | | | |
Forecast(1) | | $ | 309.9 | | $ | 391.0 | | $ | 489.3 | | $ | 568.1 | | $ | 674.9 | | $ | 750.6 | |
% Growth | | — | | 26.2 | % | 25.1 | % | 16.1 | % | 18.8 | % | 11.2 | % |
| | | | | | | | | | | | | |
Variance | | $ | 1.8 | | $ | 11.6 | | $ | 50.2 | | $ | 78.7 | | $ | 134.7 | | $ | 190.3 | |
% Difference | | 0.6 | % | 3.1 | % | 11.4 | % | 16.1 | % | 24.9 | % | 34.0 | % |
Source: Heron Management Forecast as of August 2005 and Street analyst forecasts as indicated
(1) Forecast represents only net product sales and blood testing revenues exclude NAT royalties and Ortho Joint Business profits, royalties and contract revenues.
(2) Average EPS excludes Deutsche Bank estimates.
15
2. Overview of Heron
B. Overview of Trading Performance
16
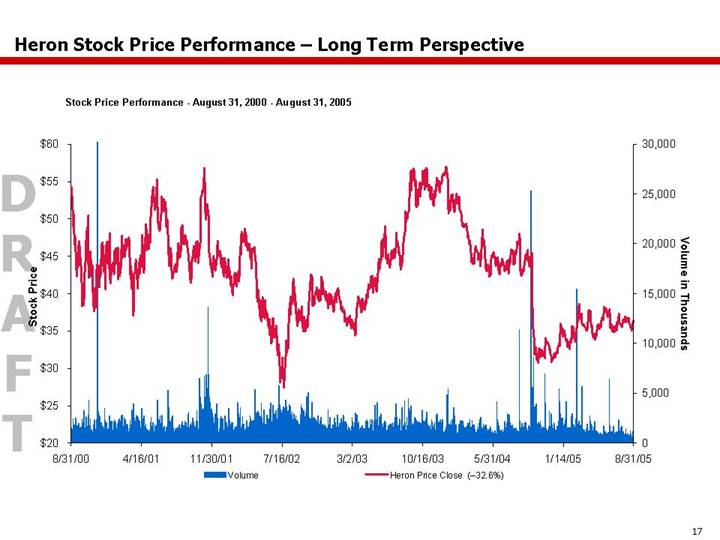
Heron Stock Price Performance – Long Term Perspective
Stock Price Performance - August 31, 2000 - August 31, 2005
[CHART]
17
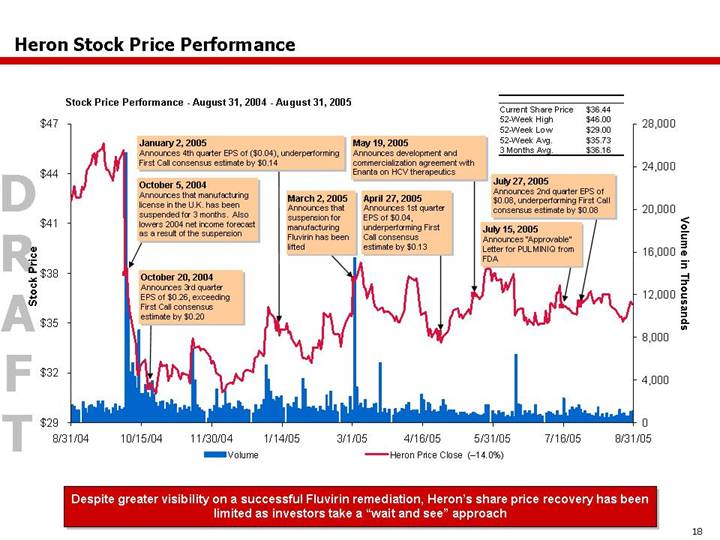
Heron Stock Price Performance
Stock Price Performance - August 31, 2004 - August 31, 2005
[CHART]
Current Share Price | | $ | 36.44 | |
52-Week High | | $ | 46.00 | |
52-Week Low | | $ | 29.00 | |
52-Week Avg. | | $ | 35.73 | |
3 Months Avg. | | $ | 36.16 | |
Despite greater visibility on a successful Fluvirin remediation, Heron's share price recovery has been limited as investors take a “wait and see” approach
18
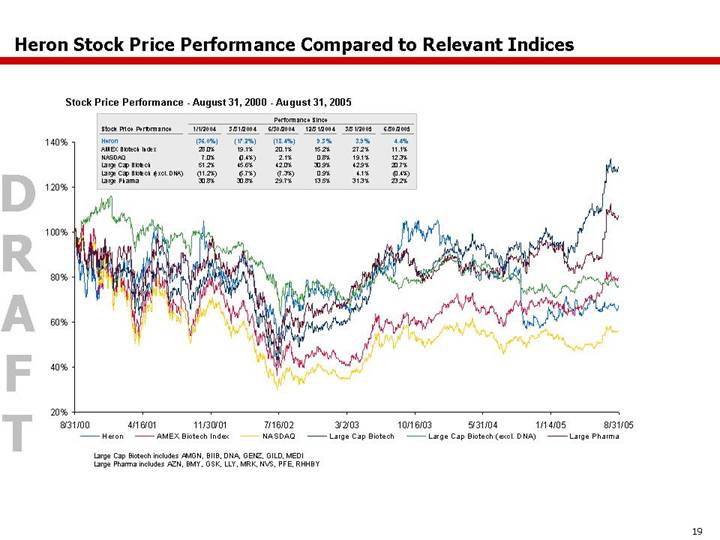
Heron Stock Price Performance Compared to Relevant Indices
Stock Price Performance - August 31, 2000 - August 31, 2005
[CHART]
| | Performance Since | |
Stock Price Performance | | 1/1/2004 | | 3/31/2004 | | 6/30/2004 | | 12/31/2004 | | 3/31/2005 | | 6/30/2005 | |
| | | | | | | | | | | | | |
Heron | | (36.0 | )% | (17.2 | )% | (18.4 | )% | 9.3 | % | 3.9 | % | 4.4 | % |
AMEX Biotech Index | | 28.0 | % | 19.1 | % | 20.1 | % | 15.2 | % | 27.2 | % | 11.1 | % |
NASDAQ | | 7.0 | % | (0.4 | )% | 2.1 | % | 0.8 | % | 19.1 | % | 12.3 | % |
Large Cap Biotech | | 51.2 | % | 45.6 | % | 42.0 | % | 30.9 | % | 42.9 | % | 20.7 | % |
Large Cap Biotech (excl. DNA) | | (11.2 | )% | (5.7 | )% | (7.3 | )% | 0.9 | % | 4.1 | % | (0.4 | )% |
Large Pharma | | 30.8 | % | 30.8 | % | 29.7 | % | 13.5 | % | 31.3 | % | 23.2 | % |
Large Cap Biotech includes AMGN, BIIB, DNA, GENZ, GILD, MEDI
Large Pharma includes AZN, BMY, GSK, LLY, MRK, NVS, PFE, RHHBY
19
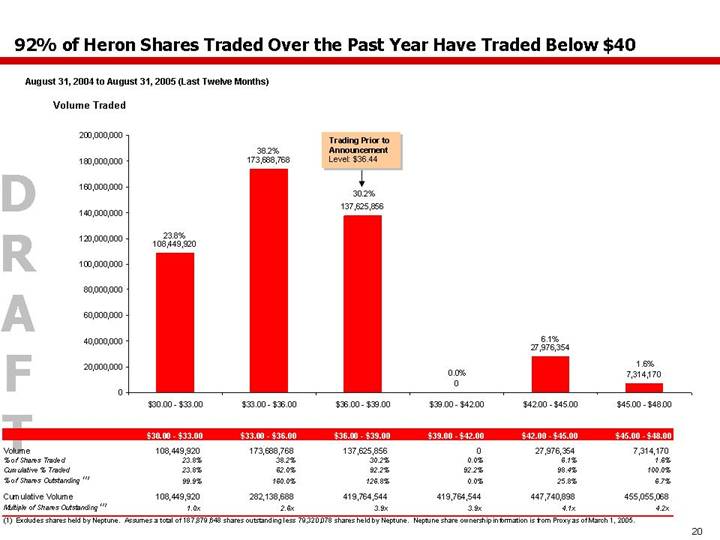
92% of Heron Shares Traded Over the Past Year Have Traded Below $40
August 31, 2004 to August 31, 2005 (Last Twelve Months)
Volume Traded
[CHART]
| | $30.00 - $33.00 | | $33.00 - $36.00 | | $36.00 - $39.00 | | $39.00 - $42.00 | | $42.00 - $45.00 | | $45.00 - $48.00 | |
Volume | | 108,449,920 | | 173,688,768 | | 137,625,856 | | 0 | | 27,976,354 | | 7,314,170 | |
% of Shares Traded | | 23.8 | % | 38.2 | % | 30.2 | % | 0.0 | % | 6.1 | % | 1.6 | % |
Cumulative % Traded | | 23.8 | % | 62.0 | % | 92.2 | % | 92.2 | % | 98.4 | % | 100.0 | % |
% of Shares Outstanding (1) | | 99.9 | % | 160.0 | % | 126.8 | % | 0.0 | % | 25.8 | % | 6.7 | % |
| | | | | | | | | | | | | |
Cumulative Volume | | 108,449,920 | | 282,138,688 | | 419,764,544 | | 419,764,544 | | 447,740,898 | | 455,055,068 | |
Multiple of Shares Outstanding (1) | | 1.0x | | 2.6x | | 3.9x | | 3.9x | | 4.1x | | 4.2x | |
(1) Excludes shares held by Neptune. Assumes a total of 187,879,648 shares outstanding less 79,320,078 shares held by Neptune. Neptune share ownership information is from Proxy as of March 1, 2005.
20
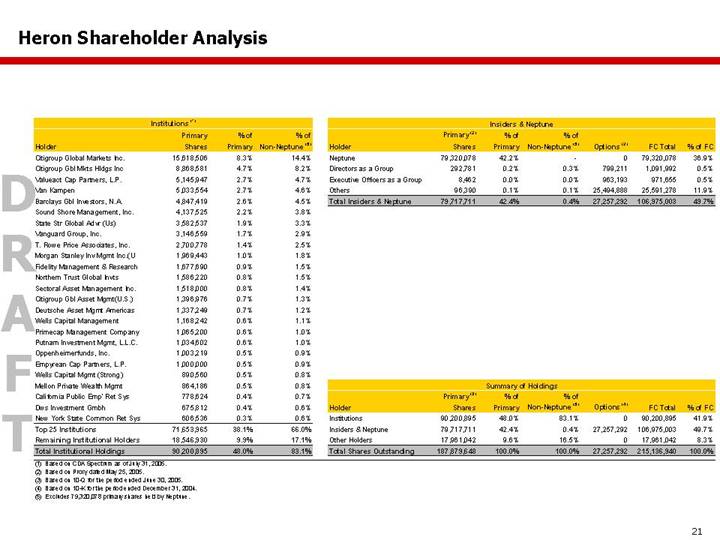
Heron Shareholder Analysis
Institutions (1)
| | Primary | | % of | | % of | |
Holder | | Shares | | Primary | | Non-Neptune (5) | |
Citigroup Global Markets Inc. | | 15,618,506 | | 8.3 | % | 14.4 | % |
Citigroup Gbl Mkts Hldgs Inc | | 8,868,581 | | 4.7 | % | 8.2 | % |
Valueact Cap Partners, L.P. | | 5,145,947 | | 2.7 | % | 4.7 | % |
Van Kampen | | 5,033,554 | | 2.7 | % | 4.6 | % |
Barclays Gbl Investors, N.A. | | 4,847,419 | | 2.6 | % | 4.5 | % |
Sound Shore Management, Inc. | | 4,137,525 | | 2.2 | % | 3.8 | % |
State Str Global Advr (Us) | | 3,582,537 | | 1.9 | % | 3.3 | % |
Vanguard Group, Inc. | | 3,146,559 | | 1.7 | % | 2.9 | % |
T. Rowe Price Associates, Inc. | | 2,700,778 | | 1.4 | % | 2.5 | % |
Morgan Stanley Inv Mgmt Inc.(U | | 1,969,443 | | 1.0 | % | 1.8 | % |
Fidelity Management & Research | | 1,677,690 | | 0.9 | % | 1.5 | % |
Northern Trust Global Invts | | 1,586,220 | | 0.8 | % | 1.5 | % |
Sectoral Asset Management Inc. | | 1,518,000 | | 0.8 | % | 1.4 | % |
Citigroup Gbl Asset Mgmt(U.S.) | | 1,396,976 | | 0.7 | % | 1.3 | % |
Deutsche Asset Mgmt Americas | | 1,337,249 | | 0.7 | % | 1.2 | % |
Wells Capital Management | | 1,168,242 | | 0.6 | % | 1.1 | % |
Primecap Management Company | | 1,065,200 | | 0.6 | % | 1.0 | % |
Putnam Investment Mgmt, L.L.C. | | 1,034,602 | | 0.6 | % | 1.0 | % |
Oppenheimerfunds, Inc. | | 1,003,219 | | 0.5 | % | 0.9 | % |
Empyrean Cap Partners, L.P. | | 1,000,000 | | 0.5 | % | 0.9 | % |
Wells Capital Mgmt (Strong) | | 890,560 | | 0.5 | % | 0.8 | % |
Mellon Private Wealth Mgmt | | 864,186 | | 0.5 | % | 0.8 | % |
California Public Emp' Ret Sys | | 778,624 | | 0.4 | % | 0.7 | % |
Dws Investment Gmbh | | 675,812 | | 0.4 | % | 0.6 | % |
New York State Common Ret Sys | | 606,536 | | 0.3 | % | 0.6 | % |
Top 25 Institutions | | 71,653,965 | | 38.1 | % | 66.0 | % |
Remaining Institutional Holders | | 18,546,930 | | 9.9 | % | 17.1 | % |
Total Institutional Holdings | | 90,200,895 | | 48.0 | % | 83.1 | % |
(1) Based on CDA Spectrum as of July 31, 2005. |
(2) Based on Proxy dated May 25, 2005. | |
(3) Based on 10-Q for the period ended June 30, 2005. |
(4) Based on 10-K for the period ended December 31, 2004. |
(5) Excludes 79,320,078 primary shares held by Neptune. |
Insiders & Neptune
| | Primary (2) | | % of | | % of | | | | | | | |
Holder | | Shares | | Primary | | Non-Neptune (5) | | Options (2) | | FC Total | | % of FC | |
Neptune | | 79,320,078 | | 42.2 | % | — | | 0 | | 79,320,078 | | 36.9 | % |
Directors as a Group | | 292,781 | | 0.2 | % | 0.3 | % | 799,211 | | 1,091,992 | | 0.5 | % |
Executive Officers as a Group | | 8,462 | | 0.0 | % | 0.0 | % | 963,193 | | 971,655 | | 0.5 | % |
Others | | 96,390 | | 0.1 | % | 0.1 | % | 25,494,888 | | 25,591,278 | | 11.9 | % |
Total Insiders & Neptune | | 79,717,711 | | 42.4 | % | 0.4 | % | 27,257,292 | | 106,975,003 | | 49.7 | % |
Summary of Holdings
| | Primary (3) | | % of | | % of | | | | | | | |
Holder | | Shares | | Primary | | Non-Neptune (5) | | Options (4) | | FC Total | | % of FC | |
Institutions | | 90,200,895 | | 48.0 | % | 83.1 | % | 0 | | 90,200,895 | | 41.9 | % |
Insiders & Neptune | | 79,717,711 | | 42.4 | % | 0.4 | % | 27,257,292 | | 106,975,003 | | 49.7 | % |
Other Holders | | 17,961,042 | | 9.6 | % | 16.5 | % | 0 | | 17,961,042 | | 8.3 | % |
Total Shares Outstanding | | 187,879,648 | | 100.0 | % | 100.0 | % | 27,257,292 | | 215,136,940 | | 100.0 | % |
21
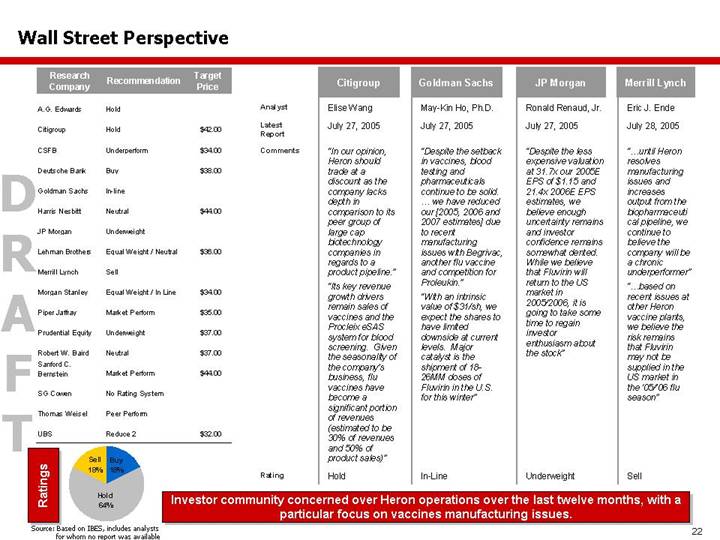
Wall Street Perspective
Research | | | | Target | |
Company | | Recommendation | | Price | |
A.G. Edwards | | Hold | | | |
| | | | | |
Citigroup | | Hold | | $ | 42.00 | |
| | | | | |
CSFB | | Underperform | | $ | 34.00 | |
| | | | | |
Deutsche Bank | | Buy | | $ | 38.00 | |
| | | | | |
Goldman Sachs | | In-line | | | |
| | | | | |
Harris Nesbitt | | Neutral | | $ | 44.00 | |
| | | | | |
JP Morgan | | Underweight | | | |
| | | | | |
Lehman Brothers | | Equal Weight / Neutral | | $ | 36.00 | |
| | | | | |
Merrill Lynch | | Sell | | | |
| | | | | |
Morgan Stanley | | Equal Weight / In Line | | $ | 34.00 | |
| | | | | |
Piper Jaffray | | Market Perform | | $ | 35.00 | |
| | | | | |
Prudential Equity | | Underweight | | $ | 37.00 | |
| | | | | |
Robert W. Baird | | Neutral | | $ | 37.00 | |
| | | | | |
Sanford C. Bernstein | | Market Perform | | $ | 44.00 | |
| | | | | |
SG Cowen | | No Rating System | | | |
| | | | | |
Thomas Weisel | | Peer Perform | | | |
| | | | | |
UBS | | Reduce 2 | | $ | 32.00 | |
Ratings
[CHART]
Source: Based on IBES, includes analysts for whom no report was available
| | Citigroup | | Goldman Sachs | | JP Morgan | | Merrill Lynch |
| | | | | | | | |
Analyst | | Elise Wang | | May-Kin Ho, Ph.D. | | Ronald Renaud, Jr. | | Eric J. Ende |
| | | | | | | | |
Latest Report | | July 27, 2005 | | July 27, 2005 | | July 27, 2005 | | July 28, 2005 |
| | | | | | | | |
Comments | | “In our opinion, Heron should trade at a discount as the company lacks depth in comparison to its peer group of large cap biotechnology companies in regards to a product pipeline.”
“Its key revenue growth drivers remain sales of vaccines and the Procleix eSAS system for blood screening. Given the seasonality of the company's business, flu vaccines have become a significant portion of revenues (estimated to be 30% of revenues and 50% of product sales)” | | “Despite the setback in vaccines, blood testing and pharmaceuticals continue to be solid.
...we have reduced our [2005, 2006 and 2007 estimates] due to recent manufacturing issues with Begrivac, another flu vaccine and competition for Proleukin.”
“...With an intrinsic value of $31/sh, we expect the shares to have limited downside at current levels. Major catalyst is the shipment of 18- 26MM doses of Fluvirin in the U.S. for this winter” | | “Despite the less expensive valuation at 31.7x our 2005E EPS of $1.15 and 21.4x 2006E EPS estimates, we believe enough uncertainty remains and investor confidence remains somewhat dented. While we believe that Fluvirin will return to the US market in 2005/2006, it is going to take some time to regain investor enthusiasm about the stock” | | “...until Heron resolves manufacturing issues and increases output from the biopharmaceuti cal pipeline, we continue to believe the company will be a chronic underperformer”
“...based on recent issues at other Heron vaccine plants, we believe the risk remains that Fluvirin may not be supplied in the US market in the '05/'06 flu season” |
| | | | | | | | |
Rating | | Hold | | In-Line | | Underweight | | Sell |
Investor community concerned over Heron operations over the last twelve months, with a particular focus on vaccines manufacturing issues.
22
3. Preliminary Financial Analysis
23
Heron's Valuation Parameters
Assessment of Valuation (1)
$
[CHART]
(1) As of August 2005, unaffected price the day immediately prior to announcement
(2) Discounted at 12.0%
(3) Assumes perpetual growth rate of 1.0% – 3.0% for BioPharma (LTM NOPAT multiple of 12.4x), 2.0% – 4.0% for Vaccines (LTM NOPAT multiple of 15.4x), 2.0% – 4.0% for Blood Testing (LTM NOPAT multiple of 13.3x) and (2.0)% – 0.0% for Corporate Royalties (LTM NOPAT multiple of 8.7x); derived from Heron Management Projections
24
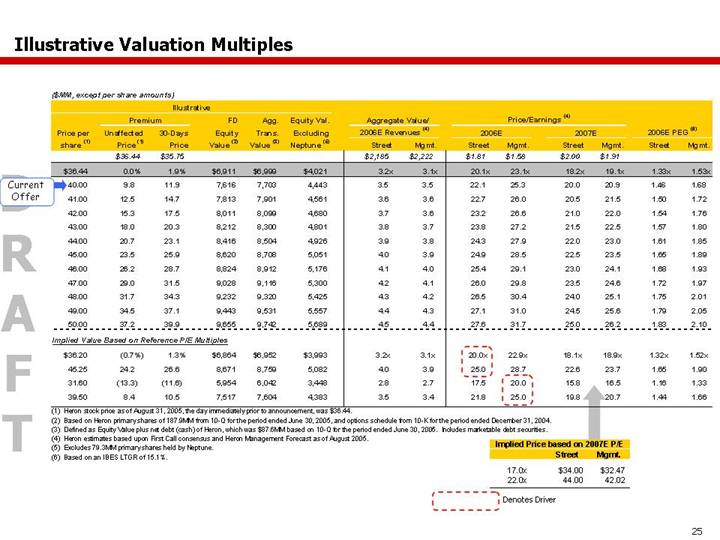
Illustrative Valuation Multiples
($MM, except per share amounts)
Illustrative | | | | | | | | | | | | | | | | | |
| | Premium | | FD | | Agg. | | Equity Val. | | Aggregate Value/ | | Price/Earnings (4) | | | | | |
Price per | | Unaffected | | 30-Days | | Equity | | Trans. | | Excluding | | 2006E Revenues (4) | | 2006E | | 2007E | | 2006E PEG (6) | |
share (1) | | Price (1) | | Price | | Value (2) | | Value (3) | | Neptune (5) | | Street | | Mgmt. | | Street | | Mgmt. | | Street | | Mgmt. | | Street | | Mgmt. | |
| | $ | 36.44 | | $ | 35.75 | | | | | | | | $ | 2,185 | | $ | 2,222 | | $ | 1.81 | | $ | 1.58 | | $ | 2.00 | | $ | 1.91 | | | | | |
| | | | | | | | | | | | | | | | | | | | | | | | | | | | | | | | | | | |
$ | 36.44 | | 0.0 | % | 1.9 | % | $ | 6,911 | | $ | 6,999 | | $ | 4,021 | | 3.2 | x | 3.1 | x | 20.1 | x | 23.1 | x | 18.2 | x | 19.1 | x | 1.33 | x | 1.53 | x |
40.00 | ** | 9.8 | ** | 11.9 | ** | 7,616 | ** | 7,703 | ** | 4,443 | ** | 3.5 | ** | 3.5 | ** | 22.1 | ** | 25.3 | ** | 20.0 | ** | 20.9 | ** | 1.46 | ** | 1.68 | ** |
41.00 | | 12.5 | | 14.7 | | 7,813 | | 7,901 | | 4,561 | | 3.6 | | 3.6 | | 22.7 | | 26.0 | | 20.5 | | 21.5 | | 1.50 | | 1.72 | |
42.00 | | 15.3 | | 17.5 | | 8,011 | | 8,099 | | 4,680 | | 3.7 | | 3.6 | | 23.2 | | 26.6 | | 21.0 | | 22.0 | | 1.54 | | 1.76 | |
43.00 | | 18.0 | | 20.3 | | 8,212 | | 8,300 | | 4,801 | | 3.8 | | 3.7 | | 23.8 | | 27.2 | | 21.5 | | 22.5 | | 1.57 | | 1.80 | |
44.00 | | 20.7 | | 23.1 | | 8,416 | | 8,504 | | 4,926 | | 3.9 | | 3.8 | | 24.3 | | 27.9 | | 22.0 | | 23.0 | | 1.61 | | 1.85 | |
45.00 | | 23.5 | | 25.9 | | 8,620 | | 8,708 | | 5,051 | | 4.0 | | 3.9 | | 24.9 | | 28.5 | | 22.5 | | 23.5 | | 1.65 | | 1.89 | |
46.00 | | 26.2 | | 28.7 | | 8,824 | | 8,912 | | 5,176 | | 4.1 | | 4.0 | | 25.4 | | 29.1 | | 23.0 | | 24.1 | | 1.68 | | 1.93 | |
47.00 | | 29.0 | | 31.5 | | 9,028 | | 9,116 | | 5,300 | | 4.2 | | 4.1 | | 26.0 | | 29.8 | | 23.5 | | 24.6 | | 1.72 | | 1.97 | |
48.00 | | 31.7 | | 34.3 | | 9,232 | | 9,320 | | 5,425 | | 4.3 | | 4.2 | | 26.5 | | 30.4 | | 24.0 | | 25.1 | | 1.75 | | 2.01 | |
49.00 | | 34.5 | | 37.1 | | 9,443 | | 9,531 | | 5,557 | | 4.4 | | 4.3 | | 27.1 | | 31.0 | | 24.5 | | 25.6 | | 1.79 | | 2.05 | |
50.00 | | 37.2 | | 39.9 | | 9,655 | | 9,742 | | 5,689 | | 4.5 | | 4.4 | | 27.6 | | 31.7 | | 25.0 | | 26.2 | | 1.83 | | 2.10 | |
| | | | | | | | | | | | | | | | | | | | | | | | | | | |
Implied Value Based on Reference P/E Multiples | | | | | | | | | | | | | | | | | | | | | | | |
$ | 36.20 | | (0.7 | )% | 1.3 | % | $ | 6,864 | | $ | 6,952 | | $ | 3,993 | | 3.2 | x | 3.1 | x | 20.0 | x* | 22.9 | x | 18.1 | x | 18.9 | x | 1.32 | x | 1.52 | x |
45.25 | | 24.2 | | 26.6 | | 8,671 | | 8,759 | | 5,082 | | 4.0 | | 3.9 | | 25.0 | * | 28.7 | | 22.6 | | 23.7 | | 1.65 | | 1.90 | |
31.60 | | (13.3 | ) | (11.6 | ) | 5,954 | | 6,042 | | 3,448 | | 2.8 | | 2.7 | | 17.5 | | 20.0 | * | 15.8 | | 16.5 | | 1.16 | | 1.33 | |
39.50 | | 8.4 | | 10.5 | | 7,517 | | 7,604 | | 4,383 | | 3.5 | | 3.4 | | 21.8 | | 25.0 | * | 19.8 | | 20.7 | | 1.44 | | 1.66 | |
(1) Heron stock price as of August 31, 2005, the day immediately prior to announcement, was $36.44.
(2) Based on Heron primary shares of 187.9MM from 10-Q for the period ended June 30, 2005, and options schedule from 10-K for the period ended December 31, 2004.
(3) Defined as Equity Value plus net debt (cash) of Heron, which was $87.6MM based on 10-Q for the period ended June 30, 2005. Includes marketable debt securities.
(4) Heron estimates based upon First Call consensus and Heron Management Forecast as of August 2005.
(5) Excludes 79.3MM primary shares held by Neptune.
(6) Based on an IBES LTGR of 15.1%.
[GRAPHIC]
Implied Price based on 2007E P/E
| | Street | | Mgmt. | |
| | | | | |
17.0x | | $ | 34.00 | | $ | 32.47 | |
22.0x | | 44.00 | | 42.02 | |
| | | | | | | |
* Denotes Driver
** Current Offer
25
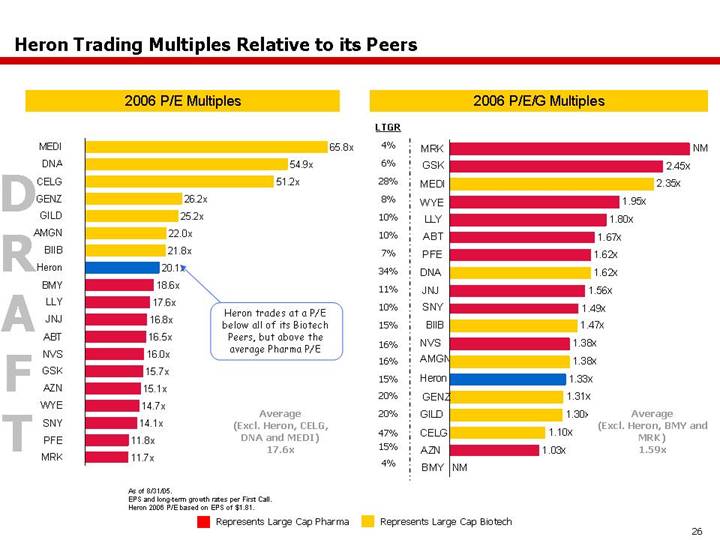
Heron Trading Multiples Relative to its Peers
2006 P/E Multiples | | 2006 P/E/G Multiples |
| | |
[CHART] | | [CHART] |
As of 8/31/05.
EPS and long-term growth rates per First Call.
Heron 2006 P/E based on EPS of $1.81.
26
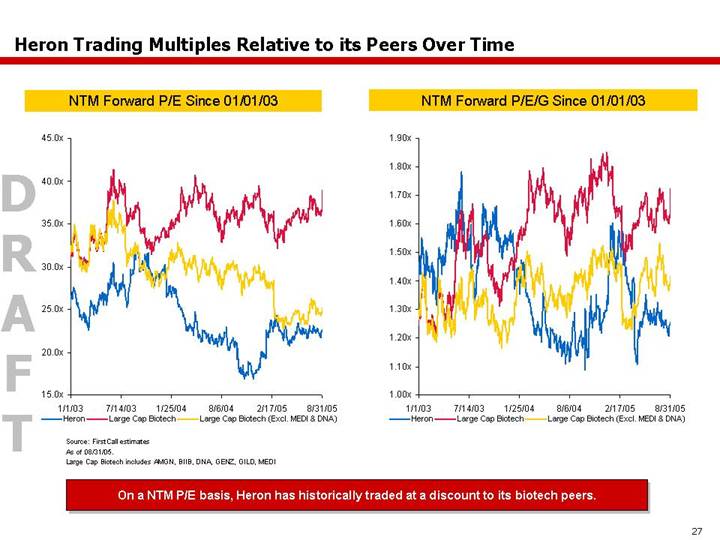
Heron Trading Multiples Relative to its Peers Over Time
NTM Forward P/E Since 01/01/03 | | NTM Forward P/E/G Since 01/01/03 |
| | |
[CHART] | | [CHART] |
Source: FirstCall estimates
As of 08/31/05.
Large Cap Biotech includes AMGN, BIIB, DNA, GENZ, GILD, MEDI
On a NTM P/E basis, Heron has historically traded at a discount to its biotech peers.
27
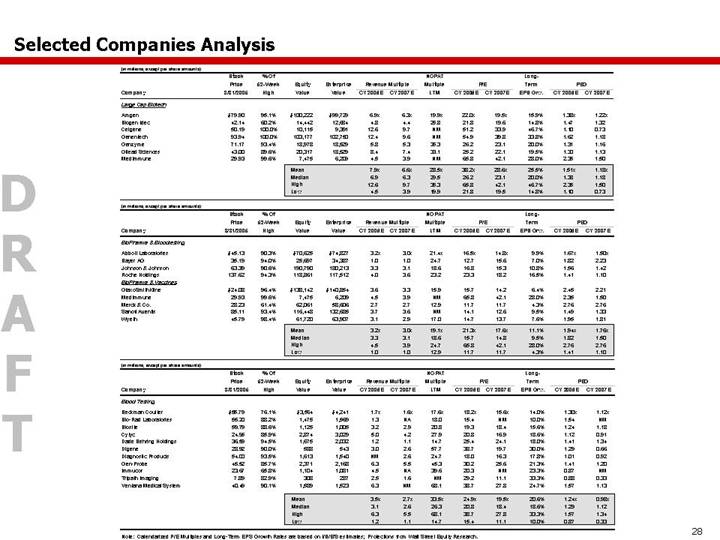
Selected Companies Analysis
(in millions, except per share amounts)
| | Stock | | % Of | | | | | | | | | | NOPAT | | | | | | Long- | | | | | |
| | Price | | 52-Week | | Equity | | Enterprise | | Revenue Multiple | | Multiple | | P/E | | Term | | PEG | |
Company | | 8/31/2005 | | High | | Value | | Value | | CY 2006E | | CY 2007E | | LTM | | CY 2006E | | CY 2007E | | EPS Grw. | | CY 2006E | | CY 2007E | |
Large Cap Biotech | | | | | | | | | | | | | | | | | | | | | | | | | |
Amgen | | $ | 79.90 | | 95.1 | % | $ | 100,222 | | $ | 99,729 | | 6.9 | x | 6.3 | x | 19.9 | x | 22.0 | x | 19.5 | x | 15.9 | % | 1.38 | x | 1.22 | x |
Biogen Idec | | 42.14 | | 60.2 | % | 14,442 | | 12,684 | | 4.8 | | 4.4 | | 25.8 | | 21.8 | | 19.6 | | 14.8 | % | 1.47 | | 1.32 | |
Celgene | | 50.19 | | 100.0 | % | 10,115 | | 9,391 | | 12.6 | | 9.7 | | NM | | 51.2 | | 33.9 | | 46.7 | % | 1.10 | | 0.73 | |
Genentech | | 93.94 | | 100.0 | % | 103,177 | | 102,750 | | 12.4 | | 9.6 | | NM | | 54.9 | | 39.8 | | 33.8 | % | 1.62 | | 1.18 | |
Genzyme | | 71.17 | | 93.4 | % | 18,978 | | 18,529 | | 5.8 | | 5.3 | | 35.3 | | 26.2 | | 23.1 | | 20.0 | % | 1.31 | | 1.16 | |
Gilead Sciences | | 43.00 | | 89.6 | % | 20,317 | | 18,529 | | 8.4 | | 7.4 | | 33.1 | | 25.2 | | 22.1 | | 19.5 | % | 1.30 | | 1.13 | |
MedImmune | | 29.93 | | 99.6 | % | 7,475 | | 6,209 | | 4.5 | | 3.9 | | NM | | 65.8 | | 42.1 | | 28.0 | % | 2.35 | | 1.50 | |
| | | | | | Mean | | | | 7.9 | x | 6.6 | x | 28.5 | x | 38.2 | x | 28.6 | x | 25.5 | % | 1.51 | x | 1.18 | x |
| | | | | | Median | | | | 6.9 | | 6.3 | | 29.5 | | 26.2 | | 23.1 | | 20.0 | % | 1.38 | | 1.18 | |
| | | | | | High | | | | 12.6 | | 9.7 | | 35.3 | | 65.8 | | 42.1 | | 46.7 | % | 2.35 | | 1.50 | |
| | | | | | Low | | | | 4.5 | | 3.9 | | 19.9 | | 21.8 | | 19.5 | | 14.8 | % | 1.10 | | 0.73 | |
| | | | | | | | | | | | | | | | | | | | | | | | | | | | |
(in millions, except per share amounts)
| | Stock | | % Of | | | | | | | | | | NOPAT | | | | | | Long- | | | | | |
| | Price | | 52-Week | | Equity | | Enterprise | | Revenue Multiple | | Multiple | | P/E | | Term | | PEG | |
Company | | 8/31/2005 | | High | | Value | | Value | | CY 2006E | | CY 2007E | | LTM | | CY 2006E | | CY 2007E | | EPS Grw. | | CY 2006E | | CY 2007E | |
BioPharma & Bloodtesting | | | | | | | | | | | | | | | | | | | | | | | | | |
Abbott Laboratories | | $ | 45.13 | | 90.3 | % | $ | 70,625 | | $ | 74,827 | | 3.2 | x | 3.0 | x | 21.4 | x | 16.5 | x | 14.8 | x | 9.9 | % | 1.67 | x | 1.50 | x |
Bayer AG | | 35.19 | | 94.0 | % | 25,697 | | 34,387 | | 1.0 | | 1.0 | | 24.7 | | 12.7 | | 15.6 | | 7.0 | % | 1.82 | | 2.23 | |
Johnson & Johnson | | 63.39 | | 90.6 | % | 190,790 | | 180,213 | | 3.3 | | 3.1 | | 18.6 | | 16.8 | | 15.3 | | 10.8 | % | 1.56 | | 1.42 | |
Roche Holdings | | 137.62 | | 94.3 | % | 118,861 | | 117,512 | | 4.0 | | 3.6 | | 23.2 | | 23.3 | | 18.2 | | 16.5 | % | 1.41 | | 1.10 | |
BioPharma & Vaccines | | | | | | | | | | | | | | | | | | | | | | | | | |
GlaxoSmithKline | | $ | 24.08 | | 96.4 | % | $ | 138,142 | | $ | 140,854 | | 3.6 | | 3.3 | | 15.9 | | 15.7 | | 14.2 | | 6.4 | % | 2.45 | | 2.21 | |
MedImmune | | 29.93 | | 99.6 | % | 7,475 | | 6,209 | | 4.5 | | 3.9 | | NM | | 65.8 | | 42.1 | | 28.0 | % | 2.35 | | 1.50 | |
Merck & Co. | | 28.23 | | 61.4 | % | 62,061 | | 58,606 | | 2.7 | | 2.7 | | 12.9 | | 11.7 | | 11.7 | | 4.3 | % | 2.76 | | 2.76 | |
Sanofi Aventis | | 85.11 | | 93.4 | % | 116,448 | | 132,685 | | 3.7 | | 3.6 | | NM | | 14.1 | | 12.6 | | 9.5 | % | 1.49 | | 1.33 | |
Wyeth | | 45.79 | | 98.4 | % | 61,720 | | 63,907 | | 3.1 | | 2.9 | | 17.0 | | 14.7 | | 13.7 | | 7.6 | % | 1.95 | | 1.81 | |
| | | | | | Mean | | | | 3.2 | x | 3.0 | x | 19.1 | x | 21.3 | x | 17.6 | x | 11.1 | % | 1.94 | x | 1.76 | x |
| | | | | | Median | | | | 3.3 | | 3.1 | | 18.6 | | 15.7 | | 14.8 | | 9.5 | % | 1.82 | | 1.50 | |
| | | | | | High | | | | 4.5 | | 3.9 | | 24.7 | | 65.8 | | 42.1 | | 28.0 | % | 2.76 | | 2.76 | |
| | | | | | Low | | | | 1.0 | | 1.0 | | 12.9 | | 11.7 | | 11.7 | | 4.3 | % | 1.41 | | 1.10 | |
(in millions, except per share amounts)
| | Stock | | % Of | | | | | | | | | | NOPAT | | | | | | Long- | | | | | |
| | Price | | 52-Week | | Equity | | Enterprise | | Revenue Multiple | | Multiple | | P/E | | Term | | PEG | |
Company | | 8/31/2005 | | High | | Value | | Value | | CY 2006E | | CY 2007E | | LTM | | CY 2006E | | CY 2007E | | EPS Grw. | | CY 2006E | | CY 2007E | |
Blood Testing | | | | | | | | | | | | | | | | | | | | | | | | | |
Beckman Coulter | | $ | 55.79 | | 76.1 | % | $ | 3,564 | | $ | 4,241 | | 1.7 | x | 1.6 | x | 17.6 | x | 18.2 | x | 15.6 | x | 14.0 | % | 1.30 | x | 1.12 | x |
Bio-Rad Laboratories | | 55.20 | | 88.2 | % | 1,475 | | 1,569 | | 1.3 | | NA | | 18.0 | | 15.4 | | NM | | 10.0 | % | 1.54 | | NM | |
Biosite | | 59.79 | | 88.6 | % | 1,125 | | 1,005 | | 3.2 | | 2.9 | | 20.8 | | 19.3 | | 18.4 | | 15.6 | % | 1.24 | | 1.18 | |
Cytyc | | 24.95 | | 85.9 | % | 2,874 | | 3,029 | | 5.0 | | 4.2 | | 27.9 | | 20.8 | | 16.9 | | 18.6 | % | 1.12 | | 0.91 | |
Dade Behring Holdings | | 36.59 | | 94.5 | % | 1,675 | | 2,032 | | 1.2 | | 1.1 | | 14.7 | | 25.4 | | 24.1 | | 18.0 | % | 1.41 | | 1.34 | |
Digene | | 28.92 | | 90.0 | % | 588 | | 543 | | 3.0 | | 2.6 | | 57.7 | | 38.7 | | 19.7 | | 30.0 | % | 1.29 | | 0.66 | |
Diagnostic Products | | 54.00 | | 93.5 | % | 1,613 | | 1,540 | | NM | | 2.6 | | 24.7 | | 18.0 | | 16.3 | | 17.8 | % | 1.01 | | 0.92 | |
Gen-Probe | | 45.52 | | 85.7 | % | 2,371 | | 2,168 | | 6.3 | | 5.5 | | 45.3 | | 30.2 | | 25.6 | | 21.3 | % | 1.41 | | 1.20 | |
Immucor | | 23.67 | | 65.8 | % | 1,104 | | 1,081 | | 4.5 | | NA | | 39.6 | | 20.3 | | NM | | 23.3 | % | 0.87 | | NM | |
Tripath Imaging | | 7.89 | | 82.9 | % | 308 | | 287 | | 2.5 | | 1.6 | | NM | | 29.2 | | 11.1 | | 33.3 | % | 0.88 | | 0.33 | |
Ventana Medical System | | 40.49 | | 90.1 | % | 1,589 | | 1,523 | | 6.3 | | NM | | 68.1 | | 38.7 | | 27.8 | | 24.7 | % | 1.57 | | 1.13 | |
| | | | | | | | | | | | | | | | | | | | | | | | | |
| | | | | | Mean | | | | 3.5 | x | 2.7 | x | 33.5 | x | 24.9 | x | 19.5 | x | 20.6 | % | 1.24 | x | 0.98 | x |
| | | | | | Median | | | | 3.1 | | 2.6 | | 26.3 | | 20.8 | | 18.4 | | 18.6 | % | 1.29 | | 1.12 | |
| | | | | | High | | | | 6.3 | | 5.5 | | 68.1 | | 38.7 | | 27.8 | | 33.3 | % | 1.57 | | 1.34 | |
| | | | | | Low | | | | 1.2 | | 1.1 | | 14.7 | | 15.4 | | 11.1 | | 10.0 | % | 0.87 | | 0.33 | |
| | | | | | | | | | | | | | | | | | | | | | | | | | | | |
Note: Calendarized P/E Multiples and Long-Term EPS Growth Rates are based on I/B/E/S estimates; Projections from Wall Street Equity Research.
28
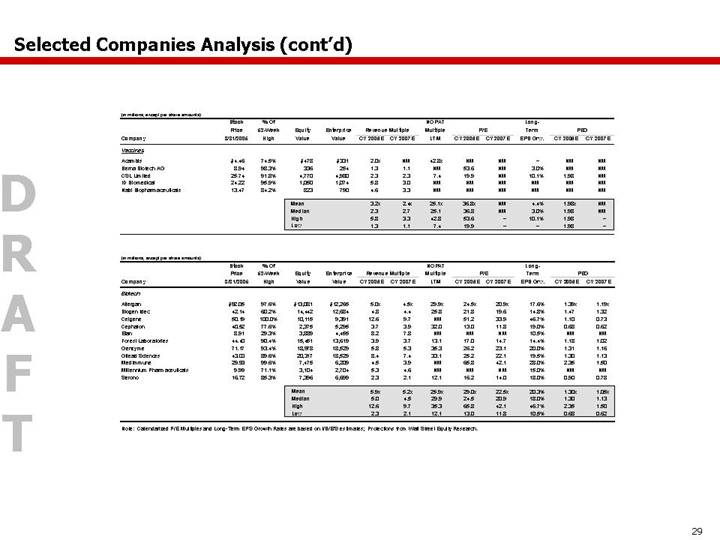
(in millions, except per share amounts)
| | Stock | | % Of | | | | | | | | | | NOPAT | | | | | | Long- | | | | | |
| | Price | | 52-Week | | Equity | | Enterprise | | Revenue Multiple | | Multiple | | P/E | | Term | | PEG | |
Company | | 8/31/2005 | | High | | Value | | Value | | CY 2006E | | CY 2007E | | LTM | | CY 2006E | | CY 2007E | | EPS Grw. | | CY 2006E | | CY 2007E | |
Vaccines | | | | | | | | | | | | | | | | | | | | | | | | | |
Acambis | | $ | 4.46 | | 74.5 | % | $ | 478 | | $ | 331 | | 2.0 | x | NM | | 42.8 | x | NM | | NM | | — | | NM | | NM | |
Berna Biotech AG | | 8.94 | | 98.3 | % | 336 | | 254 | | 1.3 | | 1.1 | | NM | | 53.6 | | NM | | 3.0 | % | NM | | NM | |
CSL Limited | | 25.74 | | 91.8 | % | 4,770 | | 4,980 | | 2.3 | | 2.3 | | 7.4 | | 19.9 | | NM | | 10.1 | % | 1.98 | | NM | |
ID Biomedical | | 24.22 | | 95.9 | % | 1,050 | | 1,074 | | 5.8 | | 3.0 | | NM | | NM | | NM | | NM | | NM | | NM | |
Nabi Biopharmaceuticals | | 13.47 | | 84.2 | % | 823 | | 790 | | 4.6 | | 3.3 | | NM | | NM | | NM | | NM | | NM | | NM | |
| | | | | | | | | | | | | | | | | | | | | | | | | |
| | | | | | Mean | | | | 3.2 | x | 2.4 | x | 25.1 | x | 36.8 | x | NM | | 4.4 | % | 1.98 | x | NM | |
| | | | | | Median | | | | 2.3 | | 2.7 | | 25.1 | | 36.8 | | NM | | 3.0 | % | 1.98 | | NM | |
| | | | | | High | | | | 5.8 | | 3.3 | | 42.8 | | 53.6 | | — | | 10.1 | % | 1.98 | | — | |
| | | | | | Low | | | | 1.3 | | 1.1 | | 7.4 | | 19.9 | | — | | — | | 1.98 | | — | |
| | | | | | | | | | | | | | | | | | | | | | | | | | | | |
(in millions, except per share amounts)
| | Stock | | % Of | | | | | | | | | | NOPAT | | | | | | Long- | | | | | |
| | Price | | 52-Week | | Equity | | Enterprise | | Revenue Multiple | | Multiple | | P/E | | Term | | PEG | |
Company | | 8/31/2005 | | High | | Value | | Value | | CY 2006E | | CY 2007E | | LTM | | CY 2006E | | CY 2007E | | EPS Grw. | | CY 2006E | | CY 2007E | |
Biotech | | | | | | | | | | | | | | | | | | | | | | | | | |
Allergan | | $ | 92.05 | | 97.6 | % | $ | 13,081 | | $ | 12,265 | | 5.0 | x | 4.5 | x | 29.9 | x | 24.5 | x | 20.9 | x | 17.6 | % | 1.39 | x | 1.19 | x |
Biogen Idec | | 42.14 | | 60.2 | % | 14,442 | | 12,684 | | 4.8 | | 4.4 | | 25.8 | | 21.8 | | 19.6 | | 14.8 | % | 1.47 | | 1.32 | |
Celgene | | 50.19 | | 100.0 | % | 10,115 | | 9,391 | | 12.6 | | 9.7 | | NM | | 51.2 | | 33.9 | | 46.7 | % | 1.10 | | 0.73 | |
Cephalon | | 40.52 | | 77.6 | % | 2,375 | | 5,295 | | 3.7 | | 3.9 | | 32.0 | | 13.0 | | 11.8 | | 19.0 | % | 0.68 | | 0.62 | |
Elan | | 8.91 | | 29.3 | % | 3,889 | | 4,455 | | 8.2 | | 7.8 | | NM | | NM | | NM | | 10.5 | % | NM | | NM | |
Forest Laboratories | | 44.40 | | 90.4 | % | 15,451 | | 13,619 | | 3.9 | | 3.7 | | 13.1 | | 17.0 | | 14.7 | | 14.4 | % | 1.18 | | 1.02 | |
Genzyme | | 71.17 | | 93.4 | % | 18,978 | | 18,529 | | 5.8 | | 5.3 | | 35.3 | | 26.2 | | 23.1 | | 20.0 | % | 1.31 | | 1.16 | |
Gilead Sciences | | 43.00 | | 89.6 | % | 20,317 | | 18,529 | | 8.4 | | 7.4 | | 33.1 | | 25.2 | | 22.1 | | 19.5 | % | 1.30 | | 1.13 | |
MedImmune | | 29.93 | | 99.6 | % | 7,475 | | 6,209 | | 4.5 | | 3.9 | | NM | | 65.8 | | 42.1 | | 28.0 | % | 2.35 | | 1.50 | |
Millennium Pharmaceuticals | | 9.99 | | 71.1 | % | 3,104 | | 2,704 | | 5.3 | | 4.6 | | NM | | NM | | NM | | 15.0 | % | NM | | NM | |
Serono | | 16.72 | | 85.3 | % | 7,396 | | 6,699 | | 2.3 | | 2.1 | | 12.1 | | 16.2 | | 14.0 | | 18.0 | % | 0.90 | | 0.78 | |
| | | | | | | | | | | | | | | | | | | | | | | | | |
| | | | | | Mean | | | | 5.9 | x | 5.2 | x | 25.9 | x | 29.0 | x | 22.5 | x | 20.3 | % | 1.30 | x | 1.05 | x |
| | | | | | Median | | | | 5.0 | | 4.5 | | 29.9 | | 24.5 | | 20.9 | | 18.0 | % | 1.30 | | 1.13 | |
| | | | | | High | | | | 12.6 | | 9.7 | | 35.3 | | 65.8 | | 42.1 | | 46.7 | % | 2.35 | | 1.50 | |
| | | | | | Low | | | | 2.3 | | 2.1 | | 12.1 | | 13.0 | | 11.8 | | 10.5 | % | 0.68 | | 0.62 | |
| | | | | | | | | | | | | | | | | | | | | | | | | | | | |
Note: Calendarized P/E Multiples and Long-Term EPS Growth Rates are based on I/B/E/S estimates; Projections from Wall Street Equity Research.
29
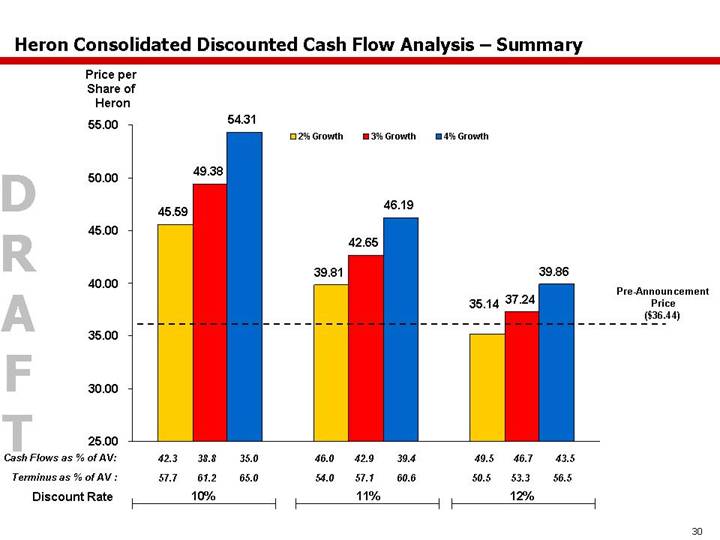
Heron Consolidated Discounted Cash Flow Analysis – Summary
[CHART]
29
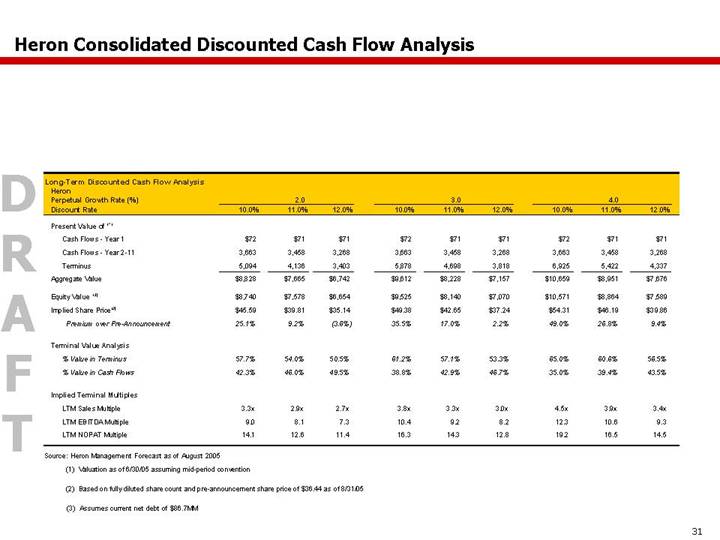
Heron Consolidated Discounted Cash Flow Analysis
Long-Term Discounted Cash Flow Analysis | | | | | | | | | | | | | | | | | | | |
Heron | | | | | | | | | | | | | | | | | | | |
Perpetual Growth Rate (%) | | 2.0 | | 3.0 | | 4.0 | |
Discount Rate | | 10.0 % | | 11.0 % | | 12.0 % | | 10.0 % | | 11.0 % | | 12.0 % | | 10.0 % | | 11.0 % | | 12.0 % | |
| | | | | | | | | | | | | | | | | | | |
Present Value of (1) | | | | | | | | | | | | | | | | | | | |
Cash Flows - Year 1 | | $ | 72 | | $ | 71 | | $ | 71 | | $ | 72 | | $ | 71 | | $ | 71 | | $ | 72 | | $ | 71 | | $ | 71 | |
Cash Flows - Year 2-11 | | 3,663 | | 3,458 | | 3,268 | | 3,663 | | 3,458 | | 3,268 | | 3,663 | | 3,458 | | 3,268 | |
Terminus | | 5,094 | | 4,136 | | 3,403 | | 5,878 | | 4,698 | | 3,818 | | 6,925 | | 5,422 | | 4,337 | |
Aggregate Value | | $ | 8,828 | | $ | 7,665 | | $ | 6,742 | | $ | 9,612 | | $ | 8,228 | | $ | 7,157 | | $ | 10,659 | | $ | 8,951 | | $ | 7,676 | |
| | | | | | | | | | | | | | | | | | | |
Equity Value (3) | | $ | 8,740 | | $ | 7,578 | | $ | 6,654 | | $ | 9,525 | | $ | 8,140 | | $ | 7,070 | | $ | 10,571 | | $ | 8,864 | | $ | 7,589 | |
Implied Share Price(2) | | $ | 45.59 | | $ | 39.81 | | $ | 35.14 | | $ | 49.38 | | $ | 42.65 | | $ | 37.24 | | $ | 54.31 | | $ | 46.19 | | $ | 39.86 | |
Premium over Pre-Announcement | | 25.1 | % | 9.2 | % | (3.6 | )% | 35.5 | % | 17.0 | % | 2.2 | % | 49.0 | % | 26.8 | % | 9.4 | % |
| | | | | | | | | | | | | | | | | | | |
Terminal Value Analysis | | | | | | | | | | | | | | | | | | | |
% Value in Terminus | | 57.7 | % | 54.0 | % | 50.5 | % | 61.2 | % | 57.1 | % | 53.3 | % | 65.0 | % | 60.6 | % | 56.5 | % |
% Value in Cash Flows | | 42.3 | % | 46.0 | % | 49.5 | % | 38.8 | % | 42.9 | % | 46.7 | % | 35.0 | % | 39.4 | % | 43.5 | % |
| | | | | | | | | | | | | | | | | | | |
Implied Terminal Multiples | | | | | | | | | | | | | | | | | | | |
LTM Sales Multiple | | 3.3 | x | 2.9 | x | 2.7 | x | 3.8 | x | 3.3 | x | 3.0 | x | 4.5 | x | 3.9 | x | 3.4 | x |
LTM EBITDA Multiple | | 9.0 | | 8.1 | | 7.3 | | 10.4 | | 9.2 | | 8.2 | | 12.3 | | 10.6 | | 9.3 | |
LTM NOPAT Multiple | | 14.1 | | 12.6 | | 11.4 | | 16.3 | | 14.3 | | 12.8 | | 19.2 | | 16.5 | | 14.5 | |
Source: Heron Management Forecast as of August 2005
(1) Valuation as of 6/30/05 assuming mid-period convention
(2) Based on fully diluted share count and pre-announcement share price of $36.44 as of 8/31/05
(3) Assumes current net debt of $86.7MM
31
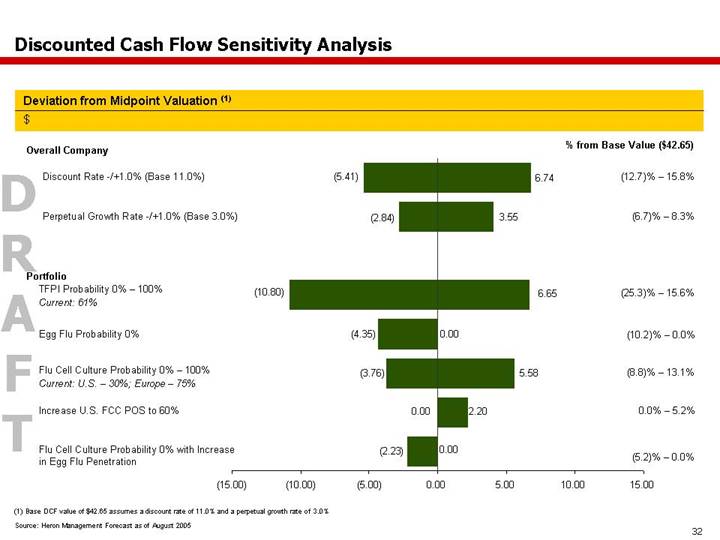
Discounted Cash Flow Sensitivity Analysis
Deviation from Midpoint Valuation (1)
$
[CHART]
(1) Base DCF value of $42.65 assumes a discount rate of 11.0% and a perpetual growth rate of 3.0%
Source: Heron Management Forecast as of August 2005
32
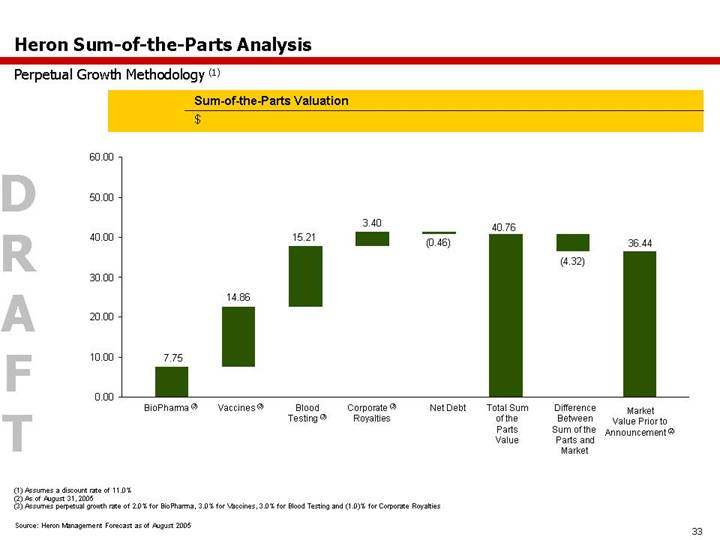
Heron Sum-of-the-Parts Analysis
Perpetual Growth Methodology (1)
Sum-of-the-Parts Valuation
$
[CHART]
(1) Assumes a discount rate of 11.0%
(2) As of August 31, 2005
(3) Assumes perpetual growth rate of 2.0% for BioPharma, 3.0% for Vaccines, 3.0% for Blood Testing and (1.0)% for Corporate Royalties
Source: Heron Management Forecast as of August 2005
33
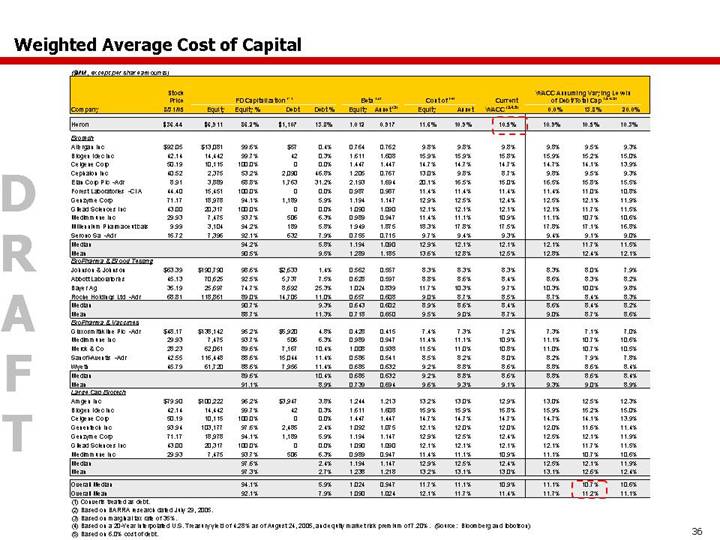
Weighted Average Cost of Capital
($MM, except per share amounts)
| | Stock | | | | | | | | | | | | | | | | | | | | WACC Assuming Varying Levels | | |
| | Price | | FD Capitalization (1) | | Beta (2) | | Cost of (4) | | Current | | of Debt/Total Cap (3),(4),(5) | |
Company | | 8/31/05 | | Equity | | Equity% | | Debt | | Debt% | | Equity | | Asset (3) | | Equity | | Asset | | WACC (3),(4),(5) | | 0.0% | | 13.8% | | 20.0% | |
| | | | | | | | | | | | | | | | | | | | | | | | | | | |
| | | | | | | | | | | | | | | | | | | | | | | | | | | | | | | | | | | | | | | | | | | | |
Heron | | $ | 36.44 | | $ | 6,911 | | 86.2 | % | $ | 1,107 | | 13.8 | % | 1.012 | | 0.917 | | 11.6 | % | 10.9 | % | 10.5 | % | 10.9 | % | 10.5 | % | 10.3 | % |
| | | | | | | | | | | | | | | | | | | | | | | | | | | |
Biotech | | | | | | | | | | | | | | | | | | | | | | | | | | | |
Allergan Inc | | $ | 92.05 | | $ | 13,081 | | 99.6 | % | $ | 57 | | 0.4 | % | 0.764 | | 0.762 | | 9.8 | % | 9.8 | % | 9.8 | % | 9.8 | % | 9.5 | % | 9.3 | % |
Biogen Idec Inc | | 42.14 | | 14,442 | | 99.7 | % | 42 | | 0.3 | % | 1.611 | | 1.608 | | 15.9 | % | 15.9 | % | 15.8 | % | 15.9 | % | 15.2 | % | 15.0 | % |
Celgene Corp | | 50.19 | | 10,115 | | 100.0 | % | 0 | | 0.0 | % | 1.447 | | 1.447 | | 14.7 | % | 14.7 | % | 14.7 | % | 14.7 | % | 14.1 | % | 13.9 | % |
Cephalon Inc | | 40.52 | | 2,375 | | 53.2 | % | 2,090 | | 46.8 | % | 1.205 | | 0.767 | | 13.0 | % | 9.8 | % | 8.7 | % | 9.8 | % | 9.5 | % | 9.3 | % |
Elan Corp Plc -Adr | | 8.91 | | 3,889 | | 68.8 | % | 1,763 | | 31.2 | % | 2.193 | | 1.694 | | 20.1 | % | 16.5 | % | 15.0 | % | 16.5 | % | 15.8 | % | 15.5 | % |
Forest Laboratories -Cl A | | 44.40 | | 15,451 | | 100.0 | % | 0 | | 0.0 | % | 0.987 | | 0.987 | | 11.4 | % | 11.4 | % | 11.4 | % | 11.4 | % | 11.0 | % | 10.8 | % |
Genzyme Corp | | 71.17 | | 18,978 | | 94.1 | % | 1,189 | | 5.9 | % | 1.194 | | 1.147 | | 12.9 | % | 12.5 | % | 12.4 | % | 12.5 | % | 12.1 | % | 11.9 | % |
Gilead Sciences Inc | | 43.00 | | 20,317 | | 100.0 | % | 0 | | 0.0 | % | 1.090 | | 1.090 | | 12.1 | % | 12.1 | % | 12.1 | % | 12.1 | % | 11.7 | % | 11.5 | % |
Medimmune Inc | | 29.93 | | 7,475 | | 93.7 | % | 506 | | 6.3 | % | 0.989 | | 0.947 | | 11.4 | % | 11.1 | % | 10.9 | % | 11.1 | % | 10.7 | % | 10.6 | % |
Millennium Pharmaceuticals | | 9.99 | | 3,104 | | 94.2 | % | 189 | | 5.8 | % | 1.949 | | 1.875 | | 18.3 | % | 17.8 | % | 17.5 | % | 17.8 | % | 17.1 | % | 16.8 | % |
Serono Sa -Adr | | 16.72 | | 7,396 | | 92.1 | % | 632 | | 7.9 | % | 0.755 | | 0.715 | | 9.7 | % | 9.4 | % | 9.3 | % | 9.4 | % | 9.1 | % | 9.0 | % |
| | | | | | | | | | | | | | | | | | | | | | | | | | | |
Median | | | | | | 94.2 | % | | | 5.8 | % | 1.194 | | 1.090 | | 12.9 | % | 12.1 | % | 12.1 | % | 12.1 | % | 11.7 | % | 11.5 | % |
Mean | | | | | | 90.5 | % | | | 9.5 | % | 1.289 | | 1.185 | | 13.6 | % | 12.8 | % | 12.5 | % | 12.8 | % | 12.4 | % | 12.1 | % |
| | | | | | | | | | | | | | | | | | | | | | | | | | | |
BioPharma & Blood Testing | | | | | | | | | | | | | | | | | | | | | | | | | | | |
Johnson & Johnson | | $ | 63.39 | | $ | 190,790 | | 98.6 | % | $ | 2,633 | | 1.4 | % | 0.562 | | 0.557 | | 8.3 | % | 8.3 | % | 8.3 | % | 8.3 | % | 8.0 | % | 7.9 | % |
Abbott Laboratories | | 45.13 | | 70,625 | | 92.5 | % | 5,737 | | 7.5 | % | 0.628 | | 0.597 | | 8.8 | % | 8.6 | % | 8.4 | % | 8.6 | % | 8.3 | % | 8.2 | % |
Bayer Ag | | 35.19 | | 25,697 | | 74.7 | % | 8,692 | | 25.3 | % | 1.024 | | 0.839 | | 11.7 | % | 10.3 | % | 9.7 | % | 10.3 | % | 10.0 | % | 9.8 | % |
Roche Holdings Ltd -Adr | | 68.81 | | 118,861 | | 89.0 | % | 14,705 | | 11.0 | % | 0.657 | | 0.608 | | 9.0 | % | 8.7 | % | 8.5 | % | 8.7 | % | 8.4 | % | 8.3 | % |
| | | | | | | | | | | | | | | | | | | | | | | | | | | |
Median | | | | | | 90.7 | % | | | 9.3 | % | 0.643 | | 0.602 | | 8.9 | % | 8.6 | % | 8.4 | % | 8.6 | % | 8.4 | % | 8.2 | % |
Mean | | | | | | 88.7 | % | | | 11.3 | % | 0.718 | | 0.650 | | 9.5 | % | 9.0 | % | 8.7 | % | 9.0 | % | 8.7 | % | 8.6 | % |
| | | | | | | | | | | | | | | | | | | | | | | | | | | |
BioPharma & Vaccines | | | | | | | | | | | | | | | | | | | | | | | | | | | |
Glaxosmithkline Plc -Adr | | $ | 48.17 | | $ | 138,142 | | 95.2 | % | $ | 6,920 | | 4.8 | % | 0.428 | | 0.415 | | 7.4 | % | 7.3 | % | 7.2 | % | 7.3 | % | 7.1 | % | 7.0 | % |
Medimmune Inc | | 29.93 | | 7,475 | | 93.7 | % | 506 | | 6.3 | % | 0.989 | | 0.947 | | 11.4 | % | 11.1 | % | 10.9 | % | 11.1 | % | 10.7 | % | 10.6 | % |
Merck & Co | | 28.23 | | 62,061 | | 89.6 | % | 7,167 | | 10.4 | % | 1.008 | | 0.938 | | 11.5 | % | 11.0 | % | 10.8 | % | 11.0 | % | 10.7 | % | 10.5 | % |
Sanofi-Aventis -Adr | | 42.55 | | 116,448 | | 88.6 | % | 15,044 | | 11.4 | % | 0.586 | | 0.541 | | 8.5 | % | 8.2 | % | 8.0 | % | 8.2 | % | 7.9 | % | 7.8 | % |
Wyeth | | 45.79 | | 61,720 | | 88.6 | % | 7,956 | | 11.4 | % | 0.685 | | 0.632 | | 9.2 | % | 8.8 | % | 8.6 | % | 8.8 | % | 8.6 | % | 8.4 | % |
| | | | | | | | | | | | | | | | | | | | | | | | | | | |
Median | | | | | | 89.6 | % | | | 10.4 | % | 0.685 | | 0.632 | | 9.2 | % | 8.8 | % | 8.6 | % | 8.8 | % | 8.6 | % | 8.4 | % |
Mean | | | | | | 91.1 | % | | | 8.9 | % | 0.739 | | 0.694 | | 9.6 | % | 9.3 | % | 9.1 | % | 9.3 | % | 9.0 | % | 8.9 | % |
| | | | | | | | | | | | | | | | | | | | | | | | | | | |
Large Cap Biotech | | | | | | | | | | | | | | | | | | | | | | | | | | | |
Amgen Inc | | $ | 79.90 | | $ | 100,222 | | 96.2 | % | $ | 3,947 | | 3.8 | % | 1.244 | | 1.213 | | 13.2 | % | 13.0 | % | 12.9 | % | 13.0 | % | 12.5 | % | 12.3 | % |
Biogen Idec Inc | | 42.14 | | 14,442 | | 99.7 | % | 42 | | 0.3 | % | 1.611 | | 1.608 | | 15.9 | % | 15.9 | % | 15.8 | % | 15.9 | % | 15.2 | % | 15.0 | % |
Celgene Corp | | 50.19 | | 10,115 | | 100.0 | % | 0 | | 0.0 | % | 1.447 | | 1.447 | | 14.7 | % | 14.7 | % | 14.7 | % | 14.7 | % | 14.1 | % | 13.9 | % |
Genentech Inc | | 93.94 | | 103,177 | | 97.6 | % | 2,485 | | 2.4 | % | 1.092 | | 1.075 | | 12.1 | % | 12.0 | % | 12.0 | % | 12.0 | % | 11.6 | % | 11.4 | % |
Genzyme Corp | | 71.17 | | 18,978 | | 94.1 | % | 1,189 | | 5.9 | % | 1.194 | | 1.147 | | 12.9 | % | 12.5 | % | 12.4 | % | 12.5 | % | 12.1 | % | 11.9 | % |
Gilead Sciences Inc | | 43.00 | | 20,317 | | 100.0 | % | 0 | | 0.0 | % | 1.090 | | 1.090 | | 12.1 | % | 12.1 | % | 12.1 | % | 12.1 | % | 11.7 | % | 11.5 | % |
Medimmune Inc | | 29.93 | | 7,475 | | 93.7 | % | 506 | | 6.3 | % | 0.989 | | 0.947 | | 11.4 | % | 11.1 | % | 10.9 | % | 11.1 | % | 10.7 | % | 10.6 | % |
| | | | | | | | | | | | | | | | | | | | | | | | | | | |
Median | | | | | | 97.6 | % | | | 2.4 | % | 1.194 | | 1.147 | | 12.9 | % | 12.5 | % | 12.4 | % | 12.5 | % | 12.1 | % | 11.9 | % |
Mean | | | | | | 97.3 | % | | | 2.7 | % | 1.238 | | 1.218 | | 13.2 | % | 13.1 | % | 13.0 | % | 13.1 | % | 12.6 | % | 12.4 | % |
| | | | | | | | | | | | | | | | | | | | | | | | | | | |
Overall Median | | | | | | 94.1 | % | | | 5.9 | % | 1.024 | | 0.947 | | 11.7 | % | 11.1 | % | 10.9 | % | 11.1 | % | 10.7 | % | 10.6 | % |
Overall Mean | | | | | | 92.1 | % | | | 7.9 | % | 1.090 | | 1.024 | | 12.1 | % | 11.7 | % | 11.4 | % | 11.7 | % | 11.2 | % | 11.1 | % |
(1) Converts treated as debt.
(2) Based on BARRA research dated July 29, 2005.
(3) Based on marginal tax rate of 35%.
(4) Based on a 20-Year Interpolated U.S. Treasury yield of 4.28% as of August 24, 2005, and equity market risk premium of 7.20%. (Source: Bloomberg and Ibbotson)
(5) Based on 6.0% cost of debt.
36
Other Financial Analysis
37
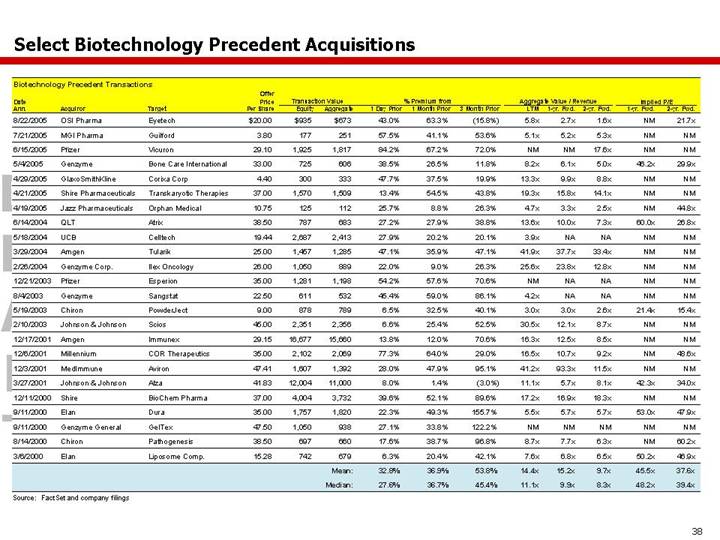
Select Biotechnology Precedent Acquisitions
Biotechnology Precedent Transactions
| | | | | | Offer | | | | | | | | | | | | | | | | | | | | | |
Date | | | | | | Price | | Transaction Value | | % Premium from | | Aggregate Value / Revenue | | Implied P/E | |
Ann. | | Acquiror | | Target | | Per Share | | Equity | | Aggregate | | 1 Day Prior | | 1 Month Prior | | 3 Month Prior | | LTM | | 1-yr. Fwd. | | 2-yr. Fwd. | | 1-yr. Fwd. | | 2-yr. Fwd. | |
8/22/2005 | | OSI Pharma | | Eyetech | | $ | 20.00 | | $ | 935 | | $ | 673 | | 43.0 | % | 63.3 | % | (15.8 | )% | 5.8 | x | 2.7 | x | 1.6 | x | NM | | 21.7 | x |
7/21/2005 | | MGI Pharma | | Guilford | | 3.80 | | 177 | | 251 | | 57.5 | % | 41.1 | % | 53.6 | % | 5.1 | x | 5.2 | x | 5.3 | x | NM | | NM | |
6/15/2005 | | Pfizer | | Vicuron | | 29.10 | | 1,925 | | 1,817 | | 84.2 | % | 67.2 | % | 72.0 | % | NM | | NM | | 17.6 | x | NM | | NM | |
5/4/2005 | | Genzyme | | Bone Care International | | 33.00 | | 725 | | 606 | | 38.5 | % | 26.5 | % | 11.8 | % | 8.2 | x | 6.1 | x | 5.0 | x | 46.2 | x | 29.9 | x |
4/29/2005 | | GlaxoSmithKline | | Corixa Corp | | 4.40 | | 300 | | 333 | | 47.7 | % | 37.5 | % | 19.9 | % | 13.3 | x | 9.9 | x | 8.8 | x | NM | | NM | |
4/21/2005 | | Shire Pharmaceuticals | | Transkaryotic Therapies | | 37.00 | | 1,570 | | 1,509 | | 13.4 | % | 54.5 | % | 43.8 | % | 19.3 | x | 15.8 | x | 14.1 | x | NM | | NM | |
4/19/2005 | | Jazz Pharmaceuticals | | Orphan Medical | | 10.75 | | 125 | | 112 | | 25.7 | % | 8.8 | % | 26.3 | % | 4.7 | x | 3.3 | x | 2.5 | x | NM | | 44.8 | x |
6/14/2004 | | QLT | | Atrix | | 38.50 | | 787 | | 683 | | 27.2 | % | 27.9 | % | 38.8 | % | 13.6 | x | 10.0 | x | 7.3 | x | 60.0 | x | 26.8 | x |
5/18/2004 | | UCB | | Celltech | | 19.44 | | 2,687 | | 2,413 | | 27.9 | % | 20.2 | % | 20.1 | % | 3.9 | x | NA | | NA | | NM | | NM | |
3/29/2004 | | Amgen | | Tularik | | 25.00 | | 1,457 | | 1,285 | | 47.1 | % | 35.9 | % | 47.1 | % | 41.9 | x | 37.7 | x | 33.4 | x | NM | | NM | |
2/26/2004 | | Genzyme Corp. | | Ilex Oncology | | 26.00 | | 1,050 | | 889 | | 22.0 | % | 9.0 | % | 26.3 | % | 25.6 | x | 23.8 | x | 12.8 | x | NM | | NM | |
12/21/2003 | | Pfizer | | Esperion | | 35.00 | | 1,281 | | 1,198 | | 54.2 | % | 57.6 | % | 70.6 | % | NM | | NA | | NA | | NM | | NM | |
8/4/2003 | | Genzyme | | Sangstat | | 22.50 | | 611 | | 532 | | 45.4 | % | 59.0 | % | 86.1 | % | 4.2 | x | NA | | NA | | NM | | NM | |
5/19/2003 | | Chiron | | PowderJect | | 9.00 | | 878 | | 789 | | 6.5 | % | 32.5 | % | 40.1 | % | 3.0 | x | 3.0 | x | 2.6 | x | 21.4 | x | 15.4 | x |
2/10/2003 | | Johnson & Johnson | | Scios | | 45.00 | | 2,351 | | 2,356 | | 6.6 | % | 25.4 | % | 52.5 | % | 30.5 | x | 12.1 | x | 8.7 | x | NM | | NM | |
12/17/2001 | | Amgen | | Immunex | | 29.15 | | 16,677 | | 15,660 | | 13.8 | % | 12.0 | % | 70.6 | % | 16.3 | x | 12.5 | x | 8.5 | x | NM | | NM | |
12/6/2001 | | Millennium | | COR Therapeutics | | 35.00 | | 2,102 | | 2,069 | | 77.3 | % | 64.0 | % | 29.0 | % | 16.5 | x | 10.7 | x | 9.2 | x | NM | | 48.6 | x |
12/3/2001 | | MedImmune | | Aviron | | 47.41 | | 1,607 | | 1,392 | | 28.0 | % | 47.9 | % | 95.1 | % | 41.2 | x | 93.3 | x | 11.5 | x | NM | | NM | |
3/27/2001 | | Johnson & Johnson | | Alza | | 41.83 | | 12,004 | | 11,000 | | 8.0 | % | 1.4 | % | (3.0 | )% | 11.1 | x | 5.7 | x | 8.1 | x | 42.3 | x | 34.0 | x |
12/11/2000 | | Shire | | BioChem Pharma | | 37.00 | | 4,004 | | 3,732 | | 39.6 | % | 52.1 | % | 89.6 | % | 17.2 | x | 16.9 | x | 18.3 | x | NM | | NM | |
9/11/2000 | | Elan | | Dura | | 35.00 | | 1,757 | | 1,820 | | 22.3 | % | 49.3 | % | 155.7 | % | 5.5 | x | 5.7 | x | 5.7 | x | 53.0 | x | 47.9 | x |
9/11/2000 | | Genzyme General | | GelTex | | 47.50 | | 1,050 | | 938 | | 27.1 | % | 33.8 | % | 122.2 | % | NM | | NM | | NM | | NM | | NM | |
8/14/2000 | | Chiron | | Pathogenesis | | 38.50 | | 697 | | 660 | | 17.6 | % | 38.7 | % | 96.8 | % | 8.7 | x | 7.7 | x | 6.3 | x | NM | | 60.2 | x |
3/6/2000 | | Elan | | Liposome Comp. | | 15.28 | | 742 | | 679 | | 6.3 | % | 20.4 | % | 42.1 | % | 7.6 | x | 6.8 | x | 6.5 | x | 50.2 | x | 46.9 | x |
| | | | | | | | | | Mean: | | 32.8 | % | 36.9 | % | 53.8 | % | 14.4 | x | 15.2 | x | 9.7 | x | 45.5 | x | 37.6 | x |
| | | | | | | | | | Median: | | 27.6 | % | 36.7 | % | 45.4 | % | 11.1 | x | 9.9 | x | 8.3 | x | 48.2 | x | 39.4 | x |
| | | | | | | | | | | | | | | | | | | | | | | | | | | | | | |
Source: FactSet and company filings
38
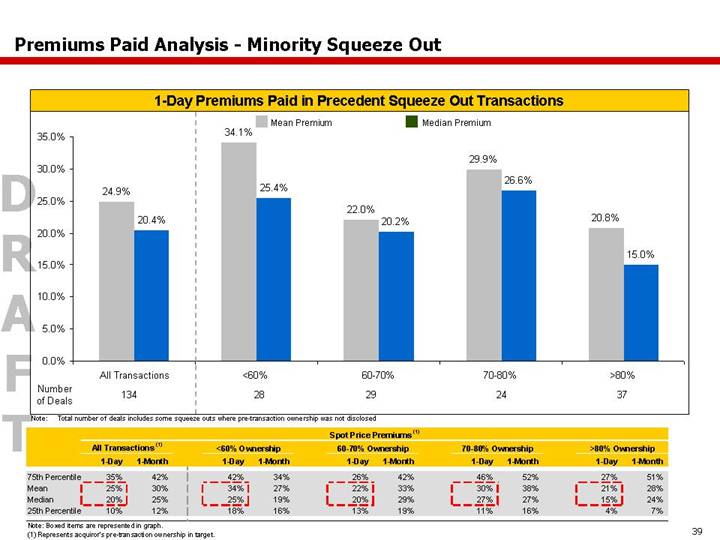
Premiums Paid Analysis - Minority Squeeze Out
1-Day Premiums Paid in Precedent Squeeze Out Transactions
[CHART]
Note: Total number of deals includes some squeeze outs where pre-transaction ownership was not disclosed
| | Spot Price Premiums (1) | |
| | All Transactions (1) | | <60% Ownership | | 60-70% Ownership | | 70-80% Ownership | | >80% Ownership | |
| | 1-Day | | 1-Month | | 1-Day | | 1-Month | | 1-Day | | 1-Month | | 1-Day | | 1-Month | | 1-Day | | 1-Month | |
75th Percentile | | 35 | % | 42 | % | 42 | % | 34 | % | 26 | % | 42 | % | 46 | % | 52 | % | 27 | % | 51 | % |
Mean | | 25 | % | 30 | % | 34 | % | 27 | % | 22 | % | 33 | % | 30 | % | 38 | % | 21 | % | 28 | % |
Median | | 20 | % | 25 | % | 25 | % | 19 | % | 20 | % | 29 | % | 27 | % | 27 | % | 15 | % | 24 | % |
25th Percentile | | 10 | % | 12 | % | 18 | % | 16 | % | 13 | % | 19 | % | 11 | % | 16 | % | 4 | % | 7 | % |
Note: Boxed items are represented in graph.
(1) Represents acquiror's pre-transaction ownership in target.
39
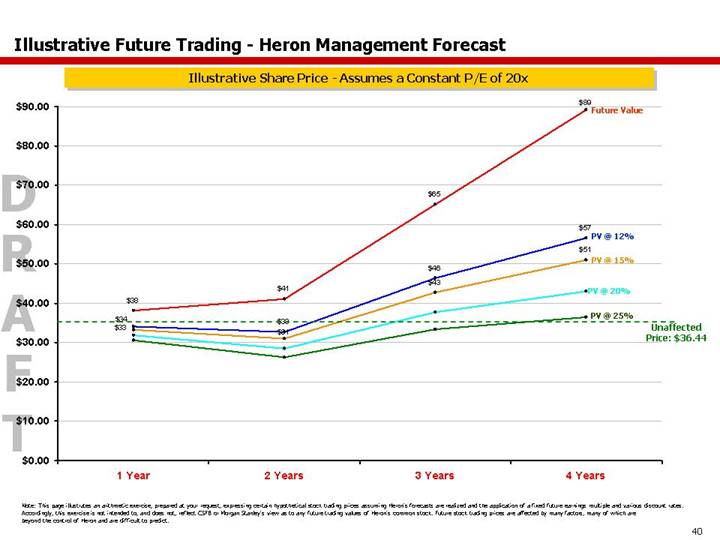
Illustrative Future Trading - Heron Management Forecast
Illustrative Share Price - Assumes a Constant P/E of 20x
[CHART]
Note: This page illustrates an arithmetic exercise, prepared at your request, expressing certain hypothetical stock trading prices assuming Heron's forecasts are realized and the application of a fixed future earnings multiple and various discount rates. Accordingly, this exercise is not intended to, and does not, reflect CSFB or Morgan Stanley's view as to any future trading values of Heron's common stock. Future stock trading prices are affected by many factors, many of which are beyond the control of Heron and are difficult to predict.
40
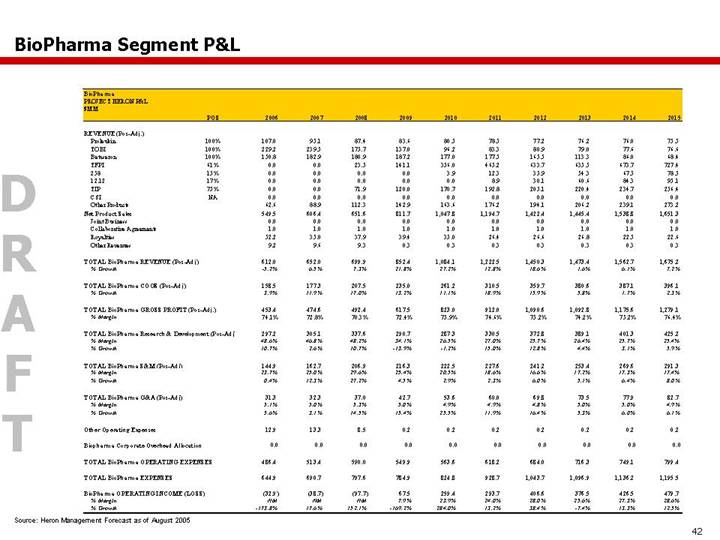
BioPharma Segment P&L
BioPharma
PROJECT HERON P&L
$MM
| | POS | | 2006 | | 2007 | | 2008 | | 2009 | | 2010 | | 2011 | | 2012 | | 2013 | | 2014 | | 2015 | |
| | | | | | | | | | | | | | | | | | | | | | | |
REVENUE (Pos-Adj.) | | | | | | | | | | | | | | | | | | | | | | | |
Proleukin | | 100 | % | 107.0 | | 95.1 | | 87.4 | | 83.6 | | 80.5 | | 78.5 | | 77.2 | | 76.2 | | 76.0 | | 75.5 | |
TOBI | | 100 | % | 229.2 | | 239.5 | | 175.7 | | 137.0 | | 96.2 | | 83.3 | | 80.9 | | 79.0 | | 77.6 | | 76.6 | |
Betaseron | | 100 | % | 150.8 | | 182.9 | | 180.9 | | 187.2 | | 177.0 | | 177.5 | | 165.5 | | 113.3 | | 86.0 | | 68.4 | |
TFPI | | 61 | % | 0.0 | | 0.0 | | 23.5 | | 141.1 | | 356.0 | | 465.2 | | 633.7 | | 635.5 | | 673.7 | | 727.4 | |
258 | | 15 | % | 0.0 | | 0.0 | | 0.0 | | 0.0 | | 3.9 | | 12.3 | | 35.9 | | 54.3 | | 67.5 | | 78.5 | |
12.12 | | 17 | % | 0.0 | | 0.0 | | 0.0 | | 0.0 | | 0.0 | | 8.9 | | 30.1 | | 60.6 | | 84.3 | | 95.1 | |
TIP | | 75 | % | 0.0 | | 0.0 | | 71.9 | | 120.0 | | 170.7 | | 192.8 | | 205.1 | | 220.4 | | 234.7 | | 256.4 | |
CSI | | NA | | 0.0 | | 0.0 | | 0.0 | | 0.0 | | 0.0 | | 0.0 | | 0.0 | | 0.0 | | 0.0 | | 0.0 | |
Other Products | | | | 62.6 | | 88.9 | | 112.3 | | 142.9 | | 163.6 | | 176.2 | | 194.1 | | 206.2 | | 239.1 | | 273.2 | |
Net Product Sales | | | | 549.5 | | 606.4 | | 651.6 | | 811.7 | | 1,047.8 | | 1,194.7 | | 1,422.4 | | 1,445.4 | | 1,538.8 | | 1,651.3 | |
Joint Business | | | | 0.0 | | 0.0 | | 0.0 | | 0.0 | | 0.0 | | 0.0 | | 0.0 | | 0.0 | | 0.0 | | 0.0 | |
Collaborative Agreements | | | | 1.0 | | 1.0 | | 1.0 | | 1.0 | | 1.0 | | 1.0 | | 1.0 | | 1.0 | | 1.0 | | 1.0 | |
Royalties | | | | 52.2 | | 35.0 | | 37.9 | | 39.4 | | 35.0 | | 26.4 | | 26.6 | | 26.8 | | 22.5 | | 22.6 | |
Other Revenues | | | | 9.2 | | 9.6 | | 9.3 | | 0.3 | | 0.3 | | 0.3 | | 0.3 | | 0.3 | | 0.3 | | 0.3 | |
| | | | | | | | | | | | | | | | | | | | | | | |
TOTAL BioPharma REVENUE (Pos-Adj) | | | | 612.0 | | 652.0 | | 699.9 | | 852.4 | | 1,084.1 | | 1,222.5 | | 1,450.3 | | 1,473.4 | | 1,562.7 | | 1,675.2 | |
% Growth | | | | -5.2 | % | 6.5 | % | 7.3 | % | 21.8 | % | 27.2 | % | 12.8 | % | 18.6 | % | 1.6 | % | 6.1 | % | 7.2 | % |
| | | | | | | | | | | | | | | | | | | | | | | |
TOTAL BioPharma COGS (Pos-Adj) | | | | 158.5 | | 177.3 | | 207.5 | | 235.0 | | 261.2 | | 310.5 | | 359.7 | | 380.6 | | 387.1 | | 396.1 | |
% Growth | | | | 3.9 | % | 11.9 | % | 17.0 | % | 13.2 | % | 11.1 | % | 18.9 | % | 15.9 | % | 5.8 | % | 1.7 | % | 2.3 | % |
| | | | | | | | | | | | | | | | | | | | | | | |
TOTAL BioPharma GROSS PROFIT (Pos-Adj.) | | | | 453.4 | | 474.6 | | 492.4 | | 617.5 | | 823.0 | | 912.0 | | 1,090.6 | | 1,092.8 | | 1,175.6 | | 1,279.1 | |
% Margin | | | | 74.1 | % | 72.8 | % | 70.3 | % | 72.4 | % | 75.9 | % | 74.6 | % | 75.2 | % | 74.2 | % | 75.2 | % | 76.4 | % |
| | | | | | | | | | | | | | | | | | | | | | | |
TOTAL BioPharma Research & Development (Pos-Adj | | | | 297.2 | | 305.1 | | 337.6 | | 290.7 | | 287.3 | | 330.5 | | 372.8 | | 389.1 | | 401.3 | | 425.2 | |
% Margin | | | | 48.6 | % | 46.8 | % | 48.2 | % | 34.1 | % | 26.5 | % | 27.0 | % | 25.7 | % | 26.4 | % | 25.7 | % | 25.4 | % |
% Growth | | | | 10.7 | % | 2.6 | % | 10.7 | % | -13.9 | % | -1.2 | % | 15.0 | % | 12.8 | % | 4.4 | % | 3.1 | % | 5.9 | % |
| | | | | | | | | | | | | | | | | | | | | | | |
TOTAL BioPharma S&M (Pos-Adj) | | | | 144.9 | | 162.7 | | 206.9 | | 216.3 | | 222.5 | | 227.6 | | 241.2 | | 253.4 | | 269.6 | | 291.3 | |
% Margin | | | | 23.7 | % | 25.0 | % | 29.6 | % | 25.4 | % | 20.5 | % | 18.6 | % | 16.6 | % | 17.2 | % | 17.3 | % | 17.4 | % |
% Growth | | | | 0.4 | % | 12.3 | % | 27.2 | % | 4.5 | % | 2.9 | % | 2.3 | % | 6.0 | % | 5.1 | % | 6.4 | % | 8.0 | % |
| | | | | | | | | | | | | | | | | | | | | | | |
TOTAL BioPharma G&A (Pos-Adj) | | | | 31.3 | | 32.3 | | 37.0 | | 42.7 | | 53.6 | | 60.0 | | 69.8 | | 73.5 | | 77.9 | | 82.7 | |
% Margin | | | | 5.1 | % | 5.0 | % | 5.3 | % | 5.0 | % | 4.9 | % | 4.9 | % | 4.8 | % | 5.0 | % | 5.0 | % | 4.9 | % |
% Growth | | | | 5.6 | % | 3.1 | % | 14.5 | % | 15.4 | % | 25.5 | % | 11.9 | % | 16.4 | % | 5.3 | % | 6.0 | % | 6.1 | % |
| | | | | | | | | | | | | | | | | | | | | | | |
Other Operating Expenses | | | | 12.9 | | 13.3 | | 8.5 | | 0.2 | | 0.2 | | 0.2 | | 0.2 | | 0.2 | | 0.2 | | 0.2 | |
| | | | | | | | | | | | | | | | | | | | | | | |
Biopharma Corporate Overhead Allocation | | | | 0.0 | | 0.0 | | 0.0 | | 0.0 | | 0.0 | | 0.0 | | 0.0 | | 0.0 | | 0.0 | | 0.0 | |
| | | | | | | | | | | | | | | | | | | | | | | |
TOTAL BioPharma OPERATING EXPENSES | | | | 486.4 | | 513.4 | | 590.0 | | 549.9 | | 563.6 | | 618.2 | | 684.0 | | 716.3 | | 749.1 | | 799.4 | |
| | | | | | | | | | | | | | | | | | | | | | | |
TOTAL BioPharma EXPENSES | | | | 644.9 | | 690.7 | | 797.6 | | 784.9 | | 824.8 | | 928.7 | | 1,043.7 | | 1,096.9 | | 1,136.2 | | 1,195.5 | |
| | | | | | | | | | | | | | | | | | | | | | | |
BioPharma OPERATING INCOME (LOSS) | | | | (32.9 | ) | (38.7 | ) | (97.7 | ) | 67.5 | | 259.4 | | 293.7 | | 406.6 | | 376.5 | | 426.5 | | 479.7 | |
% Margin | | | | NM | | NM | | NM | | 7.9 | % | 23.9 | % | 24.0 | % | 28.0 | % | 25.6 | % | 27.3 | % | 28.6 | % |
% Growth | | | | -173.8 | % | 17.6 | % | 152.1 | % | -169.2 | % | 284.0 | % | 13.2 | % | 38.4 | % | -7.4 | % | 13.3 | % | 12.5 | % |
Source: Heron Management Forecast as of August 2005
42
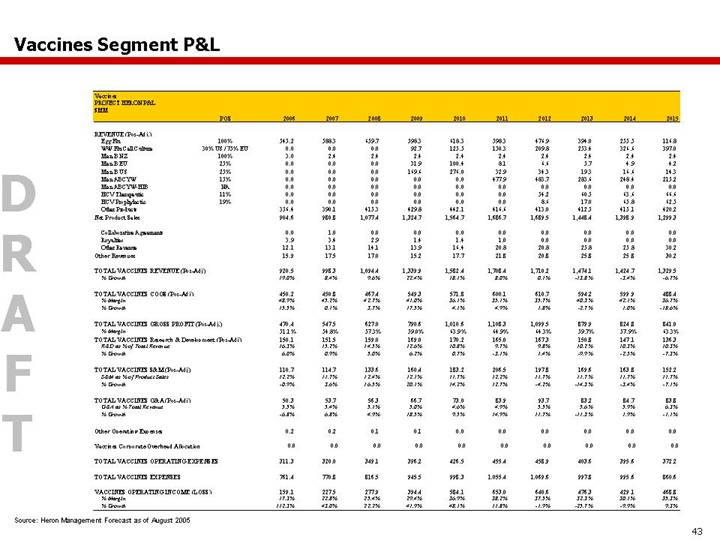
Vaccines Segment P&L
Vaccines
PROJECT HERON P&L
$MM
| | POS | | 2006 | | 2007 | | 2008 | | 2009 | | 2010 | | 2011 | | 2012 | | 2013 | | 2014 | | 2015 | |
| | | | | | | | | | | | | | | | | | | | | | | |
REVENUE (Pos-Adj.) | | | | | | | | | | | | | | | | | | | | | | | |
Egg Flu | | 10% | | 545.2 | | 588.3 | | 659.7 | | 598.3 | | 618.3 | | 598.3 | | 476.9 | | 394.0 | | 255.5 | | 116.8 | |
WW Flu Cell Culture | | 30 US / 75% EU | | 0.0 | | 0.0 | | 0.0 | | 92.7 | | 125.5 | | 150.3 | | 209.8 | | 253.4 | | 326.6 | | 397.0 | |
Men B NZ | | 100% | | 3.0 | | 2.4 | | 2.4 | | 2.4 | | 2.4 | | 2.4 | | 2.4 | | 2.4 | | 2.4 | | 2.4 | |
Men B EU | | 25% | | 0.0 | | 0.0 | | 0.0 | | 31.9 | | 100.4 | | 8.1 | | 6.6 | | 5.7 | | 4.9 | | 4.2 | |
Men B US | | 25% | | 0.0 | | 0.0 | | 0.0 | | 169.6 | | 276.0 | | 32.9 | | 34.3 | | 19.3 | | 16.6 | | 14.3 | |
Men ABCYW | | 15% | | 0.0 | | 0.0 | | 0.0 | | 0.0 | | 0.0 | | 477.9 | | 483.7 | | 283.6 | | 248.4 | | 215.2 | |
Men ABCYW-HIB | | NA | | 0.0 | | 0.0 | | 0.0 | | 0.0 | | 0.0 | | 0.0 | | 0.0 | | 0.0 | | 0.0 | | 0.0 | |
HCV Therapeutic | | 11% | | 0.0 | | 0.0 | | 0.0 | | 0.0 | | 0.0 | | 0.0 | | 54.2 | | 60.5 | | 63.6 | | 66.6 | |
HCV Prophylactic | | 19% | | 0.0 | | 0.0 | | 0.0 | | 0.0 | | 0.0 | | 0.0 | | 8.6 | | 17.0 | | 65.8 | | 62.5 | |
Other Products | | | | 356.4 | | 390.1 | | 415.3 | | 429.8 | | 442.1 | | 416.6 | | 413.0 | | 412.5 | | 415.1 | | 420.2 | |
Net Product Sales | | | | 904.6 | | 980.8 | | 1,077.4 | | 1,324.7 | | 1,564.7 | | 1,686.7 | | 1,689.5 | | 1,448.4 | | 1,398.9 | | 1,299.3 | |
| | | | | | | | | | | | | | | | | | | | | | | |
Collaborative Agreements | | | | 0.0 | | 1.0 | | 0.0 | | 0.0 | | 0.0 | | 0.0 | | 0.0 | | 0.0 | | 0.0 | | 0.0 | |
Royalties | | | | 3.9 | | 3.4 | | 2.9 | | 1.4 | | 1.4 | | 1.0 | | 0.0 | | 0.0 | | 0.0 | | 0.0 | |
Other Revenue | | | | 12.1 | | 13.1 | | 14.1 | | 13.9 | | 16.4 | | 20.8 | | 20.8 | | 25.8 | | 25.8 | | 30.2 | |
Other Revenues | | | | 15.9 | | 17.5 | | 17.0 | | 15.2 | | 17.7 | | 21.8 | | 20.8 | | 25.8 | | 25.8 | | 30.2 | |
| | | | | | | | | | | | | | | | | | | | | | | |
TOTAL VACCINES REVENUE (Pos-Adj) | | | | 920.5 | | 998.3 | | 1,094.4 | | 1,339.9 | | 1,582.4 | | 1,708.4 | | 1,710.2 | | 1,474.1 | | 1,424.7 | | 1,329.5 | |
% Growth | | | | 19.0 | % | 8.4 | % | 9.6 | % | 22.4 | % | 18.1 | % | 8.0 | % | 0.1 | % | -13.8 | % | -3.4 | % | -6.7 | % |
| | | | | | | | | | | | | | | | | | | | | | | |
TOTAL VACCINES COGS (Pos-Adj) | | | | 450.2 | | 450.8 | | 467.4 | | 549.3 | | 571.8 | | 600.1 | | 610.7 | | 594.2 | | 599.9 | | 488.4 | |
% Margin | | | | 48.9 | % | 45.2 | % | 42.7 | % | 41.0 | % | 36.1 | % | 35.1 | % | 35.7 | % | 40.3 | % | 42.1 | % | 36.7 | % |
% Growth | | | | 15.5 | % | 0.1 | % | 3.7 | % | 17.5 | % | 4.1 | % | 4.9 | % | 1.8 | % | -2.7 | % | 1.0 | % | -18.6 | % |
| | | | | | | | | | | | | | | | | | | | | | | |
TOTAL VACCINES GROSS PROFIT (Pos-Adj.) | | | | 470.4 | | 547.5 | | 627.0 | | 790.6 | | 1,010.6 | | 1,108.3 | | 1,099.5 | | 879.9 | | 824.8 | | 841.0 | |
% Margin | | | | 51.1 | % | 54.8 | % | 57.3 | % | 59.0 | % | 63.9 | % | 64.9 | % | 64.3 | % | 59.7 | % | 57.9 | % | 63.3 | % |
TOTAL VACCINES Research & Development (Pos-Adj) | | | | 150.1 | | 151.5 | | 159.0 | | 169.0 | | 170.2 | | 165.0 | | 167.3 | | 150.8 | | 147.1 | | 136.3 | |
R&D as% of Total Revenue | | | | 16.3 | % | 15.2 | % | 14.5 | % | 12.6 | % | 10.8 | % | 9.7 | % | 9.8 | % | 10.2 | % | 10.3 | % | 10.3 | % |
% Growth | | | | 6.0 | % | 0.9 | % | 5.0 | % | 6.2 | % | 0.7 | % | -3.1 | % | 1.4 | % | -9.9 | % | -2.5 | % | -7.3 | % |
| | | | | | | | | | | | | | | | | | | | | | | |
TOTAL VACCINES S&M (Pos-Adj) | | | | 110.7 | | 114.7 | | 133.6 | | 160.4 | | 183.2 | | 206.5 | | 197.8 | | 169.6 | | 163.8 | | 152.2 | |
S&M as% of Product Sales | | | | 12.2 | % | 11.7 | % | 12.4 | % | 12.1 | % | 11.7 | % | 12.2 | % | 11.7 | % | 11.7 | % | 11.7 | % | 11.7 | % |
% Growth | | | | -0.9 | % | 3.6 | % | 16.5 | % | 20.1 | % | 14.2 | % | 12.7 | % | -4.2 | % | -14.3 | % | -3.4 | % | -7.1 | % |
| | | | | | | | | | | | | | | | | | | | | | | |
TOTAL VACCINES G&A (Pos-Adj) | | | | 50.3 | | 53.7 | | 56.3 | | 66.7 | | 73.0 | | 83.9 | | 93.7 | | 83.2 | | 84.7 | | 83.8 | |
G&A as % Total Revenue | | | | 5.5 | % | 5.4 | % | 5.1 | % | 5.0 | % | 4.6 | % | 4.9 | % | 5.5 | % | 5.6 | % | 5.9 | % | 6.3 | % |
% Growth | | | | -6.8 | % | 6.8 | % | 4.9 | % | 18.5 | % | 9.5 | % | 14.9 | % | 11.7 | % | -11.3 | % | 1.9 | % | -1.1 | % |
| | | | | | | | | | | | | | | | | | | | | | | |
Other Operating Expenses | | | | 0.2 | | 0.2 | | 0.1 | | 0.1 | | 0.0 | | 0.0 | | 0.0 | | 0.0 | | 0.0 | | 0.0 | |
| | | | | | | | | | | | | | | | | | | | | | | |
Vaccines Corporate Overhead Allocation | | | | 0.0 | | 0.0 | | 0.0 | | 0.0 | | 0.0 | | 0.0 | | 0.0 | | 0.0 | | 0.0 | | 0.0 | |
| | | | | | | | | | | | | | | | | | | | | | | |
TOTAL VACCINES OPERATING EXPENSES | | | | 311.3 | | 320.0 | | 349.1 | | 396.2 | | 426.5 | | 455.4 | | 458.9 | | 403.6 | | 395.6 | | 372.2 | |
| | | | | | | | | | | | | | | | | | | | | | | |
TOTAL VACCINES EXPENSES | | | | 761.4 | | 770.8 | | 816.5 | | 945.5 | | 998.3 | | 1,055.4 | | 1,069.6 | | 997.8 | | 995.6 | | 860.6 | |
| | | | | | | | | | | | | | | | | | | | | | | |
VACCINES OPERATING INCOME (LOSS) | | | | 159.1 | | 227.5 | | 277.9 | | 394.4 | | 584.1 | | 653.0 | | 640.6 | | 476.3 | | 429.1 | | 468.8 | |
% Margin | | | | 17.3 | % | 22.8 | % | 25.4 | % | 29.4 | % | 36.9 | % | 38.2 | % | 37.5 | % | 32.3 | % | 30.1 | % | 35.3 | % |
% Growth | | | | 112.3 | % | 43.0 | % | 22.2 | % | 41.9 | % | 48.1 | % | 11.8 | % | -1.9 | % | -25.7 | % | -9.9 | % | 9.3 | % |
Source: Heron Management Forecast as of August 2005
43
Blood Testing Segment P&L
BLOOD TESTING
PROJECT HERON P&L
$MM
| | POS | | 2006 | | 2007 | | 2008 | | 2009 | | 2010 | | 2011 | | 2012 | | 2013 | | 2014 | | 2015 | |
| | | | | | | | | | | | | | | | | | | | | | | |
REVENUE (Pos-Adj.) | | | | | | | | | | | | | | | | | | | | | | | |
NAT | | | | | | | | | | | | | | | | | | | | | | | |
Current Products | | | | | | | | | | | | | | | | | | | | | | | |
Duplex | | 100 | % | 89.2 | | 23.9 | | 25.6 | | 25.6 | | 23.1 | | 20.6 | | 18.2 | | 15.7 | | 13.2 | | 10.8 | |
dHBV | | 100 | % | 1.3 | | 0.0 | | 0.0 | | 0.0 | | 0.0 | | 0.0 | | 0.0 | | 0.0 | | 0.0 | | 0.0 | |
Ultrio | | 100 | % | 229.0 | | 353.5 | | 380.7 | | 383.4 | | 353.8 | | 318.4 | | 271.8 | | 231.1 | | 190.9 | | 151.5 | |
WNV | | 100 | % | 43.3 | | 57.6 | | 57.6 | | 57.6 | | 53.7 | | 48.0 | | 42.2 | | 36.5 | | 30.8 | | 25.1 | |
Total Current Products Revenue | | | | 362.8 | | 435.0 | | 463.9 | | 466.5 | | 430.6 | | 386.9 | | 332.2 | | 283.4 | | 234.9 | | 187.3 | |
| | | | | | | | | | | | | | | | | | | | | | | |
New Products | | | | | | | | | | | | | | | | | | | | | | | |
Blood Type Conversion | | 35 | % | 0.0 | | 0.0 | | 12.7 | | 33.2 | | 61.9 | | 85.7 | | 99.4 | | 111.9 | | 116.1 | | 117.3 | |
Bacterial Detection | | NA | | 0.0 | | 0.0 | | 0.0 | | 0.0 | | 0.0 | | 0.0 | | 0.0 | | 0.0 | | 0.0 | | 0.0 | |
Parvo | | 75 | % | 0.0 | | 0.3 | | 3.0 | | 13.2 | | 11.8 | | 10.5 | | 9.1 | | 7.7 | | 6.4 | | 5.1 | |
Prion | | 50 | % | 0.0 | | 37.7 | | 68.8 | | 74.1 | | 83.7 | | 90.5 | | 89.4 | | 90.6 | | 90.6 | | 90.6 | |
Next Generation NAT | | 100 | % | 0.0 | | 0.0 | | 0.0 | | 74.1 | | 153.2 | | 253.2 | | 308.8 | | 381.9 | | 465.0 | | 548.1 | |
Total New Products Revenue | | | | 0.0 | | 38.0 | | 84.5 | | 194.6 | | 310.6 | | 439.9 | | 506.6 | | 592.1 | | 678.1 | | 761.0 | |
| | | | | | | | | | | | | | | | | | | | | | | |
Total Instrument & Service Revenue | | | | 28.2 | | 16.3 | | 19.7 | | 13.8 | | 9.4 | | 8.3 | | 7.7 | | 6.8 | | 6.0 | | 4.5 | |
| | | | | | | | | | | | | | | | | | | | | | | |
Other Plasma Sales | | | | 0.0 | | 0.0 | | 0.0 | | 0.0 | | 0.0 | | 0.0 | | 0.0 | | 0.0 | | 0.0 | | 0.0 | |
| | | | | | | | | | | | | | | | | | | | | | | |
Total NAT Product Revenue | | | | 391.0 | | 489.3 | | 568.1 | | 674.9 | | 750.6 | | 835.1 | | 846.5 | | 882.3 | | 919.0 | | 952.9 | |
| | | | | | | | | | | | | | | | | | | | | | | |
Plasma Royalties (Homebrew) | | | | 11.0 | | 11.0 | | 18.8 | | 8.3 | | 6.6 | | 6.0 | | 6.0 | | 6.0 | | 6.0 | | 6.0 | |
| | | | | | | | | | | | | | | | | | | | | | | |
Whole Blood and Plasma Royalties (Roche) | | | | 54.4 | | 50.2 | | 46.0 | | 56.8 | | 18.8 | | 18.8 | | 18.9 | | 18.9 | | 19.0 | | 19.1 | |
| | | | | | | | | | | | | | | | | | | | | | | |
Total NAT Royalty Revenue | | | | 65.4 | | 61.1 | | 64.8 | | 65.1 | | 25.4 | | 24.8 | | 24.9 | | 24.9 | | 25.0 | | 25.1 | |
| | | | | | | | | | | | | | | | | | | | | | | |
Grants for R&D (Other) | | | | 1.0 | | 1.0 | | 1.0 | | 1.0 | | 1.0 | | 1.0 | | 1.0 | | 1.0 | | 1.0 | | 1.0 | |
| | | | | | | | | | | | | | | | | | | | | | | |
TOTAL NAT REVENUE | | | | 457.4 | | 551.5 | | 634.0 | | 741.0 | | 777.0 | | 860.9 | | 872.4 | | 908.2 | | 945.0 | | 979.0 | |
% Growth | | | | 26.5 | % | 20.6 | % | 15.0 | % | 16.9 | % | 4.9 | % | 10.8 | % | 1.3 | % | 4.1 | % | 4.0 | % | 3.6 | % |
| | | | | | | | | | | | | | | | | | | | | | | |
ORTHO JOINT BUSINESS | | | | | | | | | | | | | | | | | | | | | | | |
Product Sales | | | | 26.3 | | 26.5 | | 26.8 | | 27.1 | | 27.3 | | 27.6 | | 27.9 | | 28.2 | | 28.4 | | 28.7 | |
Hep Retro Amortization (Royalty) | | | | 5.0 | | 5.0 | | 5.0 | | 5.0 | | 2.5 | | 0.0 | | 0.0 | | 0.0 | | 0.0 | | 0.0 | |
Contract Revenues | | | | 10.1 | | 10.2 | | 10.3 | | 10.4 | | 10.5 | | 10.6 | | 10.7 | | 10.8 | | 10.9 | | 11.0 | |
Joint Business Profits | | | | 109.8 | | 107.6 | | 105.4 | | 103.3 | | 101.2 | | 99.2 | | 97.2 | | 95.3 | | 93.4 | | 91.5 | |
TOTAL ORTHO REVENUE | | | | 151.2 | | 149.3 | | 147.5 | | 145.8 | | 141.6 | | 137.4 | | 135.8 | | 134.3 | | 132.8 | | 131.3 | |
| | | | | | | | | | | | | | | | | | | | | | | |
TOTAL BLOOD TESTING REVENUE | | | | 608.6 | | 700.8 | | 781.5 | | 886.8 | | 918.6 | | 998.4 | | 1,008.2 | | 1,042.5 | | 1,077.7 | | 1,110.2 | |
% Growth | | | | 13.6 | % | 15.2 | % | 11.5 | % | 13.5 | % | 3.6 | % | 8.7 | % | 1.0 | % | 3.4 | % | 3.4 | % | 3.0 | % |
| | | | | | | | | | | | | | | | | | | | | | | |
TOTAL BLOOD TESTING COGS | | | | 225.1 | | 263.8 | | 296.4 | | 348.1 | | 388.6 | | 435.0 | | 447.1 | | 471.5 | | 496.7 | | 520.7 | |
% Growth | | | | 23.7 | % | 17.2 | % | 12.4 | % | 17.4 | % | 11.6 | % | 11.9 | % | 2.8 | % | 5.5 | % | 5.3 | % | 4.8 | % |
| | | | | | | | | | | | | | | | | | | | | | | |
TOTAL BLOOD TESTING GROSS PROFIT (Pos-Adj.) | | | | 383.5 | | 437.1 | | 485.1 | | 538.7 | | 530.0 | | 563.4 | | 561.1 | | 571.0 | | 581.1 | | 589.5 | |
% Margin | | | | 63.0 | % | 62.4 | % | 62.1 | % | 60.7 | % | 57.7 | % | 56.4 | % | 55.7 | % | 54.8 | % | 53.9 | % | 53.1 | % |
| | | | | | | | | | | | | | | | | | | | | | | |
TOTAL BLOOD TESTING R&D | | | | 32.1 | | 44.6 | | 38.2 | | 40.3 | | 53.7 | | 57.5 | | 58.2 | | 59.9 | | 61.9 | | 62.7 | |
% Margin | | | | 5.3 | % | 6.4 | % | 4.9 | % | 4.5 | % | 5.8 | % | 5.8 | % | 5.8 | % | 5.7 | % | 5.7 | % | 5.6 | % |
% Growth | | | | 2.0 | % | 39.0 | % | -14.4 | % | 5.4 | % | 33.2 | % | 7.1 | % | 1.2 | % | 3.0 | % | 3.2 | % | 1.3 | % |
| | | | | | | | | | | | | | | | | | | | | | | |
TOTAL BLOOD TESTING S&M | | | | 45.2 | | 48.7 | | 55.3 | | 62.6 | | 66.1 | | 68.8 | | 70.5 | | 74.9 | | 79.2 | | 83.4 | |
% Margin | | | | 7.4 | % | 6.9 | % | 7.1 | % | 7.1 | % | 7.2 | % | 6.9 | % | 7.0 | % | 7.2 | % | 7.3 | % | 7.5 | % |
% Growth | | | | 7.8 | % | 7.7 | % | 13.6 | % | 13.3 | % | 5.5 | % | 4.1 | % | 2.5 | % | 6.2 | % | 5.7 | % | 5.3 | % |
| | | | | | | | | | | | | | | | | | | | | | | |
TOTAL BLOOD TESTING G&A | | | | 4.9 | | 5.2 | | 5.4 | | 5.7 | | 6.0 | | 6.3 | | 6.6 | | 7.0 | | 7.3 | | 7.7 | |
% Margin | | | | 0.8 | % | 0.7 | % | 0.7 | % | 0.6 | % | 0.7 | % | 0.6 | % | 0.7 | % | 0.7 | % | 0.7 | % | 0.7 | % |
% Growth | | | | -2.8 | % | 5.0 | % | 5.0 | % | 5.0 | % | 5.0 | % | 5.0 | % | 5.0 | % | 5.0 | % | 5.0 | % | 5.0 | % |
| | | | | | | | | | | | | | | | | | | | | | | |
Blood Testing Corporate Overhead Allocation | | | | 0.0 | | 0.0 | | 0.0 | | 0.0 | | 0.0 | | 0.0 | | 0.0 | | 0.0 | | 0.0 | | 0.0 | |
| | | | | | | | | | | | | | | | | | | | | | | |
TOTAL OPERATING EXPENSES | | | | 82.2 | | 98.5 | | 98.9 | | 108.6 | | 125.8 | | 132.6 | | 135.3 | | 141.8 | | 148.4 | | 153.7 | |
| | | | | | | | | | | | | | | | | | | | | | | |
TOTAL EXPENSES | | | | 307.3 | | 362.2 | | 395.4 | | 456.8 | | 514.4 | | 567.6 | | 582.4 | | 613.3 | | 645.0 | | 674.5 | |
| | | | | | | | | | | | | | | | | | | | | | | |
BLOOD TESTING OPERATING INCOME (LOSS) | | | | 301.2 | | 338.6 | | 386.1 | | 430.0 | | 404.2 | | 430.8 | | 425.8 | | 429.1 | | 432.7 | | 435.8 | |
% Margin | | | | 49.5 | % | 48.3 | % | 49.4 | % | 48.5 | % | 44.0 | % | 43.1 | % | 42.2 | % | 41.2 | % | 40.1 | % | 39.2 | % |
% Growth | | | | 9.5 | % | 12.4 | % | 14.1 | % | 11.4 | % | -6.0 | % | 6.6 | % | -1.2 | % | 0.8 | % | 0.8 | % | 0.7 | % |
Source: Heron Management Forecast as of August 2005
44
Credit Suisse First Boston (“CSFB”) and Morgan Stanley do not provide any tax advice. Any tax statement herein regarding any US federal tax is not intended or written to be used, and cannot be used, by any taxpayer for the purpose of avoiding any penalties. Any such statement herein was written to support the marketing or promotion of the transaction(s) or matter(s) to which the statement relates. Each taxpayer should seek advice based on the taxpayer's particular circumstances from an independent tax advisor.
These materials have been provided to you by CSFB and Morgan Stanley in connection with an actual or potential mandate or engagement and may not be used or relied upon for any purpose other than as specifically contemplated by a written agreement with CSFB and Morgan Stanley. In addition, these materials may not be disclosed, in whole or in part, or summarized or otherwise referred to except as agreed in writing by CSFB and Morgan Stanley. The information used in preparing these materials was obtained from or through you or your representatives or from public sources. CSFB and Morgan Stanley assume no responsibility for independent verification of such information and has relied on such information being complete and accurate in all material respects. To the extent such information includes estimates and forecasts of future financial performance (including estimates of potential cost savings and synergies) prepared by or reviewed or discussed with the managements of your company and/or other potential transaction participants or obtained from public sources, we have assumed that such estimates and forecasts have been reasonably prepared on bases reflecting the best currently available estimates and judgments of such managements (or, with respect to estimates and forecasts obtained from public sources, represent reasonable estimates). These materials were designed for use by specific persons familiar with the business and the affairs of your company and CSFB and Morgan Stanley assume no obligation to update or otherwise revise these materials. Nothing contained herein should be construed as tax, accounting or legal advice. You (and each of your employees, representatives or other agents) may disclose to any and all persons, without limitation of any kind, the tax treatment and tax structure of the transactions contemplated by these materials and all materials of any kind (including opinions or other tax analyses) that are provided to you relating to such taxt reatment and structure. For this purpose, the tax treatment of a transaction is the purported or claimed U.S. federal income tax treatment of the transaction and the tax structure of a transaction is any fact that may be relevant to understanding the purported or claimed U.S. federal income tax treatment of the transaction.
CSFB and Morgan Stanley have adopted policies and guidelines designed to preserve the independence of its research analysts. CSFB's and Morgan Stanley's policies prohibit employees from directly or indirectly offering a favorable research rating or specific price target, or offering to change a research rating or price target, as consideration for or an inducement to obtain business or other compensation. CSFB's and Morgan Stanley's policies prohibit research analysts from being compensated for their involvement in investment banking transactions except to the extent such participation is intended to benefit investor clients.
Credit Suisse First Boston or CSFB is the trade name for the investment banking business of Credit Suisse, a Swiss bank, and references to Credit Suisse First Boston or CSFB herein include all of the subsidiaries and affiliates of Credit Suisse operating under the Credit Suisse First Boston division of Credit Suisse Group. For more information on our structure, please follow the below link: http://www.creditsuisse.com/en/who_we_are/ourstructure.html.
45