Table of Contents
UNITED STATES
SECURITIES AND EXCHANGE COMMISSION
Washington, D.C. 20549
FormN-CSR
CERTIFIED SHAREHOLDER REPORT OF REGISTERED
MANAGEMENT INVESTMENT COMPANIES
Investment Company Act File Number:811-03591
CALVERT VARIABLE SERIES, INC.
(Exact Name of Registrant as Specified in Charter)
1825 Connecticut Avenue NW, Suite 400, Washington, DC 20009
(Address of Principal Executive Offices)
Maureen A. Gemma
Two International Place, Boston, Massachusetts 02110
(Name and Address of Agent for Services)
(202)238-2200
(Registrant’s Telephone Number)
December 31
Date of Fiscal Year End
December 31, 2019
Date of Reporting Period
Table of Contents
Item 1. Reports to Stockholders
Table of Contents

Calvert
VP SRI Balanced Portfolio
Annual Report
December 31, 2019
Important Note. Beginning on January 1, 2021, as permitted by regulations adopted by the Securities and Exchange Commission, you may not receive paper copies of the Fund’s annual and semi-annual shareholder reports from the insurance company or plan sponsor unless you specifically request paper copies. Instead, the reports will be made available on a website and you will be notified by mail each time a report is posted and provided with a website address to access the report. Instructions for requesting paper copies will be provided by the insurance company, plan sponsor or your financial intermediary, as applicable. Please contact the insurance company, plan sponsor or your financial intermediary, as applicable, or follow instructions included with this disclosure, if any, for more information.

Table of Contents
Commodity Futures Trading Commission Registration. Effective December 31, 2012, the Commodity Futures Trading Commission (“CFTC”) adopted certain regulatory changes that subject registered investment companies and advisers to regulation by the CFTC if a fund invests more than a prescribed level of its assets in certain CFTC-regulated instruments (including futures, certain options and swap agreements) or markets itself as providing investment exposure to such instruments. The Fund and its adviser have claimed an exclusion from the definition of the term “commodity pool operator” under the Commodity Exchange Act. Accordingly, neither the Fund nor the adviser is subject to CFTC regulation.
Fund shares are not insured by the FDIC and are not deposits or other obligations of, or guaranteed by, any depository institution. Shares are subject to investment risks, including possible loss of principal invested.
This report must be preceded or accompanied by a current summary prospectus or prospectus. Before investing, investors should consider carefully the investment objective, risks, and charges and expenses of a mutual fund. This and other important information is contained in the summary prospectus and prospectus, which can be obtained from a financial intermediary. Prospective investors should read the prospectus carefully before investing. For further information, please call1-800-368-2745.
Table of Contents
Annual Report December 31, 2019
Calvert
VP SRI Balanced Portfolio
Table of Contents
Calvert
VP SRI Balanced Portfolio
December 31, 2019
Management’s Discussion of Fund Performance 1
Economic and Market Conditions
With virtually every U.S. equity index posting strong double-digit returns for the12-month period ended December 31, 2019 — and bond markets solidly in the black as well — 2019 was a good year for investments.
As the new year dawned in January 2019, investors appeared to be taking a “glass is half full” approach. Although U.S. manufacturing output and business investment remained weak — held back by slowing global growth and anon-again/off-again U.S.-China trade war — strong spending by U.S. consumers and dovish remarks by the U.S. Federal Reserve (the Fed) combined to lift investor sentiment. U.S. unemployment, meanwhile, remained low and hiring remained strong.
As a result, U.S. stocks across multiple markets climbed from January through April 2019. Overseas, central banks around the world began to cut interest rates and employ other tools to stimulate their respective economies. Even a global stock pullback in May proved to be temporary, and the U.S. and global stock rallies resumed in June and July. After a down August, U.S. equities rallied again during the final months of the period, spurred by optimism about a U.S.-China trade détente and better-than-expected U.S. employment reports.
After holding interest rates steady through the first half of the year, the Fed cut its benchmark interest rate on July 31, 2019 — its first reduction in over a decade — followed by two additional rate cuts in September and October to end the period at1.50%-1.75%. By the end of the third quarter, 60 central banks around the world had lowered their interest rates as well.
During the12-month period ended December 31, 2019, the blue-chip Dow Jones Industrial Average®2 returned 25.34%, while the broader U.S. equity market, represented by the S&P 500® Index, returned 31.49%. The technology-laden Nasdaq Composite Index returned 36.69% during the period.Large-cap U.S. stocks, as measured by the S&P 500® Index, generally outperformed theirsmall-cap counterparts, as measured by the Russell 2000® Index. As a group, growth stocks outpaced value stocks in both large- andsmall-cap categories as measured by the Russell growth and value indexes.
Fueled by the Fed rate cuts amid continued economic growth with low inflation, bond markets delivered healthy returns during the period. Interest rates fell broadly across asset classes and maturities. The yield on the benchmark10-year Treasury declined from 2.68% at the start of the year to 1.92% atyear-end. The Bloomberg Barclays U.S. Aggregate Bond Index returned 8.72% for the period. As investors sought higher yields, both investment-grade corporate bonds and lower quality high yield securities outpaced U.S. Treasurys during the period.
Fund Performance
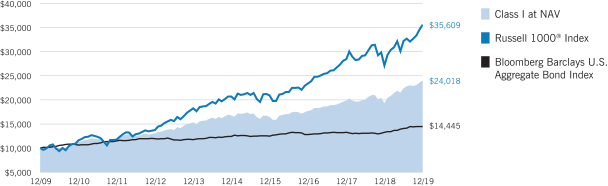
For the12-month period ended December 31, 2019, Calvert VP SRI Balanced Portfolio (the Fund) returned 24.40% for Class I shares at net asset value (NAV), underperforming its primary benchmark, the Russell 1000® Index (the Index), which returned 31.43%. The Fund outperformed its blended benchmark, which returned 22.16%.
The Balanced Blended Benchmark is an internally constructed benchmark composed of a blend of 60% Russell 1000® Index and 40% Bloomberg Barclays U.S. Aggregate Bond Index.
Stock selections in the communication services and consumer discretionary sectors in the equity portion of the Fund detracted from performance relative to the Index. Security selection and short duration5 positioning in the fixed-income portion of the Fund also detracted from relative performance during the period.
Gildan Activewear, Inc., an apparel manufacturer in the consumer discretionary sector, detracted from performance relative to the Index. The company’s shares fell following a slowdown in its apparel decoration business. Byperiod-end, the stock was sold from the Fund.
Core Laboratories NV, which provides reservoir description and production enhancement services and products to the oil and gas industry, was also a detractor. Its stock price fell as a weakened energy market led to decreased spending for oil and gas exploration and production. Byperiod-end, the stock was sold from the Fund.
The Fund’s fixed-income allocations were leading positive contributors to the Fund’s performance relative to the Index. Stock selection in health care, financials, and materials in the equity portion of the Fund further contributed to performance relative to the Index.
In the fixed-income portion of the Fund, security selections among investment-grade credits and government-related securities particularly weighed on performance relative to the Index during the period.
Ball Corp., one of the world’s leading suppliers of metal packaging to the beverage, personal care, and household products industries, was a top performer as demand for aluminum beverage cans grew globally. Byperiod-end, the stock was sold from the Fund.
Gardner Denver Holdings, Inc., an industrial conglomerate, also was a positive contributor as the company successfully executed its strategy throughout the year, despite overall weakness in the energy sector, to which the company is tied. The company also remained strong despite general sentiment, especially in the third quarter, that industrials may be headed for a cyclical low.
In the fixed-income portion of the Fund, an underweight position in U.S. Treasurys and an overweight position in investment-grade credits enhanced performance relative to the Index during the period.
See Endnotes and Additional Disclosures in this report.
Past performance is no guarantee of future results. Returns are historical and are calculated by determining the percentage change in net asset value (NAV) or offering price (as applicable) with all distributions reinvested. Investment return and principal value will fluctuate so that shares, when redeemed, may be worth more or less than their original cost. Performance for periods less than or equal to one year is cumulative. Performance is for the stated time period only; due to market volatility, current Fund performance may be lower or higher than the quoted return.
| 2 |
Table of Contents
Calvert
VP SRI Balanced Portfolio
December 31, 2019
Portfolio Managers Vishal Khanduja, CFA, Brian S. Ellis, CFA and Charles B. Gaffney, each of Calvert Research and Management
| % Average Annual Total Returns 2,3 | Class Inception Date | Performance Inception Date | One Year | Five Years | Ten Years | |||||||||||||||
Class I at NAV | 09/02/1986 | 09/02/1986 | 24.40 | % | 7.43 | % | 9.15 | % | ||||||||||||
Class F at NAV | 10/18/2013 | 09/02/1986 | 24.28 | 7.06 | 8.94 | |||||||||||||||
| ||||||||||||||||||||
Russell 1000® Index | — | — | 31.43 | % | 11.48 | % | 13.53 | % | ||||||||||||
Bloomberg Barclays U.S. Aggregate Bond Index | — | — | 8.72 | 3.05 | 3.74 | |||||||||||||||
Balanced Blended Benchmark | — | — | 22.16 | 8.25 | 9.76 | |||||||||||||||
| % Total Annual Operating Expense Ratios 4 | Class I | Class F | ||||||||||||||||||
| Gross | 0.72 | % | 0.97 | % | ||||||||||||||||
| Net | 0.70 | 0.95 | ||||||||||||||||||
Growth of $10,000
This graph shows the change in value of a hypothetical investment of $10,000 in Class I of the Fund for the period indicated. For comparison, the same investment is shown in the indicated index.
| Growth of Investment 3 | Amount Invested | Period Beginning | At NAV | With Maximum Sales Charge | ||||||||||||
| Class F | $10,000 | 12/31/2009 | $23,561 | N.A. | ||||||||||||
See Endnotes and Additional Disclosures in this report.
Past performance is no guarantee of future results. Returns are historical and are calculated by determining the percentage change in net asset value (NAV) or offering price (as applicable) with all distributions reinvested. Investment return and principal value will fluctuate so that shares, when redeemed, may be worth more or less than their original cost. Performance for periods less than or equal to one year is cumulative. Performance is for the stated time period only; due to market volatility, current Fund performance may be lower or higher than the quoted return.
| 3 |
Table of Contents
Calvert
VP SRI Balanced Portfolio
December 31, 2019
| Asset Allocation (% of total investments) | ||||
Equity | 58.9 | % | ||
Fixed Income | 41.1 | |||
Total | 100.0 | % | ||
| Equity Investments Sector Allocation (% of total investments) |
| |||
Information Technology | 14.1 | % | ||
Health Care | 8.9 | |||
Financials | 8.2 | |||
Communication Services | 6.3 | |||
Industrials | 5.3 | |||
Consumer Discretionary | 5.3 | |||
Consumer Staples | 3.9 | |||
Real Estate | 2.1 | |||
Utilities | 2.0 | |||
Materials | 1.8 | |||
Energy | 1.0 | |||
Total | 58.9 | % | ||
| Fixed Income Allocation (% of total investments) | ||||
Corporate Bonds | 15.6 | % | ||
Asset-Backed Securities | 7.6 | |||
Collateralized Mortgage-Backed Obligations | 5.3 | |||
U.S. Treasury Obligations | 3.2 | |||
U.S. Government Agency Mortgage-Backed Securities | 2.9 | |||
Commercial Mortgage-Backed Securities | 1.9 | |||
Taxable Municipal Obligations | 1.6 | |||
Short-Term Investments | 1.0 | |||
Floating Rate Loans | 0.9 | |||
Sovereign Government Bonds | 0.7 | |||
U.S. Government Agencies and Instrumentalities | 0.4 | |||
Convertible Bonds | 0.0 | * | ||
Total | 41.1 | % | ||
| * | Amount is less than 0.05%. |
See Endnotes and Additional Disclosures in this report.
| 4 |
Table of Contents
Calvert
VP SRI Balanced Portfolio
December 31, 2019
Endnotes and Additional Disclosures
| 1 | The views expressed in this report are those of the portfolio manager(s) and are current only through the date stated at the top of this page. These views are subject to change at any time based upon market or other conditions, and Calvert and the Fund(s) disclaim any responsibility to update such views. These views may not be relied upon as investment advice and, because investment decisions are based on many factors, may not be relied upon as an indication of trading intent on behalf of any Calvert fund. This commentary may contain statements that are not historical facts, referred to as “forward looking statements.” The Fund’s actual future results may differ significantly from those stated in any forward looking statement, depending on factors such as changes in securities or financial markets or general economic conditions, the volume of sales and purchases of Fund shares, the continuation of investment advisory, administrative and service contracts, and other risks discussed from time to time in the Fund’s filings with the Securities and Exchange Commission. |
| 2 | Dow Jones Industrial Average® is a price-weighted average of 30 blue-chip stocks that are generally the leaders in their industry. S&P 500® Index is an unmanaged index of large-cap stocks commonly used as a measure of U.S. stock market performance. S&P Dow Jones Indices are a product of S&P Dow Jones Indices LLC (“S&P DJI”) and have been licensed for use. S&P® and S&P 500® are registered trademarks of S&P DJI; Dow Jones® is a registered trademark of Dow Jones Trademark Holdings LLC (“Dow Jones”); S&P DJI, Dow Jones and their respective affiliates do not sponsor, endorse, sell or promote the Fund, will not have any liability with respect thereto and do not have any liability for any errors, omissions, or interruptions of the S&P Dow Jones Indices. Nasdaq Composite Index is a market capitalization-weighted index of all domestic and international securities listed on Nasdaq. Source: Nasdaq, Inc. The information is provided by Nasdaq (with its affiliates, are referred to as the “Corporations”) and Nasdaq’s third party licensors on an “as is” basis and the Corporations make no guarantees and bear no liability of any kind with respect to the information or the Fund. Russell 2000® Index is an unmanaged index of 2,000 U.S. small-cap stocks. Russell 1000® Index is an unmanaged index of 1,000 U.S. large-cap stocks. Bloomberg Barclays U.S. Aggregate Bond Index is an unmanaged index of domestic investment-grade bonds, including corporate, government and mortgage-backed securities. Balanced Blended Benchmark is an internally constructed benchmark which is comprised of a blend of 60% Russell 1000® Index and 40% Bloomberg Barclays U.S. Aggregate Bond Index, rebalanced monthly. Prior to 11/1/15, the fixed income component was the Bloomberg Barclays U.S. Credit Index. Unless otherwise stated, index returns do not reflect the effect of any applicable sales charges, commissions, expenses, taxes or leverage, as applicable. It is not possible to invest directly in an index. |
| 3 | There is no sales charge. Insurance-related charges are not included in the calculation of returns. If such charges were reflected, the returns would be lower. Please refer to the report for your insurance contract for performance data reflecting insurance-related charges. |
Performance prior to the inception date of a class may be linked to the performance of an older class of the Fund. This linked performance is adjusted for any applicable sales charge, but is not adjusted for class expense differences. If adjusted for such differences, the performance would be different. The performance of Class F is linked to Class I. Performance presented in the Financial Highlights included in the financial statements is not linked. |
Calvert Research and Management became the investment adviser to the Fund on December 31, 2016. Performance reflected prior to such date is that of the Fund’s former investment adviser. |
| 4 | Source: Fund prospectus. Net expense ratios reflect a contractual expense reimbursement that continues through 4/30/20. Without the reimbursement, if applicable, performance would have been lower. The expense ratios for the current reporting period can be found in the Financial Highlights section of this report. |
| 5 | Duration is a measure of the expected change in price of a bond — in percentage terms — given a one percent change in interest rates, all else being constant. Securities with lower durations tend to be less sensitive to interest rate changes. |
Fund profile subject to change due to active management. |
| 5 |
Table of Contents
Calvert
VP SRI Balanced Portfolio
December 31, 2019
Example
As a Fund shareholder, you incur ongoing costs, including management fees; distribution and/or service fees; and other Fund expenses. This Example is intended to help you understand your ongoing costs (in dollars) of Fund investing and to compare these costs with the ongoing costs of investing in other mutual funds. The Example is based on an investment of $1,000 invested at the beginning of the period and held for the entire period (July 1, 2019 to December 31, 2019).
Actual Expenses
The first section of the table below provides information about actual account values and actual expenses. You may use the information in this section, together with the amount you invested, to estimate the expenses that you paid over the period. Simply divide your account value by $1,000 (for example, an $8,600 account value divided by $1,000 = 8.6), then multiply the result by the number in the first section under the heading entitled “Expenses Paid During Period” to estimate the expenses you paid on your account during this period.
Hypothetical Example for Comparison Purposes
The second section of the table below provides information about hypothetical account values and hypothetical expenses based on the actual Fund expense ratio and an assumed rate of return of 5% per year (before expenses), which is not the actual Fund return. The hypothetical account values and expenses may not be used to estimate the actual ending account balance or expenses you paid for the period. You may use this information to compare the ongoing costs of investing in the Fund and other funds. To do so, compare this 5% hypothetical example with the 5% hypothetical examples that appear in the shareholder reports of the other funds.
Please note that the expenses shown in the table are meant to highlight your ongoing costs only and do not reflect expenses and charges which are, or may be imposed under the variable annuity contract or variable life insurance policy (variable contracts) (if applicable) through which your investment in the Fund is made. Therefore, the second section of the table is useful in comparing ongoing costs associated with an investment in vehicles which fund benefits under variable contracts, and will not help you determine the relative total costs of investing in the Fund through variable contracts. In addition, if these expenses and charges imposed under the variable contracts were included, your costs would have been higher.
| Beginning Account Value (7/1/19) | Ending Account Value (12/31/19) | Expenses Paid During Period* (7/1/19 – 12/31/19) | Annualized Expense Ratio | |||||||||||||
Actual | ||||||||||||||||
Class I | $ | 1,000.00 | $ | 1,072.60 | $ | 2.98 | 0.57 | % | ||||||||
Class F | $ | 1,000.00 | $ | 1,072.30 | $ | 4.28 | 0.82 | % | ||||||||
Hypothetical | ||||||||||||||||
(5% return per year before expenses) | ||||||||||||||||
Class I | $ | 1,000.00 | $ | 1,022.33 | $ | 2.91 | 0.57 | % | ||||||||
Class F | $ | 1,000.00 | $ | 1,021.07 | $ | 4.18 | 0.82 | % | ||||||||
| * | Expenses are equal to the Fund’s annualized expense ratio for the indicated Class, multiplied by the average account value over the period, multiplied by 184/365 (to reflect theone-half year period). The Example assumes that the $1,000 was invested at the net asset value per share determined at the close of business on June 30, 2019. Expenses shown do not include insurance-related charges. |
| 6 |
Table of Contents
Calvert
VP SRI Balanced Portfolio
December 31, 2019
| Asset-Backed Securities — 7.7% |
| |||||||
| Security | Principal Amount (000’s omitted) | Value | ||||||
Adams Outdoor Advertising, L.P., Series2018-1, Class A, 4.81%, 11/15/48 (1) | $ | 167 | $ | 173,668 | ||||
American Homes 4 Rent Trust, Series 2014-SFR2, Class A, 3.786%, 10/17/36 (1) | 639 | 667,494 | ||||||
Avant Loans Funding Trust: | ||||||||
Series2018-A, Class B, 3.95%, 12/15/22 (1) | 510 | 511,933 | ||||||
Series2018-A, Class C, 4.79%, 5/15/24 (1) | 150 | 151,470 | ||||||
Series2019-A, Class A, 3.48%, 7/15/22 (1) | 73 | 73,217 | ||||||
Series2019-B, Class A, 2.72%, 10/15/26 (1) | 507 | 507,910 | ||||||
Avis Budget Rental Car Funding AESOP, LLC: | ||||||||
Series2014-2A, Class A, 2.50%, 2/20/21 (1) | 664 | 664,059 | ||||||
Series2015-1A, Class A, 2.50%, 7/20/21 (1) | 304 | 304,379 | ||||||
Coinstar Funding LLC, Series2017-1A, Class A2, 5.216%, 4/25/47 (1) |
| 366 |
| 375,293 | ||||
Conn’s Receivables Funding, LLC: | ||||||||
Series2018-A, Class A, 3.25%, 1/15/23 (1) | 37 | 37,544 | ||||||
Series2018-A, Class B, 4.65%, 1/15/23 (1) | 33 | 33,255 | ||||||
Series2019-A, Class A, 3.40%, 10/16/23 (1) | 313 | 315,266 | ||||||
Series2019-A, Class B, 4.36%, 10/16/23 (1) | 260 | 262,645 | ||||||
Series2019-B, Class A, 2.66%, 6/17/24 (1) | 786 | 787,818 | ||||||
Series2019-B, Class B, 3.62%, 6/17/24 (1) | 135 | 135,182 | ||||||
Consumer Loan Underlying Bond Credit Trust: | ||||||||
Series2017-P2, Class B, 3.56%, 1/15/24 (1) | 260 | 260,537 | ||||||
Series2019-P1, Class A, 2.94%, 7/15/26 (1) | 100 | 100,166 | ||||||
Credit Acceptance Auto Loan Trust: | ||||||||
Series2017-1A, Class B, 3.04%, 12/15/25 (1) | 625 | 626,172 | ||||||
Series2017-2A, Class A, 2.55%, 2/17/26 (1) | 890 | 890,726 | ||||||
DB Master Finance, LLC, Series2017-1A, Class A2II, 4.03%, 11/20/47 (1) | 83 | 85,343 | ||||||
DRB Prime Student Loan Trust, Series2016-B, Class A2, 2.89%, 6/25/40 (1) | 108 | 108,103 | ||||||
Driven Brands Funding, LLC: | ||||||||
Series2015-1A, Class A2, 5.216%, 7/20/45 (1) | 446 | 456,814 | ||||||
Series2016-1A, Class A2, 6.125%, 7/20/46 (1) | 145 | 152,265 | ||||||
Series2018-1A, Class A2, 4.739%, 4/20/48 (1) | 29 | 29,676 | ||||||
Series2019-2A, Class A2, 3.981%, 10/20/49 (1) | 75 | 75,157 | ||||||
Element Rail Leasing I, LLC: | ||||||||
Series2014-1A, Class A1, 2.299%, 4/19/44 (1) | 32 | 31,843 | ||||||
Series2014-1A, Class B1, 4.406%, 4/19/44 (1) | 350 | 350,179 | ||||||
Enterprise Fleet Financing, LLC, Series2017-3, Class A2, 2.13%, 5/22/23 (1) | 731 | 730,554 | ||||||
ExteNet, LLC: | ||||||||
Series2019-1A, Class A2, 3.204%, 7/26/49 (1) | 345 | 346,905 | ||||||
Series2019-1A, Class B, 4.14%, 7/26/49 (1) | 30 | 30,178 | ||||||
FOCUS Brands Funding, LLC: | ||||||||
Series2017-1A, Class A2I, 3.857%, 4/30/47 (1) | 575 | 578,134 | ||||||
Series2017-1A, Class A2II, 5.093%, 4/30/47 (1) | 176 | 184,623 | ||||||
| Security | Principal Amount (000’s omitted) | Value | ||||||
Hardee’s Funding, LLC, Series2018-1A, Class A2I, 4.25%, 6/20/48 (1) | $ | 272 | $ | 273,477 | ||||
InSite Issuer, LLC, Series2016-1A, Class C, 6.414%, 11/15/46 (1) | 25 | 25,987 | ||||||
Jack in the Box Funding, LLC, Series2019-1A, Class A2I, 3.982%, 8/25/49 (1) | 295 | 297,543 | ||||||
Marlette Funding Trust: | ||||||||
Series2017-2A, Class B, 3.19%, 7/15/24 (1) | 3 | 2,738 | ||||||
Series2018-3A, Class C, 4.63%, 9/15/28 (1) | 100 | 102,359 | ||||||
Mosaic Solar Loan Trust: | ||||||||
Series2019-1A, Class A, 4.37%, 12/21/43 (1) | 364 | 379,220 | ||||||
Series2019-2A, Class B, 3.28%, 9/20/40 (1) | 870 | 865,826 | ||||||
OneMain Financial Issuance Trust: | ||||||||
Series2016-1A, Class B, 4.57%, 2/20/29 (1) | 315 | 317,162 | ||||||
Series2017-1A, Class A1, 2.37%, 9/14/32 (1) | 467 | 467,373 | ||||||
Oportun Funding VI, LLC, Series 2017-A, Class A, 3.23%, 6/8/23 (1) | 250 | 250,053 | ||||||
Oportun Funding VIII, LLC, Series 2018-A, Class A, 3.61%, 3/8/24 (1) | 706 | 712,343 | ||||||
Oportun Funding IX, LLC, Series 2018-B, Class A, 3.91%, 7/8/24 (1) | 1,154 | 1,169,671 | ||||||
Planet Fitness Master Issuer, LLC: | ||||||||
Series2018-1A, Class A2I, 4.262%, 9/5/48 (1) | 499 | 508,274 | ||||||
Series2018-1A, Class A2II, 4.666%, 9/5/48 (1) | 69 | 72,046 | ||||||
Series2019-1A, Class A2, 3.858%, 12/5/49 (1) | 280 | 276,361 | ||||||
Progress Residential Trust, Series 2015-SFR3, Class E, 5.66%, 11/12/32 (1) | 100 | 99,973 | ||||||
Prosper Marketplace Issuance Trust: | ||||||||
Series2017-1A, Class C, 5.80%, 6/15/23 (1) | 94 | 93,835 | ||||||
Series2018-2A, Class A, 3.35%, 10/15/24(1) | 213 | 213,685 | ||||||
Series2018-2A, Class B, 3.96%, 10/15/24 (1) | 440 | 443,098 | ||||||
RenewFund Receivables Trust, Series2015-1, Class A, 3.51%, 4/15/25 (1) | 54 | 53,711 | ||||||
SERVPRO Master Issuer, LLC, Series2019-1A, Class A2, 3.882%, 10/25/49 (1) | 1,157 | 1,164,556 | ||||||
Small Business Lending Trust, Series2019-A, Class A, 2.85%, 7/15/26 (1) | 341 | 340,832 | ||||||
SolarCity LMC Series I, LLC, Series2013-1, Class A, 4.80%, 11/20/38 (1) | 356 | 369,338 | ||||||
SolarCity LMC Series II, LLC, Series2014-1, Class A, 4.59%, 4/20/44 (1) | 210 | 213,747 | ||||||
SolarCity LMC Series III, LLC: | ||||||||
Series2014-2, Class A, 4.02%, 7/20/44 (1) | 561 | 564,437 | ||||||
Series2014-2, Class B, 5.44%, 7/20/44 (1) | 861 | 861,029 | ||||||
SpringCastle Funding Asset-Backed Notes,Series 2019-AA, Class A, 3.20%, 5/27/36 (1) | 685 | 687,270 | ||||||
Springleaf Funding Trust: | ||||||||
Series2016-AA, Class A, 2.90%, 11/15/29 (1) | 135 | 134,765 | ||||||
Series2016-AA, Class B, 3.80%, 11/15/29 (1) | 400 | 400,572 | ||||||
Spruce ABS Trust, Series2016-E1, Class A, 4.32%, 6/15/28 (1) | 59 | 60,511 | ||||||
| 7 | See Notes to Financial Statements. |
Table of Contents
Calvert
VP SRI Balanced Portfolio
December 31, 2019
Schedule of Investments — continued
| Security | Principal Amount (000’s omitted) | Value | ||||||
Stack Infrastructure Issuer, LLC: | ||||||||
Series2019-1A, Class A2, 4.54%, 2/25/44 (1) | $ | 1,413 | $ | 1,480,222 | ||||
Series2019-2A, Class A2, 3.08%, 10/25/44 (1) | 175 | 174,879 | ||||||
Sunrun Atlas Issuer, LLC, Series2019-2, Class A, 3.61%, 2/1/55 (1) | 220 | 219,039 | ||||||
Sunrun Callisto Issuer, LLC, Series2015-1A, Class B, 5.38%, 7/20/45 (1) | 334 | 340,163 | ||||||
TES, LLC, Series2017-1A, Class A, 4.33%, 10/20/47 (1) | 373 | 371,678 | ||||||
Tesla Auto Lease Trust: | ||||||||
Series2018-B, Class A, 3.71%, 8/20/21 (1) | 650 | 658,671 | ||||||
Series2019-A, Class A1, 2.005%, 12/18/20 (1) | 344 | 344,442 | ||||||
Series2019-A, Class A3, 2.16%, 10/20/22 (1) | 815 | 813,908 | ||||||
Series2019-A, Class A4, 2.20%, 11/21/22 (1) | 170 | 169,836 | ||||||
Series2019-A, Class B, 2.41%, 12/20/22 (1) | 75 | 74,780 | ||||||
Toyota Auto Receivables Owner Trust, Series2016-B, Class A4, 1.52%, 8/16/21 | 334 | 333,440 | ||||||
United States Small Business Administration,Series 2017-20E, Class 1, 2.88%, 5/1/37 | 695 | 712,351 | ||||||
Vantage Data Centers Issuer, LLC: | ||||||||
Series2018-1A, Class A2, 4.072%, 2/16/43 (1) | 333 | 343,261 | ||||||
Series2019-1A, Class A2, 3.188%, 7/15/44 (1) | 523 | 526,844 | ||||||
VB-S1 Issuer, LLC, Series2016-1A, Class C, 3.065%, 6/15/46 (1) | 345 | 347,183 | ||||||
Total Asset-Backed Securities | $ | 28,370,997 | ||||||
| Collateralized Mortgage-Backed Obligations — 5.4% |
| |||||||
| Security | Principal Amount (000’s omitted) | Value | ||||||
Federal Home Loan Mortgage Corp. Multifamily Structured Pass Through Certificates: | ||||||||
Series KG02, Class A2, 2.412%, 8/25/29 | $ | 1,440 | $ | 1,435,147 | ||||
Series KW06, Class A2, 3.80%, 6/25/28 | 530 | 576,338 | ||||||
Series W5FX, Class AFX, 3.214%, 4/25/28 | 192 | 201,143 | ||||||
Federal Home Loan Mortgage Corp. Structured Agency Credit Risk Debt Notes: | ||||||||
Series2015-HQ2, Class M3, 5.042%, (1 mo. USD LIBOR + 3.25%), 5/25/25 (2) | 493 | 522,230 | ||||||
Series 2015-HQA2, Class M2, 4.592%, (1 mo. USD LIBOR + 2.80%), 5/25/28 (2) | 63 | 63,559 | ||||||
Series 2017-DNA3, Class M2, 4.292%, (1 mo. USD LIBOR + 2.50%), 3/25/30 (2) | 600 | 614,583 | ||||||
Series 2018-DNA1, Class M1, 2.242%, (1 mo. USD LIBOR + 0.45%), 7/25/30 (2) | 151 | 150,624 | ||||||
Series 2018-DNA1, Class M2, 3.592%, (1 mo. USD LIBOR + 1.80%), 7/25/30 (2) | 305 | 305,870 | ||||||
| Security | Principal Amount (000’s omitted) | Value | ||||||
Federal Home Loan Mortgage Corp. Structured Agency Credit Risk Debt Notes: (continued) | ||||||||
Series 2018-DNA1, Class M2AT, 2.842%, (1 mo. USD LIBOR + 1.05%), 7/25/30 (2) | $ | 470 | $ | 469,504 | ||||
Series 2018-HQA1, Class M2, 4.092%, (1 mo. USD LIBOR + 2.30%), 9/25/30 (2) | 155 | 156,940 | ||||||
Series 2019-DNA2, Class M2, 4.242%, (1 mo. USD LIBOR + 2.45%), 3/25/49 (1)(2) | 117 | 117,697 | ||||||
Series 2019-DNA3, Class M1, 2.522%, (1 mo. USD LIBOR + 0.73%), 7/25/49 (1)(2) | 93 | 93,014 | ||||||
Series 2019-DNA3, Class M2, 3.842%, (1 mo. USD LIBOR + 2.05%), 7/25/49 (1)(2) | 823 | 827,575 | ||||||
Series 2019-DNA4, Class M1, 2.492%, (1 mo. USD LIBOR + 0.70%), 10/25/49 (1)(2) | 208 | 208,023 | ||||||
Series 2019-HQA2, Class M2, 3.842%, (1 mo. USD LIBOR + 2.05%), 4/25/49 (1)(2) | 340 | 341,625 | ||||||
Series 2019-HQA3, Class M1, 2.542%, (1 mo. USD LIBOR + 0.75%), 9/25/49 (1)(2) | 245 | 245,269 | ||||||
Series 2019-HQA3, Class M2, 3.642%, (1 mo. USD LIBOR + 1.85%), 9/25/49 (1)(2) | 80 | 80,068 | ||||||
Federal National Mortgage Association: | ||||||||
Series2017-M2, Class A1, 2.894%, 2/25/27 (3) | 121 | 122,891 | ||||||
Series2017-M13, Class A2, 3.037%, 9/25/27 (3) | 675 | 701,564 | ||||||
Series2018-M4, Class A2, 3.045%, 3/25/28 (3) | 721 | 755,414 | ||||||
Series2018-M8, Class A2, 3.325%, 6/25/28 (3) | 459 | 489,161 | ||||||
Series2018-M13, Class A2, 3.697%, 9/25/30 (3) | 1,680 | 1,843,718 | ||||||
Series2019-M1, Class A2, 3.555%, 9/25/28 (3) | 785 | 850,242 | ||||||
Series2019-M9, Class A2, 2.937%, 4/25/29 (3) | 291 | 301,453 | ||||||
Series2019-M22, Class A2, 2.522%, 8/25/29 (3) | 3,100 | 3,112,592 | ||||||
Federal National Mortgage Association Connecticut Avenue Securities: | ||||||||
Series2013-C01, Class M2, 7.042%, (1 mo. USD LIBOR + 5.25%), 10/25/23 (2) | 447 | 492,891 | ||||||
Series2014-C02, Class 1M2, 4.392%, (1 mo. USD LIBOR + 2.60%), 5/25/24 (2) | 598 | 625,775 | ||||||
Series2014-C02, Class 2M2, 4.392%, (1 mo. USD LIBOR + 2.60%), 5/25/24 (2) | 177 | 184,189 | ||||||
Series2014-C03, Class 1M2, 4.792%, (1 mo. USD LIBOR + 3.00%), 7/25/24 (2) | 367 | 387,054 | ||||||
Series2014-C03, Class 2M2, 4.692%, (1 mo. USD LIBOR + 2.90%), 7/25/24 (2) | 302 | 315,330 | ||||||
Series2014-C04, Class 1M2, 6.692%, (1 mo. USD LIBOR + 4.90%), 11/25/24 (2) | 562 | 619,047 | ||||||
Series2016-C06, Class 1M2, 6.042%, (1 mo. USD LIBOR + 4.25%), 4/25/29 (2) | 200 | 214,687 | ||||||
Series2017-C04, Class 2M1, 2.642%, (1 mo. USD LIBOR + 0.85%), 11/25/29 (2) | 157 | 157,506 | ||||||
Series2017-C05, Class 1M1, 2.342%, (1 mo. USD LIBOR + 0.55%), 1/25/30 (2) | 2 | 2,136 | ||||||
| 8 | See Notes to Financial Statements. |
Table of Contents
Calvert
VP SRI Balanced Portfolio
December 31, 2019
Schedule of Investments — continued
| Security | Principal Amount (000’s omitted) | Value | ||||||
Federal National Mortgage Association Connecticut Avenue Securities: (continued) | ||||||||
Series2017-C05, Class 1M2, 3.992%, (1 mo. USD LIBOR + 2.20%), 1/25/30 (2) | $ | 200 | $ | 203,680 | ||||
Series2017-C06, Class 1M2, 4.442%, (1 mo. USD LIBOR + 2.65%), 2/25/30 (2) | 320 | 328,188 | ||||||
Series2018-C03, Class 1M1, 2.472%, (1 mo. USD LIBOR + 0.68%), 10/25/30 (2) | 49 | 49,522 | ||||||
Series2018-R07, Class 1M2, 4.192%, (1 mo. USD LIBOR + 2.40%), 4/25/31 (1)(2) | 170 | 171,225 | ||||||
Series2019-R01, Class 2M2, 4.242%, (1 mo. USD LIBOR + 2.45%), 7/25/31 (1)(2) | 165 | 166,975 | ||||||
Series2019-R02, Class 1M2, 4.092%, (1 mo. USD LIBOR + 2.30%), 8/25/31 (1)(2) | 130 | 131,052 | ||||||
Series2019-R05, Class 1M1, 2.542%, (1 mo. USD LIBOR + 0.75%), 7/25/39 (1)(2) | 123 | 123,547 | ||||||
Series2019-R05, Class 1M2, 3.792%, (1 mo. USD LIBOR + 2.00%), 7/25/39 (1)(2) | 252 | 253,072 | ||||||
Series2019-R06, Class 2M1, 2.542%, (1 mo. USD LIBOR + 0.75%), 9/25/39 (1)(2) | 440 | 440,197 | ||||||
Federal National Mortgage Association Grantor Trust, Series2017-T1, Class A, 2.898%, 6/25/27 | 274 | 281,989 | ||||||
Toorak Mortgage Corp., Ltd., Series2018-1, Class A1, 4.336% to 4/25/21, 8/25/21 (1)(4) | 100 | 100,638 | ||||||
Total Collateralized Mortgage-Backed Obligations (identified cost $19,434,447) | $ | 19,834,944 | ||||||
| Commercial Mortgage-Backed Securities — 2.0% |
| |||||||
| Security | Principal Amount (000’s omitted) | Value | ||||||
BAMLL Commercial Mortgage Securities Trust: | ||||||||
Series2019-BPR, Class DNM, 3.843%, 11/5/32 (1)(3) | $ | 695 | $ | 690,881 | ||||
Series2019-BPR, Class ENM, 3.843%, 11/5/32 (1)(3) | 325 | 306,837 | ||||||
Series2019-BPR, Class FNM, 3.843%, 11/5/32 (1)(3) | 485 | 412,767 | ||||||
BX Commercial Mortgage Trust: | ||||||||
Series2019-XL, Class A, 2.66%, (1 mo. USD LIBOR + 0.92%), 10/15/36 (1)(2) | 695 | 696,402 | ||||||
Series2019-XL, Class B, 2.82%, (1 mo. USD LIBOR + 1.08%), 10/15/36 (1)(2) | 330 | 330,815 | ||||||
Citigroup Commercial Mortgage Trust,Series 2017-MDRC, Class D, 3.99%, (1 mo. USD LIBOR + 2.25%), 7/15/30 (1)(2) | 235 | 234,760 | ||||||
Federal National Mortgage Association Multifamily Connecticut Avenue Securities Trust,Series 2019-01, Class M10, 5.042%, (1 mo. USD LIBOR + 3.25%), 10/15/49 (1)(2) | 10 | 10,449 | ||||||
| Security | Principal Amount (000’s omitted) | Value | ||||||
JPMorgan Chase Commercial Mortgage Securities Trust: | ||||||||
Series 2014-DSTY, Class A, 3.429%, 6/10/27 (1) | $ | 100 | $ | 100,294 | ||||
Series 2014-DSTY, Class B, 3.771%, 6/10/27 (1) | 300 | 298,123 | ||||||
Series 2014-DSTY, Class C, 3.805%, 6/10/27 (1) | 100 | 94,342 | ||||||
Morgan Stanley Capital I Trust: | ||||||||
Series2017-CLS, Class A, 2.44%, (1 mo. USD LIBOR + 0.70%), 11/15/34 (1)(2) | 500 | 499,211 | ||||||
Series2019-BPR, Class A, 3.14%, (1 mo. USD LIBOR + 1.40%), 5/15/36 (1)(2) | 560 | 559,585 | ||||||
Series2019-BPR, Class B, 3.84%, (1 mo. USD LIBOR + 2.10%), 5/15/36 (1)(2) | 230 | 229,931 | ||||||
Series2019-BPR, Class C, 4.79%, (1 mo. USD LIBOR + 3.05%), 5/15/36 (1)(2) | 100 | 100,145 | ||||||
Motel 6 Trust: | ||||||||
Series 2017-MTL6, Class B, 2.93%, (1 mo. USD LIBOR + 1.19%), 8/15/34 (1)(2) | 48 | 48,195 | ||||||
Series 2017-MTL6, Class C, 3.14%, (1 mo. USD LIBOR + 1.40%), 8/15/34 (1)(2) | 638 | 638,595 | ||||||
Series 2017-MTL6, Class D, 3.89%, (1 mo. USD LIBOR + 2.15%), 8/15/34 (1)(2) | 189 | 189,126 | ||||||
Series 2017-MTL6, Class E, 4.99%, (1 mo. USD LIBOR + 3.25%), 8/15/34 (1)(2) | 67 | 67,018 | ||||||
RETL Trust: | ||||||||
Series2019-RVP, Class A, 2.89%, (1 mo. USD LIBOR + 1.15%), 3/15/36 (1)(2) | 409 | 409,859 | ||||||
Series2019-RVP, Class B, 3.29%, (1 mo. USD LIBOR + 1.55%), 3/15/36 (1)(2) | 875 | 877,052 | ||||||
WFLD Mortgage Trust, Series 2014-MONT, Class C, 3.755%, 8/10/31 (1) | 450 | 456,399 | ||||||
Total Commercial Mortgage-Backed Securities | $ | 7,250,786 | ||||||
| Common Stocks — 60.0% | ||||||||
| Security | Shares | Value | ||||||
| Aerospace & Defense — 0.7% | ||||||||
Hexcel Corp. | 34,800 | $ | 2,551,188 | |||||
| Banks — 4.0% | ||||||||
Bank of America Corp. | 151,300 | $ | 5,328,786 | |||||
JPMorgan Chase & Co. | 38,600 | 5,380,840 | ||||||
PNC Financial Services Group, Inc. (The) | 23,900 | 3,815,157 | ||||||
| $ | 14,524,783 | |||||||
| Beverages — 1.6% | ||||||||
PepsiCo, Inc. | 43,456 | $ | 5,939,132 | |||||
| 9 | See Notes to Financial Statements. |
Table of Contents
Calvert
VP SRI Balanced Portfolio
December 31, 2019
Schedule of Investments — continued
| Security | Shares | Value | ||||||
| Capital Markets — 0.6% | ||||||||
Tradeweb Markets, Inc., Class A | 49,903 | $ | 2,313,004 | |||||
| Chemicals — 0.7% | ||||||||
Ecolab, Inc. | 12,800 | $ | 2,470,272 | |||||
| Commercial Services & Supplies — 0.8% | ||||||||
Waste Management, Inc. | 27,116 | $ | 3,090,139 | |||||
| Communications Equipment — 0.8% | ||||||||
Cisco Systems, Inc. | 57,500 | $ | 2,757,700 | |||||
| Consumer Finance — 0.9% | ||||||||
American Express Co. | 25,700 | $ | 3,199,393 | |||||
| Diversified Telecommunication Services — 1.2% | ||||||||
Verizon Communications, Inc. | 73,934 | $ | 4,539,548 | |||||
| Electrical Equipment — 1.9% | ||||||||
AMETEK, Inc. | 41,600 | $ | 4,149,184 | |||||
Emerson Electric Co. | 36,700 | 2,798,742 | ||||||
| $ | 6,947,926 | |||||||
| Electronic Equipment, Instruments & Components — 0.4% | ||||||||
Zebra Technologies Corp., Class A (5) | 5,400 | $ | 1,379,376 | |||||
| Energy Equipment & Services — 1.0% | ||||||||
National Oilwell Varco, Inc. | 71,371 | $ | 1,787,844 | |||||
Oceaneering International, Inc. (5) | 119,100 | 1,775,781 | ||||||
| $ | 3,563,625 | |||||||
| Entertainment — 1.1% | ||||||||
Walt Disney Co. (The) | 28,955 | $ | 4,187,762 | |||||
| Equity Real Estate Investment Trusts (REITs) — 2.2% | ||||||||
American Tower Corp. | 18,800 | $ | 4,320,616 | |||||
AvalonBay Communities, Inc. | 17,002 | 3,565,319 | ||||||
| $ | 7,885,935 | |||||||
| Food Products — 1.4% | ||||||||
Mondelez International, Inc., Class A | 94,412 | $ | 5,200,213 | |||||
| Health Care Equipment & Supplies — 2.8% | ||||||||
Abbott Laboratories | 27,200 | $ | 2,362,592 | |||||
| Security | Shares | Value | ||||||
| Health Care Equipment & Supplies (continued) | ||||||||
Boston Scientific Corp. (5) | 64,100 | $ | 2,898,602 | |||||
Danaher Corp. | 31,900 | 4,896,012 | ||||||
| $ | 10,157,206 | |||||||
| Health Care Providers & Services — 1.5% | ||||||||
Anthem, Inc. | 18,400 | $ | 5,557,352 | |||||
| Household Products — 0.9% | ||||||||
Kimberly-Clark Corp. | 24,800 | $ | 3,411,240 | |||||
| Independent Power and Renewable Electricity Producers — 0.6% | ||||||||
NextEra Energy Partners, LP | 43,756 | $ | 2,303,753 | |||||
| Insurance — 2.9% | ||||||||
American International Group, Inc. | 65,500 | $ | 3,362,115 | |||||
Assurant, Inc. | 14,700 | 1,926,876 | ||||||
First American Financial Corp. | 36,601 | 2,134,570 | ||||||
Progressive Corp. (The) | 43,200 | 3,127,248 | ||||||
| $ | 10,550,809 | |||||||
| Interactive Media & Services — 4.1% | ||||||||
Alphabet, Inc., Class C (5) | 7,590 | $ | 10,147,982 | |||||
IAC/InterActiveCorp (5) | 19,700 | 4,907,467 | ||||||
| $ | 15,055,449 | |||||||
| Internet & Direct Marketing Retail — 2.0% | ||||||||
Amazon.com, Inc. (5) | 4,029 | $ | 7,444,947 | |||||
| IT Services — 4.6% | ||||||||
Cognizant Technology Solutions Corp., Class A | 53,200 | $ | 3,299,464 | |||||
Fidelity National Information Services, Inc. | 34,000 | 4,729,060 | ||||||
PayPal Holdings, Inc. (5) | 26,400 | 2,855,688 | ||||||
Visa, Inc., Class A | 32,700 | 6,144,330 | ||||||
| $ | 17,028,542 | |||||||
| Life Sciences Tools & Services — 1.3% | ||||||||
Thermo Fisher Scientific, Inc. | 14,318 | $ | 4,651,489 | |||||
| Machinery — 1.4% | ||||||||
Gardner Denver Holdings, Inc. (5) | 77,900 | $ | 2,857,372 | |||||
Stanley Black & Decker, Inc. | 14,000 | 2,320,360 | ||||||
| $ | 5,177,732 | |||||||
| 10 | See Notes to Financial Statements. |
Table of Contents
Calvert
VP SRI Balanced Portfolio
December 31, 2019
Schedule of Investments — continued
| Security | Shares | Value | ||||||
| Metals & Mining — 1.2% | ||||||||
Steel Dynamics, Inc. | 132,200 | $ | 4,500,088 | |||||
| Multi-Utilities — 1.4% | ||||||||
CMS Energy Corp. | 38,385 | $ | 2,412,113 | |||||
Sempra Energy | 18,208 | 2,758,148 | ||||||
| $ | 5,170,261 | |||||||
| Pharmaceuticals — 3.4% | ||||||||
Bristol-Myers Squibb Co. | 77,400 | $ | 4,968,306 | |||||
Catalent, Inc. (5) | 34,600 | 1,947,980 | ||||||
GlaxoSmithKline PLC ADR | 26,400 | 1,240,536 | ||||||
Merck & Co., Inc. | 48,500 | 4,411,075 | ||||||
| $ | 12,567,897 | |||||||
| Road & Rail — 0.6% | ||||||||
Kansas City Southern | 13,800 | $ | 2,113,608 | |||||
| Semiconductors & Semiconductor Equipment — 2.1% | ||||||||
ASML Holding NV — NY Shares | 4,300 | $ | 1,272,542 | |||||
Taiwan Semiconductor Manufacturing Co., Ltd. ADR | 48,300 | 2,806,230 | ||||||
Texas Instruments, Inc. | 27,651 | 3,547,347 | ||||||
| $ | 7,626,119 | |||||||
| Software — 4.2% | ||||||||
Adobe, Inc. (5) | 7,763 | $ | 2,560,315 | |||||
Intuit, Inc. | 5,952 | 1,559,007 | ||||||
Microsoft Corp. | 70,593 | 11,132,516 | ||||||
| $ | 15,251,838 | |||||||
| Specialty Retail — 3.3% | ||||||||
Home Depot, Inc. (The) | 18,200 | $ | 3,974,516 | |||||
Lowe’s Cos., Inc. | 45,522 | 5,451,715 | ||||||
TJX Cos., Inc. (The) | 46,500 | 2,839,290 | ||||||
| $ | 12,265,521 | |||||||
| Technology Hardware, Storage & Peripherals — 2.4% | ||||||||
Apple, Inc. | 30,472 | $ | 8,948,103 | |||||
Total Common Stocks | $ | 220,331,950 | ||||||
| Convertible Bonds — 0.0%(6) | ||||||||
| Security | Principal Amount (000’s omitted) | Value | ||||||
| Technology — 0.0%(6) | ||||||||
Rovi Corp., 0.50%, 3/1/20 | $ | 125 | $ | 124,284 | ||||
Total Convertible Bonds | $ | 124,284 | ||||||
| Corporate Bonds — 15.9% |
| |||||||
| Security | Principal Amount (000’s omitted) | Value | ||||||
| Basic Materials — 0.2% | ||||||||
LG Chem, Ltd.: | ||||||||
3.25%, 10/15/24 (1) | $ | 550 | $ | 564,648 | ||||
3.625%, 4/15/29 (1) | 250 | 258,152 | ||||||
| $ | 822,800 | |||||||
| Communications — 1.1% | ||||||||
AT&T, Inc.: | ||||||||
4.30%, 2/15/30 | $ | 577 | $ | 641,577 | ||||
4.50%, 3/9/48 | 325 | 359,155 | ||||||
4.90%, 6/15/42 | 300 | 342,843 | ||||||
Comcast Corp., 2.349%, (3 mo. USD LIBOR + 0.44%), 10/1/21 (2) | 440 | 442,279 | ||||||
CommScope Technologies, LLC, 6.00%, 6/15/25 (1) | 362 | 363,314 | ||||||
CommScope, Inc., 8.25%, 3/1/27 (1)(7) | 45 | 47,446 | ||||||
Crown Castle Towers, LLC, 3.663%, 5/15/45 (1) | 250 | 259,958 | ||||||
Discovery Communications, LLC, 5.20%, 9/20/47 | 618 | 719,474 | ||||||
NBCUniversal Media, LLC, 4.45%, 1/15/43 | 200 | 233,205 | ||||||
NortonLifeLock, Inc., 5.00%, 4/15/25 (1) | 66 | 67,440 | ||||||
Twitter, Inc., 3.875%, 12/15/27 (1) | 200 | 200,396 | ||||||
Verizon Communications, Inc., 3.875%, 2/8/29 | 340 | 375,245 | ||||||
| $ | 4,052,332 | |||||||
| Consumer, Cyclical — 1.4% | ||||||||
American Airlines Pass-Through Trust: | ||||||||
4.40%, 3/22/25 | $ | 391 | $ | 405,758 | ||||
5.25%, 7/15/25 | 241 | 254,960 | ||||||
5.60%, 1/15/22 (1) | 329 | 334,196 | ||||||
5.625%, 7/15/22 (1) | 101 | 103,385 | ||||||
Best Buy Co., Inc., 4.45%, 10/1/28 | 275 | 301,683 | ||||||
| 11 | See Notes to Financial Statements. |
Table of Contents
Calvert
VP SRI Balanced Portfolio
December 31, 2019
Schedule of Investments — continued
| Security | Principal Amount (000’s omitted) | Value | ||||||
| Consumer, Cyclical (continued) | ||||||||
Ford Motor Credit Co., LLC: | ||||||||
2.677%, (3 mo. USD LIBOR + 0.79%), 6/12/20 (2) | $ | 270 | $ | 270,178 | ||||
2.853%, (3 mo. USD LIBOR + 0.81%), 4/5/21 (2) | 200 | 199,116 | ||||||
2.881%, (3 mo. USD LIBOR + 0.88%), 10/12/21 (2) | 313 | 310,400 | ||||||
2.979%, 8/3/22 | 1,070 | 1,071,480 | ||||||
4.14%, 2/15/23 | 200 | 205,775 | ||||||
Latam Airlines Pass-Through Trust, 4.20%, 8/15/29 | 195 | 201,534 | ||||||
Nordstrom, Inc.: | ||||||||
4.375%, 4/1/30 | 360 | 367,359 | ||||||
5.00%, 1/15/44 | 453 | 443,711 | ||||||
Tapestry, Inc., 4.125%, 7/15/27 | 670 | 684,680 | ||||||
WestJet Airlines, Ltd., 3.50%, 6/16/21 (1) | 100 | 101,609 | ||||||
| $ | 5,255,824 | |||||||
| Consumer,Non-cyclical — 1.3% | ||||||||
Ashtead Capital, Inc., 4.25%, 11/1/29 (1) | $ | 204 | $ | 208,845 | ||||
Becton Dickinson and Co.: | ||||||||
2.404%, 6/5/20 | 231 | 231,263 | ||||||
2.836%, (3 mo. USD LIBOR + 0.875%), 12/29/20 (2) | 843 | 843,429 | ||||||
2.894%, 6/6/22 | 231 | 234,811 | ||||||
Centene Corp.: | ||||||||
4.25%, 12/15/27 (1) | 208 | 214,365 | ||||||
4.625%, 12/15/29 (1) | 36 | 38,005 | ||||||
Conagra Brands, Inc.: | ||||||||
2.512%, (3 mo. USD LIBOR + 0.50%), 10/9/20 (2) | 75 | 75,122 | ||||||
2.703%, (3 mo. USD LIBOR + 0.75%), 10/22/20 (2) | 122 | 122,013 | ||||||
Conservation Fund (The), 3.474%, 12/15/29 | 285 | 284,078 | ||||||
CVS Health Corp.: | ||||||||
2.605%, (3 mo. USD LIBOR + 0.72%), 3/9/21 (2) | 44 | 44,280 | ||||||
2.625%, 8/15/24 | 112 | 112,983 | ||||||
3.00%, 8/15/26 | 615 | 627,647 | ||||||
4.30%, 3/25/28 | 259 | 282,860 | ||||||
CVS Pass-Through Trust, 6.036%, 12/10/28 | 396 | 442,304 | ||||||
Grupo Bimbo SAB de CV, 4.00%, 9/6/49 (1) | 300 | 280,795 | ||||||
Kaiser Foundation Hospitals, 3.15%, 5/1/27 (7) | 322 | 336,269 | ||||||
Massachusetts Institute of Technology, 3.959%, 7/1/38 | 200 | 226,170 | ||||||
Prime Security Services Borrower, LLC/Prime Finance, Inc., 9.25%, 5/15/23 (1) | 50 | 52,531 | ||||||
| $ | 4,657,770 | |||||||
| Energy — 0.5% | ||||||||
National Oilwell Varco, Inc., 3.60%, 12/1/29 | $ | 969 | $ | 972,245 | ||||
Oceaneering International, Inc., 4.65%, 11/15/24 | 116 | 113,970 | ||||||
| Security | Principal Amount (000’s omitted) | Value | ||||||
| Energy (continued) | ||||||||
TerraForm Power Operating, LLC: | ||||||||
4.75%, 1/15/30 (1) | $ | 233 | $ | 237,509 | ||||
5.00%, 1/31/28 (1) | 580 | 614,313 | ||||||
| $ | 1,938,037 | |||||||
| Financial — 6.9% | ||||||||
Alliance Data Systems Corp., 4.75%, 12/15/24 (1) | $ | 371 | $ | 371,000 | ||||
Ally Financial, Inc., 4.125%, 3/30/20 | 543 | 545,682 | ||||||
Banco Santander S.A., 3.00%, (3 mo. USD LIBOR + 1.09%), 2/23/23 (2) | 200 | 201,386 | ||||||
Bank Nederlandse Gemeenten NV, 2.125%, 12/14/20 (1)(7) | 350 | 351,158 | ||||||
Bank of America Corp.: | ||||||||
2.456% to 10/22/24, 10/22/25 (8) | 655 | 659,210 | ||||||
3.146%, (3 mo. USD LIBOR + 1.18%), 10/21/22 (2) | 232 | 235,452 | ||||||
3.499% to 5/17/21, 5/17/22 (8) | 704 | 718,122 | ||||||
3.55% to 3/5/23, 3/5/24 (8) | 590 | 612,612 | ||||||
3.593% to 7/21/27, 7/21/28 (8) | 690 | 731,180 | ||||||
3.824% to 1/20/27, 1/20/28 (8) | 1,040 | 1,119,339 | ||||||
3.974% to 2/7/29, 2/7/30 (8) | 184 | 202,287 | ||||||
Bank of America NA, 3.335% to 1/25/22, 1/25/23 (8) | 944 | 970,483 | ||||||
Bank of Montreal, 2.05%, 11/1/22 | 822 | 825,251 | ||||||
Bank of Nova Scotia (The), 2.375%, 1/18/23 | 600 | 608,960 | ||||||
Capital One Financial Corp.: | ||||||||
2.386%, (3 mo. USD LIBOR + 0.45%), 10/30/20 (2) | 110 | 110,235 | ||||||
2.656%, (3 mo. USD LIBOR + 0.72%), 1/30/23 (2) | 300 | 300,481 | ||||||
3.30%, 10/30/24 | 209 | 217,612 | ||||||
4.20%, 10/29/25 | 300 | 323,762 | ||||||
Capital One NA, 2.65%, 8/8/22 | 295 | 299,394 | ||||||
Citigroup, Inc.: | ||||||||
2.75%, 4/25/22 | 370 | 375,763 | ||||||
2.886%, (3 mo. USD LIBOR + 0.95%), 7/24/23 (2) | 150 | 151,355 | ||||||
2.955%, (3 mo. USD LIBOR + 1.07%), 12/8/21 (2) | 150 | 152,040 | ||||||
2.976% to 11/5/29, 11/5/30 (8) | 416 | 422,370 | ||||||
3.142% to 1/24/22, 1/24/23 (8) | 388 | 396,058 | ||||||
3.887% to 1/10/27, 1/10/28 (8) | 927 | 998,579 | ||||||
Citizens Bank NA: | ||||||||
2.25%, 3/2/20 | 250 | 250,025 | ||||||
2.55%, 5/13/21 | 200 | 201,543 | ||||||
Citizens Financial Group, Inc., 2.375%, 7/28/21 | 170 | 170,835 | ||||||
Commonwealth Bank of Australia: | ||||||||
2.50%, 9/18/22 (1) | 270 | 273,546 | ||||||
3.61% to 9/12/29, 9/12/34 (1)(8) | 206 | 207,177 | ||||||
| 12 | See Notes to Financial Statements. |
Table of Contents
Calvert
VP SRI Balanced Portfolio
December 31, 2019
Schedule of Investments — continued
| Security | Principal Amount (000’s omitted) | Value | ||||||
| Financial (continued) | ||||||||
Credit Acceptance Corp.: | ||||||||
5.125%, 12/31/24 (1) | $ | 217 | $ | 225,888 | ||||
7.375%, 3/15/23 | 390 | 401,374 | ||||||
DDR Corp., 3.625%, 2/1/25 | 259 | 267,094 | ||||||
Digital Realty Trust, L.P.: | ||||||||
3.95%, 7/1/22 | 360 | 374,801 | ||||||
4.75%, 10/1/25 | 260 | 288,873 | ||||||
Discover Bank, 4.682% to 8/9/23, 8/9/28 (8) | 275 | 287,622 | ||||||
Discover Financial Services, 3.95%, 11/6/24 | 200 | 212,314 | ||||||
EPR Properties, 3.75%, 8/15/29 | 450 | 456,107 | ||||||
Goldman Sachs Group, Inc. (The): | ||||||||
2.876% to 10/31/21, 10/31/22 (8) | 53 | 53,751 | ||||||
2.905% to 7/24/22, 7/24/23 (8) | 368 | 374,674 | ||||||
2.908% to 6/5/22, 6/5/23 (8) | 567 | 576,406 | ||||||
International Finance Corp., 1.75%, 3/30/20 | 820 | 820,045 | ||||||
Iron Mountain, Inc., 4.375%, 6/1/21 (1) | 17 | 17,209 | ||||||
JPMorgan Chase & Co.: | ||||||||
2.739% to 10/15/29, 10/15/30 (8) | 217 | 216,966 | ||||||
3.797% to 7/23/23, 7/23/24 (8) | 530 | 558,608 | ||||||
KKR Group Finance Co., VI, LLC, 3.75%, 7/1/29 (1)(7) | 344 | 366,602 | ||||||
Marsh & McLennan Cos., Inc., 3.161%, (3 mo. USD LIBOR + 1.20%), 12/29/21 (2) | 168 | 168,159 | ||||||
Morgan Stanley: | ||||||||
3.336%, (3 mo. USD LIBOR + 1.40%), 10/24/23 (2) | 260 | 265,737 | ||||||
4.00%, 7/23/25 | 210 | 227,237 | ||||||
4.875%, 11/1/22 | 105 | 112,524 | ||||||
National Australia Bank, Ltd., 3.625%, 6/20/23 | 275 | 289,001 | ||||||
Nationwide Building Society, 3.96% to 7/18/29, 7/18/30 (1)(8) | 293 | 314,713 | ||||||
Newmark Group, Inc., 6.125%, 11/15/23 | 39 | 43,005 | ||||||
PNC Financial Services Group, Inc. (The), 2.20%, 11/1/24 | 2,475 | 2,483,497 | ||||||
Radian Group, Inc., 4.875%, 3/15/27 | 122 | 128,752 | ||||||
SBA Tower Trust: | ||||||||
2.836%, 1/15/25 (1) | 915 | 925,101 | ||||||
2.877%, 7/15/46 (1) | 300 | 301,315 | ||||||
3.722%, 4/9/48 (1) | 660 | 674,704 | ||||||
Synchrony Financial, 3.132%, (3 mo. USD LIBOR + 1.23%), 2/3/20 (2) | 90 | 90,072 | ||||||
Synovus Financial Corp.: | ||||||||
3.125%, 11/1/22 | 156 | 157,962 | ||||||
5.90% to 2/7/24, 2/7/29 (8) | 35 | 37,188 | ||||||
Toronto-Dominion Bank (The), 1.85%, 9/11/20 | 500 | 499,994 | ||||||
| $ | 25,220,192 | |||||||
| Security | Principal Amount (000’s omitted) | Value | ||||||
| Government — 1.1% | ||||||||
Asian Development Bank, 3.125%, 9/26/28 | $ | 540 | $ | 589,286 | ||||
Inter-American Development Bank, 3.00%, 9/26/22 | 540 | 558,700 | ||||||
International Bank for Reconstruction & Development, 3.125%, 11/20/25 | 1,200 | 1,287,094 | ||||||
International Finance Corp., 2.00%, 10/24/22 | 1,625 | 1,638,415 | ||||||
| $ | 4,073,495 | |||||||
| Industrial — 1.3% | ||||||||
FedEx Corp., 4.55%, 4/1/46 | $ | 240 | $ | 246,556 | ||||
Jabil, Inc.: | ||||||||
3.95%, 1/12/28 | 565 | 580,346 | ||||||
4.70%, 9/15/22 | 569 | 603,093 | ||||||
5.625%, 12/15/20 | 70 | 72,281 | ||||||
nVent Finance S.a.r.l., 4.55%, 4/15/28 | 855 | 887,232 | ||||||
Owens Corning: | ||||||||
3.95%, 8/15/29 | 895 | 932,167 | ||||||
4.30%, 7/15/47 | 131 | 124,218 | ||||||
Reynolds Group Issuer, Inc./Reynolds Group Issuer, LLC, 5.75%, 10/15/20 | 155 | 155,445 | ||||||
SMBC Aviation Capital Finance DAC: | ||||||||
2.65%, 7/15/21 (1) | 260 | 261,830 | ||||||
3.55%, 4/15/24 (1) | 300 | 311,579 | ||||||
Westinghouse Air Brake Technologies Corp.: | ||||||||
3.194%, (3 mo. USD LIBOR + 1.30%), 9/15/21 (2) | 486 | 486,076 | ||||||
4.95%, 9/15/28 | 140 | 154,046 | ||||||
| $ | 4,814,869 | |||||||
| Technology — 1.1% | ||||||||
Apple, Inc., 3.00%, 6/20/27 | $ | 462 | $ | 484,157 | ||||
Broadridge Financial Solutions, Inc., 3.95%, 9/1/20 | 205 | 207,608 | ||||||
Dell International, LLC/EMC Corp.: | ||||||||
4.42%, 6/15/21 (1) | 605 | 622,622 | ||||||
5.875%, 6/15/21 (1) | 36 | 36,608 | ||||||
DXC Technology Co.: | ||||||||
4.25%, 4/15/24 (7) | 52 | 55,230 | ||||||
4.75%, 4/15/27 | 221 | 237,967 | ||||||
EMC Corp., 2.65%, 6/1/20 | 10 | 10,014 | ||||||
Hewlett Packard Enterprise Co.: | ||||||||
2.567%, (3 mo. USD LIBOR + 0.68%), 3/12/21 (2) | 223 | 223,869 | ||||||
2.763%, (3 mo. USD LIBOR + 0.72%), 10/5/21 (2) | 278 | 278,038 | ||||||
Microsoft Corp.: | ||||||||
2.40%, 8/8/26 | 285 | 288,689 | ||||||
4.45%, 11/3/45 | 190 | 237,517 | ||||||
| 13 | See Notes to Financial Statements. |
Table of Contents
Calvert
VP SRI Balanced Portfolio
December 31, 2019
Schedule of Investments — continued
| Security | Principal Amount (000’s omitted) | Value | ||||||
| Technology (continued) | ||||||||
NXP BV/NXP Funding, LLC: | ||||||||
4.625%, 6/15/22 (1) | $ | 325 | $ | 342,597 | ||||
4.625%, 6/1/23 (1) | 400 | 427,690 | ||||||
Seagate HDD Cayman: | ||||||||
4.875%, 3/1/24 | 235 | 250,528 | ||||||
5.75%, 12/1/34 | 180 | 188,717 | ||||||
Western Digital Corp., 4.75%, 2/15/26 (7) | 245 | 255,872 | ||||||
| $ | 4,147,723 | |||||||
| Utilities — 1.0% | ||||||||
American Water Capital Corp., 2.95%, 9/1/27 | $ | 370 | $ | 378,089 | ||||
Avangrid, Inc.: | ||||||||
3.15%, 12/1/24 | 827 | 853,593 | ||||||
3.80%, 6/1/29 | 590 | 625,773 | ||||||
Enel Finance International NV, 2.65%, 9/10/24 (1) | 530 | 531,886 | ||||||
MidAmerican Energy Co.: | ||||||||
3.15%, 4/15/50 | 215 | 212,223 | ||||||
4.25%, 7/15/49 | 250 | 299,556 | ||||||
NextEra Energy Operating Partners, L.P., 4.25%, 9/15/24 (1) | 375 | 390,782 | ||||||
Public Service Co. of Colorado, 3.70%, 6/15/28 | 258 | 281,078 | ||||||
| $ | 3,572,980 | |||||||
Total Corporate Bonds | $ | 58,556,022 | ||||||
| Floating Rate Loans — 0.9%(9) | ||||||||
| Security | Principal Amount (000’s omitted) | Value | ||||||
| Building and Development — 0.1% | ||||||||
Cushman & Wakefield U.S. Borrower, LLC, Term Loan, 5.049%, (1 mo. USD LIBOR + 3.25%), 8/21/25 | $ | 296 | $ | 297,777 | ||||
| Cable and Satellite Television — 0.1% | ||||||||
Ziggo Secured Finance Partnership, Term Loan, 4.24%, (1 mo. USD LIBOR + 2.50%), 4/15/25 | $ | 230 | $ | 230,527 | ||||
| Cosmetics/Toiletries — 0.0%(6) | ||||||||
Prestige Brands, Inc., Term Loan, 3.799%, (1 mo. USD LIBOR + 2.00%), 1/26/24 | $ | 46 | $ | 46,165 | ||||
| Security | Principal Amount (000’s omitted) | Value | ||||||
| Drugs — 0.1% | ||||||||
Jaguar Holding Company II, Term Loan, | $ | 432 | $ | 434,903 | ||||
| Electronics/Electrical — 0.3% | ||||||||
Epicor Software Corporation, Term Loan, | $ | 219 | $ | 221,208 | ||||
Go Daddy Operating Company, LLC, Term Loan, 3.549%, (1 mo. USD LIBOR + 1.75%), 2/15/24 | 52 | 52,545 | ||||||
Hyland Software, Inc., Term Loan, 5.299%, (1 mo. USD LIBOR + 3.50%), 7/1/24 | 209 | 211,455 | ||||||
Infor (US), Inc., Term Loan, 4.695%, (3 mo. USD LIBOR + 2.75%), 2/1/22 | 442 | 444,001 | ||||||
MA FinanceCo., LLC, Term Loan, 4.299%, (1 mo. USD LIBOR + 2.50%), 6/21/24 | 19 | 18,617 | ||||||
Seattle Spinco, Inc., Term Loan, 4.299%, (1 mo. USD LIBOR + 2.50%), 6/21/24 | 125 | 125,724 | ||||||
SolarWinds Holdings, Inc., Term Loan, 4.549%, (1 mo. USD LIBOR + 2.75%), 2/5/24 | 79 | 79,901 | ||||||
| $ | 1,153,451 | |||||||
| Equipment Leasing — 0.1% | ||||||||
Avolon TLB Borrower 1 (US), LLC, Term Loan, 3.515%, (1 mo. USD LIBOR + 1.75%), 1/15/25 | $ | 266 | $ | 267,628 | ||||
| Financial — 0.0%(6) | ||||||||
Alliance Mortgage Investments, Term Loan, 0.00%, 6/1/10 (10)(11)(12) | $ | 385 | $ | 6,078 | ||||
| Health Care — 0.1% | ||||||||
Change Healthcare Holdings, LLC, Term Loan, 4.299%, (1 mo. USD LIBOR + 2.50%), 3/1/24 | $ | 198 | $ | 198,878 | ||||
| Industrial Equipment — 0.0%(6) | ||||||||
Rexnord, LLC, Term Loan, 3.535%, (1 mo. USD LIBOR + 1.75%), 8/21/24 | $ | 39 | $ | 39,307 | ||||
| Insurance — 0.1% | ||||||||
Asurion, LLC, Term Loan, 11/3/23 (13) | $ | 180 | $ | 181,331 | ||||
| Leisure Goods/Activities/Movies — 0.0%(6) | ||||||||
Bombardier Recreational Products, Inc., Term Loan, 3.799%, (1 mo. USD LIBOR + 2.00%), 5/23/25 | $ | 69 | $ | 69,608 | ||||
| Lodging and Casinos — 0.0%(6) | ||||||||
ESH Hospitality, Inc., Term Loan, 3.799%, (1 mo. USD LIBOR + 2.00%), 9/18/26 | $ | 40 | $ | 40,606 | ||||
| 14 | See Notes to Financial Statements. |
Table of Contents
Calvert
VP SRI Balanced Portfolio
December 31, 2019
Schedule of Investments — continued
| Security | Principal Amount (000’s omitted) | Value | ||||||
| Telecommunications — 0.0%(6) | ||||||||
CenturyLink, Inc., Term Loan, 1/31/25 (13) | $ | 90 | $ | 90,475 | ||||
Level 3 Financing, Inc., Term Loan, 3.549%, (1 mo. USD LIBOR + 1.75%), 3/1/27 | 74 | 74,661 | ||||||
| $ | 165,136 | |||||||
Total Floating Rate Loans | $ | 3,131,395 | ||||||
| Preferred Stocks — 0.0%(6) | ||||||||
| Security | Shares | Value | ||||||
| Oil, Gas & Consumable Fuels — 0.0%(6) | ||||||||
NuStar Energy L.P., Series B, 7.625% to 6/15/22 (8) | 1,848 | $ | 40,009 | |||||
Total Preferred Stocks | $ | 40,009 | ||||||
| Rights — 0.1% | ||||||||
| Security | Shares | Value | ||||||
| Pharmaceuticals — 0.1% | ||||||||
Bristol-Myers Squibb Co. CVR, Exp. 3/31/21 (5) | 104,000 | $ | 313,040 | |||||
Total Rights | $ | 313,040 | ||||||
| Sovereign Government Bonds — 0.7% | ||||||||
| Security | Principal Amount (000’s omitted) | Value | ||||||
Export Development Canada, 1.625%, 6/1/20 | $ | 555 | $ | 554,819 | ||||
Kreditanstalt fuer Wiederaufbau, 2.00%, 11/30/21 | 1,840 | 1,852,120 | ||||||
Nacional Financiera SNC, 3.375%, 11/5/20 (1) | 265 | 266,947 | ||||||
Total Sovereign Government Bonds | $ | 2,673,886 | ||||||
| Taxable Municipal Obligations — 1.7% | ||||||||
| Security | Principal Amount (000’s omitted) | Value | ||||||
| General Obligations — 0.5% | ||||||||
Los Angeles Unified School District, CA, 5.75%, 7/1/34 (14) | $ | 450 | $ | 576,832 | ||||
| Security | Principal Amount (000’s omitted) | Value | ||||||
| General Obligations (continued) | ||||||||
Massachusetts, Green Bonds, 3.277%, 6/1/46 | $ | 435 | $ | 441,477 | ||||
New York City, NY, 5.206%, 10/1/31 (14) | 470 | 557,176 | ||||||
San Francisco City and County, CA, (Social Bonds - Affordable Housing, 2016), 3.921%, 6/15/39 | 285 | 308,561 | ||||||
| $ | 1,884,046 | |||||||
| Special Tax Revenue — 0.7% | ||||||||
California Health Facilities Financing Authority, (No Place Like Home Program): | ||||||||
2.361%, 6/1/26 | $ | 405 | $ | 405,389 | ||||
2.484%, 6/1/27 | 290 | 290,389 | ||||||
2.534%, 6/1/28 | 360 | 359,024 | ||||||
2.584%, 6/1/29 | 200 | 198,550 | ||||||
2.984%, 6/1/33 | 220 | 218,480 | ||||||
Connecticut, Special Tax Revenue, 5.459%, 11/1/30 (14) | 300 | 356,478 | ||||||
New York City Transitional Finance Authority, NY, Future Tax Secured Revenue Bonds, 5.767%, 8/1/36 (14) | 600 | 746,010 | ||||||
| $ | 2,574,320 | |||||||
| Water and Sewer — 0.5% | ||||||||
District of Columbia Water & Sewer Authority, Green Bonds, 4.814%, 10/1/2114 | $ | 130 | $ | 171,245 | ||||
San Francisco City and County Public Utilities Commission, CA, Water Revenue, Green Bonds, 3.303%, 11/1/39 (15) | 1,440 | 1,438,099 | ||||||
| $ | 1,609,344 | |||||||
Total Taxable Municipal Obligations | $ | 6,067,710 | ||||||
| U.S. Government Agencies and Instrumentalities — 0.4% |
| |||||||
| Security | Principal Amount (000’s omitted) | Value | ||||||
Overseas Private Investment Corp.: | ||||||||
3.22%, 9/15/29 | $ | 419 | $ | 438,783 | ||||
3.52%, 9/20/32 | 402 | 430,803 | ||||||
U.S. Department of Housing and Urban Development: | ||||||||
2.547%, 8/1/22 | 137 | 139,979 | ||||||
2.618%, 8/1/23 | 69 | 71,071 | ||||||
2.668%, 8/1/24 | 240 | 248,803 | ||||||
2.738%, 8/1/25 | 240 | 251,228 | ||||||
Total U.S. Government Agencies and Instrumentalities (identified cost $1,506,680) | $ | 1,580,667 | ||||||
| 15 | See Notes to Financial Statements. |
Table of Contents
Calvert
VP SRI Balanced Portfolio
December 31, 2019
Schedule of Investments — continued
| U.S. Government Agency Mortgage-Backed Securities — 3.0% |
| |||||||
| Security | Principal Amount (000’s omitted) | Value | ||||||
Federal National Mortgage Association: | ||||||||
2.65%, 6/1/26 | $ | 329 | $ | 336,080 | ||||
2.68%, 7/1/26 | 350 | 358,890 | ||||||
4.00%, 3/1/48 | 730 | 765,676 | ||||||
30-Year, 3.00%, TBA (16) | 6,110 | 6,196,921 | ||||||
30-Year, 3.50%, TBA (16) | 1,205 | 1,239,784 | ||||||
30-Year, 4.00%, TBA (16) | 1,940 | 2,019,251 | ||||||
Total U.S. Government Agency Mortgage-Backed Securities |
| $ | 10,916,602 | |||||
| U.S. Treasury Obligations — 3.2% | ||||||||
| Security | Principal Amount (000’s omitted) | Value | ||||||
U.S. Treasury Bond, 3.00%, 2/15/49 | $ | 1,595 | $ | 1,797,834 | ||||
U.S. Treasury Inflation-Protected Notes: | ||||||||
0.125%, 4/15/20 (17) | 82 | 82,314 | ||||||
0.625%, 4/15/23 (17) | 865 | 878,526 | ||||||
0.75%, 7/15/28 (17) | 4,725 | 4,972,211 | ||||||
U.S. Treasury Notes: | ||||||||
1.375%, 1/15/20 | 637 | 636,938 | ||||||
1.50%, 10/31/24 | 1,228 | 1,216,785 | ||||||
1.75%, 7/31/21 | 1,690 | 1,694,014 | ||||||
1.75%, 11/15/29 | 447 | 439,963 | ||||||
2.625%, 12/31/25 | 28 | 29,341 | ||||||
2.625%, 2/15/29 | 31 | 32,837 | ||||||
Total U.S. Treasury Obligations | $ | 11,780,763 | ||||||
| Short-Term Investments — 1.0% | ||||||||
| Commercial Paper — 0.7% | ||||||||
| Security | Principal Amount (000’s omitted) | Value | ||||||
DXC Capital Funding, Ltd., 2.292%, 2/27/20 (1)(18) | $ | 250 | $ | 249,146 | ||||
Enel Finance America, LLC, 2.131%, 1/3/20 (1)(18) | 250 | 249,963 | ||||||
Jabil, Inc.: | ||||||||
2.255%, 1/6/20 (1)(18) | 175 | 174,923 | ||||||
2.27%, 2/6/20 (1)(18) | 1,525 | 1,520,991 | ||||||
Sherwin-Williams Co. (The), 2.132%, 1/6/20 (1)(18) | 245 | 244,936 | ||||||
Smithfield Foods, Inc., 2.337%, 1/21/20 (1)(18) | 240 | 239,674 | ||||||
Total Commercial Paper | $ | 2,679,633 | ||||||
| Securities Lending Collateral — 0.3% |
| |||||||
| Security | Shares | Value | ||||||
State Street Navigator Securities Lending Government Money Market Portfolio, 1.56% (19) | 932,685 | $ | 932,685 | |||||
Total Securities Lending Collateral | $ | 932,685 | ||||||
Total Short-Term Investments | $ | 3,612,318 | ||||||
Total Investments | $ | 374,585,373 | ||||||
Other Assets, Less Liabilities — (2.0%) | $ | (7,170,479 | ) | |||||
Net Assets — 100.0% | $ | 367,414,894 | ||||||
The percentage shown for each investment category in the Schedule of Investments is based on net assets.
Notes to Schedule of Investments
| (1) | Security is exempt from registration under Rule 144A of the Securities Act of 1933. These securities may be resold in transactions exempt from registration, normally to qualified institutional buyers. Total market value of Rule 144A securities amounts to $51,723,463, which represents 14.1% of the net assets of the Fund as of December 31, 2019. |
| (2) | Variable rate security. The stated interest rate represents the rate in effect at December 31, 2019. |
| (3) | Weighted average fixed-rate coupon that changes/updates monthly. Rate shown is the rate at December 31, 2019. |
| (4) | Step coupon security. The interest rate disclosed is that which is in effect on December 31, 2019. |
| (5) | Non-income producing security. |
| (6) | Amount is less than 0.05%. |
| (7) | All or a portion of this security was on loan at December 31, 2019. The aggregate market value of securities on loan at December 31, 2019 was $990,229. |
| (8) | Security converts to variable rate after the indicated fixed-rate coupon period. |
| (9) | Remaining maturities of floating rate loans may be less than the stated maturities shown as a result of contractual or optional prepayments by the borrower. Such prepayments cannot be predicted with certainty. Floating rate loans generally pay interest at rates which are periodicallyre-determined at a spread above the London Interbank Offered Rate (“LIBOR”) or other short-term rates. The rate shown is the rate in effect at December 31, 2019. Floating rate loans are generally considered restrictive in that the Fund is ordinarily contractually obligated to receive consent from the Agent Bank and/or borrower prior to disposition of a floating rate loan. |
| (10) | For fair value measurement disclosure purposes, security is categorized as Level 3 (see Note 1A). |
| (11) | Restricted security. Total market value of restricted securities amounts to $6,078, which represents less than 0.05% of the net assets of the Fund as of December 31, 2019. |
| 16 | See Notes to Financial Statements. |
Table of Contents
Calvert
VP SRI Balanced Portfolio
December 31, 2019
Schedule of Investments — continued
| (12) | Alliance Bancorp and its affiliates filed for Chapter 7 bankruptcy on July 13, 2007. This security is no longer accruing interest. |
| (13) | This Senior Loan will settle after December 31, 2019, at which time the interest rate will be determined. |
| (14) | Build America Bond. Represents taxable municipal obligation issued pursuant to the American Recovery and Reinvestment Act of 2009 or other legislation providing for the issuance of taxable municipal debt on which the issuer receives federal support. |
| (15) | When-issued security. |
| (16) | TBA (To Be Announced) securities are purchased on a forward commitment basis with an approximate principal amount and no definite maturity date. The actual principal amount and maturity date are determined upon settlement when the specific mortgage pools are assigned. |
| (17) | Inflation-linked security whose principal is adjusted for inflation based on changes in the U.S. Consumer Price Index. Interest is calculated based on the inflation-adjusted principal. |
| (18) | Security is exempt from registration under Section 4(2) of the Securities Act of 1933. Such securities may be sold in transactions exempt from registration only to dealers in that program or other “accredited investors”. At December 31, 2019 the aggregate value of these securities is $2,679,633, representing 0.7% of the Fund’s net assets. |
| (19) | Represents investment of cash collateral received in connection with securities lending. |
| Futures Contracts | ||||||||||||||||||||
| Description | Number of Contracts | Position | Expiration Date | Notional Amount | Value/ Unrealized | |||||||||||||||
| Interest Rate Futures | ||||||||||||||||||||
U.S.2-Year Treasury Note | 57 | Long | 3/31/20 | $ | 12,283,500 | $ | (2,142 | ) | ||||||||||||
U.S.5-Year Treasury Note | 3 | Long | 3/31/20 | 355,828 | (700 | ) | ||||||||||||||
U.S. Ultra-Long Treasury Bond | 46 | Long | 3/20/20 | 8,356,188 | (276,284 | ) | ||||||||||||||
U.S.2-Year Treasury Note | (3 | ) | Short | 3/31/20 | (646,500 | ) | 370 | |||||||||||||
U.S.5-Year Treasury Note | (42 | ) | Short | 3/31/20 | (4,981,594 | ) | 18,303 | |||||||||||||
U.S. Long Treasury Bond | (11 | ) | Short | 3/20/20 | (1,714,969 | ) | 9,433 | |||||||||||||
U.S. Ultra10-Year Treasury Note | (73 | ) | Short | 3/20/20 | (10,271,328 | ) | 116,641 | |||||||||||||
U.S. Ultra-Long Treasury Bond | (2 | ) | Short | 3/20/20 | (363,313 | ) | 11,332 | |||||||||||||
| $ | (123,047 | ) | ||||||||||||||||||
| Restricted Securities | ||||||||
| Description | Acquisition Dates | Cost | ||||||
Alliance Mortgage Investments, Term Loan, 0.00%, 6/1/10 | 5/26/05-6/13/07 | $ | 385,345 | |||||
Abbreviations:
| ADR | – | American Depositary Receipt | ||
| CVR | – | Contingent Value Rights | ||
| LIBOR | – | London Interbank Offered Rate | ||
| TBA | – | To Be Announced | ||
Currency Abbreviations:
| USD | – | United States Dollar | ||
| 17 | See Notes to Financial Statements. |
Table of Contents
Calvert
VP SRI Balanced Portfolio
December 31, 2019
Statement of Assets and Liabilities
| Assets | December 31, 2019 | |||
Investments in securities of unaffiliated issuers, at value (identified cost $319,383,747) - including | $ | 374,585,373 | ||
Cash | 4,028,024 | |||
Cash denominated in foreign currency, at value (cost $5,933) | 5,967 | |||
Receivable for investments sold | 23,424 | |||
Receivable for capital shares sold | 159,667 | |||
Dividends and interest receivable | 1,060,005 | |||
Securities lending income receivable | 849 | |||
Tax reclaims receivable | 25,163 | |||
Deposits at broker for futures contracts | 126,366 | |||
Directors’ deferred compensation plan | 60,495 | |||
Other assets | 17,504 | |||
Total assets | $ | 380,092,837 | ||
| Liabilities | ||||
Payable for variation margin on open futures contracts | $ | 29,227 | ||
Payable for investments purchased | 269,663 | |||
Payable for when-issued securities/delayed delivery/forward commitment securities | 10,883,997 | |||
Payable for capital shares redeemed | 76,951 | |||
Deposits for securities loaned | 932,685 | |||
Payable to affiliates: | ||||
Investment advisory fee | 126,330 | |||
Administrative fee | 36,975 | |||
Distribution and service fees | 1,061 | |||
Sub-transfer agency fee | 191 | |||
Directors’ deferred compensation plan | 60,495 | |||
Accrued expenses | 260,368 | |||
Total liabilities | $ | 12,677,943 | ||
Net Assets | $ | 367,414,894 | ||
| Sources of Net Assets | ||||
Paid-in capital | $ | 295,165,923 | ||
Distributable earnings | 72,248,971 | |||
Total | $ | 367,414,894 | ||
| Class I | ||||
Net Assets | $ | 362,391,688 | ||
Shares Outstanding | 158,176,420 | |||
Net Asset Value, Offering Price and Redemption Price Per Share | ||||
(net assets ÷ shares of beneficial interest outstanding) | $ | 2.29 | ||
| Class F | ||||
Net Assets | $ | 5,023,206 | ||
Shares Outstanding | 2,187,058 | |||
Net Asset Value, Offering Price and Redemption Price Per Share | ||||
(net assets ÷ shares of beneficial interest outstanding) | $ | 2.30 | ||
| 18 | See Notes to Financial Statements. |
Table of Contents
Calvert
VP SRI Balanced Portfolio
December 31, 2019
Statement of Operations
| Investment Income | Year Ended December 31, 2019 | |||
Dividend income (net of foreign taxes withheld of $39,409) | $ | 3,096,530 | ||
Interest income | 4,635,031 | |||
Securities lending income, net | 10,725 | |||
Total investment income | $ | 7,742,286 | ||
| Expenses | ||||
Investment advisory fee | $ | 1,378,386 | ||
Administrative fee | 403,430 | |||
Distribution and service fees: | ||||
Class F | 8,439 | |||
Directors’ fees and expenses | 19,975 | |||
Custodian fees | 61,565 | |||
Transfer agency fees and expenses | 28,943 | |||
Accounting fees | 75,089 | |||
Professional fees | 53,430 | |||
Reports to shareholders | 44,462 | |||
Miscellaneous | 29,626 | |||
Total expenses | $ | 2,103,345 | ||
Reimbursement of expenses - other | (7,667 | ) | ||
Net expenses | $ | 2,095,678 | ||
Net investment income | $ | 5,646,608 | ||
| Realized and Unrealized Gain (Loss) | ||||
Net realized gain (loss): | ||||
Investment securities | $ | 10,893,953 | ||
Futures contracts | 1,655,908 | |||
Foreign currency transactions | 199 | |||
Net realized gain | $ | 12,550,060 | ||
Change in unrealized appreciation (depreciation): | ||||
Investment securities | $ | 54,220,942 | ||
Futures contracts | (702,903 | ) | ||
Foreign currency | 31 | |||
Net change in unrealized appreciation (depreciation) | $ | 53,518,070 | ||
Net realized and unrealized gain | $ | 66,068,130 | ||
Net increase in net assets resulting from operations | $ | 71,714,738 | ||
| 19 | See Notes to Financial Statements. |
Table of Contents
Calvert
VP SRI Balanced Portfolio
December 31, 2019
Statements of Changes in Net Assets
| Year Ended December 31, | ||||||||
| Increase (Decrease) in Net Assets | 2019 | 2018 | ||||||
From operations: | ||||||||
Net investment income | $ | 5,646,608 | $ | 5,322,733 | ||||
Net realized gain | 12,550,060 | 11,450,521 | ||||||
Net change in unrealized appreciation (depreciation) | 53,518,070 | (24,162,286 | ) | |||||
Net increase (decrease) in net assets from operations | $ | 71,714,738 | $ | (7,389,032 | ) | |||
Distributions to shareholders: | ||||||||
Class I | $ | (17,324,508 | ) | $ | (34,758,500 | ) | ||
Class F | (195,158 | ) | (223,448 | ) | ||||
Total distributions to shareholders | $ | (17,519,666 | ) | $ | (34,981,948 | ) | ||
Capital share transactions: | ||||||||
Class I | $ | 12,319,228 | $ | 9,350,010 | ||||
Class F | 2,635,364 | 686,027 | ||||||
Net increase in net assets from capital share transactions | $ | 14,954,592 | $ | 10,036,037 | ||||
Net increase (decrease) in net assets | $ | 69,149,664 | $ | (32,334,943 | ) | |||
| Net Assets | ||||||||
At beginning of year | $ | 298,265,230 | $ | 330,600,173 | ||||
At end of year | $ | 367,414,894 | $ | 298,265,230 | ||||
| 20 | See Notes to Financial Statements. |
Table of Contents
Calvert
VP SRI Balanced Portfolio
December 31, 2019
Financial Highlights
| Class I | ||||||||||||||||||||
| Year Ended December 31, | ||||||||||||||||||||
| 2019 | 2018 | 2017 | 2016 | 2015 | ||||||||||||||||
Net asset value — Beginning of year | $ | 1.94 | $ | 2.23 | $ | 2.05 | $ | 2.00 | $ | 2.05 | ||||||||||
| Income (Loss) From Operations | ||||||||||||||||||||
Net investment income(1) | $ | 0.04 | $ | 0.04 | $ | 0.04 | $ | 0.04 | $ | 0.04 | ||||||||||
Net realized and unrealized gain (loss) | 0.43 | (0.08 | ) | 0.20 | 0.11 | (0.08 | ) | |||||||||||||
Total income (loss) from operations | $ | 0.47 | $ | (0.04 | ) | $ | 0.24 | $ | 0.15 | $ | (0.04 | ) | ||||||||
| Less Distributions | ||||||||||||||||||||
From net investment income | $ | (0.04 | ) | $ | (0.04 | ) | $ | (0.04 | ) | $ | (0.04 | ) | $ | — | (2) | |||||
From net realized gain | (0.08 | ) | (0.21 | ) | (0.02 | ) | (0.06 | ) | (0.01 | ) | ||||||||||
Total distributions | $ | (0.12 | ) | $ | (0.25 | ) | $ | (0.06 | ) | $ | (0.10 | ) | $ | (0.01 | ) | |||||
Net asset value — End of year | $ | 2.29 | $ | 1.94 | $ | 2.23 | $ | 2.05 | $ | 2.00 | ||||||||||
Total Return(3) | 24.40 | % | (2.67 | )% | 12.16 | % | 7.58 | % | (1.90 | )% | ||||||||||
| Ratios/Supplemental Data | ||||||||||||||||||||
Net assets, end of year (000’s omitted) | $ | 362,392 | $ | 296,345 | $ | 329,060 | $ | 325,638 | $ | 323,676 | ||||||||||
Ratios (as a percentage of average daily net assets):(4) | ||||||||||||||||||||
Total expenses | 0.62 | % | 0.72 | % | 0.69 | % | 0.75 | % | 0.85 | % | ||||||||||
Net expenses | 0.62 | % | 0.70 | % | 0.68 | % | 0.70 | % | 0.84 | % | ||||||||||
Net investment income | 1.68 | % | 1.66 | % | 1.73 | % | 2.06 | % | 1.73 | % | ||||||||||
Portfolio Turnover | 70 | %(5) | 77 | % | 132 | % | 129 | % | 90 | % | ||||||||||
| (1) | Computed using average shares outstanding. |
| (2) | Amount is less than $(0.005). |
| (3) | Returns are historical and are calculated by determining the percentage change in net asset value with all distributions reinvested and do not reflect fees and expenses imposed by variable annuity contracts or variable life insurance policies. If included, total return would be lower. |
| (4) | Total expenses do not reflect amounts reimbursed and/or waived by the adviser and certain of its affiliates, if applicable. Net expenses are net of all reductions and represent the net expenses paid by the Fund. |
| (5) | Includes the effect ofTo-Be-Announced (TBA) transactions. |
| 21 | See Notes to Financial Statements. |
Table of Contents
Calvert
VP SRI Balanced Portfolio
December 31, 2019
Financial Highlights — continued
| Class F | ||||||||||||||||||||
| Year Ended December 31, | ||||||||||||||||||||
| 2019 | 2018 | 2017 | 2016 | 2015 | ||||||||||||||||
Net asset value — Beginning of year | $ | 1.95 | $ | 2.24 | $ | 2.08 | $ | 2.03 | $ | 2.09 | ||||||||||
| Income (Loss) From Operations | ||||||||||||||||||||
Net investment income(1) | $ | 0.03 | $ | 0.03 | $ | 0.03 | $ | 0.03 | $ | 0.03 | ||||||||||
Net realized and unrealized gain (loss) | 0.44 | (0.07 | ) | 0.19 | 0.12 | (0.08 | ) | |||||||||||||
Total income (loss) from operations | $ | 0.47 | $ | (0.04 | ) | $ | 0.22 | $ | 0.15 | $ | (0.05 | ) | ||||||||
| Less Distributions | ||||||||||||||||||||
From net investment income | $ | (0.04 | ) | $ | (0.04 | ) | $ | (0.04 | ) | $ | (0.04 | ) | $ | — | ||||||
From net realized gain | (0.08 | ) | (0.21 | ) | (0.02 | ) | (0.06 | ) | (0.01 | ) | ||||||||||
Total distributions | $ | (0.12 | ) | $ | (0.25 | ) | $ | (0.06 | ) | $ | (0.10 | ) | $ | (0.01 | ) | |||||
Net asset value — End of year | $ | 2.30 | $ | 1.95 | $ | 2.24 | $ | 2.08 | $ | 2.03 | ||||||||||
Total Return(2) | 24.28 | % | (2.65 | )% | 11.01 | % | 7.14 | % | (2.46 | )% | ||||||||||
| Ratios/Supplemental Data | ||||||||||||||||||||
Net assets, end of year (000’s omitted) | $ | 5,023 | $ | 1,920 | $ | 1,540 | $ | 588 | $ | 324 | ||||||||||
Ratios (as a percentage of average daily net assets):(3) | ||||||||||||||||||||
Total expenses | 0.86 | % | 0.96 | % | 1.40 | % | 1.40 | % | 1.74 | % | ||||||||||
Net expenses | 0.86 | % | 0.96 | % | 1.08 | % | 1.10 | % | 1.15 | % | ||||||||||
Net investment income | 1.44 | % | 1.40 | % | 1.30 | % | 1.65 | % | 1.49 | % | ||||||||||
Portfolio Turnover | 70 | %(4) | 77 | % | 132 | % | 129 | % | 90 | % | ||||||||||
| (1) | Computed using average shares outstanding. |
| (2) | Returns are historical and are calculated by determining the percentage change in net asset value with all distributions reinvested and do not reflect fees and expenses imposed by variable annuity contracts or variable life insurance policies. If included, total return would be lower. |
| (3) | Total expenses do not reflect amounts reimbursed and/or waived by the adviser and certain of its affiliates, if applicable. Net expenses are net of all reductions and represent the net expenses paid by the Fund. |
| (4) | Includes the effect ofTo-Be-Announced (TBA) transactions. |
| 22 | See Notes to Financial Statements. |
Table of Contents
Calvert
VP SRI Balanced Portfolio
December 31, 2019
Notes to Financial Statements
1 Significant Accounting Policies
Calvert VP SRI Balanced Portfolio (the Fund) is a diversified series of Calvert Variable Series, Inc. (the Corporation). The Corporation is a Maryland corporation registered under the Investment Company Act of 1940, as amended (the 1940 Act), as anopen-end management investment company. The investment objective of the Fund is to seek to provide a competitive total return through an actively managed portfolio of stocks, bonds and money market instruments which offer income and capital growth opportunity.
Shares of the Fund are sold without sales charge to insurance companies for allocation to certain of their variable separate accounts. The Fund offers Class I and Class F shares. Among other things, each class has different: (a) dividend rates due to differences in Distribution Plan expenses and other class-specific expenses; (b) exchange privileges; and (c) class-specific voting rights.
The Fund applies the accounting and reporting guidance in the Financial Accounting Standards Board (FASB) Accounting Standards Codification Topic 946,Financial Services – Investment Companies (ASC 946). Subsequent events, if any, through the date that the financial statements were issued have been evaluated in the preparation of the financial statements.
A Investment Valuation — Net asset value per share is determined every business day as of the close of the regular session of the New York Stock Exchange (generally 4:00 p.m. Eastern time). The Fund uses independent pricing services approved by the Board ofDirectors (the Board) to value its investments wherever possible. Investments for which market quotations are not available or deemed not reliable are fair valued in good faith under the direction of the Board.
U.S. generally accepted accounting principles (U.S. GAAP) establishes a disclosure hierarchy that categorizes the inputs to valuation techniques used to value assets and liabilities at measurement date. These inputs are summarized in the three broad levels listed below:
Level 1 - quoted prices in active markets for identical securities
Level 2 - other significant observable inputs (including quoted prices for similar securities, interest rates, prepayment speeds, credit risk, etc.)
Level 3 - significant unobservable inputs (including the Fund’s own assumptions in determining the fair value of investments)
The inputs or methodologies used for valuing securities are not necessarily an indication of the risk associated with investing in those securities.
Valuation techniques used to value the Fund’s investments by major category are as follows:
Equity Securities.Equity securities (including warrants and rights) listed on a U.S. securities exchange generally are valued at the last sale or closing price as reported by an independent pricing service on the primary market or exchange on which they are traded and are categorized as Level 1 in the hierarchy. Equity securities listed on the NASDAQ Global or Global Select Market are valued at the NASDAQ official closing price and are categorized as Level 1 in the hierarchy. Unlisted or listed securities for which closing sales prices or closing quotations are not available are valued at the mean between the latest available bid and ask prices and are categorized as Level 2 in the hierarchy.
Debt Securities.Debt securities are generally valued on the basis of valuations provided by third party pricing services, as derived from such services’ pricing models. Inputs to the models may include, but are not limited to, reported trades, executable bid and ask prices, broker/dealer quotations, prices or yields of securities with similar characteristics, interest rates, anticipated prepayments, benchmark curves or information pertaining to the issuer, as well as industry and economic events. Accordingly, debt securities are generally categorized as Level 2 in the hierarchy. Short-term debt securities with a remaining maturity at time of purchase of more than sixty days are valued on the basis of valuations provided by a third party pricing service. Such securities are generally categorized as Level 2 in the hierarchy. Short-term debt securities of sufficient credit quality purchased with remaining maturities of sixty days or less are valued at amortized cost, which approximates fair value, and are categorized as Level 2 in the hierarchy.
Floating Rate Loans. Interests in floating rate loans for which reliable market quotations are readily available are valued generally at the average mean of bid and ask quotations obtained from a third party pricing service, and are categorized as Level 2 in the hierarchy.
Other Securities.Investments in registered investment companies (including money market funds) that do not trade on an exchange are valued at the net asset value per share on the valuation day and are categorized as Level 1 in the hierarchy.
Derivatives.Futures contracts are valued at unrealized appreciation (depreciation) based on the settlement price established each day by the board of trade or exchange on which they are traded and are categorized as Level 1 in the hierarchy.
Fair Valuation.If a market value cannot be determined for a security using the methodologies described above, or if, in the good faith opinion of the Fund’s adviser, the market value does not constitute a readily available market quotation, or if a significant event has occurred that would materially affect the value of the security, the security will be fair valued as determined in good faith by or at the direction of the Board in a manner that most fairly reflects the security’s “fair value”, which is the amount that the Fund might reasonably expect to receive for the security upon its current sale in the ordinary course. Each such determination is based on a consideration of relevant factors, which are likely to vary from one pricing context to another. These factors may include, but are not limited to, the type of security, the existence of any contractual restrictions on the security’s disposition, the price and extent of public trading in similar securities of the issuer or of comparable companies or entities, quotations or relevant information obtained from broker/dealers or other market participants, information obtained from the issuer, analysts, and/or the appropriate stock exchange (for exchange-traded securities), an analysis of the company’s or entity’s financial statements, and an evaluation of the forces that influence the issuer and the market(s) in which the security is purchased and sold.
| 23 |
Table of Contents
Calvert
VP SRI Balanced Portfolio
December 31, 2019
Notes to Financial Statements — continued
The values assigned to fair value investments are based on available information and do not necessarily represent amounts that might ultimately be realized. Further, due to the inherent uncertainty of valuations of such investments, the fair values may differ significantly from the values that would have been used had an active market existed, and the differences could be material.
The following table summarizes the market value of the Fund’s holdings as of December 31, 2019, based on the inputs used to value them:
| Asset Description | Level 1 | Level 2 | Level 3(1) | Total | ||||||||||||
Asset-Backed Securities | $ | — | $ | 28,370,997 | $ | — | $ | 28,370,997 | ||||||||
Collateralized Mortgage-Backed Obligations | — | 19,834,944 | — | 19,834,944 | ||||||||||||
Commercial Mortgage-Backed Securities | — | 7,250,786 | — | 7,250,786 | ||||||||||||
Common Stocks | 220,331,950 | (2) | — | — | 220,331,950 | |||||||||||
Convertible Bonds | — | 124,284 | — | 124,284 | ||||||||||||
Corporate Bonds | — | 58,556,022 | — | 58,556,022 | ||||||||||||
Floating Rate Loans | — | 3,125,317 | 6,078 | 3,131,395 | ||||||||||||
Preferred Stocks | 40,009 | — | — | 40,009 | ||||||||||||
Rights | 313,040 | — | — | 313,040 | ||||||||||||
Sovereign Government Bonds | — | 2,673,886 | — | 2,673,886 | ||||||||||||
Taxable Municipal Obligations | — | 6,067,710 | — | 6,067,710 | ||||||||||||
U.S. Government Agencies and Instrumentalities | — | 1,580,667 | — | 1,580,667 | ||||||||||||
U.S. Government Agency Mortgage-Backed Securities | — | 10,916,602 | — | 10,916,602 | ||||||||||||
U.S. Treasury Obligations | — | 11,780,763 | — | 11,780,763 | ||||||||||||
Short-Term Investments — | ||||||||||||||||
Commercial Paper | — | 2,679,633 | — | 2,679,633 | ||||||||||||
Securities Lending Collateral | 932,685 | — | — | 932,685 | ||||||||||||
Total Investments | $ | 221,617,684 | $ | 152,961,611 | $ | 6,078 | $ | 374,585,373 | ||||||||
Futures Contracts | $ | 156,079 | $ | — | $ | — | $ | 156,079 | ||||||||
Total | $ | 221,773,763 | $ | 152,961,611 | $ | 6,078 | $ | 374,741,452 | ||||||||
Liability Description | ||||||||||||||||
Futures Contracts | $ | (279,126 | ) | $ | — | $ | — | $ | (279,126 | ) | ||||||
Total | $ | (279,126 | ) | $ | — | $ | — | $ | (279,126 | ) | ||||||
| (1) | None of the unobservable inputs for Level 3 assets, individually or collectively, had a material impact on the Fund. |
| (2) | The level classification by major category of investments is the same as the category presentation in the Schedule of Investments. |
Level 3 investments at the beginning and/or end of the period in relation to net assets were not significant and accordingly, a reconciliation of Level 3 assets for the year ended December 31, 2019 is not presented.
B Investment Transactions and Income —Investment transactions for financial statement purposes are accounted for on trade date. Realized gains and losses are recorded on an identified cost basis and may include proceeds from litigation. Dividend income is recorded on theex-dividend date for dividends received in cash and/or securities or, in the case of dividends on certain foreign securities, as soon as the Fund is informed of theex-dividend date.Non-cash dividends are recorded at the fair value of the securities received. Withholding taxes on foreign dividends and interest, if any, have been provided for in accordance with the Fund’s understanding of the applicable country’s tax rules and rates. Distributions received that represent a return of capital are recorded as a reduction of cost of investments. Distributions received that represent a capital gain are recorded as a realized gain. Interest income, which includes amortization of premium and accretion of discount on debt securities, is accrued as earned. The Fund may earn certain fees in connection with its investments in floating rate loans. These fees are in addition to interest payments earned and may include amendment fees, consent fees and prepayment fees, which are recorded to income as earned. Inflation adjustments to the principal amount of inflation-adjusted bonds and notes are reflected as interest income. Deflation adjustments to the principal amount of an inflation-adjusted bond or note are reflected as reductions to interest income to the extent of interest income previously recorded on such bond or note.
C Share Class Accounting—Realized and unrealized gains and losses and net investment income and losses, other than class-specific expenses, are allocated daily to each class of shares based upon the relative net assets of each class to the total net assets of the Fund. Expenses arising in connection with a specific class are charged directly to that class.
D Foreign Currency Transactions — The Fund’s accounting records are maintained in U.S. dollars. For valuation of assets and liabilities on each date of net asset value determination, foreign denominations are converted into U.S. dollars using the current exchange rate. Security transactions, income, and
| 24 |
Table of Contents
Calvert
VP SRI Balanced Portfolio
December 31, 2019
Notes to Financial Statements — continued
expenses are translated at the prevailing rate of exchange on the date of the event. Recognized gains or losses on investment transactions attributable to changes in foreign currency exchange rates are recorded for financial statement purposes as net realized gains and losses on investments. That portion of unrealized gains and losses on investments that results from fluctuations in foreign currency exchange rates is not separately disclosed.
E Floating Rate Loans — The Fund may invest in direct debt instruments, which are interests in amounts owed to lenders or lending syndicates by corporate, governmental, or other borrowers. The Fund’s investment in loans may be in the form of participations in loans or assignments of all or a portion of loans from third parties. A loan is often administered by a bank or other financial institution (the lender) that acts as agent for all holders. The agent administers the terms of the loan, as specified in the loan agreement. The Fund may invest in multiple series or tranches of a loan, which may have varying terms and carry different associated risks. When the Fund purchases assignments from lenders, it acquires direct rights against the borrower of the loan. When investing in a loan participation, the Fund has the right to receive payments of principal, interest and any fees to which it is entitled only from the lender selling the loan agreement and only upon receipt of such payments by the lender from the borrower. The Fund generally has no right to enforce compliance by the borrower with the terms of the loan agreement. As a result, the Fund may be subject to the credit risk of both the borrower and the lender that is issuing the participation interest.
F Unfunded Loan Commitments — The Fund may enter into certain loan agreements all or a portion of which may be unfunded. The Fund is obligated to fund these commitments at the borrower’s discretion. These commitments, if any, are disclosed in the accompanying Schedule of Investments.
G Futures Contracts — The Fund may enter into futures contracts to buy or sell a financial instrument for a set price at a future date. Initial margin deposits of either cash or securities as required by the broker are made upon entering into the contract. While the contract is open, daily variation margin payments are made to or received from the broker reflecting the daily change in market value of the contract and are recorded for financial reporting purposes as unrealized gains or losses by the Fund. When a futures contract is closed, a realized gain or loss is recorded equal to the difference between the opening and closing value of the contract. The risks associated with entering into futures contracts may include the possible illiquidity of the secondary market which would limit the Fund’s ability to close out a futures contract prior to the settlement date, an imperfect correlation between the value of the contracts and the underlying financial instruments, or that the counterparty will fail to perform its obligations under the contracts’ terms. Futures contracts are designed by boards of trade, which are designated “contracts markets” by the Commodities Futures Trading Commission. Futures contracts trade on the contracts markets in a manner that is similar to the way a stock trades on a stock exchange, and the boards of trade, through their clearing corporations, guarantee the futures contracts against default. As a result, there is minimal counterparty credit risk to the Fund.
H Restricted Securities — The Fund may invest in securities that are subject to legal or contractual restrictions on resale. Generally, these securities may only be sold publicly upon registration under the Securities Act of 1933 or in transactions exempt from such registration. Information regarding restricted securities (excluding Rule 144A securities) is included at the end of the Schedule of Investments.
I Distributions to Shareholders — Distributions to shareholders are recorded by the Fund onex-dividend date. The Fund distributes any net investment income and net realized capital gains at least annually. Both types of distributions are made in shares of the Fund unless an election is made on behalf of a separate account to receive some or all of the distributions in cash. Distributions are declared separately for each class of shares. Distributions are determined in accordance with income tax regulations which may differ from U.S. GAAP; accordingly, periodic reclassifications are made within theFund’s capital accounts to reflect income and gains available for distribution under income tax regulations.
J Estimates — The preparation of financial statements in conformity with U.S. GAAP requires management to make estimates and assumptions that affect the reported amounts of assets and liabilities and disclosure of contingent assets and liabilities at the date of the financial statements and the reported amounts of increases and decreases in net assets from operations during the reporting period. Actual results could differ from those estimates.
K Indemnifications — The Corporation’sBy-Laws provide for indemnification for Directors or officers of the Corporation and certain other parties, to the fullest extent permitted by Maryland law and the 1940 Act, provided certain conditions are met. Additionally, in the normal course of business, the Fund enters into agreements with service providers that may contain indemnification clauses. The Fund’s maximum exposure under these arrangements is unknown as this would involve future claims that may be made against the Fund that have not yet occurred.
L Federal Income Taxes — No provision for federal income or excise tax is required since the Fund intends to continue to qualify as a regulated investment company under the Internal Revenue Code and to distribute substantially all of its taxable earnings.
Management has analyzed the Fund’stax positions taken for all open federal income tax years and has concluded that no provision for federal income tax is required in the Fund’s financial statements. A Fund’s federal tax return is subject to examination by the Internal Revenue Service for a period of three years from the date of filing.
M When-Issued Securities and Delayed Delivery Transactions — The Fund may purchase or sell securities on a delayed delivery, when-issued or forward commitment basis, including TBA (To Be Announced) securities. Payment and delivery may take place after the customary settlement period for that security. At the time the transaction is negotiated, the price of the security that will be delivered is fixed. The Fund maintains cash and/or security positions for these commitments such that sufficient liquid assets will be available to make payments upon settlement. Securities purchased on a delayed delivery, when-issued or forward commitment basis aremarked-to-market daily and begin earning interest on settlement date. Losses may arise due to changes in the market value of the underlying securities or if the counterparty does not perform under the contract. A forward purchase or sale commitment may be closed by entering into an offsetting commitment or delivery of securities. The Fund will realize a gain or loss on investments based on the price established when the Fund entered into the commitment.
| 25 |
Table of Contents
Calvert
VP SRI Balanced Portfolio
December 31, 2019
Notes to Financial Statements — continued
2 Related Party Transactions
The investment advisory fee is earned by Calvert Research and Management (CRM), a subsidiary of Eaton Vance Management (EVM), as compensation for investment advisory services rendered to the Fund. Pursuant to the investment advisory agreement, CRM receives a fee, payable monthly, at the following annual rates of the Fund’s average daily net assets: 0.41% on the first $500 million, 0.36% on the next $500 million, and 0.325% on the excess of $1 billion. For the year ended December 31, 2019, the investment advisory fee amounted to $1,378,386 or 0.41% of the Fund’s average daily net assets.
CRM has agreed to reimburse the Fund’s operating expenses to the extent that total annual operating expenses (relating to ordinary operating expenses only and excluding expenses such as brokerage commissions, acquired fund fees and expenses of unaffiliated funds, borrowing costs, taxes or litigation expenses) exceed 0.70% and 0.95% (0.70% and 1.07% prior to May 1, 2019) for Class I and Class F, respectively, of such class’ average daily net assets. The expense reimbursement agreement with CRM may be changed or terminated after April 30, 2020. Pursuant to this agreement, no operating expenses were waved or reimbursed for the year ended December 31, 2019.
The administrative fee is earned by CRM as compensation for administrative services rendered to the Fund. The fee is computed at an annual rate of 0.12% of the Fund’s average daily net assets attributable to Class I and Class F and is payable monthly. For the year ended December 31, 2019, CRM was paid administrative fees of $403,430.
The Fund has in effect a distribution plan for Class F shares (Class F Plan) pursuant to Rule12b-1 under the 1940 Act. Pursuant to the Class F Plan, the Fund pays Eaton Vance Distributors, Inc. (EVD), an affiliate of CRM and the Fund’s principal underwriter, a distribution and service fee of 0.25% per annum of its average daily net assets attributable to Class F shares for distribution services and facilities provided to the Fund, as well as for personal and/or account maintenance services provided to the class shareholders. Distribution and service fees paid or accrued for the year ended December 31, 2019 amounted to $8,439 for Class F shares.
EVM providessub-transfer agency and related services to the Fund pursuant to aSub-Transfer Agency Support Services Agreement. For the year ended December 31, 2019,sub-transfer agency fees and expenses incurred to EVM amounted to $723 and are included in transfer agency fees and expenses on the Statement of Operations.
Each Director of the Fund who is not an employee of CRM or its affiliates receives a fee of $3,000 for each Board meeting attended in person and $2,000 for each Board meeting attended by phone plus an annual fee of $142,000, and $1,500 for each Committee meeting attended in person and $1,000 for each Committee meeting attended by phone plus an annual Committee fee of $2,500. The Board chair receives an additional $20,000 annual retainer and Committee chairs receive an additional $6,000 annual retainer. Eligible Directors may participate in a Deferred Compensation Plan (the Plan). Amounts deferred under the Plan are treated as though equal dollar amounts had been invested in shares of the Fund or other Calvert funds selected by the Directors. The Fund purchases shares of the funds selected equal to the dollar amounts deferred under the Plan, resulting in an asset equal to the deferred compensation liability. Obligations of the Plan are paid solely from the Fund’s assets. Directors’ fees are allocated to each of the Calvert funds served. Salaries and fees of officers and Directors of the Fund who are employees of CRM or its affiliates are paid by CRM. In addition, an advisory council was established to aid the Board and CRM in advancing the cause of responsible investing through original scholarship and thought leadership. The advisory council consists of CRM’s Chief Executive Officer and four additional members. Each member (other than CRM’s Chief Executive Officer) receives annual compensation of $75,000, which is being reimbursed by Calvert Investment Management, Inc. (CIM), the Calvert funds’ former investment adviser and Ameritas Holding Company, CIM’s parent company, through the end of 2019. For the year ended December 31, 2019, the Fund’s allocated portion of such expense and reimbursement was $7,667, which are included in miscellaneous expense and reimbursement of expenses - other, respectively, on the Statement of Operations.
3 Shareholder Servicing Plan
The Corporation, on behalf of the Fund, has adopted a Shareholder Servicing Plan (Servicing Plan), which permits the Fund to enter into shareholder servicing agreements with intermediaries that maintain accounts in the Fund for the benefit of shareholders. These services may include, but are not limited to, processing purchase and redemption requests, processing dividend payments, and providing account information to shareholders. Under the Servicing Plan, the Fund may make payments at an annual rate of up to 0.11% of its average daily net assets. For the year ended December 31, 2019, expenses incurred under the Servicing Plan amounted to $24,682 and are included in transfer agency fees and expenses on the Statement of Operations.
4 Investment Activity
During the year ended December 31, 2019, the cost of purchases and proceeds from sales of investments, other than U.S. government and agency securities and short-term securities, and including maturities, paydowns and principal repayments on floating rate loans, were $160,842,360 and $171,143,966,respectively. Purchases and sales of U.S. government and agency securities, including paydowns, were $81,204,458 and $59,909,530, respectively.
| 26 |
Table of Contents
Calvert
VP SRI Balanced Portfolio
December 31, 2019
Notes to Financial Statements — continued
5 Distributions to Shareholders and Income Tax Information
The tax character of distributions declared for the years ended December 31, 2019 and December 31, 2018 was as follows:
| Year Ended December 31, | ||||||||
| 2019 | 2018 | |||||||
Ordinary income | $ | 6,318,568 | $ | 15,628,154 | ||||
Long-term capital gains | $ | 11,201,098 | $ | 19,353,794 | ||||
As of December 31, 2019, the components of distributable earnings (accumulated loss) on a tax basis were as follows:
Undistributed ordinary income | $ | 10,108,388 | ||
Undistributed long-term capital gains | $ | 7,278,575 | ||
Net unrealized appreciation | $ | 54,862,008 | ||
The cost and unrealized appreciation (depreciation) of investments, including open derivative contracts, of the Fund at December 31, 2019, as determined on a federal income tax basis, were as follows:
Aggregate cost | $ | 319,723,387 | ||
Gross unrealized appreciation | $ | 56,356,928 | ||
Gross unrealized depreciation | (1,494,942 | ) | ||
Net unrealized appreciation | $ | 54,861,986 | ||
6 Financial Instruments
A summary of futures contracts outstanding at December 31, 2019 is included in the Schedule of Investments. During the year ended December 31, 2019, the Fund used futures contracts to hedge interest rate risk and to manage duration.
At December 31, 2019, the fair value of open derivative instruments (not considered to be hedging instruments for accounting disclosure purposes) and whose primary underlying risk exposure is interest rate risk was as follows:
| Derivative | Statement of Assets and Liabilities Caption | Assets | Liabilities | |||||||||
Futures contracts | Distributable earnings | $ | 156,079 | (1) | $ | (279,126 | )(1) | |||||
| (1) | Only the current day’s variation margin is reported within the Statement of Assets and Liabilities as Receivable or Payable for variation margin on open futures contracts, as applicable. |
The effect of derivative instruments (not considered to be hedging instruments for accounting disclosure purposes) on the Statement of Operations and whose primary underlying risk exposure is interest rate risk for the year ended December 31, 2019 was as follows:
| Statement of Operations Caption | ||||||
| Derivative | Net realized gain (loss) on futures contracts | Change in unrealized appreciation (depreciation) on futures contracts | ||||
Futures contracts | $1,655,908 | $ | (702,903 | ) | ||
The average notional cost of futures contracts (long) and futures contracts (short) outstanding during the year ended December 31, 2019 was approximately $17,828,000 and $8,814,000 respectively.
| 27 |
Table of Contents
Calvert
VP SRI Balanced Portfolio
December 31, 2019
Notes to Financial Statements — continued
7 Securities Lending
To generate additional income, the Fund may lend its securities pursuant to a securities lending agency agreement with State Street Bank and Trust Company (SSBT), the securities lending agent. Security loans are subject to termination by the Fund at any time and, therefore, are not considered illiquid investments. The Fund requires that the loan be continuously collateralized by either cash or securities as collateral equal at all times to at least 102% of the market value of the domestic securities loaned and 105% of the market value of the international securities loaned (if applicable). The market value of securities loaned is determined daily and any additional required collateral is delivered to the Fund on the next business day. Cash collateral is generally invested in a money market fund registered under the 1940 Act that is managed by an affiliate of SSBT. Any gain or loss in the market price of the loaned securities that might occur and any interest earned or dividends declared during the term of the loan would accrue to the account of the Fund. Income earned on the investment of collateral, net of broker rebates and other expenses incurred by the securities lending agent, is split between the Fund and the securities lending agent on the basis of agreed upon contractual terms.Non-cash collateral, if any, is held by the lending agent on behalf of the Fund and cannot be sold orre-pledged by the Fund; accordingly, such collateral is not reflected in the Statement of Assets and Liabilities.
The risks associated with lending portfolio securities include, but are not limited to, possible delays in receiving additional collateral or in the recovery of the loaned securities, possible loss of rights to the collateral should the borrower fail financially, as well as risk of loss in the value of the collateral or the value of the investments made with the collateral. The securities lending agent shall indemnify the Fund in the case of default of any securities borrower.
At December 31, 2019, the total value of securities on loan, including accrued interest, was $1,001,415 and the total value of collateral received was $1,022,630, comprised of cash of $932,685 and U.S. government and/or agencies securities of $89,945.
The following table provides a breakdown of securities lending transactions accounted for as secured borrowings, the obligations by class of collateral pledged, and the remaining contractual maturity of those transactions as of December 31, 2019.
| Remaining Contractual Maturity of the Transactions | ||||||||||||||||||||
| Overnight and Continuous | <30 days | 30 to 90 days | >90 days | Total | ||||||||||||||||
Securities Lending Transactions | ||||||||||||||||||||
Corporate Bonds | $ | 1,022,630 | $ | — | $ | — | $ | — | $ | 1,022,630 | ||||||||||
The carrying amount of the liability for deposits for securities loaned at December 31, 2019 approximated its fair value. If measured at fair value, such liability would have been considered as Level 2 in the fair value hierarchy (see Note 1A) at December 31, 2019.
8 Line of Credit
Effective October 29, 2019, the Fund participates with other portfolios and funds managed by EVM and its affiliates, including CRM, in an $800 million unsecured line of credit with a group of banks, which is in effect through October 27, 2020. Borrowings are made by the Fund solely to facilitate the handling of unusual and/or unanticipated short-term cash requirements. Interest is charged to the Fund based on its borrowings at an amount above either the Eurodollar rate or Federal Funds rate. In addition, a fee computed at an annual rate of 0.15% on the daily unused portion of the line of credit is allocated among the participating portfolios and funds at the end of each quarter. Because the line of credit is not available exclusively to the Fund, it may be unable to borrow some or all of its requested amounts at any particular time.
Prior to October 29, 2019, the Fund participated with other funds managed by CRM in a $100 million ($62.5 million prior to June 21, 2019) committed line of credit agreement with SSBT, which was terminated by the Calvert funds. Borrowings bore interest at the higher of theone-month London Interbank Offered Rate (LIBOR) in effect that day or the overnight Federal Funds rate, plus 1.00% per annum. A commitment fee of 0.20% per annum was incurred on the unused portion of the committed facility, which was allocated to all participating funds.
The Fund had no borrowings outstanding pursuant to its lines of credit at December 31, 2019. The Fund did not have any significant borrowings or allocated fees during the year ended December 31, 2019.
9 Capital Shares
The Corporation may issue its shares in one or more series (such as the Fund). The authorized shares of the Fund consist of 500,000,000 common shares, $0.01 par value, for each Class.
| 28 |
Table of Contents
Calvert
VP SRI Balanced Portfolio
December 31, 2019
Notes to Financial Statements — continued
Transactions in capital shares for the years ended December 31, 2019 and December 31, 2018 were as follows:
| Year Ended December 31, 2019 | Year Ended December 31, 2018 | |||||||||||||||
| Shares | Amount | Shares | Amount | |||||||||||||
Class I | ||||||||||||||||
Shares sold | 12,781,947 | $ | 28,405,842 | 6,969,839 | $ | 15,217,053 | ||||||||||
Reinvestment of distributions | 8,057,911 | 17,324,508 | 16,473,223 | 34,758,500 | ||||||||||||
Shares redeemed | (15,289,150 | ) | (33,411,122 | ) | (18,490,423 | ) | (40,625,543 | ) | ||||||||
Net increase | 5,550,708 | $ | 12,319,228 | 4,952,639 | $ | 9,350,010 | ||||||||||
Class F | ||||||||||||||||
Shares sold | 1,299,569 | $ | 2,854,861 | 430,811 | $ | 982,569 | ||||||||||
Reinvestment of distributions | 90,351 | 195,158 | 105,400 | 223,448 | ||||||||||||
Shares redeemed | (186,707 | ) | (414,655 | ) | (238,454 | ) | (519,990 | ) | ||||||||
Net increase | 1,203,213 | $ | 2,635,364 | 297,757 | $ | 686,027 | ||||||||||
At December 31, 2019, separate accounts of three insurance companies each owned more than 10% of the value of the outstanding shares of the Fund, aggregating 75.6%.
| 29 |
Table of Contents
Calvert
VP SRI Balanced Portfolio
December 31, 2019
Report of Independent Registered Public Accounting Firm
To the Shareholders and Board of Directors
Calvert Variable Series, Inc.:
Opinion on the Financial Statements
We have audited the accompanying statement of assets and liabilities of Calvert VP SRI Balanced Portfolio (the Fund), a series of Calvert Variable Series Inc., including the schedule of investments, as of December 31, 2019, the related statement of operations for the year then ended, the statements of changes in net assets for each of the years in thetwo-year period then ended, and the related notes (collectively, the financial statements) and the financial highlights for each of the years in thefive-year period then ended. In our opinion, the financial statements and financial highlights present fairly, in all material respects, the financial position of the Fund as of December 31, 2019, the results of its operations for the year then ended, the changes in its net assets for each of the years in thetwo-year period then ended, and the financial highlights for each of the years in thefive-year period then ended, in conformity with U.S. generally accepted accounting principles.
Basis for Opinion
These financial statements and financial highlights are the responsibility of the Fund’s management. Our responsibility is to express an opinion on these financial statements and financial highlights based on our audits. We are a public accounting firm registered with the Public Company Accounting Oversight Board (United States) (PCAOB) and are required to be independent with respect to the Fund in accordance with the U.S. federal securities laws and the applicable rules and regulations of the Securities and Exchange Commission and the PCAOB.
We conducted our audits in accordance with the standards of the PCAOB. Those standards require that we plan and perform the audit to obtain reasonable assurance about whether the financial statements and financial highlights are free of material misstatement, whether due to error or fraud. Our audits included performing procedures to assess the risks of material misstatement of the financial statements and financial highlights, whether due to error or fraud, and performing procedures that respond to those risks. Such procedures included examining, on a test basis, evidence regarding the amounts and disclosures in the financial statements and financial highlights. Such procedures also included confirmation of securities owned as of December 31, 2019, by correspondence with the custodian, brokers, and agent banks. Our audits also included evaluating the accounting principles used and significant estimates made by management, as well as evaluating the overall presentation of the financial statements and financial highlights. We believe that our audits provide a reasonable basis for our opinion.

We have served as the auditor of one or more of the Calvert Funds since 2002.
Philadelphia, Pennsylvania
February 19, 2020
| 30 |
Table of Contents
Calvert
VP SRI Balanced Portfolio
December 31, 2019
Federal Tax Information (Unaudited)
As required by the Internal Revenue Code and/or regulations, shareholders must be notified regarding the status of the dividends received deduction for corporations and capital gains dividends.
Dividends Received Deduction.Corporate shareholders are generally entitled to take the dividends received deduction on the portion of the Fund’s dividend distribution that qualifies under tax law. For the Fund’s fiscal 2019 ordinary income dividends, 42.35% qualifies for the corporate dividends received deduction.
Capital Gains Dividends.The Fund hereby designates as a capital gain dividend with respect to the taxable year ended December 31, 2019, $7,288,473 or, if subsequently determined to be different, the net capital gain of such year.
| 31 |
Table of Contents
Calvert
VP SRI Balanced Portfolio
December 31, 2019
Fund Management.The Directors of Calvert Variable Series, Inc. (the Corporation) are responsible for the overall management and supervision of the Corporation’s affairs. The Directors and officers of the Corporation are listed below. Except as indicated, each individual has held the office shown or other offices in the same company for the last five years. Each Board member holds office until his or her successor is elected and qualified, or until his or her earlier death, resignation, retirement, removal or disqualification. Under the terms of the Fund’s current Board member retirement policy, an Independent Board member must retire at the end of the calendar year in which he or she turns 75. However, if such retirement would cause the Fund to be out of compliance with Section 16 of the 1940 Act or any other regulations or guidance of the SEC, then such retirement and resignation will not become effective until such time as action has been taken for the Fund to be in compliance upon a Board member’s retirement. The “Independent Directors” consist of those Directors who are not “interested persons” of the Corporation, as that term is defined under the 1940 Act. The business address of each Director and officer, with the exception of Ms. Gemma and Mr. Kirchner, is 1825 Connecticut Avenue NW, Suite 400, Washington, DC 20009. As used below, “CRM” refers to Calvert Research and Management. Each Director oversees 39 funds in the Calvert fund complex. Each officer serves as an officer of certain other Calvert funds.
| Name and Year of Birth | Position with the | Position Start Date | Principal Occupation(s) and Directorships During Past Five Years and Other Relevant Experience | |||
| Interested Director | ||||||
John H. Streur(1) 1960 | Director and President | 2015 | President and Chief Executive Officer of Calvert Research and Management (since December 31, 2016). President and Chief Executive Officer of Calvert Investments, Inc. (January 2015-December 2016); Chief Executive Officer of Calvert Investment Distributors, Inc. (August 2015-December 2016); Chief Compliance Officer of Calvert Investment Management, Inc. (August 2015-April 2016); President and Director, Portfolio 21 Investments, Inc. (through October 2014); President, Chief Executive Officer and Director, Managers Investment Group LLC (through January 2012); President and Director, The Managers Funds and Managers AMG Funds (through January 2012). Other Directorships in the Last Five Years.Portfolio 21 Investments, Inc. (asset management) (through October 2014); Managers Investment Group LLC (asset management) (through January 2012); The Managers Funds (asset management) (through January 2012); Managers AMG Funds (asset management) (through January 2012); Calvert Impact Capital, Inc. | |||
| Independent Directors | ||||||
Richard L. Baird, Jr. 1948 | Director | 2016 | Regional Disaster Recovery Lead, American Red Cross of Greater Pennsylvania (since 2017). Volunteer, American Red Cross (since 2015). Former President and CEO of Adagio Health Inc. (retired in 2014) in Pittsburgh, PA. Other Directorships in the Last Five Years. None. | |||
Alice Gresham Bullock 1950 | Chair and Director | 2016 (Chair); 1999 (Director) | Professor Emerita at Howard University School of Law. Dean Emerita of Howard University School of Law and Deputy Director of the Association of American Law Schools (1992-1994). Other Directorships in the Last Five Years. None. | |||
Cari M. Dominguez 1949 | Director | 2016 | Former Chair of the U.S. Equal Employment Opportunity Commission. Other Directorships in the Last Five Years. Manpower, Inc. (employment agency); Triple S Management Corporation (managed care); National Association of Corporate Directors. | |||
John G. Guffey, Jr.(2) 1948 | Director | 2016 | President of Aurora Press Inc., a privately held publisher of trade paperbacks (since January 1997). Other Directorships in the Last Five Years. Calvert Impact Capital, Inc. (through December 31, 2018); Calvert Ventures, LLC. | |||
Miles D. Harper, III 1962 | Director | 2016 | Partner, Carr Riggs & Ingram (public accounting firm) since October 2014. Partner, Gainer Donnelly & Desroches (public accounting firm) (now Carr Riggs & Ingram), November 1999-September 2014). Other Directorships in the Last Five Years.Bridgeway Funds (9) (asset management). | |||
| 32 |
Table of Contents
Calvert
VP SRI Balanced Portfolio
December 31, 2019
Management and Organization — continued
| Name and Year of Birth | Position with the | Position Start Date | Principal Occupation(s) and Directorships During Past Five Years and Other Relevant Experience | |||
| Independent Directors (continued) | ||||||
Joy V. Jones 1950 | Director | 2016 | Attorney. Other Directorships in the Last Five Years.Conduit Street Restaurants SUD 2 Limited; Palm Management Restaurant Corporation. | |||
Anthony A. Williams 1951 | Director | 2016 | CEO and Executive Director of the Federal City Council (July 2012 to present); Senior Adviser and Independent Consultant for King and Spalding LLP (September 2015 to present); Executive Director of Global Government Practice at the Corporate Executive Board (January 2010 to January 2012). Other Directorships in the Last Five Years. Freddie Mac; Evoq Properties/Meruelo Maddux Properties, Inc. (real estate management); Weston Solutions, Inc. (environmental services); Bipartisan Policy Center’s Debt Reduction Task Force; Chesapeake Bay Foundation; Catholic University of America; Urban Institute (research organization). | |||
| Name and Year of Birth | Position(s) with the Corporation | Position Start Date | Principal Occupation(s) During Past Five Years | |||
| Principal Officers who are not Directors | ||||||
Hope L. Brown 1973 | Chief Compliance Officer | 2014 | Chief Compliance Officer of 39 registered investment companies advised by CRM (since 2014). Vice President and Chief Compliance Officer, Wilmington Funds (2012-2014). | |||
Maureen A. Gemma(3) 1960 | Vice President, Secretary and Chief Legal Officer | 2016 | Vice President of CRM and officer of 39 registered investment companies advised by CRM (since 2016). Also Vice President of Eaton Vance and certain of its affiliates and officer of 159 registered investment companies advised or administered by Eaton Vance. | |||
James F. Kirchner(3) 1967 | Treasurer | 2016 | Vice President of CRM and officer of 39 registered investment companies advised by CRM (since 2016). Also Vice President of Eaton Vance and certain of its affiliates and officer of 159 registered investment companies advised or administered by Eaton Vance. | |||
| (1) | Mr. Streur is an interested person of the Fund because of his positions with the Fund’s adviser and certain affiliates. |
| (2) | Mr. Guffey is currently married to Rebecca L. Adamson, who served as a member of the Advisory Council through December 31, 2019. |
| (3) | The business address for Ms. Gemma and Mr. Kirchner is Two International Place, Boston, MA 02110. |
The SAI for the Fund includes additional information about the Directors and officers of the Fund and can be obtained without charge on Calvert’s website at www.calvert.com or by calling1-800-368-2745.
| 33 |
Table of Contents
Calvert Funds
Privacy. The Eaton Vance organization is committed to ensuring your financial privacy. Each entity listed below has adopted a privacy policy and procedures (“Privacy Program”) Eaton Vance believes is reasonably designed to protect your personal information and to govern when and with whom Eaton Vance may share your personal information.
| • | At the time of opening an account, Eaton Vance generally requires you to provide us with certain information such as name, address, social security number, tax status, account numbers, and account balances. This information is necessary for us to both open an account for you and to allow us to satisfy legal requirements such as applicable anti-money laundering reviews and know-your-customer requirements. |
| • | On an ongoing basis, in the normal course of servicing your account, Eaton Vance may share your information with unaffiliated third parties that perform various services for Eaton Vance and/or your account. These third parties include transfer agents, custodians, broker/dealers and our professional advisers, including auditors, accountants, and legal counsel. Eaton Vance may additionally share your personal information with our affiliates. |
| • | We believe our Privacy Program is reasonably designed to protect the confidentiality of your personal information and to prevent unauthorized access to that information. |
| • | We reserve the right to change our Privacy Program at any time upon proper notification to you. You may want to review our Privacy Program periodically for changes by accessing the link on our homepage: www.eatonvance.com. |
Our pledge of protecting your personal information applies to the following entities within the Eaton Vance organization: the Eaton Vance Family of Funds, Eaton Vance Management, Eaton Vance Investment Counsel, Eaton Vance Distributors, Inc., Eaton Vance Trust Company, Eaton Vance Management (International) Limited, Eaton Vance Advisers International Limited, Eaton Vance Global Advisors Limited, Eaton Vance Management’s Real Estate Investment Group, Boston Management and Research, Calvert Research and Management, and Calvert Funds. This Privacy Notice supersedes all previously issued privacy disclosures. For more information about our Privacy Program or about how your personal information may be used, please call 1-800-368-2745.
Delivery of Shareholder Documents. The Securities and Exchange Commission (SEC) permits funds to deliver only one copy of shareholder documents, including prospectuses, proxy statements and shareholder reports, to fund investors with multiple accounts at the same residential or post office box address. This practice is often called “householding” and it helps eliminate duplicate mailings to shareholders.Calvert funds, or your financial intermediary, may household the mailing of your documents indefinitely unless you instruct Calvert funds, or your financial intermediary, otherwise. If you would prefer that your Calvert fund documents not be householded, please contact Calvert funds at1-800-368-2745, or contact your financial intermediary. Your instructions that householding not apply to delivery of your Calvert fund documents will typically be effective within 30 days of receipt by Calvert funds or your financial intermediary. Separate statements will be generated for each separate account and will be householded as described above.
Portfolio Holdings. Each Calvert fund files a schedule of portfolio holdings on Part F to FormN-PORT with the SEC for the first and third quarters of each fiscal year. The FormN-PORT will be available on the Calvert funds’ website at www.calvert.com, by calling Calvert funds at1-800-368-2745 or in the EDGAR database on the SEC’s website at www.sec.gov.
Proxy Voting. The Proxy Voting Guidelines that each Calvert fund uses to determine how to vote proxies relating to portfolio securities is provided as an Appendix to the fund’s Statement of Additional Information. The Statement of Additional Information can be obtained free of charge by calling the Calvert funds at1-800-368-2745, by visiting the Calvert funds’ website at www.calvert.com or visiting the SEC’s website at www.sec.gov. Information regarding how a Calvert fund voted proxies relating to portfolio securities during the most recent12-month period ended June 30 is available by calling Calvert funds, by visiting the Calvert funds’ website at www.calvert.com or by visiting the SEC’s website at www.sec.gov.
| 34 |
Table of Contents
This Page Intentionally Left Blank
Table of Contents
This Page Intentionally Left Blank
Table of Contents
Investment Adviser and Administrator
Calvert Research and Management
1825 Connecticut Avenue NW, Suite 400
Washington, DC 20009
Principal Underwriter*
Eaton Vance Distributors, Inc.
Two International Place
Boston, MA 02110
(617)482-8260
Custodian
State Street Bank and Trust Company
State Street Financial Center, One Lincoln Street
Boston, MA 02111
Transfer Agent
DST Asset Manager Solutions, Inc.
2000 Crown Colony Drive
Quincy, MA 02169
Independent Registered Public Accounting Firm
KPMG LLP
1601 Market Street
Philadelphia, PA 19103-2499
Fund Offices
1825 Connecticut Avenue NW, Suite 400
Washington, DC 20009
| * | FINRA BrokerCheck. Investors may check the background of their Investment Professional by contacting the Financial Industry Regulatory Authority (FINRA). FINRA BrokerCheck is a free tool to help investors check the professional background of current and former FINRA-registered securities firms and brokers. FINRA BrokerCheck is available by calling1-800-289-9999 and at www.FINRA.org. The FINRA BrokerCheck brochure describing this program is available to investors at www.FINRA.org. |
Table of Contents
Printed on recycled paper.

24217 12.31.19
Table of Contents

Calvert
VP SRI Mid Cap Portfolio
Annual Report
December 31, 2019
Important Note. Beginning on January 1, 2021, as permitted by regulations adopted by the Securities and Exchange Commission, you may not receive paper copies of the Fund’s annual and semi-annual shareholder reports from the insurance company or plan sponsor unless you specifically request paper copies. Instead, the reports will be made available on a website and you will be notified by mail each time a report is posted and provided with a website address to access the report. Instructions for requesting paper copies will be provided by the insurance company, plan sponsor or your financial intermediary, as applicable. Please contact the insurance company, plan sponsor or your financial intermediary, as applicable, or follow instructions included with this disclosure, if any, for more information.

Table of Contents
Commodity Futures Trading Commission Registration. Effective December 31, 2012, the Commodity Futures Trading Commission (“CFTC”) adopted certain regulatory changes that subject registered investment companies and advisers to regulation by the CFTC if a fund invests more than a prescribed level of its assets in certain CFTC-regulated instruments (including futures, certain options and swap agreements) or markets itself as providing investment exposure to such instruments. The Fund and its adviser have claimed an exclusion from the definition of the term “commodity pool operator” under the Commodity Exchange Act. Accordingly, neither the Fund nor the adviser is subject to CFTC regulation.
Fund shares are not insured by the FDIC and are not deposits or other obligations of, or guaranteed by, any depository institution. Shares are subject to investment risks, including possible loss of principal invested.
This report must be preceded or accompanied by a current summary prospectus or prospectus. Before investing, investors should consider carefully the investment objective, risks, and charges and expenses of a mutual fund. This and other important information is contained in the summary prospectus and prospectus, which can be obtained from a financial intermediary. Prospective investors should read the prospectus carefully before investing. For further information, please call1-800-368-2745.
Table of Contents
Annual Report December 31, 2019
Calvert
VP SRI Mid Cap Portfolio
Table of Contents
Calvert
VP SRI Mid Cap Portfolio
December 31, 2019
Management’s Discussion of Fund Performance1
Economic and Market Conditions
With virtually every U.S. equity index posting strong double-digit returns for the12-month period ended December 31, 2019 — and bond markets solidly in the black as well — 2019 was a good year for investments.
As the new year dawned in January 2019, investors appeared to be taking a “glass is half full” approach. Although U.S. manufacturing output and business investment remained weak — held back by slowing global growth and anon-again/off-again U.S.-China trade war — strong spending by U.S. consumers and dovish remarks by the U.S. Federal Reserve (the Fed) combined to lift investor sentiment. After four federal funds rate hikes the previous year, markets began to project the Fed might actually lower rates in 2019 to stimulate the economy. U.S. unemployment, meanwhile, remained low and hiring remained strong.
As a result, U.S. stocks across multiple markets climbed from January through April 2019. Overseas, central banks around the world began to cut interest rates and employ other tools to stimulate their respective economies. Even a global stock pullback in May — sparked by heightened concerns about the U.S.-China trade spat — proved to be temporary, and the U.S. and global stock rallies resumed in June and July.
After holding interest rates steady through the first half of the year, the Fed cut the federal funds rate on July 31, 2019 — its first reduction in over a decade — followed by two additional rate cuts in September and October to end the period at1.50%-1.75%. By end of the third quarter, 60 central banks around the world had lowered their interest rates as well.
After falling in August, U.S. equities rallied again during the final months of the period, spurred by optimism about a U.S.-China trade détente and better-than-expected U.S. employment reports. The year ended with two events in December that did much to allay investor concerns about international trade and tariffs: passage of the United States-Mexico-Canada Agreement by the U.S. House of Representatives and the Trump administration’s agreement to aso-called “phase–one” trade deal with China.
During the12-month period ended December 31, 2019, the blue-chip Dow Jones Industrial Average®2 returned 25.34%, while the broader U.S. equity market, as measured by the S&P 500® Index, returned 31.49%. The technology-laden Nasdaq Composite Index returned 36.69% during the period.Large-cap U.S. stocks, as measured by the S&P 500® Index, generally outperformed theirsmall-cap counterparts, as measured by the Russell 2000® Index. As a group, growth stocks outpaced value stocks in both large- andsmall-cap categories, as measured by the Russell growth and value indexes.
Fund Performance
For the12-month period ended December 31, 2019, Calvert VP SRI Mid Cap Portfolio (the Fund) returned 31.36% at net asset value (NAV), outperforming its benchmark, the Russell Midcap® Index (the Index), which returned 30.54%.
Stock selections contributed to outperformance relative to the Index and were particularly strong in the materials, utilities, and financials sectors. Stock selections in the health care, communication services, and consumer staples sectors detracted from returns relative to the Index.
Ball Corp., one of the world’s leading suppliers of metal packaging to the beverage, personal care, and household products industries, was a strong contributor as demand for aluminum beverage cans grew globally.
Skyworks Solutions, Inc., a semiconductor manufacturer with a strong position in the smartphone market, was also a top performer during the period. The company proficiently executed its strategy and demand for 5G technology was robust throughout the year.
Ulta Beauty, Inc., a leader in the beauty products industry, made a positive contribution as consumer spending led to strong earnings growth in the fourth quarter of 2018 and investors rewarded the company’s ability to expand gross margins. The Fund sold the stock before the company reported lower-than-expected, second-quarter earnings and lowered guidance in August, reversing the strong start to the year.
Eventbrite, Inc., a provider of online ticketing, event hosting, organization, promotion, and advertising, detracted from returns relative to the Index. The company’s stock price was weakened by mixed earnings reports and continuing problems with the integration of Ticketfly, which Eventbrite acquired in 2017. Byperiod-end, the stock was sold from the Fund.
ICU Medical, Inc., a medical device company specializing in vascular therapy and critical care applications, also detracted. Management significantly reduced margin guidance, largely as a result of setbacks in the company’s IV solutions business. Byperiod-end, the stock was sold from the Fund.
Central Garden & Pet Co., a provider of branded private label products for lawns, gardens, and pets, further weighed on returns. Its stock price fell after softness in its pet business led the company to reduce its earnings guidance for fiscal year 2019. Byperiod-end, the stock was sold from the Fund.
See Endnotes and Additional Disclosures in this report.
Past performance is no guarantee of future results. Returns are historical and are calculated by determining the percentage change in net asset value (NAV) or offering price (as applicable) with all distributions reinvested. Investment return and principal value will fluctuate so that shares, when redeemed, may be worth more or less than their original cost. Performance for periods less than or equal to one year is cumulative. Performance is for the stated time period only; due to market volatility, current Fund performance may be lower or higher than the quoted return.
| 2 |
Table of Contents
Calvert
VP SRI Mid Cap Portfolio
December 31, 2019
Portfolio Manager Charles B. Gaffney of Calvert Research and Management
| % Average Annual Total Returns 2,3 | Inception Date | Performance Inception Date | One Year | Five Years | Ten Years | |||||||||||||||
Fund at NAV | 07/16/1991 | 07/16/1991 | 31.36 | % | 7.77 | % | 12.35 | % | ||||||||||||
| ||||||||||||||||||||
Russell Midcap® Index | — | — | 30.54 | % | 9.33 | % | 13.19 | % | ||||||||||||
| % Total Annual Operating Expense Ratios 4 | ||||||||||||||||||||
| Gross | 1.01 | % | ||||||||||||||||||
| Net | 0.99 | |||||||||||||||||||
Growth of $10,000
This graph shows the change in value of a hypothetical investment of $10,000 in the Fund for the period indicated. For comparison, the same investment is shown in the indicated index.
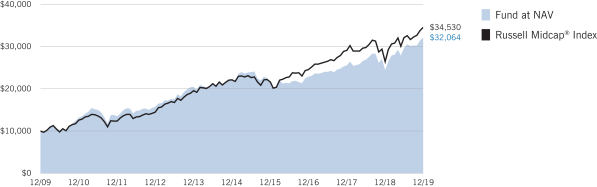
See Endnotes and Additional Disclosures in this report.
Past performance is no guarantee of future results. Returns are historical and are calculated by determining the percentage change in net asset value (NAV) or offering price (as applicable) with all distributions reinvested. Investment return and principal value will fluctuate so that shares, when redeemed, may be worth more or less than their original cost. Performance for periods less than or equal to one year is cumulative. Performance is for the stated time period only; due to market volatility, current Fund performance may be lower or higher than the quoted return.
| 3 |
Table of Contents
Calvert
VP SRI Mid Cap Portfolio
December 31, 2019
| Sector Allocation (% of net assets)5 | ||||
Information Technology | 19.3 | % | ||
Financials | 15.0 | |||
Industrials | 13.6 | |||
Health Care | 12.4 | |||
Consumer Discretionary | 10.6 | |||
Real Estate | 9.7 | |||
Utilities | 7.9 | |||
Materials | 4.7 | |||
Consumer Staples | 4.2 | |||
Communication Services | 1.4 | |||
Energy | 0.9 | |||
Total | 99.7 | % | ||
| Top 10 Holdings (% of net assets)5 | ||||
Sempra Energy | 2.4 | % | ||
Xcel Energy, Inc. | 2.2 | |||
Agilent Technologies, Inc. | 2.1 | |||
Black Knight, Inc. | 2.1 | |||
CMS Energy Corp. | 2.1 | |||
Centene Corp. | 2.1 | |||
Steel Dynamics, Inc. | 2.0 | |||
AvalonBay Communities, Inc. | 2.0 | |||
Best Buy Co., Inc. | 1.9 | |||
Extra Space Storage, Inc. | 1.9 | |||
Total | 20.8 | % | ||
See Endnotes and Additional Disclosures in this report.
| 4 |
Table of Contents
Calvert
VP SRI Mid Cap Portfolio
December 31, 2019
Endnotes and Additional Disclosures
| 1 | The views expressed in this report are those of the portfolio manager(s) and are current only through the date stated at the top of this page. These views are subject to change at any time based upon market or other conditions, and Calvert and the Fund(s) disclaim any responsibility to update such views. These views may not be relied upon as investment advice and, because investment decisions are based on many factors, may not be relied upon as an indication of trading intent on behalf of any Calvert fund. This commentary may contain statements that are not historical facts, referred to as “forward looking statements.” The Fund’s actual future results may differ significantly from those stated in any forward looking statement, depending on factors such as changes in securities or financial markets or general economic conditions, the volume of sales and purchases of Fund shares, the continuation of investment advisory, administrative and service contracts, and other risks discussed from time to time in the Fund’s filings with the Securities and Exchange Commission. |
| 2 | Dow Jones Industrial Average® is a price-weighted average of 30 blue-chip stocks that are generally the leaders in their industry. S&P 500® Index is an unmanaged index oflarge-cap stocks commonly used as a measure of U.S. stock market performance. S&P Dow Jones Indices are a product of S&P Dow Jones Indices LLC (“S&P DJI”) and have been licensed for use. S&P® and S&P 500® are registered trademarks of S&P DJI; Dow Jones® is a registered trademark of Dow Jones Trademark Holdings LLC (“Dow Jones”); S&P DJI, Dow Jones and their respective affiliates do not sponsor, endorse, sell or promote the Fund, will not have any liability with respect thereto and do not have any liability for any errors, omissions, or interruptions of the S&P Dow Jones Indices. Nasdaq Composite Index is a market capitalization-weighted index of all domestic and international securities listed on Nasdaq. Source: Nasdaq, Inc. The information is provided by Nasdaq (with its affiliates, are referred to as the “Corporations”) and Nasdaq’s third party licensors on an “as is” basis and the Corporations make no guarantees and bear no liability of any kind with respect to the information or the Fund. Russell 2000® Index is an unmanaged index of 2,000 U.S.small-cap stocks. Russell Midcap® Index is an unmanaged index of U.S.mid-cap stocks. Unless otherwise stated, index returns do not reflect the effect of any applicable sales charges, commissions, expenses, taxes or leverage, as applicable. It is not possible to invest directly in an index. |
| 3 | There is no sales charge. Insurance-related charges are not included in the calculation of returns. If such charges were reflected, the returns would be lower. Please refer to the report for your insurance contract for performance data reflecting insurance-related charges. |
Calvert Research and Management became the investment adviser to the Fund on December 31, 2016. Performance reflected prior to such date is that of the Fund’s former investment adviser. |
| 4 | Source: Fund prospectus. Net expense ratios reflect a contractual expense reimbursement that continues through 4/30/20. Without the reimbursement, performance would have been lower. The expense ratios for the current reporting period can be found in the Financial Highlights section of this report. |
| 5 | Excludes cash and cash equivalents. |
Fund profile subject to change due to active management. |
| 5 |
Table of Contents
Calvert
VP SRI Mid Cap Portfolio
December 31, 2019
Example
As a Fund shareholder, you incur ongoing costs, including management fees and other Fund expenses. This Example is intended to help you understand your ongoing costs (in dollars) of Fund investing and to compare these costs with the ongoing costs of investing in other mutual funds. The Example is based on an investment of $1,000 invested at the beginning of the period and held for the entire period (July 1, 2019 to December 31, 2019).
Actual Expenses
The first line of the table below provides information about actual account values and actual expenses. You may use the information in this line, together with the amount you invested, to estimate the expenses that you paid over the period. Simply divide your account value by $1,000 (for example, an $8,600 account value divided by $1,000 = 8.6), then multiply the result by the number in the first line under the heading entitled “Expenses Paid During Period” to estimate the expenses you paid on your account during this period.
Hypothetical Example for Comparison Purposes
The second line of the table below provides information about hypothetical account values and hypothetical expenses based on the actual Fund expense ratio and an assumed rate of return of 5% per year (before expenses), which is not the actual Fund return. The hypothetical account values and expenses may not be used to estimate the actual ending account balance or expenses you paid for the period. You may use this information to compare the ongoing costs of investing in the Fund and other funds. To do so, compare this 5% hypothetical example with the 5% hypothetical examples that appear in the shareholder reports of the other funds.
Please note that the expenses shown in the table are meant to highlight your ongoing costs only and do not reflect expenses and charges which are, or may be imposed under the variable annuity contract or variable life insurance policy (variable contracts) (if applicable) through which your investment in the Fund is made. Therefore, the second line of the table is useful in comparing ongoing costs associated with an investment in vehicles which fund benefits under variable contracts, and will not help you determine the relative total costs of investing in the Fund through variable contracts. In addition, if these expenses and charges imposed under the variable contracts were included, your costs would have been higher.
| Beginning Account Value (7/1/19) | Ending Account Value (12/31/19) | Expenses Paid During Period* (7/1/19 – 12/31/19) | Annualized Expense Ratio | |||||||||||||
Actual | ||||||||||||||||
| $ | 1,000.00 | $ | 1,083.40 | $ | 5.20 | ** | 0.99 | % | ||||||||
Hypothetical | ||||||||||||||||
(5% return per year before expenses) | �� | |||||||||||||||
| $ | 1,000.00 | $ | 1,020.22 | $ | 5.04 | ** | 0.99 | % | ||||||||
| * | Expenses are equal to the Fund’s annualized expense ratio, multiplied by the average account value over the period, multiplied by 184/365 (to reflect theone-half year period). The Example assumes that the $1,000 was invested at the net asset value per share determined at the close of business on June 30, 2019. Expenses shown do not include insurance-related charges. |
| ** | Absent a waiver and/or reimbursement of expenses by an affiliate, expenses would be higher. |
| 6 |
Table of Contents
Calvert
VP SRI Mid Cap Portfolio
December 31, 2019
| Common Stocks — 99.7% |
| |||||||
| Security | Shares | Value | ||||||
| Aerospace & Defense — 2.3% | ||||||||
CAE, Inc. | 14,100 | $ | 373,307 | |||||
Hexcel Corp. | 6,006 | 440,300 | ||||||
| $ | 813,607 | |||||||
| Auto Components — 1.8% | ||||||||
Aptiv PLC | 6,854 | $ | 650,924 | |||||
| Banks — 0.8% | ||||||||
First Republic Bank | 2,385 | $ | 280,118 | |||||
| Biotechnology — 1.2% | ||||||||
Emergent BioSolutions, Inc.(1) | 7,798 | $ | 420,702 | |||||
| Building Products — 2.2% | ||||||||
Fortune Brands Home & Security, Inc. | 7,871 | $ | 514,291 | |||||
Trex Co., Inc.(1)(2) | 3,174 | 285,279 | ||||||
| $ | 799,570 | |||||||
| Capital Markets — 5.4% | ||||||||
Cboe Global Markets, Inc. | 4,542 | $ | 545,040 | |||||
Northern Trust Corp. | 5,893 | 626,073 | ||||||
SEI Investments Co. | 5,609 | 367,277 | ||||||
Tradeweb Markets, Inc., Class A | 9,112 | 422,341 | ||||||
| $ | 1,960,731 | |||||||
| Chemicals — 1.7% | ||||||||
Sherwin-Williams Co. (The) | 1,081 | $ | 630,807 | |||||
| Commercial Services & Supplies — 2.1% | ||||||||
Republic Services, Inc. | 5,150 | $ | 461,595 | |||||
Tetra Tech, Inc. | 3,500 | 301,560 | ||||||
| $ | 763,155 | |||||||
| Communications Equipment — 1.0% | ||||||||
Motorola Solutions, Inc. | 2,215 | $ | 356,925 | |||||
| Consumer Finance — 1.4% | ||||||||
Discover Financial Services | 5,900 | $ | 500,438 | |||||
| Containers & Packaging — 0.9% | ||||||||
Ball Corp. | 5,202 | $ | 336,413 | |||||
| Security | Shares | Value | ||||||
| Diversified Consumer Services — 2.1% | ||||||||
Bright Horizons Family Solutions, Inc.(1) | 2,587 | $ | 388,800 | |||||
ServiceMaster Global Holdings, Inc.(1) | 10,009 | 386,948 | ||||||
| $ | 775,748 | |||||||
| Electric Utilities — 2.2% | ||||||||
Xcel Energy, Inc. | 12,593 | $ | 799,530 | |||||
| Electrical Equipment — 1.5% | ||||||||
AMETEK, Inc. | 5,430 | $ | 541,588 | |||||
| Electronic Equipment, Instruments & Components — 2.2% | ||||||||
CDW Corp. | 3,784 | $ | 540,507 | |||||
Zebra Technologies Corp., Class A(1) | 1,050 | 268,212 | ||||||
| $ | 808,719 | |||||||
| Energy Equipment & Services — 0.9% | ||||||||
Oceaneering International, Inc.(1) | 20,829 | $ | 310,560 | |||||
| Entertainment — 0.7% | ||||||||
Electronic Arts, Inc.(1) | 2,506 | $ | 269,420 | |||||
| Equity Real Estate Investment Trusts (REITs) — 9.7% | ||||||||
AvalonBay Communities, Inc. | 3,454 | $ | 724,304 | |||||
Extra Space Storage, Inc. | 6,594 | 696,458 | ||||||
Lamar Advertising Co., Class A | 7,676 | 685,160 | ||||||
Mid-America Apartment Communities, Inc. | 5,248 | 692,001 | ||||||
National Retail Properties, Inc. | 12,876 | 690,411 | ||||||
| $ | 3,488,334 | |||||||
| Food & Staples Retailing — 0.8% | ||||||||
BJ’s Wholesale Club Holdings, Inc.(1)(2) | 13,092 | $ | 297,712 | |||||
| Food Products — 3.4% | ||||||||
Conagra Brands, Inc. | 9,869 | $ | 337,915 | |||||
Lamb Weston Holdings, Inc. | 5,548 | 477,294 | ||||||
Nomad Foods, Ltd.(1) | 18,351 | 410,512 | ||||||
| $ | 1,225,721 | |||||||
| Health Care Equipment & Supplies — 3.3% | ||||||||
Cooper Cos., Inc. (The) | 1,339 | $ | 430,207 | |||||
Haemonetics Corp.(1) | 1,850 | 212,565 | ||||||
Teleflex, Inc. | 1,481 | 557,508 | ||||||
| $ | 1,200,280 | |||||||
| 7 | See Notes to Financial Statements. |
Table of Contents
Calvert
VP SRI Mid Cap Portfolio
December 31, 2019
Schedule of Investments — continued
| Security | Shares | Value | ||||||
| Health Care Providers & Services — 4.3% | ||||||||
Amedisys, Inc.(1) | 2,429 | $ | 405,449 | |||||
Centene Corp.(1) | 11,821 | 743,186 | ||||||
Chemed Corp. | 900 | 395,334 | ||||||
| $ | 1,543,969 | |||||||
| Independent Power and Renewable Electricity Producers — 1.2% | ||||||||
NextEra Energy Partners LP | 8,174 | $ | 430,361 | |||||
| Insurance — 7.4% | ||||||||
Alleghany Corp.(1) | 511 | $ | 408,580 | |||||
Allstate Corp. (The) | 3,800 | 427,310 | ||||||
American Financial Group, Inc. | 4,281 | 469,412 | ||||||
Assurant, Inc. | 4,800 | 629,184 | ||||||
First American Financial Corp. | 6,244 | 364,150 | ||||||
RLI Corp. | 3,922 | 353,059 | ||||||
| $ | 2,651,695 | |||||||
| Interactive Media & Services — 0.8% | ||||||||
IAC/InterActiveCorp.(1) | 1,129 | $ | 281,245 | |||||
| IT Services — 6.5% | ||||||||
Amdocs, Ltd. | 6,194 | $ | 447,145 | |||||
Black Knight, Inc.(1) | 11,729 | 756,286 | ||||||
Cognizant Technology Solutions Corp., Class A | 11,166 | 692,515 | ||||||
CSG Systems International, Inc. | 8,900 | 460,842 | ||||||
| $ | 2,356,788 | |||||||
| Life Sciences Tools & Services — 2.1% | ||||||||
Agilent Technologies, Inc. | 8,898 | $ | 759,088 | |||||
| Machinery — 2.6% | ||||||||
Fortive Corp. | 6,496 | $ | 496,229 | |||||
Xylem, Inc. | 5,416 | 426,727 | ||||||
| $ | 922,956 | |||||||
| Metals & Mining — 2.0% | ||||||||
Steel Dynamics, Inc. | 21,359 | $ | 727,060 | |||||
| Multi-Utilities — 4.4% | ||||||||
CMS Energy Corp. | 12,022 | $ | 755,463 | |||||
Sempra Energy | 5,605 | 849,045 | ||||||
| $ | 1,604,508 | |||||||
| Security | Shares | Value | ||||||
| Pharmaceuticals — 1.6% | ||||||||
Jazz Pharmaceuticals PLC(1) | 3,833 | $ | 572,190 | |||||
| Professional Services — 3.0% | ||||||||
IHS Markit, Ltd.(1) | 7,690 | $ | 579,441 | |||||
Verisk Analytics, Inc. | 3,270 | 488,342 | ||||||
| $ | 1,067,783 | |||||||
| Semiconductors & Semiconductor Equipment — 4.4% | ||||||||
Analog Devices, Inc. | 3,728 | $ | 443,036 | |||||
NXP Semiconductors NV | 3,490 | 444,137 | ||||||
Skyworks Solutions, Inc. | 5,644 | 682,247 | ||||||
| $ | 1,569,420 | |||||||
| Software — 5.2% | ||||||||
ACI Worldwide, Inc.(1) | 14,602 | $ | 553,197 | |||||
ANSYS, Inc.(1) | 1,761 | 453,299 | ||||||
Bill.com Holdings, Inc.(1) | 2,409 | 91,663 | ||||||
CDK Global, Inc. | 10,100 | 552,268 | ||||||
RealPage, Inc.(1) | 4,051 | 217,741 | ||||||
| $ | 1,868,168 | |||||||
| Specialty Retail — 4.0% | ||||||||
Best Buy Co., Inc. | 7,935 | $ | 696,693 | |||||
National Vision Holdings, Inc.(1) | 13,200 | 428,076 | ||||||
Tiffany & Co. | 2,373 | 317,152 | ||||||
| $ | 1,441,921 | |||||||
| Textiles, Apparel & Luxury Goods — 2.6% | ||||||||
Columbia Sportswear Co.(2) | 3,700 | $ | 370,703 | |||||
Gildan Activewear, Inc. | 19,292 | 569,693 | ||||||
| $ | 940,396 | |||||||
Total Common Stocks |
| $ | 35,968,550 | |||||
Total Investments |
| $ | 35,968,550 | |||||
Other Assets, Less Liabilities — 0.3% |
| $ | 97,451 | |||||
Net Assets — 100.0% |
| $ | 36,066,001 | |||||
The percentage shown for each investment category in the Schedule of Investments is based on net assets.
| 8 | See Notes to Financial Statements. |
Table of Contents
Calvert
VP SRI Mid Cap Portfolio
December 31, 2019
Schedule of Investments — continued
Notes to Schedule of Investments
| (1) | Non-income producing security. |
| (2) | All or a portion of this security was on loan at December 31, 2019. The aggregate market value of securities on loan at December 31, 2019 was $944,132. |
| 9 | See Notes to Financial Statements. |
Table of Contents
Calvert
VP SRI Mid Cap Portfolio
December 31, 2019
Statement of Assets and Liabilities
| Assets | December 31, 2019 | |||
Investments in securities of unaffiliated issuers, at value (identified cost $29,074,123) - including | $ | 35,968,550 | ||
Cash | 84,761 | |||
Cash denominated in foreign currency, at value (cost $1,017) | 1,015 | |||
Receivable for capital shares sold | 32,574 | |||
Dividends receivable | 40,796 | |||
Securities lending income receivable | 71 | |||
Receivable from affiliate | 298 | |||
Directors’ deferred compensation plan | 7,397 | |||
Other assets | 1,979 | |||
Total assets | $ | 36,137,441 | ||
| Liabilities |
| |||
Payable for capital shares redeemed | $ | 2,352 | ||
Payable to affiliates: | ||||
Investment advisory fee | 19,682 | |||
Administrative fee | 3,634 | |||
Sub-transfer agency fee | 86 | |||
Directors’ deferred compensation plan | 7,397 | |||
Accrued expenses | 38,289 | |||
Total liabilities | $ | 71,440 | ||
Net Assets | $ | 36,066,001 | ||
| Sources of Net Assets |
| |||
Paid-in capital | $ | 26,735,058 | ||
Distributable earnings | 9,330,943 | |||
Total | $ | 36,066,001 | ||
Net Assets | $ | 36,066,001 | ||
Shares Outstanding | 1,096,400 | |||
Net Asset Value, Offering Price and Redemption Price Per Share | ||||
(net assets ÷ shares of beneficial interest outstanding) | $ | 32.89 | ||
| 10 | See Notes to Financial Statements. |
Table of Contents
Calvert
VP SRI Mid Cap Portfolio
December 31, 2019
Statement of Operations
| Investment Income | Year Ended December 31, 2019 | |||
Dividend income (net of foreign taxes withheld of $3,453) | $ | 504,002 | ||
Interest income | 2,688 | |||
Securities lending income, net | 1,498 | |||
Total investment income | $ | 508,188 | ||
| Expenses | ||||
Investment advisory fee | $ | 230,545 | ||
Administrative fee | 42,562 | |||
Directors’ fees and expenses | 2,109 | |||
Custodian fees | 8,399 | |||
Transfer agency fees and expenses | 16,591 | |||
Accounting fees | 8,817 | |||
Professional fees | 31,353 | |||
Reports to shareholders | 6,456 | |||
Miscellaneous | 7,594 | |||
Total expenses | $ | 354,426 | ||
Waiver and/or reimbursement of expenses by affiliate | $ | (1,770 | ) | |
Reimbursement of expenses - other | (800 | ) | ||
Net expenses | $ | 351,856 | ||
Net investment income | $ | 156,332 | ||
| Realized and Unrealized Gain (Loss) | ||||
Net realized gain (loss): | ||||
Investment securities | $ | 2,302,188 | ||
Foreign currency transactions | (127 | ) | ||
Net realized gain | $ | 2,302,061 | ||
Change in unrealized appreciation (depreciation): | ||||
Investment securities | $ | 7,010,429 | ||
Foreign currency | (2 | ) | ||
Net change in unrealized appreciation (depreciation) | $ | 7,010,427 | ||
Net realized and unrealized gain | $ | 9,312,488 | ||
Net increase in net assets resulting from operations | $ | 9,468,820 | ||
| 11 | See Notes to Financial Statements. |
Table of Contents
Calvert
VP SRI Mid Cap Portfolio
December 31, 2019
Statements of Changes in Net Assets
| Year Ended December 31, | ||||||||
| Increase (Decrease) in Net Assets | 2019 | 2018 | ||||||
From operations: | ||||||||
Net investment income | $ | 156,332 | $ | 179,501 | ||||
Net realized gain | 2,302,061 | 2,904,421 | ||||||
Net change in unrealized appreciation (depreciation) | 7,010,427 | (4,239,757 | ) | |||||
Net increase (decrease) in net assets from operations | $ | 9,468,820 | $ | (1,155,835 | ) | |||
Distributions to shareholders | $ | (3,090,268 | ) | $ | (4,008,187 | ) | ||
Net decrease in net assets from capital share transactions | $ | (2,241,471 | ) | $ | (4,146,052 | ) | ||
Net increase (decrease) in net assets | $ | 4,137,081 | $ | (9,310,074 | ) | |||
| Net Assets | ||||||||
At beginning of year | $ | 31,928,920 | $ | 41,238,994 | ||||
At end of year | $ | 36,066,001 | $ | 31,928,920 | ||||
| 12 | See Notes to Financial Statements. |
Table of Contents
Calvert
VP SRI Mid Cap Portfolio
December 31, 2019
Financial Highlights
| Year Ended December 31, | ||||||||||||||||||||
| 2019 | 2018 | 2017 | 2016 | 2015 | ||||||||||||||||
Net asset value — Beginning of year | $ | 27.48 | $ | 31.96 | $ | 28.82 | $ | 31.01 | $ | 33.17 | ||||||||||
| Income (Loss) From Operations | ||||||||||||||||||||
Net investment income (loss)(1) | $ | 0.14 | $ | 0.15 | $ | 0.15 | $ | 0.21 | $ | (0.02 | ) | |||||||||
Net realized and unrealized gain (loss) | 8.21 | (1.09 | ) | 3.20 | 2.05 | (1.06 | ) | |||||||||||||
Total income (loss) from operations | $ | 8.35 | $ | (0.94 | ) | $ | 3.35 | $ | 2.26 | $ | (1.08 | ) | ||||||||
| Less Distributions | ||||||||||||||||||||
From net investment income | $ | (0.15 | ) | $ | (0.18 | ) | $ | (0.21 | ) | $ | — | $ | — | |||||||
From net realized gain | (2.79 | ) | (3.36 | ) | — | (4.45 | ) | (1.08 | ) | |||||||||||
Total distributions | $ | (2.94 | ) | $ | (3.54 | ) | $ | (0.21 | ) | $ | (4.45 | ) | $ | (1.08 | ) | |||||
Net asset value — End of year | $ | 32.89 | $ | 27.48 | $ | 31.96 | $ | 28.82 | $ | 31.01 | ||||||||||
Total Return(2) | 31.36 | % | (4.43 | )% | 11.65 | % | 7.27 | % | (3.31 | )% | ||||||||||
| Ratios/Supplemental Data | ||||||||||||||||||||
Net assets, end of year (000’s omitted) | $ | 36,066 | $ | 31,929 | $ | 41,239 | $ | 45,473 | $ | 49,584 | ||||||||||
Ratios (as a percentage of average daily net assets):(3) | ||||||||||||||||||||
Total expenses | 1.00 | % | 1.01 | % | 1.04 | % | 1.07 | % | 1.10 | % | ||||||||||
Net expenses | 0.99 | % | 0.99 | % | 0.99 | % | 0.99 | % | 1.09 | % | ||||||||||
Net investment income (loss) | 0.44 | % | 0.46 | % | 0.49 | % | 0.68 | % | (0.05 | )% | ||||||||||
Portfolio Turnover | 72 | % | 62 | % | 159 | % | 170 | % | 94 | % | ||||||||||
| (1) | Computed using average shares outstanding. |
| (2) | Returns are historical and are calculated by determining the percentage change in net asset value with all distributions reinvested and do not reflect fees and expenses imposed by variable annuity contracts or variable life insurance policies. If included, total return would be lower. |
| (3) | Total expenses do not reflect amounts reimbursed and/or waived by the adviser and certain of its affiliates, if applicable. Net expenses are net of all reductions and represent the net expenses paid by the Fund. |
| 13 | See Notes to Financial Statements. |
Table of Contents
Calvert
VP SRI Mid Cap Portfolio
December 31, 2019
Notes to Financial Statements
1 Significant Accounting Policies
Calvert VP SRI Mid Cap Portfolio (the Fund) is a diversified series of Calvert Variable Series, Inc. (the Corporation). The Corporation is a Maryland corporation registered under the Investment Company Act of 1940, as amended (the 1940 Act), as anopen-end management investment company. The investment objective of the Fund is to seek to provide long-term capital appreciation by investing primarily in a portfolio of the equity securities ofmid-sized companies that are undervalued but demonstrate a potential for growth.
Shares of the Fund are sold without sales charge to insurance companies for allocation to certain of their variable separate accounts.
The Fund applies the accounting and reporting guidance in the Financial Accounting Standards Board (FASB) Accounting Standards Codification Topic 946,Financial Services – Investment Companies (ASC 946). Subsequent events, if any, through the date that the financial statements were issued have been evaluated in the preparation of the financial statements.
A Investment Valuation — Net asset value per share is determined every business day as of the close of the regular session of the New York Stock Exchange (generally 4:00 p.m. Eastern time). The Fund uses independent pricing services approved by the Board of Directors (the Board) to value its investments wherever possible. Investments for which market quotations are not available or deemed not reliable are fair valued in good faith under the direction of the Board.
U.S. generally accepted accounting principles (U.S. GAAP) establishes a disclosure hierarchy that categorizes the inputs to valuation techniques used to value assets and liabilities at measurement date. These inputs are summarized in the three broad levels listed below:
Level 1 - quoted prices in active markets for identical securities
Level 2 - other significant observable inputs (including quoted prices for similar securities, interest rates, prepayment speeds, credit risk, etc.)
Level 3 - significant unobservable inputs (including the Fund’s own assumptions in determining the fair value of investments)
The inputs or methodologies used for valuing securities are not necessarily an indication of the risk associated with investing in those securities.
Valuation techniques used to value the Fund’s investments by major category are as follows:
Equity Securities. Equity securities (including warrants and rights) listed on a U.S. securities exchange generally are valued at the last sale or closing price as reported by an independent pricing service on the primary market or exchange on which they are traded and are categorized as Level 1 in the hierarchy. Equity securities listed on the NASDAQ Global or Global Select Market are valued at the NASDAQ official closing price and are categorized as Level 1 in the hierarchy. Unlisted or listed securities for which closing sales prices or closing quotations are not available are valued at the mean between the latest available bid and ask prices and are categorized as Level 2 in the hierarchy. The daily valuation of exchange-traded foreign securities generally is determined as of the close of trading on the principal exchange on which such securities trade.
Other Securities. Investments in registered investment companies (including money market funds) that do not trade on an exchange are valued at the net asset value per share on the valuation day and are categorized as Level 1 in the hierarchy.
Fair Valuation. If a market value cannot be determined for a security using the methodologies described above, or if, in the good faith opinion of the Fund’s adviser, the market value does not constitute a readily available market quotation, or if a significant event has occurred that would materially affect the value of the security, the security will be fair valued as determined in good faith by or at the direction of the Board in a manner that most fairly reflects the security’s “fair value”, which is the amount that the Fund might reasonably expect to receive for the security upon its current sale in the ordinary course. Each such determination is based on a consideration of relevant factors, which are likely to vary from one pricing context to another. These factors may include, but are not limited to, the type of security, the existence of any contractual restrictions on the security’s disposition, the price and extent of public trading in similar securities of the issuer or of comparable companies or entities, quotations or relevant information obtained from broker/dealers or other market participants, information obtained from the issuer, analysts, and/or the appropriate stock exchange (for exchange-traded securities), an analysis of the company’s or entity’s financial statements, and an evaluation of the forces that influence the issuer and the market(s) in which the security is purchased and sold.
The values assigned to fair value investments are based on available information and do not necessarily represent amounts that might ultimately be realized. Further, due to the inherent uncertainty of valuations of such investments, the fair values may differ significantly from the values that would have been used had an active market existed, and the differences could be material.
The following table summarizes the market value of the Fund’s holdings as of December 31, 2019, based on the inputs used to value them:
| Asset Description | Level 1 | Level 2 | Level 3 | Total | ||||||||||||
Common Stocks | $ | 35,968,550 | (1) | $ | — | $ | — | $ | 35,968,550 | |||||||
Total Investments | $ | 35,968,550 | $ | — | $ | — | $ | 35,968,550 | ||||||||
| (1) | The level classification by major category of investments is the same as the category presentation in the Schedule of Investments. |
| 14 |
Table of Contents
Calvert
VP SRI Mid Cap Portfolio
December 31, 2019
Notes to Financial Statements — continued
B Investment Transactions and Income — Investment transactions for financial statement purposes are accounted for on trade date. Realized gains and losses are recorded on an identified cost basis and may include proceeds from litigation. Dividend income is recorded on theex-dividend date for dividends received in cash and/or securities or, in the case of dividends on certain foreign securities, as soon as the Fund is informed of theex-dividend date.Non-cash dividends are recorded at the fair value of the securities received. Withholding taxes on foreign dividends, if any, have been provided for in accordance with the Fund’s understanding of the applicable country’s tax rules and rates. Distributions received that represent a return of capital are recorded as a reduction of cost of investments. Distributions received that represent a capital gain are recorded as a realized gain. Interest income, which includes amortization of premium and accretion of discount on debt securities, is accrued as earned.
C Foreign Currency Transactions — The Fund’s accounting records are maintained in U.S. dollars. For valuation of assets and liabilities on each date of net asset value determination, foreign denominations are converted into U.S. dollars using the current exchange rate. Security transactions, income, and expenses are translated at the prevailing rate of exchange on the date of the event. Recognized gains or losses on investment transactions attributable to changes in foreign currency exchange rates are recorded for financial statement purposes as net realized gains and losses on investments. That portion of unrealized gains and losses on investments that results from fluctuations in foreign currency exchange rates is not separately disclosed.
D Distributions to Shareholders — Distributions to shareholders are recorded by the Fund onex-dividend date. The Fund distributes any net investment income and net realized capital gains at least annually. Both types of distributions are made in shares of the Fund unless an election is made on behalf of a separate account to receive some or all of the distributions in cash. Distributions are determined in accordance with income tax regulations which may differ from U.S. GAAP; accordingly, periodic reclassifications are made within the Fund’s capital accounts to reflect income and gains available for distribution under income tax regulations.
E Estimates — The preparation of financial statements in conformity with U.S. GAAP requires management to make estimates and assumptions that affect the reported amounts of assets and liabilities and disclosure of contingent assets and liabilities at the date of the financial statements and the reported amounts of increases and decreases in net assets from operations during the reporting period. Actual results could differ from those estimates.
F Indemnifications — The Corporation’sBy-Laws provide for indemnification for Directors or officers of the Corporation and certain other parties, to the fullest extent permitted by Maryland law and the 1940 Act, provided certain conditions are met. Additionally, in the normal course of business, the Fund enters into agreements with service providers that may contain indemnification clauses. The Fund’s maximum exposure under these arrangements is unknown as this would involve future claims that may be made against the Fund that have not yet occurred.
G Federal Income Taxes — No provision for federal income or excise tax is required since the Fund intends to continue to qualify as a regulated investment company under the Internal Revenue Code and to distribute substantially all of its taxable earnings.
Management has analyzed the Fund’s tax positions taken for all open federal income tax years and has concluded that no provision for federal income tax is required in the Fund’s financial statements. A Fund’s federal tax return is subject to examination by the Internal Revenue Service for a period of three years from the date of filing.
2 Related Party Transactions
The investment advisory fee is earned by Calvert Research and Management (CRM), a subsidiary of Eaton Vance Management (EVM), as compensation for investment advisory services rendered to the Fund. Pursuant to the investment advisory agreement, CRM receives a fee, payable monthly, at the annual rate of 0.65% of the Fund’s average daily net assets. For the year ended December 31, 2019, the investment advisory fee amounted to $230,545.
CRM has agreed to reimburse the Fund’s operating expenses to the extent that total annual operating expenses (relating to ordinary operating expenses only and excluding expenses such as brokerage commissions, acquired fund fees and expenses of unaffiliated funds, borrowing costs, taxes or litigation expenses) exceed 0.99% of the Fund’s average daily net assets. The expense reimbursement agreement with CRM may be changed or terminated after April 30, 2020. For the year ended December 31, 2019, CRM waived or reimbursed expenses of $1,770.
The administrative fee is earned by CRM as compensation for administrative services rendered to the Fund. The fee is computed at an annual rate of 0.12% of the Fund’s average daily net assets and is payable monthly. For the year ended December 31, 2019, CRM was paid administrative fees of $42,562.
EVM providessub-transfer agency and related services to the Fund pursuant to aSub-Transfer Agency Support Services Agreement. For the year ended December 31, 2019,sub-transfer agency fees and expenses incurred to EVM amounted to $295 and are included in transfer agency fees and expenses on the Statement of Operations.
Each Director of the Fund who is not an employee of CRM or its affiliates receives a fee of $3,000 for each Board meeting attended in person and $2,000 for each Board meeting attended by phone plus an annual fee of $142,000, and $1,500 for each Committee meeting attended in person and $1,000 for each Committee meeting attended by phone plus an annual Committee fee of $2,500. The Board chair receives an additional $20,000 annual retainer and Committee chairs receive an additional $6,000 annual retainer. Eligible Directors may participate in a Deferred Compensation Plan (the Plan). Amounts deferred under the Plan are treated as though equal dollar amounts had been invested in shares of the Fund or other Calvert funds selected by the Directors. The Fund purchases shares of the funds selected equal to the dollar amounts deferred under the Plan, resulting in an asset equal to the deferred compensation liability. Obligations of the Plan are paid solely from the Fund’s assets. Directors’ fees are allocated to each of the Calvert funds served. Salaries and fees of officers and Directors of the Fund who are employees of CRM or its affiliates are paid by CRM. In addition, an advisory council
| 15 |
Table of Contents
Calvert
VP SRI Mid Cap Portfolio
December 31, 2019
Notes to Financial Statements — continued
was established to aid the Board and CRM in advancing the cause of responsible investing through original scholarship and thought leadership. The advisory council consists of CRM’s Chief Executive Officer and four additional members. Each member (other than CRM’s Chief Executive Officer) receives annual compensation of $75,000, which is being reimbursed by Calvert Investment Management, Inc. (CIM), the Calvert funds’ former investment adviser and Ameritas Holding Company, CIM’s parent company, through the end of 2019. For the year ended December 31, 2019, the Fund’s allocated portion of such expense and reimbursement was $800, which are included in miscellaneous expense and reimbursement of expenses-other, respectively, on the Statement of Operations.
3 Shareholder Servicing Plan
The Corporation, on behalf of the Fund, has adopted a Shareholder Servicing Plan (Servicing Plan), which permits the Fund to enter into shareholder servicing agreements with intermediaries that maintain accounts in the Fund for the benefit of shareholders. These services may include, but are not limited to, processing purchase and redemption requests, processing dividend payments, and providing account information to shareholders. Under the Servicing Plan, the Fund may make payments at an annual rate of up to 0.11% of its average daily net assets. For the year ended December 31, 2019, expenses incurred under the Servicing Plan amounted to $15,195, and are included in transfer agency fees and expenses on the Statement of Operations.
4 Investment Activity
During the year ended December 31, 2019, the cost of purchases and proceeds from sales of investments, other than short-term securities, were $25,475,749 and $30,771,142, respectively.
5 Distributions to Shareholders and Income Tax Information
The tax character of distributions declared for the years ended December 31, 2019 and December 31, 2018 was as follows:
| Year Ended December 31, | ||||||||
| 2019 | 2018 | |||||||
Ordinary income | $ | 1,712,623 | $ | 3,498,545 | ||||
Long-term capital gains | $ | 1,377,645 | $ | 509,642 | ||||
As of December 31, 2019, the components of distributable earnings (accumulated loss) on a tax basis were as follows:
Undistributed ordinary income | $ | 228,995 | ||
Undistributed long-term capital gains | $ | 2,255,057 | ||
Net unrealized appreciation (depreciation) | $ | 6,846,891 | ||
The cost and unrealized appreciation (depreciation) of investments of the Fund at December 31, 2019, as determined on a federal income tax basis, were as follows:
Aggregate cost | $ | 29,121,657 | ||
Gross unrealized appreciation | $ | 6,872,771 | ||
Gross unrealized depreciation | (25,878 | ) | ||
Net unrealized appreciation | $ | 6,846,893 | ||
6 Securities Lending
To generate additional income, the Fund may lend its securities pursuant to a securities lending agency agreement with State Street Bank and Trust Company (SSBT), the securities lending agent. Security loans are subject to termination by the Fund at any time and, therefore, are not considered illiquid investments. The Fund requires that the loan be continuously collateralized by either cash or securities as collateral equal at all times to at least 102% of the market value of the domestic securities loaned and 105% of the market value of the international securities loaned (if applicable). The market value of securities loaned is determined daily and any additional required collateral is delivered to the Fund on the next business day. Cash collateral is generally invested in a money market fund registered under the 1940 Act that is managed by an affiliate of SSBT. Any gain or loss in the market price of the loaned securities that might occur and any interest earned or dividends declared during the term of the loan would accrue to the account of the Fund. Income earned on the investment of collateral, net of broker rebates and other expenses incurred by the securities lending agent, is split between the Fund and the
| 16 |
Table of Contents
Calvert
VP SRI Mid Cap Portfolio
December 31, 2019
Notes to Financial Statements — continued
securities lending agent on the basis of agreed upon contractual terms.Non-cash collateral, if any, is held by the lending agent on behalf of the Fund and cannot be sold orre-pledged by the Fund; accordingly, such collateral is not reflected in the Statement of Assets and Liabilities.
The risks associated with lending portfolio securities include, but are not limited to, possible delays in receiving additional collateral or in the recovery of the loaned securities, possible loss of rights to the collateral should the borrower fail financially, as well as risk of loss in the value of the collateral or the value of the investments made with the collateral. The securities lending agent shall indemnify the Fund in the case of default of any securities borrower.
At December 31, 2019, the total value of securities on loan was $944,132 and the total value of collateral received was $963,248, comprised of U.S. government and/or agencies securities.
The following table provides a breakdown of securities lending transactions accounted for as secured borrowings, the obligations by class of collateral pledged, and the remaining contractual maturity of those transactions as of December 31, 2019.
| Remaining Contractual Maturity of the Transactions | ||||||||||||||||||||
Overnight and Continuous | <30 days | 30 to 90 days | >90 days | Total | ||||||||||||||||
Securities Lending Transactions |
| |||||||||||||||||||
Common Stocks | $ | 963,248 | $ | — | $ | — | $ | — | $ | 963,248 | ||||||||||
7 Line of Credit
Effective October 29, 2019, the Fund participates with other portfolios and funds managed by EVM and its affiliates, including CRM, in an $800 million unsecured line of credit with a group of banks, which is in effect through October 27, 2020. Borrowings are made by the Fund solely to facilitate the handling of unusual and/or unanticipated short-term cash requirements. Interest is charged to the Fund based on its borrowings at an amount above either the Eurodollar rate or Federal Funds rate. In addition, a fee computed at an annual rate of 0.15% on the daily unused portion of the line of credit is allocated among the participating portfolios and funds at the end of each quarter. Because the line of credit is not available exclusively to the Fund, it may be unable to borrow some or all of its requested amounts at any particular time.
Prior to October 29, 2019, the Fund participated with other funds managed by CRM in a $100 million ($62.5 million prior to June 21, 2019) committed line of credit agreement with SSBT, which was terminated by the Calvert funds. Borrowings bore interest at the higher of theone-month London Interbank Offered Rate (LIBOR) in effect that day or the overnight Federal Funds rate, plus 1.00% per annum. A commitment fee of 0.20% per annum was incurred on the unused portion of the committed facility, which was allocated to all participating funds.
The Fund had no borrowings outstanding pursuant to its lines of credit at December 31, 2019. The Fund did not have any significant borrowings or allocated fees during the year ended December 31, 2019.
8 Capital Shares
The Corporation may issue its shares in one or more series (such as the Fund). The authorized shares of the Fund consist of 1,000,000,000 common shares, $0.01 par value. Transactions in capital shares for the years ended December 31, 2019 and December 31, 2018 were as follows:
Year Ended December 31, 2019 | Year Ended December 31, 2018 | |||||||||||||||
| Shares | Amount | Shares | Amount | |||||||||||||
Shares sold | 58,178 | $ | 1,852,303 | 71,378 | $ | 2,355,273 | ||||||||||
Reinvestment of distributions | 102,530 | 3,090,268 | 126,481 | 4,008,187 | ||||||||||||
Shares redeemed | (226,020 | ) | (7,184,042 | ) | (326,637 | ) | (10,509,512 | ) | ||||||||
Net decrease | (65,312 | ) | $ | (2,241,471 | ) | (128,778 | ) | $ | (4,146,052 | ) | ||||||
At December 31, 2019, separate accounts of three insurance companies each owned more than 10% of the value of the outstanding shares of the Fund, aggregating 72.6%.
| 17 |
Table of Contents
Calvert
VP SRI Mid Cap Portfolio
December 31, 2019
Report of Independent Registered Public Accounting Firm
To the Shareholders and Board of Directors
Calvert Variable Series Inc.:
Opinion on the Financial Statements
We have audited the accompanying statement of assets and liabilities of Calvert VP SRI Mid Cap Portfolio (the Fund), a series of Calvert Variable Series Inc., including the schedule of investments, as of December 31, 2019, the related statement of operations for the year then ended, the statements of changes in net assets for each of the years in thetwo-year period then ended, and the related notes (collectively, the financial statements) and the financial highlights for each of the years in thefive-year period then ended. In our opinion, the financial statements and financial highlights present fairly, in all material respects, the financial position of the Fund as of December 31, 2019, the results of its operations for the year then ended, the changes in its net assets for each of the years in thetwo-year period then ended, and the financial highlights for each of the years in thefive-year period then ended, in conformity with U.S. generally accepted accounting principles.
Basis for Opinion
These financial statements and financial highlights are the responsibility of the Fund’s management. Our responsibility is to express an opinion on these financial statements and financial highlights based on our audits. We are a public accounting firm registered with the Public Company Accounting Oversight Board (United States) (PCAOB) and are required to be independent with respect to the Fund in accordance with the U.S. federal securities laws and the applicable rules and regulations of the Securities and Exchange Commission and the PCAOB.
We conducted our audits in accordance with the standards of the PCAOB. Those standards require that we plan and perform the audit to obtain reasonable assurance about whether the financial statements and financial highlights are free of material misstatement, whether due to error or fraud. Our audits included performing procedures to assess the risks of material misstatement of the financial statements and financial highlights, whether due to error or fraud, and performing procedures that respond to those risks. Such procedures included examining, on a test basis, evidence regarding the amounts and disclosures in the financial statements and financial highlights. Such procedures also included confirmation of securities owned as of December 31, 2019, by correspondence with the custodian and brokers. Our audits also included evaluating the accounting principles used and significant estimates made by management, as well as evaluating the overall presentation of the financial statements and financial highlights. We believe that our audits provide a reasonable basis for our opinion.

We have served as the auditor of one or more of the Calvert Funds since 2002.
Philadelphia, Pennsylvania
February 19, 2020
| 18 |
Table of Contents
Calvert
VP SRI Mid Cap Portfolio
December 31, 2019
Federal Tax Information (Unaudited)
As required by the Internal Revenue Code and/or regulations, shareholders must be notified regarding the status of the dividends received deduction for corporations and capital gains dividends.
Dividends Received Deduction. Corporate shareholders are generally entitled to take the dividends received deduction on the portion of the Fund’s dividend distribution that qualifies under tax law. For the Fund’s fiscal 2019 ordinary income dividends, 22.09% qualifies for the corporate dividends received deduction.
Capital Gains Dividends. The Fund hereby designates as a capital gain dividend with respect to the taxable year ended December 31, 2019, $2,255,110 or, if subsequently determined to be different, the net capital gain of such year.
| 19 |
Table of Contents
Calvert
VP SRI Mid Cap Portfolio
December 31, 2019
Fund Management. The Directors of Calvert Variable Series, Inc. (the Corporation) are responsible for the overall management and supervision of the Corporation’s affairs. The Directors and officers of the Corporation are listed below. Except as indicated, each individual has held the office shown or other offices in the same company for the last five years. Each Board member holds office until his or her successor is elected and qualified, or until his or her earlier death, resignation, retirement, removal or disqualification. Under the terms of the Fund’s current Board member retirement policy, an Independent Board member must retire at the end of the calendar year in which he or she turns 75. However, if such retirement would cause the Fund to be out of compliance with Section 16 of the 1940 Act or any other regulations or guidance of the SEC, then such retirement and resignation will not become effective until such time as action has been taken for the Fund to be in compliance upon a Board member’s retirement. The “Independent Directors” consist of those Directors who are not “interested persons” of the Corporation, as that term is defined under the 1940 Act. The business address of each Director and officer, with the exception of Ms. Gemma and Mr. Kirchner, is 1825 Connecticut Avenue NW, Suite 400, Washington, DC 20009. As used below, “CRM” refers to Calvert Research and Management. Each Director oversees 39 funds in the Calvert fund complex. Each officer serves as an officer of certain other Calvert funds.
| Name and Year of Birth | Position with the | Position Start Date | Principal Occupation(s) and Directorships During Past Five Years and Other Relevant Experience | |||
| Interested Director | ||||||
John H. Streur(1) 1960 | Director and President | 2015 | President and Chief Executive Officer of Calvert Research and Management (since December 31, 2016). President and Chief Executive Officer of Calvert Investments, Inc. (January 2015-December 2016); Chief Executive Officer of Calvert Investment Distributors, Inc. (August 2015-December 2016); Chief Compliance Officer of Calvert Investment Management, Inc. (August 2015-April 2016); President and Director, Portfolio 21 Investments, Inc. (through October 2014); President, Chief Executive Officer and Director, Managers Investment Group LLC (through January 2012); President and Director, The Managers Funds and Managers AMG Funds (through January 2012). Other Directorships in the Last Five Years.Portfolio 21 Investments, Inc. (asset management) (through October 2014); Managers Investment Group LLC (asset management) (through January 2012); The Managers Funds (asset management) (through January 2012); Managers AMG Funds (asset management) (through January 2012); Calvert Impact Capital, Inc. | |||
| Independent Directors | ||||||
Richard L. Baird, Jr. 1948 | Director | 2016 | Regional Disaster Recovery Lead, American Red Cross of Greater Pennsylvania (since 2017). Volunteer, American Red Cross (since 2015). Former President and CEO of Adagio Health Inc. (retired in 2014) in Pittsburgh, PA. Other Directorships in the Last Five Years. None. | |||
Alice Gresham Bullock 1950 | Chair and Director | 2016 (Chair); 1999 (Director) | Professor Emerita at Howard University School of Law. Dean Emerita of Howard University School of Law and Deputy Director of the Association of American Law Schools (1992-1994). Other Directorships in the Last Five Years. None. | |||
Cari M. Dominguez 1949 | Director | 2016 | Former Chair of the U.S. Equal Employment Opportunity Commission. Other Directorships in the Last Five Years.Manpower, Inc. (employment agency); Triple S Management Corporation (managed care); National Association of Corporate Directors. | |||
John G. Guffey, Jr.(2) 1948 | Director | 2016 | President of Aurora Press Inc., a privately held publisher of trade paperbacks (since January 1997). Other Directorships in the Last Five Years. Calvert Impact Capital, Inc. (through December 31, 2018); Calvert Ventures, LLC. | |||
Miles D. Harper, III 1962 | Director | 2016 | Partner, Carr Riggs & Ingram (public accounting firm) since October 2014. Partner, Gainer Donnelly & Desroches (public accounting firm) (now Carr Riggs & Ingram), November 1999-September 2014). Other Directorships in the Last Five Years.Bridgeway Funds (9) (asset management). | |||
Joy V. Jones 1950 | Director | 2016 | Attorney. Other Directorships in the Last Five Years.Conduit Street Restaurants SUD 2 Limited; Palm Management Restaurant Corporation. | |||
| 20 |
Table of Contents
Calvert
VP SRI Mid Cap Portfolio
December 31, 2019
Management and Organization — continued
| Name and Year of Birth | Position with the | Position Start Date | Principal Occupation(s) and Directorships During Past Five Years and Other Relevant Experience | |||
| Independent Directors (continued) | ||||||
Anthony A. Williams 1951 | Director | 2016 | CEO and Executive Director of the Federal City Council (July 2012 to present); Senior Adviser and Independent Consultant for King and Spalding LLP (September 2015 to present); Executive Director of Global Government Practice at the Corporate Executive Board (January 2010 to January 2012). Other Directorships in the Last Five Years. Freddie Mac; Evoq Properties/ Meruelo Maddux Properties, Inc. (real estate management); Weston Solutions, Inc. (environmental services); Bipartisan Policy Center’s Debt Reduction Task Force; Chesapeake Bay Foundation; Catholic University of America; Urban Institute (research organization). | |||
| Name and Year of Birth | Position(s) with the Corporation | Position Start Date | Principal Occupation(s) During Past Five Years | |||
| Principal Officers who are not Directors | ||||||
Hope L. Brown 1973 | Chief Compliance Officer | 2014 | Chief Compliance Officer of 39 registered investment companies advised by CRM (since 2014). Vice President and Chief Compliance Officer, Wilmington Funds (2012-2014). | |||
Maureen A. Gemma(3) 1960 | Vice President, Secretary and Chief Legal Officer | 2016 | Vice President of CRM and officer of 39 registered investment companies advised by CRM (since 2016). Also Vice President of Eaton Vance and certain of its affiliates and officer of 159 registered investment companies advised or administered by Eaton Vance. | |||
James F. Kirchner(3) 1967 | Treasurer | 2016 | Vice President of CRM and officer of 39 registered investment companies advised by CRM (since 2016). Also Vice President of Eaton Vance and certain of its affiliates and officer of 159 registered investment companies advised or administered by Eaton Vance. | |||
| (1) | Mr. Streur is an interested person of the Fund because of his positions with the Fund’s adviser and certain affiliates. |
| (2) | Mr. Guffey is currently married to Rebecca L. Adamson, who served as a member of the Advisory Council through December 31, 2019. |
| (3) | The business address for Ms. Gemma and Mr. Kirchner is Two International Place, Boston, MA 02110. |
The SAI for the Fund includes additional information about the Directors and officers of the Fund and can be obtained without charge on Calvert’s website at www.calvert.com or by calling1-800-368-2745.
| 21 |
Table of Contents
Calvert Funds
Privacy.The Eaton Vance organization is committed to ensuring your financial privacy. Each entity listed below has adopted a privacy policy and procedures (“Privacy Program”) Eaton Vance believes is reasonably designed to protect your personal information and to govern when and with whom Eaton Vance may share your personal information.
| • | At the time of opening an account, Eaton Vance generally requires you to provide us with certain information such as name, address, social security number, tax status, account numbers, and account balances. This information is necessary for us to both open an account for you and to allow us to satisfy legal requirements such as applicable anti-money laundering reviews and know-your-customer requirements. |
| • | On an ongoing basis, in the normal course of servicing your account, Eaton Vance may share your information with unaffiliated third parties that perform various services for Eaton Vance and/or your account. These third parties include transfer agents, custodians, broker/dealers and our professional advisers, including auditors, accountants, and legal counsel. Eaton Vance may additionally share your personal information with our affiliates. |
| • | We believe our Privacy Program is reasonably designed to protect the confidentiality of your personal information and to prevent unauthorized access to that information. |
| • | We reserve the right to change our Privacy Program at any time upon proper notification to you. You may want to review our Privacy Program periodically for changes by accessing the link on our homepage: www.eatonvance.com. |
Our pledge of protecting your personal information applies to the following entities within the Eaton Vance organization: the Eaton Vance Family of Funds, Eaton Vance Management, Eaton Vance Investment Counsel, Eaton Vance Distributors, Inc., Eaton Vance Trust Company, Eaton Vance Management (International) Limited, Eaton Vance Advisers International Limited, Eaton Vance Global Advisors Limited, Eaton Vance Management’s Real Estate Investment Group, Boston Management and Research, Calvert Research and Management, and Calvert Funds. This Privacy Notice supersedes all previously issued privacy disclosures. For more information about our Privacy Program or about how your personal information may be used, please call 1-800-368-2745.
Delivery of Shareholder Documents. The Securities and Exchange Commission (SEC) permits funds to deliver only one copy of shareholder documents, including prospectuses, proxy statements and shareholder reports, to fund investors with multiple accounts at the same residential or post office box address. This practice is often called “householding” and it helps eliminate duplicate mailings to shareholders.Calvert funds, or your financial intermediary, may household the mailing of your documents indefinitely unless you instruct Calvert funds, or your financial intermediary, otherwise. If you would prefer that your Calvert fund documents not be householded, please contact Calvert fundsat 1-800-368-2745, or contact your financial intermediary. Your instructions that householding not apply to delivery of your Calvert fund documents will typically be effective within 30 days of receipt by Calvert funds or your financial intermediary. Separate statements will be generated for each separate account and will be householded as described above.
Portfolio Holdings. Each Calvert fund files a schedule of portfolio holdings on Part F to Form N-PORT with the SEC for the first and third quarters of each fiscal year. The Form N-PORT will be available on the Calvert funds’ website at www.calvert.com, by calling Calvert fundsat 1-800-368-2745 or in the EDGAR database on the SEC’s website at www.sec.gov.
Proxy Voting. The Proxy Voting Guidelines that each Calvert fund uses to determine how to vote proxies relating to portfolio securities is provided as an Appendix to the fund’s Statement of Additional Information. The Statement of Additional Information can be obtained free of charge by calling the Calvert funds at 1-800-368-2745, by visiting the Calvert funds’ website at www.calvert.com or visiting the SEC’s website at www.sec.gov. Information regarding how a Calvert fund voted proxies relating to portfolio securities during the most recent 12-month period ended June 30 is available by calling Calvert funds, by visiting the Calvert funds’ website at www.calvert.com or by visiting the SEC’s website at www.sec.gov.
| 22 |
Table of Contents
This Page Intentionally Left Blank
Table of Contents
This Page Intentionally Left Blank
Table of Contents
Investment Adviser and Administrator
Calvert Research and Management
1825 Connecticut Avenue NW, Suite 400
Washington, DC 20009
Principal Underwriter*
Eaton Vance Distributors, Inc.
Two International Place
Boston, MA 02110
(617)482-8260
Custodian
State Street Bank and Trust Company
State Street Financial Center, One Lincoln Street
Boston, MA 02111
Transfer Agent
DST Asset Manager Solutions, Inc.
2000 Crown Colony Drive
Quincy, MA 02169
Independent Registered Public Accounting Firm
KPMG LLP
1601 Market Street
Philadelphia, PA 19103-2499
Fund Offices
1825 Connecticut Avenue NW, Suite 400
Washington, DC 20009
| * | FINRA BrokerCheck. Investors may check the background of their Investment Professional by contacting the Financial Industry Regulatory Authority (FINRA). FINRA BrokerCheck is a free tool to help investors check the professional background of current and former FINRA-registered securities firms and brokers. FINRA BrokerCheck is available by calling1-800-289-9999 and at www.FINRA.org. The FINRA BrokerCheck brochure describing this program is available to investors at www.FINRA.org. |
Table of Contents
Printed on recycled paper.

24219 12.31.19
Table of Contents
Item 2. Code of Ethics
The registrant has adopted a code of ethics applicable to its Principal Executive Officer, Principal Financial Officer and Principal Accounting Officer. The registrant undertakes to provide a copy of such code of ethics to any person upon request, without charge, by calling1-800-368-2745. The registrant has not amended the code of ethics as described in FormN-CSR during the period covered by this report. The registrant has not granted any waiver, including an implicit waiver, from a provision of the code of ethics as described in FormN-CSR during the period covered by this report.
Item 3. Audit Committee Financial Expert
The registrant’s Board of Directors has determined that Miles D. Harper III, an “independent” Director serving on the registrant’s audit committee, is an “audit committee financial expert,” as defined in Item 3 of FormN-CSR. Under applicable securities laws, a person who is determined to be an audit committee financial expert will not be deemed an “expert” for any purpose, including without limitation for the purposes of Section 11 of the Securities Act of 1933, as a result of being designated or identified as an audit committee financial expert. The designation or identification of a person as an audit committee financial expert does not impose on such person any duties, obligations, or liabilities that are greater than the duties, obligations, and liabilities imposed on such person as a member of the audit committee and Board of Directors in the absence of such designation or identification.
Item 4. Principal Accountant Fees and Services
(a) –(d)
The following table presents the aggregate fees billed to the registrant for the registrant’s fiscal years ended December 31, 2018 and December 31, 2019 by KPMG for professional services rendered for the audit of the registrant’s annual financial statements and fees billed for other services rendered by KPMG during such periods.
Fiscal Years Ended | 12/31/18 | %* | 12/31/19 | %* | ||||||||||||
Audit Fees | $ | 44,394 | 0 | % | $ | 47,431 | 0 | % | ||||||||
Audit-Related Fees(1) | $ | 0 | 0 | % | $ | 0 | 0 | % | ||||||||
Tax Fees(2) | $ | 7,100 | 0 | % | $ | 7,700 | 0 | % | ||||||||
All Other Fees(3) | $ | 0 | 0 | % | $ | 0 | 0 | % | ||||||||
|
|
|
|
|
|
|
| |||||||||
Total | $ | 51,494 | 0 | % | $ | 55,131 | 0 | % | ||||||||
|
|
|
|
|
|
|
| |||||||||
| * | Percentage of fees approved by the Audit Committee pursuant to (c)(7)(i)(C) of Rule2-01 of Reg.S-X (statutory de minimis waiver of Committee’s requirement topre-approve). |
| (1) | Audit-related fees consist of the aggregate fees billed for assurance and related services that are reasonably related to the performance of the audit of the registrant’s financial statements and are not reported under the category of audit fees. |
| (2) | Tax fees consist of the aggregate fees billed for professional services rendered by the principal accountant relating to tax compliance, tax advice, and tax planning and specifically include fees for tax return preparation and other related tax compliance/planning matters. |
| (3) | All other fees consist of the aggregate fees billed for products and services provided by the principal accountant other than audit, audit-related, and tax services. |
Table of Contents
(e) The Audit Committee is required topre-approve all audit andnon-audit services provided to the registrant by the auditors, and to the registrant’s investment adviser, and any entity controlling, controlled by, or under common control with the adviser that provides ongoing services to the registrant. In determining whether topre-approvenon-audit services, the Audit Committee considers whether the services are consistent with maintaining the independence of the auditors. The Committee may delegate its authority topre-approve certain matters to one or more of its members. In this regard, the Committee has delegated authority jointly to the Audit Committee Chair together with another Committee member with respect tonon-audit services not exceeding $25,000 in each instance. In addition, the Committee haspre-approved the retention of the auditors to providetax-related services related to the tax treatment and tax accounting of newly acquired securities, upon request by the investment adviser in each instance.
(f) Not applicable.
(g) Aggregatenon-audit fees billed by the registrant’s accountant for services rendered to the registrant, and rendered to the registrant’s investment adviser, and any entity controlling, controlled by, or under common control with the adviser that provides ongoing services to the registrant for each of the last two fiscal years of the registrant:
| Fiscal Year ended 12/31/18 | Fiscal Year ended 12/31/19 | |||||||||||||
| $ | %* | $ | %* | |||||||||||
| $ | 7,100 | 0 | % | $ | 7,700 | 0 | % | |||||||
| * | Percentage of fees approved by the Audit Committee pursuant to (c)(7)(i)(C) of Rule2-01 of Reg.S-X (statutory de minimis waiver of Committee’s requirement topre-approve) |
(h) The registrant’s audit committee has considered whether the provision by the registrant’s principal accountant ofnon-audit services to the registrant’s investment adviser and any entity controlling, controlled by, or under common control with the adviser that provides ongoing services to the registrant that were notpre-approved pursuant to Rule2-01(c)(7)(ii) of RegulationS-X is compatible with maintaining the principal accountant’s independence.
Item 5. Audit Committee of Listed Registrants
Not applicable.
Item 6. Schedule of Investments
Please see schedule of investments contained in the Report to Stockholders included under Item 1 of this FormN-CSR.
Item 7. Disclosure of Proxy Voting Policies and Procedures forClosed-End Management Investment Companies
Not applicable.
Item 8. Portfolio Managers ofClosed-End Management Investment Companies
Not applicable.
Item 9. Purchases of Equity Securities byClosed-End Management Investment Company and Affiliated Purchasers
Table of Contents
Not applicable.
Item 10. Submission of Matters to a Vote of Security Holders
No material changes.
Item 11. Controls and Procedures
(a) The registrant’s principal executive and principal financial officers have concluded that the registrant’s disclosure controls and procedures (as defined in Rule30a-3(c) under the Investment Company Act of 1940 Act, as amended (the “1940 Act”) are effective, based on the evaluation of these controls and procedures required by Rule30a-3(b) under the 1940 Act and Rules13a-15(b) or15d-15(b) under the Securities Exchange Act of 1934 (“Exchange Act”), as of a date within 90 days of the filing date of this report.
(b) There was no change in the registrant’s internal control over financial reporting (as defined in Rule30a-3(d) under the 1940 Act) that occurred during the period covered by this report that has materially affected, or is reasonably likely to materially affect, the registrant’s internal control over financial reporting.
Item 12. Disclosure of Securities Lending Activities forClosed-End Management Investment Companies.
Not applicable.
Item 13. Exhibits
| (a)(1) | Registrant’s Code of Ethics – Not applicable (please see Item 2). | |
| (a)(2)(i) | Treasurer’s Section 302 certification. | |
| (a)(2)(ii) | President’s Section 302 certification. | |
| (b) | Combined Section 906 certification. | |
Table of Contents
Signatures
Pursuant to the requirements of the Securities Exchange Act of 1934 and the Investment Company Act of 1940, the registrant has duly caused this report to be signed on its behalf by the undersigned, thereunto duly authorized.
CALVERT VARIABLE SERIES, INC.
| By: | /s/ John H. Streur | |
| John H. Streur | ||
| President | ||
| Date: | February 24, 2020 | |
Pursuant to the requirements of the Securities Exchange Act of 1934 and the Investment Company Act of 1940, this report has been signed below by the following persons on behalf of the registrant and in the capacities and on the dates indicated.
| By: | /s/ James F. Kirchner | |
| James F. Kirchner | ||
| Treasurer | ||
| Date: | February 24, 2020 | |
| By: | /s/ John H. Streur | |
| John H. Streur | ||
| President | ||
| Date: | February 24, 2020 | |