UNITED STATES
SECURITIES AND EXCHANGE COMMISSION
Washington, D.C. 20549
Form N-CSR
CERTIFIED SHAREHOLDER REPORT OF REGISTERED
MANAGEMENT INVESTMENT COMPANIES
Investment Company Act File Number: 811-03591
CALVERT VARIABLE SERIES, INC.
(Exact Name of Registrant as Specified in Charter)
1825 Connecticut Avenue NW, Suite 400, Washington, DC 20009
(Address of Principal Executive Offices)
Deidre E. Walsh
Two International Place, Boston, Massachusetts 02110
(Name and Address of Agent for Services)
(202) 238-2200
(Registrant’s Telephone Number)
December 31
Date of Fiscal Year End
December 31, 2021
Date of Reporting Period
Item 1. Reports to Stockholders
Calvert
VP SRI Balanced Portfolio
Annual Report
December 31, 2021
Commodity Futures Trading Commission Registration. The Commodity Futures Trading Commission (“CFTC”) has adopted regulations that subject registered investment companies and advisers to regulation by the CFTC if a fund invests more than a prescribed level of its assets in certain CFTC-regulated instruments (including futures, certain options and swap agreements) or markets itself as providing investment exposure to such instruments. The adviser has claimed an exclusion from the definition of “commodity pool operator” under the Commodity Exchange Act with respect to its management of the Fund and the other funds it manages. Accordingly, neither the Fund nor the adviser is subject to CFTC regulation.
Fund shares are not insured by the FDIC and are not deposits or other obligations of, or guaranteed by, any depository institution. Shares are subject to investment risks, including possible loss of principal invested.
This report must be preceded or accompanied by a current summary prospectus or prospectus. Before investing, investors should consider carefully the investment objective, risks, and charges and expenses of a mutual fund. This and other important information is contained in the summary prospectus and prospectus, which can be obtained from a financial intermediary. Prospective investors should read the prospectus carefully before investing. For further information, please call 1-800-368-2745.
Annual Report December 31, 2021
Calvert
VP SRI Balanced Portfolio
Calvert
VP SRI Balanced Portfolio
December 31, 2021
Management's Discussion of Fund Performance†
Economic and Market Conditions
The 12-month period ended December 31, 2021, was notable for a U.S. equity rally that lasted most of the year. Broad-market indexes posted strong returns as investors cheered the reopening of businesses affected by the pandemic and the rollout of several highly effective COVID-19 vaccines. The virus, however, continued to have a firm grip on the U.S. economy. Global supply-chain disruptions combined with high demand led to higher year-over-year inflation than the U.S. had seen in decades.
Still, investor optimism about a recovering economy drove stock prices up during most of the period. A significant pullback occurred in September 2021 when virtually every major U.S. stock index reported negative returns. Unexpectedly weak job creation in August and the U.S. Federal Reserve’s (the Fed’s) announcement that it might soon begin tapering its monthly bond purchases combined to drive stock prices lower.
In the final quarter of 2021, however, stock prices came roaring back. Even news in November of a more transmissible COVID-19 variant — Omicron — caused only a temporary market retreat. The Fed’s actions to tamp down inflation were applauded by investors, with stocks gaining ground after the central bank announced that tapering would be accelerated and that three interest rate hikes were forecast for 2022. Just two trading days before year-end, the S&P 500® Index, a broad measure of the U.S. stock market, closed at its 70th all-time high for the period.
Performance of fixed-income asset classes, meanwhile, ebbed and flowed as the virus advanced and retreated. For the period as a whole, low interest rates across the fixed-income spectrum made equities in general a more attractive investment. The bond assets that fared best during the period were those that stood to benefit from a U.S. and global economic revival, while so-called “safe-haven” assets fared worst as investors appeared to become more comfortable taking on increased risk.
As a result, U.S. Treasurys were one of the worst-performing fixed-income asset classes during the period, with the Bloomberg U.S. Treasury Index returning (2.32)%. The Bloomberg U.S. Aggregate Bond Index, a broad measure of the U.S. fixed-income market, was dragged down in part by its Treasury component and returned (1.54)%. The Bloomberg U.S. Corporate Bond Index fared modestly better, but still declined 1.04%.
High yield bonds, in contrast, were a standout asset class during the period. Several industries prominent within the high yield space — airlines, restaurants, retail, and travel & leisure — were among the hardest-hit businesses early in the pandemic and the biggest beneficiaries of the subsequent economic recovery. Reflecting investors’ increasing confidence in the recovery, as well as their search for yield in a historically low-yield environment, the Bloomberg U.S. Corporate High Yield Index returned 5.28% during the period.
Fund Performance
For the 12-month period ended December 31, 2021, Calvert VP SRI Balanced Portfolio (the Fund) returned 15.12% for Class I shares at net asset value (NAV), underperforming its primary benchmark, the Russell 1000® Index (the Index), which returned 26.45%. The Fund outperformed its secondary benchmark, an internally constructed benchmark composed of a blend of 60% Russell 1000® Index and 40% Bloomberg U.S. Aggregate Bond Index (the Bond Index), which returned 14.62% during the period.
Stock selections in the consumer discretionary, information technology, and energy sectors within the equity portion of the Fund detracted from performance relative to the Index during the period.
The Fund’s underweight exposure to Nvidia Corp. (Nvidia) detracted from performance relative to the Index. Nvidia’s stock price more than doubled as the company, a designer of graphics processing units, was well-positioned in a strong growth market — the semiconductor industry, including automotive, data center, gaming, and metaverse businesses.
The Fund’s ownership of Amazon.com, Inc. (Amazon) also detracted from relative returns during the period. Amazon’s stock price fell as the company’s growth decelerated from its peak reached during the COVID-19 pandemic. The stock price was also hurt by the company’s substantial reinvestment of profits.
The Fund’s overweight exposure to equities relative to its target allocation — 60% equities and 40% fixed-income — contributed to performance relative to the Index. Security selection and sector allocation within the fixed-income portion of the Fund also contributed to relative returns. Within the equity portion of the Fund, stock selections in the health care and communications services sectors further enhanced relative performance during the period.
Tradeweb Markets, Inc. (Tradeweb), a provider of electronic over-the-counter marketplaces for fixed-income and other investment products, contributed to returns relative to the Index. Tradeweb’s stock price rose as the company gained significant market share in the trading of high-grade and high yield bonds. Investors also drove Tradeweb’s stock price up in anticipation of higher interest rates, which could accelerate trading activities.
See Endnotes and Additional Disclosures in this report.
Past performance is no guarantee of future results. Returns are historical and are calculated by determining the percentage change in net asset value (NAV) or offering price (as applicable) with all distributions reinvested. Investment return and principal value will fluctuate so that shares, when redeemed, may be worth more or less than their original cost. Performance for periods less than or equal to one year is cumulative. Performance is for the stated time period only; due to market volatility, current Fund performance may be lower or higher than the quoted return.
Calvert
VP SRI Balanced Portfolio
December 31, 2021
Management's Discussion of Fund Performance† — continued
Microsoft Corp. (Microsoft) contributed to relative returns during the period. Its stock price rose as the technology company continued to grow despite expectations that such a large company’s growth must inevitably slow. The ongoing trend toward the use of cloud computing was an important contributor to Microsoft’s market strength.
In the fixed-income portion of the Fund, security selections within investment-grade corporate bonds and commercial mortgage-backed securities were especially beneficial to returns during the period relative to the Bond Index. The fixed-income portion’s overweight exposure to asset-backed securities and investment-grade corporate bonds also contributed to performance relative to the Bond Index.
The use of derivatives had a modest positive impact on relative returns during the period.
See Endnotes and Additional Disclosures in this report.
Past performance is no guarantee of future results. Returns are historical and are calculated by determining the percentage change in net asset value (NAV) or offering price (as applicable) with all distributions reinvested. Investment return and principal value will fluctuate so that shares, when redeemed, may be worth more or less than their original cost. Performance for periods less than or equal to one year is cumulative. Performance is for the stated time period only; due to market volatility, current Fund performance may be lower or higher than the quoted return.
Calvert
VP SRI Balanced Portfolio
December 31, 2021
Performance
Portfolio Manager(s) Vishal Khanduja, CFA, Brian S. Ellis, CFA and Charles B. Gaffney, each of Calvert Research and Management
| % Average Annual Total Returns1,2 | Class
Inception Date | Performance
Inception Date | One Year | Five Years | Ten Years |
| Class I at NAV | 09/02/1986 | 09/02/1986 | 15.12% | 12.49% | 10.48% |
| Class F at NAV | 10/18/2013 | 09/02/1986 | 14.72 | 12.07 | 10.18 |
|
| Russell 1000® Index | — | — | 26.45% | 18.41% | 16.53% |
| Bloomberg U.S. Aggregate Bond Index | — | — | (1.54) | 3.57 | 2.90 |
| Balanced Blended Benchmark | — | — | 14.62 | 12.59 | 11.14 |
| % Total Annual Operating Expense Ratios3 | Class I | Class F |
| | 0.63% | 0.88% |
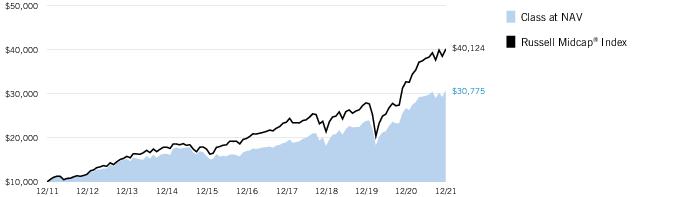
Growth of $10,000
This graph shows the change in value of a hypothetical investment of $10,000 in Class I of the Fund for the period indicated. For comparison, the same investment is shown in the indicated index.
| Growth of Investment2 | Amount Invested | Period Beginning | At NAV | With Maximum Sales Charge |
| Class F | $10,000 | 12/31/2011 | $26,395 | N.A. |
See Endnotes and Additional Disclosures in this report.
Past performance is no guarantee of future results. Returns are historical and are calculated by determining the percentage change in net asset value (NAV) or offering price (as applicable) with all distributions reinvested. Investment return and principal value will fluctuate so that shares, when redeemed, may be worth more or less than their original cost. Performance for periods less than or equal to one year is cumulative. Performance is for the stated time period only; due to market volatility, current Fund performance may be lower or higher than the quoted return.
Calvert
VP SRI Balanced Portfolio
December 31, 2021
Asset Allocation (% of total investments)
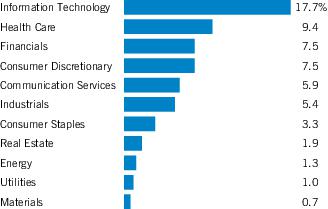
Equity Investments Sector Allocation (% of total investments)
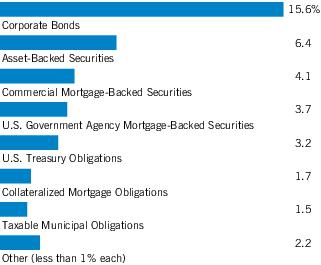
Fixed-Income Allocation (% of total investments)
Calvert
VP SRI Balanced Portfolio
December 31, 2021
Endnotes and Additional Disclosures
| † | The views expressed in this report are those of the portfolio manager(s) and are current only through the date stated at the top of this page. These views are subject to change at any time based upon market or other conditions, and Calvert and the Fund(s) disclaim any responsibility to update such views. These views may not be relied upon as investment advice and, because investment decisions are based on many factors, may not be relied upon as an indication of trading intent on behalf of any Calvert fund. This commentary may contain statements that are not historical facts, referred to as “forward-looking statements.” The Fund’s actual future results may differ significantly from those stated in any forward-looking statement, depending on factors such as changes in securities or financial markets or general economic conditions, the volume of sales and purchases of Fund shares, the continuation of investment advisory, administrative and service contracts, and other risks discussed from time to time in the Fund’s filings with the Securities and Exchange Commission. |
| | |
| 1 | Russell 1000® Index is an unmanaged index of 1,000 U.S. large-cap stocks. Bloomberg U.S. Aggregate Bond Index is an unmanaged index of domestic investment-grade bonds, including corporate, government and mortgage-backed securities. The Balanced Blended Benchmark is an internally constructed benchmark which is comprised of a blend of 60% Russell 1000® Index and 40% Bloomberg U.S. Aggregate Bond Index, and is rebalanced monthly. Prior to 11/1/15, the fixed income component was the Bloomberg U.S. Credit Index. Unless otherwise stated, index returns do not reflect the effect of any applicable sales charges, commissions, expenses, taxes or leverage, as applicable. It is not possible to invest directly in an index. |
| 2 | There is no sales charge. Insurance-related charges are not included in the calculation of returns. If such charges were reflected, the returns would be lower. Please refer to the report for your insurance contract for performance data reflecting insurance-related charges.Performance prior to the inception date of a class may be linked to the performance of an older class of the Fund. This linked performance is adjusted for any applicable sales charge, but is not adjusted for class expense differences. If adjusted for such differences, the performance would be different. The performance of Class F is linked to Class I. Performance presented in the Financial Highlights included in the financial statements is not linked.Calvert Research and Management became the investment adviser to the Fund on December 31, 2016. Performance reflected prior to such date is that of the Fund’s former investment adviser. |
| 3 | Source: Fund prospectus. The expense ratios for the current reporting period can be found in the Financial Highlights section of this report. |
| | Fund profile subject to change due to active management. |
| | Additional Information |
| | S&P 500® Index is an unmanaged index of large-cap stocks commonly used as a measure of U.S. stock market performance. S&P Dow Jones Indices are a product of S&P Dow Jones Indices LLC (“S&P DJI”) and have been licensed for use. S&P® and S&P 500® are registered trademarks of S&P DJI; Dow Jones® is a registered trademark of Dow Jones Trademark Holdings LLC (“Dow Jones”); S&P DJI, Dow Jones and their respective affiliates do not sponsor, endorse, sell or promote the Fund, will not have any liability with respect thereto and do not have any liability for any errors, omissions, or interruptions of the S&P Dow Jones Indices. The Bloomberg U.S. Treasury Index measures the performance of U.S. Treasuries with a maturity of one year or more. Bloomberg U.S. Corporate Bond Index measures the performance of investment-grade U.S. corporate securities with a maturity of one year or more. Bloomberg U.S. Corporate High Yield Index measures USD-denominated, non-investment grade corporate securities. |
Calvert
VP SRI Balanced Portfolio
December 31, 2021
Example
As a Fund shareholder, you incur ongoing costs, including management fees; distribution and/or service fees; and other Fund expenses. This Example is intended to help you understand your ongoing costs (in dollars) of Fund investing and to compare these costs with the ongoing costs of investing in other mutual funds. The Example is based on an investment of $1,000 invested at the beginning of the period and held for the entire period (July 1, 2021 to December 31, 2021).
Actual Expenses
The first section of the table below provides information about actual account values and actual expenses. You may use the information in this section, together with the amount you invested, to estimate the expenses that you paid over the period. Simply divide your account value by $1,000 (for example, an $8,600 account value divided by $1,000 = 8.6), then multiply the result by the number in the first section under the heading entitled “Expenses Paid During Period” to estimate the expenses you paid on your account during this period.
Hypothetical Example for Comparison Purposes
The second section of the table below provides information about hypothetical account values and hypothetical expenses based on the actual Fund expense ratio and an assumed rate of return of 5% per year (before expenses), which is not the actual Fund return. The hypothetical account values and expenses may not be used to estimate the actual ending account balance or expenses you paid for the period. You may use this information to compare the ongoing costs of investing in the Fund and other funds. To do so, compare this 5% hypothetical example with the 5% hypothetical examples that appear in the shareholder reports of the other funds.
Please note that the expenses shown in the table are meant to highlight your ongoing costs only and do not reflect expenses and charges which are, or may be imposed under the variable annuity contract or variable life insurance policy (variable contracts) (if applicable) or qualified pension or retirement plans (Qualified Plans) through which your investment in the Fund is made. Therefore, the second section of the table is useful in comparing ongoing costs associated with an investment in vehicles which fund benefits under variable contracts and Qualified Plans, and will not help you determine the relative total costs of investing in the Fund through variable contracts or Qualified Plans. In addition, if these expenses and charges imposed under the variable contracts or Qualified Plans were included, your costs would have been higher.
| | Beginning
Account Value
(7/1/21) | Ending
Account Value
(12/31/21) | Expenses Paid
During Period*
(7/1/21 – 12/31/21) | Annualized
Expense
Ratio |
| Actual | | | | |
| Class I | $1,000.00 | $1,058.70 | $3.27 | 0.63% |
| Class F | $1,000.00 | $1,059.00 | $4.57 | 0.88% |
| Hypothetical | | | | |
| (5% return per year before expenses) | | | | |
| Class I | $1,000.00 | $1,022.03 | $3.21 | 0.63% |
| Class F | $1,000.00 | $1,020.77 | $4.48 | 0.88% |
| * | Expenses are equal to the Fund's annualized expense ratio for the indicated Class, multiplied by the average account value over the period, multiplied by 184/365 (to reflect the one-half year period). The Example assumes that the $1,000 was invested at the net asset value per share determined at the close of business on June 30, 2021. Expenses shown do not include insurance-related charges or direct expenses of Qualified Plans. |
Calvert
VP SRI Balanced Portfolio
December 31, 2021
| Asset-Backed Securities — 6.6% |
| Security | Principal
Amount
(000's omitted) | Value |
| Adams Outdoor Advertising, L.P., Series 2018-1, Class A, 4.81%, 11/15/48(1) | $ | 156 | $ 161,253 |
| Affirm Asset Securitization Trust: | | | |
| Series 2020-A, Class A, 2.10%, 2/18/25(1) | | 377 | 377,975 |
| Series 2021-A, Class A, 0.88%, 8/15/25(1) | | 115 | 115,045 |
| Aligned Data Centers Issuer, LLC, Series 2021-1A, Class A2, 1.937%, 8/15/46(1) | | 241 | 237,975 |
| Business Jet Securities, LLC, Series 2020-1A, Class A, 2.981%, 11/15/35(1) | | 69 | 69,448 |
| Coinstar Funding, LLC, Series 2017-1A, Class A2, 5.216%, 4/25/47(1) | | 679 | 678,637 |
| Cologix Data Centers US Issuer, LLC: | | | |
| Series 2021-1A, Class A2, 3.30%, 12/26/51(1) | | 600 | 604,012 |
| Series 2021-1A, Class B, 3.79%, 12/26/51(1) | | 350 | 350,369 |
| Conn's Receivables Funding, LLC: | | | |
| Series 2020-A, Class A, 1.71%, 6/16/25(1) | | 21 | 20,679 |
| Series 2020-A, Class B, 4.27%, 6/16/25(1) | | 85 | 85,446 |
| Series 2020-A, Class C, 4.20%, 6/16/25(1) | | 52 | 52,092 |
| Series 2021-A, Class A, 1.05%, 5/15/26(1) | | 771 | 770,951 |
| Series 2021-A, Class B, 2.87%, 5/15/26(1) | | 520 | 518,768 |
| Series 2021-A, Class C, 4.59%, 5/15/26(1) | | 155 | 154,569 |
| DataBank Issuer, Series 2021-2A, Class A2, 2.40%, 10/25/51(1) | | 283 | 280,847 |
| DB Master Finance, LLC, Series 2017-1A, Class A2II, 4.03%, 11/20/47(1) | | 82 | 85,762 |
| Diamond Infrastructure Funding, LLC: | | | |
| Series 2021-1A, Class A, 1.76%, 4/15/49(1) | | 345 | 339,363 |
| Series 2021-1A, Class C, 3.475%, 4/15/49(1) | | 99 | 98,674 |
| Diamond Issuer, Series 2021-1A, Class A, 2.305%, 11/20/51(1) | | 782 | 777,875 |
| Driven Brands Funding, LLC, Series 2018-1A, Class A2, 4.739%, 4/20/48(1) | | 62 | 64,466 |
| ExteNet, LLC: | | | |
| Series 2019-1A, Class A2, 3.204%, 7/26/49(1) | | 345 | 350,088 |
| Series 2019-1A, Class B, 4.14%, 7/26/49(1) | | 55 | 56,050 |
| FOCUS Brands Funding, LLC: | | | |
| Series 2017-1A, Class A2IB, 3.857%, 4/30/47(1) | | 563 | 572,150 |
| Series 2017-1A, Class A2II, 5.093%, 4/30/47(1) | | 172 | 181,663 |
| GoodLeap Sustainable Home Solutions Trust, Series 2021-5CS, Class A, 2.31%, 10/20/48(1) | | 255 | 254,969 |
| Hardee's Funding, LLC, Series 2020-1A, Class A2, 3.981%, 12/20/50(1) | | 178 | 187,270 |
| Jack in the Box Funding, LLC, Series 2019-1A, Class A2I, 3.982%, 8/25/49(1) | | 402 | 405,386 |
| Jersey Mike's Funding, Series 2019-1A, Class A2, 4.433%, 2/15/50(1) | | 281 | 296,327 |
| Security | Principal
Amount
(000's omitted) | Value |
| JPMorgan Chase Bank, NA: | | | |
| Series 2021-2, Class B, 0.889%, 12/26/28(1) | $ | 400 | $ 397,998 |
| Series 2021-3, Class B, 0.76%, 2/26/29(1) | | 347 | 345,263 |
| Loanpal Solar Loan, Ltd., Series 2020-1GS, Class C, 2.00%, 6/20/47(1) | | 91 | 83,865 |
| Marlette Funding Trust: | | | |
| Series 2020-2A, Class B, 1.83%, 9/16/30(1) | | 119 | 119,026 |
| Series 2021-1A, Class A, 0.60%, 6/16/31(1) | | 45 | 45,292 |
| Mosaic Solar Loan Trust: | | | |
| Series 2019-1A, Class A, 4.37%, 12/21/43(1) | | 230 | 246,848 |
| Series 2019-2A, Class B, 3.28%, 9/20/40(1) | | 581 | 593,076 |
| Series 2020-1A, Class A, 2.10%, 4/20/46(1) | | 64 | 64,035 |
| Series 2020-1A, Class B, 3.10%, 4/20/46(1) | | 64 | 65,877 |
| Series 2020-2A, Class A, 1.44%, 8/20/46(1) | | 116 | 112,772 |
| Series 2020-2A, Class B, 2.21%, 8/20/46(1) | | 137 | 137,407 |
| Series 2021-1A, Class A, 1.51%, 12/20/46(1) | | 232 | 225,885 |
| Neighborly Issuer, LLC, Series 2021-1A, Class A2, 3.584%, 4/30/51(1) | | 388 | 391,321 |
| NRZ Excess Spread-Collateralized Notes, Series 2021-GNT1, Class A, 3.474%, 11/25/26(1) | | 790 | 789,974 |
| OneMain Financial Issuance Trust: | | | |
| Series 2016-3A, Class A, 3.83%, 6/18/31(1) | | 103 | 103,282 |
| Series 2018-1A, Class A, 3.30%, 3/14/29(1) | | 151 | 151,029 |
| Oportun Funding XIV, LLC, Series 2021-A, Class B, 1.76%, 3/8/28(1) | | 100 | 99,809 |
| Oportun Issuance Trust: | | | |
| Series 2021-B, Class A, 1.47%, 5/8/31(1) | | 361 | 358,994 |
| Series 2021-B, Class C, 3.65%, 5/8/31(1) | | 100 | 100,190 |
| Series 2021-C, Class A, 2.18%, 10/8/31(1) | | 1,850 | 1,840,140 |
| Series 2021-C, Class B, 2.67%, 10/8/31(1) | | 220 | 218,460 |
| Pagaya AI Debt Selection Trust: | | | |
| Series 2020-3, Class B, 3.22%, 5/17/27(1) | | 125 | 126,590 |
| Series 2021-2, 3.00%, 1/25/29(1) | | 548 | 547,867 |
| Series 2021-3, Class A, 1.15%, 5/15/29(1) | | 1,225 | 1,219,659 |
| Series 2021-5, Class A, 1.53%, 8/15/29(1) | | 824 | 824,499 |
| Series 2021-HG1, Class A, 1.22%, 1/16/29(1) | | 238 | 237,062 |
| Planet Fitness Master Issuer, LLC: | | | |
| Series 2018-1A, Class A2I, 4.262%, 9/5/48(1) | | 489 | 490,473 |
| Series 2019-1A, Class A2, 3.858%, 12/5/49(1) | | 274 | 282,596 |
| Prosper Marketplace Issuance Trust, Series 2019-4A, Class C, 4.95%, 2/17/26(1) | | 100 | 100,999 |
| ServiceMaster Funding, LLC: | | | |
| Series 2020-1, Class A2I, 2.841%, 1/30/51(1) | | 160 | 159,112 |
| Series 2020-1, Class A2II, 3.337%, 1/30/51(1) | | 181 | 182,660 |
| SERVPRO Master Issuer, LLC, Series 2019-1A, Class A2, 3.882%, 10/25/49(1) | | 931 | 955,244 |
| Small Business Lending Trust, Series 2020-A, Class A, 2.62%, 12/15/26(1) | | 19 | 19,320 |
8
See Notes to Financial Statements.
Calvert
VP SRI Balanced Portfolio
December 31, 2021
Schedule of Investments — continued
| Security | Principal
Amount
(000's omitted) | Value |
| Sofi Consumer Loan Program Trust, Series 2018-1, Class C, 3.97%, 2/25/27(1) | $ | 100 | $ 100,898 |
| SolarCity LMC Series I, LLC, Series 2013-1, Class A, 4.80%, 11/20/38(1) | | 250 | 249,631 |
| Sonic Capital, LLC, Series 2020-1A, Class A2I, 3.845%, 1/20/50(1) | | 515 | 535,590 |
| SpringCastle America Funding, LLC, Series 2020-AA, Class A, 1.97%, 9/25/37(1) | | 342 | 340,891 |
| Stack Infrastructure Issuer, LLC: | | | |
| Series 2019-1A, Class A2, 4.54%, 2/25/44(1) | | 2,144 | 2,223,964 |
| Series 2019-2A, Class A2, 3.08%, 10/25/44(1) | | 200 | 204,049 |
| Sunnova Helios II Issuer, LLC, Series 2021-A, Class A, 1.80%, 2/20/48(1) | | 322 | 317,604 |
| Sunnova Sol II Issuer, LLC, Series 2020-2A, Class A, 2.73%, 11/1/55(1) | | 564 | 565,015 |
| Sunnova Sol Issuer, LLC, Series 2020-1A, Class A, 3.35%, 2/1/55(1) | | 100 | 102,956 |
| Sunrun Atlas Issuer, LLC, Series 2019-2, Class A, 3.61%, 2/1/55(1) | | 209 | 218,959 |
| Sunrun Callisto Issuer, LLC, Series 2015-1A, Class B, 5.38%, 7/20/45(1) | | 297 | 293,565 |
| Sunrun Demeter Issuer, LLC, Series 2021-2A, Class A, 2.27%, 1/30/57(1) | | 265 | 263,976 |
| Sunrun Xanadu Issuer, LLC, Series 2019-1A, Class A, 3.98%, 6/30/54(1) | | 175 | 184,327 |
| TES, LLC, Series 2017-1A, Class A, 4.33%, 10/20/47(1) | | 365 | 381,852 |
| Tesla Auto Lease Trust, Series 2019-A, Class A3, 2.16%, 10/20/22(1) | | 757 | 760,443 |
| Theorem Funding Trust: | | | |
| Series 2020-1A, Class B, 3.95%, 10/15/26(1) | | 184 | 186,421 |
| Series 2021-1A, Class A, 1.21%, 12/15/27(1) | | 560 | 559,217 |
| Series 2021-1A, Class B, 1.84%, 12/15/27(1) | | 100 | 98,904 |
| United States Small Business Administration, Series 2017-20E, Class 1, 2.88%, 5/1/37 | | 508 | 538,537 |
| Upstart Securitization Trust, Series 2021-2, Class A, 0.91%, 6/20/31(1) | | 536 | 534,971 |
| Vantage Data Centers Issuer, LLC: | | | |
| Series 2018-2A, Class A2, 4.196%, 11/16/43(1) | | 77 | 79,524 |
| Series 2019-1A, Class A2, 3.188%, 7/15/44(1) | | 293 | 299,555 |
| Series 2020-2A, Class A2, 1.992%, 9/15/45(1) | | 570 | 560,026 |
| Series 2021-1A, Class A2, 2.165%, 10/15/46(1) | | 224 | 223,644 |
| Vivint Solar Financing VII, LLC, Series 2020-1A, Class A, 2.21%, 7/31/51(1) | | 394 | 387,168 |
| Willis Engine Structured Trust V, Series 2020-A, Class B, 4.212%, 3/15/45(1) | | 226 | 210,509 |
Total Asset-Backed Securities
(identified cost $30,036,835) | | | $ 30,206,929 |
| Collateralized Mortgage Obligations — 1.8% |
| Security | Principal
Amount
(000's omitted) | Value |
| Bellemeade Re, Ltd.: | | | |
| Series 2020-4A, Class M2A, 2.702%, (1 mo. USD LIBOR + 2.60%), 6/25/30(1)(2) | $ | 10 | $ 9,836 |
| Series 2021-1A, Class M1A, 1.80%, (30-day average SOFR + 1.75%), 3/25/31(1)(2) | | 150 | 150,708 |
| Series 2021-1A, Class M1B, 2.25%, (30-day average SOFR + 2.20%), 3/25/31(1)(2) | | 155 | 156,599 |
| Series 2021-1A, Class M1C, 3.00%, (30-day average SOFR + 2.95%), 3/25/31(1)(2) | | 150 | 154,538 |
| Series 2021-2A, Class M1A, 1.25%, (30-day average SOFR + 1.20%), 6/25/31(1)(2) | | 533 | 532,190 |
| Series 2021-3A, Class A2, 1.05%, (30-day average SOFR + 1.00%), 9/25/31(1)(2) | | 215 | 213,967 |
| Series 2021-3A, Class M1B, 1.45%, (30-day average SOFR + 1.40%), 9/25/31(1)(2) | | 170 | 169,355 |
| Eagle Re, Ltd.: | | | |
| Series 2021-1, Class M1A, 1.75%, (30-day average SOFR + 1.70%), 10/25/33(1)(2) | | 315 | 315,703 |
| Series 2021-2, Class M1C, 3.50%, (30-day average SOFR + 3.45%), 4/25/34(1)(2) | | 150 | 150,666 |
| Federal Home Loan Mortgage Corp. Structured Agency Credit Risk Debt Notes: | | | |
| Series 2015-HQ2, Class M3, 3.353%, (1 mo. USD LIBOR + 3.25%), 5/25/25(2) | | 172 | 174,774 |
| Series 2018-DNA1, Class M2, 1.903%, (1 mo. USD LIBOR + 1.80%), 7/25/30(2) | | 242 | 243,529 |
| Series 2018-DNA1, Class M2AT, 1.153%, (1 mo. USD LIBOR + 1.05%), 7/25/30(2) | | 276 | 276,420 |
| Series 2019-DNA2, Class M2, 2.553%, (1 mo. USD LIBOR + 2.45%), 3/25/49(1)(2) | | 67 | 68,245 |
| Series 2019-DNA3, Class B2, 8.253%, (1 mo. USD LIBOR + 8.15%), 7/25/49(1)(2) | | 85 | 90,197 |
| Series 2019-DNA3, Class M2, 2.153%, (1 mo. USD LIBOR + 2.05%), 7/25/49(1)(2) | | 735 | 741,608 |
| Series 2019-DNA4, Class M2, 2.053%, (1 mo. USD LIBOR + 1.95%), 10/25/49(1)(2) | | 85 | 85,382 |
| Series 2019-HQA2, Class B1, 4.203%, (1 mo. USD LIBOR + 4.10%), 4/25/49(1)(2) | | 55 | 56,368 |
| Series 2019-HQA4, Class B1, 3.053%, (1 mo. USD LIBOR + 2.95%), 11/25/49(1)(2) | | 20 | 20,156 |
| Series 2020-DNA4, Class M2, 3.853%, (1 mo. USD LIBOR + 3.75%), 8/25/50(1)(2) | | 10 | 9,517 |
| Series 2020-DNA5, Class M2, 2.85%, (30-day average SOFR + 2.80%), 10/25/50(1)(2) | | 92 | 92,992 |
| Series 2020-DNA6, Class B1, 3.05%, (30-day average SOFR + 3.00%), 12/25/50(1)(2) | | 25 | 25,351 |
| Series 2020-DNA6, Class M2, 2.05%, (30-day average SOFR + 2.00%), 12/25/50(1)(2) | | 280 | 281,863 |
| Series 2020-HQA2, Class B1, 4.203%, (1 mo. USD LIBOR + 4.10%), 3/25/50(1)(2) | | 41 | 42,475 |
| Series 2021-DNA3, Class M1, 0.80%, (30-day average SOFR + 0.75%), 10/25/33(1)(2) | | 222 | 222,202 |
9
See Notes to Financial Statements.
Calvert
VP SRI Balanced Portfolio
December 31, 2021
Schedule of Investments — continued
| Security | Principal
Amount
(000's omitted) | Value |
| Federal National Mortgage Association Connecticut Avenue Securities: | | | |
| Series 2013-C01, Class M2, 5.353%, (1 mo. USD LIBOR + 5.25%), 10/25/23(2) | $ | 142 | $ 147,479 |
| Series 2014-C02, Class 2M2, 2.703%, (1 mo. USD LIBOR + 2.60%), 5/25/24(2) | | 60 | 61,012 |
| Series 2014-C03, Class 2M2, 3.003%, (1 mo. USD LIBOR + 2.90%), 7/25/24(2) | | 92 | 93,834 |
| Series 2014-C04, Class 1M2, 5.003%, (1 mo. USD LIBOR + 4.90%), 11/25/24(2) | | 241 | 250,773 |
| Series 2018-C06, Class 1M2, 2.103%, (1 mo. USD LIBOR + 2.00%), 3/25/31(2) | | 22 | 22,625 |
| Series 2018-R07, Class 1M2, 2.502%, (1 mo. USD LIBOR + 2.40%), 4/25/31(1)(2) | | 106 | 107,064 |
| Series 2019-R01, Class 2B1, 4.453%, (1 mo. USD LIBOR + 4.35%), 7/25/31(1)(2) | | 55 | 56,648 |
| Series 2019-R02, Class 1B1, 4.253%, (1 mo. USD LIBOR + 4.15%), 8/25/31(1)(2) | | 55 | 56,468 |
| Series 2019-R02, Class 1M2, 2.403%, (1 mo. USD LIBOR + 2.30%), 8/25/31(1)(2) | | 9 | 8,809 |
| Series 2019-R03, Class 1B1, 4.203%, (1 mo. USD LIBOR + 4.10%), 9/25/31(1)(2) | | 55 | 56,525 |
| Series 2019-R05, Class 1B1, 4.203%, (1 mo. USD LIBOR + 4.10%), 7/25/39(1)(2) | | 91 | 92,673 |
| Series 2019-R05, Class 1M2, 2.103%, (1 mo. USD LIBOR + 2.00%), 7/25/39(1)(2) | | 9 | 8,859 |
| Series 2019-R06, Class 2B1, 3.852%, (1 mo. USD LIBOR + 3.75%), 9/25/39(1)(2) | | 267 | 270,990 |
| Series 2019-R07, Class 1B1, 3.503%, (1 mo. USD LIBOR + 3.40%), 10/25/39(1)(2) | | 88 | 89,290 |
| Series 2020-R02, Class 2B1, 3.103%, (1 mo. USD LIBOR + 3.00%), 1/25/40(1)(2) | | 405 | 407,681 |
| Series 2021-R01, Class 1B2, 6.05%, (30-day average SOFR + 6.00%), 10/25/41(1)(2) | | 48 | 48,648 |
| Series 2021-R02, Class 2B1, 3.35%, (30-day average SOFR + 3.30%), 11/25/41(1)(2) | | 12 | 12,333 |
| Federal National Mortgage Association Grantor Trust, Series 2017-T1, Class A, 2.898%, 6/25/27 | | 274 | 289,660 |
| FMC GMSR Issuer Trust: | | | |
| Series 2021-GT1, Class A, 3.62%, 7/25/26(1)(3) | | 100 | 99,401 |
| Series 2021-GT2, Class A, 3.85%, 10/25/26(1)(3) | | 420 | 417,621 |
| Home Re, Ltd.: | | | |
| Series 2018-1, Class M2, 3.102%, (1 mo. USD LIBOR + 3.00%), 10/25/28(1)(2) | | 344 | 347,133 |
| Series 2021-1, Class M1B, 1.652%, (1 mo. USD LIBOR + 1.55%), 7/25/33(1)(2) | | 265 | 264,207 |
| Series 2021-1, Class M2, 2.952%, (1 mo. USD LIBOR + 2.85%), 7/25/33(1)(2) | | 150 | 146,602 |
| Oaktown Re V, Ltd., Series 2020-2A, Class M1B, 3.702%, (1 mo. USD LIBOR + 3.60%), 10/25/30(1)(2) | | 138 | 139,765 |
| Security | Principal
Amount
(000's omitted) | Value |
| Toorak Mortgage Corp., Ltd., Series 2020-1, Class A1, 2.734% to 1/25/23, 3/25/23(1)(4) | $ | 250 | $ 250,635 |
Total Collateralized Mortgage Obligations
(identified cost $8,001,849) | | | $ 8,031,376 |
| Commercial Mortgage-Backed Securities — 4.2% |
| Security | Principal
Amount
(000's omitted) | Value |
| BAMLL Commercial Mortgage Securities Trust: | | | |
| Series 2019-BPR, Class DNM, 3.719%, 11/5/32(1)(3) | $ | 695 | $ 670,671 |
| Series 2019-BPR, Class ENM, 3.719%, 11/5/32(1)(3) | | 325 | 304,620 |
| Series 2019-BPR, Class FNM, 3.719%, 11/5/32(1)(3) | | 485 | 389,287 |
| BBCMS Mortgage Trust, Series 2018-RRI, Class F, 4.759%, (1 mo. USD LIBOR + 4.65%), 2/15/33(1)(2) | | 100 | 100,457 |
| BX Commercial Mortgage Trust: | | | |
| Series 2019-XL, Class A, 1.026%, (1 mo. USD LIBOR + 0.92%), 10/15/36(1)(2) | | 580 | 580,484 |
| Series 2019-XL, Class B, 1.186%, (1 mo. USD LIBOR + 1.08%), 10/15/36(1)(2) | | 280 | 280,430 |
| Series 2021-VOLT, Class B, 1.059%, (1 mo. USD LIBOR + 0.95%), 9/15/36(1)(2) | | 666 | 661,736 |
| Series 2021-VOLT, Class C, 1.209%, (1 mo. USD LIBOR + 1.10%), 9/15/36(1)(2) | | 204 | 201,802 |
| Series 2021-VOLT, Class D, 1.759%, (1 mo. USD LIBOR + 1.65%), 9/15/36(1)(2) | | 702 | 697,961 |
| CGMS Commercial Mortgage Trust, Series 2017-MDRC, Class D, 2.36%, (1 mo. USD LIBOR + 2.25%), 7/15/30(1)(2) | | 235 | 230,822 |
| Extended Stay America Trust: | | | |
| Series 2021-ESH, Class A, 1.19%, (1 mo. USD LIBOR + 1.08%), 7/15/38(1)(2) | | 231 | 231,151 |
| Series 2021-ESH, Class C, 1.81%, (1 mo. USD LIBOR + 1.70%), 7/15/38(1)(2) | | 597 | 598,058 |
| Series 2021-ESH, Class D, 2.36%, (1 mo. USD LIBOR + 2.25%), 7/15/38(1)(2) | | 201 | 201,258 |
| Federal Home Loan Mortgage Corp. Multifamily Structured Pass Through Certificates: | | | |
| Series KG02, Class A2, 2.412%, 8/25/29 | | 1,440 | 1,503,107 |
| Series KG03, Class A2, 1.297%, 6/25/30(3) | | 305 | 294,053 |
| Series KSG1, Class A2, 1.503%, 9/25/30 | | 278 | 272,236 |
| Series KW06, Class A2, 3.80%, 6/25/28(3) | | 530 | 594,902 |
| Series W5FX, Class AFX, 3.214%, 4/25/28(3) | | 192 | 208,654 |
| Federal National Mortgage Association: | | | |
| Series 2017-M13, Class A2, 2.926%, 9/25/27(3) | | 595 | 636,422 |
| Series 2018-M4, Class A2, 3.059%, 3/25/28(3) | | 1,027 | 1,113,076 |
| Series 2018-M13, Class A2, 3.709%, 9/25/30(3) | | 1,680 | 1,926,342 |
| Series 2019-M1, Class A2, 3.552%, 9/25/28(3) | | 458 | 511,049 |
| Series 2020-M1, Class A2, 2.444%, 10/25/29 | | 963 | 1,014,753 |
10
See Notes to Financial Statements.
Calvert
VP SRI Balanced Portfolio
December 31, 2021
Schedule of Investments — continued
| Security | Principal
Amount
(000's omitted) | Value |
| Federal National Mortgage Association: (continued) | | | |
| Series 2020-M20, Class A2, 1.435%, 10/25/29 | $ | 605 | $ 591,871 |
| Federal National Mortgage Association Multifamily Connecticut Avenue Securities Trust: | | | |
| Series 2019-01, Class M7, 1.802%, (1 mo. USD LIBOR + 1.70%), 10/15/49(1)(2) | | 253 | 251,907 |
| Series 2019-01, Class M10, 3.352%, (1 mo. USD LIBOR + 3.25%), 10/15/49(1)(2) | | 162 | 160,381 |
| Series 2020-01, Class M10, 3.852%, (1 mo. USD LIBOR + 3.75%), 3/25/50(1)(2) | | 504 | 512,832 |
| Hawaii Hotel Trust, Series 2019-MAUI, Class A, 1.259%, (1 mo. USD LIBOR + 1.15%), 5/15/38(1)(2) | | 588 | 588,814 |
| JPMorgan Chase Commercial Mortgage Securities Trust: | | | |
| Series 2014-DSTY, Class B, 3.771%, 6/10/27(1) | | 300 | 88,200 |
| Series 2014-DSTY, Class C, 3.805%, 6/10/27(1)(3) | | 100 | 16,800 |
| Morgan Stanley Capital I Trust: | | | |
| Series 2017-CLS, Class A, 0.81%, (1 mo. USD LIBOR + 0.70%), 11/15/34(1)(2)(5) | | 685 | 685,150 |
| Series 2017-CLS, Class E, 2.06%, (1 mo. USD LIBOR + 1.95%), 11/15/34(1)(2)(5) | | 79 | 78,896 |
| Series 2017-CLS, Class F, 2.71%, (1 mo. USD LIBOR + 2.60%), 11/15/34(1)(2)(5) | | 169 | 168,469 |
| Series 2019-BPR, Class A, 1.51%, (1 mo. USD LIBOR + 1.40%), 5/15/36(1)(2)(5) | | 539 | 533,095 |
| Series 2019-BPR, Class B, 2.21%, (1 mo. USD LIBOR + 2.10%), 5/15/36(1)(2)(5) | | 187 | 178,500 |
| Series 2019-BPR, Class C, 3.16%, (1 mo. USD LIBOR + 3.05%), 5/15/36(1)(2)(5) | | 100 | 91,069 |
| SLG Office Trust, Series 2021-OVA, Class A, 2.585%, 7/15/41(1) | | 618 | 633,984 |
| VMC Finance, LLC: | | | |
| Series 2021-HT1, Class A, 1.753%, (1 mo. USD LIBOR + 1.65%), 1/18/37(1)(2) | | 522 | 523,416 |
| Series 2021-HT1, Class B, 4.603%, (1 mo. USD LIBOR + 4.50%), 1/18/37(1)(2) | | 753 | 753,890 |
| WFLD Mortgage Trust, Series 2014-MONT, Class C, 3.755%, 8/10/31(1)(3) | | 450 | 406,874 |
Total Commercial Mortgage-Backed Securities
(identified cost $19,421,985) | | | $ 19,487,479 |
| Security | Shares | Value |
| Auto Components — 1.1% | |
| Aptiv PLC(6) | | 30,500 | $ 5,030,975 |
| | | | $ 5,030,975 |
| Automobiles — 0.6% | |
| Tesla, Inc.(6) | | 2,500 | $ 2,641,950 |
| | | | $ 2,641,950 |
| Security | Shares | Value |
| Banks — 2.9% | |
| PNC Financial Services Group, Inc. (The) | | 32,200 | $ 6,456,744 |
| Wells Fargo & Co. | | 146,400 | 7,024,272 |
| | | | $ 13,481,016 |
| Beverages — 2.3% | |
| Coca-Cola Co. (The) | | 92,200 | $ 5,459,162 |
| Coca-Cola Europacific Partners PLC | | 89,100 | 4,983,363 |
| | | | $ 10,442,525 |
| Biotechnology — 2.1% | |
| AbbVie, Inc. | | 52,500 | $ 7,108,500 |
| Neurocrine Biosciences, Inc.(6) | | 31,600 | 2,691,372 |
| | | | $ 9,799,872 |
| Building Products — 0.7% | |
| AZEK Co., Inc. (The)(6) | | 71,300 | $ 3,296,912 |
| | | | $ 3,296,912 |
| Capital Markets — 4.9% | |
| Goldman Sachs Group, Inc. (The) | | 10,900 | $ 4,169,795 |
| Intercontinental Exchange, Inc. | | 39,500 | 5,402,415 |
| S&P Global, Inc. | | 14,500 | 6,842,985 |
| Tradeweb Markets, Inc., Class A | | 61,103 | 6,118,855 |
| | | | $ 22,534,050 |
| Commercial Services & Supplies — 0.8% | |
| Waste Management, Inc. | | 22,116 | $ 3,691,161 |
| | | | $ 3,691,161 |
| Containers & Packaging — 0.7% | |
| AptarGroup, Inc. | | 25,900 | $ 3,172,232 |
| | | | $ 3,172,232 |
| Electric Utilities — 1.1% | |
| NextEra Energy, Inc. | | 52,800 | $ 4,929,408 |
| | | | $ 4,929,408 |
| Electrical Equipment — 0.8% | |
| AMETEK, Inc. | | 26,100 | $ 3,837,744 |
| | | | $ 3,837,744 |
| Electronic Equipment, Instruments & Components — 0.9% | |
| TE Connectivity, Ltd. | | 27,100 | $ 4,372,314 |
| | | | $ 4,372,314 |
11
See Notes to Financial Statements.
Calvert
VP SRI Balanced Portfolio
December 31, 2021
Schedule of Investments — continued
| Security | Shares | Value |
| Energy Equipment & Services — 1.3% | |
| Baker Hughes Co. | | 245,800 | $ 5,913,948 |
| | | | $ 5,913,948 |
| Entertainment — 0.8% | |
| Walt Disney Co. (The)(6) | | 23,700 | $ 3,670,893 |
| | | | $ 3,670,893 |
| Equity Real Estate Investment Trusts (REITs) — 1.9% | |
| EastGroup Properties, Inc. | | 16,500 | $ 3,759,525 |
| Lamar Advertising Co., Class A | | 40,100 | 4,864,130 |
| | | | $ 8,623,655 |
| Food & Staples Retailing — 1.2% | |
| Sysco Corp. | | 68,000 | $ 5,341,400 |
| | | | $ 5,341,400 |
| Health Care Equipment & Supplies — 1.3% | |
| Boston Scientific Corp.(6) | | 89,900 | $ 3,818,952 |
| Teleflex, Inc. | | 6,600 | 2,167,968 |
| | | | $ 5,986,920 |
| Health Care Providers & Services — 1.2% | |
| Anthem, Inc. | | 11,800 | $ 5,469,772 |
| | | | $ 5,469,772 |
| Hotels, Restaurants & Leisure — 0.9% | |
| Marriott International, Inc., Class A(6) | | 24,200 | $ 3,998,808 |
| | | | $ 3,998,808 |
| Interactive Media & Services — 4.5% | |
| Alphabet, Inc., Class C(6) | | 5,790 | $ 16,753,886 |
| Match Group, Inc.(6) | | 29,772 | 3,937,347 |
| | | | $ 20,691,233 |
| Internet & Direct Marketing Retail — 3.5% | |
| Amazon.com, Inc.(6) | | 4,829 | $ 16,101,528 |
| | | | $ 16,101,528 |
| IT Services — 2.5% | |
| Automatic Data Processing, Inc. | | 21,600 | $ 5,326,128 |
| Visa, Inc., Class A | | 28,700 | 6,219,577 |
| | | | $ 11,545,705 |
| Life Sciences Tools & Services — 2.6% | |
| Danaher Corp. | | 18,600 | $ 6,119,586 |
| Security | Shares | Value |
| Life Sciences Tools & Services (continued) | |
| Thermo Fisher Scientific, Inc. | | 9,018 | $ 6,017,170 |
| | | | $ 12,136,756 |
| Machinery — 0.8% | |
| Stanley Black & Decker, Inc. | | 18,600 | $ 3,508,332 |
| | | | $ 3,508,332 |
| Pharmaceuticals — 2.3% | |
| Eli Lilly & Co. | | 17,400 | $ 4,806,228 |
| Pfizer, Inc. | | 34,000 | 2,007,700 |
| Zoetis, Inc. | | 14,700 | 3,587,241 |
| | | | $ 10,401,169 |
| Professional Services — 1.5% | |
| Booz Allen Hamilton Holding Corp. | | 39,500 | $ 3,349,205 |
| Clarivate PLC(6)(7) | | 147,600 | 3,471,552 |
| | | | $ 6,820,757 |
| Road & Rail — 1.0% | |
| Union Pacific Corp. | | 18,700 | $ 4,711,091 |
| | | | $ 4,711,091 |
| Semiconductors & Semiconductor Equipment — 4.2% | |
| Analog Devices, Inc. | | 32,200 | $ 5,659,794 |
| Lam Research Corp. | | 5,700 | 4,099,155 |
| NVIDIA Corp. | | 8,900 | 2,617,579 |
| Taiwan Semiconductor Manufacturing Co., Ltd. ADR | | 24,200 | 2,911,502 |
| Texas Instruments, Inc. | | 22,351 | 4,212,493 |
| | | | $ 19,500,523 |
| Software — 6.6% | |
| Bill.com Holdings, Inc.(6) | | 10,900 | $ 2,715,735 |
| Intuit, Inc. | | 8,452 | 5,436,495 |
| Microsoft Corp. | | 66,093 | 22,228,398 |
| | | | $ 30,380,628 |
| Specialty Retail — 1.2% | |
| TJX Cos., Inc. (The) | | 70,400 | $ 5,344,768 |
| | | | $ 5,344,768 |
| Technology Hardware, Storage & Peripherals — 4.0% | |
| Apple, Inc. | | 103,188 | $ 18,323,093 |
| | | | $ 18,323,093 |
12
See Notes to Financial Statements.
Calvert
VP SRI Balanced Portfolio
December 31, 2021
Schedule of Investments — continued
| Security | Shares | Value |
| Textiles, Apparel & Luxury Goods — 0.6% | |
| Deckers Outdoor Corp.(6) | | 7,100 | $ 2,600,801 |
| | | | $ 2,600,801 |
| Wireless Telecommunication Services — 0.8% | |
| T-Mobile US, Inc.(6) | | 30,630 | $ 3,552,467 |
| | | | $ 3,552,467 |
Total Common Stocks
(identified cost $184,157,769) | | | $291,854,406 |
| Convertible Bonds — 0.0%(8) |
| Security | Principal
Amount
(000's omitted) | Value |
| Technology — 0.0%(8) | |
| ams AG, 0.875%, 9/28/22(9) | $ | 200 | $ 197,111 |
Total Convertible Bonds
(identified cost $197,575) | | | $ 197,111 |
| Security | Principal
Amount
(000's omitted) | Value |
| Basic Materials — 0.0%(8) | |
| WR Grace Holdings, LLC, 5.625%, 8/15/29(1) | $ | 50 | $ 51,313 |
| | | | $ 51,313 |
| Communications — 1.4% | |
| AT&T, Inc.: | | | |
| 2.30%, 6/1/27 | $ | 1 | $ 1,018 |
| 3.10%, 2/1/43 | | 40 | 38,968 |
| 3.50%, 9/15/53 | | 44 | 44,474 |
| 3.65%, 6/1/51 | | 1,174 | 1,218,508 |
| 3.65%, 9/15/59 | | 53 | 53,628 |
| 3.80%, 12/1/57 | | 266 | 277,554 |
| 4.90%, 6/15/42 | | 300 | 362,178 |
| CCO Holdings, LLC/CCO Holdings Capital Corp., 5.00%, 2/1/28(1) | | 124 | 129,208 |
| Charter Communications Operating, LLC/Charter Communications Operating Capital, 4.80%, 3/1/50 | | 1,105 | 1,240,230 |
| Comcast Corp.: | | | |
| 2.887%, 11/1/51(1) | | 446 | 432,531 |
| 2.937%, 11/1/56(1) | | 98 | 93,604 |
| Level 3 Financing, Inc., 3.75%, 7/15/29(1) | | 35 | 33,307 |
| NBCUniversal Media, LLC, 4.45%, 1/15/43 | | 123 | 149,482 |
| Security | Principal
Amount
(000's omitted) | Value |
| Communications (continued) | |
| Nokia Oyj: | | | |
| 4.375%, 6/12/27 | $ | 347 | $ 375,182 |
| 6.625%, 5/15/39 | | 395 | 547,126 |
| SES Global Americas Holdings GP, 5.30%, 3/25/44(1) | | 185 | 211,935 |
| SES S.A., 5.30%, 4/4/43(1) | | 109 | 125,151 |
| Sprint Corp., 7.875%, 9/15/23 | | 79 | 87,115 |
| T-Mobile USA, Inc.: | | | |
| 2.25%, 2/15/26(7) | | 23 | 23,093 |
| 2.25%, 11/15/31(7) | | 64 | 62,172 |
| 2.55%, 2/15/31 | | 147 | 146,378 |
| 2.625%, 4/15/26 | | 558 | 561,518 |
| 4.50%, 4/15/50 | | 280 | 328,186 |
| | | | $ 6,542,546 |
| Consumer, Cyclical — 1.2% | |
| 7-Eleven, Inc., 0.80%, 2/10/24(1) | $ | 214 | $ 211,655 |
| American Airlines Pass-Through Trust: | | | |
| 4.40%, 9/22/23 | | 100 | 98,219 |
| 5.25%, 1/15/24 | | 156 | 154,783 |
| American Airlines, Inc./AAdvantage Loyalty IP, Ltd.: | | | |
| 5.50%, 4/20/26(1) | | 693 | 721,711 |
| 5.75%, 4/20/29(1) | | 21 | 22,486 |
| Dave & Buster's, Inc., 7.625%, 11/1/25(1) | | 87 | 92,852 |
| Delta Air Lines, Inc., 3.625%, 3/15/22 | | 209 | 209,008 |
| Delta Air Lines, Inc./SkyMiles IP, Ltd., 4.75%, 10/20/28(1) | | 460 | 502,680 |
| Ford Motor Credit Co., LLC: | | | |
| 1.221%, (3 mo. USD LIBOR + 1.08%), 8/3/22(2) | | 250 | 250,454 |
| 2.979%, 8/3/22 | | 777 | 781,961 |
| 3.087%, 1/9/23 | | 200 | 203,644 |
| 3.375%, 11/13/25 | | 200 | 208,047 |
| 4.14%, 2/15/23 | | 200 | 205,010 |
| Hyatt Hotels Corp.: | | | |
| 1.30%, 10/1/23 | | 149 | 149,051 |
| 1.80%, 10/1/24 | | 61 | 61,065 |
| Lithia Motors, Inc.: | | | |
| 3.875%, 6/1/29(1) | | 407 | 416,168 |
| 4.375%, 1/15/31(1) | | 65 | 69,481 |
| Macy's Retail Holdings, LLC: | | | |
| 2.875%, 2/15/23 | | 252 | 254,849 |
| 3.625%, 6/1/24 | | 39 | 39,919 |
| 4.30%, 2/15/43 | | 30 | 26,369 |
| MDC Holdings, Inc., 2.50%, 1/15/31(7) | | 61 | 59,089 |
| Nordstrom, Inc.: | | | |
| 4.25%, 8/1/31(7) | | 218 | 214,516 |
| 4.375%, 4/1/30(7) | | 268 | 270,760 |
13
See Notes to Financial Statements.
Calvert
VP SRI Balanced Portfolio
December 31, 2021
Schedule of Investments — continued
| Security | Principal
Amount
(000's omitted) | Value |
| Consumer, Cyclical (continued) | |
| Nordstrom, Inc.: (continued) | | | |
| 5.00%, 1/15/44(7) | $ | 371 | $ 346,536 |
| Powdr Corp., 6.00%, 8/1/25(1) | | 92 | 95,951 |
| | | | $ 5,666,264 |
| Consumer, Non-cyclical — 1.5% | |
| Ashtead Capital, Inc.: | | | |
| 4.00%, 5/1/28(1) | $ | 200 | $ 209,097 |
| 4.25%, 11/1/29(1) | | 384 | 409,810 |
| Avantor Funding, Inc., 4.625%, 7/15/28(1) | | 372 | 388,429 |
| Avon Products, Inc., 8.45%, 3/15/43 | | 33 | 40,636 |
| Block Financial, LLC, 3.875%, 8/15/30 | | 575 | 615,894 |
| Centene Corp.: | | | |
| 2.50%, 3/1/31 | | 442 | 431,030 |
| 3.375%, 2/15/30 | | 199 | 202,991 |
| 4.25%, 12/15/27 | | 257 | 268,367 |
| 4.625%, 12/15/29 | | 36 | 38,887 |
| Coca-Cola Europacific Partners PLC, 1.50%, 1/15/27(1) | | 221 | 216,727 |
| Coca-Cola Femsa SAB de CV, 1.85%, 9/1/32 | | 255 | 240,678 |
| Conservation Fund (The), Green Bonds, 3.474%, 12/15/29 | | 285 | 301,100 |
| CVS Health Corp., 3.00%, 8/15/26 | | 415 | 438,674 |
| CVS Pass-Through Trust, 6.036%, 12/10/28 | | 324 | 369,851 |
| Doris Duke Charitable Foundation (The), 2.345%, 7/1/50 | | 678 | 627,455 |
| Ford Foundation (The), 2.415%, 6/1/50 | | 435 | 412,219 |
| Kraft Heinz Foods Co., 4.375%, 6/1/46 | | 491 | 576,213 |
| Natura Cosmeticos S.A., 4.125%, 5/3/28(1) | | 288 | 283,067 |
| Royalty Pharma PLC, 3.35%, 9/2/51 | | 431 | 413,276 |
| Smithfield Foods, Inc.: | | | |
| 2.625%, 9/13/31(1)(7) | | 323 | 312,863 |
| 3.00%, 10/15/30(1) | | 77 | 76,777 |
| 5.20%, 4/1/29(1) | | 45 | 51,445 |
| | | | $ 6,925,486 |
| Energy — 0.4% | |
| NuStar Logistics, L.P.: | | | |
| 5.75%, 10/1/25 | $ | 46 | $ 49,548 |
| 6.00%, 6/1/26 | | 439 | 476,774 |
| 6.375%, 10/1/30 | | 137 | 152,279 |
| TerraForm Power Operating, LLC: | | | |
| 4.75%, 1/15/30(1) | | 486 | 510,242 |
| 5.00%, 1/31/28(1) | | 743 | 788,044 |
| | | | $ 1,976,887 |
| Financial — 7.2% | |
| AerCap Ireland Capital DAC/AerCap Global Aviation Trust: | | | |
| 4.50%, 9/15/23 | $ | 291 | $ 305,334 |
| Security | Principal
Amount
(000's omitted) | Value |
| Financial (continued) | |
| AerCap Ireland Capital DAC/AerCap Global Aviation Trust: (continued) | | | |
| 6.50%, 7/15/25 | $ | 175 | $ 200,119 |
| Affiliated Managers Group, Inc., 3.30%, 6/15/30 | | 401 | 424,729 |
| Agree, L.P., 2.00%, 6/15/28 | | 122 | 119,612 |
| Air Lease Corp., 2.875%, 1/15/26 | | 355 | 366,512 |
| Alliance Data Systems Corp., 4.75%, 12/15/24(1) | | 420 | 428,988 |
| Alliant Holdings Intermediate, LLC/Alliant Holdings Co-Issuer, 6.75%, 10/15/27(1) | | 50 | 51,927 |
| American Assets Trust, L.P., 3.375%, 2/1/31 | | 84 | 85,867 |
| Andrew W. Mellon Foundation (The), 0.947%, 8/1/27 | | 335 | 325,211 |
| Australia & New Zealand Banking Group, Ltd., 2.95% to 7/22/25, 7/22/30(1)(10) | | 458 | 469,619 |
| Banco BTG Pactual S.A./Cayman Islands, 4.50%, 1/10/25(1) | | 275 | 277,739 |
| Banco de Chile, 2.99%, 12/9/31(1) | | 289 | 285,354 |
| Banco Santander S.A., 1.722% to 9/14/26, 9/14/27(10) | | 400 | 392,947 |
| Bank of America Corp.: | | | |
| 1.53% to 12/6/24, 12/6/25(10) | | 700 | 701,591 |
| 1.734% to 7/22/26, 7/22/27(10) | | 830 | 824,413 |
| 1.898% to 7/23/30, 7/23/31(10) | | 472 | 452,247 |
| 1.922% to 10/24/30, 10/24/31(10) | | 533 | 510,913 |
| 2.087% to 6/14/28, 6/14/29(10) | | 379 | 376,624 |
| 2.299% to 7/21/31, 7/21/32(10) | | 500 | 492,139 |
| 2.456% to 10/22/24, 10/22/25(10) | | 949 | 975,307 |
| 2.572% to 10/20/31, 10/20/32(10) | | 451 | 453,495 |
| Bank of Montreal, 2.05%, 11/1/22(7) | | 699 | 708,247 |
| Bank of Nova Scotia (The), 2.375%, 1/18/23 | | 478 | 486,320 |
| BankUnited, Inc., 5.125%, 6/11/30 | | 147 | 167,608 |
| BBVA Bancomer S.A./Texas: | | | |
| 1.875%, 9/18/25(1) | | 262 | 260,049 |
| 5.125% to 1/18/28, 1/18/33(1)(7)(10) | | 500 | 513,932 |
| Boston Properties, L.P., 2.45%, 10/1/33 | | 750 | 727,259 |
| Broadstone Net Lease, LLC, 2.60%, 9/15/31 | | 24 | 23,322 |
| Capital One Financial Corp.: | | | |
| 3.30%, 10/30/24 | | 209 | 220,107 |
| 3.75%, 7/28/26 | | 122 | 130,966 |
| 4.20%, 10/29/25 | | 190 | 207,150 |
| CI Financial Corp.: | | | |
| 3.20%, 12/17/30 | | 477 | 489,987 |
| 4.10%, 6/15/51(7) | | 269 | 292,208 |
| Citigroup, Inc.: | | | |
| 0.776% to 10/30/23, 10/30/24(10) | | 630 | 626,513 |
| 1.281% to 11/3/24, 11/3/25(10) | | 228 | 227,530 |
| 1.678% to 5/15/23, 5/15/24(10) | | 618 | 625,052 |
| 3.106% to 4/8/25, 4/8/26(10) | | 285 | 298,970 |
| 3.887% to 1/10/27, 1/10/28(10) | | 486 | 527,188 |
14
See Notes to Financial Statements.
Calvert
VP SRI Balanced Portfolio
December 31, 2021
Schedule of Investments — continued
| Security | Principal
Amount
(000's omitted) | Value |
| Financial (continued) | |
| Citigroup, Inc.: (continued) | | | |
| 4.00% to 12/10/25(10)(11) | $ | 310 | $ 313,100 |
| Corporate Office Properties L.P., 2.90%, 12/1/33 | | 226 | 221,196 |
| Discover Bank, 4.682% to 8/9/23, 8/9/28(10) | | 270 | 282,276 |
| Enact Holdings, Inc., 6.50%, 8/15/25(1) | | 461 | 504,106 |
| EPR Properties, 3.75%, 8/15/29 | | 457 | 461,686 |
| Extra Space Storage, L.P., 2.55%, 6/1/31 | | 293 | 288,674 |
| Goldman Sachs Group, Inc. (The): | | | |
| 1.948% to 10/21/26, 10/21/27(10) | | 531 | 528,906 |
| 2.65% to 10/21/31, 10/21/32(10) | | 571 | 575,145 |
| HAT Holdings I, LLC/HAT Holdings II, LLC: | | | |
| 3.375%, 6/15/26(1) | | 585 | 591,634 |
| 6.00%, 4/15/25(1) | | 283 | 294,603 |
| HSBC Holdings PLC, 2.251% to 11/22/26, 11/22/27(10) | | 508 | 509,357 |
| Iron Mountain, Inc.: | | | |
| 4.50%, 2/15/31(1) | | 449 | 454,612 |
| 5.00%, 7/15/28(1) | | 161 | 165,670 |
| JPMorgan Chase & Co.: | | | |
| 0.63%, (SOFR + 0.58%), 3/16/24(2) | | 69 | 69,152 |
| 1.47% to 9/22/26, 9/22/27(10) | | 618 | 606,054 |
| 2.522% to 4/22/30, 4/22/31(10) | | 530 | 536,262 |
| 2.739% to 10/15/29, 10/15/30(10) | | 185 | 190,276 |
| 2.956% to 5/13/30, 5/13/31(10) | | 361 | 374,165 |
| KKR Group Finance Co. VII, LLC, 3.625%, 2/25/50(1) | | 301 | 324,090 |
| KKR Group Finance Co. X, LLC, 3.25%, 12/15/51(1) | | 109 | 108,895 |
| Liberty Mutual Group, Inc., 4.125% to 9/15/26, 12/15/51(1)(10) | | 198 | 197,797 |
| Life Storage, L.P., 2.40%, 10/15/31 | | 382 | 375,904 |
| Lloyds Banking Group PLC, 2.438% to 2/5/25, 2/5/26(10) | | 356 | 363,192 |
| Macquarie Bank, Ltd.: | | | |
| 3.052% to 3/3/31, 3/3/36(1)(10) | | 630 | 621,837 |
| 3.624%, 6/3/30(1) | | 255 | 266,355 |
| National Australia Bank, Ltd., 3.625%, 6/20/23 | | 275 | 286,368 |
| National Bank of Canada, 0.55% to 11/15/23, 11/15/24(10) | | 301 | 297,625 |
| Newmark Group, Inc., 6.125%, 11/15/23 | | 134 | 143,514 |
| OneMain Finance Corp.: | | | |
| 3.50%, 1/15/27 | | 434 | 429,653 |
| 7.125%, 3/15/26 | | 71 | 81,045 |
| PNC Financial Services Group, Inc. (The), 2.20%, 11/1/24 | | 875 | 898,961 |
| Primerica, Inc., 2.80%, 11/19/31 | | 223 | 225,654 |
| Radian Group, Inc.: | | | |
| 4.875%, 3/15/27 | | 526 | 564,957 |
| 6.625%, 3/15/25 | | 37 | 40,929 |
| Sabra Health Care, L.P., 3.20%, 12/1/31(7) | | 465 | 454,923 |
| SITE Centers Corp., 3.625%, 2/1/25 | | 259 | 271,378 |
| Societe Generale S.A., 4.75% to 5/26/26(1)(10)(11) | | 200 | 203,582 |
| Security | Principal
Amount
(000's omitted) | Value |
| Financial (continued) | |
| Standard Chartered PLC: | | | |
| 1.214% to 3/23/24, 3/23/25(1)(10) | $ | 200 | $ 198,443 |
| 1.456% to 1/14/26, 1/14/27(1)(10) | | 226 | 219,073 |
| 1.822% to 11/23/24, 11/23/25(1)(10) | | 236 | 235,866 |
| Stewart Information Services Corp., 3.60%, 11/15/31 | | 396 | 401,406 |
| Stifel Financial Corp., 4.00%, 5/15/30 | | 266 | 292,025 |
| Sun Communities Operating, L.P.: | | | |
| 2.30%, 11/1/28 | | 141 | 140,938 |
| 2.70%, 7/15/31 | | 112 | 111,212 |
| Synovus Bank/Columbus, GA: | | | |
| 2.289% to 2/10/22, 2/10/23(10) | | 529 | 529,427 |
| 4.00% to 10/29/25, 10/29/30(10) | | 250 | 260,598 |
| Synovus Financial Corp.: | | | |
| 3.125%, 11/1/22 | | 156 | 158,546 |
| 5.90% to 2/7/24, 2/7/29(10) | | 35 | 37,428 |
| Texas Capital Bancshares, Inc., 4.00% to 5/6/26, 5/6/31(10) | | 240 | 248,267 |
| Truist Financial Corp.: | | | |
| 1.267% to 3/2/26, 3/2/27(10) | | 83 | 81,477 |
| 5.10% to 3/1/30(7)(10)(11) | | 409 | 458,080 |
| UBS AG, 1.25%, 6/1/26(1) | | 331 | 323,630 |
| UBS Group AG: | | | |
| 2.095% to 2/11/31, 2/11/32(1)(10) | | 359 | 347,790 |
| 4.375% to 2/10/31(1)(10)(11) | | 219 | 216,876 |
| UniCredit SpA, 5.459% to 6/30/30, 6/30/35(1)(10) | | 200 | 218,133 |
| Westpac Banking Corp., 3.02% to 11/18/31, 11/18/36(10) | | 223 | 220,685 |
| | | | $ 32,876,528 |
| Government - Multinational — 1.7% | |
| Asian Development Bank, 3.125%, 9/26/28 | $ | 540 | $ 604,723 |
| European Bank for Reconstruction & Development, 1.50%, 2/13/25 | | 475 | 481,087 |
| European Investment Bank: | | | |
| 1.625%, 5/13/31(7) | | 925 | 931,790 |
| 2.375%, 5/24/27 | | 1,026 | 1,078,022 |
| 2.875%, 6/13/25(1) | | 1,892 | 2,004,042 |
| Inter-American Development Bank, 0.875%, 4/3/25 | | 377 | 374,296 |
| International Bank for Reconstruction & Development: | | | |
| 0.18%, (SOFR + 0.13%), 1/13/23(2) | | 621 | 621,385 |
| 3.125%, 11/20/25 | | 1,200 | 1,284,940 |
| International Finance Corp., 0.14%, (SOFR + 0.09%), 4/3/24(2) | | 246 | 245,999 |
| | | | $ 7,626,284 |
15
See Notes to Financial Statements.
Calvert
VP SRI Balanced Portfolio
December 31, 2021
Schedule of Investments — continued
| Security | Principal
Amount
(000's omitted) | Value |
| Government - Regional — 0.2% | |
| Kommuninvest I Sverige AB, 0.375%, 6/19/24(1) | $ | 720 | $ 709,918 |
| | | | $ 709,918 |
| Industrial — 0.7% | |
| FedEx Corp., 4.55%, 4/1/46 | $ | 290 | $ 348,371 |
| Hexcel Corp., 4.20%, 2/15/27 | | 65 | 69,841 |
| Imola Merger Corp., 4.75%, 5/15/29(1) | | 249 | 255,938 |
| Jabil, Inc.: | | | |
| 3.00%, 1/15/31 | | 881 | 906,399 |
| 3.60%, 1/15/30 | | 493 | 531,284 |
| Owens Corning, 3.95%, 8/15/29 | | 631 | 692,002 |
| Valmont Industries, Inc.: | | | |
| 5.00%, 10/1/44 | | 55 | 68,146 |
| 5.25%, 10/1/54 | | 340 | 434,858 |
| | | | $ 3,306,839 |
| Other Revenue — 0.1% | |
| BlueHub Loan Fund, Inc., 3.099%, 1/1/30 | $ | 675 | $ 699,145 |
| | | | $ 699,145 |
| Technology — 0.5% | |
| DXC Technology Co., 2.375%, 9/15/28 | $ | 423 | $ 413,834 |
| Kyndryl Holdings, Inc.: | | | |
| 2.05%, 10/15/26(1) | | 380 | 370,214 |
| 2.70%, 10/15/28(1) | | 117 | 113,323 |
| Seagate HDD Cayman: | | | |
| 3.375%, 7/15/31 | | 435 | 425,139 |
| 4.091%, 6/1/29 | | 354 | 367,034 |
| 4.875%, 3/1/24 | | 62 | 65,810 |
| 5.75%, 12/1/34(7) | | 180 | 207,706 |
| Western Digital Corp., 4.75%, 2/15/26 | | 366 | 400,680 |
| | | | $ 2,363,740 |
| Utilities — 1.2% | |
| AES Corp. (The), 2.45%, 1/15/31 | $ | 675 | $ 658,356 |
| American Water Capital Corp.: | | | |
| 2.30%, 6/1/31 | | 223 | 223,232 |
| 2.95%, 9/1/27 | | 370 | 390,673 |
| Avangrid, Inc.: | | | |
| 3.15%, 12/1/24 | | 292 | 305,899 |
| 3.80%, 6/1/29 | | 454 | 494,088 |
| Clearway Energy Operating, LLC, 3.75%, 1/15/32(1) | | 176 | 174,933 |
| Consolidated Edison Co. of New York, Inc., 3.35%, 4/1/30 | | 209 | 225,008 |
| Enel Finance International NV: | | | |
| 1.375%, 7/12/26(1) | | 209 | 203,740 |
| Security | Principal
Amount
(000's omitted) | Value |
| Utilities (continued) | |
| Enel Finance International NV: (continued) | | | |
| 2.65%, 9/10/24(1) | $ | 330 | $ 340,045 |
| MidAmerican Energy Co.: | | | |
| 3.15%, 4/15/50 | | 215 | 225,656 |
| 4.25%, 7/15/49 | | 300 | 371,111 |
| NextEra Energy Capital Holdings, Inc., 1.90%, 6/15/28 | | 371 | 367,374 |
| NextEra Energy Operating Partners, L.P.: | | | |
| 4.25%, 9/15/24(1) | | 34 | 35,309 |
| 4.50%, 9/15/27(1) | | 60 | 64,860 |
| Niagara Mohawk Power Corp., 1.96%, 6/27/30(1) | | 233 | 222,897 |
| Pattern Energy Operations, L.P./Pattern Energy Operations, Inc., 4.50%, 8/15/28(1) | | 664 | 689,936 |
| Public Service Co. of Colorado, 3.70%, 6/15/28 | | 277 | 304,329 |
| | | | $ 5,297,446 |
Total Corporate Bonds
(identified cost $72,888,646) | | | $ 74,042,396 |
| Security | Shares | Value |
| Oil, Gas & Consumable Fuels — 0.1% | |
| NuStar Energy, L.P., Series B, 7.625% to 6/15/22(10) | | 9,964 | $ 224,190 |
| | | | $ 224,190 |
| Real Estate Management & Development — 0.1% | |
| Brookfield Property Partners, L.P.: | | | |
| Series A, 5.75% | | 13,670 | $ 322,065 |
| Series A2, 6.375% | | 12,000 | 307,920 |
| | | | $ 629,985 |
| Wireless Telecommunication Services — 0.1% | |
| United States Cellular Corp.: | | | |
| 5.50% | | 22,975 | $ 606,540 |
| 6.25% | | 2,200 | 59,620 |
| | | | $ 666,160 |
Total Preferred Stocks
(identified cost $1,502,951) | | | $ 1,520,335 |
16
See Notes to Financial Statements.
Calvert
VP SRI Balanced Portfolio
December 31, 2021
Schedule of Investments — continued
| Senior Floating-Rate Loans — 0.7%(12) |
| Borrower/Description | Principal
Amount
(000's omitted) | Value |
| Building and Development — 0.1% | |
| Cushman & Wakefield U.S. Borrower, LLC, Term Loan, 2.852%, (1 mo. USD LIBOR + 2.75%), 8/21/25 | $ | 291 | $ 289,610 |
| | | | $ 289,610 |
| Electronics/Electrical — 0.2% | |
| Hyland Software, Inc., Term Loan, 4.25%, (1 mo. USD LIBOR + 3.50%, Floor 0.75%), 7/1/24 | $ | 205 | $ 205,783 |
| Informatica, LLC, Term Loan, 2.875%, (1 mo. USD LIBOR + 2.75%), 10/27/28 | | 300 | 299,287 |
| MA FinanceCo., LLC, Term Loan, 2.854%, (1 mo. USD LIBOR + 2.75%), 6/21/24 | | 18 | 18,018 |
| Seattle Spinco, Inc., Term Loan, 2.854%, (1 mo. USD LIBOR + 2.75%), 6/21/24 | | 123 | 121,682 |
| SS&C European Holdings S.a.r.l., Term Loan, 1.854%, (1 mo. USD LIBOR + 1.75%), 4/16/25 | | 30 | 29,798 |
| SS&C Technologies, Inc., Term Loan, 1.854%, (1 mo. USD LIBOR + 1.75%), 4/16/25 | | 37 | 36,707 |
| Ultimate Software Group, Inc. (The), Term Loan, 3.854%, (1 mo. USD LIBOR + 3.75%), 5/4/26 | | 247 | 246,504 |
| | | | $ 957,779 |
| Equipment Leasing — 0.0%(8) | |
| Avolon TLB Borrower 1 (US), LLC, Term Loan, 2.50%, (1 mo. USD LIBOR + 1.75%, Floor 0.75%), 1/15/25 | $ | 147 | $ 147,538 |
| | | | $ 147,538 |
| Health Care — 0.1% | |
| Change Healthcare Holdings, LLC, Term Loan, 3.50%, (1 mo. USD LIBOR + 2.50%, Floor 1.00%), 3/1/24 | $ | 300 | $ 300,106 |
| Ortho-Clinical Diagnostics S.A., Term Loan, 3.103%, (1 mo. USD LIBOR + 3.00%), 6/30/25 | | 200 | 200,179 |
| | | | $ 500,285 |
| Insurance — 0.1% | |
| Asurion, LLC: | | | |
| Term Loan, 3.229%, (1 mo. USD LIBOR + 3.125%), 11/3/23 | $ | 97 | $ 97,080 |
| Term Loan, 3.354%, (1 mo. USD LIBOR + 3.25%), 12/23/26 | | 60 | 59,060 |
| USI, Inc., Term Loan, 3.224%, (3 mo. USD LIBOR + 3.00%), 5/16/24 | | 226 | 224,683 |
| | | | $ 380,823 |
| Leisure Goods/Activities/Movies — 0.1% | |
| Bombardier Recreational Products, Inc., Term Loan, 2.101%, (1 mo. USD LIBOR + 2.00%), 5/24/27 | $ | 68 | $ 67,181 |
| Borrower/Description | Principal
Amount
(000's omitted) | Value |
| Leisure Goods/Activities/Movies (continued) | |
| Delta 2 (LUX) S.a.r.l., Term Loan, 3.50%, (1 mo. USD LIBOR + 2.50%, Floor 1.00%), 2/1/24 | $ | 300 | $ 300,081 |
| | | | $ 367,262 |
| Telecommunications — 0.1% | |
| CenturyLink, Inc., Term Loan, 2.354%, (1 mo. USD LIBOR + 2.25%), 3/15/27 | $ | 321 | $ 317,716 |
| Level 3 Financing, Inc., Term Loan, 1.854%, (1 mo. USD LIBOR + 1.75%), 3/1/27 | | 74 | 73,331 |
| Ziggo Financing Partnership, Term Loan, 2.61%, (1 mo. USD LIBOR + 2.50%), 4/30/28 | | 325 | 321,953 |
| | | | $ 713,000 |
Total Senior Floating-Rate Loans
(identified cost $3,361,994) | | | $ 3,356,297 |
| Sovereign Government Bonds — 0.5% |
| Security | Principal
Amount
(000's omitted) | Value |
| Kreditanstalt fuer Wiederaufbau: | | | |
| 0.75%, 9/30/30 | $ | 235 | $ 219,720 |
| 1.00%, 10/1/26 | | 915 | 902,596 |
| 2.00%, 9/29/22 | | 1,048 | 1,060,391 |
Total Sovereign Government Bonds
(identified cost $2,205,944) | | | $ 2,182,707 |
| Taxable Municipal Obligations — 1.6% |
| Security | Principal
Amount
(000's omitted) | Value |
| General Obligations — 0.4% | |
| Los Angeles Unified School District, CA, 5.75%, 7/1/34(13) | $ | 450 | $ 586,237 |
| Massachusetts, Green Bonds, 3.277%, 6/1/46 | | 435 | 477,378 |
| New York City, NY, 5.206%, 10/1/31(13) | | 470 | 560,781 |
| San Francisco City and County, CA, (Social Bonds - Affordable Housing, 2016), 3.921%, 6/15/39 | | 285 | 318,735 |
| | | | $ 1,943,131 |
| Special Tax Revenue — 0.6% | |
| California Health Facilities Financing Authority, (No Place Like Home Program): | | | |
| 2.361%, 6/1/26 | $ | 405 | $ 419,697 |
| 2.484%, 6/1/27 | | 290 | 301,478 |
| 2.534%, 6/1/28 | | 360 | 372,676 |
17
See Notes to Financial Statements.
Calvert
VP SRI Balanced Portfolio
December 31, 2021
Schedule of Investments — continued
| Security | Principal
Amount
(000's omitted) | Value |
| Special Tax Revenue (continued) | |
| California Health Facilities Financing Authority, (No Place Like Home Program): (continued) | | | |
| 2.584%, 6/1/29 | $ | 200 | $ 207,374 |
| 2.984%, 6/1/33 | | 220 | 229,797 |
| Connecticut, Special Tax Revenue, 5.459%, 11/1/30(13) | | 300 | 355,047 |
| New York City Transitional Finance Authority, NY, Future Tax Secured Revenue Bonds, 5.767%, 8/1/36(13) | | 600 | 752,682 |
| | | | $ 2,638,751 |
| Water and Sewer — 0.6% | |
| District of Columbia Water & Sewer Authority, Green Bonds, 4.814%, 10/1/2114 | $ | 130 | $ 195,893 |
| Narragansett Bay Commission, RI, Wastewater System Revenue: | | | |
| Green Bonds, 2.094%, 9/1/30 | | 170 | 172,654 |
| Green Bonds, 2.184%, 9/1/31 | | 140 | 141,904 |
| Green Bonds, 2.264%, 9/1/32 | | 125 | 126,482 |
| Green Bonds, 2.344%, 9/1/33 | | 135 | 136,046 |
| San Diego County Water Authority, CA: | | | |
| Green Bonds, 1.531%, 5/1/30 | | 145 | 140,553 |
| Green Bonds, 1.701%, 5/1/31 | | 130 | 126,849 |
| Green Bonds, 1.951%, 5/1/34 | | 75 | 73,229 |
| San Francisco City and County Public Utilities Commission, CA, Water Revenue, Green Bonds, 3.303%, 11/1/39 | | 1,440 | 1,489,824 |
| | | | $ 2,603,434 |
Total Taxable Municipal Obligations
(identified cost $6,773,726) | | | $ 7,185,316 |
| U.S. Government Agencies and Instrumentalities — 0.5% |
| Security | Principal
Amount
(000's omitted) | Value |
| U.S. Department of Housing and Urban Development: | | | |
| 2.547%, 8/1/22 | $ | 137 | $ 138,813 |
| 2.618%, 8/1/23 | | 69 | 70,869 |
| 2.668%, 8/1/24 | | 240 | 249,644 |
| 2.738%, 8/1/25 | | 240 | 253,163 |
| 3.435%, 8/1/34 | | 220 | 242,375 |
| 3.485%, 8/1/35 | | 125 | 139,846 |
| 3.585%, 8/1/37 | | 225 | 254,797 |
| U.S. International Development Finance Corp.: | | | |
| 3.22%, 9/15/29 | | 359 | 384,333 |
| 3.52%, 9/20/32 | | 338 | 371,304 |
Total U.S. Government Agencies and Instrumentalities
(identified cost $2,005,651) | | | $ 2,105,144 |
| U.S. Government Agency Mortgage-Backed Securities — 3.8% |
| Security | Principal
Amount
(000's omitted) | Value |
| Federal Home Loan Mortgage Corp., Pool #ZT0383, 3.50%, 3/1/48 | $ | 124 | $ 132,110 |
| Federal National Mortgage Association: | | | |
| 2.00%, 30-Year, TBA(14) | | 332 | 331,253 |
| 2.50%, 30-Year, TBA(14) | | 6,645 | 6,786,209 |
| 3.00%, 30-Year, TBA(14) | | 7,150 | 7,411,143 |
| Pool #AN1879, 2.65%, 6/1/26 | | 316 | 329,212 |
| Pool #AN1909, 2.68%, 7/1/26 | | 347 | 363,095 |
| Pool #BM3990, 4.00%, 3/1/48 | | 323 | 346,086 |
| Pool #FM1867, 3.00%, 11/1/49 | | 319 | 331,147 |
| Pool #FM6803, 2.00%, 4/1/51 | | 260 | 261,360 |
| Pool #MA3149, 4.00%, 10/1/47 | | 393 | 421,601 |
| Government National Mortgage Association II: | | | |
| Pool #CB2653, 2.50%, 3/20/51 | | 340 | 350,341 |
| Pool #CB8629, 2.50%, 4/20/51 | | 495 | 511,445 |
Total U.S. Government Agency Mortgage-Backed Securities
(identified cost $17,541,630) | | $ 17,575,002 |
| U.S. Treasury Obligations — 3.3% |
| Security | Principal
Amount
(000's omitted) | Value |
| U.S. Treasury Bonds: | | | |
| 1.125%, 8/15/40 | $ | 99 | $ 86,470 |
| 1.375%, 8/15/50 | | 497 | 435,554 |
| 1.875%, 2/15/41 | | 481 | 476,246 |
| 1.875%, 2/15/51 | | 166 | 164,301 |
| 2.00%, 8/15/51 | | 338 | 344,654 |
| 2.25%, 5/15/41 | | 6,000 | 6,305,835 |
| U.S. Treasury Notes: | | | |
| 0.125%, 12/15/23 | | 131 | 129,506 |
| 0.125%, 1/15/24 | | 131 | 129,357 |
| 0.125%, 2/15/24(7) | | 132 | 130,304 |
| 0.25%, 3/15/24 | | 1,022 | 1,009,904 |
| 0.25%, 6/30/25 | | 89 | 86,479 |
| 0.375%, 10/31/23 | | 259 | 257,513 |
| 0.375%, 4/15/24 | | 133 | 131,680 |
| 0.375%, 9/30/27 | | 166 | 157,162 |
| 0.75%, 11/15/24 | | 105 | 104,426 |
| 0.875%, 11/15/30 | | 12 | 11,412 |
| 1.00%, 7/31/28 | | 500 | 486,895 |
| 1.125%, 2/29/28 | | 1,356 | 1,336,613 |
| 1.125%, 8/31/28 | | 113 | 110,837 |
| 1.25%, 3/31/28 | | 581 | 575,962 |
18
See Notes to Financial Statements.
Calvert
VP SRI Balanced Portfolio
December 31, 2021
Schedule of Investments — continued
| Security | Principal
Amount
(000's omitted) | Value |
| U.S. Treasury Notes: (continued) | | | |
| 1.25%, 4/30/28 | $ | 1,022 | $ 1,012,938 |
| 1.25%, 6/30/28 | | 717 | 709,830 |
| 1.375%, 10/31/28 | | 678 | 675,458 |
| 1.625%, 5/15/31 | | 112 | 113,461 |
Total U.S. Treasury Obligations
(identified cost $15,024,442) | | | $ 14,982,797 |
| Short-Term Investments — 0.7% | | | |
| Affiliated Fund — 0.1% |
| Description | Units | Value |
| Calvert Cash Reserves Fund, LLC, 0.06%(15) | | 232,492 | $ 232,492 |
Total Affiliated Fund
(identified cost $232,485) | | | $ 232,492 |
| Securities Lending Collateral — 0.6% |
| Security | Shares | Value |
| State Street Navigator Securities Lending Government Money Market Portfolio, 0.03%(16) | | 2,821,888 | $ 2,821,888 |
Total Securities Lending Collateral
(identified cost $2,821,888) | | | $ 2,821,888 |
Total Short-Term Investments
(identified cost $3,054,373) | | | $ 3,054,380 |
Total Purchased Options — 0.0%(8)
(identified cost $6,554) | | | $ 5,344 |
Total Investments — 103.7%
(identified cost $366,181,924) | | | $475,787,019 |
| Other Assets, Less Liabilities — (3.7)% | | | $ (16,867,001) |
| Net Assets — 100.0% | | | $ 458,920,018 |
| The percentage shown for each investment category in the Schedule of Investments is based on net assets. |
| (1) | Security exempt from registration under Rule 144A of the Securities Act of 1933, as amended. These securities may be sold in certain transactions in reliance on an exemption from registration (normally to qualified institutional buyers). At December 31, 2021, the aggregate value of these securities is $66,382,965 or 14.5% of the Fund's net assets. |
| (2) | Variable rate security. The stated interest rate represents the rate in effect at December 31, 2021. |
| (3) | Weighted average fixed-rate coupon that changes/updates monthly. Rate shown is the rate at December 31, 2021. |
| (4) | Step coupon security. Interest rate represents the rate in effect at
December 31, 2021. |
| (5) | Represents an investment in an issuer that may be deemed to be an affiliate effective March 1, 2021 (see Note 9). |
| (6) | Non-income producing security. |
| (7) | All or a portion of this security was on loan at December 31, 2021. The aggregate market value of securities on loan at December 31, 2021 was $5,474,678. |
| (8) | Amount is less than 0.05%. |
| (9) | Security exempt from registration under Regulation S of the Securities Act of 1933, as amended, which exempts from registration securities offered and sold outside the United States. Security may not be offered or sold in the United States except pursuant to an exemption from, or in a transaction not subject to, the registration requirements of the Securities Act of 1933, as amended. At December 31, 2021, the aggregate value of these securities is $197,111 or less than 0.05% of the Fund’s net assets. |
| (10) | Security converts to variable rate after the indicated fixed-rate coupon period. |
| (11) | Perpetual security with no stated maturity date but may be subject to calls by the issuer. |
| (12) | Senior floating-rate loans (Senior Loans) often require prepayments from excess cash flows or permit the borrowers to repay at their election. The degree to which borrowers repay, whether as a contractual requirement or at their election, cannot be predicted with accuracy. As a result, the actual remaining maturity may be substantially less than the stated maturities shown. However, Senior Loans will typically have an expected average life of approximately two to four years. Senior Loans typically have rates of interest which are redetermined periodically by reference to a base lending rate, plus a spread. These base lending rates are primarily the London Interbank Offered Rate ("LIBOR") and secondarily, the prime rate offered by one or more major United States banks (the "Prime Rate"). Base lending rates may be subject to a floor, or minimum rate. Senior Loans are generally subject to contractual restrictions that must be satisfied before they can be bought or sold. |
| (13) | Build America Bond. Represents taxable municipal obligation issued pursuant to the American Recovery and Reinvestment Act of 2009 or other legislation providing for the issuance of taxable municipal debt on which the issuer receives federal support. |
| (14) | TBA (To Be Announced) securities are purchased on a forward commitment basis with an approximate principal amount and maturity date. The actual principal amount and maturity date are determined upon settlement. |
| (15) | Affiliated investment company, available to Calvert portfolios and funds, which invests in high quality, U.S. dollar denominated money market instruments. The rate shown is the annualized seven-day yield as of December 31, 2021. |
| (16) | Represents investment of cash collateral received in connection with securities lending. |
19
See Notes to Financial Statements.
Calvert
VP SRI Balanced Portfolio
December 31, 2021
Schedule of Investments — continued
Purchased Put Options — 0.0%(1)
Exchange-Traded Options — 0.0%(1)
| Description | Number of
Contracts | Notional
Amount | Exercise
Price | Expiration
Date | Value |
| U.S. 10-Year Treasury Note Futures 3/2022 | 18 | $2,348,438 | $128.50 | 2/18/22 | $ 5,344 |
| Total | | | | | $5,344 |
| (1) | Amount is less than 0.05%. |
Futures Contracts
| Description | Number of
Contracts | Position | Expiration
Date | Notional
Amount | Value/
Unrealized
Appreciation
(Depreciation) |
| Interest Rate Futures | | | | | |
| U.S. 2-Year Treasury Note | 92 | Long | 3/31/22 | $ 20,071,813 | $ (6,500) |
| U.S. 5-Year Treasury Note | 77 | Long | 3/31/22 | 9,315,195 | 11,594 |
| U.S. 10-Year Treasury Note | 44 | Long | 3/22/22 | 5,740,625 | 55,951 |
| U.S. Ultra-Long Treasury Bond | 28 | Long | 3/22/22 | 5,519,500 | 127,712 |
| U.S. Long Treasury Bond | (2) | Short | 3/22/22 | (320,875) | (3,379) |
| U.S. Ultra 10-Year Treasury Note | (168) | Short | 3/22/22 | (24,601,500) | (333,405) |
| U.S. Ultra-Long Treasury Bond | (6) | Short | 3/22/22 | (1,182,750) | (27,383) |
| | | | | | $(175,410) |
| Abbreviations: |
| ADR | – American Depositary Receipt |
| LIBOR | – London Interbank Offered Rate |
| SOFR | – Secured Overnight Financing Rate |
| TBA | – To Be Announced |
| Currency Abbreviations: |
| USD | – United States Dollar |
20
See Notes to Financial Statements.
Calvert
VP SRI Balanced Portfolio
December 31, 2021
Statement of Assets and Liabilities
| | December 31, 2021 |
| Assets | |
Investments in securities of unaffiliated issuers, at value (identified cost $364,195,193) - including
$5,474,678 of securities on loan | $ 473,819,348 |
| Investments in securities of affiliated issuers, at value (identified cost $1,986,731) | 1,967,671 |
| Cash | 61,215 |
| Deposits at broker for futures contracts | 293,000 |
| Receivable for capital shares sold | 100,025 |
| Dividends and interest receivable | 854,139 |
| Dividends and interest receivable - affiliated | 1,382 |
| Securities lending income receivable | 1,413 |
| Tax reclaims receivable | 48,206 |
| Directors' deferred compensation plan | 78,012 |
| Total assets | $477,224,411 |
| Liabilities | |
| Payable for variation margin on open futures contracts | $ 23,892 |
| Payable for investments purchased | 176,534 |
| Payable for when-issued/delayed delivery/forward commitment securities | 14,531,226 |
| Payable for capital shares redeemed | 348,722 |
| Deposits for securities loaned | 2,821,888 |
| Payable to affiliates: | |
| Investment advisory fee | 158,646 |
| Administrative fee | 46,433 |
| Distribution and service fees | 2,704 |
| Sub-transfer agency fee | 207 |
| Directors' deferred compensation plan | 78,012 |
| Accrued expenses | 116,129 |
| Total liabilities | $ 18,304,393 |
| Net Assets | $458,920,018 |
| Sources of Net Assets | |
| Paid-in capital | $ 307,788,950 |
| Distributable earnings | 151,131,068 |
| Net Assets | $458,920,018 |
| Class I Shares | |
| Net Assets | $ 445,916,954 |
| Shares Outstanding | 160,651,686 |
Net Asset Value, Offering Price and Redemption Price Per Share
(net assets ÷ shares of beneficial interest outstanding) | $ 2.78 |
| Class F Shares | |
| Net Assets | $ 13,003,064 |
| Shares Outstanding | 4,696,928 |
Net Asset Value, Offering Price and Redemption Price Per Share
(net assets ÷ shares of beneficial interest outstanding) | $ 2.77 |
21
See Notes to Financial Statements.
Calvert
VP SRI Balanced Portfolio
December 31, 2021
| | Year Ended |
| | December 31, 2021 |
| Investment Income | |
| Dividend income (net of foreign taxes withheld of $44,818) | $ 3,394,086 |
| Dividend income - affiliated issuers | 5,404 |
| Interest and other income | 3,985,999 |
| Interest income - affiliated issuers | 19,157 |
| Securities lending income, net | 9,598 |
| Total investment income | $ 7,414,244 |
| Expenses | |
| Investment advisory fee | $ 1,812,900 |
| Administrative fee | 530,605 |
| Distribution and service fees: | |
| Class F | 25,568 |
| Directors' fees and expenses | 16,930 |
| Custodian fees | 11,874 |
| Transfer agency fees and expenses | 176,323 |
| Accounting fees | 162,721 |
| Professional fees | 36,350 |
| Reports to shareholders | 34,709 |
| Miscellaneous | 21,519 |
| Total expenses | $ 2,829,499 |
| Net investment income | $ 4,584,745 |
| Realized and Unrealized Gain (Loss) | |
| Net realized gain (loss): | |
| Investment securities | $ 37,539,605 |
| Investment securities - affiliated issuers | 619 |
| Futures contracts | 444,676 |
| Foreign currency transactions | (5,195) |
| Net realized gain | $37,979,705 |
| Change in unrealized appreciation (depreciation): | |
| Investment securities | $ 18,190,439 |
| Investment securities - affiliated issuers | 14,662 |
| Futures contracts | (166,183) |
| Foreign currency | (1,464) |
| Net change in unrealized appreciation (depreciation) | $18,037,454 |
| Net realized and unrealized gain | $56,017,159 |
| Net increase in net assets from operations | $60,601,904 |
22
See Notes to Financial Statements.
Calvert
VP SRI Balanced Portfolio
December 31, 2021
Statements of Changes in Net Assets
| | Year Ended December 31, |
| | 2021 | 2020 |
| Increase (Decrease) in Net Assets | | |
| From operations: | | |
| Net investment income | $ 4,584,745 | $ 5,130,781 |
| Net realized gain | 37,979,705 | 12,854,571 |
| Net change in unrealized appreciation (depreciation) | 18,037,454 | 36,312,374 |
| Net increase in net assets from operations | $ 60,601,904 | $ 54,297,726 |
| Distributions to shareholders: | | |
| Class I | $ (18,133,416) | $ (17,095,943) |
| Class F | (482,625) | (305,549) |
| Total distributions to shareholders | $ (18,616,041) | $ (17,401,492) |
| Capital share transactions: | | |
| Class I | $ (3,410,574) | $ 9,550,261 |
| Class F | 4,225,654 | 2,257,686 |
| Net increase in net assets from capital share transactions | $ 815,080 | $ 11,807,947 |
| Net increase in net assets | $ 42,800,943 | $ 48,704,181 |
| Net Assets | | |
| At beginning of year | $ 416,119,075 | $ 367,414,894 |
| At end of year | $458,920,018 | $416,119,075 |
23
See Notes to Financial Statements.
Calvert
VP SRI Balanced Portfolio
December 31, 2021
| | Class I |
| | Year Ended December 31, |
| | 2021 | 2020 | 2019 | 2018 | 2017 |
| Net asset value — Beginning of year | $ 2.52 | $ 2.29 | $ 1.94 | $ 2.23 | $ 2.05 |
| Income (Loss) From Operations | | | | | |
| Net investment income(1) | $ 0.03 | $ 0.03 | $ 0.04 | $ 0.04 | $ 0.04 |
| Net realized and unrealized gain (loss) | 0.34 | 0.31 | 0.43 | (0.08) | 0.20 |
| Total income (loss) from operations | $ 0.37 | $ 0.34 | $ 0.47 | $ (0.04) | $ 0.24 |
| Less Distributions | | | | | |
| From net investment income | $ (0.03) | $ (0.04) | $ (0.04) | $ (0.04) | $ (0.04) |
| From net realized gain | (0.08) | (0.07) | (0.08) | (0.21) | (0.02) |
| Total distributions | $ (0.11) | $ (0.11) | $ (0.12) | $ (0.25) | $ (0.06) |
| Net asset value — End of year | $ 2.78 | $ 2.52 | $ 2.29 | $ 1.94 | $ 2.23 |
| Total Return(2) | 15.12% | 15.26% | 24.40% | (2.67)% | 12.16% |
| Ratios/Supplemental Data | | | | | |
| Net assets, end of year (000’s omitted) | $445,917 | $408,223 | $362,392 | $296,345 | $329,060 |
| Ratios (as a percentage of average daily net assets):(3) | | | | | |
| Total expenses | 0.63% | 0.63% | 0.62% | 0.72% | 0.69% |
| Net expenses | 0.63% | 0.63% | 0.62% | 0.70% | 0.68% |
| Net investment income | 1.04% | 1.39% | 1.68% | 1.66% | 1.73% |
| Portfolio Turnover | 93% (4) | 104% (4) | 70% (4) | 77% | 132% |
| (1) | Computed using average shares outstanding. |
| (2) | Returns are historical and are calculated by determining the percentage change in net asset value with all distributions reinvested and do not reflect fees and expenses imposed by variable annuity contracts or variable life insurance policies. If included, total return would be lower. |
| (3) | Total expenses do not reflect amounts reimbursed and/or waived by the adviser and certain of its affiliates, if applicable. Net expenses are net of all reductions and represent the net expenses paid by the Fund. |
| (4) | Includes the effect of To-Be-Announced (TBA) transactions. |
24
See Notes to Financial Statements.
Calvert
VP SRI Balanced Portfolio
December 31, 2021
Financial Highlights — continued
| | Class F |
| | Year Ended December 31, |
| | 2021 | 2020 | 2019 | 2018 | 2017 |
| Net asset value — Beginning of year | $ 2.52 | $ 2.30 | $ 1.95 | $ 2.24 | $ 2.08 |
| Income (Loss) From Operations | | | | | |
| Net investment income(1) | $ 0.02 | $ 0.03 | $ 0.03 | $ 0.03 | $ 0.03 |
| Net realized and unrealized gain (loss) | 0.34 | 0.30 | 0.44 | (0.07) | 0.19 |
| Total income (loss) from operations | $ 0.36 | $ 0.33 | $ 0.47 | $ (0.04) | $ 0.22 |
| Less Distributions | | | | | |
| From net investment income | $ (0.03) | $ (0.04) | $ (0.04) | $ (0.04) | $ (0.04) |
| From net realized gain | (0.08) | (0.07) | (0.08) | (0.21) | (0.02) |
| Total distributions | $ (0.11) | $ (0.11) | $ (0.12) | $ (0.25) | $ (0.06) |
| Net asset value — End of year | $ 2.77 | $ 2.52 | $ 2.30 | $ 1.95 | $ 2.24 |
| Total Return(2) | 14.72% | 14.76% | 24.28% | (2.65)% | 11.01% |
| Ratios/Supplemental Data | | | | | |
| Net assets, end of year (000’s omitted) | $13,003 | $ 7,896 | $ 5,023 | $1,920 | $ 1,540 |
| Ratios (as a percentage of average daily net assets):(3) | | | | | |
| Total expenses | 0.88% | 0.88% | 0.86% | 0.96% | 1.40% |
| Net expenses | 0.88% | 0.88% | 0.86% | 0.96% | 1.08% |
| Net investment income | 0.79% | 1.13% | 1.44% | 1.40% | 1.30% |
| Portfolio Turnover | 93% (4) | 104% (4) | 70% (4) | 77% | 132% |
| (1) | Computed using average shares outstanding. |
| (2) | Returns are historical and are calculated by determining the percentage change in net asset value with all distributions reinvested and do not reflect fees and expenses imposed by variable annuity contracts or variable life insurance policies. If included, total return would be lower. |
| (3) | Total expenses do not reflect amounts reimbursed and/or waived by the adviser and certain of its affiliates, if applicable. Net expenses are net of all reductions and represent the net expenses paid by the Fund. |
| (4) | Includes the effect of To-Be-Announced (TBA) transactions. |
25
See Notes to Financial Statements.
Calvert
VP SRI Balanced Portfolio
December 31, 2021
Notes to Financial Statements
1 Significant Accounting Policies
Calvert VP SRI Balanced Portfolio (the Fund) is a diversified series of Calvert Variable Series, Inc. (the Corporation). The Corporation is a Maryland corporation registered under the Investment Company Act of 1940, as amended (the 1940 Act), as an open-end management investment company. The investment objective of the Fund is to seek to provide a competitive total return through an actively managed portfolio of stocks, bonds and money market instruments which offer income and capital growth opportunity.
Shares of the Fund are sold without sales charge to insurance companies for allocation to certain of their variable separate accounts and to qualified pension and retirement plans and other eligible investors. The Fund offers Class I and Class F shares. Among other things, each class has different: (a) dividend rates due to differences in Distribution Plan expenses and other class-specific expenses; (b) exchange privileges; and (c) class-specific voting rights.
The Fund applies the accounting and reporting guidance in the Financial Accounting Standards Board (FASB) Accounting Standards Codification Topic 946, Financial Services – Investment Companies (ASC 946). Subsequent events, if any, through the date that the financial statements were issued have been evaluated in the preparation of the financial statements.
A Investment Valuation— Net asset value per share is determined every business day as of the close of the regular session of the New York Stock Exchange (generally 4:00 p.m. Eastern time). The Fund uses independent pricing services approved by the Board of Directors (the Board) to value its investments wherever possible. Investments for which market quotations are not available or deemed not reliable are fair valued in good faith under the direction of the Board.
U.S. generally accepted accounting principles (U.S. GAAP) establishes a disclosure hierarchy that categorizes the inputs to valuation techniques used to value assets and liabilities at measurement date. These inputs are summarized in the three broad levels listed below:
Level 1 - quoted prices in active markets for identical securities
Level 2 - other significant observable inputs (including quoted prices for similar securities, interest rates, prepayment speeds, credit risk, etc.)
Level 3 - significant unobservable inputs (including the Fund’s own assumptions in determining the fair value of investments)
The inputs or methodologies used for valuing securities are not necessarily an indication of the risk associated with investing in those securities.
Valuation techniques used to value the Fund’s investments by major category are as follows:
Equity Securities. Equity securities (including warrants and rights) listed on a U.S. securities exchange generally are valued at the last sale or closing price as reported by an independent pricing service on the primary market or exchange on which they are traded and are categorized as Level 1 in the hierarchy. Equity securities listed on the NASDAQ National Market System are valued at the NASDAQ official closing price and are categorized as Level 1 in the hierarchy. Unlisted or listed securities for which closing sales prices or closing quotations are not available are valued at the mean between the latest available bid and ask prices and are categorized as Level 2 in the hierarchy.
Debt Securities. Debt securities are generally valued based on valuations provided by third party pricing services, as derived from such services’ pricing models. Inputs to the models may include, but are not limited to, reported trades, executable bid and ask prices, broker/dealer quotations, prices or yields of securities with similar characteristics, interest rates, anticipated prepayments, benchmark curves or information pertaining to the issuer, as well as industry and economic events. Accordingly, debt securities are generally categorized as Level 2 in the hierarchy. Short-term debt securities with a remaining maturity at time of purchase of more than sixty days are valued based on valuations provided by a third party pricing service. Such securities are generally categorized as Level 2 in the hierarchy. Short-term debt securities of sufficient credit quality purchased with remaining maturities of sixty days or less for which a valuation from a third party pricing service is not readily available may be valued at amortized cost, which approximates fair value, and are categorized as Level 2 in the hierarchy.
Senior Floating-Rate Loans. Interests in senior floating-rate loans for which reliable market quotations are readily available are valued generally at the average mean of bid and ask quotations obtained from a third party pricing service, and are categorized as Level 2 in the hierarchy.
Affiliated Fund. The Fund may invest in Calvert Cash Reserves Fund, LLC (Cash Reserves Fund), an affiliated investment company managed by Calvert Research and Management (CRM). While Cash Reserves Fund is not a registered money market mutual fund, it conducts all of its investment activities in accordance with the requirements of Rule 2a-7 under the 1940 Act. Investments in Cash Reserves Fund are valued at the closing net asset value per unit on the valuation day and are categorized as Level 2 in the hierarchy. Cash Reserves Fund generally values its investment securities based on available market quotations provided by a third party pricing service.
Other Securities. Investments in registered investment companies (including money market funds) that do not trade on an exchange are valued at the net asset value per share on the valuation day and are categorized as Level 1 in the hierarchy.
Derivatives. Futures contracts are valued at unrealized appreciation (depreciation) based on the settlement price established each day by the board of trade or exchange on which they are traded and are categorized as Level 1 in the hierarchy. U.S. exchange-traded options are valued at the mean between the bid and ask prices at valuation time as reported by the Options Price Reporting Authority and are categorized as Level 1 in the hierarchy.
Calvert
VP SRI Balanced Portfolio
December 31, 2021
Notes to Financial Statements — continued
Fair Valuation. If a market value cannot be determined for a security using the methodologies described above, or if, in the good faith opinion of the Fund's adviser, the market value does not constitute a readily available market quotation, or if a significant event has occurred that would materially affect the value of the security, the security will be fair valued as determined in good faith by or at the direction of the Board in a manner that most fairly reflects the security’s “fair value”, which is the amount that the Fund might reasonably expect to receive for the security upon its current sale in the ordinary course. Each such determination is based on a consideration of relevant factors, which are likely to vary from one pricing context to another. These factors may include, but are not limited to, the type of security, the existence of any contractual restrictions on the security’s disposition, the price and extent of public trading in similar securities of the issuer or of comparable companies or entities, quotations or relevant information obtained from broker/dealers or other market participants, information obtained from the issuer, analysts, and/or the appropriate stock exchange (for exchange-traded securities), an analysis of the company’s or entity’s financial statements, and an evaluation of the forces that influence the issuer and the market(s) in which the security is purchased and sold.
The values assigned to fair value investments are based on available information and do not necessarily represent amounts that might ultimately be realized. Further, due to the inherent uncertainty of valuations of such investments, the fair values may differ significantly from the values that would have been used had an active market existed, and the differences could be material.
The following table summarizes the market value of the Fund's holdings as of December 31, 2021, based on the inputs used to value them:
| Asset Description | Level 1 | Level 2 | Level 3 | Total |
| Asset-Backed Securities | $ — | $ 30,206,929 | $ — | $ 30,206,929 |
| Collateralized Mortgage Obligations | — | 8,031,376 | — | 8,031,376 |
| Commercial Mortgage-Backed Securities | — | 19,487,479 | — | 19,487,479 |
| Common Stocks | 291,854,406 (1) | — | — | 291,854,406 |
| Convertible Bonds | — | 197,111 | — | 197,111 |
| Corporate Bonds | — | 74,042,396 | — | 74,042,396 |
| Preferred Stocks | 1,520,335 | — | — | 1,520,335 |
| Senior Floating-Rate Loans | — | 3,356,297 | — | 3,356,297 |
| Sovereign Government Bonds | — | 2,182,707 | — | 2,182,707 |
| Taxable Municipal Obligations | — | 7,185,316 | — | 7,185,316 |
| U.S. Government Agencies and Instrumentalities | — | 2,105,144 | — | 2,105,144 |
| U.S. Government Agency Mortgage-Backed Securities | — | 17,575,002 | — | 17,575,002 |
| U.S. Treasury Obligations | — | 14,982,797 | — | 14,982,797 |
| Short-Term Investments: | | | | |
| Affiliated Fund | — | 232,492 | — | 232,492 |
| Securities Lending Collateral | 2,821,888 | — | — | 2,821,888 |
| Purchased Put Options | 5,344 | — | — | 5,344 |
| Total Investments | $296,201,973 | $179,585,046 | $ — | $475,787,019 |
| Futures Contracts | $ 195,257 | $ — | $ — | $ 195,257 |
| Total | $296,397,230 | $179,585,046 | $ — | $475,982,276 |
| Liability Description | | | | |
| Futures Contracts | $ (370,667) | $ — | $ — | $ (370,667) |
| Total | $ (370,667) | $ — | $ — | $ (370,667) |
| (1) | The level classification by major category of investments is the same as the category presentation in the Schedule of Investments. |
B Investment Transactions and Income— Investment transactions for financial statement purposes are accounted for on trade date. Realized gains and losses are recorded on an identified cost basis and may include proceeds from litigation. Dividend income is recorded on the ex-dividend date for dividends received in cash and/or securities or, in the case of dividends on certain foreign securities, as soon as the Fund is informed of the ex-dividend date. Non-cash dividends are recorded at the fair value of the securities received. Withholding taxes on foreign dividends, if any, have been provided for in accordance with the Fund's understanding of the applicable country’s tax rules and rates. Distributions received that represent a return of capital are recorded as a reduction of cost of investments. Distributions received that represent a capital gain are recorded as a realized gain. Interest income, which includes
Calvert
VP SRI Balanced Portfolio
December 31, 2021
Notes to Financial Statements — continued
amortization of premium and accretion of discount on debt securities, is accrued as earned. The Fund may earn certain fees in connection with its investments in senior floating-rate loans. These fees are in addition to interest payments earned and may include amendment fees, consent fees and prepayment fees, which are recorded to income as earned. Inflation adjustments to the principal amount of inflation-adjusted bonds and notes are reflected as interest income. Deflation adjustments to the principal amount of an inflation-adjusted bond or note are reflected as reductions to interest income to the extent of interest income previously recorded on such bond or note.
C Share Class Accounting— Realized and unrealized gains and losses and net investment income and losses, other than class-specific expenses, are allocated daily to each class of shares based upon the relative net assets of each class to the total net assets of the Fund. Expenses arising in connection with a specific class are charged directly to that class.
D Foreign Currency Transactions— The Fund’s accounting records are maintained in U.S. dollars. For valuation of assets and liabilities on each date of net asset value determination, foreign denominations are converted into U.S. dollars using the current exchange rate. Security transactions, income and expenses are translated at the prevailing rate of exchange on the date of the event. Recognized gains or losses on investment transactions attributable to changes in foreign currency exchange rates are recorded for financial statement purposes as net realized gains and losses on investments. That portion of unrealized gains and losses on investments that results from fluctuations in foreign currency exchange rates is not separately disclosed.
E Senior Floating-Rate Loans— The Fund may invest in direct debt instruments, which are interests in amounts owed to lenders or lending syndicates by corporate, governmental, or other borrowers. The Fund’s investment in loans may be in the form of participations in loans or assignments of all or a portion of loans from third parties. A loan is often administered by a bank or other financial institution (the lender) that acts as agent for all holders. The agent administers the terms of the loan, as specified in the loan agreement. The Fund may invest in multiple series or tranches of a loan, which may have varying terms and carry different associated risks. When the Fund purchases assignments from lenders, it acquires direct rights against the borrower of the loan. When investing in a loan participation, the Fund has the right to receive payments of principal, interest and any fees to which it is entitled only from the lender selling the loan agreement and only upon receipt of such payments by the lender from the borrower. The Fund generally has no right to enforce compliance by the borrower with the terms of the loan agreement. As a result, the Fund may be subject to the credit risk of both the borrower and the lender that is issuing the participation interest.
F Unfunded Loan Commitments— The Fund may enter into certain loan agreements all or a portion of which may be unfunded. The Fund is obligated to fund these commitments at the borrower's discretion. The commitments, if any, are disclosed in the accompanying Schedule of Investments.
G Futures Contracts— The Fund may enter into futures contracts to buy or sell a financial instrument for a set price at a future date. Initial margin deposits of either cash or securities as required by the broker are made upon entering into the contract. While the contract is open, daily variation margin payments are made to or received from the broker reflecting the daily change in market value of the contract and are recorded for financial reporting purposes as unrealized gains or losses by the Fund. When a futures contract is closed, a realized gain or loss is recorded equal to the difference between the opening and closing value of the contract. The risks associated with entering into futures contracts may include the possible illiquidity of the secondary market which would limit the Fund’s ability to close out a futures contract prior to the settlement date, an imperfect correlation between the value of the contracts and the underlying financial instruments, or that the counterparty will fail to perform its obligations under the contracts’ terms. Futures contracts are designed by boards of trade, which are designated “contracts markets” by the Commodities Futures Trading Commission. Futures contracts trade on the contracts markets in a manner that is similar to the way a stock trades on a stock exchange, and the boards of trade, through their clearing corporations, guarantee the futures contracts against default. As a result, there is minimal counterparty credit risk to the Fund.
H Options Contracts— Upon the purchase of a call or put option, the premium paid by the Fund is included in the Statement of Assets and Liabilities as an investment. The amount of the investment is subsequently marked-to-market to reflect the current market value of the option purchased, in accordance with the Fund’s policies on investment valuations discussed above. Premiums paid for purchasing options that expire are treated as realized losses. Premiums paid for purchasing options that are exercised or closed are added to the amounts paid or offset against the proceeds on the underlying investment transaction to determine the realized gain or loss. As the purchaser of an index option, the Fund has the right to receive a cash payment equal to any depreciation in the value of the index below the exercise price of the option (in the case of a put) or equal to any appreciation in the value of the index over the exercise price of the option (in the case of a call) as of the valuation date of the option. The risk associated with purchasing options is limited to the premium originally paid. Purchased options traded over-the-counter involve risk that the issuer or counterparty will fail to perform its contractual obligations.
I Distributions to Shareholders— Distributions to shareholders are recorded by the Fund on ex-dividend date. The Fund distributes any net investment income and net realized capital gains at least annually. Both types of distributions are made in shares of the Fund unless an election is made on behalf of a separate account to receive some or all of the distributions in cash. Distributions are declared separately for each class of shares. Distributions are determined in accordance with income tax regulations, which may differ from U.S. GAAP; accordingly, periodic reclassifications are made within the Fund's capital accounts to reflect income and gains available for distribution under income tax regulations.
J Estimates— The preparation of financial statements in conformity with U.S. GAAP requires management to make estimates and assumptions that affect the reported amounts of assets and liabilities and disclosure of contingent assets and liabilities at the date of the financial statements and the reported amounts of increases and decreases in net assets from operations during the reporting period. Actual results could differ from those estimates.
Calvert
VP SRI Balanced Portfolio
December 31, 2021
Notes to Financial Statements — continued
K Indemnifications— The Corporation’s By-Laws provide for indemnification for Directors or officers of the Corporation and certain other parties, to the fullest extent permitted by Maryland law and the 1940 Act, provided certain conditions are met. Additionally, in the normal course of business, the Fund enters into agreements with service providers that may contain indemnification clauses. The Fund’s maximum exposure under these arrangements is unknown as this would involve future claims that may be made against the Fund that have not yet occurred.
L Federal Income Taxes— No provision for federal income or excise tax is required since the Fund intends to continue to qualify as a regulated investment company under the Internal Revenue Code and to distribute substantially all of its taxable earnings.
Management has analyzed the Fund's tax positions taken for all open federal income tax years and has concluded that no provision for federal income tax is required in the Fund's financial statements. A Fund's federal tax return is subject to examination by the Internal Revenue Service for a period of three years from the date of filing.
M When-Issued Securities and Delayed Delivery Transactions— The Fund may purchase securities on a delayed delivery, when-issued or forward commitment basis, including TBA (To Be Announced) securities. Payment and delivery may take place after the customary settlement period for that security. At the time the transaction is negotiated, the price of the security that will be delivered is fixed. The Fund maintains cash and/or security positions for these commitments such that sufficient liquid assets will be available to make payments upon settlement. Securities purchased on a delayed delivery, when-issued or forward commitment basis are marked-to-market daily and begin earning interest on settlement date. Such security purchases are subject to the risk that when delivered they will be worth less than the agreed upon payment price. Losses may also arise if the counterparty does not perform under the contract. A forward purchase commitment may be closed by entering into an offsetting commitment. If an offsetting commitment is entered into, the Fund will realize a gain or loss on investments based on the price established when the Fund entered into the commitment.
2 Related Party Transactions
The investment advisory fee is earned by CRM as compensation for investment advisory services rendered to the Fund. On March 1, 2021, Morgan Stanley acquired Eaton Vance Corp. (the “Transaction”) and CRM became an indirect, wholly-owned subsidiary of Morgan Stanley. In connection with the Transaction, the Fund entered into a new investment advisory agreement (the “New Agreement”) with CRM, which took effect on March 1, 2021. Pursuant to the New Agreement (and the Fund’s investment advisory agreement with CRM in effect prior to March 1, 2021), the fee is computed at an annual rate as a percentage of the Fund’s average daily net assets as follows and is payable monthly:
| Average Daily Net Assets | Annual Fee
Rate |
| Up to and including $500 million | 0.41% |
| Over $500 million up to and including $1 billion | 0.36% |
| Over $1 billion | 0.325% |
For the year ended December 31, 2021, the investment advisory fee amounted to $1,812,900 or 0.41% of the Fund's average daily net assets. The Fund may invest its cash in Cash Reserves Fund. CRM does not currently receive a fee for advisory services provided to Cash Reserves Fund.
The administrative fee is earned by CRM as compensation for administrative services rendered to the Fund. The fee is computed at an annual rate of 0.12% of the Fund’s average daily net assets attributable to Class I and Class F and is payable monthly. For the year ended December 31, 2021, CRM was paid administrative fees of $530,605.
The Fund has in effect a distribution plan for Class F shares (Class F Plan) pursuant to Rule 12b-1 under the 1940 Act. Pursuant to the Class F Plan, the Fund pays Eaton Vance Distributors, Inc. (EVD), an affiliate of CRM and the Fund’s principal underwriter, a distribution and service fee of 0.25% per annum of its average daily net assets attributable to Class F shares for distribution services and facilities provided to the Fund, as well as for personal and/or account maintenance services provided to the class shareholders. Distribution and service fees paid or accrued for the year ended December 31, 2021 amounted to $25,568 for Class F shares.
Eaton Vance Management (EVM), an affiliate of CRM, provides sub-transfer agency and related services to the Fund pursuant to a Sub-Transfer Agency Support Services Agreement. For the year ended December 31, 2021, sub-transfer agency fees and expenses incurred to EVM amounted to $900 and are included in transfer agency fees and expenses on the Statement of Operations.
Each Director of the Fund who is not an employee of CRM or its affiliates receives an annual fee of $154,000 ($214,000 effective January 1, 2022), plus an annual Committee fee ranging from $8,500 to $16,500 depending on the Committee. The Board chair receives an additional $30,000 annual fee, Committee chairs receive an additional $6,000 annual fee and the special equities liaison receives an additional $2,500 annual fee. Eligible Directors may participate in a Deferred Compensation Plan (the Plan). Amounts deferred under the Plan are treated as though equal dollar amounts had been invested in
Calvert
VP SRI Balanced Portfolio
December 31, 2021
Notes to Financial Statements — continued
shares of the Fund or other Calvert funds selected by the Directors. The Fund purchases shares of the funds selected equal to the dollar amounts deferred under the Plan, resulting in an asset equal to the deferred compensation liability. Obligations of the Plan are paid solely from the Fund's assets. Directors’ fees are allocated to each of the Calvert funds served. Salaries and fees of officers and Directors of the Fund who are employees of CRM or its affiliates are paid by CRM.
3 Shareholder Servicing Plan
The Corporation, on behalf of the Fund, has adopted a Shareholder Servicing Plan (Servicing Plan), which permits the Fund to enter into shareholder servicing agreements with intermediaries that maintain accounts in the Fund for the benefit of shareholders. These services may include, but are not limited to, processing purchase and redemption requests, processing dividend payments, and providing account information to shareholders. Under the Servicing Plan, the Fund may make payments at an annual rate of up to 0.11% of its average daily net assets. For the year ended December 31, 2021, expenses incurred under the Servicing Plan amounted to $174,363, and are included in transfer agency fees and expenses on the Statement of Operations.
4 Investment Activity
During the year ended December 31, 2021, the cost of purchases and proceeds from sales of investments, other than U.S. government and agency securities and short-term securities and including maturities, paydowns and principal repayments on senior floating-rate loans, were $202,216,030 and $208,713,811, respectively. Purchases and sales of U.S. government and agency securities, including paydowns, were $213,043,486 and $212,829,821, respectively.
5 Distributions to Shareholders and Income Tax Information
The tax character of distributions declared for the years ended December 31, 2021 and December 31, 2020 was as follows:
| | Year Ended December 31, |
| | 2021 | 2020 |
| Ordinary income | $ 6,894,232 | $10,120,796 |
| Long-term capital gains | $11,721,809 | $ 7,280,696 |
As of December 31, 2021, the components of distributable earnings (accumulated loss) on a tax basis were as follows:
| Undistributed ordinary income | $ 8,475,486 |
| Undistributed long-term capital gains | 33,570,268 |
| Net unrealized appreciation | 109,085,314 |
| Distributable earnings | $151,131,068 |
The cost and unrealized appreciation (depreciation) of investments, including open derivative contracts, of the Fund at December 31, 2021, as determined on a federal income tax basis, were as follows:
| Aggregate cost | $366,695,106 |
| Gross unrealized appreciation | $ 112,049,197 |
| Gross unrealized depreciation | (2,962,628) |
| Net unrealized appreciation | $109,086,569 |
6 Financial Instruments
A summary of futures contracts and options contracts outstanding at December 31, 2021 is included in the Schedule of Investments. During the year ended December 31, 2021, the Fund used futures contracts and options on futures contracts to hedge interest rate risk and to manage duration.
Calvert
VP SRI Balanced Portfolio
December 31, 2021
Notes to Financial Statements — continued
At December 31, 2021, the fair value of open derivative instruments (not considered to be hedging instruments for accounting disclosure purposes) and whose primary underlying risk exposure is interest rate risk was as follows:
| Derivative | Statement of Assets and Liabilities Caption | Assets | Liabilities |
| Futures contracts | Distributable earnings | | $ 195,257(1) | $ (370,667)(1) |
| Purchased options | Investments in securities of unaffiliated issuers, at value | | 5,344 | — |
| Total | | | $200,601 | $(370,667) |
| (1) | Only the current day's variation margin is reported within the Statement of Assets and Liabilities as Receivable or Payable for variation margin on open futures contracts, as applicable. |
The effect of derivative instruments (not considered to be hedging instruments for accounting disclosure purposes) on the Statement of Operations and whose primary underlying risk exposure is interest rate risk for the year ended December 31, 2021 was as follows:
| Statement of Operations Caption | |
| Net realized gain (loss): | |
| Investment securities(1) | $ (3,845) |
| Futures contracts | 444,676 |
| Total | $ 440,831 |
| Change in unrealized appreciation (depreciation): | |
| Investment securities(1) | $ (1,210) |
| Futures contracts | (166,183) |
| Total | $(167,393) |
| (1) | Relates to purchased options. |
The average notional cost of futures contracts (long) and futures contracts (short) outstanding during the year ended December 31, 2021 was approximately $18,669,000 and $25,582,000, respectively. The average number of purchased options contracts outstanding during the year ended December 31, 2021 was 9 contracts.
7 Securities Lending
To generate additional income, the Fund may lend its securities pursuant to a securities lending agency agreement with State Street Bank and Trust Company (SSBT), the securities lending agent. Security loans are subject to termination by the Fund at any time and, therefore, are not considered illiquid investments. The Fund requires that the loan be continuously collateralized by either cash or securities in an amount at least equal to the market value of the securities on loan. The market value of securities loaned is determined daily and any additional required collateral is delivered to the Fund on the next business day. Cash collateral is generally invested in a money market fund registered under the 1940 Act that is managed by an affiliate of SSBT. Any gain or loss in the market price of the loaned securities that might occur and any interest earned or dividends declared during the term of the loan would accrue to the account of the Fund. Income earned on the investment of collateral, net of broker rebates and other expenses incurred by the securities lending agent, is split between the Fund and the securities lending agent based on agreed upon contractual terms. Non-cash collateral, if any, is held by the lending agent on behalf of the Fund and cannot be sold or re-pledged by the Fund; accordingly, such collateral is not reflected in the Statement of Assets and Liabilities.
The risks associated with lending portfolio securities include, but are not limited to, possible delays in receiving additional collateral or in the recovery of the loaned securities, possible loss of rights to the collateral should the borrower fail financially, as well as risk of loss in the value of the collateral or the value of the investments made with the collateral. The securities lending agent shall indemnify the Fund in the case of default of any securities borrower.
At December 31, 2021, the total value of securities on loan, including accrued interest, was $5,510,038 and the total value of collateral received was $5,631,631, comprised of cash of $2,821,888 and U.S. government and/or agencies securities of $2,809,743.
Calvert
VP SRI Balanced Portfolio
December 31, 2021
Notes to Financial Statements — continued
The following table provides a breakdown of securities lending transactions accounted for as secured borrowings, the obligations by class of collateral pledged, and the remaining contractual maturity of those transactions as of December 31, 2021.
| | Remaining Contractual Maturity of the Transactions |
| | Overnight and
Continuous | <30 days | 30 to 90 days | >90 days | Total |
| Corporate Bonds | $ 2,691,920 | $ — | $ — | $ — | $ 2,691,920 |
| U.S. Treasury Obligations | 129,968 | — | — | — | 129,968 |
| Total | $2,821,888 | $ — | $ — | $ — | $2,821,888 |
The carrying amount of the liability for deposits for securities loaned at December 31, 2021 approximated its fair value. If measured at fair value, such liability would have been considered as Level 2 in the fair value hierarchy (see Note 1A) at December 31, 2021.
8 Line of Credit
The Fund participates with other portfolios and funds managed by EVM and its affiliates, including CRM, in an $800 million unsecured line of credit with a group of banks, which is in effect through October 25, 2022. Borrowings are made by the Fund solely for temporary purposes related to redemptions and other short-term cash needs. Interest is charged to the Fund based on its borrowings at an amount above either the Secured Overnight Financing Rate (SOFR) or Federal Funds rate. In addition, a fee computed at an annual rate of 0.15% on the daily unused portion of the line of credit is allocated among the participating portfolios and funds at the end of each quarter. In connection with the renewal of the agreement in October 2021, an arrangement fee of $150,000 was incurred that was allocated to the participating portfolios and funds. Because the line of credit is not available exclusively to the Fund, it may be unable to borrow some or all of its requested amounts at any particular time.
The Fund had no borrowings pursuant to its line of credit during the year ended December 31, 2021.
9 Affiliated Issuers and Funds
The Fund invested in issuers that may be deemed to be affiliated with Morgan Stanley. At December 31, 2021, the value of the Fund's investment in affiliated issuers and funds was $1,967,671, which represents 0.4% of the Fund's net assets. Transactions in affiliated issuers and funds by the Fund for the year ended December 31, 2021 were as follows:
| Name | Value,
beginning
of period | Purchases | Sales
proceeds | Net
realized
gain
(loss) | Change in
unrealized
appreciation
(depreciation) | Value,
end of
period | Interest/
Dividend
income | Principal
amount/Units,
end of period |
| Commercial Mortgage-Backed Securities | | | | | | | | |
| Morgan Stanley Capital I Trust: | | | | | | | | |
| Series 2017-CLS, Class A, 0.81%, (1 mo. USD LIBOR + 0.70%), 11/15/34(1) | $ — | $ 140,109 | $ — | $ — | $ (689) | $ 685,150 | $ 4,250 | $685,000 |
| Series 2017-CLS, Class E, 2.06%, (1 mo. USD LIBOR + 1.95%), 11/15/34(1) | — | 78,938 | — | — | (42) | 78,896 | 117 | 79,000 |
| Series 2017-CLS, Class F, 2.71%, (1 mo. USD LIBOR + 2.60%), 11/15/34(1) | — | 169,317 | — | — | (840) | 168,469 | 1,293 | 169,000 |
| Series 2019-BPR, Class A, 1.51%, (1 mo. USD LIBOR + 1.40%), 5/15/36(1) | — | — | — | — | 8,764 | 533,095 | 6,877 | 539,000 |
| Series 2019-BPR, Class B, 2.21%, (1 mo. USD LIBOR + 2.10%), 5/15/36(1) | — | — | — | — | 5,431 | 178,500 | 3,619 | 187,000 |
| Series 2019-BPR, Class C, 3.16%, (1 mo. USD LIBOR + 3.05%), 5/15/36(1) | — | — | — | — | 5,372 | 91,069 | 2,678 | 100,000 |
| Corporate Bonds | | | | | | | | |
| Morgan Stanley, 0.71%, (SOFR + 0.70%), 1/20/23(1) | — | — | (716,112) | 2,112 | (3,384) | — | 323 | — |
Calvert
VP SRI Balanced Portfolio
December 31, 2021
Notes to Financial Statements — continued
| Name | Value,
beginning
of period | Purchases | Sales
proceeds | Net
realized
gain
(loss) | Change in
unrealized
appreciation
(depreciation) | Value,
end of
period | Interest/
Dividend
income | Principal
amount/Units,
end of period |
| Short-Term Investments | | | | | | |
| Calvert Cash Reserves Fund, LLC | $7,856,807 | $129,000,781 | $(136,623,653) | $ (1,493) | $ 50 | $ 232,492 | $ 5,404 | 232,492 |
| Totals | | | | $ 619 | $14,662 | $1,967,671 | $24,561 | |
| (1) | May be deemed to be an affiliated issuer as of March 1, 2021 (see Note 2). |
10 Capital Shares
The Corporation may issue its shares in one or more series (such as the Fund). The authorized shares of the Fund consist of 500,000,000 common shares, $0.01 par value, for each Class.
Transactions in capital shares for the years ended December 31, 2021 and December 31, 2020 were as follows:
| | Year Ended
December 31, 2021 | | Year Ended
December 31, 2020 |
| | Shares | Amount | | Shares | Amount |
| Class I | | | | | |
| Shares sold | 9,350,542 | $ 25,017,694 | | 13,186,923 | $ 30,978,919 |
| Reinvestment of distributions | 6,842,798 | 18,133,416 | | 7,305,959 | 17,095,943 |
| Shares redeemed | (17,282,540) | (46,561,684) | | (16,928,416) | (38,524,601) |
| Net increase (decrease) | (1,089,200) | $ (3,410,574) | | 3,564,466 | $ 9,550,261 |
| Class F | | | | | |
| Shares sold | 1,857,812 | $ 5,015,150 | | 1,508,379 | $ 3,492,301 |
| Reinvestment of distributions | 182,813 | 482,625 | | 130,576 | 305,549 |
| Shares redeemed | (471,455) | (1,272,121) | | (698,255) | (1,540,164) |
| Net increase | 1,569,170 | $ 4,225,654 | | 940,700 | $ 2,257,686 |
At December 31, 2021, separate accounts of three insurance companies each owned more than 10% of the value of the outstanding shares of the Fund, aggregating 65.9%.
11 Risks and Uncertainties
Pandemic Risk
An outbreak of respiratory disease caused by a novel coronavirus was first detected in China in late 2019 and subsequently spread internationally. This coronavirus has resulted in closing borders, enhanced health screenings, changes to healthcare service preparation and delivery, quarantines, cancellations, disruptions to supply chains and customer activity, as well as general concern and uncertainty. Health crises caused by outbreaks, such as the coronavirus outbreak, may exacerbate other pre-existing political, social and economic risks and disrupt normal market conditions and operations. The impact of this outbreak has negatively affected the worldwide economy, the economies of individual countries, individual companies, and the market in general, and may continue to do so in significant and unforeseen ways, as may other epidemics and pandemics that may arise in the future. Any such impact could adversely affect the Fund's performance, or the performance of the securities in which the Fund invests.
12 Change in Independent Registered Public Accounting Firm
On July 30, 2021, KPMG LLP (“KPMG”) informed the Audit Committee and Board of the Corporation that it was resigning as the independent registered public accounting firm to the Corporation, as upon Morgan Stanley’s acquisition of Eaton Vance Corp., the parent company of CRM (the investment adviser to each series of the Corporation), KPMG would no longer be independent of the Corporation. The Audit Committee of the Board and the Board approved the selection of Deloitte & Touche LLP (“Deloitte”) as the independent registered public accounting firm for the funds that are series of the Corporation (the “Funds”) for the fiscal year ending December 31, 2021 to be effective upon KPMG’s resignation and Deloitte’s acceptance of the engagement which became effective July 30, 2021.
Calvert
VP SRI Balanced Portfolio
December 31, 2021
Notes to Financial Statements — continued
KPMG’s reports on the financial statements for the Funds for the fiscal periods ended December 31, 2019 and December 31, 2020 contained no adverse opinion or disclaimer of opinion nor were they qualified or modified as to uncertainty, audit scope or accounting principles. During the fiscal periods ended December 31, 2019 and December 31, 2020, and during the subsequent interim period through July 30, 2021: (i) there were no disagreements with KPMG on any matter of accounting principles or practices, financial statement disclosure or auditing scope or procedure, which disagreements, if not resolved to the satisfaction of KPMG, would have caused KPMG to make reference to the subject matter of the disagreements in connection with its reports on the Funds’ financial statements for such periods; and (ii) there were no “reportable events” of the kind described in Item 304(a)(1)(v) of Regulation S-K under the Securities Exchange Act of 1934, as amended.
During the fiscal periods ended December 31, 2019 and December 31, 2020, and during the subsequent interim period through July 30, 2021: neither the Funds, nor anyone on their behalf, consulted with Deloitte on items which: (i) concerned the application of accounting principles to a specified transaction, either completed or proposed, or the type of audit opinion that might be rendered on the Funds’ financial statements; or (ii) concerned the subject of a disagreement (as defined in paragraph (a)(1)(iv) of Item 304 of Regulation S-K) or reportable events (as described in paragraph (a)(1)(v) of Item 304).
Calvert
VP SRI Balanced Portfolio
December 31, 2021
Report of Independent Registered Public Accounting Firm
To the Board of Directors of Calvert Variable Series, Inc. and Shareholders of Calvert VP SRI Balanced Portfolio:
Opinion on the Financial Statements and Financial Highlights
We have audited the accompanying statement of assets and liabilities of Calvert VP SRI Balanced Portfolio (the "Fund") (one of the funds constituting Calvert Variable Series, Inc.), including the schedule of investments, as of December 31, 2021, the related statements of operations, changes in net assets, and the financial highlights for the year then ended, and the related notes. In our opinion, the financial statements and financial highlights present fairly, in all material respects, the financial position of the Fund as of December 31, 2021, and the results of its operations, changes in its net assets, and the financial highlights for the year then ended in conformity with accounting principles generally accepted in the United States of America. The statement of changes in net assets for the year ended December 31, 2020, and the financial highlights for the years ended December 31, 2020, 2019, 2018, and 2017 were audited by other auditors whose report, dated February 18, 2021, expressed an unqualified opinion on that financial statement and those financial highlights.
Basis for Opinion
These financial statements and financial highlights are the responsibility of the Fund's management. Our responsibility is to express an opinion on the Fund's financial statements and financial highlights based on our audit. We are a public accounting firm registered with the Public Company Accounting Oversight Board (United States) (PCAOB) and are required to be independent with respect to the Fund in accordance with the U.S. federal securities laws and the applicable rules and regulations of the Securities and Exchange Commission and the PCAOB.
We conducted our audit in accordance with the standards of the PCAOB. Those standards require that we plan and perform the audit to obtain reasonable assurance about whether the financial statements and financial highlights are free of material misstatement, whether due to error or fraud. The Fund is not required to have, nor were we engaged to perform, an audit of its internal control over financial reporting. As part of our audit, we are required to obtain an understanding of internal control over financial reporting but not for the purpose of expressing an opinion on the effectiveness of the Fund’s internal control over financial reporting. Accordingly, we express no such opinion.
Our audit included performing procedures to assess the risks of material misstatement of the financial statements and financial highlights, whether due to error or fraud, and performing procedures that respond to those risks. Such procedures included examining, on a test basis, evidence regarding the amounts and disclosures in the financial statements and financial highlights. Our audit also included evaluating the accounting principles used and significant estimates made by management, as well as evaluating the overall presentation of the financial statements and financial highlights. Our procedures included confirmation of securities owned as of December 31, 2021, by correspondence with the custodian, brokers and selling or agent banks; when replies were not received from brokers and selling or agent banks, we performed other auditing procedures. We believe that our audit provides a reasonable basis for our opinion.
/s/ Deloitte & Touche LLP
Boston, Massachusetts
February 18, 2022
We have served as the auditor of one or more Calvert investment companies since 2021.
Calvert
VP SRI Balanced Portfolio
December 31, 2021
Federal Tax Information (Unaudited)
As required by the Internal Revenue Code and/or regulations, shareholders must be notified regarding the status of qualified business income, the dividends received deduction for corporations, 163(j) interest dividends and capital gains dividends.
Qualified Business Income. For the fiscal year ended December 31, 2021, the Fund designates approximately $58,796, or up to the maximum amount of such dividends allowable pursuant to the Internal Revenue Code, as qualified business income.
Dividends Received Deduction. Corporate shareholders are generally entitled to take the dividends received deduction on the portion of the Fund's dividend distribution that qualifies under tax law. For the Fund's fiscal 2021 ordinary income dividends, 41.51% qualifies for the corporate dividends received deduction.
163(j) Interest Dividends. For the fiscal year ended December 31, 2021, the Fund designates 36.96% of distributions from net investment income as a 163(j) interest dividend.
Capital Gains Dividends. The Fund hereby designates as a capital gain dividend with respect to the taxable year ended December 31, 2021, $33,578,487 or, if subsequently determined to be different, the net capital gain of such year.
Calvert
VP SRI Balanced Portfolio
December 31, 2021
Management and Organization
Fund Management. The Directors of Calvert Variable Series, Inc. (the Corporation) are responsible for the overall management and supervision of the affairs of the Corporation. The Board members and officers of the Corporation are listed below. Except as indicated, each individual has held the office shown or other offices in the same company for the last five years. Board members hold indefinite terms of office. Each Board member holds office until his or her successor is elected and qualified, or until his or her earlier death, resignation, retirement, removal or disqualification. Under the terms of the Fund’s current Board member retirement policy, an Independent Board member must retire at the end of the calendar year in which he or she turns 75. However, if such retirement would cause the Fund to be out of compliance with Section 16 of the 1940 Act or any other regulations or guidance of the SEC, then such retirement will not become effective until such time as action has been taken for the Fund to be in compliance therewith. The “noninterested Directors” consist of those Directors who are not “interested persons” of the Corporation, as that term is defined under the 1940 Act. The business address of each Board member and the Chief Compliance Officer is 1825 Connecticut Avenue, NW, Suite 400, Washington, DC 20009 and the business address of the Secretary, Vice President and Chief Legal Officer and the Treasurer is Two International Place, Boston, Massachusetts 02110. As used below, “CRM” refers to Calvert Research and Management and “Eaton Vance” refers to Eaton Vance Management. Each Director oversees 39 funds in the Calvert fund complex. Effective March 1, 2021, each of Eaton Vance and CRM are indirect, wholly-owned subsidiaries of Morgan Stanley. Each officer affiliated with CRM may hold a position with other CRM affiliates that is comparable to his or her position with CRM listed below.
| Name and Year of Birth | Corporation
Position(s) | Length of
Service | Principal Occupation(s) and Other Directorships
During Past Five Years and Other Relevant Experience |
| Interested Director |
John H. Streur(1)
1960 | Director and
President | Since 2015 | President and Chief Executive Officer of CRM (since December 31, 2016). President and Chief Executive Officer of Calvert Investments, Inc.
(January 2015 - December 2016); Chief Executive Officer of Calvert
Investment Distributors, Inc. (August 2015 - December 2016); Chief
Compliance Officer of Calvert Investment Management, Inc. (August 2015 -
April 2016); President and Director, Portfolio 21 Investments, Inc.
(through October 2014); President, Chief Executive Officer and
Director, Managers Investment Group LLC (through January 2012);
President and Director, The Managers Funds and Managers AMG
Funds (through January 2012).
Other Directorships. Portfolio 21 Investments, Inc. (asset management)
(through October 2014); Managers Investment Group LLC (asset management)
(through January 2012); The Managers Funds (asset management)
(through January 2012); Managers AMG Funds (asset management)
(through January 2012); Calvert Impact Capital, Inc. |
| Noninterested Directors |
Richard L. Baird, Jr.
1948 | Director | Since 2016 | Regional Disaster Recovery Lead, American Red Cross of Greater
Pennsylvania (since 2017). Volunteer, American Red Cross (since 2015).
Former President and CEO of Adagio Health Inc. (retired in 2014) in
Pittsburgh, PA.
Other Directorships. None. |
Alice Gresham Bullock
1950 | Chair and
Director | Since 2016 (Chair);
Since 2008 (Director) | Professor Emerita at Howard University School of Law. Dean Emerita of
Howard University School of Law and Deputy Director of the Association
of American Law Schools (1992-1994).
Other Directorships. None. |
Cari M. Dominguez
1949 | Director | Since 2016 | Former Chair of the U.S. Equal Employment Opportunity Commission.
Other Directorships. ManpowerGroup Inc. (workforce solutions company);
Triple S Management Corporation (managed care); National Association of Corporate Directors. |
John G. Guffey, Jr.
1948 | Director | Since 2016 | President of Aurora Press Inc., a privately held publisher of trade
paperbacks (since January 1997).
Other Directorships. Calvert Impact Capital, Inc. (through
December 31, 2018); Calvert Ventures, LLC. |
Miles D. Harper, III
1962 | Director | Since 2016 | Partner, Carr Riggs & Ingram (public accounting firm) since October 2014.
Partner, Gainer Donnelly & Desroches (public accounting firm) (now Carr
Riggs & Ingram) (November 1999 - September 2014).
Other Directorships. Bridgeway Funds (9) (asset management). |
Joy V. Jones
1950 | Director | Since 2016 | Attorney.
Other Directorships. Palm Management Corporation. |
Calvert
VP SRI Balanced Portfolio
December 31, 2021
Management and Organization — continued
| Name and Year of Birth | Corporation
Position(s) | Length of
Service | Principal Occupation(s) and Other Directorships
During Past Five Years and Other Relevant Experience |
| Noninterested Directors (continued) |
Anthony A. Williams
1951 | Director | Since 2016 | CEO and Executive Director of the Federal City Council (July 2012 to
present); Senior Adviser and Independent Consultant for King and
Spalding LLP (September 2015 to present); Executive Director of Global
Government Practice at the Corporate Executive Board (January 2010 to
January 2012).
Other Directorships. Freddie Mac; Evoq Properties/Meruelo Maddux
Properties, Inc. (real estate management); Weston Solutions, Inc.
(environmental services); Bipartisan Policy Center’s Debt Reduction Task Force;
Chesapeake Bay Foundation; Catholic University of America; Urban Institute (research organization); The Howard Hughes Corporation (real estate development). |
| Name and Year of Birth | Corporation
Position(s) | Length of
Service | Principal Occupation(s)
During Past Five Years |
| Principal Officers who are not Directors |
Hope L. Brown
1973 | Chief
Compliance
Officer | Since 2014 | Chief Compliance Officer of 39 registered investment companies advised
by CRM (since 2014). Vice President and Chief Compliance Officer,
Wilmington Funds (2012-2014). |
Deidre E. Walsh
1971 | Secretary,
Vice President
and Chief
Legal Officer | Since 2021 | Vice President of CRM and officer of 39 registered investment companies
advised by CRM (since 2021). Also Vice President of Eaton Vance and
certain of its affiliates and officer of 138 registered investment companies
advised or administered by Eaton Vance. |
James F. Kirchner
1967 | Treasurer | Since 2016 | Vice President of CRM and officer of 39 registered investment companies
advised by CRM (since 2016). Also Vice President of Eaton Vance and
certain of its affiliates and officer of 138 registered investment companies
advised or administered by Eaton Vance. |
| | | | |
| (1) Mr. Streur is an interested person of the Fund because of his positions with the Fund’s adviser and certain affiliates. |
The SAI for the Fund includes additional information about the Directors and officers of the Fund and can be obtained without charge on Calvert’s website at www.calvert.com or by calling 1-800-368-2745.
| FACTS | WHAT DOES EATON VANCE DO WITH YOUR
PERSONAL INFORMATION? |
| Why? | Financial companies choose how they share your personal information. Federal law gives consumers the right to limit some but not all sharing. Federal law also requires us to tell you how we collect, share, and protect your personal information. Please read this notice carefully to understand what we do. |
| |
| What? | The types of personal information we collect and share depend on the product or service you have with us. This information can include:■ Social Security number and income
■
investment experience and risk tolerance
■
checking account number and wire transfer instructions |
| |
| How? | All financial companies need to share customers’ personal information to run their everyday business. In the section below, we list the reasons financial companies can share their customers’ personal information; the reasons Eaton Vance chooses to share; and whether you can limit this sharing. |
Reasons we can share your
personal information | Does Eaton Vance
share? | Can you limit
this sharing? |
| For our everyday business purposes — such as to process your transactions, maintain your account(s), respond to court orders and legal investigations, or report to credit bureaus | Yes | No |
| For our marketing purposes — to offer our products and services to you | Yes | No |
| For joint marketing with other financial companies | No | We don’t share |
| For our investment management affiliates’ everyday business purposes — information about your transactions, experiences, and creditworthiness | Yes | Yes |
| For our affiliates’ everyday business purposes — information about your transactions and experiences | Yes | No |
| For our affiliates’ everyday business purposes — information about your creditworthiness | No | We don’t share |
| For our investment management affiliates to market to you | Yes | Yes |
| For our affiliates to market to you | No | We don’t share |
| For nonaffiliates to market to you | No | We don’t share |
To limit our
sharing | Call toll-free 1-800-368-2745 or email: CRMPrivacy@calvert.comPlease note:If you are a new customer, we can begin sharing your information 30 days from the date we sent this notice. When you are no longer our customer, we continue to share your information as described in this notice. However, you can contact us at any time to limit our sharing. |
| Questions? | Call toll-free 1-800-368-2745 or email: CRMPrivacy@calvert.com |
| Privacy Notice — continued | April 2021 |
| Who we are |
| Who is providing this notice? | Eaton Vance Management, Eaton Vance Distributors, Inc., Eaton Vance Trust Company, Eaton Vance Management (International) Limited, Eaton Vance Advisers International Ltd., Eaton Vance Global Advisors Limited, Eaton Vance Management’s Real Estate Investment Group, Boston Management and Research, Calvert Research and Management, Eaton Vance and Calvert Fund Families and our investment advisory affiliates (“Eaton Vance”) (see Investment Management Affiliates definition below) |
| What we do |
How does Eaton Vance
protect my personal
information? | To protect your personal information from unauthorized access and use, we use security measures that comply with federal law. These measures include computer safeguards and secured files and buildings. We have policies governing the proper handling of customer information by personnel and requiring third parties that provide support to adhere to appropriate security standards with respect to such information. |
How does Eaton Vance
collect my personal
information? | We collect your personal information, for example, when you■ open an account or make deposits or withdrawals from your account
■
buy securities from us or make a wire transfer
■
give us your contact informationWe also collect your personal information from others, such as credit bureaus, affiliates, or other companies. |
| Why can’t I limit all sharing? | Federal law gives you the right to limit only■ sharing for affiliates’ everyday business purposes — information about your creditworthiness
■
affiliates from using your information to market to you
■
sharing for nonaffiliates to market to youState laws and individual companies may give you additional rights to limit sharing. See below for more on your rights under state law. |
| Definitions |
Investment Management
Affiliates | Eaton Vance Investment Management Affiliates include registered investment advisers, registered broker- dealers, and registered and unregistered funds. Investment Management Affiliates does not include entities associated with Morgan Stanley Wealth Management, such as Morgan Stanley Smith Barney LLC and Morgan Stanley & Co. |
| Affiliates | Companies related by common ownership or control. They can be financial and nonfinancial companies.■ Our affiliates include companies with a Morgan Stanley name and financial companies such as Morgan Stanley Smith Barney LLC and Morgan Stanley & Co. |
| Nonaffiliates | Companies not related by common ownership or control. They can be financial and nonfinancial companies.■ Eaton Vance does not share with nonaffiliates so they can market to you. |
| Joint marketing | A formal agreement between nonaffiliated financial companies that together market financial products or services to you.■ Eaton Vance doesn’t jointly market. |
| Other important information |
| Vermont: Except as permitted by law, we will not share personal information we collect about Vermont residents with Nonaffiliates unless you provide us with your written consent to share such information.California: Except as permitted by law, we will not share personal information we collect about California residents with Nonaffiliates and we will limit sharing such personal information with our Affiliates to comply with California privacy laws that apply to us. |
Delivery of Shareholder Documents. The Securities and Exchange Commission (SEC) permits funds to deliver only one copy of shareholder documents, including prospectuses, proxy statements and shareholder reports, to fund investors with multiple accounts at the same residential or post office box address. This practice is often called “householding” and it helps eliminate duplicate mailings to shareholders. Calvert funds, or your financial intermediary, may household the mailing of your documents indefinitely unless you instruct Calvert funds, or your financial intermediary, otherwise. If you would prefer that your Calvert fund documents not be householded, please contact Calvert funds at 1-800-368-2745, or contact your financial intermediary. Your instructions that householding not apply to delivery of your Calvert fund documents will typically be effective within 30 days of receipt by Calvert funds or your financial intermediary. Separate statements will be generated for each separate account and will be householded as described above.
Portfolio Holdings. Each Calvert fund files a schedule of portfolio holdings on Part F to Form N-PORT with the SEC. Certain information filed on Form N-PORT may be viewed on the Calvert website at www.calvert.com, by calling Calvert at 1-800-368-2745 or in the EDGAR database on the SEC’s website at www.sec.gov.
Proxy Voting. The Proxy Voting Guidelines that each Calvert fund uses to determine how to vote proxies relating to portfolio securities is provided as an Appendix to the fund’s Statement of Additional Information. The Statement of Additional Information can be obtained free of charge by calling the Calvert funds at 1-800-368-2745, by visiting the Calvert funds’ website at www.calvert.com or visiting the SEC’s website at www.sec.gov. Information regarding how a Calvert fund voted proxies relating to portfolio securities during the most recent 12-month period ended June 30 is available by calling Calvert funds, by visiting the Calvert funds’ website at www.calvert.com or by visiting the SEC’s website at www.sec.gov.
This Page Intentionally Left Blank
This Page Intentionally Left Blank
This Page Intentionally Left Blank
Investment Adviser and Administrator
Calvert Research and Management
1825 Connecticut Avenue NW, Suite 400
Washington, DC 20009
Principal Underwriter*
Eaton Vance Distributors, Inc.
Two International Place
Boston, MA 02110
(617) 482-8260
Custodian
State Street Bank and Trust Company
State Street Financial Center, One Lincoln Street
Boston, MA 02111
Transfer Agent
DST Asset Manager Solutions, Inc.
2000 Crown Colony Drive
Quincy, MA 02169
Independent Registered Public Accounting Firm
Deloitte & Touche LLP
200 Berkeley Street
Boston, MA 02116-5022
Fund Offices
1825 Connecticut Avenue NW, Suite 400
Washington, DC 20009
* FINRA BrokerCheck. Investors may check the background of their Investment Professional by contacting the Financial Industry Regulatory Authority (FINRA). FINRA BrokerCheck is a free tool to help investors check the professional background of current and former FINRA-registered securities firms and brokers. FINRA BrokerCheck is available by calling 1-800-289-9999 and at www.FINRA.org. The FINRA BrokerCheck brochure describing this program is available to investors at www.FINRA.org.
Printed on recycled paper.
24217 12.31.21
Calvert
VP SRI Mid Cap Portfolio
Annual Report
December 31, 2021
Commodity Futures Trading Commission Registration. The Commodity Futures Trading Commission (“CFTC”) has adopted regulations that subject registered investment companies and advisers to regulation by the CFTC if a fund invests more than a prescribed level of its assets in certain CFTC-regulated instruments (including futures, certain options and swap agreements) or markets itself as providing investment exposure to such instruments. The adviser has claimed an exclusion from the definition of “commodity pool operator” under the Commodity Exchange Act with respect to its management of the Fund and the other funds it manages. Accordingly, neither the Fund nor the adviser is subject to CFTC regulation.
Fund shares are not insured by the FDIC and are not deposits or other obligations of, or guaranteed by, any depository institution. Shares are subject to investment risks, including possible loss of principal invested.
This report must be preceded or accompanied by a current summary prospectus or prospectus. Before investing, investors should consider carefully the investment objective, risks, and charges and expenses of a mutual fund. This and other important information is contained in the summary prospectus and prospectus, which can be obtained from a financial intermediary. Prospective investors should read the prospectus carefully before investing. For further information, please call 1-800-368-2745.
Annual Report December 31, 2021
Calvert
VP SRI Mid Cap Portfolio
Calvert
VP SRI Mid Cap Portfolio
December 31, 2021
Management's Discussion of Fund Performance†
Economic and Market Conditions
The 12-month period starting January 1, 2021, was notable for a U.S. equity rally that lasted for most of the period and resulted in U.S. stocks outperforming most other stock markets in developed economies. Except for temporary retreats in September and November, broad-market indexes generally posted strong returns during the period. Investors cheered the reopening of businesses that had been affected by the pandemic and the rollout of several highly effective COVID-19 vaccines.
COVID-19, however, continued to have a firm grip on the U.S. economy. Disease rates advanced and declined with second, third, and fourth waves of infections. Worker shortages led to global supply-chain disruptions. From computer chips to shipping containers, scarcities of key items led to temporary factory shutdowns and empty store shelves. Those shortages — combined with high demand from consumers eager to spend money saved earlier in the pandemic — led to higher year-over-year inflation than the U.S. had seen in decades.
Still, investor optimism about a recovering economy drove stock prices up during most of the period. A significant pullback, however, occurred in September 2021 when virtually every major U.S. stock index reported negative returns. Unexpectedly weak job creation in August and the U.S. Federal Reserve’s (the Fed’s) announcement that it might soon begin tapering its monthly bond purchases — which had stimulated the economy earlier — combined to drive stocks into negative territory. Rising COVID-19 infections also weighed on equity performance in September.
In the final quarter of 2021, however, stock prices came roaring back. Even the late-November news of a new and more transmissible COVID-19 variant — Omicron — caused only a temporary market retreat. The Fed’s actions to tamp down inflation were applauded by investors, with stocks gaining ground after the central bank announced that tapering would be accelerated and that three possible interest rate hikes were forecast for 2022. Just two trading days before year-end, the S&P 500® Index closed at its 70th new all-time high for the period, and the Dow Jones Industrial Average® (DJIA) closed at an all-time high as well.
For the period as a whole, the broad-market S&P 500® Index returned 28.71%; the blue-chip DJIA was up 20.95%; and the technology-laden Nasdaq Composite Index rose 22.18%. Large-cap U.S. stocks, as measured by the Russell 1000® Index, outperformed their small-cap counterparts, as measured by the Russell 2000® Index. In the large-cap space, growth stocks modestly outperformed value stocks, but in the small-cap space, value stocks strongly outperformed growth stocks during the period.
Fund Performance
For the 12-month period ended December 31, 2021, Calvert VP SRI Mid Cap Portfolio (the Fund) returned 15.03% at net asset value (NAV), underperforming its benchmark, the Russell Midcap® Index (the Index), which returned 22.58%.
Stock selections overall detracted from performance relative to the Index during the period. Selections in the health care, materials, and energy sectors especially weighed on relative performance. An underweight exposure to the energy sector, the strongest-performing sector within the Index, further detracted from relative returns. Stock selections in the communication services and real estate sectors contributed to relative performance during the period.
WEX, Inc. (WEX), a provider of payment and information management services to vehicle fleets, was one of the largest detractors from returns during the period. WEX’s stock price fell on investor concerns that new, venture-capital backed financial technology companies might siphon off WEX’s business.
Haemonetics Corp. (Haemonetics), a provider of blood and plasma products and services, was a significant detractor from returns relative to the Index during the period. Haemonetics’ stock price fell after CSL Plasma informed the company that it would discontinue use of its PCS2 plasma collection system devices, the source of about 12% of Haemonetics’ revenue. CSL Plasma said it planned to shift its business to Haemonetics’ competitor, Terumo, and ultimately bring the business in-house. By period-end, Haemonetics was sold from the Fund.
Teleflex, Inc. (Teleflex), a medical device manufacturer, detracted from relative performance during the period. Its stock price declined as rolling waves of COVID-19 infections slowed a resurgence of elective procedures. In addition, a change in reimbursement rates for Teleflex’s UroLift product — making its use less profitable for doctors — reduced demand for the product during the period.
In contrast, Bill.com Holdings, Inc. (Bill.com), a provider of cloud-based payment systems, was among the strongest contributors to Fund performance during the period. Bill.com’s stock price rose as the company’s revenue growth accelerated for four consecutive quarters, culminating in fourth-quarter year-over-year growth of 152%. The company benefited from accelerated customer growth as well as the trend shifting away from automated clearing house and check payments to other methods, like virtual cards and cross-border payments. Bill.com further benefited from two acquisitions that helped it compete in its market.
Mid-America Apartment Communities, Inc. (Mid-America) contributed to returns relative to the Index. Mid-America’s stock price outperformed other REITS as the company benefited from recent population shifts from large coastal cities toward the Sunbelt, where Mid-America is focused.
See Endnotes and Additional Disclosures in this report.
Past performance is no guarantee of future results. Returns are historical and are calculated by determining the percentage change in net asset value (NAV) or offering price (as applicable) with all distributions reinvested. Investment return and principal value will fluctuate so that shares, when redeemed, may be worth more or less than their original cost. Performance for periods less than or equal to one year is cumulative. Performance is for the stated time period only; due to market volatility, current Fund performance may be lower or higher than the quoted return.
Calvert
VP SRI Mid Cap Portfolio
December 31, 2021
Management's Discussion of Fund Performance† — continued
Tradeweb Market, Inc. (Tradeweb), a provider of electronic over-the-counter marketplaces for fixed-income and other investment products, also contributed to returns relative to the Index. Tradeweb’s stock price rose as the company gained significant market share in the trading of high-grade and high yield bonds. Investors also drove Tradeweb's stock price up in anticipation of higher interest rates, which could accelerate trading activities.
See Endnotes and Additional Disclosures in this report.
Past performance is no guarantee of future results. Returns are historical and are calculated by determining the percentage change in net asset value (NAV) or offering price (as applicable) with all distributions reinvested. Investment return and principal value will fluctuate so that shares, when redeemed, may be worth more or less than their original cost. Performance for periods less than or equal to one year is cumulative. Performance is for the stated time period only; due to market volatility, current Fund performance may be lower or higher than the quoted return.
Calvert
VP SRI Mid Cap Portfolio
December 31, 2021
Performance
Portfolio Manager(s) Charles B. Gaffney of Calvert Research and Management
| % Average Annual Total Returns1,2 | Inception Date | Performance
Inception Date | One Year | Five Years | Ten Years |
| Fund at NAV | 07/16/1991 | 07/16/1991 | 15.03% | 12.59% | 11.89% |
|
| Russell Midcap® Index | — | — | 22.58% | 15.09% | 14.89% |
| % Total Annual Operating Expense Ratios3 | |
| | 0.99% |
Growth of $10,000
This graph shows the change in value of a hypothetical investment of $10,000 in the Fund for the period indicated. For comparison, the same investment is shown in the indicated index.
See Endnotes and Additional Disclosures in this report.
Past performance is no guarantee of future results. Returns are historical and are calculated by determining the percentage change in net asset value (NAV) or offering price (as applicable) with all distributions reinvested. Investment return and principal value will fluctuate so that shares, when redeemed, may be worth more or less than their original cost. Performance for periods less than or equal to one year is cumulative. Performance is for the stated time period only; due to market volatility, current Fund performance may be lower or higher than the quoted return.
Calvert
VP SRI Mid Cap Portfolio
December 31, 2021
Sector Allocation (% of net assets)*
* Excludes cash and cash equivalents.
| Top 10 Holdings (% of net assets)* | |
| Motorola Solutions, Inc. | 2.4% |
| ANSYS, Inc. | 2.3 |
| Mid-America Apartment Communities, Inc. | 2.3 |
| Black Knight, Inc. | 2.3 |
| Baker Hughes Co. | 2.3 |
| Lamar Advertising Co., Class A | 2.2 |
| Morningstar, Inc. | 2.2 |
| Aptiv PLC | 2.2 |
| Verisk Analytics, Inc. | 2.1 |
| Broadridge Financial Solutions, Inc. | 2.1 |
| Total | 22.4% |
| * | Excludes cash and cash equivalents. |
Calvert
VP SRI Mid Cap Portfolio
December 31, 2021
Endnotes and Additional Disclosures
| † | The views expressed in this report are those of the portfolio manager(s) and are current only through the date stated at the top of this page. These views are subject to change at any time based upon market or other conditions, and Calvert and the Fund(s) disclaim any responsibility to update such views. These views may not be relied upon as investment advice and, because investment decisions are based on many factors, may not be relied upon as an indication of trading intent on behalf of any Calvert fund. This commentary may contain statements that are not historical facts, referred to as “forward-looking statements.” The Fund’s actual future results may differ significantly from those stated in any forward-looking statement, depending on factors such as changes in securities or financial markets or general economic conditions, the volume of sales and purchases of Fund shares, the continuation of investment advisory, administrative and service contracts, and other risks discussed from time to time in the Fund’s filings with the Securities and Exchange Commission. |
| | |
| 1 | Russell Midcap® Index is an unmanaged index of U.S. mid-cap stocks. Unless otherwise stated, index returns do not reflect the effect of any applicable sales charges, commissions, expenses, taxes or leverage, as applicable. It is not possible to invest directly in an index. |
| 2 | There is no sales charge. Insurance-related charges are not included in the calculation of returns. If such charges were reflected, the returns would be lower. Please refer to the report for your insurance contract for performance data reflecting insurance-related charges.Calvert Research and Management became the investment adviser to the Fund on December 31, 2016. Performance reflected prior to such date is that of the Fund’s former investment adviser. |
| 3 | Source: Fund prospectus. The expense ratios for the current reporting period can be found in the Financial Highlights section of this report. |
| | Fund profile subject to change due to active management. |
| | Additional Information |
| | S&P 500® Index is an unmanaged index of large-cap stocks commonly used as a measure of U.S. stock market performance. Dow Jones Industrial Average® is a price-weighted average of 30 blue-chip stocks that are generally the leaders in their industry. S&P Dow Jones Indices are a product of S&P Dow Jones Indices LLC (“S&P DJI”) and have been licensed for use. S&P® and S&P 500® are registered trademarks of S&P DJI; Dow Jones® is a registered trademark of Dow Jones Trademark Holdings LLC (“Dow Jones”); S&P DJI, Dow Jones and their respective affiliates do not sponsor, endorse, sell or promote the Fund, will not have any liability with respect thereto and do not have any liability for any errors, omissions, or interruptions of the S&P Dow Jones Indices. Nasdaq Composite Index is a market capitalization-weighted index of all domestic and international |
securities listed on Nasdaq. Source: Nasdaq, Inc. The information is provided by Nasdaq (with its affiliates, are referred to as the “Corporations”) and Nasdaq’s third party licensors on an “as is” basis and the Corporations make no guarantees and bear no liability of any kind with respect to the information or the Fund. Russell 1000® Index is an unmanaged index of 1,000 U.S. large- cap stocks. Russell 2000® Index is an unmanaged index of 2,000 U.S. small-cap stocks.
Calvert
VP SRI Mid Cap Portfolio
December 31, 2021
Example
As a Fund shareholder, you incur ongoing costs, including management fees and other Fund expenses. This Example is intended to help you understand your ongoing costs (in dollars) of Fund investing and to compare these costs with the ongoing costs of investing in other mutual funds. The Example is based on an investment of $1,000 invested at the beginning of the period and held for the entire period (July 1, 2021 to December 31, 2021).
Actual Expenses
The first line of the table below provides information about actual account values and actual expenses. You may use the information in this line, together with the amount you invested, to estimate the expenses that you paid over the period. Simply divide your account value by $1,000 (for example, an $8,600 account value divided by $1,000 = 8.6), then multiply the result by the number in the first line under the heading entitled “Expenses Paid During Period” to estimate the expenses you paid on your account during this period.
Hypothetical Example for Comparison Purposes
The second line of the table below provides information about hypothetical account values and hypothetical expenses based on the actual Fund expense ratio and an assumed rate of return of 5% per year (before expenses), which is not the actual Fund return. The hypothetical account values and expenses may not be used to estimate the actual ending account balance or expenses you paid for the period. You may use this information to compare the ongoing costs of investing in the Fund and other funds. To do so, compare this 5% hypothetical example with the 5% hypothetical examples that appear in the shareholder reports of the other funds.
Please note that the expenses shown in the table are meant to highlight your ongoing costs only and do not reflect expenses and charges which are, or may be imposed under the variable annuity contract or variable life insurance policy (variable contracts) (if applicable) or qualified pension or retirement plans (Qualified Plans) through which your investment in the Fund is made. Therefore, the second line of the table is useful in comparing ongoing costs associated with an investment in vehicles which fund benefits under variable contracts and Qualified Plans, and will not help you determine the relative total costs of investing in the Fund through variable contracts or Qualified Plans. In addition, if these expenses and charges imposed under the variable contracts or Qualified Plans were included, your costs would have been higher.
| | Beginning
Account Value
(7/1/21) | Ending
Account Value
(12/31/21) | Expenses Paid
During Period*
(7/1/21 – 12/31/21) | Annualized
Expense
Ratio |
| Actual | | | | |
| | $1,000.00 | $1,041.80 | $4.94 | 0.96% |
| Hypothetical | | | | |
| (5% return per year before expenses) | | | | |
| | $1,000.00 | $1,020.37 | $4.89 | 0.96% |
| * | Expenses are equal to the Fund's annualized expense ratio, multiplied by the average account value over the period, multiplied by 184/365 (to reflect the one-half year period). The Example assumes that the $1,000 was invested at the net asset value per share determined at the close of business on June 30, 2021. Expenses shown do not include insurance-related charges or direct expenses of Qualified Plans. |
Calvert
VP SRI Mid Cap Portfolio
December 31, 2021
| Security | Shares | Value |
| Auto Components — 2.2% | |
| Aptiv PLC(1) | | 4,895 | $ 807,430 |
| | | | $ 807,430 |
| Banks — 3.2% | |
| Commerce Bancshares, Inc. | | 6,847 | $ 470,663 |
| KeyCorp | | 31,175 | 721,078 |
| | | | $ 1,191,741 |
| Beverages — 1.7% | |
| Coca-Cola Europacific Partners PLC | | 11,480 | $ 642,076 |
| | | | $ 642,076 |
| Biotechnology — 1.2% | |
| Neurocrine Biosciences, Inc.(1) | | 5,226 | $ 445,098 |
| | | | $ 445,098 |
| Building Products — 2.0% | |
| AZEK Co., Inc. (The)(1) | | 9,493 | $ 438,956 |
| Trex Co., Inc.(1) | | 2,256 | 304,628 |
| | | | $ 743,584 |
| Capital Markets — 4.3% | |
| Morningstar, Inc. | | 2,361 | $ 807,438 |
| Tradeweb Markets, Inc., Class A | | 7,692 | 770,277 |
| | | | $ 1,577,715 |
| Commercial Services & Supplies — 3.0% | |
| GFL Environmental, Inc. | | 13,146 | $ 497,074 |
| Tetra Tech, Inc. | | 3,659 | 621,298 |
| | | | $ 1,118,372 |
| Communications Equipment — 3.7% | |
| F5, Inc.(1) | | 1,983 | $ 485,260 |
| Motorola Solutions, Inc. | | 3,297 | 895,795 |
| | | | $ 1,381,055 |
| Consumer Finance — 1.9% | |
| Ally Financial, Inc. | | 14,862 | $ 707,580 |
| | | | $ 707,580 |
| Containers & Packaging — 2.5% | |
| AptarGroup, Inc. | | 5,902 | $ 722,877 |
| Packaging Corp. of America | | 1,529 | 208,173 |
| | | | $ 931,050 |
| Security | Shares | Value |
| Diversified Consumer Services — 2.1% | |
| Bright Horizons Family Solutions, Inc.(1) | | 2,982 | $ 375,374 |
| Terminix Global Holdings, Inc.(1) | | 8,834 | 399,562 |
| | | | $ 774,936 |
| Electric Utilities — 1.6% | |
| Xcel Energy, Inc. | | 8,570 | $ 580,189 |
| | | | $ 580,189 |
| Electrical Equipment — 1.9% | |
| AMETEK, Inc. | | 4,878 | $ 717,261 |
| | | | $ 717,261 |
| Electronic Equipment, Instruments & Components — 3.4% | |
| TE Connectivity, Ltd. | | 4,808 | $ 775,723 |
| Zebra Technologies Corp., Class A(1) | | 791 | 470,803 |
| | | | $ 1,246,526 |
| Energy Equipment & Services — 2.3% | |
| Baker Hughes Co. | | 34,696 | $ 834,786 |
| | | | $ 834,786 |
| Entertainment — 1.4% | |
| Electronic Arts, Inc. | | 4,029 | $ 531,425 |
| | | | $ 531,425 |
| Equity Real Estate Investment Trusts (REITs) — 8.2% | |
| EastGroup Properties, Inc. | | 2,963 | $ 675,120 |
| Healthpeak Properties, Inc. | | 19,294 | 696,320 |
| Lamar Advertising Co., Class A | | 6,693 | 811,861 |
| Mid-America Apartment Communities, Inc. | | 3,694 | 847,551 |
| | | | $ 3,030,852 |
| Food & Staples Retailing — 1.6% | |
| Performance Food Group Co.(1) | | 12,759 | $ 585,511 |
| | | | $ 585,511 |
| Health Care Equipment & Supplies — 2.6% | |
| Envista Holdings Corp.(1) | | 9,564 | $ 430,954 |
| Teleflex, Inc. | | 1,630 | 535,422 |
| | | | $ 966,376 |
| Health Care Providers & Services — 1.7% | |
| R1 RCM, Inc.(1) | | 24,259 | $ 618,362 |
| | | | $ 618,362 |
8
See Notes to Financial Statements.
Calvert
VP SRI Mid Cap Portfolio
December 31, 2021
Schedule of Investments — continued
| Security | Shares | Value |
| Hotels, Restaurants & Leisure — 1.7% | |
| Wyndham Hotels & Resorts, Inc. | | 6,915 | $ 619,930 |
| | | | $ 619,930 |
| Independent Power and Renewable Electricity Producers — 1.1% | |
| NextEra Energy Partners, L.P. | | 4,571 | $ 385,792 |
| | | | $ 385,792 |
| Insurance — 4.5% | |
| Assurant, Inc. | | 4,560 | $ 710,721 |
| Primerica, Inc. | | 2,573 | 394,364 |
| Travelers Cos., Inc. (The) | | 3,574 | 559,081 |
| | | | $ 1,664,166 |
| Interactive Media & Services — 2.8% | |
| CarGurus, Inc.(1) | | 15,118 | $ 508,570 |
| Match Group, Inc.(1) | | 4,081 | 539,712 |
| | | | $ 1,048,282 |
| IT Services — 5.3% | |
| Broadridge Financial Solutions, Inc. | | 4,300 | $ 786,126 |
| Euronet Worldwide, Inc.(1) | | 5,426 | 646,616 |
| Flywire Corp.(1) | | 4,366 | 166,170 |
| WEX, Inc.(1) | | 2,632 | 369,507 |
| | | | $ 1,968,419 |
| Life Sciences Tools & Services — 5.4% | |
| Agilent Technologies, Inc. | | 3,240 | $ 517,266 |
| Avantor, Inc.(1) | | 11,243 | 473,780 |
| PerkinElmer, Inc. | | 2,337 | 469,877 |
| Waters Corp.(1) | | 1,463 | 545,114 |
| | | | $ 2,006,037 |
| Machinery — 5.0% | |
| Colfax Corp.(1) | | 11,740 | $ 539,688 |
| Stanley Black & Decker, Inc. | | 3,415 | 644,137 |
| Westinghouse Air Brake Technologies Corp. | | 7,048 | 649,191 |
| | | | $ 1,833,016 |
| Metals & Mining — 1.1% | |
| Steel Dynamics, Inc. | | 6,345 | $ 393,834 |
| | | | $ 393,834 |
| Professional Services — 4.9% | |
| Booz Allen Hamilton Holding Corp. | | 4,589 | $ 389,101 |
| Clarivate PLC(1) | | 26,807 | 630,501 |
| Security | Shares | Value |
| Professional Services (continued) | |
| Verisk Analytics, Inc. | | 3,463 | $ 792,092 |
| | | | $ 1,811,694 |
| Semiconductors & Semiconductor Equipment — 3.4% | |
| Entegris, Inc. | | 1,776 | $ 246,118 |
| ON Semiconductor Corp.(1) | | 4,357 | 295,928 |
| Teradyne, Inc. | | 4,244 | 694,021 |
| | | | $ 1,236,067 |
| Software — 6.1% | |
| ANSYS, Inc.(1) | | 2,116 | $ 848,770 |
| Bill.com Holdings, Inc.(1) | | 2,280 | 568,062 |
| Black Knight, Inc.(1) | | 10,088 | 836,194 |
| | | | $ 2,253,026 |
| Specialty Retail — 5.1% | |
| Bath & Body Works, Inc. | | 7,244 | $ 505,559 |
| National Vision Holdings, Inc.(1) | | 8,925 | 428,311 |
| Ross Stores, Inc. | | 4,270 | 487,975 |
| Ulta Beauty, Inc.(1) | | 1,138 | 469,243 |
| | | | $ 1,891,088 |
| Textiles, Apparel & Luxury Goods — 1.0% | |
| Deckers Outdoor Corp.(1) | | 1,050 | $ 384,626 |
| | | | $ 384,626 |
Total Common Stocks
(identified cost $28,784,443) | | | $36,927,902 |
| Short-Term Investments — 0.1% | | | |
| Description | Units | Value |
| Calvert Cash Reserves Fund, LLC, 0.06%(2) | | 26,304 | $ 26,304 |
Total Short-Term Investments
(identified cost $26,304) | | | $ 26,304 |
Total Investments — 100.0%
(identified cost $28,810,747) | | | $36,954,206 |
| Other Assets, Less Liabilities — 0.0%(3) | | | $ 17,382 |
| Net Assets — 100.0% | | | $36,971,588 |
9
See Notes to Financial Statements.
Calvert
VP SRI Mid Cap Portfolio
December 31, 2021
Schedule of Investments — continued
| The percentage shown for each investment category in the Schedule of Investments is based on net assets. |
| (1) | Non-income producing security. |
| (2) | Affiliated investment company, available to Calvert portfolios and funds, which invests in high quality, U.S. dollar denominated money market instruments. The rate shown is the annualized seven-day yield as of December 31, 2021. |
| (3) | Amount is less than 0.05%. |
10
See Notes to Financial Statements.
Calvert
VP SRI Mid Cap Portfolio
December 31, 2021
Statement of Assets and Liabilities
| | December 31, 2021 |
| Assets | |
| Investments in securities of unaffiliated issuers, at value (identified cost $28,784,443) | $ 36,927,902 |
| Investments in securities of affiliated issuers, at value (identified cost $26,304) | 26,304 |
| Receivable for capital shares sold | 59,403 |
| Dividends receivable | 15,821 |
| Securities lending income receivable | 4 |
| Directors' deferred compensation plan | 9,367 |
| Total assets | $37,038,801 |
| Liabilities | |
| Payable for capital shares redeemed | $ 951 |
| Payable to affiliates: | |
| Investment advisory fee | 20,009 |
| Administrative fee | 3,694 |
| Sub-transfer agency fee | 90 |
| Directors' deferred compensation plan | 9,367 |
| Accrued expenses | 33,102 |
| Total liabilities | $ 67,213 |
| Net Assets | $36,971,588 |
| Sources of Net Assets | |
| Paid-in capital | $ 22,972,984 |
| Distributable earnings | 13,998,604 |
| Net Assets | $36,971,588 |
| | |
| Net Assets | $ 36,971,588 |
| Shares Outstanding | 986,572 |
Net Asset Value, Offering Price and Redemption Price Per Share
(net assets ÷ shares of beneficial interest outstanding) | $ 37.47 |
11
See Notes to Financial Statements.
Calvert
VP SRI Mid Cap Portfolio
December 31, 2021
| | Year Ended |
| | December 31, 2021 |
| Investment Income | |
| Dividend income (net of foreign taxes withheld of $660) | $ 320,486 |
| Dividend income - affiliated issuers | 119 |
| Securities lending income, net | 584 |
| Total investment income | $ 321,189 |
| Expenses | |
| Investment advisory fee | $ 239,706 |
| Administrative fee | 44,254 |
| Directors' fees and expenses | 1,447 |
| Custodian fees | 4,888 |
| Transfer agency fees and expenses | 21,186 |
| Accounting fees | 8,330 |
| Professional fees | 25,694 |
| Reports to shareholders | 2,117 |
| Miscellaneous | 5,879 |
| Total expenses | $ 353,501 |
| Net investment loss | $ (32,312) |
| Realized and Unrealized Gain (Loss) | |
| Net realized gain (loss): | |
| Investment securities | $ 5,968,032 |
| Investment securities - affiliated issuers | (7) |
| Foreign currency transactions | (316) |
| Net realized gain | $5,967,709 |
| Change in unrealized appreciation (depreciation): | |
| Investment securities | $ (827,487) |
| Net change in unrealized appreciation (depreciation) | $ (827,487) |
| Net realized and unrealized gain | $5,140,222 |
| Net increase in net assets from operations | $5,107,910 |
12
See Notes to Financial Statements.
Calvert
VP SRI Mid Cap Portfolio
December 31, 2021
Statements of Changes in Net Assets
| | Year Ended December 31, |
| | 2021 | 2020 |
| Increase (Decrease) in Net Assets | | |
| From operations: | | |
| Net investment income (loss) | $ (32,312) | $ 84,852 |
| Net realized gain | 5,967,709 | 1,524,988 |
| Net change in unrealized appreciation (depreciation) | (827,487) | 2,076,521 |
| Net increase in net assets from operations | $ 5,107,910 | $ 3,686,361 |
| Distributions to shareholders | $ (1,642,396) | $ (2,484,214) |
| Net decrease in net assets from capital share transactions | $ (2,366,746) | $ (1,395,328) |
| Net increase (decrease) in net assets | $ 1,098,768 | $ (193,181) |
| Net Assets | | |
| At beginning of year | $ 35,872,820 | $ 36,066,001 |
| At end of year | $36,971,588 | $35,872,820 |
13
See Notes to Financial Statements.
Calvert
VP SRI Mid Cap Portfolio
December 31, 2021
| | Year Ended December 31, |
| | 2021 | 2020 | 2019 | 2018 | 2017 |
| Net asset value — Beginning of year | $ 34.10 | $ 32.89 | $ 27.48 | $ 31.96 | $ 28.82 |
| Income (Loss) From Operations | | | | | |
| Net investment income (loss)(1) | $ (0.03) | $ 0.08 | $ 0.14 | $ 0.15 | $ 0.15 |
| Net realized and unrealized gain (loss) | 5.07 | 3.63 | 8.21 | (1.09) | 3.20 |
| Total income (loss) from operations | $ 5.04 | $ 3.71 | $ 8.35 | $ (0.94) | $ 3.35 |
| Less Distributions | | | | | |
| From net investment income | $ (0.07) | $ (0.14) | $ (0.15) | $ (0.18) | $ (0.21) |
| From net realized gain | (1.60) | (2.36) | (2.79) | (3.36) | — |
| Total distributions | $ (1.67) | $ (2.50) | $ (2.94) | $ (3.54) | $ (0.21) |
| Net asset value — End of year | $ 37.47 | $ 34.10 | $ 32.89 | $ 27.48 | $ 31.96 |
| Total Return(2) | 15.03% | 12.24% | 31.36% | (4.43)% | 11.65% |
| Ratios/Supplemental Data | | | | | |
| Net assets, end of year (000’s omitted) | $36,972 | $35,873 | $36,066 | $31,929 | $41,239 |
| Ratios (as a percentage of average daily net assets):(3) | | | | | |
| Total expenses | 0.96% | 0.99% | 1.00% | 1.01% | 1.04% |
| Net expenses | 0.96% | 0.99% | 0.99% | 0.99% | 0.99% |
| Net investment income (loss) | (0.09)% | 0.26% | 0.44% | 0.46% | 0.49% |
| Portfolio Turnover | 74% | 82% | 72% | 62% | 159% |
| (1) | Computed using average shares outstanding. |
| (2) | Returns are historical and are calculated by determining the percentage change in net asset value with all distributions reinvested and do not reflect fees and expenses imposed by variable annuity contracts or variable life insurance policies. If included, total return would be lower. |
| (3) | Total expenses do not reflect amounts reimbursed and/or waived by the adviser and certain of its affiliates, if applicable. Net expenses are net of all reductions and represent the net expenses paid by the Fund. |
14
See Notes to Financial Statements.
Calvert
VP SRI Mid Cap Portfolio
December 31, 2021
Notes to Financial Statements
1 Significant Accounting Policies
Calvert VP SRI Mid Cap Portfolio (the Fund) is a diversified series of Calvert Variable Series, Inc. (the Corporation). The Corporation is a Maryland corporation registered under the Investment Company Act of 1940, as amended (the 1940 Act), as an open-end management investment company. The investment objective of the Fund is to seek to provide long-term capital appreciation by investing primarily in a portfolio of the equity securities of mid-sized companies that are undervalued but demonstrate a potential for growth.
Shares of the Fund are sold without sales charge to insurance companies for allocation to certain of their variable separate accounts and to qualified pension and retirement plans and other eligible investors.
The Fund applies the accounting and reporting guidance in the Financial Accounting Standards Board (FASB) Accounting Standards Codification Topic 946, Financial Services – Investment Companies (ASC 946). Subsequent events, if any, through the date that the financial statements were issued have been evaluated in the preparation of the financial statements.
A Investment Valuation— Net asset value per share is determined every business day as of the close of the regular session of the New York Stock Exchange (generally 4:00 p.m. Eastern time). The Fund uses independent pricing services approved by the Board of Directors (the Board) to value its investments wherever possible. Investments for which market quotations are not available or deemed not reliable are fair valued in good faith under the direction of the Board.
U.S. generally accepted accounting principles (U.S. GAAP) establishes a disclosure hierarchy that categorizes the inputs to valuation techniques used to value assets and liabilities at measurement date. These inputs are summarized in the three broad levels listed below:
Level 1 - quoted prices in active markets for identical securities
Level 2 - other significant observable inputs (including quoted prices for similar securities, interest rates, prepayment speeds, credit risk, etc.)
Level 3 - significant unobservable inputs (including the Fund’s own assumptions in determining the fair value of investments)
The inputs or methodologies used for valuing securities are not necessarily an indication of the risk associated with investing in those securities.
Valuation techniques used to value the Fund’s investments by major category are as follows:
Equity Securities. Equity securities (including warrants and rights) listed on a U.S. securities exchange generally are valued at the last sale or closing price as reported by an independent pricing service on the primary market or exchange on which they are traded and are categorized as Level 1 in the hierarchy. Equity securities listed on the NASDAQ National Market System are valued at the NASDAQ official closing price and are categorized as Level 1 in the hierarchy. Unlisted or listed securities for which closing sales prices or closing quotations are not available are valued at the mean between the latest available bid and ask prices and are categorized as Level 2 in the hierarchy.
Affiliated Fund. The Fund may invest in Calvert Cash Reserves Fund, LLC (Cash Reserves Fund), an affiliated investment company managed by Calvert Research and Management (CRM). While Cash Reserves Fund is not a registered money market mutual fund, it conducts all of its investment activities in accordance with the requirements of Rule 2a-7 under the 1940 Act. Investments in Cash Reserves Fund are valued at the closing net asset value per unit on the valuation day and are categorized as Level 2 in the hierarchy. Cash Reserves Fund generally values its investment securities based on available market quotations provided by a third party pricing service.
Fair Valuation. If a market value cannot be determined for a security using the methodologies described above, or if, in the good faith opinion of the Fund's adviser, the market value does not constitute a readily available market quotation, or if a significant event has occurred that would materially affect the value of the security, the security will be fair valued as determined in good faith by or at the direction of the Board in a manner that most fairly reflects the security’s “fair value”, which is the amount that the Fund might reasonably expect to receive for the security upon its current sale in the ordinary course. Each such determination is based on a consideration of relevant factors, which are likely to vary from one pricing context to another. These factors may include, but are not limited to, the type of security, the existence of any contractual restrictions on the security’s disposition, the price and extent of public trading in similar securities of the issuer or of comparable companies or entities, quotations or relevant information obtained from broker/dealers or other market participants, information obtained from the issuer, analysts, and/or the appropriate stock exchange (for exchange-traded securities), an analysis of the company’s or entity’s financial statements, and an evaluation of the forces that influence the issuer and the market(s) in which the security is purchased and sold.
The values assigned to fair value investments are based on available information and do not necessarily represent amounts that might ultimately be realized. Further, due to the inherent uncertainty of valuations of such investments, the fair values may differ significantly from the values that would have been used had an active market existed, and the differences could be material.
Calvert
VP SRI Mid Cap Portfolio
December 31, 2021
Notes to Financial Statements — continued
The following table summarizes the market value of the Fund's holdings as of December 31, 2021, based on the inputs used to value them:
| Asset Description | Level 1 | Level 2 | Level 3 | Total |
| Common Stocks | $ 36,927,902(1) | $ — | $ — | $ 36,927,902 |
| Short-Term Investments | — | 26,304 | — | 26,304 |
| Total Investments | $36,927,902 | $26,304 | $ — | $36,954,206 |
| (1) | The level classification by major category of investments is the same as the category presentation in the Schedule of Investments. |
B Investment Transactions and Income— Investment transactions for financial statement purposes are accounted for on trade date. Realized gains and losses are recorded on an identified cost basis and may include proceeds from litigation. Dividend income is recorded on the ex-dividend date for dividends received in cash and/or securities or, in the case of dividends on certain foreign securities, as soon as the Fund is informed of the ex-dividend date. Non-cash dividends are recorded at the fair value of the securities received. Withholding taxes on foreign dividends, if any, have been provided for in accordance with the Fund's understanding of the applicable country’s tax rules and rates. Distributions received that represent a return of capital are recorded as a reduction of cost of investments. Distributions received that represent a capital gain are recorded as a realized gain. Interest income is accrued as earned.
C Foreign Currency Transactions— The Fund’s accounting records are maintained in U.S. dollars. For valuation of assets and liabilities on each date of net asset value determination, foreign denominations are converted into U.S. dollars using the current exchange rate. Security transactions, income and expenses are translated at the prevailing rate of exchange on the date of the event. Recognized gains or losses on investment transactions attributable to changes in foreign currency exchange rates are recorded for financial statement purposes as net realized gains and losses on investments. That portion of unrealized gains and losses on investments that results from fluctuations in foreign currency exchange rates is not separately disclosed.
D Distributions to Shareholders— Distributions to shareholders are recorded by the Fund on ex-dividend date. The Fund distributes any net investment income and net realized capital gains at least annually. Both types of distributions are made in shares of the Fund unless an election is made on behalf of a separate account to receive some or all of the distributions in cash. Distributions are determined in accordance with income tax regulations, which may differ from U.S. GAAP; accordingly, periodic reclassifications are made within the Fund's capital accounts to reflect income and gains available for distribution under income tax regulations.
E Estimates— The preparation of financial statements in conformity with U.S. GAAP requires management to make estimates and assumptions that affect the reported amounts of assets and liabilities and disclosure of contingent assets and liabilities at the date of the financial statements and the reported amounts of increases and decreases in net assets from operations during the reporting period. Actual results could differ from those estimates.
F Indemnifications— The Corporation’s By-Laws provide for indemnification for Directors or officers of the Corporation and certain other parties, to the fullest extent permitted by Maryland law and the 1940 Act, provided certain conditions are met. Additionally, in the normal course of business, the Fund enters into agreements with service providers that may contain indemnification clauses. The Fund’s maximum exposure under these arrangements is unknown as this would involve future claims that may be made against the Fund that have not yet occurred.
G Federal Income Taxes— No provision for federal income or excise tax is required since the Fund intends to continue to qualify as a regulated investment company under the Internal Revenue Code and to distribute substantially all of its taxable earnings.
Management has analyzed the Fund's tax positions taken for all open federal income tax years and has concluded that no provision for federal income tax is required in the Fund's financial statements. A Fund's federal tax return is subject to examination by the Internal Revenue Service for a period of three years from the date of filing.
2 Related Party Transactions
The investment advisory fee is earned by CRM as compensation for investment advisory services rendered to the Fund. On March 1, 2021, Morgan Stanley acquired Eaton Vance Corp. (the “Transaction”) and CRM became an indirect, wholly-owned subsidiary of Morgan Stanley. In connection with the Transaction, the Fund entered into a new investment advisory agreement (the “New Agreement”) with CRM, which took effect on March 1, 2021. Pursuant to the New Agreement (and the Fund’s investment advisory agreement with CRM in effect prior to March 1, 2021), the fee is computed at the annual rate of 0.65% of the Fund’s average daily net assets and is payable monthly. For the year ended December 31, 2021, the investment advisory fee amounted to $239,706. The Fund may invest its cash in Cash Reserves Fund. CRM does not currently receive a fee for advisory services provided to Cash Reserves Fund.
The administrative fee is earned by CRM as compensation for administrative services rendered to the Fund. The fee is computed at an annual rate of 0.12% of the Fund’s average daily net assets and is payable monthly. For the year ended December 31, 2021, CRM was paid administrative fees of $44,254.
Calvert
VP SRI Mid Cap Portfolio
December 31, 2021
Notes to Financial Statements — continued
Eaton Vance Management (EVM), an affiliate of CRM, provides sub-transfer agency and related services to the Fund pursuant to a Sub-Transfer Agency Support Services Agreement. For the year ended December 31, 2021, sub-transfer agency fees and expenses incurred to EVM amounted to $375 and are included in transfer agency fees and expenses on the Statement of Operations.
Each Director of the Fund who is not an employee of CRM or its affiliates receives an annual fee of $154,000 ($214,000 effective January 1, 2022), plus an annual Committee fee ranging from $8,500 to $16,500 depending on the Committee. The Board chair receives an additional $30,000 annual fee, Committee chairs receive an additional $6,000 annual fee and the special equities liaison receives an additional $2,500 annual fee. Eligible Directors may participate in a Deferred Compensation Plan (the Plan). Amounts deferred under the Plan are treated as though equal dollar amounts had been invested in shares of the Fund or other Calvert funds selected by the Directors. The Fund purchases shares of the funds selected equal to the dollar amounts deferred under the Plan, resulting in an asset equal to the deferred compensation liability. Obligations of the Plan are paid solely from the Fund's assets. Directors’ fees are allocated to each of the Calvert funds served. Salaries and fees of officers and Directors of the Fund who are employees of CRM or its affiliates are paid by CRM.
3 Shareholder Servicing Plan
The Corporation, on behalf of the Fund, has adopted a Shareholder Servicing Plan (Servicing Plan), which permits the Fund to enter into shareholder servicing agreements with intermediaries that maintain accounts in the Fund for the benefit of shareholders. These services may include, but are not limited to, processing purchase and redemption requests, processing dividend payments, and providing account information to shareholders. Under the Servicing Plan, the Fund may make payments at an annual rate of up to 0.11% of its average daily net assets. For the year ended December 31, 2021, expenses incurred under the Servicing Plan amounted to $20,466 and are included in transfer agency fees and expenses on the Statement of Operations.
4 Investment Activity
During the year ended December 31, 2021, the cost of purchases and proceeds from sales of investments, other than short-term securities, were $27,032,909 and $30,998,284, respectively.
5 Distributions to Shareholders and Income Tax Information
The tax character of distributions declared for the years ended December 31, 2021 and December 31, 2020 was as follows:
| | Year Ended December 31, |
| | 2021 | 2020 |
| Ordinary income | $ 72,800 | $ 229,081 |
| Long-term capital gains | $1,569,596 | $2,255,133 |
As of December 31, 2021, the components of distributable earnings (accumulated loss) on a tax basis were as follows:
| Undistributed ordinary income | $ 857,502 |
| Undistributed long-term capital gains | 5,065,795 |
| Net unrealized appreciation | 8,075,306 |
| Distributable earnings | $13,998,603 |
The cost and unrealized appreciation (depreciation) of investments of the Fund at December 31, 2021, as determined on a federal income tax basis, were as follows:
| Aggregate cost | $28,878,900 |
| Gross unrealized appreciation | $ 8,408,143 |
| Gross unrealized depreciation | (332,837) |
| Net unrealized appreciation | $ 8,075,306 |
Calvert
VP SRI Mid Cap Portfolio
December 31, 2021
Notes to Financial Statements — continued
6 Securities Lending
To generate additional income, the Fund may lend its securities pursuant to a securities lending agency agreement with State Street Bank and Trust Company (SSBT), the securities lending agent. Security loans are subject to termination by the Fund at any time and, therefore, are not considered illiquid investments. The Fund requires that the loan be continuously collateralized by either cash or securities in an amount at least equal to the market value of the securities on loan. The market value of securities loaned is determined daily and any additional required collateral is delivered to the Fund on the next business day. Cash collateral is generally invested in a money market fund registered under the 1940 Act that is managed by an affiliate of SSBT. Any gain or loss in the market price of the loaned securities that might occur and any interest earned or dividends declared during the term of the loan would accrue to the account of the Fund. Income earned on the investment of collateral, net of broker rebates and other expenses incurred by the securities lending agent, is split between the Fund and the securities lending agent based on agreed upon contractual terms. Non-cash collateral, if any, is held by the lending agent on behalf of the Fund and cannot be sold or re-pledged by the Fund; accordingly, such collateral is not reflected in the Statement of Assets and Liabilities.
The risks associated with lending portfolio securities include, but are not limited to, possible delays in receiving additional collateral or in the recovery of the loaned securities, possible loss of rights to the collateral should the borrower fail financially, as well as risk of loss in the value of the collateral or the value of the investments made with the collateral. The securities lending agent shall indemnify the Fund in the case of default of any securities borrower.
The Fund did not have any securities on loan at December 31, 2021.
7 Line of Credit
The Fund participates with other portfolios and funds managed by EVM and its affiliates, including CRM, in an $800 million unsecured line of credit with a group of banks, which is in effect through October 25, 2022. Borrowings are made by the Fund solely for temporary purposes related to redemptions and other short-term cash needs. Interest is charged to the Fund based on its borrowings at an amount above either the Secured Overnight Financing Rate (SOFR) or Federal Funds rate. In addition, a fee computed at an annual rate of 0.15% on the daily unused portion of the line of credit is allocated among the participating portfolios and funds at the end of each quarter. In connection with the renewal of the agreement in October 2021, an arrangement fee of $150,000 was incurred that was allocated to the participating portfolios and funds. Because the line of credit is not available exclusively to the Fund, it may be unable to borrow some or all of its requested amounts at any particular time.
The Fund had no borrowings outstanding pursuant to its line of credit at December 31, 2021. The Fund did not have any significant borrowings or allocated fees during the year ended December 31, 2021.
8 Affiliated Funds
At December 31, 2021, the value of the Fund’s investment in affiliated funds was $26,304, which represents 0.1% of the Fund’s net assets. Transactions in affiliated funds by the Fund for the year ended December 31, 2021 were as follows:
| Name | Value,
beginning
of period | Purchases | Sales
proceeds | Net
realized
gain
(loss) | Change in
unrealized
appreciation
(depreciation) | Value,
end of
period | Dividend
income | Units,
end of
period |
| Short-Term Investments | | | | | | |
| Calvert Cash Reserves Fund, LLC | $118,053 | $6,540,480 | $(6,632,222) | $(7) | $ — | $26,304 | $119 | 26,304 |
9 Capital Shares
The Corporation may issue its shares in one or more series (such as the Fund). The authorized shares of the Fund consist of 1,000,000,000 common shares, $0.01 par value.
Calvert
VP SRI Mid Cap Portfolio
December 31, 2021
Notes to Financial Statements — continued
Transactions in capital shares for the years ended December 31, 2021 and December 31, 2020 were as follows:
| | Year Ended
December 31, 2021 | | Year Ended
December 31, 2020 |
| | Shares | Amount | | Shares | Amount |
| Shares sold | 58,905 | $ 2,163,794 | | 60,897 | $ 1,863,023 |
| Reinvestment of distributions | 45,813 | 1,642,396 | | 82,150 | 2,484,214 |
| Shares redeemed | (170,099) | (6,172,936) | | (187,494) | (5,742,565) |
| Net decrease | (65,381) | $(2,366,746) | | (44,447) | $(1,395,328) |
At December 31, 2021, separate accounts of four insurance companies each owned more than 10% of the value of the outstanding shares of the Fund, aggregating 84.9%.
10 Risks and Uncertainties
Pandemic Risk
An outbreak of respiratory disease caused by a novel coronavirus was first detected in China in late 2019 and subsequently spread internationally. This coronavirus has resulted in closing borders, enhanced health screenings, changes to healthcare service preparation and delivery, quarantines, cancellations, disruptions to supply chains and customer activity, as well as general concern and uncertainty. Health crises caused by outbreaks, such as the coronavirus outbreak, may exacerbate other pre-existing political, social and economic risks and disrupt normal market conditions and operations. The impact of this outbreak has negatively affected the worldwide economy, the economies of individual countries, individual companies, and the market in general, and may continue to do so in significant and unforeseen ways, as may other epidemics and pandemics that may arise in the future. Any such impact could adversely affect the Fund's performance, or the performance of the securities in which the Fund invests.
11 Change in Independent Registered Public Accounting Firm
On July 30, 2021, KPMG LLP (“KPMG”) informed the Audit Committee and Board of the Corporation that it was resigning as the independent registered public accounting firm to the Corporation, as upon Morgan Stanley’s acquisition of Eaton Vance Corp., the parent company of CRM (the investment adviser to each series of the Corporation), KPMG would no longer be independent of the Corporation. The Audit Committee of the Board and the Board approved the selection of Deloitte & Touche LLP (“Deloitte”) as the independent registered public accounting firm for the funds that are series of the Corporation (the “Funds”) for the fiscal year ending December 31, 2021 to be effective upon KPMG’s resignation and Deloitte’s acceptance of the engagement which became effective July 30, 2021.
KPMG’s reports on the financial statements for the Funds for the fiscal periods ended December 31, 2019 and December 31, 2020 contained no adverse opinion or disclaimer of opinion nor were they qualified or modified as to uncertainty, audit scope or accounting principles. During the fiscal periods ended December 31, 2019 and December 31, 2020, and during the subsequent interim period through July 30, 2021: (i) there were no disagreements with KPMG on any matter of accounting principles or practices, financial statement disclosure or auditing scope or procedure, which disagreements, if not resolved to the satisfaction of KPMG, would have caused KPMG to make reference to the subject matter of the disagreements in connection with its reports on the Funds’ financial statements for such periods; and (ii) there were no “reportable events” of the kind described in Item 304(a)(1)(v) of Regulation S-K under the Securities Exchange Act of 1934, as amended.
During the fiscal periods ended December 31, 2019 and December 31, 2020, and during the subsequent interim period through July 30, 2021: neither the Funds, nor anyone on their behalf, consulted with Deloitte on items which: (i) concerned the application of accounting principles to a specified transaction, either completed or proposed, or the type of audit opinion that might be rendered on the Funds’ financial statements; or (ii) concerned the subject of a disagreement (as defined in paragraph (a)(1)(iv) of Item 304 of Regulation S-K) or reportable events (as described in paragraph (a)(1)(v) of Item 304).
Calvert
VP SRI Mid Cap Portfolio
December 31, 2021
Report of Independent Registered Public Accounting Firm
To the Board of Directors of Calvert Variable Series, Inc. and Shareholders of Calvert VP SRI Mid Cap Portfolio:
Opinion on the Financial Statements and Financial Highlights
We have audited the accompanying statement of assets and liabilities of Calvert VP SRI Mid Cap Portfolio (the "Fund") (one of the funds constituting Calvert Variable Series, Inc.), including the schedule of investments, as of December 31, 2021, the related statements of operations, changes in net assets, and the financial highlights for the year then ended, and the related notes. In our opinion, the financial statements and financial highlights present fairly, in all material respects, the financial position of the Fund as of December 31, 2021, and the results of its operations, changes in its net assets, and the financial highlights for the year then ended in conformity with accounting principles generally accepted in the United States of America. The statement of changes in net assets for the year ended December 31, 2020, and the financial highlights for the years ended December 31, 2020, 2019, 2018, and 2017 were audited by other auditors whose report, dated February 18, 2021, expressed an unqualified opinion on that financial statement and those financial highlights.
Basis for Opinion
These financial statements and financial highlights are the responsibility of the Fund's management. Our responsibility is to express an opinion on the Fund's financial statements and financial highlights based on our audit. We are a public accounting firm registered with the Public Company Accounting Oversight Board (United States) (PCAOB) and are required to be independent with respect to the Fund in accordance with the U.S. federal securities laws and the applicable rules and regulations of the Securities and Exchange Commission and the PCAOB.
We conducted our audit in accordance with the standards of the PCAOB. Those standards require that we plan and perform the audit to obtain reasonable assurance about whether the financial statements and financial highlights are free of material misstatement, whether due to error or fraud. The Fund is not required to have, nor were we engaged to perform, an audit of its internal control over financial reporting. As part of our audit, we are required to obtain an understanding of internal control over financial reporting but not for the purpose of expressing an opinion on the effectiveness of the Fund’s internal control over financial reporting. Accordingly, we express no such opinion.
Our audit included performing procedures to assess the risks of material misstatement of the financial statements and financial highlights, whether due to error or fraud, and performing procedures that respond to those risks. Such procedures included examining, on a test basis, evidence regarding the amounts and disclosures in the financial statements and financial highlights. Our audit also included evaluating the accounting principles used and significant estimates made by management, as well as evaluating the overall presentation of the financial statements and financial highlights. Our procedures included confirmation of securities owned as of December 31, 2021, by correspondence with the custodian and brokers; when replies were not received from brokers, we performed other auditing procedures. We believe that our audit provides a reasonable basis for our opinion.
/s/ Deloitte & Touche LLP
Boston, Massachusetts
February 18, 2022
We have served as the auditor of one or more Calvert investment companies since 2021.
Calvert
VP SRI Mid Cap Portfolio
December 31, 2021
Federal Tax Information (Unaudited)
As required by the Internal Revenue Code and/or regulations, shareholders must be notified regarding the status of the dividends received deduction for corporations and capital gains dividends.
Dividends Received Deduction. Corporate shareholders are generally entitled to take the dividends received deduction on the portion of the Fund's dividend distribution that qualifies under tax law. For the Fund's fiscal 2021 ordinary income dividends, 99.93% qualifies for the corporate dividends received deduction.
Capital Gains Dividends. The Fund hereby designates as a capital gain dividend with respect to the taxable year ended December 31, 2021, $5,065,825 or, if subsequently determined to be different, the net capital gain of such year.
Calvert
VP SRI Mid Cap Portfolio
December 31, 2021
Management and Organization
Fund Management. The Directors of Calvert Variable Series, Inc. (the Corporation) are responsible for the overall management and supervision of the affairs of the Corporation. The Board members and officers of the Corporation are listed below. Except as indicated, each individual has held the office shown or other offices in the same company for the last five years. Board members hold indefinite terms of office. Each Board member holds office until his or her successor is elected and qualified, or until his or her earlier death, resignation, retirement, removal or disqualification. Under the terms of the Fund’s current Board member retirement policy, an Independent Board member must retire at the end of the calendar year in which he or she turns 75. However, if such retirement would cause the Fund to be out of compliance with Section 16 of the 1940 Act or any other regulations or guidance of the SEC, then such retirement will not become effective until such time as action has been taken for the Fund to be in compliance therewith. The “noninterested Directors” consist of those Directors who are not “interested persons” of the Corporation, as that term is defined under the 1940 Act. The business address of each Board member and the Chief Compliance Officer is 1825 Connecticut Avenue, NW, Suite 400, Washington, DC 20009 and the business address of the Secretary, Vice President and Chief Legal Officer and the Treasurer is Two International Place, Boston, Massachusetts 02110. As used below, “CRM” refers to Calvert Research and Management and “Eaton Vance” refers to Eaton Vance Management. Each Director oversees 39 funds in the Calvert fund complex. Effective March 1, 2021, each of Eaton Vance and CRM are indirect, wholly-owned subsidiaries of Morgan Stanley. Each officer affiliated with CRM may hold a position with other CRM affiliates that is comparable to his or her position with CRM listed below.
| Name and Year of Birth | Corporation
Position(s) | Length of
Service | Principal Occupation(s) and Other Directorships
During Past Five Years and Other Relevant Experience |
| Interested Director |
John H. Streur(1)
1960 | Director and
President | Since 2015 | President and Chief Executive Officer of CRM (since December 31, 2016). President and Chief Executive Officer of Calvert Investments, Inc.
(January 2015 - December 2016); Chief Executive Officer of Calvert
Investment Distributors, Inc. (August 2015 - December 2016); Chief
Compliance Officer of Calvert Investment Management, Inc. (August 2015 -
April 2016); President and Director, Portfolio 21 Investments, Inc.
(through October 2014); President, Chief Executive Officer and
Director, Managers Investment Group LLC (through January 2012);
President and Director, The Managers Funds and Managers AMG
Funds (through January 2012).
Other Directorships. Portfolio 21 Investments, Inc. (asset management)
(through October 2014); Managers Investment Group LLC (asset management)
(through January 2012); The Managers Funds (asset management)
(through January 2012); Managers AMG Funds (asset management)
(through January 2012); Calvert Impact Capital, Inc. |
| Noninterested Directors |
Richard L. Baird, Jr.
1948 | Director | Since 2016 | Regional Disaster Recovery Lead, American Red Cross of Greater
Pennsylvania (since 2017). Volunteer, American Red Cross (since 2015).
Former President and CEO of Adagio Health Inc. (retired in 2014) in
Pittsburgh, PA.
Other Directorships. None. |
Alice Gresham Bullock
1950 | Chair and
Director | Since 2016 (Chair);
Since 2008 (Director) | Professor Emerita at Howard University School of Law. Dean Emerita of
Howard University School of Law and Deputy Director of the Association
of American Law Schools (1992-1994).
Other Directorships. None. |
Cari M. Dominguez
1949 | Director | Since 2016 | Former Chair of the U.S. Equal Employment Opportunity Commission.
Other Directorships. ManpowerGroup Inc. (workforce solutions company);
Triple S Management Corporation (managed care); National Association of Corporate Directors. |
John G. Guffey, Jr.
1948 | Director | Since 2016 | President of Aurora Press Inc., a privately held publisher of trade
paperbacks (since January 1997).
Other Directorships. Calvert Impact Capital, Inc. (through
December 31, 2018); Calvert Ventures, LLC. |
Miles D. Harper, III
1962 | Director | Since 2016 | Partner, Carr Riggs & Ingram (public accounting firm) since October 2014.
Partner, Gainer Donnelly & Desroches (public accounting firm) (now Carr
Riggs & Ingram) (November 1999 - September 2014).
Other Directorships. Bridgeway Funds (9) (asset management). |
Joy V. Jones
1950 | Director | Since 2016 | Attorney.
Other Directorships. Palm Management Corporation. |
Calvert
VP SRI Mid Cap Portfolio
December 31, 2021
Management and Organization — continued
| Name and Year of Birth | Corporation
Position(s) | Length of
Service | Principal Occupation(s) and Other Directorships
During Past Five Years and Other Relevant Experience |
| Noninterested Directors (continued) |
Anthony A. Williams
1951 | Director | Since 2016 | CEO and Executive Director of the Federal City Council (July 2012 to
present); Senior Adviser and Independent Consultant for King and
Spalding LLP (September 2015 to present); Executive Director of Global
Government Practice at the Corporate Executive Board (January 2010 to
January 2012).
Other Directorships. Freddie Mac; Evoq Properties/Meruelo Maddux
Properties, Inc. (real estate management); Weston Solutions, Inc.
(environmental services); Bipartisan Policy Center’s Debt Reduction Task Force;
Chesapeake Bay Foundation; Catholic University of America; Urban Institute (research organization); The Howard Hughes Corporation (real estate development). |
| Name and Year of Birth | Corporation
Position(s) | Length of
Service | Principal Occupation(s)
During Past Five Years |
| Principal Officers who are not Directors |
Hope L. Brown
1973 | Chief
Compliance
Officer | Since 2014 | Chief Compliance Officer of 39 registered investment companies advised
by CRM (since 2014). Vice President and Chief Compliance Officer,
Wilmington Funds (2012-2014). |
Deidre E. Walsh
1971 | Secretary,
Vice President
and Chief
Legal Officer | Since 2021 | Vice President of CRM and officer of 39 registered investment companies
advised by CRM (since 2021). Also Vice President of Eaton Vance and
certain of its affiliates and officer of 138 registered investment companies
advised or administered by Eaton Vance. |
James F. Kirchner
1967 | Treasurer | Since 2016 | Vice President of CRM and officer of 39 registered investment companies
advised by CRM (since 2016). Also Vice President of Eaton Vance and
certain of its affiliates and officer of 138 registered investment companies
advised or administered by Eaton Vance. |
| | | | |
| (1) Mr. Streur is an interested person of the Fund because of his positions with the Fund’s adviser and certain affiliates. |
The SAI for the Fund includes additional information about the Directors and officers of the Fund and can be obtained without charge on Calvert’s website at www.calvert.com or by calling 1-800-368-2745.
| FACTS | WHAT DOES EATON VANCE DO WITH YOUR
PERSONAL INFORMATION? |
| Why? | Financial companies choose how they share your personal information. Federal law gives consumers the right to limit some but not all sharing. Federal law also requires us to tell you how we collect, share, and protect your personal information. Please read this notice carefully to understand what we do. |
| |
| What? | The types of personal information we collect and share depend on the product or service you have with us. This information can include:■ Social Security number and income
■
investment experience and risk tolerance
■
checking account number and wire transfer instructions |
| |
| How? | All financial companies need to share customers’ personal information to run their everyday business. In the section below, we list the reasons financial companies can share their customers’ personal information; the reasons Eaton Vance chooses to share; and whether you can limit this sharing. |
Reasons we can share your
personal information | Does Eaton Vance
share? | Can you limit
this sharing? |
| For our everyday business purposes — such as to process your transactions, maintain your account(s), respond to court orders and legal investigations, or report to credit bureaus | Yes | No |
| For our marketing purposes — to offer our products and services to you | Yes | No |
| For joint marketing with other financial companies | No | We don’t share |
| For our investment management affiliates’ everyday business purposes — information about your transactions, experiences, and creditworthiness | Yes | Yes |
| For our affiliates’ everyday business purposes — information about your transactions and experiences | Yes | No |
| For our affiliates’ everyday business purposes — information about your creditworthiness | No | We don’t share |
| For our investment management affiliates to market to you | Yes | Yes |
| For our affiliates to market to you | No | We don’t share |
| For nonaffiliates to market to you | No | We don’t share |
To limit our
sharing | Call toll-free 1-800-368-2745 or email: CRMPrivacy@calvert.comPlease note:If you are a new customer, we can begin sharing your information 30 days from the date we sent this notice. When you are no longer our customer, we continue to share your information as described in this notice. However, you can contact us at any time to limit our sharing. |
| Questions? | Call toll-free 1-800-368-2745 or email: CRMPrivacy@calvert.com |
| Privacy Notice — continued | April 2021 |
| Who we are |
| Who is providing this notice? | Eaton Vance Management, Eaton Vance Distributors, Inc., Eaton Vance Trust Company, Eaton Vance Management (International) Limited, Eaton Vance Advisers International Ltd., Eaton Vance Global Advisors Limited, Eaton Vance Management’s Real Estate Investment Group, Boston Management and Research, Calvert Research and Management, Eaton Vance and Calvert Fund Families and our investment advisory affiliates (“Eaton Vance”) (see Investment Management Affiliates definition below) |
| What we do |
How does Eaton Vance
protect my personal
information? | To protect your personal information from unauthorized access and use, we use security measures that comply with federal law. These measures include computer safeguards and secured files and buildings. We have policies governing the proper handling of customer information by personnel and requiring third parties that provide support to adhere to appropriate security standards with respect to such information. |
How does Eaton Vance
collect my personal
information? | We collect your personal information, for example, when you■ open an account or make deposits or withdrawals from your account
■
buy securities from us or make a wire transfer
■
give us your contact informationWe also collect your personal information from others, such as credit bureaus, affiliates, or other companies. |
| Why can’t I limit all sharing? | Federal law gives you the right to limit only■ sharing for affiliates’ everyday business purposes — information about your creditworthiness
■
affiliates from using your information to market to you
■
sharing for nonaffiliates to market to youState laws and individual companies may give you additional rights to limit sharing. See below for more on your rights under state law. |
| Definitions |
Investment Management
Affiliates | Eaton Vance Investment Management Affiliates include registered investment advisers, registered broker- dealers, and registered and unregistered funds. Investment Management Affiliates does not include entities associated with Morgan Stanley Wealth Management, such as Morgan Stanley Smith Barney LLC and Morgan Stanley & Co. |
| Affiliates | Companies related by common ownership or control. They can be financial and nonfinancial companies.■ Our affiliates include companies with a Morgan Stanley name and financial companies such as Morgan Stanley Smith Barney LLC and Morgan Stanley & Co. |
| Nonaffiliates | Companies not related by common ownership or control. They can be financial and nonfinancial companies.■ Eaton Vance does not share with nonaffiliates so they can market to you. |
| Joint marketing | A formal agreement between nonaffiliated financial companies that together market financial products or services to you.■ Eaton Vance doesn’t jointly market. |
| Other important information |
| Vermont: Except as permitted by law, we will not share personal information we collect about Vermont residents with Nonaffiliates unless you provide us with your written consent to share such information.California: Except as permitted by law, we will not share personal information we collect about California residents with Nonaffiliates and we will limit sharing such personal information with our Affiliates to comply with California privacy laws that apply to us. |
Delivery of Shareholder Documents. The Securities and Exchange Commission (SEC) permits funds to deliver only one copy of shareholder documents, including prospectuses, proxy statements and shareholder reports, to fund investors with multiple accounts at the same residential or post office box address. This practice is often called “householding” and it helps eliminate duplicate mailings to shareholders. Calvert funds, or your financial intermediary, may household the mailing of your documents indefinitely unless you instruct Calvert funds, or your financial intermediary, otherwise. If you would prefer that your Calvert fund documents not be householded, please contact Calvert funds at 1-800-368-2745, or contact your financial intermediary. Your instructions that householding not apply to delivery of your Calvert fund documents will typically be effective within 30 days of receipt by Calvert funds or your financial intermediary. Separate statements will be generated for each separate account and will be householded as described above.
Portfolio Holdings. Each Calvert fund files a schedule of portfolio holdings on Part F to Form N-PORT with the SEC. Certain information filed on Form N-PORT may be viewed on the Calvert website at www.calvert.com, by calling Calvert at 1-800-368-2745 or in the EDGAR database on the SEC’s website at www.sec.gov.
Proxy Voting. The Proxy Voting Guidelines that each Calvert fund uses to determine how to vote proxies relating to portfolio securities is provided as an Appendix to the fund’s Statement of Additional Information. The Statement of Additional Information can be obtained free of charge by calling the Calvert funds at 1-800-368-2745, by visiting the Calvert funds’ website at www.calvert.com or visiting the SEC’s website at www.sec.gov. Information regarding how a Calvert fund voted proxies relating to portfolio securities during the most recent 12-month period ended June 30 is available by calling Calvert funds, by visiting the Calvert funds’ website at www.calvert.com or by visiting the SEC’s website at www.sec.gov.
This Page Intentionally Left Blank
This Page Intentionally Left Blank
Investment Adviser and Administrator
Calvert Research and Management
1825 Connecticut Avenue NW, Suite 400
Washington, DC 20009
Principal Underwriter*
Eaton Vance Distributors, Inc.
Two International Place
Boston, MA 02110
(617) 482-8260
Custodian
State Street Bank and Trust Company
State Street Financial Center, One Lincoln Street
Boston, MA 02111
Transfer Agent
DST Asset Manager Solutions, Inc.
2000 Crown Colony Drive
Quincy, MA 02169
Independent Registered Public Accounting Firm
Deloitte & Touche LLP
200 Berkeley Street
Boston, MA 02116-5022
Fund Offices
1825 Connecticut Avenue NW, Suite 400
Washington, DC 20009
* FINRA BrokerCheck. Investors may check the background of their Investment Professional by contacting the Financial Industry Regulatory Authority (FINRA). FINRA BrokerCheck is a free tool to help investors check the professional background of current and former FINRA-registered securities firms and brokers. FINRA BrokerCheck is available by calling 1-800-289-9999 and at www.FINRA.org. The FINRA BrokerCheck brochure describing this program is available to investors at www.FINRA.org.
Printed on recycled paper.
24219 12.31.21
Item 2. Code of Ethics
The registrant has adopted a code of ethics applicable to its Principal Executive Officer, Principal Financial Officer and Principal Accounting Officer. The registrant undertakes to provide a copy of such code of ethics to any person upon request, without charge, by calling 1-800-368-2745. The registrant has not amended the code of ethics as described in Form N-CSR during the period covered by this report. The registrant has not granted any waiver, including an implicit waiver, from a provision of the code of ethics as described in Form N-CSR during the period covered by this report.
Item 3. Audit Committee Financial Expert
The registrant’s Board of Directors has determined that Miles D. Harper III, an “independent” Director serving on the registrant’s audit committee, is an “audit committee financial expert,” as defined in Item 3 of Form N-CSR. Under applicable securities laws, a person who is determined to be an audit committee financial expert will not be deemed an “expert” for any purpose, including without limitation for the purposes of Section 11 of the Securities Act of 1933, as a result of being designated or identified as an audit committee financial expert. The designation or identification of a person as an audit committee financial expert does not impose on such person any duties, obligations, or liabilities that are greater than the duties, obligations, and liabilities imposed on such person as a member of the audit committee and Board of Directors in the absence of such designation or identification.
Item 4. Principal Accountant Fees and Services
(a) –(d)
The following table presents the aggregate fees billed to the registrant for the registrant’s fiscal years ended December 31, 2020 and December 31, 2021 for professional services rendered for the audit of the registrant’s annual financial statements and fees billed for other services rendered by its principal accountant during such periods.
| | | | | | | | | | | | | | | | |
Fiscal Years Ended | | 12/31/20 | | | %* | | | 12/31/21 | | | %* | |
Audit Fees | | $ | 47,257 | | | | 0 | % | | $ | 47,000 | | | | 0 | % |
Audit-Related Fees(1) | | $ | 0 | | | | 0 | % | | $ | 0 | | | | 0 | % |
Tax Fees(2) | | $ | 7,800 | | | | 0 | % | | $ | 7,800 | | | | 0 | % |
All Other Fees(3) | | $ | 0 | | | | 0 | % | | $ | 0 | | | | 0 | % |
| | | | | | | | | | | | | | | | |
Total | | $ | 55,057 | | | �� | 0 | % | | $ | 54,800 | | | | 0 | % |
| | | | | | | | | | | | | | | | |
| * | Percentage of fees approved by the Audit Committee pursuant to (c)(7)(i)(C) of Rule 2-01 of Reg. S-X (statutory de minimis waiver of Committee’s requirement to pre-approve). |
| (1) | Audit-related fees consist of the aggregate fees billed for assurance and related services that are reasonably related to the performance of the audit of the registrant’s financial statements and are not reported under the category of audit fees. |
| (2) | Tax fees consist of the aggregate fees billed for professional services rendered by the principal accountant relating to tax compliance, tax advice, and tax planning and specifically include fees for tax return preparation and other related tax compliance/planning matters. |
| (3) | All other fees consist of the aggregate fees billed for products and services provided by the principal accountant other than audit, audit-related, and tax services. |
(e) The Audit Committee is required to pre-approve all audit and non-audit services provided to the registrant by the auditors, and to the registrant’s investment adviser, and any entity controlling, controlled by, or under common control with the adviser that provides ongoing services to the registrant. In determining whether to pre-approve non-audit services, the Audit Committee considers whether the services are consistent with maintaining the independence of the auditors. The Committee may delegate its authority to pre-approve certain matters to one or more of its members. In this regard, the Committee has delegated authority jointly to the Audit Committee Chair together with another Committee member with respect to non-audit services not exceeding $25,000 in each instance. In addition, the Committee has pre-approved the retention of the auditors to provide tax-related services related to the tax treatment and tax accounting of newly acquired securities, upon request by the investment adviser in each instance.
(f) Not applicable.
(g) Aggregate non-audit fees billed by the registrant’s principal accountant for services rendered to the registrant, and rendered to the registrant’s investment adviser, and any entity controlling, controlled by, or under common control with the adviser that provides ongoing services to the registrant for each of the last two fiscal years of the registrant:
| | | | | | |
Fiscal Year ended 12/31/20 | | Fiscal Year ended 12/31/21 |
$ | | %* | | $ | | %* |
| $7,800 | | 0% | | $7,800 | | 0% |
| * | Percentage of fees approved by the Audit Committee pursuant to (c)(7)(i)(C) of Rule 2-01 of Reg. S-X (statutory de minimis waiver of Committee’s requirement to pre-approve). |
(h) The registrant’s audit committee has considered whether the provision by the registrant’s principal accountant of non-audit services to the registrant’s investment adviser and any entity controlling, controlled by, or under common control with the adviser that provides ongoing services to the registrant that were not pre-approved pursuant to Rule 2-01(c)(7)(ii) of Regulation S-X is compatible with maintaining the principal accountant’s independence.
Item 5. Audit Committee of Listed Registrants
Not applicable.
Item 6. Schedule of Investments
Please see schedule of investments contained in the Report to Stockholders included under Item 1 of this Form N-CSR.
Item 7. Disclosure of Proxy Voting Policies and Procedures for Closed-End Management Investment Companies
Not applicable.
Item 8. Portfolio Managers of Closed-End Management Investment Companies
Not applicable.
Item 9. Purchases of Equity Securities by Closed-End Management Investment Company and Affiliated Purchasers
Not applicable.
Item 10. Submission of Matters to a Vote of Security Holders
No material changes.
Item 11. Controls and Procedures
(a) The registrant’s principal executive and principal financial officers have concluded that the registrant’s disclosure controls and procedures (as defined in Rule 30a-3(c) under the Investment Company Act of 1940 Act, as amended (the “1940 Act”) are effective, based on the evaluation of these controls and procedures required by Rule 30a-3(b) under the 1940 Act and Rules 13a-15(b) or 15d-15(b) under the Securities Exchange Act of 1934 (“Exchange Act”), as of a date within 90 days of the filing date of this report.
(b) There was no change in the registrant’s internal control over financial reporting (as defined in Rule 30a-3(d) under the 1940 Act) that occurred during the period covered by this report that has materially affected, or is reasonably likely to materially affect, the registrant’s internal control over financial reporting.
Item 12. Disclosure of Securities Lending Activities for Closed-End Management Investment Companies.
Not applicable.
Item 13. Exhibits
Signatures
Pursuant to the requirements of the Securities Exchange Act of 1934 and the Investment Company Act of 1940, the registrant has duly caused this report to be signed on its behalf by the undersigned, thereunto duly authorized.
| | |
| CALVERT VARIABLE SERIES, INC. |
| |
| By: | | /s/ John H. Streur |
| | John H. Streur |
| | President |
Date: February 23, 2022
Pursuant to the requirements of the Securities Exchange Act of 1934 and the Investment Company Act of 1940, this report has been signed below by the following persons on behalf of the registrant and in the capacities and on the dates indicated.
| | |
| By: | | /s/ James F. Kirchner |
| | James F. Kirchner |
| | Treasurer |
| |
| Date: | | February 23, 2022 |
| |
| By: | | /s/ John H. Streur |
| | John H. Streur |
| | President |
| |
| Date: | | February 23, 2022 |