UNITEDSTATES
SECURITIESANDEXCHANGECOMMISSION
Washington,D.C.20549
FORM N-CSR
CERTIFIED SHAREHOLDER REPORT OF REGISTERED MANAGEMENT
INVESTMENT COMPANIES
Investment Company Act file number 811-03595
Name of Fund: BlackRock Healthcare Fund, Inc.
Fund Address: 100 Bellevue Parkway, Wilmington, DE 19809
Name and address of agent for service: Donald C. Burke, Chief Executive Officer, BlackRock
Healthcare Fund, Inc., 800 Scudders Mill Road, Plainsboro, NJ, 08536. Mailing address:
P.O. Box 9011, Princeton, NJ, 08543-9011
Registrant’s telephone number, including area code: (800) 441-7762
Date of fiscal year end: 04/30/2009
Date of reporting period: 04/30/2009
Item 1 – Report to Stockholders
EQUITIES FIXED INCOME REAL ESTATE LIQUIDITY ALTERNATIVES BLACKROCK SOLUTIONS
BlackRock
Healthcare Fund, Inc.
ANNUAL REPORT | APRIL 30, 2009

NOT FDIC INSURED
MAY LOSE VALUE
NO BANK GUARANTEE
| |
| Table of Contents | |
| | Page |
| Dear Shareholder | 3 |
| Annual Report: | |
| Fund Summary | 4 |
| About Fund Performance | 6 |
| Disclosure of Expenses | 6 |
| Financial Statements: | |
| Schedule of Investments | 7 |
| Statement of Assets and Liabilities | 9 |
| Statement of Operations | 10 |
| Statements of Changes in Net Assets | 11 |
| Financial Highlights | 12 |
| Notes to Financial Statements | 15 |
| Report of Independent Registered Public Accounting Firm | 20 |
| Officers and Directors | 21 |
| Additional Information | 24 |
| Mutual Fund Family | 26 |
2 BLACKROCK HEALTHCARE FUND, INC.
APRIL 30, 2009
Dear Shareholder
The past 12 months reveal a tale of two markets — one of investor pessimism and decided weakness, and another of optimism and some early signs of
recovery. The majority of the past year was characterized by the former as the global financial crisis erupted into the worst recession in decades. Econo-
mic data were uniformly poor and daily headlines recounted the downfalls of storied financial firms, volatile swings in global financial markets, and mon-
umental government actions that included widespread (and globally coordinated) monetary and quantitative easing by central banks and large-scale
fiscal stimuli. Sentiment improved noticeably in March 2009, however, on the back of new program announcements by the Treasury and Federal Reserve
Board, as well as signs of improved economic performance, such as in retail sales, consumer confidence and select areas of the housing market.
Against this backdrop, US equities contended with unprecedented levels of volatility, posting steep declines early, and then pared some of those losses
in March and April. The experience in international markets was similar to that in the United States, though there was a marked divergence in regional
performance. Notably, emerging economies, which lagged most developed regions through the downturn, were among the market leaders during the
late-period rally.
In fixed income markets, while risk aversion remained a dominant theme overall, relatively attractive yields and distressed valuations, alongside a
more favorable macro environment, eventually captured investor attention, leading to a modest recovery in non-Treasury assets. A notable example
from the opposite end of the credit spectrum was the high yield sector, which generally outperformed in the first four months of 2009 after extraordi-
nary challenges and severe underperformance last year. At the same time, the new year ushered in a return to normalcy for the tax-exempt market,
which had registered one of its worst years on record in 2008.
| | |
| All told, the major benchmark indexes posted mixed results for the current reporting period, reflective of a bifurcated market. | |
| Total Returns as of April 30, 2009 | 6-month | 12-month |
| US equities (S&P 500 Index) | (8.53)% | (35.31)% |
| Small cap US equities (Russell 2000 Index) | (8.40) | (30.74) |
| International equities (MSCI Europe, Australasia, Far East Index) | (2.64) | (42.76) |
| US Treasury securities (Merrill Lynch 10-Year US Treasury Index) | 8.98 | 9.30 |
| Taxable fixed income (Barclays Capital US Aggregate Bond Index) | 7.74 | 3.84 |
| Tax-exempt fixed income (Barclays Capital Municipal Bond Index) | 8.20 | 3.11 |
| High yield bonds (Barclays Capital US Corporate High Yield 2% Issuer Capped Index) | 16.39 | (12.55) |
Past performance is no guarantee of future results. Index performance shown for illustrative purposes only. You cannot invest directly in an index.
On June 16, 2009, BlackRock, Inc. announced that it received written notice from Barclays PLC (“Barclays”) in which Barclays’ Board of Directors had
accepted BlackRock’s offer to acquire Barclays Global Investors (“BGI”). Barclays also notified BlackRock that its Board will recommend the transaction to
Barclays’ shareholders for approval at a special meeting to be held in early August 2009. The combination of BlackRock and BGI will bring together market
leaders in active and index strategies to create the preeminent asset management firm. The transaction is expected to close in the fourth quarter 2009
following approval by Barclays’ shareholders, the receipt of client consents and regulatory approvals, and satisfaction of customary closing conditions.
Through periods of market turbulence, as ever, BlackRock’s full resources are dedicated to the management of our clients’ assets. We thank you for
entrusting BlackRock with your investments and look forward to continuing to serve you in the months and years ahead.
Sincerely,

THIS PAGE NOT PART OF YOUR FUND REPORT
3
Fund Summary as of April 30, 2009
Portfolio Management Commentary
How did the Fund perform?
•For the 12-month period, Fund results outperformed those of the broad-
market S&P 500 Index and the Russell 3000 Health Care Index, which
returned (35.31)% and (21.05)%, respectively.
What factors influenced performance?
•Outperformance versus the Russell 3000 Health Care Index was driven by
superior subsector allocation decisions and strong stock selection within
several industries. Overweights in the biotechnology and medical devices &
supplies subsectors and an underweight in pharmaceuticals contributed
significantly to relative performance, as did stock selection within health-
care providers & services and medical devices & supplies. Biotechnology
stocks generally outperformed the benchmark, with a favorable risk/reward
profile based on superior growth potential, relative economic insensitivity
and a lack of near-term patent expiration risk, which is negatively affecting
many pharmaceutical companies. The medical devices & supplies subsec-
tor shares many of biotech’s positive attributes, including a high level of
innovation aimed at large markets with unmet medical needs.
•Fund performance was affected by sharp market declines in September
2008 and March 2009 as risk was re-rated, and by investor concern
regarding the potential negative impact of proposed legislation on health-
care fundamentals. Highly valued, large capitalization healthcare stocks
and more volatile, smaller capitalization biotechnology stocks bore the
brunt of investor selling. Despite excellent fundamental performance,
companies such as Celgene Corp. and Genzyme Corp., which are large
holdings of the Fund, declined sharply.
Describe recent portfolio activity.
•Position changes during the period were the result of bottom-up stock
selection, combined with our assessment of broader industry and market
trends. From a subsector standpoint, our weighting in pharmaceuticals
declined the most as we trimmed or sold many holdings due to our con-
cerns over patent expiration risks and thin new product pipelines. Proceeds
were redeployed in the healthcare providers & services and medical
devices & supplies subsectors, where valuations and anticipated growth
rates have combined to produce attractive valuations. Names such as
Laboratory Corp. of America Holdings, Omnicare, Inc. and Quest Diagnostics,
Inc. are examples of new additions in the healthcare services area. We
have also added holdings in the managed care area, where we believe
valuations have become very attractive due to market concerns about the
potential adverse impact of healthcare reform under the Obama adminis-
tration. Wellpoint, Inc. and UnitedHealth Group, Inc. were notable additions
in managed care. Another change in the Fund has been a move away
from extremely small capitalization stocks, primarily in biotechnology,
where volatility is extreme and often driven by little fundamental change.
Describe Fund positioning at period end.
•At period end, Fund holdings among the biotechnology, health care
equipment & supplies and healthcare providers & services subsectors
were nearly equal, with each representing an overweight versus the Russell
3000 Health Care Index. Pharmaceuticals is the Fund’s largest under-
weight and is our smallest weighting of the major healthcare subsectors.
•We continue to view healthcare as a very attractive investment. Investor
rotation into more cyclical areas of the market hampered sector per-
formance during the period, as did ongoing political uncertainties. We
believe some of these issues may be resolved favorably in the near term,
allowing investors to once again evaluate the sector based on its solid
fundamentals and attractive valuations. Longer-term fundamentals
remain robust and are fueled by innovation, demographic trends and
rising worldwide GDP.
The views expressed reflect the opinions of BlackRock as of the date of this report and are subject to change based on changes in market, economic or other conditions.
These views are not intended to be a forecast of future events and are no guarantee of future results.
| | | |
| Portfolio Information | | | |
| | Percent of | | Percent of |
| | Long-Term | | Long-Term |
| Ten Largest Holdings | Investments | Sector Allocation | Investments |
| Gilead Sciences, Inc. | 6% | Health Care | 98% |
| Celgene Corp. | 6 | Information Technology | 2 |
| HLTH Corp. | 5 | For Fund compliance purposes, the Fund's industry and sector classifications refer |
| Genzyme Corp. | 5 | to any one or more of the industry and sector sub-classifications used by one or |
| Express Scripts, Inc. | 5 | more widely recognized market indexes, and/or as defined by Fund management. |
| Masimo Corp. | 4 | This definition may not apply for purposes of this report, which may combine such |
| | | industry and sector sub-classifications for reporting ease. | |
| Genoptix, Inc. | 4 | | |
| VNUS Medical Technologies, Inc. | 4 | | |
| Cephalon, Inc. | 4 | | |
| Medco Health Solutions, Inc. | 4 | | |
4 BLACKROCK HEALTHCARE FUND, INC.
APRIL 30, 2009
Total Return Based on a $10,000 Investment
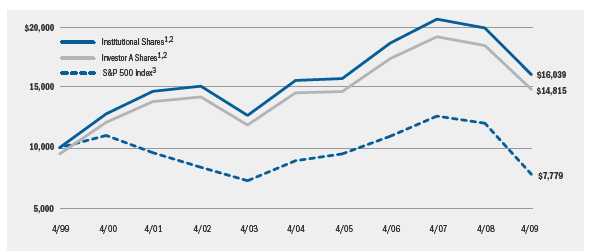
1 Assuming maximum sales charges, if any, transaction costs and other operating expenses, including advisory fees. Institutional Shares do not
have a sales charge.
2 The Fund invests worldwide primarily in equity securities of companies that, in the opinion of management, derive or are expected to derive a
substantial portion of their sales from products or services in health care.
3 This unmanaged Index covers 500 industrial, utility, transportation and financial companies of the U.S. markets (mostly New York Stock
Exchange (“NYSE”) issues) representing about 75% of NYSE market capitalization and 30% of NYSE issues.
| | | | | | | |
| Performance Summary for the Period Ended April 30, 2009 | | | | | | |
| | | | | Average Annual Total Returns4 | | |
| | | 1 Year | | 5 Years | | 10 Years |
| | 6-Month | w/o sales | w/sales | w/o sales | w/sales | w/o sales | w/sales |
| | Total Returns | charge | charge | charge | charge | charge | charge |
| Institutional | (3.43)% | (19.50)% | N/A | 0.59% | N/A | 4.84% | N/A |
| Investor A | (3.40) | (19.77) | (23.99)% | 0.36 | (0.71)% | 4.57 | 4.01% |
| Investor B | (3.51) | (20.29) | (23.88) | (0.42) | (0.65) | 3.92 | 3.92 |
| Investor C | (3.87) | (20.18) | (20.97) | (0.43) | (0.43) | 3.76 | 3.76 |
| Class R | (3.75) | (20.11) | N/A | 0.00 | N/A | 4.32 | N/A |
| S&P 500 Index | (8.53) | (35.31) | N/A | (2.70) | N/A | (2.48) | N/A |
| Russell 3000 Health Care Index5 | (8.26) | (21.05) | N/A | (3.21) | N/A | (0.56) | N/A |
4 Assuming maximum sales charges, if any. Average annual total returns with and without sales charges reflect reductions for distribution and service fees. See “About Fund
Performance” on page 6 for a detailed description of share classes, including any related sales charges and fees.
5 The Russell 3000 Health Care Index is an unmanaged index containing companies involved in medical services or healthcare in the Russell 3000 Index.
N/A — Not applicable as share class and index do not have a sales charge.
Past performance is not indicative of future results.
| | | | | | |
| Expense Example | | | | | | |
| | | Actual | | | Hypothetical7 | |
| | Beginning | Ending | | Beginning | Ending | |
| | Account Value | Account Value | Expenses Paid | Account Value | Account Value | Expenses Paid |
| | November 1, 2008 | April 30, 2009 | During the Period6 | November 1, 2008 | April 30, 2009 | During the Period6 |
| Institutional | $1,000 | $965.70 | $ 6.77 | $1,000 | $1,017.91 | $ 6.95 |
| Investor A | $1,000 | $966.00 | $ 8.24 | $1,000 | $1,016.42 | $ 8.45 |
| Investor B | $1,000 | $964.90 | $12.57 | $1,000 | $1,012.30 | $12.57 |
| Investor C | $1,000 | $961.30 | $12.11 | $1,000 | $1,012.45 | $12.42 |
| Class R | $1,000 | $962.50 | $11.43 | $1,000 | $1,013.15 | $11.73 |
6 For each class of the Fund, expenses are equal to the annualized expense ratio for the class (1.39% for Institutional, 1.69% for Investor A, 2.52% for Investor B, 2.49% for
Investor C and 2.35% for Class R), multiplied by the average account value over the period, multiplied by 181/365 (to reflect the one-half year period shown).
7 Hypothetical 5% annual return before expenses is calculated by pro-rating the number of days in the most recent fiscal half year divided by 365.
See “Disclosure of Expenses” on page 6 for further information on how expenses were calculated.
BLACKROCK HEALTHCARE FUND, INC.
APRIL 30, 2009
5
About Fund Performance
•Institutional Shares are not subject to any sales charge. Institutional
Shares bear no ongoing distribution or service fees and are available
only to eligible investors.
•Investor A Shares incur a maximum initial sales charge (front-end load)
of 5.25% and a service fee of 0.25% per year (but no distribution fee).
•Investor B Shares are subject to a maximum contingent deferred sales
charge of 4.50% declining to 0% after six years. In addition, Investor B
Shares are subject to a distribution fee of 0.75% per year and a service
fee of 0.25% per year. These shares automatically convert to Investor A
Shares after approximately eight years. (There is no initial sales charge
for automatic share conversions.) All returns for periods greater than
eight years reflect this conversion.
•Investor C Shares are subject to a distribution fee of 0.75% per year
and a service fee of 0.25% per year. In addition, Investor C Shares are
subject to a 1% contingent deferred sales charge if redeemed within
one year of purchase.
•Class R Shares do not incur a maximum initial sales charge (front-end
load) or deferred sales charge. These shares are subject to a distribution
fee of 0.25% per year and a service fee of 0.25% per year. Class R
Shares are available only to certain retirement plans. Prior to inception,
Class R Share performance results are those of the Institutional Shares
(which have no distribution or service fees) restated to reflect Class R
Share fees.
Performance information reflects past performance and does not guar-
antee future results. Current performance may be lower or higher than
the performance data quoted. Refer to www.blackrock.com/funds
to obtain performance data current to the most recent month-end.
Performance results do not reflect the deduction of taxes that a share-
holder would pay on fund distributions or the redemption of fund shares.
Figures shown in the performance table on page 5 assume reinvestment
of all dividends and capital gain distributions, if any, at net asset value
on the ex-dividend date. Investment return and principal value of shares
will fluctuate so that shares, when redeemed, may be worth more or less
than their original cost. Dividends paid to each class of shares will vary
because of the different levels of service, distribution and transfer
agency fees applicable to each class, which are deducted from the
income available to be paid to shareholders.
Disclosure of Expenses
Shareholders of this Fund may incur the following charges: (a) expenses
related to transactions, including sales charges, redemption fees and
exchange fees; and (b) operating expenses including advisory fees,
distribution fees including 12b-1 fees, and other Fund expenses. The
expense example on page 5 (which is based on a hypothetical invest-
ment of $1,000 invested on November 1, 2008 and held through April
30, 2009) is intended to assist shareholders both in calculating expens-
es based on an investment in the Fund and in comparing these expens-
es with similar costs of investing in other mutual funds.
The table provides information about actual account values and actual
expenses. In order to estimate the expenses a shareholder paid during
the period covered by this report, shareholders can divide their account
value by $1,000 and then multiply the result by the number correspon-
ding to their share class under the heading entitled “Expenses Paid
During the Period.”
The table also provides information about hypothetical account values
and hypothetical expenses based on the Fund’s actual expense ratio
and an assumed rate of return of 5% per year before expenses. In
order to assist shareholders in comparing the ongoing expenses of
investing in this Fund and other funds, compare the 5% hypothetical
example with the 5% hypothetical examples that appear in other funds’
shareholder reports.
The expenses shown in the table are intended to highlight shareholders’
ongoing costs only and do not reflect any transactional expenses, such
as sales charges, redemption fees or exchange fees. Therefore, the hypo-
thetical example is useful in comparing ongoing expenses only, and will
not help shareholders determine the relative total expenses of owning
different funds. If these transactional expenses were included, shareholder
expenses would have been higher.
6 BLACKROCK HEALTHCARE FUND, INC.
APRIL 30, 2009
Schedule of Investments April 30, 2009 (Percentages shown are based on Net Assets)
| | |
| Common Stocks | Shares | Value |
| Biotechnology — 29.0% | | |
| Alexion Pharmaceuticals, Inc. (a) | 170,000 | $ 5,681,400 |
| Biogen Idec, Inc. (a) | 52,300 | 2,528,182 |
| Celgene Corp. (a) | 422,000 | 18,027,840 |
| Cephalon, Inc. (a)(b) | 170,000 | 11,153,700 |
| Genzyme Corp. (a) | 290,000 | 15,465,700 |
| Gilead Sciences, Inc. (a) | 415,000 | 19,007,000 |
| Onyx Pharmaceuticals, Inc. (a) | 116,200 | 3,009,580 |
| Seattle Genetics, Inc. (a) | 120,453 | 1,111,781 |
| Vertex Pharmaceuticals, Inc. (a) | 345,000 | 10,632,900 |
| | | 86,618,083 |
| Health Care Equipment & Supplies — 22.3% | | |
| Alcon, Inc. | 56,000 | 5,152,560 |
| Baxter International, Inc. | 20,000 | 970,000 |
| Beckman Coulter, Inc. | 25,100 | 1,319,256 |
| Gen-Probe, Inc. (a) | 135,100 | 6,506,416 |
| Hologic, Inc. (a) | 466,700 | 6,935,162 |
| Integra LifeSciences Holdings Corp. (a) | 80,000 | 2,065,600 |
| Masimo Corp. (a) | 439,900 | 12,713,110 |
| NuVasive, Inc. (a)(b) | 96,500 | 3,657,350 |
| SonoSite, Inc. (a)(b) | 511,000 | 9,218,440 |
| St. Jude Medical, Inc. (a) | 78,500 | 2,631,320 |
| VNUS Medical Technologies, Inc. (a) | 510,000 | 11,296,500 |
| Varian Medical Systems, Inc. (a) | 75,000 | 2,502,750 |
| Zimmer Holdings, Inc. (a) | 35,100 | 1,544,049 |
| | | 66,512,513 |
| Health Care Providers & Services — 25.2% | | |
| Aetna, Inc. | 345,200 | 7,597,852 |
| AmerisourceBergen Corp. | 180,000 | 6,055,200 |
| Cigna Corp. | 154,600 | 3,047,166 |
| Express Scripts, Inc. (a) | 220,000 | 14,073,400 |
| Genoptix, Inc. (a) | 390,000 | 11,341,200 |
| Health Net, Inc. (a) | 242,800 | 3,506,032 |
| Humana, Inc. (a) | 36,500 | 1,050,470 |
| Laboratory Corp. of America Holdings (a) | 69,000 | 4,426,350 |
| Medco Health Solutions, Inc. (a) | 246,000 | 10,713,300 |
| Omnicare, Inc. | 95,000 | 2,442,450 |
| Quest Diagnostics, Inc. | 70,000 | 3,593,100 |
| UnitedHealth Group, Inc. | 79,600 | 1,872,192 |
| WellPoint, Inc. (a) | 130,000 | 5,558,800 |
| | | 75,277,512 |
| Health Care Technology — 6.0% | | |
| Cerner Corp. (a)(b) | 30,000 | 1,614,000 |
| HLTH Corp. (a)(b) | 1,488,200 | 16,370,200 |
| | | 17,984,200 |
| | |
| Common Stocks | Shares | Value |
| Internet Software & Services — 1.9% | | |
| WebMD Health Corp. Class A (a)(b) | 223,600 | $ 5,771,116 |
| Life Sciences Tools & Services — 5.5% | | |
| Charles River Laboratories International, Inc. (a) | 52,700 | 1,457,155 |
| Covance, Inc. (a) | 85,000 | 3,338,800 |
| Life Technologies Corp (a) | 51,000 | 1,902,300 |
| Thermo Fisher Scientific, Inc. (a) | 160,000 | 5,612,800 |
| Varian, Inc. (a) | 25,000 | 825,500 |
| Waters Corp. (a) | 70,000 | 3,091,900 |
| | | 16,228,455 |
| Pharmaceuticals — 10.2% | | |
| Abbott Laboratories | 21,100 | 883,035 |
| Allergan, Inc. | 140,000 | 6,532,400 |
| Bayer AG | 85,700 | 4,259,933 |
| Bristol-Myers Squibb Co. | 170,000 | 3,264,000 |
| Merck & Co., Inc. | 50,000 | 1,212,000 |
| Roche Holding AG (c) | 107,000 | 3,384,410 |
| Shire Pharmaceuticals Plc (c) | 223,000 | 8,311,210 |
| Warner Chilcott Ltd. (a) | 255,000 | 2,496,450 |
| | | 30,343,438 |
| Total Long-Term Investments | | |
| (Cost — $285,518,809) — 100.1% | | 298,735,317 |
| Short-Term Securities | | |
| BlackRock Liquidity Funds, | | |
| TempCash 0.75% (d)(e) | 774,577 | 774,577 |
| | Beneficial | |
| | Interest | |
| | (000) | |
| BlackRock Liquidity Series, LLC | | |
| Money Market Series, 0.80% (d)(e)(f) | $ 24,288 | 24,287,850 |
| Total Short-Term Securities | | |
| (Cost — $25,062,427) — 8.4% | | 25,062,427 |
| Total Investments (Cost — $310,581,236*) — 108.5% | 323,797,744 |
| Liabilities in Excess of Other Assets — (8.5)% | | (25,442,002) |
| Net Assets — 100.0% | | $298,355,742 |
See Notes to Financial Statements.
BLACKROCK HEALTHCARE FUND, INC.
APRIL 30, 2009
7
Schedule of Investments (concluded)
* The cost and unrealized appreciation (depreciation) of investments as of
April 30, 2009, as computed for federal income tax purposes, were as follows:
| |
| Aggregate cost | $314,454,293 |
| Gross unrealized appreciation | $ 23,824,319 |
| Gross unrealized depreciation | (14,480,868) |
| Net unrealized appreciation | $ 9,343,451 |
(a) Non-income producing security.
(b) Security, or a portion of security, is on loan.
(c) Depositary receipts.
(d) Investments in companies considered to be an affiliate of the Fund, for purposes
of Section 2(a)(3) of the Investment Company Act of 1940, were as follows:
| | |
| | Net | |
| Affiliate | Activity | Income |
| BlackRock Liquidity Funds, TempCash | $ 774,577 | $ 3,202 |
| BlackRock Liquidity Series, LLC | | |
| Cash Sweep Series | — | $ 203,863 |
| BlackRock Liquidity Series, LLC | | |
| Money Market Series | $ 24,287,850 | $ 471,243 |
| FFI Premier Institutional Fund | $(87,398,300) | — |
(e) Represents the current yield as of report date.
(f) Security was purchased with the cash proceeds from securities loans.
•For Fund compliance purposes, the Fund's industry classifications refer to any
one or more of the industry sub-classifications used by one or more widely
recognized market indexes or ratings group indexes, and/or as defined by Fund
management. This definition may not apply for purposes of this report, which
may combine industry sub-classifications for reporting ease.
•Effective May 1, 2008, the Fund adopted Financial Accounting Standards Board
Statement of Financial Accounting Standards No. 157, “Fair Value Measurements”
(“FAS 157”). FAS 157 clarifies the definition of fair value, establishes a frame-
work for measuring fair values and requires additional disclosures about the use
of fair value measurements. Various inputs are used in determining the fair value
of investments, which are as follows:
•Level 1 — price quotations in active markets/exchanges for identical securities
•Level 2 — other observable inputs (including, but not limited to: quoted prices
for similar assets or liabilities in markets that are active, quoted prices for
identical or similar assets in markets that are not active, inputs other than
quoted prices that are observable for the assets or liabilities (such as interest
rates, yield curves, volatilities, prepayment speeds, loss severities, credit risks
and default rates) or other market-corroborated inputs)
•Level 3 — unobservable inputs based on the best information available in the
circumstance, to the extent observable inputs are not available (including the
Fund’s own assumptions used in determining the fair value of investments)
The inputs or methodology used for valuing securities are not necessarily an
indication of the risk associated with investing in those securities. For information
about the Fund's policy regarding valuation of investments and other significant
accounting policies, please refer to Note 1 of the Notes to Financial Statements.
The following table summarizes the inputs used as of April 30, 2009 in determin-
ing the fair valuation of the Fund’s investments:
| |
| Valuation | Investments in |
| Inputs | Securities |
| Level 1 | $295,249,961 |
| Level 2 | 28,547,783 |
| Level 3 | — |
| Total | $323,797,744 |
See Notes to Financial Statements.
8 BLACKROCK HEALTHCARE FUND, INC.
APRIL 30, 2009
| |
| Statement of Assets and Liabilities | |
| April 30, 2009 | |
| Assets | |
| Investments at value — unaffiliated (including securities loaned of $18,807,770) (cost — $285,518,809) | $ 298,735,317 |
| Investments at value — affiliated (cost — $25,062,427) | 25,062,427 |
| Foreign currency at value (cost — $6) | 6 |
| Investments sold receivable | 4,873,991 |
| Capital shares sold receivable | 453,490 |
| Dividends receivable | 283,281 |
| Securities lending income receivable — affiliated | 28,913 |
| Prepaid expenses | 21,805 |
| Other assets | 28 |
| Total assets | 329,459,258 |
| Liabilities | |
| Collateral on securities loaned, at value | 24,287,850 |
| Investments purchased payable | 3,193,261 |
| Capital shares redeemed payable | 3,091,079 |
| Investment advisory fees payable | 245,806 |
| Service and distribution fees payable | 88,917 |
| Other affiliates payable | 26,337 |
| Officer’s and Directors’ fees payable | 45 |
| Other accrued expenses payable | 170,221 |
| Total liabilities | 31,103,516 |
| Net Assets | $ 298,355,742 |
| Net Assets Consist of | |
| Paid-in capital | $ 333,425,425 |
| Undistributed net investment income | 62,231 |
| Accumulated net realized loss | (48,346,439) |
| Net unrealized appreciation/depreciation | 13,214,525 |
| Net Assets | $ 298,355,742 |
| Net Asset Value | |
| Institutional — Based on net assets of $94,281,898 and 19,663,810 shares outstanding, 200,000,000 shares authorized, $0.10 par value | $ 4.79 |
| Investor A — Based on net assets of $122,868,848 and 28,815,863 shares outstanding, 100,000,000 shares authorized, $0.10 par value | $ 4.26 |
| Investor B — Based on net assets of $21,003,227 and 7,651,091 shares outstanding, 250,000,000 shares authorized, $0.10 par value | $ 2.75 |
| Investor C — Based on net assets of $51,982,410 and 19,055,550 shares outstanding, 100,000,000 shares authorized, $0.10 par value | $ 2.73 |
| Class R — Based on net assets of $8,219,359 and 2,917,196 shares outstanding, 250,000,000 shares authorized, $0.10 par value | $ 2.82 |
See Notes to Financial Statements.
BLACKROCK HEALTHCARE FUND, INC.
APRIL 30, 2009
9
| |
| Statement of Operations | |
| Year Ended April 30, 2009 | |
| Investment Income | |
| Dividends | $ 2,008,030 |
| Foreign tax withheld | (26,531) |
| Income — affiliated | 213,298 |
| Securities lending — affiliated | 471,243 |
| Total income. | 2,666,040 |
| Expenses | |
| Investment advisory | 3,651,530 |
| Service - Investor A | 374,913 |
| Service and distribution — Investor B | 321,136 |
| Service and distribution — Investor C | 611,517 |
| Service and distribution — Class R | 43,664 |
| Transfer agent — Institutional | 232,746 |
| Transfer agent — Investor A | 330,767 |
| Transfer agent — Investor B | 103,271 |
| Transfer agent — Investor C | 176,447 |
| Transfer agent — Class R | 53,733 |
| Accounting services | 150,828 |
| Custodian | 93,039 |
| Printing | 83,444 |
| Registration | 77,999 |
| Professional fees | 77,035 |
| Officer and Directors | 21,609 |
| Miscellaneous | 28,103 |
| Total expenses | 6,431,781 |
| Less fees paid indirectly | (549) |
| Total expenses after fees paid indirectly | 6,431,232 |
| Net investment loss | (3,765,192) |
| Realized and Unrealized Loss | |
| Net realized loss from: | |
| Investments (including $3 foreign capital gain tax) | (35,450,163) |
| Foreign currency | (161,528) |
| | (35,611,691) |
| Net change in unrealized appreciation/depreciation on: | |
| Investments (including $127,380 foreign capital gain credit) | (44,512,070) |
| Foreign currency | (56,604) |
| | (44,568,674) |
| Total realized and unrealized loss | (80,180,365) |
| Net Decrease in Net Assets Resulting from Operations | $ (83,945,557) |
See Notes to Financial Statements.
10 BLACKROCK HEALTHCARE FUND, INC.
APRIL 30, 2009
| | | |
| Statements of Changes in Net Assets | | | |
| | Year Ended |
| | April 30, | |
| Increase (Decrease) in Net Assets: | 2009 | | 2008 |
| Operations | | | |
| Net investment loss | $ (3,765,192) | $ (3,725,015) |
| Net realized gain (loss) | (35,611,691) | | 23,945,308 |
| Net change in unrealized appreciation/depreciation | (44,568,674) | | (39,638,687) |
| Net decrease in net assets resulting from operations | (83,945,557) | | (19,418,394) |
| Distributions to Shareholders From | | | |
| Net realized gain: | | | |
| Institutional | — | | (19,190,519) |
| Investor A | — | | (23,511,776) |
| Investor B | — | | (11,380,057) |
| Investor C | — | | (13,862,386) |
| Class R | — | | (1,455,949) |
| Tax return of capital: | | | |
| Institutional | — | | (821,866) |
| Investor A | — | | (1,066,468) |
| Investor B | — | | (519,689) |
| Investor C | — | | (681,171) |
| Class R | — | | (74,088) |
| Decrease in net assets resulting from distributions to shareholders | — | | (72,563,969) |
| Capital Share Transactions | | | |
| Net increase (decrease) in net assets derived from capital share transactions | (49,909,881) | | 72,072,219 |
| Net Assets | | | |
| Total decrease in net assets | (133,855,438) | | (19,910,144) |
| Beginning of year | 432,211,180 | | 452,121,324 |
| End of year | $ 298,355,742 | $ 432,211,180 |
| End of year undistributed (accumulated) net investment income (loss) | $ 62,231 | $ (82,870) |
See Notes to Financial Statements.
BLACKROCK HEALTHCARE FUND, INC.
APRIL 30, 2009
11
| | | | | | | | | | | |
| Financial Highlights | | | | | | | | | | | |
| | | Institutional | | | | | Investor A | | |
| | | Year Ended April 30, | | | Year Ended April 30, | |
| | 2009 | 2008 | 2007 | 2006 | 2005 | 2009 | 2008 | 2007 | | 2006 | 2005 |
| Per Share Operating Performance | | | | | | | | | | | |
| Net asset value, beginning of year | $ 5.95 | $ 7.08 | $ 7.29 | $ 6.55 | $ 6.87 | $ 5.31 | $ 6.41 | $ 6.69 | $ 6.04 | $ 6.38 |
| Net investment loss1 | (0.03) | (0.03) | (0.04) | (0.05) | (0.06) | (0.04) | (0.04) | (0.05) | | (0.07) | (0.07) |
| Net realized and unrealized gain (loss) | (1.13) | (0.14) | 0.67 | 1.27 | 0.11 | (1.01) | (0.12) | 0.61 | | 1.19 | 0.10 |
| Net increase (decrease) from investment | | | | | | | | | | | |
| operations | (1.16) | (0.17) | 0.63 | 1.22 | 0.05 | (1.05) | (0.16) | 0.56 | | 1.12 | 0.03 |
| Distributions from: | | | | | | | | | | | |
| Net realized gain | — | (0.92) | (0.84) | (0.48) | (0.37) | — | (0.90) | (0.84) | | (0.47) | (0.37) |
| Tax return of capital | — | (0.04) | — | — | — | — | (0.04) | — | | — | — |
| Total distributions | — | (0.96) | (0.84) | (0.48) | (0.37) | — | (0.94) | (0.84) | | (0.47) | (0.37) |
| Net asset value, end of year | $ 4.79 | $ 5.95 | $ 7.08 | $ 7.29 | $ 6.55 | $ 4.26 | $ 5.31 | $ 6.41 | $ 6.69 | $ 6.04 |
| Total Investment Return2 | | | | | | | | | | | |
| Based on net asset value | (19.50)% | (3.54)% | 10.62% | 18.70%3 | 0.99% | (19.77)% | (3.80)% | 10.43% | | 18.61%3 | 0.74% |
| Ratios to Average Net Assets | | | | | | | | | | | |
| Total expenses | 1.35% | 1.29% | 1.33% | 1.30% | 1.33% | 1.62% | 1.52% | 1.57% | | 1.55% | 1.58% |
| Net investment loss | (0.62)% | (0.42)% | (0.64)% | (0.75)% | (0.88)% | (0.89)% | (0.64)% | (0.89)% | | (0.99)% | (1.13)% |
| Supplemental Data | | | | | | | | | | | |
| Net assets, end of year (000) | $ 94,282 | $132,784 | $147,755 | $159,116 | $146,922 | $122,869 | $175,094 | $160,652 | $172,585 | $142,774 |
| Portfolio turnover | 156% | 163% | 152% | 120% | 127% | 156% | 163% | 152% | | 120% | 127% |
1 Based on average shares outstanding.
2 Total investment returns exclude the effects of any sales charges.
3 The previous investment advisor made a payment to the Fund, which had no impact on the total investment return.
See Notes to Financial Statements.
12 BLACKROCK HEALTHCARE FUND, INC.
APRIL 30, 2009
| | | | | | | | | | | | |
| Financial Highlights (continued) | | | | | | | | | | |
| | | | | Investor B | | | | | Investor C | | |
| | | | Year Ended April 30, | | | Year Ended April 30, | |
| | 2009 | 2008 | 2007 | 2006 | 2005 | 2009 | 2008 | 2007 | | 2006 | 2005 |
| Per Share Operating Performance | | | | | | | | | | | | |
| Net asset value, beginning of year | $ 3.45 | $ 4.44 | $ 4.93 | $ 4.57 | $ 4.96 | $ 3.42 | $ 4.43 | $ 4.92 | $ 4.57 | $ 4.96 |
| Net investment loss1 | (0.05) | | (0.06) | (0.07) | (0.09) | (0.09) | (0.05) | (0.06) | (0.07) | | (0.09) | (0.09) |
| Net realized and unrealized gain (loss) | (0.65) | | (0.06) | 0.41 | 0.89 | 0.07 | (0.64) | (0.06) | 0.41 | | 0.88 | 0.07 |
| Net increase (decrease) from investment | | | | | | | | | | | | |
| operations | (0.70) | | (0.12) | 0.34 | 0.80 | (0.02) | (0.69) | (0.12) | 0.34 | | 0.79 | (0.02) |
| Distributions from: | | | | | | | | | | | | |
| Net realized gain | — | | (0.83) | (0.83) | (0.44) | (0.37) | — | (0.85) | (0.83) | | (0.44) | (0.37) |
| Tax return of capital | — | | (0.04) | — | — | — | — | (0.04) | — | | — | — |
| Total distributions | — | | (0.87) | (0.83) | (0.44) | (0.37) | — | (0.89) | (0.83) | | (0.44) | (0.37) |
| Net asset value, end of year | $ 2.75 | $ 3.45 | $ 4.44 | $ 4.93 | $ 4.57 | $ 2.73 | $ 3.42 | $ 4.43 | $ 4.92 | $ 4.57 |
| Total Investment Return2 | | | | | | | | | | | | |
| Based on net asset value | (20.29)% | (4.49)% | 9.41% | 17.64%3 | (0.09)% | (20.18)% | (4.62)% | 9.47% | 17.50%4 | (0.09)% |
| Ratios to Average Net Assets | | | | | | | | | | | | |
| Total expenses | 2.47% | 2.37% | 2.36% | 2.33% | 2.36% | 2.43% | 2.35% | 2.36% | | 2.33% | 2.37% |
| Net investment loss | (1.74)% | (1.52)% | (1.67)% | (1.79)% | (1.91)% | (1.70)% | (1.47)% | (1.67)% | | (1.77)% | (1.92)% |
| Supplemental Data | | | | | | | | | | | | |
| Net assets, end of year (000) | $ 21,003 | $ 44,711 | $ 68,034 | $105,503 | $117,482 | $ 51,982 | $ 70,452 | $ 69,535 | $ 85,553 | $ 68,743 |
| Portfolio turnover | 156% | | 163% | 152% | 120% | 127% | 156% | 163% | 152% | | 120% | 127% |
1 Based on average shares outstanding.
2 Total investment returns exclude the effects of any sales charges.
3 The previous investment advisor made a payment to the Fund, which increased the total investment return by 0.23%.
4 The previous investment advisor made a payment to the Fund, which had no impact on the total investment return.
See Notes to Financial Statements.
BLACKROCK HEALTHCARE FUND, INC.
APRIL 30, 2009
13
| | | | | | |
| Financial Highlights (concluded) | | | | | | |
| | | | Class R | | | |
| | | | Year Ended April 30, | | |
| | 2009 | 2008 | 2007 | | 2006 | 2005 |
| Per Share Operating Performance | | | | | | |
| Net asset value, beginning of year | $ 3.53 | $ 4.57 | $ 5.04 | $ 4.66 | $ 5.02 |
| Net investment loss1 | (0.05) | (0.05) | (0.05) | | (0.06) | (0.06) |
| Net realized and unrealized gain (loss) | (0.66) | (0.06) | 0.42 | | 0.90 | 0.07 |
| Net increase (decrease) from investment operations | (0.71) | (0.11) | 0.37 | | 0.84 | 0.01 |
| Distributions from: | | | | | | |
| Net realized gain | — | (0.89) | (0.84) | | (0.46) | (0.37) |
| Tax return of capital | — | (0.04) | — | | — | — |
| Total distributions | — | (0.93) | (0.84) | | (0.46) | (0.37) |
| Net asset value, end of year | $ 2.82 | $ 3.53 | $ 4.57 | $ 5.04 | $ 4.66 |
| Total Investment Return | | | | | | |
| Based on net asset value | (20.11)% | (4.29)% | 9.98% | | 18.25%2 | 0.54% |
| Ratios to Average Net Assets | | | | | | |
| Total expenses | 2.26% | 2.06% | 1.88% | | 1.80% | 1.83% |
| Net investment loss | (1.53)% | (1.16)% | (1.20)% | | (1.20)% | (1.37)% |
| Supplemental Data | | | | | | |
| Net assets, end of year (000) | $ 8,219 | $ 9,170 | $ 6,145 | $ 4,885 | $ 1,853 |
| Portfolio turnover | 156% | 163% | 152% | | 120% | 127% |
1 Based on average shares outstanding.
2 The previous investment advisor made a payment to the Fund, which had no impact on the total investment return.
See Notes to Financial Statements.
14 BLACKROCK HEALTHCARE FUND, INC.
APRIL 30, 2009
Notes to Financial Statements
1. Organization and Significant Accounting Policies:
BlackRock Healthcare Fund, Inc. (the “Fund”) is registered under the
Investment Company Act of 1940, as amended (the “1940 Act”), as a
non-diversified, open-end management investment company. The Fund
is organized as a Maryland corporation. The Fund’s financial statements
are prepared in conformity with accounting principles generally accepted
in the United States of America, which may require the use of manage-
ment accruals and estimates. Actual results may differ from these
estimates. The Fund offers multiple classes of shares. Institutional
Shares are sold without a sales charge and only to certain eligible
investors. Investor A Shares are generally sold with a front-end sales
charge. Investor B and Investor C Shares may be subject to a contingent
deferred sales charge. Class R Shares are sold only to certain retirement
or similar plans. All classes of shares have identical voting, dividend,
liquidation and other rights and the same terms and conditions, except
that Investor A, Investor B, Investor C and Class R Shares bear certain
expenses related to the shareholder servicing of such shares, and
Investor B, Investor C and Class R Shares also bear certain expenses
related to the distribution of such shares. Each class has exclusive
voting rights with respect to matters relating to its shareholder servicing
and distribution expenditures (except that Investor B shareholders may
vote on material changes to the Investor A distribution plan).
The following is a summary of significant accounting policies followed by
the Fund:
Valuation of Investments: Equity investments traded on a recognized
securities exchange or the NASDAQ Global Market System are valued
at the last reported sale price that day or the NASDAQ official closing
price, if applicable. For equity investments traded on more than one
exchange, the last reported sale price on the exchange where the stock
is primarily traded is used. Equity investments traded on a recognized
exchange for which there were no sales on that day are valued at the
last available bid price. If no bid price is available, the prior day’s price
will be used, unless it is determined that such prior day’s price no
longer reflects the fair value of the security. Investments in open-end
investment companies are valued at net asset value each business day.
Short-term securities with maturities less than 60 days may be valued at
amortized cost, which approximates market value. Investments in open-
end investment companies are valued at net asset value each business
day. The Fund values its investments in Cash Sweep Series and Money
Market Series, each of BlackRock Liquidity Series, LLC, at fair value, which
is ordinarily based upon their pro-rata ownership in the net assets of
the underlying fund.
In the event that application of these methods of valuation results in
a price for an investment which is deemed not to be representative of
the market value of such investment, the investment will be valued by a
method approved by the Board of Directors (the “Board”) as reflecting
fair value (“Fair Value Assets”). When determining the price for Fair Value
Assets, the investment advisor and/or sub-advisor seeks to determine
the price that the Fund might reasonably expect to receive from the cur-
rent sale of that asset in an arm’s-length transaction. Fair value determi-
nations shall be based upon all available factors that the investment
advisor and/or sub-advisor deems relevant. The pricing of all Fair Value
Assets is subsequently reported to the Board or a committee thereof.
Generally, trading in foreign securities is substantially completed each
day at various times prior to the close of business on the New York Stock
Exchange (“NYSE”). The values of such securities used in computing the
net assets of the Fund are determined as of such times. Foreign cur-
rency exchange rates will be determined as of the close of business on
the NYSE. Occasionally, events affecting the values of such securities
and such exchange rates may occur between the times at which they
are determined and the close of business on the NYSE that may not
be reflected in the computation of the Fund’s net assets. If events
(for example, a company announcement, market volatility or a natural
disaster) occur during such periods that are expected to materially
affect the value of such securities, those securities will be valued at
their fair value as determined in good faith by the Board or by the
investment advisor using a pricing service and/or procedures approved
by the Board. Foreign currency exchange contracts and forward foreign
currency exchange contracts are valued at the mean between the bid
and ask prices. Interpolated values are derived when the settlement date
of the contract is an interim date for which quotations are not available.
Foreign Currency Transactions: Foreign currency amounts are translated
into United States dollars on the following basis: (i) market value of
investment securities, assets and liabilities at the current rate of
exchange; and (ii) purchases and sales of investment securities, income
and expenses at the rates of exchange prevailing on the respective dates
of such transactions.
The Fund reports foreign currency related transactions as components
of realized gains for financial reporting purposes, whereas such compo-
nents are treated as ordinary income for federal income tax purposes.
Investment Transactions and Investment Income: Investment transac-
tions are recorded on the dates the transactions are entered into (the
trade dates). Realized gains and losses on security transactions are
determined on the identified cost basis. Dividend income is recorded
on the ex-dividend dates. Dividends from foreign securities where the
ex-dividend date may have passed are subsequently recorded when the
Fund has determined the ex-dividend date. Interest income is recognized
on the accrual basis. Income and realized and unrealized gains and
losses are allocated daily to each class based on its relative net assets.
BLACKROCK HEALTHCARE FUND, INC.
APRIL 30, 2009
15
Notes to Financial Statements (continued)
Dividends and Distributions: Dividends and distributions paid by the
Fund are recorded on the ex-dividend dates.
Securities Lending: The Fund may lend securities to financial institutions
that provide cash, which will be maintained at all times in an amount
equal to at least 100% of the current market value of the loaned
securities. The market value of the loaned securities is determined at
the close of business of the Fund and any additional required collateral
is delivered to the Fund on the next business day. The Fund typically
receives the income on the loaned securities but does not receive the
income on the collateral. The Fund may invest the cash collateral and
retain the amount earned on such investment, net of any amount rebat-
ed to the borrower. Loans of securities are terminable at any time and
the borrower, after notice, is required to return borrowed securities within
the standard time period for settlement of securities transactions. The
Fund may pay reasonable lending agent, administrative and custodial
fees in connection with its loans. In the event that the borrower defaults
on its obligation to return borrowed securities because of insolvency or
for any other reason, the Fund could experience delays and costs in
gaining access to the collateral. The Fund also could suffer a loss if the
value of an investment purchased with cash collateral falls below the
market value of the loaned securities.
Income Taxes: It is the Fund’s policy to comply with the requirements of
the Internal Revenue Code applicable to regulated investment compa-
nies and to distribute substantially all of its taxable income to its share-
holders. Therefore, no federal income tax provision is required. Under the
applicable foreign tax laws, a withholding tax may be imposed on inter-
est, dividends and capital gains at various rates.
The Fund files US federal and various state and local tax returns. No
income tax returns are currently under examination. The statute of limita-
tions on the Fund’s US federal tax returns remains open for each of
the four years ended April 30, 2009. The statutes of limitations on the
Fund’s state and local tax returns may remain open for an additional
year depending upon the jurisdiction.
Recent Accounting Pronouncement: In March 2008, Statement of
Financial Accounting Standards No. 161, “Disclosures about Derivative
Instruments and Hedging Activities — an amendment of FASB Statement
No. 133” (“FAS 161”), was issued. FAS 161 is intended to improve
financial reporting for derivative instruments by requiring enhanced
disclosure that enables investors to understand how and why an entity
uses derivatives, how derivatives are accounted for, and how derivative
instruments affect an entity’s results of operations and financial posi-
tion. FAS 161 is effective for financial statements issued for fiscal
years and interim periods beginning after November 15, 2008. The
impact on the Fund’s financial statement disclosures, if any, is currently
being assessed.
Other: Expenses directly related to the Fund or its classes are charged
to that Fund or class. Other operating expenses shared by several funds
are pro-rated among those funds on the basis of relative net assets or
other appropriate methods. Other expenses of the Fund are allocated
daily to each class based on its relative net assets. Custodian fees may
be reduced by amounts calculated on uninvested cash balances, which
are shown on the Statement of Operations as fees paid indirectly.
2. Investment Advisory Agreement and Other Transactions
with Affiliates:
The Fund entered into an Investment Advisory Agreement with BlackRock
Advisors, LLC (the “Advisor”), an indirect, wholly owned subsidiary of
BlackRock, Inc. (“BlackRock”), to provide investment advisory and
administration services. The PNC Financial Services Group, Inc. (“PNC”)
and Bank of America Corporation (“BAC”) are the largest stockholders
of BlackRock. BAC became a stockholder of BlackRock following its
acquisition of Merrill Lynch & Co., Inc. (“Merrill Lynch”) on January 1,
2009. Prior to that date, both PNC and Merrill Lynch were considered
affiliates of the Fund under the 1940 Act. Subsequent to the acquisition,
PNC remains an affiliate, but due to the restructuring of Merrill Lynch’s
ownership interest of BlackRock, BAC is not deemed to be an affiliate
under the 1940 Act.
The Advisor is responsible for the management of the Fund’s invest-
ments and provides the necessary personnel, facilities, equipment and
certain other services necessary to the operations of the Fund. For such
services, the Fund pays the Advisor a monthly fee at an annual rate of
1.00% of the Fund’s average daily net assets.
The Advisor has entered into a separate sub-advisory agreement with
BlackRock Investment Management, LLC (“BIM”), an affiliate of the
Advisor, under which the Advisor pays BIM for services it provides, a
monthly fee that is a percentage of the investment advisory fee paid by
the Fund to the Advisor.
For the year ended April 30, 2009, the Fund reimbursed the Advisor
$6,807 for certain accounting services, which is included in accounting
services in the Statement of Operations.
Effective October 1, 2008, the Fund entered into separate Distribution
Agreements and Distribution Plans with BlackRock Investments, LLC
(“BIL”), which replaced FAM Distributors, Inc. (“FAMD”) and BlackRock
Distributors, Inc. and its affiliates (“BDI”) (collectively, the “Distributor”)
as the sole distributor of the Fund. FAMD is a wholly owned subsidiary of
Merrill Lynch Group, Inc. BIL and BDI are affiliates of BlackRock. The serv-
ice and distribution fees did not change as a result of this transaction.
Pursuant to the Distribution Plans adopted by the Fund in accordance
with Rule 12b-1 under the 1940 Act, the Fund pays the Distributor
16 BLACKROCK HEALTHCARE FUND, INC.
APRIL 30, 2009
Notes to Financial Statements (continued)
ongoing service and distribution fees. The fees are accrued daily and
paid monthly at annual rates based upon the average daily net assets
of the shares as follows:
| | |
| | Service | Distribution |
| | Fee | Fee |
| Investor A | 0.25% | — |
| Investor B | 0.25% | 0.75% |
| Investor C | 0.25% | 0.75% |
| Class R | 0.25% | 0.25% |
Pursuant to sub-agreements with the Distributor, broker-dealers,
including Merrill Lynch, Pierce, Fenner & Smith Incorporated (“MLPF&S”),
a wholly owned subsidiary of Merrill Lynch, and the Distributor provide
shareholder servicing and distribution services to the Fund. The on-
going service fee and/or distribution fee compensates the Distributor
and each broker-dealer for providing shareholder servicing and/or
distribution-related services to Investor A, Investor B, Investor C and
Class R shareholders.
For the year ended April 30, 2009, the Distributor earned underwriting
discounts, direct commissions and dealer concessions on sales of the
Fund’s Investor A Shares, which totaled $27,805. For the year ended
April 30, 2009, affiliates received contingent deferred sales charges
of $43,855 and $15,007 relating to transactions in Investor B and
Investor C Shares, respectively. Furthermore, affiliates received contingent
deferred sales charges of $322 relating to transactions subject to front-
end sales charge waivers on Investor A Shares.
In addition, MLPF&S and Piper Jaffray & Co. (considered an affiliate of
the Advisor for a portion of the period) received $317,590 and $18,077,
respectively, in commissions on the execution of fund security trans-
actions for the Fund during the period they were considered affiliated.
The Fund has received an exemptive order from the Securities and
Exchange Commission permitting it to lend fund securities to MLPF&S
or its affiliates. Pursuant to that order, the Fund has retained BIM as
the securities lending agent for a fee based on a share of the returns
on investment of cash collateral. BIM may, on behalf of the Fund, invest
cash collateral received by the Fund for such loans, among other things,
in a private investment company managed by the Advisor or in registered
money market funds advised by the Advisor or its affiliates. The share of
income earned by the Fund on such investments is shown as securities
lending — affiliated on the Statement of Operations. For the year ended
April 30, 2009, BIM received $113,228 in securities lending agent fees.
PNC Global Investment Servicing (U.S.) Inc., an indirect, wholly owned
subsidiary of PNC and an affiliate of the Advisor, serves as transfer agent
and dividend disbursing agent. Each class of the Fund bears the costs
of transfer agent fees associated with such respective classes. Transfer
agency fees borne by each class of the Fund are comprised of those
fees charged for all shareholder communications including mailing of
shareholder reports, dividend and distribution notices, and proxy materi-
als for shareholders meetings, as well as per account and per transac-
tion fees related to servicing and maintenance of shareholder accounts,
including the issuing, redeeming and transferring of shares of each class
of the Fund, 12b-1 fee calculation, check writing, anti-money laundering
services, and customer identification services.
Pursuant to written agreements, certain affiliates provide the Fund with
sub-accounting, recordkeeping, sub-transfer agency and other adminis-
trative services with respect to sub-accounts they service. For these
services, these affiliates receive an annual fee per shareholder account
which will vary depending on share class. For the year ended April 30,
2009, the Fund paid $410,599 in return for these services, which are
a component of the transfer agent fees in the accompanying Statement
of Operations.
The Fund may earn income on positive cash balances in demand
deposit accounts that are maintained by the transfer agent on behalf of
the Fund. For the year ended April 30, 2009, the Fund earned $6,233,
which is included in income — affiliated in the Statement of Operations.
The Advisor maintains a call center, which is responsible for providing
certain shareholder services to the Fund, such as responding to share-
holder inquiries and processing transactions based upon instructions
from shareholders with respect to the subscription and redemption of
Fund shares. For the year ended April 30, 2009, the Fund reimbursed
the Advisor the following amounts for costs incurred running the call
center, which are a component of the transfer agent fees in the accom-
panying Statement of Operations.
| |
| | Call Center |
| | Fees |
| Institutional | $6,930 |
| Investor A | $7,731 |
| Investor B | $1,967 |
| Investor C | $3,093 |
| Class R | $ 429 |
Certain officers and/or directors of the Fund are officers and/or directors
of BlackRock or its affiliates. The Fund reimburses the Advisor for
compensation paid to the Fund’s Chief Compliance Officer.
3. Investments:
Purchases and sales of investments, excluding short-term securities,
for the year ended April 30, 2009, were $560,852,334, and
$591,784,389, respectively.
BLACKROCK HEALTHCARE FUND, INC.
APRIL 30, 2009
17
Notes to Financial Statements (continued)
4. Short-Term Borrowings:
The Fund, along with certain other funds managed by the Advisor and
its affiliates, is a party to a $500 million credit agreement with a group
of lenders, which expired November 2008 and was subsequently re-
newed until November 2009. The Fund may borrow under the credit
agreement to fund shareholder redemptions and for other lawful pur-
poses other than for leverage. The Fund may borrow up to the maximum
amount allowable under the Fund’s current Prospectus and Statement
of Additional Information, subject to various other legal, regulatory or
contractual limits. The Fund paid its pro rata share of a 0.02% upfront
fee on the aggregate commitment amount based on its net assets as
of October 31, 2008. The Fund pays a commitment fee of 0.08% per
annum based on the Fund’s pro rata share of the unused portion of the
credit agreement, which is included in miscellaneous in the Statement
of Operations. Amounts borrowed under the credit agreement bear inter-
est at a rate equal to, the higher of the (a) federal funds effective rate
and (b) reserve adjusted one month LIBOR, plus, in each case, the high-
er of (i) 1.50% and (ii) 50% of the CDX Index (as defined in the credit
agreement) in effect from time to time. The Fund did not borrow under
the credit agreement during the year ended April 30, 2009.
5. Income Tax Information:
Reclassifications: Accounting principles generally accepted in the
United States of America require that certain components of net assets
be adjusted to reflect permanent differences between financial and tax
reporting. These reclassifications have no effect on net assets or net asset
values per share. The following permanent differences as of April 30,
2009 attributable to foreign currency transactions, net operating losses
and foreign taxes paid, were reclassified to the following accounts:
| |
| Paid-in capital | $(4,071,824) |
| Undistributed net investment income | 3,910,293 |
| Accumulated net realized loss | 161,531 |
The tax character of distributions paid during the fiscal years ended
April 30, 2009 and April 30, 2008 was as follows:
| | |
| | 4/30/2009 | 4/30/2008 |
| Distributions paid from: | | |
| Ordinary income | — | $21,440,851 |
| Net long-term capital gains | — | 47,959,836 |
| Tax return of capital | — | 3,163,282 |
| Total distributions | — | $72,563,969 |
As of April 30, 2009, the components of accumulated losses on a tax
basis were as follows:
| |
| Capital loss carryforward | $ (19,383,584) |
| Net unrealized losses | (15,686,099) |
| Total accumulated net losses* | $ (35,069,683) |
* The difference between book-basis and tax-basis net unrealized losses is attributable
primarily to the tax deferral of losses on wash sales, the deferral of post-October
capital losses for tax purposes and the timing and recognition of partnership income.
As of April 30, 2009, the Fund had a capital loss carryforward available to
offset future realized capital gains through the indicated expiration date:
| |
| Expires April 30, | |
| 2017 | $ 19,383,584 |
| 6. Market and Credit Risk: | |
In the normal course of business, the Fund invests in securities and
enters into transactions where risks exist due to fluctuations in the
market (market risk) or failure of the issuer of a security to meet all its
obligations (credit risk). The value of securities held by the Fund may
decline in response to certain events, including those directly involving
the issuers whose securities are owned by the Fund; conditions affecting
the general economy; overall market changes; local, regional or global
political, social or economic instability; and currency and interest rate
and price fluctuations. Similar to credit risk, the Fund may be exposed
to counterparty risk, or the risk that an entity with which the Fund has
unsettled or open transactions may default. Financial assets, which
potentially expose the Fund to credit and counterparty risks, consist
principally of investments and cash due from counterparties. The extent
of the Fund’s exposure to credit and counterparty risks with respect to
these financial assets is approximated by their value recorded in the
Fund’s Statement of Assets and Liabilities.
18 BLACKROCK HEALTHCARE FUND, INC.
APRIL 30, 2009
| | | | | | |
| Notes to Financial Statements (concluded) | | | | | |
| 7. Capital Share Transactions: | | | | | | |
| Transactions in capital shares for each class were as follows: | | | | | | |
| | Year Ended | | Year Ended | |
| | April 30, 2009 | | April 30, 2008 | |
| | Shares | | Amount | Shares | | Amount |
| Institutional | | | | | | |
| Shares sold | 2,485,002 | $ 13,275,016 | 3,636,933 | $ 24,157,299 |
| Shares issued to shareholders in reinvestment | | | | | | |
| of distributions | — | | — | 1,666,185 | | 11,110,554 |
| Total issued | 2,485,002 | | 13,275,016 | 5,303,118 | | 35,267,853 |
| Shares redeemed | (5,122,680) | | (26,961,642) | (3,859,722) | | (25,369,674) |
| Net increase (decrease) | (2,637,678) | $ (13,686,626) | 1,443,396 | $ 9,898,179 |
| Investor A | | | | | | |
| Shares sold and automatic conversion of shares | 8,617,462 | $ 41,935,454 | 13,900,855 | $ 81,903,347 |
| Shares issued to shareholders in reinvestment | | | | | | |
| of distributions | — | | — | 2,230,527 | | 13,359,839 |
| Total issued | 8,617,462 | | 41,935,454 | 16,131,382 | | 95,263,186 |
| Shares redeemed | (12,781,870) | | (58,867,847) | (8,232,045) | | (48,139,484) |
| Net increase (decrease) | (4,164,408) | $ (16,932,393) | 7,899,337 | $ 47,123,702 |
| Investor B | | | | | | |
| Shares sold | 1,139,653 | $ 3,577,779 | 2,536,472 | $ 10,043,911 |
| Shares issued to shareholders in reinvestment | | | | | | |
| of distributions | — | | — | 1,603,409 | | 6,436,538 |
| Total issued | 1,139,653 | | 3,577,779 | 4,139,881 | | 16,480,449 |
| Shares redeemed and automatic conversion of shares | (6,459,072) | | (19,746,306) | (6,493,212) | | (25,984,096) |
| Net decrease | (5,319,419) | $ (16,168,527) | (2,353,331) | $ (9,503,647) |
| Investor C | | | | | | |
| Shares sold | 4,324,579 | $ 13,579,973 | 7,623,364 | $ 29,864,565 |
| Shares issued to shareholders in reinvestment | | | | | | |
| of distributions | — | | — | 1,872,373 | | 7,474,447 |
| Total issued | 4,324,579 | | 13,579,973 | 9,495,737 | | 37,339,012 |
| Shares redeemed | (5,842,095) | | (17,698,500) | (4,610,643) | | (17,870,414) |
| Net increase (decrease) | (1,517,516) | $ (4,118,527) | 4,885,094 | $ 19,468,598 |
| Class R | | | | | | |
| Shares sold | 1,923,173 | $ 5,943,965 | 2,286,947 | $ 9,216,749 |
| Shares issued to shareholders in reinvestment | | | | | | |
| of distributions | — | | — | 186,789 | | 767,099 |
| Total issued | 1,923,173 | | 5,943,965 | 2,473,736 | | 9,983,848 |
| Shares redeemed | (1,602,907) | | (4,947,773) | (1,221,218) | | (4,898,461) |
| Net increase | 320,266 | $ 996,192 | 1,252,518 | $ 5,085,387 |
BLACKROCK HEALTHCARE FUND, INC.
APRIL 30, 2009
19
Report of Independent Registered Public Accounting Firm
To the Shareholders and Board of Directors of BlackRock
Healthcare Fund, Inc.:
We have audited the accompanying statement of assets and liabilities,
including the schedule of investments, of BlackRock Healthcare Fund,
Inc. (the “Fund”) as of April 30, 2009, and the related statement of
operations for the year then ended, the statements of changes in net
assets for each of the two years in the period then ended, and the finan-
cial highlights for each of the five years in the period then ended. These
financial statements and financial highlights are the responsibility of the
Fund’s management. Our responsibility is to express an opinion on these
financial statements and financial highlights based on our audits.
We conducted our audits in accordance with the standards of the Public
Company Accounting Oversight Board (United States). Those standards
require that we plan and perform the audit to obtain reasonable assur-
ance about whether the financial statements and financial highlights
are free of material misstatement. The Fund is not required to have, nor
were we engaged to perform, an audit of its internal control over finan-
cial reporting. Our audits included consideration of internal control over
financial reporting as a basis for designing audit procedures that are
appropriate in the circumstances, but not for the purpose of expressing
an opinion on the effectiveness of the Fund’s internal control over finan-
cial reporting. Accordingly, we express no such opinion. An audit also
includes examining, on a test basis, evidence supporting the amounts
and disclosures in the financial statements, assessing the accounting
principles used and significant estimates made by management, as well
as evaluating the overall financial statement presentation. Our proce-
dures included confirmation of securities owned as of April 30, 2009,
by correspondence with the custodian and brokers; where replies were
not received from brokers, we performed other auditing procedures.
We believe that our audits provide a reasonable basis for our opinion.
In our opinion, the financial statements and financial highlights referred
to above present fairly, in all material respects, the financial position
of BlackRock Healthcare Fund, Inc. as of April 30, 2009, the results
of its operations for the year then ended, the changes in its net assets
for each of the two years in the period then ended, and the financial
highlights for each of the five years in the period then ended, in con-
formity with accounting principles generally accepted in the United
States of America.
Deloitte & Touche LLP
Princeton, New Jersey
June 23, 2009
20 BLACKROCK HEALTHCARE FUND, INC.
APRIL 30, 2009
| | | | | |
| Officers and Directors | | | | |
| | | | | Number of | |
| | | Length of | | BlackRock- | |
| | Position(s) | Time | | Advised Funds | |
| Name, Address | Held with | Served as | | and Portfolios | Public |
| and Year of Birth | Fund | a Director2 | Principal Occupation(s) During Past 5 Years | Overseen | Directorships |
| Non-Interested Directors1 | | | | | |
| Ronald W. Forbes | Co-Chair of | Since | Professor Emeritus of Finance, School of Business, State University | 34 Funds | None |
| 40 East 52nd Street | the Board of | 2000 | of New York at Albany since 2000. | 81 Portfolios | |
| New York, NY 10022 | Directors and | | | | |
| 1940 | Director | | | | |
| Rodney D. Johnson | Co-Chair of | Since | President, Fairmount Capital Advisors, Inc. since 1987; Director, | 34 Funds | None |
| 40 East 52nd Street | the Board of | 2007 | Fox Chase Cancer Center since 2002; Member of the Archdiocesan | 81 Portfolios | |
| New York, NY 10022 | Directors and | | Investment Committee of the Archdiocese of Philadelphia since | | |
| 1941 | Director | | 2003; Director, The Committee of Seventy (civic) since 2006. | | |
| David O. Beim | Director | Since | Professor of Finance and Economics at the Columbia University | 34 Funds | None |
| 40 East 52nd Street | | 2007 | Graduate School of Business since 1991; Trustee, Phillips Exeter | 81 Portfolios | |
| New York, NY 10022 | | | Academy since 2002; Formerly Chairman, Wave Hill Inc. (public | | |
| 1940 | | | garden and cultural center) from 1990 to 2006. | | |
| Dr. Matina Horner | Director | Since | Formerly Executive Vice President of Teachers Insurance and | 34 Funds | NSTAR (electric |
| 40 East 52nd Street | | 2007 | Annuity Association and College Retirement Equities Fund | 81 Portfolios | and gas utility) |
| New York, NY 10022 | | | from 1989 to 2003. | | |
| 1939 | | | | | |
| Herbert I. London | Director and | Since | Professor Emeritus, New York University since 2005; John M. Olin | 34 Funds | AIMS Worldwide, |
| 40 East 52nd Street | Member of | 2007 | Professor of Humanities, New York University from 1993 to 2005 | 81 Portfolios | Inc. (marketing) |
| New York, NY 10022 | the Audit | | and Professor thereof from 1980 to 2005; President, Hudson Institute | | |
| 1939 | Committee | | (policy research organization) since 1997 and Trustee thereof since | | |
| | | | 1980; Chairman of the Board of Trustees for Grantham University | | |
| | | | since 2006; Director, InnoCentive, Inc. (strategic solutions company) | | |
| | | | since 2005; Director, Cerego, LLC (software development and | | |
| | | | design) since 2005. | | |
| Cynthia A. Montgomery | Director | Since | Professor, Harvard Business School since 1989; Director, Harvard | 34 Funds | Newell Rubbermaid, |
| 40 East 52nd Street | | 2000 | Business School Publishing since 2005; Director, McLean Hospital | 81 Portfolios | Inc. (manufacturing) |
| New York, NY 10022 | | | since 2005. | | |
| 1952 | | | | | |
| Joseph P. Platt, Jr. | Director | Since | Director, The West Penn Allegheny Health System (a not-for-profit | 34 Funds | Greenlight Capital |
| 40 East 52nd Street | | 2007 | health system) since 2008; Director, Jones and Brown (Canadian | 81 Portfolios | Re, Ltd (reinsurance |
| New York, NY 10022 | | | insurance broker) since 1998; General Partner, Thorn Partners, | | company) |
| 1947 | | | LP (private investment) since 1998; Formerly Partner, Amarna | | |
| | | | Corporation, LLC (private investment company) from 2002 to 2008. | | |
| Robert C. Robb, Jr. | Director | Since | Partner, Lewis, Eckert, Robb and Company (management and | 34 Funds | None |
| 40 East 52nd Street | | 2007 | financial consulting firm) since 1981. | 81 Portfolios | |
| New York, NY 10022 | | | | | |
| 1945 | | | | | |
| Toby Rosenblatt | Director | Since | President, Founders Investments Ltd. (private investments) since | 34 Funds | A.P. Pharma, Inc. |
| 40 East 52nd Street | | 2007 | 1999; Director, Forward Management, LLC since 2007; Director, | 81 Portfolios | (specialty |
| New York, NY 10022 | | | The James Irvine Foundation (philanthropic foundation) since 1997; | | pharmaceuticals) |
| 1938 | | | Formerly Trustee, State Street Research Mutual Funds from 1990 | | |
| | | | to 2005; Formerly Trustee, Metropolitan Series Funds, Inc. from | | |
| | | | 2001 to 2005. | | |
BLACKROCK HEALTHCARE FUND, INC.
APRIL 30, 2009
21
| | | | | |
| Officers and Directors (continued) | | |
| | | | | Number of | |
| | | Length of | | BlackRock- | |
| | Position(s) | Time | | Advised Funds | |
| Name, Address | Held with | Served as | | and Portfolios | Public |
| and Year of Birth | Fund | a Director2 | Principal Occupation(s) During Past 5 Years | Overseen | Directorships |
| Non-Interested Directors1 (concluded) | | | | |
| Kenneth L. Urish | Chair of | Since | Managing Partner, Urish Popeck & Co., LLC (certified public | 34 Funds | None |
| 40 East 52nd Street | the Audit | 2007 | accountants and consultants) since 1976; Member of External | 81 Portfolios | |
| New York, NY 10022 | Committee | | Advisory Board, The Pennsylvania State University Accounting | | |
| 1951 | and Director | | Department since 2001; Trustee, The Holy Family Foundation | | |
| | | | since 2001; Committee Member, Professional Ethics Committee | | |
| | | | of the Pennsylvania Institute of Certified Public Accountants | | |
| | | | since 2007; Formerly President and Trustee, Pittsburgh Catholic | | |
| | | | Publishing Associates from 2003 to 2008; Formerly Director, | | |
| | | | Inter-Tel from 2006 to 2007. | | |
| Frederick W. Winter | Director and | Since | Professor and Dean Emeritus of the Joseph M. Katz School of | 34 Funds | None |
| 40 East 52nd Street | Member of | 2007 | Business, University of Pittsburgh since 2005 and Dean thereof | 81 Portfolios | |
| New York, NY 10022 | the Audit | | from 1997 to 2005; Director, Alkon Corporation (pneumatics) | | |
| 1945 | Committee | | since 1992; Director, Tippman Sports (recreation) since 2005; | | |
| | | | Formerly Director, Indotronix International (IT services) from | | |
| | | | 2004 to 2008. | | |
| 1 Directors serve until their resignation, removal or death, or until December 31 of the year in which they turn 72. |
| | 2 Following the combination of Merrill Lynch Investment Managers, L.P. (“MLIM”) and BlackRock, Inc. (“BlackRock”) in September 2006, the |
| | various legacy MLIM and legacy BlackRock Fund boards were realigned and consolidated into three new Fund boards in 2007. As a result, |
| | although the chart shows certain directors as joining the Fund’s board in 2007, each director first became a member of the board of directors |
| | of other legacy MLIM or legacy BlackRock Funds as follows: David O. Beim, 1998; Ronald W. Forbes, 1977; Matina Horner, 2004; Rodney D. |
| | Johnson, 1995; Herbert I. London, 1987; Cynthia A. Montgomery, 1994; Joseph P. Platt, Jr., 1999; Robert C. Robb, Jr., 1999; Toby Rosenblatt, |
| | 2005; Kenneth L. Urish, 1999 and Frederick W. Winter, 1999. | | |
| Interested Directors1 | | | | | |
| Richard S. Davis | Director | Since | Managing Director, BlackRock, Inc. since 2005; Formerly Chief | 175 Funds | None |
| 40 East 52nd Street | | 2007 | Executive Officer, State Street Research & Management Company | 285 Portfolios | |
| New York, NY 10022 | | | from 2000 to 2005; Formerly Chairman of the Board of Trustees, | | |
| 1945 | | | State Street Research Mutual Funds from 2000 to 2005; Formerly | | |
| | | | Chairman, SSR Realty from 2000 to 2004. | | |
| Henry Gabbay | Director | Since | Formerly Consultant, BlackRock, Inc. from 2007 to 2008; Formerly | 175 Funds | None |
| 40 East 52nd Street | | 2007 | Managing Director, BlackRock, Inc. from 1989 to 2007; Formerly | 285 Portfolios | |
| New York, NY 10022 | | | Chief Administrative Officer, BlackRock Advisors, LLC from 1998 to | | |
| 1947 | | | 2007; Formerly President of BlackRock Funds and BlackRock Bond | | |
| | | | Allocation Target Shares from 2005 to 2007 and Treasurer of certain | | |
| | | | closed-end funds in the BlackRock fund complex from 1989 to 2006. | | |
1 Mr. Davis is an “interested person” as defined in the Investment Company Act of 1940, of the Fund based on his position with BlackRock, Inc.
and its affiliates. Mr. Gabbay is an “interested person” of the Fund based on his former positions with BlackRock, Inc. and its affiliates as well
as his ownership of BlackRock, Inc. and PNC securities. Directors serve until their resignation, removal or death, or until December 31 of the
year in which they turn 72.
22 BLACKROCK HEALTHCARE FUND, INC.
APRIL 30, 2009
| | | | | |
| Officers and Directors (concluded) | | |
| | Position(s) | | | | |
| Name, Address | Held with | Length of | | | |
| and Year of Birth | Fund | Time Served | Principal Occupation(s) During Past 5 Years | | |
| Fund Officers1 | | | | | |
| Donald C. Burke | President | Since | Managing Director of BlackRock, Inc. since 2006; Formerly Managing Director of Merrill Lynch Investment |
| 40 East 52nd Street | and Chief | 2007 | Managers, L.P. (“MLIM”) and Fund Asset Management, L.P. (“FAM”) in 2006, First Vice President thereof from |
| New York, NY 10022 | Executive | | 1997 to 2005, Treasurer thereof from 1999 to 2006 and Vice President thereof from 1990 to 1997. |
| 1960 | Officer | | | | |
| Anne F. Ackerley | Vice | Since | Managing Director of BlackRock, Inc. since 2000; Chief Operating Officer of BlackRock’s U.S. Retail Group |
| 40 East 52nd Street | President | 2007 | since 2006; Formerly Head of BlackRock’s Mutual Fund Group from 2000 to 2006. | |
| New York, NY 10022 | | | | | |
| 1962 | | | | | |
| Neal J. Andrews | Chief | Since | Managing Director of BlackRock, Inc. since 2006; Formerly Senior Vice President and Line of Business Head of |
| 40 East 52nd Street | Financial | 2007 | Fund Accounting and Administration at PNC Global Investment Servicing (U.S.) Inc. (formerly PFPC Inc.) from |
| New York, NY 10022 | Officer | | 1992 to 2006. | | |
| 1966 | | | | | |
| Jay M. Fife | Treasurer | Since | Managing Director of BlackRock, Inc. since 2007 and Director in 2006; Formerly Assistant Treasurer of the |
| 40 East 52nd Street | | 2007 | MLIM/FAM advised funds from 2005 to 2006; Director of MLIM Fund Services Group from 2001 to 2006. |
| New York, NY 10022 | | | | | |
| 1970 | | | | | |
| Brian P. Kindelan | Chief | Since | Chief Compliance Officer of the BlackRock-advised Funds since 2007; Managing Director and Senior Counsel of |
| 40 East 52nd Street | Compliance | 2007 | BlackRock, Inc. since 2005; Formerly Director and Senior Counsel of BlackRock Advisors, Inc. from 2001 to 2004. |
| New York, NY 10022 | Officer | | | | |
| 1959 | | | | | |
| Howard B. Surloff | Secretary | Since | Managing Director of BlackRock, Inc. and General Counsel of U.S. Funds at BlackRock, Inc. since 2006; Formerly |
| 40 East 52nd Street | | 2007 | General Counsel (U.S.) of Goldman Sachs Asset Management, L.P. from 1993 to 2006. | |
| New York, NY 10022 | | | | | |
| 1965 | | | | | |
| | 1 Officers of the Fund serve at the pleasure of the Board of Directors. | | |
| | Further information about the Fund’s Officers and Directors is available in the Fund’s Statement of Additional Information, which can be obtained |
| | without charge by calling (800) 441-7762. | | |
| Custodian | Transfer Agent | Accounting Agent | Independent Registered Public | Legal Counsel |
| JPMorgan Chase | PNC Global Investment | State Street Bank and | Accounting Firm | Sidley Austin LLP |
| Bank, N.A. | Servicing (U.S.) Inc. | Trust Company | Deloitte & Touche LLP | New York, NY 10019 |
| Brooklyn, NY 11245 | Wilmington, DE 19809 | Princeton, NJ 08540 | Princeton, NJ 08540 | |
BLACKROCK HEALTHCARE FUND, INC.
APRIL 30, 2009
23
Additional Information
BlackRock Privacy Principles
BlackRock is committed to maintaining the privacy of its current and
former fund investors and individual clients (collectively, “Clients”) and
to safeguarding their non-public personal information. The following infor-
mation is provided to help you understand what personal information
BlackRock collects, how we protect that information and why in certain
cases we share such information with select parties.
If you are located in a jurisdiction where specific laws, rules or regulations
require BlackRock to provide you with additional or different privacy-related
rights beyond what is set forth below, then BlackRock will comply with
those specific laws, rules or regulations.
BlackRock obtains or verifies personal non-public information from and
about you from different sources, including the following: (i) information
we receive from you or, if applicable, your financial intermediary, on appli-
cations, forms or other documents; (ii) information about your trans-
actions with us, our affiliates, or others; (iii) information we receive from
a consumer reporting agency; and (iv) from visits to our websites.
BlackRock does not sell or disclose to non-affiliated third parties any non-
public personal information about its Clients, except as permitted by law
or as is necessary to respond to regulatory requests or to service Client
accounts. These non-affiliated third parties are required to protect the
confidentiality and security of this information and to use it only for its
intended purpose.
We may share information with our affiliates to service your account or to
provide you with information about other BlackRock products or services
that may be of interest to you. In addition, BlackRock restricts access
to non-public personal information about its Clients to those BlackRock
employees with a legitimate business need for the information. BlackRock
maintains physical, electronic and procedural safeguards that are designed
to protect the non-public personal information of its Clients, including proce-
dures relating to the proper storage and disposal of such information.
General Information
Electronic Delivery
Electronic copies of most financial reports and prospectuses are available
on the Fund’s website or shareholders can sign up for e-mail notifications
of quarterly statements, annual and semi-annual reports and prospectuses
by enrolling in the Fund’s electronic delivery program.
To enroll:
Shareholders Who Hold Accounts with Investment Advisors, Banks or
Brokerages:
Please contact your financial advisor. Please note that not all investment
advisors, banks or brokerages may offer this service.
Shareholders Who Hold Accounts Directly with BlackRock:
1) Access the BlackRock website at
http://www.blackrock.com/edelivery
2) Click on the applicable link and follow the steps to sign up
3) Log into your account
Householding
The Fund will mail only one copy of shareholder documents, including
prospectuses, annual and semi-annual reports and proxy statements, to
shareholders with multiple accounts at the same address. This practice is
commonly called “householding” and it is intended to reduce expenses
and eliminate duplicate mailings of shareholder documents. Mailings of
your shareholder documents may be householded indefinitely unless you
instruct us otherwise. If you do not want the mailing of these documents
to be combined with those for other members of your household, please
contact the Fund at (800) 441-7762.
24 BLACKROCK HEALTHCARE FUND, INC.
APRIL 30, 2009
Additional Information (concluded)
General Information (concluded)
Availability of Proxy Voting Policies and Procedures
A description of the policies and procedures that the Fund uses to
determine how to vote proxies relating to portfolio securities is available
(1) without charge, upon request, by calling toll-free (800) 441-7762;
(2) at www.blackrock.com; and (3) on the Securities and Exchange
Commission’s (the “SEC”) website at http://www.sec.gov.
Availability of Proxy Voting Record
Information about how the Fund votes proxies relating to securities
held in the Fund’s portfolios during the most recent 12-month period
ended June 30 is available upon request and without charge (1) at
www.blackrock.com or by calling (800) 441-7762 and (2) on the SEC’s
website at http://www.sec.gov.
Availability of Quarterly Portfolio Schedule
The Fund files its complete schedule of portfolio holdings with the SEC
for the first and third quarters of each fiscal year on Form N-Q. The Fund’s
Forms N-Q are available on the SEC’s website at http://www.sec.gov and
may also be reviewed and copied at the SEC’s Public Reference Room
in Washington, D.C. Information on the operation of the Public Reference
Room may be obtained by calling (800) SEC-0330. The Fund’s Forms
N-Q may also be obtained upon request and without charge by calling
(800) 441-7762.
Shareholder Privileges
Account Information
Call us at (800) 441-7762 from 8:00 AM – 6:00 PM EST to get infor-
mation about your account balances, recent transactions and share
prices. You can also reach us on the Web at www.blackrock.com/funds.
Automatic Investment Plans
Investor Class shareholders who want to invest regularly can arrange to
have $50 or more automatically deducted from their checking or savings
account and invested in any of the BlackRock funds.
Systematic Withdrawal Plans
Investor Class shareholders can establish a systematic withdrawal plan
and receive periodic payments of $50 or more from their BlackRock
funds, as long as their account is at least $10,000.
Retirement Plans
Shareholders may make investments in conjunction with Traditional,
Rollover, Roth, Coverdell, Simple IRAs, SEP IRAs and 403(b) Plans.
BLACKROCK HEALTHCARE FUND, INC.
APRIL 30, 2009
25
| | |
| A World-Class Mutual Fund Family | |
| BlackRock offers a diverse lineup of open-end mutual funds crossing all investment styles and managed by experts in equity, fixed income and |
| tax-exempt investing. | | |
| Equity Funds | | |
| BlackRock All-Cap Energy & Resources Portfolio | BlackRock Global Opportunities Portfolio | BlackRock Mid-Cap Value Equity Portfolio |
| BlackRock Asset Allocation Portfolio† | BlackRock Global SmallCap Fund | BlackRock Mid Cap Value Opportunities Fund |
| BlackRock Aurora Portfolio | BlackRock Health Sciences Opportunities Portfolio | BlackRock Natural Resources Trust |
| BlackRock Balanced Capital Fund† | BlackRock Healthcare Fund | BlackRock Pacific Fund |
| BlackRock Basic Value Fund | BlackRock Index Equity Portfolio* | BlackRock Science & Technology |
| BlackRock Capital Appreciation Portfolio | BlackRock International Fund | Opportunities Portfolio |
| BlackRock Energy & Resources Portfolio | BlackRock International Diversification Fund | BlackRock Small Cap Core Equity Portfolio |
| BlackRock Equity Dividend Fund | BlackRock International Index Fund | BlackRock Small Cap Growth Equity Portfolio |
| BlackRock EuroFund | BlackRock International Opportunities Portfolio | BlackRock Small Cap Growth Fund II |
| BlackRock Focus Growth Fund | BlackRock International Value Fund | BlackRock Small Cap Index Fund |
| BlackRock Focus Value Fund | BlackRock Large Cap Core Fund | BlackRock Small Cap Value Equity Portfolio* |
| BlackRock Fundamental Growth Fund | BlackRock Large Cap Core Plus Fund | BlackRock Small/Mid-Cap Growth Portfolio |
| BlackRock Global Allocation Fund† | BlackRock Large Cap Growth Fund | BlackRock S&P 500 Index Fund |
| BlackRock Global Dynamic Equity Fund | BlackRock Large Cap Value Fund | BlackRock U.S. Opportunities Portfolio |
| BlackRock Global Emerging Markets Fund | BlackRock Latin America Fund | BlackRock Utilities and Telecommunications Fund |
| BlackRock Global Financial Services Fund | BlackRock Mid-Cap Growth Equity Portfolio | BlackRock Value Opportunities Fund |
| BlackRock Global Growth Fund | | |
| Fixed Income Funds | | |
| BlackRock Bond Portfolio | BlackRock Income Builder Portfolio† | BlackRock Short-Term Bond Fund |
| BlackRock Emerging Market Debt Portfolio | BlackRock Inflation Protected Bond Portfolio | BlackRock Strategic Income Portfolio |
| BlackRock Enhanced Income Portfolio | BlackRock Intermediate Government | BlackRock Total Return Fund |
| BlackRock GNMA Portfolio | Bond Portfolio | BlackRock Total Return Portfolio II |
| BlackRock Government Income Portfolio | BlackRock International Bond Portfolio | BlackRock World Income Fund |
| BlackRock High Income Fund | BlackRock Long Duration Bond Portfolio | |
| BlackRock High Yield Bond Portfolio | BlackRock Low Duration Bond Portfolio | |
| BlackRock Income Portfolio† | BlackRock Managed Income Portfolio | |
| Municipal Bond Funds | | |
| BlackRock AMT-Free Municipal Bond Portfolio | BlackRock Kentucky Municipal Bond Portfolio | BlackRock New York Municipal Bond Fund |
| BlackRock California Municipal Bond Fund | BlackRock Municipal Insured Fund | BlackRock Ohio Municipal Bond Portfolio |
| BlackRock Delaware Municipal Bond Portfolio | BlackRock National Municipal Fund | BlackRock Pennsylvania Municipal Bond Fund |
| BlackRock High Yield Municipal Fund | BlackRock New Jersey Municipal Bond Fund | BlackRock Short-Term Municipal Fund |
| BlackRock Intermediate Municipal Fund | | |
| Target Risk & Target Date Funds | | |
| BlackRock Prepared Portfolios | BlackRock Lifecycle Prepared Portfolios | |
| Conservative Prepared Portfolio | Prepared Portfolio 2010 | Prepared Portfolio 2030 |
| Moderate Prepared Portfolio | Prepared Portfolio 2015 | Prepared Portfolio 2035 |
| Growth Prepared Portfolio | Prepared Portfolio 2020 | Prepared Portfolio 2040 |
| Aggressive Growth Prepared Portfolio | Prepared Portfolio 2025 | Prepared Portfolio 2045 |
| | | Prepared Portfolio 2050 |
| * See the prospectus for information on specific limitations on investments in the fund. | |
| † Mixed asset fund. | | |
| BlackRock mutual funds are currently distributed by BlackRock Investments, LLC. You should consider the investment objectives, risks, charges and |
| expenses of the funds under consideration carefully before investing. Each fund’s prospectus contains this and other information and is available at |
| www.blackrock.com or by calling (800) 882-0052 or from your financial advisor. The prospectus should be read carefully before investing. |
26 BLACKROCK HEALTHCARE FUND, INC.
APRIL 30, 2009

This report is not authorized for use as an offer of sale or a solici-
tation of an offer to buy shares of the Fund unless accompanied
or preceded by the Fund’s current prospectus. Past performance
results shown in this report should not be considered a representa-
tion of future performance. Investment return and principal value
of shares will fluctuate so that shares, when redeemed, may be
worth more or less than their original cost. Statements and other
information herein are as dated and are subject to change.
BlackRock Healthcare Fund, Inc.
100 Bellevue Parkway
Wilmington, DE 19809

#10254-4/09
Item 2 – Code of Ethics – The registrant (or the “Fund”) has adopted a code of ethics, as of the end of the period
covered by this report, applicable to the registrant’s principal executive officer, principal financial officer
and principal accounting officer, or persons performing similar functions. During the period covered by
this report, there have been no amendments to or waivers granted under the code of ethics. A copy of the
code of ethics is available without charge at www.blackrock.com.
Item 3 – Audit Committee Financial Expert – The registrant’s board of directors or trustees, as applicable (the
“board of directors”) has determined that (i) the registrant has the following audit committee financial
expert serving on its audit committee and (ii) each audit committee financial expert is independent:
Kenneth L. Urish
Under applicable securities laws, a person determined to be an audit committee financial expert will not be
deemed an “expert” for any purpose, including without limitation for the purposes of Section 11 of the
Securities Act of 1933, as a result of being designated or identified as an audit committee financial expert.
The designation or identification as an audit committee financial expert does not impose on such person
any duties, obligations, or liabilities greater than the duties, obligations, and liabilities imposed on such
person as a member of the audit committee and board of directors in the absence of such designation or
identification.
Item 4 – Principal Accountant Fees and Services
| | | | | | | | |
| | (a) Audit Fees | (b) Audit-Related Fees1 | (c) Tax Fees2 | (d) All Other Fees3 |
| | Current | Previous | Current | Previous | Current | Previous | Current | Previous |
| | Fiscal Year | Fiscal Year | Fiscal Year | Fiscal Year | Fiscal Year | Fiscal Year | Fiscal Year | Fiscal Year |
| Entity Name | End | End | End | End | End | End | End | End |
| BlackRock | | | | | | | | |
| Healthcare Fund, | $34,500 | $34,300 | $0 | $0 | $11,985 | $8,488 | $1,028 | $1,049 |
| Inc. | | | | | | | | |
1 The nature of the services include assurance and related services reasonably related to the performance of the audit of financial statements
not included in Audit Fees.
2 The nature of the services include tax compliance, tax advice and tax planning.
3 The nature of the services include a review of compliance procedures and attestation thereto.
(e)(1) Audit Committee Pre-Approval Policies and Procedures:
The registrant’s audit committee (the “Committee”) has adopted policies and procedures with
regard to the pre-approval of services. Audit, audit-related and tax compliance services provided to the
registrant on an annual basis require specific pre-approval by the Committee. The Committee also must
approve other non-audit services provided to the registrant and those non-audit services provided to the
registrant’s affiliated service providers that relate directly to the operations and the financial reporting of
the registrant. Certain of these non-audit services that the Committee believes are a) consistent with the
SEC’s auditor independence rules and b) routine and recurring services that will not impair the
independence of the independent accountants may be approved by the Committee without consideration on
a specific case-by-case basis (“general pre-approval”). The term of any general pre-approval is 12 months
from the date of the pre-approval, unless the Committee provides for a different period. Tax or other non-
audit services provided to the registrant which have a direct impact on the operation or financial reporting
of the registrant will only be deemed pre-approved provided that any individual project does not exceed
$10,000 attributable to the registrant or $50,000 for all of the registrants the Committee oversees. For this
purpose, multiple projects will be aggregated to determine if they exceed the previously mentioned cost
levels.
Any proposed services exceeding the pre-approved cost levels will require specific pre-approval by
the Committee, as will any other services not subject to general pre-approval (e.g., unanticipated but
permissible services). The Committee is informed of each service approved subject to general pre-
approval at the next regularly scheduled in-person board meeting. At this meeting, an analysis of such
services is presented to the Committee for ratification. The Committee may delegate to one or more of its
members the authority to approve the provision of and fees for any specific engagement of permitted non-
audit services, including services exceeding pre-approved cost levels.
(e)(2) None of the services described in each of Items 4(b) through (d) were approved by the audit
committee pursuant to paragraph (c)(7)(i)(C) of Rule 2-01 of Regulation S-X.
(f) Not Applicable
(g) Affiliates’ Aggregate Non-Audit Fees:
| | |
| �� | Current Fiscal Year | Previous Fiscal Year |
| Entity Name | End | End |
| BlackRock Healthcare Fund, | $420,513 | $414,537 |
| Inc. | | |
(h) The registrant’s audit committee has considered and determined that the provision of non-audit services
that were rendered to the registrant’s investment adviser (not including any non-affiliated sub-adviser
whose role is primarily portfolio management and is subcontracted with or overseen by the registrant’s
investment adviser), and any entity controlling, controlled by, or under common control with the
investment adviser that provides ongoing services to the registrant that were not pre-approved pursuant to
paragraph (c)(7)(ii) of Rule 2-01 of Regulation S-X is compatible with maintaining the principal
accountant’s independence.
Regulation S-X Rule 2-01(c)(7)(ii) – $407,500, 0%
Item 5 – Audit Committee of Listed Registrants – Not Applicable
Item 6 – Investments
(a) The registrant’s Schedule of Investments is included as part of the Report to Stockholders filed under
Item 1 of this form.
(b) Not Applicable due to no such divestments during the semi-annual period covered since the previous
Form N-CSR filing.
Item 7 – Disclosure of Proxy Voting Policies and Procedures for Closed-End Management Investment Companies –
Not Applicable
Item 8 – Portfolio Managers of Closed-End Management Investment Companies – Not Applicable
Item 9 – Purchases of Equity Securities by Closed-End Management Investment Company and Affiliated
Purchasers – Not Applicable
Item 10 – Submission of Matters to a Vote of Security Holders – The registrant’s Nominating and Governance
Committee will consider nominees to the board of directors recommended by shareholders when a vacancy
becomes available. Shareholders who wish to recommend a nominee should send nominations which
include biographical information and set forth the qualifications of the proposed nominee to the
registrant’s Secretary. There have been no material changes to these procedures.
Item 11 – Controls and Procedures
11(a) – The registrant’s principal executive and principal financial officers or persons performing similar functions
have concluded that the registrant’s disclosure controls and procedures (as defined in Rule 30a-3(c) under
the Investment Company Act of 1940, as amended (the “1940 Act”)) are effective as of a date within 90
days of the filing of this report based on the evaluation of these controls and procedures required by Rule
30a-3(b) under the 1940 Act and Rule 15(d)-15(b) under the Securities Exchange Act of 1934, as
amended.
11(b) – There were no changes in the registrant’s internal control over financial reporting (as defined in Rule 30a-
3(d) under the 1940 Act) that occurred during the second fiscal quarter of the period covered by this report
that have materially affected, or are reasonably likely to materially affect, the registrant’s internal control
over financial reporting.
Item 12 – Exhibits attached hereto
12(a)(1) – Code of Ethics – See Item 2
12(a)(2) – Certifications – Attached hereto
12(a)(3) – Not Applicable
12(b) – Certifications – Attached hereto
Pursuant to the requirements of the Securities Exchange Act of 1934 and the Investment Company Act of
1940, the registrant has duly caused this report to be signed on its behalf by the undersigned, thereunto duly
authorized.
BlackRock Healthcare Fund, Inc.
By: /s/ Donald C. Burke
Donald C. Burke
Chief Executive Officer of
BlackRock Healthcare Fund, Inc.
Date: June 19, 2009
Pursuant to the requirements of the Securities Exchange Act of 1934 and the Investment Company Act of
1940, this report has been signed below by the following persons on behalf of the registrant and in the
capacities and on the dates indicated.
By: /s/ Donald C. Burke
Donald C. Burke
Chief Executive Officer (principal executive officer) of
BlackRock Healthcare Fund, Inc.
Date: June 19, 2009
By: /s/ Neal J. Andrews
Neal J. Andrews
Chief Financial Officer (principal financial officer) of
BlackRock Healthcare Fund, Inc.
Date: June 19, 2009