UNITEDSTATES
SECURITIESANDEXCHANGECOMMISSION
Washington,D.C.20549
FORM N-CSR
CERTIFIED SHAREHOLDER REPORT OF REGISTERED MANAGEMENT
INVESTMENT COMPANIES
Investment Company Act file number 811-03595
Name of Fund: BlackRock Healthcare Fund, Inc.
Fund Address: 100 Bellevue Parkway, Wilmington, DE 19809
Name and address of agent for service: John M. Perlowski, Chief Executive Officer, BlackRock
Healthcare Fund, Inc., 55 East 52nd Street, New York, NY 10055
Registrant’s telephone number, including area code: (800) 441-7762
Date of fiscal year end: 04/30/2011
Date of reporting period: 04/30/2011
Item 1 – Report to Stockholders

April 30, 2011
Annual Report
BlackRock Healthcare Fund, Inc.
Not FDIC Insured • No Bank Guarantee • May Lose Value
| |
| Table of Contents | |
| | Page |
| Dear Shareholder | 3 |
| Annual Report: | |
| Fund Summary | 4 |
| About Fund Performance | 6 |
| Disclosure of Expenses | 6 |
| Financial Statements: | |
| Schedule of Investments | 7 |
| Statement of Assets and Liabilities | 9 |
| Statement of Operations | 10 |
| Statements of Changes in Net Assets | 11 |
| Financial Highlights | 12 |
| Notes to Financial Statements | 17 |
| Report of Independent Registered Public Accounting Firm | 24 |
| Important Tax Information | 24 |
| Officers and Directors | 25 |
| Additional Information | 28 |
| Mutual Fund Family | 31 |
2 BLACKROCK HEALTHCARE FUND, INC. APRIL 30, 2011
Dear Shareholder
Time and again, we have seen how various global events and developing trends can have significant influence on financial markets. I hope you find
that the following review of recent market conditions provides additional perspective on the performance of your investments as you read this share-
holder report.
Over the past 12 months, we have seen a sluggish, stimulus-driven economic recovery at long last gain real traction, accelerate, and transition into
a consumption-driven expansion. For the most part, 2010 was plagued with widely fluctuating economic data, but as the year drew to a close, it
became clear that cyclical stimulus had beaten out structural problems as economic data releases generally became more positive and financial
markets showed signs of continuing improvement. Although the sovereign debt crisis in Europe and high inflation in developing markets that troubled
the global economy in 2010 remain challenges today, overall investor confidence has improved considerably. During the first four months of 2011,
that confidence was shaken by political turmoil in the Middle East/North Africa region, soaring prices of oil and other commodities, tremendous nat-
ural disasters in Japan and a change in the ratings outlook for US debt. However, strong corporate earnings prevailed and financial markets resumed
their course while the global economy continued to garner strength.
Equity markets experienced uneven growth and high volatility in 2010, but ended the year with gains. Following a strong start to 2011, the series of
confidence-shaking events brought spurts of heightened volatility to markets worldwide, but was not enough to derail the bull market. Overall, global
equities posted strong returns over the past 12 months. Emerging market equities, which had outperformed developed markets earlier in the period,
fell prey to heightened inflationary pressures and underperformed developed markets later in the period. In the United States, strong corporate earn-
ings and positive signals from the labor market were sources of encouragement for equity investors, although the housing market did not budge from
its slump. Early in 2011, the US Federal Reserve announced that it would continue its Treasury purchase program (“QE2”) through to completion
and keep interest rates low for an extended period. This compelled investors to continue buying riskier assets, furthering the trend of small cap
stocks outperforming large caps.
While fixed income markets saw yields trend lower (pushing bond prices higher) through most of 2010, the abrupt reversal in investor sentiment
and risk tolerance in the fourth quarter drove yields sharply upward. Global credit markets were surprisingly resilient in the face of recent headwinds
and yields regained relative stability as the period came to a close. Yield curves globally remained steep by historical standards and higher-risk
sectors continued to outperform higher-quality assets. The tax-exempt municipal market enjoyed a powerful rally during the period of low yields in
2010, but when that trend reversed, the market was dealt an additional blow as it became evident that the Build America Bond program would
not be extended. Meanwhile, municipal finance troubles raised credit concerns among investors and tax-exempt mutual funds experienced heavy
outflows, resulting in wider spreads and falling prices. The new year brought relief from these headwinds and a steady rebound in the tax-exempt
municipal market.
Cash investments, as represented by the 3-month Treasury bill, returned only a fraction over 0% for the 12-month period as short-term interest rates
remained low. Yields on money market securities remain near all-time lows.
| | |
| Risk Assets Rallied on Growing Investor Confidence: Total Returns as of April 30, 2011 | 6-month | 12-month |
| US large cap equities (S&P 500® Index) | 16.36% | 17.22% |
| US small cap equities (Russell 2000® Index) | 23.73 | 22.20 |
| International equities (MSCI Europe, Australasia, Far East Index) | 12.71 | 19.18 |
| Emerging market equities (MSCI Emerging Markets Index) | 9.74 | 20.67 |
| 3-month Treasury bill (BofA Merrill Lynch 3-Month Treasury Bill Index) | 0.09 | 0.17 |
| US Treasury securities (BofA Merrill Lynch 10-Year US Treasury Index) | (3.85) | 6.37 |
| US investment grade bonds (Barclays Capital US Aggregate Bond Index) | 0.02 | 5.36 |
| Tax-exempt municipal bonds (Barclays Capital Municipal Bond Index) | (1.68) | 2.20 |
| US high yield bonds (Barclays Capital US Corporate High Yield 2% Issuer Capped Index) | 6.18 | 13.32 |
| Past performance is no guarantee of future results. Index performance shown for illustrative purposes only. You cannot invest directly in an index. | |
While no one can peer into a crystal ball and eliminate the uncertainties presented by the economic landscape and financial markets, BlackRock
can offer investors the next best thing: partnership with the world’s largest asset management firm that delivers consistent long-term investment
results with fewer surprises. For additional market perspective and investment insight, visit www.blackrock.com/shareholdermagazine, where you’ll
find the most recent issue of our award-winning Shareholder® magazine, as well as its quarterly companion newsletter, Shareholder Perspectives.
As always, we thank you for entrusting BlackRock with your investments, and we look forward to your continued partnership in the months and
years ahead.

THIS PAGE NOT PART OF YOUR FUND REPORT 3
Fund Summary as of April 30, 2011
Investment Objective
BlackRock Healthcare Fund, Inc.'s (the “Fund”) investment objective is to seek long-term capital appreciation through worldwide investment in equity
securities of companies that, in the opinion of Fund management, derive or are expected to derive a substantial portion of their sales from products
and services in healthcare.
Portfolio Management Commentary
How did the Fund perform?
• For the 12-month period, the Fund’s Investor A and Institutional
Shares outperformed its benchmark, the Russell 3000® Healthcare
Index, while the Fund’s Investor B, Investor C and Class R Shares
underperformed the index. All shares of the Fund outperformed the
broad-market S&P 500® Index. The following discussion of relative
performance pertains to the Russell 3000® Healthcare Index.
What factors influenced performance?
• The Fund’s outperformance relative to the benchmark was attributa-
ble to both sub-sector allocation and stock selection. The largest
contributor to Fund performance was the pharmaceuticals sub-
sector, which saw significant contributions from holdings in Abbott
Laboratories, Shire Pharmaceuticals Plc and Warner Chilcott Plc.,
Class A. The biotechnology sub-sector provided the next-largest
relative contribution, with standout performances from holdings
in Alexion Pharmaceuticals, Inc., Genzyme Corp. and Vertex
Pharmaceuticals, Inc. Finally, the medical devices & supplies sub-
sector contributed to performance, fueled by strong returns on hold-
ings in Medtronic, Inc., Intuitive Surgical, Inc. and Masimo Corp.
• Detracting from performance was the Fund’s holding in Genoptix
Inc., a medical laboratory that provides services to hematologists
and oncologists. The company reported disappointing earnings and
lowered long-term expectations for growth. The Fund’s overweight
allocation to the healthcare providers & services sub-sector relative
to the benchmark index also had a negative impact. While all of
the sub-sectors performed well for the period, healthcare providers
& services lagged the others despite standout gains from its
leading constituents, health maintenance organizations WellPoint Inc.
and Cigna Corp.
Describe recent Fund activity.
• During the 12-month period, the Fund’s positioning in biotechnology
moved from a large overweight to an underweight relative to the bench-
mark index as we reduced the Fund’s holdings in that space. We added
to the Fund’s position in pharmaceuticals, which by the end of the
period represented the largest sub-sector allocation in the Fund on
an absolute basis, although it remains an underweight relative to the
benchmark index. The Fund remains solidly overweight in healthcare
providers & services, where strong performance from its existing hold-
ings along with additions to select holdings increased the Fund’s
weighting in the sub-sector over the period.
Describe Fund positioning at period end.
• At period end, the Fund continued to be positioned for slow economic
growth, with low expectations for inflation. In an absolute sense,
sub-sector weightings favored pharmaceuticals, followed by health-
care providers & services, healthcare equipment & supplies and
biotechnology.
• On March 14, 2011, the Board of Directors of the Fund approved a
plan of reorganization, subject to shareholder approval and certain
other conditions, whereby BlackRock Health Sciences Opportunities
Portfolio, a series of BlackRock Funds, will acquire substantially all
of the assets and assume certain stated liabilities of the Fund in
exchange for newly issued shares of BlackRock Health Sciences
Opportunities Portfolio.
The views expressed reflect the opinions of BlackRock as of the date of this report and are subject to change based on changesin market, economic or other conditions.
These views are not intended to be a forecast of future events and are no guarantee of future results.
| |
| Portfolio Information | |
| | Percent of |
| | Long-Term |
| Ten Largest Holdings | Investments |
| Pfizer, Inc. | 7% |
| Merck & Co., Inc. | 5 |
| Abbott Laboratories | 4 |
| WellPoint, Inc. | 4 |
| Express Scripts, Inc. | 4 |
| AmerisourceBergen Corp. | 4 |
| UnitedHealth Group, Inc. | 3 |
| Celgene Corp. | 3 |
| Bristol-Myers Squibb Co. | 3 |
| Cigna Corp. | 3 |
| |
| | Percent of |
| | Long-Term |
| Industry Allocation | Investments |
| Pharmaceuticals | 38% |
| Health Care Providers & Services | 33 |
| Health Care Equipment & Supplies | 11 |
| Biotechnology | 10 |
| Life Sciences Tools & Services | 7 |
| Internet Software & Services | 1 |
For Fund compliance purposes, the Fund's industry classifications refer to any one
or more of the industry sub-classifications used by one or more widely recognized
market indexes or rating group indexes, and/or as defined by Fund management.
These definitions may not apply for purposes of this report, which may combine
such industry sub-classifications for reporting ease.
4 BLACKROCK HEALTHCARE FUND, INC. APRIL 30, 2011
Total Return Based on a $10,000 Investment
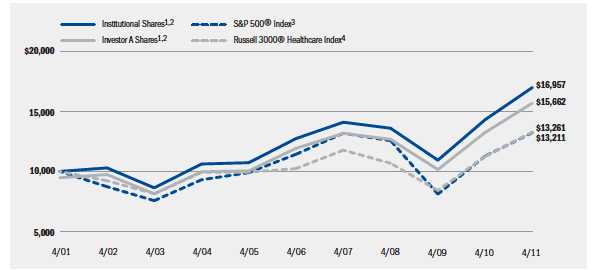
| 1 Assuming maximum sales charges, if any, transaction costs and other operating expenses, including advisory fees, if any. Institutional Shares do |
| not have a sales charge. |
| 2 The Fund invests worldwide in equity securities of companies that, in the opinion of Fund management, derive or are expected toderive a sub- |
| stantial portion of their sales from products or services in healthcare. |
| 3 This unmanaged index covers 500 industrial, utility, transportation and financial companies of the US markets (mostly New YorkStock Exchange |
| (“NYSE”) issues) representing about 75% of NYSE market capitalization and 30% of NYSE issues. |
| 4 This unmanaged index features companies involved in medical services or healthcare in the Russell 3000® Index. |
Performance Summary for the Period Ended April 30, 2011
| | | | | | | |
| | | | | Average Annual Total Returns5 | | |
| | | 1 Year | | 5 Years | | 10 Years |
| | 6-Month | w/o sales | w/sales | w/o sales | w/sales | w/o sales | w/sales |
| | Total Returns | charge | charge | charge | charge | charge | charge |
| Institutional | 17.38% | 18.69% | N/A | 5.91% | N/A | 5.42% | N/A |
| Investor A | 17.11 | 18.38 | 12.16% | 5.62 | 4.49% | 5.15 | 4.59% |
| Investor B | 16.81 | 17.47 | 12.97 | 4.72 | 4.44 | 4.50 | 4.50 |
| Investor C | 16.77 | 17.44 | 16.44 | 4.77 | 4.77 | 4.31 | 4.31 |
| Class R | 16.90 | 17.54 | N/A | 5.05 | N/A | 4.80 | N/A |
| S&P500®Index | 16.36 | 17.22 | N/A | 2.95 | N/A | 2.82 | N/A |
| Russell 3000® Healthcare Index | 16.84 | 17.93 | N/A | 5.31 | N/A | 2.86 | N/A |
5 Assuming maximum sales charges, if any. Average annual total returns with and without sales charges reflect reductions for distribution and service fees. See “About Fund
Performance” on page 6 for a detailed description of share classes, including any related sales charges and fees.
N/A — Not applicable as share class and index do not have a sales charge.
Past performance is not indicative of future results.
BLACKROCK HEALTHCARE FUND, INC. APRIL 30, 2011 5
About Fund Performance
• Institutional Shares are not subject to any sales charge. Institutional
Shares bear no ongoing distribution or service fees and are available
only to eligible investors.
• Investor A Shares incur a maximum initial sales charge (front-end load)
of 5.25% and a service fee of 0.25% per year (but no distribution fee).
• Investor B Shares are subject to a maximum contingent deferred sales
charge of 4.50% declining to 0% after six years. In addition, Investor B
Shares are subject to a distribution fee of 0.75% per year and a service
fee of 0.25% per year. These shares automatically convert to Investor A
Shares after approximately eight years. (There is no initial sales charge
for automatic share conversions.) All returns for periods greater than
eight years reflect this conversion. Investor B Shares of the Fund are
only available through exchanges and dividend reinvestment by
existing shareholders or for purchase by certain qualified employee
benefit plans.
• Investor C Shares are subject to a 1% contingent deferred sales charge
if redeemed within one year of purchase. In addition, Investor C Shares
are subject to a distribution fee of 0.75% per year and a service fee of
0.25% per year.
• Class R Shares do not incur a maximum initial sales charge (front-end
load) or deferred sales charge. These shares are subject to a distribution
fee of 0.25% per year and a service fee of 0.25% per year. Class R
Shares are available only to certain retirement plans. Prior to January 3,
2003, Class R Share performance results are those of the Institutional
Shares (which have no distribution or service fees) restated to reflect
Class R Share fees.
Performance information reflects past performance and does not guar-
antee future results. Current performance may be lower or higher than
the performance data quoted. Refer to www.blackrock.com/funds
to obtain performance data current to the most recent month end.
Performance results do not reflect the deduction of taxes that a share-
holder would pay on fund distributions or the redemption of fund shares.
Figures shown in the performance table on the previous page assume
reinvestment of all dividends and capital gain distributions, if any, at
net asset value on the ex-dividend date. Investment return and principal
value of shares will fluctuate so that shares, when redeemed, may be
worth more or less than their original cost. Dividends paid to each class
of shares will vary because of the different levels of service, distribution
and transfer agency fees applicable to each class, which are deducted
from the income available to be paid to shareholders.
Disclosure of Expenses
Shareholders of this Fund may incur the following charges: (a) expenses
related to transactions, including sales charges; and (b) operating
expenses including advisory fees, service and distribution fees, including
12b-1 fees, and other Fund expenses. The expense example below (which
is based on a hypothetical investment of $1,000 invested on November
1, 2010 and held through April 30, 2011) is intended to assist sharehold-
ers both in calculating expenses based on an investment in the Fund
and in comparing these expenses with similar costs of investing in other
mutual funds.
The table below provides information about actual account values and
actual expenses. In order to estimate the expenses a shareholder paid
during the period covered by this report, shareholders can divide their
account value by $1,000 and then multiply the result by the number
corresponding to their share class under the heading entitled “Expenses
Paid During the Period.”
The table also provides information about hypothetical account values
and hypothetical expenses based on the Fund’s actual expense ratio
and an assumed rate of return of 5% per year before expenses. In
order to assist shareholders in comparing the ongoing expenses of
investing in this Fund and other funds, compare the 5% hypothetical
example with the 5% hypothetical examples that appear in other funds’
shareholder reports.
The expenses shown in the table are intended to highlight shareholders’
ongoing costs only and do not reflect any transactional expenses, such
as sales charges or exchange fees. Therefore, the hypothetical example is
useful in comparing ongoing expenses only, and will not help sharehold-
ers determine the relative total expenses of owning different funds.
If these transactional expenses were included, shareholder expenses
would have been higher.
| | | | | | | |
| | | Actual | | | Hypothetical2 | | |
| | Beginning | Ending | | Beginning | Ending | | |
| | Account Value | Account Value | Expenses Paid | Account Value | Account Value | Expenses Paid | Annualized |
| | November 1, 2010 | April 30, 2011 | During the Period1 | November 1, 2010 | April 30, 2011 | During the Period1 | Expense Ratio |
| Institutional | $1,000.00 | $1,173.80 | $ 6.95 | $1,000.00 | $1,018.40 | $ 6.46 | 1.29% |
| Investor A | $1,000.00 | $1,171.10 | $ 8.40 | $1,000.00 | $1,017.06 | $ 7.80 | 1.56% |
| Investor B | $1,000.00 | $1,168.10 | $13.01 | $1,000.00 | $1,012.80 | $12.08 | 2.42% |
| Investor C | $1,000.00 | $1,167.70 | $12.79 | $1,000.00 | $1,013.00 | $11.88 | 2.38% |
| Class R | $1,000.00 | $1,169.00 | $11.89 | $1,000.00 | $1,013.84 | $11.04 | 2.21% |
| 1 For each class of the Fund, expenses are equal to the annualized expense ratio for the class, multiplied by the average account value over the period, multiplied by 181/365 |
| (to reflect the one-half year period shown). | | | | | | |
| 2 Hypothetical 5% annual return before expenses is calculated by pro rating the number of days in the most recent fiscal half year divided by 365. | |
6 BLACKROCK HEALTHCARE FUND, INC. APRIL 30, 2011
Schedule of Investments April 30, 2011
(Percentages shown are based on Net Assets)
| | |
| Common Stocks | Shares | Value |
| Biotechnology — 9.0% | | |
| Alexion Pharmaceuticals, Inc. (a) | 49,212 | $ 4,768,151 |
| Amgen, Inc. (a) | 100,000 | 5,685,000 |
| Celgene Corp. (a) | 156,000 | 9,185,280 |
| Cephalon, Inc. (a) | 20,000 | 1,536,000 |
| Dendreon Corp. (a) | 19,000 | 825,170 |
| Gilead Sciences, Inc. (a) | 100,000 | 3,884,000 |
| Human Genome Sciences, Inc. (a) | 25,000 | 736,750 |
| Onyx Pharmaceuticals, Inc. (a) | 104,600 | 3,929,822 |
| | | 30,550,173 |
| Chemicals — 0.1% | | |
| Sigma-Aldrich Corp. | 5,000 | 352,900 |
| Health Care Equipment & Supplies — 9.6% | | |
| Baxter International, Inc. | 100,000 | 5,690,000 |
| Becton Dickinson & Co. | 30,000 | 2,578,200 |
| Covidien Plc | 95,000 | 5,290,550 |
| Intuitive Surgical, Inc. (a) | 5,000 | 1,748,500 |
| Masimo Corp. | 45,000 | 1,565,550 |
| Medtronic, Inc. | 84,500 | 3,527,875 |
| Sirona Dental Systems, Inc. (a) | 19,000 | 1,084,330 |
| St. Jude Medical, Inc. | 50,000 | 2,672,000 |
| Stryker Corp. | 55,000 | 3,245,000 |
| Varian Medical Systems, Inc. (a) | 30,000 | 2,106,000 |
| Zimmer Holdings, Inc. (a) | 45,000 | 2,936,250 |
| | | 32,444,255 |
| Health Care Providers & Services — 29.5% | | |
| AMERIGROUP Corp. (a) | 10,800 | 737,640 |
| Aetna, Inc. | 177,500 | 7,344,950 |
| AmerisourceBergen Corp. | 262,600 | 10,672,064 |
| Cardinal Health, Inc. | 19,000 | 830,110 |
| Cigna Corp. | 181,000 | 8,476,230 |
| Express Scripts, Inc. (a) | 220,000 | 12,482,800 |
| HCA Holdings, Inc. (a) | 250,000 | 8,200,000 |
| Health Management Associates, Inc., Class A (a) | 110,000 | 1,240,800 |
| Kindred Healthcare, Inc. (a) | 30,000 | 756,600 |
| Laboratory Corp. of America Holdings (a) | 51,000 | 4,919,970 |
| LifePoint Hospitals, Inc. (a) | 21,000 | 873,810 |
| McKesson Corp. | 17,700 | 1,469,277 |
| Medco Health Solutions, Inc. (a) | 110,000 | 6,526,300 |
| Omnicare, Inc. | 23,000 | 722,660 |
| Patterson Cos., Inc. | 10,000 | 347,100 |
| Quest Diagnostics, Inc. | 83,000 | 4,679,540 |
| UnitedHealth Group, Inc. | 215,000 | 10,584,450 |
| Universal Health Services, Inc., Class B | 32,100 | 1,758,438 |
| WellCare Health Plans, Inc. (a) | 97,500 | 4,271,475 |
| WellPoint, Inc. | 170,000 | 13,054,300 |
| | | 99,948,514 |
| Internet Software & Services — 1.4% | | |
| WebMD Health Corp., Class A (a)(b) | 80,106 | 4,635,734 |
| | |
| Common Stocks | Shares | Value |
| Life Sciences Tools & Services — 6.5% | | |
| Agilent Technologies, Inc. (a) | 110,000 | $ 5,490,100 |
| Covance, Inc. (a) | 6,900 | 431,940 |
| Illumina, Inc. (a) | 25,000 | 1,774,500 |
| Life Technologies Corp. (a) | 60,000 | 3,312,000 |
| Thermo Fisher Scientific, Inc. (a) | 90,000 | 5,399,100 |
| Waters Corp. (a) | 56,700 | 5,556,600 |
| | | 21,964,240 |
| Pharmaceuticals — 34.0% | | |
| Abbott Laboratories | 260,000 | 13,530,400 |
| Allergan, Inc. | 80,800 | 6,428,448 |
| Bayer AG | 20,000 | 1,755,891 |
| Bristol-Myers Squibb Co. | 310,000 | 8,711,000 |
| Eli Lilly & Co. | 60,000 | 2,220,600 |
| GlaxoSmithKline Plc | 30,000 | 655,351 |
| GlaxoSmithKline Plc — ADR | 60,000 | 2,619,600 |
| Hospira, Inc. (a) | 70,000 | 3,971,100 |
| Johnson & Johnson | 120,000 | 7,886,400 |
| Merck & Co, Inc. | 400,000 | 14,380,000 |
| Mylan, Inc. (a) | 20,000 | 498,400 |
| Novartis AG, Registered Shares | 65,000 | 3,854,511 |
| Pfizer, Inc. | 1,030,000 | 21,588,800 |
| Roche Holding AG | 20,000 | 3,246,396 |
| Sanofi | 65,000 | 5,142,604 |
| Shire Pharmaceuticals Plc — ADR | 60,000 | 5,592,600 |
| Teva Pharmaceutical Industries Ltd. | 100,000 | 4,573,000 |
| Warner Chilcott Plc, Class A | 360,000 | 8,298,000 |
| | | 114,953,101 |
| Total Long-Term Investments | | |
| (Cost — $232,560,029) — 90.1% | | 304,848,917 |
| Short-Term Securities | | |
| BlackRock Liquidity Funds, TempCash, | | |
| Institutional Class, 0.13% (c)(d) | 18,370,482 | 18,370,482 |
| | Beneficial | |
| | Interest | |
| | (000) | |
| BlackRock Liquidity Series, LLC | | |
| Money Market Series, 0.23% (c)(d)(e) | $ 468 | 468,000 |
| Total Short-Term Securities | | |
| (Cost — $18,838,482) — 5.5% | | 18,838,482 |
| Total Investments (Cost — $251,398,511*) — 95.6% | 323,687,399 |
| Other Assets Less Liabilities — 4.4% | | 14,754,873 |
| Net Assets — 100.0% | | $338,442,272 |
* The cost and unrealized appreciation (depreciation) of investments as of April 30,
2011, as computed for federal income tax purposes, were as follows:
| |
| Aggregate cost | $252,645,570 |
| Gross unrealized appreciation | $ 71,445,111 |
| Gross unrealized depreciation | (403,282) |
| Net unrealized appreciation | $ 71,041,829 |
| |
| Portfolio Abbreviations |
| To simplify the listings of portfolio holdings in the Schedule of Investments, the |
| names and descriptions of many of the securities have been abbreviated according |
| to the following list: |
| ADR | American Depositary Receipts |
| DKK | Danish Krone |
| GBP | British Pound |
| USD | US Dollar |
See Notes to Financial Statements.
BLACKROCK HEALTHCARE FUND, INC. APRIL 30, 2011 7
Schedule of Investments (concluded)
(a) Non-income producing security.
(b) Security, or a portion of security, is on loan.
(c) Investments in companies considered to be an affiliate of the Fund during the
year, for purposes of Section 2(a)(3) of the Investment Company Act of 1940,
as amended, were as follows:
| | | | |
| Shares/Beneficial | Shares/Beneficial |
| Interest Held at | Interest Held at |
| | April 30, | Net | April 30, | |
| Affiliate | 2010 | Activity | 2011 | Income |
| BlackRock Liquidity | | | | |
| Funds, TempCash, | | | | |
| Institutional Class | 15,616,332 | 2,754,150 | 18,370,482 | $10,103 |
| BlackRock Liquidity | | | | |
| Series, LLC Money | | | | |
| Market Series | $30,687,000 $(30,219,000) | $ 468,000 | $19,760 |
(d) Represents the current yield as of report date.
(e) Security was purchased with the cash collateral from loaned securities.
• For Fund compliance purposes, the Fund’s industry classifications refer to any
one or more of the industry sub-classifications used by one or more widely
recognized market indexes or rating group indexes, and/or as defined by Fund
management. These definitions may not apply for purposes of this report, which
may combine such industry sub-classifications for reporting ease.
• Foreign currency exchange contracts as of April 30, 2011 were as follows:
| | | | |
| | | | | Unrealized |
| Currency | Currency | | Settlement Appreciation |
| Purchased | Sold | Counterparty | Date | (Depreciation) |
| USD 2,525,060 DKK 12,700,321 | State Street | | |
| | | Global Markets | 5/04/11 | $ 2,753 |
| USD 216,141 GBP 129,904 | State Street | | |
| | | Global Markets | 5/05/11 | (842) |
| Total | | | | $ 1,911 |
• Fair Value Measurements — Various inputs are used in determining the fair value
of investments and derivative financial instruments. These inputs are summa-
rized in three broad levels for financial statement purposes as follows:
• Level 1 — price quotations in active markets/exchanges for identical assets
and liabilities
• Level 2 — other observable inputs (including, but not limited to: quoted
prices for similar assets or liabilities in markets that are active, quoted prices
for identical or similar assets or liabilities in markets that are not active,
inputs other than quoted prices that are observable for the assets or liabili-
ties (such as interest rates, yield curves, volatilities, prepayment speeds, loss
severities, credit risks and default rates) or other market-corroborated inputs)
• Level 3 — unobservable inputs based on the best information available in the
circumstances, to the extent observable inputs are not available (including
the Fund’s own assumptions used in determining the fair value of invest-
ments and derivative financial instruments)
The inputs or methodologies used for valuing securities are not necessarily an
indication of the risk associated with investing in those securities. For information
about the Fund’s policy regarding valuation of investments and derivative finan-
cial instruments and other significant accounting policies, please refer to Note 1
of the Notes to Financial Statements.
The following tables summarize the inputs used as of April 30, 2011 in
determining the fair valuation of the Fund’s investments and derivative financial
instruments:
| | | | |
| Valuation Inputs | Level 1 | Level 2 | Level 3 | Total |
| Assets: | | | | |
| Investments: | | | | |
| Long-Term Investments: | | | | |
| Common Stocks: | | | | |
| Biotechnology | $ 30,550,173 | — | — | $ 30,550,173 |
| Chemicals | 352,900 | — | — | 352,900 |
| Health Care | | | | |
| Equipment | | | | |
| & Supplies | 32,444,255 | — | — | 32,444,255 |
| Health Care | | | | |
| Providers | | | | |
| & Services | 99,948,514 | — | — | 99,948,514 |
| Internet Software | | | | |
| & Services | 4,635,734 | — | — | 4,635,734 |
| Life Sciences | | | | |
| Tools & Services . | 21,964,240 | — | — | 21,964,240 |
| Pharmaceuticals | 100,298,348 | $14,654,753 | — | 114,953,101 |
| Short-Term | | | | |
| Securities | 18,370,482 | 468,000 | — | 18,838,482 |
| Total | $308,564,646 $15,122,753 | — | $323,687,399 |
| | | | |
| Derivative Financial Instruments1 |
|
| Valuation Inputs | Level 1 | Level 2 | Level 3 | Total |
| Assets: | | | | |
| Foreign currency | | | | |
| exchange contracts | — | $ 2,753 | — | $2,753 |
| Liabilities: | | | | |
| Foreign currency | | | | |
| exchange contracts | — | (842) | — | (842) |
| Total | — | $ 1,911 | — | $1,911 |
1 Derivative financial instruments are foreign currency exchange contracts,
which are valued at the unrealized appreciation/depreciation on the
instrument.
See Notes to Financial Statements.
8 BLACKROCK HEALTHCARE FUND, INC. APRIL 30, 2011
| |
| Statement of Assets and Liabilities | |
| April 30, 2011 | |
| Assets | |
| Investments at value — unaffiliated (including securities loaned at value of $462,960) (cost — $232,560,029) | $ 304,848,917 |
| Investments at value — affiliated (cost — $18,838,482) | 18,838,482 |
| Unrealized appreciation on foreign currency exchange contracts | 2,753 |
| Investments sold receivable | 28,857,802 |
| Capital shares sold receivable | 962,895 |
| Dividends receivable | 277,138 |
| Securities lending income receivable — affiliated | 1,236 |
| Prepaid expenses | 18,968 |
| Total assets | 353,808,191 |
| Liabilities | |
| Collateral on securities loaned, at value | 468,000 |
| Bank overdraft on foreign currency | 154 |
| Unrealized depreciation on foreign currency exchange contracts | 842 |
| Investments purchased payable | 13,814,127 |
| Capital shares redeemed payable | 502,211 |
| Investment advisory fees payable | 246,324 |
| Service and distribution fees payable | 84,866 |
| Other affiliates payable | 1,780 |
| Officer's and Directors' fees payable | 153 |
| Other accrued expenses payable | 246,857 |
| Other liabilities | 605 |
| Total liabilities | 15,365,919 |
| Net Assets | $ 338,442,272 |
| Net Assets Consist of | |
| Paid-in capital | $ 241,869,454 |
| Undistributed net investment income | 842 |
| Accumulated net realized gain | 24,277,386 |
| Net unrealized appreciation/depreciation | 72,294,590 |
| Net Assets | $ 338,442,272 |
| Net Asset Value | |
| Institutional — Based on net assets of $88,038,356 and 11,945,337 shares outstanding, 200 million shares authorized, $0.10 par value | $ 7.37 |
| Investor A — Based on net assets of $173,389,155 and 26,574,276 shares outstanding, 100 million shares authorized, $0.10 par value | $ 6.52 |
| Investor B — Based on net assets of $9,282,631 and 2,246,730 shares outstanding, 250 million shares authorized, $0.10 par value | $ 4.13 |
| Investor C — Based on net assets of $56,311,343 and 13,719,973 shares outstanding, 100 million shares authorized, $0.10 par value | $ 4.10 |
| Class R — Based on net assets of $11,420,787 and 2,684,950 shares outstanding, 250 million shares authorized, $0.10 par value | $ 4.25 |
See Notes to Financial Statements.
BLACKROCK HEALTHCARE FUND, INC. APRIL 30, 2011 9
| |
| Statement of Operations | |
| Year Ended April 30, 2011 | |
| Investment Income | |
| Dividends | $ 6,778,475 |
| Foreign taxes withheld | (19,910) |
| Securities lending — affiliated | 19,760 |
| Dividends — affiliated | 10,103 |
| Total income | 6,788,428 |
| Expenses | |
| Investment advisory | 2,908,896 |
| Service — Investor A | 337,743 |
| Service and distribution — Investor B | 102,924 |
| Service and distribution — Investor C | 525,186 |
| Service and distribution — Class R | 53,713 |
| Transfer agent — Institutional | 133,977 |
| Transfer agent — Investor A | 227,767 |
| Transfer agent — Investor B | 32,139 |
| Transfer agent — Investor C | 126,080 |
| Transfer agent — Class R | 57,355 |
| Professional | 82,720 |
| Reorganization | 81,928 |
| Printing | 80,227 |
| Registration | 73,649 |
| Accounting services | 68,138 |
| Custodian | 32,439 |
| Officer and Directors | 10,394 |
| Miscellaneous | 31,423 |
| Total expenses | 4,966,698 |
| Less fees waived by advisor | (3,996) |
| Less fees paid indirectly | (2,029) |
| Total expenses after fees waived and paid indirectly | 4,960,673 |
| Net investment income | 1,827,755 |
| Realized and Unrealized Gain (Loss) | |
| Net realized gain from: | |
| Investments | 39,891,398 |
| Options written | 287,513 |
| Foreign currency transactions | 11,469 |
| | 40,190,380 |
| Net change in unrealized appreciation/depreciation on: | |
| Investments | 4,931,747 |
| Foreign currency transactions | (293) |
| | 4,931,454 |
| Total realized and unrealized gain | 45,121,834 |
| Net Increase in Net Assets Resulting from Operations | $ 46,949,589 |
See Notes to Financial Statements.
10 BLACKROCK HEALTHCARE FUND, INC. APRIL 30, 2011
| | |
| Statements of Changes in Net Assets | | |
| | Year Ended April 30, |
| Increase (Decrease) in Net Assets: | 2011 | 2010 |
| Operations | | |
| Net investment income (loss) | $ 1,827,755 | $ (2,898,178) |
| Net realized gain | 40,190,380 | 32,728,969 |
| Net change in unrealized appreciation/depreciation | 4,931,454 | 54,148,611 |
| Net increase in net assets resulting from operations | 46,949,589 | 83,979,402 |
| Dividends to Shareholders From | | |
| Net investment income: | | |
| Institutional | (642,297) | — |
| Investor A | (997,377) | — |
| Investor B | (67,202) | — |
| Investor C | (419,352) | — |
| Class R | (101,342) | — |
| Decrease in net assets resulting from dividends to shareholders | (2,227,570) | — |
| Capital Share Transactions | | |
| Net decrease in net assets derived from capital share transactions | (43,137,661) | (45,477,230) |
| Net Assets | | |
| Total increase in net assets | 1,584,358 | 38,502,172 |
| Beginning of year | 336,857,914 | 298,355,742 |
| End of year | $ 338,442,272 | $ 336,857,914 |
| Undistributed net investment income | $ 842 | $ 39,869 |
See Notes to Financial Statements.
BLACKROCK HEALTHCARE FUND, INC. APRIL 30, 2011 11
| | | | | | |
| Financial Highlights | | | | | | |
| | Institutional |
| | Year Ended April 30, |
| | 2011 | 2010 | 2009 | | 2008 | 2007 |
| Per Share Operating Performance | | | | | | |
| Net asset value, beginning of year | $ 6.26 | $ 4.79 | $ 5.95 | $ 7.08 | $ 7.29 |
| Net investment income (loss)1 | 0.07 | (0.03) | (0.03) | | (0.03) | (0.04) |
| Net realized and unrealized gain (loss) | 1.09 | 1.50 | (1.13) | | (0.14) | 0.67 |
| Net increase (decrease) from investment operations | 1.16 | 1.47 | (1.16) | | (0.17) | 0.63 |
| Dividends and distributions from: | | | | | | |
| Net investment income | (0.05) | — | — | | — | — |
| Net realized gain | — | — | — | | (0.92) | (0.84) |
| Tax return of capital | — | — | — | | (0.04) | — |
| Total dividends and distributions | (0.05) | — | — | | (0.96) | (0.84) |
| Net asset value, end of year | $ 7.37 | $ 6.26 | $ 4.79 | $ 5.95 | $ 7.08 |
| Total Investment Return2 | | | | | | |
| Based on net asset value | 18.69% | 30.69% | (19.50)% | | (3.54)% | 10.62% |
| Ratios to Average Net Assets | | | | | | |
| Total expenses | 1.32% | 1.32% | 1.35% | | 1.29% | 1.33% |
| Total expenses after fees waived | 1.32% | 1.31% | 1.35% | | 1.29% | 1.33% |
| Net investment income (loss) | 0.98% | (0.50)% | (0.62)% | | (0.42)% | (0.64)% |
| Supplemental Data | | | | | | |
| Net assets, end of year (000) | $ 88,038 | $ 109,190 | $ 94,282 | $ 132,784 | $ 147,755 |
| Portfolio turnover | 138% | 96% | 156% | | 163% | 152% |
1 Based on average shares outstanding.
2 Where applicable, total investment returns exclude the effects of any sales charges and include the reinvestment of dividends and distributions.
See Notes to Financial Statements.
12 BLACKROCK HEALTHCARE FUND, INC. APRIL 30, 2011
| | | | | | |
| Financial Highlights (continued) | | | | | | |
| | Investor A |
| | Year Ended April 30, |
| | 2011 | 2010 | 2009 | | 2008 | 2007 |
| Per Share Operating Performance | | | | | | |
| Net asset value, beginning of year | $ 5.55 | $ 4.26 | $ 5.31 | $ 6.41 | $ 6.69 |
| Net investment income (loss)1 | 0.04 | (0.04) | (0.04) | | (0.04) | (0.05) |
| Net realized and unrealized gain (loss) | 0.97 | 1.33 | (1.01) | | (0.12) | 0.61 |
| Net increase (decrease) from investment operations | 1.01 | 1.29 | (1.05) | | (0.16) | 0.56 |
| Dividends and distributions from: | | | | | | |
| Net investment income | (0.04) | — | — | | — | — |
| Net realized gain | — | — | — | | (0.90) | (0.84) |
| Tax return of capital | — | — | — | | (0.04) | — |
| Total dividends and distributions | (0.04) | — | — | | (0.94) | (0.84) |
| Net asset value, end of year | $ 6.52 | $ 5.55 | $ 4.26 | $ 5.31 | $ 6.41 |
| Total Investment Return2 | | | | | | |
| Based on net asset value | 18.38% | 30.28% | (19.77)% | | (3.80)% | 10.43% |
| Ratios to Average Net Assets | | | | | | |
| Total expenses | 1.58% | 1.57% | 1.62% | | 1.52% | 1.57% |
| Total expenses after fees waived | 1.58% | 1.57% | 1.62% | | 1.52% | 1.57% |
| Net investment income (loss) | 0.77% | (0.76)% | (0.89)% | | (0.64)% | (0.89)% |
| Supplemental Data | | | | | | |
| Net assets, end of year (000) | $173,389 | $ 145,577 | $ 122,869 | $ 175,094 | $ 160,652 |
| Portfolio turnover | 138% | 96% | 156% | | 163% | 152% |
1 Based on average shares outstanding.
2 Where applicable, total investment returns exclude the effects of any sales charges and include the reinvestment of dividends and distributions.
See Notes to Financial Statements.
BLACKROCK HEALTHCARE FUND, INC. APRIL 30, 2011 13
| | | | | | |
| Financial Highlights (continued) | | | | | | |
| | Investor B |
| | Year Ended April 30, |
| | 2011 | 2010 | 2009 | | 2008 | 2007 |
| Per Share Operating Performance | | | | | | |
| Net asset value, beginning of year | $ 3.54 | $ 2.75 | $ 3.45 | $ 4.44 | $ 4.93 |
| Net investment loss1 | (0.00)2 | (0.05) | (0.05) | | (0.06) | (0.07) |
| Net realized and unrealized gain (loss) | 0.61 | 0.84 | (0.65) | | (0.06) | 0.41 |
| Net increase (decrease) from investment operations | 0.61 | 0.79 | (0.70) | | (0.12) | 0.34 |
| Dividends and distributions from: | | | | | | |
| Net investment income | (0.02) | — | — | | — | — |
| Net realized gain | — | — | — | | (0.83) | (0.83) |
| Tax return of capital | — | — | — | | (0.04) | — |
| Total dividends and distributions | (0.02) | — | — | | (0.87) | (0.83) |
| Net asset value, end of year | $ 4.13 | $ 3.54 | $ 2.75 | $ 3.45 | $ 4.44 |
| Total Investment Return3 | | | | | | |
| Based on net asset value | 17.47% | 28.73% | (20.29)% | | (4.49)% | 9.41% |
| Ratios to Average Net Assets | | | | | | |
| Total expenses | 2.47% | 2.46% | 2.47% | | 2.37% | 2.36% |
| Total expenses after fees waived | 2.47% | 2.46% | 2.47% | | 2.37% | 2.36% |
| Net investment loss | (0.04)% | (1.69)% | (1.74)% | | (1.52)% | (1.67)% |
| Supplemental Data | | | | | | |
| Net assets, end of year (000) | $ 9,283 | $ 13,100 | $ 21,003 | $ 44,711 | $ 68,034 |
| Portfolio turnover | 138% | 96% | 156% | | 163% | 152% |
1 Based on average shares outstanding.
2 Amount is less than $(0.01) per share.
3 Where applicable, total investment returns exclude the effects of any sales charges and include the reinvestment of dividends and distributions.
See Notes to Financial Statements.
14 BLACKROCK HEALTHCARE FUND, INC. APRIL 30, 2011
| | | | | | |
| Financial Highlights (continued) | | | | | | |
| | Investor C |
| | Year Ended April 30, |
| | 2011 | 2010 | 2009 | | 2008 | 2007 |
| Per Share Operating Performance | | | | | | |
| Net asset value, beginning of year | $ 3.52 | $ 2.73 | $ 3.42 | $ 4.43 | $ 4.92 |
| Net investment loss1 | (0.00)2 | (0.05) | (0.05) | | (0.06) | (0.07) |
| Net realized and unrealized gain (loss) | 0.61 | 0.84 | (0.64) | | (0.06) | 0.41 |
| Net increase (decrease) from investment operations | 0.61 | 0.79 | (0.69) | | (0.12) | 0.34 |
| Dividends and distributions from: | | | | | | |
| Net investment income | (0.03) | — | — | | — | — |
| Net realized gain | — | — | — | | (0.85) | (0.83) |
| Tax return of capital | — | — | — | | (0.04) | — |
| Total dividends and distributions | (0.03) | — | — | | (0.89) | (0.83 |
| Net asset value, end of year | $ 4.10 | $ 3.52 | $ 2.73 | $ 3.42 | $ 4.43 |
| Total Investment Return3 | | | | | | |
| Based on net asset value | 17.44% | 28.94% | (20.18)% | | (4.62)% | 9.47% |
| Ratios to Average Net Assets | | | | | | |
| Total expenses | 2.40% | 2.40% | 2.43% | | 2.35% | 2.36% |
| Total expenses after fees waived | 2.40% | 2.40% | 2.43% | | 2.35% | 2.36% |
| Net investment loss | (0.06)% | (1.59)% | (1.70)% | | (1.47)% | (1.67)% |
| Supplemental Data | | | | | | |
| Net assets, end of year (000) | $ 56,311 | $ 57,637 | $ 51,982 | $ 70,452 | $ 69,535 |
| Portfolio turnover | 138% | 96% | 156% | | 163% | 152% |
1 Based on average shares outstanding.
2 Amount is less than $(0.01) per share.
3 Where applicable, total investment returns exclude the effects of any sales charges and include the reinvestment of dividends and distributions.
See Notes to Financial Statements.
BLACKROCK HEALTHCARE FUND, INC. APRIL 30, 2011 15
| | | | | | |
| Financial Highlights (concluded) | | | | | | |
| | Class R |
| | Year Ended April 30, |
| | 2011 | 2010 | 2009 | | 2008 | 2007 |
| Per Share Operating Performance | | | | | | |
| Net asset value, beginning of year | $ 3.65 | $ 2.82 | $ 3.53 | $ 4.57 | $ 5.04 |
| Net investment income (loss)1 | 0.01 | (0.04) | (0.05) | | (0.05) | (0.05) |
| Net realized and unrealized gain (loss) | 0.62 | 0.87 | (0.66) | | (0.06) | 0.42 |
| Net increase (decrease) from investment operations | 0.63 | 0.83 | (0.71) | | (0.11) | 0.37 |
| Dividends and distributions from: | | | | | | |
| Net investment income | (0.03) | — | — | | — | — |
| Net realized gain | — | — | — | | (0.89) | (0.84) |
| Tax return of capital | — | — | — | | (0.04) | — |
| Total dividends and distributions | (0.03) | — | — | | (0.93) | (0.84) |
| Net asset value, end of year | $ 4.25 | $ 3.65 | $ 2.82 | $ 3.53 | $ 4.57 |
| Total Investment Return2 | | | | | | |
| Based on net asset value | 17.54% | 29.43% | (20.11)% | | (4.29)% | 9.98% |
| Ratios to Average Net Assets | | | | | | |
| Total expenses | 2.19% | 2.15% | 2.26% | | 2.06% | 1.88% |
| Total expenses after fees waived | 2.19% | 2.15% | 2.26% | | 2.06% | 1.88% |
| Net investment income (loss) | 0.15% | (1.30)% | (1.53)% | | (1.16)% | (1.20)% |
| Supplemental Data | | | | | | |
| Net assets, end of year (000) | $ 11,421 | $ 11,354 | $ 8,219 | $ 9,170 | $ 6,145 |
| Portfolio turnover | 138% | 96% | 156% | | 163% | 152% |
1 Based on average shares outstanding.
2 Where applicable, total investment returns include the reinvestment of dividends and distributions.
See Notes to Financial Statements.
16 BLACKROCK HEALTHCARE FUND, INC. APRIL 30, 2011
Notes to Financial Statements
1. Organization and Significant Accounting Policies:
BlackRock Healthcare Fund, Inc. (the “Fund”) is registered under the
Investment Company Act of 1940, as amended (the “1940 Act”), as a
non-diversified, open-end management investment company. The Fund
is organized as a Maryland corporation. The Fund's financial statements
are prepared in conformity with accounting principles generally accepted
in the United States of America ("US GAAP"), which may require man-
agement to make estimates and assumptions that affect the reported
amounts and disclosures in the financial statements. Actual results
could differ from those estimates. The Fund offers multiple classes of
shares. Institutional Shares are sold without a sales charge and only to
certain eligible investors. Investor A Shares are generally sold with a
front-end sales charge. Investor B and Investor C Shares may be subject
to a contingent deferred sales charge. Class R Shares are sold without
a sales charge and only to certain retirement and other similar plans.
All classes of shares have identical voting, dividend, liquidation and
other rights and the same terms and conditions, except that Investor A,
Investor B, Investor C and Class R Shares bear certain expenses related
to the shareholder servicing of such shares, and Investor B, Investor C
and Class R Shares also bear certain expenses related to the distribu-
tion of such shares. Investor B Shares automatically convert to Investor A
Shares after approximately eight years. Investor B Shares are only
available through exchanges, dividend reinvestment by existing share-
holders or for purchase by certain qualified employee benefit plans.
Each class has exclusive voting rights with respect to matters relating
to its shareholder servicing and distribution expenditures (except that
Investor B shareholders may vote on material changes to the Investor A
distribution plan).
On March 14, 2011, the Board of Directors (the “Board”) of the Fund
approved a plan of reorganization, subject to shareholder approval
and certain other conditions, whereby BlackRock Health Sciences
Opportunities Portfolio, a series of BlackRock Funds, will acquire
substantially all of the assets and assume certain stated liabilities of
the Fund in exchange for newly issued shares of BlackRock Health
Sciences Opportunities Portfolio.
The following is a summary of significant accounting policies followed
by the Fund:
Valuation: US GAAP defines fair value as the price the Fund would
receive to sell an asset or pay to transfer a liability in an orderly trans-
action between market participants at the measurement date. The Fund
fair values its financial instruments at market value using independent
dealers or pricing services under policies approved by the Board. Equity
investments traded on a recognized securities exchange or the NASDAQ
Global Market System ("NASDAQ") are valued at the last reported sale
price that day or the NASDAQ official closing price, if applicable. For
equity investments traded on more than one exchange, the last reported
sale price on the exchange where the stock is primarily traded is used.
Equity investments traded on a recognized exchange for which there
were no sales on that day are valued at the last available bid price.
If no bid price is available, the prior day’s price will be used, unless it
is determined that such prior day’s price no longer reflects the fair value
of the security.
Securities and other assets and liabilities denominated in foreign
currencies are translated into US dollars using exchange rates deter-
mined as of the close of business on the New York Stock Exchange
(“NYSE”). Foreign currency exchange contracts are valued at the mean
between the bid and ask prices and are determined as of the close of
business on the NYSE. Interpolated values are derived when the settle-
ment date of the contract is an interim date for which quotations are
not available.
Exchange-traded options are valued at the mean between the last bid
and ask prices at the close of the options market in which the options
trade. An exchange-traded option for which there is no mean price is
valued at the last bid (long positions) or ask (short positions) price. If no
bid or ask price is available, the prior day’s price will be used, unless it is
determined that the prior day’s price no longer reflects the fair value of
the option. Over-the-counter (“OTC”) options are valued by an independ-
ent pricing service using a mathematical model which incorporates a
number of market data factors, such as the trades and prices of the
underlying instruments.
The Fund values its investments in BlackRock Liquidity Series, LLC
Money Market Series (the “Money Market Series”) at fair value, which
is ordinarily based upon its pro rata ownership in the net assets of
the underlying fund. The Money Market Series seeks current income
consistent with maintaining liquidity and preserving capital. Although
the Money Market Series is not registered under the 1940 Act, its invest-
ments will follow the parameters of investments by a money market fund
that is subject to Rule 2a-7 under the 1940 Act. The Fund may withdraw
up to 25% of its investment daily, although the manager of the Money
Market Series, in its sole discretion, may permit an investor to withdraw
more than 25% on any one day.
In the event that application of these methods of valuation results in
a price for an investment which is deemed not to be representative of
the market value of such investment or is not available, the investment
will be valued in accordance with a policy approved by the Board as
reflecting fair value (“Fair Value Assets”). When determining the price
for Fair Value Assets, the investment advisor and/or the sub-advisor
seeks to determine the price that the Fund might reasonably expect
to receive from the current sale of that asset in an arm’s-length trans-
action. Fair value determinations shall be based upon all available
factors that the investment advisor and/or sub-advisor deems relevant.
The pricing of all Fair Value Assets is subsequently reported to the Board
or a committee thereof.
BLACKROCK HEALTHCARE FUND, INC. APRIL 30, 2011 17
Notes to Financial Statements (continued)
Generally, trading in foreign instruments is substantially completed
each day at various times prior to the close of business on the NYSE.
Occasionally, events affecting the values of such instruments may occur
between the foreign market close and the close of business on the NYSE
that may not be reflected in the computation of the Fund's net assets.
If events (for example, a company announcement, market volatility or a
natural disaster) occur during such periods that are expected to materi-
ally affect the value of such instruments, those instruments may be
Fair Value Assets and be valued at their fair value, as determined in good
faith by the investment advisor using a pricing service and/or
policies approved by the Board. Each business day, the Fund uses a
pricing service to assist with the valuation of certain foreign exchange-
traded equity securities and foreign exchange-traded and OTC options
(the “Systematic Fair Value Price”). Using current market factors, the
Systematic Fair Value Price is designed to value such foreign securities
and foreign options at fair value as of the close of business on the
NYSE, which follows the close of the local markets.
Foreign Currency Transactions: The Fund's books and records are main-
tained in US dollars. Purchases and sales of investment securities are
recorded at the rates of exchange prevailing on the date the transactions
are entered into. Generally, when the US dollar rises in value against a
foreign currency, the Fund's investments denominated in that currency
will lose value because its currency is worth fewer US dollars; the oppo-
site effect occurs if the US dollar falls in relative value.
The Fund reports realized currency gains (losses) on foreign currency
related transactions as components of net realized gain (loss) for
financial reporting purposes, whereas such components are treated as
ordinary income for federal income tax purposes.
Segregation and Collateralization: In cases in which the 1940 Act and
the interpretive positions of the Securities and Exchange Commission
(“SEC”) require that the Fund either delivers collateral or segregates
assets in connection with certain investments (e.g., foreign currency
exchange contracts and written options), the Fund will, consistent
with SEC rules and/or certain interpretive letters issued by the SEC,
segregate collateral or designate on its books and records cash or liquid
securities having a market value at least equal to the amount that would
otherwise be required to be physically segregated. Furthermore, based
on requirements and agreements with certain exchanges and third
party broker-dealers, each party to such transactions has requirements
to deliver/deposit securities as collateral for certain investments.
Investment Transactions and Investment Income: For financial reporting
purposes, investment transactions are recorded on the dates the trans-
actions are entered into (the trade dates). Realized gains and losses
on investment transactions are determined on the identified cost basis.
Dividend income is recorded on the ex-dividend dates. Dividends from
foreign securities where the ex-dividend date may have passed are sub-
sequently recorded when the Fund is informed of the ex-dividend date.
Under the applicable foreign tax laws, a withholding tax at various rates
may be imposed on capital gains, dividends and interest. Income and
realized and unrealized gains and losses are allocated daily to each
class based on its relative net assets.
Dividends and Distributions: Dividends and distributions paid by the
Fund are recorded on the ex-dividend dates. The amount and timing of
dividends and distributions are determined in accordance with federal
income tax regulations, which may differ from US GAAP.
Securities Lending: The Fund may lend securities to approved borrowers,
such as banks, brokers and other financial institutions. The borrower
pledges cash securities issued or guaranteed by the US government or
irrevocable letters of credit issued by a bank as collateral, which will be
maintained at all times in an amount equal to at least 100% of the
current market value of the loaned securities. The market value of the
loaned securities is determined at the close of business of the Fund and
any additional required collateral is delivered to the Fund on the next
business day. Securities lending income, as disclosed in the Statement
of Operations, represents the income earned from the investment of the
cash collateral, net of rebates paid to, or fees paid by, borrowers and
less the fees paid to the securities lending agent. During the term of the
loan, the Fund earns dividend and interest on the securities loaned but
does not receive dividend or interest income on the securities received
as collateral. Loans of securities are terminable at any time and the
borrower, after notice, is required to return borrowed securities within
the standard time period for settlement of securities transactions. In
the event that the borrower defaults on its obligation to return borrowed
securities because of insolvency or for any other reason, the Fund could
experience delays and costs in gaining access to the collateral. The Fund
also could suffer a loss if the value of an investment purchased with
cash collateral falls below the market value of loaned securities or if the
value of an investment purchased with cash collateral falls below the
value of the original cash collateral received. During the period, the Fund
accepted only cash collateral in connection with securities loaned.
Income Taxes: It is the Fund's policy to comply with the requirements
of the Internal Revenue Code of 1986, as amended, applicable to
regulated investment companies and to distribute substantially all of
its taxable income to its shareholders. Therefore, no federal income tax
provision is required.
The Fund files US federal and various state and local tax returns. No
income tax returns are currently under examination. The statute of
limitations on the Fund's US federal tax returns remains open for each
of the four years ended April 30, 2011. The statutes of limitations on
the Fund's state and local tax returns may remain open for an additional
year depending upon the jurisdiction. Management does not believe
there are any uncertain tax positions that require recognition of a
tax liability.
18 BLACKROCK HEALTHCARE FUND, INC. APRIL 30, 2011
Notes to Financial Statements (continued)
Other: Expenses directly related to the Fund or its classes are charged to
the Fund or class. Other operating expenses shared by several funds are
pro rated among those funds on the basis of relative net assets or other
appropriate methods. Other expenses of the Fund are allocated daily to
each class based on its relative net assets.
The Fund has an arrangement with the custodian whereby fees may be
reduced by credits earned on uninvested cash balances, which if appli-
cable are shown as fees paid indirectly in the Statement of Operations.
The custodian imposes fees on overdrawn cash balances, which can be
offset by accumulated credits earned or may result in additional custody
charges. The Fund may earn interest on positive cash balances in
demand deposit accounts that are maintained by the transfer agent on
behalf of the Fund. This amount is shown as income in the Statement of
Operations.
2. Derivative Financial Instruments:
The Fund engages in various portfolio investment strategies using
derivative contracts both to increase the returns of the Fund and to
economically hedge, or protect, its exposure to certain risks such as
foreign currency exchange rate risk and equity risk. These contracts may
be transacted on an exchange or OTC.
Losses may arise if the value of the contract decreases due to an
unfavorable change in the market rates or values of the underlying
instrument or if the counterparty does not perform under the contract.
The Fund's maximum risk of loss from counterparty credit risk on OTC
derivatives is generally the aggregate unrealized gain netted against any
collateral pledged by/posted to the counterparty.
The Fund may mitigate counterparty risk by procuring collateral and
through netting provisions included within an International Swaps
and Derivatives Association, Inc. master agreement (“ISDA Master
Agreement”) implemented between the Fund and each of its respective
counterparties. The ISDA Master Agreement allows the Fund to offset
with each separate counterparty certain derivative financial instrument’s
payables and/or receivables with collateral held. The amount of collat-
eral moved to/from applicable counterparties is generally based upon
minimum transfer amounts of up to $500,000. To the extent amounts
due to the Fund from its counterparties are not fully collateralized con-
tractually or otherwise, the Fund bears the risk of loss from counterparty
non-performance. See Note 1 “Segregation and Collateralization” for
information with respect to collateral practices. In addition, the Fund
manages counterparty risk by entering into agreements only with coun-
terparties that it believes have the financial resources to honor its obli-
gations and by monitoring the financial stability of those counterparties.
Certain ISDA Master Agreements allow counterparties to OTC derivatives
to terminate derivative contracts prior to maturity in the event the Fund's
net assets decline by a stated percentage or the Fund fails to meet the
terms of its ISDA Master Agreements, which would cause the Fund to
accelerate payment of any net liability owed to the counterparty.
Foreign Currency Exchange Contracts: The Fund enters into foreign cur-
rency exchange contracts as an economic hedge against either specific
transactions or portfolio instruments or to obtain exposure to foreign
currencies (foreign currency exchange rate risk). A foreign currency
exchange contract is an agreement between two parties to buy and
sell a currency at a set exchange rate on a future date. Foreign currency
exchange contracts, when used by the Fund, help to manage the overall
exposure to the currencies in which some of the investments held by the
Fund are denominated. The contract is marked-to-market daily and the
change in market value is recorded by the Fund as an unrealized gain
or loss. When the contract is closed, the Fund records a realized gain or
loss equal to the difference between the value at the time it was opened
and the value at the time it was closed. The use of foreign currency
exchange contracts involves the risk that the value of a foreign currency
exchange contract changes unfavorably due to movements in the value
of the referenced foreign currencies and the risk that a counterparty to
the contract does not perform its obligations under the agreement.
Options: The Fund purchases and writes call and put options to increase
or decrease its exposure to underlying instruments (including equity risk)
and/or, in the case of options written, to generate gains from options
premiums. A call option gives the purchaser of the option the right
(but not the obligation) to buy, and obligates the seller to sell (when the
option is exercised), the underlying instrument at the exercise or strike
price at any time or at a specified time during the option period. A put
option gives the holder the right to sell and obligates the writer to buy
the underlying instrument at the exercise or strike price at any time or
at a specified time during the option period. When the Fund purchases
(writes) an option, an amount equal to the premium paid (received)
by the Fund is reflected as an asset (liability). The amount of the asset
(liability) is subsequently marked-to-market to reflect the current market
value of the option purchased (written). When an instrument is pur-
chased or sold through an exercise of an option, the related premium
paid (or received) is added to (or deducted from) the basis of the
instrument acquired or deducted from (or added to) the proceeds of
the instrument sold. When an option expires (or the Fund enters into a
closing transaction), the Fund realizes a gain or loss on the option to the
extent of the premiums received or paid (or gain or loss to the extent the
cost of the closing transaction exceeds the premiums received or paid).
When the Fund writes a call option, such option is “covered,” meaning
that the Fund holds the underlying instrument subject to being called by
the option counterparty. When the Fund writes a put option, such option
is covered by cash in an amount sufficient to cover the obligation.
In purchasing and writing options, the Fund bears the risk of an unfavor-
able change in the value of the underlying instrument or the risk that
the Fund may not be able to enter into a closing transaction due to
BLACKROCK HEALTHCARE FUND, INC. APRIL 30, 2011 19
Notes to Financial Statements (continued)
an illiquid market. Exercise of a written option could result in the Fund
purchasing or selling a security at a price different from the current
market value.
| | | |
| Derivative Financial Instruments Categorized by Risk Exposure: | |
| Fair Value of Derivative Financial Instruments as of April 30, 2011 |
| | Asset Derivatives | |
| | Statement of | | |
| | Assets and | | |
| | Liabilities Location | | Value |
| Foreign currency exchange contracts | Unrealized appreciation | | |
| | on foreign currency | | |
| | exchange contracts | $ 2,753 |
| | |
| | Liability Derivatives |
| | Statement of | |
| | Assets and | |
| | Liabilities Location | Value |
| Foreign currency exchange contracts | Unrealized depreciation | |
| | on foreign currency | |
| | exchange contracts | $ 842 |
| | |
| The Effect of Derivative Financial Instruments in the Statement of Operations |
| Year Ended April 30, 2011 |
|
| | Net Realized Gain (Loss) from |
| | Foreign Currency | |
| | Transactions | Options |
| Foreign currency exchange contracts | $ (69) | — |
| Equity contracts | — | $ 287,513 |
| |
| | Net Change in Unrealized |
| | Appreciation/Depreciation on |
| | Foreign Currency |
| | Transactions |
| Foreign currency exchange contracts | $ 1,911 |
For the year ended April 30, 2011, the average quarterly balances of
outstanding derivative financial instruments were as follows:
| |
| Foreign currency exchange contracts: | |
| Average number of contracts-US dollars purchased | 1 |
| Average number of contracts-US dollars sold | 1 |
| Average US dollar amounts purchased | $1,075,942 |
| Average US dollar amounts sold | $ 145,187 |
| Options: | |
| Average number of option contracts written | 1,416 |
| Average notional value of option contracts written | $6,280,088 |
3. Investment Advisory Agreement and Other Transactions
with Affiliates:
As of April 30, 2011, The PNC Financial Services Group, Inc.
("PNC"), Bank of America Corporation ("BAC") and Barclays Bank
PLC ("Barclays") were the largest stockholders of BlackRock, Inc.
("BlackRock"). Due to the ownership structure, PNC is an affiliate of
the Fund for 1940 Act purposes, but BAC and Barclays are not.
The Fund entered into an Investment Advisory Agreement with BlackRock
Advisors, LLC (the “Manager”), the Fund's investment advisor, an indirect,
wholly owned subsidiary of BlackRock, to provide investment advisory
and administration services. The Manager is responsible for the manage-
ment of the Fund's portfolio and provides the necessary personnel, facil-
ities, equipment and certain other services necessary to the operations
of the Fund. For such services, the Fund pays the Manager a monthly fee
at an annual rate of 1.00% of the Fund's average daily net assets.
The Manager voluntarily agreed to waive its investment advisory fees by
the amount of investment advisory fees the Fund pays to the Manager
indirectly through its investment in affiliated money market funds, how-
ever the Manager does not waive its investment advisory fees by the
amount of investment advisory fees paid through the Fund's investment
in other affiliated investment companies, if any. This amount is shown as
fees waived by advisor in the Statement of Operations.
The Manager entered into a sub-advisory agreement with BlackRock
Investment Management, LLC ("BIM"), an affiliate of the Manager.
The Manager pays BIM for services it provides, a monthly fee that
is a percentage of the investment advisory fees paid by the Fund to
the Manager.
For the year ended April 30, 2011, the Fund reimbursed the Manager
$5,380 for certain accounting services, which are included in account-
ing services in the Statement of Operations.
The Fund received an exemptive order from the SEC permitting it, among
other things, to pay an affiliated securities lending agent a fee based on
a share of the income derived from the securities lending activities and
has retained BIM as the securities lending agent. BIM may, on behalf
of the Fund, invest cash collateral received by the Fund for such loans,
among other things, in a private investment company managed by the
Manager or in registered money market funds advised by the Manager
or its affiliates. The market value of securities on loan and the value of
the related collateral, if applicable are shown in the Statement of Assets
and Liabilities as securities loaned at value and collateral on securities
loaned at value, respectively. The cash collateral invested by BIM is dis-
closed in the Schedule of Investments. The share of income earned by
the Fund on such investments is shown as securities lending — affiliated
in the Statement of Operations. For the year ended April 30, 2011, BIM
received $4,281 in securities lending agent fees related to securities
lending activities for the Fund.
The Fund entered into a Distribution Agreement and Distribution and
Service Plan with BlackRock Investments, LLC (“BRIL”), an affiliate of
the Manager. Pursuant to the Distribution and Service Plan and in
accordance with Rule 12b-1 under the 1940 Act, the Fund pays BRIL
ongoing service and distribution fees. The fees are accrued daily and
20 BLACKROCK HEALTHCARE FUND, INC. APRIL 30, 2011
Notes to Financial Statements (continued)
paid monthly at annual rates based upon the average daily net assets
of the shares of the Fund, as follows:
| | |
| | Service | Distribution |
| | Fee | Fee |
| Investor A | 0.25% | — |
| Investor B | 0.25% | 0.75% |
| Investor C | 0.25% | 0.75% |
| Class R | 0.25% | 0.25% |
Pursuant to sub-agreements with BRIL, broker-dealers and BRIL provide
shareholder servicing and distribution services to the Fund. The ongoing
service and/or distribution fee compensates BRIL and each broker-
dealer for providing shareholder servicing and/or distribution related
services to Investor A, Investor B, Investor C and Class R shareholders.
For the year ended April 30, 2011, affiliates earned underwriting
discounts, direct commissions and dealer concessions on sales of the
Fund's Investor A Shares, which totaled $3,462.
For the year ended April 30, 2011, affiliates received the following
contingent deferred sales charges relating to transactions in Investor B
and Investor C Shares:
| |
| Investor B | $10,385 |
| Investor C | $ 2,828 |
Furthermore, affiliates received contingent deferred sale charges of
$1,481 relating to transactions subject to front-end sales charge waivers
on Investor A Shares.
BNY Mellon Investment Servicing (US) Inc. (formerly PNC Global
Investment Servicing (U.S.) Inc. ("PNCGIS")), serves as transfer agent
and dividend disbursing agent. On July 1, 2010, the Bank of New York
Mellon Corporation purchased PNCGIS, which prior to this date was an
indirect, wholly owned subsidiary of PNC and an affiliate of the Manager.
Transfer agency fees borne by the Fund are comprised of those fees
charged for all shareholder communications including mailing of share-
holder reports, dividend and distribution notices, and proxy materials for
shareholder meetings, as well as per account and per transaction fees
related to servicing and maintenance of shareholder accounts, including
the issuing, redeeming and transferring of shares, check writing,
anti-money laundering services, and customer identification services.
Pursuant to written agreements, certain financial intermediaries, some
of which may be affiliates, provide the Fund with sub-accounting, record-
keeping, sub-transfer agency and other administrative services with
respect to sub-accounts they service. For these services, these entities
receive an annual fee per shareholder account, which will vary depend-
ing on share class and/or net assets. Prior to July 1, 2010, PNCGIS
was an affiliate and earned $1,926 in transfer agent fees for the period
May 1, 2010 to June 30, 2010, which are included as a component of
transfer agent – class specific in the Statement of Operations.
The Manager maintains a call center, which is responsible for providing
certain shareholder services to the Fund, such as responding to share-
holder inquiries and processing transactions based upon instructions
from shareholders with respect to the subscription and redemption of
Fund shares. For the year ended April 30, 2011, the Fund reimbursed
the Manager the following amounts for costs incurred in running the
call center, which are included in transfer agent — class specific in the
Statement of Operations:
| |
| Institutional | $2,576 |
| Investor A | $2,629 |
| Investor B | $ 335 |
| Investor C | $1,104 |
| Class R | $ 254 |
Certain officers and/or directors of the Fund are officers and/or directors
of BlackRock or its affiliates. The Fund reimburses the Manager for com-
pensation paid to the Fund's Chief Compliance Officer.
4. Investments:
Purchases and sales of investments, excluding short-term securities,
for the year ended April 30, 2011, were $397,740,976 and
$473,057,314, respectively.
Transactions in options written for the year ended April 30, 2011, were
as follows:
| | |
| | Calls |
| | | Premiums |
| | Contracts | Received |
| Outstanding options, beginning of year | — | — |
| Options written | 7,519 | $ 712,179 |
| Options closed | (2,609) | (172,841) |
| Options expired | (2,441) | (243,439) |
| Options exercised | (2,469) | (295,899) |
| Outstanding options, end of year | — | — |
5. Income Tax Information:
Reclassifications: US GAAP requires that certain components of net
assets be adjusted to reflect permanent differences between financial
and tax reporting. These reclassifications have no effect on net assets
or net asset values per share. The following permanent differences as
of April 30, 2011 attributable to foreign currency transactions, non-
deductible expenses and the reclassification of distributions were
reclassified to the following accounts:
| |
| Paid-in capital | $ (81,928) |
| Undistributed net investment income | $ 360,788 |
| Accumulated net realized gain | $ (278,860) |
BLACKROCK HEALTHCARE FUND, INC. APRIL 30, 2011 21
Notes to Financial Statements (continued)
The tax character of distributions paid during the fiscal years ended
April 30, 2011 and April 30, 2010 was as follows:
| | |
| | 4/30/11 | 4/30/10 |
| Distributions paid from: | | |
| Ordinary income | $ 2,227,570 | — |
| Total | $ 2,227,570 | — |
As of April 30, 2011, the tax components of accumulated net earnings
were as follows:
| |
| Long-term capital gains | $ 25,524,445 |
| Net unrealized gains* | 71,048,373 |
| Total | $ 96,572,818 |
* The differences between book-basis and tax-basis net unrealized gains were
attributable primarily to the tax deferral of losses on wash sales and the realiza-
tion for tax purposes of unrealized losses on certain foreign currency contracts.
6. Borrowings:
The Fund, along with certain other funds managed by the Manager and
its affiliates, is a party to a $500 million credit agreement with a group
of lenders, which expired in November 2010. The Fund may borrow
under the credit agreement to fund shareholder redemptions. Effective
November 2009, the credit agreement had the following terms: 0.02%
upfront fee on the aggregate commitment amount which was allocated
to the Fund based on its net assets as of October 31, 2009, a commit-
ment fee of 0.10% per annum based on the Fund's pro rata share of
the unused portion of the credit agreement and interest at a rate equal
to the higher of (a) the one-month LIBOR plus 1.25% per annum and
(b) the Fed Funds rate plus 1.25% per annum on amounts borrowed.
In addition, the Fund paid administration and arrangement fees which
were allocated to the Fund based on its net assets as of October 31,
2009. Effective November 2010, the credit agreement was renewed until
November 2011 with the following terms: a commitment fee of 0.08%
per annum based on the Fund's pro rata share of the unused portion of
the credit agreement and interest at a rate equal to the higher of (a) the
one-month LIBOR plus 1.00% per annum and (b) the Fed Funds rate
plus 1.00% per annum on amounts borrowed. In addition, the Fund paid
administration and arrangement fees which were allocated to the Fund
based on its net assets as of October 31, 2010. The Fund did not bor-
row under the credit agreement during the year ended April 30, 2011.
7. Concentration, Market and Credit Risk:
As of April 30, 2011, the Fund invested a significant portion of its
assets in securities in the Pharmaceuticals and Health Care Providers
& Services sectors. Changes in economic conditions affecting the
Pharmaceuticals and Health Care Providers & Services sectors would
have a greater impact on the Fund and could affect the value, income
and/or liquidity of positions in such securities.
In the normal course of business, the Fund invests in securities and
enters into transactions where risks exist due to fluctuations in the
market (market risk) or failure of the issuer of a security to meet all its
obligations (issuer credit risk). The value of securities held by the Fund
may decline in response to certain events, including those directly
involving the issuers whose securities are owned by the Fund; conditions
affecting the general economy; overall market changes; local, regional or
global political, social or economic instability; and currency and interest
rate and price fluctuations. Similar to issuer credit risk, the Fund may be
exposed to counterparty credit risk, or the risk that an entity with which
the Fund has unsettled or open transactions may fail to or be unable to
perform on its commitments. The Fund manages counterparty credit
risk by entering into transactions only with counterparties that it believes
have the financial resources to honor their obligations and by monitoring
the financial stability of those counterparties. Financial assets, which
potentially expose the Fund to market, issuer and counterparty credit
risks, consist principally of financial instruments and receivables due
from counterparties. The extent of the Fund's exposure to market, issuer
and counterparty credit risks with respect to these financial assets is
generally approximated by their value recorded in the Fund's Statement
of Assets and Liabilities, less any collateral held by the Fund.
22 BLACKROCK HEALTHCARE FUND, INC. APRIL 30, 2011
Notes to Financial Statements (concluded)
8. Capital Share Transactions:
Transactions in capital shares for each class were as follows:
| | | | | | |
| | Year Ended | Year Ended |
| | April 30, 2011 | April 30, 2010 |
| | Shares | | Amount | Shares | | Amount |
| Institutional | | | | | | |
| Shares sold | 851,414 | $ 5,367,476 | 1,927,705 | $ 11,248,003 |
| Shares issued to shareholders in reinvestment of dividends | 85,797 | | 534,457 | — | | — |
| Total issued | 937,211 | | 5,901,933 | 1,927,705 | | 11,248,003 |
| Shares redeemed | (6,446,014) | | (38,075,929) | (4,137,375) | | (23,452,322) |
| Net decrease | (5,508,803) | $ (32,173,996) | (2,209,670) | $ (12,204,319) |
| Investor A | | | | | | |
| Shares sold and automatic conversion of shares | 9,846,246 | $ 58,937,464 | 5,509,919 | $ 28,553,259 |
| Shares issued to shareholders in reinvestment of dividends | 158,651 | | 875,719 | — | | — |
| Total issued | 10,004,897 | | 59,813,183 | 5,509,919 | | 28,553,259 |
| Shares redeemed | (9,665,814) | | (54,754,588) | (8,090,589) | | (41,188,459) |
| Net increase (decrease) | 339,083 | $ 5,058,595 | (2,580,670) | $ (12,635,200) |
| Investor B | | | | | | |
| Shares sold | 125,057 | $ 441,903 | 282,274 | $ 923,044 |
| Shares issued to shareholders in reinvestment of dividends | 17,539 | | 61,385 | — | | — |
| Total issued | 142,596 | | 503,288 | 282,274 | | 923,044 |
| Shares redeemed and automatic conversion of shares | (1,594,694) | | (5,638,752) | (4,234,537) | | (13,693,761) |
| Net decrease | (1,452,098) | $ (5,135,464) | (3,952,263) | $ (12,770,717) |
| Investor C | | | | | | |
| Shares sold | 896,447 | $ 3,152,174 | 1,845,061 | $ 6,055,541 |
| Shares issued to shareholders in reinvestment of dividends | 108,261 | | 376,740 | — | | — |
| Total issued | 1,004,708 | | 3,528,914 | 1,845,061 | | 6,055,541 |
| Shares redeemed | (3,654,311) | | (12,797,894) | (4,531,035) | | (14,707,201) |
| Net decrease | (2,649,603) | $ (9,268,980) | (2,685,974) | $ (8,651,660) |
| Class R | | | | | | |
| Shares sold | 1,295,941 | $ 4,744,907 | 1,864,411 | $ 6,374,625 |
| Shares issued to shareholders in reinvestment of dividends | 28,072 | | 101,338 | — | | — |
| Total issued | 1,324,013 | | 4,846,245 | 1,864,411 | | 6,374,625 |
| Shares redeemed | (1,753,340) | | (6,464,061) | (1,667,330) | | (5,589,959) |
| Net increase (decrease) | (429,327) | $ (1,617,816) | 197,081 | $ 784,666 |
9. Subsequent Events:
Management has evaluated the impact of all subsequent events on the
Fund through the date the financial statements were issued and has
determined that there were no subsequent events requiring adjustment
or additional disclosure in the financial statements.
BLACKROCK HEALTHCARE FUND, INC. APRIL 30, 2011 23
Report of Independent Registered Public Accounting Firm
To the Shareholders and Board of Directors of BlackRock
Healthcare Fund, Inc.:
We have audited the accompanying statement of assets and liabilities of
BlackRock Healthcare Fund, Inc. (the “Fund”), including the schedule of
investments, as of April 30, 2011, and the related statement of opera-
tions for the year then ended, the statements of changes in net assets
for each of the two years in the period then ended, and the financial
highlights for each of the five years in the period then ended. These
financial statements and financial highlights are the responsibility of the
Fund’s management. Our responsibility is to express an opinion on these
financial statements and financial highlights based on our audits.
We conducted our audits in accordance with the standards of the Public
Company Accounting Oversight Board (United States). Those standards
require that we plan and perform the audit to obtain reasonable assur-
ance about whether the financial statements and financial highlights
are free of material misstatement. The Fund is not required to have, nor
were we engaged to perform, an audit of its internal control over finan-
cial reporting. Our audits included consideration of internal control over
financial reporting as a basis for designing audit procedures that are
appropriate in the circumstances, but not for the purpose of expressing
an opinion on the effectiveness of the Fund’s internal control over finan-
cial reporting. Accordingly, we express no such opinion. An audit also
includes examining, on a test basis, evidence supporting the amounts
and disclosures in the financial statements, assessing the accounting
principles used and significant estimates made by management, as well
as evaluating the overall financial statement presentation. Our proce-
dures included confirmation of securities owned as of April 30, 2011,
by correspondence with the custodian and brokers; where replies were
not received from brokers, we performed other auditing procedures.
We believe that our audits provide a reasonable basis for our opinion.
In our opinion, the financial statements and financial highlights referred
to above present fairly, in all material respects, the financial position
of BlackRock Healthcare Fund, Inc. as of April 30, 2011, the results
of its operations for the year then ended, the changes in its net assets
for each of the two years in the period then ended, and the financial
highlights for each of the five years in the period then ended, in con-
formity with accounting principles generally accepted in the United
States of America.
Deloitte & Touche LLP
Princeton, New Jersey
June 24, 2011
Important Tax Information (Unaudited)
The following information is provided with respect to the ordinary distri-
butions paid by the Fund during the fiscal year ended April 30, 2011:
| |
| | Payable Date |
| | December 10, 2010 |
| Qualified Dividend Income for Individuals† | 100.00% |
| Dividends Qualifying for the Dividend | |
| Received Deduction for Corporations† | 31.69% |
† The Fund hereby designates the percentage indicated above or the maximum
amount allowable by law.
24 BLACKROCK HEALTHCARE FUND, INC. APRIL 30, 2011
| | | | | |
| Officers and Directors | | | | |
| | | | | Number of BlackRock- | |
| | | | | Advised Registered | |
| | | Length | | Investment Companies | |
| | Position(s) | of Time | | (“RICs”) Consisting of | |
| Name, Address | Held with | Served as | | Investment Portfolios | Public |
| and Year of Birth | Fund | a Director2 | Principal Occupation(s) During Past Five Years | (“Portfolios”) Overseen | Directorships |
| Independent Directors1 | | | | |
| Ronald W. Forbes | Co-Chair of | Since | Professor Emeritus of Finance, School of Business, State University | 36 RICs consisting of | None |
| 55 East 52nd Street | the Board | 2000 | of New York at Albany since 2000. | 98 Portfolios | |
| New York, NY 10055 | and Director | | | | |
| 1940 | | | | | |
| Rodney D. Johnson | Co-Chair of | Since | President, Fairmount Capital Advisors, Inc. since 1987; | 36RICs consisting of | None |
| 55 East 52nd Street | the Board | 2007 | Member of the Archdiocesan Investment Committee | 98 Portfolios | |
| New York, NY 10055 | and Director | | of the Archdiocese of Philadelphia since 2004; Director, | | |
| 1941 | | | The Committee of Seventy (civic) since 2006; Director, Fox | | |
| | | | Chase Cancer Center from 2004 to 2010. | | |
| David O. Beim | Director | Since | Professor of Professional Practice at the Columbia University | 36 RICs consisting of | None |
| 55 East 52nd Street | | 2007 | Graduate School of Business since 1991; Trustee, Phillips Exeter | 98Portfolios | |
| New York, NY 10055 | | | Academy since 2002; Chairman, Wave Hill, Inc. (public garden and | | |
| 1940 | | | cultural center) from 1990 to 2006. | | |
| Dr. Matina S. Horner | Director | Since | Executive Vice President of Teachers Insurance and Annuity Associa- | 36 RICs consisting of | NSTAR (electric |
| 55 East 52nd Street | | 2007 | tion and College Retirement Equities Fund from 1989 to 2003. | 98 Portfolios | and gas utility) |
| New York, NY 10055 | | | | | |
| 1939 | | | | | |
| Herbert I. London | Director | Since | Professor Emeritus, New York University since 2005; John M. Olin | 36RICs consisting of | AIMS Worldwide, |
| 55 East 52nd Street | | 2007 | Professor of Humanities, New York University from 1993 to 2005 | 98 Portfolios | Inc. (marketing) |
| New York, NY 10055 | | | and Professor thereof from 1980 to 2005; President, Hudson | | |
| 1939 | | | Institute (policy research organization) since1997 and Trustee | | |
| | | | thereof since 1980; Chairman of the Board of Trustees for Grantham | | |
| | | | University since 2006; Director, InnoCentive, Inc. (strategic solutions | | |
| | | | company) since 2005; Director, Cerego,LLC (software development | | |
| | | | and design) since 2005; Director, Cybersettle (dispute resolution | | |
| | | | technology) since 2009. | | |
| Cynthia A. Montgomery | Director | Since | Professor, Harvard Business School since 1989; Director, | 36 RICsconsisting of | Newell Rubbermaid, |
| 55 East 52nd Street | | 2000 | McLean Hospital since 2005; Director, Harvard Business | 98 Portfolios | Inc. (manufacturing) |
| New York, NY 10055 | | | School Publishing from 2005 to 2010. | | |
| 1952 | | | | | |
| Joseph P. Platt | Director | Since | Director, The West Penn Allegheny Health System (a not-for-profit | 36 RICs consisting of | Greenlight Capital |
| 55 East 52nd Street | | 2007 | health system) since 2008; Director, Jones and Brown (Canadian | 98 Portfolios | Re, Ltd (reinsurance |
| New York, NY 10055 | | | insurance broker) since 1998; General Partner, Thorn Partners, LP | | company) |
| 1947 | | | (private investment) since 1998; Director, WQED Multi-Media (public | | |
| | | | broadcasting not-for-profit) since 2001; Partner, Amarna Corporation, | | |
| | | | LLC (private investment company) from 2002 to 2008. | | |
| Robert C. Robb, Jr. | Director | Since | Partner, Lewis, Eckert, Robb and Company (management and | 36 RICs consisting of | None |
| 55 East 52nd Street | | 2007 | financial consulting firm) since 1981. | 98 Portfolios | |
| New York, NY 10055 | | | | | |
| 1945 | | | | | |
| Toby Rosenblatt | Director | Since | President, Founders Investments Ltd. (private investments) | 36 RICs consisting of | None |
| 55 East 52nd Street | | 2007 | since 1999; Director, College Access Foundation of California | 98 Portfolios | |
| New York, NY 10055 | | | (philanthropic foundation) since 2009; Director, Forward | | |
| 1938 | | | Management, LLC since 2007; Director, A.P. Pharma, Inc. | | |
| | | | (pharmaceuticals) from 1983 to 2011; Director, The James Irvine | | |
| Foundation (philanthropic foundation) from 1998 to 2008. |
BLACKROCK HEALTHCARE FUND, INC. APRIL 30, 2011 25
| | | | | |
| Officers and Directors (continued) | | |
| | | | | Number of BlackRock- | |
| | | | | Advised Registered | |
| | | Length | | Investment Companies | |
| | Position(s) | of Time | | (“RICs”) Consisting of | |
| Name, Address | Held with | Served as | | Investment Portfolios | Public |
| and Year of Birth | Fund | a Director2 | Principal Occupation(s) During Past Five Years | (“Portfolios”) Overseen | Directorships |
| Independent Directors1 (concluded) | | | | |
| Kenneth L. Urish | Director | Since | Managing Partner, Urish Popeck & Co., LLC (certified public | 36 RICs consisting of | None |
| 55 East 52nd Street | | 2007 | accountants and consultants) since 1976; Chairman Elect of | 98 Portfolios | |
| New York, NY 10055 | | | the Professional Ethics Committee of the Pennsylvania Institute | | |
| 1951 | | | of Certified Public Accountants and Committee Member thereof | | |
| | | | since 2007; Member of External Advisory Board, The Pennsylvania | | |
| | | | State University Accounting Department since 2001; Trustee, The | | |
| | | | Holy Family Foundation from 2001 to 2010; President and Trustee, | | |
| | | | Pittsburgh Catholic Publishing Associates from 2003 to 2008; | | |
| | | | Director, Inter-Tel from 2006 to 2007. | | |
| Frederick W. Winter | Director | Since | Professor and Dean Emeritus of the Joseph M. Katz School of | 36 RICs consisting of | None |
| 55 East 52nd Street | | 2007 | Business, University of Pittsburgh since 2005 and Dean thereof | 98Portfolios | |
| New York, NY 10055 | | | from 1997 to 2005; Director, Alkon Corporation (pneumatics) | | |
| 1945 | | | since 1992; Director, Tippman Sports (recreation) since 2005; | | |
| | | | Director, Indotronix International (IT services) from 2004 to 2008. | | |
| | 1 Directors serve until their resignation, removal or death, or until December 31 of the year in which they turn 72. The Board has approved one-year |
| | extensions in terms of Directors who turn 72 prior to December 31, 2013. | | |
| | 2 Date shown is the earliest date a person has served as a Director for the Fund covered by this annual report. Following the combination of Merrill |
| | Lynch Investment Managers, L.P. (“MLIM”) and BlackRock in September 2006, the various legacy MLIM and legacy BlackRock fund boards were |
| | realigned and consolidated into three new fund boards in 2007. As a result, although the chart shows certain Directors as joining the Fund’s board in |
| | 2007, each Director first became a member of the board of other legacy MLIM or legacy BlackRock funds as follows: David O. Beim, 1998; Ronald W. |
| | Forbes, 1977; Dr. Matina S. Horner, 2004; Rodney D. Johnson, 1995; Herbert I. London, 1987; Cynthia A. Montgomery, 1994; Joseph P. Platt, 1999; |
| | Robert C. Robb, Jr., 1998; Toby Rosenblatt, 2005; Kenneth L. Urish, 1999; and Frederick W. Winter, 1999. | |
| Interested Directors3 | | | | | |
| Richard S. Davis | Director | Since | Managing Director, BlackRock, Inc. since 2005; Chief Executive | 165 RICs consisting of | None |
| 55 East 52nd Street | | 2007 | Officer, State Street Research & Management Company from 2000 | 290 Portfolios | |
| New York, NY 10055 | | | to 2005; Chairman of the Board of Trustees, State Street Research | | |
| 1945 | | | Mutual Funds from 2000 to 2005. | | |
| Henry Gabbay | Director | Since | Consultant, BlackRock, Inc. from 2007 to 2008; Managing Director, | 165 RICs consisting of | None |
| 55 East 52nd Street | | 2007 | BlackRock, Inc. from 1989 to 2007; Chief Administrative Officer, | 290Portfolios | |
| New York, NY 10055 | | | BlackRock Advisors, LLC from 1998 to 2007; President of BlackRock | | |
| 1947 | | | Funds and BlackRock Bond Allocation Target Shares from 2005 to | | |
| | | | 2007 and Treasurer of certain closed-end funds in the BlackRock | | |
| | | | fund complex from 1989 to 2006. | | |
| | 3 Mr. Davis is an “interested person” as defined in the 1940 Act, of the Fund based on his position with BlackRock, Inc. and itsaffiliates. Mr. Gabbay is |
| | an “interested person” of the Fund based on his former positions with BlackRock, Inc. and its affiliates as well as his ownership of BlackRock, Inc. and |
| | The PNC Financial Services Group, Inc. securities. Directors serve until their resignation, removal or death, or until December31 of the year in which |
| they turn 72. The Board has approved one-year extensions in terms of Directors who turn 72 prior to December 31, 2013. |
26 BLACKROCK HEALTHCARE FUND, INC. APRIL 30, 2011
| | | |
| Officers and Directors (concluded) |
| | Position(s) | | |
| Name, Address | Held with | Length of | |
| and Year of Birth | Fund | Time Served | Principal Occupation(s) During Past Five Years |
| Officers1 | | | |
| John M. Perlowski | President | Since | Managing Director of BlackRock, Inc. since 2009; Global Head of BlackRock Fund Administration since 2009; |
| 55 East 52nd Street | and Chief | 2010 | Managing Director and Chief Operating Officer of the Global Product Group at Goldman Sachs Asset Management, |
| New York, NY 10055 | Executive | | L.P. from 2003 to 2009; Treasurer of Goldman Sachs Mutual Funds from 2003 to 2009 and Senior Vice President |
| 1964 | Officer | | thereof from 2007 to 2009; Director of Goldman Sachs Offshore Funds from 2002 to 2009; Director of Family |
| | | | Resource Network (charitable foundation) since 2009. |
| Brendan Kyne | Vice | Since | Managing Director of BlackRock, Inc. since 2010; Director of BlackRock, Inc.from 2008 to 2009; Head of Product |
| 55 East 52nd Street | President | 2009 | Development and Management for BlackRock’s U.S. Retail Group since 2009, Co-head thereof from 2007 to |
| New York, NY 10055 | | | 2009; Vice President of BlackRock, Inc. from 2005 to 2008. |
| 1977 | | | |
| Brian Schmidt | Vice | Since | Managing Director of BlackRock, Inc. since 2004; Various positions with U.S.Trust Company from 1991 to 2003 |
| 55 East 52nd Street | President | 2009 | including Director from 2001 to 2003 and Senior Vice President from 1998 to 2003; Vice President, Chief Financial |
| New York, NY 10055 | | | Officer and Treasurer of Excelsior Funds, Inc., Excelsior Tax-Exempt Funds, Inc. and Excelsior Funds Trust from 2001 |
| 1958 | | | to 2003. |
| Neal Andrews | Chief | Since | Managing Director of BlackRock, Inc. since 2006; Senior Vice President and Line of Business Head of Fund |
| 55 East 52nd Street | Financial | 2007 | Accounting and Administration at PNC Global Investment Servicing (U.S.)Inc. from 1992 to 2006. |
| New York, NY 10055 | Officer | | |
| 1966 | | | |
| Jay Fife | Treasurer | Since | Managing Director of BlackRock, Inc. since 2007 and Director in 2006; Assistant Treasurer of the MLIM and Fund |
| 55 East 52nd Street | | 2007 | Asset Management, L.P. advised funds from 2005 to 2006; Director of MLIM Fund Services Group from 2001 |
| New York, NY 10055 | | | to 2006. |
| 1970 | | | |
| Brian Kindelan | Chief | Since | Chief Compliance Officer of the BlackRock-advised funds since 2007; Managing Director and Senior Counsel of |
| 55 East 52nd Street | Compliance | 2007 | BlackRock, Inc. since 2005. |
| New York, NY 10055 | Officer | | |
| 1959 | | | |
| Ira P. Shapiro | Secretary | Since | Managing Director of BlackRock, Inc. since 2009; Managing Director and Associate General Counsel of Barclays |
| 55 East 52nd Street | | 2010 | Global Investors from 2008 to 2009; Principal thereof from 2004 to 2008. |
| New York, NY 10055 | | | |
| 1963 | | | |
| | 1 Officers of the Fund serve at the pleasure of the Board. |
| | Further information about the Officers and Directors is available in the Fund’s Statement of Additional Information, which can be obtained without |
| | charge by calling (800) 441-7762. |
| | | | |
| Investment Advisor | Custodian | Accounting Agent | Distributor | Address of the Fund |
| BlackRock Advisors, LLC | JP Morgan Chase Bank, N.A. | State Street Bank | BlackRock Investments, LLC | 100 Bellevue Parkway |
| Wilmington, DE 19809 | Brooklyn, NY 11245 | and Trust Company | New York, NY 10022 | Wilmington, DE 19809 |
| Princeton, NJ 08540 |
| Sub-Advisor | Transfer Agent | | Legal Counsel | |
| BlackRock Investment | BNY Mellon Investment | Independent Registered | Sidley Austin LLP | |
| Management, LLC | Servicing (US) Inc. | Public Accounting Firm | New York, NY 10019 | |
| Plainsboro, NJ 08536 | Wilmington, DE 19809 | Deloitte & Touche LLP | | |
| Princeton, NJ 08540 |
Effective November 16, 2010, Ira P. Shapiro became Secretary of the Fund.
BLACKROCK HEALTHCARE FUND, INC. APRIL 30, 2011 27
Additional Information
General Information
Electronic Delivery
Electronic copies of most financial reports and prospectuses are available
on the Fund’s website or shareholders can sign up for e-mail notifications
of quarterly statements, annual and semi-annual reports and prospectuses
by enrolling in the Fund’s electronic delivery program.
To enroll:
Shareholders Who Hold Accounts with Investment Advisors, Banks or
Brokerages:
Please contact your financial advisor. Please note that not all investment
advisers, banks or brokerages may offer this service.
Shareholders Who Hold Accounts Directly with BlackRock:
1) Access the BlackRock Web site at
http://www.blackrock.com/edelivery
2) Select “eDelivery” under the “More Information” section
3) Log into your account
Householding
The Fund will mail only one copy of shareholder documents, including
prospectuses, annual and semi-annual reports and proxy statements, to
shareholders with multiple accounts at the same address. This practice
is commonly called “householding” and is intended to reduce expenses
and eliminate duplicate mailings of shareholder documents. Mailings of
your shareholder documents may be householded indefinitely unless you
instruct us otherwise. If you do not want the mailing of these documents
to be combined with those for other members of your household, please
call (800) 441-7762.
Availability of Quarterly Schedule of Investments
The Fund files its complete schedule of portfolio holdings with the SEC
for the first and third quarters of each fiscal year on Form N-Q. The Fund’s
Forms N-Q are available on the SEC’s website at http://www.sec.gov
and may also be reviewed and copied at the SEC’s Public Reference
Room in Washington, D.C. Information on how to access documents on
the SEC’s website without charge may be obtained by calling (800)
SEC-0330. The Fund’s Forms N-Q may also be obtained upon request
and without charge by calling (800) 441-7762.
Availability of Proxy Voting Policies and Procedures
A description of the policies and procedures that the Fund uses to
determine how to vote proxies relating to portfolio securities is available
(1) without charge, upon request, by calling (800) 441-7762;
(2) at http://www.blackrock.com; and (3) on the SEC’s website
at http://www.sec.gov.
Availability of Proxy Voting Record
Information about how the Fund voted proxies relating to securities
held in the Fund’s portfolio during the most recent 12-month period
ended June 30 is available upon request and without charge (1) at
http://www.blackrock.com or by calling (800) 441-7762 and
(2) on the SEC’s website at http://www.sec.gov.
28 BLACKROCK HEALTHCARE FUND, INC. APRIL 30, 2011
Additional Information (continued)
Shareholder Privileges
Account Information
Call us at (800) 441-7762 from 8:00 AM to 6:00 PM EST on any
business day to get information about your account balances, recent
transactions and share prices. You can also reach us on the Web at
http://www.blackrock.com/funds.
Automatic Investment Plans
Investor Class shareholders who want to invest regularly can arrange to
have $50 or more automatically deducted from their checking or savings
account and invested in any of the BlackRock funds.
Systematic Withdrawal Plans
Investor Class shareholders can establish a systematic withdrawal plan
and receive periodic payments of $50 or more from their BlackRock
funds, as long as their account balance is at least $10,000.
Retirement Plans
Shareholders may make investments in conjunction with Traditional,
Rollover, Roth, Coverdell, Simple IRAs, SEP IRAs and 403(b) Plans.
BLACKROCK HEALTHCARE FUND, INC. APRIL 30, 2011 29
Additional Information (concluded)
BlackRock Privacy Principles
BlackRock is committed to maintaining the privacy of its current and
former fund investors and individual clients (collectively, “Clients”) and
to safeguarding their non-public personal information. The following infor-
mation is provided to help you understand what personal information
BlackRock collects, how we protect that information and why in certain
cases we share such information with select parties.
If you are located in a jurisdiction where specific laws, rules or regula-
tions require BlackRock to provide you with additional or different privacy-
related rights beyond what is set forth below, then BlackRock will comply
with those specific laws, rules or regulations.
BlackRock obtains or verifies personal non-public information from and
about you from different sources, including the following: (i) information
we receive from you or, if applicable, your financial intermediary, on appli-
cations, forms or other documents; (ii) information about your trans-
actions with us, our affiliates, or others; (iii) information we receive from
a consumer reporting agency; and (iv) from visits to our websites.
BlackRock does not sell or disclose to non-affiliated third parties any non-
public personal information about its Clients, except as permitted by law
or as is necessary to respond to regulatory requests or to service Client
accounts. These non-affiliated third parties are required to protect the
confidentiality and security of this information and to use it only for its
intended purpose.
We may share information with our affiliates to service your account
or to provide you with information about other BlackRock products or
services that may be of interest to you. In addition, BlackRock restricts
access to non-public personal information about its Clients to those
BlackRock employees with a legitimate business need for the information.
BlackRock maintains physical, electronic and procedural safeguards
that are designed to protect the non-public personal information of its
Clients, including procedures relating to the proper storage and disposal
of such information.
30 BLACKROCK HEALTHCARE FUND, INC. APRIL 30, 2011
| | | | |
| A World-Class Mutual Fund Family | | | |
| BlackRock offers a diverse lineup of open-end mutual funds crossing all investment styles and managed by experts in equity, fixed income and |
| tax-exempt investing. | | | | |
| Equity Funds | | | | |
| BlackRock All-Cap Energy & Resources Portfolio | BlackRock Global SmallCap Fund | BlackRock Mid Cap Value Opportunities Fund |
| BlackRock Asset Allocation Portfolio† | BlackRock Health Sciences Opportunities Portfolio | BlackRock Natural Resources Trust |
| BlackRock Balanced Capital Fund† | BlackRock Healthcare Fund | BlackRock Pacific Fund |
| BlackRock Basic Value Fund | BlackRock Index Equity Portfolio | BlackRock Russell 1000 Index Fund |
| BlackRock Capital Appreciation Fund | BlackRock India Fund | | BlackRock Science & Technology |
| BlackRock China Fund | BlackRock International Fund | Opportunities Portfolio |
| BlackRock Energy & Resources Portfolio | BlackRock International Index Fund | BlackRock Small Cap Growth Equity Portfolio |
| BlackRock Equity Dividend Fund | BlackRock International Opportunities Portfolio | BlackRock Small Cap Growth Fund II |
| BlackRock EuroFund | BlackRock International Value Fund | BlackRock Small Cap Index Fund |
| BlackRock Focus Growth Fund | BlackRock Large Cap Core Fund | BlackRock Small/Mid-Cap Growth Portfolio |
| BlackRock Focus Value Fund | BlackRock Large Cap Core Plus Fund | BlackRock S&P 500 Index Fund |
| BlackRock Global Allocation Fund† | BlackRock Large Cap Growth Fund | BlackRock S&P 500 Stock Fund |
| BlackRock Global Dividend Income Portfolio | BlackRock Large Cap Value Fund | BlackRock U.S. Opportunities Portfolio |
| BlackRock Global Dynamic Equity Fund | BlackRock Latin America Fund | BlackRock Utilities and Telecommunications Fund |
| BlackRock Global Emerging Markets Fund | BlackRock Mid-Cap Growth Equity Portfolio | BlackRock Value Opportunities Fund |
| BlackRock Global Growth Fund | BlackRock Mid-Cap Value Equity Portfolio | BlackRock World Gold Fund |
| BlackRock Global Opportunities Portfolio | | | | |
| Fixed Income Funds | | | | |
| BlackRock Bond Index Fund | BlackRock Income Portfolio† | BlackRock Multi-Sector Bond Portfolio |
| BlackRock Bond Portfolio | BlackRock Inflation Protected Bond Portfolio | BlackRock Short-Term Bond Fund |
| BlackRock Emerging Market Debt Portfolio | BlackRock Intermediate Government | BlackRock Strategic Income |
| BlackRock Floating Rate Income Portfolio | Bond Portfolio | | Opportunities Portfolio |
| BlackRock GNMA Portfolio | BlackRock International Bond Portfolio | BlackRock Total Return Fund |
| BlackRock Government Income Portfolio | BlackRock Long Duration Bond Portfolio | BlackRock Total Return Portfolio II |
| BlackRock High Income Fund | BlackRock Low Duration Bond Portfolio | BlackRock World Income Fund |
| BlackRock High Yield Bond Portfolio | BlackRock Managed Income Portfolio | | |
| Municipal Bond Funds | | | | |
| BlackRock AMT-Free Municipal Bond Portfolio | BlackRock Municipal Fund | BlackRock New York Municipal Bond Fund |
| BlackRock California Municipal Bond Fund | BlackRock National Municipal Fund | BlackRock Pennsylvania Municipal Bond Fund |
| BlackRock High Yield Municipal Fund | BlackRock New Jersey Municipal Bond Fund | BlackRock Short-Term Municipal Fund |
| BlackRock Intermediate Municipal Fund | | | | |
| Target Risk & Target Date Funds† | | | | |
| BlackRock Prepared Portfolios | BlackRock Lifecycle Prepared Portfolios | BlackRock LifePath Portfolios |
| Conservative Prepared Portfolio | 2015 | 2035 | Retirement | 2040 |
| Moderate Prepared Portfolio | 2020 | 2040 | 2020 | 2045 |
| Growth Prepared Portfolio | 2025 | 2045 | 2025 | 2050 |
| Aggressive Growth Prepared Portfolio | 2030 | 2050 | 2030 | 2055 |
| | | | 2035 | |
† Mixed asset fund.
BlackRock mutual funds are currently distributed by BlackRock Investments, LLC. You should consider the investment objectives, risks, charges and
expenses of the funds under consideration carefully before investing. Each fund’s prospectus contains this and other information and is available at
www.blackrock.com or by calling (800) 441-7762 or from your financial advisor. The prospectus should be read carefully before investing.
BLACKROCK HEALTHCARE FUND, INC. APRIL 30, 2011 31
This report is not authorized for use as an offer of sale or a
solicitation of an offer to buy shares of the Fund unless
accompanied or preceded by the Fund’s current prospec-
tus. Past performance results shown in this report should
not be considered a representation of future performance.
Invest-ment returns and principal value of shares will fluctu-
ate so that shares, when redeemed, may be worth more or
less than their original cost. Statements and other informa-
tion herein are as dated and are subject to change.


Item 2 – Code of Ethics – The registrant (or the “Fund”) has adopted a code of ethics, as of the end
of the period covered by this report, applicable to the registrant’s principal executive officer,
principal financial officer, principal accounting officer, or controller, or persons performing
similar functions. During the period covered by this report, there have been no amendments
to or waivers granted under the code of ethics. A copy of the code of ethics is available
without charge at www.blackrock.com.
Item 3 – Audit Committee Financial Expert – The registrant’s board of directors (the “board of
directors”), has determined that (i) the registrant has the following audit committee financial
expert serving on its audit committee and (ii) each audit committee financial expert is
independent:
Kenneth L. Urish
Under applicable securities laws, a person determined to be an audit committee financial
expert will not be deemed an “expert” for any purpose, including without limitation for the
purposes of Section 11 of the Securities Act of 1933, as a result of being designated or
identified as an audit committee financial expert. The designation or identification of a
person as an audit committee financial expert does not impose on such person any duties,
obligations, or liabilities greater than the duties, obligations, and liabilities imposed on such
person as a member of the audit committee and board of directors in the absence of such
designation or identification.
Item 4 – Principal Accountant Fees and Services
The following table presents fees billed by Deloitte & Touche LLP (“D&T”) in each of the
last two fiscal years for the services rendered to the Fund:
| | | | | | | | |
| | (a) Audit Fees | (b) Audit-Related Fees1 | (c) Tax Fees2 | (d) All Other Fees3 |
| | Current | Previous | Current | Previous | Current | Previous | Current | Previous |
| | Fiscal Year | Fiscal Year | Fiscal Year | Fiscal Year | Fiscal Year | Fiscal Year | Fiscal Year | Fiscal Year |
| Entity Name | End | End | End | End | End | End | End | End |
| BlackRock | | | | | | | | |
| Healthcare Fund, | $35,500 | $34,500 | $0 | $0 | $37,950 | $6,789 | $0 | $85 |
| Inc. | | | | | | | | |
The following table presents fees billed by D&T that were required to be approved by the
registrant’s audit committee (the “Committee”) for services that relate directly to the
operations or financial reporting of the Fund and that are rendered on behalf of BlackRock
Advisors, LLC (“Investment Adviser”) and entities controlling, controlled by, or under
common control with BlackRock (not including any sub-adviser whose role is primarily
portfolio management and is subcontracted with or overseen by another investment adviser)
that provide ongoing services to the Fund (“Fund Service Providers”):
| | |
| | Current Fiscal Year End | Previous Fiscal Year End |
| (b) Audit-Related Fees1 | $0 | $0 |
| (c) Tax Fees2 | $0 | $0 |
| (d) All Other Fees3 | $3,030,000 | $2,950,000 |
| 1 The nature of the services include assurance and related services reasonably related to the performance of the audit of financial statements |
| not included in Audit Fees. | | |
| 2 The nature of the services include tax compliance, tax advice and tax planning. | |
| 3 The nature of the services include a review of compliance procedures and attestation thereto. | |
(e)(1) Audit Committee Pre-Approval Policies and Procedures:
The Committee has adopted policies and procedures with regard to the pre-approval
of services. Audit, audit-related and tax compliance services provided to the registrant on
an annual basis require specific pre-approval by the Committee. The Committee also must
approve other non-audit services provided to the registrant and those non-audit services
provided to the Investment Adviser and Fund Service Providers that relate directly to the
operations and the financial reporting of the registrant. Certain of these non-audit services
that the Committee believes are a) consistent with the SEC’s auditor independence rules and
b) routine and recurring services that will not impair the independence of the independent
accountants may be approved by the Committee without consideration on a specific case-
by-case basis (“general pre-approval”). The term of any general pre-approval is 12 months
from the date of the pre-approval, unless the Committee provides for a different period. Tax
or other non-audit services provided to the registrant which have a direct impact on the
operations or financial reporting of the registrant will only be deemed pre-approved
provided that any individual project does not exceed $10,000 attributable to the registrant or
$50,000 per project. For this purpose, multiple projects will be aggregated to determine if
they exceed the previously mentioned cost levels.
Any proposed services exceeding the pre-approved cost levels will require specific
pre-approval by the Committee, as will any other services not subject to general pre-
approval (e.g., unanticipated but permissible services). The Committee is informed of each
service approved subject to general pre-approval at the next regularly scheduled in-person
board meeting. At this meeting, an analysis of such services is presented to the Committee
for ratification. The Committee may delegate to the Committee Chairman the authority to
approve the provision of and fees for any specific engagement of permitted non-audit
services, including services exceeding pre-approved cost levels.
(e)(2) None of the services described in each of Items 4(b) through (d) were approved by
the Committee pursuant to the de minimis exception in paragraph (c)(7)(i)(C) of Rule 2-01
of Regulation S-X.
(f) Not Applicable
(g) The aggregate non-audit fees paid to the accountant for services rendered by the
accountant to the registrant, the Investment Adviser and the Fund Service Providers were:
| | |
| | Current Fiscal Year | Previous Fiscal Year |
| Entity Name | End | End |
| BlackRock Healthcare Fund, | $37,950 | $17,651 |
| Inc. | | |
Additionally, SAS No. 70 fees for the current and previous fiscal years of $3,030,000 and
$2,950,000, respectively, were billed by D&T to the Investment Adviser.
(h) The Committee has considered and determined that the provision of non-audit services
that were rendered to the Investment Adviser (not including any non-affiliated sub-adviser
whose role is primarily portfolio management and is subcontracted with or overseen by the
registrant’s investment adviser), and the Fund Service Providers that were not pre-approved
pursuant to paragraph (c)(7)(ii) of Rule 2-01 of Regulation S-X is compatible with
maintaining the principal accountant’s independence.
Item 5 – Audit Committee of Listed Registrants – Not Applicable
Item 6 – Investments
(a) The registrant’s Schedule of Investments is included as part of the Report to
Stockholders filed under Item 1 of this Form.
(b) Not Applicable due to no such divestments during the semi-annual period covered since
the previous Form N-CSR filing.
Item 7 – Disclosure of Proxy Voting Policies and Procedures for Closed-End Management
Investment Companies – Not Applicable
Item 8 – Portfolio Managers of Closed-End Management Investment Companies – Not Applicable
Item 9 – Purchases of Equity Securities by Closed-End Management Investment Company and
Affiliated Purchasers – Not Applicable
Item 10 – Submission of Matters to a Vote of Security Holders – There have been no material
changes to these procedures.
Item 11 – Controls and Procedures
11(a) – The registrant’s principal executive and principal financial officers, or persons performing
similar functions, have concluded that the registrant’s disclosure controls and procedures (as
defined in Rule 30a-3(c) under the Investment Company Act of 1940, as amended (the
“1940 Act”)) are effective as of a date within 90 days of the filing of this report based on the
evaluation of these controls and procedures required by Rule 30a-3(b) under the 1940 Act
and Rule 15d-15(b) under the Securities Exchange Act of 1934, as amended.
11(b) – There were no changes in the registrant’s internal control over financial reporting (as
defined in Rule 30a-3(d) under the 1940 Act) that occurred during the second fiscal quarter
of the period covered by this report that have materially affected, or are reasonably likely to
materially affect, the registrant’s internal control over financial reporting.
Item 12 – Exhibits attached hereto
12(a)(1) – Code of Ethics – See Item 2
12(a)(2) – Certifications – Attached hereto
12(a)(3) – Not Applicable
12(b) – Certifications – Attached hereto
Pursuant to the requirements of the Securities Exchange Act of 1934 and the Investment
Company Act of 1940, the registrant has duly caused this report to be signed on its behalf by
the undersigned, thereunto duly authorized.
BlackRock Healthcare Fund, Inc.
By: /S/ John M. Perlowski
John M. Perlowski
Chief Executive Officer (principal executive officer) of
BlackRock Healthcare Fund, Inc.
Date: July 6, 2011
Pursuant to the requirements of the Securities Exchange Act of 1934 and the Investment
Company Act of 1940, this report has been signed below by the following persons on behalf
of the registrant and in the capacities and on the dates indicated.
By: /S/ John M. Perlowski
John M. Perlowski
Chief Executive Officer (principal executive officer) of
BlackRock Healthcare Fund, Inc.
Date: July 6, 2011
By: /S/ Neal J. Andrews
Neal J. Andrews
Chief Financial Officer (principal financial officer) of
BlackRock Healthcare Fund, Inc.
Date: July 6, 2011