UNITED STATES
SECURITIES AND EXCHANGE COMMISSION
Washington, D.C. 20549
FORM N-CSR
CERTIFIED SHAREHOLDER REPORT
OF
REGISTERED MANAGEMENT INVESTMENT COMPANIES
Investment Company Act File Number: 811-03599
Name of Registrant: The Royce Fund
Address of Registrant: 745 Fifth Avenue
New York, NY 10151
Name of agent for service: John E. Denneen, Esquire
Address of agent for service: 745 Fifth Avenue
New York, NY 10151
Registrant's telephone number, including area code: (212) 508-4500
Date of fiscal year end: December 31
Date of reporting period: January 1, 2022 – December 31, 2022
| Item 1. | Reports to Shareholders. |

royceinvest.com
The Royce Funds 2022 Annual
Review and Report to Shareholders
December 31, 2022
Royce Dividend Value Fund
Royce Global Financial Services Fund
Royce International Premier Fund
Royce Micro-Cap Fund
Royce Pennsylvania Mutual Fund
Royce Premier Fund
Royce Small-Cap Opportunity Fund
Royce Small-Cap Special Equity Fund
Royce Small-Cap Total Return Fund
Royce Small-Cap Value Fund
Royce Smaller-Companies Growth Fund

Table of Contents

This page is not part of the The Royce Funds 2022 Annual Report to Shareholders | 1

2022: THE MARKET’S ANNUS HORRIBILIS
Most investors were happy to see a miserable 2022 end. In a down year for U.S. equities, both small-and large-cap stocks suffered, with the Russell 2000 Index falling -20.4% while its large-cap sibling, the Russell 1000 Index, declined -19.1%. It was the third-worst calendar year performance for both indexes since their shared inception date of 12/31/78; each posted their lowest respective returns since 2008. The only two years that had lower returns were the same pair for both indexes: 2008 during the Financial Crisis and 2002 through the worst year of the Internet Bubble—which certainly puts the difficulties investors faced last year in context. The tech-heavy Nasdaq Composite fared even worse in 2022, losing -32.5%. Beyond the U.S., results were not much better: the MSCI ACWI ex USA Small Cap Index lost -20.0% for the calendar year, and the MSCI ACWI ex USA Large Cap Index fell -15.3%. Moreover, the double-digit losses were not limited to equities, as the Bloomberg Barclays U.S. Aggregate Bond Index was down -13.0% while its global counterpart, the Bloomberg Barclays Global Aggregate Bond Index, was off -16.2%.
Negative return years for both stocks and bonds are rare occurrences—it’s happened roughly a dozen times since
the Great Depression. The combined double-digit losses for large caps and bonds made 2022 even more exceptional for another, related reason: it was one of the worst years on record for that longstanding staple of diversified portfolios, the 60/40 mix of stocks and bonds. Since the 1930s, the 60/40 split has had double-digit calendar year losses only six times. So, while 2022’s final quarter saw positive results for many equity indexes, the entire year gave most investors “nowhere to run to, nowhere to hide,” beyond certain commodities and the U.S. dollar.
The steep declines for so many different investment vehicles made sense not simply due to the many challenges facing the world, but also because of the now familiar but still dizzying array of contradictory macro developments. On the negative side, we endured ongoing inflation, a decidedly hawkish Fed, the war in Ukraine, and a widely anticipated—though yet to occur—recession. On the positive end, we had strong labor markets and a surprisingly resilient U.S. economy, with real U.S. GDP (Gross Domestic Product) for the third quarter adjusted upward in December from 2.8% to 3.2%—and initial fourth quarter estimates being pegged at 2.8%. Although these figures do not equate to vibrant economic
2 | This page is not part of the The Royce Funds 2022 Annual Report to Shareholders
LETTER TO OUR SHAREHOLDERS
growth, they are far from indicating recession. The question is what comes next for stocks? If the bear market’s days are numbered, when will its number be up? While we make no claim to having a definitive answer, we have done our usual rounds of digging into history and current valuations to help us make sense of the present and to see what factors might be signaling a brighter course for small caps as well as for our own investment strategies. In our estimation, it makes sense for the bear to be feeling some high anxiety.
SMALL CAP’S BRIGHT(ER) FUTURE
The -38% decline for the average stock in the Russell 2000 is notable compared to the -27% slide for the average stock in the Russell 1000 from each index’s respective 52-week highs. Moreover, the Russell 2000 fell -31.9% from its peak on 11/8/21 through its most recent low on 6/16/22, while the Russell 1000 lost less from its peak on 1/3/22 through its most recent low on 9/30/22, down -25.0%. In addition, several years of small-cap underperformance have led to the Russell 2000 hitting an extreme point versus the Russell 1000 at year-end: apart from the Covid-related market trough in March of 2020, small caps fell to their lowest weighting in the Russell 3000 Index in more than 20 years on 12/31/22. Finally, and arguably most importantly, the Russell 2000’s valuation remained near its lowest rate in 20 years compared to the Russell 1000’s, based on our preferred valuation metric of the median last 12 months’ enterprise
value to earnings before taxes (LTM EV/EBIT)—even in the immediate aftermath of 2022’s correction.
Both the “Nifty Fifty” market of the early 1970s and the current period were marked by uncertainty and prominent worries of high inflation and recession. The Nifty Fifty was a group of mostly multinational large-cap companies that many believed offered a steady, sure, and safe road to growth—until they were badly bruised in the bear market of 1973-74. In the current period, a perception of safety was reserved until recently for an even smaller number of mega-cap stocks: the “FAAMG” group of Facebook, Apple, Amazon, Microsoft, and Google. Prior to each period’s bear market, the large-cap peak was crowded with these mega-cap stocks—which most recently reached their high in August of 2020. At 2020’s large-cap peak, these five stocks accounted for nearly 25% of the U.S. market’s total capitalization, much as AT&T, Eastman Kodak, Exxon, GM, and IBM did before the sharp correction of the 1970s. The earlier decline was followed by a long run of success for small-cap stocks on both an absolute and relative basis. Combined with small cap’s more favorable valuation and long, historically uncharacteristic period of underperformance, we think the stage is set for the asset class to retake market leadership from large cap.
Another important reversal suggests the likelihood of improved relative results for small caps in coming years: the pivot in Fed policy from the era of zero (or near zero) interest
Russell 2000 vs. Russell 1000 Median LTM EV/EBIT¹ (ex. Negative EBIT Companies)
From 12/31/02 through 12/31/22

1Earnings before interest and taxes.
Past performance is no guarantee of future results. Source: FactSet
This page is not part of the The Royce Funds 2022 Annual Report to Shareholders | 3
LETTER TO OUR SHAREHOLDERS
rates and easy money to a period of rate hikes and quantitative tightening, along with the knock-on effect of persistent inflation. For equity investors, this shift means a radically altered investment landscape. We believe those stocks that were the biggest winners under the past decade’s zero interest rate, low inflation, and low nominal growth regime will no longer lead, and that the unfolding macro environment points to small caps being able to sustainably, and not just tactically, outpace large caps.
Further supporting our relative case for small caps is the asset class’s superior record in two varying inflationary climates. A comparison of the average annual U.S. consumer price index (CPI) to returns for the Center for Research in Security Prices (CRSP) 6-10 Index (the small-cap proxy we use when reaching farther back in history than the Russell 2000’s 1979 inception) shows that the CRSP 6-10 beat the CPI in every decade since the 1930s—a claim that cannot be made for large caps. In addition to their long-term historical edge during inflationary periods, small caps tend to be nimbler than large caps, which allows them to potentially act more quickly in a climate of contracting liquidity and Fed tightening. Of course, much of the data is indicating that inflation has peaked, outside of wage inflation which is proving much stickier (and will remain so for as long as the job market stays strong). 2022 saw sharp deflation in several areas. The Baltic Dry Index, which measures the cost of shipping goods worldwide, fell more than 70% from its high in May through the end of December, while lumber, steel, and copper prices also slipped precipitously. We expect this dynamic of persistent wage inflation accompanied by decreased goods inflation to continue. And historically periods of falling inflations have also given small caps a relative advantage.
IS IT TIME FOR SMALL-CAP SUCCESS?
The performance advantage for large caps over small caps from 2011-2022 was somewhat paralleled by an edge for the Russell 2000 Growth Index over the Russell 2000 Value Index through most of that period. Over the last few years, the market has seen a deep and far-reaching re-rating of growth stocks, an unsurprising development following the Fed’s reversal. To be sure, we saw this most clearly at two ends of the equity market in 2022: in the deeper correction for small-cap growth stocks
Small-Cap (CRSP 6-10) Performance when Inflation is ≥6% and Decreasing vs All Periods
Monthly Average One-Year Returns from 12/31/45 through 12/31/22
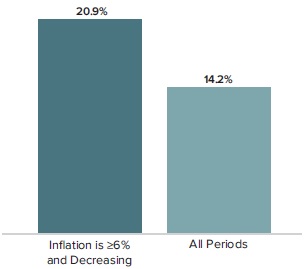
Past performance is no guarantee of future results.
Small-Cap (CRSP 6-10) vs Large-Cap (CRSP 1-5) Performance when Inflation is ≥6% and Decreasing vs All Periods
Monthly Average One-Year Return Spread from 12/31/45 through 12/31/22

Past performance is no guarantee of future results. Inflation is being measured using The Consumer Price Index (CPI). The CPI is a measure of the average change over time in the prices paid by urban consumers for a market basket of consumer goods and services. Indexes are available for the U.S. and various geographic areas. Average price data for select utility, automotive fuel, and food items are also available.
and in the steep declines for many mega-cap companies we discussed above. To be sure, rising rates and inflation have led to a period of multiple compression that we expect will reorient investors’ attention, to some degree, at least, away from the crowded and uncertain macro environment and onto corporate fundamentals, which we view as an advantage for the kind of conservatively capitalized, free cash flow generating companies that most of our major strategies hold. We saw this in 2022, when quality small caps—defined as those with higher returns on invested capital (ROIC) and earnings—held up better than
4 | This page is not part of the The Royce Funds 2022 Annual Report to Shareholders
LETTER TO OUR SHAREHOLDERS
Russell 2000 Value and Growth Shifted Median Relative LTM EV/EBIT1
Russell 2000 Value/Growth from 3/31/00 through 12/31/22
1 Last twelve months Enterprise Value/Earnings Before Interest and Taxes.
Past performance is no guarantee of future results. Source: FactSet
their lower-quality, non-earning siblings in three of 2022’s four quarters, including the fourth quarter’s upswing.
Unsurprisingly, then, the Russell 2000 Value lost significantly less than the Russell 2000 Growth in 2022, -14.5% versus -26.4%. We have been asserting for the last few years that small-cap value would recapture its long-term historical advantage over small-cap growth. One especially revealing support for this idea comes from looking at the five-year annualized return for the Russell 2000 Value as of 12/31/21, which was 9.1% versus a gain of 14.5% for the Russell 2000 Growth—a 540 basis point advantage for the latter. The relative resilience of small-cap value vis-à-vis small-cap growth in 2022 caused this spread to reverse by a considerable amount for the five-year period ended 12/31/22, when the Russell 2000 Value outpaced the growth index, up 4.1% versus 3.5%. Our confidence that value can maintain its performance edge over growth is further rooted in the fact that over all five-year monthly rolling average periods since their shared inception (12/31/78), the advantage was squarely in value’s favor, 11.8% versus 8.8%. Yet at the end of 2022, the Russell 2000 Value was at a lower valuation than its growth counterpart, based on the LTM EV/EBIT metric.
IS TIME ON SMALL-CAP’S SIDE?
Throughout 2022, we saw many small-cap stock prices hit hard regardless of their financial fundamentals and/or operating efficiency. While we were often struck by the contrast between the more confident—albeit cautious—outlooks from the many management teams our investment teams met with and the fatalistic headlines we were seeing almost every day, we are also accustomed to seeing valuations decouple from company attributes—often by what we deem to be highly disproportionate amounts. Our more than five decades of experience have taught us the value of patience—which is often hardest for investors to practice when it’s needed most.
Related to this is the fact that small-cap’s historical performance patterns show that below-average longer-term return periods have typically been followed by positive returns—most often by periods of above-average longer-term returns. For example, subsequent annualized three-year returns from three-year entry points of less than 5% have been positive 99% of the time—that is, in 75 out of 76 three-year annualized periods—averaging 16.0% since the Russell 2000’s 12/31/78 inception. The small-cap index also enjoyed positive annualized five-year returns 100% of the time—that
This page is not part of the The Royce Funds 2022 Annual Report to Shareholders | 5
LETTER TO OUR SHAREHOLDERS
is, in all 81 five-year periods—and averaged an impressive 14.9% following five-year periods with annualized returns of 5% or less. This appears especially relevant now because the respective three- and five-year annualized returns for the Russell 2000 as of 12/31/22 were 3.1% and 4.1%.
Above-Average Returns Have Tended to Follow Low Return Periods
Subsequent Average Annualized 5-Year Performance for the Russell 2000 Following 5-Year Annualized Return Ranges of Less Than 5% from 12/31/83 through 12/31/22

Past performance is no guarantee of future results. Source: FactSet
THE WAITING IS THE HARDEST PART
It is of course possible that stock prices will get worse before they get better. As of this writing, inflation and earnings multiples are higher while interest rates, credit spreads, the VIX (Volatility Index), and the unemployment rate are lower. Many market observers are convinced that sales and earnings growth are much more likely to decline—or at least flatline—in 2023 than they are to climb, at least not
until late in the year. At the same time, however, margins for many companies are expected to expand in 2023, thus helping earnings. In other words, the signals continue to flash conflicting messages—which goes some distance to explain why the outlooks for our portfolio managers range from fear that stocks have yet to touch bottom to full-throated bullishness. The ongoing presence of these mixed signals did nothing to keep stocks from enjoying a highly robust January of 2023. Notably, the Russell 2000 was well ahead of the Russell 1000 for the one-year period ended 1/31/23, down -3.4% versus -8.6%.
So, while recession is still a possibility, none of us knows how long it will last or how deep it will go. What we do firmly believe is that any recession—like any bear market—is ultimately finite. We believe any recession will be followed by a recovery. It’s worth keeping in mind that history also shows that small caps will likely begin an upward move before many of us know for sure that the economy is rebounding in earnest. As difficult as bear markets are, they also present investors with the opportunity to build their small-cap allocation at attractively low prices. The aftermath of the three worst bear markets of the past 25 years—the Internet Bubble, the Great Financial Crisis, and the Covid period—were highly rewarding for investors who showed the fortitude to stay in the market. Regardless of what the near term brings, then, we see the currently uncertain period as a highly opportune time to actively invest in select small caps for the long run.
| Sincerely, | ||
 |  |  |
Charles M. Royce Chairman, Royce Investment Partners | Christopher D. Clark Chief Executive Officer, and Co-Chief Investment Officer, Royce Investment Partners | Francis D. Gannon Co-Chief Investment Officer, Royce Investment Partners |
| January 31, 2023 |
6 | This page is not part of the The Royce Funds 2022 Annual Report to Shareholders
Performance and Expenses
| As of December 31, 2022 | AVERAGE ANNUAL TOTAL RETURNS (%) | ANNUAL OPERATING EXPENSES (%) | ||||||||
| 1-YR | 3-YR | 5-YR | 10-YR | 15-YR | 20-YR | SINCE INCEPTION | INCEPTION DATE | GROSS | NET | |
| Royce Dividend Value Fund | -13.62 | 2.72 | 3.33 | 7.24 | 7.00 | N/A | 7.72 | 5/3/04 | 1.542 | 1.342 |
| Royce Global Financial Services Fund | -20.32 | 3.37 | 3.50 | 8.68 | 6.27 | N/A | 7.31 | 12/31/03 | 1.822 | 1.532 |
| Royce International Premier Fund | -27.21 | -3.77 | 0.86 | 6.18 | N/A | N/A | 5.36 | 12/31/10 | 1.542 | 1.442 |
| Royce Micro-Cap Fund | -22.55 | 8.10 | 6.87 | 5.90 | 4.78 | 8.59 | 10.18 | 12/31/91 | 1.20 | 1.20 |
| Royce Pennsylvania Mutual Fund | -17.06 | 4.91 | 5.71 | 8.73 | 7.08 | 9.59 | 11.171 | N/A | 0.92 | 0.92 |
| Royce Premier Fund | -15.46 | 3.13 | 5.68 | 8.64 | 7.73 | 10.58 | 10.90 | 12/31/91 | 1.17 | 1.17 |
| Royce Small-Cap Opportunity Fund | -17.08 | 11.14 | 7.09 | 10.65 | 8.62 | 11.33 | 11.62 | 11/19/96 | 1.21 | 1.21 |
| Royce Small-Cap Special Equity Fund | -6.33 | 7.22 | 4.59 | 7.42 | 7.39 | 8.39 | 8.45 | 5/1/98 | 1.20 | 1.20 |
| Royce Small-Cap Total Return Fund | -13.25 | 4.25 | 4.13 | 8.14 | 6.68 | 8.50 | 9.82 | 12/15/93 | 1.25 | 1.25 |
| Royce Small-Cap Value Fund | -10.06 | 2.56 | 3.43 | 5.48 | 4.93 | 9.29 | 8.13 | 6/14/01 | 1.552 | 1.492 |
| Royce Smaller-Companies Growth Fund | -32.37 | 2.85 | 3.85 | 7.72 | 5.32 | 10.22 | 9.63 | 6/14/01 | 1.512 | 1.492 |
| INDEX | ||||||||||
| Russell 2000 Index | -20.44 | 3.10 | 4.13 | 9.01 | 7.16 | 9.36 | N/A | N/A | N/A | N/A |
| Russell Microcap Index | -21.96 | 4.05 | 3.69 | 8.86 | 6.34 | 8.64 | N/A | N/A | N/A | N/A |
| Russell 2000 Value Index | -14.48 | 4.70 | 4.13 | 8.48 | 6.81 | 8.99 | N/A | N/A | N/A | N/A |
| Russell 2000 Growth Index | -26.36 | 0.65 | 3.51 | 9.20 | 7.26 | 9.50 | N/A | N/A | N/A | N/A |
| Russell 2500 Index | -18.37 | 5.00 | 5.89 | 10.03 | 8.10 | 10.26 | N/A | N/A | N/A | N/A |
| MSCI ACWI ex USA Small Cap Index | -19.97 | 1.07 | 0.67 | 5.24 | 3.33 | 9.13 | N/A | N/A | N/A | N/A |
| MSCI ACWI Small Cap Index | -18.67 | 3.18 | 3.23 | 7.69 | 5.88 | 9.86 | N/A | N/A | N/A | N/A |
1 For Royce Pennsylvania Mutual Fund, the average annual total return shown is for the 50-year period ended 12/31/22.
2 Reflects Service Class expenses which include a 25bps distribution fee.
Important Performance, Expense, and Risk Information
All performance information in this Review and Report reflects past performance, is presented on a total return basis, reflects the reinvestment of distributions, and does not reflect the deduction of taxes a shareholder would pay on Fund distributions or the redemption of Fund shares. Past performance is no guarantee of future results. Investment return and principal value of an investment will fluctuate, so that shares may be worth more or less than their original cost when redeemed. Investment and Service Class shares redeemed within 30 days of purchase may be subject to a 1% redemption fee payable to the Fund (2% for Royce International Premier Fund). Redemption fees are not reflected in the performance shown above; if they were, performance would be lower. Current performance may be higher or lower than performance quoted. Current month-end performance may be obtained at www.royceinvest.com. All performance and expense information reflects results of the Funds’ oldest share Class (Investment Class or Service Class, as the case may be). Price and total return information is based on net asset values calculated for shareholder transactions. Annual gross operating expenses reflect the Fund’s gross total annual operating expenses and include management fees, any 12b-1 distribution and service fees, other expenses, and any applicable acquired fund fees and expenses. Annual net operating expenses reflect contractual fee waivers and/or expense reimbursements. All expense information is reported as of the Fund’s most current prospectus. Royce & Associates has contractually agreed to waive fees and/or reimburse operating expenses, excluding brokerage commissions, taxes, interest, litigation expenses, acquired fund fees and expenses, and other expenses not borne in the ordinary course of business, to the extent necessary to maintain net operating expenses at or below: 1.34% for Royce Dividend Value Fund; 1.44% for Royce International Premier Fund; and 1.49% for each the Royce Global Financial Services, Small-Cap Value, and Smaller-Companies Growth Funds through April 30, 2023. Acquired fund fees and expenses reflect the estimated amount of the fees and expenses incurred indirectly by the Fund through its investments in mutual funds, hedge funds, private equity funds, and other investment companies.
Service Class shares bear an annual distribution expense that is not borne by the Funds’ Investment Class. If such distribution expenses had been reflected for Funds showing Investment Class performance, returns would have been lower. Each series of The Royce Fund is subject to market risk–the possibility that common stock prices will decline, sometimes sharply and unpredictably, over short or extended periods of time. Such declines may be caused by various factors, including market, financial, and economic conditions, governmental or central bank actions, and other factors, such as the recent Covid pandemic, that may not be directly related to the issuer of a security held by a Fund. This pandemic could adversely affect global market, financial, and economic conditions in ways that cannot necessarily be foreseen. Investments in securities of micro-cap, small-cap, and/or mid-cap companies may involve considerably more risk than investments in securities of larger-cap companies. Certain Funds invest a significant portion of their respective assets in foreign companies that may be subject to different risks than investments in securities of U.S. companies, including adverse political, social, economic, or other developments that are unique to a particular country or region. Therefore, the prices of securities of foreign companies in particular countries or regions may, at times, move in a different direction than those of securities of U.S. companies. Because such investments are usually denominated in foreign currencies and such Funds do not intend to hedge their foreign currency exposures, the U.S. dollar value of such investments may be harmed by declines in the value of foreign currencies in relation to the U.S. dollar. Certain Funds invest a significant portion of their assets in a limited number of stocks or focus their investments in a particular sector or industry, which may involve considerably more risk than a more broadly diversified portfolio because they may be more susceptible to any single corporate, economic, political, regulatory, or market event. A broadly diversified portfolio, however, does not ensure a profit or guarantee against loss. (Please see “Primary Risks for Fund Investors” and “Investing in Foreign Securities” in the prospectus.) This Review and Report must be preceded or accompanied by a prospectus. Please read the prospectus carefully before investing or sending money. Source: MSCI. MSCI makes no express or implied warranties or representations and shall have no liability whatsoever with respect to any MSCI data contained herein. The MSCI data may not be further redistributed or used as a basis for other indexes or any securities or financial products. This report is not approved, endorsed, reviewed or produced by MSCI. None of the MSCI data is intended to constitute investment advice or a recommendation to make (or refrain from making) any kind of investment decision and may not be relied on as such. Russell Investment Group is the source and owner of the trademarks, service marks, and copyrights related to the Russell Indexes. Russell® is a trademark of Russell Investment Group. The Russell 2000 Index is an unmanaged, capitalization-weighted index of domestic small-cap stocks. It measures the performance of the 2,000 smallest publicly traded U.S. companies in the Russell 3000 Index. The Russell Microcap Index includes 1,000 of the smallest securities in the small-cap Russell 2000 Index along with the next smallest eligible securities as determined by Russell. The Russell 2000 Value and Growth Indexes consist of the respective value and growth stocks within the Russell 2000 as determined by Russell Investments. The Russell 2500 is an unmanaged, capitalization-weighted index of the 2,500 smallest publicly traded U.S. companies in the Russell 3000 index. The MSCI ACWI ex USA Small Cap Index is an unmanaged, capitalization-weighted index of global small-cap stocks, excluding the United States. The MSCI ACWI Small Cap Index is an unmanaged, capitalization-weighted index of global small-cap stocks. Index returns include net reinvested dividends and/or interest income. The performance of an index does not represent exactly any particular investment as you cannot invest directly in an index. Distributor: Royce Fund Services, LLC.
This page is not part of the The Royce Funds 2022 Annual Report to Shareholders | 7
MANAGER’S DISCUSSION (UNAUDITED)
Royce Dividend Value Fund (RDV)

Chuck Royce
FUND PERFORMANCE
Royce Dividend Value Fund outperformed its primary benchmark, the Russell 2500 Index, in 2022 down -13.6% versus -18.4%, and also lost less than the Russell 2000 Index, its secondary benchmark, which fell -20.4% for the same period.
WHAT WORKED... AND WHAT DIDN’T
Six of the portfolio’s eight equity sectors made a negative impact on calendar-year performance. The sectors making the largest detractions were Financials, Consumer Discretionary, and Health Care. The only positive impacts came from Energy and Real Estate, while Information Technology made the smallest detraction. At the industry level, capital markets (Financials), specialty retail (Consumer Discretionary), and banks (Financials) were the largest detractors while the biggest positive contributions came from trading companies & distributors (Industrials), electrical equipment (Industrials), and metals & mining (Materials).
The Fund’s top-detracting position in 2022 was Carlyle Group, a global investment firm that manages vehicles across four segments, including corporate private equity, real assets, global credit, and investment solutions. The company reported solid results in April that nonetheless fell below analysts’ estimates. In addition, as the Fed continued to tighten in the first half, financing conditions became stricter and borrowing costs rose, which particularly hurt companies involved in private equity. Rent-A-Center operates rent-to-own stores. Investors shied away from its stock after the company said that both the end of Covid relief funds and rising inflation would likely hurt its customers’ ability to buy and/or make payments. We also had concerns about the company’s 2021 acquisition of lease-to-own solutions provider Acima Holdings, which put leverage on Rent-A-Center’s balance sheet while also adding credit losses to its financial results. We sold the last of our shares in October. Listed in the U.K., Spirax-Sarco Engineering is a global leader in steam systems, electric thermal solutions, and specialty pumps that uses a recurring revenue model with its global customer base. Although demand remained strong and sales were robust, the company faced supply chain issues and crimped profit margins, both of which we see as temporary, fixable issues.
| Top Contributors to Performance | Top Detractors from Performance | |||||
| For 2022 (%)1 | For 2022 (%)2 | |||||
| Applied Industrial Technologies | 1.34 | Carlyle Group | -2.25 | |||
| Reliance Steel & Aluminum | 0.72 | Rent-A-Center | -1.65 | |||
| KBR | 0.70 | Spirax-Sarco Engineering | -1.55 | |||
| Hubbell Incorporated | 0.63 | Triumph Financial | -1.36 | |||
| Lindsay Corporation | 0.61 | Sprott | -1.09 | |||
| 1 Includes dividends | 2 Net of dividends | |||||
The top contributor was Applied Industrial Technologies, which both distributes and offers solutions for industrial motion, fluid power, flow control, and related maintenance tools. The company reported strong earnings in 2022, driven in large part by its higher-engineered solutions, service reliability, and an expanding automation platform as several customers made required investments and structural improvements to their operations. Reliance Steel & Aluminum offers metal processing services and distributes numerous metal products, including alloy, aluminum, brass, copper, carbon steel, titanium, and stainless steel, generally in small quantities on an as-needed basis. A long-time Royce holding, Reliance Steel & Aluminum benefited in 2022 from vibrant demand, especially in non-residential construction (including infrastructure), its largest end market, while demand for metals used in the semiconductor and aerospace industries recovered in the second half of the year. KBR delivers science, technology, and engineering solutions to governments and companies around the world. The company announced favorable third-quarter results and raised earnings guidance in October based on the success of projects such as developing NASA’s next generation of space suits and technological innovations designed to boost low-carbon clean ammonia capacity.
The portfolio’s advantage over the Russell 2500 in 2022 came primarily from sector allocation, though stock selection was also additive. Stock picks and—to a much lesser degree—our significantly higher weighting helped in Industrials. Our greater exposure and stock selection contributed in Materials, with a lesser contribution from the latter factor, while our much lower weighting in Information Technology also made a positive impact versus the benchmark. Conversely, stock selection hampered relative performance in Financials, as did our much lower weighting in Energy and lack of exposure to Utilities during 2022.
CURRENT POSITIONING AND OUTLOOK
We know better than to try predicting outcomes for the markets or the economy, but we routinely examine past performance patterns to help us make sense of the present as we prepare for the uncertain days ahead. The Russell 2500 fell -28.2% from 11/8/21 through the current bottom on 9/26/22, which places it around the average of Russell 2500 downturns of -15% or more since the index’s inception. Over that 44-year span, only three bear markets went markedly deeper than this one by falling at least another 10%. Each of these downturns was exacerbated by a monumental negative event: the Great Financial Crisis led to small- and mid-cap losses of -58.4% from 7/13/07-3/9/09; the bursting Internet Bubble saw the Russell 2000 down -37.7% from 3/9/00-10/9/02; and in the Covid pandemic the small-cap index declined -41.5% from 2/20/20-3/23/20. As difficult as these markets were, each presented investors with an important opportunity to build their small-cap allocation because in each case the subsequent recovery was robust—but it was much more rewarding for those who stayed invested. Regardless of what happens in the near term, then, we see the current period of uncertainty as a highly opportune time to actively invest in select small caps for the long run.
8 | The Royce Funds 2022 Annual Report to Shareholders
| PERFORMANCE AND PORTFOLIO REVIEW (UNAUDITED) | TICKER SYMBOLS RYDVX RDVIX RDIIX RDVCX |
Performance and Expenses
Average Annual Total Return (%) Through 12/31/22
| JUL-DEC 20221 | 1-YR | 3-YR | 5-YR | 10-YR | 15-YR | SINCE INCEPTION (5/3/04) | |
| RDV | 9.41 | -13.62 | 2.72 | 3.33 | 7.24 | 7.00 | 7.72 |
| Annual Gross Operating Expenses: 1.54% Annual Net Operating Expenses: 1.34% | |||||||
1 Not annualized
Morningstar Style Map™ As of 12/31/22
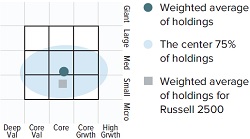
The Morningstar Style Map is the Morningstar Style Box™ with the center 75% of fund holdings plotted as the Morningstar Ownership Zone™. The Morningstar Style Box is designed to reveal a fund’s investment strategy. The Morningstar Ownership Zone provides detail about a portfolio’s investment style by showing the range of stock sizes and styles. The Ownership Zone is derived by plotting each stock in the portfolio within the proprietary Morningstar Style Box. Over time, the shape and location of a fund’s ownership zone may vary. See page 86 for additional information.
Value of $10,000
Invested on 5/3/04 as of 12/31/22 ($)

Top 10 Positions
% of Net Assets
| Applied Industrial Technologies | 6.3 | |
| KBR | 5.5 | |
| Lindsay Corporation | 4.6 | |
| HEICO Corporation Cl. A | 4.5 | |
| Franco-Nevada | 4.2 | |
| Hubbell Incorporated | 3.9 | |
| AptarGroup | 3.8 | |
| Worthington Industries | 3.7 | |
| SEI Investments | 3.7 | |
| Reliance Steel & Aluminum | 3.5 |
Portfolio Sector Breakdown
% of Net Assets
| Industrials | 42.5 | |
| Financials | 22.6 | |
| Materials | 19.3 | |
| Health Care | 3.2 | |
| Consumer Discretionary | 2.8 | |
| Information Technology | 2.0 | |
| Energy | 1.4 | |
| Real Estate | 0.5 | |
| Cash and Cash Equivalents | 5.7 |
Calendar Year Total Returns (%)
| YEAR | RDV | |
| 2022 | -13.6 | |
| 2021 | 20.1 | |
| 2020 | 4.5 | |
| 2019 | 29.8 | |
| 2018 | -16.2 | |
| 2017 | 21.7 | |
| 2016 | 16.4 | |
| 2015 | -5.7 | |
| 2014 | -2.1 | |
| 2013 | 30.7 | |
| 2012 | 16.9 | |
| 2011 | -4.5 | |
| 2010 | 30.1 | |
| 2009 | 37.7 | |
| 2008 | -31.5 |
Upside/Downside Capture Ratios
Periods Ended 12/31/22 (%)
| UPSIDE | DOWNSIDE | |||
| 10-Year | 89 | 104 | ||
| From 6/30/04 (Start of Fund’s First Full Quarter) | 91 | 92 |
Portfolio Diagnostics
| Fund Net Assets | $59 million | |
| Number of Holdings | 42 | |
| Turnover Rate | 3% | |
| Average Market Capitalization1 | $6,022 million | |
| Weighted Average P/E Ratio2,3 | 16.2x | |
| Weighted Average P/B Ratio2 | 3.0x | |
| Active Share4 | 97% | |
| U.S. Investments (% of Net Assets) | 73.0% | |
| Non-U.S. Investments (% of Net Assets) | 21.3% |
| 1 | Geometric Average. This weighted calculation uses each portfolio holding’s market cap in a way designed to not skew the effect of very large or small holdings; instead, it aims to better identify the portfolio’s center, which Royce believes offers a more accurate measure of average market cap than a simple mean or median. |
| 2 | Harmonic Average. This weighted calculation evaluates a portfolio as if it were a single stock and measures it overall. It compares the total market value of the portfolio to the portfolio’s share in the earnings or book value, as the case may be, of its underlying stocks. |
| 3 | The Fund’s P/E ratio calculation excludes companies with zero or negative earnings (2% of portfolio holdings as of 12/31/22). |
| 4 | Active Share is the sum of the absolute values of the different weightings of each holding in the Fund versus each holding in the benchmark, divided by two. |
Important Performance and Expense Information
All performance information in this Report reflects past performance, is presented on a total return basis, reflects the reinvestment of distributions, and does not reflect the deduction of taxes that a shareholder would pay on Fund distributions or the redemption of Fund shares. Past performance is no guarantee of future results. Investment return and principal value of an investment will fluctuate, so that shares may be worth more or less than their original cost when redeemed. Shares redeemed within 30 days of purchase may be subject to a 1% redemption fee payable to the Fund, which is not reflected in the performance shown above; if it were, performance would be lower. Current month-end performance may be higher or lower than performance quoted and may be obtained at www.royceinvest.com. All performance and risk information reflects results of the Service Class (its oldest class). Gross operating expenses reflect the Fund’s total gross annual operating expenses for the Service Class and include management fees, 12b-1 distribution and service fees, and other expenses. Net operating expenses reflect contractual fee waivers and/or expense reimbursements. All expense information is reported as of the Fund’s most current prospectus. Royce & Associates has contractually agreed, without right of termination, to waive fees and/or reimburse expenses to the extent necessary to maintain the Service Class’s net annual operating expenses (excluding brokerage commissions, taxes, interest, litigation expenses, acquired fund fees and expenses, and other expenses not borne in the ordinary course of business) at or below 1.34% through April 30, 2023. Regarding the “Top Contributors” and “Top Detractors” tables shown above, the sum of all contributors to, and all detractors from, performance for all securities in the portfolio would approximate the Fund’s year-to-date performance for 2022. The Sharpe Ratio is calculated for a specified period by dividing a fund’s annualized excess returns by its annualized standard deviation. The higher the Sharpe ratio, the better the fund’s historical risk-adjusted performance. Upside Capture Ratio measures a manager’s performance in up markets relative to the Fund’s benchmark (Russell Microcap). It is calculated by measuring the Fund’s performance in quarters when the benchmark went up and dividing it by the benchmark’s return in those quarters. Downside Capture Ratio measures a manager’s performance in down markets relative to the Fund’s benchmark. It is calculated by measuring the Fund’s performance in quarters when the benchmark goes down and dividing it by the benchmark’s return in those quarters.
The Royce Funds 2022 Annual Report to Shareholders | 9
MANAGER’S DISCUSSION (UNAUDITED
Royce Global Financial Services Fund (RFS)

Chuck Royce
FUND PERFORMANCE
Royce Global Financial Services Fund was down -20.3% in 2022, lagging its benchmark, MSCI ACWI Small Cap Index, which fell -18.7% for the same period. Longer-term relative results were better as the portfolio outperformed its benchmark for the three-, five-, 10-, and 15-year periods ended 12/31/22.
WHAT WORKED… AND WHAT DIDN’T
The Fund had investments in five sectors during 2022, all of which detracted from performance. Financials detracted the most, followed by Real Estate and Information Technology. All of the portfolio’s industry groups also detracted from performance. Capital markets (Financials), real estate management & development (Real Estate), and banks (Financials) had the biggest negative effect while the smallest came from metals & mining (Materials), professional services (Industrials), and electronic equipment, instruments & components (Information Technology). At the country level, Canada, the U.S., and the United Kingdom were the largest detractors in 2022 while Israel, Brazil, and Panama made positive contributions.
The Fund’s top detractor was Canaccord Genuity Group. Canada’s largest independent investment dealer, Canaccord specializes in wealth management and brokerage in capital markets—with a particular focus on growth companies and initial public offerings (“IPOs”). With both of these markets hard hit in 2022, the company’s revenue and earnings fell precipitously. We maintained our position at the end of 2022. (In early January, certain members of the c-suite announced a bid to take the company private at a 30% premium to its close on 1/8/23.) Intermediate Capital Group is a London-based private equity business that invests in private debt, credit and equity, and bridge financing, among other financial instruments. After a profitable 2021, the firm’s earnings declined sharply in 2022 against a challenging and uncertain macroeconomic environment. Taking a long-term view, we held our shares. Sprott is another Canadian business, which provides portfolio management and broker-dealer services, primarily in the precious metals area. Sprott’s shares began to fall sharply in March as precious metals prices corrected, falling through most of 2022. Having confidence in its ability to rebound, we held our shares at the end of December.
| Top Contributors to Performance | Top Detractors from Performance | |||||
For 2022 (%)1
| For 2022 (%)2 | |||||
| StoneX Group | 1.08 | Canaccord Genuity Group | -1.80 | |||
| Tel Aviv Stock Exchange | 0.66 | Intermediate Capital Group | -1.56 | |||
| Capital City Bank Group | 0.45 | Sprott | -1.45 | |||
| BOK Financial | 0.28 | MarketWise Cl. A | -1.44 | |||
| Charles Schwab | 0.24 | Carlyle Group | -1.42 | |||
| 1 Includes dividends | 2 Net of dividends | |||||
The portfolio’s top contributor for 2022 was New York City-based financial services firm StoneX Group, which benefited from the robust operating environment in its global payments business and strong margin growth rooted in the effective management of its cost structure. The company also reported strong trading volumes, growth in client funds, and strong revenue growth across all of its products and client segments for fiscal 2022 and has made progress in delivering a number of digital solutions and platforms in 2023. In addition, rising interest rates have been a boon to the company’s asset sensitivity. Tel Aviv Stock Exchange, which offers trading services for stocks, convertible securities, corporate and government bonds, short-term certificates, and index and currency options in Israel, saw steady growth in revenue and earnings in 2022 thanks in large part to increased trading and clearing commissions, listing fees and levies, and clearinghouse services. Shares of Florida-based Capital City Bank Group rose after the company announced solid second-quarter results driven by strong loan growth, credit quality, rising rates, and lower expenses. The bank’s third-quarter results were similarly sunny, with margin expansion, steady loan growth, and relative strength in its residential mortgage business (despite higher borrowing rates and a slowdown in secondary market loan sales) all driving earnings.
The portfolio’s relative performance will generally hinge not just on the performance of financial stocks—which were underwater in both the Fund and the MSCI ACWI Small Cap in 2022—but also on those sectors where we have little or no exposure vis-à-vis our broad-based global benchmark. Hurting relative results most at the sector level were our lack of exposure to Energy, scant exposure and stock selection in Industrials, and stock picks in Real Estate. Conversely, lack of exposure to Health Care and Consumer Discretionary were relative strengths in 2022, as was stock selection in Information Technology.
CURRENT POSITIONING AND OUTLOOK
While the near-term forecast for equities is as unclear as any we can recall, we also see better weather over the long-term horizon for smaller global financial stocks. Indeed, throughout 2022 we have often been struck by the contrast between the more confident— albeit cautious—outlooks from the many management teams we’ve met with and the fatalistic headlines we see almost every day. In our view, our companies boast generally strong long-term growth prospects and/or proven management expertise. We think that they appear well positioned as a whole for a market that is more focused on fundamentals and/or from a reaccelerating global economy. And while recession remains a reality or possibility (depending on geography), none of us knows how long it will last or how deep it will go. History shows us that any recession—like any bear market—is ultimately finite and that a recession will be followed by a recovery. For this and other reasons, we would welcome any degree of increased scrutiny of company fundamentals.
10 | The Royce Funds 2022 Annual Report to Shareholders
| PERFORMANCE AND PORTFOLIO REVIEW (UNAUDITED) | TICKER SYMBOLS RYFSX RGFIX |
Performance and Expenses
Average Annual Total Return (%) Through 12/31/22
| JUL-DEC 20221 | 1-YR | 3-YR | 5-YR | 10-YR | 15-YR | SINCE INCEPTION (12/31/03) | |
| RFS | 2.44 | -20.32 | 3.37 | 3.50 | 8.68 | 6.27 | 7.31 |
Annual Gross Operating Expenses: 1.82% Annual Net Operating Expenses: 1.53%
1 Not annualized
Morningstar Style Map™ As of 12/31/22
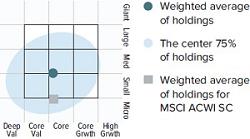
The Morningstar Style Map is the Morningstar Style Box™ with the center 75% of fund holdings plotted as the Morningstar Ownership Zone™. The Morningstar Style Box is designed to reveal a fund’s investment strategy. The Morningstar Ownership Zone provides detail about a portfolio’s investment style by showing the range of stock sizes and styles. The Ownership Zone is derived by plotting each stock in the portfolio within the proprietary Morningstar Style Box. Over time, the shape and location of a fund’s ownership zone may vary. See page 86 for additional information.
Portfolio Country Breakdown 1,2
% of Net Assets
| United States | 48.6 |
| Canada | 27.1 |
| Israel | 6.1 |
| Bermuda | 4.0 |
| India | 2.3 |
| France | 2.1 |
| United Kingdom | 2.0 |
| Brazil | 1.7 |
| New Zealand | 1.6 |
| South Africa | 1.6 |
| Panama | 1.5 |
1 Represents countries that are 1.5% or more of net assets.
2 Securities are categorized by the country of their headquarters.
Top 10 Positions
% of Net Assets
| Tel Aviv Stock Exchange | 6.1 |
| Sprott | 5.0 |
| Franco-Nevada | 4.8 |
| Charles Schwab | 4.5 |
| First Citizens BancShares Cl. A | 4.4 |
| BOK Financial | 4.0 |
| Popular | 4.0 |
| E-L Financial | 4.0 |
| FirstService Corporation | 3.8 |
| Altus Group | 3.5 |
Portfolio Industry Breakdown
% of Net Assets
| Capital Markets | 54.8 |
| Banks | 17.5 |
| Real Estate Management & Development | 9.1 |
| Insurance | 7.3 |
| Metals & Mining | 4.8 |
| Diversified Financial Services | 2.1 |
| Software | 1.4 |
| Closed-End Funds | 1.0 |
| IT Services | 0.9 |
| Thrifts & Mortgage Finance | 0.7 |
| Professional Services | 0.3 |
| Cash and Cash Equivalents | 0.1 |
Value of $10,000
Invested on 12/31/03 as of 12/31/22 ($)

Calendar Year Total Returns (%)
| YEAR | RFS |
| 2022 | -20.3 |
| 2021 | 20.3 |
| 2020 | 15.3 |
| 2019 | 24.2 |
| 2018 | -13.4 |
| 2017 | 22.5 |
| 2016 | 12.9 |
| 2015 | -4.7 |
| 2014 | 3.5 |
| 2013 | 42.0 |
| 2012 | 20.7 |
| 2011 | -11.3 |
| 2010 | 18.5 |
| 2009 | 32.1 |
| 2008 | -35.4 |
Portfolio Diagnostics
| Fund Net Assets | $27 million |
| Number of Holdings | 49 |
| Turnover Rate | 10% |
| Average Market Capitalization 1 | $3,362 million |
| Weighted Average P/E Ratio 2,3 | 13.7x |
| Weighted Average P/B Ratio 2 | 1.9x |
| Active Share 4 | 99% |
| 1 | Geometric Average. This weighted calculation uses each portfolio holding’s market cap in a way designed to not skew the effect of very large or small holdings; instead, it aims to better identify the portfolio’s center, which Royce believes offers a more accurate measure of average market cap than a simple mean or median. |
| 2 | Harmonic Average. This weighted calculation evaluates a portfolio as if it were a single stock and measures it overall. It compares the total market value of the portfolio to the portfolio’s share in the earnings or book value, as the case may be, of its underlying stocks. |
| 3 | The Fund’s P/E ratio calculation excludes companies with zero or negative earnings (12% of portfolio holdings as of 12/31/22). |
| 4 | Active Share is the sum of the absolute values of the different weightings of each holding in the Fund versus each holding in the benchmark, divided by two. |
Upside/Downside Capture Ratios
Periods Ended 12/31/22 (%)
| UPSIDE | DOWNSIDE | |
| 10-Year | 96 | 86 |
| Fund’s First Full Quarter | ||
| (12/31/03) | 88 | 86 |
Important Performance and Expense Information
All performance information in this Report reflects past performance, is presented on a total return basis, reflects the reinvestment of distributions, and does not reflect the deduction of taxes that a shareholder would pay on Fund distributions or the redemption of Fund shares. Past performance is no guarantee of future results. Investment return and principal value of an investment will fluctuate, so that shares may be worth more or less than their original cost when redeemed. Shares redeemed within 30 days of purchase may be subject to a 1% redemption fee payable to the Fund, which is not reflected in the performance shown above; if it were, performance would be lower. Current month-end performance may be higher or lower than performance quoted and may be obtained at www.royceinvest.com. Gross operating expenses reflect the Fund’s gross total annual operating expenses for the Service Class and include management fees, 12b-1 distribution and service fees, other expenses and acquired fund fees and expenses. Net operating expenses reflect contractual fee waivers and/or expense reimbursements. All expense information is reported as of the Fund’s most current prospectus. Royce & Associates has contractually agreed to waive fees and/or reimburse expenses to the extent necessary to maintain the Fund’s net annual operating expenses, (excluding brokerage commissions, taxes, interest, litigation expenses, acquired fund fees and expenses, and other expenses not borne in the ordinary course of business), at or below 1.49% through April 30, 2023. Acquired fund fees and expenses reflect the estimated amount of the fees and expenses incurred indirectly by the Fund through its investments in mutual funds, hedge funds, private equity funds, and other investment companies. Regarding the “Top Contributors” and “Top Detractors” tables shown above, the sum of all contributors to, and all detractors from, performance for all securities in the portfolio would approximate the Fund’s year-to-date performance for 2022. Upside Capture Ratio measures a manager’s performance in up markets relative to the Fund’s benchmark (MSCI ACWI SC). It is calculated by measuring the Fund’s performance in quarters when the benchmark went up and dividing it by the benchmark’s return in those quarters. Downside Capture Ratio measures a manager’s performance in down markets relative to the Fund’s benchmark. It is calculated by measuring the Fund’s performance in quarters when the benchmark goes down and dividing it by the benchmark’s return in those quarters.
The Royce Funds 2022 Annual Report to Shareholders | 11
MANAGERS’ DISCUSSION (UNAUDITED)
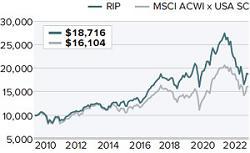
Royce International Premier Fund (RIP)

Mark Rayner, CA, Mark Fischer
FUND PERFORMANCE
Royce International Premier Fund fell -27.2% in 2022, lagging its benchmark, the MSCI ACWI ex USA Small Cap Index, which declined -20.0%. Longer-term results versus the benchmark were better, however, as the Fund outperformed its benchmark for the five-, 10-year, and since inception (12/31/10) periods ended 12/31/22.
WHAT WORKED… AND WHAT DIDN’T
Seven of the portfolio’s eight equity sectors detracted from performance in 2022, with the largest negative effects coming from Industrials, Information Technology, and Materials. Consumer Discretionary made the only positive contribution while Real Estate and Communication Services detracted least. At the country level, the U.K., Japan, and Switzerland were the largest detractors in 2022 while Brazil, India, and France contributed most.
The portfolio’s top detractor was Australia’s Bravura Solutions, which provides software solutions for the wealth management and fund administration industries. Sonata, the company’s primary product, allows customers to develop and distribute new products, engage with their customers, and navigate the complex regulatory environment. Bravura’s business was hurt by pandemic-related project deferrals that persisted longer than expected, resulting in a number of revisions to financial guidance. Then, in early November, the company announced the need for additional investments that resulted in a significant downward revision to financial guidance and cash flow expectations, which in turn led to a 50%+ decline in its share price. The update was especially disappointing because a subsequent call with the new CEO pointed to inaccuracies in prior management’s communication, specifically around undisclosed and material customer losses. We promptly exited our position as a result. U.K.-based Marlowe provides a wide range of services and related software products such as testing and certification of fire safety systems, HR compliance and e-learning software, and audits to ensure compliance with environmental regulations. In November, Marlowe published first half results that showed revenue growth and margin improvement that nonetheless led to a sell-off, as the market found fault with Marlowe’s cash generation: The company booked working capital outflows, mostly caused by timing issues that will unwind in 2023, and higher one-off restructuring costs. We see these elevated costs as temporary and expect cash generation to normalize, particularly as management has suggested the pace of M&A may moderate moving forward in the uncertain macro environment. More important, we do not believe these issues impair Marlowe’s long-term value creation pathway.
| Top Contributors to Performance | Top Detractors from Performance | |||||
| For 2022 (%)1 | For 2022 (%)2 | |||||
| LifeWorks | 0.86 | Bravura Solutions | -1.72 | |||
| Boa Vista Servicos | 0.38 | Marlowe | -1.64 | |||
| TOTVS | 0.30 | GVS | -1.57 | |||
| Loomis | 0.26 | XP Power | -1.27 | |||
| AIA Engineering | 0.26 | Restore | -1.16 | |||
| 1 Includes dividends | 2 Net of dividends | |||||
The top contributor in 2022 was Canada’s LifeWorks, which provides employee well-being solutions through an integrated platform that includes confidential counselling, employee engagement tools, perks, and health programs. LifeWork’s services are proven to boost productivity and reduce absenteeism, producing a strong customer benefit. We also liked that, despite this strong customer benefit, its services cost just $2-4 per employee per month, resulting in a loyal customer base. In June 2022, LifeWorks received an acquisition offer from Telus, a large communication services company, at a significant premium. Boa Vista Servicos—the Equifax of Brazil—is one of the leading credit bureaus in the country. Its solutions are a relatively low-cost but important part of customers’ operations, and Boa Vista serves more than 130,000 customers with no single customer accounting for more than 10% of revenue. In December, Boa Vista received a take-out offer from Equifax representing an 89% premium to the last close. We saw the likelihood of a rival bid emerging as low and sold some of our position to take advantage of the price appreciation.
The portfolio’s disadvantage versus its benchmark came from both stock selection and sector allocation in 2022. Stock selection in Industrials, stock picks and a substantial underweight in Financials, and stock selection in Materials made the biggest negative impacts versus the benchmark. Conversely, our cash holdings, stock picks and a significantly lower weighting in Consumer Discretionary, and stock selection in Health Care all contributed most to relative results in 2022.
CURRENT POSITIONING AND OUTLOOK
We note that the aggregate key operating metrics of the Fund’s holdings—high returns on invested capital (ROIC), low debt, and strong trailing growth rates—remain both robust and remarkably similar to what they were at the onset of 2022, despite the year’s highly difficult economic and geopolitical backdrop. We believe our holdings continued to create substantial shareholder value. What has materially changed, though, is valuation. Over the course of the year, the multiple the market was willing to pay for the high-quality companies we hold fell by roughly 35%. Our disappointing absolute performance, then, was primarily driven by the rapid increase in interest rates around the world, which led to significant multiple contraction. The market also tended to favor shorter-term beneficiaries of higher rates and/or the inflation they were targeted to tame—such as banks, energy, and raw materials. So, while our cash generative, low debt companies with pricing power have coped operationally well with higher rates and other increased costs, the market looked elsewhere in 2022. As long-term investors, of course, we will stick to our knitting and have therefore been working to take advantage of long-run investment opportunities.
12 | The Royce Funds 2022 Annual Report to Shareholders
| PERFORMANCE AND PORTFOLIO REVIEW (UNAUDITED) | TICKER SYMBOLS RYIPX RIPNX RINPX RIPIX |
Performance and Expenses
Average Annual Total Return (%) Through 12/31/22
| JUL-DEC 20221 | 1-YR | 3-YR | 5-YR | 10-YR | SINCE INCEPTION (12/31/10) | |
| RIP | -0.28 | -27.21 | -3.77 | 0.86 | 6.18 | 5.36 |
| Annual Gross Operating Expenses: 1.54% Annual Net Operating Expenses: 1.44% | ||||||
1 Not annualized
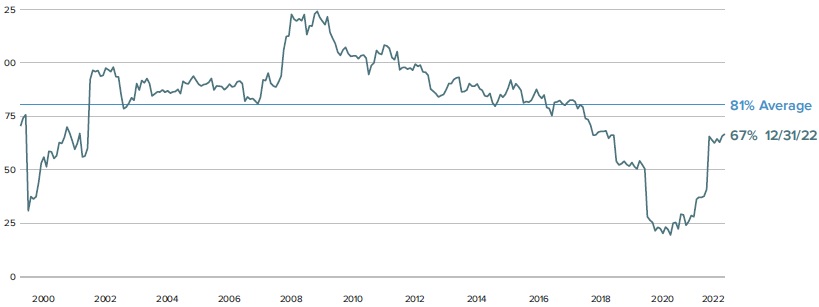
Relative Returns: Monthly Rolling Average Annual Return Periods
Since Inception Through 12/31/22
On a monthly rolling basis, The Fund outperformed the MSCI ACWI x USA SC in 100% of all 10-year periods; 100% of all 5-year periods; and 61% of all 1-year periods.
| PERIODS BEATING THE INDEX | FUND AVG (%)1 | INDEX AVG (%)1 | |||
| 10-year | 25/25 | 100% | 8.9 | 6.9 | |
| 5-year | 85/85 | 100% | 9.2 | 6.1 | |
| 1-year | 81/133 | 61% | 7.8 | 6.4 | |
1Average of monthly rolling average annual total returns over the specified periods.
Morningstar Style Map™ As of 12/31/22

The Morningstar Style Map is the Morningstar Style Box™ with the center 75% of fund holdings plotted as the Morningstar Ownership Zone™. The Morningstar Style Box is designed to reveal a fund’s investment strategy. The Morningstar Ownership Zone provides detail about a portfolio’s investment style by showing the range of stock sizes and styles. The Ownership Zone is derived by plotting each stock in the portfolio within the proprietary Morningstar Style Box. Over time, the shape and location of a fund’s ownership zone may vary. See page 86 for additional information.
Value of $10,000
Invested on 12/31/10 as of 12/31/22 ($)
| Top 10 Positions | |
% of Net Assets
| |
| TKC Corporation | 3.4 |
| Hansen Technologies | 3.2 |
| BML | 3.1 |
| IPH | 2.9 |
| Enghouse Systems | 2.9 |
| OBIC Business Consultants | 2.8 |
| New Work | 2.6 |
| FUCHS PETROLUB | 2.6 |
| Restore | 2.6 |
| JCU | 2.5 |
| Portfolio Sector Breakdown | |
% of Net Assets
| |
| Industrials | 36.8 |
| Information Technology | 28.6 |
| Health Care | 9.2 |
| Materials | 6.4 |
| Communication Services | 4.4 |
| Financials | 4.3 |
| Consumer Discretionary | 1.1 |
| Real Estate | 0.6 |
| Preferred Stock | 2.6 |
| Cash and Cash Equivalents | 6.0 |
| Upside/Downside Capture Ratios | ||
| Periods Ended 12/31/22 (%) | ||
| UPSIDE | DOWNSIDE | |
| 10-Year | 99 | 92 |
| Fund’s First Full Quarter (12/31/10) | 100 | 90 |
| Calendar Year Total Returns (%) |
| YEAR | RIP |
| 2022 | -27.2 |
| 2021 | 5.8 |
| 2020 | 15.7 |
| 2019 | 34.2 |
| 2018 | -12.8 |
| 2017 | 39.8 |
| 2016 | -1.1 |
| 2015 | 16.2 |
| 2014 | -8.2 |
| 2013 | 18.3 |
| 2012 | 23.4 |
| 2011 | -16.8 |
| Portfolio Country Breakdown 1,2 | |
% of Net Assets
| |
| Japan | 24.5 |
| United Kingdom | 17.8 |
| Sweden | 7.9 |
| Germany | 7.4 |
| Australia | 6.2 |
| Canada | 5.2 |
| Switzerland | 4.8 |
| Brazil | 3.6 |
| South Korea | 3.6 |
| Italy | 3.3 |
1 Represents countries that are 3% or more of net assets.
2 Securities are categorized by the country of their headquarters.
| Portfolio Diagnostics | |
| Fund Net Assets | $740 million |
| Number of Holdings | 57 |
| Turnover Rate | 31% |
| Average Market Capitalization1 | $1,393 million |
| Weighted Average P/E Ratio 2,3 | 18.7x |
| Weighted Average P/B Ratio 2 | 2.4x |
| Active Share 4 | 99% |
| 1 | Geometric Average. This weighted calculation uses each portfolio holding’s market cap in a way designed to not skew the effect of very large or small holdings; instead, it aims to better identify the portfolio’s center, which Royce believes offers a more accurate measure of average market cap than a simple mean or median. |
| 2 | Harmonic Average. This weighted calculation evaluates a portfolio as if it were a single stock and measures it overall. It compares the total market value of the portfolio to the portfolio’s share in the earnings or book value, as the case may be, of its underlying stocks. |
| 3 | The Fund’s P/E ratio calculation excludes companies with zero or negative earnings (2% of portfolio holdings as of 12/31/22). |
| 4 | Active Share is the sum of the absolute values of the different weightings of each holding in the Fund versus each holding in the benchmark, divided by two. |
Important Performance and Expense Information
All performance information in this Report reflects past performance, is presented on a total return basis, reflects the reinvestment of distributions, and does not reflect the deduction of taxes that a shareholder would pay on Fund distributions or the redemption of Fund shares. Past performance is no guarantee of future results. Investment return and principal value of an investment will fluctuate, so that shares may be worth more or less than their original cost when redeemed. Shares redeemed within 30 days of purchase may be subject to a 2% redemption fee payable to the Fund, which is not reflected in the performance shown above; if it were, performance would be lower. Current month-end performance may be higher or lower than performance quoted and may be obtained at www.royceinvest.com. All performance and risk information reflects results of the Service Class (its oldest class). Price and total return information is based on net asset values for shareholder transactions. Certain immaterial adjustments were made to the net assets of Royce International Premier Fund at 12/31/19 and 12/31/20 for financial reporting purposes, and as a result the calendar year total returns based on those net asset values differ from the adjusted net asset values and calendar year total returns reported in the Financial Highlights. Gross operating expenses reflect total gross annual operating expenses for the Service Class and include management fees, 12b-1 distribution and service fees, and other expenses. Net operating expenses reflect contractual fee waivers and/or expense reimbursements. All expense information is reported as of the Fund’s most current prospectus. Royce & Associates has contractually agreed to waive its fees and/or reimburse operating expenses to the extent necessary to maintain the Fund’s net annual operating expenses, (excluding brokerage commissions, taxes, interest, litigation expenses, acquired fund fees and expenses, and other expenses not borne in the ordinary course of business), at or below 1.44% through April 30, 2023. Regarding the “Top Contributors” and “Top Detractors” tables shown above, the sum of all contributors to, and all detractors from, performance for all securities in the portfolio would approximate the Fund’s year-to-date performance for 2022. Upside Capture Ratio measures a manager’s performance in up markets relative to the Fund’s benchmark (MSCI ACWI x USA SC). It is calculated by measuring the Fund’s performance in quarters when the benchmark went up and dividing it by the benchmark’s return in those quarters. Downside Capture Ratio measures a manager’s performance in down markets relative to the Fund’s benchmark. It is calculated by measuring the Fund’s performance in quarters when the benchmark goes down and dividing it by the benchmark’s return in those quarters.
The Royce Funds 2022 Annual Report to Shareholders | 13
MANAGERS’ DISCUSSION (UNAUDITED)

Jim Stoeffel, Brendan Hartman
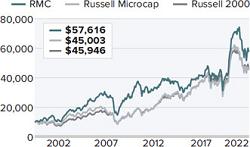
FUND PERFORMANCE
Royce Micro-Cap Fund was down -22.6% in 2022 versus a loss of -22.0% for its primary benchmark, the Russell Microcap Index, and a -20.4% loss for the small-cap Russell 2000 Index, its secondary benchmark. The portfolio outperformed the Russell Microcap for the three- and five-year periods ended 12/31/22 while also beating the Russell 2000 for the three-, five-, 25-, 30-year, and since inception (12/31/91) periods ended 12/31/22.
WHAT WORKED… AND WHAT DIDN’T
Eight of the portfolio’s nine equity sectors finished 2022 in the red, with Health Care, Consumer Discretionary, and Industrials detracting most. The lone positive impact came from Energy while Real Estate and Materials detracted least. At the industry level, health care equipment & supplies (Health Care), specialty retail (Consumer Discretionary), and electronic equipment, instruments & components (Information Technology) detracted most while software (Information Technology), auto components (Consumer Discretionary), and communications equipment (Information Technology) were the biggest contributors.
Shares of medical device company Bioventus declined sharply in 2022 following disappointing earnings that indicated greater complexity in integrating Misonix, which Bioventus acquired in October of 2021. We initially believed that the new entity’s greater scale could accelerate earnings growth, a view that shifted with November’s announcement that yearly guidance was being lowered, leading us to exit the stock. Shares of MeiraGTx Holdings, a clinical stage gene therapy company, declined despite progress in clinical trials for their retinal and salivary disease treatments and ongoing partnership with Johnson & Johnson. Rising rates seemed to drive the sell-off as much of its earnings potential remains several years away. We remained confident in its long-term promise at year-end. Industrial insulation company Aspen Aerogels saw its shares slide as it completed a dilutive financing deal to fund the capacity expansion necessary to meet growing demand from original equipment manufacturers of electric vehicles. We increased our stake in 2022. While the need for a large new plant admittedly adds timing uncertainty and execution risk, Aspen’s proven solution has been winning ample new business.
| Top Contributors to Performance | Top Detractors from Performance | |||||
| For 2022 (%)1 | For 2022 (%)2 | |||||
| Modine Manufacturing | 0.98 | Bioventus Cl. A | -1.27 | |||
| Agilysys | 0.89 | MeiraGTx Holdings | -0.86 | |||
| Digi International | 0.74 | Aspen Aerogels | -0.84 | |||
| Clearfield | 0.54 | Harvard Bioscience | -0.82 | |||
| StoneX Group | 0.46 | Apyx Medical | -0.82 | |||
| 1 Includes dividends | 2 Net of dividends | |||||
Modine Manufacturing provides thermal management systems for an array of industries and is in the midst of a turnaround, moving from commoditized areas to higher-growth and margin segments, such as electric vehicles and data center infrastructure. We maintained our position as we believe the turnaround is in its early stages and not yet fully appreciated by investors. Software developer Agilysys offers a comprehensive suite of solutions targeting the hospitality industry. Management has spent the past several years developing add-on modules to its core Property Management software offering and thus increasing the firm’s competitive advantage. We held our shares at year-end as we view its recent win with Marriott as a potential game changer. Digi International is transitioning from a pure play networking hardware business to offering ancillary software products adjacent to its core offering. These new offerings have provided a significant base of high-margin, recurring revenues. We reduced our position as we believe the market has begun to more fully recognize the company’s successful transition.
The portfolio’s disadvantage versus the Russell 2000 Microcap came mostly from sector allocation in 2022. Our lower exposure (and, to a lesser degree, stock selection) hampered relative results most in Energy. Stock picks hurt in Health Care, as did a combination of greater exposure and stock selection in Communication Services. Conversely, stock selection provided a sizable relative advantage in both Information Technology (overcoming the negative impact of our significantly higher weighting) and Industrials while the Fund’s cash holdings also contributed to relative performance in 2022.
CURRENT POSITIONING AND OUTLOOK
We see micro-cap value stocks as increasingly well positioned for the next market upturn as they were disproportionately hurt by the zero interest rate environment that favored long duration assets. While 2022’s pain was sharp for stocks, the Federal Reserve’s pivot to a more normalized interest rate environment should lead to more thoughtful approaches to investing once we exit the current downturn. The key questions revolve around inflation: When will it abate and when will the Fed begin to ease financial conditions. We see their resolution as a prerequisite for a sustained move higher in equity prices. We suspect that many inflationary pressures were related to aggressive fiscal and monetary stimuli in demand-based economies juxtaposed against significant supply chain disruptions in supply-based economies—a classic supply/demand imbalance that, while persisting for longer than we initially thought, is already showing signs of rebalancing, with the price of many goods falling rapidly. Currently invested on a pro-cyclical basis with overweights in retailers, Information Technology, and Industrials, we have made no wholesale changes to our positioning. At the same time, we believe that any easing in financial conditions against a backdrop where earnings expectations still need to come down should create enough volatility for us to find exciting investment opportunities. In short, we are cautiously optimistic about 2023 as a year of normalization in which volatility should offer excellent opportunities to position ourselves for the next significant bull phase.
14 | The Royce Funds 2022 Annual Report to Shareholders
| PERFORMANCE AND PORTFOLIO REVIEW (UNAUDITED) | TICKER SYMBOLS RYOTX RMCFX RYMCX |
Performance and Expenses
Average Annual Total Return (%) Through 12/31/22
| JUL-DEC 20221 | 1-YR | 3-YR | 5-YR | 10-YR | 15-YR | 20-YR | 25-YR | 30-YR | SINCE INCEPTION (12/31/91) | |
| RMC | 7.51 | -22.55 | 8.10 | 6.87 | 5.90 | 4.78 | 8.59 | 8.16 | 9.59 | 10.18 |
| Annual Operating Expenses: 1.20% | ||||||||||
1 Not annualized
Morningstar Style Map™ As of 12/31/22

The Morningstar Style Map is the Morningstar Style Box™ with the center 75% of fund holdings plotted as the Morningstar Ownership Zone™. The Morningstar Style Box is designed to reveal a fund’s investment strategy. The Morningstar Ownership Zone provides detail about a portfolio’s investment style by showing the range of stock sizes and styles. The Ownership Zone is derived by plotting each stock in the portfolio within the proprietary Morningstar Style Box. Over time, the shape and location of a fund’s ownership zone may vary. See page 86 for additional information.
Value of $10,000
Invested on 6/30/00 (Russell Microcap Index Inception)
as of 12/31/22 ($)
| Top 10 Positions | ||
% of Net Assets
| ||
| Agilysys | 1.5 | |
| Heritage-Crystal Clean | 1.4 | |
| Luna Innovations | 1.4 | |
| CRA International | 1.4 | |
| Western New England Bancorp | 1.3 | |
| Investar Holding Corporation | 1.3 | |
| Modine Manufacturing | 1.3 | |
| Vishay Precision Group | 1.3 | |
| StoneX Group | 1.3 | |
| Axcelis Technologies | 1.3 |
| Portfolio Sector Breakdown | ||
% of Net Assets
| ||
| Information Technology | 28.0 | |
| Industrials | 24.9 | |
| Financials | 14.0 | |
| Consumer Discretionary | 11.4 | |
| Health Care | 7.2 | |
| Materials | 4.8 | |
| Communication Services | 4.1 | |
| Energy | 2.9 | |
| Real Estate | 0.6 | |
| Cash and Cash Equivalents | 2.1 |
| Calendar Year Total Returns (%) | ||
| YEAR | RMC | |
| 2022 | -22.6 | |
| 2021 | 31.0 | |
| 2020 | 24.5 | |
| 2019 | 21.2 | |
| 2018 | -8.9 | |
| 2017 | 5.4 | |
| 2016 | 19.7 | |
| 2015 | -13.3 | |
| 2014 | -4.1 | |
| 2013 | 21.3 | |
| 2012 | 8.0 | |
| 2011 | -12.1 | |
| 2010 | 30.1 | |
| 2009 | 55.7 | |
| 2008 | -40.9 |
Upside/Downside Capture Ratios
Periods Ended 12/31/22 (%)
| UPSIDE | DOWNSIDE | |||
| 10-Year | 80 | 90 | ||
| From 6/30/00 (Russell Microcap Index Inception) | 93 | 84 |
| Portfolio Diagnostics | ||
| Fund Net Assets | $292 million | |
| Number of Holdings | 121 | |
| Turnover Rate | 13% | |
| Average Market Capitalization1 | $504 million | |
| Weighted Average P/B Ratio 2 | 1.7x | |
| Active Share3 | 91% | |
| U.S. Investments (% of Net Assets) | 87.5% | |
| Non-U.S. Investments (% of Net Assets) | 10.4% |
| 1 | Geometric Average. This weighted calculation uses each portfolio holding’s market cap in a way designed to not skew the effect of very large or small holdings; instead, it aims to better identify the portfolio’s center, which Royce believes offers a more accurate measure of average market cap than a simple mean or median. |
| 2 | Harmonic Average. This weighted calculation evaluates a portfolio as if it were a single stock and measures it overall. It compares the total market value of the portfolio to the portfolio’s share in the earnings or book value, as the case may be, of its underlying stocks. |
| 3 | Active Share is the sum of the absolute values of the different weightings of each holding in the Fund versus each holding in the benchmark, divided by two. |
Important Performance and Expense Information
All performance information in this Report reflects past performance, is presented on a total return basis, reflects the reinvestment of distributions, and does not reflect the deduction of taxes that a shareholder would pay on Fund distributions or the redemption of Fund shares. Past performance is no guarantee of future results. Investment return and principal value of an investment will fluctuate, so that shares may be worth more or less than their original cost when redeemed. Shares redeemed within 30 days of purchase may be subject to a 1% redemption fee payable to the Fund, which is not reflected in the performance shown above; if it were, performance would be lower. Current month-end performance may be higher or lower than performance quoted and may be obtained at www.royceinvest.com. All performance and risk information reflects results of the Investment Class (its oldest class). Price and total return information is based on net asset values calculated for shareholder transactions. Operating expenses reflect the Fund’s total annual operating expenses for the Investment Class as of the Fund’s most current prospectus and include management fees and other expenses. Regarding the “Top Contributors” and “Top Detractors” tables shown above, the sum of all contributors to, and all detractors from, performance for all securities in the portfolio would approximate the Fund’s year-to-date performance for 2022. Upside Capture Ratio measures a manager’s performance in up markets relative to the Fund’s benchmark (Russell Microcap Index). It is calculated by measuring the Fund’s performance in quarters when the benchmark went up and dividing it by the benchmark’s return in those quarters. Downside Capture Ratio measures a manager’s performance in down markets relative to the Fund’s benchmark. It is calculated by measuring the Fund’s performance in quarters when the benchmark goes down and dividing it by the benchmark’s return in those quarters.
The Royce Funds 2022 Annual Report to Shareholders | 15
MANAGERS’ DISCUSSION (UNAUDITED)
Royce Pennsylvania Mutual Fund® (PMF)

Steven McBoyle, Jay Kaplan, CFA®,
Chuck Royce, Miles Lewis, CFA®,
Andrew Palen, Lauren Romeo, CFA®
FUND PERFORMANCE
Our flagship, Royce Pennsylvania Mutual Fund, maintained its long-term advantages over its small-cap benchmark, the Russell 2000 Index, by losing less in 2022, -17.1% versus -20.4%. The Fund also outperformed the small-cap index for the three-, five-, 20-, 25-, 30-, 35-, and 40-year periods ended 12/31/22. So, while a negative return year is never welcome, we were pleased that Penn lost less than its benchmark and were equally pleased to celebrate 50 years of Chuck Royce’s portfolio management in 2022.
WHAT WORKED… AND WHAT DIDN’T
Nine of the Fund’s 10 equity sectors finished the year in the red, with the largest detractions coming from Information Technology, Consumer Discretionary, and Financials. Energy made a small positive contribution while the smallest detractions came from Consumer Staples and Materials. Two areas in Information Technology—semiconductors & semiconductor equipment and electronic equipment, instruments & components—detracted most at the industry level, followed by banks from Financials. Each was among the Fund’s five largest industry weightings at the end of 2022—and the two industries from tech were also significantly overweight versus the Russell 2000. All three exposures indicate our long-term confidence in spite of their stock price declines in a bearish 2022. Penn’s top-contributing industries were the metals & mining group in Materials, communications equipment in Information Technology, and energy equipment & services in Energy.
The Fund’s top detractor was Triumph Financial, a Texas-based community bank with a leading share in factoring receivables for the trucking industry and an innovative and expanding payments platform that serves the same industry. Spot rates in the trucking market, which impact the dollar amounts of receivables factored, began to decline in 2022, pressuring earnings, while a one-off credit issue also spooked investors. Moreover, we think the stock’s elevated multiple (after a strong 2021) hurt performance in a bearish environment with rising rates. Mesa Laboratories develops and manufactures electronic measurement instruments for industrial and hemodialysis customers. Mesa’s results were depressed by higher labor costs in its sterilization and disinfection segment and lost sales in its clinical genomics business in China due to Covid lockdowns. While management took actions to address its issues, we were concerned by the stock’s lofty valuation and Mesa’s strategy of continuing to shift its portfolio exposure toward faster-growing health care markets that will require additional expensive and dilutive acquisitions and therefore reduced our stake.
| Top Contributors to Performance | Top Detractors from Performance | |||||
| For 2022 (%)1 | For 2022 (%)2 | |||||
| Valmont Industries | 0.40 | Triumph Financial | -0.56 | |||
| Haemonetics Corporation | 0.39 | Mesa Laboratories | -0.55 | |||
| Meridian Bioscience | 0.27 | FormFactor | -0.51 | |||
| Digi International | 0.25 | MKS Instruments | -0.44 | |||
| Catalyst Pharmaceuticals | 0.23 | Forrester Research | -0.43 | |||
| 1 Includes dividends | 2 Net of dividends | |||||
The portfolio’s top contributor was Valmont Industries, which manufactures fabricated metal and concrete pole and tower structures as well as mechanized irrigation systems. Demand across all segments was strong in 2022, with Infrastructure seeing continued investments in utility grid resilience, clean energy solutions, lighting and transportation infrastructure upgrades, and telecommunications infrastructure driven by 5G rollout. Within Agriculture, strong farm sentiment and demand for irrigation equipment and precision agricultural solutions drove record income. Valmont is executing on a record global backlog, reflecting continued strong end market demand. Haemonetics Corporation is a global healthcare company that specializes in blood and plasma collection and transfusion services. Despite a myriad of events and pressures over the past several years, plasma collection showed a robust recovery due to the rising collection requirements needed to replenish inventory, increased donor activity, and favorable pricing strategies.
Our relative advantage came entirely from stock selection in 2022 as sector allocation was slightly negative. Eight equity sectors contributed to outperformance. At the sector level, both our lower exposure and stock selection helped in Health Care while in Industrials stock selection and our higher weighting keyed outperformance, as did stock picking in Information Technology. Conversely, relative results were hurt most by our lower exposure to Energy, along with our lack of exposure to Utilities, and a combination of stock picks and our lower weighting in Consumer Staples.
CURRENT POSITIONING AND OUTLOOK
The Russell 2000 fell -31.9% from 11/8/21 through the bottom on 6/16/22, which places it at the average of Russell 2000 downturns of 15% or more since the index’s inception. Over that 44-year span, only three bear markets went markedly deeper than this one by falling at least another 10%. Each was exacerbated by a monumental negative event: the Great Financial Crisis led to small-cap losses of -58.9% from 7/13/07-3/9/09; the bursting Internet Bubble saw the Russell 2000 down -44.1% from 3/9/00-10/9/02; and the Covid pandemic deepened the small-cap index decline of -41.8% from 8/31/18-3/18/20. As difficult as these markets were, each presented investors with an important opportunity to build their small-cap allocation because in each case the subsequent recovery was robust—but it was much more rewarding for those who stayed invested. Regardless of what happens in the near term, then, we see the current period of uncertainty as a highly opportune time to actively invest in select small caps for the long run.
16 | The Royce Funds 2022 Annual Report to Shareholders
| PERFORMANCE AND PORTFOLIO REVIEW (UNAUDITED) | TICKER SYMBOLS PENNX RYPFX RPMIX RYPCX RPMRX |
Performance and Expenses
Average Annual Total Return (%) Through 12/31/22
| JUL-DEC 20221 | 1-YR | 3-YR | 5-YR | 10-YR | 15-YR | 20-YR | 25-YR | 30-YR | 35-YR | 45-YR | |
| PMF | 5.31 | -17.06 | 4.91 | 5.71 | 8.73 | 7.08 | 9.59 | 9.07 | 9.73 | 10.40 | 12.18 |
| Annual Operating Expenses: 0.92% | |||||||||||
1 Not annualized
Morningstar Style Map™ As of 12/31/22

The Morningstar Style Map is the Morningstar Style Box™ with the center 75% of fund holdings plotted as the Morningstar Ownership Zone™. The Morningstar Style Box is designed to reveal a fund’s investment strategy. The Morningstar Ownership Zone provides detail about a portfolio’s investment style by showing the range of stock sizes and styles. The Ownership Zone is derived by plotting each stock in the portfolio within the proprietary Morningstar Style Box. Over time, the shape and location of a fund’s ownership zone may vary. See page 86 for additional information.
Value of $10,000
Invested on 12/29/78 (Russell 2000 Inception) as of 12/31/22 ($)

| Top 10 Positions | ||
% of Net Assets
| ||
| First Citizens BancShares Cl. A | 1.9 | |
| KBR | 1.7 | |
| Forward Air | 1.5 | |
| Air Lease Cl. A | 1.5 | |
| Haemonetics Corporation | 1.4 | |
| Arcosa | 1.4 | |
| Valmont Industries | 1.4 | |
| Element Solutions | 1.3 | |
| Ziff Davis | 1.2 | |
| Innospec | 1.2 |
| Portfolio Sector Breakdown | ||
% of Net Assets
| ||
| Industrials | 30.4 | |
| Financials | 17.6 | |
| Information Technology | 16.1 | |
| Consumer Discretionary | 10.6 | |
| Materials | 8.1 | |
| Health Care | 7.5 | |
| Real Estate | 2.9 | |
| Energy | 2.4 | |
| Communication Services | 2.2 | |
| Consumer Staples | 1.3 | |
| Cash and Cash Equivalents | 0.9 |
| Calendar Year Total Returns (%) | ||
| YEAR | PMF | |
| 2022 | -17.1 | |
| 2021 | 22.0 | |
| 2020 | 14.1 | |
| 2019 | 26.6 | |
| 2018 | -9.7 | |
| 2017 | 16.2 | |
| 2016 | 26.5 | |
| 2015 | -11.4 | |
| 2014 | -0.7 | |
| 2013 | 35.3 | |
| 2012 | 14.6 | |
| 2011 | -4.2 | |
| 2010 | 23.9 | |
| 2009 | 36.3 | |
| 2008 | -34.8 |
Upside/Downside Capture Ratios
Periods Ended 12/31/22 (%)
| UPSIDE | DOWNSIDE | |||
| 10-Year | 92 | 89 | ||
| From 12/31/78 | ||||
| (Russell 2000 Inception) | 90 | 75 |
| Portfolio Diagnostics | ||
| Fund Net Assets | $1,567 million | |
| Number of Holdings | 299 | |
| Turnover Rate | 45% | |
| Average Market Capitalization1 | $2,624 million | |
| Weighted Average P/E Ratio2,3 | 13.2x | |
| Weighted Average P/B Ratio2 | 2.1x | |
| Active Share4 | 88% | |
| U.S. Investments (% of Net Assets) | 86.7% | |
| Non-U.S. Investments (% of Net Assets) | 12.4% |
| 1 | Geometric Average. This weighted calculation uses each portfolio holding’s market cap in a way designed to not skew the effect of very large or small holdings; instead, it aims to better identify the portfolio’s center, which Royce believes offers a more accurate measure of average market cap than a simple mean or median. |
| 2 | Harmonic Average. This weighted calculation evaluates a portfolio as if it were a single stock and measures it overall. It compares the total market value of the portfolio to the portfolio’s share in the earnings or book value, as the case may be, of its underlying stocks. |
| 3 | The Fund’s P/E ratio calculation excludes companies with zero or negative earnings (11% of portfolio holdings as of 12/31/22). |
| 4 | Active Share is the sum of the absolute values of the different weightings of each holding in the Fund versus each holding in the benchmark, divided by two. |
Important Performance and Expense Information
All performance information in this Report reflects past performance, is presented on a total return basis, reflects the reinvestment of distributions, and does not reflect the deduction of taxes that a shareholder would pay on Fund distributions or the redemption of Fund shares. Past performance is no guarantee of future results. Investment return and principal value of an investment will fluctuate, so that shares may be worth more or less than their original cost when redeemed. Shares redeemed within 30 days of purchase may be subject to a 1% redemption fee payable to the Fund, which is not reflected in the performance shown above; if it were, performance would be lower. Current month-end performance may be higher or lower than performance quoted and may be obtained at www.royceinvest.com. All performance and risk information reflects results of the Investment Class (its oldest class). Operating expenses reflect the Fund’s total annual operating expenses for the Investment Class as of the Fund’s most current prospectus and include management fees, other expenses, and acquired fund fees and expenses. Acquired fund fees and expenses reflect the estimated amount of the fees and expenses incurred indirectly by the Fund through its investments in mutual funds, hedge funds, private equity funds, and other investment companies. Regarding the “Top Contributors” and “Top Detractors” tables shown above, the sum of all contributors to, and all detractors from, performance for all securities in the portfolio would approximate the Fund’s year-to-date performance for 2022. Upside Capture Ratio measures a manager’s performance in up markets relative to the Fund’s benchmark (Russell 2000). It is calculated by measuring the Fund’s performance in quarters when the benchmark went up and dividing it by the benchmark’s return in those quarters. Downside Capture Ratio measures a manager’s performance in down markets relative to the Fund’s benchmark. It is calculated by measuring the Fund’s performance in quarters when the benchmark goes down and dividing it by the benchmark’s return in those quarters.
The Royce Funds 2022 Annual Report to Shareholders | 17
MANAGERS’ DISCUSSION (UNAUDITED)

Andrew Palen, Lauren Romeo, CFA®,
Chuck Royce, Steven McBoyle
FUND PERFORMANCE
Royce Premier Fund beat the Russell 2000 in 2022, down -15.5% versus -20.4%, and outperformed the small-cap index for the three-, five-, 15-, 20-, 25-, 30-year, and since inception (12/31/91) periods ended 12/31/22.
WHAT WORKED… AND WHAT DIDN’T
Eight of the portfolio’s nine equity sectors finished 2022 in the red, with Information Technology, Consumer Discretionary, and Industrials having the biggest negative effect. The only positive impact came from Materials, while Consumer Staples and Communication Services detracted least. At the industry level, semiconductors & semiconductor equipment, electronic equipment, instruments & components (both in Information Technology), and capital markets (Financials) detracted most while construction & engineering (Industrials), metals & mining (Materials), and software (Information Technology) made the biggest positive contributions in 2022.
The biggest detractor was Mesa Laboratories, a company that develops and manufactures electronic measurement instruments for industrial and hemodialysis customers. Mesa’s results were depressed by higher labor costs in its sterilization and disinfection segment and lost sales in its clinical genomics business in China due to Covid lockdowns. While management took actions to address its issues, we grew concerned by the stock’s lofty valuation and Mesa’s strategy of continuing to shift its portfolio exposure toward faster-growing health care markets that will require additional expensive and dilutive acquisitions. We opted to exit our position in order to reevaluate the name, particularly relative to other candidates and existing holdings where our conviction was higher. MKS Instruments makes components, subsystems, and process control solutions that measure, control, power, and monitor semiconductor manufacturing processes. The company reduced earnings guidance on continued shipment delays due to industry supply chain issues, followed by a drop-off in orders as slowing consumer electronics demand and more cautious IT spending looked likely to cause declines in wafer fabrication equipment spending in 2023 as semiconductor manufacturers rebalance chip inventories. While it will take several quarters to work through these cyclical pressures, longer-term secular tailwinds remain intact. Semiconductor usage continues to proliferate and at the leading edge are becoming more complex to manufacture. With roughly 40% of its sales from consumables, we believe MKS should continue to generate solid free cash flow that it will use to deleverage after its most recent acquisition, following a playbook it has successfully executed in the past.
| Top Contributors to Performance | Top Detractors from Performance | |||||
| For 2022 (%)1 | For 2022 (%)2 | |||||
| Valmont Industries | 1.02 | Mesa Laboratories | -1.65 | |||
| Haemonetics Corporation | 0.75 | MKS Instruments | -1.65 | |||
| Meridian Bioscience | 0.70 | FormFactor | -1.32 | |||
| Reliance Steel & Aluminum | 0.61 | John Bean Technologies | -1.15 | |||
| Fair Isaac | 0.47 | Forrester Research | -1.14 | |||
| 1 Includes dividends | 2 Net of dividends | |||||
The portfolio’s top contributor was Valmont Industries, which manufactures fabricated metal and concrete pole and tower structures as well as mechanized irrigation systems. Demand across all segments was strong in 2022, with Infrastructure seeing continued investments in utility grid resilience, clean energy solutions, lighting and transportation infrastructure upgrades, and telecommunications infrastructure driven by 5G rollout. Within Agriculture, strong farm sentiment and demand for irrigation equipment and precision agricultural solutions drove record income. Valmont is executing on a record global backlog, reflecting continued strong end market demand. Haemonetics Corporation is a global healthcare company that specializes in blood and plasma collection and transfusion services. Despite a myriad of events and pressures over the past several years, plasma collection showed a robust recovery due to the rising collection requirements needed to replenish inventory, increased donor activity, and favorable pricing strategies.
The portfolio’s advantage over its benchmark came exclusively from stock selection in 2022—sector allocation was marginally negative. Among sectors, stock selection, as well as our higher weighting, helped in Industrials and Materials while we also benefited from our lower exposure and some savvy stock picks in Health Care. Conversely, our lack of exposure to both Energy and Utilities, along with a lower weighting in Consumer Staples, detracted most from relative results.
CURRENT POSITIONING AND OUTLOOK
The majority of the Fund’s holdings created economic value in 2022, producing returns on invested capital (ROIC) well in excess of their cost of capital. The fact that most of this value has not yet been capitalized in these companies’ valuations should, in our view, improve the portfolio’s long-term risk/reward profile. Investor sentiment is often focused on the near term, but over the long run the stock market has proven efficient at reflecting the economic value companies generate and compound in their market valuations. So, regardless of what 2023 may bring, experience has shown that our best course of action is to stick to our approach of trying to identify durable business models when they are trading at reasonable valuations and hold them for the long run (assuming, of course, that the underlying investment case remains intact or improves). Cyclical headwinds could pressure financial results in 2023, but we believe that the normalized earnings power and growth that our holdings can generate over time remain very attractive. This conviction is rooted in our holdings’ unique competitive advantages—such as switching costs, brand equity, and network effects—strong cash flows, and low-debt balance sheets, all of which should help them to not just weather a recession but also to go on offense and emerge from any downturn even stronger.
18 | The Royce Funds 2022 Annual Report to Shareholders
| PERFORMANCE AND PORTFOLIO REVIEW (UNAUDITED) | TICKER SYMBOLS RYPRX RPFFX RPFIX RPRCX RPRRX |
Performance and Expenses
Average Annual Total Return (%) Through 12/31/22
| JUL-DEC 20221 | 1-YR | 3-YR | 5-YR | 10-YR | 15-YR | 20-YR | 25-YR | 30-YR | SINCE INCEPTION (12/31/91) | |
| RPR | 4.63 | -15.46 | 3.13 | 5.68 | 8.64 | 7.73 | 10.58 | 9.88 | 10.74 | 10.90 |
Annual Operating Expenses: 1.17%
1 Not annualized
Relative Returns: Monthly Rolling Average Annual Return Periods
25 Years Through 12/31/22
On a monthly rolling basis, The Fund outperformed the Russell 2000 in 67% of all 10-year periods; 68% of all 5-year periods; and 63% of all 1-year periods.
| PERIODS BEATING THE INDEX | FUND AVG (%) 1 | INDEX AVG (%) 1 | ||
| 10-year | 122/181 | 67% | 10.3 | 8.3 |
| 5-year | 164/241 | 68% | 10.8 | 8.5 |
| 1-year | 182/289 | 63% | 11.6 | 9.8 |
1Average of monthly rolling average annual total returns over the specified periods.
Morningstar Style Map™ As of 12/31/22

The Morningstar Style Map is the Morningstar Style Box™ with the center 75% of fund holdings plotted as the Morningstar Ownership Zone™. The Morningstar Style Box is designed to reveal a fund’s investment strategy. The Morningstar Ownership Zone provides detail about a portfolio’s investment style by showing the range of stock sizes and styles. The Ownership Zone is derived by plotting each stock in the portfolio within the proprietary Morningstar Style Box. Over time, the shape and location of a fund’s ownership zone may vary. See page 86 for additional information.
Value of $10,000
Invested on 12/31/91 as of 12/31/22 ($)

Top 10 Positions
% of Net Assets
| Valmont Industries | 3.4 |
| Forward Air | 3.3 |
| Innospec | 3.2 |
| Lincoln Electric Holdings | 3.0 |
| SEI Investments | 2.9 |
| Ralph Lauren Cl. A | 2.9 |
| Reliance Steel & Aluminum | 2.8 |
| Kennedy-Wilson Holdings | 2.8 |
| Lindsay Corporation | 2.7 |
| Stella-Jones | 2.7 |
Portfolio Sector Breakdown
% of Net Assets
| Industrials | 38.2 |
| Information Technology | 12.3 |
| Materials | 11.2 |
| Financials | 9.1 |
| Consumer Discretionary | 8.8 |
| Real Estate | 6.8 |
| Health Care | 5.3 |
| Consumer Staples | 2.7 |
| Communication Services | 2.5 |
| Cash and Cash Equivalents | 3.1 |
Calendar Year Total Returns (%)
| YEAR | RPR |
| 2022 | -15.5 |
| 2021 | 16.4 |
| 2020 | 11.5 |
| 2019 | 34.1 |
| 2018 | -10.4 |
| 2017 | 23.8 |
| 2016 | 23.0 |
| 2015 | -9.9 |
| 2014 | -0.9 |
| 2013 | 27.7 |
| 2012 | 11.4 |
| 2011 | -0.9 |
| 2010 | 26.5 |
| 2009 | 33.3 |
| 2008 | -28.3 |
Upside/Downside Capture Ratios
Periods Ended 12/31/22 (%)
| UPSIDE | DOWNSIDE | |
| 10-Year | 88 | 83 |
| From 12/31/91 (Start of Fund’s First Full Quarter) | 93 | 75 |
Portfolio Diagnostics
| Fund Net Assets | $1,251 million |
| Number of Holdings | 50 |
| Turnover Rate | 23% |
| Average Market Capitalization 1 | $3,993 million |
| Weighted Average P/E Ratio 2,3 | 18.6x |
| Weighted Average P/B Ratio 2 | 2.7x |
| Active Share 4 | 98% |
| U.S. Investments (% of Net Assets) | 87.9% |
| Non-U.S. Investments (% of Net Assets) | 9.0% |
| 1 | Geometric Average. This weighted calculation uses each portfolio holding’s market cap in a way designed to not skew the effect of very large or small holdings; instead, it aims to better identify the portfolio’s center, which Royce believes offers a more accurate measure of average market cap than a simple mean or median. |
| 2 | Harmonic Average. This weighted calculation evaluates a portfolio as if it were a single stock and measures it overall. It compares the total market value of the portfolio to the portfolio’s share in the earnings or book value, as the case may be, of its underlying stocks. |
| 3 | The Fund’s P/E ratio calculation excludes companies with zero or negative earnings (2% of portfolio holdings as of 12/31/22). |
| 4 | Active Share is the sum of the absolute values of the different weightings of each holding in the Fund versus each holding in the benchmark, divided by two. |
Important Performance and Expense Information
All performance information in this Report reflects past performance, is presented on a total return basis, reflects the reinvestment of distributions, and does not reflect the deduction of taxes that a shareholder would pay on Fund distributions or the redemption of Fund shares. Past performance is no guarantee of future results. Investment return and principal value of an investment will fluctuate, so that shares may be worth more or less than their original cost when redeemed. Shares redeemed within 30 days of purchase may be subject to a 1% redemption fee payable to the Fund, which is not reflected in the performance shown above; if it were, performance would be lower. Current month-end performance may be higher or lower than performance quoted and may be obtained at www.royceinvest.com. All performance and risk information reflects results of the Investment Class (its oldest class). Operating expenses reflect the Fund’s total annual operating expenses for the Investment Class as of the Fund’s most current prospectus and include management fees and other expenses. Regarding the “Top Contributors” and “Top Detractors” tables shown above, the sum of all contributors to, and all detractors from, performance for all securities in the portfolio would approximate the Fund’s year-to-date performance for 2022. Upside Capture Ratio measures a manager’s performance in up markets relative to the Fund’s benchmark (Russell 2000). It is calculated by measuring the Fund’s performance in quarters when the benchmark went up and dividing it by the benchmark’s return in those quarters. Downside Capture Ratio measures a manager’s performance in down markets relative to the Fund’s benchmark. It is calculated by measuring the Fund’s performance in quarters when the benchmark goes down and dividing it by the benchmark’s return in those quarters.
The Royce Funds 2022 Annual Report to Shareholders | 19
MANAGERS’ DISCUSSION (UNAUDITED)
Royce Small-Cap Opportunity Fund (ROF)

Jim Harvey, CFA®, Kavitha Venkatraman,
Jim Stoeffel, Brendan Hartman
FUND PERFORMANCE
Royce Small-Cap Opportunity Fund was down -17.1% in 2022, lagging its primary benchmark, the Russell 2000 Value Index, which fell -14.5%, but ahead of the Russell 2000 Index, its secondary small-cap benchmark, which declined-20.4% for the same period. The Fund outperformed both indexes for the three-, five-, 10-, 15-, 20-, 25-year, and since inception (11/19/96) periods ended 12/31/22.
WHAT WORKED… AND WHAT DIDN’T
Eight of the portfolio’s 10 equity sectors finished 2022 in the red, with Consumer Discretionary, Information Technology, and Industrials detracting most. Energy and Materials made positive impacts while Consumer Staples detracted the least. At the industry level, specialty retail (Consumer Discretionary), semiconductors & semiconductor equipment, and software (both from Information Technology) detracted most while oil, gas & consumable fuels (Energy), metals & mining (Materials), and energy equipment & services (Energy) were the biggest contributors.
The top detractor was Horizon Global, which manufactures towing, trailering, cargo management, and other accessories. The company benefited during the early stages of Covid, when demand grew for aftermarket parts serving original equipment manufacturers (OEM) and the aftermarket. However, the company’s debt load proved too heavy when its OEM business declined as auto manufacturers were struggling with supply chain delays. Covid-driven demand also moderated when retailers had to work off excess inventory. We sold most of our shares in 4Q22. Shares of medical device company Bioventus declined following disappointing earnings that indicated greater complexity in integrating Misonix, which Bioventus acquired in October of 2021. We initially believed that the new entity’s greater scale could accelerate earnings growth, a view that shifted with November’s announcement that yearly guidance was being lowered, leading us to exit the stock. We added to our position in B. Riley Financial as its stock fell when dealmaking dried up in its investment banking and brokerage business, leading to earnings declines. The diversity of its business mix and the fact that the firm retains employees in down periods so they can react quickly when markets improve give us confidence that earnings will recover.
| Top Contributors to Performance | Top Detractors from Performance | |||||
| For 2022 (%)1 | For 2022 (%)2 | |||||
| Scorpio Tankers | 0.71 | Horizon Global | -0.57 | |||
| Ardmore Shipping | 0.66 | Bioventus Cl. A | -0.54 | |||
| Modine Manufacturing | 0.63 | B. Riley Financial | -0.52 | |||
| Dorian LPG | 0.46 | Unifi | -0.44 | |||
| Mammoth Energy Services | 0.45 | Glatfelter Corporation | -0.41 | |||
| 1 Includes dividends | 2 Net of dividends | |||||
The Fund’s two top contributors, Scorpio Tankers and Ardmore Shipping, ship refined petroleum products. Disruptions stemming from the Ukraine war and the shutdown of many high-cost refineries in Europe led to significant increases in shipping distances and shipping rates that helped both companies. These “yellow cabs of the sea” are also enjoying a tight market where no new vessel supply is expected for the next several years. Modine Manufacturing provides thermal management systems for several industries and is in the midst of a turnaround, moving from commoditized areas to higher-growth and margin segments, such as electric vehicles and data center infrastructure. We believe the turnaround is in its early stages and not yet fully appreciated by investors.
Our disadvantage versus the Russell 2000 Value resulted from sector allocation in 2022 while stock selection was additive. Both our higher weighting and, to a lesser extent, stock picking detracted in Consumer Discretionary. Our substantial underweight and stock selection also hurt relative results in Financials. In Information Technology, the positive effects of our stock selection could not overcome the negative effect of our significantly higher weight. Conversely, stock selection was additive in Materials, as were our lower exposures to both Real Estate and Health Care during 2022.
CURRENT POSITIONING AND OUTLOOK
The continued decrease in money supply and easing supply chain constraints—helped in part by a general slowdown in demand—have combined to make a material dent in inflation, which we anticipate will continue through 2023. The Fed has nevertheless said it will continue to raise rates, with its eyes focused squarely on a labor market that has so far held up during a period of rapid rate increases. We expect that managing increased labor costs and availability will likely remain challenges for our companies in 2023. Throughout 2022, we sought to take advantage of the wide dispersion in valuations to position the portfolio to benefit from a revival in business and consumer sentiment when the Fed reverses course, and when the business cycle improves. In the meantime, supply chain improvements should help small caps that have been facing higher costs or have been on allocation for inventory and have had to forego revenues. The past two years saw the beginning of the end of globalization. Re-shoring, near-shoring, and onshoring are real trends from which many of our companies should benefit. In addition, the Omnibus Spending Bill outlines a 10% increase in defense spending from which certain holdings appear poised to benefit. Taking a longer-term perspective, the normalization of interest rates away from the 0% paradigm of the last decade will put an end to free money and growth at any cost. In our minds, this is undoubtedly a positive outcome for small caps in general, more so for those management teams that are superior capital allocators, as well as for disciplined value investors such as ourselves.
20 | The Royce Funds 2022 Annual Report to Shareholders
| PERFORMANCE AND PORTFOLIO REVIEW (UNAUDITED) | TICKER SYMBOLS RYPNX RYOFX ROFCX ROFIX ROFRX |
Performance and Expenses
Average Annual Total Return (%) Through 12/31/22
| JUL-DEC 20221 | 1-YR | 3-YR | 5-YR | 10-YR | 15-YR | 20-YR | 25-YR | SINCE INCEPTION (11/19/96) | |
| ROF | 6.41 | -17.08 | 11.14 | 7.09 | 10.65 | 8.62 | 11.33 | 11.09 | 11.62 |
Annual Operating Expenses: 1.21%
1 Not annualized
Relative Returns: Monthly Rolling Average Annual Return Periods
25 Years Through 12/31/22
On a monthly rolling basis, The Fund outperformed the Russell 2000 Value in 99% of all 10-year periods; 76% of all 5-year periods; and 55% of all 1-year periods.
| PERIODS BEATING THE INDEX | FUND AVG (%) 1 | INDEX AVG (%) 1 | ||
| 10-year | 180/181 | 99% | 10.1 | 8.2 |
| 5-year | 184/241 | 76% | 11.1 | 8.9 |
| 1-year | 159/289 | 55% | 15.4 | 10.3 |
1Average of monthly rolling average annual total returns over the specified periods.
Morningstar Style Map™ As of 12/31/22

The Morningstar Style Map is the Morningstar Style Box™ with the center 75% of fund holdings plotted as the Morningstar Ownership Zone™. The Morningstar Style Box is designed to reveal a fund’s investment strategy. The Morningstar Ownership Zone provides detail about a portfolio’s investment style by showing the range of stock sizes and styles. The Ownership Zone is derived by plotting each stock in the portfolio within the proprietary Morningstar Style Box. Over time, the shape and location of a fund’s ownership zone may vary. See page 86 for additional information.
Value of $10,000
Invested on 11/19/96 as of 12/31/22 ($)
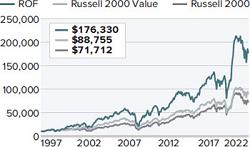
Top 10 Positions
% of Net Assets
| QuinStreet | 0.9 |
| Modine Manufacturing | 0.8 |
| Ducommun | 0.8 |
| Cohu | 0.8 |
| ATI | 0.8 |
| Stoneridge | 0.8 |
| VSE Corporation | 0.8 |
| Wabash National | 0.8 |
| Fabrinet | 0.8 |
| Advanced Energy Industries | 0.8 |
Portfolio Sector Breakdown
% of Net Assets
| Industrials | 31.1 |
| Information Technology | 19.3 |
| Consumer Discretionary | 15.2 |
| Materials | 7.6 |
| Energy | 6.9 |
| Communication Services | 4.9 |
| Health Care | 4.5 |
| Financials | 4.3 |
| Real Estate | 1.4 |
| Consumer Staples | 0.9 |
| Cash and Cash Equivalents | 3.9 |
Calendar Year Total Returns (%)
| YEAR | ROF |
| 2022 | -17.1 |
| 2021 | 30.8 |
| 2020 | 26.5 |
| 2019 | 28.2 |
| 2018 | -20.0 |
| 2017 | 21.9 |
| 2016 | 29.9 |
| 2015 | -13.6 |
| 2014 | -0.5 |
| 2013 | 43.5 |
| 2012 | 22.6 |
| 2011 | -13.0 |
| 2010 | 33.8 |
| 2009 | 62.1 |
| 2008 | -45.7 |
Upside/Downside Capture Ratios
Periods Ended 12/31/22 (%)
| UPSIDE | DOWNSIDE | |
| 10-Year | 119 | 114 |
| From 12/31/96 (Start of Fund’s First Full Quarter) | 126 | 118 |
Portfolio Diagnostics
| Fund Net Assets | $1,245 million |
| Number of Holdings | 249 |
| Turnover Rate | 35% |
| Average Market Capitalization 1 | $1,055 million |
| Weighted Average P/B Ratio 2 | 1.6x |
| Weighted Average P/S Ratio 3 | 0.9x |
| Active Share 4 | 90% |
| U.S. Investments (% of Net Assets) | 90.7% |
| Non-U.S. Investments (% of Net Assets) | 5.4% |
| 1 | Geometric Average. This weighted calculation uses each portfolio holding’s market cap in a way designed to not skew the effect of very large or small holdings; instead, it aims to better identify the portfolio’s center, which Royce believes offers a more accurate measure of average market cap than a simple mean or median. |
| 2 | Harmonic Average. This weighted calculation evaluates a portfolio as if it were a single stock and measures it overall. It compares the total market value of the portfolio to the portfolio’s share in the earnings or book value, as the case may be, of its underlying stocks. |
| 3 | Price to Sales is calculated by dividing the company’s market cap by the revenue in the most recent year. |
| 4 | Active Share is the sum of the absolute values of the different weightings of each holding in the Fund versus each holding in the benchmark, divided by two. |
Important Performance and Expense Information
All performance information in this Report reflects past performance, is presented on a total return basis, reflects the reinvestment of distributions, and does not reflect the deduction of taxes that a shareholder would pay on Fund distributions or the redemption of Fund shares. Past performance is no guarantee of future results. Investment return and principal value of an investment will fluctuate, so that shares may be worth more or less than their original cost when redeemed. Shares redeemed within 30 days of purchase may be subject to a 1% redemption fee payable to the Fund, which is not reflected in the performance shown above; if it were, performance would be lower. Current month-end performance may be higher or lower than performance quoted and may be obtained at www.royceinvest.com. All performance and risk information reflects results of the Investment Class (its oldest class). Operating expenses reflect the Fund’s total annual operating expenses for the Investment Class as of the Fund’s most current prospectus and include management fees and other expenses. Regarding the “Top Contributors” and “Top Detractors” tables shown above, the sum of all contributors to, and all detractors from, performance for all securities in the portfolio would approximate the Fund’s year-to-date performance for 2022. Upside Capture Ratio measures a manager’s performance in up markets relative to the Fund’s benchmark (Russell 2000 Value). It is calculated by measuring the Fund’s performance in quarters when the benchmark went up and dividing it by the benchmark’s return in those quarters. Downside Capture Ratio measures a manager’s performance in down markets relative to the Fund’s benchmark. It is calculated by measuring the Fund’s performance in quarters when the benchmark goes down and dividing it by the benchmark’s return in those quarters.
The Royce Funds 2022 Annual Report to Shareholders | 21
MANAGERS’ DISCUSSION (UNAUDITED)
Royce Small-Cap Special Equity Fund (RSE)

Charlie Dreifus, CFA®, Steven McBoyle
FUND PERFORMANCE
Consistent with its long-term history, Royce Small-Cap Special Equity Fund lost less in 2022 than both its primary benchmark, the Russell 2000 Value Index, and the Russell 2000 Index, its secondary benchmark. The Fund fell -6.3% for the calendar year versus -14.5% for the small-cap value index and -20.4% for the Russell 2000. The Fund also beat both indexes for the three-, five-, 15-year, and since inception (5/1/98) periods ended 12/31/22.
WHAT WORKED… AND WHAT DIDN’T
Four of the portfolio’s nine equity sectors detracted from performance in 2022, with the biggest negative effects coming from Consumer Discretionary, Real Estate, and Materials. The sectors making the largest positive contributions were Consumer Staples, Communication Services, and Industrials. At the industry level, auto components, leisure products (both in Consumer Discretionary), and real estate management & development (Real Estate) detracted most while the biggest positive contributions in 2022 came from diversified consumer services (Consumer Discretionary), food & staples retailing (Consumer Staples), and commercial services & supplies (Industrials).
Standard Motor Products, a manufacturer primarily of aftermarket auto repair parts, was the largest detractor in 2022. While end market demand remained strong, margins were pressured from increasing supply chain related costs and the impact of rising interest rates on the company’s receivables factoring program. Johnson Outdoors, which makes outdoor recreational products, reported margins well below expectations in early May, primarily due to supply chain disruptions that persisted throughout the year. While demand has remained strong, concerns surrounding the strength of the consumer have weighed on its shares. Rising interest rates are likely to have had an impact on the level of transactions for real estate brokerage Marcus & Millichap, which weighed on its stock throughout the second half of the year. Shares of Kulicke & Soffa Industries, a semiconductor packaging equipment manufacturer, were weak through most of the year amid concerns about slower consumer electronics demand and consequent capacity digestion by the company’s customers.
Tax preparation business H&R Block was the largest contributor to performance in 2022. The company reported much better-than-expected results in their key tax filing quarter, and provided guidance to multi-year double-digit earnings per share growth. The company’s consistent and sizeable cash flow generation have also made it more appealing in the current environment. Grocery retailers have historically fared well during inflationary periods thanks to their ability to pass on costs and benefit from consumers looking to save money relative to dining out—two developments that helped the performance of grocery retailer Ingles Markets. The company also has a favorable geographic position to benefit from net migration. Shares of Ennis, a business form and other graphic printing company, rallied following better-than-expected results reported in mid-June, which continued throughout the year, due in part to the company’s strong supplier relationships amid industry shortages and a favorable competitive environment. The Fund’s fourth largest contributor to performance was Atkore, which manufactures electrical conduits. Its stock rose following results reported in mid-November in which the company raised earnings guidance for fiscal 2025, alleviating concerns that the company had reached an earnings peak.
| Top Contributors to Performance | Top Detractors from Performance | |||||
| For 2022 (%)1 | For 2022 (%)2 | |||||
| H&R Block | 2.73 | Standard Motor Products | -2.04 | |||
| Ingles Markets Cl. A | 0.95 | Johnson Outdoors Cl. A | -1.83 | |||
| Ennis | 0.66 | Marcus & Millichap | -1.45 | |||
| Atkore | 0.42 | Kulicke & Soffa Industries | -1.37 | |||
| Sylvamo Corporation | 0.41 | Huntsman Corporation | -1.29 | |||
| 1 Includes dividends | 2 Net of dividends | |||||
The portfolio’s advantage over its benchmark was attributable to stock selection in 2022, most impactfully in Industrials and Consumer Staples. The Fund’s cash position also contributed to our relative advantage in 2022. Conversely, the Fund’s lack of exposure to Energy and Utilities detracted from relative results.
CURRENT POSITIONING AND OUTLOOK
We expect a global recession to hit earnings hard. As of this writing, central bank actions around the world are impacting the overall outlook, which remains challenged in our view. There is, in addition to this, the uncertain trajectory for a post-Covid China, where many are expecting renewed growth. Fed Chair Powell has acknowledged that there is no pain-free way to tame inflation. The market must at some point more fully grasp this difficult truth, which will almost certainly come with a downward recalibration of earnings. The transition from quantitative easing (QE) to quantitative tightening remains underway. We had 12 years of QE, so should we not expect the transition to take a while? Investors expect a quick fix—but is that reasonable? During previous recessions, the stock market did not bottom before the start of the recession. With the likelihood of a recession occurring in 2023, therefore, we do not believe that we have reached a durable bottom yet. During the current bear market, seller exhaustion has occurred from time to time, especially on any news that suggests lower interest rates. The market pounces on any remotely positive development. We continue to view these as temporary reprieves. More important, we believe we need lower multiples, higher credit spreads, consistently higher volatility, and a considerably higher unemployment rate to reach a durable bottom for stocks. We also are still of the belief that the market will favor short duration equities that are self-funding and return capital to their shareholders. We believe our portfolio is well represented with such names—which in our estimation have additional attractive features.
22 | The Royce Funds 2022 Annual Report to Shareholders
| PERFORMANCE AND PORTFOLIO REVIEW (UNAUDITED) | TICKER SYMBOLS RYSEX RSEFX RSEIX RSQCX |
Performance and Expenses
Average Annual Total Return (%) Through 12/31/22
| JUL-DEC 20221 | 1-YR | 3-YR | 5-YR | 10-YR | 15-YR | 20-YR | SINCE INCEPTION (5/1/98) | |
| RSE | 7.46 | -6.33 | 7.22 | 4.59 | 7.42 | 7.39 | 8.39 | 8.45 |
Annual Operating Expenses: 1.20%
1 Not annualized
Relative Risk Adjusted Returns: Monthly Rolling Sharpe Ratios
25 Years Through 12/31/22
On a monthly rolling risk-adjusted basis, the Fund outperformed the Russell 2000 Value in 74% of all 10-year periods and 61% of all 5-year periods.
| PERIODS BEATING THE INDEX | FUND AVG 1 | INDEX AVG 1 | ||
| 10-year | 89/121 | 74% | 0.56 | 0.48 |
| 5-year | 111/181 | 61% | 0.50 | 0.46 |
1Average of monthly rolling Sharpe Ratios over the specified periods.
Morningstar Style Map™ As of 12/31/22

The Morningstar Style Map is the Morningstar Style Box™ with the center 75% of fund holdings plotted as the Morningstar Ownership Zone™. The Morningstar Style Box is designed to reveal a fund’s investment strategy. The Morningstar Ownership Zone provides detail about a portfolio’s investment style by showing the range of stock sizes and styles. The Ownership Zone is derived by plotting each stock in the portfolio within the proprietary Morningstar Style Box. Over time, the shape and location of a fund’s ownership zone may vary. See page 86 for additional information.
Value of $10,000
Invested on 5/1/98 as of 12/31/22 ($)
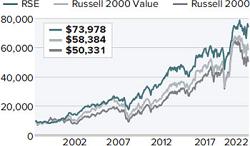
Top 10 Positions
% of Net Assets
| Ingles Markets Cl. A | 7.6 |
| Standard Motor Products | 5.5 |
| Encore Wire | 5.1 |
| Vishay Intertechnology | 5.0 |
| John B. Sanfilippo & Son | 4.8 |
| TEGNA | 4.4 |
| Marcus & Millichap | 4.1 |
| Huntsman Corporation | 4.0 |
| Movado Group | 3.8 |
| Ennis | 3.7 |
Portfolio Sector Breakdown
% of Net Assets
| Industrials | 20.6 |
| Consumer Discretionary | 17.2 |
| Consumer Staples | 12.4 |
| Information Technology | 9.5 |
| Materials | 8.8 |
| Financials | 5.7 |
| Communication Services | 4.4 |
| Real Estate | 4.1 |
| Energy | 0.4 |
| Cash and Cash Equivalents | 16.9 |
Calendar Year Total Returns (%)
| YEAR | RPR |
| 2022 | -6.3 |
| 2021 | 22.5 |
| 2020 | 7.4 |
| 2019 | 12.6 |
| 2018 | -9.9 |
| 2017 | 7.9 |
| 2016 | 32.2 |
| 2015 | -12.4 |
| 2014 | 1.1 |
| 2013 | 29.4 |
| 2012 | 15.4 |
| 2011 | 0.1 |
| 2010 | 19.6 |
| 2009 | 28.4 |
| 2008 | -19.6 |
Upside/Downside Capture Ratios
Periods Ended 12/31/22 (%)
| UPSIDE | DOWNSIDE | |
| 10-Year | 78 | 74 |
| From 6/30/98 (Start of Fund’s First Full Quarter) | 81 | 66 |
Portfolio Diagnostics
| Fund Net Assets | $754 million |
| Number of Holdings | 33 |
| Turnover Rate | 23% |
| Average Market Capitalization 1 | $1,439 million |
| Weighted Average P/E Ratio 2,3 | 8.0x |
| Weighted Average P/B Ratio 2 | 1.7x |
| Active Share 4 | 98% |
| U.S. Investments (% of Net Assets) | 82.2% |
| Non-U.S. Investments (% of Net Assets) | 0.9% |
| 1 | Geometric Average. This weighted calculation uses each portfolio holding’s market cap in a way designed to not skew the effect of very large or small holdings; instead, it aims to better identify the portfolio’s center, which Royce believes offers a more accurate measure of average market cap than a simple mean or median. |
| 2 | Harmonic Average. This weighted calculation evaluates a portfolio as if it were a single stock and measures it overall. It compares the total market value of the portfolio to the portfolio’s share in the earnings or book value, as the case may be, of its underlying stocks. |
| 3 | The Fund’s P/E ratio calculation excludes companies with zero or negative earnings (2% of portfolio holdings as of 12/31/22). |
| 4 | Active Share is the sum of the absolute values of the different weightings of each holding in the Fund versus each holding in the benchmark, divided by two. |
Important Performance and Expense Information
All performance information in this Report reflects past performance, is presented on a total return basis, reflects the reinvestment of distributions, and does not reflect the deduction of taxes that a shareholder would pay on Fund distributions or the redemption of Fund shares. Past performance is no guarantee of future results. Investment return and principal value of an investment will fluctuate, so that shares may be worth more or less than their original cost when redeemed. Shares redeemed within 30 days of purchase may be subject to a 1% redemption fee payable to the Fund, which is not reflected in the performance shown above; if it were, performance would be lower. Current month-end performance may be higher or lower than performance quoted and may be obtained at www.royceinvest.com. All performance and risk information reflects results of the Investment Class (its oldest class). Operating expenses reflect the Fund’s total annual operating expenses for the Investment Class as of the Fund’s most current prospectus and include management fees and other expenses. The Sharpe Ratio is calculated for a specified period by dividing a fund’s annualized excess returns by its annualized standard deviation. The higher the Sharpe ratio, the better the fund’s historical risk-adjusted performance. Regarding the “Top Contributors” and “Top Detractors” tables shown above, the sum of all contributors to, and all detractors from, performance for all securities in the portfolio would approximate the Fund’s year-to-date performance for 2022. Upside Capture Ratio measures a manager’s performance in up markets relative to the Fund’s benchmark (Russell 2000 Value). It is calculated by measuring the Fund’s performance in quarters when the benchmark went up and dividing it by the benchmark’s return in those quarters. Downside Capture Ratio measures a manager’s performance in down markets relative to the Fund’s benchmark. It is calculated by measuring the Fund’s performance in quarters when the benchmark goes down and dividing it by the benchmark’s return in those quarters.
The Royce Funds 2022 Annual Report to Shareholders | 23
MANAGERS’ DISCUSSION (UNAUDITED)
Royce Small-Cap Total Return Fund (RTR)

Joe Hintz, CFA®, Chuck Royce, Miles Lewis, CFA®
FUND PERFORMANCE
Royce Small-Cap Total Return Fund was down -13.3% in 2022, losing less than both its primary benchmark, the Russell 2000 Value Index, which fell -14.5%, and its secondary benchmark, the small-cap Russell 2000 Index, which declined-20.4%, for the same period. The Fund also outperformed both indexes for the five-, 25-year, and since inception (12/15/93) periods ended 12/31/22.
WHAT WORKED… AND WHAT DIDN’T
Six of the portfolio’s 10 equity sectors finished 2022 in the red, with the largest detractions coming from Financials, Consumer Discretionary, and Information Technology while the biggest positive impacts came from Energy, Materials, and Communication Services. Insurance (Financials), electronic equipment, instruments & components (Information Technology), and banks (Financials) detracted most at the industry level while containers & packaging (Materials), energy equipment & services (Energy), and professional services (Industrials) were the biggest contributors in 2022.
Top detractor Franchise Group owns four consumer businesses: The Vitamin Shoppe, Pet Supplies Plus, and two discount furniture retailers. In addition to the recessionary concerns that hurt most retailers in the first half of the year, the company’s plans to acquire retailer Kohl’s (a deal that would likely have been highly accretive for Franchise Group) fell through. In the second half of the year, the company suffered from overstocking slow-moving inventory within one of their discount furniture retailers, American Freight, that stemmed from 2021’s supply chain constraints. Our view remains that each of Franchise Group’s core assets has high-quality attributes. Spectrum Brands Holdings is a consumer products company with a variety of products and brands, including pet care, home & garden, and personal care. Entering 2022, an attractive potential catalyst for value creation was the pending divestiture of their Hardware and Home Improvement division to Swedish firm, Assa Abloy, which would have generated a massive influx of cash that would have unlocked multiple capital allocation possibilities. The deal was ultimately opposed, however, by the U.S. Department of Justice, driving Spectrum’s shares down. We were also disappointed in some leadership changes that saw the departure of one executive whom we viewed as critical to the future of the firm. For these and other reasons, we sold our position.
| Top Contributors to Performance | Top Detractors from Performance | |||||
For 2022 (%)1
| For 2022 (%)2 | |||||
| Intertape Polymer Group | 1.37 | Franchise Group Cl. A | -1.27 | |||
| Cactus Cl. A | 0.77 | Spectrum Brands Holdings | -1.23 | |||
| Pason Systems | 0.48 | Coherent Series A Conv. | -1.00 | |||
| CDK Global | 0.45 | GrafTech International | -0.97 | |||
| Barrett Business Services | 0.39 | Vontier Corporation | -0.94 | |||
| 1 Includes dividends | 2 Net of dividends | |||||
Industrial packaging company Intertape Polymer Group, which makes the black tape used on Amazon boxes, was our top contributor. When we first invested, we saw an industrial packaging company that was an effective backdoor play on e-commerce. Our research was validated in March when Intertape agreed to be taken private by a private equity buyer at an 82% premium to its prior close. We see Cactus as a high-quality company in the oil field services space whose products include wellhead and pressure control equipment. Cactus benefited from a strong year for energy companies as geopolitical factors drove increased volatility within the global supply/demand balance for oil and gas, which led to considerable increases in domestic drilling activity.
The portfolio’s advantage over the Russell 2000 Value came primarily from stock selection in 2022. Stock picks in Materials, our lower exposure to Health Care, and stock selection in Industrials helped relative results most. Conversely, both our lower weighting and stock picking hurt performance versus the benchmark in Energy, as did stock selection in Consumer Staples and Consumer Discretionary.
CURRENT POSITIONING AND OUTLOOK
The silver lining in 2022’s bear market, based on our own research and that of others, is that down years have often set the stage for solid returns in the subsequent year—and those returns are frequently well above historical averages. We remain confident that the value-led cycle within small cap has legs, in part because prior leadership stints for small-cap value tended to be multi-year events. High quality remains historically inexpensive versus low quality. We believe this is an attractive set up in its own right, and even more so in the context of a possible recession and difficult operating environment. We are therefore particularly optimistic about small-cap value and quality, the twin cornerstones of the Fund’s investment philosophy. Our team continues to find an abundance of opportunity. The carnage in the tech sector in 2022, for example, led to cheap, highly profitable, and cash generative businesses being sold along with their far more expensive, less profitable (often unprofitable), and cash burning counterparts. We capitalized by buying what we believe are high-quality tech assets, particularly in the software space. Certain areas of Consumer Discretionary also look interesting to us, notably those hit hardest by a combination of one or all of the following: a focus on the lower end consumer (whose spending was impacted greatly by inflation, which appears to be rolling over); perceived Covid beneficiaries that we believe have more enduring businesses than the market is giving them credit for; and/or companies impacted by transitory issues, such as inventory de-stocking at large customers, which look highly unlikely to repeat in 2023. Lastly, we are optimistic about holdings that in our view were disproportionately punished in 2022. We believe that we’ve found quite a few of these opportunities—which look poised to deliver strong long-term returns.
24 | The Royce Funds 2022 Annual Report to Shareholders
| PERFORMANCE AND PORTFOLIO REVIEW (UNAUDITED) | TICKER SYMBOLS RYTRX RYTFX RTRIX RYTCX RTRRX |
Performance and Expenses
Average Annual Total Return (%) Through 12/31/22
| JUL-DEC 20221 | 1-YR | 3-YR | 5-YR | 10-YR | 15-YR | 20-YR | 25-YR | SINCE INCEPTION (12/15/93) | |
| RTR | 0.44 | -13.25 | 4.25 | 4.13 | 8.14 | 6.68 | 8.50 | 8.30 | 9.82 |
Annual Operating Expenses: 1.25%
1 Not annualized
Relative Risk Adjusted Returns: Monthly Rolling Sharpe Ratios
25 Years Through 12/31/22
On a monthly rolling risk-adjusted basis, the Fund outperformed the Russell 2000 Value in 99% of all 10-year periods and 91% of all 5-year periods.
| PERIODS BEATING THE INDEX | FUND AVG 1 | INDEX AVG 1 | ||
| 10-year | 120/121 | 99% | 0.55 | 0.48 |
| 5-year | 165/181 | 91% | 0.52 | 0.46 |
1Average of monthly rolling Sharpe Ratios over the specified periods.
Morningstar Style Map™ As of 12/31/22
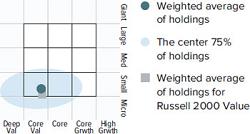
The Morningstar Style Map is the Morningstar Style Box™ with the center 75% of fund holdings plotted as the Morningstar Ownership Zone™. The Morningstar Style Box is designed to reveal a fund’s investment strategy. The Morningstar Ownership Zone provides detail about a portfolio’s investment style by showing the range of stock sizes and styles. The Ownership Zone is derived by plotting each stock in the portfolio within the proprietary Morningstar Style Box. Over time, the shape and location of a fund’s ownership zone may vary. See page 86 for additional information.
Value of $10,000
Invested on 12/15/93 as of 12/31/22 ($)
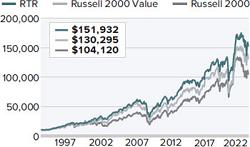
Top 10 Positions
% of Net Assets
| Vontier Corporation | 2.5 |
| International General Insurance Holdings | 2.3 |
| Home BancShares | 2.3 |
| FTAI Aviation | 2.2 |
| Helen of Troy | 2.1 |
| Teradata Corporation | 2.1 |
| RenaissanceRe Holdings | 2.0 |
| Sapiens International | 2.0 |
| Element Solutions | 2.0 |
| Air Lease Cl. A | 2.0 |
Portfolio Sector Breakdown
% of Net Assets
| Financials | 37.2 |
| Industrials | 22.1 |
| Information Technology | 12.6 |
| Consumer Discretionary | 9.3 |
| Materials | 7.1 |
| Energy | 4.2 |
| Communication Services | 1.9 |
| Real Estate | 1.6 |
| Health Care | 0.2 |
| Preferred Stock | 1.8 |
| Cash and Cash Equivalents | 2.0 |
Calendar Year Total Returns (%)
| YEAR | RTR |
| 2022 | -13.3 |
| 2021 | 25.8 |
| 2020 | 3.8 |
| 2019 | -23.5 |
| 2018 | -12.5 |
| 2017 | 13.7 |
| 2016 | 25.9 |
| 2015 | -7.2 |
| 2014 | 1.3 |
| 2013 | 32.8 |
| 2012 | 14.4 |
| 2011 | -1.7 |
| 2010 | 23.5 |
| 2009 | 26.2 |
| 2008 | -31.2 |
Upside/Downside Capture Ratios
Periods Ended 12/31/22 (%)
| UPSIDE | DOWNSIDE | |
| 10-Year | 88 | 84 |
| From 12/31/93 (Start of Fund’s First Full Quarter) | 87 | 73 |
Portfolio Diagnostics
| Fund Net Assets | $936 million |
| Number of Holdings | 85 |
| Turnover Rate | 62% |
| Average Market Capitalization 1 | $2,199 million |
| Weighted Average P/E Ratio 2,3 | 12.4x |
| Weighted Average P/B Ratio 2 | 1.8x |
| Active Share 4 | 96% |
| U.S. Investments (% of Net Assets) | 76.3% |
| Non-U.S. Investments (% of Net Assets) | 21.7% |
| 1 | Geometric Average. This weighted calculation uses each portfolio holding’s market cap in a way designed to not skew the effect of very large or small holdings; instead, it aims to better identify the portfolio’s center, which Royce believes offers a more accurate measure of average market cap than a simple mean or median. |
| 2 | Harmonic Average. This weighted calculation evaluates a portfolio as if it were a single stock and measures it overall. It compares the total market value of the portfolio to the portfolio’s share in the earnings or book value, as the case may be, of its underlying stocks. |
| 3 | The Fund’s P/E ratio calculation excludes companies with zero or negative earnings (13% of portfolio holdings as of 12/31/22). |
| 4 | Active Share is the sum of the absolute values of the different weightings of each holding in the Fund versus each holding in the benchmark, divided by two. |
Important Performance and Expense Information
All performance information in this Report reflects past performance, is presented on a total return basis, reflects the reinvestment of distributions, and does not reflect the deduction of taxes that a shareholder would pay on Fund distributions or the redemption of Fund shares. Past performance is no guarantee of future results. Investment return and principal value of an investment will fluctuate, so that shares may be worth more or less than their original cost when redeemed. Shares redeemed within 30 days of purchase may be subject to a 1% redemption fee payable to the Fund, which is not reflected in the performance shown above; if it were, performance would be lower. Current month-end performance may be higher or lower than performance quoted and may be obtained at www.royceinvest.com. All performance and risk information reflects results of the Investment Class (its oldest class). Operating expenses reflect the Fund’s total annual operating expenses for the Investment Class as of the Fund’s most current prospectus and include management fees, other expenses, and acquired fund fees and expenses. Acquired fund fees and expenses reflect the estimated amount of the fees and expenses incurred indirectly by the Fund through its investments in mutual funds, hedge funds, private equity funds, and other investment companies. Regarding the “Top Contributors” and “Top Detractors” tables shown above, the sum of all contributors to, and all detractors from, performance for all securities in the portfolio would approximate the Fund’s year-to-date performance for 2022. The Sharpe Ratio is calculated for a specified period by dividing a fund’s annualized excess returns by its annualized standard deviation. The higher the Sharpe ratio, the better the fund’s historical risk-adjusted performance. Upside Capture Ratio measures a manager’s performance in up markets relative to the Fund’s benchmark (Russell 2000 Value). It is calculated by measuring the Fund’s performance in quarters when the benchmark went up and dividing it by the benchmark’s return in those quarters. Downside Capture Ratio measures a manager’s performance in down markets relative to the Fund’s benchmark. It is calculated by measuring the Fund’s performance in quarters when the benchmark goes down and dividing it by the benchmark’s return in those quarters.
The Royce Funds 2022 Annual Report to Shareholders | 25
MANAGER’S DISCUSSION (UNAUDITED)
Royce Small-Cap Value Fund (RVV)

Jay Kaplan, CFA®
FUND PERFORMANCE
Royce Small-Cap Value Fund outperformed both of its small-cap benchmarks in 2022, down -10.1% versus a decline of -14.5% for its primary benchmark, the Russell 2000 Value Index, and a fall of -20.4% for the Russell 2000 Index, its secondary benchmark.
WHAT WORKED… AND WHAT DIDN’T
Five of the portfolio’s nine equity sectors made a negative impact on calendar year period performance, with the largest detractions coming from Consumer Discretionary, Industrials, and Financials while the largest positive impacts came from Health Care, Energy, and Communication Services. At the industry level, specialty retail, household durables (both in Consumer Discretionary), and semiconductors & semiconductor equipment (Information Technology) were the largest detractors while biotechnology (Health Care), pharmaceuticals (Health Care), and oil, gas & consumable fuels (Energy) contributed most in 2022.
Recreational boat dealer OneWater Marine was the Fund’s top detractor. Investors appeared to worry that slowing demand—which has not materialized as of this writing—would sink its prospects, keeping its stock under water for most of 2022. In November, however, the company reported record revenue for the fiscal fourth quarter and full fiscal year of 2022 before closing an acquisition in December that should help to shore up its presence in the Gulf Coast region. Wary of a possible slowdown in demand in 2023, we reduced our stake in 2022. Rent-A-Center operates rent-to-own stores. Investors shied away from its stock after the company said that both the end of Covid relief funds and rising inflation would likely hurt its customers’ ability to buy and/or make payments. We were equally concerned about how the company’s 2021 acquisition of lease-to-own solutions provider Acima Holdings put leverage on Rent-A-Center’s balance sheet while also adding credit losses to recent financial results. We sold the last of our shares in March. Family footwear retailer Shoe Carnival continues to execute well, especially compared to its competitors, by reducing costs, opening new stores, and renovating older sites. While its shares fell in an ongoing inhospitable climate for retailers, the company remains profitable and is a retailer of Nike—which has stopped supplying to many competitors—which influenced our decision to hold shares at year-end.
| Top Contributors to Performance | Top Detractors from Performance | |||||
| For 2022 (%)1 | For 2022 (%)2 | |||||
| Catalyst Pharmaceuticals | 1.76 | OneWater Marine Cl. A | -1.14 | |||
| BioDelivery Sciences International | 0.72 | Rent-A-Center | -1.04 | |||
| IBEX | 0.71 | Shoe Carnival | -0.92 | |||
| Cross Country Healthcare | 0.66 | American Eagle Outfitters | -0.90 | |||
| Sanmina Corporation | 0.63 | Lazydays Holdings | -0.81 | |||
| 1 Includes dividends | 2 Net of dividends | |||||
The portfolio’s top contributor was Catalyst Pharmaceuticals, which focuses on the acquisition, development, and commercialization of prescription drugs that treat autoimmune disorders and rare diseases. We began building our position at what we judged to be a very favorable valuation, attracted to its strong balance sheet and its approved—and profitable—drug that treats Lambert-Eaton myasthenic syndrome (LEMS) in adults. In July, the company favorably settled patent litigation and then acquired the purported infringer. BioDelivery Sciences International was a specialty pharmaceutical company that makes pain management and neurology products which treat patients living with serious and complex conditions such as chronic pain and acute migraines. In February, Collegium Pharmaceutical, which we held until September 2022 and which also specializes in pain management medicines, announced it would acquire BioDelivery at a sizable premium, leading us to sell our position in February 2022. IBEX is a customer experience company that helps companies engage more effectively with their customers. The company’s services include digital marketing, outsourced sales and support, and brand management. We initiated a position when the company went public and was beginning to add new economy names in industries such as fintech and healthcare—which helped spur revenue and earnings growth in 2022.
The portfolio’s advantage over the Russell 2000 Value came from stock selection in 2022 and was especially effective in Health Care and Information Technology (overcoming the negative impact of our overweight), and Communication Services (where our slight underweight also helped). Conversely, a combination of our greater exposure and stock picks detracted from relative results in Consumer Discretionary, as did our lower weight and stock selection in Energy and lack of exposure to Utilities.
CURRENT POSITIONING AND OUTLOOK
Our expectation is for a more volatile market until we have greater clarity about the state of economic growth. Many companies over-earned coming out of Covid, and many are likely to see earnings decline in a more muted demand environment, which has made getting a read on normalized earnings challenging. In positioning the portfolio, we have been focusing on companies that have key fundamental strengths—specifically, low debt balance sheets and the ability to generate free cash flow—and look best positioned for a more stable market over the next 18 to 24 months. We ended 2022 overweight in Information Technology, Consumer Discretionary, and Industrials and underweight in Financials, Real Estate, Utilities, Materials, and Health Care.
26 | The Royce Funds 2022 Annual Report to Shareholders
| PERFORMANCE AND PORTFOLIO REVIEW (UNAUDITED) | TICKER SYMBOLS RYVFX RVVHX RVFCX RVVRX |
Performance and Expenses
Average Annual Total Return (%) Through 12/31/22
| JUL-DEC 20221 | 1-YR | 3-YR | 5-YR | 10-YR | 15-YR | 20-YR | SINCE INCEPTION (6/14/01) | |
| RVV | 11.54 | -10.06 | 2.56 | 3.43 | 5.48 | 4.93 | 9.29 | 8.13 |
Annual Gross Operating Expenses: 1.55% Annual Net Operating Expenses: 1.49%
1 Not annualized
Morningstar Style Map™ As of 12/31/22
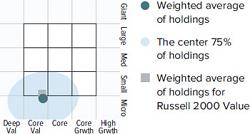
The Morningstar Style Map is the Morningstar Style Box™ with the center 75% of fund holdings plotted as the Morningstar Ownership Zone™. The Morningstar Style Box is designed to reveal a fund’s investment strategy. The Morningstar Ownership Zone provides detail about a portfolio’s investment style by showing the range of stock sizes and styles. The Ownership Zone is derived by plotting each stock in the portfolio within the proprietary Morningstar Style Box. Over time, the shape and location of a fund’s ownership zone may vary. See page 86 for additional information.
Value of $10,000
Invested on 6/14/01 as of 12/31/22 ($)
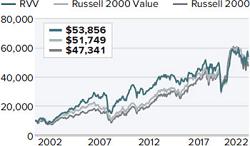
Top 10 Positions
% of Net Assets
| Sterling Infrastructure | 1.8 |
| Flex | 1.8 |
| Jabil | 1.7 |
| Sanmina Corporation | 1.7 |
| Timberland Bancorp | 1.6 |
| Evercore Cl. A | 1.6 |
| Kimball Electronics | 1.6 |
| SciPlay Corporation Cl. A | 1.6 |
| Vishay Intertechnology | 1.6 |
| Tiptree | 1.6 |
Portfolio Sector Breakdown
% of Net Assets
| Information Technology | 23.7 |
| Industrials | 17.7 |
| Consumer Discretionary | 16.2 |
| Financials | 16.0 |
| Energy | 7.7 |
| Health Care | 6.9 |
| Communication Services | 3.6 |
| Consumer Staples | 2.6 |
| Real Estate | 2.3 |
| Cash and Cash Equivalents | 3.3 |
Calendar Year Total Returns (%)
| YEAR | RVV |
| 2022 | -10.1 |
| 2021 | 28.2 |
| 2020 | -6.5 |
| 2019 | 18.2 |
| 2018 | -7.2 |
| 2017 | 5.3 |
| 2016 | 21.1 |
| 2015 | -11.5 |
| 2014 | -0.0 |
| 2013 | 27.8 |
| 2012 | 9.6 |
| 2011 | -7.4 |
| 2010 | 25.0 |
| 2009 | 44.7 |
| 2008 | -34.2 |
Upside/Downside Capture Ratios
Periods Ended 12/31/22 (%)
| UPSIDE | DOWNSIDE | |
| 10-Year | 83 | 96 |
| From 6/30/01 (Start of Fund’s First Full Quarter) | 96 | 93 |
Portfolio Diagnostics
| Fund Net Assets | $113 million |
| Number of Holdings | 91 |
| Turnover Rate | 62% |
| Average Market Capitalization 1 | $1,217 million |
| Weighted Average P/E Ratio 2,3 | 7.6x |
| Weighted Average P/B Ratio 2 | 1.6x |
| Active Share 4 | 96% |
| U.S. Investments (% of Net Assets) | 96.1% |
| Non-U.S. Investments (% of Net Assets) | 0.6% |
| 1 | Geometric Average. This weighted calculation uses each portfolio holding’s market cap in a way designed to not skew the effect of very large or small holdings; instead, it aims to better identify the portfolio’s center, which Royce believes offers a more accurate measure of average market cap than a simple mean or median. |
| 2 | Harmonic Average. This weighted calculation evaluates a portfolio as if it were a single stock and measures it overall. It compares the total market value of the portfolio to the portfolio’s share in the earnings or book value, as the case may be, of its underlying stocks. |
| 3 | The Fund’s P/E ratio calculation excludes companies with zero or negative earnings (3% of portfolio holdings as of 12/31/22). |
| 4 | Active Share is the sum of the absolute values of the different weightings of each holding in the Fund versus each holding in the benchmark, divided by two. |
Important Performance and Expense Information
All performance information in this Report reflects past performance, is presented on a total return basis, reflects the reinvestment of distributions, and does not reflect the deduction of taxes that a shareholder would pay on Fund distributions or the redemption of Fund shares. Past performance is no guarantee of future results. Investment return and principal value of an investment will fluctuate, so that shares may be worth more or less than their original cost when redeemed. Shares redeemed within 30 days of purchase may be subject to a 1% redemption fee payable to the Fund, which is not reflected in the performance shown above; if it were, performance would be lower. Current month-end performance may be higher or lower than performance quoted and may be obtained at www.royceinvest.com. All performance and risk information reflects results of the Service Class (its oldest class). Gross operating expenses reflect the Fund’s gross total annual operating expenses for the Service Class and include management fees, 12b-1 distribution and service fees, and other expenses. Net operating expenses reflect contractual fee waivers and/or expense reimbursements. All expense information is reported as of the Fund’s most current prospectus. Royce & Associates has contractually agreed, without right of termination, to waive fees and/or reimburse expenses to the extent necessary to maintain the Service Class’s net annual operating expenses (excluding brokerage commissions, taxes, interest, litigation expenses, acquired fund fees and expenses, and other expenses not borne in the ordinary course of business) at or below 1.49% through April 30, 2023. Regarding the “Top Contributors” and “Top Detractors” tables shown above, the sum of all contributors to, and all detractors from, performance for all securities in the portfolio would approximate the Fund’s year-to-date performance for 2022. Upside Capture Ratio measures a manager’s performance in up markets relative to the Fund’s benchmark (Russell 2000 Value). It is calculated by measuring the Fund’s performance in quarters when the benchmark went up and dividing it by the benchmark’s return in those quarters. Downside Capture Ratio measures a manager’s performance in down markets relative to the Fund’s benchmark. It is calculated by measuring the Fund’s performance in quarters when the benchmark goes down and dividing it by the benchmark’s return in those quarters.
The Royce Funds 2022 Annual Report to Shareholders | 27
MANAGER’S DISCUSSION (UNAUDITED)
Royce Smaller-Companies Growth Fund (RVP)

Chip Skinner, CFA®
FUND PERFORMANCE
In one of the most difficult years for small-cap stocks in general and small-cap growth stocks in particular since 2008’s Great Financial Crisis, Royce Smaller-Companies Growth Fund was down -32.4%, lagging both its primary benchmark, the Russell 2000 Growth Index, which fell 26.4%, and the Russell 2000 Index, which declined -20.4% for the same period.
WHAT WORKED… AND WHAT DIDN’T
Eight of the portfolio’s nine equity sectors had a negative impact on 2022’s performance, with the largest detractions coming from Information Technology, Health Care, and Industrials. The only positive impact came from Consumer Staples, while Real Estate and Materials detracted least. At the industry level, biotechnology (Health Care), software, and IT services (both in Information Technology) were the largest detractors while beverages (Consumer Staples), communications equipment (Information Technology), and health care equipment & supplies (Health Care) contributed most in 2022.
Our top detractor was Ambarella, a maker of video camera and computer vision semiconductor chips. Like many fabless semi companies, it experienced supply chain disruptions, in addition to some end-market weakness. It remains a key holding, however, given its growing backlog for higher volume, higher priced—and wider margin—automotive and advanced driver assistance system applications. After years of impressive growth, Freshpet hit several speed bumps in 2022, including manufacturing and operational challenges, product quality issues, and ingredient cost inflation, though it remains the leader in the fresh and refrigerated pet food segment. An aggressive, multi-year capital spending forecast and dilutive equity raise to fund this plan also factored into its stock’s difficulties through most of 2022. Its shares began to recover after an activist investor took a 10% stake in the company, which resulted in some senior management changes. Management cut back the aggressive capital plan in order to extend the company’s cash runway, made operational improvements, and implemented additional price increases to help margins—actions that influenced our decision to hold a stake in the company.
| Top Contributors to Performance | Top Detractors from Performance | |||||
| For 2022 (%)1 | For 2022 (%)2 | |||||
| TransMedics Group | 2.70 | Ambarella | -1.72 | |||
| Impinj | 1.57 | Freshpet | -1.41 | |||
| Celsius Holdings | 1.49 | Matterport Cl. A | -1.38 | |||
| Clearfield | 1.32 | Atlas Technical Consultants Cl. A | -1.13 | |||
| Halozyme Therapeutics | 1.04 | Oxford Biomedica | -1.06 | |||
| 1 Includes dividends | 2 Net of dividends | |||||
TransMedics Group was the Fund’s top contributor. A pioneer in human organ transplantation systems, TransMedics develops equipment that provides continuous blood and oxygen flow, which extends the life of an organ during transport. Management believes—and evidence is suggesting—that their technology could, at a minimum, double transplant volumes in the U.S. In addition, 2022 brought the approval and introduction of two new products (versus one in 2021) that address lung, liver, and heart procedures. Impinj is a leading innovator in the article and inventory tracking industry, selling both reader and endpoint chips with RF (“radio frequency”) capabilities. RFID is proving a powerful tool in inventory management, product logistics, and theft prevention for apparel retailers. And while the retailer market is only about 25% penetrated (both multi-channel e-commerce and Covid accelerated adoption, with Walmart recently rolling it out), Impinj is finding newer and potentially much larger applications in package delivery, non-apparel retailers, healthcare, and counterfeit prevention. For six consecutive quarters, management has said it sees 50% more demand than they have been able to supply due to chip fabrication capacity and supply constraints. We think its runway is long.
The portfolio’s disadvantage versus the Russell 2000 Growth came from stock selection in 2022. At the sector level, stock selection in Industrials, our lack of exposure to Energy, and stock picks in Consumer Discretionary detracted most versus the benchmark. Conversely, our much lower exposure and stock selection in Real Estate, along with the Fund’s cash holdings, contributed most to relative performance.
CURRENT POSITIONING AND OUTLOOK
We spent much of 2022 trying to reduce portfolio risk by selling earlier stage companies, reducing underperforming holdings, and letting our winners run. As a result of these actions, we held fewer positions at year end, as many companies experienced worsening outlooks or were in an industry that was beginning to see economic pressure. At the end of 2022, we remained overweight in Information Technology, Health Care, and Industrials and underweight in Energy, Consumer Discretionary, Financials, Real Estate, and Utilities. We believe we are well positioned for the eventual rebound in small-cap growth stocks, which generally happens the year following a big drawdown. We still believe in a reversion to the mean, but investors have remained in a risk off mode for some time now, as they await visibility regarding Fed rate hike moderation, inflation deceleration, and the net impact on the economy of New Deal-like heavy fiscal spending. We should also keep in mind that it typically takes 12-24 months for monetary policy to take effect, which may set us up for a mid-2023 recession, the magnitude of which is difficult to predict (as is always the case). The equity market historically moves up ahead of the eventual economic recovery, so we are anticipating more of the same until the second half of 2023, when we expect the market to begin recovering. In the meantime, we continue to seek companies that are benefiting from secular growth tailwinds and that have a sufficiently superior product or service to capture market share.
28 | The Royce Funds 2022 Annual Report to Shareholders
| PERFORMANCE AND PORTFOLIO REVIEW (UNAUDITED) | TICKER SYMBOLS RYVPX RVPHX RVPCX RVPIX |
Performance and Expenses
Average Annual Total Return (%) Through 12/31/22
| JUL-DEC 20221 | 1-YR | 3-YR | 5-YR | 10-YR | 15-YR | 20-YR | SINCE INCEPTION (6/14/01) | |
| RVP | 6.03 | -32.37 | 2.85 | 3.85 | 7.72 | 5.32 | 10.22 | 9.63 |
Annual Gross Operating Expenses: 1.51% Annual Net Operating Expenses: 1.49%
1 Not annualized
Morningstar Style Map™ As of 12/31/22

The Morningstar Style Map is the Morningstar Style Box™ with the center 75% of fund holdings plotted as the Morningstar Ownership Zone™. The Morningstar Style Box is designed to reveal a fund’s investment strategy. The Morningstar Ownership Zone provides detail about a portfolio’s investment style by showing the range of stock sizes and styles. The Ownership Zone is derived by plotting each stock in the portfolio within the proprietary Morningstar Style Box. Over time, the shape and location of a fund’s ownership zone may vary. See page 86 for additional information.
Value of $10,000
Invested on 6/14/01 as of 12/31/22 ($)

Top 10 Positions
% of Net Assets
| TransMedics Group | 4.6 |
| Impinj | 4.0 |
| Celsius Holdings | 3.6 |
| Halozyme Therapeutics | 3.1 |
| Axonics | 3.0 |
| Distribution Solutions Group | 2.7 |
| Alphatec Holdings | 2.5 |
| Agilysys | 2.4 |
| VSE Corporation | 2.4 |
| InMode | 2.2 |
Portfolio Sector Breakdown
% of Net Assets
| Health Care | 30.1 |
| Information Technology | 26.1 |
| Industrials | 17.9 |
| Consumer Discretionary | 9.4 |
| Consumer Staples | 7.0 |
| Materials | 3.7 |
| Financials | 2.1 |
| Real Estate | 0.6 |
| Cash and Cash Equivalents | 3.1 |
Calendar Year Total Returns (%)
| YEAR | RVP |
| 2022 | -32.4 |
| 2021 | 7.8 |
| 2020 | 49.3 |
| 2019 | 23.7 |
| 2018 | -10.2 |
| 2017 | 17.8 |
| 2016 | 9.4 |
| 2015 | -1.8 |
| 2014 | 3.9 |
| 2013 | 32.5 |
| 2012 | 15.3 |
| 2011 | -10.0 |
| 2010 | 19.7 |
| 2009 | 41.4 |
| 2008 | -41.1 |
Upside/Downside Capture Ratios
Periods Ended 12/31/22 (%)
| UPSIDE | DOWNSIDE | |
| 10-Year | 98 | 107 |
| From 6/30/01 (Start of Fund’s First Full Quarter) | 106 | 92 |
Portfolio Diagnostics
| Fund Net Assets | $175 million |
| Number of Holdings | 68 |
| Turnover Rate | 66% |
| Average Market Capitalization 1 | $1,945 million |
| Weighted Average P/B Ratio 2 | 3.3x |
| 3-5 Year EPS Growth (est.)3 | 24.0% |
| Active Share4 | 93% |
| U.S. Investments (% of Net Assets) | 86.2% |
| Non-U.S. Investments (% of Net Assets) | 10.7% |
| 1 | Geometric Average. This weighted calculation uses each portfolio holding’s market cap in a way designed to not skew the effect of very large or small holdings; instead, it aims to better identify the portfolio’s center, which Royce believes offers a more accurate measure of average market cap than a simple mean or median. |
| 2 | Harmonic Average. This weighted calculation evaluates a portfolio as if it were a single stock and measures it overall. It compares the total market value of the portfolio to the portfolio’s share in the earnings or book value, as the case may be, of its underlying stocks. |
| 3 | The 3-5 Year EPS Growth (est.) is calculated as a simple weighted average of the pre-calculated mean long-term EPS growth rate estimates by brokerage analysts. Long Term Growth (LTG) is the annual EPS growth that the company can sustain over the next 3 or 5 years. Source: Factset |
| 4 | Active Share is the sum of the absolute values of the different weightings of each holding in the Fund versus each holding in the benchmark, divided by two. |
Important Performance and Expense Information
All performance information in this Report reflects past performance, is presented on a total return basis, reflects the reinvestment of distributions, and does not reflect the deduction of taxes that a shareholder would pay on Fund distributions or the redemption of Fund shares. Past performance is no guarantee of future results. Investment return and principal value of an investment will fluctuate, so that shares may be worth more or less than their original cost when redeemed. Shares redeemed within 30 days of purchase may be subject to a 1% redemption fee payable to the Fund, which is not reflected in the performance shown above; if it were, performance would be lower. Current month-end performance may be higher or lower than performance quoted and may be obtained at www.royceinvest.com. All performance and risk information reflects results of the Service Class (its oldest class). Gross operating expenses reflect the Fund’s gross total operating expenses for the Service Class and include management fees, 12b-1 distribution and service fees, and other expenses. Net operating expenses reflect contractual fee waivers and/or expense reimbursements. All expense information is reported as of the Fund’s most current prospectus. Royce & Associates has contractually agreed, without right of termination, to waive fees and/or reimburse expenses to the extent necessary to maintain the Service Class’s net annual operating expenses (excluding brokerage commissions, taxes, interest, litigation expenses, acquired fund fees and expenses, and other expenses not borne in the ordinary course of business) at or below 1.49% through April 30, 2023. Regarding the “Top Contributors” and “Top Detractors” tables shown above, the sum of all contributors to, and all detractors from, performance for all securities in the portfolio would approximate the Fund’s year-to-date performance for 2022. Upside Capture Ratio measures a manager’s performance in up markets relative to the Fund’s benchmark (Russell 2000 Growth). It is calculated by measuring the Fund’s performance in quarters when the benchmark went up and dividing it by the benchmark’s return in those quarters. Downside Capture Ratio measures a manager’s performance in down markets relative to the Fund’s benchmark. It is calculated by measuring the Fund’s performance in quarters when the benchmark goes down and dividing it by the benchmark’s return in those quarters.
The Royce Funds 2022 Annual Report to Shareholders | 29
| Royce Dividend Value Fund | |||||||
| Common Stocks – 94.3% | |||||||
| SHARES | VALUE | ||||||
| CONSUMER DISCRETIONARY – 2.8% | |||||||
| HOUSEHOLD DURABLES - 0.5% | |||||||
| †Vistry Group | 40,000 | $ | 302,479 | ||||
| MULTILINE RETAIL - 0.8% | |||||||
| † Franchise Group Cl. A | 18,500 | 440,670 | |||||
| SPECIALTY RETAIL - 1.5% | |||||||
| USS | 56,000 | 893,935 | |||||
| Total (Cost $1,171,324) | 1,637,084 | ||||||
| ENERGY – 1.4% | |||||||
| OIL, GAS & CONSUMABLE FUELS - 1.4% | |||||||
| Gaztransport Et Technigaz | 7,800 | 833,281 | |||||
| Total (Cost $491,861) | 833,281 | ||||||
| FINANCIALS – 22.6% | |||||||
| BANKS - 2.7% | |||||||
| BOK Financial | 15,414 | 1,599,819 | |||||
| CAPITAL MARKETS - 19.9% | |||||||
| Artisan Partners Asset Management Cl. A | 19,700 | 585,090 | |||||
| B3-Brasil, Bolsa, Balcao | 336,600 | 842,177 | |||||
| Bolsa Mexicana de Valores | 444,000 | 859,678 | |||||
| Carlyle Group | 60,820 | 1,814,869 | |||||
| Evercore Cl. A | 13,500 | 1,472,580 | |||||
| KKR & Co. | 14,738 | 684,138 | |||||
| Moelis & Company Cl. A | 19,359 | 742,805 | |||||
| SEI Investments | 37,900 | 2,209,570 | |||||
| Sprott | 37,780 | 1,256,729 | |||||
| State Street | 16,800 | 1,303,176 | |||||
| 11,770,812 | |||||||
| Total (Cost $7,169,506) | 13,370,631 | ||||||
| HEALTH CARE – 3.2% | |||||||
| HEALTH CARE PROVIDERS & SERVICES - 0.9% | |||||||
| Ensign Group (The) | 5,951 | 563,024 | |||||
| PHARMACEUTICALS - 2.3% | |||||||
| Recordati Industria Chimica e Farmaceutica | 24,210 | 1,004,229 | |||||
| Santen Pharmaceutical | 41,600 | 340,433 | |||||
| 1,344,662 | |||||||
| Total (Cost $626,526) | 1,907,686 | ||||||
| INDUSTRIALS – 42.5% | |||||||
| AEROSPACE & DEFENSE - 4.5% | |||||||
| HEICO Corporation Cl. A | 22,100 | 2,648,685 | |||||
| BUILDING PRODUCTS - 0.6% | |||||||
| Geberit | 800 | 376,791 | |||||
| CONSTRUCTION & ENGINEERING - 1.7% | |||||||
| Comfort Systems USA | 8,959 | 1,031,002 | |||||
| ELECTRICAL EQUIPMENT - 3.9% | |||||||
| Hubbell Incorporated | 9,840 | 2,309,251 | |||||
| MACHINERY - 12.8% | |||||||
| Graco | 25,224 | 1,696,566 | |||||
| Lincoln Electric Holdings | 10,022 | 1,448,079 | |||||
| Lindsay Corporation | 16,530 | 2,691,911 | |||||
| Spirax-Sarco Engineering | 13,478 | 1,729,632 | |||||
| 7,566,188 | |||||||
| MARINE - 2.3% | |||||||
| Clarkson | 35,040 | 1,370,398 | |||||
| PROFESSIONAL SERVICES - 9.7% | |||||||
| KBR | 61,260 | 3,234,528 | |||||
| Korn Ferry | 10,023 | 507,365 | |||||
| ManpowerGroup | 19,300 | 1,605,953 | |||||
| Robert Half International | 4,794 | 353,941 | |||||
| 5,701,787 | |||||||
| ROAD & RAIL - 0.6% | |||||||
| Werner Enterprises | 8,643 | 347,967 | |||||
| TRADING COMPANIES & DISTRIBUTORS - 6.4% | |||||||
| Applied Industrial Technologies | 29,730 | 3,746,872 | |||||
| Total (Cost $7,260,416) | 25,098,941 | ||||||
| INFORMATION TECHNOLOGY – 2.0% | |||||||
| ELECTRONIC EQUIPMENT, INSTRUMENTS & COMPONENTS - 1.5% | |||||||
| Vishay Intertechnology | 42,497 | 916,660 | |||||
| SOFTWARE - 0.5% | |||||||
| SimCorp | 4,200 | 289,117 | |||||
| Total (Cost $680,418) | 1,205,777 | ||||||
| MATERIALS – 19.3% | |||||||
| CHEMICALS - 1.8% | |||||||
| Quaker Houghton | 6,122 | 1,021,762 | |||||
| CONTAINERS & PACKAGING - 3.8% | |||||||
| AptarGroup | 20,396 | 2,243,152 | |||||
| METALS & MINING - 13.7% | |||||||
| Franco-Nevada | 18,335 | 2,502,361 | |||||
| Reliance Steel & Aluminum | 10,288 | 2,082,703 | |||||
| Royal Gold | 11,600 | 1,307,552 | |||||
| Worthington Industries | 44,460 | 2,210,106 | |||||
| 8,102,722 | |||||||
| Total (Cost $3,679,857) | 11,367,636 | ||||||
| REAL ESTATE – 0.5% | |||||||
| REAL ESTATE MANAGEMENT & DEVELOPMENT - 0.5% | |||||||
| Kennedy-Wilson Holdings | 17,000 | 267,410 | |||||
| Total (Cost $267,206) | 267,410 | ||||||
| TOTAL COMMON STOCKS | |||||||
| (Cost $21,347,114) | 55,688,446 | ||||||
| REPURCHASE AGREEMENT– 5.7% | |||||||
Fixed Income Clearing Corporation, 1.28% dated 12/30/22, due 1/3/23, maturity value $3,342,968 (collateralized by obligations of U.S. Government Agencies, 0.375% due 4/30/25, valued at $3,409,396) | |||||||
| (Cost $3,342,493) | 3,342,493 | ||||||
| TOTAL INVESTMENTS – 100.0% | |||||||
| (Cost $24,689,607) | 59,030,939 | ||||||
| LIABILITIES LESS CASH AND OTHER ASSETS – (0.0)% | (2,620) | ||||||
| NET ASSETS – 100.0% | $ | 59,028,319 | |||||
| 30 | The Royce Funds 2022 Annual Report to Shareholders | THE ACCOMPANYING NOTES ARE AN INTEGRAL PART OF THESE FINANCIAL STATEMENTS |
December 31, 2022
| Royce Global Financial Services Fund | |||||||
| Common Stocks – 98.9% | |||||||
| SHARES | VALUE | ||||||
| BANKS - 17.5% | |||||||
| Bank of N.T. Butterfield & Son | 5,805 | $ | 173,047 | ||||
| BOK Financial | 10,450 | 1,084,606 | |||||
| Capital City Bank Group | 16,988 | 552,110 | |||||
| First Citizens BancShares Cl. A | 1,564 | 1,186,075 | |||||
| First Republic Bank | 2,599 | 316,792 | |||||
| Popular | 16,251 | 1,077,766 | |||||
| Umpqua Holdings | 17,400 | 310,590 | |||||
| Total (Cost $2,242,341) | 4,700,986 | ||||||
| CAPITAL MARKETS - 54.8% | |||||||
| Ares Management Cl. A | 12,337 | 844,344 | |||||
| Artisan Partners Asset Management Cl. A | 7,512 | 223,106 | |||||
| B3-Brasil, Bolsa, Balcao | 183,000 | 457,868 | |||||
| Canaccord Genuity Group | 113,715 | 704,630 | |||||
| Carlyle Group | �� | 21,185 | 632,160 | ||||
| Charles Schwab | 14,671 | 1,221,507 | |||||
| Coronation Fund Managers | 61,200 | 110,649 | |||||
| CRISIL | 14,000 | 518,675 | |||||
| Egyptian Financial Group-Hermes Holding | |||||||
| Company 1 | 221,749 | 160,165 | |||||
| † GCM Grosvenor Cl. A | 21,300 | 162,093 | |||||
| Intermediate Capital Group | 39,111 | 542,812 | |||||
| JSE | 51,000 | 325,578 | |||||
| KKR & Co. | 16,120 | 748,290 | |||||
| MarketAxess Holdings | 1,581 | 440,925 | |||||
| MarketWise Cl. A 1 | 88,300 | 148,344 | |||||
| Morningstar | 1,262 | 273,337 | |||||
| NZX | 580,000 | 445,573 | |||||
| Onex Corporation | 5,669 | 273,360 | |||||
| Raymond James Financial | 2,900 | 309,865 | |||||
| Rothschild & Co | 13,900 | 555,740 | |||||
| SEI Investments | 9,540 | 556,182 | |||||
| Silvercrest Asset Management Group Cl. A | 27,612 | 518,277 | |||||
| Sprott | 40,500 | 1,347,208 | |||||
| StoneX Group 1 | 9,846 | 938,324 | |||||
| Tel Aviv Stock Exchange | 273,000 | 1,630,964 | |||||
| U.S. Global Investors Cl. A | 165,500 | 478,295 | |||||
| Warsaw Stock Exchange | 23,169 | 187,833 | |||||
| Total (Cost $8,458,963) | 14,756,104 | ||||||
| DIVERSIFIED FINANCIAL SERVICES - 2.1% | |||||||
| Banco Latinoamericano de Comercio | |||||||
| Exterior Cl. E | 25,700 | 416,340 | |||||
| ECN Capital | 75,000 | 153,988 | |||||
| Total (Cost $557,932) | 570,328 | ||||||
| INSURANCE - 7.3% | |||||||
| Axis Capital Holdings | 11,554 | 625,880 | |||||
| E-L Financial | 1,638 | 1,066,999 | |||||
| James River Group Holdings | 13,700 | 286,467 | |||||
| Total (Cost $1,755,926) | 1,979,346 | ||||||
| IT SERVICES - 0.9% | |||||||
| PayPal Holdings 1 | 3,466 | 246,848 | |||||
| Total (Cost $122,211) | 246,848 | ||||||
| METALS & MINING - 4.8% | |||||||
| Franco-Nevada | 9,523 | 1,299,699 | |||||
| Total (Cost $430,881) | 1,299,699 | ||||||
| PROFESSIONAL SERVICES - 0.3% | |||||||
| Quess Corp | 17,756 | 88,512 | |||||
| Total (Cost $153,190) | 88,512 | ||||||
| REAL ESTATE MANAGEMENT & DEVELOPMENT - 9.1% | |||||||
| Altus Group | 23,760 | 948,294 | |||||
| †Colliers International Group | 1,729 | 159,137 | |||||
| FirstService Corporation | 8,379 | 1,026,847 | |||||
| †Real Matters 1 | 100,000 | 308,715 | |||||
| Total (Cost $1,475,963) | 2,442,993 | ||||||
| SOFTWARE - 1.4% | |||||||
| Envestnet 1 | 6,000 | 370,200 | |||||
| Total (Cost $256,690) | 370,200 | ||||||
| THRIFTS & MORTGAGE FINANCE - 0.7% | |||||||
| Provident Bancorp | 25,000 | 182,000 | |||||
| Total (Cost $313,394) | 182,000 | ||||||
| TOTAL COMMON STOCKS | |||||||
| (Cost $15,767,491) | 26,637,016 | ||||||
| DIVERSIFIED INVESTMENT COMPANIES – 1.0% | |||||||
| CLOSED-END FUNDS - 1.0% | |||||||
| Eagle Point Income | 19,341 | 268,260 | |||||
| Total (Cost $384,692) | 268,260 | ||||||
| REPURCHASE AGREEMENT– 0.4% | |||||||
| Fixed Income Clearing Corporation, 1.28% dated 12/30/22, due 1/3/23, maturity value $108,236 (collateralized by obligations of U.S. Government Agencies, 2.875% due 5/31/25, valued at $110,455) | |||||||
| (Cost $108,221) | 108,221 | ||||||
| TOTAL INVESTMENTS – 100.3% | |||||||
| (Cost $16,260,404) | 27,013,497 | ||||||
| LIABILITIES LESS CASH AND OTHER ASSETS – (0.3)% | (79,118) | ||||||
| NET ASSETS – 100.0% | $ | 26,934,379 |
| THE ACCOMPANYING NOTES ARE AN INTEGRAL PART OF THESE FINANCIAL STATEMENTS | The Royce Funds 2022 Annual Report to Shareholders | 31 |
Schedules of Investments
| Royce International Premier Fund | |||||||
| Common Stocks – 91.4% | |||||||
| SHARES | VALUE | ||||||
| AUSTRALIA – 6.2% | |||||||
| Hansen Technologies | 6,858,518 | $ | 24,001,862 | ||||
| IPH | 3,638,524 | 21,626,738 | |||||
| Total (Cost $31,416,398) | 45,628,600 | ||||||
| BRAZIL – 3.6% | |||||||
| † Boa Vista Servicos | 7,870,000 | 10,821,762 | |||||
| Odontoprev | 9,455,900 | 16,172,504 | |||||
| Total (Cost $32,245,934) | 26,994,266 | ||||||
| CANADA – 5.2% | |||||||
| Altus Group | 103,300 | 4,122,845 | |||||
| Enghouse Systems | 805,600 | 21,401,353 | |||||
| † Open Text | 425,100 | 12,596,021 | |||||
| Total (Cost $47,392,588) | 38,120,219 | ||||||
| DENMARK – 1.0% | |||||||
| SimCorp | 112,500 | 7,744,213 | |||||
| Total (Cost $7,826,564) | 7,744,213 | ||||||
| FRANCE – 0.6% | |||||||
| Lectra | 114,389 | 4,310,157 | |||||
| Total (Cost $4,166,865) | 4,310,157 | ||||||
| GERMANY – 4.8% | |||||||
| Amadeus Fire | 63,898 | 7,906,992 | |||||
| New Work | 118,902 | 19,422,712 | |||||
| Norma Group | 440,700 | 8,019,700 | |||||
| Total (Cost $50,601,252) | 35,349,404 | ||||||
| ICELAND – 2.3% | |||||||
| Marel | 2,889,770 | 10,004,503 | |||||
| Ossur 1 | 1,498,647 | 7,237,808 | |||||
| Total (Cost $21,851,002) | 17,242,311 | ||||||
| ITALY – 3.3% | |||||||
| Carel Industries | 252,054 | 6,340,560 | |||||
| DiaSorin | 78,463 | 10,952,385 | |||||
| GVS 1 | 1,665,451 | 7,220,264 | |||||
| Total (Cost $33,602,973) | 24,513,209 | ||||||
| JAPAN – 24.5% | |||||||
| As One | 239,500 | 10,511,429 | |||||
| Benefit One | 492,400 | 7,252,432 | |||||
| BML | 908,000 | 23,211,978 | |||||
| Fukui Computer Holdings | 614,300 | 12,366,509 | |||||
| † JCU | 798,900 | 18,748,948 | |||||
| † Maruwa | 53,000 | 6,332,216 | |||||
| Meitec Corporation | 871,300 | 15,907,001 | |||||
| NSD | 623,300 | 10,847,434 | |||||
| OBIC Business Consultants | 628,300 | 20,561,936 | |||||
| † Riken Keiki | 290,200 | 9,729,351 | |||||
| TKC Corporation | 918,600 | 25,232,802 | |||||
| USS | 501,400 | 8,003,909 | |||||
| † Zuken | 532,200 | 12,347,981 | |||||
| Total (Cost $195,106,556) | 181,053,926 | ||||||
| NETHERLANDS – 1.6% | |||||||
| IMCD | 85,200 | 12,143,586 | |||||
| Total (Cost $5,695,787) | 12,143,586 | ||||||
| POLAND – 2.3% | |||||||
| Asseco Poland | 1,039,100 | 17,218,131 | |||||
| Total (Cost $22,354,804) | 17,218,131 | ||||||
| SINGAPORE – 1.9% | |||||||
| XP Power | 556,326 | 13,686,807 | |||||
| Total (Cost $15,417,741) | 13,686,807 | ||||||
| SOUTH KOREA – 3.6% | |||||||
| Douzone Bizon | 316,800 | 9,232,171 | |||||
| NICE Information Service | 1,809,606 | 17,459,227 | |||||
| Total (Cost $52,809,466) | 26,691,398 | ||||||
| SWEDEN – 7.9% | |||||||
| Alimak Group | 1,618,527 | 11,571,045 | |||||
| Bravida Holding | 432,328 | 4,615,432 | |||||
| Hexpol | 329,100 | 3,503,932 | |||||
| Karnov Group 1 | 2,407,447 | 13,473,591 | |||||
| Loomis | 554,300 | 15,192,341 | |||||
| †Norva24 Group 1 | 3,064,679 | 9,926,942 | |||||
| Total (Cost $62,528,586) | 58,283,283 | ||||||
| SWITZERLAND – 4.8% | |||||||
| dormakaba Holding | 11,200 | 4,100,146 | |||||
| Kardex Holding | 59,100 | 9,715,244 | |||||
| Partners Group Holding | 10,000 | 8,833,613 | |||||
| VZ Holding | 162,485 | 12,617,123 | |||||
| Total (Cost $27,187,864) | 35,266,126 | ||||||
| UNITED KINGDOM – 17.8% | |||||||
| Ashmore Group | 1,462,450 | 4,232,662 | |||||
| Croda International | 127,000 | 10,139,561 | |||||
| Diploma | 305,698 | 10,259,364 | |||||
| DiscoverIE Group | 1,384,755 | 12,237,669 | |||||
| †Intertek Group | 278,800 | 13,596,810 | |||||
| Learning Technologies Group | 12,868,300 | 17,952,931 | |||||
| Marlowe 1 | 2,340,645 | 13,299,698 | |||||
| †Mortgage Advice Bureau Holdings | 982,883 | 6,297,760 | |||||
| Restore | 4,729,458 | 18,868,340 | |||||
| Spirax-Sarco Engineering | 79,500 | 10,202,239 | |||||
| Victrex | 764,845 | 14,766,811 | |||||
| Total (Cost $142,555,721) | 131,853,845 | ||||||
| TOTAL COMMON STOCKS | |||||||
| (Cost $752,760,101) | 676,099,481 | ||||||
| PREFERRED STOCK – 2.6% | |||||||
| GERMANY – 2.6% | |||||||
| FUCHS PETROLUB | 548,300 | 19,216,005 | |||||
| (Cost $24,078,742) | 19,216,005 |
| 32 | The Royce Funds 2022 Annual Report to Shareholders | THE ACCOMPANYING NOTES ARE AN INTEGRAL PART OF THESE FINANCIAL STATEMENTS |
December 31, 2022
| Royce International Premier Fund (continued) | |||
| VALUE | |||
| REPURCHASE AGREEMENT– 6.0% | |||
Fixed Income Clearing Corporation, 1.28% dated 12/30/22, due 1/3/23, maturity value $44,889,964 (collateralized by obligations of various U.S. Government Agencies, 0.375%-2.875% due 4/30/25-5/31/25, valued at $45,781,297) | |||
| (Cost $44,883,580) | $ | 44,883,580 | |
| TOTAL INVESTMENTS – 100.0% | |||
| (Cost $821,722,423) | 740,199,066 | ||
| LIABILITIES LESS CASH AND OTHER ASSETS – (0.0)% | (299,486) | ||
| NET ASSETS – 100.0% | $ | 739,899,580 | |
| Royce Micro-Cap Fund | |||||||
| Common Stocks – 97.9% | |||||||
| SHARES | VALUE | ||||||
| COMMUNICATION SERVICES – 4.1% | |||||||
| ENTERTAINMENT - 1.5% | |||||||
| Chicken Soup for the Soul Entertainment Cl. A 1 | 244,521 | $ | 1,251,947 | ||||
| Gaia Cl. A 1 | 176,568 | 420,232 | |||||
| IMAX Corporation 1 | 189,400 | 2,776,604 | |||||
| 4,448,783 | |||||||
| INTERACTIVE MEDIA & SERVICES - 1.2% | |||||||
| QuinStreet 1 | 238,846 | 3,427,440 | |||||
| MEDIA - 1.4% | |||||||
| Magnite 1 | 225,400 | 2,386,986 | |||||
| Thryv Holdings 1 | 97,704 | 1,856,376 | |||||
| 4,243,362 | |||||||
| Total (Cost $14,326,320) | 12,119,585 | ||||||
| CONSUMER DISCRETIONARY – 11.4% | |||||||
| AUTO COMPONENTS - 2.4% | |||||||
| Modine Manufacturing 1 | 193,300 | 3,838,938 | |||||
| Stoneridge 1 | 152,600 | 3,290,056 | |||||
| 7,128,994 | |||||||
| HOTELS, RESTAURANTS & LEISURE - 1.5% | |||||||
| Century Casinos 1 | 346,100 | 2,433,083 | |||||
| Lindblad Expeditions Holdings 1,2 | 254,000 | 1,955,800 | |||||
| 4,388,883 | |||||||
| HOUSEHOLD DURABLES - 0.8% | |||||||
| Legacy Housing 1 | 117,973 | 2,236,768 | |||||
| LEISURE PRODUCTS - 1.6% | |||||||
| †American Outdoor Brands 1 | 175,338 | 1,756,887 | |||||
| MasterCraft Boat Holdings 1 | 110,800 | 2,866,396 | |||||
| 4,623,283 | |||||||
| SPECIALTY RETAIL - 4.3% | |||||||
| Barnes & Noble Education 1 | 384,000 | 672,000 | |||||
| Chico’s FAS 1 | 481,300 | 2,367,996 | |||||
| Citi Trends 1 | 114,924 | 3,043,187 | |||||
| †JOANN | 149,400 | 425,790 | |||||
| OneWater Marine Cl. A 1 | 45,600 | 1,304,160 | |||||
| Shoe Carnival | 112,322 | 2,685,619 | |||||
| Zumiez 1 | 103,200 | 2,243,568 | |||||
| 12,742,320 | |||||||
| TEXTILES, APPAREL & LUXURY GOODS - 0.8% | |||||||
| Fossil Group 1 | 364,700 | 1,571,857 | |||||
| Vera Bradley 1 | 156,900 | 710,757 | |||||
| 2,282,614 | |||||||
| Total (Cost $30,502,818) | 33,402,862 | ||||||
| ENERGY – 2.9% | |||||||
| ENERGY EQUIPMENT & SERVICES - 2.9% | |||||||
| Natural Gas Services Group 1 | 292,613 | 3,353,345 | |||||
| Newpark Resources 1 | 875,100 | 3,631,665 | |||||
| Profire Energy 1 | 1,410,332 | 1,480,849 | |||||
| Total (Cost $7,145,268) | 8,465,859 | ||||||
| FINANCIALS – 14.0% | |||||||
| BANKS - 7.0% | |||||||
| BayCom Corporation | 167,842 | 3,185,641 | |||||
| HarborOne Bancorp | 251,253 | 3,492,417 | |||||
| HBT Financial | 188,700 | 3,692,859 | |||||
| HomeTrust Bancshares | 125,600 | 3,035,752 | |||||
| Investar Holding Corporation | 178,800 | 3,849,564 | |||||
| Midway Investments 1,3 | 1,858,170 | 0 | |||||
| †Stellar Bancorp | 104,677 | 3,083,784 | |||||
| 20,340,017 | |||||||
| THE ACCOMPANYING NOTES ARE AN INTEGRAL PART OF THESE FINANCIAL STATEMENTS | The Royce Funds 2022 Annual Report to Shareholders | 33 |
Schedules of Investments
| Royce Micro-Cap Fund (continued) | |||||||
| SHARES | VALUE | ||||||
| FINANCIALS (continued) | |||||||
| CAPITAL MARKETS - 4.7% | |||||||
| B. Riley Financial | 54,500 | $ | 1,863,900 | ||||
| Canaccord Genuity Group | 379,360 | 2,350,687 | |||||
| Silvercrest Asset Management Group Cl. A | 177,500 | 3,331,675 | |||||
| Sprott | 74,280 | 2,470,880 | |||||
| StoneX Group 1 | 39,000 | 3,716,700 | |||||
| 13,733,842 | |||||||
| THRIFTS & MORTGAGE FINANCE - 2.3% | |||||||
| Territorial Bancorp | 122,408 | 2,939,016 | |||||
| Western New England Bancorp | 409,806 | 3,876,765 | |||||
| 6,815,781 | |||||||
| Total (Cost $33,183,179) | 40,889,640 | ||||||
| HEALTH CARE – 7.2% | |||||||
| BIOTECHNOLOGY - 1.2% | |||||||
| Dynavax Technologies 1 | 198,000 | 2,106,720 | |||||
| MeiraGTx Holdings 1 | 222,200 | 1,448,744 | |||||
| 3,555,464 | |||||||
| HEALTH CARE EQUIPMENT & SUPPLIES - 4.8% | |||||||
| Apyx Medical 1 | 356,027 | 833,103 | |||||
| Artivion 1 | 168,855 | 2,046,523 | |||||
| AtriCure 1 | 42,800 | 1,899,464 | |||||
| Cutera 1 | 55,700 | 2,463,054 | |||||
| OrthoPediatrics Corp. 1 | 53,900 | 2,141,447 | |||||
| Profound Medical 1 | 219,700 | 2,349,524 | |||||
| Surmodics 1 | 66,922 | 2,283,379 | |||||
| 14,016,494 | |||||||
| LIFE SCIENCES TOOLS & SERVICES - 1.2% | |||||||
| Harvard Bioscience 1 | 609,952 | 1,689,567 | |||||
| NeoGenomics 1 | 27,800 | 256,872 | |||||
| Quanterix Corporation 1 | 116,600 | 1,614,910 | |||||
| 3,561,349 | |||||||
| Total (Cost $18,920,412) | 21,133,307 | ||||||
| INDUSTRIALS – 24.9% | |||||||
| AEROSPACE & DEFENSE - 1.6% | |||||||
| Astronics Corporation 1 | 163,500 | 1,684,050 | |||||
| Cadre Holdings | 97,232 | 1,958,252 | |||||
| CPI Aerostructures 1 | 343,190 | 1,098,208 | |||||
| 4,740,510 | |||||||
| BUILDING PRODUCTS - 1.1% | |||||||
| Quanex Building Products | 136,400 | 3,229,952 | |||||
| COMMERCIAL SERVICES & SUPPLIES - 3.1% | |||||||
| Acme United | 73,364 | 1,606,672 | |||||
| Heritage-Crystal Clean 1 | 124,474 | 4,042,915 | |||||
| VSE Corporation | 71,000 | 3,328,480 | |||||
| 8,978,067 | |||||||
| CONSTRUCTION & ENGINEERING - 3.7% | |||||||
| Concrete Pumping Holdings 1 | 293,100 | 1,714,635 | |||||
| Construction Partners Cl. A 1 | 130,900 | 3,493,721 | |||||
| IES Holdings 1 | 59,800 | 2,127,086 | |||||
| Northwest Pipe 1 | 108,200 | 3,646,340 | |||||
| 10,981,782 | |||||||
| ELECTRICAL EQUIPMENT - 0.5% | |||||||
| American Superconductor 1 | 372,200 | 1,369,696 | |||||
| MACHINERY - 6.3% | |||||||
| Alimak Group | 196,200 | 1,402,658 | |||||
| CIRCOR International 1 | 107,100 | 2,566,116 | |||||
| †Commercial Vehicle Group 1 | 236,500 | 1,610,565 | |||||
| Graham Corporation 1 | 234,616 | 2,257,006 | |||||
| Luxfer Holdings | 162,200 | 2,225,384 | |||||
| Porvair | 320,800 | 2,389,040 | |||||
| Shyft Group (The) | 93,700 | 2,329,382 | |||||
| Wabash National | 160,300 | 3,622,780 | |||||
| 18,402,931 | |||||||
| MARINE - 1.1% | |||||||
| Clarkson | 81,324 | 3,180,544 | |||||
| PROFESSIONAL SERVICES - 5.4% | |||||||
| CRA International | 32,483 | 3,976,894 | |||||
| Forrester Research 1 | 69,400 | 2,481,744 | |||||
| Kforce | 42,732 | 2,342,995 | |||||
| NV5 Global 1 | 26,200 | 3,466,784 | |||||
| Resources Connection | 194,652 | 3,577,704 | |||||
| 15,846,121 | |||||||
| TRADING COMPANIES & DISTRIBUTORS - 2.1% | |||||||
| Distribution Solutions Group 1 | 71,265 | 2,626,828 | |||||
| Transcat 1 | 48,474 | 3,435,352 | |||||
| 6,062,180 | |||||||
| Total (Cost $54,864,613) | 72,791,783 | ||||||
| INFORMATION TECHNOLOGY – 28.0% | |||||||
| COMMUNICATIONS EQUIPMENT - 5.6% | |||||||
| Applied Optoelectronics 1 | 277,500 | 524,475 | |||||
| Clearfield 1 | 31,800 | 2,993,652 | |||||
| Comtech Telecommunications | 136,402 | 1,655,920 | |||||
| Digi International 1 | 90,300 | 3,300,465 | |||||
| DZS 1 | 176,509 | 2,238,134 | |||||
| EMCORE Corporation 1 | 396,700 | 381,824 | |||||
| Genasys 1 | 465,088 | 1,720,826 | |||||
| Harmonic 1 | 277,000 | 3,628,700 | |||||
| 16,443,996 | |||||||
| ELECTRONIC EQUIPMENT, INSTRUMENTS & COMPONENTS - 5.8% | |||||||
| Arlo Technologies 1 | 258,700 | 908,037 | |||||
| FARO Technologies 1 | 76,145 | 2,239,424 | |||||
| LightPath Technologies Cl. A 1 | 828,984 | 1,011,361 | |||||
| Luna Innovations 1 | 456,600 | 4,013,514 | |||||
| nLIGHT 1 | 217,250 | 2,202,915 | |||||
| PAR Technology 1 | 58,500 | 1,525,095 | |||||
| PowerFleet 1 | 350,408 | 942,598 | |||||
| VIA optronics ADR 1 | 242,505 | 387,086 | |||||
| Vishay Precision Group 1 | 97,100 | 3,752,915 | |||||
| 16,982,945 | |||||||
| IT SERVICES - 1.9% | |||||||
| Cass Information Systems | 63,916 | 2,928,631 | |||||
| Computer Task Group 1 | 334,226 | 2,526,749 | |||||
| 5,455,380 | |||||||
| SEMICONDUCTORS & SEMICONDUCTOR EQUIPMENT - 11.5% | |||||||
| Aehr Test Systems 1,2 | 145,059 | 2,915,686 | |||||
| Amtech Systems 1 | 184,511 | 1,402,283 | |||||
| Axcelis Technologies 1 | 46,800 | 3,714,048 | |||||
| AXT 1 | 467,900 | 2,049,402 | |||||
| Camtek 1 | 95,900 | 2,105,964 | |||||
| Cohu 1 | 94,000 | 3,012,700 | |||||
| FormFactor 1 | 70,400 | 1,564,992 | |||||
| Ichor Holdings 1 | 85,900 | 2,303,838 | |||||
| Nova 1 | 27,700 | 2,262,536 | |||||
| NVE Corporation | 44,216 | 2,862,986 | |||||
| PDF Solutions 1 | 110,500 | 3,151,460 | |||||
| Photronics 1 | 208,600 | 3,510,738 |
| 34 | The Royce Funds 2022 Annual Report to Shareholders | THE ACCOMPANYING NOTES ARE AN INTEGRAL PART OF THESE FINANCIAL STATEMENTS |
December 31, 2022
| Royce Micro-Cap Fund (continued) | |||||||
| SHARES | VALUE | ||||||
| INFORMATION TECHNOLOGY (continued) | |||||||
| SEMICONDUCTORS & SEMICONDUCTOR EQUIPMENT (continued) | |||||||
| Ultra Clean Holdings 1 | 82,300 | $ | 2,728,245 | ||||
| 33,584,878 | |||||||
| SOFTWARE - 1.5% | |||||||
| Agilysys 1 | 56,721 | 4,488,900 | |||||
| TECHNOLOGY HARDWARE, STORAGE & PERIPHERALS - 1.7% | |||||||
| AstroNova 1 | 222,276 | 2,849,578 | |||||
| Intevac 1 | 321,813 | 2,082,130 | |||||
| 4,931,708 | |||||||
| Total (Cost $59,990,082) | 81,887,807 | ||||||
| MATERIALS – 4.8% | |||||||
| CHEMICALS - 0.6% | |||||||
| Aspen Aerogels 1 | 134,700 | 1,588,113 | |||||
| METALS & MINING - 4.2% | |||||||
| Altius Minerals | 121,800 | 1,997,916 | |||||
| Ferroglobe 1 | 280,400 | 1,079,540 | |||||
| Haynes International | 73,330 | 3,350,448 | |||||
| Major Drilling Group International 1 | 454,600 | 3,532,047 | |||||
| Universal Stainless & Alloy Products 1 | 335,000 | 2,401,950 | |||||
| 12,361,901 | |||||||
| Total (Cost $11,659,665) | 13,950,014 | ||||||
| REAL ESTATE – 0.6% | |||||||
| REAL ESTATE MANAGEMENT & DEVELOPMENT - 0.6% | |||||||
| FRP Holdings 1 | 29,575 | 1,592,910 | |||||
| Total (Cost $534,936) | 1,592,910 | ||||||
| TOTAL COMMON STOCKS | |||||||
| (Cost $231,127,293) | 286,233,767 | ||||||
| REPURCHASE AGREEMENT– 2.4% | |||||||
| Fixed Income Clearing Corporation, 1.28% dated 12/30/22, due 1/3/23, maturity value $6,933,679 (collateralized by obligations of U.S. Government Agencies, 0.375% due 4/30/25, valued at $7,071,374) | |||||||
| (Cost $6,932,693) | 6,932,693 | ||||||
| TOTAL INVESTMENTS – 100.3% | |||||||
| (Cost $238,059,986) | 293,166,460 | ||||||
| LIABILITIES LESS CASH AND OTHER ASSETS – (0.3)% | (738,104) | ||||||
| NET ASSETS – 100.0% | $ | 292,428,356 | |||||
| Royce Pennsylvania Mutual Fund | |||||||
| Common Stocks – 99.1% | |||||||
| SHARES | VALUE | ||||||
| COMMUNICATION SERVICES – 2.2% | |||||||
| DIVERSIFIED TELECOMMUNICATION SERVICES - 0.3% | |||||||
| †Cogent Communications Holdings | 13,200 | $ | 753,456 | ||||
| †Frontier Communications Parent 1 | 119,300 | 3,039,764 | |||||
| Liberty Latin America Cl. C 1 | 187,820 | 1,427,432 | |||||
| 5,220,652 | |||||||
| ENTERTAINMENT - 0.2% | |||||||
| Chicken Soup for the Soul Entertainment Cl. A 1 | 33,785 | 172,979 | |||||
| IMAX Corporation 1 | 240,219 | 3,521,611 | |||||
| 3,694,590 | |||||||
| INTERACTIVE MEDIA & SERVICES - 1.3% | |||||||
| QuinStreet 1 | 78,343 | 1,124,222 | |||||
| Ziff Davis 1 | 244,782 | 19,362,256 | |||||
| 20,486,478 | |||||||
| MEDIA - 0.4% | |||||||
| †Cable One | 6,837 | 4,866,987 | |||||
| †TechTarget 1 | 18,205 | 802,112 | |||||
| 5,669,099 | |||||||
| Total (Cost $44,317,766) | 35,070,819 | ||||||
| CONSUMER DISCRETIONARY – 10.6% | |||||||
| AUTO COMPONENTS - 2.4% | |||||||
| Dorman Products 1 | 158,712 | 12,835,040 | |||||
| Fox Factory Holding Corporation 1,2 | 65,310 | 5,958,231 | |||||
| Gentex Corporation | 320,356 | 8,736,108 | |||||
| LCI Industries | 91,741 | 8,481,456 | |||||
| Standard Motor Products | 15,168 | 527,846 | |||||
| Stoneridge 1 | 58,757 | 1,266,801 | |||||
| 37,805,482 | |||||||
| DISTRIBUTORS - 0.4% | |||||||
| LKQ Corporation | 66,921 | 3,574,251 | |||||
| Pool Corporation | 7,750 | 2,343,057 | |||||
| 5,917,308 | |||||||
| DIVERSIFIED CONSUMER SERVICES - 0.2% | |||||||
| H&R Block | 7,312 | 266,961 | |||||
| Lincoln Educational Services 1 | 501,394 | 2,903,071 | |||||
| 3,170,032 | |||||||
| HOTELS, RESTAURANTS & LEISURE - 0.5% | |||||||
| †Bloomin’ Brands | 136,000 | 2,736,320 | |||||
| Century Casinos 1 | 517,541 | 3,638,313 | |||||
| †Denny’s Corporation 1 | 205,209 | 1,889,975 | |||||
| 8,264,608 | |||||||
| HOUSEHOLD DURABLES - 1.3% | |||||||
| Helen of Troy 1 | 48,501 | 5,379,246 | |||||
| Legacy Housing 1 | 97,929 | 1,856,734 | |||||
| M/I Homes 1 | 56,768 | 2,621,546 | |||||
| PulteGroup | 69,522 | 3,165,337 | |||||
| Skyline Champion 1 | 145,371 | 7,488,060 | |||||
| 20,510,923 | |||||||
| INTERNET & DIRECT MARKETING RETAIL - 0.0% | |||||||
| 1-800-FLOWERS.COM Cl. A 1,2 | 23,842 | 227,929 | |||||
| LEISURE PRODUCTS - 1.1% | |||||||
| Brunswick Corporation | 111,269 | 8,020,270 | |||||
| Malibu Boats Cl. A 1,2 | 44,383 | 2,365,614 | |||||
| MasterCraft Boat Holdings 1 | 125,858 | 3,255,946 | |||||
| †YETI Holdings 1 | 65,033 | 2,686,513 | |||||
| 16,328,343 | |||||||
| MULTILINE RETAIL - 0.3% | |||||||
| Franchise Group Cl. A | 201,891 | 4,809,044 | |||||
| SPECIALTY RETAIL - 2.8% | |||||||
| †Academy Sports and Outdoors | 46,100 | 2,422,094 | |||||
| THE ACCOMPANYING NOTES ARE AN INTEGRAL PART OF THESE FINANCIAL STATEMENTS | The Royce Funds 2022 Annual Report to Shareholders | 35 |
Schedules of Investments
Royce Pennsylvania Mutual Fund (continued)
| SHARES | VALUE | |||
| CONSUMER DISCRETIONARY (continued) | ||||
| SPECIALTY RETAIL (continued) | ||||
| Asbury Automotive Group 1 | 92,672 | $ | 16,611,456 | |
| CarMax 1 | 17,075 | 1,039,697 | ||
| † Five Below 1,2 | 15,097 | 2,670,206 | ||
| † Floor & Decor Holdings Cl. A 1 | 36,200 | 2,520,606 | ||
| †JOANN | 213,988 | 609,866 | ||
| Lazydays Holdings 1,2 | 212,986 | 2,543,053 | ||
| Murphy USA | 16,344 | 4,568,802 | ||
| OneWater Marine Cl. A 1 | 133,692 | 3,823,591 | ||
| Shoe Carnival | 271,578 | 6,493,430 | ||
| 43,302,801 | ||||
| TEXTILES, APPAREL & LUXURY GOODS - 1.6% | ||||
| Carter’s | 56,484 | 4,214,271 | ||
| † Kontoor Brands | 71,900 | 2,875,281 | ||
| Levi Strauss & Co. Cl. A | 70,389 | 1,092,437 | ||
| Movado Group | 190,901 | 6,156,557 | ||
| Ralph Lauren Cl. A | 66,988 | 7,078,622 | ||
| Skechers U.S.A. Cl. A 1 | 65,841 | 2,762,030 | ||
| Wolverine World Wide | 105,847 | 1,156,908 | ||
| 25,336,106 | ||||
| Total (Cost $143,463,573) | 165,672,576 | |||
| CONSUMER STAPLES – 1.3% | ||||
| FOOD PRODUCTS - 0.6% | ||||
| John B. Sanfilippo & Son | 12,910 | 1,049,841 | ||
| Nomad Foods 1 | 430,865 | 7,428,113 | ||
| 8,477,954 | ||||
| PERSONAL PRODUCTS - 0.7% | ||||
| Inter Parfums | 117,833 | 11,373,241 | ||
| Total (Cost $10,806,066) | 19,851,195 | |||
| ENERGY – 2.4% | ||||
| ENERGY EQUIPMENT & SERVICES - 1.5% | ||||
| Computer Modelling Group | 2,652,180 | 11,419,653 | ||
| Core Laboratories | 83,860 | 1,699,842 | ||
| Pason Systems | 949,698 | 11,180,344 | ||
| 24,299,839 | ||||
| OIL, GAS & CONSUMABLE FUELS - 0.9% | ||||
| Antero Resources 1 | 41,755 | 1,293,987 | ||
| †Chord Energy | 19,646 | 2,687,769 | ||
| †Magnolia Oil & Gas Cl. A | 58,800 | 1,378,860 | ||
| †Matador Resources | 50,400 | 2,884,896 | ||
| †Northern Oil and Gas | 42,500 | 1,309,850 | ||
| † SilverBow Resources 1,2 | 94,641 | 2,676,448 | ||
| †Southwestern Energy 1 | 219,900 | 1,286,415 | ||
| 13,518,225 | ||||
| Total (Cost $29,948,395) | 37,818,064 | |||
| FINANCIALS – 17.6% | ||||
| BANKS - 6.1% | ||||
| Bank of N.T. Butterfield & Son | 248,703 | 7,413,836 | ||
| BankUnited | 138,360 | 4,700,089 | ||
| BOK Financial | 40,738 | 4,228,197 | ||
| First Bancshares (The) | 146,010 | 4,673,780 | ||
| First Citizens BancShares Cl. A | 39,986 | 30,323,783 | ||
| First Hawaiian | 301,653 | 7,855,044 | ||
| Home BancShares | 239,238 | 5,452,234 | ||
| Independent Bank Group | 112,540 | 6,761,403 | ||
| National Bankshares | 33,382 | 1,345,295 | ||
| Origin Bancorp | 82,947 | 3,044,155 | ||
| Popular | 189,632 | 12,576,394 | ||
| Texas Capital Bancshares 1 | 9,887 | 596,285 | ||
| Triumph Financial 1 | 134,773 | 6,586,357 | ||
| 95,556,852 | ||||
| CAPITAL MARKETS - 5.5% | ||||
| Ares Management Cl. A | 103,676 | 7,095,586 | ||
| Artisan Partners Asset Management Cl. A | 388,099 | 11,526,540 | ||
| B. Riley Financial | 33,802 | 1,156,029 | ||
| Evercore Cl. A | 28,317 | 3,088,818 | ||
| GCM Grosvenor Cl. A | 984,323 | 7,490,698 | ||
| Houlihan Lokey Cl. A | 47,815 | 4,167,556 | ||
| Lazard Cl. A | 29,748 | 1,031,363 | ||
| MarketWise Cl. A 1 | 500,000 | 840,000 | ||
| Moelis & Company Cl. A | 65,982 | 2,531,729 | ||
| Morningstar | 40,288 | 8,725,978 | ||
| Newtek Business Services | 94,973 | 1,543,311 | ||
| SEI Investments | 320,707 | 18,697,218 | ||
| Silvercrest Asset Management Group Cl. A | 37,918 | 711,721 | ||
| Sprott | 244,764 | 8,141,928 | ||
| TMX Group | 56,620 | 5,667,018 | ||
| Tradeweb Markets Cl. A | 65,100 | 4,226,943 | ||
| 86,642,436 | ||||
| DIVERSIFIED FINANCIAL SERVICES - 0.2% | ||||
| Compass Diversified Holdings | 189,321 | 3,451,322 | ||
| INSURANCE - 5.5% | ||||
| AMERISAFE | 85,251 | 4,430,494 | ||
| Assured Guaranty | 106,823 | 6,650,800 | ||
| Axis Capital Holdings | 67,661 | 3,665,196 | ||
| E-L Financial | 24,818 | 16,166,526 | ||
| Employers Holdings | 37,455 | 1,615,434 | ||
| First American Financial | 26,098 | 1,365,969 | ||
| International General Insurance Holdings | 513,561 | 4,108,488 | ||
| James River Group Holdings | 524,470 | 10,966,668 | ||
| ProAssurance Corporation | 287,500 | 5,022,625 | ||
| RenaissanceRe Holdings | 43,805 | 8,070,195 | ||
| RLI Corp. | 53,547 | 7,029,115 | ||
| Safety Insurance Group | 68,754 | 5,793,212 | ||
| Stewart Information Services | 41,034 | 1,753,383 | ||
| Tiptree | 217,720 | 3,013,245 | ||
| White Mountains Insurance Group | 4,536 | 6,415,401 | ||
| 86,066,751 | ||||
| THRIFTS & MORTGAGE FINANCE - 0.3% | ||||
| Timberland Bancorp | 99,201 | 3,385,730 | ||
| TrustCo Bank Corp NY | 22,340 | 839,761 | ||
| 4,225,491 | ||||
| Total (Cost $230,812,859) | 275,942,852 | |||
| HEALTH CARE – 7.5% | ||||
| BIOTECHNOLOGY - 0.8% | ||||
| CareDx 1 | 100,005 | 1,141,057 | ||
| Catalyst Pharmaceuticals 1,2 | 157,647 | 2,932,234 | ||
| Ironwood Pharmaceuticals Cl. A 1 | 601,300 | 7,450,107 | ||
| MeiraGTx Holdings 1 | 95,578 | 623,169 | ||
| 12,146,567 | ||||
| HEALTH CARE EQUIPMENT & SUPPLIES - 4.0% | ||||
| AtriCure 1 | 24,482 | 1,086,511 | ||
| Atrion Corporation | 8,442 | 4,722,877 | ||
| Bioventus Cl. A 1,2 | 189,802 | 495,383 | ||
| Cutera 1,2 | 46,800 | 2,069,496 |
| 36 | The Royce Funds 2022 Annual Report to Shareholders | THE ACCOMPANYING NOTES ARE AN INTEGRAL PART OF THESE FINANCIAL STATEMENTS |
December 31, 2022
Royce Pennsylvania Mutual Fund (continued)
| SHARES | VALUE | |||
| HEALTH CARE (continued) | ||||
| HEALTH CARE EQUIPMENT & SUPPLIES (continued) | ||||
| Enovis Corporation 1 | 263,532 | $ | 14,104,233 | |
| Haemonetics Corporation 1 | 286,766 | 22,554,146 | ||
| Mesa Laboratories | 54,071 | 8,987,141 | ||
| Neogen Corporation 1 | 52,300 | 796,529 | ||
| OrthoPediatrics Corp. 1 | 55,623 | 2,209,902 | ||
| Profound Medical 1 | 52,098 | 557,148 | ||
| QuidelOrtho 1 | 48,840 | 4,184,123 | ||
| Surmodics 1 | 42,305 | 1,443,446 | ||
| 63,210,935 | ||||
| HEALTH CARE PROVIDERS & SERVICES - 0.4% | ||||
| Cross Country Healthcare 1 | 92,376 | 2,454,430 | ||
| Molina Healthcare 1 | 13,139 | 4,338,761 | ||
| 6,793,191 | ||||
| HEALTH CARE TECHNOLOGY - 0.5% | ||||
| † Certara 1 | 121,200 | 1,947,684 | ||
| † Doximity Cl. A 1,2 | 65,600 | 2,201,536 | ||
| Simulations Plus | 79,205 | 2,896,527 | ||
| 7,045,747 | ||||
| LIFE SCIENCES TOOLS & SERVICES - 1.6% | ||||
| Azenta 1 | 129,518 | 7,540,538 | ||
| Bio-Techne | 67,072 | 5,558,927 | ||
| Harvard Bioscience 1 | 121,940 | 337,774 | ||
| † Maravai LifeSciences Holdings Cl. A 1 | 50,000 | 715,500 | ||
| Quanterix Corporation 1 | 30,848 | 427,245 | ||
| † Repligen Corporation 1 | 34,660 | 5,868,284 | ||
| † Stevanato Group | 237,301 | 4,264,299 | ||
| 24,712,567 | ||||
| PHARMACEUTICALS - 0.2% | ||||
| Harmony Biosciences Holdings 1,2 | 41,494 | 2,286,320 | ||
| Supernus Pharmaceuticals 1 | 41,033 | 1,463,647 | ||
| 3,749,967 | ||||
| Total (Cost $109,401,648) | 117,658,974 | |||
| INDUSTRIALS – 30.4% | ||||
| AEROSPACE & DEFENSE - 0.9% | ||||
| HEICO Corporation | 80,074 | 12,302,569 | ||
| † Leonardo DRS 1,2 | 136,800 | 1,748,304 | ||
| 14,050,873 | ||||
| AIR FREIGHT & LOGISTICS - 2.1% | ||||
| Forward Air | 222,451 | 23,332,885 | ||
| Hub Group Cl. A 1 | 129,806 | 10,318,279 | ||
| 33,651,164 | ||||
| AIRLINES - 0.2% | ||||
| Sun Country Airlines Holdings 1,2 | 194,570 | 3,085,880 | ||
| BUILDING PRODUCTS - 3.1% | ||||
| AAON | 20,368 | 1,534,118 | ||
| Advanced Drainage Systems | 47,355 | 3,881,689 | ||
| Builders FirstSource 1 | 234,776 | 15,232,267 | ||
| Carlisle Companies | 10,173 | 2,397,267 | ||
| CSW Industrials | 2,900 | 336,197 | ||
| Gibraltar Industries 1 | 19,346 | 887,595 | ||
| † Hayward Holdings 1,2 | 22,552 | 211,989 | ||
| Quanex Building Products | 185,345 | 4,388,970 | ||
| Simpson Manufacturing | 84,287 | 7,472,885 | ||
| UFP Industries | 141,252 | 11,194,221 | ||
| Zurn Elkay Water Solutions | 60,808 | 1,286,089 | ||
| 48,823,287 | ||||
| COMMERCIAL SERVICES & SUPPLIES - 2.0% | ||||
| Brady Corporation Cl. A | 68,500 | 3,226,350 | ||
| INDUSTRIALS (continued) | ||||
| Deluxe Corporation | 43,365 | 736,338 | ||
| †Driven Brands Holdings 1 | 160,600 | 4,385,986 | ||
| †GFL Environmental | 171,700 | 5,018,791 | ||
| Healthcare Services Group | 411,110 | 4,933,320 | ||
| Heritage-Crystal Clean 1 | 222,687 | 7,232,874 | ||
| IAA 1 | 160,505 | 6,420,200 | ||
| 31,953,859 | ||||
| CONSTRUCTION & ENGINEERING - 3.9% | ||||
| Arcosa | 408,098 | 22,176,045 | ||
| Construction Partners Cl. A 1 | 141,106 | 3,766,119 | ||
| EMCOR Group | 26,020 | 3,853,822 | ||
| Great Lakes Dredge & Dock 1 | 186,853 | 1,111,776 | ||
| Northwest Pipe 1 | 75,074 | 2,529,994 | ||
| Primoris Services | 47,288 | 1,037,499 | ||
| Sterling Infrastructure 1 | 97,904 | 3,211,251 | ||
| Valmont Industries | 66,392 | 21,953,843 | ||
| WillScot Mobile Mini Holdings Corp. 1 | 44,430 | 2,006,903 | ||
| 61,647,252 | ||||
| ELECTRICAL EQUIPMENT - 1.3% | ||||
| American Superconductor 1 | 93,326 | 343,440 | ||
| †Atkore 1 | 10,000 | 1,134,200 | ||
| Encore Wire | 50,554 | 6,954,208 | ||
| GrafTech International | 88,314 | 420,375 | ||
| Preformed Line Products | 141,776 | 11,808,523 | ||
| 20,660,746 | ||||
| MACHINERY - 7.1% | ||||
| Allison Transmission Holdings | 31,648 | 1,316,557 | ||
| Chart Industries 1 | 14,565 | 1,678,325 | ||
| CIRCOR International 1 | 203,897 | 4,885,372 | ||
| Crane Holdings | 6,070 | 609,732 | ||
| †Douglas Dynamics | 103,446 | 3,740,607 | ||
| †ESAB Corporation | 221,672 | 10,400,850 | ||
| ESCO Technologies | 76,639 | 6,708,978 | ||
| Graham Corporation 1 | 91,849 | 883,587 | ||
| Helios Technologies | 69,419 | 3,779,170 | ||
| Hurco Companies | 32,693 | 854,268 | ||
| John Bean Technologies | 122,407 | 11,179,431 | ||
| Kadant | 102,443 | 18,196,950 | ||
| Lincoln Electric Holdings | 111,211 | 16,068,878 | ||
| Lindsay Corporation | 67,056 | 10,920,070 | ||
| Miller Industries | 253,262 | 6,751,965 | ||
| Mueller Industries | 3,300 | 194,700 | ||
| RBC Bearings 1 | 59,642 | 12,486,053 | ||
| Westport Fuel Systems 1 | 165,989 | 128,608 | ||
| 110,784,101 | ||||
| MARINE - 0.8% | ||||
| Clarkson | 30,004 | 1,173,442 | ||
| Kirby Corporation 1 | 164,439 | 10,581,650 | ||
| 11,755,092 | ||||
| PROFESSIONAL SERVICES - 3.4% | ||||
| CBIZ 1 | 15,891 | 744,493 | ||
| †Dun & Bradstreet Holdings | 189,300 | 2,320,818 | ||
| Forrester Research 1 | 344,323 | 12,312,991 | ||
| Heidrick & Struggles International | 76,545 | 2,140,964 | ||
| KBR | 506,108 | 26,722,502 | ||
| Korn Ferry | 95,372 | 4,827,731 | ||
| NV5 Global 1 | 10,870 | 1,438,318 | ||
| Resources Connection | 156,485 | 2,876,194 | ||
| 53,384,011 |
| THE ACCOMPANYING NOTES ARE AN INTEGRAL PART OF THESE FINANCIAL STATEMENTS | The Royce Funds 2022 Annual Report to Shareholders | 37 |
Schedules of Investments
Royce Pennsylvania Mutual Fund (continued)
| SHARES | VALUE | |||
| INDUSTRIALS (continued) | ||||
| ROAD & RAIL - 1.4% | ||||
| ArcBest Corporation | 36,153 | $ | 2,532,156 | |
| Landstar System | 75,623 | 12,318,987 | ||
| Saia 1 | 2,945 | 617,508 | ||
| Schneider National Cl. B | 143,575 | 3,359,655 | ||
| Werner Enterprises | 66,747 | 2,687,234 | ||
| 21,515,540 | ||||
| TRADING COMPANIES & DISTRIBUTORS - 4.2% | ||||
| Air Lease Cl. A | 602,017 | 23,129,493 | ||
| Applied Industrial Technologies | 73,043 | 9,205,609 | ||
| Distribution Solutions Group 1 | 39,594 | 1,459,435 | ||
| EVI Industries 1,2 | 332,790 | 7,943,697 | ||
| † FTAI Aviation | 231,961 | 3,971,172 | ||
| † Hudson Technologies 1 | 266,360 | 2,695,563 | ||
| MSC Industrial Direct Cl. A | 20,587 | 1,681,958 | ||
| Richelieu Hardware | 302,341 | 8,085,501 | ||
| Transcat 1 | 96,894 | 6,866,878 | ||
| 65,039,306 | ||||
| Total (Cost $314,146,944) | 476,351,111 | |||
| INFORMATION TECHNOLOGY – 16.1% | ||||
| COMMUNICATIONS EQUIPMENT - 1.4% | ||||
| Aviat Networks 1 | 92,144 | 2,873,971 | ||
| Calix 1 | 62,608 | 4,284,265 | ||
| Digi International 1 | 303,783 | 11,103,269 | ||
| Harmonic 1 | 325,400 | 4,262,740 | ||
| 22,524,245 | ||||
| ELECTRONIC EQUIPMENT, INSTRUMENTS & COMPONENTS - 5.7% | ||||
| Belden | 941 | 67,658 | ||
| Cognex Corporation | 94,061 | 4,431,214 | ||
| Coherent 1 | 108,830 | 3,819,933 | ||
| ePlus 1 | 82,300 | 3,644,244 | ||
| Fabrinet 1 | 92,947 | 11,917,664 | ||
| FARO Technologies 1 | 226,314 | 6,655,895 | ||
| Flex 1 | 145,300 | 3,118,138 | ||
| Jabil | 43,659 | 2,977,544 | ||
| Kimball Electronics 1 | 302,672 | 6,837,360 | ||
| Littelfuse | 10,402 | 2,290,520 | ||
| Luna Innovations 1,2 | 766,388 | 6,736,550 | ||
| nLIGHT 1,2 | 55,802 | 565,832 | ||
| PAR Technology 1 | 231,475 | 6,034,553 | ||
| PowerFleet 1 | 155,315 | 417,797 | ||
| Rogers Corporation 1 | 8,713 | 1,039,809 | ||
| Sanmina Corporation 1 | 48,926 | 2,802,971 | ||
| TD SYNNEX | 30,391 | 2,878,332 | ||
| Teledyne Technologies 1 | 7,470 | 2,987,328 | ||
| Vishay Intertechnology | 139,547 | 3,010,029 | ||
| Vishay Precision Group 1 | 117,126 | 4,526,920 | ||
| Vontier Corporation | 598,699 | 11,572,852 | ||
| 88,333,143 | ||||
| IT SERVICES - 0.7% | ||||
| Hackett Group (The) | 112,706 | 2,295,821 | ||
| † Kyndryl Holdings 1 | 499,309 | 5,552,316 | ||
| Repay Holdings Cl. A 1,2 | 401,426 | 3,231,480 | ||
| 11,079,617 | ||||
| SEMICONDUCTORS & SEMICONDUCTOR EQUIPMENT - 6.2% | ||||
| Alpha and Omega Semiconductor 1 | 86,404 | 2,468,562 | ||
| Amkor Technology | 106,562 | 2,555,357 | ||
| Axcelis Technologies 1 | 77,282 | 6,133,100 | ||
| Camtek 1 | 79,224 | 1,739,759 | ||
| Cirrus Logic 1 | 173,392 | 12,914,236 | ||
| Cohu 1 | 235,885 | 7,560,114 | ||
| FormFactor 1 | 483,872 | 10,756,475 | ||
| Ichor Holdings 1 | 29,770 | 798,431 | ||
| Kulicke & Soffa Industries | 188,233 | 8,331,193 | ||
| Lattice Semiconductor 1 | 30,200 | 1,959,376 | ||
| †MaxLinear 1 | 99,475 | 3,377,176 | ||
| MKS Instruments | 107,828 | 9,136,266 | ||
| Nova 1,2 | 52,494 | 4,287,710 | ||
| NVE Corporation | 36,499 | 2,363,310 | ||
| Onto Innovation 1 | 192,546 | 13,110,457 | ||
| Photronics 1 | 132,417 | 2,228,578 | ||
| Power Integrations | 5,050 | 362,186 | ||
| †Rambus 1 | 76,700 | 2,747,394 | ||
| SiTime Corporation 1 | 17,603 | 1,788,817 | ||
| Ultra Clean Holdings 1 | 84,806 | 2,811,319 | ||
| 97,429,816 | ||||
| SOFTWARE - 1.6% | ||||
| Adeia | 279,800 | 2,652,504 | ||
| Agilysys 1 | 56,407 | 4,464,050 | ||
| †Alkami Technology 1 | 37,029 | 540,253 | ||
| Consensus Cloud Solutions 1 | 31,509 | 1,693,924 | ||
| Dolby Laboratories Cl. A | 66,887 | 4,718,209 | ||
| nCino 1 | 31,100 | 822,284 | ||
| †Procore Technologies 1,2 | 34,035 | 1,605,771 | ||
| †Sapiens International | 203,075 | 3,752,826 | ||
| Teradata Corporation 1 | 131,222 | 4,416,933 | ||
| 24,666,754 | ||||
| TECHNOLOGY HARDWARE, STORAGE & PERIPHERALS - 0.5% | ||||
| AstroNova 1 | 81,672 | 1,047,035 | ||
| Avid Technology 1 | 251,218 | 6,679,887 | ||
| 7,726,922 | ||||
| Total (Cost $204,220,261) | 251,760,497 | |||
| MATERIALS – 8.1% | ||||
| CHEMICALS - 4.7% | ||||
| Aspen Aerogels 1 | 73,981 | 872,236 | ||
| Balchem Corporation | 68,346 | 8,345,730 | ||
| Element Solutions | 1,145,413 | 20,835,062 | ||
| Innospec | 183,122 | 18,835,929 | ||
| Minerals Technologies | 199,644 | 12,122,384 | ||
| Quaker Houghton | 80,394 | 13,417,759 | ||
| 74,429,100 | ||||
| CONTAINERS & PACKAGING - 0.4% | ||||
| Graphic Packaging Holding Company | 152,131 | 3,384,915 | ||
| Silgan Holdings | 45,717 | 2,369,969 | ||
| 5,754,884 | ||||
| METALS & MINING - 1.9% | ||||
| Alamos Gold Cl. A | 1,393,592 | 14,090,306 | ||
| Haynes International | 62,674 | 2,863,575 | ||
| Materion Corporation | 50,000 | 4,375,500 | ||
| Reliance Steel & Aluminum | 43,902 | 8,887,521 | ||
| 30,216,902 | ||||
| PAPER & FOREST PRODUCTS - 1.1% | ||||
| Louisiana-Pacific | 86,863 | 5,142,290 | ||
| Stella-Jones | 332,561 | 11,917,178 | ||
| 17,059,468 | ||||
| Total (Cost $69,341,128) | 127,460,354 | |||
| 38 | The Royce Funds 2022 Annual Report to Shareholders | THE ACCOMPANYING NOTES ARE AN INTEGRAL PART OF THESE FINANCIAL STATEMENTS |
December 31, 2022
Royce Pennsylvania Mutual Fund (continued)
| SHARES | VALUE | |||
| REAL ESTATE – 2.9% | ||||
| REAL ESTATE MANAGEMENT & DEVELOPMENT - 2.9% | ||||
| Colliers International Group | 67,645 | $ | 6,226,046 | |
| † DigitalBridge Group Cl. A | 270,925 | 2,963,920 | ||
| FirstService Corporation | 27,037 | 3,313,384 | ||
| FRP Holdings 1 | 91,915 | 4,950,542 | ||
| Kennedy-Wilson Holdings | 1,066,236 | 16,771,892 | ||
| Marcus & Millichap | 219,178 | 7,550,682 | ||
| RMR Group (The) Cl. A | 104,860 | 2,962,295 | ||
| Total (Cost $44,164,121) | 44,738,761 | |||
| TOTAL COMMON STOCKS | ||||
| (Cost $1,200,622,761) | 1,552,325,203 |
REPURCHASE AGREEMENT– 0.6%
Fixed Income Clearing Corporation, 1.28% dated 12/30/22, due 1/3/23, maturity value
$9,240,869 (collateralized by obligations of U.S. Government Agencies, 0.25%
due 7/31/25, valued at $9,424,397)
| (Cost $9,239,555) | 9,239,555 |
COLLATERAL RECEIVED FOR SECURITIES LOANED – 0.1%
Money Market Funds
Federated Hermes Government Obligations Fund - Institutional Shares (7 day yield-4.10%)
| (Cost $2,722,487) | 2,722,487 | 2,722,487 | ||
| TOTAL INVESTMENTS – 99.8% | ||||
| (Cost $1,212,584,803) | 1,564,287,245 | |||
| CASH AND OTHER ASSETS LESS LIABILITIES – 0.2% | 2,389,718 | |||
| NET ASSETS – 100.0% | $ | 1,566,676,963 | ||
Royce Premier Fund
Common Stocks – 96.9%
| SHARES | VALUE | |||
| COMMUNICATION SERVICES – 2.5% | ||||
| INTERACTIVE MEDIA & SERVICES - 1.9% | ||||
| †Ziff Davis 1 | 297,500 | $ | 23,532,250 | |
| MEDIA - 0.6% | ||||
| †TechTarget 1 | 187,000 | 8,239,220 | ||
| Total (Cost $38,548,159) | 31,771,470 | |||
| CONSUMER DISCRETIONARY – 8.8% | ||||
| AUTO COMPONENTS - 2.9% | ||||
| Dorman Products 1 | 292,151 | 23,626,252 | ||
| LCI Industries | 134,538 | 12,438,038 | ||
| 36,064,290 | ||||
| DISTRIBUTORS - 1.2% | ||||
| Pool Corporation | 50,355 | 15,223,827 | ||
| LEISURE PRODUCTS - 1.8% | ||||
| Brunswick Corporation | 313,291 | 22,582,015 | ||
| TEXTILES, APPAREL & LUXURY GOODS - 2.9% | ||||
| Ralph Lauren Cl. A | 338,840 | 35,805,223 | ||
| Total (Cost $85,421,363) | 109,675,355 | |||
| CONSUMER STAPLES – 2.7% | ||||
| PERSONAL PRODUCTS - 2.7% | ||||
| Inter Parfums | 347,389 | 33,529,986 | ||
| Total (Cost $15,826,294) | 33,529,986 | |||
| FINANCIALS – 9.1% | ||||
| CAPITAL MARKETS - 9.1% | ||||
| Ares Management Cl. A | 226,393 | 15,494,337 | ||
| Lazard Cl. A | 394,401 | 13,673,883 | ||
| Morningstar | 135,516 | 29,351,410 | ||
| SEI Investments | 615,771 | 35,899,449 | ||
| TMX Group | 194,583 | 19,475,545 | ||
| Total (Cost $62,119,463) | 113,894,624 | |||
| HEALTH CARE – 5.3% | ||||
| HEALTH CARE EQUIPMENT & SUPPLIES - 3.9% | ||||
| Enovis Corporation 1 | 343,957 | 18,408,579 | ||
| Haemonetics Corporation 1 | 380,779 | 29,948,268 | ||
| 48,356,847 | ||||
| LIFE SCIENCES TOOLS & SERVICES - 1.4% | ||||
| Bio-Techne | 216,192 | 17,917,993 | ||
| Total (Cost $48,868,397) | 66,274,840 | |||
| INDUSTRIALS – 38.2% | ||||
| AEROSPACE & DEFENSE - 1.8% | ||||
| Woodward | 232,215 | 22,434,291 | ||
| AIR FREIGHT & LOGISTICS - 3.3% | ||||
| Forward Air | 395,138 | 41,446,025 | ||
| BUILDING PRODUCTS - 1.7% | ||||
| Simpson Manufacturing | 238,603 | 21,154,542 | ||
| COMMERCIAL SERVICES & SUPPLIES - 3.7% | ||||
| †IAA 1 | 667,700 | 26,708,000 | ||
| Ritchie Bros. Auctioneers | 336,521 | 19,461,009 | ||
| 46,169,009 | ||||
| CONSTRUCTION & ENGINEERING - 6.1% | ||||
| Arcosa | 611,320 | 33,219,129 | ||
| Valmont Industries | 129,999 | 42,986,769 | ||
| 76,205,898 | ||||
| MACHINERY - 14.5% | ||||
| †ESAB Corporation | 245,591 | 11,523,130 | ||
| ESCO Technologies | 268,953 | 23,544,146 | ||
| John Bean Technologies | 281,250 | 25,686,563 |
| THE ACCOMPANYING NOTES ARE AN INTEGRAL PART OF THESE FINANCIAL STATEMENTS | The Royce Funds 2022 Annual Report to Shareholders | 39 |
Schedules of Investments
Royce Premier Fund (continued)
| SHARES | VALUE | |||
| INDUSTRIALS (continued) | ||||
| MACHINERY (continued) | ||||
| Kadant | 165,402 | $ | 29,380,357 | |
| Lincoln Electric Holdings | 257,811 | 37,251,111 | ||
| Lindsay Corporation | 210,011 | 34,200,291 | ||
| RBC Bearings 1 | 99,294 | 20,787,199 | ||
| 182,372,797 | ||||
| PROFESSIONAL SERVICES - 2.8% | ||||
| Forrester Research 1 | 751,762 | 26,883,009 | ||
| † Korn Ferry | 159,500 | 8,073,890 | ||
| 34,956,899 | ||||
| ROAD & RAIL - 2.1% | ||||
| Landstar System | 161,303 | 26,276,259 | ||
| TRADING COMPANIES & DISTRIBUTORS - 2.2% | ||||
| Air Lease Cl. A | 712,000 | 27,355,040 | ||
| Total (Cost $242,428,597) | 478,370,760 | |||
| INFORMATION TECHNOLOGY – 12.3% | ||||
| ELECTRONIC EQUIPMENT, INSTRUMENTS & COMPONENTS - 3.5% | ||||
| Cognex Corporation | 328,446 | 15,473,091 | ||
| National Instruments | 539,875 | 19,921,388 | ||
| Rogers Corporation 1 | 69,500 | 8,294,130 | ||
| 43,688,609 | ||||
| SEMICONDUCTORS & SEMICONDUCTOR EQUIPMENT - 5.2% | ||||
| Cirrus Logic 1 | 287,595 | 21,420,075 | ||
| FormFactor 1 | 826,000 | 18,361,980 | ||
| MKS Instruments | 301,141 | 25,515,677 | ||
| 65,297,732 | ||||
| SOFTWARE - 1.7% | ||||
| Fair Isaac 1 | 35,443 | 21,215,471 | ||
| TECHNOLOGY HARDWARE, STORAGE & PERIPHERALS - 1.9% | ||||
| Avid Technology 1 | 870,384 | 23,143,511 | ||
| Total (Cost $93,348,168) | 153,345,323 | |||
| MATERIALS – 11.2% | ||||
| CHEMICALS - 5.7% | ||||
| Innospec | 395,276 | 40,658,089 | ||
| Quaker Houghton | 182,413 | 30,444,730 | ||
| 71,102,819 | ||||
| METALS & MINING - 2.8% | ||||
| Reliance Steel & Aluminum | 175,812 | 35,591,381 | ||
| PAPER & FOREST PRODUCTS - 2.7% | ||||
| Stella-Jones | 945,631 | 33,886,275 | ||
| Total (Cost $85,073,409) | 140,580,475 | |||
| REAL ESTATE – 6.8% | ||||
| REAL ESTATE MANAGEMENT & DEVELOPMENT - 6.8% | ||||
| † Colliers International Group | 162,200 | 14,928,888 | ||
| † FirstService Corporation | 197,800 | 24,240,390 | ||
| Kennedy-Wilson Holdings | 2,250,335 | 35,397,770 | ||
| Marcus & Millichap | 290,000 | 9,990,500 | ||
| Total (Cost $91,325,170) | 84,557,548 | |||
| TOTAL COMMON STOCKS | ||||
| (Cost $762,959,020) | 1,212,000,381 | |||
REPURCHASE AGREEMENT– 3.2%
Fixed Income Clearing Corporation, 1.28% dated 12/30/22, due 1/3/23, maturity value
$39,959,856 (collateralized by obligations of U.S. Government Agencies, 0.375%
due 7/15/25, valued at $40,753,272)
| (Cost $39,954,174) | $ | 39,954,174 |
| TOTAL INVESTMENTS – 100.1% | ||
| (Cost $802,913,194) | 1,251,954,555 | |
| LIABILITIES LESS CASH AND OTHER ASSETS – (0.1)% | (794,537) | |
| NET ASSETS – 100.0% | $ | 1,251,160,018 |
| 40 | The Royce Funds 2022 Annual Report to Shareholders | THE ACCOMPANYING NOTES ARE AN INTEGRAL PART OF THESE FINANCIAL STATEMENTS |
December 31, 2022
Royce Small-Cap Opportunity Fund
Common Stocks – 96.1%
| SHARES | VALUE | ||||||
| COMMUNICATION SERVICES – 4.9% | |||||||
| DIVERSIFIED TELECOMMUNICATION SERVICES - 0.5% | |||||||
| Ooma 1,2 | 428,303 | $ | 5,833,487 | ||||
| ENTERTAINMENT - 0.6% | |||||||
| †IMAX Corporation 1 | 184,000 | 2,697,440 | |||||
| Marcus Corporation (The) | 360,629 | 5,189,451 | |||||
| 7,886,891 | |||||||
| INTERACTIVE MEDIA & SERVICES - 2.4% | |||||||
| Cars.com 1 | 300,200 | 4,133,754 | |||||
| DHI Group 1 | 932,628 | 4,933,602 | |||||
| EverQuote Cl. A 1,2 | 376,000 | 5,542,240 | |||||
| †IAC 1 | 88,666 | 3,936,771 | |||||
| QuinStreet 1 | 772,400 | 11,083,940 | |||||
| 29,630,307 | |||||||
| MEDIA - 1.4% | |||||||
| comScore 1,2 | 1,439,462 | 1,669,776 | |||||
| Entravision Communications Cl. A | 1,124,700 | 5,398,560 | |||||
| Magnite 1 | 530,600 | 5,619,054 | |||||
| Thryv Holdings 1,2 | 269,938 | 5,128,822 | |||||
| 17,816,212 | |||||||
| Total (Cost $66,158,690) | 61,166,897 | ||||||
| CONSUMER DISCRETIONARY – 15.2% | |||||||
| AUTO COMPONENTS - 3.5% | |||||||
| †Adient 1 | 148,200 | 5,141,058 | |||||
| Dana | 241,053 | 3,647,132 | |||||
| Garrett Motion 1 | 913,585 | 6,961,518 | |||||
| †Goodyear Tire & Rubber 1 | 320,600 | 3,254,090 | |||||
| Horizon Global 1 | 1,031,520 | 401,055 | |||||
| Modine Manufacturing 1 | 525,963 | 10,445,625 | |||||
| Patrick Industries | 56,800 | 3,442,080 | |||||
| Stoneridge 1 | 463,380 | 9,990,473 | |||||
| 43,283,031 | |||||||
| DIVERSIFIED CONSUMER SERVICES - 0.2% | |||||||
| Adtalem Global Education 1 | 56,500 | 2,005,750 | |||||
| HOTELS, RESTAURANTS & LEISURE - 1.3% | |||||||
| Carrols Restaurant Group 1 | 1,081,568 | 1,470,933 | |||||
| Century Casinos 1 | 287,694 | 2,022,489 | |||||
| Krispy Kreme | 217,789 | 2,247,582 | |||||
| Noodles & Company Cl. A 1 | 1,008,554 | 5,536,961 | |||||
| Ruth’s Hospitality Group | 324,710 | 5,026,511 | |||||
| 16,304,476 | |||||||
| HOUSEHOLD DURABLES - 2.9% | |||||||
| Beazer Homes USA 1 | 214,706 | 2,739,649 | |||||
| Cavco Industries 1 | 21,800 | 4,932,250 | |||||
| Century Communities | 64,700 | 3,235,647 | |||||
| Helen of Troy 1 | 30,600 | 3,393,846 | |||||
| M/I Homes 1 | 57,500 | 2,655,350 | |||||
| Skyline Champion 1 | 140,300 | 7,226,853 | |||||
| Taylor Morrison Home 1 | 179,454 | 5,446,429 | |||||
| Toll Brothers | 63,986 | 3,194,181 | |||||
| Tri Pointe Homes 1 | 185,906 | 3,455,992 | |||||
| 36,280,197 | |||||||
| INTERNET & DIRECT MARKETING RETAIL - 0.3% | |||||||
| iMedia Brands 1,2 | 857,360 | 548,710 | |||||
| Overstock.com 1 | 164,300 | 3,180,848 | |||||
| 3,729,558 | |||||||
| MULTILINE RETAIL - 1.3% | |||||||
| Dillard’s Cl. A | 26,133 | 8,446,186 | |||||
| †Franchise Group Cl. A | 121,700 | 2,898,894 | |||||
| Nordstrom | 274,200 | 4,425,588 | |||||
| 15,770,668 | |||||||
| SPECIALTY RETAIL - 4.0% | |||||||
| Asbury Automotive Group 1 | 46,700 | 8,370,975 | |||||
| Barnes & Noble Education 1,2 | 708,132 | 1,239,231 | |||||
| Caleres | 346,700 | 7,724,476 | |||||
| Chico’s FAS 1 | 665,692 | 3,275,205 | |||||
| Designer Brands Cl. A | 509,579 | 4,983,682 | |||||
| Express 1 | 1,210,900 | 1,235,118 | |||||
| J.Jill 1 | 266,939 | 6,620,087 | |||||
| JOANN | 631,047 | 1,798,484 | |||||
| Sonic Automotive Cl. A | 89,400 | 4,404,738 | |||||
| †Sportsman’s Warehouse Holdings 1 | 399,000 | 3,754,590 | |||||
| Victoria’s Secret & Co. 1,2 | 176,829 | 6,326,942 | |||||
| 49,733,528 | |||||||
| TEXTILES, APPAREL & LUXURY GOODS - 1.7% | |||||||
| Fossil Group 1 | 538,600 | 2,321,366 | |||||
| †Lakeland Industries 1 | 273,810 | 3,641,673 | |||||
| Movado Group | 79,500 | 2,563,875 | |||||
| Rocky Brands | 145,341 | 3,432,954 | |||||
| Skechers U.S.A. Cl. A 1 | 120,022 | 5,034,923 | |||||
| Unifi 1 | 523,100 | 4,503,891 | |||||
| Vera Bradley1,2 | 81,702 | 370,110 | |||||
| 21,868,792 | |||||||
| Total (Cost $197,613,088) | 188,976,000 | ||||||
| CONSUMER STAPLES – 0.9% | |||||||
| FOOD PRODUCTS - 0.4% | |||||||
| Calavo Growers | 28,741 | 844,985 | |||||
| SunOpta 1 | 419,500 | 3,540,580 | |||||
| 4,385,565 | |||||||
| HOUSEHOLD PRODUCTS - 0.1% | |||||||
| Spectrum Brands Holdings | 25,900 | 1,577,828 | |||||
| PERSONAL PRODUCTS - 0.4% | |||||||
| †Inter Parfums | 44,500 | 4,295,140 | |||||
| †LifeMD 1,2 | 635,900 | 1,233,646 | |||||
| 5,528,786 | |||||||
| Total (Cost $10,361,814) | 11,492,179 | ||||||
| ENERGY – 6.9% | |||||||
| ENERGY EQUIPMENT & SERVICES - 1.7% | |||||||
| Archrock | 614,700 | 5,520,006 | |||||
| DMC Global 1 | 214,600 | 4,171,824 | |||||
| Mammoth Energy Services 1 | 883,317 | 7,640,692 | |||||
| Ranger Energy Services Cl. A 1,2 | 312,556 | 3,441,242 | |||||
| 20,773,764 | |||||||
| OIL, GAS & CONSUMABLE FUELS - 5.2% | |||||||
| Ardmore Shipping 1 | 511,393 | 7,369,173 | |||||
| Baytex Energy 1,4 | 790,500 | 3,549,345 | |||||
| Chesapeake Energy | 82,100 | 7,747,777 | |||||
| Dorian LPG | 468,992 | 8,887,398 | |||||
| Earthstone Energy Cl. A 1 | 528,872 | 7,525,849 | |||||
| Matador Resources | 138,383 | 7,921,043 | |||||
| Navigator Holdings 1 | 531,884 | 6,361,333 | |||||
| †Northern Oil and Gas | 180,200 | 5,553,764 | |||||
| Scorpio Tankers | 103,450 | 5,562,506 | |||||
| Southwestern Energy 1 | 674,381 | 3,945,129 | |||||
| 64,423,317 | |||||||
| Total (Cost $46,027,101) | 85,197,081 | ||||||
| THE ACCOMPANYING NOTES ARE AN INTEGRAL PART OF THESE FINANCIAL STATEMENTS | The Royce Funds 2022 Annual Report to Shareholders | 41 |
Schedules of Investments
Royce Small-Cap Opportunity Fund (continued)
| SHARES | VALUE | ||||||
| FINANCIALS – 4.3% | |||||||
| BANKS - 1.9% | |||||||
| †BayCom Corporation | 261,559 | $ | 4,964,390 | ||||
| †First Bancshares (The) | 161,200 | 5,160,012 | |||||
| Hilltop Holdings | 220,008 | 6,602,440 | |||||
| Seacoast Banking Corporation of Florida | 204,450 | 6,376,796 | |||||
| 23,103,638 | |||||||
| CAPITAL MARKETS - 1.6% | |||||||
| †Artisan Partners Asset Management Cl. A | 101,600 | 3,017,520 | |||||
| B. Riley Financial | 205,867 | 7,040,651 | |||||
| †Canaccord Genuity Group | 635,200 | 3,935,988 | |||||
| †Focus Financial Partners Cl. A 1 | 84,400 | 3,145,588 | |||||
| Moelis & Company Cl. A | 88,226 | 3,385,232 | |||||
| 20,524,979 | |||||||
| INSURANCE - 0.3% | |||||||
| Brighthouse Financial 1 | 77,000 | 3,947,790 | |||||
| THRIFTS & MORTGAGE FINANCE - 0.5% | |||||||
| Axos Financial 1 | 165,800 | 6,336,876 | |||||
| Total (Cost $49,286,398) | 53,913,283 | ||||||
| HEALTH CARE – 4.5% | |||||||
| BIOTECHNOLOGY - 0.1% | |||||||
| †MiMedx Group 1 | 447,900 | 1,245,162 | |||||
| HEALTH CARE EQUIPMENT & SUPPLIES - 1.6% | |||||||
| Accuray 1 | 1,833,308 | 3,831,613 | |||||
| †Apyx Medical 1 | 186,400 | 436,176 | |||||
| †Artivion 1 | 358,400 | 4,343,808 | |||||
| Orthofix Medical 1 | 60,996 | 1,252,248 | |||||
| †Tactile Systems Technology 1 | 304,800 | 3,499,104 | |||||
| Varex Imaging 1,2 | 328,846 | 6,675,574 | |||||
| 20,038,523 | |||||||
| HEALTH CARE PROVIDERS & SERVICES - 2.0% | |||||||
| ATI Physical Therapy Cl. A 1,2 | 383,300 | 116,907 | |||||
| Community Health Systems 1 | 719,614 | 3,108,733 | |||||
| Cross Country Healthcare 1 | 134,320 | 3,568,882 | |||||
| Option Care Health 1 | 225,471 | 6,784,422 | |||||
| RadNet 1 | 302,400 | 5,694,192 | |||||
| Select Medical Holdings | 207,000 | 5,139,810 | |||||
| 24,412,946 | |||||||
| LIFE SCIENCES TOOLS & SERVICES - 0.2% | |||||||
| †NeoGenomics 1 | 254,000 | 2,346,960 | |||||
| PHARMACEUTICALS - 0.6% | |||||||
| Organon & Co | 227,703 | 6,359,745 | |||||
| †Societal CDMO 1 | 1,143,900 | 1,704,411 | |||||
| 8,064,156 | |||||||
| Total (Cost $53,165,976) | 56,107,747 | ||||||
| INDUSTRIALS – 31.1% | |||||||
| AEROSPACE & DEFENSE - 5.4% | |||||||
| AAR Corporation 1 | 201,900 | 9,065,310 | |||||
| Astronics Corporation 1 | 582,131 | 5,995,949 | |||||
| †BWX Technologies | 120,400 | 6,992,832 | |||||
| Ducommun 1 | 202,886 | 10,136,185 | |||||
| Hexcel Corporation | 153,100 | 9,009,935 | |||||
| Kaman Corporation | 117,406 | 2,618,154 | |||||
| Kratos Defense & Security Solutions 1 | 235,200 | 2,427,264 | |||||
| †Leonardo DRS 1,2 | 320,576 | 4,096,961 | |||||
| Mercury Systems 1 | 69,000 | 3,087,060 | |||||
| Spirit AeroSystems Holdings Cl. A | 194,400 | 5,754,240 | |||||
| †Terran Orbital 1,2 | 543,000 | 857,940 | |||||
| Triumph Group 1 | 638,716 | 6,719,292 | |||||
| 66,761,122 | |||||||
| AIR FREIGHT & LOGISTICS - 0.9% | |||||||
| Hub Group Cl. A 1 | 91,600 | 7,281,284 | |||||
| Radiant Logistics 1 | 711,769 | 3,622,904 | |||||
| 10,904,188 | |||||||
| AIRLINES - 0.5% | |||||||
| Alaska Air Group 1 | 98,700 | 4,238,178 | |||||
| Allegiant Travel 1 | 27,525 | 1,871,424 | |||||
| Mesa Air Group 1 | 304,309 | 465,593 | |||||
| 6,575,195 | |||||||
| BUILDING PRODUCTS - 2.6% | |||||||
| Apogee Enterprises | 54,700 | 2,431,962 | |||||
| Gibraltar Industries 1 | 146,200 | 6,707,656 | |||||
| Griffon Corporation | 253,267 | 9,064,426 | |||||
| Insteel Industries | 190,233 | 5,235,212 | |||||
| PGT Innovations 1 | 182,343 | 3,274,880 | |||||
| Resideo Technologies 1 | 339,216 | 5,580,103 | |||||
| 32,294,239 | |||||||
| COMMERCIAL SERVICES & SUPPLIES - 2.7% | |||||||
| †ACV Auctions Cl. A 1,2 | 263,500 | 2,163,335 | |||||
| †Healthcare Services Group | 500,500 | 6,006,000 | |||||
| Heritage-Crystal Clean 1 | 274,688 | 8,921,866 | |||||
| Interface | 335,767 | 3,314,021 | |||||
| MillerKnoll | 71,500 | 1,502,215 | |||||
| Steelcase Cl. A | 268,800 | 1,900,416 | |||||
| VSE Corporation | 212,032 | 9,940,060 | |||||
| 33,747,913 | |||||||
| CONSTRUCTION & ENGINEERING - 4.7% | |||||||
| Arcosa | 68,006 | 3,695,446 | |||||
| †Argan | 71,300 | 2,629,544 | |||||
| Comfort Systems USA | 31,510 | 3,626,171 | |||||
| Concrete Pumping Holdings 1 | 984,097 | 5,756,967 | |||||
| Construction Partners Cl. A 1 | 305,759 | 8,160,708 | |||||
| Limbach Holdings 1,5 | 654,981 | 6,818,352 | |||||
| Matrix Service 1 | 856,446 | 5,327,094 | |||||
| Northwest Pipe 1 | 268,745 | 9,056,707 | |||||
| Orion Group Holdings 1,2 | 1,070,066 | 2,546,757 | |||||
| Primoris Services | 334,480 | 7,338,491 | |||||
| †Sterling Infrastructure 1 | 127,700 | 4,188,560 | |||||
| 59,144,797 | |||||||
| ELECTRICAL EQUIPMENT - 1.2% | |||||||
| †American Superconductor 1 | 596,673 | 2,195,757 | |||||
| Babcock & Wilcox Enterprises 1 | 1,365,795 | 7,880,637 | |||||
| Power Solutions International 1,4 | 343,740 | 859,350 | |||||
| †TPI Composites 1 | 396,700 | 4,022,538 | |||||
| 14,958,282 | |||||||
| MACHINERY - 6.1% | |||||||
| Barnes Group | 125,700 | 5,134,845 | |||||
| CIRCOR International 1 | 274,003 | 6,565,112 | |||||
| Commercial Vehicle Group 1 | 1,039,057 | 7,075,978 | |||||
| EnPro Industries | 81,100 | 8,814,759 | |||||
| Evercel 1,4 | 203,243 | 243,891 | |||||
| †Helios Technologies | 55,400 | 3,015,976 | |||||
| Hurco Companies | 77,351 | 2,021,182 | |||||
| Luxfer Holdings | 515,400 | 7,071,288 | |||||
| Manitex International 1 | 921,820 | 3,687,280 | |||||
| †Mayville Engineering 1,2 | 111,200 | 1,407,792 | |||||
| NN 1 | 1,417,265 | 2,125,897 | |||||
| 42 | The Royce Funds 2022 Annual Report to Shareholders | THE ACCOMPANYING NOTES ARE AN INTEGRAL PART OF THESE FINANCIAL STATEMENTS |
December 31, 2022
Royce Small-Cap Opportunity Fund (continued)
| SHARES | VALUE | ||||||
| INDUSTRIALS (continued) | |||||||
| MACHINERY (continued) | |||||||
| Shyft Group (The) | 278,338 | $ | 6,919,483 | ||||
| Trinity Industries | 297,624 | 8,800,742 | |||||
| Twin Disc 1 | 300,312 | 2,919,033 | |||||
| Wabash National | 434,200 | 9,812,920 | |||||
| 75,616,178 | |||||||
| MARINE - 0.2% | |||||||
| Diana Shipping | 600,510 | 2,341,989 | |||||
| PROFESSIONAL SERVICES - 2.2% | |||||||
| †HireRight Holdings 1,2 | 220,200 | 2,611,572 | |||||
| Korn Ferry | 128,045 | 6,481,638 | |||||
| Mistras Group 1 | 874,907 | 4,313,291 | |||||
| †Resources Connection | 384,400 | 7,065,272 | |||||
| †Sterling Check 1,2 | 148,600 | 2,298,842 | |||||
| TrueBlue 1 | 247,836 | 4,852,629 | |||||
| 27,623,244 | |||||||
| ROAD & RAIL - 0.4% | |||||||
| Daseke 1 | 855,200 | 4,866,088 | |||||
| TRADING COMPANIES & DISTRIBUTORS - 4.2% | |||||||
| Air Lease Cl. A | 214,838 | 8,254,076 | |||||
| BlueLinx Holdings 1 | 87,400 | 6,215,014 | |||||
| Herc Holdings | 65,319 | 8,594,021 | |||||
| Hudson Technologies 1 | 743,518 | 7,524,402 | |||||
| †MRC Global 1 | 499,200 | 5,780,736 | |||||
| †NOW 1 | 295,200 | 3,749,040 | |||||
| Univar Solutions 1 | 98,700 | 3,138,660 | |||||
| WESCO International 1 | 71,504 | 8,952,301 | |||||
| 52,208,250 | |||||||
| Total (Cost $364,220,624) | 387,041,485 | ||||||
| INFORMATION TECHNOLOGY – 19.3% | |||||||
| COMMUNICATIONS EQUIPMENT - 4.6% | |||||||
| ADTRAN Holdings | 410,500 | 7,713,295 | |||||
| Aviat Networks 1 | 201,344 | 6,279,919 | |||||
| CalAmp Corporation 1 | 1,003,200 | 4,494,336 | |||||
| Cambium Networks 1 | 271,481 | 5,882,993 | |||||
| Comtech Telecommunications | 549,417 | 6,669,923 | |||||
| Digi International 1 | 205,102 | 7,496,478 | |||||
| DZS 1 | 687,229 | 8,714,064 | |||||
| Infinera Corporation 1,2 | 769,046 | 5,183,370 | |||||
| PCTEL 1,5 | 1,044,693 | 4,492,180 | |||||
| 56,926,558 | |||||||
| ELECTRONIC EQUIPMENT, INSTRUMENTS & COMPONENTS - 5.6% | |||||||
| Advanced Energy Industries | 109,453 | 9,388,878 | |||||
| Arlo Technologies 1 | 637,800 | 2,238,678 | |||||
| Avnet | 83,900 | 3,488,562 | |||||
| Benchmark Electronics | 274,200 | 7,318,398 | |||||
| CTS Corporation | 233,614 | 9,209,064 | |||||
| Fabrinet 1 | 73,329 | 9,402,244 | |||||
| Frequency Electronics 1 | 271,693 | 1,915,436 | |||||
| Identiv 1 | 347,020 | 2,512,425 | |||||
| Knowles Corporation 1 | 445,420 | 7,313,797 | |||||
| †nLIGHT 1,2 | 559,800 | 5,676,372 | |||||
| VIA optronics ADR 1 | 800,832 | 1,278,288 | |||||
| Vishay Intertechnology | 285,209 | 6,151,958 | |||||
| Vishay Precision Group 1 | 100,088 | 3,868,401 | |||||
| 69,762,501 | |||||||
| IT SERVICES - 1.1% | |||||||
| Conduent 1 | 1,060,400 | 4,294,620 | |||||
| Edgio 1 | 897,500 | 1,014,175 | |||||
| †Kyndryl Holdings 1 | 255,100 | 2,836,712 | |||||
| †TTEC Holdings | 130,400 | 5,754,552 | |||||
| 13,900,059 | |||||||
| SEMICONDUCTORS & SEMICONDUCTOR EQUIPMENT - 5.6% | |||||||
| Alpha and Omega Semiconductor 1 | 156,913 | 4,483,004 | |||||
| Amkor Technology | 296,240 | 7,103,835 | |||||
| Amtech Systems 1 | 663,484 | 5,042,478 | |||||
| Cohu 1 | 314,376 | 10,075,751 | |||||
| FormFactor 1 | 214,113 | 4,759,732 | |||||
| Ichor Holdings 1 | 304,594 | 8,169,211 | |||||
| †inTEST Corporation 1 | 16,200 | 166,860 | |||||
| Kulicke & Soffa Industries | 145,065 | 6,420,577 | |||||
| Onto Innovation 1 | 87,619 | 5,965,978 | |||||
| Ultra Clean Holdings 1 | 274,327 | 9,093,940 | |||||
| Veeco Instruments 1 | 452,487 | 8,407,209 | |||||
| 69,688,575 | |||||||
| SOFTWARE - 1.1% | |||||||
| A10 Networks | 388,726 | 6,464,513 | |||||
| †Digital Turbine 1 | 162,200 | 2,471,928 | |||||
| Marin Software 1 | 586,867 | 586,867 | |||||
| ON24 1 | 116,900 | 1,008,847 | |||||
| SecureWorks Corp. Cl. A 1 | 574,302 | 3,669,790 | |||||
| 14,201,945 | |||||||
| TECHNOLOGY HARDWARE, STORAGE & PERIPHERALS - 1.3% | |||||||
| Avid Technology 1 | 213,085 | 5,665,930 | |||||
| Immersion Corporation 1 | 603,900 | 4,245,417 | |||||
| Intevac 1 | 968,302 | 6,264,914 | |||||
| 16,176,261 | |||||||
| Total (Cost $216,702,719) | 240,655,899 | ||||||
| MATERIALS – 7.6% | |||||||
| CHEMICALS - 1.2% | |||||||
| Aspen Aerogels 1 | 100,800 | 1,188,432 | |||||
| Huntsman Corporation | 229,300 | 6,301,164 | |||||
| Livent Corporation 1 | 226,100 | 4,492,607 | |||||
| Tronox Holdings | 263,100 | 3,607,101 | |||||
| 15,589,304 | |||||||
| CONSTRUCTION MATERIALS - 0.6% | |||||||
| †Summit Materials Cl. A 1 | 246,400 | 6,995,296 | |||||
| CONTAINERS & PACKAGING - 0.5% | |||||||
| TriMas Corporation | 208,110 | 5,772,971 | |||||
| METALS & MINING - 5.3% | |||||||
| ATI 1 | 336,714 | 10,054,280 | |||||
| Carpenter Technology | 229,742 | 8,486,670 | |||||
| Century Aluminum 1 | 301,410 | 2,465,534 | |||||
| Cleveland-Cliffs 1 | 351,849 | 5,668,287 | |||||
| Commercial Metals | 176,000 | 8,500,800 | |||||
| Ferroglobe 1 | 1,319,871 | 5,081,503 | |||||
| Haynes International | 199,861 | 9,131,649 | |||||
| Major Drilling Group International 1 | 721,500 | 5,605,746 | |||||
| Noranda Aluminum Holding Corporation 1,3 | 488,157 | 0 | |||||
| Olympic Steel | 117,827 | 3,956,631 | |||||
| TimkenSteel Corporation 1 | 419,700 | 7,625,949 | |||||
| 66,577,049 | |||||||
| Total (Cost $61,201,482) | 94,934,620 | ||||||
| REAL ESTATE – 1.4% | |||||||
| EQUITY REAL ESTATE INVESTMENT TRUSTS (REITS) - 1.2% | |||||||
| Alexander & Baldwin | 68,700 | 1,286,751 |
| THE ACCOMPANYING NOTES ARE AN INTEGRAL PART OF THESE FINANCIAL STATEMENTS | The Royce Funds 2022 Annual Report to Shareholders | 43 |
Schedules of Investments
Royce Small-Cap Opportunity Fund (continued)
| SHARES | VALUE | ||||||
| REAL ESTATE (continued) | |||||||
| EQUITY REAL ESTATE INVESTMENT TRUSTS (REITS) (continued) | |||||||
| Braemar Hotels & Resorts | 268,953 | $ | 1,105,397 | ||||
| Chatham Lodging Trust | 179,400 | 2,201,238 | |||||
| Macerich Company | 571,700 | 6,437,342 | |||||
| Ryman Hospitality Properties | 20,871 | 1,706,830 | |||||
| Tanger Factory Outlet Centers | 116,700 | 2,093,598 | |||||
| 14,831,156 | |||||||
| REAL ESTATE MANAGEMENT & DEVELOPMENT - 0.2% | |||||||
| Anywhere Real Estate 1 | 354,820 | 2,267,300 | |||||
| Total (Cost $15,013,218) | 17,098,456 | ||||||
| TOTAL COMMON STOCKS | |||||||
| (Cost $1,079,751,110) | 1,196,583,647 | ||||||
| WARRANTS – 0.0% | |||||||
| INDUSTRIALS – 0.0% | |||||||
| AEROSPACE & DEFENSE - 0.0% | |||||||
| †Triumph Group (Warrants) 1,4 | 190,834 | 125,951 | |||||
| Total (Cost $0) | 125,951 | ||||||
| REPURCHASE AGREEMENT– 4.0% | |||||||
Fixed Income Clearing Corporation, 1.28% dated 12/30/22, due 1/3/23, maturity value $50,056,840 (collateralized by obligations of U.S. Government Agencies, 2.875% due 5/31/25, valued at $51,050,778) | |||||||
| (Cost $50,049,722) | 50,049,722 | ||||||
| COLLATERAL RECEIVED FOR SECURITIES LOANED – 0.2% | |||||||
| Money Market Funds | |||||||
| Federated Hermes Government Obligations Fund - Institutional Shares (7 day yield-4.10%) | |||||||
| (Cost $1,993,229) | 1,993,229 | 1,993,229 | |||||
| TOTAL INVESTMENTS – 100.3% | |||||||
| (Cost $1,131,794,061) | 1,248,752,549 | ||||||
| LIABILITIES LESS CASH AND OTHER ASSETS – (0.3)% | (3,867,672) | ||||||
| NET ASSETS – 100.0% | $ | 1,244,884,877 | |||||
Royce Small-Cap Special Equity Fund
Common Stocks – 83.1%
| SHARES | VALUE | ||||||
| COMMUNICATION SERVICES – 4.4% | |||||||
| MEDIA - 4.4% | |||||||
| TEGNA | 1,556,000 | $ | 32,971,640 | ||||
| Total (Cost $31,406,182) | 32,971,640 | ||||||
| CONSUMER DISCRETIONARY – 17.2% | |||||||
| AUTO COMPONENTS - 5.5% | |||||||
| Standard Motor Products 5 | 1,188,000 | 41,342,400 | |||||
| DIVERSIFIED CONSUMER SERVICES - 3.1% | |||||||
| H&R Block | 632,100 | 23,077,971 | |||||
| HOTELS, RESTAURANTS & LEISURE - 0.2% | |||||||
| †Nathan’s Famous | 22,100 | 1,485,341 | |||||
| HOUSEHOLD DURABLES - 0.9% | |||||||
| Ethan Allen Interiors | 265,000 | 7,001,300 | |||||
| LEISURE PRODUCTS - 1.4% | |||||||
| Johnson Outdoors Cl. A | 159,500 | 10,546,140 | |||||
| MULTILINE RETAIL - 2.3% | |||||||
| †Macy’s | 842,000 | 17,387,300 | |||||
| TEXTILES, APPAREL & LUXURY GOODS - 3.8% | |||||||
| Movado Group | 896,000 | 28,896,000 | |||||
| Total (Cost $113,405,265) | 129,736,452 | ||||||
| CONSUMER STAPLES – 12.4% | |||||||
| FOOD & STAPLES RETAILING - 7.6% | |||||||
| Ingles Markets Cl. A | 591,500 | 57,056,090 | |||||
| FOOD PRODUCTS - 4.8% | |||||||
| John B. Sanfilippo & Son | 445,000 | 36,187,400 | |||||
| Total (Cost $66,174,063) | 93,243,490 | ||||||
| ENERGY – 0.4% | |||||||
| ENERGY EQUIPMENT & SERVICES - 0.4% | |||||||
| RPC | 377,500 | 3,355,975 | |||||
| Total (Cost $3,199,700) | 3,355,975 | ||||||
| FINANCIALS – 5.7% | |||||||
| CAPITAL MARKETS - 5.7% | |||||||
| Diamond Hill Investment Group | 138,800 | 25,680,776 | |||||
| Federated Hermes Cl. B | 354,000 | 12,853,740 | |||||
| †GAMCO Investors Cl. A 4 | 313,600 | 4,751,040 | |||||
| Total (Cost $33,090,059) | 43,285,556 | ||||||
| INDUSTRIALS – 20.6% | |||||||
| BUILDING PRODUCTS - 2.4% | |||||||
| Insteel Industries | 406,000 | 11,173,120 | |||||
| UFP Industries | 93,700 | 7,425,725 | |||||
| 18,598,845 | |||||||
| COMMERCIAL SERVICES & SUPPLIES - 3.7% | |||||||
| Ennis | 1,250,000 | 27,700,000 | |||||
| ELECTRICAL EQUIPMENT - 6.9% | |||||||
| †Atkore 1 | 119,400 | 13,542,348 | |||||
| Encore Wire | 278,000 | 38,241,680 | |||||
| 51,784,028 | |||||||
| MACHINERY - 6.0% | |||||||
| Gencor Industries 1,5 | 1,066,000 | 10,766,600 | |||||
| Hurco Companies 5 | 580,000 | 15,155,400 | |||||
| Mueller Industries | 327,000 | 19,293,000 | |||||
| 45,215,000 | |||||||
| PROFESSIONAL SERVICES - 0.9% | |||||||
| Resources Connection | 370,000 | 6,800,600 | |||||
| 44 | The Royce Funds 2022 Annual Report to Shareholders | THE ACCOMPANYING NOTES ARE AN INTEGRAL PART OF THESE FINANCIAL STATEMENTS |
December 31, 2022
Royce Small-Cap Special Equity Fund (continued)
| SHARES | VALUE | ||||||
| INDUSTRIALS (continued) | |||||||
| TRADING COMPANIES & DISTRIBUTORS - 0.7% | |||||||
| †Titan Machinery 1 | 130,000 | $ | 5,164,900 | ||||
| Total (Cost $123,320,991) | 155,263,373 | ||||||
| INFORMATION TECHNOLOGY – 9.5% | |||||||
| ELECTRONIC EQUIPMENT, INSTRUMENTS & COMPONENTS - 5.0% | |||||||
| Vishay Intertechnology | 1,740,000 | 37,531,800 | |||||
| SEMICONDUCTORS & SEMICONDUCTOR EQUIPMENT - 4.5% | |||||||
| Axcelis Technologies 1 | 39,000 | 3,095,040 | |||||
| Kulicke & Soffa Industries | 147,000 | 6,506,220 | |||||
| NVE Corporation 5 | 371,500 | 24,054,625 | |||||
| 33,655,885 | |||||||
| Total (Cost $54,109,193) | 71,187,685 | ||||||
| MATERIALS – 8.8% | |||||||
| CHEMICALS - 4.0% | |||||||
| Huntsman Corporation | 1,085,000 | 29,815,800 | |||||
| CONSTRUCTION MATERIALS - 2.5% | |||||||
| United States Lime & Minerals | 135,000 | 19,002,600 | |||||
| METALS & MINING - 0.2% | |||||||
| †TimkenSteel Corporation 1 | 80,000 | 1,453,600 | |||||
| PAPER & FOREST PRODUCTS - 2.1% | |||||||
| †Sylvamo Corporation | 333,000 | 16,180,470 | |||||
| Total (Cost $48,205,494) | 66,452,470 | ||||||
| REAL ESTATE – 4.1% | |||||||
| REAL ESTATE MANAGEMENT & DEVELOPMENT - 4.1% | |||||||
| Marcus & Millichap | 895,000 | 30,832,750 | |||||
| Total (Cost $25,831,506) | 30,832,750 | ||||||
| TOTAL COMMON STOCKS | |||||||
| (Cost $498,742,453) | 626,329,391 | ||||||
REPURCHASE AGREEMENT– 17.2% | |||||||
Fixed Income Clearing Corporation, 1.28% dated 12/30/22, due 1/3/23, maturity value $129,830,861 (collateralized by obligations of various U.S. Government Agencies, 0.25%-2.875% due 5/31/25-7/15/25, valued at $132,408,665) | |||||||
| (Cost $129,812,399) | 129,812,399 | ||||||
| TOTAL INVESTMENTS – 100.3% | |||||||
| (Cost $628,554,852) | 756,141,790 | ||||||
| LIABILITIES LESS CASH AND OTHER ASSETS – (0.3)% | (2,576,311) | ||||||
| NET ASSETS – 100.0% | $ | 753,565,479 | |||||
Royce Small-Cap Total Return Fund
Common Stocks – 96.2%
| SHARES | VALUE | ||||||
| COMMUNICATION SERVICES – 1.9% | |||||||
| ENTERTAINMENT - 0.2% | |||||||
| World Wrestling Entertainment Cl. A | 23,848 | $ | 1,634,065 | ||||
| INTERACTIVE MEDIA & SERVICES - 1.7% | |||||||
| Ziff Davis 1 | 207,520 | 16,414,832 | |||||
| Total (Cost $19,214,269) | 18,048,897 | ||||||
| CONSUMER DISCRETIONARY – 9.3% | |||||||
| AUTO COMPONENTS - 0.3% | |||||||
| †Vitesco Technologies Group 1 | 47,900 | 2,781,643 | |||||
| HOTELS, RESTAURANTS & LEISURE - 1.4% | |||||||
| Denny’s Corporation 1 | 1,375,500 | 12,668,355 | |||||
| HOUSEHOLD DURABLES - 2.1% | |||||||
| Helen of Troy 1 | 177,000 | 19,631,070 | |||||
| LEISURE PRODUCTS - 1.1% | |||||||
| †YETI Holdings 1 | 260,800 | 10,773,648 | |||||
| MULTILINE RETAIL - 1.8% | |||||||
| Franchise Group Cl. A | 720,401 | 17,159,952 | |||||
| SPECIALTY RETAIL - 1.3% | |||||||
| †JOANN | 1,573,119 | 4,483,389 | |||||
| †OneWater Marine Cl. A 1 | 261,409 | 7,476,297 | |||||
| 11,959,686 | |||||||
| TEXTILES, APPAREL & LUXURY GOODS - 1.3% | |||||||
| Levi Strauss & Co. Cl. A | 452,247 | 7,018,874 | |||||
| Ralph Lauren Cl. A | 44,945 | 4,749,338 | |||||
| 11,768,212 | |||||||
| Total (Cost $95,938,847) | 86,742,566 | ||||||
| ENERGY – 4.2% | |||||||
| ENERGY EQUIPMENT & SERVICES - 4.2% | |||||||
| Cactus Cl. A | 181,159 | 9,105,051 | |||||
| Core Laboratories | 640,100 | 12,974,827 | |||||
| Oceaneering International 1 | 103,433 | 1,809,043 | |||||
| Pason Systems | 1,300,976 | 15,315,774 | |||||
| Total (Cost $30,797,075) | 39,204,695 | ||||||
| FINANCIALS – 37.2% | |||||||
| BANKS - 18.6% | |||||||
| †Atlantic Union Bankshares | 222,900 | 7,832,706 | |||||
| Bank of N.T. Butterfield & Son | 409,923 | 12,219,805 | |||||
| BankUnited | 384,247 | 13,052,871 | |||||
| BOK Financial | 124,601 | 12,932,338 | |||||
| †First Bancorp | 84,200 | 3,607,128 | |||||
| First Bancshares (The) | 339,609 | 10,870,884 | |||||
| HBT Financial | 392,772 | 7,686,548 | |||||
| Home BancShares | 938,167 | 21,380,826 | |||||
| Independent Bank Group | 303,599 | 18,240,228 | |||||
| Origin Bancorp | 307,328 | 11,278,938 | |||||
| Preferred Bank | 30,716 | 2,292,028 | |||||
| QCR Holdings | 98,583 | 4,893,660 | |||||
| TowneBank | 343,448 | 10,591,936 | |||||
| Triumph Financial 1 | 103,492 | 5,057,654 | |||||
| UMB Financial | 109,870 | 9,176,342 | |||||
| Valley National Bancorp | 1,423,721 | 16,102,284 | |||||
| †Veritex Holdings | 253,500 | 7,118,280 | |||||
| 174,334,456 | |||||||
| CAPITAL MARKETS - 5.5% | |||||||
| Artisan Partners Asset Management Cl. A | 255,903 | 7,600,319 | |||||
| Moelis & Company Cl. A | 199,737 | 7,663,909 | |||||
| Newtek Business Services | 471,100 | 7,655,375 | |||||
| †Tel Aviv Stock Exchange | 3,011,800 | 17,993,172 | |||||
| THE ACCOMPANYING NOTES ARE AN INTEGRAL PART OF THESE FINANCIAL STATEMENTS | The Royce Funds 2022 Annual Report to Shareholders | 45 |
Schedules of Investments
Royce Small-Cap Total Return Fund (continued)
| SHARES | VALUE | ||||||
| FINANCIALS (continued) | |||||||
| CAPITAL MARKETS (continued) | |||||||
| TMX Group | 99,104 | $ | 9,919,183 | ||||
| 50,831,958 | |||||||
| DIVERSIFIED FINANCIAL SERVICES - 1.9% | |||||||
| Compass Diversified Holdings | 978,112 | 17,830,982 | |||||
| INSURANCE - 11.2% | |||||||
| AMERISAFE | 121,709 | 6,325,217 | |||||
| Assured Guaranty | 38,600 | 2,403,236 | |||||
| Axis Capital Holdings | 335,897 | 18,195,540 | |||||
| First American Financial | 154,445 | 8,083,651 | |||||
| International General Insurance Holdings 5 | 2,747,997 | 21,983,976 | |||||
| James River Group Holdings | 365,903 | 7,651,032 | |||||
| ProAssurance Corporation | 655,865 | 11,457,962 | |||||
| RenaissanceRe Holdings | 102,491 | 18,881,917 | |||||
| Stewart Information Services | 235,604 | 10,067,359 | |||||
| 105,049,890 | |||||||
| Total (Cost $303,344,448) | 348,047,286 | ||||||
| HEALTH CARE – 0.2% | |||||||
| HEALTH CARE PROVIDERS & SERVICES - 0.2% | |||||||
| Patterson Companies | 53,691 | 1,504,959 | |||||
| Total (Cost $820,312) | 1,504,959 | ||||||
| INDUSTRIALS – 22.1% | |||||||
| BUILDING PRODUCTS - 2.9% | |||||||
| Fortune Brands Innovations | 105,967 | 6,051,775 | |||||
| Simpson Manufacturing | 96,900 | 8,591,154 | |||||
| UFP Industries | 160,399 | 12,711,621 | |||||
| 27,354,550 | |||||||
| COMMERCIAL SERVICES & SUPPLIES - 1.3% | |||||||
| Healthcare Services Group | 172,975 | 2,075,700 | |||||
| †Loomis | 349,500 | 9,579,150 | |||||
| 11,654,850 | |||||||
| ELECTRICAL EQUIPMENT - 0.8% | |||||||
| nVent Electric | 203,234 | 7,818,412 | |||||
| MACHINERY - 5.8% | |||||||
| †Allison Transmission Holdings | 206,400 | 8,586,240 | |||||
| Crane Holdings | 60,239 | 6,051,007 | |||||
| Douglas Dynamics | 440,179 | 15,916,873 | |||||
| Lincoln Electric Holdings | 53,966 | 7,797,547 | |||||
| Timken Company (The) | 219,113 | 15,484,716 | |||||
| 53,836,383 | |||||||
| PROFESSIONAL SERVICES - 2.6% | |||||||
| Barrett Business Services | 109,927 | 10,253,991 | |||||
| KBR | 274,254 | 14,480,611 | |||||
| 24,734,602 | |||||||
| TRADING COMPANIES & DISTRIBUTORS - 8.7% | |||||||
| Air Lease Cl. A | 479,000 | 18,403,180 | |||||
| Applied Industrial Technologies | 111,260 | 14,022,098 | |||||
| †FTAI Aviation | 1,183,900 | 20,268,368 | |||||
| Global Industrial | 239,964 | 5,646,353 | |||||
| MSC Industrial Direct Cl. A | 157,710 | 12,884,907 | |||||
| †NOW 1 | 797,600 | 10,129,520 | |||||
| 81,354,426 | |||||||
| Total (Cost $162,145,131) | 206,753,223 | ||||||
| INFORMATION TECHNOLOGY – 12.6% | |||||||
| ELECTRONIC EQUIPMENT, INSTRUMENTS & COMPONENTS - 3.2% | |||||||
| Avnet | 159,409 | 6,628,226 | |||||
| Vontier Corporation | 1,197,853 | 23,154,499 | |||||
| 29,782,725 | |||||||
| IT SERVICES - 4.2% | |||||||
| Hackett Group (The) | 660,409 | 13,452,531 | |||||
| †Kyndryl Holdings 1 | 1,236,400 | 13,748,768 | |||||
| †Repay Holdings Cl. A 1,2 | 1,495,178 | 12,036,183 | |||||
| 39,237,482 | |||||||
| SEMICONDUCTORS & SEMICONDUCTOR EQUIPMENT - 1.2% | |||||||
| Kulicke & Soffa Industries | 151,884 | 6,722,386 | |||||
| MKS Instruments | 57,105 | 4,838,507 | |||||
| 11,560,893 | |||||||
| SOFTWARE - 4.0% | |||||||
| †Sapiens International | 1,007,277 | 18,614,479 | |||||
| Teradata Corporation 1 | 573,467 | 19,302,899 | |||||
| 37,917,378 | |||||||
| Total (Cost $128,694,109) | 118,498,478 | ||||||
| MATERIALS – 7.1% | |||||||
| CHEMICALS - 3.6% | |||||||
| Element Solutions | 1,015,166 | 18,465,869 | |||||
| Innospec | 17,157 | 1,764,769 | |||||
| Minerals Technologies | 215,980 | 13,114,306 | |||||
| 33,344,944 | |||||||
| CONTAINERS & PACKAGING - 3.5% | |||||||
| Graphic Packaging Holding Company | 526,160 | 11,707,060 | |||||
| Silgan Holdings | 228,171 | 11,828,385 | |||||
| TriMas Corporation | 340,940 | 9,457,675 | |||||
| 32,993,120 | |||||||
| Total (Cost $53,028,441) | 66,338,064 | ||||||
| REAL ESTATE – 1.6% | |||||||
| REAL ESTATE MANAGEMENT & DEVELOPMENT - 1.6% | |||||||
| Kennedy-Wilson Holdings | 986,297 | 15,514,452 | |||||
| Total (Cost $18,276,946) | 15,514,452 | ||||||
| TOTAL COMMON STOCKS | |||||||
| (Cost $812,259,578) | 900,652,620 | ||||||
| PREFERRED STOCK – 1.8% | |||||||
| INFORMATION TECHNOLOGY – 1.8% | |||||||
| ELECTRONIC EQUIPMENT, INSTRUMENTS & COMPONENTS - 1.8% | |||||||
| Coherent Series A Conv. | 108,124 | 17,289,028 | |||||
| (Cost $25,882,165) | 17,289,028 | ||||||
| REPURCHASE AGREEMENT– 2.1% | |||||||
Fixed Income Clearing Corporation, 1.28% dated 12/30/22, due 1/3/23, maturity value $19,729,642 (collateralized by obligations of U.S. Government Agencies, 0.375% due 7/15/25, valued at $20,121,480) | |||||||
| (Cost $19,726,836) | 19,726,836 | ||||||
| TOTAL INVESTMENTS – 100.1% | |||||||
| (Cost $857,868,579) | 937,668,484 | ||||||
| LIABILITIES LESS CASH AND OTHER ASSETS – (0.1)% | (1,264,510) | ||||||
| NET ASSETS – 100.0% | $ | 936,403,974 | |||||
| 46 | The Royce Funds 2022 Annual Report to Shareholders | THE ACCOMPANYING NOTES ARE AN INTEGRAL PART OF THESE FINANCIAL STATEMENTS |
December 31, 2022
Royce Small-Cap Value Fund
Common Stocks – 96.7%
| SHARES | VALUE | ||||||
| COMMUNICATION SERVICES – 3.6% | |||||||
| ENTERTAINMENT - 1.6% | |||||||
| SciPlay Corporation Cl. A 1 | 112,268 | $ | 1,805,270 | ||||
| MEDIA - 2.0% | |||||||
| Entravision Communications Cl. A | 268,857 | 1,290,513 | |||||
| Saga Communications Cl. A | 42,616 | 1,005,738 | |||||
| 2,296,251 | |||||||
| Total (Cost $4,225,197) | 4,101,521 | ||||||
| CONSUMER DISCRETIONARY – 16.2% | |||||||
| DIVERSIFIED CONSUMER SERVICES - 1.3% | |||||||
| Lincoln Educational Services 1 | 246,407 | 1,426,697 | |||||
| HOTELS, RESTAURANTS & LEISURE - 1.2% | |||||||
| †Bloomin’ Brands | 69,700 | 1,402,364 | |||||
| HOUSEHOLD DURABLES - 1.8% | |||||||
| M/I Homes 1 | 16,821 | 776,794 | |||||
| PulteGroup | 27,200 | 1,238,416 | |||||
| 2,015,210 | |||||||
| LEISURE PRODUCTS - 1.5% | |||||||
| Malibu Boats Cl. A 1 | 14,890 | 793,637 | |||||
| MasterCraft Boat Holdings 1 | 34,467 | 891,661 | |||||
| 1,685,298 | |||||||
| SPECIALTY RETAIL - 4.2% | |||||||
| Container Store Group (The) 1 | 170,089 | 733,084 | |||||
| Haverty Furniture | 26,415 | 789,808 | |||||
| Lazydays Holdings 1 | 87,640 | 1,046,422 | |||||
| OneWater Marine Cl. A 1 | 26,988 | 771,857 | |||||
| Shoe Carnival | 61,283 | 1,465,276 | |||||
| 4,806,447 | |||||||
| TEXTILES, APPAREL & LUXURY GOODS - 6.2% | |||||||
| Carter’s | 11,400 | 850,554 | |||||
| †Kontoor Brands | 33,700 | 1,347,663 | |||||
| Movado Group | 46,601 | 1,502,882 | |||||
| †Skechers U.S.A. Cl. A 1 | 36,600 | 1,535,370 | |||||
| Steven Madden | 42,500 | 1,358,300 | |||||
| Tapestry | 10,000 | 380,800 | |||||
| 6,975,569 | |||||||
| Total (Cost $17,007,561) | 18,311,585 | ||||||
| CONSUMER STAPLES – 2.6% | |||||||
| FOOD & STAPLES RETAILING - 2.6% | |||||||
| †Ingles Markets Cl. A | 15,575 | 1,502,364 | |||||
| Village Super Market Cl. A | 63,999 | 1,490,537 | |||||
| Total (Cost $2,817,955) | 2,992,901 | ||||||
| ENERGY – 7.7% | |||||||
| OIL, GAS & CONSUMABLE FUELS - 7.7% | |||||||
| †Chord Energy | 12,052 | 1,648,834 | |||||
| Civitas Resources | 25,100 | 1,454,043 | |||||
| Dorchester Minerals L.P. | 55,104 | 1,649,262 | |||||
| †Matador Resources | 25,900 | 1,482,516 | |||||
| †Riley Exploration Permian | 44,230 | 1,301,689 | |||||
| †SilverBow Resources 1,2 | 40,896 | 1,156,539 | |||||
| Total (Cost $7,376,480) | 8,692,883 | ||||||
| FINANCIALS – 16.0% | |||||||
| BANKS - 7.2% | |||||||
| †Bank of Princeton | 30,421 | 964,954 | |||||
| Chemung Financial | 1,360 | 62,383 | |||||
| Citizens Community Bancorp | 63,897 | 768,681 | |||||
| CNB Financial | 49,624 | 1,180,555 | |||||
| Financial Institutions | 36,636 | 892,453 | |||||
| †First United | 4,206 | 82,648 | |||||
| Landmark Bancorp | 14,250 | 322,477 | |||||
| †Mid Penn Bancorp | 32,591 | 976,752 | |||||
| National Bankshares | 19,295 | 777,589 | |||||
| †Riverview Bancorp | 86,608 | 665,149 | |||||
| Unity Bancorp | 52,481 | 1,434,306 | |||||
| 8,127,947 | |||||||
| CAPITAL MARKETS - 3.3% | |||||||
| Evercore Cl. A | 16,742 | 1,826,217 | |||||
| Houlihan Lokey Cl. A | 12,090 | 1,053,765 | |||||
| Moelis & Company Cl. A | 21,432 | 822,346 | |||||
| 3,702,328 | |||||||
| INSURANCE - 1.9% | |||||||
| Employers Holdings | 9,577 | 413,056 | |||||
| Tiptree | 128,896 | 1,783,921 | |||||
| 2,196,977 |
| THRIFTS & MORTGAGE FINANCE - 3.6% | |||||||
| Timberland Bancorp | 54,119 | 1,847,081 | |||||
| TrustCo Bank Corp NY | 32,434 | 1,219,194 | |||||
| †Western New England Bancorp | 102,878 | 973,226 | |||||
| 4,039,501 | |||||||
| Total (Cost $14,829,601) | 18,066,753 | ||||||
| HEALTH CARE – 6.9% | |||||||
| BIOTECHNOLOGY - 2.3% | |||||||
| Catalyst Pharmaceuticals 1 | 55,006 | 1,023,112 | |||||
| Ironwood Pharmaceuticals Cl. A 1 | 125,234 | 1,551,649 | |||||
| 2,574,761 | |||||||
| HEALTH CARE PROVIDERS & SERVICES - 3.4% | |||||||
| Cross Country Healthcare 1 | 58,957 | 1,566,487 | |||||
| Ensign Group (The) | 6,491 | 614,114 | |||||
| Molina Healthcare 1 | 5,040 | 1,664,309 | |||||
| 3,844,910 | |||||||
| PHARMACEUTICALS - 1.2% | |||||||
| SIGA Technologies | 180,123 | 1,325,705 | |||||
| Total (Cost $5,845,011) | 7,745,376 | ||||||
| INDUSTRIALS – 17.7% | |||||||
| AIR FREIGHT & LOGISTICS - 1.3% | |||||||
| †Hub Group Cl. A 1 | 18,112 | 1,439,723 | |||||
| BUILDING PRODUCTS - 3.8% | |||||||
| Builders FirstSource 1 | 12,541 | 813,660 | |||||
| †Insteel Industries | 32,912 | 905,738 | |||||
| Quanex Building Products | 58,795 | 1,392,266 | |||||
| UFP Industries | 14,800 | 1,172,900 | |||||
| 4,284,564 | |||||||
| CONSTRUCTION & ENGINEERING - 3.0% | |||||||
| Northwest Pipe 1 | 39,369 | 1,326,735 | |||||
| Sterling Infrastructure 1 | 63,556 | 2,084,637 | |||||
| 3,411,372 | |||||||
| ELECTRICAL EQUIPMENT - 1.2% | |||||||
| †Preformed Line Products | 15,559 | 1,295,909 | |||||
| PROFESSIONAL SERVICES - 3.9% | |||||||
| Barrett Business Services | 16,394 | 1,529,232 | |||||
| Kforce | 4,795 | 262,910 | |||||
| Korn Ferry | 18,164 | 919,462 | |||||
| †Mastech Digital 1 | 20,188 | 222,270 | |||||
| Resources Connection | 78,915 | 1,450,458 | |||||
| 4,384,332 | |||||||
| THE ACCOMPANYING NOTES ARE AN INTEGRAL PART OF THESE FINANCIAL STATEMENTS | The Royce Funds 2022 Annual Report to Shareholders | 47 |
Schedules of Investments
Royce Small-Cap Value Fund (continued)
| SHARES | VALUE | ||||||
| INDUSTRIALS (continued) | |||||||
| ROAD & RAIL - 4.5% | |||||||
| ArcBest Corporation | 18,428 | $ | 1,290,697 | ||||
| Heartland Express | 70,313 | 1,078,601 | |||||
| Schneider National Cl. B | 70,750 | 1,655,550 | |||||
| Werner Enterprises | 27,476 | 1,106,184 | |||||
| 5,131,032 | |||||||
| Total (Cost $15,561,153) | 19,946,932 | ||||||
| INFORMATION TECHNOLOGY – 23.7% | |||||||
| COMMUNICATIONS EQUIPMENT - 1.3% | |||||||
| †Aviat Networks 1 | 46,619 | 1,454,047 | |||||
| ELECTRONIC EQUIPMENT, INSTRUMENTS & COMPONENTS - 13.5% | |||||||
| ePlus 1 | 31,034 | 1,374,185 | |||||
| Flex 1 | 95,881 | 2,057,606 | |||||
| Insight Enterprises 1 | 15,107 | 1,514,779 | |||||
| Jabil | 28,475 | 1,941,995 | |||||
| Kimball Electronics 1 | 80,567 | 1,820,009 | |||||
| PC Connection | 28,015 | 1,313,903 | |||||
| Sanmina Corporation 1 | 32,540 | 1,864,217 | |||||
| TD SYNNEX | 16,966 | 1,606,850 | |||||
| Vishay Intertechnology | 83,304 | 1,796,867 | |||||
| 15,290,411 | |||||||
| IT SERVICES - 2.1% | |||||||
| †Computer Task Group 1 | 134,220 | 1,014,703 | |||||
| IBEX 1 | 56,684 | 1,408,598 | |||||
| 2,423,301 | |||||||
| SEMICONDUCTORS & SEMICONDUCTOR EQUIPMENT - 5.6% | |||||||
| †Alpha and Omega Semiconductor 1 | 44,000 | 1,257,080 | |||||
| Amkor Technology | 60,957 | 1,461,749 | |||||
| Cohu 1 | 42,109 | 1,349,593 | |||||
| Kulicke & Soffa Industries | 15,465 | 684,481 | |||||
| MKS Instruments | 1,580 | 133,873 | |||||
| †Ultra Clean Holdings 1 | 42,851 | 1,420,511 | |||||
| 6,307,287 | |||||||
| SOFTWARE - 1.2% | |||||||
| †Adeia | 140,037 | 1,327,551 | |||||
| Total (Cost $20,763,898) | 26,802,597 | ||||||
| REAL ESTATE – 2.3% | |||||||
| REAL ESTATE MANAGEMENT & DEVELOPMENT - 2.3% | |||||||
| Marcus & Millichap | 40,807 | 1,405,801 | |||||
| †RMR Group (The) Cl. A | 42,456 | 1,199,382 | |||||
| Total (Cost $2,693,776) | 2,605,183 | ||||||
| TOTAL COMMON STOCKS | |||||||
| (Cost $91,120,632) | 109,265,731 | ||||||
| REPURCHASE AGREEMENT– 3.8% | |||||||
Fixed Income Clearing Corporation, 1.28% dated 12/30/22, due 1/3/23, maturity value $4,305,246 (collateralized by obligations of U.S. Government Agencies, 2.875% due 5/31/25, valued at $4,390,748) | |||||||
| (Cost $4,304,634) | 4,304,634 | ||||||
| COLLATERAL RECEIVED FOR SECURITIES LOANED – 0.5% | |||||||
| Money Market Funds | |||||||
| Federated Hermes Government Obligations Fund - Institutional Shares (7 day yield-4.10%) | |||||||
| (Cost $511,027) | 511,027 | 511,027 | |||||
| TOTAL INVESTMENTS – 101.0% | |||
| (Cost $95,936,293) | $ | 114,081,392 | |
| LIABILITIES LESS CASH AND OTHER ASSETS – (1.0)% | (1,137,256) | ||
| NET ASSETS – 100.0% | $ | 112,944,136 |
| 48 | The Royce Funds 2022 Annual Report to Shareholders | THE ACCOMPANYING NOTES ARE AN INTEGRAL PART OF THESE FINANCIAL STATEMENTS |
December 31, 2022
Royce Smaller-Companies Growth Fund
Common Stocks – 96.9%
| SHARES | VALUE | ||||||
| CONSUMER DISCRETIONARY – 9.4% | |||||||
| HOTELS, RESTAURANTS & LEISURE - 2.5% | |||||||
| Bragg Gaming Group 1 | 250,000 | $ | 969,350 | ||||
| DraftKings Cl. A 1,2 | 62,000 | 706,180 | |||||
| Texas Roadhouse | 30,000 | 2,728,500 | |||||
| 4,404,030 | |||||||
| INTERNET & DIRECT MARKETING RETAIL - 2.3% | |||||||
| CarParts.com 1 | 210,000 | 1,314,600 | |||||
| †Vivid Seats Cl. A 1 | 112,000 | 817,600 | |||||
| †Xometry Cl. A 1,2 | 57,000 | 1,837,110 | |||||
| 3,969,310 | |||||||
| LEISURE PRODUCTS - 2.2% | |||||||
| Topgolf Callaway Brands 1 | 196,000 | 3,871,000 | |||||
| MULTILINE RETAIL - 1.4% | |||||||
| Ollie’s Bargain Outlet Holdings 1 | 51,000 | 2,388,840 | |||||
| SPECIALTY RETAIL - 1.0% | |||||||
| Lithia Motors | 9,000 | 1,842,660 | |||||
| Total (Cost $19,159,783) | 16,475,840 | ||||||
| CONSUMER STAPLES – 7.0% | |||||||
| BEVERAGES - 5.0% | |||||||
| Celsius Holdings 1 | 61,000 | 6,346,440 | |||||
| MGP Ingredients | 22,000 | 2,340,360 | |||||
| 8,686,800 | |||||||
| FOOD PRODUCTS - 2.0% | |||||||
| Freshpet 1 | 67,000 | 3,535,590 | |||||
| Total (Cost $10,725,986) | 12,222,390 | ||||||
| FINANCIALS – 2.1% | |||||||
| BANKS - 2.1% | |||||||
| †Atlantic Union Bankshares | 27,000 | 948,780 | |||||
| Seacoast Banking Corporation of Florida | 90,000 | 2,807,100 | |||||
| Total (Cost $3,042,367) | 3,755,880 | ||||||
| HEALTH CARE – 30.1% | |||||||
| BIOTECHNOLOGY - 5.8% | |||||||
| Avid Bioservices 1,2 | 78,000 | 1,074,060 | |||||
| †Halozyme Therapeutics 1 | 96,000 | 5,462,400 | |||||
| MeiraGTx Holdings 1 | 146,337 | 954,117 | |||||
| PureTech Health 1 | 846,000 | 2,725,687 | |||||
| 10,216,264 | |||||||
| HEALTH CARE EQUIPMENT & SUPPLIES - 18.9% | |||||||
| Alphatec Holdings 1 | 356,000 | 4,396,600 | |||||
| Axonics 1 | 85,000 | 5,315,050 | |||||
| InMode 1 | 110,000 | 3,927,000 | |||||
| Inspire Medical Systems 1,2 | 12,488 | 3,145,478 | |||||
| †Lantheus Holdings 1,2 | 46,000 | 2,344,160 | |||||
| SI-BONE 1 | 96,000 | 1,305,600 | |||||
| STAAR Surgical 1 | 51,000 | 2,475,540 | |||||
| TransMedics Group 1 | 131,000 | 8,085,320 | |||||
| ViewRay 1 | 468,000 | 2,096,640 | |||||
| 33,091,388 | |||||||
| HEALTH CARE PROVIDERS & SERVICES - 3.1% | |||||||
| †Hims & Hers Health Cl. A 1 | 188,000 | 1,205,080 | |||||
| †Privia Health Group 1 | 77,000 | 1,748,670 | |||||
| Progyny 1 | 81,000 | 2,523,150 | |||||
| 5,476,900 | |||||||
| LIFE SCIENCES TOOLS & SERVICES - 1.2% | |||||||
| CryoPort 1 | 48,198 | 836,235 | |||||
| †MaxCyte 1,2 | 210,000 | 1,146,600 | |||||
| 1,982,835 | |||||||
| PHARMACEUTICALS - 1.1% | |||||||
| †Harmony Biosciences Holdings 1 | 35,000 | 1,928,500 | |||||
| Total (Cost $40,675,993) | 52,695,887 | ||||||
| INDUSTRIALS – 17.9% | |||||||
| AEROSPACE & DEFENSE - 1.6% | |||||||
| AeroVironment 1 | 33,000 | 2,826,780 | |||||
| AIR FREIGHT & LOGISTICS - 1.7% | |||||||
| †GXO Logistics 1 | 69,000 | 2,945,610 | |||||
| COMMERCIAL SERVICES & SUPPLIES - 3.6% | |||||||
| ACV Auctions Cl. A 1 | 258,000 | 2,118,180 | |||||
| VSE Corporation | 88,000 | 4,125,440 | |||||
| 6,243,620 | |||||||
| ELECTRICAL EQUIPMENT - 2.2% | |||||||
| EnerSys | 15,000 | 1,107,600 | |||||
| Enovix Corporation 1,2 | 86,000 | 1,069,840 | |||||
| †Shoals Technologies Group Cl. A 1 | 68,000 | 1,677,560 | |||||
| 3,855,000 | |||||||
| MACHINERY - 3.4% | |||||||
| ATS 1 | 104,000 | 3,232,910 | |||||
| Chart Industries 1 | 17,000 | 1,958,910 | |||||
| †Symbotic Cl. A 1 | 64,500 | 770,130 | |||||
| 5,961,950 | |||||||
| PROFESSIONAL SERVICES - 2.7% | |||||||
| ASGN 1 | 35,000 | 2,851,800 | |||||
| Atlas Technical Consultants Cl. A 1,2 | 376,000 | 1,936,400 | |||||
| 4,788,200 | |||||||
| TRADING COMPANIES & DISTRIBUTORS - 2.7% | |||||||
| Distribution Solutions Group 1 | 130,000 | 4,791,800 | |||||
| Total (Cost $29,977,783) | 31,412,960 | ||||||
| INFORMATION TECHNOLOGY – 26.1% | |||||||
| COMMUNICATIONS EQUIPMENT - 2.7% | |||||||
| †Clearfield 1,2 | 36,500 | 3,436,110 | |||||
| Genasys 1 | 328,000 | 1,213,600 | |||||
| 4,649,710 | |||||||
| ELECTRONIC EQUIPMENT, INSTRUMENTS & COMPONENTS - 3.1% | |||||||
| Iteris 1 | 844,474 | 2,626,314 | |||||
| †Napco Security Technologies 1 | 105,000 | 2,885,400 | |||||
| 5,511,714 | |||||||
| SEMICONDUCTORS & SEMICONDUCTOR EQUIPMENT - 10.8% | |||||||
| †Aehr Test Systems 1,2 | 132,000 | 2,653,200 | |||||
| Ambarella 1 | 44,000 | 3,618,120 | |||||
| AXT 1 | 216,400 | 947,832 | |||||
| †Credo Technology Group Holding 1,2 | 83,000 | 1,104,730 | |||||
| Impinj 1,2 | 64,555 | 7,048,115 | |||||
| †indie Semiconductor Cl. A 1,2 | 67,000 | 390,610 | |||||
| Silicon Laboratories 1 | 24,000 | 3,256,080 | |||||
| 19,018,687 | |||||||
| SOFTWARE - 8.6% | |||||||
| Agilysys 1 | 53,000 | 4,194,420 | |||||
| Descartes Systems Group (The) 1 | 41,033 | 2,857,949 | |||||
| Digital Turbine 1 | 66,000 | 1,005,840 | |||||
| †JFrog 1 | 113,000 | 2,410,290 | |||||
| Paylocity Holding Corporation 1 | 7,786 | 1,512,508 | |||||
| Sprout Social Cl. A 1,2 | 54,000 | 3,048,840 | |||||
| 15,029,847 | |||||||
| TECHNOLOGY HARDWARE, STORAGE & PERIPHERALS - 0.9% | |||||||
| Stratasys 1 | 133,000 | 1,577,380 | |||||
| Total (Cost $38,353,807) | 45,787,338 |
| THE ACCOMPANYING NOTES ARE AN INTEGRAL PART OF THESE FINANCIAL STATEMENTS | The Royce Funds 2022 Annual Report to Shareholders | 49 |
December 31, 2022
Schedules of Investments
Royce Smaller-Companies Growth Fund (continued)
| SHARES | VALUE | ||||||
| MATERIALS – 3.7% | |||||||
| CHEMICALS - 1.6% | |||||||
| †Aspen Aerogels 1 | 101,000 | $ | 1,190,790 | ||||
| ��Bioceres Crop Solutions 1,2 | 133,000 | 1,599,990 | |||||
| 2,790,780 | |||||||
| METALS & MINING - 2.1% | |||||||
| †AMG Advanced Metallurgical Group | 102,589 | 3,777,682 | |||||
| Total (Cost $6,910,882) | 6,568,462 | ||||||
| REAL ESTATE – 0.6% | |||||||
| EQUITY REAL ESTATE INVESTMENT TRUSTS (REITS) - 0.6% | |||||||
| Postal Realty Trust Cl. A | 70,000 | 1,017,100 | |||||
| Total (Cost $1,130,446) | 1,017,100 | ||||||
| TOTAL COMMON STOCKS | |||||||
| (Cost $149,977,047) | 169,935,857 | ||||||
| REPURCHASE AGREEMENT– 3.4% | |||||||
| Fixed Income Clearing Corporation, 1.28% dated 12/30/22, due 1/3/23, maturity value $5,882,943 (collateralized by obligations of U.S. Government Agencies, 2.875% due 5/31/25, valued at $5,999,762) | |||||||
| (Cost $5,882,106) | 5,882,106 | ||||||
| COLLATERAL RECEIVED FOR SECURITIES LOANED – 1.1% | |||||||
| Money Market Funds | |||||||
| Federated Hermes Government Obligations Fund - Institutional Shares (7 day yield-4.10%) | |||||||
| (Cost $1,935,673) | 1,935,673 | 1,935,673 | |||||
| TOTAL INVESTMENTS – 101.4% | |||||||
| (Cost $157,794,826) | 177,753,636 | ||||||
| LIABILITIES LESS CASH AND OTHER ASSETS – (1.4)% | (2,467,105) | ||||||
| NET ASSETS – 100.0% | $ | 175,286,531 | |||||
ADR- American Depository Receipt
| † | New additions in 2022. |
| 1 | Non-income producing. |
| 2 | All or a portion of these securities were on loan as of December 31, 2022. |
Securities of Royce International Premier Fund are categorized by the country of their headquarters.
Bold indicates a Fund’s 20 largest equity holdings in terms of December 31, 2022, market value.
| 50 | The Royce Funds 2022 Annual Report to Shareholders | THE ACCOMPANYING NOTES ARE AN INTEGRAL PART OF THESE FINANCIAL STATEMENTS |
| Statements of Assets and Liabilities | December 31, 2022 |
| Royce Dividend Value Fund | Royce Global Financial Services Fund | Royce International Premier Fund | Royce Micro-Cap Fund | |||||
| ASSETS: | ||||||||
| Investments at value 1 | ||||||||
| Non-Affiliated Companies | $ | 55,688,446 | $ | 26,905,276 | $ | 695,315,486 | $ | 286,233,767 |
| Repurchase agreements (at cost and value) | 3,342,493 | 108,221 | 44,883,580 | 6,932,693 | ||||
| Foreign currency2 | 1,543 | 268,723 | 1 | – | ||||
| Receivable for capital shares sold | 163,809 | 1,347 | 785,994 | (32,702) | ||||
| Receivable for dividends and interest | 96,481 | 58,922 | 2,616,209 | 43,459 | ||||
| Receivable for securities lending income | – | – | – | 364 | ||||
| Prepaid expenses and other assets | 661 | 360 | 12,616 | 4,159 | ||||
| Total Assets | 59,293,433 | 27,342,849 | 743,613,886 | 293,181,740 | ||||
| LIABILITIES: | ||||||||
| Payable for investments purchased | – | 267,411 | 384,362 | – | ||||
| Payable for capital shares redeemed | 109,800 | 15,024 | 1,916,706 | 225,869 | ||||
| Payable for investment advisory fees | 43,158 | 23,056 | 586,877 | 252,429 | ||||
| Payable for trustees’ fees | 2,264 | 1,088 | 32,897 | 11,432 | ||||
| Accrued expenses | 109,892 | 101,891 | 793,464 | 263,654 | ||||
| Total Liabilities | 265,114 | 408,470 | 3,714,306 | 753,384 | ||||
| Net Assets | $ | 59,028,319 | $ | 26,934,379 | $ | 739,899,580 | $ | 292,428,356 |
| ANALYSIS OF NET ASSETS: | ||||||||
| Paid-in capital | $ | 24,647,772 | $ | 17,084,855 | $ | 852,577,435 | $ | 237,845,688 |
| Total distributable earnings (loss) | 34,380,547 | 9,849,524 | (112,677,855) | 54,582,668 | ||||
| Net Assets | $ | 59,028,319 | $ | 26,934,379 | $ | 739,899,580 | $ | 292,428,356 |
| Investment Class | $ | 43,264,338 | $ | 248,169,758 | $ | 149,934,574 | ||
| Service Class | 14,005,615 | $ | 19,443,007 | 33,163,039 | 132,132,615 | |||
| Consultant Class | 1,626,632 | 4,773,559 | 10,361,167 | |||||
| Institutional Class | 131,734 | 7,491,372 | 453,793,224 | |||||
| SHARES OUTSTANDING (unlimited number of $.001 par value): | ||||||||
| Investment Class | 7,889,856 | 19,798,065 | 15,167,908 | |||||
| Service Class | 2,452,445 | 2,066,829 | 2,204,459 | 13,771,378 | ||||
| Consultant Class | 249,897 | 300,478 | 1,421,466 | |||||
| Institutional Class | 24,420 | 608,291 | 36,209,322 | |||||
| NET ASSET VALUES (Net Assets ÷ Shares Outstanding): | ||||||||
| Investment Class3 | $5.48 | $12.54 | $9.88 | |||||
| Service Class3 | 5.71 | $ 9.41 | 15.04 | 9.59 | ||||
| Consultant Class4 | 6.51 | 15.89 | 7.29 | |||||
| Institutional Class5 | 5.39 | 12.32 | 12.53 | |||||
| Investments at identified cost - Non-Affiliated Companies | $ | 21,347,114 | $ | 16,152,183 | $ | 776,838,843 | $ | 231,127,293 |
| Market value of loaned securities6 | – | – | – | 1,902,903 | ||||
1 See Notes to Financial Statements for information on non-cash collateral on loaned securities.
2 The cost of foreign currency is $1,543 for Royce Dividend Value Fund, $268,724 for Royce Global Financial Services Fund and $1 for Royce International Premier Fund.
3 Offering and redemption price per share; shares held less than 30 days may be subject to a 1% redemption fee, or a 2% redemption fee (Royce International Premier Fund), payable to the Fund.
4 Offering and redemption price per share; shares held less than 365 days may be subject to a 1% contingent deferred sales charge, payable to Royce Fund Services, LLC.
5 Offering and redemption price per share.
6 Market value of loaned securities backed by non-cash collateral is as of prior business day.
| THE ACCOMPANYING NOTES ARE AN INTEGRAL PART OF THESE FINANCIAL STATEMENTS | The Royce Funds 2022 Annual Report to Shareholders | 51 |
Statements of Assets and Liabilities
| Royce Pennsylvania Mutual Fund | Royce Premier Fund | Royce Small-Cap Opportunity Fund | Royce Small-Cap Special Equity Fund | ||||||
| ASSETS: | |||||||||
| Investments at value (including collateral on loaned securities)1 | |||||||||
| Non-Affiliated Companies | $ | 1,555,047,690 | $ | 1,212,000,381 | $ | 1,187,392,295 | $ | 535,010,366 | |
| Affiliated Companies | – | – | 11,310,532 | 91,319,025 | |||||
| Repurchase agreements (at cost and value) | 9,239,555 | 39,954,174 | 50,049,722 | 129,812,399 | |||||
| Foreign currency2 | 71,543 | – | – | – | |||||
| Receivable for investments sold | 4,714,001 | – | 1,213,279 | 517,894 | |||||
| Receivable for capital shares sold | 3,164,323 | 1,277,885 | 1,653,617 | 1,279,466 | |||||
| Receivable for dividends and interest | 1,354,538 | 1,559,788 | 893,869 | 687,155 | |||||
| Receivable for securities lending income | 2,792 | – | 11,852 | – | |||||
| Prepaid expenses and other assets | 2,007,859 | 16,799 | 19,000 | 10,208 | |||||
| Total Assets | 1,575,602,301 | 1,254,809,027 | 1,252,544,166 | 758,636,513 | |||||
| LIABILITIES: | |||||||||
| Payable for collateral on loaned securities | 2,722,487 | – | 1,993,229 | – | |||||
| Payable for investments purchased | 2,508,659 | – | 1,229,044 | 22,580 | |||||
| Payable for capital shares redeemed | 1,728,900 | 1,948,478 | 2,505,069 | 3,934,170 | |||||
| Payable for investment advisory fees | 1,043,649 | 1,099,479 | 1,091,931 | 669,911 | |||||
| Payable for trustees’ fees | 61,828 | 51,022 | 50,795 | 31,125 | |||||
| Accrued expenses | 859,815 | 550,030 | 789,221 | 413,248 | |||||
| Total Liabilities | 8,925,338 | 3,649,009 | 7,659,289 | 5,071,034 | |||||
| Net Assets | $ | 1,566,676,963 | $ | 1,251,160,018 | $ | 1,244,884,877 | $ | 753,565,479 | |
| ANALYSIS OF NET ASSETS: | |||||||||
| Paid-in capital | $ | 1,227,418,580 | $ | 793,756,430 | $ | 1,140,198,765 | $ | 613,362,046 | |
| Total distributable earnings (loss) | 339,258,383 | 457,403,588 | 104,686,112 | 140,203,433 | |||||
| Net Assets | $ | 1,566,676,963 | $ | 1,251,160,018 | $ | 1,244,884,877 | $ | 753,565,479 | |
| Investment Class | $ | 1,191,940,873 | $ | 1,001,893,677 | $ | 911,802,216 | $ | 587,346,226 | |
| Service Class | 58,042,762 | 24,968,346 | 68,292,094 | 34,728,456 | |||||
| Consultant Class | 175,956,379 | 11,264,594 | 11,396,185 | 15,189,383 | |||||
| Institutional Class | 133,605,831 | 206,915,668 | 214,423,649 | 116,301,414 | |||||
| R Class | 7,131,118 | 6,117,733 | 38,970,733 | ||||||
| SHARES OUTSTANDING (unlimited number of $.001 par value): | |||||||||
| Investment Class | 156,714,935 | 99,631,386 | 68,949,584 | 36,888,357 | |||||
| Service Class | 7,674,407 | 2,567,678 | 5,657,928 | 2,181,687 | |||||
| Consultant Class | 29,913,557 | 1,469,401 | 1,103,076 | 1,047,949 | |||||
| Institutional Class | 17,502,264 | 20,252,205 | 15,779,744 | 7,372,917 | |||||
| R Class | 1,019,056 | 671,929 | 3,358,085 | ||||||
| NET ASSET VALUES (Net Assets ÷ Shares Outstanding): | |||||||||
| Investment Class3 | $7.61 | $10.06 | $13.22 | $15.92 | |||||
| Service Class3 | 7.56 | 9.72 | 12.07 | 15.92 | |||||
| Consultant Class4 | 5.88 | 7.67 | 10.33 | 14.49 | |||||
| Institutional Class5 | 7.63 | 10.22 | 13.59 | 15.77 | |||||
| R Class5 | 7.00 | 9.10 | 11.61 | ||||||
| Investments at identified cost - Non-Affiliated Companies | $ | 1,203,345,248 | $ | 762,959,020 | $ | 1,070,274,048 | $ | 406,449,318 | |
| Investments at identified cost - Affiliated Companies | – | – | 11,470,291 | 92,293,135 | |||||
| Market value of loaned securities6 | 13,488,447 | – | 14,251,574 | – | |||||
1 See Notes to Financial Statements for information on non-cash collateral on loaned securities.
2 The cost of foreign currency is $71,532 for Royce Pennsylvania Mutual Fund.
3 Offering and redemption price per share; shares held less than 30 days may be subject to a 1% redemption fee, payable to the Fund.
4 Offering and redemption price per share; shares held less than 365 days may be subject to a 1% contingent deferred sales charge, payable to Royce Fund Services, LLC.
5 Offering and redemption price per share.
6 Market value of loaned securities backed by non-cash collateral is as of prior business day.
| 52 | The Royce Funds 2022 Annual Report to Shareholders | THE ACCOMPANYING NOTES ARE AN INTEGRAL PART OF THESE FINANCIAL STATEMENTS |
December 31, 2022
| Royce Small-Cap Total Return Fund | Royce Small-Cap Value Fund | Royce Smaller- Companies Growth Fund | ||||
| ASSETS: | ||||||
| Investments at value (including collateral on loaned securities)1 | ||||||
| Non-Affiliated Companies | $ | 895,957,672 | $ | 109,776,758 | $ | 171,871,530 |
| Affiliated Companies | 21,983,976 | – | – | |||
| Repurchase agreements (at cost and value) | 19,726,836 | 4,304,634 | 5,882,106 | |||
| Cash and foreign currency2 | 141,024 | – | – | |||
| Receivable for investments sold | 3,625,599 | – | – | |||
| Receivable for capital shares sold | 425,091 | 40,916 | 119,275 | |||
| Receivable for dividends and interest | 2,136,699 | 138,534 | 418 | |||
| Receivable for securities lending income | 35 | 216 | 12,555 | |||
| Prepaid expenses and other assets | 13,341 | 1,298 | 2,845 | |||
| Total Assets | 944,010,273 | 114,262,356 | 177,888,729 | |||
| LIABILITIES: | ||||||
| Payable for collateral on loaned securities | – | 511,027 | 1,935,673 | |||
| Payable for investments purchased | 4,198,452 | 353,506 | – | |||
| Payable for capital shares redeemed | 1,952,172 | 201,261 | 302,680 | |||
| Payable for investment advisory fees | 813,578 | 98,569 | 153,968 | |||
| Payable for trustees’ fees | 40,111 | 4,179 | 7,588 | |||
| Accrued expenses | 601,986 | 149,678 | 202,289 | |||
| Total Liabilities | 7,606,299 | 1,318,220 | 2,602,198 | |||
| Net Assets | $ | 936,403,974 | $ | 112,944,136 | $ | 175,286,531 |
| ANALYSIS OF NET ASSETS: | ||||||
| Paid-in capital | $ | 852,620,757 | $ | 94,396,763 | $ | 177,530,314 |
| Total distributable earnings (loss) | 83,783,217 | 18,547,373 | (2,243,783) | |||
| Net Assets | $ | 936,403,974 | $ | 112,944,136 | $ | 175,286,531 |
| Investment Class | $ | 591,729,867 | $ | 35,545,248 | $ | 61,107,246 |
| Service Class | 58,570,884 | 68,455,087 | 105,585,114 | |||
| Consultant Class | 84,447,645 | 3,183,806 | 4,193,908 | |||
| Institutional Class | 181,475,722 | 4,400,263 | ||||
| R Class | 20,179,856 | 5,759,995 | ||||
| SHARES OUTSTANDING (unlimited number of $.001 par value): | ||||||
| Investment Class | 90,221,443 | 4,014,331 | 10,746,768 | |||
| Service Class | 8,612,544 | 7,773,627 | 19,250,356 | |||
| Consultant Class | 12,258,194 | 418,126 | 918,364 | |||
| Institutional Class | 28,238,376 | 762,068 | ||||
| R Class | 2,916,585 | 688,825 | ||||
| NET ASSET VALUES (Net Assets ÷ Shares Outstanding): | ||||||
| Investment Class3 | $6.56 | $8.85 | $5.69 | |||
| Service Class3 | 6.80 | 8.81 | 5.48 | |||
| Consultant Class4 | 6.89 | 7.61 | 4.57 | |||
| Institutional Class5 | 6.43 | 5.77 | ||||
| R Class5 | 6.92 | 8.36 | ||||
| Investments at identified cost - Non-Affiliated Companies | $ | 815,284,943 | $ | 91,631,659 | $ | 151,912,720 |
| Investments at identified cost - Affiliated Companies | 22,856,800 | – | – | |||
| Market value of loaned securities6 | 109,072 | 494,080 | 14,023,794 | |||
1 See Notes to Financial Statements for information on non-cash collateral on loaned securities.
2 The cost of cash and foreign currency is $141,009 for Royce Small-Cap Total Return Fund.
3 Offering and redemption price per share; shares held less than 30 days may be subject to a 1% redemption fee, payable to the Fund.
4 Offering and redemption price per share; shares held less than 365 days may be subject to a 1% contingent deferred sales charge, payable to Royce Fund Services, LLC.
5 Offering and redemption price per share.
6 Market value of loaned securities backed by non-cash collateral is as of prior business day.
| THE ACCOMPANYING NOTES ARE AN INTEGRAL PART OF THESE FINANCIAL STATEMENTS | The Royce Funds 2022 Annual Report to Shareholders | 53 |
Statements of Operations
| Royce Dividend Value Fund | Royce Global Financial Services Fund | Royce International Premier Fund | Royce Micro-Cap Fund | |||||||||
| INVESTMENT INCOME: | ||||||||||||
| INCOME: | ||||||||||||
| Dividends | ||||||||||||
| Non-Affiliated Companies | $ | 1,207,706 | $ | 715,228 | $ | 20,148,950 | $ | 2,366,308 | ||||
| Affiliated Companies | – | – | 623,415 | – | ||||||||
| Foreign withholding tax | (37,843) | (53,851) | (1,948,475) | (40,050) | ||||||||
| Interest | 10,477 | 3,737 | 168,611 | 39,939 | ||||||||
| Securities lending | – | – | – | 24,396 | ||||||||
| Total income | 1,180,340 | 665,114 | 18,992,501 | 2,390,593 | ||||||||
| EXPENSES: | ||||||||||||
| Investment advisory fees | 530,001 | 302,336 | 9,090,529 | 3,219,478 | ||||||||
| Distribution fees | 51,464 | 55,376 | 158,648 | 490,241 | ||||||||
| Shareholder servicing | 112,282 | 42,334 | 705,541 | 421,972 | ||||||||
| Registration | 56,248 | 32,533 | 86,700 | 51,273 | ||||||||
| Administrative and office facilities | 48,024 | 33,770 | 482,080 | 175,024 | ||||||||
| Audit | 34,589 | 33,135 | 44,090 | 36,796 | ||||||||
| Custody | 30,898 | 33,176 | 383,106 | 42,464 | ||||||||
| Trustees’ fees | 9,290 | 4,593 | 142,250 | 48,571 | ||||||||
| Shareholder reports | 8,130 | 3,285 | 93,974 | 47,617 | ||||||||
| Legal | 3,602 | 1,871 | 62,745 | 19,902 | ||||||||
| Other expenses | 8,529 | 10,772 | 77,699 | 25,783 | ||||||||
| Total expenses | 893,057 | 553,181 | 11,327,362 | 4,579,121 | ||||||||
| Compensating balance credits | (248) | (131) | (11,114) | (2,008) | ||||||||
| Fees waived by investment adviser and distributor | – | (6,645) | (831,880) | – | ||||||||
| Expenses reimbursed by investment adviser | (161,696) | (95,924) | (366,046) | (78,837) | ||||||||
| Net expenses | 731,113 | 450,481 | 10,118,322 | 4,498,276 | ||||||||
| Net investment income (loss) | 449,227 | 214,633 | 8,874,179 | (2,107,683) | ||||||||
| REALIZED AND UNREALIZED GAIN (LOSS) ON INVESTMENTS AND FOREIGN CURRENCY: | ||||||||||||
| NET REALIZED GAIN (LOSS): | ||||||||||||
| Investments in Non-Affiliated Companies | 369,504 | (322,683) | (4,316,868) | 1,597,206 | ||||||||
| Investments in Affiliated Companies | – | – | (26,223,761) | – | ||||||||
| Foreign currency transactions | (19,144) | (1,821) | (568,925) | (2,737) | ||||||||
| NET CHANGE IN UNREALIZED APPRECIATION (DEPRECIATION): | ||||||||||||
| Investments in Non-Affiliated Companies | (11,010,807) | (7,298,356) | (321,745,034) | (93,507,037) | ||||||||
| Investments in Affiliated Companies | – | – | 9,515,765 | – | ||||||||
| Other assets and liabilities denominated in foreign currency | (1,851) | 4,213 | (48,556) | – | ||||||||
| Net realized and unrealized gain (loss) on investments and foreign currency | (10,662,298) | (7,618,647) | (343,387,379) | (91,912,568) | ||||||||
| NET INCREASE (DECREASE) IN NET ASSETS FROM INVESTMENT OPERATIONS | $ | (10,213,071) | $ | (7,404,014) | $ | (334,513,200) | $ | (94,020,251) | ||||
| 54 | The Royce Funds 2022 Annual Report to Shareholders | THE ACCOMPANYING NOTES ARE AN INTEGRAL PART OF THESE FINANCIAL STATEMENTS |
Year Ended December 31, 2022
| Royce Pennsylvania Mutual Fund | Royce Premier Fund | Royce Small-Cap Opportunity Fund | Royce Small-Cap Special Equity Fund | |||||||||||||
| INVESTMENT INCOME: | ||||||||||||||||
| INCOME: | ||||||||||||||||
| Dividends | ||||||||||||||||
| Non-Affiliated Companies | $ | 21,194,738 | $ | 16,380,443 | $ | 18,038,595 | $ | 15,220,052 | ||||||||
| Affiliated Companies | – | – | – | 3,404,141 | ||||||||||||
| Foreign withholding tax | (378,682 | ) | (236,322 | ) | (10,379 | ) | – | |||||||||
| Interest | 675,654 | 300,874 | 207,579 | 596,868 | ||||||||||||
| Securities lending | 66,344 | 963 | 205,978 | – | ||||||||||||
| Total income | 21,558,054 | 16,445,958 | 18,441,773 | 19,221,061 | ||||||||||||
| EXPENSES: | ||||||||||||||||
| Investment advisory fees | 13,209,795 | 14,135,011 | 14,570,053 | 8,686,719 | ||||||||||||
| Distribution fees | 2,205,279 | 233,430 | 542,875 | 321,026 | ||||||||||||
| Shareholder servicing | 1,276,806 | 1,077,955 | 1,578,558 | 838,183 | ||||||||||||
| Registration | 92,116 | 78,566 | 115,014 | 75,874 | ||||||||||||
| Administrative and office facilities | 846,902 | 686,441 | 752,880 | 435,982 | ||||||||||||
| Audit | 45,835 | 38,796 | 46,322 | 39,141 | ||||||||||||
| Custody | 174,625 | 107,486 | 151,240 | 73,317 | ||||||||||||
| Trustees’ fees | 259,174 | 210,975 | 221,953 | 131,307 | ||||||||||||
| Shareholder reports | 174,378 | 132,475 | 125,000 | 77,224 | ||||||||||||
| Legal | 104,963 | 83,935 | 116,491 | 52,432 | ||||||||||||
| Other expenses | 131,560 | 110,258 | 110,126 | 67,640 | ||||||||||||
| Total expenses | 18,521,433 | 16,895,328 | 18,330,512 | 10,798,845 | ||||||||||||
| Compensating balance credits | (8,426 | ) | (3,070 | ) | (4,837 | ) | (3,131 | ) | ||||||||
| Fees waived by distributor | (6,679 | ) | – | – | – | |||||||||||
| Expenses reimbursed by investment adviser | (28,042 | ) | (29,615 | ) | (37,440 | ) | (35,371 | ) | ||||||||
| Net expenses | 18,478,286 | 16,862,643 | 18,288,235 | 10,760,343 | ||||||||||||
| Net investment income (loss) | 3,079,768 | (416,685 | ) | 153,538 | 8,460,718 | |||||||||||
| REALIZED AND UNREALIZED GAIN (LOSS) ON INVESTMENTS AND FOREIGN CURRENCY: | ||||||||||||||||
| NET REALIZED GAIN (LOSS): | ||||||||||||||||
| Investments in Non-Affiliated Companies | 25,459,209 | 93,970,287 | (1,750,906 | ) | 67,247,442 | |||||||||||
| Investments in Affiliated Companies | – | – | 2,220,648 | (24,032,223 | ) | |||||||||||
| Foreign currency transactions | 2,943 | (12,635 | ) | 4,103 | – | |||||||||||
| NET CHANGE IN UNREALIZED APPRECIATION (DEPRECIATION): | ||||||||||||||||
| Investments in Non-Affiliated Companies | (394,795,177 | ) | (357,293,399 | ) | (303,232,019 | ) | (102,305,401 | ) | ||||||||
| Investments in Affiliated Companies | – | – | 1,577,050 | (16,843,427 | ) | |||||||||||
| Other assets and liabilities denominated in foreign currency | (437 | ) | – | – | – | |||||||||||
| Net realized and unrealized gain (loss) on investments and foreign currency | (369,333,462 | ) | (263,335,747 | ) | (301,181,124 | ) | (75,933,609 | ) | ||||||||
| NET INCREASE (DECREASE) IN NET ASSETS FROM INVESTMENT OPERATIONS | $ | (366,253,694 | ) | $ | (263,752,432 | ) | $ | (301,027,586 | ) | $ | (67,472,891 | ) | ||||
| THE ACCOMPANYING NOTES ARE AN INTEGRAL PART OF THESE FINANCIAL STATEMENTS | The Royce Funds 2022 Annual Report to Shareholders | 55 |
| Statements of Operations | Year Ended December 31, 2022 |
| Royce Small-Cap Total Return Fund | Royce Small-Cap Value Fund | Royce Smaller- Companies Growth Fund | ||||||||||
| INVESTMENT INCOME: | ||||||||||||
| INCOME: | ||||||||||||
| Dividends | ||||||||||||
| Non-Affiliated Companies | $ | 23,675,231 | $ | 2,338,507 | $ | 337,184 | ||||||
| Affiliated Companies | 420,786 | – | – | |||||||||
| Foreign withholding tax | (170,983 | ) | – | (4,709 | ) | |||||||
| Interest | 104,692 | 21,822 | 28,423 | |||||||||
| Securities lending | 214,621 | 3,057 | 195,038 | |||||||||
| Total income | 24,244,347 | 2,363,386 | 555,936 | |||||||||
| EXPENSES: | ||||||||||||
| Investment advisory fees | 10,997,354 | 1,180,478 | 2,064,279 | |||||||||
| Distribution fees | 1,228,460 | 247,678 | 357,223 | |||||||||
| Shareholder servicing | 938,475 | 193,416 | 276,392 | |||||||||
| Registration | 93,326 | 51,503 | 61,369 | |||||||||
| Administrative and office facilities | 571,580 | 73,273 | 124,014 | |||||||||
| Audit | 45,301 | 31,741 | 31,570 | |||||||||
| Custody | 122,205 | 33,093 | 32,412 | |||||||||
| Trustees’ fees | 170,477 | 17,274 | 31,373 | |||||||||
| Shareholder reports | 124,827 | 16,281 | 28,698 | |||||||||
| Legal | 69,717 | 6,808 | 13,928 | |||||||||
| Other expenses | 245,956 | 11,470 | 20,998 | |||||||||
| Total expenses | 14,607,678 | 1,863,015 | 3,042,256 | |||||||||
| Compensating balance credits | (3,065 | ) | (509 | ) | (1,007 | ) | ||||||
| Expenses reimbursed by investment adviser | (50,892 | ) | (114,920 | ) | (128,101 | ) | ||||||
| Net expenses | 14,553,721 | 1,747,586 | 2,913,148 | |||||||||
| Net investment income (loss) | 9,690,626 | 615,800 | (2,357,212 | ) | ||||||||
| REALIZED AND UNREALIZED GAIN (LOSS) ON INVESTMENTS AND FOREIGN CURRENCY: | ||||||||||||
| NET REALIZED GAIN (LOSS): | ||||||||||||
| Investments in Non-Affiliated Companies | 96,740,631 | 3,877,777 | (20,961,832 | ) | ||||||||
| Investments in Affiliated Companies | (18,861,548 | ) | – | – | ||||||||
| Foreign currency transactions | 198,794 | – | 19,371 | |||||||||
| NET CHANGE IN UNREALIZED APPRECIATION (DEPRECIATION): | ||||||||||||
| Investments in Non-Affiliated Companies | (276,430,976 | ) | (18,825,234 | ) | (71,120,031 | ) | ||||||
| Investments in Affiliated Companies | 12,712,215 | – | – | |||||||||
| Other assets and liabilities denominated in foreign currency | (3,402 | ) | – | – | ||||||||
| Net realized and unrealized gain (loss) on investments and foreign currency | (185,644,286 | ) | (14,947,457 | ) | (92,062,492 | ) | ||||||
| NET INCREASE (DECREASE) IN NET ASSETS FROM INVESTMENT OPERATIONS | $ | (175,953,660 | ) | $ | (14,331,657 | ) | $ | (94,419,704 | ) | |||
| 56 | The Royce Funds 2022 Annual Report to Shareholders | THE ACCOMPANYING NOTES ARE AN INTEGRAL PART OF THESE FINANCIAL STATEMENTS |
Statements of Changes in Net Assets
| Royce Global Financial | ||||||||||||||||||||||||
| Royce Dividend Value Fund | Services Fund | Royce International Premier Fund | ||||||||||||||||||||||
| Year Ended 12/31/22 | Year Ended 12/31/21 | Year Ended 12/31/22 | Year Ended 12/31/21 | Year Ended 12/31/22 | Year Ended 12/31/21 | |||||||||||||||||||
| INVESTMENT OPERATIONS: | ||||||||||||||||||||||||
| Net investment income (loss) | $ | 449,227 | $ | 529,141 | $ | 214,633 | $ | 744,041 | $ | 8,874,179 | $ | 4,563,554 | ||||||||||||
| Net realized gain (loss) on investments and foreign currency | 350,360 | 7,611,984 | (324,504 | ) | 1,050,527 | (31,109,554 | ) | 112,803,814 | ||||||||||||||||
| Net change in unrealized appreciation (depreciation) on investments and foreign currency | (11,012,658 | ) | 5,963,833 | (7,294,143 | ) | 5,109,397 | (312,277,825 | ) | (44,640,890 | ) | ||||||||||||||
| Net increase (decrease) in net assets from investment operations | (10,213,071 | ) | 14,104,958 | (7,404,014 | ) | 6,903,965 | (334,513,200 | ) | 72,726,478 | |||||||||||||||
| DISTRIBUTIONS: | ||||||||||||||||||||||||
| Total distributable earnings | ||||||||||||||||||||||||
| Investment Class | (459,825 | ) | (7,025,655 | ) | (9,009,895 | ) | (22,789,281 | ) | ||||||||||||||||
| Service Class | (84,861 | ) | (2,453,636 | ) | (399,279 | ) | (1,668,236 | ) | (1,026,583 | ) | (2,605,039 | ) | ||||||||||||
| Consultant Class | (3,174 | ) | (163,702 | ) | (126,023 | ) | (367,166 | ) | ||||||||||||||||
| Institutional Class | (4,561 | ) | (122,395 | ) | (136,659 | ) | (490,070 | ) | (17,241,958 | ) | (34,239,175 | ) | ||||||||||||
| Total distributions | (552,421 | ) | (9,765,388 | ) | (535,938 | ) | (2,158,306 | ) | (27,404,459 | ) | (60,000,661 | ) | ||||||||||||
| CAPITAL SHARE TRANSACTIONS: | ||||||||||||||||||||||||
| Net capital share transactions | ||||||||||||||||||||||||
| Investment Class | (3,483,571 | ) | (2,013,993 | ) | (96,556,648 | ) | (12,468,633 | ) | ||||||||||||||||
| Service Class | (2,803,992 | ) | (1,344,558 | ) | (3,264,882 | ) | (1,005,797 | ) | (9,925,065 | ) | (11,025,900 | ) | ||||||||||||
| Consultant Class | 467,815 | 69,045 | (1,238,324 | ) | (896,223 | ) | ||||||||||||||||||
| Institutional Class | (686,375 | ) | 137,821 | (144,030 | ) | 876,025 | (43,429,085 | ) | 132,006,580 | |||||||||||||||
| Shareholder redemption fees | ||||||||||||||||||||||||
| Investment Class | 73 | 154 | 24,429 | 7,525 | ||||||||||||||||||||
| Service Class | – | 4 | 3 | 2,234 | 77 | 1,675 | ||||||||||||||||||
| Net increase (decrease) in net assets from capital share transactions | (6,506,050 | ) | (3,151,527 | ) | (3,408,909 | ) | (127,538 | ) | (151,124,616 | ) | 107,625,024 | |||||||||||||
| Net Increase (Decrease) In Net Assets | (17,271,542 | ) | 1,188,043 | (11,348,861 | ) | 4,618,121 | (513,042,275 | ) | 120,350,841 | |||||||||||||||
| NET ASSETS: | ||||||||||||||||||||||||
| Beginning of year | 76,299,861 | 75,111,818 | 38,283,240 | 33,665,119 | 1,252,941,855 | 1,132,591,014 | ||||||||||||||||||
| End of year | $ | 59,028,319 | $ | 76,299,861 | $ | 26,934,379 | $ | 38,283,240 | $ | 739,899,580 | $ | 1,252,941,855 | ||||||||||||
| THE ACCOMPANYING NOTES ARE AN INTEGRAL PART OF THESE FINANCIAL STATEMENTS | The Royce Funds 2022 Annual Report to Shareholders | 57 |
Statements of Changes in Net Assets
| Royce Micro-Cap Fund | Royce Pennsylvania Mutual Fund | Royce Premier Fund | ||||||||||||||||||||||
| Year Ended 12/31/22 | Year Ended 12/31/21 | Year Ended 12/31/22 | Year Ended 12/31/21 | Year Ended 12/31/22 | Year Ended 12/31/21 | |||||||||||||||||||
| INVESTMENT OPERATIONS: | ||||||||||||||||||||||||
| Net investment income (loss) | $ | (2,107,683 | ) | $ | (2,524,821 | ) | $ | 3,079,768 | $ | 374,058 | $ | (416,685 | ) | $ | (3,517,815 | ) | ||||||||
| Net realized gain (loss) on investments and foreign currency | 1,594,469 | 90,610,373 | 25,462,152 | 514,781,507 | 93,957,652 | 310,335,119 | ||||||||||||||||||
| Net change in unrealized appreciation (depreciation) on investments and foreign currency | (93,507,037 | ) | 16,728,861 | (394,795,614 | ) | (102,219,678 | ) | (357,293,399 | ) | (36,690,666 | ) | |||||||||||||
| Net increase (decrease) in net assets from investment operations | (94,020,251 | ) | 104,814,413 | (366,253,694 | ) | 412,935,887 | (263,752,432 | ) | 270,126,638 | |||||||||||||||
| DISTRIBUTIONS: | ||||||||||||||||||||||||
| Total distributable earnings | ||||||||||||||||||||||||
| Investment Class | (7,366,380 | ) | (40,188,397 | ) | (59,541,547 | ) | (359,795,213 | ) | (84,853,039 | ) | (254,117,355 | ) | ||||||||||||
| Service Class | (6,478,764 | ) | (37,503,482 | ) | (2,986,880 | ) | (18,850,717 | ) | (2,108,066 | ) | (6,510,568 | ) | ||||||||||||
| Consultant Class | (509,147 | ) | (3,014,349 | ) | (8,814,162 | ) | (55,761,614 | ) | (947,447 | ) | (2,839,443 | ) | ||||||||||||
| Institutional Class | (6,715,538 | ) | (43,586,641 | ) | (17,404,485 | ) | (48,578,890 | ) | ||||||||||||||||
| R Class | (345,932 | ) | (2,135,655 | ) | (509,268 | ) | (1,430,819 | ) | ||||||||||||||||
| Total distributions | (14,354,291 | ) | (80,706,228 | ) | (78,404,059 | ) | (480,129,840 | ) | (105,822,305 | ) | (313,477,075 | ) | ||||||||||||
| CAPITAL SHARE TRANSACTIONS: | ||||||||||||||||||||||||
| Net capital share transactions | ||||||||||||||||||||||||
| Investment Class | (5,409,081 | ) | 23,749,676 | (82,899,142 | ) | 229,480,577 | (102,448,486 | ) | 20,274,064 | |||||||||||||||
| Service Class | (14,429,642 | ) | 16,625,148 | (8,699,031 | ) | 5,763,904 | (3,824,328 | ) | 8,433,761 | |||||||||||||||
| Consultant Class | (1,259,829 | ) | 765,475 | (21,132,136 | ) | 19,154,129 | (1,226,087 | ) | 895,780 | |||||||||||||||
| Institutional Class | (24,377,993 | ) | 43,861,946 | (7,385,423 | ) | 14,733,388 | ||||||||||||||||||
| R Class | (377,644 | ) | 1,818,834 | (158,880 | ) | (1,206,906 | ) | |||||||||||||||||
| Shareholder redemption fees | ||||||||||||||||||||||||
| Investment Class | 2,824 | 851 | 532 | 1,394 | 646 | 797 | ||||||||||||||||||
| Service Class | 586 | 39 | 37 | 11,839 | 245 | 2 | ||||||||||||||||||
| Net increase (decrease) in net assets from capital share transactions | (21,095,142 | ) | 41,141,189 | (137,485,377 | ) | 300,092,623 | (115,042,313 | ) | 43,130,886 | |||||||||||||||
| Net Increase (Decrease) In Net Assets | (129,469,684 | ) | 65,249,374 | (582,143,130 | ) | 232,898,670 | (484,617,050 | ) | (219,551 | ) | ||||||||||||||
| NET ASSETS: | ||||||||||||||||||||||||
| Beginning of year | 421,898,040 | 356,648,666 | 2,148,820,093 | 1,915,921,423 | 1,735,777,068 | 1,735,996,619 | ||||||||||||||||||
| End of year | $ | 292,428,356 | $ | 421,898,040 | $ | 1,566,676,963 | $ | 2,148,820,093 | $ | 1,251,160,018 | $ | 1,735,777,068 | ||||||||||||
| 58 | The Royce Funds 2022 Annual Report to Shareholders | THE ACCOMPANYING NOTES ARE AN INTEGRAL PART OF THESE FINANCIAL STATEMENTS |
| Royce Small-Cap Opportunity Fund | Royce Small-Cap Special Equity Fund | Royce Small-Cap Total Return Fund | ||||||||||||||||||||||
| Year Ended 12/31/22 | Year Ended 12/31/21 | Year Ended 12/31/22 | Year Ended 12/31/21 | Year Ended 12/31/22 | Year Ended 12/31/21 | |||||||||||||||||||
| INVESTMENT OPERATIONS: | ||||||||||||||||||||||||
| Net investment income (loss) | $ | 153,538 | $ | (6,255,416 | ) | $ | 8,460,718 | $ | 8,728,848 | $ | 9,690,626 | $ | 15,178,871 | |||||||||||
| Net realized gain (loss) on investments and foreign currency | 473,845 | 410,541,948 | 43,215,219 | 180,557,276 | 78,077,877 | 394,147,843 | ||||||||||||||||||
| Net change in unrealized appreciation (depreciation) | ||||||||||||||||||||||||
| on investments and foreign currency | (301,654,969 | ) | 28,335,835 | (119,148,828 | ) | 23,728,401 | (263,722,163 | ) | (75,267,763 | ) | ||||||||||||||
| Net increase (decrease) in net assets from investment operations | (301,027,586 | ) | 432,622,367 | (67,472,891 | ) | 213,014,525 | (175,953,660 | ) | 334,058,951 | |||||||||||||||
| DISTRIBUTIONS: | ||||||||||||||||||||||||
| Total distributable earnings | ||||||||||||||||||||||||
| Investment Class | (45,279,449 | ) | (253,497,536 | ) | (67,152,279 | ) | (110,703,898 | ) | (84,408,846 | ) | (260,605,655 | ) | ||||||||||||
| Service Class | (3,382,755 | ) | (20,814,959 | ) | (3,804,020 | ) | (8,484,724 | ) | (7,882,450 | ) | (19,720,772 | ) | ||||||||||||
| Consultant Class | (558,361 | ) | (2,744,573 | ) | (1,537,324 | ) | (3,392,907 | ) | (10,861,139 | ) | (28,195,237 | ) | ||||||||||||
| Institutional Class | (10,695,245 | ) | (69,978,355 | ) | (13,788,855 | ) | (34,779,856 | ) | (25,579,974 | ) | (70,461,595 | ) | ||||||||||||
| R Class | (1,917,058 | ) | (9,575,942 | ) | (2,507,527 | ) | (6,650,410 | ) | ||||||||||||||||
| Total distributions | (61,832,868 | ) | (356,611,365 | ) | (86,282,478 | ) | (157,361,385 | ) | (131,239,936 | ) | (385,633,669 | ) | ||||||||||||
| CAPITAL SHARE TRANSACTIONS: | ||||||||||||||||||||||||
| Net capital share transactions | ||||||||||||||||||||||||
| Investment Class | (151,490,562 | ) | 525,739,965 | (52,903,109 | ) | 9,907,666 | (227,485,345 | ) | 154,834,034 | |||||||||||||||
| Service Class | (20,199,622 | ) | (41,632,774 | ) | (14,674,150 | ) | 9,185,477 | (3,697,202 | ) | 13,568,408 | ||||||||||||||
| Consultant Class | (322,670 | ) | 238,523 | (6,601,167 | ) | 5,591,804 | (1,904,964 | ) | 4,839,213 | |||||||||||||||
| Institutional Class | (18,386,325 | ) | (83,562,703 | ) | (95,455,503 | ) | 33,619,039 | (38,430,721 | ) | 85,362,325 | ||||||||||||||
| R Class | (1,746,516 | ) | 14,012,071 | (893,138 | ) | (3,336,971 | ) | |||||||||||||||||
| Shareholder redemption fees | ||||||||||||||||||||||||
| Investment Class | 30,160 | 32,624 | 844 | 3,575 | 724 | 2,371 | ||||||||||||||||||
| Service Class | 2,437 | 25,893 | 214 | 3,095 | 24 | 2,104 | ||||||||||||||||||
| Net increase (decrease) in net assets from capital share transactions | (192,113,098 | ) | 414,853,599 | (169,632,871 | ) | 58,310,656 | (272,410,622 | ) | 255,271,484 | |||||||||||||||
| Net Increase (Decrease) In Net Assets | (554,973,552 | ) | 490,864,601 | (323,388,240 | ) | 113,963,796 | (579,604,218 | ) | 203,696,766 | |||||||||||||||
| NET ASSETS: | ||||||||||||||||||||||||
| Beginning of year | 1,799,858,429 | 1,308,993,828 | 1,076,953,719 | 962,989,923 | 1,516,008,192 | 1,312,311,426 | ||||||||||||||||||
| End of year | $ | 1,244,884,877 | $ | 1,799,858,429 | $ | 753,565,479 | $ | 1,076,953,719 | $ | 936,403,974 | $ | 1,516,008,192 | ||||||||||||
| THE ACCOMPANYING NOTES ARE AN INTEGRAL PART OF THESE FINANCIAL STATEMENTS | The Royce Funds 2022 Annual Report to Shareholders | 59 |
Statements of Changes in Net Assets
| Royce Smaller-Companies | ||||||||||||||||
| Royce Small-Cap Value Fund | Growth Fund | |||||||||||||||
| Year Ended 12/31/22 | Year Ended 12/31/21 | Year Ended 12/31/22 | Year Ended 12/31/21 | |||||||||||||
| INVESTMENT OPERATIONS: | ||||||||||||||||
| Net investment income (loss) | $ | 615,800 | $ | (57,611 | ) | $ | (2,357,212 | ) | $ | (3,790,013 | ) | |||||
| Net realized gain (loss) on investments and foreign currency | 3,877,777 | 26,822,412 | (20,942,461 | ) | 63,175,041 | |||||||||||
| Net change in unrealized appreciation (depreciation) on investments and foreign currency | (18,825,234 | ) | 6,630,576 | (71,120,031 | ) | (33,250,563 | ) | |||||||||
| Net increase (decrease) in net assets from investment operations | (14,331,657 | ) | 33,395,377 | (94,419,704 | ) | 26,134,465 | ||||||||||
| DISTRIBUTIONS: | ||||||||||||||||
| Total distributable earnings | ||||||||||||||||
| Investment Class | (2,107,308 | ) | (2,477,475 | ) | (2,603,831 | ) | (27,701,937 | ) | ||||||||
| Service Class | (3,950,446 | ) | (4,508,382 | ) | (4,447,234 | ) | (46,351,836 | ) | ||||||||
| Consultant Class | (175,045 | ) | (272,817 | ) | (183,821 | ) | (1,990,024 | ) | ||||||||
| Institutional Class | (182,340 | ) | (1,864,715 | ) | ||||||||||||
| R Class | (317,866 | ) | (466,939 | ) | ||||||||||||
| Total distributions | (6,550,665 | ) | (7,725,613 | ) | (7,417,226 | ) | (77,908,512 | ) | ||||||||
| CAPITAL SHARE TRANSACTIONS: | ||||||||||||||||
| Net capital share transactions | ||||||||||||||||
| Investment Class | (2,457,198 | ) | 2,304,788 | (8,834,564 | ) | 11,179,225 | ||||||||||
| Service Class | (1,118,738 | ) | (9,385,293 | ) | (12,386,941 | ) | 28,379,873 | |||||||||
| Consultant Class | (1,230,672 | ) | 605,718 | (776,959 | ) | 827,458 | ||||||||||
| Institutional Class | (572,961 | ) | 3,093,038 | |||||||||||||
| R Class | (1,190,060 | ) | (438,074 | ) | ||||||||||||
| Shareholder redemption fees | ||||||||||||||||
| Investment Class | 382 | 103 | 323 | 1,340 | ||||||||||||
| Service Class | 1 | 220 | 426 | 2,633 | ||||||||||||
| Net increase (decrease) in net assets from capital share transactions | (5,996,285 | ) | (6,912,538 | ) | (22,570,676 | ) | 43,483,567 | |||||||||
| Net Increase (Decrease) In Net Assets | (26,878,607 | ) | 18,757,226 | (124,407,606 | ) | (8,290,480 | ) | |||||||||
| NET ASSETS: | ||||||||||||||||
| Beginning of year | 139,822,743 | 121,065,517 | 299,694,137 | 307,984,617 | ||||||||||||
| End of year | $ | 112,944,136 | $ | 139,822,743 | $ | 175,286,531 | $ | 299,694,137 | ||||||||
| 60 | The Royce Funds 2022 Annual Report to Shareholders | THE ACCOMPANYING NOTES ARE AN INTEGRAL PART OF THESE FINANCIAL STATEMENTS |
Financial Highlights
This table is presented to show selected data for a share outstanding throughout each year or other indicated period and to assist shareholders in evaluating a Fund’s performance for the periods presented. Per share amounts have been determined on the basis of the weighted average number of shares outstanding during the period.
| Net Realized and | Distributions | Ratio of Expenses to Average Net Assets | Ratio of | |||||||||||||||||||||||||||||||||||||||||||||||||||||
| Net Asset Value, Beginning of Period | Net Investment Income (Loss) | Unrealized Gain (Loss) on Investments and Foreign Currency | Total from Investment Operations | Distributions from Net Investment Income | from Net Realized Gain on Investments and Foreign Currency | Total Distributions | Net Asset Value, End of Period | Total Return | Net Assets, End of Period (in thousands) | Prior to Fee Waivers, Expense Reimbursements and Balance Credits | Prior to Fee Waivers and Expense Reimbursements | Net of Fee Waivers and Expense Reimbursements | Net Investment Income (Loss) to Average Net Assets | Portfolio Turnover Rate | ||||||||||||||||||||||||||||||||||||||||||
| Royce Dividend Value Fund–Investment Class | ||||||||||||||||||||||||||||||||||||||||||||||||||||||||
| 2022 | $ | 6.40 | $ | 0.04 | $ | (0.90 | ) | $ | (0.86 | ) | $ | (0.05 | ) | $ | (0.01 | ) | $ | (0.06 | ) | $ | 5.48 | (13.45 | )% | $ | 43,264 | 1.27 | % | 1.27 | % | 1.09 | % | 0.80 | % | 3 | % | |||||||||||||||||||||
| 2021 | 6.11 | 0.05 | 1.17 | 1.22 | (0.06 | ) | (0.87 | ) | (0.93 | ) | 6.40 | 20.47 | 54,466 | 1.21 | 1.21 | 1.09 | 0.76 | 0 | ||||||||||||||||||||||||||||||||||||||
| 2020 | 6.21 | 0.07 | 0.20 | 0.27 | (0.11 | ) | (0.26 | ) | (0.37 | ) | 6.11 | 4.57 | 53,421 | 1.26 | 1.26 | 1.09 | 1.27 | 4 | ||||||||||||||||||||||||||||||||||||||
| 2019 | 5.56 | 0.09 | 1.58 | 1.67 | (0.10 | ) | (0.92 | ) | (1.02 | ) | 6.21 | 30.34 | 76,273 | 1.21 | 1.20 | 1.09 | 1.37 | 8 | ||||||||||||||||||||||||||||||||||||||
| 2018 | 7.56 | 0.10 | (1.27 | ) | (1.17 | ) | (0.10 | ) | (0.73 | ) | (0.83 | ) | 5.56 | (16.06 | ) | 88,036 | 1.13 | 1.13 | 1.04 | 1.29 | 13 | |||||||||||||||||||||||||||||||||||
| Royce Dividend Value Fund–Service Class | ||||||||||||||||||||||||||||||||||||||||||||||||||||||||
| 2022 | $ | 6.65 | $ | 0.03 | $ | (0.94 | ) | $ | (0.91 | ) | $ | (0.02 | ) | $ | (0.01 | ) | $ | (0.03 | ) | $ | 5.71 | (13.62 | )% | $ | 14,005 | 1.62 | % | 1.62 | % | 1.34 | % | 0.55 | % | 3 | % | |||||||||||||||||||||
| 2021 | 6.34 | 0.04 | 1.21 | 1.25 | (0.04 | ) | (0.90 | ) | (0.94 | ) | 6.65 | 20.11 | 19,518 | 1.54 | 1.54 | 1.34 | 0.51 | 0 | ||||||||||||||||||||||||||||||||||||||
| 2020 | 6.42 | 0.06 | 0.21 | 0.27 | (0.08 | ) | (0.27 | ) | (0.35 | ) | 6.34 | 4.47 | 19,687 | 1.60 | 1.60 | 1.34 | 1.02 | 4 | ||||||||||||||||||||||||||||||||||||||
| 2019 | 5.73 | 0.08 | 1.61 | 1.69 | (0.06 | ) | (0.94 | ) | (1.00 | ) | 6.42 | 29.78 | 25,256 | 1.53 | 1.52 | 1.34 | 1.14 | 8 | ||||||||||||||||||||||||||||||||||||||
| 2018 | 7.76 | 0.07 | (1.29 | ) | (1.22 | ) | (0.06 | ) | (0.75 | ) | (0.81 | ) | 5.73 | (16.24 | ) | 28,120 | 1.43 | 1.43 | 1.34 | 1.01 | 13 | |||||||||||||||||||||||||||||||||||
| Royce Dividend Value Fund–Consultant Class | ||||||||||||||||||||||||||||||||||||||||||||||||||||||||
| 2022 | $ | 7.61 | $ | (0.01 | ) | $ | (1.08 | ) | $ | (1.09 | ) | $ | – | $ | (0.01 | ) | $ | (0.01 | ) | $ | 6.51 | (14.27 | )% | $ | 1,627 | 3.64 | % | 3.64 | % | 2.09 | % | (0.18 | )% | 3 | % | |||||||||||||||||||||
| 2021 | 7.27 | (0.02 | ) | 1.39 | 1.37 | – | (1.03 | ) | (1.03 | ) | 7.61 | 19.28 | 1,364 | 3.47 | 3.47 | 2.09 | (0.23 | ) | 0 | |||||||||||||||||||||||||||||||||||||
| 2020 | 7.33 | 0.02 | 0.23 | 0.25 | (0.01 | ) | (0.30 | ) | (0.31 | ) | 7.27 | 3.55 | 1,228 | 3.32 | 3.32 | 2.09 | 0.30 | 4 | ||||||||||||||||||||||||||||||||||||||
| 2019 | 6.53 | 0.03 | 1.85 | 1.88 | (0.01 | ) | (1.07 | ) | (1.08 | ) | 7.33 | 29.03 | 1,621 | 3.30 | 3.29 | 2.09 | 0.40 | 8 | ||||||||||||||||||||||||||||||||||||||
| 2018 | 8.87 | 0.02 | (1.48 | ) | (1.46 | ) | (0.03 | ) | (0.85 | ) | (0.88 | ) | 6.53 | (16.93 | ) | 1,349 | 3.44 | 3.44 | 2.09 | 0.24 | 13 | |||||||||||||||||||||||||||||||||||
| Royce Dividend Value Fund–Institutional Class | ||||||||||||||||||||||||||||||||||||||||||||||||||||||||
| 2022 | $ | 6.29 | $ | 0.04 | $ | (0.89 | ) | $ | (0.85 | ) | $ | (0.04 | ) | $ | (0.01 | ) | $ | (0.05 | ) | $ | 5.39 | (13.48 | )% | $ | 132 | 4.33 | % | 4.33 | % | 1.09 | % | 0.73 | % | 3 | % | |||||||||||||||||||||
| 2021 | 6.02 | 0.05 | 1.14 | 1.19 | (0.06 | ) | (0.86 | ) | (0.92 | ) | 6.29 | 20.18 | 952 | 3.02 | 3.02 | 1.09 | 0.78 | 0 | ||||||||||||||||||||||||||||||||||||||
| 2020 | 6.10 | 0.07 | 0.21 | 0.28 | (0.11 | ) | (0.25 | ) | (0.36 | ) | 6.02 | 4.82 | 776 | 3.75 | 3.75 | 1.09 | 1.27 | 4 | ||||||||||||||||||||||||||||||||||||||
| 2019 | 5.48 | 0.15 | 1.48 | 1.63 | (0.11 | ) | (0.90 | ) | (1.01 | ) | 6.10 | 30.08 | 883 | 1.98 | 1.98 | 0.97 | 1.62 | 8 | ||||||||||||||||||||||||||||||||||||||
| 2018 | 7.46 | 0.09 | (1.23 | ) | (1.14 | ) | (0.12 | ) | (0.72 | ) | (0.84 | ) | 5.48 | (15.94 | ) | 3,016 | 1.89 | 1.89 | 0.89 | 1.28 | 13 | |||||||||||||||||||||||||||||||||||
| Royce Global Financial Services Fund–Service Class | ||||||||||||||||||||||||||||||||||||||||||||||||||||||||
| 2022 | $ | 12.06 | $ | 0.07 | $ | (2.52 | ) | $ | (2.45 | ) | $ | (0.08 | ) | $ | (0.12 | ) | $ | (0.20 | ) | $ | 9.41 | (20.32 | )% | $ | 19,443 | 1.90 | % | 1.90 | % | 1.49 | % | 0.71 | % | 10 | % | |||||||||||||||||||||
| 2021 | 10.66 | 0.23 | 1 | 1.91 | 2.14 | (0.39 | ) | (0.35 | ) | (0.74 | ) | 12.06 | 20.27 | 28,574 | 1.78 | 1.78 | 1.49 | 1.84 | 1 | 5 | ||||||||||||||||||||||||||||||||||||
| 2020 | 9.91 | 0.07 | 1.42 | 1.49 | (0.04 | ) | (0.70 | ) | (0.74 | ) | 10.66 | 15.25 | 25,919 | 1.88 | 1.88 | 1.49 | 0.80 | 4 | ||||||||||||||||||||||||||||||||||||||
| 2019 | 8.18 | 0.10 | 1.87 | 1.97 | (0.15 | ) | (0.09 | ) | (0.24 | ) | 9.91 | 24.17 | 30,202 | 1.82 | 1.81 | 1.49 | 0.86 | 5 | ||||||||||||||||||||||||||||||||||||||
| 2018 | 10.57 | 0.07 | (1.45 | ) | (1.38 | ) | (0.09 | ) | (0.92 | ) | (1.01 | ) | 8.18 | (13.41 | ) | 32,113 | 1.68 | 1.68 | 1.49 | 0.61 | 8 | |||||||||||||||||||||||||||||||||||
| Royce Global Financial Services Fund–Institutional Class | ||||||||||||||||||||||||||||||||||||||||||||||||||||||||
| 2022 | $ | 15.76 | $ | 0.10 | $ | (3.31 | ) | $ | (3.21 | ) | $ | (0.08 | ) | $ | (0.15 | ) | $ | (0.23 | ) | $ | 12.32 | (20.35 | )% | $ | 7,491 | 1.64 | % | 1.64 | % | 1.49 | % | 0.72 | % | 10 | % | |||||||||||||||||||||
| 2021 | 13.81 | 0.32 | 1 | 2.47 | 2.79 | (0.39 | ) | (0.45 | ) | (0.84 | ) | 15.76 | 20.35 | 9,709 | 1.51 | 1.51 | 1.49 | 1.98 | 1 | 5 | ||||||||||||||||||||||||||||||||||||
| 2020 | 12.83 | 0.10 | 1.82 | 1.92 | (0.04 | ) | (0.90 | ) | (0.94 | ) | 13.81 | 15.18 | 7,746 | 1.67 | 1.67 | 1.49 | 0.81 | 4 | ||||||||||||||||||||||||||||||||||||||
| 2019 | 10.55 | 0.14 | 2.42 | 2.56 | (0.16 | ) | (0.12 | ) | (0.28 | ) | 12.83 | 24.35 | 6,738 | 1.60 | 1.60 | 1.33 | 1.04 | 5 | ||||||||||||||||||||||||||||||||||||||
| 2018 | 13.58 | 0.15 | (1.85 | ) | (1.70 | ) | (0.14 | ) | (1.19 | ) | (1.33 | ) | 10.55 | (12.87 | ) | 6,951 | 1.43 | 1.43 | 1.04 | 1.06 | 8 | |||||||||||||||||||||||||||||||||||
1 For Royce Global Financial Services Fund, a special distribution from ECN Capital resulted in an increase in net investment income (loss) per share of $0.12 and an increase in the ratio of net investment income (loss) to average net assets of 1.00% for the Service Class, and $0.18 per share and 1.14% for the Institutional Class.
| THE ACCOMPANYING NOTES ARE AN INTEGRAL PART OF THESE FINANCIAL STATEMENTS | The Royce Funds 2022 Annual Report to Shareholders | 61 |
Financial Highlights
This table is presented to show selected data for a share outstanding throughout each year or other indicated period and to assist shareholders in evaluating a Fund’s performance for the periods presented. Per share amounts have been determined on the basis of the weighted average number of shares outstanding during the period.
| Net Realized and | Distributions | Ratio of Expenses to Average Net Assets | Ratio of | |||||||||||||||||||||||||||||||||||||||||||||||||||||
| Net Asset Value, Beginning of Period | Net Investment Income (Loss) | Unrealized Gain (Loss) on Investments and Foreign Currency | Total from Investment Operations | Distributions from Net Investment Income | from Net Realized Gain on Investments and Foreign Currency | Total Distributions | Net Asset Value, End of Period | Total Return | Net Assets, End of Period (in thousands) | Prior to Fee Waivers, Expense Reimbursements and Balance Credits | Prior to Fee Waivers and Expense Reimbursements | Net of Fee Waivers and Expense Reimbursements | Net Investment Income (Loss) to Average Net Assets | Portfolio Turnover Rate | ||||||||||||||||||||||||||||||||||||||||||
| Royce International Premier Fund–Investment Class | ||||||||||||||||||||||||||||||||||||||||||||||||||||||||
| 2022 | $ | 17.81 | $ | 0.13 | $ | (4.94 | ) | $ | (4.81 | ) | $ | (0.13 | ) | $ | (0.33 | ) | $ | (0.46 | ) | $ | 12.54 | (26.96 | )% | $ | 248,170 | 1.26 | % | 1.26 | % | 1.17 | % | 0.95 | % | 31 | % | |||||||||||||||||||||
| 2021 | 17.64 | 0.06 | 0.99 | 1.05 | (0.07 | ) | (0.81 | ) | (0.88 | ) | 17.81 | 6.06 | 480,550 | 1.23 | 1.23 | 1.16 | 0.33 | 32 | ||||||||||||||||||||||||||||||||||||||
| 2020 | 15.25 | 0.04 | 2.40 | 2.44 | (0.05 | ) | – | (0.05 | ) | 17.64 | 15.99 | 486,378 | 1.26 | 1.26 | 1.19 | 0.30 | 21 | |||||||||||||||||||||||||||||||||||||||
| 2019 | 11.39 | 0.11 | 3.82 | 3.93 | (0.07 | ) | – | (0.07 | ) | 15.25 | 34.49 | 360,623 | 1.26 | 1.26 | 1.18 | 0.74 | 40 | |||||||||||||||||||||||||||||||||||||||
| 2018 | 13.07 | 0.09 | (1.72 | ) | (1.63 | ) | (0.05 | ) | – | (0.05 | ) | 11.39 | (12.45 | ) | 285,065 | 1.27 | 1.26 | 1.16 | 1.00 | 65 | ||||||||||||||||||||||||||||||||||||
| Royce International Premier Fund–Service Class | ||||||||||||||||||||||||||||||||||||||||||||||||||||||||
| 2022 | $ | 21.33 | $ | 0.11 | $ | (5.92 | ) | $ | (5.81 | ) | $ | (0.08 | ) | $ | (0.40 | ) | $ | (0.48 | ) | $ | 15.04 | (27.21 | )% | $ | 33,163 | 1.59 | % | 1.59 | % | 1.44 | % | 0.63 | % | 31 | % | |||||||||||||||||||||
| 2021 | 21.10 | 0.01 | 1.18 | 1.19 | – | (0.96 | ) | (0.96 | ) | 21.33 | 5.78 | 59,258 | 1.54 | 1.54 | 1.44 | 0.05 | 32 | |||||||||||||||||||||||||||||||||||||||
| 2020 | 18.24 | 0.01 | 2.85 | 2.86 | – | – | – | 21.10 | 15.68 | 69,153 | 1.57 | 1.57 | 1.44 | 0.04 | 21 | |||||||||||||||||||||||||||||||||||||||||
| 2019 | 13.61 | 0.10 | 4.57 | 4.67 | (0.04 | ) | – | (0.04 | ) | 18.24 | 34.29 | 71,350 | 1.58 | 1.58 | 1.41 | 0.63 | 40 | |||||||||||||||||||||||||||||||||||||||
| 2018 | 15.60 | 0.11 | (2.10 | ) | (1.99 | ) | – | – | – | 13.61 | (12.76 | ) | 36,303 | 1.59 | 1.59 | 1.44 | 0.71 | 65 | ||||||||||||||||||||||||||||||||||||||
| Royce International Premier Fund–Consultant Class | ||||||||||||||||||||||||||||||||||||||||||||||||||||||||
| 2022 | $ | 22.58 | $ | (0.02 | ) | $ | (6.25 | ) | $ | (6.27 | ) | $ | – | $ | (0.42 | ) | $ | (0.42 | ) | $ | 15.89 | (27.75 | )% | $ | 4,774 | 2.54 | % | 2.54 | % | 2.19 | % | (0.09 | )% | 31 | % | |||||||||||||||||||||
| 2021 | 22.50 | (0.16 | ) | 1.26 | 1.10 | – | (1.02 | ) | (1.02 | ) | 22.58 | 5.02 | 8,419 | 2.38 | 2.38 | 2.19 | (0.69 | ) | 32 | |||||||||||||||||||||||||||||||||||||
| 2020 | 19.60 | (0.13 | ) | 3.03 | 2.90 | – | – | – | 22.50 | 14.80 | 9,182 | 2.42 | 2.41 | 2.19 | (0.70 | ) | 21 | |||||||||||||||||||||||||||||||||||||||
| 2019 | 14.71 | (0.03 | ) | 4.92 | 4.89 | – | – | – | 19.60 | 33.24 | 9,894 | 2.41 | 2.41 | 2.18 | (0.17 | ) | 40 | |||||||||||||||||||||||||||||||||||||||
| 2018 | 16.99 | (0.00 | ) | (2.28 | ) | (2.28 | ) | – | – | – | 14.71 | (13.42 | ) | 8,546 | 2.33 | 2.32 | 2.19 | (0.00 | ) | 65 | ||||||||||||||||||||||||||||||||||||
| Royce International Premier Fund–Institutional Class a | ||||||||||||||||||||||||||||||||||||||||||||||||||||||||
| 2022 | $ | 17.82 | $ | 0.14 | $ | (4.95 | ) | $ | (4.81 | ) | $ | (0.15 | ) | $ | (0.33 | ) | $ | (0.48 | ) | $ | 12.53 | (26.92 | )% | $ | 453,793 | 1.20 | % | 1.19 | % | 1.04 | % | 1.03 | % | 31 | % | |||||||||||||||||||||
| 2021 | 17.64 | 0.08 | 0.99 | 1.07 | (0.09 | ) | (0.80 | ) | (0.89 | ) | 17.82 | 6.23 | 704,714 | 1.16 | 1.16 | 1.04 | 0.44 | 32 | ||||||||||||||||||||||||||||||||||||||
| 2020 | 15.25 | 0.06 | 2.39 | 2.45 | (0.06 | ) | – | (0.06 | ) | 17.64 | 16.12 | 567,878 | 1.20 | 1.20 | 1.04 | 0.44 | 21 | |||||||||||||||||||||||||||||||||||||||
| 2019 | 11.39 | (0.03 | ) | 3.98 | 3.95 | (0.09 | ) | – | (0.09 | ) | 15.25 | 34.68 | 366,870 | 1.19 | 1.19 | 1.04 | 0.57 | 40 | ||||||||||||||||||||||||||||||||||||||
| 2018 | 12.98 | (0.00 | ) | (1.53 | ) | (1.53 | ) | (0.06 | ) | – | (0.06 | ) | 11.39 | (11.78 | )2 | 32,340 | 1.34 | 3 | 1.34 | 3 | 1.04 | 3 | 0.84 | 3 | 65 | |||||||||||||||||||||||||||||||
| Royce Micro-Cap Fund–Investment Class | ||||||||||||||||||||||||||||||||||||||||||||||||||||||||
| 2022 | $ | 13.41 | $ | (0.05 | ) | $ | (2.98 | ) | $ | (3.03 | ) | $ | – | $ | (0.50 | ) | $ | (0.50 | ) | $ | 9.88 | (22.55 | )% | $ | 149,934 | 1.25 | % | 1.24 | % | 1.24 | % | (0.50 | )% | 13 | % | |||||||||||||||||||||
| 2021 | 12.74 | (0.07 | ) | 3.84 | 3.77 | – | (3.10 | ) | (3.10 | ) | 13.41 | 31.02 | 209,032 | 1.20 | 1.20 | 1.20 | (0.43 | ) | 26 | |||||||||||||||||||||||||||||||||||||
| 2020 | 11.02 | (0.05 | ) | 2.71 | 2.66 | – | (0.94 | ) | (0.94 | ) | 12.74 | 24.50 | 174,339 | 1.29 | 1.29 | 1.24 | (0.46 | ) | 25 | |||||||||||||||||||||||||||||||||||||
| 2019 | 9.35 | (0.05 | ) | 2.02 | 1.97 | – | (0.30 | ) | (0.30 | ) | 11.02 | 21.16 | 158,112 | 1.51 | 1.50 | 1.36 | (0.46 | ) | 21 | |||||||||||||||||||||||||||||||||||||
| 2018 | 11.64 | (0.05 | ) | (0.94 | ) | (0.99 | ) | – | (1.30 | ) | (1.30 | ) | 9.35 | (8.94 | ) | 117,040 | 1.50 | 1.50 | 1.49 | (0.43 | ) | 24 | ||||||||||||||||||||||||||||||||||
| Royce Micro-Cap Fund–Service Class | ||||||||||||||||||||||||||||||||||||||||||||||||||||||||
| 2022 | $ | 13.05 | $ | (0.08 | ) | $ | (2.89 | ) | $ | (2.97 | ) | $ | – | $ | (0.49 | ) | $ | (0.49 | ) | $ | 9.59 | (22.76 | )% | $ | 132,133 | 1.54 | % | 1.54 | % | 1.49 | % | (0.75 | )% | 13 | % | |||||||||||||||||||||
| 2021 | 12.45 | (0.11 | ) | 3.74 | 3.63 | – | (3.03 | ) | (3.03 | ) | 13.05 | 30.64 | 197,089 | 1.51 | 1.51 | 1.49 | (0.73 | ) | 26 | |||||||||||||||||||||||||||||||||||||
| 2020 | 10.79 | (0.07 | ) | 2.65 | 2.58 | – | (0.92 | ) | (0.92 | ) | 12.45 | 24.26 | 168,285 | 1.60 | 1.60 | 1.49 | (0.71 | ) | 25 | |||||||||||||||||||||||||||||||||||||
| 2019 | 9.15 | (0.01 | ) | 1.94 | 1.93 | – | (0.29 | ) | (0.29 | ) | 10.79 | 21.22 | 164,956 | 1.51 | 1.51 | 1.50 | (0.09 | ) | 21 | |||||||||||||||||||||||||||||||||||||
| 2018 | 11.41 | (0.07 | ) | (0.91 | ) | (0.98 | ) | – | (1.28 | ) | (1.28 | ) | 9.15 | (9.09 | ) | 8,053 | 1.90 | 1.89 | 1.61 | (0.56 | ) | 24 | ||||||||||||||||||||||||||||||||||
a The Class commenced operations on May 2, 2018.
| 62 | The Royce Funds 2022 Annual Report to Shareholders | THE ACCOMPANYING NOTES ARE AN INTEGRAL PART OF THESE FINANCIAL STATEMENTS |
Financial Highlights
This table is presented to show selected data for a share outstanding throughout each year or other indicated period and to assist shareholders in evaluating a Fund’s performance for the periods presented. Per share amounts have been determined on the basis of the weighted average number of shares outstanding during the period.
| Net Realized and | Distributions | Ratio of Expenses to Average Net Assets | Ratio of | |||||||||||||||||||||||||||||||||||||||||||||||||||||
| Net Asset Value, Beginning of Period | Net Investment Income (Loss) | Unrealized Gain (Loss) on Investments and Foreign Currency | Total from Investment Operations | Distributions from Net Investment Income | from Net Realized Gain on Investments and Foreign Currency | Total Distributions | Net Asset Value, End of Period | Total Return | Net Assets, End of Period (in thousands) | Prior to Fee Waivers, Expense Reimbursements and Balance Credits | Prior to Fee Waivers and Expense Reimbursements | Net of Fee Waivers and Expense Reimbursements | Net Investment Income (Loss) to Average Net Assets | Portfolio Turnover Rate | ||||||||||||||||||||||||||||||||||||||||||
| Royce Micro-Cap Fund–Consultant Class | ||||||||||||||||||||||||||||||||||||||||||||||||||||||||
| 2022 | $ | 10.00 | $ | (0.13 | ) | $ | (2.21 | ) | $ | (2.34 | ) | $ | – | $ | (0.37 | ) | $ | (0.37 | ) | $ | 7.29 | (23.37 | )% | $ | 10,361 | 2.37 | % | 2.37 | % | 2.37 | % | (1.63 | )% | 13 | % | |||||||||||||||||||||
| 2021 | 9.62 | (0.18 | ) | 2.89 | 2.71 | – | (2.33 | ) | (2.33 | ) | 10.00 | 29.56 | 15,777 | 2.30 | 2.30 | 2.30 | (1.53 | ) | 26 | |||||||||||||||||||||||||||||||||||||
| 2020 | 8.42 | (0.13 | ) | 2.04 | 1.91 | – | (0.71 | ) | (0.71 | ) | 9.62 | 23.04 | 14,025 | 2.41 | 2.41 | 2.41 | (1.63 | ) | 25 | |||||||||||||||||||||||||||||||||||||
| 2019 | 7.23 | (0.13 | ) | 1.55 | 1.42 | – | (0.23 | ) | (0.23 | ) | 8.42 | 19.72 | 14,204 | 2.59 | 2.59 | 2.58 | (1.69 | ) | 21 | |||||||||||||||||||||||||||||||||||||
| 2018 | 9.10 | (0.14 | ) | (0.72 | ) | (0.86 | ) | – | (1.01 | ) | (1.01 | ) | 7.23 | (9.93 | ) | 16,680 | 2.56 | 2.56 | 2.56 | (1.50 | ) | 24 | ||||||||||||||||||||||||||||||||||
| Royce Pennsylvania Mutual Fund–Investment Class | ||||||||||||||||||||||||||||||||||||||||||||||||||||||||
| 2022 | $ | 9.65 | $ | 0.03 | $ | (1.68 | ) | $ | (1.65 | ) | $ | (0.00 | ) | $ | (0.39 | ) | $ | (0.39 | ) | $ | 7.61 | (17.06 | )% | $ | 1,191,941 | 0.94 | % | 0.94 | % | 0.94 | % | 0.31 | % | 45 | % | |||||||||||||||||||||
| 2021 | 10.24 | 0.02 | 2.11 | 2.13 | (0.01 | ) | (2.71 | ) | (2.72 | ) | 9.65 | 22.05 | 1,605,587 | 0.91 | 0.91 | 0.91 | 0.15 | 60 | ||||||||||||||||||||||||||||||||||||||
| 2020 | 9.44 | 0.03 | 1.29 | 1.32 | (0.06 | ) | (0.46 | ) | (0.52 | ) | 10.24 | 14.08 | 1,426,472 | 0.95 | 0.95 | 0.95 | 0.37 | 32 | ||||||||||||||||||||||||||||||||||||||
| 2019 | 7.75 | 0.04 | 2.01 | 2.05 | (0.02 | ) | (0.34 | ) | (0.36 | ) | 9.44 | 26.56 | 1,429,042 | 0.95 | 0.94 | 0.94 | 0.39 | 30 | ||||||||||||||||||||||||||||||||||||||
| 2018 | 10.52 | 0.04 | (0.97 | ) | (0.93 | ) | (0.02 | ) | (1.82 | ) | (1.84 | ) | 7.75 | (9.66 | ) | 1,203,967 | 0.92 | 0.92 | 0.92 | 0.33 | 35 | |||||||||||||||||||||||||||||||||||
| Royce Pennsylvania Mutual Fund–Service Class | ||||||||||||||||||||||||||||||||||||||||||||||||||||||||
| 2022 | $ | 9.62 | $ | (0.00 | ) | $ | (1.67 | ) | $ | (1.67 | ) | $ | – | $ | (0.39 | ) | $ | (0.39 | ) | $ | 7.56 | (17.41 | )% | $ | 58,043 | 1.30 | % | 1.30 | % | 1.25 | % | (0.01 | )% | 45 | % | |||||||||||||||||||||
| 2021 | 10.23 | (0.02 | ) | 2.11 | 2.09 | – | (2.70 | ) | (2.70 | ) | 9.62 | 21.64 | 84,060 | 1.27 | 1.27 | 1.27 | (0.22 | ) | 60 | |||||||||||||||||||||||||||||||||||||
| 2020 | 9.42 | 0.02 | 1.28 | 1.30 | (0.03 | ) | (0.46 | ) | (0.49 | ) | 10.23 | 13.88 | 78,789 | 1.25 | 1.24 | 1.13 | 0.23 | 32 | ||||||||||||||||||||||||||||||||||||||
| 2019 | 7.77 | (0.00 | ) | 2.00 | 2.00 | (0.01 | ) | (0.34 | ) | (0.35 | ) | 9.42 | 25.75 | 142,864 | 1.31 | 1.30 | 1.30 | (0.01 | ) | 30 | ||||||||||||||||||||||||||||||||||||
| 2018 | 10.56 | (0.01 | ) | (0.96 | ) | (0.97 | ) | – | (1.82 | ) | (1.82 | ) | 7.77 | (9.96 | ) | 32,191 | 1.30 | 1.30 | 1.30 | (0.07 | ) | 35 | ||||||||||||||||||||||||||||||||||
| Royce Pennsylvania Mutual Fund–Consultant Class | ||||||||||||||||||||||||||||||||||||||||||||||||||||||||
| 2022 | $ | 7.53 | $ | (0.04 | ) | $ | (1.31 | ) | $ | (1.35 | ) | $ | – | $ | (0.30 | ) | $ | (0.30 | ) | $ | 5.88 | (17.94 | )% | $ | 175,956 | 1.94 | % | 1.94 | % | 1.94 | % | (0.70 | )% | 45 | % | |||||||||||||||||||||
| 2021 | 8.07 | (0.08 | ) | 1.66 | 1.58 | – | (2.12 | ) | (2.12 | ) | 7.53 | 20.78 | 249,816 | 1.92 | 1.92 | 1.92 | (0.86 | ) | 60 | |||||||||||||||||||||||||||||||||||||
| 2020 | 7.47 | (0.04 | ) | 1.00 | 0.96 | – | (0.36 | ) | (0.36 | ) | 8.07 | 12.94 | 238,595 | 1.96 | 1.96 | 1.96 | (0.64 | ) | 32 | |||||||||||||||||||||||||||||||||||||
| 2019 | 6.18 | (0.04 | ) | 1.60 | 1.56 | – | (0.27 | ) | (0.27 | ) | 7.47 | 25.25 | 262,007 | 1.96 | 1.95 | 1.95 | (0.62 | ) | 30 | |||||||||||||||||||||||||||||||||||||
| 2018 | 8.46 | (0.06 | ) | (0.77 | ) | (0.83 | ) | – | (1.45 | ) | (1.45 | ) | 6.18 | (10.56 | ) | 249,004 | 1.93 | 1.93 | 1.93 | (0.69 | ) | 35 | ||||||||||||||||||||||||||||||||||
| Royce Pennsylvania Mutual Fund–Institutional Class | ||||||||||||||||||||||||||||||||||||||||||||||||||||||||
| 2022 | $ | 9.68 | $ | 0.03 | $ | (1.68 | ) | $ | (1.65 | ) | $ | (0.01 | ) | $ | (0.39 | ) | $ | (0.40 | ) | $ | 7.63 | (17.07 | )% | $ | 133,606 | 0.90 | % | 0.90 | % | 0.90 | % | 0.33 | % | 45 | % | |||||||||||||||||||||
| 2021 | 10.27 | 0.03 | 2.12 | 2.15 | (0.01 | ) | (2.73 | ) | (2.74 | ) | 9.68 | 22.10 | 199,842 | 0.86 | 0.86 | 0.86 | 0.21 | 60 | ||||||||||||||||||||||||||||||||||||||
| 2020 | 9.47 | 0.04 | 1.28 | 1.32 | (0.06 | ) | (0.46 | ) | (0.52 | ) | 10.27 | 14.10 | 163,944 | 0.89 | 0.89 | 0.89 | 0.42 | 32 | ||||||||||||||||||||||||||||||||||||||
| 2019 | 7.78 | 0.04 | 2.02 | 2.06 | (0.03 | ) | (0.34 | ) | (0.37 | ) | 9.47 | 26.53 | 106,564 | 0.89 | 0.89 | 0.89 | 0.45 | 30 | ||||||||||||||||||||||||||||||||||||||
| 2018 | 10.55 | 0.04 | (0.97 | ) | (0.93 | ) | (0.02 | ) | (1.82 | ) | (1.84 | ) | 7.78 | (9.56 | ) | 83,908 | 0.88 | 0.88 | 0.88 | 0.40 | 35 | |||||||||||||||||||||||||||||||||||
| Royce Pennsylvania Mutual Fund–R Class | ||||||||||||||||||||||||||||||||||||||||||||||||||||||||
| 2022 | $ | 8.94 | $ | (0.04 | ) | $ | (1.54 | ) | $ | (1.58 | ) | $ | – | $ | (0.36 | ) | $ | (0.36 | ) | $ | 7.00 | (17.72 | )% | $ | 7,131 | 1.80 | % | 1.80 | % | 1.75 | % | (0.51 | )% | 45 | % | |||||||||||||||||||||
| 2021 | 9.56 | (0.07 | ) | 1.96 | 1.89 | – | (2.51 | ) | (2.51 | ) | 8.94 | 21.00 | 9,515 | 1.73 | 1.73 | 1.73 | (0.66 | ) | 60 | |||||||||||||||||||||||||||||||||||||
| 2020 | 8.84 | (0.04 | ) | 1.19 | 1.15 | – | (0.43 | ) | (0.43 | ) | 9.56 | 13.07 | 8,121 | 1.83 | 1.83 | 1.83 | (0.51 | ) | 32 | |||||||||||||||||||||||||||||||||||||
| 2019 | 7.30 | (0.03 | ) | 1.89 | 1.86 | – | (0.32 | ) | (0.32 | ) | 8.84 | 25.48 | 8,853 | 1.75 | 1.74 | 1.74 | (0.41 | ) | 30 | |||||||||||||||||||||||||||||||||||||
| 2018 | 9.94 | (0.03 | ) | (0.91 | ) | (0.94 | ) | – | (1.70 | ) | (1.70 | ) | 7.30 | (10.15 | ) | 10,014 | 1.58 | 1.57 | 1.57 | (0.34 | ) | 35 | ||||||||||||||||||||||||||||||||||
| THE ACCOMPANYING NOTES ARE AN INTEGRAL PART OF THESE FINANCIAL STATEMENTS | The Royce Funds 2022 Annual Report to Shareholders | 63 |
Financial Highlights
This table is presented to show selected data for a share outstanding throughout each year or other indicated period and to assist shareholders in evaluating a Fund’s performance for the periods presented. Per share amounts have been determined on the basis of the weighted average number of shares outstanding during the period.
| Net Realized and | Distributions | Ratio of Expenses to Average Net Assets | Ratio of | |||||||||||||||||||||||||||||||||||||||||||||||||||||
| Net Asset Value, Beginning of Period | Net Investment Income (Loss) | Unrealized Gain (Loss) on Investments and Foreign Currency | Total from Investment Operations | Distributions from Net Investment Income | from Net Realized Gain on Investments and Foreign Currency | Total Distributions | Net Asset Value, End of Period | Total Return | Net Assets, End of Period (in thousands) | Prior to Fee Waivers, Expense Reimbursements and Balance Credits | Prior to Fee Waivers and Expense Reimbursements | Net of Fee Waivers and Expense Reimbursements | Net Investment Income (Loss) to Average Net Assets | Portfolio Turnover Rate | ||||||||||||||||||||||||||||||||||||||||||
| Royce Premier Fund–Investment Class | ||||||||||||||||||||||||||||||||||||||||||||||||||||||||
| 2022 | $ | 12.97 | $ | (0.00 | ) | $ | (2.00 | ) | $ | (2.00 | ) | $ | – | $ | (0.91 | ) | $ | (0.91 | ) | $ | 10.06 | (15.46 | )% | $ | 1,001,894 | 1.18 | % | 1.18 | % | 1.18 | % | (0.02 | )% | 23 | % | |||||||||||||||||||||
| 2021 | 13.59 | (0.03 | ) | 2.16 | 2.13 | (0.01 | ) | (2.74 | ) | (2.75 | ) | 12.97 | 16.36 | 1,401,347 | 1.17 | 1.17 | 1.17 | (0.19 | ) | 20 | ||||||||||||||||||||||||||||||||||||
| 2020 | 12.88 | 0.05 | 1.41 | 1.46 | (0.12 | ) | (0.63 | ) | (0.75 | ) | 13.59 | 11.50 | 1,414,718 | 1.21 | 1.21 | 1.21 | 0.41 | 23 | ||||||||||||||||||||||||||||||||||||||
| 2019 | 11.62 | 0.05 | 3.87 | 3.92 | (0.05 | ) | (2.61 | ) | (2.66 | ) | 12.88 | 34.13 | 1,505,821 | 1.20 | 1.19 | 1.19 | 0.32 | 19 | ||||||||||||||||||||||||||||||||||||||
| 2018 | 16.60 | 0.02 | (1.60 | ) | (1.58 | ) | (0.01 | ) | (3.39 | ) | (3.40 | ) | 11.62 | (10.40 | ) | 1,398,965 | 1.17 | 1.17 | 1.17 | 0.11 | 23 | |||||||||||||||||||||||||||||||||||
| Royce Premier Fund–Service Class | ||||||||||||||||||||||||||||||||||||||||||||||||||||||||
| 2022 | $ | 12.58 | $ | (0.04 | ) | $ | (1.95 | ) | $ | (1.99 | ) | $ | – | $ | (0.87 | ) | $ | (0.87 | ) | $ | 9.72 | (15.79 | )% | $ | 24,968 | 1.59 | % | 1.59 | % | 1.49 | % | (0.33 | )% | 23 | % | |||||||||||||||||||||
| 2021 | 13.22 | (0.07 | ) | 2.09 | 2.02 | – | (2.66 | ) | (2.66 | ) | 12.58 | 15.98 | 36,488 | 1.56 | 1.56 | 1.49 | (0.50 | ) | 20 | |||||||||||||||||||||||||||||||||||||
| 2020 | 12.54 | 0.01 | 1.37 | 1.38 | (0.09 | ) | (0.61 | ) | (0.70 | ) | 13.22 | 11.16 | 29,588 | 1.57 | 1.57 | 1.49 | 0.12 | 23 | ||||||||||||||||||||||||||||||||||||||
| 2019 | 11.31 | (0.01 | ) | 3.78 | 3.77 | – | (2.54 | ) | (2.54 | ) | 12.54 | 33.65 | 29,696 | 1.57 | 1.57 | 1.46 | (0.06 | ) | 19 | |||||||||||||||||||||||||||||||||||||
| 2018 | 16.15 | (0.03 | ) | (1.55 | ) | (1.58 | ) | – | (3.26 | ) | (3.26 | ) | 11.31 | (10.66 | ) | 41,738 | 1.52 | 1.52 | 1.48 | (0.19 | ) | 23 | ||||||||||||||||||||||||||||||||||
| Royce Premier Fund–Consultant Class | ||||||||||||||||||||||||||||||||||||||||||||||||||||||||
| 2022 | $ | 10.00 | $ | (0.10 | ) | $ | (1.53 | ) | $ | (1.63 | ) | $ | – | $ | (0.70 | ) | $ | (0.70 | ) | $ | 7.67 | (16.36 | )% | $ | 11,265 | 2.33 | % | 2.33 | % | 2.33 | % | (1.17 | )% | 23 | % | |||||||||||||||||||||
| 2021 | 10.60 | (0.15 | ) | 1.67 | 1.52 | – | (2.12 | ) | (2.12 | ) | 10.00 | 15.01 | 16,016 | 2.29 | 2.29 | 2.29 | (1.30 | ) | 20 | |||||||||||||||||||||||||||||||||||||
| 2020 | 10.09 | (0.07 | ) | 1.09 | 1.02 | (0.02 | ) | (0.49 | ) | (0.51 | ) | 10.60 | 10.19 | 15,686 | 2.34 | 2.34 | 2.34 | (0.72 | ) | 23 | ||||||||||||||||||||||||||||||||||||
| 2019 | 9.17 | (0.10 | ) | 3.05 | 2.95 | – | (2.03 | ) | (2.03 | ) | 10.09 | 32.55 | 17,585 | 2.26 | 2.26 | 2.26 | (0.91 | ) | 19 | |||||||||||||||||||||||||||||||||||||
| 2018 | 13.21 | (0.12 | ) | (1.27 | ) | (1.39 | ) | – | (2.65 | ) | (2.65 | ) | 9.17 | (11.41 | ) | 21,370 | 2.21 | 2.21 | 2.21 | (0.93 | ) | 23 | ||||||||||||||||||||||||||||||||||
| Royce Premier Fund–Institutional Class | ||||||||||||||||||||||||||||||||||||||||||||||||||||||||
| 2022 | $ | 13.16 | $ | 0.01 | $ | (2.03 | ) | $ | (2.02 | ) | $ | – | $ | (0.92 | ) | $ | (0.92 | ) | $ | 10.22 | (15.37 | )% | $ | 206,916 | 1.11 | % | 1.11 | % | 1.11 | % | 0.05 | % | 23 | % | ||||||||||||||||||||||
| 2021 | 13.80 | (0.02 | ) | 2.19 | 2.17 | (0.02 | ) | (2.79 | ) | (2.81 | ) | 13.16 | 16.39 | 273,853 | 1.09 | 1.09 | 1.09 | (0.11 | ) | 20 | ||||||||||||||||||||||||||||||||||||
| 2020 | 13.08 | 0.05 | 1.44 | 1.49 | (0.13 | ) | (0.64 | ) | (0.77 | ) | 13.80 | 11.53 | 266,587 | 1.15 | 1.15 | 1.15 | 0.44 | 23 | ||||||||||||||||||||||||||||||||||||||
| 2019 | 11.79 | 0.05 | 3.94 | 3.99 | (0.05 | ) | (2.65 | ) | (2.70 | ) | 13.08 | 34.23 | 244,343 | 1.15 | 1.15 | 1.15 | 0.33 | 19 | ||||||||||||||||||||||||||||||||||||||
| 2018 | 16.82 | 0.03 | (1.63 | ) | (1.60 | ) | (0.02 | ) | (3.41 | ) | (3.43 | ) | 11.79 | (10.41 | ) | 197,697 | 1.12 | 1.12 | 1.12 | 0.16 | 23 | |||||||||||||||||||||||||||||||||||
| Royce Premier Fund–R Class | ||||||||||||||||||||||||||||||||||||||||||||||||||||||||
| 2022 | $ | 11.84 | $ | (0.08 | ) | $ | (1.84 | ) | $ | (1.92 | ) | $ | – | $ | (0.82 | ) | $ | (0.82 | ) | $ | 9.10 | (16.22 | )% | $ | 6,118 | 2.00 | % | 2.00 | % | 1.99 | % | (0.82 | )% | 23 | % | |||||||||||||||||||||
| 2021 | 12.49 | (0.13 | ) | 1.99 | 1.86 | – | (2.51 | ) | (2.51 | ) | 11.84 | 15.51 | 8,073 | 1.93 | 1.93 | 1.93 | (0.95 | ) | 20 | |||||||||||||||||||||||||||||||||||||
| 2020 | 11.86 | (0.04 | ) | 1.29 | 1.25 | (0.04 | ) | (0.58 | ) | (0.62 | ) | 12.49 | 10.64 | 9,418 | 1.95 | 1.95 | 1.95 | (0.33 | ) | 23 | ||||||||||||||||||||||||||||||||||||
| 2019 | 10.73 | (0.05 | ) | 3.57 | 3.52 | – | (2.39 | ) | (2.39 | ) | 11.86 | 33.17 | 10,949 | 1.90 | 1.90 | 1.90 | (0.43 | ) | 19 | |||||||||||||||||||||||||||||||||||||
| 2018 | 15.39 | (0.08 | ) | (1.48 | ) | (1.56 | ) | – | (3.10 | ) | (3.10 | ) | 10.73 | (11.01 | ) | 9,715 | 1.80 | 1.80 | 1.80 | (0.52 | ) | 23 | ||||||||||||||||||||||||||||||||||
| Royce Small-Cap Opportunity Fund–Investment Class | ||||||||||||||||||||||||||||||||||||||||||||||||||||||||
| 2022 | $ | 16.76 | $ | 0.00 | $ | (2.86 | ) | $ | (2.86 | ) | $ | – | $ | (0.68 | ) | $ | (0.68 | ) | $ | 13.22 | (17.08 | )% | $ | 911,802 | 1.23 | % | 1.23 | % | 1.23 | % | 0.03 | % | 35 | % | ||||||||||||||||||||||
| 2021 | 15.84 | (0.06 | ) | 4.75 | 4.69 | – | (3.77 | ) | (3.77 | ) | 16.76 | 30.85 | 1,332,050 | 1.21 | 1.21 | 1.21 | (0.30 | ) | 69 | |||||||||||||||||||||||||||||||||||||
| 2020 | 12.52 | (0.03 | ) | 3.35 | 3.32 | – | – | – | 15.84 | 26.52 | 786,849 | 1.24 | 1.23 | 1.23 | (0.28 | ) | 53 | |||||||||||||||||||||||||||||||||||||||
| 2019 | 9.92 | (0.06 | ) | 2.86 | 2.80 | – | (0.20 | ) | (0.20 | ) | 12.52 | 28.21 | 609,316 | 1.23 | 1.22 | 1.22 | (0.50 | ) | 47 | |||||||||||||||||||||||||||||||||||||
| 2018 | 13.58 | (0.04 | ) | (2.61 | ) | (2.65 | ) | – | (1.01 | ) | (1.01 | ) | 9.92 | (19.97 | ) | 557,003 | 1.20 | 1.20 | 1.20 | (0.30 | ) | 47 | ||||||||||||||||||||||||||||||||||
| 64 | The Royce Funds 2022 Annual Report to Shareholders | THE ACCOMPANYING NOTES ARE AN INTEGRAL PART OF THESE FINANCIAL STATEMENTS |
Financial Highlights
This table is presented to show selected data for a share outstanding throughout each year or other indicated period and to assist shareholders in evaluating a Fund’s performance for the periods presented. Per share amounts have been determined on the basis of the weighted average number of shares outstanding during the period.
| Net Realized and | Distributions | Ratio of Expenses to Average Net Assets | Ratio of | |||||||||||||||||||||||||||||||||||||||||||||||||||||
| Net Asset Value, Beginning of Period | Net Investment Income (Loss) | Unrealized Gain (Loss) on Investments and Foreign Currency | Total from Investment Operations | Distributions from Net Investment Income | from Net Realized Gain on Investments and Foreign Currency | Total Distributions | Net Asset Value, End of Period | Total Return | Net Assets, End of Period (in thousands) | Prior to Fee Waivers, Expense Reimbursements and Balance Credits | Prior to Fee Waivers and Expense Reimbursements | Net of Fee Waivers and Expense Reimbursements | Net Investment Income (Loss) to Average Net Assets | Portfolio Turnover Rate | ||||||||||||||||||||||||||||||||||||||||||
| Royce Small-Cap Opportunity Fund– Service Class | ||||||||||||||||||||||||||||||||||||||||||||||||||||||||
| 2022 | $ | 15.34 | $ | (0.03 | ) | $ | (2.62 | ) | $ | (2.65 | ) | $ | – | $ | (0.62 | ) | $ | (0.62 | ) | $ | 12.07 | (17.28 | )% | $ | 68,292 | 1.54 | % | 1.54 | % | 1.49 | % | (0.23 | )% | 35 | % | |||||||||||||||||||||
| 2021 | 14.66 | (0.11 | ) | 4.39 | 4.28 | – | (3.60 | ) | (3.60 | ) | 15.34 | 30.43 | 109,440 | 1.50 | 1.50 | 1.49 | (0.61 | ) | 69 | |||||||||||||||||||||||||||||||||||||
| 2020 | 11.61 | (0.06 | ) | 3.11 | 3.05 | – | – | – | 14.66 | 26.27 | 131,725 | 1.54 | 1.54 | 1.49 | (0.54 | ) | 53 | |||||||||||||||||||||||||||||||||||||||
| 2019 | 9.23 | (0.09 | ) | 2.65 | 2.56 | – | (0.18 | ) | (0.18 | ) | 11.61 | 27.79 | 46,032 | 1.55 | 1.55 | 1.49 | (0.77 | ) | 47 | |||||||||||||||||||||||||||||||||||||
| 2018 | 12.66 | (0.07 | ) | (2.42 | ) | (2.49 | ) | – | (0.94 | ) | (0.94 | ) | 9.23 | (20.14 | ) | 48,797 | 1.52 | 1.52 | 1.49 | (0.59 | ) | 47 | ||||||||||||||||||||||||||||||||||
| Royce Small-Cap Opportunity Fund– Consultant Class | ||||||||||||||||||||||||||||||||||||||||||||||||||||||||
| 2022 | $ | 13.24 | $ | (0.12 | ) | $ | (2.26 | ) | $ | (2.38 | ) | $ | – | $ | (0.53 | ) | $ | (0.53 | ) | $ | 10.33 | (17.98 | )% | $ | 11,396 | 2.35 | % | 2.35 | % | 2.35 | % | (1.07 | )% | 35 | % | |||||||||||||||||||||
| 2021 | 12.61 | (0.21 | ) | 3.78 | 3.57 | – | (2.94 | ) | (2.94 | ) | 13.24 | 29.46 | 14,871 | 2.26 | 2.26 | 2.26 | (1.35 | ) | 69 | |||||||||||||||||||||||||||||||||||||
| 2020 | 10.09 | (0.14 | ) | 2.66 | 2.52 | – | – | – | 12.61 | 24.98 | 13,477 | 2.45 | 2.45 | 2.45 | (1.50 | ) | 53 | |||||||||||||||||||||||||||||||||||||||
| 2019 | 8.09 | (0.16 | ) | 2.32 | 2.16 | – | (0.16 | ) | (0.16 | ) | 10.09 | 26.70 | 8,621 | 2.41 | 2.41 | 2.41 | (1.67 | ) | 47 | |||||||||||||||||||||||||||||||||||||
| 2018 | 11.19 | (0.16 | ) | (2.12 | ) | (2.28 | ) | – | (0.82 | ) | (0.82 | ) | 8.09 | (20.81 | ) | 9,831 | 2.30 | 2.29 | 2.29 | (1.39 | ) | 47 | ||||||||||||||||||||||||||||||||||
| Royce Small-Cap Opportunity Fund– Institutional Class | ||||||||||||||||||||||||||||||||||||||||||||||||||||||||
| 2022 | $ | 17.21 | $ | 0.02 | $ | (2.94 | ) | $ | (2.92 | ) | $ | – | $ | (0.70 | ) | $ | (0.70 | ) | $ | 13.59 | (16.94 | )% | $ | 214,424 | 1.12 | % | 1.12 | % | 1.12 | % | 0.15 | % | 35 | % | ||||||||||||||||||||||
| 2021 | 16.22 | (0.03 | ) | 4.84 | 4.81 | – | (3.82 | ) | (3.82 | ) | 17.21 | 30.89 | 291,961 | 1.08 | 1.08 | 1.08 | (0.18 | ) | 69 | |||||||||||||||||||||||||||||||||||||
| 2020 | 12.80 | (0.02 | ) | 3.44 | 3.42 | – | – | – | 16.22 | 26.72 | 340,877 | 1.12 | 1.12 | 1.12 | (0.17 | ) | 53 | |||||||||||||||||||||||||||||||||||||||
| 2019 | 10.13 | (0.05 | ) | 2.92 | 2.87 | – | (0.20 | ) | (0.20 | ) | 12.80 | 28.36 | 230,439 | 1.12 | 1.12 | 1.12 | (0.39 | ) | 47 | |||||||||||||||||||||||||||||||||||||
| 2018 | 13.84 | (0.02 | ) | (2.66 | ) | (2.68 | ) | – | (1.03 | ) | (1.03 | ) | 10.13 | (19.83 | ) | 227,261 | 1.08 | 1.08 | 1.08 | (0.17 | ) | 47 | ||||||||||||||||||||||||||||||||||
| Royce Small-Cap Opportunity Fund– R Class | ||||||||||||||||||||||||||||||||||||||||||||||||||||||||
| 2022 | $ | 14.80 | $ | (0.07 | ) | $ | (2.53 | ) | $ | (2.60 | ) | $ | – | $ | (0.59 | ) | $ | (0.59 | ) | $ | 11.61 | (17.54 | )% | $ | 38,971 | 1.85 | % | 1.85 | % | 1.85 | % | (0.57 | )% | 35 | % | |||||||||||||||||||||
| 2021 | 14.03 | (0.16 | ) | 4.20 | 4.04 | – | (3.27 | ) | (3.27 | ) | 14.80 | 30.01 | 51,537 | 1.81 | 1.81 | 1.81 | (0.90 | ) | 69 | |||||||||||||||||||||||||||||||||||||
| 2020 | 11.16 | (0.09 | ) | 2.96 | 2.87 | – | – | – | 14.03 | 25.72 | 36,065 | 1.88 | 1.87 | 1.87 | (0.93 | ) | 53 | |||||||||||||||||||||||||||||||||||||||
| 2019 | 8.90 | (0.12 | ) | 2.55 | 2.43 | – | (0.17 | ) | (0.17 | ) | 11.16 | 27.38 | 31,230 | 1.86 | 1.85 | 1.85 | (1.13 | ) | 47 | |||||||||||||||||||||||||||||||||||||
| 2018 | 12.25 | (0.11 | ) | (2.33 | ) | (2.44 | ) | – | (0.91 | ) | (0.91 | ) | 8.90 | (20.42 | ) | 26,337 | 1.84 | 1.84 | 1.84 | (0.93 | ) | 47 | ||||||||||||||||||||||||||||||||||
| Royce Small-Cap Special Equity Fund –Investment Class | ||||||||||||||||||||||||||||||||||||||||||||||||||||||||
| 2022 | $ | 19.09 | $ | 0.18 | $ | (1.39 | ) | $ | (1.21 | ) | $ | (0.19 | ) | $ | (1.77 | ) | $ | (1.96 | ) | $ | 15.92 | (6.33 | )% | $ | 587,346 | 1.21 | % | 1.21 | % | 1.21 | % | 1.01 | % | 23 | % | |||||||||||||||||||||
| 2021 | 18.22 | 0.17 | 3.86 | 4.03 | (0.20 | ) | (2.96 | ) | (3.16 | ) | 19.09 | 22.50 | 755,338 | 1.20 | 1.20 | 1.20 | 0.82 | 42 | ||||||||||||||||||||||||||||||||||||||
| 2020 | 17.59 | 0.27 | 1.03 | 1.30 | (0.26 | ) | (0.41 | ) | (0.67 | ) | 18.22 | 7.43 | 702,556 | 1.23 | 1.23 | 1.23 | 1.68 | 39 | ||||||||||||||||||||||||||||||||||||||
| 2019 | 17.43 | 0.21 | 1.98 | 2.19 | (0.21 | ) | (1.82 | ) | (2.03 | ) | 17.59 | 12.63 | 819,015 | 1.21 | 1.21 | 1.21 | 0.99 | 20 | ||||||||||||||||||||||||||||||||||||||
| 2018 | 21.79 | 0.23 | (2.31 | ) | (2.08 | ) | (0.22 | ) | (2.06 | ) | (2.28 | ) | 17.43 | (9.86 | ) | 909,113 | 1.18 | 1.18 | 1.18 | 1.04 | 21 | |||||||||||||||||||||||||||||||||||
| Royce Small-Cap Special Equity Fund –Service Class | ||||||||||||||||||||||||||||||||||||||||||||||||||||||||
| 2022 | $ | 19.06 | $ | 0.12 | $ | (1.37 | ) | $ | (1.25 | ) | $ | (0.13 | ) | $ | (1.76 | ) | $ | (1.89 | ) | $ | 15.92 | (6.56 | )% | $ | 34,729 | 1.57 | % | 1.57 | % | 1.49 | % | 0.70 | % | 23 | % | |||||||||||||||||||||
| 2021 | 18.19 | 0.12 | 3.85 | 3.97 | (0.16 | ) | (2.94 | ) | (3.10 | ) | 19.06 | 22.19 | 57,738 | 1.54 | 1.54 | 1.46 | 0.57 | 42 | ||||||||||||||||||||||||||||||||||||||
| 2020 | 17.56 | 0.24 | 1.04 | 1.28 | (0.24 | ) | (0.41 | ) | (0.65 | ) | 18.19 | 7.29 | 46,671 | 1.60 | 1.60 | 1.39 | 1.49 | 39 | ||||||||||||||||||||||||||||||||||||||
| 2019 | 17.41 | 0.16 | 1.99 | 2.15 | (0.17 | ) | (1.83 | ) | (2.00 | ) | 17.56 | 12.40 | 60,070 | 1.58 | 1.58 | 1.39 | 0.80 | 20 | ||||||||||||||||||||||||||||||||||||||
| 2018 | 21.76 | 0.20 | (2.33 | ) | (2.13 | ) | (0.18 | ) | (2.04 | ) | (2.22 | ) | 17.41 | (10.13 | ) | 62,706 | 1.51 | 1.50 | 1.39 | 0.88 | 21 | |||||||||||||||||||||||||||||||||||
| THE ACCOMPANYING NOTES ARE AN INTEGRAL PART OF THESE FINANCIAL STATEMENTS | The Royce Funds 2022 Annual Report to Shareholders | 65 |
Financial Highlights
This table is presented to show selected data for a share outstanding throughout each year or other indicated period and to assist shareholders in evaluating a Fund’s performance for the periods presented. Per share amounts have been determined on the basis of the weighted average number of shares outstanding during the period.
| Net Realized and | Distributions | Ratio of Expenses to Average Net Assets | Ratio of | |||||||||||||||||||||||||||||||||||||||||||||||||||||
| Net Asset Value, Beginning of Period | Net Investment Income (Loss) | Unrealized Gain (Loss) on Investments and Foreign Currency | Total from Investment Operations | Distributions from Net Investment Income | from Net Realized Gain on Investments and Foreign Currency | Total Distributions | Net Asset Value, End of Period | Total Return | Net Assets, End of Period (in thousands) | Prior to Fee Waivers, Expense Reimbursements and Balance Credits | Prior to Fee Waivers and Expense Reimbursements | Net of Fee Waivers and Expense Reimbursements | Net Investment Income (Loss) to Average Net Assets | Portfolio Turnover Rate | ||||||||||||||||||||||||||||||||||||||||||
| Royce Small-Cap Special Equity Fund –Consultant Class | ||||||||||||||||||||||||||||||||||||||||||||||||||||||||
| 2022 | $ | 17.37 | $ | (0.04 | ) | $ | (1.25 | ) | $ | (1.29 | ) | $ | – | $ | (1.59 | ) | $ | (1.59 | ) | $ | 14.49 | (7.43 | )% | $ | 15,189 | 2.40 | % | 2.40 | % | 2.40 | % | (0.23 | )% | 23 | % | |||||||||||||||||||||
| 2021 | 16.60 | (0.05 | ) | 3.50 | 3.45 | (0.01 | ) | (2.67 | ) | (2.68 | ) | 17.37 | 21.16 | 25,068 | 2.31 | 2.31 | 2.31 | (0.29 | ) | 42 | ||||||||||||||||||||||||||||||||||||
| 2020 | 16.05 | 0.09 | 0.92 | 1.01 | (0.09 | ) | (0.37 | ) | (0.46 | ) | 16.60 | 6.27 | 18,852 | 2.31 | 2.31 | 2.31 | 0.59 | 39 | ||||||||||||||||||||||||||||||||||||||
| 2019 | 15.90 | (0.02 | ) | 1.82 | 1.80 | (0.00 | ) | (1.65 | ) | (1.65 | ) | 16.05 | 11.38 | 24,793 | 2.25 | 2.25 | 2.25 | (0.12 | ) | 20 | ||||||||||||||||||||||||||||||||||||
| 2018 | 19.86 | 0.01 | (2.10 | ) | (2.09 | ) | (0.01 | ) | (1.86 | ) | (1.87 | ) | 15.90 | (10.83 | ) | 30,234 | 2.19 | 2.19 | 2.19 | 0.04 | 21 | |||||||||||||||||||||||||||||||||||
| Royce Small-Cap Special Equity Fund –Institutional Class | ||||||||||||||||||||||||||||||||||||||||||||||||||||||||
| 2022 | $ | 18.92 | $ | 0.19 | $ | (1.37 | ) | $ | (1.18 | ) | $ | (0.21 | ) | $ | (1.76 | ) | $ | (1.97 | ) | $ | 15.77 | (6.27 | )% | $ | 116,301 | 1.12 | % | 1.12 | % | 1.12 | % | 1.08 | % | 23 | % | |||||||||||||||||||||
| 2021 | 18.06 | 0.19 | 3.82 | 4.01 | (0.22 | ) | (2.93 | ) | (3.15 | ) | 18.92 | 22.63 | 238,810 | 1.11 | 1.11 | 1.11 | 0.92 | 42 | ||||||||||||||||||||||||||||||||||||||
| 2020 | 17.43 | 0.30 | 1.01 | 1.31 | (0.28 | ) | (0.40 | ) | (0.68 | ) | 18.06 | 7.52 | 194,911 | 1.15 | 1.15 | 1.15 | 1.84 | 39 | ||||||||||||||||||||||||||||||||||||||
| 2019 | 17.28 | 0.22 | 1.96 | 2.18 | (0.22 | ) | (1.81 | ) | (2.03 | ) | 17.43 | 12.65 | 187,785 | 1.14 | 1.14 | 1.14 | 1.04 | 20 | ||||||||||||||||||||||||||||||||||||||
| 2018 | 21.61 | 0.25 | (2.30 | ) | (2.05 | ) | (0.24 | ) | (2.04 | ) | (2.28 | ) | 17.28 | (9.81 | ) | 202,317 | 1.11 | 1.11 | 1.11 | 1.14 | 21 | |||||||||||||||||||||||||||||||||||
| Royce Small-Cap Total Return Fund– Investment Class | ||||||||||||||||||||||||||||||||||||||||||||||||||||||||
| 2022 | $ | 8.78 | $ | 0.08 | $ | (1.25 | ) | $ | (1.17 | ) | $ | (0.11 | ) | $ | (0.94 | ) | $ | (1.05 | ) | $ | 6.56 | (13.25 | )% | $ | 591,730 | 1.22 | % | 1.22 | % | 1.22 | % | 0.97 | % | 62 | % | |||||||||||||||||||||
| 2021 | 9.34 | 0.12 | 2.21 | 2.33 | (0.13 | ) | (2.76 | ) | (2.89 | ) | 8.78 | 25.78 | 1,016,331 | 1.20 | 1.20 | 1.20 | 1.09 | 64 | ||||||||||||||||||||||||||||||||||||||
| 2020 | 10.93 | 0.17 | 0.19 | 0.36 | (0.21 | ) | (1.74 | ) | (1.95 | ) | 9.34 | 3.82 | 893,868 | 1.24 | 1.24 | 1.24 | 1.88 | 61 | ||||||||||||||||||||||||||||||||||||||
| 2019 | 9.71 | 0.16 | 2.10 | 2.26 | (0.15 | ) | (0.89 | ) | (1.04 | ) | 10.93 | 23.45 | 1,026,074 | 1.21 | 1.21 | 1.21 | 1.42 | 21 | ||||||||||||||||||||||||||||||||||||||
| 2018 | 13.58 | 0.20 | (1.78 | ) | (1.58 | ) | (0.19 | ) | (2.10 | ) | (2.29 | ) | 9.71 | (12.46 | ) | 1,036,211 | 1.18 | 1.18 | 1.18 | 1.45 | 22 | |||||||||||||||||||||||||||||||||||
| Royce Small-Cap Total Return Fund– Service Class | ||||||||||||||||||||||||||||||||||||||||||||||||||||||||
| 2022 | $ | 9.08 | $ | 0.06 | $ | (1.30 | ) | $ | (1.24 | ) | $ | (0.07 | ) | $ | (0.97 | ) | $ | (1.04 | ) | $ | 6.80 | (13.54 | )% | $ | 58,571 | 1.57 | % | 1.57 | % | 1.49 | % | 0.74 | % | 62 | % | |||||||||||||||||||||
| 2021 | 9.62 | 0.09 | 2.28 | 2.37 | (0.07 | ) | (2.84 | ) | (2.91 | ) | 9.08 | 25.54 | 80,478 | 1.52 | 1.52 | 1.49 | 0.78 | 64 | ||||||||||||||||||||||||||||||||||||||
| 2020 | 11.27 | 0.16 | 0.18 | 0.34 | (0.19 | ) | (1.80 | ) | (1.99 | ) | 9.62 | 3.51 | 69,634 | 1.55 | 1.55 | 1.49 | 1.64 | 61 | ||||||||||||||||||||||||||||||||||||||
| 2019 | 9.97 | 0.13 | 2.16 | 2.29 | (0.08 | ) | (0.91 | ) | (0.99 | ) | 11.27 | 23.08 | 77,177 | 1.52 | 1.52 | 1.49 | 1.13 | 21 | ||||||||||||||||||||||||||||||||||||||
| 2018 | 13.88 | 0.16 | (1.82 | ) | (1.66 | ) | (0.11 | ) | (2.14 | ) | (2.25 | ) | 9.97 | (12.71 | ) | 83,368 | 1.52 | 1.52 | 1.48 | 1.15 | 22 | |||||||||||||||||||||||||||||||||||
| Royce Small-Cap Total Return Fund– Consultant Class | ||||||||||||||||||||||||||||||||||||||||||||||||||||||||
| 2022 | $ | 9.18 | $ | 0.00 | $ | (1.31 | ) | $ | (1.31 | ) | $ | – | $ | (0.98 | ) | $ | (0.98 | ) | $ | 6.89 | (14.15 | )% | $ | 84,448 | 2.23 | % | 2.23 | % | 2.23 | % | 0.01 | % | 62 | % | ||||||||||||||||||||||
| 2021 | 9.75 | 0.01 | 2.31 | 2.32 | (0.01 | ) | (2.88 | ) | (2.89 | ) | 9.18 | 24.63 | 112,649 | 2.18 | 2.18 | 2.18 | 0.09 | 64 | ||||||||||||||||||||||||||||||||||||||
| 2020 | 11.31 | 0.09 | 0.18 | 0.27 | (0.03 | ) | (1.80 | ) | (1.83 | ) | 9.75 | 2.76 | 110,179 | 2.22 | 2.22 | 2.22 | 0.88 | 61 | ||||||||||||||||||||||||||||||||||||||
| 2019 | 10.02 | 0.05 | 2.17 | 2.22 | (0.02 | ) | (0.91 | ) | (0.93 | ) | 11.31 | 22.18 | 150,175 | 2.20 | 2.20 | 2.20 | 0.43 | 21 | ||||||||||||||||||||||||||||||||||||||
| 2018 | 13.95 | 0.06 | (1.82 | ) | (1.76 | ) | (0.02 | ) | (2.15 | ) | (2.17 | ) | 10.02 | (13.26 | ) | 160,540 | 2.17 | 2.17 | 2.17 | 0.45 | 22 | |||||||||||||||||||||||||||||||||||
| Royce Small-Cap Total Return Fund– Institutional Class | ||||||||||||||||||||||||||||||||||||||||||||||||||||||||
| 2022 | $ | 8.61 | $ | 0.08 | $ | (1.22 | ) | $ | (1.14 | ) | $ | (0.12 | ) | $ | (0.92 | ) | $ | (1.04 | ) | $ | 6.43 | (13.13 | )% | $ | 181,476 | 1.14 | % | 1.14 | % | 1.14 | % | 1.07 | % | 62 | % | |||||||||||||||||||||
| 2021 | 9.17 | 0.13 | 2.17 | 2.30 | (0.14 | ) | (2.72 | ) | (2.86 | ) | 8.61 | 25.91 | 279,510 | 1.10 | 1.10 | 1.10 | 1.19 | 64 | ||||||||||||||||||||||||||||||||||||||
| 2020 | 10.77 | 0.18 | 0.18 | 0.36 | (0.24 | ) | (1.72 | ) | (1.96 | ) | 9.17 | 3.87 | 208,605 | 1.13 | 1.13 | 1.13 | 1.98 | 61 | ||||||||||||||||||||||||||||||||||||||
| 2019 | 9.58 | 0.17 | 2.07 | 2.24 | (0.18 | ) | (0.87 | ) | (1.05 | ) | 10.77 | 23.59 | 232,479 | 1.13 | 1.13 | 1.13 | 1.49 | 21 | ||||||||||||||||||||||||||||||||||||||
| 2018 | 13.40 | 0.21 | (1.76 | ) | (1.55 | ) | (0.21 | ) | (2.06 | ) | (2.27 | ) | 9.58 | (12.39 | ) | 218,268 | 1.09 | 1.09 | 1.09 | 1.53 | 22 | |||||||||||||||||||||||||||||||||||
| 66 | The Royce Funds 2022 Annual Report to Shareholders | THE ACCOMPANYING NOTES ARE AN INTEGRAL PART OF THESE FINANCIAL STATEMENTS |
Financial Highlights
This table is presented to show selected data for a share outstanding throughout each year or other indicated period and to assist shareholders in evaluating a Fund’s performance for the periods presented. Per share amounts have been determined on the basis of the weighted average number of shares outstanding during the period.
| Net Realized and | Distributions | Ratio of Expenses to Average Net Assets | Ratio of | |||||||||||||||||||||||||||||||||||||||||||||||||||||
| Net Asset Value, Beginning of Period | Net Investment Income (Loss) | Unrealized Gain (Loss) on Investments and Foreign Currency | Total from Investment Operations | Distributions from Net Investment Income | from Net Realized Gain on Investments and Foreign Currency | Total Distributions | Net Asset Value, End of Period | Total Return | Net Assets, End of Period (in thousands) | Prior to Fee Waivers, Expense Reimbursements and Balance Credits | Prior to Fee Waivers and Expense Reimbursements | Net of Fee Waivers and Expense Reimbursements | Net Investment Income (Loss) to Average Net Assets | Portfolio Turnover Rate | ||||||||||||||||||||||||||||||||||||||||||
| Royce Small-Cap Total Return Fund– R Class | ||||||||||||||||||||||||||||||||||||||||||||||||||||||||
| 2022 | $ | 9.20 | $ | 0.03 | $ | (1.32 | ) | $ | (1.29 | ) | $ | (0.01 | ) | $ | (0.98 | ) | $ | (0.99 | ) | $ | 6.92 | (13.87 | )% | $ | 20,180 | 1.91 | % | 1.91 | % | 1.91 | % | 0.32 | % | 62 | % | |||||||||||||||||||||
| 2021 | 9.76 | 0.05 | 2.31 | 2.36 | (0.04 | ) | (2.88 | ) | (2.92 | ) | 9.20 | 25.01 | 27,040 | 1.85 | 1.85 | 1.85 | 0.42 | 64 | ||||||||||||||||||||||||||||||||||||||
| 2020 | 11.38 | 0.12 | 0.18 | 0.30 | (0.12 | ) | (1.80 | ) | (1.92 | ) | 9.76 | 3.08 | 30,027 | 1.89 | 1.88 | 1.88 | 1.23 | 61 | ||||||||||||||||||||||||||||||||||||||
| 2019 | 10.06 | 0.09 | 2.18 | 2.27 | (0.03 | ) | (0.92 | ) | (0.95 | ) | 11.38 | 22.66 | 36,345 | 1.85 | 1.84 | 1.84 | 0.76 | 21 | ||||||||||||||||||||||||||||||||||||||
| 2018 | 13.99 | 0.11 | (1.83 | ) | (1.72 | ) | (0.06 | ) | (2.15 | ) | (2.21 | ) | 10.06 | (12.96 | ) | 45,145 | 1.81 | 1.81 | 1.81 | 0.82 | 22 | |||||||||||||||||||||||||||||||||||
| Royce Small-Cap Value Fund–Investment Class | ||||||||||||||||||||||||||||||||||||||||||||||||||||||||
| 2022 | $ | 10.43 | $ | 0.07 | $ | (1.09 | ) | $ | (1.02 | ) | $ | (0.05 | ) | $ | (0.51 | ) | $ | (0.56 | ) | $ | 8.85 | (9.87 | )% | $ | 35,545 | 1.35 | % | 1.35 | % | 1.24 | % | 0.76 | % | 62 | % | |||||||||||||||||||||
| 2021 | 8.61 | 0.02 | 2.41 | 2.43 | (0.01 | ) | (0.60 | ) | (0.61 | ) | 10.43 | 28.48 | 44,621 | 1.31 | 1.31 | 1.24 | 0.20 | 53 | ||||||||||||||||||||||||||||||||||||||
| 2020 | 9.57 | 0.06 | (0.66 | ) | (0.60 | ) | (0.17 | ) | (0.19 | ) | (0.36 | ) | 8.61 | (6.25 | ) | 34,523 | 1.39 | 1.39 | 1.24 | 0.76 | 61 | |||||||||||||||||||||||||||||||||||
| 2019 | 8.35 | 0.09 | 1.46 | 1.55 | (0.08 | ) | (0.25 | ) | (0.33 | ) | 9.57 | 18.60 | 53,234 | 1.30 | 1.30 | 1.24 | 0.84 | 64 | ||||||||||||||||||||||||||||||||||||||
| 2018 | 10.16 | 0.05 | (0.73 | ) | (0.68 | ) | (0.04 | ) | (1.09 | ) | (1.13 | ) | 8.35 | (7.05 | ) | 56,433 | 1.26 | 1.26 | 1.24 | 0.45 | 64 | |||||||||||||||||||||||||||||||||||
| Royce Small-Cap Value Fund–Service Class | ||||||||||||||||||||||||||||||||||||||||||||||||||||||||
| 2022 | $ | 10.38 | $ | 0.05 | $ | (1.09 | ) | $ | (1.04 | ) | $ | (0.03 | ) | $ | (0.50 | ) | $ | (0.53 | ) | $ | 8.81 | (10.06 | )% | $ | 68,455 | 1.59 | % | 1.59 | % | 1.49 | % | 0.52 | % | 62 | % | |||||||||||||||||||||
| 2021 | 8.58 | (0.01 | ) | 2.41 | 2.40 | – | (0.60 | ) | (0.60 | ) | 10.38 | 28.24 | 81,840 | 1.55 | 1.55 | 1.49 | (0.06 | ) | 53 | |||||||||||||||||||||||||||||||||||||
| 2020 | 9.54 | 0.04 | (0.66 | ) | (0.62 | ) | (0.15 | ) | (0.19 | ) | (0.34 | ) | 8.58 | (6.47 | ) | 75,502 | 1.62 | 1.62 | 1.49 | 0.50 | 61 | |||||||||||||||||||||||||||||||||||
| 2019 | 8.33 | 0.07 | 1.44 | 1.51 | (0.05 | ) | (0.25 | ) | (0.30 | ) | 9.54 | 18.21 | 102,465 | 1.56 | 1.55 | 1.49 | 0.65 | 64 | ||||||||||||||||||||||||||||||||||||||
| 2018 | 10.12 | 0.02 | (0.72 | ) | (0.70 | ) | (0.01 | ) | (1.08 | ) | (1.09 | ) | 8.33 | (7.17 | ) | 111,855 | 1.53 | 1.53 | 1.49 | 0.19 | 64 | |||||||||||||||||||||||||||||||||||
| Royce Small-Cap Value Fund–Consultant Class | ||||||||||||||||||||||||||||||||||||||||||||||||||||||||
| 2022 | $ | 9.06 | $ | (0.06 | ) | $ | (0.96 | ) | $ | (1.02 | ) | $ | – | $ | (0.43 | ) | $ | (0.43 | ) | $ | 7.61 | (11.27 | )% | $ | 3,184 | 2.73 | % | 2.73 | % | 2.73 | % | (0.77 | )% | 62 | % | |||||||||||||||||||||
| 2021 | 7.57 | (0.11 | ) | 2.11 | 2.00 | – | (0.51 | ) | (0.51 | ) | 9.06 | 26.75 | 5,269 | 2.66 | 2.66 | 2.66 | (1.22 | ) | 53 | |||||||||||||||||||||||||||||||||||||
| 2020 | 8.44 | (0.05 | ) | (0.60 | ) | (0.65 | ) | (0.06 | ) | (0.16 | ) | (0.22 | ) | 7.57 | (7.71 | ) | 3,899 | 2.74 | 2.73 | 2.73 | (0.71 | ) | 61 | |||||||||||||||||||||||||||||||||
| 2019 | 7.40 | (0.04 | ) | 1.30 | 1.26 | – | (0.22 | ) | (0.22 | ) | 8.44 | 17.03 | 7,486 | 2.44 | 2.44 | 2.44 | (0.50 | ) | 64 | |||||||||||||||||||||||||||||||||||||
| 2018 | 9.06 | (0.06 | ) | (0.64 | ) | (0.70 | ) | – | (0.96 | ) | (0.96 | ) | 7.40 | (8.07 | ) | 9,641 | 2.35 | 2.34 | 2.34 | (0.66 | ) | 64 | ||||||||||||||||||||||||||||||||||
| Royce Small-Cap Value Fund–R Class | ||||||||||||||||||||||||||||||||||||||||||||||||||||||||
| 2022 | $ | 9.88 | $ | (0.00 | ) | $ | (1.03 | ) | $ | (1.03 | ) | $ | – | $ | (0.49 | ) | $ | (0.49 | ) | $ | 8.36 | (10.52 | )% | $ | 5,760 | 2.09 | % | 2.08 | % | 1.99 | % | (0.00 | )% | 62 | % | |||||||||||||||||||||
| 2021 | 8.22 | (0.05 | ) | 2.29 | 2.24 | – | (0.58 | ) | (0.58 | ) | 9.88 | 27.51 | 8,093 | 2.03 | 2.03 | 1.99 | (0.54 | ) | 53 | |||||||||||||||||||||||||||||||||||||
| 2020 | 9.16 | (0.00 | ) | (0.64 | ) | (0.64 | ) | (0.12 | ) | (0.18 | ) | (0.30 | ) | 8.22 | (6.95 | ) | 7,142 | 2.10 | 2.10 | 1.99 | (0.02 | ) | 61 | |||||||||||||||||||||||||||||||||
| 2019 | 8.00 | 0.01 | 1.40 | 1.41 | (0.01 | ) | (0.24 | ) | (0.25 | ) | 9.16 | 17.68 | 8,083 | 1.98 | 1.98 | 1.97 | 0.11 | 64 | ||||||||||||||||||||||||||||||||||||||
| 2018 | 9.75 | (0.03 | ) | (0.68 | ) | (0.71 | ) | – | (1.04 | ) | (1.04 | ) | 8.00 | (7.62 | ) | 8,254 | 1.92 | 1.92 | 1.92 | (0.26 | ) | 64 | ||||||||||||||||||||||||||||||||||
| Royce Smaller-Companies Growth Fund–Investment Class | ||||||||||||||||||||||||||||||||||||||||||||||||||||||||
| 2022 | $ | 8.74 | $ | (0.06 | ) | $ | (2.74 | ) | $ | (2.80 | ) | $ | – | $ | (0.25 | ) | $ | (0.25 | ) | $ | 5.69 | (32.07 | )% | $ | 61,107 | 1.26 | % | 1.26 | % | 1.24 | % | (0.97 | )% | 66 | % | |||||||||||||||||||||
| 2021 | 11.06 | (0.11 | ) | 0.83 | 0.72 | – | (3.04 | ) | (3.04 | ) | 8.74 | 8.09 | 106,318 | 1.19 | 1.19 | 1.19 | (0.91 | ) | 50 | |||||||||||||||||||||||||||||||||||||
| 2020 | 8.21 | (0.07 | ) | 4.06 | 3.99 | – | (1.14 | ) | (1.14 | ) | 11.06 | 49.61 | 112,668 | 1.25 | 1.25 | 1.24 | (0.86 | ) | 61 | |||||||||||||||||||||||||||||||||||||
| 2019 | 6.86 | (0.05 | ) | 1.68 | 1.63 | – | (0.28 | ) | (0.28 | ) | 8.21 | 23.92 | 91,670 | 1.25 | 1.24 | 1.24 | (0.69 | ) | 53 | |||||||||||||||||||||||||||||||||||||
| 2018 | 10.93 | (0.07 | ) | (0.86 | ) | (0.93 | ) | – | (3.14 | ) | (3.14 | ) | 6.86 | (9.94 | ) | 87,213 | 1.21 | 1.21 | 1.21 | (0.62 | ) | 61 | ||||||||||||||||||||||||||||||||||
| THE ACCOMPANYING NOTES ARE AN INTEGRAL PART OF THESE FINANCIAL STATEMENTS | The Royce Funds 2022 Annual Report to Shareholders | 67 |
Financial Highlights
This table is presented to show selected data for a share outstanding throughout each year or other indicated period and to assist shareholders in evaluating a Fund’s performance for the periods presented. Per share amounts have been determined on the basis of the weighted average number of shares outstanding during the period.
| Net Realized and | Distributions | �� | Ratio of Expenses to Average Net Assets | Ratio of | ||||||||||||||||||||||||||||||||||||||||||||||||||||
| Net Asset Value, Beginning of Period | Net Investment Income (Loss) | Unrealized Gain (Loss) on Investments and Foreign Currency | Total from Investment Operations | Distributions from Net Investment Income | from Net Realized Gain on Investments and Foreign Currency | Total Distributions | Net Asset Value, End of Period | Total Return | Net Assets, End of Period (in thousands) | Prior to Fee Waivers, Expense Reimbursements and Balance Credits | Prior to Fee Waivers and Expense Reimbursements | Net of Fee Waivers and Expense Reimbursements | Net Investment Income (Loss) to Average Net Assets | Portfolio Turnover Rate | ||||||||||||||||||||||||||||||||||||||||||
| Royce Smaller-Companies Growth Fund–Service Class | ||||||||||||||||||||||||||||||||||||||||||||||||||||||||
| 2022 | $ | 8.45 | $ | (0.08 | ) | $ | (2.65 | ) | $ | (2.73 | ) | $ | – | $ | (0.24 | ) | $ | (0.24 | ) | $ | 5.48 | (32.37 | )% | $ | 105,585 | 1.55 | % | 1.55 | % | 1.49 | % | (1.22 | )% | 66 | % | |||||||||||||||||||||
| 2021 | 10.74 | (0.15 | ) | 0.82 | 0.67 | – | (2.96 | ) | (2.96 | ) | 8.45 | 7.78 | 178,553 | 1.51 | 1.51 | 1.49 | (1.21 | ) | 50 | |||||||||||||||||||||||||||||||||||||
| 2020 | 7.99 | (0.09 | ) | 3.95 | 3.86 | – | (1.11 | ) | (1.11 | ) | 10.74 | 49.26 | 181,591 | 1.54 | 1.54 | 1.49 | (1.11 | ) | 61 | |||||||||||||||||||||||||||||||||||||
| 2019 | 6.69 | (0.07 | ) | 1.65 | 1.58 | – | (0.28 | ) | (0.28 | ) | 7.99 | 23.67 | 154,236 | 1.55 | 1.54 | 1.49 | (0.93 | ) | 53 | |||||||||||||||||||||||||||||||||||||
| 2018 | 10.69 | (0.10 | ) | (0.85 | ) | (0.95 | ) | – | (3.05 | ) | (3.05 | ) | 6.69 | (10.22 | ) | 156,057 | 1.52 | 1.52 | 1.49 | (0.90 | ) | 61 | ||||||||||||||||||||||||||||||||||
| Royce Smaller-Companies Growth Fund–Consultant Class | ||||||||||||||||||||||||||||||||||||||||||||||||||||||||
| 2022 | $ | 7.09 | $ | (0.10 | ) | $ | (2.22 | ) | $ | (2.32 | ) | $ | – | $ | (0.20 | ) | $ | (0.20 | ) | $ | 4.57 | (32.78 | )% | $ | 4,194 | 2.60 | % | 2.60 | % | 2.24 | % | (1.97 | )% | 66 | % | |||||||||||||||||||||
| 2021 | 9.08 | (0.20 | ) | 0.69 | 0.49 | – | (2.48 | ) | (2.48 | ) | 7.09 | 6.97 | 7,544 | 2.40 | 2.40 | 2.24 | (1.96 | ) | 50 | |||||||||||||||||||||||||||||||||||||
| 2020 | 6.81 | (0.13 | ) | 3.34 | 3.21 | – | (0.94 | ) | (0.94 | ) | 9.08 | 48.05 | 8,080 | 2.54 | 2.54 | 2.24 | (1.86 | ) | 61 | |||||||||||||||||||||||||||||||||||||
| 2019 | 5.74 | (0.11 | ) | 1.42 | 1.31 | – | (0.24 | ) | (0.24 | ) | 6.81 | 22.85 | 6,298 | 2.52 | 2.51 | 2.11 | (1.71 | ) | 53 | |||||||||||||||||||||||||||||||||||||
| 2018 | 9.28 | (0.16 | ) | (0.72 | ) | (0.88 | ) | – | (2.66 | ) | (2.66 | ) | 5.74 | (10.95 | ) | 6,328 | 2.40 | 2.40 | 2.24 | (1.66 | ) | 61 | ||||||||||||||||||||||||||||||||||
| Royce Smaller-Companies Growth Fund–Institutional Class | ||||||||||||||||||||||||||||||||||||||||||||||||||||||||
| 2022 | $ | 8.87 | $ | (0.06 | ) | $ | (2.79 | ) | $ | (2.85 | ) | $ | – | $ | (0.25 | ) | $ | (0.25 | ) | $ | 5.77 | (32.17 | )% | $ | 4,400 | 1.53 | % | 1.53 | % | 1.16 | % | (0.89 | )% | 66 | % | |||||||||||||||||||||
| 2021 | 11.23 | (0.11 | ) | 0.85 | 0.74 | – | (3.10 | ) | (3.10 | ) | 8.87 | 8.16 | 7,278 | 1.41 | 1.41 | 1.16 | (0.88 | ) | 50 | |||||||||||||||||||||||||||||||||||||
| 2020 | 8.33 | (0.07 | ) | 4.13 | 4.06 | – | (1.16 | ) | (1.16 | ) | 11.23 | 49.70 | 5,646 | 1.44 | 1.44 | 1.23 | (0.85 | ) | 61 | |||||||||||||||||||||||||||||||||||||
| 2019 | 6.95 | (0.05 | ) | 1.72 | 1.67 | – | (0.29 | ) | (0.29 | ) | 8.33 | 24.10 | 8,021 | 1.35 | 1.35 | 1.17 | (0.62 | ) | 53 | |||||||||||||||||||||||||||||||||||||
| 2018 | 11.06 | (0.06 | ) | (0.88 | ) | (0.94 | ) | – | (3.17 | ) | (3.17 | ) | 6.95 | (9.94 | ) | 7,165 | 1.28 | 1.28 | 1.08 | (0.49 | ) | 61 | ||||||||||||||||||||||||||||||||||
| 68 | The Royce Funds 2022 Annual Report to Shareholders | THE ACCOMPANYING NOTES ARE AN INTEGRAL PART OF THESE FINANCIAL STATEMENTS |
Summary of Significant Accounting Policies:
Royce Dividend Value Fund, Royce Global Financial Services Fund, Royce International Premier Fund, Royce Micro-Cap Fund, Royce Pennsylvania Mutual Fund, Royce Premier Fund, Royce Small-Cap Opportunity Fund (formerly Royce Opportunity Fund), Royce Small-Cap Special Equity Fund (formerly Royce Special Equity Fund), Royce Small-Cap Total Return Fund (formerly Royce Total Return Fund), Royce Small-Cap Value Fund and Royce Smaller-Companies Growth Fund (the “Fund” or “Funds”), are the eleven series of The Royce Fund (the “Trust”), an open-end management investment company organized as a Delaware statutory trust.
Classes of shares have equal rights as to earnings and assets, except that each class may bear different fees and expenses for distribution, shareholder servicing, registration and shareholder reports, and receive different compensating balance credits and expense reimbursements. Investment income, realized and unrealized capital gains or losses on investments and foreign currency, and expenses other than those attributable to a specific class are allocated to each class of shares based on its relative net assets.
The preparation of financial statements in conformity with accounting principles generally accepted in the United States of America requires management to make estimates and assumptions that affect the reported amounts of assets and liabilities and the disclosure of contingent assets and liabilities at the date of the financial statements and the reported amounts of income and expenses during the reporting period. Actual results could differ from those estimates.
Each Fund is an investment company and accordingly follows the investment company accounting and reporting guidance of the Financial Accounting Standards Board (FASB) Accounting Standard Codification Topic 946 “Financial Services-Investment Companies.”
Royce & Associates, LP, the Funds’ investment adviser, is a majority-owned subsidiary of Franklin Resources, Inc. and primarily conducts business using the name Royce Investment Partners (“Royce”). As of December 31, 2022, officers and employees of Royce, Fund trustees, the Royce retirement plans and other affiliates owned more than 10% of the following Fund:
Royce Global Financial Services Fund 14%
VALUATION OF INVESTMENTS:
Portfolio securities held by the Funds are valued as of the close of trading on the New York Stock Exchange (“NYSE”) (generally 4:00 p.m. Eastern time) on the valuation date. Investments in money market funds are valued at net asset value per share. Values for non-U.S. dollar denominated equity securities are converted to U.S. dollars daily based upon prevailing foreign currency exchange rates as quoted by a major bank.
Equity securities that are listed on an exchange or Nasdaq, or traded on OTC Market Group Inc.’s OTC Link ATS or other alternative trading system, are valued: (i) on the basis of their last reported sales prices or official closing prices, as applicable, on a valuation date; or (ii) at their highest reported bid prices in the event such equity securities did not trade on a valuation date. Such inputs are generally referred to as “Level 1” inputs because they represent reliable quoted prices in active markets for identical securities.
If the value of a portfolio security held by a Fund cannot be determined solely by reference to Level 1 inputs, such portfolio security will be “fair valued.” The Trust’s Board of Trustees has designated Royce as valuation designee to perform fair value determinations for such portfolio securities in accordance with Rule 2a-5 under the Investment Company Act of 1940 (“Rule 2a-5”). Pursuant to Rule 2a-5, fair values are determined in accordance with policies and procedures approved by the Trust’s Board of Trustees and policies and procedures adopted by Royce in its capacity as valuation designee for the Trust. Fair valued securities are reported as either “Level 2” or “Level 3” securities.
As a general principle, the fair value of a security is the amount which a Fund might reasonably expect to receive for the security upon its current sale. However, in light of the judgment involved in fair valuations, no assurance can be given that a fair value assigned to a particular portfolio security will be the amount which the Fund might be able to receive upon its current sale. When a fair value pricing methodology is used, the fair value prices used by the Fund for such securities will likely differ from the quoted or published prices for the same securities.
Level 2 inputs are other significant observable inputs (e.g., dealer bid side quotes and quoted prices for securities with comparable characteristics). Examples of situations in which Level 2 inputs are used to fair value portfolio securities held by the Funds on a particular valuation date include:
| ● | Over-the-counter equity securities other than those traded on OTC Market Group Inc.’s OTC Link ATS or other alternative trading system (collectively referred to herein as “Other OTC Equity Securities”) are fair valued at their highest bid price when Royce receives at least two bid side quotes from dealers who make markets in such securities; |
| ● | Certain bonds and other fixed income securities may be fair valued by reference to other securities with comparable ratings, interest rates, and maturities in accordance with valuation methodologies maintained by certain independent pricing services; and |
| ● | The Funds use an independent pricing service to fair value certain non-U.S. equity securities when U.S. market volatility exceeds a certain threshold. This pricing service uses proprietary correlations it has developed between the movement of prices of non-U.S. equity securities and indices of U.S.-traded securities, futures contracts, and other indications to estimate the fair value of such non-U.S. securities. |
The Royce Funds 2022 Annual Report to Shareholders | 69
Notes to Financial Statements (continued)
VALUATION OF INVESTMENTS (continued):
Level 3 inputs are significant unobservable inputs. Examples of Level 3 inputs include (without limitation) the last trade price for a security before trading was suspended or terminated; discounts to last trade price for lack of marketability or otherwise; market price information regarding other securities; information received from the issuer and/or published documents, including SEC filings and financial statements; and other publicly available information. Pursuant to the above-referenced policies and procedures, Royce may use various techniques in making fair value determinations based upon Level 3 inputs, which techniques may include (without limitation): (i) workout valuation methods (e.g., earnings multiples, discounted cash flows, liquidation values, derivations of book value, firm or probable offers from qualified buyers for the issuer’s ongoing business, etc.); (ii) discount or premium from market, or compilation of other observable market information, for other similar freely traded securities; (iii) conversion from the readily available market price of a security into which an affected security is convertible or exchangeable; and (iv) pricing models or other formulas. In the case of restricted securities, fair value determinations generally start with the inherent or intrinsic worth of the relevant security, without regard to the restrictive feature, and are reduced for any diminution in value resulting from the restrictive feature. Due to the inherent uncertainty of such valuations, these fair values may differ significantly from the values that would have been used had an active market existed.
A security that is valued by reference to Level 1 or Level 2 inputs may drop to Level 3 on a particular valuation date for several reasons, including if:
| ● | an equity security that is listed on an exchange or Nasdaq, or traded on OTC Market Group Inc.’s OTC Link ATS or other alternative trading system, has not traded and there are no bids; |
| ● | Royce does not receive at least two bid side quotes for an Other OTC Equity Security; |
| ● | the independent pricing services are unable to supply fair value prices; or |
| ● | the Level 1 or Level 2 inputs become otherwise unreliable for any reason (e.g., a significant event occurs after the close of trading for a security but prior to the time a Fund prices its shares). |
The table below shows the aggregate value of the various Level 1, Level 2, and Level 3 securities held by the Funds as of December 31, 2022. Any Level 2 or Level 3 securities held by a Fund are noted in its Schedule of Investments. The inputs or methodology used for valuing securities are not necessarily an indication of the risk associated with owning those securities.
| LEVEL 1 | LEVEL 2 | LEVEL 3 | TOTAL | |||||||||||||
| Royce Dividend Value Fund | ||||||||||||||||
| Common Stocks | $ | 55,688,446 | $ | – | $ | – | $ | 55,688,446 | ||||||||
| Repurchase Agreement | – | 3,342,493 | – | 3,342,493 | ||||||||||||
| Royce Global Financial Services Fund | ||||||||||||||||
| Common Stocks | 26,637,016 | – | – | 26,637,016 | ||||||||||||
| Diversified Investment Companies | 268,260 | – | – | 268,260 | ||||||||||||
| Repurchase Agreement | – | 108,221 | – | 108,221 | ||||||||||||
| Royce International Premier Fund | ||||||||||||||||
| Common Stocks | 676,099,481 | – | – | 676,099,481 | ||||||||||||
| Preferred Stocks | 19,216,005 | – | – | 19,216,005 | ||||||||||||
| Repurchase Agreement | – | 44,883,580 | – | 44,883,580 | ||||||||||||
| Royce Micro-Cap Fund | ||||||||||||||||
| Common Stocks | 286,233,767 | – | 0 | 286,233,767 | ||||||||||||
| Repurchase Agreement | – | 6,932,693 | – | 6,932,693 | ||||||||||||
| Royce Pennsylvania Mutual Fund | ||||||||||||||||
| Common Stocks | 1,552,325,203 | – | – | 1,552,325,203 | ||||||||||||
| Repurchase Agreement | – | 9,239,555 | – | 9,239,555 | ||||||||||||
| Money Market Fund/Collateral Received for Securities Loaned | 2,722,487 | – | – | 2,722,487 | ||||||||||||
| Royce Premier Fund | ||||||||||||||||
| Common Stocks | 1,212,000,381 | – | – | 1,212,000,381 | ||||||||||||
| Repurchase Agreement | – | 39,954,174 | – | 39,954,174 | ||||||||||||
| Royce Small-Cap Opportunity Fund | ||||||||||||||||
| Common Stocks | 1,191,931,061 | 4,652,586 | 0 | 1,196,583,647 | ||||||||||||
| Warrants | – | 125,951 | – | 125,951 | ||||||||||||
| Repurchase Agreement | – | 50,049,722 | – | 50,049,722 | ||||||||||||
| Money Market Fund/Collateral Received for Securities Loaned | 1,993,229 | – | – | 1,993,229 | ||||||||||||
| Royce Small-Cap Special Equity Fund | ||||||||||||||||
| Common Stocks | 621,578,351 | 4,751,040 | – | 626,329,391 | ||||||||||||
| Repurchase Agreement | – | 129,812,399 | – | 129,812,399 | ||||||||||||
| Royce Small-Cap Total Return Fund | ||||||||||||||||
| Common Stocks | 900,652,620 | – | – | 900,652,620 | ||||||||||||
| Preferred Stocks | 17,289,028 | – | – | 17,289,028 | ||||||||||||
| Repurchase Agreement | – | 19,726,836 | – | 19,726,836 | ||||||||||||
70 | The Royce Funds 2022 Annual Report to Shareholders
VALUATION OF INVESTMENTS (continued):
| LEVEL 1 | LEVEL 2 | LEVEL 3 | TOTAL | ||
| Royce Small-Cap Value Fund | |||||
| Common Stocks | $ 109,265,731 | $ | – | $ – | $ 109,265,731 |
| Repurchase Agreement | – | 4,304,634 | – | 4,304,634 | |
| Money Market Fund/Collateral Received for Securities Loaned | 511,027 | – | – | 511,027 | |
| Royce Smaller-Companies Growth Fund | |||||
| Common Stocks | 169,935,857 | – | – | 169,935,857 | |
| Repurchase Agreement | – | 5,882,106 | – | 5,882,106 | |
| Money Market Fund/Collateral Received for Securities Loaned | 1,935,673 | – | – | 1,935,673 | |
Level 3 Reconciliation:
| UNREALIZED GAIN (LOSS) 1 | ||||||||||
| BALANCE AS OF 12/31/21 | PURCHASES | CORPORATE ACTIONS | SALES | REALIZED GAIN (LOSS) 1 | CURRENTLY HELD SECURITIES | SECURITIES NO LONGER HELD | BALANCE AS OF 12/31/22 | |||
| Royce Micro-Cap Fund | ||||||||||
| Common Stocks | $ 666,497 | $ | – | $ | – | $ 1,337,628 | $ 193,457 | $ 0 | $ 477,674 | $ 0 |
| Royce Pennsylvania Mutual Fund | ||||||||||
| Common Stocks | 0 | – | (10,862) | – | 10,862 | – | – | – | ||
| Royce Small-Cap Opportunity Fund | ||||||||||
| Common Stocks | 49 | – | – | – | – | (49) | – | 0 | ||
| Royce Small-Cap Total Return Fund | ||||||||||
| Common Stocks | 0 | – | – | 0 | 0 | – | – | – | ||
| 1 | The net change in unrealized appreciation (depreciation) is included in the accompanying Statement of Operations. Change in unrealized appreciation (depreciation) includes net unrealized appreciation (depreciation) resulting from changes in investment values during the reporting period and the reversal of previously recorded unrealized appreciation (depreciation) when gains or losses are realized. Net realized gain (loss) from investments and foreign currency transactions is included in the accompanying Statement of Operations. |
REPURCHASE AGREEMENTS:
The Funds may enter into repurchase agreements with institutions that the Funds’ investment adviser has determined are creditworthy. Each Fund restricts repurchase agreements to maturities of no more than seven days. Securities pledged as collateral for repurchase agreements, which are held until maturity of the repurchase agreements, are marked-to-market daily and maintained at a value at least equal to the principal amount of the repurchase agreement (including accrued interest). Repurchase agreements could involve certain risks in the event of default or insolvency of the counter-party, including possible delays or restrictions upon the ability of each Fund to dispose of its underlying securities. The remaining contractual maturities of repurchase agreements held by the Funds as of December 31, 2022, are next business day and continuous.
FOREIGN CURRENCY:
Net realized foreign exchange gains or losses arise from sales and maturities of short-term securities, sales of foreign currencies, expiration of currency forward contracts, currency gains or losses realized between the trade and settlement dates on securities transactions, and the difference between the amounts of dividends, interest, and foreign withholding taxes recorded on each Fund’s books and the U.S. dollar equivalent of the amounts actually received or paid. Net unrealized foreign exchange gains and losses arise from changes in the value of assets and liabilities, other than investments in securities at the end of the reporting period, as a result of changes in foreign currency exchange rates.
The Funds do not isolate that portion of the results of operations resulting from fluctuations in foreign exchange rates on investments from the fluctuations arising from changes in market prices of securities held. Such fluctuations are included with the net realized and unrealized gain or loss on investments.
Certain Funds invest a significant portion of their respective assets in foreign companies that may be subject to different risks than investments in securities of U.S. companies, including adverse political, social, economic, or other developments that are unique to a particular country or region. Therefore, the prices of securities of foreign companies in particular countries or regions may, at times, move in a different direction than those of securities of U.S. companies. Because such investments are usually denominated in foreign currencies and such Funds do not intend to hedge their foreign currency exposures, the U.S. dollar value of such investments may be harmed by declines in the value of foreign currencies in relation to the U.S. dollar.
SECURITIES LENDING:
The Funds loan securities through a lending agent, State Street Bank and Trust Company, to qualified institutional investors for the purpose of earning additional income. The lending agent receives and holds collateral from such borrowers to secure their obligations to the Funds. Such loans must be secured at all times by collateral in an amount at least equal to the market value of the loaned securities. The market values of the loaned securities and the collateral fluctuate and are determined at the close of each business day by the lending agent. Borrowers are required to post additional collateral to the lending agent on the next succeeding business day in the event
The Royce Funds 2022 Annual Report to Shareholders | 71
Notes to Financial Statements (continued)
SECURITIES LENDING (continued):
of a collateral shortfall. Counterparty risk is further reduced by loaning securities only to parties that participate in a Global Securities Lending Program organized and monitored by the lending agent and that are deemed by it to satisfy its requirements and by having the lending agent enter into securities lending agreements with such borrowers. The lending agent is not affiliated with Royce.
Collateral may be in the form of cash or U.S. Treasuries. Cash collateral is invested in certain money market pooled investment vehicles. The Funds record a liability in their respective Statements of Assets and Liabilities for the return of such cash collateral during periods in which securities are on loan. The Funds bear the risk of loss for any decrease in the market value of the loaned securities or the investments purchased with cash collateral received from the borrowers.
Pursuant to the agreement in place between the Funds and the lending agent, if a borrower fails to return loaned securities, and the cash collateral being maintained by the lending agent on behalf of such borrower is insufficient to cover the value of loaned securities and provided such collateral insufficiency is not the result of investment losses, the lending agent shall, at its option, either replace the loaned securities or pay the amount of the shortfall to the Funds. In the event of the bankruptcy of a borrower, the Funds could experience delay in recovering the loaned securities or only recover cash or a security of equivalent value.
Loans of securities generally do not have stated maturity dates, and the Funds may recall a security at any time. The Funds’ securities lending income consists of the income earned on investing cash collateral, plus any premium payments received for lending certain securities, less any rebates paid to borrowers and lending agent fees associated with the loan. Pursuant to the agreement in place between the Funds and the lending agent, the Funds are responsible for any shortfall in the event the value of the investments purchased with cash collateral is insufficient to pay the rebate fee to the borrower.
The following table presents cash collateral and the market value of securities on loan collateralized by cash collateral held by the Funds as of December 31, 2022:
| CASH COLLATERAL1 | SECURITIES ON LOAN COLLATERALIZED BY CASH COLLATERAL | NET AMOUNT | |
| Royce Pennsylvania Mutual Fund | $ 2,722,487 | $(2,654,287) | $ 68,200 |
| Royce Small-Cap Opportunity Fund | 1,993,229 | (1,747,914) | 245,315 |
| Royce Small-Cap Value Fund | 511,027 | (494,080) | 16,947 |
| Royce Smaller-Companies Growth Fund | 1,935,673 | (1,961,784) | (26,111) |
| 1 | Absent an event of default, assets and liabilities are presented gross and not offset in the Statements of Assets and Liabilities. The contractual maturity of cash collateral is overnight and continuous. |
The following table presents non-cash collateral and the market value of securities on loan collateralized by non-cash collateral held by the Funds’ custodian as of December 31, 2022:
| NON-CASH COLLATERAL | SECURITIES ON LOAN COLLATERALIZED BY NON-CASH COLLATERAL | NET AMOUNT | |
| Royce Micro-Cap Fund | $ 1,946,520 | $ (1,902,903) | $ 43,617 |
| Royce Pennsylvania Mutual Fund | 11,091,956 | (10,834,160) | 257,796 |
| Royce Small-Cap Opportunity Fund | 12,819,206 | (12,503,660) | 315,546 |
| Royce Small-Cap Total Return Fund | 111,593 | (109,072) | 2,521 |
| Royce Smaller-Companies Growth Fund | 12,351,131 | (12,062,010) | 289,121 |
DISTRIBUTIONS AND TAXES:
As qualified regulated investment companies under Subchapter M of the Internal Revenue Code, the Funds are not subject to income taxes to the extent that each Fund distributes substantially all of its taxable income for its fiscal year.
Royce Dividend Value Fund and Royce Small-Cap Total Return Fund pay any dividends from net investment income quarterly and make any distributions from net realized gains annually in December. The other Funds pay any dividends and capital gain distributions annually in December. Dividends from net investment income and distributions from capital gains are determined at a class level. Because federal income tax regulations differ from generally accepted accounting principles, income and capital gain distributions determined in accordance with tax regulations may differ from net investment income and realized gains recognized for financial reporting purposes. Accordingly, the character of distributions and composition of net assets for tax purposes differ from those reflected in the accompanying financial statements.
CAPITAL GAINS TAXES:
The Funds may be subject to a tax imposed on capital gains on securities of issuers domiciled in certain countries. The Funds record an estimated deferred tax liability for gains in these securities that have been held for less than one year. This amount, if any, is reported as deferred capital gains tax in the accompanying Statements of Assets and Liabilities, assuming those positions were disposed of at the end of the period, and accounted for as a reduction in the market value of the security.
INVESTMENT TRANSACTIONS AND RELATED INVESTMENT INCOME:
Investment transactions are accounted for on the trade date. Dividend income is recorded on the ex-dividend date. Non-cash dividend income is recorded at the fair market value of the securities received. Interest income is recorded on an accrual basis. Premiums and discounts on debt securities are amortized using the effective yield-to-maturity method. Realized gains and losses from investment transactions are determined on the basis of identified cost for book and tax purposes.
72 | The Royce Funds 2022 Annual Report to Shareholders
EXPENSES:
The Funds incur direct and indirect expenses. Expenses directly attributable to a Fund are charged to the Fund, while expenses applicable to more than one of the Royce Funds are allocated equitably. Certain personnel, occupancy costs and other administrative expenses related to all of the Royce Funds are allocated by Royce under an administration agreement and are included in administrative and office facilities and legal expenses.
COMPENSATING BALANCE CREDITS:
The Funds have arrangements with their custodian bank and transfer agent, whereby a portion of the custodian’s fee and transfer agent’s fee is paid indirectly by credits earned on a Fund’s cash on deposit with the bank and transfer agent. These deposit arrangements are an alternative to purchasing overnight investments. Conversely, a Fund pays interest to the custodian on any cash overdrafts, to the extent they are not offset by credits earned on positive cash balances.
LINE OF CREDIT:
The Funds, along with certain other Royce Funds, participate in a $65 million line of credit (“Credit Agreement”) with State Street Bank and Trust Company to be used for temporary or emergency purposes. This revolving Credit Agreement expires on October 6, 2023. Pursuant to the Credit Agreement, each participating Fund is liable for a portion of the commitment fee for the credit facility (i.e., 0.25% of any unused portion of the line of credit) and for principal and interest payments related to borrowings made by that Fund. Borrowings under the Credit Agreement bear interest at a variable rate equal to the Applicable Rate plus the Applicable Margin. The term Applicable Rate means, for any day, a rate equal to the sum of (a) 0.10%, plus (b) the higher of (i) the Federal Funds Effective Rate for such day, or (ii) the Overnight Bank Funding Rate for such day. The term Applicable Margin means 1.25%. The Funds did not utilize the line of credit during the year ended December 31, 2022.
Capital Share Transactions (in dollars):
| SHARES SOLD | SHARES ISSUED FOR REINVESTMENT OF DISTRIBUTIONS | SHARES REDEEMED | NET INCREASE (DECREASE) FROM CAPITAL SHARE TRANSACTIONS | |||||||||||||||||||||||||||||
| Year Ended 12/31/22 | Year Ended 12/31/21 | Year Ended 12/31/22 | Year Ended 12/31/21 | Year Ended 12/31/22 | Year Ended 12/31/21 | Year Ended 12/31/22 | Year Ended 12/31/21 | |||||||||||||||||||||||||
| Royce Dividend Value Fund | ||||||||||||||||||||||||||||||||
| Investment Class | $ | 5,462,654 | $ | 4,059,720 | $ | 398,478 | $ | 6,255,221 | $ | (9,344,703 | ) | $ | (12,328,934 | ) | $ | (3,483,571 | ) | $ | (2,013,993) | |||||||||||||
| Service Class | 343,158 | 624,759 | 71,850 | 2,121,953 | (3,219,000 | ) | (4,091,270 | ) | (2,803,992 | ) | (1,344,558) | |||||||||||||||||||||
| Consultant Class | 503,470 | 17,465 | 2,987 | 149,739 | (38,642 | ) | (98,159 | ) | 467,815 | 69,045 | ||||||||||||||||||||||
| Institutional Class | 26,893 | 59,431 | 4,475 | 122,259 | (717,743 | ) | (43,869 | ) | (686,375 | ) | 137,821 | |||||||||||||||||||||
| Royce Global Financial Services Fund | ||||||||||||||||||||||||||||||||
| Service Class | 519,913 | 6,577,740 | 363,123 | 1,493,301 | (4,147,918 | ) | (9,076,838 | ) | (3,264,882 | ) | (1,005,797) | |||||||||||||||||||||
| Institutional Class | 2,957 | 392,172 | 136,659 | 490,070 | (283,646 | ) | (6,217 | ) | (144,030 | ) | 876,025 | |||||||||||||||||||||
| Royce International Premier Fund | ||||||||||||||||||||||||||||||||
| Investment Class | 76,204,270 | 116,385,707 | 6,751,294 | 17,304,166 | (179,512,212 | ) | (146,158,506 | ) | (96,556,648 | ) | (12,468,633) | |||||||||||||||||||||
| Service Class | 2,997,323 | 8,681,331 | 914,665 | 2,320,181 | (13,837,053 | ) | (22,027,412 | ) | (9,925,065 | ) | (11,025,900) | |||||||||||||||||||||
| Consultant Class | 149,330 | 238,697 | 105,632 | 302,929 | (1,493,286 | ) | (1,437,849 | ) | (1,238,324 | ) | (896,223) | |||||||||||||||||||||
| Institutional Class | 99,085,388 | 191,546,144 | 11,395,192 | 21,236,509 | (153,909,665 | ) | (80,776,073 | ) | (43,429,085 | ) | 132,006,580 | |||||||||||||||||||||
| Royce Micro-Cap Fund | ||||||||||||||||||||||||||||||||
| Investment Class | 9,965,275 | 26,166,336 | 6,703,670 | 35,324,986 | (22,078,026 | ) | (37,741,646 | ) | (5,409,081 | ) | 23,749,676 | |||||||||||||||||||||
| Service Class | 1,724,500 | 5,902,180 | 5,984,514 | 34,403,989 | (22,138,656 | ) | (23,681,021 | ) | (14,429,642 | ) | 16,625,148 | |||||||||||||||||||||
| Consultant Class | 41,889 | 91,238 | 477,041 | 2,788,315 | (1,778,759 | ) | (2,114,078 | ) | (1,259,829 | ) | 765,475 | |||||||||||||||||||||
| Royce Pennsylvania Mutual Fund | ||||||||||||||||||||||||||||||||
| Investment Class | 65,094,251 | 133,236,353 | 53,749,475 | 321,945,640 | (201,742,868 | ) | (225,701,416 | ) | (82,899,142 | ) | 229,480,577 | |||||||||||||||||||||
| Service Class | 5,348,597 | 77,966,809 | 2,664,829 | 16,976,489 | (16,712,457 | ) | (89,179,394 | ) | (8,699,031 | ) | 5,763,904 | |||||||||||||||||||||
| Consultant Class | 2,842,618 | 2,796,661 | 8,180,229 | 51,391,322 | (32,154,983 | ) | (35,033,854 | ) | (21,132,136 | ) | 19,154,129 | |||||||||||||||||||||
| Institutional Class | 20,667,714 | 108,306,266 | 6,645,063 | 43,369,949 | (51,690,770 | ) | (107,814,269 | ) | (24,377,993 | ) | 43,861,946 | |||||||||||||||||||||
| R Class | 578,197 | 1,794,969 | 345,904 | 2,135,458 | (1,301,745 | ) | (2,111,593 | ) | (377,644 | ) | 1,818,834 | |||||||||||||||||||||
| Royce Premier Fund | ||||||||||||||||||||||||||||||||
| Investment Class | 87,824,319 | 106,716,414 | 68,480,604 | 201,105,839 | (258,753,409 | ) | (287,548,189 | ) | (102,448,486 | ) | 20,274,064 | |||||||||||||||||||||
| Service Class | 5,324,371 | 14,435,396 | 1,942,373 | 6,046,944 | (11,091,072 | ) | (12,048,579 | ) | (3,824,328 | ) | 8,433,761 | |||||||||||||||||||||
| Consultant Class | 532,280 | 118,942 | 895,363 | 2,688,134 | (2,653,730 | ) | (1,911,296 | ) | (1,226,087 | ) | 895,780 | |||||||||||||||||||||
| Institutional Class | 32,203,696 | 88,840,619 | 16,488,407 | 46,812,431 | (56,077,526 | ) | (120,919,662 | ) | (7,385,423 | ) | 14,733,388 | |||||||||||||||||||||
| R Class | 212,423 | 333,549 | 509,268 | 1,430,819 | (880,571 | ) | (2,971,274 | ) | (158,880 | ) | (1,206,906) | |||||||||||||||||||||
| Royce Small-Cap Opportunity Fund | ||||||||||||||||||||||||||||||||
| Investment Class | 318,411,947 | 909,585,405 | 38,901,508 | 212,409,964 | (508,804,017 | ) | (596,255,404 | ) | (151,490,562 | ) | 525,739,965 | |||||||||||||||||||||
| Service Class | 20,170,973 | 115,744,785 | 3,244,630 | 19,323,015 | (43,615,225 | ) | (176,700,574 | ) | (20,199,622 | ) | (41,632,774) | |||||||||||||||||||||
| Consultant Class | 2,341,420 | 2,520,066 | 507,115 | 2,576,218 | (3,171,205 | ) | (4,857,761 | ) | (322,670 | ) | 238,523 | |||||||||||||||||||||
| Institutional Class | 61,510,399 | 187,501,000 | 7,698,601 | 54,524,149 | (87,595,325 | ) | (325,587,852 | ) | (18,386,325 | ) | (83,562,703) | |||||||||||||||||||||
| R Class | 4,362,167 | 19,167,914 | 1,917,055 | 9,409,270 | (8,025,738 | ) | (14,565,113 | ) | (1,746,516 | ) | 14,012,071 | |||||||||||||||||||||
The Royce Funds 2022 Annual Report to Shareholders | 73
Notes to Financial Statements (continued)
Capital Share Transactions (in dollars) (continued):
| SHARES SOLD | SHARES ISSUED FOR REINVESTMENT OF DISTRIBUTIONS | SHARES REDEEMED | NET INCREASE (DECREASE) FROM CAPITAL SHARE TRANSACTIONS | |||||
| Year Ended 12/31/22 | Year Ended 12/31/21 | Year Ended 12/31/22 | Year Ended 12/31/21 | Year Ended 12/31/22 | Year Ended 12/31/21 | Year Ended 12/31/22 | Year Ended 12/31/21 | |
| Royce Small-Cap Special Equity Fund | ||||||||
| Investment Class | $ 74,793,750 | $ 121,262,899 | $ 57,163,323 | $ 93,229,234 | $ (184,860,182) | $ (204,584,467) | $ (52,903,109) | $ 9,907,666 |
| Service Class | 6,968,245 | 17,100,065 | 3,021,117 | 7,161,186 | (24,663,512) | (15,075,774) | (14,674,150) | 9,185,477 |
| Consultant Class | 1,652,880 | 7,651,086 | 1,374,559 | 3,066,063 | (9,628,606) | (5,125,345) | (6,601,167) | 5,591,804 |
| Institutional Class | 32,007,338 | 56,739,669 | 9,529,968 | 23,784,552 | (136,992,809) | (46,905,182) | (95,455,503) | 33,619,039 |
| Royce Small-Cap Total Return Fund | ||||||||
| Investment Class | 67,023,280 | 165,781,541 | 73,842,790 | 229,840,473 | (368,351,415) | (240,787,980) | (227,485,345) | 154,834,034 |
| Service Class | 11,930,918 | 26,413,084 | 7,431,362 | 18,522,033 | (23,059,482) | (31,366,709) | (3,697,202) | 13,568,408 |
| Consultant Class | 6,136,234 | 1,295,728 | 9,977,238 | 25,379,612 | (18,018,436) | (21,836,127) | (1,904,964) | 4,839,213 |
| Institutional Class | 90,024,255 | 102,146,125 | 25,398,176 | 67,746,029 | (153,853,152) | (84,529,829) | (38,430,721) | 85,362,325 |
| R Class | 2,628,567 | 4,675,698 | 2,507,527 | 6,650,410 | (6,029,232) | (14,663,079) | (893,138) | (3,336,971) |
| Royce Small-Cap Value Fund | ||||||||
| Investment Class | 4,143,624 | 6,525,775 | 1,987,585 | 2,309,669 | (8,588,407) | (6,530,656) | (2,457,198) | 2,304,788 |
| Service Class | 3,414,009 | 2,982,199 | 3,640,221 | 4,167,486 | (8,172,968) | (16,534,978) | (1,118,738) | (9,385,293) |
| Consultant Class | 537,262 | 860,233 | 166,877 | 255,409 | (1,934,811) | (509,924) | (1,230,672) | 605,718 |
| R Class | 634,416 | 2,441,657 | 317,866 | 466,938 | (2,142,342) | (3,346,669) | (1,190,060) | (438,074) |
| Royce Smaller-Companies Growth Fund | ||||||||
| Investment Class | 7,127,233 | 31,489,085 | 1,870,679 | 19,936,818 | (17,832,476) | (40,246,678) | (8,834,564) | 11,179,225 |
| Service Class | 2,229,200 | 17,231,454 | 4,255,864 | 44,252,911 | (18,872,005) | (33,104,492) | (12,386,941) | 28,379,873 |
| Consultant Class | 77,046 | 23,195 | 179,296 | 1,908,240 | (1,033,301) | (1,103,977) | (776,959) | 827,458 |
| Institutional Class | 1,561,613 | 2,728,335 | 180,637 | 1,851,226 | (2,315,211) | (1,486,523) | (572,961) | 3,093,038 |
Capital Share Transactions (in shares):
| SHARES SOLD | SHARES ISSUED FOR REINVESTMENT OF DISTRIBUTIONS | SHARES REDEEMED | NET INCREASE (DECREASE) IN SHARES OUTSTANDING | |||||
| Year Ended 12/31/22 | Year Ended 12/31/21 | Year Ended 12/31/22 | Year Ended 12/31/21 | Year Ended 12/31/22 | Year Ended 12/31/21 | Year Ended 12/31/22 | Year Ended 12/31/21 | |
| Royce Dividend Value Fund | ||||||||
| Investment Class | 987,739 | 597,759 | 74,537 | 1,004,092 | (1,686,240) | (1,826,156) | (623,964) | (224,305) |
| Service Class | 59,649 | 87,469 | 13,282 | 327,936 | (556,523) | (583,911) | (483,592) | (168,506) |
| Consultant Class | 75,541 | 2,301 | 460 | 20,290 | (5,405) | (12,152) | 70,596 | 10,439 |
| Institutional Class | 4,889 | 8,971 | 859 | 19,950 | (132,627) | (6,700) | (126,879) | 22,221 |
| Royce Global Financial Services Fund | ||||||||
| Service Class | 48,678 | 529,857 | 39,172 | 127,089 | (389,775) | (720,226) | (301,925) | (63,280) |
| Institutional Class | 223 | 23,717 | 11,257 | 31,926 | (19,358) | (404) | (7,878) | 55,239 |
| Royce International Premier Fund | ||||||||
| Investment Class | 5,289,428 | 6,404,093 | 548,440 | 997,991 | (13,017,673) | (8,000,230) | (7,179,805) | (598,146) |
| Service Class | 182,020 | 399,923 | 61,921 | 111,708 | (817,074) | (1,011,419) | (573,133) | (499,788) |
| Consultant Class | 9,100 | 10,355 | 6,767 | 13,782 | (88,299) | (59,363) | (72,432) | (35,226) |
| Institutional Class | 7,050,212 | 10,502,184 | 925,686 | 1,224,006 | (11,306,819) | (4,372,610) | (3,330,921) | 7,353,580 |
| Royce Micro-Cap Fund | ||||||||
| Investment Class | 919,547 | 1,679,399 | 680,575 | 2,790,283 | (2,020,079) | (2,562,221) | (419,957) | 1,907,461 |
| Service Class | 159,057 | 390,449 | 625,341 | 2,792,531 | (2,117,819) | (1,591,829) | (1,333,421) | 1,591,151 |
| Consultant Class | 4,950 | 8,029 | 65,618 | 295,059 | (226,642) | (182,910) | (156,074) | 120,178 |
| Royce Pennsylvania Mutual Fund | ||||||||
| Investment Class | 7,884,090 | 11,535,799 | 7,044,491 | 34,918,649 | (24,619,020) | (19,375,279) | (9,690,439) | 27,079,169 |
| Service Class | 636,726 | 6,771,205 | 351,097 | 1,847,279 | (2,054,556) | (7,579,796) | (1,066,733) | 1,038,688 |
| Consultant Class | 446,394 | 313,298 | 1,384,133 | 7,137,684 | (5,085,840) | (3,852,945) | (3,255,313) | 3,598,037 |
| Institutional Class | 2,479,284 | 9,058,325 | 867,502 | 4,683,580 | (6,483,597) | (9,060,627) | (3,136,811) | 4,681,278 |
| R Class | 75,395 | 167,145 | 49,204 | 249,761 | (169,561) | (202,597) | (44,962) | 214,309 |
| Royce Premier Fund | ||||||||
| Investment Class | 7,856,376 | 7,384,195 | 6,800,457 | 16,011,612 | (23,106,332) | (19,450,154) | (8,449,499) | 3,945,653 |
| Service Class | 490,501 | 1,003,487 | 199,422 | 496,465 | (1,023,836) | (837,328) | (333,913) | 662,624 |
| Consultant Class | 64,613 | 10,306 | 116,584 | 277,413 | (312,726) | (166,627) | (131,529) | 121,092 |
| Institutional Class | 2,774,442 | 5,715,214 | 1,611,770 | 3,671,563 | (4,940,162) | (7,905,009) | (553,950) | 1,481,768 |
| R Class | 20,583 | 24,599 | 55,841 | 124,745 | (86,589) | (221,309) | (10,165) | (71,965) |
74 | The Royce Funds 2022 Annual Report to Shareholders
Capital Share Transactions (in shares) (continued):
| SHARES SOLD | SHARES ISSUED FOR REINVESTMENT OF DISTRIBUTIONS | SHARES REDEEMED | NET INCREASE (DECREASE) IN SHARES OUTSTANDING | |||||||||||||||||||||||||||||
| Year Ended 12/31/22 | Year Ended 12/31/21 | Year Ended 12/31/22 | Year Ended 12/31/21 | Year Ended 12/31/22 | Year Ended 12/31/21 | Year Ended 12/31/22 | Year Ended 12/31/21 | |||||||||||||||||||||||||
| Royce Small-Cap Opportunity Fund | ||||||||||||||||||||||||||||||||
| Investment Class | 21,261,017 | 46,829,638 | 2,947,084 | 13,325,594 | (34,745,434 | ) | (30,327,827 | ) | (10,537,333 | ) | 29,827,405 | |||||||||||||||||||||
| Service Class | 1,497,972 | 6,458,725 | 269,264 | 1,324,401 | (3,245,880 | ) | (9,633,721 | ) | (1,478,644 | ) | (1,850,595 | ) | ||||||||||||||||||||
| Consultant Class | 208,534 | 165,086 | 49,139 | 204,462 | (277,875 | ) | (314,729 | ) | (20,202 | ) | 54,819 | |||||||||||||||||||||
| Institutional Class | 4,054,020 | 9,437,181 | 567,743 | 3,330,736 | (5,805,365 | ) | (16,826,206 | ) | (1,183,602 | ) | (4,058,289 | ) | ||||||||||||||||||||
| R Class | 333,870 | 1,097,275 | 165,406 | 668,272 | (624,233 | ) | (853,589 | ) | (124,957 | ) | 911,958 | |||||||||||||||||||||
| Royce Small-Cap Special Equity Fund | ||||||||||||||||||||||||||||||||
| Investment Class | 4,274,293 | 5,959,352 | 3,583,907 | 4,996,208 | (10,534,392 | ) | (9,958,593 | ) | (2,676,192 | ) | 996,967 | |||||||||||||||||||||
| Service Class | 390,359 | 822,632 | 189,412 | 384,184 | (1,426,751 | ) | (744,037 | ) | (846,980 | ) | 462,779 | |||||||||||||||||||||
| Consultant Class | 104,981 | 400,306 | 94,602 | 180,463 | (594,479 | ) | (273,618 | ) | (394,896 | ) | 307,151 | |||||||||||||||||||||
| Institutional Class | 1,808,501 | 2,827,346 | 603,162 | 1,286,347 | (7,662,116 | ) | (2,284,477 | ) | (5,250,453 | ) | 1,829,216 | |||||||||||||||||||||
| Royce Small-Cap Total Return Fund | ||||||||||||||||||||||||||||||||
| Investment Class | 8,441,346 | 15,913,267 | 11,291,465 | 26,713,010 | (45,260,446 | ) | (22,616,714 | ) | (25,527,635 | ) | 20,009,563 | |||||||||||||||||||||
| Service Class | 1,449,780 | 2,344,739 | 1,099,407 | 2,085,738 | (2,802,333 | ) | (2,801,404 | ) | (253,146 | ) | 1,629,073 | |||||||||||||||||||||
| Consultant Class | 758,766 | 116,620 | 1,465,086 | 2,839,663 | (2,239,607 | ) | (1,983,657 | ) | (15,755 | ) | 972,626 | |||||||||||||||||||||
| Institutional Class | 11,078,565 | 9,428,489 | 3,957,140 | 8,018,807 | (19,251,358 | ) | (7,744,779 | ) | (4,215,653 | ) | 9,702,517 | |||||||||||||||||||||
| R Class | 322,555 | 409,104 | 366,132 | 740,127 | (711,510 | ) | (1,286,978 | ) | (22,823 | ) | (137,747 | ) | ||||||||||||||||||||
| Royce Small-Cap Value Fund | ||||||||||||||||||||||||||||||||
| Investment Class | 451,885 | 669,061 | 222,325 | 230,276 | (937,108 | ) | (630,400 | ) | (262,898 | ) | 268,937 | |||||||||||||||||||||
| Service Class | 363,428 | 289,142 | 409,474 | 417,584 | (886,422 | ) | (1,615,922 | ) | (113,520 | ) | (909,196 | ) | ||||||||||||||||||||
| Consultant Class | 62,235 | 94,431 | 21,700 | 29,324 | (247,539 | ) | (56,758 | ) | (163,604 | ) | 66,997 | |||||||||||||||||||||
| R Class | 72,512 | 246,103 | 37,662 | 49,151 | (240,352 | ) | (344,878 | ) | (130,178 | ) | (49,624 | ) | ||||||||||||||||||||
| Royce Smaller-Companies Growth Fund | ||||||||||||||||||||||||||||||||
| Investment Class | 1,080,273 | 2,901,010 | 325,335 | 2,413,659 | (2,821,049 | ) | (3,340,198 | ) | (1,415,441 | ) | 1,974,471 | |||||||||||||||||||||
| Service Class | 363,858 | 1,426,653 | 766,823 | 5,538,537 | (3,012,840 | ) | (2,744,346 | ) | (1,882,159 | ) | 4,220,844 | |||||||||||||||||||||
| Consultant Class | 13,619 | 2,323 | 38,808 | 284,812 | (198,445 | ) | (112,984 | ) | (146,018 | ) | 174,151 | |||||||||||||||||||||
| Institutional Class | 242,144 | 214,208 | 30,931 | 220,910 | (331,936 | ) | (117,034 | ) | (58,861 | ) | 318,084 | |||||||||||||||||||||
Investment Adviser and Distributor:
INVESTMENT ADVISER:
Under the Trust’s investment advisory agreements with Royce, Royce is entitled to receive investment advisory fees in respect of each Fund that are computed daily and payable monthly. Royce has contractually agreed, without right of termination, to waive fees and/or reimburse expenses (excluding brokerage commissions, taxes, interest, litigation expenses, acquired fund fees and expenses, and other expenses not borne in the ordinary course of business) to the extent necessary to maintain certain Funds’ net annual operating expense ratios at specified levels through April 30, 2023. To the extent that they impacted net expenses for the year ended December 31, 2022, the effects of those arrangements are shown below. See the Prospectuses for contractual waivers and expiration dates for all classes of all Funds.
| ANNUAL CONTRACTUAL ADVISORY FEE AS A PERCENTAGE OF AVERAGE NET ASSETS1 | COMMITTED NET ANNUAL OPERATING EXPENSE RATIO CAP | YEAR ENDED DECEMBER 31, 2022 | |||||||
| Investment Class | Service Class | Consultant Class | Institutional Class | R Class | Net advisory fees | Advisory fees waived | |||
| Royce Dividend Value Fund | 0.85% | 1.09% | 1.34% | 2.09% | 1.09% | N/A | $ | 530,001 | $ – |
| Royce Global Financial Services Fund | 1.00% | N/A | 1.49%3 | N/A | 1.49%3 | N/A | 302,336 | – | |
| Royce International Premier Fund | 1.00% | 1.19% | 1.44% | 2.19% | 1.04% | N/A | 8,258,649 | 831,880 | |
| Royce Micro-Cap Fund | 1.00% | 1.24% | 1.49% | N/A | N/A | N/A | 3,219,478 | – | |
| Royce Pennsylvania Mutual Fund | 0.76%2 | N/A | 1.25%3 | N/A | N/A | 1.75%3 | 13,209,795 | – | |
| Royce Premier Fund | 1.00% | N/A | 1.49% | N/A | N/A | 1.99% | 14,135,011 | – | |
| Royce Small-Cap Opportunity Fund | 1.00% | N/A | 1.49% | N/A | N/A | N/A | 14,570,053 | – | |
| Royce Small-Cap Special Equity Fund | 1.00% | N/A | 1.49% | N/A | N/A | N/A | 8,686,719 | – | |
| Royce Small-Cap Total Return Fund | 1.00% | N/A | 1.49%3 | N/A | N/A | N/A | 10,997,354 | – | |
| Royce Small-Cap Value Fund | 1.00% | 1.24% | 1.49% | N/A | N/A | 1.99% | 1,180,478 | – | |
| Royce Smaller-Companies Growth Fund | 1.00% | 1.24% | 1.49% | 2.24% | 1.16% | N/A | 2,064,279 | – | |
| 1 | From a base annual rate of 1.00% (0.85% for Royce Dividend Value Fund), the annual rates of investment advisory fees payable by each of the Funds, other than Royce Pennsylvania Mutual Fund, are reduced by the indicated amount at the following breakpoints applicable to a Fund’s net assets in excess of $2 billion: more than $2 billion to $3 billion – .05% per annum; more than $3 billion to $4 billion – .10% per annum; over $4 billion – .15% per annum. |
| 2 | Royce Pennsylvania Mutual Fund's fees are calculated at the annual rate of 1.00% of the first $50 million of the Fund's average net assets, 0.875% of the next $50 million of average net assets and 0.75% of average net assets in excess of $100 million. |
| 3 | Committed net annual operating expense ratio cap excludes acquired fund fees and expenses. |
The Royce Funds 2022 Annual Report to Shareholders | 75
Notes to Financial Statements (continued)
DISTRIBUTOR:
Royce Fund Services, LLC (“RFS”), the distributor of the Trust’s shares, is a wholly owned subsidiary of Royce. RFS is entitled to receive distribution fees that are computed daily and payable monthly.
| ANNUAL CONTRACTUAL DISTRIBUTION FEE AS A PERCENTAGE OF AVERAGE NET ASSETS | YEAR ENDED DECEMBER 31, 2022 | ||
| Net distribution fees | Distribution fees waived | ||
| Royce Dividend Value Fund – Service Class | 0.25% | $ 39,395 | $ – |
| Royce Dividend Value Fund – Consultant Class | 1.00% | 12,069 | – |
| Royce Global Financial Services Fund – Service Class | 0.25% | 48,731 | 6,645 |
| Royce International Premier Fund – Service Class | 0.25% | 98,674 | – |
| Royce International Premier Fund – Consultant Class | 1.00% | 59,974 | – |
| Royce Micro-Cap Fund – Service Class | 0.25% | 371,321 | – |
| Royce Micro-Cap Fund – Consultant Class | 1.00% | 118,920 | – |
| Royce Pennsylvania Mutual Fund – Service Class | 0.25% | 160,290 | 6,679 |
| Royce Pennsylvania Mutual Fund – Consultant Class | 1.00% | 2,000,030 | – |
| Royce Pennsylvania Mutual Fund – R Class | 0.50% | 38,280 | – |
| Royce Premier Fund – Service Class | 0.25% | 72,546 | – |
| Royce Premier Fund – Consultant Class | 1.00% | 127,628 | – |
| Royce Premier Fund – R Class | 0.50% | 33,256 | – |
| Royce Small-Cap Opportunity Fund – Service Class | 0.25% | 204,551 | – |
| Royce Small-Cap Opportunity Fund – Consultant Class | 1.00% | 122,566 | – |
| Royce Small-Cap Opportunity Fund – R Class | 0.50% | 215,758 | – |
| Royce Small-Cap Special Equity Fund – Service Class | 0.25% | 112,302 | – |
| Royce Small-Cap Special Equity Fund – Consultant Class | 1.00% | 208,724 | – |
| Royce Small-Cap Total Return Fund – Service Class | 0.25% | 167,336 | – |
| Royce Small-Cap Total Return Fund – Consultant Class | 1.00% | 950,833 | – |
| Royce Small-Cap Total Return Fund – R Class | 0.50% | 110,291 | – |
| Royce Small-Cap Value Fund – Service Class | 0.25% | 174,751 | – |
| Royce Small-Cap Value Fund – Consultant Class | 1.00% | 40,240 | – |
| Royce Small-Cap Value Fund – R Class | 0.50% | 32,687 | – |
| Royce Smaller-Companies Growth Fund – Service Class | 0.25% | 305,967 | – |
| Royce Smaller-Companies Growth Fund – Consultant Class | 1.00% | 51,256 | – |
Purchases and Sales of Investment Securities:
For the year ended December 31, 2022, the costs of purchases and the proceeds from sales of investment securities, other than short-term securities and collateral received for securities loaned, were as follows:
| PURCHASES | SALES1 | |
| Royce Dividend Value Fund | $ 1,628,253 | $ 8,885,363 |
| Royce Global Financial Services Fund | 3,019,836 | 2,950,965 |
| Royce International Premier Fund | 267,144,418 | 422,679,632 |
| Royce Micro-Cap Fund | 40,442,202 | 69,982,861 |
| Royce Pennsylvania Mutual Fund | 773,823,257 | 945,720,768 |
| Royce Premier Fund | 320,938,446 | 494,492,172 |
| Royce Small-Cap Opportunity Fund | 493,041,873 | 748,854,970 |
| Royce Small-Cap Special Equity Fund | 164,390,894 | 372,976,839 |
| Royce Small-Cap Total Return Fund | 668,286,906 | 1,015,868,115 |
| Royce Small-Cap Value Fund | 71,048,047 | 81,807,600 |
| Royce Smaller-Companies Growth Fund | 134,346,472 | 151,208,026 |
1 Excludes the value of securities delivered as a result of redemptions-in-kind.
Cross trades were executed by the Funds pursuant to Rule 17a-7 under the 1940 Act. Cross trading is the buying or selling of portfolio securities between funds to which Royce or an affiliate of Franklin Resources, Inc. serves as investment adviser. The Trust’s Chief Compliance Officer reviews such transactions each quarter for compliance with the requirements and restrictions set forth by Rule 17a-7, and reports the results of that review to the Board of Trustees. Cross trades for the year ended December 31, 2022, were as follows:
| COSTS OF PURCHASES | PROCEEDS FROM SALES | REALIZED GAIN (LOSS) | |
| Royce Global Financial Services Fund | $ 173,808 | $ – | $ – |
| Royce Pennsylvania Mutual Fund | 2,532,174 | 7,909,547 | 1,318,754 |
| Royce Premier Fund | 408,000 | 2,936,304 | (1,700,033) |
| Royce Small-Cap Special Equity Fund | – | 492,947 | 281,015 |
| Royce Small-Cap Total Return Fund | – | 8,318,213 | (465,942) |
| Royce Smaller-Companies Growth Fund | – | 332,304 | (364,554) |
76 | The Royce Funds 2022 Annual Report to Shareholders
Redemptions-In-Kind:
The Funds may make payment for Fund shares redeemed wholly or in part by distributing portfolio securities to shareholders. The net realized gain will not be realized for tax purposes. For the year ended December 31, 2022, the following Fund had redemptions-in-kind:
| AMOUNT REDEEMED IN-KIND | REALIZED GAIN | |
| Royce Small-Cap Total Return Fund | $60,509,570 | $17,406,328 |
Class Specific Expenses:
Class specific expenses were as follows for the year ended December 31, 2022:
| NET DISTRIBUTION FEES | SHAREHOLDER SERVICING | SHAREHOLDER REPORTS | REGISTRATION | TRANSFER AGENT BALANCE CREDITS | TOTAL | CLASS LEVEL EXPENSES REIMBURSED BY INVESTMENT ADVISER | ||||||||
| Royce Dividend Value Fund – Investment Class | $ | – | $ | 66,901 | $ | 6,570 | $ | 17,998 | $ | (155) | $ | 91,314 | $ | 80,824 |
| Royce Dividend Value Fund – Service Class | 39,395 | 31,133 | 2,057 | 14,812 | (78) | 87,319 | 44,138 | |||||||
| Royce Dividend Value Fund – Consultant Class | 12,069 | 7,466 | (553) | 12,025 | (7) | 31,000 | 18,676 | |||||||
| Royce Dividend Value Fund – Institutional Class | – | 6,782 | 56 | 11,413 | (5) | 18,246 | 18,058 | |||||||
| 51,464 | 112,282 | 8,130 | 56,248 | (245) | 161,696 | |||||||||
| Royce Global Financial Services Fund – Service Class | 48,731 | 35,645 | 3,248 | 18,790 | (129) | 106,285 | 83,608 | |||||||
| Royce Global Financial Services Fund – Institutional Class | – | 6,689 | 37 | 13,743 | (2) | 20,467 | 12,316 | |||||||
| 48,731 | 42,334 | 3,285 | 32,533 | (131) | 95,924 | |||||||||
| Royce International Premier Fund – Investment Class | – | 375,532 | 33,695 | 31,618 | (355) | 440,490 | – | |||||||
| Royce International Premier Fund – Service Class | 98,674 | 64,333 | 4,274 | 13,450 | (69) | 180,662 | 22,450 | |||||||
| Royce International Premier Fund – Consultant Class | 59,974 | 11,695 | 980 | 11,980 | (16) | 84,613 | 15,612 | |||||||
| Royce International Premier Fund – Institutional Class | – | 253,981 | 55,025 | 29,652 | (10,674) | 327,984 | 327,984 | |||||||
| 158,648 | 705,541 | 93,974 | 86,700 | (11,114) | 366,046 | |||||||||
| Royce Micro-Cap Fund – Investment Class | – | 170,343 | 30,569 | 19,585 | (1,748) | 218,749 | 6,355 | |||||||
| Royce Micro-Cap Fund – Service Class | 371,321 | 234,232 | 15,226 | 19,268 | (198) | 639,849 | 72,482 | |||||||
| Royce Micro-Cap Fund – Consultant Class | 118,920 | 17,397 | 1,822 | 12,420 | (62) | 150,497 | – | |||||||
| 490,241 | 421,972 | 47,617 | 51,273 | (2,008) | 78,837 | |||||||||
| Royce Pennsylvania Mutual Fund – Investment Class | – | 957,334 | 128,092 | 32,971 | (5,838) | 1,112,559 | – | |||||||
| Royce Pennsylvania Mutual Fund – Service Class | 160,290 | 105,352 | 10,753 | 14,879 | (228) | 291,046 | 24,225 | |||||||
| Royce Pennsylvania Mutual Fund – Consultant Class | 2,000,030 | 148,025 | 19,657 | 16,868 | (788) | 2,183,792 | – | |||||||
| Royce Pennsylvania Mutual Fund – Institutional Class | – | 41,703 | 14,315 | 18,912 | (1,511) | 73,419 | – | |||||||
| Royce Pennsylvania Mutual Fund – R Class | 38,280 | 24,392 | 1,561 | 8,486 | (61) | 72,658 | 3,817 | |||||||
| 2,198,600 | 1,276,806 | 174,378 | 92,116 | (8,426) | 28,042 | |||||||||
| Royce Premier Fund – Investment Class | – | 978,802 | 85,196 | 32,491 | (2,644) | 1,093,845 | – | |||||||
| Royce Premier Fund – Service Class | 72,546 | 48,508 | 11,422 | 13,269 | (206) | 145,539 | 28,730 | |||||||
| Royce Premier Fund – Consultant Class | 127,628 | 18,085 | 1,271 | 12,096 | (53) | 159,027 | – | |||||||
| Royce Premier Fund – Institutional Class | – | 12,261 | 32,083 | 15,857 | (154) | 60,047 | – | |||||||
| Royce Premier Fund – R Class | 33,256 | 20,299 | 2,503 | 4,853 | (13) | 60,898 | 885 | |||||||
| 233,430 | 1,077,955 | 132,475 | 78,566 | (3,070) | 29,615 | |||||||||
The Royce Funds 2022 Annual Report to Shareholders | 77
Notes to Financial Statements (continued)
Class Specific Expenses (continued):
| NET DISTRIBUTION FEES | SHAREHOLDER SERVICING | SHAREHOLDER REPORTS | REGISTRATION | TRANSFER AGENT BALANCE CREDITS | TOTAL | CLASS LEVEL EXPENSES REIMBURSED BY INVESTMENT ADVISER | |||||||
| Royce Small-Cap Opportunity Fund – Investment Class | $ | – | $ | 1,321,323 | $ | 97,712 | $ | 52,042 | $ | (4,264) | $ 1,466,813 | $ | – |
| Royce Small-Cap Opportunity Fund – Service Class | 204,551 | 124,723 | 12,135 | 19,060 | (98) | 360,371 | 37,440 | ||||||
| Royce Small-Cap Opportunity Fund – Consultant Class | 122,566 | 15,727 | 1,709 | 13,090 | (40) | 153,052 | – | ||||||
| Royce Small-Cap Opportunity Fund – Institutional Class | – | 22,081 | 11,239 | 19,432 | (359) | 52,393 | – | ||||||
| Royce Small-Cap Opportunity Fund – R Class | 215,758 | 94,704 | 2,205 | 11,390 | (76) | 323,981 | – | ||||||
| 542,875 | 1,578,558 | 125,000 | 115,014 | (4,837) | 37,440 | ||||||||
| Royce Small-Cap Special Equity Fund – Investment Class | – | 692,365 | 52,853 | 30,029 | (2,013) | 773,234 | – | ||||||
| Royce Small-Cap Special Equity Fund – Service Class | 112,302 | 81,108 | 4,917 | 15,928 | (68) | 214,187 | 35,371 | ||||||
| Royce Small-Cap Special Equity Fund – Consultant Class | 208,724 | 40,064 | 11,803 | 13,100 | (368) | 273,323 | – | ||||||
| Royce Small-Cap Special Equity Fund – Institutional Class | – | 24,646 | 7,651 | 16,817 | (682) | 48,432 | – | ||||||
| 321,026 | 838,183 | 77,224 | 75,874 | (3,131) | 35,371 | ||||||||
| Royce Small-Cap Total Return Fund – Investment Class | – | 683,294 | 73,353 | 31,541 | (2,433) | 785,755 | – | ||||||
| Royce Small-Cap Total Return Fund – Service Class | 167,336 | 109,600 | 8,568 | 17,651 | (144) | 303,011 | 50,892 | ||||||
| Royce Small-Cap Total Return Fund – Consultant Class | 950,833 | 79,862 | 9,009 | 18,349 | (301) | 1,057,752 | – | ||||||
| Royce Small-Cap Total Return Fund – Institutional Class | – | 11,558 | 30,061 | 17,722 | (85) | 59,256 | – | ||||||
| Royce Small-Cap Total Return Fund – R Class | 110,291 | 54,161 | 3,836 | 8,063 | (102) | 176,249 | – | ||||||
| 1,228,460 | 938,475 | 124,827 | 93,326 | (3,065) | 50,892 | ||||||||
| Royce Small-Cap Value Fund – Investment Class | – | 54,750 | 5,943 | 14,522 | (317) | 74,898 | 39,978 | ||||||
| Royce Small-Cap Value Fund – Service Class | 174,751 | 105,715 | 8,490 | 19,460 | (130) | 308,286 | 68,737 | ||||||
| Royce Small-Cap Value Fund – Consultant Class | 40,240 | 11,142 | 607 | 11,868 | (28) | 63,829 | – | ||||||
| Royce Small-Cap Value Fund – R Class | 32,687 | 21,809 | 1,241 | 5,653 | (34) | 61,356 | 6,205 | ||||||
| 247,678 | 193,416 | 16,281 | 51,503 | (509) | 114,920 | ||||||||
| Royce Smaller-Companies Growth Fund – Investment Class | – | 73,194 | 12,968 | 16,761 | (773) | 102,150 | 15,436 | ||||||
| Royce Smaller-Companies Growth Fund – Service Class | 305,967 | 184,627 | 14,279 | 20,981 | (188) | 525,666 | 76,788 | ||||||
| Royce Smaller-Companies Growth Fund – Consultant Class | 51,256 | 11,205 | 971 | 12,107 | (30) | 75,509 | 18,258 | ||||||
| Royce Smaller-Companies Growth Fund – Institutional Class | – | 7,366 | 480 | 11,520 | (16) | 19,350 | 17,619 | ||||||
| 357,223 | 276,392 | 28,698 | 61,369 | (1,007) | 128,101 | ||||||||
78 | The Royce Funds 2022 Annual Report to Shareholders
Tax Information:
As of December 31, 2022, net unrealized appreciation (depreciation) based on identified cost for tax purposes was as follows:
| TAX BASIS COST | NET UNREALIZED APPRECIATION (DEPRECIATION) | GROSS UNREALIZED | ||
| Appreciation | (Depreciation) | |||
| Royce Dividend Value Fund | $ 24,869,226 | $ 34,161,713 | $ 34,161,713 | $ – |
| Royce Global Financial Services Fund | 16,580,835 | 10,432,662 | 11,927,576 | 1,494,914 |
| Royce International Premier Fund | 823,547,697 | (83,348,631) | 73,326,944 | 156,675,575 |
| Royce Micro-Cap Fund | 238,183,283 | 54,983,177 | 90,991,406 | 36,008,229 |
| Royce Pennsylvania Mutual Fund | 1,220,678,551 | 343,608,694 | 432,848,747 | 89,240,053 |
| Royce Premier Fund | 805,085,751 | 446,868,804 | 468,731,711 | 21,862,907 |
| Royce Small-Cap Opportunity Fund | 1,144,800,275 | 103,952,274 | 259,808,591 | 155,856,317 |
| Royce Small-Cap Special Equity Fund | 628,564,477 | 127,577,313 | 133,886,874 | 6,309,561 |
| Royce Small-Cap Total Return Fund | 864,364,597 | 73,303,887 | 137,983,678 | 64,679,791 |
| Royce Small-Cap Value Fund | 95,837,929 | 18,243,463 | 21,467,601 | 3,224,138 |
| Royce Smaller-Companies Growth Fund | 158,189,147 | 19,564,489 | 39,685,766 | 20,121,277 |
The primary causes of the difference between book and tax basis cost are the timing of the recognition of losses on securities sold, investments in Real Estate Investment Trusts, investments in publicly traded partnerships, underlying investments and mark-to-market of Passive Foreign Investment Companies.
Distributions during the years ended December 31, 2022 and 2021, were characterized as follows for tax purposes:
| ORDINARY INCOME | LONG-TERM CAPITAL GAINS | RETURN OF CAPITAL | ||||
| 2022 | 2021 | 2022 | 2021 | 2022 | 2021 | |
| Royce Dividend Value Fund | $ 425,788 | $ 590,238 | $ 126,633 | $ 9,174,538 | $ – | $ 612 |
| Royce Global Financial Services Fund | 213,571 | 1,124,557 | 322,343 | 1,033,749 | 24 | – |
| Royce International Premier Fund | 8,603,671 | 5,751,838 | 18,800,788 | 54,248,823 | – | – |
| Royce Micro-Cap Fund | 1,948,933 | 9,652,843 | 12,404,460 | 71,053,385 | 898 | – |
| Royce Pennsylvania Mutual Fund | 5,035,816 | 42,700,145 | 73,368,243 | 437,429,695 | – | – |
| Royce Premier Fund | – | 908,951 | 105,822,305 | 312,568,124 | – | – |
| Royce Small-Cap Opportunity Fund | 6,215,236 | 90,710,580 | 55,617,632 | 265,900,785 | – | – |
| Royce Small-Cap Special Equity Fund | 17,122,442 | 52,776,581 | 69,160,036 | 104,584,804 | – | – |
| Royce Small-Cap Total Return Fund | 18,597,278 | 84,924,753 | 112,642,658 | 300,708,916 | – | – |
| Royce Small-Cap Value Fund | 391,419 | 28,469 | 6,159,246 | 7,697,144 | – | – |
| Royce Smaller-Companies Growth Fund | 3,273,074 | 13,787,403 | 4,143,044 | 64,121,109 | 1,108 | – |
The tax basis components of distributable earnings as of December 31, 2022, were as follows:
UNDISTRIBUTED ORDINARY INCOME | UNDISTRIBUTED LONG-TERM CAPITAL GAINS OR (CAPITAL LOSS CARRYFORWARD) | NET UNREALIZED APPRECIATION (DEPRECIATION)1 | QUALIFIED LATE YEAR ORDINARY AND POST-OCTOBER LOSS DEFERRALS2 | TOTAL DISTRIBUTABLE EARNINGS | CAPITAL LOSS CARRYFORWARD UTILIZED | |
| Royce Dividend Value Fund | $ 7,114 | $ 218,875 | $ 34,159,633 | $ (5,075) | $ 34,380,547 | $ – |
| Royce Global Financial Services Fund | – | (583,010) | 10,432,534 | – | 9,849,524 | – |
| Royce International Premier Fund | 65,029 | (2,748,427) | (83,354,337) | (26,640,120) | (112,677,855) | 64,221 |
| Royce Micro-Cap Fund | – | – | 54,983,170 | (400,502) | 54,582,668 | – |
| Royce Pennsylvania Mutual Fund | 247,177 | – | 343,608,483 | (4,597,277) | 339,258,383 | – |
| Royce Premier Fund | – | 10,536,094 | 446,868,801 | (1,307) | 457,403,588 | – |
| Royce Small-Cap Opportunity Fund | 17,895 | 716,452 | 103,952,273 | (508) | 104,686,112 | – |
| Royce Small-Cap Special Equity Fund | 43,369 | 12,582,754 | 127,577,310 | – | 140,203,433 | – |
| Royce Small-Cap Total Return Fund | 1,330,914 | 9,136,664 | 73,315,639 | – | 83,783,217 | – |
| Royce Small-Cap Value Fund | 34,909 | 303,268 | 18,243,461 | (34,265) | 18,547,373 | – |
| Royce Smaller-Companies Growth Fund | – | (20,571,779) | 19,550,408 | (1,222,412) | (2,243,783) | – |
| 1 | Includes timing differences on foreign currency, recognition of losses on securities sold, investments in Real Estate Investment Trusts, investments in publicly traded partnerships, underlying investments and mark-to-market of Passive Foreign Investment Companies. |
| 2 | Under the current tax law, capital losses and qualified late year ordinary losses incurred after October 31 may be deferred and treated as occurring on the first day of the following fiscal year. This column also includes passive activity losses and 857 (b)(9) adjustments. |
The Royce Funds 2022 Annual Report to Shareholders | 79
Notes to Financial Statements (continued)
Tax Information (continued):
For financial reporting purposes, capital accounts and distributions to shareholders are adjusted to reflect the tax character of permanent book/tax differences. For the year ended December 31, 2022, the Funds recorded the following permanent reclassifications, which relate primarily to current net operating losses, distribution reclassifications, investments in Real Estate Investment Trusts, publicly traded partnerships, foreign currency transactions, foreign capital gains tax, redemptions-in-kind, return of capital distributions and gains from the sale of Passive Foreign Investment Companies. Results of operations and net assets were not affected by these reclassifications.
| TOTAL DISTRIBUTABLE EARNINGS (LOSS) | PAID-IN CAPITAL | |||
| Royce Dividend Value Fund | $ | – | $ | – |
| Royce Global Financial Services Fund | 424,991 | (424,991) | ||
| Royce International Premier Fund | – | – | ||
| Royce Micro-Cap Fund | 2,111,332 | (2,111,332) | ||
| Royce Pennsylvania Mutual Fund | 7,894 | (7,894) | ||
| Royce Premier Fund | 451,313 | (451,313) | ||
| Royce Small-Cap Opportunity Fund | 14,656 | (14,656) | ||
| Royce Small-Cap Special Equity Fund | – | – | ||
| Royce Small-Cap Total Return Fund | (8,716,600) | 8,716,600 | ||
| Royce Small-Cap Value Fund | (35,793) | 35,793 | ||
| Royce Smaller-Companies Growth Fund | 4,572,712 | (4,572,712) | ||
Management has analyzed the Funds’ tax positions taken on federal income tax returns for all open tax years (2019 – 2022) and has concluded that as of December 31, 2022, no provision for income tax is required in the Funds’ financial statements.
Transactions in Affiliated Companies:
An “Affiliated Company,” as defined in the 1940 Act, is a company in which a Fund owns 5% or more of the company’s outstanding voting securities at any time during the period. The following transactions were effected in shares of such companies for the year ended December 31, 2022:
| AFFILIATED COMPANY 1 | ||||||||||
| SHARES 12/31/21 | MARKET VALUE 12/31/21 | COSTS OF PURCHASES | PROCEEDS FROM SALES | REALIZED GAIN (LOSS) | CHANGE IN NET UNREALIZED APPRECIATION (DEPRECIATION) | DIVIDEND INCOME | SHARES 12/31/22 | MARKET VALUE 12/31/22 | ||
| Royce International Premier Fund | ||||||||||
| AUSTRALIA – 0.0% | ||||||||||
| Bravura Solutions 2 | 15,808,630 | $ 28,408,875 | $ 736,853 | $ 12,437,732 | $(26,223,761) | $ 9,515,765 | $ | 623,415 | n/a | n/a |
| 28,408,875 | (26,223,761) | 9,515,765 | 623,415 | |||||||
| Royce Small-Cap Opportunity Fund | ||||||||||
| HEALTH CARE – 0.0% | ||||||||||
| HEALTH CARE EQUIPMENT & SUPPLIES – 0.0% | ||||||||||
| IntriCon Corporation 2,3 | 486,447 | 7,865,848 | – | 11,579,543 | 2,355,413 | 1,358,282 | – | n/a | n/a | |
| 7,865,848 | 2,355,413 | 1,358,282 | – | |||||||
| INDUSTRIALS – 0.5% | ||||||||||
| CONSTRUCTION & ENGINEERING – 0.5% | ||||||||||
| Limbach Holdings 3,4 | 635,423 | 5,718,807 | 1,008,201 | 1,431,189 | (49,623) | 1,572,156 | – | 654,981 | $ 6,818,352 | |
| 5,718,807 | (49,623) | 1,572,156 | – | 6,818,352 | ||||||
| INFORMATION TECHNOLOGY – 0.4% | ||||||||||
| COMMUNICATIONS EQUIPMENT – 0.4% | ||||||||||
| PCTEL 3,4 | 1,000,593 | 5,673,362 | 521,258 | 263,910 | (85,142) | (1,353,388) | – | 1,044,693 | 4,492,180 | |
| 5,673,362 | (85,142) | (1,353,388) | – | 4,492,180 | ||||||
| 19,258,017 | 2,220,648 | 1,577,050 | – | 11,310,532 | ||||||
| Royce Small-Cap Special Equity Fund | ||||||||||
| CONSUMER DISCRETIONARY– 5.5% | ||||||||||
| AUTO COMPONENTS – 5.5% | ||||||||||
| Standard Motor Products 4 | 1,171,500 | 61,374,885 | 1,432,819 | 890,163 | 9,320 | (20,584,461) | 1,279,935 | 1,188,000 | 41,342,400 | |
| HOUSEHOLD DURABLES – 0.0% | ||||||||||
| Flexsteel Industries 2 | 767,500 | 20,615,050 | – | 14,352,219 | (13,061,794) | 6,798,963 | – | n/a | n/a | |
| Hooker Furnishings 2 | 1,137,000 | 26,469,360 | – | 21,153,315 | (7,013,961) | 1,697,916 | 220,000 | n/a | n/a | |
| 47,084,410 | (20,075,755) | 8,496,879 | 220,000 | |||||||
| 108,459,295 | (20,066,435) | (12,087,582) | 1,499,935 | 41,342,400 | ||||||
| INDUSTRIALS – 3.4% | ||||||||||
| MACHINERY – 3.4% | ||||||||||
| Gencor Industries 3,4 | 1,066,000 | 12,290,980 | – | – | – | (1,524,380) | – | 1,066,000 | 10,766,600 | |
| Hurco Companies 4 | 580,000 | 17,226,000 | – | – | – | (2,070,600) | 348,000 | 580,000 | 15,155,400 | |
| Miller Industries 2 | 754,000 | 25,183,600 | 316,992 | 20,509,497 | (3,965,788) | (1,025,307) | 167,706 | n/a | n/a | |
| 54,700,580 | (3,965,788) | (4,620,287) | 515,706 | 25,922,000 |
80 | The Royce Funds 2022 Annual Report to Shareholders
Transactions in Affiliated Companies (continued):
| AFFILIATED COMPANY 1 | |||||||||||
| SHARES 12/31/21 | MARKET VALUE 12/31/21 | COSTS OF PURCHASES | PROCEEDS FROM SALES | REALIZED GAIN (LOSS) | CHANGE IN NET UNREALIZED APPRECIATION (DEPRECIATION) | DIVIDEND INCOME | SHARES 12/31/22 | MARKET VALUE 12/31/22 | |||
| Royce Small-Cap Special Equity Fund (continued) | |||||||||||
| INFORMATION TECHNOLOGY – 3.2% | |||||||||||
| SEMICONDUCTORS & SEMICONDUCTOR | |||||||||||
| EQUIPMENT – 3.2% | |||||||||||
| NVE Corporation 4 | 300,100 | $ 20,496,830 | $ 3,693,353 | $ | – | $ | – | $ (135,558) | $ 1,388,500 | 371,500 | $24,054,625 |
| 20,496,830 | – | (135,558) | 1,388,500 | 24,054,625 | |||||||
| 183,656,705 | (24,032,223) | (16,843,427) | 3,404,141 | 91,319,025 | |||||||
| Royce Small-Cap Total Return Fund | |||||||||||
| FINANCIALS – 2.3% | |||||||||||
| INSURANCE – 2.3% | |||||||||||
| International General Insurance Holdings4 | 1,797,165 | 14,557,036 | 7,992,267 | 682,753 | 3,559 | 113,867 | 420,786 | 2,747,997 | 21,983,976 | ||
| Trean Insurance Group 2,3 | 2,821,597 | 25,140,429 | 7,558,202 | 26,431,872 | (18,865,107) | 12,598,348 | – | n/a | n/a | ||
| 39,697,465 | (18,861,548) | 12,712,215 | 420,786 | 21,983,976 | |||||||
| 1 | Percentages represent the percentages of the investments in the Affiliated Companies of the Fund’s net assets. |
| 2 | Not an Affiliated Company as of December 31, 2022. |
| 3 | Non-income producing. |
| 4 | As of December 31, 2022, the Fund owned 5% or more of the Company’s outstanding voting securities thereby making the Company an Affiliated Company as that term is defined in the Investment Company Act of 1940. |
Subsequent Events:
Subsequent events have been evaluated through the date the financial statements were issued and it has been determined that no events have occurred that require disclosure.
The Royce Funds 2022 Annual Report to Shareholders | 81
Report of Independent Registered Public Accounting Firm
To the Board of Trustees of The Royce Fund and Shareholders of Royce Dividend Value Fund, Royce Global Financial Services Fund, Royce International Premier Fund, Royce Micro-Cap Fund, Royce Pennsylvania Mutual Fund, Royce Premier Fund, Royce Small-Cap Opportunity Fund, Royce Small-Cap Special Equity Fund, Royce Small-Cap Total Return Fund, Royce Small-Cap Value Fund and Royce Smaller-Companies Growth Fund:
Opinions on the Financial Statements
We have audited the accompanying statements of assets and liabilities, including the schedules of investments, of Royce Dividend Value Fund, Royce Global Financial Services Fund, Royce International Premier Fund, Royce Micro-Cap Fund, Royce Pennsylvania Mutual Fund, Royce Premier Fund, Royce Small-Cap Opportunity Fund, Royce Small-Cap Special Equity Fund, Royce Small-Cap Total Return Fund, Royce Small-Cap Value Fund and Royce Smaller-Companies Growth Fund (constituting The Royce Fund, hereafter collectively referred to as the “Funds”) as of December 31, 2022, the related statements of operations for the year ended December 31, 2022, the statements of changes in net assets for each of the two years in the period ended December 31, 2022, including the related notes, and the financial highlights for each of the periods indicated therein (collectively referred to as the “financial statements”). In our opinion, the financial statements present fairly, in all material respects, the financial position of each of the Funds as of December 31, 2022, the results of each of their operations for the year then ended, the changes in each of their net assets for each of the two years in the period ended December 31, 2022 and each of the financial highlights for each of the periods indicated therein in conformity with accounting principles generally accepted in the United States of America.
Basis for Opinions
These financial statements are the responsibility of the Funds’ management. Our responsibility is to express an opinion on the Funds’ financial statements based on our audits. We are a public accounting firm registered with the Public Company Accounting Oversight Board (United States) (PCAOB) and are required to be independent with respect to the Funds in accordance with the U.S. federal securities laws and the applicable rules and regulations of the Securities and Exchange Commission and the PCAOB.
We conducted our audits of these financial statements in accordance with the standards of the PCAOB. Those standards require that we plan and perform the audit to obtain reasonable assurance about whether the financial statements are free of material misstatement, whether due to error or fraud.
Our audits included performing procedures to assess the risks of material misstatement of the financial statements, whether due to error or fraud, and performing procedures that respond to those risks. Such procedures included examining, on a test basis, evidence regarding the amounts and disclosures in the financial statements. Our audits also included evaluating the accounting principles used and significant estimates made by management, as well as evaluating the overall presentation of the financial statements. Our procedures included confirmation of securities owned as of December 31, 2022 by correspondence with the custodian and brokers; when replies were not received from brokers, we performed other auditing procedures. We believe that our audits provide a reasonable basis for our opinions.
/s/PricewaterhouseCoopers LLP
New York, New York
February 20, 2023
We have served as the auditor of one or more investment companies in the Franklin Templeton Group of Funds since 1948.
82 | The Royce Funds 2022 Annual Report to Shareholders
Understanding Your Fund’s Expenses (unaudited)
As a shareholder of a mutual fund, you pay ongoing expenses, including management fees and other Fund expenses including, for some funds, distribution and/or service (12b-1) fees. Using the information below, you can estimate how these ongoing expenses (in dollars) affect your investment and compare them with the ongoing expenses of other funds. You may also incur one-time transaction expenses, including redemption fees, which are not shown in this section and would result in higher total costs. The example is based on an investment of $1,000 invested at July 1, 2022, and held for the entire six-month period ended December 31, 2022. Service, Consultant and R Class shares are generally available only through certain brokers or retirement plan administrators who receive distribution and/or service fees from the Fund for services that they perform. Institutional Class shares are generally available only to institutions or intermediaries with a minimum account size of $1 million.
Actual Expenses
The first part of the table below provides information about actual account values and actual expenses. You may use the information in this section, together with the amount you invested, to estimate the expenses that you paid over the period. Simply divide your account value at December 31, 2022, by $1,000 (for example, an $8,600 account value divided by $1,000 = 8.6), then multiply the result by the number under the heading entitled “Expenses Paid During the Period” to estimate the expenses you paid on your account during this period.
Hypothetical Example for Comparison Purposes
The second part of the table below provides information about hypothetical account values and hypothetical expenses based on the Fund’s actual expense ratio and an assumed rate of return of 5% per year before expenses, which is not the Fund’s actual return. The hypothetical account values and expenses may not be used to estimate the actual ending account balance or expenses you paid for the period. You may use this information to compare the ongoing costs of investing in the Fund and other funds. To do so, compare this 5% hypothetical example with the 5% hypothetical examples that appear in the shareholder reports of the other funds.
Please note that the expenses shown in the table are meant to highlight your ongoing costs only and do not reflect any transactional costs, such as sales charges (loads), redemption fees, or exchange fees. Therefore, this section is useful in comparing ongoing costs only, and will not help you determine the relative total costs of owning different funds. In addition, if these transactional costs were included, your costs would have been higher.
| ACTUAL | HYPOTHETICAL (5% PER YEAR BEFORE EXPENSES) | ||||||||||||
| Beginning Account Value 7/1/22 | Ending Account Value 12/31/22 | Expenses Paid During the Period1 | Beginning Account Value 7/1/22 | Ending Account Value 12/31/22 | Expenses Paid During the Period1 | Net Annualized Operating Expense Ratio2 | |||||||
| Investment Class | |||||||||||||
| Royce Dividend Value Fund | $ | 1,000.00 | $ | 1,096.05 | $ | 5.76 | $ | 1,000.00 | $ | 1,019.71 | $ | 5.55 | 1.09% |
| Royce International Premier Fund | 1,000.00 | 999.06 | 5.84 | 1,000.00 | 1,019.36 | 5.90 | 1.16% | ||||||
| Royce Micro-Cap Fund | 1,000.00 | 1,075.13 | 6.49 | 1,000.00 | 1,018.95 | 6.31 | 1.24% | ||||||
| Royce Pennsylvania Mutual Fund3 | 1,000.00 | 1,053.11 | 4.81 | 1,000.00 | 1,020.52 | 4.74 | 0.93% | ||||||
| Royce Premier Fund | 1,000.00 | 1,046.26 | 6.09 | 1,000.00 | 1,019.26 | 6.01 | 1.18% | ||||||
| Royce Small-Cap Opportunity Fund | 1,000.00 | 1,064.12 | 6.40 | 1,000.00 | 1,019.00 | 6.26 | 1.23% | ||||||
| Royce Small-Cap Special Equity Fund | 1,000.00 | 1,074.56 | 6.33 | 1,000.00 | 1,019.11 | 6.16 | 1.21% | ||||||
| Royce Small-Cap Total Return Fund | 1,000.00 | 1,004.38 | 6.11 | 1,000.00 | 1,019.11 | 6.16 | 1.21% | ||||||
| Royce Small-Cap Value Fund | 1,000.00 | 1,115.15 | 6.61 | 1,000.00 | 1,018.95 | 6.31 | 1.24% | ||||||
| Royce Smaller-Companies Growth Fund | 1,000.00 | 1,062.04 | 6.44 | 1,000.00 | 1,018.95 | 6.31 | 1.24% | ||||||
| Service Class | |||||||||||||
| Royce Dividend Value Fund | 1,000.00 | 1,094.07 | 7.07 | 1,000.00 | 1,018.45 | 6.82 | 1.34% | ||||||
| Royce Global Financial Services Fund | 1,000.00 | 1,024.44 | 7.60 | 1,000.00 | 1,017.69 | 7.58 | 1.49% | ||||||
| Royce International Premier Fund | 1,000.00 | 997.21 | 7.25 | 1,000.00 | 1,017.95 | 7.32 | 1.44% | ||||||
| Royce Micro-Cap Fund | 1,000.00 | 1,073.52 | 7.79 | 1,000.00 | 1,017.69 | 7.58 | 1.49% | ||||||
| Royce Pennsylvania Mutual Fund3 | 1,000.00 | 1,050.91 | 6.15 | 1,000.00 | 1,019.21 | 6.06 | 1.19% | ||||||
| Royce Premier Fund | 1,000.00 | 1,043.66 | 7.68 | 1,000.00 | 1,017.69 | 7.58 | 1.49% | ||||||
| Royce Small-Cap Opportunity Fund | 1,000.00 | 1,063.58 | 7.75 | 1,000.00 | 1,017.69 | 7.58 | 1.49% | ||||||
| Royce Small-Cap Special Equity Fund | 1,000.00 | 1,073.56 | 7.79 | 1,000.00 | 1,017.69 | 7.58 | 1.49% | ||||||
| Royce Small-Cap Total Return Fund | 1,000.00 | 1,002.73 | 7.52 | 1,000.00 | 1,017.69 | 7.58 | 1.49% | ||||||
| Royce Small-Cap Value Fund | 1,000.00 | 1,115.41 | 7.94 | 1,000.00 | 1,017.69 | 7.58 | 1.49% | ||||||
| Royce Smaller-Companies Growth Fund | 1,000.00 | 1,060.28 | 7.74 | 1,000.00 | 1,017.69 | 7.58 | 1.49% | ||||||
| Consultant Class | |||||||||||||
| Royce Dividend Value Fund | 1,000.00 | 1,090.94 | 11.01 | 1,000.00 | 1,014.67 | 10.61 | 2.09% | ||||||
| Royce International Premier Fund | 1,000.00 | 993.57 | 11.00 | 1,000.00 | 1,014.17 | 11.12 | 2.19% | ||||||
| Royce Micro-Cap Fund | 1,000.00 | 1,070.23 | 12.47 | 1,000.00 | 1,013.16 | 12.13 | 2.39% | ||||||
| Royce Pennsylvania Mutual Fund3 | 1,000.00 | 1,047.32 | 10.01 | 1,000.00 | 1,015.43 | 9.86 | 1.94% | ||||||
| Royce Premier Fund | 1,000.00 | 1,040.31 | 12.03 | 1,000.00 | 1,013.41 | 11.88 | 2.34% | ||||||
| Royce Small-Cap Opportunity Fund | 1,000.00 | 1,058.36 | 12.30 | 1,000.00 | 1,013.26 | 12.03 | 2.37% | ||||||
| Royce Small-Cap Special Equity Fund | 1,000.00 | 1,067.66 | 12.66 | 1,000.00 | 1,012.96 | 12.33 | 2.43% | ||||||
| Royce Small-Cap Total Return Fund | 1,000.00 | 1,000.10 | 11.34 | 1,000.00 | 1,013.86 | 11.42 | 2.25% | ||||||
| Royce Small-Cap Value Fund | 1,000.00 | 1,105.80 | 14.97 | 1,000.00 | 1,010.99 | 14.29 | 2.82% | ||||||
| Royce Smaller-Companies Growth Fund | 1,000.00 | 1,056.75 | 11.61 | 1,000.00 | 1,013.91 | 11.37 | 2.24% | ||||||
The Royce Funds 2022 Annual Report to Shareholders | 83
Understanding Your Fund’s Expenses (unaudited) (continued)
| ACTUAL | HYPOTHETICAL (5% PER YEAR BEFORE EXPENSES) | ||||||
Beginning Account Value 7/1/22 | Ending Account Value 12/31/22 | Expenses Paid During the Period1 | Beginning Account Value 7/1/22 | Ending Account Value 12/31/22 | Expenses Paid During the Period1 | Net Annualized Operating Expense Ratio2 | |
Institutional Class Royce Dividend Value Fund | $ 1,000.00 | $ 1,094.21 | $ 5.75 | $ 1,000.00 | $ 1,019.71 | $ 5.55 | 1.09% |
| Royce Global Financial Services Fund | 1,000.00 | 1,023.84 | 7.60 | 1,000.00 | 1,017.69 | 7.58 | 1.49% |
| Royce International Premier Fund | 1,000.00 | 999.47 | 5.24 | 1,000.00 | 1,019.96 | 5.30 | 1.04% |
| Royce Pennsylvania Mutual Fund | 1,000.00 | 1,052.10 | 4.71 | 1,000.00 | 1,020.62 | 4.63 | 0.91% |
| Royce Premier Fund | 1,000.00 | 1,046.75 | 5.78 | 1,000.00 | 1,019.56 | 5.70 | 1.12% |
| Royce Small-Cap Opportunity Fund | 1,000.00 | 1,065.24 | 5.88 | 1,000.00 | 1,019.51 | 5.75 | 1.13% |
| Royce Small-Cap Special Equity Fund | 1,000.00 | 1,074.77 | 5.91 | 1,000.00 | 1,019.51 | 5.75 | 1.13% |
| Royce Small-Cap Total Return Fund | 1,000.00 | 1,004.90 | 5.91 | 1,000.00 | 1,019.31 | 5.96 | 1.17% |
| Royce Smaller-Companies Growth Fund | 1,000.00 | 1,061.15 | 6.03 | 1,000.00 | 1,019.36 | 5.90 | 1.16% |
R Class Royce Pennsylvania Mutual Fund | 1,000.00 | 1,049.35 | 9.04 | 1,000.00 | 1,016.38 | 8.89 | 1.75% |
| Royce Premier Fund | 1,000.00 | 1,040.86 | 10.24 | 1,000.00 | 1,015.17 | 10.11 | 1.99% |
| Royce Small-Cap Opportunity Fund | 1,000.00 | 1,062.15 | 9.56 | 1,000.00 | 1,015.93 | 9.35 | 1.84% |
| Royce Small-Cap Total Return Fund | 1,000.00 | 1,001.79 | 9.64 | 1,000.00 | 1,015.58 | 9.70 | 1.91% |
| Royce Small-Cap Value Fund | 1,000.00 | 1,112.04 | 10.59 | 1,000.00 | 1,015.17 | 10.11 | 1.99% |
| 1 | Expenses are equal to the Fund's net annualized operating expense ratio multiplied by the average account value for the period, multiplied by 184 days in the most recent fiscal half-year divided by 365 days (to reflect the half-year period). |
| 2 | Net annualized operating expense ratio used to derive figures in the table is based on the most recent fiscal half-year. |
| 3 | GiftShare accounts pay an annual $50 trustee fee to Alliance Trust Company, as trustee. If these fees were included above, your costs would be higher. |
Federal Tax Information
In January 2023, taxable shareholders that opted out of e-delivery were mailed a Form 1099-DIV reporting the federal tax status of all distributions paid during the calendar year 2022. Shareholders who elected e-delivery have received electronic notification of the form being available for download via their Online Account Access.
2022 Supplemental Tax Information:
| % QDI | % U.S. GOVT INCOME | % INCOME QUALIFYING FOR DRD | LONG-TERM CAPITAL GAIN DISTRIBUTION OR MAXIMUM ALLOWABLE (OOO’S) | |
| Royce Dividend Value Fund | 100.00% | N/A | 100.00% | $ 127 |
| Royce Global Financial Services Fund | 100.00% | N/A | 95.44% | 322 |
| Royce International Premier Fund | 100.00% | N/A | 0.00% | 18,801 |
| Royce Micro-Cap Fund | 0.01% | N/A | 98.20% | 12,404 |
| Royce Pennsylvania Mutual Fund | 19.55% | N/A | 100.00% | 73,368 |
| Royce Premier Fund | 0.00% | N/A | 0.00% | 105,822 |
| Royce Small-Cap Opportunity Fund | 0.02% | N/A | 100.00% | 55,618 |
| Royce Small-Cap Special Equity Fund | 49.16% | N/A | 100.00% | 69,160 |
| Royce Small-Cap Total Return Fund | 23.49% | N/A | 100.00% | 112,642 |
| Royce Small-Cap Value Fund | 100.00% | N/A | 100.00% | 6,159 |
| Royce Smaller-Companies Growth Fund | 0.03% | N/A | 6.67% | 4,143 |
Definitions:
% QDI: Qualified Dividend Income; % of net investment income and/or short-term capital gains distributions that qualify for treatment at long-term capital gain rates.
% U.S. Govt Income: % of investment income paid from U.S. Government obligations.
% Income Qualifying for DRD: % of investment income eligible for the corporate dividend received deduction.
Foreign Tax Credit:
For the year ended December 31, 2022, Royce International Premier Fund had elected to pass through the credit for tax paid in foreign countries. The net foreign source income and foreign tax per share outstanding on the dividend distribution date are as follows:
NET FOREIGN SOURCE INCOME | NET FOREIGN SOURCE INCOME PER SHARE | FOREIGN TAX | FOREIGN TAX PER SHARE |
| $10,653,802 | $0.1857 | $1,948,475 | $0.0340 |
84 | The Royce Funds 2022 Annual Report to Shareholders
All Trustees and Officers may be reached c/o The Royce Funds, 745 Fifth Avenue, New York, NY 10151
Christopher D. Clark, Trustee 1, President
Age: 57 | Number of Funds Overseen: 16 | Tenure: Since 2014
Principal Occupation(s) During Past Five Years: Chief Executive Officer (since July 2016), President (since July 2014), Co-Chief Investment Officer (since January 2014), Managing Director of Royce, a Member of the Board of Managers of Royce, having been employed by Royce since May 2007.
Patricia W. Chadwick, Trustee
Age: 74 | Number of Funds Overseen: 16 | Tenure: Since 2009
Non-Royce Directorships: Trustee of Voya Mutual Funds
Principal Occupation(s) During Past 5 Years: Consultant and President, Ravengate Partners LLC (since 2000). Formerly Director, Wisconsin Energy Corp. (until 2022).
Christopher C. Grisanti, Trustee
Age: 61 | Number of Funds Overseen: 16 | Tenure: Since 2017
Non-Royce Directorships: None
Principal Occupation(s) During Past Five Years: Chief Equity Strategist and Senior Portfolio Manager, MAI Capital Management LLC (investment advisory firm) (since May 2020). Formerly Co-Founder and Chief Executive Officer, Grisanti Capital Management LLC (investment advisory firm) (from 1999 to 2020); Director of Research and Portfolio Manager, Spears Benzak, Salomon & Farrell (from 1994 to 1999); and Senior Associate, Simpson, Thacher & Bartlett (law firm) (from 1988 to 1994).
Cecile B. Harper, Trustee
Age: 59 | Number of Funds Overseen: 16 | Tenure: Since 2020
Non-Royce Directorships: None
Principal Occupation(s) During Past Five Years: Chief Financial Officer and Chief Operating Officer, College Foundation at the University of Virginia (since October 2019). Formerly Board Member, Pyramid Peak Foundation (January 2012 to 2022); Board Member, Regional One Health Foundation (from June 2013 to September 2019); and Principal, Southeastern Asset Management (from December 1993 to September 2019).
Arthur S. Mehlman, Trustee
Age: 80 | Number of Funds Overseen: 16 | Tenure: Since 2004
Non-Royce Directorships: None
Principal Occupation(s) During Past Five Years: Director, University of Maryland Foundation (non-profits). Formerly Director/Trustee, registered investment companies constituting the Legg Mason Funds (from 2002 to June 2021); Director, The League for People with Disabilities, Inc. (from June 2003 to June 2018); Director, Municipal Mortgage & Equity, LLC (from October 2004 to April 2011); Director, University of Maryland College Park Foundation (non-profit) (from 1998 to 2005); Director, Maryland Business Roundtable for Education (from July 1984 to June 2002); and Partner, KPMG LLP (international accounting firm) (from 1972 to 2002).
G. Peter O’Brien, Trustee
Age: 77 | Number of Funds Overseen: 73 | Tenure: Since 2001
Non-Royce Directorships: Director/Trustee of registered investment companies constituting the 57 Legg Mason Funds.
Principal Occupation(s) During Past Five Years: Trustee Emeritus, Colgate University (since 2005); and Emeritus Board Member, Hill House, Inc. (since 2019). Formerly Director, TICC Capital Corp. (from 2003-2017); Trustee, Colgate University (from 1996 to 2005); President, Hill House, Inc. (from 2001 to 2005); Board Member, Hill House, Inc. (from 1999 to 2019); Director, Bridges School (from 2006 to 2018); and Managing Director/ Equity Capital Markets Group, Merrill Lynch & Co. (from 1971 to 1999).
Michael K. Shields, Trustee
Age: 64 | Number of Funds Overseen: 16 | Tenure: Since 2015
Non-Royce Directorships: None
Principal Occupation(s) During Past Five Years: President and Chief Executive Officer, Piedmont Trust Company (privately-owned North Carolina trust company) (since February 2012); Chairman, UNC Charlotte Investment Fund Board (since February 2016); and Chairman, Halftime Carolinas Board (since February 2011). Formerly Owner, Shields Advisors (investment consulting firm) (from April 2010 to June 2012); President and Chief Executive Officer, Eastover Capital Management (2005-2007); President and Chief Executive Officer, Campbell, Cowperthwait (investment subsidiary of U.S. Trust Corporation) (1997-2002); and equity portfolio manager and co-manager of Quality Growth Team, Scudder, Stevens and Clark (1992-1997).
Francis D. Gannon, Vice President
Age: 55 | Tenure: Since 2014
Principal Occupation(s) During Past Five Years: Co-Chief Investment Officer (since January 2014) and Managing Director of Royce, having been employed by Royce since September 2006.
Daniel A. O’Byrne, Vice President
Age: 60 | Tenure: Since 1994
Principal Occupation(s) During Past Five Years: Principal and Vice President of Royce, having been employed by Royce since October 1986.
Peter K. Hoglund, Treasurer
Age: 56 | Tenure: Since 2015
Principal Occupation(s) During Past Five Years: Chief Financial Officer, Chief Administrative Officer, and Managing Director of Royce, having been employed by Royce since December 2014. Prior to joining Royce, Mr. Hoglund spent more than 20 years with Munder Capital Management in Birmingham, MI, serving as Managing Director and Chief Financial Officer and overseeing all financial aspects of the firm. He began his career at Munder as a portfolio manager.
John E. Denneen, Secretary and Chief Legal Officer
Age: 55 | Tenure: 1996-2001 and Since 2002
Principal Occupation(s) During Past Five Years: General Counsel, Managing Director, and, since June 2015, a Member of the Board of Managers of Royce. Chief Legal and Compliance Officer and Secretary of Royce.
John P. Schwartz, Chief Compliance Officer
Age: 51 | Tenure: Since 2022
Principal Occupation(s) During Past Five Years: Chief Compliance Officer of The Royce Funds (since May 2022) and Associate General Counsel and Compliance Officer of Royce (since March 2013).
| 1 | Interested Trustee. |
Trustees will hold office until their successors have been duly elected and qualified or until their earlier resignation or removal. The Statement of Additional Information, which contains additional information about the Trust’s trustees and officers, is available and can be obtained without charge at www.royceinvest.com or by calling (800) 221-4268.
The Royce Funds 2022 Annual Report to Shareholders | 85
Notes to Performance and Other Important Information
The thoughts expressed in this report concerning recent market movements and future prospects for small company stocks are solely the opinion of Royce at December 31, 2022, and, of course, historical market trends are not necessarily indicative of future market movements. Statements regarding the future prospects for particular securities held in the Funds’ portfolios and Royce’s investment intentions with respect to those securities reflect Royce’s opinions as of December 31, 2022 and are subject to change at any time without notice. There can be no assurance that securities mentioned in this report will be included in any Royce-managed portfolio in the future.
Sector weightings are determined using the Global Industry Classification Standard (“GICS”). GICS was developed by, and is the exclusive property of, Standard & Poor’s Financial Services LLC (“S&P”) and MSCI Inc. (“MSCI”). GICS is the trademark of S&P and MSCI. “Global Industry Classification Standard (GICS)” and “GICS Direct” are service marks of S&P and MSCI.
All indexes referenced are unmanaged and capitalization weighted. Each index’s returns include net reinvested dividends and/or interest income. Frank Russell Company (“Russell”) is the source and owner of the trademarks, service marks and copyrights related to the Russell Indexes. Russell® is a trademark of Frank Russell Company. Neither Russell nor its licensors accept any liability for any errors or omissions in the Russell Indexes and/or Russell ratings or underlying data and no party may rely on any Russell Indexes and/or Russell ratings and/or underlying data contained in this communication. No further distribution of Russell Data is permitted without Russell’s express written consent. Russell does not promote, sponsor or endorse the content of this communication. The Russell 2000 is an index of domestic small-cap stocks. It measures the performance of the 2,000 smallest publicly traded U.S. companies in the Russell 3000 Index. The Russell 2000 Value and Growth Indexes consist of the respective value and growth stocks within the Russell 2000 as determined by Russell Investments. The Russell Microcap Index includes 1,000 of the smallest securities in the small-cap Russell 2000 Index along with the next smallest eligible securities as determined by Russell. The Russell 2500 is an index of the 2,500 smallest publicly traded U.S. companies in the Russell 3000 index. The Russell 1000 Index is an index of domestic large-cap stocks. It measures the performance of the largest 1,000 publicly traded U.S. companies in the Russell 3000 Index. Securities are weighted based on their style score. Source: MSCI. MSCI makes no express or implied warranties or representations and shall have no liability whatsoever with respect to any MSCI data contained herein. The MSCI data may not be further redistributed or used as a basis for other indexes or any securities or financial products. This material is not approved, endorsed, reviewed or produced by MSCI. None of the MSCI data is intended to constitute investment advice or a recommendation to make (or refrain from making) any kind of investment decision and may not be relied on as such. The MSCI ACWI Small Cap Index is an unmanaged, capitalization-weighted index of global small-cap stocks. The MSCI ACWI ex USA Small Cap Index is an unmanaged, capitalization weighted index of global small-cap stocks, excluding the United States. The MSCI Emerging Markets Index is an unmanaged, capitalization-weighted index of stocks in emerging markets countries. The Nasdaq Composite Index is a market capitalization-weighted index of more than 3,700 stocks listed on the Nasdaq stock exchange. The CBOE S&P 500 Volatility Index (VIX) measures market expectations of near-term volatility conveyed by S&P 500 stock index option prices. It is the square root of the risk-neutral expectation of the S&P 500 variance over the next 30 calendar days and is quoted as an annualized standard deviation. The Center for Research in Securities Prices (CRSP) equally divides the companies listed on the NYSE into 10 deciles based on market capitalization. Deciles 1-5 represent the largest domestic equity companies and Deciles 6-10 represent the smallest. CRSP then sorts all listed domestic equity companies based on these market cap ranges. By way of comparison, the CRSP 1-5 would have similar capitalization parameters to the S&P 500 and the CRSP 6-10 would have similar capitalization parameters to those of the Russell 2000. The Purchasing Managers’ Index (PMI) is an index of the prevailing direction of economic trends in the manufacturing and service sectors. The purpose of the PMI is to provide information about current and future business conditions to company decision makers, analysts, and investors. The performance of an index does not represent exactly any particular investment, as you cannot invest directly in an index. Returns for the market indexes used in this report were based on information supplied to Royce by Russell Investments. Royce has not independently verified the above described information.
The Price-Earnings, or P/E, Ratio is calculated by dividing a company’s share price by its trailing 12-month earnings-per-share (EPS). The Price-to-Book, or P/B, Ratio is calculated by dividing a company’s share price by its book value per share. Standard deviation is a statistical measure within which a fund’s total returns have varied over time. The greater the standard deviation, the greater a fund’s volatility. Beta is a measure of the volatility or risk of an investment compared to the market as a whole. Alpha describes an investment strategy’s ability to beat the market. The Morningstar Style Map uses proprietary scores of a stock’s value and growth characteristics to determine its placement in one of the five categories listed on the horizontal axis. These characteristics are then compared to those of other stocks within the same market capitalization band. Each is scored from zero to 100 for both value and growth attributes. The value score is subtracted from the growth score to determine the overall style score. For the vertical, market cap axis, Morningstar subdivides into size groups. Giant-cap stocks are defined as those that account for the top 40% of the capitalization of each style zone; large-cap stocks represent the next 30%; midcap stocks the next 20%; small-cap stocks the next 7%; micro-cap stocks the smallest 3%. For the Morningstar Small Blend Category: ©2023 Morningstar. All Rights Reserved. The information regarding the category in this piece is: (1) is proprietary to Morningstar and/ or its content providers; (2) may not be copied or distributed; and (3) is not warranted to be accurate, complete or timely. Neither Morningstar nor its content providers are responsible for any damages or losses arising from any use of this information. Cyclical and Defensive are defined as follows: Cyclical: Communication Services, Consumer Discretionary, Energy, Financials, Industrials, Information Technology, and Materials. Defensive: Consumer Staples, Health Care, Real Estate, and Utilities. Return on Invested Capital is calculated by dividing a company’s past 12 months of operating income (earnings before interest and taxes) by its average invested capital (total equity, less cash and cash equivalents, plus total debt, minority interest, and preferred stock). Investments in securities of micro-cap, small-cap, and/or mid-cap companies may involve considerably more risk than investments in securities of larger-cap companies. Certain Funds invest a significant portion of their respective assets in foreign companies that may be subject to different risks than investments in securities of U.S. companies. Therefore, the prices of securities of foreign companies in particular countries or regions may, at times, move in a different direction than those of securities of U.S. companies. Because such investments are usually denominated in foreign currencies and such Funds do not intend to hedge their foreign currency exposures, the U.S. dollar value of such investments may be harmed by declines in the value of foreign currencies in relation to the U.S. dollar. Certain Funds invest a significant portion of their assets in a limited number of stocks or focus their investments in a particular sector or industry, which may involve considerably more risk than a more broadly diversified
86 | The Royce Funds 2022 Annual Report to Shareholders
Notes to Performance and Other Important Information (continued)
portfolio because they may be more susceptible to any single corporate, economic, political, regulatory, or market event. (Please see “Primary Risks for Fund Investors” and “Investing in Foreign Securities” in the prospectus.) A broadly diversified portfolio does not, however, ensure a profit for a Fund or guarantee against loss. Please read the prospectus carefully before investing or sending money.
A copy of the Funds’ current prospectus and Statement of Additional Information may be obtained by calling (800) 221-4268 or by visiting www.royceinvest.com. All publicly released material Fund information is disclosed by the Funds on their website at www. royceinvest.com. The Royce Funds is a service mark of The Royce Funds. Distributor: Royce Fund Services, LLC.
Forward-Looking Statements
This material contains forward-looking statements within the meaning of the Securities Exchange Act of 1934, as amended (the “Exchange Act”), that involve risks and uncertainties, including, among others, statements as to:
| • | the Funds’ future operating results, |
| • | the prospects of the Funds’ portfolio companies, |
| • | the impact of investments that the Funds have made or may make, the dependence of the Funds’ future success on the general economy and its impact on the companies and industries in which the Funds invest, and |
| • | the ability of the Funds’ portfolio companies to achieve their objectives. |
This review and report use words such as “anticipates,” “believes,” “expects,” “future,” “intends,” and similar expressions to identify forward-looking statements. Actual results may differ materially from those projected in the forward-looking statements for any reason.
The Royce Funds have based the forward-looking statements included in this review and report on information available to us on the date of the report, and we assume no obligation to update any such forward-looking statements. Although The Royce Funds undertake no obligation to revise or update any forward-looking statements, whether as a result of new information, future events, or otherwise, you are advised to consult any additional disclosures that we may make through future shareholder communications or reports.
Proxy Voting
A copy of the policies and procedures that The Royce Funds use to determine how to vote proxies relating to portfolio securities and information regarding how each of The Royce Funds voted proxies relating to portfolio securities during the most recent 12-month period ended June 30 is available, without charge, on The Royce Funds’ website at www.royceinvest.com, by calling (800) 221-4268 (tollfree), and on the website of the Securities and Exchange Commission (“SEC”) at www.sec.gov.
Disclosure of Portfolio Holdings
The Funds’ complete portfolio holdings are also available on Exhibit F to Form N-PORT, which filings are made with the SEC within 60 days of the end of the first and third fiscal quarters. The Funds’ Form N-PORT filings are available on the SEC’s website at http://www.sec.gov.
The Royce Funds 2022 Annual Report to Shareholders | 87
This page is intentionally left blank.
88 | The Royce Funds 2022 Annual Report to Shareholders


About Royce Investment Partners
Unparalleled Knowledge + Experience
Pioneers in small-cap investing, with 45+ years
of experience, depth of knowledge, and focus.
Independent Thinking
The confidence to go against consensus, the insight
to uncover opportunities others might miss, and the
tenacity to stay the course through market cycles.
Specialized Approaches
U.S., international, and global investment strategies
that pursue approaches with different risk profiles.
Unwavering Commitment
Our team of 17 portfolio managers has significant
personal investments in the strategies they manage.
Contact Us
GENERAL INFORMATION
General Royce Funds information including:
| • | How to open an account |
| • | An overview of our firm and Funds |
| • | Ordering literature including Prospectuses |
(800) 221-4268
ACCOUNT INFORMATION
Speak with a representative about:
| • | Your account, transactions, and forms |
(800) 841-1180
FINANCIAL ADVISORS, CONSULTANTS, AND INSTITUTIONS
Speak with your regional Royce contact regarding:
| • | Scheduling a meeting or call |
| • | Information about our firm, strategies, and funds |
| • | Resources for financial professionals, such as portfolio attribution reports |
(800) 337-6923
AUTOMATED ACCOUNT INFORMATION
24-hour Automated Telephone Service
(800) 787-6923
OE-REP-1222
| Item 2. | Code(s) of Ethics. As of the end of the period covered by this report, the Registrant had adopted a code of ethics, as defined in Item 2 of Form N-CSR, applicable to its principal executive officer, principal financial officer, principal accounting officer or controller, or persons performing similar functions. A copy of this code of ethics is filed as an exhibit to this Form N-CSR. During the period covered by this report, the Registrant did not: (i) amend any provision of its code of ethics that applies to its principal executive officer, principal financial officer, principal accounting officer or controller, or persons performing similar functions or (ii) grant any waiver, including an implicit waiver, from a provision of such code of ethics to its principal executive officer, principal financial officer, principal accounting officer or controller, or persons performing similar functions. |
| Item 3. | Audit Committee Financial Expert. |
| (a)(1) | The Board of Trustees of the Registrant has determined that it has an audit committee financial expert serving on its audit committee. |
| (a)(2) | Arthur S. Mehlman and Patricia W. Chadwick were designated by the Board of Trustees as the Registrant’s Audit Committee Financial Experts, effective April 15, 2004, and April 8, 2010, respectively. Mr. Mehlman and Ms. Chadwick are “independent” as defined in Section 2(a)(19) of the Investment Company Act of 1940 (the “1940 Act”). |
| Item 4. | Principal Accountant Fees and Services. |
| (a) | Audit Fees: |
Year ended December 31, 2022 - $294,345
Year ended December 31, 2021 - $288,574
| (b) | Audit-Related Fees: |
Year ended December 31, 2022 - $0
Year ended December 31, 2021 - $0
| (c) | Tax Fees: |
Year ended December 31, 2022 - $123,886 – Preparation of tax returns and excise tax review
Year ended December 31, 2021 - $121,457 – Preparation of tax returns and excise tax review
| (d) | All Other Fees: |
Year ended December 31, 2022 - $0
Year ended December 31, 2021 - $0
| (e)(1) | Annual Pre-Approval: On an annual basis, the Registrant’s independent auditor submits to the Audit Committee a schedule of proposed audit, audit-related, tax and other non-audit services to be rendered to the Registrant and/or its investment adviser and its affiliates for the following year that require pre-approval by the Audit Committee. This schedule provides a description of each type of service that is expected to require pre-approval and the maximum fees that can be paid for each such service without further Audit Committee approval. The Audit Committee then reviews and determines whether to approve the types of scheduled services and the projected fees associated with them. Any subsequent revision to already pre-approved services or fees are presented for consideration at the next regularly scheduled Audit Committee meeting, as needed. |
If subsequent to the annual pre-approval of services and fees by the Audit Committee, the Registrant and/or its investment adviser and its affiliates determines that it would like to engage the Registrant’s independent auditor to perform a service not already pre-approved, the request is to be submitted to the Registrant’s Chief Financial Officer, and if he or she determines that the service fits within the independence guidelines (i.e., it is not a prohibited service), he or she will then arrange for a discussion of the proposed service and fee to be included on the agenda for the next regularly scheduled Audit Committee meeting so that pre-approval can be considered.
Interim Pre-Approval: If, in the judgment of the Registrant's Chief Financial Officer, a proposed engagement needs to commence before the next regularly scheduled Audit Committee meeting, he or she shall submit a written summary of the proposed engagement to all members of the Audit Committee, outlining the services, the estimated maximum cost, the category of the services (e.g., audit, audit-related, tax or other) and the rationale for engaging the Registrant’s independent auditor to perform the services. To the extent the proposed engagement involves audit, audit-related or tax services, any individual member of the Audit Committee who is an independent Board member is authorized to pre-approve the engagement. To the extent the proposed engagement involves non-audit services other than audit-related or tax, only the Chairman of the Audit Committee is authorized to pre-approve the engagement. The Registrant’s Chief Financial Officer will arrange for this interim review and coordinate with the appropriate member(s) of the Audit Committee. The Registrant’s independent auditor may not commence the engagement under consideration until the Registrant’s Chief Financial Officer has informed the auditor in writing that the required pre-approval has been obtained from an individual member of the Audit Committee who is an independent Board member or the Chairman of the Audit Committee, as applicable. Each member of the Audit Committee who pre-approves any engagements in between regularly scheduled Audit Committee meetings is to report, for informational purposes only, any pre-approval decisions to the Audit Committee at its next regularly scheduled meeting.
(e)(2) Not Applicable
(f) Not Applicable
(g) Year ended December 31, 2022 - $123,886
Year ended December 31, 2021 - $121,457
| (h) | No such services were rendered during 2022 or 2021. |
Item 5. Audit Committee of Listed Registrants. Not Applicable.
Item 6. Investments.
(a) See Item 1.
(b) Not Applicable.
Item 7. Disclosure of Proxy Voting Policies and Procedures for Closed-End Management Investment Companies. Not Applicable.
Item 8. Portfolio Managers of Closed-End Management Investment Companies. Not Applicable.
Item 9. Purchases of Equity Securities by Closed-End Management Investment Company and Affiliated Purchasers. Not Applicable.
Item 10. Submission of Matters to a Vote of Security Holders. Not Applicable.
Item 11. Controls and Procedures.
(a) Disclosure Controls and Procedures. The Principal Executive and Financial Officers concluded that the Registrant's Disclosure Controls and Procedures are effective based on their evaluation of the Disclosure Controls and Procedures as of a date within 90 days of the filing date of this report.
(b) Internal Control over Financial Reporting. There were no significant changes in Registrant's internal control over financial reporting or in other factors that could significantly affect this control subsequent to the date of the evaluation, including any corrective actions with regard to significant deficiencies and material weaknesses during the period covered by this report.
Item 12. Disclosure of Securities Lending Activities for Closed-End Management Investment Companies. Not applicable.
Item 13. Exhibits. Attached hereto.
(a)(1) The Registrant’s code of ethics pursuant to Item 2 of Form N-CSR.
(a)(2) Separate certifications by the Registrant’s Principal Executive Officer and Principal Financial Officer as required by Rule 30a-2(a) under the 1940 Act.
(a)(3) Not Applicable.
(b) Separate certifications by the Registrant’s Principal Executive Officer and Principal Financial Officer, pursuant to Section 906 of the Sarbanes-Oxley Act of 2002 and required by Rule 30a-2(b) under the 1940 Act.
[Signature page to follow.]
Pursuant to the requirements of the Securities Exchange Act of 1934 (the “Exchange Act”) and the 1940 Act, the registrant has duly caused this report to be signed on its behalf by the undersigned, thereunto duly authorized.
THE ROYCE FUND
BY: /s/ Christopher D. Clark
Christopher D. Clark
President
Date: February 28, 2023
Pursuant to the requirements of the Exchange Act and the 1940 Act, this report has been signed below by the following persons on behalf of the registrant and in the capacities and on the dates indicated.
| THE ROYCE FUND | THE ROYCE FUND |
| BY: /s/ Christopher D. Clark | BY: /s/ Peter K. Hoglund |
| Christopher D. Clark | Peter K. Hoglund |
| President | Treasurer |
| Date: February 28, 2023 | Date: February 28, 2023 |