UNITED STATES
SECURITIES AND EXCHANGE COMMISSION
Washington, D.C. 20549
FORM N-CSR
CERTIFIED SHAREHOLDER REPORT
OF
REGISTERED MANAGEMENT INVESTMENT COMPANIES
Investment Company Act File Number: 811-03599
Name of Registrant: The Royce Fund
Address of Registrant: 745 Fifth Avenue
New York, NY 10151
Name of agent for service: John E. Denneen, Esquire
Address of agent for service: 745 Fifth Avenue
New York, NY 10151
Registrant's telephone number, including area code: (212) 508-4500
Date of fiscal year end: December 31
Date of reporting period: January 1, 2021 – December 31, 2021
| Item 1. | Reports to Shareholders. |

The Royce Funds 2021 Annual
Review and Report to Shareholders
December 31, 2021
Royce Dividend Value Fund
Royce Global Financial Services Fund
Royce International Premier Fund
Royce Micro-Cap Fund
Royce Opportunity Fund
Royce Pennsylvania Mutual Fund
Royce Premier Fund
Royce Small-Cap Value Fund
Royce Smaller-Companies Growth Fund
Royce Special Equity Fund
Royce Total Return Fund

Table of Contents

| | This page is not part of the The Royce Funds 2021 Annual Report to Shareholders | 1 |
Letter to Our Shareholders

THE BEAR IS BACK—NOW WHAT?
2021 was a year of decelerating optimism for many small-cap investors as performance momentum slowed as the weeks passed by between April and December. With the benefit of a late January vantage point, we can now see that decreasing market momentum, increasing concerns about inflation throughout the last nine months of 2021, and a significant Fed pivot all foreshadowed a sharp small-cap decline to start 2022. So while the Russell 2000 Index enjoyed a strong year on an absolute basis, rising 14.8%, nearly all of the year’s gain came in the first quarter, when the Russell 2000 climbed 12.7%. Following this strong and promising start, the small-cap index gained only 1.9% from the second through the fourth quarter of 2021. Having so little to show for the last nine months was even more frustrating in light of the generally strong earnings growth from small-cap companies, many of which also raised guidance or offered optimistic outlooks in the second half of 2021.
Bigger Was Better After 2021’s First Quarter
1Q21 Returns and 2Q21-4Q21 for the Russell 2000 and Russell 1000 Indexes
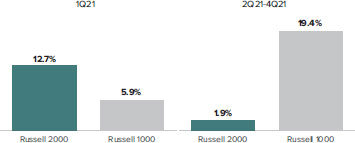
In addition to the disappointment felt by making little progress after a strong start, small-cap investors also saw the asset class progressively cede its wide first-quarter lead over large-caps, with the Russell 2000 finishing the year substantially behind the large-cap Russell 1000 Index’s 26.5% advance in 2021. We suspect that many investors turned to mega-cap stocks during the year in a ‘flight to safety’ as concerns about the Omicron variant and the pace of economic growth emerged, especially when interest rates were still so low. As the early results in 2022 have indicated, we expect these same mega-cap stocks to struggle going forward because their valuations are particularly vulnerable to higher inflation, rising interest rates, and constrained liquidity.
Regardless of the more recent struggles for equities of all capitalization sizes, we recognize that it may seem odd to characterize small-cap investors as feeling let down after a year that provided a healthy 14.8% return—while also marking a third consecutive year of double-digit positive performance for the Russell 2000. Yet we are cognizant that 2021 might feel like a year of unfulfilled promise for many of these investors. After all, 2021 did begin with an ample dose of confidence in both the absolute and relative returns for the Russell 2000—which was rewarded in the first quarter. However, a closer look at small-cap returns in 2021 suggests that one’s perspective on the year probably differs considerably depending on how heavily an investor leaned towards small-cap value or small-cap growth.
| 2 | This page is not part of the The Royce Funds 2021 Annual Report to Shareholders | Past performance is no guarantee of future results. |
LETTER TO OUR SHAREHOLDERS
VALUE: SMALL-CAP’S HAPPY EXCEPTION
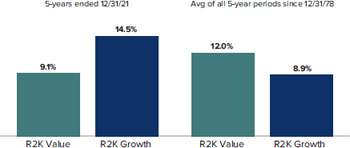
The best news for small-cap investors in 2021 arguably came from value stocks. The Russell 2000 Value Index had a wonderful year—advancing 28.3% (thus beating the Russell 1000). The small-cap value index also walloped the Russell 2000 Growth Index, which was up a paltry 2.8% for the year. 2021 marked the first calendar-year outperformance for the Russell 2000 Value over its small-cap growth sibling since 2016. We think small-cap value is just starting to flex its relative performance muscles, as it were, and we see three reasons to be optimistic about small-cap value’s prospects. First, in spite of the strength it’s shown since the fourth quarter of 2020, the Russell 2000 Value’s annualized three- and five-year returns still trailed those for its growth sibling at the end of 2021—by a significant amount on the five-year number. Equally important, this result stands in stark contrast to the average return spread for all five-year periods, which is about 300 basis points in favor of small-cap value. Based on history, then, it appears that the Russell 2000 Value has further to go before fully reverting to its historical outperformance of the Russell 2000 Growth over multiyear periods. This also suggests that the difficult times for small-cap growth investors may persist longer than its adherents would like.
Small-Cap Growth’s Recent 5-Year Outperformance Contrasts with Historical Pattern
As of 12/31/21
ADVANTAGE VALUE?
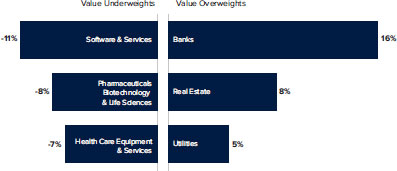
A second reason underscoring our confidence in the ongoing leadership for small-cap value is that significant differences exist in economic exposures among value and growth portfolios, which are mirrored by the meaningful divergences in composition between the two small-cap styles indexes. Looking into each index’s composition reveals certain factors that help explain why returns often have varied so much between the two style indexes over the last 40-plus years. The two industry groups where
the Russell 2000 Value is most overweight compared with the Russell 2000 Growth are banks and real estate, both traditional beneficiaries of inflation and cyclical activity. These industry groups, banks in particular, often have high exposures in active small-cap value portfolios. Conversely, the three industry groups where the Russell 2000 Value is most underweight—software & services; pharmaceuticals, biotechnology & life sciences; and health care equipment & services—are areas that have historically struggled in inflationary environments and tend not to participate in cyclical expansions. Notably, these three areas also have a large percentage of non-earning companies, and we expect that the forthcoming market environment of reduced liquidity will be much less supportive of non-earners than most of the past 10 years have been. We’ve also observed that these three areas are often lower weighted in active small-cap value portfolios. This compositional analysis corroborates our expectation that an economic environment of above-average growth and higher-than-average inflation is likely to favor the overweighted areas within small-cap value and create headwinds for those groups with greater exposure within small-cap growth.
Russell 2000 Value vs Russell 2000 Growth Top Three Underweights and Overweights by Industry Group
As of 12/31/21
Finally, as we have noted elsewhere, despite its significant outperformance, small-cap value is still priced near the bottom of its 20-year valuation range compared with small-cap growth, as measured by one of our preferred valuation metrics, the median last 12 months’ enterprise value over earnings before interest & taxes (LTM EV/EBIT), excluding companies with negative EBIT. For all these reasons, we think small-cap value may have many years left in its current outperformance trend.
| Past performance is no guarantee of future results. | This page is not part of the The Royce Funds 2021 Annual Report to Shareholders | 3 |
LETTER TO OUR SHAREHOLDERS
IN THE SHADOW OF THE BEAR
As of this writing, of course, most investors are wondering—and worrying—about the correction that pushed small-caps into bear territory (a decline of 20% or more). The Russell 2000 fell 20.7% from its most recent peak on 11/8/21 through 1/27/22, as share price weakness broadened and deepened considerably in January. The speed of this descent—just 49 days between the 52-week high in early November and its initial 52-week low in January—was the fourth fastest such move in the Russell 2000’s history. A genuinely startling fall, though steep, sharp declines have been more common than not since the Financial Crisis.
As we seek to understand the market’s latest movements, we think it’s important to note that bond market signals have yet to move in the direction they often took in prior equity declines—bond yields commonly fall, and high-yield spreads widen when there are heightened concerns about future economic growth. We have seen neither so far in 2022. The contrast between the dramatic volatility of stocks and the nonplussed reaction of the bond market leads us to view this decline as a resetting of equity valuations rather than an increased concern about, or signal of, recession. Even more important, this latter view is corroborated by our recent conversations with company managements, where their largest challenges remain supply channel issues and the shortage of skilled workers to keep pace with the demand these companies are seeing.
Still, in our view, it’s significant that the Federal Reserve is making such a consequential pivot—from extraordinary monetary accommodation to mitigate the effects of COVID to more aggressive, and opposite, actions in an attempt to tame inflation. Liquidity and inflation are therefore now center stage. They have pushed Omicron and the pace of GDP growth toward the wings, though it is fair to say that all these developments (along with lingering supply chain issues) are interrelated. Indeed, periods like the present offer a reminder, however sobering, that, while equity markets are connected to the economy, the Fed functions in large part as the connective
tissue between the two because it’s the gatekeeper of liquidity. The consequence of this interrelationship is that any major move from the Fed will spur volatility. The central bank’s newest policies constitute two significant reversals—the shift from keeping a lid on rates to raising them and the move away from keeping the capital markets awash in liquidity to limiting it. After being in place for most of the last decade, these related Fed policy reversals happened in comparably short order, and thus it’s not surprising that the market has been reacting in an extreme fashion. From our perspective as experienced small-cap investors, this downturn is not about company fundamentals—it’s about valuations and liquidity. The days of generous monetary policy driving multiple expansion are over. It made sense to us, then, that more speculative assets— cryptocurrencies and growth stocks, for instance—experienced some of the most negative reactions to the Fed’s policy shift.
Importantly, if we are correct in suggesting that we are experiencing a valuation reset due to concerns about higher inflation, it’s worth recalling that, based on the CRSP (The Center for Research in Security Prices) data, small-caps are the only major asset class to have outpaced inflation in every decade since the 1970’s.
Small-Caps Have Beaten Inflation in Every Decade
Average Annual Consumer Price Index (CPI) versus Average Annual CRSP 6-10 Index
12/31/1930- 12/31/2020 (%)
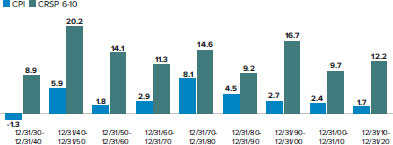
Sources: Bureau of Labor Statistics (CPI) and CRSP
Additionally, since 2003, small-caps have on average delivered attractive returns when inflation expectations were
The best news for small-cap investors in 2021 arguably came from value stocks The Russell 2000 Value Index had a wonderful year—advancing 28.3% (thus beating the Russell 1000). The small-cap value index also walloped the Russell 2000 Growth Index, which was up a paltry 2.8% for the year.
| 4 | This page is not part of the The Royce Funds 2021 Annual Report to Shareholders | Past performance is no guarantee of future results. |
LETTER TO OUR SHAREHOLDERS
From our perspective as experienced small-cap investors, this downturn is not about company fundamentals—it’s about valuations and liquidity. The days of generous monetary policy driving multiple expansion are over.
rising. Finally, if all equity assets are undergoing a valuation reset, then it may be comforting to know that small-caps are at the low end of their relative valuation range over the past 20 years versus large-caps, which may limit their downside exposure relative to their larger siblings.
We hasten to add that we live in a complex world where it’s critical for us to practice humility about attributing causes and effects. As of this writing, there is also heightened geopolitical tension, and the possibility of an armed conflict on a scale not seen in decades. It’s difficult to imagine that these events are not exerting downward pressure of their own on equity valuations.
THE VALUE IN SMALL-CAP
What, then, are small-cap investors to do? We have already outlined why we think small-cap value stocks look poised to endure the current spate of higher volatility and lower returns in better shape than their growth counterparts. Even amid a challenging and uncertain climate for equities, much about the small-cap earnings picture remains constructive—particularly in the more cyclical precincts where we are most active currently. As we noted above, the probability of a U.S. recession looks low for at least this year and perhaps longer. U.S. and global GDP growth continue to trend in a positive, if bumpy, fashion. While our portfolio teams pursue distinct investment strategies and tend to focus on different types of small-cap stocks, they have found some common ground in identifying opportunities in the Industrial and Financial sectors, as well as in the lower valuation areas of Information Technology. Four areas that appear attractive are the semiconductor and housing ecosystems, select capital goods companies, and regional banks.
Given our confidence in the prospects for ongoing small-cap value leadership, we think it’s also useful for investors to know that a robust historical trend exists connecting value-led markets to success for active small-cap management. In 81% of value-led markets, active small-cap management outperformed the Russell 2000, a far more frequent record of success than in growth-led
markets, when active management outperformed the small-cap index in only 14% of the five-year periods ended 12/31/21.
Active Small Blend Management: Better in Value-Led Markets
% of Outperformance Periods for Morningstar Small Blend Category Average¹ vs the Russell 2000
12/31/78- 12/31/21
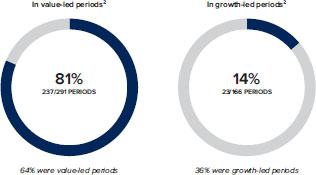
Small Blend outperformed in 68% of 10-year periods (270/397) with an average of 10.8% vs Russell 2000 average 10.0%. ¹There were 523 US Fund Small Blend Funds tracked by Morningstar with at least five years of performance history as of 12/31/21. ²5-Year Monthly Rolling Returns From 12/31/78 to 12/31/21 (457 Periods). Source: Morningstar
FACING THE GREAT UNKNOWN
How these various macroeconomic uncertainties play out is beyond our circle of competence. Our own expertise and focus lie in identifying attractive valued stocks. If pressed to offer a market outlook beyond our long-term confidence in small-cap value, we would be hard pressed to offer an expectation, starting from late January’s low levels, of other than an intermediate term-return similar to the Russell 2000’s historical average of about 10%. The favorable and unfavorable factors seem roughly in balance. For the latter, economic growth, though likely above average this year, will also likely slow next year; high-yield spreads, whose decline is often an accelerant for small-cap returns, remain at low levels; valuations, while not concerning, are also not so low that they offer much potential for expanding multiples, and a Federal Reserve that is removing monetary accommodation is rarely coincident with above-average equity returns. Still, on the positive side, we begin (as we often do) with the long term: Since 1945, based on data from CRSP, small-cap stocks have posted positive annualized three-year returns 88% of the time on a rolling monthly basis, with an average return in the low
| Past performance is no guarantee of future results. | This page is not part of the The Royce Funds 2021 Annual Report to Shareholders | 5 |
LETTER TO OUR SHAREHOLDERS
Subsequent 1-Year Performance of Russell 2000 after a 20% Decline
As of 1/31/22
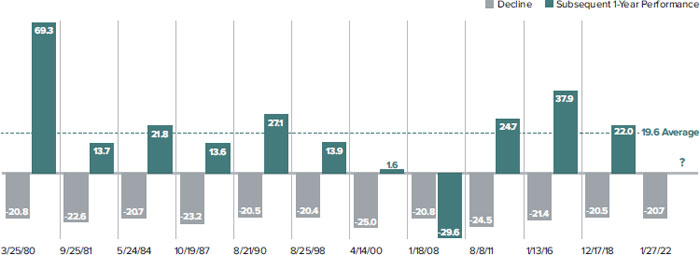
First Day of 20% Decline
double digits. Moreover, there is the impressive record of small-cap rebounds from declines of 20% or more from a previous peak. The recent January 2022 low marked the twelfth such decline since the 1979 launch of the Russell 2000. The average subsequent one-year return from the first day of the eleven previous declines was 19.6%. In addition, the small-cap index produced positive returns over the subsequent year in all eleven periods, save one—which occurred in the Great Financial Crisis.
Even with the myriad challenges currently facing the world, we think it’s fair to say that current conditions do not resemble those of the Great Financial Crisis. However, another historical instance may be worth noting. The last time the Fed aggressively removed monetary accommodation with the move not triggering a recession occurred in 1994, when the Russell 2000 was down 1.8% for the year. But that reset year was followed by
a glorious period for small-caps, with the annualized return for 1995-97 totaling 22.3% for the Russell 2000.
We also remain convinced that earnings ultimately drive individual company stock returns, and (as we mentioned above) the earnings prospects for many small-cap companies remain promising, specifically those with sound fundamentals, including low-debt balance sheets, positive cash flows, and the ability to pass on higher costs in this inflationary period. We have always believed that focusing on what we know and not worrying about what we cannot control are paramount to effective and successful active management. Our commitment to a disciplined process across each of our small-cap strategies is the best way to give our shareholders the greatest opportunities to build wealth over the long run. This remains true even in the most challenging times.
| Sincerely, | | |
| | | |
 |  |  |
| | | |
Charles M. Royce Chairman, Royce Investment Partners | Christopher D. Clark Chief Executive Officer, and Co-Chief Investment Officer, Royce Investment Partners | Francis D. Gannon Co-Chief Investment Officer, Royce Investment Partners |
| January 31, 2022 | | |
| 6 | This page is not part of the The Royce Funds 2021 Annual Report to Shareholders | Past performance is no guarantee of future results. |
Performance and Expenses
Performance and Expenses
As of December 31, 2021
| | | AVERAGE ANNUAL TOTAL RETURNS (%) | | ANNUAL OPERATING EXPENSES (%) |
| | | | | | | | SINCE | INCEPTION | | |
| | 1-YR | 3-YR | 5-YR | 10-YR | 15-YR | 20-YR | INCEPTION | DATE | GROSS | NET |
| Royce Dividend Value Fund | 20.11 | 17.65 | 10.66 | 10.54 | 8.05 | N/A | 9.08 | 5/3/04 | 1.602 | 1.342 |
| Royce Global Financial Services Fund | 20.27 | 19.84 | 12.79 | 13.29 | 7.55 | N/A | 9.10 | 12/31/03 | 2.072 | 1.682 |
| Royce International Premier Fund | 5.78 | 18.01 | 14.92 | 11.94 | N/A | N/A | 8.96 | 12/31/10 | 1.57 2 | 1.442 |
| Royce Micro-Cap Fund | 31.02 | 25.49 | 13.67 | 9.48 | 7.06 | 9.19 | 11.48 | 12/31/91 | 1.29 | 1.24 |
| Royce Opportunity Fund | 30.85 | 28.51 | 15.67 | 15.06 | 9.84 | 11.34 | 12.94 | 11/19/96 | 1.23 | 1.23 |
| Royce Pennsylvania Mutual Fund | 22.05 | 20.78 | 13.10 | 12.30 | 8.62 | 10.09 | 13.181 | N/A | 0.95 | 0.95 |
| Royce Premier Fund | 16.36 | 20.28 | 14.05 | 11.68 | 9.82 | 11.07 | 11.91 | 12/31/91 | 1.21 | 1.21 |
| Royce Small-Cap Value Fund | 28.24 | 12.34 | 6.74 | 7.58 | 5.93 | 8.41 | 9.10 | 6/14/01 | 1.622 | 1.492 |
| Royce Smaller-Companies Growth Fund | 7.78 | 25.77 | 16.04 | 13.62 | 8.33 | 11.50 | 12.24 | 6/14/01 | 1.542 | 1.492 |
| Royce Special Equity Fund | 22.50 | 14.02 | 7.58 | 9.68 | 8.20 | 9.52 | 9.12 | 5/1/98 | 1.23 | 1.23 |
| Royce Total Return Fund | 25.78 | 17.26 | 9.91 | 11.17 | 7.87 | 9.19 | 10.75 | 12/15/93 | 1.25 | 1.25 |
| INDEX | | | | | | | | | | |
| Russell 2000 | 14.82 | 20.02 | 12.02 | 13.23 | 8.69 | 9.36 | N/A | N/A | N/A | N/A |
| Russell Microcap | 19.34 | 20.90 | 11.69 | 13.62 | 7.51 | 9.04 | N/A | N/A | N/A | N/A |
| Russell 2000 Value | 28.27 | 17.99 | 9.07 | 12.03 | 7.19 | 9.18 | N/A | N/A | N/A | N/A |
| Russell 2500 | 18.18 | 21.91 | 13.75 | 14.15 | 9.67 | 10.30 | N/A | N/A | N/A | N/A |
| MSCI ACWI ex USA Small Cap | 12.93 | 16.46 | 11.21 | 9.46 | 5.59 | 10.03 | N/A | N/A | N/A | N/A |
| MSCI ACWI Small Cap | 16.10 | 18.96 | 12.28 | 11.78 | 7.82 | 10.31 | N/A | N/A | N/A | N/A |
1For Royce Pennsylvania Mutual Fund, the average annual total return shown is for the 45-year period ended 12/31/21.
2Reflects Service Class expenses which include a 25bps distribution fee.
Important Performance, Expense, and Risk Information
All performance information in this Review and Report reflects past performance, is presented on a total return basis, reflects the reinvestment of distributions, and does not reflect the deduction of taxes a shareholder would pay on fund distributions or the redemption of fund shares. Past performance is no guarantee of future results. Investment return and principal value of an investment will fluctuate, so that shares may be worth more or less than their original cost when redeemed. Investment and Service Class shares redeemed within 30 days of purchase may be subject to a 1% redemption fee payable to the Fund (2% for Royce International Premier Fund). Redemption fees are not reflected in the performance shown above; if they were, performance would be lower. Current performance may be higher or lower than performance quoted. Current month-end performance may be obtained at www.royceinvest.com. All performance and expense information reflects results of the Funds’ oldest share Class (Investment Class or Service Class, as the case may be). Price and total return information is based on net asset values calculated for shareholder transactions. Annual gross operating expenses reflect the Fund’s gross total annual operating expenses and include management fees, any 12b-1 distribution and service fees, other expenses, and any applicable acquired fund fees and expenses. Annual net operating expenses reflect contractual fee waivers and/or expense reimbursements. All expense information is reported as of the Fund’s most current prospectus. Royce & Associates has contractually agreed to waive fees and/or reimburse operating expenses, excluding brokerage commissions, taxes, interest, litigation expenses, acquired fund fees and expenses, and other expenses not borne in the ordinary course of business, to the extent necessary to maintain net operating expenses at or below: 1.24% for Royce Micro-Cap Fund; 1.34% for Royce Dividend Value Fund; 1.44% for Royce International Premier Fund; 1.49% for Royce Global Financial Services, Small-Cap Value, and Smaller-Companies Growth Funds through April 30, 2022. Acquired fund fees and expenses reflect the estimated amount of the fees and expenses incurred indirectly by the Fund through its investments in mutual funds, hedge funds, private equity funds, and other investment companies.
Service Class shares bear an annual distribution expense that is not borne by the Funds’ Investment Class. If such distribution expenses had been reflected for Funds showing Investment Class performance, returns would have been lower. Each series of The Royce Fund is subject to market risk–the possibility that common stock prices will decline, sometimes sharply and unpredictably, over short or extended periods of time. Such declines may be caused by various factors, including market, financial, and economic conditions, governmental or central bank actions, and other factors, such as the recent COVID-19 pandemic, that may not be directly related to the issuer of a security held by a Fund. This pandemic could adversely affect global market, financial, and economic conditions in ways that cannot necessarily be foreseen. Investments in securities of micro-cap, small-cap, and/or mid-cap companies may involve considerably more risk than investments in securities of larger-cap companies. (Please see “Primary Risks for Fund Investors” in the prospectus.) Certain Funds invest a significant portion of their respective assets in foreign companies that may be subject to different risks than investments in securities of U.S. companies, including adverse political, social, economic, or other developments that are unique to a particular country or region. (Please see “Investing in Foreign Securities” in the prospectus.) Therefore, the prices of securities of foreign companies in particular countries or regions may, at times, move in a different direction than those of securities of U.S. companies. (Please see “Primary Risk of Fund Investors” in the prospectus.) Certain Funds generally invest a significant portion of their assets in a limited number of stocks, which may involve considerably more risk than a more broadly diversified portfolio because a decline in the value of any of these stocks would cause their overall value to decline to a greater degree. A broadly diversified portfolio, however, does not ensure a profit or guarantee against loss. This Review and Report must be preceded or accompanied by a prospectus. Please read the prospectus carefully before investing or sending money. Source: MSCI. MSCI makes no express or implied warranties or representations and shall have no liability whatsoever with respect to any MSCI data contained herein. The MSCI data may not be further redistributed or used as a basis for other indexes or any securities or financial products. This report is not approved, endorsed, reviewed or produced by MSCI. None of the MSCI data is intended to constitute investment advice or a recommendation to make (or refrain from making) any kind of investment decision and may not be relied on as such. Russell Investment Group is the source and owner of the trademarks, service marks, and copyrights related to the Russell Indexes. Russell® is a trademark of Russell Investment Group. The Russell 2000 Index is an unmanaged, capitalization-weighted index of domestic small-cap stocks. It measures the performance of the 2,000 smallest publicly traded U.S. companies in the Russell 3000 Index. The Russell Microcap Index includes 1,000 of the smallest securities in the small-cap Russell 2000 Index along with the next smallest eligible securities as determined by Russell. The Russell 2000 Value Index consists of the respective value stocks within the Russell 2000 as determined by Russell Investments. The Russell 2500 is an unmanaged, capitalization-weighted index of the 2,500 smallest publicly traded U.S. companies in the Russell 3000 index. The MSCI ACWI ex USA Small Cap Index is an unmanaged, capitalization-weighted index of global small-cap stocks, excluding the United States. The MSCI ACWI Small Cap Index is an unmanaged, capitalization-weighted index of global small-cap stocks. Index returns include net reinvested dividends and/or interest income. The performance of an index does not represent exactly any particular investment as you cannot invest directly in an index. Distributor: Royce Fund Services, LLC.
| This page is not part of the The Royce Funds 2021 Annual Report to Shareholders | 7 |
MANAGERS’ DISCUSSION (UNAUDITED)
Royce Dividend Value Fund (RDV)

Chuck Royce
Miles Lewis, CFA®
FUND PERFORMANCE
Royce Dividend Value Fund advanced 20.1% in 2021, outperforming both its benchmark, the Russell 2500 Index, which rose 18.2%, and the Russell 2000 Index, which gained 14.8%, for the same period.
WHAT WORKED… AND WHAT DIDN’T
Seven of the portfolio’s nine equity sectors made a positive impact on calendar-year performance. The sectors making the largest positive contributions were Industrials, Financials, and Consumer Discretionary while the only negative impacts came from Energy and Real Estate. Consumer Staples made the smallest positive impact. At the industry level, capital markets (Financials), professional services (Industrials), and banks (Financials) contributed most in 2021 period while containers & packaging (Materials), chemicals (Materials), and software (Information Technology) were the largest detractors.
The Fund’s top contributor at the position level was Carlyle Group, which manages investment vehicles across four segments: corporate private equity, real assets, global credit, and investment solutions. The firm reported record levels of fee-related earnings with strong margins and a confident outlook in February, which was followed by healthy fee-based and other earnings announced in April. The firm then reported third-quarter results in October, highlighting additional progress in fee-related earnings, record highs in quarterly distributable earnings, and strong fund-raising momentum. KBR, the portfolio’s next-best contributor, is a global engineering & construction company. The company made an acquisition in 2020 in order to move further into the aerospace & defense markets and in January 2021 signed an agreement with Mura Technology to offer an advanced plastics recycling process. In October, KBR reported robust earnings and revenue growth while raising fiscal 2021 revenue and earnings guidance. Its success was driven mostly by government contracts and wins for its sustainable technology solutions. Carlyle and KBR were the Fund’s two biggest holdings at year-end.
The biggest detractor at the position level was B3-Brasil, Bolsa, Balcao, a stock exchange located in São Paulo, Brazil. Its decline in 2021 may have been a case of investors expecting more. Brazil’s economy and equity markets have been recovering in 2021, and the company reported slightly better-than-expected profits and earnings in May. The company’s third quarter results showed lower revenues compared to 3Q20 and 2Q21 (though those two quarters were positively impacted by the reversal of non-recurring provisions). However, third-quarter recurring net income rose, even as investors continued to avoid the stock. Headquartered in the U.K., Ashmore Group specializes in actively managed emerging markets strategies in equities, fixed income, and alternative investments. The company reported declines in adjusted net revenue and EBITDA (Earnings before Interest, Taxes, Depreciation, & Amortization) for the fiscal year ended 6/30/21 and then in October announced declines in assets under management and negative investment performance for the third quarter as market sentiment for certain of its key strategies deteriorated.
| | | | | |
| | Top Contributors to Performance | | Top Detractors from Performance | |
| | For 2021 (%)1 | | | For 2021 (%)2 | |
| | | | | | |
| | Carlyle Group | 2.55 | | B3-Brasil, Bolsa, Balcao | -0.84 | |
| | KBR | 2.18 | | Ashmore Group | -0.57 | |
| | Triumph Bancorp | 1.52 | | AptarGroup | -0.33 | |
| | Sprott | 1.42 | | USS | -0.32 | |
| | Applied Industrial Technologies | 1.18 | | Quaker Chemical | -0.26 | |
| | 1 Includes dividends | | | 2 Net of dividends | | |
| | | | | | | |
The portfolio’s advantage over the Russell 2500 resulted from sector allocation decisions in 2021—stock selection was a negative factor versus the benchmark. The Fund’s substantially lower exposure to Health Care—which was the only sector in the Russell 2500 to finish the year in the red—helped most. Our stock selection was also positive in the sector. Both our significantly greater exposure and savvy stock picking provided a relative edge in Industrials, while our overweight in Financials also made a notable positive impact. Conversely, stock picking hampered relative results in Materials, overcoming the positive effect of our large sector overweight. Our stock selection and lower exposure hurt in Energy—which had the highest return of any sector in the Russell 2500. The same combination also led Real Estate to detract from relative performance in 2021
CURRENT POSITIONING AND OUTLOOK
We reduced the number of positions in the Fund in 2021, finishing the year with 49 holdings versus 67 at the end of 2020, while increasing our exposure to U.S. stocks. Our outlook is very positive for small-cap value, though it’s more nuanced for small-cap as a whole. The Russell 2500 enjoyed a third consecutive year of double-digit positive returns in 2021, which is rare for any equity index. It’s happened only twice before since the inception of the Russell 2500 in 1979: from 1991-1993 and 1995-1997. In each instance, a fourth year of double-digit positive performance failed to materialize. We always place a lot of weight on history, and this pattern, along with a less accommodative Fed, makes us think that performance for both the Russell 2500 and Russell 2000 will be more muted in 2022. History also tells us, however, that small-cap value and cyclicals do well, particularly on a relative basis, during periods of improving economic growth. This is consistent with the encouraging signs we’ve been seeing on a company-by-company basis. We also are optimistic of the relative performance outlook for high quality stocks—which we primarily define as companies with high returns on invested capital and stable returns on assets. We think the Fund’s combined focus on dividend payers, high-quality, and value should be supportive for attractive returns, particularly relative to its benchmark.
8 | The Royce Funds 2021 Annual Report to Shareholders
| PERFORMANCE AND PORTFOLIO REVIEW (UNAUDITED) | | TICKER SYMBOLS RYDVX RDVIX RDIIX RDVCX |
Performance and Expenses
Average Annual Total Return (%) Through 12/31/21
| | JUL-DEC 20211 | 1-YR | 3-YR | 5-YR | 10-YR | 15-YR | SINCE INCEPTION (5/3/04) |
| RDV | 2.76 | 20.11 | 17.65 | 10.66 | 10.54 | 8.05 | 9.08 |
| Annual Gross Operating Expenses: 1.60% | Annual Net Operating Expenses: 1.34% |
1 Not annualized
Morningstar Style Map™ As of 12/31/21
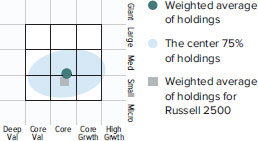
The Morningstar Style Map is the Morningstar Style Box™ with the center 75% of fund holdings plotted as the Morningstar Ownership Zone™. The Morningstar Style Box is designed to reveal a fund’s investment strategy. The Morningstar Ownership Zone provides detail about a portfolio’s investment style by showing the range of stock sizes and styles. The Ownership Zone is derived by plotting each stock in the portfolio within the proprietary Morningstar Style Box. Over time, the shape and location of a fund’s ownership zone may vary. See page 86 for additional information.
Value of $10,000
Invested on 5/3/04 as of 12/31/21 ($)

Top 10 Positions
% of Net Assets
| Carlyle Group | | 5.1 |
| KBR | | 5.0 |
| Applied Industrial Technologies | | 4.2 |
| HEICO Corporation Cl. A | | 3.9 |
| Spirax-Sarco Engineering | | 3.8 |
| Sprott | | 3.5 |
| Lindsay Corporation | | 3.5 |
| Franco-Nevada | | 3.3 |
| AptarGroup | | 3.3 |
| Worthington Industries | | 3.2 |
Portfolio Sector Breakdown
% of Net Assets
| Industrials | | 37.8 |
| Financials | | 29.9 |
| Materials | | 16.3 |
| Consumer Discretionary | | 5.9 |
| Health Care | | 3.4 |
| Information Technology | | 1.8 |
| Energy | | 1.4 |
| Cash and Cash Equivalents | | 3.5 |
Calendar Year Total Returns (%)
| YEAR | | RDV |
| 2021 | | 20.1 |
| 2020 | | 4.5 |
| 2019 | | 29.8 |
| 2018 | | -16.2 |
| 2017 | | 21.7 |
| 2016 | | 16.4 |
| 2015 | | -5.7 |
| 2014 | | -2.1 |
| 2013 | | 30.7 |
| 2012 | | 16.9 |
| 2011 | | -4.5 |
| 2010 | | 30.1 |
| 2009 | | 37.7 |
| 2008 | | -31.5 |
| 2007 | | -0.0 |
Upside/Downside Capture Ratios
Periods Ended 12/31/21 (%)
| | | UPSIDE | | DOWNSIDE |
| 10-Year | | 87 | | 107 |
| From 6/30/04 (Start of Fund’s First Full Quarter) | | 89 | | 91 |
Portfolio Diagnostics
| Fund Net Assets | | $76 million |
| Number of Holdings | | 49 |
| Turnover Rate | | 0% |
| Average Market Capitalization1 | | $6,258 million |
| Weighted Average P/E Ratio 2,3 | | 16.4x |
| Weighted Average P/B Ratio 2 | | 3.4x |
| Active Share 4 | | 98% |
| U.S. Investments (% of Net Assets) | | 69.8% |
| Non-U.S. Investments (% of Net Assets) | | 26.7% |
| 1 | Geometric Average. This weighted calculation uses each portfolio holding’s market cap in a way designed to not skew the effect of very large or small holdings; instead, it aims to better identify the portfolio’s center, which Royce believes offers a more accurate measure of average market cap than a simple mean or median. |
| 2 | Harmonic Average. This weighted calculation evaluates a portfolio as if it were a single stock and measures it overall. It compares the total market value of the portfolio to the portfolio’s share in the earnings or book value, as the case may be, of its underlying stocks. |
| 3 | The Fund’s P/E ratio calculation excludes companies with zero or negative earnings (8% of portfolio holdings as of 12/31/21). |
| 4 | Active Share is the sum of the absolute values of the different weightings of each holding in the Fund versus each holding in the benchmark, divided by two. |
Important Performance and Expense Information
All performance information in this Report reflects past performance, is presented on a total return basis, reflects the reinvestment of distributions, and does not reflect the deduction of taxes that a shareholder would pay on fund distributions or the redemption of fund shares. Past performance is no guarantee of future results. Investment return and principal value of an investment will fluctuate, so that shares may be worth more or less than their original cost when redeemed. Shares redeemed within 30 days of purchase may be subject to a 1% redemption fee payable to the Fund, which is not reflected in the performance shown above; if it were, performance would be lower. Current month-end performance may be higher or lower than performance quoted and may be obtained at www.royceinvest.com. All performance and risk information reflects results of the Service Class (its oldest class). Gross operating expenses reflect the Fund’s total gross annual operating expenses for the Service Class and include management fees, 12b-1 distribution and service fees, and other expenses. Net operating expenses reflect contractual fee waivers and/or expense reimbursements. All expense information is reported as of the Fund’s most current prospectus. Royce & Associates has contractually agreed, without right of termination, to waive fees and/or reimburse expenses to the extent necessary to maintain the Service Class’s net annual operating expenses (excluding brokerage commissions, taxes, interest, litigation expenses, acquired fund fees and expenses, and other expenses not borne in the ordinary course of business) at or below 1.34% through April 30, 2022. Regarding the “Top Contributors” and “Top Detractors” tables shown above, the sum of all contributors to, and all detractors from, performance for all securities in the portfolio would approximate the Fund’s year-to-date performance for 2021. The Sharpe Ratio is calculated for a specified period by dividing a fund’s annualized excess returns by its annualized standard deviation. The higher the Sharpe ratio, the better the fund’s historical risk-adjusted performance. Upside Capture Ratio measures a manager’s performance in up markets relative to the Fund’s benchmark (Russell 2500). It is calculated by measuring the Fund’s performance in quarters when the benchmark went up and dividing it by the benchmark’s return in those quarters. Downside Capture Ratio measures a manager’s performance in down markets relative to the Fund’s benchmark. It is calculated by measuring the Fund’s performance in quarters when the benchmark goes down and dividing it by the benchmark’s return in those quarters.
The Royce Funds 2021 Annual Report to Shareholders | 9
MANAGER’S DISCUSSION (UNAUDITED)
Royce Global Financial Services Fund (RFS)

Chuck Royce
FUND PERFORMANCE
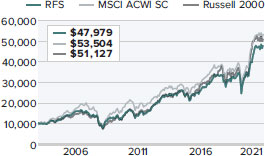
Royce Global Financial Services Fund rose 20.3% in 2021, outperforming its benchmark, the MSCI ACWI Small Cap Index, which was up 16.1% for the same period. In addition to its calendar-year advantage, the Fund also outperformed its benchmark for the 3-, 5-, and 10-year periods ended 12/31/21.
WHAT WORKED… AND WHAT DIDN’T
The Fund’s top contributor at the position level in 2021 was Sprott, a Canadian asset manager that focuses on precious metals. Its shares first rose during 1Q21, no doubt boosted by the announcement in February of an 88% increase in assets under management that helped earnings considerably. Strong third-quarter earnings then helped its shares recover from a brief mid-year slump. Popular, the portfolio’s second top contributor, is the largest bank by both assets and deposits in Puerto Rico and ranks as one of the top thrifts by total assets in the U.S. Its business benefited from the continued rebound in economic activity, the unprecedented level of federal stimulus, and the bank’s diversified sources of revenue. Adoption of the bank’s digital channels among its retail customers continues to grow, while its auto loan and lease originations, along with mortgage originations, remained solid. The next top contributor was KKR & Co., a leading alternative asset manager that offers investment strategies such as private equity, energy, credit, infrastructure, real estate, and hedge funds. The company enjoyed strong results throughout 2021, capped by third-quarter earnings in which the company reported fee-related earnings per share and after-tax distributable earnings that were as high as any KKR had ever reported, along with management fees that were up more than 50% since the third quarter of 2020. These improvements drove a 60% increase in fee-related earnings per share on a year-over-year basis.
The biggest detractor at the position level was B3-Brasil, Bolsa, Balcao, a stock exchange located in São Paulo, Brazil. Its decline in 2021 may have been a case of investors expecting more. Brazil’s economy and equity markets have been recovering in 2021, and the company reported slightly better-than-expected profits and earnings in May. The company’s third quarter results showed lower revenues compared to 3Q20 and 2Q21 (though those two quarters were positively impacted by the reversal of non-recurring provisions).
| | | | | |
| | Top Contributors to Performance | | Top Detractors from Performance | |
| | For 2021 (%)1 | | | For 2021 (%)2 | |
| | | | | | |
| | Sprott | 2.29 | | B3-Brasil, Bolsa, Balcao | -0.90 | |
| | Popular | 1.81 | | MarketAxess Holdings | -0.63 | |
| | KKR & Co. | 1.75 | | Ashmore Group | -0.58 | |
| | First Citizens BancShares Cl. A | 1.57 | | Trean Insurance Group | -0.46 | |
| | Carlyle Group | 1.43 | | Great Elm Group | -0.29 | |
| | 1 Includes dividends | | | 2 Net of dividends | | |
| | | | | | | |
However, third-quarter recurring net income rose, even as investors continued to avoid the stock. The Fund’s second-biggest detractor at the position level was MarketAxess Holdings, which operates an electronic trading platform for corporate bonds and other fixed-income securities. Its shares typically do best during periods of high trading volume and volatility. For example, fixed income instruments saw higher-than-usual volatility and trading activity throughout 2020 and into early 2021, boosting the company’s revenues and earnings. However, its stock began to slip in 2Q21 as volatility fell in the fixed-income space, trading activity slowed, and analysts re-rated its shares. Credit-market trading continued to face headwinds in the second half due to a combination of historically low credit spreads and credit spread volatility. Through the first three quarters of fiscal 2021, commission revenue for MarketAxess was down about 1% versus the same point in 2020. We agree with management’s view, however, that credit conditions will mean revert, helping its shares to rebound. Headquartered in the U.K., Ashmore Group specializes in actively managed emerging markets strategies in equities, fixed income, and alternative investments. The company reported declines in adjusted net revenue and EBITDA (Earnings before Interest, Taxes, Depreciation, & Amortization) for the fiscal year ended 6/30/21 and then in October announced declines in assets under management and negative investment performance for the third quarter as market sentiment for certain of its key strategies deteriorated.
CURRENT POSITIONING AND OUTLOOK
We were very pleased with both the Fund’s shorter- and longer-term performance and think that these results validate the Fund’s central investment thesis—that our distinctive approach to investing in companies in the broadly defined financial services ecosystem can produce attractive results compared with the global small-cap asset class. We continue to focus on what we view as the most attractive business models and investment opportunities, while also maintaining diversification across sub-industries and geographies. At year end, the Fund had 50 holdings, down from 61 a year ago, while still holding investments in businesses that can be expected to fare differently at different stages of the economic and market cycles. These investments include select traditional banks and insurance companies that we see as cyclically favored, alternative asset managers where we see continued strong growth prospects, stock exchanges in non-U.S. countries where there are often considerable barriers to competitive entry, and specialized technology platforms serving niches of the financial services ecosystem where we often see high quality attributes such as enduring competitive advantages and low capital requirements. Looking towards 2022, many of the Fund’s investments tend to do well when their respective countries’ economies are expanding, so as the global economy continues its uneven path of recovery, we look forward to another year of strong performance for the Fund.
10 | The Royce Funds 2021 Annual Report to Shareholders
| PERFORMANCE AND PORTFOLIO REVIEW (UNAUDITED) | | TICKER SYMBOLS RYFSX RGFIX |
Performance and Expenses
Average Annual Total Return (%) Through 12/31/21
| | JUL-DEC 20211 | 1-YR | 3-YR | 5-YR | 10-YR | 15-YR | SINCE INCEPTION (12/31/03) |
| RFS | 2.16 | 20.27 | 19.84 | 12.79 | 13.29 | 7.55 | 9.10 |
| Annual Gross Operating Expenses: 2.07% | Annual Net Operating Expenses: 1.68% |
1 Not annualized
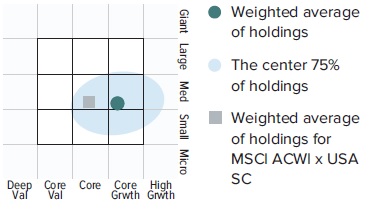
Morningstar Style Map™ As of 12/31/21
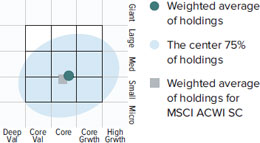
The Morningstar Style Map is the Morningstar Style Box™ with the center 75% of fund holdings plotted as the Morningstar Ownership Zone™. The Morningstar Style Box is designed to reveal a fund’s investment strategy. The Morningstar Ownership Zone provides detail about a portfolio’s investment style by showing the range of stock sizes and styles. The Ownership Zone is derived by plotting each stock in the portfolio within the proprietary Morningstar Style Box. Over time, the shape and location of a fund’s ownership zone may vary. See page 86 for additional information.
Value of $10,000
Invested on 12/31/03 as of 12/31/21 ($)
Top 10 Positions
% of Net Assets
| Sprott | | 4.8 |
| FirstService Corporation | | 4.3 |
| Popular | | 4.3 |
| First Citizens BancShares Cl. A | | 4.0 |
| Tel Aviv Stock Exchange | | 3.9 |
| KKR & Co. | | 3.7 |
| Canaccord Genuity Group | | 3.5 |
| Altus Group | | 3.5 |
| Franco-Nevada | | 3.4 |
| Charles Schwab | | 3.2 |
Portfolio Sector Breakdown
% of Net Assets
| Capital Markets | | 48.9 |
| Banks | | 16.4 |
| Real Estate Management & Development | | 9.0 |
| Insurance | | 4.7 |
| Metals & Mining | | 3.4 |
| Software | | 3.0 |
| Diversified Financial Services | | 1.9 |
| IT Services | | 1.7 |
| Thrifts & Mortgage Finance | | 1.2 |
| Closed-End Funds | | 0.9 |
| Professional Services | | 0.5 |
| Cash and Cash Equivalents | | 8.4 |
Upside/Downside Capture Ratios
Periods Ended 12/31/21 (%)
| | UPSIDE | DOWNSIDE |
| 10-Year | 99 | 83 |
| Fund’s First Full Quarter (12/31/03) | 88 | 85 |
Calendar Year Total Returns (%)
| YEAR | | RFS |
| 2021 | | 20.3 |
| 2020 | | 15.3 |
| 2019 | | 24.2 |
| 2018 | | -13.4 |
| 2017 | | 22.5 |
| 2016 | | 12.9 |
| 2015 | | -4.7 |
| 2014 | | 3.5 |
| 2013 | | 42.0 |
| 2012 | | 20.7 |
| 2011 | | -11.3 |
| 2010 | | 18.5 |
| 2009 | | 32.1 |
| 2008 | | -35.4 |
| 2007 | | -4.7 |
Portfolio Country Breakdown 1,2
% of Net Assets
| United States | | 47.1 |
| Canada | | 24.4 |
| United Kingdom | | 4.0 |
| Israel | | 3.8 |
| India | | 1.9 |
| New Zealand | | 1.9 |
| France | | 1.7 |
| Bermuda | | 1.6 |
| ¹ | Represents countries that are 1.5% or more of net assets. |
| ² | Securities are categorized by the country of their headquarters. |
Portfolio Diagnostics
| Fund Net Assets | | $38 million |
| Number of Holdings | | 50 |
| Turnover Rate | | 5% |
| Average Market Capitalization1 | | $3,931 million |
| Weighted Average P/E Ratio 2,3 | | 11.3x |
| Weighted Average P/B Ratio 2 | | 2.0x |
| Active Share 4 | | 99% |
| 1 | Geometric Average. This weighted calculation uses each portfolio holding’s market cap in a way designed to not skew the effect of very large or small holdings; instead, it aims to better identify the portfolio’s center, which Royce believes offers a more accurate measure of average market cap than a simple mean or median. |
| 2 | Harmonic Average. This weighted calculation evaluates a portfolio as if it were a single stock and measures it overall. It compares the total market value of the portfolio to the portfolio’s share in the earnings or book value, as the case may be, of its underlying stocks. |
| 3 | The Fund’s P/E ratio calculation excludes companies with zero or negative earnings (5% of portfolio holdings as of 12/31/21). |
| 4 | Active Share is the sum of the absolute values of the different weightings of each holding in the Fund versus each holding in the benchmark, divided by two. |
Important Performance and Expense Information
All performance information in this Report reflects past performance, is presented on a total return basis, reflects the reinvestment of distributions, and does not reflect the deduction of taxes that a shareholder would pay on fund distributions or the redemption of fund shares. Past performance is no guarantee of future results. Investment return and principal value of an investment will fluctuate, so that shares may be worth more or less than their original cost when redeemed. Shares redeemed within 30 days of purchase may be subject to a 1% redemption fee payable to the Fund, which is not reflected in the performance shown above; if it were, performance would be lower. Current month-end performance may be higher or lower than performance quoted and may be obtained at www.royceinvest.com. Gross operating expenses reflect the Fund’s gross total annual operating expenses for the Service Class and include management fees, 12b-1 distribution and service fees, other expenses and acquired fund fees and expenses. Net operating expenses reflect contractual fee waivers and/or expense reimbursements. All expense information is reported as of the Fund’s most current prospectus. Royce & Associates has contractually agreed to waive fees and/or reimburse expenses to the extent necessary to maintain the Fund’s net annual operating expenses, (excluding brokerage commissions, taxes, interest, litigation expenses, acquired fund fees and expenses, and other expenses not borne in the ordinary course of business), at or below 1.49% through April 30, 2022. Acquired fund fees and expenses reflect the estimated amount of the fees and expenses incurred indirectly by the Fund through its investments in mutual funds, hedge funds, private equity funds, and other investment companies. Regarding the “Top Contributors” and “Top Detractors” tables shown above, the sum of all contributors to, and all detractors from, performance for all securities in the portfolio would approximate the Fund’s year-to-date performance for 2021. Upside Capture Ratio measures a manager’s performance in up markets relative to the Fund’s benchmark (MSCI ACWI SC). It is calculated by measuring the Fund’s performance in quarters when the benchmark went up and dividing it by the benchmark’s return in those quarters. Downside Capture Ratio measures a manager’s performance in down markets relative to the Fund’s benchmark. It is calculated by measuring the Fund’s performance in quarters when the benchmark goes down and dividing it by the benchmark’s return in those quarters.
The Royce Funds 2021 Annual Report to Shareholders | 11
MANAGERS’ DISCUSSION (UNAUDITED)
Royce International Premier Fund (RIP)

Mark Rayner, CA
Mark Fischer
FUND PERFORMANCE
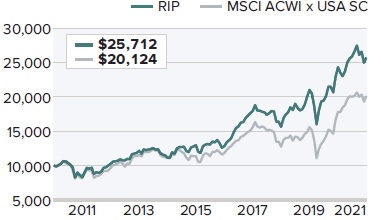
2021 saw Royce International Premier Fund underperform its benchmark after four consecutive years of outperformance. The Fund advanced 5.8% in 2021, trailing its benchmark, the MSCI ACWI ex-USA Small Cap Index, which was up 12.9% for the same period. The Fund beat the benchmark for the 3-, 5-, 10-year, and since inception (12/31/10) periods ended 12/31/21.
WHAT WORKED… AND WHAT DIDN’T
Four of the portfolio’s nine equity sectors made a positive impact on 2021’s performance, led by Industrials, Materials, and Real Estate, while Health Care, Information Technology, and Consumer Discretionary made the largest detractions. The Fund’s top-contributing position in 2021 was IMCD—a leading distributor of specialty chemicals. Based in the Netherlands, IMCD offers more than 40,000 products to a diverse range of industrial and life sciences customers in areas that range from personal care to food and pharmaceuticals. Its shares rose steadily in 2021 and gained nearly 75% for the year. Results for the first nine months of 2021, announced in November, saw strong organic growth stemming from the company’s pricing power (a key attribute in inflationary periods) and ability to gain market share. IMCD also announced 10 acquisitions in 2021, consistent with its proven ability to acquire businesses at attractive prices.
Next came Australia’s Hansen Technologies, which provides billing software and customer care technologies for utilities and the telecom industry. Its shares gained sharply in March on the announcement that it had executed a Master Agreement with Telefonica’s Germany operations before rallying again in June after the company announced it had received an unsolicited proposal to be acquired by private equity firm BGH. The stock then gave back much of those gains when BGH unexpectedly withdrew its proposal in September. As investors then re-focused on the company’s fundamentals, the stock was mostly flat through the rest of the year as sentiment fluctuated between optimism around long-term performance and concerns about cost inflation and the achievement of the company’s short-term organic growth targets.
| | | | | |
| | Top Contributors to Performance | | Top Detractors from Performance | |
| | For 2021 (%)1 | | | For 2021 (%)2 | |
| | | | | | |
| | IMCD | 1.40 | | Bravura Solutions | -0.69 | |
| | Hansen Technologies | 1.17 | | OBIC Business Consultants | -0.66 | |
| | Croda International | 0.97 | | TKC Corporation | -0.61 | |
| | IPH | 0.95 | | GVS | -0.51 | |
| | Marlowe | 0.90 | | NICE Information Service | -0.47 | |
| | 1 Includes dividends | | | 2 Net of dividends | | |
| | | | | | | |
The top detracting position was Australia’s Bravura Solutions, which offers software solutions for the wealth management and fund administration industries. Its stock fell by almost 40% from mid-August through the end of the year, triggered by the release of full fiscal year 2021 results that, while in line with management’s guidance, reflected weaker results of “just” mid-teens growth. The company also announced the unexpected retirement of a popular long-time CEO, who was succeeded by the company’s COO. The market’s adverse reaction to his departure was exacerbated by the company’s limited communication about the departure, which followed an earlier management departure and the pending retirement of the company’s CFO. Our call with the company’s outgoing CFO, however, underlined Bravura’s strong ongoing customer retention, M&A pipeline, and positive long-term outlook supported by recovering client demand.
The second biggest detractor was Japan��s OBIC Business Consultants, an accounting software company with a leading market share among small- to medium-sized businesses. OBIC allows these companies to digitize and more efficiently conduct mission critical accounting processes. We suspect that 2021’s underperformance came from profit taking, as the year saw a broad reversal in the Japanese equity market. This reversal was particularly pronounced in the IT sector, where several companies that were in top performers in 2020 wound up correcting in 2021.
In 2021, non-U.S. small-cap companies in the top quintile of leverage underperformed those in the bottom quintile—and our holdings carry little to no debt. As such, our disadvantage came from stock selection in 2021, with the Information Technology, Health Care, and Financials sectors making the most significant negative impact on that basis while Industrials, Consumer Staples, and Real Estate contributed most to relative performance—mostly the result of sector allocation decisions.
CURRENT POSITIONING AND OUTLOOK
During 2021, ultra-low interest rates, substantial asset purchases by central banks, and unprecedented levels of COVID support packages from governments combined to soak financial markets with liquidity. At the same time, we believe the volatile nature of the pandemic continued to affect commerce and social behaviors, providing investors with both the means and the opportunity to bet on shorter-term stock market outcomes. The result, in our view, was a more speculative three-way tug of war between ‘growth at any price,’ ‘cheap re-opening plays,’ and ‘inflation hedges.’ Given that our investment philosophy is rooted in the focus on long-term value creation rather than the pursuit of short-term price appreciation, the market backdrop was difficult, to say the least. While the stock market hasn’t so far, in our view, correctly priced in the value that our portfolio companies created in 2021, we continue to believe that our approach will be rewarded with correlated price appreciation in the long run. Of course, we cannot predict when the market will refocus on ‘mathematics’ rather than ‘thematics.’ However, we do believe that such a moment is long overdue, and that, in the meantime, our companies continue to create additional shareholder value.
12 | The Royce Funds 2021 Annual Report to Shareholders
| PERFORMANCE AND PORTFOLIO REVIEW (UNAUDITED) | | TICKER SYMBOLS RYIPX RIPNX RINPX RIPIX |
Performance and Expenses
Average Annual Total Return (%) Through 12/31/21
| | JUL-DEC 20211 | 1-YR | 3-YR | 5-YR | 10-YR | SINCE INCEPTION (12/31/10) |
| RIP | -0.58 | 5.78 | 18.01 | 14.92 | 11.94 | 8.96 |
| Annual Gross Operating Expenses: 1.57% | Annual Net Operating Expenses: 1.44% |
1 Not annualized
Relative Returns: Monthly Rolling Average Annual Return Periods
Since Inception Through 12/31/21
On a monthly rolling basis, The Fund outperformed the MSCI ACWI x USA SC in 100% of all 10-year periods; 100% of all 5-year periods; and 67% of all 1-year periods.
| | PERIODS BEATING THE INDEX | FUND AVG (%) 1 | INDEX AVG (%) 1 |
| 10-year | 13/13 | 100% | 10.1 | 7.4 |
| 5-year | 73/73 | 100% | 9.9 | 6.5 |
| 1-year | 81/121 | | 67% | 10.7 | 8.5 |
| | | | | | |
1Average of monthly rolling average annual total returns over the specified periods.
Morningstar Style Map™ As of 12/31/21
The Morningstar Style Map is the Morningstar Style Box™ with the center 75% of fund holdings plotted as the Morningstar Ownership Zone™. The Morningstar Style Box is designed to reveal a fund’s investment strategy. The Morningstar Ownership Zone provides detail about a portfolio’s investment style by showing the range of stock sizes and styles. The Ownership Zone is derived by plotting each stock in the portfolio within the proprietary Morningstar Style Box. Over time, the shape and location of a fund’s ownership zone may vary. See page 86 for additional information.
Value of $10,000
Invested on 12/31/10 as of 12/31/21 ($)
Top 10 Positions
% of Net Assets
| IPH | 3.3 |
| TKC Corporation | 2.9 |
| Meitec Corporation | 2.8 |
| Hansen Technologies | 2.5 |
| Victrex | 2.4 |
| Bravura Solutions | 2.3 |
| FUCHS PETROLUB | 2.2 |
| OBIC Business Consultants | 2.2 |
| Loomis | 2.1 |
| GVS | 2.1 |
Portfolio Sector Breakdown
% of Net Assets
| | |
| Industrials | 38.2 |
| Information Technology | 25.2 |
| Health Care | 11.7 |
| Materials | 7.1 |
| Financials | 4.1 |
| Communication Services | 3.9 |
| Consumer Discretionary | 1.5 |
| Real Estate | 1.4 |
| Preferred Stock | 2.2 |
| Cash and Cash Equivalents | 4.7 |
Upside/Downside Capture Ratios
Periods Ended 12/31/21 (%)
| | | UPSIDE | | DOWNSIDE |
| 10-Year | | 99 | | 76 |
| Fund’s First Full Quarter (12/31/10) | | 100 | | 79 |
Calendar Year Total Returns (%)
| YEAR | | RIP |
| 2021 | | 5.8 |
| 2020 | | 15.7 |
| 2019 | | 34.2 |
| 2018 | | -12.8 |
| 2017 | | 39.8 |
| 2016 | | -1.1 |
| 2015 | | 16.2 |
| 2014 | | -8.2 |
| 2013 | | 18.3 |
| 2012 | | 23.4 |
| 2011 | | -16.8 |
Portfolio Country Breakdown 1,2
% of Net Assets
| Japan | 18.2 |
| United Kingdom | 16.8 |
| Australia | 10.1 |
| Sweden | 8.9 |
| Switzerland | 7.1 |
| Germany | 6.9 |
| Italy | 4.9 |
| Canada | 4.8 |
| South Korea | 3.2 |
| 1 | Represents countries that are 3% or more of net assets. |
| 2 | Securities are categorized by the country of their headquarters. |
Portfolio Diagnostics
| Fund Net Assets | | $1,253 million |
| Number of Holdings | | 60 |
| Turnover Rate | | 32% |
| Average Market Capitalization 1 | | $2,325 million |
| Weighted Average P/E Ratio 2,3 | | 27.2x |
| Weighted Average P/B Ratio 2 | | 3.8x |
| Active Share 4 | | 99% |
| 1 | Geometric Average. This weighted calculation uses each portfolio holding’s market cap in a way designed to not skew the effect of very large or small holdings; instead, it aims to better identify the portfolio’s center, which Royce believes offers a more accurate measure of average market cap than a simple mean or median. |
| 2 | Harmonic Average. This weighted calculation evaluates a portfolio as if it were a single stock and measures it overall. It compares the total market value of the portfolio to the portfolio’s share in the earnings or book value, as the case may be, of its underlying stocks. |
| 3 | The Fund’s P/E ratio calculation excludes companies with zero or negative earnings (4% of portfolio holdings as of 12/31/21). |
| 4 | Active Share is the sum of the absolute values of the different weightings of each holding in the Fund versus each holding in the benchmark, divided by two. |
Important Performance and Expense Information
All performance information in this Report reflects past performance, is presented on a total return basis, reflects the reinvestment of distributions, and does not reflect the deduction of taxes that a shareholder would pay on fund distributions or the redemption of fund shares. Past performance is no guarantee of future results. Investment return and principal value of an investment will fluctuate, so that shares may be worth more or less than their original cost when redeemed. Shares redeemed within 30 days of purchase may be subject to a 2% redemption fee payable to the Fund, which is not reflected in the performance shown above; if it were, performance would be lower. Current month-end performance may be higher or lower than performance quoted and may be obtained at www.royceinvest.com. All performance and risk information reflects results of the Service Class (its oldest class). Price and total return information is based on net asset values for shareholder transactions. Certain immaterial adjustments were made to the net assets of Royce International Premier Fund at 12/31/19 and 12/31/20 for financial reporting purposes, and as a result the calendar year total returns based on those net asset values differ from the adjusted net asset values and calendar year total returns reported in the Financial Highlights. Gross operating expenses reflect total gross annual operating expenses for the Service Class and include management fees, 12b-1 distribution and service fees, and other expenses. Net operating expenses reflect contractual fee waivers and/or expense reimbursements. All expense information is reported as of the Fund’s most current prospectus. Royce & Associates has contractually agreed to waive its fees and/or reimburse operating expenses to the extent necessary to maintain the Fund’s net annual operating expenses, (excluding brokerage commissions, taxes, interest, litigation expenses, acquired fund fees and expenses, and other expenses not borne in the ordinary course of business), at or below 1.44% through April 30, 2022. Regarding the “Top Contributors” and “Top Detractors” tables shown above, the sum of all contributors to, and all detractors from, performance for all securities in the portfolio would approximate the Fund’s year-to-date performance for 2021. Upside Capture Ratio measures a manager’s performance in up markets relative to the Fund’s benchmark (MSCI ACWI x USA SC). It is calculated by measuring the Fund’s performance in quarters when the benchmark went up and dividing it by the benchmark’s return in those quarters. Downside Capture Ratio measures a manager’s performance in down markets relative to the Fund’s benchmark. It is calculated by measuring the Fund’s performance in quarters when the benchmark goes down and dividing it by the benchmark’s return in those quarters.
The Royce Funds 2021 Annual Report to Shareholders | 13
MANAGERS’ DISCUSSION (UNAUDITED)
Royce Micro-Cap Fund (RMC)

Jim Stoeffel
Brendan Hartman
FUND PERFORMANCE
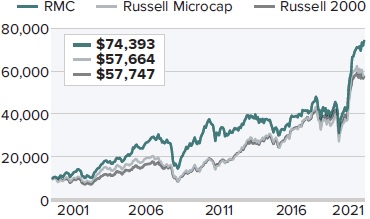
Royce Micro-Cap Fund gained 31.0% in 2021, beating both the Russell Microcap Index (+19.3%), its primary benchmark, and the Russell 2000 (+14.8%) for the same period. The Fund also outperformed both indexes for the 3- and 5-year periods ended 12/31/21. In addition, the Fund outpaced the Russell 2000 for the 25- year and identical 30-year and since inception periods ended 12/31/21. We are very pleased to have celebrated the Fund’s 30th anniversary at the end of 2021.
WHAT WORKED… AND WHAT DIDN’T
All 10 equity sectors in which the Fund held investments made positive contributions to performance for the calendar year. Information Technology, Industrials, and Financials made the most sizable positive impacts while Consumer Staples, Real Estate, and Communication Services made the smallest positive contributions. At the industry level, semiconductors & semiconductor equipment (Information Technology), specialty retail (Consumer Discretionary), and professional services (Industrials) contributed most in 2021 while auto components (Consumer Discretionary), electronic equipment, instruments & components (Information Technology), and electrical equipment (Industrials) were the largest detractors.
At the position level, the Fund gained most from Aehr Test Systems, a worldwide supplier of systems for testing and burning-in logic, memory, photonic, power devices, and SiC (silicon carbide) wafers. The company is beginning to see significant traction in applications such as electric vehicles, where the cost of semiconductor failure is extremely high. While we have trimmed shares given its significant price appreciation, we maintained a meaningful position at year-end as we believe we are at the early stages of adoption in many of the company’s key end markets. Aspen Aerogels was the Fund’s next top contributor. Aspen sells proprietary insulation materials to the energy market—which rebounded in 2021—and to developing markets, including electric vehicles. The company secured the necessary financing to double its production capacity over the next several years in 2021, allowing it to meet its growing demand. In addition, it has several exciting new product applications in the research and development phase that hold potential growth opportunities. We continue to hold a large position as we believe electric vehicles are a significant long-term growth opportunity. B. Riley Financial, a capital markets firm that boasts operations spanning from investment banking to retailer bankruptcy liquidations, was the third top contributing position in 2021 as it continued to benefit from market share gains in its brokerage business.
| | | | | |
| | Top Contributors to Performance | | Top Detractors from Performance | |
| | For 2021 (%)1 | | | For 2021 (%)2 | |
| | | | | | |
| | Aehr Test Systems | 2.41 | | Motorsport Games Cl A | -0.66 | |
| | Aspen Aerogels | 1.33 | | American Superconductor | -0.48 | |
| | B Riley Financial | 1.27 | | Profound Medical | -0.40 | |
| | Transcat | 1.21 | | CIRCOR International | -0.36 | |
| | Citi Trends | 1.11 | | Stoneridge | -0.33 | |
| | 1 Includes dividends | | | 2 Net of dividends | | |
| | | | | | | |
Conversely, Motorsport Games, which develops gaming software, detracted most for the calendar year. Unfortunately, a NASCAR-themed game that was its first software release following its IPO, had technical glitches that resulted in lower-than-expected sales. We have been selling our position as we wait for more clarity as to whether this game’s failed launch has permanently damaged the company’s game development reputation. American Superconductor is an energy technologies company specializing in the design and manufacture of power systems and superconducting wire. As a smaller company dealing with state and local governments, utilities, and the U.S Navy, order flows and revenue generation tend to be unpredictable. After a strong year in 2020, new flows were less robust in 2021, resulting in the shares declining. We have been adding to our position as we view the company’s technology as vibrant and critical to improving electric grids and believe that as business opportunities gain scale, the company’s results will become less volatile. Profound Medical develops and commercializes technology for the treatment of localized prostate cancer and was impacted by limitations to sell its product given COVID restrictions in many hospitals.
The portfolio’s advantage over the Russell Microcap came primarily from stock selection in 2021, though sector allocation also helped. Our substantially lower exposure and stock picks in Health Care gave the Fund its biggest advantage, followed by savvy stock selection in Information Technology and Industrials. Conversely, ineffective stock picks and our lower exposure to Consumer Discretionary caused a drag on relative results for the calendar year while Financials and Real Estate detracted because of our lower weightings, though stock selection also hurt in the latter sector.
CURRENT POSITIONING AND OUTLOOK
Micro-cap stocks began the year with very strong returns before struggling through the second half of 2021. This has created considerable long-term prospects in many sectors, such as in technology, where supply chain consolidation has allowed certain micro-cap names to secure greater market share in a growing, high-demand industry. We have added on the margin to companies involved in energy and banks, where we remain underweight. This former group is mostly on the services side, with some holdings categorized in Industrials. In addition, we believe the long-term prospects and current valuations for value micro-caps look especially attractive to us. We think there is pent-up demand for autos and other consumer areas. With the global economy looking sound—especially once supply chain issues are resolved and COVID becomes more manageable—we are optimistic about the current environment, in particular for disciplined stock pickers with a long-term investment horizon like ourselves.
14 | The Royce Funds 2021 Annual Report to Shareholders
| PERFORMANCE AND PORTFOLIO REVIEW (UNAUDITED) | | TICKER SYMBOLS RYOTX RMCFX RYMCX |
Performance and Expenses
Average Annual Total Return (%) Through 12/31/21
| | JUL-DEC 20211 | 1-YR | 3-YR | 5-YR | 10-YR | 15-YR | 20-YR | 25-YR | SINCE INCEPTION (12/31/91) |
| RCS | 4.58 | 31.02 | 25.49 | 13.67 | 9.48 | 7.06 | 9.19 | 10.24 | 11.48 |
| Annual Gross Operating Expenses: 1.29% Annual Net Operating Expenses: 1.24% |
1 Not annualized
Morningstar Style Map™ As of 12/31/21

The Morningstar Style Map is the Morningstar Style Box™ with the center 75% of fund holdings plotted as the Morningstar Ownership Zone™. The Morningstar Style Box is designed to reveal a fund’s investment strategy. The Morningstar Ownership Zone provides detail about a portfolio’s investment style by showing the range of stock sizes and styles. The Ownership Zone is derived by plotting each stock in the portfolio within the proprietary Morningstar Style Box. Over time, the shape and location of a fund’s ownership zone may vary. See page 86 for additional information.
Value of $10,000
Invested on 6/30/00 (Russell Microcap Index Inception) as of 12/31/21 ($)
Top 10 Positions
% of Net Assets
| Photronics | 1.2 |
| Citi Trends | 1.2 |
| B Riley Financial | 1.2 |
| Axcelis Technologies | 1.2 |
| Ultra Clean Holdings | 1.1 |
| Digi International | 1.1 |
| MeiraGTx Holdings | 1.1 |
| Haynes International | 1.1 |
| PDF Solutions | 1.1 |
| Camtek | 1.1 |
Portfolio Sector Breakdown
% of Net Assets
| | |
| Information Technology | 25.4 |
| Industrials | 23.4 |
| Financials | 12.6 |
| Health Care | 12.2 |
| Consumer Discretionary | 12.0 |
| Communication Services | 4.5 |
| Materials | 3.5 |
| Energy | 2.6 |
| Real Estate | 0.4 |
| Cash and Cash Equivalents | 3.4 |
Calendar Year Total Returns (%)
| YEAR | | RMC |
| 2021 | | 31.0 |
| 2020 | | 24.5 |
| 2019 | | 21.2 |
| 2018 | | -8.9 |
| 2017 | | 5.4 |
| 2016 | | 19.7 |
| 2015 | | -13.3 |
| 2014 | | -4.1 |
| 2013 | | 21.3 |
| 2012 | | 8.0 |
| 2011 | | -12.1 |
| 2010 | | 30.1 |
| 2009 | | 55.7 |
| 2008 | | -40.9 |
| 2007 | | 7.1 |
Upside/Downside Capture Ratios
Periods Ended 12/31/21 (%)
| | | UPSIDE | | DOWNSIDE |
| 10-Year | | 77 | | 87 |
| From 6/30/00 (Russell Microcap Index Inception) | | 91 | | 80 |
Portfolio Diagnostics
| Fund Net Assets | | $422 million |
| Number of Holdings | | 133 |
| Turnover Rate | | 26% |
| Average Market Capitalization 1 | | $644 million |
| Weighted Average P/B Ratio 2 | | 2.2x |
| Active Share 3 | | 91% |
| U S Investments (% of Net Assets) | | 85.3% |
| Non-U.S Investments (% of Net Assets) | | 11.3% |
| 1 | Geometric Average. This weighted calculation uses each portfolio holding’s market cap in a way designed to not skew the effect of very large or small holdings; instead, it aims to better identify the portfolio’s center, which Royce believes offers a more accurate measure of average market cap than a simple mean or median. |
| 2 | Harmonic Average. This weighted calculation evaluates a portfolio as if it were a single stock and measures it overall. It compares the total market value of the portfolio to the portfolio’s share in the earnings or book value, as the case may be, of its underlying stocks. |
| 3 | Active Share is the sum of the absolute values of the different weightings of each holding in the Fund versus each holding in the benchmark, divided by two. |
Important Performance and Expense Information
All performance information in this Report reflects past performance, is presented on a total return basis, reflects the reinvestment of distributions, and does not reflect the deduction of taxes that a shareholder would pay on fund distributions or the redemption of fund shares. Past performance is no guarantee of future results. Investment return and principal value of an investment will fluctuate, so that shares may be worth more or less than their original cost when redeemed. Shares redeemed within 30 days of purchase may be subject to a 1% redemption fee payable to the Fund, which is not reflected in the performance shown above; if it were, performance would be lower. Current month-end performance may be higher or lower than performance quoted and may be obtained at www.royceinvest.com. All performance and risk information reflects results of the Investment Class (its oldest class). Price and total return information is based on net asset values calculated for shareholder transactions. Certain immaterial adjustments were made to the net assets of Royce Micro-Cap Fund at 12/31/17 for financial reporting purposes, and as a result the calendar year total returns based on those net asset values differ from the adjusted net asset values and calendar year total returns reported in the Financial Highlights. Gross operating expenses reflect the Fund’s total gross annual operating expenses for the Investment Class and include management fee and other expenses. Net operating expenses reflect contractual fee waivers and/or expense reimbursements. All expense information is reported as of the Fund’s most current prospectus. Royce & Associates has contractually agreed, without right of termination, to waive fees and/or reimburse expenses to the extent necessary to maintain the Investment Class’s net annual operating expenses (excluding brokerage commissions, taxes, interest, litigation expenses, acquired fund fees and expenses, and other expenses not borne in the ordinary course of business) at or below 1.24% through April 30, 2022. Regarding the “Top Contributors” and “Top Detractors” tables shown above, the sum of all contributors to, and all detractors from, performance for all securities in the portfolio would approximate the Fund’s year-to-date performance for 2021. Upside Capture Ratio measures a manager’s performance in up markets relative to the Fund’s benchmark (Russell Microcap Index). It is calculated by measuring the Fund’s performance in quarters when the benchmark went up and dividing it by the benchmark’s return in those quarters. Downside Capture Ratio measures a manager’s performance in down markets relative to the Fund’s benchmark. It is calculated by measuring the Fund’s performance in quarters when the benchmark goes down and dividing it by the benchmark’s return in those quarters.
The Royce Funds 2021 Annual Report to Shareholders | 15
MANAGERS’ DISCUSSION (UNAUDITED)
Royce Opportunity Fund (ROF)

Jim Stoeffel, Brendan Hartman, Jim
Harvey, CFA®, Kavitha Venkatraman
FUND PERFORMANCE
Royce Opportunity Fund advanced 30.8% in 2021, outpacing both its benchmark, the Russell 2000 Value, which gained 28.3%, and the Russell 2000 Index, which was up 14.8% for the same period. We were even more pleased that the Fund also outperformed both the Russell 2000 Value and the Russell 2000 for the 3-, 5-, 10-, 15-, 20-, 25-year, and since inception (11/19/96) periods ended 12/31/21.
WHAT WORKED… AND WHAT DIDN’T
All of the portfolio’s 11 equity sectors made a positive impact on performance in 2021, with the largest positive impacts contributions coming from Industrials, Information Technology, and Materials while the smallest positive impacts came from Utilities, Consumer Staples, and Communication Services. At the industry level, semiconductors & semiconductor equipment (Information Technology), health care providers & services (Health Care), and chemicals (Materials) contributed most while biotechnology (Health Care), auto components (Consumer Discretionary), and diversified consumer services (Consumer Discretionary) were the largest detractors in the calendar year.
The holding making the largest contribution in 2021 was Alpha & Omega Semiconductor, which designs, develops, and supplies a broad range of power semiconductors. In September, the company reported double-digit growth in each of its market segments, along with record revenue. Next best was Herc Holdings, which provides rental equipment through its subsidiaries in several industries, including construction, manufacturing, refineries, and emergency response. Herc announced in September that it was raising guidance for the rest of 2021 while also offering an optimistic long-term forecast. With plans to expand into urban areas, Herc set goals for organic compound annual growth ranging from 12% to 15% in rental revenue and 17% to 20% in adjusted EBITDA (Earnings before Interest, Taxes, Depreciation, & Amortization) from 2021 to 2024. We reduced our stakes in both companies as their prices rose in 2021.
The largest detractor at the position level was LL Flooring Holdings, better known as Lumber Liquidators. The company retails hard-surface flooring, including hardwood, laminate, vinyl plank, tile, bamboo, and cork flooring, as well as flooring tools and accessories. Its shares fell in May after the company reported fairly good results but removed guidance due to COVID concerns. Its stock slid again in the fall on pandemic-related supply and inventory replenishment issues and year-over- year sales declines. Confident that it can turn its business around as supply chain delays are worked through, we held shares at year end. Emergent BioSolutions was our second-biggest detractor. It’s a specialty pharmaceuticals company that manufactures the only FDA-approved anthrax vaccine, among other treatments and therapeutics. Its stock fell precipitously in the spring after the FDA discovered cross contamination issues at one of its plants that was preparing COVID vaccines just as the company was ramping up efforts to be included in the vaccine supply chain. Its shares declined again in November on news that the U.S. Department of Health and Human Services had canceled a multimillion-dollar agreement with the company. We held a small position at the end of 2021, believing that the market has not fully recognized the value of its assets or its existing contracts with the U.S. government.
| | | | | |
| | Top Contributors to Performance | | Top Detractors from Performance | |
| | For 2021 (%)1 | | | For 2021 (%)2 | |
| | | | | | |
| | Alpha & Omega Semiconductor | 0.78 | | LL Flooring Holdings | -0.23 | |
| | Herc Holdings | 0.74 | | Emergent BioSolutions | -0.22 | |
| | B. Riley Financial | 0.73 | | Regis Corporation | -0.20 | |
| | Cross Country Healthcare | 0.69 | | CalAmp Corporation | -0.18 | |
| | Avid Technology | 0.67 | | Kirkland’s | -0.18 | |
| | 1 Includes dividends | | | 2 Net of dividends | | |
| | | | | | | |
The portfolio’s advantage over the Russell 2000 Value in 2021 was entirely attributable to stock selection, with particular strength from picks in Materials, Health Care, and Information Technology. Conversely, stock selection hindered relative results in Consumer Discretionary. The Fund’s cash holdings and a combination of stock picks and lower exposure to Energy also detracted from 2021’s relative performance.
CURRENT POSITIONING AND OUTLOOK
Neither positioning nor our outlook has shifted appreciably since mid-year. We still expect generally better performance for business-to-business than business-to-consumer companies over the long run as consumers are likely to continue feeling the bite of inflation. The portfolio’s opportunistic value strategy often leads us to places where few, if any, other investors are looking because the stocks are performing poorly. We believe select areas in consumer retail offer an example where many companies are dealing with much of what investors are avoiding in stocks: the resurgence of COVID, supply chain issues—where shortages are pressuring profit margins—and higher energy prices, all of which are creating what we see as attractive valuations for certain retailers. We’ve also been active in the aerospace & defense industry, which sustained a double whammy in 2021 from COVID and issues around the Boeing 737 MAX. These issues created hiccups in production. Neither has righted itself to the extent that many had hoped, though the industry was approaching more historically normal conditions at the end of 2021. We have purchased shares of companies where we see attractively low valuations and the capacity for growth. In addition, we continue to see opportunities in industries in temporary staffing and industrial distributors—both of which have benefited from the otherwise challenging issue of skilled labor shortages. Finally, we see what we think are very promising long-term opportunities in select areas of technology, where supply chain consolidation has helped certain companies gain market share.
16 | The Royce Funds 2021 Annual Report to Shareholders
| PERFORMANCE AND PORTFOLIO REVIEW (UNAUDITED) | | TICKER SYMBOLS RYPNX RYOFX ROFCX ROFIX ROFRX |
Performance and Expenses
Average Annual Total Return (%) Through 12/31/21
| | | | | | | | | | SINCE INCEPTION |
| | JUL-DEC 20211 | 1-YR | 3-YR | 5-YR | 10-YR | 15-YR | 20-YR | 25-YR | (11/19/96) |
| ROF | -0.02 | 30.85 | 28.51 | 15.67 | 15.06 | 9.84 | 11.34 | 12.78 | 12.94 |
| Annual Operating Expenses: 1.23% | | | | | | |
1 Not annualized
Relative Returns: Monthly Rolling Average Annual Return Periods
20 Years Through 12/31/21
On a monthly rolling basis, The Fund outperformed the Russell 2000 Value in 99% of all 10-year periods; 74% of all 5-year periods; and 57% of all 1-year periods.
| | PERIODS BEATING THE INDEX | FUND AVG (%) 1 | INDEX AVG (%) 1 |
| 10-year | 120/121 | 99% | 9.9 | 8.4 |
| 5-year | 134/181 | | 74% | 9.7 | 8.1 |
| 1-year | 131/229 | | | 57% | 16.1 | 11.7 |
| | | | | | | |
1Average of monthly rolling average annual total returns over the specified periods.
Morningstar Style Map™ As of 12/31/21

The Morningstar Style Map is the Morningstar Style Box™ with the center 75% of fund holdings plotted as the Morningstar Ownership Zone™. The Morningstar Style Box is designed to reveal a fund’s investment strategy. The Morningstar Ownership Zone provides detail about a portfolio’s investment style by showing the range of stock sizes and styles. The Ownership Zone is derived by plotting each stock in the portfolio within the proprietary Morningstar Style Box. Over time, the shape and location of a fund’s ownership zone may vary. See page 86 for additional information.
Value of $10,000
Invested on 11/19/96 as of 12/31/21 ($)
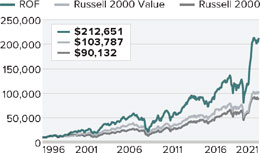
Top 10 Positions
% of Net Assets
| BlueLinx Holdings | 0.8 |
| VSE Corporation | 0.8 |
| Digi International | 0.7 |
| Knowles Corporation | 0.7 |
| Commercial Metals | 0.7 |
| Wabash National | 0.7 |
| Haynes International | 0.7 |
| EnPro Industries | 0.7 |
| Hub Group Cl. A | 0.7 |
| Ultra Clean Holdings | 0.7 |
Portfolio Sector Breakdown
% of Net Assets
| Industrials for | 29.3 |
| Information Technology | 19.8 |
| Consumer Discretionary | 15.8 |
| Materials | 9.6 |
| Financials | 5.9 |
| Health Care | 5.9 |
| Energy | 3.9 |
| Real Estate | 3.1 |
| Communication Services | 3.0 |
| Consumer Staples | 1.1 |
| Cash and Cash Equivalents | 2.6 |
Calendar Year Total Returns (%)
| YEAR | | ROF |
| 2021 | | 30.8 |
| 2020 | | 26.5 |
| 2019 | | 28.2 |
| 2018 | | -20.0 |
| 2017 | | 21.9 |
| 2016 | | 29.9 |
| 2015 | | -13.6 |
| 2014 | | -0.5 |
| 2013 | | 43.5 |
| 2012 | | 22.6 |
| 2011 | | -13.0 |
| 2010 | | 33.8 |
| 2009 | | 62.1 |
| 2008 | | -45.7 |
| 2007 | | -2.0 |
Upside/Downside Capture Ratios
Periods Ended 12/31/21 (%)
| | | UPSIDE | | DOWNSIDE |
| 10-Year | | 120 | | 112 |
| From 12/31/96 (Start of Fund’s First Full Quarter) | | 125 | | 117 |
Portfolio Diagnostics
| Fund Net Assets | $1,800 million |
| Number of Holdings | 245 |
| Turnover Rate | 69% |
| Average Market Capitalization1 | $1,287 million |
| Weighted Average P/B Ratio2 | 1.9x |
| Weighted Average P/S Ratio3 | 0.9x |
| Active Share4 | 89% |
| U.S. Investments (% of Net Assets) | 92.1% |
| Non-U.S. Investments (% of Net Assets) | 5.3% |
| 1 | Geometric Average. This weighted calculation uses each portfolio holding’s market cap in a way designed to not skew the effect of very large or small holdings; instead, it aims to better identify the portfolio’s center, which Royce believes offers a more accurate measure of average market cap than a simple mean or median. |
| 2 | Harmonic Average. This weighted calculation evaluates a portfolio as if it were a single stock and measures it overall. It compares the total market value of the portfolio to the portfolio’s share in the earnings or book value, as the case may be, of its underlying stocks. |
| 3 | Price to Sales is calculated by dividing the company’s market cap by the revenue in the most recent year. |
| 4 | Active Share is the sum of the absolute values of the different weightings of each holding in the Fund versus each holding in the benchmark, divided by two. |
Important Performance and Expense Information
All performance information in this Report reflects past performance, is presented on a total return basis, reflects the reinvestment of distributions, and does not reflect the deduction of taxes that a shareholder would pay on fund distributions or the redemption of fund shares. Past performance is no guarantee of future results. Investment return and principal value of an investment will fluctuate, so that shares may be worth more or less than their original cost when redeemed. Shares redeemed within 30 days of purchase may be subject to a 1% redemption fee payable to the Fund, which is not reflected in the performance shown above; if it were, performance would be lower. Current month-end performance may be higher or lower than performance quoted and may be obtained at www.royceinvest.com. All performance and risk information reflects results of the Investment Class (its oldest class). Operating expenses reflect the Fund’s total annual operating expenses for the Investment Class as of the Fund’s most current prospectus and include management fees and other expenses. Regarding the “Top Contributors” and “Top Detractors” tables shown above, the sum of all contributors to, and all detractors from, performance for all securities in the portfolio would approximate the Fund’s year-to-date performance for 2021. Upside Capture Ratio measures a manager’s performance in up markets relative to the Fund’s benchmark (Russell 2000 Value). It is calculated by measuring the Fund’s performance in quarters when the benchmark went up and dividing it by the benchmark’s return in those quarters. Downside Capture Ratio measures a manager’s performance in down markets relative to the Fund’s benchmark. It is calculated by measuring the Fund’s performance in quarters when the benchmark goes down and dividing it by the benchmark’s return in those quarters.
The Royce Funds 2021 Annual Report to Shareholders | 17
MANAGERS’ DISCUSSION (UNAUDITED)
Royce Pennsylvania Mutual Fund® (PMF)

Chuck Royce, Jay Kaplan, CFA®,
Steven McBoyle, Lauren Romeo, CFA®,
Miles Lewis, CFA®, Andrew Palen
FUND PERFORMANCE
Our flagship, Royce Pennsylvania Mutual Fund, advanced 22.0% in 2021, outperforming its small-cap benchmark, the Russell 2000 Index, which was up 14.8% for the same period. In addition to its calendar-year advantage, the Fund beat the Russell 2000 for the 3-, 5-, 20-, 25-, 30-, 35-, 40-year periods ended 12/31/21, all under the management of Chuck Royce. The Fund’s 45-year average annual total return for the period ended 12/31/21 was 13.2%.
WHAT WORKED… AND WHAT DIDN’T
Nine of the portfolio’s 10 equity sectors made a positive impact on calendar year performance. The sectors making the largest positive contributions were Industrials, Information Technology, and Financials while the only negative impact came from Communication Services. Health Care and Energy made the smallest positive contributions to 2021’s performance. At the industry level, semiconductors & semiconductor equipment (Information Technology), banks (Financials), and machinery (Industrials) contributed most in 2021 while software (Information Technology), health care equipment & supplies (Health Care), and diversified telecommunication services (Communication Services) were the largest detractors.
At the position level, the Fund’s top contributor was Kulicke & Soffa Industries, which primarily supplies equipment for semiconductor wire bonding assembly and other capital equipment. The proliferation of demand for semiconductors is accelerating growth for Kulicke’s bonder equipment, in particular because 80% of the world’s semiconductor packages use wire bonding, while its new product innovations in advanced display and electronics have broadened its overall addressable market and improved its gross margin mix. Triumph Bancorp was our second largest contributor. Through most of 2021, the market’s recognition of the bank’s fintech expertise validated our original investment thesis. Triumph has developed a payment platform that is changing how payments and invoices are handled in the trucking industry. This platform will better connect carriers, shippers, factoring companies, and freight brokers in a way that allows much more efficient handling of invoices and other payments. The robust market for trucking, in terms of the spot prices that drive Triumph’s revenue, led to an outstanding year in its core receivables factoring business, which allows companies to sell invoices for cash advances. While our long-term confidence is strong, returns for the payment platform may have been pulled forward, a concern that led us to trim our position.
| | | | | |
| | Top Contributors to Performance | | Top Detractors from Performance | |
| | For 2021 (%)1 | | | For 2021 (%)2 | | |
| | | | | | | |
| | Kulicke & Soffa Industries | 0.70 | | Upland Software | -0.50 | |
| | Triumph Bancorp | 0.61 | | SmileDirectClub Cl. A | -0.36 | |
| | First Citizens BancShares Cl. A | 0.56 | | Bandwidth Cl. A | -0.33 | |
| | Builders FirstSource | 0.50 | | Haemonetics Corporation | -0.27 | |
| | SiTime Corporation | 0.47 | | Trean Insurance Group | -0.21 | |
| | 1 Includes dividends | | | 2 Net of dividends | | |
| | | | | | | |
The Fund’s biggest detractor was Upland Software, which provides cloud-based enterprise work management software. Its shares fell on mixed revenue performance following outsized presidential election-related growth in 2020 and disappointing execution of the transition of its go-to-market strategy. Profit margins contracted as the company sustained elevated investments in advance of an improvement in revenue productivity. Although we still appreciate much about its strategic allocation of capital, these factors led us to substantially reduce our position in the fourth quarter. We chose to sell our entire stake in SmileDirectClub, which manufactures clear aligners and braces. Achieving profitably and meeting its revenue targets became a longer-term issue than we were willing to accept, especially after the company removed profit guidance in August. It was also struggling with customer acquisition, which was hampered both by changes to Apple’s iOS privacy policy and inflationary pressures that hit hard on the spending of its low-to-middle income consumer demographic.
The portfolio’s advantage over its benchmark was primarily attributable to sector allocation in 2021, with our significant underweight in Health Care helping most on the sector level as that sector was the biggest detractor within the Russell 2000. We also benefited from both our higher exposure and savvy stock selection in Industrials, and primarily from the latter factor in Information Technology. Conversely, our underweight in Energy, which was strong within the Russell 2000, hurt relative results, as did the Fund’s cash position. Successful stock selection was not enough to outweigh the negative impact of our overweight in Materials, which also detracted from relative results in 2021.
CURRENT POSITIONING AND OUTLOOK
Our outlook is very positive for small-cap value but is more nuanced for small-cap as a whole. The Russell 2000 enjoyed a third consecutive year of double-digit positive returns in 2021, which is rare for any equity index. It’s happened only twice before since the inception of the Russell 2000 in 1979—from 1991-1993 and 1995-1997. In each instance, a fourth year of double-digit positive performance failed to materialize. We always place a lot of weight on history, and this pattern, along with a less accommodative Fed, makes us think that performance for the Russell 2000 will be more muted in 2022. History also tells us, however, that small-cap value and cyclicals do well, particularly on a relative basis, during periods of improving economic growth—which is consistent with the encouraging signs we’ve been seeing on a company-by-company basis. We also are optimistic of the relative performance outlook for high quality stocks—which we primarily define as companies with high returns on invested capital and stable returns on assets. We think the Fund’s combined focus on high-quality and value should be supportive for attractive returns, particularly relative to its benchmark.
18 | The Royce Funds 2021 Annual Report to Shareholders
| PERFORMANCE AND PORTFOLIO REVIEW (UNAUDITED) | | TICKER SYMBOLS PENNX RYPFX RPMIX RYPCX RPMRX |
Performance and Expenses
Average Annual Total Return (%) Through 12/31/21
| | JUL-DEC 20211 | 1-YR | 3-YR | 5-YR | 10-YR | 15-YR | 20-YR | 25-YR | 30-YR | 35-YR | 45-YR |
| PMF | 4.67 | 22.05 | 20.78 | 13.10 | 12.30 | 8.62 | 10.09 | 10.88 | 10.97 | 11.04 | 13.18 |
| Annual Operating Expenses: 0.95% | | | | | | | | |
1 Not annualized
Morningstar Style Map™ As of 12/31/21
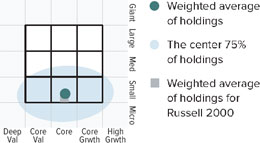
The Morningstar Style Map is the Morningstar Style Box™ with the center 75% of fund holdings plotted as the Morningstar Ownership Zone™. The Morningstar Style Box is designed to reveal a fund’s investment strategy. The Morningstar Ownership Zone provides detail about a portfolio’s investment style by showing the range of stock sizes and styles. The Ownership Zone is derived by plotting each stock in the portfolio within the proprietary Morningstar Style Box. Over time, the shape and location of a fund’s ownership zone may vary. See page 86 for additional information.
Value of $10,000
Invested on on 12/29/78 (Russell 2000 Inception) as of 12/31/21 ($)
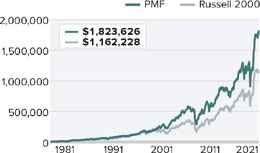
Top 10 Positions
% of Net Assets
| First Citizens BancShares Cl. A | 1.3 |
| Element Solutions | 1.2 |
| KBR | 1.1 |
| Kulicke & Soffa Industries | 1.1 |
| Mesa Laboratories | 1.1 |
| Innospec | 1.1 |
| MKS Instruments | 1.0 |
| Kadant | 1.0 |
| Forward Air | 1.0 |
| Air Lease Cl. A | 0.9 |
Portfolio Sector Breakdown
% of Net Assets
| Industrials | 26.9 |
| Information Technology | 20.9 |
| Financials | 18.4 |
| Consumer Discretionary | 11.2 |
| Materials | 7.9 |
| Health Care | 6.1 |
| Real Estate | 2.3 |
| Energy | 1.7 |
| Communication Services | 1.5 |
| Consumer Staples | 1.1 |
| Cash and Cash Equivalents | 2.0 |
Calendar Year Total Returns (%)
| YEAR | | PMF |
| 2021 | | 22.0 |
| 2020 | | 14.1 |
| 2019 | | 26.6 |
| 2018 | | -9.7 |
| 2017 | | 16.2 |
| 2016 | | 26.5 |
| 2015 | | -11.4 |
| 2014 | | -0.7 |
| 2013 | | 35.3 |
| 2012 | | 14.6 |
| 2011 | | -4.2 |
| 2010 | | 23.9 |
| 2009 | | 36.3 |
| 2008 | | -34.8 |
| 2007 | | 2.8 |
| | | |
Upside/Downside Capture Ratios
Periods Ended 12/31/21 (%)
| | | UPSIDE | | DOWNSIDE |
| 10-Year | | 92 | | 90 |
| From 12/31/78 (Russell 2000 Inception) | | 90 | | 73 |
Portfolio Diagnostics
| Fund Net Assets | $2,149 million |
| Number of Holdings | 297 |
| Turnover Rate | 60% |
| Average Market Capitalization1 | $2,939 million |
| Weighted Average P/E Ratio2,3 | 16.4x |
| Weighted Average P/B Ratio2 | 2.5x |
| Active Share4 | 87% |
| U.S. Investments (% of Net Assets) | 87.6% |
| Non-U.S. Investments (% of Net Assets) | 10.4% |
| 1 | Geometric Average. This weighted calculation uses each portfolio holding’s market cap in a way designed to not skew the effect of very large or small holdings; instead, it aims to better identify the portfolio’s center, which Royce believes offers a more accurate measure of average market cap than a simple mean or median. |
| 2 | Harmonic Average. This weighted calculation evaluates a portfolio as if it were a single stock and measures it overall. It compares the total market value of the portfolio to the portfolio’s share in the earnings or book value, as the case may be, of its underlying stocks. |
| 3 | The Fund’s P/E ratio calculation excludes companies with zero or negative earnings (11% of portfolio holdings as of 12/31/21). |
| 4 | Active Share is the sum of the absolute values of the different weightings of each holding in the Fund versus each holding in the benchmark, divided by two. |
Important Performance and Expense Information
All performance information in this Report reflects past performance, is presented on a total return basis, reflects the reinvestment of distributions, and does not reflect the deduction of taxes that a shareholder would pay on fund distributions or the redemption of fund shares. Past performance is no guarantee of future results. Investment return and principal value of an investment will fluctuate, so that shares may be worth more or less than their original cost when redeemed. Shares redeemed within 30 days of purchase may be subject to a 1% redemption fee payable to the Fund, which is not reflected in the performance shown above; if it were, performance would be lower. Current month-end performance may be higher or lower than performance quoted and may be obtained at www.royceinvest.com. All performance and risk information reflects results of the Investment Class (its oldest class). Certain immaterial adjustments were made to the net assets of Royce Pennsylvania Mutual Fund at 6/30/19 for financial reporting purposes, and as a result the net asset values shareholder transactions on that date and the calendar year total returns (%) based on those net asset values differ from the adjusted net asset values and calendar year total returns reported in the Financial Highlights. Operating expenses reflect the Fund’s total annual operating expenses for the Investment Class as of the Fund’s most current prospectus and include management fees and other expenses. Regarding the “Top Contributors” and “Top Detractors” tables shown above, the sum of all contributors to, and all detractors from, performance for all securities in the portfolio would approximate the Fund’s year-to-date performance for 2021. Upside Capture Ratio measures a manager’s performance in up markets relative to the Fund’s benchmark (Russell 2000). It is calculated by measuring the Fund’s performance in quarters when the benchmark went up and dividing it by the benchmark’s return in those quarters. Downside Capture Ratio measures a manager’s performance in down markets relative to the Fund’s benchmark. It is calculated by measuring the Fund’s performance in quarters when the benchmark goes down and dividing it by the benchmark’s return in those quarters.
The Royce Funds 2021 Annual Report to Shareholders | 19
MANAGERS’ DISCUSSION (UNAUDITED)
Royce Premier Fund (RPR)

Chuck Royce
Lauren Romeo, CFA®
Steven McBoyle
FUND PERFORMANCE
Thanks to a strong second half, Royce Premier Fund advanced 16.4% in 2021, outperforming its small-cap benchmark, the Russell 2000 Index, which was up 14.8% for the same period. In addition to its calendar-year outperformance, the Fund beat its benchmark for the 3-, 5-, 15-, 20-, 25-, 30-year, and since inception (12/31/91) periods ended 12/31/21.
WHAT WORKED… AND WHAT DIDN’T
All of the portfolio’s eight equity sectors made a positive impact on 2021’s performance, with the largest positive contributions coming from Industrials, Information Technology (its two largest weightings), and Consumer Discretionary while the smallest positive impacts came from Health Care, Materials, and Real Estate. Contributing most at the industry level were machinery in Industrials, electronic, instruments & components in Information Technology, and capital markets in Financials while the largest detractors were health care equipment & supplies in Health Care, software in Information Technology, and commercial services & supplies in Industrials.
Rogers Corporation contributed most at the position level in 2021, due to DuPont’s announcement in November that it was acquiring the company. Rogers works with specialty engineered materials that enable high performance and high reliability in EV/HEV, wireless infrastructure, automotive safety, and portable electronics. Morningstar, which provides independent investment research to investors across the globe, was our next-best contributor. In October, the company announced a significant increase in organic revenue and an even bigger boost in operating income for its fiscal third quarter, leading its shares to climb. Inter Parfums is a global developer and designer of prestige fragrances, primarily under licenses of high-end brands such as Mont Blanc, Coach, Jimmy Choo, and Guess. After managing effectively through a very challenging 2020, its stock rose more than 60% in 2021, lifted by better-than-expected growth from improved store traffic and higher gross margins driven by improved sales for newer higher-margin products. The company reported in September that, excluding one-time gains, 2021 would be its best year ever for sales and earnings per share.
| | | | | |
| | Top Contributors to Performance | | Top Detractors from Performance | |
| | For 2021 (%)1 | | | For 2021 (%)2 | | |
| | Rogers Corporation | 1.41 | | Haemonetics Corporation | -1.31 | |
| | Morningstar | 1.33 | | Upland Software | -1.13 | |
| | Inter Parfums | 1.14 | | Ashmore Group | -0.59 | |
| | Coherent | 1.13 | | GCM Grosvenor Cl. A | -0.30 | |
| | Kadant | 1.09 | | IPG Photonics | -0.29 | |
| | 1 Includes dividends | | | 2 Net of dividends | | |
| | | | | | | |
Blood and plasma supplies and services provider Haemonetics Corporation detracted most at the position level. The company reported healthy revenues in November but also lowered guidance for the second half of fiscal 2022 due to ongoing plasma collection volatility due to the pandemic. We reduced our position, though we think it can engineer an eventual turnaround driven by the company’s long-term expertise in its niche. Upland Software, which was the second biggest detractor, provides cloud-based enterprise work management software. Its shares fell on mixed revenue performance following outsized presidential election-related growth in 2020 and disappointing execution of the transition of its go-to-market strategy. Profit margins contracted as the company sustained elevated investments in advance of an improvement in revenue productivity. Although we still appreciate much about its strategic allocation of capital, these factors led us to exit our position in December. Headquartered in the U.K., Ashmore Group specializes in actively managed emerging markets strategies in equities, fixed income, and alternative investments. The company reported declines in profitability for the fiscal year and then in October announced declines in assets under management and negative investment performance for the third quarter as market sentiment for certain key strategies deteriorated.
The portfolio’s advantage over the Russell 2000 came mostly from sector allocation in 2021, with Health Care, Industrials, and Consumer Staples making the most significant positive impact versus the benchmark. In the first two sectors, our respective underweight and overweight drove relative results, while in the third, stock selection helped most. Conversely, Financials, Materials, and Energy detracted most from relative results. In the first two sectors, lackluster stock selection hurt. Having no weighting in the third sector also detracted since Energy was such a strong performer within the small-cap index.
CURRENT POSITIONING AND OUTLOOK
We were very encouraged by the second-half performance of the Fund. After lagging by more than 700 basis points in the first half, the Fund outperformed the Russell 2000 by more than 850 basis points in the second half to beat its benchmark for the year. We also believe that high quality, as we define it, is just beginning an extended period of outperformance. Our rationale is based on high quality’s still relatively inexpensive valuation within small-cap, and the history this Fund has had of enjoying its best excess returns starting from periods of low high-yield spreads, similar to where we finished 2021. So, while our outlook for the small-cap asset class overall is for low to moderate returns, such return periods have historically been good for the Fund’s relative returns. We were pleased that the Fund benefitted from two takeovers in the fourth quarter—CMC Materials and Rogers Corporation—as strategic buyers recognized the same attributes that we had identified and paid significant premiums to acquire these companies. With M&A transactions expected to remain at high levels, we anticipate the Fund may continue to benefit from acquisitions in 2022.
20 | The Royce Funds 2021 Annual Report to Shareholders
| PERFORMANCE AND PORTFOLIO REVIEW (UNAUDITED) | | TICKER SYMBOLS RYPRX RPFFX RPFIX RPRCX RPRRX |
Performance and Expenses
Average Annual Total Return (%) Through 12/31/21
| | JUL-DEC 20211 | 1-YR | 3-YR | 5-YR | 10-YR | 15-YR | 20-YR | 25-YR | SINCE INCEPTION (12/31/91) |
| RPR | 5.42 | 16.36 | 20.28 | 14.05 | 11.68 | 9.82 | 11.07 | 11.37 | 11.91 |
| Annual Operating Expenses: 1.21% | | | | | | | |
1 Not annualized
Relative Returns: Monthly Rolling Average Annual Return Periods
20 Years Through 12/31/21
On a monthly rolling basis, The Fund outperformed the Russell 2000 in 61% of all 10-year periods; 57% of all 5-year periods; and 58% of all 1-year periods.
| | PERIODS BEATING THE INDEX | FUND AVG (%) 1 | INDEX AVG (%) 1 |
| 10-year | 74/121 | | | 61% | 10.0 | 9.4 |
| 5-year | 104/181 | | 57% | 10.3 | 9.1 |
| 1-year | 132/229 | | 58% | 13.0 | 12.4 |
| | | | | | |
1Average of monthly rolling average annual total returns over the specified periods.
Morningstar Style Map™ As of 12/31/21
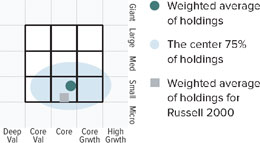
The Morningstar Style Map is the Morningstar Style Box™ with the center 75% of fund holdings plotted as the Morningstar Ownership Zone™. The Morningstar Style Box is designed to reveal a fund’s investment strategy. The Morningstar Ownership Zone provides detail about a portfolio’s investment style by showing the range of stock sizes and styles. The Ownership Zone is derived by plotting each stock in the portfolio within the proprietary Morningstar Style Box. Over time, the shape and location of a fund’s ownership zone may vary. See page 86 for additional information.
Value of $10,000
Invested on 12/31/91 as of 12/31/21 ($)
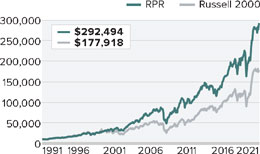
Top 10 Positions
% of Net Assets
| Morningstar | 3.5 |
| CMC Materials | 2.9 |
| Kennedy-Wilson Holdings | 2.9 |
| Lincoln Electric Holdings | 2.9 |
| Forrester Research | 2.5 |
| MKS Instruments | 2.5 |
| John Bean Technologies | 2.5 |
| Valmont Industries | 2.5 |
| Mesa Laboratories | 2.5 |
| Innospec | 2.5 |
Portfolio Sector Breakdown
% of Net Assets
| Industrials | 32.7 |
| Information Technology | 21.5 |
| Financials | 13.9 |
| Materials | 8.8 |
| Consumer Discretionary | 8.4 |
| Health Care | 5.9 |
| Real Estate | 2.9 |
| Consumer Staples | 2.3 |
| Cash and Cash Equivalents | 3.6 |
Calendar Year Total Returns (%)
| YEAR | RPR |
| 2021 | 16.4 |
| 2020 | 11.5 |
| 2019 | 34.1 |
| 2018 | -10.4 |
| 2017 | 23.8 |
| 2016 | 23.0 |
| 2015 | -9.9 |
| 2014 | -0.9 |
| 2013 | 27.7 |
| 2012 | 11.4 |
| 2011 | -0.9 |
| 2010 | 26.5 |
| 2009 | 33.3 |
| 2008 | -28.3 |
| 2007 | 12.7 |
Upside/Downside Capture Ratios
Periods Ended 12/31/21 (%)
| | | UPSIDE | | DOWNSIDE |
| 10-Year | | 87 | | 86 |
| From 12/31/91 (Start of Fund’s First Full Quarter) | | 92 | | 73 |
Portfolio Diagnostics
| Fund Net Assets | $1,736 million |
| Number of Holdings | 55 |
| Turnover Rate | 20% |
| Average Market Capitalization1 | $4,555 million |
| Weighted Average P/E Ratio2,3 | 23.9x |
| Weighted Average P/B Ratio2 | 3.4x |
| Active Share4 | 98% |
| U.S. Investments (% of Net Assets) | 90.9% |
| Non-U.S. Investments (% of Net Assets) | 5.5% |
| 1 | Geometric Average. This weighted calculation uses each portfolio holding’s market cap in a way designed to not skew the effect of very large or small holdings; instead, it aims to better identify the portfolio’s center, which Royce believes offers a more accurate measure of average market cap than a simple mean or median. |
| 2 | Harmonic Average. This weighted calculation evaluates a portfolio as if it were a single stock and measures it overall. It compares the total market value of the portfolio to the portfolio’s share in the earnings or book value, as the case may be, of its underlying stocks. |
| 3 | The Fund’s P/E ratio calculation excludes companies with zero or negative earnings (5% of portfolio holdings as of 12/31/21). |
| 4 | Active Share is the sum of the absolute values of the different weightings of each holding in the Fund versus each holding in the benchmark, divided by two. |
Important Performance and Expense Information
All performance information in this Report reflects past performance, is presented on a total return basis, reflects the reinvestment of distributions, and does not reflect the deduction of taxes that a shareholder would pay on fund distributions or the redemption of fund shares. Past performance is no guarantee of future results. Investment return and principal value of an investment will fluctuate, so that shares may be worth more or less than their original cost when redeemed. Shares redeemed within 30 days of purchase may be subject to a 1% redemption fee payable to the Fund, which is not reflected in the performance shown above; if it were, performance would be lower. Current month-end performance may be higher or lower than performance quoted and may be obtained at www.royceinvest.com. All performance and risk information reflects results of the Investment Class (its oldest class). Certain immaterial adjustments were made to the net assets of Royce Premier Fund at 6/30/19 for financial reporting purposes, and as a result the net asset values shareholder transactions on that date and the calendar year total returns (%) based on those net asset values differ from the adjusted net asset values and calendar year total returns reported in the Financial Highlights. Operating expenses reflect the Fund’s total annual operating expenses for the Investment Class as of the Fund’s most current prospectus and include management fees and other expenses. Regarding the “Top Contributors” and “Top Detractors” tables shown above, the sum of all contributors to, and all detractors from, performance for all securities in the portfolio would approximate the Fund’s year-to-date performance for 2021. Upside Capture Ratio measures a manager’s performance in up markets relative to the Fund’s benchmark (Russell 2000). It is calculated by measuring the Fund’s performance in quarters when the benchmark went up and dividing it by the benchmark’s return in those quarters. Downside Capture Ratio measures a manager’s performance in down markets relative to the Fund’s benchmark. It is calculated by measuring the Fund’s performance in quarters when the benchmark goes down and dividing it by the benchmark’s return in those quarters.
The Royce Funds 2021 Annual Report to Shareholders | 21
MANAGER’S DISCUSSION (UNAUDITED)
Royce Small-Cap Value Fund (RVV)

Jay Kaplan, CFA®
FUND PERFORMANCE
Royce Small-Cap Value Fund gained 28.2% in 2021, trailing the 28.3% gain for its primary benchmark, the Russell 2000 Value Index, by the thinnest of margins and beating the Russell 2000 Index, which rose 14.8% for the same period.
WHAT WORKED… AND WHAT DIDN’T
All of the portfolio’s nine equity sectors made a positive impact on 2021 performance. Industrials, Information Technology, and Consumer Discretionary made the most sizable positive contributions, while the smallest positive impacts came from Consumer Staples, Real Estate, and Energy. Specialty retail in Consumer Discretionary, electronic equipment, instruments & components in Information Technology, and road & rail in Industrials contributed most at the industry level. Conversely, communications equipment in Information Technology, insurance, and consumer finance (both in Financials) were the largest detractors for the calendar year.
At the position level, the Fund’s top contributor was Arkansas-based freight and logistics solutions provider ArcBest. In its third-quarter earnings release, the company announced record quarterly revenue and operating income, with consolidated quarterly revenues of more than $1 billion. ArcBest also benefited from its acquisition of Chicago-based truckload brokerage company MoLo Solutions. The second top contributing position for the calendar year was Shoe Carnival, a discount footwear retailer. Many of the company’s competitors have closed their doors, helping its business. In addition, Nike consolidated the number of stores that can sell its products, which included Shoe Carnival. The company was also able to discontinue deep discounting due to stronger demand, leading to margin expansion. Kulicke & Soffa Industries is a leader in manufacturing equipment and tools used to assemble and package semiconductor devices. Kulicke is benefiting from record industry wafer fab equipment spending and a structural increase in the complexity of chip packaging due to increased advanced packaging or multi-die packaging techniques. Approximately 50% of all semiconductors processed utilize the company’s wire bonding equipment. Additionally, Kulicke has been benefiting from new product introductions in the mini-LED packaging market, which is growing quickly.
| | | | | |
| | Top Contributors to Performance | | Top Detractors from Performance | |
| | For 2021 (%)1 | | | For 2021 (%)2 | | |
| | ArcBest | 2.91 | | Nautilus | -0.65 | |
| | Shoe Carnival | 1.90 | | James River Group Holdings | -0.43 | |
| | Kulicke & Soffa Industries | 1.69 | | NETGEAR | -0.40 | |
| | OneWater Marine Cl. A | 1.65 | | Heritage Insurance Holdings | -0.39 | |
| | Rent-A-Center | 1.13 | | Haverty Furniture | -0.36 | |
| | 1 Includes dividends | | | 2 Net of dividends | | |
| | | | | | | |
The biggest detractor was fitness equipment manufacturer Nautilus. The company’s third quarter results were hurt by inflation, as well as by global shipping and supply chain challenges, which made profitability unlikely. For these reasons, we exited our position. James River Group Holdings, the portfolio’s next biggest detractor, focuses on “Excess & Surplus” insurance. Its stock saw its most severe dip in 2021’s first half. The company then took a charge in the fourth quarter related to its non-core reinsurance division that, while fairly small, came on the heels of the much larger charge taken earlier in the year in its commercial auto business (specifically Uber), which led its shares to drift lower. Current management has been attempting to fix the issues created by the prior team, though our own concerns about the timing and extent of the fixes led us to reduce our position significantly. Super-regional property and casualty insurance holding company Heritage Insurance Holdings also detracted. The company, which has significant business in coastal areas, was hurt by poor weather in Florida during 2021. We believe that Heritage Insurance can benefit from premium insurance rate increases. The stock is inexpensive, and we maintained our position.
The portfolio’s very narrow disadvantage versus the Russell 2000 Value was attributable to sector allocation. Financials detracted most at the sector level due to stock selection while our much lower exposure to Energy also hurt, as did our cash position. Conversely, stock selection in 2021 was especially strong in Industrials, Health Care, and Information Technology. Our underweight in the second sector was also beneficial.
CURRENT POSITIONING AND OUTLOOK
We expect that 2022 will be a good year for small-cap value as all signs point to continued economic strength, though we’re mindful that continuing COVID resurgences could disrupt this positive backdrop. In addition, the Fed has clearly signaled that interest rates will rise in 2022, which should bode well for value investors like us. There had been a disconnect between the stagnant 10-year Treasury yield and the Fed’s language until recently. Though the 10-year yield, however, it is beginning to rise. We believe the equity market is incorporating this view, as seen by the weak performance of many long-duration assets like richly valued, non-earning, story-based growth stocks. We see the semiconductor supply chain issue lasting through most of 2022, and labor shortages and wage pressures look likely to continue. Inflation is with us now and is real. In this context, we have been buying selectively, adding, for example, to our technology weighting, pharmaceutical companies with proven products and promising pipelines, and homebuilders and other housing related companies in the area of home furnishings.
22 | The Royce Funds 2021 Annual Report to Shareholders
| PERFORMANCE AND PORTFOLIO REVIEW (UNAUDITED) | | TICKER SYMBOLS RYVFX RVVHX RVFCX RVVRX |
Performance and Expenses
Average Annual Total Return (%) Through 12/31/21
| | JUL-DEC 20211 | 1-YR | 3-YR | 5-YR | 10-YR | 15-YR | 20-YR | SINCE INCEPTION (6/14/01) |
| RVV | 4.20 | 28.24 | 12.34 | 6.74 | 7.58 | 5.93 | 8.41 | 9.10 |
| Annual Gross Operating Expenses: 1.62% | Annual Net Operating Expenses: 1.49% |
1 Not annualized
Morningstar Style Map™ As of 12/31/21

The Morningstar Style Map is the Morningstar Style Box™ with the center 75% of fund holdings plotted as the Morningstar Ownership Zone™. The Morningstar Style Box is designed to reveal a fund’s investment strategy. The Morningstar Ownership Zone provides detail about a portfolio’s investment style by showing the range of stock sizes and styles. The Ownership Zone is derived by plotting each stock in the portfolio within the proprietary Morningstar Style Box. Over time, the shape and location of a fund’s ownership zone may vary. See page 86 for additional information.
Value of $10,000
Invested on 6/14/01 as of 12/31/21 ($)
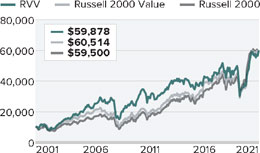
Top 10 Positions
% of Net Assets
| OneWater Marine Cl. A | 2.6 |
| Kulicke & Soffa Industries | 2.5 |
| Sanmina Corporation | 2.5 |
| PulteGroup | 2.5 |
| Shoe Carnival | 2.4 |
| Rent-A-Center | 2.4 |
| Aaron’s Company (The) | 2.2 |
| La-Z-Boy | 2.2 |
| Evercore Cl. A | 2.1 |
| Schneider National Cl. B | 1.9 |
Portfolio Sector Breakdown
% of Net Assets
| Consumer Discretionary | 26.8 |
| Information Technology | 20.7 |
| Financials | 19.7 |
| Industrials | 18.8 |
| Health Care | 7.9 |
| Communication Services | 1.0 |
| Energy | 0.7 |
| Consumer Staples | 0.5 |
| Real Estate | 0.5 |
| Cash and Cash Equivalents | 3.4 |
Calendar Year Total Returns (%)
| YEAR | | RVV |
| 2021 | | 28.2 |
| 2020 | | -6.5 |
| 2019 | | 18.2 |
| 2018 | | -7.2 |
| 2017 | | 5.3 |
| 2016 | | 21.1 |
| 2015 | | -11.5 |
| 2014 | | -0.0 |
| 2013 | | 27.8 |
| 2012 | | 9.6 |
| 2011 | | -7.4 |
| 2010 | | 25.0 |
| 2009 | | 44.7 |
| 2008 | | -34.2 |
| 2007 | | 3.8 |
Upside/Downside Capture Ratios
Periods Ended 12/31/21 (%)
| | | UPSIDE | | DOWNSIDE |
| 10-Year | | 83 | | 105 |
| From 6/30/01 (Start of Fund’s First Full Quarter) | | 95 | | 92 |
Portfolio Diagnostics
| Fund Net Assets | $140 million |
| Number of Holdings | 95 |
| Turnover Rate | 53% |
| Average Market Capitalization1 | $1,534 million |
| Weighted Average P/E Ratio2,3 | 10.7x |
| Weighted Average P/B Ratio2 | 1.9x |
| Active Share4 | 96% |
| U.S. Investments (% of Net Assets) | 93.6% |
| Non-U.S. Investments (% of Net Assets) | 3.0% |
| 1 | Geometric Average. This weighted calculation uses each portfolio holding’s market cap in a way designed to not skew the effect of very large or small holdings; instead, it aims to better identify the portfolio’s center, which Royce believes offers a more accurate measure of average market cap than a simple mean or median. |
| 2 | Harmonic Average. This weighted calculation evaluates a portfolio as if it were a single stock and measures it overall. It compares the total market value of the portfolio to the portfolio’s share in the earnings or book value, as the case may be, of its underlying stocks. |
| 3 | The Fund’s P/E ratio calculation excludes companies with zero or negative earnings (0% of portfolio holdings as of 12/31/21). |
| 4 | Active Share is the sum of the absolute values of the different weightings of each holding in the Fund versus each holding in the benchmark, divided by two. |
Important Performance and Expense Information
All performance information in this Report reflects past performance, is presented on a total return basis, reflects the reinvestment of distributions, and does not reflect the deduction of taxes that a shareholder would pay on fund distributions or the redemption of fund shares. Past performance is no guarantee of future results. Investment return and principal value of an investment will fluctuate, so that shares may be worth more or less than their original cost when redeemed. Shares redeemed within 30 days of purchase may be subject to a 1% redemption fee payable to the Fund, which is not reflected in the performance shown above; if it were, performance would be lower. Current month-end performance may be higher or lower than performance quoted and may be obtained at www.royceinvest.com. All performance and risk information reflects results of the Service Class (its oldest class). Certain immaterial adjustments were made to the net assets of Royce Small-Cap Value Fund at 6/30/16 for financial reporting purposes, and as a result the net asset values for shareholder transactions on that date and the calendar year Total Returns (%) based on those net asset values differ from the adjusted net asset values and calendar year total returns reported in the Financial Highlights. Gross operating expenses reflect the Fund’s gross total annual operating expenses for the Service Class and include management fees, 12b-1 distribution and service fees, and other expenses. Net operating expenses reflect contractual fee waivers and/or expense reimbursements. All expense information is reported as of the Fund’s most current prospectus. Royce & Associates has contractually agreed, without right of termination, to waive fees and/or reimburse expenses to the extent necessary to maintain the Service Class’s net annual operating expenses (excluding brokerage commissions, taxes, interest, litigation expenses, acquired fund fees and expenses, and other expenses not borne in the ordinary course of business) at or below 1.49% through April 30, 2022. Regarding the “Top Contributors” and “Top Detractors” tables shown above, the sum of all contributors to, and all detractors from, performance for all securities in the portfolio would approximate the Fund’s year-to-date performance for 2021. Upside Capture Ratio measures a manager’s performance in up markets relative to the Fund’s benchmark (Russell 2000 Value). It is calculated by measuring the Fund’s performance in quarters when the benchmark went up and dividing it by the benchmark’s return in those quarters. Downside Capture Ratio measures a manager’s performance in down markets relative to the Fund’s benchmark. It is calculated by measuring the Fund’s performance in quarters when the benchmark goes down and dividing it by the benchmark’s return in those quarters.
The Royce Funds 2021 Annual Report to Shareholders | 23
MANAGER’S DISCUSSION (UNAUDITED)
Royce Smaller-Companies Growth Fund (RVP)

Chip Skinner, CFA®
FUND PERFORMANCE
Royce Smaller-Companies Growth Fund gained 7.8% in 2021, lagging its primary benchmark, the Russell 2000 Index, which was up 14.8%, but beating the Russell 2000 Growth Index, which rose 2.8% for the same period. The Fund was stronger over longer-term periods, outperforming the Russell 2000 for the 3-, 5-, 10-, 20-year, and since inception (6/14/01) periods ended 12/31/21 and beating the Russell 2000 Growth for the 3-, 5, 20-year, and since inception periods.
WHAT WORKED… AND WHAT DIDN’T
Six of the portfolio’s 10 equity sectors made a positive impact on 2021’s performance. The sectors making the largest positive contributions were Information Technology, Health Care, and Financials while the biggest detractions came from Consumer Discretionary, Consumer Staples, and Communication Services. At the industry level, semiconductors & semiconductor equipment (Information Technology), life sciences tools & services (Health Care), and banks (Financials) contributed most in 2021 while electrical equipment (Industrials), interactive media & services (Communication Services), and diversified consumer services (Consumer Discretionary) were the largest detractors.
InMode, which makes medical devices that emit radio frequencies which allow for minimally and (in some instances) non-invasive ways to perform certain types of plastic surgery, skin care treatments, and other procedures, was the Fund’s top-contributing position. Robust revenue growth driven by the rapid adoption of its innovative devices, along with prospects for recurring revenues going forward, led its stock to lofty heights in 2021. Ambarella develops image processing SoCs (system on chips) and computer vision chips. Its SoCs process photos, videos for cameras, and other gadgets, while its computer vision chips help security cameras identify faces and driverless vehicles avoid obstacles. Its strong niche in these areas drove impressive growth in earnings and revenue in 2021. In a deal announced in August, Canadian sports media and online betting company Score Media and Gaming was acquired for a sizable premium by Penn National thanks to its strong position in the fast-growing online sports media and betting markets.
| | | | | |
| | Top Contributors to Performance | | Top Detractors from Performance | |
| | For 2021 (%)1 | | | For 2021 (%)2 | | |
| | InMode | 2.69 | | Enthusiast Gaming Holdings | -1.14 | |
| | Ambarella | 1.57 | | Lottery.com | -0.79 | |
| | Score Media and Gaming Cl. A | 1.41 | | American Superconductor | -0.66 | |
| | Joint Corp. (The) | 1.34 | | Aspen Group | -0.66 | |
| | ATS Automation Tooling Systems | 1.13 | | Neuronetics | -0.65 | |
| | 1 Includes dividends | | | 2 Net of dividends | | |
| | | | | | | |
The top detractor at the position level was another Canadian media property, Enthusiast Gaming Holdings, which runs digital media platforms that include more than 100 gaming-related websites. A top outperformer from 4Q20 through the first half of 2021, its revenue growth was nothing short of spectacular in 2021. However, that growth was partly due to an acquisition, and the company still has not become profitable, which drove investors to take profits in the second half of 2021. Liking its long-term growth prospects, we added to our stake. Lottery.com allows users to play state-sanctioned lottery games online and on mobile devices, and with more states set to legalize online lotteries, it appeared to be a strong growth opportunity. However, its reverse SPAC merger reported quarterly results using what we thought was aggressive accounting, which raised doubts for us about its ability to achieve near term financial targets, leading us to begin exiting our position in November. American Superconductor manufactures advanced power systems, naval ship protection systems, and wind turbines using superconducting technology. The company enjoyed improved revenue and earnings growth in 2020 that decelerated in 2021—which caused Wall Street estimates to be lowered multiple times during the year. We still like its long-term prospects and added shares in May.
The portfolio’s disadvantage versus the Russell 2000 in 2021 came entirely from sector allocation as our stock selection was modestly positive. At the sector level, stock picking and, to a lesser degree, lower exposure, hurt relative performance in Consumer Discretionary, as did stock selection in Industrials. The Fund’s cash position also detracted from relative results. Conversely, stock selection was a strength in Health Care, easily overcoming the negative impact of our overweight in a poor performing sector within the Russell 2000. Savvy stock picking also provided more modest relative advantages in Materials and Information Technology.
CURRENT POSITIONING AND OUTLOOK
Through most of 2021, faster-growing, higher-multiple, and/or unprofitable companies were particularly hard hit, and that valuation compression has continued into the first weeks of 2022. Underperformance for small-cap growth could continue through the first half of 2022 due primarily to the persistence of high multiples, as well as lingering inflation and the expectations of higher interest rates. Ongoing labor shortages and consequent upward wage pressures should make inflation more lasting. Additionally, aggressive monetary and fiscal stimulus will ease at some point, given the economy would likely be growing faster without recurring COVID outbreaks and their attendant anxieties. Still, our long-term outlook for the portfolio is positive. First, we expect the recent panic-like selling in some of our holdings to stabilize. We also believe COVID will be a less negative factor in 2022. Turning to the portfolio, we are highly confident in our current themes, including cloud computing, enterprise software adoption, electric vehicle/power storage penetration, drug discovery tools and services, and automation/robotics. We see each of these as decade-long opportunities that should hold up well against the ups and downs of valuation. We have been putting cash to work by adding to favorites and taking advantage of lower valuations more generally.
24 | The Royce Funds 2021 Annual Report to Shareholders
| PERFORMANCE AND PORTFOLIO REVIEW (UNAUDITED) | | TICKER SYMBOLS RYVPX RVPHX RVPCX RVPIX |
Performance and Expenses
Average Annual Total Return (%) Through 12/31/21
| | JUL-DEC 20211 | 1-YR | 3-YR | 5-YR | 10-YR | 15-YR | 20-YR | SINCE INCEPTION (6/14/01) |
| RVP | -9.36 | 7.78 | 25.77 | 16.04 | 13.62 | 8.33 | 11.50 | 12.24 |
| Annual Gross Operating Expenses: 1.54% | Annual Net Operating Expenses: 1.49% |
1 Not annualized
Morningstar Style Map™ As of 12/31/21
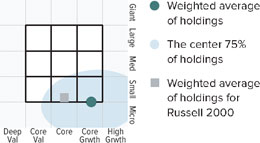
The Morningstar Style Map is the Morningstar Style Box™ with the center 75% of fund holdings plotted as the Morningstar Ownership Zone™. The Morningstar Style Box is designed to reveal a fund’s investment strategy. The Morningstar Ownership Zone provides detail about a portfolio’s investment style by showing the range of stock sizes and styles. The Ownership Zone is derived by plotting each stock in the portfolio within the proprietary Morningstar Style Box. Over time, the shape and location of a fund’s ownership zone may vary. See page 86 for additional information.
Value of $10,000
Invested on 6/14/01 as of 12/31/21 ($)
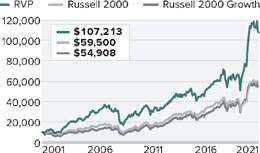
Top 10 Positions
% of Net Assets
| Unisys Corporation | 2.9 |
| Lawson Products | 2.9 |
| Ambarella | 2.8 |
| Magnachip Semiconductor | 2.8 |
| Impinj | 2.6 |
| ATS Automation Tooling Systems | 2.6 |
| Matterport Cl. A | 2.3 |
| InMode | 2.1 |
| Enthusiast Gaming Holdings | 2.0 |
| BRP Group Cl. A | 1.8 |
Portfolio Sector Breakdown
% of Net Assets
| Information Technology | 29.8 |
| Health Care | 25.7 |
| Industrials | 16.6 |
| Consumer Discretionary | 6.6 |
| Financials | 5.7 |
| Communication Services | 3.9 |
| Materials | 2.1 |
| Consumer Staples | 1.5 |
| Real Estate | 1.1 |
| Cash and Cash Equivalents | 7.0 |
Calendar Year Total Returns (%)
| YEAR | | RVP |
| 2021 | | 7.8 |
| 2020 | | 49.3 |
| 2019 | | 23.7 |
| 2018 | | -10.2 |
| 2017 | | 17.8 |
| 2016 | | 9.4 |
| 2015 | | -1.8 |
| 2014 | | 3.9 |
| 2013 | | 32.5 |
| 2012 | | 15.3 |
| 2011 | | -10.0 |
| 2010 | | 19.7 |
| 2009 | | 41.4 |
| 2008 | | -41.1 |
| 2007 | | 3.2 |
Upside/Downside Capture Ratios
Periods Ended 12/31/21 (%)
| | | UPSIDE | | DOWNSIDE |
| 10-Year | | 104 | | 105 |
| From 6/30/01 (Start of Fund’s First Full Quarter) | | 113 | | 99 |
Portfolio Diagnostics
| Fund Net Assets | $300 million |
| Number of Holdings | 98 |
| Turnover Rate | 50% |
| Average Market Capitalization1 | $1,806 million |
| Weighted Average P/B Ratio2 | 3.9x |
| 3-5 Year EPS Growth (est.)3 | 25.9% |
| Active Share4 | 95% |
| U.S. Investments (% of Net Assets) | 75.1% |
| Non-U.S. Investments (% of Net Assets) | 17.9% |
| 1 | Geometric Average. This weighted calculation uses each portfolio holding’s market cap in a way designed to not skew the effect of very large or small holdings; instead, it aims to better identify the portfolio’s center, which Royce believes offers a more accurate measure of average market cap than a simple mean or median. |
| 2 | Harmonic Average. This weighted calculation evaluates a portfolio as if it were a single stock and measures it overall. It compares the total market value of the portfolio to the portfolio’s share in the earnings or book value, as the case may be, of its underlying stocks. |
| 3 | The 3-5 Year EPS Growth (est.) is calculated as a simple weighted average of the pre-calculated mean long-term EPS growth rate estimates by brokerage analysts. Long Term Growth (LTG) is the annual EPS growth that the company can sustain over the next 3 or 5 years. Source: Factset |
| 4 | Active Share is the sum of the absolute values of the different weightings of each holding in the Fund versus each holding in the benchmark, divided by two. |
Important Performance and Expense Information
All performance information in this Report reflects past performance, is presented on a total return basis, reflects the reinvestment of distributions, and does not reflect the deduction of taxes that a shareholder would pay on fund distributions or the redemption of fund shares. Past performance is no guarantee of future results. Investment return and principal value of an investment will fluctuate, so that shares may be worth more or less than their original cost when redeemed. Shares redeemed within 30 days of purchase may be subject to a 1% redemption fee payable to the Fund, which is not reflected in the performance shown above; if it were, performance would be lower. Current month-end performance may be higher or lower than performance quoted and may be obtained at www.royceinvest.com. All performance and risk information reflects results of the Service Class (its oldest class). Gross operating expenses reflect the Fund’s gross total operating expenses for the Service Class and include management fees, 12b-1 distribution and service fees, and other expenses. Net operating expenses reflect contractual fee waivers and/or expense reimbursements. All expense information is reported as of the Fund’s most current prospectus. Royce & Associates has contractually agreed, without right of termination, to waive fees and/or reimburse expenses to the extent necessary to maintain the Service Class’s net annual operating expenses (excluding brokerage commissions, taxes, interest, litigation expenses, acquired fund fees and expenses, and other expenses not borne in the ordinary course of business) at or below 1.49% through April 30, 2022. Regarding the “Top Contributors” and “Top Detractors” tables shown above, the sum of all contributors to, and all detractors from, performance for all securities in the portfolio would approximate the Fund’s year-to-date performance for 2021. Upside Capture Ratio measures a manager’s performance in up markets relative to the Fund’s benchmark (Russell 2000). It is calculated by measuring the Fund’s performance in quarters when the benchmark went up and dividing it by the benchmark’s return in those quarters. Downside Capture Ratio measures a manager’s performance in down markets relative to the Fund’s benchmark. It is calculated by measuring the Fund’s performance in quarters when the benchmark goes down and dividing it by the benchmark’s return in those quarters.
The Royce Funds 2021 Annual Report to Shareholders | 25
MANAGERS’ DISCUSSION (UNAUDITED)
Royce Special Equity Fund (RSE)

Charlie Dreifus, CFA®
Steven McBoyle
FUND PERFORMANCE
Royce Special Equity Fund advanced 22.5% in 2021, trailing its primary benchmark, Russell 2000 Value Index, which was up 28.3%, but well ahead of the Russell 2000 Index, which rose 14.8% for the same period. The portfolio outperformed the Russell 2000 Value for the 15-, 20-year, and since inception (5/1/98) periods ended 12/31/21.
WHAT WORKED… AND WHAT DIDN’T
All of the portfolio’s nine equity sectors made a positive impact on calendar-year performance. The sectors making the largest positive contributions were Industrials, Information Technology, and Consumer Staples while the smallest came from Health Care, Real Estate, and Financials. At the industry level, semiconductors & semiconductor equipment (Information Technology), auto components (Consumer Discretionary), and electrical equipment (Industrials) contributed most for the year-to-date period while household durables (Consumer Discretionary), leisure products (Consumer Discretionary), and IT services (Information Technology) were the largest detractors.
The portfolio’s top contributor at the position level for 2021 was Kulicke & Soffa Industries, a leader in manufacturing equipment and tools used to assemble and package semiconductor devices. Approximately 50% of all semiconductors processed utilize the company’s wire bonding equipment. Kulicke is benefiting from record industry wafer fab equipment spending and a structural increase in the complexity of chip packaging due to increased advanced packaging or multi-die packaging techniques. Further, Kulicke has been benefiting from new product introductions in the mini-LED packaging market, which is growing quickly. Meredith Corporation, a premier media and digital marketing company, was the next best performer. Its media properties include magazine brands such as People and Time, which have a total readership of more than 120 million while its website properties receive nearly 135 million monthly unique visitors, making the company a top ten digital media company. Meredith recently embarked on a significant number of value creating events, including the spinoff of its television properties, which ultimately led to the sale of its remaining magazine and digital properties to IAC. Huntsman Corporation is a global maker of specialty chemicals that benefited from an ongoing transformation and portfolio optimization program towards higher valued products, which was reflected in a strong third-quarter earnings report issued in October.
| | | | | | | |
| | Top Contributors to Performance | | Top Detractors from Performance | |
| | For 2021 (%)1 | | | For 2021 (%)2 | | |
| | Kulicke & Soffa Industries | 3.00 | | Hooker Furnishings | -0.90 | |
| | Meredith Corporation | 2.00 | | Flexsteel Industries | -0.69 | |
| | Huntsman Corporation | 1.93 | | Johnson Outdoors Cl. A | -0.56 | |
| | Ingles Markets Cl. A | 1.84 | | Miller Industries | -0.25 | |
| | Encore Wire | 1.77 | | TEGNA | -0.22 | |
| | 1 Includes dividends | | | 2 Net of dividends | | |
| | | | | | | |
The Fund’s biggest detractor was Hooker Furnishings, which manufactures and imports home furniture primarily in the medium- to high price ranges. COVID created major difficulties for its business in 2020. While 2021 sales and earnings were positive, though somewhat mixed, investor sentiment—and thus its stock price performance—was influenced by 2021’s highly visible supply chain issues. Flexsteel Industries makes and imports upholstered and wooden furniture for the residential and commercial markets. Its business also showed encouraging, though mixed, signs of recovery through 2021 after a highly challenging 2020. In addition, Flexsteel was adversely affected by the supply chain issues that lingered throughout 2021 and their associated cost inflation. This all took place as the business itself continued to progress nicely, with much success related to strategic growth initiatives and backlog growth. Johnson Outdoors, which makes recreation products in four businesses: Fishing, Camping, Watercraft, and Diving, was the Fund’s third-biggest detractor. Though the company posted strong revenue and earnings in 2021, the market sentiment was muted due to the ongoing debate as to the sustainability of positive industry trends that have helped its business, particularly within the company’s Fishing segment, as well as logistical challenges.
The Fund’s disadvantage versus the Russell 2000 Value came primarily from sector allocation. Stock selection in Consumer Discretionary overcame the positive effect of our substantially larger weighting while our cash position and lack of exposure to Energy also hurt relative results. Conversely, Health Care, Communication Services, and Consumer Staples sectors contributed most to relative performance in 2021.
CURRENT POSITIONING AND OUTLOOK
During the periods of low inflation wrought by the residual effects of the Great Financial Crisis, followed by the COVID pandemic, governments superimposed loose fiscal and monetary conditions. Too much liquidity has always created bubbles. However, it is now also creating CPI (Consumer Price Index) inflation well beyond their targeted level. To us, this is a warning sign that an already overheated market may be due for a correction. As always, we have positioned the portfolio with companies that we think are well positioned to withstand the effects of both higher levels of volatility and lower equity prices. Yet if one digs deeper, one will also find strong evidence that small-cap quality looks very attractive. Indeed, we believe that Special Equity’s valuation, leverage, and profitability metrics were very attractive at the end of 2021. We are thus faced with a general market valuation that gives us pause but a portfolio that looks very attractive to us against the backdrop of a pivoting Fed likely to initiate multiple rate increases in the not-too-distant future. Investors may want to fasten their seat belts.
26 | The Royce Funds 2021 Annual Report to Shareholders
| PERFORMANCE AND PORTFOLIO REVIEW (UNAUDITED) | | TICKER SYMBOLS RYSEX RSEFX RSEIX RSQCX |
Performance and Expenses
Average Annual Total Return (%) Through 12/31/21
| | JUL-DEC 20211 | 1-YR | 3-YR | 5-YR | 10-YR | 15-YR | 20-YR | SINCE INCEPTION (5/1/98) |
| RSE | 7.30 | 22.50 | 14.02 | 7.58 | 9.68 | 8.20 | 9.52 | 9.12 |
| Annual Operating Expenses: 1.23% | | | | | | |
1 Not annualized
Relative Risk Adjusted Returns: Monthly Rolling Sharpe Ratios
20 Years Through 12/31/21
On a monthly rolling risk-adjusted basis, the Fund outperformed the Russell 2000 Value in 81% of all 10-year periods and 60% of all 5-year periods.
| | PERIODS BEATING THE INDEX | FUND AVG (%) 1 | INDEX AVG (%) 1 |
| 10-year | 98/121 | 81% | 0.56 | 0.47 |
| 5-year | 109/181 | | 60% | 0.53 | 0.49 |
| | | | | | |
1Average of monthly rolling average annual total returns over the specified periods.
Morningstar Style Map™ As of 12/31/21
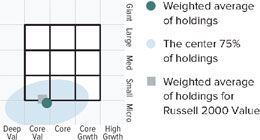
The Morningstar Style Map is the Morningstar Style Box™ with the center 75% of fund holdings plotted as the Morningstar Ownership Zone™. The Morningstar Style Box is designed to reveal a fund’s investment strategy. The Morningstar Ownership Zone provides detail about a portfolio’s investment style by showing the range of stock sizes and styles. The Ownership Zone is derived by plotting each stock in the portfolio within the proprietary Morningstar Style Box. Over time, the shape and location of a fund’s ownership zone may vary. See page 86 for additional information.
Value of $10,000
Invested on 5/1/98 as of 12/31/21 ($)
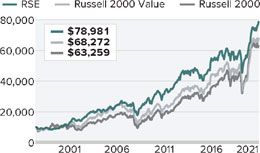
Top 10 Positions
% of Net Assets
| Ingles Markets Cl. A | 5.8 |
| Standard Motor Products | 5.7 |
| Huntsman Corporation | 5.7 |
| Kulicke & Soffa Industries | 3.9 |
| Johnson Outdoors Cl. A | 3.9 |
| Marcus & Millichap | 3.9 |
| John B. Sanfilippo & Son | 3.7 |
| H&R Block | 3.4 |
| Vishay Intertechnology | 3.2 |
| Mueller Industries | 2.9 |
Portfolio Sector Breakdown
% of Net Assets
| Consumer Discretionary | 23.3 |
| Industrials | 22.1 |
| Information Technology | 10.7 |
| Consumer Staples | 9.5 |
| Materials | 8.2 |
| Financials | 4.3 |
| Real Estate | 3.9 |
| Communication Services | 2.6 |
| Cash and Cash Equivalents | 15.4 |
Calendar Year Total Returns (%)
| YEAR | | RSE |
| 2021 | | 22.5 |
| 2020 | | 7.4 |
| 2019 | | 12.6 |
| 2018 | | -9.9 |
| 2017 | | 7.9 |
| 2016 | | 32.2 |
| 2015 | | -12.4 |
| 2014 | | 1.1 |
| 2013 | | 29.4 |
| 2012 | | 15.4 |
| 2011 | | 0.1 |
| 2010 | | 19.6 |
| 2009 | | 28.4 |
| 2008 | | -19.6 |
| 2007 | | 4.7 |
Upside/Downside Capture Ratios
Periods Ended 12/31/21 (%)
| | | UPSIDE | | DOWNSIDE |
| 10-Year | | 78 | | 76 |
| From 6/30/98 (Start of Fund’s First Full Quarter) | | 80 | | 65 |
Portfolio Diagnostics
| Fund Net Assets | $1,077 million |
| Number of Holdings | 36 |
| Turnover Rate | 42% |
| Average Market Capitalization1 | $1,588 million |
| Weighted Average P/E Ratio2,3 | 11.0x |
| Weighted Average P/B Ratio2 | 2.2x |
| Active Share4 | 98% |
| U.S. Investments (% of Net Assets) | 80.7% |
| Non-U.S. Investments (% of Net Assets) | 3.9% |
| 1 | Geometric Average. This weighted calculation uses each portfolio holding’s market cap in a way designed to not skew the effect of very large or small holdings; instead, it aims to better identify the portfolio’s center, which Royce believes offers a more accurate measure of average market cap than a simple mean or median. |
| 2 | Harmonic Average. This weighted calculation evaluates a portfolio as if it were a single stock and measures it overall. It compares the total market value of the portfolio to the portfolio’s share in the earnings or book value, as the case may be, of its underlying stocks. |
| 3 | The Fund’s P/E ratio calculation excludes companies with zero or negative earnings (0% of portfolio holdings as of 12/31/21). |
| 4 | Active Share is the sum of the absolute values of the different weightings of each holding in the Fund versus each holding in the benchmark, divided by two. |
Important Performance and Expense Information
All performance information in this Report reflects past performance, is presented on a total return basis, reflects the reinvestment of distributions, and does not reflect the deduction of taxes that a shareholder would pay on fund distributions or the redemption of fund shares. Past performance is no guarantee of future results. Investment return and principal value of an investment will fluctuate, so that shares may be worth more or less than their original cost when redeemed. Shares redeemed within 30 days of purchase may be subject to a 1% redemption fee payable to the Fund, which is not reflected in the performance shown above; if it were, performance would be lower. Current month-end performance may be higher or lower than performance quoted and may be obtained at www.royceinvest.com. All performance and risk information reflects results of the Investment Class (its oldest class). Operating expenses reflect the Fund’s total annual operating expenses for the Investment Class as of the Fund’s most current prospectus and include management fees and other expenses. The Sharpe Ratio is calculated for a specified period by dividing a fund’s annualized excess returns by its annualized standard deviation. The higher the Sharpe ratio, the better the fund’s historical risk-adjusted performance. Regarding the “Top Contributors” and “Top Detractors” tables shown above, the sum of all contributors to, and all detractors from, performance for all securities in the portfolio would approximate the Fund’s year-to-date performance for 2021. Upside Capture Ratio measures a manager’s performance in up markets relative to the Fund’s benchmark (Russell 2000 Value). It is calculated by measuring the Fund’s performance in quarters when the benchmark went up and dividing it by the benchmark’s return in those quarters. Downside Capture Ratio measures a manager’s performance in down markets relative to the Fund’s benchmark. It is calculated by measuring the Fund’s performance in quarters when the benchmark goes down and dividing it by the benchmark’s return in those quarters.
The Royce Funds 2021 Annual Report to Shareholders | 27
MANAGERS’ DISCUSSION (UNAUDITED)
Royce Total Return Fund (RTR)

Miles Lewis, CFA®
Chuck Royce
FUND PERFORMANCE
Royce Total Return Fund gained 25.8% in 2021, lagging its primary benchmark, the Russell 2000 Value Index, which was up 28.3%, and outpacing the Russell 2000 Index, which rose 14.8%, for the same period.
WHAT WORKED… AND WHAT DIDN’T
All of the portfolio’s 11 equity sectors made a positive impact on calendar-year performance. Financials, Industrials, and Consumer Discretionary contributed most while the smallest positive impacts came from Utilities, Health Care, and Communication Services. At the industry level, banks (Financials), building products (Industrials), and insurance (Financials) contributed most while software (Information Technology), equity real estate investment trusts (REITs) (Real Estate), and commercial services & supplies (Industrials) were the largest detractors.
Triumph Bancorp, which offers traditional and more specialized banking services and products, made the largest positive contribution at the position level. Through most of 2021, the market’s recognition of the bank’s fintech expertise validated our original investment thesis. Triumph has developed a payment platform, for example, that is changing how payments and invoices are handled in the trucking industry by allowing much more efficient processing via better connecting carriers, shippers, factoring companies, and freight brokers. The robust market for trucking, in terms of the spot prices that drive Triumph’s revenue, led to an outstanding year in its core receivables factoring business, which allows companies to sell invoices for cash advances. While our long-term confidence is strong, returns for the payment platform may have been pulled forward, a concern that led us to reduce our position. Our second top contributor was Signature Bank, whose shares rose from a combination of the bank’s own exceptional fundamentals and the market recognizing that New York City remains a strong market. We sold our shares as it moved from a value opportunity to more of a growth stock.
| | | | | |
| | Top Contributors to Performance | | Top Detractors from Performance | |
| | For 2021 (%)1 | | | For 2021 (%)2 | |
| | | | | | |
| | Triumph Bancorp | 1.99 | | Trean Insurance Group | -0.86 | |
| | Signature Bank | 1.47 | | James River Group Holdings | -0.74 | |
| | Kulicke & Soffa Industries | 1.08 | | Healthcare Services Group | -0.40 | |
| | Compass Diversified Holdings | 0.93 | | Teradata Corporation | -0.27 | |
| | Carlisle Companies | 0.81 | | CDK Global | -0.24 | |
| | 1 Includes dividends | | | 2 Net of dividends | | |
| | | | | | | |
Full-service insurance management company Trean Insurance Group, which focuses on workers compensation insurance, was 2021’s largest detractor. Its business model is both asset light and, in our view, unique. Trean retains only around 20% of the risk written on behalf of third parties while also collecting fees for its claims handling services. Unfortunately, the distinctive features that appeal so much to us do not seem well understood by other investors—though we also believe that management could have done more to communicate its distinctive features. We also believe these attributes can help its shares to reverse course. The portfolio’s next biggest detractor, James River Group Holdings, focuses on the “Excess & Surplus” niche. Its stock saw its most severe dip in 2021’s first half. The company then took a charge in the fourth quarter related to its non-core reinsurance division that, while fairly small, came on the heels of the much larger charge taken earlier in the year in its commercial auto business (specifically Uber), which led its shares to drift lower. However, current management has been effectively fixing problems created by the prior team, and we like the company’s long-term prospects.
The portfolio’s disadvantage versus the Russell 2000 Value came entirely from stock selection in 2021. A combination of stock picking and our underweight hurt in both Energy and Consumer Discretionary, while stock selection detracted in Materials. Conversely, stock picks were a relative strength in Financials (as was our overweight in this strong sector). We also benefited from our significantly lower exposure to index laggards Health Care and Utilities.
CURRENT POSITIONING AND OUTLOOK
Supply chain issues, labor inflation/shortages, and price inflation dominated the headlines in 2021’s second half. And while these developments played a role in the more muted gains for small-caps in the second half of the year, we believe the market will return to its more typical forward-looking role, shifting to an environment that is more conducive to stock picking. This was not always the case in 2021. The property & casualty insurance group, which did not perform to our expectations in 2021 despite steadily improving fundamentals, was emblematic of a theme we saw in many of our underperformers: strong fundamentals in the underlying businesses, yet underperformance in the stocks, often driven by multiple contraction. Because the market is comprised of literally millions of participants, we can’t predict when investors will recognize the fundamental improvements in our holdings. We believe, however, that stock prices follow fundamentals over the long run, and it is only a matter of time before the market begins to reflect the improvements we anticipated. In this context, we entered 2022 with optimism for the long run. From a top-down perspective, the market climate appears far more conducive to our style of investing: Small-cap value, quality, and dividend payers—all of which are historically cheap versus their respective counterparts—look well positioned for 2022. From our bottom-up perspective, we are very confident in our portfolio, which we believe holds high-quality, undervalued businesses.
28 | The Royce Funds 2021 Annual Report to Shareholders
| PERFORMANCE AND PORTFOLIO REVIEW (UNAUDITED) | | TICKER SYMBOLS RYTRX RYTFX RTRIX RYTCX RTRRX |
Performance and Expenses
Average Annual Total Return (%) Through 12/31/21
| | JUL-DEC 20211 | 1-YR | 3-YR | 5-YR | 10-YR | 15-YR | 20-YR | 25-YR | SINCE INCEPTION (12/15/93) |
| RTR | 5.00 | 25.78 | 17.26 | 9.91 | 11.17 | 7.87 | 9.19 | 9.85 | 10.75 |
| Annual Operating Expenses: 1.25% | | | | | | | |
1 Not annualized
Relative Risk Adjusted Returns: Monthly Rolling Sharpe Ratios
20 Years Through 12/31/21
On a monthly rolling risk-adjusted basis, the Fund outperformed the Russell 2000 Value in 100% of all 10-year periods and 93% of all 5-year periods.
| | PERIODS BEATING THE INDEX | FUND AVG (%) 1 | INDEX AVG (%) 1 |
| 10-year | 121/121 | 100% | 0.53 | 0.47 |
| 5-year | 168/181 | | 93% | 0.56 | 0.49 |
| | | | | | |
1Average of monthly rolling Sharpe Ratios over the specified periods.
Morningstar Style Map™ As of 12/31/21
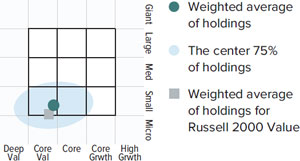
The Morningstar Style Map is the Morningstar Style Box™ with the center 75% of fund holdings plotted as the Morningstar Ownership Zone™. The Morningstar Style Box is designed to reveal a fund’s investment strategy. The Morningstar Ownership Zone provides detail about a portfolio’s investment style by showing the range of stock sizes and styles. The Ownership Zone is derived by plotting each stock in the portfolio within the proprietary Morningstar Style Box. Over time, the shape and location of a fund’s ownership zone may vary. See page 86 for additional information.
Value of $10,000
Invested on 12/15/93 as of 12/31/21 ($)
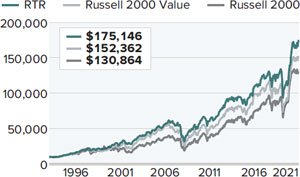
| Top 10 Positions | |
| % of Net Assets | |
| | |
| Vontier Corporation | 2.5 |
| Element Solutions | 2.1 |
| CDK Global | 2.0 |
| James River Group Holdings | 2.0 |
| RenaissanceRe Holdings | 1.9 |
| Timken Company (The) | 1.9 |
| Bank of N.T. Butterfield & Son | 1.9 |
| Minerals Technologies | 1.9 |
| Franchise Group Cl. A | 1.9 |
| Independent Bank Group | 1.8 |
| Portfolio Sector Breakdown | |
| % of Net Assets | |
| | |
| Financials | 38.3 |
| Industrials | 20.1 |
| Materials | 11.1 |
| Information Technology | 10.3 |
| Consumer Discretionary | 6.7 |
| Energy | 3.7 |
| Consumer Staples | 3.0 |
| Real Estate | 2.7 |
| Communication Services | 1.7 |
| Health Care | 0.7 |
| Preferred Stock | 1.4 |
| Cash and Cash Equivalents | 0.3 |
| Calendar Year Total Returns (%) | |
| | |
| YEAR | RTR |
| 2021 | 25.8 |
| 2020 | 3.8 |
| 2019 | 23.5 |
| 2018 | -12.5 |
| 2017 | 13.7 |
| 2016 | 25.9 |
| 2015 | -7.2 |
| 2014 | 1.3 |
| 2013 | 32.8 |
| 2012 | 14.4 |
| 2011 | -1.7 |
| 2010 | 23.5 |
| 2009 | 26.2 |
| 2008 | -31.2 |
| 2007 | 2.4 |
| Upside/Downside Capture Ratios | |
| Periods Ended 12/31/21 (%) | | |
| | | |
| | UPSIDE | DOWNSIDE |
| 10-Year | 87 | 81 |
| From 12/31/93 (Start of Fund’s First Full Quarter) | 86 | 70 |
| Portfolio Diagnostics | |
| | |
| Fund Net Assets | $1,516 million |
| Number of Holdings | 98 |
| Turnover Rate | 64% |
| Average Market Capitalization1 | $3,115 million |
| Weighted Average P/E Ratio 2,3 | 14.2x |
| Weighted Average P/B Ratio 2 | 2.2x |
| Active Share 4 | 96% |
| U.S. Investments (% of Net Assets) | 85.0% |
| Non-U.S. Investments (% of Net Assets) | 14.7% |
| 1 | Geometric Average. This weighted calculation uses each portfolio holding’s market cap in a way designed to not skew the effect of very large or small holdings; instead, it aims to better identify the portfolio’s center, which Royce believes offers a more accurate measure of average market cap than a simple mean or median. |
| 2 | Harmonic Average. This weighted calculation evaluates a portfolio as if it were a single stock and measures it overall. It compares the total market value of the portfolio to the portfolio’s share in the earnings or book value, as the case may be, of its underlying stocks. |
| 3 | The Fund’s P/E ratio calculation excludes companies with zero or negative earnings (9% of portfolio holdings as of 12/31/21). |
| 4 | Active Share is the sum of the absolute values of the different weightings of each holding in the Fund versus each holding in the benchmark, divided by two. |
Important Performance and Expense Information
All performance information in this Report reflects past performance, is presented on a total return basis, reflects the reinvestment of distributions, and does not reflect the deduction of taxes that a shareholder would pay on fund distributions or the redemption of fund shares. Past performance is no guarantee of future results. Investment return and principal value of an investment will fluctuate, so that shares may be worth more or less than their original cost when redeemed. Shares redeemed within 30 days of purchase may be subject to a 1% redemption fee payable to the Fund, which is not reflected in the performance shown above; if it were, performance would be lower. Current month-end performance may be higher or lower than performance quoted and may be obtained at www.royceinvest.com. All performance and risk information reflects results of the Investment Class (its oldest class). Certain immaterial adjustments were made to the net assets of Royce Total Return Fund at 6/30/17 for financial reporting purposes, and as a result the net asset values for shareholder transactions on that date and the calendar year Total Returns (%) based on those net asset values differ from the adjusted net asset values and calendar year total returns reported in the Financial Highlights. Operating expenses reflect the Fund’s total annual operating expenses for the Investment Class as of the Fund’s most current prospectus and include management fees, other expenses, and acquired fund fees and expenses. Acquired fund fees and expenses reflect the estimated amount of the fees and expenses incurred indirectly by the Fund through its investments in mutual funds, hedge funds, private equity funds, and other investment companies. Regarding the “Top Contributors” and “Top Detractors” tables shown above, the sum of all contributors to, and all detractors from, performance for all securities in the portfolio would approximate the Fund’s year-to-date performance for 2021. The Sharpe Ratio is calculated for a specified period by dividing a fund’s annualized excess returns by its annualized standard deviation. The higher the Sharpe ratio, the better the fund’s historical risk-adjusted performance. Upside Capture Ratio measures a manager’s performance in up markets relative to the Fund’s benchmark (Russell 2000 Value). It is calculated by measuring the Fund’s performance in quarters when the benchmark went up and dividing it by the benchmark’s return in those quarters. Downside Capture Ratio measures a manager’s performance in down markets relative to the Fund’s benchmark. It is calculated by measuring the Fund’s performance in quarters when the benchmark goes down and dividing it by the benchmark’s return in those quarters.
The Royce Funds 2021 Annual Report to Shareholders | 29
Schedules of Investments
Royce Dividend Value Fund
Common Stocks – 96.5%
| | | SHARES | | | VALUE | |
| | | | | | | | | |
| CONSUMER DISCRETIONARY – 5.9% | | | | | | | | |
| AUTO COMPONENTS - 0.9% | | | | | | | | |
| Nokian Renkaat | | | 18,000 | | | $ | 682,417 | |
| HOUSEHOLD DURABLES - 0.8% | | | | | | | | |
| PulteGroup | | | 10,900 | | | | 623,044 | |
| SPECIALTY RETAIL - 4.2% | | | | | | | | |
| American Eagle Outfitters | | | 24,345 | | | | 616,415 | |
| Rent-A-Center | | | 36,466 | | | | 1,751,827 | |
| USS | | | 56,000 | | | | 874,346 | |
| | | | | | | | 3,242,588 | |
| Total (Cost $2,370,193) | | | | | | | 4,548,049 | |
| | | | | | | | | |
| ENERGY – 1.4% | | | | | | | | |
| ENERGY EQUIPMENT & SERVICES - 0.4% | | | | | | | | |
| TGS | | | 32,400 | | | | 311,177 | |
| OIL, GAS & CONSUMABLE FUELS - 1.0% | | | | | | | | |
| Gaztransport Et Technigaz | | | 7,800 | | | | 730,404 | |
| Total (Cost $1,196,477) | | | | | | | 1,041,581 | |
| | | | | | | | | |
| FINANCIALS – 29.9% | | | | | | | | |
| BANKS - 5.7% | | | | | | | | |
| Bank of Georgia Group | | | 39,500 | | | | 891,800 | |
| BOK Financial | | | 15,414 | | | | 1,626,023 | |
| Triumph Bancorp 1 | | | 15,000 | | | | 1,786,200 | |
| | | | | | | | 4,304,023 | |
| CAPITAL MARKETS - 24.2% | | | | | | | | |
| Ashmore Group | | | 244,300 | | | | 962,256 | |
| B3-Brasil, Bolsa, Balcao | | | 336,600 | | | | 673,200 | |
| Bolsa Mexicana de Valores | | | 444,000 | | | | 839,405 | |
| Carlyle Group | | | 71,520 | | | | 3,926,448 | |
| Coronation Fund Managers | | | 153,700 | | | | 506,771 | |
| Evercore Cl. A | | | 13,500 | | | | 1,833,975 | |
| Jupiter Fund Management | | | 225,700 | | | | 783,293 | |
| KKR & Co. | | | 16,338 | | | | 1,217,181 | |
| Moelis & Company Cl. A | | | 19,359 | | | | 1,210,131 | |
| SEI Investments | | | 37,900 | | | | 2,309,626 | |
| Sprott | | | 58,860 | | | | 2,656,017 | |
| State Street | | | 16,800 | | | | 1,562,400 | |
| | | | | | | | 18,480,703 | |
| Total (Cost $11,238,290) | | | | | | | 22,784,726 | |
| | | | | | | | | |
| HEALTH CARE – 3.4% | | | | | | | | |
| HEALTH CARE PROVIDERS & SERVICES - 0.7% | | | | | | | | |
| Ensign Group (The) | | | 5,951 | | | | 499,646 | |
| PHARMACEUTICALS - 2.7% | | | | | | | | |
| Recordati Industria Chimica e Farmaceutica | | | 24,210 | | | | 1,557,314 | |
| Santen Pharmaceutical | | | 41,600 | | | | 508,834 | |
| | | | | | | | 2,066,148 | |
| Total (Cost $626,525) | | | | | | | 2,565,794 | |
| | | | | | | | | |
| INDUSTRIALS – 37.8% | | | | | | | | |
| AEROSPACE & DEFENSE - 3.9% | | | | | | | | |
| HEICO Corporation Cl. A | | | 23,259 | | | | 2,989,247 | |
| BUILDING PRODUCTS - 0.9% | | | | | | | | |
| Geberit | | | 800 | | | | 654,258 | |
| COMMERCIAL SERVICES & SUPPLIES - 0.4% | | | | | | | | |
| Healthcare Services Group | | | 15,700 | | | | 279,303 | |
| CONSTRUCTION & ENGINEERING - 1.2% | | | | | | | | |
| Comfort Systems USA | | | 8,959 | | | | 886,403 | |
| ELECTRICAL EQUIPMENT - 3.1% | | | | | | | | |
| Hubbell Incorporated | | | 11,462 | | | | 2,387,191 | |
| MACHINERY - 11.8% | | | | | | |
| Graco | | | 25,224 | | | | 2,033,559 | |
| Lincoln Electric Holdings | | | 10,022 | | | | 1,397,768 | |
| Lindsay Corporation | | | 17,400 | | | | 2,644,800 | |
| Spirax-Sarco Engineering | | | 13,478 | | | | 2,928,025 | |
| | | | | | | | 9,004,152 | |
| MARINE - 2.4% | | | | | | | | |
| Clarkson | | | 35,040 | | | | 1,840,222 | |
| PROFESSIONAL SERVICES - 9.4% | | | | | | | | |
| KBR | | | 80,690 | | | | 3,842,458 | |
| Korn Ferry | | | 10,023 | | | | 759,041 | |
| ManpowerGroup | | | 19,300 | | | | 1,878,469 | |
| Robert Half International | | | 5,994 | | | | 668,451 | |
| | | | | | | | 7,148,419 | |
| ROAD & RAIL - 0.5% | | | | | | | | |
| Werner Enterprises | | | 8,643 | | | | 411,925 | |
| TRADING COMPANIES & DISTRIBUTORS - 4.2% | | | | | | | | |
| Applied Industrial Technologies | | | 31,294 | | | | 3,213,894 | |
| Total (Cost $8,381,404) | | | | | | | 28,815,014 | |
| | | | | | | | | |
| INFORMATION TECHNOLOGY – 1.8% | | | | | | | | |
| ELECTRONIC EQUIPMENT, INSTRUMENTS & COMPONENTS - 1.2% | | | | | | | | |
| Vishay Intertechnology | | | 42,497 | | | | 929,409 | |
| SOFTWARE - 0.6% | | | | | | | | |
| SimCorp | | | 4,200 | | | | 459,605 | |
| Total (Cost $680,418) | | | | | | | 1,389,014 | |
| | | | | | | | | |
| MATERIALS – 16.3% | | | | | | | | |
| CHEMICALS - 2.7% | | | | | | | | |
| Quaker Chemical | | | 9,137 | | | | 2,108,637 | |
| CONTAINERS & PACKAGING - 3.3% | | | | | | | | |
| AptarGroup | | | 20,396 | | | | 2,498,102 | |
| METALS & MINING - 10.3% | | | | | | | | |
| Franco-Nevada | | | 18,335 | | | | 2,535,547 | |
| Reliance Steel & Aluminum | | | 10,288 | | | | 1,668,919 | |
| Royal Gold | | | 11,600 | | | | 1,220,436 | |
| Worthington Industries | | | 44,460 | | | | 2,430,184 | |
| | | | | | | | 7,855,086 | |
| Total (Cost $3,760,557) | | | | | | | 12,461,825 | |
| |
| TOTAL COMMON STOCKS |
| (Cost $28,253,864) | | | | | | | 73,606,003 | |
| | | | | | | | | |
| REPURCHASE AGREEMENT– 3.5% | | | | | | | | |
Fixed Income Clearing Corporation, 0.00% dated 12/31/21, due 1/3/22, maturity value $2,690,108 (collateralized by obligations of various U.S. Government Agencies, 2.50% due 1/15/29, valued at $2,744,007) | |
| (Cost $2,690,108) | | | | | | | 2,690,108 | |
| |
| TOTAL INVESTMENTS – 100.0% |
| (Cost $30,943,972) | | | | | | | 76,296,111 | |
| | | | | | | | | |
| CASH AND OTHER ASSETS LESS LIABILITIES – 0.0% | | | | | | | 3,750 | |
| | | | | | | | | |
| NET ASSETS – 100.0% | | | | | | $ | 76,299,861 | |
| 30 | The Royce Funds 2021 Annual Report to Shareholders | THE ACCOMPANYING NOTES ARE AN INTEGRAL PART OF THESE FINANCIAL STATEMENTS |
December 31, 2021
Royce Global Financial Services Fund Common Stocks – 91.6% |
| | | SHARES | | | VALUE | |
| | | | | | | | | |
| BANKS - 16.4% | | | | | | | | |
| BOK Financial | | | 10,450 | | | $ | 1,102,370 | |
| †Cadence Bank | | | 11,120 | | | | 331,265 | |
| Capital City Bank Group | | | 16,988 | | | | 448,483 | |
| First Citizens BancShares Cl. A | | | 1,828 | | | | 1,516,948 | |
| First Republic Bank | | | 2,599 | | | | 536,719 | |
| Popular | | | 20,063 | | | | 1,645,969 | |
| TriState Capital Holdings 1 | | | 11,600 | | | | 351,016 | |
| Umpqua Holdings | | | 17,400 | | | | 334,776 | |
| Total (Cost $2,745,625) | | | | | | | 6,267,546 | |
| | | | | | | | | |
| CAPITAL MARKETS - 48.9% | | | | | | | | |
| Ares Management Cl. A | | | 14,986 | | | | 1,217,912 | |
| B3-Brasil, Bolsa, Balcao | | | 183,000 | | | | 366,000 | |
| Canaccord Genuity Group | | | 113,715 | | | | 1,355,644 | |
| Carlyle Group | | | 22,300 | | | | 1,224,270 | |
| Charles Schwab | | | 14,671 | | | | 1,233,831 | |
| Coronation Fund Managers | | | 61,200 | | | | 201,785 | |
| CRISIL | | | 14,000 | | | | 544,288 | |
| Egyptian Financial Group-Hermes Holding Company 1 | | | 184,791 | | | | 174,205 | |
| Hellenic Exchanges - Athens Stock Exchange | | | 50,000 | | | | 211,192 | |
| Insignia Financial | | | 55,000 | | | | 144,855 | |
| Intermediate Capital Group | | | 39,111 | | | | 1,161,475 | |
| JSE | | | 51,000 | | | | 358,456 | |
| Jupiter Fund Management | | | 106,900 | | | | 370,997 | |
| KKR & Co. | | | 19,120 | | | | 1,424,440 | |
| MarketAxess Holdings | | | 1,581 | | | | 650,218 | |
| †MarketWise Cl. A 1 | | | 88,300 | | | | 665,782 | |
| NZX | | | 580,000 | | | | 719,008 | |
| RF Capital Group 1 | | | 108,000 | | | | 162,220 | |
| Rothschild & Co | | | 13,900 | | | | 638,544 | |
| SEI Investments | | | 7,950 | | | | 484,473 | |
| Silvercrest Asset Management Group Cl. A | | | 27,612 | | | | 474,098 | |
| Sprott | | | 40,500 | | | | 1,827,535 | |
| StoneX Group 1 | | | 9,846 | | | | 603,067 | |
| Tel Aviv Stock Exchange | | | 273,000 | | | | 1,474,347 | |
| U.S. Global Investors Cl. A | | | 165,500 | | | | 728,200 | |
| Warsaw Stock Exchange | | | 9,500 | | | | 97,661 | |
| Westaim Corporation (The) 1 | | | 105,000 | | | | 207,518 | |
| Total (Cost $8,998,068) | | | | | | | 18,722,021 | |
| | | | | | | | | |
| CLOSED-END FUNDS - 0.9% | | | | | | | | |
| Eagle Point Income | | | 19,341 | | | | 329,377 | |
| Total (Cost $384,692) | | | | | | | 329,377 | |
| | | | | | | | | |
| DIVERSIFIED FINANCIAL SERVICES - 1.9% | | | | | | | | |
| Banco Latinoamericano de Comercio | | | | | | | | |
| Exterior Cl. E | | | 25,700 | | | | 426,620 | |
| ECN Capital | | | 75,000 | | | | 316,613 | |
| Total (Cost $557,932) | | | | | | | 743,233 | |
| | | | | | | | | |
| INSURANCE - 4.7% | | | | | | | | |
| Axis Capital Holdings | | | 11,554 | | | | 629,347 | |
| E-L Financial | | | 1,638 | | | | 1,175,457 | |
| Total (Cost $1,367,523) | | | | | | | 1,804,804 | |
| | | | | | | | | |
| IT SERVICES - 1.7% | | | | | | | | |
| PayPal Holdings 1 | | | 3,466 | | | | 653,618 | |
| Total (Cost $122,211) | | | | | | | 653,618 | |
| | | | | | | |
| METALS & MINING - 3.4% | | | | | | |
| Franco-Nevada | | | 9,523 | | | | 1,316,936 | |
| Total (Cost $430,881) | | | | | | | 1,316,936 | |
| | | | | | | | | |
| PROFESSIONAL SERVICES - 0.5% | | | | | | | | |
| Quess Corp | | | 17,756 | | | | 203,296 | |
| Total (Cost $153,190) | | | | | | | 203,296 | |
| | | | | | | | | |
| REAL ESTATE MANAGEMENT & DEVELOPMENT - 9.0% | | | | | | | | |
| Altus Group | | | 23,760 | | | | 1,333,054 | |
| FirstService Corporation | | | 8,379 | | | | 1,646,222 | |
| FRP Holdings 1 | | | 7,957 | | | | 459,915 | |
| Total (Cost $1,125,800) | | | | | | | 3,439,191 | |
| | | | | | | | | |
| SOFTWARE - 3.0% | | | | | | | | |
| Benefitfocus 1 | | | 10,600 | | | | 112,996 | |
| Bottomline Technologies 1 | | | 9,800 | | | | 553,406 | |
| Envestnet 1 | | | 6,000 | | | | 476,040 | |
| Total (Cost $836,700) | | | | | | | 1,142,442 | |
| | | | | | | | | |
| THRIFTS & MORTGAGE FINANCE - 1.2% | | | | | | | | |
| Provident Bancorp | | | 25,000 | | | | 465,000 | |
| Total (Cost $313,394) | | | | | | | 465,000 | |
| |
| TOTAL COMMON STOCKS |
| (Cost $17,036,016) | | | | | | | 35,087,464 | |
| | | | | | | | | |
| REPURCHASE AGREEMENT– 8.5% | | | | | | | | |
Fixed Income Clearing Corporation, 0.00% dated 12/31/21, due 1/3/22, maturity value $3,236,285 (collateralized by obligations of various U.S. Government Agencies, 0.25% due 7/15/29, valued at $3,301,108) | |
| (Cost $3,236,285) | | | | | | | 3,236,285 | |
| |
| TOTAL INVESTMENTS – 100.1% |
| (Cost $20,272,301) | | | | | | | 38,323,749 | |
| | | | | | | | | |
| LIABILITIES LESS CASH AND OTHER ASSETS – (0.1)% | | | | | | | (40,509 | ) |
| | | | | | | | | |
| NET ASSETS – 100.0% | | | | | | $ | 38,283,240 | |
| THE ACCOMPANYING NOTES ARE AN INTEGRAL PART OF THESE FINANCIAL STATEMENTS | The Royce Funds 2021 Annual Report to Shareholders | 31 |
Schedules of Investments
Royce International Premier Fund Common Stocks – 93.1% |
| | | SHARES | | | VALUE | |
| AUSTRALIA – 10.1% | | | | | | | | |
| Bravura Solutions 2 | | | 15,808,630 | | | $ | 28,408,875 | |
| Cochlear | | | 78,400 | | | | 12,327,467 | |
| Hansen Technologies | | | 8,027,746 | | | | 31,247,138 | |
| IPH | | | 6,495,520 | | | | 41,492,660 | |
| Technology One | | | 1,461,800 | | | | 13,623,852 | |
| Total (Cost $104,000,570) | | | | | | | 127,099,992 | |
| | | | | | | | | |
| BRAZIL – 2.3% | | | | | | | | |
| Odontoprev | | | 7,991,400 | | | | 18,077,494 | |
| TOTVS | | | 2,095,000 | | | | 10,772,136 | |
| Total (Cost $33,401,388) | | | | | | | 28,849,630 | |
| | | | | | | | | |
| CANADA – 4.8% | | | | | | | | |
| Altus Group | | | 311,400 | | | | 17,471,092 | |
| †Enghouse Systems | | | 539,300 | | | | 20,647,693 | |
| LifeWorks | | | 1,062,800 | | | | 21,450,084 | |
| Total (Cost $51,141,089) | | | | | | | 59,568,869 | |
| | | | | | | | | |
| DENMARK – 2.7% | | | | | | | | |
| Chr. Hansen Holding | | | 245,700 | | | | 19,386,529 | |
| SimCorp | | | 130,000 | | | | 14,225,856 | |
| Total (Cost $31,307,485) | | | | | | | 33,612,385 | |
| | | | | | | | | |
| GERMANY – 4.7% | | | | | | | | |
| Amadeus Fire | | | 62,798 | | | | 13,012,181 | |
| New Work | | | 103,900 | | | | 25,728,099 | |
| Norma Group | | | 513,200 | | | | 19,795,339 | |
| Total (Cost $54,544,749) | | | | | | | 58,535,619 | |
| | | | | | | | | |
| ICELAND – 2.6% | | | | | | | | |
| Marel | | | 2,828,670 | | | | 19,069,440 | |
| Ossur 1 | | | 2,136,966 | | | | 13,838,483 | |
| Total (Cost $26,153,043) | | | | | | | 32,907,923 | |
| | | | | | | | | |
| INDIA – 1.3% | | | | | | | | |
| AIA Engineering | | | 626,411 | | | | 15,833,098 | |
| Total (Cost $14,983,177) | | | | | | | 15,833,098 | |
| | | | | | | | | |
| ITALY – 4.9% | | | | | | | | |
| Carel Industries | | | 581,094 | | | | 17,597,903 | |
| DiaSorin | | | 93,463 | | | | 17,817,951 | |
| GVS | | | 2,201,212 | | | | 26,439,133 | |
| Total (Cost $54,422,246) | | | | | | | 61,854,987 | |
| | | | | | | | | |
| JAPAN – 18.2% | | | | | | | | |
| As One | | | 294,400 | | | | 19,732,452 | |
| †BML | | | 659,500 | | | | 20,496,501 | |
| Daifuku | | | 118,100 | | | | 9,650,874 | |
| Fukui Computer Holdings | | | 694,800 | | | | 20,838,564 | |
| Medikit | | | 160,000 | | | | 3,966,965 | |
| Meitec Corporation | | | 593,200 | | | | 34,912,318 | |
| NSD | | | 1,143,300 | | | | 20,772,816 | |
| OBIC Business Consultants | | | 654,400 | | | | 27,591,411 | |
| TechnoPro Holdings | | | 465,600 | | | | 14,126,263 | |
| TKC Corporation | | | 1,209,300 | | | | 36,322,103 | |
| USS | | | 1,249,500 | | | | 19,508,841 | |
| Total (Cost $204,287,260) | | | | | | | 227,919,108 | |
| | | | | | | | | |
| NETHERLANDS – 1.6% | | | | | | | | |
| IMCD | | | 89,300 | | | | 19,794,763 | |
| Total (Cost $5,982,710) | | | | | | | 19,794,763 | |
| | | | | | | |
| NEW ZEALAND – 1.1% | | | | | | |
| Fisher & Paykel Healthcare | | | 605,000 | | | | 13,574,583 | |
| Total (Cost $4,868,369) | | | | | | | 13,574,583 | |
| | | | | | | | | |
| POLAND – 1.3% | | | | | | | | |
| †Asseco Poland | | | 744,700 | | | | 15,978,386 | |
| Total (Cost $17,550,956) | | | | | | | 15,978,386 | |
| | | | | | | | | |
| SINGAPORE – 1.5% | | | | | | | | |
| XP Power | | | 267,484 | | | | 18,464,701 | |
| Total (Cost $7,103,838) | | | | | | | 18,464,701 | |
| | | | | | | | | |
| SOUTH KOREA – 3.2% | | | | | | | | |
| †Douzone Bizon | | | 249,100 | | | | 15,296,993 | |
| †NICE Information Service | | | 1,658,400 | | | | 25,111,419 | |
| Total (Cost $51,468,945) | | | | | | | 40,408,412 | |
| | | | | | | | | |
| SWEDEN – 8.9% | | | | | | | | |
| Alimak Group | | | 1,725,300 | �� | | | 21,842,624 | |
| Bravida Holding | | | 1,165,928 | | | | 16,386,629 | |
| Hexpol | | | 1,242,600 | | | | 16,680,395 | |
| Karnov Group | | | 3,057,013 | | | | 22,666,593 | |
| Lagercrantz Group | | | 503,300 | | | | 7,413,429 | |
| Loomis | | | 1,010,200 | | | | 26,909,004 | |
| Total (Cost $88,838,184) | | | | | | | 111,898,674 | |
| | | | | | | | | |
| SWITZERLAND – 7.1% | | | | | | | | |
| dormakaba Holding | | | 26,600 | | | | 17,617,537 | |
| Kardex Holding | | | 66,200 | | | | 21,795,435 | |
| LEM Holding | | | 5,600 | | | | 15,610,185 | |
| Partners Group Holding | | | 10,400 | | | | 17,262,950 | |
| VZ Holding | | | 155,385 | | | | 16,677,626 | |
| Total (Cost $43,643,586) | | | | | | | 88,963,733 | |
| | | | | | | | | |
| UNITED KINGDOM – 16.8% | | | | | | | | |
| Ashmore Group | | | 4,434,550 | | | | 17,466,940 | |
| Croda International | | | 162,600 | | | | 22,272,827 | |
| Diploma | | | 234,698 | | | | 10,718,370 | |
| †DiscoverlE Group | | | 1,467,200 | | | | 20,375,626 | |
| FDM Group Holdings | | | 828,438 | | | | 14,263,346 | |
| †Learning Technologies Group | | | 9,478,000 | | | | 22,809,867 | |
| Marlowe 1 | | | 1,492,287 | | | | 20,602,827 | |
| Restore | | | 3,919,839 | | | | 25,997,920 | |
| Spirax-Sarco Engineering | | | 119,700 | | | | 26,004,199 | |
| Victrex | | | 918,345 | | | | 30,379,551 | |
| Total (Cost $141,969,505) | | | | | | | 210,891,473 | |
| |
| TOTAL COMMON STOCKS |
| (Cost $935,667,100) | | | | | | | 1,166,156,336 | |
| | | | | | | | | |
| PREFERRED STOCK – 2.2% | | | | | | | | |
| GERMANY – 2.2% | | | | | | | | |
| FUCHS PETROLUB | | | 616,800 | | | | 28,032,884 | |
| (Cost $27,816,511) | | | 616,800 | | | | 28,032,884 | |
| 32 | The Royce Funds 2021 Annual Report to Shareholders | THE ACCOMPANYING NOTES ARE AN INTEGRAL PART OF THESE FINANCIAL STATEMENTS |
December 31, 2021
Royce International Premier Fund (continued)
| | | VALUE | |
| |
REPURCHASE AGREEMENT– 4.6% Fixed Income Clearing Corporation, 0.00% dated 12/31/21, due 1/3/22, maturity value $58,034,150 (collateralized by obligations of various U.S. Government Agencies, 2.50% due 1/15/29, valued at $59,194,920) | |
| (Cost $58,034,150) | | $ | 58,034,150 | |
| | | | | |
| TOTAL INVESTMENTS – 99.9% | | | | |
| (Cost $1,021,517,761) | | | 1,252,223,370 | |
| | | | | |
| CASH AND OTHER ASSETS LESS LIABILITIES – 0.1% | | | 718,485 | |
| | | | | |
| NET ASSETS – 100.0% | | $ | 1,252,941,855 | |
Royce Micro-Cap Fund Common Stocks – 96.6% |
| | | SHARES | | | VALUE | |
| COMMUNICATION SERVICES – 4.5% | | | | | | | | |
| ENTERTAINMENT - 2.1% | | | | | | | | |
| Chicken Soup For The Soul Entertainment Cl. A 1 | | | 192,332 | | | $ | 2,661,875 | |
| Gaia Cl. A 1 | | | 321,800 | | | | 2,757,826 | |
| IMAX Corporation 1 | | | 172,900 | | | | 3,084,536 | |
| †Motorsport Games Cl. A 1 | | | 111,391 | | | | 378,729 | |
| | | | | | | | 8,882,966 | |
| INTERACTIVE MEDIA & SERVICES - 1.2% | | | | | | | | |
| †Enthusiast Gaming Holdings 1 | | | 583,000 | | | | 1,714,502 | |
| QuinStreet 1 | | | 185,846 | | | | 3,380,539 | |
| | | | | | | | 5,095,041 | |
| MEDIA - 1.2% | | | | | | | | |
| Magnite 1,3 | | | 63,000 | | | | 1,102,500 | |
| †Thryv Holdings 1 | | | 97,704 | | | | 4,018,566 | |
| | | | | | | | 5,121,066 | |
| Total (Cost $18,310,863) | | | | | | | 19,099,073 | |
| | | | | | | | | |
| CONSUMER DISCRETIONARY – 12.0% | | | | | | | | |
| AUTO COMPONENTS - 1.6% | | | | | | | | |
| Modine Manufacturing 1 | | | 277,500 | | | | 2,799,975 | |
| Stoneridge 1 | | | 152,600 | | | | 3,012,324 | |
| Unique Fabricating 1 | | | 373,951 | | | | 732,944 | |
| | | | | | | | 6,545,243 | |
| HOTELS, RESTAURANTS & LEISURE - 2.0% | | | | | | | | |
| Century Casinos 1 | | | 346,100 | | | | 4,215,498 | |
| Lindblad Expeditions Holdings 1,3 | | | 206,700 | | | | 3,224,520 | |
| †Lottery.com 1,3 | | | 161,400 | | | | 1,028,118 | |
| | | | | | | | 8,468,136 | |
| HOUSEHOLD DURABLES - 1.1% | | | | | | | | |
| Legacy Housing 1 | | | 165,900 | | | | 4,391,373 | |
| LEISURE PRODUCTS - 0.9% | | | | | | | | |
| MasterCraft Boat Holdings 1 | | | 137,900 | | | | 3,906,707 | |
| SPECIALTY RETAIL - 5.1% | | | | | | | | |
| †Barnes & Noble Education 1 | | | 297,800 | | | | 2,028,018 | |
| Chico’s FAS 1 | | | 487,500 | | | | 2,622,750 | |
| Citi Trends 1 | | | 51,724 | | | | 4,900,849 | |
| OneWater Marine Cl. A | | | 73,200 | | | | 4,463,004 | |
| Shoe Carnival | | | 110,622 | | | | 4,323,108 | |
| Zumiez 1 | | | 66,400 | | | | 3,186,536 | |
| | | | | | | | 21,524,265 | |
| TEXTILES, APPAREL & LUXURY GOODS - 1.3% | | | | | | | | |
| Fossil Group 1 | | | 211,900 | | | | 2,180,451 | |
| Vera Bradley 1 | | | 404,600 | | | | 3,443,146 | |
| | | | | | | | 5,623,597 | |
| Total (Cost $34,551,676) | | | | | | | 50,459,321 | |
| | | | | | | | | |
| ENERGY – 2.6% | | | | | | | | |
| ENERGY EQUIPMENT & SERVICES - 2.6% | | | | | | | | |
| Aspen Aerogels 1 | | | 72,200 | | | | 3,594,838 | |
| Natural Gas Services Group 1 | | | 327,713 | | | | 3,431,155 | |
| Newpark Resources 1 | | | 921,100 | | | | 2,708,034 | |
| Profire Energy 1 | | | 1,389,432 | | | | 1,472,798 | |
| Total (Cost $8,982,971) | | | | | | | 11,206,825 | |
| | | | | | | | | |
| FINANCIALS – 12.6% | | | | | | | | |
| BANKS - 5.3% | | | | | | | | |
| Allegiance Bancshares | | | 76,600 | | | | 3,233,286 | |
| BayCom Corporation 1,3 | | | 171,842 | | | | 3,223,756 | |
| Caribbean Investment Holdings 1,4 | | | 1,858,138 | | | | 666,497 | |
| HarborOne Bancorp | | | 267,953 | | | | 3,976,422 | |
| HBT Financial | | | 199,600 | | | | 3,738,508 | |
| THE ACCOMPANYING NOTES ARE AN INTEGRAL PART OF THESE FINANCIAL STATEMENTS | The Royce Funds 2021 Annual Report to Shareholders | 33 |
Schedules of Investments
| Royce Micro-Cap Fund (continued) | | | | | | | |
| | | | | | | | |
| | | | SHARES | | | | VALUE |
| | | | | | | | |
| FINANCIALS (continued) | | | | | | | |
| BANKS (continued) | | | | | | | |
| HomeTrust Bancshares | | | 137,700 | | | $ | 4,265,946 |
| Investar Holding Corporation | | | 180,900 | | | | 3,330,369 |
| Midway Investments 1,4 | | | 1,858,170 | | | | 0 |
| | | | | | | | 22,434,784 |
| CAPITAL MARKETS - 4.8% | | | | | | | |
| B. Riley Financial | | | 54,900 | | | | 4,878,414 |
| Canaccord Genuity Group | | | 386,100 | | | | 4,602,860 |
| Silvercrest Asset Management Group Cl. A | | | 204,000 | | | | 3,502,680 |
| Sprott | | | 98,380 | | | | 4,439,330 |
| StoneX Group 1 | | | 48,700 | | | | 2,982,875 |
| | | | | | | | 20,406,159 |
| DIVERSIFIED FINANCIAL SERVICES - 0.0% | | | | | | | |
| Waterloo Investment Holdings 1,4 | | | 2,760,000 | | | | 0 |
| THRIFTS & MORTGAGE FINANCE - 2.5% | | | | | | | |
| PCSB Financial | | | 174,400 | | | | 3,320,576 |
| Territorial Bancorp | | | 122,408 | | | | 3,090,802 |
| Western New England Bancorp | | | 442,000 | | | | 3,871,920 |
| | | | | | | | 10,283,298 |
| Total (Cost $40,047,620) | | | | | | | 53,124,241 |
| | | | | | | | |
| HEALTH CARE – 12.2% | | | | | | | |
| BIOTECHNOLOGY - 2.1% | | | | | | | |
| CareDx 1 | | | 32,200 | | | | 1,464,456 |
| Dynavax Technologies 1 | | | 198,000 | | | | 2,785,860 |
| MeiraGTx Holdings 1 | | | 198,900 | | | | 4,721,886 |
| | | | | | | | 8,972,202 |
| HEALTH CARE EQUIPMENT & SUPPLIES - 6.6% | | | | | | | |
| Apyx Medical 1 | | | 298,027 | | | | 3,820,706 |
| AtriCure 1 | | | 42,800 | | | | 2,975,884 |
| †Bioventus Cl. A 1 | | | 298,364 | | | | 4,323,294 |
| Chembio Diagnostics 1 | | | 120,753 | | | | 137,659 |
| CryoLife 1 | | | 143,355 | | | | 2,917,274 |
| Cutera 1 | | | 88,800 | | | | 3,669,216 |
| †IntriCon Corporation 1 | | | 63,086 | | | | 1,020,101 |
| OrthoPediatrics Corp. 1 | | | 57,400 | | | | 3,435,964 |
| Profound Medical 1 | | | 206,700 | | | | 2,330,165 |
| Surmodics 1 | | | 63,822 | | | | 3,073,029 |
| | | | | | | | 27,703,292 |
| HEALTH CARE PROVIDERS & SERVICES - 0.6% | | | | | | | |
| Sharps Compliance 1 | | | 365,000 | | | | 2,602,450 |
| LIFE SCIENCES TOOLS & SERVICES - 2.9% | | | | | | | |
| Harvard Bioscience 1 | | | 633,052 | | | | 4,463,017 |
| †Inotiv 1,3 | | | 91,600 | | | | 3,853,612 |
| NeoGenomics 1 | | | 43,900 | | | | 1,497,868 |
| Quanterix Corporation 1 | | | 54,300 | | | | 2,302,320 |
| | | | | | | | 12,116,817 |
| Total (Cost $27,856,834) | | | | | | | 51,394,761 |
| | | | | | | | |
| INDUSTRIALS – 23.4% | | | | | | | |
| AEROSPACE & DEFENSE - 1.9% | | | | | | | |
| Astronics Corporation 1 | | | 237,400 | | | | 2,848,800 |
| †Cadre Holdings | | | 152,800 | | | | 3,884,176 |
| CPI Aerostructures 1 | | | 468,290 | | | | 1,278,432 |
| | | | | | | | 8,011,408 |
| BUILDING PRODUCTS - 0.8% | | | | | | | |
| Quanex Building Products | | | 136,400 | | | | 3,379,992 |
| COMMERCIAL SERVICES & SUPPLIES - 2.3% | | | | | | | |
| Acme United | | | 72,400 | | | | 2,439,880 |
| Heritage-Crystal Clean 1 | | | 124,474 | | | | 3,985,657 |
| COMMERCIAL SERVICES & SUPPLIES (continued) | | | | | | | |
| †VSE Corporation | | | 52,200 | | | | 3,181,068 |
| | | | | | | | 9,606,605 |
| CONSTRUCTION & ENGINEERING - 4.7% | | | | | | | |
| Ameresco Cl. A 1 | | | 28,400 | | | | 2,312,896 |
| †Concrete Pumping Holdings 1 | | | 243,200 | | | | 1,994,240 |
| Construction Partners Cl. A 1 | | | 128,700 | | | | 3,785,067 |
| IES Holdings 1 | | | 54,800 | | | | 2,775,072 |
| Northwest Pipe 1 | | | 144,600 | | | | 4,598,280 |
| NV5 Global 1 | | | 30,800 | | | | 4,254,096 |
| | | | | | | | 19,719,651 |
| ELECTRICAL EQUIPMENT - 0.6% | | | | | | | |
| American Superconductor 1 | | | 216,400 | | | | 2,354,432 |
| Power Solutions International 1,5 | | | 99,900 | | | | 259,740 |
| | | | | | | | 2,614,172 |
| MACHINERY - 5.7% | | | | | | | |
| Alimak Group | | | 196,200 | | | | 2,483,929 |
| CIRCOR International 1 | | | 120,400 | | | | 3,272,472 |
| Graham Corporation | | | 234,903 | | | | 2,922,194 |
| Luxfer Holdings | | | 165,700 | | | | 3,199,667 |
| Porvair | | | 313,000 | | | | 3,050,360 |
| Shyft Group (The) | | | 88,100 | | | | 4,328,353 |
| Wabash National | | | 195,600 | | | | 3,818,112 |
| Westport Fuel Systems 1 | | | 407,700 | | | | 966,249 |
| | | | | | | | 24,041,336 |
| MARINE - 1.0% | | | | | | | |
| Clarkson | | | 83,324 | | | | 4,375,988 |
| PROFESSIONAL SERVICES - 4.4% | | | | | | | |
| CRA International | | | 35,983 | | | | 3,359,373 |
| Forrester Research 1 | | | 59,900 | | | | 3,517,927 |
| Heidrick & Struggles International | | | 86,440 | | | | 3,780,021 |
| Kforce | | | 55,932 | | | | 4,207,205 |
| Resources Connection | | | 200,252 | | | | 3,572,496 |
| | | | | | | | 18,437,022 |
| TRADING COMPANIES & DISTRIBUTORS - 2.0% | | | | | | | |
| Lawson Products 1 | | | 71,265 | | | | 3,901,758 |
| Transcat 1 | | | 48,474 | | | | 4,480,452 |
| | | | | | | | 8,382,210 |
| Total (Cost $59,828,912) | | | | | | | 98,568,384 |
| | | | | | | | |
| INFORMATION TECHNOLOGY – 25.4% | | | | | | | |
| COMMUNICATIONS EQUIPMENT - 3.8% | | | | | | | |
| †Comtech Telecommunications | | | 100,402 | | | | 2,378,523 |
| Digi International 1 | | | 192,300 | | | | 4,724,811 |
| EMCORE Corporation 1 | | | 420,000 | | | | 2,931,600 |
| †Genasys 1 | | | 555,301 | | | | 2,210,098 |
| Harmonic 1 | | | 306,600 | | | | 3,605,616 |
| | | | | | | | 15,850,648 |
| ELECTRONIC EQUIPMENT, INSTRUMENTS & COMPONENTS - 5.0% | | | | | | | |
| †Arlo Technologies 1 | | | 88,000 | | | | 923,120 |
| FARO Technologies 1 | | | 41,300 | | | | 2,891,826 |
| LightPath Technologies Cl. A 1 | | | 819,884 | | | | 2,000,517 |
| Luna Innovations 1 | | | 444,700 | | | | 3,753,268 |
| nLIGHT 1 | | | 86,600 | | | | 2,074,070 |
| PAR Technology 1 | | | 55,000 | | | | 2,902,350 |
| PowerFleet 1 | | | 535,319 | | | | 2,537,412 |
| †VIA optronics ADR 1 | | | 50,200 | | | | 368,970 |
| Vishay Precision Group 1 | | | 97,100 | | | | 3,604,352 |
| | | | | | | | 21,055,885 |
| 34 | The Royce Funds 2021 Annual Report to Shareholders | THE ACCOMPANYING NOTES ARE AN INTEGRAL PART OF THESE FINANCIAL STATEMENTS |
December 31, 2021
| Royce Micro-Cap Fund (continued) | | | | | | | | |
| | | | | | | | | |
| | | | SHARES | | | | VALUE | |
| | | | | | | | | |
| INFORMATION TECHNOLOGY (continued) | | | | | | | | |
| IT SERVICES - 1.4% | | | | | | | | |
| Cass Information Systems | | | 67,416 | | | $ | 2,650,797 | |
| Computer Task Group 1 | | | 318,979 | | | | 3,180,221 | |
| | | | | | | | 5,831,018 | |
| SEMICONDUCTORS & SEMICONDUCTOR EQUIPMENT - 13.2% | | | | | | | | |
| Aehr Test Systems 1,3 | | | 176,959 | | | | 4,278,869 | |
| Amtech Systems 1 | | | 105,400 | | | | 1,041,352 | |
| Axcelis Technologies 1 | | | 65,200 | | | | 4,861,312 | |
| AXT 1 | | | 462,100 | | | | 4,071,101 | |
| Camtek 1 | | | 100,500 | | | | 4,627,020 | |
| Cohu 1 | | | 96,100 | | | | 3,660,449 | |
| CyberOptics Corporation 1 | | | 98,537 | | | | 4,581,970 | |
| FormFactor 1 | | | 70,400 | | | | 3,218,688 | |
| Ichor Holdings 1 | | | 76,700 | | | | 3,530,501 | |
| Nova 1 | | | 30,900 | | | | 4,526,850 | |
| NVE Corporation | | | 44,216 | | | | 3,019,953 | |
| PDF Solutions 1 | | | 146,900 | | | | 4,669,951 | |
| Photronics 1 | | | 269,600 | | | | 5,081,960 | |
| Ultra Clean Holdings 1 | | | 82,700 | | | | 4,743,672 | |
| | | | | | | | 55,913,648 | |
| SOFTWARE - 1.3% | | | | | | | | |
| Agilysys 1 | | | 73,821 | | | | 3,282,082 | |
| †GTY Technology Holdings 1 | | | 344,803 | | | | 2,310,180 | |
| | | | | | | | 5,592,262 | |
| TECHNOLOGY HARDWARE, STORAGE & PERIPHERALS - 0.7% | | | | | | | | |
| AstroNova 1 | | | 228,700 | | | | 3,087,450 | |
| Total (Cost $56,230,761) | | | | | | | 107,330,911 | |
| | | | | | | | | |
| MATERIALS – 3.5% | | | | | | | | |
| METALS & MINING - 3.5% | | | | | | | | |
| Altius Minerals | | | 165,400 | | | | 2,276,465 | |
| Ferroglobe 1 | | | 94,100 | | | | 584,361 | |
| Ferroglobe (Warranty Insurance Trust) 1,4 | | | 205,763 | | | | 0 | |
| Haynes International | | | 116,130 | | | | 4,683,523 | |
| Major Drilling Group International 1 | | | 694,700 | | | | 4,536,323 | |
| Universal Stainless & Alloy Products 1 | | | 343,900 | | | | 2,713,371 | |
| Total (Cost $12,728,910) | | | | | | | 14,794,043 | |
| | | | | | | | | |
| REAL ESTATE – 0.4% | | | | | | | | |
| REAL ESTATE MANAGEMENT & DEVELOPMENT - 0.4% | | | | | | | | |
| FRP Holdings 1 | | | 29,575 | | | | 1,709,435 | |
| Total (Cost $534,936) | | | | | | | 1,709,435 | |
| | | | | | | | | |
| TOTAL COMMON STOCKS | | | | | | | | |
| (Cost $259,073,483) | | | | | | | 407,686,994 | |
| | | | | | | | | |
| REPURCHASE AGREEMENT – 3.6% | | | | | | | | |
Fixed Income Clearing Corporation, 0.00% dated 12/31/21, due 1/3/22, maturity value $15,244,270 (collateralized by obligations of various U.S. Government Agencies, 0.25% due 7/15/29, valued at $15,549,164) | |
| (Cost $15,244,270) | | | | | | | 15,244,270 | |
| | | | | | | | | |
| COLLATERAL RECEIVED FOR SECURITIES LOANED – 0.2% | |
| Money Market Funds | | | | | | | | |
| Federated Government Obligations Fund - Institutional Shares (7 day yield-0.03%) | | | | | | | | |
| (Cost $827,269) | | | 827,269 | | | | 827,269 | |
| | | | | | | | | |
| TOTAL INVESTMENTS – 100.4% | | | | | | | | |
| (Cost $275,145,022) | | | | | | $ | 423,758,533 | |
| | | | | | | | | |
| LIABILITIES LESS CASH AND OTHER ASSETS – (0.4)% | | | | | | | (1,860,493 | ) |
| | | | | | | | | |
| NET ASSETS – 100.0% | | | | | | $ | 421,898,040 | |
| THE ACCOMPANYING NOTES ARE AN INTEGRAL PART OF THESE FINANCIAL STATEMENTS | The Royce Funds 2021 Annual Report to Shareholders | 35 |
Schedules of Investments
Royce Opportunity Fund
Common Stocks – 97.4%
| | | SHARES | | VALUE |
| | | | | |
| COMMUNICATION SERVICES – 3.0% | | | | |
| DIVERSIFIED TELECOMMUNICATION SERVICES - 0.3% | | | | | | | |
| Ooma 1 | | | 275,278 | | | $ | 5,626,682 |
| ENTERTAINMENT - 0.4% | | | | | | | |
| †Marcus Corporation (The) 1 | | | 384,100 | | | | 6,860,026 |
| INTERACTIVE MEDIA & SERVICES - 1.0% | | | | | | | |
| Cars.com 1 | | | 259,800 | | | | 4,180,182 |
| DHI Group 1 | | | 547,428 | | | | 3,415,951 |
| QuinStreet 1 | | | 593,200 | | | | 10,790,308 |
| | | | | | | | 18,386,441 |
| MEDIA - 1.3% | | | | | | | |
| comScore 1 | | | 1,802,062 | | | | 6,018,887 |
| Entravision Communications Cl. A | | | 919,100 | | | | 6,231,498 |
| †Thryv Holdings 1 | | | 279,038 | | | | 11,476,833 |
| | | | | | | | 23,727,218 |
| Total (Cost $45,774,560) | | | | | | | 54,600,367 |
| | | | | | | | |
| CONSUMER DISCRETIONARY – 15.8% | | | | | | | |
| AUTO COMPONENTS - 2.4% | | | | | | | |
| Dana | | | 505,453 | | | | 11,534,437 |
| †Garrett Motion 1 | | | 718,985 | | | | 5,773,449 |
| Horizon Global 1 | | | 1,057,812 | | | | 8,441,340 |
| Modine Manufacturing 1 | | | 922,663 | | | | 9,309,670 |
| Stoneridge 1 | | | 456,277 | | | | 9,006,908 |
| | | | | | | | 44,065,804 |
| DIVERSIFIED CONSUMER SERVICES - 1.2% | | | | | | | |
| †American Public Education 1 | | | 454,300 | | | | 10,108,175 |
| Houghton Mifflin Harcourt 1,3 | | | 502,546 | | | | 8,090,990 |
| Regis Corporation 1 | | | 657,827 | | | | 1,144,619 |
| †Zovio 1,3 | | | 1,548,288 | | | | 1,966,326 |
| | | | | | | | 21,310,110 |
| HOTELS, RESTAURANTS & LEISURE - 1.0% | | | | | | | |
| Carrols Restaurant Group | | | 619,592 | | | | 1,833,992 |
| Century Casinos 1 | | | 267,094 | | | | 3,253,205 |
| †Krispy Kreme | | | 254,900 | | | | 4,822,708 |
| Noodles & Company Cl. A 1 | | | 383,754 | | | | 3,480,649 |
| Ruth’s Hospitality Group 1 | | | 263,610 | | | | 5,245,839 |
| | | | | | | | 18,636,393 |
| HOUSEHOLD DURABLES - 3.3% | | | | | | | |
| Beazer Homes USA 1 | | | 295,506 | | | | 6,861,649 |
| Cavco Industries 1 | | | 11,100 | | | | 3,525,915 |
| Century Communities | | | 93,500 | | | | 7,647,365 |
| Dixie Group (The) 1 | | | 577,956 | | | | 3,311,688 |
| †GoPro Cl. A 1,3 | | | 513,400 | | | | 5,293,154 |
| LGI Homes 1,3 | | | 34,770 | | | | 5,371,270 |
| Skyline Champion 1 | | | 100,200 | | | | 7,913,796 |
| Taylor Morrison Home 1 | | | 158,854 | | | | 5,553,536 |
| Toll Brothers | | | 105,086 | | | | 7,607,176 |
| Tri Pointe Homes 1 | | | 235,606 | | | | 6,571,051 |
| | | | | | | | 59,656,600 |
| INTERNET & DIRECT MARKETING RETAIL - 0.7% | | | | | | | |
| iMedia Brands 1 | | | 473,514 | | | | 2,841,084 |
| †Overstock.com 1 | | | 163,800 | | | | 9,665,838 |
| | | | | | | | 12,506,922 |
| MULTILINE RETAIL - 0.5% | | | | | | | |
| Dillard’s Cl. A | | | 16,633 | | | | 4,075,418 |
| †Nordstrom 1 | | | 203,400 | | | | 4,600,908 |
| | | | | | | | 8,676,326 |
| SPECIALTY RETAIL - 4.6% | | | | | | | |
| †Barnes & Noble Education 1 | | | 814,532 | | | | 5,546,963 |
| Caleres | | | 214,300 | | | | 4,860,324 |
| Chico’s FAS 1 | | | 1,209,892 | | | | 6,509,219 |
| Conn’s 1 | | | 465,104 | | | | 10,939,246 |
| Designer Brands Cl. A 1 | | | 591,779 | | | | 8,409,179 |
| †Express 1 | | | 822,200 | | | | 2,532,376 |
| Guess? | | | 305,694 | | | | 7,238,834 |
| †J.Jill 1 | | | 345,443 | | | | 6,625,597 |
| †JOANN | | | 493,805 | | | | 5,125,696 |
| Kirkland’s 1 | | | 349,300 | | | | 5,215,049 |
| LL Flooring Holdings 1 | | | 496,900 | | | | 8,482,083 |
| Sonic Automotive Cl. A | | | 63,100 | | | | 3,120,295 |
| †Victoria’s Secret & Co. 1 | | | 150,929 | | | | 8,382,597 |
| | | | | | | | 82,987,458 |
| TEXTILES, APPAREL & LUXURY GOODS - 2.1% | | | | | | | |
| Fossil Group 1,3 | | | 758,000 | | | | 7,799,820 |
| †Rocky Brands | | | 100,500 | | | | 3,999,900 |
| Skechers U.S.A. Cl. A 1 | | | 235,122 | | | | 10,204,295 |
| Unifi 1 | | | 449,300 | | | | 10,401,295 |
| †Vera Bradley 1 | | | 596,602 | | | | 5,077,083 |
| | | | | | | | 37,482,393 |
| Total (Cost $247,580,384) | | | | | | | 285,322,006 |
| | | | | | | | |
| CONSUMER STAPLES – 1.1% | | | | | | | |
| FOOD PRODUCTS - 0.4% | | | | | | | |
| †Calavo Growers | | | 146,441 | | | | 6,209,098 |
| HOUSEHOLD PRODUCTS - 0.7% | | | | | | | |
| Central Garden & Pet Cl. A 1 | | | 87,600 | | | | 4,191,660 |
| †Spectrum Brands Holdings | | | 89,300 | | | | 9,083,596 |
| | | | | | | | 13,275,256 |
| Total (Cost $18,330,620) | | | | | | | 19,484,354 |
| | | | | | | | |
| ENERGY – 3.9% | | | | | | | |
| ENERGY EQUIPMENT & SERVICES - 0.8% | | | | | | | |
| Archrock | | | 445,800 | | | | 3,334,584 |
| DMC Global 1 | | | 86,000 | | | | 3,406,460 |
| Mammoth Energy Services 1 | | | 802,295 | | | | 1,460,177 |
| Ranger Energy Services Cl. A 1 | | | 268,256 | | | | 2,754,989 |
| U.S. Silica Holdings 1 | | | 403,902 | | | | 3,796,679 |
| | | | | | | | 14,752,889 |
| | | | | | | | |
| OIL, GAS & CONSUMABLE FUELS - 3.1% | | | | | | | |
| Ardmore Shipping 1 | | | 1,146,193 | | | | 3,874,132 |
| Baytex Energy 1,5 | | | 1,240,800 | | | | 3,809,256 |
| †Chesapeake Energy | | | 129,100 | | | | 8,329,532 |
| Dorian LPG | | | 624,392 | | | | 7,923,535 |
| Earthstone Energy Cl. A 1 | | | 881,472 | | | | 9,643,304 |
| Matador Resources | | | 229,983 | | | | 8,490,972 |
| Navigator Holdings 1 | | | 594,484 | | | | 5,273,073 |
| Scorpio Tankers | | | 386,500 | | | | 4,951,065 |
| Southwestern Energy 1 | | | 658,081 | | | | 3,066,657 |
| | | | | | | | 55,361,526 |
| Total (Cost $58,200,938) | | | | | | | 70,114,415 |
| | | | | | | | |
| FINANCIALS – 5.9% | | | | | | | |
| BANKS - 1.6% | | | | | | | |
| First Foundation | | | 280,600 | | | | 6,975,716 |
| Hilltop Holdings | | | 343,208 | | | | 12,060,329 |
| Seacoast Banking Corporation of Florida | | | 299,650 | | | | 10,604,614 |
| | | | | | | | 29,640,659 |
| CAPITAL MARKETS - 1.1% | | | | | | | |
| B. Riley Financial | | | 141,667 | | | | 12,588,530 |
| 36 | The Royce Funds 2021 Annual Report to Shareholders | THE ACCOMPANYING NOTES ARE AN INTEGRAL PART OF THESE FINANCIAL STATEMENTS |
December 31, 2021
Royce Opportunity Fund (continued)
| | | SHARES | | VALUE |
| | | | | |
| FINANCIALS (continued) | | | | | | | |
| CAPITAL MARKETS (continued) | | | | | | | |
| Houlihan Lokey Cl. A | | | 13,989 | | | $ | 1,448,141 |
| Moelis & Company Cl. A | | | 103,526 | | | | 6,471,410 |
| | | | | | | | 20,508,081 |
| INSURANCE - 2.1% | | | | | | | |
| Brighthouse Financial 1 | | | 240,600 | | | | 12,463,080 |
| HCI Group | | | 76,976 | | | | 6,430,575 |
| Old Republic International | | | 467,300 | | | | 11,486,234 |
| Stewart Information Services | | | 83,852 | | | | 6,685,520 |
| | | | | | | | 37,065,409 |
| THRIFTS & MORTGAGE FINANCE - 1.1% | | | | | | | |
| Axos Financial 1 | | | 160,300 | | | | 8,962,373 |
| Walker & Dunlop | | | 68,988 | | | | 10,408,909 |
| | | | | | | | 19,371,282 |
| Total (Cost $63,019,167) | | | | | | | 106,585,431 |
| | | | | | | | |
| HEALTH CARE – 5.9% | | | | | | | |
| BIOTECHNOLOGY - 0.3% | | | | | | | |
| Emergent BioSolutions 1 | | | 112,226 | | | | 4,878,464 |
| HEALTH CARE EQUIPMENT & SUPPLIES - 2.2% | | | | | | | |
| Accuray 1 | | | 1,236,008 | | | | 5,895,758 |
| †Bioventus Cl. A 1 | | | 470,315 | | | | 6,814,864 |
| IntriCon Corporation 1,2 | | | 486,447 | | | | 7,865,848 |
| Invacare Corporation 1 | | | 371,908 | | | | 1,011,590 |
| †Ortho Clinical Diagnostics Holdings 1 | | | 288,900 | | | | 6,179,571 |
| Orthofix Medical 1 | | | 113,996 | | | | 3,544,136 |
| Sientra 1,3 | | | 231,616 | | | | 850,031 |
| Varex Imaging 1 | | | 253,646 | | | | 8,002,531 |
| | | | | | | | 40,164,329 |
| HEALTH CARE PROVIDERS & SERVICES - 2.8% | | | | | | | |
| †ATI Physical Therapy Cl. A 1,3 | | | 445,500 | | | | 1,510,245 |
| Community Health Systems 1 | | | 549,714 | | | | 7,316,693 |
| Cross Country Healthcare 1 | | | 451,020 | | | | 12,520,315 |
| Option Care Health 1 | | | 285,171 | | | | 8,110,263 |
| Owens & Minor | | | 273,307 | | | | 11,888,855 |
| RadNet 1 | | | 143,800 | | | | 4,329,818 |
| Select Medical Holdings | | | 187,100 | | | | 5,500,740 |
| | | | | | | | 51,176,929 |
| PHARMACEUTICALS - 0.6% | | | | | | | |
| †Organon & Co. | | | 330,003 | | | | 10,048,592 |
| Total (Cost $69,290,649) | | | | | | | 106,268,314 |
| | | | | | | | |
| INDUSTRIALS – 29.3% | | | | | | | |
| AEROSPACE & DEFENSE - 3.4% | | | | | | | |
| AAR Corporation 1 | | | 326,400 | | | | 12,739,392 |
| Astronics Corporation 1 | | | 710,900 | | | | 8,530,800 |
| Ducommun 1 | | | 221,286 | | | | 10,349,546 |
| Hexcel Corporation 1 | | | 181,000 | | | | 9,375,800 |
| Spirit AeroSystems Holdings Cl. A | | | 214,400 | | | | 9,238,496 |
| Triumph Group 1 | | | 603,616 | | | | 11,185,005 |
| | | | | | | | 61,419,039 |
| AIR FREIGHT & LOGISTICS - 1.6% | | | | | | | |
| Atlas Air Worldwide Holdings 1,3 | | | 122,036 | | | | 11,486,028 |
| Hub Group Cl. A 1 | | | 151,700 | | | | 12,779,208 |
| Radiant Logistics 1 | | | 685,069 | | | | 4,994,153 |
| | | | | | | | 29,259,389 |
| AIRLINES - 1.2% | | | | | | | |
| Alaska Air Group 1 | | | 115,100 | | | | 5,996,710 |
| JetBlue Airways 1 | | | 620,400 | | | | 8,834,496 |
| Mesa Air Group 1 | | | 1,150,246 | | | | 6,441,378 |
| | | | | | | | 21,272,584 |
| BUILDING PRODUCTS - 3.1% | | | | | | | |
| Apogee Enterprises | | | 247,300 | | | | 11,907,495 |
| Gibraltar Industries 1 | | | 63,600 | | | | 4,240,848 |
| Griffon Corporation | | | 372,667 | | | | 10,613,556 |
| Insteel Industries | | | 107,633 | | | | 4,284,870 |
| JELD-WEN Holding 1 | | | 345,813 | | | | 9,115,631 |
| PGT Innovations 1 | | | 187,943 | | | | 4,226,838 |
| Resideo Technologies 1,3 | | | 403,216 | | | | 10,495,712 |
| | | | | | | | 54,884,950 |
| COMMERCIAL SERVICES & SUPPLIES - 3.5% | | | | | | | |
| Heritage-Crystal Clean 1 | | | 289,388 | | | | 9,266,204 |
| Interface | | | 498,967 | | | | 7,958,524 |
| KAR Auction Services 1 | | | 434,980 | | | | 6,794,387 |
| MillerKnoll | | | 238,700 | | | | 9,354,653 |
| Pitney Bowes | | | 1,359,494 | | | | 9,013,445 |
| Steelcase Cl. A | | | 585,400 | | | | 6,860,888 |
| †VSE Corporation | | | 221,932 | | | | 13,524,536 |
| | | | | | | | 62,772,637 |
| CONSTRUCTION & ENGINEERING - 3.4% | | | | | | | |
| Arcosa | | | 207,506 | | | | 10,935,566 |
| Comfort Systems USA | | | 75,110 | | | | 7,431,384 |
| Concrete Pumping Holdings 1,3 | | | 785,299 | | | | 6,439,452 |
| Construction Partners Cl. A 1 | | | 183,159 | | | | 5,386,706 |
| †Limbach Holdings 1,2 | | | 635,423 | | | | 5,718,807 |
| Matrix Service 1 | | | 694,546 | | | | 5,222,986 |
| Northwest Pipe 1 | | | 370,418 | | | | 11,779,292 |
| Orion Group Holdings 1 | | | 556,653 | | | | 2,098,582 |
| Primoris Services | | | 275,880 | | | | 6,615,602 |
| | | | | | | | 61,628,377 |
| ELECTRICAL EQUIPMENT - 0.9% | | | | | | | |
| Babcock & Wilcox Enterprises 1 | | | 1,193,395 | | | | 10,764,423 |
| LSI Industries | | | 555,973 | | | | 3,813,975 |
| Power Solutions International 1,5 | | | 343,740 | | | | 893,724 |
| | | | | | | | 15,472,122 |
| MACHINERY - 6.5% | | | | | | | |
| Barnes Group | | | 161,300 | | | | 7,514,967 |
| CIRCOR International 1 | | | 374,103 | | | | 10,168,119 |
| Commercial Vehicle Group 1 | | | 785,257 | | | | 6,329,171 |
| EnPro Industries | | | 116,500 | | | | 12,823,155 |
| †Evercel 1,5 | | | 203,243 | | | | 386,162 |
| Hurco Companies | | | 77,351 | | | | 2,297,325 |
| Hyster-Yale Materials Handling Cl. A | | | 93,366 | | | | 3,837,343 |
| †Luxfer Holdings | | | 457,800 | | | | 8,840,118 |
| Manitex International 1 | | | 786,453 | | | | 5,001,841 |
| Meritor 1 | | | 349,208 | | | | 8,653,374 |
| NN 1 | | | 1,226,665 | | | | 5,029,326 |
| Park-Ohio Holdings | | | 188,893 | | | | 3,998,865 |
| Shyft Group (The) | | | 238,038 | | | | 11,694,807 |
| Trinity Industries | | | 348,224 | | | | 10,516,365 |
| Twin Disc 1 | | | 327,853 | | | | 3,593,269 |
| Wabash National | | | 671,000 | | | | 13,097,920 |
| Westport Fuel Systems 1 | | | 1,542,333 | | | | 3,655,329 |
| | | | | | | | 117,437,456 |
| MARINE - 0.1% | | | | | | | |
| Diana Shipping | | | 649,710 | | | | 2,527,372 |
| PROFESSIONAL SERVICES - 1.7% | | | | | | | |
| Heidrick & Struggles International | | | 160,665 | | | | 7,025,881 |
| THE ACCOMPANYING NOTES ARE AN INTEGRAL PART OF THESE FINANCIAL STATEMENTS | The Royce Funds 2021 Annual Report to Shareholders | 37 |
Schedules of Investments
Royce Opportunity Fund (continued)
| | | SHARES | | VALUE |
| | | | | |
| INDUSTRIALS (continued) | | | | | | | |
| PROFESSIONAL SERVICES (continued) | | | | | | | |
| Korn Ferry | | | 129,645 | | | $ | 9,818,016 |
| Mistras Group 1 | | | 471,007 | | | | 3,499,582 |
| TrueBlue 1 | | | 380,036 | | | | 10,515,596 |
| | | | | | | | 30,859,075 |
| ROAD & RAIL - 0.6% | | | | | | | |
| †Daseke 1 | | | 502,600 | | | | 5,046,104 |
| †U.S. Xpress Enterprises Cl. A 1 | | | 923,328 | | | | 5,419,935 |
| | | | | | | | 10,466,039 |
| TRADING COMPANIES & DISTRIBUTORS - 3.3% | | | | | | | |
| Air Lease Cl. A | | | 281,738 | | | | 12,461,272 |
| †BlueLinx Holdings 1 | | | 143,800 | | | | 13,770,288 |
| Herc Holdings | | | 50,019 | | | | 7,830,475 |
| †Hudson Technologies 1 | | | 395,818 | | | | 1,757,432 |
| Univar Solutions 1 | | | 390,900 | | | | 11,082,015 |
| †WESCO International 1 | | | 95,804 | | | | 12,606,848 |
| | | | | | | | 59,508,330 |
| Total (Cost $432,926,416) | | | | | | | 527,507,370 |
| | | | | | | | |
| INFORMATION TECHNOLOGY – 19.8% | | | | | | | |
| COMMUNICATIONS EQUIPMENT - 5.2% | | | | | | | |
| ADTRAN | | | 550,100 | | | | 12,558,783 |
| Applied Optoelectronics 1,3 | | | 782,700 | | | | 4,023,078 |
| Aviat Networks 1 | | | 271,578 | | | | 8,712,222 |
| CalAmp Corporation 1 | | | 1,036,900 | | | | 7,320,514 |
| †Cambium Networks 1 | | | 125,900 | | | | 3,226,817 |
| Ceragon Networks 1,3 | | | 1,131,416 | | | | 2,919,053 |
| Comtech Telecommunications | | | 442,117 | | | | 10,473,752 |
| Digi International 1 | | | 548,102 | | | | 13,466,866 |
| DZS 1 | | | 645,529 | | | | 10,470,480 |
| Infinera Corporation 1,3 | | | 749,546 | | | | 7,188,146 |
| PCTEL 1,2 | | | 1,000,593 | | | | 5,673,362 |
| †Sierra Wireless 1,3 | | | 430,691 | | | | 7,588,776 |
| | | | | | | | 93,621,849 |
| ELECTRONIC EQUIPMENT, INSTRUMENTS & COMPONENTS - 4.7% | | | | | | | |
| Advanced Energy Industries | | | 128,953 | | | | 11,742,460 |
| †Arlo Technologies 1 | | | 204,600 | | | | 2,146,254 |
| Avnet | | | 295,500 | | | | 12,183,465 |
| Benchmark Electronics | | | 78,700 | | | | 2,132,770 |
| CTS Corporation | | | 273,014 | | | | 10,025,074 |
| Fabrinet 1 | | | 90,529 | | | | 10,724,971 |
| Frequency Electronics 1 | | | 289,393 | | | | 2,853,415 |
| Identiv 1 | | | 170,720 | | | | 4,804,061 |
| Knowles Corporation 1 | | | 568,620 | | | | 13,277,277 |
| SigmaTron International 1 | | | 67,400 | | | | 696,242 |
| VIA optronics ADR 1 | | | 719,932 | | | | 5,291,500 |
| Vishay Intertechnology | | | 402,409 | | | | 8,800,685 |
| | | | | | | | 84,678,174 |
| IT SERVICES - 0.3% | | | | | | | |
| †Conduent 1 | | | 899,800 | | | | 4,804,932 |
| SEMICONDUCTORS & SEMICONDUCTOR EQUIPMENT - 5.7% | | | | | | | |
| Alpha & Omega Semiconductor 1 | | | 143,513 | | | | 8,691,147 |
| Amkor Technology | | | 472,440 | | | | 11,711,788 |
| Amtech Systems 1 | | | 606,884 | | | | 5,996,014 |
| Cohu 1 | | | 333,676 | | | | 12,709,719 |
| FormFactor 1 | | | 243,513 | | | | 11,133,414 |
| Ichor Holdings 1 | | | 239,994 | | | | 11,046,924 |
| Kulicke & Soffa Industries | | | 152,165 | | | | 9,212,069 |
| Onto Innovation 1 | | | 66,619 | | | | 6,743,841 |
| Ultra Clean Holdings 1 | | | 222,527 | | | | 12,764,149 |
| Veeco Instruments 1,3 | | | 439,887 | | | | 12,523,583 |
| | | | | | | | 102,532,648 |
| SOFTWARE - 2.9% | | | | | | | |
| A10 Networks | | | 565,126 | | | | 9,369,789 |
| Avaya Holdings 1 | | | 528,454 | | | | 10,463,389 |
| Ebix | | | 209,700 | | | | 6,374,880 |
| InterDigital | | | 96,500 | | | | 6,912,295 |
| Kaleyra 1,3 | | | 697,957 | | | | 7,007,488 |
| Marin Software 1 | | | 452,830 | | | | 1,680,000 |
| †ON24 1 | | | 204,600 | | | | 3,549,810 |
| SecureWorks Corp. Cl. A 1 | | | 475,762 | | | | 7,597,919 |
| | | | | | | | 52,955,570 |
| TECHNOLOGY HARDWARE, STORAGE & PERIPHERALS - 1.0% | | | | | | | |
| Avid Technology 1 | | | 330,485 | | | | 10,763,897 |
| †Immersion Corporation 1 | | | 670,400 | | | | 3,827,984 |
| Intevac 1 | | | 591,102 | | | | 2,784,090 |
| | | | | | | | 17,375,971 |
| Total (Cost $245,474,592) | | | | | | | 355,969,144 |
| | | | | | | | |
| MATERIALS – 9.6% | | | | | | | |
| CHEMICALS - 3.2% | | | | | | | |
| AdvanSix | | | 242,112 | | | | 11,439,792 |
| American Vanguard | | | 373,714 | | | | 6,125,172 |
| Huntsman Corporation | | | 347,100 | | | | 12,106,848 |
| Intrepid Potash 1 | | | 87,882 | | | | 3,755,198 |
| Livent Corporation 1,3 | | | 230,300 | | | | 5,614,714 |
| LSB Industries 1 | | | 623,962 | | | | 6,894,780 |
| Trecora Resources 1 | | | 640,431 | | | | 5,174,683 |
| Tronox Holdings | | | 247,700 | | | | 5,952,231 |
| | | | | | | | 57,063,418 |
| CONTAINERS & PACKAGING - 0.5% | | | | | | | |
| TriMas Corporation | | | 258,410 | | | | 9,561,170 |
| METALS & MINING - 5.3% | | | | | | | |
| Allegheny Technologies 1 | | | 676,214 | | | | 10,772,089 |
| Carpenter Technology | | | 281,442 | | | | 8,215,292 |
| Century Aluminum 1 | | | 501,610 | | | | 8,306,662 |
| Cleveland-Cliffs 1 | | | 453,549 | | | | 9,873,762 |
| Coeur Mining 1 | | | 714,832 | | | | 3,602,753 |
| Commercial Metals | | | 362,200 | | | | 13,144,238 |
| Ferroglobe 1 | | | 1,242,571 | | | | 7,716,366 |
| Haynes International | | | 321,661 | | | | 12,972,588 |
| Major Drilling Group International 1 | | | 970,900 | | | | 6,339,882 |
| Noranda Aluminum Holding Corporation 1,4 | | | 488,157 | | | | 49 |
| †Olympic Steel | | | 170,995 | | | | 4,018,382 |
| TimkenSteel Corporation 1 | | | 657,700 | | | | 10,852,050 |
| | | | | | | | 95,814,113 |
| PAPER & FOREST PRODUCTS - 0.6% | | | | | | | |
| Glatfelter Corporation | | | 588,545 | | | | 10,122,974 |
| Total (Cost $118,022,665) | | | | | | | 172,561,675 |
| | | | | | | | |
| REAL ESTATE – 3.1% | | | | | | | |
| EQUITY REAL ESTATE INVESTMENT TRUSTS (REITS) - 2.7% | | | | | | | |
| Alexander & Baldwin | | | 379,700 | | | | 9,526,673 |
| Armada Hoffler Properties | | | 369,534 | | | | 5,624,308 |
| †Braemar Hotels & Resorts 1 | | | 489,753 | | | | 2,497,740 |
| †Chatham Lodging Trust 1 | | | 265,800 | | | | 3,646,776 |
| Diversified Healthcare Trust | | | 294,000 | | | | 908,460 |
| †Macerich Company | | | 645,100 | | | | 11,147,328 |
| Ryman Hospitality Properties 1 | | | 50,271 | | | | 4,622,921 |
| 38 | The Royce Funds 2021 Annual Report to Shareholders | THE ACCOMPANYING NOTES ARE AN INTEGRAL PART OF THESE FINANCIAL STATEMENTS |
December 31, 2021
Royce Opportunity Fund (continued)
| | | SHARES | | VALUE | |
| | | | | | |
| REAL ESTATE (continued) | | | | | |
| EQUITY REAL ESTATE INVESTMENT TRUSTS (REITS) (continued) | | | | | | | | |
| Tanger Factory Outlet Centers | | | 533,800 | | | $ | 10,291,664 | |
| | | | | | | | 48,265,870 | |
| REAL ESTATE MANAGEMENT & DEVELOPMENT - 0.4% | | | | | | | | |
| Realogy Holdings 1 | | | 409,320 | | | | 6,880,669 | |
| Total (Cost $36,326,167) | | | | | | | 55,146,539 | |
| | | | | | | | | |
| TOTAL COMMON STOCKS | | | | | | | | |
| (Cost $1,334,946,158) | | | | | | | 1,753,559,615 | |
| | | | | | | | | |
| REPURCHASE AGREEMENT – 2.4% | | | | | | | | |
Fixed Income Clearing Corporation, 0.00% dated 12/31/21, due 1/3/22, maturity value $42,681,217 (collateralized by obligations of various U.S. Government Agencies, 2.50% due 1/15/29, valued at $43,534,879) | |
| (Cost $42,681,217) | | | | | | | 42,681,217 | |
| | | | | | | | | |
| COLLATERAL RECEIVED FOR SECURITIES LOANED – 0.2% | | | | | | | | |
| Money Market Funds | | | | | | | | |
| Federated Government Obligations Fund - Institutional Shares (7 day yield-0.03%) | | | | | | | | |
| (Cost $3,651,391) | | | 3,651,391 | | | | 3,651,391 | |
| | | | | | | | | |
| TOTAL INVESTMENTS – 100.0% | | | | | | | | |
| (Cost $1,381,278,766) | | | | | | | 1,799,892,223 | |
| | | | | | | | | |
| LIABILITIES LESS CASH AND OTHER ASSETS – (0.0)% | | | | | | | (33,794 | ) |
| | | | | | | | | |
| NET ASSETS – 100.0% | | | | | | $ | 1,799,858,429 | |
Royce Pennsylvania Mutual Fund
Common Stocks – 98.0%
| | | SHARES | | VALUE |
| | | | | |
| COMMUNICATION SERVICES – 1.5% | | | | | | | |
| DIVERSIFIED TELECOMMUNICATION SERVICES - 0.2% | | | | | | | |
| Liberty Latin America Cl. C 1 | | | 375,620 | | | $ | 4,282,068 |
| ENTERTAINMENT - 0.3% | | | | | | | |
| †Chicken Soup For The Soul Entertainment Cl. A 1 | | | 33,785 | | | | 467,584 |
| IMAX Corporation 1 | | | 240,219 | | | | 4,285,507 |
| World Wrestling Entertainment Cl. A | | | 62,818 | | | | 3,099,440 |
| | | | | | | | 7,852,531 |
| INTERACTIVE MEDIA & SERVICES - 0.6% | | | | | | | |
| QuinStreet 1 | | | 78,343 | | | | 1,425,059 |
| Ziff Davis 1 | | | 97,870 | | | | 10,849,868 |
| | | | | | | | 12,274,927 |
| MEDIA - 0.4% | | | | | | | |
| Media General (Rights) 1,4 | | | 102,272 | | | | 0 |
| New York Times Cl. A | | | 165,886 | | | | 8,012,294 |
| | | | | | | | 8,012,294 |
| Total (Cost $34,894,432) | | | | | | | 32,421,820 |
| | | | | | | | |
| CONSUMER DISCRETIONARY – 11.2% | | | | | | | |
| AUTO COMPONENTS - 2.1% | | | | | | | |
| Dorman Products 1 | | | 100,012 | | | | 11,302,356 |
| Gentex Corporation | | | 277,656 | | | | 9,676,312 |
| LCI Industries | | | 71,735 | | | | 11,181,334 |
| Patrick Industries | | | 98,982 | | | | 7,986,858 |
| Standard Motor Products | | | 44,068 | | | | 2,308,722 |
| Stoneridge 1 | | | 103,047 | | | | 2,034,148 |
| | | | | | | | 44,489,730 |
| AUTOMOBILES - 0.4% | | | | | | | |
| Winnebago Industries | | | 113,253 | | | | 8,484,915 |
| DISTRIBUTORS - 0.2% | | | | | | | |
| LKQ Corporation | | | 89,921 | | | | 5,397,958 |
| DIVERSIFIED CONSUMER SERVICES - 0.1% | | | | | | | |
| †H&R Block | | | 46,877 | | | | 1,104,422 |
| Lincoln Educational Services 1 | | | 15,200 | | | | 113,544 |
| | | | | | | | 1,217,966 |
| HOTELS, RESTAURANTS & LEISURE - 1.0% | | | | | | | |
| Century Casinos 1 | | | 498,941 | | | | 6,077,101 |
| †Hyatt Hotels Cl. A 1 | | | 17,952 | | | | 1,721,597 |
| Scientific Games 1 | | | 206,147 | | | | 13,776,804 |
| | | | | | | | 21,575,502 |
| HOUSEHOLD DURABLES - 1.3% | | | | | | | |
| La-Z-Boy | | | 138,442 | | | | 5,026,829 |
| Legacy Housing 1 | | | 97,929 | | | | 2,592,181 |
| †M/I Homes 1 | | | 50,623 | | | | 3,147,738 |
| PulteGroup | | | 104,253 | | | | 5,959,101 |
| Skyline Champion 1 | | | 118,264 | | | | 9,340,491 |
| TopBuild Corp. 1,3 | | | 5,149 | | | | 1,420,660 |
| | | | | | | | 27,487,000 |
| INTERNET & DIRECT MARKETING RETAIL - 0.1% | | | | | | | |
| 1-800-FLOWERS.COM Cl. A 1 | | | 82,537 | | | | 1,928,890 |
| LEISURE PRODUCTS - 1.0% | | | | | | | |
| Brunswick Corporation | | | 47,569 | | | | 4,791,625 |
| Malibu Boats Cl. A 1 | | | 80,038 | | | | 5,501,012 |
| MasterCraft Boat Holdings 1 | | | 430,275 | | | | 12,189,691 |
| | | | | | | | 22,482,328 |
| MULTILINE RETAIL - 0.2% | | | | | | | |
| Franchise Group Cl. A | | | 90,253 | | | | 4,707,596 |
| †Ollie’s Bargain Outlet Holdings 1,3 | | | 9,793 | | | | 501,304 |
| | | | | | | | 5,208,900 |
| SPECIALTY RETAIL - 3.5% | | | | | | | |
| Aaron’s Company (The) | | | 203,027 | | | | 5,004,616 |
| THE ACCOMPANYING NOTES ARE AN INTEGRAL PART OF THESE FINANCIAL STATEMENTS | The Royce Funds 2021 Annual Report to Shareholders | 39 |
Schedules of Investments
Royce Pennsylvania Mutual Fund (continued)
| | | SHARES | | VALUE |
| | | | | |
| CONSUMER DISCRETIONARY (continued) | | | | | | | |
| SPECIALTY RETAIL (continued) | | | | | | | |
| American Eagle Outfitters | | | 197,569 | | | $ | 5,002,447 |
| America’s Car-Mart 1 | | | 69,019 | | | | 7,067,546 |
| Asbury Automotive Group 1 | | | 88,072 | | | | 15,212,677 |
| Haverty Furniture | | | 154,342 | | | | 4,718,235 |
| †Lazydays Holdings 1,3 | | | 197,834 | | | | 4,261,344 |
| OneWater Marine Cl. A | | | 139,461 | | | | 8,502,937 |
| Rent-A-Center | | | 297,011 | | | | 14,268,408 |
| Shoe Carnival | | | 276,028 | | | | 10,787,174 |
| | | | | | | | 74,825,384 |
| TEXTILES, APPAREL & LUXURY GOODS - 1.3% | | | | | | | |
| Canada Goose Holdings 1,3 | | | 205,977 | | | | 7,633,508 |
| †Levi Strauss & Co. Cl. A | | | 132,393 | | | | 3,313,797 |
| Movado Group | | | 100,401 | | | | 4,199,774 |
| Ralph Lauren Cl. A | | | 67,404 | | | | 8,011,639 |
| Wolverine World Wide | | | 174,347 | | | | 5,022,937 |
| | | | | | | | 28,181,655 |
| Total (Cost $153,603,827) | | | | | | | 241,280,228 |
| | | | | | | | |
| CONSUMER STAPLES – 1.1% | | | | | | | |
| FOOD PRODUCTS - 0.4% | | | | | | | |
| Nomad Foods 1 | | | 150,865 | | | | 3,830,462 |
| Seneca Foods Cl. A 1 | | | 92,085 | | | | 4,415,476 |
| | | | | | | | 8,245,938 |
| HOUSEHOLD PRODUCTS - 0.1% | | | | | | | |
| Spectrum Brands Holdings | | | 28,675 | | | | 2,916,821 |
| PERSONAL PRODUCTS - 0.6% | | | | | | | |
| Inter Parfums | | | 117,153 | | | | 12,523,656 |
| Total (Cost $8,851,986) | | | | | | | 23,686,415 |
| | | | | | | | |
| ENERGY – 1.7% | | | | | | | |
| ENERGY EQUIPMENT & SERVICES - 1.3% | | | | | | | |
| †Aspen Aerogels 1 | | | 126,230 | | | | 6,284,992 |
| Computer Modelling Group | | | 2,652,180 | | | | 8,931,805 |
| Pason Systems | | | 1,494,958 | | | | 13,638,338 |
| | | | | | | | 28,855,135 |
| OIL, GAS & CONSUMABLE FUELS - 0.4% | | | | | | | |
| †Antero Resources 1 | | | 241,533 | | | | 4,226,827 |
| †PDC Energy | | | 89,546 | | | | 4,368,054 |
| | | | | | | | 8,594,881 |
| Total (Cost $31,335,542) | | | | | | | 37,450,016 |
| | | | | | | | |
| FINANCIALS – 18.4% | | | | | | | |
| BANKS - 6.4% | | | | | | | |
| Bank of N.T. Butterfield & Son | | | 60,065 | | | | 2,289,077 |
| BankUnited | | | 134,636 | | | | 5,696,449 |
| BOK Financial | | | 40,738 | | | | 4,297,452 |
| CIT Group | | | 111,276 | | | | 5,712,910 |
| First Bancshares (The) | | | 190,673 | | | | 7,363,791 |
| First Citizens BancShares Cl. A | | | 33,979 | | | | 28,197,134 |
| First Hawaiian | | | 399,637 | | | | 10,922,079 |
| German American Bancorp | | | 45,950 | | | | 1,791,131 |
| Home BancShares | | | 281,068 | | | | 6,844,006 |
| Independent Bank Group | | | 119,969 | | | | 8,655,763 |
| National Bankshares | | | 96,758 | | | | 3,508,445 |
| Origin Bancorp | | | 104,548 | | | | 4,487,200 |
| Popular | | | 189,632 | | | | 15,557,409 |
| Signature Bank | | | 24,915 | | | | 8,059,255 |
| †Silvergate Capital Cl. A 1 | | | 29,725 | | | | 4,405,245 |
| Texas Capital Bancshares 1 | | | 36,555 | | | | 2,202,439 |
| Triumph Bancorp 1 | | | 154,852 | | | | 18,439,776 |
| | | | | | | | 138,429,561 |
| CAPITAL MARKETS - 5.5% | | | | | | | |
| Ares Management Cl. A | | | 143,976 | | | | 11,700,929 |
| Artisan Partners Asset Management Cl. A | | | 123,111 | | | | 5,865,008 |
| B. Riley Financial | | | 33,002 | | | | 2,932,558 |
| Evercore Cl. A | | | 42,456 | | | | 5,767,648 |
| GCM Grosvenor Cl. A | | | 1,333,022 | | | | 13,996,731 |
| Houlihan Lokey Cl. A | | | 92,118 | | | | 9,536,055 |
| Lazard Cl. A | | | 99,648 | | | | 4,347,642 |
| †MarketWise Cl. A 1 | | | 500,000 | | | | 3,770,000 |
| Moelis & Company Cl. A | | | 54,597 | | | | 3,412,858 |
| Morningstar | | | 51,838 | | | | 17,728,078 |
| †Newtek Business Services | | | 114,067 | | | | 3,151,671 |
| SEI Investments | | | 303,597 | | | | 18,501,201 |
| Silvercrest Asset Management Group Cl. A | | | 170,681 | | | | 2,930,593 |
| Sprott | | | 181,064 | | | | 8,170,389 |
| TMX Group | | | 56,620 | | | | 5,740,555 |
| | | | | | | | 117,551,916 |
| CONSUMER FINANCE - 0.3% | | | | | | | |
| PROG Holdings 1 | | | 125,373 | | | | 5,655,576 |
| DIVERSIFIED FINANCIAL SERVICES - 0.2% | | | | | | | |
| Compass Diversified Holdings | | | 155,336 | | | | 4,750,175 |
| INSURANCE - 5.4% | | | | | | | |
| Alleghany Corporation 1 | | | 10,160 | | | | 6,782,714 |
| AMERISAFE | | | 106,723 | | | | 5,744,899 |
| Assured Guaranty | | | 124,544 | | | | 6,252,109 |
| Axis Capital Holdings | | | 101,044 | | | | 5,503,867 |
| CNO Financial Group | | | 249,087 | | | | 5,938,234 |
| E-L Financial | | | 24,818 | | | | 17,809,826 |
| †Employers Holdings | | | 109,724 | | | | 4,540,379 |
| †First American Financial | | | 38,512 | | | | 3,012,794 |
| †International General Insurance Holdings | | | 198,684 | | | | 1,609,340 |
| James River Group Holdings | | | 479,229 | | | | 13,806,587 |
| Old Republic International | | | 190,275 | | | | 4,676,960 |
| ProAssurance Corporation | | | 311,380 | | | | 7,877,914 |
| RenaissanceRe Holdings | | | 31,381 | | | | 5,313,745 |
| RLI Corp. | | | 69,047 | | | | 7,740,169 |
| †Safety Insurance Group | | | 63,654 | | | | 5,412,500 |
| Stewart Information Services | | | 42,421 | | | | 3,382,226 |
| †Tiptree | | | 30,247 | | | | 418,316 |
| †Trean Insurance Group 1 | | | 419,642 | | | | 3,739,010 |
| White Mountains Insurance Group | | | 5,236 | | | | 5,308,780 |
| | | | | | | | 114,870,369 |
| THRIFTS & MORTGAGE FINANCE - 0.6% | | | | | | | |
| Axos Financial 1 | | | 120,414 | | | | 6,732,347 |
| Southern Missouri Bancorp | | | 8,715 | | | | 454,662 |
| Timberland Bancorp | | | 107,601 | | | | 2,980,548 |
| TrustCo Bank Corp NY | | | 90,463 | | | | 3,013,322 |
| | | | | | | | 13,180,879 |
| Total (Cost $276,921,097) | | | | | | | 394,438,476 |
| | | | | | | | |
| HEALTH CARE – 6.1% | | | | | | | |
| BIOTECHNOLOGY - 0.6% | | | | | | | |
| CareDx 1 | | | 100,005 | | | | 4,548,227 |
| †Catalyst Pharmaceuticals 1 | | | 605,347 | | | | 4,098,199 |
| †Ironwood Pharmaceuticals Cl. A 1 | | | 163,300 | | | | 1,904,078 |
| †MeiraGTx Holdings 1 | | | 95,578 | | | | 2,269,022 |
| | | | | | | | 12,819,526 |
| 40 | The Royce Funds 2021 Annual Report to Shareholders | THE ACCOMPANYING NOTES ARE AN INTEGRAL PART OF THESE FINANCIAL STATEMENTS |
December 31, 2021
Royce Pennsylvania Mutual Fund (continued)
| | | SHARES | | VALUE |
| | | | | |
| HEALTH CARE (continued) | | | | | | | |
| HEALTH CARE EQUIPMENT & SUPPLIES - 3.5% | | | | | | | |
| AtriCure 1 | | | 24,482 | | | $ | 1,702,233 |
| Atrion Corporation | | | 8,442 | | | | 5,950,766 |
| †Bioventus Cl. A 1 | | | 331,782 | | | | 4,807,521 |
| Cutera 1 | | | 47,300 | | | | 1,954,436 |
| †FIGS Cl. A 1,3 | | | 169,176 | | | | 4,662,491 |
| Haemonetics Corporation 1 | | | 261,831 | | | | 13,887,516 |
| Meridian Bioscience 1 | | | 505,743 | | | | 10,317,157 |
| Mesa Laboratories | | | 74,233 | | | | 24,355,105 |
| Natus Medical 1 | | | 101,650 | | | | 2,412,154 |
| OrthoPediatrics Corp. 1,3 | | | 55,623 | | | | 3,329,593 |
| Profound Medical 1 | | | 52,098 | | | | 587,310 |
| Surmodics 1 | | | 42,305 | | | | 2,036,986 |
| | | | | | | | 76,003,268 |
| HEALTH CARE PROVIDERS & SERVICES - 0.7% | | | | | | | |
| Encompass Health | | | 105,038 | | | | 6,854,780 |
| Ensign Group (The) | | | 20,690 | | | | 1,737,132 |
| Molina Healthcare 1 | | | 18,439 | | | | 5,865,077 |
| Sharps Compliance 1 | | | 145,130 | | | | 1,034,777 |
| | | | | | | | 15,491,766 |
| HEALTH CARE TECHNOLOGY - 0.3% | | | | | | | |
| Simulations Plus | | | 122,705 | | | | 5,803,947 |
| LIFE SCIENCES TOOLS & SERVICES - 0.6% | | | | | | | |
| Bio-Techne | | | 6,768 | | | | 3,501,357 |
| Harvard Bioscience 1 | | | 243,940 | | | | 1,719,777 |
| †MaxCyte 1,3 | | | 499,818 | | | | 5,093,146 |
| Quanterix Corporation 1 | | | 30,848 | | | | 1,307,955 |
| | | | | | | | 11,622,235 |
| PHARMACEUTICALS - 0.4% | | | | | | | |
| †BioDelivery Sciences International 1 | | | 694,097 | | | | 2,151,701 |
| †Harmony Biosciences Holdings 1,3 | | | 88,394 | | | | 3,769,120 |
| Supernus Pharmaceuticals 1,3 | | | 85,268 | | | | 2,486,415 |
| | | | | | | | 8,407,236 |
| Total (Cost $107,097,676) | | | | | | | 130,147,978 |
| | | | | | | | |
| INDUSTRIALS – 26.9% | | | | | | | |
| AEROSPACE & DEFENSE - 0.9% | | | | | | | |
| HEICO Corporation | | | 80,074 | | | | 11,548,272 |
| Vectrus 1 | | | 186,490 | | | | 8,535,648 |
| | | | | | | | 20,083,920 |
| AIR FREIGHT & LOGISTICS - 1.4% | | | | | | | |
| Forward Air | | | 174,856 | | | | 21,173,313 |
| Hub Group Cl. A 1 | | | 95,106 | | | | 8,011,730 |
| | | | | | | | 29,185,043 |
| AIRLINES - 0.5% | | | | | | | |
| †Sun Country Airlines Holdings 1,3 | | | 354,896 | | | | 9,670,916 |
| BUILDING PRODUCTS - 2.9% | | | | | | | |
| Advanced Drainage Systems | | | 36,852 | | | | 5,016,663 |
| †AZEK Company (The) Cl. A 1 | | | 37,900 | | | | 1,752,496 |
| †Builders FirstSource 1 | | | 221,228 | | | | 18,961,452 |
| Carlisle Companies | | | 27,152 | | | | 6,736,954 |
| Gibraltar Industries 1 | | | 85,446 | | | | 5,697,539 |
| Quanex Building Products | | | 118,518 | | | | 2,936,876 |
| Simpson Manufacturing | | | 50,494 | | | | 7,022,201 |
| UFP Industries | | | 156,008 | | | | 14,354,296 |
| | | | | | | | 62,478,477 |
| COMMERCIAL SERVICES & SUPPLIES - 0.7% | | | | | | | |
| †Deluxe Corporation | | | 175,875 | | | | 5,647,346 |
| Healthcare Services Group | | | 266,145 | | | | 4,734,720 |
| Heritage-Crystal Clean 1 | | | 151,087 | | | | 4,837,806 |
| | | | | | | | 15,219,872 |
| CONSTRUCTION & ENGINEERING - 3.6% | | | | | | | |
| Arcosa | | | 371,767 | | | | 19,592,121 |
| Construction Partners Cl. A 1,3 | | | 141,106 | | | | 4,149,927 |
| EMCOR Group | | | 28,938 | | | | 3,686,412 |
| Great Lakes Dredge & Dock 1 | | | 610,287 | | | | 9,593,712 |
| †Northwest Pipe 1 | | | 102,274 | | | | 3,252,313 |
| †NV5 Global 1 | | | 10,870 | | | | 1,501,364 |
| Primoris Services | | | 207,707 | | | | 4,980,814 |
| Sterling Construction 1 | | | 139,504 | | | | 3,668,955 |
| Valmont Industries | | | 77,271 | | | | 19,356,386 |
| WillScot Mobile Mini Holdings Corp. 1 | | | 195,025 | | | | 7,964,821 |
| | | | | | | | 77,746,825 |
| ELECTRICAL EQUIPMENT - 1.1% | | | | | | | |
| †American Superconductor 1 | | | 93,326 | | | | 1,015,387 |
| Encore Wire | | | 49,532 | | | | 7,088,029 |
| GrafTech International | | | 578,358 | | | | 6,841,975 |
| Preformed Line Products | | | 141,776 | | | | 9,172,907 |
| | | | | | | | 24,118,298 |
| MACHINERY - 7.0% | | | | | | | |
| CIRCOR International 1 | | | 108,897 | | | | 2,959,820 |
| Colfax Corporation 1,3 | | | 310,320 | | | | 14,265,410 |
| Crane Co. | | | 33,876 | | | | 3,446,205 |
| ESCO Technologies | | | 69,439 | | | | 6,248,816 |
| Graham Corporation | | | 91,849 | | | | 1,142,602 |
| Helios Technologies | | | 69,419 | | | | 7,300,796 |
| Hurco Companies | | | 66,102 | | | | 1,963,229 |
| John Bean Technologies | | | 100,057 | | | | 15,364,753 |
| Kadant | | | 92,153 | | | | 21,239,423 |
| Lincoln Electric Holdings | | | 123,611 | | | | 17,240,026 |
| Lindsay Corporation | | | 67,056 | | | | 10,192,512 |
| Meritor 1 | | | 326,161 | | | | 8,082,270 |
| Middleby Corporation (The) 1 | | | 99,792 | | | | 19,635,074 |
| Miller Industries | | | 312,074 | | | | 10,423,272 |
| Mueller Industries | | | 23,408 | | | | 1,389,499 |
| RBC Bearings 1 | | | 44,677 | | | | 9,023,414 |
| †Westport Fuel Systems 1 | | | 165,989 | | | | 393,394 |
| | | | | | | | 150,310,515 |
| MARINE - 0.6% | | | | | | | |
| Clarkson | | | 136,052 | | | | 7,145,143 |
| Kirby Corporation 1 | | | 95,774 | | | | 5,690,891 |
| | | | | | | | 12,836,034 |
| PROFESSIONAL SERVICES - 3.1% | | | | | | | |
| Forrester Research 1 | | | 271,918 | | | | 15,969,744 |
| Heidrick & Struggles International | | | 227,412 | | | | 9,944,727 |
| KBR | | | 513,108 | | | | 24,434,203 |
| Korn Ferry | | | 85,772 | | | | 6,495,513 |
| LifeWorks | | | 53,600 | | | | 1,081,788 |
| ManpowerGroup | | | 25,997 | | | | 2,530,288 |
| Upwork 1 | | | 194,341 | | | | 6,638,689 |
| | | | | | | | 67,094,952 |
| ROAD & RAIL - 2.0% | | | | | | | |
| ArcBest | | | 47,687 | | | | 5,715,287 |
| Landstar System | | | 91,040 | | | | 16,297,981 |
| Saia 1 | | | 25,131 | | | | 8,469,901 |
| Schneider National Cl. B | | | 195,175 | | | | 5,252,159 |
| Universal Logistics Holdings | | | 299,946 | | | | 5,656,982 |
| THE ACCOMPANYING NOTES ARE AN INTEGRAL PART OF THESE FINANCIAL STATEMENTS | The Royce Funds 2021 Annual Report to Shareholders | 41 |
Schedules of Investments
Royce Pennsylvania Mutual Fund (continued)
| | | SHARES | | VALUE |
| | | | | |
| INDUSTRIALS (continued) | | | | | | | |
| ROAD & RAIL (continued) | | | | | | | |
| Werner Enterprises | | | 27,347 | | | $ | 1,303,358 |
| | | | | | | | 42,695,668 |
| TRADING COMPANIES & DISTRIBUTORS - 3.1% | | | | | | | |
| Air Lease Cl. A | | | 458,977 | | | | 20,300,553 |
| Applied Industrial Technologies | | | 90,534 | | | | 9,297,842 |
| EVI Industries 1,3 | | | 332,790 | | | | 10,393,032 |
| Lawson Products 1 | | | 20,894 | | | | 1,143,946 |
| MSC Industrial Direct Cl. A | | | 48,118 | | | | 4,044,799 |
| Richelieu Hardware | | | 355,741 | | | | 12,270,034 |
| Transcat 1 | | | 101,294 | | | | 9,362,604 |
| | | | | | | | 66,812,810 |
| Total (Cost $337,206,896) | | | | | | | 578,253,330 |
| | | | | | | | |
| INFORMATION TECHNOLOGY – 20.9% | | | | | | | |
| COMMUNICATIONS EQUIPMENT - 0.7% | | | | | | | |
| †Calix 1 | | | 102,947 | | | | 8,232,672 |
| Digi International 1 | | | 307,783 | | | | 7,562,228 |
| | | | | | | | 15,794,900 |
| ELECTRONIC EQUIPMENT, INSTRUMENTS & COMPONENTS - 6.3% | | | | | | | |
| Belden | | | 42,307 | | | | 2,780,839 |
| Cognex Corporation | | | 89,061 | | | | 6,925,383 |
| ePlus 1 | | | 65,376 | | | | 3,522,459 |
| Fabrinet 1 | | | 99,315 | | | | 11,765,848 |
| FARO Technologies 1 | | | 173,224 | | | | 12,129,144 |
| Flex 1 | | | 10,000 | | | | 183,300 |
| Insight Enterprises 1 | | | 48,203 | | | | 5,138,440 |
| IPG Photonics 1 | | | 13,349 | | | | 2,297,897 |
| Jabil | | | 71,959 | | | | 5,062,316 |
| Kimball Electronics 1 | | | 399,698 | | | | 8,697,428 |
| Littelfuse | | | 7,222 | | | | 2,272,619 |
| Luna Innovations 1 | | | 766,388 | | | | 6,468,315 |
| National Instruments | | | 17,921 | | | | 782,610 |
| nLIGHT 1,3 | | | 163,961 | | | | 3,926,866 |
| PAR Technology 1 | | | 231,475 | | | | 12,214,936 |
| †PowerFleet 1 | | | 155,315 | | | | 736,193 |
| Rogers Corporation 1 | | | 34,854 | | | | 9,515,142 |
| Sanmina Corporation 1 | | | 147,123 | | | | 6,099,720 |
| TD SYNNEX | | | 44,491 | | | | 5,087,991 |
| Vishay Intertechnology | | | 483,754 | | | | 10,579,700 |
| Vishay Precision Group 1 | | | 101,126 | | | | 3,753,797 |
| †Vontier Corporation | | | 520,378 | | | | 15,991,216 |
| | | | | | | | 135,932,159 |
| IT SERVICES - 1.7% | | | | | | | |
| Computer Services 5 | | | 143,710 | | | | 7,504,536 |
| Repay Holdings Cl. A 1,3 | | | 666,845 | | | | 12,183,258 |
| Shift4 Payments Cl. A 1,3 | | | 223,666 | | | | 12,956,972 |
| Unisys Corporation 1 | | | 122,411 | | | | 2,517,994 |
| | | | | | | | 35,162,760 |
| SEMICONDUCTORS & SEMICONDUCTOR EQUIPMENT - 9.4% | | | | | | | |
| †Amkor Technology | | | 6,100 | | | | 151,219 |
| Axcelis Technologies 1 | | | 75,892 | | | | 5,658,508 |
| Azenta | | | 79,518 | | | | 8,199,101 |
| †BE Semiconductor Industries | | | 21,200 | | | | 1,810,697 |
| †Camtek 1 | | | 337,208 | | | | 15,525,056 |
| Cirrus Logic 1 | | | 168,966 | | | | 15,548,251 |
| CMC Materials | | | 61,826 | | | | 11,851,426 |
| Cohu 1 | | | 398,838 | | | | 15,191,739 |
| †CyberOptics Corporation 1 | | | 145,326 | | | | 6,757,659 |
| FormFactor 1 | | | 427,962 | | | | 19,566,423 |
| †Ichor Holdings 1 | | | 29,770 | | | | 1,370,313 |
| Kulicke & Soffa Industries | | | 403,255 | | | | 24,413,058 |
| Lattice Semiconductor 1 | | | 87,716 | | | | 6,759,395 |
| MKS Instruments | | | 129,053 | | | | 22,477,161 |
| Nova 1,3 | | | 78,767 | | | | 11,539,366 |
| NVE Corporation | | | 51,278 | | | | 3,502,287 |
| Onto Innovation 1 | | | 131,146 | | | | 13,275,910 |
| Photronics 1 | | | 141,017 | | | | 2,658,170 |
| †SiTime Corporation 1 | | | 33,785 | | | | 9,883,464 |
| Ultra Clean Holdings 1 | | | 84,806 | | | | 4,864,472 |
| | | | | | | | 201,003,675 |
| SOFTWARE - 2.2% | | | | | | | |
| ACI Worldwide 1 | | | 167,494 | | | | 5,812,042 |
| Agilysys 1 | | | 103,204 | | | | 4,588,450 |
| †CDK Global | | | 96,599 | | | | 4,032,042 |
| ChannelAdvisor Corporation 1 | | | 174,594 | | | | 4,308,980 |
| †Consensus Cloud Solutions 1 | | | 25,600 | | | | 1,481,472 |
| Dolby Laboratories Cl. A | | | 94,227 | | | | 8,972,295 |
| Fair Isaac 1 | | | 4,505 | | | | 1,953,683 |
| †PagerDuty 1,3 | | | 176,344 | | | | 6,127,954 |
| †Semrush Holdings Cl. A 1 | | | 262,331 | | | | 5,469,601 |
| Teradata Corporation 1 | | | 95,969 | | | | 4,075,804 |
| Upland Software 1 | | | 63,327 | | | | 1,136,086 |
| | | | | | | | 47,958,409 |
| TECHNOLOGY HARDWARE, STORAGE & PERIPHERALS - 0.6% | | | | | | | |
| AstroNova 1 | | | 81,672 | | | | 1,102,572 |
| Avid Technology 1 | | | 338,187 | | | | 11,014,750 |
| | | | | | | | 12,117,322 |
| Total (Cost $284,826,251) | | | | | | | 447,969,225 |
| | | | | | | | |
| MATERIALS – 7.9% | | | | | | | |
| CHEMICALS - 5.4% | | | | | | | |
| Balchem Corporation | | | 68,346 | | | | 11,523,135 |
| Element Solutions | | | 1,060,109 | | | | 25,739,446 |
| Huntsman Corporation | | | 204,377 | | | | 7,128,670 |
| Innospec | | | 251,973 | | | | 22,763,241 |
| Minerals Technologies | | | 207,499 | | | | 15,178,552 |
| Mosaic Company (The) | | | 395,140 | | | | 15,525,051 |
| Quaker Chemical | | | 74,419 | | | | 17,174,417 |
| | | | | | | | 115,032,512 |
| CONSTRUCTION MATERIALS - 0.4% | | | | | | | |
| Eagle Materials | | | 47,542 | | | | 7,913,841 |
| CONTAINERS & PACKAGING - 0.5% | | | | | | | |
| Graphic Packaging Holding Company | | | 269,322 | | | | 5,251,779 |
| †Intertape Polymer Group | | | 121,637 | | | | 2,530,919 |
| Silgan Holdings | | | 85,073 | | | | 3,644,527 |
| | | | | | | | 11,427,225 |
| METALS & MINING - 1.0% | | | | | | | |
| Alamos Gold Cl. A | | | 1,272,092 | | | | 9,784,936 |
| Haynes International | | | 62,674 | | | | 2,527,643 |
| IAMGOLD Corporation 1 | | | 701,472 | | | | 2,195,607 |
| Reliance Steel & Aluminum | | | 48,802 | | | | 7,916,661 |
| | | | | | | | 22,424,847 |
| PAPER & FOREST PRODUCTS - 0.6% | | | | | | | |
| Louisiana-Pacific | | | 50,635 | | | | 3,967,252 |
| Stella-Jones | | | 307,177 | | | | 9,715,919 |
| | | | | | | | 13,683,171 |
| Total (Cost $95,843,074) | | | | | | | 170,481,596 |
| 42 | The Royce Funds 2021 Annual Report to Shareholders | THE ACCOMPANYING NOTES ARE AN INTEGRAL PART OF THESE FINANCIAL STATEMENTS |
December 31, 2021
Royce Pennsylvania Mutual Fund (continued)
| | | SHARES | | VALUE | |
| | | | | | |
| REAL ESTATE – 2.3% | | | | | |
| REAL ESTATE MANAGEMENT & DEVELOPMENT - 2.3% | | | | | | | | |
| †Altus Group | | | 44,800 | | | $ | 2,513,503 | |
| Colliers International Group | | | 23,900 | | | | 3,552,735 | |
| †Cushman & Wakefield 1 | | | 99,222 | | | | 2,206,697 | |
| FirstService Corporation | | | 4,830 | | | | 948,950 | |
| FRP Holdings 1 | | | 163,864 | | | | 9,471,339 | |
| Jones Lang LaSalle 1 | | | 5,101 | | | | 1,373,904 | |
| Kennedy-Wilson Holdings | | | 702,036 | | | | 16,764,620 | |
| Marcus & Millichap 1 | | | 199,125 | | | | 10,246,973 | |
| †RMR Group (The) Cl. A | | | 41,424 | | | | 1,436,584 | |
| Total (Cost $29,552,956) | | | | | | | 48,515,305 | |
| | | | | | | | | |
| TOTAL COMMON STOCKS | | | | | | | | |
| (Cost $1,360,133,737) | | | | | | | 2,104,644,389 | |
| | | | | | | | | |
| REPURCHASE AGREEMENT – 1.6% | | | | | | | | |
Fixed Income Clearing Corporation, 0.00% dated 12/31/21, due 1/3/22, maturity value $33,979,828 (collateralized by obligations of various U.S. Government Agencies, 1.75% due 1/15/28, valued at $34,659,487) | |
| (Cost $33,979,828) | | | | | | | 33,979,828 | |
| | | | | | | | | |
| COLLATERAL RECEIVED FOR SECURITIES LOANED – 0.5% | | | | | | | | |
| Money Market Funds | | | | | | | | |
| Federated Government Obligations Fund - Institutional Shares (7 day yield-0.03%) | | | | | | | | |
| (Cost $11,352,400) | | | 11,352,400 | | | | 11,352,400 | |
| | | | | | | | | |
| TOTAL INVESTMENTS – 100.1% | | | | | | | | |
| (Cost $1,405,465,965) | | | | | | | 2,149,976,617 | |
| | | | | | | | | |
| LIABILITIES LESS CASH AND OTHER ASSETS – (0.1)% | | | | | | | (1,156,524 | ) |
| | | | | | | | | |
| NET ASSETS – 100.0% | | | | | | $ | 2,148,820,093 | |
Royce Premier Fund
Common Stocks – 96.4%
| | | SHARES | | VALUE |
| | | | | |
| CONSUMER DISCRETIONARY – 8.4% | | | | | | | |
| AUTO COMPONENTS - 3.1% | | | | | | | |
| Dorman Products 1 | | | 315,744 | | | $ | 35,682,230 |
| LCI Industries | | | 119,738 | | | | 18,663,562 |
| | | | | | | | 54,345,792 |
| DISTRIBUTORS - 1.7% | | | | | | | |
| Pool Corporation | | | 50,355 | | | | 28,500,930 |
| LEISURE PRODUCTS - 1.3% | | | | | | | |
| Brunswick Corporation | | | 227,591 | | | | 22,925,241 |
| TEXTILES, APPAREL & LUXURY GOODS - 2.3% | | | | | | | |
| Ralph Lauren Cl. A | | | 330,940 | | | | 39,335,528 |
| Total (Cost $80,261,418) | | | | | | | 145,107,491 |
| | | | | | | | |
| CONSUMER STAPLES – 2.3% | | | | | | | |
| PERSONAL PRODUCTS - 2.3% | | | | | | | |
| Inter Parfums | | | 378,903 | | | | 40,504,731 |
| Total (Cost $17,487,770) | | | | | | | 40,504,731 |
| | | | | | | | |
| FINANCIALS – 13.9% | | | | | | | |
| CAPITAL MARKETS - 12.2% | | | | | | | |
| Ares Management Cl. A | | | 312,693 | | | | 25,412,560 |
| Ashmore Group | | | 5,917,301 | | | | 23,307,245 |
| GCM Grosvenor Cl. A | | | 2,169,600 | | | | 22,780,800 |
| Lazard Cl. A | | | 503,001 | | | | 21,945,933 |
| Morningstar | | | 179,816 | | | | 61,495,274 |
| †SEI Investments | | | 604,571 | | | | 36,842,557 |
| TMX Group | | | 194,583 | | | | 19,728,266 |
| | | | | | | | 211,512,635 |
| INSURANCE - 1.7% | | | | | | | |
| Alleghany Corporation 1 | | | 46,077 | | | | 30,760,544 |
| Total (Cost $121,204,397) | | | | | | | 242,273,179 |
| | | | | | | | |
| HEALTH CARE – 5.9% | | | | | | | |
| HEALTH CARE EQUIPMENT & SUPPLIES - 4.4% | | | | | | | |
| Haemonetics Corporation 1 | | | 335,379 | | | | 17,788,502 |
| †Meridian Bioscience 1 | | | 819,804 | | | | 16,724,002 |
| Mesa Laboratories | | | 130,192 | | | | 42,714,693 |
| | | | | | | | 77,227,197 |
| LIFE SCIENCES TOOLS & SERVICES - 1.5% | | | | | | | |
| Bio-Techne | | | 49,448 | | | | 25,581,428 |
| Total (Cost $78,338,921) | | | | | | | 102,808,625 |
| | | | | | | | |
| INDUSTRIALS – 32.7% | | | | | | | |
| AIR FREIGHT & LOGISTICS - 2.3% | | | | | | | |
| Forward Air | | | 331,938 | | | | 40,194,373 |
| BUILDING PRODUCTS - 1.9% | | | | | | | |
| Simpson Manufacturing | | | 238,603 | | | | 33,182,519 |
| COMMERCIAL SERVICES & SUPPLIES - 1.2% | | | | | | | |
| Ritchie Bros. Auctioneers | | | 336,521 | | | | 20,598,450 |
| CONSTRUCTION & ENGINEERING - 4.4% | | | | | | | |
| Arcosa | | | 640,820 | | | | 33,771,214 |
| Valmont Industries | | | 170,599 | | | | 42,735,050 |
| | | | | | | | 76,506,264 |
| MACHINERY - 16.0% | | | | | | | |
| Colfax Corporation 1 | | | 606,773 | | | | 27,893,355 |
| ESCO Technologies | | | 302,017 | | | | 27,178,510 |
| Helios Technologies | | | 55,074 | | | | 5,792,133 |
| John Bean Technologies | | | 281,250 | | | | 43,188,750 |
| Kadant | | | 165,402 | | | | 38,121,853 |
| Lincoln Electric Holdings | | | 354,711 | | | | 49,471,543 |
| Lindsay Corporation | | | 262,511 | | | | 39,901,672 |
| THE ACCOMPANYING NOTES ARE AN INTEGRAL PART OF THESE FINANCIAL STATEMENTS | The Royce Funds 2021 Annual Report to Shareholders | 43 |
Schedules of Investments
Royce Premier Fund (continued)
| | | SHARES | | VALUE |
| | | | | |
| INDUSTRIALS (continued) | | | | | | | |
| MACHINERY (continued) | | | | | | | |
| RBC Bearings 1 | | | 99,294 | | | $ | 20,054,409 |
| Woodward | | | 232,215 | | | | 25,418,254 |
| | | | | | | | 277,020,479 |
| MARINE - 0.5% | | | | | | | |
| Kirby Corporation 1 | | | 139,553 | | | | 8,292,239 |
| PROFESSIONAL SERVICES - 2.5% | | | | | | | |
| Forrester Research 1 | | | 746,762 | | | | 43,857,332 |
| ROAD & RAIL - 1.6% | | | | | | | |
| Landstar System | | | 157,603 | | | | 28,214,089 |
| TRADING COMPANIES & DISTRIBUTORS - 2.3% | | | | | | | |
| Air Lease Cl. A | | | 886,735 | | | | 39,220,289 |
| Total (Cost $237,179,368) | | | | | | | 567,086,034 |
| | | | | | | | |
| INFORMATION TECHNOLOGY – 21.5% | | | | | | | |
| ELECTRONIC EQUIPMENT, INSTRUMENTS & COMPONENTS - 9.3% | | | | | | | |
| Cognex Corporation | | | 322,346 | | | | 25,065,625 |
| FARO Technologies 1 | | | 389,482 | | | | 27,271,530 |
| IPG Photonics 1 | | | 95,743 | | | | 16,481,200 |
| National Instruments | | | 539,875 | | | | 23,576,341 |
| Rogers Corporation 1 | | | 132,656 | | | | 36,215,088 |
| †Vontier Corporation | | | 1,053,676 | | | | 32,379,463 |
| | | | | | | | 160,989,247 |
| IT SERVICES - 2.1% | | | | | | | |
| Computer Services 5 | | | 620,200 | | | | 32,386,844 |
| Jack Henry & Associates | | | 24,236 | | | | 4,047,170 |
| | | | | | | | 36,434,014 |
| SEMICONDUCTORS & SEMICONDUCTOR EQUIPMENT - 7.8% | | | | | | | |
| Cirrus Logic 1 | | | 307,595 | | | | 28,304,892 |
| CMC Materials | | | 262,710 | | | | 50,358,880 |
| †FormFactor 1 | | | 310,676 | | | | 14,204,106 |
| MKS Instruments | | | 248,341 | | | | 43,253,552 |
| | | | | | | | 136,121,430 |
| SOFTWARE - 0.9% | | | | | | | |
| Fair Isaac 1 | | | 35,443 | | | | 15,370,566 |
| TECHNOLOGY HARDWARE, STORAGE & PERIPHERALS - 1.4% | | | | | | | |
| †Avid Technology 1 | | | 729,984 | | | | 23,775,579 |
| Total (Cost $202,897,364) | | | | | | | 372,690,836 |
| | | | | | | | |
| MATERIALS – 8.8% | | | | | | | |
| CHEMICALS - 4.6% | | | | | | | |
| Innospec | | | 470,794 | | | | 42,531,530 |
| Quaker Chemical | | | 157,813 | | | | 36,420,084 |
| | | | | | | | 78,951,614 |
| METALS & MINING - 2.4% | | | | | | | |
| Reliance Steel & Aluminum | | | 256,412 | | | | 41,595,155 |
| PAPER & FOREST PRODUCTS - 1.8% | | | | | | | |
| Stella-Jones | | | 1,012,691 | | | | 32,031,121 |
| Total (Cost $92,495,010) | | | | | | | 152,577,890 |
| | | | | | | | |
| REAL ESTATE – 2.9% | | | | | | | �� |
| REAL ESTATE MANAGEMENT & DEVELOPMENT - 2.9% | | | | | | | |
| Kennedy-Wilson Holdings | | | 2,099,335 | | | | 50,132,120 |
| Total (Cost $36,981,898) | | | | | | | 50,132,120 |
| | | | | | | | |
| TOTAL COMMON STOCKS | | | | | | | |
| (Cost $866,846,146) | | | | | | | 1,673,180,906 |
| | | | | | | | |
| REPURCHASE AGREEMENT – 3.6% | | | | | | | |
Fixed Income Clearing Corporation, 0.00% dated 12/31/21, due 1/3/22, maturity value $62,015,718 (collateralized by obligations of various U.S. Government Agencies, 0.25% due 7/15/29, valued at $63,256,115) |
| (Cost $62,015,718) | | | | | | $ | 62,015,718 |
| | | | | | | | |
| TOTAL INVESTMENTS – 100.0% | | | | | | | |
| (Cost $928,861,864) | | | | | | | 1,735,196,624 |
| | | | | | | | |
| CASH AND OTHER ASSETS LESS LIABILITIES – 0.0% | | | | | | | 580,444 |
| | | | | | | | |
| NET ASSETS – 100.0% | | | | | | $ | 1,735,777,068 |
| 44 | The Royce Funds 2021 Annual Report to Shareholders | THE ACCOMPANYING NOTES ARE AN INTEGRAL PART OF THESE FINANCIAL STATEMENTS |
December 31, 2021
Royce Small-Cap Value Fund
Common Stocks – 96.6%
| | | SHARES | | VALUE |
| | | | | |
| COMMUNICATION SERVICES – 1.0% | | | | | | | |
| MEDIA - 1.0% | | | | | | | |
| †Entravision Communications Cl. A | | | 126,308 | | | $ | 856,368 |
| Saga Communications Cl. A | | | 22,526 | | | | 540,849 |
| Total (Cost $1,626,868) | | | | | | | 1,397,217 |
| | | | | | | | |
| CONSUMER DISCRETIONARY – 26.8% | | | | | | | |
| AUTO COMPONENTS - 0.3% | | | | | | | |
| Gentex Corporation | | | 10,440 | | | | 363,834 |
| DIVERSIFIED CONSUMER SERVICES - 1.3% | | | | | | | |
| †Lincoln Educational Services 1 | | | 249,965 | | | | 1,867,239 |
| HOUSEHOLD DURABLES - 7.9% | | | | | | | |
| La-Z-Boy | | | 84,402 | | | | 3,064,637 |
| †M/I Homes 1 | | | 32,498 | | | | 2,020,726 |
| †Meritage Homes 1 | | | 20,910 | | | | 2,552,274 |
| PulteGroup | | | 60,700 | | | | 3,469,612 |
| | | | | | | | 11,107,249 |
| LEISURE PRODUCTS - 3.1% | | | | | | | |
| Malibu Boats Cl. A 1 | | | 27,090 | | | | 1,861,895 |
| MasterCraft Boat Holdings 1 | | | 87,554 | | | | 2,480,405 |
| | | | | | | | 4,342,300 |
| SPECIALTY RETAIL - 14.2% | | | | | | | |
| Aaron’s Company (The) | | | 125,146 | | | | 3,084,849 |
| American Eagle Outfitters | | | 81,661 | | | | 2,067,657 |
| †Container Store Group (The) 1 | | | 14,049 | | | | 140,209 |
| †Haverty Furniture | | | 68,003 | | | | 2,078,852 |
| †Lazydays Holdings 1 | | | 100,336 | | | | 2,161,237 |
| OneWater Marine Cl. A | | | 59,020 | | | | 3,598,449 |
| Rent-A-Center | | | 69,824 | | | | 3,354,345 |
| Shoe Carnival | | | 86,000 | | | | 3,360,880 |
| | | | | | | | 19,846,478 |
| Total (Cost $28,093,078) | | | | | | | 37,527,100 |
| | | | | | | | |
| CONSUMER STAPLES – 0.5% | | | | | | | |
| FOOD & STAPLES RETAILING - 0.5% | | | | | | | |
| Village Super Market Cl. A | | | 33,107 | | | | 774,373 |
| Total (Cost $747,555) | | | | | | | 774,373 |
| | | | | | | | |
| ENERGY – 0.7% | | | | | | | |
| OIL, GAS & CONSUMABLE FUELS - 0.7% | | | | | | | |
| Dorchester Minerals L.P. | | | 47,304 | | | | 936,146 |
| Total (Cost $670,728) | | | | | | | 936,146 |
| | | | | | | | |
| FINANCIALS – 19.7% | | | | | | | |
| BANKS - 6.7% | | | | | | | |
| Ames National | | | 30,293 | | | | 741,876 |
| Camden National | | | 15,876 | | | | 764,588 |
| †Chemung Financial | | | 15,857 | | | | 725,933 |
| †Citizens Community Bancorp | | | 41,124 | | | | 566,277 |
| City Holding Company | | | 8,418 | | | | 688,508 |
| CNB Financial | | | 33,581 | | | | 889,897 |
| Financial Institutions | | | 23,978 | | | | 762,500 |
| Landmark Bancorp | | | 23,841 | | | | 679,469 |
| MidWestOne Financial Group | | | 20,927 | | | | 677,407 |
| National Bankshares | | | 53,504 | | | | 1,940,055 |
| Unity Bancorp | | | 36,467 | | | | 957,259 |
| | | | | | | | 9,393,769 |
| CAPITAL MARKETS - 3.4% | | | | | | | |
| Evercore Cl. A | | | 21,742 | | | | 2,953,651 |
| Houlihan Lokey Cl. A | | | 4,395 | | | | 454,971 |
| Moelis & Company Cl. A | | | 21,932 | | | | 1,370,969 |
| | | | | | | | 4,779,591 |
| CONSUMER FINANCE - 1.8% | | | | | | | |
| PROG Holdings 1 | | | 56,700 | | | | 2,557,737 |
| INSURANCE - 5.2% | | | | | | | |
| CNO Financial Group | | | 92,900 | | | | 2,214,736 |
| †Donegal Group Cl. A | | | 46,848 | | | | 669,458 |
| †Employers Holdings | | | 48,077 | | | | 1,989,426 |
| Heritage Insurance Holdings | | | 56,762 | | | | 333,761 |
| James River Group Holdings | | | 3,629 | | | | 104,551 |
| Selective Insurance Group | | | 7,437 | | | | 609,388 |
| †Tiptree | | | 94,711 | | | | 1,309,853 |
| | | | | | | | 7,231,173 |
| THRIFTS & MORTGAGE FINANCE - 2.6% | | | | | | | |
| Southern Missouri Bancorp | | | 13,437 | | | | 701,008 |
| Timberland Bancorp | | | 54,119 | | | | 1,499,096 |
| TrustCo Bank Corp NY | | | 42,211 | | | | 1,406,049 |
| | | | | | | | 3,606,153 |
| Total (Cost $21,647,474) | | | | | | | 27,568,423 |
| | | | | | | | |
| HEALTH CARE – 7.9% | | | | | | | |
| BIOTECHNOLOGY - 2.3% | | | | | | | |
| Catalyst Pharmaceuticals 1 | | | 288,989 | | | | 1,956,456 |
| †Ironwood Pharmaceuticals Cl. A 1 | | | 83,251 | | | | 970,707 |
| Vanda Pharmaceuticals 1 | | | 20,638 | | | | 323,810 |
| | | | | | | | 3,250,973 |
| HEALTH CARE PROVIDERS & SERVICES - 1.9% | | | | | | | |
| Ensign Group (The) | | | 7,121 | | | | 597,879 |
| Molina Healthcare 1 | | | 6,514 | | | | 2,071,973 |
| | | | | | | | 2,669,852 |
| PHARMACEUTICALS - 3.7% | | | | | | | |
| †BioDelivery Sciences International 1 | | | 455,516 | | | | 1,412,099 |
| †Collegium Pharmaceutical 1,3 | | | 77,529 | | | | 1,448,242 |
| †SIGA Technologies 1 | | | 144,723 | | | | 1,088,317 |
| Supernus Pharmaceuticals 1 | | | 38,605 | | | | 1,125,722 |
| | | | | | | | 5,074,380 |
| Total (Cost $8,942,025) | | | | | | | 10,995,205 |
| | | | | | | | |
| INDUSTRIALS – 18.8% | | | | | | | |
| AEROSPACE & DEFENSE - 1.6% | | | | | | | |
| Vectrus 1 | | | 47,663 | | | | 2,181,536 |
| BUILDING PRODUCTS - 2.2% | | | | | | | |
| †Builders FirstSource 1 | | | 8,241 | | | | 706,336 |
| †Quanex Building Products | | | 40,971 | | | | 1,015,261 |
| UFP Industries | | | 15,000 | | | | 1,380,150 |
| | | | | | | | 3,101,747 |
| CONSTRUCTION & ENGINEERING - 4.6% | | | | | | | |
| Comfort Systems USA | | | 3,138 | | | | 310,474 |
| Great Lakes Dredge & Dock 1 | | | 53,875 | | | | 846,915 |
| MYR Group 1 | | | 4,540 | | | | 501,897 |
| Northwest Pipe 1 | | | 26,204 | | | | 833,287 |
| Primoris Services | | | 78,899 | | | | 1,891,998 |
| †Sterling Construction 1 | | | 76,856 | | | | 2,021,313 |
| | | | | | | | 6,405,884 |
| MACHINERY - 1.4% | | | | | | | |
| Alamo Group | | | 2,663 | | | | 391,940 |
| Federal Signal | | | 3,910 | | | | 169,459 |
| Miller Industries | | | 42,904 | | | | 1,432,994 |
| | | | | | | | 1,994,393 |
| THE ACCOMPANYING NOTES ARE AN INTEGRAL PART OF THESE FINANCIAL STATEMENTS | The Royce Funds 2021 Annual Report to Shareholders | 45 |
Schedules of Investments
Royce Small-Cap Value Fund (continued)
| | | SHARES | | VALUE |
| | | | | |
| INDUSTRIALS (continued) | | | | | | | |
| PROFESSIONAL SERVICES - 5.0% | | | | | | | |
| Barrett Business Services | | | 11,215 | | | $ | 774,508 |
| Heidrick & Struggles International | | | 48,871 | | | | 2,137,129 |
| Kforce | | | 8,295 | | | | 623,950 |
| Korn Ferry | | | 20,764 | | | | 1,572,458 |
| Resources Connection | | | 91,313 | | | | 1,629,024 |
| Robert Half International | | | 2,516 | | | | 280,584 |
| | | | | | | | 7,017,653 |
| ROAD & RAIL - 4.0% | | | | | | | |
| ArcBest | | | 15,928 | | | | 1,908,971 |
| Schneider National Cl. B | | | 96,650 | | | | 2,600,851 |
| Werner Enterprises | | | 22,376 | | | | 1,066,440 |
| | | | | | | | 5,576,262 |
| Total (Cost $16,984,130) | | | | | | | 26,277,475 |
| | | | | | | | |
| INFORMATION TECHNOLOGY – 20.7% | | | | | | | |
| ELECTRONIC EQUIPMENT, INSTRUMENTS & COMPONENTS - 14.2% | | | | | | | |
| ePlus 1 | | | 33,000 | | | | 1,778,040 |
| Fabrinet 1 | | | 4,554 | | | | 539,512 |
| †Flex 1 | | | 95,381 | | | | 1,748,334 |
| Insight Enterprises 1 | | | 8,707 | | | | 928,166 |
| †Jabil | | | 34,675 | | | | 2,439,386 |
| Kimball Electronics 1 | | | 97,167 | | | | 2,114,354 |
| Methode Electronics | | | 13,719 | | | | 674,563 |
| PC Connection | | | 14,689 | | | | 633,537 |
| Plexus Corporation 1 | | | 5,853 | | | | 561,244 |
| Sanmina Corporation 1 | | | 83,941 | | | | 3,480,194 |
| TD SYNNEX | | | 22,066 | | | | 2,523,468 |
| Vishay Intertechnology | | | 113,760 | | | | 2,487,931 |
| | | | | | | | 19,908,729 |
| IT SERVICES - 0.8% | | | | | | | |
| Concentrix Corporation | | | 2,800 | | | | 500,136 |
| IBEX 1,3 | | | 42,314 | | | | 545,427 |
| | | | | | | | 1,045,563 |
| SEMICONDUCTORS & SEMICONDUCTOR EQUIPMENT - 5.7% | | | | | | | |
| †Amkor Technology | | | 79,100 | | | | 1,960,889 |
| Cohu 1 | | | 49,709 | | | | 1,893,416 |
| Kulicke & Soffa Industries | | | 58,465 | | | | 3,539,471 |
| MKS Instruments | | | 3,280 | | | | 571,278 |
| | | | | | | | 7,965,054 |
| Total (Cost $19,011,339) | | | | | | | 28,919,346 |
| | | | | | | | |
| REAL ESTATE – 0.5% | | | | | | | |
| REAL ESTATE MANAGEMENT & DEVELOPMENT - 0.5% | | | | | | | |
| Marcus & Millichap 1 | | | 13,189 | | | | 678,706 |
| Total (Cost $380,461) | | | | | | | 678,706 |
| | | | | | | | |
| TOTAL COMMON STOCKS | | | | | | | |
| (Cost $98,103,658) | | | | | | | 135,073,991 |
| | | | | | | | |
| REPURCHASE AGREEMENT – 3.4% | | | | | | | |
Fixed Income Clearing Corporation, 0.00% dated 12/31/21, due 1/3/22, maturity value $4,698,139 (collateralized by obligations of various U.S. Government Agencies, 2.50% due 1/15/29, valued at $4,792,213) |
| (Cost $4,698,139) | | | | | | $ | 4,698,139 |
| | | | | | | | |
| TOTAL INVESTMENTS – 100.0% | | | | | | | |
| (Cost $102,801,797) | | | | | | | 139,772,130 |
| | | | | | | | |
| CASH AND OTHER ASSETS LESS LIABILITIES – 0.0% | | | | | | | 50,613 |
| | | | | | | | |
| NET ASSETS – 100.0% | | | | | | $ | 139,822,743 |
| 46 | The Royce Funds 2021 Annual Report to Shareholders | THE ACCOMPANYING NOTES ARE AN INTEGRAL PART OF THESE FINANCIAL STATEMENTS |
December 31, 2021
Royce Smaller-Companies Growth Fund
Common Stocks – 93.0%
| | | SHARES | | VALUE |
| | | | | |
| COMMUNICATION SERVICES – 3.9% | | | | | | | |
| ENTERTAINMENT - 1.9% | | | | | | | |
| CuriosityStream Cl. A 1,3 | | | 117,700 | | | $ | 697,961 |
| Sea Cl. A ADR 1 | | | 23,000 | | | | 5,145,330 |
| | | | | | | | 5,843,291 |
| INTERACTIVE MEDIA & SERVICES - 2.0% | | | | | | | |
| Enthusiast Gaming Holdings 1 | | | 1,990,800 | | | | 5,854,600 |
| Total (Cost $5,968,990) | | | | | | | 11,697,891 |
| | | | | | | | |
| CONSUMER DISCRETIONARY – 6.6% | | | | | | | |
| HOTELS, RESTAURANTS & LEISURE - 3.3% | | | | | | | |
| †Bragg Gaming Group 1 | | | 177,000 | | | | 898,328 |
| DraftKings Cl. A 1,3 | | | 12,000 | | | | 329,640 |
| Papa John’s International | | | 27,000 | | | | 3,603,690 |
| Rush Street Interactive Cl. A 1 | | | 178,000 | | | | 2,937,000 |
| Texas Roadhouse | | | 23,000 | | | | 2,053,440 |
| | | | | | | | 9,822,098 |
| HOUSEHOLD DURABLES - 0.9% | | | | | | | |
| Lovesac Company (The) 1,3 | | | 38,666 | | | | 2,562,009 |
| INTERNET & DIRECT MARKETING RETAIL - 0.6% | | | | | | | |
| CarParts.com 1,3 | | | 163,000 | | | | 1,825,600 |
| LEISURE PRODUCTS - 0.5% | | | | | | | |
| Callaway Golf 1 | | | 58,000 | | | | 1,591,520 |
| SPECIALTY RETAIL - 1.3% | | | | | | | |
| Lithia Motors | | | 13,000 | | | | 3,860,350 |
| Total (Cost $14,420,273) | | | | | | | 19,661,577 |
| | | | | | | | |
| CONSUMER STAPLES – 1.5% | | | | | | | |
| FOOD PRODUCTS - 0.8% | | | | | | | |
| Freshpet 1 | | | 23,000 | | | | 2,191,210 |
| HOUSEHOLD PRODUCTS - 0.7% | | | | | | | |
| †Central Garden & Pet Cl. A 1 | | | 45,000 | | | | 2,153,250 |
| Total (Cost $3,551,233) | | | | | | | 4,344,460 |
| | | | | | | | |
| FINANCIALS – 5.7% | | | | | | | |
| BANKS - 1.9% | | | | | | | |
| Primis Financial | | | 4,000 | | | | 60,160 |
| Seacoast Banking Corporation of Florida | | | 82,000 | | | | 2,901,980 |
| †Triumph Bancorp 1 | | | 24,000 | | | | 2,857,920 |
| | | | | | | | 5,820,060 |
| CAPITAL MARKETS - 0.4% | | | | | | | |
| MarketAxess Holdings | | | 3,000 | | | | 1,233,810 |
| CONSUMER FINANCE - 0.6% | | | | | | | |
| LendingTree 1 | | | 15,000 | | | | 1,839,000 |
| INSURANCE - 2.8% | | | | | | | |
| †BRP Group Cl. A 1 | | | 148,000 | | | | 5,344,280 |
| †Trean Insurance Group 1 | | | 179,800 | | | | 1,602,018 |
| †Trupanion 1 | | | 10,000 | | | | 1,320,300 |
| | | | | | | | 8,266,598 |
| Total (Cost $12,989,753) | | | | | | | 17,159,468 |
| | | | | | | | |
| HEALTH CARE – 25.7% | | | | | | | |
| BIOTECHNOLOGY - 7.0% | | | | | | | |
| Avid Bioservices 1,3 | | | 154,000 | | | | 4,493,720 |
| †BiomX 1 | | | 106,696 | | | | 170,714 |
| CareDx 1 | | | 97,000 | | | | 4,411,560 |
| MeiraGTx Holdings 1 | | | 157,000 | | | | 3,727,180 |
| Oxford Biomedica 1 | | | 224,000 | | | | 3,729,301 |
| PureTech Health 1 | | | 846,000 | | | | 3,343,701 |
| †Synlogic 1 | | | 484,041 | | | | 1,171,379 |
| | | | | | | | 21,047,555 |
| HEALTH CARE EQUIPMENT & SUPPLIES - 9.5% | | | | | | | |
| Alphatec Holdings 1 | | | 254,000 | | | | 2,903,220 |
| Axonics 1,3 | | | 55,000 | | | | 3,080,000 |
| CryoPort 1 | | | 34,198 | | | | 2,023,496 |
| CytoSorbents Corporation 1 | | | 251,000 | | | | 1,051,690 |
| InMode 1 | | | 90,000 | | | | 6,352,200 |
| Neuronetics 1 | | | 386,500 | | | | 1,723,790 |
| Profound Medical 1 | | | 123,000 | | | | 1,386,600 |
| †Semler Scientific 1 | | | 24,000 | | | | 2,199,600 |
| SI-BONE 1 | | | 82,000 | | | | 1,821,220 |
| STAAR Surgical 1 | | | 50,000 | | | | 4,565,000 |
| TransMedics Group 1 | | | 61,000 | | | | 1,168,760 |
| | | | | | | | 28,275,576 |
| HEALTH CARE PROVIDERS & SERVICES - 5.7% | | | | | | | |
| Addus HomeCare 1 | | | 25,000 | | | | 2,337,750 |
| †Greenbrook TMS 1 | | | 223,500 | | | | 976,695 |
| Joint Corp. (The) 1,3 | | | 19,000 | | | | 1,248,110 |
| ModivCare 1 | | | 32,000 | | | | 4,745,280 |
| Pennant Group 1 | | | 109,000 | | | | 2,515,720 |
| Progyny 1 | | | 65,000 | | | | 3,272,750 |
| Sharps Compliance 1 | | | 284,000 | | | | 2,024,920 |
| | | | | | | | 17,121,225 |
| HEALTH CARE TECHNOLOGY - 1.0% | | | | | | | |
| CareCloud 1,3 | | | 312,000 | | | | 1,971,840 |
| †Inspire Medical Systems 1 | | | 4,488 | | | | 1,032,510 |
| | | | | | | | 3,004,350 |
| | | | | | | | |
| LIFE SCIENCES TOOLS & SERVICES - 2.5% | | | | | | | |
| Harvard Bioscience 1 | | | 213,600 | | | | 1,505,880 |
| Medpace Holdings 1,3 | | | 15,000 | | | | 3,264,600 |
| West Pharmaceutical Services | | | 6,000 | | | | 2,814,060 |
| | | | | | | | 7,584,540 |
| Total (Cost $55,355,153) | | | | | | | 77,033,246 |
| | | | | | | | |
| INDUSTRIALS – 16.6% | | | | | | | |
| AEROSPACE & DEFENSE - 1.2% | | | | | | | |
| AeroVironment 1 | | | 31,000 | | | | 1,922,930 |
| †Byrna Technologies 1,3 | | | 125,000 | | | | 1,668,750 |
| | | | | | | | 3,591,680 |
| COMMERCIAL SERVICES & SUPPLIES - 1.9% | | | | | | | |
| †ACV Auctions Cl. A 1 | | | 37,000 | | | | 697,080 |
| †VSE Corporation | | | 82,000 | | | | 4,997,080 |
| | | | | | | | 5,694,160 |
| CONSTRUCTION & ENGINEERING - 1.0% | | | | | | | |
| †Ameresco Cl. A 1 | | | 36,000 | | | | 2,931,840 |
| ELECTRICAL EQUIPMENT - 3.5% | | | | | | | |
| American Superconductor 1 | | | 226,349 | | | | 2,462,677 |
| EnerSys | | | 29,000 | | | | 2,292,740 |
| †Enovix Corporation 1,3 | | | 80,000 | | | | 2,182,400 |
| Eos Energy Enterprises 1,3 | | | 90,000 | | | | 676,800 |
| †GrafTech International | | | 245,000 | | | | 2,898,350 |
| | | | | | | | 10,512,967 |
| MACHINERY - 3.8% | | | | | | | |
| ATS Automation Tooling Systems 1 | | | 193,000 | | | | 7,665,378 |
| Chart Industries 1,3 | | | 18,000 | | | | 2,870,820 |
| †Velo3D 1,3 | | | 100,000 | | | | 781,000 |
| | | | | | | | 11,317,198 |
| PROFESSIONAL SERVICES - 2.4% | | | | | | | |
| ASGN 1 | | | 26,000 | | | | 3,208,400 |
| Atlas Technical Consultants Cl. A 1 | | | 349,000 | | | | 2,938,580 |
| THE ACCOMPANYING NOTES ARE AN INTEGRAL PART OF THESE FINANCIAL STATEMENTS | The Royce Funds 2021 Annual Report to Shareholders | 47 |
Schedules of Investments
Royce Smaller-Companies Growth Fund (continued)
| | | SHARES | | VALUE |
| | | | | |
| INDUSTRIALS (continued) | | | | | | | |
| PROFESSIONAL SERVICES (continued) | | | | | | | |
| †LegalZoom.com 1,3 | | | 62,000 | | | $ | 996,340 |
| | | | | | | | 7,143,320 |
| TRADING COMPANIES & DISTRIBUTORS - 2.8% | | | | | | | |
| Lawson Products 1 | | | 157,000 | | | | 8,595,750 |
| Total (Cost $36,589,415) | | | | | | | 49,786,915 |
| | | | | | | | |
| INFORMATION TECHNOLOGY – 29.8% | | | | | | | |
| COMMUNICATIONS EQUIPMENT - 0.5% | | | | | | | |
| †Genasys 1 | | | 404,000 | | | | 1,607,920 |
| ELECTRONIC EQUIPMENT, INSTRUMENTS & COMPONENTS - 2.0% | | | | | | | |
| Iteris 1 | | | 1,159,474 | | | | 4,637,896 |
| nLIGHT 1 | | | 59,000 | | | | 1,413,050 |
| | | | | | | | 6,050,946 |
| IT SERVICES - 4.2% | | | | | | | |
| Cantaloupe 1 | | | 428,996 | | | | 3,809,484 |
| Unisys Corporation 1 | | | 426,900 | | | | 8,781,333 |
| | | | | | | | 12,590,817 |
| SEMICONDUCTORS & SEMICONDUCTOR EQUIPMENT - 14.1% | | | | | | | |
| Ambarella 1 | | | 42,000 | | | | 8,521,380 |
| AXT 1 | | | 216,400 | | | | 1,906,484 |
| Canadian Solar 1,3 | | | 68,000 | | | | 2,127,720 |
| CyberOptics Corporation 1 | | | 39,000 | | | | 1,813,500 |
| Impinj 1,3 | | | 88,555 | | | | 7,854,829 |
| Lattice Semiconductor 1 | | | 33,000 | | | | 2,542,980 |
| Magnachip Semiconductor 1 | | | 403,461 | | | | 8,460,577 |
| Onto Innovation 1 | | | 43,000 | | | | 4,352,890 |
| Silicon Laboratories 1 | | | 22,000 | | | | 4,541,240 |
| | | | | | | | 42,121,600 |
| SOFTWARE - 8.4% | | | | | | | |
| Agilysys 1 | | | 50,000 | | | | 2,223,000 |
| Coupa Software 1 | | | 5,000 | | | | 790,250 |
| Descartes Systems Group (The) 1 | | | 56,033 | | | | 4,632,808 |
| Everbridge 1 | | | 27,000 | | | | 1,817,910 |
| †GTY Technology Holdings 1 | | | 193,000 | | | | 1,293,100 |
| †Matterport Cl. A 1,3 | | | 336,000 | | | | 6,935,040 |
| Paylocity Holding Corporation 1 | | | 7,786 | | | | 1,838,742 |
| †Ping Identity Holding Corp. 1 | | | 83,000 | | | | 1,899,040 |
| †Sprout Social Cl. A 1 | | | 8,000 | | | | 725,520 |
| Veritone 1,3 | | | 130,000 | | | | 2,922,400 |
| | | | | | | | 25,077,810 |
| TECHNOLOGY HARDWARE, STORAGE & PERIPHERALS - 0.6% | | | | | | | |
| †Stratasys 1 | | | 79,000 | | | | 1,934,710 |
| Total (Cost $52,538,651) | | | | | | | 89,383,803 |
| | | | | | | | |
| MATERIALS – 2.1% | | | | | | | |
| CHEMICALS - 0.5% | | | | | | | |
| NanoXplore 1 | | | 289,000 | | | | 1,491,893 |
| METALS & MINING - 1.6% | | | | | | | |
| †Core Lithium 1 | | | 4,716,202 | | | | 2,024,451 |
| †ioneer 1 | | | 5,000,000 | | | | 2,910,200 |
| | | | | | | | 4,934,651 |
| Total (Cost $3,536,749) | | | | | | | 6,426,544 |
| | | | | | | | |
| REAL ESTATE – 1.1% | | | | | | | |
| EQUITY REAL ESTATE INVESTMENT TRUSTS (REITS) - 1.1% | | | | | | | |
| Postal Realty Trust Cl. A | | | 170,000 | | | | 3,366,000 |
| Total (Cost $2,830,846) | | | | | | | 3,366,000 |
| | | | | | | | |
| TOTAL COMMON STOCKS | | | | | | | |
| (Cost $187,781,063) | | | | | | | 278,859,904 |
| | | | | | | | |
| REPURCHASE AGREEMENT – 7.3% | | | | | | | |
Fixed Income Clearing Corporation, 0.00% dated 12/31/21, due 1/3/22, maturity value $21,722,702 (collateralized by obligations of various U.S. Government Agencies, 1.375%-2.50% due 12/31/28-1/15/29, valued at $22,157,240) |
| (Cost $21,722,702) | | | | | | | 21,722,702 |
| | | | | | | | |
| COLLATERAL RECEIVED FOR SECURITIES LOANED – 5.0% | | | | | | | |
| Money Market Funds | | | | | | | |
| Federated Government Obligations Fund - Institutional Shares (7 day yield-0.03%) | | | | | | | |
| (Cost $14,874,213) | | | 14,874,213 | | | | 14,874,213 |
| | | | | | | | |
| TOTAL INVESTMENTS – 105.3% | | | | | | | |
| (Cost $224,377,978) | | | | | | | 315,456,819 |
| | | | | | | | |
| LIABILITIES LESS CASH AND OTHER ASSETS – (5.3)% | | | | | | | (15,762,682) |
| | | | | | | | |
| NET ASSETS – 100.0% | | | | | | $ | 299,694,137 |
| 48 | The Royce Funds 2021 Annual Report to Shareholders | THE ACCOMPANYING NOTES ARE AN INTEGRAL PART OF THESE FINANCIAL STATEMENTS |
December 31, 2021
Royce Special Equity Fund
Common Stocks – 84.6%
| | | SHARES | | VALUE |
| | | | | |
| COMMUNICATION SERVICES – 2.6% | | | | | | | |
| MEDIA - 2.6% | | | | | | | |
| †TEGNA | | | 1,512,500 | | | $ | 28,072,000 |
| Total (Cost $30,553,477) | | | | | | | 28,072,000 |
| | | | | | | | |
| CONSUMER DISCRETIONARY – 23.3% | | | | | | | |
| AUTO COMPONENTS - 6.9% | | | | | | | |
| Gentex Corporation | | | 359,700 | | | | 12,535,545 |
| Standard Motor Products 2 | | | 1,171,500 | | | | 61,374,885 |
| | | | | | | | 73,910,430 |
| AUTOMOBILES - 2.1% | | | | | | | |
| Winnebago Industries | | | 303,000 | | | | 22,700,760 |
| DIVERSIFIED CONSUMER SERVICES - 3.4% | | | | | | | |
| †H&R Block | | | 1,540,000 | | | | 36,282,400 |
| HOUSEHOLD DURABLES - 4.6% | | | | | | | |
| Ethan Allen Interiors | | | 87,900 | | | | 2,310,891 |
| Flexsteel Industries 2 | | | 767,500 | | | | 20,615,050 |
| Hooker Furnishings 2 | | | 1,137,000 | | | | 26,469,360 |
| | | | | | | | 49,395,301 |
| LEISURE PRODUCTS - 3.8% | | | | | | | |
| Johnson Outdoors Cl. A | | | 443,500 | | | | 41,551,515 |
| TEXTILES, APPAREL & LUXURY GOODS - 2.5% | | | | | | | |
| Movado Group | | | 650,000 | | | | 27,189,500 |
| Total (Cost $196,629,318) | | | | | | | 251,029,906 |
| | | | | | | | |
| CONSUMER STAPLES – 9.5% | | | | | | | |
| FOOD & STAPLES RETAILING - 5.8% | | | | | | | |
| †Ingles Markets Cl. A | | | 727,000 | | | | 62,769,180 |
| FOOD PRODUCTS - 3.7% | | | | | | | |
| John B. Sanfilippo & Son | | | 436,000 | | | | 39,309,760 |
| Total (Cost $74,280,734) | | | | | | | 102,078,940 |
| | | | | | | | |
| FINANCIALS – 4.3% | | | | | | | |
| CAPITAL MARKETS - 4.3% | | | | | | | |
| †BrightSphere Investment Group | | | 126,500 | | | | 3,238,400 |
| Diamond Hill Investment Group | | | 136,000 | | | | 26,415,280 |
| †Federated Hermes Cl. B | | | 438,000 | | | | 16,460,040 |
| Total (Cost $33,151,561) | | | | | | | 46,113,720 |
| | | | | | | | |
| INDUSTRIALS – 22.1% | | | | | | | |
| AEROSPACE & DEFENSE - 1.3% | | | | | | | |
| National Presto Industries | | | 170,700 | | | | 14,002,521 |
| BUILDING PRODUCTS - 3.2% | | | | | | | |
| Insteel Industries | | | 268,000 | | | | 10,669,080 |
| †UFP Industries | | | 261,500 | | | | 24,060,615 |
| | | | | | | | 34,729,695 |
| COMMERCIAL SERVICES & SUPPLIES - 2.1% | | | | | | | |
| Ennis | | | 1,147,300 | | | | 22,406,769 |
| CONSTRUCTION & ENGINEERING - 2.1% | | | | | | | |
| Argan | | | 324,000 | | | | 12,535,560 |
| †MYR Group 1 | | | 22,600 | | | | 2,498,430 |
| †Sterling Construction 1 | | | 295,000 | | | | 7,758,500 |
| | | | | | | | 22,792,490 |
| ELECTRICAL EQUIPMENT - 2.9% | | | | | | | |
| Encore Wire | | | 218,000 | | | | 31,195,800 |
| MACHINERY - 8.0% | | | | | | | |
| Gencor Industries 1,2 | | | 1,066,000 | | | | 12,290,980 |
| Hurco Companies 2 | | | 580,000 | | | | 17,226,000 |
| Miller Industries 2 | | | 754,000 | | | | 25,183,600 |
| Mueller Industries | | | 526,000 | | | | 31,223,360 |
| | | | | | | | 85,923,940 |
| TRADING COMPANIES & DISTRIBUTORS - 2.5% | | | | | | | |
| MSC Industrial Direct Cl. A | | | 327,000 | | | | 27,487,620 |
| Total (Cost $181,985,151) | | | | | | | 238,538,835 |
| | | | | | | | |
| INFORMATION TECHNOLOGY – 10.7% | | | | | | | |
| ELECTRONIC EQUIPMENT, INSTRUMENTS & COMPONENTS - 3.2% | | | | | | | |
| Vishay Intertechnology | | | 1,582,500 | | | | 34,609,275 |
| IT SERVICES - 1.7% | | | | | | | |
| Computer Services 5 | | | 359,300 | | | | 18,762,646 |
| SEMICONDUCTORS & SEMICONDUCTOR EQUIPMENT- 5.8% | | | | | | | |
| Kulicke & Soffa Industries | | | 687,500 | | | | 41,621,250 |
| NVE Corporation 2 | | | 300,100 | | | | 20,496,830 |
| | | | | | | | 62,118,080 |
| Total (Cost $66,975,971) | | | | | | | 115,490,001 |
| | | | | | | | |
| MATERIALS – 8.2% | | | | | | | |
| CHEMICALS - 5.7% | | | | | | | |
| Huntsman Corporation | | | 1,745,000 | | | | 60,865,600 |
| CONSTRUCTION MATERIALS - 1.3% | | | | | | | |
| United States Lime & Minerals | | | 109,300 | | | | 14,101,886 |
| PAPER & FOREST PRODUCTS - 1.2% | | | | | | | |
| Louisiana-Pacific | | | 166,500 | | | | 13,045,275 |
| Total (Cost $58,088,325) | | | | | | | 88,012,761 |
| | | | | | | | |
| REAL ESTATE – 3.9% | | | | | | | |
| REAL ESTATE MANAGEMENT & DEVELOPMENT - 3.9% | | | | | | | |
| Marcus & Millichap 1 | | | 806,700 | | | | 41,512,782 |
| Total (Cost $22,448,642) | | | | | | | 41,512,782 |
| | | | | | | | |
| TOTAL COMMON STOCKS | | | | | | | |
| (Cost $664,113,179) | | | | | | | 910,848,945 |
| | | | | | | | |
| REPURCHASE AGREEMENT – 15.1% | | | | | | | |
Fixed Income Clearing Corporation, 0.00% dated 12/31/21, due 1/3/22, maturity value $162,932,275 (collateralized by obligations of various U.S. Government Agencies, 0.25%-3.875% due 1/15/29-7/15/29, valued at $166,190,951) |
| (Cost $162,932,275) | | | | | | | 162,932,275 |
| | | | | | | | |
| TOTAL INVESTMENTS – 99.7% | | | | | | | |
| (Cost $827,045,454) | | | | | | | 1,073,781,220 |
| | | | | | | | |
| CASH AND OTHER ASSETS LESS LIABILITIES – 0.3% | | | | | | | 3,172,499 |
| | | | | | | | |
| NET ASSETS – 100.0% | | | | | | $ | 1,076,953,719 |
| THE ACCOMPANYING NOTES ARE AN INTEGRAL PART OF THESE FINANCIAL STATEMENTS | The Royce Funds 2021 Annual Report to Shareholders | 49 |
Schedules of Investments
Royce Total Return Fund
Common Stocks – 98.3%
| | | SHARES | | VALUE |
| | | | | |
| COMMUNICATION SERVICES – 1.7% | | | | |
| DIVERSIFIED TELECOMMUNICATION SERVICES - 0.4% | | | | | | | |
| ATN International | | | 143,957 | | | $ | 5,751,082 |
| ENTERTAINMENT - 1.3% | | | | | | | |
| World Wrestling Entertainment Cl. A | | | 412,643 | | | | 20,359,806 |
| Total (Cost $22,623,023) | | | | | | | 26,110,888 |
| | | | | | | | |
| CONSUMER DISCRETIONARY – 6.7% | | | | | | | |
| AUTO COMPONENTS - 0.8% | | | | | | | |
| Gentex Corporation | | | 176,992 | | | | 6,168,171 |
| LCI Industries | | | 38,669 | | | | 6,027,337 |
| | | | | | | | 12,195,508 |
| HOTELS, RESTAURANTS & LEISURE - 1.8% | | | | | | | |
| †Denny’s Corporation 1 | | | 1,357,280 | | | | 21,716,480 |
| Hyatt Hotels Cl. A 1 | | | 60,484 | | | | 5,800,416 |
| | | | | | | | 27,516,896 |
| MULTILINE RETAIL - 1.9% | | | | | | | |
| Franchise Group Cl. A | | | 541,745 | | | | 28,257,419 |
| TEXTILES, APPAREL & LUXURY GOODS - 2.2% | | | | | | | |
| Levi Strauss & Co. Cl. A | | | 642,634 | | | | 16,085,129 |
| Ralph Lauren Cl. A | | | 142,440 | | | | 16,930,418 |
| | | | | | | | 33,015,547 |
| Total (Cost $68,996,116) | | | | | | | 100,985,370 |
| | | | | | | | |
| CONSUMER STAPLES – 3.0% | | | | | | | |
| HOUSEHOLD PRODUCTS - 3.0% | | | | | | | |
| Reynolds Consumer Products | | | 678,702 | | | | 21,311,243 |
| Spectrum Brands Holdings | | | 240,793 | | | | 24,493,464 |
| Total (Cost $32,810,294) | | | | | | | 45,804,707 |
| | | | | | | | |
| ENERGY – 3.7% | | | | | | | |
| ENERGY EQUIPMENT & SERVICES - 3.7% | | | | | | | |
| †Cactus Cl. A | | | 456,066 | | | | 17,389,796 |
| †ChampionX Corporation 1 | | | 594,376 | | | | 12,012,339 |
| Helmerich & Payne | | | 226,814 | | | | 5,375,492 |
| Oceaneering International 1 | | | 402,089 | | | | 4,547,627 |
| Pason Systems | | | 1,836,676 | | | | 16,755,793 |
| Total (Cost $52,378,388) | | | | | | | 56,081,047 |
| | | | | | | | |
| FINANCIALS – 38.3% | | | | | | | |
| BANKS - 18.0% | | | | | | | |
| Bank of N.T. Butterfield & Son | | | 752,709 | | | | 28,685,740 |
| BankUnited | | | 434,985 | | | | 18,404,215 |
| BOK Financial | | | 184,312 | | | | 19,443,073 |
| †CapStar Financial Holdings | | | 134,412 | | | | 2,826,684 |
| †CBTX | | | 108,387 | | | | 3,143,223 |
| †First Bancshares (The) | | | 393,684 | | | | 15,204,076 |
| First Citizens BancShares Cl. A | | | 14,429 | | | | 11,973,761 |
| First Hawaiian | | | 521,054 | | | | 14,240,406 |
| HBT Financial | | | 439,831 | | | | 8,238,035 |
| †Heritage Commerce | | | 199,035 | | | | 2,376,478 |
| Home BancShares | | | 992,273 | | | | 24,161,848 |
| †HomeTrust Bancshares | | | 87,139 | | | | 2,699,566 |
| Independent Bank Group | | | 381,004 | | | | 27,489,439 |
| OceanFirst Financial | | | 144,805 | | | | 3,214,671 |
| †Origin Bancorp | | | 385,009 | | | | 16,524,586 |
| †Preferred Bank | | | 84,117 | | | | 6,038,759 |
| †Primis Financial | | | 184,122 | | | | 2,769,195 |
| †QCR Holdings | | | 144,062 | | | | 8,067,472 |
| †Southern First Bancshares 1 | | | 49,710 | | | | 3,106,378 |
| †TowneBank | | | 327,014 | | | | 10,330,372 |
| Triumph Bancorp 1 | | | 102,321 | | | | 12,184,385 |
| UMB Financial | | | 134,130 | | | | 14,232,534 |
| Valley National Bancorp | | | 1,219,381 | | | | 16,766,489 |
| | | | | | | | 272,121,385 |
| CAPITAL MARKETS - 4.2% | | | | | | | |
| Ares Management Cl. A | | | 72,063 | | | | 5,856,560 |
| Artisan Partners Asset Management Cl. A | | | 307,702 | | | | 14,658,923 |
| Moelis & Company Cl. A | | | 178,376 | | | | 11,150,284 |
| †Newtek Business Services | | | 654,696 | | | | 18,089,251 |
| TMX Group | | | 135,904 | | | | 13,778,954 |
| | | | | | | | 63,533,972 |
| DIVERSIFIED FINANCIAL SERVICES - 1.9% | | | | | | | |
| Compass Diversified Holdings | | | 782,683 | | | | 23,934,446 |
| Equitable Holdings | | | 161,562 | | | | 5,297,618 |
| | | | | | | | 29,232,064 |
| INSURANCE - 14.2% | | | | | | | |
| AMERISAFE | | | 261,276 | | | | 14,064,487 |
| Assured Guaranty | | | 108,193 | | | | 5,431,289 |
| Axis Capital Holdings | | | 490,847 | | | | 26,736,436 |
| First American Financial | | | 234,573 | | | | 18,350,646 |
| †International General Insurance Holdings | | | 1,797,165 | | | | 14,557,036 |
| James River Group Holdings | | | 1,026,944 | | | | 29,586,257 |
| Old Republic International | | | 383,645 | | | | 9,429,994 |
| ProAssurance Corporation | | | 830,094 | | | | 21,001,378 |
| RenaissanceRe Holdings | | | 171,187 | | | | 28,987,095 |
| Stewart Information Services | | | 284,615 | | | | 22,692,354 |
| †Trean Insurance Group 1,2 | | | 2,821,597 | | | | 25,140,429 |
| | | | | | | | 215,977,401 |
| Total (Cost $439,415,309) | | | | | | | 580,864,822 |
| | | | | | | | |
| HEALTH CARE – 0.7% | | | | | | | |
| HEALTH CARE PROVIDERS & SERVICES - 0.7% | | | | | | | |
| Patterson Companies | | | 359,513 | | | | 10,551,707 |
| Total (Cost $6,676,534) | | | | | | | 10,551,707 |
| | | | | | | | |
| INDUSTRIALS – 20.1% | | | | | | | |
| BUILDING PRODUCTS - 3.3% | | | | | | | |
| Carlisle Companies | | | 57,249 | | | | 14,204,622 |
| Fortune Brands Home & Security | | | 135,866 | | | | 14,524,076 |
| UFP Industries | | | 236,833 | | | | 21,791,004 |
| | | | | | | | 50,519,702 |
| COMMERCIAL SERVICES & SUPPLIES - 1.5% | | | | | | | |
| Deluxe Corporation | | | 477,929 | | | | 15,346,300 |
| Healthcare Services Group | | | 397,397 | | | | 7,069,693 |
| | | | | | | | 22,415,993 |
| ELECTRICAL EQUIPMENT - 3.0% | | | | | | | |
| GrafTech International | | | 2,069,888 | | | | 24,486,775 |
| †nVent Electric | | | 556,006 | | | | 21,128,228 |
| | | | | | | | 45,615,003 |
| MACHINERY - 5.4% | | | | | | | |
| Crane Co. | | | 199,393 | | | | 20,284,250 |
| Douglas Dynamics | | | 497,304 | | | | 19,424,694 |
| Lincoln Electric Holdings | | | 95,662 | | | | 13,341,979 |
| Timken Company (The) | | | 416,698 | | | | 28,873,005 |
| | | | | | | | 81,923,928 |
| PROFESSIONAL SERVICES - 2.2% | | | | | | | |
| Barrett Business Services | | | 168,518 | | | | 11,637,853 |
| KBR | | | 443,354 | | | | 21,112,517 |
| | | | | | | | 32,750,370 |
| 50 | The Royce Funds 2021 Annual Report to Shareholders | THE ACCOMPANYING NOTES ARE AN INTEGRAL PART OF THESE FINANCIAL STATEMENTS |
December 31, 2021
Royce Total Return Fund (continued)
| | | SHARES | | VALUE |
| | | | | |
| INDUSTRIALS (continued) | | | | | | | |
| ROAD & RAIL - 0.5% | | | | | | | |
| Werner Enterprises | | | 153,747 | | | $ | 7,327,582 |
| TRADING COMPANIES & DISTRIBUTORS - 4.2% | | | | | | | |
| Applied Industrial Technologies | | | 230,811 | | | | 23,704,290 |
| Global Industrial | | | 221,261 | | | | 9,049,575 |
| Lawson Products 1 | | | 69,067 | | | | 3,781,418 |
| MSC Industrial Direct Cl. A | | | 245,885 | | | | 20,669,093 |
| Watsco | | | 22,170 | | | | 6,936,549 |
| | | | | | | | 64,140,925 |
| Total (Cost $217,210,561) | | | | | | | 304,693,503 |
| | | | | | | | |
| INFORMATION TECHNOLOGY – 10.3% | | | | | | | |
| ELECTRONIC EQUIPMENT, INSTRUMENTS & COMPONENTS - 3.7% | | | | | | | |
| Avnet | | | 221,910 | | | | 9,149,349 |
| PC Connection | | | 200,833 | | | | 8,661,927 |
| †Vontier Corporation | | | 1,215,850 | | | | 37,363,071 |
| | | | | | | | 55,174,347 |
| IT SERVICES - 1.3% | | | | | | | |
| EVERTEC | | | 291,093 | | | | 14,548,828 |
| Hackett Group (The) | | | 259,045 | | | | 5,318,194 |
| | | | | | | | 19,867,022 |
| SEMICONDUCTORS & SEMICONDUCTOR EQUIPMENT - 1.9% | | | | | | | |
| Kulicke & Soffa Industries | | | 310,675 | | | | 18,808,265 |
| MKS Instruments | | | 58,971 | | | | 10,270,979 |
| | | | | | | | 29,079,244 |
| SOFTWARE - 3.4% | | | | | | | |
| †CDK Global | | | 711,496 | | | | 29,697,843 |
| †Teradata Corporation 1 | | | 514,401 | | | | 21,846,610 |
| | | | | | | | 51,544,453 |
| Total (Cost $136,372,988) | | | | | | | 155,665,066 |
| | | | | | | | |
| MATERIALS – 11.1% | | | | | | | |
| CHEMICALS - 5.5% | | | | | | | |
| Element Solutions | | | 1,315,145 | | | | 31,931,721 |
| Innospec | | | 252,378 | | | | 22,799,828 |
| Minerals Technologies | | | 389,100 | | | | 28,462,665 |
| | | | | | | | 83,194,214 |
| CONTAINERS & PACKAGING - 5.6% | | | | | | | |
| Graphic Packaging Holding Company | | | 1,321,756 | | | | 25,774,242 |
| †Intertape Polymer Group | | | 923,500 | | | | 19,215,400 |
| Silgan Holdings | | | 606,905 | | | | 25,999,810 |
| †TriMas Corporation | | | 388,912 | | | | 14,389,744 |
| | | | | | | | 85,379,196 |
| METALS & MINING - 0.0% | | | | | | | |
| Ferroglobe (Warranty Insurance Trust) 1,4 | | | 569,803 | | | | 0 |
| Total (Cost $138,359,461) | | | | | | | 168,573,410 |
| | | | | | | | |
| REAL ESTATE – 2.7% | | | | | | | |
| REAL ESTATE MANAGEMENT & DEVELOPMENT - 2.7% | | | | | | | |
| †Cushman & Wakefield 1 | | | 684,544 | | | | 15,224,259 |
| Kennedy-Wilson Holdings | | | 1,052,396 | | | | 25,131,216 |
| Total (Cost $33,424,155) | | | | | | | 40,355,475 |
| | | | | | | | |
| TOTAL COMMON STOCKS | | | | | | | |
| (Cost $1,148,266,829) | | | | | | | 1,489,685,995 |
| | | | | | | | |
| PREFERRED STOCK - 1.4% | | | | | | | |
| INFORMATION TECHNOLOGY – 1.4% | | | | | | | |
| ELECTRONIC EQUIPMENT, INSTRUMENTS & COMPONENTS – 1.4% | | | | | | | |
| †II-VI Series A Conv. | | | 77,684 | | | | 21,986,126 |
| (Cost $19,887,816) | | | | | | | 21,986,126 |
| | | | | | | | |
| REPURCHASE AGREEMENT – 0.4% | | | | | | | |
Fixed Income Clearing Corporation, 0.00% dated 12/31/21, due 1/3/22, maturity value $5,380,814 (collateralized by obligations of various U.S. Government Agencies, 0.25% due 7/15/29, valued at $5,488,547) |
| (Cost $5,380,814) | | | | | | | 5,380,814 |
| | | | | | | | |
| TOTAL INVESTMENTS – 100.1% | | | | | | | |
| (Cost $1,173,535,459) | | | | | | | 1,517,052,935 |
| | | | | | | | |
| LIABILITIES LESS CASH AND OTHER ASSETS – (0.1)% | | | | | | | (1,044,743) |
| | | | | | | | |
| NET ASSETS – 100.0% | | | | | | $ | 1,516,008,192 |
ADR- American Depository Receipt
| 2 | At December 31, 2021, the Fund owned 5% or more of the Company’s outstanding voting securities thereby making the Company an Affiliated Company as that term is defined in the Investment Company Act of 1940. See Notes to Financial Statements. |
| 3 | All or a portion of these securities were on loan at December 31, 2021. |
| 4 | Securities for which market quotations are not readily available represent 0.2%, 0.0%, 0.0% and 0.0% of net assets for Royce Micro-Cap Fund, Royce Opportunity Fund, Royce Pennsylvania Mutual Fund and Royce Total Return Fund. These securities have been valued at their fair value under procedures approved by the Fund’s Board of Trustees. These securities are defined as Level 3 securities due to the use of significant unobservable inputs in the determination of fair value. See Notes to Financial Statements. |
| 5 | These securities are defined as Level 2 securities due to fair value being based on quoted prices for similar securities. See Notes to Financial Statements. |
Securities of Royce International Premier Fund are categorized by the country of their headquarters.
Bold indicates a Fund’s 20 largest equity holdings in terms of December 31, 2021, market value.
| THE ACCOMPANYING NOTES ARE AN INTEGRAL PART OF THESE FINANCIAL STATEMENTS | The Royce Funds 2021 Annual Report to Shareholders | 51 |
Statements of Assets and Liabilities
| | | Royce Dividend
Value Fund | | | Royce Global
Financial Services
Fund | | | Royce International
Premier Fund | | | Royce Micro-Cap
Fund | |
| ASSETS: | | | | | | | | | | | | |
| Investments at value (including collateral on loaned securities)1 | | | | | | | | | | | | |
| Non-Affiliated Companies | | $ | 73,606,003 | | | $ | 35,087,464 | | | $ | 1,165,780,345 | | | $ | 408,514,263 | |
| Affiliated Companies | | | – | | | | – | | | | 28,408,875 | | | | – | |
| Repurchase agreements (at cost and value) | | | 2,690,108 | | | | 3,236,285 | | | | 58,034,150 | | | | 15,244,270 | |
| Foreign currency2 | | | 9,031 | | | | 4,914 | | | | 106,563 | | | | – | |
| Receivable for investments sold | | | – | | | | – | | | | 39,297 | | | | 91,418 | |
| Receivable for capital shares sold | | | 41,870 | | | | 1,410 | | | | 1,459,218 | | | | 71,196 | |
| Receivable for dividends | | | 91,999 | | | | 60,626 | | | | 1,884,295 | | | | 14,472 | |
| Receivable for securities lending income | | | – | | | | – | | | | – | | | | 4,570 | |
| Prepaid expenses and other assets | | | 828 | | | | 396 | | | | 13,102 | | | | 4,197 | |
| Total Assets | | | 76,439,839 | | | | 38,391,095 | | | | 1,255,725,845 | | | | 423,944,386 | |
| LIABILITIES: | | | | | | | | | | | | | | | | |
| Payable for collateral on loaned securities | | | – | | | | – | | | | – | | | | 827,269 | |
| Payable for investments purchased | | | – | | | | – | | | | 763,937 | | | | 281,227 | |
| Payable for capital shares redeemed | | | 4,427 | | | | 6,939 | | | | 610,357 | | | | 330,664 | |
| Payable for investment advisory fees | | | 54,023 | | | | 32,027 | | | | 919,166 | | | | 350,510 | |
| Payable for trustees’ fees | | | 2,182 | | | | 1,094 | | | | 33,731 | | | | 11,085 | |
| Accrued expenses | | | 79,346 | | | | 61,345 | | | | 456,799 | | | | 245,591 | |
| Deferred capital gains tax | | | – | | | | 6,450 | | | | – | | | | – | |
| Total Liabilities | | | 139,978 | | | | 107,855 | | | | 2,783,990 | | | | 2,046,346 | |
| Net Assets | | $ | 76,299,861 | | | $ | 38,283,240 | | | $ | 1,252,941,855 | | | $ | 421,898,040 | |
| ANALYSIS OF NET ASSETS: | | | | | | | | | | | | | | | | |
| Paid-in capital | | $ | 31,153,822 | | | $ | 20,918,755 | | | $ | 1,003,702,051 | | | $ | 261,052,162 | |
| Total distributable earnings (loss) | | | 45,146,039 | | | | 17,364,485 | | | | 249,239,804 | | | | 160,845,878 | |
| Net Assets | | $ | 76,299,861 | | | $ | 38,283,240 | | | $ | 1,252,941,855 | | | $ | 421,898,040 | |
| Investment Class | | $ | 54,465,968 | | | | | | | $ | 480,550,393 | | | $ | 209,032,201 | |
| Service Class | | | 19,518,064 | | | $ | 28,574,506 | | | | 59,258,234 | | | | 197,088,440 | |
| Consultant Class | | | 1,363,594 | | | | | | | | 8,418,912 | | | | 15,777,399 | |
| Institutional Class | | | 952,235 | | | | 9,708,734 | | | | 704,714,316 | | | | | |
| SHARES OUTSTANDING (unlimited number of $.001 par value): | | | | | | | | | | | | | | | | |
| Investment Class | | | 8,513,820 | | | | | | | | 26,977,870 | | | | 15,587,865 | |
| Service Class | | | 2,936,037 | | | | 2,368,754 | | | | 2,777,592 | | | | 15,104,799 | |
| Consultant Class | | | 179,301 | | | | | | | | 372,910 | | | | 1,577,540 | |
| Institutional Class | | | 151,299 | | | | 616,169 | | | | 39,540,243 | | | | | |
| NET ASSET VALUES (Net Assets ÷ Shares Outstanding): | | | | | | | | | | | | | | | | |
| Investment Class3 | | | $6.40 | | | | | | | | $17.81 | | | | $13.41 | |
| Service Class3 | | | 6.65 | | | | $12.06 | | | | 21.33 | | | | 13.05 | |
| Consultant Class4 | | | 7.61 | | | | | | | | 22.58 | | | | 10.00 | |
| Institutional Class5 | | | 6.29 | | | | 15.76 | | | | 17.82 | | | | | |
| Investments at identified cost – Non-Affiliated Companies | | $ | 28,253,864 | | | $ | 17,036,016 | | | $ | 925,558,971 | | | $ | 259,900,752 | |
| Investments at identified cost – Affiliated Companies | | | – | | | | – | | | | 37,924,640 | | | | – | |
| Market value of loaned securities6 | | | – | | | | – | | | | – | | | | 9,034,598 | |
1 See Notes to Financial Statements for information on non-cash collateral on loaned securities.
2 The cost of foreign currency is $9,031 for Royce Dividend Value Fund, $4,914 for Royce Global Financial Services Fund and $106,260 for Royce International Premier Fund.
3 Offering and redemption price per share; shares held less than 30 days may be subject to a 1% redemption fee, or a 2% redemption fee (Royce International Premier Fund), payable to the Fund.
4 Offering and redemption price per share; shares held less than 365 days may be subject to a 1% contingent deferred sales charge, payable to Royce Fund Services, LLC.
5 Offering and redemption price per share.
6 Market value of loaned securities backed by non-cash collateral is as of prior business day.
| 52 | The Royce Funds 2021 Annual Report to Shareholders | THE ACCOMPANYING NOTES ARE AN INTEGRAL PART OF THESE FINANCIAL STATEMENTS |
December 31, 2021
| | | Royce Opportunity
Fund | | | Royce Pennsylvania
Mutual Fund | | | Royce Premier Fund | | | Royce Small-Cap
Value Fund | |
| ASSETS: | | | | | | | | | | | | |
| Investments at value (including collateral on loaned securities)1 | | | | | | | | | | | | |
| Non-Affiliated Companies | | $ | 1,737,952,989 | | | $ | 2,115,996,789 | | | $ | 1,673,180,906 | | | $ | 135,073,991 | |
| Affiliated Companies | | | 19,258,017 | | | | – | | | | – | | | | – | |
| Repurchase agreements (at cost and value) | | | 42,681,217 | | | | 33,979,828 | | | | 62,015,718 | | | | 4,698,139 | |
| Foreign currency2 | | | – | | | | 57,180 | | | | – | | | | – | |
| Receivable for investments sold | | | 12,760,733 | | | | 13,892,561 | | | | 1,538,943 | | | | 1,043,900 | |
| Receivable for capital shares sold | | | 4,717,456 | | | | 1,440,796 | | | | 1,394,596 | | | | 8,362 | |
| Receivable for dividends | | | 500,253 | | | | 1,462,066 | | | | 1,531,158 | | | | 120,557 | |
| Receivable for securities lending income | | | 22,206 | | | | 10,603 | | | | – | | | | 87 | |
| Prepaid expenses and other assets | | | 16,045 | | | | 3,569,994 | | | | 19,148 | | | | 1,400 | |
| Total Assets | | | 1,817,908,916 | | | | 2,170,409,817 | | | | 1,739,680,469 | | | | 140,946,436 | |
| LIABILITIES: | | | | | | | | | | | | | | | | |
| Payable for collateral on loaned securities | | | 3,651,391 | | | | 11,352,400 | | | | – | | | | – | |
| Payable for investments purchased | | | 5,343,206 | | | | 4,384,015 | | | | – | | | | 709,283 | |
| Payable for capital shares redeemed | | | 6,658,812 | | | | 3,594,576 | | | | 1,821,935 | | | | 169,130 | |
| Payable for investment advisory fees | | | 1,592,646 | | | | 1,358,466 | | | | 1,463,533 | | | | 116,214 | |
| Payable for trustees’ fees | | | 52,316 | | | | 60,230 | | | | 49,937 | | | | 3,850 | |
| Accrued expenses | | | 752,116 | | | | 840,037 | | | | 567,996 | | | | 125,216 | |
| Total Liabilities | | | 18,050,487 | | | | 21,589,724 | | | | 3,903,401 | | | | 1,123,693 | |
| Net Assets | | $ | 1,799,858,429 | | | $ | 2,148,820,093 | | | $ | 1,735,777,068 | | | $ | 139,822,743 | |
| ANALYSIS OF NET ASSETS: | | | | | | | | | | | | | | | | |
| Paid-in capital | | $ | 1,332,326,519 | | | $ | 1,364,911,851 | | | $ | 909,250,056 | | | $ | 100,357,255 | |
| Total distributable earnings (loss) | | | 467,531,910 | | | | 783,908,242 | | | | 826,527,012 | | | | 39,465,488 | |
| Net Assets | | $ | 1,799,858,429 | | | $ | 2,148,820,093 | | | $ | 1,735,777,068 | | | $ | 139,822,743 | |
| Investment Class | | $ | 1,332,049,802 | | | $ | 1,605,587,375 | | | $ | 1,401,346,761 | | | $ | 44,620,632 | |
| Service Class | | | 109,440,222 | | | | 84,059,770 | | | | 36,487,966 | | | | 81,839,644 | |
| Consultant Class | | | 14,871,264 | | | | 249,816,160 | | | | 16,016,185 | | | | 5,269,181 | |
| Institutional Class | | | 291,960,535 | | | | 199,842,118 | | | | 273,853,176 | | | | | |
| R Class | | | 51,536,606 | | | | 9,514,670 | | | | 8,072,980 | | | | 8,093,286 | |
| SHARES OUTSTANDING (unlimited number of $.001 par value): | | | | | | | | | | | | | | | | |
| Investment Class | | | 79,486,917 | | | | 166,405,374 | | | | 108,080,885 | | | | 4,277,229 | |
| Service Class | | | 7,136,572 | | | | 8,741,140 | | | | 2,901,591 | | | | 7,887,147 | |
| Consultant Class | | | 1,123,278 | | | | 33,168,870 | | | | 1,600,930 | | | | 581,730 | |
| Institutional Class | | | 16,963,346 | | | | 20,639,075 | | | | 20,806,155 | | | | | |
| R Class | | | 3,483,042 | | | | 1,064,018 | | | | 682,094 | | | | 819,003 | |
| NET ASSET VALUES (Net Assets ÷ Shares Outstanding): | | | | | | | | | | | | | | | | |
| Investment Class3 | | | $16.76 | | | | $9.65 | | | | $12.97 | | | | $10.43 | |
| Service Class3 | | | 15.34 | | | | 9.62 | | | | 12.58 | | | | 10.38 | |
| Consultant Class4 | | | 13.24 | | | | 7.53 | | | | 10.00 | | | | 9.06 | |
| Institutional Class5 | | | 17.21 | | | | 9.68 | | | | 13.16 | | | | | |
| R Class5 | | | 14.80 | | | | 8.94 | | | | 11.84 | | | | 9.88 | |
| Investments at identified cost – Non-Affiliated Companies | | $ | 1,317,373,165 | | | $ | 1,371,486,137 | | | $ | 866,846,146 | | | $ | 98,103,658 | |
| Investments at identified cost – Affiliated Companies | | | 21,224,384 | | | | – | | | | – | | | | – | |
| Market value of loaned securities6 | | | 37,138,400 | | | | 24,388,004 | | | | – | | | | 1,518,928 | |
1 See Notes to Financial Statements for information on non-cash collateral on loaned securities.
2 The cost of foreign currency is $56,745 for Royce Pennsylvania Mutual Fund.
3 Offering and redemption price per share; shares held less than 30 days may be subject to a 1% redemption fee, payable to the Fund.
4 Offering and redemption price per share; shares held less than 365 days may be subject to a 1% contingent deferred sales charge, payable to Royce Fund Services, LLC.
5 Offering and redemption price per share.
6 Market value of loaned securities backed by non-cash collateral is as of prior business day.
| THE ACCOMPANYING NOTES ARE AN INTEGRAL PART OF THESE FINANCIAL STATEMENTS | The Royce Funds 2021 Annual Report to Shareholders | 53 |
| Statements of Assets and Liabilities | December 31, 2021 |
| | | Royce Smaller-
Companies Growth
Fund | | | Royce Special Equity
Fund | | | Royce Total Return
Fund | |
| ASSETS: | | | | | | | | | |
| Investments at value (including collateral on loaned securities)1 | | | | | | | | | |
| Non-Affiliated Companies | | $ | 293,734,117 | | | $ | 727,192,240 | | | $ | 1,486,531,692 | |
| Affiliated Companies | | | – | | | | 183,656,705 | | | | 25,140,429 | |
| Repurchase agreements (at cost and value) | | | 21,722,702 | | | | 162,932,275 | | | | 5,380,814 | |
| Foreign currency2 | | | – | | | | – | | | | 158,255 | |
| Receivable for investments sold | | | – | | | | 1,230,816 | | | | 267,097 | |
| Receivable for capital shares sold | | | 120,117 | | | | 3,398,868 | | | | 1,451,978 | |
| Receivable for dividends | | | – | | | | 845,109 | | | | 2,503,336 | |
| Receivable for securities lending income | | | 75,265 | | | | – | | | | 1 | |
| Prepaid expenses and other assets | | | 3,359 | | | | 10,949 | | | | 15,275 | |
| Total Assets | | | 315,655,560 | | | | 1,079,266,962 | | | | 1,521,448,877 | |
| LIABILITIES: | | | | | | | | | | | | |
| Payable for collateral on loaned securities | | | 14,874,213 | | | | – | | | | – | |
| Payable for investments purchased | | | – | | | | 309,115 | | | | 87,405 | |
| Payable for capital shares redeemed | | | 628,514 | | | | 640,548 | | | | 3,363,075 | |
| Payable for investment advisory fees | | | 251,264 | | | | 915,858 | | | | 1,270,445 | |
| Payable for trustees’ fees | | | 9,411 | | | | 29,706 | | | | 41,893 | |
| Accrued expenses | | | 198,021 | | | | 418,016 | | | | 677,867 | |
| Total Liabilities | | | 15,961,423 | | | | 2,313,243 | | | | 5,440,685 | |
| Net Assets | | $ | 299,694,137 | | | $ | 1,076,953,719 | | | $ | 1,516,008,192 | |
| ANALYSIS OF NET ASSETS: | | | | | | | | | | | | |
| Paid-in capital | | $ | 204,673,702 | | | $ | 782,994,917 | | | $ | 1,116,314,779 | |
| Total distributable earnings (loss) | | | 95,020,435 | | | | 293,958,802 | | | | 399,693,413 | |
| Net Assets | | $ | 299,694,137 | | | $ | 1,076,953,719 | | | $ | 1,516,008,192 | |
| Investment Class | | $ | 106,317,929 | | | $ | 755,337,897 | | | $ | 1,016,330,559 | |
| Service Class | | | 178,553,463 | | | | 57,738,276 | | | | 80,478,390 | |
| Consultant Class | | | 7,544,373 | | | | 25,067,634 | | | | 112,648,766 | |
| Institutional Class | | | 7,278,372 | | | | 238,809,912 | | | | 279,510,479 | |
| R Class | | | | | | | | | | | 27,039,998 | |
| SHARES OUTSTANDING (unlimited number of $.001 par value): | | | | | | | | | | | | |
| Investment Class | | | 12,162,209 | | | | 39,564,549 | | | | 115,749,078 | |
| Service Class | | | 21,132,515 | | | | 3,028,667 | | | | 8,865,690 | |
| Consultant Class | | | 1,064,382 | | | | 1,442,845 | | | | 12,273,949 | |
| Institutional Class | | | 820,929 | | | | 12,623,370 | | | | 32,454,029 | |
| R Class | | | | | | | | | | | 2,939,408 | |
| NET ASSET VALUES (Net Assets ÷ Shares Outstanding): | | | | | | | | | | | | |
| Investment Class3 | | | $8.74 | | | | $19.09 | | | | $8.78 | |
| Service Class3 | | | 8.45 | | | | 19.06 | | | | 9.08 | |
| Consultant Class4 | | | 7.09 | | | | 17.37 | | | | 9.18 | |
| Institutional Class5 | | | 8.87 | | | | 18.92 | | | | 8.61 | |
| R Class5 | | | | | | | | | | | 9.20 | |
| Investments at identified cost – Non-Affiliated Companies | | $ | 202,655,276 | | | $ | 496,325,791 | | | $ | 1,130,415,868 | |
| Investments at identified cost – Affiliated Companies | | | – | | | | 167,787,388 | | | | 37,738,777 | |
| Market value of loaned securities6 | | | 28,256,273 | | | | – | | | | – | |
1 See Notes to Financial Statements for information on non-cash collateral on loaned securities.
2 The cost of foreign currency is $157,050 for Royce Total Return Fund.
3 Offering and redemption price per share; shares held less than 30 days may be subject to a 1% redemption fee, payable to the Fund.
4 Offering and redemption price per share; shares held less than 365 days may be subject to a 1% contingent deferred sales charge, payable to Royce Fund Services, LLC.
5 Offering and redemption price per share.
6 Market value of loaned securities backed by non-cash collateral is as of prior business day.
| 54 | The Royce Funds 2021 Annual Report to Shareholders | THE ACCOMPANYING NOTES ARE AN INTEGRAL PART OF THESE FINANCIAL STATEMENTS |
| Statements of Operations | Year Ended December 31, 2021 |
| | | Royce Dividend
Value Fund | | | Royce Global
Financial Services
Fund | | | Royce International
Premier Fund | | | Royce Micro-Cap
Fund | |
| INVESTMENT INCOME: | | | | | | | | | | | | |
| INCOME: | | | | | | | | | | | | |
| Dividends | | | | | | | | | | | | |
| Non-Affiliated Companies | | $ | 1,489,304 | | | $ | 1,427,961 | | | $ | 19,263,033 | | | $ | 3,142,244 | |
| Affiliated Companies | | | – | | | | – | | | | 819,692 | | | | – | |
| Foreign withholding tax | | | (50,976 | ) | | | (91,307 | ) | | | (1,602,380 | ) | | | (45,585 | ) |
| Securities lending | | | – | | | | – | | | | – | | | | 30,959 | |
| Total income | | | 1,438,328 | | | | 1,336,654 | | | | 18,480,345 | | | | 3,127,618 | |
| EXPENSES: | | | | | | | | | | | | | | | | |
| Investment advisory fees | | | 659,299 | | | | 397,726 | | | | 12,443,465 | | | | 4,099,315 | |
| Distribution fees | | | 63,733 | | | | 76,692 | | | | 253,195 | | | | 647,107 | |
| Shareholder servicing | | | 128,061 | | | | 56,297 | | | | 839,376 | | | | 486,688 | |
| Registration | | | 56,777 | | | | 33,022 | | | | 89,586 | | | | 49,855 | |
| Administrative and office facilities | | | 49,371 | | | | 33,587 | | | | 476,348 | | | | 171,556 | |
| Audit | | | 33,042 | | | | 31,495 | | | | 41,233 | | | | 35,293 | |
| Custody | | | 32,285 | | | | 37,314 | | | | 487,838 | | | | 47,993 | |
| Shareholder reports | | | 10,785 | | | | 5,547 | | | | 203,562 | | | | 62,915 | |
| Trustees’ fees | | | 9,023 | | | | 4,517 | | | | 142,916 | | | | 47,774 | |
| Legal | | | 3,038 | | | | 1,458 | | | | 45,013 | | | | 15,067 | |
| Other expenses | | | 8,956 | | | | 3,956 | | | | 72,126 | | | | 23,749 | |
| Total expenses | | | 1,054,370 | | | | 681,611 | | | | 15,094,658 | | | | 5,687,312 | |
| Compensating balance credits | | | (42 | ) | | | (20 | ) | | | (1,588 | ) | | | (335 | ) |
| Fees waived by investment adviser and distributor | | | – | | | | (9,203 | ) | | | (774,555 | ) | | | – | |
| Expenses reimbursed by investment adviser | | | (145,141 | ) | | | (79,775 | ) | | | (401,724 | ) | | | (34,538 | ) |
| Net expenses | | | 909,187 | | | | 592,613 | | | | 13,916,791 | | | | 5,652,439 | |
| Net investment income (loss) | | | 529,141 | | | | 744,041 | | | | 4,563,554 | | | | (2,524,821 | ) |
| REALIZED AND UNREALIZED GAIN (LOSS) ON INVESTMENTS AND FOREIGN CURRENCY: | | | | | | | | | | | | | |
| NET REALIZED GAIN (LOSS): | | | | | | | | | | | | | | | | |
| Investments in Non-Affiliated Companies | | | 7,611,076 | | | | 1,055,744 | | | | 113,040,059 | | | | 90,611,147 | |
| Investments in Affiliated Companies | | | – | | | | – | | | | 18,038 | | | | – | |
| Foreign currency transactions | | | 908 | | | | (5,217 | ) | | | (254,283 | ) | | | (774 | ) |
| NET CHANGE IN UNREALIZED APPRECIATION (DEPRECIATION): | | | | | | | | | | | | | | | | |
| Investments in Non-Affiliated Companies | | | 5,976,855 | | | | 5,116,585 | | | | (35,491,783 | ) | | | 16,728,861 | |
| Investments in Affiliated Companies | | | – | | | | – | | | | (9,100,483 | ) | | | – | |
| Other assets and liabilities denominated in foreign currency | | | (13,022 | ) | | | (7,188 | ) | | | (48,624 | ) | | | – | |
| Net realized and unrealized gain (loss) on investments and foreign currency | | | 13,575,817 | | | | 6,159,924 | | | | 68,162,924 | | | | 107,339,234 | |
| NET INCREASE (DECREASE) IN NET ASSETS FROM INVESTMENT OPERATIONS | | $ | 14,104,958 | | | $ | 6,903,965 | | | $ | 72,726,478 | | | $ | 104,814,413 | |
| THE ACCOMPANYING NOTES ARE AN INTEGRAL PART OF THESE FINANCIAL STATEMENTS | The Royce Funds 2021 Annual Report to Shareholders | 55 |
Statements of Operations
| | | Royce Opportunity
Fund | | | Royce
Pennsylvania
Mutual Fund | | | Royce Premier
Fund | | | Royce Small-Cap
Value Fund | |
| INVESTMENT INCOME: | | | | | | | | | | | | |
| INCOME: | | | | | | | | | | | | |
| Dividends | | $ | 17,315,254 | | | $ | 23,329,727 | | | $ | 17,726,322 | | | $ | 1,999,726 | |
| Foreign withholding tax | | | – | | | | (470,945 | ) | | | (210,982 | ) | | | – | |
| Interest | | | 175 | | | | 347,781 | | | | – | | | | – | |
| Securities lending | | | 631,945 | | | | 155,671 | | | | 105,678 | | | | 1,234 | |
| Total income | | | 17,947,374 | | | | 23,362,234 | | | | 17,621,018 | | | | 2,000,960 | |
| EXPENSES: | | | | | | | | | | | | | | | | |
| Investment advisory fees | | | 19,692,832 | | | | 16,653,958 | | | | 17,965,482 | | | | 1,391,283 | |
| Distribution fees | | | 775,780 | | | | 2,894,477 | | | | 289,749 | | | | 293,762 | |
| Shareholder servicing | | | 1,917,325 | | | | 1,506,968 | | | | 1,345,231 | | | | 220,847 | |
| Registration | | | 179,414 | | | | 100,933 | | | | 77,476 | | | | 53,332 | |
| Administrative and office facilities | | | 696,642 | | | | 849,288 | | | | 726,712 | | | | 71,937 | |
| Audit | | | 47,386 | | | | 51,357 | | | | 44,689 | | | | 30,122 | |
| Custody | | | 247,676 | | | | 208,174 | | | | 145,502 | | | | 27,728 | |
| Shareholder reports | | | 236,769 | | | | 224,397 | | | | 158,263 | | | | 22,220 | |
| Trustees’ fees | | | 226,999 | | | | 258,927 | | | | 215,041 | | | | 16,221 | |
| Legal | | | 105,721 | | | | 88,009 | | | | 76,249 | | | | 5,113 | |
| Other expenses | | | 86,224 | | | | 155,488 | | | | 117,914 | | | | 11,619 | |
| Total expenses | | | 24,212,768 | | | | 22,991,976 | | | | 21,162,308 | | | | 2,144,184 | |
| Compensating balance credits | | | (745 | ) | | | (1,290 | ) | | | (567 | ) | | | (92 | ) |
| Fees waived by distributor | | | – | | | | (2,510 | ) | | | – | | | | – | |
| Expenses reimbursed by investment adviser | | | (9,233 | ) | | | – | | | | (22,908 | ) | | | (85,521 | ) |
| Net expenses | | | 24,202,790 | | | | 22,988,176 | | | | 21,138,833 | | | | 2,058,571 | |
| Net investment income (loss) | | | (6,255,416 | ) | | | 374,058 | | | | (3,517,815 | ) | | | (57,611 | ) |
| REALIZED AND UNREALIZED GAIN (LOSS) ON INVESTMENTS AND FOREIGN CURRENCY: | | | | | | | | | | | |
| NET REALIZED GAIN (LOSS): | | | | | | | | | | | | | | | | |
| Investments in Non-Affiliated Companies | | | 410,549,729 | | | | 514,769,927 | | | | 310,416,474 | | | | 26,822,412 | |
| Investments in Affiliated Companies | | | (12,186 | ) | | | – | | | | – | | | | – | |
| Foreign currency transactions | | | 4,405 | | | | 11,580 | | | | (81,355 | ) | | | – | |
| NET CHANGE IN UNREALIZED APPRECIATION (DEPRECIATION): | | | | | | | | | | | | | | | | |
| Investments in Non-Affiliated Companies | | | 30,536,785 | | | | (102,219,564 | ) | | | (36,690,666 | ) | | | 6,630,576 | |
| Investments in Affiliated Companies | | | (2,200,950 | ) | | | – | | | | – | | | | – | |
| Other assets and liabilities denominated in foreign currency | | | – | | | | (114 | ) | | | – | | | | – | |
| Net realized and unrealized gain (loss) on investments and foreign currency | | | 438,877,783 | | | | 412,561,829 | | | | 273,644,453 | | | | 33,452,988 | |
| NET INCREASE (DECREASE) IN NET ASSETS FROM INVESTMENT OPERATIONS | | $ | 432,622,367 | | | $ | 412,935,887 | | | $ | 270,126,638 | | | $ | 33,395,377 | |
| 56 | The Royce Funds 2021 Annual Report to Shareholders | THE ACCOMPANYING NOTES ARE AN INTEGRAL PART OF THESE FINANCIAL STATEMENTS |
Year Ended December 31, 2021
| | | | | | | | | | | | | |
| | | Royce Smaller-
Companies Growth
Fund | | | Royce Special
Equity Fund | | | Royce Total Return
Fund | |
| INVESTMENT INCOME: | | | | | | | | | | | | |
| INCOME: | | | | | | | | | | | | |
| Dividends | | | | | | | | | | | | |
| Non-Affiliated Companies | | $ | 341,640 | | | $ | 15,067,280 | | | $ | 35,005,656 | |
| Affiliated Companies | | | – | | | | 6,810,710 | | | | – | |
| Foreign withholding tax | | | – | | | | – | | | | (201,366 | ) |
| Securities lending | | | 596,623 | | | | – | | | | 32 | |
| Total income | | | 938,263 | | | | 21,877,990 | | | | 34,804,322 | |
| EXPENSES: | | | | | | | | | | | | |
| Investment advisory fees | | | 3,397,206 | | | | 10,826,951 | | | | 15,239,276 | |
| Distribution fees | | | 585,375 | | | | 371,834 | | | | 1,565,733 | |
| Shareholder servicing | | | 407,674 | | | | 959,039 | | | | 1,287,485 | |
| Registration | | | 65,944 | | | | 83,700 | | | | 85,006 | |
| Administrative and office facilities | | | 152,370 | | | | 427,881 | | | | 591,802 | |
| Audit | | | 32,939 | | | | 39,323 | | | | 51,580 | |
| Custody | | | 40,446 | | | | 95,051 | | | | 136,545 | |
| Shareholder reports | | | 39,555 | | | | 123,766 | | | | 245,992 | |
| Trustees’ fees | | | 41,584 | | | | 126,210 | | | | 177,025 | |
| Legal | | | 14,800 | | | | 45,373 | | | | 168,069 | |
| Other expenses | | | 21,906 | | | | 93,196 | | | | 103,832 | |
| Total expenses | | | 4,799,799 | | | | 13,192,324 | | | | 19,652,345 | |
| Compensating balance credits | | | (229 | ) | | | (567 | ) | | | (597 | ) |
| Expenses reimbursed by investment adviser | | | (71,294 | ) | | | (42,615 | ) | | | (26,297 | ) |
| Net expenses | | | 4,728,276 | | | | 13,149,142 | | | | 19,625,451 | |
| Net investment income (loss) | | | (3,790,013 | ) | | | 8,728,848 | | | | 15,178,871 | |
| REALIZED AND UNREALIZED GAIN (LOSS) ON INVESTMENTS AND FOREIGN CURRENCY: | | | | | | | | | |
| NET REALIZED GAIN (LOSS): | | | | | | | | | | | | |
| Investments in Non-Affiliated Companies | | | 63,188,424 | | | | 173,827,297 | | | | 394,004,651 | |
| Investments in Affiliated Companies | | | – | | | | 6,729,979 | | | | 47,958 | |
| Foreign currency transactions | | | (13,383 | ) | | | – | | | | 95,234 | |
| NET CHANGE IN UNREALIZED APPRECIATION (DEPRECIATION): | | | | | | | | | | | | |
| Investments in Non-Affiliated Companies | | | (33,250,491 | ) | | | 39,493,019 | | | | (62,663,178 | ) |
| Investments in Affiliated Companies | | | – | | | | (15,764,618 | ) | | | (12,598,348 | ) |
| Other assets and liabilities denominated in foreign currency | | | (72 | ) | | | – | | | | (6,237 | ) |
| Net realized and unrealized gain (loss) on investments and foreign currency | | | 29,924,478 | | | | 204,285,677 | | | | 318,880,080 | |
| NET INCREASE (DECREASE) IN NET ASSETS FROM INVESTMENT OPERATIONS | | $ | 26,134,465 | | | $ | 213,014,525 | | | $ | 334,058,951 | |
| THE ACCOMPANYING NOTES ARE AN INTEGRAL PART OF THESE FINANCIAL STATEMENTS | The Royce Funds 2021 Annual Report to Shareholders | 57 |
Statements of Changes in Net Assets
| | | Royce Dividend Value Fund | | | Royce Global Financial
Services Fund | | | Royce International Premier Fund | |
| | | Year Ended 12/31/21 | | | Year Ended 12/31/20 | | | Year Ended 12/31/21 | | | Year Ended 12/31/20 | | | Year Ended 12/31/21 | | | Year Ended 12/31/20 | |
| INVESTMENT OPERATIONS: | | | | | | | | | | | | | | | | | | | | | | | | |
| Net investment income (loss) | | $ | 529,141 | | | $ | 922,919 | | | $ | 744,041 | | | $ | 250,118 | | | $ | 4,563,554 | | | $ | 2,943,349 | |
| Net realized gain (loss) on investments and | | | | | | | | | | | | | | | | | | | | | | | | |
| foreign currency | | | 7,611,984 | | | | 2,367,798 | | | | 1,050,527 | | | | 1,465,214 | | | | 112,803,814 | | | | 22,478,465 | |
| Net change in unrealized appreciation (depreciation) | | | | | | | | | | | | | | | | | | | | | | | | |
| on investments and foreign currency | | | 5,963,833 | | | | (4,365,237 | ) | | | 5,109,397 | | | | 2,115,926 | | | | (44,640,890 | ) | | | 134,690,339 | |
| Net increase (decrease) in net assets from | | | | | | | | | | | | | | | | | | | | | | | | |
| investment operations | | | 14,104,958 | | | | (1,074,520 | ) | | | 6,903,965 | | | | 3,831,258 | | | | 72,726,478 | | | | 160,112,153 | |
| DISTRIBUTIONS: | | | | | | | | | | | | | | | | | | | | | | | | |
| Total distributable earnings | | | | | | | | | | | | | | | | | | | | | | | | |
| Investment Class | | | (7,025,655 | ) | | | (3,240,413 | ) | | | | | | | | | | | (22,789,281 | ) | | | (1,247,887 | ) |
| Service Class | | | (2,453,636 | ) | | | (1,079,729 | ) | | | (1,668,236 | ) | | | (1,687,634 | ) | | | (2,605,039 | ) | | | – | |
| Consultant Class | | | (163,702 | ) | | | (50,593 | ) | | | | | | | | | | | (367,166 | ) | | | – | |
| Institutional Class | | | (122,395 | ) | | | (45,009 | ) | | | (490,070 | ) | | | (490,704 | ) | | | (34,239,175 | ) | | | (1,995,035 | ) |
| Total distributions | | | (9,765,388 | ) | | | (4,415,744 | ) | | | (2,158,306 | ) | | | (2,178,338 | ) | | | (60,000,661 | ) | | | (3,242,922 | ) |
| CAPITAL SHARE TRANSACTIONS: | | | | | | | | | | | | | | | | | | | | | | | | |
| Net capital share transactions | | | | | | | | | | | | | | | | | | | | | | | | |
| Investment Class | | | (2,013,993 | ) | | | (18,600,025 | ) | | | | | | | | | | | (12,468,633 | ) | | | 55,751,664 | |
| Service Class | | | (1,344,558 | ) | | | (4,485,993 | ) | | | (1,005,797 | ) | | | (5,406,864 | ) | | | (11,025,900 | ) | | | (10,968,052 | ) |
| Consultant Class | | | 69,045 | | | | (320,764 | ) | | | | | | | | | | | (896,223 | ) | | | (1,726,782 | ) |
| Institutional Class | | | 137,821 | | | | (30,118 | ) | | | 876,025 | | | | 478,106 | | | | 132,006,580 | | | | 123,907,508 | |
| Shareholder redemption fees | | | | | | | | | | | | | | | | | | | | | | | | |
| Investment Class | | | 154 | | | | 6,074 | | | | | | | | | | | | 7,525 | | | | 15,694 | |
| Service Class | | | 4 | | | | 1 | | | | 2,234 | | | | 833 | | | | 1,675 | | | | 4,735 | |
| Net increase (decrease) in net assets from capital | | | | | | | | | | | | | | | | | | | | | | | | |
| share transactions | | | (3,151,527 | ) | | | (23,430,825 | ) | | | (127,538 | ) | | | (4,927,925 | ) | | | 107,625,024 | | | | 166,984,767 | |
| Net Increase (Decrease) In Net Assets | | | 1,188,043 | | | | (28,921,089 | ) | | | 4,618,121 | | | | (3,275,005 | ) | | | 120,350,841 | | | | 323,853,998 | |
| NET ASSETS: | | | | | | | | | | | | | | | | | | | | | | | | |
| Beginning of year | | | 75,111,818 | | | | 104,032,907 | | | | 33,665,119 | | | | 36,940,124 | | | | 1,132,591,014 | | | | 808,737,016 | |
| End of year | | $ | 76,299,861 | | | $ | 75,111,818 | | | $ | 38,283,240 | | | $ | 33,665,119 | | | $ | 1,252,941,855 | | | $ | 1,132,591,014 | |
| 58 | The Royce Funds 2021 Annual Report to Shareholders | THE ACCOMPANYING NOTES ARE AN INTEGRAL PART OF THESE FINANCIAL STATEMENTS |
| | | Royce Micro-Cap Fund | | | Royce Opportunity Fund | | | Royce Pennsylvania Mutual Fund | |
| | | Year Ended 12/31/21 | | | Year Ended 12/31/20 | | | Year Ended 12/31/21 | | | Year Ended 12/31/20 | | | Year Ended 12/31/21 | | | Year Ended 12/31/20 | |
| INVESTMENT OPERATIONS: | | | | | | | | | | | | | | | | | | | | | | | | |
| Net investment income (loss) | | $ | (2,524,821 | ) | | $ | (1,813,798 | ) | | $ | (6,255,416 | ) | | $ | (2,562,219 | ) | | $ | 374,058 | | | $ | 3,704,489 | |
| Net realized gain (loss) on investments and | | | | | | | | | | | | | | | | | | | | | | | | |
| foreign currency | | | 90,610,373 | | | | 23,319,990 | | | | 410,541,948 | | | | 9,918,591 | | | | 514,781,507 | | | | 35,621,900 | |
| Net change in unrealized appreciation (depreciation) | | | | | | | | | | | | | | | | | | | | | | | | |
| on investments and foreign currency | | | 16,728,861 | | | | 44,803,849 | | | | 28,335,835 | | | | 256,040,438 | | | | (102,219,678 | ) | | | 163,878,166 | |
| Net increase (decrease) in net assets from | | | | | | | | | | | | | | | | | | | | | | | | |
| investment operations | | | 104,814,413 | | | | 66,310,041 | | | | 432,622,367 | | | | 263,396,810 | | | | 412,935,887 | | | | 203,204,555 | |
| DISTRIBUTIONS: | | | | | | | | | | | | | | | | | | | | | | | | |
| Total distributable earnings | | | | | | | | | | | | | | | | | | | | | | | | |
| Investment Class | | | (40,188,397 | ) | | | (12,180,419 | ) | | | (253,497,536 | ) | | | – | | | | (359,795,213 | ) | | | (69,231,208 | ) |
| Service Class | | | (37,503,482 | ) | | | (11,758,124 | ) | | | (20,814,959 | ) | | | – | | | | (18,850,717 | ) | | | (3,611,159 | ) |
| Consultant Class | | | (3,014,349 | ) | | | (980,127 | ) | | | (2,744,573 | ) | | | – | | | | (55,761,614 | ) | | | (10,246,820 | ) |
| Institutional Class | | | | | | | | | | | (69,978,355 | ) | | | – | | | | (43,586,641 | ) | | | (8,012,607 | ) |
| R Class | | | | | | | | | | | (9,575,942 | ) | | | – | | | | (2,135,655 | ) | | | (345,468 | ) |
| Total distributions | | | (80,706,228 | ) | | | (24,918,670 | ) | | | (356,611,365 | ) | | | – | | | | (480,129,840 | ) | | | (91,447,262 | ) |
| CAPITAL SHARE TRANSACTIONS: | | | | | | | | | | | | | | | | | | | | | | | | |
| Net capital share transactions | | | | | | | | | | | | | | | | | | | | | | | | |
| Investment Class | | | 23,749,676 | | | | (5,433,235 | ) | | | 525,739,965 | | | | 24,573,263 | | | | 229,480,577 | | | | (88,625,855 | ) |
| Service Class | | | 16,625,148 | | | | (14,965,795 | ) | | | (41,632,774 | ) | | | 55,823,736 | | | | 5,763,904 | | | | (63,518,198 | ) |
| Consultant Class | | | 765,475 | | | | (1,616,260 | ) | | | 238,523 | | | | 2,345,556 | | | | 19,154,129 | | | | (35,210,467 | ) |
| Institutional Class | | | | | | | | | | | (83,562,703 | ) | | | 40,046,884 | | | | 43,861,946 | | | | 43,371,094 | |
| R Class | | | | | | | | | | | 14,012,071 | | | | (2,834,479 | ) | | | 1,818,834 | | | | (1,187,456 | ) |
| Shareholder redemption fees | | | | | | | | | | | | | | | | | | | | | | | | |
| Investment Class | | | 851 | | | | 731 | | | | 32,624 | | | | 4,415 | | | | 1,394 | | | | 5,223 | |
| Service Class | | | 39 | | | | 2 | | | | 25,893 | | | | 94 | | | | 11,839 | | | | 19 | |
| Net increase (decrease) in net assets from | | | | | | | | | | | | | | | | | | | | | | | | |
| capital share transactions | | | 41,141,189 | | | | (22,014,557 | ) | | | 414,853,599 | | | | 119,959,469 | | | | 300,092,623 | | | | (145,165,640 | ) |
| Net Increase (Decrease) In Net Assets | | | 65,249,374 | | | | 19,376,814 | | | | 490,864,601 | | | | 383,356,279 | | | | 232,898,670 | | | | (33,408,347 | ) |
| NET ASSETS: | | | | | | | | | | | | | | | | | | | | | | | | |
| Beginning of year | | | 356,648,666 | | | | 337,271,852 | | | | 1,308,993,828 | | | | 925,637,549 | | | | 1,915,921,423 | | | | 1,949,329,770 | |
| End of year | | $ | 421,898,040 | | | $ | 356,648,666 | | | $ | 1,799,858,429 | | | $ | 1,308,993,828 | | | $ | 2,148,820,093 | | | $ | 1,915,921,423 | |
| THE ACCOMPANYING NOTES ARE AN INTEGRAL PART OF THESE FINANCIAL STATEMENTS | The Royce Funds 2021 Annual Report to Shareholders | 59 |
Statements of Changes in Net Assets
| | | Royce Premier Fund | | | Royce Small-Cap Value Fund | | | Royce Smaller-Companies
Growth Fund | |
| | | Year Ended 12/31/21 | | | Year Ended 12/31/20 | | | Year Ended 12/31/21 | | | Year Ended 12/31/20 | | | Year Ended 12/31/21 | | | Year Ended 12/31/20 | |
| INVESTMENT OPERATIONS: | | | | | | | | | | | | | | | | | | | | | | | | |
| Net investment income (loss) | | $ | (3,517,815 | ) | | $ | 6,088,084 | | | $ | (57,611 | ) | | $ | 587,163 | | | $ | (3,790,013 | ) | | $ | (2,496,079 | ) |
| Net realized gain (loss) on investments and | | | | | | | | | | | | | | | | | | | | | | | | |
| foreign currency | | | 310,335,119 | | | | 116,147,396 | | | | 26,822,412 | | | | (14,605,696 | ) | | | 63,175,041 | | | | 48,688,482 | |
| Net change in unrealized appreciation (depreciation) | | | | | | | | | | | | | | | | | | | | | | | | |
| on investments and foreign currency | | | (36,690,666 | ) | | | 47,760,937 | | | | 6,630,576 | | | | (4,160,421 | ) | | | (33,250,563 | ) | | | 57,485,397 | |
| Net increase (decrease) in net assets from | | | | | | | | | | | | | | | | | | | | | | | | |
| investment operations | | | 270,126,638 | | | | 169,996,417 | | | | 33,395,377 | | | | (18,178,954 | ) | | | 26,134,465 | | | | 103,677,800 | |
| DISTRIBUTIONS: | | | | | | | | | | | | | | | | | | | | | | | | |
| Total distributable earnings | | | | | | | | | | | | | | | | | | | | | | | | |
| Investment Class | | | (254,117,355 | ) | | | (75,818,358 | ) | | | (2,477,475 | ) | | | (1,397,547 | ) | | | (27,701,937 | ) | | | (10,744,144 | ) |
| Service Class | | | (6,510,568 | ) | | | (1,489,604 | ) | | | (4,508,382 | ) | | | (2,901,432 | ) | | | (46,351,836 | ) | | | (17,138,595 | ) |
| Consultant Class | | | (2,839,443 | ) | | | (723,891 | ) | | | (272,817 | ) | | | (118,304 | ) | | | (1,990,024 | ) | | | (754,437 | ) |
| Institutional Class | | | (48,578,890 | ) | | | (14,256,624 | ) | | | | | | | | | | | (1,864,715 | ) | | | (526,528 | ) |
| R Class | | | (1,430,819 | ) | | | (449,228 | ) | | | (466,939 | ) | | | (253,771 | ) | | | | | | | | |
| Total distributions | | | (313,477,075 | ) | | | (92,737,705 | ) | | | (7,725,613 | ) | | | (4,671,054 | ) | | | (77,908,512 | ) | | | (29,163,704 | ) |
| CAPITAL SHARE TRANSACTIONS: | | | | | | | | | | | | | | | | | | | | | | | | |
| Net capital share transactions | | | | | | | | | | | | | | | | | | | | | | | | |
| Investment Class | | | 20,274,064 | | | | (144,735,583 | ) | | | 2,304,788 | | | | (11,132,948 | ) | | | 11,179,225 | | | | (6,812,104 | ) |
| Service Class | | | 8,433,761 | | | | (1,348,855 | ) | | | (9,385,293 | ) | | | (13,760,257 | ) | | | 28,379,873 | | | | (16,079,760 | ) |
| Consultant Class | | | 895,780 | | | | (2,305,819 | ) | | | 605,718 | | | | (2,225,129 | ) | | | 827,458 | | | | (75,431 | ) |
| Institutional Class | | | 14,733,388 | | | | 488,982 | | | | | | | | | | | | 3,093,038 | | | | (3,787,896 | ) |
| R Class | | | (1,206,906 | ) | | | (1,755,980 | ) | | | (438,074 | ) | | | (234,297 | ) | | | | | | | | |
| Shareholder redemption fees | | | | | | | | | | | | | | | | | | | | | | | | |
| Investment Class | | | 797 | | | | 1,373 | | | | 103 | | | | – | | | | 1,340 | | | | 4 | |
| Service Class | | | 2 | | | | 83 | | | | 220 | | | | 94 | | | | 2,633 | | | | 257 | |
| Net increase (decrease) in net assets from capital | | | | | | | | | | | | | | | | | | | | | | | | |
| share transactions | | | 43,130,886 | | | | (149,655,799 | ) | | | (6,912,538 | ) | | | (27,352,537 | ) | | | 43,483,567 | | | | (26,754,930 | ) |
| Net Increase (Decrease) In Net Assets | | | (219,551 | ) | | | (72,397,087 | ) | | | 18,757,226 | | | | (50,202,545 | ) | | | (8,290,480 | ) | | | 47,759,166 | |
| NET ASSETS: | | | | | | | | | | | | | | | | | | | | | | | | |
| Beginning of year | | | 1,735,996,619 | | | | 1,808,393,706 | | | | 121,065,517 | | | | 171,268,062 | | | | 307,984,617 | | | | 260,225,451 | |
| End of year | | $ | 1,735,777,068 | | | $ | 1,735,996,619 | | | $ | 139,822,743 | | | $ | 121,065,517 | | | $ | 299,694,137 | | | $ | 307,984,617 | |
| 60 | The Royce Funds 2021 Annual Report to Shareholders | THE ACCOMPANYING NOTES ARE AN INTEGRAL PART OF THESE FINANCIAL STATEMENTS |
| | | Royce Special Equity Fund | | | Royce Total Return Fund | |
| | | Year Ended 12/31/21 | | | Year Ended 12/31/20 | | | Year Ended 12/31/21 | | | Year Ended 12/31/20 | |
| INVESTMENT OPERATIONS: | | | | | | | | | | | | | | | | |
| Net investment income (loss) | | $ | 8,728,848 | | | $ | 14,493,483 | | | $ | 15,178,871 | | | $ | 21,768,475 | |
| Net realized gain (loss) on investments and foreign currency | | | 180,557,276 | | | | 53,147,713 | | | | 394,147,843 | | | | 255,117,502 | |
| Net change in unrealized appreciation (depreciation) on investments and foreign currency | | | 23,728,401 | | | | (16,019,772 | ) | | | (75,267,763 | ) | | | (248,636,152 | ) |
| Net increase (decrease) in net assets from investment operations | | | 213,014,525 | | | | 51,621,424 | | | | 334,058,951 | | | | 28,249,825 | |
| DISTRIBUTIONS: | | | | | | | | | | | | | | | | |
| Total distributable earnings | | | | | | | | | | | | | | | | |
| Investment Class | | | (110,703,898 | ) | | | (24,875,767 | ) | | | (260,605,655 | ) | | | (163,088,384 | ) |
| Service Class | | | (8,484,724 | ) | | | (1,595,055 | ) | | | (19,720,772 | ) | | | (12,587,274 | ) |
| Consultant Class | | | (3,392,907 | ) | | | (513,029 | ) | | | (28,195,237 | ) | | | (18,324,601 | ) |
| Institutional Class | | | (34,779,856 | ) | | | (7,057,430 | ) | | | (70,461,595 | ) | | | (37,383,740 | ) |
| R Class | | | | | | | | | | | (6,650,410 | ) | | | (5,028,388 | ) |
| Total distributions | | | (157,361,385 | ) | | | (34,041,281 | ) | | | (385,633,669 | ) | | | (236,412,387 | ) |
| CAPITAL SHARE TRANSACTIONS: | | | | | | | | | | | | | | | | |
| Net capital share transactions | | | | | | | | | | | | | | | | |
| Investment Class | | | 9,907,666 | | | | (128,578,387 | ) | | | 154,834,034 | | | | 9,353,382 | |
| Service Class | | | 9,185,477 | | | | (15,238,819 | ) | | | 13,568,408 | | | | 3,463,014 | |
| Consultant Class | | | 5,591,804 | | | | (6,046,446 | ) | | | 4,839,213 | | | | (19,183,979 | ) |
| Institutional Class | | | 33,619,039 | | | | 3,602,098 | | | | 85,362,325 | | | | 5,823,751 | |
| R Class | | | | | | | | | | | (3,336,971 | ) | | | (1,232,394 | ) |
| Shareholder redemption fees | | | | | | | | | | | | | | | | |
| Investment Class | | | 3,575 | | | | 6,740 | | | | 2,371 | | | | 607 | |
| Service Class | | | 3,095 | | | | 1,954 | | | | 2,104 | | | | 17 | |
| Net increase (decrease) in net assets from capital share transactions | | | 58,310,656 | | | | (146,252,860 | ) | | | 255,271,484 | | | | (1,775,602 | ) |
| Net Increase (Decrease) In Net Assets | | | 113,963,796 | | | | (128,672,717 | ) | | | 203,696,766 | | | | (209,938,164 | ) |
| NET ASSETS: | | | | | | | | | | | | | | | | |
| Beginning of year | | | 962,989,923 | | | | 1,091,662,640 | | | | 1,312,311,426 | | | | 1,522,249,590 | |
| End of year | | $ | 1,076,953,719 | | | $ | 962,989,923 | | | $ | 1,516,008,192 | | | $ | 1,312,311,426 | |
| THE ACCOMPANYING NOTES ARE AN INTEGRAL PART OF THESE FINANCIAL STATEMENTS | The Royce Funds 2021 Annual Report to Shareholders | 61 |
Financial Highlights
This table is presented to show selected data for a share outstanding throughout each year or other indicated period and to assist shareholders in evaluating a Fund’s performance for the periods presented. Per share amounts have been determined on the basis of the weighted average number of shares outstanding during the period.
| | | | | | | | | | | | | | | | | | | | | | | | | | | | | | | | | | Ratio of Expenses to Average Net Assets | | | | | | | |
| | | | Net Asset Value, Beginning of Period | | | Net Investment Income (Loss) | | | Net Realized and Unrealized Gain (Loss) on Investments and Foreign Currency | | | Total from Investment Operations | | | Distributions from Net Investment Income | | | Distributions from Net Realized Gain on Investments and Foreign Currency | | | Total Distributions | | | Net Asset Value, End of Period | | | Total Return | | | Net Assets, End of Period (in thousands) | | | Prior to Fee Waivers, Expense Reimbursements and Balance Credits | | | Prior to Fee Waivers and Expense Reimbursements | | | Net of Fee Waivers and Expense Reimbursements | | | Ratio of Net Investment Income (Loss) to Average Net Assets | | | Portfolio Turnover Rate | |
| Royce Dividend Value Fund–Investment Class |
| 2021 | | | $ | 6.11 | | | $ | 0.05 | | | $ | 1.17 | | | $ | 1.22 | | | $ | (0.06 | ) | | $ | (0.87 | ) | | $ | (0.93 | ) | | $ | 6.40 | | | | 20.47 | % | | $ | 54,466 | | | | 1.21 | % | | | 1.21 | % | | | 1.09 | % | | | 0.76 | % | | | 0 | % |
| 2020 | | | | 6.21 | | | | 0.07 | | | | 0.20 | | | | 0.27 | | | | (0.11 | ) | | | (0.26 | ) | | | (0.37 | ) | | | 6.11 | | | | 4.57 | | | | 53,421 | | | | 1.26 | | | | 1.26 | | | | 1.09 | | | | 1.27 | | | | 4 | |
| 2019 | | | | 5.56 | | | | 0.09 | | | | 1.58 | | | | 1.67 | | | | (0.10 | ) | | | (0.92 | ) | | | (1.02 | ) | | | 6.21 | | | | 30.34 | | | | 76,273 | | | | 1.21 | | | | 1.20 | | | | 1.09 | | | | 1.37 | | | | 8 | |
| 2018 | | | | 7.56 | | | | 0.10 | | | | (1.27 | ) | | | (1.17 | ) | | | (0.10 | ) | | | (0.73 | ) | | | (0.83 | ) | | | 5.56 | | | | (16.06 | ) | | | 88,036 | | | | 1.13 | | | | 1.13 | | | | 1.04 | | | | 1.29 | | | | 13 | |
| 2017 | | | | 7.18 | | | | 0.10 | | | | 1.43 | | | | 1.53 | | | | (0.13 | ) | | | (1.02 | ) | | | (1.15 | ) | | | 7.56 | | | | 21.91 | | | | 121,209 | | | | 1.13 | | | | 1.13 | | | | 1.06 | | | | 1.24 | | | | 16 | |
| Royce Dividend Value Fund–Service Class |
| 2021 | | | $ | 6.34 | | | $ | 0.04 | | | $ | 1.21 | | | $ | 1.25 | | | $ | (0.04 | ) | | $ | (0.90 | ) | | $ | (0.94 | ) | | $ | 6.65 | | | | 20.11 | % | | $ | 19,518 | | | | 1.54 | % | | | 1.54 | % | | | 1.34 | % | | | 0.51 | % | | | 0 | % |
| 2020 | | | | 6.42 | | | | 0.06 | | | | 0.21 | | | | 0.27 | | | | (0.08 | ) | | | (0.27 | ) | | | (0.35 | ) | | | 6.34 | | | | 4.47 | | | | 19,687 | | | | 1.60 | | | | 1.60 | | | | 1.34 | | | | 1.02 | | | | 4 | |
| 2019 | | | | 5.73 | | | | 0.08 | | | | 1.61 | | | | 1.69 | | | | (0.06 | ) | | | (0.94 | ) | | | (1.00 | ) | | | 6.42 | | | | 29.78 | | | | 25,256 | | | | 1.53 | | | | 1.52 | | | | 1.34 | | | | 1.14 | | | | 8 | |
| 2018 | | | | 7.76 | | | | 0.07 | | | | (1.29 | ) | | | (1.22 | ) | | | (0.06 | ) | | | (0.75 | ) | | | (0.81 | ) | | | 5.73 | | | | (16.24 | ) | | | 28,120 | | | | 1.43 | | | | 1.43 | | | | 1.34 | | | | 1.01 | | | | 13 | |
| 2017 | | | | 7.33 | | | | 0.08 | | | | 1.46 | | | | 1.54 | | | | (0.07 | ) | | | (1.04 | ) | | | (1.11 | ) | | | 7.76 | | | | 21.66 | | | | 59,641 | | | | 1.40 | | | | 1.39 | | | | 1.31 | | | | 1.04 | | | | 16 | |
| Royce Dividend Value Fund–Consultant Class |
| 2021 | | | $ | 7.27 | | | $ | (0.02 | ) | | $ | 1.39 | | | $ | 1.37 | | | $ | – | | | $ | (1.03 | ) | | $ | (1.03 | ) | | $ | 7.61 | | | | 19.28 | % | | $ | 1,364 | | | | 3.47 | % | | | 3.47 | % | | | 2.09 | % | | | (0.23 | )% | | | 0 | % |
| 2020 | | | | 7.33 | | | | 0.02 | | | | 0.23 | | | | 0.25 | | | | (0.01 | ) | | | (0.30 | ) | | | (0.31 | ) | | | 7.27 | | | | 3.55 | | | | 1,228 | | | | 3.32 | | | | 3.32 | | | | 2.09 | | | | 0.30 | | | | 4 | |
| 2019 | | | | 6.53 | | | | 0.03 | | | | 1.85 | | | | 1.88 | | | | (0.01 | ) | | | (1.07 | ) | | | (1.08 | ) | | | 7.33 | | | | 29.03 | | | | 1,621 | | | | 3.30 | | | | 3.29 | | | | 2.09 | | | | 0.40 | | | | 8 | |
| 2018 | | | | 8.87 | | | | 0.02 | | | | (1.48 | ) | | | (1.46 | ) | | | (0.03 | ) | | | (0.85 | ) | | | (0.88 | ) | | | 6.53 | | | | (16.93 | ) | | | 1,349 | | | | 3.44 | | | | 3.44 | | | | 2.09 | | | | 0.24 | | | | 13 | |
| 2017 | | | | 8.39 | | | | 0.02 | | | | 1.68 | | | | 1.70 | | | | (0.03 | ) | | | (1.19 | ) | | | (1.22 | ) | | | 8.87 | | | | 20.71 | | | | 1,534 | | | | 3.26 | | | | 3.26 | | | | 2.09 | | | | 0.23 | | | | 16 | |
| Royce Dividend Value Fund–Institutional Class |
| 2021 | | | $ | 6.02 | | | $ | 0.05 | | | $ | 1.14 | | | $ | 1.19 | | | $ | (0.06 | ) | | $ | (0.86 | ) | | $ | (0.92 | ) | | $ | 6.29 | | | | 20.18 | % | | $ | 952 | | | | 3.02 | % | | | 3.02 | % | | | 1.09 | % | | | 0.78 | % | | | 0 | % |
| 2020 | | | | 6.10 | | | | 0.07 | | | | 0.21 | | | | 0.28 | | | | (0.11 | ) | | | (0.25 | ) | | | (0.36 | ) | | | 6.02 | | | | 4.82 | | | | 776 | | | | 3.75 | | | | 3.75 | | | | 1.09 | | | | 1.27 | | | | 4 | |
| 2019 | | | | 5.48 | | | | 0.15 | | | | 1.48 | | | | 1.63 | | | | (0.11 | ) | | | (0.90 | ) | | | (1.01 | ) | | | 6.10 | | | | 30.08 | | | | 883 | | | | 1.98 | | | | 1.98 | | | | 0.97 | | | | 1.62 | | | | 8 | |
| 2018 | | | | 7.46 | | | | 0.09 | | | | (1.23 | ) | | | (1.14 | ) | | | (0.12 | ) | | | (0.72 | ) | | | (0.84 | ) | | | 5.48 | | | | (15.94 | ) | | | 3,016 | | | | 1.89 | | | | 1.89 | | | | 0.89 | | | | 1.28 | | | | 13 | |
| 2017 | | | | 7.09 | | | | 0.11 | | | | 1.42 | | | | 1.53 | | | | (0.15 | ) | | | (1.01 | ) | | | (1.16 | ) | | | 7.46 | | | | 22.21 | | | | 1,112 | | | | 2.79 | | | | 2.79 | | | | 0.89 | | | | 1.43 | | | | 16 | |
| Royce Global Financial Services Fund–Service Class |
| 2021 | | | $ | 10.66 | | | $ | 0.23 | 1 | | $ | 1.91 | | | $ | 2.14 | | | $ | (0.39 | ) | | $ | (0.35 | ) | | $ | (0.74 | ) | | $ | 12.06 | | | | 20.27 | % | | $ | 28,574 | | | | 1.78 | % | | | 1.78 | % | | | 1.49 | % | | | 1.84 | %1 | | | 5 | % |
| 2020 | | | | 9.91 | | | | 0.07 | | | | 1.42 | | | | 1.49 | | | | (0.04 | ) | | | (0.70 | ) | | | (0.74 | ) | | | 10.66 | | | | 15.25 | | | | 25,919 | | | | 1.88 | | | | 1.88 | | | | 1.49 | | | | 0.80 | | | | 4 | |
| 2019 | | | | 8.18 | | | | 0.10 | | | | 1.87 | | | | 1.97 | | | | (0.15 | ) | | | (0.09 | ) | | | (0.24 | ) | | | 9.91 | | | | 24.17 | | | | 30,202 | | | | 1.82 | | | | 1.81 | | | | 1.49 | | | | 0.86 | | | | 5 | |
| 2018 | | | | 10.57 | | | | 0.07 | | | | (1.45 | ) | | | (1.38 | ) | | | (0.09 | ) | | | (0.92 | ) | | | (1.01 | ) | | | 8.18 | | | | (13.41 | ) | | | 32,113 | | | | 1.68 | | | | 1.68 | | | | 1.49 | | | | 0.61 | | | | 8 | |
| 2017 | | | | 8.95 | | | | 0.10 | | | | 1.90 | | | | 2.00 | | | | (0.23 | ) | | | (0.15 | ) | | | (0.38 | ) | | | 10.57 | | | | 22.46 | | | | 47,197 | | | | 1.68 | | | | 1.68 | | | | 1.49 | | | | 0.83 | | | | 19 | |
| Royce Global Financial Services Fund–Institutional Class |
| 2021 | | | $ | 13.81 | | | $ | 0.32 | 1 | | $ | 2.47 | | | $ | 2.79 | | | $ | (0.39 | ) | | $ | (0.45 | ) | | $ | (0.84 | ) | | $ | 15.76 | | | | 20.35 | % | | $ | 9,709 | | | | 1.51 | % | | | 1.51 | % | | | 1.49 | % | | | 1.98 | %1 | | | 5 | % |
| 2020 | | | | 12.83 | | | | 0.10 | | | | 1.82 | | | | 1.92 | | | | (0.04 | ) | | | (0.90 | ) | | | (0.94 | ) | | | 13.81 | | | | 15.18 | | | | 7,746 | | | | 1.67 | | | | 1.67 | | | | 1.49 | | | | 0.81 | | | | 4 | |
| 2019 | | | | 10.55 | | | | 0.14 | | | | 2.42 | | | | 2.56 | | | | (0.16 | ) | | | (0.12 | ) | | | (0.28 | ) | | | 12.83 | | | | 24.35 | | | | 6,738 | | | | 1.60 | | | | 1.60 | | | | 1.33 | | | | 1.04 | | | | 5 | |
| 2018 | | | | 13.58 | | | | 0.15 | | | | (1.85 | ) | | | (1.70 | ) | | | (0.14 | ) | | | (1.19 | ) | | | (1.33 | ) | | | 10.55 | | | | (12.87 | ) | | | 6,951 | | | | 1.43 | | | | 1.43 | | | | 1.04 | | | | 1.06 | | | | 8 | |
| 2017 | | | | 11.43 | | | | 0.15 | | | | 2.47 | | | | 2.62 | | | | (0.27 | ) | | | (0.20 | ) | | | (0.47 | ) | | | 13.58 | | | | 23.01 | | | | 8,608 | | | | 1.44 | | | | 1.44 | | | | 1.04 | | | | 1.29 | | | | 19 | |
| 1 | For Royce Global Financial Services Fund, a special distribution from ECN Capital resulted in an increase in net investment income (loss) per share of $0.12 per share and an increase in the ratio of net investment income (loss) to average net assets of 1.00% for the Service Class, and $0.18 per share and 1.14% for the Institutional Class. |
| 62 | The Royce Funds 2021 Annual Report to Shareholders | THE ACCOMPANYING NOTES ARE AN INTEGRAL PART OF THESE FINANCIAL STATEMENTS |
Financial Highlights
This table is presented to show selected data for a share outstanding throughout each year or other indicated period and to assist shareholders in evaluating a Fund’s performance for the periods presented. Per share amounts have been determined on the basis of the weighted average number of shares outstanding during the period.
| | | | | | | | | | | | | | | | | | | | | | | | | | | | | | | | | | Ratio of Expenses to Average Net Assets | | | | | | | |
| | | | Net Asset Value, Beginning of Period | | | Net Investment Income (Loss) | | | Net Realized and Unrealized Gain (Loss) on Investments and Foreign Currency | | | Total from Investment Operations | | | Distributions from Net Investment Income | | | Distributions from Net Realized Gain on Investments and Foreign Currency | | | Total Distributions | | | Net Asset Value, End of Period | | | Total Return | | | Net Assets, End of Period (in thousands) | | | Prior to Fee Waivers, Expense Reimbursements and Balance Credits | | | Prior to Fee Waivers and Expense Reimbursements | | | Net of Fee Waivers and Expense Reimbursements | | | Ratio of Net Investment Income (Loss) to Average Net Assets | | | Portfolio Turnover Rate | |
| Royce International Premier Fund–Investment Class |
| 2021 | | | $ | 17.64 | | | $ | 0.06 | | | $ | 0.99 | | | $ | 1.05 | | | $ | (0.07 | ) | | $ | (0.81 | ) | | $ | (0.88 | ) | | $ | 17.81 | | | | 6.06 | % | | $ | 480,550 | | | | 1.23 | % | | | 1.23 | % | | | 1.16 | % | | | 0.33 | % | | | 32 | % |
| 2020 | | | | 15.25 | | | | 0.04 | | | | 2.40 | | | | 2.44 | | | | (0.05 | ) | | | – | | | | (0.05 | ) | | | 17.64 | | | | 15.99 | | | | 486,378 | | | | 1.26 | | | | 1.26 | | | | 1.19 | | | | 0.30 | | | | 21 | |
| 2019 | | | | 11.39 | | | | 0.11 | | | | 3.82 | | | | 3.93 | | | | (0.07 | ) | | | – | | | | (0.07 | ) | | | 15.25 | | | | 34.49 | | | | 360,623 | | | | 1.26 | | | | 1.26 | | | | 1.18 | | | | 0.74 | | | | 40 | |
| 2018 | | | | 13.07 | | | | 0.09 | | | | (1.72 | ) | | | (1.63 | ) | | | (0.05 | ) | | | – | | | | (0.05 | ) | | | 11.39 | | | | (12.45 | ) | | | 285,065 | | | | 1.27 | | | | 1.26 | | | | 1.16 | | | | 1.00 | | | | 65 | |
| 2017 | | | | 9.44 | | | | (0.10 | ) | | | 3.88 | | | | 3.78 | | | | (0.15 | ) | | | – | | | | (0.15 | ) | | | 13.07 | | | | 40.08 | | | | 103,032 | | | | 1.37 | | | | 1.37 | | | | 1.19 | | | | 0.32 | | | | 41 | |
| Royce International Premier Fund–Service Class |
| 2021 | | | $ | 21.10 | | | $ | 0.01 | | | $ | 1.18 | | | $ | 1.19 | | | $ | – | | | $ | (0.96 | ) | | $ | (0.96 | ) | | $ | 21.33 | | | | 5.78 | % | | $ | 59,258 | | | | 1.54 | % | | | 1.54 | % | | | 1.44 | % | | | 0.05 | % | | | 32 | % |
| 2020 | | | | 18.24 | | | | 0.01 | | | | 2.85 | | | | 2.86 | | | | – | | | | – | | | | – | | | | 21.10 | | | | 15.68 | | | | 69,153 | | | | 1.57 | | | | 1.57 | | | | 1.44 | | | | 0.04 | | | | 21 | |
| 2019 | | | | 13.61 | | | | 0.10 | | | | 4.57 | | | | 4.67 | | | | (0.04 | ) | | | – | | | | (0.04 | ) | | | 18.24 | | | | 34.29 | | | | 71,350 | | | | 1.58 | | | | 1.58 | | | | 1.41 | | | | 0.63 | | | | 40 | |
| 2018 | | | | 15.60 | | | | 0.11 | | | | (2.10 | ) | | | (1.99 | ) | | | – | | | | – | | | | – | | | | 13.61 | | | | (12.76 | ) | | | 36,303 | | | | 1.59 | | | | 1.59 | | | | 1.44 | | | | 0.71 | | | | 65 | |
| 2017 | | | | 11.24 | | | | 0.05 | | | | 4.42 | | | | 4.47 | | | | (0.11 | ) | | | – | | | | (0.11 | ) | | | 15.60 | | | | 39.81 | | | | 48,642 | | | | 1.65 | | | | 1.65 | | | | 1.44 | | | | 0.28 | | | | 41 | |
| Royce International Premier Fund–Consultant Class |
| 2021 | | | $ | 22.50 | | | $ | (0.16 | ) | | $ | 1.26 | | | $ | 1.10 | | | $ | – | | | $ | (1.02 | ) | | $ | (1.02 | ) | | $ | 22.58 | | | | 5.02 | % | | $ | 8,419 | | | | 2.38 | % | | | 2.38 | % | | | 2.19 | % | | | (0.69 | )% | | | 32 | % |
| 2020 | | | | 19.60 | | | | (0.13 | ) | | | 3.03 | | | | 2.90 | | | | – | | | | – | | | | – | | | | 22.50 | | | | 14.80 | | | | 9,182 | | | | 2.42 | | | | 2.41 | | | | 2.19 | | | | (0.70 | ) | | | 21 | |
| 2019 | | | | 14.71 | | | | (0.03 | ) | | | 4.92 | | | | 4.89 | | | | – | | | | – | | | | – | | | | 19.60 | | | | 33.24 | | | | 9,894 | | | | 2.41 | | | | 2.41 | | | | 2.18 | | | | (0.17 | ) | | | 40 | |
| 2018 | | | | 16.99 | | | | (0.00 | ) | | | (2.28 | ) | | | (2.28 | ) | | | – | | | | – | | | | – | | | | 14.71 | | | | (13.42 | ) | | | 8,546 | | | | 2.33 | | | | 2.32 | | | | 2.19 | | | | (0.00 | ) | | | 65 | |
| 2017 | | | | 12.27 | | | | (0.08 | ) | | | 4.83 | | | | 4.75 | | | | (0.03 | ) | | | – | | | | (0.03 | ) | | | 16.99 | | | | 38.73 | | | | 9,281 | | | | 2.73 | | | | 2.73 | | | | 2.19 | | | | (0.52 | ) | | | 41 | |
| Royce International Premier Fund–Institutional Class a |
| 2021 | | | $ | 17.64 | | | $ | 0.08 | | | $ | 0.99 | | | $ | 1.07 | | | $ | (0.09 | ) | | $ | (0.80 | ) | | $ | (0.89 | ) | | $ | 17.82 | | | | 6.23 | % | | $ | 704,714 | | | | 1.16 | % | | | 1.16 | % | | | 1.04 | % | | | 0.44 | % | | | 32 | % |
| 2020 | | | | 15.25 | | | | 0.06 | | | | 2.39 | | | | 2.45 | | | | (0.06 | ) | | | – | | | | (0.06 | ) | | | 17.64 | | | | 16.12 | | | | 567,878 | | | | 1.20 | | | | 1.20 | | | | 1.04 | | | | 0.44 | | | | 21 | |
| 2019 | | | | 11.39 | | | | (0.03 | ) | | | 3.98 | | | | 3.95 | | | | (0.09 | ) | | | – | | | | (0.09 | ) | | | 15.25 | | | | 34.68 | | | | 366,870 | | | | 1.19 | | | | 1.19 | | | | 1.04 | | | | 0.57 | | | | 40 | |
| 2018 | | | | 12.98 | | | | (0.00 | ) | | | (1.53 | ) | | | (1.53 | ) | | | (0.06 | ) | | | – | | | | (0.06 | ) | | | 11.39 | | | | (11.78 | )1 | | | 32,340 | | | | 1.34 | 2 | | | 1.34 | 2 | | | 1.04 | 2 | | | 0.84 | 2 | | | 65 | |
| Royce Micro-Cap Fund–Investment Class |
| 2021 | | | $ | 12.74 | | | $ | (0.07 | ) | | $ | 3.84 | | | $ | 3.77 | | | $ | – | | | $ | (3.10 | ) | | $ | (3.10 | ) | | $ | 13.41 | | | | 31.02 | % | | $ | 209,032 | | | | 1.20 | % | | | 1.20 | % | | | 1.20 | % | | | (0.43 | )% | | | 26 | % |
| 2020 | | | | 11.02 | | | | (0.05 | ) | | | 2.71 | | | | 2.66 | | | | – | | | | (0.94 | ) | | | (0.94 | ) | | | 12.74 | | | | 24.50 | | | | 174,339 | | | | 1.29 | | | | 1.29 | | | | 1.24 | | | | (0.46 | ) | | | 25 | |
| 2019 | | | | 9.35 | | | | (0.05 | ) | | | 2.02 | | | | 1.97 | | | | – | | | | (0.30 | ) | | | (0.30 | ) | | | 11.02 | | | | 21.16 | | | | 158,112 | | | | 1.51 | | | | 1.50 | | | | 1.36 | | | | (0.46 | ) | | | 21 | |
| 2018 | | | | 11.64 | | | | (0.05 | ) | | | (0.94 | ) | | | (0.99 | ) | | | – | | | | (1.30 | ) | | | (1.30 | ) | | | 9.35 | | | | (8.94 | ) | | | 117,040 | | | | 1.50 | | | | 1.50 | | | | 1.49 | | | | (0.43 | ) | | | 24 | |
| 2017 | | | | 11.92 | | | | (0.03 | ) | | | 0.66 | | | | 0.63 | | | | (0.01 | ) | | | (0.90 | ) | | | (0.91 | ) | | | 11.64 | | | | 5.43 | | | | 166,935 | | | | 1.51 | | | | 1.51 | | | | 1.49 | | | | (0.28 | ) | | | 26 | |
| Royce Micro-Cap Fund–Service Class |
| 2021 | | | $ | 12.45 | | | $ | (0.11 | ) | | $ | 3.74 | | | $ | 3.63 | | | $ | – | | | $ | (3.03 | ) | | $ | (3.03 | ) | | $ | 13.05 | | | | 30.64 | % | | $ | 197,089 | | | | 1.51 | % | | | 1.51 | % | | | 1.49 | % | | | (0.73 | )% | | | 26 | % |
| 2020 | | | | 10.79 | | | | (0.07 | ) | | | 2.65 | | | | 2.58 | | | | – | | | | (0.92 | ) | | | (0.92 | ) | | | 12.45 | | | | 24.26 | | | | 168,285 | | | | 1.60 | | | | 1.60 | | | | 1.49 | | | | (0.71 | ) | | | 25 | |
| 2019 | | | | 9.15 | | | | (0.01 | ) | | | 1.94 | | | | 1.93 | | | | – | | | | (0.29 | ) | | | (0.29 | ) | | | 10.79 | | | | 21.22 | | | | 164,956 | | | | 1.51 | | | | 1.51 | | | | 1.50 | | | | (0.09 | ) | | | 21 | |
| 2018 | | | | 11.41 | | | | (0.07 | ) | | | (0.91 | ) | | | (0.98 | ) | | | – | | | | (1.28 | ) | | | (1.28 | ) | | | 9.15 | | | | (9.09 | ) | | | 8,053 | | | | 1.90 | | | | 1.89 | | | | 1.61 | | | | (0.56 | ) | | | 24 | |
| 2017 | | | | 11.69 | | | | (0.05 | ) | | | 0.65 | | | | 0.60 | | | | – | | | | (0.88 | ) | | | (0.88 | ) | | | 11.41 | | | | 5.32 | | | | 13,880 | | | | 1.86 | | | | 1.86 | | | | 1.61 | | | | (0.40 | ) | | | 26 | |
a The Class commenced operations on May 2, 2018.
1 Not annualized
2 Annualized
| THE ACCOMPANYING NOTES ARE AN INTEGRAL PART OF THESE FINANCIAL STATEMENTS | The Royce Funds 2021 Annual Report to Shareholders | 63 |
Financial Highlights
This table is presented to show selected data for a share outstanding throughout each year or other indicated period and to assist shareholders in evaluating a Fund’s performance for the periods presented. Per share amounts have been determined on the basis of the weighted average number of shares outstanding during the period.
| | | | | | | | | | | | | | | | | | | | | | | | | | | | | | | | | | Ratio of Expenses to Average Net Assets | | | | | | | |
| | | | Net Asset Value, Beginning of Period | | | Net Investment Income (Loss) | | | Net Realized and Unrealized Gain (Loss) on Investments and Foreign Currency | | | Total from Investment Operations | | | Distributions from Net Investment Income | | | Distributions from Net Realized Gain on Investments and Foreign Currency | | | Total Distributions | | | Net Asset Value, End of Period | | | Total Return | | | Net Assets, End of Period (in thousands) | | | Prior to Fee Waivers, Expense Reimbursements and Balance Credits | | | Prior to Fee Waivers and Expense Reimbursements | | | Net of Fee Waivers and Expense Reimbursements | | | Ratio of Net Investment Income (Loss) to Average Net Assets | | | Portfolio Turnover Rate | |
| Royce Micro-Cap Fund–Consultant Class |
| 2021 | | | $ | 9.62 | | | $ | (0.18 | ) | | $ | 2.89 | | | $ | 2.71 | | | $ | – | | | $ | (2.33 | ) | | $ | (2.33 | ) | | $ | 10.00 | | | | 29.56 | % | | $ | 15,777 | | | | 2.30 | % | | | 2.30 | % | | | 2.30 | % | | | (1.53 | )% | | | 26 | % |
| 2020 | | | | 8.42 | | | | (0.13 | ) | | | 2.04 | | | | 1.91 | | | | – | | | | (0.71 | ) | | | (0.71 | ) | | | 9.62 | | | | 23.04 | | | | 14,025 | | | | 2.41 | | | | 2.41 | | | | 2.41 | | | | (1.63 | ) | | | 25 | |
| 2019 | | | | 7.23 | | | | (0.13 | ) | | | 1.55 | | | | 1.42 | | | | – | | | | (0.23 | ) | | | (0.23 | ) | | | 8.42 | | | | 19.72 | | | | 14,204 | | | | 2.59 | | | | 2.59 | | | | 2.58 | | | | (1.69 | ) | | | 21 | |
| 2018 | | | | 9.10 | | | | (0.14 | ) | | | (0.72 | ) | | | (0.86 | ) | | | – | | | | (1.01 | ) | | | (1.01 | ) | | | 7.23 | | | | (9.93 | ) | | | 16,680 | | | | 2.56 | | | | 2.56 | | | | 2.56 | | | | (1.50 | ) | | | 24 | |
| 2017 | | | | 9.41 | | | | (0.13 | ) | | | 0.53 | | | | 0.40 | | | | – | | | | (0.71 | ) | | | (0.71 | ) | | | 9.10 | | | | 4.35 | | | | 24,396 | | | | 2.54 | | | | 2.54 | | | | 2.54 | | | | (1.34 | ) | | | 26 | |
| Royce Opportunity Fund–Investment Class |
| 2021 | | | $ | 15.84 | | | $ | (0.06 | ) | | $ | 4.75 | | | $ | 4.69 | | | $ | – | | | $ | (3.77 | ) | | $ | (3.77 | ) | | $ | 16.76 | | | | 30.85 | % | | $ | 1,332,050 | | | | 1.21 | % | | | 1.21 | % | | | 1.21 | % | | | (0.30 | )% | | | 69 | % |
| 2020 | | | | 12.52 | | | | (0.03 | ) | | | 3.35 | | | | 3.32 | | | | – | | | | – | | | | – | | | | 15.84 | | | | 26.52 | | | | 786,849 | | | | 1.24 | | | | 1.23 | | | | 1.23 | | | | (0.28 | ) | | | 53 | |
| 2019 | | | | 9.92 | | | | (0.06 | ) | | | 2.86 | | | | 2.80 | | | | – | | | | (0.20 | ) | | | (0.20 | ) | | | 12.52 | | | | 28.21 | | | | 609,316 | | | | 1.23 | | | | 1.22 | | | | 1.22 | | | | (0.50 | ) | | | 47 | |
| 2018 | | | | 13.58 | | | | (0.04 | ) | | | (2.61 | ) | | | (2.65 | ) | | | – | | | | (1.01 | ) | | | (1.01 | ) | | | 9.92 | | | | (19.97 | ) | | | 557,003 | | | | 1.20 | | | | 1.20 | | | | 1.20 | | | | (0.30 | ) | | | 47 | |
| 2017 | | | | 12.85 | | | | (0.04 | ) | | | 2.79 | | | | 2.75 | | | | – | | | | (2.02 | ) | | | (2.02 | ) | | | 13.58 | | | | 21.88 | | | | 805,660 | | | | 1.18 | | | | 1.18 | | | | 1.18 | | | | (0.28 | ) | | | 43 | |
| Royce Opportunity Fund–Service Class |
| 2021 | | | $ | 14.66 | | | $ | (0.11 | ) | | $ | 4.39 | | | $ | 4.28 | | | $ | – | | | $ | (3.60 | ) | | $ | (3.60 | ) | | $ | 15.34 | | | | 30.43 | % | | $ | 109,440 | | | | 1.50 | % | | | 1.50 | % | | | 1.49 | % | | | (0.61 | )% | | | 69 | % |
| 2020 | | | | 11.61 | | | | (0.06 | ) | | | 3.11 | | | | 3.05 | | | | – | | | | – | | | | – | | | | 14.66 | | | | 26.27 | | | | 131,725 | | | | 1.54 | | | | 1.54 | | | | 1.49 | | | | (0.54 | ) | | | 53 | |
| 2019 | | | | 9.23 | | | | (0.09 | ) | | | 2.65 | | | | 2.56 | | | | – | | | | (0.18 | ) | | | (0.18 | ) | | | 11.61 | | | | 27.79 | | | | 46,032 | | | | 1.55 | | | | 1.55 | | | | 1.49 | | | | (0.77 | ) | | | 47 | |
| 2018 | | | | 12.66 | | | | (0.07 | ) | | | (2.42 | ) | | | (2.49 | ) | | | – | | | | (0.94 | ) | | | (0.94 | ) | | | 9.23 | | | | (20.14 | ) | | | 48,797 | | | | 1.52 | | | | 1.52 | | | | 1.49 | | | | (0.59 | ) | | | 47 | |
| 2017 | | | | 12.02 | | | | (0.08 | ) | | | 2.61 | | | | 2.53 | | | | – | | | | (1.89 | ) | | | (1.89 | ) | | | 12.66 | | | | 21.46 | | | | 96,663 | | | | 1.53 | | | | 1.53 | | | | 1.49 | | | | (0.61 | ) | | | 43 | |
| Royce Opportunity Fund–Consultant Class |
| 2021 | | | $ | 12.61 | | | $ | (0.21 | ) | | $ | 3.78 | | | $ | 3.57 | | | $ | – | | | $ | (2.94 | ) | | $ | (2.94 | ) | | $ | 13.24 | | | | 29.46 | % | | $ | 14,871 | | | | 2.26 | % | | | 2.26 | % | | | 2.26 | % | | | (1.35 | )% | | | 69 | % |
| 2020 | | | | 10.09 | | | | (0.14 | ) | | | 2.66 | | | | 2.52 | | | | – | | | | – | | | | – | | | | 12.61 | | | | 24.98 | | | | 13,477 | | | | 2.45 | | | | 2.45 | | | | 2.45 | | | | (1.50 | ) | | | 53 | |
| 2019 | | | | 8.09 | | | | (0.16 | ) | | | 2.32 | | | | 2.16 | | | | – | | | | (0.16 | ) | | | (0.16 | ) | | | 10.09 | | | | 26.70 | | | | 8,621 | | | | 2.41 | | | | 2.41 | | | | 2.41 | | | | (1.67 | ) | | | 47 | |
| 2018 | | | | 11.19 | | | | (0.16 | ) | | | (2.12 | ) | | | (2.28 | ) | | | – | | | | (0.82 | ) | | | (0.82 | ) | | | 8.09 | | | | (20.81 | ) | | | 9,831 | | | | 2.30 | | | | 2.29 | | | | 2.29 | | | | (1.39 | ) | | | 47 | |
| 2017 | | | | 10.71 | | | | (0.16 | ) | | | 2.31 | | | | 2.15 | | | | – | | | | (1.67 | ) | | | (1.67 | ) | | | 11.19 | | | | 20.50 | | | | 20,574 | | | | 2.27 | | | | 2.27 | | | | 2.27 | | | | (1.37 | ) | | | 43 | |
| Royce Opportunity Fund–Institutional Class |
| 2021 | | | $ | 16.22 | | | $ | (0.03 | ) | | $ | 4.84 | | | $ | 4.81 | | | $ | – | | | $ | (3.82 | ) | | $ | (3.82 | ) | | $ | 17.21 | | | | 30.89 | % | | $ | 291,961 | | | | 1.08 | % | | | 1.08 | % | | | 1.08 | % | | | (0.18 | )% | | | 69 | % |
| 2020 | | | | 12.80 | | | | (0.02 | ) | | | 3.44 | | | | 3.42 | | | | – | | | | – | | | | – | | | | 16.22 | | | | 26.72 | | | | 340,877 | | | | 1.12 | | | | 1.12 | | | | 1.12 | | | | (0.17 | ) | | | 53 | |
| 2019 | | | | 10.13 | | | | (0.05 | ) | | | 2.92 | | | | 2.87 | | | | – | | | | (0.20 | ) | | | (0.20 | ) | | | 12.80 | | | | 28.36 | | | | 230,439 | | | | 1.12 | | | | 1.12 | | | | 1.12 | | | | (0.39 | ) | | | 47 | |
| 2018 | | | | 13.84 | | | | (0.02 | ) | | | (2.66 | ) | | | (2.68 | ) | | | – | | | | (1.03 | ) | | | (1.03 | ) | | | 10.13 | | | | (19.83 | ) | | | 227,261 | | | | 1.08 | | | | 1.08 | | | | 1.08 | | | | (0.17 | ) | | | 47 | |
| 2017 | | | | 13.08 | | | | (0.02 | ) | | | 2.84 | | | | 2.82 | | | | – | | | | (2.06 | ) | | | (2.06 | ) | | | 13.84 | | | | 22.02 | | | | 639,057 | | | | 1.07 | | | | 1.07 | | | | 1.07 | | | | (0.17 | ) | | | 43 | |
| Royce Opportunity Fund–R Class |
| 2021 | | | $ | 14.03 | | | $ | (0.16 | ) | | $ | 4.20 | | | $ | 4.04 | | | $ | – | | | $ | (3.27 | ) | | $ | (3.27 | ) | | $ | 14.80 | | | | 30.01 | % | | $ | 51,537 | | | | 1.81 | % | | | 1.81 | % | | | 1.81 | % | | | (0.90 | )% | | | 69 | % |
| 2020 | | | | 11.16 | | | | (0.09 | ) | | | 2.96 | | | | 2.87 | | | | – | | | | – | | | | – | | | | 14.03 | | | | 25.72 | | | | 36,065 | | | | 1.88 | | | | 1.87 | | | | 1.87 | | | | (0.93 | ) | | | 53 | |
| 2019 | | | | 8.90 | | | | (0.12 | ) | | | 2.55 | | | | 2.43 | | | | – | | | | (0.17 | ) | | | (0.17 | ) | | | 11.16 | | | | 27.38 | | | | 31,230 | | | | 1.86 | | | | 1.85 | | | | 1.85 | | | | (1.13 | ) | | | 47 | |
| 2018 | | | | 12.25 | | | | (0.11 | ) | | | (2.33 | ) | | | (2.44 | ) | | | – | | | | (0.91 | ) | | | (0.91 | ) | | | 8.90 | | | | (20.42 | ) | | | 26,337 | | | | 1.84 | | | | 1.84 | | | | 1.84 | | | | (0.93 | ) | | | 47 | |
| 2017 | | | | 11.67 | | | | (0.12 | ) | | | 2.53 | | | | 2.41 | | | | – | | | | (1.83 | ) | | | (1.83 | ) | | | 12.25 | | | | 21.06 | | | | 39,311 | | | | 1.82 | | | | 1.82 | | | | 1.82 | | | | (0.92 | ) | | | 43 | |
| 64 | The Royce Funds 2021 Annual Report to Shareholders | THE ACCOMPANYING NOTES ARE AN INTEGRAL PART OF THESE FINANCIAL STATEMENTS |
Financial Highlights
This table is presented to show selected data for a share outstanding throughout each year or other indicated period and to assist shareholders in evaluating a Fund’s performance for the periods presented. Per share amounts have been determined on the basis of the weighted average number of shares outstanding during the period.
| | | | | | | | | | | | | | | | | | | | | | | | | | | | | | | | | | Ratio of Expenses to Average Net Assets | | | | | | | |
| | | | Net Asset Value, Beginning of Period | | | Net Investment Income (Loss) | | | Net Realized and Unrealized Gain (Loss) on Investments and Foreign Currency | | | Total from Investment Operations | | | Distributions from Net Investment Income | | | Distributions from Net Realized Gain on Investments and Foreign Currency | | | Total Distributions | | | Net Asset Value, End of Period | | | Total Return | | | Net Assets, End of Period (in thousands) | | | Prior to Fee Waivers, Expense Reimbursements and Balance Credits | | | Prior to Fee Waivers and Expense Reimbursements | | | Net of Fee Waivers and Expense Reimbursements | | | Ratio of Net Investment Income (Loss) to Average Net Assets | | | Portfolio Turnover Rate | |
| Royce Pennsylvania Mutual Fund–Investment Class |
| 2021 | | | $ | 10.24 | | | $ | 0.02 | | | $ | 2.11 | | | $ | 2.13 | | | $ | (0.01 | ) | | $ | (2.71 | ) | | $ | (2.72 | ) | | $ | 9.65 | | | | 22.05 | % | | $ | 1,605,587 | | | | 0.91 | % | | | 0.91 | % | | | 0.91 | % | | | 0.15 | % | | | 60 | % |
| 2020 | | | | 9.44 | | | | 0.03 | | | | 1.29 | | | | 1.32 | | | | (0.06 | ) | | | (0.46 | ) | | | (0.52 | ) | | | 10.24 | | | | 14.08 | | | | 1,426,472 | | | | 0.95 | | | | 0.95 | | | | 0.95 | | | | 0.37 | | | | 32 | |
| 2019 | | | | 7.75 | | | | 0.04 | | | | 2.01 | | | | 2.05 | | | | (0.02 | ) | | | (0.34 | ) | | | (0.36 | ) | | | 9.44 | | | | 26.56 | | | | 1,429,042 | | | | 0.95 | | | | 0.94 | | | | 0.94 | | | | 0.39 | | | | 30 | |
| 2018 | | | | 10.52 | | | | 0.04 | | | | (0.97 | ) | | | (0.93 | ) | | | (0.02 | ) | | | (1.82 | ) | | | (1.84 | ) | | | 7.75 | | | | (9.66 | ) | | | 1,203,967 | | | | 0.92 | | | | 0.92 | | | | 0.92 | | | | 0.33 | | | | 35 | |
| 2017 | | | | 11.02 | | | | 0.06 | | | | 1.68 | | | | 1.74 | | | | (0.06 | ) | | | (2.18 | ) | | | (2.24 | ) | | | 10.52 | | | | 16.24 | | | | 1,622,523 | | | | 0.92 | | | | 0.92 | | | | 0.92 | | | | 0.47 | | | | 27 | |
| Royce Pennsylvania Mutual Fund–Service Class |
| 2021 | | | $ | 10.23 | | | $ | (0.02 | ) | | $ | 2.11 | | | $ | 2.09 | | | $ | – | | | $ | (2.70 | ) | | $ | (2.70 | ) | | $ | 9.62 | | | | 21.64 | % | | $ | 84,060 | | | | 1.27 | % | | | 1.27 | % | | | 1.27 | % | | | (0.22 | )% | | | 60 | % |
| 2020 | | | | 9.42 | | | | 0.02 | | | | 1.28 | | | | 1.30 | | | | (0.03 | ) | | | (0.46 | ) | | | (0.49 | ) | | | 10.23 | | | | 13.88 | | | | 78,789 | | | | 1.25 | | | | 1.24 | | | | 1.13 | | | | 0.23 | | | | 32 | |
| 2019 | | | | 7.77 | | | | (0.00 | ) | | | 2.00 | | | | 2.00 | | | | (0.01 | ) | | | (0.34 | ) | | | (0.35 | ) | | | 9.42 | | | | 25.75 | | | | 142,864 | | | | 1.31 | | | | 1.30 | | | | 1.30 | | | | (0.01 | ) | | | 30 | |
| 2018 | | | | 10.56 | | | | (0.01 | ) | | | (0.96 | ) | | | (0.97 | ) | | | – | | | | (1.82 | ) | | | (1.82 | ) | | | 7.77 | | | | (9.96 | ) | | | 32,191 | | | | 1.30 | | | | 1.30 | | | | 1.30 | | | | (0.07 | ) | | | 35 | |
| 2017 | | | | 11.03 | | | | 0.01 | | | | 1.69 | | | | 1.70 | | | | – | | | | (2.17 | ) | | | (2.17 | ) | | | 10.56 | | | | 15.88 | | | | 54,938 | | | | 1.27 | | | | 1.27 | | | | 1.27 | | | | 0.07 | | | | 27 | |
| Royce Pennsylvania Mutual Fund–Consultant Class |
| 2021 | | | $ | 8.07 | | | $ | (0.08 | ) | | $ | 1.66 | | | $ | 1.58 | | | $ | – | | | $ | (2.12 | ) | | $ | (2.12 | ) | | $ | 7.53 | | | | 20.78 | % | | $ | 249,816 | | | | 1.92 | % | | | 1.92 | % | | | 1.92 | % | | | (0.86 | )% | | | 60 | % |
| 2020 | | | | 7.47 | | | | (0.04 | ) | | | 1.00 | | | | 0.96 | | | | – | | | | (0.36 | ) | | | (0.36 | ) | | | 8.07 | | | | 12.94 | | | | 238,595 | | | | 1.96 | | | | 1.96 | | | | 1.96 | | | | (0.64 | ) | | | 32 | |
| 2019 | | | | 6.18 | | | | (0.04 | ) | | | 1.60 | | | | 1.56 | | | | – | | | | (0.27 | ) | | | (0.27 | ) | | | 7.47 | | | | 25.25 | | | | 262,007 | | | | 1.96 | | | | 1.95 | | | | 1.95 | | | | (0.62 | ) | | | 30 | |
| 2018 | | | | 8.46 | | | | (0.06 | ) | | | (0.77 | ) | | | (0.83 | ) | | | – | | | | (1.45 | ) | | | (1.45 | ) | | | 6.18 | | | | (10.56 | ) | | | 249,004 | | | | 1.93 | | | | 1.93 | | | | 1.93 | | | | (0.69 | ) | | �� | 35 | |
| 2017 | | | | 8.90 | | | | (0.05 | ) | | | 1.35 | | | | 1.30 | | | | – | | | | (1.74 | ) | | | (1.74 | ) | | | 8.46 | | | | 15.06 | | | | 361,569 | | | | 1.93 | | | | 1.92 | | | | 1.92 | | | | (0.54 | ) | | | 27 | |
| Royce Pennsylvania Mutual Fund–Institutional Class |
| 2021 | | | $ | 10.27 | | | $ | 0.03 | | | $ | 2.12 | | | $ | 2.15 | | | $ | (0.01 | ) | | $ | (2.73 | ) | | $ | (2.74 | ) | | $ | 9.68 | | | | 22.10 | % | | $ | 199,842 | | | | 0.86 | % | | | 0.86 | % | | | 0.86 | % | | | 0.21 | % | | | 60 | % |
| 2020 | | | | 9.47 | | | | 0.04 | | | | 1.28 | | | | 1.32 | | | | (0.06 | ) | | | (0.46 | ) | | | (0.52 | ) | | | 10.27 | | | | 14.10 | | | | 163,944 | | | | 0.89 | | | | 0.89 | | | | 0.89 | | | | 0.42 | | | | 32 | |
| 2019 | | | | 7.78 | | | | 0.04 | | | | 2.02 | | | | 2.06 | | | | (0.03 | ) | | | (0.34 | ) | | | (0.37 | ) | | | 9.47 | | | | 26.53 | | | | 106,564 | | | | 0.89 | | | | 0.89 | | | | 0.89 | | | | 0.45 | | | | 30 | |
| 2018 | | | | 10.55 | | | | 0.04 | | | | (0.97 | ) | | | (0.93 | ) | | | (0.02 | ) | | | (1.82 | ) | | | (1.84 | ) | | | 7.78 | | | | (9.56 | ) | | | 83,908 | | | | 0.88 | | | | 0.88 | | | | 0.88 | | | | 0.40 | | | | 35 | |
| 2017 | | | | 11.04 | | | | 0.09 | | | | 1.67 | | | | 1.76 | | | | (0.07 | ) | | | (2.18 | ) | | | (2.25 | ) | | | 10.55 | | | | 16.44 | | | | 53,367 | | | | 0.83 | | | | 0.83 | | | | 0.83 | | | | 0.42 | | | | 27 | |
| Royce Pennsylvania Mutual Fund–R Class |
| 2021 | | | $ | 9.56 | | | $ | (0.07 | ) | | $ | 1.96 | | | $ | 1.89 | | | $ | – | | | $ | (2.51 | ) | | $ | (2.51 | ) | | $ | 8.94 | | | | 21.00 | % | | $ | 9,515 | | | | 1.73 | % | | | 1.73 | % | | | 1.73 | % | | | (0.66 | )% | | | 60 | % |
| 2020 | | | | 8.84 | | | | (0.04 | ) | | | 1.19 | | | | 1.15 | | | | – | | | | (0.43 | ) | | | (0.43 | ) | | | 9.56 | | | | 13.07 | | | | 8,121 | | | | 1.83 | | | | 1.83 | | | | 1.83 | | | | (0.51 | ) | | | 32 | |
| 2019 | | | | 7.30 | | | | (0.03 | ) | | | 1.89 | | | | 1.86 | | | | – | | | | (0.32 | ) | | | (0.32 | ) | | | 8.84 | | | | 25.48 | | | | 8,853 | | | | 1.75 | | | | 1.74 | | | | 1.74 | | | | (0.41 | ) | | | 30 | |
| 2018 | | | | 9.94 | | | | (0.03 | ) | | | (0.91 | ) | | | (0.94 | ) | | | – | | | | (1.70 | ) | | | (1.70 | ) | | | 7.30 | | | | (10.15 | ) | | | 10,014 | | | | 1.58 | | | | 1.57 | | | | 1.57 | | | | (0.34 | ) | | | 35 | |
| 2017 | | | | 10.44 | | | | (0.04 | ) | | | 1.58 | | | | 1.54 | | | | – | | | | (2.04 | ) | | | (2.04 | ) | | | 9.94 | | | | 15.25 | | | | 15,136 | | | | 1.73 | | | | 1.73 | | | | 1.73 | | | | (0.36 | ) | | | 27 | |
| Royce Premier Fund–Investment Class |
| 2021 | | | $ | 13.59 | | | $ | (0.03 | ) | | $ | 2.16 | | | $ | 2.13 | | | $ | (0.01 | ) | | $ | (2.74 | ) | | $ | (2.75 | ) | | $ | 12.97 | | | | 16.36 | % | | $ | 1,401,347 | | | | 1.17 | % | | | 1.17 | % | | | 1.17 | % | | | (0.19 | )% | | | 20 | % |
| 2020 | | | | 12.88 | | | | 0.05 | | | | 1.41 | | | | 1.46 | | | | (0.12 | ) | | | (0.63 | ) | | | (0.75 | ) | | | 13.59 | | | | 11.50 | | | | 1,414,718 | | | | 1.21 | | | | 1.21 | | | | 1.21 | | | | 0.41 | | | | 23 | |
| 2019 | | | | 11.62 | | | | 0.05 | | | | 3.87 | | | | 3.92 | | | | (0.05 | ) | | | (2.61 | ) | | | (2.66 | ) | | | 12.88 | | | | 34.13 | | | | 1,505,821 | | | | 1.20 | | | | 1.19 | | | | 1.19 | | | | 0.32 | | | | 19 | |
| 2018 | | | | 16.60 | | | | 0.02 | | | | (1.60 | ) | | | (1.58 | ) | | | (0.01 | ) | | | (3.39 | ) | | | (3.40 | ) | | | 11.62 | | | | (10.40 | ) | | | 1,398,965 | | | | 1.17 | | | | 1.17 | | | | 1.17 | | | | 0.11 | | | | 23 | |
| 2017 | | | | 15.51 | | | | 0.00 | | | | 3.63 | | | | 3.63 | | | | (0.02 | ) | | | (2.52 | ) | | | (2.54 | ) | | | 16.60 | | | | 23.77 | | | | 1,978,847 | | | | 1.16 | | | | 1.16 | | | | 1.16 | | | | 0.00 | | | | 8 | |
| THE ACCOMPANYING NOTES ARE AN INTEGRAL PART OF THESE FINANCIAL STATEMENTS | The Royce Funds 2021 Annual Report to Shareholders | 65 |
Financial Highlights
This table is presented to show selected data for a share outstanding throughout each year or other indicated period and to assist shareholders in evaluating a Fund’s performance for the periods presented. Per share amounts have been determined on the basis of the weighted average number of shares outstanding during the period.
| | | | | | | | | | | | | | | | | | | | | | | | | | | | | | | | | | Ratio of Expenses to Average Net Assets | | | | | | | |
| | | | Net Asset Value, Beginning of Period | | | Net Investment Income (Loss) | | | Net Realized and Unrealized Gain (Loss) on Investments and Foreign Currency | | | Total from Investment Operations | | | Distributions from Net Investment Income | | | Distributions from Net Realized Gain on Investments and Foreign Currency | | | Total Distributions | | | Net Asset Value, End of Period | | | Total Return | | | Net Assets, End of Period (in thousands) | | | Prior to Fee Waivers, Expense Reimbursements and Balance Credits | | | Prior to Fee Waivers and Expense Reimbursements | | | Net of Fee Waivers and Expense Reimbursements | | | Ratio of Net Investment Income (Loss) to Average Net Assets | | | Portfolio Turnover Rate | |
| Royce Premier Fund–Service Class |
| 2021 | | | $ | 13.22 | | | $ | (0.07 | ) | | $ | 2.09 | | | $ | 2.02 | | | $ | – | | | $ | (2.66 | ) | | $ | (2.66 | ) | | $ | 12.58 | | | | 15.98 | % | | $ | 36,488 | | | | 1.56 | % | | | 1.56 | % | | | 1.49 | % | | | (0.50 | )% | | | 20 | % |
| 2020 | | | | 12.54 | | | | 0.01 | | | | 1.37 | | | | 1.38 | | | | (0.09 | ) | | | (0.61 | ) | | | (0.70 | ) | | | 13.22 | | | | 11.16 | | | | 29,588 | | | | 1.57 | | | | 1.57 | | | | 1.49 | | | | 0.12 | | | | 23 | |
| 2019 | | | | 11.31 | | | | (0.01 | ) | | | 3.78 | | | | 3.77 | | | | – | | | | (2.54 | ) | | | (2.54 | ) | | | 12.54 | | | | 33.65 | | | | 29,696 | | | | 1.57 | | | | 1.57 | | | | 1.46 | | | | (0.06 | ) | | | 19 | |
| 2018 | | | | 16.15 | | | | (0.03 | ) | | | (1.55 | ) | | | (1.58 | ) | | | – | | | | (3.26 | ) | | | (3.26 | ) | | | 11.31 | | | | (10.66 | ) | | | 41,738 | | | | 1.52 | | | | 1.52 | | | | 1.48 | | | | (0.19 | ) | | | 23 | |
| 2017 | | | | 15.13 | | | | (0.06 | ) | | | 3.53 | | | | 3.47 | | | | – | | | | (2.45 | ) | | | (2.45 | ) | | | 16.15 | | | | 23.32 | | | | 54,557 | | | | 1.53 | | | | 1.53 | | | | 1.49 | | | | (0.34 | ) | | | 8 | |
| Royce Premier Fund–Consultant Class |
| 2021 | | | $ | 10.60 | | | $ | (0.15 | ) | | $ | 1.67 | | | $ | 1.52 | | | $ | – | | | $ | (2.12 | ) | | $ | (2.12 | ) | | $ | 10.00 | | | | 15.01 | % | | $ | 16,016 | | | | 2.29 | % | | | 2.29 | % | | | 2.29 | % | | | (1.30 | )% | | | 20 | % |
| 2020 | | | | 10.09 | | | | (0.07 | ) | | | 1.09 | | | | 1.02 | | | | (0.02 | ) | | | (0.49 | ) | | | (0.51 | ) | | | 10.60 | | | | 10.19 | | | | 15,686 | | | | 2.34 | | | | 2.34 | | | | 2.34 | | | | (0.72 | ) | | | 23 | |
| 2019 | | | | 9.17 | | | | (0.10 | ) | | | 3.05 | | | | 2.95 | | | | – | | | | (2.03 | ) | | | (2.03 | ) | | | 10.09 | | | | 32.55 | | | | 17,585 | | | | 2.26 | | | | 2.26 | | | | 2.26 | | | | (0.91 | ) | | | 19 | |
| 2018 | | | | 13.21 | | | | (0.12 | ) | | | (1.27 | ) | | | (1.39 | ) | | | – | | | | (2.65 | ) | | | (2.65 | ) | | | 9.17 | | | | (11.41 | ) | | | 21,370 | | | | 2.21 | | | | 2.21 | | | | 2.21 | | | | (0.93 | ) | | | 23 | |
| 2017 | | | | 12.46 | | | | (0.14 | ) | | | 2.89 | | | | 2.75 | | | | – | | | | (2.00 | ) | | | (2.00 | ) | | | 13.21 | | | | 22.49 | | | | 31,489 | | | | 2.21 | | | | 2.21 | | | | 2.21 | | | | (1.06 | ) | | | 8 | |
| Royce Premier Fund–Institutional Class |
| 2021 | | | $ | 13.80 | | | $ | (0.02 | ) | | $ | 2.19 | | | $ | 2.17 | | | $ | (0.02 | ) | | $ | (2.79 | ) | | $ | (2.81 | ) | | $ | 13.16 | | | | 16.39 | % | | $ | 273,853 | | | | 1.09 | % | | | 1.09 | % | | | 1.09 | % | | | (0.11 | )% | | | 20 | % |
| 2020 | | | | 13.08 | | | | 0.05 | | | | 1.44 | | | | 1.49 | | | | (0.13 | ) | | | (0.64 | ) | | | (0.77 | ) | | | 13.80 | | | | 11.53 | | | | 266,587 | | | | 1.15 | | | | 1.15 | | | | 1.15 | | | | 0.44 | | | | 23 | |
| 2019 | | | | 11.79 | | | | 0.05 | | | | 3.94 | | | | 3.99 | | | | (0.05 | ) | | | (2.65 | ) | | | (2.70 | ) | | | 13.08 | | | | 34.23 | | | | 244,343 | | | | 1.15 | | | | 1.15 | | | | 1.15 | | | | 0.33 | | | | 19 | |
| 2018 | | | | 16.82 | | | | 0.03 | | | | (1.63 | ) | | | (1.60 | ) | | | (0.02 | ) | | | (3.41 | ) | | | (3.43 | ) | | | 11.79 | | | | (10.41 | ) | | | 197,697 | | | | 1.12 | | | | 1.12 | | | | 1.12 | | | | 0.16 | | | | 23 | |
| 2017 | | | | 15.72 | | | | 0.01 | | | | 3.68 | | | | 3.69 | | | | (0.03 | ) | | | (2.56 | ) | | | (2.59 | ) | | | 16.82 | | | | 23.85 | | | | 250,119 | | | | 1.09 | | | | 1.09 | | | | 1.09 | | | | 0.07 | | | | 8 | |
| Royce Premier Fund–R Class |
| 2021 | | | $ | 12.49 | | | $ | (0.13 | ) | | $ | 1.99 | | | $ | 1.86 | | | $ | – | | | $ | (2.51 | ) | | $ | (2.51 | ) | | $ | 11.84 | | | | 15.51 | % | | $ | 8,073 | | | | 1.93 | % | | | 1.93 | % | | | 1.93 | % | | | (0.95 | )% | | | 20 | % |
| 2020 | | | | 11.86 | | | | (0.04 | ) | | | 1.29 | | | | 1.25 | | | | (0.04 | ) | | | (0.58 | ) | | | (0.62 | ) | | | 12.49 | | | | 10.64 | | | | 9,418 | | | | 1.95 | | | | 1.95 | | | | 1.95 | | | | (0.33 | ) | | | 23 | |
| 2019 | | | | 10.73 | | | | (0.05 | ) | | | 3.57 | | | | 3.52 | | | | – | | | | (2.39 | ) | | | (2.39 | ) | | | 11.86 | | | | 33.17 | | | | 10,949 | | | | 1.90 | | | | 1.90 | | | | 1.90 | | | | (0.43 | ) | | | 19 | |
| 2018 | | | | 15.39 | | | | (0.08 | ) | | | (1.48 | ) | | | (1.56 | ) | | | – | | | | (3.10 | ) | | | (3.10 | ) | | | 10.73 | | | | (11.01 | ) | | | 9,715 | | | | 1.80 | | | | 1.80 | | | | 1.80 | | | | (0.52 | ) | | | 23 | |
| 2017 | | | | 14.47 | | | | (0.12 | ) | | | 3.37 | | | | 3.25 | | | | – | | | | (2.33 | ) | | | (2.33 | ) | | | 15.39 | | | | 22.88 | | | | 12,841 | | | | 1.90 | | | | 1.90 | | | | 1.90 | | | | (0.75 | ) | | | 8 | |
| Royce Small-Cap Value Fund–Investment Class |
| 2021 | | | $ | 8.61 | | | $ | 0.02 | | | $ | 2.41 | | | $ | 2.43 | | | $ | (0.01 | ) | | $ | (0.60 | ) | | $ | (0.61 | ) | | $ | 10.43 | | | | 28.48 | % | | $ | 44,621 | | | | 1.31 | % | | | 1.31 | % | | | 1.24 | % | | | 0.20 | % | | | 53 | % |
| 2020 | | | | 9.57 | | | | 0.06 | | | | (0.66 | ) | | | (0.60 | ) | | | (0.17 | ) | | | (0.19 | ) | | | (0.36 | ) | | | 8.61 | | | | (6.25 | ) | | | 34,523 | | | | 1.39 | | | | 1.39 | | | | 1.24 | | | | 0.76 | | | | 61 | |
| 2019 | | | | 8.35 | | | | 0.09 | | | | 1.46 | | | | 1.55 | | | | (0.08 | ) | | | (0.25 | ) | | | (0.33 | ) | | | 9.57 | | | | 18.60 | | | | 53,234 | | | | 1.30 | | | | 1.30 | | | | 1.24 | | | | 0.84 | | | | 64 | |
| 2018 | | | | 10.16 | | | | 0.05 | | | | (0.73 | ) | | | (0.68 | ) | | | (0.04 | ) | | | (1.09 | ) | | | (1.13 | ) | | | 8.35 | | | | (7.05 | ) | | | 56,433 | | | | 1.26 | | | | 1.26 | | | | 1.24 | | | | 0.45 | | | | 64 | |
| 2017 | | | | 10.03 | | | | 0.04 | | | | 0.50 | | | | 0.54 | | | | (0.06 | ) | | | (0.35 | ) | | | (0.41 | ) | | | 10.16 | | | | 5.49 | | | | 66,094 | | | | 1.26 | | | | 1.25 | | | | 1.24 | | | | 0.44 | | | | 61 | |
| Royce Small-Cap Value Fund–Service Class |
| 2021 | | | $ | 8.58 | | | $ | (0.01 | ) | | $ | 2.41 | | | $ | 2.40 | | | $ | – | | | $ | (0.60 | ) | | $ | (0.60 | ) | | $ | 10.38 | | | | 28.24 | % | | $ | 81,840 | | | | 1.55 | % | | | 1.55 | % | | | 1.49 | % | | | (0.06 | )% | | | 53 | % |
| 2020 | | | | 9.54 | | | | 0.04 | | | | (0.66 | ) | | | (0.62 | ) | | | (0.15 | ) | | | (0.19 | ) | | | (0.34 | ) | | | 8.58 | | | | (6.47 | ) | | | 75,502 | | | | 1.62 | | | | 1.62 | | | | 1.49 | | | | 0.50 | | | | 61 | |
| 2019 | | | | 8.33 | | | | 0.07 | | | | 1.44 | | | | 1.51 | | | | (0.05 | ) | | | (0.25 | ) | | | (0.30 | ) | | | 9.54 | | | | 18.21 | | | | 102,465 | | | | 1.56 | | | | 1.55 | | | | 1.49 | | | | 0.65 | | | | 64 | |
| 2018 | | | | 10.12 | | | | 0.02 | | | | (0.72 | ) | | | (0.70 | ) | | | (0.01 | ) | | | (1.08 | ) | | | (1.09 | ) | | | 8.33 | | | | (7.17 | ) | | | 111,855 | | | | 1.53 | | | | 1.53 | | | | 1.49 | | | | 0.19 | | | | 64 | |
| 2017 | | | | 9.98 | | | | 0.02 | | | | 0.50 | | | | 0.52 | | | | (0.03 | ) | | | (0.35 | ) | | | (0.38 | ) | | | 10.12 | | | | 5.27 | | | | 152,232 | | | | 1.51 | | | | 1.51 | | | | 1.49 | | | | 0.17 | | | | 61 | |
| 66 | The Royce Funds 2021 Annual Report to Shareholders | THE ACCOMPANYING NOTES ARE AN INTEGRAL PART OF THESE FINANCIAL STATEMENTS |
Financial Highlights
This table is presented to show selected data for a share outstanding throughout each year or other indicated period and to assist shareholders in evaluating a Fund’s performance for the periods presented. Per share amounts have been determined on the basis of the weighted average number of shares outstanding during the period.
| | | | | | | | | | | | | | | | | | | | | | | | | | | | | | | | | | Ratio of Expenses to Average Net Assets | | | | | | | |
| | | | Net Asset Value, Beginning of Period | | | Net Investment Income (Loss) | | | Net Realized and Unrealized Gain (Loss) on Investments and Foreign Currency | | | Total from Investment Operations | | | Distributions from Net Investment Income | | | Distributions from Net Realized Gain on Investments and Foreign Currency | | | Total Distributions | | | Net Asset Value, End of Period | | | Total Return | | | Net Assets, End of Period (in thousands) | | | Prior to Fee Waivers, Expense Reimbursements and Balance Credits | | | Prior to Fee Waivers and Expense Reimbursements | | | Net of Fee Waivers and Expense Reimbursements | | | Ratio of Net Investment Income (Loss) to Average Net Assets | | | Portfolio Turnover Rate | |
| Royce Small-Cap Value Fund–Consultant Class |
| 2021 | | | $ | 7.57 | | | $ | (0.11 | ) | | $ | 2.11 | | | $ | 2.00 | | | $ | – | | | $ | (0.51 | ) | | $ | (0.51 | ) | | $ | 9.06 | | | | 26.75 | % | | $ | 5,269 | | | | 2.66 | % | | | 2.66 | % | | | 2.66 | % | | | (1.22 | )% | | | 53 | % |
| 2020 | | | | 8.44 | | | | (0.05 | ) | | | (0.60 | ) | | | (0.65 | ) | | | (0.06 | ) | | | (0.16 | ) | | | (0.22 | ) | | | 7.57 | | | | (7.71 | ) | | | 3,899 | | | | 2.74 | | | | 2.73 | | | | 2.73 | | | | (0.71 | ) | | | 61 | |
| 2019 | | | | 7.40 | | | | (0.04 | ) | | | 1.30 | | | | 1.26 | | | | – | | | | (0.22 | ) | | | (0.22 | ) | | | 8.44 | | | | 17.03 | | | | 7,486 | | | | 2.44 | | | | 2.44 | | | | 2.44 | | | | (0.50 | ) | | | 64 | |
| 2018 | | | | 9.06 | | | | (0.06 | ) | | | (0.64 | ) | | | (0.70 | ) | | | – | | | | (0.96 | ) | | | (0.96 | ) | | | 7.40 | | | | (8.07 | ) | | | 9,641 | | | | 2.35 | | | | 2.34 | | | | 2.34 | | | | (0.66 | ) | | | 64 | |
| 2017 | | | | 8.98 | | | | (0.06 | ) | | | 0.45 | | | | 0.39 | | | | – | | | | (0.31 | ) | | | (0.31 | ) | | | 9.06 | | | | 4.44 | | | | 13,111 | | | | 2.32 | | | | 2.32 | | | | 2.32 | | | | (0.66 | ) | | | 61 | |
| Royce Small-Cap Value Fund–R Class |
| 2021 | | | $ | 8.22 | | | $ | (0.05 | ) | | $ | 2.29 | | | $ | 2.24 | | | $ | – | | | $ | (0.58 | ) | | $ | (0.58 | ) | | $ | 9.88 | | | | 27.51 | % | | $ | 8,093 | | | | 2.03 | % | | | 2.03 | % | | | 1.99 | % | | | (0.54 | )% | | | 53 | % |
| 2020 | | | | 9.16 | | | | (0.00 | ) | | | (0.64 | ) | | | (0.64 | ) | | | (0.12 | ) | | | (0.18 | ) | | | (0.30 | ) | | | 8.22 | | | | (6.95 | ) | | | 7,142 | | | | 2.10 | | | | 2.10 | | | | 1.99 | | | | (0.02 | ) | | | 61 | |
| 2019 | | | | 8.00 | | | | 0.01 | | | | 1.40 | | | | 1.41 | | | | (0.01 | ) | | | (0.24 | ) | | | (0.25 | ) | | | 9.16 | | | | 17.68 | | | | 8,083 | | | | 1.98 | | | | 1.98 | | | | 1.97 | | | | 0.11 | | | | 64 | |
| 2018 | | | | 9.75 | | | | (0.03 | ) | | | (0.68 | ) | | | (0.71 | ) | | | – | | | | (1.04 | ) | | | (1.04 | ) | | | 8.00 | | | | (7.62 | ) | | | 8,254 | | | | 1.92 | | | | 1.92 | | | | 1.92 | | | | (0.26 | ) | | | 64 | |
| 2017 | | | | 9.63 | | | | (0.02 | ) | | | 0.48 | | | | 0.46 | | | | – | | | | (0.34 | ) | | | (0.34 | ) | | | 9.75 | | | | 4.81 | | | | 14,620 | | | | 1.88 | | | | 1.88 | | | | 1.88 | | | | (0.21 | ) | | | 61 | |
| Royce Smaller-Companies Growth Fund–Investment Class |
| 2021 | | | $ | 11.06 | | | $ | (0.11 | ) | | $ | 0.83 | | | $ | 0.72 | | | $ | – | | | $ | (3.04 | ) | | $ | (3.04 | ) | | $ | 8.74 | | | | 8.09 | % | | $ | 106,318 | | | | 1.19 | % | | | 1.19 | % | | | 1.19 | % | | | (0.91 | )% | | | 50 | % |
| 2020 | | | | 8.21 | | | | (0.07 | ) | | | 4.06 | | | | 3.99 | | | | – | | | | (1.14 | ) | | | (1.14 | ) | | | 11.06 | | | | 49.61 | | | | 112,668 | | | | 1.25 | | | | 1.25 | | | | 1.24 | | | | (0.86 | ) | | | 61 | |
| 2019 | | | | 6.86 | | | | (0.05 | ) | | | 1.68 | | | | 1.63 | | | | – | | | | (0.28 | ) | | | (0.28 | ) | | | 8.21 | | | | 23.92 | | | | 91,670 | | | | 1.25 | | | | 1.24 | | | | 1.24 | | | | (0.69 | ) | | | 53 | |
| 2018 | | | | 10.93 | | | | (0.07 | ) | | | (0.86 | ) | | | (0.93 | ) | | | – | | | | (3.14 | ) | | | (3.14 | ) | | | 6.86 | | | | (9.94 | ) | | | 87,213 | | | | 1.21 | | | | 1.21 | | | | 1.21 | | | | (0.62 | ) | | | 61 | |
| 2017 | | | | 11.22 | | | | (0.09 | ) | | | 2.08 | | | | 1.99 | | | | – | | | | (2.28 | ) | | | (2.28 | ) | | | 10.93 | | | | 18.20 | | | | 119,745 | | | | 1.19 | | | | 1.19 | | | | 1.19 | | | | (0.67 | ) | | | 64 | |
| Royce Smaller-Companies Growth Fund–Service Class |
| 2021 | | | $ | 10.74 | | | $ | (0.15 | ) | | $ | 0.82 | | | $ | 0.67 | | | $ | – | | | $ | (2.96 | ) | | $ | (2.96 | ) | | $ | 8.45 | | | | 7.78 | % | | $ | 178,553 | | | | 1.51 | % | | | 1.51 | % | | | 1.49 | % | | | (1.21 | )% | | | 50 | % |
| 2020 | | | | 7.99 | | | | (0.09 | ) | | | 3.95 | | | | 3.86 | | | | – | | | | (1.11 | ) | | | (1.11 | ) | | | 10.74 | | | | 49.26 | | | | 181,591 | | | | 1.54 | | | | 1.54 | | | | 1.49 | | | | (1.11 | ) | | | 61 | |
| 2019 | | | | 6.69 | | | | (0.07 | ) | | | 1.65 | | | | 1.58 | | | | – | | | | (0.28 | ) | | | (0.28 | ) | | | 7.99 | | | | 23.67 | | | | 154,236 | | | | 1.55 | | | | 1.54 | | | | 1.49 | | | | (0.93 | ) | | | 53 | |
| 2018 | | | | 10.69 | | | | (0.10 | ) | | | (0.85 | ) | | | (0.95 | ) | | | – | | | | (3.05 | ) | | | (3.05 | ) | | | 6.69 | | | | (10.22 | ) | | | 156,057 | | | | 1.52 | | | | 1.52 | | | | 1.49 | | | | (0.90 | ) | | | 61 | |
| 2017 | | | | 11.01 | | | | (0.12 | ) | | | 2.03 | | | | 1.91 | | | | – | | | | (2.23 | ) | | | (2.23 | ) | | | 10.69 | | | | 17.80 | | | | 228,008 | | | | 1.49 | | | | 1.49 | | | | 1.47 | | | | (0.96 | ) | | | 64 | |
| Royce Smaller-Companies Growth Fund–Consultant Class |
| 2021 | | | $ | 9.08 | | | $ | (0.20 | ) | | $ | 0.69 | | | $ | 0.49 | | | $ | – | | | $ | (2.48 | ) | | $ | (2.48 | ) | | $ | 7.09 | | | | 6.97 | % | | $ | 7,544 | | | | 2.40 | % | | | 2.40 | % | | | 2.24 | % | | | (1.96 | )% | | | 50 | % |
| 2020 | | | | 6.81 | | | | (0.13 | ) | | | 3.34 | | | | 3.21 | | | | – | | | | (0.94 | ) | | | (0.94 | ) | | | 9.08 | | | | 48.05 | | | | 8,080 | | | | 2.54 | | | | 2.54 | | | | 2.24 | | | | (1.86 | ) | | | 61 | |
| 2019 | | | | 5.74 | | | | (0.11 | ) | | | 1.42 | | | | 1.31 | | | | – | | | | (0.24 | ) | | | (0.24 | ) | | | 6.81 | | | | 22.85 | | | | 6,298 | | | | 2.52 | | | | 2.51 | | | | 2.11 | | | | (1.71 | ) | | | 53 | |
| 2018 | | | | 9.28 | | | | (0.16 | ) | | | (0.72 | ) | | | (0.88 | ) | | | – | | | | (2.66 | ) | | | (2.66 | ) | | | 5.74 | | | | (10.95 | ) | | | 6,328 | | | | 2.40 | | | | 2.40 | | | | 2.24 | | | | (1.66 | ) | | | 61 | |
| 2017 | | | | 9.63 | | | | (0.18 | ) | | | 1.77 | | | | 1.59 | | | | – | | | | (1.94 | ) | | | (1.94 | ) | | | 9.28 | | | | 16.92 | | | | 10,119 | | | | 2.36 | | | | 2.36 | | | | 2.24 | | | | (1.73 | ) | | | 64 | |
| Royce Smaller-Companies Growth Fund–Institutional Class |
| 2021 | | | $ | 11.23 | | | $ | (0.11 | ) | | $ | 0.85 | | | $ | 0.74 | | | $ | – | | | $ | (3.10 | ) | | $ | (3.10 | ) | | $ | 8.87 | | | | 8.16 | % | | $ | 7,278 | | | | 1.41 | % | | | 1.41 | % | | | 1.16 | % | | | (0.88 | )% | | | 50 | % |
| 2020 | | | | 8.33 | | | | (0.07 | ) | | | 4.13 | | | | 4.06 | | | | – | | | | (1.16 | ) | | | (1.16 | ) | | | 11.23 | | | | 49.70 | | | | 5,646 | | | | 1.44 | | | | 1.44 | | | | 1.23 | | | | (0.85 | ) | | | 61 | |
| 2019 | | | | 6.95 | | | | (0.05 | ) | | | 1.72 | | | | 1.67 | | | | – | | | | (0.29 | ) | | | (0.29 | ) | | | 8.33 | | | | 24.10 | | | | 8,021 | | | | 1.35 | | | | 1.35 | | | | 1.17 | | | | (0.62 | ) | | | 53 | |
| 2018 | | | | 11.06 | | | | (0.06 | ) | | | (0.88 | ) | | | (0.94 | ) | | | – | | | | (3.17 | ) | | | (3.17 | ) | | | 6.95 | | | | (9.94 | ) | | | 7,165 | | | | 1.28 | | | | 1.28 | | | | 1.08 | | | | (0.49 | ) | | | 61 | |
| 2017 | | | | 11.35 | | | | (0.09 | ) | | | 2.11 | | | | 2.02 | | | | – | | | | (2.31 | ) | | | (2.31 | ) | | | 11.06 | | | | 18.23 | | | | 9,315 | | | | 1.21 | | | | 1.21 | | | | 1.21 | | | | (0.70 | ) | | | 64 | |
| THE ACCOMPANYING NOTES ARE AN INTEGRAL PART OF THESE FINANCIAL STATEMENTS | The Royce Funds 2021 Annual Report to Shareholders | 67 |
Financial Highlights
This table is presented to show selected data for a share outstanding throughout each year or other indicated period and to assist shareholders in evaluating a Fund’s performance for the periods presented. Per share amounts have been determined on the basis of the weighted average number of shares outstanding during the period.
| | | | | | | | | | | | | | | | | | | | | | | Ratio of Expenses to Average Net Assets | | | | |
| | | Net Asset Value, Beginning of Period | | | Net Investment Income (Loss) | | | Net Realized and Unrealized Gain (Loss) on Investments and Foreign Currency | | | Total from Investment Operations | | | Distributions from Net Investment Income | | | Distributions from Net Realized Gain on Investments and Foreign Currency | | | Total Distributions | | | Net Asset Value, End of Period | | | Total Return | | | Net Assets, End of Period (in thousands) | | | Prior to Fee Waivers, Expense Reimbursements and Balance Credits | | | Prior to Fee Waivers and Expense Reimbursements | | | Net of Fee Waivers and Expense Reimbursements | | | Ratio of Net Investment Income (Loss) to Average Net Assets | | | | Portfolio Turnover Rate | |
| Royce Special Equity Fund–Investment Class |
| 2021 | | | $ | 18.22 | | | $ | 0.17 | | | $ | 3.86 | | | $ | 4.03 | | | $ | (0.20 | ) | | $ | (2.96 | ) | | $ | (3.16 | ) | | $ | 19.09 | | | | 22.50 | % | | $ | 755,338 | | | | 1.20 | % | | | 1.20 | % | | | 1.20 | % | | | 0.82 | % | | | 42 | % |
| 2020 | | | | 17.59 | | | | 0.27 | | | | 1.03 | | | | 1.30 | | | | (0.26 | ) | | | (0.41 | ) | | | (0.67 | ) | | | 18.22 | | | | 7.43 | | | | 702,556 | | | | 1.23 | | | | 1.23 | | | | 1.23 | | | | 1.68 | | | | 39 | |
| 2019 | | | | 17.43 | | | | 0.21 | | | | 1.98 | | | | 2.19 | | | | (0.21 | ) | | | (1.82 | ) | | | (2.03 | ) | | | 17.59 | | | | 12.63 | | | | 819,015 | | | | 1.21 | | | | 1.21 | | | | 1.21 | | | | 0.99 | | | | 20 | |
| 2018 | | | | 21.79 | | | | 0.23 | | | | (2.31 | ) | | | (2.08 | ) | | | (0.22 | ) | | | (2.06 | ) | | | (2.28 | ) | | | 17.43 | | | | (9.86 | ) | | | 909,113 | | | | 1.18 | | | | 1.18 | | | | 1.18 | | | | 1.04 | | | | 21 | |
| 2017 | | | | 22.02 | | | | 0.13 | | | | 1.56 | | | | 1.69 | | | | (0.12 | ) | | | (1.80 | ) | | | (1.92 | ) | | | 21.79 | | | | 7.87 | | | | 1,142,224 | | | | 1.17 | | | | 1.17 | | | | 1.17 | | | | 0.54 | | | | 15 | |
| Royce Special Equity Fund–Service Class |
| 2021 | | | $ | 18.19 | | | $ | 0.12 | | | $ | 3.85 | | | $ | 3.97 | | | $ | (0.16 | ) | | $ | (2.94 | ) | | $ | (3.10 | ) | | $ | 19.06 | | | | 22.19 | % | | $ | 57,738 | | | | 1.54 | % | | | 1.54 | % | | | 1.46 | % | | | 0.57 | % | | | 42 | % |
| 2020 | | | | 17.56 | | | | 0.24 | | | | 1.04 | | | | 1.28 | | | | (0.24 | ) | | | (0.41 | ) | | | (0.65 | ) | | | 18.19 | | | | 7.29 | | | | 46,671 | | | | 1.60 | | | | 1.60 | | | | 1.39 | | | | 1.49 | | | | 39 | |
| 2019 | | | | 17.41 | | | | 0.16 | | | | 1.99 | | | | 2.15 | | | | (0.17 | ) | | | (1.83 | ) | | | (2.00 | ) | | | 17.56 | | | | 12.40 | | | | 60,070 | | | | 1.58 | | | | 1.58 | | | | 1.39 | | | | 0.80 | | | | 20 | |
| 2018 | | | | 21.76 | | | | 0.20 | | | | (2.33 | ) | | | (2.13 | ) | | | (0.18 | ) | | | (2.04 | ) | | | (2.22 | ) | | | 17.41 | | | | (10.13 | ) | | | 62,706 | | | | 1.51 | | | | 1.50 | | | | 1.39 | | | | 0.88 | | | | 21 | |
| 2017 | | | | 21.98 | | | | 0.08 | | | | 1.56 | | | | 1.64 | | | | (0.07 | ) | | | (1.79 | ) | | | (1.86 | ) | | | 21.76 | | | | 7.66 | | | | 108,001 | | | | 1.50 | | | | 1.50 | | | | 1.39 | | | | 0.32 | | | | 15 | |
| Royce Special Equity Fund–Consultant Class |
| 2021 | | | $ | 16.60 | | | $ | (0.05 | ) | | $ | 3.50 | | | $ | 3.45 | | | $ | (0.01 | ) | | $ | (2.67 | ) | | $ | (2.68 | ) | | $ | 17.37 | | | | 21.16 | % | | $ | 25,068 | | | | 2.31 | % | | | 2.31 | % | | | 2.31 | % | | | (0.29 | )% | | | 42 | % |
| 2020 | | | | 16.05 | | | | 0.09 | | | | 0.92 | | | | 1.01 | | | | (0.09 | ) | | | (0.37 | ) | | | (0.46 | ) | | | 16.60 | | | | 6.27 | | | | 18,852 | | | | 2.31 | | | | 2.31 | | | | 2.31 | | | | 0.59 | | | | 39 | |
| 2019 | | | | 15.90 | | | | (0.02 | ) | | | 1.82 | | | | 1.80 | | | | (0.00 | ) | | | (1.65 | ) | | | (1.65 | ) | | | 16.05 | | | | 11.38 | | | | 24,793 | | | | 2.25 | | | | 2.25 | | | | 2.25 | | | | (0.12 | ) | | | 20 | |
| 2018 | | | | 19.86 | | | | 0.01 | | | | (2.10 | ) | | | (2.09 | ) | | | (0.01 | ) | | | (1.86 | ) | | | (1.87 | ) | | | 15.90 | | | | (10.83 | ) | | | 30,234 | | | | 2.19 | | | | 2.19 | | | | 2.19 | | | | 0.04 | | | | 21 | |
| 2017 | | | | 20.16 | | | | (0.10 | ) | | | 1.43 | | | | 1.33 | | | | – | | | | (1.63 | ) | | | (1.63 | ) | | | 19.86 | | | | 6.77 | | | | 46,654 | | | | 2.21 | | | | 2.20 | | | | 2.20 | | | | (0.49 | ) | | | 15 | |
| Royce Special Equity Fund–Institutional Class |
| 2021 | | | $ | 18.06 | | | $ | 0.19 | | | $ | 3.82 | | | $ | 4.01 | | | $ | (0.22 | ) | | $ | (2.93 | ) | | $ | (3.15 | ) | | $ | 18.92 | | | | 22.63 | % | | $ | 238,810 | | | | 1.11 | % | | | 1.11 | % | | | 1.11 | % | | | 0.92 | % | | | 42 | % |
| 2020 | | | | 17.43 | | | | 0.30 | | | | 1.01 | | | | 1.31 | | | | (0.28 | ) | | | (0.40 | ) | | | (0.68 | ) | | | 18.06 | | | | 7.52 | | | | 194,911 | | | | 1.15 | | | | 1.15 | | | | 1.15 | | | | 1.84 | | | | 39 | |
| 2019 | | | | 17.28 | | | | 0.22 | | | | 1.96 | | | | 2.18 | | | | (0.22 | ) | | | (1.81 | ) | | | (2.03 | ) | | | 17.43 | | | | 12.65 | | | | 187,785 | | | | 1.14 | | | | 1.14 | | | | 1.14 | | | | 1.04 | | | | 20 | |
| 2018 | | | | 21.61 | | | | 0.25 | | | | (2.30 | ) | | | (2.05 | ) | | | (0.24 | ) | | | (2.04 | ) | | | (2.28 | ) | | | 17.28 | | | | (9.81 | ) | | | 202,317 | | | | 1.11 | | | | 1.11 | | | | 1.11 | | | | 1.14 | | | | 21 | |
| 2017 | | | | 21.84 | | | | 0.14 | | | | 1.55 | | | | 1.69 | | | | (0.14 | ) | | | (1.78 | ) | | | (1.92 | ) | | | 21.61 | | | | 7.96 | | | | 247,004 | | | | 1.09 | | | | 1.09 | | | | 1.09 | | | | 0.60 | | | | 15 | |
| Royce Total Return Fund–Investment Class |
| 2021 | | | $ | 9.34 | | | $ | 0.12 | | | $ | 2.21 | | | $ | 2.33 | | | $ | (0.13 | ) | | $ | (2.76 | ) | | $ | (2.89 | ) | | $ | 8.78 | | | | 25.78 | % | | $ | 1,016,331 | | | | 1.20 | % | | | 1.20 | % | | | 1.20 | % | | | 1.09 | % | | | 64 | % |
| 2020 | | | | 10.93 | | | | 0.17 | | | | 0.19 | | | | 0.36 | | | | (0.21 | ) | | | (1.74 | ) | | | (1.95 | ) | | | 9.34 | | | | 3.82 | | | | 893,868 | | | | 1.24 | | | | 1.24 | | | | 1.24 | | | | 1.88 | | | | 61 | |
| 2019 | | | | 9.71 | | | | 0.16 | | | | 2.10 | | | | 2.26 | | | | (0.15 | ) | | | (0.89 | ) | | | (1.04 | ) | | | 10.93 | | | | 23.45 | | | | 1,026,074 | | | | 1.21 | | | | 1.21 | | | | 1.21 | | | | 1.42 | | | | 21 | |
| 2018 | | | | 13.58 | | | | 0.20 | | | | (1.78 | ) | | | (1.58 | ) | | | (0.19 | ) | | | (2.10 | ) | | | (2.29 | ) | | | 9.71 | | | | (12.46 | ) | | | 1,036,211 | | | | 1.18 | | | | 1.18 | | | | 1.18 | | | | 1.45 | | | | 22 | |
| 2017 | | | | 13.68 | | | | 0.14 | | | | 1.67 | | | | 1.81 | | | | (0.12 | ) | | | (1.79 | ) | | | (1.91 | ) | | | 13.58 | | | | 13.65 | | | | 1,550,893 | | | | 1.19 | | | | 1.19 | | | | 1.19 | | | | 1.00 | | | | 12 | |
| Royce Total Return Fund–Service Class |
| 2021 | | | $ | 9.62 | | | $ | 0.09 | | | $ | 2.28 | | | $ | 2.37 | | | $ | (0.07 | ) | | $ | (2.84 | ) | | $ | (2.91 | ) | | $ | 9.08 | | | | 25.54 | % | | $ | 80,478 | | | | 1.52 | % | | | 1.52 | % | | | 1.49 | % | | | 0.78 | % | | | 64 | % |
| 2020 | | | | 11.27 | | | | 0.16 | | | | 0.18 | | | | 0.34 | | | | (0.19 | ) | | | (1.80 | ) | | | (1.99 | ) | | | 9.62 | | | | 3.51 | | | | 69,634 | | | | 1.55 | | | | 1.55 | | | | 1.49 | | | | 1.64 | | | | 61 | |
| 2019 | | | | 9.97 | | | | 0.13 | | | | 2.16 | | | | 2.29 | | | | (0.08 | ) | | | (0.91 | ) | | | (0.99 | ) | | | 11.27 | | | | 23.08 | | | | 77,177 | | | | 1.52 | | | | 1.52 | | | | 1.49 | | | | 1.13 | | | | 21 | |
| 2018 | | | | 13.88 | | | | 0.16 | | | | (1.82 | ) | | | (1.66 | ) | | | (0.11 | ) | | | (2.14 | ) | | | (2.25 | ) | | | 9.97 | | | | (12.71 | ) | | | 83,368 | | | | 1.52 | | | | 1.52 | | | | 1.48 | | | | 1.15 | | | | 22 | |
| 2017 | | | | 13.98 | | | | 0.10 | | | | 1.69 | | | | 1.79 | | | | (0.07 | ) | | | (1.82 | ) | | | (1.89 | ) | | | 13.88 | | | | 13.24 | | | | 97,854 | | | | 1.49 | | | | 1.48 | | | | 1.48 | | | | 0.72 | | | | 12 | |
| 68 | The Royce Funds 2021 Annual Report to Shareholders | THE ACCOMPANYING NOTES ARE AN INTEGRAL PART OF THESE FINANCIAL STATEMENTS |
Financial Highlights
This table is presented to show selected data for a share outstanding throughout each year or other indicated period and to assist shareholders in evaluating a Fund’s performance for the periods presented. Per share amounts have been determined on the basis of the weighted average number of shares outstanding during the period.
| | | | | | | | | | | | | | | | | | | | | | | Ratio of Expenses to Average Net Assets | | | | |
| | | Net Asset Value, Beginning of Period | | | Net Investment Income (Loss) | | | Net Realized and Unrealized Gain (Loss) on Investments and Foreign Currency | | | Total from Investment Operations | | | Distributions from Net Investment Income | | | Distributions from Net Realized Gain on Investments and Foreign Currency | | | Total Distributions | | | Net Asset Value, End of Period | | | Total Return | | | Net Assets, End of Period (in thousands) | | | Prior to Fee Waivers, Expense Reimbursements and Balance Credits | | | Prior to Fee Waivers and Expense Reimbursements | | | Net of Fee Waivers and Expense Reimbursements | | | Ratio of Net Investment Income (Loss) to Average Net Assets | | | Portfolio Turnover Rate | |
| Royce Total Return Fund–Consultant Class |
| 2021 | | | $ | 9.75 | | | $ | 0.01 | | | $ | 2.31 | | | $ | 2.32 | | | $ | (0.01 | ) | | $ | (2.88 | ) | | $ | (2.89 | ) | | $ | 9.18 | | | | 24.63 | % | | $ | 112,649 | | | | 2.18 | % | | | 2.18 | % | | | 2.18 | % | | | 0.09 | % | | | 64 | % |
| 2020 | | | | 11.31 | | | | 0.09 | | | | 0.18 | | | | 0.27 | | | | (0.03 | ) | | | (1.80 | ) | | | (1.83 | ) | | | 9.75 | | | | 2.76 | | | | 110,179 | | | | 2.22 | | | | 2.22 | | | | 2.22 | | | | 0.88 | | | | 61 | |
| 2019 | | | | 10.02 | | | | 0.05 | | | | 2.17 | | | | 2.22 | | | | (0.02 | ) | | | (0.91 | ) | | | (0.93 | ) | | | 11.31 | | | | 22.18 | | | | 150,175 | | | | 2.20 | | | | 2.20 | | | | 2.20 | | | | 0.43 | | | | 21 | |
| 2018 | | | | 13.95 | | | | 0.06 | | | | (1.82 | ) | | | (1.76 | ) | | | (0.02 | ) | | | (2.15 | ) | | | (2.17 | ) | | | 10.02 | | | | (13.26 | ) | | | 160,540 | | | | 2.17 | | | | 2.17 | | | | 2.17 | | | | 0.45 | | | | 22 | |
| 2017 | | | | 14.07 | | | | 0.01 | | | | 1.70 | | | | 1.71 | | | | – | | | | (1.83 | ) | | | (1.83 | ) | | | 13.95 | | | | 12.53 | | | | 247,914 | | | | 2.16 | | | | 2.16 | | | | 2.16 | | | | 0.04 | | | | 12 | |
| Royce Total Return Fund–Institutional Class |
| 2021 | | | $ | 9.17 | | | $ | 0.13 | | | $ | 2.17 | | | $ | 2.30 | | | $ | (0.14 | ) | | $ | (2.72 | ) | | $ | (2.86 | ) | | $ | 8.61 | | | | 25.91 | % | | $ | 279,510 | | | | 1.10 | % | | | 1.10 | % | | | 1.10 | % | | | 1.19 | % | | | 64 | % |
| 2020 | | | | 10.77 | | | | 0.18 | | | | 0.18 | | | | 0.36 | | | | (0.24 | ) | | | (1.72 | ) | | | (1.96 | ) | | | 9.17 | | | | 3.87 | | | | 208,605 | | | | 1.13 | | | | 1.13 | | | | 1.13 | | | | 1.98 | | | | 61 | |
| 2019 | | | | 9.58 | | | | 0.17 | | | | 2.07 | | | | 2.24 | | | | (0.18 | ) | | | (0.87 | ) | | | (1.05 | ) | | | 10.77 | | | | 23.59 | | | | 232,479 | | | | 1.13 | | | | 1.13 | | | | 1.13 | | | | 1.49 | | | | 21 | |
| 2018 | | | | 13.40 | | | | 0.21 | | | | (1.76 | ) | | | (1.55 | ) | | | (0.21 | ) | | | (2.06 | ) | | | (2.27 | ) | | | 9.58 | | | | (12.39 | ) | | | 218,268 | | | | 1.09 | | | | 1.09 | | | | 1.09 | | | | 1.53 | | | | 22 | |
| 2017 | | | | 13.52 | | | | 0.16 | | | | 1.64 | | | | 1.80 | | | | (0.15 | ) | | | (1.77 | ) | | | (1.92 | ) | | | 13.40 | | | | 13.80 | | | | 310,603 | | | | 1.06 | | | | 1.06 | | | | 1.06 | | | | 1.13 | | | | 12 | |
| Royce Total Return Fund–R Class |
| 2021 | | | $ | 9.76 | | | $ | 0.05 | | | $ | 2.31 | | | $ | 2.36 | | | $ | (0.04 | ) | | $ | (2.88 | ) | | $ | (2.92 | ) | | $ | 9.20 | | | | 25.01 | % | | $ | 27,040 | | | | 1.85 | % | | | 1.85 | % | | | 1.85 | % | | | 0.42 | % | | | 64 | % |
| 2020 | | | | 11.38 | | | | 0.12 | | | | 0.18 | | | | 0.30 | | | | (0.12 | ) | | | (1.80 | ) | | | (1.92 | ) | | | 9.76 | | | | 3.08 | | | | 30,027 | | | | 1.89 | | | | 1.88 | | | | 1.88 | | | | 1.23 | | | | 61 | |
| 2019 | | | | 10.06 | | | | 0.09 | | | | 2.18 | | | | 2.27 | | | | (0.03 | ) | | | (0.92 | ) | | | (0.95 | ) | | | 11.38 | | | | 22.66 | | | | 36,345 | | | | 1.85 | | | | 1.84 | | | | 1.84 | | | | 0.76 | | | | 21 | |
| 2018 | | | | 13.99 | | | | 0.11 | | | | (1.83 | ) | | | (1.72 | ) | | | (0.06 | ) | | | (2.15 | ) | | | (2.21 | ) | | | 10.06 | | | | (12.96 | ) | | | 45,145 | | | | 1.81 | | | | 1.81 | | | | 1.81 | | | | 0.82 | | | | 22 | |
| 2017 | | | | 14.09 | | | | 0.06 | | | | 1.71 | | | | 1.77 | | | | (0.03 | ) | | | (1.84 | ) | | | (1.87 | ) | | | 13.99 | | | | 12.97 | | | | 54,979 | | | | 1.80 | | | | 1.80 | | | | 1.80 | | | | 0.40 | | | | 12 | |
| THE ACCOMPANYING NOTES ARE AN INTEGRAL PART OF THESE FINANCIAL STATEMENTS | The Royce Funds 2021 Annual Report to Shareholders | 69 |
Notes to Financial Statements
Summary of Significant Accounting Policies:
Royce Dividend Value Fund, Royce Global Financial Services Fund, Royce International Premier Fund, Royce Micro-Cap Fund, Royce Opportunity Fund, Royce Pennsylvania Mutual Fund, Royce Premier Fund, Royce Small-Cap Value Fund, Royce Smaller-Companies Growth Fund, Royce Special Equity Fund and Royce Total Return Fund (the “Fund” or “Funds”), are the eleven series of The Royce Fund (the “Trust”), an open-end management investment company organized as a Delaware statutory trust.
Classes of shares have equal rights as to earnings and assets, except that each class may bear different fees and expenses for distribution, shareholder servicing, registration and shareholder reports, and receive different compensating balance credits and expense reimbursements. Investment income, realized and unrealized capital gains or losses on investments and foreign currency, and expenses other than those attributable to a specific class are allocated to each class of shares based on its relative net assets.
The preparation of financial statements in conformity with accounting principles generally accepted in the United States requires management to make estimates and assumptions that affect the reported amounts of assets and liabilities and the disclosure of contingent assets and liabilities at the date of the financial statements and the reported amounts of income and expenses during the reporting period. Actual results could differ from those estimates.
Each Fund is an investment company and accordingly follows the investment company accounting and reporting guidance of the Financial Accounting Standards Board (FASB) Accounting Standard Codification Topic 946 “Financial Services-Investment Companies.”
Royce & Associates, LP, the Funds’ investment adviser, is a majority-owned subsidiary of Franklin Resources, Inc. and primarily conducts business using the name Royce Investment Partners (“Royce”). At December 31, 2021, officers and employees of Royce, Fund trustees, the Royce retirement plans and other affiliates owned more than 10% of the following Fund:
Royce Global Financial Services Fund 12%
VALUATION OF INVESTMENTS:
Securities are valued as of the close of trading on the New York Stock Exchange (“NYSE”) (generally 4:00 p.m. Eastern time) on the valuation date. Securities that trade on an exchange, and securities traded on Nasdaq’s Electronic Bulletin Board, are valued at their last reported sales price or Nasdaq official closing price taken from the primary market in which each security trades or, if no sale is reported for such day, at their highest bid price. Other over-the-counter securities for which market quotations are readily available are valued at their highest bid price, except in the case of some bonds and other fixed income securities which may be valued by reference to other securities with comparable ratings, interest rates and maturities, using established independent pricing services. The Funds value their non-U.S. dollar denominated securities in U.S. dollars daily at the prevailing foreign currency exchange rates as quoted by a major bank. Securities for which market quotations are not readily available are valued at their fair value in accordance with the provisions of the Investment Company Act of 1940 (“1940 Act”), under procedures approved by the Trust’s Board of Trustees, and are reported as Level 3 securities. As a general principle, the fair value of a security is the amount which the Fund might reasonably expect to receive for the security upon its current sale. However, in light of the judgment involved in fair valuations, there can be no assurance that a fair value assigned to a particular security will be the amount which the Fund might be able to receive upon its current sale. In addition, if, between the time trading ends on a particular security and the close of the customary trading session on the NYSE, events occur that are significant and may make the closing price unreliable, a Fund may fair value the security. The Funds use an independent pricing service to provide fair value estimates for relevant non-U.S. equity securities on days when the U.S. market volatility exceeds a certain threshold. This pricing service uses proprietary correlations it has developed between the movement of prices of non-U.S. equity securities and indices of U.S.-traded securities, futures contracts and other indications to estimate the fair value of relevant non-U.S. securities. When fair value pricing is employed, the prices of securities used by a Fund may differ from quoted or published prices for the same security. Investments in money market funds are valued at net asset value per share.
Various inputs are used in determining the value of each Fund’s investments, as noted above. These inputs are summarized in the three broad levels below:
| | Level 1 – | quoted prices in active markets for identical securities. |
| | Level 2 – | other significant observable inputs (including quoted prices for similar securities, foreign securities that may be fair valued and repurchase agreements). The table below includes all Level 2 securities. Level 2 securities with values based on quoted prices for similar securities are noted in the Schedules of Investments. |
| | Level 3 – | significant unobservable inputs (including last trade price before trading was suspended, or at a discount thereto for lack of marketability or otherwise, market price information regarding other securities, information received from the company and/or published documents, including SEC filings and financial statements, or other publicly available information). |
The inputs or methodology used for valuing securities are not necessarily an indication of the risk associated with investing in those securities.
| 70 | The Royce Funds 2021 Annual Report to Shareholders | |
VALUATION OF INVESTMENTS (continued):
The following is a summary of the inputs used to value each Fund’s investments as of December 31, 2021. For a detailed breakout of common stocks by sector classification or country, please refer to the Schedules of Investments.
| | | LEVEL 1 | | | LEVEL 2 | | | LEVEL 3 | | | TOTAL | |
| Royce Dividend Value Fund | | | | | | | | | | | | | | | | |
| Common Stocks | | $ | 73,606,003 | | | $ | – | | | $ | – | | | $ | 73,606,003 | |
| Repurchase Agreement | | | – | | | | 2,690,108 | | | | – | | | | 2,690,108 | |
| Royce Global Financial Services Fund | | | | | | | | | | | | | | | | |
| Common Stocks | | | 35,087,464 | | | | – | | | | – | | | | 35,087,464 | |
| Repurchase Agreement | | | – | | | | 3,236,285 | | | | – | | | | 3,236,285 | |
| Royce International Premier Fund | | | | | | | | | | | | | | | | |
| Common Stocks | | | 1,166,156,336 | | | | – | | | | – | | | | 1,166,156,336 | |
| Preferred Stocks | | | 28,032,884 | | | | – | | | | – | | | | 28,032,884 | |
| Repurchase Agreement | | | – | | | | 58,034,150 | | | | – | | | | 58,034,150 | |
| Royce Micro-Cap Fund | | | | | | | | | | | | | | | | |
| Common Stocks | | | 406,760,757 | | | | 259,740 | | | | 666,497 | | | | 407,686,994 | |
| Repurchase Agreement | | | – | | | | 15,244,270 | | | | – | | | | 15,244,270 | |
| Money Market Fund/Collateral Received for Securities Loaned | | | 827,269 | | | | – | | | | – | | | | 827,269 | |
| Royce Opportunity Fund | | | | | | | | | | | | | | | | |
| Common Stocks | | | 1,748,470,424 | | | | 5,089,142 | | | | 49 | | | | 1,753,559,615 | |
| Repurchase Agreement | | | – | | | | 42,681,217 | | | | – | | | | 42,681,217 | |
| Money Market Fund/Collateral Received for Securities Loaned | | | 3,651,391 | | | | – | | | | – | | | | 3,651,391 | |
| Royce Pennsylvania Mutual Fund | | | | | | | | | | | | | | | | |
| Common Stocks | | | 2,097,139,853 | | | | 7,504,536 | | | | 0 | | | | 2,104,644,389 | |
| Repurchase Agreement | | | – | | | | 33,979,828 | | | | – | | | | 33,979,828 | |
| Money Market Fund/Collateral Received for Securities Loaned | | | 11,352,400 | | | | – | | | | – | | | | 11,352,400 | |
| Royce Premier Fund | | | | | | | | | | | | | | | | |
| Common Stocks | | | 1,640,794,062 | | | | 32,386,844 | | | | – | | | | 1,673,180,906 | |
| Repurchase Agreement | | | – | | | | 62,015,718 | | | | – | | | | 62,015,718 | |
| Royce Small-Cap Value Fund | | | | | | | | | | | | | | | | |
| Common Stocks | | | 135,073,991 | | | | – | | | | – | | | | 135,073,991 | |
| Repurchase Agreement | | | – | | | | 4,698,139 | | | | – | | | | 4,698,139 | |
| Royce Smaller-Companies Growth Fund | | | | | | | | | | | | | | | | |
| Common Stocks | | | 278,859,904 | | | | – | | | | – | | | | 278,859,904 | |
| Repurchase Agreement | | | – | | | | 21,722,702 | | | | – | | | | 21,722,702 | |
| Money Market Fund/Collateral Received for Securities Loaned | | | 14,874,213 | | | | – | | | | – | | | | 14,874,213 | |
| Royce Special Equity Fund | | | | | | | | | | | | | | | | |
| Common Stocks | | | 892,086,299 | | | | 18,762,646 | | | | – | | | | 910,848,945 | |
| Repurchase Agreement | | | – | | | | 162,932,275 | | | | – | | | | 162,932,275 | |
| Royce Total Return Fund | | | | | | | | | | | | | | | | |
| Common Stocks | | | 1,489,685,995 | | | | – | | | | 0 | | | | 1,489,685,995 | |
| Preferred Stocks | | | 21,986,126 | | | | – | | | | – | | | | 21,986,126 | |
| Repurchase Agreement | | | – | | | | 5,380,814 | | | | – | | | | 5,380,814 | |
Level 3 Reconciliation:
| | | BALANCE AS OF 12/31/20 | | | PURCHASES | | | TRANSFERS IN 1 | | | SALES | | | REALIZED GAIN (LOSS) 2 | | | UNREALIZED GAIN (LOSS) 2 | | | BALANCE AS OF 12/31/21 | |
| Royce Micro-Cap Fund | | | | | | | | | | | | | | | | | | | | | |
| Common Stocks | | $ | 690,000 | | | $ | – | | | $ | 666,497 | | | $ | – | | | $ | – | | | $ | (690,000 | ) | | $ | 666,497 | |
| Royce Opportunity Fund | | | | | | | | | | | | | | | | | | | | | | | | | | | | |
| Common Stocks | | | – | | | | – | | | | 49 | | | | – | | | | – | | | | – | | | | 49 | |
| Royce Pennsylvania Mutual Fund | | | | | | | | | | | | | | | | | | | | | | | | | | | | |
| Common Stocks | | | 0 | | | | – | | | | – | | | | – | | | | – | | | | – | | | | 0 | |
| Royce Total Return Fund | | | | | | | | | | | | | | | | | | | | | | | | | | | | |
| Common Stocks | | | 506,127 | | | | – | | | | – | | | | 614,038 | | | | (3,470,385 | ) | | | 3,578,296 | | | | 0 | |
| 1 | Transfers into Level 3 represent securities for which there were no longer readily available market quotations at December 31, 2021. |
| 2 | The net change in unrealized appreciation (depreciation) is included in the accompanying Statement of Operations. Change in unrealized appreciation (depreciation) includes net unrealized appreciation (depreciation) resulting from changes in investment values during the reporting period and the reversal of previously recorded unrealized appreciation (depreciation) when gains or losses are realized. Net realized gain (loss) from investments and foreign currency transactions is included in the accompanying Statement of Operations. |
| The Royce Funds 2021 Annual Report to Shareholders | 71 |
Notes to Financial Statements (continued)
REPURCHASE AGREEMENTS:
The Funds may enter into repurchase agreements with institutions that the Funds’ investment adviser has determined are creditworthy. Each Fund restricts repurchase agreements to maturities of no more than seven days. Securities pledged as collateral for repurchase agreements, which are held until maturity of the repurchase agreements, are marked-to-market daily and maintained at a value at least equal to the principal amount of the repurchase agreement (including accrued interest). Repurchase agreements could involve certain risks in the event of default or insolvency of the counter-party, including possible delays or restrictions upon the ability of each Fund to dispose of its underlying securities. The remaining contractual maturities of repurchase agreements held by the Funds at December 31, 2021 are overnight and continuous.
FOREIGN CURRENCY:
Net realized foreign exchange gains or losses arise from sales and maturities of short-term securities, sales of foreign currencies, expiration of currency forward contracts, currency gains or losses realized between the trade and settlement dates on securities transactions, and the difference between the amounts of dividends, interest, and foreign withholding taxes recorded on each Fund’s books and the U.S. dollar equivalent of the amounts actually received or paid. Net unrealized foreign exchange gains and losses arise from changes in the value of assets and liabilities, other than investments in securities at the end of the reporting period, as a result of changes in foreign currency exchange rates.
The Funds do not isolate that portion of the results of operations resulting from fluctuations in foreign exchange rates on investments from the fluctuations arising from changes in market prices of securities held. Such fluctuations are included with the net realized and unrealized gain or loss on investments.
SECURITIES LENDING:
The Funds loan securities through a lending agent, State Street Bank and Trust Company, to qualified institutional investors for the purpose of earning additional income. The lending agent receives and holds collateral from such borrowers to secure their obligations to the Funds. Such loans must be secured at all times by collateral in an amount at least equal to the market value of the loaned securities. The market values of the loaned securities and the collateral fluctuate and are determined at the close of each business day by the lending agent. Borrowers are required to post additional collateral to the lending agent on the next succeeding business day in the event of a collateral shortfall. Counterparty risk is further reduced by loaning securities only to parties that participate in a Global Securities Lending Program organized and monitored by the lending agent and that are deemed by it to satisfy its requirements and by having the lending agent enter into securities lending agreements with such borrowers. The lending agent is not affiliated with Royce.
Collateral may be in the form of cash or U.S. Treasuries. Cash collateral is invested in certain money market pooled investment vehicles. The Funds record a liability in their respective Statements of Assets and Liabilities for the return of such cash collateral during periods in which securities are on loan. The Funds bear the risk of loss for any decrease in the market value of the loaned securities or the investments purchased with cash collateral received from the borrowers.
Pursuant to the agreement in place between the Funds and the lending agent, if a borrower fails to return loaned securities, and the cash collateral being maintained by the lending agent on behalf of such borrower is insufficient to cover the value of loaned securities and provided such collateral insufficiency is not the result of investment losses, the lending agent shall, at its option, either replace the loaned securities or pay the amount of the shortfall to the Funds. In the event of the bankruptcy of a borrower, the Funds could experience delay in recovering the loaned securities or only recover cash or a security of equivalent value.
Loans of securities generally do not have stated maturity dates, and the Funds may recall a security at any time. The Funds’ securities lending income consists of the income earned on investing cash collateral, plus any premium payments received for lending certain securities, less any rebates paid to borrowers and lending agent fees associated with the loan. Pursuant to the agreement in place between the Funds and the lending agent, the Funds are responsible for any shortfall in the event the value of the investments purchased with cash collateral is insufficient to pay the rebate fee to the borrower.
The following table presents cash collateral and the market value of securities on loan collateralized by cash collateral held by the Funds at December 31, 2021:
| | | CASH COLLATERAL1 | | SECURITIES ON LOAN COLLATERALIZED
BY CASH COLLATERAL | | NET AMOUNT |
| Royce Micro-Cap Fund | | $ | 827,269 | | | $ | (781,989 | ) | | $ | 45,280 | |
| Royce Opportunity Fund | | | 3,651,391 | | | | (3,632,958 | ) | | | 18,433 | |
| Royce Pennsylvania Mutual Fund | | | 11,352,400 | | | | (10,824,796 | ) | | | 527,604 | |
| Royce Smaller-Companies Growth Fund | | | 14,874,213 | | | | (14,027,253 | ) | | | 846,960 | |
| 1 | Absent an event of default, assets and liabilities are presented gross and not offset in the Statements of Assets and Liabilities. The contractual maturity of cash collateral is overnight and continuous. |
72 | The Royce Funds 2021 Annual Report to Shareholders
SECURITIES LENDING (continued):
The following table presents non-cash collateral and the market value of securities on loan collateralized by non-cash collateral held by the Funds’ custodian at December 31, 2021:
| | | NON-CASH COLLATERAL | | SECURITIES ON LOAN COLLATERALIZED
BY NON-CASH COLLATERAL | | NET AMOUNT |
| Royce Micro-Cap Fund | | $ | 8,441,211 | | | $ | (8,252,609 | ) | | $ | 188,602 | |
| Royce Opportunity Fund | | | 34,359,635 | | | | (33,505,442 | ) | | | 854,193 | |
| Royce Pennsylvania Mutual Fund | | | 14,715,302 | | | | (13,563,208 | ) | | | 1,152,094 | |
| Royce Small-Cap Value Fund | | | 1,552,406 | | | | (1,518,928 | ) | | | 33,478 | |
| Royce Smaller-Companies Growth Fund | | | 14,545,365 | | | | (14,229,020 | ) | | | 316,345 | |
DISTRIBUTIONS AND TAXES:
As qualified regulated investment companies under Subchapter M of the Internal Revenue Code, the Funds are not subject to income taxes to the extent that each Fund distributes substantially all of its taxable income for its fiscal year.
Royce Dividend Value Fund and Royce Total Return Fund pay any dividends from net investment income quarterly and make any distributions from net realized gains annually in December. The other Funds pay any dividends and capital gain distributions annually in December. Dividends from net investment income and distributions from capital gains are determined at a class level. Because federal income tax regulations differ from generally accepted accounting principles, income and capital gain distributions determined in accordance with tax regulations may differ from net investment income and realized gains recognized for financial reporting purposes. Accordingly, the character of distributions and composition of net assets for tax purposes differ from those reflected in the accompanying financial statements.
CAPITAL GAINS TAXES:
The Funds may be subject to a tax imposed on capital gains on securities of issuers domiciled in certain countries. The Funds record an estimated deferred tax liability for gains in these securities that have been held for less than one year. This amount, if any, is reported as deferred capital gains tax in the accompanying Statements of Assets and Liabilities, assuming those positions were disposed of at the end of the period, and accounted for as a reduction in the market value of the security.
INVESTMENT TRANSACTIONS AND RELATED INVESTMENT INCOME:
Investment transactions are accounted for on the trade date. Dividend income is recorded on the ex-dividend date. Non-cash dividend income is recorded at the fair market value of the securities received. Interest income is recorded on an accrual basis. Premiums and discounts on debt securities are amortized using the effective yield-to-maturity method. Realized gains and losses from investment transactions are determined on the basis of identified cost for book and tax purposes.
EXPENSES:
The Funds incur direct and indirect expenses. Expenses directly attributable to a Fund are charged to the Fund’s operations, while expenses applicable to more than one of the Royce Funds are allocated equitably. Certain personnel, occupancy costs and other administrative expenses related to all of the Royce Funds are allocated by Royce under an administration agreement and are included in administrative and office facilities and legal expenses.
COMPENSATING BALANCE CREDITS:
The Funds have arrangements with their custodian bank and transfer agent, whereby a portion of the custodian’s fee and transfer agent’s fee is paid indirectly by credits earned on a Fund’s cash on deposit with the bank and transfer agent. These deposit arrangements are an alternative to purchasing overnight investments. Conversely, a Fund pays interest to the custodian on any cash overdrafts, to the extent they are not offset by credits earned on positive cash balances.
LINE OF CREDIT:
The Funds, along with certain other Royce Funds, participate in a $65 million line of credit (“Credit Agreement”) with State Street Bank and Trust Company to be used for temporary or emergency purposes. This revolving Credit Agreement expires on October 7, 2022. Pursuant to the Credit Agreement, each participating Fund is liable for a portion of the commitment fee for the credit facility and for principal and interest payments related to borrowings made by that Fund. Borrowings under the Credit Agreement bear interest at a variable rate equal to the Applicable Rate plus the Applicable Margin. The term Applicable Rate means, for any day, a rate equal to the sum of (a) 0.10%, plus (b) the higher of (i) the Federal Funds Effective Rate for such day, or (ii) the Overnight Bank Funding Rate for such day. The term Applicable Margin means 1.25%. The Funds did not utilize the line of credit during the year ended December 31, 2021.
The Royce Funds 2021 Annual Report to Shareholders | 73
Notes to Financial Statements (continued)
Capital Share Transactions (in dollars):
| | | SHARES SOLD | | | SHARES ISSUED
FOR REINVESTMENT
OF DISTRIBUTIONS | | | SHARES REDEEMED | | | NET INCREASE (DECREASE) FROM CAPITAL SHARE TRANSACTIONS | |
| | | Year Ended | | | Year Ended | | | Year Ended | | | Year Ended | | | Year Ended | | | Year Ended | | | Year Ended | | | Year Ended | |
| | | 12/31/21 | | | 12/31/20 | | | 12/31/21 | | | 12/31/20 | | | 12/31/21 | | | 12/31/20 | | | 12/31/21 | | | 12/31/20 | |
| Royce Dividend Value Fund | | | | | | | | | | | | | | | | | | | | | | | | | | |
| Investment Class | | $ | 4,059,720 | | | $ | 7,191,951 | | | $ | 6,255,221 | | | $ | 2,949,058 | | | $ | (12,328,934 | ) | | $ | (28,741,034 | ) | | $ | (2,013,993 | ) | | $ | (18,600,025 | ) |
| Service Class | | | 624,759 | | | | 644,642 | | | | 2,121,953 | | | | 948,324 | | | | (4,091,270 | ) | | | (6,078,959 | ) | | | (1,344,558 | ) | | | (4,485,993 | ) |
| Consultant Class | | | 17,465 | | | | 11,980 | | | | 149,739 | | | | 46,021 | | | | (98,159 | ) | | | (378,765 | ) | | | 69,045 | | | | (320,764 | ) |
| Institutional Class | | | 59,431 | | | | 185,589 | | | | 122,259 | | | | 44,783 | | | | (43,869 | ) | | | (260,490 | ) | | | 137,821 | | | | (30,118 | ) |
| Royce Global Financial Services Fund | | | | | | | | | | | | | | | | | | | | | | | | | | |
| Service Class | | | 6,577,740 | | | | 3,804,511 | | | | 1,493,301 | | | | 1,530,984 | | | | (9,076,838 | ) | | | (10,742,359 | ) | | | (1,005,797 | ) | | | (5,406,864 | ) |
| Institutional Class | | | 392,172 | | | | – | | | | 490,070 | | | | 490,704 | | | | (6,217 | ) | | | (12,598 | ) | | | 876,025 | | | | 478,106 | |
| Royce International Premier Fund | | | | | | | | | | | | | | | | | | | | | | | | | | |
| Investment Class | | | 116,385,707 | | | | 204,010,079 | | | | 17,304,166 | | | | 916,927 | | | | (146,158,506 | ) | | | (149,175,342 | ) | | | (12,468,633 | ) | | | 55,751,664 | |
| Service Class | | | 8,681,331 | | | | 26,685,353 | | | | 2,320,181 | | | | – | | | | (22,027,412 | ) | | | (37,653,405 | ) | | | (11,025,900 | ) | | | (10,968,052 | ) |
| Consultant Class | | | 238,697 | | | | 576,990 | | | | 302,929 | | | | – | | | | (1,437,849 | ) | | | (2,303,772 | ) | | | (896,223 | ) | | | (1,726,782 | ) |
| Institutional Class | | | 191,546,144 | | | | 187,478,073 | | | | 21,236,509 | | | | 1,123,513 | | | | (80,776,073 | ) | | | (64,694,078 | ) | | | 132,006,580 | | | | 123,907,508 | |
| Royce Micro-Cap Fund | | | | | | | | | | | | | | | | | | | | | | | | | | |
| Investment Class | | | 26,166,336 | | | | 7,333,691 | | | | 35,324,986 | | | | 11,024,344 | | | | (37,741,646 | ) | | | (23,791,270 | ) | | | 23,749,676 | | | | (5,433,235 | ) |
| Service Class | | | 5,902,180 | | | | 2,833,711 | | | | 34,403,989 | | | | 11,018,041 | | | | (23,681,021 | ) | | | (28,817,547 | ) | | | 16,625,148 | | | | (14,965,795 | ) |
| Consultant Class | | | 91,238 | | | | 215,088 | | | | 2,788,315 | | | | 907,664 | | | | (2,114,078 | ) | | | (2,739,012 | ) | | | 765,475 | | | | (1,616,260 | ) |
| Royce Opportunity Fund | | | | | | | | | | | | | | | | | | | | | | | | | | |
| Investment Class | | | 909,585,405 | | | | 171,205,300 | | | | 212,409,964 | | | | – | | | | (596,255,404 | ) | | | (146,632,037 | ) | | | 525,739,965 | | | | 24,573,263 | |
| Service Class | | | 115,744,785 | | | | 74,701,884 | | | | 19,323,015 | | | | – | | | | (176,700,574 | ) | | | (18,878,148 | ) | | | (41,632,774 | ) | | | 55,823,736 | |
| Consultant Class | | | 2,520,066 | | | | 4,354,940 | | | | 2,576,218 | | | | – | | | | (4,857,761 | ) | | | (2,009,384 | ) | | | 238,523 | | | | 2,345,556 | |
| Institutional Class | | | 187,501,000 | | | | 159,214,915 | | | | 54,524,149 | | | | – | | | | (325,587,852 | ) | | | (119,168,031 | ) | | | (83,562,703 | ) | | | 40,046,884 | |
| R Class | | | 19,167,914 | | | | 5,428,658 | | | | 9,409,270 | | | | – | | | | (14,565,113 | ) | | | (8,263,137 | ) | | | 14,012,071 | | | | (2,834,479 | ) |
| Royce Pennsylvania Mutual Fund | | | | | | | | | | | | | | | | | | | | | | | | | | |
| Investment Class | | | 133,236,353 | | | | 129,712,233 | | | | 321,945,640 | | | | 62,415,440 | | | | (225,701,416 | ) | | | (280,753,528 | ) | | | 229,480,577 | | | | (88,625,855 | ) |
| Service Class | | | 77,966,809 | | | | 11,914,461 | | | | 16,976,489 | | | | 3,351,244 | | | | (89,179,394 | ) | | | (78,783,903 | ) | | | 5,763,904 | | | | (63,518,198 | ) |
| Consultant Class | | | 2,796,661 | | | | 4,275,481 | | | | 51,391,322 | | | | 9,558,258 | | | | (35,033,854 | ) | | | (49,044,206 | ) | | | 19,154,129 | | | | (35,210,467 | ) |
| Institutional Class | | | 108,306,266 | | | | 66,450,769 | | | | 43,369,949 | | | | 7,982,989 | | | | (107,814,269 | ) | | | (31,062,664 | ) | | | 43,861,946 | | | | 43,371,094 | |
| R Class | | | 1,794,969 | | | | 762,130 | | | | 2,135,458 | | | | 345,260 | | | | (2,111,593 | ) | | | (2,294,846 | ) | | | 1,818,834 | | | | (1,187,456 | ) |
| Royce Premier Fund | | | | | | | | | | | | | | | | | | | | | | | | | | |
| Investment Class | | | 106,716,414 | | | | 180,850,254 | | | | 201,105,839 | | | | 61,454,622 | | | | (287,548,189 | ) | | | (387,040,459 | ) | | | 20,274,064 | | | | (144,735,583 | ) |
| Service Class | | | 14,435,396 | | | | 8,349,210 | | | | 6,046,944 | | | | 1,387,591 | | | | (12,048,579 | ) | | | (11,085,656 | ) | | | 8,433,761 | | | | (1,348,855 | ) |
| Consultant Class | | | 118,942 | | | | 779,765 | | | | 2,688,134 | | | | 689,259 | | | | (1,911,296 | ) | | | (3,774,843 | ) | | | 895,780 | | | | (2,305,819 | ) |
| Institutional Class | | | 88,840,619 | | | | 87,405,548 | | | | 46,812,431 | | | | 13,980,733 | | | | (120,919,662 | ) | | | (100,897,299 | ) | | | 14,733,388 | | | | 488,982 | |
| R Class | | | 333,549 | | | | 597,038 | | | | 1,430,819 | | | | 449,228 | | | | (2,971,274 | ) | | | (2,802,246 | ) | | | (1,206,906 | ) | | | (1,755,980 | ) |
| Royce Small-Cap Value Fund | | | | | | | | | | | | | | | | | | | | | | | | | | |
| Investment Class | | | 6,525,775 | | | | 3,457,167 | | | | 2,309,669 | | | | 1,216,083 | | | | (6,530,656 | ) | | | (15,806,198 | ) | | | 2,304,788 | | | | (11,132,948 | ) |
| Service Class | | | 2,982,199 | | | | 2,271,024 | | | | 4,167,486 | | | | 2,650,395 | | | | (16,534,978 | ) | | | (18,681,676 | ) | | | (9,385,293 | ) | | | (13,760,257 | ) |
| Consultant Class | | | 860,233 | | | | 248,256 | | | | 255,409 | | | | 112,639 | | | | (509,924 | ) | | | (2,586,024 | ) | | | 605,718 | | | | (2,225,129 | ) |
| R Class | | | 2,441,657 | | | | 1,341,968 | | | | 466,938 | | | | 253,771 | | | | (3,346,669 | ) | | | (1,830,036 | ) | | | (438,074 | ) | | | (234,297 | ) |
| Royce Smaller-Companies Growth Fund | | | | | | | | | | | | | | | | | | | | | | | | | | |
| Investment Class | | | 31,489,085 | | | | 4,059,712 | | | | 19,936,818 | | | | 8,872,763 | | | | (40,246,678 | ) | | | (19,744,579 | ) | | | 11,179,225 | | | | (6,812,104 | ) |
| Service Class | | | 17,231,454 | | | | 4,157,959 | | | | 44,252,911 | | | | 16,456,391 | | | | (33,104,492 | ) | | | (36,694,110 | ) | | | 28,379,873 | | | | (16,079,760 | ) |
| Consultant Class | | | 23,195 | | | | 72,295 | | | | 1,908,240 | | | | 730,139 | | | | (1,103,977 | ) | | | (877,865 | ) | | | 827,458 | | | | (75,431 | ) |
| Institutional Class | | | 2,728,335 | | | | 648,706 | | | | 1,851,226 | | | | 520,741 | | | | (1,486,523 | ) | | | (4,957,343 | ) | | | 3,093,038 | | | | (3,787,896 | ) |
| Royce Special Equity Fund | | | | | | | | | | | | | | | | | | | | | | | | | | |
| Investment Class | | | 121,262,899 | | | | 175,354,994 | | | | 93,229,234 | | | | 21,056,949 | | | | (204,584,467 | ) | | | (324,990,330 | ) | | | 9,907,666 | | | | (128,578,387 | ) |
| Service Class | | | 17,100,065 | | | | 20,262,269 | | | | 7,161,186 | | | | 1,314,464 | | | | (15,075,774 | ) | | | (36,815,552 | ) | | | 9,185,477 | | | | (15,238,819 | ) |
| Consultant Class | | | 7,651,086 | | | | 748,171 | | | | 3,066,063 | | | | 454,137 | | | | (5,125,345 | ) | | | (7,248,754 | ) | | | 5,591,804 | | | | (6,046,446 | ) |
| Institutional Class | | | 56,739,669 | | | | 173,759,435 | | | | 23,784,552 | | | | 4,804,761 | | | | (46,905,182 | ) | | | (174,962,098 | ) | | | 33,619,039 | | | | 3,602,098 | |
| Royce Total Return Fund | | | | | | | | | | | | | | | | | | | | | | | | | | |
| Investment Class | | | 165,781,541 | | | | 152,290,416 | | | | 229,840,473 | | | | 141,179,953 | | | | (240,787,980 | ) | | | (284,116,987 | ) | | | 154,834,034 | | | | 9,353,382 | |
| Service Class | | | 26,413,084 | | | | 18,551,062 | | | | 18,522,033 | | | | 11,684,426 | | | | (31,366,709 | ) | | | (26,772,474 | ) | | | 13,568,408 | | | | 3,463,014 | |
| Consultant Class | | | 1,295,728 | | | | 2,633,113 | | | | 25,379,612 | | | | 16,711,733 | | | | (21,836,127 | ) | | | (38,528,825 | ) | | | 4,839,213 | | | | (19,183,979 | ) |
| Institutional Class | | | 102,146,125 | | | | 75,965,309 | | | | 67,746,029 | | | | 35,429,144 | | | | (84,529,829 | ) | | | (105,570,702 | ) | | | 85,362,325 | | | | 5,823,751 | |
| R Class | | | 4,675,698 | | | | 3,797,612 | | | | 6,650,410 | | | | 5,028,346 | | | | (14,663,079 | ) | | | (10,058,352 | ) | | | (3,336,971 | ) | | | (1,232,394 | ) |
| 74 | The Royce Funds 2021 Annual Report to Shareholders |
Capital Share Transactions (in shares):
| | | | | | | | | | | | | | | | | | | | | | |
| | | SHARES SOLD | | | SHARES ISSUED
FOR REINVESTMENT
OF DISTRIBUTIONS | | | SHARES REDEEMED | | | NET INCREASE (DECREASE) IN
SHARES OUTSTANDING | |
| | | Year Ended | | | Year Ended | | | Year Ended | | | Year Ended | | | Year Ended | | | Year Ended | | | Year Ended | | | Year Ended | |
| | | 12/31/21 | | | 12/31/20 | | | 12/31/21 | | | 12/31/20 | | | 12/31/21 | | | 12/31/20 | | | 12/31/21 | | | 12/31/20 | |
| Royce Dividend Value Fund | | | | | | | | | | | | | | | | | | | | | | | | | |
| Investment Class | | | 597,759 | | | | 1,491,917 | | | | 1,004,092 | | | | 505,159 | | | | (1,826,156 | ) | | | (5,548,817 | ) | | | (224,305 | ) | | | (3,551,741 | ) |
| Service Class | | | 87,469 | | | | 110,691 | | | | 327,936 | | | | 155,513 | | | | (583,911 | ) | | | (1,092,901 | ) | | | (168,506 | ) | | | (826,697 | ) |
| Consultant Class | | | 2,301 | | | | 1,626 | | | | 20,290 | | | | 6,502 | | | | (12,152 | ) | | | (60,476 | ) | | | 10,439 | | | | (52,348 | ) |
| Institutional Class | | | 8,971 | | | | 35,276 | | | | 19,950 | | | | 7,729 | | | | (6,700 | ) | | | (58,716 | ) | | | 22,221 | | | | (15,711 | ) |
| Royce Global Financial Services Fund | | | | | | | | | | | | | | | | | | | | | | | | | |
| Service Class | | | 529,857 | | | | 404,322 | | | | 127,089 | | | | 148,495 | | | | (720,226 | ) | | | (1,167,633 | ) | | | (63,280 | ) | | | (614,816 | ) |
| Institutional Class | | | 23,717 | | | | – | | | | 31,926 | | | | 36,729 | | | | (404 | ) | | | (962 | ) | | | 55,239 | | | | 35,767 | |
| Royce International Premier Fund | | | | | | | | | | | | | | | | | | | | | | | | | |
| Investment Class | | | 6,404,093 | | | | 14,592,460 | | | | 997,991 | | | | 54,906 | | | | (8,000,230 | ) | | | (10,718,019 | ) | | | (598,146 | ) | | | 3,929,347 | |
| Service Class | | | 399,923 | | | | 1,574,067 | | | | 111,708 | | | | – | | | | (1,011,419 | ) | | | (2,208,142 | ) | | | (499,788 | ) | | | (634,075 | ) |
| Consultant Class | | | 10,355 | | | | 30,314 | | | | 13,782 | | | | – | | | | (59,363 | ) | | | (127,076 | ) | | | (35,226 | ) | | | (96,762 | ) |
| Institutional Class | | | 10,502,184 | | | | 12,732,043 | | | | 1,224,006 | | | | 67,236 | | | | (4,372,610 | ) | | | (4,668,427 | ) | | | 7,353,580 | | | | 8,130,852 | |
| Royce Micro-Cap Fund | | | | | | | | | | | | | | | | | | | | | | | | | |
| Investment Class | | | 1,679,399 | | | | 796,798 | | | | 2,790,283 | | | | 899,213 | | | | (2,562,221 | ) | | | (2,365,898 | ) | | | 1,907,461 | | | | (669,887 | ) |
| Service Class | | | 390,449 | | | | 296,175 | | | | 2,792,531 | | | | 919,703 | | | | (1,591,829 | ) | | | (2,986,275 | ) | | | 1,591,151 | | | | (1,770,397 | ) |
| Consultant Class | | | 8,029 | | | | 25,771 | | | | 295,059 | | | | 98,020 | | | | (182,910 | ) | | | (353,855 | ) | | | 120,178 | | | | (230,064 | ) |
| Royce Opportunity Fund | | | | | | | | | | | | | | | | | | | | | | | | | |
| Investment Class | | | 46,829,638 | | | | 14,661,281 | | | | 13,325,594 | | | | – | | | | (30,327,827 | ) | | | (13,657,249 | ) | | | 29,827,405 | | | | 1,004,032 | |
| Service Class | | | 6,458,725 | | | | 6,849,928 | | | | 1,324,401 | | | | – | | | | (9,633,721 | ) | | | (1,826,392 | ) | | | (1,850,595 | ) | | | 5,023,536 | |
| Consultant Class | | | 165,086 | | | | 454,655 | | | | 204,462 | | | | – | | | | (314,729 | ) | | | (240,344 | ) | | | 54,819 | | | | 214,311 | |
| Institutional Class | | | 9,437,181 | | | | 13,611,720 | | | | 3,330,736 | | | | – | | | | (16,826,206 | ) | | | (10,590,136 | ) | | | (4,058,289 | ) | | | 3,021,584 | |
| R Class | | | 1,097,275 | | | | 565,983 | | | | 668,272 | | | | – | | | | (853,589 | ) | | | (793,591 | ) | | | 911,958 | | | | (227,608 | ) |
| Royce Pennsylvania Mutual Fund | | | | | | | | | | | | | | | | | | | | | | | | | |
| Investment Class | | | 11,535,799 | | | | 15,208,886 | | | | 34,918,649 | | | | 6,235,307 | | | | (19,375,279 | ) | | | (33,501,741 | ) | | | 27,079,169 | | | | (12,057,548 | ) |
| Service Class | | | 6,771,205 | | | | 1,396,869 | | | | 1,847,279 | | | | 335,124 | | | | (7,579,796 | ) | | | (9,188,921 | ) | | | 1,038,688 | | | | (7,456,928 | ) |
| Consultant Class | | | 313,298 | | | | 641,767 | | | | 7,137,684 | | | | 1,211,439 | | | | (3,852,945 | ) | | | (7,355,627 | ) | | | 3,598,037 | | | | (5,502,421 | ) |
| Institutional Class | | | 9,058,325 | | | | 7,639,708 | | | | 4,683,580 | | | | 795,118 | | | | (9,060,627 | ) | | | (3,728,269 | ) | | | 4,681,278 | | | | 4,706,557 | |
| R Class | | | 167,145 | | | | 101,253 | | | | 249,761 | | | | 36,926 | | | | (202,597 | ) | | | (290,280 | ) | | | 214,309 | | | | (152,101 | ) |
| Royce Premier Fund | | | | | | | | | | | | | | | | | | | | | | | | | |
| Investment Class | | | 7,384,195 | | | | 16,310,049 | | | | 16,011,612 | | | | 4,620,630 | | | | (19,450,154 | ) | | | (33,679,066 | ) | | | 3,945,653 | | | | (12,748,387 | ) |
| Service Class | | | 1,003,487 | | | | 750,092 | | | | 496,465 | | | | 107,233 | | | | (837,328 | ) | | | (986,464 | ) | | | 662,624 | | | | (129,139 | ) |
| Consultant Class | | | 10,306 | | | | 85,497 | | | | 277,413 | | | | 66,403 | | | | (166,627 | ) | | | (414,639 | ) | | | 121,092 | | | | (262,739 | ) |
| Institutional Class | | | 5,715,214 | | | | 7,594,039 | | | | 3,671,563 | | | | 1,035,610 | | | | (7,905,009 | ) | | | (7,985,684 | ) | | | 1,481,768 | | | | 643,965 | |
| R Class | | | 24,599 | | | | 57,807 | | | | 124,745 | | | | 36,732 | | | | (221,309 | ) | | | (263,346 | ) | | | (71,965 | ) | | | (168,807 | ) |
| Royce Small-Cap Value Fund | | | | | | | | | | | | | | | | | | | | | | | | | |
| Investment Class | | | 669,061 | | | | 506,019 | | | | 230,276 | | | | 143,745 | | | | (630,400 | ) | | | (2,203,807 | ) | | | 268,937 | | | | (1,554,043 | ) |
| Service Class | | | 289,142 | | | | 330,143 | | | | 417,584 | | | | 314,400 | | | | (1,615,922 | ) | | | (2,585,606 | ) | | | (909,196 | ) | | | (1,941,063 | ) |
| Consultant Class | | | 94,431 | | | | 38,081 | | | | 29,324 | | | | 15,140 | | | | (56,758 | ) | | | (425,583 | ) | | | 66,997 | | | | (372,362 | ) |
| R Class | | | 246,103 | | | | 207,737 | | | | 49,151 | | | | 31,408 | | | | (344,878 | ) | | | (252,973 | ) | | | (49,624 | ) | | | (13,828 | ) |
| Royce Smaller-Companies Growth Fund | | | | | | | | | | | | | | | | | | | | | | | | | |
| Investment Class | | | 2,901,010 | | | | 490,453 | | | | 2,413,659 | | | | 858,101 | | | | (3,340,198 | ) | | | (2,323,038 | ) | | | 1,974,471 | | | | (974,484 | ) |
| Service Class | | | 1,426,653 | | | | 481,738 | | | | 5,538,537 | | | | 1,639,083 | | | | (2,744,346 | ) | | | (4,507,093 | ) | | | 4,220,844 | | | | (2,386,272 | ) |
| Consultant Class | | | 2,323 | | | | 10,070 | | | | 284,812 | | | | 86,000 | | | | (112,984 | ) | | | (131,084 | ) | | | 174,151 | | | | (35,014 | ) |
| Institutional Class | | | 214,208 | | | | 75,338 | | | | 220,910 | | | | 49,642 | | | | (117,034 | ) | | | (584,614 | ) | | | 318,084 | | | | (459,634 | ) |
| Royce Special Equity Fund | | | | | | | | | | | | | | | | | | | | | | | | | |
| Investment Class | | | 5,959,352 | | | | 10,858,599 | | | | 4,996,208 | | | | 1,158,248 | | | | (9,958,593 | ) | | | (20,023,301 | ) | | | 996,967 | | | | (8,006,454 | ) |
| Service Class | | | 822,632 | | | | 1,282,416 | | | | 384,184 | | | | 72,382 | | | | (744,037 | ) | | | (2,209,225 | ) | | | 462,779 | | | | (854,427 | ) |
| Consultant Class | | | 400,306 | | | | 50,624 | | | | 180,463 | | | | 27,391 | | | | (273,618 | ) | | | (487,054 | ) | | | 307,151 | | | | (409,039 | ) |
| Institutional Class | | | 2,827,346 | | | | 11,083,103 | | | | 1,286,347 | | | | 266,635 | | | | (2,284,477 | ) | | | (11,328,678 | ) | | | 1,829,216 | | | | 21,060 | |
| Royce Total Return Fund | | | | | | | | | | | | | | | | | | | | | | | | | |
| Investment Class | | | 15,913,267 | | | | 17,443,229 | | | | 26,713,010 | | | | 15,382,416 | | | | (22,616,714 | ) | | | (30,941,230 | ) | | | 20,009,563 | | | | 1,884,415 | |
| Service Class | | | 2,344,739 | | | | 1,967,665 | | | | 2,085,738 | | | | 1,235,560 | | | | (2,801,404 | ) | | | (2,812,704 | ) | | | 1,629,073 | | | | 390,521 | |
| Consultant Class | | | 116,620 | | | | 294,027 | | | | 2,839,663 | | | | 1,743,701 | | | | (1,983,657 | ) | | | (4,014,620 | ) | | | 972,626 | | | | (1,976,892 | ) |
| Institutional Class | | | 9,428,489 | | | | 7,809,989 | | | | 8,018,807 | | | | 3,929,141 | | | | (7,744,779 | ) | | | (10,576,324 | ) | | | 9,702,517 | | | | 1,162,806 | |
| R Class | | | 409,104 | | | | 418,932 | | | | 740,127 | | | | 524,317 | | | | (1,286,978 | ) | | | (1,061,005 | ) | | | (137,747 | ) | | | (117,756 | ) |
The Royce Funds 2021 Annual Report to Shareholders | 75
Notes to Financial Statements (continued)
Investment Adviser and Distributor:
INVESTMENT ADVISER:
Under the Trust’s investment advisory agreements with Royce, Royce is entitled to receive investment advisory fees in respect of each Fund that are computed daily and payable monthly. Royce has contractually agreed, without right of termination, to waive fees and/or reimburse expenses (excluding brokerage commissions, taxes, interest, litigation expenses, acquired fund fees and expenses, and other expenses not borne in the ordinary course of business) to the extent necessary to maintain certain Funds’ net annual operating expense ratios at specified levels through April 30, 2022. To the extent that they impacted net expenses for the year ended December 31, 2021, the effects of those arrangements are shown below. See the Prospectuses for contractual waivers and expiration dates for all classes of all Funds.
| | | ANNUAL CONTRACTUAL | | | | | | | | | | | | | | | | | | YEAR ENDED | |
| | | ADVISORY FEE AS A | | | COMMITTED NET ANNUAL OPERATING EXPENSE RATIO CAP | | | DECEMBER 31, 2021 | |
| | | PERCENTAGE OF AVERAGE | | | Investment | | | Service | | | Consultant | | | Institutional | | | | | | Net advisory | | | Advisory fees | |
| | | NET ASSETS1 | | | Class | | | Class | | | Class | | | Class | | | R Class | | | fees | | | waived | |
| Royce Dividend Value Fund | | 0.85% | | | 1.09% | | | 1.34% | | | 2.09% | | | 1.09% | | | N/A | | | $ | 659,299 | | | $ | – | |
| Royce Global Financial Services Fund | | 1.00% | | | N/A | | | 1.49%3 | | | N/A | | | 1.49%3 | | | N/A | | | | 397,726 | | | | – | |
| Royce International Premier Fund | | 1.00% | | | 1.19% | | | 1.44% | | | 2.19% | | | 1.04% | | | N/A | | | | 11,668,910 | | | | 774,555 | |
| Royce Micro-Cap Fund | | 1.00% | | | N/A | | | 1.49% | | | N/A | | | N/A | | | N/A | | | | 4,099,315 | | | | – | |
| Royce Opportunity Fund | | 1.00% | | | N/A | | | 1.49% | | | N/A | | | N/A | | | N/A | | | | 19,692,832 | | | | – | |
| Royce Pennsylvania Mutual Fund | | 0.76%2 | | | N/A | | | N/A | | | N/A | | | N/A | | | N/A | | | | 16,653,958 | | | | – | |
| Royce Premier Fund | | 1.00% | | | N/A | | | 1.49% | | | N/A | | | N/A | | | N/A | | | | 17,965,482 | | | | – | |
| Royce Small-Cap Value Fund | | 1.00% | | | 1.24% | | | 1.49% | | | N/A | | | N/A | | | 1.99% | | | | 1,391,283 | | | | – | |
| Royce Smaller-Companies Growth Fund | | 1.00% | | | N/A | | | 1.49% | | | 2.24% | | | 1.16% | | | N/A | | | | 3,397,206 | | | | – | |
| Royce Special Equity Fund | | 1.00% | | | N/A | | | 1.49%4 | | | N/A | | | N/A | | | N/A | | | | 10,826,951 | | | | – | |
| Royce Total Return Fund | | 1.00% | | | N/A | | | 1.49%3 | | | N/A | | | N/A | | | N/A | | | | 15,239,276 | | | | – | |
| 1 | From a base annual rate of 1.00% (0.85% for Royce Dividend Value Fund), the annual rates of investment advisory fees payable by each of the Funds, other than Royce Pennsylvania Mutual Fund, are reduced by the indicated amount at the following breakpoints applicable to a Fund’s net assets in excess of $2 billion: more than $2 billion to $3 billion – .05% per annum; more than $3 billion to $4 billion – .10% per annum; over $4 billion – .15% per annum. |
| 2 | Royce Pennsylvania Mutual Fund’s fees are calculated at the annual rate of 1.00% of the first $50 million of the Fund’s average net assets, 0.875% of the next $50 million of average net assets and 0.75% of average net assets in excess of $100 million. |
| 3 | Committed net annual operating expense ratio cap excludes acquired fund fees and expenses. |
| 4 | Royce Special Equity Fund’s committed net annual operating expense ratio cap was increased from 1.39% to 1.49% for Service Class, effective May 1, 2021. |
DISTRIBUTOR:
Royce Fund Services, LLC (“RFS”), the distributor of the Trust’s shares, is a wholly owned subsidiary of Royce. RFS is entitled to receive distribution fees that are computed daily and payable monthly.
| | ANNUAL CONTRACTUAL DISTRIBUTION FEE AS A | YEAR ENDED DECEMBER 31, 2021 |
| | PERCENTAGE OF AVERAGE NET ASSETS | Net distribution fees | Distribution fees waived |
| Royce Dividend Value Fund – Service Class | 0.25% | $ | 50,006 | $ | – |
| Royce Dividend Value Fund – Consultant Class | 1.00% | | 13,727 | | – |
| Royce Global Financial Services Fund – Service Class | 0.25% | | 67,489 | | 9,203 |
| Royce International Premier Fund – Service Class | 0.25% | | 161,285 | | – |
| Royce International Premier Fund – Consultant Class | 1.00% | | 91,910 | | – |
| Royce Micro-Cap Fund – Service Class | 0.25% | | 486,136 | | – |
| Royce Micro-Cap Fund – Consultant Class | 1.00% | | 160,971 | | – |
| Royce Opportunity Fund – Service Class | 0.25% | | 367,270 | | – |
| Royce Opportunity Fund – Consultant Class | 1.00% | | 159,522 | | – |
| Royce Opportunity Fund – R Class | 0.50% | | 248,988 | | – |
| Royce Pennsylvania Mutual Fund – Service Class | 0.25% | | 268,756 | | 2,510 |
| Royce Pennsylvania Mutual Fund – Consultant Class | 1.00% | | 2,575,844 | | – |
| Royce Pennsylvania Mutual Fund – R Class | 0.50% | | 47,367 | | – |
| Royce Premier Fund – Service Class | 0.25% | | 82,681 | | – |
| Royce Premier Fund – Consultant Class | 1.00% | | 163,315 | | – |
| Royce Premier Fund – R Class | 0.50% | | 43,753 | | – |
| Royce Small-Cap Value Fund – Service Class | 0.25% | | 207,706 | | – |
| Royce Small-Cap Value Fund – Consultant Class | 1.00% | | 44,782 | | – |
| Royce Small-Cap Value Fund – R Class | 0.50% | | 41,274 | | – |
| Royce Smaller-Companies Growth Fund – Service Class | 0.25% | | 500,314 | | – |
| Royce Smaller-Companies Growth Fund – Consultant Class | 1.00% | | 85,061 | | – |
| Royce Special Equity Fund – Service Class | 0.25% | | 137,427 | | – |
| Royce Special Equity Fund – Consultant Class | 1.00% | | 234,407 | | – |
| Royce Total Return Fund – Service Class | 0.25% | | 203,793 | | – |
| Royce Total Return Fund – Consultant Class | 1.00% | | 1,199,022 | | – |
| Royce Total Return Fund – R Class | 0.50% | | 162,918 | | – |
| 76 | The Royce Funds 2021 Annual Report to Shareholders |
Purchases and Sales of Investment Securities:
For the year ended December 31, 2021, the costs of purchases and the proceeds from sales of investment securities, other than short-term securities and collateral received for securities loaned, were as follows:
| | | PURCHASES | | SALES1 |
| Royce Dividend Value Fund | $ | – | $ | 12,730,679 |
| Royce Global Financial Services Fund | | 1,852,764 | | 5,525,058 |
| Royce International Premier Fund | | 425,881,359 | | 375,164,681 |
| Royce Micro-Cap Fund | | 100,409,905 | | 152,805,256 |
| Royce Opportunity Fund | | 1,298,847,790 | | 1,226,462,389 |
| Royce Pennsylvania Mutual Fund | | 1,260,363,820 | | 1,413,270,262 |
| Royce Premier Fund | | 344,165,787 | | 590,240,948 |
| Royce Small-Cap Value Fund | | 70,983,028 | | 88,033,793 |
| Royce Smaller-Companies Growth Fund | | 159,804,640 | | 205,381,769 |
| Royce Special Equity Fund | | 377,864,870 | | 450,578,592 |
| Royce Total Return Fund | | 950,702,983 | | 1,009,687,367 |
1 Excludes the value of securities delivered as a result of redemptions-in-kind.
Cross trades were executed by the Funds pursuant to Rule 17a-7 under the 1940 Act. Cross trading is the buying or selling of portfolio securities between funds to which Royce serves as investment adviser. The Trust’s Chief Compliance Officer reviews such transactions each quarter for compliance with the requirements and restrictions set forth by Rule 17a-7, and reports the results of that review to the Board of Trustees. Cross trades for the year ended December 31, 2021, were as follows:
| | COSTS OF PURCHASES | PROCEEDS FROM SALES | REALIZED GAIN (LOSS) |
| Royce Global Financial Services Fund | $ | – | $ 216,069 | $ (203,584) |
| Royce International Premier Fund | | 324,002 | – | – |
| Royce Micro-Cap Fund | | 478,333 | 2,747,350 | 851,747 |
| Royce Opportunity Fund | | 23,248,476 | 1,398,559 | (298,722) |
| Royce Pennsylvania Mutual Fund | | 15,478,528 | 8,529,022 | (2,039,491) |
| Royce Premier Fund | | 9,906,235 | 3,226,400 | (2,241,047) |
| Royce Special Equity Fund | | – | 113,834 | 78,523 |
| Royce Total Return Fund | | 2,503,601 | 5,589,922 | (1,101,089) |
Redemptions-In-Kind:
The Funds may make payment for Fund shares redeemed wholly or in part by distributing portfolio securities to shareholders. The net realized gain will not be realized for tax purposes. For the year ended December 31, 2021, the following funds had redemptions-in-kind:
| | AMOUNT REDEEMED IN-KIND | REALIZED GAIN |
| Royce Pennsylvania Mutual Fund | $41,702,385 | $21,653,661 |
| Royce Premier Fund | 47,562,017 | 26,331,890 |
| Royce Total Return Fund | 37,576,901 | 12,965,893 |
Class Specific Expenses:
Class specific expenses were as follows for the year ended December 31, 2021:
| | | NET DISTRIBUTION
FEES | | | SHAREHOLDER
SERVICING | | | SHAREHOLDER
REPORTS | | | REGISTRATION | | | TRANSFER AGENT
BALANCE CREDITS | | | TOTAL | | | CLASS LEVEL
EXPENSES
REIMBURSED BY
INVESTMENT
ADVISER | |
| Royce Dividend Value Fund – Investment Class | | $ | – | | | $ | 77,525 | | | $ | 6,731 | | | $ | 19,306 | | | $ | (25 | ) | | $ | 103,537 | | | $ | 67,608 | |
| Royce Dividend Value Fund – Service Class | | | 50,006 | | | | 36,637 | | | | 3,234 | | | | 14,061 | | | | (15 | ) | | | 103,923 | | | | 40,898 | |
| Royce Dividend Value Fund – Consultant Class | | | 13,727 | | | | 7,141 | | | | 670 | | | | 12,049 | | | | (1 | ) | | | 33,586 | | | | 18,966 | |
| Royce Dividend Value Fund – Institutional Class | | | – | | | | 6,758 | | | | 150 | | | | 11,361 | | | | (1 | ) | | | 18,268 | | | | 17,669 | |
| | | | 63,733 | | | | 128,061 | | | | 10,785 | | | | 56,777 | | | | (42 | ) | | | | | | | 145,141 | |
| Royce Global Financial Services Fund – Service Class | | | 67,489 | | | | 49,659 | | | | 5,520 | | | | 19,431 | | | | (20 | ) | | | 142,079 | | | | 78,271 | |
| Royce Global Financial Services Fund – Institutional Class | | | – | | | | 6,638 | | | | 27 | | | | 13,591 | | | | – | | | | 20,256 | | | | 1,504 | |
| | | | 67,489 | | | | 56,297 | | | | 5,547 | | | | 33,022 | | | | (20 | ) | | | | | | | 79,775 | |
The Royce Funds 2021 Annual Report to Shareholders | 77
Notes to Financial Statements (continued)
Class Specific Expenses (continued):
| | | NET DISTRIBUTION
FEES | | | SHAREHOLDER
SERVICING | | | SHAREHOLDER
REPORTS | | | REGISTRATION | | | TRANSFER AGENT
BALANCE CREDITS | | | TOTAL | | | CLASS LEVEL EXPENSES REIMBURSED BY INVESTMENT ADVISER | |
| Royce International Premier Fund – Investment Class | | $ | – | | | $ | 549,104 | | | $ | 34,153 | | | $ | 33,963 | | | $ | (56 | ) | | $ | 617,164 | | | $ | – | |
| Royce International Premier Fund – Service Class | | | 161,285 | | | | 103,721 | | | | 5,125 | | | | 13,915 | | | | (11 | ) | | | 284,035 | | | | 24,634 | |
| Royce International Premier Fund – Consultant Class | | | 91,910 | | | | 12,397 | | | | 1,137 | | | | 12,046 | | | | (2 | ) | | | 117,488 | | | | 11,646 | |
| Royce International Premier Fund – Institutional Class | | | – | | | | 174,154 | | | | 163,147 | | | | 29,662 | | | | (1,519 | ) | | | 365,444 | | | | 365,444 | |
| | | | 253,195 | | | | 839,376 | | | | 203,562 | | | | 89,586 | | | | (1,588 | ) | | | | | | | 401,724 | |
| Royce Micro-Cap Fund – Investment Class | | | – | | | | 165,165 | | | | 42,289 | | | | 17,753 | | | | (276 | ) | | | 224,931 | | | | – | |
| Royce Micro-Cap Fund – Service Class | | | 486,136 | | | | 301,733 | | | | 18,057 | | | | 19,706 | | | | (32 | ) | | | 825,600 | | | | 34,538 | |
| Royce Micro-Cap Fund – Consultant Class | | | 160,971 | | | | 19,790 | | | | 2,569 | | | | 12,396 | | | | (10 | ) | | | 195,716 | | | | – | |
| | | | 647,107 | | | | 486,688 | | | | 62,915 | | | | 49,855 | | | | (318 | ) | | | | | | | 34,538 | |
| Royce Opportunity Fund – Investment Class | | | – | | | | 1,548,272 | | | | 195,297 | | | | 107,834 | | | | (554 | ) | | | 1,850,849 | | | | – | |
| Royce Opportunity Fund – Service Class | | | 367,270 | | | | 227,000 | | | | 21,226 | | | | 20,972 | | | | (14 | ) | | | 636,454 | | | | 9,233 | |
| Royce Opportunity Fund – Consultant Class | | | 159,522 | | | | 17,075 | | | | 1,797 | | | | 11,647 | | | | (6 | ) | | | 190,035 | | | | – | |
| Royce Opportunity Fund – Institutional Class | | | – | | | | 18,389 | | | | 16,538 | | | | 26,357 | | | | (93 | ) | | | 61,191 | | | | – | |
| Royce Opportunity Fund – R Class | | | 248,988 | | | | 106,589 | | | | 1,911 | | | | 12,604 | | | | (10 | ) | | | 370,082 | | | | – | |
| | | | 775,780 | | | | 1,917,325 | | | | 236,769 | | | | 179,414 | | | | (677 | ) | | | | | | | 9,233 | |
| Royce Pennsylvania Mutual Fund – Investment Class | | | – | | | | 1,109,820 | | | | 163,732 | | | | 31,909 | | | | (950 | ) | | | 1,304,511 | | | | – | |
| Royce Pennsylvania Mutual Fund – Service Class | | | 268,756 | | | | 173,946 | | | | 12,045 | | | | 20,614 | | | | (42 | ) | | | 475,319 | | | | – | |
| Royce Pennsylvania Mutual Fund – Consultant Class | | | 2,575,844 | | | | 179,355 | | | | 29,980 | | | | 17,138 | | | | (130 | ) | | | 2,802,187 | | | | – | |
| Royce Pennsylvania Mutual Fund – Institutional Class | | | – | | | | 17,078 | | | | 16,489 | | | | 22,735 | | | | (58 | ) | | | 56,244 | | | | – | |
| Royce Pennsylvania Mutual Fund – R Class | | | 47,367 | | | | 26,769 | | | | 2,151 | | | | 8,537 | | | | (11 | ) | | | 84,813 | | | | – | |
| | | | 2,891,967 | | | | 1,506,968 | | | | 224,397 | | | | 100,933 | | | | (1,191 | ) | | | | | | | – | |
| Royce Premier Fund – Investment Class | | | – | | | | 1,232,251 | | | | 121,158 | | | | 31,811 | | | | (446 | ) | | | 1,384,774 | | | | – | |
| Royce Premier Fund – Service Class | | | 82,681 | | | | 56,132 | | | | 7,378 | | | | 14,242 | | | | (15 | ) | | | 160,418 | | | | 22,908 | |
| Royce Premier Fund – Consultant Class | | | 163,315 | | | | 20,628 | | | | 2,007 | | | | 12,093 | | | | (8 | ) | | | 198,035 | | | | – | |
| Royce Premier Fund – Institutional Class | | | – | | | | 11,717 | | | | 26,081 | | | | 14,367 | | | | (34 | ) | | | 52,131 | | | | – | |
| Royce Premier Fund – R Class | | | 43,753 | | | | 24,503 | | | | 1,639 | | | | 4,963 | | | | (2 | ) | | | 74,856 | | | | – | |
| | | | 289,749 | | | | 1,345,231 | | | | 158,263 | | | | 77,476 | | | | (505 | ) | | | | | | | 22,908 | |
| Royce Small-Cap Value Fund – Investment Class | | | – | | | | 58,290 | | | | 8,596 | | | | 15,240 | | | | (54 | ) | | | 82,072 | | | | 28,941 | |
| Royce Small-Cap Value Fund – Service Class | | | 207,706 | | | | 125,806 | | | | 11,512 | | | | 18,389 | | | | (25 | ) | | | 363,388 | | | | 53,277 | |
| Royce Small-Cap Value Fund – Consultant Class | | | 44,782 | | | | 11,651 | | | | 934 | | | | 11,884 | | | | (5 | ) | | | 69,246 | | | | – | |
| Royce Small-Cap Value Fund – R Class | | | 41,274 | | | | 25,100 | | | | 1,178 | | | | 7,819 | | | | (6 | ) | | | 75,365 | | | | 3,303 | |
| | | | 293,762 | | | | 220,847 | | | | 22,220 | | | | 53,332 | | | | (90 | ) | | | | | | | 85,521 | |
| Royce Smaller-Companies Growth Fund – Investment Class | | | – | | | | 85,207 | | | | 21,714 | | | | 16,713 | | | | (132 | ) | | | 123,502 | | | | – | |
| Royce Smaller-Companies Growth Fund – Service Class | | | 500,314 | | | | 302,475 | | | | 16,151 | | | | 23,642 | | | | (31 | ) | | | 842,551 | | | | 41,273 | |
| Royce Smaller-Companies Growth Fund – Consultant Class | | | 85,061 | | | | 13,021 | | | | 1,310 | | | | 12,203 | | | | (5 | ) | | | 111,590 | | | | 13,735 | |
| Royce Smaller-Companies Growth Fund – Institutional Class | | | – | | | | 6,971 | | | | 380 | | | | 13,386 | | | | (1 | ) | | | 20,736 | | | | 16,286 | |
| | | | 585,375 | | | | 407,674 | | | | 39,555 | | | | 65,944 | | | | (169 | ) | | | | | | | 71,294 | |
78 | The Royce Funds 2021 Annual Report to Shareholders
Class Specific Expenses (continued):
| | | NET DISTRIBUTION
FEES | | | SHAREHOLDER
SERVICING | | | SHAREHOLDER
REPORTS | | | REGISTRATION | | | TRANSFER AGENT
BALANCE CREDITS | | | TOTAL | | | CLASS LEVEL
EXPENSES
REIMBURSED BY
INVESTMENT
ADVISER | |
| Royce Special Equity Fund – Investment Class | | $ | – | | | $ | 811,047 | | | $ | 85,378 | | | $ | 34,768 | | | $ | (398 | ) | | $ | 930,795 | | | $ | – | |
| Royce Special Equity Fund – Service Class | | | 137,427 | | | | 96,731 | | | | 5,889 | | | | 12,669 | | | | (12 | ) | | | 252,704 | | | | 42,615 | |
| Royce Special Equity Fund – Consultant Class | | | 234,407 | | | | 33,474 | | | | 9,032 | | | | 12,282 | | | | (39 | ) | | | 289,156 | | | | – | |
| Royce Special Equity Fund – Institutional Class | | | – | | | | 17,787 | | | | 23,467 | | | | 23,981 | | | | (107 | ) | | | 65,128 | | | | – | |
| | | | 371,834 | | | | 959,039 | | | | 123,766 | | | | 83,700 | | | | (556 | ) | | | | | | | 42,615 | |
| Royce Total Return Fund – Investment Class | | | – | | | | 973,401 | | | | 189,687 | | | | 35,719 | | | | (393 | ) | | | 1,198,414 | | | | – | |
| Royce Total Return Fund – Service Class | | | 203,793 | | | | 132,603 | | | | 10,491 | | | | 13,533 | | | | (25 | ) | | | 360,395 | | | | 26,297 | |
| Royce Total Return Fund – Consultant Class | | | 1,199,022 | | | | 95,731 | | | | 13,233 | | | | 13,276 | | | | (52 | ) | | | 1,321,210 | | | | – | |
| Royce Total Return Fund – Institutional Class | | | – | | | | 9,786 | | | | 28,955 | | | | 14,837 | | | | (13 | ) | | | 53,565 | | | | – | |
| Royce Total Return Fund – R Class | | | 162,918 | | | | 75,964 | | | | 3,626 | | | | 7,641 | | | | (17 | ) | | | 250,132 | | | | – | |
| | | | 1,565,733 | | | | 1,287,485 | | | | 245,992 | | | | 85,006 | | | | (500 | ) | | | | | | | 26,297 | |
Tax Information:
At December 31, 2021, net unrealized appreciation (depreciation) based on identified cost for tax purposes was as follows:
| | | | | NET UNREALIZED APPRECIATION | | GROSS UNREALIZED |
| | | TAX BASIS COST | | (DEPRECIATION) | | Appreciation | | (Depreciation) |
| Royce Dividend Value Fund | | $ | 31,147,587 | | | $ | 45,148,524 | | | $ | 45,664,886 | | | $ | 516,362 | |
| Royce Global Financial Services Fund | | | 21,227,324 | | | | 17,096,425 | | | | 18,261,094 | | | | 1,164,669 | |
| Royce International Premier Fund | | | 1,022,071,318 | | | | 230,152,052 | | | | 296,424,812 | | | | 66,272,760 | |
| Royce Micro-Cap Fund | | | 275,704,402 | | | | 148,054,131 | | | | 169,212,362 | | | | 21,158,231 | |
| Royce Opportunity Fund | | | 1,392,145,537 | | | | 407,746,686 | | | | 490,656,433 | | | | 82,909,747 | |
| Royce Pennsylvania Mutual Fund | | | 1,409,607,770 | | | | 740,368,847 | | | | 792,971,347 | | | | 52,602,500 | |
| Royce Premier Fund | | | 928,965,223 | | | | 806,231,401 | | | | 821,753,590 | | | | 15,522,189 | |
| Royce Small-Cap Value Fund | | | 102,732,640 | | | | 37,039,490 | | | | 39,002,086 | | | | 1,962,596 | |
| Royce Smaller-Companies Growth Fund | | | 226,851,792 | | | | 88,605,027 | | | | 100,849,552 | | | | 12,244,525 | |
| Royce Special Equity Fund | | | 827,068,510 | | | | 246,712,710 | | | | 263,840,472 | | | | 17,127,762 | |
| Royce Total Return Fund | | | 1,173,257,425 | | | | 343,795,510 | | | | 385,366,976 | | | | 41,571,466 | |
The primary causes of the difference between book and tax basis cost are the timing of the recognition of losses on securities sold, investments in Real Estate Investment Trusts, investments in publicly traded partnerships, underlying investments and mark-to-market of Passive Foreign Investment Companies.
Distributions during the years ended December 31, 2021 and 2020, were characterized as follows for tax purposes:
| | | ORDINARY INCOME | | LONG-TERM CAPITAL GAINS | | RETURN OF CAPITAL |
| | | 2021 | | 2020 | | 2021 | | 2020 | | 2021 | | 2020 |
| Royce Dividend Value Fund | | $ | 590,238 | | | $ | 1,343,015 | | | $ | 9,174,538 | | | $ | 3,072,729 | | | $ | 612 | | | $ | – | |
| Royce Global Financial Services Fund | | | 1,124,557 | | | | 118,498 | | | | 1,033,749 | | | | 2,059,840 | | | | – | | | | – | |
| Royce International Premier Fund | | | 5,751,838 | | | | 3,194,667 | | | | 54,248,823 | | | | – | | | | – | | | | 48,255 | |
| Royce Micro-Cap Fund | | | 9,652,843 | | | | – | | | | 71,053,385 | | | | 24,918,670 | | | | – | | | | – | |
| Royce Opportunity Fund | | | 90,710,580 | | | | – | | | | 265,900,785 | | | | – | | | | – | | | | – | |
| Royce Pennsylvania Mutual Fund | | | 42,700,145 | | | | 9,295,173 | | | | 437,429,695 | | | | 82,152,089 | | | | – | | | | – | |
| Royce Premier Fund | | | 908,951 | | | | 14,872,440 | | | | 312,568,124 | | | | 77,865,265 | | | | – | | | | – | |
| Royce Small-Cap Value Fund | | | 28,469 | | | | 2,100,141 | | | | 7,697,144 | | | | 2,570,913 | | | | – | | | | – | |
| Royce Smaller-Companies Growth Fund | | | 13,787,403 | | | | – | | | | 64,121,109 | | | | 29,163,704 | | | | – | | | | – | |
| Royce Special Equity Fund | | | 52,776,581 | | | | 13,517,035 | | | | 104,584,804 | | | | 20,524,246 | | | | – | | | | – | |
| Royce Total Return Fund | | | 84,924,753 | | | | 24,529,558 | | | | 300,708,916 | | | | 211,882,829 | | | | – | | | | – | |
The Royce Funds 2021 Annual Report to Shareholders | 79
Notes to Financial Statements (continued)
Tax Information (continued):
The tax basis components of distributable earnings at December 31, 2021, were as follows:
| | | UNDISTRIBUTED
ORDINARY
INCOME | | UNDISTRIBUTED
LONG-TERM
CAPITAL GAINS OR
(CAPITAL LOSS
CARRYFORWARD) | | NET UNREALIZED
APPRECIATION
(DEPRECIATION)1 | | QUALIFIED
LATE YEAR
ORDINARY AND
POST-OCTOBER LOSS
DEFERRALS2 | | TOTAL
DISTRIBUTABLE
EARNINGS | | CAPITAL LOSS
CARRYFORWARD
UTILIZED |
| Royce Dividend Value Fund | | $ | – | | | $ | – | | | $ | 45,148,295 | | | $ | (2,256 | ) | | $ | 45,146,039 | | | $ | – | |
| Royce Global Financial Services Fund | | | 213,571 | | | | 322,343 | | | | 17,092,085 | | | | (263,514 | ) | | | 17,364,485 | | | | – | |
| Royce International Premier Fund | | | 372,602 | 3 | | | 18,736,567 | 3 | | | 230,195,205 | | | | (64,570 | ) | | | 249,239,804 | | | | 38,282,295 | |
| Royce Micro-Cap Fund | | | 1,947,989 | | | | 10,843,758 | | | | 148,054,145 | | | | (14 | ) | | | 160,845,878 | | | | – | |
| Royce Opportunity Fund | | | 6,184,582 | | | | 53,766,782 | | | | 407,580,546 | | | | – | | | | 467,531,910 | | | | – | |
| Royce Pennsylvania Mutual Fund | | | 4,443,309 | | | | 39,095,436 | | | | 740,369,497 | | | | – | | | | 783,908,242 | | | | – | |
| Royce Premier Fund | | | – | | | | 39,019,695 | | | | 806,231,399 | | | | (18,724,082 | ) | | | 826,527,012 | | | | – | |
| Royce Small-Cap Value Fund | | | – | | | | 4,220,868 | | | | 37,039,488 | | | | (1,794,868 | ) | | | 39,465,488 | | | | 16,603,072 | |
| Royce Smaller-Companies Growth Fund | | | 3,259,228 | | | | 4,144,500 | | | | 88,590,945 | | | | (974,238 | ) | | | 95,020,435 | | | | – | |
| Royce Special Equity Fund | | | 8,705,093 | | | | 38,541,003 | | | | 246,712,706 | | | | – | | | | 293,958,802 | | | | – | |
| Royce Total Return Fund | | | 7,343,376 | | | | 48,538,181 | | | | 343,811,856 | | | | – | | | | 399,693,413 | | | | – | |
| 1 | Includes timing differences on foreign currency, recognition of losses on securities sold, investments in Real Estate Investment Trusts, investments in publicly traded partnerships, underlying investments and mark-to-market of Passive Foreign Investment Companies. |
| 2 | Under the current tax law, capital losses and qualified late year ordinary losses incurred after October 31 may be deferred and treated as occurring on the first day of the following fiscal year. This column also includes passive activity losses and 857 (b)(9) adjustments. |
| 3 | A portion of these amounts ($175,786 ordinary income and $64,221 long-term gains) is comprised of capital loss carryforwards from business combinations, which may be limited in future years under the Internal Revenue Code Sections 381-384. |
For financial reporting purposes, capital accounts and distributions to shareholders are adjusted to reflect the tax character of permanent book/tax differences. For the year ended December 31, 2021, the Funds recorded the following permanent reclassifications, which relate primarily to current net operating losses, distribution reclassifications, investments in Real Estate Investment Trusts, publicly traded partnerships, foreign currency transactions, foreign capital gains tax, redemptions-in-kind, return of capital distributions and gains from the sale of Passive Foreign Investment Companies. Results of operations and net assets were not affected by these reclassifications.
| | | TOTAL DISTRIBUTABLE EARNINGS (LOSS) | | PAID-IN CAPITAL |
| Royce Dividend Value Fund | | $ | 612 | | | $ | (612 | ) |
| Royce Global Financial Services Fund | | | – | | | | – | |
| Royce International Premier Fund | | | 1 | | | | (1 | ) |
| Royce Micro-Cap Fund | | | 34,102 | | | | (34,102 | ) |
| Royce Opportunity Fund | | | (18,338 | ) | | | 18,338 | |
| Royce Pennsylvania Mutual Fund | | | (21,405,932 | ) | | | 21,405,932 | |
| Royce Premier Fund | | | (25,699,612 | ) | | | 25,699,612 | |
| Royce Small-Cap Value Fund | | | 125,652 | | | | (125,652 | ) |
| Royce Smaller-Companies Growth Fund | | | 38,320 | | | | (38,320 | ) |
| Royce Special Equity Fund | | | 24,049 | | | | (24,049 | ) |
| Royce Total Return Fund | | | (13,143,621 | ) | | | 13,143,621 | |
Management has analyzed the Funds’ tax positions taken on federal income tax returns for all open tax years (2018 – 2021) and has concluded that as of December 31, 2021, no provision for income tax is required in the Funds’ financial statements.
Transactions in Affiliated Companies:
An “Affiliated Company,” as defined in the 1940 Act, is a company in which a fund owns 5% or more of the company’s outstanding voting securities at any time during the period. The following transactions were effected in shares of such companies for the year ended December 31, 2021:
| AFFILIATED COMPANY 1 | | SHARES
12/31/20 | | | MARKET
VALUE
12/31/20 | | | COSTS OF
PURCHASES | | | PROCEEDS
FROM SALES | | | REALIZED
GAIN
(LOSS) | | CHANGE IN NET
UNREALIZED
APPRECIATION
(DEPRECIATION) | | | DIVIDEND
INCOME | | | SHARES
12/31/21 | | | MARKET
VALUE
12/31/21 | |
| Royce International Premier Fund | | | | | | | | | | | | | | | | | | | | | | | | | | | | | | | | | | | | |
| AUSTRALIA – 2.3% | | | | | | | | | | | | | | | | | | | | | | | | | | | | | | | | | | | | |
| Bravura Solutions 2 | | | 11,180,629 | | | $ | 27,783,984 | | | $ | 11,313,618 | | | $ | 1,606,282 | | | $ | 18,038 | | | $ | (9,100,483 | ) | | $ | 819,692 | | | | 15,808,630 | | | $ | 28,408,875 | |
| | | | | | | | 27,783,984 | | | | | | | | | | | | 18,038 | | | | (9,100,483 | ) | | | 819,692 | | | | | | | | 28,408,875 | |
80 | The Royce Funds 2021 Annual Report to Shareholders
Transactions in Affiliated Companies (continued):
| AFFILIATED COMPANY 1 | | SHARES
12/31/20 | | | MARKET
VALUE
12/31/20 | | | COSTS OF
PURCHASES | | | PROCEEDS
FROM SALES | | | REALIZED
GAIN
(LOSS) | | | CHANGE IN NET
UNREALIZED
APPRECIATION
(DEPRECIATION) | | | DIVIDEND
INCOME | | | SHARES
12/31/21 | | | MARKET
VALUE
12/31/21 | |
| Royce Opportunity Fund | | | | | | | | | | | | | | | | | | | | | | | | | | | |
| HEALTH CARE – 0.4% | | | | | | | | | | | | | | | | | | | | | | | | | | | | | | | | | | | | |
| HEALTH CARE EQUIPMENT & SUPPLIES – 0.4% | | | | | | | | | | | | | | | | | | | | | | | | | | | | | | | | | | | | |
| IntriCon Corporation 2,3 | | | 395,910 | | | $ | 7,165,971 | | | $ | 2,267,559 | | | $ | 81,515 | | | $ | (18,978 | ) | | $ | (1,467,189 | ) | | $ | – | | | | 486,447 | | | $ | 7,865,848 | |
| | | | | | | | 7,165,971 | | | | | | | | | | | | (18,978 | ) | | | (1,467,189 | ) | | | – | | | | | | | | 7,865,848 | |
| INDUSTRIALS – 0.3% | | | | | | | | | | | | | | | | | | | | | | | | | | | | | | | | | | | | |
| CONSTRUCTION & ENGINEERING – 0.3% | | | | | | | | | | | | | | | | | | | | | | | | | | | | | | | | | | | | |
| Limbach Holdings 2,3 | | | | | | | | | | | 5,609,073 | | | | – | | | | – | | | | 109,734 | | | | – | | | | 635,423 | | | | 5,718,807 | |
| | | | | | | | | | | | | | | | | | | | – | | | | 109,734 | | | | – | | | | | | | | 5,718,807 | |
| INFORMATION TECHNOLOGY – 0.3% | | | | | | | | | | | | | | | | | | | | | | | | | | | | | | | | | | | | |
| COMMUNICATIONS EQUIPMENT – 0.3% | | | | | | | | | | | | | | | | | | | | | | | | | | | | | | | | | | | | |
| PCTEL 2,3 | | | 586,462 | | | | 3,853,055 | | | | 2,719,497 | | | | 62,487 | | | | 6,792 | | | | (843,495 | ) | | | – | | | | 1,000,593 | | | | 5,673,362 | |
| | | | | | | | 3,853,055 | | | | | | | | | | | | 6,792 | | | | (843,495 | ) | | | – | | | | | | | | 5,673,362 | |
| | | | | | | | 11,019,026 | | | | | | | | | | | | (12,186 | ) | | | (2,200,950 | ) | | | – | | | | | | | | 19,258,017 | |
| Royce Special Equity Fund | | | | | | | | | | | | | | | | | | | | | | | | | | | | | | | | | | | | |
| CONSUMER DISCRETIONARY– 10.1% | | | | | | | | | | | | | | | | | | | | | | | | | | | | | | | | | | | | |
| AUTO COMPONENTS – 5.7% | | | | | | | | | | | | | | | | | | | | | | | | | | | | | | | | | | | | |
| Standard Motor Products 2 | | | 827,500 | | | | 33,480,650 | | | | 14,701,168 | | | | – | | | | – | | | | 13,193,067 | | | | 1,065,250 | | | | 1,171,500 | | | | 61,374,885 | |
| HOTELS, RESTAURANTS & LEISURE – 0.0% | | | | | | | | | | | | | | | | | | | | | | | | | | | | | | | | | | | | |
| Bowl America Cl. A 4 | | | 347,000 | | | | 3,270,475 | | | | – | | | | 2,979,032 | | | | (1,557,851 | ) | | | 1,266,408 | | | | 192,000 | | | | | | | | | |
| HOUSEHOLD DURABLES – 4.4% | | | | | | | | | | | | | | | | | | | | | | | | | | | | | | | | | | | | |
| Flexsteel Industries 2 | | | 767,500 | | | | 26,839,475 | | | | – | | | | – | | | | – | | | | (6,224,425 | ) | | | 460,500 | | | | 767,500 | | | | 20,615,050 | |
| Hooker Furnishings 2 | | | 1,130,000 | | | | 36,442,500 | | | | 254,942 | | | | – | | | | – | | | | (10,228,082 | ) | | | 838,860 | | | | 1,137,000 | | | | 26,469,360 | |
| | | | | | | | 63,281,975 | | | | | | | | | | | | – | | | | (16,452,507 | ) | | | 1,299,360 | | | | | | | | 47,084,410 | |
| | | | | | | | 100,033,100 | | | | | | | | | | | | (1,557,851 | ) | | | (1,993,032 | ) | | | 2,556,610 | | | | | | | | 108,459,295 | |
| INDUSTRIALS – 6.4% | | | | | | | | | | | | | | | | | | | | | | | | | | | | | | | | | | | | |
| AEROSPACE & DEFENSE – 1.3% | | | | | | | | | | | | | | | | | | | | | | | | | | | | | | | | | | | | |
| National Presto Industries 4 | | | 393,100 | | | | 34,761,833 | | | | 1,492,053 | | | | 19,949,215 | | | | 8,287,830 | | | | (10,589,980 | ) | | | 2,462,613 | | | | | | | | | |
| MACHINERY – 5.1% | | | | | | | | | | | | | | | | | | | | | | | | | | | | | | | | | | | | |
| Gencor Industries 2,3 | | | 1,065,000 | | | | 13,099,500 | | | | 11,460 | | | | – | | | | – | | | | (819,980 | ) | | | – | | | | 1,066,000 | | | | 12,290,980 | |
| Hurco Companies 2 | | | 580,000 | | | | 17,400,000 | | | | – | | | | – | | | | – | | | | (174,000 | ) | | | 400,200 | | | | 580,000 | | | | 17,226,000 | |
| Miller Industries 2 | | | 575,500 | | | | 21,880,510 | | | | 7,073,223 | | | | – | | | | – | | | | (3,770,133 | ) | | | 497,484 | | | | 754,000 | | | | 25,183,600 | |
| | | | | | | | 52,380,010 | | | | | | | | | | | | – | | | | (4,764,113 | ) | | | 897,684 | | | | | | | | 54,700,580 | |
| | | | | | | | 87,141,843 | | | | | | | | | | | | 8,287,830 | | | | (15,354,093 | ) | | | 3,360,297 | | | | | | | | 54,700,580 | |
| INFORMATION TECHNOLOGY – 1.9% | | | | | | | | | | | | | | | | | | | | | | | | | | | | | | | | | | | | |
| SEMICONDUCTORS & SEMICONDUCTOR EQUIPMENT – 1.9% | | | | | | | | | | | | | | | | | | | | | | | | | | | | | | | | | | | | |
| NVE Corporation 2 | | | 124,000 | | | | 6,966,320 | | | | 11,948,003 | | | | – | | | | – | | | | 1,582,507 | | | | 893,803 | | | | 300,100 | | | | 20,496,830 | |
| | | | | | | | 6,966,320 | | | | | | | | | | | | – | | | | 1,582,507 | | | | 893,803 | | | | | | | | 20,496,830 | |
| | | | | | | | 194,141,263 | | | | | | | | | | | | 6,729,979 | | | | (15,764,618 | ) | | | 6,810,710 | | | | | | | | 183,656,705 | |
| Royce Total Return Fund | | | | | | | | | | | | | | | | | | | | | | | | | | | | | | | | | | | | |
| FINANCIALS – 1.7% | | | | | | | | | | | | | | | | | | | | | | | | | | | | | | | | | | | | |
| INSURANCE – 1.7% | | | | | | | | | | | | | | | | | | | | | | | | | | | | | | | | | | | | |
| Trean Insurance Group 2,3 | | | | | | | | | | | 38,301,457 | | | | 610,638 | | | | 47,958 | | | | (12,598,348 | ) | | | – | | | | 2,821,597 | | | | 25,140,429 | |
| | | | | | | | | | | | | | | | | | | | 47,958 | | | | (12,598,348 | ) | | | – | | | | | | | | 25,140,429 | |
| 1 | Percentages represent the percentages of the investments in the Affiliated Companies of the Fund’s net assets. |
| 2 | At December 31, 2021, the Fund owned 5% or more of the Company’s outstanding voting securities thereby making the Company an Affiliated Company as that term is defined in the Investment Company Act of 1940. |
| 4 | Not an Affiliated Company at December 31, 2021. |
Subsequent Events:
Subsequent events have been evaluated through the date the financial statements were issued and it has been determined that no events have occurred that require disclosure.
The Royce Funds 2021 Annual Report to Shareholders | 81
Report of Independent Registered Public Accounting Firm
To the Board of Trustees of The Royce Fund and Shareholders of Royce Dividend Value Fund, Royce Global Financial Services Fund, Royce International Premier Fund, Royce Micro-Cap Fund, Royce Opportunity Fund, Royce Pennsylvania Mutual Fund, Royce Premier Fund, Royce Small-Cap Value Fund, Royce Smaller-Companies Growth Fund, Royce Special Equity Fund and Royce Total Return Fund:
Opinions on the Financial Statements
We have audited the accompanying statements of assets and liabilities, including the schedules of investments, of Royce Dividend Value Fund, Royce Global Financial Services Fund, Royce International Premier Fund, Royce Micro-Cap Fund, Royce Opportunity Fund, Royce Pennsylvania Mutual Fund, Royce Premier Fund, Royce Small-Cap Value Fund, Royce Smaller-Companies Growth Fund, Royce Special Equity Fund and Royce Total Return Fund (constituting The Royce Fund, hereafter collectively referred to as the “Funds”) as of December 31, 2021, the related statements of operations for the year ended December 31, 2021, the statements of changes in net assets for each of the two years in the period ended December 31, 2021, including the related notes, and the financial highlights for each of the periods indicated therein (collectively referred to as the “financial statements”). In our opinion, the financial statements present fairly, in all material respects, the financial position of each of the Funds as of December 31, 2021, the results of each of their operations for the year then ended, the changes in each of their net assets for each of the two years in the period ended December 31, 2021 and each of the financial highlights for each of the periods indicated therein in conformity with accounting principles generally accepted in the United States of America.
Basis for Opinions
These financial statements are the responsibility of the Funds’ management. Our responsibility is to express an opinion on the Funds’ financial statements based on our audits. We are a public accounting firm registered with the Public Company Accounting Oversight Board (United States) (PCAOB) and are required to be independent with respect to the Funds in accordance with the U.S. federal securities laws and the applicable rules and regulations of the Securities and Exchange Commission and the PCAOB.
We conducted our audits of these financial statements in accordance with the standards of the PCAOB. Those standards require that we plan and perform the audit to obtain reasonable assurance about whether the financial statements are free of material misstatement, whether due to error or fraud.
Our audits included performing procedures to assess the risks of material misstatement of the financial statements, whether due to error or fraud, and performing procedures that respond to those risks. Such procedures included examining, on a test basis, evidence regarding the amounts and disclosures in the financial statements. Our audits also included evaluating the accounting principles used and significant estimates made by management, as well as evaluating the overall presentation of the financial statements. Our procedures included confirmation of securities owned as of December 31, 2021 by correspondence with the custodian and brokers; when replies were not received from brokers, we performed other auditing procedures. We believe that our audits provide a reasonable basis for our opinions.
/s/PricewaterhouseCoopers LLP
New York, New York
February 18, 2022
We have served as the auditor of one or more investment companies in the Franklin Templeton Group of Funds since 1948.
| 82 | The Royce Funds 2021 Annual Report to Shareholders | |
Understanding Your Fund’s Expenses (unaudited)
As a shareholder of a mutual fund, you pay ongoing expenses, including management fees and other Fund expenses including, for some funds, distribution and/or service (12b-1) fees. Using the information below, you can estimate how these ongoing expenses (in dollars) affect your investment and compare them with the ongoing expenses of other funds. You may also incur one-time transaction expenses, including redemption fees, which are not shown in this section and would result in higher total costs. The example is based on an investment of $1,000 invested at July 1, 2021, and held for the entire six-month period ended December 31, 2021. Service, Consultant and R Class shares are generally available only through certain brokers or retirement plan administrators who receive distribution and/or service fees from the Fund for services that they perform. Institutional Class shares are generally available only to institutions or intermediaries with a minimum account size of $1 million.
Actual Expenses
The first part of the table below provides information about actual account values and actual expenses. You may use the information in this section, together with the amount you invested, to estimate the expenses that you paid over the period. Simply divide your account value at December 31, 2021, by $1,000 (for example, an $8,600 account value divided by $1,000 = 8.6), then multiply the result by the number under the heading entitled “Expenses Paid During the Period” to estimate the expenses you paid on your account during this period.
Hypothetical Example for Comparison Purposes
The second part of the table below provides information about hypothetical account values and hypothetical expenses based on the Fund’s actual expense ratio and an assumed rate of return of 5% per year before expenses, which is not the Fund’s actual return. The hypothetical account values and expenses may not be used to estimate the actual ending account balance or expenses you paid for the period. You may use this information to compare the ongoing costs of investing in the Fund and other funds. To do so, compare this 5% hypothetical example with the 5% hypothetical examples that appear in the shareholder reports of the other funds.
Please note that the expenses shown in the table are meant to highlight your ongoing costs only and do not reflect any transactional costs, such as sales charges (loads), redemption fees, or exchange fees. Therefore, this section is useful in comparing ongoing costs only, and will not help you determine the relative total costs of owning different funds. In addition, if these transactional costs were included, your costs would have been higher.
| | | ACTUAL | HYPOTHETICAL (5% PER YEAR BEFORE EXPENSES) | |
| | | Beginning Account Value 7/1/21 | Ending Account Value 12/31/21 | Expenses Paid During the Period1 | Beginning Account Value 7/1/21 | Ending Account Value 12/31/21 | Expenses Paid During the Period1 | Annualized Expense Ratio2 |
| Investment Class | | | | | | | | | | | | | | | | | | | | | | |
| Royce Dividend Value Fund | | $ | 1,000.00 | | $ | 1,029.44 | | $ | 5.58 | | $ | 1,000.00 | | $ | 1,019.71 | | $ | 5.55 | | | 1.09 | % |
| Royce International Premier Fund | | | 1,000.00 | | | 995.71 | | | 5.84 | | | 1,000.00 | | | 1,019.36 | | | 5.90 | | | 1.16 | % |
| Royce Micro-Cap Fund | | | 1,000.00 | | | 1,045.82 | | | 6.14 | | | 1,000.00 | | | 1,019.21 | | | 6.06 | | | 1.19 | % |
| Royce Opportunity Fund | | | 1,000.00 | | | 999.81 | | | 6.40 | | | 1,000.00 | | | 1,018.80 | | | 6.46 | | | 1.27 | % |
| Royce Pennsylvania Mutual Fund3 | | | 1,000.00 | | | 1,046.73 | | | 4.75 | | | 1,000.00 | | | 1,020.57 | | | 4.69 | | | 0.92 | % |
| Royce Premier Fund | | | 1,000.00 | | | 1,054.19 | | | 6.06 | | | 1,000.00 | | | 1,019.31 | | | 5.96 | | | 1.17 | % |
| Royce Small-Cap Value Fund | | | 1,000.00 | | | 1,042.63 | | | 6.38 | | | 1,000.00 | | | 1,018.95 | | | 6.31 | | | 1.24 | % |
| Royce Smaller-Companies Growth Fund | | | 1,000.00 | | | 907.71 | | | 5.77 | | | 1,000.00 | | | 1,019.16 | | | 6.11 | | | 1.20 | % |
| Royce Special Equity Fund | | | 1,000.00 | | | 1,073.03 | | | 6.32 | | | 1,000.00 | | | 1,019.11 | | | 6.16 | | | 1.21 | % |
| Royce Total Return Fund | | | 1,000.00 | | | 1,049.95 | | | 6.25 | | | 1,000.00 | | | 1,019.11 | | | 6.16 | | | 1.21 | % |
| Service Class | | | | | | | | | | | | | | | | | | | | | | |
| Royce Dividend Value Fund | | | 1,000.00 | | | 1,027.63 | | | 6.85 | | | 1,000.00 | | | 1,018.45 | | | 6.82 | | | 1.34 | % |
| Royce Global Financial Services Fund | | | 1,000.00 | | | 1,021.57 | | | 7.59 | | | 1,000.00 | | | 1,017.69 | | | 7.58 | | | 1.49 | % |
| Royce International Premier Fund | | | 1,000.00 | | | 994.16 | | | 7.24 | | | 1,000.00 | | | 1,017.95 | | | 7.32 | | | 1.44 | % |
| Royce Micro-Cap Fund | | | 1,000.00 | | | 1,044.62 | | | 7.68 | | | 1,000.00 | | | 1,017.69 | | | 7.58 | | | 1.49 | % |
| Royce Opportunity Fund | | | 1,000.00 | | | 998.51 | | | 7.91 | | | 1,000.00 | | | 1,017.29 | | | 7.98 | | | 1.57 | % |
| Royce Pennsylvania Mutual Fund3 | | | 1,000.00 | | | 1,044.83 | | | 6.85 | | | 1,000.00 | | | 1,018.50 | | | 6.77 | | | 1.33 | % |
| Royce Premier Fund | | | 1,000.00 | | | 1,052.31 | | | 7.71 | | | 1,000.00 | | | 1,017.69 | | | 7.58 | | | 1.49 | % |
| Royce Small-Cap Value Fund | | | 1,000.00 | | | 1,041.95 | | | 7.67 | | | 1,000.00 | | | 1,017.69 | | | 7.58 | | | 1.49 | % |
| Royce Smaller-Companies Growth Fund | | | 1,000.00 | | | 906.45 | | | 7.16 | | | 1,000.00 | | | 1,017.69 | | | 7.58 | | | 1.49 | % |
| Royce Special Equity Fund | | | 1,000.00 | | | 1,071.14 | | | 7.78 | | | 1,000.00 | | | 1,017.69 | | | 7.58 | | | 1.49 | % |
| Royce Total Return Fund | | | 1,000.00 | | | 1,048.40 | | | 7.69 | | | 1,000.00 | | | 1,017.69 | | | 7.58 | | | 1.49 | % |
| Consultant Class | | | | | | | | | | | | | | | | | | | | | | |
| Royce Dividend Value Fund | | | 1,000.00 | | | 1,023.80 | | | 10.66 | | | 1,000.00 | | | 1,014.67 | | | 10.61 | | | 2.09 | % |
| Royce International Premier Fund | | | 1,000.00 | | | 990.74 | | | 10.99 | | | 1,000.00 | | | 1,014.17 | | | 11.12 | | | 2.19 | % |
| Royce Micro-Cap Fund | | | 1,000.00 | | | 1,039.53 | | | 11.82 | | | 1,000.00 | | | 1,013.61 | | | 11.67 | | | 2.30 | % |
| Royce Opportunity Fund | | | 1,000.00 | | | 994.19 | | | 11.46 | | | 1,000.00 | | | 1,013.71 | | | 11.57 | | | 2.28 | % |
| Royce Pennsylvania Mutual Fund3 | | | 1,000.00 | | | 1,041.34 | | | 9.88 | | | 1,000.00 | | | 1,015.53 | | | 9.75 | | | 1.92 | % |
| Royce Premier Fund | | | 1,000.00 | | | 1,047.38 | | | 11.77 | | | 1,000.00 | | | 1,013.71 | | | 11.57 | | | 2.28 | % |
| Royce Small-Cap Value Fund | | | 1,000.00 | | | 1,036.14 | | | 13.55 | | | 1,000.00 | | | 1,011.90 | | | 13.39 | | | 2.64 | % |
| Royce Smaller-Companies Growth Fund | | | 1,000.00 | | | 903.56 | | | 10.75 | | | 1,000.00 | | | 1,013.91 | | | 11.37 | | | 2.24 | % |
| Royce Special Equity Fund | | | 1,000.00 | | | 1,066.39 | | | 12.24 | | | 1,000.00 | | | 1,013.36 | | | 11.93 | | | 2.35 | % |
| Royce Total Return Fund | | | 1,000.00 | | | 1,045.25 | | | 11.24 | | | 1,000.00 | | | 1,014.22 | | | 11.07 | | | 2.18 | % |
The Royce Funds 2021 Annual Report to Shareholders | 83
Understanding Your Fund’s Expenses (unaudited) (continued)
| | | ACTUAL | HYPOTHETICAL (5% PER YEAR BEFORE EXPENSES) |
| | | Beginning Account
Value 7/1/21 | Ending Account Value
12/31/21 | Expenses Paid During
the Period1 | Beginning Account
Value 7/1/21 | Ending Account Value
12/31/21 | Expenses Paid During
the Period1 | Annualized Expense
Ratio2 |
| Institutional Class | | | | | | | | | | | | | | | | | | | | | | |
| Royce Dividend Value Fund | | $ | 1,000.00 | | $ | 1,027.66 | | $ | 5.57 | | $ | 1,000.00 | | $ | 1,019.71 | | $ | 5.55 | | | 1.09 | % |
| Royce Global Financial Services Fund | | | 1,000.00 | | | 1,022.18 | | | 7.59 | | | 1,000.00 | | | 1,017.69 | | | 7.58 | | | 1.49 | % |
| Royce International Premier Fund | | | 1,000.00 | | | 996.18 | | | 5.23 | | | 1,000.00 | | | 1,019.96 | | | 5.30 | | | 1.04 | % |
| Royce Opportunity Fund | | | 1,000.00 | | | 1,000.05 | | | 5.55 | | | 1,000.00 | | | 1,019.66 | | | 5.60 | | | 1.10 | % |
| Royce Pennsylvania Mutual Fund | | | 1,000.00 | | | 1,045.84 | | | 4.49 | | | 1,000.00 | | | 1,020.82 | | | 4.43 | | | 0.87 | % |
| Royce Premier Fund | | | 1,000.00 | | | 1,053.92 | | | 5.59 | | | 1,000.00 | | | 1,019.76 | | | 5.50 | | | 1.08 | % |
| Royce Smaller-Companies Growth Fund | | | 1,000.00 | | | 908.51 | | | 5.58 | | | 1,000.00 | | | 1,019.36 | | | 5.90 | | | 1.16 | % |
| Royce Special Equity Fund | | | 1,000.00 | | | 1,073.57 | | | 5.75 | | | 1,000.00 | | | 1,019.66 | | | 5.60 | | | 1.10 | % |
| Royce Total Return Fund | | | 1,000.00 | | | 1,049.70 | | | 5.68 | | | 1,000.00 | | | 1,019.66 | | | 5.60 | | | 1.10 | % |
| R Class | | | | | | | | | | | | | | | | | | | | | | |
| Royce Opportunity Fund | | | 1,000.00 | | | 996.71 | | | 9.36 | | | 1,000.00 | | | 1,015.83 | | | 9.45 | | | 1.86 | % |
| Royce Pennsylvania Mutual Fund | | | 1,000.00 | | | 1,042.15 | | | 9.01 | | | 1,000.00 | | | 1,016.38 | | | 8.89 | | | 1.75 | % |
| Royce Premier Fund | | | 1,000.00 | | | 1,050.00 | | | 10.13 | | | 1,000.00 | | | 1,015.32 | | | 9.96 | | | 1.96 | % |
| Royce Small-Cap Value Fund | | | 1,000.00 | | | 1,038.77 | | | 10.23 | | | 1,000.00 | | | 1,015.17 | | | 10.11 | | | 1.99 | % |
| Royce Total Return Fund | | | 1,000.00 | | | 1,046.45 | | | 9.65 | | | 1,000.00 | | | 1,015.78 | | | 9.50 | | | 1.87 | % |
1Expenses are equal to the Fund’s annualized expense ratio multiplied by the average account value for the period, multiplied by 184 days in the most recent fiscal half-year divided by 365 days (to reflect the half-year period).
2Annualized expense ratio used to derive figures in the table is based on the most recent fiscal half-year.
3GiftShare accounts pay an annual $50 trustee fee to Alliance Trust Company, as trustee. If these fees were included above, your costs would be higher.
Federal Tax Information
In January 2022, taxable shareholders that opted out of e-delivery were mailed a Form 1099-DIV reporting the federal tax status of all distributions paid during the calendar year 2021. Shareholders who elected e-delivery have received electronic notification of the form being available for download via their Online Account Access.
2021 Supplemental Tax Information:
| FUND | | % QDI | | % U.S. GOVT INCOME | | % INCOME
QUALIFYING FOR DRD | | LONG-TERM CAPITAL
GAIN DISTRIBUTION OR
MAXIMUM ALLOWABLE (OOO’S) | |
| Royce Dividend Value Fund | | | 100.00 | % | | | N/A | | | | 100.00 | % | | $ | 9,175 | | |
| Royce Global Financial Services Fund | | | 100.00 | % | | | N/A | | | | 28.02 | % | | | 1,034 | | |
| Royce International Premier Fund | | | 100.00 | % | | | N/A | | | | 0.01 | % | | | 54,249 | | |
| Royce Micro-Cap Fund | | | 32.42 | % | | | N/A | | | | 27.85 | % | | | 71,053 | | |
| Royce Opportunity Fund | | | 16.91 | % | | | N/A | | | | 16.63 | % | | | 265,901 | | |
| Royce Pennsylvania Mutual Fund | | | 53.55 | % | | | N/A | | | | 44.92 | % | | | 437,430 | | |
| Royce Premier Fund | | | 100.00 | % | | | N/A | | | | 100.00 | % | | | 312,568 | | |
| Royce Small-Cap Value Fund | | | 100.00 | % | | | N/A | | | | 100.00 | % | | | 7,697 | | |
| Royce Smaller-Companies Growth Fund | | | 2.38 | % | | | N/A | | | | 2.39 | % | | | 64,121 | | |
| Royce Special Equity Fund | | | 62.23 | % | | | N/A | | | | 40.86 | % | | | 104,585 | | |
| Royce Total Return Fund | | | 39.09 | % | | | N/A | | | | 34.35 | % | | | 300,709 | | |
Definitions:
% QDI: Qualified Dividend Income; % of net investment income and/or short-term capital gains distributions that qualify for treatment at long-term capital gain rates.
% U.S. Govt Income: % of investment income paid from U.S. Government obligations.
% Income Qualifying for DRD: % of investment income eligible for the corporate dividend received deduction.
Foreign Tax Credit:
For the year ended December 31, 2021, Royce International Premier Fund had elected to pass through the credit for tax paid in foreign countries. The net foreign source income and foreign tax per share outstanding on the dividend distribution date are as follows:
NET FOREIGN
SOURCE INCOME | | | NET FOREIGN SOURCE
INCOME PER SHARE | | | FOREIGN TAX | | | FOREIGN TAX PER SHARE | |
| $ 6,166,005 | | | $ 0.0959 | | | $ 1,601,035 | | | $ 0.0249 | |
84 | The Royce Funds 2021 Annual Report to Shareholders
Trustees and Officers
All Trustees and Officers may be reached c/o The Royce Funds, 745 Fifth Avenue, New York, NY 10151
Christopher D. Clark, Trustee1, President
Age: 56 | Number of Funds Overseen: 16 | Tenure: Since 2014
Principal Occupation(s) During Past Five Years: Chief Executive Officer (since July 2016), President (since July 2014), Co-Chief Investment Officer (since January 2014), Managing Director of Royce, a Member of the Board of Managers of Royce, having been employed by Royce since May 2007.
Patricia W. Chadwick, Trustee
Age: 73 | Number of Funds Overseen: 16 | Tenure: Since 2009
Non-Royce Directorships: Trustee of Voya Mutual Funds and Director of Wisconsin Energy Corp.
Principal Occupation(s) During Past 5 Years: Consultant and President of Ravengate Partners LLC (since 2000).
Christopher C. Grisanti, Trustee
Age: 60 | Number of Funds Overseen: 16 | Tenure: Since 2017
Non-Royce Directorships: None
Principal Occupation(s) During Past Five Years: Chief Equity Strategist and Senior Portfolio Manager at MAI Capital Management LLC, an investment advisory firm (since May 2020). Previously, Mr. Grisanti was Co-Founder and Chief Executive Officer of Grisanti Capital Management LLC, an investment advisory firm (from 1999 to 2020). Mr. Grisanti’s prior business experience also includes serving as Director of Research and Portfolio Manager at Spears Benzak, Salomon & Farrell (from 1994 to 1999) and a senior associate at the law firm of Simpson, Thacher & Bartlett (from 1988 to 1994).
Cecile B. Harper, Trustee
Age: 58 | Number of Funds Overseen: 16 | Tenure: Since 2020
Non-Royce Directorships: None
Principal Occupation(s) During Past Five Years: Board Member of Pyramid Peak Foundation (since January 2012); and Chief Operating Officer at the College Foundation at the University of Virginia (since October 2019). Ms. Harper’s prior business experience includes serving as Principal of Southeastern Asset Management (from December 1993 to September 2019); and a Board Member of Regional One Health Foundation (from June 2013 to September 2019).
Arthur S. Mehlman, Trustee
Age: 79 | Number of Funds Overseen: 16 | Tenure: Since 2004
Principal Occupation(s) During Past Five Years: Director/Trustee of registered investment companies constituting the Legg Mason Funds until his retirement on June 30, 2021; Director of The League for People with Disabilities, Inc.; Director of University of Maryland Foundation (non-profits). Formerly: Director of Municipal Mortgage & Equity, LLC (from October 2004 to April 1, 2011); Director of University of Maryland College Park Foundation (non-profit) (from 1998 to 2005); Partner, KPMG LLP (international accounting firm) (from 1972 to 2002); Director of Maryland Business Roundtable for Education (from July 1984 to June 2002).
G. Peter O’Brien, Trustee
Age: 76 | Number of Funds Overseen: 76 | Tenure: Since 2001
Non-Royce Directorships: Director/Trustee of registered investment companies constituting the 60 Legg Mason Funds.
Principal Occupation(s) During Past Five Years: Trustee Emeritus of Colgate University (since 2005); Board Member of Hill House, Inc. (since 1999); Formerly Director of TICC Capital Corp (from 2003-2017): Trustee of Colgate University (from 1996 to 2005), President of Hill House, Inc. (from 2001 to 2005) and Managing Director/Equity Capital Markets Group of Merrill Lynch & Co. (from 1971 to 1999).
Michael K. Shields, Trustee
Age: 63 | Number of Funds Overseen: 16 | Tenure: Since 2015
Principal Occupation(s) During Past Five Years: President and Chief Executive Officer of Piedmont Trust Company, a privately-owned North Carolina trust company and wealth management firm (since May 2012). Mr. Shields’s prior business experience includes managing institutional and mutual fund equity portfolios in New York at Scudder, Stevens & Clark where he was a Principal in the Global Equity Group (1992 – 1997) and US Trust where he was President & CIO of a wholly-owned investment firm subsidiary (1997 – 2002).
Francis D. Gannon, Vice President
Age: 54 | Tenure: Since 2014
Principal Occupation(s) During Past Five Years: Co-Chief Investment Officer (since January 2014) and Managing Director of Royce, having been employed by Royce since September 2006.
Daniel A. O’Byrne, Vice President
Age: 59 | Tenure: Since 1994
Principal Occupation(s) During Past Five Years: Principal and Vice President of Royce, having been employed by Royce since October 1986.
Peter K. Hoglund, Treasurer
Age: 55 | Tenure: Since 2015
Principal Occupation(s) During Past Five Years: Chief Financial Officer, Chief Administrative Officer, and Managing Director of Royce, having been employed by Royce since December 2014. Prior to joining Royce, Mr. Hoglund spent more than 20 years with Munder Capital Management in Birmingham, MI, serving as Managing Director and Chief Financial Officer and overseeing all financial aspects of the firm. He began his career at Munder as a portfolio manager.
John E. Denneen, Secretary and Chief Legal Officer
Age: 54 | Tenure: 1996-2001 and Since 2002
Principal Occupation(s) During Past Five Years: General Counsel, Managing Director, and, since June 2015, a Member of the Board of Managers of Royce. Chief Legal and Compliance Officer and Secretary of Royce.
Lisa Curcio, Chief Compliance Officer
Age: 62 | Tenure: Since 2004
Principal Occupation(s) During Past Five Years: Chief Compliance Officer of The Royce Funds (since October 2004) and Compliance Officer of Royce (since June 2004).
1 Interested Trustee.
Trustees will hold office until their successors have been duly elected and qualified or until their earlier resignation or removal. The Statement of Additional Information, which contains additional information about the Trust’s trustees and officers, is available and can be obtained without charge at www.royceinvest.com or by calling (800) 221-4268.
The Royce Funds 2021 Annual Report to Shareholders | 85
Notes to Performance and Other Important Information
The thoughts expressed in this report concerning recent market movements and future prospects for small company stocks are solely the opinion of Royce at December 31, 2021, and, of course, historical market trends are not necessarily indicative of future market movements. Statements regarding the future prospects for particular securities held in the Funds’ portfolios and Royce’s investment intentions with respect to those securities reflect Royce’s opinions as of December 31, 2021 and are subject to change at any time without notice. There can be no assurance that securities mentioned in this report will be included in any Royce-managed portfolio in the future. There can be no assurance that companies that currently pay a dividend will continue to do so in the future.
Sector weightings are determined using the Global Industry Classification Standard (“GICS”). GICS was developed by, and is the exclusive property of, Standard & Poor’s Financial Services LLC (“S&P”) and MSCI Inc. (“MSCI”). GICS is the trademark of S&P and MSCI. “Global Industry Classification Standard (GICS)” and “GICS Direct” are service marks of S&P and MSCI.
All indexes referred to are unmanaged and capitalization weighted. Each index’s returns include net reinvested dividends and/or interest income. Frank Russell Company (“Russell”) is the source and owner of the trademarks, service marks and copyrights related to the Russell Indexes. Russell® is a trademark of Frank Russell Company. Neither Russell nor its licensors accept any liability for any errors or omissions in the Russell Indexes and/or Russell ratings or underlying data and no party may rely on any Russell Indexes and/or Russell ratings and/or underlying data contained in this communication. No further distribution of Russell Data is permitted without Russell’s express written consent. Russell does not promote, sponsor or endorse the content of this communication. The Russell 2000 Index is an index of domestic small-cap stocks. It measures the performance of the 2,000 smallest publicly traded U.S. companies in the Russell 3000 Index. The Russell 2000 Value and Growth Indexes consist of the respective value and growth stocks within the Russell 2000 as determined by Russell Investments. Securities are weighted based on their style score. The Russell 1000 Index is an index of domestic large-cap stocks. It measures the performance of the 1,000 largest publicly traded U.S. companies in the Russell 3000 Index. The Russell Microcap Index includes 1,000 of the smallest securities in the Russell 2000 Index, along with the next smallest eligible securities as determined by Russell. The Russell 2500 is an unmanaged, capitalization-weighted index of the 2,500 smallest publicly traded U.S. companies in the Russell 3000 index. Source: MSCI. MSCI makes no express or implied warranties or representations and shall have no liability whatsoever with respect to any MSCI data contained herein. The MSCI data may not be further redistributed or used as a basis for other indexes or any securities or financial products. This report is not approved, endorsed, reviewed or produced by MSCI. None of the MSCI data is intended to constitute investment advice or a recommendation to make (or refrain from making) any kind of investment decision and may not be relied on as such. The MSCI ACWI Small Cap Index is an unmanaged, capitalization-weighted index of global small-cap stocks. The MSCI ACWI ex USA Small Cap Index is an unmanaged, capitalization-weighted index of global small-cap stocks, excluding the United States. The (Center for Research in Security Prices) CRSP (Center for Research in Security Pricing) equally divides the companies listed on the NYSE into 10 deciles based on market capitalization. Deciles 1-5 represent the largest domestic equity companies and Deciles 6-10 represent the smallest. CRSP then sorts all listed domestic equity companies based on these market cap ranges. By way of comparison, the CRSP 1-5 would have similar capitalization parameters to the S&P 500 and the CRSP 6-10 would have similar capitalization parameters to those of the Russell 2000. The Consumer Price Index (CPI) is a measure of the average change over time in the prices paid by urban consumers for a market basket of consumer goods and services. Indexes are available for the U.S. and various geographic areas. Average price data for select utility, automotive fuel, and food items are also available. The performance of an index does not represent exactly any particular investment, as you cannot invest directly in an index. Index returns used in this Report were based on information supplied to Royce by Russell for the Russell market indexes and by MSCI for the MSCI market indexes. Royce has not independently verified the above described information.
The Price-Earnings, or P/E, Ratio is calculated by dividing a company’s share price by its trailing 12-month earnings-per-share (EPS). The Price-to-Book, or P/B, Ratio is calculated by dividing a company’s share price by its book value per share. Standard deviation is a statistical measure within which a fund’s total returns have varied over time. The greater the standard deviation, the greater a fund’s volatility. Beta is a measure of the volatility or risk of an investment compared to the market as a whole. Alpha describes an investment strategy’s ability to beat the market. The Morningstar Style Map uses proprietary scores of a stock’s value and growth characteristics to determine its placement in one of the five categories listed on the horizontal axis. These characteristics are then compared to those of other stocks within the same market capitalization band. Each is scored from zero to 100 for both value and growth attributes. The value score is subtracted from the growth score to determine the overall style score. For the vertical, market cap axis, Morningstar subdivides into size groups. Giant-cap stocks are defined as those that account for the top 40% of the capitalization of each style zone; large-cap stocks represent the next 30%; mid-cap stocks the next 20%; small-cap stocks the next 7%; micro-cap stocks the smallest 3%. For the Morningstar Small Blend Category: ©2021 Morningstar. All Rights Reserved. The information regarding the category in this piece is: (1) is proprietary to Morningstar and/or its content providers; (2) may not be copied or distributed; and (3) is not warranted to be accurate, complete or timely. Neither Morningstar nor its content providers are responsible for any damages or losses arising from any use of this information. Cyclical and Defensive are defined as follows: Cyclical: Communication Services, Consumer Discretionary, Energy, Financials, Industrials, Information Technology, and Materials. Defensive: Consumer Staples, Health Care, Real Estate, and Utilities. Investments in securities of micro-cap, small-cap, and/or mid-cap companies may involve considerably more risk than investments in securities of larger-cap companies. (Please see “Primary Risks for Fund Investors” in the prospectus.) Investments in foreign securities, which generally may involve political, economic, currency, and other risks not encountered in U.S. investments. (Please see “Investing in Foreign Securities” in the prospectus.) A Fund that invests a significant portion of its assets in a limited number of stocks may be subject to considerably more risk than a more broadly diversified Fund because a decline in the value of any of these stocks would cause that Fund’s overall value to decline to a greater degree. A broadly diversified portfolio does not, however, ensure a profit for a Fund or guarantee against loss. Please read the prospectus carefully before investing or sending money. A copy of the Funds’ current prospectus and Statement of Additional
86 | The Royce Funds 2021 Annual Report to Shareholders
Notes to Performance and Other Important Information (continued)
Information may be obtained by calling (800) 221-4268 or by visiting www.royceinvest.com. All publicly released material Fund information is disclosed by the Funds on their website at www.royceinvest.com. The Royce Funds is a service mark of The Royce Funds. Distributor: Royce Fund Services, LLC.
Forward-Looking Statements
This material contains forward-looking statements within the meaning of the Securities Exchange Act of 1934, as amended (the “Exchange Act”), that involve risks and uncertainties, including, among others, statements as to:
| • | the Funds’ future operating results, |
| • | the prospects of the Funds’ portfolio companies, |
| • | the impact of investments that the Funds have made or may make, the dependence of the Funds’ future success on the general economy and its impact on the companies and industries in which the Funds invest, and |
| • | the ability of the Funds’ portfolio companies to achieve their objectives. |
This review and report use words such as “anticipates,” “believes,” “expects,” “future,” “intends,” and similar expressions to identify forward-looking statements. Actual results may differ materially from those projected in the forward-looking statements for any reason.
The Royce Funds have based the forward-looking statements included in this review and report on information available to us on the date of the report, and we assume no obligation to update any such forward-looking statements. Although The Royce Funds undertake no obligation to revise or update any forward-looking statements, whether as a result of new information, future events, or otherwise, you are advised to consult any additional disclosures that we may make through future shareholder communications or reports.
Disclosure of Portfolio Holdings
The Funds’ complete portfolio holdings are also available on Exhibit F to Form N-PORT, which filings are made with the SEC within 60 days of the end of the first and third fiscal quarters. The Funds’ Form N-PORT filings are available on the SEC’s website at http://www.sec.gov.
The Royce Funds 2021 Annual Report to Shareholders | 87
This page is intentionally left blank.
88 | The Royce Funds 2021 Annual Report to Shareholders


About Royce Investment Partners
Unparalleled Knowledge + Experience
Pioneers in small-cap investing, with 45+ years
of experience, depth of knowledge, and focus.
Independent Thinking
The confidence to go against consensus, the insight
to uncover opportunities others might miss, and the
tenacity to stay the course through market cycles.
Specialized Approaches
U.S., international, and global investment strategies
that pursue approaches with different risk profiles.
Unwavering Commitment
Our team of 16 portfolio managers has significant
personal investments in the strategies they manage.
Contact Us
GENERAL INFORMATION
General Royce Funds information including:
• How to open an account
• An overview of our firm and Funds
• Ordering literature including Prospectuses
(800) 221-4268
ACCOUNT INFORMATION
Speak with a representative about:
• Your account, transactions, and forms
(800) 841-1180
FINANCIAL ADVISORS, CONSULTANTS,
AND INSTITUTIONS
Speak with your regional Royce contact regarding:
• Scheduling a meeting or call
• Information about our firm, strategies, and funds
• Resources for financial professionals, such as
portfolio attribution reports
(800) 337-6923
AUTOMATED ACCOUNT INFORMATION
24-hour Automated Telephone Service
(800) 787-6923
OE-REP-1221
| Item 2. | Code(s) of Ethics. As of the end of the period covered by this report, the Registrant had adopted a code of ethics, as defined in Item 2 of Form N-CSR, applicable to its principal executive officer, principal financial officer, principal accounting officer or controller, or persons performing similar functions. A copy of this code of ethics is filed as an exhibit to this Form N-CSR. During the period covered by this report, the Registrant did not: (i) amend any provision of its code of ethics that applies to its principal executive officer, principal financial officer, principal accounting officer or controller, or persons performing similar functions or (ii) grant any waiver, including an implicit waiver, from a provision of such code of ethics to its principal executive officer, principal financial officer, principal accounting officer or controller, or persons performing similar functions. |
| Item 3. | Audit Committee Financial Expert. |
| (a)(1) | The Board of Trustees of the Registrant has determined that it has an audit committee financial expert serving on its audit committee. |
| (a)(2) | Arthur S. Mehlman and Patricia W. Chadwick were designated by the Board of Trustees as the Registrant’s Audit Committee Financial Experts, effective April 15, 2004, and April 8, 2010, respectively. Mr. Mehlman and Ms. Chadwick are “independent” as defined in Section 2(a)(19) of the Investment Company Act of 1940 (the “1940 Act”). |
| Item 4. | Principal Accountant Fees and Services. |
Year ended December 31, 2021 - $288,574
Year ended December 31, 2020 - $282,915
Year ended December 31, 2021 - $0
Year ended December 31, 2020 - $0
Year ended December 31, 2021 - $121,457 – Preparation of tax returns and excise tax review
Year ended December 31, 2020 - $119,075 – Preparation of tax returns and excise tax review
Year ended December 31, 2021 - $0
Year ended December 31, 2020 - $0
| (e)(1) | Annual Pre-Approval: On an annual basis, the Registrant’s independent auditor submits to the Audit Committee a schedule of proposed audit, audit-related, tax and other non-audit services to be rendered to the Registrant and/or its investment adviser and its affiliates for the following year that require pre-approval by the Audit Committee. This schedule provides a description of each type of service that is expected to require pre-approval and the maximum fees that can be paid for each such service without further Audit Committee approval. The Audit Committee then reviews and determines whether to approve the types of scheduled services and the projected fees associated with them. Any subsequent revision to already pre-approved services or fees are presented for consideration at the next regularly scheduled Audit Committee meeting, as needed. |
If subsequent to the annual pre-approval of services and fees by the Audit Committee, the Registrant and/or its investment adviser and its affiliates determines that it would like to engage the Registrant’s independent auditor to perform a service not already pre-approved, the request is to be submitted to the Registrant’s Chief Financial Officer, and if he or she determines that the service fits within the independence guidelines (i.e., it is not a prohibited service), he or she will then arrange for a discussion of the proposed service and fee to be included on the agenda for the next regularly scheduled Audit Committee meeting so that pre-approval can be considered.
Interim Pre-Approval: If, in the judgment of the Registrant's Chief Financial Officer, a proposed engagement needs to commence before the next regularly scheduled Audit Committee meeting, he or she shall submit a written summary of the proposed engagement to all members of the Audit Committee, outlining the services, the estimated maximum cost, the category of the services (e.g., audit, audit-related, tax or other) and the rationale for engaging the Registrant’s independent auditor to perform the services. To the extent the proposed engagement involves audit, audit-related or tax services, any individual member of the Audit Committee who is an independent Board member is authorized to pre-approve the engagement. To the extent the proposed engagement involves non-audit services other than audit-related or tax, only the Chairman of the Audit Committee is authorized to pre-approve the engagement. The Registrant’s Chief Financial Officer will arrange for this interim review and coordinate with the appropriate member(s) of the Audit Committee. The Registrant’s independent auditor may not commence the engagement under consideration until the Registrant’s Chief Financial Officer has informed the auditor in writing that the required pre-approval has been obtained from an individual member of the Audit Committee who is an independent Board member or the Chairman of the Audit Committee, as applicable. Each member of the Audit Committee who pre-approves any engagements in between regularly scheduled Audit Committee meetings is to report, for informational purposes only, any pre-approval decisions to the Audit Committee at its next regularly scheduled meeting.
(e)(2) Not Applicable
(f) Not Applicable
(g) Year ended December 31, 2021 - $121,457
Year ended December 31, 2020 - $119,075
| (h) | No such services were rendered during 2021 or 2020. |
Item 5. Audit Committee of Listed Registrants. Not Applicable.
Item 6. Investments.
(a) See Item 1.
(b) Not Applicable.
Item 7. Disclosure of Proxy Voting Policies and Procedures for Closed-End Management Investment Companies. Not Applicable.
Item 8. Portfolio Managers of Closed-End Management Investment Companies. Not Applicable.
Item 9. Purchases of Equity Securities by Closed-End Management Investment Company and Affiliated Purchasers. Not Applicable.
Item 10. Submission of Matters to a Vote of Security Holders. Not Applicable.
Item 11. Controls and Procedures.
(a) Disclosure Controls and Procedures. The Principal Executive and Financial Officers concluded that the Registrant's Disclosure Controls and Procedures are effective based on their evaluation of the Disclosure Controls and Procedures as of a date within 90 days of the filing date of this report.
(b) Internal Control over Financial Reporting. There were no significant changes in Registrant's internal control over financial reporting or in other factors that could significantly affect this control subsequent to the date of the evaluation, including any corrective actions with regard to significant deficiencies and material weaknesses during the second fiscal quarter of the period covered by this report.
Item 12. Disclosure of Securities Lending Activities for Closed-End Management Investment Companies. Not applicable.
Item 13. Exhibits. Attached hereto.
(a)(1) The Registrant’s code of ethics pursuant to Item 2 of Form N-CSR.
(a)(2) Separate certifications by the Registrant’s Principal Executive Officer and Principal Financial Officer as required by Rule 30a-2(a) under the 1940 Act.
(a)(3) Not Applicable.
(b) Separate certifications by the Registrant’s Principal Executive Officer and Principal Financial Officer, pursuant to Section 906 of the Sarbanes-Oxley Act of 2002 and required by Rule 30a-2(b) under the 1940 Act.
[Signature page to follow.]
Pursuant to the requirements of the Securities Exchange Act of 1934 (the “Exchange Act”) and the 1940 Act, the registrant has duly caused this report to be signed on its behalf by the undersigned, thereunto duly authorized.
THE ROYCE FUND
BY: /s/ Christopher D. Clark
Christopher D. Clark
President
Date: February 25, 2022
Pursuant to the requirements of the Exchange Act and the 1940 Act, this report has been signed below by the following persons on behalf of the registrant and in the capacities and on the dates indicated.
| THE ROYCE FUND | THE ROYCE FUND |
| BY: /s/ Christopher D. Clark | BY: /s/ Peter K. Hoglund |
| Christopher D. Clark | Peter K. Hoglund |
| Date: February 25, 2022 | Date: February 25, 2022 |