UNITED STATES
SECURITIES AND EXCHANGE COMMISSION
Washington, D.C. 20549
FORM N-CSR
CERTIFIED SHAREHOLDER REPORT
OF
REGISTERED MANAGEMENT INVESTMENT COMPANIES
Investment Company Act File Number: 811-03599
Name of Registrant: The Royce Fund
Address of Registrant: 745 Fifth Avenue
New York, NY 10151
| Name and address of agent for service: | John E. Denneen, Esquire 745 Fifth Avenue New York, NY 10151 |
Registrant’s telephone number, including area code: (212) 508-4500
Date of fiscal year end: December 31
Date of reporting period: January 1, 2019 - December 31, 2019
1
Item 1. Reports to Shareholders.

The Royce Funds 2019 Annual
Review and Report to Shareholders
December 31, 2019
Royce Dividend Value Fund
Royce Global Financial Services Fund
Royce International Premier Fund
Royce Micro-Cap Fund
Royce Opportunity Fund
Royce Pennsylvania Mutual Fund
Royce Premier Fund
Royce Small-Cap Value Fund
Royce Smaller-Companies Growth Fund
Royce Special Equity Fund
Royce Total Return Fund
Beginning on January 1, 2021, as permitted by regulations adopted by the U.S. Securities and Exchange Commission, paper copies of the Funds’ shareholder reports like this one will no longer be sent by mail, unless you specifically request paper copies of the reports from the Funds or from your financial intermediary (such as a broker-dealer or bank). Instead, the reports will be made available on the Funds’ website (www.royceinvest.com), and you will be notified by mail each time a report is posted and provided with a website link to access the report. If you already elected to receive shareholder reports electronically, you will not be affected by this change and you need not take any action. You may elect to receive shareholder reports and other communications from the Funds electronically anytime by contacting your financial intermediary or, if you are a direct investor with the Funds, by calling 1-800-841-1180. Beginning on January 1, 2019, you may elect to receive all future reports in paper free of charge. If you invest through a financial intermediary, you can contact your financial intermediary to request that you continue to receive paper copies of your shareholder reports. If you invest directly with the Funds, you can call 1-800-841-1180 to let the Funds know you wish to continue receiving paper copies of your shareholder reports. Your election to receive reports in paper will apply to all Funds held in your account if you invest through your financial intermediary or all Funds held with our fund complex if you invest directly with the Funds.

Table of Contents

This page is not part of theThe Royce Funds 2019 Annual Report to Shareholders | 1
A BIG YEAR FOR STOCKS
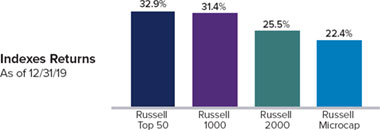
Aperiod of pauses, pivots, and rallies, 2019 ended as a highly rewarding year for equities. The major domestic and international indexes posted healthy double-digit returns, most in the range of 20-35%. The small-cap Russell 2000 Index gained 25.5% while the Russell Top 50 Mega Cap Index advanced 32.9%, the large-cap Russell 1000 Index was up 31.4%, and the Russell Microcap Index increased 22.4%—generally, bigger was better in 2019. Still, the 25.5% gain for the Russell 2000 placed it in the index’s top 27% of calendar-year showings since its 1978 inception. The advance was also impressively broad, with 70% of the stocks in the small-cap index posting positive returns, 61% advancing at least 10%, and 49% posting a calendar-year gain of 20% or more. Additionally, 10 of 11 Russell 2000 sectors were positive for the year (Energy was the sole detractor).
Although many investors think that some event, or series of events, must be present to propel share prices, there are times when the absence of negative developments is more than enough to push stocks consistently upward. This was the case in 2019, when both a
recession and a more hawkish Fed failed to materialize, which was all it took to kick-start the recovery that succeeded the dramatic downturn that saw out 2018. The Fed’s course was especially interesting. Arguably out of touch with the anxieties bred by slipping oil prices and an inverted yield curve in December 2018, the Fed raised rates and announced that 2019 would likely see at least two more hikes—all of this based on the central bank’s cautiously optimistic outlook on the U.S. economy. Once the market’s plunge showed that investors did not share this view, the Fed paused, saying it would hold the line on rates. The central bank then pivoted in July 2019, reversing course by lowering rates—which it proceeded to do again in September and October. These cuts fueled a healthy fourth quarter and helped stocks to end the year on a decidedly upbeat note.
WHAT WILL FOLLOW MEGA-CAP MANIA?
Performance in 2019 was mostly in line with previous snapbacks off precipitous declines—biotech, software, and other growth stocks were among those that did best, along with non-dividend payers and companies with high debt. The somewhat peculiar exception to the pattern was large-cap outperformance. In high-octane markets such as what we saw in 2019, small-cap stocks have typically contended with few, if any, competitors for leadership. This pattern was undone by the ongoing leadership of mega-cap stocks—including the now familiar “FAANG” group of Facebook, Apple, Amazon, Netflix, and Google—which have led the market by a substantial margin over the last 18 months. For example, from 6/30/18-12/31/19, the Russell
2 | This page is not part of theThe Royce Funds2019 Annual Report to Shareholders
LETTER TO OUR SHAREHOLDERS
Top 50 Index advanced 26.1% cumulatively compared with a paltry 3.7% gain for small-caps—and a decline of 3.9% for micro-caps.
If the dominance of mega-caps were to unwind, or even pause, we see the potential for a subsequent rotation to small-caps. We think one point effectively illustrates the size of the potential opportunity: over the last 20 years, the 50 biggest stocks in the Russell 3000 Index have averaged a combined total market cap of about four times the total market cap of the Russell 2000. At the end of 2019, however, that ratio was more than six times, which is higher than it was even at the height of the Internet bubble in 2000. We’re certainly not expecting mega-caps to collapse any time soon, which would be anomalous behavior in what we think will be an advancing market. But we do think a performance pause at their current high valuations could occur, allowing small- and micro-cap stocks to catch up.
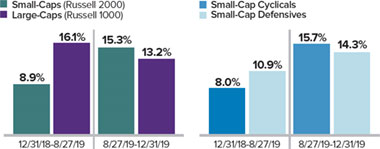
We may have seen the first seeds of such a leadership reversal in the last four months of 2019, which from our perspective provided the year’s most compelling developments. Beginning on August 27th, several reversals inverted previous market leadership patterns, each of which held through the end of 2019: small-caps outpaced large-caps, cyclicals outperformed defensives, small-cap value beat small-cap growth, and micro-caps led domestic equity performance. What was of particular interest to us about these reversals was their simultaneity. Leadership rotation is common, but the changes typically emerge over longer stretches of time before they take root.
August’s Reversals Held
Late August Saw Key Market Shifts That Held Through The End Of 2019
Equally important, we would also argue that valuations—both relative and absolute—must be kept in mind when looking at returns. In spite of the performance boosts that came with the late August reversals, relative valuations for small-cap versus large-cap, small-cap cyclicals versus small-cap defensives, and small-cap value versus small-cap growth still looked attractive to us. At the end of 2019, each remained near the 20-year lows they hit in late August.
Small-Cap’s Relative Valuation Is Below Its Long-Term Average
Russell 2000 vs. Russell 1000 Median LTM EV/EBIT¹ (ex. Negative EBIT Companies) from 12/31/01 to 12/31/19
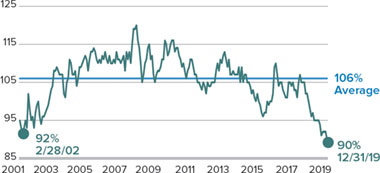
1Earnings before interest and taxes. Source: FactSet
As the chart above shows, small-cap stocks have lagged large-caps for so long that they were relatively cheaper at the end of 2019 than at any other time since 2001 based on our favorite valuation metric, EV/EBIT, (enterprise value over earnings before interest and taxes).
BEWARE OF THE CALENDAR
When thinking about the prospects for small-cap performance, we think it’s important to avoid a common pitfall that we all stumble into occasionally—the tendency to put more emphasis on year-end results than on other month-end periods. From the vantage point of the calendar year, small-cap performance certainly looks good. But if we look at the two-year annualized return for the Russell 2000, we see a markedly lower gain of 5.7%. Moreover, three- and five-year annualized returns for the Russell 2000 were below their respective monthly rolling averages since inception (12/31/78) at the end of 2019.
Recent 3- and 5-Year Returns Lower Than History
Russell 2000 Average Annual Total Returns vs. Long-Term Rolling Monthly Averages as of 12/31/19

Finally, the Russell 2000 finished 2019 2.2% off its most recent peak—and all-time high—reached on 8/31/18. What do these observations of historical performance suggest? Taken together, we think they suggest that, despite 2019’s strong calendar-year return, caution or pessimism about future small-cap returns and opportunities may be misplaced.
This page is not part of theThe Royce Funds2019 Annual Report to Shareholders | 3
LETTER TO OUR SHAREHOLDERS
THE CASE FOR SMALL-CAP CYCLICALS
To be sure, we believe that small-cap stocks are more than capable of a strong run in 2020—and certainly resumed market leadership could be part of the equation. Even after a terrific 2019, many small-caps are still carrying what we would call a recession discount from the deep downturn at the end of 2018. Small-cap cyclicals continued to trade at a significant valuation discount to defensives at the end of 2019—based on EV/EBIT. In fact, the spread was wider than it was in October 2008, when a recession was exacerbated by the Great Financial Crisis.
These historically low relative valuations offer support for our view that late August’s performance reversals can be sustained in 2020. This confidence has led us to be active buyers in areas as diverse as energy services; healthcare devices, diagnostics, and testing; paper & packaging; semiconductors & semiconductor equipment; chemicals; and consumer finance.
Small-Cap Cyclicals Are Relatively Cheaper Than in 2008
Russell 2000 Relative Median EV/EBIT (Ex Negative EBIT) From 12/31/99 to 12/31/19

Small-caps have also historically outpaced large-caps when the economy is growing and have lagged when it’s contracting. They have beaten large-caps, for example, in 70% of all trailing monthly rolling one-year periods—74 out of 106—when the ISM PMI rose over the last 20 years.1 This dynamic holds true for cyclicals versus defensives as well. So if the most recent slowdown is behind us, and the global economy is gradually improving (which appears to be the case), then renewed expansion supports a continuation of August’s reversals.
THE GLOBAL SMALL-CAP SCENE
Our confidence for small-cap extends beyond our borders. Japan has shown intermittent but promising signs of renewed growth, as had
1The ISM PMI rose in 106 of 229 periods.
China prior to the outbreak of the coronavirus. Europe, particularly Germany, has been caught in the middle of the U.S.-China trade and tariff disputes given its more export-driven economies. It was also slowed by the protracted uncertainty over Brexit. Yet December showed marginal improvements through much of Europe, including upticks in business confidence and retail sales, which indicate that the global economy has bottomed—it grew by about 2% in 2019. If it were to begin rebounding towards the 20-year average annual nominal GDP rate of around 5%—a not unreasonable expectation, we think—then that should create tailwinds to sustain small-cap cyclicals.
Also worth noting is that the cumulative two-year return for non-U.S. small-caps, as measured by the MSCI ACWI ex USA Small Cap Index, was essentially flat, up just 0.1%. Over this same period, however, earnings have been growing at a healthy clip, suggesting that returns can narrow this gap. We think that the combination of attractive valuations for cyclicals, a strengthening global economy, and the flat two-year return imply that the next few years are likely to be at least as good for international small-caps as the last few—and quite possibly better.
Of course, our greatest source of confidence is not macroeconomic analysis or the examination of long-term performance patterns (though they certainly help)—it comes from our own research into companies and industries as well as the numerous conversations we have with small-cap management teams. Much to our satisfaction, most of the management teams we’ve been meeting with report that they are hiring or holding steady and seeing little if any contraction in their orders or demand.
GOOD-BYE TO ALL THAT?
2019 closes out one of the most interesting—and challenging—decades that we have seen in more than 45 years of managing small-cap portfolios. It was a decade in which financial assets performed far better than the economy did—mostly due to frequent central bank interventions that suppressed rates and kept the capital markets flush with liquidity. We also saw developments that we would never have thought possible, such as negative interest rates. In addition, years of highly accommodative monetary policy had the unintended consequence of creating few, if any, penalties for companies that borrowed extensively.
4 | This page is not part of theThe Royce Funds2019 Annual Report to Shareholders
LETTER TO OUR SHAREHOLDERS
Does the Small-Cap Recovery Have Room to Run?
Russell 2000 Declines and Two Subsequent Calendar Year’s Performance from 12/31/78 through 12/31/19 (%)
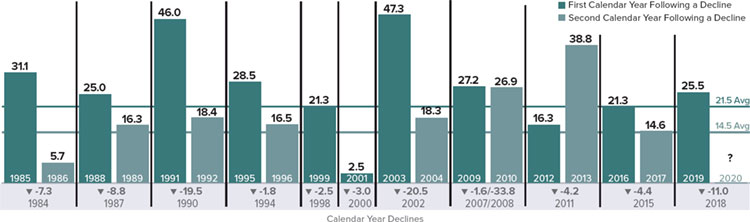
Past performance is no guarantee of future results.
We anticipate that each of these unusual developments should unwind to some extent over the next decade. This makes us highly confident about the prospects for select small-caps, particularly in cyclical areas, that haven’t fully participated in the decade that just passed. However, the persistence of these peculiar developments has thrown up numerous road blocks on the road back to normalization. (Indeed, one thing that has not changed over the last 10 years is the humbling nature of the prediction business.)
The question is whether or not the last decade-plus (stretching back to the 2007 market peaks and the Great Financial Crisis of 2008) of slow growth, historically low rates, and regular central bank interventions represents a “New Normal.” While our initial contention was that it did not, we now suspect that we will arrive at a blend of the old and the new. As Mark Twain is said to have quipped, “History doesn’t repeat itself, but it often rhymes.” Perhaps, then, this will result in a series of lows—low rates, low inflation, and low (by which we mean slow) economic growth—which will translate into lower U.S. equity returns than what we have seen over the last decade, along with more frequent bouts of volatility and wider variations in stock returns. While this menu may seem unpalatable, periods with more modest performance have historically been very favorable for disciplined active management approaches.
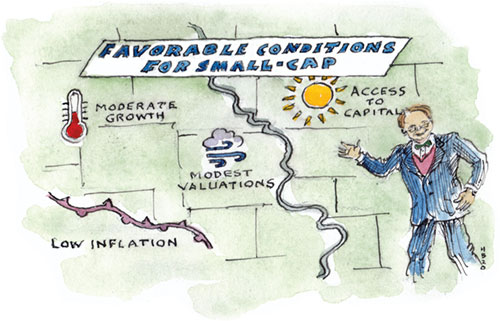
FAVORABLE CONDITIONS FOR SMALL-CAPS
The current backdrop looks quite promising to us for solid to strong small-cap performance overall thanks to the four favorable factors that we cited in July’s “Letter to Our Shareholders”—low inflation, modest valuations, moderate growth, and ample access to capital. Together, they suggest that small-cap returns can go higher, especially the many small-cap cyclical areas that we typically like best. A few historical factors are also worth noting. Over the past 30 years, 76% of all monthly rolling one-year returns for the Russell 2000 have been positive—with an average return of 11.5%. So investors who are bearish on small-cap stocks are betting against the odds. To get a firmer sense of what 2020 may hold, we went back to the inception of the Russell 2000 and looked at the 11 calendar years when small-caps declined, as in 2018, and examined what happened in the second subsequent year. In nine of those 11 years the small-cap index advanced by an average of 14.5%. (2000 and 2002 were the exceptions.)
And two consecutive years of double-digit increases are fairly common for small-caps. Periods in which a healthy second year followed a strong one occurred in the following two-year spans: 1988-89, 1991-92, 1995-96, 2003-04, 2009-10, 2012-13, and 2016-17. With the favorable conditions we’ve outlined above in mind, we suspect that the current small-cap rally can continue, with the potential to add 2019-20 to this list.
| Sincerely, | ||
 |  |  |
| Charles M. Royce | Christopher D. Clark | Francis D. Gannon |
| Chairman, | Chief Executive Officer, and | Co-Chief Investment Officer, |
| Royce Investment Partners | Co-Chief Investment Officer, | Royce Investment Partners |
| Royce Investment Partners | ||
| January 31, 2020 |
This page is not part of theThe Royce Funds 2019 Annual Report to Shareholders | 5
Performance and Expenses
| ANNUAL OPERATING EXPENSES (%) | ||||||||||
| 45-YR/SINCE | INCEPTION | |||||||||
| 1-YR | 3-YR | 5-YR | 10-YR | 15-YR | 20-YR | INCEPTION | DATE | GROSS | NET | |
| Royce Dividend Value Fund | 29.78 | 9.76 | 7.73 | 10.43 | 8.22 | N/A | 8.71 | 5/3/04 | 1.43 | 1.34 |
| Royce Global Financial Services Fund | 24.17 | 9.60 | 7.22 | 10.20 | 7.62 | N/A | 8.07 | 12/31/03 | 1.77 | 1.58 |
| Royce International Premier Fund | 34.22 | 17.86 | 13.49 | N/A | N/A | N/A | 8.59 | 12/31/10 | 1.59 | 1.44 |
| Royce Micro-Cap Fund | 21.16 | 5.17 | 3.84 | 5.66 | 5.79 | 8.51 | 10.40 | 12/31/91 | 1.25 | 1.24 |
| Royce Opportunity Fund | 28.21 | 7.74 | 7.02 | 11.09 | 7.77 | 10.43 | 11.68 | 11/19/96 | 1.20 | 1.20 |
| Royce Pennsylvania Mutual Fund | 26.56 | 9.95 | 8.28 | 10.52 | 8.08 | 10.12 | 15.37 | N/A | 0.92 | 0.92 |
| Royce Premier Fund | 34.13 | 14.15 | 10.52 | 11.30 | 9.69 | 11.01 | 11.77 | 12/31/91 | 1.17 | 1.17 |
| Royce Small-Cap Value Fund | 18.21 | 4.92 | 4.35 | 7.20 | 6.87 | N/A | 9.06 | 6/14/01 | 1.53 | 1.49 |
| Royce Smaller-Companies Growth Fund | 23.67 | 9.36 | 7.03 | 9.16 | 7.08 | N/A | 10.77 | 6/14/01 | 1.52 | 1.49 |
| Royce Special Equity Fund | 12.63 | 3.07 | 4.88 | 8.65 | 7.09 | 10.32 | 8.62 | 5/1/98 | 1.18 | 1.18 |
| Royce Total Return Fund | 23.45 | 7.09 | 7.49 | 10.36 | 7.49 | 9.45 | 10.48 | 12/15/93 | 1.20 | 1.20 |
| INDEX | ||||||||||
| Russell 2000 | 25.52 | 8.59 | 8.23 | 11.83 | 7.92 | 7.59 | N/A | N/A | N/A | N/A |
| Russell Microcap | 22.43 | 6.39 | 6.57 | 11.26 | 6.16 | N/A | N/A | N/A | N/A | N/A |
| Russell 2000 Value | 22.39 | 4.77 | 6.99 | 10.56 | 6.92 | 9.41 | N/A | N/A | N/A | N/A |
| Russell 2500 | 27.77 | 10.33 | 8.93 | 12.58 | 8.79 | 8.68 | N/A | N/A | N/A | N/A |
| MSCI ACWI ex USA Small Cap | 22.42 | 9.65 | 7.04 | 6.92 | 6.92 | 6.71 | N/A | N/A | N/A | N/A |
Important Performance, Expense, and Risk Information
All performance information in thisReview and Report reflects past performance, is presented on a total return basis, reflects the reinvestment of distributions, and does not reflect the deduction of taxes a shareholder would pay on fund distributions or the redemption of fund shares. Past performance is no guarantee of future results. Investment return and principal value of an investment will fluctuate, so that shares may be worth more or less than their original cost when redeemed. Investment and Service Class shares redeemed within 30 days of purchase may be subject to a 1% redemption fee payable to the Fund (2% for Royce International Premier Fund). Redemption fees are not reflected in the performance shown above; if they were, performance would be lower. Current performance may be higher or lower than performance quoted. Current month-end performance may be obtained at www.royceinvest.com. All performance and expense information reflects results of the Funds’ oldest share Class (Investment Class or Service Class, as the case may be). Price and total return information is based on net asset values calculated for shareholder transactions. Certain immaterial adjustments were made to the net assets of Royce International Premier Fund at 12/31/19 for financial reporting purposes, and as a result the calendar year total returns based on those net asset values differ from the adjusted net values and calendar year total returns reported in the Financial Highlights. Gross annual operating expenses reflect the Fund’s gross total annual operating expenses and include management fees, any 12b-1 distribution and service fees, other expenses, and any applicable acquired fund fees and expenses. Net annual operating expenses reflect contractual fee waivers and/or expense reimbursements. All expense information is reported as of the Fund’s most current prospectus. Royce & Associates has contractually agreed to waive fees and/or reimburse operating expenses, excluding brokerage commissions, taxes, interest, litigation expenses, acquired fund fees and expenses, and other expenses not borne in the ordinary course of business, to the extent necessary to maintain net operating expenses at or below: 1.24% for Royce Micro-Cap Fund; 1.34% for Royce Dividend Value Fund; 1.44% for Royce International Premier Fund; 1.49% for Royce Global Financial Services, Small-Cap Value, and Smaller-Companies Growth Funds through April 30, 2020. Acquired fund fees and expenses reflect the estimated amount of the fees and expenses incurred indirectly by the Fund through its investments in mutual funds, hedge funds, private equity funds, and other investment companies.
Service Class shares bear an annual distribution expense that is not borne by the Funds’ Investment Class. If such distribution expenses had been reflected for Funds showing Investment Class performance, returns would have been lower. Investments in securities of micro-cap, small-cap, and/or mid-cap companies may involve considerably more risk than investments in securities of larger-cap companies. (Please see “Primary Risks for Fund Investors” in the prospectus.) Certain Funds invest a significant portion of their respective assets in foreign companies that may be subject to different risks than investments in securities of U.S. companies, including adverse political, social, economic, or other developments that are unique to a particular country or region. (Please see “Investing in Foreign Securities” in the prospectus.) Therefore, the prices of securities of foreign companies in particular countries or regions may, at times, move in a different direction than those of securities of U.S. companies. (Please see “Primary Risk of Fund Investors” in the prospectus.) Certain Funds generally invest a significant portion of their assets in a limited number of stocks, which may involve considerably more risk than a more broadly diversified portfolio because a decline in the value of any of these stocks would cause their overall value to decline to a greater degree. A broadly diversified portfolio, however, does not ensure a profit or guarantee against loss. This Review and Report must be preceded or accompanied by a prospectus. Please read the prospectus carefully before investing or sending money. Source: MSCI. MSCI makes no express or implied warranties or representations and shall have no liability whatsoever with respect to any MSCI data contained herein. The MSCI data may not be further redistributed or used as a basis for other indexes or any securities or financial products. This report is not approved, endorsed, reviewed or produced by MSCI. None of the MSCI data is intended to constitute investment advice or a recommendation to make (or refrain from making) any kind of investment decision and may not be relied on as such. Russell Investment Group is the source and owner of the trademarks, service marks, and copyrights related to the Russell Indexes. Russell® is a trademark of Russell Investment Group. The Russell 2000 Index is an unmanaged, capitalization-weighted index of domestic small-cap stocks. It measures the performance of the 2,000 smallest publicly traded U.S. companies in the Russell 3000 Index. The Russell Microcap Index includes 1,000 of the smallest securities in the small-cap Russell 2000 Index along with the next smallest eligible securities as determined by Russell. The Russell 2000 Value Index consists of the respective value stocks within the Russell 2000 as determined by Russell Investments. The Russell 2500 is an unmanaged, capitalization-weighted index of the 2,500 smallest publicly traded U.S. companies in the Russell 3000 index. The MSCI ACWI ex USA Small Cap Index is an unmanaged, capitalization-weighted index of global small-cap stocks, excluding the United States. The performance of an index does not represent exactly any particular investment as you cannot invest directly in an index. Distributor: Royce Fund Services, LLC.
6 | This page is not part of theThe Royce Funds 2019 Annual Report to Shareholders
The Royce Funds and Relative Risk-Adjusted Rolling Returns
We have always believed that a long-term perspective is crucial for determining the success of an investment approach.
Flourishing in an up market is wonderful, but surviving a bear market by losing less (or not at all) is equally desirable, making results over bull and bear periods the true tests of a portfolio’s mettle. This is why we prefer to examine results that include up and down market phases—primarily by looking at rolling return periods.
Our rationale for using long-term rolling periods is based on the fact that investors buy and sell at many times throughout any given year. In our view, examining performance over a larger series of dates using rolling returns provides a more comprehensive picture of performance, providing a more in-depth measure than calendar-based annualized periods. This allows an investor to evaluate the consistency of performance over time—including the ups and downs of market cycles.
Closely related to this preference for rolling period analysis is the idea that the success of an investment approach should also be evaluated based on the return it generates compared with the amount of risk taken. We aim to achieve strong, long-term absolute and relative returns on both a traditional and risk-adjusted basis. We use Sharpe ratios, a widely used measure of return per unit of risk that measures the volatility of returns to gauge how our major domestic strategies with more than 20 years of history have fared versus their benchmark, the Russell 2000 Index. We calculate the Sharpe Ratio for each relevant Fund and the index for each rolling five- and 10-year period over the past 20 years and then show both the average Sharpe ratio for these periods as well as each Fund’s batting average—that is, the number and percentage of times the Fund beat the index over the total number of periods—as a measure of that Fund’s success.
We are very pleased that on a monthly rolling risk-adjusted basis, our four largest Funds had higher average Sharpe Ratios than the Russell 2000 for the majority of both the 10- and 5-year periods for the 20 years ended 12/31/19.
Royce Funds Relative Risk Adjusted Returns: Monthly Rolling Sharpe Ratios
5- and 10-Year Monthly Rolling Sharpe Ratios–20 Years through 12/31/19

Included are all Royce Funds benchmarked against the Russell 2000 with at least 20 years of history.
TheSharpe Ratiois calculated for a specified period by dividing the fund or index’s average excess returns by its annualized standard deviation. The higher the Sharpe Ratio, the better the fund or index’s historical risk-adjusted performance.
Standard deviationis a statistical measure within which a fund or index’s total returns have varied over time. The greater the standard deviation, the greater a fund or index’s volatility. The performance of an index does not represent exactly any particular investment, as you cannot invest directly in an index.
Past performance is no guarantee of future results. For more information on performance please see page 6.
This page is not part of theThe Royce Funds2019 Annual Report to Shareholders | 7
| MANAGERS’ DISCUSSION (UNAUDITED) |
| Royce Dividend Value Fund (RDV) |

| Chuck Royce Jay Kaplan, CFA |
| FUND PERFORMANCE |
Royce Dividend Value Fund came back strong in 2019, advancing 29.8% and outpacing its small- and smid-cap benchmarks, the Russell 2000 and Russell 2500 Indexes, which rose 25.5% and 27.8%, respectively, for the same period.The Fund also beat the Russell 2000 for the three-, 15-year, and since inception (5/3/04) periods ended 12/31/19. The portfolio’s performance was notable in that small-cap dividend payers lagged their non-dividend-paying peers in 2019. |
| WHAT WORKED… AND WHAT DIDN’T |
Nine of the 10 equity sectors in which the Fund held investments had a positive impact on 2019’s performance. Two areas dominated, as Financials and Industrials—the portfolio’s two largest sectors—made respective contributions that more than doubled the positive impact of Information Technology, the third-largest contributor. Consumer Staples detracted very modestly while the smallest contributions came from Real Estate and Consumer Discretionary. At the industry level, capital markets (Financials) made by far the biggest positive impact, followed by notable contributions from metals & mining (Materials) and machinery (Industrials). Detractors at this level had a far more modest effect and were led by food & staples retailing (Consumer Staples), chemicals (Materials), and textiles, apparel & luxury goods (Consumer Discretionary).
The Fund’s top contributing position was global investment firm Carlyle Group, whose shares reaped the rewards of sustained earnings growth. This was the result of successful deals—both acquisitions and sales—as well as more than doubling its fee-related earnings from the prior-year period in the second quarter and boosting its total assets under management to a record-high $223 billion in July 2019. The firm also pays a steady dividend. KBR, another consistent dividend payer, offers differentiated engineering and related services and technologies. The company operates in three synergistic segments: Government Solutions, Technology Solutions, and Energy Solutions. Its shares benefited from KBR exceeding earnings estimates for four consecutive quarters as of October 2019. This growth was driven by robust book-to-bill rates and notable strength in its Energy Solutions division. Each company was a top-10 holding at year-end.
The top detractor at the position level was Value Partners Group, an asset management business that focuses mainly on investors in China and other parts of the Asia-Pacific region. We were initially drawn to its success managing assets with a risk-conscious, value orientation and dominant position in a fast-growing region. We chose to sell our stake in Dividend Value’s portfolio in August, however, after the company reported double-digit second-quarter declines in its revenues and operating income from the previous year. We maintained our position in the Fund’s next largest detractor, American Eagle Outfitters, which designs, markets, and sells its own brand of casual clothing, targeting younger consumers with affordable, high-quality merchandise. Few areas have been hit harder by the expansion of e-commerce than brick-and-mortar clothing retailers. While this has created challenges for American Eagle’s business, we think its stock’s decline was more attributable to the misguided perception that retail is dying—as opposed to changing. We therefore placed greater weight on the company’s efforts to navigate the seismic shifts faced by its industry. Additionally, a new denim cycle began in 2019 and the firm’s subbrand, Aerie, is growing rapidly.
Outperformance relative to the Russell 2000 was driven entirely by stock selection—sector allocation was negative in the calendar year. The biggest advantages on a sector level came from stock selection in Financials (where our larger exposure detracted slightly) and Industrials, where our overweight also proved additive. Savvy stock picks also gave us an advantage in Energy that more than compensated for the negative effect of our sector overweight. Among the Fund’s industries, the aforementioned capital markets group was especially strong on a relative basis. Conversely, stock selection detracted from relative performance in Consumer Discretionary, as did our lower exposure to Health Care, particularly in biotechnology, where conservatively capitalized dividend payers are thin on the ground. The portfolio’s cash position also detracted from results versus the small-cap index.
| Top Contributors to Performance | Top Detractors from Performance | |||||
| For 2019 (%)1 | For 2019 (%)2 | |||||
| Carlyle Group | 1.81 | Value Partners Group | -0.30 | |||
| KBR | 1.79 | American Eagle Outfitters | -0.21 | |||
| KKR & Co. Cl. A | 1.48 | Designer Brands Cl. A | -0.21 | |||
| HEICO Corporation Cl. A | 1.46 | Alliance Resource Partners L.P. | -0.18 | |||
| Reliance Steel & Aluminum | 1.44 | FamilyMart | -0.15 | |||
| 1 Includes dividends | 2 Net of dividends | |||||
| CURRENT POSITIONING AND OUTLOOK |
The backdrop looks quite favorable to us for solid to strong small-cap performance overall. We have previously cited four favorable factors in the current market environment—low inflation, modest valuations, moderate growth, and ample access to capital, which all remain in force and which suggest that small-cap returns can go higher. We see a global economy that’s showing signs of renewed life (the coronavirus outbreak not withstanding), an ISM Manufacturing Index that’s been incrementally rising (despite December’s setback), and, most important, valuations that range from reasonable to attractive among the many small-cap cyclical areas that we typically like best. During the second half of 2019, we increased investments in professional services firms that appear well positioned to benefit from a growing economy and added a turnaround investment in a consumer rental business that’s been benefiting from cost containment, increased traffic trends, and improved cash flows while reducing its debt load. |
| 8 | The Royce Funds 2019 Annual Report to Shareholders |
|
| PERFORMANCE AND PORTFOLIO REVIEW (UNAUDITED) | TICKER SYMBOLS RYDVX RDVIX RDIIX RDVCX |
Performance and Expenses
Average Annual Total Return (%) Through 12/31/19
| JUL-DEC 20191 | 1-YR | 3-YR | 5-YR | 10-YR | 15-YR | SINCE INCEPTION (5/3/04) | |
| RDV | 7.52 | 29.78 | 9.76 | 7.73 | 10.43 | 8.22 | 8.71 |
| Annual Gross Operating Expenses: 1.43% Annual Net Operating Expenses: 1.34% | |||||||
1Not annualized
Relative Risk Adjusted Returns: Monthly Rolling Sharpe Ratios
Since Inception Through 12/31/19
On a monthly rolling risk-adjusted basis, the Fund outperformed the Russell 2000 in 88% of all 10-year periods and 52% of all 5-year periods.
| PERIODS BEATING THE INDEX | FUND AVG (%)1 | INDEX AVG (%)1 | |||||
| 10-year | 60/68 | 88% | 0.55 | 0.51 | |||
| 5-year | 66/128 | 52% | 0.56 | 0.54 | |||
1 Average of monthly rolling Sharpe Ratios over the specified periods.
Morningstar Style Map™As of 12/31/19
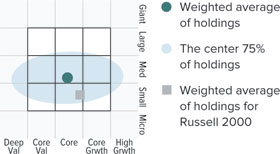
TheMorningstar Style Map is theMorningstar Style Box™ with the center 75% of fund holdings plotted as theMorningstar Ownership Zone™. The Morningstar Style Box is designed to reveal a fund’s investment strategy. The Morningstar Ownership Zone provides detail about a portfolio’s investment style by showing the range of stock sizes and styles. The Ownership Zone is derived by plotting each stock in the portfolio within the proprietary Morningstar Style Box. Over time, the shape and location of a fund’s ownership zone may vary. See page 89 for additional information.
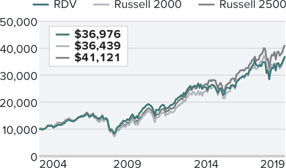
Value of $10,000
Invested on 5/3/04 as of 12/31/19 ($)
Top 10 Positions
% of Net Assets
| HEICO Corporation Cl. A | 3.3 |
| KKR & Co. Cl. A | 3.3 |
| FLIR Systems | 3.3 |
| KBR | 3.1 |
| Carlyle Group | 2.7 |
| Reliance Steel & Aluminum | 2.6 |
| Franco-Nevada | 2.6 |
| Quaker Chemical | 2.6 |
| AptarGroup | 2.5 |
| SEI Investments | 2.4 |
Portfolio Sector Breakdown
% of Net Assets
| Financials | 29.6 |
| Industrials | 24.6 |
| Materials | 14.1 |
| Information Technology | 9.5 |
| Consumer Discretionary | 8.2 |
| Energy | 5.7 |
| Health Care | 2.1 |
| Utilities | 1.8 |
| Consumer Staples | 0.5 |
| Real Estate | 0.5 |
| Cash and Cash Equivalents | 3.4 |
Calendar Year Total Returns (%)
| YEAR | RDV |
| 2019 | 29.8 |
| 2018 | -16.2 |
| 2017 | 21.7 |
| 2016 | 16.4 |
| 2015 | -5.7 |
| 2014 | -2.1 |
| 2013 | 30.7 |
| 2012 | 16.9 |
| 2011 | -4.5 |
| 2010 | 30.1 |
| 2009 | 37.7 |
| 2008 | -31.5 |
| 2007 | -0.0 |
| 2006 | 19.9 |
| 2005 | 7.3 |
Upside/Downside Capture Ratios
Periods Ended 12/31/19 (%)
| UPSIDE | DOWNSIDE | |
| 10-Year | 86 | 84 |
| From 6/30/04 (Start of Fund’s First Full Quarter) | 89 | 78 |
Portfolio Diagnostics
| Fund Net Assets | $104 million |
| Number of Holdings | 79 |
| Turnover Rate | 8% |
| Average Market Capitalization1 | $4,704 million |
| Weighted Average P/E Ratio2,3 | 18.6x |
| Weighted Average P/B Ratio2 | 2.6x |
| Active Share4 | 97% |
| U.S. Investments (% of Net Assets) | 67.3% |
| Non-U.S. Investments (% of Net Assets) | 29.3% |
| 1 | Geometric Average. This weighted calculation uses each portfolio holding’s market cap in a way designed to not skew the effect of very large or small holdings; instead, it aims to better identify the portfolio’s center, which Royce believes offers a more accurate measure of average market cap than a simple mean or median. |
| 2 | Harmonic Average.This weighted calculation evaluates a portfolio as if it were a single stock and measures it overall. It compares the total market value of the portfolio to the portfolio’s share in the earnings or book value, as the case may be, of its underlying stocks. |
| 3 | The Fund’s P/E ratio calculation excludes companies with zero or negative earnings (3% of portfolio holdings as of 12/31/19). |
| 4 | Active Shareis the sum of the absolute values of the different weightings of each holding in the Fund versus each holding in the benchmark, divided by two. |
Important Performance and Expense Information
All performance information in thisReport reflects past performance, is presented on a total return basis, reflects the reinvestment of distributions, and does not reflect the deduction of taxes that a shareholder would pay on fund distributions or the redemption of fund shares. Past performance is no guarantee of future results. Investment return and principal value of an investment will fluctuate, so that shares may be worth more or less than their original cost when redeemed. Shares redeemed within 30 days of purchase may be subject to a 1% redemption fee payable to the Fund, which is not reflected in the performance shown above; if it were, performance would be lower. Current month-end performance may be higher or lower than performance quoted and may be obtained at www.royceinvest.com. All performance and risk information reflects results of the Service Class (its oldest class). Certain immaterial adjustments were made to the net assets of Royce Dividend Value Fund at 6/30/15 for financial reporting purposes, and as a result the net asset values for shareholder transactions on that date and the calendar year Total Returns (%) based on those net asset values differ from the adjusted net asset values and calendar year total returns reported in the Financial Highlights. Gross operating expenses reflect the Fund’s total gross annual operating expenses for the Service Class and include management fees, 12b-1 distribution and service fees, and other expenses. Net operating expenses reflect contractual fee waivers and/or expense reimbursements. All expense information is reported as of the Fund’s most current prospectus. Royce & Associates has contractually agreed, without right of termination, to waive fees and/or reimburse expenses to the extent necessary to maintain the Service Class’s net annual operating expenses (excluding brokerage commissions, taxes, interest, litigation expenses, acquired fund fees and expenses, and other expenses not borne in the ordinary course of business) at or below 1.34% through April 30, 2020. Regarding the “Top Contributors” and “Top Detractors” tables shown above, the sum of all contributors to, and all detractors from, performance for all securities in the portfolio would approximate the Fund’s year-to-date performance for 2019. The Sharpe Ratio is calculated for a specified period by dividing a fund’s annualized excess returns by its annualized standard deviation. The higher the Sharpe ratio, the better the fund’s historical risk-adjusted performance. Upside Capture Ratio measures a manager’s performance in up markets relative to the Fund’s benchmark. It is calculated by measuring the Fund’s performance in quarters when the benchmark went up and dividing it by the benchmark’s return in those quarters. Downside Capture Ratio measures a manager’s performance in down markets relative to the Fund’s benchmark (Russell 2000). It is calculated by measuring the Fund’s performance in quarters when the benchmark goes down and dividing it by the benchmark’s return in those quarters.
The Royce Funds 2019 Annual Report to Shareholders | 9
| MANAGERS’ DISCUSSION (UNAUDITED) |
| Royce Global Financial Services Fund (RFS) |

| Chuck Royce Chris Flynn |
| FUND PERFORMANCE |
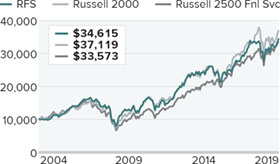
Royce Global Financial Services Fund posted a strong absolute return in 2019, up 24.2% and bouncing back from 2018’s decline.This compares to an increase of 25.5% for the domestic small-cap Russell 2000 Index and an increase of 27.2% for the Financial Services stocks in the domestic smid-cap Russell 2500 Index in 2019. We think the Fund’s calendar-year result was more impressive when seen in the context of a year in which international stocks generally lagged those in the U.S., and financials mostly lagged the overall market. Although the Fund only modestly lagged the 2019 gain for the Russell 2000, an arguably more relevant comparison is that the portfolio bested the financial stocks within the MSCI ACWI Small Cap Index, a global small-cap index that advanced 20.3% in 2019. |
| WHAT WORKED... AND WHAT DIDN’T |
The Fund’s gains were notably broad based in 2019, as 77% of our holdings advanced. Moreover, stocks in 72%—that is, 13 out of 18—of the countries where the Fund had holdings rose. In contrast with the broad market’s experience, the Fund’s international holdings slightly outpaced its U.S. stocks. (Currency translations added a minor contribution in 2019 as well.) The countries that made the most significant contribution on a country basis were the U.S., Canada, and the United Kingdom, while holdings headquartered in India, France, and South Africa detracted most, albeit on a comparably more modest scale.
Ares Management was the top-contributing position in 2019. The firm is an asset manager that focuses on tradable credit, direct lending, private equity, and real estate. Ares’s stock more than doubled during the year as investors became more optimistic about the company’s ability to sustain mid-teens, high margin earnings growth for an extended period. The company also converted to C-corp. status, which broadened ownership, supporting an increase in its valuation. MarketAxess Holdings operates an electronic, multi-dealer trading platform for investment grade and high-yield corporate and emerging market bonds. The company seems very well positioned to benefit from the continued electronification of corporate bond trading. While we are optimistic about continued growth and potential margin expansion, we also found its stock’s valuation a bit high, which led us to trim our position in the second half.
Virtu Financial detracted most at the position level. Virtu is a New York City based financial company that uses its technology to act as a market maker and liquidity provider to the global financial markets. Its business endured a slump through most of the year as the company typically does best in highly volatile markets—which were mostly absent in 2019—and/or when global trading volumes are heavy. Believing that higher volatility is more likely, we held our position. Benefitfocus is a cloud-based software provider of benefits solutions to employers and brokers. The company continued to disappoint investors with organic growth that fell below expectations. We retained our shares because the company provides the worthwhile value of helping its customers manage escalating benefits costs efficiently, and we are hopeful of seeing better execution in the coming year.
| Top Contributors to Performance | Top Detractors from Performance | |||||
| For 2019 (%)1 | For 2019 (%)2 | |||||
| Ares Management Cl. A | 2.11 | Virtu Financial Cl. A | -1.18 | |||
| MarketAxess Holdings | 2.05 | Benefitfocus | -0.67 | |||
| Carlyle Group Inc | 1.54 | Edelweiss Financial Services | -0.49 | |||
| Franco-Nevada | 1.53 | Rothschild & Co | -0.48 | |||
| Ashmore Group | 1.25 | JSE | -0.32 | |||
| 1 Includes dividends | 2Net of dividends | |||||
| CURRENT POSITIONING AND OUTLOOK |
We significantly narrowed the Fund’s holdings in 2019, moving from 84 to 68 positions, as we focused more intensively on business models where we have the greatest conviction. This net reduction in holdings came despite adding six new positions that we have identified as attractive opportunities, including the recently publicly listed Tel Aviv Stock Exchange, which in our view has a well-protected franchise with solid growth prospects. The year-end portfolio reflected some additional repositioning. We reduced our weightings in more traditional financial industries such as insurance and banks while we increased our exposure to capital markets. Our perspective is that the combination of ongoing low interest rates and a flattish yield curve is a persistent headwind to the business models of many banks and insurance companies. In contrast, we are more optimistic about selected areas within capital markets, including traditional non-U.S. exchanges—we currently own nine—alternative transaction platforms, specialist traditional asset managers, and alternative asset managers. |
While we are not in the business of making macroeconomic forecasts, we do believe that the odds favor a rebound in global growth from 2019’s more subdued levels. If that scenario develops, it is helpful to note that many of the Fund’s holdings, like many financial stocks, have a pro-cyclical bias in that their profits tend to grow faster when economies are rebounding. Beyond this potential cyclical boost, we believe that many of our holdings are equally well positioned to capitalize on more durable secular trends, including the persistent need of investors for attractive income and the opportunities to use technology in order to provide lower cost alternatives, to automate processes, and/or to deliver analytical insights. |
| 10 | The Royce Funds 2019 Annual Report to Shareholders |
|
| PERFORMANCE AND PORTFOLIO REVIEW (UNAUDITED) | TICKER SYMBOLS RYFSX RGFIX |
Performance and Expenses
Average Annual Total Return (%) Through 12/31/19
| JUL-DEC 20191 | 1-YR | 3-YR | 5-YR | 10-YR | 15-YR | SINCE INCEPTION (12/31/03) | |
| RFS | 6.80 | 24.17 | 9.60 | 7.22 | 10.20 | 7.62 | 8.07 |
| Annual Gross Operating Expenses: 1.77% Annual Net Operating Expenses: 1.58% | |||||||
1Not annualized
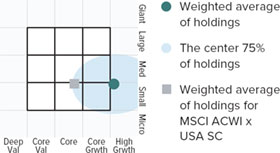
Morningstar Style Map™As of 12/31/19
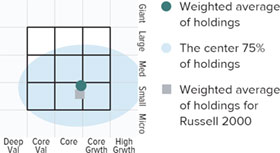
TheMorningstar Style Mapis theMorningstar Style BoxTM with the center 75% of fund holdings plotted as theMorningstar Ownership ZoneTM. The Morningstar Style Box is designed to reveal a fund’s investment strategy. The Morningstar Ownership Zone provides detail about a portfolio’s investment style by showing the range of stock sizes and styles. The Ownership Zone is derived by plotting each stock in the portfolio within the proprietary Morningstar Style Box. Over time, the shape and location of a fund’s ownership zone may vary. See page 89 for additional information.
Value of $10,000
Invested on 12/31/03 as of 12/31/19 ($)
| Top 10 Positions | ||
| % of Net Assets | ||
| Franco-Nevada | 3.7 | |
| Popular | 3.7 | |
| MarketAxess Holdings | 3.4 | |
| Ares Management Cl. A | 3.4 | |
| FirstService Corporation | 3.2 | |
| E-L Financial | 3.1 | |
| Sprott | 3.1 | |
| Ashmore Group | 2.9 | |
| First Citizens BancShares Cl. A | 2.6 | |
| Altus Group | 2.5 | |
| ||
| Portfolio Industry Breakdown | ||
| % of Net Assets (Subject to Change) | ||
| Capital Markets | 53.3 | |
| Banks | 17.1 | |
| Real Estate Management & Development | 8.0 | |
| Insurance | 3.8 | |
| Metals & Mining | 3.7 | |
| Software | 3.2 | |
| Trading Companies & Distributors | 2.5 | |
| IT Services | 2.0 | |
| Professional Services | 1.3 | |
| Closed-End Funds | 1.0 | |
| Thrifts & Mortgage Finance | 0.8 | |
| Diversified Financial Services | 0.7 | |
| Consumer Finance | 0.5 | |
| Hotels, Restaurants & Leisure | 0.2 | |
| Cash and Cash Equivalents | 1.9 | |
| Upside/Downside Capture Ratios | ||||
| Periods Ended 12/31/19 (%) | ||||
| UPSIDE | DOWNSIDE | |||
| 10-Year | 85 | 84 | ||
| Fund’s First Full Quarter (12/31/03) | 85 | 78 | ||
| Calendar Year Total Returns (%) | ||
| YEAR | RFS | |
| 2019 | 24.2 | |
| 2018 | -13.4 | |
| 2017 | 22.5 | |
| 2016 | 12.9 | |
| 2015 | -4.7 | |
| 2014 | 3.5 | |
| 2013 | 42.0 | |
| 2012 | 20.7 | |
| 2011 | -11.3 | |
| 2010 | 18.5 | |
| 2009 | 32.1 | |
| 2008 | -35.4 | |
| 2007 | -4.7 | |
| 2006 | 24.8 | |
| 2005 | 12.2 | |
| Portfolio Country Breakdown1,2 | ||
| % of Net Assets | ||
| United States | 53.2 | |
| Canada | 21.6 | |
| United Kingdom | 6.7 | |
| India | 2.2 | |
| France | 2.2 | |
| Israel | 2.1 | |
| Brazil | 1.8 | |
| South Africa | 1.7 | |
| ¹ Represents countries that are 1.5% or more of net assets. | ||
| ² Securities are categorized by the country of their headquarters. | ||
| Portfolio Diagnostics | ||
| Fund Net Assets | $37 million | |
| Number of Holdings | 68 | |
| Turnover Rate | 5% | |
| Average Market Capitalization1 | $2,469 million | |
| Weighted Average P/E Ratio2,3 | 17.3x | |
| Weighted Average P/B Ratio2 | 1.9x | |
| Active Share4 | 99% | |
| 1 | Geometric Average. This weighted calculation uses each portfolio holding’s market cap in a way designed to not skew the effect of very large or small holdings; instead, it aims to better identify the portfolio’s center, which Royce believes offers a more accurate measure of average market cap than a simple mean or median. |
| 2 | Harmonic Average.This weighted calculation evaluates a portfolio as if it were a single stock and measures it overall. It compares the total market value of the portfolio to the portfolio’s share in the earnings or book value, as the case may be, of its underlying stocks. |
| 3 | The Fund’s P/E ratio calculation excludes companies with zero or negative earnings (11% of portfolio holdings as of 12/31/19). |
| 4 | Active Shareis the sum of the absolute values of the different weightings of each holding in the Fund versus each holding in the benchmark, divided by two. |
Important Performance and Expense Information
All performance information in thisReport reflects past performance, is presented on a total return basis, reflects the reinvestment of distributions, and does not reflect the deduction of taxes that a shareholder would pay on fund distributions or the redemption of fund shares. Past performance is no guarantee of future results. Investment return and principal value of an investment will fluctuate, so that shares may be worth more or less than their original cost when redeemed. Shares redeemed within 30 days of purchase may be subject to a 1% redemption fee payable to the Fund, which is not reflected in the performance shown above; if it were, performance would be lower. Current month-end performance may be higher or lower than performance quoted and may be obtained at www.royceinvest.com. Gross operating expenses reflect the Fund’s gross total annual operating expenses for the Service Class and include management fees, 12b-1 distribution and service fees, other expenses and acquired fund fees and expenses. Net operating expenses reflect contractual fee waivers and/or expense reimbursements. All expense information is reported as of the Fund’s most current prospectus. Royce & Associates has contractually agreed to waive fees and/or reimburse expenses to the extent necessary to maintain the Fund’s net annual operating expenses, (excluding brokerage commissions, taxes, interest, litigation expenses, acquired fund fees and expenses, and other expenses not borne in the ordinary course of business), at or below 1.49% through April 30, 2020. Acquired fund fees and expenses reflect the estimated amount of the fees and expenses incurred indirectly by the Fund through its investments in mutual funds, hedge funds, private equity funds, and other investment companies. Regarding the “Top Contributors” and “Top Detractors” tables shown above, the sum of all contributors to, and all detractors from, performance for all securities in the portfolio would approximate the Fund’s year-to-date performance for 2019. Upside Capture Ratio measures a manager’s performance in up markets relative to the Fund’s benchmark. It is calculated by measuring the Fund’s performance in quarters when the benchmark went up and dividing it by the benchmark’s return in those quarters. Downside Capture Ratio measures a manager’s performance in down markets relative to the Fund’s benchmark (Russell 2000). It is calculated by measuring the Fund’s performance in quarters when the benchmark goes down and dividing it by the benchmark’s return in those quarters.
The Royce Funds2019 Annual Report to Shareholders | 11
| MANAGER’S DISCUSSION (UNAUDITED) |
| Royce International Premier Fund (RIP) |

| Mark Rayner, CA |
| FUND PERFORMANCE |
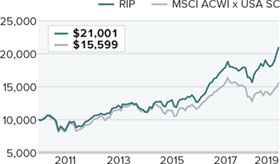
The Fund gained an impressive 34.2% in 2019, once again outpacing the MSCI ACWI ex USA Small Cap Index, which was up 22.4% for the same period.This strong calendar-year result helped the portfolio to solidify its long-term relative edge as the Fund beat its benchmark for the three-, five-year, and since inception (12/31/10) periods ended 12/31/19. |
| WHAT WORKED... AND WHAT DIDN’T |
All nine of the equity sectors in which the portfolio had investments in 2019 made a positive contribution to performance. Industrials— the Fund’s largest sector weighting—made by far the biggest positive contribution, followed by a strong showing for Information Technology. The smallest contributions came from Communication Services, Consumer Discretionary, and Energy—three sectors to which the Fund had little exposure in 2019. The top-contributing industries in 2019 were professional services (Industrials) and software (Information Technology), followed by health care equipment & supplies (Health Care). Construction & engineering (Industrials) was the only industry that detracted—and it did so modestly—while the smallest contributions came from interactive media & services (Communication Services) and containers & packaging (Materials).
The Fund’s top contributor at the position level was Brazil’s TOTVS, which provides enterprise resource planning and supply chain management software solutions. TOTVS capped a strong 2019 with robust revenue growth, effective cost management that created greater operational efficiency, and adjusted EBITDA margin expansion, driven by its core software business. The cost of its new initiatives also did not significantly impact the firm’s profits. Finally, TOTVS acquired SUPPLIER, a credit card company with a virtual private label B2B solution.
Amadeus Fire, which focuses on finance professionals in Germany, was the next biggest contributor. We initially purchased it as a replacement for another company with a similar ‘employee leasing’ model that we like. These models work especially well in countries with strict labor laws and tight labor markets. The client receives increased workforce flexibility and access to skilled personnel for which it is willing to pay a premium. Amadeus bears the employment risk, which it can dissipate through economies of scale. Earnings grew and its margins expanded through most of 2019. In addition, Amadeus announced the takeover of Comcave in late December. This is a 25% EBITDA margin business that retrains white-collar professionals who are leaving their existing employment or are in-between jobs. Within Amadeus, it will also act as a funnel for recruitment into Amadeus’s core employee leasing business. The market aggressively re-rated Amadeus’s stock following the acquisition.
We sold our stake in each of the Fund’s two biggest detractors for 2019. Consort Medical is a U.K.-based Contract Development & Manufacturing Organization that makes high-volume, disposable drug delivery devices primarily for respiratory treatments. Full-year results announced in June showed revenues and operating profits both down, but in line with the reduced expectations. The company also reported mixed news on the development of a relatively narrow, though expanding, portfolio of commercialized and in-development projects. Adding to its challenges was an explosion in its Northumberland facility in July, though we began to reduce our position in June. SH Kelkar & Company is a family-run fragrance producer based in India whose ongoing declines in earnings and revenues led us to sell the last of our shares in April.
Relative outperformance for the calendar year was due primarily to stock selection, though sector allocation was also positive versus the benchmark. The strongest sector by far on a relative basis was Industrials, driven overwhelmingly by superior stock picking. The portfolio also benefited from its significantly larger weighting in Information Technology. Conversely, our lack of exposure to Utilities was a modest disadvantage while the portfolio’s cash holdings created an additional drag on relative performance.
| Top Contributors to Performance | Top Detractors from Performance | |||||
| For 2019 (%)1 | For 2019 (%)2 | |||||
| TOTVS | 2.09 | Consort Medical | -0.34 | |||
| Amadeus Fire | 1.29 | SH Kelkar & Company | -0.17 | |||
| Altus Group | 1.28 | AIA Engineering | -0.11 | |||
| Restore | 1.24 | Burkhalter Holding | -0.04 | |||
| XP Power | 1.21 | Cyient | -0.03 | |||
| 1 Includes dividends | 2Net of dividends | |||||
| CURRENT POSITIONING AND OUTLOOK |
Over the last few years, we’ve been cautious and somewhat underweight when contrasted with the potential to invest in U.K. companies based on the strong fundamental opportunity set. As the political risks have diminished in the aftermath of the elections, however, we’ve been reevaluating the opportunities for many U.K. companies both in and out of our database of high-quality international small-caps. The portfolio’s exposure to the U.K. increased in 2019—it finished the year as our second-largest country weighting. Our strategy typically places a materially lower emphasis on short- to medium-term macroeconomic news or forecasts and rarely if ever positions itself to take account of such data. During 2019, we made our investment decisions based on this core philosophy and remain constructive with regard to the long-term opportunities for high-quality international small-caps. We are encouraged by incremental but solid improvements in the global economy, which should help to diffuse recession risk. Moreover, central banks throughout the developed world remain accommodative, keeping rates low and/or providing ample liquidity. Each of these developments should remain supportive for equities in 2020. |
| 12 | The Royce Funds 2019 Annual Report to Shareholders |
|
| PERFORMANCE AND PORTFOLIO REVIEW (UNAUDITED) | TICKER SYMBOLS RYIPX RIPNX RINPX RIPIX |
Performance and Expenses
Average Annual Total Return (%) Through 12/31/19
| JUL-DEC 20191 | 1-YR | 3-YR | 5-YR | SINCE INCEPTION (12/31/10) | |
| RIP | 10.58 | 34.22 | 17.86 | 13.49 | 8.59 |
| Annual Gross Operating Expenses: 1.59% Annual Net Operating Expenses: 1.44% | |||||
1Not annualized
Relative Returns: Monthly Rolling Average Annual Return Periods
Since Inception Through 12/31/19
On a monthly rolling basis, the Fund outperformed the MSCI ACWI x USA SC in 100% of all 5-year periods; 85% of all 3-year periods; and 71% of all 1-year periods.
| PERIODS BEATING THE INDEX | FUND AVG (%)1 | INDEX AVG (%)1 | |||||
| 5-year | 49/49 | 100% | 8.7 | 6.0 | |||
| 3-year | 62/73 | 85% | 9.4 | 6.8 | |||
| 1-year | 69/97 | 71% | 8.9 | 5.8 | |||
1 Average of monthly rolling average annual total returns over the specified periods.
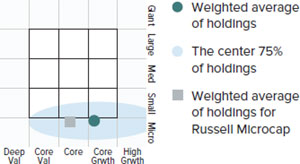
Morningstar Style Map™As of 12/31/19
TheMorningstar Style Mapis theMorningstar Style BoxTM with the center 75% of fund holdings plotted as theMorningstar Ownership ZoneTM. The Morningstar Style Box is designed to reveal a fund’s investment strategy. The Morningstar Ownership Zone provides detail about a portfolio’s investment style by showing the range of stock sizes and styles. The Ownership Zone is derived by plotting each stock in the portfolio within the proprietary Morningstar Style Box. Over time, the shape and location of a fund’s ownership zone may vary. See page 89 for additional information.
Value of $10,000
Invested on 12/31/10 as of 12/31/19 ($)
| Top 10 Positions | ||
| % of Net Assets | ||
| IMCD | 2.8 | |
| Victrex | 2.8 | |
| Intertrust | 2.7 | |
| Loomis Cl. B | 2.6 | |
| Daifuku | 2.6 | |
| Croda International | 2.5 | |
| TKC Corporation | 2.4 | |
| Spirax-Sarco Engineering | 2.3 | |
| Amadeus Fire | 2.2 | |
| XP Power | 2.2 | |
| Portfolio Sector Breakdown | ||
| % of Net Assets | ||
| Industrials | 42.8 | |
| Information Technology | 19.4 | |
| Health Care | 9.0 | |
| Materials | 7.0 | |
| Financials | 5.9 | |
| Energy | 2.0 | |
| Consumer Discretionary | 1.7 | |
| Real Estate | 1.5 | |
| Communication Services | 1.2 | |
| Preferred Stock | 1.9 | |
| Cash and Cash Equivalents | 7.6 | |
| Upside/Downside Capture Ratios | ||||
| Periods Ended 12/31/19 (%) | ||||
| UPSIDE | DOWNSIDE | |||
| Fund’s First Full Quarter (12/31/10) | 110 | 80 | ||
| Calendar Year Total Returns (%) | ||
| YEAR | RIP | |
| 2019 | 34.2 | |
| 2018 | -12.8 | |
| 2017 | 39.8 | |
| 2016 | -1.1 | |
| 2015 | 16.2 | |
| 2014 | -8.2 | |
| 2013 | 18.3 | |
| 2012 | 23.4 | |
| 2011 | -16.8 | |
| Portfolio Country Breakdown1,2 | ||
| % of Net Assets | ||
| Japan | 17.7 | |
| United Kingdom | 13.6 | |
| Switzerland | 11.6 | |
| Sweden | 9.3 | |
| Australia | 8.4 | |
| Germany | 7.2 | |
| Netherlands | 5.5 | |
| Brazil | 3.0 | |
| ¹ Represents countries that are 3% or more of net assets. | ||
| ² Securities are categorized by the country of their headquarters. | ||
| Portfolio Diagnostics | ||
| Fund Net Assets | $809 million | |
| Number of Holdings | 54 | |
| Turnover Rate | 40% | |
| Average Market Capitalization1 | $2,133 million | |
| Weighted Average P/E Ratio2,3 | 26.3x | |
| Weighted Average P/B Ratio2 | 3.9x | |
| Active Share4 | 98% | |
| 1 | Geometric Average. This weighted calculation uses each portfolio holding’s market cap in a way designed to not skew the effect of very large or small holdings; instead, it aims to better identify the portfolio’s center, which Royce believes offers a more accurate measure of average market cap than a simple mean or median. |
| 2 | Harmonic Average.This weighted calculation evaluates a portfolio as if it were a single stock and measures it overall. It compares the total market value of the portfolio to the portfolio’s share in the earnings or book value, as the case may be, of its underlying stocks. |
| 3 | The Fund’s P/E ratio calculation excludes companies with zero or negative earnings (1% of portfolio holdings as of 12/31/19). |
| 4 | Active Shareis the sum of the absolute values of the different weightings of each holding in the Fund versus each holding in the benchmark, divided by two. |
Important Performance and Expense Information
All performance information in thisReport reflects past performance, is presented on a total return basis, reflects the reinvestment of distributions, and does not reflect the deduction of taxes that a shareholder would pay on fund distributions or the redemption of fund shares. Past performance is no guarantee of future results. Investment return and principal value of an investment will fluctuate, so that shares may be worth more or less than their original cost when redeemed. Shares redeemed within 30 days of purchase may be subject to a 2% redemption fee payable to the Fund, which is not reflected in the performance shown above; if it were, performance would be lower. Current month-end performance may be higher or lower than performance quoted and may be obtained at www.royceinvest.com. All performance and risk information reflects results of the Service Class (its oldest class). Price and total return information is based on net asset values for shareholder transactions. Certain immaterial adjustments were made to the net assets of Royce International Premier Fund at 12/31/19 for financial reporting purposes, and as a result the calendar year total returns based on those net asset values differ from the adjusted net asset values and calendar year total returns reported in the Financial Highlights. Gross operating expenses reflect total gross annual operating expenses for the Service Class and include management fees, 12b-1 distribution and service fees, and other expenses. Net operating expenses reflect contractual fee waivers and/or expense reimbursements. All expense information is reported as of the Fund’s most current prospectus. Royce & Associates has contractually agreed to waive its fees and/or reimburse operating expenses to the extent necessary to maintain the Fund’s net annual operating expenses, (excluding brokerage commissions, taxes, interest, litigation expenses, acquired fund fees and expenses, and other expenses not borne in the ordinary course of business), at or below 1.44% through April 30, 2020. Regarding the “Top Contributors” and “Top Detractors” tables shown above, the sum of all contributors to, and all detractors from, performance for all securities in the portfolio would approximate the Fund’s year-to-date performance for 2019. Upside Capture Ratio measures a manager’s performance in up markets relative to the Fund’s benchmark. It is calculated by measuring the Fund’s performance in quarters when the benchmark went up and dividing it by the benchmark’s return in those quarters. Downside Capture Ratio measures a manager’s performance in down markets relative to the Fund’s benchmark (MSCI ACWI x USA SC). It is calculated by measuring the Fund’s performance in quarters when the benchmark goes down and dividing it by the benchmark’s return in those quarters.
The Royce Funds 2019 Annual Report to Shareholders | 13
| MANAGERS’ DISCUSSION (UNAUDITED) |
| Royce Micro-Cap Fund (RMC) |

| Jim Stoeffel Brendan Hartman |
| FUND PERFORMANCE |
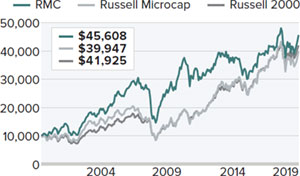
Royce Micro-Cap Fund delivered a strong absolute return of 21.2% for 2019, though the Fund lagged the Russell Microcap and the Russell 2000 Indexes, which returned 22.4% and 25.5%, respectively, for the same period. |
| WHAT WORKED... AND WHAT DIDN’T |
Six of the Fund’s 10 equity sectors finished 2019 in the black. Information Technology made the most sizable positive contribution by far, followed by Industrials and Health Care. Consumer Discretionary, Energy, and Communication Services detracted from performance, but they did so on a modest scale. At the industry level, semiconductors & semiconductor equipment (Information Technology) generated the biggest impact on performance, more than tripling the impact of the portfolio’s next best contributor, machinery (Industrials). Conversely, energy equipment & services (Energy) was the worst performing industry, followed by leisure products (Consumer Discretionary).
Biotechnology company Axsome Therapeutics was the top-contributing position in 2019. The company saw positive clinical results across its product portfolio, which includes developing therapies for central nervous system disorders. AXS-05, Axsome’s lead molecule, has been performing well in clinical trials that are expected to be finished quickly because two of its ingredients were previously approved by the Food and Drug Administration. Ultra Clean Holdings develops and supplies critical subsystems for the semiconductor capital equipment and flat panel display industries. Not only did the stock benefit from the recent semiconductor industry upturn, but performance was also boosted by management’s decision to diversify its service offerings and customer base. Zealand Pharma focuses on developing peptide-based therapeutics for metabolic and gastrointestinal diseases. The Copenhagen-based company’s two latest stage products targeting short bowel system and hypoglycemia in diabetics had positive results during the year. Zealand Pharma also completed its first ever acquisition, buying Encycle Therapeutics in October.
Conversely, Red Lion Hotels was hurt in its efforts to transition from company-owned hotels to a franchise model. Selling its company-owned units took longer than anticipated, and Red Lion experienced greater-than-expected attrition in its newly acquired franchisees—factors that led us to sell our position. Correvio Pharma develops and discovers cardiovascular drugs for the treatment of atrial arrhythmia, congestive heart failure, and bacterial skin infections. The company’s atrial fibrillation drug, which is used extensively in Europe, failed to gain approval from an FDA Advisory Panel. This led us to exit the position. Branded fitness and apparel product maker Nautilus also detracted from performance. Two consecutive failed product launches resulted in a decision to remove the CEO. While we liked several of the strategic decisions the company made over the past several years, we sold our position based on our lack of confidence in management’s ability to effectively judge the rapidly changing fitness markets. We also expected it to take at least a year to rebuild its product pipeline.
The Fund’s narrow relative underperformance versus the Russell Micro-cap was a result of sector allocation—stock selection was additive to relative results in 2019. Consumer Discretionary hampered relative performance mostly due to poor stock picks—our overexposure detracted very modestly. The sector was home to three of the top five relative detracting positions: Red Lion Hotels, Nautilus, and Kirkland’s. Ineffective stock picks in Energy also hindered results. Our lower exposure to biotechnology (Health Care)—the strongest contributor to the micro-cap index’s returns—hurt results most at the industry level. Conversely, Information Technology was the strongest contributor to performance, as the sector’s relative contribution made more than six times the impact of the next best contributor, Industrials. Savvy stock selection drove outperformance in both sectors. Two of the top five relative performing positions came from Information Technology—Ultra Clean Holdings and Adesto Technologies. At the industry level, semiconductors & semiconductor equipment (Information Technology) aided performance versus the benchmark most, followed by construction & engineering (Industrials).
| Top Contributors to Performance | Top Detractors from Performance | |||||
| For 2019 (%)1 | For 2019 (%)2 | |||||
| Axsome Therapeutics | 2.07 | Red Lion Hotels | -0.65 | |||
| Ultra Clean Holdings | 1.30 | Correvio Pharma | -0.53 | |||
| Zealand Pharma | 1.28 | Nautilus | -0.50 | |||
| NeoGenomics | 0.98 | Kirkland’s | -0.45 | |||
| Zealand Pharma | 0.77 | ORBCOMM | -0.43 | |||
| 1Includes dividends | 2Net of dividends | |||||
| CURRENT POSITIONING AND OUTLOOK |
While issues surrounding trade have finally begun to stabilize, we find ourselves in the midst of what promises to be an eventful U.S. election cycle, with outcomes that could have major implications for investors. Despite this uncertainty, we remain generally constructive of the U.S. economy, particularly because the current Fed tightening cycle appears to have ended. Along with a possible truce in the trade wars, we believe the favorable backdrop should support underlying growth for our overweighted sectors, such as Information Technology and Industrials. Valuations look relatively attractive to us in many corners of the micro-cap world, even as recent returns show that the performance gap between micro-caps and large-caps is gradually beginning to narrow. We took advantage of these opportunities for much of the second half of 2019 as micro-cap stocks were selling at their steepest discount to large-caps since 2001. We don’t know if this recent upward move will last, but after a long period of underperformance for micro-caps, we anticipate some degree of mean reversion. |
| 14 | The Royce Funds 2019 Annual Report to Shareholders |
|
| PERFORMANCE AND PORTFOLIO REVIEW (UNAUDITED) | TICKER SYMBOLS RYOTX RMCFX RYMCX | |
| Performance and Expenses | |||||||||||||||||
| Average Annual Total Return (%) Through 12/31/19 | |||||||||||||||||
| JUL-DEC 20191 | 1-YR | 3-YR | 5-YR | 10-YR | 15-YR | 20-YR | 25-YR | SINCE INCEPTION (12/31/91) | |||||||||
| RCM | 9.56 | 21.16 | 5.17 | 3.84 | 5.66 | 5.79 | 8.51 | 9.49 | 10.40 | ||||||||
| Annual Gross Operating Expenses: 1.25% Annual Net Operating Expenses: 1.24% | |||||||||||||||||
| 1 Not annualized | |||||||||||||||||
Morningstar Style Map™As of 12/31/19
TheMorningstar Style Map is theMorningstar Style Box™ with the center 75% of fund holdings plotted as theMorningstar Ownership Zone™. The Morningstar Style Box is designed to reveal a fund’s investment strategy. The Morningstar Ownership Zone provides detail about a portfolio’s investment style by showing the range of stock sizes and styles. The Ownership Zone is derived by plotting each stock in the portfolio within the proprietary Morningstar Style Box. Over time, the shape and location of a fund’s ownership zone may vary. See page 89 for additional information.
Value of $10,000
Invested on 6/30/00 (Russell Microcap Index Inception) as of 12/31/19 ($)
| Top 10 Positions | ||
| % of Net Assets | ||
| Ultra Clean Holdings | 1.4 | |
| Photronics | 1.4 | |
| Zealand Pharma | 1.4 | |
| Northwest Pipe | 1.3 | |
| Nova Measuring Instruments | 1.3 | |
| Axsome Therapeutics | 1.3 | |
| FormFactor | 1.2 | |
| QAD Cl. A | 1.2 | |
| OrthoPediatrics Corporation | 1.2 | |
| NeoGenomics | 1.1 | |
| Portfolio Sector Breakdown | ||
| % of Net Assets | ||
| Information Technology | 26.5 | |
| Industrials | 21.4 | |
| Financials | 13.2 | |
| Health Care | 11.7 | |
| Consumer Discretionary | 9.6 | |
| Materials | 3.2 | |
| Energy | 2.8 | |
| Real Estate | 2.1 | |
| Communication Services | 2.0 | |
| Consumer Staples | 0.2 | |
| Cash and Cash Equivalents | 7.3 | |
| Calendar Year Total Returns (%) | ||
| YEAR | RCM | |
| 2019 | 21.2 | |
| 2018 | -8.9 | |
| 2017 | 5.4 | |
| 2016 | 19.7 | |
| 2015 | -13.3 | |
| 2014 | -4.1 | |
| 2013 | 21.3 | |
| 2012 | 8.0 | |
| 2011 | -12.1 | |
| 2010 | 30.1 | |
| 2009 | 55.7 | |
| 2008 | -40.9 | |
| 2007 | 7.1 | |
| 2006 | 22.3 | |
| 2005 | 11.5 |
| Upside/Downside Capture Ratios | ||||
| Periods Ended 12/31/19 (%) | ||||
| UPSIDE | DOWNSIDE | |||
| 10-Year | 72 | 95 | ||
| From 6/30/00 (Russell Microcap Index Inception) | 90 | 81 | ||
Portfolio Diagnostics
| ||
| Fund Net Assets | $337 million | |
| Number of Holdings | 138 | |
| Turnover Rate | 21% | |
| Average Market Capitalization1 | $545 million | |
| Weighted Average P/B Ratio2 | 2.0x | |
| Active Share3 | 89% | |
| U.S. Investments (% of Net Assets) | 80.3% | |
| Non-U.S. Investments (% of Net Assets) | 12.4% | |
| 1 | Geometric Average. This weighted calculation uses each portfolio holding’s market cap in a way designed to not skew the effect of very large or small holdings; instead, it aims to better identify the portfolio’s center, which Royce believes offers a more accurate measure of average market cap than a simple mean or median. |
| 2 | Harmonic Average.This weighted calculation evaluates a portfolio as if it were a single stock and measures it overall. It compares the total market value of the portfolio to the portfolio’s share in the earnings or book value, as the case may be, of its underlying stocks. |
| 3 | Active Shareis the sum of the absolute values of the different weightings of each holding in the Fund versus each holding in the benchmark, divided by two. |
Important Performance and Expense Information All performance information in thisReport reflects past performance, is presented on a total return basis, reflects the reinvestment of distributions, and does not reflect the deduction of taxes that a shareholder would pay on fund distributions or the redemption of fund shares. Past performance is no guarantee of future results. Investment return and principal value of an investment will fluctuate, so that shares may be worth more or less than their original cost when redeemed. Shares redeemed within 30 days of purchase may be subject to a 1% redemption fee payable to the Fund, which is not reflected in the performance shown above; if it were, performance would be lower. Current month-end performance may be higher or lower than performance quoted and may be obtained at www.royceinvest.com. All performance and risk information reflects results of the Investment Class (its oldest class). Price and total return information is based on net asset values calculated for shareholder transactions. Certain immaterial adjustments were made to the net assets of Royce Micro-Cap Fund at 12/31/17 for financial reporting purposes, and as a result the calendar year total returns based on those net asset values differ from the adjusted net asset values and calendar year total returns reported in the Financial Highlights. Gross operating expenses reflect the Fund’s total gross annual operating expenses for the Investment Class and include management fee and other expenses. Net operating expenses reflect contractual fee waivers and/or expense reimbursements. All expense information is reported as of the Fund’s most current prospectus. Royce & Associates has contractually agreed, without right of termination, to waive fees and/or reimburse expenses to the extent necessary to maintain the Investment Class’s net annual operating expenses (excluding brokerage commissions, taxes, interest, litigation expenses, acquired fund fees and expenses, and other expenses not borne in the ordinary course of business) at or below 1.24% through April 30, 2020. Regarding the “Top Contributors” and “Top Detractors” tables shown above, the sum of all contributors to, and all detractors from, performance for all securities in the portfolio would approximate the Fund’s year-to-date performance for 2019. Upside Capture Ratio measures a manager’s performance in up markets relative to the Fund’s benchmark. It is calculated by measuring the Fund’s performance in quarters when the benchmark went up and dividing it by the benchmark’s return in those quarters. Downside Capture Ratio measures a manager’s performance in down markets relative to the Fund’s benchmark (Russell Microcap Index). It is calculated by measuring the Fund’s performance in quarters when the benchmark goes down and dividing it by the benchmark’s return in those quarters. |
The Royce Fund 2019 Annual Report to Shareholders | 15
MANAGERS’ DISCUSSION (UNAUDITED)

Bill Hench
Suzanne Franks
Rob Kosowsky, CFA
FUND PERFORMANCE
Royce Opportunity Fund gained 28.2% in 2019, outperforming both the Russell 2000 and Russell 2000 Value Indexes, which were up 25.5% and 22.4%, respectively, for the same period.The Fund also outpaced the value index for the three-, five-, 10-, 15-, 20-year, and since inception (11/19/96) periods ended 12/31/19 while it beat the Russell 2000 for the 20-year and since inception periods. We were especially pleased that the theme-based Deep Value strategy we use in the portfolio did well on both an absolute and relative basis in a year when many value stocks underperformed.
WHAT WORKED… AND WHAT DIDN’T
Each of the portfolio’s 11 equity sectors finished 2019 in the black. Information Technology and Industrials—its two largest—made the biggest positive contributions to calendar-year performance while the smallest came from Utilities and Real Estate. At the industry level, semiconductors & semiconductor equipment (Information Technology) had an outsized positive impact—without placing a single holding among the portfolio’s five top contributors—followed by machinery (Industrials). The impact of detractors was far more modest, led by energy equipment & services (Energy) and health care technology (Health Care).
Of the portfolio’s four investment themes, we enjoyed the most success in 2019 with holdings in the Turnaround and Undervalued Growth categories, while many in Interrupted Earnings began to do well in the second half of the year. Dorian LPG, a company that owns and operates tankers for liquefied petroleum gas transportation, was the portfolio’s top contributor at the position level. Its success in 2019 was driven by the expansion of U.S. export capacity and increasing demand in Asia from the petro-chemical sector. Dorian looks well-positioned to benefit from growth in the liquefied petroleum gas transportation market, which we think is in its early stages. The downturn in 2018’s fourth quarter gave us an opportunity to build our stake in Forterra, a manufacturer of water and drainage infrastructure pipes and products. Its shares were especially beaten down and therefore looked very attractive to us. Its business improved in concert with robust expansion in the construction industry, and new management was able to raise pricing, both of which helped attract investors to its stock.
The portfolio’s top detractor in 2019 was Resideo Technologies, which offers home automation solutions, including smart thermostats and security cameras. Initially drawn to Resideo’s position in the growing “smart home” market, we chose to sell our shares in October when the company cut guidance and announced a management change, signs that further convinced us that the company would continue to fare poorly in an intensely competitive industry. We built our stake in KLX Energy Services, which provides mission critical, asset light oilfield services. Weak pricing throughout the oil services industry depressed earnings, but we like its turnaround potential when oil and gas prices rebound.
Relative outperformance was driven entirely by stock selection in 2019—sector allocation was slightly negative. Superior stock selection and our overweight boosted relative results in Information Technology, where our significant exposure to semiconductors & semiconductor equipment stocks was a plus. Savvy stock selection and, to a lesser degree, our overweight in Industrials provided another advantage versus the benchmark. Hurting calendar-year relative performance was poor stock picking in Health Care—one of the top-contributing sectors in the Russell 2000 in 2019. Our lower weighting in Real Estate also hampered relative results as that sector turned in an index-beating performance in 2019. In addition, the portfolio’s cash holdings were a drag on relative results.
| Top Contributors to Performance | Top Detractors from Performance | |||||
| For 2019 (%)1 | For 2019 (%)2 | |||||
| Dorian LPG | 0.87 | Resideo Technologies | -0.42 | |||
| Forterra | 0.82 | KLX Energy Services Holdings | -0.36 | |||
| EverQuote Cl. A | 0.77 | Bloom Energy Cl. A | -0.31 | |||
| Stage Stores | 0.74 | Tupperware Brands | -0.29 | |||
| Herc Holdings | 0.68 | Whiting Petroleum | -0.24 | |||
| 1Includes dividends | 2Net of dividends | |||||
CURRENT POSITIONING AND OUTLOOK
We have been populating the portfolio with names from almost all sectors that share the dual characteristics of looking both cheap and capable of recovery based on growth catalysts that we have identified. During 2019, we trimmed some positions in the semiconductor and housing areas when share prices were moving beyond our sell targets, though we still have ample exposure to both. We also continue to like the long-term prospects for healthcare companies that can bend the cost curve as we believe this is a secular trend that is reshaping the industry. Examples include Surgery Partners, a firm that manages surgical facilities, physician-partnered hospitals, and diagnostic laboratories; RadNet, which operates outpatient diagnostic imaging centers in California and IntriCon Corporation, an industrial company that makes microelectronic body-worn devices, including insulin pumps and hearing aids. Slumping oil and gas prices have also provided us with buying opportunities in the Energy sector, especially as many exploration & production budgets are being re-set after a reasonably long period of lower spending. Several positions throughout the portfolio look primed for solid returns in 2020 (others, of course, will require more patience). While the list of macro and micro events that could hamper markets remains as long as ever—and thus continues to present us with what we think is advantageous pricing for patient, long-term investors like ourselves—we are optimistic about both the markets and economy in 2020.
| 16 | The Royce Funds 2019 Annual Report to Shareholders |
| PERFORMANCE AND PORTFOLIO REVIEW (UNAUDITED) | TICKER SYMBOLS RYPNX RYOFX ROFCX ROFIX ROFRX |
Performance and Expenses
Average Annual Total Return (%) Through 12/31/19
| JUL-DEC 20191 | 1-YR | 3-YR | 5-YR | 10-YR | 15-YR | 20-YR | SINCE INCEPTION (11/19/96) | |||||||||
| ROF | 10.89 | 28.21 | 7.74 | 7.02 | 11.09 | 7.77 | 10.43 | 11.68 |
Annual Operating Expenses: 1.20%
1Not annualized
Relative Returns: Monthly Rolling Average Annual Return Periods
20 Years Through 12/31/19
On a monthly rolling basis, the Fund outperformed the Russell 2000 in 73% of all 10-year periods; 60% of all 5-year periods; and 60% of all 1-year periods.
| PERIODS BEATING THE INDEX | FUND AVG (%)1 | INDEX AVG (%)1 | |||||
| 10-year | 88/121 | 73% | 9.5 | 8.2 | |||
| 5-year | 109/181 | 60% | 10.1 | 8.8 | |||
| 1-year | 138/229 | 60% | 12.7 | 9.2 | |||
1 Average of monthly rolling average annual total returns over the specified periods.
Morningstar Style Map™ As of 12/31/19
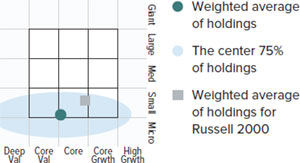
TheMorningstar Style Map is theMorningstar Style Box™ with the center 75% of fund holdings plotted as theMorningstar Ownership Zone™. The Morningstar Style Box is designed to reveal a fund’s investment strategy. The Morningstar Ownership Zone provides detail about a portfolio’s investment style by showing the range of stock sizes and styles. The Ownership Zone is derived by plotting each stock in the portfolio within the proprietary Morningstar Style Box. Over time, the shape and location of a fund’s ownership zone may vary. See page 89 for additional information.
Value of $10,000
Invested on 11/19/96 as of 12/31/19 ($)
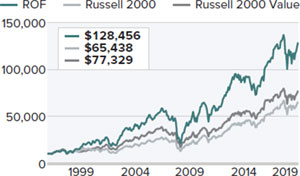
Top 10 Positions
% of Net Assets
| Alpha & Omega Semiconductor | 1.1 | |
| Surgery Partners | 1.1 | |
| Dorian LPG | 1.1 | |
| MACOM Technology Solutions Holdings | 1.0 | |
| Onto Innovation | 1.0 | |
| Forterra | 1.0 | |
| KEMET Corporation | 1.0 | |
| Air Lease Cl. A | 1.0 | |
| Herc Holdings | 0.9 | |
| Invacare Corporation | 0.9 |
Portfolio Sector Breakdown
% of Net Assets
| Information Technology | 23.7 | |
| Industrials | 19.9 | |
| Health Care | 13.8 | |
| Financials | 9.6 | |
| Consumer Discretionary | 9.3 | |
| Materials | 8.5 | |
| Energy | 8.3 | |
| Communication Services | 1.4 | |
| Real Estate | 1.3 | |
| Consumer Staples | 0.6 | |
| Utilities | 0.2 | |
| Cash and Cash Equivalents | 3.4 |
Calendar Year Total Returns (%)
| YEAR | ROF | |
| 2019 | 28.2 | |
| 2018 | -20.0 | |
| 2017 | 21.9 | |
| 2016 | 29.9 | |
| 2015 | -13.6 | |
| 2014 | -0.5 | |
| 2013 | 43.5 | |
| 2012 | 22.6 | |
| 2011 | -13.0 | |
| 2010 | 33.8 | |
| 2009 | 62.1 | |
| 2008 | -45.7 | |
| 2007 | -2.0 | |
| 2006 | 18.8 | |
| 2005 | 4.8 |
Upside/Downside Capture Ratios
Periods Ended 12/31/19 (%)
| UPSIDE | DOWNSIDE | |
| 10-Year | 108 | 123 |
| From 12/31/96 (Start of Fund’s First Full Quarter) | 122 | 110 |
Portfolio Diagnostics
| Fund Net Assets | $926 million | |
| Number of Holdings | 261 | |
| Turnover Rate | 47% | |
| Average Market Capitalization1 | $871 million | |
| Weighted Average P/B Ratio2 | 1.6x | |
| Weighted Average P/S Ratio3 | 0.9x | |
| Active Share4 | 91% | |
| U.S. Investments (% of Net Assets) | 92.7% | |
| Non-U.S. Investments (% of Net Assets) | 3.9% |
| 1 | Geometric Average. This weighted calculation uses each portfolio holding’s market cap in a way designed to not skew the effect of very large or small holdings; instead, it aims to better identify the portfolio’s center, which Royce believes offers a more accurate measure of average market cap than a simple mean or median. |
| 2 | Harmonic Average.This weighted calculation evaluates a portfolio as if it were a single stock and measures it overall. It compares the total market value of the portfolio to the portfolio’s share in the earnings or book value, as the case may be, of its underlying stocks. |
| 3 | Price to Salesis calculated by dividing the company’s market cap by the revenue in the most recent year. |
| 4 | Active Shareis the sum of the absolute values of the different weightings of each holding in the Fund versus each holding in the benchmark, divided by two. |
Important Performance and Expense Information
All performance information in thisReport reflects past performance, is presented on a total return basis, reflects the reinvestment of distributions, and does not reflect the deduction of taxes that a shareholder would pay on fund distributions or the redemption of fund shares. Past performance is no guarantee of future results. Investment return and principal value of an investment will fluctuate, so that shares may be worth more or less than their original cost when redeemed. Shares redeemed within 30 days of purchase may be subject to a 1% redemption fee payable to the Fund, which is not reflected in the performance shown above; if it were, performance would be lower. Current month-end performance may be higher or lower than performance quoted and may be obtained at www.royceinvest.com. All performance and risk information reflects results of the Investment Class (its oldest class). Operating expenses reflect the Fund’s total annual operating expenses for the Investment Class as of the Fund’s most current prospectus and include management fees and other expenses. Regarding the “Top Contributors” and “Top Detractors” tables shown above, the sum of all contributors to, and all detractors from, performance for all securities in the portfolio would approximate the Fund’s year-to-date performance for 2019. Upside Capture Ratio measures a manager’s performance in up markets relative to the Fund’s benchmark. It is calculated by measuring the Fund’s performance in quarters when the benchmark went up and dividing it by the benchmark’s return in those quarters. Downside Capture Ratio measures a manager’s performance in down markets relative to the Fund’s benchmark (Russell 2000). It is calculated by measuring the Fund’s performance in quarters when the benchmark goes down and dividing it by the benchmark’s return in those quarters.
The Royce Funds2019 Annual Report to Shareholders | 17
|
MANAGERS’ DISCUSSION (UNAUDITED)
Royce Pennsylvania Mutual Fund® (PMF)

Chuck Royce
Jay Kaplan, CFA
Lauren Romeo, CFA
Steven McBoyle
FUND PERFORMANCE
2019 marked the fourth consecutive year in which our flagship, Royce Pennsylvania Mutual Fund, beat its small-cap benchmark, the Russell 2000 Index, helping the portfolio to outperform the small-cap index for the three-, five-, 15-, 20-, 25-, 30-, 35-, and 40-year periods ended 12/31/19.The Fund advanced 26.6% in 2019 versus a gain of 25.5% for the Russell 2000. Following the Fund’s strong showing in 2018’s more challenging environment, we were equally pleased to see it also do well in 2019’s more bullish, and far less volatile, market.
WHAT WORKED… AND WHAT DIDN’T
Nine of the portfolio’s 11 equity sectors finished 2019 in the black. Our two largest sector weightings—Industrials and Information Technology—made by far the biggest contributions to calendar-year performance while Communication Services and Utilities were the only sectors that detracted. Semiconductors & semiconductor equipment (Information Technology), machinery (Industrials), and electronic equipment, instruments & components (Information Technology) contributed most on an industry basis. The impact of detracting industries was, unsurprisingly, far more modest, led by internet & direct marketing (Consumer Discretionary), media (Communications Services), and oil, gas & consumable fuels (Energy).
Ares Management was the top-contributing position in 2019. The firm is an asset manager that focuses on tradable credit, direct lending, private equity, and real estate. Investors became more optimistic about the company’s ability to sustain mid-teens, high margin earnings growth for an extended period. The company also converted to C-corp. status, which broadened ownership, supporting an increase in its valuation. The two stocks that followed were also the leading contributors from the Information Technology sector—Cirrus Logic, a leading producer of specialized audio and voice devices and solutions, and MKS Instruments, which manufactures devices and instruments used in semiconductor production. After several strong months, shares of Cirrus rose by double digits in October on news of better-than-expected third-quarter results keyed by increased demand for its innovative products. MKS Instruments also sailed past (admittedly fairly low) third-quarter earnings estimates. It pleased us to see revenues in its advanced markets segment rise as well as what looked like a bottom in the semiconductor capital equipment cycle.
Virtu Financial detracted most at the position level. Virtu is a New York City based financial company that uses its technology to act as a market maker and liquidity provider to the global financial markets. Its business endured a slump through most of the year, and the company typically does best in highly volatile markets—which were mostly absent in 2019—and/or when global trading volumes are heavy. Believing that volatility is more likely, we built our position. Merit Medical Systems manufactures devices for diagnostic and interventional cardiology and radiology procedures. We chose to move on from the stock after the company reported two consecutive quarters of disappointing earnings. Diversified publishing and broadcasting company Meredith Corporation was hurt by declining revenues and earnings as the company tries to navigate an ever-shifting media landscape.
The Fund’s outperformance versus the Russell 2000 was the result of both positive sector allocation and savvy stock selection. Information Technology was the greatest source of outperformance due to both our overweight and superior stock selection, with semiconductors & semiconductor equipment standing out. The Fund also saw outperformance from Industrials from the same combination of larger exposure and better stock selection.
The two largest areas of relative underperformance were Health Care, where the Fund’s underweight in biotechnology and ineffective stock selection were the primary culprits, and Materials, where underperformance was largely due to lagging stock selection. Quaker Chemical, a provider of custom-formulated specialty products for use primarily in the steel and automotive industries, and Stella-Jones, which produces pressure-treated wood for utility poles and railroad ties, were the largest detractors in the sector.
| Top Contributors to Performance | Top Detractors from Performance | |||||
| For 2019 (%)1 | For 2019 (%)2 | |||||
| Ares Management Cl. A | 0.88 | Virtu Financial Cl. A | -0.35 | |||
| Cirrus Logic | 0.87 | Merit Medical Systems | -0.26 | |||
| MKS Instruments | 0.68 | Meredith Corporation | -0.21 | |||
| HEICO Corporation | 0.68 | FutureFuel Corporation | -0.17 | |||
| Genworth MI Canada | 0.57 | Pason Systems | -0.14 | |||
| 1 Includes dividends | 2 Net of dividends | |||||
CURRENT POSITIONING AND OUTLOOK
The backdrop looks quite favorable to us for solid to strong small-cap performance overall. We have previously cited four favorable factors in the current market environment—low inflation, modest valuations, moderate growth, and ample access to capital. Each of these remains present and suggests that small-cap returns can go higher. We see a global economy that’s showing signs of renewed life, an ISM Manufacturing Index that’s been incrementally rising (despite December’s setback), and, most important, valuations that range from reasonable to attractive among the many small-cap cyclical areas that we typically like best. While 2019 was a very strong year for small-cap stocks, two consecutive years of double-digit increases are fairly common for this asset class. Periods in which a healthy second year followed a strong one came in 1988-9, 1991-2, 1995-6, 2003-4, 2009-10, 2012-13, and 2016-17. With the favorable conditions we’ve outlined above in mind, we suspect that the current small-cap rally can continue, with the potential to add 2019-20 to this list.
18 | The Royce Funds2019 Annual Report to Shareholders
|
| PERFORMANCE AND PORTFOLIO REVIEW (UNAUDITED) | TICKER SYMBOLSPENNX RYPFX RPMIX RYPCX RPMRX |
Performance and Expenses
Average Annual Total Return (%) Through 12/31/19
| JUL-DEC 20191 | 1-YR | 3-YR | 5-YR | 10-YR | 15-YR | 20-YR | 25-YR | 30-YR | 35-YR | 45-YR | |
| PMF | 7.43 | 26.56 | 9.95 | 8.28 | 10.52 | 8.08 | 10.12 | 10.70 | 10.32 | 11.08 | 15.37 |
| Annual Operating Expenses: 0.92% | |||||||||||
1 Not annualized
Morningstar Style Map™As of 12/31/19
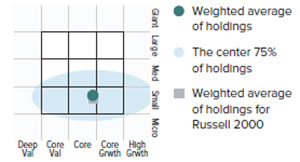
TheMorningstar Style Mapis theMorningstar Style Box™ with the center 75% of fund holdings plotted as theMorningstar Ownership Zone™. The Morningstar Style Box is designed to reveal a fund’s investment strategy. The Morningstar Ownership Zone provides detail about a portfolio’s investment style by showing the range of stock sizes and styles. The Ownership Zone is derived by plotting each stock in the portfolio within the proprietary Morningstar Style Box. Over time, the shape and location of a fund’s ownership zone may vary. See page 89 for additional information.
Value of $10,000
Invested on 12/29/78 (Russell 2000 Inception)
as of 12/31/19 ($)
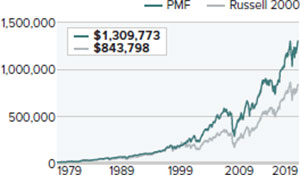
Top 10 Positions
% of Net Assets
| First Citizens BancShares Cl. A | 1.2 |
| Genworth MI Canada | 1.2 |
| Colfax Corporation | 1.2 |
| HEICO Corporation | 1.1 |
| Stella-Jones | 1.1 |
| Quaker Chemical | 1.1 |
| SEACOR Holdings | 1.1 |
| Ares Management Cl. A | 1.0 |
| FLIR Systems | 1.0 |
| Reliance Steel & Aluminum | 1.0 |
Portfolio Sector Breakdown
% of Net Assets
| Industrials | 27.5 |
| Information Technology | 19.0 |
| Financials | 16.0 |
| Consumer Discretionary | 8.9 |
| Materials | 8.7 |
| Health Care | 6.2 |
| Energy | 4.3 |
| Real Estate | 2.9 |
| Consumer Staples | 1.4 |
| Communication Services | 1.1 |
| Cash and Cash Equivalents | 4.0 |
Calendar Year Total Returns (%)
| YEAR | PMF |
| 2019 | 26.6 |
| 2018 | -9.7 |
| 2017 | 16.2 |
| 2016 | 26.5 |
| 2015 | -11.4 |
| 2014 | -0.7 |
| 2013 | 35.3 |
| 2012 | 14.6 |
| 2011 | -4.2 |
| 2010 | 23.9 |
| 2009 | 36.3 |
| 2008 | -34.8 |
| 2007 | 2.8 |
| 2006 | 14.8 |
| 2005 | 12.5 |
Upside/Downside Capture Ratios
Periods Ended 12/31/19 (%)
| UPSIDE | DOWNSIDE | |
| 10-Year | 89 | 90 |
| From 12/31/78 (Russell 2000 Inception) | 89 | 71 |
Portfolio Diagnostics
| Fund Net Assets | $1,949 million |
| Number of Holdings | 283 |
| Turnover Rate | 30% |
| Average Market Capitalization1 | $2,215 million |
| Weighted Average P/E Ratio2,3 | 20.1x |
| Weighted Average P/B Ratio2 | 2.2x |
| Active Share4 | 88% |
| U.S. Investments (% of Net Assets) | 84.9% |
| Non-U.S. Investments (% of Net Assets) | 11.1% |
| 1 | Geometric Average.This weighted calculation uses each portfolio holding’s market cap in a way designed to not skew the effect of very large or small holdings; instead, it aims to better identify the portfolio’s center, which Royce believes offers a more accurate measure of average market cap than a simple mean or median. |
| 2 | Harmonic Average.This weighted calculation evaluates a portfolio as if it were a single stock and measures it overall. It compares the total market value of the portfolio to the portfolio’s share in the earnings or book value, as the case may be, of its underlying stocks. |
| 3 | The Fund’s P/E ratio calculation excludes companies with zero or negative earnings (10% of portfolio holdings as of 12/31/19). |
| 4 | Active Shareis the sum of the absolute values of the different weightings of each holding in the Fund versus each holding in the benchmark, divided by two. |
Important Performance and Expense Information
All performance information in thisReportreflects past performance, is presented on a total return basis, reflects the reinvestment of distributions, and does not reflect the deduction of taxes that a shareholder would pay on fund distributions or the redemption of fund shares. Past performance is no guarantee of future results. Investment return and principal value of an investment will fluctuate, so that shares may be worth more or less than their original cost when redeemed. Shares redeemed within 30 days of purchase may be subject to a 1% redemption fee payable to the Fund, which is not reflected in the performance shown above; if it were, performance would be lower. Current month-end performance may be higher or lower than performance quoted and may be obtained at www.royceinvest.com. All performance and risk information reflects results of the Investment Class (its oldest class). Certain immaterial adjustments were made to the net assets of Royce Pennsylvania Mutual Fund at 6/30/19 for financial reporting purposes, and as a result the net asset values shareholder transactions on that date and the calendar year total returns (%) based on those net asset values differ from the adjusted net asset values and calendar year total returns reported in the Financial Highlights. Operating expenses reflect the Fund’s total annual operating expenses for the Investment Class as of the Fund’s most current prospectus and include management fees and other expenses. Regarding the “Top Contributors” and “Top Detractors” tables shown above, the sum of all contributors to, and all detractors from, performance for all securities in the portfolio would approximate the Fund’s year-to-date performance for 2019. Upside Capture Ratio measures a manager’s performance in up markets relative to the Fund’s benchmark. It is calculated by measuring the Fund’s performance in quarters when the benchmark went up and dividing it by the benchmark’s return in those quarters. Downside Capture Ratio measures a manager’s performance in down markets relative to the Fund’s benchmark (Russell 2000). It is calculated by measuring the Fund’s performance in quarters when the benchmark goes down and dividing it by the benchmark’s return in those quarters.
The Royce Funds2019 Annual Report to Shareholders | 19
|
MANAGERS’ DISCUSSION (UNAUDITED)

Chuck Royce
Lauren Romeo, CFA
Steven McBoyle
FUND PERFORMANCE
Royce Premier Fund, which looks for high-quality small-cap stocks, advanced 34.1% in 2019, marking its fourth consecutive year of outperformance as it significantly outpaced its small-cap benchmark, the Russell 2000 Index, which was up 25.5% for the same period. Premier’s recent run of outperformance helped it to beat its benchmark for the three-, five-, 15-, 20-, 25-year, and since inception (12/31/91) periods ended 12/31/19.
WHAT WORKED… AND WHAT DIDN’T
Each of the nine equity sectors in which the portfolio held investments made a positive contribution to performance in 2019. The biggest by far came from Industrials, the Fund’s largest sector weighting, with notable positive impacts also coming from Information Technology and Financials—its next two largest sector weights. The smallest contributions came from Energy, Consumer Staples, and Real Estate, three areas to which the Fund has little exposure (though its weighting in Energy was higher than the benchmark’s at year-end). At the industry level, machinery (Industrials) dominated with an outsized positive contribution, thanks to strong results from CIRCOR International, Woodward, and John Bean Technologies. Industrial conglomerates (Industrials) was the only industry that detracted, due to a disappointing year for Raven Industries, a U.S. manufacturer of precision agriculture products, high-altitude balloons, plastic film and sheeting, and radar systems.
The Fund’s top contributor overall was Ares Management, an asset manager that focuses on tradable credit, direct lending, private equity, and real estate. Investors became more optimistic about the company’s ability to sustain mid-teens, high margin earnings growth for an extended period. The company also converted to C-corp. status, which broadened ownership, supporting an increase in its valuation. Fair Isaac continued to reap the rewards of recent initiatives that have reaccelerated revenue growth in its core, high-margin credit score business—the ubiquitous, industry-standard FICO score. Fair Isaac has also been broadening its addressable market, which is aimed at assessing the creditworthiness of borrowers with little or no credit history, while growing its financial software business. These efforts paid off in the form of double-digit revenue and EPS growth in 2019.
Canadian company Pason Systems, the Fund’s top detractor, provides instrumentation and data management systems for drilling rigs. The company saw its near-term outlook weaken in 2019 as North American drilling activity declined through the year on supply/demand concerns exacerbated by slumping oil and natural gas prices as well as the slower global economy. We think the market has more than fully discounted the negative impact of these developments on Pason’s near-term fundamentals while also seeming not to recognize the attributes that look obvious to us: a durable, high-ROIC business model, an innovative and robust technology pipeline, and a debt-free balance sheet. We felt less sure about the prospects for nLIGHT, which designs and manufactures semiconductor laser products. Declining revenues and gross margins, in particular during an otherwise vibrant year for the electrical equipment industry, prompted us to sell our shares in Premier’s portfolio.
The Fund’s outperformance in 2019 came primarily from superior stock selection, though sector allocation was also positive. Industrials led, with both stock selection and, to a lesser degree, sector allocation contributing. Machinery was the sector’s largest relative industry contributor. Financials was another source of relative outperformance, largely due to savvy stock selection, most notably in the capital markets industry. There were few sources of underperformance on a sector and industry basis, leaving cash as the largest relative detractor (as is often the case in high-return years for the index). Materials followed as stock selection in both the chemicals and paper & forest products industries proved ineffective. Quaker Chemical, a global leader in process fluids and lubricant solutions for a diverse set of industries, predominantly steel and metalworking, was the sector’s largest relative detractor. Quaker finally closed its long-delayed merger with Houghton in July and subsequently announced quarterly results that fell below expectations and provided pro forma guidance for 2021 that disappointed many investors.
| Top Contributors to Performance | Top Detractors from Performance | |||||
| For 2019 (%)1 | For 2019 (%)2 | |||||
| Ares Management Cl. A | 2.32 | Pason Systems | -0.38 | |||
| Fair Isaac | 2.19 | nLIGHT | -0.36 | |||
| Air Lease Cl. A | 1.83 | Dorman Products | -0.34 | |||
| Manhattan Associates | 1.75 | Virtu Financial Cl. A | -0.32 | |||
| MKS Instruments | 1.63 | National Instruments | -0.14 | |||
| 1 Includes dividends | 2 Net of dividends | |||||
CURRENT POSITIONING AND OUTLOOK
The backdrop looks quite favorable to us for solid to strong small-cap performance overall. We have previously cited four favorable factors in the current market environment—low inflation, modest valuations, moderate growth, and ample access to capital. Each of these remains present and suggests that small-cap returns can go higher. We see a global economy that’s showing signs of renewed life, an ISM Manufacturing Index that’s been incrementally rising (despite December’s setback), and, most important, valuations that range from reasonable to attractive among the many small-cap cyclical areas that we typically like best. We believe that the market is starting to pivot from rewarding those areas that have succeeded to those that have lagged, so our focus has been on those areas that either didn’t participate in 2019’s upswing or trailed significantly. More specifically, we added several cyclical stocks at the larger end of the micro-cap universe, an area that lagged meaningfully prior to 2019’s fourth quarter.
20 | The Royce Funds2019 Annual Report to Shareholders
|
| PERFORMANCE AND PORTFOLIO REVIEW (UNAUDITED) | TICKER SYMBOLSRYPRX RPFFX RPFIX RPRCX RPRRX |
Performance and Expenses
Average Annual Total Return (%) Through 12/31/19
| JUL-DEC 20191 | 1-YR | 3-YR | 5-YR | 10-YR | 15-YR | 20-YR | 25-YR | SINCE INCEPTION 12/31/91 | |
| RPR | 10.23 | 34.13 | 14.15 | 10.52 | 11.30 | 9.69 | 11.01 | 11.68 | 11.77 |
| Annual Operating Expenses: 1.17% | |||||||||
1Not annualized
Relative Returns: Monthly Rolling Average Annual Return Periods
20 Years Through 12/31/19
On a monthly rolling basis, the Fund outperformed the Russell 2000 in 79% of all 10-year periods; 59% of all 5-year periods; and 65% of all 1-year periods.
| PERIODS BEATING THE INDEX | FUND AVG (%)1 | INDEX AVG (%)1 | |||||
| 10-year | 96/121 | 79% | 10.2 | 8.2 | |||
| 5-year | 106/181 | 59% | 10.6 | 8.8 | |||
| 1-year | 148/229 | 65% | 12.0 | 9.2 | |||
1Average of monthly rolling average annual total returns over the specified periods.
Morningstar Style Map™As of 12/31/19
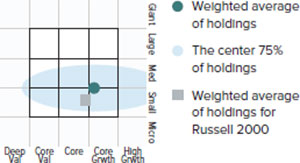
TheMorningstar Style Mapis theMorningstar Style Box™ with the center 75% of fund holdings plotted as theMorningstar Ownership Zone™. The Morningstar Style Box is designed to reveal a fund’s investment strategy. The Morningstar Ownership Zone provides detail about a portfolio’s investment style by showing the range of stock sizes and styles. The Ownership Zone is derived by plotting each stock in the portfolio within the proprietary Morningstar Style Box. Over time, the shape and location of a fund’s ownership zone may vary. See page 89 for additional information.
Value of $10,000
Invested on 12/31/91 as of 12/31/19 ($)
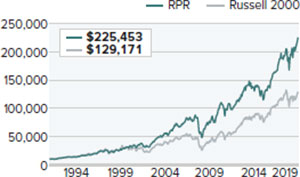
Top 10 Positions
% of Net Assets
| Air Lease Cl. A | 3.2 |
| Kirby Corporation | 3.2 |
| Lincoln Electric Holdings | 3.0 |
| Cabot Microelectronics | 3.0 |
| MKS Instruments | 2.9 |
| Ashmore Group | 2.8 |
| Woodward | 2.7 |
| Morningstar | 2.7 |
| Quaker Chemical | 2.7 |
| Genworth MI Canada | 2.6 |
Portfolio Sector Breakdown
% of Net Assets
| Industrials | 38.3 |
| Information Technology | 18.6 |
| Financials | 18.0 |
| Materials | 8.9 |
| Energy | 5.0 |
| Consumer Discretionary | 3.3 |
| Health Care | 3.1 |
| Real Estate | 1.3 |
| Cash and Cash Equivalents | 3.5 |
Calendar Year Total Returns (%)
| YEAR | RPR |
| 2019 | 34.1 |
| 2018 | -10.4 |
| 2017 | 23.8 |
| 2016 | 23.0 |
| 2015 | -9.9 |
| 2014 | -0.9 |
| 2013 | 27.7 |
| 2012 | 11.4 |
| 2011 | -0.9 |
| 2010 | 26.5 |
| 2009 | 33.3 |
| 2008 | -28.3 |
| 2007 | 12.7 |
| 2006 | 8.8 |
| 2005 | 17.1 |
Upside/Downside Capture Ratios
Periods Ended 12/31/19 (%)
| UPSIDE | DOWNSIDE | |
| 10-Year | 91 | 85 |
| From 12/31/91 (Start of Fund’s First Full Quarter) | 93 | 71 |
Portfolio Diagnostics
| Fund Net Assets | $1,808 million |
| Number of Holdings | 52 |
| Turnover Rate | 19% |
| Average Market Capitalization1 | $3,699 million |
| Weighted Average P/E Ratio2,3 | 28.4x |
| Weighted Average P/B Ratio2 | 2.8x |
| Active Share4 | 98% |
| U.S. Investments (% of Net Assets) | 81.6% |
| Non-U.S. Investments (% of Net Assets) | 14.9% |
| 1 | Geometric Average.This weighted calculation uses each portfolio holding’s market cap in a way designed to not skew the effect of very large or small holdings; instead, it aims to better identify the portfolio’s center, which Royce believes offers a more accurate measure of average market cap than a simple mean or median. |
| 2 | Harmonic Average.This weighted calculation evaluates a portfolio as if it were a single stock and measures it overall. It compares the total market value of the portfolio to the portfolio’s share in the earnings or book value, as the case may be, of its underlying stocks. |
| 3 | The Fund’s P/E ratio calculation excludes companies with zero or negative earnings (4% of portfolio holdings as of 12/31/19). |
| 4 | Active Shareis the sum of the absolute values of the different weightings of each holding in the Fund versus each holding in the benchmark, divided by two. |
Important Performance and Expense Information
All performance information in thisReportreflects past performance, is presented on a total return basis, reflects the reinvestment of distributions, and does not reflect the deduction of taxes that a shareholder would pay on fund distributions or the redemption of fund shares. Past performance is no guarantee of future results. Investment return and principal value of an investment will fluctuate, so that shares may be worth more or less than their original cost when redeemed. Shares redeemed within 30 days of purchase may be subject to a 1% redemption fee payable to the Fund, which is not reflected in the performance shown above; if it were, performance would be lower. Current month-end performance may be higher or lower than performance quoted and may be obtained at www.royceinvest.com. All performance and risk information reflects results of the Investment Class (its oldest class). Certain immaterial adjustments were made to the net assets of Royce Premier Fund at 6/30/19 for financial reporting purposes, and as a result the net asset values shareholder transactions on that date and the calendar year total returns (%) based on those net asset values differ from the adjusted net asset values and calendar year total returns reported in the Financial Highlights. Operating expenses reflect the Fund’s total annual operating expenses for the Investment Class as of the Fund’s most current prospectus and include management fees and other expenses. Regarding the “Top Contributors” and “Top Detractors” tables shown above, the sum of all contributors to, and all detractors from, performance for all securities in the portfolio would approximate the Fund’s year-to-date performance for 2019. Upside Capture Ratio measures a manager’s performance in up markets relative to the Fund’s benchmark. It is calculated by measuring the Fund’s performance in quarters when the benchmark went up and dividing it by the benchmark’s return in those quarters. Downside Capture Ratio measures a manager’s performance in down markets relative to the Fund’s benchmark (Russell 2000). It is calculated by measuring the Fund’s performance in quarters when the benchmark goes down and dividing it by the benchmark’s return in those quarters.
The Royce Funds2019 Annual Report to Shareholders | 21
| MANAGER’S DISCUSSION (UNAUDITED) |
| Royce Small-Cap Value Fund (RVV) |

| Jay Kaplan, CFA |
| FUND PERFORMANCE |
Royce Small-Cap Value Fund, which uses a disciplined contrarian value approach, increased 18.2% in 2019, trailing respective gains of 25.5% and 22.4% for its small-cap benchmarks, the Russell 2000 and Russell 2000 Value Indexes, for the same period. |
| WHAT WORKED… AND WHAT DIDN’T |
For the calendar year, seven of the portfolio’s 11 equity sectors finished in the black. Three sectors dominated the positive contributors—Information Technology, Industrials, and Financials—while Utilities were flat, and Energy, Consumer Staples, and Communication Services detracted. At the industry level, electronic equipment, instruments & components (Information Technology) led by a wide margin, followed by banks and thrifts & mortgage finance (both in Financials), as well as machinery (Industrials). Oil, gas & consumable fuels (Energy) was the largest detractor at the industry level in 2019, followed by specialty retail, textiles, apparel & luxury goods (both in Consumer Discretionary), and food & staples retailing (Consumer Staples).
The portfolio’s largest holding at year-end, Insight Enterprises contributed most at the position level, as it did for the six-month period ended 6/30/19. The company provides information technology hardware and software for large and small enterprises and was key to the electronic equipment, instruments & components group’s strong performance in 2019. Insight continued to execute profitably in 2019, with steadily increasing revenues and better-than-expected earnings. The company also saw its sales grow as a result of its acquisition of PCM in August, which expands the firm’s reach into higher-margin end markets that are expected to drive additional improvement in the future and which are a large part of Insight’s optimistic outlook for 2020.
Another company in the same industry was also a top contributor in 2019—PC Connection, a direct marketer of a technology products and services, including computer systems, software and peripheral equipment, and networking communications. The company beat earnings estimates in both the second and third quarters while also exceeding consensus revenue estimates in three out of the last four quarters—both evidence of the kind of successful execution we like from our holdings. Genworth MI Canada, which provides private residential mortgage insurance in that nation, also stood out. Its stock began to rise in July when Genworth Financial, a related U.S. firm, agreed to sell its shares of Genworth MI Canada to Brookfield Business Partners in order to win regulatory approval for its own acquisition by a Chinese company. The firm also had steadily growing revenues and net income throughout 2019.
The specialty retail industry was home to the Fund’s worst performing position, footwear retailer Designer Brands (formerly known as DSW). The company has faced challenges as many leading brands are opting for more direct customer relationships. In December, the company also reported a decline in its gross margins related to unseasonably warm fall weather, which hindered performance, and tariff concerns that led to an inventory pullback and a cut in marketing investments in anticipation of lower spending by consumers that didn’t materialize. Confident that the company can right itself and navigate the secular shifts affecting retailers, we added shares in 2019. Low-fare airline operator Spirit Airlines grappled with lower fares throughout the industry and poor weather (including hurricanes). Spirit also opted to aggressively schedule more flights, which left little room for error when mechanical or weather-related problems arose. Seeing these as solvable short-term issues, we built our position. ArcBest is a freight and logistics solutions specialist that saw its business stall in 2019, though we think its long-term prospects are solid, especially if the economy reaccelerates in 2020.
Both stock selection and, to a lesser degree, sector allocation hurt performance versus the Russell 2000 in 2019. Consumer Discretionary and Health Care detracted most. Underperformance in the first sector was almost entirely the result of poor stock selection while in Health Care both our lower exposure and ineffective stock picks created a disadvantage. Specialty retail (Consumer Discretionary) fared worst on an industry basis, followed by biotechnology, which dominated results in Health Care. The portfolio’s cash position also detracted from relative results. Conversely, our overweight in Information Technology and underweight in Utilities helped relative results.
| Top Contributors to Performance | Top Detractors from Performance | |||||
| For 2019 (%)1 | For 2019 (%)2 | |||||
| Insight Enterprises | 1.46 | Designer Brands Cl. A | -0.64 | |||
| Genworth MI Canada | 1.34 | Spirit Airlines | -0.53 | |||
| PC Connection | 1.25 | ArcBest | -0.52 | |||
| Meritor | 0.98 | G-III Apparel Group | -0.46 | |||
| Miller Industries | 0.91 | Alliance Resource Partners L.P. | -0.46 | |||
| 1 Includes dividends | 2 Net of dividends | |||||
| CURRENT POSITIONING AND OUTLOOK |
The market’s shift to value proved short-lived as the Russell 2000 Value trailed its growth counterpart in 2019’s fourth quarter. Whether growth’s resurgence will last or value can reassert itself is of course an open question. The fear of recession appears to have diminished, with green shoots indicating that the global slowdown may have bottomed. Details on a China trade deal are still vague, however, and this is not the first time that an agreement has appeared close, so economic reacceleration may remain elusive. In the meantime, the Fed is holding the line on rates, and yield curve inversion is over for now. In other words, the outlook remains uncertain before we even consider geopolitical tensions or the November elections. In this environment, we been adding select positions that look attractively valued and capable of rebounding in energy services and pharmaceuticals. |
| 22 | The Royce Funds 2019 Annual Report to Shareholders |
|
| PERFORMANCE AND PORTFOLIO REVIEW (UNAUDITED) | TICKER SYMBOLS RYVFX RVVHX RVFCX RVVRX |
Performance and Expenses
Average Annual Total Return (%) Through 12/31/19
| JUL-DEC 20191 | 1-YR | 3-YR | 5-YR | 10-YR | 15-YR | SINCE INCEPTION (6/14/01) | |
| RVV | 8.57 | 18.21 | 4.92 | 4.35 | 7.20 | 6.87 | 9.06 |
| Annual Gross Operating Expenses: 1.53% Annual Net Operating Expenses: 1.49% | |||||||
1Not annualized
Morningstar Style Map™As of 12/31/19
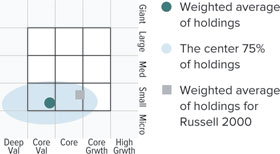
TheMorningstar Style Mapis theMorningstar Style Box™with the center 75% of fund holdings plotted as theMorningstar Ownership Zone™. The Morningstar Style Box is designed to reveal a fund’s investment strategy. The Morningstar Ownership Zone provides detail about a portfolio’s investment style by showing the range of stock sizes and styles. The Ownership Zone is derived by plotting each stock in the portfolio within the proprietary Morningstar Style Box. Over time, the shape and location of a fund’s ownership zone may vary. See page 89 for additional information.
Value of $10,000
Invested on 6/14/01 as of 12/31/19 ($)
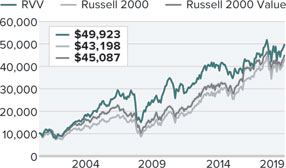
Top 10 Positions
% of Net Assets
| Insight Enterprises | 2.6 |
| Genworth MI Canada | 2.5 |
| Miller Industries | 2.5 |
| Sanmina Corporation | 2.3 |
| WSFS Financial | 2.2 |
| Spirit Airlines | 2.2 |
| Designer Brands Cl. A | 2.1 |
| Caleres | 2.0 |
| Shoe Carnival | 2.0 |
| Rent-A-Center | 1.9 |
Portfolio Sector Breakdown
% of Net Assets
| Industrials | 27.6 |
| Financials | 25.7 |
| Consumer Discretionary | 15.4 |
| Information Technology | 11.3 |
| Energy | 6.5 |
| Health Care | 2.4 |
| Real Estate | 1.5 |
| Communication Services | 0.9 |
| Consumer Staples | 0.5 |
| Materials | 0.3 |
| Cash and Cash Equivalents | 7.9 |
Calendar Year Total Returns (%)
| YEAR | RVV |
| 2019 | 18.2 |
| 2018 | -7.2 |
| 2017 | 5.3 |
| 2016 | 21.1 |
| 2015 | -11.5 |
| 2014 | -0.0 |
| 2013 | 27.8 |
| 2012 | 9.6 |
| 2011 | -7.4 |
| 2010 | 25.0 |
| 2009 | 44.7 |
| 2008 | -34.2 |
| 2007 | 3.8 |
| 2006 | 16.8 |
| 2005 | 17.2 |
Upside/Downside Capture Ratios
Periods Ended 12/31/19 (%)
| UPSIDE | DOWNSIDE | |
| 10-Year | 70 | 82 |
| From 6/30/01 (Start of Fund’s First Full Quarter) | 95 | 87 |
Portfolio Diagnostics
| Fund Net Assets | $171 million |
| Number of Holdings | 82 |
| Turnover Rate | 64% |
| Average Market Capitalization1 | $1,197 million |
| Weighted Average P/E Ratio2,3 | 11.6x |
| Weighted Average P/B Ratio2 | 1.6x |
| Active Share4 | 96% |
| U.S. Investments (% of Net Assets) | 85.1% |
| Non-U.S. Investments (% of Net Assets) | 7.0% |
| 1 | Geometric Average.This weighted calculation uses each portfolio holding’s market cap in a way designed to not skew the effect of very large or small holdings; instead, it aims to better identify the portfolio’s center, which Royce believes offers a more accurate measure of average market cap than a simple mean or median. |
| 2 | Harmonic Average.This weighted calculation evaluates a portfolio as if it were a single stock and measures it overall. It compares the total market value of the portfolio to the portfolio’s share in the earnings or book value, as the case may be, of its underlying stocks. |
| 3 | The Fund’s P/E ratio calculation excludes companies with zero or negative earnings (4% of portfolio holdings as of 12/31/19). |
| 4 | Active Shareis the sum of the absolute values of the different weightings of each holding in the Fund versus each holding in the benchmark, divided by two. |
Important Performance and Expense Information
All performance information in thisReportreflects past performance, is presented on a total return basis, reflects the reinvestment of distributions, and does not reflect the deduction of taxes that a shareholder would pay on fund distributions or the redemption of fund shares. Past performance is no guarantee of future results. Investment return and principal value of an investment will fluctuate, so that shares may be worth more or less than their original cost when redeemed. Shares redeemed within 30 days of purchase may be subject to a 1% redemption fee payable to the Fund, which is not reflected in the performance shown above; if it were, performance would be lower. Current month-end performance may be higher or lower than performance quoted and may be obtained at www.royceinvest.com. All performance and risk information reflects results of the Service Class (its oldest class). Certain immaterial adjustments were made to the net assets of Royce Small-Cap Value Fund at 6/30/16 for financial reporting purposes, and as a result the net asset values for shareholder transactions on that date and the calendar year Total Returns (%) based on those net asset values differ from the adjusted net asset values and calendar year total returns reported in the Financial Highlights. Gross operating expenses reflect the Fund’s gross total annual operating expenses for the Service Class and include management fees, 12b-1 distribution and service fees, and other expenses. Net operating expenses reflect contractual fee waivers and/or expense reimbursements. All expense information is reported as of the Fund’s most current prospectus. Royce & Associates has contractually agreed, without right of termination, to waive fees and/or reimburse expenses to the extent necessary to maintain the Service Class’s net annual operating expenses (excluding brokerage commissions, taxes, interest, litigation expenses, acquired fund fees and expenses, and other expenses not borne in the ordinary course of business) at or below 1.49% through April 30, 2020. Regarding the “Top Contributors” and “Top Detractors” tables shown above, the sum of all contributors to, and all detractors from, performance for all securities in the portfolio would approximate the Fund’s year-to-date performance for 2019. Upside Capture Ratio measures a manager’s performance in up markets relative to the Fund’s benchmark. It is calculated by measuring the Fund’s performance in quarters when the benchmark went up and dividing it by the benchmark’s return in those quarters. Downside Capture Ratio measures a manager’s performance in down markets relative to the Fund’s benchmark (Russell 2000). It is calculated by measuring the Fund’s performance in quarters when the benchmark goes down and dividing it by the benchmark’s return in those quarters.
The Royce Funds 2019 Annual Report to Shareholders | 23
| MANAGER’S DISCUSSION (UNAUDITED) |
| Royce Smaller-Companies Growth Fund (RVP) |

| Chip Skinner, CFA |
| FUND PERFORMANCE |
Royce Smaller Companies Growth Fund delivered a strong absolute return of 23.7% in 2019, though the Fund lagged its benchmark, the Russell 2000 Index, which advanced 25.5% for the same period. |
| WHAT WORKED… AND WHAT DIDN’T |
Eight of the Fund’s 10 equity sectors finished the year in the black. Information Technology was the top performer, more than tripling the impact of the portfolio’s next best contributor, Industrials. Materials and Energy detracted, but did so on a modest scale. Three industries in Information Technology were among the top-contributors: software, semiconductors & semiconductor equipment, and IT services. Biotechnology (Health Care) was also additive. Conversely, Internet & direct marketing retail (Consumer Discretionary), pharmaceuticals, and health care technology (both in Health Care) were the biggest detractors.
The top-contributing position for the year was software company Paylocity Holding Corporation. The company provides cloud-based payroll and HR solutions for smaller companies and benefited from low unemployment and market share wins, which spurred demand for its payroll and human resources software and services. Enphase Energy, another technology holding, makes products that increase the productivity and reliability of solar modules. Enphase has been a significant contributor for two consecutive years as new management has been successful in leading a multi-year transformation with a new set of competitive products for the solar inverter market. It also is expanding its solution footprint to include back-up power/ electricity storage solutions. Enphase is part of an expanding group of companies in the portfolio in the “electrification” theme. Genetic testing company Veracyte also made a strong contribution, as the company saw all three of its marketed products that treat lung and thyroid cancer generating revenues at varying above-average rates. Veracyte also announced initial study results from a nasal swab test for lung cancer that could be on the market by 2021.
Waitr Holdings, a food and restaurant order delivery business that targets smaller communities, was the portfolio’s largest detractor in 2019, the result of its business being hurt by intensifying competition and dropping prices—factors that led us to sell our stake. We also saw poor performance in Evolus, a medical aesthetics company that produces Jeuveau, a drug for the treatment of frown lines which competes with Botox treatments. The company has seen incredible success since its launch in May 2019 as a result of what we thought was a stellar digital launch campaign, but others questioned whether Jeuveau would continue to take share from competitors beyond the early promotional period. While we think these sentiments could crimp share-price growth in 2020, we held our shares at year-end based on our confidence in the appeal of the drug. Inogen also hampered performance during the year as the company struggled to reestablish growth in its portable oxygen concentrator business despite an aggressive ramp up of sales people near the end of 2018. We sold our shares in 2019’s first half.
The Fund’s relative underperformance in 2019 was driven entirely by stock selection—sector allocation was additive. Health Care was the largest source of underperformance due to poor selection in several industries, including health care technology and pharmaceuticals. Consumer Discretionary also hindered relative performance because of stock selection, particularly in internet & direct marketing retail. In addition, the Fund’s cash position hampered performance versus the benchmark. Conversely, we saw strong results in Information Technology due to both savvy stock selection and our overexposure to the sector. Stock selection in Communication Services proved additive, while our lower exposure to Energy also provided positive relative performance. Semiconductors & semiconductor equipment and software (both in Information Technology) yielded the strongest relative results at the industry level, followed by communications equipment (Communication Services).
| Top Contributors to Performance | Top Detractors from Performance | |||||
| For 2019 (%)1 | For 2019 (%)2 | |||||
| Paylocity Holding Corporation | 2.06 | Waitr Holdings | -0.75 | |||
| Veracyte | 1.42 | Evolus | -0.43 | |||
| Enphase Energy | 1.30 | Inogen | -0.34 | |||
| USA Technologies | 1.11 | Intersect ENT | -0.31 | |||
| KEYW Holding Corporation | 1.11 | Mitek Systems | -0.31 | |||
| 1 Includes dividends | 2 Net of dividends | |||||
| CURRENT POSITIONING AND OUTLOOK |
The U.S. economy decelerated through 2019 but continues to show slow positive growth, with the overhang of trade and tariff issues impeding acceleration. While there was evidence of an industrial slowdown in the second half of 2019, a recession appears to have been averted. An accommodative Fed, which lowered rates three times between July and October, and the first phase of a possible trade deal with China, both helped to lift returns in the second half of the year. We are more cautious in our outlook for 2020, which we believe could have difficulty repeating the success of 2019. The economic expansion is long in the tooth, political risks are looming, fixed income and high yield markets are sending signs of speculation, and certain segments of the equity market, such as biotechnology and big private equity “unicorns,” are showing signs of fatigue—all of which leads us to a more circumspect view. Still, high-return years can come in twos, especially since 2020 is an election year—which have historically been good ones for stocks—and long-term returns at the end of 2019 were below their rolling averages. |
| 24 | The Royce Funds 2019 Annual Report to Shareholders |
|
| PERFORMANCE AND PORTFOLIO REVIEW (UNAUDITED) | TICKER SYMBOLS RYVPX RVPHX RVPCX RVPIX |
Performance and Expenses
Average Annual Total Return (%) Through 12/31/19
| JUL-DEC 20191 | 1-YR | 3-YR | 5-YR | 10-YR | 15-YR | SINCE INCEPTION (6/14/01) | |
| RVP | 2.14 | 23.67 | 9.36 | 7.03 | 9.16 | 7.08 | 10.77 |
| Annual Gross Operating Expenses: 1.52% Annual Net Operating Expenses: 1.49% | |||||||
1Not annualized
Morningstar Style Map™As of 12/31/19
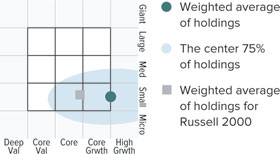
TheMorningstar Style Map is theMorningstar Style Box™ with the center 75% of fund holdings plotted as theMorningstar Ownership Zone™. The Morningstar Style Box is designed to reveal a fund’s investment strategy. The Morningstar Ownership Zone provides detail about a portfolio’s investment style by showing the range of stock sizes and styles. The Ownership Zone is derived by plotting each stock in the portfolio within the proprietary Morningstar Style Box. Over time, the shape and location of a fund’s ownership zone may vary. See page 89 for additional information.
Value of $10,000
Invested on 6/14/01 as of 12/31/19 ($)
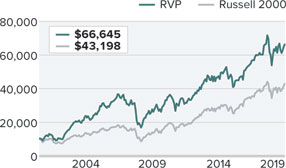
Top 10 Positions
% of Net Assets
| Unisys Corporation | 3.1 |
| Iteris | 3.1 |
| Paylocity Holding Corporation | 3.0 |
| Lovesac Company (The) | 2.1 |
| GP Strategies | 2.0 |
| Lawson Products | 1.9 |
| Lumentum Holdings | 1.9 |
| USA Technologies | 1.9 |
| CryoPort | 1.8 |
| Freshpet | 1.7 |
Portfolio Sector Breakdown
% of Net Assets
| Information Technology | 36.4 |
| Health Care | 24.2 |
| Industrials | 11.0 |
| Consumer Discretionary | 10.5 |
| Financials | 7.1 |
| Real Estate | 2.6 |
| Communication Services | 2.1 |
| Consumer Staples | 1.7 |
| Energy | 1.0 |
| Cash and Cash Equivalents | 3.4 |
Calendar Year Total Returns (%)
| YEAR | RVP |
| 2019 | 23.7 |
| 2018 | -10.2 |
| 2017 | 17.8 |
| 2016 | 9.4 |
| 2015 | -1.8 |
| 2014 | 3.9 |
| 2013 | 32.5 |
| 2012 | 15.3 |
| 2011 | -10.0 |
| 2010 | 19.7 |
| 2009 | 41.4 |
| 2008 | -41.1 |
| 2007 | 3.2 |
| 2006 | 19.3 |
| 2005 | 13.2 |
Upside/Downside Capture Ratios
Periods Ended 12/31/19 (%)
| UPSIDE | DOWNSIDE | |
| 10-Year | 94 | 113 |
| From 6/30/01 (Start of Fund’s First Full Quarter) | 114 | 103 |
Portfolio Diagnostics
| Fund Net Assets | $260 million |
| Number of Holdings | 102 |
| Turnover Rate | 53% |
| Average Market Capitalization1 | $1,501 million |
| Weighted Average P/B Ratio2 | 3.9x |
| 3-5 Year EPS Growth (est.)3 | 16.5% |
| Active Share4 | 95% |
| U.S. Investments (% of Net Assets) | 88.5% |
| Non-U.S. Investments (% of Net Assets) | 8.1% |
| 1 | Geometric Average. This weighted calculation uses each portfolio holding’s market cap in a way designed to not skew the effect of very large or small holdings; instead, it aims to better identify the portfolio’s center, which Royce believes offers a more accurate measure of average market cap than a simple mean or median. |
| 2 | Harmonic Average.This weighted calculation evaluates a portfolio as if it were a single stock and measures it overall. It compares the total market value of the portfolio to the portfolio’s share in the earnings or book value, as the case may be, of its underlying stocks. |
| 3 | The 3-5 Year EPS Growth (est.) is calculated as a simple weighted average of the pre-calculated mean long-term EPS growth rate estimates by brokerage analysts. Long Term Growth (LTG) is the annual EPS growth that the company can sustain over the next 3 or 5 years. Source:Factset |
| 4 | Active Shareis the sum of the absolute values of the different weightings of each holding in the Fund versus each holding in the benchmark, divided by two. |
Important Performance and Expense Information
All performance information in thisReportreflects past performance, is presented on a total return basis, reflects the reinvestment of distributions, and does not reflect the deduction of taxes that a shareholder would pay on fund distributions or the redemption of fund shares. Past performance is no guarantee of future results. Investment return and principal value of an investment will fluctuate, so that shares may be worth more or less than their original cost when redeemed. Shares redeemed within 30 days of purchase may be subject to a 1% redemption fee payable to the Fund, which is not reflected in the performance shown above; if it were, performance would be lower. Current month-end performance may be higher or lower than performance quoted and may be obtained at www.royceinvest.com. All performance and risk information reflects results of the Service Class (its oldest class). Gross operating expenses reflect the Fund’s gross total operating expenses for the Service Class and include management fees, 12b-1 distribution and service fees, and other expenses. Net operating expenses reflect contractual fee waivers and/or expense reimbursements. All expense information is reported as of the Fund’s most current prospectus. Royce & Associates has contractually agreed, without right of termination, to waive fees and/or reimburse expenses to the extent necessary to maintain the Service Class’s net annual operating expenses (excluding brokerage commissions, taxes, interest, litigation expenses, acquired fund fees and expenses, and other expenses not borne in the ordinary course of business) at or below 1.49% through April 30, 2020. Regarding the “Top Contributors” and “Top Detractors” tables shown above, the sum of all contributors to, and all detractors from, performance for all securities in the portfolio would approximate the Fund’s year-to-date performance for 2019. Upside Capture Ratio measures a manager’s performance in up markets relative to the Fund’s benchmark. It is calculated by measuring the Fund’s performance in quarters when the benchmark went up and dividing it by the benchmark’s return in those quarters. Downside Capture Ratio measures a manager’s performance in down markets relative to the Fund’s benchmark (Russell 2000). It is calculated by measuring the Fund’s performance in quarters when the benchmark goes down and dividing it by the benchmark’s return in those quarters.
The Royce Funds 2019 Annual Report to Shareholders | 25
| MANAGERS’ DISCUSSION (UNAUDITED) |
| Royce Special Equity Fund (RSE) |

| Charlie Dreifus, CFA Steven McBoyle |
| FUND PERFORMANCE |
Royce Special Equity Fund gained 12.6% in 2019, lagging respective gains of 25.5% and 22.4% for its small-cap benchmarks, the Russell 2000 and Russell 2000 Value Indexes, for the same period. While our results began to improve in late August, we were still challenged by the success for many growth stocks, including biotechs (seven of the year’s 10 best performers in the Russell 2000 were biotech stocks), an industry to which we have no exposure. Ultimately, 2019 was largely a snapback market off the calamitous fourth quarter of 2018—when Special Equity held its value significantly better than its benchmarks, down 9.8% versus respective losses of 20.2% and 18.7% for the small-cap and small-cap value indexes. Despite 2019’s strong headwinds, we saw certain higher-quality value names start to perform better during the fourth quarter, and we believe there is more to come. |
| WHAT WORKED… AND WHAT DIDN’T |
Six of the eight equity sectors in which the Fund had investments finished 2019 in the black. Information Technology made by far the biggest positive contribution, followed by Industrials and Consumer Staples. Communication Services and Energy detracted, the latter on a very modest basis, while Real Estate made the smallest positive contribution. At the industry level, food products (Consumer Staples) led, followed by IT services (Information Technology) and electrical equipment (Industrials) while media (Communication Services), aerospace & defense (Industrials), and food & staples retailing (Consumer Staples) had the biggest negative effect.
At the position level, the portfolio’s five top contributors for 2019 were the same companies—in the same order—as the top contributors for the year-to-date period ended 6/30/19. Each holding built on its earlier net gains. Snack food company John B. Sanfilippo & Son made the biggest positive contribution in 2019, followed by Computer Services, which offers bank, payment processing, and related services. Hubbell Incorporated, which manufactures, designs, and sells electrical and electronic products, came next. AVX Corporation, which manufactures passive electronic components including ceramic and tantalum capacitors that store, filter, and regulate electric energy in electronic products, was fourth. Its shares rose in November on news that Japanese conglomerate Kyocera, which already owns more than 70% of AVX’s stock, wants to acquire the entire company. Recreational vehicle maker Winnebago Industries also enjoyed a strong year.
Only 12 stocks detracted from performance in 2019. The portfolio’s six largest detractors at the position level had a disproportionate effect on performance, accounting for more than 90% of the detraction in the Fund. Diversified publishing and broadcasting company, Meredith Corporation, was the top detractor by a significant margin. It was followed by one of 2018’s contributors, diversified manufacturing company National Presto Industries, which saw its stock decline steadily through 2019. Value-priced apparel and accessories retailer, The Children’s Place, also disappointed in 2019 as did supermarket operator Weis Markets and RPC, which provides a broad range of specialized oilfield services and equipment to companies engaged in the exploration, production, and development of oil and gas properties throughout the U.S. and in selected international markets. The sixth-biggest detractor was Bassett Furniture Industries, which manufactures and sells furniture.
Performance relative to the Russell 2000 in 2019 was hurt by both sector allocation and stock selection, with the latter making the largest negative impact. This pattern held in the two sectors that detracted most from results versus the benchmark—Communication Services and Consumer Discretionary. Poor stock selection in the media industry had the biggest negative effect in the first sector while in the second the primary detractors were household durables, specialty retail, and auto components. The portfolio’s cash position also hurt relative performance in 2019. Conversely, stock picking was a relative strength in Consumer Staples, particularly in food products, and Information Technology, where IT services stood out on a relative basis. The portfolio’s lack of exposure to Energy—the only small-cap sector to finish 2019 in the red—also helped versus the benchmark.
| Top Contributors to Performance | Top Detractors from Performance | |||||
| For 2019 (%)1 | For 2019 (%)2 | |||||
| John B. Sanfilippo & Son | 2.88 | Meredith Corporation | -2.41 | |||
| Computer Services | 2.82 | National Presto Industries | -0.85 | |||
| Hubbell Incorporated | 2.36 | Children’s Place | -0.74 | |||
| AVX Corporation | 1.63 | Weis Markets | -0.51 | |||
| Winnebago Industries | 1.24 | RPC | -0.31 | |||
| 1 Includes dividends | 2 Net of dividends | |||||
| CURRENT POSITIONING AND OUTLOOK |
We have maintained for a while that value was deeply neglected and therefore attractive, particularly if global economic conditions bottomed and interest rates and commodity prices firmed. To some degree, this has occurred. The yield curve is its steepest since September 2018, consistent with the view that the global economy has bottomed. In addition, commodity prices are rising, as are global economic diffusion indexes. If this continues, we maintain that we are only in the early innings of the rotation to value. One no longer has to pay steep multiples for growth stocks; earnings growth can be bought much less expensively in value stocks. While known for the caution inherent in our strategy, we must admit that equities could go still higher given the current continued state of more-than-ample liquidity and signs of economic bottoming. The challenge we face is that adhering to our long-established discipline in the current market climate makes it difficult to find new names that meet our stringent selection requirements, though a correction of course would likely produce some new portfolio entries. |
| 26 | The Royce Funds 2019 Annual Report to Shareholders |
|
| PERFORMANCE AND PORTFOLIO REVIEW (UNAUDITED) | TICKER SYMBOLS RYSEX RSEFX RSEIX RSQCX |
Performance and Expenses
Average Annual Total Return (%) Through 12/31/19
| JUL-DEC 20191 | 1-YR | 3-YR | 5-YR | 10-YR | 15-YR | 20-YR | SINCE INCEPTION (5/1/98) | |
| RSE | 7.69 | 12.63 | 3.07 | 4.88 | 8.65 | 7.09 | 10.32 | 8.62 |
| Annual Operating Expenses: 1.18% | ||||||||
1Not annualized
Relative Risk Adjusted Returns: Monthly Rolling Sharpe Ratios
20 Years Through 12/31/19
On a monthly rolling risk-adjusted basis, the Fund outperformed the Russell 2000 in 89% of all 10-year periods and 59% of all 5-year periods.
| PERIODS BEATING THE INDEX | FUND AVG (%)1 | INDEX AVG (%)1 | |||||
| 10-year | 108/121 | 89% | 0.58 | 0.44 | |||
| 5-year | 107/181 | 59% | 0.63 | 0.51 | |||
1 Average of monthly rolling Sharpe Ratios over the specified periods.
Morningstar Style Map™As of 12/31/19
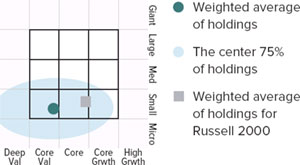
TheMorningstar Style Map is theMorningstar Style Box™ with the center 75% of fund holdings plotted as theMorningstar Ownership Zone™. The Morningstar Style Box is designed to reveal a fund’s investment strategy. The Morningstar Ownership Zone provides detail about a portfolio’s investment style by showing the range of stock sizes and styles. The Ownership Zone is derived by plotting each stock in the portfolio within the proprietary Morningstar Style Box. Over time, the shape and location of a fund’s ownership zone may vary. See page 89 for additional information.
Value of $10,000
Invested on 5/1/98 as of 12/31/19 ($)
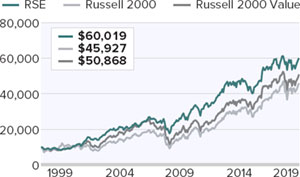
Top 10 Positions
% of Net Assets
| Standard Motor Products | 6.0 |
| Computer Services | 6.0 |
| Hubbell Incorporated | 5.7 |
| Scholastic Corporation | 4.8 |
| Marcus & Millichap | 4.8 |
| AVX Corporation | 4.4 |
| Meredith Corporation | 4.3 |
| Huntsman Corporation | 3.4 |
| National Presto Industries | 3.3 |
| Kulicke & Soffa Industries | 3.0 |
Portfolio Sector Breakdown
% of Net Assets
| Consumer Discretionary | 22.8 |
| Industrials | 22.3 |
| Information Technology | 16.5 |
| Materials | 9.2 |
| Communication Services | 9.1 |
| Real Estate | 4.8 |
| Consumer Staples | 2.6 |
| Cash and Cash Equivalents | 12.7 |
Calendar Year Total Returns (%)
| YEAR | RSE |
| 2019 | 12.6 |
| 2018 | -9.9 |
| 2017 | 7.9 |
| 2016 | 32.2 |
| 2015 | -12.4 |
| 2014 | 1.1 |
| 2013 | 29.4 |
| 2012 | 15.4 |
| 2011 | 0.1 |
| 2010 | 19.6 |
| 2009 | 28.4 |
| 2008 | -19.6 |
| 2007 | 4.7 |
| 2006 | 14.0 |
| 2005 | -1.0 |
Upside/Downside Capture Ratios
Periods Ended 12/31/19 (%)
| UPSIDE | DOWNSIDE | |
| 10-Year | 72 | 72 |
| From 6/30/98 (Start of Fund’s First Full Quarter) | 71 | 49 |
Portfolio Diagnostics
| Fund Net Assets | $1,092 million |
| Number of Holdings | 36 |
| Turnover Rate | 20% |
| Average Market Capitalization1 | $1,295 million |
| Weighted Average P/E Ratio2,3 | 19.9x |
| Weighted Average P/B Ratio2 | 1.8x |
| Active Share4 | 99% |
| U.S. Investments (% of Net Assets) | 82.6% |
| Non-U.S. Investments (% of Net Assets) | 4.7% |
| 1 | Geometric Average. This weighted calculation uses each portfolio holding’s market cap in a way designed to not skew the effect of very large or small holdings; instead, it aims to better identify the portfolio’s center, which Royce believes offers a more accurate measure of average market cap than a simple mean or median. |
| 2 | Harmonic Average.This weighted calculation evaluates a portfolio as if it were a single stock and measures it overall. It compares the total market value of the portfolio to the portfolio’s share in the earnings or book value, as the case may be, of its underlying stocks. |
| 3 | The Fund’s P/E ratio calculation excludes companies with zero or negative earnings (8% of portfolio holdings as of 12/31/19). |
| 4 | Active Shareis the sum of the absolute values of the different weightings of each holding in the Fund versus each holding in the benchmark, divided by two. |
Important Performance and Expense Information
All performance information in thisReportreflects past performance, is presented on a total return basis, reflects the reinvestment of distributions, and does not reflect the deduction of taxes that a shareholder would pay on fund distributions or the redemption of fund shares. Past performance is no guarantee of future results. Investment return and principal value of an investment will fluctuate, so that shares may be worth more or less than their original cost when redeemed. Shares redeemed within 30 days of purchase may be subject to a 1% redemption fee payable to the Fund, which is not reflected in the performance shown above; if it were, performance would be lower. Current month-end performance may be higher or lower than performance quoted and may be obtained at www.royceinvest.com. All performance and risk information reflects results of the Investment Class (its oldest class). Operating expenses reflect the Fund’s total annual operating expenses for the Investment Class as of the Fund’s most current prospectus and include management fees and other expenses. The Sharpe Ratio is calculated for a specified period by dividing a fund’s annualized excess returns by its annualized standard deviation. The higher the Sharpe ratio, the better the fund’s historical risk-adjusted performance. Regarding the “Top Contributors” and “Top Detractors” tables shown above, the sum of all contributors to, and all detractors from, performance for all securities in the portfolio would approximate the Fund’s year-to-date performance for 2019. Upside Capture Ratio measures a manager’s performance in up markets relative to the Fund’s benchmark. It is calculated by measuring the Fund’s performance in quarters when the benchmark went up and dividing it by the benchmark’s return in those quarters. Downside Capture Ratio measures a manager’s performance in down markets relative to the Fund’s benchmark (Russell 2000). It is calculated by measuring the Fund’s performance in quarters when the benchmark goes down and dividing it by the benchmark’s return in those quarters.
The Royce Funds 2019 Annual Report to Shareholders | 27
| MANAGERS’ DISCUSSION (UNAUDITED) |
| Royce Total Return Fund (RTR) |

| Chuck Royce Jay Kaplan, CFA |
| FUND PERFORMANCE |
Royce Total Return Fund delivered a very strong absolute return in 2019, up 23.5%. It lagged the Russell 2000 Index, which gained 25.5% for this period, though it beat the Russell 2000 Value Index, which was up 22.4%.The Fund followed this performance pattern of beating the Russell 2000 Value, but trailing the Russell 2000, for the three-, five, and 15-year periods ended 12/31/19. For the 20-, 25-year, and since inception (12/15/93) periods, the Fund beat both indexes. |
| WHAT WORKED… AND WHAT DIDN’T |
Ten of the Fund’s 11 equity sectors made a positive impact in 2019. Financials was the largest contributor, followed by Industrials and Information Technology. Communications Service was the only sector that declined for the year while Consumer Staples and Energy made the smallest contributions. Capital markets and banks (both in Financials) were the leading industries, followed by machinery (Industrials), while media (Communications Services), oil, gas & consumable fuels (Energy), and diversified telecommunication services (Communication Services) were the biggest detractors.
Part of the capital markets group, Ares Management, an asset manager that focuses on tradable credit, direct lending, private equity, and real estate, was the portfolio’s top contributor in 2019. Investors became more optimistic about the company’s ability to sustain mid-teens, high margin earnings growth for an extended period. The company also converted to C-corp. status, which broadened ownership, supporting an increase in its valuation. Although its share price peaked in July, property and casualty insurer Erie Indemnity was the second-best contributor in 2019. Erie has an attractive and uncommon corporate structure. Erie Insurance Exchange, an affiliated policyholder-owned company, issues and owns the policies, while Erie Indemnity provides management services to the Exchange. This gives it little direct liability, so it has low capital requirements and high returns on capital. Erie’s stock advanced strongly through July as the company reported consistent growth and expanding margins in 2019’s first half before retracing somewhat after reporting disappointing margins in the third quarter. Headquartered in Toronto, TMX Group operates global markets and provides data and analytic solutions to businesses, traders, and investors. Part of the capital markets group, TMX benefited from its global expansion efforts and effective execution, both of which helped it to raise its dividend and post record revenues and earnings in the third quarter.
Meredith Corporation, a diversified publishing and broadcasting company, was the portfolio’s largest detractor in 2019, hurt by declining revenues and earnings as the company struggled to navigate an ever-shifting media landscape. We chose to sell our shares in Total Return’s portfolio in October. Following on the list of detractors was Virtu Financial, which uses its technology to act as a market maker and liquidity provider to the global financial markets. Its business slumped through most of the year, as the company typically does best when global trading volumes are heavy and/or in highly volatile markets, which were mostly absent during 2019. Believing that volatility is more likely, we built our position. We made the opposite decision with coal producer Alliance Resource Partners, moving on after two consecutive quarters of declining earnings.
The Fund’s relative underperformance for the calendar year was entirely the result of sector allocation—stock selection was additive. Information Technology was the largest source of underperformance due entirely to our underweight in this sector, as stock selection was a plus. The Fund typically has much lower exposure to this sector, where dividend-paying small-caps are rare. Consumer Staples also detracted. This was largely driven by ineffective stock selection, notably in the food products industry, where shares of supermarket operator Village Super Markets and specialty food supplier Lancaster Colony both declined. In contrast, Financials saw superior stock selection boost relative performance, as our larger sector weighting was a modest hindrance. In addition to Ares Management, REIT specialist asset manager Cohen & Steers was a top relative contributor. Outperformance in Industrials was driven by overweighting this strongly performing sector and savvy stock selection.
| Top Contributors to Performance | Top Detractors from Performance | |||||
| For 2019 (%)1 | For 2019 (%)2 | |||||
| Ares Management Cl. A | 1.37 | Meredith Corporation | -0.48 | |||
| Erie Indemnity Cl. A | 0.72 | Virtu Financial Cl. A | -0.28 | |||
| TMX Group | 0.72 | Alliance Resource Partners L.P. | -0.16 | |||
| Cohen & Steers | 0.68 | ATN International | -0.14 | |||
| First Citizens BancShares Cl. A | 0.62 | ArcBest | -0.14 | |||
| 1 Includes dividends | 2 Net of dividends | |||||
| CURRENT POSITIONING AND OUTLOOK |
The backdrop looks quite favorable to us for solid to strong small-cap performance overall. We have previously cited four favorable factors in the current market environment—low inflation, modest valuations, moderate growth, and ample access to capital, which all remain present and suggest that small-cap returns can go higher. We see a global economy that’s showing signs of renewed life, an ISM Manufacturing Index that’s been incrementally rising (despite December’s setback), and, most important, valuations that range from reasonable to attractive among the many small-cap cyclical areas that we typically like best. During the second half of 2019, we increased investments in asset-light cyclicals, including professional services firms and M&A advisory businesses, which appear well positioned to benefit from a growing economy. We also added contrarian investments in selected energy services companies whose valuations we see as reflecting excessive pessimism. |
| 28 | The Royce Funds 2019 Annual Report to Shareholders |
|
| PERFORMANCE AND PORTFOLIO REVIEW (UNAUDITED) | TICKER SYMBOLS RYTRX RYTFX RTRIX RYTCX RTRRX |
Performance and Expenses
Average Annual Total Return (%) Through 12/31/19
| JUL-DEC 20191 | 1-YR | 3-YR | 5-YR | 10-YR | 15-YR | 20-YR | 25-YR | SINCE INCEPTION (12/15/93) | |
| RTR | 7.05 | 23.45 | 7.09 | 7.49 | 10.36 | 7.49 | 9.45 | 10.72 | 10.48 |
| Annual Operating Expenses: 1.20% | |||||||||
1Not annualized
Relative Risk Adjusted Returns: Monthly Rolling Sharpe Ratios
20 Years Through 12/31/19
On a monthly rolling risk-adjusted basis, the Fund outperformed the Russell 2000 in 93% of all 10-year periods and 78% of all 5-year periods.
| PERIODS BEATING THE INDEX | FUND AVG (%)1 | INDEX AVG (%)1 | |||||
| 10-year | 112/121 | 93% | 0.51 | 0.44 | |||
| 5-year | 142/181 | 78% | 0.63 | 0.51 | |||
1 Average of monthly rolling Sharpe Ratios over the specified periods.
Morningstar Style Map™As of 12/31/19
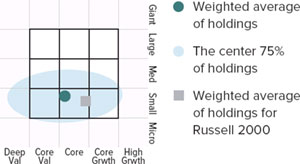
TheMorningstar Style Map is theMorningstar Style Box™ with the center 75% of fund holdings plotted as theMorningstar Ownership Zone™. The Morningstar Style Box is designed to reveal a fund’s investment strategy. The Morningstar Ownership Zone provides detail about a portfolio’s investment style by showing the range of stock sizes and styles. The Ownership Zone is derived by plotting each stock in the portfolio within the proprietary Morningstar Style Box. Over time, the shape and location of a fund’s ownership zone may vary. See page 89 for additional information.
Value of $10,000
Invested on 12/15/93 as of 12/31/19 ($)
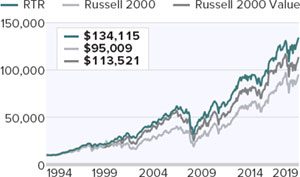
Top 10 Positions
% of Net Assets
| Ares Management Cl. A | 2.1 |
| First Citizens BancShares Cl. A | 1.7 |
| E-L Financial | 1.7 |
| Erie Indemnity Cl. A | 1.5 |
| TMX Group | 1.5 |
| Hubbell Incorporated | 1.5 |
| Ritchie Bros. Auctioneers | 1.5 |
| Bank of Hawaii | 1.4 |
| BOK Financial | 1.4 |
| Quaker Chemical | 1.3 |
Portfolio Sector Breakdown
% of Net Assets
| Financials | 35.2 |
| Industrials | 26.9 |
| Materials | 8.7 |
| Consumer Discretionary | 6.5 |
| Information Technology | 5.7 |
| Energy | 3.7 |
| Utilities | 3.5 |
| Consumer Staples | 2.8 |
| Health Care | 1.5 |
| Real Estate | 1.3 |
| Communication Services | 0.6 |
| Diversified Investment Companies | 0.1 |
| Corporate Bonds & Preferred Stock | 0.4 |
| Cash and Cash Equivalents | 3.1 |
Calendar Year Total Returns (%)
| YEAR | RTR |
| 2019 | 23.5 |
| 2018 | -12.5 |
| 2017 | 13.7 |
| 2016 | 25.9 |
| 2015 | -7.2 |
| 2014 | 1.3 |
| 2013 | 32.8 |
| 2012 | 14.4 |
| 2011 | -1.7 |
| 2010 | 23.5 |
| 2009 | 26.2 |
| 2008 | -31.2 |
| 2007 | 2.4 |
| 2006 | 14.5 |
| 2005 | 8.2 |
Upside/Downside Capture Ratios
Periods Ended 12/31/19 (%)
| UPSIDE | DOWNSIDE | |
| 10-Year | 80 | 72 |
| From 12/31/93 (Start of Fund’s First Full Quarter) | 81 | 57 |
Portfolio Diagnostics
| Fund Net Assets | $1,522 million |
| Number of Holdings | 179 |
| Turnover Rate | 21% |
| Average Market Capitalization1 | $2,403 million |
| Weighted Average P/E Ratio2,3 | 19.0x |
| Weighted Average P/B Ratio2 | 2.1x |
| Active Share4 | 93% |
| U.S. Investments (% of Net Assets) | 81.6% |
| Non-U.S. Investments (% of Net Assets) | 15.3% |
| 1 | Geometric Average. This weighted calculation uses each portfolio holding’s market cap in a way designed to not skew the effect of very large or small holdings; instead, it aims to better identify the portfolio’s center, which Royce believes offers a more accurate measure of average market cap than a simple mean or median. |
| 2 | Harmonic Average.This weighted calculation evaluates a portfolio as if it were a single stock and measures it overall. It compares the total market value of the portfolio to the portfolio’s share in the earnings or book value, as the case may be, of its underlying stocks. |
| 3 | The Fund’s P/E ratio calculation excludes companies with zero or negative earnings (2% of portfolio holdings as of 12/31/19). |
| 4 | Active Shareis the sum of the absolute values of the different weightings of each holding in the Fund versus each holding in the benchmark, divided by two. |
Important Performance and Expense Information
All performance information in thisReportreflects past performance, is presented on a total return basis, reflects the reinvestment of distributions, and does not reflect the deduction of taxes that a shareholder would pay on fund distributions or the redemption of fund shares. Past performance is no guarantee of future results. Investment return and principal value of an investment will fluctuate, so that shares may be worth more or less than their original cost when redeemed. Shares redeemed within 30 days of purchase may be subject to a 1% redemption fee payable to the Fund, which is not reflected in the performance shown above; if it were, performance would be lower. Current month-end performance may be higher or lower than performance quoted and may be obtained at www.royceinvest.com. All performance and risk information reflects results of the Investment Class (its oldest class). Certain immaterial adjustments were made to the net assets of Royce Total Return Fund at 6/30/17 for financial reporting purposes, and as a result the net asset values for shareholder transactions on that date and the calendar year Total Returns (%) based on those net asset values differ from the adjusted net asset values and calendar year total returns reported in the Financial Highlights. Operating expenses reflect the Fund’s total annual operating expenses for the Investment Class as of the Fund’s most current prospectus and include management fees, other expenses, and acquired fund fees and expenses. Acquired fund fees and expenses reflect the estimated amount of the fees and expenses incurred indirectly by the Fund through its investments in mutual funds, hedge funds, private equity funds, and other investment companies. Regarding the “Top Contributors” and “Top Detractors” tables shown above, the sum of all contributors to, and all detractors from, performance for all securities in the portfolio would approximate the Fund’s year-to-date performance for 2019. The Sharpe Ratio is calculated for a specified period by dividing a fund’s annualized excess returns by its annualized standard deviation. The higher the Sharpe ratio, the better the fund’s historical risk-adjusted performance. Upside Capture Ratio measures a manager’s performance in up markets relative to the Fund’s benchmark. It is calculated by measuring the Fund’s performance in quarters when the benchmark went up and dividing it by the benchmark’s return in those quarters. Downside Capture Ratio measures a manager’s performance in down markets relative to the Fund’s benchmark (Russell 2000). It is calculated by measuring the Fund’s performance in quarters when the benchmark goes down and dividing it by the benchmark’s return in those quarters.
The Royce Funds 2019 Annual Report to Shareholders | 29
| Royce Dividend Value Fund | ||||||||
| Common Stocks – 96.6% | ||||||||
| SHARES | VALUE | |||||||
| CONSUMER DISCRETIONARY – 8.2% | ||||||||
| AUTO COMPONENTS - 1.2% | ||||||||
| Gentex Corporation | 7,301 | $ | 211,583 | |||||
| Nokian Renkaat | 35,600 | 1,023,471 | ||||||
| 1,235,054 | ||||||||
| HOTELS, RESTAURANTS & LEISURE - 0.1% | ||||||||
| Cheesecake Factory | 2,329 | 90,505 | ||||||
| HOUSEHOLD DURABLES - 1.4% | ||||||||
| Hunter Douglas | 20,000 | 1,301,172 | ||||||
| La-Z-Boy | 6,515 | 205,092 | ||||||
| 1,506,264 | ||||||||
| SPECIALTY RETAIL - 4.9% | ||||||||
| American Eagle Outfitters | 66,031 | 970,656 | ||||||
| Caleres | 53,478 | 1,270,103 | ||||||
| Designer Brands Cl. A | 64,015 | 1,007,596 | ||||||
| †Rent-A-Center | 26,566 | 766,163 | ||||||
| USS | 56,000 | 1,064,801 | ||||||
| 5,079,319 | ||||||||
| TEXTILES, APPAREL & LUXURY GOODS - 0.6% | ||||||||
| HUGO BOSS | 9,800 | 475,542 | ||||||
| Steven Madden | 2,378 | 102,278 | ||||||
| 577,820 | ||||||||
| Total (Cost $7,268,586) | 8,488,962 | |||||||
| CONSUMER STAPLES – 0.5% | ||||||||
| FOOD & STAPLES RETAILING - 0.4% | ||||||||
| FamilyMart | 19,200 | 463,854 | ||||||
| HOUSEHOLD PRODUCTS - 0.1% | ||||||||
| †Spectrum Brands Holdings | 1,496 | 96,178 | ||||||
| Total (Cost $254,551) | 560,032 | |||||||
| ENERGY – 5.7% | ||||||||
| ENERGY EQUIPMENT & SERVICES - 3.4% | ||||||||
| Helmerich & Payne | 29,504 | 1,340,367 | ||||||
| TGS-NOPEC Geophysical | 72,700 | 2,211,813 | ||||||
| 3,552,180 | ||||||||
| OIL, GAS & CONSUMABLE FUELS - 2.3% | ||||||||
| Cimarex Energy | 17,300 | 908,077 | ||||||
| Gaztransport Et Technigaz | 15,600 | 1,494,373 | ||||||
| �� | 2,402,450 | |||||||
| Total (Cost $5,668,050) | 5,954,630 | |||||||
| FINANCIALS – 29.6% | ||||||||
| BANKS - 2.6% | ||||||||
| Bank of Georgia Group | 39,500 | 850,227 | ||||||
| BOK Financial | 15,414 | 1,347,184 | ||||||
| City Holding Company | 5,389 | 441,629 | ||||||
| 2,639,040 | ||||||||
| CAPITAL MARKETS - 22.2% | ||||||||
| Ashmore Group | 349,000 | 2,394,638 | ||||||
| AURELIUS Equity Opportunities | 7,200 | 314,973 | ||||||
| B3-Brasil, Bolsa, Balcao | 168,300 | 1,797,761 | ||||||
| Bolsa Mexicana de Valores | 888,000 | 1,952,825 | ||||||
| Carlyle Group | 88,000 | 2,823,040 | ||||||
| Coronation Fund Managers | 153,700 | 438,406 | ||||||
| Federated Investors Cl. B | 25,900 | 844,081 | ||||||
| Houlihan Lokey Cl. A | 6,446 | 315,016 | ||||||
| Jupiter Fund Management | 225,700 | 1,224,549 | ||||||
| KKR & Co. Cl. A | 119,200 | 3,477,064 | ||||||
| Moelis & Company Cl. A | 18,359 | 586,019 | ||||||
| Northern Trust | 16,800 | 1,784,832 | ||||||
| SEI Investments | 37,900 | 2,481,692 | ||||||
| Sprott | 588,600 | 1,350,759 | ||||||
| State Street | 16,800 | 1,328,880 | ||||||
| 23,114,535 | ||||||||
| DIVERSIFIED FINANCIAL SERVICES - 1.2% | ||||||||
| Jefferies Financial Group | 59,700 | 1,275,789 | ||||||
| INSURANCE - 1.2% | ||||||||
| Reinsurance Group of America | 7,605 | 1,240,071 | ||||||
| THRIFTS & MORTGAGE FINANCE - 2.4% | ||||||||
| Genworth MI Canada | 29,848 | 1,306,044 | ||||||
| WSFS Financial | 26,601 | 1,170,178 | ||||||
| 2,476,222 | ||||||||
| Total (Cost $18,634,384) | 30,745,657 | |||||||
| HEALTH CARE – 2.1% | ||||||||
| HEALTH CARE PROVIDERS & SERVICES - 0.1% | ||||||||
| Ensign Group (The) | 2,651 | 120,276 | ||||||
| PHARMACEUTICALS - 2.0% | ||||||||
| Recordati | 29,900 | 1,260,054 | ||||||
| Santen Pharmaceutical | 41,600 | 798,652 | ||||||
| 2,058,706 | ||||||||
| Total (Cost $560,702) | 2,178,982 | |||||||
| INDUSTRIALS – 24.6% | ||||||||
| AEROSPACE & DEFENSE - 3.4% | ||||||||
| HEICO Corporation Cl. A | 38,920 | 3,484,508 | ||||||
| AIRLINES - 2.3% | ||||||||
| Allegiant Travel | 7,171 | 1,248,041 | ||||||
| Hawaiian Holdings | 40,656 | 1,190,814 | ||||||
| 2,438,855 | ||||||||
| BUILDING PRODUCTS - 0.4% | ||||||||
| Geberit | 800 | 449,018 | ||||||
| COMMERCIAL SERVICES & SUPPLIES - 0.3% | ||||||||
| Herman Miller | 6,476 | 269,725 | ||||||
| CONSTRUCTION & ENGINEERING - 0.1% | ||||||||
| Comfort Systems USA | 2,059 | 102,641 | ||||||
| ELECTRICAL EQUIPMENT - 1.9% | ||||||||
| EnerSys | 1,370 | 102,517 | ||||||
| Hubbell Incorporated | 12,700 | 1,877,314 | ||||||
| 1,979,831 | ||||||||
| MACHINERY - 8.7% | ||||||||
| Alamo Group | 788 | 98,933 | ||||||
| Federal Signal | 3,129 | 100,910 | ||||||
| Graco | 45,400 | 2,360,800 | ||||||
| Lincoln Electric Holdings | 10,550 | 1,020,502 | ||||||
| Lindsay Corporation | 21,400 | 2,054,186 | ||||||
| Spirax-Sarco Engineering | 20,800 | 2,449,344 | ||||||
| Wabash National | 67,392 | 989,989 | ||||||
| 9,074,664 | ||||||||
| MARINE - 1.9% | ||||||||
| Clarkson | 48,600 | 1,947,360 | ||||||
| PROFESSIONAL SERVICES - 2.8% | ||||||||
| Korn Ferry | 11,401 | 483,403 | ||||||
| ManpowerGroup | 20,300 | 1,971,130 | ||||||
| Robert Half International | 6,994 | 441,671 | ||||||
| 2,896,204 | ||||||||
| ROAD & RAIL - 0.5% | ||||||||
| Old Dominion Freight Line | 500 | 94,890 |
| 30 | The Royce Funds 2019 Annual Report to Shareholders | THE ACCOMPANYING NOTES ARE AN INTEGRAL PART OF THESE FINANCIAL STATEMENTS |
December 31, 2019
| Royce Dividend Value Fund (continued) |
| SHARES | VALUE | |||||||
| INDUSTRIALS (continued) | ||||||||
| ROAD & RAIL (continued) | ||||||||
| Werner Enterprises | 11,543 | $ | 420,050 | |||||
| 514,940 | ||||||||
| TRADING COMPANIES & DISTRIBUTORS - 2.3% | ||||||||
| Applied Industrial Technologies | 36,500 | 2,434,185 | ||||||
| Total (Cost $12,084,515) | 25,591,931 | |||||||
| INFORMATION TECHNOLOGY – 9.5% | ||||||||
| ELECTRONIC EQUIPMENT, INSTRUMENTS & COMPONENTS - 5.5% | ||||||||
| FLIR Systems | 65,800 | 3,426,206 | ||||||
| Methode Electronics | 31,338 | 1,233,151 | ||||||
| Vishay Intertechnology | 50,897 | 1,083,597 | ||||||
| 5,742,954 | ||||||||
| IT SERVICES - 3.1% | ||||||||
| KBR | 106,200 | 3,239,100 | ||||||
| SEMICONDUCTORS & SEMICONDUCTOR EQUIPMENT - 0.3% | ||||||||
| MKS Instruments | 2,808 | 308,908 | ||||||
| SOFTWARE - 0.6% | ||||||||
| SimCorp | 5,600 | 636,760 | ||||||
| Total (Cost $5,728,964) | 9,927,722 | |||||||
| MATERIALS – 14.1% | ||||||||
| CHEMICALS - 2.6% | ||||||||
| Quaker Chemical | 16,400 | 2,698,128 | ||||||
| CONTAINERS & PACKAGING - 2.5% | ||||||||
| AptarGroup | 22,600 | 2,613,012 | ||||||
| METALS & MINING - 9.0% | ||||||||
| Franco-Nevada | 26,400 | 2,727,120 | ||||||
| Reliance Steel & Aluminum | 22,900 | 2,742,504 | ||||||
| Royal Gold | 15,500 | 1,894,875 | ||||||
| Worthington Industries | 46,800 | 1,974,024 | ||||||
| 9,338,523 | ||||||||
| Total (Cost $5,489,716) | 14,649,663 | |||||||
| REAL ESTATE – 0.5% | ||||||||
| REAL ESTATE MANAGEMENT & DEVELOPMENT - 0.5% | ||||||||
| Relo Group | 18,400 | 516,497 | ||||||
| Total (Cost $85,795) | 516,497 | |||||||
| UTILITIES – 1.8% | ||||||||
| WATER UTILITIES - 1.8% | ||||||||
| Aqua America | 39,800 | 1,868,212 | ||||||
| Total (Cost $953,083) | 1,868,212 | |||||||
| TOTAL COMMON STOCKS | ||||||||
| (Cost $56,728,346) | 100,482,288 | |||||||
| REPURCHASE AGREEMENT– 3.6% | ||||||||
| Fixed Income Clearing Corporation, 0.25% dated 12/31/19, due 1/2/20, maturity value $3,713,052 (collateralized by obligations of various U.S. Government Agencies, 2.25%- 2.875% due 11/15/24-8/15/28, valued at $3,792,063) | ||||||||
| (Cost $3,713,000) | 3,713,000 | |||||||
| TOTAL INVESTMENTS – 100.2% | ||||||||
| (Cost $60,441,346) | 104,195,288 | |||||||
| LIABILITIES LESS CASH AND OTHER ASSETS – (0.2)% | (162,381 | ) | ||||||
| NET ASSETS – 100.0% | $ | 104,032,907 | ||||||
| Royce Global Financial Services Fund | ||||||||
| Common Stocks - 98.1% | ||||||||
| SHARES | VALUE | |||||||
| BANKS - 17.1% | ||||||||
| BOK Financial | 10,450 | $ | 913,330 | |||||
| Bryn Mawr Bank | 10,000 | 412,400 | ||||||
| †Cadence Bancorporation Cl. A | 15,887 | 288,031 | ||||||
| Canadian Western Bank | 14,000 | 343,814 | ||||||
| Capital City Bank Group | 25,481 | 777,171 | ||||||
| First Citizens BancShares Cl. A | 1,828 | 972,880 | ||||||
| First Republic Bank | 5,198 | 610,505 | ||||||
| Popular | 23,465 | 1,378,569 | ||||||
| TriState Capital Holdings1 | 11,600 | 302,992 | ||||||
| Umpqua Holdings | 17,400 | 307,980 | ||||||
| Total (Cost $3,902,447) | 6,307,672 | |||||||
| CAPITAL MARKETS - 53.3% | ||||||||
| Ares Management Cl. A | 35,055 | 1,251,113 | ||||||
| Ashmore Group | 157,000 | 1,077,244 | ||||||
| Associated Capital Group Cl. A | 7,000 | 274,400 | ||||||
| B3-Brasil, Bolsa, Balcao | 61,000 | 651,595 | ||||||
| Bolsa Mexicana de Valores | 174,000 | 382,648 | ||||||
| Canaccord Genuity Group | 133,000 | 495,722 | ||||||
| Carlyle Group | 22,300 | 715,384 | ||||||
| Charles Schwab | 8,400 | 399,504 | ||||||
| Coronation Fund Managers | 61,200 | 174,564 | ||||||
| CRISIL | 14,000 | 373,252 | ||||||
| Edelweiss Financial Services | 155,000 | 237,349 | ||||||
| Egyptian Financial Group-Hermes Holding Company | 307,987 | 321,611 | ||||||
| †Garrison Capital | 50,000 | 291,000 | ||||||
| GMP Capital | 108,000 | 160,518 | ||||||
| Great Elm Capital Group1 | 115,545 | 385,920 | ||||||
| Hellenic Exchanges - Athens Stock Exchange | 50,000 | 259,954 | ||||||
| Intermediate Capital Group | 39,111 | 834,083 | ||||||
| INTL FCStone1 | 12,870 | 628,442 | ||||||
| IOOF Holdings | 55,000 | 303,367 | ||||||
| JSE | 51,000 | 435,208 | ||||||
| Jupiter Fund Management | 106,900 | 579,992 | ||||||
| KKR & Co. Cl. A | 23,900 | 697,163 | ||||||
| MarketAxess Holdings | 3,321 | 1,259,024 | ||||||
| Northern Trust | 3,770 | 400,525 | ||||||
| NZX | 580,000 | 531,020 | ||||||
| Rothschild & Co | 27,700 | 795,420 | ||||||
| SEI Investments | 7,950 | 520,566 | ||||||
| Silvercrest Asset Management Group Cl. A | 41,600 | 523,328 | ||||||
| Sprott | 500,000 | 1,147,434 | ||||||
| TD Ameritrade Holding Corporation | 8,680 | 431,396 | ||||||
| †Tel Aviv Stock Exchange1 | 228,800 | 779,164 | ||||||
| TMX Group | 3,700 | 320,407 | ||||||
| U.S. Global Investors Cl. A | 183,900 | 264,816 | ||||||
| Value Partners Group | 772,000 | 475,546 | ||||||
| Virtu Financial Cl. A | 47,400 | 757,926 | ||||||
| Warsaw Stock Exchange | 19,000 | 196,816 | ||||||
| Westaim Corporation1 | 105,000 | 214,277 | ||||||
| WisdomTree Investments | 27,100 | 131,164 | ||||||
| Total (Cost $14,124,526) | 19,678,862 | |||||||
| CLOSED-END FUNDS - 1.0% | ||||||||
| †Eagle Point Income | 19,341 | 362,740 | ||||||
| Total (Cost $384,692) | 362,740 |
| THE ACCOMPANYING NOTES ARE AN INTEGRAL PART OF THESE FINANCIAL STATEMENTS | The Royce Funds 2019 Annual Report to Shareholders | 31 |
Schedules of Investments
| Royce Global Financial Services Fund (continued) | |||||||||
| SHARES | VALUE | ||||||||
| CONSUMER FINANCE - 0.5% | |||||||||
| Currency Exchange International1 | 13,000 | $ | 180,201 | ||||||
| Total (Cost $268,728) | 180,201 | ||||||||
| DIVERSIFIED FINANCIAL SERVICES - 0.7% | |||||||||
| ECN Capital | 75,000 | 276,655 | |||||||
| Total (Cost $231,044) | 276,655 | ||||||||
| HOTELS, RESTAURANTS & LEISURE - 0.2% | |||||||||
| Thomas Cook (India) | 94,000 | 84,283 | |||||||
| Total (Cost $117,326) | 84,283 | ||||||||
| INSURANCE - 3.8% | |||||||||
| E-L Financial | 1,820 | 1,161,826 | |||||||
| First American Financial | 3,900 | 227,448 | |||||||
| Total (Cost $1,195,830) | 1,389,274 | ||||||||
| IT SERVICES - 2.0% | |||||||||
| Cass Information Systems | 5,016 | 289,624 | |||||||
| PayPal Holdings1 | 4,054 | 438,521 | |||||||
| Total (Cost $357,571) | 728,145 | ||||||||
| METALS & MINING - 3.7% | |||||||||
| Franco-Nevada | 13,365 | 1,380,604 | |||||||
| Total (Cost $670,707) | 1,380,604 | ||||||||
| PROFESSIONAL SERVICES - 1.3% | |||||||||
| People Corporation1 | 45,300 | 349,897 | |||||||
| †Quess Corp1 | 17,756 | 119,965 | |||||||
| Total (Cost $349,177) | 469,862 | ||||||||
| REAL ESTATE MANAGEMENT & DEVELOPMENT - 8.0% | |||||||||
| Altus Group | 32,000 | 935,444 | |||||||
| FirstService Corporation | 12,600 | 1,172,304 | |||||||
| FRP Holdings1 | 7,957 | 396,338 | |||||||
| RMR Group (The) Cl. A | 10,000 | 456,400 | |||||||
| Total (Cost $1,804,823) | 2,960,486 | ||||||||
| SOFTWARE - 3.2% | |||||||||
| Benefitfocus1 | 10,600 | 232,564 | |||||||
| Bottomline Technologies1 | 9,800 | 525,280 | |||||||
| Envestnet1 | 6,000 | 417,780 | |||||||
| Total (Cost $836,700) | 1,175,624 | ||||||||
| �� | |||||||||
| THRIFTS & MORTGAGE FINANCE - 0.8% | |||||||||
| †Provident Bancorp1 | 25,000 | 311,250 | |||||||
| Total (Cost $313,394) | 311,250 | ||||||||
| TRADING COMPANIES & DISTRIBUTORS - 2.5% | |||||||||
| Air Lease Cl. A | 19,500 | 926,640 | |||||||
| Total (Cost $854,966) | 926,640 | ||||||||
| TOTAL COMMON STOCKS | |||||||||
| (Cost $25,411,931) | 36,232,298 | ||||||||
| REPURCHASE AGREEMENT– 2.3% | ||||
| Fixed Income Clearing Corporation, 0.25% dated 12/31/19, due 1/2/20, maturity value $850,012 (collateralized by obligations of various U.S. Government Agencies, 2.25% due 11/15/24, valued at $869,580) | ||||
| (Cost $850,000) | 850,000 | |||
| TOTAL INVESTMENTS – 100.4% | ||||
| (Cost $26,261,931) | 37,082,298 | |||
| LIABILITIES LESS CASH AND OTHER ASSETS – (0.4)% | (142,174 | ) | ||
| NET ASSETS – 100.0% | $ | 36,940,124 | ||
| 32 | The Royce Funds 2019 Annual Report to Shareholders | THE ACCOMPANYING NOTES ARE AN INTEGRAL PART OF THESE FINANCIAL STATEMENTS |
December 31, 2019
| Royce International Premier Fund | ||||||||
| Common Stocks – 90.5% | ||||||||
| SHARES | VALUE | |||||||
| AUSTRALIA – 8.4% | ||||||||
| Bravura Solutions | 4,911,921 | $ | 17,924,090 | |||||
| Cochlear | 58,900 | 9,288,781 | ||||||
| Hansen Technologies | 5,820,235 | 15,520,529 | ||||||
| IPH | 2,331,900 | 13,418,568 | ||||||
| Technology One | 2,040,900 | 11,872,950 | ||||||
| Total (Cost $52,015,466) | 68,024,918 | |||||||
| BRAZIL – 3.0% | ||||||||
| OdontoPrev | 3,312,200 | 13,890,376 | ||||||
| TOTVS | 634,900 | 10,187,882 | ||||||
| Total (Cost $17,620,800) | 24,078,258 | |||||||
| CANADA – 2.9% | ||||||||
| Altus Group | 423,400 | 12,377,085 | ||||||
| Morneau Shepell | 420,600 | 10,944,572 | ||||||
| Total (Cost $16,780,362) | 23,321,657 | |||||||
| CHINA – 0.9% | ||||||||
| TravelSky Technology | 3,141,800 | 7,668,729 | ||||||
| Total (Cost $7,626,887) | 7,668,729 | |||||||
| DENMARK – 1.3% | ||||||||
| SimCorp | 90,500 | 10,290,497 | ||||||
| Total (Cost $6,391,581) | 10,290,497 | |||||||
| FRANCE – 2.9% | ||||||||
| Neurones | 492,071 | 11,370,294 | ||||||
| Thermador Groupe | 197,034 | 11,713,691 | ||||||
| Total (Cost $23,952,153) | 23,083,985 | |||||||
| GERMANY – 5.3% | ||||||||
| Amadeus Fire | 109,400 | 18,137,126 | ||||||
| Carl Zeiss Meditec | 76,200 | 9,718,341 | ||||||
| †Norma Group | 362,100 | 15,434,367 | ||||||
| Total (Cost $31,946,577) | 43,289,834 | |||||||
| INDIA – 1.4% | ||||||||
| AIA Engineering | 494,111 | 11,421,335 | ||||||
| Total (Cost $11,787,189) | 11,421,335 | |||||||
| ITALY – 1.3% | ||||||||
| DiaSorin | 83,700 | 10,834,477 | ||||||
| Total (Cost $7,004,130) | 10,834,477 | |||||||
| JAPAN – 17.7% | ||||||||
| As One | 119,200 | 11,200,884 | ||||||
| Benefit One | 461,500 | 9,603,345 | ||||||
| Cosel | 999,000 | 10,849,202 | ||||||
| Daifuku | 347,300 | 21,287,727 | ||||||
| †Fukui Computer Holdings | 297,300 | 9,713,451 | ||||||
| Medikit | 128,200 | 8,329,962 | ||||||
| Meitec Corporation | 276,200 | 15,633,243 | ||||||
| NSD | 789,600 | 13,066,134 | ||||||
| †TechnoPro Holdings | 152,300 | 10,722,884 | ||||||
| TKC Corporation | 400,000 | 19,179,973 | ||||||
| USS | 705,200 | 13,408,892 | ||||||
| Total (Cost $117,546,544) | 142,995,697 | |||||||
| NETHERLANDS – 5.5% | ||||||||
| IMCD | 261,600 | 22,829,376 | ||||||
| Intertrust | 1,111,600 | 21,583,522 | ||||||
| Total (Cost $40,092,330) | 44,412,898 | |||||||
| NEW ZEALAND – 1.2% | ||||||||
| Fisher & Paykel Healthcare | 655,500 | 9,796,472 | ||||||
| Total (Cost $5,330,001) | 9,796,472 | |||||||
| NORWAY – 2.0% | ||||||||
| TGS-NOPEC Geophysical | 523,300 | 15,920,794 | ||||||
| Total (Cost $14,076,891) | 15,920,794 | |||||||
| SINGAPORE – 2.2% | ||||||||
| XP Power | 439,900 | 18,063,435 | ||||||
| Total (Cost $13,342,917) | 18,063,435 | |||||||
| SWEDEN – 9.3% | ||||||||
| †Alimak Group | 298,027 | 4,441,919 | ||||||
| Bravida Holding | 1,595,000 | 15,487,917 | ||||||
| Hexpol | 1,459,700 | 14,306,583 | ||||||
| †Karnov Group1 | 1,677,241 | 9,490,759 | ||||||
| Lagercrantz Group | 630,900 | 9,861,233 | ||||||
| Loomis Cl. B | 515,200 | 21,331,101 | ||||||
| Total (Cost $62,537,539) | 74,919,512 | |||||||
| SWITZERLAND – 11.6% | ||||||||
| †Bossard Holding | 87,840 | 15,856,218 | ||||||
| dormakaba Holding | 23,600 | 16,886,753 | ||||||
| Kardex | 85,700 | 14,433,871 | ||||||
| LEM Holding | 9,500 | 13,978,095 | ||||||
| Partners Group Holding | 16,700 | 15,312,647 | ||||||
| VZ Holding | 55,600 | 17,148,791 | ||||||
| Total (Cost $77,708,454) | 93,616,375 | |||||||
| UNITED KINGDOM – 13.6% | ||||||||
| Ashmore Group | 2,181,000 | 14,964,772 | ||||||
| Croda International | 294,100 | 19,945,718 | ||||||
| FDM Group Holdings | 430,793 | 5,900,297 | ||||||
| †Marlowe1 | 1,576,306 | 10,596,471 | ||||||
| †Restore | 2,383,639 | 17,365,523 | ||||||
| Spirax-Sarco Engineering | 155,800 | 18,346,529 | ||||||
| Victrex | 689,800 | 22,787,901 | ||||||
| Total (Cost $87,208,957) | 109,907,211 | |||||||
| TOTAL COMMON STOCKS | ||||||||
| (Cost $592,968,778) | 731,646,084 | |||||||
| PREFERRED STOCK – 1.9% | ||||||||
| GERMANY – 1.9% | ||||||||
| FUCHS PETROLUB | 315.200 | 15,613,202 | ||||||
| (Cost $13,580,838) | 15,613,202 | |||||||
| REPURCHASE AGREEMENT– 6.7% | ||||||||
Fixed Income Clearing Corporation, 0.25% dated 12/31/19, due 1/2/20, maturity value $54,399,756 (collateralized by obligations of various U.S. Government Agencies, 2.25% due 11/15/24, valued at $55,488,479) | ||||||||
| (Cost $54,399,000) | 54,399,000 | |||||||
| TOTAL INVESTMENTS – 99.1% | ||||||||
| (Cost $660,948,616) | 801,658,286 | |||||||
| CASH AND OTHER ASSETS LESS LIABILITIES – 0.9% | 7,078,730 | |||||||
| NET ASSETS – 100.0% | $ | 808,737,016 | ||||||
| THE ACCOMPANYING NOTES ARE AN INTEGRAL PART OF THESE FINANCIAL STATEMENTS | The Royce Funds 2019 Annual Report to Shareholders | 33 |
Schedules of Investments
Royce Micro-Cap Fund
Common Stocks – 92.7%
| SHARES | VALUE | |||||||
| COMMUNICATION SERVICES – 2.0% | ||||||||
| ENTERTAINMENT - 0.6% | ||||||||
| Gaia Cl. A1 | 258,200 | $ | 2,063,018 | |||||
| INTERACTIVE MEDIA & SERVICES - 1.0% | ||||||||
| QuinStreet1 | 218,146 | 3,339,815 | ||||||
| MEDIA - 0.4% | ||||||||
| Marchex Cl. B1 | 344,200 | 1,301,076 | ||||||
| Total (Cost $5,755,188) | 6,703,909 | |||||||
| CONSUMER DISCRETIONARY – 9.6% | ||||||||
| AUTO COMPONENTS - 2.3% | ||||||||
| Fox Factory Holding1,2 | 34,500 | 2,400,165 | ||||||
| Stoneridge1 | 128,600 | 3,770,552 | ||||||
| Unique Fabricating1 | 389,041 | 1,501,698 | ||||||
| 7,672,415 | ||||||||
| HOTELS, RESTAURANTS & LEISURE - 1.7% | ||||||||
| Century Casinos1 | 412,100 | 3,263,832 | ||||||
| Lindblad Expeditions Holdings1 | 140,700 | 2,300,445 | ||||||
| 5,564,277 | ||||||||
| HOUSEHOLD DURABLES - 0.6% | ||||||||
| Lovesac Company (The)1,2 | 125,400 | 2,012,670 | ||||||
| INTERNET & DIRECT MARKETING RETAIL - 0.8% | ||||||||
| Rubicon Project (The)1 | 348,500 | 2,843,760 | ||||||
| LEISURE PRODUCTS - 0.7% | ||||||||
| MasterCraft Boat Holdings1 | 156,100 | 2,458,575 | ||||||
| SPECIALTY RETAIL - 2.7% | ||||||||
| Buckle (The) | 62,675 | 1,694,732 | ||||||
| Citi Trends | 108,724 | 2,513,699 | ||||||
| Designer Brands Cl. A | 85,400 | 1,344,196 | ||||||
| Shoe Carnival | 98,211 | 3,661,306 | ||||||
| 9,213,933 | ||||||||
| TEXTILES, APPAREL & LUXURY GOODS - 0.8% | ||||||||
| Vera Bradley1,2 | 217,800 | 2,570,040 | ||||||
| Total (Cost $23,411,168) | 32,335,670 | |||||||
| CONSUMER STAPLES – 0.2% | ||||||||
| BEVERAGES - 0.2% | ||||||||
| †Eastside Distilling1 | 179,800 | 530,410 | ||||||
| Total (Cost $748,210) | 530,410 | |||||||
| ENERGY – 2.8% | ||||||||
| ENERGY EQUIPMENT & SERVICES - 2.0% | ||||||||
| Natural Gas Services Group1 | 111,687 | 1,369,283 | ||||||
| Newpark Resources1 | 434,000 | 2,721,180 | ||||||
| Pason Systems | 84,750 | 855,625 | ||||||
| Profire Energy1 | 1,170,732 | 1,697,561 | ||||||
| 6,643,649 | ||||||||
| OIL, GAS & CONSUMABLE FUELS - 0.8% | ||||||||
| Ardmore Shipping1 | 319,875 | 2,894,869 | ||||||
| Total (Cost $9,962,897) | 9,538,518 | |||||||
| FINANCIALS – 13.2% | ||||||||
| BANKS - 6.0% | ||||||||
| Allegiance Bancshares1,2 | 66,200 | 2,489,120 | ||||||
| BayCom Corporation1 | 103,900 | 2,362,686 | ||||||
| Caribbean Investment Holdings1 | 1,858,138 | 824,532 | ||||||
| County Bancorp | 92,400 | 2,368,212 | ||||||
| HarborOne Bancorp1 | 285,653 | 3,139,326 | ||||||
| HomeTrust Bancshares | 88,200 | 2,366,406 | ||||||
| Investar Holding | 120,600 | 2,894,400 | ||||||
| Midway Investments1,3 | 1,858,170 | 0 | ||||||
| TriState Capital Holdings1 | 143,457 | 3,747,097 | ||||||
| 20,191,779 | ||||||||
| CAPITAL MARKETS - 3.9% | ||||||||
| B. Riley Financial | 149,900 | 3,774,482 | ||||||
| Canaccord Genuity Group | 476,800 | 1,777,146 | ||||||
| INTL FCStone1 | 56,200 | 2,744,246 | ||||||
| Silvercrest Asset Management Group Cl. A | 204,000 | 2,566,320 | ||||||
| †Sprott | 971,000 | 2,228,316 | ||||||
| 13,090,510 | ||||||||
| DIVERSIFIED FINANCIAL SERVICES - 0.2% | ||||||||
| Waterloo Investment Holdings1,3 | 2,760,000 | 828,000 | ||||||
| INSURANCE - 0.2% | ||||||||
| Health Insurance Innovations Cl. A1,2 | 27,200 | 524,688 | ||||||
| THRIFTS & MORTGAGE FINANCE - 2.9% | ||||||||
| Meridian Bancorp | 71,700 | 1,440,453 | ||||||
| PCSB Financial | 152,200 | 3,082,050 | ||||||
| Territorial Bancorp | 75,900 | 2,348,346 | ||||||
| Western New England Bancorp | 307,100 | 2,957,373 | ||||||
| 9,828,222 | ||||||||
| Total (Cost $40,758,985) | 44,463,199 | |||||||
| HEALTH CARE – 11.7% | ||||||||
| BIOTECHNOLOGY - 2.8% | ||||||||
| BioSpecifics Technologies1 | 37,200 | 2,118,168 | ||||||
| Dynavax Technologies1 | 198,700 | 1,136,564 | ||||||
| †Heron Therapeutics1 | 70,000 | 1,645,000 | ||||||
| Zealand Pharma1 | 129,500 | 4,575,951 | ||||||
| 9,475,683 | ||||||||
| HEALTH CARE EQUIPMENT & SUPPLIES - 5.0% | ||||||||
| †Apyx Medical1 | 144,700 | 1,224,162 | ||||||
| AtriCure1 | 91,100 | 2,961,661 | ||||||
| Chembio Diagnostics1 | 280,053 | 1,277,042 | ||||||
| CryoLife1 | 112,655 | 3,051,824 | ||||||
| Mesa Laboratories | 4,700 | 1,172,180 | ||||||
| OrthoPediatrics Corporation1,2 | 83,600 | 3,928,364 | ||||||
| †Profound Medical1 | 58,400 | 663,355 | ||||||
| Surmodics1 | 61,422 | 2,544,713 | ||||||
| 16,823,301 | ||||||||
| LIFE SCIENCES TOOLS & SERVICES - 2.6% | ||||||||
| Harvard Bioscience1 | 807,179 | 2,461,896 | ||||||
| NeoGenomics1 | 132,100 | 3,863,925 | ||||||
| Quanterix Corporation1 | 113,600 | 2,684,368 | ||||||
| 9,010,189 | ||||||||
| PHARMACEUTICALS - 1.3% | ||||||||
| †Axsome Therapeutics1,2 | 41,500 | 4,289,440 | ||||||
| Total (Cost $20,321,187) | 39,598,613 | |||||||
| INDUSTRIALS – 21.4% | ||||||||
| AEROSPACE & DEFENSE - 1.6% | ||||||||
| Astronics Corporation1 | 37,591 | 1,050,669 | ||||||
| CPI Aerostructures1 | 373,984 | 2,516,912 | ||||||
| †Kratos Defense & Security Solutions1 | 105,700 | 1,903,657 | ||||||
| 5,471,238 | ||||||||
| COMMERCIAL SERVICES & SUPPLIES - 1.3% | ||||||||
| Acme United | 49,800 | 1,184,742 | ||||||
| Heritage-Crystal Clean1 | 101,774 | 3,192,650 | ||||||
| 4,377,392 | ||||||||
| CONSTRUCTION & ENGINEERING - 4.0% | ||||||||
| †Ameresco Cl. A1 | 199,500 | 3,491,250 | ||||||
| 34 | The Royce Funds 2019 Annual Report to Shareholders | THE ACCOMPANYING NOTES ARE AN INTEGRAL PART OF THESE FINANCIAL STATEMENTS |
December 31, 2019
Royce Micro-Cap Fund (continued)
| SHARES | VALUE | |||||||
| INDUSTRIALS (continued) | ||||||||
| CONSTRUCTION & ENGINEERING (continued) | ||||||||
| Construction Partners Cl. A1 | 198,900 | $ | 3,355,443 | |||||
| IES Holdings1 | 89,800 | 2,304,268 | ||||||
| Northwest Pipe1 | 134,300 | 4,473,533 | ||||||
| 13,624,494 | ||||||||
| ELECTRICAL EQUIPMENT - 1.2% | ||||||||
| American Superconductor1 | 244,200 | 1,916,970 | ||||||
| Encore Wire | 20,200 | 1,159,480 | ||||||
| Power Solutions International1,4 | 99,900 | 789,210 | ||||||
| 3,865,660 | ||||||||
| INDUSTRIAL CONGLOMERATES - 0.4% | ||||||||
| Raven Industries | 37,000 | 1,275,020 | ||||||
| MACHINERY - 6.6% | ||||||||
| Alimak Group | 103,200 | 1,538,136 | ||||||
| CIRCOR International1 | 37,600 | 1,738,624 | ||||||
| Exco Technologies | 133,200 | 813,427 | ||||||
| Graham Corporation | 168,588 | 3,688,706 | ||||||
| Lindsay Corporation | 12,000 | 1,151,880 | ||||||
| Luxfer Holdings | 138,400 | 2,561,784 | ||||||
| Lydall1 | 82,100 | 1,684,692 | ||||||
| †Porvair | 344,400 | 3,047,364 | ||||||
| Spartan Motors | 159,700 | 2,887,376 | ||||||
| †Wabash National | 149,200 | 2,191,748 | ||||||
| Westport Fuel Systems1 | 433,400 | 1,027,158 | ||||||
| 22,330,895 | ||||||||
| MARINE - 1.1% | ||||||||
| Clarkson | 89,831 | 3,599,451 | ||||||
| PROFESSIONAL SERVICES - 3.9% | ||||||||
| CRA International | 47,783 | 2,602,740 | ||||||
| GP Strategies1 | 189,818 | 2,511,292 | ||||||
| Heidrick & Struggles International | 80,740 | 2,624,050 | ||||||
| Kforce | 64,232 | 2,550,011 | ||||||
| Resources Connection | 181,952 | 2,971,276 | ||||||
| 13,259,369 | ||||||||
| ROAD & RAIL - 0.3% | ||||||||
| Marten Transport | 50,955 | 1,095,023 | ||||||
| TRADING COMPANIES & DISTRIBUTORS - 1.0% | ||||||||
| Lawson Products1 | 30,200 | 1,573,420 | ||||||
| †Transcat1 | 56,400 | 1,796,904 | ||||||
| 3,370,324 | ||||||||
| Total (Cost $49,548,009) | 72,268,866 | |||||||
| INFORMATION TECHNOLOGY – 26.5% | ||||||||
| COMMUNICATIONS EQUIPMENT - 2.0% | ||||||||
| Digi International1 | 205,900 | 3,648,548 | ||||||
| EMCORE Corporation1 | 219,000 | 665,760 | ||||||
| Harmonic1 | 306,600 | 2,391,480 | ||||||
| 6,705,788 | ||||||||
| ELECTRONIC EQUIPMENT, INSTRUMENTS & COMPONENTS - 5.6% | ||||||||
| Fabrinet1 | 45,849 | 2,972,849 | ||||||
| FARO Technologies1 | 32,700 | 1,646,445 | ||||||
| †LightPath Technologies Cl. A1 | 1,115,984 | 809,088 | ||||||
| †Luna Innovations1 | 183,200 | 1,335,528 | ||||||
| nLIGHT1,2 | 127,700 | 2,589,756 | ||||||
| Novanta1 | 25,342 | 2,241,247 | ||||||
| †PAR Technology1 | 21,800 | 670,132 | ||||||
| PC Connection | 68,100 | 3,381,846 | ||||||
| Vishay Precision Group1 | 98,300 | 3,342,200 | ||||||
| 18,989,091 | ||||||||
| IT SERVICES - 0.4% | ||||||||
| Cass Information Systems | 24,216 | 1,398,232 | ||||||
| SEMICONDUCTORS & SEMICONDUCTOR EQUIPMENT - 15.9% | ||||||||
| Adesto Technologies1,2 | 443,600 | 3,770,600 | ||||||
| Aehr Test Systems1,2 | 869,700 | 1,739,400 | ||||||
| Axcelis Technologies1 | 35,300 | 850,553 | ||||||
| AXT1 | 474,700 | 2,064,945 | ||||||
| Brooks Automation | 51,282 | 2,151,793 | ||||||
| †Camtek | 207,200 | 2,243,976 | ||||||
| †Cirrus Logic1 | 31,600 | 2,604,156 | ||||||
| Cohu | 136,000 | 3,107,600 | ||||||
| CyberOptics Corporation1 | 95,700 | 1,758,966 | ||||||
| Everspin Technologies1,2 | 220,300 | 1,158,778 | ||||||
| †FormFactor1 | 162,300 | 4,214,931 | ||||||
| †Ichor Holdings1 | 89,600 | 2,980,992 | ||||||
| †Inphi Corporation1 | 25,000 | 1,850,500 | ||||||
| NeoPhotonics Corporation1 | 391,700 | 3,454,794 | ||||||
| Nova Measuring Instruments1,2 | 117,800 | 4,456,374 | ||||||
| Onto Innovation1 | 24,207 | 884,524 | ||||||
| PDF Solutions1 | 211,900 | 3,578,991 | ||||||
| Photronics1 | 300,500 | 4,735,880 | ||||||
| Silicon Motion Technology ADR | 25,800 | 1,308,318 | ||||||
| Ultra Clean Holdings1 | 203,500 | 4,776,145 | ||||||
| 53,692,216 | ||||||||
| SOFTWARE - 2.2% | ||||||||
| Agilysys1 | 127,100 | 3,229,611 | ||||||
| QAD Cl. A | 82,413 | 4,197,294 | ||||||
| 7,426,905 | ||||||||
| TECHNOLOGY HARDWARE, STORAGE & PERIPHERALS - 0.4% | ||||||||
| AstroNova | 98,300 | 1,348,676 | ||||||
| Total (Cost $57,187,954) | 89,560,908 | |||||||
| MATERIALS – 3.2% | ||||||||
| CHEMICALS - 0.8% | ||||||||
| FutureFuel Corporation | 62,500 | 774,375 | ||||||
| Trecora Resources1 | 282,301 | 2,018,452 | ||||||
| 2,792,827 | ||||||||
| METALS & MINING - 2.4% | ||||||||
| †Altius Minerals | 99,000 | 911,817 | ||||||
| †Ferroglobe (Warranty Insurance Trust)1,3 | 205,763 | 0 | ||||||
| Haynes International | 63,330 | 2,265,947 | ||||||
| Major Drilling Group International1 | 645,800 | 2,819,827 | ||||||
| Universal Stainless & Alloy Products1 | 131,400 | 1,957,860 | ||||||
| 7,955,451 | ||||||||
| Total (Cost $12,953,970) | 10,748,278 | |||||||
| REAL ESTATE – 2.1% | ||||||||
| EQUITY REAL ESTATE INVESTMENT TRUSTS (REITS) - 1.2% | ||||||||
| Community Healthcare Trust | 43,600 | 1,868,696 | ||||||
| †Postal Realty Trust Cl. A | 120,100 | 2,035,695 | ||||||
| 3,904,391 | ||||||||
| REAL ESTATE MANAGEMENT & DEVELOPMENT - 0.9% | ||||||||
| FRP Holdings1 | 38,975 | 1,941,345 | ||||||
| Marcus & Millichap1 | 33,800 | 1,259,050 | ||||||
| 3,200,395 | ||||||||
| Total (Cost $5,121,384) | 7,104,786 | |||||||
| TOTAL COMMON STOCKS | ||||||||
| (Cost $225,768,952) | 312,853,157 | |||||||
| THE ACCOMPANYING NOTES ARE AN INTEGRAL PART OF THESE FINANCIAL STATEMENTS | The Royce Funds 2019 Annual Report to Shareholders | 35 |
Schedules of Investments
Royce Micro-Cap Fund (continued)
| VALUE | ||||
| REPURCHASE AGREEMENT– 7.3% | ||||
| Fixed Income Clearing Corporation, 0.25% dated 12/31/19, due 1/2/20, maturity value $24,628,342 (collateralized by obligations of various U.S. Government Agencies, 2.00% due 5/31/24, valued at $25,121,979) | ||||
| (Cost $24,628,000) | $ | 24,628,000 | ||
| COLLATERAL RECEIVED FOR SECURITIES LOANED – 0.3% | ||||
| Money Market Funds | ||||
| Federated Government Obligations Fund (7 day yield-1.49%) | ||||
| (Cost $882,470) | 882,470 | |||
| TOTAL INVESTMENTS – 100.3% | ||||
| (Cost $251,279,422) | 338,363,627 | |||
| LIABILITIES LESS CASH AND OTHER ASSETS – (0.3)% | (1,091,775 | ) | ||
| NET ASSETS – 100.0% | $ | 337,271,852 | ||
Royce Opportunity Fund
Common Stocks – 96.6%
| SHARES | VALUE | |||||||
| COMMUNICATION SERVICES – 1.4% | ||||||||
| DIVERSIFIED TELECOMMUNICATION SERVICES - 0.6% | ||||||||
| Iridium Communications1,2 | 102,993 | $ | 2,537,748 | |||||
| Ooma1 | 251,178 | 3,323,085 | ||||||
| 5,860,833 | ||||||||
| INTERACTIVE MEDIA & SERVICES - 0.6% | ||||||||
| †Eventbrite Cl. A1 | 154,800 | 3,122,316 | ||||||
| EverQuote Cl. A1,2 | 82,800 | 2,844,180 | ||||||
| 5,966,496 | ||||||||
| MEDIA - 0.2% | ||||||||
| †comScore1,2 | 308,500 | 1,523,990 | ||||||
| Total (Cost $7,794,889) | 13,351,319 | |||||||
| CONSUMER DISCRETIONARY – 9.3% | ||||||||
| AUTO COMPONENTS - 1.0% | ||||||||
| Cooper Tire & Rubber | 77,400 | 2,225,250 | ||||||
| Horizon Global1,2 | 835,560 | 2,916,104 | ||||||
| Modine Manufacturing1 | 445,637 | 3,431,405 | ||||||
| †Shiloh Industries1 | 121,500 | 432,540 | ||||||
| 9,005,299 | ||||||||
| DIVERSIFIED CONSUMER SERVICES - 0.6% | ||||||||
| frontdoor1,2 | 117,699 | 5,581,287 | ||||||
| HOTELS, RESTAURANTS & LEISURE - 2.0% | ||||||||
| Carrols Restaurant Group1 | 815,705 | 5,750,720 | ||||||
| Century Casinos1 | 263,340 | 2,085,653 | ||||||
| El Pollo Loco Holdings1,2 | 177,306 | 2,684,413 | ||||||
| †Kura Sushi USA Cl. A1,2 | 98,226 | 2,499,852 | ||||||
| †Noodles & Company Cl. A1 | 127,928 | 708,721 | ||||||
| †Playa Hotels & Resorts1,2 | 313,506 | 2,633,450 | ||||||
| †Scientific Games 1 | 73,441 | 1,966,750 | ||||||
| 18,329,559 | ||||||||
| HOUSEHOLD DURABLES - 2.8% | ||||||||
| Beazer Homes USA1 | 418,141 | 5,908,332 | ||||||
| †Century Communities1,2 | 34,700 | 949,045 | ||||||
| LGI Homes1,2 | 38,870 | 2,746,165 | ||||||
| Libbey1 | 264,810 | 383,975 | ||||||
| M.D.C. Holdings | 77,316 | 2,950,379 | ||||||
| M/I Homes1 | 92,848 | 3,653,569 | ||||||
| New Home1 | 240,350 | 1,120,031 | ||||||
| TRI Pointe Group1,2 | 169,606 | 2,642,461 | ||||||
| †Turtle Beach 1,2 | 96,600 | 912,870 | ||||||
| VOXX International Cl. A1 | 361,918 | 1,585,201 | ||||||
| William Lyon Homes Cl. A1 | 153,519 | 3,067,310 | ||||||
| 25,919,338 | ||||||||
| INTERNET & DIRECT MARKETING RETAIL - 0.5% | ||||||||
| Leaf Group1 | 66,267 | 265,068 | ||||||
| Rubicon Project (The)1 | 531,466 | 4,336,762 | ||||||
| 4,601,830 | ||||||||
| MULTILINE RETAIL - 0.0% | ||||||||
| Tuesday Morning1 | 187,762 | 347,360 | ||||||
| SPECIALTY RETAIL - 1.8% | ||||||||
| Conn's1 | 285,000 | 3,531,150 | ||||||
| Lumber Liquidators Holdings1,2 | 536,166 | 5,238,342 | ||||||
| RTW Retailwinds1 | 436,441 | 349,589 | ||||||
| Stage Stores1 | 819,711 | 6,656,053 | ||||||
| Zumiez1 | 18,500 | 638,990 | ||||||
| 16,414,124 | ||||||||
| TEXTILES, APPAREL & LUXURY GOODS - 0.6% | ||||||||
| Jerash Holdings (US) | 61,704 | 361,585 | ||||||
| Unifi1 | 176,754 | 4,464,806 | ||||||
| 36 | The Royce Funds 2019 Annual Report to Shareholders | THE ACCOMPANYING NOTES ARE AN INTEGRAL PART OF THESE FINANCIAL STATEMENTS |
December 31, 2019
Royce Opportunity Fund (continued)
| SHARES | VALUE | |||||||
| CONSUMER DISCRETIONARY (continued) | ||||||||
| TEXTILES, APPAREL & LUXURY GOODS (continued) | ||||||||
| Vince Holding1 | 57,783 | $ | 1,000,224 | |||||
| 5,826,615 | ||||||||
| Total (Cost $70,390,759) | 86,025,412 | |||||||
| CONSUMER STAPLES – 0.6% | ||||||||
| BEVERAGES - 0.5% | ||||||||
| †Eastside Distilling1 | 80,400 | 237,180 | ||||||
| MGP Ingredients | 73,200 | 3,546,540 | ||||||
| †Reed's1 | 256,067 | 233,021 | ||||||
| 4,016,741 | ||||||||
| FOOD PRODUCTS - 0.1% | ||||||||
| SunOpta1 | 465,427 | 1,163,568 | ||||||
| Total (Cost $7,443,795) | 5,180,309 | |||||||
| ENERGY – 8.3% | ||||||||
| ENERGY EQUIPMENT & SERVICES - 3.0% | ||||||||
| Archrock | 403,600 | 4,052,144 | ||||||
| Aspen Aerogels1 | 363,940 | 2,824,174 | ||||||
| DMC Global | 88,700 | 3,986,178 | ||||||
| Independence Contract Drilling1,2 | 772,781 | 770,308 | ||||||
| KLX Energy Services Holdings1,2 | 243,726 | 1,569,595 | ||||||
| †Nabors Industries | 386,320 | 1,112,602 | ||||||
| Newpark Resources1 | 804,273 | 5,042,792 | ||||||
| Patterson-UTI Energy | 215,185 | 2,259,442 | ||||||
| Ranger Energy Services Cl. A1 | 277,984 | 1,790,217 | ||||||
| †TETRA Technologies1 | 506,330 | 992,407 | ||||||
| U.S. Silica Holdings | 475,901 | 2,926,791 | ||||||
| 27,326,650 | ||||||||
| OIL, GAS & CONSUMABLE FUELS - 5.3% | ||||||||
| Ardmore Shipping1 | 400,099 | 3,620,896 | ||||||
| Baytex Energy1 | 943,700 | 1,368,365 | ||||||
| Bonanza Creek Energy1 | 113,300 | 2,644,422 | ||||||
| †Centennial Resource Development Cl. A1 | 71,000 | 328,020 | ||||||
| Dorian LPG1 | 632,348 | 9,788,747 | ||||||
| †Earthstone Energy Cl. A1 | 59,904 | 379,192 | ||||||
| GasLog | 213,604 | 2,091,183 | ||||||
| GasLog Partners L.P. | 153,780 | 2,405,119 | ||||||
| HighPoint Resources1 | 69,400 | 117,286 | ||||||
| Matador Resources1 | 412,383 | 7,410,523 | ||||||
| †Montage Resources1,2 | 269,370 | 2,138,798 | ||||||
| Navigator Holdings1 | 460,284 | 6,200,026 | ||||||
| Scorpio Tankers | 27,887 | 1,097,075 | ||||||
| Talos Energy1,2 | 153,123 | 4,616,658 | ||||||
| Teekay LNG Partners L.P. | 301,743 | 4,695,121 | ||||||
| Whiting Petroleum1 | 25,268 | 185,467 | ||||||
| 49,086,898 | ||||||||
| Total (Cost $84,731,962) | 76,413,548 | |||||||
| FINANCIALS – 9.6% | ||||||||
| BANKS - 4.4% | ||||||||
| Allegiance Bancshares1,2 | 55,000 | 2,068,000 | ||||||
| CenterState Bank | 229,766 | 5,739,555 | ||||||
| First Foundation | 184,300 | 3,206,820 | ||||||
| Franklin Financial Network | 142,614 | 4,895,939 | ||||||
| Hilltop Holdings | 306,899 | 7,650,992 | ||||||
| Independent Bank Group | 98,158 | 5,441,880 | ||||||
| Seacoast Banking Corporation of Florida1 | 122,200 | 3,735,654 | ||||||
| Southern National Bancorp of Virginia | 117,086 | 1,914,356 | ||||||
| Texas Capital Bancshares1 | 46,900 | 2,662,513 | ||||||
| TriState Capital Holdings1 | 110,761 | 2,893,077 | ||||||
| Umpqua Holdings | 43,182 | 764,321 | ||||||
| 40,973,107 | ||||||||
| CAPITAL MARKETS - 1.1% | ||||||||
| B. Riley Financial | 214,017 | 5,388,948 | ||||||
| Evercore Cl. A | 65,500 | 4,896,780 | ||||||
| †GAIN Capital Holdings | 74,800 | 295,460 | ||||||
| 10,581,188 | ||||||||
| INSURANCE - 2.1% | ||||||||
| HCI Group | 97,776 | 4,463,475 | ||||||
| Heritage Insurance Holdings | 439,991 | 5,829,881 | ||||||
| MBIA1 | 265,778 | 2,471,735 | ||||||
| †Stewart Information Services | 150,900 | 6,155,211 | ||||||
| 18,920,302 | ||||||||
| THRIFTS & MORTGAGE FINANCE - 2.0% | ||||||||
| Axos Financial1 | 50,400 | 1,526,112 | ||||||
| MGIC Investment | 108,272 | 1,534,214 | ||||||
| NMI Holdings Cl. A1,2 | 69,263 | 2,298,146 | ||||||
| Radian Group | 220,298 | 5,542,698 | ||||||
| Walker & Dunlop | 123,528 | 7,989,791 | ||||||
| 18,890,961 | ||||||||
| Total (Cost $76,134,954) | 89,365,558 | |||||||
| HEALTH CARE – 13.8% | ||||||||
| BIOTECHNOLOGY - 1.8% | ||||||||
| AMAG Pharmaceuticals1 | 73,300 | 892,061 | ||||||
| †CareDx 1,2 | 207,541 | 4,476,659 | ||||||
| †Emergent BioSolutions1 | 144,731 | 7,808,237 | ||||||
| †Flexion Therapeutics1,2 | 157,424 | 3,258,677 | ||||||
| 16,435,634 | ||||||||
| HEALTH CARE EQUIPMENT & SUPPLIES - 4.2% | ||||||||
| Accuray1,2 | 900,008 | 2,538,023 | ||||||
| Alphatec Holdings1 | 281,000 | 1,993,695 | ||||||
| AngioDynamics1 | 229,512 | 3,674,487 | ||||||
| †Chembio Diagnostics1 | 153,160 | 698,410 | ||||||
| †Conformis 1 | 23,520 | 35,280 | ||||||
| †IntriCon Corporation1,2 | 283,900 | 5,110,200 | ||||||
| Invacare Corporation | 947,716 | 8,548,398 | ||||||
| Merit Medical Systems1 | 52,400 | 1,635,928 | ||||||
| Orthofix Medical1 | 105,396 | 4,867,187 | ||||||
| †Ra Medical Systems1,2 | 140,373 | 158,621 | ||||||
| RTI Surgical Holdings1 | 476,528 | 1,305,687 | ||||||
| †SmileDirectClub Cl. A1 | 324,400 | 2,835,256 | ||||||
| Varex Imaging1 | 183,052 | 5,456,780 | ||||||
| 38,857,952 | ||||||||
| HEALTH CARE PROVIDERS & SERVICES - 6.8% | ||||||||
| AAC Holdings1,2,4 | 767,365 | 414,300 | ||||||
| Acadia Healthcare1,2 | 207,579 | 6,895,774 | ||||||
| †Addus HomeCare1,2 | 3,389 | 329,479 | ||||||
| †BioTelemetry1 | 138,500 | 6,412,550 | ||||||
| Brookdale Senior Living1 | 32,309 | 234,886 | ||||||
| Community Health Systems1 | 1,452,414 | 4,212,001 | ||||||
| Cross Country Healthcare1 | 688,520 | 8,000,602 | ||||||
| †Fulgent Genetics1,2 | 33,295 | 429,506 | ||||||
| Option Care Health1,2 | 1,310,285 | 4,887,363 | ||||||
| Owens & Minor | 978,269 | 5,057,651 | ||||||
| R1 RCM1,2 | 598,743 | 7,771,684 | ||||||
| RadNet1 | 170,600 | 3,463,180 | ||||||
| Select Medical Holdings1 | 198,100 | 4,623,654 | ||||||
| THE ACCOMPANYING NOTES ARE AN INTEGRAL PART OF THESE FINANCIAL STATEMENTS | The Royce Funds 2019 Annual Report to Shareholders | 37 |
Schedules of Investments
Royce Opportunity Fund (continued)
| SHARES | VALUE | |||||||
| HEALTH CARE (continued) | ||||||||
| HEALTH CARE PROVIDERS & SERVICES (continued) | ||||||||
| Surgery Partners1,2 | 650,636 | $ | 10,185,707 | |||||
| 62,918,337 | ||||||||
| HEALTH CARE TECHNOLOGY - 1.0% | ||||||||
| Allscripts Healthcare Solutions1 | 244,428 | 2,399,061 | ||||||
| Castlight Health Cl. B1 | 971,542 | 1,292,151 | ||||||
| Evolent Health Cl. A1,2 | 198,600 | 1,797,330 | ||||||
| †Tabula Rasa HealthCare1,2 | 77,600 | 3,777,568 | ||||||
| 9,266,110 | ||||||||
| Total (Cost $131,302,488) | 127,478,033 | |||||||
| INDUSTRIALS – 19.9% | ||||||||
| AEROSPACE & DEFENSE - 1.1% | ||||||||
| †Astronics Corporation1 | 179,300 | 5,011,435 | ||||||
| Kratos Defense & Security Solutions1 | 41,313 | 744,047 | ||||||
| Triumph Group | 151,401 | 3,825,903 | ||||||
| Wesco Aircraft Holdings1 | 36,736 | 404,831 | ||||||
| 9,986,216 | ||||||||
| AIR FREIGHT & LOGISTICS - 0.2% | ||||||||
| Atlas Air Worldwide Holdings1,2 | 74,298 | 2,048,396 | ||||||
| AIRLINES - 0.5% | ||||||||
| Hawaiian Holdings | 86,600 | 2,536,514 | ||||||
| Mesa Air Group1 | 230,600 | 2,061,564 | ||||||
| 4,598,078 | ||||||||
| BUILDING PRODUCTS - 2.0% | ||||||||
| American Woodmark1 | 40,600 | 4,243,106 | ||||||
| Builders FirstSource1 | 52,295 | 1,328,816 | ||||||
| Griffon Corporation | 233,459 | 4,746,222 | ||||||
| Insteel Industries | 147,550 | 3,170,850 | ||||||
| PGT Innovations1 | 222,343 | 3,315,134 | ||||||
| Quanex Building Products | 68,980 | 1,178,178 | ||||||
| 17,982,306 | ||||||||
| COMMERCIAL SERVICES & SUPPLIES - 0.8% | ||||||||
| Interface | 99,772 | 1,655,218 | ||||||
| Pitney Bowes | 567,600 | 2,287,428 | ||||||
| Team1 | 204,586 | 3,267,238 | ||||||
| 7,209,884 | ||||||||
| CONSTRUCTION & ENGINEERING - 3.7% | ||||||||
| Aegion Corporation1 | 164,385 | 3,677,293 | ||||||
| Ameresco Cl. A1 | 400,376 | 7,006,580 | ||||||
| Arcosa | 164,025 | 7,307,314 | ||||||
| †Concrete Pumping Holdings1,2 | 58,100 | 317,807 | ||||||
| Construction Partners Cl. A1,2 | 187,879 | 3,169,519 | ||||||
| Great Lakes Dredge & Dock1 | 72,216 | 818,207 | ||||||
| Northwest Pipe1 | 253,901 | 8,457,442 | ||||||
| †Primoris Services | 169,380 | 3,767,011 | ||||||
| 34,521,173 | ||||||||
| ELECTRICAL EQUIPMENT - 1.6% | ||||||||
| †Bloom Energy Cl. A1,2 | 359,300 | 2,683,971 | ||||||
| †Generac Holdings1 | 84,100 | 8,459,619 | ||||||
| †LSI Industries | 397,853 | 2,407,010 | ||||||
| Power Solutions International1,4 | 146,143 | 1,154,530 | ||||||
| 14,705,130 | ||||||||
| MACHINERY - 5.8% | ||||||||
| Astec Industries | 121,535 | 5,104,470 | ||||||
| Commercial Vehicle Group1 | 353,974 | 2,247,735 | ||||||
| FreightCar America1 | 143,067 | 296,149 | ||||||
| †Gencor Industries1 | 26,199 | 305,742 | ||||||
| Hurco Companies | 71,765 | 2,752,905 | ||||||
| Hyster-Yale Materials Handling Cl. A | 97,864 | 5,770,061 | ||||||
| †LiqTech International1,2 | 104,400 | 610,740 | ||||||
| Lydall1 | 230,526 | 4,730,394 | ||||||
| †Manitex International1 | 240,020 | 1,428,119 | ||||||
| Meritor1 | 55,108 | 1,443,279 | ||||||
| Mueller Water Products | 328,172 | 3,931,501 | ||||||
| NN1 | 317,248 | 2,934,544 | ||||||
| Park-Ohio Holdings | 51,790 | 1,742,733 | ||||||
| Spartan Motors | 338,638 | 6,122,575 | ||||||
| TriMas Corporation1 | 132,510 | 4,162,139 | ||||||
| Trinity Industries | 165,100 | 3,656,965 | ||||||
| Wabash National | 64,500 | 947,505 | ||||||
| Westport Fuel Systems1 | 2,356,974 | 5,586,028 | ||||||
| 53,773,584 | ||||||||
| MARINE - 0.4% | ||||||||
| Eagle Bulk Shipping1 | 365,333 | 1,680,532 | ||||||
| Scorpio Bulkers | 354,187 | 2,256,171 | ||||||
| 3,936,703 | ||||||||
| PROFESSIONAL SERVICES - 0.7% | ||||||||
| †GP Strategies1 | 204,245 | 2,702,161 | ||||||
| †Mistras Group1 | 289,000 | 4,124,030 | ||||||
| 6,826,191 | ||||||||
| ROAD & RAIL - 0.9% | ||||||||
| Hertz Global Holdings1,2 | 495,593 | 7,805,590 | ||||||
| TRADING COMPANIES & DISTRIBUTORS - 2.2% | ||||||||
| Air Lease Cl. A | 189,538 | 9,006,846 | ||||||
| †Fortress Transportation & Infrastructure Investors | 51,300 | 1,002,402 | ||||||
| †General Finance1 | 172,287 | 1,907,217 | ||||||
| Herc Holdings1 | 175,098 | 8,569,296 | ||||||
| 20,485,761 | ||||||||
| Total (Cost $147,451,889) | 183,879,012 | |||||||
| INFORMATION TECHNOLOGY – 23.7% | ||||||||
| COMMUNICATIONS EQUIPMENT - 3.6% | ||||||||
| Applied Optoelectronics1,2 | 98,500 | 1,170,180 | ||||||
| Aviat Networks1 | 45,499 | 639,261 | ||||||
| †CalAmp Corporation1 | 453,442 | 4,343,974 | ||||||
| Ciena Corporation1 | 66,573 | 2,842,001 | ||||||
| †CommScope Holding Company1 | 71,500 | 1,014,585 | ||||||
| Comtech Telecommunications | 189,176 | 6,713,856 | ||||||
| †DASAN Zhone Solutions1 | 98,600 | 873,596 | ||||||
| Digi International1 | 309,300 | 5,480,796 | ||||||
| EMCORE Corporation1 | 109,016 | 331,409 | ||||||
| Extreme Networks1 | 217,000 | 1,599,290 | ||||||
| Infinera Corporation1,2 | 604,946 | 4,803,271 | ||||||
| PCTEL | 220,920 | 1,871,193 | ||||||
| Ribbon Communications1 | 462,185 | 1,432,774 | ||||||
| 33,116,186 | ||||||||
| ELECTRONIC EQUIPMENT, INSTRUMENTS & COMPONENTS - 3.8% | ||||||||
| Fabrinet1 | 81,205 | 5,265,332 | ||||||
| Frequency Electronics1 | 325,535 | 3,323,712 | ||||||
| Identiv1 | 456,497 | 2,574,643 | ||||||
| II-VI1 | 249,068 | 8,386,120 | ||||||
| KEMET Corporation | 348,205 | 9,418,945 | ||||||
| Perceptron1 | 136,718 | 751,949 | ||||||
| Vishay Intertechnology | 242,224 | 5,156,949 | ||||||
| 34,877,650 | ||||||||
| IT SERVICES - 1.6% | ||||||||
| †CoreLogic1 | 116,100 | 5,074,731 | ||||||
| 38 | The Royce Funds 2019 Annual Report to Shareholders | THE ACCOMPANYING NOTES ARE AN INTEGRAL PART OF THESE FINANCIAL STATEMENTS |
December 31, 2019
Royce Opportunity Fund (continued)
| SHARES | VALUE | |||||||
| INFORMATION TECHNOLOGY (continued) | ||||||||
| IT SERVICES (continued) | ||||||||
| Limelight Networks1 | 920,824 | $ | 3,756,962 | |||||
| Perspecta | 241,959 | 6,397,396 | ||||||
| 15,229,089 | ||||||||
| SEMICONDUCTORS & SEMICONDUCTOR EQUIPMENT - 9.2% | ||||||||
| Advanced Energy Industries1 | 91,900 | 6,543,280 | ||||||
| Alpha & Omega Semiconductor1 | 780,486 | 10,630,219 | ||||||
| Amkor Technology1 | 371,400 | 4,828,200 | ||||||
| Amtech Systems1 | 263,975 | 1,890,061 | ||||||
| Axcelis Technologies1 | 41,900 | 1,009,581 | ||||||
| AXT1 | 411,106 | 1,788,311 | ||||||
| Brooks Automation | 74,320 | 3,118,467 | ||||||
| Cohu | 233,876 | 5,344,067 | ||||||
| FormFactor1 | 280,613 | 7,287,520 | ||||||
| Ichor Holdings1,2 | 98,094 | 3,263,587 | ||||||
| Kulicke & Soffa Industries | 260,565 | 7,087,368 | ||||||
| MACOM Technology Solutions Holdings1,2 | 364,539 | 9,696,737 | ||||||
| Onto Innovation1 | 263,419 | 9,625,330 | ||||||
| Ultra Clean Holdings1 | 338,827 | 7,952,270 | ||||||
| Veeco Instruments1,2 | 338,787 | 4,975,087 | ||||||
| 85,040,085 | ||||||||
| SOFTWARE - 3.6% | ||||||||
| A10 Networks1 | 751,726 | 5,164,358 | ||||||
| †Asure Software1 | 293,649 | 2,402,049 | ||||||
| Avaya Holdings1,2 | 542,954 | 7,329,879 | ||||||
| †Cloudera1,2 | 243,000 | 2,826,090 | ||||||
| Ebix | 154,700 | 5,168,527 | ||||||
| SecureWorks Corporation Cl. A1,2 | 264,330 | 4,403,738 | ||||||
| Telaria1 | 703,767 | 6,200,187 | ||||||
| 33,494,828 | ||||||||
| TECHNOLOGY HARDWARE, STORAGE & PERIPHERALS - 1.9% | ||||||||
| Avid Technology1 | 847,715 | 7,273,395 | ||||||
| Intevac1 | 631,830 | 4,460,720 | ||||||
| NCR Corporation1 | 111,800 | 3,930,888 | ||||||
| Stratasys1,2 | 47,961 | 970,011 | ||||||
| 3D Systems1 | 169,587 | 1,483,886 | ||||||
| 18,118,900 | ||||||||
| Total (Cost $153,520,944) | 219,876,738 | |||||||
| MATERIALS – 8.5% | ||||||||
| CHEMICALS - 3.0% | ||||||||
| †American Vanguard | 103,700 | 2,019,039 | ||||||
| Ferro Corporation1 | 228,467 | 3,388,166 | ||||||
| Huntsman Corporation | 182,800 | 4,416,448 | ||||||
| Intrepid Potash1 | 988,900 | 2,679,919 | ||||||
| Kraton Corporation1 | 288,145 | 7,295,831 | ||||||
| †Livent Corporation1,2 | 211,600 | 1,809,180 | ||||||
| Olin Corporation | 207,700 | 3,582,825 | ||||||
| †Rayonier Advanced Materials1 | 72,400 | 278,016 | ||||||
| †Trecora Resources1 | 290,612 | 2,077,876 | ||||||
| 27,547,300 | ||||||||
| CONSTRUCTION MATERIALS - 1.6% | ||||||||
| Forterra1,2 | 828,737 | 9,580,199 | ||||||
| U.S. Concrete1,2 | 119,762 | 4,989,285 | ||||||
| 14,569,484 | ||||||||
| METALS & MINING - 3.6% | ||||||||
| Allegheny Technologies1 | 80,614 | 1,665,485 | ||||||
| Carpenter Technology | 40,212 | 2,001,753 | ||||||
| Century Aluminum1 | 612,710 | 4,604,516 | ||||||
| Cleveland-Cliffs | 707,552 | 5,943,437 | ||||||
| Commercial Metals | 193,109 | 4,300,538 | ||||||
| Ferroglobe1 | 1,197,278 | 1,125,441 | ||||||
| Haynes International | 117,888 | 4,218,033 | ||||||
| Noranda Aluminum Holding Corporation1,4 | 488,157 | 1,757 | ||||||
| Synalloy Corporation1 | 374,221 | 4,831,193 | ||||||
| TimkenSteel Corporation1 | 137,735 | 1,082,597 | ||||||
| Universal Stainless & Alloy Products1,2 | 227,941 | 3,396,321 | ||||||
| 33,171,071 | ||||||||
| PAPER & FOREST PRODUCTS - 0.3% | ||||||||
| Glatfelter (P. H.) Company | 176,400 | 3,228,120 | ||||||
| Total (Cost $68,248,200) | 78,515,975 | |||||||
| REAL ESTATE – 1.3% | ||||||||
| EQUITY REAL ESTATE INVESTMENT TRUSTS (REITS) - 0.7% | ||||||||
| †Armada Hoffler Properties | 228,003 | 4,183,855 | ||||||
| CatchMark Timber Trust Cl. A | 197,400 | 2,264,178 | ||||||
| 6,448,033 | ||||||||
| REAL ESTATE MANAGEMENT & DEVELOPMENT - 0.6% | ||||||||
| †Realogy Holdings1 | 312,200 | 3,022,096 | ||||||
| Tejon Ranch1 | 167,106 | 2,670,354 | ||||||
| 5,692,450 | ||||||||
| Total (Cost $12,405,742) | 12,140,483 | |||||||
| UTILITIES – 0.2% | ||||||||
| WATER UTILITIES - 0.2% | ||||||||
| Pure Cycle1 | 170,799 | 2,150,359 | ||||||
| Total (Cost $713,940) | 2,150,359 | |||||||
| TOTAL COMMON STOCKS | ||||||||
| (Cost $760,139,562) | 894,376,746 | |||||||
| REPURCHASE AGREEMENT– 3.4% | ||||||||
| Fixed Income Clearing Corporation, 0.25% dated 12/31/19, due 1/2/20, maturity value $31,152,433 (collateralized by obligations of various U.S. Government Agencies, 2.875% due 11/15/21, valued at $31,776,556) | ||||||||
| (Cost $31,152,000) | 31,152,000 | |||||||
| COLLATERAL RECEIVED FOR SECURITIES LOANED – 2.5% | ||||||||
| Money Market Funds | ||||||||
| Federated Government Obligations Fund (7 day yield-1.49%) | ||||||||
| (Cost $22,880,089) | 22,880,089 | |||||||
| TOTAL INVESTMENTS – 102.5% | ||||||||
| (Cost $814,171,651) | 948,408,835 | |||||||
| LIABILITIES LESS CASH AND OTHER ASSETS – (2.5)% | (22,771,286 | ) | ||||||
| NET ASSETS – 100.0% | $ | 925,637,549 | ||||||
| THE ACCOMPANYING NOTES ARE AN INTEGRAL PART OF THESE FINANCIAL STATEMENTS | The Royce Funds 2019 Annual Report to Shareholders | 39 |
Schedules of Investments
Royce Pennsylvania Mutual Fund
Common Stocks - 96.0%
| SHARES | VALUE | |||||||
| COMMUNICATION SERVICES – 1.1% | ||||||||
| DIVERSIFIED TELECOMMUNICATION SERVICES - 0.2% | ||||||||
| †Bandwidth Cl. A1,2 | 70,835 | $ | 4,536,982 | |||||
| MEDIA - 0.9% | ||||||||
| Liberty Latin America Cl. C1,2 | 281,143 | 5,471,043 | ||||||
| †Media General (Rights)1,3 | 102,272 | 0 | ||||||
| Meredith Corporation | 150,323 | 4,880,988 | ||||||
| †Nexstar Media Group Cl. A | 26,125 | 3,063,156 | ||||||
| Saga Communications Cl. A | 115,661 | 3,516,094 | ||||||
| 16,931,281 | ||||||||
| Total (Cost $24,485,599) | 21,468,263 | |||||||
| CONSUMER DISCRETIONARY – 8.9% | ||||||||
| AUTO COMPONENTS - 1.8% | ||||||||
| Dorman Products1 | 131,380 | 9,948,093 | ||||||
| Gentex Corporation | 226,552 | 6,565,477 | ||||||
| LCI Industries | 128,870 | 13,805,843 | ||||||
| Stoneridge1 | 158,446 | 4,645,637 | ||||||
| 34,965,050 | ||||||||
| AUTOMOBILES - 0.4% | ||||||||
| Winnebago Industries | 158,610 | 8,403,158 | ||||||
| DISTRIBUTORS - 0.4% | ||||||||
| LKQ Corporation1 | 131,323 | 4,688,231 | ||||||
| Weyco Group | 85,418 | 2,259,306 | ||||||
| 6,947,537 | ||||||||
| DIVERSIFIED CONSUMER SERVICES - 0.3% | ||||||||
| Regis Corporation1 | 349,853 | 6,251,873 | ||||||
| HOTELS, RESTAURANTS & LEISURE - 0.5% | ||||||||
| †Century Casinos1 | 496,867 | 3,935,187 | ||||||
| Hilton Grand Vacations1 | 185,099 | 6,365,554 | ||||||
| 10,300,741 | ||||||||
| HOUSEHOLD DURABLES - 0.6% | ||||||||
| Ethan Allen Interiors | 13,928 | 265,468 | ||||||
| La-Z-Boy | 105,106 | 3,308,737 | ||||||
| †Legacy Housing1,2 | 189,025 | 3,145,376 | ||||||
| †LGI Homes1,2 | 65,442 | 4,623,477 | ||||||
| 11,343,058 | ||||||||
| INTERNET & DIRECT MARKETING RETAIL - 0.4% | ||||||||
| Etsy1 | 159,283 | 7,056,237 | ||||||
| LEISURE PRODUCTS - 0.3% | ||||||||
| Johnson Outdoors Cl. A | 28,015 | 2,148,751 | ||||||
| MasterCraft Boat Holdings1 | 249,071 | 3,922,868 | ||||||
| 6,071,619 | ||||||||
| SPECIALTY RETAIL - 3.2% | ||||||||
| American Eagle Outfitters | 342,966 | 5,041,600 | ||||||
| America's Car-Mart1 | 95,046 | 10,422,744 | ||||||
| †Asbury Automotive Group1 | 49,743 | 5,560,770 | ||||||
| Caleres | 292,284 | 6,941,745 | ||||||
| Children's Place | 63,809 | 3,989,339 | ||||||
| Designer Brands Cl. A | 431,283 | 6,788,394 | ||||||
| Monro | 50,639 | 3,959,970 | ||||||
| Rent-A-Center | 405,072 | 11,682,277 | ||||||
| Shoe Carnival | 218,939 | 8,162,046 | ||||||
| 62,548,885 | ||||||||
| TEXTILES, APPAREL & LUXURY GOODS - 1.0% | ||||||||
| †Canada Goose Holdings1,2 | 100,979 | 3,659,479 | ||||||
| G-III Apparel Group1 | 280,732 | 9,404,522 | ||||||
| Movado Group | 14,923 | 324,426 | ||||||
| Wolverine World Wide | 163,755 | 5,525,094 | ||||||
| 18,913,521 | ||||||||
| Total (Cost $125,056,316) | 172,801,679 | |||||||
| CONSUMER STAPLES – 1.4% | ||||||||
| FOOD PRODUCTS - 0.5% | ||||||||
| Cal-Maine Foods1 | 35,815 | 1,531,091 | ||||||
| Industrias Bachoco ADR Ser. B | 20,037 | 1,041,924 | ||||||
| Nomad Foods1 | 154,056 | 3,446,233 | ||||||
| Seneca Foods Cl. A1 | 104,533 | 4,263,901 | ||||||
| Tootsie Roll Industries | 14,027 | 478,882 | ||||||
| 10,762,031 | ||||||||
| PERSONAL PRODUCTS - 0.9% | ||||||||
| †BellRing Brands Cl. A1,2 | 179,076 | 3,812,528 | ||||||
| Inter Parfums | 177,526 | 12,907,915 | ||||||
| 16,720,443 | ||||||||
| Total (Cost $12,110,160) | 27,482,474 | |||||||
| ENERGY – 4.3% | ||||||||
| ENERGY EQUIPMENT & SERVICES - 3.6% | ||||||||
| †DMC Global | 47,863 | 2,150,963 | ||||||
| Era Group1 | 544,900 | 5,541,633 | ||||||
| Helmerich & Payne | 83,847 | 3,809,169 | ||||||
| Oil States International1 | 9,750 | 159,022 | ||||||
| Pason Systems | 1,106,349 | 11,169,563 | ||||||
| SEACOR Holdings1 | 500,358 | 21,590,448 | ||||||
| SEACOR Marine Holdings1,2 | 701,179 | 9,669,258 | ||||||
| †Solaris Oilfield Infrastructure Cl. A | 110,405 | 1,545,670 | ||||||
| TGS-NOPEC Geophysical | 517,270 | 15,737,339 | ||||||
| 71,373,065 | ||||||||
| OIL, GAS & CONSUMABLE FUELS - 0.7% | ||||||||
| †Bonanza Creek Energy1 | 176,015 | 4,108,190 | ||||||
| EQT Corporation | 99,487 | 1,084,408 | ||||||
| †Laredo Petroleum1,2 | 1,567,513 | 4,498,762 | ||||||
| †Penn Virginia1,2 | 128,465 | 3,898,913 | ||||||
| 13,590,273 | ||||||||
| Total (Cost $74,423,863) | 84,963,338 | |||||||
| FINANCIALS – 16.0% | ||||||||
| BANKS - 4.5% | ||||||||
| BOK Financial | 77,519 | 6,775,160 | ||||||
| Camden National | 123,346 | 5,681,317 | ||||||
| City Holding Company | 54,724 | 4,484,632 | ||||||
| CNB Financial | 161,481 | 5,277,199 | ||||||
| Financial Institutions | 101,067 | 3,244,251 | ||||||
| First Citizens BancShares Cl. A | 44,671 | 23,774,353 | ||||||
| National Bankshares | 118,842 | 5,339,571 | ||||||
| Northrim BanCorp | 94,495 | 3,619,158 | ||||||
| Popular | 204,049 | 11,987,879 | ||||||
| TriState Capital Holdings1,2 | 98,561 | 2,574,413 | ||||||
| Unity Bancorp | 84,105 | 1,898,250 | ||||||
| Webster Financial | 258,286 | 13,782,141 | ||||||
| 88,438,324 | ||||||||
| CAPITAL MARKETS - 5.8% | ||||||||
| Ares Management Cl. A | 573,100 | 20,453,939 | ||||||
| Artisan Partners Asset Management Cl. A | 134,502 | 4,347,105 | ||||||
| B. Riley Financial | 69,658 | 1,753,988 | ||||||
| Diamond Hill Investment Group | 36,016 | 5,058,807 | ||||||
| Houlihan Lokey Cl. A | 318,447 | 15,562,505 | ||||||
| Lazard Cl. A | 230,750 | 9,220,770 | ||||||
| Moelis & Company Cl. A | 126,524 | 4,038,646 | ||||||
| Morningstar | 96,994 | 14,676,162 | ||||||
| SEI Investments | 157,519 | 10,314,344 | ||||||
| Sprott | 1,716,948 | 3,940,168 | ||||||
| TMX Group | 47,000 | 4,070,040 | ||||||
| 40 | The Royce Funds 2019 Annual Report to Shareholders | THE ACCOMPANYING NOTES ARE AN INTEGRAL PART OF THESE FINANCIAL STATEMENTS |
December 31, 2019
Royce Pennsylvania Mutual Fund (continued)
| SHARES | VALUE | |||||||
| FINANCIALS (continued) | ||||||||
| CAPITAL MARKETS (continued) | ||||||||
| †Tradeweb Markets Cl. A | 85,400 | $ | 3,958,290 | |||||
| Virtu Financial Cl. A | 969,584 | 15,503,648 | ||||||
| 112,898,412 | ||||||||
| DIVERSIFIED FINANCIAL SERVICES - 0.1% | ||||||||
| †Onex Corporation | 50,000 | 3,163,913 | ||||||
| INSURANCE - 3.2% | ||||||||
| Alleghany Corporation1 | 8,775 | 7,016,227 | ||||||
| Assured Guaranty | 193,882 | 9,504,096 | ||||||
| E-L Financial | 26,318 | 16,800,513 | ||||||
| †FBL Financial Group Cl. A | 82,812 | 4,880,111 | ||||||
| Kingstone Companies | 154,713 | 1,199,026 | ||||||
| ProAssurance Corporation | 289,221 | 10,452,447 | ||||||
| RLI Corp. | 68,753 | 6,189,145 | ||||||
| Trupanion1,2 | 155,390 | 5,820,909 | ||||||
| 61,862,474 | ||||||||
| THRIFTS & MORTGAGE FINANCE - 2.4% | ||||||||
| Axos Financial1,2 | 166,350 | 5,037,078 | ||||||
| Genworth MI Canada | 537,129 | 23,502,884 | ||||||
| Southern Missouri Bancorp | 61,461 | 2,357,644 | ||||||
| Timberland Bancorp | 96,237 | 2,862,088 | ||||||
| TrustCo Bank Corp. NY | 659,130 | 5,714,657 | ||||||
| WSFS Financial | 154,359 | 6,790,253 | ||||||
| 46,264,604 | ||||||||
| Total (Cost $226,062,774) | 312,627,727 | |||||||
| HEALTH CARE – 6.2% | ||||||||
| BIOTECHNOLOGY – 0.4% | ||||||||
| †BioSpecifics Technologies1,2 | 62,858 | 3,579,135 | ||||||
| †CareDx1,2 | 34,820 | 751,067 | ||||||
| Eagle Pharmaceuticals1,2 | 7,362 | 442,309 | ||||||
| †Pfenex1 | 93,189 | 1,023,215 | ||||||
| Zealand Pharma1 | 77,222 | 2,728,680 | ||||||
| 8,524,406 | ||||||||
| HEALTH CARE EQUIPMENT & SUPPLIES - 2.2% | ||||||||
| AtriCure1 | 35,943 | 1,168,507 | ||||||
| Atrion Corporation | 8,442 | 6,344,163 | ||||||
| †BioLife Solutions1 | 220,716 | 3,571,185 | ||||||
| CryoLife1 | 67,758 | 1,835,564 | ||||||
| Haemonetics1 | 16,069 | 1,846,328 | ||||||
| Hill-Rom Holdings | 45,576 | 5,174,243 | ||||||
| Mesa Laboratories | 50,145 | 12,506,163 | ||||||
| †OrthoPediatrics Corporation1,2 | 13,500 | 634,365 | ||||||
| Quidel Corporation1 | 39,216 | 2,942,377 | ||||||
| †STAAR Surgical1,2 | 75,641 | 2,660,294 | ||||||
| †Tandem Diabetes Care1 | 67,086 | 3,998,996 | ||||||
| 42,682,185 | ||||||||
| HEALTH CARE PROVIDERS & SERVICES - 2.0% | ||||||||
| AMN Healthcare Services1,2 | 84,132 | 5,242,265 | ||||||
| Encompass Health | 139,160 | 9,639,613 | ||||||
| Ensign Group (The) | 63,835 | 2,896,194 | ||||||
| National Research | 125,963 | 8,306,000 | ||||||
| †Pennant Group1 | 27,540 | 910,748 | ||||||
| Tivity Health1,2 | 28,427 | 578,347 | ||||||
| U.S. Physical Therapy | 94,684 | 10,827,116 | ||||||
| 38,400,283 | ||||||||
| HEALTH CARE TECHNOLOGY - 0.2% | ||||||||
| †Simulations Plus | 137,250 | 3,989,858 | ||||||
| LIFE SCIENCES TOOLS & SERVICES - 1.3% | ||||||||
| Bio-Techne | 59,070 | 12,966,456 | ||||||
| ICON1 | 31,848 | 5,485,181 | ||||||
| NeoGenomics1 | 62,083 | 1,815,928 | ||||||
| PRA Health Sciences1 | 9,949 | 1,105,831 | ||||||
| Quanterix Corporation1,2 | 122,399 | 2,892,288 | ||||||
| 24,265,684 | ||||||||
| PHARMACEUTICALS - 0.1% | ||||||||
| †Supernus Pharmaceuticals1 | 93,617 | 2,220,595 | ||||||
| Total (Cost $67,765,065) | 120,083,011 | |||||||
| INDUSTRIALS – 27.5% | ||||||||
| AEROSPACE & DEFENSE - 1.6% | ||||||||
| HEICO Corporation | 142,187 | 16,230,646 | ||||||
| HEICO Corporation Cl. A | 66,910 | 5,990,452 | ||||||
| Hexcel Corporation | 40,332 | 2,956,739 | ||||||
| Magellan Aerospace | 208,471 | 2,257,212 | ||||||
| †Vectrus1 | 74,469 | 3,817,281 | ||||||
| 31,252,330 | ||||||||
| AIR FREIGHT & LOGISTICS - 0.6% | ||||||||
| Forward Air | 100,469 | 7,027,807 | ||||||
| Hub Group Cl. A1 | 107,918 | 5,535,114 | ||||||
| 12,562,921 | ||||||||
| AIRLINES - 1.0% | ||||||||
| Allegiant Travel | 35,412 | 6,163,104 | ||||||
| Hawaiian Holdings | 197,299 | 5,778,888 | ||||||
| Spirit Airlines1,2 | 187,761 | 7,568,646 | ||||||
| 19,510,638 | ||||||||
| BUILDING PRODUCTS - 1.2% | ||||||||
| Apogee Enterprises | 73,798 | 2,398,435 | ||||||
| Gibraltar Industries1 | 106,327 | 5,363,134 | ||||||
| Patrick Industries | 158,191 | 8,293,954 | ||||||
| Simpson Manufacturing | 87,299 | 7,003,999 | ||||||
| 23,059,522 | ||||||||
| COMMERCIAL SERVICES & SUPPLIES - 1.7% | ||||||||
| Healthcare Services Group | 163,811 | 3,983,884 | ||||||
| Heritage-Crystal Clean1 | 154,283 | 4,839,858 | ||||||
| Kimball International Cl. B | 412,317 | 8,522,592 | ||||||
| Mobile Mini | 82,807 | 3,139,213 | ||||||
| PICO Holdings1 | 325,026 | 3,614,289 | ||||||
| Steelcase Cl. A | 16,232 | 332,107 | ||||||
| UniFirst Corporation | 39,285 | 7,934,784 | ||||||
| 32,366,727 | ||||||||
| CONSTRUCTION & ENGINEERING - 1.7% | ||||||||
| Arcosa | 316,212 | 14,087,245 | ||||||
| Comfort Systems USA | 80,131 | 3,994,530 | ||||||
| †Construction Partners Cl. A1,2 | 144,891 | 2,444,311 | ||||||
| Sterling Construction1 | 8,968 | 126,269 | ||||||
| Valmont Industries | 85,225 | 12,765,001 | ||||||
| 33,417,356 | ||||||||
| ELECTRICAL EQUIPMENT - 1.1% | ||||||||
| Encore Wire | 80,104 | 4,597,970 | ||||||
| EnerSys | 13,401 | 1,002,797 | ||||||
| Hubbell Incorporated | 12,535 | 1,852,924 | ||||||
| Preformed Line Products | 218,153 | 13,165,533 | ||||||
| Sensata Technologies Holding1,2 | 22,800 | 1,228,236 | ||||||
| 21,847,460 | ||||||||
| INDUSTRIAL CONGLOMERATES - 1.2% | ||||||||
| Carlisle Companies | 36,313 | 5,876,896 | ||||||
| Raven Industries | 505,204 | 17,409,330 | ||||||
| 23,286,226 | ||||||||
| THE ACCOMPANYING NOTES ARE AN INTEGRAL PART OF THESE FINANCIAL STATEMENTS | The Royce Funds 2019 Annual Report to Shareholders | 41 |
Schedules of Investments
Royce Pennsylvania Mutual Fund (continued)
| SHARES | VALUE | |||||||
| INDUSTRIALS (continued) | ||||||||
| MACHINERY - 9.4% | ||||||||
| Alamo Group | 12,501 | $ | 1,569,501 | |||||
| CIRCOR International1 | 134,242 | 6,207,350 | ||||||
| Colfax Corporation1,2 | 617,034 | 22,447,697 | ||||||
| Franklin Electric | 137,078 | 7,857,311 | ||||||
| Graco | 180,999 | 9,411,948 | ||||||
| Graham Corporation | 72,292 | 1,581,749 | ||||||
| Helios Technologies | 375,110 | 17,341,335 | ||||||
| John Bean Technologies | 116,550 | 13,130,523 | ||||||
| Kadant | 123,728 | 13,033,507 | ||||||
| Lincoln Electric Holdings | 161,417 | 15,613,866 | ||||||
| Lindsay Corporation | 116,390 | 11,172,276 | ||||||
| Luxfer Holdings | 34,100 | 631,191 | ||||||
| Meritor1 | 663,314 | 17,372,194 | ||||||
| Miller Industries | 208,843 | 7,754,341 | ||||||
| Nordson Corporation | 48,336 | 7,871,034 | ||||||
| Proto Labs1,2 | 31,438 | 3,192,529 | ||||||
| RBC Bearings1 | 54,522 | 8,633,013 | ||||||
| Tennant Company | 231,480 | 18,036,922 | ||||||
| 182,858,287 | ||||||||
| MARINE - 1.7% | ||||||||
| Clarkson | 405,000 | 16,228,003 | ||||||
| Eagle Bulk Shipping1 | 377,886 | 1,738,276 | ||||||
| Kirby Corporation1 | 165,579 | 14,824,288 | ||||||
| 32,790,567 | ||||||||
| PROFESSIONAL SERVICES - 2.6% | ||||||||
| Exponent | 74,566 | 5,145,800 | ||||||
| Forrester Research1 | 154,823 | 6,456,119 | ||||||
| GP Strategies1 | 71,813 | 950,086 | ||||||
| Heidrick & Struggles International | 295,333 | 9,598,322 | ||||||
| Kforce | 78,471 | 3,115,299 | ||||||
| Korn Ferry | 232,319 | 9,850,325 | ||||||
| ManpowerGroup | 10,247 | 994,984 | ||||||
| †Morneau Shepell | 53,600 | 1,394,743 | ||||||
| Resources Connection | 204,684 | 3,342,490 | ||||||
| TrueBlue1 | 120,811 | 2,906,713 | ||||||
| †Upwork1,2 | 621,593 | 6,632,397 | ||||||
| 50,387,278 | ||||||||
| ROAD & RAIL - 1.8% | ||||||||
| ArcBest | 210,247 | 5,802,817 | ||||||
| Landstar System | 137,120 | 15,613,854 | ||||||
| Saia1 | 66,462 | 6,188,942 | ||||||
| Universal Logistics Holdings | 430,275 | 8,158,014 | ||||||
| 35,763,627 | ||||||||
| TRADING COMPANIES & DISTRIBUTORS - 1.9% | ||||||||
| Air Lease Cl. A | 315,915 | 15,012,281 | ||||||
| Applied Industrial Technologies | 121,091 | 8,075,559 | ||||||
| †BMC Stock Holdings1 | 95,349 | 2,735,563 | ||||||
| †EVI Industries1,2 | 97,718 | 2,642,295 | ||||||
| Richelieu Hardware | 310,641 | 6,490,077 | ||||||
| Watsco | 9,849 | 1,774,297 | ||||||
| 36,730,072 | ||||||||
| Total (Cost $319,798,336) | 535,833,011 | |||||||
| INFORMATION TECHNOLOGY – 19.0% | ||||||||
| COMMUNICATIONS EQUIPMENT - 0.3% | ||||||||
| ADTRAN | 61,465 | 607,889 | ||||||
| Digi International1 | 287,193 | 5,089,060 | ||||||
| NetScout Systems1 | 11,938 | 287,348 | ||||||
| 5,984,297 | ||||||||
| ELECTRONIC EQUIPMENT, INSTRUMENTS & COMPONENTS - 8.1% | ||||||||
| Badger Meter | 220,602 | 14,323,688 | ||||||
| Cognex Corporation | 104,493 | 5,855,788 | ||||||
| Coherent1 | 90,691 | 15,086,448 | ||||||
| Dolby Laboratories Cl. A | 94,540 | 6,504,352 | ||||||
| Fabrinet1 | 189,232 | 12,269,803 | ||||||
| FARO Technologies1 | 233,398 | 11,751,589 | ||||||
| FLIR Systems | 380,101 | 19,791,859 | ||||||
| HollySys Automation Technologies | 71,531 | 1,173,824 | ||||||
| Insight Enterprises1 | 189,493 | 13,319,463 | ||||||
| IPG Photonics1 | 42,231 | 6,120,117 | ||||||
| Kimball Electronics1 | 186,492 | 3,272,935 | ||||||
| Littelfuse | 12,933 | 2,474,083 | ||||||
| Methode Electronics | 10,048 | 395,389 | ||||||
| MTS Systems | 43,710 | 2,099,391 | ||||||
| National Instruments | 261,316 | 11,064,119 | ||||||
| †PAR Technology1 | 282,289 | 8,677,564 | ||||||
| PC Connection | 184,349 | 9,154,771 | ||||||
| Sanmina Corporation1 | 204,060 | 6,987,014 | ||||||
| Vishay Intertechnology | 138,090 | 2,939,936 | ||||||
| Vishay Precision Group1 | 153,244 | 5,210,296 | ||||||
| 158,472,429 | ||||||||
| IT SERVICES - 0.8% | ||||||||
| †Computer Services4 | 4,079 | 181,515 | ||||||
| KBR | 514,874 | 15,703,657 | ||||||
| †Switch Cl. A | 8,556 | 126,800 | ||||||
| 16,011,972 | ||||||||
| SEMICONDUCTORS & SEMICONDUCTOR EQUIPMENT - 6.4% | ||||||||
| †Adesto Technologies1,2 | 174,699 | 1,484,942 | ||||||
| Advanced Energy Industries1 | 71,703 | 5,105,254 | ||||||
| †Axcelis Technologies1 | 173,016 | 4,168,821 | ||||||
| Brooks Automation | 189,613 | 7,956,161 | ||||||
| Cabot Microelectronics | 120,757 | 17,427,650 | ||||||
| Cirrus Logic1 | 197,140 | 16,246,307 | ||||||
| Cohu | 244,918 | 5,596,376 | ||||||
| Diodes1 | 195,294 | 11,008,723 | ||||||
| Entegris | 181,116 | 9,072,100 | ||||||
| FormFactor1 | 183,166 | 4,756,821 | ||||||
| Kulicke & Soffa Industries | 340,851 | 9,271,147 | ||||||
| Lattice Semiconductor1 | 162,771 | 3,115,437 | ||||||
| MKS Instruments | 140,280 | 15,432,203 | ||||||
| Nova Measuring Instruments1,2 | 96,554 | 3,652,638 | ||||||
| Onto Innovation1,2 | 75,220 | 2,748,539 | ||||||
| Photronics1 | 142,794 | 2,250,433 | ||||||
| Silicon Motion Technology ADR | 60,370 | 3,061,363 | ||||||
| Ultra Clean Holdings1 | 89,571 | 2,102,231 | ||||||
| 124,457,146 | ||||||||
| SOFTWARE - 3.4% | ||||||||
| ACI Worldwide1 | 237,597 | 9,001,362 | ||||||
| Agilysys1 | 99,487 | 2,527,965 | ||||||
| †Cloudflare Cl. A1 | 168,311 | 2,871,386 | ||||||
| Descartes Systems Group (The)1 | 80,547 | 3,440,968 | ||||||
| Fair Isaac1 | 29,068 | 10,891,198 | ||||||
| j2 Global1 | 72,377 | 6,782,449 | ||||||
| Manhattan Associates1 | 61,164 | 4,877,829 | ||||||
| QAD Cl. A | 45,841 | 2,334,682 | ||||||
| Qualys1,2 | 45,927 | 3,828,934 | ||||||
| †SPS Commerce1 | 58,705 | 3,253,431 | ||||||
| †SVMK1,2 | 266,645 | 4,764,946 | ||||||
| Upland Software1,2 | 252,615 | 9,020,882 | ||||||
| 42 |The Royce Funds 2019 Annual Report to Shareholders | THE ACCOMPANYING NOTES ARE AN INTEGRAL PART OF THESE FINANCIAL STATEMENTS |
December 31, 2019
Royce Pennsylvania Mutual Fund (continued)
| SHARES | VALUE | |||||||
| INFORMATION TECHNOLOGY (continued) | ||||||||
| SOFTWARE (continued) | ||||||||
| †Zuora Cl. A1,2 | 170,520 | $ | 2,443,551 | |||||
| 66,039,583 | ||||||||
| Total (Cost $201,675,921) | 370,965,427 | |||||||
| MATERIALS – 8.7% | ||||||||
| CHEMICALS - 4.3% | ||||||||
| Balchem Corporation | 129,022 | 13,112,506 | ||||||
| Element Solutions1 | 1,026,749 | 11,992,428 | ||||||
| †Huntsman Corporation | 57,105 | 1,379,657 | ||||||
| Ingevity Corporation1 | 54,804 | 4,788,774 | ||||||
| Innospec | 127,742 | 13,213,633 | ||||||
| Minerals Technologies | 215,484 | 12,418,343 | ||||||
| Quaker Chemical | 134,297 | 22,094,542 | ||||||
| Sensient Technologies | 23,379 | 1,545,118 | ||||||
| Westlake Chemical | 38,402 | 2,693,900 | ||||||
| 83,238,901 | ||||||||
| CONSTRUCTION MATERIALS - 0.1% | ||||||||
| Imerys | 40,000 | 1,690,626 | ||||||
| CONTAINERS & PACKAGING - 0.6% | ||||||||
| AptarGroup | 94,054 | 10,874,524 | ||||||
| †Packaging Corporation of America | 8,954 | 1,002,758 | ||||||
| 11,877,282 | ||||||||
| METALS & MINING - 2.6% | ||||||||
| Alamos Gold Cl. A | 2,522,435 | 15,209,785 | ||||||
| Franco-Nevada | 92,738 | 9,579,835 | ||||||
| Haynes International | 37,450 | 1,339,961 | ||||||
| IAMGOLD Corporation1 | 795,894 | 2,968,685 | ||||||
| †Mayville Engineering1 | 142,603 | 1,337,616 | ||||||
| Pretium Resources1 | 89,241 | 993,056 | ||||||
| Reliance Steel & Aluminum | 155,349 | 18,604,596 | ||||||
| 50,033,534 | ||||||||
| PAPER & FOREST PRODUCTS - 1.1% | ||||||||
| Stella-Jones | 767,901 | 22,187,552 | ||||||
| Total (Cost $93,754,990) | 169,027,895 | |||||||
| REAL ESTATE – 2.9% | ||||||||
| REAL ESTATE MANAGEMENT & DEVELOPMENT - 2.9% | ||||||||
| FRP Holdings1 | 254,888 | 12,695,971 | ||||||
| Jones Lang LaSalle | 16,515 | 2,875,097 | ||||||
| Kennedy-Wilson Holdings | 654,921 | 14,604,738 | ||||||
| Marcus & Millichap1 | 402,185 | 14,981,391 | ||||||
| St. Joe Company (The)1 | 246,454 | 4,887,183 | ||||||
| Tejon Ranch1 | 407,307 | 6,508,766 | ||||||
| Total (Cost $43,818,571) | 56,553,146 | |||||||
| TOTAL COMMON STOCKS | ||||||||
| (Cost $1,188,951,595) | 1,871,805,971 | |||||||
| REPURCHASE AGREEMENT– 3.9% | ||||||||
| Fixed Income Clearing Corporation, 0.25% dated 12/31/19, due 1/2/20, maturity value $76,281,059 (collateralized by obligations of various U.S. Government Agencies, 2.00% due 5/31/24, valued at $77,808,563) | ||||||||
| (Cost $76,280,000) | 76,280,000 | |||||||
| COLLATERAL RECEIVED FOR SECURITIES LOANED – 0.6% | ||||||||
| Money Market Funds | ||||||||
| Federated Government Obligations Fund (7 day yield-1.49%) | ||||||||
| (Cost $11,003,360) | 11,003,360 | |||||||
| TOTAL INVESTMENTS – 100.5% | ||||||||
| (Cost $1,276,234,955) | 1,959,089,331 | |||||||
| LIABILITIES LESS CASH AND OTHER ASSETS – (0.5)% | (9,759,561 | ) | ||||||
| NET ASSETS – 100.0% | $ | 1,949,329,770 | ||||||
| THE ACCOMPANYING NOTES ARE AN INTEGRAL PART OF THESE FINANCIAL STATEMENTS | The Royce Funds 2019 Annual Report to Shareholders | 43 |
Schedules of Investments
| Royce Premier Fund | ||||||||
| Common Stocks — 96.5% | ||||||||
| SHARES | VALUE | |||||||
| CONSUMER DISCRETIONARY – 3.3% | ||||||||
| AUTO COMPONENTS - 2.1% | ||||||||
| Dorman Products1 | 234,295 | $ | 17,740,817 | |||||
| LCI Industries | 187,919 | 20,131,763 | ||||||
| 37,872,580 | ||||||||
| DISTRIBUTORS - 1.2% | ||||||||
| Pool Corporation | 107,291 | 22,786,462 | ||||||
| Total (Cost $25,640,824) | 60,659,042 | |||||||
| ENERGY – 5.0% | ||||||||
| ENERGY EQUIPMENT & SERVICES - 5.0% | ||||||||
| Pason Systems | 3,009,000 | 30,378,492 | ||||||
| SEACOR Holdings1 | 586,395 | 25,302,944 | ||||||
| TGS-NOPEC Geophysical | 1,134,000 | 34,500,632 | ||||||
| Total (Cost $93,729,813) | 90,182,068 | |||||||
| FINANCIALS – 18.0% | ||||||||
| CAPITAL MARKETS - 11.5% | ||||||||
| Ares Management Cl. A | 1,274,278 | 45,478,982 | ||||||
| Ashmore Group | 7,429,400 | 50,976,286 | ||||||
| Lazard Cl. A | 425,683 | 17,010,293 | ||||||
| Morningstar | 321,044 | 48,577,168 | ||||||
| TMX Group | 268,494 | 23,250,664 | ||||||
| †Virtu Financial Cl. A | 1,437,954 | 22,992,884 | ||||||
| 208,286,277 | ||||||||
| INSURANCE - 3.9% | ||||||||
| Alleghany Corporation1 | 51,600 | 41,257,812 | ||||||
| ProAssurance Corporation | 783,807 | 28,326,785 | ||||||
| 69,584,597 | ||||||||
| THRIFTS & MORTGAGE FINANCE - 2.6% | ||||||||
| Genworth MI Canada | 1,092,965 | 47,824,320 | ||||||
| Total (Cost $173,294,685) | 325,695,194 | |||||||
| HEALTH CARE – 3.1% | ||||||||
| HEALTH CARE EQUIPMENT & SUPPLIES - 1.5% | ||||||||
| †Mesa Laboratories | 111,079 | 27,703,102 | ||||||
| LIFE SCIENCES TOOLS & SERVICES - 1.6% | ||||||||
| Bio-Techne | 127,778 | 28,048,549 | ||||||
| Total (Cost $37,010,277) | 55,751,651 | |||||||
| INDUSTRIALS – 38.3% | ||||||||
| AIR FREIGHT & LOGISTICS - 2.0% | ||||||||
| Forward Air | 521,063 | 36,448,357 | ||||||
| BUILDING PRODUCTS - 1.5% | ||||||||
| Simpson Manufacturing | 335,951 | 26,953,349 | ||||||
| COMMERCIAL SERVICES & SUPPLIES - 1.7% | ||||||||
| Ritchie Bros. Auctioneers | 700,846 | 30,101,336 | ||||||
| CONSTRUCTION & ENGINEERING - 2.0% | ||||||||
| Valmont Industries | 235,749 | 35,310,485 | ||||||
| INDUSTRIAL CONGLOMERATES - 1.3% | ||||||||
| †Raven Industries | 658,195 | 22,681,400 | ||||||
| MACHINERY - 20.7% | ||||||||
| CIRCOR International1 | 391,380 | 18,097,411 | ||||||
| †Colfax Corporation1,2 | 1,304,482 | 47,457,055 | ||||||
| Franklin Electric | 228,935 | 13,122,554 | ||||||
| Helios Technologies | 741,565 | 34,282,550 | ||||||
| John Bean Technologies | 419,670 | 47,280,022 | ||||||
| Kadant | 210,352 | 22,158,480 | ||||||
| Lincoln Electric Holdings | 561,910 | 54,353,554 | ||||||
| Lindsay Corporation | 407,385 | 39,104,886 | ||||||
| RBC Bearings1 | 134,575 | 21,308,606 | ||||||
| †Tennant Company | 368,973 | 28,750,376 | ||||||
| Woodward | 416,139 | 49,287,503 | ||||||
| 375,202,997 | ||||||||
| MARINE - 4.3% | ||||||||
| Clarkson | 510,106 | 20,439,511 | ||||||
| Kirby Corporation1 | 637,919 | 57,112,888 | ||||||
| 77,552,399 | ||||||||
| ROAD & RAIL - 1.6% | ||||||||
| Landstar System | 259,925 | 29,597,660 | ||||||
| TRADING COMPANIES & DISTRIBUTORS - 3.2% | ||||||||
| Air Lease Cl. A | 1,227,647 | 58,337,785 | ||||||
| Total (Cost $370,856,321) | 692,185,768 | |||||||
| INFORMATION TECHNOLOGY – 18.6% | ||||||||
| ELECTRONIC EQUIPMENT, INSTRUMENTS & COMPONENTS - 7.4% | ||||||||
| Cognex Corporation | 555,770 | 31,145,351 | ||||||
| Coherent1 | 236,957 | 39,417,797 | ||||||
| †FARO Technologies1 | 205,663 | 10,355,132 | ||||||
| IPG Photonics1 | 110,712 | 16,044,383 | ||||||
| National Instruments | 876,775 | 37,122,654 | ||||||
| 134,085,317 | ||||||||
| IT SERVICES - 1.0% | ||||||||
| Jack Henry & Associates | 123,178 | 17,943,339 | ||||||
| SEMICONDUCTORS & SEMICONDUCTOR EQUIPMENT - 5.8% | ||||||||
| Cabot Microelectronics | 375,064 | 54,129,237 | ||||||
| MKS Instruments | 473,848 | 52,128,018 | ||||||
| 106,257,255 | ||||||||
| SOFTWARE - 4.4% | ||||||||
| Fair Isaac1 | 117,205 | 43,914,369 | ||||||
| Manhattan Associates1 | 442,174 | 35,263,377 | ||||||
| 79,177,746 | ||||||||
| Total (Cost $118,892,361) | 337,463,657 | |||||||
| MATERIALS – 8.9% | ||||||||
| CHEMICALS - 4.6% | ||||||||
| †Innospec | 338,893 | 35,055,092 | ||||||
| Quaker Chemical | 292,117 | 48,059,089 | ||||||
| 83,114,181 | ||||||||
| METALS & MINING - 2.5% | ||||||||
| Reliance Steel & Aluminum | 374,331 | 44,829,880 | ||||||
| PAPER & FOREST PRODUCTS - 1.8% | ||||||||
| Stella-Jones | 1,133,000 | 32,736,637 | ||||||
| Total (Cost $111,294,826) | 160,680,698 | |||||||
| REAL ESTATE – 1.3% | ||||||||
| REAL ESTATE MANAGEMENT & DEVELOPMENT - 1.3% | ||||||||
| Kennedy-Wilson Holdings | 1,026,399 | 22,888,698 | ||||||
| Total (Cost $19,461,791) | 22,888,698 | |||||||
| TOTAL COMMON STOCKS | ||||||||
| (Cost $950,180,898) | 1,745,506,776 | |||||||
| 44 | The Royce Funds 2019 Annual Report to Shareholders | THE ACCOMPANYING NOTES ARE AN INTEGRAL PART OF THESE FINANCIAL STATEMENTS |
December 31, 2019
| Royce Premier Fund (continued) | ||||
| VALUE | ||||
| REPURCHASE AGREEMENT – 3.6% | ||||
| Fixed Income Clearing Corporation, 0.25% dated 12/31/19, due 1/2/20, maturity value $65,358,908 (collateralized by obligations of various U.S. Government Agencies, 2.00% due 5/31/24, valued at $66,666,938) | ||||
| (Cost $65,358,000) | $ | 65,358,000 | ||
| TOTAL INVESTMENTS – 100.1% | ||||
| (Cost $1,015,538,898) | 1,810,864,776 | |||
| LIABILITIES LESS CASH AND OTHER ASSETS – (0.1)% | (2,471,070 | ) | ||
| NET ASSETS – 100.0% | $ | 1,808,393,706 | ||
| Royce Small-Cap Value Fund | ||||||||
| Common Stocks - 92.1% | ||||||||
| SHARES | VALUE | |||||||
| COMMUNICATION SERVICES – 0.9% | ||||||||
| MEDIA - 0.9% | ||||||||
| Saga Communications Cl. A | 52,529 | $ | 1,596,882 | |||||
| Total (Cost $2,211,910) | 1,596,882 | |||||||
| CONSUMER DISCRETIONARY – 15.4% | ||||||||
| AUTO COMPONENTS - 0.9% | ||||||||
| Gentex Corporation | 29,027 | 841,203 | ||||||
| Stoneridge1 | 25,798 | 756,397 | ||||||
| 1,597,600 | ||||||||
| HOTELS, RESTAURANTS & LEISURE - 1.5% | ||||||||
| Hilton Grand Vacations1 | 74,401 | 2,558,650 | ||||||
| HOUSEHOLD DURABLES - 1.0% | ||||||||
| La-Z-Boy | 53,702 | 1,690,539 | ||||||
| SPECIALTY RETAIL - 9.7% | ||||||||
| American Eagle Outfitters | 200,445 | 2,946,541 | ||||||
| Caleres | 146,831 | 3,487,236 | ||||||
| Designer Brands Cl. A | 228,348 | 3,594,198 | ||||||
| †Rent-A-Center | 114,470 | 3,301,315 | ||||||
| Shoe Carnival | 89,838 | 3,349,161 | ||||||
| 16,678,451 | ||||||||
| TEXTILES, APPAREL & LUXURY GOODS - 2.3% | ||||||||
| G-III Apparel Group1 | 91,100 | 3,051,850 | ||||||
| Steven Madden | 19,849 | 853,705 | ||||||
| 3,905,555 | ||||||||
| Total (Cost $24,504,248) | 26,430,795 | |||||||
| CONSUMER STAPLES - 0.5% | ||||||||
| FOOD & STAPLES RETAILING - 0.5% | ||||||||
| Village Super Market Cl. A | 37,679 | 874,153 | ||||||
| Total (Cost $1,058,890) | 874,153 | |||||||
| ENERGY – 6.5% | ||||||||
| ENERGY EQUIPMENT & SERVICES - 2.3% | ||||||||
| †DMC Global | 20,257 | 910,350 | ||||||
| Helmerich & Payne | 48,584 | 2,207,171 | ||||||
| †Solaris Oilfield Infrastructure Cl. A | 57,386 | 803,404 | ||||||
| 3,920,925 | ||||||||
| OIL, GAS & CONSUMABLE FUELS - 4.2% | ||||||||
| †Bonanza Creek Energy1 | 96,533 | 2,253,080 | ||||||
| †Dorchester Minerals L.P. | 17,834 | 347,941 | ||||||
| †Laredo Petroleum1,2 | 861,055 | 2,471,228 | ||||||
| †Penn Virginia1 | 70,240 | 2,131,784 | ||||||
| 7,204,033 | ||||||||
| Total (Cost $9,616,139) | 11,124,958 | |||||||
| FINANCIALS – 25.7% | ||||||||
| BANKS - 12.4% | ||||||||
| Ames National | 85,520 | 2,399,691 | ||||||
| Camden National | 61,201 | 2,818,918 | ||||||
| City Holding Company | 32,876 | 2,694,188 | ||||||
| CNB Financial | 87,567 | 2,861,690 | ||||||
| Codorus Valley Bancorp | 33,333 | 767,659 | ||||||
| Financial Institutions | 40,966 | 1,315,009 | ||||||
| Landmark Bancorp | 25,230 | 632,011 | ||||||
| MidWestOne Financial Group | 36,286 | 1,314,642 | ||||||
| National Bankshares | 62,963 | 2,828,928 | ||||||
| Northrim BanCorp | 54,688 | 2,094,550 | ||||||
| Unity Bancorp | 69,312 | 1,564,372 | ||||||
| 21,291,658 | ||||||||
| CAPITAL MARKETS - 2.2% | ||||||||
| Houlihan Lokey Cl. A | 51,995 | 2,540,996 | ||||||
| THE ACCOMPANYING NOTES ARE AN INTEGRAL PART OF THESE FINANCIAL STATEMENTS | The Royce Funds 2019 Annual Report to Shareholders | 45 |
Schedules of Investments
| Royce Small-Cap Value Fund (continued) | ||||||||
| SHARES | VALUE | |||||||
| FINANCIALS (continued) | ||||||||
| CAPITAL MARKETS (continued) | ||||||||
| Moelis & Company Cl. A | 26,738 | $ | 853,477 | |||||
| Pzena Investment Management Cl. A | 43,178 | 372,194 | ||||||
| 3,766,667 | ||||||||
| INSURANCE - 3.0% | ||||||||
| James River Group Holdings | 41,305 | 1,702,179 | ||||||
| Kingstone Companies | 97,482 | 755,485 | ||||||
| Reinsurance Group of America | 16,936 | 2,761,584 | ||||||
| 5,219,248 | ||||||||
| THRIFTS & MORTGAGE FINANCE - 8.1% | ||||||||
| Genworth MI Canada | 99,389 | 4,348,914 | ||||||
| Southern Missouri Bancorp | 35,449 | 1,359,824 | ||||||
| Timberland Bancorp | 48,271 | 1,435,580 | ||||||
| TrustCo Bank Corp. NY | 330,850 | 2,868,469 | ||||||
| WSFS Financial | 86,626 | 3,810,678 | ||||||
| 13,823,465 | ||||||||
| Total (Cost $31,129,783) | 44,101,038 | |||||||
| HEALTH CARE – 2.4% | ||||||||
| BIOTECHNOLOGY - 0.5% | ||||||||
| †Catalyst Pharmaceuticals1 | 233,638 | 876,143 | ||||||
| HEALTH CARE PROVIDERS & SERVICES - 1.3% | ||||||||
| AMN Healthcare Services1 | 13,717 | 854,706 | ||||||
| Ensign Group (The) | 23,865 | 1,082,755 | ||||||
| †Pennant Group1 | 9,582 | 316,877 | ||||||
| 2,254,338 | ||||||||
| PHARMACEUTICALS - 0.6% | ||||||||
| †Supernus Pharmaceuticals1 | 39,900 | 946,428 | ||||||
| Total (Cost $3,228,939) | 4,076,909 | |||||||
| INDUSTRIALS – 27.6% | ||||||||
| AEROSPACE & DEFENSE - 1.3% | ||||||||
| Magellan Aerospace | 156,800 | 1,697,746 | ||||||
| †Vectrus1 | 10,600 | 543,356 | ||||||
| 2,241,102 | ||||||||
| AIRLINES - 5.7% | ||||||||
| Allegiant Travel | 17,330 | 3,016,113 | ||||||
| Hawaiian Holdings | 102,823 | 3,011,686 | ||||||
| Spirit Airlines1,2 | 92,236 | 3,718,033 | ||||||
| 9,745,832 | ||||||||
| COMMERCIAL SERVICES & SUPPLIES - 2.5% | ||||||||
| Herman Miller | 38,899 | 1,620,143 | ||||||
| Kimball International Cl. B | 130,174 | 2,690,697 | ||||||
| 4,310,840 | ||||||||
| CONSTRUCTION & ENGINEERING - 0.5% | ||||||||
| Comfort Systems USA | 16,638 | 829,404 | ||||||
| ELECTRICAL EQUIPMENT - 0.5% | ||||||||
| EnerSys | 11,214 | 839,144 | ||||||
| MACHINERY - 6.6% | ||||||||
| Alamo Group | 6,963 | 874,205 | ||||||
| †Commercial Vehicle Group1 | 364,440 | 2,314,194 | ||||||
| Federal Signal | 25,210 | 813,022 | ||||||
| Meritor1 | 114,382 | 2,995,665 | ||||||
| Miller Industries | 115,477 | 4,287,661 | ||||||
| 11,284,747 | ||||||||
| PROFESSIONAL SERVICES - 6.4% | ||||||||
| Heidrick & Struggles International | 98,834 | 3,212,105 | ||||||
| Kforce | 20,609 | 818,177 | ||||||
| Korn Ferry | 72,960 | 3,093,504 | ||||||
| Resources Connection | 80,220 | 1,309,993 | ||||||
| Robert Half International | 25,216 | 1,592,391 | ||||||
| TrueBlue1 | 35,488 | 853,841 | ||||||
| 10,880,011 | ||||||||
| ROAD & RAIL - 3.3% | ||||||||
| ArcBest | 95,016 | 2,622,441 | ||||||
| Old Dominion Freight Line | 4,364 | 828,200 | ||||||
| Saia1 | 8,641 | 804,650 | ||||||
| Werner Enterprises | 40,354 | 1,468,482 | ||||||
| 5,723,773 | ||||||||
| TRADING COMPANIES & DISTRIBUTORS - 0.8% | ||||||||
| †BMC Stock Holdings1 | 47,034 | 1,349,405 | ||||||
| Total (Cost $37,508,280) | 47,204,258 | |||||||
| INFORMATION TECHNOLOGY – 11.3% | ||||||||
| ELECTRONIC EQUIPMENT, INSTRUMENTS & COMPONENTS - 8.8% | ||||||||
| Fabrinet1 | 26,254 | 1,702,309 | ||||||
| Insight Enterprises1 | 62,888 | 4,420,398 | ||||||
| PC Connection | 50,278 | 2,496,805 | ||||||
| Sanmina Corporation1 | 113,741 | 3,894,492 | ||||||
| Vishay Intertechnology | 119,539 | 2,544,985 | ||||||
| 15,058,989 | ||||||||
| SEMICONDUCTORS & SEMICONDUCTOR EQUIPMENT - 2.5% | ||||||||
| Advanced Energy Industries1 | 12,165 | 866,148 | ||||||
| Kulicke & Soffa Industries | 94,869 | 2,580,437 | ||||||
| MKS Instruments | 7,780 | 855,878 | ||||||
| 4,302,463 | ||||||||
| Total (Cost $11,367,297) | 19,361,452 | |||||||
| MATERIALS – 0.3% | ||||||||
| METALS & MINING - 0.3% | ||||||||
| †Mayville Engineering1 | 45,922 | 430,748 | ||||||
| Total (Cost $576,072) | 430,748 | |||||||
| REAL ESTATE – 1.5% | ||||||||
| REAL ESTATE MANAGEMENT & DEVELOPMENT - 1.5% | ||||||||
| Marcus & Millichap1 | 68,346 | 2,545,889 | ||||||
| Total (Cost $2,045,389) | 2,545,889 | |||||||
| TOTAL COMMON STOCKS | ||||||||
| (Cost $123,246,947) | 157,747,082 | |||||||
| REPURCHASE AGREEMENT– 8.1% | ||||||||
| Fixed Income Clearing Corporation, 0.25% dated 12/31/19, due 1/2/20, maturity value $13,848,192 (collateralized by obligations of various U.S. Government Agencies, 2.25% due 11/15/24, valued at $14,129,392) | ||||||||
| (Cost $13,848,000) | 13,848,000 | |||||||
| TOTAL INVESTMENTS – 100.2% | ||||||||
| (Cost $137,094,947) | 171,595,082 | |||||||
| LIABILITIES LESS CASH AND OTHER ASSETS – (0.2)% | (327,020 | ) | ||||||
| NET ASSETS – 100.0% | $ | 171,268,062 | ||||||
| 46 | The Royce Funds 2019 Annual Report to Shareholders | THE ACCOMPANYING NOTES ARE AN INTEGRAL PART OF THESE FINANCIAL STATEMENTS |
December 31, 2019
| Royce Smaller-Companies Growth Fund | ||||||||
| Common Stocks - 96.6% | ||||||||
| SHARES | VALUE | |||||||
| COMMUNICATION SERVICES – 2.1% | ||||||||
| DIVERSIFIED TELECOMMUNICATION SERVICES - 0.6% | ||||||||
| Bandwidth Cl. A1 | 26,000 | $ | 1,665,300 | |||||
| ENTERTAINMENT - 1.2% | ||||||||
| †Sea Cl. A ADR1 | 79,000 | 3,177,380 | ||||||
| MEDIA - 0.3% | ||||||||
| Marchex Cl. B1 | 186,099 | 703,454 | ||||||
| Total (Cost $2,153,864) | 5,546,134 | |||||||
| CONSUMER DISCRETIONARY - 10.5% | ||||||||
| DIVERSIFIED CONSUMER SERVICES - 0.9% | ||||||||
| †Bright Horizons Family Solutions1 | 15,000 | 2,254,350 | ||||||
| HOTELS, RESTAURANTS & LEISURE - 1.7% | ||||||||
| †Allied Esports Entertainment1,2 | 201,000 | 522,600 | ||||||
| †Papa John’s International | 30,000 | 1,894,500 | ||||||
| Texas Roadhouse | 36,000 | 2,027,520 | ||||||
| 4,444,620 | ||||||||
| HOUSEHOLD DURABLES - 3.8% | ||||||||
| †Cavco Industries1 | 10,000 | 1,953,800 | ||||||
| Lovesac Company (The)1,2 | 335,666 | 5,387,439 | ||||||
| †Skyline Champion1 | 80,000 | 2,536,000 | ||||||
| 9,877,239 | ||||||||
| LEISURE PRODUCTS - 0.8% | ||||||||
| Callaway Golf | 98,000 | 2,077,600 | ||||||
| SPECIALTY RETAIL - 2.7% | ||||||||
| Carvana Cl. A1,2 | 28,000 | 2,577,400 | ||||||
| Five Below1 | 11,000 | 1,406,460 | ||||||
| Monro | 40,000 | 3,128,000 | ||||||
| 7,111,860 | ||||||||
| TEXTILES, APPAREL & LUXURY GOODS - 0.6% | ||||||||
| Columbia Sportswear | 15,000 | 1,502,850 | ||||||
| Total (Cost $20,986,580) | 27,268,519 | |||||||
| CONSUMER STAPLES – 1.7% | ||||||||
| FOOD PRODUCTS - 1.7% | ||||||||
| Freshpet1,2 | 73,000 | 4,313,570 | ||||||
| Total (Cost $1,334,569) | 4,313,570 | |||||||
| ENERGY – 1.0% | ||||||||
| OIL, GAS & CONSUMABLE FUELS - 1.0% | ||||||||
| Magnolia Oil & Gas Cl. A1,2 | 128,000 | 1,610,240 | ||||||
| Viper Energy Partners L.P. | 35,000 | 863,100 | ||||||
| Total (Cost $2,619,610) | 2,473,340 | |||||||
| FINANCIALS – 7.1% | ||||||||
| BANKS - 3.8% | ||||||||
| Enterprise Financial Services | 41,500 | 2,000,715 | ||||||
| Seacoast Banking Corporation of Florida1 | 82,000 | 2,506,740 | ||||||
| Southern National Bancorp of Virginia | 73,000 | 1,193,550 | ||||||
| TriState Capital Holdings1 | 161,057 | 4,206,809 | ||||||
| 9,907,814 | ||||||||
| CAPITAL MARKETS - 2.4% | ||||||||
| MarketAxess Holdings | 7,000 | 2,653,770 | ||||||
| Northern Trust | 22,000 | 2,337,280 | ||||||
| PJT Partners Cl. A | 24,000 | 1,083,120 | ||||||
| 6,074,170 | ||||||||
| THRIFTS & MORTGAGE FINANCE - 0.9% | ||||||||
| LendingTree1 | 8,000 | 2,427,520 | ||||||
| Total (Cost $11,736,142) | 18,409,504 | |||||||
HEALTH CARE – 24.2% BIOTECHNOLOGY - 7.3% | ||||||||
| †Arrowhead Pharmaceuticals1 | 22,000 | 1,395,460 | ||||||
| †Avid Bioservices1,2 | 334,000 | 2,561,780 | ||||||
| bluebird bio1,2 | 19,000 | 1,667,250 | ||||||
| CareDx1 | 42,000 | 905,940 | ||||||
| †Natera1,2 | 37,000 | 1,246,530 | ||||||
| Oxford Biomedica1 | 224,000 | 1,913,782 | ||||||
| REGENXBIO1,2 | 60,000 | 2,458,200 | ||||||
| uniQure1 | 60,000 | 4,299,600 | ||||||
| Veracyte1,2 | 91,150 | 2,544,908 | ||||||
| 18,993,450 | ||||||||
| HEALTH CARE EQUIPMENT & SUPPLIES - 9.5% | ||||||||
| †Alphatec Holdings1 | 264,000 | 1,873,080 | ||||||
| Apyx Medical1 | 272,415 | 2,304,631 | ||||||
| CONMED Corporation | 29,000 | 3,243,070 | ||||||
| CryoPort1 | 290,198 | 4,776,659 | ||||||
| †Glaukos Corporation1,2 | 25,125 | 1,368,559 | ||||||
| †Itamar Medical ADR1 | 9,712 | 124,993 | ||||||
| Penumbra1 | 17,000 | 2,792,590 | ||||||
| †Profound Medical1 | 99,000 | 1,124,524 | ||||||
| †STAAR Surgical1,2 | 38,000 | 1,336,460 | ||||||
| ViewRay1 | 563,000 | 2,375,860 | ||||||
| West Pharmaceutical Services | 23,000 | 3,457,590 | ||||||
| 24,778,016 | ||||||||
| HEALTH CARE PROVIDERS & SERVICES - 3.9% | ||||||||
| Addus HomeCare1 | 30,000 | 2,916,600 | ||||||
| †Joint Corp. (The)1 | 140,000 | 2,259,600 | ||||||
| †Pennant Group1 | 81,000 | 2,678,670 | ||||||
| PetIQ Cl. A1,2 | 50,000 | 1,252,500 | ||||||
| †Viemed Healthcare1 | 166,000 | 1,039,297 | ||||||
| 10,146,667 | ||||||||
| LIFE SCIENCES TOOLS & SERVICES - 2.9% | ||||||||
| Harvard Bioscience1 | 413,600 | 1,261,480 | ||||||
| †Medpace Holdings1,2 | 15,000 | 1,260,900 | ||||||
| †PureTech Health1 | 645,000 | 2,733,974 | ||||||
| Quanterix Corporation1 | 97,600 | 2,306,288 | ||||||
| 7,562,642 | ||||||||
| PHARMACEUTICALS - 0.6% | ||||||||
| †Evolus1,2 | 128,000 | 1,557,760 | ||||||
| Total (Cost $48,328,790) | 63,038,535 | |||||||
| INDUSTRIALS - 11.0% | ||||||||
| AEROSPACE & DEFENSE - 4.0% | ||||||||
| AeroVironment1,2 | 49,000 | 3,025,260 | ||||||
| BWX Technologies | 41,000 | 2,545,280 | ||||||
| Cubic Corporation | 49,000 | 3,114,930 | ||||||
| †Kratos Defense & Security Solutions1 | 101,000 | 1,819,010 | ||||||
| 10,504,480 | ||||||||
| ELECTRICAL EQUIPMENT - 1.9% | ||||||||
| American Superconductor1 | 269,349 | 2,114,389 | ||||||
| EnerSys | 15,000 | 1,122,450 | ||||||
| †Vicor Corporation1 | 35,000 | 1,635,200 | ||||||
| 4,872,039 | ||||||||
| MACHINERY - 1.2% | ||||||||
| †Energy Recovery1,2 | 126,000 | 1,233,540 | ||||||
| Woodward | 15,000 | 1,776,600 | ||||||
| 3,010,140 | ||||||||
| PROFESSIONAL SERVICES - 2.0% | ||||||||
| GP Strategies1 | 398,282 | 5,269,271 | ||||||
| THE ACCOMPANYING NOTES ARE AN INTEGRAL PART OF THESE FINANCIAL STATEMENTS | The Royce Funds 2019 Annual Report to Shareholders | 47 |
Schedules of Investments
| Royce Smaller-Companies Growth Fund (continued) | ||||||||
| SHARES | VALUE | |||||||
| INDUSTRIALS (continued) | ||||||||
| TRADING COMPANIES & DISTRIBUTORS - 1.9% | ||||||||
| Lawson Products1 | 96,000 | $ | 5,001,600 | |||||
| Total (Cost $26,818,567) | 28,657,530 | |||||||
| INFORMATION TECHNOLOGY – 36.4% | ||||||||
| COMMUNICATIONS EQUIPMENT - 2.6% | ||||||||
| Lumentum Holdings1,2 | 63,000 | 4,995,900 | ||||||
| †Viavi Solutions1 | 125,000 | 1,875,000 | ||||||
| 6,870,900 | ||||||||
| ELECTRONIC EQUIPMENT, INSTRUMENTS & COMPONENTS - 5.9% | ||||||||
| FLIR Systems | 48,600 | 2,530,602 | ||||||
| Iteris1 | 1,607,000 | 8,018,930 | ||||||
| Knowles Corporation1 | 132,000 | 2,791,800 | ||||||
| Rogers Corporation1 | 16,000 | 1,995,680 | ||||||
| 15,337,012 | ||||||||
| IT SERVICES - 5.1% | ||||||||
| Unisys Corporation1 | 691,000 | 8,195,260 | ||||||
| USA Technologies1,4 | 671,996 | 4,972,771 | ||||||
| 13,168,031 | ||||||||
| SEMICONDUCTORS & SEMICONDUCTOR EQUIPMENT - 8.2% | ||||||||
| Advanced Energy Industries1 | 31,000 | 2,207,200 | ||||||
| Ambarella1 | 43,000 | 2,604,080 | ||||||
| AXT1 | 278,000 | 1,209,300 | ||||||
| Brooks Automation | 31,000 | 1,300,760 | ||||||
| CyberOptics Corporation1 | 118,000 | 2,168,840 | ||||||
| Enphase Energy1,2 | 80,000 | 2,090,400 | ||||||
| †First Solar1,2 | 23,000 | 1,287,080 | ||||||
| MagnaChip Semiconductor1 | 249,961 | 2,902,047 | ||||||
| †Onto Innovation1 | 61,000 | 2,228,940 | ||||||
| Silicon Laboratories1,2 | 29,000 | 3,363,420 | ||||||
| 21,362,067 | ||||||||
| SOFTWARE - 14.6% | ||||||||
| Alarm.com Holdings1,2 | 32,000 | 1,375,040 | ||||||
| Avalara1 | 38,000 | 2,783,500 | ||||||
| †Blue Prism Group1 | 50,000 | 750,386 | ||||||
| †Cerence1 | 30,000 | 678,900 | ||||||
| †Coupa Software1,2 | 15,000 | 2,193,750 | ||||||
| †Descartes Systems Group (The)1 | 54,000 | 2,306,880 | ||||||
| Envestnet1,2 | 22,000 | 1,531,860 | ||||||
| LivePerson1,2 | 90,000 | 3,330,000 | ||||||
| Manhattan Associates1 | 34,000 | 2,711,500 | ||||||
| Materialise ADR1,2 | 234,577 | 4,295,105 | ||||||
| Paylocity Holding Corporation1 | 64,786 | 7,827,444 | ||||||
| †PROS Holdings1,2 | 22,000 | 1,318,240 | ||||||
| QAD Cl. A | 45,000 | 2,291,850 | ||||||
| RingCentral Cl. A1 | 24,000 | 4,048,080 | ||||||
| †Rosetta Stone1 | 37,000 | 671,180 | ||||||
| 38,113,715 | ||||||||
| Total (Cost $66,139,446) | 94,851,725 | |||||||
| REAL ESTATE - 2.6% | ||||||||
| EQUITY REAL ESTATE INVESTMENT TRUSTS (REITS) - 2.6% | ||||||||
| Community Healthcare Trust | 89,000 | 3,814,540 | ||||||
| †Postal Realty Trust Cl. A | 170,000 | 2,881,500 | ||||||
| Total (Cost $4,293,323) | 6,696,040 | |||||||
| TOTAL COMMON STOCKS | ||||||||
| (Cost $184,410,891) | 251,254,897 | |||||||
| REPURCHASE AGREEMENT– 3.8% | ||||
| Fixed Income Clearing Corporation, 0.25% dated 12/31/19, due 1/2/20, maturity value $9,859,137 (collateralized by obligations of various U.S. Government Agencies, 2.25% due 11/15/24, valued at $10,059,345) | ||||
| (Cost $9,859,000) | 9,859,000 | |||
| COLLATERAL RECEIVED FOR SECURITIES LOANED – 2.5% | ||||
| Money Market Funds | ||||
| Federated Government Obligations Fund (7 day yield-1.49%) | ||||
| (Cost $6,554,812) | 6,554,812 | |||
| TOTAL INVESTMENTS – 102.9% | ||||
| (Cost $200,824,703) | 267,668,709 | |||
| LIABILITIES LESS CASH AND OTHER ASSETS – (2.9)% | (7,443,258 | ) | ||
| NET ASSETS – 100.0% | $ | 260,225,451 |
| 48 | The Royce Funds 2019 Annual Report to Shareholders | THE ACCOMPANYING NOTES ARE AN INTEGRAL PART OF THESE FINANCIAL STATEMENTS |
December 31, 2019
| Royce Special Equity Fund | ||||||||
| Common Stocks - 87.3% | ||||||||
| SHARES | VALUE | |||||||
| COMMUNICATION SERVICES – 9.1% | ||||||||
| MEDIA - 9.1% | ||||||||
| Meredith Corporation | 1,445,000 | $ | 46,919,150 | |||||
| Scholastic Corporation | 1,374,000 | 52,830,300 | ||||||
| Total (Cost $95,066,212) | 99,749,450 | |||||||
| CONSUMER DISCRETIONARY – 22.8% | ||||||||
| AUTO COMPONENTS - 11.5% | ||||||||
| Cooper Tire & Rubber | 1,065,000 | 30,618,750 | ||||||
| Gentex Corporation | 1,002,000 | 29,037,960 | ||||||
| Standard Motor Products5 | 1,229,000 | 65,407,380 | ||||||
| 125,064,090 | ||||||||
| AUTOMOBILES - 1.5% | ||||||||
| Winnebago Industries | 304,000 | 16,105,920 | ||||||
| HOTELS, RESTAURANTS & LEISURE - 0.5% | ||||||||
| Bowl America Cl. A5 | 374,000 | 5,797,000 | ||||||
| HOUSEHOLD DURABLES - 3.7% | ||||||||
| Flexsteel Industries5 | 720,000 | 14,342,400 | ||||||
| Hooker Furniture5 | 1,000,000 | 25,690,000 | ||||||
| 40,032,400 | ||||||||
| LEISURE PRODUCTS - 1.8% | ||||||||
| Johnson Outdoors Cl. A | 254,000 | 19,481,800 | ||||||
| SPECIALTY RETAIL - 3.8% | ||||||||
| Children’s Place | 487,000 | 30,447,240 | ||||||
| Haverty Furniture | 569,000 | 11,471,040 | ||||||
| 41,918,280 | ||||||||
| Total (Cost $202,990,476) | 248,399,490 | |||||||
| CONSUMER STAPLES – 2.6% | ||||||||
| FOOD & STAPLES RETAILING - 1.6% | ||||||||
| Weis Markets | 445,000 | 18,018,050 | ||||||
| FOOD PRODUCTS - 1.0% | ||||||||
| John B Sanfilippo & Son | 118,000 | 10,771,040 | ||||||
| Total (Cost $22,196,463) | 28,789,090 | |||||||
| INDUSTRIALS – 22.3% | ||||||||
| AEROSPACE & DEFENSE - 3.3% | ||||||||
| National Presto Industries5 | 409,000 | 36,151,510 | ||||||
| BUILDING PRODUCTS - 1.9% | ||||||||
| Insteel Industries5 | 969,000 | 20,823,810 | ||||||
| COMMERCIAL SERVICES & SUPPLIES - 1.7% | ||||||||
| Ennis | 839,000 | 18,164,350 | ||||||
| CONSTRUCTION & ENGINEERING - 1.0% | ||||||||
| Argan | 269,000 | 10,797,660 | ||||||
| ELECTRICAL EQUIPMENT - 5.7% | ||||||||
| Hubbell Incorporated | 421,000 | 62,232,220 | ||||||
| MACHINERY - 4.7% | ||||||||
| Gencor Industries1,5 | 1,130,000 | 13,187,100 | ||||||
| Hurco Companies5 | 623,600 | 23,921,296 | ||||||
| Miller Industries | 381,500 | 14,165,095 | ||||||
| 51,273,491 | ||||||||
| PROFESSIONAL SERVICES - 1.9% | ||||||||
| Resources Connection | 1,294,400 | 21,137,552 | ||||||
| TRADING COMPANIES & DISTRIBUTORS - 2.1% | ||||||||
| †BMC Stock Holdings1 | 407,000 | 11,676,830 | ||||||
| †MSC Industrial Direct Cl. A | 144,000 | 11,299,680 | ||||||
| 22,976,510 | ||||||||
| Total (Cost $161,716,690) | 243,557,103 | |||||||
| INFORMATION TECHNOLOGY – 16.5% | ||||||||
| ELECTRONIC EQUIPMENT, INSTRUMENTS & COMPONENTS - 6.3% | ||||||||
| AVX Corporation | 2,328,000 | 47,654,160 | ||||||
| Vishay Intertechnology | 982,000 | 20,906,780 | ||||||
| 68,560,940 | ||||||||
| IT SERVICES - 6.0% | ||||||||
| Computer Services4,5 | 1,463,000 | 65,103,500 | ||||||
| SEMICONDUCTORS & SEMICONDUCTOR EQUIPMENT - 4.2% | ||||||||
| Axcelis Technologies1 | 525,000 | 12,649,875 | ||||||
| Kulicke & Soffa Industries | 1,222,000 | 33,238,400 | ||||||
| 45,888,275 | ||||||||
| Total (Cost $100,737,572) | 179,552,715 | |||||||
| MATERIALS – 9.2% | ||||||||
| CHEMICALS - 3.7% | ||||||||
| Huntsman Corporation | 1,552,500 | 37,508,400 | ||||||
| †Livent Corporation1 | 325,000 | 2,778,750 | ||||||
| 40,287,150 | ||||||||
| PAPER & FOREST PRODUCTS - 5.5% | ||||||||
| Louisiana-Pacific | 390,000 | 11,571,300 | ||||||
| †Mercer International | 1,440,000 | 17,712,000 | ||||||
| †Verso Corporation Cl. A1 | 1,722,000 | 31,047,660 | ||||||
| 60,330,960 | ||||||||
| Total (Cost $92,384,789) | 100,618,110 | |||||||
| REAL ESTATE – 4.8% | ||||||||
| REAL ESTATE MANAGEMENT & DEVELOPMENT - 4.8% | ||||||||
| Marcus & Millichap1 | 1,407,000 | 52,410,750 | ||||||
| Total (Cost $38,957,370) | 52,410,750 | |||||||
| TOTAL COMMON STOCKS | ||||||||
| (Cost $714,049,572) | 953,076,708 | |||||||
| REPURCHASE AGREEMENT– 12.9% | ||||||||
| Fixed Income Clearing Corporation, 0.25% dated 12/31/19, due 1/2/20, maturity value $141,099,960 (collateralized by obligations of various U.S. Government Agencies, 2.875% due 11/15/21, valued at $143,923,970) | ||||||||
| (Cost $141,098,000) | 141,098,000 | |||||||
| TOTAL INVESTMENTS – 100.2% | ||||||||
| (Cost $855,147,572) | 1,094,174,708 | |||||||
| LIABILITIES LESS CASH AND OTHER ASSETS – (0.2)% | (2,512,068 | ) | ||||||
| NET ASSETS – 100.0% | $ | 1,091,662,640 | ||||||
| THE ACCOMPANYING NOTES ARE AN INTEGRAL PART OF THESE FINANCIAL STATEMENTS | The Royce Funds 2019 Annual Report to Shareholders | 49 |
Schedules of Investments
| Royce Total Return Fund | ||||||
| Common Stocks – 96.5% | ||||||
| SHARES | VALUE | |||||
| COMMUNICATION SERVICES – 0.6% | ||||||
| DIVERSIFIED TELECOMMUNICATION SERVICES - 0.6% | ||||||
| ATN International | 151,229 | $ | 8,376,574 | |||
| MEDIA - 0.0% | ||||||
| †Gannett Company2 | 89,563 | 571,412 | ||||
| Total (Cost $4,722,925) | 8,947,986 | |||||
| CONSUMER DISCRETIONARY – 6.5% | ||||||
| AUTO COMPONENTS - 1.8% | ||||||
| Gentex Corporation | 331,889 | 9,618,143 | ||||
| LCI Industries | 85,091 | 9,115,799 | ||||
| Nokian Renkaat | 142,529 | 4,097,590 | ||||
| Standard Motor Products | 74,475 | 3,963,560 | ||||
| 26,795,092 | ||||||
| AUTOMOBILES - 0.5% | ||||||
| Thor Industries | 94,110 | 6,991,432 | ||||
| HOTELS, RESTAURANTS & LEISURE - 0.3% | ||||||
| Cheesecake Factory | 133,082 | 5,171,567 | ||||
| HOUSEHOLD DURABLES - 0.9% | ||||||
| Ethan Allen Interiors | 379,714 | 7,237,349 | ||||
| La-Z-Boy | 209,057 | 6,581,114 | ||||
| 13,818,463 | ||||||
| SPECIALTY RETAIL - 3.0% | ||||||
| American Eagle Outfitters | 498,934 | 7,334,330 | ||||
| Bed Bath & Beyond | 91,027 | 1,574,767 | ||||
| Buckle (The) | 56,703 | 1,533,249 | ||||
| Caleres | 334,752 | 7,950,360 | ||||
| Cato Corporation (The) Cl. A | 59,174 | 1,029,628 | ||||
| Designer Brands Cl. A | 441,167 | 6,943,968 | ||||
| Rent-A-Center | 329,951 | 9,515,787 | ||||
| Shoe Carnival | 271,766 | 10,131,436 | ||||
| 46,013,525 | ||||||
| TEXTILES, APPAREL & LUXURY GOODS - 0.0% | ||||||
| J.G. Boswell Company4 | 966 | 579,600 | ||||
| Total (Cost $77,522,076) | 99,369,679 | |||||
| CONSUMER STAPLES – 2.8% | ||||||
| BEVERAGES - 0.1% | ||||||
| Compania Cervecerias Unidas ADR | 80,895 | 1,534,578 | ||||
| FOOD & STAPLES RETAILING - 0.2% | ||||||
| Village Super Market Cl. A | 145,338 | 3,371,842 | ||||
| FOOD PRODUCTS - 2.2% | ||||||
| Flowers Foods | 256,382 | 5,573,745 | ||||
| Fresh Del Monte Produce | 179,033 | 6,262,574 | ||||
| Hershey Creamery4 | 666 | 2,727,669 | ||||
| Lancaster Colony | 45,940 | 7,354,994 | ||||
| Tootsie Roll Industries | 369,007 | 12,597,899 | ||||
| 34,516,881 | ||||||
| HOUSEHOLD PRODUCTS - 0.1% | ||||||
| †Spectrum Brands Holdings | 4,019 | 258,381 | ||||
| WD-40 Company | 4,548 | 882,949 | ||||
| 1,141,330 | ||||||
| PERSONAL PRODUCTS - 0.2% | ||||||
| Nu Skin Enterprises Cl. A | 67,870 | 2,781,313 | ||||
| Total (Cost $27,104,328) | 43,345,944 | |||||
| DIVERSIFIED INVESTMENT COMPANIES – 0.1% | ||||||
| CLOSED-END FUNDS - 0.1% | ||||||
| †Eagle Point Income | 121,333 | 2,275,601 | ||||
| Total (Cost $2,413,313) | 2,275,601 | |||||
| ENERGY – 3.7% | ||||||
| ENERGY EQUIPMENT & SERVICES - 3.0% | ||||||
| Computer Modelling Group | 970,000 | 6,140,233 | ||||
| DMC Global | 151,157 | 6,792,996 | ||||
| Helmerich & Payne | 146,949 | 6,675,893 | ||||
| Pason Systems | 380,700 | 3,843,500 | ||||
| †Solaris Oilfield Infrastructure Cl. A | 437,000 | 6,118,000 | ||||
| TGS-NOPEC Geophysical | 530,159 | 16,129,471 | ||||
| 45,700,093 | ||||||
| OIL, GAS & CONSUMABLE FUELS - 0.7% | ||||||
| †Arch Coal | 23,271 | 1,669,462 | ||||
| Dorchester Minerals L.P. | 295,638 | 5,767,897 | ||||
| PBF Energy Cl. A | 83,162 | 2,608,792 | ||||
| 10,046,151 | ||||||
| Total (Cost $44,551,793) | 55,746,244 | |||||
| FINANCIALS – 35.2% | ||||||
| BANKS - 12.7% | ||||||
| Ames National | 252,071 | 7,073,112 | ||||
| Associated Banc-Corp | 532,461 | 11,735,441 | ||||
| Bank of Hawaii | 223,138 | 21,233,812 | ||||
| Bank of N.T. Butterfield & Son | 177,139 | 6,557,686 | ||||
| Bank OZK | 88,719 | 2,706,373 | ||||
| Bar Harbor Bankshares | 84,656 | 2,149,416 | ||||
| BOK Financial | 237,464 | 20,754,354 | ||||
| Camden National | 175,111 | 8,065,613 | ||||
| Canadian Western Bank | 498,441 | 12,240,794 | ||||
| City Holding Company | 98,650 | 8,084,368 | ||||
| CNB Financial | 271,327 | 8,866,966 | ||||
| Farmers & Merchants Bank of Long Beach4 | 397 | 3,116,053 | ||||
| Financial Institutions | 251,553 | 8,074,851 | ||||
| First Citizens BancShares Cl. A | 49,953 | 26,585,486 | ||||
| First National Bank Alaska4 | 23,922 | 5,813,046 | ||||
| First of Long Island (The) | 56,485 | 1,416,644 | ||||
| National Bankshares | 134,682 | 6,051,262 | ||||
| Northrim BanCorp | 130,780 | 5,008,874 | ||||
| Peapack-Gladstone Financial | 377,260 | 11,657,334 | ||||
| Popular | 213,065 | 12,517,569 | ||||
| Unity Bancorp | 196,309 | 4,430,694 | ||||
| 194,139,748 | ||||||
| CAPITAL MARKETS - 11.5% | ||||||
| AllianceBernstein Holding L.P. | 371,187 | 11,232,119 | ||||
| Ares Management Cl. A | 913,741 | 32,611,416 | ||||
| Ashmore Group | 2,033,996 | 13,956,115 | ||||
| Associated Capital Group Cl. A | 156,062 | 6,117,630 | ||||
| Bolsa Mexicana de Valores | 4,831,182 | 10,624,384 | ||||
| Cohen & Steers | 291,026 | 18,264,792 | ||||
| Federated Investors Cl. B | 257,558 | 8,393,815 | ||||
| †Golub Capital BDC | 161,777 | 2,985,595 | ||||
| Houlihan Lokey Cl. A | 245,237 | 11,984,732 | ||||
| Lazard Cl. A | 152,051 | 6,075,958 | ||||
| Moelis & Company Cl. A | 194,044 | 6,193,884 | ||||
| Pzena Investment Management Cl. A | 440,072 | 3,793,421 | ||||
| Sprott | 3,448,362 | 7,913,533 | ||||
| TMX Group | 266,024 | 23,036,771 | ||||
| Virtu Financial Cl. A | 737,750 | 11,796,623 | ||||
| 174,980,788 | ||||||
| INSURANCE - 8.2% | ||||||
| Alleghany Corporation1 | 23,749 | 18,988,988 | ||||
| Assured Guaranty | 250,210 | 12,265,294 | ||||
| E-L Financial | 40,052 | 25,567,830 |
| 50 | The Royce Funds 2019 Annual Report to Shareholders | THE ACCOMPANYING NOTES ARE AN INTEGRAL PART OF THESE FINANCIAL STATEMENTS |
December 31, 2019
| Royce Total Return Fund (continued) |
| SHARES | VALUE | |||||
| FINANCIALS (continued) | ||||||
| INSURANCE (continued) | ||||||
| Employers Holdings | 29,790 | $ | 1,243,732 | |||
| Erie Indemnity Cl. A | 141,427 | 23,476,882 | ||||
| First American Financial | 106,758 | 6,226,127 | ||||
| Horace Mann Educators | 15,933 | 695,635 | ||||
| James River Group Holdings | 184,601 | 7,607,407 | ||||
| Mercury General | 60,317 | 2,939,247 | ||||
| ProAssurance Corporation | 260,999 | 9,432,504 | ||||
| Reinsurance Group of America | 38,385 | 6,259,058 | ||||
| RLI Corp. | 107,993 | 9,721,530 | ||||
| Universal Insurance Holdings | 36,349 | 1,017,409 | ||||
| 125,441,643 | ||||||
| THRIFTS & MORTGAGE FINANCE - 2.8% | ||||||
| Genworth MI Canada | 341,750 | 14,953,783 | ||||
| New York Community Bancorp | 151,768 | 1,824,251 | ||||
| Southern Missouri Bancorp | 136,381 | 5,231,575 | ||||
| Timberland Bancorp | 148,829 | 4,426,174 | ||||
| TrustCo Bank Corp. NY | 920,510 | 7,980,822 | ||||
| WSFS Financial | 175,050 | 7,700,450 | ||||
| 42,117,055 | ||||||
| Total (Cost $318,557,282) | 536,679,234 | |||||
| HEALTH CARE – 1.5% | ||||||
| HEALTH CARE EQUIPMENT & SUPPLIES - 0.9% | ||||||
| Atrion Corporation | 4,915 | 3,693,622 | ||||
| Hill-Rom Holdings | 90,528 | 10,277,644 | ||||
| 13,971,266 | ||||||
| HEALTH CARE PROVIDERS & SERVICES - 0.6% | ||||||
| Ensign Group (The) | 182,097 | 8,261,741 | ||||
| Total (Cost $11,627,325) | 22,233,007 | |||||
| INDUSTRIALS – 26.9% | ||||||
| AEROSPACE & DEFENSE - 1.6% | ||||||
| HEICO Corporation | 165,665 | 18,910,660 | ||||
| Magellan Aerospace | 534,821 | 5,790,754 | ||||
| 24,701,414 | ||||||
| AIRLINES - 1.2% | ||||||
| Allegiant Travel | 50,883 | 8,855,677 | ||||
| Hawaiian Holdings | 303,120 | 8,878,385 | ||||
| 17,734,062 | ||||||
| COMMERCIAL SERVICES & SUPPLIES - 6.0% | ||||||
| ABM Industries | 330,578 | 12,466,096 | ||||
| †ACCO Brands | 129,599 | 1,213,046 | ||||
| Ennis | 26,278 | 568,919 | ||||
| Herman Miller | 87,246 | 3,633,796 | ||||
| Kimball International Cl. B | 776,439 | 16,048,994 | ||||
| McGrath RentCorp | 218,505 | 16,724,373 | ||||
| †Mobile Mini | 103,325 | 3,917,051 | ||||
| MSA Safety | 98,025 | 12,386,439 | ||||
| Ritchie Bros. Auctioneers | 518,580 | 22,273,011 | ||||
| Tetra Tech | 15,788 | 1,360,294 | ||||
| 90,592,019 | ||||||
| CONSTRUCTION & ENGINEERING - 0.9% | ||||||
| Arcosa | 156,792 | 6,985,084 | ||||
| Argan | 172,454 | 6,922,303 | ||||
| 13,907,387 | ||||||
| ELECTRICAL EQUIPMENT - 2.4% | ||||||
| EnerSys | 86,118 | 6,444,210 | ||||
| Hubbell Incorporated | 153,786 | 22,732,647 |
| Preformed Line Products | 128,580 | 7,759,803 | ||||
| 36,936,660 | ||||||
| INDUSTRIAL CONGLOMERATES - 0.9% | ||||||
| Raven Industries | 377,520 | 13,009,339 | ||||
| MACHINERY - 8.4% | ||||||
| Federal Signal | 197,471 | 6,368,440 | ||||
| Franklin Electric | 277,592 | 15,911,573 | ||||
| Gorman-Rupp Company (The) | 285,118 | 10,691,925 | ||||
| Kadant | 17,995 | 1,895,593 | ||||
| Lincoln Electric Holdings | 123,105 | 11,907,947 | ||||
| Lindsay Corporation | 132,631 | 12,731,250 | ||||
| Miller Industries | 274,418 | 10,189,140 | ||||
| Mueller Industries | 250,381 | 7,949,597 | ||||
| Nordson Corporation | 32,764 | 5,335,290 | ||||
| Standex International | 15,765 | 1,250,953 | ||||
| Tennant Company | 243,004 | 18,934,872 | ||||
| Trinity Industries | 470,377 | 10,418,850 | ||||
| Woodward | 117,602 | 13,928,781 | ||||
| 127,514,211 | ||||||
| MARINE - 1.1% | ||||||
| Clarkson | 426,371 | 17,084,321 | ||||
| PROFESSIONAL SERVICES - 3.2% | ||||||
| Exponent | 19,119 | 1,319,402 | ||||
| Heidrick & Struggles International | 276,826 | 8,996,845 | ||||
| Kforce | 116,301 | 4,617,150 | ||||
| Korn Ferry | 210,082 | 8,907,477 | ||||
| ManpowerGroup | 120,598 | 11,710,066 | ||||
| Resources Connection | 306,988 | 5,013,114 | ||||
| Robert Half International | 133,851 | 8,452,690 | ||||
| 49,016,744 | ||||||
| ROAD & RAIL - 0.4% | ||||||
| Werner Enterprises | 175,796 | 6,397,216 | ||||
| TRADING COMPANIES & DISTRIBUTORS - 0.8% | ||||||
| Air Lease Cl. A | 106,618 | 5,066,487 | ||||
| Applied Industrial Technologies | 38,226 | 2,549,292 | ||||
| Systemax | 172,950 | 4,351,422 | ||||
| 11,967,201 | ||||||
| Total (Cost $174,367,035) | 408,860,574 | |||||
| INFORMATION TECHNOLOGY – 5.7% | ||||||
| ELECTRONIC EQUIPMENT, INSTRUMENTS & COMPONENTS - 3.8% | ||||||
| AVX Corporation | 645,193 | 13,207,101 | ||||
| Methode Electronics | 397,926 | 15,658,388 | ||||
| National Instruments | 207,379 | 8,780,427 | ||||
| PC Connection | 200,904 | 9,976,892 | ||||
| Vishay Intertechnology | 479,138 | 10,200,848 | ||||
| 57,823,656 | ||||||
| IT SERVICES - 1.0% | ||||||
| KBR | 421,906 | 12,868,133 | ||||
| MAXIMUS | 33,480 | 2,490,577 | ||||
| 15,358,710 | ||||||
| SEMICONDUCTORS & SEMICONDUCTOR EQUIPMENT - 0.9% | ||||||
| Kulicke & Soffa Industries | 269,458 | 7,329,258 | ||||
| MKS Instruments | 61,490 | 6,764,515 | ||||
| 14,093,773 | ||||||
| Total (Cost $45,545,515) | 87,276,139 |
| THE ACCOMPANYING NOTES ARE AN INTEGRAL PART OF THESE FINANCIAL STATEMENTS | The Royce Funds 2019 Annual Report to Shareholders | 51 |
| Schedules of Investments | December 31, 2019 |
| Royce Total Return Fund (continued) | ||||||
| SHARES | VALUE | |||||
| MATERIALS – 8.7% | ||||||
| CHEMICALS - 3.8% | ||||||
| Albemarle Corporation | 87,795 | $ | 6,412,547 | |||
| Balchem Corporation | 109,840 | 11,163,039 | ||||
| Chase Corporation | 90,597 | 10,733,932 | ||||
| FutureFuel Corporation | 84,966 | 1,052,729 | ||||
| Minerals Technologies | 148,249 | 8,543,590 | ||||
| Quaker Chemical | 122,439 | 20,143,664 | ||||
| 58,049,501 | ||||||
| CONTAINERS & PACKAGING - 1.6% | ||||||
| AptarGroup | 68,943 | 7,971,189 | ||||
| Sonoco Products | 265,397 | 16,380,303 | ||||
| 24,351,492 | ||||||
| METALS & MINING - 2.8% | ||||||
| Carpenter Technology | 106,301 | 5,291,664 | ||||
| Ferroglobe (Warranty Insurance Trust)1,3 | 569,803 | 0 | ||||
| Franco-Nevada | 63,824 | 6,593,019 | ||||
| Gold Fields ADR | 1,162,743 | 7,674,104 | ||||
| Haynes International | 222,084 | 7,946,166 | ||||
| Royal Gold | 15,933 | 1,947,809 | ||||
| Worthington Industries | 322,124 | 13,587,190 | ||||
| 43,039,952 | ||||||
| PAPER & FOREST PRODUCTS - 0.5% | ||||||
| Domtar Corporation | 131,382 | 5,024,048 | ||||
| Neenah | 7,717 | 543,508 | ||||
| Schweitzer-Mauduit International | 31,941 | 1,341,203 | ||||
| 6,908,759 | ||||||
| Total (Cost $60,485,213) | 132,349,704 | |||||
| REAL ESTATE – 1.3% | ||||||
| EQUITY REAL ESTATE INVESTMENT TRUSTS (REITS) - 0.2% | ||||||
| Lexington Realty Trust | 279,902 | 2,972,559 | ||||
| REAL ESTATE MANAGEMENT & DEVELOPMENT - 1.1% | ||||||
| Kennedy-Wilson Holdings | 729,088 | 16,258,663 | ||||
| Total (Cost $15,671,480) | 19,231,222 | |||||
| UTILITIES – 3.5% | ||||||
| ELECTRIC UTILITIES - 0.9% | ||||||
| ALLETE | 147,757 | 11,993,436 | ||||
| †Spark Energy Cl. A | 104,987 | 969,030 | ||||
| 12,962,466 | ||||||
| WATER UTILITIES - 2.6% | ||||||
| Aqua America | 329,503 | 15,466,871 | ||||
| SJW Group | 264,894 | 18,823,368 | ||||
| York Water | 127,267 | 5,868,281 | ||||
| 40,158,520 | ||||||
| Total (Cost $17,854,162) | 53,120,986 | |||||
| TOTAL COMMON STOCKS | ||||||
| (Cost $800,422,447) | 1,469,436,320 |
| PREFERRED STOCK - 0.2% | ||||||
| †Chicken Soup For The Soul Entertainment | ||||||
| 9.75 % Ser. A | 78,724 | 2,025,568 | ||||
| (Cost $1,981,326) | 2,025,568 | |||||
| PRINCIPAL AMOUNT | ||||||
| CORPORATE BONDS – 0.2% | ||||||
| Meritor 6.25% | ||||||
| due 2/15/24 | $ | 811,839 | 831,892 | |||
| Unit Corporation 6.625% | ||||||
| due 5/15/21 | 4,269,155 | 2,348,035 | ||||
| TOTAL CORPORATE BONDS | ||||||
| (Cost $4,807,663) | 3,179,927 | |||||
| REPURCHASE AGREEMENT– 3.5% | ||||||
| Fixed Income Clearing Corporation, 0.25% dated 12/31/19, due 1/2/20, maturity value $53,225,739 (collateralized by obligations of various U.S. Government Agencies, 2.125% due 5/31/21, valued at $54,291,492) | ||||||
| (Cost $53,225,000) | 53,225,000 | |||||
| TOTAL INVESTMENTS – 100.4% | ||||||
| (Cost $860,436,436) | 1,527,866,815 | |||||
| LIABILITIES LESS CASH AND OTHER ASSETS – (0.4)% | (5,617,225 | ) | ||||
| NET ASSETS – 100.0% | $ | 1,522,249,590 |
ADR- American Depository Receipt
| † | New additions in 2019. |
| 1 | Non-income producing. |
| 2 | All or a portion of these securities were on loan at December 31, 2019. |
| 4 | These securities are defined as Level 2 securities due to fair value being based on quoted prices for similar securities. See Notes to Financial Statements. |
Bold indicates a Fund’s 20 largest equity holdings in terms of December 31, 2019, market value.
| 52 | The Royce Funds 2019 Annual Report to Shareholders | THE ACCOMPANYING NOTES ARE AN INTEGRAL PART OF THESE FINANCIAL STATEMENTS |
| Statements of Assets and Liabilities | December 31, 2019 |
| Royce Dividend Value Fund | Royce Global Financial Services Fund | Royce International Premier Fund | Royce Micro-Cap Fund | |||||||||||||
ASSETS: Investments at value (including collateral on loaned securities)1 | ||||||||||||||||
| Non-Affiliated Companies | $ | 100,482,288 | $ | 36,232,298 | $ | 747,259,286 | $ | 313,735,627 | ||||||||
| Repurchase agreements (at cost and value) | 3,713,000 | 850,000 | 54,399,000 | 24,628,000 | ||||||||||||
| Cash and foreign currency2 | 799 | 24,957 | 21,771 | 128 | ||||||||||||
| Receivable for investments sold | — | — | — | 1,325,935 | ||||||||||||
| Receivable for capital shares sold | 87,169 | 89,032 | 11,273,013 | 53,688 | ||||||||||||
| Receivable for dividends and interest | 123,915 | 79,847 | 1,088,024 | 135,492 | ||||||||||||
| Receivable for securities lending income | — | — | — | 2,930 | ||||||||||||
| Prepaid expenses and other assets | 1,699 | 570 | 5,205 | 3,514 | ||||||||||||
| Total Assets | 104,408,870 | 37,276,704 | 814,046,299 | 339,885,314 | ||||||||||||
| LIABILITIES: Payable for collateral on loaned securities | — | — | — | 882,470 | ||||||||||||
| Payable for investments purchased | — | — | 3,538,305 | 595,596 | ||||||||||||
| Payable for capital shares redeemed | 179,780 | 249,672 | 874,357 | 589,279 | ||||||||||||
| Payable for investment advisory fees | 75,346 | 31,066 | 599,866 | 282,455 | ||||||||||||
| Payable for trustees' fees | 3,755 | 1,294 | 17,092 | 11,165 | ||||||||||||
| Accrued expenses | 117,082 | 54,548 | 279,663 | 252,497 | ||||||||||||
| Total Liabilities | 375,963 | 336,580 | 5,309,283 | 2,613,462 | ||||||||||||
| Net Assets | $ | 104,032,907 | $ | 36,940,124 | $ | 808,737,016 | $ | 337,271,852 | ||||||||
| ANALYSIS OF NET ASSETS: Paid-in capital | $ | 57,736,961 | $ | 25,974,218 | $ | 729,140,516 | $ | 243,614,580 | ||||||||
| Total distributable earnings (loss) | 46,295,946 | 10,965,906 | 79,596,500 | 93,657,272 | ||||||||||||
| Net Assets | $ | 104,032,907 | $ | 36,940,124 | $ | 808,737,016 | $ | 337,271,852 | ||||||||
| Investment Class | $ | 76,273,043 | $ | 360,623,366 | $ | 158,111,648 | ||||||||||
| Service Class | 25,255,683 | $ | 30,202,414 | 71,349,414 | 164,956,102 | |||||||||||
| Consultant Class | 1,620,770 | 9,894,165 | 14,204,102 | |||||||||||||
| Institutional Class | 883,411 | 6,737,710 | 366,870,071 | |||||||||||||
| SHARES OUTSTANDING (unlimited number of $.001 par value): Investment Class | 12,289,866 | 23,646,669 | 14,350,291 | |||||||||||||
| Service Class | 3,931,240 | 3,046,850 | 3,911,455 | 15,284,045 | ||||||||||||
| Consultant Class | 221,210 | 504,898 | 1,687,426 | |||||||||||||
| Institutional Class | 144,789 | 525,163 | 24,055,811 | |||||||||||||
NET ASSET VALUES (Net Assets ÷ Shares Outstanding): Investment Class3 | $ | 6.21 | $ | 15.25 | $ | 11.02 | ||||||||||
| Service Class3 | 6.42 | $ | 9.91 | 18.24 | 10.79 | |||||||||||
| Consultant Class4 | 7.33 | 19.60 | 8.42 | |||||||||||||
| Institutional Class5 | 6.10 | 12.83 | 15.25 | |||||||||||||
| Investments at identified cost | $ | 56,728,346 | $ | 25,411,931 | $ | 606,549,616 | $ | 226,651,422 | ||||||||
| Market value of loaned securities6 | — | — | — | 13,334,654 | ||||||||||||
1See Notes to Financial Statements for information on non-cash collateral on loaned securities.
2Royce Global Financial Services Fund includes $314 in cash and $24,643 (cost $24,543) in foreign currency.
3Offering and redemption price per share; shares held less than 30 days may be subject to a 1% redemption fee, or a 2% redemption fee (Royce International Premier Fund), payable to the Fund.
4Offering and redemption price per share; shares held less than 365 days may be subject to a 1% contingent deferred sales charge, payable to Royce Fund Services, LLC.
5Offering and redemption price per share.
6Market value of loaned securities backed by non-cash collateral is as of prior business day.
| THE ACCOMPANYING NOTES ARE AN INTEGRAL PART OF THESE FINANCIAL STATEMENTS | The Royce Funds 2019 Annual Report to Shareholders | 53 |
Statements of Assets and Liabilities
| Royce Opportunity Fund | Royce Pennsylvania Mutual Fund | Royce Premier Fund | Royce Small-Cap Value Fund | |||||||||||||
ASSETS: Investments at value (including collateral on loaned securities)1 | ||||||||||||||||
| Non-Affiliated Companies | $ | 917,256,835 | $ | 1,882,809,331 | $ | 1,745,506,776 | $ | 157,747,082 | ||||||||
| Repurchase agreements (at cost and value) | 31,152,000 | 76,280,000 | 65,358,000 | 13,848,000 | ||||||||||||
| Cash and foreign currency | 755 | 14,869 | 75 | 11,443 | ||||||||||||
| Receivable for investments sold | 5,300,616 | 6,542,716 | 1,074,783 | 494,356 | ||||||||||||
| Receivable for capital shares sold | 1,342,005 | 574,135 | 2,624,791 | 171,094 | ||||||||||||
| Receivable for dividends and interest | 242,852 | 1,467,209 | 2,318,210 | 185,326 | ||||||||||||
| Receivable for securities lending income | 48,901 | 24,950 | 3,480 | 293 | ||||||||||||
| Prepaid expenses and other assets | 13,793 | 2,896,752 | 25,272 | 2,582 | ||||||||||||
| Total Assets | 955,357,757 | 1,970,609,962 | 1,816,911,387 | 172,460,176 | ||||||||||||
| LIABILITIES: Payable for collateral on loaned securities | 22,880,089 | 11,003,360 | — | — | ||||||||||||
| Payable for investments purchased | 2,782,482 | 3,587,468 | 1,079,961 | 398,409 | ||||||||||||
| Payable for capital shares redeemed | 2,717,912 | 4,254,141 | 4,917,865 | 449,844 | ||||||||||||
| Payable for investment advisory fees | 780,611 | 1,254,650 | 1,544,284 | 145,442 | ||||||||||||
| Payable for trustees' fees | 31,497 | 63,294 | 60,619 | 6,318 | ||||||||||||
| Accrued expenses | 527,617 | 1,117,279 | 914,952 | 192,101 | ||||||||||||
| Total Liabilities | 29,720,208 | 21,280,192 | 8,517,681 | 1,192,114 | ||||||||||||
| Net Assets | $ | 925,637,549 | $ | 1,949,329,770 | $ | 1,808,393,706 | $ | 171,268,062 | ||||||||
| ANALYSIS OF NET ASSETS: Paid-in capital | $ | 800,566,061 | $ | 1,188,548,337 | $ | 979,570,812 | $ | 134,749,127 | ||||||||
| Total distributable earnings (loss) | 125,071,488 | 760,781,433 | 828,822,894 | 36,518,935 | ||||||||||||
| Net Assets | $ | 925,637,549 | $ | 1,949,329,770 | $ | 1,808,393,706 | $ | 171,268,062 | ||||||||
| Investment Class | $ | 609,316,176 | $ | 1,429,041,800 | $ | 1,505,821,427 | $ | 53,234,644 | ||||||||
| Service Class | 46,031,446 | 142,864,316 | 29,696,016 | 102,464,755 | ||||||||||||
| Consultant Class | 8,621,279 | 262,006,885 | 17,585,112 | 7,485,684 | ||||||||||||
| Institutional Class | 230,438,699 | 106,564,382 | 244,342,664 | |||||||||||||
| R Class | 31,229,949 | 8,852,387 | 10,948,487 | 8,082,979 | ||||||||||||
| SHARES OUTSTANDING (unlimited number of $.001 par value): Investment Class | 48,655,480 | 151,383,753 | 116,883,619 | 5,562,335 | ||||||||||||
| Service Class | 3,963,631 | 15,159,380 | 2,368,106 | 10,737,406 | ||||||||||||
| Consultant Class | 854,148 | 35,073,254 | 1,742,577 | 887,095 | ||||||||||||
| Institutional Class | 18,000,051 | 11,251,240 | 18,680,422 | |||||||||||||
| R Class | 2,798,692 | 1,001,810 | 922,866 | 882,455 | ||||||||||||
NET ASSET VALUES (Net Assets ÷ Shares Outstanding): Investment Class2 | $ | 12.52 | $ | 9.44 | $ | 12.88 | $ | 9.57 | ||||||||
| Service Class2 | 11.61 | 9.42 | 12.54 | 9.54 | ||||||||||||
| Consultant Class3 | 10.09 | 7.47 | 10.09 | 8.44 | ||||||||||||
| Institutional Class4 | 12.80 | 9.47 | 13.08 | |||||||||||||
| R Class4 | 11.16 | 8.84 | 11.86 | 9.16 | ||||||||||||
| Investments at identified cost | $ | 783,019,651 | $ | 1,199,954,955 | $ | 950,180,898 | $ | 123,246,947 | ||||||||
| Market value of loaned securities5 | 91,868,756 | 69,516,295 | 33,620,428 | 2,559,798 | ||||||||||||
1See Notes to Financial Statements for information on non-cash collateral on loaned securities.
2Offering and redemption price per share; shares held less than 30 days may be subject to a 1% redemption fee, payable to the Fund.
3Offering and redemption price per share; shares held less than 365 days may be subject to a 1% contingent deferred sales charge, payable to Royce Fund Services, LLC.
4Offering and redemption price per share.
5Market value of loaned securities backed by non-cash collateral is as of prior business day.
| 54 | The Royce Funds 2019 Annual Report to Shareholders | THE ACCOMPANYING NOTES ARE AN INTEGRAL PART OF THESE FINANCIAL STATEMENTS |
December 31, 2019
| Royce Smaller- Companies Growth Fund | Royce Special Equity Fund | Royce Total Return Fund | ||||||||||
ASSETS: Investments at value (including collateral on loaned securities)1 | ||||||||||||
| Non-Affiliated Companies | $ | 257,809,709 | $ | 682,652,712 | $ | 1,474,641,815 | ||||||
| Affiliated Companies | — | 270,423,996 | — | |||||||||
| Repurchase agreements (at cost and value) | 9,859,000 | 141,098,000 | 53,225,000 | |||||||||
| Cash and foreign currency | 128 | 873 | 37,512 | |||||||||
| Receivable for investments sold | — | — | 883,542 | |||||||||
| Receivable for capital shares sold | 174,025 | 1,779,343 | 1,101,656 | |||||||||
| Receivable for dividends and interest | 24,508 | 408,661 | 2,102,457 | |||||||||
| Receivable for securities lending income | 22,486 | — | 41 | |||||||||
| Prepaid expenses and other assets | 3,880 | 16,313 | 23,014 | |||||||||
| Total Assets | 267,893,736 | 1,096,379,898 | 1,532,015,037 | |||||||||
| LIABILITIES: Payable for collateral on loaned securities | 6,554,812 | — | — | |||||||||
| Payable for investments purchased | 84,619 | 1,177,013 | 1,530,478 | |||||||||
| Payable for capital shares redeemed | 561,526 | 1,941,634 | 5,889,894 | |||||||||
| Payable for investment advisory fees | 220,820 | 942,737 | 1,302,695 | |||||||||
| Payable for trustees' fees | 9,339 | 40,257 | 53,062 | |||||||||
| Accrued expenses | 237,169 | 615,617 | 989,318 | |||||||||
| Total Liabilities | 7,668,285 | 4,717,258 | 9,765,447 | |||||||||
| Net Assets | $ | 260,225,451 | $ | 1,091,662,640 | $ | 1,522,249,590 | ||||||
| ANALYSIS OF NET ASSETS: Paid-in capital | $ | 190,524,172 | $ | 845,908,116 | $ | 834,134,564 | ||||||
| Total distributable earnings (loss) | 69,701,279 | 245,754,524 | 688,115,026 | |||||||||
| Net Assets | $ | 260,225,451 | $ | 1,091,662,640 | $ | 1,522,249,590 | ||||||
| Investment Class | $ | 91,670,201 | $ | 819,015,014 | $ | 1,026,073,576 | ||||||
| Service Class | 154,236,122 | 60,069,590 | 77,177,385 | |||||||||
| Consultant Class | 6,297,729 | 24,793,331 | 150,174,442 | |||||||||
| Institutional Class | 8,021,399 | 187,784,705 | 232,479,386 | |||||||||
| R Class | 36,344,801 | |||||||||||
| SHARES OUTSTANDING (unlimited number of $.001 par value): Investment Class | 11,162,222 | 46,574,036 | 93,855,100 | |||||||||
| Service Class | 19,297,943 | 3,420,315 | 6,846,096 | |||||||||
| Consultant Class | 925,245 | 1,544,733 | 13,278,215 | |||||||||
| Institutional Class | 962,479 | 10,773,094 | 21,588,706 | |||||||||
| R Class | 3,194,911 | |||||||||||
NET ASSET VALUES (Net Assets ÷ Shares Outstanding): Investment Class2 | $ | 8.21 | $ | 17.59 | $ | 10.93 | ||||||
| Service Class2 | 7.99 | 17.56 | 11.27 | |||||||||
| Consultant Class3 | 6.81 | 16.05 | 11.31 | |||||||||
| Institutional Class4 | 8.33 | 17.43 | 10.77 | |||||||||
| R Class4 | 11.38 | |||||||||||
| Investments at identified cost | $ | 190,965,703 | $ | 714,049,572 | $ | 807,211,436 | ||||||
| Market value of loaned securities5 | 41,098,607 | — | 541,755 | |||||||||
1See Notes to Financial Statements for information on non-cash collateral on loaned securities.
2Offering and redemption price per share; shares held less than 30 days may be subject to a 1% redemption fee, payable to the Fund.
3Offering and redemption price per share; shares held less than 365 days may be subject to a 1% contingent deferred sales charge, payable to Royce Fund Services, LLC.
4Offering and redemption price per share.
5Market value of loaned securities backed by non-cash collateral is as of prior business day.
| THE ACCOMPANYING NOTES ARE AN INTEGRAL PART OF THESE FINANCIAL STATEMENTS | The Royce Funds 2019 Annual Report to Shareholders | 55 |
Statements of Operations
| Royce Dividend Value Fund | Royce Global Financial Services Fund | Royce International Premier Fund | Royce Micro-Cap Fund | |||||||||||||
INVESTMENT INCOME: INCOME: | ||||||||||||||||
| Dividends | $ | 2,842,079 | $ | 962,812 | $ | 11,530,757 | $ | 1,950,503 | ||||||||
| Foreign withholding tax | (130,693 | ) | (62,529 | ) | (1,170,205 | ) | (43,237 | ) | ||||||||
| Interest | 7,389 | 3,605 | 136,427 | 33,961 | ||||||||||||
| Securities lending | — | — | — | 116,335 | ||||||||||||
| Other income | 7,972 | 4,836 | 97,414 | 440,220 | ||||||||||||
| Total income | 2,726,747 | 908,724 | 10,594,393 | 2,497,782 | ||||||||||||
| EXPENSES: | ||||||||||||||||
| Investment advisory fees | 939,513 | 385,837 | 5,716,414 | 2,517,207 | ||||||||||||
| Distribution fees | 83,588 | 79,285 | 233,896 | 359,103 | ||||||||||||
| Shareholder servicing | 165,813 | 57,755 | 553,521 | 226,120 | ||||||||||||
| Administrative and office facilities | 74,021 | 37,703 | 223,262 | 135,462 | ||||||||||||
| Registration | 55,801 | 33,368 | 124,914 | 50,712 | ||||||||||||
| Custody | 40,887 | 33,371 | 229,939 | 50,931 | ||||||||||||
| Audit | 36,224 | 34,669 | 60,078 | 35,463 | ||||||||||||
| Shareholder reports | 32,187 | 10,095 | 112,674 | 77,189 | ||||||||||||
| Trustees' fees | 18,627 | 6,354 | 78,447 | 39,657 | ||||||||||||
| Legal | 5,294 | 1,759 | 24,813 | 10,780 | ||||||||||||
| Other expenses | 15,410 | 5,692 | 33,568 | 167,770 | ||||||||||||
| Total expenses | 1,467,365 | 685,888 | 7,391,526 | 3,670,394 | ||||||||||||
| Compensating balance credits | (2,822 | ) | (1,401 | ) | (4,954 | ) | (14,742 | ) | ||||||||
| Fees waived by investment adviser and distributor | (48,190 | ) | (38,918 | ) | (445,375 | ) | (4,843 | ) | ||||||||
| Expenses reimbursed by investment adviser | (130,188 | ) | (81,929 | ) | (194,589 | ) | (192,550 | ) | ||||||||
| Net expenses | 1,286,165 | 563,640 | 6,746,608 | 3,458,259 | ||||||||||||
| Net investment income (loss) | 1,440,582 | 345,084 | 3,847,785 | (960,477 | ) | |||||||||||
REALIZED AND UNREALIZED GAIN (LOSS) ON INVESTMENTS AND FOREIGN CURRENCY: NET REALIZED GAIN (LOSS): | ||||||||||||||||
| Investments | 13,553,762 | 998,471 | 314,618 | 16,404,500 | ||||||||||||
| Foreign currency transactions | 15,731 | 1,129 | (2,213 | ) | (8,314 | ) | ||||||||||
| NET CHANGE IN UNREALIZED APPRECIATION (DEPRECIATION): | ||||||||||||||||
| Investments | 15,522,656 | 7,078,411 | 161,752,803 | 30,253,024 | ||||||||||||
| Other assets and liabilities denominated in foreign currency | (388 | ) | 1,722 | 14,789 | (1,215 | ) | ||||||||||
| Net realized and unrealized gain (loss) on investments and foreign currency | 29,091,761 | 8,079,733 | 162,079,997 | 46,647,995 | ||||||||||||
| NET INCREASE (DECREASE) IN NET ASSETS FROM INVESTMENT OPERATIONS | $ | 30,532,343 | $ | 8,424,817 | $ | 165,927,782 | $ | 45,687,518 | ||||||||
| 56 | The Royce Funds 2019 Annual Report to Shareholders | THE ACCOMPANYING NOTES ARE AN INTEGRAL PART OF THESE FINANCIAL STATEMENTS |
Year Ended December 31, 2019
| Royce Opportunity Fund | Royce Pennsylvania Mutual Fund | Royce Premier Fund | Royce Small-Cap Value Fund | |||||||||||||
INVESTMENT INCOME: INCOME: | ||||||||||||||||
| Dividends | $ | 5,994,339 | $ | 24,595,296 | $ | 27,966,870 | $ | 3,823,698 | ||||||||
| Foreign withholding tax | – | (728,506 | ) | (1,381,426 | ) | (78,927 | ) | |||||||||
| Interest | 244,096 | 192,054 | 310,623 | 64,615 | ||||||||||||
| Securities lending | 465,840 | 309,838 | 33,079 | 1,763 | ||||||||||||
| Other income | 23,618 | 53,656 | 794,095 | 59,527 | ||||||||||||
| Total income | 6,727,893 | 24,422,338 | 27,723,241 | 3,870,676 | ||||||||||||
| EXPENSES: | ||||||||||||||||
| Investment advisory fees | 9,296,627 | 13,948,675 | 18,393,314 | 1,838,169 | ||||||||||||
| Distribution fees | 362,143 | 2,957,730 | 374,074 | 408,956 | ||||||||||||
| Shareholder servicing | 791,919 | 1,390,109 | 1,490,778 | 269,765 | ||||||||||||
| Administrative and office facilities | 462,622 | 863,931 | 858,022 | 107,082 | ||||||||||||
| Registration | 81,558 | 92,971 | 77,285 | 49,560 | ||||||||||||
| Custody | 118,597 | 172,641 | 169,833 | 30,751 | ||||||||||||
| Audit | 38,631 | 34,763 | 40,894 | 30,190 | ||||||||||||
| Shareholder reports | 158,953 | 363,212 | 408,681 | 43,681 | ||||||||||||
| Trustees' fees | 152,226 | 293,897 | 294,291 | 30,523 | ||||||||||||
| Legal | 42,356 | 161,923 | 78,695 | 8,309 | ||||||||||||
| Other expenses | 92,125 | 158,489 | 158,730 | 18,707 | ||||||||||||
| Total expenses | 11,597,757 | 20,438,341 | 22,344,597 | 2,835,693 | ||||||||||||
| Compensating balance credits | (23,388 | ) | (65,699 | ) | (31,200 | ) | (5,964 | ) | ||||||||
| Fees waived by distributor | – | – | (19,622 | ) | – | |||||||||||
| Expenses reimbursed by investment adviser | (29,375 | ) | – | (23,274 | ) | (103,527 | ) | |||||||||
| Net expenses | 11,544,994 | 20,372,642 | 22,270,501 | 2,726,202 | ||||||||||||
| Net investment income (loss) | (4,817,101 | ) | 4,049,696 | 5,452,740 | 1,144,474 | |||||||||||
REALIZED AND UNREALIZED GAIN (LOSS) ON INVESTMENTS AND FOREIGN CURRENCY:
NET REALIZED GAIN (LOSS):
| Investments in Non-Affiliated Companies | 1,127,436 | 130,348,032 | 282,955,730 | 2,869,603 | ||||||||||||
| Investments in Affiliated Companies | – | – | (5,866,538 | ) | – | |||||||||||
| Foreign currency transactions | – | 4,068 | (54,375 | ) | (2,618 | ) | ||||||||||
| NET CHANGE IN UNREALIZED APPRECIATION (DEPRECIATION): | ||||||||||||||||
| Investments in Non-Affiliated Companies | 232,030,066 | 283,909,932 | 222,761,728 | 26,275,533 | ||||||||||||
| Investments in Affiliated Companies | – | – | 28,639,191 | – | ||||||||||||
| Other assets and liabilities denominated in foreign currency | – | (1,026 | ) | (22,721 | ) | (46 | ) | |||||||||
| Net realized and unrealized gain (loss) on investments and foreign currency | 233,157,502 | 414,261,006 | 528,413,015 | 29,142,472 | ||||||||||||
| NET INCREASE (DECREASE) IN NET ASSETS FROM INVESTMENT OPERATIONS | $ | 228,340,401 | $ | 418,310,702 | $ | 533,865,755 | $ | 30,286,946 |
| THE ACCOMPANYING NOTES ARE AN INTEGRAL PART OF THESE FINANCIAL STATEMENTS | The Royce Funds 2019 Annual Report to Shareholders | 57 |
| Statements of Operations | Year Ended December 31, 2019 |
| Royce Smaller- Companies Growth Fund | Royce Special Equity Fund | Royce Total Return Fund | ||||||||
| INVESTMENT INCOME: | ||||||||||
| INCOME: | ||||||||||
| Dividends | ||||||||||
| Non-Affiliated Companies | $ | 883,030 | $ | 15,906,520 | $ | 41,751,847 | ||||
| Affiliated Companies | – | 9,278,375 | – | |||||||
| Foreign withholding tax | (23 | ) | – | (1,054,372 | ) | |||||
| Interest | 64,284 | 935,047 | 614,991 | |||||||
| Securities lending | 524,363 | – | 16,869 | |||||||
| Other income | 41,017 | 195,660 | 89,240 | |||||||
| Total income | 1,512,671 | 26,315,602 | 41,418,575 | |||||||
| EXPENSES: | ||||||||||
| Investment advisory fees | 2,754,379 | 12,025,071 | 15,770,405 | |||||||
| Distribution fees | 480,913 | 436,071 | 2,019,369 | |||||||
| Shareholder servicing | 353,220 | 1,031,557 | 1,379,205 | |||||||
| Administrative and office facilities | 147,569 | 589,904 | 762,649 | |||||||
| Registration | 60,945 | 79,225 | 79,756 | |||||||
| Custody | 36,109 | 103,897 | 178,997 | |||||||
| Audit | 34,198 | 40,920 | 49,204 | |||||||
| Shareholder reports | 79,001 | 249,619 | 321,639 | |||||||
| Trustees’ fees | 44,889 | 200,155 | 257,924 | |||||||
| Legal | 12,110 | 52,946 | 71,000 | |||||||
| Other expenses | 26,275 | 102,176 | 164,294 | |||||||
| Total expenses | 4,029,608 | 14,911,541 | 21,054,442 | |||||||
| Compensating balance credits | (11,753 | ) | (27,196 | ) | (34,148 | ) | ||||
| Fees waived by investment adviser and distributor | (19,380 | ) | – | – | ||||||
| Expenses reimbursed by investment adviser | (119,739 | ) | (115,213 | ) | (25,019 | ) | ||||
| Net expenses | 3,878,736 | 14,769,132 | 20,995,275 | |||||||
| Net investment income (loss) | (2,366,065 | ) | 11,546,470 | 20,423,300 | ||||||
| REALIZED AND UNREALIZED GAIN (LOSS) ON INVESTMENTS AND FOREIGN CURRENCY: | ||||||||||
| NET REALIZED GAIN (LOSS): | ||||||||||
| Investments in Non-Affiliated Companies | 7,135,805 | 84,967,521 | 118,856,764 | |||||||
| Investments in Affiliated Companies | – | 23,695,757 | (3,919,823 | ) | ||||||
| Foreign currency transactions | 13,825 | – | (11,238 | ) | ||||||
| NET CHANGE IN UNREALIZED APPRECIATION (DEPRECIATION): | ||||||||||
| Investments in Non-Affiliated Companies | 53,476,679 | (11,831,762 | ) | 192,697,540 | ||||||
| Investments in Affiliated Companies | – | 28,795,088 | 4,272,787 | |||||||
| Other assets and liabilities denominated in foreign currency | – | – | 5,881 | |||||||
| Net realized and unrealized gain (loss) on investments and foreign currency | 60,626,309 | 125,626,604 | 311,901,911 | |||||||
| NET INCREASE (DECREASE) IN NET ASSETS FROM INVESTMENT OPERATIONS | $ | 58,260,244 | $ | 137,173,074 | $ | 332,325,211 | ||||
| 58 |The Royce Funds 2019 Annual Report to Shareholders | THE ACCOMPANYING NOTES ARE AN INTEGRAL PART OF THESE FINANCIAL STATEMENTS |
Statements of Changes in Net Assets
| Royce Dividend Value Fund | Royce Global Financial Services Fund | Royce International Premier Fund | ||||||||||||||||||||||
| Year Ended 12/31/19 | Year Ended 12/31/18 | Year Ended 12/31/19 | Year Ended 12/31/18 | Year Ended 12/31/19 | Year Ended 12/31/18 | |||||||||||||||||||
| INVESTMENT OPERATIONS: | ||||||||||||||||||||||||
| Net investment income (loss) | $ | 1,440,582 | $ | 2,012,643 | $ | 345,084 | $ | 367,171 | $ | 3,847,785 | $ | 2,263,660 | ||||||||||||
| Net realized gain (loss) on investments and foreign currency | 13,569,493 | 12,616,968 | 999,600 | 2,979,071 | 312,405 | 8,070,741 | ||||||||||||||||||
| Net change in unrealized appreciation (depreciation) on investments and foreign currency | 15,522,268 | (40,185,073 | ) | 7,080,133 | (9,527,242 | ) | 161,767,592 | (49,866,583 | ) | |||||||||||||||
| Net increase (decrease) in net assets from investment operations | 30,532,343 | (25,555,462 | ) | 8,424,817 | (6,181,000 | ) | 165,927,782 | (39,532,182 | ) | |||||||||||||||
| DISTRIBUTIONS: | ||||||||||||||||||||||||
| Total distributable earnings | ||||||||||||||||||||||||
| Investment Class | (11,256,453 | ) | (12,605,262 | ) | (1,519,599 | ) | (1,380,251 | ) | ||||||||||||||||
| Service Class | (3,520,064 | ) | (3,997,819 | ) | (725,690 | ) | (3,729,655 | ) | (136,306 | ) | – | |||||||||||||
| Consultant Class | (211,294 | ) | (122,078 | ) | – | – | ||||||||||||||||||
| Institutional Class | (135,321 | ) | (380,526 | ) | (144,374 | ) | (783,011 | ) | (2,094,953 | ) | (136,828 | ) | ||||||||||||
| R Class | – | |||||||||||||||||||||||
| Total distributions | (15,123,132 | ) | (17,105,685 | ) | (870,064 | ) | (4,512,666 | ) | (3,750,858 | ) | (1,517,079 | ) | ||||||||||||
| CAPITAL SHARE TRANSACTIONS: | ||||||||||||||||||||||||
| Net capital share transactions | ||||||||||||||||||||||||
| Investment Class | (22,891,835 | ) | (1,874,541 | ) | (27,120,594 | ) | 213,971,721 | |||||||||||||||||
| Service Class | (6,605,916 | ) | (21,458,903 | ) | (8,137,121 | ) | (6,175,338 | ) | 19,225,102 | (6,987,199 | ) | |||||||||||||
| Consultant Class | 99,037 | 146,686 | (1,266,625 | ) | 613,402 | |||||||||||||||||||
| Institutional Class | (2,500,925 | ) | 2,872,340 | (1,542,523 | ) | 126,326 | 293,459,479 | 34,743,935 | ||||||||||||||||
| R Class | (72,570 | ) | ||||||||||||||||||||||
| Shareholder redemption fees | ||||||||||||||||||||||||
| Investment Class | 1,850 | 354 | 8,159 | 2,207 | ||||||||||||||||||||
| Service Class | 152 | 65 | 1,009 | 1,770 | 617 | 4,049 | ||||||||||||||||||
| Net increase (decrease) in net assets from capital share transactions | (31,897,637 | ) | (20,313,999 | ) | (9,678,635 | ) | (6,047,242 | ) | 284,306,138 | 242,275,545 | ||||||||||||||
| Net Increase (Decrease) In Net Assets | (16,488,426 | ) | (62,975,146 | ) | (2,123,882 | ) | (16,740,908 | ) | 446,483,062 | 201,226,284 | ||||||||||||||
| NET ASSETS: | ||||||||||||||||||||||||
| Beginning of year | 120,521,333 | 183,496,479 | 39,064,006 | 55,804,914 | 362,253,954 | 161,027,670 | ||||||||||||||||||
| End of year | $ | 104,032,907 | $ | 120,521,333 | $ | 36,940,124 | $ | 39,064,006 | $ | 808,737,016 | $ | 362,253,954 | ||||||||||||
| THE ACCOMPANYING NOTES ARE AN INTEGRAL PART OF THESE FINANCIAL STATEMENTS | The Royce Funds 2019 Annual Report to Shareholders | 59 |
Statements of Changes in Net Assets
| Royce Micro-Cap Fund | Royce Opportunity Fund | Royce Pennsylvania Mutual Fund | ||||||||||||||||||||||
| Year Ended 12/31/19 | Year Ended 12/31/18 | Year Ended 12/31/19 | Year Ended 12/31/18 | Year Ended 12/31/19 | Year Ended 12/31/18 | |||||||||||||||||||
| INVESTMENT OPERATIONS: | ||||||||||||||||||||||||
| Net investment income (loss) | $ | (960,477 | ) | $ | (1,071,296 | ) | $ | (4,817,101 | ) | $ | (4,033,771 | ) | $ | 4,049,696 | $ | 2,940,631 | ||||||||
| Net realized gain (loss) on investments and foreign currency | 16,396,186 | 17,269,067 | 1,127,436 | 191,294,014 | 130,352,100 | 300,733,207 | ||||||||||||||||||
| Net change in unrealized appreciation (depreciation) on investments and foreign currency | 30,251,809 | (28,935,176 | ) | 232,030,066 | (410,163,454 | ) | 283,908,906 | (476,364,644 | ) | |||||||||||||||
| Net increase (decrease) in net assets from investment operations | 45,687,518 | (12,737,405 | ) | 228,340,401 | (222,903,211 | ) | 418,310,702 | (172,690,806 | ) | |||||||||||||||
| DISTRIBUTIONS: | ||||||||||||||||||||||||
| Total distributable earnings | ||||||||||||||||||||||||
| Investment Class | (4,262,534 | ) | (14,965,777 | ) | (9,526,035 | ) | (54,326,168 | ) | (53,721,411 | ) | (250,290,314 | ) | ||||||||||||
| Service Class | (4,422,915 | ) | (1,066,109 | ) | (733,734 | ) | (4,760,005 | ) | (5,169,309 | ) | (6,860,517 | ) | ||||||||||||
| Consultant Class | (383,826 | ) | (2,112,496 | ) | (136,771 | ) | (996,034 | ) | (9,327,862 | ) | (50,324,521 | ) | ||||||||||||
| Institutional Class | (3,585,669 | ) | (22,358,870 | ) | (4,072,855 | ) | (12,015,566 | ) | ||||||||||||||||
| R Class | (483,977 | ) | (2,423,347 | ) | (314,939 | ) | (1,931,480 | ) | ||||||||||||||||
| K Class | – | – | ||||||||||||||||||||||
| Total distributions | (9,069,275 | ) | (18,144,382 | ) | (14,466,186 | ) | (84,864,424 | ) | (72,606,376 | ) | (321,422,398 | ) | ||||||||||||
| CAPITAL SHARE TRANSACTIONS: | ||||||||||||||||||||||||
| Net capital share transactions | ||||||||||||||||||||||||
| Investment Class | (30,491,304 | ) | (24,536,300 | ) | (104,388,520 | ) | (48,887,275 | ) | (121,858,940 | ) | (35,970,327 | ) | ||||||||||||
| Service Class | (15,609,902 | ) | (4,025,626 | ) | (14,001,010 | ) | (30,180,961 | ) | (20,865,625 | ) | (12,430,134 | ) | ||||||||||||
| Consultant Class | (4,905,556 | ) | (3,995,491 | ) | (3,323,961 | ) | (6,974,656 | ) | (44,014,764 | ) | (33,550,757 | ) | ||||||||||||
| Institutional Class | (51,379,957 | ) | (334,335,230 | ) | 4,153,231 | 49,826,835 | ||||||||||||||||||
| R Class | (1,709,300 | ) | (3,932,968 | ) | (3,040,572 | ) | (2,160,705 | ) | ||||||||||||||||
| K Class | (7,623,085 | ) | (2,826,318 | ) | ||||||||||||||||||||
| Value of shares issued in connection with fund mergers | 209,887,857 | 17,332,098 | 210,165,813 | |||||||||||||||||||||
| Shareholder redemption fees | ||||||||||||||||||||||||
| Investment Class | 12 | 25 | 4,899 | 1,927 | 2,134 | 1,208 | ||||||||||||||||||
| Service Class | – | 400 | 553 | 4,255 | 5 | 1,416 | ||||||||||||||||||
| Net increase (decrease) in net assets from capital share transactions | 158,881,107 | (32,556,992 | ) | (157,465,198 | ) | (431,927,993 | ) | 24,541,282 | (37,108,782 | ) | ||||||||||||||
| Net Increase (Decrease) In Net Assets | 195,499,350 | (63,438,779 | ) | 56,409,017 | (739,695,628 | ) | 370,245,608 | (531,221,986 | ) | |||||||||||||||
| NET ASSETS: | ||||||||||||||||||||||||
| Beginning of year | 141,772,502 | 205,211,281 | 869,228,532 | 1,608,924,160 | 1,579,084,162 | 2,110,306,148 | ||||||||||||||||||
| End of year | $ | 337,271,852 | $ | 141,772,502 | $ | 925,637,549 | $ | 869,228,532 | $ | 1,949,329,770 | $ | 1,579,084,162 | ||||||||||||
| 60 |The Royce Funds 2019 Annual Report to Shareholders | THE ACCOMPANYING NOTES ARE AN INTEGRAL PART OF THESE FINANCIAL STATEMENTS |
| Royce | ||||||||||||||||||||||||
| Royce Premier Fund | Royce Small-Cap Value Fund | Smaller-Companies Growth Fund | ||||||||||||||||||||||
| Year Ended 12/31/19 | Year Ended 12/31/18 | Year Ended 12/31/19 | Year Ended 12/31/18 | Year Ended 12/31/19 | Year Ended 12/31/18 | |||||||||||||||||||
| INVESTMENT OPERATIONS: | ||||||||||||||||||||||||
| Net investment income (loss) | $ | 5,452,740 | $ | 2,121,899 | $ | 1,144,474 | $ | 447,552 | $ | (2,366,065 | ) | $ | (2,871,983 | ) | ||||||||||
| Net realized gain(loss) on investments and foreign currency | 277,034,817 | 429,412,796 | 2,866,985 | 20,466,232 | 7,149,630 | 59,623,708 | ||||||||||||||||||
| Net change in unrealized appreciation (depreciation) on investments and foreign currency | 251,378,198 | (629,691,624 | ) | 26,275,487 | (34,834,657 | ) | 53,476,679 | (83,719,682 | ) | |||||||||||||||
| Net increase (decrease) in net assets from investment operations | 533,865,755 | (198,156,929 | ) | 30,286,946 | (13,920,873 | ) | 58,260,244 | (26,967,957 | ) | |||||||||||||||
| DISTRIBUTIONS: | ||||||||||||||||||||||||
| Total distributable earnings | ||||||||||||||||||||||||
| Investment Class | (270,134,126 | ) | (343,875,339 | ) | (1,802,865 | ) | (7,078,045 | ) | (3,105,680 | ) | (29,890,884 | ) | ||||||||||||
| Service Class | (5,059,792 | ) | (9,798,555 | ) | (3,228,412 | ) | (13,404,578 | ) | (5,286,102 | ) | (51,970,195 | ) | ||||||||||||
| Consultant Class | (3,012,350 | ) | (4,962,544 | ) | (192,647 | ) | (1,153,070 | ) | (215,621 | ) | (2,217,718 | ) | ||||||||||||
| Institutional Class | (41,871,825 | ) | (45,506,838 | ) | – | (269,713 | ) | (2,394,890 | ) | |||||||||||||||
| W Class | – | |||||||||||||||||||||||
| R Class | (1,855,165 | ) | (2,176,396 | ) | (220,872 | ) | (944,360 | ) | – | |||||||||||||||
| K Class | – | |||||||||||||||||||||||
| Total distributions | (321,933,258 | ) | (406,319,672 | ) | (5,444,796 | ) | (22,580,053 | ) | (8,877,116 | ) | (86,473,687 | ) | ||||||||||||
| CAPITAL SHARE TRANSACTIONS: | ||||||||||||||||||||||||
| Net capital share transactions | ||||||||||||||||||||||||
| Investment Class | (70,768,449 | ) | (68,385,184 | ) | (10,616,728 | ) | 2,085,467 | (12,626,574 | ) | 6,715,178 | ||||||||||||||
| Service Class | (18,247,575 | ) | 1,871,516 | (24,440,364 | ) | (19,031,191 | ) | (31,562,938 | ) | (3,929,820 | ) | |||||||||||||
| Consultant Class | (6,917,899 | ) | (2,498,476 | ) | (3,382,618 | ) | (1,459,212 | ) | (1,180,143 | ) | (834,711 | ) | ||||||||||||
| Institutional Class | 22,849,733 | 15,591,155 | (3,864,348 | ) | (551,637 | ) | 1,069,284 | |||||||||||||||||
| W Class | (32,627,052 | ) | ||||||||||||||||||||||
| R Class | 45,596 | 192,909 | (1,317,046 | ) | (4,756,940 | ) | (595,855 | ) | ||||||||||||||||
| K Class | (1,969,073 | ) | ||||||||||||||||||||||
| Shareholder redemption fees | ||||||||||||||||||||||||
| Investment Class | 15,132 | 3,844 | 1 | 2 | 495 | – | ||||||||||||||||||
| Service Class | 67 | 37 | 29 | 473 | 96 | 370 | ||||||||||||||||||
| Net increase (decrease) in net assets from capital share transactions | (73,023,395 | ) | (85,851,251 | ) | (39,756,726 | ) | (28,994,822 | ) | (45,920,701 | ) | 2,424,446 | |||||||||||||
| Net Increase (Decrease) In Net Assets | 138,909,102 | (690,327,852 | ) | (14,914,576 | ) | (65,495,748 | ) | 3,462,427 | (111,017,198 | ) | ||||||||||||||
| NET ASSETS: | ||||||||||||||||||||||||
| Beginning of year | 1,669,484,604 | 2,359,812,456 | 186,182,638 | 251,678,386 | 256,763,024 | 367,780,222 | ||||||||||||||||||
| End of year | $ | 1,808,393,706 | $ | 1,669,484,604 | $ | 171,268,062 | $ | 186,182,638 | $ | 260,225,451 | $ | 256,763,024 | ||||||||||||
| THE ACCOMPANYING NOTES ARE AN INTEGRAL PART OF THESE FINANCIAL STATEMENTS | The Royce Funds 2019 Annual Report to Shareholders | 61 |
Statements of Changes in Net Assets
| Royce Special Equity Fund | Royce Total Return Fund | |||||||||||||||
| Year Ended 12/31/19 | Year Ended 12/31/18 | Year Ended 12/31/19 | Year Ended 12/31/18 | |||||||||||||
| INVESTMENT OPERATIONS: | ||||||||||||||||
| Net investment income (loss) | $ | 11,546,470 | $ | 14,296,007 | $ | 20,423,300 | $ | 28,615,219 | ||||||||
| Net realized gain (loss) on investments and foreign currency | 108,663,278 | 128,379,606 | 114,925,703 | 350,348,950 | ||||||||||||
| Net change in unrealized appreciation (depreciation) on investments and foreign currency | 16,963,326 | (286,833,332 | ) | 196,976,208 | (622,350,876 | ) | ||||||||||
| Net increase (decrease) in net assets from investment operations | 137,173,074 | (144,157,719 | ) | 332,325,211 | (243,386,707 | ) | ||||||||||
| DISTRIBUTIONS: | ||||||||||||||||
| Total distributable earnings | ||||||||||||||||
| Investment Class | (88,177,876 | ) | (113,623,179 | ) | (93,615,989 | ) | (225,309,236 | ) | ||||||||
| Service Class | (6,161,502 | ) | (7,307,745 | ) | (6,498,298 | ) | (16,161,811 | ) | ||||||||
| Consultant Class | (2,409,822 | ) | (3,348,220 | ) | (11,752,705 | ) | (31,360,737 | ) | ||||||||
| Institutional Class | (20,029,031 | ) | (22,075,060 | ) | (21,255,144 | ) | (44,088,716 | ) | ||||||||
| W Class | (278,190 | ) | ||||||||||||||
| R Class | (2,882,429 | ) | (8,404,156 | ) | ||||||||||||
| K Class | (58,255 | ) | ||||||||||||||
| Total distributions | (116,778,231 | ) | (146,354,204 | ) | (136,004,565 | ) | (325,661,101 | ) | ||||||||
| CAPITAL SHARE TRANSACTIONS: | ||||||||||||||||
| Net capital share transactions | ||||||||||||||||
| Investment Class | (107,269,970 | ) | (11,589,585 | ) | (141,611,166 | ) | (123,762,427 | ) | ||||||||
| Service Class | (3,843,977 | ) | (29,107,261 | ) | (17,455,317 | ) | 13,551,539 | |||||||||
| Consultant Class | (6,019,051 | ) | (8,996,204 | ) | (31,214,004 | ) | (28,831,097 | ) | ||||||||
| Institutional Class | (15,974,413 | ) | 686,503 | (12,344,314 | ) | (14,128,910 | ) | |||||||||
| W Class | (98,540,528 | ) | ||||||||||||||
| R Class | (14,978,169 | ) | 5,579,991 | |||||||||||||
| K Class | (37,154,510 | ) | ||||||||||||||
| Shareholder redemption fees | ||||||||||||||||
| Investment Class | 4,063 | 4,643 | 279 | 1,812 | ||||||||||||
| Service Class | 920 | 1,015 | 10 | 6,244 | ||||||||||||
| Net increase (decrease) in net assets from capital share transactions | (133,102,428 | ) | (49,000,889 | ) | (217,602,681 | ) | (283,277,886 | ) | ||||||||
| Net Increase (Decrease) In Net Assets | (112,707,585 | ) | (339,512,812 | ) | (21,282,035 | ) | (852,325,694 | ) | ||||||||
| NET ASSETS: | ||||||||||||||||
| Beginning of year | 1,204,370,225 | 1,543,883,037 | 1,543,531,625 | 2,395,857,319 | ||||||||||||
| End of year | $ | 1,091,662,640 | $ | 1,204,370,225 | $ | 1,522,249,590 | $ | 1,543,531,625 | ||||||||
| 62 |The Royce Funds 2019 Annual Report to Shareholders | THE ACCOMPANYING NOTES ARE AN INTEGRAL PART OF THESE FINANCIAL STATEMENTS |
Financial Highlights
This table is presented to show selected data for a share outstanding throughout each year or other indicated period and to assist shareholders in evaluating a Fund’s performance for the periods presented. Per share amounts have been determined on the basis of the weighted average number of shares outstanding during the period.
| Ratio of Expenses to Average Net Assets | |||||||||||||||||||||||||||||||||||||||||||||||||||||||||||||
| Net Asset Value, Beginning of Period | Net Investment Income (Loss) | Net Realized and Unrealized Gain (Loss) on Investments and Foreign Currency | Total from Investment Operations | Distributions from Net Investment Income | Distributions from Net Realized Gain on Investments and Foreign Currency | Total Distributions | Net Asset Value, End of Period | Total Return | Net Assets, End of Period (in thousands) | Prior to Fee Waivers, Expense Reimbursements and Balance Credits | Prior to Fee Waivers and Expense Reimbursements | Net of Fee Waivers and Expense Reimbursements | Ratio of Net Investment Income (Loss) to Average Net Assets | Portfolio Turnover Rate | |||||||||||||||||||||||||||||||||||||||||||||||
| Royce Dividend Value Fund–Investment Class | |||||||||||||||||||||||||||||||||||||||||||||||||||||||||||||
| 2019 | $ | 5.56 | $ | 0.09 | $ | 1.58 | $ | 1.67 | $ | (0.10 | ) | $ | (0.92 | ) | $ | (1.02 | ) | $ | 6.21 | 30.34 | % | $ | 76,273 | 1.21 | % | 1.20 | % | 1.09 | % | 1.37 | % | 8 | % | ||||||||||||||||||||||||||||
| 2018 | 7.56 | 0.10 | (1.27 | ) | (1.17 | ) | (0.10 | ) | (0.73 | ) | (0.83 | ) | 5.56 | (16.06 | ) | 88,036 | 1.13 | 1.13 | 1.04 | 1.29 | 13 | ||||||||||||||||||||||||||||||||||||||||
| 2017 | 7.18 | 0.10 | 1.43 | 1.53 | (0.13 | ) | (1.02 | ) | (1.15 | ) | 7.56 | 21.91 | 121,209 | 1.13 | 1.13 | 1.06 | 1.24 | 16 | |||||||||||||||||||||||||||||||||||||||||||
| 2016 | 6.84 | 0.12 | 1.02 | 1.14 | (0.11 | ) | (0.69 | ) | (0.80 | ) | 7.18 | 16.75 | 99,462 | 1.16 | 1.16 | 1.11 | 1.64 | 21 | |||||||||||||||||||||||||||||||||||||||||||
| 2015 | 8.12 | 0.12 | (0.57 | ) | (0.45 | ) | (0.13 | ) | (0.70 | ) | (0.83 | ) | 6.84 | (5.54 | ) | 116,053 | 1.24 | 1.24 | 1.22 | 1.49 | 14 | ||||||||||||||||||||||||||||||||||||||||
| Royce Dividend Value Fund–Service Class | |||||||||||||||||||||||||||||||||||||||||||||||||||||||||||||
| 2019 | $ | 5.73 | $ | 0.08 | $ | 1.61 | $ | 1.69 | $ | (0.06 | ) | $ | (0.94 | ) | $ | (1.00 | ) | $ | 6.42 | 29.78 | % | $ | 25,256 | 1.53 | % | 1.52 | % | 1.34 | % | 1.14 | % | 8 | % | ||||||||||||||||||||||||||||
| 2018 | 7.76 | 0.07 | (1.29 | ) | (1.22 | ) | (0.06 | ) | (0.75 | ) | (0.81 | ) | 5.73 | (16.24 | ) | 28,120 | 1.43 | 1.43 | 1.34 | 1.01 | 13 | ||||||||||||||||||||||||||||||||||||||||
| 2017 | 7.33 | 0.08 | 1.46 | 1.54 | (0.07 | ) | (1.04 | ) | (1.11 | ) | 7.76 | 21.66 | 59,641 | 1.40 | 1.39 | 1.31 | 1.04 | 16 | |||||||||||||||||||||||||||||||||||||||||||
| 2016 | 6.96 | 0.10 | 1.04 | 1.14 | (0.08 | ) | (0.69 | ) | (0.77 | ) | 7.33 | 16.36 | 115,547 | 1.43 | 1.43 | 1.37 | 1.39 | 21 | |||||||||||||||||||||||||||||||||||||||||||
| 2015 | 8.22 | 0.10 | (0.57 | ) | (0.47 | ) | (0.09 | ) | (0.70 | ) | (0.79 | ) | 6.96 | (5.72 | ) | 167,165 | 1.49 | 1.49 | 1.47 | 1.25 | 14 | ||||||||||||||||||||||||||||||||||||||||
| Royce Dividend Value Fund–Consultant Class | |||||||||||||||||||||||||||||||||||||||||||||||||||||||||||||
| 2019 | $ | 6.53 | $ | 0.03 | $ | 1.85 | $ | 1.88 | $ | (0.01 | ) | $ | (1.07 | ) | $ | (1.08 | ) | $ | 7.33 | 29.03 | % | $ | 1,621 | 3.30 | % | 3.29 | % | 2.09 | % | 0.40 | % | 8 | % | ||||||||||||||||||||||||||||
| 2018 | 8.87 | 0.02 | (1.48 | ) | (1.46 | ) | (0.03 | ) | (0.85 | ) | (0.88 | ) | 6.53 | (16.93 | ) | 1,349 | 3.44 | 3.44 | 2.09 | 0.24 | 13 | ||||||||||||||||||||||||||||||||||||||||
| 2017 | 8.39 | 0.02 | 1.68 | 1.70 | (0.03 | ) | (1.19 | ) | (1.22 | ) | 8.87 | 20.71 | 1,534 | 3.26 | 3.26 | 2.09 | 0.23 | 16 | |||||||||||||||||||||||||||||||||||||||||||
| 2016 | 7.90 | 0.05 | 1.17 | 1.22 | (0.04 | ) | (0.69 | ) | (0.73 | ) | 8.39 | 15.44 | 1,572 | 3.26 | 3.26 | 2.14 | 0.58 | 21 | |||||||||||||||||||||||||||||||||||||||||||
| 2015 | 9.22 | 0.04 | (0.63 | ) | (0.59 | ) | (0.03 | ) | (0.70 | ) | (0.73 | ) | 7.90 | (6.39 | ) | 1,886 | 3.78 | 3.78 | 2.24 | 0.46 | 14 | ||||||||||||||||||||||||||||||||||||||||
| Royce Dividend Value Fund–Institutional Class | |||||||||||||||||||||||||||||||||||||||||||||||||||||||||||||
| 2019 | $ | 5.48 | $ | 0.15 | $ | 1.48 | $ | 1.63 | $ | (0.11 | ) | $ | (0.90 | ) | $ | (1.01 | ) | $ | 6.10 | 30.08 | % | $ | 883 | 1.98 | % | 1.98 | % | 0.97 | % | 1.62 | % | 8 | % | ||||||||||||||||||||||||||||
| 2018 | 7.46 | 0.09 | (1.23 | ) | (1.14 | ) | (0.12 | ) | (0.72 | ) | (0.84 | ) | 5.48 | (15.94 | ) | 3,016 | 1.89 | 1.89 | 0.89 | 1.28 | 13 | ||||||||||||||||||||||||||||||||||||||||
| 2017 | 7.09 | 0.11 | 1.42 | 1.53 | (0.15 | ) | (1.01 | ) | (1.16 | ) | 7.46 | 22.21 | 1,112 | 2.79 | 2.79 | 0.89 | 1.43 | 16 | |||||||||||||||||||||||||||||||||||||||||||
| 2016 | 6.78 | 0.13 | 1.00 | 1.13 | (0.13 | ) | (0.69 | ) | (0.82 | ) | 7.09 | 16.70 | 823 | 3.30 | 3.30 | 0.93 | 1.81 | 21 | |||||||||||||||||||||||||||||||||||||||||||
| 2015 | 8.09 | 0.17 | (0.62 | ) | (0.45 | ) | (0.16 | ) | (0.70 | ) | (0.86 | ) | 6.78 | (5.61 | ) | 658 | 1.11 | 1.11 | 1.04 | 1.60 | 14 | ||||||||||||||||||||||||||||||||||||||||
| Royce Global Financial Services Fund–Service Class | |||||||||||||||||||||||||||||||||||||||||||||||||||||||||||||
| 2019 | $ | 8.18 | $ | 0.10 | $ | 1.87 | $ | 1.97 | $ | (0.15 | ) | $ | (0.09 | ) | $ | (0.24 | ) | $ | 9.91 | 24.17 | % | $ | 30,202 | 1.82 | % | 1.81 | % | 1.49 | % | 0.86 | % | 5 | % | ||||||||||||||||||||||||||||
| 2018 | 10.57 | 0.07 | (1.45 | ) | (1.38 | ) | (0.09 | ) | (0.92 | ) | (1.01 | ) | 8.18 | (13.41 | ) | 32,113 | 1.68 | 1.68 | 1.49 | 0.61 | 8 | ||||||||||||||||||||||||||||||||||||||||
| 2017 | 8.95 | 0.10 | 1.90 | 2.00 | (0.23 | ) | (0.15 | ) | (0.38 | ) | 10.57 | 22.46 | 47,197 | 1.68 | 1.68 | 1.49 | 0.83 | 19 | |||||||||||||||||||||||||||||||||||||||||||
| 2016 | 7.99 | 0.11 | 0.92 | 1.03 | (0.05 | ) | (0.02 | ) | (0.07 | ) | 8.95 | 12.93 | 43,629 | 1.67 | 1.67 | 1.49 | 1.25 | 37 | |||||||||||||||||||||||||||||||||||||||||||
| 2015 | 9.28 | 0.11 | (0.55 | ) | (0.44 | ) | (0.11 | ) | (0.74 | ) | (0.85 | ) | 7.99 | (4.71 | ) | 52,013 | 1.65 | 1.65 | 1.49 | 1.19 | 46 | ||||||||||||||||||||||||||||||||||||||||
| Royce Global Financial Services Fund–Institutional Classa | |||||||||||||||||||||||||||||||||||||||||||||||||||||||||||||
| 2019 | $ | 10.55 | $ | 0.14 | $ | 2.42 | $ | 2.56 | $ | (0.16 | ) | $ | (0.12 | ) | $ | (0.28 | ) | $ | 12.83 | 24.35 | % | $ | 6,738 | 1.60 | % | 1.60 | % | 1.33 | % | 1.04 | % | 5 | % | ||||||||||||||||||||||||||||
| 2018 | 13.58 | 0.15 | (1.85 | ) | (1.70 | ) | (0.14 | ) | (1.19 | ) | (1.33 | ) | 10.55 | (12.87 | ) | 6,951 | 1.43 | 1.43 | 1.04 | 1.06 | 8 | ||||||||||||||||||||||||||||||||||||||||
| 2017 | 11.43 | 0.15 | 2.47 | 2.62 | (0.27 | ) | (0.20 | ) | (0.47 | ) | 13.58 | 23.01 | 8,608 | 1.44 | 1.44 | 1.04 | 1.29 | 19 | |||||||||||||||||||||||||||||||||||||||||||
| 2016 | 10.00 | 0.18 | 1.36 | 1.54 | (0.09 | ) | (0.02 | ) | (0.11 | ) | 11.43 | 15.41 | 1 | 6,474 | 1.85 | 2 | 1.85 | 2 | 1.04 | 2 | 1.82 | 2 | 37 | ||||||||||||||||||||||||||||||||||||||
| THE ACCOMPANYING NOTES ARE AN INTEGRAL PART OF THESE FINANCIAL STATEMENTS | The Royce Funds 2019 Annual Report to Shareholders | 63 |
Financial Highlights
This table is presented to show selected data for a share outstanding throughout each year or other indicated period and to assist shareholders in evaluating a Fund’s performance for the periods presented. Per share amounts have been determined on the basis of the weighted average number of shares outstanding during the period.
| Ratio of Expenses to Average Net Assets | |||||||||||||||||||||||||||||||||||||||||||||||||||||||||||||
| Net Asset Value, Beginning of Period | Net Investment Income (Loss) | Net Realized and Unrealized Gain (Loss) on Investments and Foreign Currency | Total from Investment Operations | Distributions from Net Investment Income | Distributions from Net Realized Gain on Investments and Foreign Currency | Total Distributions | Net Asset Value, End of Period | Total Return | Net Assets, End of Period (in thousands) | Prior to Fee Waivers, Expense Reimbursements and Balance Credits | Prior to Fee Waivers and Expense Reimbursements | Net of Fee Waivers and Expense Reimbursements | Ratio of Net Investment Income (Loss) to Average Net Assets | Portfolio Turnover Rate | |||||||||||||||||||||||||||||||||||||||||||||||
| Royce International Premier Fund–Investment Class | |||||||||||||||||||||||||||||||||||||||||||||||||||||||||||||
| 2019 | $ | 11.39 | $ | 0.11 | $ | 3.82 | $ | 3.93 | $ | (0.07 | ) | $ | – | $ | (0.07 | ) | $ | 15.25 | 34.49 | % | $ | 360,623 | 1.26 | % | 1.26 | % | 1.18 | % | 0.74 | % | 40 | % | |||||||||||||||||||||||||||||
| 2018 | 13.07 | 0.09 | (1.72 | ) | (1.63 | ) | (0.05 | ) | – | (0.05 | ) | 11.39 | (12.45 | ) | 285,065 | 1.27 | 1.26 | 1.16 | 1.00 | 65 | |||||||||||||||||||||||||||||||||||||||||
| 2017 | 9.44 | (0.10 | ) | 3.88 | 3.78 | (0.15 | ) | – | (0.15 | ) | 13.07 | 40.08 | 103,032 | 1.37 | 1.37 | 1.19 | 0.32 | 41 | |||||||||||||||||||||||||||||||||||||||||||
| 2016 | 9.82 | 0.10 | (0.19 | ) | (0.09 | ) | (0.28 | ) | (0.01 | ) | (0.29 | ) | 9.44 | (0.79 | ) | 19,556 | 1.59 | 1.59 | 1.19 | 0.96 | 67 | ||||||||||||||||||||||||||||||||||||||||
| 2015 | 8.71 | 0.16 | 1.27 | 1.43 | (0.32 | ) | – | (0.32 | ) | 9.82 | 16.42 | 3,623 | 2.80 | 2.80 | 1.38 | 1.72 | 67 | ||||||||||||||||||||||||||||||||||||||||||||
| Royce International Premier Fund–Service Class | |||||||||||||||||||||||||||||||||||||||||||||||||||||||||||||
| 2019 | $ | 13.61 | $ | 0.10 | $ | 4.57 | $ | 4.67 | $ | (0.04 | ) | $ | – | $ | (0.04 | ) | $ | 18.24 | 34.29 | % | $ | 71,350 | 1.58 | % | 1.58 | % | 1.41 | % | 0.63 | % | 40 | % | |||||||||||||||||||||||||||||
| 2018 | 15.60 | 0.11 | (2.10 | ) | (1.99 | ) | – | – | – | 13.61 | (12.76 | ) | 36,303 | 1.59 | 1.59 | 1.44 | 0.71 | 65 | |||||||||||||||||||||||||||||||||||||||||||
| 2017 | 11.24 | 0.05 | 4.42 | 4.47 | (0.11 | ) | – | (0.11 | ) | 15.60 | 39.81 | 48,642 | 1.65 | 1.65 | 1.44 | 0.28 | 41 | ||||||||||||||||||||||||||||||||||||||||||||
| 2016 | 11.64 | 0.06 | (0.19 | ) | (0.13 | ) | (0.26 | ) | (0.01 | ) | (0.27 | ) | 11.24 | (1.06 | ) | 38,884 | 1.84 | 1.84 | 1.44 | 0.66 | 67 | ||||||||||||||||||||||||||||||||||||||||
| 2015 | 10.28 | (0.00 | ) | 1.66 | 1.66 | (0.30 | ) | – | (0.30 | ) | 11.64 | 16.22 | 9,015 | 2.65 | 2.65 | 1.60 | 1.10 | 67 | |||||||||||||||||||||||||||||||||||||||||||
| Royce International Premier Fund–Consultant Classb | |||||||||||||||||||||||||||||||||||||||||||||||||||||||||||||
| 2019 | $ | 14.71 | $ | (0.03 | ) | $ | 4.92 | $ | 4.89 | $ | – | $ | – | $ | – | $ | 19.60 | 33.24 | % | $ | 9,894 | 2.41 | % | 2.41 | % | 2.18 | % | (0.17 | )% | 40 | % | ||||||||||||||||||||||||||||||
| 2018 | 16.99 | (0.00 | ) | (2.28 | ) | (2.28 | ) | – | – | – | 14.71 | (13.42 | ) | 8,546 | 2.33 | 2.32 | 2.19 | (0.00 | ) | 65 | |||||||||||||||||||||||||||||||||||||||||
| 2017 | 12.27 | (0.08 | ) | 4.83 | 4.75 | (0.03 | ) | – | (0.03 | ) | 16.99 | 38.73 | 9,281 | 2.73 | 2.73 | 2.19 | (0.52 | ) | 41 | ||||||||||||||||||||||||||||||||||||||||||
| 2016 | 11.59 | 0.01 | 0.85 | 0.86 | (0.17 | ) | (0.01 | ) | (0.18 | ) | 12.27 | 7.49 | 1 | 5,086 | 2.70 | 2 | 2.70 | 2 | 2.19 | 2 | (0.04 | )2 | 67 | ||||||||||||||||||||||||||||||||||||||
| Royce International Premier Fund–Institutional Classc | |||||||||||||||||||||||||||||||||||||||||||||||||||||||||||||
| 2019 | $ | 11.39 | $ | (0.03 | ) | $ | 3.98 | $ | 3.95 | $ | (0.09 | ) | $ | – | $ | (0.09 | ) | $ | 15.25 | 34.68 | % | $ | 366,870 | 1.19 | % | 1.19 | % | 1.04 | % | 0.57 | % | 40 | % | ||||||||||||||||||||||||||||
| 2018 | 12.98 | (0.00 | ) | (1.53 | ) | (1.53 | ) | (0.06 | ) | – | (0.06 | ) | 11.39 | (11.78 | )1 | 32,340 | 1.34 | 2 | 1.34 | 2 | 1.04 | 2 | 0.84 | 2 | 65 | ||||||||||||||||||||||||||||||||||||
| Royce Micro-Cap Fund–Investment Class | |||||||||||||||||||||||||||||||||||||||||||||||||||||||||||||
| 2019 | $ | 9.35 | $ | (0.05 | ) | $ | 2.02 | $ | 1.97 | $ | – | $ | (0.30 | ) | $ | (0.30 | ) | $ | 11.02 | 21.16 | % | $ | 158,112 | 1.51 | % | 1.50 | % | 1.36 | % | (0.46 | )% | 21 | % | ||||||||||||||||||||||||||||
| 2018 | 11.64 | (0.05 | ) | (0.94 | ) | (0.99 | ) | – | (1.30 | ) | (1.30 | ) | 9.35 | (8.94 | ) | 117,040 | 1.50 | 1.50 | 1.49 | (0.43 | ) | 24 | |||||||||||||||||||||||||||||||||||||||
| 2017 | 11.92 | (0.03 | ) | 0.66 | 0.63 | (0.01 | ) | (0.90 | ) | (0.91 | ) | 11.64 | 5.43 | 166,935 | 1.51 | 1.51 | 1.49 | (0.28 | ) | 26 | |||||||||||||||||||||||||||||||||||||||||
| 2016 | 11.09 | 0.01 | 2.18 | 2.19 | (0.06 | ) | (1.30 | ) | (1.36 | ) | 11.92 | 19.74 | 192,731 | 1.48 | 1.48 | 1.48 | 0.03 | 38 | |||||||||||||||||||||||||||||||||||||||||||
| 2015 | 14.47 | 0.02 | (1.96 | ) | (1.94 | ) | – | (1.44 | ) | (1.44 | ) | 11.09 | (13.32 | ) | 219,272 | 1.51 | 1.51 | 1.51 | 0.15 | 41 | |||||||||||||||||||||||||||||||||||||||||
| Royce Micro-Cap Fund–Service Class | |||||||||||||||||||||||||||||||||||||||||||||||||||||||||||||
| 2019 | $ | 9.15 | $ | (0.01 | ) | $ | 1.94 | $ | 1.93 | $ | – | $ | (0.29 | ) | $ | (0.29 | ) | $ | 10.79 | 21.22 | % | $ | 164,956 | 1.51 | % | 1.51 | % | 1.50 | % | (0.09 | )% | 21 | % | ||||||||||||||||||||||||||||
| 2018 | 11.41 | (0.07 | ) | (0.91 | ) | (0.98 | ) | – | (1.28 | ) | (1.28 | ) | 9.15 | (9.09 | ) | 8,053 | 1.90 | 1.89 | 1.61 | (0.56 | ) | 24 | |||||||||||||||||||||||||||||||||||||||
| 2017 | 11.69 | (0.05 | ) | 0.65 | 0.60 | – | (0.88 | ) | (0.88 | ) | 11.41 | 5.32 | 13,880 | 1.86 | 1.86 | 1.61 | (0.40 | ) | 26 | ||||||||||||||||||||||||||||||||||||||||||
| 2016 | 10.90 | (0.01 | ) | 2.15 | 2.14 | (0.05 | ) | (1.30 | ) | (1.35 | ) | 11.69 | 19.59 | 17,343 | 1.83 | 1.83 | 1.61 | (0.11 | ) | 38 | |||||||||||||||||||||||||||||||||||||||||
| 2015 | 14.26 | 0.00 | (1.92 | ) | (1.92 | ) | – | (1.44 | ) | (1.44 | ) | 10.90 | (13.37 | ) | 20,538 | 1.80 | 1.80 | 1.63 | 0.01 | 41 | |||||||||||||||||||||||||||||||||||||||||
| 64 | The Royce Funds 2019 Annual Report to Shareholders | THE ACCOMPANYING NOTES ARE AN INTEGRAL PART OF THESE FINANCIAL STATEMENTS |
Financial Highlights
This table is presented to show selected data for a share outstanding throughout each year or other indicated period and to assist shareholders in evaluating a Fund’s performance for the periods presented. Per share amounts have been determined on the basis of the weighted average number of shares outstanding during the period.
| Ratio of Expenses to Average Net Assets | |||||||||||||||||||||||||||||||||||||||||||||||||||||||||||||
| Net Asset Value, Beginning of Period | Net Investment Income (Loss) | Net Realized and Unrealized Gain (Loss) on Investments and Foreign Currency | Total from Investment Operations | Distributions from Net Investment Income | Distributions from Net Realized Gain on Investments and Foreign Currency | Total Distributions | Net Asset Value, End of Period | Total Return | Net Assets, End of Period (in thousands) | Prior to Fee Waivers, Expense Reimbursements and Balance Credits | Prior to Fee Waivers and Expense Reimbursements | Net of Fee Waivers and Expense Reimbursements | Ratio of Net Investment Income (Loss) to Average Net Assets | Portfolio Turnover Rate | |||||||||||||||||||||||||||||||||||||||||||||||
| Royce Micro-Cap Fund–Consultant Class | |||||||||||||||||||||||||||||||||||||||||||||||||||||||||||||
| 2019 | $ | 7.23 | $ | (0.13 | ) | $ | 1.55 | $ | 1.42 | $ | – | $ | (0.23 | ) | $ | (0.23 | ) | $ | 8.42 | 19.72 | % | $ | 14,204 | 2.59 | % | 2.59 | % | 2.58 | % | (1.69 | )% | 21 | % | ||||||||||||||||||||||||||||
| 2018 | 9.10 | (0.14 | ) | (0.72 | ) | (0.86 | ) | – | (1.01 | ) | (1.01 | ) | 7.23 | (9.93 | ) | 16,680 | 2.56 | 2.56 | 2.56 | (1.50 | ) | 24 | |||||||||||||||||||||||||||||||||||||||
| 2017 | 9.41 | (0.13 | ) | 0.53 | 0.40 | – | (0.71 | ) | (0.71 | ) | 9.10 | 4.35 | 24,396 | 2.54 | 2.54 | 2.54 | (1.34 | ) | 26 | ||||||||||||||||||||||||||||||||||||||||||
| 2016 | 9.04 | (0.09 | ) | 1.76 | 1.67 | – | (1.30 | ) | (1.30 | ) | 9.41 | 18.48 | 33,622 | 2.53 | 2.53 | 2.53 | (1.02 | ) | 38 | ||||||||||||||||||||||||||||||||||||||||||
| 2015 | 12.23 | (0.10 | ) | (1.65 | ) | (1.75 | ) | – | (1.44 | ) | (1.44 | ) | 9.04 | (14.21 | ) | 41,024 | 2.54 | 2.54 | 2.54 | (0.90 | ) | 41 | |||||||||||||||||||||||||||||||||||||||
| Royce Opportunity Fund–Investment Class | |||||||||||||||||||||||||||||||||||||||||||||||||||||||||||||
| 2019 | $ | 9.92 | $ | (0.06 | ) | $ | 2.86 | $ | 2.80 | $ | – | $ | (0.20 | ) | $ | (0.20 | ) | $ | 12.52 | 28.21 | % | $ | 609,316 | 1.23 | % | 1.22 | % | 1.22 | % | (0.50 | )% | 47 | % | ||||||||||||||||||||||||||||
| 2018 | 13.58 | (0.04 | ) | (2.61 | ) | (2.65 | ) | – | (1.01 | ) | (1.01 | ) | 9.92 | (19.97 | ) | 557,003 | 1.20 | 1.20 | 1.20 | (0.30 | ) | 47 | |||||||||||||||||||||||||||||||||||||||
| 2017 | 12.85 | (0.04 | ) | 2.79 | 2.75 | – | (2.02 | ) | (2.02 | ) | 13.58 | 21.88 | 805,660 | 1.18 | 1.18 | 1.18 | (0.28 | ) | 43 | ||||||||||||||||||||||||||||||||||||||||||
| 2016 | 10.57 | (0.02 | ) | 3.19 | 3.17 | – | (0.89 | ) | (0.89 | ) | 12.85 | 29.86 | 751,184 | 1.19 | 1.19 | 1.19 | (0.18 | ) | 26 | ||||||||||||||||||||||||||||||||||||||||||
| 2015 | 13.46 | (0.03 | ) | (1.80 | ) | (1.83 | ) | – | (1.06 | ) | (1.06 | ) | 10.57 | (13.57 | ) | 746,052 | 1.17 | 1.17 | 1.17 | (0.27 | ) | 27 | |||||||||||||||||||||||||||||||||||||||
| Royce Opportunity Fund–Service Class | |||||||||||||||||||||||||||||||||||||||||||||||||||||||||||||
| 2019 | $ | 9.23 | $ | (0.09 | ) | $ | 2.65 | $ | 2.56 | $ | – | $ | (0.18 | ) | $ | (0.18 | ) | $ | 11.61 | 27.79 | % | $ | 46,032 | 1.55 | % | 1.55 | % | 1.49 | % | (0.77 | )% | 47 | % | ||||||||||||||||||||||||||||
| 2018 | 12.66 | (0.07 | ) | (2.42 | ) | (2.49 | ) | – | (0.94 | ) | (0.94 | ) | 9.23 | (20.14 | ) | 48,797 | 1.52 | 1.52 | 1.49 | (0.59 | ) | 47 | |||||||||||||||||||||||||||||||||||||||
| 2017 | 12.02 | (0.08 | ) | 2.61 | 2.53 | – | (1.89 | ) | (1.89 | ) | 12.66 | 21.46 | 96,663 | 1.53 | 1.53 | 1.49 | (0.61 | ) | 43 | ||||||||||||||||||||||||||||||||||||||||||
| 2016 | 9.95 | (0.05 | ) | 3.01 | 2.96 | – | (0.89 | ) | (0.89 | ) | 12.02 | 29.61 | 73,517 | 1.53 | 1.53 | 1.49 | (0.48 | ) | 26 | ||||||||||||||||||||||||||||||||||||||||||
| 2015 | 12.80 | (0.07 | ) | (1.72 | ) | (1.79 | ) | – | (1.06 | ) | (1.06 | ) | 9.95 | (13.96 | ) | 100,918 | 1.49 | 1.49 | 1.49 | (0.59 | ) | 27 | |||||||||||||||||||||||||||||||||||||||
| Royce Opportunity Fund–Consultant Class | |||||||||||||||||||||||||||||||||||||||||||||||||||||||||||||
| 2019 | $ | 8.09 | $ | (0.16 | ) | $ | 2.32 | $ | 2.16 | $ | – | $ | (0.16 | ) | $ | (0.16 | ) | $ | 10.09 | 26.70 | % | $ | 8,621 | 2.41 | % | 2.41 | % | 2.41 | % | (1.67 | )% | 47 | % | ||||||||||||||||||||||||||||
| 2018 | 11.19 | (0.16 | ) | (2.12 | ) | (2.28 | ) | – | (0.82 | ) | (0.82 | ) | 8.09 | (20.81 | ) | 9,831 | 2.30 | 2.29 | 2.29 | (1.39 | ) | 47 | |||||||||||||||||||||||||||||||||||||||
| 2017 | 10.71 | (0.16 | ) | 2.31 | 2.15 | – | (1.67 | ) | (1.67 | ) | 11.19 | 20.50 | 20,574 | 2.27 | 2.27 | 2.27 | (1.37 | ) | 43 | ||||||||||||||||||||||||||||||||||||||||||
| 2016 | 9.01 | (0.12 | ) | 2.71 | 2.59 | – | (0.89 | ) | (0.89 | ) | 10.71 | 28.59 | 21,116 | 2.28 | 2.28 | 2.28 | (1.27 | ) | 26 | ||||||||||||||||||||||||||||||||||||||||||
| 2015 | 11.79 | (0.15 | ) | (1.57 | ) | (1.72 | ) | – | (1.06 | ) | (1.06 | ) | 9.01 | (14.56 | ) | 19,464 | 2.26 | 2.26 | 2.26 | (1.34 | ) | 27 | |||||||||||||||||||||||||||||||||||||||
| Royce Opportunity Fund–Institutional Class | |||||||||||||||||||||||||||||||||||||||||||||||||||||||||||||
| 2019 | $ | 10.13 | $ | (0.05 | ) | $ | 2.92 | $ | 2.87 | $ | – | $ | (0.20 | ) | $ | (0.20 | ) | $ | 12.80 | 28.36 | % | $ | 230,439 | 1.12 | % | 1.12 | % | 1.12 | % | (0.39 | )% | 47 | % | ||||||||||||||||||||||||||||
| 2018 | 13.84 | (0.02 | ) | (2.66 | ) | (2.68 | ) | – | (1.03 | ) | (1.03 | ) | 10.13 | (19.83 | ) | 227,261 | 1.08 | 1.08 | 1.08 | (0.17 | ) | 47 | |||||||||||||||||||||||||||||||||||||||
| 2017 | 13.08 | (0.02 | ) | 2.84 | 2.82 | – | (2.06 | ) | (2.06 | ) | 13.84 | 22.02 | 639,057 | 1.07 | 1.07 | 1.07 | (0.17 | ) | 43 | ||||||||||||||||||||||||||||||||||||||||||
| 2016 | 10.74 | (0.01 | ) | 3.24 | 3.23 | – | (0.89 | ) | (0.89 | ) | 13.08 | 29.94 | 583,975 | 1.07 | 1.07 | 1.07 | (0.06 | ) | 26 | ||||||||||||||||||||||||||||||||||||||||||
| 2015 | 13.64 | (0.02 | ) | (1.82 | ) | (1.84 | ) | – | (1.06 | ) | (1.06 | ) | 10.74 | (13.46 | ) | 600,945 | 1.05 | 1.05 | 1.05 | (0.15 | ) | 27 | |||||||||||||||||||||||||||||||||||||||
| Royce Opportunity Fund–R Class | |||||||||||||||||||||||||||||||||||||||||||||||||||||||||||||
| 2019 | $ | 8.90 | $ | (0.12 | ) | $ | 2.55 | $ | 2.43 | $ | – | $ | (0.17 | ) | $ | (0.17 | ) | $ | 11.16 | 27.38 | % | $ | 31,230 | 1.86 | % | 1.85 | % | 1.85 | % | (1.13 | )% | 47 | % | ||||||||||||||||||||||||||||
| 2018 | 12.25 | (0.11 | ) | (2.33 | ) | (2.44 | ) | – | (0.91 | ) | (0.91 | ) | 8.90 | (20.42 | ) | 26,337 | 1.84 | 1.84 | 1.84 | (0.93 | ) | 47 | |||||||||||||||||||||||||||||||||||||||
| 2017 | 11.67 | (0.12 | ) | 2.53 | 2.41 | – | (1.83 | ) | (1.83 | ) | 12.25 | 21.06 | 39,311 | 1.82 | 1.82 | 1.82 | (0.92 | ) | 43 | ||||||||||||||||||||||||||||||||||||||||||
| 2016 | 9.72 | (0.08 | ) | 2.92 | 2.84 | – | (0.89 | ) | (0.89 | ) | 11.67 | 29.08 | 38,902 | 1.82 | 1.82 | 1.82 | (0.81 | ) | 26 | ||||||||||||||||||||||||||||||||||||||||||
| 2015 | 12.56 | (0.11 | ) | (1.67 | ) | (1.78 | ) | – | (1.06 | ) | (1.06 | ) | 9.72 | (14.15 | ) | 32,599 | 1.82 | 1.82 | 1.82 | (0.90 | ) | 27 | |||||||||||||||||||||||||||||||||||||||
| THE ACCOMPANYING NOTES ARE AN INTEGRAL PART OF THESE FINANCIAL STATEMENTS | The Royce Funds 2019 Annual Report to Shareholders | 65 |
Financial Highlights
This table is presented to show selected data for a share outstanding throughout each year or other indicated period and to assist shareholders in evaluating a Fund’s performance for the periods presented. Per share amounts have been determined on the basis of the weighted average number of shares outstanding during the period.
| Ratio of Expenses to Average Net Assets | |||||||||||||||||||||||||||||||||||||||||||||||||||||||||||||
| Net Asset Value, Beginning of Period | Net Investment Income (Loss) | Net Realized and Unrealized Gain (Loss) on Investments and Foreign Currency | Total from Investment Operations | Distributions from Net Investment Income | Distributions from Net Realized Gain on Investments and Foreign Currency | Total Distributions | Net Asset Value, End of Period | Total Return | Net Assets, End of Period (in thousands) | Prior to Fee Waivers, Expense Reimbursements and Balance Credits | Prior to Fee Waivers and Expense Reimbursements | Net of Fee Waivers and Expense Reimbursements | Ratio of Net Investment Income (Loss) to Average Net Assets | Portfolio Turnover Rate | |||||||||||||||||||||||||||||||||||||||||||||||
| Royce Pennsylvania Mutual Fund–Investment Class | |||||||||||||||||||||||||||||||||||||||||||||||||||||||||||||
| 2019 | $ | 7.75 | $ | 0.04 | $ | 2.01 | $ | 2.05 | $ | (0.02 | ) | $ | (0.34 | ) | $ | (0.36 | ) | $ | 9.44 | 26.56 | % | $ | 1,429,042 | 0.95 | % | 0.94 | % | 0.94 | % | 0.39 | % | 30 | % | ||||||||||||||||||||||||||||
| 2018 | 10.52 | 0.04 | (0.97 | ) | (0.93 | ) | (0.02 | ) | (1.82 | ) | (1.84 | ) | 7.75 | (9.66 | ) | 1,203,967 | 0.92 | 0.92 | 0.92 | 0.33 | 35 | ||||||||||||||||||||||||||||||||||||||||
| 2017 | 11.02 | 0.06 | 1.68 | 1.74 | (0.06 | ) | (2.18 | ) | (2.24 | ) | 10.52 | 16.24 | 1,622,523 | 0.92 | 0.92 | 0.92 | 0.47 | 27 | |||||||||||||||||||||||||||||||||||||||||||
| 2016 | 9.33 | 0.07 | 2.41 | 2.48 | (0.04 | ) | (0.75 | ) | (0.79 | ) | 11.02 | 26.47 | 1,671,848 | 0.92 | 0.92 | 0.92 | 0.60 | 18 | |||||||||||||||||||||||||||||||||||||||||||
| 2015 | 13.00 | 0.09 | (1.58 | ) | (1.49 | ) | (0.10 | ) | (2.08 | ) | (2.18 | ) | 9.33 | (11.43 | ) | 1,925,419 | 0.92 | 0.92 | 0.92 | 0.58 | 21 | ||||||||||||||||||||||||||||||||||||||||
| Royce Pennsylvania Mutual Fund–Service Class | |||||||||||||||||||||||||||||||||||||||||||||||||||||||||||||
| 2019 | $ | 7.77 | $ | (0.00 | ) | $ | 2.00 | $ | 2.00 | $ | (0.01 | ) | $ | (0.34 | ) | $ | (0.35 | ) | $ | 9.42 | 25.75 | % | $ | 142,864 | 1.31 | % | 1.30 | % | 1.30 | % | (0.01 | )% | 30 | % | |||||||||||||||||||||||||||
| 2018 | 10.56 | (0.01 | ) | (0.96 | ) | (0.97 | ) | – | (1.82 | ) | (1.82 | ) | 7.77 | (9.96 | ) | 32,191 | 1.30 | 1.30 | 1.30 | (0.07 | ) | 35 | |||||||||||||||||||||||||||||||||||||||
| 2017 | 11.03 | 0.01 | 1.69 | 1.70 | – | (2.17 | ) | (2.17 | ) | 10.56 | 15.88 | 54,938 | 1.27 | 1.27 | 1.27 | 0.07 | 27 | ||||||||||||||||||||||||||||||||||||||||||||
| 2016 | 9.35 | 0.03 | 2.41 | 2.44 | (0.01 | ) | (0.75 | ) | (0.76 | ) | 11.03 | 25.99 | 100,598 | 1.26 | 1.26 | 1.26 | 0.27 | 18 | |||||||||||||||||||||||||||||||||||||||||||
| 2015 | 12.96 | 0.05 | (1.56 | ) | (1.51 | ) | (0.02 | ) | (2.08 | ) | (2.10 | ) | 9.35 | (11.57 | ) | 102,341 | 1.23 | 1.23 | 1.23 | 0.29 | 21 | ||||||||||||||||||||||||||||||||||||||||
| Royce Pennsylvania Mutual Fund–Consultant Class | |||||||||||||||||||||||||||||||||||||||||||||||||||||||||||||
| 2019 | $ | 6.18 | $ | (0.04 | ) | $ | 1.60 | $ | 1.56 | $ | – | $ | (0.27 | ) | $ | (0.27 | ) | $ | 7.47 | 25.25 | % | $ | 262,007 | 1.96 | % | 1.95 | % | 1.95 | % | (0.62 | )% | 30 | % | ||||||||||||||||||||||||||||
| 2018 | 8.46 | (0.06 | ) | (0.77 | ) | (0.83 | ) | – | (1.45 | ) | (1.45 | ) | 6.18 | (10.56 | ) | 249,004 | 1.93 | 1.93 | 1.93 | (0.69 | ) | 35 | |||||||||||||||||||||||||||||||||||||||
| 2017 | 8.90 | (0.05 | ) | 1.35 | 1.30 | – | (1.74 | ) | (1.74 | ) | 8.46 | 15.06 | 361,569 | 1.93 | 1.92 | 1.92 | (0.54 | ) | 27 | ||||||||||||||||||||||||||||||||||||||||||
| 2016 | 7.70 | (0.03 | ) | 1.98 | 1.95 | – | (0.75 | ) | (0.75 | ) | 8.90 | 25.20 | 402,114 | 1.94 | 1.94 | 1.94 | (0.42 | ) | 18 | ||||||||||||||||||||||||||||||||||||||||||
| 2015 | 11.16 | (0.05 | ) | (1.33 | ) | (1.38 | ) | – | (2.08 | ) | (2.08 | ) | 7.70 | (12.31 | ) | 416,862 | 1.94 | 1.94 | 1.94 | (0.44 | ) | 21 | |||||||||||||||||||||||||||||||||||||||
| Royce Pennsylvania Mutual Fund–Institutional Class | |||||||||||||||||||||||||||||||||||||||||||||||||||||||||||||
| 2019 | $ | 7.78 | $ | 0.04 | $ | 2.02 | $ | 2.06 | $ | (0.03 | ) | $ | (0.34 | ) | $ | (0.37 | ) | $ | 9.47 | 26.53 | % | $ | 106,564 | 0.89 | % | 0.89 | % | 0.89 | % | 0.45 | % | 30 | % | ||||||||||||||||||||||||||||
| 2018 | 10.55 | 0.04 | (0.97 | ) | (0.93 | ) | (0.02 | ) | (1.82 | ) | (1.84 | ) | 7.78 | (9.56 | ) | 83,908 | 0.88 | 0.88 | 0.88 | 0.40 | 35 | ||||||||||||||||||||||||||||||||||||||||
| 2017 | 11.04 | 0.09 | 1.67 | 1.76 | (0.07 | ) | (2.18 | ) | (2.25 | ) | 10.55 | 16.44 | 53,367 | 0.83 | 0.83 | 0.83 | 0.42 | 27 | |||||||||||||||||||||||||||||||||||||||||||
| 2016 | 9.34 | 0.09 | 2.41 | 2.50 | (0.05 | ) | (0.75 | ) | (0.80 | ) | 11.04 | 26.65 | 245,009 | 0.83 | 0.83 | 0.83 | 0.63 | 18 | |||||||||||||||||||||||||||||||||||||||||||
| 2015 | 13.02 | 0.11 | (1.60 | ) | (1.49 | ) | (0.11 | ) | (2.08 | ) | (2.19 | ) | 9.34 | (11.34 | ) | 498,374 | 0.81 | 0.81 | 0.81 | 0.68 | 21 | ||||||||||||||||||||||||||||||||||||||||
| Royce Pennsylvania Mutual Fund–R Class | |||||||||||||||||||||||||||||||||||||||||||||||||||||||||||||
| 2019 | $ | 7.30 | $ | (0.03 | ) | $ | 1.89 | $ | 1.86 | $ | – | $ | (0.32 | ) | $ | (0.32 | ) | $ | 8.84 | 25.48 | % | $ | 8,853 | 1.75 | % | 1.74 | % | 1.74 | % | (0.41 | )% | 30 | % | ||||||||||||||||||||||||||||
| 2018 | 9.94 | (0.03 | ) | (0.91 | ) | (0.94 | ) | – | (1.70 | ) | (1.70 | ) | 7.30 | (10.15 | ) | 10,014 | 1.58 | 1.57 | 1.57 | (0.34 | ) | 35 | |||||||||||||||||||||||||||||||||||||||
| 2017 | 10.44 | (0.04 | ) | 1.58 | 1.54 | – | (2.04 | ) | (2.04 | ) | 9.94 | 15.25 | 15,136 | 1.73 | 1.73 | 1.73 | (0.36 | ) | 27 | ||||||||||||||||||||||||||||||||||||||||||
| 2016 | 8.90 | (0.01 | ) | 2.30 | 2.29 | – | (0.75 | ) | (0.75 | ) | 10.44 | 25.62 | 17,059 | 1.63 | 1.63 | 1.63 | (0.11 | ) | 18 | ||||||||||||||||||||||||||||||||||||||||||
| 2015 | 12.50 | (0.02 | ) | (1.50 | ) | (1.52 | ) | – | (2.08 | ) | (2.08 | ) | 8.90 | (12.10 | ) | 18,675 | 1.65 | 1.65 | 1.65 | (0.15 | ) | 21 | |||||||||||||||||||||||||||||||||||||||
| Royce Premier Fund–Investment Class | |||||||||||||||||||||||||||||||||||||||||||||||||||||||||||||
| 2019 | $ | 11.62 | $ | 0.05 | $ | 3.87 | $ | 3.92 | $ | (0.05 | ) | $ | (2.61 | ) | $ | (2.66 | ) | $ | 12.88 | 34.13 | % | $ | 1,505,821 | 1.20 | % | 1.19 | % | 1.19 | % | 0.32 | % | 19 | % | ||||||||||||||||||||||||||||
| 2018 | 16.60 | 0.02 | (1.60 | ) | (1.58 | ) | (0.01 | ) | (3.39 | ) | (3.40 | ) | 11.62 | (10.40 | ) | 1,398,965 | 1.17 | 1.17 | 1.17 | 0.11 | 23 | ||||||||||||||||||||||||||||||||||||||||
| 2017 | 15.51 | 0.00 | 3.63 | 3.63 | (0.02 | ) | (2.52 | ) | (2.54 | ) | 16.60 | 23.77 | 1,978,847 | 1.16 | 1.16 | 1.16 | 0.00 | 8 | |||||||||||||||||||||||||||||||||||||||||||
| 2016 | 14.28 | 0.06 | 3.25 | 3.31 | (0.04 | ) | (2.04 | ) | (2.08 | ) | 15.51 | 23.00 | 1,768,580 | 1.16 | 1.16 | 1.16 | 0.35 | 15 | |||||||||||||||||||||||||||||||||||||||||||
| 2015 | 19.72 | 0.13 | (2.11 | ) | (1.98 | ) | (0.13 | ) | (3.33 | ) | (3.46 | ) | 14.28 | (9.90 | ) | 2,015,905 | 1.13 | 1.13 | 1.13 | 0.49 | 13 | ||||||||||||||||||||||||||||||||||||||||
| 66 | The Royce Funds 2019 Annual Report to Shareholders | THE ACCOMPANYING NOTES ARE AN INTEGRAL PART OF THESE FINANCIAL STATEMENTS |
Financial Highlights
This table is presented to show selected data for a share outstanding throughout each year or other indicated period and to assist shareholders in evaluating a Fund’s performance for the periods presented. Per share amounts have been determined on the basis of the weighted average number of shares outstanding during the period.
| Ratio of Expenses to Average Net Assets | |||||||||||||||||||||||||||||||||||||||||||||||||||||||||||||
| Net Asset Value, Beginning of Period | Net Investment Income (Loss) | Net Realized and Unrealized Gain (Loss) on Investments and Foreign Currency | Total from Investment Operations | Distributions from Net Investment Income | Distributions from Net Realized Gain on Investments and Foreign Currency | Total Distributions | Net Asset Value, End of Period | Total Return | Net Assets, End of Period (in thousands) | Prior to Fee Waivers, Expense Reimbursements and Balance Credits | Prior to Fee Waivers and Expense Reimbursements | Net of Fee Waivers and Expense Reimbursements | Ratio of Net Investment Income (Loss) to Average Net Assets | Portfolio Turnover Rate | |||||||||||||||||||||||||||||||||||||||||||||||
| Royce Premier Fund–Service Class | |||||||||||||||||||||||||||||||||||||||||||||||||||||||||||||
| 2019 | $ | 11.31 | $ | (0.01 | ) | $ | 3.78 | $ | 3.77 | $ | – | $ | (2.54 | ) | $ | (2.54 | ) | $ | 12.54 | 33.65 | % | $ | 29,696 | 1.57 | % | 1.57 | % | 1.46 | % | (0.06 | )% | 19 | % | ||||||||||||||||||||||||||||
| 2018 | 16.15 | (0.03 | ) | (1.55 | ) | (1.58 | ) | – | (3.26 | ) | (3.26 | ) | 11.31 | (10.66 | ) | 41,738 | 1.52 | 1.52 | 1.48 | (0.19 | ) | 23 | |||||||||||||||||||||||||||||||||||||||
| 2017 | 15.13 | (0.06 | ) | 3.53 | 3.47 | – | (2.45 | ) | (2.45 | ) | 16.15 | 23.32 | 54,557 | 1.53 | 1.53 | 1.49 | (0.34 | ) | 8 | ||||||||||||||||||||||||||||||||||||||||||
| 2016 | 13.98 | 0.00 | 3.19 | 3.19 | – | (2.04 | ) | (2.04 | ) | 15.13 | 22.63 | 46,550 | 1.50 | 1.50 | 1.49 | 0.02 | 15 | ||||||||||||||||||||||||||||||||||||||||||||
| 2015 | 19.33 | 0.06 | (2.04 | ) | (1.98 | ) | (0.04 | ) | (3.33 | ) | (3.37 | ) | 13.98 | (10.13 | ) | 61,969 | 1.44 | 1.43 | 1.43 | 0.23 | 13 | ||||||||||||||||||||||||||||||||||||||||
| Royce Premier Fund–Consultant Class | |||||||||||||||||||||||||||||||||||||||||||||||||||||||||||||
| 2019 | $ | 9.17 | $ | (0.10 | ) | $ | 3.05 | $ | 2.95 | $ | – | $ | (2.03 | ) | $ | (2.03 | ) | $ | 10.09 | 32.55 | % | $ | 17,585 | 2.26 | % | 2.26 | % | 2.26 | % | (0.91 | )% | 19 | % | ||||||||||||||||||||||||||||
| 2018 | 13.21 | (0.12 | ) | (1.27 | ) | (1.39 | ) | – | (2.65 | ) | (2.65 | ) | 9.17 | (11.41 | ) | 21,370 | 2.21 | 2.21 | 2.21 | (0.93 | ) | 23 | |||||||||||||||||||||||||||||||||||||||
| 2017 | 12.46 | (0.14 | ) | 2.89 | 2.75 | – | (2.00 | ) | (2.00 | ) | 13.21 | 22.49 | 31,489 | 2.21 | 2.21 | 2.21 | (1.06 | ) | 8 | ||||||||||||||||||||||||||||||||||||||||||
| 2016 | 11.89 | (0.09 | ) | 2.70 | 2.61 | – | (2.04 | ) | (2.04 | ) | 12.46 | 21.72 | 31,353 | 2.22 | 2.22 | 2.22 | (0.72 | ) | 15 | ||||||||||||||||||||||||||||||||||||||||||
| 2015 | 17.09 | (0.09 | ) | (1.78 | ) | (1.87 | ) | – | (3.33 | ) | (3.33 | ) | 11.89 | (10.80 | ) | 32,982 | 2.17 | 2.17 | 2.17 | (0.55 | ) | 13 | |||||||||||||||||||||||||||||||||||||||
| Royce Premier Fund–Institutional Class | |||||||||||||||||||||||||||||||||||||||||||||||||||||||||||||
| 2019 | $ | 11.79 | $ | 0.05 | $ | 3.94 | $ | 3.99 | $ | (0.05 | ) | $ | (2.65 | ) | $ | (2.70 | ) | $ | 13.08 | 34.23 | % | $ | 244,343 | 1.15 | % | 1.15 | % | 1.15 | % | 0.33 | % | 19 | % | ||||||||||||||||||||||||||||
| 2018 | 16.82 | 0.03 | (1.63 | ) | (1.60 | ) | (0.02 | ) | (3.41 | ) | (3.43 | ) | 11.79 | (10.41 | ) | 197,697 | 1.12 | 1.12 | 1.12 | 0.16 | 23 | ||||||||||||||||||||||||||||||||||||||||
| 2017 | 15.72 | 0.01 | 3.68 | 3.69 | (0.03 | ) | (2.56 | ) | (2.59 | ) | 16.82 | 23.85 | 250,119 | 1.09 | 1.09 | 1.09 | 0.07 | 8 | |||||||||||||||||||||||||||||||||||||||||||
| 2016 | 14.44 | 0.08 | 3.30 | 3.38 | (0.06 | ) | (2.04 | ) | (2.10 | ) | 15.72 | 23.20 | 250,826 | 1.07 | 1.07 | 1.07 | 0.44 | 15 | |||||||||||||||||||||||||||||||||||||||||||
| 2015 | 19.91 | 0.16 | (2.14 | ) | (1.98 | ) | (0.16 | ) | (3.33 | ) | (3.49 | ) | 14.44 | (9.82 | ) | 294,477 | 1.02 | 1.02 | 1.02 | 0.60 | 13 | ||||||||||||||||||||||||||||||||||||||||
| Royce Premier Fund–R Class | |||||||||||||||||||||||||||||||||||||||||||||||||||||||||||||
| 2019 | $ | 10.73 | $ | (0.05 | ) | $ | 3.57 | $ | 3.52 | $ | – | $ | (2.39 | ) | $ | (2.39 | ) | $ | 11.86 | 33.17 | % | $ | 10,949 | 1.90 | % | 1.90 | % | 1.90 | % | (0.43 | )% | 19 | % | ||||||||||||||||||||||||||||
| 2018 | 15.39 | (0.08 | ) | (1.48 | ) | (1.56 | ) | – | (3.10 | ) | (3.10 | ) | 10.73 | (11.01 | ) | 9,715 | 1.80 | 1.80 | 1.80 | (0.52 | ) | 23 | |||||||||||||||||||||||||||||||||||||||
| 2017 | 14.47 | (0.12 | ) | 3.37 | 3.25 | – | (2.33 | ) | (2.33 | ) | 15.39 | 22.88 | 12,841 | 1.90 | 1.90 | 1.90 | (0.75 | ) | 8 | ||||||||||||||||||||||||||||||||||||||||||
| 2016 | 13.49 | (0.05 | ) | 3.07 | 3.02 | – | (2.04 | ) | (2.04 | ) | 14.47 | 22.18 | 13,889 | 1.84 | 1.84 | 1.84 | (0.33 | ) | 15 | ||||||||||||||||||||||||||||||||||||||||||
| 2015 | 18.82 | (0.03 | ) | (1.97 | ) | (2.00 | ) | – | (3.33 | ) | (3.33 | ) | 13.49 | (10.50 | ) | 16,129 | 1.78 | 1.78 | 1.78 | (0.16 | ) | 13 | |||||||||||||||||||||||||||||||||||||||
| Royce Small-Cap Value Fund–Investment Class | |||||||||||||||||||||||||||||||||||||||||||||||||||||||||||||
| 2019 | $ | 8.35 | $ | 0.09 | $ | 1.46 | $ | 1.55 | $ | (0.08 | ) | $ | (0.25 | ) | $ | (0.33 | ) | $ | 9.57 | 18.60 | % | $ | 53,234 | 1.30 | % | 1.30 | % | 1.24 | % | 0.84 | % | 64 | % | ||||||||||||||||||||||||||||
| 2018 | 10.16 | 0.05 | (0.73 | ) | (0.68 | ) | (0.04 | ) | (1.09 | ) | (1.13 | ) | 8.35 | (7.05 | ) | 56,433 | 1.26 | 1.26 | 1.24 | 0.45 | 64 | ||||||||||||||||||||||||||||||||||||||||
| 2017 | 10.03 | 0.04 | 0.50 | 0.54 | (0.06 | ) | (0.35 | ) | (0.41 | ) | 10.16 | 5.49 | 66,094 | 1.26 | 1.25 | 1.24 | 0.44 | 61 | |||||||||||||||||||||||||||||||||||||||||||
| 2016 | 8.74 | 0.08 | 1.79 | 1.87 | (0.08 | ) | (0.50 | ) | (0.58 | ) | 10.03 | 21.37 | 72,863 | 1.24 | 1.24 | 1.24 | 0.72 | 56 | |||||||||||||||||||||||||||||||||||||||||||
| 2015 | 11.81 | 0.10 | (1.43 | ) | (1.33 | ) | (0.09 | ) | (1.65 | ) | (1.74 | ) | 8.74 | (11.25 | ) | 77,821 | 1.23 | 1.23 | 1.23 | 0.69 | 60 | ||||||||||||||||||||||||||||||||||||||||
| Royce Small-Cap Value Fund–Service Class | |||||||||||||||||||||||||||||||||||||||||||||||||||||||||||||
| 2019 | $ | 8.33 | $ | 0.07 | $ | 1.44 | $ | 1.51 | $ | (0.05 | ) | $ | (0.25 | ) | $ | (0.30 | ) | $ | 9.54 | 18.21 | % | $ | 102,465 | 1.56 | % | 1.55 | % | 1.49 | % | 0.65 | % | 64 | % | ||||||||||||||||||||||||||||
| 2018 | 10.12 | 0.02 | (0.72 | ) | (0.70 | ) | (0.01 | ) | (1.08 | ) | (1.09 | ) | 8.33 | (7.17 | ) | 111,855 | 1.53 | 1.53 | 1.49 | 0.19 | 64 | ||||||||||||||||||||||||||||||||||||||||
| 2017 | 9.98 | 0.02 | 0.50 | 0.52 | (0.03 | ) | (0.35 | ) | (0.38 | ) | 10.12 | 5.27 | 152,232 | 1.51 | 1.51 | 1.49 | 0.17 | 61 | |||||||||||||||||||||||||||||||||||||||||||
| 2016 | 8.70 | 0.05 | 1.79 | 1.84 | (0.06 | ) | (0.50 | ) | (0.56 | ) | 9.98 | 21.06 | 213,067 | 1.49 | 1.49 | 1.48 | 0.48 | 56 | |||||||||||||||||||||||||||||||||||||||||||
| 2015 | 11.76 | 0.06 | (1.41 | ) | (1.35 | ) | (0.06 | ) | (1.65 | ) | (1.71 | ) | 8.70 | (11.51 | ) | 252,814 | 1.48 | 1.48 | 1.48 | 0.45 | 60 | ||||||||||||||||||||||||||||||||||||||||
| THE ACCOMPANYING NOTES ARE AN INTEGRAL PART OF THESE FINANCIAL STATEMENTS | The Royce Funds 2019 Annual Report to Shareholders | 67 |
Financial Highlights
This table is presented to show selected data for a share outstanding throughout each year or other indicated period and to assist shareholders in evaluating a Fund’s performance for the periods presented. Per share amounts have been determined on the basis of the weighted average number of shares outstanding during the period.
| Ratio of Expenses to Average Net Assets | |||||||||||||||||||||||||||||||||||||||||||||||||||||||||||||
| Net Asset Value, Beginning of Period | Net Investment Income (Loss) | Net Realized and Unrealized Gain (Loss) on Investments and Foreign Currency | Total from Investment Operations | Distributions from Net Investment Income | Distributions from Net Realized Gain on Investments and Foreign Currency | Total Distributions | Net Asset Value, End of Period | Total Return | Net Assets, End of Period (in thousands) | Prior to Fee Waivers, Expense Reimbursements and Balance Credits | Prior to Fee Waivers and Expense Reimbursements | Net of Fee Waivers and Expense Reimbursements | Ratio of Net Investment Income (Loss) to Average Net Assets | Portfolio Turnover Rate | |||||||||||||||||||||||||||||||||||||||||||||||
| Royce Small-Cap Value Fund–Consultant Class | |||||||||||||||||||||||||||||||||||||||||||||||||||||||||||||
| 2019 | $ | 7.40 | $ | (0.04 | ) | $ | 1.30 | $ | 1.26 | $ | – | $ | (0.22 | ) | $ | (0.22 | ) | $ | 8.44 | 17.03 | % | $ | 7,486 | 2.44 | % | 2.44 | % | 2.44 | % | (0.50 | )% | 64 | % | ||||||||||||||||||||||||||||
| 2018 | 9.06 | (0.06 | ) | (0.64 | ) | (0.70 | ) | – | (0.96 | ) | (0.96 | ) | 7.40 | (8.07 | ) | 9,641 | 2.35 | 2.34 | 2.34 | (0.66 | ) | 64 | |||||||||||||||||||||||||||||||||||||||
| 2017 | 8.98 | (0.06 | ) | 0.45 | 0.39 | – | (0.31 | ) | (0.31 | ) | 9.06 | 4.44 | 13,111 | 2.32 | 2.32 | 2.32 | (0.66 | ) | 61 | ||||||||||||||||||||||||||||||||||||||||||
| 2016 | 7.89 | (0.03 | ) | 1.62 | 1.59 | – | (0.50 | ) | (0.50 | ) | 8.98 | 20.10 | 16,484 | 2.28 | 2.28 | 2.28 | (0.33 | ) | 56 | ||||||||||||||||||||||||||||||||||||||||||
| 2015 | 10.87 | (0.04 | ) | (1.29 | ) | (1.33 | ) | – | (1.65 | ) | (1.65 | ) | 7.89 | (12.24 | ) | 18,404 | 2.27 | 2.27 | 2.27 | (0.36 | ) | 60 | |||||||||||||||||||||||||||||||||||||||
| Royce Small-Cap Value Fund–R Class | |||||||||||||||||||||||||||||||||||||||||||||||||||||||||||||
| 2019 | $ | 8.00 | $ | 0.01 | $ | 1.40 | $ | 1.41 | $ | (0.01 | ) | $ | (0.24 | ) | $ | (0.25 | ) | $ | 9.16 | 17.68 | % | $ | 8,083 | 1.98 | % | 1.98 | % | 1.97 | % | 0.11 | % | 64 | % | ||||||||||||||||||||||||||||
| 2018 | 9.75 | (0.03 | ) | (0.68 | ) | (0.71 | ) | – | (1.04 | ) | (1.04 | ) | 8.00 | (7.62 | ) | 8,254 | 1.92 | 1.92 | 1.92 | (0.26 | ) | 64 | |||||||||||||||||||||||||||||||||||||||
| 2017 | 9.63 | (0.02 | ) | 0.48 | 0.46 | – | (0.34 | ) | (0.34 | ) | 9.75 | 4.81 | 14,620 | 1.88 | 1.88 | 1.88 | (0.21 | ) | 61 | ||||||||||||||||||||||||||||||||||||||||||
| 2016 | 8.42 | 0.01 | 1.73 | 1.74 | (0.03 | ) | (0.50 | ) | (0.53 | ) | 9.63 | 20.60 | 18,059 | 1.85 | 1.85 | 1.85 | 0.11 | 56 | |||||||||||||||||||||||||||||||||||||||||||
| 2015 | 11.43 | 0.01 | (1.35 | ) | (1.34 | ) | (0.02 | ) | (1.65 | ) | (1.67 | ) | 8.42 | (11.71 | ) | 19,200 | 1.83 | 1.83 | 1.83 | 0.09 | 60 | ||||||||||||||||||||||||||||||||||||||||
| Royce Smaller-Companies Growth Fund–Investment Class | |||||||||||||||||||||||||||||||||||||||||||||||||||||||||||||
| 2019 | $ | 6.86 | $ | (0.05 | ) | $ | 1.68 | $ | 1.63 | $ | – | $ | (0.28 | ) | $ | (0.28 | ) | $ | 8.21 | 23.92 | % | $ | 91,670 | 1.25 | % | 1.24 | % | 1.24 | % | (0.69 | )% | 53 | % | ||||||||||||||||||||||||||||
| 2018 | 10.93 | (0.07 | ) | (0.86 | ) | (0.93 | ) | – | (3.14 | ) | (3.14 | ) | 6.86 | (9.94 | ) | 87,213 | 1.21 | 1.21 | 1.21 | (0.62 | ) | 61 | |||||||||||||||||||||||||||||||||||||||
| 2017 | 11.22 | (0.09 | ) | 2.08 | 1.99 | – | (2.28 | ) | (2.28 | ) | 10.93 | 18.20 | 119,745 | 1.19 | 1.19 | 1.19 | (0.67 | ) | 64 | ||||||||||||||||||||||||||||||||||||||||||
| 2016 | 11.36 | (0.05 | ) | 1.17 | 1.12 | – | (1.26 | ) | (1.26 | ) | 11.22 | 9.67 | 98,962 | 1.15 | 1.15 | 1.15 | (0.41 | ) | 59 | ||||||||||||||||||||||||||||||||||||||||||
| 2015 | 14.36 | (0.06 | ) | (0.19 | ) | (0.25 | ) | – | (2.75 | ) | (2.75 | ) | 11.36 | (1.59 | ) | 139,979 | 1.32 | 1.32 | 1.24 | (0.38 | ) | 45 | |||||||||||||||||||||||||||||||||||||||
| Royce Smaller-Companies Growth Fund–Service Class | |||||||||||||||||||||||||||||||||||||||||||||||||||||||||||||
| 2019 | $ | 6.69 | $ | (0.07 | ) | $ | 1.65 | $ | 1.58 | $ | – | $ | (0.28 | ) | $ | (0.28 | ) | $ | 7.99 | 23.67 | % | $ | 154,236 | 1.55 | % | 1.54 | % | 1.49 | % | (0.93 | )% | 53 | % | ||||||||||||||||||||||||||||
| 2018 | 10.69 | (0.10 | ) | (0.85 | ) | (0.95 | ) | – | (3.05 | ) | (3.05 | ) | 6.69 | (10.22 | ) | 156,057 | 1.52 | 1.52 | 1.49 | (0.90 | ) | 61 | |||||||||||||||||||||||||||||||||||||||
| 2017 | 11.01 | (0.12 | ) | 2.03 | 1.91 | – | (2.23 | ) | (2.23 | ) | 10.69 | 17.80 | 228,008 | 1.49 | 1.49 | 1.47 | (0.96 | ) | 64 | ||||||||||||||||||||||||||||||||||||||||||
| 2016 | 11.20 | (0.08 | ) | 1.15 | 1.07 | – | (1.26 | ) | (1.26 | ) | 11.01 | 9.37 | 284,640 | 1.51 | 1.51 | 1.49 | (0.74 | ) | 59 | ||||||||||||||||||||||||||||||||||||||||||
| 2015 | 14.23 | (0.08 | ) | (0.20 | ) | (0.28 | ) | – | (2.75 | ) | (2.75 | ) | 11.20 | (1.82 | ) | 408,744 | 1.47 | 1.47 | 1.45 | (0.58 | ) | 45 | |||||||||||||||||||||||||||||||||||||||
| Royce Smaller-Companies Growth Fund–Consultant Class | |||||||||||||||||||||||||||||||||||||||||||||||||||||||||||||
| 2019 | $ | 5.74 | $ | (0.11 | ) | $ | 1.42 | $ | 1.31 | $ | – | $ | (0.24 | ) | $ | (0.24 | ) | $ | 6.81 | 22.85 | % | $ | 6,298 | 2.52 | % | 2.51 | % | 2.11 | % | (1.71 | )% | 53 | % | ||||||||||||||||||||||||||||
| 2018 | 9.28 | (0.16 | ) | (0.72 | ) | (0.88 | ) | – | (2.66 | ) | (2.66 | ) | 5.74 | (10.95 | ) | 6,328 | 2.40 | 2.40 | 2.24 | (1.66 | ) | 61 | |||||||||||||||||||||||||||||||||||||||
| 2017 | 9.63 | (0.18 | ) | 1.77 | 1.59 | – | (1.94 | ) | (1.94 | ) | 9.28 | 16.92 | 10,119 | 2.36 | 2.36 | 2.24 | (1.73 | ) | 64 | ||||||||||||||||||||||||||||||||||||||||||
| 2016 | 10.01 | (0.14 | ) | 1.02 | 0.88 | – | (1.26 | ) | (1.26 | ) | 9.63 | 8.58 | 10,593 | 2.35 | 2.35 | 2.24 | (1.50 | ) | 59 | ||||||||||||||||||||||||||||||||||||||||||
| 2015 | 13.12 | (0.18 | ) | (0.18 | ) | (0.36 | ) | – | (2.75 | ) | (2.75 | ) | 10.01 | (2.61 | ) | 14,411 | 2.32 | 2.32 | 2.24 | (1.36 | ) | 45 | |||||||||||||||||||||||||||||||||||||||
| Royce Smaller-Companies Growth Fund–Institutional Class | |||||||||||||||||||||||||||||||||||||||||||||||||||||||||||||
| 2019 | $ | 6.95 | $ | (0.05 | ) | $ | 1.72 | $ | 1.67 | $ | – | $ | (0.29 | ) | $ | (0.29 | ) | $ | 8.33 | 24.10 | % | $ | 8,021 | 1.35 | % | 1.35 | % | 1.17 | % | (0.62 | )% | 53 | % | ||||||||||||||||||||||||||||
| 2018 | 11.06 | (0.06 | ) | (0.88 | ) | (0.94 | ) | – | (3.17 | ) | (3.17 | ) | 6.95 | (9.94 | ) | 7,165 | 1.28 | 1.28 | 1.08 | (0.49 | ) | 61 | |||||||||||||||||||||||||||||||||||||||
| 2017 | 11.35 | (0.09 | ) | 2.11 | 2.02 | – | (2.31 | ) | (2.31 | ) | 11.06 | 18.23 | 9,315 | 1.21 | 1.21 | 1.21 | (0.70 | ) | 64 | ||||||||||||||||||||||||||||||||||||||||||
| 2016 | 11.48 | (0.05 | ) | 1.18 | 1.13 | – | (1.26 | ) | (1.26 | ) | 11.35 | 9.66 | 20,523 | 1.15 | 1.15 | 1.15 | (0.41 | ) | 59 | ||||||||||||||||||||||||||||||||||||||||||
| 2015 | 14.46 | (0.03 | ) | (0.20 | ) | (0.23 | ) | – | (2.75 | ) | (2.75 | ) | 11.48 | (1.45 | ) | 39,763 | 1.10 | 1.10 | 1.10 | (0.22 | ) | 45 | |||||||||||||||||||||||||||||||||||||||
| 68 | The Royce Funds 2019 Annual Report to Shareholders | THE ACCOMPANYING NOTES ARE AN INTEGRAL PART OF THESE FINANCIAL STATEMENTS |
Financial Highlights
This table is presented to show selected data for a share outstanding throughout each year or other indicated period and to assist shareholders in evaluating a Fund’s performance for the periods presented. Per share amounts have been determined on the basis of the weighted average number of shares outstanding during the period.
| Ratio of Expenses to Average Net Assets | |||||||||||||||||||||||||||||||||||||||||||||||||||||||||||||
| Net Asset Value, Beginning of Period | Net Investment Income (Loss) | Net Realized and Unrealized Gain (Loss) on Investments and Foreign Currency | Total from Investment Operations | Distributions from Net Investment Income | Distributions from Net Realized Gain on Investments and Foreign Currency | Total Distributions | Net Asset Value, End of Period | Total Return | Net Assets, End of Period (in thousands) | Prior to Fee Waivers, Expense Reimbursements and Balance Credits | Prior to Fee Waivers and Expense Reimbursements | Net of Fee Waivers and Expense Reimbursements | Ratio of Net Investment Income (Loss) to Average Net Assets | Portfolio Turnover Rate | |||||||||||||||||||||||||||||||||||||||||||||||
| Royce Special Equity Fund–Investment Class | |||||||||||||||||||||||||||||||||||||||||||||||||||||||||||||
| 2019 | $ | 17.43 | $ | 0.21 | $ | 1.98 | $ | 2.19 | $ | (0.21 | ) | $ | (1.82 | ) | $ | (2.03 | ) | $ | 17.59 | 12.63 | % | $ | 819,015 | 1.21 | % | 1.21 | % | 1.21 | % | 0.99 | % | 20 | % | ||||||||||||||||||||||||||||
| 2018 | 21.79 | 0.23 | (2.31 | ) | (2.08 | ) | (0.22 | ) | (2.06 | ) | (2.28 | ) | 17.43 | (9.86 | ) | 909,113 | 1.18 | 1.18 | 1.18 | 1.04 | 21 | ||||||||||||||||||||||||||||||||||||||||
| 2017 | 22.02 | 0.13 | 1.56 | 1.69 | (0.12 | ) | (1.80 | ) | (1.92 | ) | 21.79 | 7.87 | 1,142,224 | 1.17 | 1.17 | 1.17 | 0.54 | 15 | |||||||||||||||||||||||||||||||||||||||||||
| 2016 | 17.94 | 0.21 | 5.57 | 5.78 | (0.21 | ) | (1.49 | ) | (1.70 | ) | 22.02 | 32.21 | 1,225,095 | 1.17 | 1.17 | 1.17 | 0.99 | 29 | |||||||||||||||||||||||||||||||||||||||||||
| 2015 | 22.86 | 0.22 | (3.04 | ) | (2.82 | ) | (0.24 | ) | (1.86 | ) | (2.10 | ) | 17.94 | (12.36 | ) | 1,098,106 | 1.15 | 1.15 | 1.15 | 0.80 | 15 | ||||||||||||||||||||||||||||||||||||||||
| Royce Special Equity Fund–Service Class | |||||||||||||||||||||||||||||||||||||||||||||||||||||||||||||
| 2019 | $ | 17.41 | $ | 0.16 | $ | 1.99 | $ | 2.15 | $ | (0.17 | ) | $ | (1.83 | ) | $ | (2.00 | ) | $ | 17.56 | 12.40 | % | $ | 60,070 | 1.58 | % | 1.58 | % | 1.39 | % | 0.80 | % | 20 | % | ||||||||||||||||||||||||||||
| 2018 | 21.76 | 0.20 | (2.33 | ) | (2.13 | ) | (0.18 | ) | (2.04 | ) | (2.22 | ) | 17.41 | (10.13 | ) | 62,706 | 1.51 | 1.50 | 1.39 | 0.88 | 21 | ||||||||||||||||||||||||||||||||||||||||
| 2017 | 21.98 | 0.08 | 1.56 | 1.64 | (0.07 | ) | (1.79 | ) | (1.86 | ) | 21.76 | 7.66 | 108,001 | 1.50 | 1.50 | 1.39 | 0.32 | 15 | |||||||||||||||||||||||||||||||||||||||||||
| 2016 | 17.92 | 0.16 | 5.56 | 5.72 | (0.17 | ) | (1.49 | ) | (1.66 | ) | 21.98 | 31.92 | 128,102 | 1.50 | 1.50 | 1.39 | 0.77 | 29 | |||||||||||||||||||||||||||||||||||||||||||
| 2015 | 22.81 | 0.17 | (3.03 | ) | (2.86 | ) | (0.17 | ) | (1.86 | ) | (2.03 | ) | 17.92 | (12.55 | ) | 112,315 | 1.47 | 1.47 | 1.39 | 0.57 | 15 | ||||||||||||||||||||||||||||||||||||||||
| Royce Special Equity Fund–Consultant Class | |||||||||||||||||||||||||||||||||||||||||||||||||||||||||||||
| 2019 | $ | 15.90 | $ | (0.02 | ) | $ | 1.82 | $ | 1.80 | $ | (0.00 | ) | $ | (1.65 | ) | $ | (1.65 | ) | $ | 16.05 | 11.38 | % | $ | 24,793 | 2.25 | % | 2.25 | % | 2.25 | % | (0.12 | )% | 20 | % | |||||||||||||||||||||||||||
| 2018 | 19.86 | 0.01 | (2.10 | ) | (2.09 | ) | (0.01 | ) | (1.86 | ) | (1.87 | ) | 15.90 | (10.83 | ) | 30,234 | 2.19 | 2.19 | 2.19 | 0.04 | 21 | ||||||||||||||||||||||||||||||||||||||||
| 2017 | 20.16 | (0.10 | ) | 1.43 | 1.33 | – | (1.63 | ) | (1.63 | ) | 19.86 | 6.77 | 46,654 | 2.21 | 2.20 | 2.20 | (0.49 | ) | 15 | ||||||||||||||||||||||||||||||||||||||||||
| 2016 | 16.57 | (0.01 | ) | 5.13 | 5.12 | (0.04 | ) | (1.49 | ) | (1.53 | ) | 20.16 | 30.91 | 50,514 | 2.20 | 2.20 | 2.20 | (0.04 | ) | 29 | |||||||||||||||||||||||||||||||||||||||||
| 2015 | 21.27 | (0.05 | ) | (2.76 | ) | (2.81 | ) | (0.03 | ) | (1.86 | ) | (1.89 | ) | 16.57 | (13.23 | ) | 42,427 | 2.18 | 2.18 | 2.18 | (0.24 | ) | 15 | ||||||||||||||||||||||||||||||||||||||
| Royce Special Equity Fund–Institutional Class | |||||||||||||||||||||||||||||||||||||||||||||||||||||||||||||
| 2019 | $ | 17.28 | $ | 0.22 | $ | 1.96 | $ | 2.18 | $ | (0.22 | ) | $ | (1.81 | ) | $ | (2.03 | ) | $ | 17.43 | 12.65 | % | $ | 187,785 | 1.14 | % | 1.14 | % | 1.14 | % | 1.04 | % | 20 | % | ||||||||||||||||||||||||||||
| 2018 | 21.61 | 0.25 | (2.30 | ) | (2.05 | ) | (0.24 | ) | (2.04 | ) | (2.28 | ) | 17.28 | (9.81 | ) | 202,317 | 1.11 | 1.11 | 1.11 | 1.14 | 21 | ||||||||||||||||||||||||||||||||||||||||
| 2017 | 21.84 | 0.14 | 1.55 | 1.69 | (0.14 | ) | (1.78 | ) | (1.92 | ) | 21.61 | 7.96 | 247,004 | 1.09 | 1.09 | 1.09 | 0.60 | 15 | |||||||||||||||||||||||||||||||||||||||||||
| 2016 | 17.80 | 0.23 | 5.53 | 5.76 | (0.23 | ) | (1.49 | ) | (1.72 | ) | 21.84 | 32.35 | 206,270 | 1.07 | 1.07 | 1.07 | 1.10 | 29 | |||||||||||||||||||||||||||||||||||||||||||
| 2015 | 22.71 | 0.33 | (3.12 | ) | (2.79 | ) | (0.26 | ) | (1.86 | ) | (2.12 | ) | 17.80 | (12.27 | ) | 208,952 | 1.04 | 1.04 | 1.04 | 1.02 | 15 | ||||||||||||||||||||||||||||||||||||||||
| Royce Total Return Fund–Investment Class | |||||||||||||||||||||||||||||||||||||||||||||||||||||||||||||
| 2019 | $ | 9.71 | $ | 0.16 | $ | 2.10 | $ | 2.26 | $ | (0.15 | ) | $ | (0.89 | ) | $ | (1.04 | ) | $ | 10.93 | 23.45 | % | $ | 1,026,074 | 1.21 | % | 1.21 | % | 1.21 | % | 1.42 | % | 21 | % | ||||||||||||||||||||||||||||
| 2018 | 13.58 | 0.20 | (1.78 | ) | (1.58 | ) | (0.19 | ) | (2.10 | ) | (2.29 | ) | 9.71 | (12.46 | ) | 1,036,211 | 1.18 | 1.18 | 1.18 | 1.45 | 22 | ||||||||||||||||||||||||||||||||||||||||
| 2017 | 13.68 | 0.14 | 1.67 | 1.81 | (0.12 | ) | (1.79 | ) | (1.91 | ) | 13.58 | 13.65 | 1,550,893 | 1.19 | 1.19 | 1.19 | 1.00 | 12 | |||||||||||||||||||||||||||||||||||||||||||
| 2016 | 11.91 | 0.15 | 2.93 | 3.08 | (0.22 | ) | (1.09 | ) | (1.31 | ) | 13.68 | 25.86 | 1,835,927 | 1.19 | 1.19 | 1.19 | 1.08 | 16 | |||||||||||||||||||||||||||||||||||||||||||
| 2015 | 14.74 | 0.17 | (1.23 | ) | (1.06 | ) | (0.12 | ) | (1.65 | ) | (1.77 | ) | 11.91 | (7.19 | ) | 1,850,309 | 1.15 | 1.15 | 1.15 | 1.18 | 11 | ||||||||||||||||||||||||||||||||||||||||
| Royce Total Return Fund–Service Class | |||||||||||||||||||||||||||||||||||||||||||||||||||||||||||||
| 2019 | $ | 9.97 | $ | 0.13 | $ | 2.16 | $ | 2.29 | $ | (0.08 | ) | $ | (0.91 | ) | $ | (0.99 | ) | $ | 11.27 | 23.08 | % | $ | 77,177 | 1.52 | % | 1.52 | % | 1.49 | % | 1.13 | % | 21 | % | ||||||||||||||||||||||||||||
| 2018 | 13.88 | 0.16 | (1.82 | ) | (1.66 | ) | (0.11 | ) | (2.14 | ) | (2.25 | ) | 9.97 | (12.71 | ) | 83,368 | 1.52 | 1.52 | 1.48 | 1.15 | 22 | ||||||||||||||||||||||||||||||||||||||||
| 2017 | 13.98 | 0.10 | 1.69 | 1.79 | (0.07 | ) | (1.82 | ) | (1.89 | ) | 13.88 | 13.24 | 97,854 | 1.49 | 1.48 | 1.48 | 0.72 | 12 | |||||||||||||||||||||||||||||||||||||||||||
| 2016 | 12.12 | 0.11 | 3.00 | 3.11 | (0.16 | ) | (1.09 | ) | (1.25 | ) | 13.98 | 25.60 | 142,606 | 1.46 | 1.46 | 1.46 | 0.80 | 16 | |||||||||||||||||||||||||||||||||||||||||||
| 2015 | 14.98 | 0.13 | (1.25 | ) | (1.12 | ) | (0.09 | ) | (1.65 | ) | (1.74 | ) | 12.12 | (7.48 | ) | 137,594 | 1.43 | 1.43 | 1.43 | 0.90 | 11 | ||||||||||||||||||||||||||||||||||||||||
| THE ACCOMPANYING NOTES ARE AN INTEGRAL PART OF THESE FINANCIAL STATEMENTS | The Royce Funds 2019 Annual Report to Shareholders | 69 |
Financial Highlights
This table is presented to show selected data for a share outstanding throughout each year or other indicated period and to assist shareholders in evaluating a Fund’s performance for the periods presented. Per share amounts have been determined on the basis of the weighted average number of shares outstanding during the period.
| Ratio of Expenses to Average Net Assets | |||||||||||||||||||||||||||||||||||||||||||||||||||||||||||||
| Net Asset Value, Beginning of Period | Net Investment Income (Loss) | Net Realized and Unrealized Gain (Loss) on Investments and Foreign Currency | Total from Investment Operations | Distributions from Net Investment Income | Distributions from Net Realized Gain on Investments and Foreign Currency | Total Distributions | Net Asset Value, End of Period | Total Return | Net Assets, End of Period (in thousands) | Prior to Fee Waivers, Expense Reimbursements and Balance Credits | Prior to Fee Waivers and Expense Reimbursements | Net of Fee Waivers and Expense Reimbursements | Ratio of Net Investment Income (Loss) to Average Net Assets | Portfolio Turnover Rate | |||||||||||||||||||||||||||||||||||||||||||||||
| Royce Total Return Fund–Consultant Class | |||||||||||||||||||||||||||||||||||||||||||||||||||||||||||||
| 2019 | $ | 10.02 | $ | 0.05 | $ | 2.17 | $ | 2.22 | $ | (0.02 | ) | $ | (0.91 | ) | $ | (0.93 | ) | $ | 11.31 | 22.18 | % | $ | 150,175 | 2.20 | % | 2.20 | % | 2.20 | % | 0.43 | % | 21 | % | ||||||||||||||||||||||||||||
| 2018 | 13.95 | 0.06 | (1.82 | ) | (1.76 | ) | (0.02 | ) | (2.15 | ) | (2.17 | ) | 10.02 | (13.26 | ) | 160,540 | 2.17 | 2.17 | 2.17 | 0.45 | 22 | ||||||||||||||||||||||||||||||||||||||||
| 2017 | 14.07 | 0.01 | 1.70 | 1.71 | – | (1.83 | ) | (1.83 | ) | 13.95 | 12.53 | 247,914 | 2.16 | 2.16 | 2.16 | 0.04 | 12 | ||||||||||||||||||||||||||||||||||||||||||||
| 2016 | 12.15 | 0.01 | 3.01 | 3.02 | (0.01 | ) | (1.09 | ) | (1.10 | ) | 14.07 | 24.73 | 267,083 | 2.16 | 2.16 | 2.16 | 0.11 | 16 | |||||||||||||||||||||||||||||||||||||||||||
| 2015 | 15.05 | 0.03 | (1.26 | ) | (1.23 | ) | (0.02 | ) | (1.65 | ) | (1.67 | ) | 12.15 | (8.15 | ) | 262,131 | 2.16 | 2.16 | 2.16 | 0.18 | 11 | ||||||||||||||||||||||||||||||||||||||||
| Royce Total Return Fund–Institutional Class | |||||||||||||||||||||||||||||||||||||||||||||||||||||||||||||
| 2019 | $ | 9.58 | $ | 0.17 | $ | 2.07 | $ | 2.24 | $ | (0.18 | ) | $ | (0.87 | ) | $ | (1.05 | ) | $ | 10.77 | 23.59 | % | $ | 232,479 | 1.13 | % | 1.13 | % | 1.13 | % | 1.49 | % | 21 | % | ||||||||||||||||||||||||||||
| 2018 | 13.40 | 0.21 | (1.76 | ) | (1.55 | ) | (0.21 | ) | (2.06 | ) | (2.27 | ) | 9.58 | (12.39 | ) | 218,268 | 1.09 | 1.09 | 1.09 | 1.53 | 22 | ||||||||||||||||||||||||||||||||||||||||
| 2017 | 13.52 | 0.16 | 1.64 | 1.80 | (0.15 | ) | (1.77 | ) | (1.92 | ) | 13.40 | 13.80 | 310,603 | 1.06 | 1.06 | 1.06 | 1.13 | 12 | |||||||||||||||||||||||||||||||||||||||||||
| 2016 | 11.78 | 0.18 | 2.90 | 3.08 | (0.25 | ) | (1.09 | ) | (1.34 | ) | 13.52 | 26.13 | 420,375 | 1.05 | 1.05 | 1.05 | 1.22 | 16 | |||||||||||||||||||||||||||||||||||||||||||
| 2015 | 14.61 | 0.18 | (1.22 | ) | (1.04 | ) | (0.14 | ) | (1.65 | ) | (1.79 | ) | 11.78 | (7.17 | ) | 374,555 | 1.03 | 1.03 | 1.03 | 1.28 | 11 | ||||||||||||||||||||||||||||||||||||||||
| Royce Total Return Fund–R Class | |||||||||||||||||||||||||||||||||||||||||||||||||||||||||||||
| 2019 | $ | 10.06 | $ | 0.09 | $ | 2.18 | $ | 2.27 | $ | (0.03 | ) | $ | (0.92 | ) | $ | (0.95 | ) | $ | 11.38 | 22.66 | % | $ | 36,345 | 1.85 | % | 1.84 | % | 1.84 | % | 0.76 | % | 21 | % | ||||||||||||||||||||||||||||
| 2018 | 13.99 | 0.11 | (1.83 | ) | (1.72 | ) | (0.06 | ) | (2.15 | ) | (2.21 | ) | 10.06 | (12.96 | ) | 45,145 | 1.81 | 1.81 | 1.81 | 0.82 | 22 | ||||||||||||||||||||||||||||||||||||||||
| 2017 | 14.09 | 0.06 | 1.71 | 1.77 | (0.03 | ) | (1.84 | ) | (1.87 | ) | 13.99 | 12.97 | 54,979 | 1.80 | 1.80 | 1.80 | 0.40 | 12 | |||||||||||||||||||||||||||||||||||||||||||
| 2016 | 12.19 | 0.07 | 3.00 | 3.07 | (0.08 | ) | (1.09 | ) | (1.17 | ) | 14.09 | 25.14 | 53,896 | 1.78 | 1.78 | 1.78 | 0.49 | 16 | |||||||||||||||||||||||||||||||||||||||||||
| 2015 | 15.07 | 0.08 | (1.25 | ) | (1.17 | ) | (0.06 | ) | (1.65 | ) | (1.71 | ) | 12.19 | (7.79 | ) | 50,684 | 1.77 | 1.77 | 1.77 | 0.56 | 11 | ||||||||||||||||||||||||||||||||||||||||
| 1 | Not annualized |
| 2 | Annualized |
| a | The Class commenced operations on January 5, 2016. |
| b | The Class commenced operations on February 26, 2016. |
| c | The Class commenced operations on May 2, 2018. |
| 70 | The Royce Funds 2019 Annual Report to Shareholders | THE ACCOMPANYING NOTES ARE AN INTEGRAL PART OF THESE FINANCIAL STATEMENTS |
Summary of Significant Accounting Policies:
Royce Dividend Value Fund, Royce Global Financial Services Fund, Royce International Premier Fund, Royce Micro-Cap Fund, Royce Opportunity Fund, Royce Pennsylvania Mutual Fund, Royce Premier Fund, Royce Small-Cap Value Fund, Royce Smaller-Companies Growth Fund, Royce Special Equity Fund and Royce Total Return Fund (the “Fund” or “Funds”), are the eleven series of The Royce Fund (the “Trust”), an open-end management investment company organized as a Delaware statutory trust.
Classes of shares have equal rights as to earnings and assets, except that each class may bear different fees and expenses for distribution, shareholder servicing, registration and shareholder reports, and receive different compensating balance credits and expense reimbursements. Investment income, realized and unrealized capital gains or losses on investments and foreign currency, and expenses other than those attributable to a specific class are allocated to each class of shares based on its relative net assets.
The preparation of financial statements in conformity with accounting principles generally accepted in the United States requires management to make estimates and assumptions that affect the reported amounts of assets and liabilities and the disclosure of contingent assets and liabilities at the date of the financial statements and the reported amounts of income and expenses during the reporting period. Actual results could differ from those estimates.
Each Fund is an investment company and accordingly follows the investment company accounting and reporting guidance of the Financial Accounting Standards Board (FASB) Accounting Standard Codification Topic 946 “Financial Services-Investment Companies.”
Royce & Associates, LP, the Funds’ investment adviser, primarily conducts business using the name Royce Investment Partners (“Royce”). At December 31, 2019, officers, employees of Royce, Fund trustees, the Royce retirement plans and other affiliates owned more than 10% of the following Funds:
Royce Global Financial Services Fund 11%
VALUATION OF INVESTMENTS:
Securities are valued as of the close of trading on the New York Stock Exchange (NYSE) (generally 4:00 p.m. Eastern time) on the valuation date. Securities that trade on an exchange, and securities traded on Nasdaq’s Electronic Bulletin Board, are valued at their last reported sales price or Nasdaq official closing price taken from the primary market in which each security trades or, if no sale is reported for such day, at their highest bid price. Other over-the-counter securities for which market quotations are readily available are valued at their highest bid price, except in the case of some bonds and other fixed income securities which may be valued by reference to other securities with comparable ratings, interest rates and maturities, using established independent pricing services. The Funds value their non-U.S. dollar denominated securities in U.S. dollars daily at the prevailing foreign currency exchange rates as quoted by a major bank. Securities for which market quotations are not readily available are valued at their fair value in accordance with the provisions of the 1940 Act, under procedures approved by the Trust's Board of Trustees, and are reported as Level 3 securities. As a general principle, the fair value of a security is the amount which the Fund might reasonably expect to receive for the security upon its current sale. However, in light of the judgment involved in fair valuations, there can be no assurance that a fair value assigned to a particular security will be the amount which the Fund might be able to receive upon its current sale. In addition, if, between the time trading ends on a particular security and the close of the customary trading session on the NYSE, events occur that are significant and may make the closing price unreliable, a Fund may fair value the security. The Funds use an independent pricing service to provide fair value estimates for relevant non-U.S. equity securities on days when the U.S. market volatility exceeds a certain threshold. This pricing service uses proprietary correlations it has developed between the movement of prices of non-U.S. equity securities and indices of U.S.-traded securities, futures contracts and other indications to estimate the fair value of relevant non-U.S. securities. When fair value pricing is employed, the prices of securities used by a Fund may differ from quoted or published prices for the same security. Investments in money market funds are valued at net asset value per share.
Various inputs are used in determining the value of each Fund’s investments, as noted above. These inputs are summarized in the three broad levels below:
| Level 1 | – | quoted prices in active markets for identical securities. |
| Level 2 | – | other significant observable inputs (including quoted prices for similar securities, foreign securities that may be fair valued and repurchase agreements). The table below includes all Level 2 securities. Level 2 securities with values based on quoted prices for similar securities are noted in the Schedules of Investments. |
| Level 3 | – | significant unobservable inputs (including last trade price before trading was suspended, or at a discount thereto for lack of marketability or otherwise, market price information regarding other securities, information received from the company and/or published documents, including SEC filings and financial statements, or other publicly available information). |
The inputs or methodology used for valuing securities are not necessarily an indication of the risk associated with investing in those securities.
The Royce Funds 2019 Annual Report to Shareholders | 71
Notes to Financial Statements(continued)
VALUATION OF INVESTMENTS (continued):
The following is a summary of the inputs used to value each Fund’s investments as of December 31, 2019. For a detailed breakout of common stocks by sector classification or country, please refer to the Schedules of Investments.
| LEVEL 1 | LEVEL 2 | LEVEL 3 | TOTAL | |||||||||||||
| Royce Dividend Value Fund | ||||||||||||||||
| Common Stocks | $ | 100,482,288 | $ | – | $ | – | $ | 100,482,288 | ||||||||
| Repurchase Agreement | – | 3,713,000 | – | 3,713,000 | ||||||||||||
| Royce Global Financial Services Fund | ||||||||||||||||
| Common Stocks | 36,232,298 | – | – | 36,232,298 | ||||||||||||
| Repurchase Agreement | – | 850,000 | – | 850,000 | ||||||||||||
| Royce International Premier Fund | ||||||||||||||||
| Common Stocks | 731,646,084 | – | – | 731,646,084 | ||||||||||||
| Preferred Stocks | 15,613,202 | – | – | 15,613,202 | ||||||||||||
| Repurchase Agreement | – | 54,399,000 | – | 54,399,000 | ||||||||||||
| Royce Micro-Cap Fund | ||||||||||||||||
| Common Stocks | 311,235,947 | 789,210 | 828,000 | 312,853,157 | ||||||||||||
| Repurchase Agreement | – | 24,628,000 | – | 24,628,000 | ||||||||||||
| Money Market Fund/Collateral Received for Securities Loaned | 882,470 | – | – | 882,470 | ||||||||||||
| Royce Opportunity Fund | ||||||||||||||||
| Common Stocks | 892,806,158 | 1,570,588 | – | 894,376,746 | ||||||||||||
| Repurchase Agreement | – | 31,152,000 | – | 31,152,000 | ||||||||||||
| Money Market Fund/Collateral Received for Securities Loaned | 22,880,089 | – | – | 22,880,089 | ||||||||||||
| Royce Pennsylvania Mutual Fund | ||||||||||||||||
| Common Stocks | 1,871,624,456 | 181,515 | 0 | 1,871,805,971 | ||||||||||||
| Repurchase Agreement | – | 76,280,000 | – | 76,280,000 | ||||||||||||
| Money Market Fund/Collateral Received for Securities Loaned | 11,003,360 | – | – | 11,003,360 | ||||||||||||
| Royce Premier Fund | ||||||||||||||||
| Common Stocks | 1,745,506,776 | – | – | 1,745,506,776 | ||||||||||||
| Repurchase Agreement | – | 65,358,000 | – | 65,358,000 | ||||||||||||
| Royce Small-Cap Value Fund | ||||||||||||||||
| Common Stocks | 157,747,082 | – | – | 157,747,082 | ||||||||||||
| Repurchase Agreement | – | 13,848,000 | – | 13,848,000 | ||||||||||||
| Royce Smaller-Companies Growth Fund | ||||||||||||||||
| Common Stocks | 246,282,127 | 4,972,770 | – | 251,254,897 | ||||||||||||
| Repurchase Agreement | – | 9,859,000 | – | 9,859,000 | ||||||||||||
| Money Market Fund/Collateral Received for Securities Loaned | 6,554,812 | – | – | 6,554,812 | ||||||||||||
| Royce Special Equity Fund | ||||||||||||||||
| Common Stocks | 887,973,208 | 65,103,500 | – | 953,076,708 | ||||||||||||
| Repurchase Agreement | – | 141,098,000 | – | 141,098,000 | ||||||||||||
| Royce Total Return Fund | ||||||||||||||||
| Common Stocks | 1,457,199,951 | 12,236,369 | 0 | 1,469,436,320 | ||||||||||||
| Preferred Stocks | 2,025,568 | – | – | 2,025,568 | ||||||||||||
| Corporate Bonds | – | 3,179,927 | – | 3,179,927 | ||||||||||||
| Repurchase Agreement | – | 53,225,000 | – | 53,225,000 | ||||||||||||
Level 3 Reconciliation:
| BALANCE AS OF 12/31/18 | ACQUISITIONS FROM MERGERS | SALES | REALIZED GAIN (LOSS) | UNREALIZED GAIN (LOSS)1 | BALANCE AS OF 12/31/19 | |
| Royce Micro-Cap Fund | ||||||
| Common Stocks | $ 828,000 | $ 0 | $ – | $ – | $ – | $ 828,000 |
| Royce Pennsylvania Mutual Fund | ||||||
| Common Stocks | – | 0 | – | – | – | 0 |
| Royce Total Return Fund | ||||||
| Common Stocks | 0 | – | – | – | – | 0 |
| 1 | The net change in unrealized appreciation (depreciation) is included in the accompanying Statement of Operations. Change in unrealized appreciation (depreciation) includes net unrealized appreciation (depreciation) resulting from changes in investment values during the reporting period and the reversal of previously recorded unrealized appreciation (depreciation) when gains or losses are realized. Net realized gain (loss) from investments and foreign currency transactions is included in the accompanying Statement of Operations. |
72|The Royce Funds 2019 Annual Report to Shareholders
VALUATION OF INVESTMENTS (continued):
The following table summarizes the valuation techniques used and unobservable inputs approved by the Valuation Committee to determine the fair value of certain Level 3 investments. The table does not include Level 3 investments with values derived utilizing prices from prior transactions or third party pricing information with adjustments (e.g. broker quotes, pricing services, net asset values).
| FAIR VALUE AT 12/31/19 | VALUATION TECHNIQUE(S) | UNOBSERVABLE INPUT(S) | RANGE AVERAGE | IMPACT TO VALUATION FROM AN INCREASE IN INPUT1 | |
| Royce Micro-Cap Fund | |||||
| Common Stocks | $828,000 | Discounted Present Value Balance Sheet Analysis | Liquidity Discount | 30%-40% | Decrease |
| 1 | This column represents the directional change in the fair value of the Level 3 investments that would result in an increase from the corresponding unobservable input. A decrease to the unobservable input would have the opposite effect. Significant increases and decreases in these unobservable inputs in isolation could result in significantly higher or lower fair value measurements. |
REPURCHASE AGREEMENTS:
The Funds may enter into repurchase agreements with institutions that the Funds’ investment adviser has determined are creditworthy. Each Fund restricts repurchase agreements to maturities of no more than seven days. Securities pledged as collateral for repurchase agreements, which are held until maturity of the repurchase agreements, are marked-to-market daily and maintained at a value at least equal to the principal amount of the repurchase agreement (including accrued interest). Repurchase agreements could involve certain risks in the event of default or insolvency of the counter-party, including possible delays or restrictions upon the ability of each Fund to dispose of its underlying securities. The remaining contractual maturities of repurchase agreements held by the Funds at December 31, 2019 are overnight and continuous.
FOREIGN CURRENCY:
Net realized foreign exchange gains or losses arise from sales and maturities of short-term securities, sales of foreign currencies, expiration of currency forward contracts, currency gains or losses realized between the trade and settlement dates on securities transactions, and the difference between the amounts of dividends, interest, and foreign withholding taxes recorded on each Fund’s books and the U.S. dollar equivalent of the amounts actually received or paid. Net unrealized foreign exchange gains and losses arise from changes in the value of assets and liabilities, other than investments in securities at the end of the reporting period, as a result of changes in foreign currency exchange rates.
The Funds do not isolate that portion of the results of operations resulting from fluctuations in foreign exchange rates on investments from the fluctuations arising from changes in market prices of securities held. Such fluctuations are included with the net realized and unrealized gain or loss on investments.
SECURITIES LENDING:
The Funds loan securities through a lending agent, State Street Bank and Trust Company, to qualified institutional investors for the purpose of earning additional income. The lending agent receives and holds collateral from such borrowers to secure their obligations to the Funds. Such loans must be secured at all times by collateral in an amount at least equal to the market value of the loaned securities. The market values of the loaned securities and the collateral fluctuate and are determined at the close of each business day by the lending agent. Borrowers are required to post additional collateral to the lending agent on the next succeeding business day in the event of a collateral shortfall. Counterparty risk is further reduced by loaning securities only to parties that participate in a Global Securities Lending Program organized and monitored by the lending agent and that are deemed by it to satisfy its requirements and by having the lending agent enter into securities lending agreements with such borrowers. The lending agent is not affiliated with Royce.
Collateral may be in the form of cash or U.S. Treasuries. Cash collateral is invested in certain money market pooled investment vehicles. The Funds record a liability in their respective Statements of Assets and Liabilities for the return of such cash collateral during periods in which securities are on loan. The Funds bear the risk of loss for any decrease in the market value of the loaned securities or the investments purchased with cash collateral received from the borrowers.
Pursuant to the agreement in place between the Funds and the lending agent, if a borrower fails to return loaned securities, and the cash collateral being maintained by the lending agent on behalf of such borrower is insufficient to cover the value of loaned securities and provided such collateral insufficiency is not the result of investment losses, the lending agent shall, at its option, either replace the loaned securities or pay the amount of the shortfall to the Funds. In the event of the bankruptcy of a borrower, the Funds could experience delay in recovering the loaned securities or only recover cash or a security of equivalent value.
Loans of securities generally do not have stated maturity dates, and the Funds may recall a security at any time. The Funds’ securities lending income consists of the income earned on investing cash collateral, plus any premium payments received for lending certain securities, less any rebates paid to borrowers and lending agent fees associated with the loan. Pursuant to the agreement in place between the Funds and the lending agent, the Funds are responsible for any shortfall in the event the value of the investments purchased with cash collateral is insufficient to pay the rebate fee to the borrower.
The Royce Funds 2019 Annual Report to Shareholders | 73
Notes to Financial Statements(continued)
SECURITIES LENDING (continued):
The following table presents cash collateral and the market value of securities on loan collateralized by cash collateral held by the Funds at December 31, 2019:
| CASH COLLATERAL1 | SECURITIES ON LOAN COLLATERALIZED BY CASH COLLATERAL | NET AMOUNT | |
| Royce Micro-Cap Fund | $ 882,470 | $ (857,635) | $ 24,835 |
| Royce Opportunity Fund | 22,880,089 | (21,891,764) | 988,325 |
| Royce Pennsylvania Mutual Fund | 11,003,360 | (10,890,928) | 112,432 |
| Royce Smaller-Companies Growth Fund | 6,554,812 | (6,432,525) | 122,287 |
| 1 | Absent an event of default, assets and liabilities are presented gross and not offset in the Statements of Assets and Liabilities. The remaining contractual maturity of cash collateral is overnight and continuous. |
The following table presents non-cash collateral and the market value of securities on loan collateralized by non-cash collateral held by the Funds’ custodian at December 31, 2019:
| NON-CASH COLLATERAL | SECURITIES ON LOAN COLLATERALIZED BY NON-CASH COLLATERAL | NET AMOUNT | |
| Royce Micro-Cap Fund | $ 12,757,563 | $ (12,477,019) | $ 280,544 |
| Royce Opportunity Fund | 71,526,230 | (69,976,992) | 1,549,238 |
| Royce Pennsylvania Mutual Fund | 59,874,033 | (58,625,367) | 1,248,666 |
| Royce Premier Fund | 34,349,384 | (33,620,428) | 728,956 |
| Royce Small-Cap Value Fund | 2,613,411 | (2,559,798) | 53,613 |
| Royce Smaller-Companies Growth Fund | 35,421,248 | (34,666,082) | 755,166 |
| Royce Total Return Fund | 553,516 | (541,755) | 11,761 |
DISTRIBUTIONS AND TAXES:
As qualified regulated investment companies under Subchapter M of the Internal Revenue Code, the Funds are not subject to income taxes to the extent that each Fund distributes substantially all of its taxable income for its fiscal year.
Royce Dividend Value Fund and Royce Total Return Fund pay any dividends from net investment income quarterly and make any distributions from net realized gains annually in December. The other Funds pay any dividends and capital gain distributions annually in December. Dividends from net investment income and distributions from capital gains are determined at a class level. Because federal income tax regulations differ from generally accepted accounting principles, income and capital gain distributions determined in accordance with tax regulations may differ from net investment income and realized gains recognized for financial reporting purposes. Accordingly, the character of distributions and composition of net assets for tax purposes differ from those reflected in the accompanying financial statements.
CAPITAL GAINS TAXES:
The Funds are subject to a tax imposed on short-term capital gains on securities of issuers domiciled in certain countries. The Funds record an estimated deferred tax liability for gains in these securities that have been held for less than one year. This amount, if any, is reported as deferred capital gains tax in the accompanying Statements of Assets and Liabilities, assuming those positions were disposed of at the end of the period, and accounted for as a reduction in the market value of the security.
INVESTMENT TRANSACTIONS AND RELATED INVESTMENT INCOME:
Investment transactions are accounted for on the trade date. Dividend income is recorded on the ex-dividend date. Non-cash dividend income is recorded at the fair market value of the securities received. Interest income is recorded on an accrual basis. Premiums and discounts on debt securities are amortized using the effective yield-to-maturity method. Realized gains and losses from investment transactions are determined on the basis of identified cost for book and tax purposes.
EXPENSES:
The Funds incur direct and indirect expenses. Expenses directly attributable to a Fund are charged to the Fund’s operations, while expenses applicable to more than one of the Royce Funds are allocated equitably. Certain personnel, occupancy costs and other administrative expenses related to the Funds are allocated by Royce under an administration agreement and are included in administrative and office facilities and legal expenses. The Trust has adopted a deferred fee agreement that allows the Trustees to defer the receipt of all or a portion of trustees’ fees otherwise payable. The deferred fees are invested in certain Royce Funds until distributed in accordance with the agreement.
COMPENSATING BALANCE CREDITS:
The Funds have arrangements with their custodian bank and transfer agent, whereby a portion of the custodian’s fee and transfer agent’s fee is paid indirectly by credits earned on a Fund’s cash on deposit with the bank and transfer agent. These deposit arrangements are an alternative to purchasing overnight investments. Conversely, a Fund pays interest to the custodian on any cash overdrafts, to the extent they are not offset by credits earned on positive cash balances.
74|The Royce Funds 2019 Annual Report to Shareholders
LINE OF CREDIT:
The Funds, along with certain other Royce Funds, participate in a $65 million line of credit (“Credit Agreement”) with State Street Bank and Trust Company to be used for temporary or emergency purposes. This revolving Credit Agreement expires on October 9, 2020. Pursuant to the Credit Agreement, each participating Fund is liable for a portion of the commitment fee for the credit facility and for principal and interest payments related to borrowings made by that Fund. Borrowings under the Credit Agreement bear interest at a rate equal to the higher of the federal funds rate or One-Month LIBOR rate, plus 1.25%. The Funds did not utilize the line of credit during the year ended December 31, 2019.
Capital Share Transactions (in dollars):
| SHARES SOLD | SHARES ISSUED FOR REINVESTMENT OF DISTRIBUTIONS | SHARES REDEEMED | SHARE CLASS CONVERSIONS | NET INCREASE (DECREASE) FROM CAPITAL SHARE TRANSACTIONS | ||||||||||||||||||||||||||||||||||||
| Year Ended 12/31/19 | Period Ended 12/31/18 | Year Ended 12/31/19 | Period Ended 12/31/18 | Year Ended 12/31/19 | Period Ended 12/31/18 | Year Ended 12/31/19 | Period Ended 12/31/181 | Year Ended 12/31/19 | Period Ended 12/31/18 | |||||||||||||||||||||||||||||||
| Royce Dividend Value Fund | ||||||||||||||||||||||||||||||||||||||||
| Investment Class | $ | 14,951,419 | $ | 25,972,222 | $ | 9,876,525 | $ | 11,367,989 | $ | (47,719,779 | ) | $ | (39,214,752 | ) | $ | (22,891,835 | ) | $ | (1,874,541) | |||||||||||||||||||||
| Service Class | 1,022,313 | 1,385,407 | 3,110,695 | 3,493,185 | (10,738,924 | ) | (26,337,495 | ) | (6,605,916 | ) | (21,458,903) | |||||||||||||||||||||||||||||
| Consultant Class | 60,887 | 493,061 | 200,251 | 114,313 | (162,101 | ) | (460,688 | ) | 99,037 | 146,686 | ||||||||||||||||||||||||||||||
| Institutional Class | 110,655 | 2,912,358 | 134,514 | 380,526 | (2,746,094 | ) | (420,544 | ) | (2,500,925 | ) | 2,872,340 | |||||||||||||||||||||||||||||
| Royce Global Financial Services Fund | ||||||||||||||||||||||||||||||||||||||||
| Service Class | 3,520,923 | 11,314,172 | 664,311 | 3,421,029 | (12,322,355 | ) | (20,910,539 | ) | (8,137,121 | ) | (6,175,338) | |||||||||||||||||||||||||||||
| Institutional Class | – | 4,000 | 144,374 | 783,011 | (1,686,897 | ) | (660,685 | ) | (1,542,523 | ) | 126,326 | |||||||||||||||||||||||||||||
| Royce International Premier Fund | ||||||||||||||||||||||||||||||||||||||||
| Investment Class | 218,606,733 | 285,246,637 | 1,179,927 | 848,230 | (246,907,254 | ) | (72,123,146 | ) | (27,120,594 | ) | 213,971,721 | |||||||||||||||||||||||||||||
| Service Class | 34,586,615 | 21,039,927 | 111,744 | – | (15,473,257 | ) | (28,042,214 | ) | $ | 15,088 | 19,225,102 | (6,987,199) | ||||||||||||||||||||||||||||
| Consultant Class | 1,130,565 | 3,320,267 | – | – | (2,397,190 | ) | (2,706,865 | ) | (1,266,625 | ) | 613,402 | |||||||||||||||||||||||||||||
| Institutional Class | 305,727,657 | 35,603,235 | 1,133,061 | 62,839 | (13,401,239 | ) | (922,139 | ) | 293,459,479 | 34,743,935 | ||||||||||||||||||||||||||||||
| R Class | 200 | – | (57,682 | ) | (15,088 | ) | (72,570) | |||||||||||||||||||||||||||||||||
| Royce Micro-Cap Fund | ||||||||||||||||||||||||||||||||||||||||
| Investment Class | 6,921,267 | 5,230,274 | 3,856,739 | 13,468,098 | (41,269,310 | ) | (43,234,672 | ) | (30,491,304 | ) | (24,536,300) | |||||||||||||||||||||||||||||
| Service Class | 3,725,977 | 3,844,992 | 4,187,631 | 957,677 | (23,523,510 | ) | (8,828,295 | ) | (15,609,902 | ) | (4,025,626) | |||||||||||||||||||||||||||||
| Consultant Class | 68,408 | 190,964 | 356,880 | 1,971,129 | (5,330,844 | ) | (6,157,584 | ) | (4,905,556 | ) | (3,995,491) | |||||||||||||||||||||||||||||
| Royce Opportunity Fund | ||||||||||||||||||||||||||||||||||||||||
| Investment Class | 63,473,524 | 93,500,228 | 8,305,468 | 46,105,025 | (176,167,512 | ) | (188,492,528 | ) | (104,388,520 | ) | (48,887,275) | |||||||||||||||||||||||||||||
| Service Class | 9,904,077 | 27,214,604 | 662,956 | 4,309,945 | (24,568,043 | ) | (69,306,409 | ) | 7,600,899 | (14,001,010 | ) | (30,180,961) | ||||||||||||||||||||||||||||
| Consultant Class | 565,245 | 991,331 | 121,025 | 888,800 | (4,010,231 | ) | (8,854,787 | ) | (3,323,961 | ) | (6,974,656) | |||||||||||||||||||||||||||||
| Institutional Class | 39,658,834 | 43,463,191 | 2,972,533 | 18,881,233 | (94,011,324 | ) | (396,679,654 | ) | (51,379,957 | ) | (334,335,230) | |||||||||||||||||||||||||||||
| R Class | 2,947,587 | 3,509,170 | 483,977 | 2,423,347 | (5,140,864 | ) | (9,865,485 | ) | (1,709,300 | ) | (3,932,968) | |||||||||||||||||||||||||||||
| K Class | 748,866 | – | (771,052 | ) | (7,600,899 | ) | (7,623,085) | |||||||||||||||||||||||||||||||||
| Royce Pennsylvania Mutual Fund | ||||||||||||||||||||||||||||||||||||||||
| Investment Class | 65,649,301 | 92,452,580 | 48,352,103 | 222,270,728 | (235,860,344 | ) | (350,693,635 | ) | (121,858,940 | ) | (35,970,327) | |||||||||||||||||||||||||||||
| Service Class | 4,005,041 | 8,411,192 | 4,949,810 | 4,802,081 | (29,820,476 | ) | (27,674,585 | ) | 2,031,178 | (20,865,625 | ) | (12,430,134) | ||||||||||||||||||||||||||||
| Consultant Class | 5,577,749 | 7,715,097 | 8,757,411 | 47,076,762 | (58,349,924 | ) | (88,342,616 | ) | (44,014,764 | ) | (33,550,757) | |||||||||||||||||||||||||||||
| Institutional Class | 31,436,891 | 97,962,498 | 4,025,072 | 11,826,618 | (31,308,732 | ) | (59,962,281 | ) | 4,153,231 | 49,826,835 | ||||||||||||||||||||||||||||||
| R Class | 1,063,963 | 1,591,148 | 314,800 | 1,930,873 | (4,419,335 | ) | (5,682,726 | ) | (3,040,572 | ) | (2,160,705) | |||||||||||||||||||||||||||||
| K Class | 55,427 | – | (850,567 | ) | (2,031,178 | ) | (2,826,318) | |||||||||||||||||||||||||||||||||
| Royce Premier Fund | ||||||||||||||||||||||||||||||||||||||||
| Investment Class | 144,090,535 | 151,864,129 | 225,067,779 | 282,874,055 | (439,926,763 | ) | (523,969,418 | ) | 20,846,050 | (70,768,449 | ) | (68,385,184) | ||||||||||||||||||||||||||||
| Service Class | 8,630,787 | 12,416,438 | 4,715,600 | 8,910,292 | (31,593,962 | ) | (19,455,214 | ) | (18,247,575 | ) | 1,871,516 | |||||||||||||||||||||||||||||
| Consultant Class | 832,801 | 1,534,237 | 2,925,141 | 4,818,150 | (10,675,841 | ) | (8,850,863 | ) | (6,917,899 | ) | (2,498,476) | |||||||||||||||||||||||||||||
| Institutional Class | 105,506,582 | 104,457,137 | 41,651,701 | 45,360,949 | (124,308,550 | ) | (134,226,931 | ) | 22,849,733 | 15,591,155 | ||||||||||||||||||||||||||||||
| W Class | 152,877 | – | (11,933,879 | ) | (20,846,050 | ) | (32,627,052) | |||||||||||||||||||||||||||||||||
| R Class | 495,012 | 692,268 | 1,855,165 | 2,176,396 | (2,304,581 | ) | (2,675,755 | ) | 45,596 | 192,909 | ||||||||||||||||||||||||||||||
| Royce Small-Cap Value Fund | ||||||||||||||||||||||||||||||||||||||||
| Investment Class | 4,471,832 | 7,444,311 | 1,639,034 | 6,296,922 | (16,727,594 | ) | (15,135,406 | ) | 3,479,640 | (10,616,728 | ) | 2,085,467 | ||||||||||||||||||||||||||||
| Service Class | 2,929,944 | 4,541,944 | 2,948,814 | 11,996,003 | (30,319,122 | ) | (37,125,376 | ) | 1,556,238 | (24,440,364 | ) | (19,031,191) | ||||||||||||||||||||||||||||
| Consultant Class | 148,760 | 466,673 | 184,165 | 1,108,696 | (3,715,543 | ) | (3,034,581 | ) | (3,382,618 | ) | (1,459,212) | |||||||||||||||||||||||||||||
| Institutional Class | 172,026 | – | (556,734 | ) | (3,479,640 | ) | (3,864,348) | |||||||||||||||||||||||||||||||||
| R Class | 931,036 | 1,381,891 | 220,872 | 944,360 | (2,468,954 | ) | (7,083,191 | ) | (1,317,046 | ) | (4,756,940) | |||||||||||||||||||||||||||||
| K Class | 323,211 | – | (736,046 | ) | (1,556,238 | ) | (1,969,073) | |||||||||||||||||||||||||||||||||
The Royce Funds 2019 Annual Report to Shareholders | 75
Notes to Financial Statements(continued)
Capital Share Transactions (in dollars) (continued):
| SHARES SOLD | SHARES ISSUED FOR REINVESTMENT | SHARES REDEEMED | SHARE CLASS CONVERSIONS | NET INCREASE (DECREASE) FROM CAPITAL SHARE TRANSACTIONS | ||||||||||||||||||||||||||||||||||||
| Year Ended 12/31/19 | Period Ended 12/31/18 | Year Ended 12/31/19 | Period Ended 12/31/18 | Year Ended 12/31/19 | Period Ended 12/31/18 | Year Ended 12/31/19 | Period Ended 12/31/181 | Year Ended 12/31/19 | Period Ended 12/31/18 | |||||||||||||||||||||||||||||||
| Royce Smaller-Companies Growth Fund | ||||||||||||||||||||||||||||||||||||||||
| Investment Class | $ | 6,186,917 | $ | 14,761,046 | $ | 2,606,452 | $ | 24,904,985 | $ | (21,419,943 | ) | $ | (32,950,853 | ) | $ | (12,626,574 | ) | $ | 6,715,178 | |||||||||||||||||||||
| Service Class | 4,934,901 | 8,483,893 | 5,048,550 | 49,014,107 | (41,546,389 | ) | (62,051,370 | ) | $ | 623,550 | (31,562,938 | ) | (3,929,820 | ) | ||||||||||||||||||||||||||
| Consultant Class | 25,144 | 339,101 | 208,839 | 2,118,800 | (1,414,126 | ) | (3,292,612 | ) | (1,180,143 | ) | (834,711 | ) | ||||||||||||||||||||||||||||
| Institutional Class | 477,056 | 898,827 | 241,367 | 2,073,085 | (1,270,060 | ) | (1,902,628 | ) | (551,637 | ) | 1,069,284 | |||||||||||||||||||||||||||||
| R Class | 139,588 | – | (111,893 | ) | (623,550 | ) | (595,855 | ) | ||||||||||||||||||||||||||||||||
| Royce Special Equity Fund | ||||||||||||||||||||||||||||||||||||||||
| Investment Class | 131,799,238 | 222,486,956 | 75,485,588 | 94,473,851 | (314,554,796 | ) | (328,550,392 | ) | (107,269,970 | ) | (11,589,585 | ) | ||||||||||||||||||||||||||||
| Service Class | 13,920,271 | 43,284,766 | 5,811,061 | 6,535,526 | (23,575,309 | ) | (78,927,553 | ) | (3,843,977 | ) | (29,107,261 | ) | ||||||||||||||||||||||||||||
| Consultant Class | 713,644 | 2,381,819 | 2,162,200 | 3,028,564 | (8,894,895 | ) | (14,406,587 | ) | (6,019,051 | ) | (8,996,204 | ) | ||||||||||||||||||||||||||||
| Institutional Class | 85,607,154 | 77,996,165 | 17,428,965 | 20,150,304 | (119,010,532 | ) | (97,459,966 | ) | (15,974,413 | ) | 686,503 | |||||||||||||||||||||||||||||
| Royce Total Return Fund | ||||||||||||||||||||||||||||||||||||||||
| Investment Class | 116,694,245 | 172,331,070 | 78,223,473 | 185,080,886 | (336,528,884 | ) | (486,165,820 | ) | 4,991,437 | (141,611,166 | ) | (123,762,427 | ) | |||||||||||||||||||||||||||
| Service Class | 11,398,903 | 17,605,970 | 5,938,201 | 14,354,667 | (34,792,421 | ) | (53,275,300 | ) | 34,866,202 | (17,455,317 | ) | 13,551,539 | ||||||||||||||||||||||||||||
| Consultant Class | 3,348,914 | 7,766,358 | 10,654,155 | 28,157,591 | (45,217,073 | ) | (64,755,046 | ) | (31,214,004 | ) | (28,831,097 | ) | ||||||||||||||||||||||||||||
| Institutional Class | 101,415,320 | 133,802,754 | 20,099,865 | 38,645,065 | (133,859,499 | ) | (186,576,729 | ) | (12,344,314 | ) | (14,128,910 | ) | ||||||||||||||||||||||||||||
| W Class | 3,384,456 | 153,879 | (97,087,426 | ) | (4,991,437 | ) | (98,540,528 | ) | ||||||||||||||||||||||||||||||||
| R Class | 5,018,902 | 11,526,424 | 2,882,429 | 8,367,129 | (22,879,500 | ) | (14,313,562 | ) | (14,978,169 | ) | 5,579,991 | |||||||||||||||||||||||||||||
| K Class | 4,184,983 | 58,255 | (6,531,546 | ) | (34,866,202 | ) | (37,154,510 | ) | ||||||||||||||||||||||||||||||||
Capital Share Transactions (in shares):
| SHARES SOLD | SHARES ISSUED FOR REINVESTMENT OF DISTRIBUTIONS | SHARES REDEEMED | SHARE CLASS CONVERSIONS | NET INCREASE (DECREASE) IN SHARES OUTSTANDING | ||||||||||||||||||||||||||||||||||||
| Year Ended 12/31/19 | Period Ended 12/31/18 | Year Ended 12/31/19 | Period Ended 12/31/18 | Year Ended 12/31/19 | Period Ended 12/31/18 | Year Ended 12/31/19 | Period Ended 12/31/181 | Year Ended 12/31/19 | Period Ended 12/31/18 | |||||||||||||||||||||||||||||||
| Royce Dividend Value Fund | ||||||||||||||||||||||||||||||||||||||||
| Investment Class | 2,364,642 | 3,612,556 | 1,614,615 | 1,926,261 | (7,517,404 | ) | (5,740,059 | ) | (3,538,147 | ) | (201,242 | ) | ||||||||||||||||||||||||||||
| Service Class | 151,423 | 182,554 | 488,966 | 572,558 | (1,617,085 | ) | (3,528,363 | ) | (976,696 | ) | (2,773,251 | ) | ||||||||||||||||||||||||||||
| Consultant Class | 8,708 | 72,025 | 27,613 | 16,665 | (21,585 | ) | (55,073 | ) | 14,736 | 33,617 | ||||||||||||||||||||||||||||||
| Institutional Class | 17,296 | 389,716 | 22,238 | 66,051 | (444,665 | ) | (54,927 | ) | (405,131 | ) | 400,840 | |||||||||||||||||||||||||||||
| Royce Global Financial Services Fund | ||||||||||||||||||||||||||||||||||||||||
| Service Class | 385,405 | 1,032,931 | 68,840 | 402,001 | (1,331,073 | ) | (1,977,301 | ) | (876,828 | ) | (542,369 | ) | ||||||||||||||||||||||||||||
| Institutional Class | – | 281 | 11,559 | 71,378 | (145,047 | ) | (46,913 | ) | (133,488 | ) | 24,746 | |||||||||||||||||||||||||||||
| Royce International Premier Fund | ||||||||||||||||||||||||||||||||||||||||
| Investment Class | 16,346,057 | 22,969,262 | 79,349 | 72,747 | (17,814,511 | ) | (5,886,292 | ) | (1,389,105 | ) | 17,155,717 | |||||||||||||||||||||||||||||
| Service Class | 2,205,839 | 1,367,064 | 6,285 | – | (968,096 | ) | (1,818,416 | ) | 964 | 1,244,028 | �� | (450,388 | ) | |||||||||||||||||||||||||||
| Consultant Class | 66,520 | 203,769 | – | – | (142,639 | ) | (169,091 | ) | (76,119 | ) | 34,678 | |||||||||||||||||||||||||||||
| Institutional Class | 22,112,617 | 2,916,865 | 76,198 | 5,389 | (972,608 | ) | (82,650 | ) | 21,216,207 | 2,839,604 | ||||||||||||||||||||||||||||||
| R Class | 16 | – | (4,618 | ) | (1,202 | ) | (5,804 | ) | ||||||||||||||||||||||||||||||||
| Royce Micro-Cap Fund | ||||||||||||||||||||||||||||||||||||||||
| Investment Class2 | 5,534,664 | 442,085 | 359,770 | 1,379,928 | (4,056,845 | ) | (3,650,567 | ) | 1,837,589 | (1,828,554 | ) | |||||||||||||||||||||||||||||
| Service Class2 | 16,336,340 | 312,618 | 399,583 | 100,175 | (2,331,513 | ) | (750,133 | ) | 14,404,410 | (337,340 | ) | |||||||||||||||||||||||||||||
| Consultant Class | 8,631 | 20,513 | 43,522 | 261,077 | (671,085 | ) | (657,240 | ) | (618,932 | ) | (375,650 | ) | ||||||||||||||||||||||||||||
| Royce Opportunity Fund | ||||||||||||||||||||||||||||||||||||||||
| Investment Class3 | 7,115,781 | 7,069,808 | 671,420 | 4,353,638 | (15,254,758 | ) | (14,641,615 | ) | (7,467,557 | ) | (3,218,169 | ) | ||||||||||||||||||||||||||||
| Service Class | 933,331 | 2,128,949 | 57,799 | 437,558 | (2,315,305 | ) | (5,517,655 | ) | 601,813 | (1,324,175 | ) | (2,349,335 | ) | |||||||||||||||||||||||||||
| Consultant Class | 59,509 | 97,465 | 12,127 | 102,870 | (432,321 | ) | (824,172 | ) | (360,685 | ) | (623,837 | ) | ||||||||||||||||||||||||||||
| Institutional Class | 3,422,144 | 3,124,242 | 234,983 | 1,745,031 | (8,081,501 | ) | (28,617,157 | ) | (4,424,374 | ) | (23,747,884 | ) | ||||||||||||||||||||||||||||
| R Class | 290,546 | 289,556 | 43,878 | 255,089 | (495,232 | ) | (794,614 | ) | (160,808 | ) | (249,969 | ) | ||||||||||||||||||||||||||||
| K Class | 66,744 | – | (70,091 | ) | (684,679 | ) | (688,026 | ) | ||||||||||||||||||||||||||||||||
| Royce Pennsylvania Mutual Fund | ||||||||||||||||||||||||||||||||||||||||
| Investment Class4 | 17,135,747 | 9,032,724 | 5,187,994 | 27,406,995 | (26,216,826 | ) | (35,352,581 | ) | (3,893,085 | ) | 1,087,138 | |||||||||||||||||||||||||||||
| Service Class4 | 13,777,776 | 758,686 | 531,666 | 591,389 | (3,294,387 | ) | (2,597,089 | ) | 188,596 | 11,015,055 | (1,058,418 | ) | ||||||||||||||||||||||||||||
| Consultant Class4 | 1,758,010 | 1,042,114 | 1,186,641 | 7,276,161 | (8,156,766 | ) | (10,773,630 | ) | (5,212,115 | ) | (2,455,355 | ) | ||||||||||||||||||||||||||||
| Institutional Class | 3,448,798 | 10,176,610 | 430,489 | 1,454,689 | (3,415,712 | ) | (5,904,434 | ) | 463,575 | 5,726,865 | ||||||||||||||||||||||||||||||
| R Class | 129,815 | 154,050 | 36,060 | 253,063 | (536,743 | ) | (556,956 | ) | (370,868 | ) | (149,843 | ) | ||||||||||||||||||||||||||||
| K Class | 6,293 | – | (96,193 | ) | (230,227 | ) | (320,127 | ) | ||||||||||||||||||||||||||||||||
| 76 |The Royce Funds 2019 Annual Report to Shareholders |
Capital Share Transactions (in shares) (continued):
| SHARES SOLD | SHARES ISSUED FOR REINVESTMENT OF DISTRIBUTIONS | SHARES REDEEMED | SHARE CLASS CONVERSIONS | NET INCREASE (DECREASE) IN SHARES OUTSTANDING | ||||||||||||||||||||||||||||||||||||
| Year Ended 12/31/19 | Period Ended 12/31/18 | Year Ended 12/31/19 | Period Ended 12/31/18 | Year Ended 12/31/19 | Period Ended 12/31/18 | Year Ended 12/31/19 | Period Ended 12/31/181 | Year Ended 12/31/19 | Period Ended 12/31/18 | |||||||||||||||||||||||||||||||
| Royce Premier Fund | ||||||||||||||||||||||||||||||||||||||||
| Investment Class | 10,661,184 | 9,774,025 | 17,749,825 | 23,300,993 | (31,948,702 | ) | (33,088,705 | ) | 1,246,773 | (3,537,693 | ) | 1,233,086 | ||||||||||||||||||||||||||||
| Service Class | 643,620 | 762,638 | 382,139 | 753,832 | (2,349,430 | ) | (1,202,121 | ) | (1,323,671 | ) | 314,349 | |||||||||||||||||||||||||||||
| Consultant Class | 81,778 | 132,860 | 294,280 | 502,414 | (963,591 | ) | (689,765 | ) | (587,533 | ) | (54,491 | ) | ||||||||||||||||||||||||||||
| Institutional Class | 7,151,202 | 6,477,889 | 3,236,340 | 3,678,909 | (8,470,440 | ) | (8,262,556 | ) | 1,917,102 | 1,894,242 | ||||||||||||||||||||||||||||||
| W Class | 8,969 | – | (683,832 | ) | (1,239,921 | ) | (1,914,784 | ) | ||||||||||||||||||||||||||||||||
| R Class | 38,838 | 49,442 | 158,833 | 193,975 | (180,025 | ) | (172,520 | ) | 17,646 | 70,897 | ||||||||||||||||||||||||||||||
| Royce Small-Cap Value Fund | ||||||||||||||||||||||||||||||||||||||||
| Investment Class | 491,082 | 720,316 | 172,712 | 732,200 | (1,856,300 | ) | (1,521,627 | ) | 319,820 | (1,192,506 | ) | 250,709 | ||||||||||||||||||||||||||||
| Service Class | 316,985 | 433,604 | 311,714 | 1,399,767 | (3,327,197 | ) | (3,589,532 | ) | 152,722 | (2,698,498 | ) | (1,603,439 | ) | |||||||||||||||||||||||||||
| Consultant Class | 18,053 | 56,074 | 21,977 | 145,498 | (455,254 | ) | (346,507 | ) | (415,224 | ) | (144,935 | ) | ||||||||||||||||||||||||||||
| Institutional Class | 16,201 | – | (54,436 | ) | (316,248 | ) | (354,483 | ) | ||||||||||||||||||||||||||||||||
| R Class | 107,199 | 138,804 | 24,298 | 114,607 | (280,913 | ) | (720,582 | ) | (149,416 | ) | (467,171 | ) | ||||||||||||||||||||||||||||
| K Class | 46,711 | – | (106,029 | ) | (221,047 | ) | (280,365 | ) | ||||||||||||||||||||||||||||||||
| Royce Smaller-Companies Growth Fund | ||||||||||||||||||||||||||||||||||||||||
| Investment Class | 795,238 | 1,409,407 | 324,589 | 3,454,228 | (2,675,412 | ) | (3,097,890 | ) | (1,555,585 | ) | 1,765,745 | |||||||||||||||||||||||||||||
| Service Class | 631,242 | 746,094 | 646,422 | 6,972,135 | (5,305,904 | ) | (5,772,215 | ) | 57,897 | (4,028,240 | ) | 2,003,911 | ||||||||||||||||||||||||||||
| Consultant Class | 3,867 | 47,341 | 31,357 | 350,795 | (212,170 | ) | (386,332 | ) | (176,946 | ) | 11,804 | |||||||||||||||||||||||||||||
| Institutional Class | 58,868 | 74,788 | 29,615 | 283,596 | (156,168 | ) | (170,523 | ) | (67,685 | ) | 187,861 | |||||||||||||||||||||||||||||
| R Class | 13,782 | – | (11,097 | ) | (62,268 | ) | (59,583 | ) | ||||||||||||||||||||||||||||||||
| Royce Special Equity Fund | ||||||||||||||||||||||||||||||||||||||||
| Investment Class | 7,136,926 | 10,606,597 | 4,308,538 | 5,245,633 | (17,035,695 | ) | (16,096,361 | ) | (5,590,231 | ) | (244,131 | ) | ||||||||||||||||||||||||||||
| Service Class | 759,604 | 2,028,507 | 332,061 | 363,287 | (1,272,328 | ) | (3,754,389 | ) | (180,663 | ) | (1,362,595 | ) | ||||||||||||||||||||||||||||
| Consultant Class | 42,622 | 129,355 | 135,137 | 184,219 | (534,211 | ) | (761,826 | ) | (356,452 | ) | (448,252 | ) | ||||||||||||||||||||||||||||
| Institutional Class | 4,577,817 | 3,801,951 | 1,003,395 | 1,128,868 | (6,517,702 | ) | (4,649,863 | ) | (936,490 | ) | 280,956 | |||||||||||||||||||||||||||||
| Royce Total Return Fund | ||||||||||||||||||||||||||||||||||||||||
| Investment Class | 10,644,890 | 13,088,971 | 7,198,720 | 17,953,975 | (30,673,054 | ) | (38,922,836 | ) | 376,428 | (12,829,444 | ) | (7,503,462 | ) | |||||||||||||||||||||||||||
| Service Class | 1,033,705 | 1,289,618 | 530,268 | 1,367,521 | (3,078,129 | ) | (3,895,252 | ) | 2,550,563 | (1,514,156 | ) | 1,312,450 | ||||||||||||||||||||||||||||
| Consultant Class | 297,041 | 621,031 | 945,606 | 2,684,766 | (3,993,278 | ) | (5,045,159 | ) | (2,750,631 | ) | (1,739,362 | ) | ||||||||||||||||||||||||||||
| Institutional Class | 9,223,771 | 10,380,153 | 1,874,917 | 3,797,631 | (12,289,410 | ) | (14,578,110 | ) | (1,190,722 | ) | (400,326 | ) | ||||||||||||||||||||||||||||
| W Class | 248,431 | 11,258 | (6,960,700 | ) | (375,375 | ) | (7,076,386 | ) | ||||||||||||||||||||||||||||||||
| R Class | 447,819 | 834,627 | 254,355 | 791,987 | (1,996,603 | ) | (1,066,832 | ) | (1,294,429 | ) | 559,782 | |||||||||||||||||||||||||||||
| K Class | 468,780 | 6,516 | (724,647 | ) | (3,926,286 | ) | (4,175,637 | ) | ||||||||||||||||||||||||||||||||
| 1 | On April 13, 2018, Royce Smaller-Companies Growth Fund R Class shares converted to Service Class shares and K Class shares converted to Service Class shares for the following funds: Royce Opportunity Fund, Royce Pennsylvania Mutual Fund, Royce Small-Cap Value Fund and Royce Total Return Fund. On April 16, 2018, Royce International Premier Fund R Class shares converted to Service Class shares. On June 27, 2018, Royce Small-Cap Value Fund Institutional Class shares converted to Investment Class shares. On October 10, 2018, W Class shares converted to Investment Class shares for Royce Premier Fund and Royce Total Return Fund. |
| 2 | Includes shares issued in connection with the merger of Royce Low-Priced Stock Fund (4,874,935 for Investment Class and 15,964,843 for Service Class) for the year ended 12/31/19. |
| 3 | Includes shares issued in connection with the merger of Royce Micro-Cap Opportunity Fund (1,587,186 for Investment Class) for the year ended 12/31/19. |
| 4 | Includes shares issued in connection with the mergers of Royce Small-Cap Leaders Fund and Royce Small/Mid-Cap Premier Fund (9,793,096 for Investment Class, 13,319,368 for Service Class and 969,311 for Consultant Class) for the year ended 12/31/19. |
| The Royce Funds 2019 Annual Report to Shareholders | 77 |
Notes to Financial Statements(continued)
Investment Adviser and Distributor:
INVESTMENT ADVISER:
Under the Trust’s investment advisory agreements with Royce, Royce is entitled to receive investment advisory fees in respect of each Fund that are computed daily and payable monthly. Royce has contractually agreed, without right of termination, to waive fees and/or reimburse expenses (excluding brokerage commissions, taxes, interest, litigation expenses, acquired fund fees and expenses, and other expenses not borne in the ordinary course of business) to the extent necessary to maintain certain Funds’ net annual operating expense ratios at specified levels through April 30, 2020, and is shown below to the extent that it impacted net expenses for the year ended December 31, 2019. See the Prospectus for contractual waiver expiration dates.
| ANNUAL CONTRACTUAL ADVISORY FEE AS A | COMMITTED NET ANNUAL OPERATING EXPENSE RATIO CAP4 | YEAR ENDED DECEMBER 31, 2019 | ||||||||||||||||
| PERCENTAGE OF AVERAGE NET ASSETS1 | Investment Class4 | Service Class4 | Consultant Class4 | Institutional Class4 | R Class4 | Net advisory fees | Advisory fees waived | |||||||||||
| Royce Dividend Value Fund | 0.85% | 1.09% | 1.34% | 2.09% | 1.09%7 | N/A | $ | 891,323 | $ | 48,190 | ||||||||
| Royce Global Financial Services Fund | 1.00% | N/A | 1.49% | N/A | N/A8 | N/A | 353,262 | 32,575 | ||||||||||
| Royce International Premier Fund | 1.00% | 1.19% | 1.44% | 2.19% | 1.04% | N/A | 5,271,039 | 445,375 | ||||||||||
| Royce Micro-Cap Fund | 1.00%2 | 1.24%5 | 1.49%6 | N/A | N/A | N/A | 2,512,364 | 4,843 | ||||||||||
| Royce Opportunity Fund | 1.00% | N/A | 1.49% | N/A | N/A | N/A | 9,296,627 | – | ||||||||||
| Royce Pennsylvania Mutual Fund | 0.76%3 | N/A | N/A | N/A | N/A | N/A | 13,948,675 | – | ||||||||||
| Royce Premier Fund | 1.00% | N/A | 1.49% | N/A | N/A | N/A | 18,393,314 | – | ||||||||||
| Royce Small-Cap Value Fund | 1.00% | 1.24% | 1.49% | N/A | N/A | N/A | 1,838,169 | – | ||||||||||
| Royce Smaller-Companies Growth Fund | 1.00% | N/A | 1.49% | 2.24% | 1.21%9 | N/A | 2,734,999 | 19,380 | ||||||||||
| Royce Special Equity Fund | 1.00% | N/A | 1.39% | N/A | N/A | N/A | 12,025,071 | – | ||||||||||
| Royce Total Return Fund | 1.00% | N/A | 1.49% | N/A | N/A | N/A | 15,770,405 | – | ||||||||||
| 1 | From a base annual rate of 1.00% (0.85% for Royce Dividend Value Fund), the annual rates of investment advisory fees payable by each of the Funds, other than Royce Pennsylvania Mutual Fund, are reduced by the indicated amount at the following breakpoints applicable to a Fund’s net assets in excess of $2 billion: more than $2 billion to $3 billion – .05% per annum; more than $3 billion to $4 billion – .10% per annum; over $4 billion – .15% per annum. |
| 2 | Royce Micro-Cap Fund's base annual contractual advisory fee was reduced from 1.25% to 1.00%, effective July 15, 2019. |
| 3 | Royce Pennsylvania Mutual Fund's fees are calculated at the annual rate of 1.00% of the first $50 million of the Fund's average net assets, 0.875% of the next $50 million of average net assets and 0.75% of average net assets in excess of $100 million. |
| 4 | Committed net annual operating expense ratio cap excludes acquired fund fees and expenses. |
| 5 | Royce Micro-Cap Fund's committed net annual operating expense ratio cap was reduced from 1.49% to 1.24% for Investment Class, effective July 15, 2019. |
| 6 | Royce Micro-Cap Fund's committed net annual operating expense ratio cap was reduced from 1.61% to 1.49% for Service Class, effective July 15, 2019. |
| 7 | Royce Dividend Value Fund's committed net annual operating expense ratio cap was increased from 0.89% to 1.09% for Institutional Class, effective May 1, 2019. |
| 8 | Royce Global Financial Services Fund's committed net annual operating expense ratio cap was eliminated from 1.04% for Institutional Class, effective May 1, 2019. |
| 9 | Royce Smaller-Companies Growth Fund's committed net annual operating expense ratio cap was increased from 1.08% to 1.21% for Institutional Class, effective May 1, 2019. |
DISTRIBUTOR:
Royce Fund Services, LLC (“RFS”), the distributor of the Trust’s shares, is a wholly owned subsidiary of Royce. RFS is entitled to receive distribution fees that are computed daily and payable monthly.
| ANNUAL CONTRACTUAL DISTRIBUTION FEE AS A | YEAR ENDED DECEMBER 31, 2019 | |||||||||
| PERCENTAGE OF AVERAGE NET ASSETS | Net distribution fees | Distribution fees waived | ||||||||
| Royce Dividend Value Fund – Service Class | 0.25% | $ | 68,093 | $ | – | |||||
| Royce Dividend Value Fund – Consultant Class | 1.00% | 15,495 | – | |||||||
| Royce Global Financial Services Fund – Service Class | 0.25% | 72,942 | 6,343 | |||||||
| Royce International Premier Fund – Service Class | 0.25% | 142,264 | – | |||||||
| Royce International Premier Fund – Consultant Class | 1.00% | 91,632 | – | |||||||
| Royce Micro-Cap Fund – Service Class | 0.25% | 198,349 | – | |||||||
| Royce Micro-Cap Fund – Consultant Class | 1.00% | 160,754 | – | |||||||
| Royce Opportunity Fund – Service Class | 0.25% | 121,220 | – | |||||||
| Royce Opportunity Fund – Consultant Class | 1.00% | 91,351 | – | |||||||
| Royce Opportunity Fund – R Class | 0.50% | 149,572 | – | |||||||
| Royce Pennsylvania Mutual Fund – Service Class | 0.25% | 233,159 | – | |||||||
| Royce Pennsylvania Mutual Fund – Consultant Class | 1.00% | 2,676,059 | – | |||||||
| Royce Pennsylvania Mutual Fund – R Class | 0.50% | 48,512 | – | |||||||
| Royce Premier Fund – Service Class | 0.25% | 78,489 | 19,622 | |||||||
| Royce Premier Fund – Consultant Class | 1.00% | 221,889 | – | |||||||
| Royce Premier Fund – R Class | 0.50% | 54,074 | – | |||||||
| Royce Small-Cap Value Fund – Service Class | 0.25% | 274,332 | – | |||||||
| Royce Small-Cap Value Fund – Consultant Class | 1.00% | 92,333 | – | |||||||
| Royce Small-Cap Value Fund – R Class | 0.50% | 42,291 | – | |||||||
| Royce Smaller-Companies Growth Fund – Service Class | 0.25% | 415,017 | – | |||||||
| Royce Smaller-Companies Growth Fund – Consultant Class | 1.00% | 65,896 | – | |||||||
| 78 |The Royce Funds 2019 Annual Report to Shareholders |
DISTRIBUTOR (continued):
| ANNUAL CONTRACTUAL DISTRIBUTION FEE AS A | YEAR ENDED DECEMBER 31, 2019 | |||||||||
| PERCENTAGE OF AVERAGE NET ASSETS | Net distribution fees | Distribution fees waived | ||||||||
| Royce Special Equity Fund – Service Class | 0.25% | $ | 151,160 | $ | – | |||||
| Royce Special Equity Fund – Consultant Class | 1.00% | 284,911 | – | |||||||
| Royce Total Return Fund – Service Class | 0.25% | 208,827 | – | |||||||
| Royce Total Return Fund – Consultant Class | 1.00% | 1,608,432 | – | |||||||
| Royce Total Return Fund – R Class | 0.50% | 202,110 | – | |||||||
Purchases and Sales of Investment Securities:
For the year ended December 31, 2019, the costs of purchases and the proceeds from sales of investment securities, other than short-term securities and collateral received for securities loaned, were as follows:
| PURCHASES1 | SALES2 | |||||||
| Royce Dividend Value Fund | $ | 8,907,903 | $ | 52,457,627 | ||||
| Royce Global Financial Services Fund | 2,021,334 | 11,937,378 | ||||||
| Royce International Premier Fund | 458,672,346 | 215,965,747 | ||||||
| Royce Micro-Cap Fund | 46,147,519 | 114,804,106 | ||||||
| Royce Opportunity Fund | 407,319,688 | 585,706,807 | ||||||
| Royce Pennsylvania Mutual Fund | 545,334,245 | 802,237,494 | ||||||
| Royce Premier Fund | 335,093,591 | 698,251,002 | ||||||
| Royce Small-Cap Value Fund | 107,189,712 | 159,602,005 | ||||||
| Royce Smaller-Companies Growth Fund | 139,318,654 | 197,084,935 | ||||||
| Royce Special Equity Fund | 197,381,847 | 446,095,877 | ||||||
| Royce Total Return Fund | 324,807,859 | 625,421,613 | ||||||
| 1 | Excludes the following securities market values due to mergers: Royce Micro-Cap Fund $196,795,055, Royce Opportunity Fund $14,107,068 and Royce Pennsylvania Mutual Fund $163,380,735. These amounts were not used in the calculation of portfolio turnover. |
| 2 | Excludes the value of securities delivered as a result of redemptions-in-kind. |
Cross trades were executed by the Funds pursuant to Rule 17a-7 under the 1940 Act. Cross trading is the buying or selling of portfolio securities between funds to which Royce serves as investment adviser. The Trust’s Chief Compliance Officer reviews such transactions each quarter for compliance with the requirements and restrictions set forth by Rule 17a-7, and reports the results of her review to the Board of Trustees. Cross trades for the year ended December 31, 2019, were as follows:
| COSTS OF PURCHASES | PROCEEDS FROM SALES | REALIZED GAIN (LOSS) | ||||||||||
| Royce Dividend Value Fund | $ | – | $ | 339,662 | $ | (703,063 | ) | |||||
| Royce Global Financial Services Fund | – | 302,179 | (37,566 | ) | ||||||||
| Royce International Premier Fund | 606,363 | 4,700,424 | (1,476,135 | ) | ||||||||
| Royce Micro-Cap Fund | – | 1,217,411 | 1,086,058 | |||||||||
| Royce Pennsylvania Mutual Fund | 4,291,997 | 23,621,748 | (11,554,463 | ) | ||||||||
| Royce Premier Fund | 9,863,274 | 9,164,743 | (2,920,224 | ) | ||||||||
| Royce Total Return Fund | 19,725,045 | 16,609,357 | (1,286,227 | ) | ||||||||
Redemptions-In-Kind:
The Funds may make payment for Fund shares redeemed wholly or in part by distributing portfolio securities to shareholders. The net realized gain will not be realized for tax purposes. For the year ended December 31, 2019, the following funds had redemptions-in-kind:
| PROCEEDS | REALIZED GAIN | |||||||
| Royce Pennsylvania Mutual Fund | $ | 9,049,046 | $ | 4,639,705 | ||||
| Royce Premier Fund | 43,538,691 | 23,232,922 | ||||||
| Royce Special Equity Fund | 16,641,392 | 6,773,281 | ||||||
| Royce Total Return Fund | 66,747,535 | 34,254,262 | ||||||
Class Specific Expenses:
Class specific expenses were as follows for the year ended December 31, 2019:
| NET DISTRIBUTION FEES | SHAREHOLDER SERVICING | SHAREHOLDER REPORTS | REGISTRATION | TRANSFER AGENT BALANCE CREDITS | TOTAL | CLASS LEVEL EXPENSES REIMBURSED BY INVESTMENT ADVISER | ||||||||||||||||||||||
| Royce Dividend Value Fund – Investment Class | $ | – | $ | 105,009 | $ | 23,316 | $ | 18,790 | $ | (1,508 | ) | $ | 145,607 | $ | 57,164 | |||||||||||||
| Royce Dividend Value Fund – Service Class | 68,093 | 47,109 | 7,941 | 13,824 | (1,206 | ) | 135,761 | 37,494 | ||||||||||||||||||||
| Royce Dividend Value Fund – Consultant Class | 15,495 | 7,201 | 787 | 11,738 | (75 | ) | 35,146 | 17,997 | ||||||||||||||||||||
| Royce Dividend Value Fund – Institutional Class | – | 6,494 | 143 | 11,449 | (33 | ) | 18,053 | 17,533 | ||||||||||||||||||||
| 83,588 | 165,813 | 32,187 | 55,801 | (2,822 | ) | 130,188 | ||||||||||||||||||||||
| The Royce Funds 2019 Annual Report to Shareholders | 79 |
Notes to Financial Statements(continued)
Class Specific Expenses (continued):
| NET DISTRIBUTION FEES | SHAREHOLDER SERVICING | SHAREHOLDER REPORTS | REGISTRATION | TRANSFER AGENT BALANCE CREDITS | TOTAL | CLASS LEVEL EXPENSES REIMBURSED BY INVESTMENT ADVISER | ||||||||||||||||||||||
| Royce Global Financial Services Fund – Service Class | $ | 72,942 | $ | 51,294 | $ | 10,064 | $ | 20,282 | $ | (1,386 | ) | $ | 153,196 | $ | 69,522 | |||||||||||||
| Royce Global Financial Services Fund – Institutional Class | – | 6,461 | 31 | 13,086 | (15 | ) | 19,563 | 12,407 | ||||||||||||||||||||
| 72,942 | 57,755 | 10,095 | 33,368 | (1,401 | ) | 81,929 | ||||||||||||||||||||||
| Royce International Premier Fund – Investment Class | – | 433,420 | 66,282 | 49,224 | (2,479 | ) | 546,447 | 40,416 | ||||||||||||||||||||
| Royce International Premier Fund – Service Class | 142,264 | 87,916 | 10,975 | 27,907 | (752 | ) | 268,310 | 53,726 | ||||||||||||||||||||
| Royce International Premier Fund – Consultant Class | 91,632 | 13,434 | 1,850 | 12,234 | (182 | ) | 118,968 | 13,784 | ||||||||||||||||||||
| Royce International Premier Fund – Institutional Class | – | 18,751 | 33,567 | 35,549 | (1,204 | ) | 86,663 | 86,663 | ||||||||||||||||||||
| 233,896 | 553,521 | 112,674 | 124,914 | (4,617 | ) | 194,589 | ||||||||||||||||||||||
| Royce Micro-Cap Fund – Investment Class | – | 157,616 | 66,055 | 26,306 | (12,453 | ) | 237,524 | 181,355 | ||||||||||||||||||||
| Royce Micro-Cap Fund – Service Class | 198,349 | 47,885 | 6,057 | 11,852 | (599 | ) | 263,544 | 11,195 | ||||||||||||||||||||
| Royce Micro-Cap Fund – Consultant Class | 160,754 | 20,619 | 5,077 | 12,554 | (719 | ) | 198,285 | – | ||||||||||||||||||||
| 359,103 | 226,120 | 77,189 | 50,712 | (13,771 | ) | 192,550 | ||||||||||||||||||||||
| Royce Opportunity Fund – Investment Class | – | 626,265 | 127,312 | 28,399 | (19,398 | ) | 762,578 | – | ||||||||||||||||||||
| Royce Opportunity Fund – Service Class | 121,220 | 76,899 | 10,371 | 12,770 | (724 | ) | 220,536 | 29,375 | ||||||||||||||||||||
| Royce Opportunity Fund – Consultant Class | 91,351 | 14,766 | 2,842 | 11,476 | (596 | ) | 119,839 | – | ||||||||||||||||||||
| Royce Opportunity Fund – Institutional Class | – | 9,801 | 15,902 | 18,520 | (813 | ) | 43,410 | – | ||||||||||||||||||||
| Royce Opportunity Fund – R Class | 149,572 | 64,188 | 2,526 | 10,393 | (485 | ) | 226,194 | – | ||||||||||||||||||||
| 362,143 | 791,919 | 158,953 | 81,558 | (22,016 | ) | 29,375 | ||||||||||||||||||||||
| Royce Pennsylvania Mutual Fund – Investment Class | – | 1,012,653 | 252,314 | 38,006 | (50,616 | ) | 1,252,357 | – | ||||||||||||||||||||
| Royce Pennsylvania Mutual Fund – Service Class | 233,159 | 139,467 | 36,203 | 15,669 | (4,532 | ) | 419,966 | – | ||||||||||||||||||||
| Royce Pennsylvania Mutual Fund – Consultant Class | 2,676,059 | 202,105 | 57,924 | 16,070 | (9,180 | ) | 2,942,978 | – | ||||||||||||||||||||
| Royce Pennsylvania Mutual Fund – Institutional Class | – | 9,014 | 13,804 | 14,673 | (679 | ) | 36,812 | – | ||||||||||||||||||||
| Royce Pennsylvania Mutual Fund – R Class | 48,512 | 26,870 | 2,967 | 8,553 | (692 | ) | 86,210 | – | ||||||||||||||||||||
| 2,957,730 | 1,390,109 | 363,212 | 92,971 | (65,699 | ) | – | ||||||||||||||||||||||
| Royce Premier Fund – Investment Class | – | 1,362,339 | 284,227 | 34,251 | (29,364 | ) | 1,651,453 | – | ||||||||||||||||||||
| Royce Premier Fund – Service Class | 78,489 | 69,938 | 9,464 | 13,279 | (435 | ) | 170,735 | 23,274 | ||||||||||||||||||||
| Royce Premier Fund – Consultant Class | 221,889 | 22,475 | 4,050 | 11,872 | (673 | ) | 259,613 | – | ||||||||||||||||||||
| Royce Premier Fund – Institutional Class | – | 8,528 | 109,711 | 13,034 | (532 | ) | 130,741 | – | ||||||||||||||||||||
| Royce Premier Fund – R Class | 54,074 | 27,498 | 1,229 | 4,849 | (196 | ) | 87,454 | – | ||||||||||||||||||||
| 354,452 | 1,490,778 | 408,681 | 77,285 | (31,200 | ) | 23,274 | ||||||||||||||||||||||
| Royce Small-Cap Value Fund – Investment Class | – | 71,944 | 15,754 | 14,329 | (3,076 | ) | 98,951 | 32,669 | ||||||||||||||||||||
| Royce Small-Cap Value Fund – Service Class | 274,332 | 159,512 | 24,032 | 17,829 | (1,893 | ) | 473,812 | 70,348 | ||||||||||||||||||||
| Royce Small-Cap Value Fund – Consultant Class | 92,333 | 14,839 | 2,480 | 11,945 | (368 | ) | 121,229 | – | ||||||||||||||||||||
| Royce Small-Cap Value Fund – R Class | 42,291 | 23,470 | 1,415 | 5,457 | (300 | ) | 72,333 | 510 | ||||||||||||||||||||
| 408,956 | 269,765 | 43,681 | 49,560 | (5,637 | ) | 103,527 | ||||||||||||||||||||||
80 |The Royce Funds 2019 Annual Report to Shareholders
Class Specific Expenses (continued):
| NET DISTRIBUTION FEES | SHAREHOLDER SERVICING | SHAREHOLDER REPORTS | REGISTRATION | TRANSFER AGENT BALANCE CREDITS | TOTAL | CLASS LEVEL EXPENSES REIMBURSED BY INVESTMENT ADVISER | ||||||||||||||||||||||
| Royce Smaller-Companies Growth Fund – Investment Class | $ | – | $ | 81,892 | $ | 38,391 | $ | 15,551 | $ | (7,780 | ) | $ | 128,054 | $ | – | |||||||||||||
| Royce Smaller-Companies Growth Fund – Service Class | 415,017 | 252,014 | 37,240 | 21,909 | (1,870 | ) | 724,310 | 79,514 | ||||||||||||||||||||
| Royce Smaller-Companies Growth Fund – Consultant Class | 65,896 | 12,597 | 2,469 | 11,915 | (424 | ) | 92,453 | 26,282 | ||||||||||||||||||||
| Royce Smaller-Companies Growth Fund – Institutional Class | – | 6,717 | 901 | 11,570 | (113 | ) | 19,075 | 13,943 | ||||||||||||||||||||
| 480,913 | 353,220 | 79,001 | 60,945 | (10,187 | ) | 119,739 | ||||||||||||||||||||||
| Royce Special Equity Fund – Investment Class | – | 877,604 | 162,587 | 32,027 | (23,351 | ) | 1,048,867 | – | ||||||||||||||||||||
| Royce Special Equity Fund – Service Class | 151,160 | 113,640 | 19,355 | 12,441 | (479 | ) | 296,117 | 115,213 | ||||||||||||||||||||
| Royce Special Equity Fund – Consultant Class | 284,911 | 27,869 | 6,489 | 12,158 | (1,403 | ) | 330,024 | – | ||||||||||||||||||||
| Royce Special Equity Fund – Institutional Class | – | 12,444 | 61,188 | 22,599 | (1,887 | ) | 94,344 | – | ||||||||||||||||||||
| 436,071 | 1,031,557 | 249,619 | 79,225 | (27,120 | ) | 115,213 | ||||||||||||||||||||||
| Royce Total Return Fund – Investment Class | – | 1,027,190 | 226,026 | 30,437 | (26,407 | ) | 1,257,246 | – | ||||||||||||||||||||
| Royce Total Return Fund – Service Class | 208,827 | 127,134 | 9,061 | 12,544 | (1,124 | ) | 356,442 | 25,019 | ||||||||||||||||||||
| Royce Total Return Fund – Consultant Class | 1,608,432 | 126,445 | 30,707 | 15,652 | (4,119 | ) | 1,777,117 | – | ||||||||||||||||||||
| Royce Total Return Fund – Institutional Class | – | 9,096 | 49,894 | 13,190 | (939 | ) | 71,241 | – | ||||||||||||||||||||
| Royce Total Return Fund – R Class | 202,110 | 89,340 | 5,951 | 7,933 | (1,559 | ) | 303,775 | – | ||||||||||||||||||||
| 2,019,369 | 1,379,205 | 321,639 | 79,756 | (34,148 | ) | 25,019 | ||||||||||||||||||||||
Tax Information:
At December 31, 2019, net unrealized appreciation (depreciation) based on identified cost for tax purposes was as follows:
| NET UNREALIZED | GROSS UNREALIZED | |||||||||||||||
| TAX BASIS COST | APPRECIATION (DEPRECIATION) | Appreciation | Depreciation | |||||||||||||
| Royce Dividend Value Fund | $ | 60,928,119 | $ | 43,267,169 | $ | 45,683,696 | $ | 2,416,527 | ||||||||
| Royce Global Financial Services Fund | 27,028,476 | 10,053,822 | 11,436,330 | 1,382,508 | ||||||||||||
| Royce International Premier Fund | 661,505,963 | 140,152,323 | 142,356,327 | 2,204,004 | ||||||||||||
| Royce Micro-Cap Fund | 251,804,811 | 86,558,816 | 101,826,874 | 15,268,058 | ||||||||||||
| Royce Opportunity Fund | 822,526,617 | 125,882,218 | 199,603,200 | 73,720,982 | ||||||||||||
| Royce Pennsylvania Mutual Fund | 1,279,970,545 | 679,118,786 | 716,794,947 | 37,676,161 | ||||||||||||
| Royce Premier Fund | 1,017,635,498 | 793,229,278 | 810,544,099 | 17,314,821 | ||||||||||||
| Royce Small-Cap Value Fund | 137,370,166 | 34,224,916 | 38,430,092 | 4,205,176 | ||||||||||||
| Royce Smaller-Companies Growth Fund | 201,147,726 | 66,520,983 | 76,699,132 | 10,178,149 | ||||||||||||
| Royce Special Equity Fund | 855,254,010 | 238,920,698 | 271,813,469 | 32,892,771 | ||||||||||||
| Royce Total Return Fund | 863,000,782 | 664,866,033 | 679,956,232 | 15,090,199 | ||||||||||||
The primary causes of the difference between book and tax basis cost are the timing of the recognition of losses on securities sold, investments in Real Estate Investment Trusts, investments in publicly traded partnerships and Trusts, underlying investments and mark-to-market of Passive Foreign Investment Companies.
Distributions during the years ended December 31, 2019 and 2018, were characterized as follows for tax purposes:
| ORDINARY INCOME | LONG-TERM CAPITAL GAINS | RETURN OF CAPITAL | ||||||||||||||||||||||
| 2019 | 2018 | 2019 | 2018 | 2019 | 2018 | |||||||||||||||||||
| Royce Dividend Value Fund | $ | 1,454,404 | $ | 3,187,798 | $ | 13,668,728 | $ | 13,917,887 | $ | – | $ | – | ||||||||||||
| Royce Global Financial Services Fund | 531,381 | 388,788 | 338,683 | 4,123,878 | – | – | ||||||||||||||||||
| Royce International Premier Fund | 3,750,858 | 1,517,079 | – | – | – | – | ||||||||||||||||||
| Royce Micro-Cap Fund | – | – | 9,069,275 | 18,144,382 | – | – | ||||||||||||||||||
| Royce Opportunity Fund | – | 18,209,363 | 14,461,640 | 66,655,061 | 4,546 | – | ||||||||||||||||||
| Royce Pennsylvania Mutual Fund | 3,770,922 | 12,292,768 | 68,835,454 | 309,129,630 | – | – | ||||||||||||||||||
| Royce Premier Fund | 5,706,644 | 1,125,376 | 316,226,614 | 405,194,296 | – | – | ||||||||||||||||||
| Royce Small-Cap Value Fund | 2,060,443 | 3,440,279 | 3,384,353 | 19,139,774 | – | – | ||||||||||||||||||
| Royce Smaller-Companies Growth Fund | – | 10,324,521 | 8,877,116 | 76,149,166 | – | – | ||||||||||||||||||
| Royce Special Equity Fund | 11,726,391 | 14,919,426 | 105,051,840 | 131,434,778 | – | – | ||||||||||||||||||
| Royce Total Return Fund | 18,888,956 | 31,554,994 | 117,115,609 | 294,106,107 | – | – | ||||||||||||||||||
The Royce Funds 2019 Annual Report to Shareholders | 81
Notes to Financial Statements(continued)
Tax Information (continued):
The tax basis components of distributable earnings at December 31, 2019, were as follows:
| UNDISTRIBUTED ORDINARY INCOME | UNDISTRIBUTED LONG-TERM CAPITAL GAINS OR (CAPITAL LOSS CARRYFORWARD) | NET UNREALIZED APPRECIATION (DEPRECIATION)1 | QUALIFIED LATE YEAR ORDINARY AND POST-OCTOBER LOSS DEFERRALS2 | TOTAL DISTRIBUTABLE EARNINGS | CAPITAL LOSS CARRYFORWARD UTILIZED | |||||||||||||||||||
| Royce Dividend Value Fund | $ | – | $ | 3,029,405 | $ | 43,266,541 | $ | – | $ | 46,295,946 | $ | – | ||||||||||||
| Royce Global Financial Services Fund | 99,635 | 811,029 | 10,055,242 | – | 10,965,906 | – | ||||||||||||||||||
| Royce International Premier Fund | 106,062 | (60,649,854 | )3 | 140,140,292 | – | 79,596,500 | – | |||||||||||||||||
| Royce Micro-Cap Fund | – | 7,104,431 | 86,555,406 | (2,565 | ) | 93,657,272 | – | |||||||||||||||||
| Royce Opportunity Fund | – | (810,728 | )4 | 125,882,216 | – | 125,071,488 | – | |||||||||||||||||
| Royce Pennsylvania Mutual Fund | – | 81,664,213 | 679,117,220 | – | 760,781,433 | – | ||||||||||||||||||
| Royce Premier Fund | – | 36,078,647 | 793,167,886 | (423,639 | ) | 828,822,894 | – | |||||||||||||||||
| Royce Small-Cap Value Fund | 6,090 | 2,588,951 | 34,224,957 | (301,063 | ) | 36,518,935 | – | |||||||||||||||||
| Royce Smaller-Companies Growth Fund | – | 5,075,060 | 66,506,904 | (1,880,685 | ) | 69,701,279 | – | |||||||||||||||||
| Royce Special Equity Fund | – | 6,833,828 | 238,920,696 | – | 245,754,524 | – | ||||||||||||||||||
| Royce Total Return Fund | – | 23,263,168 | 664,873,396 | (21,538 | ) | 688,115,026 | – | |||||||||||||||||
| 1 | Includes timing differences on foreign currency, recognition of losses on securities sold, investments in Real Estate Investment Trusts, investments in publicly traded partnerships and Trusts, underlying investments and mark-to-market of Passive Foreign Investment Companies. |
| 2 | Under the current tax law, capital losses and qualified late year ordinary losses incurred after October 31 may be deferred and treated as occurring on the first day of the following fiscal year. This column also includes passive activity losses and 857 (b)(9) adjustments. |
| 3 | The entire amount is comprised of capital loss carryforwards from business combinations, which may be limited in future years under the Internal Revenue Code Sections 381-384. |
| 4 | A portion of this amount is comprised of capital loss carryforwards from business combinations, which may be limited in future years under the Internal Revenue Code Sections 381-384. |
For financial reporting purposes, capital accounts and distributions to shareholders are adjusted to reflect the tax character of permanent book/tax differences. For the year ended December 31, 2019, the Funds recorded the following permanent reclassifications, which relate primarily to current net operating losses, distribution reclassifications, investments in Real Estate Investment Trusts, publicly traded partnerships and Trusts, foreign currency transactions, foreign capital gains tax, redemptions-in-kind, non-deductible excise taxes paid, market timing payments, reorganization expenses, merger related adjustments, return of capital distributions and gains from the sale of Passive Foreign Investment Companies. Results of operations and net assets were not affected by these reclassifications.
| TOTAL DISTRIBUTABLE EARNINGS (LOSS) | PAID-IN CAPITAL | |||||||
| Royce Dividend Value Fund | $ | 2,831 | $ | (2,831 | ) | |||
| Royce Global Financial Services Fund | 299 | (299 | ) | |||||
| Royce International Premier Fund | 187 | (187 | ) | |||||
| Royce Micro-Cap Fund | (560,813 | ) | 560,813 | |||||
| Royce Opportunity Fund | 4,551,825 | (4,551,825 | ) | |||||
| Royce Pennsylvania Mutual Fund | (5,151,507 | ) | 5,151,507 | |||||
| Royce Premier Fund | (23,207,709 | ) | 23,207,709 | |||||
| Royce Small-Cap Value Fund | – | – | ||||||
| Royce Smaller-Companies Growth Fund | 2,412,281 | (2,412,281 | ) | |||||
| Royce Special Equity Fund | (6,773,281 | ) | 6,773,281 | |||||
| Royce Total Return Fund | (34,290,218 | ) | 34,290,218 | |||||
Management has analyzed the Funds’ tax positions taken on federal income tax returns for all open tax years (2016 – 2019) and has concluded that as of December 31, 2019, no provision for income tax is required in the Funds’ financial statements.
82 |The Royce Funds 2019 Annual Report to Shareholders
Transactions in Affiliated Companies:
An “Affiliated Company,” as defined in the Investment Company Act of 1940, is a company in which a fund owns 5% or more of the company’s outstanding voting securities at any time during the period. The following transactions were effected in shares of such companies for the year ended December 31, 2019:
| AFFILIATED COMPANY | SHARES 12/31/18 | MARKET VALUE 12/31/18 | COSTS OF PURCHASES | PROCEEDS FROM SALES | REALIZED GAIN (LOSS) | CHANGE IN NET UNREALIZED APPRECIATION (DEPRECIATION) | DIVIDEND INCOME | SHARES 12/31/19 | MARKET VALUE 12/31/19 |
| Royce Premier Fund | |||||||||
| INDUSTRIALS - 1.0% | |||||||||
| MACHINARY - 1.0% | |||||||||
| CIRCOR International1,3 | 1,024,687 | $21,825,833 | $ – | $ 26,501,075 | $(5,866,538) | $28,639,191 | $ – | ||
| $21,825,833 | $(5,866,538) | $28,639,191 | $ – | ||||||
| Royce Special Equity Fund | |||||||||
| CONSUMER DISCRETIONARY - 10.2% | |||||||||
| AUTO COMPONENTS - 6.0% | |||||||||
| Standard Motor Products2 | 1,380,000 | $ 66,833,400 | $ – | $ 7,884,388 | $ 1,462,150 | $ 4,996,218 | $1,260,975 | 1,229,000 | $ 65,407,380 |
| HOTELS, RESTAURANTS & LEISURE - 0.5% | |||||||||
| Bowl America Cl. A2 | 343,000 | 5,230,750 | 542,826 | 101,744 | 29,549 | 95,619 | 251,300 | 374,000 | 5,797,000 |
| HOUSEHOLD DURABLES - 3.7% | |||||||||
| Flexsteel Industries2 | 775,000 | 17,112,000 | 716,803 | 1,481,928 | (2,590,185) | 585,710 | 667,590 | 720,000 | 14,342,400 |
| Hooker Furniture2 | 1,155,000 | 30,422,700 | – | 3,476,302 | (1,745,856) | 489,458 | 679,060 | 1,000,000 | 25,690,000 |
| 47,534,700 | (4,336,041) | 1,075,168 | 1,346,650 | 40,032,400 | |||||
| 119,598,850 | (2,844,342) | 6,167,005 | 2,858,925 | 111,236,780 | |||||
| CONSUMER STAPLES - 1.0% | |||||||||
| FOOD PRODUCTS - 1.0% | |||||||||
| John B. Sanfilippo & Son1 | 911,500 | 50,734,090 | – | 69,667,479 | 24,428,570 | 5,275,859 | 2,216,100 | ||
| 50,734,090 | 24,428,570 | 5,275,859 | 2,216,100 | ||||||
| INDUSTRIALS - 8.6% | |||||||||
| AEROSPACE & DEFENSE - 3.3% | |||||||||
| National Presto Industries2 | 421,800 | 49,316,856 | 510,400 | 1,628,546 | 81,002 | (12,128,202) | 2,530,800 | 409,000 | 36,151,510 |
| BUILDING PRODUCTS - 1.9% | |||||||||
| Insteel Industries2 | 605,500 | 14,701,540 | 11,387,894 | 3,777,100 | (712,605) | (775,919) | 123,180 | 969,000 | 20,823,810 |
| MACHINARY - 3.4% | |||||||||
| Gencor Industries2,3 | 1,033,500 | 11,337,495 | 1,665,546 | 537,199 | (98,601) | 819,859 | – | 1,130,000 | 13,187,100 |
| Hurco Companies2 | 580,400 | 20,720,280 | 2,006,164 | 423,517 | 277,389 | 1,340,980 | 359,523 | 623,600 | 23,921,296 |
| 32,057,775 | 178,788 | 2,160,839 | 359,523 | 37,108,396 | |||||
| 96,076,171 | (452,815) | (10,743,282) | 3,013,503 | 94,083,716 | |||||
| INFORMATION TECHNOLOGY - 6.0% | |||||||||
| IT SERVICES - 6.0% | |||||||||
| Computer Services2,4 | 779,000 | 38,950,000 | 1,461,346 | 5,967,696 | 2,564,344 | 28,095,506 | 1,189,847 | 1,463,000 | 65,103,500 |
| 38,950,000 | 2,564,344 | 28,095,506 | 1,189,847 | 65,103,500 | |||||
| $305,359,111 | $23,695,757 | $28,795,088 | $9,278,375 | $270,423,996 | |||||
| Royce Total Return Fund | |||||||||
| INDUSTRIALS - 0.0% | |||||||||
| MACHINARY - 0.0% | |||||||||
| Starrett (L.S.) Company (The) Cl. A1,3 | 387,817 | $2,028,283 | $ – | $2,381,247 | $(3,919,823) | $4,272,787 | $ – | ||
| $2,028,283 | $(3,919,823) | $4,272,787 | $ – |
| 1 | Not an Affiliated Company at December 31, 2019. |
| 2 | At December 31, 2019, the Fund owned 5% or more of the Company's outstanding voting securities thereby making the Company an Affiliated Company as that term is defined in the Investment Company Act of 1940. |
| 3 | Non-income producing. |
| 4 | These securities are defined as Level 2 securities due to fair value being based on quoted prices for similar securities. |
The Royce Funds 2019 Annual Report to Shareholders | 83
Notes to Financial Statements(continued)
Merger Information:
As of the close of business on the New York Stock Exchange on June 14, 2019, Royce Opportunity Fund acquired all of the assets and assumed all of the liabilities of Royce Micro-Cap Opportunity Fund. Based on the opinion of counsel delivered to Royce Opportunity Fund, the acquisition, which was approved by shareholders of Royce Micro-Cap Opportunity Fund on May 28, 2019, qualified as a tax-free reorganization for federal income tax purposes with no gain or loss recognized to the Funds or their shareholders. Royce Micro-Cap Opportunity Fund’s net assets of $17,332,098, including $3,256,310 of unrealized appreciation, were combined with Royce Opportunity Fund for total net assets after the acquisition of $903,239,970. Assuming the acquisition had been completed on January 1, 2019, the pro forma results of operations for the year ended December 31, 2019, are as follows:
Net investment income (loss): $(4,901,614)
Net realized and change in unrealized gain (loss) on investments: $235,031,362
Net increase (decrease) in net assets resulting from operations: $230,129,748
Because the combined investment portfolios have been managed as a single integrated portfolio since the acquisition was completed, it is not practicable to separate the amounts of revenue and earnings of Royce Micro-Opportunity Fund that have been included in Royce Opportunity Fund’s Statement of Operations since June 14, 2019.
As of the close of business on the New York Stock Exchange on June 14, 2019, Royce Pennsylvania Mutual Fund acquired all of the assets and assumed all of the liabilities of Royce Small-Cap Leaders Fund and Royce Small/Mid-Cap Premier Fund. Based on the opinions of counsel delivered to Royce Pennsylvania Mutual Fund, the acquisitions, which were approved by shareholders of Royce Small-Cap Leaders Fund and Royce Small/Mid-Cap Premier Fund on May 28, 2019, qualified as tax-free reorganizations for federal income tax purposes with no gain or loss recognized to the Funds or their respective shareholders. Royce Small-Cap Leaders Fund’s net assets of $44,751,244, including $9,113,761 of unrealized appreciation, and Royce Small/Mid-Cap Premier Fund’s net assets of $165,414,569, including $17,832,090 of unrealized appreciation, were combined with Royce Pennsylvania Mutual Fund for total net assets after the acquisitions of $1,907,630,569. Assuming the acquisitions had been completed on January 1, 2019, the pro forma results of operations for the year ended December 31, 2019, are as follows:
Net investment income (loss): $4,098,369
Net realized and change in unrealized gain (loss) on investments: $441,964,475
Net increase (decrease) in net assets resulting from operations: $446,062,844
Because the combined investment portfolios have been managed as a single integrated portfolio since the acquisitions were completed, it is not practicable to separate the amounts of revenue and earnings of Royce Small-Cap Leaders Fund and Royce Small/Mid-Cap Premier Fund that have been included in Royce Pennsylvania Mutual Fund’s Statement of Operations since June 14, 2019.
As of the close of business on the New York Stock Exchange on July 12, 2019, Royce Micro-Cap Fund acquired all of the assets and assumed all of the liabilities of Royce Low-Priced Stock Fund. Based on the opinion of counsel delivered to Royce Micro-Cap Fund, the acquisition, which was approved by shareholders of Royce Low-Priced Stock Fund at a special meeting that was originally opened on May 28, 2019 and adjourned to June 27, 2019, qualified as a tax-free reorganization for federal income tax purposes with no gain or loss recognized to the Funds or their shareholders. Royce Low-Priced Stock Fund’s net assets of $209,887,857, including $41,559,475 of unrealized appreciation, were combined with Royce Micro-Cap Fund for total net assets after the acquisition of $344,553,391. Assuming the acquisition had been completed on January 1, 2019, the pro forma results of operations for the year ended December 31, 2019, are as follows:
Net investment income (loss): $(1,688,214)
Net realized and change in unrealized gain (loss) on investments: $75,449,738
Net increase (decrease) in net assets resulting from operations: $73,761,524
Because the combined investment portfolios have been managed as a single integrated portfolio since the acquisition was completed, it is not practicable to separate the amounts of revenue and earnings of Royce Low-Priced Stock Fund that have been included in Royce Micro-Cap Fund’s Statement of Operations since July 12, 2019.
Subsequent Events:
On February 18, 2020, Franklin Resources, Inc., a global investment management organization operating as Franklin Templeton, announced that it had entered into a definitive agreement to acquire Legg Mason, Inc., the parent company of Royce. This transaction is subject to approval by Legg Mason’s shareholders and is expected to close no later than the third quarter of 2020. Royce will continue to operate as an independent investment organization with its own brand. There are no changes planned to the management of the organization or investment teams at Royce as a result of this transaction. Shareholders of The Royce Funds are expected to be asked to approve new investment advisory agreements with Royce due to the change of control resulting from the transaction.
| 84 | The Royce Funds 2019 Annual Report to Shareholders |
Report of Independent Registered Public Accounting Firm
To the Board of Trustees of The Royce Fund and Shareholders of Royce Dividend Value Fund, Royce Global Financial Services Fund, Royce International Premier Fund, Royce Micro-Cap Fund, Royce Opportunity Fund, Royce Pennsylvania Mutual Fund, Royce Premier Fund, Royce Small-Cap Value Fund, Royce Smaller-Companies Growth Fund, Royce Special Equity Fund and Royce Total Return Fund:
Opinions on the Financial Statements
We have audited the accompanying statements of assets and liabilities, including the schedules of investments, of Royce Dividend Value Fund, Royce Global Financial Services Fund, Royce International Premier Fund, Royce Micro-Cap Fund, Royce Opportunity Fund, Royce Pennsylvania Mutual Fund, Royce Premier Fund, Royce Small-Cap Value Fund, Royce Smaller-Companies Growth Fund, Royce Special Equity Fund and Royce Total Return Fund (constituting The Royce Fund, hereafter collectively referred to as the “Funds”) as of December 31, 2019, the related statements of operations for the year ended December 31, 2019, the statements of changes in net assets for each of the two years in the period ended December 31, 2019, including the related notes, and the financial highlights for each of the periods indicated therein (collectively referred to as the “financial statements”). In our opinion, the financial statements present fairly, in all material respects, the financial position of each of the Funds as of December 31, 2019, the results of each of their operations for the year then ended, the changes in each of their net assets for each of the two years in the period ended December 31, 2019 and each of the financial highlights for each of the periods indicated therein in conformity with accounting principles generally accepted in the United States of America.
Basis for Opinions
These financial statements are the responsibility of the Funds’ management. Our responsibility is to express an opinion on the Funds’ financial statements based on our audits. We are a public accounting firm registered with the Public Company Accounting Oversight Board (United States) (“PCAOB”) and are required to be independent with respect to the Funds in accordance with the U.S. federal securities laws and the applicable rules and regulations of the Securities and Exchange Commission and the PCAOB.
We conducted our audits of these financial statements in accordance with the standards of the PCAOB. Those standards require that we plan and perform the audit to obtain reasonable assurance about whether the financial statements are free of material misstatement, whether due to error or fraud.
Our audits included performing procedures to assess the risks of material misstatement of the financial statements, whether due to error or fraud, and performing procedures that respond to those risks. Such procedures included examining, on a test basis, evidence regarding the amounts and disclosures in the financial statements. Our audits also included evaluating the accounting principles used and significant estimates made by management, as well as evaluating the overall presentation of the financial statements. Our procedures included confirmation of securities owned as of December 31, 2019 by correspondence with the custodian and brokers; when replies were not received from brokers, we performed other auditing procedures. We believe that our audits provide a reasonable basis for our opinions.
/s/PricewaterhouseCoopers LLP
New York, New York
February 19, 2020
We have served as the auditor of one or more investment companies in the Royce investment company group since at least 1967. We have not been able to determine the specific year we began serving as auditor.
The Royce Funds 2019 Annual Report to Shareholders | 85
Understanding Your Fund’s Expenses(unaudited)
As a shareholder of a mutual fund, you pay ongoing expenses, including management fees and other Fund expenses including, for some funds, distribution and/or service (12b-1) fees. Using the information below, you can estimate how these ongoing expenses (in dollars) affect your investment and compare them with the ongoing expenses of other funds. You may also incur one-time transaction expenses, including redemption fees, which are not shown in this section and would result in higher total costs. The example is based on an investment of $1,000 invested at July 1, 2019, and held for the entire six-month period ended December 31, 2019. Service, Consultant and R Class shares are generally available only through certain brokers or retirement plan administrators who receive distribution and/or service fees from the Fund for services that they perform. Institutional Class shares are generally available only to institutions or intermediaries with a minimum account size of $1 million.
Actual Expenses
The first part of the table below provides information about actual account values and actual expenses. You may use the information in this section, together with the amount you invested, to estimate the expenses that you paid over the period. Simply divide your account value at December 31, 2019, by $1,000 (for example, an $8,600 account value divided by $1,000 = 8.6), then multiply the result by the number under the heading entitled “Expenses Paid During the Period” to estimate the expenses you paid on your account during this period.
Hypothetical Example for Comparison Purposes
The second part of the table below provides information about hypothetical account values and hypothetical expenses based on the Fund’s actual expense ratio and an assumed rate of return of 5% per year before expenses, which is not the Fund’s actual return. The hypothetical account values and expenses may not be used to estimate the actual ending account balance or expenses you paid for the period. You may use this information to compare the ongoing costs of investing in the Fund and other funds. To do so, compare this 5% hypothetical example with the 5% hypothetical examples that appear in the shareholder reports of the other funds.
Please note that the expenses shown in the table are meant to highlight your ongoing costs only and do not reflect any transactional costs, such as sales charges (loads), redemption fees, or exchange fees. Therefore, this section is useful in comparing ongoing costs only, and will not help you determine the relative total costs of owning different funds. In addition, if these transactional costs were included, your costs would have been higher.
| ACTUAL | HYPOTHETICAL (5% PER YEAR BEFORE EXPENSES) | |||||||||||||||||||||||||||
| Beginning Account Value 7/1/19 | Ending Account Value 12/31/19 | Expenses Paid During the Period1 | Beginning Account Value 7/1/19 | Ending Account Value 12/31/19 | Expenses Paid During the Period1 | Annualized Expense Ratio2 | ||||||||||||||||||||||
| Investment Class | ||||||||||||||||||||||||||||
| Royce Dividend Value Fund | $ | 1,000.00 | $ | 1,078.05 | $ | 5.71 | $ | 1,000.00 | $ | 1,019.71 | $ | 5.55 | 1.09% | |||||||||||||||
| Royce International Premier Fund | 1,000.00 | 1,106.84 | 6.43 | 1,000.00 | 1,019.11 | 6.16 | 1.21% | |||||||||||||||||||||
| Royce Micro-Cap Fund | 1,000.00 | 1,095.59 | 6.66 | 1,000.00 | 1,018.85 | 6.41 | 1.26% | |||||||||||||||||||||
| Royce Opportunity Fund | 1,000.00 | 1,108.87 | 6.43 | 1,000.00 | 1,019.11 | 6.16 | 1.21% | |||||||||||||||||||||
| Royce Pennsylvania Mutual Fund3 | 1,000.00 | 1,073.13 | 4.91 | 1,000.00 | 1,020.47 | 4.79 | 0.94% | |||||||||||||||||||||
| Royce Premier Fund | 1,000.00 | 1,101.47 | 6.25 | 1,000.00 | 1,019.26 | 6.01 | 1.18% | |||||||||||||||||||||
| Royce Small-Cap Value Fund | 1,000.00 | 1,087.08 | 6.52 | 1,000.00 | 1,018.95 | 6.31 | 1.24% | |||||||||||||||||||||
| Royce Smaller-Companies Growth Fund | 1,000.00 | 1,022.98 | 6.42 | 1,000.00 | 1,018.85 | 6.41 | 1.26% | |||||||||||||||||||||
| Royce Special Equity Fund | 1,000.00 | 1,076.87 | 6.33 | 1,000.00 | 1,019.11 | 6.16 | 1.21% | |||||||||||||||||||||
| Royce Total Return Fund | 1,000.00 | 1,070.53 | 6.21 | 1,000.00 | 1,019.21 | 6.06 | 1.19% | |||||||||||||||||||||
| Service Class | ||||||||||||||||||||||||||||
| Royce Dividend Value Fund | 1,000.00 | 1,075.16 | 7.01 | 1,000.00 | 1,018.45 | 6.82 | 1.34% | |||||||||||||||||||||
| Royce Global Financial Services Fund | 1,000.00 | 1,068.02 | 7.77 | 1,000.00 | 1,017.69 | 7.58 | 1.49% | |||||||||||||||||||||
| Royce International Premier Fund | 1,000.00 | 1,106.39 | 7.38 | 1,000.00 | 1,018.20 | 7.07 | 1.39% | |||||||||||||||||||||
| Royce Micro-Cap Fund | 1,000.00 | 1,097.09 | 7.88 | 1,000.00 | 1,017.69 | 7.58 | 1.49% | |||||||||||||||||||||
| Royce Opportunity Fund | 1,000.00 | 1,107.50 | 7.91 | 1,000.00 | 1,017.69 | 7.58 | 1.49% | |||||||||||||||||||||
| Royce Pennsylvania Mutual Fund3 | 1,000.00 | 1,071.38 | 6.79 | 1,000.00 | 1,018.65 | 6.61 | 1.30% | |||||||||||||||||||||
| Royce Premier Fund | 1,000.00 | 1,098.55 | 7.51 | 1,000.00 | 1,018.05 | 7.22 | 1.42% | |||||||||||||||||||||
| Royce Small-Cap Value Fund | 1,000.00 | 1,085.70 | 7.83 | 1,000.00 | 1,017.69 | 7.58 | 1.49% | |||||||||||||||||||||
| Royce Smaller-Companies Growth Fund | 1,000.00 | 1,021.41 | 7.59 | 1,000.00 | 1,017.69 | 7.58 | 1.49% | |||||||||||||||||||||
| Royce Special Equity Fund | 1,000.00 | 1,075.18 | 7.27 | 1,000.00 | 1,018.20 | 7.07 | 1.39% | |||||||||||||||||||||
| Royce Total Return Fund | 1,000.00 | 1,068.76 | 7.77 | 1,000.00 | 1,017.69 | 7.58 | 1.49% | |||||||||||||||||||||
| Consultant Class | ||||||||||||||||||||||||||||
| Royce Dividend Value Fund | 1,000.00 | 1,071.92 | 10.91 | 1,000.00 | 1,014.67 | 10.61 | 2.09% | |||||||||||||||||||||
| Royce International Premier Fund | 1,000.00 | 1,101.74 | 11.50 | 1,000.00 | 1,014.27 | 11.02 | 2.17% | |||||||||||||||||||||
| Royce Micro-Cap Fund | 1,000.00 | 1,090.16 | 12.70 | 1,000.00 | 1,013.06 | 12.23 | 2.41% | |||||||||||||||||||||
| Royce Opportunity Fund | 1,000.00 | 1,102.16 | 12.61 | 1,000.00 | 1,013.21 | 12.08 | 2.38% | |||||||||||||||||||||
| Royce Pennsylvania Mutual Fund3 | 1,000.00 | 1,067.66 | 10.11 | 1,000.00 | 1,015.43 | 9.86 | 1.94% | |||||||||||||||||||||
| Royce Premier Fund | 1,000.00 | 1,093.04 | 11.87 | 1,000.00 | 1,013.86 | 11.42 | 2.25% | |||||||||||||||||||||
| Royce Small-Cap Value Fund | 1,000.00 | 1,078.45 | 12.84 | 1,000.00 | 1,012.85 | 12.43 | 2.45% | |||||||||||||||||||||
| Royce Smaller-Companies Growth Fund | 1,000.00 | 1,018.98 | 9.97 | 1,000.00 | 1,015.32 | 9.96 | 1.96% | |||||||||||||||||||||
| Royce Special Equity Fund | 1,000.00 | 1,070.07 | 11.74 | 1,000.00 | 1,013.86 | 11.42 | 2.25% | |||||||||||||||||||||
| Royce Total Return Fund | 1,000.00 | 1,065.00 | 11.35 | 1,000.00 | 1,014.22 | 11.07 | 2.18% | |||||||||||||||||||||
| 86 | The Royce Funds 2019 Annual Report to Shareholders |
| ACTUAL | HYPOTHETICAL (5% PER YEAR BEFORE EXPENSES) | |||||||||||||||||||||||||||
| Beginning Account Value 7/1/19 | Ending Account Value 12/31/19 | Expenses Paid During the Period1 | Beginning Account Value 7/1/19 | Ending Account Value 12/31/19 | Expenses Paid During the Period1 | Annualized Expense Ratio2 | ||||||||||||||||||||||
| Institutional Class | ||||||||||||||||||||||||||||
| Royce Dividend Value Fund | $ | 1,000.00 | $ | 1,076.42 | $ | 5.70 | $ | 1,000.00 | $ | 1,019.71 | $ | 5.55 | 1.09% | |||||||||||||||
| Royce Global Financial Services Fund | 1,000.00 | 1,068.30 | 7.77 | 1,000.00 | 1,017.69 | 7.58 | 1.49% | |||||||||||||||||||||
| Royce International Premier Fund | 1,000.00 | 1,107.62 | 5.52 | 1,000.00 | 1,019.96 | 5.30 | 1.04% | |||||||||||||||||||||
| Royce Opportunity Fund | 1,000.00 | 1,109.49 | 5.96 | 1,000.00 | 1,019.56 | 5.70 | 1.12% | |||||||||||||||||||||
| Royce Pennsylvania Mutual Fund | 1,000.00 | 1,073.52 | 4.70 | 1,000.00 | 1,020.67 | 4.58 | 0.90% | |||||||||||||||||||||
| Royce Premier Fund | 1,000.00 | 1,101.32 | 6.09 | 1,000.00 | 1,019.41 | 5.85 | 1.15% | |||||||||||||||||||||
| Royce Smaller-Companies Growth Fund | 1,000.00 | 1,023.14 | 6.17 | 1,000.00 | 1,019.11 | 6.16 | 1.21% | |||||||||||||||||||||
| Royce Special Equity Fund | 1,000.00 | 1,076.62 | 6.02 | 1,000.00 | 1,019.41 | 5.85 | 1.15% | |||||||||||||||||||||
| Royce Total Return Fund | 1,000.00 | 1,070.74 | 5.90 | 1,000.00 | 1,019.51 | 5.75 | 1.13% | |||||||||||||||||||||
| R Class | ||||||||||||||||||||||||||||
| Royce Opportunity Fund | 1,000.00 | 1,106.05 | 9.71 | 1,000.00 | 1,015.98 | 9.30 | 1.83% | |||||||||||||||||||||
| Royce Pennsylvania Mutual Fund | 1,000.00 | 1,070.07 | 9.03 | 1,000.00 | 1,016.48 | 8.79 | 1.73% | |||||||||||||||||||||
| Royce Premier Fund | 1,000.00 | 1,096.60 | 9.99 | 1,000.00 | 1,015.68 | 9.60 | 1.89% | |||||||||||||||||||||
| Royce Small-Cap Value Fund | 1,000.00 | 1,083.32 | 10.24 | 1,000.00 | 1,015.38 | 9.91 | 1.95% | |||||||||||||||||||||
| Royce Total Return Fund | 1,000.00 | 1,067.82 | 9.43 | 1,000.00 | 1,016.08 | 9.20 | 1.81% | |||||||||||||||||||||
| 1 | Expenses are equal to the Fund’s annualized expense ratio multiplied by the average account value for the period, multiplied by 184 days in the most recent fiscal half-year divided by 365 days (to reflect the half-year period). |
| 2 | Annualized expense ratio used to derive figures in the table is based on the most recent fiscal half-year. |
| 3 | GiftShare accounts pay an annual $50 trustee fee to Alliance Trust Company, as trustee. If these fees were included above, your costs would be higher. |
Federal Tax Information
In January 2020, taxable shareholders were mailed a Form 1099-DIV reporting the federal tax status of all distributions paid during the calendar year 2019.
2019 Supplemental Tax Information:
| FUND | % QDI | % U.S. GOVT INCOME | % INCOME QUALIFYING FOR DRD | LONG-TERM CAPITAL GAIN DISTRIBUTION OR MAXIMUM ALLOWABLE (OOO’S) | ||||||||||
| Royce Dividend Value Fund | 100.00 | % | N/A | 100.00 | % | $ | 13,669 | |||||||
| Royce Global Financial Services Fund | 100.00 | % | N/A | 100.00 | % | 339 | ||||||||
| Royce International Premier Fund | 100.00 | % | N/A | 0.00 | % | – | ||||||||
| Royce Micro-Cap Fund | 0.00 | % | N/A | 0.00 | % | 9,069 | ||||||||
| Royce Opportunity Fund | 0.00 | % | N/A | 0.00 | % | 14,462 | ||||||||
| Royce Pennsylvania Mutual Fund | 100.00 | % | N/A | 100.00 | % | 68,835 | ||||||||
| Royce Premier Fund | 100.00 | % | N/A | 100.00 | % | 316,227 | ||||||||
| Royce Small-Cap Value Fund | 59.28 | % | N/A | 100.00 | % | 3,384 | ||||||||
| Royce Smaller-Companies Growth Fund | 0.00 | % | N/A | 0.00 | % | 8,877 | ||||||||
| Royce Special Equity Fund | 100.00 | % | N/A | 100.00 | % | 105,052 | ||||||||
| Royce Total Return Fund | 100.00 | % | N/A | 100.00 | % | 117,116 | ||||||||
DEFINITIONS:
% QDI:Qualified Dividend Income; % of net investment income and/or short-term capital gains distributions that qualify for treatment at long-term capital gain rates.
% U.S. Govt Income: % of investment income paid from U.S. Government obligations.
% Income Qualifying for DRD: % of investment income eligible for the corporate dividend received deduction.
Foreign Tax Credit:
For the year ended December 31, 2019, Royce International Premier Fund had elected to pass through the credit for tax paid in foreign countries. The net foreign source income and foreign tax per share outstanding on the dividend distribution date are as follows:
| NET FOREIGN SOURCE INCOME | NET FOREIGN SOURCE INCOME PER SHARE | FOREIGN TAX | FOREIGN TAX PER SHARE |
| $4,782,560 | $0.0954 | $1,170,206 | $0.0233 |
The Royce Funds 2019 Annual Report to Shareholders | 87
All Trustees and Officers may be reached c/o The Royce Funds, 745 Fifth Avenue, New York, NY 10151
Charles M. Royce, Trustee1
Age: 80 | Number of Funds Overseen: 16 | Tenure: Since 1982
Non-Royce Directorships: Director of Oxford Square Capital Corp.
Principal Occupation(s) During Past Five Years: A member of the Board of Managers of Royce & Associates, LP (“Royce”), the Trust’s investment adviser; Chief Executive Officer (1972–June 2016), President (1972-June 2014) of Royce.
Christopher D. Clark, Trustee1, President
Age: 54 | Number of Funds Overseen: 16 | Tenure: Since 2014
Principal Occupation(s) During Past Five Years: Chief Executive Officer (since July 2016), President (since July 2014), Co-Chief Investment Officer (Since January 2014), Managing Director of Royce, a Member of the Board of Managers of Royce, having been employed by Royce since May 2007.
Patricia W. Chadwick, Trustee
Age: 71 | Number of Funds Overseen: 16 | Tenure: Since 2009
Non-Royce Directorships: Trustee of Voya Mutual Funds and Director of Wisconsin Energy Corp.
Principal Occupation(s) During Past 5 Years: Consultant and President of Ravengate Partners LLC (since 2000).
Christopher C. Grisanti, Trustee
Age: 58 | Number of Funds Overseen: 16 | Tenure: Since 2017
Non-Royce Directorships:None
Principal Occupation(s) During Past Five Years:Co-Founder and Chief Executive Officer of Grisanti Capital Management LLC, an investment advisory firm (since 1999). Mr. Grisanti’s prior business experience includes serving as Director of Research and Portfolio Manager at Spears Benzak, Salomon & Farrell (from 1994 to 1999) and a senior associate at the law firm of Simpson, Thacher & Bartlett (from 1988 to 1994).
Stephen L. Isaacs, Trustee2
Age: 80 | Number of Funds Overseen: 16 | Tenure: Since 1989
Non-Royce Directorships: None
Principal Occupation(s) During Past Five Years: Attorney and President of Health Policy Associates, Inc., consultants. Mr. Isaacs’s prior business experience includes having served as President of the Center for Health and Social Policy (from 1996 to 2012); Director of Columbia University Development Law and Policy Program and Professor at Columbia University (until August 1996).
Arthur S. Mehlman, Trustee
Age: 77 | Number of Funds Overseen: 36 | Tenure: Since 2004
Non-Royce Directorships: Director/Trustee of registered investment companies constituting the 19 Legg Mason Funds.
Principal Occupation(s) During Past Five Years: Director of The League for People with Disabilities, Inc.; Director of University of Maryland Foundation (non-profits). Formerly: Director of Municipal Mortgage & Equity, LLC (from October 2004 to April 1, 2011); Director of University of Maryland College Park Foundation (non-profit) (from 1998 to 2005); Partner, KPMG LLP (international accounting firm) (from 1972 to 2002); Director of Maryland Business Roundtable for Education (from July 1984 to June 2002).
David L. Meister, Trustee2
Age: 80 | Number of Funds Overseen: 16 | Tenure: Since 1982
Non-Royce Directorships: None
Principal Occupation(s) During Past Five Years: Consultant. Chairman and Chief Executive Officer of The Tennis Channel (from June 2000 to March 2005). Mr. Meister’s prior business experience includes having served as Chief Executive Officer of Seniorlife.com, a consultant to the communications industry, President of Financial News Network, Senior Vice President of HBO, President of Time-Life Films, and Head of Broadcasting for Major League Baseball.
G. Peter O’Brien, Trustee
Age: 73 | Number of Funds Overseen: 36 | Tenure: Since 2001
Non-Royce Directorships: Director/Trustee of registered investment companies constituting the 19 Legg Mason Funds.
Principal Occupation(s) During Past Five Years: Trustee Emeritus of Colgate University (since 2005); Board Member of Hill House, Inc. (since 1999); Formerly Director of TICC Capital Corp (from 2003-2017): Trustee of Colgate University (from 1996 to 2005), President of Hill House, Inc. (from 2001 to 2005) and Managing Director/Equity Capital Markets Group of Merrill Lynch & Co. (from 1971 to 1999).
Michael K. Shields, Trustee
Age: 61 | Number of Funds Overseen: 16 | Tenure: Since 2015
Principal Occupation(s) During Past Five Years: President and Chief Executive Officer of Piedmont Trust Company, a private North Carolina trust company (since May 2012). Mr. Shields’s prior business experience includes owning Shields Advisors, an investment consulting firm (from April 2010 to June 2012).
Francis D. Gannon, Vice President
Age: 52 | Tenure: Since 2014
Principal Occupation(s) During Past Five Years: Co-Chief Investment Officer (since January 2014) and Managing Director of Royce, having been employed by Royce since September 2006.
Daniel A. O’Byrne, Vice President
Age: 57 | Tenure: Since 1994
Principal Occupation(s) During Past Five Years: Principal and Vice President of Royce, having been employed by Royce since October 1986.
Peter K. Hoglund, Treasurer
Age: 53 | Tenure: Since 2015
Principal Occupation(s) During Past Five Years: Chief Financial Officer, Chief Administrative Officer, and Managing Director of Royce, having been employed by Royce since December 2014. Prior to joining Royce, Mr. Hoglund spent more than 20 years with Munder Capital Management in Birmingham, MI, serving as Managing Director and Chief Financial Officer and overseeing all financial aspects of the firm. He began his career at Munder as a portfolio manager.
John E. Denneen, Secretary and Chief Legal Officer
Age: 52 | Tenure: 1996-2001 and Since 2002
Principal Occupation(s) During Past Five Years: General Counsel, Managing Director, and, since June 2015, a Member of the Board of Managers of Royce. Chief Legal and Compliance Officer and Secretary of Royce.
Lisa Curcio, Chief Compliance Officer
Age: 60 | Tenure: Since 2004
Principal Occupation(s) During Past Five Years: Chief Compliance Officer of The Royce Funds (since October 2004) and Compliance Officer of Royce (since June 2004).
| 1 | Interested Trustee. |
| 2 | Retired effective December 31, 2019. |
Trustees will hold office until their successors have been duly elected and qualified or until their earlier resignation or removal. The Statement of Additional Information, which contains additional information about the Trust’s trustees and officers, is available and can be obtained without charge at www.royceinvest.com or by calling (800) 221-4268.
| 88 | The Royce Funds 2019 Annual Report to Shareholders |
Notes to Performance and Other Important Information
The thoughts expressed in this report concerning recent market movements and future prospects for small company stocks are solely the opinion of Royce at December 31, 2019, and, of course, historical market trends are not necessarily indicative of future market movements. Statements regarding the future prospects for particular securities held in the Funds’ portfolios and Royce’s investment intentions with respect to those securities reflect Royce’s opinions as of December 31, 2019 and are subject to change at any time without notice. There can be no assurance that securities mentioned in this report will be included in any Royce-managed portfolio in the future.
Sector weightings are determined using the Global Industry Classification Standard (“GICS”). GICS was developed by, and is the exclusive property of, Standard & Poor’s Financial Services LLC (“S&P”) and MSCI Inc. (“MSCI”). GICS is the trademark of S&P and MSCI. “Global Industry Classification Standard (GICS)” and “GICS Direct” are service marks of S&P and MSCI.
All indexes referred to are unmanaged and capitalization weighted. Each index’s returns include net reinvested dividends and/or interest income. Frank Russell Company (“Russell”) is the source and owner of the trademarks, service marks and copyrights related to the Russell Indexes. Russell® is a trademark of Frank Russell Company. Neither Russell nor its licensors accept any liability for any errors or omissions in the Russell Indexes and/or Russell ratings or underlying data and no party may rely on any Russell Indexes and/or Russell ratings and/or underlying data contained in this communication. No further distribution of Russell Data is permitted without Russell’s express written consent. Russell does not promote, sponsor or endorse the content of this communication. The Russell 2000 Index is an index of domestic small-cap stocks. It measures the performance of the 2,000 smallest publicly traded U.S. companies in the Russell 3000 Index. The Russell 2000 Value and Growth Indexes consist of the respective value and growth stocks within the Russell 2000 as determined by Russell Investments. The Russell 1000 Index is an index of domestic large-cap stocks. It measures the performance of the 1,000 largest publicly traded U.S. companies in the Russell 3000 Index. The Russell Microcap Index includes 1,000 of the smallest securities in the Russell 2000 Index, along with the next smallest eligible securities as determined by Russell. The Russell 2500 is an unmanaged, capitalization-weighted index of the 2,500 smallest publicly traded U.S. companies in the Russell 3000 index. The Russell Top 50 Mega Cap Index is an unmanaged, capitalization-weighted index of domestic mega-cap stocks that measures the performance of the 50 largest publicly traded U.S. companies in the Russell 3000 index. Source: MSCI. MSCI makes no express or implied warranties or representations and shall have no liability whatsoever with respect to any MSCI data contained herein. The MSCI data may not be further redistributed or used as a basis for other indexes or any securities or financial products. This report is not approved, endorsed, reviewed or produced by MSCI. None of the MSCI data is intended to constitute investment advice or a recommendation to make (or refrain from making) any kind of investment decision and may not be relied on as such. The MSCI ACWI Small Cap Index is an unmanaged, capitalization-weighted index of global small-cap stocks. The MSCI ACWI ex USA Small Cap Index is an unmanaged, capitalization-weighted index of global small-cap stocks, excluding the United States. The MSCI ACWI ex USA Large Cap Index is an unmanaged, capitalization-weighted index of global large-cap stocks, excluding the United States. The performance of an index does not represent exactly any particular investment, as you cannot invest directly in an index. Returns for the Russell market indexes used in this report were based on information supplied to Royce by Russell Investments. Royce has not independently verified the above described information. The ISM Manufacturing Index (ISM) monitors employment, production, inventories, new orders and supplier deliveries.
The Price-Earnings, or P/E, Ratio is calculated by dividing a company’s share price by its trailing 12-month earnings-per-share (EPS). The Price-to-Book, or P/B, Ratio is calculated by dividing a company’s share price by its book value per share. Standard deviation is a statistical measure within which a fund’s total returns have varied over time. The greater the standard deviation, the greater a fund’s volatility. The Morningstar Style Map uses proprietary scores of a stock’s value and growth characteristics to determine its placement in one of the five categories listed on the horizontal axis. These characteristics are then compared to those of other stocks within the same market capitalization band. Each is scored from zero to 100 for both value and growth attributes. The value score is subtracted from the growth score to determine the overall style score. For the vertical, market cap axis, Morningstar subdivides into size groups. Giant-cap stocks are defined as those that account for the top 40% of the capitalization of each style zone; large-cap stocks represent the next 30%; mid-cap stocks the next 20%; small-cap stocks the next 7%; micro-cap stocks the smallest 3%. Investments in securities of micro-cap, small-cap, and/or mid-cap companies may involve considerably more risk than investments in securities of larger-cap companies. (Please see “Primary Risks for Fund Investors” in the prospectus.) Investments in foreign securities, which generally may involve political, economic, currency, and other risks not encountered in U.S. investments. (Please see “Investing in Foreign Securities” in the prospectus.) A Fund that invests a significant portion of its assets in a limited number of stocks may be subject to considerably more risk than a more broadly diversified Fund because a decline in the value of any of these stocks would cause that Fund’s overall value to decline to a greater degree. A broadly diversified portfolio does not, however, ensure a profit for a Fund or guarantee against loss. Please read the prospectus carefully before investing or sending money. A copy of the Funds’ current prospectus and Statement of Additional Information may be obtained by calling (800) 221-4268 or by visiting www.royceinvest.com. All publicly released material Fund information is disclosed by the Funds on their website at www.royceinvest.com. The Royce Funds is a service mark of The Royce Funds. Distributor: Royce Fund Services, LLC.
Forward-Looking Statements
This material contains forward-looking statements within the meaning of the Securities Exchange Act of 1934, as amended (the “Exchange Act”), that involve risks and uncertainties, including, among others, statements as to:
| • | the Funds’ future operating results, |
| • | the prospects of the Funds’ portfolio companies, |
| • | the impact of investments that the Funds have made or may make, the dependence of the Funds’ future success on the general economy and its impact on the companies and industries in which the Funds invest, and |
| • | the ability of the Funds’ portfolio companies to achieve their objectives. |
This review and report use words such as “anticipates,” “believes,” “expects,” “future,” “intends,” and similar expressions to identify forward-looking statements. Actual results may differ materially from those projected in the forward-looking statements for any reason.
The Royce Funds have based the forward-looking statements included in this review and report on information available to us on the date of the report, and we assume no obligation to update any such forward-looking statements. Although The Royce Funds undertake no obligation to revise or update any forward-looking statements, whether as a result of new information, future events, or otherwise, you are advised to consult any additional disclosures that we may make through future shareholder communications or reports.
Disclosure of Portfolio Holdings
The Funds’ complete portfolio holdings are also available on Exhibit F to Form N-PORT, which filings are made with the SEC within 60 days of the end of the first and third fiscal quarters. The Funds’ Form N-PORT filings are available on the SEC’s website at http://www.sec.gov.
The Royce Funds 2019 Annual Report to Shareholders | 89
| About Royce Investment Partners | Contact Us | |||
Unparalleled Knowledge + Experience | GENERAL INFORMATION | |||
| Pioneers in small-cap investing, with 45+ years | General Royce Funds information including: | |||
| of experience, depth of knowledge, and focus. | ● How to open an account | |||
| ● An overview of our firm and Funds | ||||
| Independent Thinking | ● Ordering literature including Prospectuses | |||
| The confidence to go against consensus, the insight | (800) 221-4268 | |||
| to uncover opportunities others might miss, and the | ||||
| tenacity to stay the course through market cycles. | ACCOUNT INFORMATION | |||
| Speak with a representative about: | ||||
| Specialized Approaches | ● Your account, transactions, and forms | |||
| U.S., international, and global investment strategies | (800) 841-1180 | |||
| that pursue approaches with different risk profiles. | ||||
| FINANCIAL ADVISORS, CONSULTANTS, | ||||
| Unwavering Commitment | AND INSTITUTIONS | |||
| Our team of 17 portfolio managers has significant | Speak with your regional Royce contact regarding: | |||
| personal investments in the strategies they manage. | ● Scheduling a meeting or call | |||
| ● Information about our firm, strategies, and funds | ||||
| ● Resources for financial professionals, such as portfolio attribution reports | ||||
| (800) 337-6923 | ||||
| AUTOMATED ACCOUNT INFORMATION | ||||
| 24-hour Automated Telephone Service | ||||
| (800) 787-6923 | ||||
 |  | |||
OE-REP-1219 | ||||
Item 2. Code(s) of Ethics. As of the end of the period covered by this report, the Registrant had adopted a code of ethics, as defined in Item 2 of Form N-CSR, applicable to its principal executive officer, principal financial officer, principal accounting officer or controller, or persons performing similar functions. A copy of this code of ethics is filed as an exhibit to this Form N-CSR. No substantive amendments were approved or waivers were granted to this code of ethics during the period covered by this report.
Item 3. Audit Committee Financial Expert.
(a)(1) | The Board of Trustees of the Registrant has determined that it has an audit committee financial expert. |
(a)(2) | Arthur S. Mehlman and Patricia W. Chadwick were designated by the Board of Trustees as the Registrant’s Audit Committee Financial Experts, effective April 15, 2004 and April 8, 2010, respectively. Mr. Mehlman and Ms. Chadwick are “independent” as defined under Item 3 of Form N-CSR. |
Item 4. Principal Accountant Fees and Services.
(a) | Audit Fees: |
Year ended December 31, 2019 - $297,369
Year ended December 31, 2018 - $364,841
(b) | Audit-Related Fees: |
Year ended December 31, 2019 - $0
Year ended December 31, 2018 - $0
(c) | Tax Fees: |
Year ended December 31, 2019 - $160,058 – Preparation of tax returns and excise tax review
Year ended December 31, 2018 - $165,420 – Preparation of tax returns and excise tax review
(d) | All Other Fees: |
Year ended December 31, 2019 - $0
Year ended December 31, 2018 - $0
(e)(1) Annual Pre-Approval: On an annual basis, the Registrant’s independent auditor submits to the Audit Committee a schedule of proposed audit, audit-related, tax and other non-audit services to be rendered to the Registrant and/or investment adviser(s) for the following year that require pre-approval by the Audit Committee. This schedule provides a description of each type of service that is expected to require pre-approval and the maximum fees that can be paid for each such service without further Audit Committee approval. The Audit Committee then reviews and determines whether to approve the types of scheduled services and the projected fees for them. Any subsequent revision to already pre-approved services or fees (including fee increases) are presented for consideration at the next regularly scheduled Audit Committee meeting, as needed.
If subsequent to the annual pre-approval of services and fees by the Audit Committee, the Registrant or one of its affiliates determines that it would like to engage the Registrant’s independent auditor to perform a service not already pre-approved, the request is to be submitted to the Registrant’s Chief Financial Officer, and if he or she determines that the service fits within the independence guidelines (e.g., it is not a prohibited service), he or she will then arrange for a discussion of the proposed service and fee to be included on the agenda for the next regularly scheduled Audit Committee meeting so that pre-approval can be considered.
Interim Pre-Approval: If, in the judgment of the Registrant’s Chief Financial Officer, a proposed engagement needs to commence before the next regularly scheduled Audit Committee meeting, he or she shall submit a written summary of the proposed engagement to all members of the Audit Committee, outlining the services, the estimated maximum cost, the category of the services (e.g., audit, audit-related, tax or other) and the rationale for engaging the Registrant’s independent auditor to perform the services. To the extent the proposed engagement involves audit, audit-related or tax services, any individual member of the Audit Committee who is an independent Board member is authorized to pre-approve the engagement. To the extent the proposed engagement involves non-audit services other than audit-related or tax, the Chairman of the Audit Committee is authorized to pre-approve the engagement. The Registrant’s Chief Financial Officer will arrange for this interim review and coordinate with the appropriate member(s) of the Committee. The independent auditor may not commence the engagement under consideration until the Registrant’s Chief Financial Officer has informed the auditor in writing that pre-approval has been obtained from the Audit Committee or an individual member who is an independent Board member. The member of the Audit Committee who pre-approves any engagements in between regularly scheduled Audit Committee meetings is to report, for informational purposes only, any pre-approval decisions to the Audit Committee at its next regularly scheduled meeting.
1
| (e)(2) | Not Applicable |
| (f) | Not Applicable |
| (g) | Year ended December 31, 2019 - $160,058 |
Year ended December 31, 2018 - $165,420
| (h) | No such services were rendered during 2019 or 2018. |
Item 5. Audit Committee of Listed Registrants. Not Applicable.
Item 6. Investments.
(a) See Item 1.
(b) Not Applicable
Item 7. Disclosure of Proxy Voting Policies and Procedures for Closed-End Management Investment Companies. Not Applicable.
Item 8. Portfolio Managers of Closed-End Management Investment Companies. Not Applicable.
Item 9. Purchases of Equity Securities by Closed-End Management Investment Company and Affiliated Purchasers. Not Applicable
Item 10. Submission of Matters to a Vote of Security Holders. Not Applicable.
Item 11. Controls and Procedures.
(a) Disclosure Controls and Procedures. The Principal Executive and Financial Officers concluded that the Registrant’s Disclosure Controls and Procedures are effective based on their evaluation of the Disclosure Controls and Procedures as of a date within 90 days of the filing date of this report.
(b) Internal Control over Financial Reporting. There were no significant changes in Registrant’s internal control over financial reporting or in other factors that could significantly affect this control subsequent to the date of the evaluation, including any corrective actions with regard to significant deficiencies and material weaknesses during the second fiscal quarter of the period covered by this report.
2
Item 12. Exhibits. Attached hereto.
(a)(1) The Registrant’s code of ethics pursuant to Item 2 of Form N-CSR.
(a)(2) Separate certifications by the Registrant’s Principal Executive Officer and Principal Financial Officer as required by Rule 30a-2(a) under the Investment Company Act of 1940.
(a)(3) Not Applicable
(b) Separate certifications by the Registrant’s Principal Executive Officer and Principal Financial Officer, pursuant to Section 906 of the Sarbanes-Oxley Act of 2002 and required by Rule 30a-2(b) under the Investment Company Act of 1940.
Pursuant to the requirements of the Securities Exchange Act of 1934 and the Investment Company Act of 1940, the registrant has duly caused this report to be signed on its behalf by the undersigned, thereunto duly authorized.
THE ROYCE FUND | ||
|
| |
BY: | /s/ Christopher D. Clark | |
| Christopher D. Clark | |
| President | |
Date: February 28, 2020
Pursuant to the requirements of the Securities Exchange Act of 1934 and the Investment Company Act of 1940, this report has been signed below by the following persons on behalf of the registrant and in the capacities and on the dates indicated.
| THE ROYCE FUND | THE ROYCE FUND | |||
| BY: | /s/ Christopher D. Clark | BY: | /s/ Peter K. Hoglund | |
| Christopher D. Clark | Peter K. Hoglund | |||
| President | Treasurer | |||
| ||||
| Date: February 28, 2020 | Date: February 28, 2020 | |||
3