UNITED STATES
SECURITIES AND EXCHANGE COMMISSION
Washington, D.C. 20549
FORM N-CSR
CERTIFIED SHAREHOLDER REPORT
OF
REGISTERED MANAGEMENT INVESTMENT COMPANIES
Investment Company Act File Number: 811-03599
Name of Registrant: The Royce Fund
Address of Registrant: 745 Fifth Avenue
New York, NY 10151
| Name and address of agent for service: | John E. Denneen, Esquire | |
| 745 Fifth Avenue | ||
| New York, NY 10151 |
Registrant’s telephone number, including area code: (212) 508-4500
Date of fiscal year end: December 31
Date of reporting period: January 1, 2018 - December 31, 2018
Item 1. Reports to Shareholders.
 |
| DECEMBER 31, 2018 | ||
| 2018 Annual | ||
| Review and Report to Shareholders | ||
| Royce Dividend Value Fund | |||
| Royce Global Financial Services Fund | |||
| Royce International Premier Fund | |||
| Royce Low-Priced Stock Fund | |||
| Royce Micro-Cap Fund | |||
| Royce Micro-Cap Opportunity Fund | |||
| Royce Opportunity Fund | |||
| Royce Pennsylvania Mutual Fund | |||
| Royce Premier Fund | |||
| Royce Small-Cap Leaders Fund | |||
| Royce Small-Cap Value Fund | |||
| Royce Small/Mid-Cap Premier Fund | |||
| Royce Smaller-Companies Growth Fund | |||
| Royce Special Equity Fund | |||
| Royce Special Equity Multi-Cap Fund | |||
| Royce Total Return Fund | |||
| Beginning on January 1, 2021, as permitted by regulations adopted by the U.S. Securities and Exchange Commission, paper copies of the Funds’ shareholder reports like this one will no longer be sent by mail, unless you specifically request paper copies of the reports from the Funds or from your financial intermediary (such as a broker-dealer or bank). Instead, the reports will be made available on the Funds’ website (www.roycefunds.com), and you will be notified by mail each time a report is posted and provided with a website link to access the report. If you already elected to receive shareholder reports electronically, you will not be affected by this change and you need not take any action. You may elect to receive shareholder reports and other communications from the Funds electronically anytime by contacting your financial intermediary or, if you are a direct investor with the Funds, by calling 1-800-841-1180. Beginning on January 1, 2019, you may elect to receive all future reports in paper free of charge. If you invest through a financial intermediary, you can contact your financial intermediary to request that you continue to receive paper copies of your shareholder reports. If you invest directly with the Funds, you can call 1-800-841-1180 to let the Funds know you wish to continue receiving paper copies of your shareholder reports. Your election to receive reports in paper will apply to all Funds held in your account if you invest through your financial intermediary or all Funds held with our fund complex if you invest directly with the Funds. | |||
| roycefunds.com |  | ||
| Table of Contents | |||
| Annual Review | |||
| Letter to Our Shareholders | 2 | ||
| Performance and Expenses | 6 | ||
| The Royce Funds and Rolling Returns | 7 | ||
| Annual Report to Shareholders | |||
| Managers’ Discussions of Fund Performance | |||
Royce Dividend Value Fund | 8 | ||
Royce Global Financial Services Fund | 10 | ||
Royce International Premier Fund | 12 | ||
Royce Low-Priced Stock Fund | 14 | ||
Royce Micro-Cap Fund | 16 | ||
Royce Micro-Cap Opportunity Fund | 18 | ||
Royce Opportunity Fund | 20 | ||
Royce Pennsylvania Mutual Fund | 22 | ||
Royce Premier Fund | 24 | ||
Royce Small-Cap Leaders Fund | 26 | ||
Royce Small-Cap Value Fund | 28 | ||
Royce Small/Mid-Cap Premier Fund | 30 | ||
Royce Smaller-Companies Growth Fund | 32 | ||
Royce Special Equity Fund | 34 | ||
Royce Special Equity Multi-Cap Fund | 36 | ||
Royce Total Return Fund | 38 | ||
| Schedules of Investments and Financial Statements | 40 | ||
| Notes to Financial Statements | 96 | ||
| Report of Independent Registered Public Accounting Firm | 112 | ||
| Understanding Your Fund’s Expenses | 113 | ||
| Trustees and Officers | 116 | ||
| Notes to Performance and Other Important Information | 117 |

| This page is not part of the 2018 Annual Report to Shareholders | 1 |
Letter to Our Shareholders
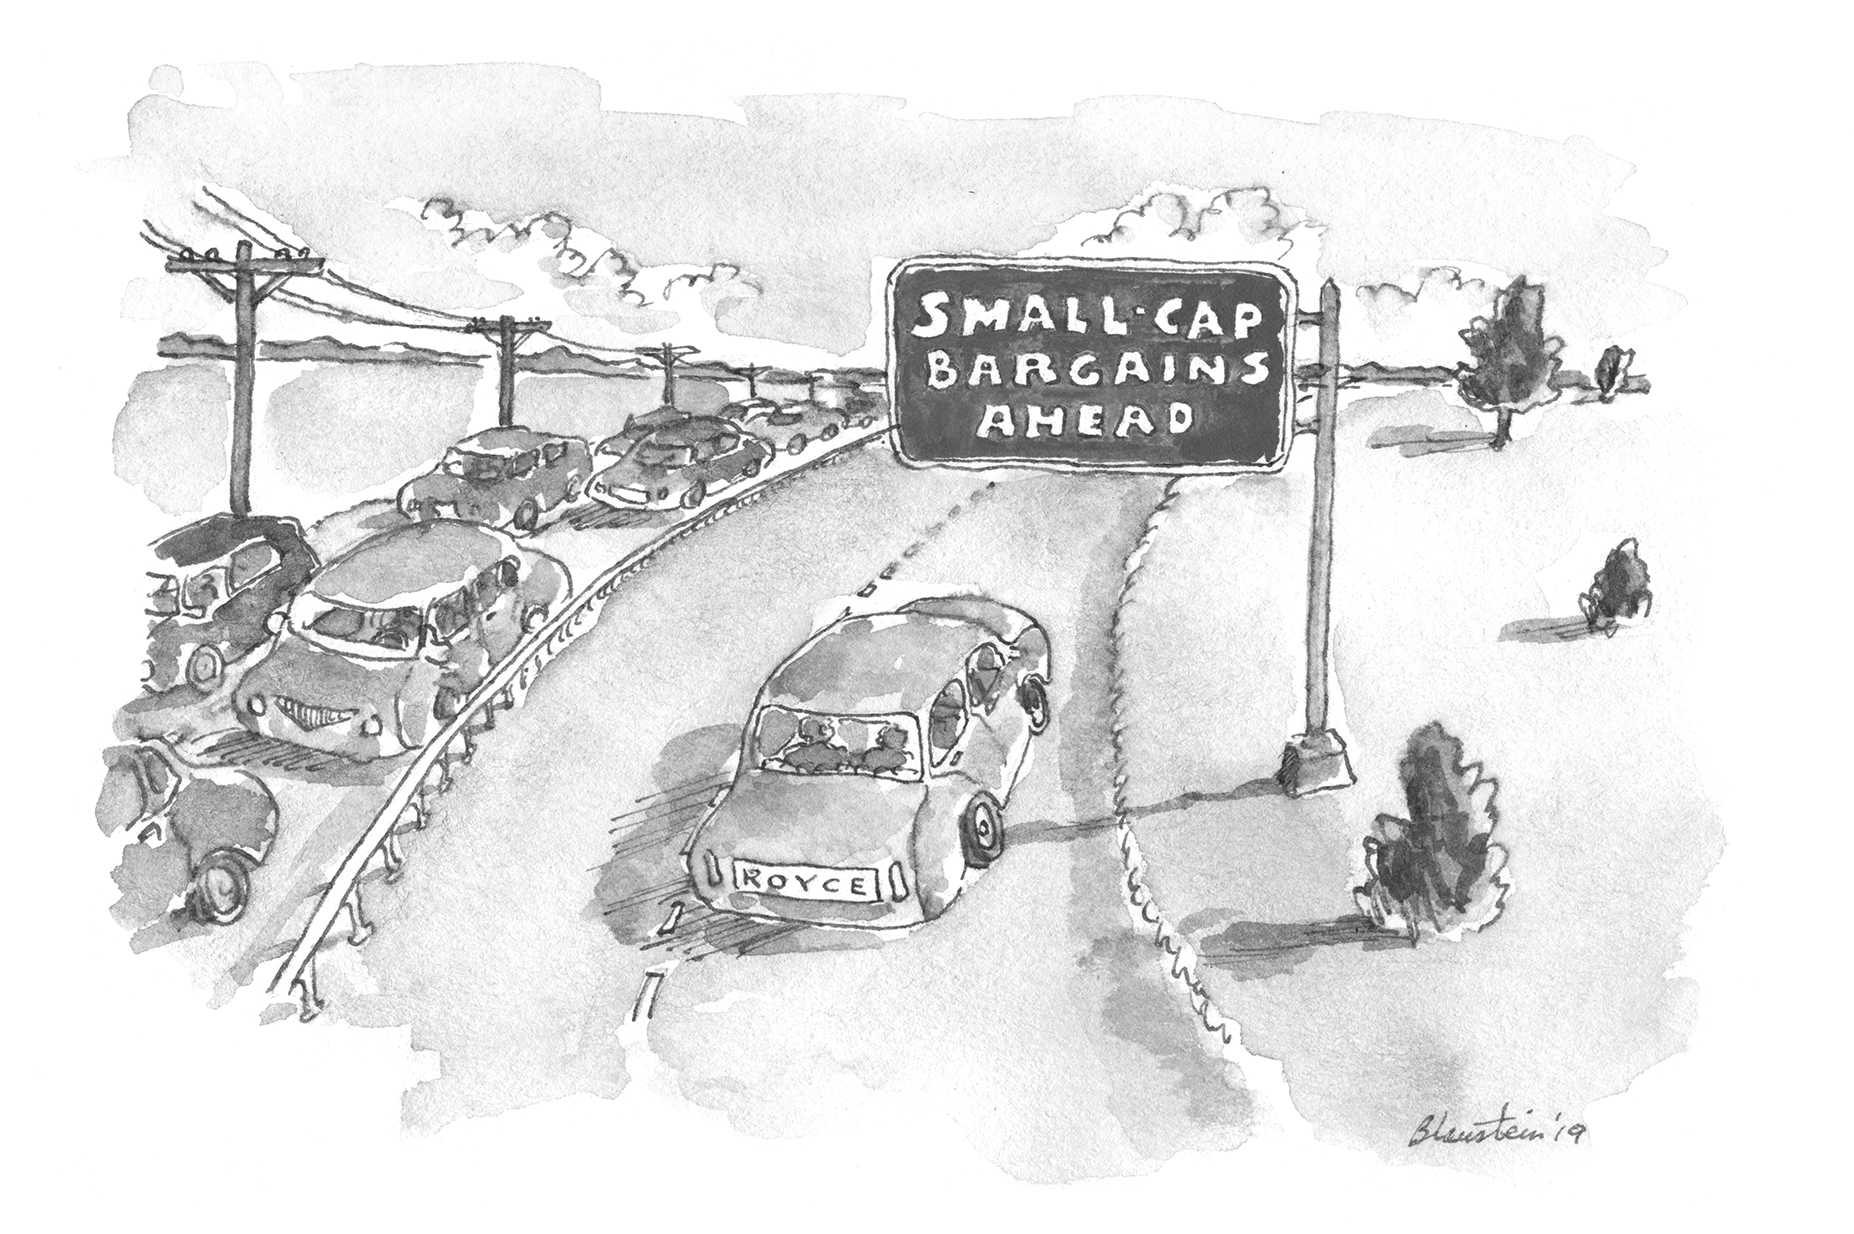
| This was quite a memorable year for the equity markets—for reasons most investors would prefer to forget. A bull market ended with a bang that left many investors whimpering. Of course, the end of any upswing for share prices is bound to be disappointing—what made this pullback so jarring was its speed and severity. Back in the summer, everyone seemed to agree that valuations were stretched to the point where an adjustment to prices was all but inevitable, yet the force of the decline felt more like the engine of a precision-engineered sports car suddenly seizing than the anticipated tapping of the brakes. So while 2018’s downturn initially looked as if it would assume a place among the most predicted in history, no one, including us, was expecting a fall as steep and fast as this one has been. It has also, however, performed the role down markets do—which is to provide active managers with an ample supply of potential long-term opportunities. Part of the reason the jolt was so unexpected may be due to the placid nature of the bull market it wrenched to a stop. For much of 2018, the U.S. market cruised confidently ahead, with very little congestion and few potholes. Through the first three quarters of the year, volatility barely registered in the small-cap market, with only 22% of the trading days having intraday moves of at least 1% in the small-cap Russell 2000 Index (and our chosen asset class has |
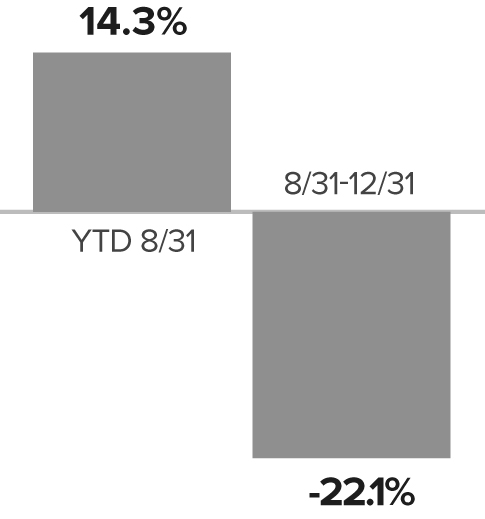
| historically been the most volatile precinct of the equity world). Of course, this all changed dramatically later in the year. For small-caps, it began after the Russell 2000 reached an all-time high on August 31, following which a wave of volatility hit. In the fourth quarter, 54% of the trading days for the Russell 2000 had intraday moves of at least 1%. The volatility itself would have perhaps been more bearable if it had not also taken returns in the year’s last three months from ‘bad’ to ‘historically awful’—the Russell 2000 fell 20.2% for the fourth quarter. Its worst month by far was December. In fact, the first few months of the corrective phase had enough push and pull that the year-to-date return at the end of November for the Russell 2000 was 1.0%. From our perspective, then, the downturn had two phases—the first was the widely expected recalibration from late August through mid-December. The second was a blur of panic selling between December 12th and 24th. Losses mounted as the gentler descent of the initial stage gave way to a wild downhill. The markets careened down the slope at breakneck speed as the calendar approached year-end, with small-caps reaching a 2018 bottom on Christmas Eve before stabilizing over the next week, giving the Russell 2000 a loss of 11.9% for December. In the context of its 11.0% decline for calendar 2018, it may be easy to forget that year-to-date through August 31, the Russell 2000 was up 14.3%. |
| 2 | This page is not part of the 2018 Annual Report to Shareholders |
LETTER TO OUR SHAREHOLDERS
| A Tale of Two Markets Russell 2000 2018 |
 |
| So 2018 was truly A Tale of Two Markets, and offered yet another lesson from history that the market can—and often does—turn in a hurry. For an additional sense of the tumult and—we want to stress again—the opportunities the correction created, consider that the average stock in the Russell 2000 declined 37.2% from its previous 52-week high through year-end. Many declined more than that: energy stocks in the Russell 2000 fell more than 50%, materials slid 42.5%, and transportation was down 42.3% from their respective highs. |
| “WHAT JUST HAPPENED?” |
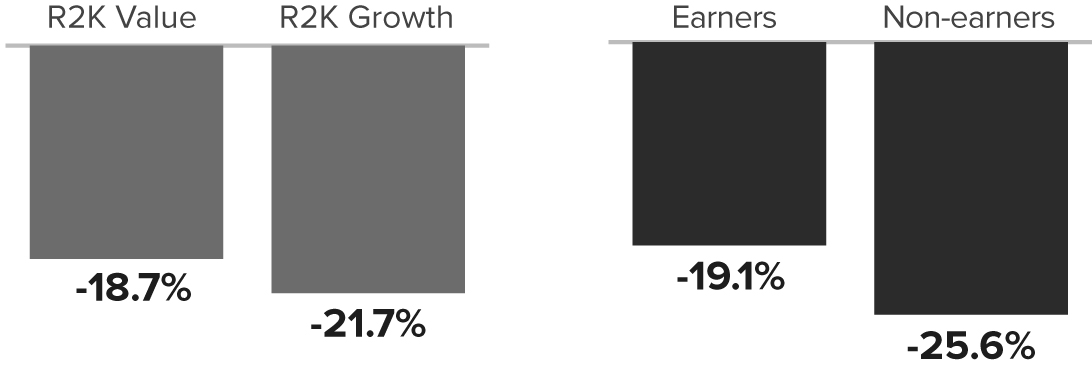
| Retrospect offers the opportunity to look at the contour of the correction and at the confluence of factors that may have led to and exacerbated it. In spite of its historic awfulness, the downturn displayed some familiar traits: small-caps lost more than large-caps, for example, which is consistent with most bear markets, as is the fact that small-caps entered ‘classic’ bear market territory before their larger counterparts. (By a ‘classic’ bear, we mean a decline of 20% or more from a previous peak—the Russell 2000 lost 22.1% from 8/31/18-12/31/18.) Within small-cap, we also saw value beat growth, dividend payers lose less than non-payers, earners hold up better than non-earners, and defensives outpace cyclicals. All of this is also essentially consistent with history, which was reassuring (though painful in the short run). |
| Identifying this mix of the familiar and the unexpected helps to shed light on the question of what drove shares down in such |
| A Familiar Pattern in 4Q18 Decline |
| precipitous fashion, turning what at first looked like a historically typical bull market detour into the bear market ditch. First, there was the by-now familiar cloud of tariffs and trade wars looming over the market, arguably the major factor in underperformance for economically sensitive cyclical stocks in 2018. Oil prices began to collapse in October, while shortly afterward slowdowns were reported in both housing and auto sales. Consumer confidence began to dip, and Europe and China continued to weaken. Yet all of this was, if not old news, then at least well established news by the end of November. Moreover, much of the economic news in the U.S. remained positive. Job and wage gain growth remained robust (as they continue to do as of this writing) as did corporate profits. In mid-December, however, other factors came into play that helped to bring the witches’ brew to a boil. Investors looked at the coincidence of a flattening yield curve and the abrupt drop in oil prices as a surefire recession warning. Ratcheting up the already high level of anxiety, the December Fed meeting announcement and subsequent press conference were widely seen as conveying an unhealthy detachment from current financial conditions, which exacerbated the downward spiral. This is how ‘bad’ became ‘worse.’ A SENSE OF WHERE WE ARE A month into 2019, which featured a welcome rally that recovered most of December’s losses, the signals remain decidedly mixed. The PMI (Purchasing Managers’ Index) report for December issued in early January perhaps best distills the mixed, if not confusing, state of play in the U.S. economy. The report is designed to show the health of the manufacturing and service sectors. The index hit a 15-month low in December, which is admittedly concerning, especially given the marked fall-off from November. However, of its 18 manufacturing sectors, 11 showed growth in December. Additionally, the 54.1% number reported for that month was comfortably in the range of a growing economy because any number north of 50% typically indicates growth. Even with the uncertain course of U.S. growth, it seems clear to us that in 2018 many investors reacted as if the economy has only two gears—forward and reverse. |
| This page is not part of the 2018 Annual Report to Shareholders | 3 |
| We see a more nuanced picture that’s closer to the midpoint of these extremes. The economy looks essentially healthy and capable of expansion to us, though probably at a slower pace than we saw over the last two years. There are undoubtedly risks on the horizon—political, financial, and economic. Yet we believe that these have already been reflected, in some cases excessively so, in current small-cap valuations. The market shifted in short order from a period when small-cap’s extended valuations seemed out of sync in light of the index’s high levels of debt and low profitability, to one at the end of the year when valuations reflected more pessimism than we think is warranted—at least in select instances. |
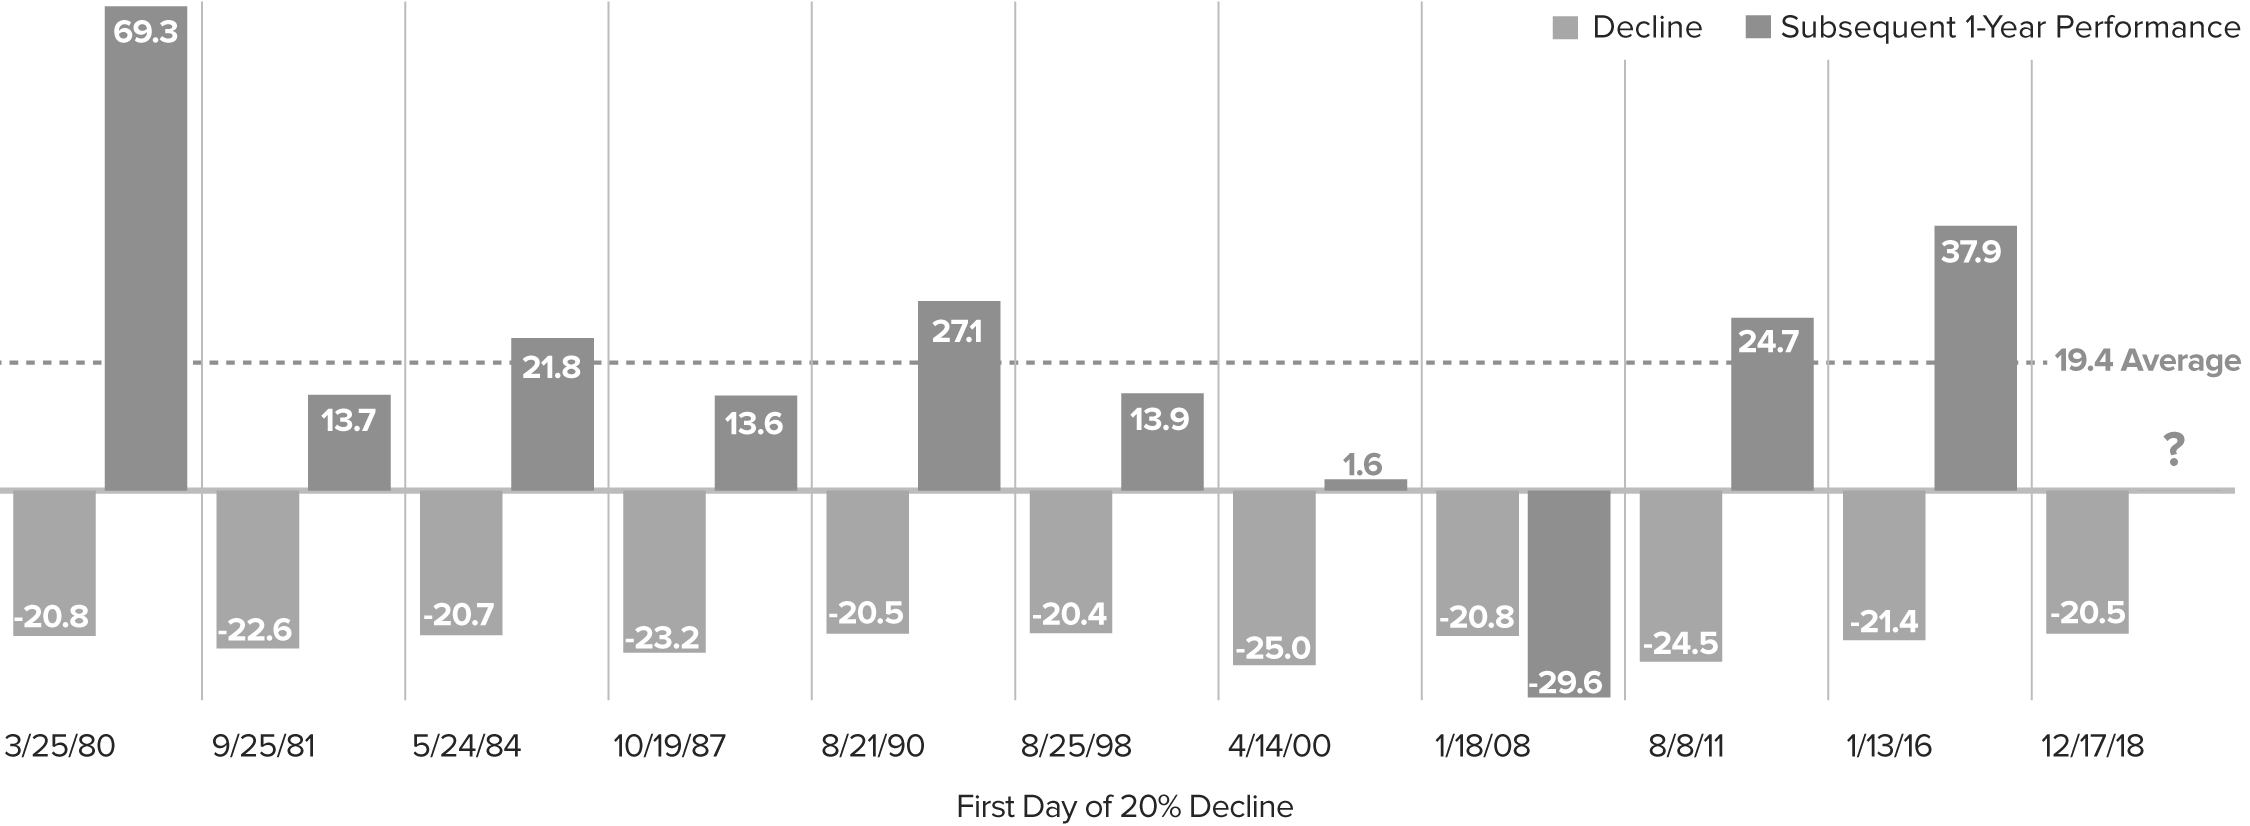
| THE LESSONS OF HISTORY We examined the recent bear phase from a calendar-year and market cycle perspective and uncovered encouraging data. First, 2018 was the twelfth negative calendar year in the 40-year history of the Russell 2000. In 10 of the previous 11 years, a positive calendar-year return followed—with an average one-year return of 21.1%. (Unsurprisingly, the lone exception was 2007-08.) Turning to market cycles also shows compelling positive news. 2018 saw the eleventh decline of 20% or more from a previous small-cap peak. In nine of the previous 10 periods, the subsequent average one-year return from the first day on which the index declined 20% from its peak was a positive 19.4%. (The exception, again unsurprisingly, came in 2008-09.) These historical examples certainly suggest the possibility of a solid 2019. |
| Historical Comparison CRSP 6-10 Declines and Subsequent 12-Month Performance |

| To be sure, our belief is that we are a long way from the crisis era of a decade ago. We are also in a stronger position economically than we were in the two prior bear markets in 2011-12 or 2015-16. In fact, we see the closest historical parallels farther back. In our view, 1987 or 1962 are the more relevant comparisons—two cases in which the markets experienced a deep decline before recovering in the midst of a still growing economy. Moreover, we also see little resemblance between the present and prior bearish periods such as 1998, 2001-02, or 2008-09, when there were more than enough reasons for investors to sell in the form of financial crises and/or recessions (while contrarians like us were casting about for opportunities). It’s worth emphasizing that the only decline over the last 10-plus years that featured both a recession and a financial crisis was 2008-09. Unless investors are expecting something in the way of a repeat performance—and we are obviously not—history suggests this may be a good time to consider committing more money to small-caps. |
| After the Bear Market, Then What? Subsequent 1-Year Performance of Russell 2000 after a 20% Decline as of 12/31/18 |
| 4 | This page is not part of the 2018 Annual Report to Shareholders |
LETTER TO OUR SHAREHOLDERS
| A DELIBERATE PACE ON THE ROAD TO NORMAL |
| We would, however, add a note or two mixing intermediate-term caution for the small-cap market with long-term optimism for small-cap active management. 2019 may well be a terrific year for small-cap performance, particularly if January is any kind of bellwether. However, we suspect that annualized small-cap returns over the next three to five years may be in the mid to high single digits. From our perspective as disciplined small-cap specialists, this is not necessarily bad news. Lower-than-average returns for the Russell 2000 have historically benefited active management approaches, including a number of our own strategies, especially coming out of periods of deep pessimism such as we saw late in 2018, when investors often miss the long-term opportunities falling markets create. We also believe that the long and winding road back to more normal terrain for the capital markets will be marked by three occurrences: a normalizing rate structure, with rates moving higher, resulting in a steepening yield curve; more historically average levels of volatility (which was higher in 2018 than it was over the previous two years); and the more historically typical returns that we mentioned above. All three of these market conditions have been supportive for small-cap active management in the past. The overall state of small-cap, however, still has several unresolved issues. Of the three that worried us most about the Russell 2000 over the summer—lofty valuations, many companies with barely manageable debt, and too many with no earnings—only the first is no longer a pressing matter. We think that the fundamentals we value most—such as high returns on invested capital, positive cash flow, and an identifiable catalyst (or two) for earnings growth or recovery—should be rewarded in the coming market environment, as they have often been over the long term. |
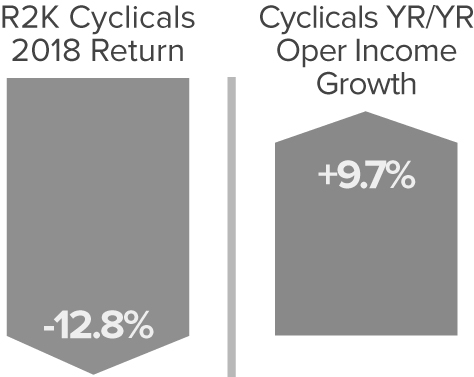
| IDENTIFYING OPPORTUNITIES IN A VOLATILE CLIMATE In all of our strategies, we’ve been working to take advantage of long-term buying opportunities across a broad spectrum of sectors and industries. This includes companies involved in energy services, RV parts, infrastructure, laser-based photonics, shipping, trucking, banking, outpatient healthcare facilities that bend the cost curve, and semiconductor capital equipment, to name just a few. Within our high-quality strategies, we’ve also been buying more of the companies that we know best, those in which we have the highest confidence, because of their demonstrated ability to deal effectively with adversity in previous down markets. Within these cyclical sectors, especially in the broad industrial and technology spaces, there are diverse industry groups with distinct business cycle dynamics. Each responds to multiple company- or industry-specific factors that help to determine performance as a business—they seldom march in lockstep. That diversity is very attractive to us as selective active managers. So while there’s no question that we were incorrect in thinking that investors would more readily recognize and then close the gap between operating income and stock prices, we think that many small-cap cyclical companies were disproportionately punished in the downturn to the point where many look as if a recession has already been priced in—which makes them even more attractive to us. |
| Cyclical Market Disconnect |
| Across each of our small-cap strategies, we are confident in our holdings, which generally possess some combination of solid cash flows, modest valuations, effective managements, and encouraging prospects. These are the businesses that look most likely to weather or even thrive in a period with even more volatility and uncertainty than usual. |
| Sincerely, |
 |  |  | ||
| Charles M. Royce | Christopher D. Clark | Francis D. Gannon | ||
| Chairman, | Chief Executive Officer, and | Co-Chief Investment Officer, | ||
| Royce & Associates, LP | Co-Chief Investment Officer, | Royce & Associates, LP | ||
| Royce & Associates, LP | ||||
| January 31, 2019 |
| This page is not part of the 2018 Annual Report to Shareholders | 5 |
Performance and Expenses
| Performance and Expenses | |||||||||||||||||||||
| ANNUAL OPERATING EXPENSES (%) | |||||||||||||||||||||
| 1-YR | 5-YR | 10-YR | 15-YR | 20-YR | 45-YR/SINCE INCEPTION | INCEPTION DATE | GROSS | NET | |||||||||||||
| Royce Dividend Value Fund | -16.24 | 1.81 | 11.08 | N/A | N/A | 7.40 | 5/3/04 | 1.39 | 1.34 | ||||||||||||
| Royce Global Financial Services Fund | -13.41 | 3.37 | 10.88 | 7.07 | N/A | 7.07 | 12/31/03 | 1.77 | 1.58 | ||||||||||||
| Royce International Premier Fund | -12.76 | 5.18 | N/A | N/A | N/A | 5.76 | 12/31/10 | 1.65 | 1.44 | ||||||||||||
| Royce Low-Priced Stock Fund | -9.31 | -0.01 | 7.36 | 4.64 | 8.15 | 9.22 | 12/15/93 | 1.61 | 1.58 | ||||||||||||
| Royce Micro-Cap Fund | -8.94 | -0.91 | 8.34 | 5.47 | 8.16 | 10.03 | 12/31/91 | 1.60 | 1.58 | ||||||||||||
| Royce Micro-Cap Opportunity Fund | -14.01 | 1.23 | N/A | N/A | N/A | 10.14 | 8/31/10 | 1.28 | 1.24 | ||||||||||||
| Royce Opportunity Fund | -19.97 | 1.73 | 13.73 | 7.14 | 10.61 | 10.98 | 11/19/96 | 1.18 | 1.18 | ||||||||||||
| Royce Pennsylvania Mutual Fund | -9.66 | 3.15 | 11.34 | 7.71 | 9.15 | 13.20 | N/A | 0.92 | 0.92 | ||||||||||||
| Royce Premier Fund | -10.40 | 4.03 | 11.23 | 9.04 | 9.99 | 11.02 | 12/31/91 | 1.16 | 1.16 | ||||||||||||
| Royce Small-Cap Leaders Fund | -12.72 | 0.42 | 9.15 | 7.68 | N/A | 8.12 | 6/30/03 | 1.59 | 1.49 | ||||||||||||
| Royce Small-Cap Value Fund | -7.17 | 0.92 | 9.39 | 7.60 | N/A | 8.56 | 6/14/01 | 1.51 | 1.49 | ||||||||||||
| Royce Small/Mid-Cap Premier Fund | -15.16 | 2.29 | 10.96 | 7.43 | 9.61 | 11.35 | 12/27/95 | 1.32 | 1.32 | ||||||||||||
| Royce Smaller-Companies Growth Fund | -10.22 | 3.36 | 10.63 | 7.34 | N/A | 10.07 | 6/14/01 | 1.49 | 1.49 | ||||||||||||
| Royce Special Equity Fund | -9.86 | 2.64 | 10.08 | 7.18 | 9.11 | 8.43 | 5/1/98 | 1.17 | 1.17 | ||||||||||||
| Royce Special Equity Multi-Cap Fund | -10.57 | 2.06 | N/A | N/A | N/A | 7.67 | 12/31/10 | 1.39 | 1.24 | ||||||||||||
| Royce Total Return Fund | -12.46 | 3.32 | 10.61 | 7.14 | 8.39 | 9.99 | 12/15/93 | 1.21 | 1.21 | ||||||||||||
| INDEX | |||||||||||||||||||||
| Russell 2000 | -11.01 | 4.41 | 11.97 | 7.50 | 7.40 | N/A | N/A | N/A | N/A | ||||||||||||
| Russell Microcap | -13.08 | 3.08 | 11.71 | 5.67 | N/A | N/A | N/A | N/A | N/A | ||||||||||||
| Russell 2000 Value | -12.86 | 3.61 | 10.40 | 6.91 | 8.23 | N/A | N/A | N/A | N/A | ||||||||||||
| Russell 2500 | -10.00 | 5.15 | 13.15 | 8.23 | 8.52 | N/A | N/A | N/A | N/A | ||||||||||||
| Russell 1000 | -4.78 | 8.21 | 13.28 | 7.93 | 5.85 | N/A | N/A | N/A | N/A | ||||||||||||
| MSCI ACWI ex USA Small Cap1 | -18.20 | 1.96 | 10.02 | 7.31 | 7.14 | N/A | N/A | N/A | N/A | ||||||||||||
| Russell Global ex-U.S. Small Cap | -17.93 | 1.73 | 9.48 | 7.02 | 7.29 | N/A | N/A | N/A | N/A | ||||||||||||
Important Performance, Expense, and Risk Information
All performance information in this Review and Report reflects past performance, is presented on a total return basis, reflects the reinvestment of distributions, and does not reflect the deduction of taxes a shareholder would pay on fund distributions or the redemption of fund shares. Past performance is no guarantee of future results. Investment return and principal value of an investment will fluctuate, so that shares may be worth more or less than their original cost when redeemed. Investment and Service Class shares redeemed within 30 days of purchase may be subject to a 1% redemption fee payable to the Fund (2% for Royce International Premier Fund). Redemption fees are not reflected in the performance shown above; if they were, performance would be lower. Current performance may be higher or lower than performance quoted. Current month-end performance may be obtained at www.roycefunds.com. All performance and expense information reflects results of the Funds’ oldest share Class (Investment Class or Service Class, as the case may be). Price and total return information is based on net asset values calculated for shareholder transactions. Gross annual operating expenses reflect the Fund’s gross total annual operating expenses and include management fees, any 12b-1 distribution and service fees, other expenses, and any applicable acquired fund fees and expenses. Net annual operating expenses reflect contractual fee waivers and/or expense reimbursements. All expense information is reported as of the Fund’s most current prospectus. Royce & Associates has contractually agreed to waive fees and/or reimburse operating expenses, excluding brokerage commissions, taxes, interest, litigation expenses, acquired fund fees and expenses, and other expenses not borne in the ordinary course of business, to the extent necessary to maintain net operating expenses at or below: 1.24% for Royce Micro-Cap Opportunity and Special Equity Multi-Cap Funds; 1.34% for Royce Dividend Value Fund; 1.44% for Royce International Premier Fund; 1.49% for Royce Global Financial Services, Low- Priced Stock, Micro-Cap, Small-Cap Leaders, and Small-Cap Value Funds through April 30, 2019. Acquired fund fees and expenses reflect the estimated amount of fees and expenses incurred indirectly by the Fund through its investments in mutual funds, hedge funds, private equity funds, and other investment companies.
Service Class shares bear an annual distribution expense that is not borne by the Funds’ Investment Class. If such distribution expenses had been reflected for Funds showing Investment Class performance, returns would have been lower. Investments in securities of micro-cap, small-cap, and/or mid-cap companies may involve considerably more risk than investments in securities of larger-cap companies. (Please see “Primary Risks for Fund Investors” in the prospectus.) Certain Funds invest a significant portion of their respective assets in foreign companies that may be subject to different risks than investments in securities of U.S. companies, including adverse political, social, economic, or other developments that are unique to a particular country or region. (Please see “Investing in Foreign Securities” in the prospectus.) Therefore, the prices of securities of foreign companies in particular countries or regions may, at times, move in a different direction than those of securities of U.S. companies. (Please see “Primary Risk of Fund Investors” in the prospectus.) Certain Funds generally invest a significant portion of their assets in a limited number of stocks, which may involve considerably more risk than a more broadly diversified portfolio because a decline in the value of any of these stocks would cause their overall value to decline to a greater degree. A broadly diversified portfolio, however, does not ensure a profit or guarantee against loss. This Review and Report must be preceded or accompanied by a prospectus. Please read the prospectus carefully before investing or sending money. Source: MSCI. MSCI makes no express or implied warranties or representations and shall have no liability whatsoever with respect to any MSCI data contained herein. The MSCI data may not be further redistributed or used as a basis for other indexes or any securities or financial products. This report is not approved, endorsed, reviewed or produced by MSCI. None of the MSCI data is intended to constitute investment advice or a recommendation to make (or refrain from making) any kind of investment decision and may not be relied on as such. Russell Investment Group is the source and owner of the trademarks, service marks, and copyrights related to the Russell Indexes. Russell® is a trademark of Russell Investment Group. The Russell 2000 Index is an unmanaged, capitalization-weighted index of domestic small-cap stocks. It measures the performance of the 2,000 smallest publicly traded U.S. companies in the Russell 3000 Index. The Russell Microcap Index includes 1,000 of the smallest securities in the small-cap Russell 2000 Index along with the next smallest eligible securities as determined by Russell. The Russell 2000 Value Index consists of the respective value stocks within the Russell 2000 as determined by Russell Investments. The Russell 2500 is an unmanaged, capitalization-weighted index of the 2,500 smallest publicly traded U.S. companies in the Russell 3000 index. The Russell 1000 is an unmanaged, capitalization-weighted index of domestic large-cap stocks. It measures the performance of the 1,000 largest publicly traded U.S. companies in the Russell 3,000 Index. The Russell Global ex-U.S. Small Cap Index is an index of global small-cap stocks, excluding the United States. The MSCI ACWI ex USA Small Cap Index is an unmanaged, capitalization-weighted index of global small-cap stocks, excluding the United States. The performance of an index does not represent exactly any particular investment as you cannot invest directly in an index. Distributor: Royce Fund Services, LLC.
| 6 | This page is not part of the 2018 Annual Report to Shareholders |
The Royce Funds and Rolling Returns
We believe strongly in the idea that a long-term perspective is crucial for determining the success of an investment approach. Flourishing in an up market is wonderful, but surviving a bear market by losing less (or not at all) is equally desirable. In any case, the true tests of a portfolio’s mettle are results over bull and bear periods. This is why we prefer to examine results that include up and down market phases—primarily by looking at rolling return periods.
| When evaluating fund performance, it is common practice to review results for the most recent year (often the calendar year) along with its related longer-term trailing periods. However, a calendar-year return is not necessarily any more or less important to consider than any other 12-month period (or related trailing period). It is also true that few investors buy mutual funds on New Year’s Eve and then sell exactly five or 10 years later. Of course, the reality is that trailing returns ending last month or last quarter are the most commonly available and easily comparable results, so these otherwise arbitrary periods often drive investor decisions and flows. |
| Keeping in mind that investors will buy and sell at any time throughout any given year, we think it makes sense to examine performance over a larger series of dates. We believe rolling returns offer a more effective measure because they provide a more accurate and in-depth picture of a portfolio’s performance. Rather than “point-in-time” results anchored by the end of the month or quarter, |
| rolling returns account for the fact that investors typically do not invest at the beginning of the current five- or 10-year period but instead are in fact investing over many periods. |
| So instead of assuming that an investment was made on January 1, rolling returns calculate all of the periods starting not only in January, but also in February, March, April, etc. For example, a monthly five-year rolling return accounts for all of the five-year returns beginning at a given inception date and advancing one month sequentially. This method allows an investor to evaluate the consistency of a fund’s performance over time—including the ups and downs of market cycles. |
| We believe that rolling returns provide a particularly robust analytical tool for evaluating manager performance, especially during volatile periods when simply shifting the performance date range one or two months in either direction can paint a very different picture. |
| Royce Funds1 vs. The Benchmark2 |
| Monthly Rolling Average Annual Return Periods and Relative Results Since the Last 20 Years through December 31, 2018 |
| Average Annual 10-Year Rolling Return | Average Annual 5-Year Rolling Return | |||||||||||||||||||||||||||||||||||||||||||
| FUND | PERIODS BEATING THE INDEX | FUND AVG (%)3 | INDEX AVG (%)3 | PERIODS BEATING THE INDEX | FUND AVG (%)3 | INDEX AVG (%)3 | ||||||||||||||||||||||||||||||||||||||
| U.S. EQUITY | ||||||||||||||||||||||||||||||||||||||||||||
| Low-Priced Stock | 48/121 | 40% | 7.0 | 7.2 | 101/181 | 56% | 7.9 | 8.8 | ||||||||||||||||||||||||||||||||||||
| Micro-Cap | 60/103 | 58% | 7.5 | 6.7 | 92/163 | 56% | 8.1 | 8.3 | ||||||||||||||||||||||||||||||||||||
| Opportunity | 96/121 | 79% | 9.0 | 7.2 | 121/181 | 67% | 11.2 | 8.8 | ||||||||||||||||||||||||||||||||||||
| Pennsylvania Mutual | 73/121 | 60% | 8.5 | 7.2 | 109/181 | 60% | 10.1 | 8.8 | ||||||||||||||||||||||||||||||||||||
| Premier | 108/121 | 89% | 10.0 | 7.2 | 113/181 | 62% | 11.1 | 8.8 | ||||||||||||||||||||||||||||||||||||
| Special Equity | 94/121 | 78% | 9.3 | 7.2 | 99/181 | 55% | 10.3 | 8.8 | ||||||||||||||||||||||||||||||||||||
| Total Return | 54/121 | 45% | 7.9 | 7.2 | 97/181 | 54% | 9.5 | 8.8 | ||||||||||||||||||||||||||||||||||||
| GLOBAL/INTERNATIONAL EQUITY | ||||||||||||||||||||||||||||||||||||||||||||
| Global Financial Services | 19/61 | 31% | 7.6 | 8.2 | 37/121 | 31% | 7.7 | 8.3 | ||||||||||||||||||||||||||||||||||||
| 1 Included are all Royce Funds with at least 20 years of history. |
| 2 The Russell 2000 Index is the benchmark for most funds. Royce Micro-Cap Fund is compared to the Russell Microcap Index from the inception of that index. Royce Small/Mid-Cap Premier Fund is compared to the Russell 2500 Index. |
| 3 Average return shown is the average of all month-end trailing five- and 10-year total returns. |
| Past performance is no guarantee of future results. For more information on performance please see page 6. |
| This page is not part of the 2018 Annual Report to Shareholders | 7 |
| MANAGERS’ DISCUSSION |
| Royce Dividend Value Fund (RDV) |
 |
| Chuck Royce Jay Kaplan, CFA |
| FUND PERFORMANCE |
| Royce Dividend Value Fund was down 16.2% in 2018 versus a loss of 11.0% for its small-cap benchmark, the Russell 2000 Index, for the same period. Underperformance came as a result of the Fund lagging its benchmark through the first three, more bullish quarters of the year, a period of low volatility in which small-cap growth stocks beat small-cap value, and small-cap companies that pay no dividends outpaced those that do. We were pleased, then, to see the Fund hold its value better than its index in the fourth-quarter downturn, -17.7% versus -20.2%. This was the index’s tenth negative quarter over the last decade—and the Fund outperformed in seven of them, consistent with what its lower volatility dividend value strategy seeks to deliver. |
| WHAT WORKED... AND WHAT DIDN’T |
| Ten of the portfolio’s 11 equity sectors finished 2018 in the red, with the biggest negative impacts coming from Financials and Industrials, its two largest sectors at year-end as well as two of its most significant overweights versus its benchmark. Consumer Staples was the only sector to make a positive contribution, and it did so modestly. At the industry level, capital markets detracted most by a wide margin. A perennial area of concentration for the Fund due to the large number of dividend-paying asset management companies within it, the group saw disappointing performances from several holdings, including SEI Investments, which provides investment processing, investment management, and investment operations solutions to clients around the globe. With products and services knit into the operations of several customers, SEI has what we think is a strong niche that’s built for the long term. Investors mostly avoided its stock in 2018, however, especially in the downturn, when most companies associated with asset management slumped. Shares of Jupiter Fund Management, a U.K. based asset manager, fell earlier in the year due to concerns about ongoing investments in the business that will lead to cost increases in excess of revenue growth, along with continued fee declines and fund outflows. Its shares slipped further in the fourth quarter after the company reported larger-than-expected outflows. We held our position based on our belief that Jupiter is a well-managed franchise positioned for long-term growth and capable of a strong recovery. |
| Global staffing and services company ManpowerGroup detracted most in the Industrials sector and in the portfolio overall. Its 2018 revenues slid, as the economic environment, particularly in its European business, proved more challenging than the company had been anticipating. We held shares based on the ongoing strength of its North American and Asian business and its record of successful execution. Recreational vehicle manufacturer Thor Industries suffered through a 65% decline for its stock in 2018. Sales began to decline in the fall, forcing Thor to scale back production as independent RV dealers had overstocked their inventories earlier in the year. However, inventories were normalizing at the end of December, and Thor has also improved its production process in order to meet variable levels of demand. DENTSPLY SIRONA, a dental equipment and consumables manufacturer, was engaged in turnaround efforts aimed at improving topline growth and operating margins. The firm then suffered a serious enough decline in its fiscal third-quarter earnings for us to exit our position. |
| Positive contributions at both the industry and position levels were modest. The aerospace & defense (Industrials), chemicals (Materials), and specialty retail (Consumer Discretionary) groups contributed most at the industry level. The portfolio’s top-contributing holding was footwear and accessories retailer DSW, which benefited from robust business. The firm also raised guidance in December for the remainder of fiscal 2018. HEICO Corporation, which supplies electronics and other parts to aerospace companies has defensible strength in a highly specialized niche and a conservatively capitalized balance sheet. Both attracted our initial attention while other investors seemed drawn to its steady earnings growth in 2018. Relative to the Russell 2000, performance was impacted most in 2018 by sector allocation—stock selection was additive. Three sectors drove underperformance: ineffective stock picking hurt most in Financials, primarily due to the aforementioned capital markets group, while stock selection and our underweight each detracted in the Information Technology and Health Care sectors. Conversely, the portfolio had sizable stock selection advantages in Energy and Materials. |
| Top Contributors to Performance | |||
| For 2018 (%)1 | |||
| DSW Cl. A | 0.37 | ||
| HEICO Corporation Cl. A | 0.27 | ||
| Gaztransport Et Technigaz | 0.21 | ||
| Expeditors International of Washington | 0.20 | ||
| Quaker Chemical | 0.20 | ||
| 1 Includes dividends | |||
| Top Detractors from Performance | |||
| For 2018 (%)2 | |||
| ManpowerGroup | -0.88 | ||
| DENTSPLY SIRONA | -0.76 | ||
| SEI Investments | -0.67 | ||
| Thor Industries | -0.64 | ||
| Jupiter Fund Management | -0.62 | ||
| 2 Net of dividends | |||
| CURRENT POSITIONING AND OUTLOOK |
| While we acknowledge the many potential sources of risk on the horizon—economic, geopolitical, and financial—we also think that these concerns have already been largely reflected, perhaps even excessively so, in current valuations. In short order, we went from a period this summer when small-cap’s extended valuations seemed out of sync given the index’s high levels of debt and low profitability, to one at the end of the year where valuations seemed more pessimistic than we think is warranted—at least in select instances. We believe that the portfolio’s cyclical tilt will be rewarded as recessionary concerns dissipate during the year. |
| 8 | The Royce Funds 2018 Annual Report to Shareholders |
| PERFORMANCE AND PORTFOLIO REVIEW | TICKER SYMBOLS RYDVX RDVIX RDIIX RDVCX |
| Performance and Expenses Average Annual Total Return (%) Through 12/31/18 | ||||||||||||
| JUL-DEC 20181 | 1-YR | 3-YR | 5-YR | 10-YR | SINCE INCEPTION (5/3/04) | |||||||
| RDV | -14.51 | -16.24 | 5.84 | 1.81 | 11.08 | 7.40 | ||||||
| Annual Gross Operating Expenses: 1.39% Annual Net Operating Expenses: 1.34% | ||||||||||||
| 1 Not annualized | ||||||||||||
| Relative Risk Adjusted Returns: Monthly Rolling Sharpe Ratios Since Inception Through 12/31/18 On a monthly rolling risk-adjusted basis, the Fund outperformed the Russell 2000 in 95% of all 10-year periods and 56% of all 5-year periods. | ||||||||||||
| PERIODS BEATING THE INDEX | FUND AVG (%)1 | INDEX AVG (%)1 | ||||||||||||
| 10-year | 53/56 | 95% | 0.50 | 0.45 | ||||||||||
| 5-year | 65/116 | 56% | 0.58 | 0.55 | ||||||||||
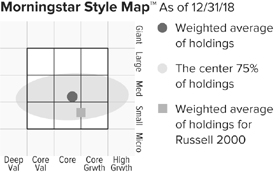
The Morningstar Style Map is the Morningstar Style BoxTM with the center 75% of fund holdings plotted as the Morningstar Ownership ZoneTM. The Morningstar Style Box is designed to reveal a fund’s investment strategy. The Morningstar Ownership Zone provides detail about a portfolio’s investment style by showing the range of stock sizes and styles. The Ownership Zone is derived by plotting each stock in the portfolio within the proprietary Morningstar Style Box. Over time, the shape and location of a fund’s ownership zone may vary. See page 117 for additional information. |
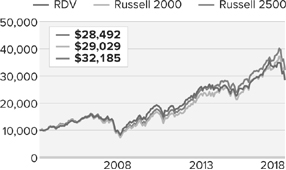
Value of $10,000
| Top 10 Positions | ||
| % of Net Assets | ||
| Quaker Chemical | 3.0 | |
| FLIR Systems | 3.0 | |
| HEICO Corporation Cl. A | 3.0 | |
| AptarGroup | 2.9 | |
| KKR & Co. Cl. A | 2.7 | |
| IDEX Corporation | 2.2 | |
| Graco | 2.2 | |
| Lindsay Corporation | 2.1 | |
| Reliance Steel & Aluminum | 2.1 | |
| Applied Industrial Technologies | 2.0 | |
| Portfolio Sector Breakdown | ||
| % of Net Assets | ||
| Industrials | 28.4 | |
| Financials | 28.2 | |
| Materials | 13.2 | |
| Consumer Discretionary | 8.1 | |
| Information Technology | 7.3 | |
| Energy | 5.9 | |
| Health Care | 2.1 | |
| Utilities | 1.4 | |
| Consumer Staples | 0.6 | |
| Real Estate | 0.5 | |
| Cash and Cash Equivalents | 4.3 | |
| Calendar Year Total Returns (%) | ||
| YEAR | RDV | |
| 2018 | -16.2 | |
| 2017 | 21.7 | |
| 2016 | 16.4 | |
| 2015 | -5.7 | |
| 2014 | -2.1 | |
| 2013 | 30.7 | |
| 2012 | 16.9 | |
| 2011 | -4.5 | |
| 2010 | 30.1 | |
| 2009 | 37.7 | |
| 2008 | -31.5 | |
| 2007 | -0.0 | |
| 2006 | 19.9 | |
| 2005 | 7.3 | |
| Upside/Downside Capture Ratios | |||
| Periods Ended 12/31/18 (%) | |||
| UPSIDE | DOWNSIDE | |||
| 10-Year | 86 | 80 | ||
| From 6/30/04 (Start of Fund’s First Full Quarter) | 87 | 78 | ||
| Portfolio Diagnostics | |||
| Fund Net Assets | $121 million | ||
| Number of Holdings | 88 | ||
| Turnover Rate | 13% | ||
| Average Market Capitalization1 | $3,504 million | ||
| Weighted Average P/E Ratio2,3 | 13.0x | ||
| Weighted Average P/B Ratio2 | 2.2x | ||
| Active Share4 | 97% | ||
| U.S. Investments (% of Net Assets) | 65.4% | ||
| Non-U.S. Investments (% of Net Assets) | 30.3% | ||
| 1 | Geometric Average. This weighted calculation uses each portfolio holding’s market cap in a way designed to not skew the effect of very large or small holdings; instead, it aims to better identify the portfolio’s center, which Royce believes offers a more accurate measure of average market cap than a simple mean or median. |
| 2 | Harmonic Average. This weighted calculation evaluates a portfolio as if it were a single stock and measures it overall. It compares the total market value of the portfolio to the portfolio’s share in the earnings or book value, as the case may be, of its underlying stocks. |
| 3 | The Fund’s P/E ratio calculation excludes companies with zero or negative earnings (4% of portfolio holdings as of 12/31/18). |
| 4 | Active Share is the sum of the absolute values of the different weightings of each holding in the Fund versus each holding in the benchmark, divided by two. |
| Important Performance and Expense Information |
All performance information in this Report reflects past performance, is presented on a total return basis, reflects the reinvestment of distributions, and does not reflect the deduction of taxes that a shareholder would pay on fund distributions or the redemption of fund shares. Past performance is no guarantee of future results. Investment return and principal value of an investment will fluctuate, so that shares may be worth more or less than their original cost when redeemed. Shares redeemed within 30 days of purchase may be subject to a 1% redemption fee payable to the Fund, which is not reflected in the performance shown above; if it were, performance would be lower. Current month-end performance may be higher or lower than performance quoted and may be obtained at www.roycefunds.com. All performance and risk information reflects results of the Service Class (its oldest class). Certain immaterial adjustments were made to the net assets of Royce Dividend Value Fund at 6/30/15 for financial reporting purposes, and as a result the net asset values for shareholder transactions on that date and the calendar year Total Returns (%) based on those net asset values differ from the adjusted net asset values and calendar year total returns reported in the Financial Highlights. Gross operating expenses reflect the Fund’s total gross annual operating expenses for the Service Class and include management fees, 12b-1 distribution and service fees, and other expenses. Net operating expenses reflect contractual fee waivers and/or expense reimbursements. All expense information is reported as of the Fund’s most current prospectus. Royce & Associates has contractually agreed, without right of termination, to waive fees and/or reimburse expenses to the extent necessary to maintain the Service Class’s net annual operating expenses (excluding brokerage commissions, taxes, interest, litigation expenses, acquired fund fees and expenses, and other expenses not borne in the ordinary course of business) at or below 1.34% through April 30, 2019. Regarding the “Top Contributors” and “Top Detractors” tables shown above, the sum of all contributors to, and all detractors from, performance for all securities in the portfolio would approximate the Fund’s year-to-date performance for 2018. The Sharpe Ratio is calculated for a specified period by dividing a fund’s annualized excess returns by its annualized standard deviation. The higher the Sharpe ratio, the better the fund’s historical risk-adjusted performance. Upside Capture Ratio measures a manager’s performance in up markets relative to the Fund’s benchmark. It is calculated by measuring the Fund’s performance in quarters when the benchmark went up and dividing it by the benchmark’s return in those quarters. Downside Capture Ratio measures a manager’s performance in down markets relative to the Fund’s benchmark (Russell 2000). It is calculated by measuring the Fund’s performance in quarters when the benchmark goes down and dividing it by the benchmark’s return in those quarters. |
| The Royce Funds 2018 Annual Report to Shareholders | 9 |
| MANAGERS’ DISCUSSION |
| Royce Global Financial Services Fund (RFS) |
 |
| Chuck Royce Chris Flynn |
| FUND PERFORMANCE |
| Royce Global Financial Services Fund fell 13.4% in 2018, trailing both the Russell 2000 Index, which declined 11.0%, and the Russell 2500 Financial Services Indexes, which was down 9.1% for the same period. After returning more than 22% in 2017 (and outpacing both indexes in the process), a moderation in the Fund’s pace of gains in 2018 would not have been unexpected, though we were not anticipating such a sharp correction as the one we had in 2018, which pushed calendar-year returns for most equities into negative territory for the year. We were pleased, however, that the Fund held its value better than the small-cap index in the precipitous fourth-quarter downturn, down 15.3% versus a loss of 20.2% for the Russell 2000. |
| WHAT WORKED... AND WHAT DIDN’T |
| The capital markets group was our largest weighting, comprising almost 50% of assets at year-end. Our holdings in this space constituted a mix of traditional and alternative asset management businesses, both domestic and international, that we think run differentiated franchises with the ability to grow their businesses in an increasingly volatile environment. The downturn, however, proved no respecter of franchise strength or profit potential, and led to disappointing performances from several holdings. The largest detractor was Jupiter Fund Management, a U.K. based asset manager whose shares fell earlier in the year due to concerns about ongoing investments in the business that will lead to cost increases in excess of revenue growth, along with continued fee declines and fund outflows. Its stock slipped further in the fourth quarter after the company reported larger-than-expected outflows. We held our position based on our belief that Jupiter is a well-managed franchise positioned for long-term growth. |
| Two top-contributing holdings from 2017 underwent significant reversals and landed among the bottom five detractors for 2018. SEI Investments runs a diverse business that provides investment processing, investment management, and investment operations solutions to clients around the globe. With products and services knit into the operations of several customers, SEI has what we think is a strong niche that’s built for the long term. Concerns about future spending levels from its primary client base as well as a second-quarter earnings disappointment led investors to mostly avoid its stock through the first three quarters of 2018, before its shares slumped further during the downturn, along with most other companies associated with asset management. U.S. Global Investors is a specialty asset manager focused mostly on emerging markets, precious metals, and, more recently, digital currencies. Its shares surged in 2017 following its investment in a blockchain technology company, which led us to sell nearly half our position. This move proved prescient as its stock began to decline significantly in 2018 when the price of the highly volatile cryptocurrency Ethereum collapsed in March. Volatile precious metals prices and a quarterly loss reported in November then combined to keep U.S. Global’s stock price tumbling. Virtu Financial made the biggest positive contribution to performance. Based in New York City, the firm uses its technology to act as a market maker and liquidity provider to the global financial markets. Virtu announced impressive first-quarter results in profits and earnings, thanks to increased volatility, high trading volumes, and better-than-expected progress integrating a large acquisition. We took some gains around this time, just as its shares began to slide. Its shares then advanced in the fourth quarter as its business model again benefited from increased volatility. In 2017, we added to our stake in Popular, one of the largest Puerto Rico-based banks, as its stock was lagging, so we were especially pleased to see it rebound from a difficult 2017 to become one of 2018’s top contributors. Strong earnings in 2018, along with an opportunistic, accretive acquisition, have led the stock to outperform, a happy exception to a poor year for most small-cap banks. |
| Top Contributors to Performance | |||
| For 2018 (%)1 | |||
| Virtu Financial Cl. A | 1.34 | ||
| Popular | 0.56 | ||
| Benefitfocus | 0.32 | ||
| Financial Engines | 0.31 | ||
| Bottomline Technologies | 0.27 | ||
| 1 Includes dividends | |||
| Top Detractors from Performance | |||
| For 2018 (%)2 | |||
| Jupiter Fund Management | -0.75 | ||
| SEI Investments | -0.75 | ||
| U.S. Global Investors Cl. A | -0.74 | ||
| Clarkson | -0.71 | ||
| Altus Group | -0.64 | ||
| 2 Net of dividends | |||
| CURRENT POSITIONING AND OUTLOOK |
| 2018 marked another year in the march towards what we believe are normalizing markets. We see three components in this process: a more normally sloped yield curve, which is steeper than today; a more historically typical level of volatility, which is higher than investors have experienced, other than in 2018’s fourth quarter; and below average intermediate-term returns—we expect mid- to high-single digits for the small-cap index, compared with low double-digit historical returns. These changes in the market environment should be supportive of many of the Fund’s investments. Higher volatility has historically provided active managers more room to outperform while steeper yield curves are supportive for banks and other lenders. We remain constructive on bank holdings based on the belief that certain positions have excellent prospects for growth in their wealth management operations while others offer what we think is an attractively differentiated business model or a geographic franchise that we think will help subsequent growth. Equally important, low nominal returns should continue to support demand among institutional investors for alternative asset managers and among high net worth investors for wealth management services. We believe that the portfolio is therefore well positioned to benefit from the coming environment. |
| 10 | The Royce Funds 2018 Annual Report to Shareholders |
| PERFORMANCE AND PORTFOLIO REVIEW | TICKER SYMBOLS RYFSX RGFIX |
| Performance and Expenses | ||||||||||||||
| Average Annual Total Return (%) Through 12/31/18 | ||||||||||||||
| JUL-DEC 20181 | 1-YR | 3-YR | 5-YR | 10-YR | SINCE INCEPTION (12/31/03) | |||||||||
| RFS | -15.64 | -13.41 | 6.19 | 3.37 | 10.88 | 7.07 | ||||||||
| Annual Gross Operating Expenses: 1.77% Annual Net Operating Expenses: 1.58% | ||||||||||||||
| 1 Not annualized | ||||||||||||||

The Morningstar Style Map is the Morningstar Style BoxTM with the center 75% of fund holdings plotted as the Morningstar Ownership ZoneTM. The Morningstar Style Box is designed to reveal a fund’s investment strategy. The Morningstar Ownership Zone provides detail about a portfolio’s investment style by showing the range of stock sizes and styles. The Ownership Zone is derived by plotting each stock in the portfolio within the proprietary Morningstar Style Box. Over time, the shape and location of a fund’s ownership zone may vary. See page 117 for additional information. |
Value of $10,000

| Top 10 Positions | ||
| % of Net Assets | ||
| E-L Financial | 3.3 | |
| Virtu Financial Cl. A | 3.1 | |
| Popular | 3.0 | |
| Franco-Nevada Corporation | 3.0 | |
| First Citizens BancShares Cl. A | 2.6 | |
| Ashmore Group | 2.6 | |
| Rothschild & Co | 2.5 | |
| MarketAxess Holdings | 2.5 | |
| Sprott | 2.4 | |
| VZ Holding | 2.3 | |
| Portfolio Industry Breakdown | ||
| % of Net Assets (Subject to Change) | ||
| Capital Markets | 49.7 | |
| Banks | 18.3 | |
| Insurance | 8.5 | |
| Real Estate Management & Development | 6.5 | |
| Software | 3.2 | |
| Metals & Mining | 3.0 | |
| IT Services | 2.3 | |
| Professional Services | 1.9 | |
| Marine | 1.6 | |
| Diversified Financial Services | 1.5 | |
| Trading Companies & Distributors | 1.5 | |
| Hotels, Restaurants & Leisure | 0.8 | |
| Consumer Finance | 0.7 | |
| Equity Real Estate Investment Trusts (REITs) | 0.4 | |
| Cash and Cash Equivalents | 0.1 | |
| Upside/Downside Capture Ratios | ||||
| Periods Ended 12/31/18 (%) | ||||
| UPSIDE | DOWNSIDE | |||
| 10-Year | 85 | 81 | ||
| Fund’s First Full Quarter (12/31/03) | 84 | 78 | ||
| Calendar Year Total Returns (%) | ||
| YEAR | RFS | |
| 2018 | -13.4 | |
| 2017 | 22.5 | |
| 2016 | 12.9 | |
| 2015 | -4.7 | |
| 2014 | 3.5 | |
| 2013 | 42.0 | |
| 2012 | 20.7 | |
| 2011 | -11.3 | |
| 2010 | 18.5 | |
| 2009 | 32.1 | |
| 2008 | -35.4 | |
| 2007 | -4.7 | |
| 2006 | 24.8 | |
| 2005 | 12.2 | |
| 2004 | 15.1 | |
| Portfolio Country Breakdown1,2 | ||
| % of Net Assets | ||
| United States | 53.3 | |
| Canada | 18.2 | |
| United Kingdom | 8.6 | |
| Switzerland | 3.5 | |
| India | 2.7 | |
| France | 2.5 | |
| South Africa | 1.9 | |
| Singapore | 1.8 | |
| Hong Kong | 1.8 | |
| 1 | Represents countries that are 1.5% or more of net assets. |
| 2 | Securities are categorized by the country of their headquarters. |
| Portfolio Diagnostics | ||
| Fund Net Assets | $39 million | |
| Number of Holdings | 84 | |
| Turnover Rate | 8% | |
| Average Market Capitalization1 | $1,811 million | |
| Weighted Average P/E Ratio2,3 | 11.8x | |
| Weighted Average P/B Ratio2 | 1.6x | |
| Active Share4 | 99% | |
| 1 | Geometric Average. This weighted calculation uses each portfolio holding’s market cap in a way designed to not skew the effect of very large or small holdings; instead, it aims to better identify the portfolio’s center, which Royce believes offers a more accurate measure of average market cap than a simple mean or median. |
| 2 | Harmonic Average. This weighted calculation evaluates a portfolio as if it were a single stock and measures it overall. It compares the total market value of the portfolio to the portfolio’s share in the earnings or book value, as the case may be, of its underlying stocks. |
| 3 | The Fund’s P/E ratio calculation excludes companies with zero or negative earnings (8% of portfolio holdings as of 12/31/18). |
| 4 | Active Share is the sum of the absolute values of the different weightings of each holding in the Fund versus each holding in the benchmark, divided by two. |
| Important Performance and Expense Information All performance information in this Report reflects past performance, is presented on a total return basis, reflects the reinvestment of distributions, and does not reflect the deduction of taxes that a shareholder would pay on fund distributions or the redemption of fund shares. Past performance is no guarantee of future results. Investment return and principal value of an investment will fluctuate, so that shares may be worth more or less than their original cost when redeemed. Shares redeemed within 30 days of purchase may be subject to a 1% redemption fee payable to the Fund, which is not reflected in the performance shown above; if it were, performance would be lower. Current month-end performance may be higher or lower than performance quoted and may be obtained at www.roycefunds.com. Gross operating expenses reflect the Fund’s gross total annual operating expenses for the Service Class and include management fees, 12b-1 distribution and service fees, other expenses and acquired fund fees and expenses. Net operating expenses reflect contractual fee waivers and/or expense reimbursements. All expense information is reported as of the Fund’s most current prospectus. Royce & Associates has contractually agreed to waive fees and/or reimburse expenses to the extent necessary to maintain the Fund’s net annual operating expenses, (excluding brokerage commissions, taxes, interest, litigation expenses, acquired fund fees and expenses, and other expenses not borne in the ordinary course of business), at or below 1.49% through April 30, 2019. Acquired fund fees and expenses reflect the estimated amount of the fees and expenses incurred indirectly by the Fund through its investments in mutual funds, hedge funds, private equity funds, and other investment companies. Regarding the “Top Contributors” and “Top Detractors” tables shown above, the sum of all contributors to, and all detractors from, performance for all securities in the portfolio would approximate the Fund’s year-to-date performance for 2018. Upside Capture Ratio measures a manager’s performance in up markets relative to the Fund’s benchmark. It is calculated by measuring the Fund’s performance in quarters when the benchmark went up and dividing it by the benchmark’s return in those quarters. Downside Capture Ratio measures a manager’s performance in down markets relative to the Fund’s benchmark (Russell 2000). It is calculated by measuring the Fund’s performance in quarters when the benchmark goes down and dividing it by the benchmark’s return in those quarters. |
| The Royce Funds 2018 Annual Report to Shareholders | 11 |
| MANAGERS’ DISCUSSION | ||
| Royce International Premier Fund (RIP) |
 |
| David Nadel Mark Rayner, CA |
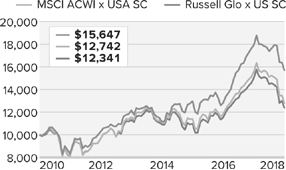
| FUND PERFORMANCE Royce International Premier Fund was down 12.8% in 2018, losing significantly less than both its new benchmark, the MSCI ACWI ex USA Small Cap Index, which declined 18.2%, and the Russell Global ex-U.S. Small Cap Index (which Russell Investments has discontinued), which fell 17.9% for the same period. As we would hope, better performance in a down market, in particular through the steep decline in 2018’s fourth quarter, was a factor in helping our QARP (“Quality At a Reasonable Price”) strategy to also outpace both indexes for the three-, five-year, and since inception (12/31/10) periods ended December 31, 2018. |
| WHAT WORKED... AND WHAT DIDN’T |
| Nine of the 10 equity sectors in which the portfolio held investments detracted from results in 2018, with only Consumer Staples managing a slight positive contribution. Industrials was by far the largest detractor, followed by Materials and Information Technology. SH Kelkar & Company detracted most at the position level. A family-run firm and one of the largest fragrance producers in India, its earnings were hurt as rising input costs and a dip in demand from certain export markets crimped margins. Thinking more about the long term, we like the firm’s long record of business success, which led us to hold our position. We held in a similar opinion about Computer Modelling Group, a Canadian software company whose products help oil companies maximize extractions. Its shares slumped in the second half due to its exposure to the energy industry, which was hurt by falling oil prices, and some slight disappointments in the firm’s revenues and earnings. Based on its lack of debt, relatively high annual dividend, and strong position in a highly specialized niche, we liked its long-term prospects at year-end. Burkhalter Holding is the leading provider of electrical engineering services in Switzerland. Its stock price was hurt by increasing talk that competition would pressure pricing. Seeing these issues as more temporal than structural, we held our position at year-end. |
| On the positive side, Australia’s Bravura Solutions Limited makes software that focuses on the wealth management and investment fund administration markets. It has what we like in its industry—a market and product application we can readily understand that also delivers mission-critical customer benefits. The company offers a market-leading product, developed after a multi-year period of substantial R&D, and was able to take market share in a growing market. Sartorius Stedim Biotech is listed in France, but headquartered in Germany. The firm manufactures mostly single use or consumable products used by biopharmaceutical companies. Many of its products have technology-based barriers to entry that are further raised by the strict certification processes imposed by the FDA and other regulatory authorities around the globe. Strong earnings helped its stock in 2018. Trade Me Group, New Zealand’s leader in online classifieds, saw its shares rise when a bidding war broke out between two rival suitors, prompting us to sell our stake. While we always try to be mindful of portfolio turnover, holdings are not infrequently the targets of acquisition offers. Relative to the MSCI ACWI ex USA Small Cap, the Fund benefited from stock selection in 2018 while sector allocation had a modest negative impact. Stock selection drove results most in the Industrials, Information Technology, and Health Care (where our overweight also helped relative results) sectors. Conversely, lower exposure and ineffective stock selection were relative disadvantages in Real Estate and Communication Services. In Materials, the chemicals group had a negative effect on relative returns, as did our lack of exposure to Utilities and our lower exposure to Consumer Staples. |
| Top Contributors to Performance For 2018 (%)1 | |||
| Bravura Solutions | 1.15 | ||
| Sartorius Stedim Biotech | 0.66 | ||
| SimCorp | 0.53 | ||
| Trade Me Group | 0.52 | ||
| TGS-NOPEC Geophysical | 0.48 | ||
| 1 Includes dividends | |||
| Top Detractors from Performance For 2018 (%)2 | |||
| SH Kelkar & Company | -0.97 | ||
| Computer Modelling Group | -0.93 | ||
| Burkhalter Holding | -0.87 | ||
| Vakrangee | -0.82 | ||
| ITE Group | -0.75 | ||
| 2 Net of dividends | |||
| CURRENT POSITIONING AND OUTLOOK |
| At the end of the year, the portfolio’s largest country overweights were Switzerland, Australia, and Sweden. The first is, in our view, perhaps the highest-quality small-cap market in the world, and we typically maintain an overweight in positions based there. Australia’s equity markets and currency weakened in 2018 due to perceived overreliance on commodities and trade with China. In our view, this has resulted in attractive valuations for high-quality names. Slower global growth created challenges for many international small-caps in 2018, while also making valuations look more attractive to us as we entered 2019. The portfolio had lower exposure to Consumer Discretionary at the end of December, in part due to the departure of Trade Me Group. We also added two positions in Industrials, as diverse a sector outside the U.S. as it is within. Market volatility gave us the opportunity to buy shares of two long-followed companies—IMCD, a leader in the marketing and distribution of specialty chemicals and food additives that’s headquartered in the Netherlands, and Loomis, a Swedish firm that’s a global leader in the transit of cash and valuables. In Materials, we returned to a previously held investment, Fuchs Petrolub, a German business that has grown into one of the world’s largest independent manufacturers of lubricants. We are very pleased with the quality of the businesses we hold as we enter 2019. |
| 12 | The Royce Funds 2018 Annual Report to Shareholders |
| PERFORMANCE AND PORTFOLIO REVIEW | TICKER SYMBOLS RYIPX RIPNX RINPX RIPIX |
| Performance and Expenses | ||||||||||
| Average Annual Total Return (%) Through 12/31/18 | ||||||||||
| JUL-DEC 20181 | 1-YR | 3-YR | 5-YR | SINCE INCEPTION (12/31/10) | ||||||
| RIP | -9.99 | -12.76 | 6.47 | 5.18 | 5.76 | |||||
| Annual Gross Operating Expenses: 1.65% Annual Net Operating Expenses: 1.44% | ||||||||||
| 1 Not annualized | ||||||||||
| Relative Returns: Monthly Rolling Average Annual Return Periods Since Inception Through 12/31/18 On a monthly rolling basis, the Fund outperformed the MSCI ACWI x USA SC in 100% of all 5-year periods; 82% of all 3-year periods; and 67% of all 1-year periods. | ||||||||||||
| PERIODS BEATING THE INDEX | FUND AVG (%)1 | INDEX AVG (%)1 | ||||||||||||
| 5-year | 37/37 | 100% | 8.7 | 6.6 | ||||||||||
| 3-year | 50/61 | 82% | 8.7 | 6.7 | ||||||||||
| 1-year | 57/85 | 67% | 9.2 | 7.1 | ||||||||||
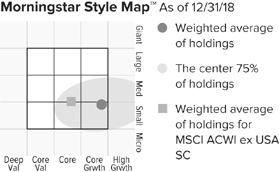
The Morningstar Style Map is the Morningstar Style BoxTM with the center 75% of fund holdings plotted as the Morningstar Ownership ZoneTM. The Morningstar Style Box is designed to reveal a fund’s investment strategy. The Morningstar Ownership Zone provides detail about a portfolio’s investment style by showing the range of stock sizes and styles. The Ownership Zone is derived by plotting each stock in the portfolio within the proprietary Morningstar Style Box. Over time, the shape and location of a fund’s ownership zone may vary. See page 117 for additional information. |
Value of $10,000
| Top 10 Positions | ||
| % of Net Assets | ||
| Intertrust | 3.1 | |
| Meitec Corporation | 3.0 | |
| Partners Group Holding | 2.6 | |
| USS | 2.5 | |
| Benefit One | 2.4 | |
| Kardex | 2.3 | |
| OdontoPrev | 2.3 | |
| Spirax-Sarco Engineering | 2.3 | |
| Daifuku | 2.2 | |
| IMCD | 2.2 | |
| Portfolio Sector Breakdown | ||
| % of Net Assets | ||
| Industrials | 33.7 | |
| Information Technology | 23.1 | |
| Health Care | 14.9 | |
| Materials | 6.9 | |
| Financials | 6.1 | |
| Real Estate | 3.5 | |
| Consumer Discretionary | 2.6 | |
| Energy | 1.7 | |
| Preferred Stock | 2.0 | |
| Cash and Cash Equivalents | 5.5 | |
| Upside/Downside Capture Ratios | ||||||||||||||
| Periods Ended 12/31/18 (%) | ||||||||||||||
| UPSIDE | DOWNSIDE | |||||||||||||
| Fund’s First Full Quarter (12/31/10) | 100 | 76 | ||||||||||||
| Calendar Year Total Returns (%) | ||
| YEAR | RIP | |
| 2018 | -12.8 | |
| 2017 | 39.8 | |
| 2016 | -1.1 | |
| 2015 | 16.2 | |
| 2014 | -8.2 | |
| 2013 | 18.3 | |
| 2012 | 23.4 | |
| 2011 | -16.8 | |
| Portfolio Country Breakdown1,2 | ||
| % of Net Assets | ||
| Japan | 21.7 | |
| Switzerland | 12.2 | |
| Australia | 9.2 | |
| United Kingdom | 7.4 | |
| Sweden | 6.8 | |
| Netherlands | 5.2 | |
| Canada | 5.1 | |
| France | 4.8 | |
| Brazil | 4.1 | |
| India | 3.0 | |
| 1 | Represents countries that are 3% or more of net assets. |
| 2 | Securities are categorized by the country of their headquarters. |
| Portfolio Diagnostics | ||
| Fund Net Assets | $362 million | |
| Number of Holdings | 51 | |
| Turnover Rate | 65% | |
| Average Market Capitalization1 | $1,554 million | |
| Weighted Average P/E Ratio2,3 | 20.3x | |
| Weighted Average P/B Ratio2 | 3.3x | |
| Active Share4 | 99% | |
| 1 | Geometric Average. This weighted calculation uses each portfolio holding’s market cap in a way designed to not skew the effect of very large or small holdings; instead, it aims to better identify the portfolio’s center, which Royce believes offers a more accurate measure of average market cap than a simple mean or median. |
| 2 | Harmonic Average. This weighted calculation evaluates a portfolio as if it were a single stock and measures it overall. It compares the total market value of the portfolio to the portfolio’s share in the earnings or book value, as the case may be, of its underlying stocks. |
| 3 | The Fund’s P/E ratio calculation excludes companies with zero or negative earnings (0% of portfolio holdings as of 12/31/18). |
| 4 | Active Share is the sum of the absolute values of the different weightings of each holding in the Fund versus each holding in the benchmark, divided by two. |
| Important Performance and Expense Information All performance information in this Report reflects past performance, is presented on a total return basis, reflects the reinvestment of distributions, and does not reflect the deduction of taxes that a shareholder would pay on fund distributions or the redemption of fund shares. Past performance is no guarantee of future results. Investment return and principal value of an investment will fluctuate, so that shares may be worth more or less than their original cost when redeemed. Shares redeemed within 30 days of purchase may be subject to a 2% redemption fee payable to the Fund, which is not reflected in the performance shown above; if it were, performance would be lower. Current month-end performance may be higher or lower than performance quoted and may be obtained at www.roycefunds.com. All performance and risk information reflects results of the Service Class (its oldest class). Price and total return information is based on net asset values for shareholder transactions. Certain immaterial adjustments were made to the net assets of Royce International Premier Fund at 6/30/14 for financial reporting purposes, and as a result the calendar year total returns based on those net assets values differ from the adjusted net values and calendar year total returns reported in the Financial Highlights. Gross operating expenses reflect total gross annual operating expenses for the Service Class and include management fees, 12b-1 distribution and service fees, and other expenses. Net operating expenses reflect contractual fee waivers and/or expense reimbursements. All expense information is reported as of the Fund’s most current prospectus. Royce & Associates has contractually agreed to waive its fees and/or reimburse operating expenses to the extent necessary to maintain the Fund’s net annual operating expenses, (excluding brokerage commissions, taxes, interest, litigation expenses, acquired fund fees and expenses, and other expenses not borne in the ordinary course of business), at or below 1.44% through April 30, 2019. Regarding the “Top Contributors” and “Top Detractors” tables shown above, the sum of all contributors to, and all detractors from, performance for all securities in the portfolio would approximate the Fund’s year-to-date performance for 2018. Upside Capture Ratio measures a manager’s performance in up markets relative to the Fund’s benchmark. It is calculated by measuring the Fund’s performance in quarters when the benchmark went up and dividing it by the benchmark’s return in those quarters. Downside Capture Ratio measures a manager’s performance in down markets relative to the Fund’s benchmark (MSCI ACWI ex USA Small Cap). It is calculated by measuring the Fund’s performance in quarters when the benchmark goes down and dividing it by the benchmark’s return in those quarters. |
| The Royce Funds 2018 Annual Report to Shareholders | 13 |
| MANAGER’S DISCUSSION | ||
| Royce Low-Priced Stock Fund (RLP) |
 |
| Jim Stoeffel |
| FUND PERFORMANCE Although Royce Low-Priced Stock Fund had a negative return in 2018, the Fund outperformed its index, most notably during the bearish environment we saw toward the end of the year. The Fund was down -9.3% for 2018, outperforming the Russell 2000 Index, which fell 11.0% for the same period. The Fund beat its benchmark in the year’s slightly more volatile first quarter and its very volatile—and bearish—fourth quarter, down 18.0% versus a 20.2% decline for the index. |
| WHAT WORKED... AND WHAT DIDN’T |
| As share prices began to decline, we used the pullback, which felt indiscriminate, to allocate capital from lower-conviction names into those in which we had greater confidence, including names in Information Technology, which saw several stocks particularly hard hit on concerns over slowing global growth, a trade war with China, tariff-related supply chain issues, and short-term oversupply in memory semiconductors. We believe all of the longer-term positive demand drivers in the technology sector remain intact and should benefit the industry’s high-quality micro-cap companies. Along with Industrials, Information Technology was one of our two largest weightings and two largest overweights at year-end, as was Consumer Discretionary. These weightings reflect our confidence in the ongoing growth of the U.S. economy where we remain optimistic about the prospects for micro-cap stocks in what looks to us like a still-vibrant environment. Anticipating more robust growth in the U.S. relative to the rest of the globe, we stayed primarily focused on companies that derive most of their revenues from the U.S. economy. The sectors making the biggest negative impact in 2018 were Industrials, Energy, Consumer Discretionary, and Materials. In total, seven of the Fund’s 10 equity sectors finished the year in the red. Positive contributions were more modest and came from Information Technology and Health Care. At the industry level, energy equipment & services (Energy) hurt performance most as the drop in oil prices adversely affected our holdings. Machinery (Industrials) was another source of negative performance, with many holdings hurt by tariffs, trade war worries, and falling oil prices, all of which fueled investors’ concerns about cyclical businesses. Weakness in commodity prices led to a poor showing for the metals & mining group, the Fund’s second-biggest detracting industry. The portfolio’s biggest detractor at the position level was Ultra Clean Holdings, which provides gas panel subsystems to semiconductor equipment manufacturers. Its shares were hurt by the global slowdown in semiconductor equipment production. We believe the recent acquisition of Quantum Global, which provides ultra-purity cleaning solution to the semiconductor equipment industry, can strengthen Ultra Clean’s already formidable competitive position. ASV Holdings is a machinery company that provides skid steers and loading equipment for the construction and agriculture markets. The company missed earnings expectations in 2018 as changes in its parts distribution strategy and higher raw materials prices crimped margins. Women’s clothing retailer Francesca’s Holdings was engaged in a turnaround designed to win back core customers who were lost through an ill-advised shift in merchandising strategy. We sold our shares when it seemed to us that the turnaround was proving slower to develop than we had anticipated. Paratek Pharmaceuticals is a clinical stage biotechnology firm whose lead asset is a new antibiotic, omadacycline. Weakness in the stock seemed to be due to concerns over incremental FDA approval scrutiny, the potential for a slow commercial ramp, and a capital raise in April. We held our position given the opportunity for a new antibiotic associated with the increased human resistance to older varieties. |
| Top Contributors to Performance For 2018 (%)1 | ||||
| Electro Scientific Industries | 0.89 | |||
| Attunity | 0.74 | |||
| QuinStreet | 0.56 | |||
| Fabrinet | 0.50 | |||
| AtriCure | 0.50 | |||
| 1 Includes dividends | ||||
| Top Detractors from Performance For 2018 (%)2 | ||||
| Ultra Clean Holdings | -0.66 | |||
| ASV Holdings | -0.65 | |||
| Francesca’s Holdings | -0.61 | |||
| Paratek Pharmaceuticals | -0.55 | |||
| Atento | -0.53 | |||
| 2 Net of dividends | ||||
| On the positive side, electronic equipment, instruments & components (Information Technology) and health care equipment & supplies (Health Care) boosted performance most at the industry level. Within the first group, Electro Scientific Industries was acquired at a 100% premium while Fabrinet, a contract manufacturer of fiber optic components and laser solutions, continued to execute successfully and profitably in 2018. The second group is home to medical technology company AtriCure, a global leader in treating atrial fibrillation (Afib) with a successful R&D pipeline that has driven ongoing market share gains. Relative to the Russell 2000, savvy stock selection drove results—sector allocation detracted slightly. Information Technology was by far the largest source of outperformance, driven mostly by stock selection in the aforementioned electronic equipment, instruments & components industry, while Health Care and Industrials followed. The health care equipment & supplies group was the leading industry in the first sector while construction & engineering stood out in the second—in each group thanks mostly to strong stock selection. Our cash position also benefited the Fund relative to its index. Materials was the largest relative detractor for 2018, followed by Consumer Discretionary and Utilities. Ineffective stock picking in metals & mining hurt performance most in Materials, while stock selection in Internet & direct marketing retail and textiles, apparel & luxury goods dampened results in Consumer Discretionary. In Utilities, our lower exposure hindered performance. |
| 14 | The Royce Funds 2018 Annual Report to Shareholders |
| PERFORMANCE AND PORTFOLIO REVIEW | TICKER SYMBOLS RYLPX RLPHX |
| Performance and Expenses | ||||||||||||||||
| Average Annual Total Return (%) Through 12/31/18 | ||||||||||||||||
| JUL-DEC 20181 | 1-YR | 3-YR | 5-YR | 10-YR | 15-YR | 20-YR | SINCE INCEPTION (12/15/93) | |||||||||
| RLP | -17.06 | -9.31 | 4.91 | -0.01 | 7.36 | 4.64 | 8.15 | 9.22 | ||||||||
| Annual Operating Expenses: 1.61% Annual Net Operating Expenses: 1.58% | ||||||||||||||||
| 1 Not annualized | ||||||||||||||||

The Morningstar Style Map is the Morningstar Style BoxTM with the center 75% of fund holdings plotted as the Morningstar Ownership ZoneTM. The Morningstar Style Box is designed to reveal a fund’s investment strategy. The Morningstar Ownership Zone provides detail about a portfolio’s investment style by showing the range of stock sizes and styles. The Ownership Zone is derived by plotting each stock in the portfolio within the proprietary Morningstar Style Box. Over time, the shape and location of a fund’s ownership zone may vary. See page 117 for additional information. |
Value of $10,000
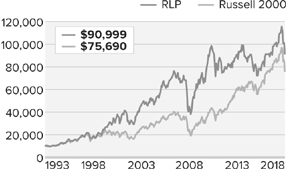
| Top 10 Positions | ||
| % of Net Assets | ||
| Ameresco Cl. A | 1.6 | |
| Attunity | 1.6 | |
| AtriCure | 1.5 | |
| Kornit Digital | 1.5 | |
| Electro Scientific Industries | 1.5 | |
| FormFactor | 1.4 | |
| Century Casinos | 1.4 | |
| Graham Corporation | 1.4 | |
| CryoLife | 1.4 | |
| Northwest Pipe | 1.4 | |
| Portfolio Sector Breakdown | ||
| % of Net Assets | ||
| Information Technology | 25.3 | |
| Industrials | 18.6 | |
| Consumer Discretionary | 15.8 | |
| Health Care | 11.8 | |
| Financials | 10.5 | |
| Energy | 6.0 | |
| Communication Services | 2.9 | |
| Materials | 2.7 | |
| Consumer Staples | 2.5 | |
| Cash and Cash Equivalents | 3.9 | |
| Calendar Year Total Returns (%) | ||
| YEAR | RLP | |
| 2018 | -9.3 | |
| 2017 | 9.7 | |
| 2016 | 16.1 | |
| 2015 | -10.4 | |
| 2014 | -3.4 | |
| 2013 | 12.9 | |
| 2012 | 4.5 | |
| 2011 | -14.6 | |
| 2010 | 31.5 | |
| 2009 | 53.6 | |
| 2008 | -36.0 | |
| 2007 | 2.3 | |
| 2006 | 19.0 | |
| 2005 | 9.7 | |
| 2004 | 13.6 | |
| Upside/Downside Capture Ratios | ||||
| Periods Ended 12/31/18 (%) | ||||
| UPSIDE | DOWNSIDE | |||
| 10-Year | 83 | 105 | ||
| From 12/31/93 (Start of the Fund’s First Full Quarter) | 100 | 93 | ||
| Portfolio Diagnostics | ||
| Fund Net Assets | $202 million | |
| Number of Holdings | 120 | |
| Turnover Rate | 58% | |
| Average Market Capitalization1 | $453 million | |
| Weighted Average P/B Ratio2 | 1.8x | |
| Active Share3 | 97% | |
| U.S. Investments (% of Net Assets) | 81.5% | |
| Non-U.S. Investments (% of Net Assets) | 14.6% | |
| 1 | Geometric Average. This weighted calculation uses each portfolio holding’s market cap in a way designed to not skew the effect of very large or small holdings; instead, it aims to better identify the portfolio’s center, which Royce believes offers a more accurate measure of average market cap than a simple mean or median. |
| 2 | Harmonic Average. This weighted calculation evaluates a portfolio as if it were a single stock and measures it overall. It compares the total market value of the portfolio to the portfolio’s share in the earnings or book value, as the case may be, of its underlying stocks. |
| 3 | Active Share is the sum of the absolute values of the different weightings of each holding in the Fund versus each holding in the benchmark, divided by two. |
| Important Performance and Expense Information All performance information in this Report reflects past performance, is presented on a total return basis, reflects the reinvestment of distributions, and does not reflect the deduction of taxes that a shareholder would pay on fund distributions or the redemption of fund shares. Past performance is no guarantee of future results. Investment return and principal value of an investment will fluctuate, so that shares may be worth more or less than their original cost when redeemed. Shares redeemed within 30 days of purchase may be subject to a 1% redemption fee payable to the Fund, which is not reflected in the performance shown above; if it were, performance would be lower. Current month-end performance may be higher or lower than performance quoted and may be obtained at www.roycefunds.com. All performance and risk information reflects results of the Service Class (its oldest class). Price and total return information is based on net asset values for shareholder transactions. Certain immaterial adjustments were made to the net assets of Royce Low-Priced Stock Fund at 6/30/13 for financial reporting purposes, and as a result the calendar year total returns based on those net asset values differ from the adjusted net asset values and calendar year total returns reported in the Financial Highlights. Gross operating expenses reflect the Fund’s total gross annual operating expenses for the Service Class and include management fees, 12b-1 distribution and service fees, other expenses, and acquired fund fees and expenses. Net operating expenses reflect contractual fee waivers and/or expense reimbursements. All expense information is reported as of the Fund’s most current prospectus. Royce & Associates has contractually agreed to waive fees and/or reimburse operating expenses to the extent necessary to maintain the Fund’s net annual operating expenses (excluding brokerage commissions, taxes, interest, litigation expenses, acquired fund fees and expenses, and other expenses not borne in the ordinary course of business) at or below 1.49% through April 30, 2019. Acquired fund fees and expenses reflect the estimated amount of the fees and expenses incurred indirectly by the Fund through its investments in mutual funds, hedge funds, private equity funds, and other investment companies. Regarding the “Top Contributors” and “Top Detractors” tables shown above, the sum of all contributors to, and all detractors from, performance for all securities in the portfolio would approximate the Fund’s year-to-date performance for 2018. Upside Capture Ratio measures a manager’s performance in up markets relative to the Fund’s benchmark. It is calculated by measuring the Fund’s performance in quarters when the benchmark went up and dividing it by the benchmark’s return in those quarters. Downside Capture Ratio measures a manager’s performance in down markets relative to the Fund’s benchmark (Russell 2000). It is calculated by measuring the Fund’s performance in quarters when the benchmark goes down and dividing it by the benchmark’s return in those quarters. |
| The Royce Funds 2018 Annual Report to Shareholders | 15 |
| MANAGERS’ DISCUSSION | ||
| Royce Micro-Cap Fund (RMC) |
 |
| Jim Stoeffel Brendan Hartman |
| FUND PERFORMANCE Royce Micro-Cap Fund held an advantage over its benchmarks for the calendar-year period, in large part due to losing less during the downturn that hit the markets from September through the end of the year. The Fund fell 8.9% in 2018 compared to the Russell Microcap and Russell 2000 Indexes, which fell 13.1% and 11.0%, respectively, for the same period. |
| WHAT WORKED... AND WHAT DIDN’T |
| Six of the portfolio’s 10 equity sectors detracted from performance in 2018. Financials, Industrials, and Energy made the largest negative impacts while Health Care made the biggest positive contribution, followed by Information Technology, historically one of our heaviest weightings. We were pleased to see these contributions because accruing positive performance was no small feat during such a difficult year. In fact, most of the cyclical areas where we focus struggled in 2018, including machinery (Industrials), which was the portfolio’s top detractor at the industry level. This group was followed by energy equipment & services holdings (Energy), which were mostly hurt by plummeting oil prices, while holdings in capital markets (Financials) slumped because most of our positions are asset management companies, an industry that is often sensitive to market pullbacks. |
| Lydall, the Fund’s top-detracting position in 2018, is a machinery company that manufactures an assortment of specialized products with automotive and industrial applications. A multi-year restructuring effort in the company’s Thermal/Acoustical Solutions segment has been slow to generate positive returns, a problem exacerbated by slowing light vehicle sales. We built our position as recent data points to a bottom for its margins while we remain cognizant of the risks inherent in its end market exposure. Ultra Clean Holdings provides gas panel subsystems to semiconductor equipment manufacturers. Its shares were hurt by the global slowdown in semiconductor equipment production. We added to our position as we believe the recent acquisition of Quantum Global, which provides ultra-purity cleaning solutions to the semiconductor equipment industry, can strengthen Ultra Clean’s already formidable competitive position. |
| Health care equipment & supplies (Health Care) was the Fund’s top-contributing industry, with results driven by positive performance for five of our top six holdings, including AtriCure, Tactile Systems Technology, and CryoLife. Positive results also came from electronic equipment, instruments & components (Information Technology), where Fabrinet and laser solutions company Electro Scientific Industries, which was acquired at a 100% premium, boosted performance. The Fund’s top contributor at the position level was Attunity, which makes database management software that addresses the increasing need for rapid access to data. Its shares benefited from the accelerating adoption of its products, which lifted enterprise sales. We trimmed our stake but maintained a position as we see its opportunity as relatively open ended in the intermediate term. Relative to the Russell Microcap, stock selection drove calendar-year results while sector allocation detracted somewhat. The largest stock selection advantage came from Information Technology, where our holdings in electronic, equipment instruments & components, specifically Fabrinet and Electro Scientific Industries, did most to drive results. Stock picking in Health Care, Consumer Discretionary, and Industrials also boosted relative performance. In the first sector, health care equipment & supplies dominated. In Industrials, electrical equipment did best while auto components and household durables stood out in Consumer Discretionary. Financials was the largest detractor for the calendar-year period, mostly due to stock picking issues in the aforementioned capital markets group, where Westwood Holdings Group detracted most. Energy also had a negative relative effect, mostly due to poor stock selection in energy equipment & services. Smaller detractions came from Consumer Staples and Utilities. |
| Top Contributors to Performance For 2018 (%)1 | ||||
| Attunity | 1.03 | |||
| American Superconducter | 0.67 | |||
| Electro Scientific Industries | 0.55 | |||
| QuinStreet | 0.55 | |||
| AtriCure | 0.47 | |||
| 1 Includes dividends | ||||
| Top Detractors from Performance For 2018 (%)2 | ||||
| Lydall | -0.55 | |||
| Ultra Clean Holdings | -0.55 | |||
| Paratek Pharmaceuticals | -0.50 | |||
| FreightCar America | -0.46 | |||
| Francesca’s Holdings | -0.43 | |||
| 2 Net of dividends | ||||
| CURRENT POSITIONING AND OUTLOOK |
| We used the sharp pullback to allocate capital from lower-conviction names into those in which we had greater confidence, including several in Information Technology, which saw several stocks particularly hard hit on concerns over slowing global growth, a trade war with China, tariff-related supply chain issues, and short-term oversupply in memory semiconductors. We believe all of the longer-term positive demand drivers in the technology sector, a long list that includes growing storage demand, increasing mobility, and connectedness encompassing the “Internet of Things,” remain intact and should benefit the industry’s high-quality micro-cap companies. We also maintained a sizable exposure to Consumer Discretionary. Health Care was one of our most underweighted sectors, although we began to add a few new ideas in the fourth quarter when valuations looked particularly attractive to us. These weightings are consistent with the portfolio’s historical emphasis on cyclical areas while also reflecting our confidence in the ongoing growth of the U.S. economy. We remain optimistic about the prospects for micro-cap stocks in this still-vibrant environment. Anticipating more robust growth in the U.S. relative to the rest of the globe, we stayed primarily focused on companies that derive most of their revenues from the U.S. economy. |
| 16 | The Royce Funds 2018 Annual Report to Shareholders |
| PERFORMANCE AND PORTFOLIO REVIEW | TICKER SYMBOLS RYOTX RMCFX RYMCX |
| Performance and Expenses | ||||||||||||||||||
| Average Annual Total Return (%) Through 12/31/18 | ||||||||||||||||||
| JUL-DEC 20181 | 1-YR | 3-YR | 5-YR | 10-YR | 15-YR | 20-YR | 25-YR | SINCE INCEPTION (12/31/91) | ||||||||||
| RMC | -17.38 | -8.94 | 4.76 | -0.91 | 8.34 | 5.47 | 8.16 | 8.80 | 10.03 | |||||||||
| Annual Gross Operating Expenses: 1.60% Annual Net Operating Expenses: 1.58% | ||||||||||||||||||
| 1 Not annualized | ||||||||||||||||||
Relative Returns: Monthly Rolling Average Annual Return Periods
| On a monthly rolling basis, the Fund outperformed the Russell Microcap in 58% of all 10-year periods; 56% of all 5-year periods; and 50% of all 1-year periods. |
| PERIODS BEATING THE INDEX | FUND AVG (%)1 | INDEX AVG (%)1 | ||||||||||||
| 10-year | 60/103 | 58% | 7.5 | 6.7 | ||||||||||
| 5-year | 92/163 | 56% | 8.1 | 8.3 | ||||||||||
| 1-year | 105/211 | 50% | 10.4 | 10.8 | ||||||||||

The Morningstar Style Map is the Morningstar Style BoxTM with the center 75% of fund holdings plotted as theMorningstar Ownership ZoneTM. The Morningstar Style Box is designed to reveal a fund’s investment strategy. The Morningstar Ownership Zone provides detail about a portfolio’s investment style by showing the range of stock sizes and styles. The Ownership Zone is derived by plotting each stock in the portfolio within the proprietary Morningstar Style Box. Over time, the shape and location of a fund’s ownership zone may vary. See page 117 for additional information. |
Value of $10,000
Inception) as of 12/31/18 ($)

| Top 10 Positions | ||
| % of Net Assets | ||
| Attunity | 1.1 | |
| American Superconducter | 1.1 | |
| QuinStreet | 1.1 | |
| Northwest Pipe | 1.1 | |
| BioSpecifics Technologies | 1.1 | |
| Stoneridge | 1.1 | |
| Photronics | 1.1 | |
| Graham Corporation | 1.1 | |
| AtriCure | 1.1 | |
| Kornit Digital | 1.1 | |
| Portfolio Sector Breakdown | ||
| % of Net Assets | ||
| Industrials | 22.2 | |
| Information Technology | 21.1 | |
| Financials | 14.3 | |
| Consumer Discretionary | 13.8 | |
| Health Care | 11.4 | |
| Energy | 4.3 | |
| Materials | 3.4 | |
| Consumer Staples | 2.5 | |
| Real Estate | 2.5 | |
| Communication Services | 1.9 | |
| Cash and Cash Equivalents | 2.6 | |
| Calendar Year Total Returns (%) | ||
| YEAR | RMC | |
| 2018 | -8.9 | |
| 2017 | 5.4 | |
| 2016 | 19.7 | |
| 2015 | -13.3 | |
| 2014 | -4.1 | |
| 2013 | 21.3 | |
| 2012 | 8.0 | |
| 2011 | -12.1 | |
| 2010 | 30.1 | |
| 2009 | 55.7 | |
| 2008 | -40.9 | |
| 2007 | 7.1 | |
| 2006 | 22.3 | |
| 2005 | 11.5 | |
| 2004 | 15.8 | |
| Upside/Downside Capture Ratios | ||||||||||||||
| Periods Ended 12/31/18 (%) | ||||||||||||||
| UPSIDE | DOWNSIDE | |||||||||||||
| 10-Year | 77 | 84 | ||||||||||||
| From 6/30/00 (Russell Microcap Index Inception) | 90 | 82 | ||||||||||||
| Portfolio Diagnostics | ||
| Fund Net Assets | $142 million | |
| Number of Holdings | 143 | |
| Turnover Rate | 24% | |
| Average Market Capitalization1 | $401 million | |
| Weighted Average P/B Ratio2 | 1.7x | |
| Active Share3 | 90% | |
| U.S. Investments (% of Net Assets) | 85.3% | |
| Non-U.S. Investments (% of Net Assets) | 12.1% | |
| 1 | Geometric Average. This weighted calculation uses each portfolio holding’s market cap in a way designed to not skew the effect of very large or small holdings; instead, it aims to better identify the portfolio’s center, which Royce believes offers a more accurate measure of average market cap than a simple mean or median. |
| 2 | Harmonic Average. This weighted calculation evaluates a portfolio as if it were a single stock and measures it overall. It compares the total market value of the portfolio to the portfolio’s share in the earnings or book value, as the case may be, of its underlying stocks. |
| 3 | Active Share is the sum of the absolute values of the different weightings of each holding in the Fund versus each holding in the benchmark, divided by two. |
| Important Performance and Expense Information |
All performance information in this Report reflects past performance, is presented on a total return basis, reflects the reinvestment of distributions, and does not reflect the deduction of taxes that a shareholder would pay on fund distributions or the redemption of fund shares. Past performance is no guarantee of future results. Investment return and principal value of an investment will fluctuate, so that shares may be worth more or less than their original cost when redeemed. Shares redeemed within 30 days of purchase may be subject to a 1% redemption fee payable to the Fund, which is not reflected in the performance shown above; if it were, performance would be lower. Current month-end performance may be higher or lower than performance quoted and may be obtained at www.roycefunds.com. All performance and risk information reflects results of the Investment Class (its oldest class). Price and total return information is based on net asset values calculated for shareholder transactions. Certain immaterial adjustments were made to the net assets of Royce Micro-Cap Fund at 12/31/17 for financial reporting purposes, and as a result the calendar year total returns based on those net assets values differ from the adjusted net values and calendar year total returns reported in the Financial Highlights. Gross operating expenses reflect the Fund’s total gross annual operating expenses for the Investment Class and include management fees, other expenses, and acquired fund fees and expenses. Net operating expenses reflect contractual fee waivers and/or expense reimbursements. All expense information is reported as of the Fund’s most current prospectus. Royce & Associates has contractually agreed, without right of termination, to waive fees and/or reimburse expenses to the extent necessary to maintain the Investment Class’s net annual operating expenses (excluding brokerage commissions, taxes, interest, litigation expenses, acquired fund fees and expenses, and other expenses not borne in the ordinary course of business) at or below 1.49% through April 30, 2019. Acquired fund fees and expenses reflect the estimated amount of the fees and expenses incurred indirectly by the Fund through its investment in mutual funds, hedge funds, private equity funds, and other investment companies. Regarding the “Top Contributors” and “Top Detractors” tables shown above, the sum of all contributors to, and all detractors from, performance for all securities in the portfolio would approximate the Fund’s year-to-date performance for 2018. Upside Capture Ratio measures a manager’s performance in up markets relative to the Fund’s benchmark. It is calculated by measuring the Fund’s performance in quarters when the benchmark went up and dividing it by the benchmark’s return in those quarters. Downside Capture Ratio measures a manager’s performance in down markets relative to the Fund’s benchmark (Russell Microcap Index). It is calculated by measuring the Fund’s performance in quarters when the benchmark goes down and dividing it by the benchmark’s return in those quarters. |
| The Royce Funds 2018 Annual Report to Shareholders | 17 |
| MANAGERS’ DISCUSSION | ||
| Royce Micro-Cap Opportunity Fund (ROS) |
 |
| Bill Hench Suzanne Franks Rob Kosowsky, CFA |
| FUND PERFORMANCE Royce Micro-Cap Opportunity Fund was down 14.0% in 2018 compared to a decline of 13.1% for its benchmark, the Russell Microcap Index, for the same period. The Fund did, however, lose less than its index in the steep fourth-quarter downturn, -20.0% versus -22.1%. In addition, we were pleased to see that our consistent and time-tested deep value strategy allowed the Fund to outpace the index for the three-year period ended December 31, 2018. |
| WHAT WORKED... AND WHAT DIDN’T |
| We have invested most heavily over the last few years in cyclical areas, including homebuilding, infrastructure, semiconductors, and manufacturing materials. The bulk of our holdings in these areas, particularly in the industrial space, were executing very effectively early in 2018, with many reporting earnings strength consistent with the fast pace of U.S. economic growth. In fact, energy was the one end market awaiting a rebound for many of these businesses. By late summer, however, tariffs, trade war worries and falling oil prices coincided to raise suspicions that these cyclical businesses would be unable to maintain their strengths. A slowing global economy only served to exacerbate these fears. So while a number of our companies continued to report attractive results, investors grew, if anything, increasingly unconvinced, as evidenced by the dramatic decline that shook the markets in 2018’s fourth quarter. |
| Unsurprisingly, then, Consumer Discretionary, Industrials, Materials, and Energy detracted most in 2018, followed by net losses for five other sectors, including its largest, Information Technology. The only portfolio sector to finish 2018 in the black was Health Care. Household durables (Consumer Discretionary) was the largest detractor at the industry level, followed by semiconductors & semiconductor equipment (Information Technology) and machinery (Industrials). The biggest positive contributors were biotechnology (Health Care), which had a nicely outsized effect, and two groups from the broad and diverse tech sector, software and electronic equipment, instruments & components. Forterra, which makes water and drainage pipes, stormwater filtration products, and specialty precast products, detracted most at the position level, as rising costs in its water businesses dampened earnings and outweighed the effects of ongoing strong demand for its services—demand that we think should help it to turn around. New Home was the second-largest detractor in the Fund and the biggest in household durables. The company builds and sells homes in California, where higher home prices and interest rates discouraged customers, which pushed earnings and revenues lower in 2018. |
| The portfolio’s top contributor at the position level was CareDx, which specializes in diagnostic testing for transplant recipients. A top-10 position at the end of December, its success extended throughout 2018, as it continued to benefit from the favorable resolution of reimbursement issues and stayed well ahead of the competitors in its niche. Its stock also bucked the downward trend by finishing strong as the company made good on its goal of achieving positive adjusted earnings ahead of schedule in the third quarter. |
| Relative to the Russell Microcap, stock selection and was the largest contributor versus the index. The biggest relative advantage came from significant stock selection advantages in Health Care and Information Technology. The portfolio’s cash position also benefited the Fund versus the Russell Microcap in 2018. The largest negative impact versus the micro-cap benchmark came from both stock picking miscues and our overweight in Materials while stock selection hurt in Consumer Staples, Energy, and Consumer Discretionary. |
| Top Contributors to Performance For 2018 (%)1 | ||||
| CareDx | 3.33 | |||
| Electro Scientific Industries | 1.15 | |||
| eGain Corporation | 1.04 | |||
| SeaSpine Holdings | 0.84 | |||
| Ameresco Cl. A | 0.75 | |||
| 1 Includes dividends | ||||
| Top Detractors from Performance For 2018 (%)2 | ||||
| Forterra | -1.53 | |||
| New Home | -1.44 | |||
| Basic Energy Services | -1.10 | |||
| Celadon Group | -1.07 | |||
| Intrepid Potash | -0.93 | |||
| 2 Net of dividends | ||||
| We are guardedly optimistic about the ongoing health of the U.S. economy and the potentially positive effect that this could have on cyclical industries going forward, especially with stock prices falling to such low levels in December. A slower pace of U.S. growth is very different from a recession. To us, a slower growth rate following peak levels is also part of the typical ebb and flow of any healthy economic cycle. So while headwinds are undoubtedly present in the form of tariffs, anemic global growth, contracting liquidity, and the risk of recession, we have enough positive information from companies and on the industry level to indicate that slower growth seems more likely in 2019 than recession. Micro-cap stocks generally looked relatively inexpensive at the end of 2018, but we are focused as much on potential drivers of growth as we are on price. As such, we have been diligent and discriminating buyers, looking for what we see as the most promising combination of attractively low valuations and potential earnings growth, especially for companies that the market seems to have all but abandoned. This has led us to investments in businesses involved in areas such as infrastructure, housing, healthcare services, and select areas within the industrial and technology spaces. |
| 18 | The Royce Funds 2018 Annual Report to Shareholders |
| PERFORMANCE AND PORTFOLIO REVIEW | TICKER SYMBOL ROSFX |
| Performance and Expenses | ||||||||||
| Average Annual Total Return (%) Through 12/31/18 | ||||||||||
| JUL-DEC 20181 | 1-YR | 3-YR | 5-YR | SINCE INCEPTION (8/31/10) | ||||||
| ROS | -20.22 | -14.01 | 10.00 | 1.23 | 10.14 | |||||
| Annual Gross Operating Expenses: 1.28% Annual Net Operating Expenses: 1.24% | ||||||||||
| 1 Not annualized | ||||||||||
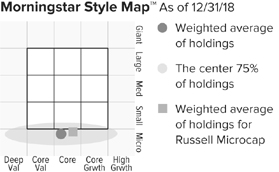
The Morningstar Style Map is the Morningstar Style BoxTM with the center 75% of fund holdings plotted as the Morningstar Ownership ZoneTM. The Morningstar Style Box is designed to reveal a fund’s investment strategy. The Morningstar Ownership Zone provides detail about a portfolio’s investment style by showing the range of stock sizes and styles. The Ownership Zone is derived by plotting each stock in the portfolio within the proprietary Morningstar Style Box. Over time, the shape and location of a fund’s ownership zone may vary. See page 117 for additional information. |
Value of $10,000
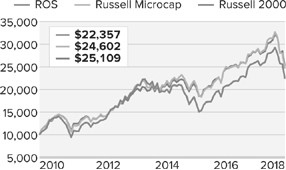
| Top 10 Positions | ||
| % of Net Assets | ||
| Ameresco Cl. A | 3.4 | |
| BioScrip | 2.8 | |
| Alpha & Omega Semiconductor | 2.4 | |
| Old Line Bancshares | 2.4 | |
| General Finance | 2.3 | |
| Intrepid Potash | 2.3 | |
| CareDx | 2.2 | |
| New Home | 2.2 | |
| HCI Group | 2.1 | |
| Amber Road | 2.0 | |
| Portfolio Sector Breakdown | ||
| % of Net Assets | ||
| Information Technology | 21.0 | |
| Industrials | 14.9 | |
| Health Care | 12.9 | |
| Financials | 9.3 | |
| Materials | 8.4 | |
| Consumer Discretionary | 8.3 | |
| Consumer Staples | 4.7 | |
| Energy | 4.2 | |
| Communication Services | 2.2 | |
| Real Estate | 0.8 | |
| Cash and Cash Equivalents | 13.3 | |
| Calendar Year Total Returns (%) | ||
| YEAR | ROS | |
| 2018 | -14.0 | |
| 2017 | 25.0 | |
| 2016 | 23.8 | |
| 2015 | -16.0 | |
| 2014 | -5.0 | |
| 2013 | 44.6 | |
| 2012 | 35.1 | |
| 2011 | -17.1 | |
| Portfolio Diagnostics | ||
| Fund Net Assets | $18 million | |
| Number of Holdings | 82 | |
| Turnover Rate | 52% | |
| Average Market Capitalization1 | $319 million | |
| Weighted Average P/B Ratio2 | 1.3x | |
| Weighted Average P/S Ratio3 | 1.0x | |
| Active Share4 | 94% | |
| U.S. Investments (% of Net Assets) | 85.6% | |
| Non-U.S. Investments (% of Net Assets) | 1.1% | |
| 1 | Geometric Average. This weighted calculation uses each portfolio holding’s market cap in a way designed to not skew the effect of very large or small holdings; instead, it aims to better identify the portfolio’s center, which Royce believes offers a more accurate measure of average market cap than a simple mean or median. |
| 2 | Harmonic Average. This weighted calculation evaluates a portfolio as if it were a single stock and measures it overall. It compares the total market value of the portfolio to the portfolio’s share in the earnings or book value, as the case may be, of its underlying stocks. |
| 3 | Price to Sales is calculated by dividing the company’s market cap by the revenue in the most recent year. |
| 4 | Active Share is the sum of the absolute values of the different weightings of each holding in the Fund versus each holding in the benchmark, divided by two. |
| Important Performance and Expense Information All performance information in this Report reflects past performance, is presented on a total return basis, reflects the reinvestment of distributions, and does not reflect the deduction of taxes that a shareholder would pay on fund distributions or the redemption of fund shares. Past performance is no guarantee of future results. Investment return and principal value of an investment will fluctuate, so that shares may be worth more or less than their original cost when redeemed. Shares redeemed within 30 days of purchase may be subject to a 1% redemption fee, payable to the Fund, which is not reflected in the performance shown above; if it were, performance would be lower. Current month-end performance may be higher or lower than performance quoted and may be obtained at www.roycefunds.com. All performance and risk information reflects results of the Investment Class (its oldest share class). Certain immaterial adjustments were made to the net assets of Royce Micro-Cap Opportunity Fund at 12/31/17 for financial reporting purposes, and as a result the calendar year total returns based on those net assets values differ from the adjusted net values and calendar year total returns reported in the Financial Highlights. Gross operating expenses reflect the Fund’s total gross annual operating expenses for the Investment Class and include management fees and other expenses. Net operating expenses reflect contractual fee waivers and/or expense reimbursements. All expense information is reported as of the Funds most current prospectus. Royce & Associates has contractually agreed to waive fees and/or reimburse operating expenses to the extent necessary to maintain the Fund’s net annual operating expenses, (excluding dividend and interest expenses relating to short sale activities, brokerage commissions, taxes, interest, litigation expenses, acquired fund fees and expenses, and other expenses not borne in the ordinary course of business), at or below 1.24% through April 30, 2019. Regarding the “Top Contributors” and “Top Detractors” tables shown above, the sum of all contributors to, and all detractors from, performance for all securities in the portfolio would approximate the Fund’s year-to-date performance for 2018. |
| The Royce Funds 2018 Annual Report to Shareholders | 19 |
| MANAGERS’ DISCUSSION | ||
| Royce Opportunity Fund (ROF) |
 |
| Bill Hench Suzanne Franks Rob Kosowsky, CFA |
| FUND PERFORMANCE The bear market that emerged late in the year failed to deter Royce Opportunity Fund’s longer-term relative advantages. The Fund was down 20.0% in 2018 compared to respective declines of 11.0% and 12.9% for its small-cap benchmarks, the Russell 2000 and Russell 2000 Value Indexes, for the same period. However, our consistent and time-tested deep value strategy allowed Opportunity to outpace both indexes for the three-, 10-, 20-year, and since inception (11/19/96) periods ended December 31, 2018 while also beating the Russell 2000 Value for the 15-year period. Just as we were disappointed by the Fund losing more than its benchmark in 2018, we are similarly confident that its long history of robust rebounds in market recoveries can continue. |
| WHAT WORKED... AND WHAT DIDN’T |
| We have historically invested most heavily in cyclical areas, including technology, industrials, and manufacturing materials. The bulk of our holdings in these areas, particularly in the industrial space, were executing effectively early in 2018, with many reporting earnings strength consistent with the fast pace of U.S. economic growth. By late summer, however, tariffs, trade war worries and falling oil prices coincided to raise suspicions that these cyclical businesses would be unable to maintain their strengths. A slowing global economy only served to exacerbate these fears. So while a number of our companies continued to report attractive results, investors grew, if anything, increasingly unconvinced, as evidenced by the dramatic decline that shook the markets in 2018’s fourth quarter. |
| Unsurprisingly, then, Industrials detracted most by a wide margin in 2018, followed by net losses for Energy, Health Care, and Consumer Discretionary. The only two portfolio sectors to finish 2018 in the black were Communication Services and Utilities. Machinery (Industrials) was the largest detractor at the industry level by a wide margin, followed by oil, gas, & consumable fuels and energy equipment & services (both from Energy), and health care providers & services (Health Care). The biggest positive contributors were hotels, restaurants & leisure (Consumer Discretionary) and consumer finance (Financials). Invacare Corporation, which manufactures health care products to the global non-acute care market, detracted most at the position level. While its European markets remain solid, sales have been sluggish elsewhere, hurt by tariffs, increased freight expenses, and higher commodity and material costs. We built our stake in 2018, as we did with United Natural Foods, the largest wholesale distributor to the natural, organic, and specialty foods industry in the U.S. and Canada. Rising prices have pressured earnings, but we have confidence in the strength of its franchise. |
| Relative to the Russell 2000, stock selection hurt calendar-year relative results most, with sector allocation having a much smaller negative effect. The largest negative impact versus the benchmark came from Industrials— the result of poor stock selection and our overweight— while ineffective stock picks and our underweight in Health Care hurt nearly as much. Machinery companies Westport Fuel Systems, which manufactures and supplies alternative fuel systems and components, and NN, which makes high-precision components and assemblies, struggled most due to earnings disappointments while several holdings in health care providers & services endured heightened competition that dampened revenue and earnings. |
| The biggest relative advantage in 2018 came from savvy stock selection in Financials, where holdings in the consumer finance and, to a lesser extent, capital markets industries drove results. Enova International stood out in consumer finance, and in the overall portfolio, due to the comparative resilience of its stock price between September and December. Enova is a payday lender that’s been expanding its roster of offerings to include installment loans and lines of credit that are not subject to banking regulations. The portfolio’s cash position was an additional net positive versus the Russell 2000 in 2018. |
| Top Contributors to Performance For 2018 (%)1 | ||||
| Enova International | 0.43 | |||
| Fabrinet | 0.41 | |||
| Belmond Cl. A | 0.35 | |||
| Ciena Corporation | 0.34 | |||
| SUPERVALU | 0.32 | |||
| 1 Includes dividends | ||||
| Top Detractors from Performance For 2018 (%)2 | ||||
| Invacare Corporation | -0.66 | |||
| United Natural Foods | -0.62 | |||
| Westport Fuel Systems | -0.55 | |||
| NN | -0.55 | |||
| Herc Holdings | -0.51 | |||
| 2 Net of dividends | ||||
| CURRENT POSITIONING AND OUTLOOK |
| We are guardedly optimistic about the ongoing health of the U.S. economy and the potentially positive effect that this could have on cyclical industries going forward, especially with stock prices falling to such low levels in December. A slower pace in U.S. growth is very different from a recession. To us, a slower growth rate following peak levels is also part of the typical ebb and flow of any healthy economic cycle. So while headwinds are undoubtedly present in the form of tariffs, anemic global growth, contracting liquidity, and the risk of recession, we have enough positive information from companies and on the industry level to indicate that slower growth seems more likely in 2019 than recession. Small-cap stocks generally looked relatively inexpensive at the end of 2018, but we are focused as much on potential drivers of growth as we are on price. As such, we have been diligent and discriminating buyers, looking for what we see as the most promising combination of attractively low valuations and potential earnings growth, especially for companies that the market seems to have all but abandoned. This has led us to investments in businesses involved in areas such as infrastructure, housing, healthcare services, and select areas within the industrial and technology spaces. |
| 20 | The Royce Funds 2018 Annual Report to Shareholders |
| PERFORMANCE AND PORTFOLIO REVIEW | TICKER SYMBOLS RYPNX RYOFX ROFCX ROFIX ROFRX |
| Performance and Expenses | ||||||||||||||||
| Average Annual Total Return (%) Through 12/31/18 | ||||||||||||||||
| JUL-DEC 20181 | 1-YR | 3-YR | 5-YR | 10-YR | 15-YR | 20-YR | SINCE INCEPTION (11/19/96) | |||||||||
| ROF | -23.08 | -19.97 | 8.20 | 1.73 | 13.73 | 7.14 | 10.61 | 10.98 | ||||||||
| Annual Operating Expenses: 1.18% | ||||||||||||||||
| 1 Not annualized | ||||||||||||||||
Relative Returns: Monthly Rolling Average Annual Return Periods
| On a monthly rolling basis, the Fund outperformed the Russell 2000 in 79% of all 10-year periods; 67% of all 5-year periods; and 65% of all 1-year periods. |
| PERIODS BEATING THE INDEX | FUND AVG (%)1 | INDEX AVG (%)1 | |||||||||
| 10-year | 96/121 | 79% | 9.0 | 7.2 | |||||||
| 5-year | 121/181 | 67% | 11.2 | 8.8 | |||||||
| 1-year | 149/229 | 65% | 15.3 | 10.3 | |||||||
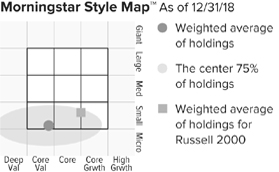
The Morningstar Style Map is the Morningstar Style BoxTM with the center 75% of fund holdings plotted as the Morningstar Ownership ZoneTM. The Morningstar Style Box is designed to reveal a fund’s investment strategy. The Morningstar Ownership Zone provides detail about a portfolio’s investment style by showing the range of stock sizes and styles. The Ownership Zone is derived by plotting each stock in the portfolio within the proprietary Morningstar Style Box. Over time, the shape and location of a fund’s ownership zone may vary. See page 117 for additional information. |
Value of $10,000

| Top 10 Positions | ||
| % of Net Assets | ||
| Northwest Pipe | 1.1 | |
| Comtech Telecommunications | 1.0 | |
| Granite Construction | 1.0 | |
| Kratos Defense & Security Solutions | 1.0 | |
| Carpenter Technology | 1.0 | |
| Meritor | 0.9 | |
| Mueller Water Products Cl. A | 0.9 | |
| KEMET Corporation | 0.9 | |
| Cray | 0.9 | |
| Ciena Corporation | 0.8 | |
| Portfolio Sector Breakdown | ||
| % of Net Assets | ||
| Industrials | 25.5 | |
| Information Technology | 24.0 | |
| Consumer Discretionary | 11.8 | |
| Materials | 8.1 | |
| Financials | 7.8 | |
| Energy | 7.5 | |
| Health Care | 7.3 | |
| Consumer Staples | 1.7 | |
| Communication Services | 1.0 | |
| Real Estate | 0.3 | |
| Utilities | 0.3 | |
| Cash and Cash Equivalents | 4.7 | |
| Calendar Year Total Returns (%) | ||
| YEAR | ROF | |
| 2018 | -20.0 | |
| 2017 | 21.9 | |
| 2016 | 29.9 | |
| 2015 | -13.6 | |
| 2014 | -0.5 | |
| 2013 | 43.5 | |
| 2012 | 22.6 | |
| 2011 | -13.0 | |
| 2010 | 33.8 | |
| 2009 | 62.1 | |
| 2008 | -45.7 | |
| 2007 | -2.0 | |
| 2006 | 18.8 | |
| 2005 | 4.8 | |
| 2004 | 17.5 | |
| Upside/Downside Capture Ratios | ||||
| Periods Ended 12/31/18 (%) | ||||
| UPSIDE | DOWNSIDE | |||
| 10-Year | 118 | 121 | ||
| From 12/31/96 (Start of Fund’s First Full Quarter) | 123 | 111 | ||
| Portfolio Diagnostics | ||
| Fund Net Assets | $869 million | |
| Number of Holdings | 273 | |
| Turnover Rate | 47% | |
| Average Market Capitalization1 | $727 million | |
| Weighted Average P/B Ratio2 | �� | 1.3x |
| Weighted Average P/S Ratio3 | 0.8x | |
| Active Share4 | 91% | |
| U.S. Investments (% of Net Assets) | 91.0% | |
| Non-U.S. Investments (% of Net Assets) | 4.3% | |
| 1 | Geometric Average. This weighted calculation uses each portfolio holding’s market cap in a way designed to not skew the effect of very large or small holdings; instead, it aims to better identify the portfolio’s center, which Royce believes offers a more accurate measure of average market cap than a simple mean or median. |
| 2 | Harmonic Average. This weighted calculation evaluates a portfolio as if it were a single stock and measures it overall. It compares the total market value of the portfolio to the portfolio’s share in the earnings or book value, as the case may be, of its underlying stocks. |
| 3 | Price to Sales is calculated by dividing the company’s market cap by the revenue in the most recent year. |
| 4 | Active Share is the sum of the absolute values of the different weightings of each holding in the Fund versus each holding in the benchmark, divided by two. |
| Important Performance and Expense Information All performance information in this Report reflects past performance, is presented on a total return basis, reflects the reinvestment of distributions, and does not reflect the deduction of taxes that a shareholder would pay on fund distributions or the redemption of fund shares. Past performance is no guarantee of future results. Investment return and principal value of an investment will fluctuate, so that shares may be worth more or less than their original cost when redeemed. Shares redeemed within 30 days of purchase may be subject to a 1% redemption fee payable to the Fund, which is not reflected in the performance shown above; if it were, performance would be lower. Current month-end performance may be higher or lower than performance quoted and may be obtained at www.roycefunds.com. All performance and risk information reflects results of the Investment Class (its oldest class). Operating expenses reflect the Fund’s total annual operating expenses for the Investment Class as of the Fund’s most current prospectus and include management fees and other expenses. Regarding the “Top Contributors” and “Top Detractors” tables shown above, the sum of all contributors to, and all detractors from, performance for all securities in the portfolio would approximate the Fund’s year-to-date performance for 2018. Upside Capture Ratio measures a manager’s performance in up markets relative to the Fund’s benchmark. It is calculated by measuring the Fund’s performance in quarters when the benchmark went up and dividing it by the benchmark’s return in those quarters. Downside Capture Ratio measures a manager’s performance in down markets relative to the Fund’s benchmark (Russell 2000). It is calculated by measuring the Fund’s performance in quarters when the benchmark goes down and dividing it by the benchmark’s return in those quarters. |
| The Royce Funds 2018 Annual Report to Shareholders | 21 |
| MANAGERS’ DISCUSSION | ||
| Royce Pennsylvania Mutual Fund® (PMF) |
 |
| Chuck Royce Jay Kaplan, CFA Lauren Romeo, CFA |
| FUND PERFORMANCE In a difficult market, our flagship Royce Pennsylvania Mutual Fund managed to stay ahead of its small-cap benchmark for the third consecutive year, which helped it to outperform the Russell 2000 Index for the one-, three-, 15-, 20-, 25-, 30-, 35-, and 40-year periods ended December 31, 2018. The Fund lost 9.7% in 2018, losing less than the Russell 2000, which declined 11.0% for the same period. We believe that the portfolio’s multi-discipline approach, which integrates quality and value, helped it to preserve capital, especially in 2018’s calamitous fourth quarter, as the Fund has done during most declines over its long history. |
| WHAT WORKED... AND WHAT DIDN’T |
| Nine of the Fund’s 11 equity sectors declined in 2018. Industrials detracted most by a sizable margin, followed by Financials and Information Technology. Health Care made a notable positive contribution, followed by a far more modest impact from Consumer Staples. The six industry groups with the most significant net losses for the Fund came from five different sectors, which gives a sense of how broad declines were for small-caps in 2018. By sizable margins, the machinery group was both the biggest detractor and our heaviest weighting in Industrials at year-end. Fourth-quarter difficulties for two machinery stocks—Sun Hydraulics (which does business as Helios Technologies) and CIRCOR International—had sizable negative impacts on performance. Sun Hydraulics manufactures hydraulic and electronic controls systems for a variety of industrial and recreational equipment makers. The company continued to book solid incoming orders, but labor and materials cost pressures, as well as a series of operational miscues stemming from a rush to meet growing demand, brought margins and earnings below expectations. CIRCOR makes valves for fluid control systems. Its shares fell precipitously in the fourth quarter amid concerns that slowing global growth, U.S.-China trade tensions, and the significant drop in oil prices—energy companies being among its larger end markets—would put a damper on CIRCOR’s positive order trends, pushing out a long-awaited improvement in profit margins and free cash flow earmarked for debt reduction. We held shares in each company at year-end, confident in their respective abilities to recover. Capital markets (Financials) followed at the industry level as the bulk of the Fund’s holdings in traditional asset managers suffered the steep declines that often afflict these businesses in down markets. Next came Information Technology’s semiconductors & semiconductor equipment group, where most stocks fell on warnings of a more prolonged industry slowdown than had been initially anticipated, and energy equipment & services, where slumping oil prices resulted in Energy suffering by far the steepest losses of any sector in the Russell 2000 for the calendar year. Generally confident in the long-term prospects for our holdings in all three areas, we were overweight in each at the end of 2018. Health care equipment & supplies and health care providers & services (Health Care) contributed most at the industry level. The portfolio’s two top-contributing positions, however, hailed from Information Technology’s electronic equipment, instruments & components group—Electro Scientific Industries, which was acquired by MKS Instruments at a 100% premium, and Fabrinet, a contract manufacturer that offers specialized products and services to original equipment manufacturers in the technology space. The merger of two large customers appeared to drive investors away in 2017 over concerns that the consolidation would contract Fabrinet’s business. The company then went ahead and executed successfully, and profitably, in 2018, which led its stock to recover. The Fund’s outperformance in 2018 was the result of superior stock selection as sector allocation made a minor negative impact. Health Care was strongest, helped both by our underweight in the lagging biotechnology and pharmaceuticals industries as well as strong stock selection in health care providers & services. Also contributing to relative results was savvy stock picking in Energy, particularly in energy equipment & services. Conversely, our overweight in Industrials was the largest source of underperformance (though stock selection was additive in the sector). Our very low exposure to Utilities also hurt as did stock selection in Communication Services (where our underweight also hurt slightly). |
| Top Contributors to Performance For 2018 (%)1 | ||||
| Electro Scientific Industries | 0.40 | |||
| Fabrinet | 0.39 | |||
| U.S. Physical Therapy | 0.33 | |||
| America’s Car-Mart | 0.26 | |||
| Inter Parfums | 0.25 | |||
| 1 Includes dividends | ||||
| Top Detractors from Performance For 2018 (%)2 | ||||
| Sun Hydraulics | -0.96 | |||
| CIRCOR International | -0.52 | |||
| comScore | -0.33 | |||
| Valmont Industries | -0.33 | |||
| Air Lease Cl. A | -0.32 | |||
| 2 Net of dividends | ||||
| CURRENT POSITIONING AND OUTLOOK |
| While we acknowledge the many potential sources of risk on the horizon—economic, geopolitical, and financial—we also think that these concerns have already been reflected, perhaps even excessively so, in current valuations. In relatively short order, we transitioned from a period this summer when small-cap’s extended valuations seemed out of sync given the index’s high levels of debt and low profitability, to one at the end of the year where valuations seemed more pessimistic than we think is warranted—at least in select instances. As a result, we reduced the Fund’s cash holdings to a minimal amount by year-end. Down years for small-caps have often been followed by strong ones. We believe that the portfolio’s cyclical tilt will be rewarded as recessionary concerns dissipate during the year. |
| 22 | The Royce Funds 2018 Annual Report to Shareholders |
| PERFORMANCE AND PORTFOLIO REVIEW | TICKER SYMBOLS PENNX RYPFX RPMIX RYPCX RPMRX |
| Performance and Expenses | ||||||||||||||||||||||
| Average Annual Total Return (%) Through 12/31/18 | ||||||||||||||||||||||
| JUL-DEC 20181 | 1-YR | 3-YR | 5-YR | 10-YR | 15-YR | 20-YR | 25-YR | 30-YR | 35-YR | 45-YR | ||||||||||||
| PMF | -14.54 | -9.66 | 9.92 | 3.15 | 11.34 | 7.71 | 9.15 | 9.63 | 10.02 | 10.43 | 13.20 | |||||||||||
| Annual Operating Expenses: 0.92% | ||||||||||||||||||||||
| 1 Not annualized | ||||||||||||||||||||||
Relative Returns: Monthly Rolling Average Annual Return Periods
20 Years Through 12/31/18
| On a monthly rolling basis, the Fund outperformed the Russell 2000 in 60% of all 10-year periods; 60% of all 5-year periods; and 56% of all 1-year periods. |
| PERIODS BEATING THE INDEX | FUND AVG (%)1 | INDEX AVG (%)1 | |||||||||
| 10-year | 73/121 | 60% | 8.5 | 7.2 | |||||||
| 5-year | 109/181 | 60% | 10.1 | 8.8 | |||||||
| 1-year | 129/229 | 56% | 12.0 | 10.3 | |||||||
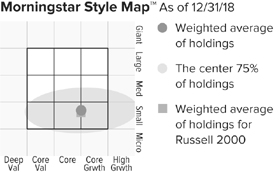
The Morningstar Style Map is the Morningstar Style BoxTM with the center 75% of fund holdings plotted as the Morningstar Ownership ZoneTM. The Morningstar Style Box is designed to reveal a fund’s investment strategy. The Morningstar Ownership Zone provides detail about a portfolio’s investment style by showing the range of stock sizes and styles. The Ownership Zone is derived by plotting each stock in the portfolio within the proprietary Morningstar Style Box. Over time, the shape and location of a fund’s ownership zone may vary. See page 117 for additional information. |
Value of $10,000
as of 12/31/18 ($)

| Top 10 Positions | ||
| % of Net Assets | ||
| FLIR Systems | 2.1 | |
| HEICO Corporation | 1.8 | |
| First Citizens BancShares Cl. A | 1.6 | |
| Quaker Chemical | 1.5 | |
| Sun Hydraulics | 1.3 | |
| Raven Industries | 1.3 | |
| SEACOR Holdings | 1.2 | |
| E-L Financial | 1.1 | |
| Stella-Jones | 1.0 | |
| Genworth MI Canada | 1.0 | |
| Portfolio Sector Breakdown | ||
| % of Net Assets | ||
| Industrials | 26.9 | |
| Information Technology | 21.0 | |
| Financials | 16.7 | |
| Materials | 9.4 | |
| Consumer Discretionary | 7.7 | |
| Health Care | 7.2 | |
| Energy | 3.8 | |
| Real Estate | 3.3 | |
| Communication Services | 1.4 | |
| Consumer Staples | 1.4 | |
| Cash and Cash Equivalents | 1.2 | |
| Calendar Year Total Returns (%) | ||
| YEAR | PMF | |
| 2018 | -9.7 | |
| 2017 | 16.2 | |
| 2016 | 26.5 | |
| 2015 | -11.4 | |
| 2014 | -0.7 | |
| 2013 | 35.3 | |
| 2012 | 14.6 | |
| 2011 | -4.2 | |
| 2010 | 23.9 | |
| 2009 | 36.3 | |
| 2008 | -34.8 | |
| 2007 | 2.8 | |
| 2006 | 14.8 | |
| 2005 | 12.5 | |
| 2004 | 20.2 | |
| Upside/Downside Capture Ratios | ||||
| Periods Ended 12/31/18 (%) | ||||
| UPSIDE | DOWNSIDE | |||
| 10-Year | 92 | 90 | ||
| From 12/31/78 (Russell 2000 Inception) | 89 | 71 | ||
| Portfolio Diagnostics | ||
| Fund Net Assets | $1,579 million | |
| Number of Holdings | 269 | |
| Turnover Rate | 35% | |
| Average Market Capitalization1 | $1,723 million | |
| Weighted Average P/E Ratio2,3 | 14.8x | |
| Weighted Average P/B Ratio2 | 2.0x | |
| Active Share4 | 88% | |
| U.S. Investments (% of Net Assets) | 88.2% | |
| Non-U.S. Investments (% of Net Assets) | 10.6% | |
| 1 | Geometric Average. This weighted calculation uses each portfolio holding’s market cap in a way designed to not skew the effect of very large or small holdings; instead, it aims to better identify the portfolio’s center, which Royce believes offers a more accurate measure of average market cap than a simple mean or median. |
| 2 | Harmonic Average. This weighted calculation evaluates a portfolio as if it were a single stock and measures it overall. It compares the total market value of the portfolio to the portfolio’s share in the earnings or book value, as the case may be, of its underlying stocks. |
| 3 | The Fund’s P/E ratio calculation excludes companies with zero or negative earnings (11% of portfolio holdings as of 12/31/18). |
| 4 | Active Share is the sum of the absolute values of the different weightings of each holding in the Fund versus each holding in the benchmark, divided by two. |
| Important Performance and Expense Information All performance information in this Report reflects past performance, is presented on a total return basis, reflects the reinvestment of distributions, and does not reflect the deduction of taxes that a shareholder would pay on fund distributions or the redemption of fund shares. Past performance is no guarantee of future results. Investment return and principal value of an investment will fluctuate, so that shares may be worth more or less than their original cost when redeemed. Shares redeemed within 30 days of purchase may be subject to a 1% redemption fee payable to the Fund, which is not reflected in the performance shown above; if it were, performance would be lower. Current month-end performance may be higher or lower than performance quoted and may be obtained at www.roycefunds.com. All performance and risk information reflects results of the Investment Class (its oldest class). Operating expenses reflect the Fund’s total annual operating expenses for the Investment Class as of the Fund’s most current prospectus and include management fees and other expenses. Regarding the “Top Contributors” and “Top Detractors” tables shown above, the sum of all contributors to, and all detractors from, performance for all securities in the portfolio would approximate the Fund’s year-to-date performance for 2018. Upside Capture Ratio measures a manager’s performance in up markets relative to the Fund’s benchmark. It is calculated by measuring the Fund’s performance in quarters when the benchmark went up and dividing it by the benchmark’s return in those quarters. Downside Capture Ratio measures a manager’s performance in down markets relative to the Fund’s benchmark (Russell 2000). It is calculated by measuring the Fund’s performance in quarters when the benchmark goes down and dividing it by the benchmark’s return in those quarters. |
| The Royce Funds 2018 Annual Report to Shareholders | 23 |
| MANAGERS’ DISCUSSION | ||
| Royce Premier Fund (RPR) |
 |
| Chuck Royce Lauren Romeo, CFA Steven McBoyle |
| FUND PERFORMANCE Boosted by its index-beating performance in each of the past three years, Royce Premier Fund remained ahead of its small-cap benchmark, the Russell 2000 Index, for the one, three-, 15-, 20-, 25-year, and since inception (12/31/91) periods ended December 31, 2018. This helped make a difficult 2018 more bearable. The Fund fell 10.4% for the calendar year, losing less than the Russell 2000, which declined 11.0% for the same period. We were pleased that the Fund’s relative advantages have been driven by its focus on high-quality companies, which also helped to mitigate losses in the down market—as has typically been the case through its long history. |
| WHAT WORKED... AND WHAT DIDN’T |
| Seven of the Fund’s nine equity sectors declined in 2018. Industrials was the largest detractor by far, followed by Materials and Information Technology. Each sector consists of a large number of cyclical businesses, and cyclical stocks generally fared worse than defensives in 2018 as concerns mounted about an imminent recession. Health Care and Consumer Discretionary were the only sectors to post positive returns for the year. At the industry level, machinery detracted most by a substantial margin. Housed in Industrials, this group was also our biggest weighting in that sector and home to two of the portfolio’s three largest detractors for the year—CIRCOR International and Sun Hydraulics (which does business as Helios Technologies). CIRCOR makes valves for fluid control systems. Its shares fell precipitously in the fourth quarter amid concerns that slowing global growth, U.S.-China trade tensions, and the significant drop in oil prices—energy companies being among its larger end markets—would put a damper on CIRCOR’s positive order trends, pushing out a long-awaited improvement in profit margins and free cash flow earmarked for debt reduction. Sun Hydraulics manufactures hydraulic and electronic controls systems for a variety of industrial and recreational equipment makers. The company continued to book solid incoming orders, but labor and materials cost pressures, as well as a series of operational miscues stemming from a rush to meet growing demand, brought margins and earnings below expectations. We held shares in each company at year-end, confident in both ongoing economic growth and their respective abilities to recover. Air Lease is a leading aircraft leasing business that saw its shares lose altitude throughout the year, particularly in December, when the airline industry came under considerable pressure throughout the eurozone, which resulted in the shuttering of a number of poorly capitalized carriers. Though Air Lease was less exposed to this dynamic, there were concerns among investors that a similar trend would materialize in other geographies. Confident in the potential for its shares to rise when tailwinds return to its business, we increased our stake in 2018. It was a top-10 position at year-end. The portfolio’s top contributor for both 2018 and the historically bearish fourth quarter was Dorman Products, the leading provider of formerly dealer-only aftermarket auto parts. Demand for auto replacement parts inflected positively as the industry entered the three- to seven-year sweet spot for replacement parts, as well as from replenished auto retailer inventories. In addition, its growth initiatives in heavy duty truck and electronic components continued to take hold. Copart, a leading provider of auctions for salvaged vehicles, was the second largest contributor as the company saw increases in volume and revenue per car in 2018. After reducing our stake throughout the year, we exited our position in December. Relative outperformance in 2018 was due to superior stock selection as opposed to sector allocation, which detracted. The struggling Energy sector was the most significant source of outperformance owing to strong stock selection among energy equipment & services holdings, as well as having no holdings in the struggling oil, gas & consumable fuels industry. Financials provided another relative edge as the Fund’s holdings outperformed in the capital markets industry. Our decision to avoid lagging bank stocks also helped. Information Technology was the source of the greatest underperformance in 2018, hurt by ineffective stock selection in electronic equipment, instruments & components and our underweight in software. Our greater exposure to Industrials also detracted—stock selection was additive in this lagging sector. |
| Top Contributors to Performance For 2018 (%)1 | ||||
| Dorman Products | 0.70 | |||
| Copart | 0.65 | |||
| Core-Mark Holding Company | 0.48 | |||
| Fair Isaac | 0.44 | |||
| IDEXX Laboratories | 0.38 | |||
| 1 Includes dividends | ||||
| Top Detractors from Performance For 2018 (%)2 | ||||
| CIRCOR International | -1.27 | |||
| Air Lease Cl. A | -1.27 | |||
| Sun Hydraulics | -1.06 | |||
| Valmont Industries | -0.87 | |||
| Thor Industries | -0.74 | |||
| 2 Net of dividends | ||||
| CURRENT POSITIONING AND OUTLOOK |
| We believe that the recent downturn is more likely a risk reset rather than a foreshadowing of recession. While the U.S. economy has slowed and non-U.S. economies have weakened, our conversations with companies and our own research lead us to see the decline as a buying opportunity. As such, we have been adding to existing as well as new names, activities that dropped cash levels down to minimal levels at year-end. We are confident in our current holdings, which generally have solid cash flows, modest valuations, effective managements, and encouraging prospects. These are the businesses that look most likely to weather or even thrive in a period with even more volatility and uncertainty than usual. |
| 24 | The Royce Funds 2018 Annual Report to Shareholders |
| PERFORMANCE AND PORTFOLIO REVIEW | TICKER SYMBOLS RYPRX RPFFX RPFIX RPRCX RPRRX |
| Performance and Expenses | ||||||||||||||||||
| Average Annual Total Return (%) Through 12/31/18 | ||||||||||||||||||
| JUL-DEC 20181 | 1-YR | 3-YR | 5-YR | 10-YR | 15-YR | 20-YR | 25-YR | SINCE INCEPTION (12/31/91) | ||||||||||
| RPR | -12.66 | -10.40 | 10.91 | 4.03 | 11.23 | 9.04 | 9.99 | 10.52 | 11.02 | |||||||||
| Annual Operating Expenses: 1.16% | ||||||||||||||||||
| 1 Not annualized | ||||||||||||||||||
Relative Returns: Monthly Rolling Average Annual Return Periods
| On a monthly rolling basis, the Fund outperformed the Russell 2000 in 89% of all 10-year periods; 62% of all 5-year periods; and 63% of all 1-year periods. |
| PERIODS BEATING THE INDEX | FUND AVG (%)1 | INDEX AVG (%)1 | |||||||||
| 10-year | 108/121 | 89% | 10.0 | 7.2 | |||||||
| 5-year | 113/181 | 62% | 11.1 | 8.8 | |||||||
| 1-year | 144/229 | 63% | 12.6 | 10.3 | |||||||
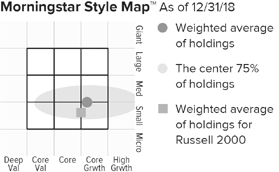
The Morningstar Style Map is the Morningstar Style BoxTM with the center 75% of fund holdings plotted as the Morningstar Ownership ZoneTM. The Morningstar Style Box is designed to reveal a fund’s investment strategy. The Morningstar Ownership Zone provides detail about a portfolio’s investment style by showing the range of stock sizes and styles. The Ownership Zone is derived by plotting each stock in the portfolio within the proprietary Morningstar Style Box. Over time, the shape and location of a fund’s ownership zone may vary. See page 117 for additional information. |
Value of $10,000
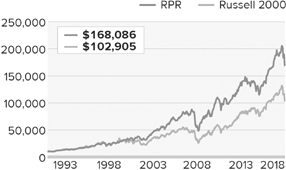
| Top 10 Positions | ||
| % of Net Assets | ||
| Kirby Corporation | 3.8 | |
| Lincoln Electric Holdings | 3.4 | |
| National Instruments | 3.1 | |
| Woodward | 2.9 | |
| Air Lease Cl. A | 2.8 | |
| Lindsay Corporation | 2.8 | |
| Dorman Products | 2.8 | |
| Medidata Solutions | 2.7 | |
| Ashmore Group | 2.7 | |
| Ares Management L.P. | 2.6 | |
| Portfolio Sector Breakdown | ||
| % of Net Assets | ||
| Industrials | 34.6 | |
| Information Technology | 17.9 | |
| Financials | 15.1 | |
| Consumer Discretionary | 9.8 | |
| Materials | 8.9 | |
| Health Care | 4.1 | |
| Energy | 3.6 | |
| Consumer Staples | 2.8 | |
| Real Estate | 1.5 | |
| Cash and Cash Equivalents | 1.7 | |
| Calendar Year Total Returns (%) | ||
| YEAR | RPR | |
| 2018 | -10.4 | |
| 2017 | 23.8 | |
| 2016 | 23.0 | |
| 2015 | -9.9 | |
| 2014 | -0.9 | |
| 2013 | 27.7 | |
| 2012 | 11.4 | |
| 2011 | -0.9 | |
| 2010 | 26.5 | |
| 2009 | 33.3 | |
| 2008 | -28.3 | |
| 2007 | 12.7 | |
| 2006 | 8.8 | |
| 2005 | 17.1 | |
| 2004 | 22.8 | |
| Upside/Downside Capture Ratios | ||||
| Periods Ended 12/31/18 (%) | ||||
| UPSIDE | DOWNSIDE | |||
| 10-Year | 90 | 86 | ||
| From 12/31/91 (Start of Fund’s First Full Quarter) | 93 | 72 | ||
| Portfolio Diagnostics | ||
| Fund Net Assets | $1,669 million | |
| Number of Holdings | 56 | |
| Turnover Rate | 23% | |
| Average Market Capitalization1 | $2,934 million | |
| Weighted Average P/E Ratio2,3 | 16.2x | |
| Weighted Average P/B Ratio2 | 2.3x | |
| Active Share4 | 97% | |
| U.S. Investments (% of Net Assets) | 86.6% | |
| Non-U.S. Investments (% of Net Assets) | 11.7% | |
| 1 | Geometric Average. This weighted calculation uses each portfolio holding’s market cap in a way designed to not skew the effect of very large or small holdings; instead, it aims to better identify the portfolio’s center, which Royce believes offers a more accurate measure of average market cap than a simple mean or median. |
| 2 | Harmonic Average. This weighted calculation evaluates a portfolio as if it were a single stock and measures it overall. It compares the total market value of the portfolio to the portfolio’s share in the earnings or book value, as the case may be, of its underlying stocks. |
| 3 | The Fund’s P/E ratio calculation excludes companies with zero or negative earnings (0% of portfolio holdings as of 12/31/18). |
| 4 | Active Share is the sum of the absolute values of the different weightings of each holding in the Fund versus each holding in the benchmark, divided by two. |
| Important Performance and Expense Information All performance information in this Report reflects past performance, is presented on a total return basis, reflects the reinvestment of distributions, and does not reflect the deduction of taxes that a shareholder would pay on fund distributions or the redemption of fund shares. Past performance is no guarantee of future results. Investment return and principal value of an investment will fluctuate, so that shares may be worth more or less than their original cost when redeemed. Shares redeemed within 30 days of purchase may be subject to a 1% redemption fee payable to the Fund, which is not reflected in the performance shown above; if it were, performance would be lower. Current month-end performance may be higher or lower than performance quoted and may be obtained at www.roycefunds.com. All performance and risk information reflects results of the Investment Class (its oldest class). Operating expenses reflect the Fund’s total annual operating expenses for the Investment Class as of the Fund’s most current prospectus and include management fees and other expenses. Regarding the “Top Contributors” and “Top Detractors” tables shown above, the sum of all contributors to, and all detractors from, performance for all securities in the portfolio would approximate the Fund’s year-to-date performance for 2018. Upside Capture Ratio measures a manager’s performance in up markets relative to the Fund’s benchmark. It is calculated by measuring the Fund’s performance in quarters when the benchmark went up and dividing it by the benchmark’s return in those quarters. Downside Capture Ratio measures a manager’s performance in down markets relative to the Fund’s benchmark (Russell 2000). It is calculated by measuring the Fund’s performance in quarters when the benchmark goes down and dividing it by the benchmark’s return in those quarters. |
| The Royce Funds 2018 Annual Report to Shareholders | 25 |
| MANAGER’S DISCUSSION | ||
| Royce Small-Cap Leaders Fund (ROH) |
 |
| Lauren Romeo, CFA |
| FUND PERFORMANCE Royce Small-Cap Leaders Fund was down 12.7% in 2018 compared to a decline of 11.0% for its small-cap benchmark, the Russell 2000 Index, for the same period. Underperformance resulted from the Fund trailing its benchmark through the first three quarters of the year, a bullish period of low volatility in which small-cap growth stocks beat small-cap value, and defensives outpaced cyclicals. We were pleased, then, to see the Fund hold its value better than its index in the fourth-quarter downturn, -18.3% versus -20.2%. |
| WHAT WORKED... AND WHAT DIDN’T |
| Many companies in the industrial and technology areas were especially hard hit in the downturn, which resulted in certain highly profitable cyclical holdings performing better as companies in 2018 than they did as stocks. The potential of these companies to execute effectively in a slower but still growing U.S. economy, as well as the attractive valuations of these companies (even on a normalized earnings basis) failed to draw attention. Investors’ shorter-term focus seemed to give little credit to what we think are the true drivers of these companies’ long-run market worth—their ability to grow and compound value at above-average returns into the future. But in 2018 investors were more concerned with falling energy prices, inflation-driven margin compression, and recession anxieties. While we acknowledge the many potential sources of risk on the horizon—economic, geopolitical, and financial—we also think that these concerns have already been reflected, perhaps even excessively so, in current valuations. In relatively short order, we transitioned from a period this summer when small-cap’s extended valuations seemed out of sync given the index’s high levels of debt and low profitability, to one at the end of the year where valuations seemed more pessimistic than we think is warranted—at least in select instances. Six of the Fund’s 10 equity sectors detracted from performance in 2018. With a negative impact more than three times as large as the second-worst performer at the sector level (Financials), Industrials had by far the biggest adverse effect on 2018’s results, accounting for more than 70% of the Fund’s loss. The four sectors that made positive contributions registered a collectively modest impact, led by Consumer Staples and Health Care. Housed in Industrials, the machinery group detracted most. Nine of the portfolio’s 10 holdings in this industry detracted from 2018’s results, including three of its biggest at the position level. CIRCOR International makes valves for fluid control systems. Its shares fell in the fourth quarter amid concerns that slowing global growth, U.S.-China trade tensions, and the significant drop in oil prices—energy companies being among its larger end markets—would put a damper on CIRCOR’s positive order trends, pushing out a long-awaited improvement in profit margins and free cash flow earmarked for debt reduction. Sun Hydraulics (which does business as Helios Technologies) manufactures hydraulic and electronic controls systems for a variety of industrial and recreational equipment makers. The company continued to book solid incoming orders, but labor and materials cost pressures, as well as a series of operational miscues stemming from a rush to meet growing demand, brought margins and earnings below expectations. Wabash National makes truck trailers and has seen robust orders since the second half of 2017. However, component shortages, raw materials cost increases, and self-inflicted operational issues all pressured margins, causing the company to post earnings well below expectations in such a vibrant demand environment. |
| Top Contributors to Performance For 2018 (%)1 | ||||
| Fabrinet | 1.17 | |||
| Inter Parfums | 0.80 | |||
| RLI Corp. | 0.38 | |||
| Marcus & Millichap | 0.31 | |||
| Heidrick & Struggles International | 0.31 | |||
| 1 Includes dividends | ||||
| Top Detractors from Performance For 2018 (%)2 | ||||
| CIRCOR International | -1.49 | |||
| Artisan Partners Asset Management Cl. A | -1.21 | |||
| Sun Hydraulics | -0.88 | |||
| Wabash National | -0.86 | |||
| Advanced Energy Industries | -0.69 | |||
| 2 Net of dividends | ||||
| Contract manufacturer Fabrinet was the Fund’s top contributor in 2018, as optical equipment spending by telecommunications and datacenter customers reaccelerated, and its business development efforts continued to ride a tailwind. Additional strong demand from industrial laser customers in its non-optical business provided welcome diversification and the company remains focused on increasing that business from its current 35% of sales toward 50% over the long term. Fabrinet has also benefited from U.S.-China trade disputes as American optical component companies began to reconfigure their supply chains by shifting outsourced production from China to Fabrinet’s facilities in Thailand. Inter Parfums, which produces a wide array of fragrances and related products, saw strong new product introductions and brand extensions, as well as an uptick in European and Asian demand for its roster of prestige fragrances. These developments drove better-than-expected sales growth in 2018. With an active new product launch calendar in 2019, as well as the addition of brands first licensed in 2018, the company seems poised for sales growth to accelerate toward the mid-to-high single digit range and earnings-per-share growth in the low teens—should consumers respond well to its new offerings. Relative to the Russell 2000 in 2018, our overweight and ineffective stock selection in Industrials hurt most by far, followed by stock picking mishaps in Information Technology. Conversely, savvy stock selection gave the Fund a relative edge in Energy and Consumer Staples while our cash holdings also helped relative performance. |
| 26 | The Royce Funds 2018 Annual Report to Shareholders |
| PERFORMANCE AND PORTFOLIO REVIEW | TICKER SYMBOLS RYOHX ROHHX |
| Performance and Expenses | ||||||||||||
| Average Annual Total Return (%) Through 12/31/18 | ||||||||||||
| JUL-DEC 20181 | 1-YR | 3-YR | 5-YR | 10-YR | SINCE INCEPTION (6/30/03) | |||||||
| ROH | -15.78 | -12.72 | 6.46 | 0.42 | 9.15 | 8.12 | ||||||
| Annual Gross Operating Expenses: 1.59% Annual Net Operating Expenses: 1.49% | ||||||||||||
| 1 Not annualized | ||||||||||||

The Morningstar Style Map is the Morningstar Style BoxTM with the center 75% of fund holdings plotted as the Morningstar Ownership ZoneTM. The Morningstar Style Box is designed to reveal a fund’s investment strategy. The Morningstar Ownership Zone provides detail about a portfolio’s investment style by showing the range of stock sizes and styles. The Ownership Zone is derived by plotting each stock in the portfolio within the proprietary Morningstar Style Box. Over time, the shape and location of a fund’s ownership zone may vary. See page 117 for additional information. |
Value of $10,000

| Top 10 Positions | ||
| % of Net Assets | ||
| Genworth MI Canada | 3.1 | |
| Marcus & Millichap | 3.1 | |
| Meritor | 2.9 | |
| Inter Parfums | 2.6 | |
| Minerals Technologies | 2.5 | |
| Houlihan Lokey Cl. A | 2.4 | |
| Greenbrier Companies (The) | 2.4 | |
| Artisan Partners Asset Management Cl. A | 2.3 | |
| Kennedy-Wilson Holdings | 2.2 | |
| j2 Global | 2.1 | |
| Portfolio Sector Breakdown | ||
| % of Net Assets | ||
| Industrials | 28.9 | |
| Information Technology | 17.7 | |
| Financials | 13.5 | |
| Consumer Discretionary | 11.0 | |
| Real Estate | 5.3 | |
| Consumer Staples | 4.9 | |
| Materials | 3.7 | |
| Energy | 3.6 | |
| Health Care | 3.3 | |
| Communication Services | 0.7 | |
| Cash and Cash Equivalents | 7.4 | |
| Calendar Year Total Returns (%) | ||
| YEAR | ROH | |
| 2018 | -12.7 | |
| 2017 | 10.1 | |
| 2016 | 25.5 | |
| 2015 | -12.5 | |
| 2014 | -3.3 | |
| 2013 | 30.9 | |
| 2012 | 11.5 | |
| 2011 | -6.5 | |
| 2010 | 24.8 | |
| 2009 | 38.0 | |
| 2008 | -29.2 | |
| 2007 | 7.3 | |
| 2006 | 13.7 | |
| 2005 | 14.9 | |
| 2004 | 27.2 | |
| Upside/Downside Capture Ratios | ||||
| Periods Ended 12/31/18 (%) | ||||
| UPSIDE | DOWNSIDE | |||
| 10-Year | 87 | 99 | ||
| From 6/30/03 (Start of Fund’s First Full Quarter) | 92 | 93 | ||
| Portfolio Diagnostics | ||
| Fund Net Assets | $55 million | |
| Number of Holdings | 78 | |
| Turnover Rate | 62% | |
| Average Market Capitalization1 | $1,474 million | |
| Weighted Average P/E Ratio2,3 | 15.2x | |
| Weighted Average P/B Ratio2 | 2.0x | |
| Active Share4 | 96% | |
| U.S. Investments (% of Net Assets) | 81.6% | |
| Non-U.S. Investments (% of Net Assets) | 11.0% | |
| 1 | Geometric Average. This weighted calculation uses each portfolio holding’s market cap in a way designed to not skew the effect of very large or small holdings; instead, it aims to better identify the portfolio’s center, which Royce believes offers a more accurate measure of average market cap than a simple mean or median. |
| 2 | Harmonic Average. This weighted calculation evaluates a portfolio as if it were a single stock and measures it overall. It compares the total market value of the portfolio to the portfolio’s share in the earnings or book value, as the case may be, of its underlying stocks. |
| 3 | The Fund’s P/E ratio calculation excludes companies with zero or negative earnings (6% of portfolio holdings as of 12/31/18). |
| 4 | Active Share is the sum of the absolute values of the different weightings of each holding in the Fund versus each holding in the benchmark, divided by two. |
| Important Performance and Expense Information All performance information in this Report reflects past performance, is presented on a total return basis, reflects the reinvestment of distributions, and does not reflect the deduction of taxes that a shareholder would pay on fund distributions or the redemption of fund shares. Past performance is no guarantee of future results. Investment return and principal value of an investment will fluctuate, so that shares may be worth more or less than their original cost when redeemed. Shares redeemed within 30 days of purchase may be subject to a 1% redemption fee payable to the Fund, which is not reflected in the performance shown above; if it were, performance would be lower. Current month-end performance may be higher or lower than performance quoted and may be obtained at www.roycefunds.com. All performance and risk information reflects results of the Service Class (its oldest class). Gross operating expenses reflect the Fund’s gross total annual operating expenses for the Service Class and include management fees, 12b-1 distribution and service fees, and other expenses. Net operating expenses reflect contractual fee waivers and/or expense reimbursements. All expense information is reported as of the Fund’s most current prospectus. Royce & Associates has contractually agreed to waive fees and/or reimburse operating expenses to the extent necessary to maintain the Service Class’s net annual operating expenses (excluding brokerage commissions, taxes, interest, litigation expenses, acquired fund fees and expenses, and other expenses not borne in the ordinary course of business), at or below 1.49% through April 30, 2019. Regarding the “Top Contributors” and “Top Detractors” tables shown above, the sum of all contributors to, and all detractors from, performance for all securities in the portfolio would approximate the Fund’s year-to-date performance for 2018. Upside Capture Ratio measures a manager’s performance in up markets relative to the Fund’s benchmark. It is calculated by measuring the Fund’s performance in quarters when the benchmark went up and dividing it by the benchmark’s return in those quarters. Downside Capture Ratio measures a manager’s performance in down markets relative to the Fund’s benchmark (Russell 2000). It is calculated by measuring the Fund’s performance in quarters when the benchmark goes down and dividing it by the benchmark’s return in those quarters. |
| The Royce Funds 2018 Annual Report to Shareholders | 27 |
| MANAGER’S DISCUSSION | ||
| Royce Small-Cap Value Fund (RVV) |
 |
| Jay Kaplan, CFA |
| FUND PERFORMANCE In the context of a down year, we were about as pleased as we could be with the performance for Royce Small-Cap Value Fund. Demonstrating better downside protection, the Fund was down 7.2% in 2018 versus a loss of 11.0% for the Russell 2000 Index, its small-cap benchmark, for the same period. |
| WHAT WORKED... AND WHAT DIDN’T |
| Five of the Fund’s 10 equity sectors finished 2018 in the red, with the largest negative impact coming from Financials, which was followed by Industrials. These broad and diverse cyclical sectors were also the portfolio’s largest at year-end, along with Information Technology. Modest positive contributions could be found in Health Care, Consumer Discretionary, Consumer Staples, Information Technology, and Real Estate. Like Industrials and Financials, tech is a highly diverse sector that is also home to semiconductors & semiconductor equipment companies, which detracted most at the industry level in 2018. Five of our six holdings were down, led by power conversion, measurement, and control products maker Advanced Energy Industries. The company’s stock fell victim to the more prolonged slowdown in its business cycle, which hurt many companies involved in semiconductor production in 2018. However, the global importance of the industry, along with Advanced Energy’s efforts to broaden its business, gave us confidence in its potential to rebound. Two companies in the Industrials sector were the biggest detractors at the position level. Wabash National makes a variety of truck trailers. We like its core business and record of successful execution, but its earnings were adversely affected in 2018 by rising supply and labor costs as well as freight issues that made picking up trailers difficult for many customers. Hawaiian Holdings operates a regional airline in that state as well as on the West Coast and in the South Pacific. Weather-related scares and the prospect of increased competition helped to ground its stock, but we see the first issue as temporary and like the firm’s ability to successfully compete in its core geographic region. The electronic equipment, instruments & components (Information Technology) group was home to five of the portfolio’s top 20 contributors, including its two strongest—Electro Scientific Industries, which was acquired by MKS Instruments at a 100% premium, and Fabrinet, a contract manufacturer specializing in advanced optical packaging and precision optical, electro-mechanical, and electronic manufacturing services to original equipment manufacturers in the technology space. The merger of two large customers appeared to drive investors away from Fabrinet’s shares in 2017 over concerns that the consolidation would contract its business. The firm then executed successfully, and profitably, in 2018, which led its stock to recover. For the portfolio as a whole in 2018, stock selection was a greater factor in relative outperformance than sector allocation, though both contributed. Savvy stock picks in Consumer Discretionary provided the most significant relative edge, most impactfully in specialty retail, where footwear businesses Shoe Carnival and DSW led. Energy was by far the worst-performing sector in the Russell 2000 in 2018. It also provided the Fund with a sizable advantage versus the benchmark, driven by a combination of having no exposure to its oil, gas & consumable fuels group and better stock picking in its energy equipment & services industry. Our overweight in Information Technology added an edge while stock selection in Industrials helped (most notably in machinery), as did the Fund’s cash holdings. A stock selection disadvantage in Financials hurt relative performance most, as the capital markets group disappointed due to poor results for asset managers such as Federated Investors, a position we exited in the fourth quarter. The portfolio’s low exposure to Utilities also dampened relative returns. The sector is often seen as a relatively safe haven during challenging markets, and 2018 was no exception as it was the only Russell 2000 sector to finish 2018 in the black. Both ineffective stock picking and our underweight also led to a modest detraction in Communication Services. |
| Top Contributors to Performance For 2018 (%)1 | ||||
| Electro Scientific Industries | 1.65 | |||
| Fabrinet | 1.12 | |||
| Shoe Carnival | 0.67 | |||
| Ensign Group (The) | 0.57 | |||
| Nutrisystem | 0.52 | |||
| 1 Includes dividends | ||||
| Top Detractors from Performance For 2018 (%)2 | ||||
| Wabash National | -0.84 | |||
| Hawaiian Holdings | -0.83 | |||
| Advanced Energy Industries | -0.70 | |||
| Cooper-Standard Holdings | -0.69 | |||
| Methode Electronics | -0.64 | |||
| 2 Net of dividends | ||||
| CURRENT POSITIONING AND OUTLOOK |
| Risks can be found throughout the economy and markets. Stocks continue to trade as if investors see an imminent recession; inflation is apparent in supply chains and labor costs, which threatens margin expansion; the anniversary of the tax cuts has arrived, which will slow earnings growth; and the Fed’s subsequent path is unclear, even in light of Chair Powell’s slightly more dovish tone in early January. Our own view is that a recession looks unlikely over the next several months—and may be even further out than that. Growth does not appear ready to contract but rather continue to slow. Given the severity of the market’s decline, this has created interesting valuations within the small-cap marketplace. Within the portfolio, we think the risk/return relationship looks more attractive than it has in some time. We have therefore been adding to those holdings where we see both good value and strong potential while also initiating positions where our analyses have uncovered the same combination among a diverse set of companies involved in aerospace & defense, trucking, investment management, banks, and technology. |
| 28 | The Royce Funds 2018 Annual Report to Shareholders |
| PERFORMANCE AND PORTFOLIO REVIEW | TICKER SYMBOLS RYVFX RVVHX RVFCX RVVRX |
| Performance and Expenses | ||||||||||||||
| Average Annual Total Return (%) Through 12/31/18 | ||||||||||||||
| JUL-DEC 20181 | 1-YR | 3-YR | 5-YR | 10-YR | 15-YR | SINCE INCEPTION (6/14/01) | ||||||||
| RVV | -13.34 | -7.17 | 5.76 | 0.92 | 9.39 | 7.60 | 8.56 | |||||||
| Annual Gross Operating Expenses: 1.51% Annual Net Operating Expenses: 1.49% | ||||||||||||||
| 1 Not annualized | ||||||||||||||
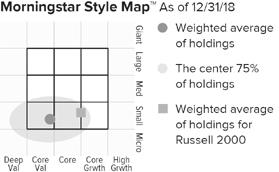
The Morningstar Style Map is the Morningstar Style BoxTM with the center 75% of fund holdings plotted as the Morningstar Ownership ZoneTM. The Morningstar Style Box is designed to reveal a fund’s investment strategy. The Morningstar Ownership Zone provides detail about a portfolio’s investment style by showing the range of stock sizes and styles. The Ownership Zone is derived by plotting each stock in the portfolio within the proprietary Morningstar Style Box. Over time, the shape and location of a fund’s ownership zone may vary. See page 117 for additional information. |
Value of $10,000
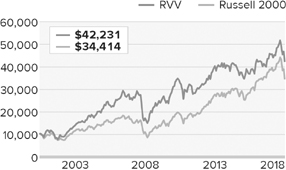
| Top 10 Positions | ||
| % of Net Assets | ||
| Electro Scientific Industries | 4.6 | |
| Insight Enterprises | 2.5 | |
| Miller Industries | 2.5 | |
| Genworth MI Canada | 2.5 | |
| Vishay Intertechnology | 2.4 | |
| Kulicke & Soffa Industries | 2.3 | |
| PC Connection | 2.2 | |
| Advanced Energy Industries | 2.2 | |
| Celestica | 2.1 | |
| TrustCo Bank Corp. NY | 2.1 | |
| Portfolio Sector Breakdown | ||
| % of Net Assets | ||
| Financials | 26.7 | |
| Information Technology | 26.0 | |
| Industrials | 24.0 | |
| Consumer Discretionary | 13.9 | |
| Consumer Staples | 1.8 | |
| Communication Services | 1.8 | |
| Energy | 1.4 | |
| Real Estate | 1.0 | |
| Health Care | 0.9 | |
| Utilities | 0.3 | |
| Cash and Cash Equivalents | 2.2 | |
| Calendar Year Total Returns (%) | ||
| YEAR | RVV | |
| 2018 | -7.2 | |
| 2017 | 5.3 | |
| 2016 | 21.1 | |
| 2015 | -11.5 | |
| 2014 | -0.0 | |
| 2013 | 27.8 | |
| 2012 | 9.6 | |
| 2011 | -7.4 | |
| 2010 | 25.0 | |
| 2009 | 44.7 | |
| 2008 | -34.2 | |
| 2007 | 3.8 | |
| 2006 | 16.8 | |
| 2005 | 17.2 | |
| 2004 | 30.9 | |
| Upside/Downside Capture Ratios | ||||
| Periods Ended 12/31/18 (%) | ||||
| UPSIDE | DOWNSIDE | |||
| 10-Year | 78 | 79 | ||
| From 6/30/01 (Start of Fund’s First Full Quarter) | 98 | 89 | ||
| Portfolio Diagnostics | ||
| Fund Net Assets | $186 million | |
| Number of Holdings | 78 | |
| Turnover Rate | 64% | |
| Average Market Capitalization1 | $1,062 million | |
| Weighted Average P/E Ratio2,3 | 11.5x | |
| Weighted Average P/B Ratio2 | 1.7x | |
| Active Share4 | 96% | |
| U.S. Investments (% of Net Assets) | 87.4% | |
| Non-U.S. Investments (% of Net Assets) | 10.4% | |
| 1 | Geometric Average. This weighted calculation uses each portfolio holding’s market cap in a way designed to not skew the effect of very large or small holdings; instead, it aims to better identify the portfolio’s center, which Royce believes offers a more accurate measure of average market cap than a simple mean or median. |
| 2 | Harmonic Average. This weighted calculation evaluates a portfolio as if it were a single stock and measures it overall. It compares the total market value of the portfolio to the portfolio’s share in the earnings or book value, as the case may be, of its underlying stocks. |
| 3 | The Fund’s P/E ratio calculation excludes companies with zero or negative earnings (7% of portfolio holdings as of 12/31/18). |
| 4 | Active Share is the sum of the absolute values of the different weightings of each holding in the Fund versus each holding in the benchmark, divided by two. |
| Important Performance and Expense Information All performance information in this Report reflects past performance, is presented on a total return basis, reflects the reinvestment of distributions, and does not reflect the deduction of taxes that a shareholder would pay on fund distributions or the redemption of fund shares. Past performance is no guarantee of future results. Investment return and principal value of an investment will fluctuate, so that shares may be worth more or less than their original cost when redeemed. Shares redeemed within 30 days of purchase may be subject to a 1% redemption fee payable to the Fund, which is not reflected in the performance shown above; if it were, performance would be lower. Current month-end performance may be higher or lower than performance quoted and may be obtained at www.roycefunds.com. All performance and risk information reflects results of the Service Class (its oldest class). Certain immaterial adjustments were made to the net assets of Royce Small-Cap Value Fund at 6/30/16 for financial reporting purposes, and as a result the net asset values for shareholder transactions on that date and the calendar year Total Returns (%) based on those net asset values differ from the adjusted net asset values and calendar year total returns reported in the Financial Highlights. Gross operating expenses reflect the Fund’s gross total annual operating expenses for the Service Class and include management fees, 12b-1 distribution and service fees, and other expenses. Net operating expenses reflect contractual fee waivers and/or expense reimbursements. All expense information is reported as of the Fund’s most current prospectus. Royce & Associates has contractually agreed, without right of termination, to waive fees and/or reimburse expenses to the extent necessary to maintain the Service Class’s net annual operating expenses (excluding brokerage commissions, taxes, interest, litigation expenses, acquired fund fees and expenses, and other expenses not borne in the ordinary course of business) at or below 1.49% through April 30, 2019. Regarding the “Top Contributors” and “Top Detractors” tables shown above, the sum of all contributors to, and all detractors from, performance for all securities in the portfolio would approximate the Fund’s year-to-date performance for 2018. Upside Capture Ratio measures a manager’s performance in up markets relative to the Fund’s benchmark. It is calculated by measuring the Fund’s performance in quarters when the benchmark went up and dividing it by the benchmark’s return in those quarters. Downside Capture Ratio measures a manager’s performance in down markets relative to the Fund’s benchmark (Russell 2000). It is calculated by measuring the Fund’s performance in quarters when the benchmark goes down and dividing it by the benchmark’s return in those quarters. |
| The Royce Funds 2018 Annual Report to Shareholders | 29 |
| MANAGER’S DISCUSSION |
| Royce Small/Mid-Cap Premier Fund (RHF) |
 |
| Steven McBoyle |
| FUND PERFORMANCE |
| Royce Small/Mid-Cap Premier Fund was down 15.2% in 2018, trailing its small- and mid-cap benchmark, the Russell 2500 Index, which declined 10.0% for the same period. Underperformance was the result of the Fund lagging its benchmark through the first three quarters of the year, a bullish period of low volatility in which small-cap growth stocks beat small-cap value, and defensives outpaced cyclicals. We were pleased, then, to see the Fund hold its value better than its index in the fourth-quarter downturn, -14.4% versus -18.5%. |
| WHAT WORKED... AND WHAT DIDN’T |
| Certain companies in the consumer, industrial, and industrial commodity spaces were lagging the wider small- and mid-cap markets prior to the fourth-quarter downturn. Within these areas, a number were high-earning cyclical companies that wound up performing better as businesses in 2018 than they did as stocks. In the last months of the year, however, investors were far more concerned with trade and tariff issues, recession worries, and falling energy prices than with the longer-term prospects for these businesses. So while we were pleased to see the Fund hold its value better through the decline, it was an otherwise frustrating year for many of the businesses that we saw as high-quality enterprises in 2018. |
| While we continue to see many potential sources of risk on the horizon—economic, geopolitical, and financial—we also think that many of these concerns have already been reflected, perhaps even excessively so, in valuations at the end of 2018. In relatively short order, we transitioned from a period this summer when small-cap’s extended valuations seemed out of sync given the index’s high levels of debt and low profitability, to one at the end of the year where valuations seemed more pessimistic than we think is warranted—at least in select instances. Nine of the Fund’s 10 equity sectors detracted from 2018 results, with the most significant negative impacts coming from Consumer Discretionary, Industrials, and Materials. Utilities was the only portfolio sector to make a positive contribution. At the industry level, three groups had a sizable negative effect—capital markets (Financials), chemicals (Materials), and specialty retail (Consumer Discretionary). Detracting most at the position level was LKQ Corporation, which provides alternative and specialty vehicle parts and operates in North America, Europe, and Taiwan. Positive sales and earnings were not enough to keep its shares from stalling as the firm sought to deal with rising costs, execution issues, trade policy uncertainty, and some additional debt due to its acquisition of Stahlgruber, a European distributor of aftermarket spare parts. The stock of Affiliated Managers Group, which owns a suite of boutique investment firms, also slipped in 2018, mostly due to the market downturn—corrections typically pose problems for the shares of asset management companies. Global staffing and services company ManpowerGroup detracted most in the Industrials sector and third most in the portfolio overall. Its 2018 revenues slid, as the economic environment, particularly in its European business, proved more challenging than the company had been anticipating. Camping World retails recreational vehicles and accessories. Slower-than-expected sales growth in the spring and summer months led many to think that the booming RV market had peaked, a view that was supported when the company had a small earning miss in May. We sold our position in August and September. Air Lease is a leading aircraft leasing business that saw its shares lose altitude throughout the year, particularly in December, when the airline industry came under considerable pressure throughout the eurozone, which resulted in the shuttering of a number of poorly capitalized carriers. Though Air Lease was less exposed to this dynamic, there were concerns among investors that a similar trend would materialize in other geographies. Seeing long-term potential at what we thought was an increasingly attractive price, we added to our position in 2018. |
| Top Contributors to Performance | ||||
| For 2018 (%)1 | ||||
| Copart | 0.76 | |||
| Dorman Products | 0.61 | |||
| Core-Mark Holding Company | 0.38 | |||
| UGI Corporation | 0.31 | |||
| Westinghouse Air Brake Technologies | 0.21 | |||
| 1 Includes dividends | ||||
| Top Detractors from Performance | ||||
| For 2018 (%)2 | ||||
| LKQ Corporation | -1.39 | |||
| Affiliated Managers Group | -1.18 | |||
| ManpowerGroup | -1.17 | |||
| Camping World Holdings Cl. A | -0.83 | |||
| Air Lease Cl. A | -0.81 | |||
| 2 Net of dividends | ||||
| The portfolio’s top contributor for 2018 was Copart, a leading provider of auctions for salvaged vehicles, which saw increases in volume and revenue per car in 2018. Dorman Products is the leading provider of formerly dealer-only aftermarket auto parts. Demand for auto replacement parts inflected positively as the industry entered the three- to seven-year sweet spot for replacement parts, as well as from replenished auto retailer inventories. In addition, its growth initiatives in heavy duty truck and electronic components continued to take hold. Relative to the Russell 2500, performance was hurt most in 2018 by stock selection, though sector allocation was also a negative. Ineffective stock picks in Consumer Discretionary made the largest negative impact, with the sector’s distributors and specialty retail industries detracting most. Stock selection and our underweight also hurt relative performance in both the Information Technology and Health Care sectors. Conversely, the portfolio benefited from having no exposure to Energy, which had the worst return in the index for 2018. Stock selection in Industrials was also a source of outperformance, as were the portfolio’s cash holdings. |
| 30 | The Royce Funds 2018 Annual Report to Shareholders |
| PERFORMANCE AND PORTFOLIO REVIEW | TICKER SYMBOLS RGFAX RHFHX RYGCX |
| Performance and Expenses Average Annual Total Return (%) Through 12/31/18 | ||||||||||||||||
| JUL-DEC 20181 | 1-YR | 3-YR | 5-YR | 10-YR | 15-YR | 20-YR | SINCE INCEPTION (12/27/95) | |||||||||
| RHF | -12.41 | -15.16 | 6.61 | 2.29 | 10.96 | 7.43 | 9.61 | 11.35 | ||||||||
| Annual Operating Expenses: 1.32% | ||||||||||||||||
| 1 Not annualized | ||||||||||||||||

The Morningstar Style Map is the Morningstar Style BoxTM with the center 75% of fund holdings plotted as the Morningstar Ownership ZoneTM. The Morningstar Style Box is designed to reveal a fund’s investment strategy. The Morningstar Ownership Zone provides detail about a portfolio’s investment style by showing the range of stock sizes and styles. The Ownership Zone is derived by plotting each stock in the portfolio within the proprietary Morningstar Style Box. Over time, the shape and location of a fund’s ownership zone may vary. See page 117 for additional information. |
Value of $10,000
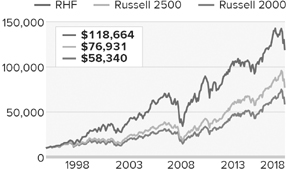
| Top 10 Positions | |||
| % of Net Assets | |||
| Alleghany Corporation | 3.5 | ||
| Kirby Corporation | 3.0 | ||
| CarMax | 2.8 | ||
| Carlisle Companies | 2.8 | ||
| Stella-Jones | 2.7 | ||
| Dorman Products | 2.6 | ||
| Minerals Technologies | 2.5 | ||
| Lincoln Electric Holdings | 2.5 | ||
| LKQ Corporation | 2.4 | ||
| UGI Corporation | 2.4 | ||
| Portfolio Sector Breakdown | |||
| % of Net Assets | |||
| Industrials | 27.6 | ||
| Consumer Discretionary | 17.5 | ||
| Materials | 14.1 | ||
| Information Technology | 12.1 | ||
| Financials | 8.8 | ||
| Communication Services | 3.4 | ||
| Real Estate | 2.9 | ||
| Utilities | 2.4 | ||
| Health Care | 2.1 | ||
| Consumer Staples | 0.3 | ||
| Cash and Cash Equivalents | 8.8 | ||
| Calendar Year Total Returns (%) | |||
| YEAR | RHF | ||
| 2018 | -15.2 | ||
| 2017 | 21.2 | ||
| 2016 | 17.8 | ||
| 2015 | -6.5 | ||
| 2014 | -1.1 | ||
| 2013 | 26.0 | ||
| 2012 | 14.3 | ||
| 2011 | -9.3 | ||
| 2010 | 27.5 | ||
| 2009 | 51.8 | ||
| 2008 | -36.2 | ||
| 2007 | 1.2 | ||
| 2006 | 22.6 | ||
| 2005 | 8.7 | ||
| 2004 | 20.4 | ||
| Upside/Downside Capture Ratios | |||
| Periods Ended 12/31/18 (%) | |||
| UPSIDE | DOWNSIDE | |||
| 10-Year | 92 | 104 | ||
| From 12/31/95 (Start of Fund’s First Full Quarter) | 107 | 95 | ||
| Portfolio Diagnostics | |||
| Fund Net Assets | $155 million | ||
| Number of Holdings | 66 | ||
| Turnover Rate | 69% | ||
| Average Market Capitalization1 | $4,097 million | ||
| Weighted Average P/E Ratio2,3 | 13.6x | ||
| Weighted Average P/B Ratio2 | 2.2x | ||
| Active Share4 | 94% | ||
| U.S. Investments (% of Net Assets) | 88.4% | ||
| Non-U.S. Investments (% of Net Assets) | 2.8% | ||
| 1 | Geometric Average. This weighted calculation uses each portfolio holding’s market cap in a way designed to not skew the effect of very large or small holdings; instead, it aims to better identify the portfolio’s center, which Royce believes offers a more accurate measure of average market cap than a simple mean or median. |
| 2 | Harmonic Average. This weighted calculation evaluates a portfolio as if it were a single stock and measures it overall. It compares the total market value of the portfolio to the portfolio’s share in the earnings or book value, as the case may be, of its underlying stocks. |
| 3 | The Fund’s P/E ratio calculation excludes companies with zero or negative earnings (0% of portfolio holdings as of 12/31/18). |
| 4 | Active Share is the sum of the absolute values of the different weightings of each holding in the Fund versus each holding in the benchmark, divided by two. |
| Important Performance and Expense Information |
All performance information in this Report reflects past performance, is presented on a total return basis, reflects the reinvestment of distributions, and does not reflect the deduction of taxes that a shareholder would pay on fund distributions or the redemption of fund shares. Past performance is no guarantee of future results. Investment return and principal value of an investment will fluctuate, so that shares may be worth more or less than their original cost when redeemed. Shares redeemed within 30 days of purchase may be subject to a 1% redemption fee payable to the Fund, which is not reflected in the performance shown above; if it were, performance would be lower. Current month-end performance may be higher or lower than performance quoted and may be obtained at www.roycefunds.com. All performance and risk information reflects results of the Service Class (its oldest class). Price and total return information is based on net asset values calculated for shareholder transactions. Operating expenses reflect the Fund’s total annual operating expenses for the Service Class as of the Fund’s most current prospectus and include management fees, 12b-1 distribution and service fees, and other expenses. Regarding the “Top Contributors” and “Top Detractors” tables shown above, the sum of all contributors to, and all detractors from, performance for all securities in the portfolio would approximate the Fund’s year-to-date performance for 2018. Upside Capture Ratio measures a manager’s performance in up markets relative to the Fund’s benchmark. It is calculated by measuring the Fund’s performance in quarters when the benchmark went up and dividing it by the benchmark’s return in those quarters. Downside Capture Ratio measures a manager’s performance in down markets relative to the Fund’s benchmark (Russell 2500). It is calculated by measuring the Fund’s performance in quarters when the benchmark goes down and dividing it by the benchmark’s return in those quarters. |
| The Royce Funds 2018 Annual Report to Shareholders | 31 |
| MANAGER’S DISCUSSION |
| Royce Smaller-Companies Growth Fund (RVP) |
 |
| Chip Skinner, CFA |
| FUND PERFORMANCE |
| Royce Smaller-Companies Growth Fund was down 10.2% in 2018, losing less than the Russell 2000 Index, its small-cap benchmark, which declined 11.0% for the same period. We were pleased that the Fund’s GARP (“Growth at a Reasonable Price”) strategy held its value more effectively in what was a very challenging year for small-cap stocks, especially during the downturn that persisted throughout the fourth quarter and was particularly tough in December, when both the Fund (-10.5%) and its benchmark (-11.9%) saw their steepest losses for the year. |
| WHAT WORKED... AND WHAT DIDN’T |
| Eight of the Fund’s 10 equity sectors detracted from performance in 2018. Materials made the biggest negative impact, hurt most by holdings in the metals & mining group, followed by sizable net losses for Industrials and Financials. Information Technology and Consumer Staples were the only sectors that made positive contributions. Information Technology saw an interesting contrast between industries with significant detractions—the electronic equipment, instruments and components and semiconductors & semiconductor equipment groups—and those that made large positive contributions—software and IT services. This was a testament to the breadth and diversity of the sector, which features both cyclical and secular businesses as well as asset-heavy and asset-light companies. The lion’s share of the net losses in metals & mining came from two positions that produce metals integral to the battery energy storage markets, especially electric vehicles. Adoption of these vehicles was slower than many had been anticipating in 2018, which was a factor in both stocks’ performance. Cobalt 27 Capital is a Toronto-based investment vehicle that gives investors access to cobalt and nickel production. Its stock often tracks closely with cobalt commodity prices, which fell in 2018 as short- and intermediate-term supply outstripped demand, and production in certain of Cobalt 27’s key mines was delayed. We began to reduce our position in June, though our long-term outlook for its business remains constructive given the necessity of nickel and cobalt to electric vehicle batteries as well as our bullish outlook on that industry. With operations in Argentina, Australia’s Orocobre is one of the world’s largest and lowest-cost lithium producers. Its stock first began to tumble on news of short-term production issues, which was compounded by news of potentially increased lithium production in Chile. The company then announced in December that it received lower prices for its lithium output than it had earlier in the year—and that it expected little price improvement in the short run. Again focused on the long run, we were encouraged by its strategic partnerships, which include an arrangement with Toyota, and strong market position. USA Technologies makes e-Port, a credit card payment system used at vending machines, convenience stores, gas pumps, etc. Its stock began to slide in September when the company reported a delay in its annual report filing for fiscal 2018. An internal investigation and audit led the firm to implement new measures to strengthen its governance and improve oversight. Believing from the outset that the firm would be able to right itself in relatively short order, we added shares. We built an even bigger stake in Iteris as its stock price was slipping. A leader in applied informatics for transportation and agriculture, Iteris makes sensors and systems to optimize traffic flows and enhance agricultural yields, among other applications. The company endured the loss of a large customer and faced headwinds from another, but we see its partnership with Cisco and growing demand in its smart transportation and digital agriculture markets as potential growth drivers going forward. Turning to positive contributors, we enjoyed the most success with Materialise, a Belgian software business that specializes in 3D printing with applications used in industrial production and medicine. Its shares rose in December, perhaps in part due to better-than-expected earnings announced late in October—the firm made no major news in December. We like its growing business in what looks to us like a highly correlated long-run growth trajectory for 3D printing. Relative to the Russell 2000 in 2018, the Fund benefited from sector allocation—stock selection in aggregate was slightly negative for the year. The most pronounced edge came from our overweight in Information Technology’s software group, while both our underweight and stock picking helped in Energy. Conversely, ineffective stock picking hurt in Materials and, to a lesser extent, in Financials. |
| Top Contributors to Performance | ||||
| For 2018 (%)1 | ||||
| Materialise ADR | 1.07 | |||
| Apyx Medical | 0.63 | |||
| ABIOMED | 0.59 | |||
| Enphase Energy | 0.55 | |||
| RingCentral Cl. A | 0.55 | |||
| 1 Includes dividends | ||||
| Top Detractors from Performance | ||||
| For 2018 (%)2 | ||||
| Cobalt 27 Capital | -0.92 | |||
| USA Technologies | -0.76 | |||
| Iteris | -0.76 | |||
| Restoration Robotics | -0.69 | |||
| Orocobre | -0.64 | |||
| 2 Net of dividends | ||||
| CURRENT POSITIONING AND OUTLOOK |
| Few events inspire a bullish outlook more than a significant decline for the Russell 2000, and in 2018, the correction generated a number of long-term buying opportunities. So while the risks are real, including weakness in China and Europe, we see the greater impact coming from a still growing U.S. economy and the likelihood of a global trade deal some time in 2019. In this admittedly uncertain environment, we are emphasizing companies that look capable of ongoing earnings growth or, in more select cases, what we see as the potential for strong recovery. Although it remained by far the portfolio’s largest sector at year-end, we reduced our exposure to Information Technology somewhat and increased our weight in Industrials in 2018. |
| 32 | The Royce Funds 2018 Annual Report to Shareholders |
| PERFORMANCE AND PORTFOLIO REVIEW | TICKER SYMBOLS RYVPX RVPHX RVPCX RVPIX |
| Performance and Expenses | ||||||||||||||||
| Average Annual Total Return (%) Through 12/31/18 | ||||||||||||||||
| JUL-DEC 20181 | 1-YR | 3-YR | 5-YR | 10-YR | 15-YR | SINCE INCEPTION (6/14/01) | ||||||||||
| RVP | -18.67 | -10.22 | 4.97 | 3.36 | 10.63 | 7.34 | 10.07 | |||||||||
| Annual Operating Expenses: 1.49% | ||||||||||||||||
| 1 Not annualized | ||||||||||||||||
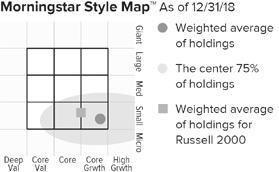
The Morningstar Style Map is the Morningstar Style BoxTM with the center 75% of fund holdings plotted as the Morningstar Ownership ZoneTM. The Morningstar Style Box is designed to reveal a fund’s investment strategy. The Morningstar Ownership Zone provides detail about a portfolio’s investment style by showing the range of stock sizes and styles. The Ownership Zone is derived by plotting each stock in the portfolio within the proprietary Morningstar Style Box. Over time, the shape and location of a fund’s ownership zone may vary. See page 117 for additional information. |

| Top 10 Positions | ||
| % of Net Assets | ||
| Materialise ADR | 3.1 | |
| Unisys Corporation | 2.2 | |
| TriState Capital Holdings | 2.1 | |
| Iteris | 2.1 | |
| Paylocity Holding Corporation | 2.1 | |
| Apyx Medical | 1.8 | |
| KEYW Holding Corporation | 1.7 | |
| Northern Trust | 1.7 | |
| Monro | 1.7 | |
| GP Strategies | 1.6 | |
| Portfolio Sector Breakdown | ||
| % of Net Assets | ||
| Information Technology | 28.6 | |
| Health Care | 21.4 | |
| Industrials | 15.8 | |
| Financials | 12.0 | |
| Consumer Discretionary | 9.3 | |
| Real Estate | 2.7 | |
| Energy | 2.2 | |
| Materials | 2.1 | |
| Consumer Staples | 1.9 | |
| Communication Services | 1.6 | |
| Cash and Cash Equivalents | 2.4 | |
| Calendar Year Total Returns (%) | ||
| YEAR | RVP | |
| 2018 | -10.2 | |
| 2017 | 17.8 | |
| 2016 | 9.4 | |
| 2015 | -1.8 | |
| 2014 | 3.9 | |
| 2013 | 32.5 | |
| 2012 | 15.3 | |
| 2011 | -10.0 | |
| 2010 | 19.7 | |
| 2009 | 41.4 | |
| 2008 | -41.1 | |
| 2007 | 3.2 | |
| 2006 | 19.3 | |
| 2005 | 13.2 | |
| 2004 | 28.2 | |
| Upside/Downside Capture Ratios | ||||
| Periods Ended 12/31/18 (%) | ||||
| UPSIDE | DOWNSIDE | |||
| 10-Year | 94 | 99 | ||
| From 6/30/01 (Start of Fund’s First Full Quarter) | 114 | 101 | ||
| Portfolio Diagnostics | ||
| Fund Net Assets | $257 million | |
| Number of Holdings | 121 | |
| Turnover Rate | 61% | |
| Average Market Capitalization1 | $1,024 million | |
| Weighted Average P/B Ratio2 | 2.6x | |
| 3-5 Year EPS Growth (est.)3 | 20.0% | |
| Active Share4 | 94% | |
| U.S. Investments (% of Net Assets) | 87.6% | |
| Non-U.S. Investments (% of Net Assets) | 10.0% | |
| 1 | Geometric Average. This weighted calculation uses each portfolio holding’s market cap in a way designed to not skew the effect of very large or small holdings; instead, it aims to better identify the portfolio’s center, which Royce believes offers a more accurate measure of average market cap than a simple mean or median. |
| 2 | Harmonic Average. This weighted calculation evaluates a portfolio as if it were a single stock and measures it overall. It compares the total market value of the portfolio to the portfolio’s share in the earnings or book value, as the case may be, of its underlying stocks. |
| 3 | The 3-5 Year EPS Growth (est.) is calculated as a simple weighted average of the pre-calculated mean long-term EPS growth rate estimates by brokerage analysts. Long Term Growth (LTG) is the annual EPS growth that the company can sustain over the next 3 or 5 years. Source: Factset |
| 4 | Active Share is the sum of the absolute values of the different weightings of each holding in the Fund versus each holding in the benchmark, divided by two. |
| Important Performance and Expense Information All performance information in this Report reflects past performance, is presented on a total return basis, reflects the reinvestment of distributions, and does not reflect the deduction of taxes that a shareholder would pay on fund distributions or the redemption of fund shares. Past performance is no guarantee of future results. Investment return and principal value of an investment will fluctuate, so that shares may be worth more or less than their original cost when redeemed. Shares redeemed within 30 days of purchase may be subject to a 1% redemption fee payable to the Fund, which is not reflected in the performance shown above; if it were, performance would be lower. Current month-end performance may be higher or lower than performance quoted and may be obtained at www.roycefunds.com. All performance and risk information reflects results of the Service Class (its oldest class). Operating expenses reflect the Fund’s total annual operating expenses for the Service Class as of the Fund’s most current prospectus and include management fees, 12b-1 distribution and service fees, and other expenses. Regarding the “Top Contributors” and “Top Detractors” tables shown above, the sum of all contributors to, and all detractors from, performance for all securities in the portfolio would approximate the Fund’s year-to-date performance for 2018. Upside Capture Ratio measures a manager’s performance in up markets relative to the Fund’s benchmark. It is calculated by measuring the Fund’s performance in quarters when the benchmark went up and dividing it by the benchmark’s return in those quarters. Downside Capture Ratio measures a manager’s performance in down markets relative to the Fund’s benchmark (Russell 2000). It is calculated by measuring the Fund’s performance in quarters when the benchmark goes down and dividing it by the benchmark’s return in those quarters. |
| The Royce Funds 2018 Annual Report to Shareholders | 33 |
| MANAGERS’ DISCUSSION | ||
| Royce Special Equity Fund (RSE) |
 |
| Charlie Dreifus, CFA Steven McBoyle |
| FUND PERFORMANCE Royce Special Equity Fund fell 9.9% in 2018, losing less than both of its small-cap benchmarks, Russell 2000 Index, which declined 11.0%, and the Russell 2000 Value, which fell 12.9%, for the same period. Much of the Fund’s calendar-year relative advantage was won during the fourth-quarter downturn, when it held its value significantly better than its benchmarks, down 9.8% versus respective losses of 20.2% and 18.7% for the small-cap and small-cap value indexes. This pattern of better downside protection helped for the three-year period ended December 31, 2018 as well—Special Equity’s average annual total return during that period was 8.7% versus 7.4% for the Russell 2000 and 7.4% for the Russell 2000 Value. |
| WHAT WORKED... AND WHAT DIDN’T |
| For calendar 2018, six of the Fund’s eight equity sectors detracted from performance. Consumer Discretionary fared worst by a substantial margin, followed by Industrials. These were also the portfolio’s largest sectors at year-end as well as two of its biggest overweights. Consumer Staples and Real Estate managed small positive contributions for the year. Hurt by particularly poor showings for furniture manufacturers Hooker Furniture, Flexsteel Industries, and Bassett Furniture Industries, the household durables group (Consumer Discretionary) detracted most at the industry level. Specialty retail, also part of Consumer Discretionary, and electrical equipment (Industrials) followed. Apparel retailer The Children’s Place made most of the negative impact in specialty retail while electrical and electronic products maker Hubbell detracted most in electrical equipment. Motor home and recreational vehicle manufacturer Winnebago Industries also endured a difficult year. We held shares in all six companies at year-end. Food & staples retailing (Consumer Staples), diversified consumer services (Consumer Discretionary), and aerospace & defense (Industrials) made the largest positive contributions at the industry level in 2018. For-profit education company Capella Education led at the position level after news of a merger lifted its stock. Supermarket operator Weis Markets and diversified manufacturing company National Presto Industries followed as top contributors. Relative to the Russell 2000 in 2018, outperformance resulted from sector allocation—stock selection actually (and unfortunately) detracted from calendar-year returns. The portfolio’s very limited exposure to Energy boosted relative results most, followed by a combination of savvy stock selection and (to a much smaller degree) our overweight in Consumer Staples. Both our underweight and successful stock picking were additive in Materials while stock selection lifted Industrials. The Fund’s cash position also benefited relative performance. Conversely, ineffective stock selection in Consumer Discretionary made by far the biggest negative impact, with the sector’s largest detractions coming from holdings in the aforementioned household durables and specialty retail industries. Our lack of exposure to software and poor stock picking in semiconductors & semiconductor equipment hindered relative performance in Information Technology while the same was true for our lack of exposure to Health Care and Utilities, where the first sector lost less than the Russell 2000 and the second came out of 2018 with a positive return. |
| Top Contributors to Performance For 2018 (%)1 | |||
| Capella Education | 1.01 | ||
| Weis Markets | 0.88 | ||
| National Presto Industries | 0.69 | ||
| Standard Motor Products | 0.45 | ||
| Park Electrochemical | 0.27 | ||
| 1 Includes dividends | |||
| Top Detractors from Performance For 2018 (%)2 | |||
| Children’s Place | -1.46 | ||
| Hubbell Cl. B | -1.30 | ||
| Winnebago Industries | -1.20 | ||
| Hooker Furniture | -1.14 | ||
| Flexsteel Industries | -0.96 | ||
| 2 Net of dividends | |||
| CURRENT POSITIONING AND OUTLOOK |
| With multiple challenges facing the developed world’s economies, it’s still reasonable to believe that quality will be in greater demand in 2019, particularly after a transition from quantitative easing to quantitative tightening. According to Deutsche Bank Asset Management, 84% of the companies in the Russell 2000 with a credit rating are rated junk. In addition, unprofitable companies represented about 36% of the Russell 2000 but only 13% of the Russell 1000 at year-end, which likely means that small-cap companies will receive greater scrutiny regarding their sustainability and quality. We think this can inure to the benefit of the portfolio. Our careful selection practice and the requirement that a company have good financials and accountability should stand out in a more selective environment. A number of negative issues have been weighing on the market, some of which could be viewed as magnifying the odds of a recession. However, as of this writing it is not yet evident that a recession will occur in the near term. Still, that does not mean that investors will no longer fret about one or that one won’t occur. We certainly do not dismiss the market’s forward-looking discounting mechanism with regard to macro issues. We are also mindful of how quickly the trade and monetary concerns could turn. Certain economic signposts have turned weaker as have both consumer and corporate confidence. It’s important to emphasize again that these are not necessarily signs of a recession, though they certainly look like yellow flashing lights. The substitution of uncertainty for optimism will likely create greater volatility, as it has historically—and this has helped relative performance in the past. Most important for us, falling prices have bred opportunities to add new names to the portfolio. We have been trying to take advantage of other investors’ selling, which in many cases seems more motivated by fear than fundamentals. We have found new investment opportunities, but we are buying at a very deliberate pace. Stocks may not yet have hit bottom, so prices can still move lower. |
| 34 | The Royce Funds 2018 Annual Report to Shareholders |
| PERFORMANCE AND PORTFOLIO REVIEW | TICKER SYMBOLS RYSEX RSEFX RSEIX RSQCX |
| Performance and Expenses | ||||||||||||||||||
| Average Annual Total Return (%) Through 12/31/18 | ||||||||||||||||||
| JUL-DEC 20181 | 1-YR | 3-YR | 5-YR | 10-YR | 15-YR | 20-YR | SINCE INCEPTION (5/1/98) | |||||||||||
| RSE | -9.57 | -9.86 | 8.73 | 2.64 | 10.08 | 7.18 | 9.11 | 8.43 | ||||||||||
| Annual Operating Expenses: 1.17% | ||||||||||||||||||
| 1 Not annualized | ||||||||||||||||||
Relative Risk Adjusted Returns: Monthly Rolling Sharpe Ratios
| On a monthly rolling risk-adjusted basis, the Fund outperformed the Russell 2000 in 99% of all 10-year periods and 66% of all 5-year periods. |
| PERIODS BEATING THE INDEX | FUND AVG (%)1 | INDEX AVG (%)1 | ||||||||||||
| 10-year | 120/121 | 99% | 0.56 | 0.37 | ||||||||||
| 5-year | 119/181 | 66% | 0.68 | 0.50 | ||||||||||
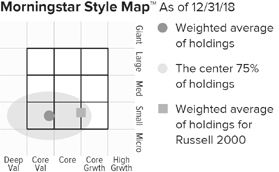
The Morningstar Style Map is the Morningstar Style BoxTM with the center 75% of fund holdings plotted as the Morningstar Ownership ZoneTM. The Morningstar Style Box is designed to reveal a fund’s investment strategy. The Morningstar Ownership Zone provides detail about a portfolio’s investment style by showing the range of stock sizes and styles. The Ownership Zone is derived by plotting each stock in the portfolio within the proprietary Morningstar Style Box. Over time, the shape and location of a fund’s ownership zone may vary. See page 117 for additional information. |
Invested on 5/1/98 as of 12/31/18 ($)

| Top 10 Positions | ||
| % of Net Assets | ||
| Meredith Corporation | 5.7 | |
| Standard Motor Products | 5.5 | |
| Scholastic Corporation | 5.3 | |
| AVX Corporation | 4.6 | |
| Hubbell Cl. B | 4.4 | |
| UniFirst Corporation | 4.3 | |
| John B. Sanfilippo & Son | 4.2 | |
| Cooper Tire & Rubber | 4.2 | |
| National Presto Industries | 4.1 | |
| Weis Markets | 4.0 | |
| Portfolio Sector Breakdown | ||
| % of Net Assets | ||
| Consumer Discretionary | 24.5 | |
| Industrials | 20.4 | |
| Information Technology | 17.4 | |
| Communication Services | 11.0 | |
| Consumer Staples | 9.5 | |
| Real Estate | 3.8 | |
| Materials | 3.1 | |
| Energy | 1.0 | |
| Cash and Cash Equivalents | 9.3 | |
| Calendar Year Total Returns (%) | ||
| YEAR | RSE | |
| 2018 | -9.9 | |
| 2017 | 7.9 | |
| 2016 | 32.2 | |
| 2015 | -12.4 | |
| 2014 | 1.1 | |
| 2013 | 29.4 | |
| 2012 | 15.4 | |
| 2011 | 0.1 | |
| 2010 | 19.6 | |
| 2009 | 28.4 | |
| 2008 | -19.6 | |
| 2007 | 4.7 | |
| 2006 | 14.0 | |
| 2005 | -1.0 | |
| 2004 | 13.9 | |
| Upside/Downside Capture Ratios | ||||||||||||||
| Periods Ended 12/31/18 (%) | ||||||||||||||
| UPSIDE | DOWNSIDE | |||||||||||||
| 10-Year | 78 | 72 | ||||||||||||
| From 6/30/98 (Start of Fund’s First Full Quarter) | 73 | 50 | ||||||||||||
| Portfolio Diagnostics | ||
| Fund Net Assets | $1,204 million | |
| Number of Holdings | 39 | |
| Turnover Rate | 21% | |
| Average Market Capitalization1 | $1,280 million | |
| Weighted Average P/E Ratio2,3 | 18.2x | |
| Weighted Average P/B Ratio2 | 1.7x | |
| Active Share4 | 98% | |
| U.S. Investments (% of Net Assets) | 88.7% | |
| Non-U.S. Investments (% of Net Assets) | 2.0% | |
| 1 | Geometric Average. This weighted calculation uses each portfolio holding’s market cap in a way designed to not skew the effect of very large or small holdings; instead, it aims to better identify the portfolio’s center, which Royce believes offers a more accurate measure of average market cap than a simple mean or median. |
| 2 | Harmonic Average. This weighted calculation evaluates a portfolio as if it were a single stock and measures it overall. It compares the total market value of the portfolio to the portfolio’s share in the earnings or book value, as the case may be, of its underlying stocks. |
| 3 | The Fund’s P/E ratio calculation excludes companies with zero or negative earnings (10% of portfolio holdings as of 12/31/18). |
| 4 | Active Share is the sum of the absolute values of the different weightings of each holding in the Fund versus each holding in the benchmark, divided by two. |
| Important Performance and Expense Information |
All performance information in this Report reflects past performance, is presented on a total return basis, reflects the reinvestment of distributions, and does not reflect the deduction of taxes that a shareholder would pay on fund distributions or the redemption of fund shares. Past performance is no guarantee of future results. Investment return and principal value of an investment will fluctuate, so that shares may be worth more or less than their original cost when redeemed. Shares redeemed within 30 days of purchase may be subject to a 1% redemption fee payable to the Fund, which is not reflected in the performance shown above; if it were, performance would be lower. Current month-end performance may be higher or lower than performance quoted and may be obtained at www.roycefunds.com. All performance and risk information reflects results of the Investment Class (its oldest class). Operating expenses reflect the Fund’s total annual operating expenses for the Investment Class as of the Fund’s most current prospectus and include management fees and other expenses. The Sharpe Ratio is calculated for a specified period by dividing a fund’s annualized excess returns by its annualized standard deviation. The higher the Sharpe ratio, the better the fund’s historical risk-adjusted performance. Regarding the “Top Contributors” and “Top Detractors” tables shown above, the sum of all contributors to, and all detractors from, performance for all securities in the portfolio would approximate the Fund’s year-to-date performance for 2018. Upside Capture Ratio measures a manager’s performance in up markets relative to the Fund’s benchmark. It is calculated by measuring the Fund’s performance in quarters when the benchmark went up and dividing it by the benchmark’s return in those quarters. Downside Capture Ratio measures a manager’s performance in down markets relative to the Fund’s benchmark (Russell 2000). It is calculated by measuring the Fund’s performance in quarters when the benchmark goes down and dividing it by the benchmark’s return in those quarters. |
| The Royce Funds 2018 Annual Report to Shareholders | 35 |
| MANAGERS’ DISCUSSION | ||
| Royce Special Equity Multi-Cap Fund (RSM) |
 |
| Charlie Dreifus, CFA Steven McBoyle |
| IMPORTANT NEWS FOR SHAREHOLDERS The Royce Fund’s Board of Trustees has approved a plan of liquidation for Royce Special Equity Multi-Cap Fund, to be effective on February 25, 2019. The Fund is being liquidated primarily because it has not attracted and maintained assets at a sufficient level for it to be viable. A distribution was paid on January 23, 2019 to shareholders of record on January 22, 2019. |
| FUND PERFORMANCE |
Royce Special Equity Multi-Cap Fund was down 10.6% in 2018, lagging its large-cap benchmark, the Russell 1000 Index, which fell 4.8% for the same period. A relatively solid performance in the fourth-quarter downturn, when the Fund lost 13.3% versus a decline of 13.8% for the Russell 1000, was not nearly enough to turn the tide of the Fund’s relative disadvantage through the year’s first three quarters. This capped a difficult and disappointing year in which growth again outperformed value, and defensive sectors outpaced their cyclical counterparts. So while our emphasis on companies with low leverage, dividends, and low beta—all characteristics of our discipline— certainly helped in the fourth quarter, they were decidedly out of favor during the rest of 2018—and over large stretches of the Fund’s history, a period dominated by low interest rates, little volatility, and growth-stock leadership. WHAT WORKED... AND WHAT DIDN’T Four of the six equity sectors in which the Fund had investments detracted from performance in 2018. By far, the biggest negative impact came from Industrials, where the portfolio was also significantly overweight relative to its benchmark. Within that sector, we had the largest exposure to the machinery group, which had a correspondingly substantial negative effect on 2018’s results. Four of the portfolio’s five holdings in machinery detracted from performance, with two making an outsized impact. Illinois Tool Works has a global business manufacturing products such as industrial fluids and adhesives, tooling for specialty applications, welding products, and quality measurement equipment and systems. Parker Hannifin specializes in motion control products, including fluid power systems, electromechanical controls, and related components. ManpowerGroup, a holding in Industrials from outside the machinery group that provides workforce solutions and services to a global market, was another significant detractor. Housed in the aerospace & defense group within Industrials, General Dynamics is a diversified defense company with a broad portfolio of products and services in business aviation, combat vehicles, weapons systems, munitions, shipbuilding design and construction, information systems, and technologies. From the Materials sector, Packaging Corporation of America also disappointed. The firm manufactures containerboard and corrugated packaging products that are used to protect goods during shipment. On the positive side, the Information Technology and Financials sectors made positive contributions. From the first of these sectors, Cisco Systems was the portfolio’s top-performing position in 2018. The company makes Internet Protocol based networking and other products that transmit data, voice, and video. The top contributor in Financials was Brown & Brown, an insurance broker offering a range of insurance and reinsurance products as well as providing risk management, employee benefit administration, and managed health care services. Four holdings in Consumer Discretionary made positive contributions in 2018. The top contributor was Genuine Parts, which distributes automotive and industrial replacement parts, office products, and electrical and electronic materials while V.F. Corporation, the sector’s second-best contributor, operates a slate of popular retail brands including The North Face, Vans, Timberland, and JanSport. |
| Top Contributors to Performance For 2018 (%)1 | |||
| Cisco Systems | 0.76 | ||
| Genuine Parts | 0.32 | ||
| Brown & Brown | 0.29 | ||
| V.F. Corporation | 0.26 | ||
| McDonald’s Corporation | 0.24 | ||
| 1 Includes dividends | |||
| Top Detractors from Performance For 2018 (%)2 | |||
| Illinois Tool Works | -2.13 | ||
| ManpowerGroup | -1.44 | ||
| Parker Hannifin | -1.30 | ||
| Packaging Corporation of America | -1.23 | ||
| General Dynamics | -1.04 | ||
| 2 Net of dividends | |||
| Relative to the Russell 1000, the Fund’s disadvantage came from both sector allocation and ineffective stock selection in 2018. The bulk of its underperformance came from its holdings in machinery companies, as well as from ManpowerGroup in the professional services group. The portfolio’s lack of exposure to Health Care was another source of underperformance. Conversely, the Fund benefited from its low exposure to Financials, as well as drawing a smaller advantage from stock selection in the sector. Our lack of any holdings in Energy, which suffered the deepest losses of any sector in the Russell 1000, also helped relative performance. If you would like to know more about Charlie Dreifus’s outlook on the market, please read the Manager’s Discussion for Royce Special Equity Fund on page 34. |
| 36 | The Royce Funds 2018 Annual Report to Shareholders |
| PERFORMANCE AND PORTFOLIO REVIEW | TICKER SYMBOLS RSEMX RSMCX RMUIX RSMLX |
| Performance and Expenses | ||||||||||||
| Average Annual Total Return (%) Through 12/31/18 | ||||||||||||
| JUL-DEC 20181 | 1-YR | 3-YR | 5-YR | SINCE INCEPTION (12/31/10) | ||||||||
| RSM | -5.20 | -10.57 | 5.47 | 2.06 | 7.67 | |||||||
| Annual Gross Operating Expenses: 1.39% Annual Net Operating Expenses: 1.24% | ||||||||||||
| 1Not annualized | ||||||||||||
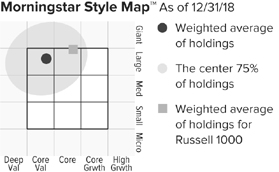
The Morningstar Style Map is the Morningstar Style Box™ with the center 75% of fund holdings plotted as the Morningstar Ownership Zone™. The Morningstar Style Box is designed to reveal a fund’s investment strategy. The Morningstar Ownership Zone provides detail about a portfolio’s investment style by showing the range of stock sizes and styles. The Ownership Zone is derived by plotting each stock in the portfolio within the proprietary Morningstar Style Box. Over time, the shape and location of a fund’s ownership zone may vary. See page 117 for additional information. |
Value of $10,000
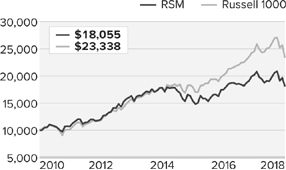
| Top 10 Positions | ||
| % of Net Assets | ||
| Illinois Tool Works | 12.8 | |
| Lowe’s Companies | 10.5 | |
| Genuine Parts | 9.2 | |
| Cisco Systems | 8.5 | |
| Packaging Corporation of America | 8.4 | |
| Apple | 4.9 | |
| General Dynamics | 4.9 | |
| United Technologies | 4.9 | |
| Carlisle Companies | 4.8 | |
| Procter & Gamble | 4.7 | |
| Portfolio Sector Breakdown | ||
| % of Net Assets | ||
| Industrials | 48.4 | |
| Consumer Discretionary | 24.0 | |
| Information Technology | 13.5 | |
| Materials | 8.4 | |
| Consumer Staples | 4.8 | |
| Cash and Cash Equivalents | 0.9 | |
| Calendar Year Total Returns (%) | ||
| YEAR | RSM | |
| 2018 | -10.6 | |
| 2017 | 15.4 | |
| 2016 | 13.7 | |
| 2015 | -13.6 | |
| 2014 | 9.3 | |
| 2013 | 36.3 | |
| 2012 | 11.6 | |
| 2011 | 7.2 | |
| Portfolio Diagnostics | ||
| Fund Net Assets | $42 million | |
| Number of Holdings | 17 | |
| Turnover Rate | 14% | |
| Average Market Capitalization1 | $43,048 million | |
| Weighted Average P/E Ratio2,3 | 18.1x | |
| Weighted Average P/B Ratio2 | 4.2x | |
| Active Share4 | 92% | |
| U.S. Investments (% of Net Assets) | 99.1% | |
| Non-U.S. Investments (% of Net Assets) | 0.0% | |
| 1 | Geometric Average. This weighted calculation uses each portfolio holding’s market cap in a way designed to not skew the effect of very large or small holdings; instead, it aims to better identify the portfolio’s center, which Royce believes offers a more accurate measure of average market cap than a simple mean or median. |
| 2 | Harmonic Average. This weighted calculation evaluates a portfolio as if it were a single stock and measures it overall. It compares the total market value of the portfolio to the portfolio’s share in the earnings or book value, as the case may be, of its underlying stocks. |
| 3 | The Fund’s P/E ratio calculation excludes companies with zero or negative earnings (0% of portfolio holdings as of 12/31/18). |
| 4 | Active Share is the sum of the absolute values of the different weightings of each holding in the Fund versus each holding in the benchmark, divided by two. |
| Important Performance and Expense Information |
All performance information in this Report reflects past performance, is presented on a total return basis, reflects the reinvestment of distributions, and does not reflect the deduction of taxes that a shareholder would pay on fund distributions or the redemption of fund shares. Past performance is no guarantee of future results. Investment return and principal value of an investment will fluctuate, so that shares may be worth more or less than their original cost when redeemed. Shares redeemed within 30 days of purchase may be subject to a 1% redemption fee payable to the Fund, which is not reflected in the performance shown above; if it were, performance would be lower. Current month-end performance may be higher or lower than performance quoted and may be obtained at www.roycefunds.com. All performance and risk information reflects results of the Service Class (its oldest class). Gross operating expenses reflect gross total annual operating expenses for the Service Class and include management fees, 12b-1 distribution and service fees and other expenses. Net operating expenses reflect contractual fee waivers and/or reimbursements. All expense information is reported as of the Fund’s most current prospectus. Royce & Associates has contractually agreed to waive fees and/or reimburse operating expenses to the extent necessary to maintain the Service Classes’s net annual operating expenses, (excluding brokerage commissions, taxes, interest litigation expenses, acquired fund fees and expenses, and other expenses not borne in the ordinary course of business), at or below 1.24% through April 30, 2019. Regarding the “Top Contributors” and “Top Detractors” tables shown above, the sum of all contributors to, and all detractors from, performance for all securities in the portfolio would approximate the Fund’s year-to-date performance for 2018. |
| The Royce Funds 2018 Annual Report to Shareholders | 37 |
| MANAGERS’ DISCUSSION | ||
| Royce Total Return Fund (RTR) |
 |
| Chuck Royce Jay Kaplan, CFA |
| FUND PERFORMANCE Royce Total Return Fund was down 12.5% in 2018, lagging the Russell 2000 Index, its small-cap benchmark, which fell 11.0% for the same period. While disappointed by our underperformance, we were nonetheless pleased that the Fund was able to narrow the performance gap during the stormy fourth quarter, when its historical resilience in downturns was once again in evidence as it lost 15.3% compared to a 20.2% decline for the Russell 2000. This marked the index’s tenth negative quarter over the last decade—and the Fund outperformed in eight of them, consistent with what its lower volatility dividend value strategy seeks to deliver. Despite a mostly inhospitable market environment over the last three years for our cautious, dividend-centric approach, the Fund beat its benchmark for the three-year period ended December 31, 2018. |
| WHAT WORKED... AND WHAT DIDN’T |
| The portfolio saw declines in nine of the 11 equity sectors where it had investments in 2018, and its two largest, Financials and Industrials, were also its biggest detractors by a wide margin. Materials and Information Technology followed. Positive contributions at the sector level were small, with Health Care and Consumer Staples the only areas to finish 2018 in the black. Banks and capital markets, two groups in Financials, detracted most at the industry level. Bank stocks in general slumped on fears of a flattening yield curve, slower-than-expected loan growth, and fears that a recession would mean increased loan losses. Two of our holdings—BOK Financial and Canadian Western Bank, also felt the negative effects of oil price declines owing to their locations in energy-focused regions. We remain constructive on our holdings as a group, however, based on the belief that the long-term direction of interest rates is upward, with a steepening yield curve. The banks we hold are also mainly smaller community-centered businesses where we saw attributes that go beyond the overall improved conditions for the industry that should help them recover. They have some combination of a strong deposit franchise, impressive loan growth, and/or a strong geographic advantage. The Fund’s holdings in capital markets are a mix of alternative and traditional asset management businesses, most of which suffered the steep declines that down markets often wreak on these businesses. The Fund’s biggest detractor at the position level was ManpowerGroup, an Industrials holding that provides workforce solutions and services to a global market. Its 2018 revenues slid, as the economic environment, particularly in its European business, proved more challenging than the company had been anticipating. We held shares based on the ongoing strength of its North American and Asian business and its record of successful execution. The long-term prospects for recreational vehicle manufacturer Thor Industries inspired a similar level of confidence in spite of a 65% decline for its stock in 2018. Sales began to decline in the fall, forcing Thor to scale back production as independent RV dealers had overstocked their inventories earlier in the year. However, inventories were normalizing at the end of December, and Thor has also improved its production process in order to meet variable levels of demand. Positive contributions at both the industry and position levels were very modest. Aerospace & defense (Industrials) was boosted by strength for HEICO Corporation, which supplies electronics and other parts to aerospace companies. Its defensible moat in a highly specialized niche and conservatively capitalized balance sheet attracted our attention while other investors seemed drawn to its steady earnings growth in 2018. A Consumer Staples holding, Lancaster Colony makes specialty food products for the retail and foodservice channels. Its shares were nourished in the second half of 2018 by strong sales growth and margin expansion in its fiscal first quarter. The Fund’s 2018 underperformance resulted from sector allocation—stock selection was additive for the year. Information Technology was by far the biggest source of underperformance due both to our underweight and ineffective stock selection. Consumer Discretionary holdings also detracted from relative results. Conversely, Energy contributed most to relative results as the Fund’s holdings in the energy equipment & services industry did significantly better than those in the index. Consumer Staples stocks were another a source of outperformance, with food & staples retailing contributing most, led by Village Super Markets. |
| Top Contributors to Performance For 2018 (%)1 | |||
| HEICO Corporation | 0.25 | ||
| Lancaster Colony | 0.22 | ||
| American Railcar Industries | 0.20 | ||
| Shoe Carnival | 0.20 | ||
| Quaker Chemical | 0.19 | ||
| 1Includes dividends | |||
| Top Detractors from Performance For 2018 (%)2 | |||
| ManpowerGroup | -0.72 | ||
| Thor Industries | -0.60 | ||
| Methode Electronics | -0.46 | ||
| Clarkson | -0.40 | ||
| Hubbell Cl. B | -0.31 | ||
| 2Net of dividends | |||
| CURRENT POSITIONING AND OUTLOOK |
| While we acknowledge the many potential sources of risk on the horizon—economic, geopolitical, and financial—we also think that these concerns have already been largely reflected, perhaps even excessively so, in current valuations. In relatively short order, we transitioned from a period this summer when small-cap’s extended valuations seemed out of sync given the index’s high levels of debt and low profitability, to one at the end of the year where valuations seemed more pessimistic than we think is warranted—at least in select instances. As a result, we reduced the Fund’s cash holdings to a minimal amount by year-end. Historically, down years for small-caps have often been followed by strong ones. We believe that the portfolio’s cyclical tilt will be rewarded as recessionary concerns dissipate during the year. |
| 38 | The Royce Funds 2018 Annual Report to Shareholders |
| PERFORMANCE AND PORTFOLIO REVIEW | TICKER SYMBOLS RYTRX RYTFX RTRIX RYTCX RTRRX RTRWX |
| Performance and Expenses | ||||||||||||||||
| Average Annual Total Return (%) Through 12/31/18 | ||||||||||||||||
| JUL-DEC 20181 | 1-YR | 3-YR | 5-YR | 10-YR | 15-YR | 20-YR | SINCE INCEPTION (12/15/93) | |||||||||
| RTR | -12.97 | -12.46 | 7.78 | 3.32 | 10.61 | 7.14 | 8.39 | 9.99 | ||||||||
| Annual Operating Expenses: 1.21% | ||||||||||||||||
| 1Not annualized | ||||||||||||||||
Relative Risk Adjusted Returns: Monthly Rolling Sharpe Ratios
| On a monthly rolling risk-adjusted basis, the Fund outperformed the Russell 2000 in 93% of all 10-year periods and 85% of all 5-year periods. |
| PERIODS BEATING THE INDEX | FUND AVG (%)1 | INDEX AVG (%)1 | ||||||||||||
| 10-year | 112/121 | 93% | 0.46 | 0.37 | ||||||||||
| 5-year | 153/181 | 85% | 0.66 | 0.50 | ||||||||||

The Morningstar Style Map is the Morningstar Style Box™ with the center 75% of fund holdings plotted as the Morningstar Ownership Zone™. The Morningstar Style Box is designed to reveal a fund’s investment strategy. The Morningstar Ownership Zone provides detail about a portfolio’s investment style by showing the range of stock sizes and styles. The Ownership Zone is derived by plotting each stock in the portfolio within the proprietary Morningstar Style Box. Over time, the shape and location of a fund’s ownership zone may vary. See page 117 for additional information. |
Value of $10,000
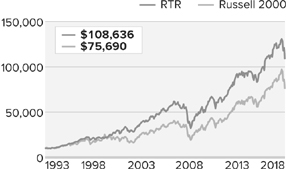
| Top 10 Positions | ||
| % of Net Assets | ||
| Erie Indemnity Cl. A | 1.9 | |
| Quaker Chemical | 1.9 | |
| E-L Financial | 1.5 | |
| First Citizens BancShares Cl. A | 1.5 | |
| Ares Management | 1.3 | |
| BOK Financial | 1.3 | |
| Alleghany Corporation | 1.3 | |
| Ritchie Bros. Auctioneers | 1.2 | |
| Meredith Corporation | 1.2 | |
| Tootsie Roll Industries | 1.2 | |
| Portfolio Sector Breakdown | ||
| % of Net Assets | ||
| Financials | 33.8 | |
| Industrials | 25.8 | |
| Materials | 10.0 | |
| Consumer Discretionary | 6.7 | |
| Information Technology | 5.9 | |
| Consumer Staples | 4.6 | |
| Energy | 3.3 | |
| Utilities | 3.1 | |
| Communication Services | 2.6 | |
| Real Estate | 1.7 | |
| Health Care | 1.4 | |
| Corporate Bonds | 0.3 | |
| Cash and Cash Equivalents | 0.8 | |
| Calendar Year Total Returns (%) | ||
| YEAR | RTR | |
| 2018 | -12.5 | |
| 2017 | 13.7 | |
| 2016 | 25.9 | |
| 2015 | -7.2 | |
| 2014 | 1.3 | |
| 2013 | 32.8 | |
| 2012 | 14.4 | |
| 2011 | -1.7 | |
| 2010 | 23.5 | |
| 2009 | 26.2 | |
| 2008 | -31.2 | |
| 2007 | 2.4 | |
| 2006 | 14.5 | |
| 2005 | 8.2 | |
| 2004 | 17.5 | |
| Upside/Downside Capture Ratios | ||||||||||||||
| Periods Ended 12/31/18 (%) | ||||||||||||||
| UPSIDE | DOWNSIDE | |||||||||||||
| 10-Year | 82 | 76 | ||||||||||||
| From 12/31/93 (Start of Fund’s First Full Quarter) | 81 | 57 | ||||||||||||
| Portfolio Diagnostics | ||
| Fund Net Assets | $1,544 million | |
| Number of Holdings | 251 | |
| Turnover Rate | 22% | |
| Average Market Capitalization1 | $1,829 million | |
| Weighted Average P/E Ratio2,3 | 14.1x | |
| Weighted Average P/B Ratio2 | 1.8x | |
| Active Share4 | 91% | |
| U.S. Investments (% of Net Assets) | 84.8% | |
| Non-U.S. Investments (% of Net Assets) | 14.4% | |
| 1 | Geometric Average. This weighted calculation uses each portfolio holding’s market cap in a way designed to not skew the effect of very large or small holdings; instead, it aims to better identify the portfolio’s center, which Royce believes offers a more accurate measure of average market cap than a simple mean or median. |
| 2 | Harmonic Average. This weighted calculation evaluates a portfolio as if it were a single stock and measures it overall. It compares the total market value of the portfolio to the portfolio’s share in the earnings or book value, as the case may be, of its underlying stocks. |
| 3 | The Fund’s P/E ratio calculation excludes companies with zero or negative earnings (5% of portfolio holdings as of 12/31/18). |
| 4 | Active Share is the sum of the absolute values of the different weightings of each holding in the Fund versus each holding in the benchmark, divided by two. |
| Important Performance and Expense Information All performance information in this Report reflects past performance, is presented on a total return basis, reflects the reinvestment of distributions, and does not reflect the deduction of taxes that a shareholder would pay on fund distributions or the redemption of fund shares. Past performance is no guarantee of future results. Investment return and principal value of an investment will fluctuate, so that shares may be worth more or less than their original cost when redeemed. Shares redeemed within 30 days of purchase may be subject to a 1% redemption fee payable to the Fund, which is not reflected in the performance shown above; if it were, performance would be lower. Current month-end performance may be higher or lower than performance quoted and may be obtained at www.roycefunds.com. All performance and risk information reflects results of the Investment Class (its oldest class). Certain immaterial adjustments were made to the net assets of Royce Total Return Fund at 6/30/17 for financial reporting purposes, and as a result the net asset values for shareholder transactions on that date and the calendar year Total Returns (%) based on those net asset values differ from the adjusted net asset values and calendar year total returns reported in the Financial Highlights. Operating expenses reflect the Fund’s total annual operating expenses for the Investment Class as of the Fund’s most current prospectus and include management fees, other expenses, and acquired fund fees and expenses. Acquired fund fees and expenses reflect the estimated amount of the fees and expenses incurred indirectly by the Fund through its investments in mutual funds, hedge funds, private equity funds, and other investment companies. Regarding the “Top Contributors” and “Top Detractors” tables shown above, the sum of all contributors to, and all detractors from, performance for all securities in the portfolio would approximate the Fund’s year-to-date performance for 2018. The Sharpe Ratio is calculated for a specified period by dividing a fund’s annualized excess returns by its annualized standard deviation. The higher the Sharpe ratio, the better the fund’s historical risk-adjusted performance. Upside Capture Ratio measures a manager’s performance in up markets relative to the Fund’s benchmark. It is calculated by measuring the Fund’s performance in quarters when the benchmark went up and dividing it by the benchmark’s return in those quarters. Downside Capture Ratio measures a manager’s performance in down markets relative to the Fund’s benchmark (Russell 2000). It is calculated by measuring the Fund’s performance in quarters when the benchmark goes down and dividing it by the benchmark’s return in those quarters. |
| The Royce Funds 2018 Annual Report to Shareholders | 39 |
| Schedules of Investments |
| Royce Dividend Value Fund |
| Common Stocks – 95.7% |
| SHARES | VALUE | |||||||
| CONSUMER DISCRETIONARY – 8.1% | ||||||||
| AUTO COMPONENTS - 2.1% | ||||||||
Gentex Corporation | 56,296 | $ | 1,137,742 | |||||
Nokian Renkaat | 44,500 | 1,367,441 | ||||||
| 2,505,183 | ||||||||
| AUTOMOBILES - 0.6% | ||||||||
Thor Industries | 12,840 | 667,680 | ||||||
| HOTELS, RESTAURANTS & LEISURE - 0.1% | ||||||||
Cheesecake Factory | 2,929 | 127,441 | ||||||
| HOUSEHOLD DURABLES - 1.8% | ||||||||
Hunter Douglas | 25,000 | 1,667,066 | ||||||
La-Z-Boy | 18,915 | 524,134 | ||||||
| 2,191,200 | ||||||||
| SPECIALTY RETAIL - 2.8% | ||||||||
American Eagle Outfitters | 67,331 | 1,301,508 | ||||||
†Caleres | 19,278 | 536,507 | ||||||
DSW Cl. A | 15,515 | 383,220 | ||||||
USS | 70,000 | 1,180,877 | ||||||
| 3,402,112 | ||||||||
| TEXTILES, APPAREL & LUXURY GOODS - 0.7% | ||||||||
HUGO BOSS | 12,300 | 759,880 | ||||||
Steven Madden | 4,278 | 129,452 | ||||||
| 889,332 | ||||||||
| Total (Cost $7,833,133) | 9,782,948 | |||||||
| CONSUMER STAPLES – 0.6% | ||||||||
| FOOD & STAPLES RETAILING - 0.6% | ||||||||
FamilyMart UNY Holdings | 6,000 | 761,462 | ||||||
| Total (Cost $225,028) | 761,462 | |||||||
| ENERGY – 5.9% | ||||||||
| ENERGY EQUIPMENT & SERVICES - 3.4% | ||||||||
Helmerich & Payne | 39,904 | 1,912,998 | ||||||
TGS-NOPEC Geophysical | 90,900 | 2,195,098 | ||||||
| 4,108,096 | ||||||||
| OIL, GAS & CONSUMABLE FUELS - 2.5% | ||||||||
Cimarex Energy | 21,100 | 1,300,815 | ||||||
†Gaztransport Et Technigaz | 22,700 | 1,746,472 | ||||||
| 3,047,287 | ||||||||
| Total (Cost $7,506,618) | 7,155,383 | |||||||
| FINANCIALS – 28.2% | ||||||||
| BANKS - 2.5% | ||||||||
Bank of Georgia Group | 49,400 | 867,031 | ||||||
BOK Financial | 21,414 | 1,570,289 | ||||||
City Holding Company | 7,389 | 499,422 | ||||||
| 2,936,742 | ||||||||
| CAPITAL MARKETS - 22.2% | ||||||||
Ashmore Group | 459,000 | 2,138,911 | ||||||
AURELIUS Equity Opportunities | 9,000 | 327,089 | ||||||
B3-Brasil, Bolsa, Balcao | 275,000 | 1,902,277 | ||||||
Bolsa Mexicana de Valores | 1,234,000 | 2,103,579 | ||||||
Carlyle Group L.P. | 122,300 | 1,926,225 | ||||||
Coronation Fund Managers | 192,000 | 551,812 | ||||||
Federated Investors Cl. B | 49,100 | 1,303,605 | ||||||
| 49,400 | 642,875 | |||||||
Gluskin Sheff + Associates | 51,700 | 394,983 | ||||||
Houlihan Lokey Cl. A | 18,800 | 691,840 | ||||||
Jupiter Fund Management | 282,000 | 1,061,058 | ||||||
KKR & Co. Cl. A | 165,600 | 3,250,728 | ||||||
Lazard Cl. A | 29,600 | 1,092,536 | ||||||
Moelis & Company Cl. A | 23,959 | 823,710 | ||||||
Northern Trust | 23,300 | 1,947,647 | ||||||
SEI Investments | 47,400 | 2,189,880 | ||||||
Sprott | 735,700 | 1,384,961 | ||||||
State Street | 23,200 | 1,463,224 | ||||||
Value Partners Group | 2,272,200 | 1,575,640 | ||||||
| 26,772,580 | ||||||||
| DIVERSIFIED FINANCIAL SERVICES - 1.1% | ||||||||
Jefferies Financial Group | 74,600 | 1,295,056 | ||||||
| INSURANCE - 0.9% | ||||||||
Reinsurance Group of America | 7,905 | 1,108,518 | ||||||
| THRIFTS & MORTGAGE FINANCE - 1.5% | ||||||||
Genworth MI Canada | 44,148 | 1,299,993 | ||||||
†WSFS Financial | 13,800 | 523,158 | ||||||
| 1,823,151 | ||||||||
| Total (Cost $29,859,147) | 33,936,047 | |||||||
| HEALTH CARE – 2.1% | ||||||||
| HEALTH CARE PROVIDERS & SERVICES - 0.1% | ||||||||
Ensign Group (The) | 3,251 | 126,106 | ||||||
| PHARMACEUTICALS - 2.0% | ||||||||
Recordati | 48,800 | 1,693,592 | ||||||
Santen Pharmaceutical | 52,000 | 752,448 | ||||||
| 2,446,040 | ||||||||
| Total (Cost $777,950) | 2,572,146 | |||||||
| INDUSTRIALS – 28.4% | ||||||||
| AEROSPACE & DEFENSE - 3.0% | ||||||||
HEICO Corporation Cl. A | 56,820 | 3,579,660 | ||||||
| AIRLINES - 1.9% | ||||||||
Allegiant Travel | 9,200 | 922,024 | ||||||
Hawaiian Holdings | 49,376 | 1,304,020 | ||||||
| 2,226,044 | ||||||||
| BUILDING PRODUCTS - 1.8% | ||||||||
Apogee Enterprises | 14,600 | 435,810 | ||||||
Geberit | 1,000 | 388,951 | ||||||
TOTO | 37,000 | 1,286,164 | ||||||
| 2,110,925 | ||||||||
| COMMERCIAL SERVICES & SUPPLIES - 0.8% | ||||||||
Herman Miller | 33,576 | 1,015,674 | ||||||
| CONSTRUCTION & ENGINEERING - 1.8% | ||||||||
Comfort Systems USA | 3,892 | 170,003 | ||||||
KBR | 132,800 | 2,015,904 | ||||||
| 2,185,907 | ||||||||
| ELECTRICAL EQUIPMENT - 1.4% | ||||||||
EnerSys | 1,631 | 126,582 | ||||||
Hubbell Cl. B | 15,900 | 1,579,506 | ||||||
| 1,706,088 | ||||||||
| MACHINERY - 12.1% | ||||||||
Alamo Group | 6,948 | 537,219 | ||||||
Federal Signal | 6,429 | 127,937 | ||||||
Graco | 63,000 | 2,636,550 | ||||||
IDEX Corporation | 21,400 | 2,701,964 | ||||||
Lincoln Electric Holdings | 13,150 | 1,036,878 | ||||||
Lindsay Corporation | 26,700 | 2,569,875 | ||||||
Pfeiffer Vacuum Technology | 12,000 | 1,494,516 | ||||||
Spirax-Sarco Engineering | 27,400 | 2,179,260 | ||||||
Wabash National | 100,292 | 1,311,819 | ||||||
| 14,596,018 | ||||||||
| 40 | The Royce Funds 2018 Annual Report to Shareholders | THE ACCOMPANYING NOTES ARE AN INTEGRAL PART OF THESE FINANCIAL STATEMENTS |
| December 31, 2018 |
| Royce Dividend Value Fund (continued) | ||||||||
| SHARES | VALUE | |||||||
| INDUSTRIALS (continued) | ||||||||
| MARINE - 1.2% | ||||||||
Clarkson | 60,700 | $ | 1,469,996 | |||||
| PROFESSIONAL SERVICES - 2.0% | ||||||||
Korn Ferry | 10,501 | 415,209 | ||||||
ManpowerGroup | 28,300 | 1,833,840 | ||||||
Robert Half International | 2,664 | 152,381 | ||||||
| 2,401,430 | ||||||||
| ROAD & RAIL - 0.4% | ||||||||
†Old Dominion Freight Line | 1,000 | 123,490 | ||||||
Werner Enterprises | 10,043 | 296,670 | ||||||
| 420,160 | ||||||||
| TRADING COMPANIES & DISTRIBUTORS - 2.0% | ||||||||
Applied Industrial Technologies | 45,600 | 2,459,664 | ||||||
| Total (Cost $23,403,447) | 34,171,566 | |||||||
| INFORMATION TECHNOLOGY – 7.3% | ||||||||
| ELECTRONIC EQUIPMENT, INSTRUMENTS & COMPONENTS - 5.8% | ||||||||
†Benchmark Electronics | 53,978 | 1,143,254 | ||||||
FLIR Systems | 82,300 | 3,583,342 | ||||||
Methode Electronics | 43,338 | 1,009,342 | ||||||
Vishay Intertechnology | 72,563 | 1,306,860 | ||||||
| 7,042,798 | ||||||||
| SEMICONDUCTORS & SEMICONDUCTOR EQUIPMENT - 1.1% | ||||||||
MKS Instruments | 20,222 | 1,306,543 | ||||||
| SOFTWARE - 0.4% | ||||||||
SimCorp | 7,000 | 478,662 | ||||||
| Total (Cost $8,054,245) | 8,828,003 | |||||||
| MATERIALS – 13.2% | ||||||||
| CHEMICALS - 3.0% | ||||||||
Quaker Chemical | 20,500 | 3,643,055 | ||||||
| CONTAINERS & PACKAGING - 3.1% | ||||||||
AptarGroup | 36,900 | 3,471,183 | ||||||
Greif Cl. A | 7,800 | 289,458 | ||||||
| 3,760,641 | ||||||||
| METALS & MINING - 7.1% | ||||||||
Franco-Nevada Corporation | 33,000 | 2,315,610 | ||||||
Reliance Steel & Aluminum | 35,400 | 2,519,418 | ||||||
Royal Gold | 19,300 | 1,653,045 | ||||||
Worthington Industries | 58,500 | 2,038,140 | ||||||
| 8,526,213 | ||||||||
| Total (Cost $8,189,407) | 15,929,909 | |||||||
| REAL ESTATE – 0.5% | ||||||||
| REAL ESTATE MANAGEMENT & DEVELOPMENT - 0.5% | ||||||||
Relo Group | 23,000 | 539,930 | ||||||
| Total (Cost $107,244) | 539,930 | |||||||
| UTILITIES – 1.4% | ||||||||
| WATER UTILITIES - 1.4% | ||||||||
Aqua America | 49,800 | 1,702,662 | ||||||
| Total (Cost $1,192,551) | 1,702,662 | |||||||
| TOTAL COMMON STOCKS | ||||||||
| (Cost $87,148,770) | 115,380,056 | |||||||
| TOTAL INVESTMENTS – 95.7% | ||||||||
| (Cost $87,148,770) | 115,380,056 | |||||||
| CASH AND OTHER ASSETS LESS LIABILITIES – 4.3% | 5,141,277 | |||||||
| NET ASSETS – 100.0% | $ | 120,521,333 | ||||||
| THE ACCOMPANYING NOTES ARE AN INTEGRAL PART OF THESE FINANCIAL STATEMENTS | The Royce Funds 2018 Annual Report to Shareholders | 41 |
| Schedules of Investments |
| Royce Global Financial Services Fund | ||||||||
| Common Stocks – 99.9% | ||||||||
| SHARES | VALUE | |||||||
| BANKS - 18.3% | ||||||||
Bank of Princeton | 5,000 | $ | 139,500 | |||||
†Bank OZK | 5,900 | 134,697 | ||||||
BankUnited | 4,100 | 122,754 | ||||||
BOK Financial | 11,000 | 806,630 | ||||||
Bryn Mawr Bank | 10,000 | 344,000 | ||||||
†Canadian Western Bank | 14,000 | 267,038 | ||||||
Capital City Bank Group | 25,481 | 591,414 | ||||||
Chemung Financial | 14,512 | 599,491 | ||||||
County Bancorp | 15,895 | 276,096 | ||||||
First Citizens BancShares Cl. A | 2,672 | 1,007,477 | ||||||
First Republic Bank | 6,840 | 594,396 | ||||||
Live Oak Bancshares | 22,500 | 333,225 | ||||||
Popular | 24,700 | 1,166,334 | ||||||
State Bank Financial | 12,500 | 269,875 | ||||||
| 11,600 | 225,736 | |||||||
Umpqua Holdings | 17,400 | 276,660 | ||||||
| Total (Cost $6,134,515) | 7,155,323 | |||||||
| CAPITAL MARKETS - 49.7% | ||||||||
Ares Management | 41,000 | 728,980 | ||||||
Ashmore Group | 216,000 | 1,006,546 | ||||||
Associated Capital Group Cl. A | 7,000 | 246,610 | ||||||
B3-Brasil, Bolsa, Balcao | 61,000 | 421,960 | ||||||
Bolsa Mexicana de Valores | 174,000 | 296,615 | ||||||
Canaccord Genuity Group | 133,000 | 562,123 | ||||||
Carlyle Group L.P. | 33,400 | 526,050 | ||||||
Charles Schwab (The) Corporation | 8,400 | 348,852 | ||||||
Coronation Fund Managers | 61,200 | 175,890 | ||||||
CRISIL | 14,000 | 322,051 | ||||||
Edelweiss Financial Services | 155,000 | 404,845 | ||||||
Edmond de Rothschild (Suisse) | 30 | 457,829 | ||||||
Egyptian Financial Group-Hermes | ||||||||
Holding Company 1 | 307,987 | 258,805 | ||||||
Gluskin Sheff + Associates | 63,400 | 484,370 | ||||||
GMP Capital | 108,000 | 148,725 | ||||||
Great Elm Capital Group 1 | 115,545 | 390,542 | ||||||
Hamilton Lane Cl. A | 11,500 | 425,500 | ||||||
Hellenic Exchanges - Athens Stock Exchange | 50,000 | 211,964 | ||||||
Intermediate Capital Group | 39,111 | 466,106 | ||||||
INTL FCStone 1 | 12,870 | 470,784 | ||||||
IOOF Holdings | 55,000 | 200,282 | ||||||
JSE | 51,000 | 586,868 | ||||||
Jupiter Fund Management | 106,900 | 402,224 | ||||||
KKR & Co. Cl. A | 23,900 | 469,157 | ||||||
Lazard Cl. A | 3,700 | 136,567 | ||||||
MarketAxess Holdings | 4,600 | 972,026 | ||||||
Northern Trust | 3,770 | 315,134 | ||||||
NZX | 580,000 | 393,189 | ||||||
Rothschild & Co | 27,700 | 979,095 | ||||||
SEI Investments | 15,900 | 734,580 | ||||||
Silvercrest Asset Management Group Cl. A | 41,600 | 550,368 | ||||||
Singapore Exchange | 114,300 | 599,615 | ||||||
Sprott | 500,000 | 941,254 | ||||||
TD Ameritrade Holding Corporation | 8,680 | 424,973 | ||||||
U.S. Global Investors Cl. A | 183,900 | 202,290 | ||||||
UOB-Kay Hian Holdings | 129,000 | 110,738 | ||||||
Value Partners Group | 772,000 | 535,337 | ||||||
Virtu Financial Cl. A | 47,400 | 1,221,024 | ||||||
VZ Holding | 3,350 | 903,195 | ||||||
Warsaw Stock Exchange | 19,000 | 186,073 | ||||||
Westaim Corporation 1 | 105,000 | 198,432 | ||||||
| Total (Cost $17,413,950) | 19,417,568 | |||||||
| CONSUMER FINANCE - 0.7% | ||||||||
Currency Exchange International 1 | 13,000 | 254,725 | ||||||
| Total (Cost $268,728) | 254,725 | |||||||
| DIVERSIFIED FINANCIAL SERVICES - 1.5% | ||||||||
ECN Capital | 75,000 | 189,533 | ||||||
†Onex Corporation | 5,000 | 272,304 | ||||||
SHUAA Capital | 580,000 | 129,480 | ||||||
| Total (Cost $879,670) | 591,317 | |||||||
| EQUITY REAL ESTATE INVESTMENT TRUSTS (REITS) - 0.4% | ||||||||
Colony Capital Cl. A | 31,500 | 147,420 | ||||||
| Total (Cost $376,985) | 147,420 | |||||||
| HOTELS, RESTAURANTS & LEISURE - 0.8% | ||||||||
Thomas Cook (India) | 94,000 | 314,455 | ||||||
| Total (Cost $270,518) | 314,455 | |||||||
| INSURANCE - 8.5% | ||||||||
E-L Financial | 2,365 | 1,275,007 | ||||||
First American Financial | 3,900 | 174,096 | ||||||
Jardine Lloyd Thompson Group | 11,900 | 286,974 | ||||||
MBIA 1 | 95,300 | 850,076 | ||||||
National Western Life Group Cl. A | 2,475 | 744,232 | ||||||
| Total (Cost $3,099,500) | 3,330,385 | |||||||
| IT SERVICES - 2.3% | ||||||||
Cass Information Systems | 5,016 | 265,447 | ||||||
GBST Holdings | 105,000 | 105,758 | ||||||
PayPal Holdings 1 | 6,400 | 538,176 | ||||||
| Total (Cost $765,866) | 909,381 | |||||||
| MARINE - 1.6% | ||||||||
Clarkson | 26,000 | 629,652 | ||||||
| Total (Cost $928,924) | 629,652 | |||||||
| METALS & MINING - 3.0% | ||||||||
Franco-Nevada Corporation | 16,500 | 1,157,805 | ||||||
| Total (Cost $900,426) | 1,157,805 | |||||||
| PROFESSIONAL SERVICES - 1.9% | ||||||||
IHS Markit 1 | 11,900 | 570,843 | ||||||
People Corporation 1 | 35,000 | 186,768 | ||||||
| Total (Cost $412,944) | 757,611 | |||||||
| REAL ESTATE MANAGEMENT & DEVELOPMENT - 6.5% | ||||||||
Altus Group | 32,000 | 554,820 | ||||||
FirstService Corporation | 12,600 | 862,848 | ||||||
FRP Holdings 1 | 9,306 | 428,169 | ||||||
Midland Holdings | 800,000 | 153,247 | ||||||
RMR Group Cl. A | 10,000 | 530,800 | ||||||
| Total (Cost $2,149,003) | 2,529,884 | |||||||
| SOFTWARE - 3.2% | ||||||||
| 10,600 | 484,632 | |||||||
Bottomline Technologies 1 | 9,800 | 470,400 | ||||||
| 42 | The Royce Funds 2018 Annual Report to Shareholders | THE ACCOMPANYING NOTES ARE AN INTEGRAL PART OF THESE FINANCIAL STATEMENTS |
| December 31, 2018 |
| Royce Global Financial Services Fund (continued) | ||||||||
| SHARES | VALUE | |||||||
| SOFTWARE (continued) | ||||||||
Envestnet 1 | 6,000 | $ | 295,140 | |||||
| Total (Cost $836,700) | 1,250,172 | |||||||
| TRADING COMPANIES & DISTRIBUTORS - 1.5% | ||||||||
Air Lease Cl. A | 19,500 | 589,095 | ||||||
| Total (Cost $854,965) | 589,095 | |||||||
| TOTAL COMMON STOCKS | ||||||||
| (Cost $35,292,694) | 39,034,793 | |||||||
| REPURCHASE AGREEMENT – 0.6% | ||||||||
| Fixed Income Clearing Corporation, 0.50% dated 12/31/18, due 1/2/19, maturity value | ||||||||
| $229,006 (collateralized by obligations of various U.S. Government Agencies, 0.125% due | ||||||||
| 07/15/24, valued at $234,479) | ||||||||
| (Cost $229,000) | 229,000 | |||||||
| TOTAL INVESTMENTS – 100.5% | ||||||||
| (Cost $35,521,694) | 39,263,793 | |||||||
| LIABILITIES LESS CASH AND OTHER ASSETS – (0.5)% | (199,787 | ) | ||||||
| NET ASSETS – 100.0% | $ | 39,064,006 | ||||||
| Royce International Premier Fund |
| Common Stocks – 92.5% |
| SHARES | VALUE | |||||||
| AUSTRALIA – 9.2% | ||||||||
Bravura Solutions | 2,300,000 | $ | 5,994,017 | |||||
Cochlear | 56,000 | 6,846,224 | ||||||
Hansen Technologies | 2,841,592 | 6,985,148 | ||||||
IPH | 1,800,000 | 6,858,959 | ||||||
†Technology One | 1,545,000 | 6,703,438 | ||||||
| Total (Cost $30,019,033) | 33,387,786 | |||||||
| AUSTRIA – 1.8% | ||||||||
Mayr-Melnhof Karton | 52,000 | 6,553,688 | ||||||
| Total (Cost $6,810,499) | 6,553,688 | |||||||
| BRAZIL – 4.1% | ||||||||
OdontoPrev | 2,350,000 | 8,337,096 | ||||||
TOTVS | 925,000 | 6,479,714 | ||||||
| Total (Cost $15,960,963) | 14,816,810 | |||||||
| CANADA – 5.1% | ||||||||
†Altus Group | 370,000 | 6,415,104 | ||||||
†Computer Modelling Group | 1,385,000 | 6,178,326 | ||||||
Morneau Shepell | 318,000 | 5,832,640 | ||||||
| Total (Cost $23,642,979) | 18,426,070 | |||||||
| CHINA – 2.0% | ||||||||
TravelSky Technology | 2,800,000 | 7,169,402 | ||||||
| Total (Cost $6,887,624) | 7,169,402 | |||||||
| DENMARK – 1.5% | ||||||||
SimCorp | 80,200 | 5,484,097 | ||||||
| Total (Cost $5,328,980) | 5,484,097 | |||||||
| FRANCE – 4.8% | ||||||||
†Lectra | 231,717 | 4,826,603 | ||||||
Neurones | 295,455 | 6,397,980 | ||||||
Thermador Groupe | 120,000 | 6,118,303 | ||||||
| Total (Cost $20,169,680) | 17,342,886 | |||||||
| GERMANY – 2.9% | ||||||||
Amadeus Fire | 62,000 | 5,789,473 | ||||||
Carl Zeiss Meditec | 61,700 | 4,828,315 | ||||||
| Total (Cost $10,093,726) | 10,617,788 | |||||||
| INDIA – 3.0% | ||||||||
†AIA Engineering | 249,500 | 5,932,393 | ||||||
SH Kelkar & Company | 2,045,000 | 5,038,172 | ||||||
| Total (Cost $13,021,175) | 10,970,565 | |||||||
| ITALY – 1.8% | ||||||||
DiaSorin | 82,500 | 6,682,871 | ||||||
| Total (Cost $6,836,592) | 6,682,871 | |||||||
| JAPAN – 21.7% | ||||||||
As One | 95,000 | 6,517,951 | ||||||
†Benefit One | 280,000 | 8,621,869 | ||||||
†Cosel | 665,000 | 5,636,467 | ||||||
†Daifuku | 173,000 | 7,923,544 | ||||||
EPS Holdings | 425,000 | 6,483,281 | ||||||
†Medikit | 77,500 | 3,924,319 | ||||||
Meitec Corporation | 263,000 | 10,713,882 | ||||||
†NSD | 320,000 | 6,195,338 | ||||||
Relo Group | 265,000 | 6,220,930 | ||||||
†TKC Corporation | 200,000 | 7,134,711 | ||||||
| THE ACCOMPANYING NOTES ARE AN INTEGRAL PART OF THESE FINANCIAL STATEMENTS | The Royce Funds 2018 Annual Report to Shareholders | 43 |
| Schedules of Investments |
| Royce International Premier Fund (continued) | ||||||||
| SHARES | VALUE | |||||||
| JAPAN (continued) | ||||||||
USS | 547,000 | $ | 9,227,708 | |||||
| Total (Cost $83,213,393) | 78,600,000 | |||||||
| NETHERLANDS – 5.2% | ||||||||
†IMCD | 123,000 | 7,891,924 | ||||||
†Intertrust | 660,000 | 11,108,501 | ||||||
| Total (Cost $20,575,457) | 19,000,425 | |||||||
| NEW ZEALAND – 1.4% | ||||||||
Fisher & Paykel Healthcare | 559,402 | 4,881,118 | ||||||
| Total (Cost $4,293,375) | 4,881,118 | |||||||
| SINGAPORE – 1.6% | ||||||||
XP Power | 213,000 | 5,714,859 | ||||||
| Total (Cost $6,969,138) | 5,714,859 | |||||||
| SWEDEN – 6.8% | ||||||||
Bravida Holding | 986,824 | 6,825,302 | ||||||
Hexpol | 887,000 | 7,010,572 | ||||||
†Lagercrantz Group | 558,400 | 5,424,632 | ||||||
†Loomis Cl. B | 163,000 | 5,259,874 | ||||||
| Total (Cost $26,579,760) | 24,520,380 | |||||||
| SWITZERLAND – 12.2% | ||||||||
Burkhalter Holding | 68,313 | 5,421,115 | ||||||
Inficon Holding | 14,500 | 7,340,726 | ||||||
†Kardex | 72,500 | 8,364,534 | ||||||
LEM Holding | 7,100 | 7,570,251 | ||||||
Partners Group Holding | 15,500 | 9,398,718 | ||||||
VZ Holding | 22,500 | 6,066,233 | ||||||
| Total (Cost $47,199,711) | 44,161,577 | |||||||
| UNITED KINGDOM – 7.4% | ||||||||
Ashmore Group | 1,450,000 | 6,756,908 | ||||||
Consort Medical | 450,425 | 5,367,944 | ||||||
Spirax-Sarco Engineering | 102,500 | 8,152,340 | ||||||
Victrex | 222,600 | 6,491,649 | ||||||
| Total (Cost $27,680,347) | 26,768,841 | |||||||
| TOTAL COMMON STOCKS | ||||||||
| (Cost $355,282,432) | 335,099,163 | |||||||
| PREFERRED STOCK – 2.0% | ||||||||
| GERMANY – 2.0% | ||||||||
†FUCHS PETROLUB | 179,000 | 7,379,109 | ||||||
| (Cost $8,248,180) | 7,379,109 | |||||||
| REPURCHASE AGREEMENT – 5.5% | ||||||||
| Fixed Income Clearing Corporation, 0.50% dated 12/31/18, due 1/2/19, maturity value | ||||||||
| $19,730,548 (collateralized by obligations of various U.S. Government Agencies, 2.50% | ||||||||
| due 05/15/24, valued at $20,127,643) | ||||||||
| (Cost $19,730,000) | 19,730,000 | |||||||
| TOTAL INVESTMENTS – 100.0% | ||||||||
| (Cost $383,260,612) | 362,208,272 | |||||||
| CASH AND OTHER ASSETS LESS LIABILITIES – 0.0% | 45,682 | |||||||
| NET ASSETS – 100.0% | $ | 362,253,954 | ||||||
| Royce Low-Priced Stock Fund | ||||||||
| Common Stocks – 96.1% | ||||||||
| SHARES | VALUE | |||||||
| COMMUNICATION SERVICES – 2.9% | ||||||||
| DIVERSIFIED TELECOMMUNICATION SERVICES - 0.9% | ||||||||
ORBCOMM 1 | 214,500 | $ | 1,771,770 | |||||
| INTERACTIVE MEDIA & SERVICES - 1.2% | ||||||||
QuinStreet 1 | 143,742 | 2,332,933 | ||||||
| MEDIA - 0.8% | ||||||||
ITE Group | 1,511,999 | 1,223,768 | ||||||
†Marchex Cl. B | 174,000 | 461,100 | ||||||
| 1,684,868 | ||||||||
| Total (Cost $4,397,470) | 5,789,571 | |||||||
| CONSUMER DISCRETIONARY – 15.8% | ||||||||
| AUTO COMPONENTS - 3.8% | ||||||||
| 33,800 | 1,989,806 | |||||||
Modine Manufacturing 1 | 183,900 | 1,987,959 | ||||||
Stoneridge 1 | 114,900 | 2,832,285 | ||||||
Unique Fabricating | 209,041 | 882,153 | ||||||
| 7,692,203 | ||||||||
| HOTELS, RESTAURANTS & LEISURE - 4.1% | ||||||||
Century Casinos 1 | 393,300 | 2,906,487 | ||||||
| 166,200 | 1,660,338 | |||||||
| 114,000 | 1,534,440 | |||||||
| 257,400 | 2,110,680 | |||||||
| 8,211,945 | ||||||||
| HOUSEHOLD DURABLES - 0.7% | ||||||||
| 65,500 | 1,502,570 | |||||||
| INTERNET & DIRECT MARKETING RETAIL - 0.8% | ||||||||
Gaia Cl. A 1 | 157,900 | 1,635,844 | ||||||
| LEISURE PRODUCTS - 1.7% | ||||||||
MasterCraft Boat Holdings 1 | 71,900 | 1,344,530 | ||||||
Nautilus 1 | 182,313 | 1,987,212 | ||||||
| 3,331,742 | ||||||||
| SPECIALTY RETAIL - 4.1% | ||||||||
Buckle (The) | 95,975 | 1,856,156 | ||||||
Build-A-Bear Workshop 1 | 116,000 | 458,200 | ||||||
DSW Cl. A | 85,400 | 2,109,380 | ||||||
Kirkland’s 1 | 180,900 | 1,723,977 | ||||||
Shoe Carnival | 63,100 | 2,114,481 | ||||||
| 8,262,194 | ||||||||
| TEXTILES, APPAREL & LUXURY GOODS - 0.6% | ||||||||
| 147,200 | 1,261,504 | |||||||
| Total (Cost $32,243,947) | 31,898,002 | |||||||
| CONSUMER STAPLES – 2.5% | ||||||||
| BEVERAGES - 0.8% | ||||||||
| 124,500 | 1,744,245 | |||||||
| FOOD PRODUCTS - 1.7% | ||||||||
| 54,739 | 1,277,061 | |||||||
Landec Corporation 1 | 178,800 | 2,116,992 | ||||||
| 3,394,053 | ||||||||
| Total (Cost $5,766,779) | 5,138,298 | |||||||
| ENERGY – 6.0% | ||||||||
| ENERGY EQUIPMENT & SERVICES - 5.6% | ||||||||
Gulf Island Fabrication 1 | 154,700 | 1,116,934 | ||||||
Mammoth Energy Services | 49,800 | 895,404 | ||||||
| 85,000 | 1,397,400 | |||||||
Newpark Resources 1 | 276,800 | 1,901,616 | ||||||
Pason Systems | 70,250 | 941,161 | ||||||
Profire Energy 1 | 703,100 | 1,019,495 | ||||||
TGS-NOPEC Geophysical | 52,000 | 1,255,722 | ||||||
| 44 | The Royce Funds 2018 Annual Report to Shareholders | THE ACCOMPANYING NOTES ARE AN INTEGRAL PART OF THESE FINANCIAL STATEMENTS |
| December 31, 2018 |
| Royce Low-Priced Stock Fund (continued) | ||||||||
| SHARES | VALUE | |||||||
| ENERGY (continued) | ||||||||
| ENERGY EQUIPMENT & SERVICES (continued) | ||||||||
Total Energy Services | 215,500 | $ | 1,542,217 | |||||
Unit Corporation 1 | 82,400 | 1,176,672 | ||||||
| 11,246,621 | ||||||||
| OIL, GAS & CONSUMABLE FUELS - 0.4% | ||||||||
Ardmore Shipping 1 | 194,600 | 908,782 | ||||||
| Total (Cost $12,557,938) | 12,155,403 | |||||||
| FINANCIALS – 10.5% | ||||||||
| BANKS - 4.5% | ||||||||
| 45,200 | 1,463,124 | |||||||
| 15,100 | 348,659 | |||||||
Brookline Bancorp | 122,400 | 1,691,568 | ||||||
| 124,300 | 1,975,127 | |||||||
†Investar Holding | 73,000 | 1,810,400 | ||||||
| 90,700 | 1,765,022 | |||||||
| 9,053,900 | ||||||||
| CAPITAL MARKETS - 3.5% | ||||||||
†B. Riley Financial | 103,400 | 1,468,280 | ||||||
Hamilton Lane Cl. A | 40,888 | 1,512,856 | ||||||
Silvercrest Asset Management Group Cl. A | 164,300 | 2,173,689 | ||||||
Sprott | 971,000 | 1,827,915 | ||||||
| 6,982,740 | ||||||||
| INSURANCE - 0.4% | ||||||||
| 30,000 | 801,900 | |||||||
| THRIFTS & MORTGAGE FINANCE - 2.1% | ||||||||
†PCSB Financial | 114,600 | 2,241,576 | ||||||
Western New England Bancorp | 202,800 | 2,036,112 | ||||||
| 4,277,688 | ||||||||
| Total (Cost $22,724,953) | 21,116,228 | |||||||
| HEALTH CARE – 11.8% | ||||||||
| BIOTECHNOLOGY - 3.2% | ||||||||
| 25,800 | 391,902 | |||||||
| 105,100 | 961,665 | |||||||
Heron Therapeutics 1 | 70,000 | 1,815,800 | ||||||
Progenics Pharmaceuticals 1 | 310,074 | 1,302,311 | ||||||
| 163,700 | 2,069,958 | |||||||
| 6,541,636 | ||||||||
| HEALTH CARE EQUIPMENT & SUPPLIES - 5.1% | ||||||||
AtriCure 1 | 102,300 | 3,130,380 | ||||||
CryoLife 1 | 100,700 | 2,857,866 | ||||||
| 74,200 | 2,588,096 | |||||||
Surmodics 1 | 34,300 | 1,621,018 | ||||||
| 10,197,360 | ||||||||
| LIFE SCIENCES TOOLS & SERVICES - 2.7% | ||||||||
Harvard Bioscience 1 | 532,700 | 1,693,986 | ||||||
| 107,300 | 1,353,053 | |||||||
Quanterix Corporation 1 | 131,700 | 2,411,427 | ||||||
| 5,458,466 | ||||||||
| PHARMACEUTICALS - 0.8% | ||||||||
Axsome Therapeutics 1 | 332,400 | 937,368 | ||||||
Paratek Pharmaceuticals 1 | 126,100 | 646,893 | ||||||
| 1,584,261 | ||||||||
| Total (Cost $20,743,187) | 23,781,723 | |||||||
| INDUSTRIALS – 18.6% | ||||||||
| AEROSPACE & DEFENSE - 1.6% | ||||||||
CPI Aerostructures 1 | 246,766 | 1,571,899 | ||||||
Kratos Defense & Security Solutions 1 | 120,300 | 1,695,027 | ||||||
| 3,266,926 | ||||||||
| COMMERCIAL SERVICES & SUPPLIES - 1.3% | ||||||||
Atento 1 | 280,900 | 1,126,409 | ||||||
Heritage-Crystal Clean 1 | 67,900 | 1,562,379 | ||||||
| 2,688,788 | ||||||||
| CONSTRUCTION & ENGINEERING - 4.2% | ||||||||
Ameresco Cl. A 1 | 234,500 | 3,306,450 | ||||||
| 97,100 | 857,393 | |||||||
IES Holdings 1 | 89,800 | 1,396,390 | ||||||
Northwest Pipe 1 | 122,000 | 2,841,380 | ||||||
| 8,401,613 | ||||||||
| ELECTRICAL EQUIPMENT - 0.7% | ||||||||
| 39,400 | 439,310 | |||||||
| 99,900 | 919,080 | |||||||
| 1,358,390 | ||||||||
| INDUSTRIAL CONGLOMERATES - 0.8% | ||||||||
Raven Industries | 45,300 | 1,639,407 | ||||||
| MACHINERY - 6.0% | ||||||||
ASV Holdings 1 | 296,390 | 592,780 | ||||||
FreightCar America 1 | 114,900 | 768,681 | ||||||
†Graham Corporation | 126,900 | 2,898,396 | ||||||
| 158,700 | 2,970,864 | |||||||
†Luxfer Holdings | 57,700 | 1,017,251 | ||||||
Porvair | 364,400 | 1,925,204 | ||||||
Wabash National | 140,500 | 1,837,740 | ||||||
| 12,010,916 | ||||||||
| MARINE - 0.7% | ||||||||
Clarkson | 60,931 | 1,475,590 | ||||||
| PROFESSIONAL SERVICES - 3.3% | ||||||||
| 122,500 | 1,544,725 | |||||||
Heidrick & Struggles International | 46,740 | 1,457,821 | ||||||
Kforce | 53,674 | 1,659,600 | ||||||
Resources Connection | 144,700 | 2,054,740 | ||||||
| 6,716,886 | ||||||||
| Total (Cost $34,558,625) | 37,558,516 | |||||||
| INFORMATION TECHNOLOGY – 25.3% | ||||||||
| COMMUNICATIONS EQUIPMENT - 1.5% | ||||||||
| 139,200 | 1,404,528 | |||||||
Harmonic 1 | 330,000 | 1,557,600 | ||||||
| 2,962,128 | ||||||||
| ELECTRONIC EQUIPMENT, INSTRUMENTS & COMPONENTS - 6.9% | ||||||||
CUI Global 1 | 379,100 | 466,293 | ||||||
Electro Scientific Industries 1 | 98,900 | 2,963,044 | ||||||
| 40,600 | 2,083,186 | |||||||
LightPath Technologies Cl. A 1 | 890,384 | 1,326,672 | ||||||
| 81,100 | 1,441,958 | |||||||
Novanta 1 | 28,500 | 1,795,500 | ||||||
PC Connection | 63,800 | 1,896,774 | ||||||
Vishay Precision Group 1 | 67,000 | 2,025,410 | ||||||
| 13,998,837 | ||||||||
| IT SERVICES - 1.1% | ||||||||
Carbonite 1 | 92,200 | 2,328,972 | ||||||
| SEMICONDUCTORS & SEMICONDUCTOR EQUIPMENT - 10.0% | ||||||||
| 67,200 | 295,680 | |||||||
| 590,400 | 832,464 | |||||||
| 47,400 | 206,190 | |||||||
Brooks Automation | 66,582 | 1,743,117 | ||||||
| THE ACCOMPANYING NOTES ARE AN INTEGRAL PART OF THESE FINANCIAL STATEMENTS | The Royce Funds 2018 Annual Report to Shareholders | 45 |
| Schedules of Investments |
| Royce Low-Priced Stock Fund (continued) |
| SHARES | VALUE | |||||||
| INFORMATION TECHNOLOGY (continued) | ||||||||
| SEMICONDUCTORS & SEMICONDUCTOR EQUIPMENT (continued) | ||||||||
Cirrus Logic 1 | 31,600 | $ | 1,048,488 | |||||
†Cohu | 62,700 | 1,007,589 | ||||||
| 48,700 | 858,581 | |||||||
FormFactor 1 | 206,500 | 2,909,585 | ||||||
Inphi Corporation 1 | 63,400 | 2,038,310 | ||||||
| 86,300 | 1,965,914 | |||||||
| 123,200 | 1,038,576 | |||||||
Photronics 1 | 270,000 | 2,613,600 | ||||||
Rudolph Technologies 1 | 116,100 | 2,376,567 | ||||||
Ultra Clean Holdings 1 | 153,400 | 1,299,298 | ||||||
| 20,233,959 | ||||||||
| SOFTWARE - 5.8% | ||||||||
Agilysys 1 | 127,700 | 1,831,218 | ||||||
Amber Road 1 | 312,700 | 2,573,521 | ||||||
| 160,237 | 3,153,464 | |||||||
†QAD Cl. A | 66,513 | 2,615,956 | ||||||
Rubicon Project 1 | 403,500 | 1,505,055 | ||||||
| 11,679,214 | ||||||||
| Total (Cost $41,511,969) | 51,203,110 | |||||||
| MATERIALS – 2.7% | ||||||||
| CHEMICALS - 0.7% | ||||||||
Trecora Resources 1 | 187,400 | 1,461,720 | ||||||
| METALS & MINING - 2.0% | ||||||||
| 205,763 | 0 | |||||||
Major Drilling Group International 1 | 468,500 | 1,578,597 | ||||||
Pretium Resources 1 | 155,700 | 1,319,549 | ||||||
Superior Gold 1 | 1,700,000 | 1,046,001 | ||||||
| 3,944,147 | ||||||||
| Total (Cost $7,224,893) | 5,405,867 | |||||||
| TOTAL COMMON STOCKS | ||||||||
| (Cost $181,729,761) | 194,046,718 | |||||||
| REPURCHASE AGREEMENT – 4.4% | ||||||||
| Fixed Income Clearing Corporation, 0.50% dated 12/31/18, due 1/2/19, maturity value | ||||||||
| $8,961,249 (collateralized by obligations of various U.S. Government Agencies, 2.125% | ||||||||
| due 07/31/24, valued at $9,141,314) | ||||||||
| (Cost $8,961,000) | 8,961,000 | |||||||
| COLLATERAL RECEIVED FOR SECURITIES LOANED – 2.4% | ||||||||
| Money Market Funds | ||||||||
Federated Government Obligations Fund (7 day yield-2.2268%) | ||||||||
| (Cost $4,834,830) | 4,834,830 | |||||||
| TOTAL INVESTMENTS – 102.9% | ||||||||
| (Cost $195,525,591) | 207,842,548 | |||||||
| LIABILITIES LESS CASH AND OTHER ASSETS – (2.9)% | (5,816,420 | ) | ||||||
| NET ASSETS – 100.0% | $ | 202,026,128 | ||||||
| Royce Micro-Cap Fund |
| Common Stocks – 97.4% |
| SHARES | VALUE | |||||||
| COMMUNICATION SERVICES – 1.9% | ||||||||
| DIVERSIFIED TELECOMMUNICATION SERVICES - 0.7% | ||||||||
ORBCOMM 1 | 115,300 | $ | 952,378 | |||||
| INTERACTIVE MEDIA & SERVICES - 1.1% | ||||||||
QuinStreet 1 | 97,804 | 1,587,359 | ||||||
| MEDIA - 0.1% | ||||||||
†Marchex Cl. B | 80,300 | 212,795 | ||||||
| Total (Cost $1,327,440) | 2,752,532 | |||||||
| CONSUMER DISCRETIONARY – 13.8% | ||||||||
| AUTO COMPONENTS - 2.9% | ||||||||
Fox Factory Holding 1 | 17,000 | 1,000,790 | ||||||
Standard Motor Products | 19,000 | 920,170 | ||||||
Stoneridge 1 | 63,700 | 1,570,205 | ||||||
Unique Fabricating | 157,200 | 663,384 | ||||||
| 4,154,549 | ||||||||
| HOTELS, RESTAURANTS & LEISURE - 2.7% | ||||||||
| 109,600 | 809,944 | |||||||
Del Taco Restaurants 1 | 105,100 | 1,049,949 | ||||||
| 62,500 | 841,250 | |||||||
| 147,100 | 1,206,220 | |||||||
| 3,907,363 | ||||||||
| HOUSEHOLD DURABLES - 1.4% | ||||||||
Cavco Industries 1 | 5,210 | 679,280 | ||||||
| 57,000 | 1,307,580 | |||||||
| 1,986,860 | ||||||||
| INTERNET & DIRECT MARKETING RETAIL - 0.7% | ||||||||
Gaia Cl. A 1 | 90,500 | 937,580 | ||||||
| LEISURE PRODUCTS - 1.4% | ||||||||
MasterCraft Boat Holdings 1 | 47,000 | 878,900 | ||||||
Nautilus 1 | 106,100 | 1,156,490 | ||||||
| 2,035,390 | ||||||||
| SPECIALTY RETAIL - 3.6% | ||||||||
Build-A-Bear Workshop 1 | 99,100 | 391,445 | ||||||
Citi Trends | 48,724 | 993,482 | ||||||
Haverty Furniture | 66,200 | 1,243,236 | ||||||
Kirkland’s 1 | 116,700 | 1,112,151 | ||||||
Shoe Carnival | 40,711 | 1,364,226 | ||||||
| 5,104,540 | ||||||||
| TEXTILES, APPAREL & LUXURY GOODS - 1.1% | ||||||||
Culp | 31,474 | 594,858 | ||||||
Vera Bradley 1 | 105,300 | 902,421 | ||||||
| 1,497,279 | ||||||||
| Total (Cost $18,597,494) | 19,623,561 | |||||||
| CONSUMER STAPLES – 2.5% | ||||||||
| BEVERAGES - 0.7% | ||||||||
Primo Water 1 | 70,600 | 989,106 | ||||||
| FOOD PRODUCTS - 1.8% | ||||||||
Farmer Bros. 1 | 47,600 | 1,110,508 | ||||||
John B. Sanfilippo & Son | 18,000 | 1,001,880 | ||||||
| 35,800 | 423,872 | |||||||
| 2,536,260 | ||||||||
| Total (Cost $3,666,176) | 3,525,366 | |||||||
| ENERGY – 4.3% | ||||||||
| ENERGY EQUIPMENT & SERVICES - 3.8% | ||||||||
Gulf Island Fabrication 1 | 96,518 | 696,860 | ||||||
Independence Contract Drilling 1 | 305,386 | 952,804 | ||||||
Natural Gas Services Group 1 | 60,087 | 987,830 | ||||||
Newpark Resources 1 | 165,600 | 1,137,672 | ||||||
| 46 | The Royce Funds 2018 Annual Report to Shareholders | THE ACCOMPANYING NOTES ARE AN INTEGRAL PART OF THESE FINANCIAL STATEMENTS |
| December 31, 2018 |
| Royce Micro-Cap Fund (continued) |
| SHARES | VALUE | |||||||
| ENERGY (continued) | ||||||||
| ENERGY EQUIPMENT & SERVICES (continued) | ||||||||
Profire Energy 1 | 485,812 | $ | 704,428 | |||||
Total Energy Services | 131,900 | 943,937 | ||||||
| 5,423,531 | ||||||||
| OIL, GAS & CONSUMABLE FUELS - 0.5% | ||||||||
Ardmore Shipping 1 | 140,175 | 654,617 | ||||||
| Total (Cost $6,713,250) | 6,078,148 | |||||||
| FINANCIALS – 14.3% | ||||||||
| BANKS - 7.4% | ||||||||
Allegiance Bancshares 1 | 29,700 | 961,389 | ||||||
| 35,000 | 808,150 | |||||||
Brookline Bancorp | 61,100 | 844,402 | ||||||
Caribbean Investment Holdings 1 | 1,858,138 | 402,625 | ||||||
County Bancorp | 54,200 | 941,454 | ||||||
HarborOne Bancorp 1 | 76,300 | 1,212,407 | ||||||
†HomeTrust Bancshares | 45,500 | 1,191,190 | ||||||
†Investar Holding | 47,600 | 1,180,480 | ||||||
| 1,858,170 | 0 | |||||||
Stewardship Financial | 94,500 | 859,950 | ||||||
TriState Capital Holdings 1 | 52,757 | 1,026,651 | ||||||
Two River Bancorp | 71,100 | 1,084,986 | ||||||
| 10,513,684 | ||||||||
| CAPITAL MARKETS - 3.0% | ||||||||
B. Riley Financial | 74,100 | 1,052,220 | ||||||
Canaccord Genuity Group | 267,600 | 1,131,008 | ||||||
Silvercrest Asset Management Group Cl. A | 96,700 | 1,279,341 | ||||||
Westwood Holdings Group | 22,572 | 767,448 | ||||||
| 4,230,017 | ||||||||
| DIVERSIFIED FINANCIAL SERVICES - 0.6% | ||||||||
| 2,760,000 | 828,000 | |||||||
| INSURANCE - 0.5% | ||||||||
| 28,700 | 767,151 | |||||||
| THRIFTS & MORTGAGE FINANCE - 2.8% | ||||||||
PCSB Financial | 66,200 | 1,294,872 | ||||||
Territorial Bancorp | 45,000 | 1,169,100 | ||||||
Western New England Bancorp | 142,100 | 1,426,684 | ||||||
| 3,890,656 | ||||||||
| Total (Cost $19,660,631) | 20,229,508 | |||||||
| HEALTH CARE – 11.4% | ||||||||
| BIOTECHNOLOGY - 3.1% | ||||||||
AMAG Pharmaceuticals 1 | 18,500 | 281,015 | ||||||
BioSpecifics Technologies 1 | 26,000 | 1,575,600 | ||||||
Dynavax Technologies 1 | 55,500 | 507,825 | ||||||
Progenics Pharmaceuticals 1 | 205,900 | 864,780 | ||||||
Zealand Pharma 1 | 97,000 | 1,226,548 | ||||||
| 4,455,768 | ||||||||
| HEALTH CARE EQUIPMENT & SUPPLIES - 5.0% | ||||||||
AtriCure 1 | 49,100 | 1,502,460 | ||||||
Chembio Diagnostics 1 | 136,053 | 770,060 | ||||||
CryoLife 1 | 49,555 | 1,406,371 | ||||||
OrthoPediatrics Corporation 1 | 41,400 | 1,444,032 | ||||||
Surmodics 1 | 23,922 | 1,130,554 | ||||||
| 18,500 | 842,675 | |||||||
| 7,096,152 | ||||||||
| LIFE SCIENCES TOOLS & SERVICES - 2.4% | ||||||||
Harvard Bioscience 1 | 331,179 | 1,053,149 | ||||||
NeoGenomics 1 | 88,200 | 1,112,202 | ||||||
| 68,700 | 1,257,897 | |||||||
| 3,423,248 | ||||||||
| PHARMACEUTICALS - 0.9% | ||||||||
| 200,500 | 499,245 | |||||||
Paratek Pharmaceuticals 1 | 91,600 | 469,908 | ||||||
| 225,500 | 254,815 | |||||||
| 1,223,968 | ||||||||
| Total (Cost $13,729,973) | 16,199,136 | |||||||
| INDUSTRIALS – 22.2% | ||||||||
| AEROSPACE & DEFENSE - 1.6% | ||||||||
Astronics Corporation 1 | 38,291 | 1,165,961 | ||||||
CPI Aerostructures 1 | 166,518 | 1,060,720 | ||||||
| 2,226,681 | ||||||||
| COMMERCIAL SERVICES & SUPPLIES - 2.0% | ||||||||
Acme United | 49,800 | 709,650 | ||||||
Heritage-Crystal Clean 1 | 48,774 | 1,122,290 | ||||||
Viad Corporation | 21,000 | 1,051,890 | ||||||
| 2,883,830 | ||||||||
| CONSTRUCTION & ENGINEERING - 1.8% | ||||||||
| 106,300 | 938,629 | |||||||
Northwest Pipe 1 | 68,000 | 1,583,720 | ||||||
| 2,522,349 | ||||||||
| ELECTRICAL EQUIPMENT - 2.0% | ||||||||
American Superconducter 1 | 145,700 | 1,624,555 | ||||||
Encore Wire | 24,100 | 1,209,338 | ||||||
| 2,833,893 | ||||||||
| INDUSTRIAL CONGLOMERATES - 0.7% | ||||||||
Raven Industries | 26,500 | 959,035 | ||||||
| MACHINERY - 9.0% | ||||||||
Alimak Group | 87,200 | 1,082,258 | ||||||
Exco Technologies | 154,400 | 1,021,266 | ||||||
FreightCar America 1 | 86,209 | 576,738 | ||||||
Global Brass and Copper Holdings | 38,700 | 973,305 | ||||||
Graham Corporation | 67,388 | 1,539,142 | ||||||
Greenbrier Companies (The) | 15,800 | 624,732 | ||||||
Kadant | 12,276 | 1,000,003 | ||||||
| 79,700 | 1,491,984 | |||||||
Lindsay Corporation | 12,000 | 1,155,000 | ||||||
†Luxfer Holdings | 42,700 | 752,801 | ||||||
Lydall 1 | 37,600 | 763,656 | ||||||
Sun Hydraulics | 19,100 | 633,929 | ||||||
| 46,000 | 678,500 | |||||||
| 322,100 | 428,393 | |||||||
| 12,721,707 | ||||||||
| MARINE - 0.6% | ||||||||
Clarkson | 36,500 | 883,935 | ||||||
| PROFESSIONAL SERVICES - 3.8% | ||||||||
CRA International | 21,783 | 926,867 | ||||||
GP Strategies 1 | 87,918 | 1,108,646 | ||||||
Heidrick & Struggles International | 33,000 | 1,029,270 | ||||||
Kforce | 32,658 | 1,009,785 | ||||||
Resources Connection | 92,052 | 1,307,138 | ||||||
| 5,381,706 | ||||||||
| ROAD & RAIL - 0.7% | ||||||||
Marten Transport | 61,855 | 1,001,432 | ||||||
| Total (Cost $26,269,570) | 31,414,568 | |||||||
| THE ACCOMPANYING NOTES ARE AN INTEGRAL PART OF THESE FINANCIAL STATEMENTS | The Royce Funds 2018 Annual Report to Shareholders | 47 |
| Schedules of Investments |
| Royce Micro-Cap Fund (continued) |
| SHARES | VALUE | |||||||
| INFORMATION TECHNOLOGY – 21.1% | ||||||||
| COMMUNICATIONS EQUIPMENT - 1.2% | ||||||||
Digi International 1 | 106,100 | $ | 1,070,549 | |||||
EMCORE Corporation 1 | 146,800 | 616,560 | ||||||
| 1,687,109 | ||||||||
| ELECTRONIC EQUIPMENT, INSTRUMENTS & COMPONENTS - 6.4% | ||||||||
| 52,000 | 515,320 | |||||||
CUI Global 1 | 321,474 | 395,413 | ||||||
| 20,600 | 617,176 | |||||||
ePlus 1 | 13,634 | 970,332 | ||||||
Fabrinet 1 | 23,949 | 1,228,823 | ||||||
Mesa Laboratories | 6,100 | 1,271,179 | ||||||
| 41,700 | 741,426 | |||||||
Novanta 1 | 15,442 | 972,846 | ||||||
PC Connection | 40,300 | 1,198,119 | ||||||
Vishay Precision Group 1 | 41,700 | 1,260,591 | ||||||
| 9,171,225 | ||||||||
| IT SERVICES - 0.9% | ||||||||
Cass Information Systems | 24,216 | 1,281,511 | ||||||
| SEMICONDUCTORS & SEMICONDUCTOR EQUIPMENT - 8.3% | ||||||||
| 226,000 | 994,400 | |||||||
| 279,300 | 393,813 | |||||||
AXT 1 | 33,200 | 144,420 | ||||||
Brooks Automation | 32,100 | 840,378 | ||||||
†Cohu | 30,800 | 494,956 | ||||||
CyberOptics Corporation 1 | 30,600 | 539,478 | ||||||
| 97,900 | 549,219 | |||||||
NeoPhotonics Corporation 1 | 171,100 | 1,108,728 | ||||||
| 53,900 | 1,227,842 | |||||||
| 88,700 | 747,741 | |||||||
Photronics 1 | 161,200 | 1,560,416 | ||||||
Rudolph Technologies 1 | 68,851 | 1,409,380 | ||||||
Silicon Motion Technology ADR | 25,800 | 890,100 | ||||||
Ultra Clean Holdings 1 | 98,500 | 834,295 | ||||||
| 11,735,166 | ||||||||
| SOFTWARE - 3.7% | ||||||||
Agilysys 1 | 73,600 | 1,055,424 | ||||||
Amber Road 1 | 160,100 | 1,317,623 | ||||||
Attunity 1 | 82,765 | 1,628,815 | ||||||
QAD Cl. A | 32,500 | 1,278,225 | ||||||
| 5,280,087 | ||||||||
| TECHNOLOGY HARDWARE, STORAGE & PERIPHERALS - 0.6% | ||||||||
AstroNova | 43,100 | 808,125 | ||||||
| Total (Cost $25,615,774) | 29,963,223 | |||||||
| MATERIALS – 3.4% | ||||||||
| CHEMICALS - 2.1% | ||||||||
FutureFuel Corporation | 62,500 | 991,250 | ||||||
Quaker Chemical | 6,060 | 1,076,922 | ||||||
Trecora Resources 1 | 113,900 | 888,420 | ||||||
| 2,956,592 | ||||||||
| METALS & MINING - 1.3% | ||||||||
Haynes International | 39,030 | 1,030,392 | ||||||
Major Drilling Group International 1 | 241,700 | 814,401 | ||||||
| 1,844,793 | ||||||||
| Total (Cost $5,159,641) | 4,801,385 | |||||||
| REAL ESTATE – 2.5% | ||||||||
| EQUITY REAL ESTATE INVESTMENT TRUSTS (REITS) - 0.9% | ||||||||
Community Healthcare Trust | 41,700 | 1,202,211 | ||||||
| REAL ESTATE MANAGEMENT & DEVELOPMENT - 1.6% | ||||||||
FRP Holdings 1 | 22,975 | 1,057,080 | ||||||
Marcus & Millichap 1 | 35,500 | 1,218,715 | ||||||
| 2,275,795 | ||||||||
| Total (Cost $2,053,778) | 3,478,006 | |||||||
| TOTAL COMMON STOCKS | ||||||||
| (Cost $122,793,727) | 138,065,433 | |||||||
| REPURCHASE AGREEMENT – 2.2% | ||||||||
| Fixed Income Clearing Corporation, 0.50% dated 12/31/18, due 1/2/19, maturity value | ||||||||
| $3,126,087 (collateralized by obligations of various U.S. Government Agencies, 2.125% | ||||||||
| due 07/31/24, valued at $3,193,064) | ||||||||
| (Cost $3,126,000) | 3,126,000 | |||||||
| COLLATERAL RECEIVED FOR SECURITIES LOANED – 3.2% | ||||||||
| Money Market Funds | ||||||||
Federated Government Obligations Fund (7 day yield-2.2268%) | ||||||||
| (Cost $4,584,805) | 4,584,805 | |||||||
| TOTAL INVESTMENTS – 102.8% | ||||||||
| (Cost $130,504,532) | 145,776,238 | |||||||
| LIABILITIES LESS CASH AND OTHER ASSETS – (2.8)% | (4,003,736 | ) | ||||||
| NET ASSETS – 100.0% | $ | 141,772,502 | ||||||
| 48 | The Royce Funds 2018 Annual Report to Shareholders | THE ACCOMPANYING NOTES ARE AN INTEGRAL PART OF THESE FINANCIAL STATEMENTS |
| December 31, 2018 |
| Royce Micro-Cap Opportunity Fund |
| Common Stocks – 86.7% |
| SHARES | VALUE | |||||||
| COMMUNICATION SERVICES – 2.2% | ||||||||
| DIVERSIFIED TELECOMMUNICATION SERVICES - 1.7% | ||||||||
Ooma 1 | 22,073 | $ | 306,373 | |||||
| INTERACTIVE MEDIA & SERVICES - 0.5% | ||||||||
| 22,000 | 91,960 | |||||||
| Total (Cost $440,011) | 398,333 | |||||||
| CONSUMER DISCRETIONARY – 8.3% | ||||||||
| AUTO COMPONENTS - 0.4% | ||||||||
| 20,891 | 29,874 | |||||||
Shiloh Industries 1 | 7,525 | 43,871 | ||||||
| 73,745 | ||||||||
| DIVERSIFIED CONSUMER SERVICES - 1.6% | ||||||||
| 16,000 | 112,160 | |||||||
| 7,000 | 173,530 | |||||||
| 285,690 | ||||||||
| HOTELS, RESTAURANTS & LEISURE - 0.4% | ||||||||
| 10,000 | 73,900 | |||||||
| HOUSEHOLD DURABLES - 4.1% | ||||||||
Beazer Homes USA 1 | 22,040 | 208,939 | ||||||
†Libbey | 36,600 | 142,008 | ||||||
New Home 1 | 76,357 | 399,347 | ||||||
| 750,294 | ||||||||
| MULTILINE RETAIL - 0.7% | ||||||||
Fred’s Cl. A 1 | 65,000 | 122,850 | ||||||
SPECIALTY RETAIL - 0.2% | ||||||||
| 1,000 | 18,310 | |||||||
RTW Retailwinds 1 | 8,565 | 24,239 | ||||||
| 42,549 | ||||||||
| TEXTILES, APPAREL & LUXURY GOODS - 0.9% | ||||||||
Vince Holding 1 | 18,053 | 168,435 | ||||||
| Total (Cost $1,984,758) | 1,517,463 | |||||||
| CONSUMER STAPLES – 4.7% | ||||||||
| BEVERAGES - 1.2% | ||||||||
| 35,150 | 217,227 | |||||||
| FOOD & STAPLES RETAILING - 1.4% | ||||||||
| 54,837 | 259,927 | |||||||
| FOOD PRODUCTS - 1.1% | ||||||||
Landec Corporation 1 | 16,028 | 189,772 | ||||||
| PERSONAL PRODUCTS - 1.0% | ||||||||
| 122,500 | 186,200 | |||||||
| Total (Cost $1,024,387) | 853,126 | |||||||
| ENERGY – 4.2% | ||||||||
| ENERGY EQUIPMENT & SERVICES - 2.4% | ||||||||
Aspen Aerogels 1 | 18,065 | 38,478 | ||||||
| 61,125 | 190,710 | |||||||
Newpark Resources 1 | 30,069 | 206,574 | ||||||
| 435,762 | ||||||||
| OIL, GAS & CONSUMABLE FUELS - 1.8% | ||||||||
| 35,084 | 329,790 | |||||||
| Total (Cost $855,662) | 765,552 | |||||||
| FINANCIALS – 9.3% | ||||||||
| BANKS - 3.6% | ||||||||
| 500 | 16,185 | |||||||
Old Line Bancshares | 16,522 | 434,859 | ||||||
TriState Capital Holdings 1 | 10,041 | 195,398 | ||||||
| 646,442 | ||||||||
| CAPITAL MARKETS - 1.5% | ||||||||
B. Riley Financial | 19,028 | 270,198 | ||||||
| INSURANCE - 3.3% | ||||||||
HCI Group | 7,500 | 381,075 | ||||||
Heritage Insurance Holdings | 15,000 | 220,800 | ||||||
| 601,875 | ||||||||
| THRIFTS & MORTGAGE FINANCE - 0.9% | ||||||||
Axos Financial 1 | 1,000 | 25,180 | ||||||
NMI Holdings Cl. A 1 | 8,063 | 143,924 | ||||||
| 169,104 | ||||||||
| Total (Cost $1,287,735) | 1,687,619 | |||||||
| HEALTH CARE – 12.9% | ||||||||
BIOTECHNOLOGY - 3.6% | ||||||||
| 16,500 | 250,635 | |||||||
CareDx 1 | 16,041 | 403,271 | ||||||
| 653,906 | ||||||||
| HEALTH CARE EQUIPMENT & SUPPLIES - 3.3% | ||||||||
GenMark Diagnostics 1 | 45,000 | 218,700 | ||||||
Invacare Corporation | 13,000 | 55,900 | ||||||
SeaSpine Holdings 1 | 18,288 | 333,573 | ||||||
| 608,173 | ||||||||
| HEALTH CARE PROVIDERS & SERVICES - 5.9% | ||||||||
| 47,030 | 65,842 | |||||||
BioScrip 1 | 142,500 | 508,725 | ||||||
Civitas Solutions 1 | 3,588 | 62,826 | ||||||
Fulgent Genetics 1 | 37,061 | 117,483 | ||||||
Surgery Partners 1 | 33,003 | 323,099 | ||||||
| 1,077,975 | ||||||||
| HEALTH CARE TECHNOLOGY - 0.1% | ||||||||
Castlight Health Cl. B 1 | 5,000 | 10,850 | ||||||
| Total (Cost $2,012,463) | 2,350,904 | |||||||
| INDUSTRIALS – 14.9% | ||||||||
| AEROSPACE & DEFENSE - 1.3% | ||||||||
Ducommun 1 | 3,000 | 108,960 | ||||||
KEYW Holding Corporation 1 | 9,045 | 60,511 | ||||||
Kratos Defense & Security Solutions 1 | 5,000 | 70,450 | ||||||
| 239,921 | ||||||||
| BUILDING PRODUCTS - 0.9% | ||||||||
PGT Innovations 1 | 9,765 | 154,775 | ||||||
| CONSTRUCTION & ENGINEERING - 3.4% | ||||||||
Ameresco Cl. A 1 | 43,378 | 611,630 | ||||||
| MACHINERY - 4.7% | ||||||||
Astec Industries | 3,400 | 102,646 | ||||||
Commercial Vehicle Group 1 | 19,270 | 109,839 | ||||||
Gencor Industries 1 | 26,199 | 287,403 | ||||||
NN | 19,905 | 133,562 | ||||||
Spartan Motors | 30,531 | 220,739 | ||||||
| 854,189 | ||||||||
| ROAD & RAIL - 1.4% | ||||||||
| 5,000 | 4,000 | |||||||
Covenant Transport Group Cl. A 1 | 13,000 | 249,600 | ||||||
| 253,600 | ||||||||
| TRADING COMPANIES & DISTRIBUTORS - 3.2% | ||||||||
| 7,000 | 162,610 | |||||||
| 42,025 | 424,873 | |||||||
| 587,483 | ||||||||
| Total (Cost $2,111,792) | 2,701,598 | |||||||
| THE ACCOMPANYING NOTES ARE AN INTEGRAL PART OF THESE FINANCIAL STATEMENTS | The Royce Funds 2018 Annual Report to Shareholders | 49 |
| Schedules of Investments |
| Royce Micro-Cap Opportunity Fund (continued) |
| SHARES | VALUE | |||||||
| INFORMATION TECHNOLOGY – 21.0% | ||||||||
| COMMUNICATIONS EQUIPMENT - 3.1% | ||||||||
Aerohive Networks 1 | 50,000 | $ | 163,000 | |||||
Comtech Telecommunications | 8,576 | 208,740 | ||||||
Quantenna Communications 1 | 13,000 | 186,550 | ||||||
| 558,290 | ||||||||
| ELECTRONIC EQUIPMENT, INSTRUMENTS & COMPONENTS - 1.8% | ||||||||
| 12,500 | 132,500 | |||||||
KEMET Corporation | 10,048 | 176,242 | ||||||
| 17,062 | 25,422 | |||||||
| 334,164 | ||||||||
| SEMICONDUCTORS & SEMICONDUCTOR EQUIPMENT - 7.4% | ||||||||
Alpha & Omega Semiconductor 1 | 43,096 | 439,148 | ||||||
AXT 1 | 65,023 | 282,850 | ||||||
FormFactor 1 | 18,029 | 254,029 | ||||||
Kopin Corporation 1 | 5,055 | 5,050 | ||||||
| 5,000 | 72,550 | |||||||
NeoPhotonics Corporation 1 | 16,200 | 104,976 | ||||||
Rudolph Technologies 1 | 9,048 | 185,213 | ||||||
| 1,343,816 | ||||||||
| SOFTWARE - 6.4% | ||||||||
Amber Road 1 | 43,534 | 358,285 | ||||||
eGain Corporation 1 | 30,080 | 197,626 | ||||||
| 50,000 | 186,500 | |||||||
| 15,028 | 253,823 | |||||||
Telaria 1 | 60,083 | 164,026 | ||||||
| 1,160,260 | ||||||||
| TECHNOLOGY HARDWARE, STORAGE & PERIPHERALS - 2.3% | ||||||||
Avid Technology 1 | 64,610 | 306,897 | ||||||
Intevac 1 | 23,003 | 120,306 | ||||||
| 427,203 | ||||||||
| Total (Cost $3,239,186) | 3,823,733 | |||||||
| MATERIALS – 8.4% | ||||||||
| CHEMICALS - 3.2% | ||||||||
Intrepid Potash 1 | 160,000 | 416,000 | ||||||
Kraton Corporation 1 | 7,576 | 165,460 | ||||||
| 581,460 | ||||||||
| CONSTRUCTION MATERIALS - 1.8% | ||||||||
Forterra 1 | 90,000 | 338,400 | ||||||
| METALS & MINING - 3.4% | ||||||||
†Ferroglobe | 12,500 | 19,875 | ||||||
†Synalloy Corporation | 21,090 | 349,883 | ||||||
Universal Stainless & Alloy Products 1 | 15,080 | 244,447 | ||||||
| 614,205 | ||||||||
| Total (Cost $1,593,033) | 1,534,065 | |||||||
| REAL ESTATE – 0.8% | ||||||||
| EQUITY REAL ESTATE INVESTMENT TRUSTS (REITS) - 0.8% | ||||||||
Armada Hoffler Properties | 10,063 | 141,486 | ||||||
| Total (Cost $129,396) | 141,486 | |||||||
| TOTAL COMMON STOCKS | ||||||||
| (Cost $14,678,423) | 15,773,879 | |||||||
| REPURCHASE AGREEMENT – 11.7% | ||||||||
| Fixed Income Clearing Corporation, 0.50% dated 12/31/18, due 1/2/19, maturity value | ||||||||
| $2,131,059 (collateralized by obligations of various U.S. Government Agencies, 0.125% | ||||||||
| due 07/15/24, valued at $2,176,579) | ||||||||
| (Cost $2,131,000) | 2,131,000 | |||||||
| TOTAL INVESTMENTS – 98.4% | ||||||||
| (Cost $16,809,423) | 17,904,879 | |||||||
| CASH AND OTHER ASSETS LESS LIABILITIES – 1.6% | 283,529 | |||||||
| NET ASSETS – 100.0% | $ | 18,188,408 | ||||||
| 50 | The Royce Funds 2018 Annual Report to Shareholders | THE ACCOMPANYING NOTES ARE AN INTEGRAL PART OF THESE FINANCIAL STATEMENTS |
| December 31, 2018 |
| Royce Opportunity Fund |
| Common Stocks – 95.3% |
| SHARES | VALUE | |||||||
| COMMUNICATION SERVICES – 1.0% | ||||||||
| DIVERSIFIED TELECOMMUNICATION SERVICES - 0.8% | ||||||||
| 249,093 | $ | 4,595,766 | ||||||
Ooma 1 | 168,805 | 2,343,013 | ||||||
| 6,938,779 | ||||||||
| INTERACTIVE MEDIA & SERVICES - 0.1% | ||||||||
| 207,100 | 865,678 | |||||||
| MEDIA - 0.1% | ||||||||
McClatchy Company (The) Cl. A 1 | 180,833 | 1,383,373 | ||||||
| Total (Cost $9,682,498) | 9,187,830 | |||||||
| CONSUMER DISCRETIONARY – 11.8% | ||||||||
| AUTO COMPONENTS - 2.4% | ||||||||
American Axle & Manufacturing Holdings 1 | 298,245 | 3,310,520 | ||||||
Cooper Tire & Rubber | 66,064 | 2,135,849 | ||||||
Dana | 280,635 | 3,825,055 | ||||||
| 427,600 | 611,468 | |||||||
Modine Manufacturing 1 | 467,137 | 5,049,751 | ||||||
Tower International | 116,804 | 2,779,935 | ||||||
VOXX International Cl. A 1 | 713,570 | 2,825,737 | ||||||
| 20,538,315 | ||||||||
| AUTOMOBILES - 0.3% | ||||||||
Winnebago Industries | 125,400 | 3,035,934 | ||||||
| DIVERSIFIED CONSUMER SERVICES - 0.8% | ||||||||
| 95,299 | 2,535,907 | |||||||
Houghton Mifflin Harcourt 1 | 122,023 | 1,081,124 | ||||||
K12 1 | 141,594 | 3,510,115 | ||||||
| 7,127,146 | ||||||||
| HOTELS, RESTAURANTS & LEISURE - 1.0% | ||||||||
Carrols Restaurant Group 1 | 343,356 | 3,378,623 | ||||||
| 129,940 | 960,257 | |||||||
El Pollo Loco Holdings 1 | 295,806 | 4,487,377 | ||||||
| 8,826,257 | ||||||||
| HOUSEHOLD DURABLES - 3.7% | ||||||||
Beazer Homes USA 1 | 453,801 | 4,302,033 | ||||||
Dixie Group 1 | 500,015 | 351,460 | ||||||
| 99,000 | 4,476,780 | |||||||
Libbey | 650,568 | 2,524,204 | ||||||
M.D.C. Holdings | 207,208 | 5,824,617 | ||||||
M/I Homes 1 | 182,048 | 3,826,649 | ||||||
| 104,400 | 546,012 | |||||||
| 167,006 | 1,825,376 | |||||||
†Tupperware Brands | 193,500 | 6,108,795 | ||||||
William Lyon Homes Cl. A 1 | 199,419 | 2,131,789 | ||||||
| 31,917,715 | ||||||||
| INTERNET & DIRECT MARKETING RETAIL - 0.2% | ||||||||
Leaf Group 1 | 250,872 | 1,718,473 | ||||||
| MULTILINE RETAIL - 0.3% | ||||||||
Fred’s Cl. A 1 | 706,725 | 1,335,710 | ||||||
Tuesday Morning 1 | 591,141 | 1,004,940 | ||||||
| 2,340,650 | ||||||||
| SPECIALTY RETAIL - 2.1% | ||||||||
American Eagle Outfitters | 185,533 | 3,586,353 | ||||||
Ascena Retail Group 1 | 377,687 | 947,995 | ||||||
Barnes & Noble | 91,593 | 649,394 | ||||||
bebe stores 3 | 92,090 | 607,794 | ||||||
Conn’s 1 | 40,470 | 763,264 | ||||||
DSW Cl. A | 147,516 | 3,643,645 | ||||||
Guess? | 57,826 | 1,201,046 | ||||||
| 250,000 | 2,380,000 | |||||||
MarineMax 1 | 53,742 | 984,016 | ||||||
| 734,423 | 2,078,417 | |||||||
| 222,185 | 473,254 | |||||||
Stage Stores | 798,833 | 591,137 | ||||||
| 17,906,315 | ||||||||
| TEXTILES, APPAREL & LUXURY GOODS - 1.0% | ||||||||
| 111,900 | 1,760,187 | |||||||
†Jerash Holdings (US) | 45,900 | 268,515 | ||||||
Unifi 1 | 243,154 | 5,553,637 | ||||||
Vince Holding 1 | 159,654 | 1,489,572 | ||||||
| 9,071,911 | ||||||||
| Total (Cost $111,919,900) | 102,482,716 | |||||||
| CONSUMER STAPLES – 1.7% | ||||||||
| FOOD & STAPLES RETAILING - 0.6% | ||||||||
| 444,276 | 2,105,868 | |||||||
United Natural Foods 1 | 279,854 | 2,963,654 | ||||||
| 5,069,522 | ||||||||
| FOOD PRODUCTS - 0.8% | ||||||||
Landec Corporation 1 | 442,802 | 5,242,776 | ||||||
SunOpta 1 | 516,927 | 2,000,507 | ||||||
| 7,243,283 | ||||||||
| PERSONAL PRODUCTS - 0.3% | ||||||||
| 1,931,906 | 2,936,497 | |||||||
| Total (Cost $26,785,684) | 15,249,302 | |||||||
| ENERGY – 7.5% | ||||||||
| ENERGY EQUIPMENT & SERVICES - 2.9% | ||||||||
†Archrock | 10,100 | 75,649 | ||||||
Aspen Aerogels 1 | 305,354 | 650,404 | ||||||
| 598,451 | 1,867,167 | |||||||
| 161,226 | 3,780,749 | |||||||
†Mammoth Energy Services | 104,612 | 1,880,924 | ||||||
Matrix Service 1 | 175,187 | 3,142,855 | ||||||
Newpark Resources 1 | 955,299 | 6,562,904 | ||||||
Patterson-UTI Energy | 295,385 | 3,057,235 | ||||||
| 165,254 | 854,363 | |||||||
U.S. Silica Holdings | 324,001 | 3,298,330 | ||||||
| 25,170,580 | ||||||||
| OIL, GAS & CONSUMABLE FUELS - 4.6% | ||||||||
Ardmore Shipping 1 | 586,399 | 2,738,483 | ||||||
| 276,200 | 486,112 | |||||||
Bonanza Creek Energy 1 | 147,500 | 3,048,825 | ||||||
| 772,224 | 4,502,066 | |||||||
GasLog | 215,004 | 3,538,966 | ||||||
GasLog Partners L.P. | 174,604 | 3,457,159 | ||||||
| 355,775 | 885,880 | |||||||
Matador Resources 1 | 263,383 | 4,090,338 | ||||||
| 358,200 | 3,367,080 | |||||||
Scorpio Tankers | 233,540 | 411,031 | ||||||
StealthGas 1 | 495,417 | 1,367,351 | ||||||
| 282,923 | 4,617,303 | |||||||
†Teekay LNG Partners L.P. | 321,300 | 3,540,726 | ||||||
Whiting Petroleum 1 | 160,268 | 3,636,481 | ||||||
| 39,687,801 | ||||||||
| Total (Cost $96,166,948) | 64,858,381 | |||||||
| FINANCIALS – 7.8% | ||||||||
| BANKS - 4.6% | ||||||||
| 49,200 | 1,592,604 | |||||||
| THE ACCOMPANYING NOTES ARE AN INTEGRAL PART OF THESE FINANCIAL STATEMENTS | The Royce Funds 2018 Annual Report to Shareholders | 51 |
| Schedules of Investments |
| Royce Opportunity Fund (continued) |
| SHARES | VALUE | |||||||
| FINANCIALS (continued) | ||||||||
| BANKS (continued) | ||||||||
Boston Private Financial Holdings | 188,234 | $ | 1,989,633 | |||||
CenterState Bank | 261,966 | 5,511,765 | ||||||
| 190,300 | 2,447,258 | |||||||
| 140,714 | 3,710,628 | |||||||
Guaranty Bancorp | 80,967 | 1,680,065 | ||||||
Hilltop Holdings | 332,399 | 5,926,674 | ||||||
Independent Bank Group | 65,700 | 3,007,089 | ||||||
†Old Line Bancshares | 65,393 | 1,721,144 | ||||||
†Renasant Corporation | 50,200 | 1,515,036 | ||||||
| 116,100 | 3,020,922 | |||||||
Southern National Bancorp of Virginia | 197,890 | 2,616,106 | ||||||
Texas Capital Bancshares 1 | 37,100 | 1,895,439 | ||||||
| 45,920 | 893,603 | |||||||
Umpqua Holdings | 149,282 | 2,373,584 | ||||||
| 39,901,550 | ||||||||
| CAPITAL MARKETS - 0.3% | ||||||||
B. Riley Financial | 194,989 | 2,768,844 | ||||||
| INSURANCE - 1.6% | ||||||||
†HCI Group | 79,146 | 4,021,408 | ||||||
Heritage Insurance Holdings | 306,307 | 4,508,839 | ||||||
MBIA 1 | 580,200 | 5,175,384 | ||||||
| 13,705,631 | ||||||||
| THRIFTS & MORTGAGE FINANCE - 1.3% | ||||||||
| 28,200 | 710,076 | |||||||
MGIC Investment 1 | 151,072 | 1,580,213 | ||||||
Radian Group | 256,798 | 4,201,216 | ||||||
Walker & Dunlop | 110,928 | 4,797,636 | ||||||
| 11,289,141 | ||||||||
| Total (Cost $70,587,903) | 67,665,166 | |||||||
| HEALTH CARE – 7.3% | ||||||||
| BIOTECHNOLOGY - 0.3% | ||||||||
| 165,700 | 2,516,983 | |||||||
| HEALTH CARE EQUIPMENT & SUPPLIES - 2.0% | ||||||||
| 695,702 | 2,372,344 | |||||||
| 14,200 | 32,518 | |||||||
AngioDynamics 1 | 310,212 | 6,244,567 | ||||||
Invacare Corporation | 874,816 | 3,761,709 | ||||||
RTI Surgical 1 | 397,128 | 1,469,374 | ||||||
| 146,100 | 3,459,648 | |||||||
| 17,340,160 | ||||||||
| HEALTH CARE PROVIDERS & SERVICES - 3.5% | ||||||||
| 566,938 | 793,713 | |||||||
| 182,379 | 4,688,964 | |||||||
Aceto Corporation | 165,922 | 139,374 | ||||||
BioScrip 1 | 770,345 | 2,750,132 | ||||||
Brookdale Senior Living 1 | 543,009 | 3,638,160 | ||||||
Community Health Systems 1 | 744,214 | 2,098,683 | ||||||
Cross Country Healthcare 1 | 386,414 | 2,832,415 | ||||||
| 157,300 | 2,117,258 | |||||||
Owens & Minor | 469,823 | 2,973,980 | ||||||
| 228,318 | 1,815,128 | |||||||
| 90,400 | 919,368 | |||||||
Select Medical Holdings 1 | 131,400 | 2,016,990 | ||||||
| 402,372 | 3,939,222 | |||||||
| 30,723,387 | ||||||||
| HEALTH CARE TECHNOLOGY - 0.9% | ||||||||
Allscripts Healthcare Solutions 1 | 636,104 | 6,132,043 | ||||||
| 413,097 | 896,420 | |||||||
| 14,100 | 281,295 | |||||||
| 7,309,758 | ||||||||
| LIFE SCIENCES TOOLS & SERVICES - 0.1% | ||||||||
Cambrex Corporation 1 | 24,400 | 921,344 | ||||||
| PHARMACEUTICALS - 0.5% | ||||||||
Mallinckrodt 1 | 286,996 | 4,534,537 | ||||||
| Total (Cost $92,507,548) | 63,346,169 | |||||||
| INDUSTRIALS – 25.5% | ||||||||
| AEROSPACE & DEFENSE - 3.4% | ||||||||
| 136,254 | 4,800,228 | |||||||
Ducommun 1 | 48,305 | 1,754,438 | ||||||
Engility Holdings 1 | 20,050 | 570,623 | ||||||
KEYW Holding Corporation 1 | 585,729 | 3,918,527 | ||||||
Kratos Defense & Security Solutions 1 | 595,417 | 8,389,426 | ||||||
Triumph Group | 357,101 | 4,106,661 | ||||||
Wesco Aircraft Holdings 1 | 768,018 | 6,067,342 | ||||||
| 29,607,245 | ||||||||
| AIR FREIGHT & LOGISTICS - 0.6% | ||||||||
| 115,404 | 4,868,895 | |||||||
| AIRLINES - 0.2% | ||||||||
Hawaiian Holdings | 57,800 | 1,526,498 | ||||||
| BUILDING PRODUCTS - 2.9% | ||||||||
American Woodmark 1 | 45,500 | 2,533,440 | ||||||
Apogee Enterprises | 173,373 | 5,175,184 | ||||||
Builders FirstSource 1 | 84,795 | 925,113 | ||||||
Griffon Corporation | 399,923 | 4,179,195 | ||||||
Insteel Industries | 123,111 | 2,989,135 | ||||||
NCI Building Systems 1 | 277,218 | 2,009,831 | ||||||
PGT Innovations 1 | 117,330 | 1,859,681 | ||||||
Quanex Building Products | 331,288 | 4,502,204 | ||||||
| 52,700 | 1,082,985 | |||||||
| 25,256,768 | ||||||||
| COMMERCIAL SERVICES & SUPPLIES - 2.0% | ||||||||
Herman Miller | 156,224 | 4,725,776 | ||||||
Interface | 206,796 | 2,946,843 | ||||||
†Pitney Bowes | 351,300 | 2,076,183 | ||||||
Steelcase Cl. A | 139,001 | 2,061,385 | ||||||
Team 1 | 355,986 | 5,215,195 | ||||||
| 17,025,382 | ||||||||
| CONSTRUCTION & ENGINEERING - 3.2% | ||||||||
Aegion Corporation 1 | 295,585 | 4,823,947 | ||||||
Ameresco Cl. A 1 | 16,000 | 225,600 | ||||||
| 97,600 | 2,702,544 | |||||||
| 41,200 | 363,796 | |||||||
†Granite Construction | 213,482 | 8,599,055 | ||||||
Great Lakes Dredge & Dock 1 | 349,416 | 2,313,134 | ||||||
Northwest Pipe 1 | 393,069 | 9,154,577 | ||||||
| 28,182,653 | ||||||||
| ELECTRICAL EQUIPMENT - 0.2% | ||||||||
| 1,044,781 | 407,882 | |||||||
| 146,143 | 1,344,516 | |||||||
| 1,752,398 | ||||||||
| MACHINERY - 9.2% | ||||||||
Astec Industries | 216,835 | 6,546,249 | ||||||
Commercial Vehicle Group 1 | 793,304 | 4,521,833 | ||||||
Federal Signal | 135,774 | 2,701,903 | ||||||
FreightCar America 1 | 508,487 | 3,401,778 | ||||||
Hurco Companies | 111,397 | 3,976,873 | ||||||
| 52 | The Royce Funds 2018 Annual Report to Shareholders | THE ACCOMPANYING NOTES ARE AN INTEGRAL PART OF THESE FINANCIAL STATEMENTS |
| December 31, 2018 |
| Royce Opportunity Fund (continued) |
| SHARES | VALUE | |||||||
| INDUSTRIALS (continued) | ||||||||
| MACHINERY (continued) | ||||||||
Hyster-Yale Materials Handling Cl. A | 100,706 | $ | 6,239,744 | |||||
Meritor 1 | 483,910 | 8,182,918 | ||||||
Milacron Holdings 1 | 440,984 | 5,243,300 | ||||||
Mueller Industries | 295,937 | 6,913,088 | ||||||
Mueller Water Products Cl. A | 895,972 | 8,153,345 | ||||||
NN | 651,986 | 4,374,826 | ||||||
†Park-Ohio Holdings | 46,590 | 1,429,847 | ||||||
†REV Group | 98,497 | 739,712 | ||||||
Spartan Motors | 503,347 | 3,639,199 | ||||||
TriMas Corporation 1 | 260,110 | 7,098,402 | ||||||
Trinity Industries | 93,200 | 1,918,988 | ||||||
Wabash National | 66,100 | 864,588 | ||||||
Westport Fuel Systems 1 | 2,902,640 | 3,860,511 | ||||||
| 79,807,104 | ||||||||
| MARINE - 0.6% | ||||||||
Diana Shipping 1 | 581,977 | 1,850,687 | ||||||
| 245,333 | 1,130,985 | |||||||
Scorpio Bulkers | 381,959 | 2,112,233 | ||||||
| 5,093,905 | ||||||||
| ROAD & RAIL - 0.5% | ||||||||
| 487,331 | 389,865 | |||||||
| 297,465 | 4,060,397 | |||||||
| 4,450,262 | ||||||||
| TRADING COMPANIES & DISTRIBUTORS - 2.7% | ||||||||
†Air Lease Cl. A | 157,500 | 4,758,075 | ||||||
| 216,116 | 5,020,375 | |||||||
Herc Holdings 1 | 240,978 | 6,263,018 | ||||||
Textainer Group Holdings 1 | 329,629 | 3,283,105 | ||||||
| 255,652 | 4,535,266 | |||||||
| 23,859,839 | ||||||||
| Total (Cost $241,698,100) | 221,430,949 | |||||||
| INFORMATION TECHNOLOGY – 24.0% | ||||||||
| COMMUNICATIONS EQUIPMENT - 3.8% | ||||||||
Aerohive Networks 1 | 666,834 | 2,173,879 | ||||||
Aviat Networks 1 | 68,769 | 911,189 | ||||||
Ciena Corporation 1 | 210,973 | 7,154,094 | ||||||
Comtech Telecommunications | 364,185 | 8,864,263 | ||||||
Digi International 1 | 35,600 | 359,204 | ||||||
EMCORE Corporation 1 | 339,525 | 1,426,005 | ||||||
Finisar Corporation 1 | 284,207 | 6,138,871 | ||||||
Harmonic 1 | 455,682 | 2,150,819 | ||||||
PCTEL | 77,291 | 331,578 | ||||||
Ribbon Communications 1 | 792,085 | 3,817,850 | ||||||
Westell Technologies Cl. A 1 | 8,250 | 15,593 | ||||||
| 33,343,345 | ||||||||
| ELECTRONIC EQUIPMENT, INSTRUMENTS & COMPONENTS - 6.2% | ||||||||
Benchmark Electronics | 41,733 | 883,905 | ||||||
| 14,100 | 1,490,511 | |||||||
CUI Global 1 | 493,857 | 607,444 | ||||||
Daktronics | 73,815 | 546,231 | ||||||
Fabrinet 1 | 113,105 | 5,803,418 | ||||||
Frequency Electronics 1 | 205,932 | 2,182,879 | ||||||
Identiv 1 | 516,371 | 1,858,936 | ||||||
II-VI 1 | 125,568 | 4,075,937 | ||||||
KEMET Corporation | 463,637 | 8,132,193 | ||||||
| 348,755 | 4,641,929 | |||||||
Maxwell Technologies 1 | 478,173 | 989,818 | ||||||
Park Electrochemical | 154,466 | 2,791,201 | ||||||
PCM 1 | 221,313 | 3,897,322 | ||||||
Perceptron 1 | 355,187 | 2,862,807 | ||||||
Sanmina Corporation 1 | 133,534 | 3,212,828 | ||||||
SigmaTron International 1 | 108,709 | 255,466 | ||||||
TTM Technologies 1 | 269,857 | 2,625,709 | ||||||
Vishay Intertechnology | 383,024 | 6,898,262 | ||||||
| 53,756,796 | ||||||||
| IT SERVICES - 1.2% | ||||||||
Limelight Networks 1 | 230,157 | 538,567 | ||||||
†Perspecta | 306,900 | 5,284,818 | ||||||
Unisys Corporation 1 | 432,482 | 5,029,766 | ||||||
| 10,853,151 | ||||||||
| SEMICONDUCTORS & SEMICONDUCTOR EQUIPMENT - 7.6% | ||||||||
| 583,134 | 5,942,135 | |||||||
| 62,200 | 408,032 | |||||||
Amtech Systems 1 | 380,475 | 1,723,552 | ||||||
AXT 1 | 609,491 | 2,651,286 | ||||||
Brooks Automation | 89,620 | 2,346,252 | ||||||
Cohu | 101,276 | 1,627,505 | ||||||
Cypress Semiconductor | 411,861 | 5,238,872 | ||||||
FormFactor 1 | 394,984 | 5,565,324 | ||||||
| 216,400 | 3,527,320 | |||||||
Kopin Corporation 1 | 931,320 | 930,389 | ||||||
Kulicke & Soffa Industries | 254,560 | 5,159,931 | ||||||
| 405,605 | 5,885,328 | |||||||
MaxLinear 1 | 214,971 | 3,783,490 | ||||||
Nanometrics 1 | 43,812 | 1,197,382 | ||||||
NeoPhotonics Corporation 1 | 756,961 | 4,905,107 | ||||||
Rudolph Technologies 1 | 165,565 | 3,389,115 | ||||||
| 185,495 | 6,902,269 | |||||||
Ultra Clean Holdings 1 | 207,427 | 1,756,907 | ||||||
| 397,187 | 2,943,156 | |||||||
| 65,883,352 | ||||||||
| SOFTWARE - 2.3% | ||||||||
A10 Networks 1 | 417,706 | 2,606,486 | ||||||
Amber Road 1 | 346,817 | 2,854,304 | ||||||
| 366,454 | 5,335,570 | |||||||
| 114,000 | 98,040 | |||||||
Rubicon Project 1 | 545,366 | 2,034,215 | ||||||
| 282,200 | 4,766,358 | |||||||
Telaria 1 | 822,584 | 2,245,654 | ||||||
| 19,940,627 | ||||||||
| TECHNOLOGY HARDWARE, STORAGE & PERIPHERALS - 2.9% | ||||||||
Avid Technology 1 | 645,181 | 3,064,610 | ||||||
Cray 1 | 373,144 | 8,056,179 | ||||||
Intevac 1 | 600,727 | 3,141,802 | ||||||
| 189,700 | 4,378,276 | |||||||
| 203,026 | 3,656,498 | |||||||
3D Systems 1 | 300,962 | 3,060,784 | ||||||
| 25,358,149 | ||||||||
| Total (Cost $199,715,607) | 209,135,420 | |||||||
| MATERIALS – 8.1% | ||||||||
| CHEMICALS - 2.1% | ||||||||
Ferro Corporation 1 | 362,284 | 5,680,613 | ||||||
Huntsman Corporation | 130,800 | 2,523,132 | ||||||
Intrepid Potash 1 | 811,600 | 2,110,160 | ||||||
Kraton Corporation 1 | 227,269 | 4,963,555 | ||||||
| 140,700 | 776,664 | |||||||
| THE ACCOMPANYING NOTES ARE AN INTEGRAL PART OF THESE FINANCIAL STATEMENTS | The Royce Funds 2018 Annual Report to Shareholders | 53 |
| Schedules of Investments |
| Royce Opportunity Fund (continued) |
| SHARES | VALUE | |||||||
| MATERIALS (continued) | ||||||||
CHEMICALS (continued) | ||||||||
Olin Corporation | 93,900 | $ | 1,888,329 | |||||
†Tronox Cl. A | 24,100 | 187,498 | ||||||
| 18,129,951 | ||||||||
| CONSTRUCTION MATERIALS - 0.4% | ||||||||
| 853,237 | 3,208,171 | |||||||
| METALS & MINING - 5.6% | ||||||||
AK Steel Holding Corporation 1 | 518,685 | 1,167,041 | ||||||
Allegheny Technologies 1 | 320,514 | 6,977,590 | ||||||
Carpenter Technology | 234,112 | 8,336,728 | ||||||
Century Aluminum 1 | 186,560 | 1,363,754 | ||||||
Cleveland-Cliffs 1 | 489,752 | 3,766,193 | ||||||
Coeur Mining 1 | 112,273 | 501,860 | ||||||
Commercial Metals | 439,309 | 7,037,730 | ||||||
†Ferroglobe | 308,400 | 490,356 | ||||||
Haynes International | 256,925 | 6,782,820 | ||||||
Hecla Mining | 466,448 | 1,100,817 | ||||||
| 488,157 | 4,882 | |||||||
Synalloy Corporation | 271,089 | 4,497,367 | ||||||
TimkenSteel Corporation 1 | 451,066 | 3,942,317 | ||||||
Universal Stainless & Alloy Products 1 | 179,461 | 2,909,063 | ||||||
| 48,878,518 | ||||||||
| Total (Cost $76,082,058) | 70,216,640 | |||||||
| REAL ESTATE – 0.3% | ||||||||
| EQUITY REAL ESTATE INVESTMENT TRUSTS (REITS) - 0.0% | ||||||||
†CatchMark Timber Trust Cl. A | 65,500 | 465,050 | ||||||
| REAL ESTATE MANAGEMENT & DEVELOPMENT - 0.3% | ||||||||
Tejon Ranch 1 | 140,506 | 2,329,589 | ||||||
| Total (Cost $3,624,617) | 2,794,639 | |||||||
| UTILITIES – 0.3% | ||||||||
| WATER UTILITIES - 0.3% | ||||||||
Pure Cycle 1 | 235,558 | 2,339,091 | ||||||
| Total (Cost $984,632) | 2,339,091 | |||||||
| TOTAL COMMON STOCKS | ||||||||
| (Cost $929,755,495) | 828,706,303 | |||||||
| REPURCHASE AGREEMENT – 5.1% | ||||||||
| Fixed Income Clearing Corporation, 0.50% dated 12/31/18, due 1/2/19, maturity value | ||||||||
| $44,052,224 (collateralized by obligations of various U.S. Government Agencies, 2.125% | ||||||||
| due 07/31/24, valued at $44,934,132) | ||||||||
| (Cost $44,051,000) | 44,051,000 | |||||||
| COLLATERAL RECEIVED FOR SECURITIES LOANED – 2.3% | ||||||||
| Money Market Funds | ||||||||
Federated Government Obligations Fund (7 day yield-2.2268%) | ||||||||
| (Cost $20,077,125) | 20,077,125 | |||||||
| TOTAL INVESTMENTS – 102.7% | ||||||||
| (Cost $993,883,620) | 892,834,428 | |||||||
| LIABILITIES LESS CASH AND OTHER ASSETS – (2.7)% | (23,605,896 | ) | ||||||
| NET ASSETS – 100.0% | $ | 869,228,532 | ||||||
| Royce Pennsylvania Mutual Fund | ||||||||
| Common Stocks – 98.8% | ||||||||
| SHARES | VALUE | |||||||
| COMMUNICATION SERVICES – 1.4% | ||||||||
| MEDIA - 1.4% | ||||||||
| 522,674 | $ | 7,542,186 | ||||||
Liberty Latin America Cl. C 1 | 232,593 | 3,388,880 | ||||||
Meredith Corporation | 151,841 | 7,886,622 | ||||||
Saga Communications Cl. A | 116,258 | 3,863,253 | ||||||
| Total (Cost $28,450,440) | 22,680,941 | |||||||
| CONSUMER DISCRETIONARY – 7.7% | ||||||||
| AUTO COMPONENTS - 2.7% | ||||||||
| 82,087 | 5,099,244 | |||||||
Dorman Products 1 | 118,473 | 10,664,940 | ||||||
Gentex Corporation | 295,805 | 5,978,219 | ||||||
LCI Industries | 94,803 | 6,332,840 | ||||||
Standard Motor Products | 106,756 | 5,170,193 | ||||||
Stoneridge 1 | 220,093 | 5,425,293 | ||||||
| 54,397 | 3,279,051 | |||||||
| 41,949,780 | ||||||||
| AUTOMOBILES - 0.3% | ||||||||
Thor Industries | 32,896 | 1,710,592 | ||||||
Winnebago Industries | 158,610 | 3,839,948 | ||||||
| 5,550,540 | ||||||||
| DISTRIBUTORS - 0.4% | ||||||||
Core-Mark Holding Company | 57,395 | 1,334,434 | ||||||
Weyco Group | 199,832 | 5,829,099 | ||||||
| 7,163,533 | ||||||||
| HOTELS, RESTAURANTS & LEISURE - 0.8% | ||||||||
| 245,368 | 6,475,262 | |||||||
Lindblad Expeditions Holdings 1 | 367,713 | 4,949,417 | ||||||
| 93,171 | 764,002 | |||||||
| 12,188,681 | ||||||||
| HOUSEHOLD DURABLES - 0.2% | ||||||||
La-Z-Boy | 121,221 | 3,359,034 | ||||||
| INTERNET & DIRECT MARKETING RETAIL - 0.4% | ||||||||
Etsy 1 | 68,489 | 3,258,022 | ||||||
| 126,859 | 1,414,478 | |||||||
| 12,983 | 1,768,669 | |||||||
| 6,441,169 | ||||||||
| LEISURE PRODUCTS - 0.3% | ||||||||
MasterCraft Boat Holdings 1 | 161,714 | 3,024,052 | ||||||
Nautilus 1 | 96,465 | 1,051,468 | ||||||
| 4,075,520 | ||||||||
| SPECIALTY RETAIL - 2.3% | ||||||||
American Eagle Outfitters | 128,013 | 2,474,491 | ||||||
America’s Car-Mart 1 | 109,064 | 7,901,687 | ||||||
Barnes & Noble | 75,187 | 533,076 | ||||||
Caleres | 58,769 | 1,635,541 | ||||||
†Camping World Holdings Cl. A | 544,376 | 6,243,993 | ||||||
DSW Cl. A | 96,594 | 2,385,872 | ||||||
Monro | 163,723 | 11,255,956 | ||||||
Shoe Carnival | 101,806 | 3,411,519 | ||||||
| 35,842,135 | ||||||||
| TEXTILES, APPAREL & LUXURY GOODS - 0.3% | ||||||||
Steven Madden | 58,806 | 1,779,470 | ||||||
Wolverine World Wide | 80,800 | 2,576,712 | ||||||
| 4,356,182 | ||||||||
| Total (Cost $86,379,191) | 120,926,574 | |||||||
| CONSUMER STAPLES – 1.4% | ||||||||
| FOOD PRODUCTS - 0.6% | ||||||||
Cal-Maine Foods | 53,112 | 2,246,638 | ||||||
| 54 | The Royce Funds 2018 Annual Report to Shareholders | THE ACCOMPANYING NOTES ARE AN INTEGRAL PART OF THESE FINANCIAL STATEMENTS |
| December 31, 2018 |
| Royce Pennsylvania Mutual Fund (continued) |
| SHARES | VALUE | |||||||
| CONSUMER STAPLES (continued) | ||||||||
| FOOD PRODUCTS (continued) | ||||||||
Farmer Bros. 1 | 52,408 | $ | 1,222,679 | |||||
John B. Sanfilippo & Son | 20,126 | 1,120,213 | ||||||
| 139,773 | 2,337,004 | |||||||
Seneca Foods Cl. A 1 | 105,072 | 2,965,132 | ||||||
Seneca Foods Cl. B 1 | 6,292 | 177,497 | ||||||
| 10,069,163 | ||||||||
| PERSONAL PRODUCTS - 0.8% | ||||||||
Inter Parfums | 191,012 | 12,524,657 | ||||||
| Total (Cost $10,549,664) | 22,593,820 | |||||||
| ENERGY – 3.8% | ||||||||
| ENERGY EQUIPMENT & SERVICES - 3.7% | ||||||||
Era Group 1 | 532,774 | 4,656,445 | ||||||
| 134,485 | 555,423 | |||||||
Helmerich & Payne | 81,880 | 3,925,327 | ||||||
Natural Gas Services Group 1 | 48,162 | 791,783 | ||||||
Pason Systems | 1,040,509 | 13,940,016 | ||||||
RPC | 260,074 | 2,566,931 | ||||||
SEACOR Holdings 1 | 510,007 | 18,870,259 | ||||||
| 481,549 | 5,663,016 | |||||||
TGS-NOPEC Geophysical | 335,320 | 8,097,475 | ||||||
Unit Corporation 1 | 8,950 | 127,806 | ||||||
| 59,194,481 | ||||||||
| OIL, GAS & CONSUMABLE FUELS - 0.1% | ||||||||
San Juan Basin Royalty Trust | 181,003 | 868,814 | ||||||
| Total (Cost $54,788,424) | 60,063,295 | |||||||
| FINANCIALS – 16.7% | ||||||||
| BANKS - 5.3% | ||||||||
Ames National | 35,783 | 909,604 | ||||||
Bar Harbor Bankshares | 48,324 | 1,083,907 | ||||||
BOK Financial | 140,934 | 10,334,690 | ||||||
Camden National | 112,400 | 4,043,028 | ||||||
City Holding Company | 45,154 | 3,051,959 | ||||||
CNB Financial | 195,735 | 4,492,118 | ||||||
†Financial Institutions | 29,373 | 754,886 | ||||||
First Citizens BancShares Cl. A | 65,446 | 24,676,414 | ||||||
Landmark Bancorp | 23,150 | 530,251 | ||||||
MidWestOne Financial Group | 156,172 | 3,877,751 | ||||||
National Bankshares | 89,855 | 3,273,418 | ||||||
Northrim BanCorp | 86,512 | 2,843,649 | ||||||
Popular | 205,102 | 9,684,916 | ||||||
| 97,584 | 1,898,985 | |||||||
Unity Bancorp | 51,875 | 1,076,925 | ||||||
Webster Financial | 223,305 | 11,006,704 | ||||||
| 83,539,205 | ||||||||
| CAPITAL MARKETS - 6.3% | ||||||||
Ares Management | 811,281 | 14,424,576 | ||||||
Artisan Partners Asset Management Cl. A | 256,133 | 5,663,101 | ||||||
†B. Riley Financial | 59,917 | 850,821 | ||||||
Cohen & Steers | 7,393 | 253,728 | ||||||
Diamond Hill Investment Group | 51,918 | 7,759,145 | ||||||
Houlihan Lokey Cl. A | 310,119 | 11,412,379 | ||||||
Lazard Cl. A | 156,565 | 5,778,814 | ||||||
Moelis & Company Cl. A | 93,720 | 3,222,094 | ||||||
Morningstar | 92,494 | 10,159,541 | ||||||
Oaktree Capital Group LLC Cl. A | 214,946 | 8,544,104 | ||||||
Pzena Investment Management Cl. A | 66,146 | 572,163 | ||||||
Reinet Investments DR | 116,469 | 1,768,386 | ||||||
Rothschild & Co | 101,069 | 3,572,423 | ||||||
SEI Investments | 154,476 | 7,136,791 | ||||||
Sprott | 1,716,948 | 3,232,168 | ||||||
Virtu Financial Cl. A | 562,354 | 14,486,239 | ||||||
Westwood Holdings Group | 24,434 | 830,756 | ||||||
| 99,667,229 | ||||||||
| INSURANCE - 3.0% | ||||||||
Ambac Financial Group 1 | 38,442 | 662,740 | ||||||
E-L Financial | 32,356 | 17,443,610 | ||||||
James River Group Holdings | 85,836 | 3,136,448 | ||||||
Kingstone Companies | 98,785 | 1,747,507 | ||||||
MBIA 1 | 692,387 | 6,176,092 | ||||||
ProAssurance Corporation | 261,613 | 10,611,023 | ||||||
RLI Corp. | 65,108 | 4,491,801 | ||||||
| 141,592 | 3,604,932 | |||||||
| 47,874,153 | ||||||||
| INVESTMENT COMPANIES - 0.1% | ||||||||
Social Capital Hedosophia Holdings (Units) 1 | 177,515 | 1,815,978 | ||||||
| THRIFTS & MORTGAGE FINANCE - 2.0% | ||||||||
| 167,208 | 4,210,297 | |||||||
Genworth MI Canada | 552,769 | 16,276,966 | ||||||
Southern Missouri Bancorp | 31,803 | 1,078,122 | ||||||
Timberland Bancorp | 96,333 | 2,148,226 | ||||||
TrustCo Bank Corp. NY | 693,322 | 4,756,189 | ||||||
†WSFS Financial | 83,500 | 3,165,485 | ||||||
| 31,635,285 | ||||||||
| Total (Cost $234,801,491) | 264,531,850 | |||||||
| HEALTH CARE – 7.2% | ||||||||
| BIOTECHNOLOGY - 0.2% | ||||||||
AMAG Pharmaceuticals 1 | 83,536 | 1,268,911 | ||||||
Progenics Pharmaceuticals 1 | 275,365 | 1,156,533 | ||||||
Zealand Pharma 1 | 101,722 | 1,286,257 | ||||||
| 3,711,701 | ||||||||
| HEALTH CARE EQUIPMENT & SUPPLIES - 2.0% | ||||||||
AtriCure 1 | 123,833 | 3,789,290 | ||||||
Atrion Corporation | 8,592 | 6,367,359 | ||||||
| 34,844 | 992,706 | |||||||
CryoLife 1 | 68,108 | 1,932,905 | ||||||
Hill-Rom Holdings | 45,811 | 4,056,564 | ||||||
| 118,832 | 1,859,721 | |||||||
†LeMaitre Vascular | 75,978 | 1,796,120 | ||||||
Merit Medical Systems 1 | 198,088 | 11,055,291 | ||||||
| 31,849,956 | ||||||||
| HEALTH CARE PROVIDERS & SERVICES - 2.4% | ||||||||
| 93,330 | 5,288,078 | |||||||
Encompass Health | 125,485 | 7,742,424 | ||||||
Ensign Group (The) | 29,764 | 1,154,546 | ||||||
HealthEquity 1 | 42,628 | 2,542,760 | ||||||
National Research | 136,613 | 5,210,420 | ||||||
| 74,749 | 1,854,523 | |||||||
U.S. Physical Therapy | 133,872 | 13,701,799 | ||||||
| 37,494,550 | ||||||||
| HEALTH CARE TECHNOLOGY - 1.0% | ||||||||
Medidata Solutions 1 | 230,671 | 15,551,839 | ||||||
| LIFE SCIENCES TOOLS & SERVICES - 1.6% | ||||||||
Bio-Rad Laboratories Cl. A 1 | 25,953 | 6,026,806 | ||||||
Bio-Techne | 79,397 | 11,490,334 | ||||||
ICON 1 | 31,848 | 4,115,080 | ||||||
| THE ACCOMPANYING NOTES ARE AN INTEGRAL PART OF THESE FINANCIAL STATEMENTS | The Royce Funds 2018 Annual Report to Shareholders | 55 |
| Schedules of Investments |
| Royce Pennsylvania Mutual Fund (continued) | ||||||||
| SHARES | VALUE | |||||||
| HEALTH CARE (continued) | ||||||||
| LIFE SCIENCES TOOLS & SERVICES (continued) | ||||||||
| 52,403 | $ | 660,802 | ||||||
| 158,379 | 2,899,919 | |||||||
| 25,192,941 | ||||||||
| Total (Cost $63,419,874) | 113,800,987 | |||||||
| INDUSTRIALS – 26.9% | ||||||||
| AEROSPACE & DEFENSE - 1.9% | ||||||||
HEICO Corporation | 261,065 | 20,227,316 | ||||||
HEICO Corporation Cl. A | 142,534 | 8,979,642 | ||||||
†Magellan Aerospace | 70,271 | 771,066 | ||||||
| 29,978,024 | ||||||||
| AIR FREIGHT & LOGISTICS - 0.8% | ||||||||
Forward Air | 157,115 | 8,617,758 | ||||||
Hub Group Cl. A 1 | 113,964 | 4,224,645 | ||||||
| 12,842,403 | ||||||||
| AIRLINES - 0.6% | ||||||||
Allegiant Travel | 18,845 | 1,888,646 | ||||||
Hawaiian Holdings | 238,754 | 6,305,493 | ||||||
| 26,730 | 1,548,202 | |||||||
| 9,742,341 | ||||||||
| BUILDING PRODUCTS - 0.9% | ||||||||
Apogee Enterprises | 210,137 | 6,272,589 | ||||||
Gibraltar Industries 1 | 144,789 | 5,153,041 | ||||||
Simpson Manufacturing | 53,000 | 2,868,890 | ||||||
| 14,294,520 | ||||||||
| COMMERCIAL SERVICES & SUPPLIES - 2.2% | ||||||||
Healthcare Services Group | 164,656 | 6,615,878 | ||||||
Heritage-Crystal Clean 1 | 167,241 | 3,848,215 | ||||||
Kimball International Cl. B | 483,857 | 6,865,931 | ||||||
Mobile Mini | 154,633 | 4,909,598 | ||||||
PICO Holdings 1 | 326,703 | 2,986,065 | ||||||
Ritchie Bros. Auctioneers | 39,233 | 1,283,704 | ||||||
Team 1 | 141,510 | 2,073,121 | ||||||
UniFirst Corporation | 31,208 | 4,464,929 | ||||||
Viad Corporation | 20,864 | 1,045,078 | ||||||
| 34,092,519 | ||||||||
| CONSTRUCTION & ENGINEERING - 2.1% | ||||||||
| 395,838 | 10,960,754 | |||||||
KBR | 470,489 | 7,142,023 | ||||||
Valmont Industries | 132,101 | 14,656,606 | ||||||
| 32,759,383 | ||||||||
| ELECTRICAL EQUIPMENT - 1.3% | ||||||||
Encore Wire | 144,259 | 7,238,917 | ||||||
Preformed Line Products | 233,761 | 12,681,534 | ||||||
| 19,920,451 | ||||||||
| INDUSTRIAL CONGLOMERATES - 1.3% | ||||||||
Raven Industries | 564,110 | 20,415,141 | ||||||
| MACHINERY - 9.5% | ||||||||
Alamo Group | 38,956 | 3,012,078 | ||||||
CIRCOR International 1 | 344,615 | 7,340,299 | ||||||
| 113,964 | 2,381,848 | |||||||
Franklin Electric | 225,023 | 9,648,986 | ||||||
Graco | 185,633 | 7,768,741 | ||||||
Graham Corporation | 44,465 | 1,015,581 | ||||||
Greenbrier Companies (The) | 85,446 | 3,378,535 | ||||||
John Bean Technologies | 134,682 | 9,671,514 | ||||||
Kadant | 114,206 | 9,303,221 | ||||||
| 59,526 | 1,114,327 | |||||||
Lincoln Electric Holdings | 112,290 | 8,854,066 | ||||||
Lindsay Corporation | 119,403 | 11,492,539 | ||||||
Lydall 1 | 30,728 | 624,086 | ||||||
| 681,049 | 11,516,539 | |||||||
Miller Industries | 218,218 | 5,891,886 | ||||||
Nordson Corporation | 68,760 | 8,206,506 | ||||||
RBC Bearings 1 | 60,338 | 7,910,312 | ||||||
Sun Hydraulics | 619,964 | 20,576,605 | ||||||
Tennant Company | 240,474 | 12,531,100 | ||||||
Wabash National | 627,668 | 8,209,897 | ||||||
| 150,448,666 | ||||||||
| MARINE - 1.2% | ||||||||
Clarkson | 405,000 | 9,808,045 | ||||||
Eagle Bulk Shipping 1 | 279,836 | 1,290,044 | ||||||
Kirby Corporation 1 | 112,933 | 7,607,167 | ||||||
| 18,705,256 | ||||||||
| PROFESSIONAL SERVICES - 1.7% | ||||||||
Exponent | 194,349 | 9,855,438 | ||||||
GP Strategies 1 | 80,727 | 1,017,967 | ||||||
Heidrick & Struggles International | 125,928 | 3,927,694 | ||||||
Kforce | 91,376 | 2,825,346 | ||||||
Korn Ferry | 78,443 | 3,101,636 | ||||||
ManpowerGroup | 76,110 | 4,931,928 | ||||||
Resources Connection | 42,928 | 609,578 | ||||||
TrueBlue 1 | 59,734 | 1,329,082 | ||||||
| 27,598,669 | ||||||||
| ROAD & RAIL - 1.8% | ||||||||
Landstar System | 156,307 | 14,953,891 | ||||||
Saia 1 | 63,017 | 3,517,609 | ||||||
Universal Logistics Holdings | 482,495 | 8,728,334 | ||||||
Werner Enterprises | 34,496 | 1,019,012 | ||||||
| 28,218,846 | ||||||||
| TRADING COMPANIES & DISTRIBUTORS - 1.6% | ||||||||
Air Lease Cl. A | 466,067 | 14,079,884 | ||||||
Applied Industrial Technologies | 128,116 | 6,910,577 | ||||||
Richelieu Hardware | 245,741 | 4,084,283 | ||||||
| 25,074,744 | ||||||||
| Total (Cost $301,389,787) | 424,090,963 | |||||||
| INFORMATION TECHNOLOGY – 21.0% | ||||||||
| COMMUNICATIONS EQUIPMENT - 0.2% | ||||||||
ADTRAN | 54,205 | 582,161 | ||||||
Digi International 1 | 297,575 | 3,002,532 | ||||||
| 3,584,693 | ||||||||
| ELECTRONIC EQUIPMENT, INSTRUMENTS & COMPONENTS - 11.2% | ||||||||
Badger Meter | 280,426 | 13,799,763 | ||||||
Benchmark Electronics | 344,222 | 7,290,622 | ||||||
Celestica 1 | 676,039 | 5,928,862 | ||||||
Cognex Corporation | 157,547 | 6,092,342 | ||||||
Coherent 1 | 51,018 | 5,393,113 | ||||||
Dolby Laboratories Cl. A | 95,028 | 5,876,532 | ||||||
Electro Scientific Industries 1 | 140,993 | 4,224,150 | ||||||
Fabrinet 1 | 156,170 | 8,013,083 | ||||||
FARO Technologies 1 | 299,843 | 12,185,620 | ||||||
FLIR Systems | 756,241 | 32,926,733 | ||||||
HollySys Automation Technologies | 71,900 | 1,258,969 | ||||||
Insight Enterprises 1 | 191,368 | 7,798,246 | ||||||
IPG Photonics 1 | 58,063 | 6,577,957 | ||||||
| 182,454 | 2,826,212 | |||||||
Mesa Laboratories | 46,004 | 9,586,774 | ||||||
| 56 | The Royce Funds 2018 Annual Report to Shareholders | THE ACCOMPANYING NOTES ARE AN INTEGRAL PART OF THESE FINANCIAL STATEMENTS |
| December 31, 2018 |
| Royce Pennsylvania Mutual Fund (continued) |
| SHARES | VALUE | |||||||
| INFORMATION TECHNOLOGY (continued) | ||||||||
| ELECTRONIC EQUIPMENT, INSTRUMENTS & COMPONENTS (continued) | ||||||||
Methode Electronics | 7,575 | $ | 176,422 | |||||
MTS Systems | 57,688 | 2,315,019 | ||||||
National Instruments | 312,534 | 14,182,793 | ||||||
| 483,043 | 8,588,505 | |||||||
PC Connection | 321,859 | 9,568,868 | ||||||
Richardson Electronics | 137,743 | 1,196,987 | ||||||
Sanmina Corporation 1 | 146,413 | 3,522,697 | ||||||
Vishay Intertechnology | 420,445 | 7,572,214 | ||||||
| 176,902,483 | ||||||||
| SEMICONDUCTORS & SEMICONDUCTOR EQUIPMENT - 6.2% | ||||||||
Advanced Energy Industries 1 | 234,360 | 10,061,075 | ||||||
Brooks Automation | 391,252 | 10,242,977 | ||||||
Cabot Microelectronics | 97,841 | 9,329,139 | ||||||
Cirrus Logic 1 | 312,010 | 10,352,492 | ||||||
Cohu | 260,085 | 4,179,566 | ||||||
Diodes 1 | 196,302 | 6,332,703 | ||||||
Entegris | 241,599 | 6,739,404 | ||||||
FormFactor 1 | 203,270 | 2,864,074 | ||||||
Kulicke & Soffa Industries | 529,268 | 10,728,262 | ||||||
MKS Instruments | 213,092 | 13,767,874 | ||||||
Nanometrics 1 | 65,370 | 1,786,562 | ||||||
| 48,304 | 1,100,365 | |||||||
Photronics 1 | 154,371 | 1,494,311 | ||||||
Silicon Motion Technology ADR | 146,739 | 5,062,496 | ||||||
Ultra Clean Holdings 1 | 88,433 | 749,028 | ||||||
†Versum Materials | 121,099 | 3,356,864 | ||||||
| 98,147,192 | ||||||||
| SOFTWARE - 3.2% | ||||||||
ACI Worldwide 1 | 379,964 | 10,513,604 | ||||||
| 62,154 | 1,714,207 | |||||||
Amber Road 1 | 119,809 | 986,028 | ||||||
| 180,531 | 3,047,363 | |||||||
| 97,462 | 2,578,845 | |||||||
| 50,744 | 2,880,230 | |||||||
Fair Isaac 1 | 48,464 | 9,062,768 | ||||||
| 76,116 | 3,327,792 | |||||||
j2 Global | 63,369 | 4,396,541 | ||||||
Manhattan Associates 1 | 67,517 | 2,860,695 | ||||||
QAD Cl. A | 43,477 | 1,709,951 | ||||||
| 23,500 | 1,756,390 | |||||||
TiVo | 254,622 | 2,395,993 | ||||||
| 89,179 | 2,423,885 | |||||||
Varonis Systems 1 | 4,727 | 250,058 | ||||||
| 49,904,350 | ||||||||
| TECHNOLOGY HARDWARE, STORAGE & PERIPHERALS - 0.2% | ||||||||
Cray 1 | 123,702 | 2,670,726 | ||||||
| Total (Cost $261,411,950) | 331,209,444 | |||||||
| MATERIALS – 9.4% | ||||||||
| CHEMICALS - 5.1% | ||||||||
Balchem Corporation | 144,988 | 11,359,810 | ||||||
Chase Corporation | 33,780 | 3,379,689 | ||||||
FutureFuel Corporation | 567,519 | 9,000,851 | ||||||
Ingevity Corporation 1 | 83,197 | 6,962,757 | ||||||
Innospec | 81,901 | 5,058,206 | ||||||
Minerals Technologies | 233,415 | 11,983,526 | ||||||
Platform Specialty Products 1 | 907,638 | 9,375,900 | ||||||
Quaker Chemical | 131,201 | 23,315,730 | ||||||
| 80,436,469 | ||||||||
| CONSTRUCTION MATERIALS - 0.1% | ||||||||
†Imerys | 40,000 | 1,923,943 | ||||||
| CONTAINERS & PACKAGING - 0.6% | ||||||||
AptarGroup | 99,439 | 9,354,227 | ||||||
| METALS & MINING - 2.5% | ||||||||
†Alamos Gold Cl. A | 2,113,448 | 7,601,106 | ||||||
Commercial Metals | 39,034 | 625,325 | ||||||
Franco-Nevada Corporation | 93,216 | 6,540,967 | ||||||
Haynes International | 37,643 | 993,775 | ||||||
Hecla Mining | 151,513 | 357,571 | ||||||
IAMGOLD Corporation 1 | 800,000 | 2,944,000 | ||||||
Major Drilling Group International 1 | 913,761 | 3,078,890 | ||||||
Pretium Resources 1 | 89,701 | 760,211 | ||||||
Reliance Steel & Aluminum | 141,198 | 10,049,061 | ||||||
Worthington Industries | 198,086 | 6,901,316 | ||||||
| 39,852,222 | ||||||||
| PAPER & FOREST PRODUCTS - 1.1% | ||||||||
Stella-Jones | 569,501 | 16,523,539 | ||||||
| Total (Cost $98,074,631) | 148,090,400 | |||||||
| REAL ESTATE – 3.3% | ||||||||
| REAL ESTATE MANAGEMENT & DEVELOPMENT - 3.3% | ||||||||
FRP Holdings 1 | 322,003 | 14,815,358 | ||||||
Kennedy-Wilson Holdings | 543,368 | 9,872,996 | ||||||
Marcus & Millichap 1 | 432,786 | 14,857,543 | ||||||
St. Joe Company (The) 1 | 248,863 | 3,277,526 | ||||||
Tejon Ranch 1 | 598,465 | 9,922,550 | ||||||
| Total (Cost $49,470,265) | 52,745,973 | |||||||
| TOTAL COMMON STOCKS | ||||||||
| (Cost $1,188,735,717) | 1,560,734,247 | |||||||
| COLLATERAL RECEIVED FOR SECURITIES LOANED – 0.7% | ||||||||
| Money Market Funds | ||||||||
Federated Government Obligations Fund (7 day yield-2.2268%) | ||||||||
| (Cost $11,147,862) | 11,147,862 | |||||||
| TOTAL INVESTMENTS – 99.5% | ||||||||
| (Cost $1,199,883,579) | 1,571,882,109 | |||||||
| CASH AND OTHER ASSETS LESS LIABILITIES – 0.5% | 7,202,053 | |||||||
| NET ASSETS – 100.0% | $ | 1,579,084,162 | ||||||
| THE ACCOMPANYING NOTES ARE AN INTEGRAL PART OF THESE FINANCIAL STATEMENTS | The Royce Funds 2018 Annual Report to Shareholders | 57 |
| Schedules of Investments |
| Royce Premier Fund |
| Common Stocks – 98.3% |
| SHARES | VALUE | |||||||
| CONSUMER DISCRETIONARY – 9.8% | ||||||||
| AUTO COMPONENTS - 4.2% | ||||||||
Dorman Products 1 | 512,103 | $ | 46,099,512 | |||||
†LCI Industries | 352,740 | 23,563,032 | ||||||
| 69,662,544 | ||||||||
| AUTOMOBILES - 0.6% | ||||||||
Thor Industries | 182,382 | 9,483,864 | ||||||
| DISTRIBUTORS - 1.4% | ||||||||
Pool Corporation | 155,376 | 23,096,643 | ||||||
| DIVERSIFIED CONSUMER SERVICES - 0.8% | ||||||||
Sotheby’s 1 | 364,242 | 14,474,977 | ||||||
| TEXTILES, APPAREL & LUXURY GOODS - 2.8% | ||||||||
Columbia Sportswear | 260,416 | 21,898,381 | ||||||
Wolverine World Wide | 774,359 | 24,694,309 | ||||||
| 46,592,690 | ||||||||
| Total (Cost $83,529,580) | 163,310,718 | |||||||
| CONSUMER STAPLES – 2.8% | ||||||||
| FOOD PRODUCTS - 2.8% | ||||||||
Cal-Maine Foods | 722,552 | 30,563,950 | ||||||
Sanderson Farms | 160,946 | 15,980,328 | ||||||
| Total (Cost $28,652,468) | 46,544,278 | |||||||
| ENERGY – 3.6% | ||||||||
| ENERGY EQUIPMENT & SERVICES - 3.6% | ||||||||
Pason Systems | 2,695,145 | 36,107,678 | ||||||
SEACOR Holdings 1 | 629,035 | 23,274,295 | ||||||
| Total (Cost $62,415,037) | 59,381,973 | |||||||
| FINANCIALS – 15.1% | ||||||||
| CAPITAL MARKETS - 9.5% | ||||||||
Ares Management | 2,487,021 | 44,219,233 | ||||||
Ashmore Group | 9,745,000 | 45,411,084 | ||||||
Lazard Cl. A | 559,716 | 20,659,118 | ||||||
Morningstar | 344,447 | 37,834,058 | ||||||
TMX Group | 203,694 | 10,553,235 | ||||||
| 158,676,728 | ||||||||
| INSURANCE - 3.6% | ||||||||
Alleghany Corporation | 68,135 | 42,469,908 | ||||||
ProAssurance Corporation | 447,565 | 18,153,237 | ||||||
| 60,623,145 | ||||||||
| THRIFTS & MORTGAGE FINANCE - 2.0% | ||||||||
Genworth MI Canada | 1,138,465 | 33,523,508 | ||||||
| Total (Cost $169,559,907) | 252,823,381 | |||||||
| HEALTH CARE – 4.1% | ||||||||
| HEALTH CARE TECHNOLOGY - 2.8% | ||||||||
Medidata Solutions 1 | 676,646 | 45,619,473 | ||||||
| LIFE SCIENCES TOOLS & SERVICES - 1.3% | ||||||||
Bio-Techne | 153,253 | 22,178,774 | ||||||
| Total (Cost $60,035,202) | 67,798,247 | |||||||
| INDUSTRIALS – 34.6% | ||||||||
| AIR FREIGHT & LOGISTICS - 2.0% | ||||||||
Forward Air | 602,149 | 33,027,873 | ||||||
| BUILDING PRODUCTS - 1.7% | ||||||||
Simpson Manufacturing | 527,195 | 28,537,065 | ||||||
| COMMERCIAL SERVICES & SUPPLIES - 1.8% | ||||||||
Ritchie Bros. Auctioneers | 916,109 | 29,975,086 | ||||||
| CONSTRUCTION & ENGINEERING - 2.5% | ||||||||
Valmont Industries | 373,985 | 41,493,636 | ||||||
| MACHINERY - 16.5% | ||||||||
| 1,024,687 | 21,825,833 | |||||||
Franklin Electric | 261,983 | 11,233,831 | ||||||
†John Bean Technologies | 438,523 | 31,490,337 | ||||||
Kadant | 157,444 | 12,825,388 | ||||||
Lincoln Electric Holdings | 712,017 | 56,142,540 | ||||||
Lindsay Corporation | 484,370 | 46,620,612 | ||||||
RBC Bearings 1 | 159,905 | 20,963,546 | ||||||
Sun Hydraulics | 805,072 | 26,720,340 | ||||||
Woodward | 644,686 | 47,893,723 | ||||||
| 275,716,150 | ||||||||
| MARINE - 4.6% | ||||||||
Clarkson | 603,206 | 14,608,078 | ||||||
Kirby Corporation 1 | 930,238 | 62,660,832 | ||||||
| 77,268,910 | ||||||||
| ROAD & RAIL - 2.7% | ||||||||
Landstar System | 460,540 | 44,059,862 | ||||||
| TRADING COMPANIES & DISTRIBUTORS - 2.8% | ||||||||
Air Lease Cl. A | 1,552,579 | 46,903,412 | ||||||
| Total (Cost $395,135,222) | 576,981,994 | |||||||
| INFORMATION TECHNOLOGY – 17.9% | ||||||||
| ELECTRONIC EQUIPMENT, INSTRUMENTS & COMPONENTS - 8.2% | ||||||||
Anixter International 1 | 231,882 | 12,593,511 | ||||||
Cognex Corporation | 608,494 | 23,530,463 | ||||||
| 326,645 | 34,529,643 | |||||||
IPG Photonics 1 | 114,024 | 12,917,779 | ||||||
National Instruments | 1,156,800 | 52,495,584 | ||||||
| 136,066,980 | ||||||||
| IT SERVICES - 1.1% | ||||||||
Jack Henry & Associates | 149,663 | 18,935,363 | ||||||
| SEMICONDUCTORS & SEMICONDUCTOR EQUIPMENT - 4.0% | ||||||||
Cabot Microelectronics | 323,583 | 30,853,639 | ||||||
MKS Instruments | 568,769 | 36,748,165 | ||||||
| 67,601,804 | ||||||||
| SOFTWARE - 4.6% | ||||||||
Fair Isaac 1 | 231,211 | 43,236,457 | ||||||
Manhattan Associates 1 | 797,114 | 33,773,720 | ||||||
| 77,010,177 | ||||||||
| Total (Cost $156,373,621) | 299,614,324 | |||||||
| MATERIALS – 8.9% | ||||||||
| CHEMICALS - 5.4% | ||||||||
Chase Corporation | 45,428 | 4,545,071 | ||||||
Minerals Technologies | 557,585 | 28,626,414 | ||||||
| 674,237 | 6,964,868 | |||||||
Quaker Chemical | 217,379 | 38,630,422 | ||||||
Westlake Chemical | 182,244 | 12,059,086 | ||||||
| 90,825,861 | ||||||||
| METALS & MINING - 2.0% | ||||||||
Reliance Steel & Aluminum | 463,028 | 32,953,703 | ||||||
| PAPER & FOREST PRODUCTS - 1.5% | ||||||||
Stella-Jones | 869,740 | 25,234,692 | ||||||
| Total (Cost $114,325,514) | 149,014,256 | |||||||
| 58 | The Royce Funds 2018 Annual Report to Shareholders | THE ACCOMPANYING NOTES ARE AN INTEGRAL PART OF THESE FINANCIAL STATEMENTS |
| December 31, 2018 |
| Royce Premier Fund (continued) |
| SHARES | VALUE | |||||||
| REAL ESTATE – 1.5% | ||||||||
| REAL ESTATE MANAGEMENT & DEVELOPMENT - 1.5% | ||||||||
Kennedy-Wilson Holdings | 1,354,242 | $ | 24,606,577 | |||||
| Total (Cost $26,124,382) | 24,606,577 | |||||||
| TOTAL COMMON STOCKS | ||||||||
| (Cost $1,096,150,933) | 1,640,075,748 | |||||||
| REPURCHASE AGREEMENT – 0.0% | ||||||||
| Fixed Income Clearing Corporation, 0.50% dated 12/31/18, due 1/2/19, maturity value | ||||||||
| $484,013 (collateralized by obligations of various U.S. Government Agencies, 0.125% due | ||||||||
| 04/15/20, valued at $495,958) | ||||||||
| (Cost $484,000) | 484,000 | |||||||
| TOTAL INVESTMENTS – 98.3% | ||||||||
| (Cost $1,096,634,933) | 1,640,559,748 | |||||||
| CASH AND OTHER ASSETS LESS LIABILITIES – 1.7% | 28,924,856 | |||||||
| NET ASSETS – 100.0% | $ | 1,669,484,604 | ||||||
| Royce Small-Cap Leaders Fund |
| Common Stocks – 92.6% |
| SHARES | VALUE | |||||||
| COMMUNICATION SERVICES – 0.7% | ||||||||
| MEDIA - 0.7% | ||||||||
E.W. Scripps Company Cl. A | 25,690 | $ | 404,104 | |||||
| Total (Cost $329,340) | 404,104 | |||||||
| CONSUMER DISCRETIONARY – 11.0% | ||||||||
| AUTO COMPONENTS - 4.7% | ||||||||
Gentex Corporation | 21,234 | 429,139 | ||||||
LCI Industries | 14,532 | 970,738 | ||||||
†Standard Motor Products | 6,100 | 295,423 | ||||||
| 14,100 | 347,565 | |||||||
| 8,700 | 524,436 | |||||||
| 2,567,301 | ||||||||
| HOTELS, RESTAURANTS & LEISURE - 1.2% | ||||||||
| 89,900 | 664,361 | |||||||
| HOUSEHOLD DURABLES - 0.5% | ||||||||
Ethan Allen Interiors | 15,500 | 272,645 | ||||||
| LEISURE PRODUCTS - 1.0% | ||||||||
MasterCraft Boat Holdings 1 | 29,000 | 542,300 | ||||||
| SPECIALTY RETAIL - 2.2% | ||||||||
Caleres | 27,400 | 762,542 | ||||||
†Monro | 6,700 | 460,625 | ||||||
| 1,223,167 | ||||||||
| TEXTILES, APPAREL & LUXURY GOODS - 1.4% | ||||||||
Movado Group | 20,200 | 638,724 | ||||||
†Wolverine World Wide | 5,000 | 159,450 | ||||||
| 798,174 | ||||||||
| Total (Cost $5,240,632) | 6,067,948 | |||||||
| CONSUMER STAPLES – 4.9% | ||||||||
| FOOD PRODUCTS - 2.3% | ||||||||
Cal-Maine Foods | 8,158 | 345,084 | ||||||
Industrias Bachoco ADR | 7,700 | 304,612 | ||||||
Tootsie Roll Industries | 18,300 | 611,220 | ||||||
| 1,260,916 | ||||||||
| PERSONAL PRODUCTS - 2.6% | ||||||||
Inter Parfums | 22,130 | 1,451,064 | ||||||
| Total (Cost $1,718,903) | 2,711,980 | |||||||
| ENERGY – 3.6% | ||||||||
| ENERGY EQUIPMENT & SERVICES - 3.6% | ||||||||
Oil States International 1 | 23,440 | 334,723 | ||||||
Pason Systems | 69,340 | 928,969 | ||||||
TGS-NOPEC Geophysical | 29,550 | 713,588 | ||||||
| Total (Cost $1,573,314) | 1,977,280 | |||||||
| FINANCIALS – 13.5% | ||||||||
| CAPITAL MARKETS - 7.2% | ||||||||
Artisan Partners Asset Management Cl. A | 56,400 | 1,247,004 | ||||||
Federated Investors Cl. B | 13,660 | 362,673 | ||||||
Houlihan Lokey Cl. A | 36,200 | 1,332,160 | ||||||
Lazard Cl. A | 28,470 | 1,050,827 | ||||||
| 3,992,664 | ||||||||
| INSURANCE - 3.2% | ||||||||
†ProAssurance Corporation | 16,500 | 669,240 | ||||||
RLI Corp. | 15,900 | 1,096,941 | ||||||
| 1,766,181 | ||||||||
| THRIFTS & MORTGAGE FINANCE - 3.1% | ||||||||
Genworth MI Canada | 58,760 | 1,730,261 | ||||||
| Total (Cost $6,300,570) | 7,489,106 | |||||||
| THE ACCOMPANYING NOTES ARE AN INTEGRAL PART OF THESE FINANCIAL STATEMENTS | The Royce Funds 2018 Annual Report to Shareholders | 59 |
| Schedules of Investments |
| Royce Small-Cap Leaders Fund (continued) |
| SHARES | VALUE | |||||||
| HEALTH CARE – 3.3% | ||||||||
| BIOTECHNOLOGY - 0.1% | ||||||||
| 1,700 | $ | 68,493 | ||||||
| HEALTH CARE EQUIPMENT & SUPPLIES - 0.8% | ||||||||
Lantheus Holdings 1 | 27,100 | 424,115 | ||||||
| HEALTH CARE PROVIDERS & SERVICES - 0.7% | ||||||||
AMN Healthcare Services 1 | 7,000 | 396,620 | ||||||
| LIFE SCIENCES TOOLS & SERVICES - 1.7% | ||||||||
Bio-Techne | 6,394 | 925,340 | ||||||
| Total (Cost $1,201,865) | 1,814,568 | |||||||
| INDUSTRIALS – 28.9% | ||||||||
| BUILDING PRODUCTS - 3.2% | ||||||||
Apogee Enterprises | 23,100 | 689,535 | ||||||
| 23,100 | 822,129 | |||||||
Simpson Manufacturing | 4,820 | 260,906 | ||||||
| 1,772,570 | ||||||||
| COMMERCIAL SERVICES & SUPPLIES - 4.1% | ||||||||
Kimball International Cl. B | 44,230 | 627,624 | ||||||
PICO Holdings 1 | 33,900 | 309,846 | ||||||
Ritchie Bros. Auctioneers | 6,700 | 219,224 | ||||||
Steelcase Cl. A | 18,800 | 278,804 | ||||||
UniFirst Corporation | 5,600 | 801,192 | ||||||
| 2,236,690 | ||||||||
| CONSTRUCTION & ENGINEERING - 4.7% | ||||||||
| 35,500 | 982,995 | |||||||
Comfort Systems USA | 7,900 | 345,072 | ||||||
| 60,500 | 658,845 | |||||||
Valmont Industries | 5,495 | 609,670 | ||||||
| 2,596,582 | ||||||||
| ELECTRICAL EQUIPMENT - 1.0% | ||||||||
EnerSys | 7,300 | 566,553 | ||||||
| MACHINERY - 12.3% | ||||||||
CIRCOR International 1 | 28,620 | 609,606 | ||||||
Greenbrier Companies (The) | 33,600 | 1,328,544 | ||||||
John Bean Technologies | 13,099 | 940,639 | ||||||
Kadant | 13,060 | 1,063,868 | ||||||
| 93,300 | 1,577,703 | |||||||
RBC Bearings 1 | 980 | 128,478 | ||||||
Sun Hydraulics | 10,500 | 348,495 | ||||||
Wabash National | 59,800 | 782,184 | ||||||
| 6,779,517 | ||||||||
| PROFESSIONAL SERVICES - 0.9% | ||||||||
Heidrick & Struggles International | 16,300 | 508,397 | ||||||
| ROAD & RAIL - 2.7% | ||||||||
Landstar System | 9,620 | 920,346 | ||||||
Saia 1 | 10,220 | 570,480 | ||||||
| 1,490,826 | ||||||||
| Total (Cost $15,981,230) | 15,951,135 | |||||||
| INFORMATION TECHNOLOGY – 17.7% | ||||||||
| COMMUNICATIONS EQUIPMENT - 0.7% | ||||||||
| 17,200 | 406,436 | |||||||
| ELECTRONIC EQUIPMENT, INSTRUMENTS & COMPONENTS - 7.2% | ||||||||
Coherent 1 | 5,300 | 560,263 | ||||||
| 11,500 | 344,540 | |||||||
Fabrinet 1 | 5,400 | 277,074 | ||||||
FARO Technologies 1 | 9,260 | 376,326 | ||||||
Kimball Electronics 1 | 58,456 | 905,484 | ||||||
| 25,500 | 453,390 | |||||||
Vishay Intertechnology | 31,700 | 570,917 | ||||||
| 16,100 | 486,703 | |||||||
| 3,974,697 | ||||||||
| SEMICONDUCTORS & SEMICONDUCTOR EQUIPMENT - 7.7% | ||||||||
Advanced Energy Industries 1 | 20,800 | 892,944 | ||||||
Cabot Microelectronics | 5,636 | 537,393 | ||||||
Cohu | 38,260 | 614,838 | ||||||
Kulicke & Soffa Industries | 22,400 | 454,048 | ||||||
MKS Instruments | 5,645 | 364,723 | ||||||
Nanometrics 1 | 14,838 | 405,523 | ||||||
| 16,400 | 373,592 | |||||||
Rudolph Technologies 1 | 8,100 | 165,807 | ||||||
Silicon Motion Technology ADR | 12,200 | 420,900 | ||||||
| 4,229,768 | ||||||||
| SOFTWARE - 2.1% | ||||||||
j2 Global | 16,724 | 1,160,311 | ||||||
| Total (Cost $9,300,886) | 9,771,212 | |||||||
| MATERIALS – 3.7% | ||||||||
| CHEMICALS - 2.5% | ||||||||
Minerals Technologies | 26,856 | 1,378,787 | ||||||
| PAPER & FOREST PRODUCTS - 1.2% | ||||||||
Stella-Jones | 22,400 | 649,915 | ||||||
| Total (Cost $2,114,802) | 2,028,702 | |||||||
| REAL ESTATE – 5.3% | ||||||||
| REAL ESTATE MANAGEMENT & DEVELOPMENT - 5.3% | ||||||||
†Kennedy-Wilson Holdings | 66,100 | 1,201,037 | ||||||
Marcus & Millichap 1 | 50,110 | 1,720,276 | ||||||
| Total (Cost $2,358,285) | 2,921,313 | |||||||
| TOTAL COMMON STOCKS | ||||||||
| (Cost $46,119,827) | 51,137,348 | |||||||
| REPURCHASE AGREEMENT – 8.2% | ||||||||
| Fixed Income Clearing Corporation, 0.50% dated 12/31/18, due 1/2/19, maturity value | ||||||||
| $4,528,126 (collateralized by obligations of various U.S. Government Agencies, 0.125% | ||||||||
| due 07/15/24, valued at $4,623,319) | ||||||||
| (Cost $4,528,000) | 4,528,000 | |||||||
| TOTAL INVESTMENTS – 100.8% | ||||||||
| (Cost $50,647,827) | 55,665,348 | |||||||
| LIABILITIES LESS CASH AND OTHER ASSETS – (0.8)% | (429,455 | ) | ||||||
| NET ASSETS – 100.0% | $ | 55,235,893 | ||||||
| 60 | The Royce Funds 2018 Annual Report to Shareholders | THE ACCOMPANYING NOTES ARE AN INTEGRAL PART OF THESE FINANCIAL STATEMENTS |
| December 31, 2018 |
| Royce Small-Cap Value Fund |
| Common Stocks – 97.8% |
| SHARES | VALUE | |||||||
| COMMUNICATION SERVICES – 1.8% | ||||||||
| MEDIA - 1.8% | ||||||||
Saga Communications Cl. A | 98,617 | $ | 3,277,043 | |||||
| Total (Cost $4,344,496) | 3,277,043 | |||||||
| CONSUMER DISCRETIONARY – 13.9% | ||||||||
| AUTO COMPONENTS - 5.5% | ||||||||
| 48,373 | 3,004,930 | |||||||
Gentex Corporation | 123,728 | 2,500,543 | ||||||
Stoneridge 1 | 76,249 | 1,879,538 | ||||||
| 45,700 | 2,754,796 | |||||||
| 10,139,807 | ||||||||
| HOTELS, RESTAURANTS & LEISURE - 2.1% | ||||||||
Cheesecake Factory | 20,100 | 874,551 | ||||||
| 117,800 | 3,108,742 | |||||||
| 3,983,293 | ||||||||
| HOUSEHOLD DURABLES - 1.0% | ||||||||
La-Z-Boy | 66,598 | 1,845,431 | ||||||
| SPECIALTY RETAIL - 4.8% | ||||||||
American Eagle Outfitters | 145,845 | 2,819,184 | ||||||
†Caleres | 93,900 | 2,613,237 | ||||||
DSW Cl. A | 73,191 | 1,807,817 | ||||||
Shoe Carnival | 52,094 | 1,745,670 | ||||||
| 8,985,908 | ||||||||
| TEXTILES, APPAREL & LUXURY GOODS - 0.5% | ||||||||
Steven Madden | 30,249 | 915,335 | ||||||
| Total (Cost $25,903,558) | 25,869,774 | |||||||
| CONSUMER STAPLES – 1.8% | ||||||||
| FOOD & STAPLES RETAILING - 1.8% | ||||||||
Village Super Market Cl. A | 124,494 | 3,328,969 | ||||||
| Total (Cost $3,628,860) | 3,328,969 | |||||||
| ENERGY – 1.4% | ||||||||
| ENERGY EQUIPMENT & SERVICES - 1.4% | ||||||||
Helmerich & Payne | 48,584 | 2,329,117 | ||||||
Unit Corporation 1 | 22,900 | 327,012 | ||||||
| Total (Cost $1,643,942) | 2,656,129 | |||||||
| FINANCIALS – 26.7% | ||||||||
| BANKS - 12.4% | ||||||||
Ames National | 103,450 | 2,629,699 | ||||||
†Bar Harbor Bankshares | 46,471 | 1,042,345 | ||||||
Camden National | 106,161 | 3,818,611 | ||||||
City Holding Company | 26,577 | 1,796,339 | ||||||
CNB Financial | 111,401 | 2,556,653 | ||||||
Codorus Valley Bancorp | 44,414 | 943,798 | ||||||
†Financial Institutions | 76,566 | 1,967,746 | ||||||
Landmark Bancorp | 25,129 | 575,580 | ||||||
MidWestOne Financial Group | 75,322 | 1,870,245 | ||||||
National Bankshares | 68,463 | 2,494,107 | ||||||
Northrim BanCorp | 58,762 | 1,931,507 | ||||||
Unity Bancorp | 73,412 | 1,524,033 | ||||||
| 23,150,663 | ||||||||
| CAPITAL MARKETS - 3.8% | ||||||||
Houlihan Lokey Cl. A | 78,432 | 2,886,298 | ||||||
Moelis & Company Cl. A | 80,495 | 2,767,418 | ||||||
†Pzena Investment Management Cl. A | 157,142 | 1,359,278 | ||||||
| 7,012,994 | ||||||||
| INSURANCE - 3.1% | ||||||||
James River Group Holdings | 50,673 | 1,851,592 | ||||||
Kingstone Companies | 67,442 | 1,193,049 | ||||||
Reinsurance Group of America | 20,036 | 2,809,648 | ||||||
| 5,854,289 | ||||||||
| THRIFTS & MORTGAGE FINANCE - 7.4% | ||||||||
Genworth MI Canada | 156,489 | 4,608,012 | ||||||
Southern Missouri Bancorp | 64,025 | 2,170,447 | ||||||
Timberland Bancorp | 52,400 | 1,168,520 | ||||||
TrustCo Bank Corp. NY | 565,949 | 3,882,410 | ||||||
†WSFS Financial | 49,476 | 1,875,635 | ||||||
| 13,705,024 | ||||||||
| Total (Cost $44,945,803) | 49,722,970 | |||||||
| HEALTH CARE – 0.9% | ||||||||
| HEALTH CARE PROVIDERS & SERVICES - 0.9% | ||||||||
AMN Healthcare Services 1 | 16,017 | 907,523 | ||||||
Ensign Group (The) | 21,465 | 832,628 | ||||||
| Total (Cost $1,117,074) | 1,740,151 | |||||||
| INDUSTRIALS – 24.0% | ||||||||
| AEROSPACE & DEFENSE - 0.5% | ||||||||
†Magellan Aerospace | 78,700 | 863,556 | ||||||
| AIRLINES - 3.5% | ||||||||
Allegiant Travel | 18,466 | 1,850,663 | ||||||
Hawaiian Holdings | 142,822 | 3,771,929 | ||||||
Spirit Airlines 1 | 15,798 | 915,020 | ||||||
| 6,537,612 | ||||||||
| BUILDING PRODUCTS - 1.3% | ||||||||
Apogee Enterprises | 81,510 | 2,433,073 | ||||||
| COMMERCIAL SERVICES & SUPPLIES - 3.1% | ||||||||
Herman Miller | 81,199 | 2,456,270 | ||||||
Kimball International Cl. B | 233,056 | 3,307,064 | ||||||
| 5,763,334 | ||||||||
| CONSTRUCTION & ENGINEERING - 0.6% | ||||||||
Comfort Systems USA | 25,157 | 1,098,858 | ||||||
| ELECTRICAL EQUIPMENT - 0.5% | ||||||||
EnerSys | 11,920 | 925,111 | ||||||
| MACHINERY - 7.8% | ||||||||
Alamo Group | 35,833 | 2,770,608 | ||||||
Federal Signal | 42,210 | 839,979 | ||||||
| 207,093 | 3,501,943 | |||||||
Miller Industries | 172,566 | 4,659,282 | ||||||
Wabash National | 213,992 | 2,799,015 | ||||||
| 14,570,827 | ||||||||
| PROFESSIONAL SERVICES - 4.5% | ||||||||
Heidrick & Struggles International | 59,230 | 1,847,384 | ||||||
Kforce | 60,697 | 1,876,751 | ||||||
Korn Ferry | 68,994 | 2,728,023 | ||||||
Robert Half International | 16,116 | 921,835 | ||||||
TrueBlue 1 | 40,300 | 896,675 | ||||||
| 8,270,668 | ||||||||
| ROAD & RAIL - 2.2% | ||||||||
Old Dominion Freight Line | 7,064 | 872,333 | ||||||
Saia 1 | 26,341 | 1,470,355 | ||||||
Werner Enterprises | 61,052 | 1,803,476 | ||||||
| 4,146,164 | ||||||||
| Total (Cost $43,927,519) | 44,609,203 | |||||||
| INFORMATION TECHNOLOGY – 26.0% | ||||||||
| ELECTRONIC EQUIPMENT, INSTRUMENTS & COMPONENTS - 18.0% | ||||||||
Benchmark Electronics | 131,484 | 2,784,831 | ||||||
| THE ACCOMPANYING NOTES ARE AN INTEGRAL PART OF THESE FINANCIAL STATEMENTS | The Royce Funds 2018 Annual Report to Shareholders | 61 |
| Schedules of Investments |
| Royce Small-Cap Value Fund (continued) |
| SHARES | VALUE | |||||||
| INFORMATION TECHNOLOGY (continued) | ||||||||
| ELECTRONIC EQUIPMENT, INSTRUMENTS & COMPONENTS (continued) | ||||||||
Celestica 1 | 452,824 | $ | 3,971,267 | |||||
| 283,908 | 8,505,884 | |||||||
Fabrinet 1 | 17,890 | 917,936 | ||||||
Insight Enterprises 1 | 115,583 | 4,710,007 | ||||||
Methode Electronics | 49,663 | 1,156,651 | ||||||
PC Connection | 138,115 | 4,106,159 | ||||||
Sanmina Corporation 1 | 115,941 | 2,789,541 | ||||||
Vishay Intertechnology | 249,939 | 4,501,401 | ||||||
| 33,443,677 | ||||||||
| SEMICONDUCTORS & SEMICONDUCTOR EQUIPMENT - 8.0% | ||||||||
Advanced Energy Industries 1 | 94,348 | 4,050,360 | ||||||
Kulicke & Soffa Industries | 214,075 | 4,339,300 | ||||||
MKS Instruments | 58,880 | 3,804,237 | ||||||
Silicon Motion Technology ADR | 78,201 | 2,697,934 | ||||||
| 14,891,831 | ||||||||
| Total (Cost $46,275,261) | 48,335,508 | |||||||
| REAL ESTATE – 1.0% | ||||||||
| REAL ESTATE MANAGEMENT & DEVELOPMENT - 1.0% | ||||||||
Marcus & Millichap 1 | 54,000 | 1,853,820 | ||||||
| Total (Cost $1,375,673) | 1,853,820 | |||||||
| UTILITIES – 0.3% | ||||||||
| GAS UTILITIES - 0.3% | ||||||||
Star Group L.P. | 69,565 | 649,737 | ||||||
| Total (Cost $656,458) | 649,737 | |||||||
| TOTAL COMMON STOCKS | ||||||||
| (Cost $173,818,644) | 182,043,304 | |||||||
| REPURCHASE AGREEMENT – 1.9% | ||||||||
| Fixed Income Clearing Corporation, 0.50% dated 12/31/18, due 1/2/19, maturity value | ||||||||
| $3,633,101 (collateralized by obligations of various U.S. Government Agencies, 0.125% | ||||||||
| due 07/15/24, valued at $3,705,792) | ||||||||
| (Cost $3,633,000) | 3,633,000 | |||||||
| TOTAL INVESTMENTS – 99.7% | ||||||||
| (Cost $177,451,644) | 185,676,304 | |||||||
| CASH AND OTHER ASSETS LESS LIABILITIES – 0.3% | 506,334 | |||||||
| NET ASSETS – 100.0% | $ | 186,182,638 | ||||||
| Royce Small/Mid-Cap Premier Fund | ||||||||
| Common Stocks – 91.2% | ||||||||
| SHARES | VALUE | |||||||
| COMMUNICATION SERVICES – 3.4% | ||||||||
| MEDIA - 3.4% | ||||||||
| 102,272 | $ | 0 | ||||||
| Meredith Corporation | 68,950 | 3,581,263 | ||||||
Nexstar Media Group Cl. A | 22,131 | 1,740,382 | ||||||
| Total (Cost $4,698,157) | 5,321,645 | |||||||
| CONSUMER DISCRETIONARY – 17.5% | ||||||||
| AUTO COMPONENTS - 7.0% | ||||||||
Cooper Tire & Rubber | 29,300 | 947,269 | ||||||
Dorman Products 1 | 44,700 | 4,023,894 | ||||||
LCI Industries | 32,300 | 2,157,640 | ||||||
Standard Motor Products | 77,030 | 3,730,563 | ||||||
| 10,859,366 | ||||||||
| DISTRIBUTORS - 2.5% | ||||||||
LKQ Corporation 1 | 160,000 | 3,796,800 | ||||||
| HOTELS, RESTAURANTS & LEISURE - 1.5% | ||||||||
†Aramark | 78,700 | 2,279,939 | ||||||
| SPECIALTY RETAIL - 4.8% | ||||||||
CarMax 1 | 70,400 | 4,416,192 | ||||||
Children’s Place | 17,000 | 1,531,530 | ||||||
Monro | 22,400 | 1,540,000 | ||||||
| 7,487,722 | ||||||||
| TEXTILES, APPAREL & LUXURY GOODS - 1.7% | ||||||||
Wolverine World Wide | 84,200 | 2,685,138 | ||||||
| Total (Cost $28,926,834) | 27,108,965 | |||||||
| CONSUMER STAPLES – 0.3% | ||||||||
| FOOD PRODUCTS - 0.3% | ||||||||
Cal-Maine Foods | 9,700 | 410,310 | ||||||
| Total (Cost $357,992) | 410,310 | |||||||
| FINANCIALS – 8.8% | ||||||||
| BANKS - 0.7% | ||||||||
†Webster Financial | 22,145 | 1,091,527 | ||||||
| CAPITAL MARKETS - 3.6% | ||||||||
Affiliated Managers Group | 5,630 | 548,587 | ||||||
Lazard Cl. A | 52,550 | 1,939,621 | ||||||
Oaktree Capital Group LLC Cl. A | 32,700 | 1,299,825 | ||||||
SEI Investments | 38,500 | 1,778,700 | ||||||
| 5,566,733 | ||||||||
| INSURANCE - 4.5% | ||||||||
Alleghany Corporation | 8,820 | 5,497,682 | ||||||
Berkley (W.R.) | 20,310 | 1,501,112 | ||||||
| 6,998,794 | ||||||||
| Total (Cost $12,825,915) | 13,657,054 | |||||||
| HEALTH CARE – 2.1% | ||||||||
| LIFE SCIENCES TOOLS & SERVICES - 2.1% | ||||||||
Bio-Rad Laboratories Cl. A 1 | 10,626 | 2,467,570 | ||||||
PerkinElmer | 10,074 | 791,312 | ||||||
| Total (Cost $3,331,185) | 3,258,882 | |||||||
| INDUSTRIALS – 27.6% | ||||||||
| AEROSPACE & DEFENSE - 2.5% | ||||||||
Hexcel Corporation | 39,240 | 2,250,022 | ||||||
Teledyne Technologies 1 | 7,700 | 1,594,439 | ||||||
| 3,844,461 | ||||||||
| BUILDING PRODUCTS - 2.9% | ||||||||
Lennox International | 11,257 | 2,463,707 | ||||||
Simpson Manufacturing | 37,700 | 2,040,701 | ||||||
| 4,504,408 | ||||||||
| 62 | The Royce Funds 2018 Annual Report to Shareholders | THE ACCOMPANYING NOTES ARE AN INTEGRAL PART OF THESE FINANCIAL STATEMENTS |
| December 31, 2018 |
| Royce Small/Mid-Cap Premier Fund (continued) |
| SHARES | VALUE | |||||||
| INDUSTRIALS (continued) | ||||||||
| COMMERCIAL SERVICES & SUPPLIES - 2.1% | ||||||||
Copart 1 | 45,100 | $ | 2,154,878 | |||||
UniFirst Corporation | 8,240 | 1,178,897 | ||||||
| 3,333,775 | ||||||||
| CONSTRUCTION & ENGINEERING - 0.6% | ||||||||
Comfort Systems USA | 21,200 | 926,016 | ||||||
| ELECTRICAL EQUIPMENT - 3.2% | ||||||||
Hubbell Cl. B | 22,721 | 2,257,104 | ||||||
Sensata Technologies Holding 1 | 59,750 | 2,679,190 | ||||||
| 4,936,294 | ||||||||
| INDUSTRIAL CONGLOMERATES - 2.8% | ||||||||
Carlisle Companies | 43,103 | 4,332,713 | ||||||
| MACHINERY - 5.1% | ||||||||
†Allison Transmission Holdings | 69,000 | 3,029,790 | ||||||
Franklin Electric | 21,960 | 941,645 | ||||||
Lincoln Electric Holdings | 49,960 | 3,939,346 | ||||||
| 7,910,781 | ||||||||
| MARINE - 3.0% | ||||||||
Kirby Corporation 1 | 68,450 | 4,610,792 | ||||||
| PROFESSIONAL SERVICES - 0.8% | ||||||||
ManpowerGroup | 19,000 | 1,231,200 | ||||||
| ROAD & RAIL - 2.0% | ||||||||
†J.B. Hunt Transport Services | 7,700 | 716,408 | ||||||
Landstar System | 25,810 | 2,469,243 | ||||||
| 3,185,651 | ||||||||
| TRADING COMPANIES & DISTRIBUTORS - 2.6% | ||||||||
Air Lease Cl. A | 112,300 | 3,392,583 | ||||||
Diploma | 13,585 | 209,517 | ||||||
Watsco | 3,000 | 417,420 | ||||||
| 4,019,520 | ||||||||
| Total (Cost $42,549,256) | 42,835,611 | |||||||
| INFORMATION TECHNOLOGY – 12.1% | ||||||||
| ELECTRONIC EQUIPMENT, INSTRUMENTS & COMPONENTS - 5.8% | ||||||||
AVX Corporation | 26,800 | 408,700 | ||||||
Coherent 1 | 18,590 | 1,965,149 | ||||||
FLIR Systems | 64,500 | 2,808,330 | ||||||
Littelfuse | 15,300 | 2,623,644 | ||||||
| 50,000 | 889,000 | |||||||
Zebra Technologies Cl. A 1 | 1,810 | 288,206 | ||||||
| 8,983,029 | ||||||||
| IT SERVICES - 0.7% | ||||||||
| 7,200 | 1,008,432 | |||||||
| SEMICONDUCTORS & SEMICONDUCTOR EQUIPMENT - 5.6% | ||||||||
Cabot Microelectronics | 34,320 | 3,272,412 | ||||||
†Entegris | 96,300 | 2,686,289 | ||||||
MKS Instruments | 43,320 | 2,798,905 | ||||||
| 8,757,606 | ||||||||
| Total (Cost $20,384,208) | 18,749,067 | |||||||
| MATERIALS – 14.1% | ||||||||
| CHEMICALS - 7.7% | ||||||||
Innospec | 32,000 | 1,976,320 | ||||||
Minerals Technologies | 76,846 | 3,945,274 | ||||||
NewMarket Corporation | 4,780 | 1,969,790 | ||||||
Sensient Technologies | 31,342 | 1,750,451 | ||||||
Westlake Chemical | 36,350 | 2,405,279 | ||||||
| 12,047,114 | ||||||||
| CONTAINERS & PACKAGING - 0.9% | ||||||||
†Packaging Corporation of America | 16,100 | 1,343,706 | ||||||
| METALS & MINING - 2.8% | ||||||||
Kaiser Aluminum | 17,560 | 1,567,933 | ||||||
Reliance Steel & Aluminum | 39,655 | 2,822,246 | ||||||
| 4,390,179 | ||||||||
| PAPER & FOREST PRODUCTS - 2.7% | ||||||||
Stella-Jones | 143,000 | 4,149,011 | ||||||
| Total (Cost $23,903,779) | 21,930,010 | |||||||
| REAL ESTATE – 2.9% | ||||||||
| REAL ESTATE MANAGEMENT & DEVELOPMENT - 2.9% | ||||||||
Jones Lang LaSalle | 10,209 | 1,292,459 | ||||||
Kennedy-Wilson Holdings | 123,400 | 2,242,178 | ||||||
Marcus & Millichap 1 | 30,000 | 1,029,900 | ||||||
| Total (Cost $4,489,900) | 4,564,537 | |||||||
| UTILITIES – 2.4% | ||||||||
| GAS UTILITIES - 2.4% | ||||||||
UGI Corporation | 70,000 | 3,734,500 | ||||||
| Total (Cost $2,411,237) | 3,734,500 | |||||||
| TOTAL COMMON STOCKS | ||||||||
| (Cost $143,878,463) | 141,570,581 | |||||||
| REPURCHASE AGREEMENT – 8.9% | ||||||||
| Fixed Income Clearing Corporation, 0.50% dated 12/31/18, due 1/2/19, maturity value | ||||||||
| $13,754,382 (collateralized by obligations of various U.S. Government Agencies, 2.125% | ||||||||
| due 07/31/24, valued at $14,031,769) | ||||||||
| (Cost $13,754,000) | 13,754,000 | |||||||
| TOTAL INVESTMENTS – 100.1% | ||||||||
| (Cost $157,632,463) | 155,324,581 | |||||||
| LIABILITIES LESS CASH AND OTHER ASSETS – (0.1)% | (164,108 | ) | ||||||
| NET ASSETS – 100.0% | $ | 155,160,473 | ||||||
| THE ACCOMPANYING NOTES ARE AN INTEGRAL PART OF THESE FINANCIAL STATEMENTS | The Royce Funds 2018 Annual Report to Shareholders | 63 |
| Schedules of Investments |
| Royce Smaller-Companies Growth Fund |
| Common Stocks – 97.6% |
| SHARES | VALUE | |||||||
| COMMUNICATION SERVICES – 1.6% | ||||||||
| DIVERSIFIED TELECOMMUNICATION SERVICES - 0.5% | ||||||||
Bandwidth Cl. A 1 | 35,000 | $ | 1,426,250 | |||||
| MEDIA - 0.3% | ||||||||
†Marchex Cl. B | 253,099 | 670,712 | ||||||
| WIRELESS TELECOMMUNICATION SERVICES - 0.8% | ||||||||
| 95,000 | 1,954,150 | |||||||
| Total (Cost $4,321,861) | 4,051,112 | |||||||
| CONSUMER DISCRETIONARY – 9.3% | ||||||||
| HOTELS, RESTAURANTS & LEISURE - 2.0% | ||||||||
Dave & Busters Entertainment | 55,000 | 2,450,800 | ||||||
Texas Roadhouse | 46,000 | 2,746,200 | ||||||
| 5,197,000 | ||||||||
| HOUSEHOLD DURABLES - 1.4% | ||||||||
| 150,272 | 3,447,240 | |||||||
| INTERNET & DIRECT MARKETING RETAIL - 1.6% | ||||||||
| 198,000 | 2,051,280 | |||||||
| 188,000 | 2,007,840 | |||||||
| 4,059,120 | ||||||||
| LEISURE PRODUCTS - 0.5% | ||||||||
Callaway Golf | 85,000 | 1,300,500 | ||||||
| MULTILINE RETAIL - 0.2% | ||||||||
| 9,000 | 598,590 | |||||||
| SPECIALTY RETAIL - 3.1% | ||||||||
| 19,000 | 621,490 | |||||||
†Dick’s Sporting Goods | 76,000 | 2,371,200 | ||||||
| 7,000 | 716,240 | |||||||
Monro | 62,000 | 4,262,500 | ||||||
| 7,971,430 | ||||||||
| TEXTILES, APPAREL & LUXURY GOODS - 0.5% | ||||||||
Columbia Sportswear | 15,000 | 1,261,350 | ||||||
| Total (Cost $21,405,357) | 23,835,230 | |||||||
| CONSUMER STAPLES – 1.9% | ||||||||
| BEVERAGES - 0.4% | ||||||||
| 75,000 | 1,050,750 | |||||||
| FOOD PRODUCTS - 1.5% | ||||||||
Farmer Bros. 1 | 66,000 | 1,539,780 | ||||||
| 73,000 | 2,347,680 | |||||||
| 3,887,460 | ||||||||
| Total (Cost $4,250,389) | 4,938,210 | |||||||
| ENERGY – 2.2% | ||||||||
| OIL, GAS & CONSUMABLE FUELS - 2.2% | ||||||||
Centennial Resource Development Cl. A 1 | 142,000 | 1,564,840 | ||||||
| 216,000 | 2,421,360 | |||||||
†Viper Energy Partners L.P. | 60,000 | 1,562,400 | ||||||
| Total (Cost $6,243,903) | 5,548,600 | |||||||
| FINANCIALS – 12.0% | ||||||||
| BANKS - 7.7% | ||||||||
Banc of California | 148,000 | 1,969,880 | ||||||
Enterprise Financial Services | 71,500 | 2,690,545 | ||||||
†Great Western Bancorp | 21,000 | 656,250 | ||||||
Seacoast Banking Corporation of Florida 1 | 146,000 | 3,798,920 | ||||||
ServisFirst Bancshares | 71,000 | 2,262,770 | ||||||
†Southern National Bancorp of Virginia | 53,000 | 700,660 | ||||||
TriState Capital Holdings 1 | 283,057 | 5,508,289 | ||||||
Webster Financial | 43,000 | 2,119,470 | ||||||
| 19,706,784 | ||||||||
| CAPITAL MARKETS - 3.2% | ||||||||
MarketAxess Holdings | 9,000 | 1,901,790 | ||||||
Northern Trust | 51,000 | 4,263,090 | ||||||
†PJT Partners Cl. A | 18,000 | 697,680 | ||||||
WisdomTree Investments | 208,000 | 1,383,200 | ||||||
| 8,245,760 | ||||||||
| THRIFTS & MORTGAGE FINANCE - 1.1% | ||||||||
| 7,000 | 1,536,990 | |||||||
OceanFirst Financial | 63,000 | 1,418,130 | ||||||
| 2,955,120 | ||||||||
| Total (Cost $27,584,272) | 30,907,664 | |||||||
| HEALTH CARE – 21.4% | ||||||||
| BIOTECHNOLOGY - 6.3% | ||||||||
| 27,000 | 678,780 | |||||||
| 12,000 | 1,628,400 | |||||||
Myriad Genetics 1 | 10,000 | 290,700 | ||||||
Oxford Biomedica 1 | 224,000 | 2,019,129 | ||||||
Progenics Pharmaceuticals 1 | 377,200 | 1,584,240 | ||||||
| 28,000 | 1,174,600 | |||||||
| 21,000 | 241,080 | |||||||
uniQure 1 | 60,000 | 1,729,200 | ||||||
| 247,150 | 3,109,147 | |||||||
| 160,000 | 2,784,000 | |||||||
| 135,000 | 1,032,750 | |||||||
| 16,272,026 | ||||||||
| HEALTH CARE EQUIPMENT & SUPPLIES - 8.7% | ||||||||
Apyx Medical 1 | 695,000 | 4,503,600 | ||||||
| 101,000 | 2,063,430 | |||||||
†CONMED Corporation | 29,000 | 1,861,800 | ||||||
CryoPort 1 | 240,198 | 2,649,384 | ||||||
Inogen 1 | 16,255 | 2,018,383 | ||||||
| 18,000 | 1,026,000 | |||||||
Penumbra 1 | 17,000 | 2,077,400 | ||||||
| 765,441 | 333,426 | |||||||
| 463,000 | 2,810,410 | |||||||
West Pharmaceutical Services | 29,000 | 2,842,870 | ||||||
| 22,186,703 | ||||||||
| HEALTH CARE PROVIDERS & SERVICES - 1.4% | ||||||||
| 10,000 | 678,800 | |||||||
| 64,984 | 1,289,933 | |||||||
HealthEquity 1 | 19,000 | 1,133,350 | ||||||
| 25,000 | 586,750 | |||||||
| 3,688,833 | ||||||||
| HEALTH CARE TECHNOLOGY - 1.5% | ||||||||
| 71,000 | 1,416,450 | |||||||
| 27,000 | 1,721,520 | |||||||
| 20,000 | 787,000 | |||||||
| 3,924,970 | ||||||||
| LIFE SCIENCES TOOLS & SERVICES - 2.4% | ||||||||
| 148,400 | 1,279,208 | |||||||
| 508,600 | 1,617,348 | |||||||
Quanterix Corporation 1 | 177,600 | 3,251,856 | ||||||
| 6,148,412 | ||||||||
| PHARMACEUTICALS - 1.1% | ||||||||
Intersect ENT 1 | 100,000 | 2,818,000 | ||||||
| Total (Cost $52,602,144) | 55,038,944 | |||||||
| 64 | The Royce Funds 2018 Annual Report to Shareholders | THE ACCOMPANYING NOTES ARE AN INTEGRAL PART OF THESE FINANCIAL STATEMENTS |
| December 31, 2018 |
| Royce Smaller-Companies Growth Fund (continued) |
| SHARES | VALUE | |||||||
| INDUSTRIALS – 15.8% | ||||||||
| AEROSPACE & DEFENSE - 3.5% | ||||||||
| 22,500 | $ | 1,528,875 | ||||||
†BWX Technologies | 17,000 | 649,910 | ||||||
Cubic Corporation | 46,000 | 2,472,040 | ||||||
| 641,000 | 4,288,290 | |||||||
| 8,939,115 | ||||||||
| AIR FREIGHT & LOGISTICS - 0.8% | ||||||||
| 47,000 | 1,982,930 | |||||||
| BUILDING PRODUCTS - 0.7% | ||||||||
DIRTT Environmental Solutions 1 | 388,000 | 1,736,507 | ||||||
| CONSTRUCTION & ENGINEERING - 0.7% | ||||||||
NV5 Global 1 | 31,585 | 1,912,472 | ||||||
| ELECTRICAL EQUIPMENT - 0.9% | ||||||||
American Superconducter 1 | 202,349 | 2,256,191 | ||||||
| MACHINERY - 3.1% | ||||||||
| 140,000 | 2,620,800 | |||||||
| 126,000 | 1,861,020 | |||||||
Proto Labs 1 | 11,000 | 1,240,690 | ||||||
Woodward | 30,000 | 2,228,700 | ||||||
| 7,951,210 | ||||||||
| MARINE - 2.9% | ||||||||
Clarkson | 129,976 | 3,147,680 | ||||||
Scorpio Bulkers | 362,000 | 2,001,860 | ||||||
Star Bulk Carriers 1 | 244,000 | 2,230,160 | ||||||
| 7,379,700 | ||||||||
| PROFESSIONAL SERVICES - 2.4% | ||||||||
ASGN 1 | 36,000 | 1,962,000 | ||||||
| 334,647 | 4,219,899 | |||||||
| 6,181,899 | ||||||||
| TRADING COMPANIES & DISTRIBUTORS - 0.8% | ||||||||
| 68,000 | 2,148,800 | |||||||
| Total (Cost $45,398,970) | 40,488,824 | |||||||
| INFORMATION TECHNOLOGY – 28.6% | ||||||||
| COMMUNICATIONS EQUIPMENT - 1.6% | ||||||||
| 63,000 | 2,646,630 | |||||||
| 100,000 | 1,435,000 | |||||||
| 4,081,630 | ||||||||
| ELECTRONIC EQUIPMENT, INSTRUMENTS & COMPONENTS - 5.0% | ||||||||
| 239,511 | 2,373,554 | |||||||
FLIR Systems | 67,600 | 2,943,304 | ||||||
| 1,457,000 | 5,434,610 | |||||||
Knowles Corporation 1 | 132,000 | 1,756,920 | ||||||
Seeing Machines 1 | 7,875,700 | 421,611 | ||||||
| 12,929,999 | ||||||||
| IT SERVICES - 2.9% | ||||||||
| 20,000 | 1,786,000 | |||||||
Unisys Corporation 1 | 483,000 | 5,617,290 | ||||||
| 7,403,290 | ||||||||
| SEMICONDUCTORS & SEMICONDUCTOR EQUIPMENT - 5.0% | ||||||||
AXT 1 | 360,000 | 1,566,000 | ||||||
Brooks Automation | 91,000 | 2,382,380 | ||||||
CyberOptics Corporation 1 | 158,000 | 2,785,540 | ||||||
MagnaChip Semiconductor 1 | 249,961 | 1,552,258 | ||||||
| 29,000 | 2,285,490 | |||||||
Silicon Motion Technology ADR | 9,000 | 310,500 | ||||||
Universal Display | 20,000 | 1,871,400 | ||||||
| 12,753,568 | ||||||||
| SOFTWARE - 13.0% | ||||||||
| 32,000 | 1,659,840 | |||||||
| 25,000 | 778,750 | |||||||
| 41,000 | 2,327,160 | |||||||
Five9 1 | 40,000 | 1,748,800 | ||||||
| 26,000 | 675,740 | |||||||
| 49,000 | 1,837,990 | |||||||
| 169,000 | 3,187,340 | |||||||
| 392,577 | 7,863,318 | |||||||
| 89,786 | 5,406,015 | |||||||
| 75,000 | 1,766,250 | |||||||
QAD Cl. A | 76,000 | 2,989,080 | ||||||
RingCentral Cl. A 1 | 31,000 | 2,555,640 | ||||||
| 47,000 | 697,950 | |||||||
| 33,493,873 | ||||||||
| TECHNOLOGY HARDWARE, STORAGE & PERIPHERALS - 1.1% | ||||||||
USA Technologies 1 | 701,000 | 2,726,890 | ||||||
| Total (Cost $65,124,961) | 73,389,250 | |||||||
| MATERIALS – 2.1% | ||||||||
| CHEMICALS - 1.3% | ||||||||
Albemarle Corporation | 20,000 | 1,541,400 | ||||||
†American Vanguard | 125,000 | 1,898,750 | ||||||
| 3,440,150 | ||||||||
| METALS & MINING - 0.8% | ||||||||
Cobalt 27 Capital 1 | 234,000 | 565,632 | ||||||
Orocobre 1 | 642,350 | 1,461,378 | ||||||
| 2,027,010 | ||||||||
| Total (Cost $6,231,876) | 5,467,160 | |||||||
| REAL ESTATE – 2.7% | ||||||||
| EQUITY REAL ESTATE INVESTMENT TRUSTS (REITS) - 2.7% | ||||||||
Community Healthcare Trust | 128,000 | 3,690,240 | ||||||
CyrusOne | 62,000 | 3,278,560 | ||||||
| Total (Cost $4,102,733) | 6,968,800 | |||||||
| TOTAL COMMON STOCKS | ||||||||
| (Cost $237,266,466) | 250,633,794 | |||||||
| REPURCHASE AGREEMENT – 3.0% | ||||||||
| Fixed Income Clearing Corporation, 0.50% dated 12/31/18, due 1/2/19, maturity value | ||||||||
| $7,619,212 (collateralized by obligations of various U.S. Government Agencies, 0.125% | ||||||||
| due 07/15/24, valued at $7,773,497) | ||||||||
| (Cost $7,619,000) | 7,619,000 | |||||||
| COLLATERAL RECEIVED FOR SECURITIES LOANED – 5.5% | ||||||||
| Money Market Funds | ||||||||
Federated Government Obligations Fund (7 day yield-2.2268%) | ||||||||
| (Cost $14,169,776) | 14,169,776 | |||||||
| TOTAL INVESTMENTS – 106.1% | ||||||||
| (Cost $259,055,242) | 272,422,570 | |||||||
| LIABILITIES LESS CASH AND OTHER ASSETS – (6.1)% | (15,659,546 | ) | ||||||
| NET ASSETS – 100.0% | $ | 256,763,024 | ||||||
| THE ACCOMPANYING NOTES ARE AN INTEGRAL PART OF THESE FINANCIAL STATEMENTS | The Royce Funds 2018 Annual Report to Shareholders | 65 |
| Schedules of Investments |
| Royce Special Equity Fund |
| Common Stocks – 90.7% |
| SHARES | VALUE | |||||||
| COMMUNICATION SERVICES – 11.0% | ||||||||
| MEDIA - 11.0% | ||||||||
Meredith Corporation | 1,312,000 | $ | 68,145,280 | |||||
Scholastic Corporation | 1,598,000 | 64,335,480 | ||||||
| Total (Cost $98,262,686) | 132,480,760 | |||||||
| CONSUMER DISCRETIONARY – 24.5% | ||||||||
| AUTO COMPONENTS - 11.5% | ||||||||
Cooper Tire & Rubber | 1,565,000 | 50,596,450 | ||||||
Gentex Corporation | 1,010,000 | 20,412,100 | ||||||
Standard Motor Products 5 | 1,380,000 | 66,833,400 | ||||||
| 137,841,950 | ||||||||
| AUTOMOBILES - 1.3% | ||||||||
Winnebago Industries | 635,000 | 15,373,350 | ||||||
| DIVERSIFIED CONSUMER SERVICES - 2.2% | ||||||||
†Strategic Education | 231,000 | 26,200,020 | ||||||
| HOTELS, RESTAURANTS & LEISURE - 0.4% | ||||||||
Bowl America Cl. A 5 | 343,000 | 5,230,750 | ||||||
| HOUSEHOLD DURABLES - 4.7% | ||||||||
Bassett Furniture Industries | 462,000 | 9,258,480 | ||||||
Flexsteel Industries 5 | 775,000 | 17,112,000 | ||||||
Hooker Furniture 5 | 1,155,000 | 30,422,700 | ||||||
| 56,793,180 | ||||||||
| LEISURE PRODUCTS - 0.5% | ||||||||
Johnson Outdoors Cl. A | 106,000 | 6,226,440 | ||||||
| SPECIALTY RETAIL - 3.9% | ||||||||
Children’s Place | 326,200 | 29,387,358 | ||||||
Haverty Furniture | 965,000 | 18,122,700 | ||||||
| 47,510,058 | ||||||||
| Total (Cost $260,734,921) | 295,175,748 | |||||||
| CONSUMER STAPLES – 9.5% | ||||||||
FOOD & STAPLES RETAILING - 4.0% | ||||||||
Weis Markets | 1,004,200 | 47,980,676 | ||||||
| FOOD PRODUCTS - 4.2% | ||||||||
John B. Sanfilippo & Son 5 | 911,500 | 50,734,090 | ||||||
| TOBACCO - 1.3% | ||||||||
Universal Corporation | 292,500 | 15,838,875 | ||||||
| Total (Cost $108,681,990) | 114,553,641 | |||||||
| ENERGY – 1.0% | ||||||||
| ENERGY EQUIPMENT & SERVICES - 1.0% | ||||||||
RPC | 1,162,500 | 11,473,875 | ||||||
| Total (Cost $16,009,179) | 11,473,875 | |||||||
| INDUSTRIALS – 20.4% | ||||||||
| AEROSPACE & DEFENSE - 4.1% | ||||||||
National Presto Industries 5 | 421,800 | 49,316,856 | ||||||
| BUILDING PRODUCTS - 1.2% | ||||||||
Insteel Industries | 605,500 | 14,701,540 | ||||||
| COMMERCIAL SERVICES & SUPPLIES - 5.7% | ||||||||
Ennis | 860,000 | 16,555,000 | ||||||
UniFirst Corporation | 365,000 | 52,220,550 | ||||||
| 68,775,550 | ||||||||
| CONSTRUCTION & ENGINEERING - 0.9% | ||||||||
Argan | 270,000 | 10,216,800 | ||||||
| ELECTRICAL EQUIPMENT - 4.4% | ||||||||
Hubbell Cl. B | 532,200 | 52,868,748 | ||||||
| MACHINERY - 3.2% | ||||||||
| 1,033,500 | 11,337,495 | |||||||
Hurco Companies 5 | 580,400 | 20,720,280 | ||||||
†Miller Industries | 240,100 | 6,482,700 | ||||||
| 38,540,475 | ||||||||
| PROFESSIONAL SERVICES - 0.9% | ||||||||
Resources Connection | 790,000 | 11,218,000 | ||||||
| Total (Cost $147,561,571) | 245,637,969 | |||||||
| INFORMATION TECHNOLOGY – 17.4% | ||||||||
| ELECTRONIC EQUIPMENT, INSTRUMENTS & COMPONENTS - 9.2% | ||||||||
AVX Corporation | 3,640,000 | 55,510,000 | ||||||
Park Electrochemical | 492,000 | 8,890,440 | ||||||
Vishay Intertechnology | 2,585,000 | 46,555,850 | ||||||
| 110,956,290 | ||||||||
| IT SERVICES - 3.2% | ||||||||
| 779,000 | 38,950,000 | |||||||
| SEMICONDUCTORS & SEMICONDUCTOR EQUIPMENT - 5.0% | ||||||||
| 643,000 | 11,445,400 | |||||||
Kulicke & Soffa Industries | 1,185,000 | 24,019,950 | ||||||
Teradyne | 790,000 | 24,790,200 | ||||||
| 60,255,550 | ||||||||
| Total (Cost $166,542,936) | 210,161,840 | |||||||
| MATERIALS – 3.1% | ||||||||
| CHEMICALS - 1.7% | ||||||||
†Huntsman Corporation | 1,046,900 | 20,194,701 | ||||||
| METALS & MINING - 1.1% | ||||||||
Kaiser Aluminum | 152,000 | 13,572,080 | ||||||
| PAPER & FOREST PRODUCTS - 0.3% | ||||||||
†Louisiana-Pacific Corporation | 150,000 | 3,333,000 | ||||||
| Total (Cost $36,002,287) | 37,099,781 | |||||||
| REAL ESTATE – 3.8% | ||||||||
| REAL ESTATE MANAGEMENT & DEVELOPMENT - 3.8% | ||||||||
Marcus & Millichap 1 | 1,346,400 | 46,221,912 | ||||||
| Total (Cost $36,946,146) | 46,221,912 | |||||||
| TOTAL COMMON STOCKS | ||||||||
| (Cost $870,741,716) | 1,092,805,526 | |||||||
| REPURCHASE AGREEMENT – 9.6% | ||||||||
| Fixed Income Clearing Corporation, 0.50% dated 12/31/18, due 1/2/19, maturity value | ||||||||
| $115,578,210 (collateralized by obligations of various U.S. Government Agencies, 0.125%- | ||||||||
| 2.125% due 07/15/24-07/31/24, valued at $117,891,492) | ||||||||
| (Cost $115,575,000) | 115,575,000 | |||||||
| TOTAL INVESTMENTS – 100.3% | ||||||||
| (Cost $986,316,716) | 1,208,380,526 | |||||||
| LIABILITIES LESS CASH AND OTHER ASSETS – (0.3)% | (4,010,301 | ) | ||||||
| NET ASSETS – 100.0% | $ | 1,204,370,225 | ||||||
| 66 | The Royce Funds 2018 Annual Report to Shareholders | THE ACCOMPANYING NOTES ARE AN INTEGRAL PART OF THESE FINANCIAL STATEMENTS |
| December 31, 2018 |
| Royce Special Equity Multi-Cap Fund |
| Common Stocks – 99.1% |
| SHARES | VALUE | |||||||
| CONSUMER DISCRETIONARY – 24.0% | ||||||||
| DISTRIBUTORS - 9.2% | ||||||||
Genuine Parts | 40,000 | $ | 3,840,800 | |||||
| HOTELS, RESTAURANTS & LEISURE - 4.3% | ||||||||
McDonald’s Corporation | 10,000 | 1,775,700 | ||||||
| SPECIALTY RETAIL - 10.5% | ||||||||
Lowe’s Companies | 47,500 | 4,387,100 | ||||||
| Total (Cost $7,099,007) | 10,003,600 | |||||||
| CONSUMER STAPLES – 4.8% | ||||||||
| HOUSEHOLD PRODUCTS - 4.8% | ||||||||
Procter & Gamble | 21,500 | 1,976,280 | ||||||
| Total (Cost $1,849,442) | 1,976,280 | |||||||
| INDUSTRIALS – 48.4% | ||||||||
| AEROSPACE & DEFENSE - 9.8% | ||||||||
General Dynamics | 13,000 | 2,043,730 | ||||||
United Technologies | 19,000 | 2,023,120 | ||||||
| 4,066,850 | ||||||||
| ELECTRICAL EQUIPMENT - 4.1% | ||||||||
Emerson Electric | 28,500 | 1,702,875 | ||||||
| INDUSTRIAL CONGLOMERATES - 8.0% | ||||||||
Carlisle Companies | 20,000 | 2,010,400 | ||||||
3M | 7,000 | 1,333,780 | ||||||
| 3,344,180 | ||||||||
| MACHINERY - 23.4% | ||||||||
Cummins | 13,500 | 1,804,140 | ||||||
Illinois Tool Works | 42,000 | 5,320,980 | ||||||
Lincoln Electric Holdings | 8,500 | 670,225 | ||||||
Parker Hannifin | 13,000 | 1,938,820 | ||||||
| 9,734,165 | ||||||||
| PROFESSIONAL SERVICES - 3.1% | ||||||||
ManpowerGroup | 20,000 | 1,296,000 | ||||||
| Total (Cost $15,028,823) | 20,144,070 | |||||||
| INFORMATION TECHNOLOGY – 13.5% | ||||||||
| COMMUNICATIONS EQUIPMENT - 8.6% | ||||||||
Cisco Systems | 82,000 | 3,553,060 | ||||||
| TECHNOLOGY HARDWARE, STORAGE & PERIPHERALS - 4.9% | ||||||||
Apple | 13,000 | 2,050,620 | ||||||
| Total (Cost $2,355,766) | 5,603,680 | |||||||
| MATERIALS – 8.4% | ||||||||
| CONTAINERS & PACKAGING - 8.4% | ||||||||
†Packaging Corporation of America | 42,000 | 3,505,320 | ||||||
| Total (Cost $4,325,624) | 3,505,320 | |||||||
| TOTAL COMMON STOCKS | ||||||||
| (Cost $30,658,662) | 41,232,950 | |||||||
| REPURCHASE AGREEMENT – 2.1% | ||||||||
| Fixed Income Clearing Corporation, 0.50% dated 12/31/18, due 1/2/19, maturity value | ||||||||
| $866,024 (collateralized by obligations of various U.S. Government Agencies, 0.125% due | ||||||||
| 07/15/24, valued at $886,943) | ||||||||
| (Cost $866,000) | 866,000 | |||||||
| TOTAL INVESTMENTS – 101.2% | ||||||||
| (Cost $31,524,662) | 42,098,950 | |||||||
| LIABILITIES LESS CASH AND OTHER ASSETS – (1.2)% | (479,605 | ) | ||||||
| NET ASSETS – 100.0% | $ | 41,619,345 | ||||||
| THE ACCOMPANYING NOTES ARE AN INTEGRAL PART OF THESE FINANCIAL STATEMENTS | The Royce Funds 2018 Annual Report to Shareholders | 67 |
| Schedules of Investments |
| Royce Total Return Fund |
| Common Stocks – 98.9% |
| SHARES | VALUE | |||||||
| COMMUNICATION SERVICES – 2.6% | ||||||||
| DIVERSIFIED TELECOMMUNICATION SERVICES - 0.8% | ||||||||
ATN International | 158,651 | $ | 11,348,306 | |||||
†IDT Corporation Cl. B | 47,475 | 293,870 | ||||||
| 11,642,176 | ||||||||
| MEDIA - 1.7% | ||||||||
Gannett Company | 270,618 | 2,308,372 | ||||||
Meredith Corporation | 349,348 | 18,145,135 | ||||||
Saga Communications Cl. A | 178,449 | 5,929,860 | ||||||
| 26,383,367 | ||||||||
| WIRELESS TELECOMMUNICATION SERVICES - 0.1% | ||||||||
Telephone and Data Systems | 48,374 | 1,574,090 | ||||||
| Total (Cost $33,518,832) | 39,599,633 | |||||||
| CONSUMER DISCRETIONARY – 6.7% | ||||||||
| AUTO COMPONENTS - 1.9% | ||||||||
Gentex Corporation | 715,267 | 14,455,546 | ||||||
LCI Industries | 99,166 | 6,624,289 | ||||||
Nokian Renkaat | 142,529 | 4,379,775 | ||||||
Standard Motor Products | 78,129 | 3,783,787 | ||||||
| 29,243,397 | ||||||||
| AUTOMOBILES - 0.5% | ||||||||
Thor Industries | 136,691 | 7,107,932 | ||||||
| DISTRIBUTORS - 0.4% | ||||||||
Weyco Group | 226,024 | 6,593,120 | ||||||
| HOTELS, RESTAURANTS & LEISURE - 0.3% | ||||||||
Brinker International | 35,187 | 1,547,524 | ||||||
Cheesecake Factory | 63,529 | 2,764,147 | ||||||
| 4,311,671 | ||||||||
| HOUSEHOLD DURABLES - 1.1% | ||||||||
Ethan Allen Interiors | 417,417 | 7,342,365 | ||||||
La-Z-Boy | 302,890 | 8,393,082 | ||||||
Tupperware Brands | 19,245 | 607,565 | ||||||
| 16,343,012 | ||||||||
| MULTILINE RETAIL - 0.2% | ||||||||
Big Lots | 33,082 | 956,732 | ||||||
Dillard’s Cl. A | 30,827 | 1,859,176 | ||||||
| 2,815,908 | ||||||||
| SPECIALTY RETAIL - 2.1% | ||||||||
Aaron’s | 33,634 | 1,414,310 | ||||||
American Eagle Outfitters | 430,563 | 8,322,783 | ||||||
†Bed Bath & Beyond | 57,429 | 650,096 | ||||||
Buckle (The) | 115,215 | 2,228,258 | ||||||
Caleres | 216,949 | 6,037,691 | ||||||
†Camping World Holdings Cl. A | 25,000 | 286,750 | ||||||
Cato Corporation (The) Cl. A | 69,690 | 994,476 | ||||||
Children’s Place | 40,024 | 3,605,762 | ||||||
DSW Cl. A | 122,431 | 3,024,046 | ||||||
†Penske Automotive Group | 92,877 | 3,744,800 | ||||||
Shoe Carnival | 86,815 | 2,909,171 | ||||||
| 33,218,143 | ||||||||
| TEXTILES, APPAREL & LUXURY GOODS - 0.2% | ||||||||
J.G. Boswell Company 3 | 1,014 | 557,700 | ||||||
Movado Group | 45,920 | 1,451,990 | ||||||
Steven Madden | 50,430 | 1,526,012 | ||||||
| 3,535,702 | ||||||||
| Total (Cost $87,497,029) | 103,168,885 | |||||||
| CONSUMER STAPLES – 4.6% | ||||||||
| BEVERAGES - 0.1% | ||||||||
Compania Cervecerias Unidas ADR | 84,864 | 2,132,632 | ||||||
| FOOD & STAPLES RETAILING - 1.1% | ||||||||
Village Super Market Cl. A | 623,592 | 16,674,850 | ||||||
| FOOD PRODUCTS - 3.1% | ||||||||
Flowers Foods | 268,963 | 4,967,746 | ||||||
Fresh Del Monte Produce | 187,818 | 5,309,615 | ||||||
Hershey Creamery 3 | 699 | 2,659,695 | ||||||
Lancaster Colony | 92,558 | 16,369,808 | ||||||
Tootsie Roll Industries | 532,900 | 17,798,860 | ||||||
| 47,105,724 | ||||||||
| HOUSEHOLD PRODUCTS - 0.2% | ||||||||
WD-40 Company | 15,918 | 2,917,133 | ||||||
| PERSONAL PRODUCTS - 0.1% | ||||||||
Nu Skin Enterprises Cl. A | 30,400 | 1,864,432 | ||||||
| Total (Cost $47,233,324) | 70,694,771 | |||||||
| ENERGY – 3.3% | ||||||||
| ENERGY EQUIPMENT & SERVICES - 2.5% | ||||||||
†Computer Modelling Group | 225,949 | 1,007,933 | ||||||
Helmerich & Payne | 173,660 | 8,325,260 | ||||||
Pason Systems | 915,250 | 12,261,883 | ||||||
RPC | 98,470 | 971,899 | ||||||
| 261,026 | 3,069,666 | |||||||
TGS-NOPEC Geophysical | 530,159 | 12,802,544 | ||||||
| 38,439,185 | ||||||||
| OIL, GAS & CONSUMABLE FUELS - 0.8% | ||||||||
Dorchester Minerals L.P. | 249,438 | 3,651,772 | ||||||
PBF Energy Cl. A | 71,551 | 2,337,571 | ||||||
Permian Basin Royalty Trust | 680,666 | 4,015,929 | ||||||
Sabine Royalty Trust | 9,095 | 339,062 | ||||||
San Juan Basin Royalty Trust | 370,621 | 1,778,981 | ||||||
| 12,123,315 | ||||||||
| Total (Cost $54,037,987) | 50,562,500 | |||||||
| FINANCIALS – 33.8% | ||||||||
| BANKS - 10.9% | ||||||||
Ames National | 228,658 | 5,812,486 | ||||||
Associated Banc-Corp | 387,327 | 7,665,201 | ||||||
Bank of Hawaii | 253,973 | 17,097,462 | ||||||
Bank of N.T. Butterfield & Son | 46,729 | 1,464,954 | ||||||
Bank OZK | 79,787 | 1,821,537 | ||||||
†Bar Harbor Bankshares | 153,155 | 3,435,267 | ||||||
BLOM Bank Cl. B GDR | 225,597 | 2,154,451 | ||||||
BOK Financial | 274,669 | 20,141,478 | ||||||
Camden National | 195,905 | 7,046,703 | ||||||
Canadian Western Bank | 514,560 | 9,814,784 | ||||||
City Holding Company | 93,071 | 6,290,669 | ||||||
CNB Financial | 213,917 | 4,909,395 | ||||||
Codorus Valley Bancorp | 84,644 | 1,798,685 | ||||||
Farmers & Merchants Bank of Long Beach 3 | 416 | 3,120,000 | ||||||
†Financial Institutions | 155,792 | 4,003,855 | ||||||
First Citizens BancShares Cl. A | 60,698 | 22,886,181 | ||||||
First National Bank Alaska 3 | 25,096 | 6,324,192 | ||||||
†First of Long Island (The) | 56,478 | 1,126,736 | ||||||
†Hanmi Financial | 50,032 | 985,630 | ||||||
Landmark Bancorp | 65,233 | 1,494,162 | ||||||
MidWestOne Financial Group | 240,524 | 5,972,211 | ||||||
National Bankshares | 124,127 | 4,521,947 | ||||||
Northrim BanCorp | 125,668 | 4,130,707 | ||||||
Peapack-Gladstone Financial | 416,627 | 10,490,668 | ||||||
Popular | 230,445 | 10,881,613 | ||||||
| 68 | The Royce Funds 2018 Annual Report to Shareholders | THE ACCOMPANYING NOTES ARE AN INTEGRAL PART OF THESE FINANCIAL STATEMENTS |
| December 31, 2018 |
| Royce Total Return Fund (continued) | ||||||||
| SHARES | VALUE | |||||||
| FINANCIALS (continued) | ||||||||
| BANKS (continued) | ||||||||
†State Bank Financial | 37,283 | $ | 804,940 | |||||
Unity Bancorp | 124,154 | 2,577,437 | ||||||
| 168,773,351 | ||||||||
| CAPITAL MARKETS - 11.3% | ||||||||
AllianceBernstein Holding L.P. | 371,187 | 10,140,829 | ||||||
Ares Management | 1,164,900 | 20,711,922 | ||||||
Artisan Partners Asset Management Cl. A | 185,754 | 4,107,021 | ||||||
Ashmore Group | 2,509,996 | 11,696,423 | ||||||
Associated Capital Group Cl. A | 163,721 | 5,767,891 | ||||||
†BlackRock TCP Capital | 96,747 | 1,261,581 | ||||||
Bolsa Mexicana de Valores | 4,831,182 | 8,235,633 | ||||||
Cohen & Steers | 311,498 | 10,690,611 | ||||||
Coronation Fund Managers | 470,890 | 1,353,349 | ||||||
Edmond de Rothschild (Suisse) | 219 | 3,342,151 | ||||||
Egyptian Financial Group-Hermes | ||||||||
Holding Company 1 | 1,298,385 | 1,091,049 | ||||||
Federated Investors Cl. B | 342,918 | 9,104,473 | ||||||
†FS KKR Capital | 96,747 | 501,150 | ||||||
GAMCO Investors Cl. A | 218,387 | 3,688,556 | ||||||
Houlihan Lokey Cl. A | 142,468 | 5,242,822 | ||||||
Moelis & Company Cl. A | 145,379 | 4,998,130 | ||||||
Morningstar | 25,808 | 2,834,751 | ||||||
MVC Capital | 280,165 | 2,300,155 | ||||||
Oaktree Capital Group LLC Cl. A | 415,142 | 16,501,895 | ||||||
Oaktree Specialty Lending | 240,330 | 1,016,596 | ||||||
Och-Ziff Capital Management Group LLC Cl. A | 595,020 | 547,418 | ||||||
†Pzena Investment Management Cl. A | 265,079 | 2,292,933 | ||||||
Rothschild & Co | 84,542 | 2,988,253 | ||||||
†Sprott | 3,337,775 | 6,283,388 | ||||||
TMX Group | 274,627 | 14,228,221 | ||||||
Value Partners Group | 9,631,870 | 6,679,146 | ||||||
Virtu Financial Cl. A | 385,154 | 9,921,567 | ||||||
Vontobel Holding | 64,993 | 3,332,635 | ||||||
Waddell & Reed Financial Cl. A | 88,586 | 1,601,635 | ||||||
Westwood Holdings Group | 69,267 | 2,355,078 | ||||||
| 174,817,262 | ||||||||
| DIVERSIFIED FINANCIAL SERVICES - 0.2% | ||||||||
First Pacific | 638,477 | 246,242 | ||||||
Jefferies Financial Group | 118,274 | 2,053,237 | ||||||
| 2,299,479 | ||||||||
| INSURANCE - 9.3% | ||||||||
Alleghany Corporation | 31,287 | 19,501,813 | ||||||
Assured Guaranty | 262,488 | 10,048,041 | ||||||
E-L Financial | 42,586 | 22,958,758 | ||||||
Employers Holdings | 67,879 | 2,848,882 | ||||||
Erie Indemnity Cl. A | 215,451 | 28,721,773 | ||||||
First American Financial | 68,042 | 3,037,395 | ||||||
Horace Mann Educators | 16,715 | 625,977 | ||||||
James River Group Holdings | 127,626 | 4,663,454 | ||||||
Kingstone Companies | 115,428 | 2,041,921 | ||||||
Mercury General | 99,440 | 5,142,042 | ||||||
National Western Life Group Cl. A | 5,286 | 1,589,500 | ||||||
ProAssurance Corporation | 395,329 | 16,034,544 | ||||||
Protective Insurance Cl. B | 105,039 | 1,748,899 | ||||||
Reinsurance Group of America | 45,952 | 6,443,849 | ||||||
RLI Corp. | 113,293 | 7,816,084 | ||||||
State Auto Financial | 176,392 | 6,004,384 | ||||||
Universal Insurance Holdings | 55,976 | 2,122,610 | ||||||
White Mountains Insurance Group | 2,108 | 1,808,010 | ||||||
| 143,157,936 | ||||||||
| THRIFTS & MORTGAGE FINANCE - 2.1% | ||||||||
Genworth MI Canada | 456,102 | 13,430,487 | ||||||
New York Community Bancorp | 229,059 | 2,155,445 | ||||||
Southern Missouri Bancorp | 99,676 | 3,379,016 | ||||||
Timberland Bancorp | 139,163 | 3,103,335 | ||||||
TrustCo Bank Corp. NY | 1,044,223 | 7,163,370 | ||||||
†WSFS Financial | 82,000 | 3,108,620 | ||||||
| 32,340,273 | ||||||||
| Total (Cost $395,426,873) | 521,388,301 | |||||||
| HEALTH CARE – 1.4% | ||||||||
| HEALTH CARE EQUIPMENT & SUPPLIES - 1.1% | ||||||||
Atrion Corporation | 6,946 | 5,147,542 | ||||||
Hill-Rom Holdings | 99,926 | 8,848,447 | ||||||
Meridian Bioscience | 136,656 | 2,372,348 | ||||||
| 16,368,337 | ||||||||
| HEALTH CARE PROVIDERS & SERVICES - 0.3% | ||||||||
Chemed Corporation | 13,814 | 3,913,230 | ||||||
Ensign Group (The) | 39,314 | 1,524,990 | ||||||
| 5,438,220 | ||||||||
| Total (Cost $8,601,656) | 21,806,557 | |||||||
| INDUSTRIALS – 25.8% | ||||||||
| AEROSPACE & DEFENSE - 1.1% | ||||||||
HEICO Corporation | 192,359 | 14,903,975 | ||||||
†Magellan Aerospace | 236,239 | 2,592,192 | ||||||
| 17,496,167 | ||||||||
| AIRLINES - 0.7% | ||||||||
Allegiant Travel | 33,740 | 3,381,423 | ||||||
Hawaiian Holdings | 305,468 | 8,067,410 | ||||||
| 11,448,833 | ||||||||
| BUILDING PRODUCTS - 0.9% | ||||||||
A. O. Smith Corporation | 162,990 | 6,959,673 | ||||||
Apogee Enterprises | 181,350 | 5,413,297 | ||||||
†Owens Corning | 22,196 | 976,180 | ||||||
| 13,349,150 | ||||||||
| COMMERCIAL SERVICES & SUPPLIES - 6.0% | ||||||||
ABM Industries | 357,501 | 11,479,357 | ||||||
Deluxe Corporation | 29,870 | 1,148,203 | ||||||
Ennis | 158,306 | 3,047,391 | ||||||
Herman Miller | 164,942 | 4,989,496 | ||||||
HNI Corporation | 311,909 | 11,050,936 | ||||||
Kimball International Cl. B | 1,031,334 | 14,634,629 | ||||||
McGrath RentCorp | 251,393 | 12,941,712 | ||||||
MSA Safety | 114,271 | 10,772,327 | ||||||
Ritchie Bros. Auctioneers | 566,689 | 18,542,064 | ||||||
Tetra Tech | 19,829 | 1,026,547 | ||||||
UniFirst Corporation | 18,634 | 2,665,966 | ||||||
| 92,298,628 | ||||||||
| CONSTRUCTION & ENGINEERING - 1.7% | ||||||||
| 164,487 | 4,554,645 | |||||||
†Argan | 180,917 | 6,845,899 | ||||||
Comfort Systems USA | 134,828 | 5,889,287 | ||||||
EMCOR Group | 49,686 | 2,965,758 | ||||||
KBR | 442,611 | 6,718,835 | ||||||
| 26,974,424 | ||||||||
| THE ACCOMPANYING NOTES ARE AN INTEGRAL PART OF THESE FINANCIAL STATEMENTS | The Royce Funds 2018 Annual Report to Shareholders | 69 |
| Schedules of Investments |
| Royce Total Return Fund (continued) |
| SHARES | VALUE | |||||||
| INDUSTRIALS (continued) | ||||||||
| ELECTRICAL EQUIPMENT - 1.7% | ||||||||
EnerSys | 19,789 | $ | 1,535,824 | |||||
Hubbell Cl. B | 162,025 | 16,095,564 | ||||||
Preformed Line Products | 148,780 | 8,071,315 | ||||||
| 25,702,703 | ||||||||
| INDUSTRIAL CONGLOMERATES - 0.9% | ||||||||
Raven Industries | 396,046 | 14,332,905 | ||||||
| MACHINERY - 8.7% | ||||||||
Alamo Group | 71,433 | 5,523,200 | ||||||
Federal Signal | 73,582 | 1,464,282 | ||||||
Franklin Electric | 411,326 | 17,637,659 | ||||||
Gorman-Rupp Company (The) | 299,110 | 9,694,155 | ||||||
Greenbrier Companies (The) | 46,439 | 1,836,198 | ||||||
Hillenbrand | 23,281 | 883,048 | ||||||
Kadant | 21,913 | 1,785,033 | ||||||
Lincoln Electric Holdings | 129,146 | 10,183,162 | ||||||
Lindsay Corporation | 139,140 | 13,392,225 | ||||||
Miller Industries | 340,809 | 9,201,843 | ||||||
Mueller Industries | 224,912 | 5,253,944 | ||||||
Nordson Corporation | 34,372 | 4,102,298 | ||||||
Standex International | 38,997 | 2,619,819 | ||||||
| 387,817 | 2,028,283 | |||||||
Sun Hydraulics | 135,726 | 4,504,746 | ||||||
Tennant Company | 254,929 | 13,284,350 | ||||||
Trinity Industries | 493,461 | 10,160,362 | ||||||
Wabash National | 798,955 | 10,450,331 | ||||||
Woodward | 139,730 | 10,380,542 | ||||||
| 134,385,480 | ||||||||
| MARINE - 0.8% | ||||||||
Clarkson | 526,371 | 12,747,335 | ||||||
| PROFESSIONAL SERVICES - 2.4% | ||||||||
Exponent | 65,637 | 3,328,452 | ||||||
Forrester Research | 35,774 | 1,599,098 | ||||||
Heidrick & Struggles International | 156,593 | 4,884,136 | ||||||
†Kforce | 100,285 | 3,100,812 | ||||||
Korn Ferry | 119,500 | 4,725,030 | ||||||
ManpowerGroup | 268,528 | 17,400,614 | ||||||
Robert Half International | 26,721 | 1,528,441 | ||||||
| 36,566,583 | ||||||||
| ROAD & RAIL - 0.2% | ||||||||
Werner Enterprises | 106,178 | 3,136,498 | ||||||
| TRADING COMPANIES & DISTRIBUTORS - 0.6% | ||||||||
†Air Lease Cl. A | 111,850 | 3,378,988 | ||||||
Applied Industrial Technologies | 40,102 | 2,163,102 | ||||||
Systemax | 181,438 | 4,334,554 | ||||||
| 9,876,644 | ||||||||
| TRANSPORTATION INFRASTRUCTURE - 0.1% | ||||||||
Grupo Aeroportuario del Pacifico | 96,468 | 786,107 | ||||||
| Total (Cost $225,798,886) | 399,101,457 | |||||||
| INFORMATION TECHNOLOGY – 5.9% | ||||||||
| COMMUNICATIONS EQUIPMENT - 0.1% | ||||||||
ADTRAN | 122,753 | 1,318,367 | ||||||
| ELECTRONIC EQUIPMENT, INSTRUMENTS & COMPONENTS - 3.8% | ||||||||
AVX Corporation | 843,491 | 12,863,238 | ||||||
Bel Fuse Cl. A | 18,665 | 256,644 | ||||||
†Benchmark Electronics | 30,965 | 655,839 | ||||||
Methode Electronics | 600,648 | 13,989,092 | ||||||
National Instruments | 217,556 | 9,872,691 | ||||||
PC Connection | 295,773 | 8,793,331 | ||||||
Vishay Intertechnology | 729,316 | 13,134,981 | ||||||
| 59,565,816 | ||||||||
| IT SERVICES - 0.2% | ||||||||
MAXIMUS | 45,899 | 2,987,566 | ||||||
| SEMICONDUCTORS & SEMICONDUCTOR EQUIPMENT - 1.4% | ||||||||
†Kulicke & Soffa Industries | 461,421 | 9,353,003 | ||||||
MKS Instruments | 106,090 | 6,854,475 | ||||||
Silicon Motion Technology ADR | 157,456 | 5,432,232 | ||||||
| 21,639,710 | ||||||||
| SOFTWARE - 0.4% | ||||||||
Ebix | 45,156 | 1,921,839 | ||||||
j2 Global | 60,854 | 4,222,051 | ||||||
| 6,143,890 | ||||||||
| Total (Cost $75,517,852) | 91,655,349 | |||||||
| MATERIALS – 10.0% | ||||||||
| CHEMICALS - 5.6% | ||||||||
Albemarle Corporation | 92,103 | 7,098,378 | ||||||
Balchem Corporation | 121,321 | 9,505,501 | ||||||
Cabot Corporation | 285,296 | 12,250,610 | ||||||
Chase Corporation | 171,887 | 17,197,294 | ||||||
FutureFuel Corporation | 138,724 | 2,200,163 | ||||||
Minerals Technologies | 160,976 | 8,264,508 | ||||||
Quaker Chemical | 161,199 | 28,646,674 | ||||||
Trinseo | 30,678 | 1,404,439 | ||||||
| 86,567,567 | ||||||||
| CONTAINERS & PACKAGING - 1.7% | ||||||||
AptarGroup | 72,327 | 6,803,801 | ||||||
Mayr-Melnhof Karton | 49,643 | 6,256,629 | ||||||
Sonoco Products | 238,351 | 12,663,589 | ||||||
| 25,724,019 | ||||||||
| METALS & MINING - 2.2% | ||||||||
Carpenter Technology | 111,517 | 3,971,120 | ||||||
| 569,803 | 0 | |||||||
Franco-Nevada Corporation | 66,956 | 4,698,302 | ||||||
Gold Fields ADR | 1,219,803 | 4,293,706 | ||||||
Haynes International | 232,982 | 6,150,725 | ||||||
Reliance Steel & Aluminum | 24,410 | 1,737,260 | ||||||
Royal Gold | 16,715 | 1,431,640 | ||||||
Schnitzer Steel Industries Cl. A | 101,158 | 2,179,955 | ||||||
Worthington Industries | 293,982 | 10,242,333 | ||||||
| 34,705,041 | ||||||||
| PAPER & FOREST PRODUCTS - 0.5% | ||||||||
Domtar Corporation | 94,163 | 3,307,946 | ||||||
Neenah | 32,738 | 1,928,923 | ||||||
Pope Resources L.P. | 11,682 | 761,666 | ||||||
Resolute Forest Products | 80,107 | 635,249 | ||||||
Schweitzer-Mauduit International | 33,691 | 843,960 | ||||||
| 7,477,744 | ||||||||
| Total (Cost $81,706,527) | 154,474,371 | |||||||
| REAL ESTATE – 1.7% | ||||||||
| EQUITY REAL ESTATE INVESTMENT TRUSTS (REITS) - 0.7% | ||||||||
CBL & Associates Properties | 251,808 | 483,471 | ||||||
†Kite Realty Group Trust | 89,588 | 1,262,295 | ||||||
Lexington Realty Trust | 293,638 | 2,410,768 | ||||||
†PotlatchDeltic Corporation | 214,686 | 6,792,665 | ||||||
| 10,949,199 | ||||||||
| 70 | The Royce Funds 2018 Annual Report to Shareholders | THE ACCOMPANYING NOTES ARE AN INTEGRAL PART OF THESE FINANCIAL STATEMENTS |
| December 31, 2018 |
| Royce Total Return Fund (continued) | ||||||||
| SHARES | VALUE | |||||||
| REAL ESTATE (continued) | ||||||||
| REAL ESTATE MANAGEMENT & DEVELOPMENT - 1.0% | ||||||||
†Kennedy-Wilson Holdings | 805,129 | $ | 14,629,194 | |||||
| Total (Cost $26,390,527) | 25,578,393 | |||||||
| UTILITIES – 3.1% | ||||||||
| ELECTRIC UTILITIES - 0.6% | ||||||||
ALLETE | 129,881 | 9,899,530 | ||||||
| GAS UTILITIES - 0.2% | ||||||||
Star Group L.P. | 372,311 | 3,477,385 | ||||||
| WATER UTILITIES - 2.3% | ||||||||
Aqua America | 394,903 | 13,501,733 | ||||||
SJW Group | 307,922 | 17,126,622 | ||||||
York Water | 133,512 | 4,280,395 | ||||||
| 34,908,750 | ||||||||
| Total (Cost $20,144,733) | 48,285,665 | |||||||
| TOTAL COMMON STOCKS | ||||||||
| (Cost $1,055,874,226) | 1,526,315,882 | |||||||
| PRINCIPAL | ||||||||
| AMOUNT | ||||||||
| CORPORATE BONDS – 0.3% | ||||||||
†Meritor 6.25% | ||||||||
due 2/15/24 | $ | 825,000 | 787,875 | |||||
Unit Corporation 6.625% | ||||||||
due 5/15/21 | 4,269,155 | 3,884,931 | ||||||
| TOTAL CORPORATE BONDS | ||||||||
| (Cost $4,654,243) | 4,672,806 | |||||||
| TOTAL INVESTMENTS – 99.2% | ||||||||
| (Cost $1,060,528,469) | 1,530,988,688 | |||||||
| CASH AND OTHER ASSETS LESS LIABILITIES – 0.8% | 12,542,937 | |||||||
| NET ASSETS – 100.0% | $ | 1,543,531,625 | ||||||
| ADR – American Depository Receipt | |
| † | New additions in 2018. |
| 1 | Non-income producing. |
| 2 | All or a portion of these securities were on loan at December 31, 2018. |
| 3 | These securities are defined as Level 2 securities due to fair value being based on quoted prices for similar securities. See Notes to Financial Statements. |
| 4 | Securities for which market quotations are not readily available represent 0.0%, 0.6%, 0.0% and 0.0% of net assets for Royce Low-Priced Stock Fund, Royce Micro-Cap Fund, Royce Small/Mid-Cap Premier Fund and Royce Total Return Fund. These securities have been valued at their fair value under procedures approved by the Fund’s Board of Trustees. These securities are defined as Level 3 securities due to the use of significant unobservable inputs in the determination of fair value. See Notes to Financial Statements. |
| 5 | At December 31, 2018, the Fund owned 5% or more of the Company’s outstanding voting securities thereby making the Company an Affiliated Company as that term is defined in the Investment Company Act of 1940. See Notes to Financial Statements. |
Securities of Royce International Premier Fund are categorized by the country of their headquarters, with the exception of exchange-traded funds. | |
Bold indicates a Fund’s 20 largest equity holdings in terms of December 31, 2018, market value. |
| THE ACCOMPANYING NOTES ARE AN INTEGRAL PART OF THESE FINANCIAL STATEMENTS | The Royce Funds 2018 Annual Report to Shareholders | 71 |
| Statements of Assets and Liabilities |
| Royce Global | ||||||||||||||||
| Royce Dividend | Financial Services | Royce International | Royce Low-Priced | |||||||||||||
| Value Fund | Fund | Premier Fund | Stock Fund | |||||||||||||
| ASSETS: | ||||||||||||||||
| Investments at value (including collateral on loaned securities)1 | ||||||||||||||||
Non-Affiliated Companies | $ | 115,380,056 | $ | 39,034,793 | $ | 342,478,272 | $ | 198,881,548 | ||||||||
| Repurchase agreements (at cost and value) | – | 229,000 | 19,730,000 | 8,961,000 | ||||||||||||
| Cash and foreign currency2 | – | 155 | 2,257,620 | 8,812 | ||||||||||||
| Receivable for investments sold | 6,472,466 | 149,916 | 6,132,967 | 312,624 | ||||||||||||
| Receivable for capital shares sold | 720,284 | 11,050 | 5,216,499 | 24,959 | ||||||||||||
| Receivable for dividends and interest | 153,186 | 80,160 | 631,306 | 68,093 | ||||||||||||
| Receivable for securities lending income | – | – | – | 4,695 | ||||||||||||
| Prepaid expenses and other assets | 1,009 | 608 | 2,220 | – | ||||||||||||
| Total Assets | 122,727,001 | 39,505,682 | 376,448,884 | 208,261,731 | ||||||||||||
| LIABILITIES: | ||||||||||||||||
| Payable for collateral on loaned securities | – | – | – | 4,834,830 | ||||||||||||
| Payable to custodian for cash and foreign currency overdrawn | 1,034,763 | – | – | – | ||||||||||||
| Payable for investments purchased | – | – | 9,983,874 | 259,008 | ||||||||||||
| Payable for capital shares redeemed | 965,173 | 353,790 | 3,702,013 | 356,380 | ||||||||||||
| Payable for investment advisory fees | 82,959 | 26,218 | 252,418 | 176,893 | ||||||||||||
| Payable for trustees’ fees | 5,998 | 1,922 | 9,333 | 8,090 | ||||||||||||
| Accrued expenses | 116,775 | 59,746 | 247,292 | 600,402 | ||||||||||||
| Total Liabilities | 2,205,668 | 441,676 | 14,194,930 | 6,235,603 | ||||||||||||
| Net Assets | $ | 120,521,333 | $ | 39,064,006 | $ | 362,253,954 | $ | 202,026,128 | ||||||||
| ANALYSIS OF NET ASSETS: | ||||||||||||||||
| Paid-in capital | $ | 89,637,429 | $ | 35,653,152 | $ | 444,834,565 | $ | 188,645,408 | ||||||||
| Total distributable earnings (loss) | 30,883,904 | 3,410,854 | (82,580,611 | ) | 13,380,720 | |||||||||||
| Net Assets | $ | 120,521,333 | $ | 39,064,006 | $ | 362,253,954 | $ | 202,026,128 | ||||||||
Investment Class | $ | 88,036,475 | $ | 285,065,369 | $ | 46,430,314 | ||||||||||
Service Class | 28,119,718 | $ | 32,112,511 | 36,303,086 | 155,595,814 | |||||||||||
Consultant Class | 1,349,081 | 8,545,905 | ||||||||||||||
Institutional Class | 3,016,059 | 6,951,495 | 32,339,594 | |||||||||||||
| SHARES OUTSTANDING (unlimited number of $.001 par value): | ||||||||||||||||
Investment Class | 15,828,013 | 25,035,774 | 7,283,512 | |||||||||||||
Service Class | 4,907,936 | 3,923,678 | 2,667,427 | 24,562,747 | ||||||||||||
Consultant Class | 206,474 | 581,017 | ||||||||||||||
Institutional Class | 549,920 | 658,651 | 2,839,604 | |||||||||||||
| NET ASSET VALUES (Net Assets ÷ Shares Outstanding): | ||||||||||||||||
Investment Class3 | $ | 5.56 | $ | 11.39 | $ | 6.37 | ||||||||||
Service Class3 | 5.73 | $ | 8.18 | 13.61 | 6.33 | |||||||||||
Consultant Class4 | 6.53 | 14.71 | ||||||||||||||
Institutional Class5 | 5.48 | 10.55 | 11.39 | |||||||||||||
| Investments at identified cost | $ | 87,148,770 | $ | 35,292,694 | $ | 363,530,612 | $ | 186,564,591 | ||||||||
| Market value of loaned securities6 | – | – | – | 11,111,588 | ||||||||||||
| 1 | See Notes to Financial Statements for information on non-cash collateral on loaned securities. |
| 2 | Royce International Premier Fund includes $489 in cash and $2,257,131 (cost $2,247,106) in foreign currency. |
| 3 | Offering and redemption price per share; shares held less than 30 days may be subject to a 1% redemption fee, or a 2% redemption fee (Royce International Premier Fund) payable to the Fund. |
| 4 | Offering and redemption price per share; shares held less than 365 days may be subject to a 1% contingent deferred sales charge, payable to Royce Fund Services, LLC. |
| 5 | Offering and redemption price per share. |
| 6 | Market value of loaned securities backed by non-cash collateral is as of prior business day. |
| 72 | The Royce Funds 2018 Annual Report to Shareholders | THE ACCOMPANYING NOTES ARE AN INTEGRAL PART OF THESE FINANCIAL STATEMENTS |
| December 31, 2018 |
| Royce Micro-Cap | Royce Micro-Cap | Royce Opportunity | Royce Pennsylvania | |||||||||||||
| Fund | Opportunity Fund | Fund | Mutual Fund | |||||||||||||
| ASSETS: | ||||||||||||||||
| Investments at value (including collateral on loaned securities)1 | ||||||||||||||||
Non-Affiliated Companies | $ | 142,650,238 | $ | 15,773,879 | $ | 848,783,428 | $ | 1,571,882,109 | ||||||||
| Repurchase agreements (at cost and value) | 3,126,000 | 2,131,000 | 44,051,000 | – | ||||||||||||
| Cash and foreign currency | 480 | 729 | 586 | – | ||||||||||||
| Receivable for investments sold | 1,316,874 | 347,654 | 4,582,225 | 35,664,664 | ||||||||||||
| Receivable for capital shares sold | 80,464 | 3,000 | 2,575,190 | 3,748,303 | ||||||||||||
| Receivable for dividends and interest | 99,524 | 4,553 | 528,221 | 1,677,332 | ||||||||||||
| Receivable for securities lending income | 5,388 | – | 25,855 | 11,710 | ||||||||||||
| Prepaid expenses and other assets | 805 | 579 | 7,911 | 2,866,330 | ||||||||||||
| Total Assets | 147,279,773 | 18,261,394 | 900,554,416 | 1,615,850,448 | ||||||||||||
| LIABILITIES: | ||||||||||||||||
| Payable for collateral on loaned securities | 4,584,805 | – | 20,077,125 | 11,147,862 | ||||||||||||
| Payable to custodian for cash and foreign currency overdrawn | – | – | – | 8,606,852 | ||||||||||||
| Payable for investments purchased | 134,739 | 4,166 | 1,704,646 | 765,641 | ||||||||||||
| Payable for capital shares redeemed | 454,994 | 22,714 | 8,236,851 | 14,174,992 | ||||||||||||
| Payable for investment advisory fees | 158,495 | 18,245 | 803,711 | 1,091,736 | ||||||||||||
| Payable for trustees’ fees | 6,778 | 1,595 | 47,225 | 72,466 | ||||||||||||
| Accrued expenses | 167,460 | 26,266 | 456,326 | 906,737 | ||||||||||||
| Total Liabilities | 5,507,271 | 72,986 | 31,325,884 | 36,766,286 | ||||||||||||
| Net Assets | $ | 141,772,502 | $ | 18,188,408 | $ | 869,228,532 | $ | 1,579,084,162 | ||||||||
| ANALYSIS OF NET ASSETS: | ||||||||||||||||
| Paid-in capital | $ | 125,732,134 | $ | 15,096,838 | $ | 965,839,394 | $ | 1,185,801,399 | ||||||||
| Total distributable earnings (loss) | 16,040,368 | 3,091,570 | (96,610,862 | ) | 393,282,763 | |||||||||||
| Net Assets | $ | 141,772,502 | $ | 18,188,408 | $ | 869,228,532 | $ | 1,579,084,162 | ||||||||
Investment Class | $ | 117,040,213 | $ | 18,188,408 | $ | 557,003,458 | $ | 1,203,966,585 | ||||||||
Service Class | 8,052,517 | 48,796,715 | 32,191,197 | |||||||||||||
Consultant Class | 16,679,772 | 9,830,617 | 249,004,314 | |||||||||||||
Institutional Class | 227,260,733 | 83,908,171 | ||||||||||||||
R Class | 26,337,009 | 10,013,895 | ||||||||||||||
| SHARES OUTSTANDING (unlimited number of $.001 par value): | ||||||||||||||||
Investment Class | 12,512,702 | 1,531,707 | 56,123,037 | 155,276,838 | ||||||||||||
Service Class | 879,635 | 5,287,806 | 4,144,325 | |||||||||||||
Consultant Class | 2,306,358 | 1,214,833 | 40,285,369 | |||||||||||||
Institutional Class | 22,424,425 | 10,787,665 | ||||||||||||||
R Class | 2,959,500 | 1,372,678 | ||||||||||||||
| NET ASSET VALUES (Net Assets ÷ Shares Outstanding): | ||||||||||||||||
Investment Class2 | $ | 9.35 | $ | 11.87 | $ | 9.92 | $ | 7.75 | ||||||||
Service Class2 | 9.15 | 9.23 | 7.77 | |||||||||||||
Consultant Class3 | 7.23 | 8.09 | 6.18 | |||||||||||||
Institutional Class4 | 10.13 | 7.78 | ||||||||||||||
R Class4 | 8.90 | 7.30 | ||||||||||||||
| Investments at identified cost | $ | 127,378,532 | $ | 14,678,423 | $ | 949,832,620 | $ | 1,199,883,579 | ||||||||
| Market value of loaned securities5 | 6,069,277 | – | 68,113,989 | 31,228,766 | ||||||||||||
| 1 | See Notes to Financial Statements for information on non-cash collateral on loaned securities. |
| 2 | Offering and redemption price per share; shares held less than 30 days may be subject to a 1% redemption fee, payable to the Fund. |
| 3 | Offering and redemption price per share; shares held less than 365 days may be subject to a 1% contingent deferred sales charge, payable to Royce Fund Services, LLC. |
| 4 | Offering and redemption price per share. |
| 5 | Market value of loaned securities backed by non-cash collateral is as of prior business day. |
| THE ACCOMPANYING NOTES ARE AN INTEGRAL PART OF THESE FINANCIAL STATEMENTS | The Royce Funds 2018 Annual Report to Shareholders | 73 |
| Statements of Assets and Liabilities |
| Royce Small-Cap | Royce Small-Cap | Royce Small/Mid-Cap | ||||||||||||||
| Royce Premier Fund | Leaders Fund | Value Fund | Premier Fund | |||||||||||||
| ASSETS: | ||||||||||||||||
| Investments at value | ||||||||||||||||
Non-Affiliated Companies | $ | 1,618,249,915 | $ | 51,137,348 | $ | 182,043,304 | $ | 141,570,581 | ||||||||
Affiliated Companies | 21,825,833 | – | – | – | ||||||||||||
| Repurchase agreements (at cost and value) | 484,000 | 4,528,000 | 3,633,000 | 13,754,000 | ||||||||||||
| Cash and foreign currency | 303,021 | 8,755 | 14,566 | 791 | ||||||||||||
| Receivable for investments sold | 36,273,971 | 100,603 | 1,380,139 | 317,942 | ||||||||||||
| Receivable for capital shares sold | 6,611,484 | 256,382 | 411,509 | 17,156 | ||||||||||||
| Receivable for dividends and interest | 2,807,324 | 52,286 | 273,724 | 160,812 | ||||||||||||
| Receivable for securities lending income | 131 | 61 | – | – | ||||||||||||
| Prepaid expenses and other assets | 12,400 | 243 | 952 | 1,135 | ||||||||||||
| Total Assets | 1,686,568,079 | 56,083,678 | 187,757,194 | 155,822,417 | ||||||||||||
| LIABILITIES: | ||||||||||||||||
| Payable for investments purchased | – | 131,165 | 420,670 | 240,641 | ||||||||||||
| Payable for capital shares redeemed | 13,892,944 | 566,309 | 757,127 | 204,386 | ||||||||||||
| Payable for investment advisory fees | 1,528,737 | 48,088 | 165,078 | 114,994 | ||||||||||||
| Payable for trustees’ fees | 80,239 | 3,088 | 8,725 | 6,828 | ||||||||||||
| Accrued expenses | 1,581,555 | 99,135 | 222,956 | 95,095 | ||||||||||||
| Total Liabilities | 17,083,475 | 847,785 | 1,574,556 | 661,944 | ||||||||||||
| Net Assets | $ | 1,669,484,604 | $ | 55,235,893 | $ | 186,182,638 | $ | 155,160,473 | ||||||||
| ANALYSIS OF NET ASSETS: | ||||||||||||||||
| Paid-in capital | $ | 1,029,386,498 | $ | 50,224,482 | $ | 174,505,853 | $ | 157,408,146 | ||||||||
| Total distributable earnings (loss) | 640,098,106 | 5,011,411 | 11,676,785 | (2,247,673 | ) | |||||||||||
| Net Assets | $ | 1,669,484,604 | $ | 55,235,893 | $ | 186,182,638 | $ | 155,160,473 | ||||||||
Investment Class | $ | 1,398,964,827 | $ | 28,041,820 | $ | 56,433,158 | $ | 64,376,412 | ||||||||
Service Class | 41,738,048 | 27,194,073 | 111,855,049 | 84,555,180 | ||||||||||||
Consultant Class | 21,370,207 | 9,640,295 | 6,228,881 | |||||||||||||
Institutional Class | 197,696,952 | |||||||||||||||
R Class | 9,714,570 | 8,254,136 | ||||||||||||||
| SHARES OUTSTANDING (unlimited number of $.001 par value): | ||||||||||||||||
Investment Class | 120,421,312 | 5,946,340 | 6,754,841 | 5,989,658 | ||||||||||||
Service Class | 3,691,777 | 5,828,474 | 13,435,904 | 7,896,265 | ||||||||||||
Consultant Class | 2,330,110 | 1,302,319 | 828,659 | |||||||||||||
Institutional Class | 16,763,320 | |||||||||||||||
R Class | 905,220 | 1,031,871 | ||||||||||||||
| NET ASSET VALUES (Net Assets ÷ Shares Outstanding): | ||||||||||||||||
Investment Class1 | $ | 11.62 | $ | 4.72 | $ | 8.35 | $ | 10.75 | ||||||||
Service Class1 | 11.31 | 4.67 | 8.33 | 10.71 | ||||||||||||
Consultant Class2 | 9.17 | 7.40 | 7.52 | |||||||||||||
Institutional Class3 | 11.79 | |||||||||||||||
R Class3 | 10.73 | 8.00 | ||||||||||||||
| Investments at identified cost | $ | 1,096,150,933 | $ | 46,119,827 | $ | 173,818,644 | $ | 143,878,463 | ||||||||
| Market value of loaned securities4 | – | 444,361 | – | – | ||||||||||||
| 1 | Offering and redemption price per share; shares held less than 30 days may be subject to a 1% redemption fee, payable to the Fund. |
| 2 | Offering and redemption price per share; shares held less than 365 days may be subject to a 1% contingent deferred sales charge, payable to Royce Fund Services, LLC. |
| 3 | Offering and redemption price per share. |
| 4 | Market value of loaned securities backed by non-cash collateral is as of prior business day. |
| 74 | The Royce Funds 2018 Annual Report to Shareholders | THE ACCOMPANYING NOTES ARE AN INTEGRAL PART OF THESE FINANCIAL STATEMENTS |
| December 31, 2018 |
| Royce Smaller- | ||||||||||||||||
| Companies Growth | Royce Special Equity | Royce Special Equity | Royce Total Return | |||||||||||||
| Fund | Fund | Multi-Cap Fund | Fund | |||||||||||||
| ASSETS: | ||||||||||||||||
| Investments at value (including collateral on loaned securities)1 | ||||||||||||||||
Non-Affiliated Companies | $ | 264,803,570 | $ | 802,147,955 | $ | 41,232,950 | $ | 1,528,960,405 | ||||||||
Affiliated Companies | – | 290,657,571 | – | 2,028,283 | ||||||||||||
| Repurchase agreements (at cost and value) | 7,619,000 | 115,575,000 | 866,000 | – | ||||||||||||
| Cash and foreign currency | 598 | 476 | 243 | – | ||||||||||||
| Receivable for investments sold | 122,629 | 2,428,783 | 766,397 | 48,073,257 | ||||||||||||
| Receivable for capital shares sold | 915,990 | 4,222,320 | 1,050 | 4,284,285 | ||||||||||||
| Receivable for dividends and interest | 115,288 | 453,423 | 107,987 | 3,798,164 | ||||||||||||
| Receivable for securities lending income | 20,320 | – | – | 75 | ||||||||||||
| Prepaid expenses and other assets | 1,454 | 8,216 | 873 | 12,581 | ||||||||||||
| Total Assets | 273,598,849 | 1,215,493,744 | 42,975,500 | 1,587,157,050 | ||||||||||||
| LIABILITIES: | ||||||||||||||||
| Payable for collateral on loaned securities | 14,169,776 | – | – | – | ||||||||||||
| Payable to custodian for cash and foreign currency overdrawn | – | – | – | 21,085,476 | ||||||||||||
| Payable for investments purchased | – | 85,504 | – | 73,683 | ||||||||||||
| Payable for capital shares redeemed | 2,179,657 | 9,204,386 | 1,286,752 | 19,909,358 | ||||||||||||
| Payable for investment advisory fees | 231,115 | 1,079,803 | 30,085 | 1,452,882 | ||||||||||||
| Payable for trustees’ fees | 12,744 | 49,961 | 2,760 | 78,291 | ||||||||||||
| Accrued expenses | 242,533 | 703,865 | 36,558 | 1,025,735 | ||||||||||||
| Total Liabilities | 16,835,825 | 11,123,519 | 1,356,155 | 43,625,425 | ||||||||||||
| Net Assets | $ | 256,763,024 | $ | 1,204,370,225 | $ | 41,619,345 | $ | 1,543,531,625 | ||||||||
| ANALYSIS OF NET ASSETS: | ||||||||||||||||
| Paid-in capital | $ | 238,857,154 | $ | 972,237,262 | $ | 28,968,024 | $ | 1,017,447,027 | ||||||||
| Total distributable earnings (loss) | 17,905,870 | 232,132,963 | 12,651,321 | 526,084,598 | ||||||||||||
| Net Assets | $ | 256,763,024 | $ | 1,204,370,225 | $ | 41,619,345 | $ | 1,543,531,625 | ||||||||
Investment Class | $ | 87,212,790 | $ | 909,113,130 | $ | 23,105,089 | $ | 1,036,210,680 | ||||||||
Service Class | 156,057,348 | 62,706,437 | 14,408,035 | 83,368,160 | ||||||||||||
Consultant Class | 6,328,382 | 30,234,221 | 2,164,685 | 160,539,900 | ||||||||||||
Institutional Class | 7,164,504 | 202,316,437 | 1,941,536 | 218,267,576 | ||||||||||||
R Class | 45,145,309 | |||||||||||||||
| SHARES OUTSTANDING (unlimited number of $.001 par value): | ||||||||||||||||
Investment Class | 12,717,807 | 52,164,267 | 2,124,440 | 106,684,544 | ||||||||||||
Service Class | 23,326,183 | 3,600,978 | 1,318,591 | 8,360,252 | ||||||||||||
Consultant Class | 1,102,191 | 1,901,185 | 306,813 | 16,028,846 | ||||||||||||
Institutional Class | 1,030,164 | 11,709,584 | 178,735 | 22,779,428 | ||||||||||||
R Class | 4,489,340 | |||||||||||||||
| NET ASSET VALUES (Net Assets ÷ Shares Outstanding): | ||||||||||||||||
Investment Class2 | $ | 6.86 | $ | 17.43 | $ | 10.88 | $ | 9.71 | ||||||||
Service Class2 | 6.69 | 17.41 | 10.93 | 9.97 | ||||||||||||
Consultant Class3 | 5.74 | 15.90 | 7.06 | 10.02 | ||||||||||||
Institutional Class4 | 6.95 | 17.28 | 10.86 | 9.58 | ||||||||||||
R Class4 | 10.06 | |||||||||||||||
| Investments at identified cost | $ | 251,436,242 | $ | 870,741,716 | $ | 30,658,662 | $ | 1,060,528,469 | ||||||||
| Market value of loaned securities5 | 32,406,788 | – | – | 516,097 | ||||||||||||
| 1 | See Notes to Financial Statements for information on non-cash collateral on loaned securities. |
| 2 | Offering and redemption price per share; shares held less than 30 days may be subject to a 1% redemption fee, payable to the Fund. |
| 3 | Offering and redemption price per share; shares held less than 365 days may be subject to a 1% contingent deferred sales charge, payable to Royce Fund Services, LLC. |
| 4 | Offering and redemption price per share. |
| 5 | Market value of loaned securities backed by non-cash collateral is as of prior business day. |
| THE ACCOMPANYING NOTES ARE AN INTEGRAL PART OF THESE FINANCIAL STATEMENTS | The Royce Funds 2018 Annual Report to Shareholders | 75 |
| Statements of Changes in Net Assets |
| Royce Dividend Value Fund | Royce Global Financial Services Fund | Royce International Premier Fund | ||||||||||||||||||||||
| Year Ended 12/31/18 | Year Ended 12/31/17 | Year Ended 12/31/18 | Year Ended 12/31/17 | Year Ended 12/31/18 | Year Ended 12/31/17 | |||||||||||||||||||
| INVESTMENT OPERATIONS: | ||||||||||||||||||||||||
| Net investment income (loss) | $ | 2,012,643 | $ | 2,280,180 | $ | 367,171 | $ | 471,327 | $ | 2,263,660 | $ | 237,349 | ||||||||||||
| Net realized gain (loss) on investments and | ||||||||||||||||||||||||
foreign currency | 12,616,968 | 18,297,291 | 2,979,071 | 2,858,049 | 8,070,741 | 3,680,377 | ||||||||||||||||||
| Net change in unrealized appreciation (depreciation) | ||||||||||||||||||||||||
on investments and foreign currency | (40,185,073 | ) | 18,224,489 | (9,527,242 | ) | 7,231,886 | (49,866,583 | ) | 27,102,687 | |||||||||||||||
| Net increase (decrease) in net assets from | ||||||||||||||||||||||||
investment operations | (25,555,462 | ) | 38,801,960 | (6,181,000 | ) | 10,561,262 | (39,532,182 | ) | 31,020,413 | |||||||||||||||
| DISTRIBUTIONS: | ||||||||||||||||||||||||
| Total distributable earnings1 | �� | |||||||||||||||||||||||
Investment Class | (12,605,262 | ) | (1,380,251 | ) | ||||||||||||||||||||
Service Class | (3,997,819 | ) | (3,729,655 | ) | – | |||||||||||||||||||
Consultant Class | (122,078 | ) | – | |||||||||||||||||||||
Institutional Class | (380,526 | ) | (783,011 | ) | (136,828 | ) | ||||||||||||||||||
R Class | – | |||||||||||||||||||||||
| Net investment income | ||||||||||||||||||||||||
Investment Class | (1,688,912 | ) | (1,090,465 | ) | ||||||||||||||||||||
Service Class | (846,970 | ) | (986,382 | ) | (339,271 | ) | ||||||||||||||||||
Consultant Class | (4,237 | ) | (16,145 | ) | ||||||||||||||||||||
Institutional Class | (18,851 | ) | (167,148 | ) | ||||||||||||||||||||
R Class | (528 | ) | ||||||||||||||||||||||
K Class | – | |||||||||||||||||||||||
| Net realized gain on investments and | ||||||||||||||||||||||||
foreign currency | ||||||||||||||||||||||||
Investment Class | (14,477,583 | ) | – | |||||||||||||||||||||
Service Class | (7,304,418 | ) | (662,198 | ) | – | |||||||||||||||||||
Consultant Class | (181,382 | ) | – | |||||||||||||||||||||
Institutional Class | (130,731 | ) | (120,249 | ) | ||||||||||||||||||||
R Class | – | |||||||||||||||||||||||
K Class | – | |||||||||||||||||||||||
| Total distributions | (17,105,685 | ) | (24,653,084 | ) | (4,512,666 | ) | (1,935,977 | ) | (1,517,079 | ) | (1,446,409 | ) | ||||||||||||
| CAPITAL SHARE TRANSACTIONS: | ||||||||||||||||||||||||
| Net capital share transactions | ||||||||||||||||||||||||
Investment Class | (1,874,541 | ) | 16,740,068 | 213,971,721 | 70,906,431 | |||||||||||||||||||
Service Class | (21,458,903 | ) | (64,897,762 | ) | (6,175,338 | ) | (3,795,110 | ) | (6,987,199 | ) | (5,164,114 | ) | ||||||||||||
Consultant Class | 146,686 | (143,060 | ) | 613,402 | 2,132,432 | |||||||||||||||||||
Institutional Class | 2,872,340 | 243,028 | 126,326 | 871,153 | 34,743,935 | |||||||||||||||||||
R Class | (72,570 | ) | 1,636 | |||||||||||||||||||||
K Class | (24,050 | ) | ||||||||||||||||||||||
| Shareholder redemption fees | ||||||||||||||||||||||||
Investment Class | 354 | 685 | 2,207 | 124 | ||||||||||||||||||||
Service Class | 65 | 297 | 1,770 | 803 | 4,049 | 1,070 | ||||||||||||||||||
| Net increase (decrease) in net assets from capital | ||||||||||||||||||||||||
share transactions | (20,313,999 | ) | (48,056,744 | ) | (6,047,242 | ) | (2,923,154 | ) | 242,275,545 | 67,853,529 | ||||||||||||||
| Net Increase (Decrease) In Net Assets | (62,975,146 | ) | (33,907,868 | ) | (16,740,908 | ) | 5,702,131 | 201,226,284 | 97,427,533 | |||||||||||||||
| NET ASSETS: | ||||||||||||||||||||||||
| Beginning of year | 183,496,479 | 217,404,347 | 55,804,914 | 50,102,783 | 161,027,670 | 63,600,137 | ||||||||||||||||||
| End of year | $ | 120,521,333 | $ | 183,496,479 | $ | 39,064,006 | $ | 55,804,914 | $ | 362,253,954 | $ | 161,027,670 | ||||||||||||
| Undistributed Net Investment Income (Loss) at | ||||||||||||||||||||||||
End of Year2 | $ | 1 | $ | (704,412 | ) | $ | (2,062,792 | ) | ||||||||||||||||
| 1 | Distributions from net investment income and from realized gains are no longer required to be separately disclosed. See Notes to Financial Statements. |
| 2 | Parenthetical disclosure of undistributed net investment income is no longer required. See Notes to Financial Statements. |
| 76 | The Royce Funds 2018 Annual Report to Shareholders | THE ACCOMPANYING NOTES ARE AN INTEGRAL PART OF THESE FINANCIAL STATEMENTS |
| Royce Low-Priced Stock Fund | Royce Micro-Cap Fund | Royce Micro-Cap Opportunity Fund | ||||||||||||||||||||||
| Year Ended 12/31/18 | Year Ended 12/31/17 | Year Ended 12/31/18 | Year Ended 12/31/17 | Year Ended 12/31/18 | Year Ended 12/31/17 | |||||||||||||||||||
| INVESTMENT OPERATIONS: | ||||||||||||||||||||||||
| Net investment income (loss) | $ | (1,133,831 | ) | $ | (291,010 | ) | $ | (1,071,296 | ) | $ | (942,398 | ) | $ | (403,911 | ) | $ | (367,349 | ) | ||||||
| Net realized gain (loss) on investments and | ||||||||||||||||||||||||
foreign currency | 35,163,344 | 15,097,585 | 17,269,067 | 10,296,764 | 6,296,456 | 7,858,653 | ||||||||||||||||||
| Net change in unrealized appreciation (depreciation) | ||||||||||||||||||||||||
on investments and foreign currency | (52,982,915 | ) | 10,250,496 | (28,935,176 | ) | 1,327,812 | (9,402,817 | ) | 3,535,862 | |||||||||||||||
| Net increase (decrease) in net assets from | ||||||||||||||||||||||||
investment operations | (18,953,402 | ) | 25,057,071 | (12,737,405 | ) | 10,682,178 | (3,510,272 | ) | 11,027,166 | |||||||||||||||
| DISTRIBUTIONS: | ||||||||||||||||||||||||
| Total distributable earnings1 | ||||||||||||||||||||||||
Investment Class | (8,649,166 | ) | (14,965,777 | ) | (6,619,877 | ) | ||||||||||||||||||
Service Class | (28,763,572 | ) | (1,066,109 | ) | – | |||||||||||||||||||
Consultant Class | (2,112,496 | ) | ||||||||||||||||||||||
Institutional Class | – | |||||||||||||||||||||||
R Class | – | |||||||||||||||||||||||
| Net investment income | ||||||||||||||||||||||||
Investment Class | (85,079 | ) | (86,233 | ) | – | |||||||||||||||||||
Service Class | – | – | – | |||||||||||||||||||||
Consultant Class | – | |||||||||||||||||||||||
Institutional Class | – | |||||||||||||||||||||||
R Class | – | |||||||||||||||||||||||
K Class | – | |||||||||||||||||||||||
| Net realized gain on investments and | ||||||||||||||||||||||||
foreign currency | ||||||||||||||||||||||||
Investment Class | (3,133,238 | ) | (12,264,977 | ) | (3,626,362 | ) | ||||||||||||||||||
Service Class | (13,190,619 | ) | (1,040,573 | ) | (92,454 | ) | ||||||||||||||||||
Consultant Class | (1,796,683 | ) | ||||||||||||||||||||||
Institutional Class | (510,913 | ) | ||||||||||||||||||||||
R Class | (63,719 | ) | ||||||||||||||||||||||
K Class | – | |||||||||||||||||||||||
| Total distributions | (37,412,738 | ) | (16,983,568 | ) | (18,144,382 | ) | (15,188,466 | ) | (6,619,877 | ) | (3,718,816 | ) | ||||||||||||
| CAPITAL SHARE TRANSACTIONS: | ||||||||||||||||||||||||
| Net capital share transactions | ||||||||||||||||||||||||
Investment Class | 7,272,812 | 30,348,947 | (24,536,300 | ) | (22,312,303 | ) | (17,699,350 | ) | (6,319,564 | ) | ||||||||||||||
Service Class | (10,675,180 | ) | (80,488,211 | ) | (4,025,626 | ) | (3,223,507 | ) | (1,104,544 | ) | 3,024 | |||||||||||||
Consultant Class | (3,995,491 | ) | (8,442,359 | ) | ||||||||||||||||||||
Institutional Class | (5,851,516 | ) | (7,324,047 | ) | ||||||||||||||||||||
R Class | (1,044,390 | ) | (11,249 | ) | ||||||||||||||||||||
K Class | (1,100,085 | ) | ||||||||||||||||||||||
| Shareholder redemption fees | ||||||||||||||||||||||||
Investment Class | – | 1 | 25 | 101 | 524 | 40 | ||||||||||||||||||
Service Class | 371 | 1,313 | 400 | 1 | – | 268 | ||||||||||||||||||
| Net increase (decrease) in net assets from capital | ||||||||||||||||||||||||
share transactions | (10,297,903 | ) | (58,573,331 | ) | (32,556,992 | ) | (33,978,067 | ) | (18,803,370 | ) | (6,316,232 | ) | ||||||||||||
| Net Increase (Decrease) In Net Assets | (66,664,043 | ) | (50,499,828 | ) | (63,438,779 | ) | (38,484,355 | ) | (28,933,519 | ) | 992,118 | |||||||||||||
| NET ASSETS: | ||||||||||||||||||||||||
| Beginning of year | 268,690,171 | 319,189,999 | 205,211,281 | 243,695,636 | 47,121,927 | 46,129,809 | ||||||||||||||||||
| End of year | $ | 202,026,128 | $ | 268,690,171 | $ | 141,772,502 | $ | 205,211,281 | $ | 18,188,408 | $ | 47,121,927 | ||||||||||||
| Undistributed Net Investment Income (Loss) at | ||||||||||||||||||||||||
End of Year2 | $ | (836,737 | ) | $ | (391,832 | ) | $ | (170 | ) | |||||||||||||||
| 1 | Distributions from net investment income and from realized gains are no longer required to be separately disclosed. See Notes to Financial Statements. |
| 2 | Parenthetical disclosure of undistributed net investment income is no longer required. See Notes to Financial Statements. |
| THE ACCOMPANYING NOTES ARE AN INTEGRAL PART OF THESE FINANCIAL STATEMENTS | The Royce Funds 2018 Annual Report to Shareholders | 77 |
| Statements of Changes in Net Assets |
| Royce Opportunity Fund | Royce Pennsylvania Mutual Fund | Royce Premier Fund | ||||||||||||||||||||||
| Year Ended 12/31/18 | Year Ended 12/31/17 | Year Ended 12/31/18 | Year Ended 12/31/17 | Year Ended 12/31/18 | Year Ended 12/31/17 | |||||||||||||||||||
| INVESTMENT OPERATIONS: | ||||||||||||||||||||||||
| Net investment income (loss) | $ | (4,033,771 | ) | $ | (4,431,770 | ) | $ | 2,940,631 | $ | 6,440,543 | $ | 2,121,899 | $ | (492,893 | ) | |||||||||
| Net realized gain (loss) on investments and | ||||||||||||||||||||||||
foreign currency | 191,294,014 | 216,170,387 | 300,733,207 | 488,742,487 | 429,412,796 | 459,154,057 | ||||||||||||||||||
| Net change in unrealized appreciation (depreciation) | ||||||||||||||||||||||||
on investments and foreign currency | (410,163,454 | ) | 90,098,545 | (476,364,644 | ) | (154,036,247 | ) | (629,691,624 | ) | 29,910,588 | ||||||||||||||
| Net increase (decrease) in net assets from | ||||||||||||||||||||||||
investment operations | (222,903,211 | ) | 301,837,162 | (172,690,806 | ) | 341,146,783 | (198,156,929 | ) | 488,571,752 | |||||||||||||||
| DISTRIBUTIONS: | ||||||||||||||||||||||||
| Total distributable earnings1 | ||||||||||||||||||||||||
Investment Class | (54,326,168 | ) | (250,290,314 | ) | (343,875,339 | ) | ||||||||||||||||||
Service Class | (4,760,005 | ) | (6,860,517 | ) | (9,798,555 | ) | ||||||||||||||||||
Consultant Class | (996,034 | ) | (50,324,521 | ) | (4,962,544 | ) | ||||||||||||||||||
Institutional Class | (22,358,870 | ) | (12,015,566 | ) | (45,506,838 | ) | ||||||||||||||||||
W Class | – | |||||||||||||||||||||||
R Class | (2,423,347 | ) | (1,931,480 | ) | (2,176,396 | ) | ||||||||||||||||||
K Class | – | – | ||||||||||||||||||||||
| Net investment income | ||||||||||||||||||||||||
Investment Class | – | (7,987,534 | ) | (1,809,066 | ) | |||||||||||||||||||
Service Class | – | – | – | |||||||||||||||||||||
Consultant Class | – | – | – | |||||||||||||||||||||
Institutional Class | – | (388,357 | ) | (410,543 | ) | |||||||||||||||||||
W Class | – | |||||||||||||||||||||||
R Class | – | – | – | |||||||||||||||||||||
K Class | – | – | ||||||||||||||||||||||
| Net realized gain on investments and | ||||||||||||||||||||||||
foreign currency | ||||||||||||||||||||||||
Investment Class | (108,241,208 | ) | (285,042,653 | ) | (267,764,787 | ) | ||||||||||||||||||
Service Class | (12,864,359 | ) | (10,218,444 | ) | (7,252,558 | ) | ||||||||||||||||||
Consultant Class | (2,689,459 | ) | (63,150,785 | ) | (4,144,802 | ) | ||||||||||||||||||
Institutional Class | (83,520,830 | ) | (12,499,024 | ) | (33,418,762 | ) | ||||||||||||||||||
W Class | (4,597,603 | ) | ||||||||||||||||||||||
R Class | (5,143,569 | ) | (2,671,936 | ) | (1,727,921 | ) | ||||||||||||||||||
K Class | (1,024,733 | ) | (494,633 | ) | ||||||||||||||||||||
| Total distributions | (84,864,424 | ) | (213,484,158 | ) | (321,422,398 | ) | (382,453,366 | ) | (406,319,672 | ) | (321,126,042 | ) | ||||||||||||
| CAPITAL SHARE TRANSACTIONS: | ||||||||||||||||||||||||
| Net capital share transactions | ||||||||||||||||||||||||
Investment Class | (48,887,275 | ) | 9,573,855 | (35,970,327 | ) | (542,378 | ) | (68,385,184 | ) | 81,514,928 | ||||||||||||||
Service Class | (30,180,961 | ) | 18,697,997 | (12,430,134 | ) | (45,893,771 | ) | 1,871,516 | 4,336,691 | |||||||||||||||
Consultant Class | (6,974,656 | ) | (1,650,429 | ) | (33,550,757 | ) | (29,481,038 | ) | (2,498,476 | ) | (2,058,012 | ) | ||||||||||||
Institutional Class | (334,335,230 | ) | 19,603,227 | 49,826,835 | (210,408,701 | ) | 15,591,155 | (15,282,802 | ) | |||||||||||||||
W Class | (32,627,052 | ) | (133,231,371 | ) | ||||||||||||||||||||
R Class | (3,932,968 | ) | (1,661,406 | ) | (2,160,705 | ) | (1,566,030 | ) | 192,909 | (2,049,376 | ) | |||||||||||||
K Class | (7,623,085 | ) | 613,559 | (2,826,318 | ) | (330,664 | ) | |||||||||||||||||
| Shareholder redemption fees | ||||||||||||||||||||||||
Investment Class | 1,927 | 882 | 1,208 | 3,623 | 3,844 | 1,501 | ||||||||||||||||||
Service Class | 4,255 | 1,535 | 1,416 | 3,258 | 37 | 210 | ||||||||||||||||||
| Net increase (decrease) in net assets from capital | ||||||||||||||||||||||||
share transactions | (431,927,993 | ) | 45,179,220 | (37,108,782 | ) | (288,215,701 | ) | (85,851,251 | ) | (66,768,231 | ) | |||||||||||||
| Net Increase (Decrease) In Net Assets | (739,695,628 | ) | 133,532,224 | (531,221,986 | ) | (329,522,284 | ) | (690,327,852 | ) | 100,677,479 | ||||||||||||||
| NET ASSETS: | ||||||||||||||||||||||||
| Beginning of year | 1,608,924,160 | 1,475,391,936 | 2,110,306,148 | 2,439,828,432 | 2,359,812,456 | 2,259,134,977 | ||||||||||||||||||
| End of year | $ | 869,228,532 | $ | 1,608,924,160 | $ | 1,579,084,162 | $ | 2,110,306,148 | $ | 1,669,484,604 | $ | 2,359,812,456 | ||||||||||||
| Undistributed Net Investment Income (Loss) at | ||||||||||||||||||||||||
End of Year2 | $ | (1,476,027 | ) | $ | (1,135,644 | ) | $ | (2 | ) | |||||||||||||||
| 1 | Distributions from net investment income and from realized gains are no longer required to be separately disclosed. See Notes to Financial Statements. |
| 2 | Parenthetical disclosure of undistributed net investment income is no longer required. See Notes to Financial Statements. |
| 78 | The Royce Funds 2018 Annual Report to Shareholders | THE ACCOMPANYING NOTES ARE AN INTEGRAL PART OF THESE FINANCIAL STATEMENTS |
| Royce Small-Cap Leaders Fund | Royce Small-Cap Value Fund | Royce Small/Mid-Cap Premier Fund | ||||||||||||||||||||||
| Year Ended 12/31/18 | Year Ended 12/31/17 | Year Ended 12/31/18 | Year Ended 12/31/17 | Year Ended 12/31/18 | Year Ended 12/31/17 | |||||||||||||||||||
| INVESTMENT OPERATIONS: | ||||||||||||||||||||||||
| Net investment income (loss) | $ | 76,051 | $ | 416,289 | $ | 447,552 | $ | 847,504 | $ | (30,175 | ) | $ | 255,723 | |||||||||||
| Net realized gain (loss) on investments and | ||||||||||||||||||||||||
foreign currency | 7,446,125 | 13,922,956 | 20,466,232 | 25,191,109 | 24,817,472 | 27,250,361 | ||||||||||||||||||
| Net change in unrealized appreciation (depreciation) | ||||||||||||||||||||||||
on investments and foreign currency | (15,563,281 | ) | (5,697,082 | ) | (34,834,657 | ) | (24,332,356 | ) | (53,745,845 | ) | 12,933,995 | |||||||||||||
| Net increase (decrease) in net assets from | ||||||||||||||||||||||||
investment operations | (8,041,105 | ) | 8,642,163 | (13,920,873 | ) | 1,706,257 | (28,958,548 | ) | 40,440,079 | |||||||||||||||
| DISTRIBUTIONS: | ||||||||||||||||||||||||
| Total distributable earnings1 | ||||||||||||||||||||||||
Investment Class | (5,464,311 | ) | (7,078,045 | ) | (12,787,440 | ) | ||||||||||||||||||
Service Class | (5,395,282 | ) | (13,404,578 | ) | (16,958,635 | ) | ||||||||||||||||||
Consultant Class | (1,153,070 | ) | (1,321,031 | ) | ||||||||||||||||||||
Institutional Class | – | |||||||||||||||||||||||
R Class | – | (944,360 | ) | – | ||||||||||||||||||||
K Class | – | |||||||||||||||||||||||
| Net investment income | ||||||||||||||||||||||||
Investment Class | (283,985 | ) | (381,978 | ) | (118,389 | ) | ||||||||||||||||||
Service Class | (137,349 | ) | (408,089 | ) | – | |||||||||||||||||||
Consultant Class | – | – | ||||||||||||||||||||||
Institutional Class | (7,395 | ) | ||||||||||||||||||||||
R Class | – | – | – | |||||||||||||||||||||
K Class | – | (2,874 | ) | – | ||||||||||||||||||||
| Net realized gain on investments and | ||||||||||||||||||||||||
foreign currency | ||||||||||||||||||||||||
Investment Class | (6,411,507 | ) | (2,247,083 | ) | (9,480,846 | ) | ||||||||||||||||||
Service Class | (5,651,383 | ) | (5,138,678 | ) | (13,095,068 | ) | ||||||||||||||||||
Consultant Class | (444,590 | ) | (1,217,825 | ) | ||||||||||||||||||||
Institutional Class | (134,011 | ) | ||||||||||||||||||||||
R Class | (257,152 | ) | (500,452 | ) | (253,421 | ) | ||||||||||||||||||
K Class | – | (68,590 | ) | – | ||||||||||||||||||||
| Total distributions | (10,859,593 | ) | (12,741,376 | ) | (22,580,053 | ) | (9,333,740 | ) | (31,067,106 | ) | (24,165,549 | ) | ||||||||||||
| CAPITAL SHARE TRANSACTIONS: | ||||||||||||||||||||||||
| Net capital share transactions | ||||||||||||||||||||||||
Investment Class | (6,336,974 | ) | (1,951,684 | ) | 2,085,467 | (6,999,180 | ) | 7,358,264 | (11,893,481 | ) | ||||||||||||||
Service Class | (2,266,894 | ) | (9,943,272 | ) | (19,031,191 | ) | (61,247,469 | ) | 4,785,777 | (17,897,723 | ) | |||||||||||||
Consultant Class | (1,459,212 | ) | (3,351,678 | ) | (1,419,436 | ) | (2,055,396 | ) | ||||||||||||||||
Institutional Class | (3,864,348 | ) | (115,759,482 | ) | ||||||||||||||||||||
R Class | (1,817,087 | ) | 34,966 | (4,756,940 | ) | (3,502,573 | ) | (2,143,847 | ) | 140,638 | ||||||||||||||
K Class | (507,282 | ) | (1,969,073 | ) | (1,014,434 | ) | (4,272,121 | ) | ||||||||||||||||
| Shareholder redemption fees | ||||||||||||||||||||||||
Investment Class | – | – | 2 | 2 | 298 | 56 | ||||||||||||||||||
Service Class | – | 9 | 473 | 215 | 382 | 31 | ||||||||||||||||||
| Net increase (decrease) in net assets from capital | ||||||||||||||||||||||||
share transactions | (10,420,955 | ) | (12,367,263 | ) | (28,994,822 | ) | (191,874,599 | ) | 8,581,438 | (35,977,996 | ) | |||||||||||||
| Net Increase (Decrease) In Net Assets | (29,321,653 | ) | (16,466,476 | ) | (65,495,748 | ) | (199,502,082 | ) | (51,444,216 | ) | (19,703,466 | ) | ||||||||||||
| NET ASSETS: | ||||||||||||||||||||||||
| Beginning of year | 84,557,546 | 101,024,022 | 251,678,386 | 451,180,468 | 206,604,689 | 226,308,155 | ||||||||||||||||||
| End of year | $ | 55,235,893 | $ | 84,557,546 | $ | 186,182,638 | $ | 251,678,386 | $ | 155,160,473 | $ | 206,604,689 | ||||||||||||
| Undistributed Net Investment Income (Loss) at | ||||||||||||||||||||||||
End of Year2 | $ | (1,148 | ) | $ | 72,017 | $ | 2,410 | |||||||||||||||||
| 1 | Distributions from net investment income and from realized gains are no longer required to be separately disclosed. See Notes to Financial Statements. |
| 2 | Parenthetical disclosure of undistributed net investment income is no longer required. See Notes to Financial Statements. |
| THE ACCOMPANYING NOTES ARE AN INTEGRAL PART OF THESE FINANCIAL STATEMENTS | The Royce Funds 2018 Annual Report to Shareholders | 79 |
| Statements of Changes in Net Assets |
| Royce Smaller-Companies Growth Fund | Royce Special Equity Fund | |||||||||||||||
| Year Ended 12/31/18 | Year Ended 12/31/17 | Year Ended 12/31/18 | Year Ended 12/31/17 | |||||||||||||
| INVESTMENT OPERATIONS: | ||||||||||||||||
| Net investment income (loss) | $ | (2,871,983 | ) | $ | (3,551,983 | ) | $ | 14,296,007 | $ | 7,799,885 | ||||||
| Net realized gain (loss) on investments and foreign currency | 59,623,708 | 79,279,642 | 128,379,606 | 93,712,628 | ||||||||||||
| Net change in unrealized appreciation (depreciation) on investments and foreign currency | (83,719,682 | ) | (9,991,302 | ) | (286,833,332 | ) | 12,284,811 | |||||||||
| Net increase (decrease) in net assets from investment operations | (26,967,957 | ) | 65,736,357 | (144,157,719 | ) | 113,797,324 | ||||||||||
| DISTRIBUTIONS: | ||||||||||||||||
| Total distributable earnings1 | ||||||||||||||||
Investment Class | (29,890,884 | ) | (113,623,179 | ) | ||||||||||||
Service Class | (51,970,195 | ) | (7,307,745 | ) | ||||||||||||
Consultant Class | (2,217,718 | ) | (3,348,220 | ) | ||||||||||||
Institutional Class | (2,394,890 | ) | (22,075,060 | ) | ||||||||||||
R Class | – | |||||||||||||||
| Net investment income | ||||||||||||||||
Investment Class | – | (5,996,532 | ) | |||||||||||||
Service Class | – | (342,321 | ) | |||||||||||||
Consultant Class | – | – | ||||||||||||||
Institutional Class | – | (1,491,423 | ) | |||||||||||||
R Class | – | |||||||||||||||
K Class | – | |||||||||||||||
| Net realized gain on investments and foreign currency | ||||||||||||||||
Investment Class | (21,690,840 | ) | (87,581,521 | ) | ||||||||||||
Service Class | (40,468,096 | ) | (8,430,728 | ) | ||||||||||||
Consultant Class | (1,837,925 | ) | (3,556,231 | ) | ||||||||||||
Institutional Class | (1,658,704 | ) | (18,778,224 | ) | ||||||||||||
R Class | (121,248 | ) | ||||||||||||||
K Class | – | |||||||||||||||
| Total distributions | (86,473,687 | ) | (65,776,813 | ) | (146,354,204 | ) | (126,176,980 | ) | ||||||||
| CAPITAL SHARE TRANSACTIONS: | ||||||||||||||||
| Net capital share transactions | ||||||||||||||||
Investment Class | 6,715,178 | 25,645,877 | (11,589,585 | ) | (73,416,864 | ) | ||||||||||
Service Class | (3,929,820 | ) | (60,569,518 | ) | (29,107,261 | ) | (18,993,676 | ) | ||||||||
Consultant Class | (834,711 | ) | (326,137 | ) | (8,996,204 | ) | (3,257,402 | ) | ||||||||
Institutional Class | 1,069,284 | (12,235,750 | ) | 686,503 | 41,944,286 | |||||||||||
R Class | (595,855 | ) | (199,205 | ) | ||||||||||||
K Class | (210,263 | ) | ||||||||||||||
| Shareholder redemption fees | ||||||||||||||||
Investment Class | – | 2 | 4,643 | 4,736 | ||||||||||||
Service Class | 370 | 1,059 | 1,015 | 874 | ||||||||||||
| Net increase (decrease) in net assets from capital share transactions | 2,424,446 | (47,893,935 | ) | (49,000,889 | ) | (53,718,046 | ) | |||||||||
| Net Increase (Decrease) In Net Assets | (111,017,198 | ) | (47,934,391 | ) | (339,512,812 | ) | (66,097,702 | ) | ||||||||
| NET ASSETS: | ||||||||||||||||
| Beginning of year | 367,780,222 | 415,714,613 | 1,543,883,037 | 1,609,980,739 | ||||||||||||
| End of year | $ | 256,763,024 | $ | 367,780,222 | $ | 1,204,370,225 | $ | 1,543,883,037 | ||||||||
| Undistributed Net Investment Income (Loss) at End of Year2 | $ | (759,557 | ) | $ | 9,620 | |||||||||||
| 1 | Distributions from net investment income and from realized gains are no longer required to be separately disclosed. See Notes to Financial Statements. |
| 2 | Parenthetical disclosure of undistributed net investment income is no longer required. See Notes to Financial Statements. |
| 80 | The Royce Funds 2018 Annual Report to Shareholders | THE ACCOMPANYING NOTES ARE AN INTEGRAL PART OF THESE FINANCIAL STATEMENTS |
| Royce Special Equity Multi-Cap Fund | Royce Total Return Fund | |||||||||||||||
| Year Ended 12/31/18 | Year Ended 12/31/17 | Year Ended 12/31/18 | Year Ended 12/31/17 | |||||||||||||
| INVESTMENT OPERATIONS: | ||||||||||||||||
| Net investment income (loss) | $ | 760,151 | $ | 971,383 | $ | 28,615,219 | $ | 23,921,732 | ||||||||
| Net realized gain (loss) on investments and foreign currency | 11,829,017 | 3,720,016 | 350,348,950 | 408,831,782 | ||||||||||||
| Net change in unrealized appreciation (depreciation) on investments and foreign currency | (20,157,128 | ) | 11,167,655 | (622,350,876 | ) | (108,501,062 | ) | |||||||||
| Net increase (decrease) in net assets from investment operations | (7,567,960 | ) | 15,859,054 | (243,386,707 | ) | 324,252,452 | ||||||||||
| DISTRIBUTIONS: | ||||||||||||||||
| Total distributable earnings1 | ||||||||||||||||
Investment Class | (6,316,562 | ) | (225,309,236 | ) | ||||||||||||
Service Class | (4,231,108 | ) | (16,161,811 | ) | ||||||||||||
Consultant Class | (560,232 | ) | (31,360,737 | ) | ||||||||||||
Institutional Class | (456,053 | ) | (44,088,716 | ) | ||||||||||||
W Class | (278,190 | ) | ||||||||||||||
R Class | (8,404,156 | ) | ||||||||||||||
K Class | (58,255 | ) | ||||||||||||||
| Net investment income | ||||||||||||||||
Investment Class | (391,717 | ) | (14,671,278 | ) | ||||||||||||
Service Class | (152,606 | ) | (628,984 | ) | ||||||||||||
Consultant Class | (21,715 | ) | – | |||||||||||||
Institutional Class | (413,349 | ) | (4,157,749 | ) | ||||||||||||
W Class | (752,370 | ) | ||||||||||||||
R Class | (128,596 | ) | ||||||||||||||
K Class | (139,421 | ) | ||||||||||||||
| Net realized gain on investments and foreign currency | ||||||||||||||||
Investment Class | (778,005 | ) | (185,609,966 | ) | ||||||||||||
Service Class | (455,851 | ) | (11,988,461 | ) | ||||||||||||
Consultant Class | (81,754 | ) | (29,213,594 | ) | ||||||||||||
Institutional Class | (752,887 | ) | (36,590,353 | ) | ||||||||||||
W Class | (11,357,934 | ) | ||||||||||||||
R Class | (6,415,999 | ) | ||||||||||||||
K Class | (4,389,812 | ) | ||||||||||||||
| Total distributions | (11,563,955 | ) | (3,047,884 | ) | (325,661,101 | ) | (306,044,517 | ) | ||||||||
| CAPITAL SHARE TRANSACTIONS: | ||||||||||||||||
| Net capital share transactions | ||||||||||||||||
Investment Class | (8,148,370 | ) | 1,984,319 | (123,762,427 | ) | (295,781,143 | ) | |||||||||
Service Class | (3,284,931 | ) | (16,693,774 | ) | 13,551,539 | (45,762,084 | ) | |||||||||
Consultant Class | (1,081,191 | ) | (1,317,152 | ) | (28,831,097 | ) | (19,333,580 | ) | ||||||||
Institutional Class | (34,893,676 | ) | (3,303,018 | ) | (14,128,910 | ) | (116,618,839 | ) | ||||||||
W Class | (98,540,528 | ) | 16,885,446 | |||||||||||||
R Class | 5,579,991 | 1,068,022 | ||||||||||||||
K Class | (37,154,510 | ) | (3,354,130 | ) | ||||||||||||
| Shareholder redemption fees | ||||||||||||||||
Investment Class | – | 195 | 1,812 | 1,178 | ||||||||||||
Service Class | 1 | 3 | 6,244 | 3,101 | ||||||||||||
| Net increase (decrease) in net assets from capital share transactions | (47,408,167 | ) | (19,329,427 | ) | (283,277,886 | ) | (462,892,029 | ) | ||||||||
| Net Increase (Decrease) In Net Assets | (66,540,082 | ) | (6,518,257 | ) | (852,325,694 | ) | (444,684,094 | ) | ||||||||
| NET ASSETS: | ||||||||||||||||
| Beginning of year | 108,159,427 | 114,677,684 | 2,395,857,319 | 2,840,541,413 | ||||||||||||
| End of year | $ | 41,619,345 | $ | 108,159,427 | $ | 1,543,531,625 | $ | 2,395,857,319 | ||||||||
| Undistributed Net Investment Income (Loss) at End of Year2 | $ | 253 | $ | 1,717,903 | ||||||||||||
| 1 | Distributions from net investment income and from realized gains are no longer required to be separately disclosed. See Notes to Financial Statements. |
| 2 | Parenthetical disclosure of undistributed net investment income is no longer required. See Notes to Financial Statements. |
| THE ACCOMPANYING NOTES ARE AN INTEGRAL PART OF THESE FINANCIAL STATEMENTS | The Royce Funds 2018 Annual Report to Shareholders | 81 |
| Statements of Operations |
| Royce Global | ||||||||||||||||
| Royce Dividend | Financial Services | Royce International | Royce Low-Priced | |||||||||||||
| Value Fund | Fund | Premier Fund | Stock Fund | |||||||||||||
| INVESTMENT INCOME: | ||||||||||||||||
| INCOME: | ||||||||||||||||
| Dividends | $ | 4,045,482 | $ | 1,189,317 | $ | 5,912,442 | $ | 2,465,029 | ||||||||
| Foreign withholding tax | (151,989 | ) | (64,755 | ) | (582,614 | ) | (51,801 | ) | ||||||||
| Interest | 11,771 | 5,360 | 55,670 | 46,098 | ||||||||||||
| Securities lending | – | – | – | 106,373 | ||||||||||||
| Total income | 3,905,264 | 1,129,922 | 5,385,498 | 2,565,699 | ||||||||||||
| EXPENSES: | ||||||||||||||||
| Investment advisory fees | 1,421,965 | 537,693 | 2,507,723 | 2,571,299 | ||||||||||||
| Distribution fees | 132,545 | 113,085 | 207,398 | 499,061 | ||||||||||||
| Shareholder servicing | 234,044 | 77,229 | 236,940 | 391,889 | ||||||||||||
| Administrative and office facilities | 60,113 | 23,824 | 67,060 | 85,764 | ||||||||||||
| Registration | 54,944 | 30,409 | 102,268 | 48,801 | ||||||||||||
| Custody | 52,640 | 37,389 | 147,970 | 47,594 | ||||||||||||
| Audit | 43,644 | 33,749 | 41,239 | 37,350 | ||||||||||||
| Shareholder reports | 40,141 | 14,073 | 49,985 | 83,478 | ||||||||||||
| Trustees’ fees | 22,120 | 7,156 | 28,062 | 33,203 | ||||||||||||
| Legal | 5,381 | 1,652 | 17,069 | 7,944 | ||||||||||||
| Other expenses | 14,110 | 6,937 | 22,358 | 18,206 | ||||||||||||
| Total expenses | 2,081,647 | 883,196 | 3,428,072 | 3,824,589 | ||||||||||||
| Compensating balance credits | (1,744 | ) | (761 | ) | (1,603 | ) | (6,327 | ) | ||||||||
| Fees waived by investment adviser and distributor | (152,867 | ) | (97,588 | ) | (276,043 | ) | (24,971 | ) | ||||||||
| Expenses reimbursed by investment adviser | (34,415 | ) | (22,096 | ) | (28,588 | ) | (93,761 | ) | ||||||||
| Net expenses | 1,892,621 | 762,751 | 3,121,838 | 3,699,530 | ||||||||||||
| Net investment income (loss) | 2,012,643 | 367,171 | 2,263,660 | (1,133,831 | ) | |||||||||||
| REALIZED AND UNREALIZED GAIN (LOSS) ON INVESTMENTS AND FOREIGN CURRENCY: | ||||||||||||||||
| NET REALIZED GAIN (LOSS): | ||||||||||||||||
| Investments | 12,623,503 | 2,987,784 | 8,178,251 | 35,188,199 | ||||||||||||
| Foreign currency transactions | (6,535 | ) | (8,713 | ) | (107,510 | ) | (24,855 | ) | ||||||||
| NET CHANGE IN UNREALIZED APPRECIATION (DEPRECIATION): | ||||||||||||||||
| Investments | (40,184,899 | ) | (9,602,524 | ) | (50,275,577 | ) | (52,983,119 | ) | ||||||||
| Other assets and liabilities denominated in foreign currency | (174 | ) | 75,282 | 408,994 | 204 | |||||||||||
| Net realized and unrealized gain (loss) on investments and foreign currency | (27,568,105 | ) | (6,548,171 | ) | (41,795,842 | ) | (17,819,571 | ) | ||||||||
| NET INCREASE (DECREASE) IN NET ASSETS FROM INVESTMENT OPERATIONS | $ | (25,555,462 | ) | $ | (6,181,000 | ) | $ | (39,532,182 | ) | $ | (18,953,402 | ) | ||||
| 82 | The Royce Funds 2018 Annual Report to Shareholders | THE ACCOMPANYING NOTES ARE AN INTEGRAL PART OF THESE FINANCIAL STATEMENTS |
| Year Ended December 31, 2018 |
| Royce | ||||||||||||||||
| Royce Micro-Cap | Royce Micro-Cap | Royce Opportunity | Pennsylvania | |||||||||||||
| Fund | Opportunity Fund | Fund | Mutual Fund | |||||||||||||
| INVESTMENT INCOME: | ||||||||||||||||
| INCOME: | ||||||||||||||||
| Dividends | ||||||||||||||||
Non-Affiliated Companies | $ | 1,814,692 | $ | 127,698 | $ | 10,563,782 | $ | 24,581,018 | ||||||||
Affiliated Companies | – | – | – | 195,483 | ||||||||||||
| Foreign withholding tax | (42,378 | ) | – | – | (510,433 | ) | ||||||||||
| Interest | 22,233 | 9,464 | 281,603 | 454,825 | ||||||||||||
| Securities lending | 181,632 | – | 1,016,008 | 614,664 | ||||||||||||
| Total income | 1,976,179 | 137,162 | 11,861,393 | 25,335,557 | ||||||||||||
| EXPENSES: | ||||||||||||||||
| Investment advisory fees | 2,341,557 | 434,461 | 13,093,348 | 15,435,767 | ||||||||||||
| Distribution fees | 256,920 | 2,381 | 552,873 | 3,572,101 | ||||||||||||
| Shareholder servicing | 211,198 | 45,544 | 1,082,790 | 1,663,556 | ||||||||||||
| Administrative and office facilities | 65,512 | 20,927 | 444,561 | 627,420 | ||||||||||||
| Registration | 42,881 | 33,557 | 81,807 | 80,023 | ||||||||||||
| Custody | 29,241 | 15,503 | 143,286 | 202,428 | ||||||||||||
| Audit | 34,904 | 25,194 | 46,627 | 50,331 | ||||||||||||
| Shareholder reports | 73,737 | 4,648 | 167,491 | 343,820 | ||||||||||||
| Trustees’ fees | 24,434 | 5,827 | 180,461 | 261,106 | ||||||||||||
| Legal | 5,931 | 1,384 | 44,006 | 64,480 | ||||||||||||
| Other expenses | 14,982 | 4,925 | 92,461 | 132,011 | ||||||||||||
| Total expenses | 3,101,297 | 594,351 | 15,929,711 | 22,433,043 | ||||||||||||
| Compensating balance credits | (6,567 | ) | (312 | ) | (12,672 | ) | (36,699 | ) | ||||||||
| Expenses reimbursed by investment adviser | (47,255 | ) | (52,966 | ) | (21,875 | ) | (1,418 | ) | ||||||||
| Net expenses | 3,047,475 | 541,073 | 15,895,164 | 22,394,926 | ||||||||||||
| Net investment income (loss) | (1,071,296 | ) | (403,911 | ) | (4,033,771 | ) | 2,940,631 | |||||||||
| REALIZED AND UNREALIZED GAIN (LOSS) ON INVESTMENTS AND FOREIGN CURRENCY: | ||||||||||||||||
| NET REALIZED GAIN (LOSS): | ||||||||||||||||
| Investments in Non-Affiliated Companies | 17,270,697 | 6,296,456 | 197,077,173 | 299,645,876 | ||||||||||||
| Investments in Affiliated Companies | – | – | (5,783,453 | ) | 1,101,984 | |||||||||||
| Foreign currency transactions | (1,630 | ) | – | 294 | (14,653 | ) | ||||||||||
| NET CHANGE IN UNREALIZED APPRECIATION (DEPRECIATION): | ||||||||||||||||
| Investments in Non-Affiliated Companies | (28,932,947 | ) | (9,402,817 | ) | (414,535,069 | ) | (471,384,762 | ) | ||||||||
| Investments in Affiliated Companies | – | – | 4,371,615 | (4,976,463 | ) | |||||||||||
| Other assets and liabilities denominated in foreign currency | (2,229 | ) | – | – | (3,419 | ) | ||||||||||
| Net realized and unrealized gain (loss) on investments and foreign currency | (11,666,109 | ) | (3,106,361 | ) | (218,869,440 | ) | (175,631,437 | ) | ||||||||
| NET INCREASE (DECREASE) IN NET ASSETS FROM INVESTMENT OPERATIONS | $ | (12,737,405 | ) | $ | (3,510,272 | ) | $ | (222,903,211 | ) | $ | (172,690,806 | ) | ||||
| THE ACCOMPANYING NOTES ARE AN INTEGRAL PART OF THESE FINANCIAL STATEMENTS | The Royce Funds 2018 Annual Report to Shareholders | 83 |
| Statements of Operations |
| Royce Premier | Royce Small-Cap | Royce Small-Cap | Royce Small/Mid- | |||||||||||||
| Fund | Leaders Fund | Value Fund | Cap Premier Fund | |||||||||||||
| INVESTMENT INCOME: | ||||||||||||||||
| INCOME: | ||||||||||||||||
| Dividends | $ | 29,083,290 | $ | 1,119,815 | $ | 3,880,057 | $ | 2,097,244 | ||||||||
| Foreign withholding tax | (682,572 | ) | (35,959 | ) | (37,715 | ) | (6,185 | ) | ||||||||
| Interest | 391,280 | 23,178 | 55,229 | 81,474 | ||||||||||||
| Securities lending | 13,485 | 22,557 | 6,246 | 78 | ||||||||||||
| Total income | 28,805,483 | 1,129,591 | 3,903,817 | 2,172,611 | ||||||||||||
| EXPENSES: | ||||||||||||||||
| Investment advisory fees | 22,363,793 | 775,395 | 2,320,116 | 1,622,445 | ||||||||||||
| Distribution fees | 479,365 | 91,548 | 529,356 | 352,264 | ||||||||||||
| Shareholder servicing | 1,858,095 | 96,314 | 349,402 | 121,133 | ||||||||||||
| Administrative and office facilities | 701,446 | 31,548 | 79,952 | 66,695 | ||||||||||||
| Registration | 101,762 | 33,599 | 64,331 | 42,623 | ||||||||||||
| Custody | 197,404 | 21,301 | 38,901 | 25,234 | ||||||||||||
| Audit | 49,213 | 27,908 | 30,939 | 37,571 | ||||||||||||
| Shareholder reports | 439,269 | 24,632 | 56,763 | 58,616 | ||||||||||||
| Trustees’ fees | 294,747 | 10,226 | 29,875 | 25,035 | ||||||||||||
| Legal | 69,017 | 2,478 | 7,637 | 6,002 | ||||||||||||
| Other expenses | 167,106 | 6,769 | 19,782 | 15,339 | ||||||||||||
| Total expenses | 26,721,217 | 1,121,718 | 3,527,054 | 2,372,957 | ||||||||||||
| Compensating balance credits | (18,801 | ) | (1,463 | ) | (3,640 | ) | (6,277 | ) | ||||||||
| Fees waived by distributor | (18,832 | ) | (1,825 | ) | (3,592 | ) | (146,097 | ) | ||||||||
| Expenses reimbursed by investment adviser | – | (64,890 | ) | (63,557 | ) | (17,797 | ) | |||||||||
| Net expenses | 26,683,584 | 1,053,540 | 3,456,265 | 2,202,786 | ||||||||||||
| Net investment income (loss) | 2,121,899 | 76,051 | 447,552 | (30,175 | ) | |||||||||||
| REALIZED AND UNREALIZED GAIN (LOSS) ON INVESTMENTS AND FOREIGN CURRENCY: | ||||||||||||||||
| NET REALIZED GAIN (LOSS): | ||||||||||||||||
| Investments in Non-Affiliated Companies | 431,165,368 | 7,451,138 | 20,466,667 | 24,820,101 | ||||||||||||
| Investments in Affiliated Companies | (1,680,592 | ) | – | – | – | |||||||||||
| Foreign currency transactions | (71,980 | ) | (5,013 | ) | (435 | ) | (2,629 | ) | ||||||||
| NET CHANGE IN UNREALIZED APPRECIATION (DEPRECIATION): | ||||||||||||||||
| Investments in Non-Affiliated Companies | (604,311,213 | ) | (15,563,033 | ) | (34,834,687 | ) | (53,745,945 | ) | ||||||||
| Investments in Affiliated Companies | (25,355,756 | ) | – | – | – | |||||||||||
| Other assets and liabilities denominated in foreign currency | (24,655 | ) | (248 | ) | 30 | 100 | ||||||||||
| Net realized and unrealized gain (loss) on investments and foreign currency | (200,278,828 | ) | (8,117,156 | ) | (14,368,425 | ) | (28,928,373 | ) | ||||||||
| NET INCREASE (DECREASE) IN NET ASSETS FROM INVESTMENT OPERATIONS | $ | (198,156,929 | ) | $ | (8,041,105 | ) | $ | (13,920,873 | ) | $ | (28,958,548 | ) | ||||
| 84 | The Royce Funds 2018 Annual Report to Shareholders | THE ACCOMPANYING NOTES ARE AN INTEGRAL PART OF THESE FINANCIAL STATEMENTS |
| Year Ended December 31, 2018 |
| Royce Smaller- | Royce Special | |||||||||||||||
| Companies Growth | Royce Special | Equity Multi-Cap | Royce Total Return | |||||||||||||
| Fund | Equity Fund | Fund | Fund | |||||||||||||
| INVESTMENT INCOME: | ||||||||||||||||
| INCOME: | ||||||||||||||||
| Dividends | ||||||||||||||||
Non-Affiliated Companies | $ | 1,493,618 | $ | 17,213,562 | $ | 1,560,982 | $ | 57,070,259 | ||||||||
Affiliated Companies | – | 13,473,117 | – | – | ||||||||||||
| Foreign withholding tax | (8,985 | ) | – | – | (964,278 | ) | ||||||||||
| Interest | 67,218 | 629,778 | 26,077 | 650,398 | ||||||||||||
| Securities lending | 503,687 | – | – | 82,951 | ||||||||||||
| Total income | 2,055,538 | 31,316,457 | 1,587,059 | 56,839,330 | ||||||||||||
| EXPENSES: | ||||||||||||||||
| Investment advisory fees | 3,509,847 | 14,104,333 | 639,711 | 21,606,876 | ||||||||||||
| Distribution fees | 629,694 | 584,696 | 87,744 | 2,788,688 | ||||||||||||
| Shareholder servicing | 455,512 | 1,183,571 | 57,620 | 1,889,775 | ||||||||||||
| Administrative and office facilities | 114,846 | 441,932 | 34,603 | 692,145 | ||||||||||||
| Registration | 59,576 | 74,707 | 53,386 | 92,190 | ||||||||||||
| Custody | 48,682 | 118,722 | 13,890 | 249,206 | ||||||||||||
| Audit | 33,489 | 40,890 | 27,968 | 55,146 | ||||||||||||
| Shareholder reports | 95,334 | 252,842 | 7,104 | 386,624 | ||||||||||||
| Trustees’ fees | 45,499 | 182,586 | 11,004 | 284,925 | ||||||||||||
| Legal | 10,895 | 43,590 | 2,799 | 69,805 | ||||||||||||
| Other expenses | 24,479 | 90,249 | 8,265 | 170,674 | ||||||||||||
| Total expenses | 5,027,853 | 17,118,118 | 944,094 | 28,286,054 | ||||||||||||
| Compensating balance credits | (5,997 | ) | (15,563 | ) | (808 | ) | (21,573 | ) | ||||||||
| Fees waived by investment adviser and distributor | (10,967 | ) | – | (65,271 | ) | (40,370 | ) | |||||||||
| Expenses reimbursed by investment adviser | (83,368 | ) | (82,105 | ) | (51,107 | ) | – | |||||||||
| Net expenses | 4,927,521 | 17,020,450 | 826,908 | 28,224,111 | ||||||||||||
| Net investment income (loss) | (2,871,983 | ) | 14,296,007 | 760,151 | 28,615,219 | |||||||||||
| REALIZED AND UNREALIZED GAIN (LOSS) ON INVESTMENTS AND FOREIGN CURRENCY: | ||||||||||||||||
| NET REALIZED GAIN (LOSS): | ||||||||||||||||
| Investments in Non-Affiliated Companies | 59,641,256 | 125,677,509 | 11,829,017 | 351,282,168 | ||||||||||||
| Investments in Affiliated Companies | – | 2,702,097 | – | (945,044 | ) | |||||||||||
| Foreign currency transactions | (17,548 | ) | – | – | 11,826 | |||||||||||
| NET CHANGE IN UNREALIZED APPRECIATION (DEPRECIATION): | ||||||||||||||||
| Investments in Non-Affiliated Companies | (83,719,254 | ) | (196,527,752 | ) | (20,157,128 | ) | (621,343,200 | ) | ||||||||
| Investments in Affiliated Companies | – | (90,305,580 | ) | – | (1,017,805 | ) | ||||||||||
| Other assets and liabilities denominated in foreign currency | (428 | ) | – | – | 10,129 | |||||||||||
| Net realized and unrealized gain (loss) on investments and foreign currency | (24,095,974 | ) | (158,453,726 | ) | (8,328,111 | ) | (272,001,926 | ) | ||||||||
| NET INCREASE (DECREASE) IN NET ASSETS FROM INVESTMENT OPERATIONS | $ | (26,967,957 | ) | $ | (144,157,719 | ) | $ | (7,567,960 | ) | $ | (243,386,707 | ) | ||||
| THE ACCOMPANYING NOTES ARE AN INTEGRAL PART OF THESE FINANCIAL STATEMENTS | The Royce Funds 2018 Annual Report to Shareholders | 85 |
Financial Highlights
This table is presented to show selected data for a share outstanding throughout each year or other indicated period and to assist shareholders in evaluating a Fund’s performance for the periods presented. Per share amounts have been determined on the basis of the weighted average number of shares outstanding during the period.
| Ratio of Expenses to Average Net Assets | |||||||||||||||||||||||||||||||||||||||||||||||||||||||||||||||
| Net Asset Value, Beginning of Period | Net Investment Income (Loss) | Net Realized and Unrealized Gain (Loss) on Investments and Foreign Currency | Total from Investment Operations | Distributions from Net Investment Income | Distributions from Net Realized Gain on Investments and Foreign Currency | Total Distributions | Shareholder Redemption Fees | Net Asset Value, End of Period | Total Return | Net Assets, End of Period (in thousands) | Prior to Fee Waivers, Expense Reimbursements and Balance Credits | Prior to Fee Waivers and Expense Reimbursements | Net of Fee Waivers and Expense Reimbursements | Ratio of Net Investment Income (Loss) to Average Net Assets | Portfolio Turnover Rate | ||||||||||||||||||||||||||||||||||||||||||||||||
| Royce Dividend Value Fund–Investment Class | |||||||||||||||||||||||||||||||||||||||||||||||||||||||||||||||
| 2018 | $ | 7.56 | $ | 0.10 | $ | (1.27 | ) | $ | (1.17 | ) | $ | (0.10 | ) | $ | (0.73 | ) | $ | (0.83 | ) | $ | – | $ | 5.56 | (16.06 | )% | $ | 88,036 | 1.13 | % | 1.13 | % | 1.04 | % | 1.29 | % | 13 | % | ||||||||||||||||||||||||||
| 2017 | 7.18 | 0.10 | 1.43 | 1.53 | (0.13 | ) | (1.02 | ) | (1.15 | ) | – | 7.56 | 21.91 | 121,209 | 1.13 | 1.13 | 1.06 | 1.24 | 16 | ||||||||||||||||||||||||||||||||||||||||||||
| 2016 | 6.84 | 0.12 | 1.02 | 1.14 | (0.11 | ) | (0.69 | ) | (0.80 | ) | – | 7.18 | 16.75 | 99,462 | 1.16 | 1.16 | 1.11 | 1.64 | 21 | ||||||||||||||||||||||||||||||||||||||||||||
| 2015 | 8.12 | 0.12 | (0.57 | ) | (0.45 | ) | (0.13 | ) | (0.70 | ) | (0.83 | ) | – | 6.84 | (5.54 | ) | 116,053 | 1.24 | 1.24 | 1.22 | 1.49 | 14 | |||||||||||||||||||||||||||||||||||||||||
| 2014 | 8.90 | 0.11 | (0.29 | ) | (0.18 | ) | (0.10 | ) | (0.50 | ) | (0.60 | ) | – | 8.12 | (1.90 | ) | 176,002 | 1.21 | 1.21 | 1.19 | 1.25 | 22 | |||||||||||||||||||||||||||||||||||||||||
| Royce Dividend Value Fund–Service Class | |||||||||||||||||||||||||||||||||||||||||||||||||||||||||||||||
| 2018 | $ | 7.76 | $ | 0.07 | $ | (1.29 | ) | $ | (1.22 | ) | $ | (0.06 | ) | $ | (0.75 | ) | $ | (0.81 | ) | $ | – | $ | 5.73 | (16.24 | )% | $ | 28,120 | 1.43 | % | 1.43 | % | 1.34 | % | 1.01 | % | 13 | % | ||||||||||||||||||||||||||
| 2017 | 7.33 | 0.08 | 1.46 | 1.54 | (0.07 | ) | (1.04 | ) | (1.11 | ) | – | 7.76 | 21.66 | 59,641 | 1.40 | 1.39 | 1.31 | 1.04 | 16 | ||||||||||||||||||||||||||||||||||||||||||||
| 2016 | 6.96 | 0.10 | 1.04 | 1.14 | (0.08 | ) | (0.69 | ) | (0.77 | ) | – | 7.33 | 16.36 | 115,547 | 1.43 | 1.43 | 1.37 | 1.39 | 21 | ||||||||||||||||||||||||||||||||||||||||||||
| 2015 | 8.22 | 0.10 | (0.57 | ) | (0.47 | ) | (0.09 | ) | (0.70 | ) | (0.79 | ) | – | 6.96 | (5.72 | ) | 167,165 | 1.49 | 1.49 | 1.47 | 1.25 | 14 | |||||||||||||||||||||||||||||||||||||||||
| 2014 | 8.98 | 0.09 | (0.29 | ) | (0.20 | ) | (0.06 | ) | (0.50 | ) | (0.56 | ) | – | 8.22 | (2.14 | ) | 295,560 | 1.47 | 1.47 | 1.44 | 0.98 | 22 | |||||||||||||||||||||||||||||||||||||||||
| Royce Dividend Value Fund–Consultant Classa | |||||||||||||||||||||||||||||||||||||||||||||||||||||||||||||||
| 2018 | $ | 8.87 | $ | 0.02 | $ | (1.48 | ) | $ | (1.46 | ) | $ | (0.03 | ) | $ | (0.85 | ) | $ | (0.88 | ) | $ | – | $ | 6.53 | (16.93 | )% | $ | 1,349 | 3.44 | % | 3.44 | % | 2.09 | % | 0.24 | % | 13 | % | ||||||||||||||||||||||||||
| 2017 | 8.39 | 0.02 | 1.68 | 1.70 | (0.03 | ) | (1.19 | ) | (1.22 | ) | – | 8.87 | 20.71 | 1,534 | 3.26 | 3.26 | 2.09 | 0.23 | 16 | ||||||||||||||||||||||||||||||||||||||||||||
| 2016 | 7.90 | 0.05 | 1.17 | 1.22 | (0.04 | ) | (0.69 | ) | (0.73 | ) | – | 8.39 | 15.44 | 1,572 | 3.26 | 3.26 | 2.14 | 0.58 | 21 | ||||||||||||||||||||||||||||||||||||||||||||
| 2015 | 9.22 | 0.04 | (0.63 | ) | (0.59 | ) | (0.03 | ) | (0.70 | ) | (0.73 | ) | – | 7.90 | (6.39 | ) | 1,886 | 3.78 | 3.78 | 2.24 | 0.46 | 14 | |||||||||||||||||||||||||||||||||||||||||
| 2014 | 10.00 | 0.01 | (0.27 | ) | (0.26 | ) | (0.02 | ) | (0.50 | ) | (0.52 | ) | – | 9.22 | (2.43) | 1 | 912 | 9.25 | 2 | 9.25 | 2 | 2.24 | 2 | 0.45 | 2 | 22 | |||||||||||||||||||||||||||||||||||||
| Royce Dividend Value Fund–Institutional Class | |||||||||||||||||||||||||||||||||||||||||||||||||||||||||||||||
| 2018 | $ | 7.46 | $ | 0.09 | $ | (1.23 | ) | $ | (1.14 | ) | $ | (0.12 | ) | $ | (0.72 | ) | $ | (0.84 | ) | $ | – | $ | 5.48 | (15.94 | )% | $ | 3,016 | 1.89 | % | 1.89 | % | 0.89 | % | 1.28 | % | 13 | % | ||||||||||||||||||||||||||
| 2017 | 7.09 | 0.11 | 1.42 | 1.53 | (0.15 | ) | (1.01 | ) | (1.16 | ) | – | 7.46 | 22.21 | 1,112 | 2.79 | 2.79 | 0.89 | 1.43 | 16 | ||||||||||||||||||||||||||||||||||||||||||||
| 2016 | 6.78 | 0.13 | 1.00 | 1.13 | (0.13 | ) | (0.69 | ) | (0.82 | ) | – | 7.09 | 16.70 | 823 | 3.30 | 3.30 | 0.93 | 1.81 | 21 | ||||||||||||||||||||||||||||||||||||||||||||
| 2015 | 8.09 | 0.17 | (0.62 | ) | (0.45 | ) | (0.16 | ) | (0.70 | ) | (0.86 | ) | – | 6.78 | (5.61 | ) | 658 | 1.11 | 1.11 | 1.04 | 1.60 | 14 | |||||||||||||||||||||||||||||||||||||||||
| 2014 | 8.88 | 0.12 | (0.29 | ) | (0.17 | ) | (0.12 | ) | (0.50 | ) | (0.62 | ) | – | 8.09 | (1.76 | ) | 40,942 | 1.10 | 1.10 | 1.04 | 1.42 | 22 | |||||||||||||||||||||||||||||||||||||||||
| Royce Global Financial Services Fund–Service Class | |||||||||||||||||||||||||||||||||||||||||||||||||||||||||||||||
| 2018 | $ | 10.57 | $ | 0.07 | $ | (1.45 | ) | $ | (1.38 | ) | $ | (0.09 | ) | $ | (0.92 | ) | $ | (1.01 | ) | $ | – | $ | 8.18 | (13.41 | )% | $ | 32,113 | 1.68 | % | 1.68 | % | 1.49 | % | 0.61 | % | 8 | % | ||||||||||||||||||||||||||
| 2017 | 8.95 | 0.10 | 1.90 | 2.00 | (0.23 | ) | (0.15 | ) | (0.38 | ) | – | 10.57 | 22.46 | 47,197 | 1.68 | 1.68 | 1.49 | 0.83 | 19 | ||||||||||||||||||||||||||||||||||||||||||||
| 2016 | 7.99 | 0.11 | 0.92 | 1.03 | (0.05 | ) | (0.02 | ) | (0.07 | ) | – | 8.95 | 12.93 | 43,629 | 1.67 | 1.67 | 1.49 | 1.25 | 37 | ||||||||||||||||||||||||||||||||||||||||||||
| 2015 | 9.28 | 0.11 | (0.55 | ) | (0.44 | ) | (0.11 | ) | (0.74 | ) | (0.85 | ) | – | 7.99 | (4.71 | ) | 52,013 | 1.65 | 1.65 | 1.49 | 1.19 | 46 | |||||||||||||||||||||||||||||||||||||||||
| 2014 | 9.68 | 0.09 | 0.22 | 0.31 | (0.06 | ) | (0.65 | ) | (0.71 | ) | – | 9.28 | 3.45 | 53,707 | 1.68 | 1.68 | 1.49 | 0.91 | 41 | ||||||||||||||||||||||||||||||||||||||||||||
| Royce Global Financial Services Fund–Institutional Classb | |||||||||||||||||||||||||||||||||||||||||||||||||||||||||||||||
| 2018 | $ | 13.58 | $ | 0.15 | $ | (1.85 | ) | $ | (1.70 | ) | $ | (0.14 | ) | $ | (1.19 | ) | $ | (1.33 | ) | $ | – | $ | 10.55 | (12.87 | )% | $ | 6,951 | 1.43 | % | 1.43 | % | 1.04 | % | 1.06 | % | 8 | % | ||||||||||||||||||||||||||
| 2017 | 11.43 | 0.15 | 2.47 | 2.62 | (0.27 | ) | (0.20 | ) | (0.47 | ) | – | 13.58 | 23.01 | 8,608 | 1.44 | 1.44 | 1.04 | 1.29 | 19 | ||||||||||||||||||||||||||||||||||||||||||||
| 2016 | 10.00 | 0.18 | 1.36 | 1.54 | (0.09 | ) | (0.02 | ) | (0.11 | ) | – | 11.43 | 15.41 | 1 | 6,474 | 1.85 | 2 | 1.85 | 2 | 1.04 | 2 | 1.82 | 2 | 37 | |||||||||||||||||||||||||||||||||||||||
| 86 | The Royce Funds 2018 Annual Report to Shareholders | THE ACCOMPANYING NOTES ARE AN INTEGRAL PART OF THESE FINANCIAL STATEMENTS |
Financial Highlights
This table is presented to show selected data for a share outstanding throughout each year or other indicated period and to assist shareholders in evaluating a Fund’s performance for the periods presented. Per share amounts have been determined on the basis of the weighted average number of shares outstanding during the period.
| Ratio of Expenses to Average Net Assets | |||||||||||||||||||||||||||||||||||||||||||||||||||||||||||||||
| Net Asset Value, Beginning of Period | Net Investment Income (Loss) | Net Realized and Unrealized Gain (Loss) on Investments and Foreign Currency | Total from Investment Operations | Distributions from Net Investment Income | Distributions from Net Realized Gain on Investments and Foreign Currency | Total Distributions | Shareholder Redemption Fees | Net Asset Value, End of Period | Total Return | Net Assets, End of Period (in thousands) | Prior to Fee Waivers, Expense Reimbursements and Balance Credits | Prior to Fee Waivers and Expense Reimbursements | Net of Fee Waivers and Expense Reimbursements | Ratio of Net Investment Income (Loss) to Average Net Assets | Portfolio Turnover Rate | ||||||||||||||||||||||||||||||||||||||||||||||||
| Royce International Premier Fund–Investment Classc | |||||||||||||||||||||||||||||||||||||||||||||||||||||||||||||||
| 2018 | $ | 13.07 | $ | 0.09 | $ | (1.72 | ) | $ | (1.63 | ) | $ | (0.05 | ) | $ | – | $ | (0.05 | ) | $ | – | $ | 11.39 | (12.45 | )% | $ | 285,065 | 1.27 | % | 1.26 | % | 1.16 | % | 1.00 | % | 65 | % | |||||||||||||||||||||||||||
| 2017 | 9.44 | (0.10 | ) | 3.88 | 3.78 | (0.15 | ) | – | (0.15 | ) | – | 13.07 | 40.08 | 103,032 | 1.37 | 1.37 | 1.19 | 0.32 | 41 | ||||||||||||||||||||||||||||||||||||||||||||
| 2016 | 9.82 | 0.10 | (0.19 | ) | (0.09 | ) | (0.28 | ) | (0.01 | ) | (0.29 | ) | – | 9.44 | (0.79 | ) | 19,556 | 1.59 | 1.59 | 1.19 | 0.96 | 67 | |||||||||||||||||||||||||||||||||||||||||
| 2015 | 8.71 | 0.16 | 1.27 | 1.43 | (0.32 | ) | – | (0.32 | ) | – | 9.82 | 16.42 | 3,623 | 2.80 | 2.80 | 1.38 | 1.72 | 67 | |||||||||||||||||||||||||||||||||||||||||||||
| 2014 | 10.00 | 0.03 | (0.85 | ) | (0.82 | ) | (0.16 | ) | (0.31 | ) | (0.47 | ) | – | 8.71 | (8.16) | 1 | 3,481 | 3.17 | 2 | 3.17 | 2 | 1.44 | 2 | 1.00 | 2 | 62 | |||||||||||||||||||||||||||||||||||||
| Royce International Premier Fund–Service Class | |||||||||||||||||||||||||||||||||||||||||||||||||||||||||||||||
| 2018 | $ | 15.60 | $ | 0.11 | $ | (2.10 | ) | $ | (1.99 | ) | $ | – | $ | – | $ | – | $ | – | $ | 13.61 | (12.76 | )% | $ | 36,303 | 1.59 | % | 1.59 | % | 1.44 | % | 0.71 | % | 65 | % | |||||||||||||||||||||||||||||
| 2017 | 11.24 | 0.05 | 4.42 | 4.47 | (0.11 | ) | – | (0.11 | ) | – | 15.60 | 39.81 | 48,642 | 1.65 | 1.65 | 1.44 | 0.28 | 41 | |||||||||||||||||||||||||||||||||||||||||||||
| 2016 | 11.64 | 0.06 | (0.19 | ) | (0.13 | ) | (0.26 | ) | (0.01 | ) | (0.27 | ) | – | 11.24 | (1.06 | ) | 38,884 | 1.84 | 1.84 | 1.44 | 0.66 | 67 | |||||||||||||||||||||||||||||||||||||||||
| 2015 | 10.28 | (0.00 | ) | 1.66 | 1.66 | (0.30 | ) | – | (0.30 | ) | – | 11.64 | 16.22 | 9,015 | 2.65 | 2.65 | 1.60 | 1.10 | 67 | ||||||||||||||||||||||||||||||||||||||||||||
| 2014 | 11.67 | 0.17 | (1.13 | ) | (0.96 | ) | (0.12 | ) | (0.31 | ) | (0.43 | ) | – | 10.28 | (8.22 | ) | 4,045 | 2.45 | 2.45 | 1.69 | 1.26 | 62 | |||||||||||||||||||||||||||||||||||||||||
| Royce International Premier Fund–Consultant Classd | |||||||||||||||||||||||||||||||||||||||||||||||||||||||||||||||
| 2018 | $ | 16.99 | $ | (0.00 | ) | $ | (2.28 | ) | $ | (2.28 | ) | $ | – | $ | – | $ | – | $ | – | $ | 14.71 | (13.42 | )% | $ | 8,546 | 2.33 | % | 2.32 | % | 2.19 | % | (0.00 | )% | 65 | % | ||||||||||||||||||||||||||||
| 2017 | 12.27 | (0.08 | ) | 4.83 | 4.75 | (0.03 | ) | – | (0.03 | ) | – | 16.99 | 38.73 | 9,281 | 2.73 | 2.73 | 2.19 | (0.52 | ) | 41 | |||||||||||||||||||||||||||||||||||||||||||
| 2016 | 11.59 | 0.01 | 0.85 | 0.86 | (0.17 | ) | (0.01 | ) | (0.18 | ) | – | 12.27 | 7.49 | 1 | 5,086 | 2.70 | 2 | 2.70 | 2 | 2.19 | 2 | (0.04) | 2 | 67 | |||||||||||||||||||||||||||||||||||||||
| Royce International Premier Fund–Institutional Classe | |||||||||||||||||||||||||||||||||||||||||||||||||||||||||||||||
| 2018 | $ | 12.98 | $ | (0.00 | ) | $ | (1.53 | ) | $ | (1.53 | ) | $ | (0.06 | ) | $ | – | $ | (0.06 | ) | $ | – | $ | 11.39 | (11.78)% | 1 | $ | 32,340 | 1.34% | 2 | 1.34% | 2 | 1.04% | 2 | 0.84% | 2 | 65 | % | ||||||||||||||||||||||||||
| Royce Low-Priced Stock Fund–Investment Class | |||||||||||||||||||||||||||||||||||||||||||||||||||||||||||||||
| 2018 | $ | 8.49 | $ | (0.02 | ) | $ | (0.70 | ) | $ | (0.72 | ) | $ | – | $ | (1.40 | ) | $ | (1.40 | ) | $ | – | $ | 6.37 | (9.04 | )% | $ | 46,430 | 1.32 | % | 1.31 | % | 1.24 | % | (0.27 | )% | 58 | % | ||||||||||||||||||||||||||
| 2017 | 8.26 | (0.00 | ) | 0.80 | 0.80 | (0.02 | ) | (0.55 | ) | (0.57 | ) | – | 8.49 | 9.86 | 52,912 | 1.30 | 1.30 | 1.24 | 0.12 | 26 | |||||||||||||||||||||||||||||||||||||||||||
| 2016 | 7.77 | 0.04 | 1.24 | 1.28 | (0.06 | ) | (0.73 | ) | (0.79 | ) | – | 8.26 | 16.42 | 22,852 | 1.31 | 1.31 | 1.24 | 0.39 | 34 | ||||||||||||||||||||||||||||||||||||||||||||
| 2015 | 9.46 | 0.00 | (0.97 | ) | (0.97 | ) | – | (0.72 | ) | (0.72 | ) | – | 7.77 | (10.21 | ) | 28,732 | 1.28 | 1.28 | 1.24 | 0.03 | 53 | ||||||||||||||||||||||||||||||||||||||||||
| 2014 | 13.60 | 0.06 | (0.58 | ) | (0.52 | ) | (0.01 | ) | (3.61 | ) | (3.62 | ) | – | 9.46 | (3.15 | ) | 50,371 | 1.25 | 1.25 | 1.24 | 0.46 | 29 | |||||||||||||||||||||||||||||||||||||||||
| Royce Low-Priced Stock Fund–Service Class | |||||||||||||||||||||||||||||||||||||||||||||||||||||||||||||||
| 2018 | $ | 8.46 | $ | (0.04 | ) | $ | (0.70 | ) | $ | (0.74 | ) | $ | – | $ | (1.39 | ) | $ | (1.39 | ) | $ | – | $ | 6.33 | (9.31 | )% | $ | 155,596 | 1.53 | % | 1.53 | % | 1.49 | % | (0.49 | )% | 58 | % | ||||||||||||||||||||||||||
| 2017 | 8.23 | (0.01 | ) | 0.79 | 0.78 | – | (0.55 | ) | (0.55 | ) | – | 8.46 | 9.67 | 209,369 | 1.52 | 1.52 | 1.49 | (0.13 | ) | 26 | |||||||||||||||||||||||||||||||||||||||||||
| 2016 | 7.75 | 0.02 | 1.23 | 1.25 | (0.04 | ) | (0.73 | ) | (0.77 | ) | – | 8.23 | 16.09 | 281,873 | 1.52 | 1.52 | 1.49 | 0.14 | 34 | ||||||||||||||||||||||||||||||||||||||||||||
| 2015 | 9.46 | (0.02 | ) | (0.97 | ) | (0.99 | ) | – | (0.72 | ) | (0.72 | ) | – | 7.75 | (10.42 | ) | 316,475 | 1.49 | 1.49 | 1.47 | (0.20 | ) | 53 | ||||||||||||||||||||||||||||||||||||||||
| 2014 | 13.62 | 0.03 | (0.58 | ) | (0.55 | ) | – | (3.61 | ) | (3.61 | ) | – | 9.46 | (3.37 | ) | 520,905 | 1.55 | 1.55 | 1.49 | 0.21 | 29 | ||||||||||||||||||||||||||||||||||||||||||
| Royce Micro-Cap Fund–Investment Class | |||||||||||||||||||||||||||||||||||||||||||||||||||||||||||||||
| 2018 | $ | 11.64 | $ | (0.05 | ) | $ | (0.94 | ) | $ | (0.99 | ) | $ | – | $ | (1.30 | ) | $ | (1.30 | ) | $ | – | $ | 9.35 | (8.94 | )% | $ | 117,040 | 1.50 | % | 1.50 | % | 1.49 | % | (0.43 | )% | 24 | % | ||||||||||||||||||||||||||
| 2017 | 11.92 | (0.03 | ) | 0.66 | 0.63 | (0.01 | ) | (0.90 | ) | (0.91 | ) | – | 11.64 | 5.43 | 166,935 | 1.51 | 1.51 | 1.49 | (0.28 | ) | 26 | ||||||||||||||||||||||||||||||||||||||||||
| 2016 | 11.09 | 0.01 | 2.18 | 2.19 | (0.06 | ) | (1.30 | ) | (1.36 | ) | – | 11.92 | 19.74 | 192,731 | 1.48 | 1.48 | 1.48 | 0.03 | 38 | ||||||||||||||||||||||||||||||||||||||||||||
| 2015 | 14.47 | 0.02 | (1.96 | ) | (1.94 | ) | – | (1.44 | ) | (1.44 | ) | – | 11.09 | (13.32 | ) | 219,272 | 1.51 | 1.51 | 1.51 | 0.15 | 41 | ||||||||||||||||||||||||||||||||||||||||||
| 2014 | 16.68 | (0.08 | ) | (0.65 | ) | (0.73 | ) | – | (1.48 | ) | (1.48 | ) | – | 14.47 | (4.13 | ) | 414,120 | 1.52 | 1.52 | 1.52 | (0.49 | ) | 18 | ||||||||||||||||||||||||||||||||||||||||
| THE ACCOMPANYING NOTES ARE AN INTEGRAL PART OF THESE FINANCIAL STATEMENTS | The Royce Funds 2018 Annual Report to Shareholders | 87 |
Financial Highlights
This table is presented to show selected data for a share outstanding throughout each year or other indicated period and to assist shareholders in evaluating a Fund’s performance for the periods presented. Per share amounts have been determined on the basis of the weighted average number of shares outstanding during the period.
| Ratio of Expenses to Average Net Assets | |||||||||||||||||||||||||||||||||||||||||||||||||||||||||||||||
| Net Asset Value, Beginning of Period | Net Investment Income (Loss) | Net Realized and Unrealized Gain (Loss) on Investments and Foreign Currency | Total from Investment Operations | Distributions from Net Investment Income | Distributions from Net Realized Gain on Investments and Foreign Currency | Total Distributions | Shareholder Redemption Fees | Net Asset Value, End of Period | Total Return | Net Assets, End of Period (in thousands) | Prior to Fee Waivers, Expense Reimbursements and Balance Credits | Prior to Fee Waivers and Expense Reimbursements | Net of Fee Waivers and Expense Reimbursements | Ratio of Net Investment Income (Loss) to Average Net Assets | Portfolio Turnover Rate | ||||||||||||||||||||||||||||||||||||||||||||||||
| Royce Micro-Cap Fund–Service Class | |||||||||||||||||||||||||||||||||||||||||||||||||||||||||||||||
| 2018 | $ | 11.41 | $ | (0.07 | ) | $ | (0.91 | ) | $ | (0.98 | ) | $ | – | $ | (1.28 | ) | $ | (1.28 | ) | $ | – | $ | 9.15 | (9.09 | )% | $ | 8,053 | 1.90 | % | 1.89 | % | 1.61 | % | (0.56 | )% | 24 | % | ||||||||||||||||||||||||||
| 2017 | 11.69 | (0.05 | ) | 0.65 | 0.60 | – | (0.88 | ) | (0.88 | ) | – | 11.41 | 5.32 | 13,880 | 1.86 | 1.86 | 1.61 | (0.40 | ) | 26 | |||||||||||||||||||||||||||||||||||||||||||
| 2016 | 10.90 | (0.01 | ) | 2.15 | 2.14 | (0.05 | ) | (1.30 | ) | (1.35 | ) | – | 11.69 | 19.59 | 17,343 | 1.83 | 1.83 | 1.61 | (0.11 | ) | 38 | ||||||||||||||||||||||||||||||||||||||||||
| 2015 | 14.26 | 0.00 | (1.92 | ) | (1.92 | ) | – | (1.44 | ) | (1.44 | ) | – | 10.90 | (13.37 | ) | 20,538 | 1.80 | 1.80 | 1.63 | 0.01 | 41 | ||||||||||||||||||||||||||||||||||||||||||
| 2014 | 16.48 | (0.10 | ) | (0.65 | ) | (0.75 | ) | – | (1.48 | ) | (1.48 | ) | 0.01 | 14.26 | (4.24 | ) | 38,645 | 1.77 | 1.77 | 1.66 | (0.63 | ) | 18 | ||||||||||||||||||||||||||||||||||||||||
| Royce Micro-Cap Fund–Consultant Class | |||||||||||||||||||||||||||||||||||||||||||||||||||||||||||||||
| 2018 | $ | 9.10 | $ | (0.14 | ) | $ | (0.72 | ) | $ | (0.86 | ) | $ | – | $ | (1.01 | ) | $ | (1.01 | ) | $ | – | $ | 7.23 | (9.93 | )% | $ | 16,680 | 2.56 | % | 2.56 | % | 2.56 | % | (1.50 | )% | 24 | % | ||||||||||||||||||||||||||
| 2017 | 9.41 | (0.13 | ) | 0.53 | 0.40 | – | (0.71 | ) | (0.71 | ) | – | 9.10 | 4.35 | 24,396 | 2.54 | 2.54 | 2.54 | (1.34 | ) | 26 | |||||||||||||||||||||||||||||||||||||||||||
| 2016 | 9.04 | (0.09 | ) | 1.76 | 1.67 | – | (1.30 | ) | (1.30 | ) | – | 9.41 | 18.48 | 33,622 | 2.53 | 2.53 | 2.53 | (1.02 | ) | 38 | |||||||||||||||||||||||||||||||||||||||||||
| 2015 | 12.23 | (0.10 | ) | (1.65 | ) | (1.75 | ) | – | (1.44 | ) | (1.44 | ) | – | 9.04 | (14.21 | ) | 41,024 | 2.54 | 2.54 | 2.54 | (0.90 | ) | 41 | ||||||||||||||||||||||||||||||||||||||||
| 2014 | 14.48 | (0.20 | ) | (0.57 | ) | (0.77 | ) | – | (1.48 | ) | (1.48 | ) | – | 12.23 | (5.03 | ) | 75,868 | 2.48 | 2.48 | 2.48 | (1.45 | ) | 18 | ||||||||||||||||||||||||||||||||||||||||
| Royce Micro-Cap Opportunity Fund–Investment Class | |||||||||||||||||||||||||||||||||||||||||||||||||||||||||||||||
| 2018 | $ | 19.76 | $ | (0.19 | ) | $ | (2.20 | ) | $ | (2.39 | ) | $ | – | $ | (5.50 | ) | $ | (5.50 | ) | $ | – | $ | 11.87 | (13.96 | )% | $ | 18,188 | 1.32 | % | 1.32 | % | 1.24 | % | (0.92 | )% | 52 | % | ||||||||||||||||||||||||||
| 2017 | 17.19 | (0.14 | ) | 4.38 | 4.24 | – | (1.67 | ) | (1.67 | ) | – | 19.76 | 24.92 | 45,992 | 1.28 | 1.28 | 1.24 | (0.75 | ) | 70 | |||||||||||||||||||||||||||||||||||||||||||
| 2016 | 13.88 | (0.08 | ) | 3.39 | 3.31 | – | – | – | – | 17.19 | 23.85 | 45,135 | 1.30 | 1.30 | 1.24 | (0.55 | ) | 83 | |||||||||||||||||||||||||||||||||||||||||||||
| 2015 | 16.52 | (0.09 | ) | (2.55 | ) | (2.64 | ) | – | (0.00 | ) | (0.00 | ) | – | 13.88 | (15.98 | ) | 34,437 | 1.39 | 1.39 | 1.25 | (0.58 | ) | 105 | ||||||||||||||||||||||||||||||||||||||||
| 2014 | 17.93 | (0.11 | ) | (0.81 | ) | (0.92 | ) | – | (0.51 | ) | (0.51 | ) | 0.02 | 16.52 | (4.97 | ) | 18,221 | 1.56 | 1.56 | 1.28 | (0.60 | ) | 131 | ||||||||||||||||||||||||||||||||||||||||
| Royce Opportunity Fund–Investment Class | |||||||||||||||||||||||||||||||||||||||||||||||||||||||||||||||
| 2018 | $ | 13.58 | $ | (0.04 | ) | $ | (2.61 | ) | $ | (2.65 | ) | $ | – | $ | (1.01 | ) | $ | (1.01 | ) | $ | – | $ | 9.92 | (19.97 | )% | $ | 557,003 | 1.20 | % | 1.20 | % | 1.20 | % | (0.30 | )% | 47 | % | ||||||||||||||||||||||||||
| 2017 | 12.85 | (0.04 | ) | 2.79 | 2.75 | – | (2.02 | ) | (2.02 | ) | – | 13.58 | 21.88 | 805,660 | 1.18 | 1.18 | 1.18 | (0.28 | ) | 43 | |||||||||||||||||||||||||||||||||||||||||||
| 2016 | 10.57 | (0.02 | ) | 3.19 | 3.17 | – | (0.89 | ) | (0.89 | ) | – | 12.85 | 29.86 | 751,184 | 1.19 | 1.19 | 1.19 | (0.18 | ) | 26 | |||||||||||||||||||||||||||||||||||||||||||
| 2015 | 13.46 | (0.03 | ) | (1.80 | ) | (1.83 | ) | – | (1.06 | ) | (1.06 | ) | – | 10.57 | (13.57 | ) | 746,052 | 1.17 | 1.17 | 1.17 | (0.27 | ) | 27 | ||||||||||||||||||||||||||||||||||||||||
| 2014 | 15.54 | (0.05 | ) | (0.09 | ) | (0.14 | ) | – | (1.94 | ) | (1.94 | ) | – | 13.46 | (0.48 | ) | 1,284,044 | 1.14 | 1.14 | 1.14 | (0.30 | ) | 36 | ||||||||||||||||||||||||||||||||||||||||
| Royce Opportunity Fund–Service Class | |||||||||||||||||||||||||||||||||||||||||||||||||||||||||||||||
| 2018 | $ | 12.66 | $ | (0.07 | ) | $ | (2.42 | ) | $ | (2.49 | ) | $ | – | $ | (0.94 | ) | $ | (0.94 | ) | $ | – | $ | 9.23 | (20.14 | )% | $ | 48,797 | 1.52 | % | 1.52 | % | 1.49 | % | (0.59 | )% | 47 | % | ||||||||||||||||||||||||||
| 2017 | 12.02 | (0.08 | ) | 2.61 | 2.53 | – | (1.89 | ) | (1.89 | ) | – | 12.66 | 21.46 | 96,663 | 1.53 | 1.53 | 1.49 | (0.61 | ) | 43 | |||||||||||||||||||||||||||||||||||||||||||
| 2016 | 9.95 | (0.05 | ) | 3.01 | 2.96 | – | (0.89 | ) | (0.89 | ) | – | 12.02 | 29.61 | 73,517 | 1.53 | 1.53 | 1.49 | (0.48 | ) | 26 | |||||||||||||||||||||||||||||||||||||||||||
| 2015 | 12.80 | (0.07 | ) | (1.72 | ) | (1.79 | ) | – | (1.06 | ) | (1.06 | ) | – | 9.95 | (13.96 | ) | 100,918 | 1.49 | 1.49 | 1.49 | (0.59 | ) | 27 | ||||||||||||||||||||||||||||||||||||||||
| 2014 | 14.92 | (0.09 | ) | (0.09 | ) | (0.18 | ) | – | (1.94 | ) | (1.94 | ) | – | 12.80 | (0.74 | ) | 155,085 | 1.47 | 1.47 | 1.47 | (0.64 | ) | 36 | ||||||||||||||||||||||||||||||||||||||||
| Royce Opportunity Fund–Consultant Class | |||||||||||||||||||||||||||||||||||||||||||||||||||||||||||||||
| 2018 | $ | 11.19 | $ | (0.16 | ) | $ | (2.12 | ) | $ | (2.28 | ) | $ | – | $ | (0.82 | ) | $ | (0.82 | ) | $ | – | $ | 8.09 | (20.81 | )% | $ | 9,831 | 2.30 | % | 2.29 | % | 2.29 | % | (1.39 | )% | 47 | % | ||||||||||||||||||||||||||
| 2017 | 10.71 | (0.16 | ) | 2.31 | 2.15 | – | (1.67 | ) | (1.67 | ) | – | 11.19 | 20.50 | 20,574 | 2.27 | 2.27 | 2.27 | (1.37 | ) | 43 | |||||||||||||||||||||||||||||||||||||||||||
| 2016 | 9.01 | (0.12 | ) | 2.71 | 2.59 | – | (0.89 | ) | (0.89 | ) | – | 10.71 | 28.59 | 21,116 | 2.28 | 2.28 | 2.28 | (1.27 | ) | 26 | |||||||||||||||||||||||||||||||||||||||||||
| 2015 | 11.79 | (0.15 | ) | (1.57 | ) | (1.72 | ) | – | (1.06 | ) | (1.06 | ) | – | 9.01 | (14.56 | ) | 19,464 | 2.26 | 2.26 | 2.26 | (1.34 | ) | 27 | ||||||||||||||||||||||||||||||||||||||||
| 2014 | 14.02 | (0.19 | ) | (0.10 | ) | (0.29 | ) | – | (1.94 | ) | (1.94 | ) | – | 11.79 | (1.61 | ) | 20,518 | 2.24 | 2.24 | 2.24 | (1.40 | ) | 36 | ||||||||||||||||||||||||||||||||||||||||
| 88 | The Royce Funds 2018 Annual Report to Shareholders | THE ACCOMPANYING NOTES ARE AN INTEGRAL PART OF THESE FINANCIAL STATEMENTS |
Financial Highlights
This table is presented to show selected data for a share outstanding throughout each year or other indicated period and to assist shareholders in evaluating a Fund’s performance for the periods presented. Per share amounts have been determined on the basis of the weighted average number of shares outstanding during the period.
| Ratio of Expenses to Average Net Assets | |||||||||||||||||||||||||||||||||||||||||||||||||||||||||||||||
| Net Asset Value, Beginning of Period | Net Investment Income (Loss) | Net Realized and Unrealized Gain (Loss) on Investments and Foreign Currency | Total from Investment Operations | Distributions from Net Investment Income | Distributions from Net Realized Gain on Investments and Foreign Currency | Total Distributions | Shareholder Redemption Fees | Net Asset Value, End of Period | Total Return | Net Assets, End of Period (in thousands) | Prior to Fee Waivers, Expense Reimbursements and Balance Credits | Prior to Fee Waivers and Expense Reimbursements | Net of Fee Waivers and Expense Reimbursements | Ratio of Net Investment Income (Loss) to Average Net Assets | Portfolio Turnover Rate | ||||||||||||||||||||||||||||||||||||||||||||||||
| Royce Opportunity Fund–Institutional Class | |||||||||||||||||||||||||||||||||||||||||||||||||||||||||||||||
| 2018 | $ | 13.84 | $ | (0.02 | ) | $ | (2.66 | ) | $ | (2.68 | ) | $ | – | $ | (1.03 | ) | $ | (1.03 | ) | $ | – | $ | 10.13 | (19.83 | )% | $ | 227,261 | 1.08 | % | 1.08 | % | 1.08 | % | (0.17 | )% | 47 | % | ||||||||||||||||||||||||||
| 2017 | 13.08 | (0.02 | ) | 2.84 | 2.82 | – | (2.06 | ) | (2.06 | ) | – | 13.84 | 22.02 | 639,057 | 1.07 | 1.07 | 1.07 | (0.17 | ) | 43 | |||||||||||||||||||||||||||||||||||||||||||
| 2016 | 10.74 | (0.01 | ) | 3.24 | 3.23 | – | (0.89 | ) | (0.89 | ) | – | 13.08 | 29.94 | 583,975 | 1.07 | 1.07 | 1.07 | (0.06 | ) | 26 | |||||||||||||||||||||||||||||||||||||||||||
| 2015 | 13.64 | (0.02 | ) | (1.82 | ) | (1.84 | ) | – | (1.06 | ) | (1.06 | ) | – | 10.74 | (13.46 | ) | 600,945 | 1.05 | 1.05 | 1.05 | (0.15 | ) | 27 | ||||||||||||||||||||||||||||||||||||||||
| 2014 | 15.71 | (0.03 | ) | (0.10 | ) | (0.13 | ) | – | (1.94 | ) | (1.94 | ) | – | 13.64 | (0.41 | ) | 799,131 | 1.03 | 1.03 | 1.03 | (0.20 | ) | 36 | ||||||||||||||||||||||||||||||||||||||||
| Royce Opportunity Fund–R Class | |||||||||||||||||||||||||||||||||||||||||||||||||||||||||||||||
| 2018 | $ | 12.25 | $ | (0.11 | ) | $ | (2.33 | ) | $ | (2.44 | ) | $ | – | $ | (0.91 | ) | $ | (0.91 | ) | $ | – | $ | 8.90 | (20.42 | )% | $ | 26,337 | 1.84 | % | 1.84 | % | 1.84 | % | (0.93 | )% | 47 | % | ||||||||||||||||||||||||||
| 2017 | 11.67 | (0.12 | ) | 2.53 | 2.41 | – | (1.83 | ) | (1.83 | ) | – | 12.25 | 21.06 | 39,311 | 1.82 | 1.82 | 1.82 | (0.92 | ) | 43 | |||||||||||||||||||||||||||||||||||||||||||
| 2016 | 9.72 | (0.08 | ) | 2.92 | 2.84 | – | (0.89 | ) | (0.89 | ) | – | 11.67 | 29.08 | 38,902 | 1.82 | 1.82 | 1.82 | (0.81 | ) | 26 | |||||||||||||||||||||||||||||||||||||||||||
| 2015 | 12.56 | (0.11 | ) | (1.67 | ) | (1.78 | ) | – | (1.06 | ) | (1.06 | ) | – | 9.72 | (14.15 | ) | 32,599 | 1.82 | 1.82 | 1.82 | (0.90 | ) | 27 | ||||||||||||||||||||||||||||||||||||||||
| 2014 | 14.73 | (0.13 | ) | (0.10 | ) | (0.23 | ) | – | (1.94 | ) | (1.94 | ) | – | 12.56 | (1.12 | ) | 33,699 | 1.78 | 1.78 | 1.78 | (0.93 | ) | 36 | ||||||||||||||||||||||||||||||||||||||||
| Royce Pennsylvania Mutual Fund–Investment Class | |||||||||||||||||||||||||||||||||||||||||||||||||||||||||||||||
| 2018 | $ | 10.52 | $ | 0.04 | $ | (0.97 | ) | $ | (0.93 | ) | $ | (0.02 | ) | $ | (1.82 | ) | $ | (1.84 | ) | $ | – | $ | 7.75 | (9.66 | )% | $ | 1,203,967 | 0.92 | % | 0.92 | % | 0.92 | % | 0.33 | % | 35 | % | ||||||||||||||||||||||||||
| 2017 | 11.02 | 0.06 | 1.68 | 1.74 | (0.06 | ) | (2.18 | ) | (2.24 | ) | – | 10.52 | 16.24 | 1,622,523 | 0.92 | 0.92 | 0.92 | 0.47 | 27 | ||||||||||||||||||||||||||||||||||||||||||||
| 2016 | 9.33 | 0.07 | 2.41 | 2.48 | (0.04 | ) | (0.75 | ) | (0.79 | ) | – | 11.02 | 26.47 | 1,671,848 | 0.92 | 0.92 | 0.92 | 0.60 | 18 | ||||||||||||||||||||||||||||||||||||||||||||
| 2015 | 13.00 | 0.09 | (1.58 | ) | (1.49 | ) | (0.10 | ) | (2.08 | ) | (2.18 | ) | – | 9.33 | (11.43 | ) | 1,925,419 | 0.92 | 0.92 | 0.92 | 0.58 | 21 | |||||||||||||||||||||||||||||||||||||||||
| 2014 | 14.73 | 0.06 | (0.21 | ) | (0.15 | ) | (0.04 | ) | (1.54 | ) | (1.58 | ) | – | 13.00 | (0.70 | ) | 3,869,579 | 0.91 | 0.91 | 0.91 | 0.35 | 21 | |||||||||||||||||||||||||||||||||||||||||
| Royce Pennsylvania Mutual Fund–Service Class | |||||||||||||||||||||||||||||||||||||||||||||||||||||||||||||||
| 2018 | $ | 10.56 | $ | (0.01 | ) | $ | (0.96 | ) | $ | (0.97 | ) | $ | – | $ | (1.82 | ) | $ | (1.82 | ) | $ | – | $ | 7.77 | (9.96 | )% | $ | 32,191 | 1.30 | % | 1.30 | % | 1.30 | % | (0.07 | )% | 35 | % | ||||||||||||||||||||||||||
| 2017 | 11.03 | 0.01 | 1.69 | 1.70 | – | (2.17 | ) | (2.17 | ) | – | 10.56 | 15.88 | 54,938 | 1.27 | 1.27 | 1.27 | 0.07 | 27 | |||||||||||||||||||||||||||||||||||||||||||||
| 2016 | 9.35 | 0.03 | 2.41 | 2.44 | (0.01 | ) | (0.75 | ) | (0.76 | ) | – | 11.03 | 25.99 | 100,598 | 1.26 | 1.26 | 1.26 | 0.27 | 18 | ||||||||||||||||||||||||||||||||||||||||||||
| 2015 | 12.96 | 0.05 | (1.56 | ) | (1.51 | ) | (0.02 | ) | (2.08 | ) | (2.10 | ) | – | 9.35 | (11.57 | ) | 102,341 | 1.23 | 1.23 | 1.23 | 0.29 | 21 | |||||||||||||||||||||||||||||||||||||||||
| 2014 | 14.69 | 0.00 | (0.19 | ) | (0.19 | ) | – | (1.54 | ) | (1.54 | ) | – | 12.96 | (1.04 | ) | 333,548 | 1.23 | 1.23 | 1.23 | 0.03 | 21 | ||||||||||||||||||||||||||||||||||||||||||
| Royce Pennsylvania Mutual Fund–Consultant Class | |||||||||||||||||||||||||||||||||||||||||||||||||||||||||||||||
| 2018 | $ | 8.46 | $ | (0.06 | ) | $ | (0.77 | ) | $ | (0.83 | ) | $ | – | $ | (1.45 | ) | $ | (1.45 | ) | $ | – | $ | 6.18 | (10.56 | )% | $ | 249,004 | 1.93 | % | 1.93 | % | 1.93 | % | (0.69 | )% | 35 | % | ||||||||||||||||||||||||||
| 2017 | 8.90 | (0.05 | ) | 1.35 | 1.30 | – | (1.74 | ) | (1.74 | ) | – | 8.46 | 15.06 | 361,569 | 1.93 | 1.92 | 1.92 | (0.54 | ) | 27 | |||||||||||||||||||||||||||||||||||||||||||
| 2016 | 7.70 | (0.03 | ) | 1.98 | 1.95 | – | (0.75 | ) | (0.75 | ) | – | 8.90 | 25.20 | 402,114 | 1.94 | 1.94 | 1.94 | (0.42 | ) | 18 | |||||||||||||||||||||||||||||||||||||||||||
| 2015 | 11.16 | (0.05 | ) | (1.33 | ) | (1.38 | ) | – | (2.08 | ) | (2.08 | ) | – | 7.70 | (12.31 | ) | 416,862 | 1.94 | 1.94 | 1.94 | (0.44 | ) | 21 | ||||||||||||||||||||||||||||||||||||||||
| 2014 | 12.96 | (0.08 | ) | (0.18 | ) | (0.26 | ) | – | (1.54 | ) | (1.54 | ) | – | 11.16 | (1.72 | ) | 676,347 | 1.91 | 1.91 | 1.91 | (0.64 | ) | 21 | ||||||||||||||||||||||||||||||||||||||||
| Royce Pennsylvania Mutual Fund–Institutional Class | |||||||||||||||||||||||||||||||||||||||||||||||||||||||||||||||
| 2018 | $ | 10.55 | $ | 0.04 | $ | (0.97 | ) | $ | (0.93 | ) | $ | (0.02 | ) | $ | (1.82 | ) | $ | (1.84 | ) | $ | – | $ | 7.78 | (9.56 | )% | $ | 83,908 | 0.88 | % | 0.88 | % | 0.88 | % | 0.40 | % | 35 | % | ||||||||||||||||||||||||||
| 2017 | 11.04 | 0.09 | 1.67 | 1.76 | (0.07 | ) | (2.18 | ) | (2.25 | ) | – | 10.55 | 16.44 | 53,367 | 0.83 | 0.83 | 0.83 | 0.42 | 27 | ||||||||||||||||||||||||||||||||||||||||||||
| 2016 | 9.34 | 0.09 | 2.41 | 2.50 | (0.05 | ) | (0.75 | ) | (0.80 | ) | – | 11.04 | 26.65 | 245,009 | 0.83 | 0.83 | 0.83 | 0.63 | 18 | ||||||||||||||||||||||||||||||||||||||||||||
| 2015 | 13.02 | 0.11 | (1.60 | ) | (1.49 | ) | (0.11 | ) | (2.08 | ) | (2.19 | ) | – | 9.34 | (11.34 | ) | 498,374 | 0.81 | 0.81 | 0.81 | 0.68 | 21 | |||||||||||||||||||||||||||||||||||||||||
| 2014 | 14.75 | 0.07 | (0.20 | ) | (0.13 | ) | (0.06 | ) | (1.54 | ) | (1.60 | ) | – | 13.02 | (0.58 | ) | 802,517 | 0.79 | 0.79 | 0.79 | 0.48 | 21 | |||||||||||||||||||||||||||||||||||||||||
| THE ACCOMPANYING NOTES ARE AN INTEGRAL PART OF THESE FINANCIAL STATEMENTS | The Royce Funds 2018 Annual Report to Shareholders | 89 |
Financial Highlights
This table is presented to show selected data for a share outstanding throughout each year or other indicated period and to assist shareholders in evaluating a Fund’s performance for the periods presented. Per share amounts have been determined on the basis of the weighted average number of shares outstanding during the period.
| Ratio of Expenses to Average Net Assets | |||||||||||||||||||||||||||||||||||||||||||||||||||||||||||||||
| Net Asset Value, Beginning of Period | Net Investment Income (Loss) | Net Realized and Unrealized Gain (Loss) on Investments and Foreign Currency | Total from Investment Operations | Distributions from Net Investment Income | Distributions from Net Realized Gain on Investments and Foreign Currency | Total Distributions | Shareholder Redemption Fees | Net Asset Value, End of Period | Total Return | Net Assets, End of Period (in thousands) | Prior to Fee Waivers, Expense Reimbursements and Balance Credits | Prior to Fee Waivers and Expense Reimbursements | Net of Fee Waivers and Expense Reimbursements | Ratio of Net Investment Income (Loss) to Average Net Assets | Portfolio Turnover Rate | ||||||||||||||||||||||||||||||||||||||||||||||||
| Royce Pennsylvania Mutual Fund–R Class | |||||||||||||||||||||||||||||||||||||||||||||||||||||||||||||||
| 2018 | $ | 9.94 | $ | (0.03 | ) | $ | (0.91 | ) | $ | (0.94 | ) | $ | – | $ | (1.70 | ) | $ | (1.70 | ) | $ | – | $ | 7.30 | (10.15 | )% | $ | 10,014 | 1.58 | % | 1.57 | % | 1.57 | % | (0.34 | )% | 35 | % | ||||||||||||||||||||||||||
| 2017 | 10.44 | (0.04 | ) | 1.58 | 1.54 | – | (2.04 | ) | (2.04 | ) | – | 9.94 | 15.25 | 15,136 | 1.73 | 1.73 | 1.73 | (0.36 | ) | 27 | |||||||||||||||||||||||||||||||||||||||||||
| 2016 | 8.90 | (0.01 | ) | 2.30 | 2.29 | – | (0.75 | ) | (0.75 | ) | – | 10.44 | 25.62 | 17,059 | 1.63 | 1.63 | 1.63 | (0.11 | ) | 18 | |||||||||||||||||||||||||||||||||||||||||||
| 2015 | 12.50 | (0.02 | ) | (1.50 | ) | (1.52 | ) | – | (2.08 | ) | (2.08 | ) | – | 8.90 | (12.10 | ) | 18,675 | 1.65 | 1.65 | 1.65 | (0.15 | ) | 21 | ||||||||||||||||||||||||||||||||||||||||
| 2014 | 14.26 | (0.03 | ) | (0.19 | ) | (0.22 | ) | – | (1.54 | ) | (1.54 | ) | – | 12.50 | (1.28 | ) | 36,622 | 1.48 | 1.48 | 1.48 | (0.21 | ) | 21 | ||||||||||||||||||||||||||||||||||||||||
| Royce Premier Fund–Investment Class | |||||||||||||||||||||||||||||||||||||||||||||||||||||||||||||||
| 2018 | $ | 16.60 | $ | 0.02 | $ | (1.60 | ) | $ | (1.58 | ) | $ | (0.01 | ) | $ | (3.39 | ) | $ | (3.40 | ) | $ | – | $ | 11.62 | (10.40 | )% | $ | 1,398,965 | 1.17 | % | 1.17 | % | 1.17 | % | 0.11 | % | 23 | % | ||||||||||||||||||||||||||
| 2017 | 15.51 | 0.00 | 3.63 | 3.63 | (0.02 | ) | (2.52 | ) | (2.54 | ) | – | 16.60 | 23.77 | 1,978,847 | 1.16 | 1.16 | 1.16 | 0.00 | 8 | ||||||||||||||||||||||||||||||||||||||||||||
| 2016 | 14.28 | 0.06 | 3.25 | 3.31 | (0.04 | ) | (2.04 | ) | (2.08 | ) | – | 15.51 | 23.00 | 1,768,580 | 1.16 | 1.16 | 1.16 | 0.35 | 15 | ||||||||||||||||||||||||||||||||||||||||||||
| 2015 | 19.72 | 0.13 | (2.11 | ) | (1.98 | ) | (0.13 | ) | (3.33 | ) | (3.46 | ) | – | 14.28 | (9.90 | ) | 2,015,905 | 1.13 | 1.13 | 1.13 | 0.49 | 13 | |||||||||||||||||||||||||||||||||||||||||
| 2014 | 22.11 | 0.08 | (0.32 | ) | (0.24 | ) | (0.08 | ) | (2.07 | ) | (2.15 | ) | – | 19.72 | (0.86 | ) | 4,097,961 | 1.10 | 1.10 | 1.10 | 0.34 | 9 | |||||||||||||||||||||||||||||||||||||||||
| Royce Premier Fund–Service Class | |||||||||||||||||||||||||||||||||||||||||||||||||||||||||||||||
| 2018 | $ | 16.15 | $ | (0.03 | ) | $ | (1.55 | ) | $ | (1.58 | ) | $ | – | $ | (3.26 | ) | $ | (3.26 | ) | $ | – | $ | 11.31 | (10.66 | )% | $ | 41,738 | 1.52 | % | 1.52 | % | 1.48 | % | (0.19 | )% | 23 | % | ||||||||||||||||||||||||||
| 2017 | 15.13 | (0.06 | ) | 3.53 | 3.47 | – | (2.45 | ) | (2.45 | ) | – | 16.15 | 23.32 | 54,557 | 1.53 | 1.53 | 1.49 | (0.34 | ) | 8 | |||||||||||||||||||||||||||||||||||||||||||
| 2016 | 13.98 | 0.00 | 3.19 | 3.19 | – | (2.04 | ) | (2.04 | ) | – | 15.13 | 22.63 | 46,550 | 1.50 | 1.50 | 1.49 | 0.02 | 15 | |||||||||||||||||||||||||||||||||||||||||||||
| 2015 | 19.33 | 0.06 | (2.04 | ) | (1.98 | ) | (0.04 | ) | (3.33 | ) | (3.37 | ) | – | 13.98 | (10.13 | ) | 61,969 | 1.44 | 1.43 | 1.43 | 0.23 | 13 | |||||||||||||||||||||||||||||||||||||||||
| 2014 | 21.70 | 0.01 | (0.31 | ) | (0.30 | ) | – | (2.07 | ) | (2.07 | ) | – | 19.33 | (1.16 | ) | 172,810 | 1.38 | 1.38 | 1.38 | 0.05 | 9 | ||||||||||||||||||||||||||||||||||||||||||
| Royce Premier Fund–Consultant Class | |||||||||||||||||||||||||||||||||||||||||||||||||||||||||||||||
| 2018 | $ | 13.21 | $ | (0.12 | ) | $ | (1.27 | ) | $ | (1.39 | ) | $ | – | $ | (2.65 | ) | $ | (2.65 | ) | $ | – | $ | 9.17 | (11.41 | )% | $ | 21,370 | 2.21 | % | 2.21 | % | 2.21 | % | (0.93 | )% | 23 | % | ||||||||||||||||||||||||||
| 2017 | 12.46 | (0.14 | ) | 2.89 | 2.75 | – | (2.00 | ) | (2.00 | ) | – | 13.21 | 22.49 | 31,489 | 2.21 | 2.21 | 2.21 | (1.06 | ) | 8 | |||||||||||||||||||||||||||||||||||||||||||
| 2016 | 11.89 | (0.09 | ) | 2.70 | 2.61 | – | (2.04 | ) | (2.04 | ) | – | 12.46 | 21.72 | 31,353 | 2.22 | 2.22 | 2.22 | (0.72 | ) | 15 | |||||||||||||||||||||||||||||||||||||||||||
| 2015 | 17.09 | (0.09 | ) | (1.78 | ) | (1.87 | ) | – | (3.33 | ) | (3.33 | ) | – | 11.89 | (10.80 | ) | 32,982 | 2.17 | 2.17 | 2.17 | (0.55 | ) | 13 | ||||||||||||||||||||||||||||||||||||||||
| 2014 | 19.58 | (0.13 | ) | (0.29 | ) | (0.42 | ) | – | (2.07 | ) | (2.07 | ) | – | 17.09 | (1.92 | ) | 56,884 | 2.10 | 2.10 | 2.10 | (0.66 | ) | 9 | ||||||||||||||||||||||||||||||||||||||||
| Royce Premier Fund–Institutional Class | |||||||||||||||||||||||||||||||||||||||||||||||||||||||||||||||
| 2018 | $ | 16.82 | $ | 0.03 | $ | (1.63 | ) | $ | (1.60 | ) | $ | (0.02 | ) | $ | (3.41 | ) | $ | (3.43 | ) | $ | – | $ | 11.79 | (10.41 | )% | $ | 197,697 | 1.12 | % | 1.12 | % | 1.12 | % | 0.16 | % | 23 | % | ||||||||||||||||||||||||||
| 2017 | 15.72 | 0.01 | 3.68 | 3.69 | (0.03 | ) | (2.56 | ) | (2.59 | ) | – | 16.82 | 23.85 | 250,119 | 1.09 | 1.09 | 1.09 | 0.07 | 8 | ||||||||||||||||||||||||||||||||||||||||||||
| 2016 | 14.44 | 0.08 | 3.30 | 3.38 | (0.06 | ) | (2.04 | ) | (2.10 | ) | – | 15.72 | 23.20 | 250,826 | 1.07 | 1.07 | 1.07 | 0.44 | 15 | ||||||||||||||||||||||||||||||||||||||||||||
| 2015 | 19.91 | 0.16 | (2.14 | ) | (1.98 | ) | (0.16 | ) | (3.33 | ) | (3.49 | ) | – | 14.44 | (9.82 | ) | 294,477 | 1.02 | 1.02 | 1.02 | 0.60 | 13 | |||||||||||||||||||||||||||||||||||||||||
| 2014 | 22.31 | 0.12 | (0.34 | ) | (0.22 | ) | (0.11 | ) | (2.07 | ) | (2.18 | ) | – | 19.91 | (0.79 | ) | 594,463 | 0.98 | 0.98 | 0.98 | 0.45 | 9 | |||||||||||||||||||||||||||||||||||||||||
| Royce Premier Fund–R Class | |||||||||||||||||||||||||||||||||||||||||||||||||||||||||||||||
| 2018 | $ | 15.39 | $ | (0.08 | ) | $ | (1.48 | ) | $ | (1.56 | ) | $ | – | $ | (3.10 | ) | $ | (3.10 | ) | $ | – | $ | 10.73 | (11.01 | )% | $ | 9,715 | 1.80 | % | 1.80 | % | 1.80 | % | (0.52 | )% | 23 | % | ||||||||||||||||||||||||||
| 2017 | 14.47 | (0.12 | ) | 3.37 | 3.25 | – | (2.33 | ) | (2.33 | ) | – | 15.39 | 22.88 | 12,841 | 1.90 | 1.90 | 1.90 | (0.75 | ) | 8 | |||||||||||||||||||||||||||||||||||||||||||
| 2016 | 13.49 | (0.05 | ) | 3.07 | 3.02 | – | (2.04 | ) | (2.04 | ) | – | 14.47 | 22.18 | 13,889 | 1.84 | 1.84 | 1.84 | (0.33 | ) | 15 | |||||||||||||||||||||||||||||||||||||||||||
| 2015 | 18.82 | (0.03 | ) | (1.97 | ) | (2.00 | ) | – | (3.33 | ) | (3.33 | ) | – | 13.49 | (10.50 | ) | 16,129 | 1.78 | 1.78 | 1.78 | (0.16 | ) | 13 | ||||||||||||||||||||||||||||||||||||||||
| 2014 | 21.25 | (0.06 | ) | (0.30 | ) | (0.36 | ) | – | (2.07 | ) | (2.07 | ) | – | 18.82 | (1.48 | ) | 27,355 | 1.71 | 1.71 | 1.71 | (0.28 | ) | 9 | ||||||||||||||||||||||||||||||||||||||||
| 90 | The Royce Funds 2018 Annual Report to Shareholders | THE ACCOMPANYING NOTES ARE AN INTEGRAL PART OF THESE FINANCIAL STATEMENTS |
Financial Highlights
This table is presented to show selected data for a share outstanding throughout each year or other indicated period and to assist shareholders in evaluating a Fund’s performance for the periods presented. Per share amounts have been determined on the basis of the weighted average number of shares outstanding during the period.
| Ratio of Expenses to Average Net Assets | |||||||||||||||||||||||||||||||||||||||||||||||||||||||||||||||
| Net Asset Value, Beginning of Period | Net Investment Income (Loss) | Net Realized and Unrealized Gain (Loss) on Investments and Foreign Currency | Total from Investment Operations | Distributions from Net Investment Income | Distributions from Net Realized Gain on Investments and Foreign Currency | Total Distributions | Shareholder Redemption Fees | Net Asset Value, End of Period | Total Return | Net Assets, End of Period (in thousands) | Prior to Fee Waivers, Expense Reimbursements and Balance Credits | Prior to Fee Waivers and Expense Reimbursements | Net of Fee Waivers and Expense Reimbursements | Ratio of Net Investment Income (Loss) to Average Net Assets | Portfolio Turnover Rate | ||||||||||||||||||||||||||||||||||||||||||||||||
| Royce Small-Cap Leaders Fund–Investment Class | |||||||||||||||||||||||||||||||||||||||||||||||||||||||||||||||
| 2018 | $ | 6.67 | $ | 0.02 | $ | (0.83 | ) | $ | (0.81 | ) | $ | (0.01 | ) | $ | (1.13 | ) | $ | (1.14 | ) | $ | – | $ | 4.72 | (12.53 | )% | $ | 28,042 | 1.28 | % | 1.27 | % | 1.24 | % | 0.21 | % | 62 | % | ||||||||||||||||||||||||||
| 2017 | 7.12 | 0.05 | 0.66 | 0.71 | (0.05 | ) | (1.11 | ) | (1.16 | ) | – | 6.67 | 10.47 | 43,875 | 1.24 | 1.24 | 1.24 | 0.62 | 74 | ||||||||||||||||||||||||||||||||||||||||||||
| 2016 | 6.28 | 0.05 | 1.58 | 1.63 | (0.06 | ) | (0.73 | ) | (0.79 | ) | – | 7.12 | 25.84 | 48,128 | 1.23 | 1.23 | 1.23 | 0.62 | 65 | ||||||||||||||||||||||||||||||||||||||||||||
| 2015 | 8.74 | 0.03 | (1.09 | ) | (1.06 | ) | (0.04 | ) | (1.36 | ) | (1.40 | ) | – | 6.28 | (12.21 | ) | 50,410 | 1.24 | 1.24 | 1.24 | 0.40 | 64 | |||||||||||||||||||||||||||||||||||||||||
| 2014 | 10.11 | (0.00 | ) | (0.32 | ) | (0.32 | ) | – | (1.05 | ) | (1.05 | ) | – | 8.74 | (2.95 | ) | 68,898 | 1.22 | 1.22 | 1.22 | (0.03 | ) | 39 | ||||||||||||||||||||||||||||||||||||||||
| Royce Small-Cap Leaders Fund–Service Class | |||||||||||||||||||||||||||||||||||||||||||||||||||||||||||||||
| 2018 | $ | 6.59 | $ | (0.00 | ) | $ | (0.81 | ) | $ | (0.81 | ) | $ | – | $ | (1.11 | ) | $ | (1.11 | ) | $ | – | $ | 4.67 | (12.72 | )% | $ | 27,194 | 1.62 | % | 1.62 | % | 1.49 | % | (0.03 | )% | 62 | % | ||||||||||||||||||||||||||
| 2017 | 7.03 | 0.03 | 0.66 | 0.69 | (0.03 | ) | (1.10 | ) | (1.13 | ) | – | 6.59 | 10.15 | 38,864 | 1.59 | 1.59 | 1.49 | 0.31 | 74 | ||||||||||||||||||||||||||||||||||||||||||||
| 2016 | 6.21 | 0.03 | 1.56 | 1.59 | (0.04 | ) | (0.73 | ) | (0.77 | ) | – | 7.03 | 25.51 | 50,523 | 1.58 | 1.58 | 1.49 | 0.37 | 65 | ||||||||||||||||||||||||||||||||||||||||||||
| 2015 | 8.65 | 0.02 | (1.09 | ) | (1.07 | ) | (0.01 | ) | (1.36 | ) | (1.37 | ) | – | 6.21 | (12.50 | ) | 57,729 | 1.54 | 1.54 | 1.49 | 0.18 | 64 | |||||||||||||||||||||||||||||||||||||||||
| 2014 | 10.05 | (0.04 | ) | (0.31 | ) | (0.35 | ) | – | (1.05 | ) | (1.05 | ) | – | 8.65 | (3.26 | ) | 149,736 | 1.52 | 1.52 | 1.50 | (0.39 | ) | 39 | ||||||||||||||||||||||||||||||||||||||||
| Royce Small-Cap Value Fund–Investment Class | |||||||||||||||||||||||||||||||||||||||||||||||||||||||||||||||
| 2018 | $ | 10.16 | $ | 0.05 | $ | (0.73 | ) | $ | (0.68 | ) | $ | (0.04 | ) | $ | (1.09 | ) | $ | (1.13 | ) | $ | – | $ | 8.35 | (7.05 | )% | $ | 56,433 | 1.26 | % | 1.26 | % | 1.24 | % | 0.45 | % | 64 | % | ||||||||||||||||||||||||||
| 2017 | 10.03 | 0.04 | 0.50 | 0.54 | (0.06 | ) | (0.35 | ) | (0.41 | ) | – | 10.16 | 5.49 | 66,094 | 1.26 | 1.25 | 1.24 | 0.44 | 61 | ||||||||||||||||||||||||||||||||||||||||||||
| 2016 | 8.74 | 0.08 | 1.79 | 1.87 | (0.08 | ) | (0.50 | ) | (0.58 | ) | – | 10.03 | 21.37 | 72,863 | 1.24 | 1.24 | 1.24 | 0.72 | 56 | ||||||||||||||||||||||||||||||||||||||||||||
| 2015 | 11.81 | 0.10 | (1.43 | ) | (1.33 | ) | (0.09 | ) | (1.65 | ) | (1.74 | ) | – | 8.74 | (11.25 | ) | 77,821 | 1.23 | 1.23 | 1.23 | 0.69 | 60 | |||||||||||||||||||||||||||||||||||||||||
| 2014 | 13.52 | 0.04 | (0.05 | ) | (0.01 | ) | (0.03 | ) | (1.67 | ) | (1.70 | ) | – | 11.81 | 0.27 | 140,163 | 1.18 | 1.18 | 1.18 | 0.32 | 38 | ||||||||||||||||||||||||||||||||||||||||||
| Royce Small-Cap Value Fund–Service Class | |||||||||||||||||||||||||||||||||||||||||||||||||||||||||||||||
| 2018 | $ | 10.12 | $ | 0.02 | $ | (0.72 | ) | $ | (0.70 | ) | $ | (0.01 | ) | $ | (1.08 | ) | $ | (1.09 | ) | $ | – | $ | 8.33 | (7.17 | )% | $ | 111,855 | 1.53 | % | 1.53 | % | 1.49 | % | 0.19 | % | 64 | % | ||||||||||||||||||||||||||
| 2017 | 9.98 | 0.02 | 0.50 | 0.52 | (0.03 | ) | (0.35 | ) | (0.38 | ) | – | 10.12 | 5.27 | 152,232 | 1.51 | 1.51 | 1.49 | 0.17 | 61 | ||||||||||||||||||||||||||||||||||||||||||||
| 2016 | 8.70 | 0.05 | 1.79 | 1.84 | (0.06 | ) | (0.50 | ) | (0.56 | ) | – | 9.98 | 21.06 | 213,067 | 1.49 | 1.49 | 1.48 | 0.48 | 56 | ||||||||||||||||||||||||||||||||||||||||||||
| 2015 | 11.76 | 0.06 | (1.41 | ) | (1.35 | ) | (0.06 | ) | (1.65 | ) | (1.71 | ) | – | 8.70 | (11.51 | ) | 252,814 | 1.48 | 1.48 | 1.48 | 0.45 | 60 | |||||||||||||||||||||||||||||||||||||||||
| 2014 | 13.48 | 0.01 | (0.06 | ) | (0.05 | ) | – | (1.67 | ) | (1.67 | ) | – | 11.76 | (0.02 | ) | 477,999 | 1.45 | 1.45 | 1.45 | 0.04 | 38 | ||||||||||||||||||||||||||||||||||||||||||
| Royce Small-Cap Value Fund–Consultant Class | |||||||||||||||||||||||||||||||||||||||||||||||||||||||||||||||
| 2018 | $ | 9.06 | $ | (0.06 | ) | $ | (0.64 | ) | $ | (0.70 | ) | $ | – | $ | (0.96 | ) | $ | (0.96 | ) | $ | – | $ | 7.40 | (8.07 | )% | $ | 9,641 | 2.35 | % | 2.34 | % | 2.34 | % | (0.66 | )% | 64 | % | ||||||||||||||||||||||||||
| 2017 | 8.98 | (0.06 | ) | 0.45 | 0.39 | – | (0.31 | ) | (0.31 | ) | – | 9.06 | 4.44 | 13,111 | 2.32 | 2.32 | 2.32 | (0.66 | ) | 61 | |||||||||||||||||||||||||||||||||||||||||||
| 2016 | 7.89 | (0.03 | ) | 1.62 | 1.59 | – | (0.50 | ) | (0.50 | ) | – | 8.98 | 20.10 | 16,484 | 2.28 | 2.28 | 2.28 | (0.33 | ) | 56 | |||||||||||||||||||||||||||||||||||||||||||
| 2015 | 10.87 | (0.04 | ) | (1.29 | ) | (1.33 | ) | – | (1.65 | ) | (1.65 | ) | – | 7.89 | (12.24 | ) | 18,404 | 2.27 | 2.27 | 2.27 | (0.36 | ) | 60 | ||||||||||||||||||||||||||||||||||||||||
| 2014 | 12.68 | (0.09 | ) | (0.05 | ) | (0.14 | ) | – | (1.67 | ) | (1.67 | ) | – | 10.87 | (0.74 | ) | 26,716 | 2.21 | 2.21 | 2.21 | (0.71 | ) | 38 | ||||||||||||||||||||||||||||||||||||||||
| Royce Small-Cap Value Fund–R Class | |||||||||||||||||||||||||||||||||||||||||||||||||||||||||||||||
| 2018 | $ | 9.75 | $ | (0.03 | ) | $ | (0.68 | ) | $ | (0.71 | ) | $ | – | $ | (1.04 | ) | $ | (1.04 | ) | $ | – | $ | 8.00 | (7.62 | )% | $ | 8,254 | 1.92 | % | 1.92 | % | 1.92 | % | (0.26 | )% | 64 | % | ||||||||||||||||||||||||||
| 2017 | 9.63 | (0.02 | ) | 0.48 | 0.46 | – | (0.34 | ) | (0.34 | ) | – | 9.75 | 4.81 | 14,620 | 1.88 | 1.88 | 1.88 | (0.21 | ) | 61 | |||||||||||||||||||||||||||||||||||||||||||
| 2016 | 8.42 | 0.01 | 1.73 | 1.74 | (0.03 | ) | (0.50 | ) | (0.53 | ) | – | 9.63 | 20.60 | 18,059 | 1.85 | 1.85 | 1.85 | 0.11 | 56 | ||||||||||||||||||||||||||||||||||||||||||||
| 2015 | 11.43 | 0.01 | (1.35 | ) | (1.34 | ) | (0.02 | ) | (1.65 | ) | (1.67 | ) | – | 8.42 | (11.71 | ) | 19,200 | 1.83 | 1.83 | 1.83 | 0.09 | 60 | |||||||||||||||||||||||||||||||||||||||||
| 2014 | 13.19 | (0.03 | ) | (0.06 | ) | (0.09 | ) | – | (1.67 | ) | (1.67 | ) | – | 11.43 | (0.34 | ) | 31,043 | 1.77 | 1.77 | 1.77 | (0.26 | ) | 38 | ||||||||||||||||||||||||||||||||||||||||
| THE ACCOMPANYING NOTES ARE AN INTEGRAL PART OF THESE FINANCIAL STATEMENTS | The Royce Funds 2018 Annual Report to Shareholders | 91 |
Financial Highlights
This table is presented to show selected data for a share outstanding throughout each year or other indicated period and to assist shareholders in evaluating a Fund’s performance for the periods presented. Per share amounts have been determined on the basis of the weighted average number of shares outstanding during the period.
| Ratio of Expenses to Average Net Assets | |||||||||||||||||||||||||||||||||||||||||||||||||||||||||||||||
| Net Asset Value, Beginning of Period | Net Investment Income (Loss) | Net Realized and Unrealized Gain (Loss) on Investments and Foreign Currency | Total from Investment Operations | Distributions from Net Investment Income | Distributions from Net Realized Gain on Investments and Foreign Currency | Total Distributions | Shareholder Redemption Fees | Net Asset Value, End of Period | Total Return | Net Assets, End of Period (in thousands) | Prior to Fee Waivers, Expense Reimbursements and Balance Credits | Prior to Fee Waivers and Expense Reimbursements | Net of Fee Waivers and Expense Reimbursements | Ratio of Net Investment Income (Loss) to Average Net Assets | Portfolio Turnover Rate | ||||||||||||||||||||||||||||||||||||||||||||||||
| Royce Small/Mid-Cap Premier Fund–Investment Class | |||||||||||||||||||||||||||||||||||||||||||||||||||||||||||||||
| 2018 | $ | 15.66 | $ | 0.02 | $ | (2.32 | ) | $ | (2.30 | ) | $ | (0.01 | ) | $ | (2.60 | ) | $ | (2.61 | ) | $ | – | $ | 10.75 | (15.05 | )% | $ | 64,376 | 1.02 | % | 1.02 | % | 1.02 | % | 0.12 | % | 69 | % | ||||||||||||||||||||||||||
| 2017 | 14.64 | 0.05 | 3.05 | 3.10 | (0.03 | ) | (2.05 | ) | (2.08 | ) | – | 15.66 | 21.47 | 81,549 | 0.99 | 0.99 | 0.99 | 0.29 | 54 | ||||||||||||||||||||||||||||||||||||||||||||
| 2016 | 12.87 | 0.04 | 2.30 | 2.34 | (0.06 | ) | (0.51 | ) | (0.57 | ) | – | 14.64 | 18.12 | 88,378 | 1.02 | 1.02 | 1.02 | 0.22 | 67 | ||||||||||||||||||||||||||||||||||||||||||||
| 2015 | 15.21 | 0.12 | (1.09 | ) | (0.97 | ) | (0.11 | ) | (1.26 | ) | (1.37 | ) | – | 12.87 | (6.33 | ) | 89,766 | 1.10 | 1.10 | 1.10 | 0.54 | 66 | |||||||||||||||||||||||||||||||||||||||||
| 2014 | 16.24 | 0.10 | (0.25 | ) | (0.15 | ) | (0.05 | ) | (0.83 | ) | (0.88 | ) | – | 15.21 | (0.81 | ) | 160,558 | 1.09 | 1.09 | 1.09 | 0.66 | 35 | |||||||||||||||||||||||||||||||||||||||||
| Royce Small/Mid-Cap Premier Fund–Service Class | |||||||||||||||||||||||||||||||||||||||||||||||||||||||||||||||
| 2018 | $ | 15.61 | $ | (0.01 | ) | $ | (2.30 | ) | $ | (2.31 | ) | $ | – | $ | (2.59 | ) | $ | (2.59 | ) | $ | – | $ | 10.71 | (15.16 | )% | $ | 84,555 | 1.32 | % | 1.31 | % | 1.17 | % | (0.04 | )% | 69 | % | ||||||||||||||||||||||||||
| 2017 | 14.60 | 0.02 | 3.03 | 3.05 | – | (2.04 | ) | (2.04 | ) | – | 15.61 | 21.21 | 112,520 | 1.32 | 1.32 | 1.19 | 0.10 | 54 | |||||||||||||||||||||||||||||||||||||||||||||
| 2016 | 12.84 | 0.00 | 2.30 | 2.30 | (0.03 | ) | (0.51 | ) | (0.54 | ) | – | 14.60 | 17.84 | 120,254 | 1.36 | 1.36 | 1.25 | (0.01 | ) | 67 | |||||||||||||||||||||||||||||||||||||||||||
| 2015 | 15.17 | 0.05 | (1.05 | ) | (1.00 | ) | (0.07 | ) | (1.26 | ) | (1.33 | ) | – | 12.84 | (6.53 | ) | 120,381 | 1.46 | 1.46 | 1.35 | 0.31 | 66 | |||||||||||||||||||||||||||||||||||||||||
| 2014 | 16.20 | 0.05 | (0.25 | ) | (0.20 | ) | – | (0.83 | ) | (0.83 | ) | – | 15.17 | (1.14 | ) | 175,433 | 1.43 | 1.43 | 1.40 | 0.32 | 35 | ||||||||||||||||||||||||||||||||||||||||||
| Royce Small/Mid-Cap Premier Fund–Consultant Class | |||||||||||||||||||||||||||||||||||||||||||||||||||||||||||||||
| 2018 | $ | 11.06 | $ | (0.10 | ) | $ | (1.62 | ) | $ | (1.72 | ) | $ | – | $ | (1.82 | ) | $ | (1.82 | ) | $ | – | $ | 7.52 | (15.95 | )% | $ | 6,229 | 2.25 | % | 2.24 | % | 2.09 | % | (0.96 | )% | 69 | % | ||||||||||||||||||||||||||
| 2017 | 10.44 | (0.09 | ) | 2.16 | 2.07 | – | (1.45 | ) | (1.45 | ) | – | 11.06 | 20.10 | 10,328 | 2.24 | 2.24 | 2.09 | (0.81 | ) | 54 | |||||||||||||||||||||||||||||||||||||||||||
| 2016 | 9.37 | (0.09 | ) | 1.67 | 1.58 | – | (0.51 | ) | (0.51 | ) | – | 10.44 | 16.78 | 11,643 | 2.28 | 2.28 | 2.14 | (0.89 | ) | 67 | |||||||||||||||||||||||||||||||||||||||||||
| 2015 | 11.47 | (0.06 | ) | (0.78 | ) | (0.84 | ) | – | (1.26 | ) | (1.26 | ) | – | 9.37 | (7.31 | ) | 11,369 | 2.41 | 2.41 | 2.24 | (0.58 | ) | 66 | ||||||||||||||||||||||||||||||||||||||||
| 2014 | 12.57 | (0.07 | ) | (0.20 | ) | (0.27 | ) | – | (0.83 | ) | (0.83 | ) | – | 11.47 | (2.02 | ) | 13,338 | 2.31 | 2.31 | 2.31 | (0.59 | ) | 35 | ||||||||||||||||||||||||||||||||||||||||
| Royce Smaller-Companies Growth Fund–Investment Class | |||||||||||||||||||||||||||||||||||||||||||||||||||||||||||||||
| 2018 | $ | 10.93 | $ | (0.07 | ) | $ | (0.86 | ) | $ | (0.93 | ) | $ | – | $ | (3.14 | ) | $ | (3.14 | ) | $ | – | $ | 6.86 | (9.94 | )% | $ | 87,213 | 1.21 | % | 1.21 | % | 1.21 | % | (0.62 | )% | 61 | % | ||||||||||||||||||||||||||
| 2017 | 11.22 | (0.09 | ) | 2.08 | 1.99 | – | (2.28 | ) | (2.28 | ) | – | 10.93 | 18.20 | 119,745 | 1.19 | 1.19 | 1.19 | (0.67 | ) | 64 | |||||||||||||||||||||||||||||||||||||||||||
| 2016 | 11.36 | (0.05 | ) | 1.17 | 1.12 | – | (1.26 | ) | (1.26 | ) | – | 11.22 | 9.67 | 98,962 | 1.15 | 1.15 | 1.15 | (0.41 | ) | 59 | |||||||||||||||||||||||||||||||||||||||||||
| 2015 | 14.36 | (0.06 | ) | (0.19 | ) | (0.25 | ) | – | (2.75 | ) | (2.75 | ) | – | 11.36 | (1.59 | ) | 139,979 | 1.32 | 1.32 | 1.24 | (0.38 | ) | 45 | ||||||||||||||||||||||||||||||||||||||||
| 2014 | 17.03 | (0.07 | ) | 0.68 | 0.61 | – | (3.28 | ) | (3.28 | ) | – | 14.36 | 4.04 | 295,412 | 1.33 | 1.33 | 1.33 | (0.40 | ) | 52 | |||||||||||||||||||||||||||||||||||||||||||
| Royce Smaller-Companies Growth Fund–Service Class | |||||||||||||||||||||||||||||||||||||||||||||||||||||||||||||||
| 2018 | $ | 10.69 | $ | (0.10 | ) | $ | (0.85 | ) | $ | (0.95 | ) | $ | – | $ | (3.05 | ) | $ | (3.05 | ) | $ | – | $ | 6.69 | (10.22 | )% | $ | 156,057 | 1.52 | % | 1.52 | % | 1.49 | % | (0.90 | )% | 61 | % | ||||||||||||||||||||||||||
| 2017 | 11.01 | (0.12 | ) | 2.03 | 1.91 | – | (2.23 | ) | (2.23 | ) | – | 10.69 | 17.80 | 228,008 | 1.49 | 1.49 | 1.47 | (0.96 | ) | 64 | |||||||||||||||||||||||||||||||||||||||||||
| 2016 | 11.20 | (0.08 | ) | 1.15 | 1.07 | – | (1.26 | ) | (1.26 | ) | – | 11.01 | 9.37 | 284,640 | 1.51 | 1.51 | 1.49 | (0.74 | ) | 59 | |||||||||||||||||||||||||||||||||||||||||||
| 2015 | 14.23 | (0.08 | ) | (0.20 | ) | (0.28 | ) | – | (2.75 | ) | (2.75 | ) | – | 11.20 | (1.82 | ) | 408,744 | 1.47 | 1.47 | 1.45 | (0.58 | ) | 45 | ||||||||||||||||||||||||||||||||||||||||
| 2014 | 16.93 | (0.09 | ) | 0.67 | 0.58 | – | (3.28 | ) | (3.28 | ) | – | 14.23 | 3.89 | 572,899 | 1.44 | 1.44 | 1.42 | (0.51 | ) | 52 | |||||||||||||||||||||||||||||||||||||||||||
| Royce Smaller-Companies Growth Fund–Consultant Class | |||||||||||||||||||||||||||||||||||||||||||||||||||||||||||||||
| 2018 | $ | 9.28 | $ | (0.16 | ) | $ | (0.72 | ) | $ | (0.88 | ) | $ | – | $ | (2.66 | ) | $ | (2.66 | ) | $ | – | $ | 5.74 | (10.95 | )% | $ | 6,328 | 2.40 | % | 2.40 | % | 2.24 | % | (1.66 | )% | 61 | % | ||||||||||||||||||||||||||
| 2017 | 9.63 | (0.18 | ) | 1.77 | 1.59 | – | (1.94 | ) | (1.94 | ) | – | 9.28 | 16.92 | 10,119 | 2.36 | 2.36 | 2.24 | (1.73 | ) | 64 | |||||||||||||||||||||||||||||||||||||||||||
| 2016 | 10.01 | (0.14 | ) | 1.02 | 0.88 | – | (1.26 | ) | (1.26 | ) | – | 9.63 | 8.58 | 10,593 | 2.35 | 2.35 | 2.24 | (1.50 | ) | 59 | |||||||||||||||||||||||||||||||||||||||||||
| 2015 | 13.12 | (0.18 | ) | (0.18 | ) | (0.36 | ) | – | (2.75 | ) | (2.75 | ) | – | 10.01 | (2.61 | ) | 14,411 | 2.32 | 2.32 | 2.24 | (1.36 | ) | 45 | ||||||||||||||||||||||||||||||||||||||||
| 2014 | 15.99 | (0.22 | ) | 0.63 | 0.41 | – | (3.28 | ) | (3.28 | ) | – | 13.12 | 3.05 | 17,158 | 2.29 | 2.29 | 2.29 | (1.37 | ) | 52 | |||||||||||||||||||||||||||||||||||||||||||
| 92 | The Royce Funds 2018 Annual Report to Shareholders | THE ACCOMPANYING NOTES ARE AN INTEGRAL PART OF THESE FINANCIAL STATEMENTS |
Financial Highlights
This table is presented to show selected data for a share outstanding throughout each year or other indicated period and to assist shareholders in evaluating a Fund’s performance for the periods presented. Per share amounts have been determined on the basis of the weighted average number of shares outstanding during the period.
| Ratio of Expenses to Average Net Assets | |||||||||||||||||||||||||||||||||||||||||||||||||||||||||||||||
| Net Asset Value, Beginning of Period | Net Investment Income (Loss) | Net Realized and Unrealized Gain (Loss) on Investments and Foreign Currency | Total from Investment Operations | Distributions from Net Investment Income | Distributions from Net Realized Gain on Investments and Foreign Currency | Total Distributions | Shareholder Redemption Fees | Net Asset Value, End of Period | Total Return | Net Assets, End of Period (in thousands) | Prior to Fee Waivers, Expense Reimbursements and Balance Credits | Prior to Fee Waivers and Expense Reimbursements | Net of Fee Waivers and Expense Reimbursements | Ratio of Net Investment Income (Loss) to Average Net Assets | Portfolio Turnover Rate | ||||||||||||||||||||||||||||||||||||||||||||||||
| Royce Smaller-Companies Growth Fund–Institutional Class | |||||||||||||||||||||||||||||||||||||||||||||||||||||||||||||||
| 2018 | $ | 11.06 | $ | (0.06 | ) | $ | (0.88 | ) | $ | (0.94 | ) | $ | – | $ | (3.17 | ) | $ | (3.17 | ) | $ | – | $ | 6.95 | (9.94 | )% | $ | 7,165 | 1.28 | % | 1.28 | % | 1.08 | % | (0.49 | )% | 61 | % | ||||||||||||||||||||||||||
| 2017 | 11.35 | (0.09 | ) | 2.11 | 2.02 | – | (2.31 | ) | (2.31 | ) | – | 11.06 | 18.23 | 9,315 | 1.21 | 1.21 | 1.21 | (0.70 | ) | 64 | |||||||||||||||||||||||||||||||||||||||||||
| 2016 | 11.48 | (0.05 | ) | 1.18 | 1.13 | – | (1.26 | ) | (1.26 | ) | – | 11.35 | 9.66 | 20,523 | 1.15 | 1.15 | 1.15 | (0.41 | ) | 59 | |||||||||||||||||||||||||||||||||||||||||||
| 2015 | 14.46 | (0.03 | ) | (0.20 | ) | (0.23 | ) | – | (2.75 | ) | (2.75 | ) | – | 11.48 | (1.45 | ) | 39,763 | 1.10 | 1.10 | 1.10 | (0.22 | ) | 45 | ||||||||||||||||||||||||||||||||||||||||
| 2014 | 17.09 | (0.03 | ) | 0.68 | 0.65 | – | (3.28 | ) | (3.28 | ) | – | 14.46 | 4.26 | 38,718 | 1.06 | 1.06 | 1.06 | (0.16 | ) | 52 | |||||||||||||||||||||||||||||||||||||||||||
| Royce Special Equity Fund–Investment Class | |||||||||||||||||||||||||||||||||||||||||||||||||||||||||||||||
| 2018 | $ | 21.79 | $ | 0.23 | $ | (2.31 | ) | $ | (2.08 | ) | $ | (0.22 | ) | $ | (2.06 | ) | $ | (2.28 | ) | $ | – | $ | 17.43 | (9.86 | )% | $ | 909,113 | 1.18 | % | 1.18 | % | 1.18 | % | 1.04 | % | 21 | % | ||||||||||||||||||||||||||
| 2017 | 22.02 | 0.13 | 1.56 | 1.69 | (0.12 | ) | (1.80 | ) | (1.92 | ) | – | 21.79 | 7.87 | 1,142,224 | 1.17 | 1.17 | 1.17 | 0.54 | 15 | ||||||||||||||||||||||||||||||||||||||||||||
| 2016 | 17.94 | 0.21 | 5.57 | 5.78 | (0.21 | ) | (1.49 | ) | (1.70 | ) | – | 22.02 | 32.21 | 1,225,095 | 1.17 | 1.17 | 1.17 | 0.99 | 29 | ||||||||||||||||||||||||||||||||||||||||||||
| 2015 | 22.86 | 0.22 | (3.04 | ) | (2.82 | ) | (0.24 | ) | (1.86 | ) | (2.10 | ) | – | 17.94 | (12.36 | ) | 1,098,106 | 1.15 | 1.15 | 1.15 | 0.80 | 15 | |||||||||||||||||||||||||||||||||||||||||
| 2014 | 25.02 | 0.13 | 0.09 | 0.22 | (0.12 | ) | (2.26 | ) | (2.38 | ) | – | 22.86 | 1.09 | 1,950,211 | 1.12 | 1.12 | 1.12 | 0.47 | 21 | ||||||||||||||||||||||||||||||||||||||||||||
| Royce Special Equity Fund–Service Class | |||||||||||||||||||||||||||||||||||||||||||||||||||||||||||||||
| 2018 | $ | 21.76 | $ | 0.20 | $ | (2.33 | ) | $ | (2.13 | ) | $ | (0.18 | ) | $ | (2.04 | ) | $ | (2.22 | ) | $ | – | $ | 17.41 | (10.13 | )% | $ | 62,706 | 1.51 | % | 1.50 | % | 1.39 | % | 0.88 | % | 21 | % | ||||||||||||||||||||||||||
| 2017 | 21.98 | 0.08 | 1.56 | 1.64 | (0.07 | ) | (1.79 | ) | (1.86 | ) | – | 21.76 | 7.66 | 108,001 | 1.50 | 1.50 | 1.39 | 0.32 | 15 | ||||||||||||||||||||||||||||||||||||||||||||
| 2016 | 17.92 | 0.16 | 5.56 | 5.72 | (0.17 | ) | (1.49 | ) | (1.66 | ) | – | 21.98 | 31.92 | 128,102 | 1.50 | 1.50 | 1.39 | 0.77 | 29 | ||||||||||||||||||||||||||||||||||||||||||||
| 2015 | 22.81 | 0.17 | (3.03 | ) | (2.86 | ) | (0.17 | ) | (1.86 | ) | (2.03 | ) | – | 17.92 | (12.55 | ) | 112,315 | 1.47 | 1.47 | 1.39 | 0.57 | 15 | |||||||||||||||||||||||||||||||||||||||||
| 2014 | 24.97 | 0.06 | 0.09 | 0.15 | (0.05 | ) | (2.26 | ) | (2.31 | ) | – | 22.81 | 0.80 | 233,791 | 1.44 | 1.44 | 1.39 | 0.20 | 21 | ||||||||||||||||||||||||||||||||||||||||||||
| Royce Special Equity Fund–Consultant Class | |||||||||||||||||||||||||||||||||||||||||||||||||||||||||||||||
| 2018 | $ | 19.86 | $ | 0.01 | $ | (2.10 | ) | $ | (2.09 | ) | $ | (0.01 | ) | $ | (1.86 | ) | $ | (1.87 | ) | $ | – | $ | 15.90 | (10.83 | )% | $ | 30,234 | 2.19 | % | 2.19 | % | 2.19 | % | 0.04 | % | 21 | % | ||||||||||||||||||||||||||
| 2017 | 20.16 | (0.10 | ) | 1.43 | 1.33 | – | (1.63 | ) | (1.63 | ) | – | 19.86 | 6.77 | 46,654 | 2.21 | 2.20 | 2.20 | (0.49 | ) | 15 | |||||||||||||||||||||||||||||||||||||||||||
| 2016 | 16.57 | (0.01 | ) | 5.13 | 5.12 | (0.04 | ) | (1.49 | ) | (1.53 | ) | – | 20.16 | 30.91 | 50,514 | 2.20 | 2.20 | 2.20 | (0.04 | ) | 29 | ||||||||||||||||||||||||||||||||||||||||||
| 2015 | 21.27 | (0.05 | ) | (2.76 | ) | (2.81 | ) | (0.03 | ) | (1.86 | ) | (1.89 | ) | – | 16.57 | (13.23 | ) | 42,427 | 2.18 | 2.18 | 2.18 | (0.24 | ) | 15 | |||||||||||||||||||||||||||||||||||||||
| 2014 | 23.57 | (0.13 | ) | 0.09 | (0.04 | ) | – | (2.26 | ) | (2.26 | ) | – | 21.27 | 0.04 | 63,981 | 2.14 | 2.14 | 2.14 | (0.56 | ) | 21 | ||||||||||||||||||||||||||||||||||||||||||
| Royce Special Equity Fund–Institutional Class | |||||||||||||||||||||||||||||||||||||||||||||||||||||||||||||||
| 2018 | $ | 21.61 | $ | 0.25 | $ | (2.30 | ) | $ | (2.05 | ) | $ | (0.24 | ) | $ | (2.04 | ) | $ | (2.28 | ) | $ | – | $ | 17.28 | (9.81 | )% | $ | 202,317 | 1.11 | % | 1.11 | % | 1.11 | % | 1.14 | % | 21 | % | ||||||||||||||||||||||||||
| 2017 | 21.84 | 0.14 | 1.55 | 1.69 | (0.14 | ) | (1.78 | ) | (1.92 | ) | – | 21.61 | 7.96 | 247,004 | 1.09 | 1.09 | 1.09 | 0.60 | 15 | ||||||||||||||||||||||||||||||||||||||||||||
| 2016 | 17.80 | 0.23 | 5.53 | 5.76 | (0.23 | ) | (1.49 | ) | (1.72 | ) | – | 21.84 | 32.35 | 206,270 | 1.07 | 1.07 | 1.07 | 1.10 | 29 | ||||||||||||||||||||||||||||||||||||||||||||
| 2015 | 22.71 | 0.33 | (3.12 | ) | (2.79 | ) | (0.26 | ) | (1.86 | ) | (2.12 | ) | – | 17.80 | (12.27 | ) | 208,952 | 1.04 | 1.04 | 1.04 | 1.02 | 15 | |||||||||||||||||||||||||||||||||||||||||
| 2014 | 24.88 | 0.14 | 0.10 | 0.24 | (0.15 | ) | (2.26 | ) | (2.41 | ) | – | 22.71 | 1.17 | 639,723 | 1.02 | 1.02 | 1.02 | 0.56 | 21 | ||||||||||||||||||||||||||||||||||||||||||||
| Royce Special Equity Multi-Cap Fund–Investment Class | |||||||||||||||||||||||||||||||||||||||||||||||||||||||||||||||
| 2018 | $ | 15.63 | $ | 0.21 | $ | (1.69 | ) | $ | (1.48 | ) | $ | (0.23 | ) | $ | (3.04 | ) | $ | (3.27 | ) | $ | – | $ | 10.88 | (10.37 | )% | $ | 23,105 | 1.10 | % | 1.10 | % | 1.02 | % | 1.11 | % | 14 | % | ||||||||||||||||||||||||||
| 2017 | 13.90 | 0.14 | 2.04 | 2.18 | (0.15 | ) | (0.30 | ) | (0.45 | ) | – | 15.63 | 15.77 | 41,081 | 1.04 | 1.04 | 0.99 | 0.96 | 28 | ||||||||||||||||||||||||||||||||||||||||||||
| 2016 | 12.34 | 0.17 | 1.55 | 1.72 | (0.16 | ) | – | (0.16 | ) | – | 13.90 | 13.92 | 34,858 | 1.02 | 1.02 | 0.97 | 1.15 | 50 | |||||||||||||||||||||||||||||||||||||||||||||
| 2015 | 15.55 | 0.40 | (2.48 | ) | (2.08 | ) | (0.35 | ) | (0.78 | ) | (1.13 | ) | – | 12.34 | (13.40 | ) | 43,999 | 1.01 | 1.01 | 0.99 | 1.49 | 31 | |||||||||||||||||||||||||||||||||||||||||
| 2014 | 14.92 | 0.10 | 1.30 | 1.40 | (0.11 | ) | (0.66 | ) | (0.77 | ) | – | 15.55 | 9.53 | 123,545 | 0.97 | 0.97 | 0.96 | 0.95 | 39 | ||||||||||||||||||||||||||||||||||||||||||||
| THE ACCOMPANYING NOTES ARE AN INTEGRAL PART OF THESE FINANCIAL STATEMENTS | The Royce Funds 2018 Annual Report to Shareholders | 93 |
Financial Highlights
This table is presented to show selected data for a share outstanding throughout each year or other indicated period and to assist shareholders in evaluating a Fund’s performance for the periods presented. Per share amounts have been determined on the basis of the weighted average number of shares outstanding during the period.
| Ratio of Expenses to Average Net Assets | |||||||||||||||||||||||||||||||||||||||||||||||||||||||||||||||
| Net Asset Value, Beginning of Period | Net Investment Income (Loss) | Net Realized and Unrealized Gain (Loss) on Investments and Foreign Currency | Total from Investment Operations | Distributions from Net Investment Income | Distributions from Net Realized Gain on Investments and Foreign Currency | Total Distributions | Shareholder Redemption Fees | Net Asset Value, End of Period | Total Return | Net Assets, End of Period (in thousands) | Prior to Fee Waivers, Expense Reimbursements and Balance Credits | Prior to Fee Waivers and Expense Reimbursements | Net of Fee Waivers and Expense Reimbursements | Ratio of Net Investment Income (Loss) to Average Net Assets | Portfolio Turnover Rate | ||||||||||||||||||||||||||||||||||||||||||||||||
| Royce Special Equity Multi-Cap Fund–Service Class | |||||||||||||||||||||||||||||||||||||||||||||||||||||||||||||||
| 2018 | $ | 15.69 | $ | 0.15 | $ | (1.66 | ) | $ | (1.51 | ) | $ | (0.20 | ) | $ | (3.05 | ) | $ | (3.25 | ) | $ | – | $ | 10.93 | (10.57 | )% | $ | 14,408 | 1.47 | % | 1.47 | % | 1.24 | % | 0.89 | % | 14 | % | ||||||||||||||||||||||||||
| 2017 | 13.95 | 0.12 | 2.02 | 2.14 | (0.10 | ) | (0.30 | ) | (0.40 | ) | – | 15.69 | 15.42 | 24,182 | 1.39 | 1.39 | 1.24 | 0.68 | 28 | ||||||||||||||||||||||||||||||||||||||||||||
| 2016 | 12.38 | 0.13 | 1.57 | 1.70 | (0.13 | ) | – | (0.13 | ) | – | 13.95 | 13.69 | 37,495 | 1.34 | 1.34 | 1.23 | 0.89 | 50 | |||||||||||||||||||||||||||||||||||||||||||||
| 2015 | 15.60 | 0.26 | (2.39 | ) | (2.13 | ) | (0.31 | ) | (0.78 | ) | (1.09 | ) | – | 12.38 | (13.64 | ) | 47,630 | 1.29 | 1.29 | 1.23 | 1.21 | 31 | |||||||||||||||||||||||||||||||||||||||||
| 2014 | 14.96 | 0.10 | 1.27 | 1.37 | (0.07 | ) | (0.66 | ) | (0.73 | ) | – | 15.60 | 9.28 | 94,878 | 1.34 | 1.34 | 1.24 | 0.66 | 39 | ||||||||||||||||||||||||||||||||||||||||||||
| Royce Special Equity Multi-Cap Fund–Consultant Classf | |||||||||||||||||||||||||||||||||||||||||||||||||||||||||||||||
| 2018 | $ | 10.19 | $ | 0.04 | $ | (1.09 | ) | $ | (1.05 | ) | $ | (0.11 | ) | $ | (1.97 | ) | $ | (2.08 | ) | $ | – | $ | 7.06 | (11.18 | )% | $ | 2,165 | 2.17 | % | 2.17 | % | 1.99 | % | 0.13 | % | 14 | % | ||||||||||||||||||||||||||
| 2017 | 9.12 | (0.00 | ) | 1.32 | 1.32 | (0.05 | ) | (0.20 | ) | (0.25 | ) | – | 10.19 | 14.50 | 4,190 | 2.73 | 2.73 | 1.99 | (0.06 | ) | 28 | ||||||||||||||||||||||||||||||||||||||||||
| 2016 | 8.15 | 0.02 | 1.03 | 1.05 | (0.08 | ) | – | (0.08 | ) | – | 9.12 | 12.89 | 4,986 | 2.38 | 2.38 | 1.99 | 0.12 | 50 | |||||||||||||||||||||||||||||||||||||||||||||
| 2015 | 10.72 | 0.09 | (1.63 | ) | (1.54 | ) | (0.25 | ) | (0.78 | ) | (1.03 | ) | – | 8.15 | (14.35 | ) | 6,825 | 2.19 | 2.19 | 1.99 | 0.50 | 31 | |||||||||||||||||||||||||||||||||||||||||
| 2014 | 10.00 | (0.04 | ) | 1.48 | 1.44 | (0.06 | ) | (0.66 | ) | (0.72 | ) | – | 10.72 | 14.57 | 1 | 9,223 | 2.54 | 2 | 2.54 | 2 | 1.99 | 2 | (0.05) | 2 | 39 | ||||||||||||||||||||||||||||||||||||||
| Royce Special Equity Multi-Cap Fund–Institutional Class | |||||||||||||||||||||||||||||||||||||||||||||||||||||||||||||||
| 2018 | $ | 15.62 | $ | 0.39 | $ | (1.86 | ) | $ | (1.47 | ) | $ | (0.25 | ) | $ | (3.04 | ) | $ | (3.29 | ) | $ | – | $ | 10.86 | (10.35 | )% | $ | 1,941 | 1.09 | % | 1.09 | % | 0.89 | % | 1.14 | % | 14 | % | ||||||||||||||||||||||||||
| 2017 | 13.89 | 0.17 | 2.03 | 2.20 | (0.17 | ) | (0.30 | ) | (0.47 | ) | – | 15.62 | 15.89 | 38,706 | 0.99 | 0.99 | 0.89 | 1.06 | 28 | ||||||||||||||||||||||||||||||||||||||||||||
| 2016 | 12.33 | 0.16 | 1.57 | 1.73 | (0.17 | ) | – | (0.17 | ) | – | 13.89 | 14.04 | 37,339 | 0.99 | 0.99 | 0.89 | 1.22 | 50 | |||||||||||||||||||||||||||||||||||||||||||||
| 2015 | 15.56 | 0.34 | (2.41 | ) | (2.07 | ) | (0.38 | ) | (0.78 | ) | (1.16 | ) | – | 12.33 | (13.32 | ) | 36,864 | 0.94 | 0.94 | 0.89 | 1.56 | 31 | |||||||||||||||||||||||||||||||||||||||||
| 2014 | 14.92 | 0.12 | 1.30 | 1.42 | (0.12 | ) | (0.66 | ) | (0.78 | ) | – | 15.56 | 9.64 | 75,941 | 0.93 | 0.93 | 0.89 | 1.01 | 39 | ||||||||||||||||||||||||||||||||||||||||||||
| Royce Total Return Fund–Investment Class | |||||||||||||||||||||||||||||||||||||||||||||||||||||||||||||||
| 2018 | $ | 13.58 | $ | 0.20 | $ | (1.78 | ) | $ | (1.58 | ) | $ | (0.19 | ) | $ | (2.10 | ) | $ | (2.29 | ) | $ | – | $ | 9.71 | (12.46 | )% | $ | 1,036,211 | 1.18 | % | 1.18 | % | 1.18 | % | 1.45 | % | 22 | % | ||||||||||||||||||||||||||
| 2017 | 13.68 | 0.14 | 1.67 | 1.81 | (0.12 | ) | (1.79 | ) | (1.91 | ) | – | 13.58 | 13.65 | 1,550,893 | 1.19 | 1.19 | 1.19 | 1.00 | 12 | ||||||||||||||||||||||||||||||||||||||||||||
| 2016 | 11.91 | 0.15 | 2.93 | 3.08 | (0.22 | ) | (1.09 | ) | (1.31 | ) | – | 13.68 | 25.86 | 1,835,927 | 1.19 | 1.19 | 1.19 | 1.08 | 16 | ||||||||||||||||||||||||||||||||||||||||||||
| 2015 | 14.74 | 0.17 | (1.23 | ) | (1.06 | ) | (0.12 | ) | (1.65 | ) | (1.77 | ) | – | 11.91 | (7.19 | ) | 1,850,309 | 1.15 | 1.15 | 1.15 | 1.18 | 11 | |||||||||||||||||||||||||||||||||||||||||
| 2014 | 16.47 | 0.17 | 0.00 | 0.17 | (0.28 | ) | (1.62 | ) | (1.90 | ) | – | 14.74 | 1.34 | 3,077,951 | 1.13 | 1.13 | 1.13 | 0.95 | 18 | ||||||||||||||||||||||||||||||||||||||||||||
| Royce Total Return Fund–Service Class | |||||||||||||||||||||||||||||||||||||||||||||||||||||||||||||||
| 2018 | $ | 13.88 | $ | 0.16 | $ | (1.82 | ) | $ | (1.66 | ) | $ | (0.11 | ) | $ | (2.14 | ) | $ | (2.25 | ) | $ | – | $ | 9.97 | (12.71 | )% | $ | 83,368 | 1.52 | % | 1.52 | % | 1.48 | % | 1.15 | % | 22 | % | ||||||||||||||||||||||||||
| 2017 | 13.98 | 0.10 | 1.69 | 1.79 | (0.07 | ) | (1.82 | ) | (1.89 | ) | – | 13.88 | 13.24 | 97,854 | 1.49 | 1.48 | 1.48 | 0.72 | 12 | ||||||||||||||||||||||||||||||||||||||||||||
| 2016 | 12.12 | 0.11 | 3.00 | 3.11 | (0.16 | ) | (1.09 | ) | (1.25 | ) | – | 13.98 | 25.60 | 142,606 | 1.46 | 1.46 | 1.46 | 0.80 | 16 | ||||||||||||||||||||||||||||||||||||||||||||
| 2015 | 14.98 | 0.13 | (1.25 | ) | (1.12 | ) | (0.09 | ) | (1.65 | ) | (1.74 | ) | – | 12.12 | (7.48 | ) | 137,594 | 1.43 | 1.43 | 1.43 | 0.90 | 11 | |||||||||||||||||||||||||||||||||||||||||
| 2014 | 16.61 | 0.12 | 0.01 | 0.13 | (0.14 | ) | (1.62 | ) | �� | (1.76 | ) | – | 14.98 | 1.08 | 232,814 | 1.42 | 1.42 | 1.42 | 0.60 | 18 | |||||||||||||||||||||||||||||||||||||||||||
| Royce Total Return Fund–Consultant Class | |||||||||||||||||||||||||||||||||||||||||||||||||||||||||||||||
| 2018 | $ | 13.95 | $ | 0.06 | $ | (1.82 | ) | $ | (1.76 | ) | $ | (0.02 | ) | $ | (2.15 | ) | $ | (2.17 | ) | $ | – | $ | 10.02 | (13.26 | )% | $ | 160,540 | 2.17 | % | 2.17 | % | 2.17 | % | 0.45 | % | 22 | % | ||||||||||||||||||||||||||
| 2017 | 14.07 | 0.01 | 1.70 | 1.71 | – | (1.83 | ) | (1.83 | ) | – | 13.95 | 12.53 | 247,914 | 2.16 | 2.16 | 2.16 | 0.04 | 12 | |||||||||||||||||||||||||||||||||||||||||||||
| 2016 | 12.15 | 0.01 | 3.01 | 3.02 | (0.01 | ) | (1.09 | ) | (1.10 | ) | – | 14.07 | 24.73 | 267,083 | 2.16 | 2.16 | 2.16 | 0.11 | 16 | ||||||||||||||||||||||||||||||||||||||||||||
| 2015 | 15.05 | 0.03 | (1.26 | ) | (1.23 | ) | (0.02 | ) | (1.65 | ) | (1.67 | ) | – | 12.15 | (8.15 | ) | 262,131 | 2.16 | 2.16 | 2.16 | 0.18 | 11 | |||||||||||||||||||||||||||||||||||||||||
| 2014 | 16.68 | (0.00 | ) | 0.02 | 0.02 | (0.03 | ) | (1.62 | ) | (1.65 | ) | – | 15.05 | 0.37 | 356,731 | 2.12 | 2.12 | 2.12 | (0.04 | ) | 18 | ||||||||||||||||||||||||||||||||||||||||||
| 94 | The Royce Funds 2018 Annual Report to Shareholders | THE ACCOMPANYING NOTES ARE AN INTEGRAL PART OF THESE FINANCIAL STATEMENTS |
Financial Highlights
This table is presented to show selected data for a share outstanding throughout each year or other indicated period and to assist shareholders in evaluating a Fund’s performance for the periods presented. Per share amounts have been determined on the basis of the weighted average number of shares outstanding during the period.
| Ratio of Expenses to Average Net Assets | |||||||||||||||||||||||||||||||||||||||||||||||||||||||||||||||
| Net Asset Value, Beginning of Period | Net Investment Income (Loss) | Net Realized and Unrealized Gain (Loss) on Investments and Foreign Currency | Total from Investment Operations | Distributions from Net Investment Income | Distributions from Net Realized Gain on Investments and Foreign Currency | Total Distributions | Shareholder Redemption Fees | Net Asset Value, End of Period | Total Return | Net Assets, End of Period (in thousands) | Prior to Fee Waivers, Expense Reimbursements and Balance Credits | Prior to Fee Waivers and Expense Reimbursements | Net of Fee Waivers and Expense Reimbursements | Ratio of Net Investment Income (Loss) to Average Net Assets | Portfolio Turnover Rate | ||||||||||||||||||||||||||||||||||||||||||||||||
| Royce Total Return Fund–Institutional Class | |||||||||||||||||||||||||||||||||||||||||||||||||||||||||||||||
| 2018 | $ | 13.40 | $ | 0.21 | $ | (1.76 | ) | $ | (1.55 | ) | $ | (0.21 | ) | $ | (2.06 | ) | $ | (2.27 | ) | $ | – | $ | 9.58 | (12.39 | )% | $ | 218,268 | 1.09 | % | 1.09 | % | 1.09 | % | 1.53 | % | 22 | % | ||||||||||||||||||||||||||
| 2017 | 13.52 | 0.16 | 1.64 | 1.80 | (0.15 | ) | (1.77 | ) | (1.92 | ) | – | 13.40 | 13.80 | 310,603 | 1.06 | 1.06 | 1.06 | 1.13 | 12 | ||||||||||||||||||||||||||||||||||||||||||||
| 2016 | 11.78 | 0.18 | 2.90 | 3.08 | (0.25 | ) | (1.09 | ) | (1.34 | ) | – | 13.52 | 26.13 | 420,375 | 1.05 | 1.05 | 1.05 | 1.22 | 16 | ||||||||||||||||||||||||||||||||||||||||||||
| 2015 | 14.61 | 0.18 | (1.22 | ) | (1.04 | ) | (0.14 | ) | (1.65 | ) | (1.79 | ) | – | 11.78 | (7.17 | ) | 374,555 | 1.03 | 1.03 | 1.03 | 1.28 | 11 | |||||||||||||||||||||||||||||||||||||||||
| 2014 | 16.35 | 0.18 | 0.02 | 0.20 | (0.32 | ) | (1.62 | ) | (1.94 | ) | – | 14.61 | 1.51 | 572,662 | 1.00 | 1.00 | 1.00 | 1.09 | 18 | ||||||||||||||||||||||||||||||||||||||||||||
| Royce Total Return Fund–R Class | |||||||||||||||||||||||||||||||||||||||||||||||||||||||||||||||
| 2018 | $ | 13.99 | $ | 0.11 | $ | (1.83 | ) | $ | (1.72 | ) | $ | (0.06 | ) | $ | (2.15 | ) | $ | (2.21 | ) | $ | – | $ | 10.06 | (12.96 | )% | $ | 45,145 | 1.81 | % | 1.81 | % | 1.81 | % | 0.82 | % | 22 | % | ||||||||||||||||||||||||||
| 2017 | 14.09 | 0.06 | 1.71 | 1.77 | (0.03 | ) | (1.84 | ) | (1.87 | ) | – | 13.99 | 12.97 | 54,979 | 1.80 | 1.80 | 1.80 | 0.40 | 12 | ||||||||||||||||||||||||||||||||||||||||||||
| 2016 | 12.19 | 0.07 | 3.00 | 3.07 | (0.08 | ) | (1.09 | ) | (1.17 | ) | – | 14.09 | 25.14 | 53,896 | 1.78 | 1.78 | 1.78 | 0.49 | 16 | ||||||||||||||||||||||||||||||||||||||||||||
| 2015 | 15.07 | 0.08 | (1.25 | ) | (1.17 | ) | (0.06 | ) | (1.65 | ) | (1.71 | ) | – | 12.19 | (7.79 | ) | 50,684 | 1.77 | 1.77 | 1.77 | 0.56 | 11 | |||||||||||||||||||||||||||||||||||||||||
| 2014 | 16.73 | 0.07 | 0.01 | 0.08 | (0.12 | ) | (1.62 | ) | (1.74 | ) | – | 15.07 | 0.73 | 65,501 | 1.72 | 1.72 | 1.72 | 0.37 | 18 | ||||||||||||||||||||||||||||||||||||||||||||
| 1 Not annualized |
| 2 Annualized |
| a The Class commenced operations on March 21, 2014. |
| b The Class commenced operations on January 5, 2016. |
| c The Class commenced operations on January 22, 2014. |
| d The Class commenced operations on February 26, 2016. |
| e The Class commenced operations on May 2, 2018. |
| f The Class commenced operations on January 27, 2014. |
| THE ACCOMPANYING NOTES ARE AN INTEGRAL PART OF THESE FINANCIAL STATEMENTS | The Royce Funds 2018 Annual Report to Shareholders | 95 |
Notes to Financial Statements
| Royce Micro-Cap Opportunity Fund | 29% | |
| Royce Special Equity Multi-Cap Fund | 15% |
| Level 1 – | quoted prices in active markets for identical securities. | |
| Level 2 – | other significant observable inputs (including quoted prices for similar securities, foreign securities that may be fair valued and repurchase agreements). The table below includes all Level 2 securities. Level 2 securities with values based on quoted prices for similar securities are noted in the Schedules of Investments. | |
| Level 3 – | significant unobservable inputs (including last trade price before trading was suspended, or at a discount thereto for lack of marketability or otherwise, market price information regarding other securities, information received from the company and/or published documents, including SEC filings and financial statements, or other publicly available information). |
| 96 | The Royce Funds 2018 Annual Report to Shareholders |
| LEVEL 1 | LEVEL 2 | LEVEL 3 | TOTAL | ||||||||||
| Royce Dividend Value Fund | |||||||||||||
| Common Stocks | $ | 115,380,056 | $ | – | $ | – | $ | 115,380,056 | |||||
| Royce Global Financial Services Fund | |||||||||||||
| Common Stocks | 39,034,793 | – | – | 39,034,793 | |||||||||
| Repurchase Agreement | – | 229,000 | – | 229,000 | |||||||||
| Royce International Premier Fund | |||||||||||||
| Common Stocks | 335,099,163 | – | – | 335,099,163 | |||||||||
| Preferred Stocks | 7,379,109 | – | – | 7,379,109 | |||||||||
| Repurchase Agreement | – | 19,730,000 | – | 19,730,000 | |||||||||
| Royce Low-Priced Stock Fund | |||||||||||||
| Common Stocks | 193,127,638 | 919,080 | 0 | 194,046,718 | |||||||||
| Repurchase Agreement | – | 8,961,000 | – | 8,961,000 | |||||||||
| Money Market Fund/Collateral Received for Securities Loaned | 4,834,830 | – | – | 4,834,830 | |||||||||
| Royce Micro-Cap Fund | |||||||||||||
| Common Stocks | 137,237,433 | – | 828,000 | 138,065,433 | |||||||||
| Repurchase Agreement | – | 3,126,000 | – | 3,126,000 | |||||||||
| Money Market Fund/Collateral Received for Securities Loaned | 4,584,805 | – | – | 4,584,805 | |||||||||
| Royce Micro-Cap Opportunity Fund | |||||||||||||
| Common Stocks | 15,769,879 | 4,000 | – | 15,773,879 | |||||||||
| Repurchase Agreement | – | 2,131,000 | – | 2,131,000 | |||||||||
| Royce Opportunity Fund | |||||||||||||
| Common Stocks | 826,261,207 | 2,445,096 | – | 828,706,303 | |||||||||
| Repurchase Agreement | – | 44,051,000 | – | 44,051,000 | |||||||||
| Money Market Fund/Collateral Received for Securities Loaned | 20,077,125 | – | – | 20,077,125 | |||||||||
| Royce Pennsylvania Mutual Fund | |||||||||||||
| Common Stocks | 1,560,734,247 | – | – | 1,560,734,247 | |||||||||
| Money Market Fund/Collateral Received for Securities Loaned | 11,147,862 | – | – | 11,147,862 | |||||||||
| Royce Premier Fund | |||||||||||||
| Common Stocks | 1,640,075,748 | – | – | 1,640,075,748 | |||||||||
| Repurchase Agreement | – | 484,000 | – | 484,000 | |||||||||
| Royce Small-Cap Leaders Fund | |||||||||||||
| Common Stocks | 51,137,348 | – | – | 51,137,348 | |||||||||
| Repurchase Agreement | – | 4,528,000 | – | 4,528,000 | |||||||||
| Royce Small-Cap Value Fund | |||||||||||||
| Common Stocks | 182,043,304 | – | – | 182,043,304 | |||||||||
| Repurchase Agreement | – | 3,633,000 | – | 3,633,000 | |||||||||
| Royce Small/Mid-Cap Premier Fund | |||||||||||||
| Common Stocks | 141,570,581 | – | 0 | 141,570,581 | |||||||||
| Repurchase Agreement | – | 13,754,000 | – | 13,754,000 | |||||||||
| Royce Smaller-Companies Growth Fund | |||||||||||||
| Common Stocks | 250,633,794 | – | – | 250,633,794 | |||||||||
| Repurchase Agreement | – | 7,619,000 | – | 7,619,000 | |||||||||
| Money Market Fund/Collateral Received for Securities Loaned | 14,169,776 | – | – | 14,169,776 | |||||||||
| Royce Special Equity Fund | |||||||||||||
| Common Stocks | 1,053,855,526 | 38,950,000 | – | 1,092,805,526 | |||||||||
| Repurchase Agreement | – | 115,575,000 | – | 115,575,000 | |||||||||
| Royce Special Equity Multi-Cap Fund | |||||||||||||
| Common Stocks | 41,232,950 | – | – | 41,232,950 | |||||||||
| Repurchase Agreement | – | 866,000 | – | 866,000 | |||||||||
| Royce Total Return Fund | |||||||||||||
| Common Stocks | 1,513,654,295 | 12,661,587 | 0 | 1,526,315,882 | |||||||||
| Corporate Bonds | – | 4,672,806 | – | 4,672,806 | |||||||||
| The Royce Funds 2018 Annual Report to Shareholders | 97 |
Notes to Financial Statements (continued)
VALUATION OF INVESTMENTS (continued):
| TRANSFERS FROM LEVEL 1 TO LEVEL 2 | TRANSFERS FROM LEVEL 2 TO LEVEL 1 | TRANSFERS FROM LEVEL 1 TO LEVEL 2 | TRANSFERS FROM LEVEL 2 TO LEVEL 1 | |||||||||||
| Royce Dividend Value Fund | $ | – | $ | 25,616,323 | Royce Pennsylvania Mutual Fund | $ – | $ | 30,306,386 | ||||||
| Royce Global Financial Services Fund | – | 9,820,217 | Royce Premier Fund | – | 60,019,162 | |||||||||
| Royce International Premier Fund | – | 190,509,066 | Royce Small-Cap Leaders Fund | – | 713,588 | |||||||||
| Royce Low-Priced Stock Fund | – | 7,950,242 | Royce Small/Mid-Cap Premier Fund | – | 209,517 | |||||||||
| Royce Micro-Cap Fund | – | 3,192,741 | Royce Smaller-Companies Growth Fund | – | 5,030,670 | |||||||||
| Royce Micro-Cap Opportunity Fund | 4,000 | – | Royce Total Return Fund | – | 66,915,532 | |||||||||
| Royce Opportunity Fund | 389,865 | – | ||||||||||||
Level 3 Reconciliation:
| BALANCE AS OF 12/31/17 | PURCHASES | SALES | REALIZED GAIN (LOSS) | UNREALIZED GAIN (LOSS)1 | BALANCE AS OF 12/31/18 | ||||||||||||||
| Royce Low-Priced Stock Fund | |||||||||||||||||||
| Common Stocks | $ | 0 | $ | – | $ | – | $ | – | $ | – | $ | 0 | |||||||
| Royce Micro-Cap Fund | |||||||||||||||||||
| Common Stocks | 828,000 | – | 0 | (37,370) | 37,370 | 828,000 | |||||||||||||
| Royce Small/Mid-Cap Premier Fund | |||||||||||||||||||
| Common Stocks | 0 | – | – | – | – | 0 | |||||||||||||
| Royce Total Return Fund | |||||||||||||||||||
| Common Stocks | 0 | – | – | – | – | 0 | |||||||||||||
| 1 | The net change in unrealized appreciation (depreciation) is included in the accompanying Statement of Operations. Change in unrealized appreciation (depreciation) includes net unrealized appreciation (depreciation) resulting from changes in investment values during the reporting period and the reversal of previously recorded unrealized appreciation (depreciation) when gains or losses are realized. Net realized gain (loss) from investments and foreign currency transactions is included in the accompanying Statement of Operations. |
The following table summarizes the valuation techniques used and unobservable inputs approved by the Valuation Committee to determine the fair value of certain Level 3 investments. The table does not include Level 3 investments with values derived utilizing prices from prior transactions or third party pricing information with adjustments (e.g. broker quotes, pricing services, net asset values).
| FAIR VALUE AT | IMPACT TO VALUATION FROM | ||||||||||
| 12/31/18 | VALUATION TECHNIQUE(S) | UNOBSERVABLE INPUT(S) | RANGE AVERAGE | AN INCREASE IN INPUT1 | |||||||
| Royce Micro-Cap Fund | |||||||||||
| Discounted Present Value | |||||||||||
| Common Stocks | $828,000 | Balance Sheet Analysis | Liquidity Discount | 30%-40% | Decrease | ||||||
| 1 | This column represents the directional change in the fair value of the Level 3 investments that would result in an increase from the corresponding unobservable input. A decrease to the unobservable input would have the opposite effect. Significant increases and decreases in these unobservable inputs in isolation could result in significantly higher or lower fair value measurements. |
| 98 | The Royce Funds 2018 Annual Report to Shareholders |
| SECURITIES ON LOAN | ||||||||||||
| CASH COLLATERAL1 | COLLATERALIZED BY CASH COLLATERAL | NET AMOUNT | ||||||||||
| Royce Low-Priced Stock Fund | $ | 4,834,830 | $ | (4,642,915 | ) | $ | 191,915 | |||||
| Royce Micro-Cap Fund | 4,584,805 | (4,430,823 | ) | 153,982 | ||||||||
| Royce Opportunity Fund | 20,077,125 | (19,086,868 | ) | 990,257 | ||||||||
| Royce Pennsylvania Mutual Fund | 11,147,862 | (10,916,937 | ) | 230,925 | ||||||||
| Royce Smaller-Companies Growth Fund | 14,169,776 | (13,612,372 | ) | 557,404 | ||||||||
| 1 | Absent an event of default, assets and liabilities are presented gross and not offset in the Statements of Assets and Liabilities. The remaining contractual maturity of cash collateral is overnight and continuous. |
The following table presents non-cash collateral and the market value of securities on loan collateralized by non-cash collateral held by the Funds’ custodian at December 31, 2018:
| SECURITIES ON LOAN | ||||||||||||
| NON-CASH COLLATERAL | COLLATERALIZED BY NON-CASH COLLATERAL | NET AMOUNT | ||||||||||
| Royce Low-Priced Stock Fund | $ | 6,640,579 | $ | (6,468,673 | ) | $ | 171,906 | |||||
| Royce Micro-Cap Fund | 1,677,450 | (1,638,454 | ) | 38,996 | ||||||||
| Royce Opportunity Fund | 50,065,593 | (49,027,121 | ) | 1,038,472 | ||||||||
| Royce Pennsylvania Mutual Fund | 22,903,585 | (20,311,829 | ) | 2,591,756 | ||||||||
| Royce Small-Cap Leaders Fund | 453,376 | (444,361 | ) | 9,015 | ||||||||
| Royce Smaller-Companies Growth Fund | 19,243,862 | (18,794,416 | ) | 449,446 | ||||||||
| Royce Total Return Fund | 526,996 | (516,097 | ) | 10,899 | ||||||||
| The Royce Funds 2018 Annual Report to Shareholders | 99 |
| SHARES ISSUED FOR | ||||||||||||||||||||||||||||||||||||||||
| REINVESTMENT | NET INCREASE (DECREASE) FROM | |||||||||||||||||||||||||||||||||||||||
| SHARES SOLD | OF DISTRIBUTIONS | SHARES REDEEMED | SHARE CLASS CONVERSIONS | CAPITAL SHARE TRANSACTIONS | ||||||||||||||||||||||||||||||||||||
| Period Ended | Year Ended | Period Ended | Year Ended | Period Ended | Year Ended | Period Ended | Year Ended | Period Ended | Year Ended | |||||||||||||||||||||||||||||||
| 12/31/18 | 12/31/17 | 12/31/18 | 12/31/17 | 12/31/18 | 12/31/17 | 12/31/181 | 12/31/172 | 12/31/18 | 12/31/17 | |||||||||||||||||||||||||||||||
| Royce Dividend Value Fund | ||||||||||||||||||||||||||||||||||||||||
| Investment Class | $ | 25,972,222 | $ | 33,358,164 | $ | 11,367,989 | $ | 14,559,845 | $ | (39,214,752 | ) | $ | (34,756,532 | ) | $ | 3,578,591 | $ | (1,874,541 | ) | $ | 16,740,068 | |||||||||||||||||||
| Service Class | 1,385,407 | 4,595,603 | 3,493,185 | 6,925,218 | (26,337,495 | ) | (72,839,992 | ) | (3,578,591 | ) | (21,458,903 | ) | (64,897,762 | ) | ||||||||||||||||||||||||||
| Consultant Class | 493,061 | 43,403 | 114,313 | 179,517 | (460,688 | ) | (365,980 | ) | 146,686 | (143,060 | ) | |||||||||||||||||||||||||||||
| Institutional Class | 2,912,358 | 156,698 | 380,526 | 149,582 | (420,544 | ) | (63,252 | ) | 2,872,340 | 243,028 | ||||||||||||||||||||||||||||||
| Royce Global Financial Services Fund | ||||||||||||||||||||||||||||||||||||||||
| Service Class | 11,314,172 | 19,803,777 | 3,421,029 | 1,524,105 | (20,910,539 | ) | (25,122,992 | ) | (6,175,338 | ) | (3,795,110 | ) | ||||||||||||||||||||||||||||
| Institutional Class | 4,000 | 1,030,249 | 783,011 | 287,397 | (660,685 | ) | (446,493 | ) | 126,326 | 871,153 | ||||||||||||||||||||||||||||||
| Royce International Premier Fund | ||||||||||||||||||||||||||||||||||||||||
| Investment Class | 285,246,637 | 68,809,358 | 848,230 | 879,967 | (72,123,146 | ) | (9,492,960 | ) | 10,710,066 | 213,971,721 | 70,906,431 | |||||||||||||||||||||||||||||
| Service Class | 21,039,927 | 15,361,047 | – | 309,552 | (28,042,214 | ) | (10,148,697 | ) | $ | 15,088 | (10,686,016 | ) | (6,987,199 | ) | (5,164,114 | ) | ||||||||||||||||||||||||
| Consultant Class | 3,320,267 | 2,900,964 | – | 13,784 | (2,706,865 | ) | (782,316 | ) | 613,402 | 2,132,432 | ||||||||||||||||||||||||||||||
| Institutional Class | 35,603,235 | 62,839 | (922,139 | ) | 34,743,935 | |||||||||||||||||||||||||||||||||||
| R Class | 200 | 1,108 | – | 528 | (57,682 | ) | – | (15,088 | ) | (72,570 | ) | 1,636 | ||||||||||||||||||||||||||||
| K Class | – | – | – | (24,050 | ) | (24,050 | ) | |||||||||||||||||||||||||||||||||
| Royce Low-Priced Stock Fund | �� | |||||||||||||||||||||||||||||||||||||||
| Investment Class | 5,908,132 | 4,827,741 | 8,242,747 | 3,042,673 | (11,942,721 | ) | (7,679,466 | ) | 5,064,654 | 30,157,999 | 7,272,812 | 30,348,947 | ||||||||||||||||||||||||||||
| Service Class | 5,416,151 | 5,359,019 | 27,201,978 | 12,483,625 | (43,586,859 | ) | (69,244,052 | ) | 293,550 | (29,086,803 | ) | (10,675,180 | ) | (80,488,211 | ) | |||||||||||||||||||||||||
| Institutional Class | 247,714 | 315,958 | – | 499,044 | (1,034,576 | ) | (8,139,049 | ) | (5,064,654 | ) | (5,851,516 | ) | (7,324,047 | ) | ||||||||||||||||||||||||||
| R Class | 15,465 | 98,627 | – | 63,719 | (766,305 | ) | (173,595 | ) | (293,550 | ) | (1,044,390 | ) | (11,249 | ) | ||||||||||||||||||||||||||
| K Class | 13,656 | – | (42,545 | ) | (1,071,196 | ) | (1,100,085 | ) | ||||||||||||||||||||||||||||||||
| Royce Micro-Cap Fund | ||||||||||||||||||||||||||||||||||||||||
| Investment Class | 5,230,274 | 8,604,513 | 13,468,098 | 11,026,347 | (43,234,672 | ) | (42,144,313 | ) | 201,150 | (24,536,300 | ) | (22,312,303 | ) | |||||||||||||||||||||||||||
| Service Class | 3,844,992 | 3,672,153 | 957,677 | 937,168 | (8,828,295 | ) | (7,631,678 | ) | (201,150 | ) | (4,025,626 | ) | (3,223,507 | ) | ||||||||||||||||||||||||||
| Consultant Class | 190,964 | 466,511 | 1,971,129 | 1,683,462 | (6,157,584 | ) | (10,592,332 | ) | (3,995,491 | ) | (8,442,359 | ) | ||||||||||||||||||||||||||||
| Royce Micro-Cap Opportunity Fund | ||||||||||||||||||||||||||||||||||||||||
| Investment Class | 3,916,213 | 2,803,349 | 5,568,963 | 3,283,146 | (28,368,348 | ) | (12,453,128 | ) | 1,183,822 | 47,069 | (17,699,350 | ) | (6,319,564 | ) | ||||||||||||||||||||||||||
| Service Class | 237,802 | 368,449 | – | 82,715 | (158,524 | ) | (401,071 | ) | (1,183,822 | ) | (47,069 | ) | (1,104,544 | ) | 3,024 | |||||||||||||||||||||||||
| Royce Opportunity Fund | ||||||||||||||||||||||||||||||||||||||||
| Investment Class | 93,500,228 | 95,914,276 | 46,105,025 | 89,555,952 | (188,492,528 | ) | (176,705,384 | ) | 809,011 | (48,887,275 | ) | 9,573,855 | ||||||||||||||||||||||||||||
| Service Class | 27,214,604 | 50,250,124 | 4,309,945 | 11,529,769 | (69,306,409 | ) | (42,272,885 | ) | 7,600,899 | (809,011 | ) | (30,180,961 | ) | 18,697,997 | ||||||||||||||||||||||||||
| Consultant Class | 991,331 | 1,258,054 | 888,800 | 2,481,422 | (8,854,787 | ) | (5,389,905 | ) | (6,974,656 | ) | (1,650,429 | ) | ||||||||||||||||||||||||||||
| Institutional Class | 43,463,191 | 65,630,056 | 18,881,233 | 77,029,241 | (396,679,654 | ) | (123,056,070 | ) | (334,335,230 | ) | 19,603,227 | |||||||||||||||||||||||||||||
| R Class | 3,509,170 | 7,407,124 | 2,423,347 | 5,142,835 | (9,865,485 | ) | (14,211,365 | ) | (3,932,968 | ) | (1,661,406 | ) | ||||||||||||||||||||||||||||
| K Class | 748,866 | 3,768,309 | – | 1,024,733 | (771,052 | ) | (4,179,483 | ) | (7,600,899 | ) | (7,623,085 | ) | 613,559 | |||||||||||||||||||||||||||
| 100 | The Royce Funds 2018 Annual Report to Shareholders |
Capital Share Transactions (in dollars) (continued):
| SHARES ISSUED FOR | ||||||||||||||||||||||||||||||||||||||||
| REINVESTMENT | NET INCREASE (DECREASE) FROM | |||||||||||||||||||||||||||||||||||||||
| SHARES SOLD | OF DISTRIBUTIONS | SHARES REDEEMED | SHARE CLASS CONVERSIONS | CAPITAL SHARE TRANSACTIONS | ||||||||||||||||||||||||||||||||||||
| Period Ended | Year Ended | Period Ended | Year Ended | Period Ended | Year Ended | Period Ended | Year Ended | Period Ended | Year Ended | |||||||||||||||||||||||||||||||
| 12/31/18 | 12/31/17 | 12/31/18 | 12/31/17 | 12/31/18 | 12/31/17 | 12/31/181 | 12/31/172 | 12/31/18 | 12/31/17 | |||||||||||||||||||||||||||||||
| Royce Pennsylvania Mutual Fund | ||||||||||||||||||||||||||||||||||||||||
| Investment Class | $ | 92,452,580 | $ | 108,329,916 | $ | 222,270,728 | $ | 254,272,581 | $ | (350,693,635 | ) | $ | (364,099,258 | ) | $ | 954,383 | $ | (35,970,327 | ) | $ | (542,378 | ) | ||||||||||||||||||
| Service Class | 8,411,192 | 21,525,651 | 4,802,081 | 6,601,511 | (27,674,585 | ) | (73,066,550 | ) | $ | 2,031,178 | (954,383 | ) | (12,430,134 | ) | (45,893,771 | ) | ||||||||||||||||||||||||
| Consultant Class | 7,715,097 | 6,858,381 | 47,076,762 | 59,284,622 | (88,342,616 | ) | (95,624,041 | ) | (33,550,757 | ) | (29,481,038 | ) | ||||||||||||||||||||||||||||
| Institutional Class | 97,962,498 | 174,059,170 | 11,826,618 | 12,113,429 | (59,962,281 | ) | (396,581,300 | ) | 49,826,835 | (210,408,701 | ) | |||||||||||||||||||||||||||||
| R Class | 1,591,148 | 2,869,674 | 1,930,873 | 2,671,302 | (5,682,726 | ) | (7,107,006 | ) | (2,160,705 | ) | (1,566,030 | ) | ||||||||||||||||||||||||||||
| K Class | 55,427 | 356,892 | – | 494,633 | (850,567 | ) | (1,182,189 | ) | (2,031,178 | ) | (2,826,318 | ) | (330,664 | ) | ||||||||||||||||||||||||||
| Royce Premier Fund | ||||||||||||||||||||||||||||||||||||||||
| Investment Class | 151,864,129 | 241,047,460 | 282,874,055 | 223,171,515 | (523,969,418 | ) | (382,949,395 | ) | 20,846,050 | 245,348 | (68,385,184 | ) | 81,514,928 | |||||||||||||||||||||||||||
| Service Class | 12,416,438 | 14,869,157 | 8,910,292 | 6,885,399 | (19,455,214 | ) | (17,172,517 | ) | (245,348 | ) | 1,871,516 | 4,336,691 | ||||||||||||||||||||||||||||
| Consultant Class | 1,534,237 | 2,882,510 | 4,818,150 | 3,994,852 | (8,850,863 | ) | (8,935,374 | ) | (2,498,476 | ) | (2,058,012 | ) | ||||||||||||||||||||||||||||
| Institutional Class | 104,457,137 | 261,675,152 | 45,360,949 | 33,768,589 | (134,226,931 | ) | (310,726,543 | ) | 15,591,155 | (15,282,802 | ) | |||||||||||||||||||||||||||||
| W Class | 152,877 | 10,076,719 | – | 2,010,290 | (11,933,879 | ) | (145,318,380 | ) | (20,846,050 | ) | (32,627,052 | ) | (133,231,371 | ) | ||||||||||||||||||||||||||
| R Class | 692,268 | 690,774 | 2,176,396 | 1,724,204 | (2,675,755 | ) | (4,464,354 | ) | 192,909 | (2,049,376 | ) | |||||||||||||||||||||||||||||
| Royce Small-Cap Leaders Fund | ||||||||||||||||||||||||||||||||||||||||
| Investment Class | 5,797,928 | 3,821,850 | 4,739,907 | 5,604,193 | (16,874,809 | ) | (15,331,606 | ) | 3,953,879 | (6,336,974 | ) | (1,951,684 | ) | |||||||||||||||||||||||||||
| Service Class | 2,190,660 | 2,089,523 | 5,102,872 | 5,365,200 | (11,194,878 | ) | (13,946,182 | ) | 1,634,452 | (3,451,813 | ) | (2,266,894 | ) | (9,943,272 | ) | |||||||||||||||||||||||||
| R Class | 152,669 | 626,596 | – | 257,152 | (335,304 | ) | (848,782 | ) | (1,634,452 | ) | (1,817,087 | ) | 34,966 | |||||||||||||||||||||||||||
| K Class | 8,625 | – | (13,841 | ) | (502,066 | ) | (507,282 | ) | ||||||||||||||||||||||||||||||||
| Royce Small-Cap Value Fund | ||||||||||||||||||||||||||||||||||||||||
| Investment Class | 7,444,311 | 7,212,852 | 6,296,922 | 2,298,668 | (15,135,406 | ) | (27,843,241 | ) | 3,479,640 | 11,332,541 | 2,085,467 | (6,999,180 | ) | |||||||||||||||||||||||||||
| Service Class | 4,541,944 | 5,782,230 | 11,996,003 | 4,963,542 | (37,125,376 | ) | (60,660,700 | ) | 1,556,238 | (11,332,541 | ) | (19,031,191 | ) | (61,247,469 | ) | |||||||||||||||||||||||||
| Consultant Class | 466,673 | 528,340 | 1,108,696 | 419,883 | (3,034,581 | ) | (4,299,901 | ) | (1,459,212 | ) | (3,351,678 | ) | ||||||||||||||||||||||||||||
| Institutional Class | 172,026 | 5,715,018 | – | 135,010 | (556,734 | ) | (121,609,510 | ) | (3,479,640 | ) | (3,864,348 | ) | (115,759,482 | ) | ||||||||||||||||||||||||||
| R Class | 1,381,891 | 2,325,469 | 944,360 | 486,662 | (7,083,191 | ) | (6,314,704 | ) | (4,756,940 | ) | (3,502,573 | ) | ||||||||||||||||||||||||||||
| K Class | 323,211 | 515,109 | – | 71,464 | (736,046 | ) | (1,601,007 | ) | (1,556,238 | ) | (1,969,073 | ) | (1,014,434 | ) | ||||||||||||||||||||||||||
| Royce Small/Mid-Cap Premier Fund | ||||||||||||||||||||||||||||||||||||||||
| Investment Class | 4,392,469 | 2,802,152 | 12,430,677 | 9,333,591 | (9,464,882 | ) | (38,615,198 | ) | 14,585,974 | 7,358,264 | (11,893,481 | ) | ||||||||||||||||||||||||||||
| Service Class | 1,836,612 | 2,862,831 | 16,524,646 | 12,670,685 | (14,772,880 | ) | (23,075,898 | ) | 1,197,399 | (10,355,341 | ) | 4,785,777 | (17,897,723 | ) | ||||||||||||||||||||||||||
| Consultant Class | 258,719 | 203,495 | 1,263,081 | 1,168,599 | (2,941,236 | ) | (3,427,490 | ) | (1,419,436 | ) | (2,055,396 | ) | ||||||||||||||||||||||||||||
| R Class | 55,770 | 325,929 | – | 253,421 | (1,002,218 | ) | (438,712 | ) | (1,197,399 | ) | (2,143,847 | ) | 140,638 | |||||||||||||||||||||||||||
| K Class | 73,214 | – | (114,702 | ) | (4,230,633 | ) | (4,272,121 | ) | ||||||||||||||||||||||||||||||||
| Royce Smaller-Companies Growth Fund | ||||||||||||||||||||||||||||||||||||||||
| Investment Class | 14,761,046 | 8,568,833 | 24,904,985 | 17,465,075 | (32,950,853 | ) | (31,336,604 | ) | 30,948,573 | 6,715,178 | 25,645,877 | |||||||||||||||||||||||||||||
| Service Class | 8,483,893 | 7,939,518 | 49,014,107 | 37,667,971 | (62,051,370 | ) | (75,375,930 | ) | 623,550 | (30,801,077 | ) | (3,929,820 | ) | (60,569,518 | ) | |||||||||||||||||||||||||
| Consultant Class | 339,101 | 436,581 | 2,118,800 | 1,736,168 | (3,292,612 | ) | (2,498,886 | ) | (834,711 | ) | (326,137 | ) | ||||||||||||||||||||||||||||
| Institutional Class | 898,827 | 2,292,066 | 2,073,085 | 1,401,477 | (1,902,628 | ) | (15,929,293 | ) | 1,069,284 | (12,235,750 | ) | |||||||||||||||||||||||||||||
| R Class | 139,588 | 253,510 | – | 121,248 | (111,893 | ) | (573,963 | ) | (623,550 | ) | (595,855 | ) | (199,205 | ) | ||||||||||||||||||||||||||
| K Class | 10,337 | – | (73,104 | ) | (147,496 | ) | (210,263 | ) | ||||||||||||||||||||||||||||||||
| Royce Special Equity Fund | ||||||||||||||||||||||||||||||||||||||||
| Investment Class | 222,486,956 | 135,718,687 | 94,473,851 | 78,155,944 | (328,550,392 | ) | (287,748,016 | ) | 456,521 | (11,589,585 | ) | (73,416,864 | ) | |||||||||||||||||||||||||||
| Service Class | 43,284,766 | 17,484,310 | 6,535,526 | 7,079,422 | (78,927,553 | ) | (43,100,887 | ) | (456,521 | ) | (29,107,261 | ) | (18,993,676 | ) | ||||||||||||||||||||||||||
| Consultant Class | 2,381,819 | 3,664,645 | 3,028,564 | 3,280,685 | (14,406,587 | ) | (10,202,732 | ) | (8,996,204 | ) | (3,257,402 | ) | ||||||||||||||||||||||||||||
| Institutional Class | 77,996,165 | 119,222,833 | 20,150,304 | 18,780,245 | (97,459,966 | ) | (96,058,792 | ) | 686,503 | 41,944,286 | ||||||||||||||||||||||||||||||
| Royce Special Equity Multi-Cap Fund | ||||||||||||||||||||||||||||||||||||||||
| Investment Class | 866,127 | 2,451,602 | 5,847,802 | 1,040,135 | (14,862,299 | ) | (5,918,178 | ) | 4,410,760 | (8,148,370 | ) | 1,984,319 | ||||||||||||||||||||||||||||
| Service Class | 330,765 | 1,980,085 | 3,993,217 | 546,406 | (7,608,913 | ) | (14,809,505 | ) | (4,410,760 | ) | (3,284,931 | ) | (16,693,774 | ) | ||||||||||||||||||||||||||
| Consultant Class | 77,389 | 246,555 | 488,959 | 93,069 | (1,647,539 | ) | (1,656,776 | ) | (1,081,191 | ) | (1,317,152 | ) | ||||||||||||||||||||||||||||
| Institutional Class | 431,638 | 241,566 | 456,053 | 1,120,943 | (35,781,367 | ) | (4,665,527 | ) | (34,893,676 | ) | (3,303,018 | ) | ||||||||||||||||||||||||||||
| Royce Total Return Fund | ||||||||||||||||||||||||||||||||||||||||
| Investment Class | 172,331,070 | 165,438,966 | 185,080,886 | 160,024,214 | (486,165,820 | ) | (621,860,725 | ) | 4,991,437 | 616,402 | (123,762,427 | ) | (295,781,143 | ) | ||||||||||||||||||||||||||
| Service Class | 17,605,970 | 37,626,452 | 14,354,667 | 10,955,024 | (53,275,300 | ) | (93,727,158 | ) | 34,866,202 | (616,402 | ) | 13,551,539 | (45,762,084 | ) | ||||||||||||||||||||||||||
| Consultant Class | 7,766,358 | 7,849,294 | 28,157,591 | 26,542,808 | (64,755,046 | ) | (53,725,682 | ) | (28,831,097 | ) | (19,333,580 | ) | ||||||||||||||||||||||||||||
| Institutional Class | 133,802,754 | 267,365,781 | 38,645,065 | 34,156,423 | (186,576,729 | ) | (418,141,043 | ) | (14,128,910 | ) | (116,618,839 | ) | ||||||||||||||||||||||||||||
| W Class | 3,384,456 | 23,629,518 | 153,879 | 9,432,413 | (97,087,426 | ) | (16,176,485 | ) | (4,991,437 | ) | (98,540,528 | ) | 16,885,446 | |||||||||||||||||||||||||||
| R Class | 11,526,424 | 13,477,855 | 8,367,129 | 6,544,516 | (14,313,562 | ) | (18,954,349 | ) | 5,579,991 | 1,068,022 | ||||||||||||||||||||||||||||||
| K Class | 4,184,983 | 10,702,334 | 58,255 | 4,529,233 | (6,531,546 | ) | (18,585,697 | ) | (34,866,202 | ) | (37,154,510 | ) | (3,354,130 | ) | ||||||||||||||||||||||||||
| The Royce Funds 2018 Annual Report to Shareholders | 101 |
Notes to Financial Statements (continued)
Capital Share Transactions (in shares):
| SHARES ISSUED FOR | ||||||||||||||||||||||||||||||||||||||||
| REINVESTMENT | NET INCREASE (DECREASE) IN | |||||||||||||||||||||||||||||||||||||||
| SHARES SOLD | OF DISTRIBUTIONS | SHARES REDEEMED | SHARE CLASS CONVERSIONS | SHARES OUTSTANDING | ||||||||||||||||||||||||||||||||||||
| Period Ended | Year Ended | Period Ended | Year Ended | Period Ended | Year Ended | Period Ended | Year Ended | Period Ended | Year Ended | |||||||||||||||||||||||||||||||
| 12/31/18 | 12/31/17 | 12/31/18 | 12/31/17 | 12/31/18 | 12/31/17 | 12/31/181 | 12/31/172 | 12/31/18 | 12/31/17 | |||||||||||||||||||||||||||||||
| Royce Dividend Value Fund | ||||||||||||||||||||||||||||||||||||||||
| Investment Class | 3,612,556 | 4,298,687 | 1,926,261 | 1,985,078 | (5,740,059 | ) | (4,549,529 | ) | 436,413 | (201,242 | ) | 2,170,649 | ||||||||||||||||||||||||||||
| Service Class | 182,554 | 593,367 | 572,558 | 919,198 | (3,528,363 | ) | (9,162,991 | ) | (427,550 | ) | (2,773,251 | ) | (8,077,976 | ) | ||||||||||||||||||||||||||
| Consultant Class | 72,025 | 4,932 | 16,665 | 20,882 | (55,073 | ) | (40,367 | ) | 33,617 | (14,553 | ) | |||||||||||||||||||||||||||||
| Institutional Class | 389,716 | 20,750 | 66,051 | 20,657 | (54,927 | ) | (8,312 | ) | 400,840 | 33,095 | ||||||||||||||||||||||||||||||
| Royce Global Financial Services Fund | ||||||||||||||||||||||||||||||||||||||||
| Service Class | 1,032,931 | 2,011,114 | 402,001 | 147,399 | (1,977,301 | ) | (2,568,417 | ) | (542,369 | ) | (409,904 | ) | ||||||||||||||||||||||||||||
| Institutional Class | 281 | 82,514 | 71,378 | 21,641 | (46,913 | ) | (36,663 | ) | 24,746 | 67,492 | ||||||||||||||||||||||||||||||
| Royce International Premier Fund | ||||||||||||||||||||||||||||||||||||||||
| Investment Class | 22,969,262 | 5,700,233 | 72,747 | 69,180 | (5,886,292 | ) | (801,879 | ) | 840,664 | 17,155,717 | 5,808,198 | |||||||||||||||||||||||||||||
| Service Class | 1,367,064 | 1,104,260 | – | 20,392 | (1,818,416 | ) | (760,763 | ) | 964 | (704,906 | ) | (450,388 | ) | (341,017 | ) | |||||||||||||||||||||||||
| Consultant Class | 203,769 | 185,684 | – | 834 | (169,091 | ) | (54,788 | ) | 34,678 | 131,730 | ||||||||||||||||||||||||||||||
| Institutional Class | 2,916,865 | 5,389 | (82,650 | ) | 2,839,604 | |||||||||||||||||||||||||||||||||||
| R Class | 16 | 103 | – | 44 | (4,618 | ) | – | (1,202 | ) | (5,804 | ) | 147 | ||||||||||||||||||||||||||||
| K Class | – | – | – | (2,551 | ) | (2,551 | ) | |||||||||||||||||||||||||||||||||
| Royce Low-Priced Stock Fund | ||||||||||||||||||||||||||||||||||||||||
| Investment Class | 664,694 | 577,375 | 1,247,011 | 367,917 | (1,402,203 | ) | (915,749 | ) | 544,002 | 3,434,852 | 1,053,504 | 3,464,395 | ||||||||||||||||||||||||||||
| Service Class | 627,095 | 640,080 | 4,140,332 | 1,515,003 | (4,994,573 | ) | (8,306,853 | ) | 33,703 | (3,325,309 | ) | (193,443 | ) | (9,477,079 | ) | |||||||||||||||||||||||||
| Institutional Class | 28,573 | 37,701 | – | 60,126 | (114,370 | ) | (959,231 | ) | (543,255 | ) | (629,052 | ) | (861,404 | ) | ||||||||||||||||||||||||||
| R Class | 1,925 | 12,437 | – | 8,190 | (97,337 | ) | (22,168 | ) | (35,709 | ) | (131,121 | ) | (1,541 | ) | ||||||||||||||||||||||||||
| K Class | 9,447 | – | (29,290 | ) | (741,056 | ) | (760,899 | ) | ||||||||||||||||||||||||||||||||
| Royce Micro-Cap Fund | ||||||||||||||||||||||||||||||||||||||||
| Investment Class | 442,085 | 715,505 | 1,379,928 | 965,522 | (3,650,567 | ) | (3,519,967 | ) | 16,447 | (1,828,554 | ) | (1,822,493 | ) | |||||||||||||||||||||||||||
| Service Class | 312,618 | 314,908 | 100,175 | 83,750 | (750,133 | ) | (648,355 | ) | (16,790 | ) | (337,340 | ) | (266,487 | ) | ||||||||||||||||||||||||||
| Consultant Class | 20,513 | 49,719 | 261,077 | 188,517 | (657,240 | ) | (1,128,904 | ) | (375,650 | ) | (890,668 | ) | ||||||||||||||||||||||||||||
| Royce Micro-Cap Opportunity Fund | ||||||||||||||||||||||||||||||||||||||||
| Investment Class | 196,798 | 148,676 | 437,811 | 171,086 | (1,490,891 | ) | (620,649 | ) | 60,834 | 2,287 | (795,448 | ) | (298,600 | ) | ||||||||||||||||||||||||||
| Service Class | 22,569 | 37,846 | – | 8,572 | (15,094 | ) | (42,970 | ) | (121,226 | ) | (4,548 | ) | (113,751 | ) | (1,100 | ) | ||||||||||||||||||||||||
| Royce Opportunity Fund | ||||||||||||||||||||||||||||||||||||||||
| Investment Class | 7,069,808 | 6,866,763 | 4,353,638 | 6,779,406 | (14,641,615 | ) | (12,814,149 | ) | 53,934 | (3,218,169 | ) | 885,954 | ||||||||||||||||||||||||||||
| Service Class | 2,128,949 | 3,856,271 | 437,558 | 935,858 | (5,517,655 | ) | (3,215,595 | ) | 601,813 | (57,828 | ) | (2,349,335 | ) | 1,518,706 | ||||||||||||||||||||||||||
| Consultant Class | 97,465 | 108,753 | 102,870 | 227,862 | (824,172 | ) | (470,217 | ) | (623,837 | ) | (133,602 | ) | ||||||||||||||||||||||||||||
| Institutional Class | 3,124,242 | 4,638,535 | 1,745,031 | 5,718,577 | (28,617,157 | ) | (8,815,496 | ) | (23,747,884 | ) | 1,541,616 | |||||||||||||||||||||||||||||
| R Class | 289,556 | 578,202 | 255,089 | 431,446 | (794,614 | ) | (1,134,320 | ) | (249,969 | ) | (124,672 | ) | ||||||||||||||||||||||||||||
| K Class | 66,744 | 331,425 | – | 94,533 | (70,091 | ) | (370,027 | ) | (684,679 | ) | (688,026 | ) | 55,931 | |||||||||||||||||||||||||||
| Royce Pennsylvania Mutual Fund | ||||||||||||||||||||||||||||||||||||||||
| Investment Class | 9,032,724 | 9,353,969 | 27,406,995 | 24,734,687 | (35,352,581 | ) | (31,659,681 | ) | 76,842 | 1,087,138 | 2,505,817 | |||||||||||||||||||||||||||||
| Service Class | 758,686 | 1,905,268 | 591,389 | 639,681 | (2,597,089 | ) | (6,382,646 | ) | 188,596 | (77,029 | ) | (1,058,418 | ) | (3,914,726 | ) | |||||||||||||||||||||||||
| Consultant Class | 1,042,114 | 752,114 | 7,276,161 | 7,168,636 | (10,773,630 | ) | (10,375,300 | ) | (2,455,355 | ) | (2,454,550 | ) | ||||||||||||||||||||||||||||
| Institutional Class | 10,176,610 | 14,104,272 | 1,454,689 | 1,176,061 | (5,904,434 | ) | (32,419,747 | ) | 5,726,865 | (17,139,414 | ) | |||||||||||||||||||||||||||||
| R Class | 154,050 | 268,144 | 253,063 | 275,108 | (556,956 | ) | (655,493 | ) | (149,843 | ) | (112,241 | ) | ||||||||||||||||||||||||||||
| K Class | 6,293 | 38,113 | – | 58,398 | (96,193 | ) | (127,563 | ) | (230,227 | ) | (320,127 | ) | (31,052 | ) | ||||||||||||||||||||||||||
| Royce Premier Fund | ||||||||||||||||||||||||||||||||||||||||
| Investment Class | 9,774,025 | 14,016,958 | 23,300,993 | 13,759,039 | (33,088,705 | ) | (22,598,666 | ) | 1,246,773 | 13,233 | 1,233,086 | 5,190,564 | ||||||||||||||||||||||||||||
| Service Class | 762,638 | 901,293 | 753,832 | 436,337 | (1,202,121 | ) | (1,023,456 | ) | (13,608 | ) | 314,349 | 300,566 | ||||||||||||||||||||||||||||
| Consultant Class | 132,860 | 217,332 | 502,414 | 309,679 | (689,765 | ) | (658,762 | ) | (54,491 | ) | (131,751 | ) | ||||||||||||||||||||||||||||
| Institutional Class | 6,477,889 | 15,121,922 | 3,678,909 | 2,055,301 | (8,262,556 | ) | (18,265,426 | ) | 1,894,242 | (1,088,203 | ) | |||||||||||||||||||||||||||||
| W Class | 8,969 | 609,443 | – | 123,331 | (683,832 | ) | (8,321,109 | ) | (1,239,921 | ) | (1,914,784 | ) | (7,588,335 | ) | ||||||||||||||||||||||||||
| R Class | 49,442 | 44,412 | 193,975 | 114,717 | (172,520 | ) | (284,373 | ) | 70,897 | (125,244 | ) | |||||||||||||||||||||||||||||
| Royce Small-Cap Leaders Fund | ||||||||||||||||||||||||||||||||||||||||
| Investment Class | 1,072,490 | 535,267 | 981,347 | 862,183 | (2,684,017 | ) | (2,108,703 | ) | 524,387 | (630,180 | ) | (186,866 | ) | |||||||||||||||||||||||||||
| Service Class | 344,773 | 296,333 | 1,067,547 | 834,401 | (1,725,163 | ) | (1,966,267 | ) | 247,644 | (461,537 | ) | (65,199 | ) | (1,297,070 | ) | |||||||||||||||||||||||||
| R Class | 16,629 | 64,228 | – | 28,894 | (36,696 | ) | (86,349 | ) | (179,116 | ) | (199,183 | ) | 6,773 | |||||||||||||||||||||||||||
| K Class | 860 | – | (1,392 | ) | (49,764 | ) | (50,296 | ) | ||||||||||||||||||||||||||||||||
| 102 | The Royce Funds 2018 Annual Report to Shareholders |
Capital Share Transactions (in shares) (continued):
| SHARES ISSUED FOR | ||||||||||||||||||||||||||||||||||||||||
| REINVESTMENT | NET INCREASE (DECREASE) IN | |||||||||||||||||||||||||||||||||||||||
| SHARES SOLD | OF DISTRIBUTIONS | SHARES REDEEMED | SHARE CLASS CONVERSIONS | SHARES OUTSTANDING | ||||||||||||||||||||||||||||||||||||
| Period Ended | Year Ended | Period Ended | Year Ended | Period Ended | Year Ended | Period Ended | Year Ended | Period Ended | Year Ended | |||||||||||||||||||||||||||||||
| 12/31/18 | 12/31/17 | 12/31/18 | 12/31/17 | 12/31/18 | 12/31/17 | 12/31/181 | 12/31/172 | 12/31/18 | 12/31/17 | |||||||||||||||||||||||||||||||
| Royce Small-Cap Value Fund | ||||||||||||||||||||||||||||||||||||||||
| Investment Class | 720,316 | 741,807 | 732,200 | 231,721 | (1,521,627 | ) | (2,868,196 | ) | 319,820 | 1,133,254 | 250,709 | (761,414 | ) | |||||||||||||||||||||||||||
| Service Class | 433,604 | 576,985 | 1,399,767 | 502,382 | (3,589,532 | ) | (6,244,261 | ) | 152,722 | (1,140,095 | ) | (1,603,439 | ) | (6,304,989 | ) | |||||||||||||||||||||||||
| Consultant Class | 56,074 | 59,530 | 145,498 | 47,444 | (346,507 | ) | (494,608 | ) | (144,935 | ) | (387,634 | ) | ||||||||||||||||||||||||||||
| Institutional Class | 16,201 | 580,786 | – | 13,407 | (54,436 | ) | (12,978,342 | ) | (316,248 | ) | (354,483 | ) | (12,384,149 | ) | ||||||||||||||||||||||||||
| R Class | 138,804 | 248,260 | 114,607 | 51,120 | (720,582 | ) | (676,071 | ) | (467,171 | ) | (376,691 | ) | ||||||||||||||||||||||||||||
| K Class | 46,711 | 75,821 | – | 10,448 | (106,029 | ) | (233,932 | ) | (221,047 | ) | (280,365 | ) | (147,663 | ) | ||||||||||||||||||||||||||
| Royce Small/Mid-Cap Premier Fund | ||||||||||||||||||||||||||||||||||||||||
| Investment Class | 298,218 | 180,885 | 1,130,054 | 609,640 | (646,967 | ) | (2,481,762 | ) | 862,565 | 781,305 | (828,672 | ) | ||||||||||||||||||||||||||||
| Service Class | 120,727 | 186,926 | 1,507,723 | 829,776 | (1,018,603 | ) | (1,456,138 | ) | 79,141 | (589,610 | ) | 688,988 | (1,029,046 | ) | ||||||||||||||||||||||||||
| Consultant Class | 32,408 | 18,648 | 164,048 | 108,003 | (301,736 | ) | (308,411 | ) | (105,280 | ) | (181,760 | ) | ||||||||||||||||||||||||||||
| R Class | 5,564 | 31,664 | – | 25,521 | (101,173 | ) | (43,525 | ) | (121,948 | ) | (217,557 | ) | 13,660 | |||||||||||||||||||||||||||
| K Class | 7,418 | – | (11,712 | ) | (419,319 | ) | (423,613 | ) | ||||||||||||||||||||||||||||||||
| Royce Smaller-Companies Growth Fund | ||||||||||||||||||||||||||||||||||||||||
| Investment Class | 1,409,407 | 726,175 | 3,454,228 | 1,632,250 | (3,097,890 | ) | (2,610,111 | ) | 2,386,166 | 1,765,745 | 2,134,480 | |||||||||||||||||||||||||||||
| Service Class | 746,094 | 667,456 | 6,972,135 | 3,597,705 | (5,772,215 | ) | (6,376,008 | ) | 57,897 | (2,426,035 | ) | 2,003,911 | (4,536,882 | ) | ||||||||||||||||||||||||||
| Consultant Class | 47,341 | 42,850 | 350,795 | 190,998 | (386,332 | ) | (243,879 | ) | 11,804 | (10,031 | ) | |||||||||||||||||||||||||||||
| Institutional Class | 74,788 | 186,029 | 283,596 | 129,407 | (170,523 | ) | (1,280,636 | ) | 187,861 | (965,200 | ) | |||||||||||||||||||||||||||||
| R Class | 13,782 | 22,294 | – | 12,448 | (11,097 | ) | (52,310 | ) | (62,268 | ) | (59,583 | ) | (17,568 | ) | ||||||||||||||||||||||||||
| K Class | 1,824 | – | (13,381 | ) | (25,935 | ) | (37,492 | ) | ||||||||||||||||||||||||||||||||
| Royce Special Equity Fund | ||||||||||||||||||||||||||||||||||||||||
| Investment Class | 10,606,597 | 6,201,776 | 5,245,633 | 3,671,017 | (16,096,361 | ) | (13,116,344 | ) | 20,317 | (244,131 | ) | (3,223,234 | ) | |||||||||||||||||||||||||||
| Service Class | 2,028,507 | 799,233 | 363,287 | 332,993 | (3,754,389 | ) | (1,975,892 | ) | (20,390 | ) | (1,362,595 | ) | (864,056 | ) | ||||||||||||||||||||||||||
| Consultant Class | 129,355 | 185,121 | 184,219 | 169,107 | (761,826 | ) | (510,780 | ) | (448,252 | ) | (156,552 | ) | ||||||||||||||||||||||||||||
| Institutional Class | 3,801,951 | 5,531,768 | 1,128,868 | 889,637 | (4,649,863 | ) | (4,436,735 | ) | 280,956 | 1,984,670 | ||||||||||||||||||||||||||||||
| Royce Special Equity Multi-Cap Fund | ||||||||||||||||||||||||||||||||||||||||
| Investment Class | 57,035 | 165,273 | 513,867 | 67,983 | (1,074,875 | ) | (402,101 | ) | 290,182 | (503,973 | ) | 121,337 | ||||||||||||||||||||||||||||
| Service Class | 21,816 | 135,187 | 349,058 | 35,573 | (593,442 | ) | (1,028,167 | ) | (289,800 | ) | (222,568 | ) | (1,147,207 | ) | ||||||||||||||||||||||||||
| Consultant Class | 7,512 | 25,805 | 66,165 | 9,326 | (177,885 | ) | (171,041 | ) | (104,208 | ) | (135,910 | ) | ||||||||||||||||||||||||||||
| Institutional Class | 29,271 | 16,730 | 40,110 | 73,360 | (2,369,114 | ) | (299,588 | ) | (2,299,733 | ) | (209,498 | ) | ||||||||||||||||||||||||||||
| Royce Total Return Fund | ||||||||||||||||||||||||||||||||||||||||
| Investment Class | 13,088,971 | 11,868,856 | 17,953,975 | 12,067,778 | (38,922,836 | ) | (43,955,697 | ) | 376,428 | 41,593 | (7,503,462 | ) | (19,977,470 | ) | ||||||||||||||||||||||||||
| Service Class | 1,289,618 | 2,650,293 | 1,367,521 | 808,230 | (3,895,252 | ) | (6,572,028 | ) | 2,550,563 | (40,740 | ) | 1,312,450 | (3,154,245 | ) | ||||||||||||||||||||||||||
| Consultant Class | 621,031 | 544,363 | 2,684,766 | 1,953,113 | (5,045,159 | ) | (3,711,048 | ) | (1,739,362 | ) | (1,213,572 | ) | ||||||||||||||||||||||||||||
| Institutional Class | 10,380,153 | 18,520,572 | 3,797,631 | 2,608,378 | (14,578,110 | ) | (29,035,003 | ) | (400,326 | ) | (7,906,053 | ) | ||||||||||||||||||||||||||||
| W Class | 248,431 | 1,674,617 | 11,258 | 713,915 | (6,960,700 | ) | (1,143,414 | ) | (375,375 | ) | (7,076,386 | ) | 1,245,118 | |||||||||||||||||||||||||||
| R Class | 834,627 | 934,952 | 791,987 | 480,019 | (1,066,832 | ) | (1,309,309 | ) | 559,782 | 105,662 | ||||||||||||||||||||||||||||||
| K Class | 468,780 | 1,143,530 | 6,516 | 515,092 | (724,647 | ) | (1,995,811 | ) | (3,926,286 | ) | (4,175,637 | ) | (337,189 | ) | ||||||||||||||||||||||||||
| 1 | On April 13, 2018, R Class shares converted to Service Class shares for the following funds: Royce Low-Priced Stock Fund, Royce Small-Cap Leaders Fund, Royce Small/Mid-Cap Premier Fund and Royce Smaller-Companies Growth Fund and K Class shares converted to Service Class shares for the following funds: Royce Opportunity Fund, Royce Pennsylvania Mutual Fund, Royce Small-Cap Value Fund and Royce Total Return Fund. On April 16, 2018, Royce International Premier Fund R Class shares converted to Service Class shares. On June 27, 2018, Institutional Class shares converted to Investment Class shares for Royce Low-Priced Stock Fund and Royce Small-Cap Value Fund. On October 10, 2018, W Class shares converted to Investment Class shares for Royce Premier Fund and Royce Total Return Fund and Service Class shares converted to Investment Class shares for Royce Micro-Cap Opportunity Fund. |
| 2 | On February 7, 2017, Royce International Premier Fund K Class shares converted to Service Class shares. On February 24, 2017, K Class shares converted to Service Class shares for the following funds: Royce Low-Priced Stock Fund, Royce Small-Cap Leaders Fund, Royce Small/Mid-Cap Premier Fund and Royce Smaller-Companies Growth Fund. On November 10, 2017, the following funds had certain shares in the Service Class convert to Investment Class shares: Royce Dividend Value Fund, Royce International Premier Fund, Royce Low-Priced Stock Fund, Royce Micro-Cap Fund, Royce Micro-Cap Opportunity Fund, Royce Opportunity Fund, Royce Pennsylvania Mutual Fund, Royce Premier Fund, Royce Small-Cap Leaders Fund, Royce Small-Cap Value Fund, Royce Small/Mid-Cap Premier Fund, Royce Smaller-Companies Growth Fund, Royce Special Equity Fund, Royce Special Equity Multi-Cap Fund and Royce Total Return Fund. |
| The Royce Funds 2018 Annual Report to Shareholders | 103 |
Notes to Financial Statements (continued)
Investment Adviser and Distributor:
| ANNUAL CONTRACTUAL | YEAR ENDED | ||||||||||||||||
| ADVISORY FEE AS A | COMMITTED NET ANNUAL OPERATING EXPENSE RATIO CAP3 | DECEMEBER 31, 2018 | |||||||||||||||
| PERCENTAGE OF AVERAGE | Investment | Service | Consultant | Institutional | Advisory fees | ||||||||||||
| NET ASSETS1 | Class3 | Class3 | Class3 | Class3 | W Class3 | R Class3 | K Class3 | Net advisory fees | waived | ||||||||
| Royce Dividend Value Fund | 0.85% | 1.09% | 1.34% | 2.09% | 0.89% | N/A | N/A | N/A | $ | 1,270,529 | $ | 151,436 | |||||
| Royce Global Financial Services Fund | 1.00% | N/A | 1.49% | N/A | 1.04% | N/A | N/A | N/A | 447,970 | 89,723 | |||||||
| Royce International Premier Fund | 1.00% | 1.19% | 1.44% | 2.19% | 1.04% | N/A | 1.74% | N/A | 2,244,877 | 262,846 | |||||||
| Royce Low-Priced Stock Fund | 1.00% | 1.24% | 1.49% | N/A | N/A | N/A | 1.84% | N/A | 2,571,299 | – | |||||||
| Royce Micro-Cap Fund | 1.25% | 1.49% | 1.61% | N/A | N/A | N/A | N/A | N/A | 2,341,557 | – | |||||||
| Royce Micro-Cap Opportunity Fund | 1.00% | 1.24% | 1.49% | N/A | N/A | N/A | N/A | N/A | 434,461 | – | |||||||
| Royce Opportunity Fund | 1.00% | N/A | 1.49% | N/A | N/A | N/A | N/A | N/A | 13,093,348 | – | |||||||
| Royce Pennsylvania Mutual Fund | 0.76%2 | N/A | N/A | N/A | N/A | N/A | N/A | 1.99% | 15,435,767 | – | |||||||
| Royce Premier Fund | 0.99% | N/A | N/A | N/A | N/A | N/A | N/A | N/A | 22,363,793 | – | |||||||
| Royce Small-Cap Leaders Fund | 1.00% | 1.24% | 1.49% | N/A | N/A | N/A | 1.84% | N/A | 775,395 | – | |||||||
| Royce Small-Cap Value Fund | 1.00% | 1.24% | 1.49% | N/A | N/A | N/A | N/A | 1.99% | 2,320,116 | – | |||||||
| Royce Small/Mid-Cap Premier Fund | 0.85% | N/A | N/A | 2.09% | N/A | N/A | 1.69% | N/A | 1,622,445 | – | |||||||
| Royce Smaller-Companies Growth Fund | 1.00% | N/A | 1.49% | 2.24% | 1.08% | N/A | 1.84% | N/A | 3,509,847 | – | |||||||
| Royce Special Equity Fund | 1.00% | N/A | 1.39% | N/A | N/A | N/A | N/A | N/A | 14,104,333 | – | |||||||
| Royce Special Equity Multi-Cap Fund | 0.85% | N/A | 1.24% | 1.99% | 0.89% | N/A | N/A | N/A | 577,921 | 61,790 | |||||||
| Royce Total Return Fund | 1.00% | N/A | 1.49% | N/A | N/A | N/A | N/A | N/A | 21,606,876 | – | |||||||
| 1 | From a base annual rate of 1.00% (0.85% for Royce Dividend Value Fund, Royce Small/Mid-Cap Premier Fund and Royce Special Equity Multi-Cap Fund and 1.25% for Royce Micro-Cap Fund), the annual rates of investment advisory fees payable by each of the Funds, other than Royce Pennsylvania Mutual Fund, are reduced by the indicated amount at the following breakpoints applicable to a Fund’s net assets in excess of $2 billion: more than $2 billion to $3 billion – .05% per annum; more than $3 billion to $4 billion – .10% per annum; over $4 billion – .15% per annum. |
| 2 | Royce Pennsylvania Mutual Fund’s fees are calculated at the annual rate of 1.00% of the first $50 million of the Fund’s average net assets, 0.875% of the next $50 million of average net assets and 0.75% of average net assets in excess of $100 million. |
| 3 | Committed net annual operating expense ratio cap excludes acquired fund fees and expenses. |
| ANNUAL CONTRACTUAL DISTRIBUTION FEE AS A | YEAR ENDED DECEMBER 31, 2018 | ||||||||||
| PERCENTAGE OF AVERAGE NET ASSETS | Net distribution fees | Distribution fees waived | |||||||||
| Royce Dividend Value Fund – Service Class | 0.25% | $ | 117,834 | $ | 1,431 | ||||||
| Royce Dividend Value Fund – Consultant Class | 1.00% | 13,280 | – | ||||||||
| Royce Global Financial Services Fund – Service Class | 0.25% | 105,220 | 7,865 | ||||||||
| Royce International Premier Fund – Service Class | 0.25% | 96,619 | 13,197 | ||||||||
| Royce International Premier Fund – Consultant Class | 1.00% | 97,478 | – | ||||||||
| Royce International Premier Fund – R Class | 0.50% | 104 | – | ||||||||
| Royce Low-Priced Stock Fund – Service Class | 0.25% | 473,047 | 24,971 | ||||||||
| Royce Low-Priced Stock Fund – R Class | 0.50% | 1,043 | – | ||||||||
| Royce Micro-Cap Fund – Service Class | 0.25% | 30,810 | – | ||||||||
| Royce Micro-Cap Fund – Consultant Class | 1.00% | 226,110 | – | ||||||||
| Royce Micro-Cap Opportunity Fund – Service Class | 0.25% | 2,381 | – | ||||||||
| Royce Opportunity Fund – Service Class | 0.25% | 203,051 | – | ||||||||
| Royce Opportunity Fund – Consultant Class | 1.00% | 168,578 | – | ||||||||
| Royce Opportunity Fund – R Class | 0.50% | 175,638 | – | ||||||||
| Royce Opportunity Fund – K Class | 0.25% | 5,606 | – | ||||||||
| Royce Pennsylvania Mutual Fund – Service Class | 0.25% | 123,797 | – | ||||||||
| Royce Pennsylvania Mutual Fund – Consultant Class | 1.00% | 3,380,763 | – | ||||||||
| Royce Pennsylvania Mutual Fund – R Class | 0.50% | 65,917 | – | ||||||||
| Royce Pennsylvania Mutual Fund – K Class | 0.25% | 1,624 | – | ||||||||
| Royce Premier Fund – Service Class | 0.25% | 109,411 | 18,832 | ||||||||
| Royce Premier Fund – Consultant Class | 1.00% | 290,930 | – | ||||||||
| Royce Premier Fund – R Class | 0.50% | 60,192 | – | ||||||||
| 104 | The Royce Funds 2018 Annual Report to Shareholders |
| ANNUAL CONTRACTUAL DISTRIBUTION FEE AS A | YEAR ENDED DECEMBER 31, 2018 | |||||||||
| PERCENTAGE OF AVERAGE NET ASSETS | Net distribution fees | Distribution fees waived | ||||||||
| Royce Small-Cap Leaders Fund – Service Class | 0.25% | $ | 87,206 | $ | 1,825 | |||||
| Royce Small-Cap Leaders Fund – R Class | 0.50% | 2,517 | – | |||||||
| Royce Small-Cap Value Fund – Service Class | 0.25% | 346,088 | 3,592 | |||||||
| Royce Small-Cap Value Fund – Consultant Class | 1.00% | 122,313 | – | |||||||
| Royce Small-Cap Value Fund – R Class | 0.50% | 56,159 | – | |||||||
| Royce Small-Cap Value Fund – K Class | 0.25% | 1,204 | – | |||||||
| Royce Small/Mid-Cap Premier Fund – Service Class | 0.25% | 114,790 | 146,097 | |||||||
| Royce Small/Mid-Cap Premier Fund – Consultant Class | 1.00% | 88,490 | – | |||||||
| Royce Small/Mid-Cap Premier Fund – R Class | 0.50% | 2,887 | – | |||||||
| Royce Smaller-Companies Growth Fund – Service Class | 0.25% | 522,424 | 10,967 | |||||||
| Royce Smaller-Companies Growth Fund – Consultant Class | 1.00% | 95,361 | – | |||||||
| Royce Smaller-Companies Growth Fund – R Class | 0.50% | 942 | – | |||||||
| Royce Special Equity Fund – Service Class | 0.25% | 185,034 | – | |||||||
| Royce Special Equity Fund – Consultant Class | 1.00% | 399,662 | – | |||||||
| Royce Special Equity Multi-Cap Fund – Service Class | 0.25% | 50,085 | 3,481 | |||||||
| Royce Special Equity Multi-Cap Fund – Consultant Class | 1.00% | 34,178 | – | |||||||
| Royce Total Return Fund – Service Class | 0.25% | 214,591 | 40,370 | |||||||
| Royce Total Return Fund – Consultant Class | 1.00% | 2,247,519 | – | |||||||
| Royce Total Return Fund – R Class | 0.50% | 261,497 | – | |||||||
| Royce Total Return Fund – K Class | 0.25% | 24,711 | – | |||||||
| PURCHASES | SALES1 | |||||
| Royce Dividend Value Fund | $ | 21,163,701 | $ | 58,191,296 | ||
| Royce Global Financial Services Fund | 4,083,984 | 13,126,997 | ||||
| Royce International Premier Fund | 383,371,271 | 154,460,692 | ||||
| Royce Low-Priced Stock Fund | 140,600,014 | 193,524,307 | ||||
| Royce Micro-Cap Fund | 43,594,711 | 89,700,089 | ||||
| Royce Micro-Cap Opportunity Fund | 20,643,869 | 45,363,064 | ||||
| Royce Opportunity Fund | 566,278,101 | 762,052,910 | ||||
| Royce Pennsylvania Mutual Fund | 691,402,415 | 1,006,833,927 | ||||
| Royce Premier Fund | 478,461,733 | 676,347,291 | ||||
| Royce Small-Cap Leaders Fund | 43,397,828 | 65,633,902 | ||||
| Royce Small-Cap Value Fund | 137,408,501 | 173,353,843 | ||||
| Royce Small/Mid-Cap Premier Fund | 114,493,849 | 122,889,004 | ||||
| Royce Smaller-Companies Growth Fund | 198,915,990 | 270,747,972 | ||||
| Royce Special Equity Fund | 255,221,485 | 388,903,471 | ||||
| Royce Special Equity Multi-Cap Fund | 9,014,759 | 59,505,371 | ||||
| Royce Total Return Fund | 454,834,483 | 940,794,744 | ||||
1 Excludes the value of securities delivered as a result of redemptions-in-kind. |
Cross trades were executed by the Funds pursuant to Rule 17a-7 under the 1940 Act. Cross trading is the buying or selling of portfolio securities between funds to which Royce serves as investment adviser. At its regularly scheduled quarterly meetings, the Board reviews such transactions as of the most recent calendar quarter for compliance with the requirements and restrictions set forth by Rule 17a-7. Cross trades for the year ended December 31, 2018, were as follows:
| COSTS OF PURCHASES | PROCEEDS FROM SALES | REALIZED GAIN (LOSS) | ||||||||||
| Royce Dividend Value Fund | $ | – | $ | 1,047,279 | $ | (480,584 | ) | |||||
| Royce Global Financial Services Fund | 381,287 | 610,994 | 206,490 | |||||||||
| Royce International Premier Fund | 387,602 | 1,869,195 | (12,975 | ) | ||||||||
| Royce Low-Priced Stock Fund | 546,867 | 92,744 | 56,246 | |||||||||
| Royce Micro-Cap Fund | 380 941 | – | – | |||||||||
| Royce Opportunity Fund | – | 51,480 | (12,091 | ) | ||||||||
| Royce Pennsylvania Mutual Fund | 32,298,854 | 63,629,359 | (11,618,259 | ) | ||||||||
| Royce Premier Fund | 18,112,189 | 95,683,421 | (18,820,890 | ) | ||||||||
| Royce Small/Mid-Cap Premier Fund | – | 387,602 | 249,310 | |||||||||
| Royce Special Equity Fund | 425,801 | – | – | |||||||||
| Royce Total Return Fund | 33,579,538 | 61,460,789 | (6,313,451 | ) | ||||||||
| The Royce Funds 2018 Annual Report to Shareholders | 105 |
Notes to Financial Statements (continued)
| PROCEEDS | REALIZED GAIN | |||||
| Royce Opportunity Fund | $ | 263,568,680 | $ | 111,295,549 | ||
| Royce Pennsylvania Mutual Fund | 39,965,142 | 17,663,495 | ||||
| Royce Premier Fund | 74,599,503 | 36,848,547 | ||||
| Royce Total Return Fund | 53,395,482 | 24,032,831 | ||||
| CLASS LEVEL | ||||||||||||||||||||||||||||
| EXPENSES | ||||||||||||||||||||||||||||
| REIMBURSED BY | ||||||||||||||||||||||||||||
| NET DISTRIBUTION | SHAREHOLDER | SHAREHOLDER | TRANSFER AGENT | INVESTMENT | ||||||||||||||||||||||||
| FEES | SERVICING | REPORTS | REGISTRATION | BALANCE CREDITS | TOTAL | ADVISER | ||||||||||||||||||||||
| Royce Dividend Value Fund – | ||||||||||||||||||||||||||||
Investment Class | $ | – | $ | 138,467 | $ | 33,238 | $ | 17,335 | $ | (772 | ) | $ | 188,268 | $ | – | |||||||||||||
| Royce Dividend Value Fund – Service Class | 117,834 | 82,458 | 5,786 | 14,567 | (755 | ) | 219,890 | – | ||||||||||||||||||||
| Royce Dividend Value Fund – | ||||||||||||||||||||||||||||
Consultant Class | 13,280 | 6,872 | 994 | 11,664 | (49 | ) | 32,761 | 16,680 | ||||||||||||||||||||
| Royce Dividend Value Fund – | ||||||||||||||||||||||||||||
Institutional Class | – | 6,247 | 123 | 11,378 | (13 | ) | 17,735 | 17,735 | ||||||||||||||||||||
| 131,114 | 234,044 | 40,141 | 54,944 | (1,589 | ) | 34,415 | ||||||||||||||||||||||
| Royce Global Financial Services Fund – | ||||||||||||||||||||||||||||
Service Class | 105,220 | 71,019 | 13,913 | 17,918 | (745 | ) | 207,325 | 3,251 | ||||||||||||||||||||
| Royce Global Financial Services Fund – | ||||||||||||||||||||||||||||
Institutional Class | – | 6,210 | 160 | 12,491 | (16 | ) | 18,845 | 18,845 | ||||||||||||||||||||
| 105,220 | 77,229 | 14,073 | 30,409 | (761 | ) | 22,096 | ||||||||||||||||||||||
| Royce International Premier Fund – | ||||||||||||||||||||||||||||
Investment Class | – | 154,058 | 35,655 | 64,672 | (1,047 | ) | 253,338 | – | ||||||||||||||||||||
| Royce International Premier Fund – | ||||||||||||||||||||||||||||
Service Class | 96,619 | 71,014 | 9,224 | 15,659 | (425 | ) | 192,091 | 6,437 | ||||||||||||||||||||
| Royce International Premier Fund – | ||||||||||||||||||||||||||||
Consultant Class | 97,478 | 6,956 | 2,159 | 10,700 | (109 | ) | 117,184 | 3,095 | ||||||||||||||||||||
| Royce International Premier Fund – | ||||||||||||||||||||||||||||
Institutional Class | – | 2,722 | 2,947 | 9,755 | (3 | ) | 15,421 | 15,421 | ||||||||||||||||||||
| Royce International Premier Fund – R Class | 104 | 2,190 | – | 1,482 | (4 | ) | 3,772 | 3,635 | ||||||||||||||||||||
| 194,201 | 236,940 | 49,985 | 102,268 | (1,588 | ) | 28,588 | ||||||||||||||||||||||
| Royce Low-Priced Stock Fund – | ||||||||||||||||||||||||||||
Investment Class | – | 67,031 | 44,721 | 13,837 | (5,041 | ) | 120,548 | 37,778 | ||||||||||||||||||||
| Royce Low-Priced Stock Fund – Service Class | 473,047 | 319,031 | 38,391 | 20,505 | (1,029 | ) | 849,945 | 51,850 | ||||||||||||||||||||
| Royce Low-Priced Stock Fund – | ||||||||||||||||||||||||||||
Institutional Class | – | 3,185 | 259 | 12,512 | (25 | ) | 15,931 | – | ||||||||||||||||||||
| Royce Low-Priced Stock Fund – R Class | 1,043 | 2,642 | 107 | 1,947 | (19 | ) | 5,720 | 4,133 | ||||||||||||||||||||
| 474,090 | 391,889 | 83,478 | 48,801 | (6,114 | ) | 93,761 | ||||||||||||||||||||||
| Royce Micro-Cap Fund – Investment Class | – | 159,467 | 63,495 | 18,536 | (5,957 | ) | 235,541 | 12,184 | ||||||||||||||||||||
| Royce Micro-Cap Fund – Service Class | 30,810 | 21,244 | 4,161 | 11,886 | (67 | ) | 68,034 | 35,071 | ||||||||||||||||||||
| Royce Micro-Cap Fund – Consultant Class | 226,110 | 30,487 | 6,081 | 12,459 | (434 | ) | 274,703 | – | ||||||||||||||||||||
| 256,920 | 211,198 | 73,737 | 42,881 | (6,458 | ) | 47,255 | ||||||||||||||||||||||
| Royce Micro-Cap Opportunity Fund – | ||||||||||||||||||||||||||||
Investment Class | – | 38,417 | 4,414 | 21,127 | (293 | ) | 63,665 | 33,993 | ||||||||||||||||||||
| Royce Micro-Cap Opportunity Fund – | ||||||||||||||||||||||||||||
Service Class | 2,381 | 7,127 | 234 | 12,430 | (14 | ) | 22,158 | 18,973 | ||||||||||||||||||||
| 2,381 | 45,544 | 4,648 | 33,557 | (307 | ) | 52,966 | ||||||||||||||||||||||
| Royce Opportunity Fund – Investment Class | – | 831,935 | 137,196 | 24,297 | (9,887 | ) | 983,541 | – | ||||||||||||||||||||
| Royce Opportunity Fund – Service Class | 203,051 | 134,035 | 10,321 | 14,073 | (531 | ) | 360,949 | 21,875 | ||||||||||||||||||||
| Royce Opportunity Fund – Consultant Class | 168,578 | 22,040 | 3,972 | 11,583 | (462 | ) | 205,711 | – | ||||||||||||||||||||
| Royce Opportunity Fund – Institutional Class | – | 8,244 | 14,132 | 18,016 | (229 | ) | 40,163 | – | ||||||||||||||||||||
| Royce Opportunity Fund – R Class | 175,638 | 80,347 | 1,593 | 9,974 | (252 | ) | 267,300 | – | ||||||||||||||||||||
| Royce Opportunity Fund – K Class | 5,606 | 6,189 | 277 | 3,864 | (79 | ) | 15,857 | – | ||||||||||||||||||||
| 552,873 | 1,082,790 | 167,491 | 81,807 | (11,440 | ) | 21,875 | ||||||||||||||||||||||
| 106 | The Royce Funds 2018 Annual Report to Shareholders |
| CLASS LEVEL | ||||||||||||||||||||||||||||
| EXPENSES | ||||||||||||||||||||||||||||
| REIMBURSED BY | ||||||||||||||||||||||||||||
| NET DISTRIBUTION | SHAREHOLDER | SHAREHOLDER | TRANSFER AGENT | INVESTMENT | ||||||||||||||||||||||||
| FEES | SERVICING | REPORTS | REGISTRATION | BALANCE CREDITS | TOTAL | ADVISER | ||||||||||||||||||||||
| Royce Pennsylvania Mutual Fund – | ||||||||||||||||||||||||||||
Investment Class | $ | – | $ | 1,254,779 | $ | 256,003 | $ | 23,695 | $ | (26,952 | ) | $ | 1,507,525 | $ | – | |||||||||||||
| Royce Pennsylvania Mutual Fund – | ||||||||||||||||||||||||||||
Service Class | 123,797 | 85,472 | 14,359 | 12,921 | (508 | ) | 236,041 | – | ||||||||||||||||||||
| Royce Pennsylvania Mutual Fund – | ||||||||||||||||||||||||||||
Consultant Class | 3,380,763 | 289,978 | 61,601 | 15,953 | (4,753 | ) | 3,743,542 | – | ||||||||||||||||||||
| Royce Pennsylvania Mutual Fund – | ||||||||||||||||||||||||||||
Institutional Class | – | 8,634 | 8,341 | 15,069 | (370 | ) | 31,674 | – | ||||||||||||||||||||
| Royce Pennsylvania Mutual Fund – R Class | 65,917 | 21,271 | 3,367 | 8,552 | (386 | ) | 98,721 | – | ||||||||||||||||||||
| Royce Pennsylvania Mutual Fund – K Class | 1,624 | 3,422 | 149 | 3,833 | (32 | ) | 8,996 | 1,418 | ||||||||||||||||||||
| 3,572,101 | 1,663,556 | 343,820 | 80,023 | (33,001 | ) | 1,418 | ||||||||||||||||||||||
| Royce Premier Fund – Investment Class | – | 1,701,578 | 314,220 | 32,378 | (14,778 | ) | 2,033,398 | – | ||||||||||||||||||||
| Royce Premier Fund – Service Class | 109,411 | 83,888 | 10,689 | 13,681 | (677 | ) | 216,992 | – | ||||||||||||||||||||
| Royce Premier Fund – Consultant Class | 290,930 | 27,756 | 4,713 | 11,649 | (346 | ) | 334,702 | – | ||||||||||||||||||||
| Royce Premier Fund – Institutional Class | – | 9,584 | 112,752 | 24,425 | (227 | ) | 146,534 | – | ||||||||||||||||||||
| Royce Premier Fund – W Class | – | 11,889 | (4,301 | ) | 14,839 | (1,157 | ) | 21,270 | – | |||||||||||||||||||
| Royce Premier Fund – R Class | 60,192 | 23,400 | 1,196 | 4,790 | (89 | ) | 89,489 | – | ||||||||||||||||||||
| 460,533 | 1,858,095 | 439,269 | 101,762 | (17,274 | ) | – | ||||||||||||||||||||||
| Royce Small-Cap Leaders Fund – | ||||||||||||||||||||||||||||
Investment Class | – | 30,338 | 14,771 | 15,570 | (999 | ) | 59,680 | 13,715 | ||||||||||||||||||||
| Royce Small-Cap Leaders Fund – | ||||||||||||||||||||||||||||
Service Class | 87,206 | 62,581 | 9,392 | 14,966 | (297 | ) | 173,848 | 45,501 | ||||||||||||||||||||
| Royce Small-Cap Leaders Fund – R Class | 2,517 | 3,395 | 469 | 3,063 | (136 | ) | 9,308 | 5,674 | ||||||||||||||||||||
| 89,723 | 96,314 | 24,632 | 33,599 | (1,432 | ) | 64,890 | ||||||||||||||||||||||
| Royce Small-Cap Value Fund – | ||||||||||||||||||||||||||||
Investment Class | – | 79,766 | 20,777 | 13,848 | (1,983 | ) | 112,408 | 12,091 | ||||||||||||||||||||
| Royce Small-Cap Value Fund – Service Class | 346,088 | 216,004 | 31,239 | 15,937 | (1,116 | ) | 608,152 | 47,522 | ||||||||||||||||||||
| Royce Small-Cap Value Fund – | ||||||||||||||||||||||||||||
Consultant Class | 122,313 | 16,683 | 2,675 | 11,926 | (250 | ) | 153,347 | – | ||||||||||||||||||||
| Royce Small-Cap Value Fund – | ||||||||||||||||||||||||||||
Institutional Class | – | 3,350 | 258 | 13,356 | (42 | ) | 16,922 | – | ||||||||||||||||||||
| Royce Small-Cap Value Fund – R Class | 56,159 | 30,530 | 1,666 | 5,421 | (217 | ) | 93,559 | – | ||||||||||||||||||||
| Royce Small-Cap Value Fund – K Class | 1,204 | 3,069 | 148 | 3,843 | (29 | ) | 8,235 | 3,944 | ||||||||||||||||||||
| 525,764 | 349,402 | 56,763 | 64,331 | (3,637 | ) | 63,557 | ||||||||||||||||||||||
| Royce Small/Mid-Cap Premier Fund – | ||||||||||||||||||||||||||||
Investment Class | – | 28,752 | 14,014 | 14,960 | (1,389 | ) | 56,337 | – | ||||||||||||||||||||
| Royce Small/Mid-Cap Premier Fund – | ||||||||||||||||||||||||||||
Service Class | 114,790 | 76,012 | 39,910 | 15,760 | (4,274 | ) | 242,198 | – | ||||||||||||||||||||
| Royce Small/Mid-Cap Premier Fund – | �� | |||||||||||||||||||||||||||
Consultant Class | 88,490 | 13,015 | 4,507 | 9,663 | (436 | ) | 115,239 | 13,547 | ||||||||||||||||||||
| Royce Small/Mid-Cap Premier Fund – R Class | 2,887 | 3,354 | 185 | 2,240 | (36 | ) | 8,630 | 4,250 | ||||||||||||||||||||
| 206,167 | 121,133 | 58,616 | 42,623 | (6,135 | ) | 17,797 | ||||||||||||||||||||||
| Royce Smaller-Companies Growth Fund – | ||||||||||||||||||||||||||||
Investment Class | – | 87,842 | 51,985 | 14,818 | (3,797 | ) | 150,848 | – | ||||||||||||||||||||
| Royce Smaller-Companies Growth Fund – | ||||||||||||||||||||||||||||
Service Class | 522,424 | 342,267 | 39,968 | 18,935 | (1,398 | ) | 922,196 | 45,037 | ||||||||||||||||||||
| Royce Smaller-Companies Growth Fund – | ||||||||||||||||||||||||||||
Consultant Class | 95,361 | 15,998 | 2,863 | 11,863 | (260 | ) | 125,825 | 15,052 | ||||||||||||||||||||
| Royce Smaller-Companies Growth Fund – | ||||||||||||||||||||||||||||
Institutional Class | – | 6,943 | 342 | 11,597 | (54 | ) | 18,828 | 18,801 | ||||||||||||||||||||
| Royce Smaller-Companies Growth Fund – | ||||||||||||||||||||||||||||
| R Class | 942 | 2,462 | 176 | 2,363 | (29 | ) | 5,914 | 4,478 | ||||||||||||||||||||
| 618,727 | 455,512 | 95,334 | 59,576 | (5,538 | ) | 83,368 | ||||||||||||||||||||||
| The Royce Funds 2018 Annual Report to Shareholders | 107 |
Notes to Financial Statements (continued)
| CLASS LEVEL | ||||||||||||||||||||||||||||
| EXPENSES | ||||||||||||||||||||||||||||
| REIMBURSED BY | ||||||||||||||||||||||||||||
| NET DISTRIBUTION | SHAREHOLDER | SHAREHOLDER | TRANSFER AGENT | INVESTMENT | ||||||||||||||||||||||||
| FEES | SERVICING | REPORTS | REGISTRATION | BALANCE CREDITS | TOTAL | ADVISER | ||||||||||||||||||||||
| Royce Special Equity Fund – Investment Class | $ | – | $ | 1,031,153 | $ | 163,626 | $ | 31,759 | $ | (10,463 | ) | $ | 1,216,075 | $ | – | |||||||||||||
| Royce Special Equity Fund – Service Class | 185,034 | 110,014 | 21,419 | 12,559 | (3,511 | ) | 325,515 | 82,105 | ||||||||||||||||||||
| Royce Special Equity Fund – Consultant Class | 399,662 | 32,424 | 7,322 | 11,931 | (730 | ) | 450,609 | – | ||||||||||||||||||||
| Royce Special Equity Fund – | ||||||||||||||||||||||||||||
Institutional Class | – | 9,980 | 60,475 | 18,458 | (520 | ) | 88,393 | – | ||||||||||||||||||||
| 584,696 | 1,183,571 | 252,842 | 74,707 | (15,224 | ) | 82,105 | ||||||||||||||||||||||
| Royce Special Equity Multi-Cap Fund – | ||||||||||||||||||||||||||||
Investment Class | – | 21,527 | 4,131 | 15,511 | (515 | ) | 40,654 | – | ||||||||||||||||||||
| Royce Special Equity Multi-Cap Fund – | ||||||||||||||||||||||||||||
Service Class | 50,085 | 35,201 | 2,141 | 12,714 | (148 | ) | 99,993 | 27,417 | ||||||||||||||||||||
| Royce Special Equity Multi-Cap Fund – | ||||||||||||||||||||||||||||
Consultant Class | 34,178 | (5,350 | ) | 808 | 10,939 | (124 | ) | 40,451 | 3,213 | |||||||||||||||||||
| Royce Special Equity Multi-Cap Fund – | ||||||||||||||||||||||||||||
Institutional Class | – | 6,242 | 24 | 14,222 | (11 | ) | 20,477 | 20,477 | ||||||||||||||||||||
| 84,263 | 57,620 | 7,104 | 53,386 | (798 | ) | 51,107 | ||||||||||||||||||||||
| Royce Total Return Fund – Investment Class | – | 1,349,238 | 241,938 | 27,168 | (14,462 | ) | 1,603,882 | – | ||||||||||||||||||||
| Royce Total Return Fund – Service Class | 214,591 | 166,942 | 34,692 | 12,131 | (648 | ) | 427,708 | – | ||||||||||||||||||||
| Royce Total Return Fund – Consultant Class | 2,247,519 | 183,101 | 36,013 | 14,204 | (2,260 | ) | 2,478,577 | – | ||||||||||||||||||||
| Royce Total Return Fund – Institutional Class | – | 11,504 | 55,865 | 13,865 | (419 | ) | 80,815 | – | ||||||||||||||||||||
| Royce Total Return Fund – W Class | – | 42,324 | 10,003 | 14,532 | (139 | ) | 66,720 | – | ||||||||||||||||||||
| Royce Total Return Fund – R Class | 261,497 | 115,930 | 7,218 | 6,416 | (866 | ) | 390,195 | – | ||||||||||||||||||||
| Royce Total Return Fund – K Class | 24,711 | 20,736 | 895 | 3,874 | (170 | ) | 50,046 | – | ||||||||||||||||||||
| 2,748,318 | 1,889,775 | 386,624 | 92,190 | (18,964 | ) | – | ||||||||||||||||||||||
| NET UNREALIZED | GROSS UNREALIZED | |||||||||||||||
| TAX BASIS COST | APPRECIATION (DEPRECIATION) | Appreciation | Depreciation | |||||||||||||
| Royce Dividend Value Fund | $ | 87,453,748 | $ | 27,926,308 | $ | 36,497,108 | $ | 8,570,800 | ||||||||
| Royce Global Financial Services Fund | 35,885,684 | 3,378,109 | 7,722,138 | 4,344,029 | ||||||||||||
| Royce International Premier Fund | 384,454,987 | (22,246,715 | ) | 9,393,716 | 31,640,431 | |||||||||||
| Royce Low-Priced Stock Fund | 196,640,508 | 11,202,040 | 39,037,664 | 27,835,624 | ||||||||||||
| Royce Micro-Cap Fund | 130,885,623 | 14,890,615 | 34,278,889 | 19,388,274 | ||||||||||||
| Royce Micro-Cap Opportunity Fund | 16,816,437 | 1,088,442 | 3,257,542 | 2,169,100 | ||||||||||||
| Royce Opportunity Fund | 1,001,850,603 | (109,016,175 | ) | 105,457,089 | 214,473,264 | |||||||||||
| Royce Pennsylvania Mutual Fund | 1,203,288,318 | 368,593,791 | 483,422,423 | 114,828,632 | ||||||||||||
| Royce Premier Fund | 1,095,012,022 | 545,547,726 | 622,243,020 | 76,695,294 | ||||||||||||
| Royce Small-Cap Leaders Fund | 51,083,468 | 4,581,880 | 8,029,496 | 3,447,616 | ||||||||||||
| Royce Small-Cap Value Fund | 177,951,209 | 7,725,095 | 22,952,826 | 15,227,731 | ||||||||||||
| Royce Small/Mid-Cap Premier Fund | 157,847,658 | (2,523,077 | ) | 10,290,925 | 12,814,002 | |||||||||||
| Royce Smaller-Companies Growth Fund | 259,797,759 | 12,624,811 | 46,251,133 | 33,626,322 | ||||||||||||
| Royce Special Equity Fund | 986,519,843 | 221,860,683 | 262,406,207 | 40,545,524 | ||||||||||||
| Royce Special Equity Multi-Cap Fund | 31,524,662 | 10,574,288 | 11,467,972 | 893,684 | ||||||||||||
| Royce Total Return Fund | 1,059,898,770 | 471,089,918 | 548,040,663 | 76,950,745 | ||||||||||||
| 108 | The Royce Funds 2018 Annual Report to Shareholders |
| ORDINARY INCOME | LONG-TERM CAPITAL GAINS | RETURN OF CAPITAL | ||||||||||||||||
| 2018 | 2017 | 2018 | 2017 | 2018 | 2017 | |||||||||||||
| Royce Dividend Value Fund | $ | 3,187,798 | $ | 3,294,788 | $ | 13,917,887 | $ | 21,358,296 | $ | – | $ | – | ||||||
| Royce Global Financial Services Fund | 388,788 | 1,153,530 | 4,123,878 | 782,447 | – | – | ||||||||||||
| Royce International Premier Fund | 1,517,079 | 1,445,419 | – | – | – | 990 | ||||||||||||
| Royce Low-Priced Stock Fund | 350,493 | 1,232,346 | 37,062,245 | 15,751,222 | – | – | ||||||||||||
| Royce Micro-Cap Fund | – | 1,597,877 | 18,144,382 | 13,590,589 | – | – | ||||||||||||
| Royce Micro-Cap Opportunity Fund | 250,724 | – | 6,369,153 | 3,718,816 | – | – | ||||||||||||
| Royce Opportunity Fund | 18,209,363 | 14,009,998 | 66,655,061 | 199,474,160 | – | – | ||||||||||||
| Royce Pennsylvania Mutual Fund | 12,292,768 | 8,375,891 | 309,129,630 | 374,077,475 | – | – | ||||||||||||
| Royce Premier Fund | 1,125,376 | 2,214,026 | 405,194,296 | 318,912,016 | – | – | ||||||||||||
| Royce Small-Cap Leaders Fund | 66,626 | 420,604 | 10,792,967 | 12,320,772 | – | – | ||||||||||||
| Royce Small-Cap Value Fund | 3,440,279 | 800,336 | 19,139,774 | 8,533,404 | – | – | ||||||||||||
| Royce Small/Mid-Cap Premier Fund | 4,781,659 | 3,852,864 | 26,285,447 | 20,312,685 | – | – | ||||||||||||
| Royce Smaller-Companies Growth Fund | 10,324,521 | 1,788,092 | 76,149,166 | 63,988,721 | – | – | ||||||||||||
| Royce Special Equity Fund | 14,919,426 | 10,664,189 | 131,434,778 | 115,512,791 | – | – | ||||||||||||
| Royce Special Equity Multi-Cap Fund | 859,345 | 979,387 | 10,704,610 | 2,068,497 | – | – | ||||||||||||
| Royce Total Return Fund | 31,554,994 | 22,791,657 | 294,106,107 | 283,252,860 | – | – | ||||||||||||
| UNDISTRIBUTED ORDINARY INCOME | UNDISTRIBUTED LONG-TERM CAPITAL GAINS OR (CAPITAL LOSS CARRYFORWARD) | NET UNREALIZED APPRECIATION (DEPRECIATION)1 | QUALIFIED LATE YEAR ORDINARY AND POST-OCTOBER LOSS DEFERRALS2 | TOTAL DISTRIBUTABLE EARNINGS | CAPITAL LOSS CARRYFORWARD UTILIZED | |||||||||||||||||||
| Royce Dividend Value Fund | $ | 2,690 | $ | 3,067,246 | $ | 27,926,067 | $ | (112,099 | ) | $ | 30,883,904 | $ | – | |||||||||||
| Royce Global Financial Services Fund | – | 281,547 | 3,377,666 | (248,359 | ) | 3,410,854 | – | |||||||||||||||||
| Royce International Premier Fund | 35,742 | (60,295,931 | )3 | (22,302,523 | ) | (17,899 | ) | (82,580,611 | ) | 7,258,867 | ||||||||||||||
| Royce Low-Priced Stock Fund | – | 2,208,430 | 11,202,255 | (29,965 | ) | 13,380,720 | – | |||||||||||||||||
| Royce Micro-Cap Fund | – | 1,827,962 | 14,888,420 | (676,014 | ) | 16,040,368 | – | |||||||||||||||||
| Royce Micro-Cap Opportunity Fund | – | 2,003,123 | 1,088,447 | – | 3,091,570 | – | ||||||||||||||||||
| Royce Opportunity Fund | – | 13,967,245 | (109,016,178 | ) | (1,561,929 | ) | (96,610,862 | ) | – | |||||||||||||||
| Royce Pennsylvania Mutual Fund | 144,894 | 32,095,296 | 368,593,313 | (7,550,740 | ) | 393,282,763 | – | |||||||||||||||||
| Royce Premier Fund | 9,052 | 98,158,495 | 545,509,201 | (3,578,642 | ) | 640,098,106 | – | |||||||||||||||||
| Royce Small-Cap Leaders Fund | 3,264 | 426,461 | 4,581,686 | – | 5,011,411 | – | ||||||||||||||||||
| Royce Small-Cap Value Fund | 1,058,928 | 2,893,705 | 7,725,124 | (972 | ) | 11,676,785 | – | |||||||||||||||||
| Royce Small/Mid-Cap Premier Fund | 31,655 | 244,846 | (2,523,999 | ) | (175 | ) | (2,247,673 | ) | – | |||||||||||||||
| Royce Smaller-Companies Growth Fund | – | 6,653,237 | 12,610,732 | (1,358,099 | ) | 17,905,870 | – | |||||||||||||||||
| Royce Special Equity Fund | 179,921 | 10,092,360 | 221,860,682 | – | 232,132,963 | – | ||||||||||||||||||
| Royce Special Equity Multi-Cap Fund | 1,570 | 2,113,467 | 10,574,290 | (38,006 | ) | 12,651,321 | – | |||||||||||||||||
| Royce Total Return Fund | – | 72,052,806 | 471,091,233 | (17,059,441 | ) | 526,084,598 | – | |||||||||||||||||
| 1 | Includes timing differences on foreign currency, recognition of losses on securities sold, investments in Real Estate Investment Trusts, investments in publicly traded partnerships and Trusts, underlying investments and mark-to-market of Passive Foreign Investment Companies. |
| 2 | Under the current tax law, capital losses and qualified late year ordinary losses incurred after October 31 may be deferred and treated as occurring on the first day of the following fiscal year. This column also includes passive activity losses and 857 (b)(9) adjustments. |
| 3 | The entire amount is comprised of capital loss carryforwards from business combinations, which may be limited in future years under the Internal Revenue Code Sections 381-384. |
| PAID-IN | |||||||
| TOTAL DISTRIBUTABLE EARNINGS (LOSS) | CAPITAL | ||||||
| Royce Dividend Value Fund | $ | 54 | $ | (54 | ) | ||
| Royce Global Financial Services Fund | 33,987 | (33,987 | ) | ||||
| Royce International Premier Fund | – | – | |||||
| The Royce Funds 2018 Annual Report to Shareholders | 109 |
| PAID-IN | |||||||||
| TOTAL DISTRIBUTABLE EARNINGS (LOSS) | CAPITAL | ||||||||
| Royce Low-Priced Stock Fund | $ | 1,156,883 | $ | (1,156,883 | ) | ||||
| Royce Micro-Cap Fund | 1,108,993 | (1,108,993 | ) | ||||||
| Royce Micro-Cap Opportunity Fund | 403,911 | (403,911 | ) | ||||||
| Royce Opportunity Fund | (106,463,390 | ) | 106,463,390 | ||||||
| Royce Pennsylvania Mutual Fund | (17,555,289 | ) | 17,555,289 | ||||||
| Royce Premier Fund | (36,696,931 | ) | 36,696,931 | ||||||
| Royce Small-Cap Leaders Fund | – | – | |||||||
| Royce Small-Cap Value Fund | (20,785 | ) | 20,785 | ||||||
| Royce Small/Mid-Cap Premier Fund | (1,077 | ) | 1,077 | ||||||
| Royce Smaller-Companies Growth Fund | 3,300,187 | (3,300,187 | ) | ||||||
| Royce Special Equity Fund | – | – | |||||||
| Royce Special Equity Multi-Cap Fund | – | – | |||||||
| Royce Total Return Fund | (24,584,532 | ) | 24,584,532 | ||||||
| AFFILIATED COMPANY | SHARES 12/31/17 | MARKET VALUE 12/31/17 | COSTS OF PURCHASES | PROCEEDS FROM SALES | REALIZED GAIN (LOSS) | CHANGE IN NET UNREALIZED APPRECIATION (DEPRECIATION) | DIVIDEND INCOME | SHARES 12/31/18 | MARKET VALUE 12/31/18 | |||||||||||||||||||||||||||
| Royce Opportunity Fund | ||||||||||||||||||||||||||||||||||||
| Dixie Group1 | 849,935 | $ | 3,272,250 | $ | 16,265 | $ | 773,472 | $ | (2,324,013 | ) | $ | 160,431 | $ | – | ||||||||||||||||||||||
| Echelon Corporation1 | 230,152 | 1,298,057 | – | 1,756,837 | (2,919,936 | ) | 3,378,715 | – | ||||||||||||||||||||||||||||
| Noranda Aluminum Holding Corporation1 | 593,726 | 7,718 | – | 4,223 | 596 | 789 | – | |||||||||||||||||||||||||||||
| Northwest Pipe1 | 489,326 | 9,365,700 | 465,690 | 2,511,389 | 147,322 | 1,687,254 | – | |||||||||||||||||||||||||||||
| SigmaTron International1 | 282,757 | 2,867,156 | – | 1,068,694 | (687,422 | ) | (855,574 | ) | – | |||||||||||||||||||||||||||
| 16,810,881 | (5,783,453 | ) | 4,371,615 | – | ||||||||||||||||||||||||||||||||
| Royce Pennsylvania Mutual Fund | ||||||||||||||||||||||||||||||||||||
| Preformed Line Products1 | 260,064 | 18,477,547 | 198,686 | 2,120,219 | 1,101,984 | (4,976,463 | ) | 195,483 | ||||||||||||||||||||||||||||
| 18,477,547 | 1,101,984 | (4,976,463 | ) | 195,483 | ||||||||||||||||||||||||||||||||
| Royce Premier Fund | ||||||||||||||||||||||||||||||||||||
| CIRCOR International | 878,443 | 42,762,605 | 18,064,252 | 11,964,676 | (1,680,592 | ) | (25,355,756 | ) | – | 1,024,687 | $ | 21,825,833 | ||||||||||||||||||||||||
| 42,762,605 | (1,680,592 | ) | (25,355,756 | ) | – | 21,825,833 | ||||||||||||||||||||||||||||||
| Royce Special Equity Fund | ||||||||||||||||||||||||||||||||||||
| Bassett Furniture Industries1 | 781,000 | 29,365,600 | 2,837,585 | 11,100,987 | (1,691,175 | ) | (10,152,543 | ) | 291,460 | |||||||||||||||||||||||||||
| Bowl America Cl. A | 343,000 | 5,145,000 | – | – | – | 85,750 | 234,955 | 343,000 | 5,230,750 | |||||||||||||||||||||||||||
| Capella Education1 | 588,000 | 45,511,200 | – | 7,254,354 | 2,952,057 | (41,208,903 | ) | 505,680 | ||||||||||||||||||||||||||||
| Computer Services | 756,000 | 35,222,040 | 1,128,871 | – | – | 2,599,089 | 1,029,570 | 779,000 | 38,950,000 | |||||||||||||||||||||||||||
| CSS Industries1 | 695,900 | 19,366,897 | – | 14,658,217 | 908,590 | (5,617,270 | ) | 69,540 | ||||||||||||||||||||||||||||
| Flexsteel Industries | 567,000 | 26,524,260 | 5,761,631 | – | – | (15,173,891 | ) | 557,142 | 775,000 | 17,112,000 | ||||||||||||||||||||||||||
| Gencor Industries | 521,979 | 8,638,752 | 7,225,950 | – | – | (4,527,207 | ) | – | 1,033,500 | 11,337,495 | ||||||||||||||||||||||||||
| Hooker Furniture | 1,127,000 | 47,841,150 | 1,075,434 | – | – | (18,493,884 | ) | 654,150 | 1,155,000 | 30,422,700 | ||||||||||||||||||||||||||
| Hurco Companies | 525,000 | 22,155,000 | 2,410,395 | – | – | (3,845,115 | ) | 230,700 | 580,400 | 20,720,280 | ||||||||||||||||||||||||||
| John B. Sanfilippo & Son | 726,500 | 45,951,125 | 12,092,114 | – | – | (7,309,149 | ) | 1,912,500 | 911,500 | 50,734,090 | ||||||||||||||||||||||||||
| National Presto Industries | 469,000 | 46,642,050 | 1,314,797 | 7,138,317 | 2,944,792 | 5,553,534 | 2,820,000 | 421,800 | 49,316,856 | |||||||||||||||||||||||||||
| Park Electrochemical1 | 1,557,000 | 30,595,050 | 865,347 | 22,751,144 | (2,682,001 | ) | 2,863,188 | 3,995,200 | ||||||||||||||||||||||||||||
| Standard Motor Products | 1,350,000 | 60,628,500 | 3,362,480 | 2,348,235 | 269,834 | 4,920,821 | 1,172,220 | 1,380,000 | 66,833,400 | |||||||||||||||||||||||||||
| 423,586,624 | 2,702,097 | (90,305,580 | ) | 13,473,117 | 290,657,571 | |||||||||||||||||||||||||||||||
| Royce Total Return Fund | ||||||||||||||||||||||||||||||||||||
| Mueller (Paul) Company1 | 100,714 | 3,927,846 | – | 3,406,891 | (91,602 | ) | (429,353 | ) | – | |||||||||||||||||||||||||||
| Starrett (L.S.) Company (The) Cl. A | 439,557 | 3,780,190 | – | 310,013 | (853,442 | ) | (588,452 | ) | – | 387,817 | 2,028,283 | |||||||||||||||||||||||||
| 7,708,036 | (945,044 | ) | (1,017,805 | ) | – | 2,028,283 | ||||||||||||||||||||||||||||||
| 1 Not an Affiliated Company at December 31, 2018. |
| 110 | The Royce Funds 2018 Annual Report to Shareholders |
| TARGET FUND | ACQUIRING FUND |
| Royce Small-Cap Leaders Fund | Royce Pennsylvania Mutual Fund |
| Royce Small/Mid-Cap Premier Fund | Royce Pennsylvania Mutual Fund |
| Royce Low-Priced Stock Fund | Royce Micro-Cap Fund |
| Royce Micro-Cap Opportunity Fund | Royce Opportunity Fund |
| The Royce Funds 2018 Annual Report to Shareholders | 111 |
Report of Independent Registered Public Accounting Firm
To the Board of Trustees of The Royce Fund and Shareholders of Royce Dividend Value Fund, Royce Global Financial Services Fund, Royce International Premier Fund, Royce Low-Priced Stock Fund, Royce Micro-Cap Fund, Royce Micro-Cap Opportunity Fund, Royce Opportunity Fund, Royce Pennsylvania Mutual Fund, Royce Premier Fund, Royce Small-Cap Leaders Fund, Royce Small-Cap Value Fund, Royce Small/Mid-Cap Premier Fund, Royce Smaller-Companies Growth Fund, Royce Special Equity Fund, Royce Special Equity Multi-Cap Fund and Royce Total Return Fund:
Opinions on the Financial Statements
We have audited the accompanying statements of assets and liabilities, including the schedules of investments, of Royce Dividend Value Fund, Royce Global Financial Services Fund, Royce International Premier Fund, Royce Low-Priced Stock Fund, Royce Micro-Cap Fund, Royce Micro-Cap Opportunity Fund, Royce Opportunity Fund, Royce Pennsylvania Mutual Fund, Royce Premier Fund, Royce Small-Cap Leaders Fund, Royce Small-Cap Value Fund, Royce Small/Mid-Cap Premier Fund, Royce Smaller-Companies Growth Fund, Royce Special Equity Fund, Royce Special Equity Multi-Cap Fund and Royce Total Return Fund (constituting The Royce Fund, hereafter collectively referred to as the “Funds”) as of December 31, 2018, the related statements of operations for the year ended December 31, 2018, the statements of changes in net assets for each of the two years in the period ended December 31, 2018, including the related notes, and the financial highlights for each of the periods indicated therein (collectively referred to as the “financial statements”). In our opinion, the financial statements present fairly, in all material respects, the financial position of each of the Funds as of December 31, 2018, the results of each of their operations for the year then ended, the changes in each of their net assets for each of the two years in the period ended December 31, 2018 and each of the financial highlights for each of the periods indicated therein in conformity with accounting principles generally accepted in the United States of America.
Basis for Opinions
These financial statements are the responsibility of the Funds’ management. Our responsibility is to express an opinion on the Funds’ financial statements based on our audits. We are a public accounting firm registered with the Public Company Accounting Oversight Board (United States) (“PCAOB”) and are required to be independent with respect to the Fund in accordance with the U.S. federal securities laws and the applicable rules and regulations of the Securities and Exchange Commission and the PCAOB.
We conducted our audits of these financial statements in accordance with the standards of the PCAOB. Those standards require that we plan and perform the audit to obtain reasonable assurance about whether the financial statements are free of material misstatement, whether due to error or fraud.
Our audits included performing procedures to assess the risks of material misstatement of the financial statements, whether due to error or fraud, and performing procedures that respond to those risks. Such procedures included examining, on a test basis, evidence regarding the amounts and disclosures in the financial statements. Our audits also included evaluating the accounting principles used and significant estimates made by management, as well as evaluating the overall presentation of the financial statements. Our procedures included confirmation of securities owned as of December 31, 2018 by correspondence with the custodian and brokers; when replies were not received from brokers, we performed other auditing procedures. We believe that our audits provide a reasonable basis for our opinions.
Subsequent Event
As discussed in the Subsequent Events footnote to the financial statements, the Board of Trustees of The Royce Fund has approved a plan of liquidation for Royce Special Equity Multi-Cap Fund.
/s/PricewaterhouseCoopers LLP
New York, New York
February 21, 2019
We have served as the auditor of one or more investment companies in the Royce investment company group since at least 1967. We have not been able to determine the specific year we began serving as auditor.
| 112 | The Royce Funds 2018 Annual Report to Shareholders |
Understanding Your Fund’s Expenses (unaudited)
As a shareholder of a mutual fund, you pay ongoing expenses, including management fees and other Fund expenses including, for some funds, distribution and/or service (12b-1) fees. Using the information below, you can estimate how these ongoing expenses (in dollars) affect your investment and compare them with the ongoing expenses of other funds. You may also incur one-time transaction expenses, including redemption fees, which are not shown in this section and would result in higher total costs. The example is based on an investment of $1,000 invested at July 1, 2018, and held for the entire six-month period ended December 31, 2018. Service, Consultant and R Class shares are generally available only through certain brokers or retirement plan administrators who receive distribution and/or service fees from the Fund for services that they perform. Institutional Class shares are generally available only to institutions or intermediaries with a minimum account size of $1 million.
Actual Expenses
The first part of the table below provides information about actual account values and actual expenses. You may use the information in this section, together with the amount you invested, to estimate the expenses that you paid over the period. Simply divide your account value at December 31, 2018, by $1,000 (for example, an $8,600 account value divided by $1,000 = 8.6), then multiply the result by the number under the heading entitled “Expenses Paid During the Period” to estimate the expenses you paid on your account during this period.
Hypothetical Example for Comparison Purposes
The second part of the table below provides information about hypothetical account values and hypothetical expenses based on the Fund’s actual expense ratio and an assumed rate of return of 5% per year before expenses, which is not the Fund’s actual return. The hypothetical account values and expenses may not be used to estimate the actual ending account balance or expenses you paid for the period. You may use this information to compare the ongoing costs of investing in the Fund and other funds. To do so, compare this 5% hypothetical example with the 5% hypothetical examples that appear in the shareholder reports of the other funds.
Please note that the expenses shown in the table are meant to highlight your ongoing costs only and do not reflect any transactional costs, such as sales charges (loads), redemption fees, or exchange fees. Therefore, this section is useful in comparing ongoing costs only, and will not help you determine the relative total costs of owning different funds. In addition, if these transactional costs were included, your costs would have been higher.
| ACTUAL | HYPOTHETICAL (5% PER YEAR BEFORE EXPENSES) | ||||||
| Beginning Account Value 7/1/18 | Ending Account Value 12/31/18 | Expenses Paid During the Period1 | Beginning Account Value 7/1/18 | Ending Account Value 12/31/18 | Expenses Paid During the Period1 | Annualized Expense Ratio2 | |
| Investment Class | |||||||
| Royce Dividend Value Fund | $ 1,000.00 | $ 856.60 | $ 4.77 | $ 1,000.00 | $ 1,020.06 | $ 5.19 | 1.02% |
| Royce International Premier Fund | 1,000.00 | 902.47 | 5.66 | 1,000.00 | 1,019.26 | 6.01 | 1.18% |
| Royce Low-Priced Stock Fund | 1,000.00 | 830.38 | 5.72 | 1,000.00 | 1,018.95 | 6.31 | 1.24% |
| Royce Micro-Cap Fund | 1,000.00 | 826.17 | 6.86 | 1,000.00 | 1,017.69 | 7.58 | 1.49% |
| Royce Micro-Cap Opportunity Fund | 1,000.00 | 797.80 | 5.62 | 1,000.00 | 1,018.95 | 6.31 | 1.24% |
| Royce Opportunity Fund | 1,000.00 | 769.19 | 5.40 | 1,000.00 | 1,019.11 | 6.16 | 1.21% |
| Royce Pennsylvania Mutual Fund | 1,000.00 | 854.64 | 4.30 | 1,000.00 | 1,020.57 | 4.69 | 0.92% |
| Royce Premier Fund | 1,000.00 | 873.42 | 5.57 | 1,000.00 | 1,019.26 | 6.01 | 1.18% |
| Royce Small-Cap Leaders Fund | 1,000.00 | 843.07 | 5.76 | 1,000.00 | 1,018.95 | 6.31 | 1.24% |
| Royce Small-Cap Value Fund | 1,000.00 | 867.19 | 5.84 | 1,000.00 | 1,018.95 | 6.31 | 1.24% |
| Royce Small/Mid-Cap Premier Fund3 | 1,000.00 | 876.36 | 4.92 | 1,000.00 | 1,019.96 | 5.30 | 1.04% |
| Royce Smaller-Companies Growth Fund | 1,000.00 | 814.22 | 5.58 | 1,000.00 | 1,019.06 | 6.21 | 1.22% |
| Royce Special Equity Fund | 1,000.00 | 904.27 | 5.66 | 1,000.00 | 1,019.26 | 6.01 | 1.18% |
| Royce Special Equity Multi-Cap Fund | 1,000.00 | 949.09 | 5.06 | 1,000.00 | 1,020.01 | 5.24 | 1.03% |
| Royce Total Return Fund | 1,000.00 | 870.29 | 5.52 | 1,000.00 | 1,019.31 | 5.96 | 1.17% |
| Service Class | |||||||
| Royce Dividend Value Fund | 1,000.00 | 854.91 | 6.22 | 1,000.00 | 1,018.50 | 6.77 | 1.33% |
| Royce Global Financial Services Fund | 1,000.00 | 843.59 | 6.92 | 1,000.00 | 1,017.69 | 7.58 | 1.49% |
| Royce International Premier Fund | 1,000.00 | 900.10 | 7.28 | 1,000.00 | 1,017.54 | 7.73 | 1.52% |
| Royce Low-Priced Stock Fund | 1,000.00 | 829.42 | 6.87 | 1,000.00 | 1,017.69 | 7.58 | 1.49% |
| Royce Micro-Cap Fund | 1,000.00 | 825.86 | 7.41 | 1,000.00 | 1,017.09 | 8.19 | 1.61% |
| Royce Opportunity Fund | 1,000.00 | 768.83 | 6.64 | 1,000.00 | 1,017.69 | 7.58 | 1.49% |
| Royce Pennsylvania Mutual Fund | 1,000.00 | 853.55 | 5.98 | 1,000.00 | 1,018.75 | 6.51 | 1.28% |
| Royce Premier Fund | 1,000.00 | 872.35 | 6.94 | 1,000.00 | 1,017.80 | 7.48 | 1.47% |
| Royce Small-Cap Leaders Fund | 1,000.00 | 842.15 | 6.92 | 1,000.00 | 1,017.69 | 7.58 | 1.49% |
| Royce Small-Cap Value Fund | 1,000.00 | 866.60 | 7.01 | 1,000.00 | 1,017.69 | 7.58 | 1.49% |
| Royce Small/Mid-Cap Premier Fund3 | 1,000.00 | 875.88 | 5.53 | 1,000.00 | 1,019.31 | 5.96 | 1.17% |
| Royce Smaller-Companies Growth Fund | 1,000.00 | 813.31 | 6.81 | 1,000.00 | 1,017.69 | 7.58 | 1.49% |
| Royce Special Equity Fund | 1,000.00 | 902.86 | 6.67 | 1,000.00 | 1,018.20 | 7.07 | 1.39% |
| Royce Special Equity Multi-Cap Fund | 1,000.00 | 948.03 | 6.09 | 1,000.00 | 1,018.95 | 6.31 | 1.24% |
| Royce Total Return Fund | 1,000.00 | 869.16 | 6.97 | 1,000.00 | 1,017.74 | 7.53 | 1.48% |
The Royce Funds 2018 Annual Report to Shareholders | 113
Understanding Your Fund’s Expenses (unaudited) (continued)
| ACTUAL | HYPOTHETICAL (5% PER YEAR BEFORE EXPENSES) | ||||||
| Beginning Account Value 7/1/18 | Ending Account Value 12/31/18 | Expenses Paid During the Period1 | Beginning Account Value 7/1/18 | Ending Account Value 12/31/18 | Expenses Paid During the Period1 | Annualized Expense Ratio2 | |
| Consultant Class | |||||||
| Royce Dividend Value Fund | $ 1,000.00 | $ 851.44 | $ 9.75 | $ 1,000.00 | $ 1,014.67 | $ 10.61 | 2.09% |
| Royce International Premier Fund | 1,000.00 | 897.50 | 10.47 | 1,000.00 | 1,014.17 | 11.12 | 2.19% |
| Royce Micro-Cap Fund | 1,000.00 | 822.08 | 11.76 | 1,000.00 | 1,012.30 | 12.98 | 2.56% |
| Royce Opportunity Fund | 1,000.00 | 765.25 | 10.28 | 1,000.00 | 1,013.56 | 11.72 | 2.31% |
| Royce Pennsylvania Mutual Fund | 1,000.00 | 850.14 | 9.00 | 1,000.00 | 1,015.48 | 9.80 | 1.93% |
| Royce Premier Fund | 1,000.00 | 868.83 | 10.46 | 1,000.00 | 1,014.01 | 11.27 | 2.22% |
| Royce Small-Cap Value Fund | 1,000.00 | 862.18 | 10.98 | 1,000.00 | 1,013.41 | 11.88 | 2.34% |
| Royce Small/Mid-Cap Premier Fund3 | 1,000.00 | 872.09 | 9.86 | 1,000.00 | 1,014.67 | 10.61 | 2.09% |
| Royce Smaller-Companies Growth Fund | 1,000.00 | 810.18 | 10.22 | 1,000.00 | 1,013.91 | 11.37 | 2.24% |
| Royce Special Equity Fund | 1,000.00 | 899.38 | 10.44 | 1,000.00 | 1,014.22 | 11.07 | 2.18% |
| Royce Special Equity Multi-Cap Fund | 1,000.00 | 944.80 | 9.75 | 1,000.00 | 1,015.17 | 10.11 | 1.99% |
| Royce Total Return Fund | 1,000.00 | 866.50 | 10.21 | 1,000.00 | 1,014.27 | 11.02 | 2.17% |
| Institutional Class | |||||||
| Royce Dividend Value Fund | 1,000.00 | 856.35 | 4.16 | 1,000.00 | 1,020.72 | 4.53 | 0.89% |
| Royce Global Financial Services Fund | 1,000.00 | 846.98 | 4.84 | 1,000.00 | 1,019.96 | 5.30 | 1.04% |
| Royce International Premier Fund | 1,000.00 | 902.32 | 4.99 | 1,000.00 | 1,019.96 | 5.30 | 1.04% |
| Royce Opportunity Fund | 1,000.00 | 770.01 | 4.86 | 1,000.00 | 1,019.71 | 5.55 | 1.09% |
| Royce Pennsylvania Mutual Fund | 1,000.00 | 855.69 | 4.12 | 1,000.00 | 1,020.77 | 4.48 | 0.88% |
| Royce Premier Fund | 1,000.00 | 873.09 | 5.43 | 1,000.00 | 1,019.41 | 5.85 | 1.15% |
| Royce Smaller-Companies Growth Fund | 1,000.00 | 814.42 | 4.94 | 1,000.00 | 1,019.76 | 5.50 | 1.08% |
| Royce Special Equity Fund | 1,000.00 | 904.88 | 5.38 | 1,000.00 | 1,019.56 | 5.70 | 1.12% |
| Royce Special Equity Multi-Cap Fund | 1,000.00 | 949.41 | 4.37 | 1,000.00 | 1,020.72 | 4.53 | 0.89% |
| Royce Total Return Fund | 1,000.00 | 870.62 | 5.23 | 1,000.00 | 1,019.61 | 5.65 | 1.11% |
| R Class | |||||||
| Royce Opportunity Fund | 1,000.00 | 767.62 | 8.20 | 1,000.00 | 1,015.93 | 9.35 | 1.84% |
| Royce Pennsylvania Mutual Fund | 1,000.00 | 853.02 | 7.01 | 1,000.00 | 1,017.64 | 7.63 | 1.50% |
| Royce Premier Fund | 1,000.00 | 870.68 | 8.35 | 1,000.00 | 1,016.28 | 9.00 | 1.77% |
| Royce Small-Cap Value Fund | 1,000.00 | 864.36 | 8.93 | 1,000.00 | 1,015.63 | 9.65 | 1.90% |
| Royce Total Return Fund | 1,000.00 | 867.92 | 8.52 | 1,000.00 | 1,016.08 | 9.20 | 1.81% |
| 1 | Expenses are equal to the Fund's annualized expense ratio multiplied by the average account value for the period, multiplied by 184 days in the most recent fiscal half-year divided by 365 days (to reflect the half-year period). |
| 2 | Annualized expense ratio used to derive figures in the table is based on the most recent fiscal half-year. |
| 3 | GiftShare accounts pay an annual $50 trustee fee to Alliance Trust Company, as trustee. If these fees were included above, your costs would be higher. |
114 | The Royce Funds 2018 Annual Report to Shareholders
Federal Tax Information
In January 2019, taxable shareholders were mailed a Form 1099-DIV reporting the federal tax status of all distributions paid during the calendar year 2018.
2018 Supplemental Tax Information:
| LONG-TERM CAPITAL | |||||||||||||||
| % INCOME | GAIN DISTRIBUTION OR | ||||||||||||||
| FUND | % QDI | % U.S. GOVT INCOME | QUALIFYING FOR DRD | MAXIMUM ALLOWABLE (OOO’S) | |||||||||||
| Royce Dividend Value Fund | 100.00 | % | N/A | 65.47 | % | $ | 13,917 | ||||||||
| Royce Global Financial Services Fund | 46.04 | % | N/A | 87.43 | % | 4,123 | |||||||||
| Royce International Premier Fund | 100.00 | % | N/A | 0.00 | % | – | |||||||||
| Royce Low-Priced Stock Fund | 100.00 | % | N/A | 100.00 | % | 37,062 | |||||||||
| Royce Micro-Cap Fund | 0.00 | % | N/A | 0.00 | % | 18,144 | |||||||||
| Royce Micro-Cap Opportunity Fund | 72.58 | % | N/A | 44.25 | % | 6,369 | |||||||||
| Royce Opportunity Fund | 51.86 | % | N/A | 51.70 | % | 66,655 | |||||||||
| Royce Pennsylvania Mutual Fund | 100.00 | % | N/A | 100.00 | % | 309,130 | |||||||||
| Royce Premier Fund | 100.00 | % | N/A | 100.00 | % | 405,194 | |||||||||
| Royce Small-Cap Leaders Fund | 100.00 | % | N/A | 100.00 | % | 10,793 | |||||||||
| Royce Small-Cap Value Fund | 100.00 | % | N/A | 97.59 | % | 19,140 | |||||||||
| Royce Small/Mid-Cap Premier Fund | 37.15 | % | N/A | 40.20 | % | 26,285 | |||||||||
| Royce Smaller-Companies Growth Fund | 0.00 | % | N/A | 9.56 | % | 76,149 | |||||||||
| Royce Special Equity Fund | 100.00 | % | N/A | 100.00 | % | 131,435 | |||||||||
| Royce Special Equity Multi-Cap Fund | 100.00 | % | N/A | 100.00 | % | 10,705 | |||||||||
| Royce Total Return Fund | 100.00 | % | N/A | 100.00 | % | 294,106 | |||||||||
| NET FOREIGN | NET FOREIGN SOURCE | |||||
| SOURCE INCOME | INCOME PER SHARE | FOREIGN TAX | FOREIGN TAX PER SHARE | |||
| $3,395,527 | $0.1184 | $581,227 | $0.0203 | |||
| The Royce Funds 2018 Annual Report to Shareholders | 115 |
Trustees and Officers
All Trustees and Officers may be reached c/o The Royce Funds, 745 Fifth Avenue, New York, NY 10151
Charles M. Royce, Trustee1
Age: 79 | Number of Funds Overseen: 21 | Tenure: Since 1982
Non-Royce Directorships: Director of Oxford Square Capital Corp.
Principal Occupation(s) During Past Five Years: Chairman of the Board of Managers of Royce & Associates, LP (“Royce”), the Trust’s investment adviser; Chief Executive Officer (1972–June 2016), President (1972-June 2014) of Royce.
Christopher D. Clark, Trustee1, President
Age: 53 | Number of Funds Overseen: 21 | Tenure: Since 2014
Principal Occupation(s) During Past Five Years: Chief Executive Officer (since July 2016), President (since July 2014), Co-Chief Investment Officer (Since January 2014), Managing Director of Royce, a Member of the Board of Managers of Royce, having been employed by Royce since May 2007.
Patricia W. Chadwick, Trustee
Age: 70 | Number of Funds Overseen: 21 | Tenure: Since 2009
Non-Royce Directorships: Trustee of Voya Mutual Funds and Director of Wisconsin Energy Corp.
Principal Occupation(s) During Past 5 Years: Consultant and President of Ravengate Partners LLC (since 2000).
Christopher C. Grisanti, Trustee
Age: 57 | Number of Funds Overseen: 21 | Tenure: Since 2017
Non-Royce Directorships: None
Principal Occupation(s) During Past Five Years: Co-Founder and Chief Executive Officer of Grisanti Capital Management LLC, an investment advisory firm (since 1999). Mr. Grisanti’s prior business experience includes serving as Director of Research and Portfolio Manager at Spears Benzak, Salomon & Farrell (from 1994 to 1999) and a senior associate at the law firm of Simpson, Thacher & Bartlett (from 1988 to 1994).
Stephen L. Isaacs, Trustee
Age: 79 | Number of Funds Overseen: 21 | Tenure: Since 1989
Non-Royce Directorships: None
Principal Occupation(s) During Past Five Years: Attorney and President of Health Policy Associates, Inc., consultants. Mr. Isaacs’s prior business experience includes having served as President of the Center for Health and Social Policy (from 1996 to 2012); Director of Columbia University Development Law and Policy Program and Professor at Columbia University (until August 1996).
Arthur S. Mehlman, Trustee
Age: 76 | Number of Funds Overseen: 40 | Tenure: Since 2004
Non-Royce Directorships: Director/Trustee of registered investment companies constituting the 19 Legg Mason Funds.
Principal Occupation(s) During Past Five Years: Director of The League for People with Disabilities, Inc.; Director of University of Maryland Foundation (non-profits). Formerly: Director of Municipal Mortgage & Equity, LLC (from October 2004 to April 1, 2011); Director of University of Maryland College Park Foundation (non-profit) (from 1998 to 2005); Partner, KPMG LLP (international accounting firm) (from 1972 to 2002); Director of Maryland Business Roundtable for Education (from July 1984 to June 2002).
David L. Meister, Trustee
Age: 79 | Number of Funds Overseen: 21 | Tenure: Since 1982
Non-Royce Directorships: None
Principal Occupation(s) During Past Five Years: Consultant. Chairman and Chief Executive Officer of The Tennis Channel (from June 2000 to March 2005). Mr. Meister’s prior business experience includes having served as Chief Executive Officer of Seniorlife.com, a consultant to the communications industry, President of Financial News Network, Senior Vice President of HBO, President of Time-Life Films, and Head of Broadcasting for Major League Baseball.
G. Peter O’Brien, Trustee
Age: 73 | Number of Funds Overseen: 40 | Tenure: Since 2001
Non-Royce Directorships: Director/Trustee of registered investment companies constituting the 19 Legg Mason Funds.
Principal Occupation(s) During Past Five Years: Trustee Emeritus of Colgate University (since 2005); Board Member of Hill House, Inc. (since 1999); Formerly Director of TICC Capital Corp (from 2003-2017): Trustee of Colgate University (from 1996 to 2005), President of Hill House, Inc. (from 2001 to 2005) and Managing Director/Equity Capital Markets Group of Merrill Lynch & Co. (from 1971 to 1999).
Michael K. Shields, Trustee
Age: 60 | Number of Funds Overseen: 21 | Tenure: Since 2015
Principal Occupation(s) During Past Five Years: President and Chief Executive Officer of Piedmont Trust Company, a private North Carolina trust company (since May 2012). Mr. Shields’s prior business experience includes owning Shields Advisors, an investment consulting firm (from April 2010 to June 2012).
Francis D. Gannon, Vice President
Age: 51 | Tenure: Since 2014
Principal Occupation(s) During Past Five Years: Co-Chief Investment Officer (since January 2014) and Managing Director of Royce, having been employed by Royce since September 2006.
Daniel A. O’Byrne, Vice President
Age: 56 | Tenure: Since 1994
Principal Occupation(s) During Past Five Years: Principal and Vice President of Royce, having been employed by Royce since October 1986.
Peter K. Hoglund, Treasurer
Age: 52 | Tenure: Since 2015
Principal Occupation(s) During Past Five Years: Chief Financial Officer, Chief Administrative Officer, and Managing Director of Royce, having been employed by Royce since December 2014. Prior to joining Royce, Mr. Hoglund spent more than 20 years with Munder Capital Management in Birmingham, MI, serving as Managing Director and Chief Financial Officer and overseeing all financial aspects of the firm. He began his career at Munder as a portfolio manager.
John E. Denneen, Secretary and Chief Legal Officer
Age: 51 | Tenure: 1996-2001 and Since 2002
Principal Occupation(s) During Past Five Years: General Counsel, Managing Director, and, since June 2015, a Member of the Board of Managers of Royce. Chief Legal and Compliance Officer and Secretary of Royce.
Lisa Curcio, Chief Compliance Officer
Age: 59 | Tenure: Since 2004
Principal Occupation(s) During Past Five Years: Chief Compliance Officer of The Royce Funds (since October 2004) and Compliance Officer of Royce (since June 2004).
| 116 | The Royce Funds 2018 Annual Report to Shareholders |
Notes to Performance and Other Important Information
This material contains forward-looking statements within the meaning of the Securities Exchange Act of 1934, as amended (the “Exchange Act”), that involve risks and uncertainties, including, among others, statements as to:
| • | the Funds’ future operating results, |
| • | the prospects of the Funds’ portfolio companies, |
| • | the impact of investments that the Funds have made or may make, the dependence of the Funds’ future success on the general economy and its impact on the companies and industries in which the Funds invest, and |
| • | the ability of the Funds’ portfolio companies to achieve their objectives. |
| The Royce Funds 2018 Annual Report to Shareholders | 117 |
Notes to Performance and Other Important Information (continued)
The Royce Funds have based the forward-looking statements included in this review and report on information available to us on the date of the report, and we assume no obligation to update any such forward-looking statements. Although The Royce Funds undertake no obligation to revise or update any forward-looking statements, whether as a result of new information, future events, or otherwise, you are advised to consult any additional disclosures that we may make through future shareholder communications or reports.
| 118 | The Royce Funds 2018 Annual Report to Shareholders |
This page is intentionally left blank.
| This page is not part of the 2018 Annual Report to Shareholders | 119 |
This page is intentionally left blank.
| 120 | This page is not part of the 2018 Annual Report to Shareholders |
 | |||||
| About The Royce Funds | Contact Us | ||||
Unparalleled Knowledge + Experience Pioneers in small-cap investing, with 40+ years of experience, depth of knowledge, and focus. Independent Thinking The confidence to go against consensus, the insight to uncover opportunities others might miss, and the tenacity to stay the course through market cycles. | GENERAL INFORMATION General Royce Funds information including: • How to open an account • An overview of our firm and Funds • Ordering literature including Prospectuses (800) 221-4268 | ||||
Specialized Approaches Strategies that use value, core, or growth investment approaches to select micro-cap, small-cap, and mid-cap companies. | ACCOUNT INFORMATION Speak with a representative about: • Your account, transactions, and forms (800) 841-1180 | ||||
| Unwavering Commitment | |||||
Our team of 18 portfolio managers have significant personal investments in the strategies they manage. | FINANCIAL ADVISORS, CONSULTANTS, AND INSTITUTIONS Speak with your regional Royce contact regarding: • Scheduling a meeting or call • Information about our firm, strategies, and funds • Resources for financial professionals, such as portfolio attribution reports (800) 337-6923 | ||||
| AUTOMATED ACCOUNT INFORMATION 24-hour Automated Telephone Service (800) 787-6923 | |||||
 |  |  | |||
Item 2. Code(s) of Ethics. As of the end of the period covered by this report, the Registrant had adopted a code of ethics, as defined in Item 2 of Form N-CSR, applicable to its principal executive officer, principal financial officer, principal accounting officer or controller, or persons performing similar functions. A copy of this code of ethics is filed as an exhibit to this Form N-CSR. No substantive amendments were approved or waivers were granted to this code of ethics during the period covered by this report.
Item 3. Audit Committee Financial Expert.
| (a)(1) | The Board of Trustees of the Registrant has determined that it has an audit committee financial expert. | |
| (a)(2) | Arthur S. Mehlman and Patricia W. Chadwick were designated by the Board of Trustees as the Registrant’s Audit Committee Financial Experts, effective April 15, 2004 and April 8, 2010, respectively. Mr. Mehlman and Ms. Chadwick are “independent” as defined under Item 3 of Form N-CSR. |
Item 4. Principal Accountant Fees and Services.
| (a) | Audit Fees: | |
| Year ended December 31, 2018 - $364,841 | ||
| Year ended December 31, 2017 - $380,325 | ||
| (b) | Audit-Related Fees: | |
| Year ended December 31, 2018 - $0 | ||
| Year ended December 31, 2017 - $0 | ||
| (c) | Tax Fees: | |
| Year ended December 31, 2018 - $165,420 – Preparation of tax returns and excise tax review | ||
| Year ended December 31, 2017 - $170,800 – Preparation of tax returns and excise tax review | ||
| (d) | All Other Fees: | |
| Year ended December 31, 2018 - $0 | ||
| Year ended December 31, 2017 - $0 |
(e)(1) Annual Pre-Approval: On an annual basis, the Registrant’s independent auditor submits to the Audit Committee a schedule of proposed audit, audit-related, tax and other non-audit services to be rendered to the Registrant and/or investment adviser(s) for the following year that require pre-approval by the Audit Committee. This schedule provides a description of each type of service that is expected to require pre-approval and the maximum fees that can be paid for each such service without further Audit Committee approval. The Audit Committee then reviews and determines whether to approve the types of scheduled services and the projected fees for them. Any subsequent revision to already pre-approved services or fees (including fee increases) are presented for consideration at the next regularly scheduled Audit Committee meeting, as needed.
If subsequent to the annual pre-approval of services and fees by the Audit Committee, the Registrant or one of its affiliates determines that it would like to engage the Registrant’s independent auditor to perform a service not already pre-approved, the request is to be submitted to the Registrant’s Chief Financial Officer, and if he or she determines that the service fits within the independence guidelines (e.g., it is not a prohibited service), he or she will then arrange for a discussion of the proposed service and fee to be included on the agenda for the next regularly scheduled Audit Committee meeting so that pre-approval can be considered.
Interim Pre-Approval: If, in the judgment of the Registrant’s Chief Financial Officer, a proposed engagement needs to commence before the next regularly scheduled Audit Committee meeting, he or she shall submit a written summary of the proposed engagement to all members of the Audit Committee, outlining the services, the estimated maximum cost, the category of the services (e.g., audit, audit-related, tax or other) and the rationale for engaging the Registrant’s independent auditor to perform the services. To the extent the proposed engagement involves audit, audit-related or tax services, any individual member of the Audit Committee who is an independent Board member is authorized to pre-approve the engagement. To the extent the proposed engagement involves non-audit services other than audit-related or tax, the Chairman of the Audit Committee is authorized to
pre-approve the engagement. The Registrant’s Chief Financial Officer will arrange for this interim review and coordinate with the appropriate member(s) of the Committee. The independent auditor may not commence the engagement under consideration until the Registrant’s Chief Financial Officer has informed the auditor in writing that pre-approval has been obtained from the Audit Committee or an individual member who is an independent Board member. The member of the Audit Committee who pre-approves any engagements in between regularly scheduled Audit Committee meetings is to report, for informational purposes only, any pre-approval decisions to the Audit Committee at its next regularly scheduled meeting.
| (e)(2) | Not Applicable | |
| (f) | Not Applicable | |
| (g) | Year ended December 31, 2018 - $165,420 | |
| Year ended December 31, 2017 - $170,800 | ||
| (h) | No such services were rendered during 2018 or 2017. |
Item 5. Audit Committee of Listed Registrants. Not Applicable.
Item 6. Investments.
(a) See Item 1.
(b) Not Applicable
Item 7. Disclosure of Proxy Voting Policies and Procedures for Closed-End Management Investment Companies. Not Applicable.
Item 8. Portfolio Managers of Closed-End Management Investment Companies. Not Applicable.
Item 9. Purchases of Equity Securities by Closed-End Management Investment Company and Affiliated Purchasers. Not Applicable
Item 10. Submission of Matters to a Vote of Security Holders. Not Applicable.
Item 11. Controls and Procedures.
(a) Disclosure Controls and Procedures. The Principal Executive and Financial Officers concluded that the Registrant’s Disclosure Controls and Procedures are effective based on their evaluation of the Disclosure Controls and Procedures as of a date within 90 days of the filing date of this report.
(b) Internal Control over Financial Reporting. There were no significant changes in Registrant’s internal control over financial reporting or in other factors that could significantly affect this control subsequent to the date of the evaluation, including any corrective actions with regard to significant deficiencies and material weaknesses during the second fiscal quarter of the period covered by this report.
Item 12. Exhibits. Attached hereto.
(a)(1) The Registrant’s code of ethics pursuant to Item 2 of Form N-CSR.
(a)(2) Separate certifications by the Registrant’s Principal Executive Officer and Principal Financial Officer as required by Rule 30a-2(a) under the Investment Company Act of 1940.
(a)(3) Not Applicable
(b) Separate certifications by the Registrant’s Principal Executive Officer and Principal Financial Officer, pursuant to Section 906 of the Sarbanes-Oxley Act of 2002 and required by Rule 30a-2(b) under the Investment Company Act of 1940.
Pursuant to the requirements of the Securities Exchange Act of 1934 and the Investment Company Act of 1940, the registrant has duly caused this report to be signed on its behalf by the undersigned, thereunto duly authorized.
| THE ROYCE FUND |
| BY: /s/ Christopher D. Clark |
| Christopher D. Clark |
| President |
| Date: February 27, 2019 |
Pursuant to the requirements of the Securities Exchange Act of 1934 and the Investment Company Act of 1940, this report has been signed below by the following persons on behalf of the registrant and in the capacities and on the dates indicated.
| THE ROYCE FUND | THE ROYCE FUND | |
| BY: /s/ Christopher D. Clark | BY: /s/ Peter K. Hoglund | |
| Christopher D. Clark | Peter K. Hoglund | |
| President | Treasurer | |
| Date: February 27, 2019 | Date: February 27, 2019 |