UNITED STATES
SECURITIES AND EXCHANGE COMMISSION
Washington, D.C. 20549
FORM N-CSR
CERTIFIED SHAREHOLDER REPORT
OF
REGISTERED MANAGEMENT INVESTMENT COMPANIES
Investment Company Act File Number: 811-03599
Name of Registrant: The Royce Fund
Address of Registrant:
745 Fifth Avenue
New York, NY 10151
Name and address of agent for service: | John E. Denneen, Esquire 745 Fifth Avenue New York, NY 10151 |
Registrant's telephone number, including area code: (212) 508-4500
Date of fiscal year end: December 31
Date of reporting period: January 1, 2017 - December 31, 2017
Item 1. Reports to Shareholders.
| 333333333 | |||
 |
| DECEMBER 31, 2017 | ||
| 2017 Annual | ||
| Review and Report to Shareholders | ||
| Royce Dividend Value Fund | |||
| Royce Global Financial Services Fund | |||
| Royce International Discovery Fund (formerly named Royce International Micro-Cap Fund) | |||
| Royce International Premier Fund | |||
| Royce Low-Priced Stock Fund | |||
| Royce Micro-Cap Fund | |||
| Royce Micro-Cap Opportunity Fund | |||
| Royce Opportunity Fund | |||
| Royce Pennsylvania Mutual Fund | |||
| Royce Premier Fund | |||
| Royce Small-Cap Leaders Fund | |||
| Royce Small-Cap Value Fund | |||
| Royce Small/Mid-Cap Premier Fund | |||
| Royce Smaller-Companies Growth Fund | |||
| Royce Special Equity Fund | |||
| Royce Special Equity Multi-Cap Fund | |||
| Royce Total Return Fund | |||
| roycefunds.com |  | ||
LETTER TO OUR SHAREHOLDERS
| Table of Contents | ||
| Annual Review | ||
| Letter to Our Shareholders | 2 | |
| Performance and Expenses | 6 | |
| The Royce Funds and Rolling Returns | 7 | |
| Annual Report to Shareholders | ||
| Managers’ Discussions of Fund Performance | ||
Royce Dividend Value Fund | 8 | |
Royce Global Financial Services Fund | 10 | |
Royce International Discovery Fund (formerly named Royce International Micro-Cap Fund) | 12 | |
Royce International Premier Fund | 14 | |
Royce Low-Priced Stock Fund | 16 | |
Royce Micro-Cap Fund | 18 | |
Royce Micro-Cap Opportunity Fund | 20 | |
Royce Opportunity Fund | 22 | |
Royce Pennsylvania Mutual Fund | 24 | |
Royce Premier Fund | 26 | |
Royce Small-Cap Leaders Fund | 28 | |
Royce Small-Cap Value Fund | 30 | |
Royce Small/Mid-Cap Premier Fund | 32 | |
Royce Smaller-Companies Growth Fund | 34 | |
Royce Special Equity Fund | 36 | |
Royce Special Equity Multi-Cap Fund | 38 | |
Royce Total Return Fund | 40 | |
| Schedules of Investments and Financial Statements | 42 | |
| Notes to Financial Statements | 105 | |
| Report of Independent Registered Public Accounting Firm | 122 | |
| Understanding Your Fund’s Expenses | 123 | |
| Trustees and Officers | 126 | |
| Board Approval of Investments Advisory Agreements | 127 | |
| Notes to Performance and Other Important Information | 128 |

| This page is not part of the 2017 Annual Report to Shareholders | 1 |
Letter to Our Shareholders
| It was a terrific year for stocks in 2017 up and down the asset class scale and across much of the globe. Yet it was also a seemingly odd year, and it played out much differently than we thought it would. A second consecutive year of double-digit returns for small-cap stocks, with the Russell 2000 Index gaining 14.6% in 2017,1 was more than welcome, of course, even as returns also defied what we would have anticipated against the backdrop of a rapidly growing domestic economy and a rebounding global one. While large-cap’s relatively higher returns in 2017 made sense to us in this context, we also expected that small-cap would draw the bulk of its strength from cyclicals and value stocks in this healthy environment. So we were surprised to see certain growth and defensive stocks take the lead early in 2017 after lagging—in some cases significantly—in 2016, a year that marked its own significant (and in our view favorable) leadership reversals to cyclicals and value. Over the last three years, then, we have transitioned from 2015’s very narrow, growth-led market to 2016’s broader move driven by cyclicals and value stocks to 2017, in which growth reasserted leadership while value lagged significantly. |
| At first, we chalked up this apparent oddity to the market’s long history of refusing to behave in a logical fashion, at least over the short term. As we parsed the data more closely, however, we were able to more accurately decode what happened. First, the advantages enjoyed by growth stocks and defensives within the Russell 2000 came disproportionately from Health Care, which rose 35.5% in 2017, making it by far the best-performing sector within the small-cap index. Rising more than 50%, biotechnology was particularly strong, bouncing back from a corrective phase in 2016 while pharmaceuticals also made an impressive recovery, climbing 37.2%. In aggregate, five of the six industry groups that comprise the Health Care sector in the Russell 2000 outpaced the overall index in 2017. |
| It was a terrific year for stocks in 2017 up and down the asset class scale and across much of the globe. |
| Following Health Care, however, were four sectors in more cyclical areas, each of which also beat the small-cap index: Consumer Discretionary (+15.6%), Industrials (+19.8%), Information Technology (+17.4%), and Materials (+16.7%). Among the index’s |
| 1 It was also the first calendar year since its 1978 inception in which the small-cap index posted a return between 6% and 16%. |
| 2 | This page is not part of the 2017 Annual Report to Shareholders |
LETTER TO OUR SHAREHOLDERS
| largest sectors, tech is also arguably its most diverse, embracing a mix of cyclical growth and value companies. Two of its more growth-oriented industries—Internet software & services (+28.4%) and software (+27.3%)—did very well while two of its more cyclical industries—electronic equipment, instruments & components (+23.9%) and semiconductors & semiconductor equipment (+15.2%)—also had index-beating returns in 2017. |
| What, then, contributed most to the odd disparity in small-cap results between cyclicals and defensives, value and growth? An underwhelming, low single-digit performance from banks was arguably the major factor. Slotted in the Financials sector, banks had a weighting just shy of 11% in the Russell 2000 at year-end, larger than six of the 11 sectors in the index, which gives their performance a meaningful impact. (In the Russell 2000 Value Index, their weighting was just shy of 20% at year-end—larger than any other sector in the style index.) Anemic returns for small-cap banks thus played a major role in relative disadvantages for both cyclicals and value. We find the following illustration especially revealing: defensives were up 19.9% in 2017 versus 12.7% for cyclicals. With banks, biotechnology, and pharmaceuticals excluded, however, cyclicals showed better absolute and relative performance—up 15.0% versus 11.4% for defensives. |
| A Different Picture Emerges Ex-Outliers 2017 Russell 2000 Cyclical vs Defensive Sector Returns |

| Cyclical and Defensive are defined as follows: Cyclical: Consumer Discretionary, Energy, Financials, Industrials. Defensive: Consumer Staples, Health Care, Real Estate, Telecommunication Services, Utilities. |
| We think this outlier-excluding comparison goes a long way toward explaining why results for cyclicals versus defensives and value versus growth at first glance looked so strange in a period of economic acceleration. |
| ARE SMALL-CAPS POISED FOR ANOTHER SHIFT? |
| After an encouraging 4Q17, can small-cap cyclicals take the lead going forward? |
| Being narrower, growth-led markets typically create challenges for active managers, who tend to embrace a wider swath of companies. So it was not surprising that results for domestic active small-cap strategies were more varied, and we were pleased to see a number of market-beating performances for a select number of approaches. No doubt, the intertwined effect of strong absolute and relative results for certain cyclical sectors and vibrant global economic growth was the dominant factor. So while active strategies faced crosscurrents during the year as investors revisited more speculative issues, they were also bolstered by the expanding global economy. |
| This raises the question of when and how—even if—the market’s response to the quickening pace of global growth will mark a more pronounced shift to cyclicals. A clue may have been found in a reversal that occurred in the fourth quarter, when small-cap cyclicals enjoyed higher returns than defensives, which is typically the case in a growing economy. After trailing through the first three quarters of 2017, small-cap cyclicals advanced 3.9% while defensive stocks were up 1.9% (and the Russell 2000 was up 3.3%). Going forward, we expect investors to increasingly focus on individual company attributes, especially cyclical exposure and company-specific risks. Our view is that this performance pattern should extend into 2018. |
| WHEN IT COMES TO SMALL-CAP, IT’S THE COMPANIES, NOT THE INDEXES |
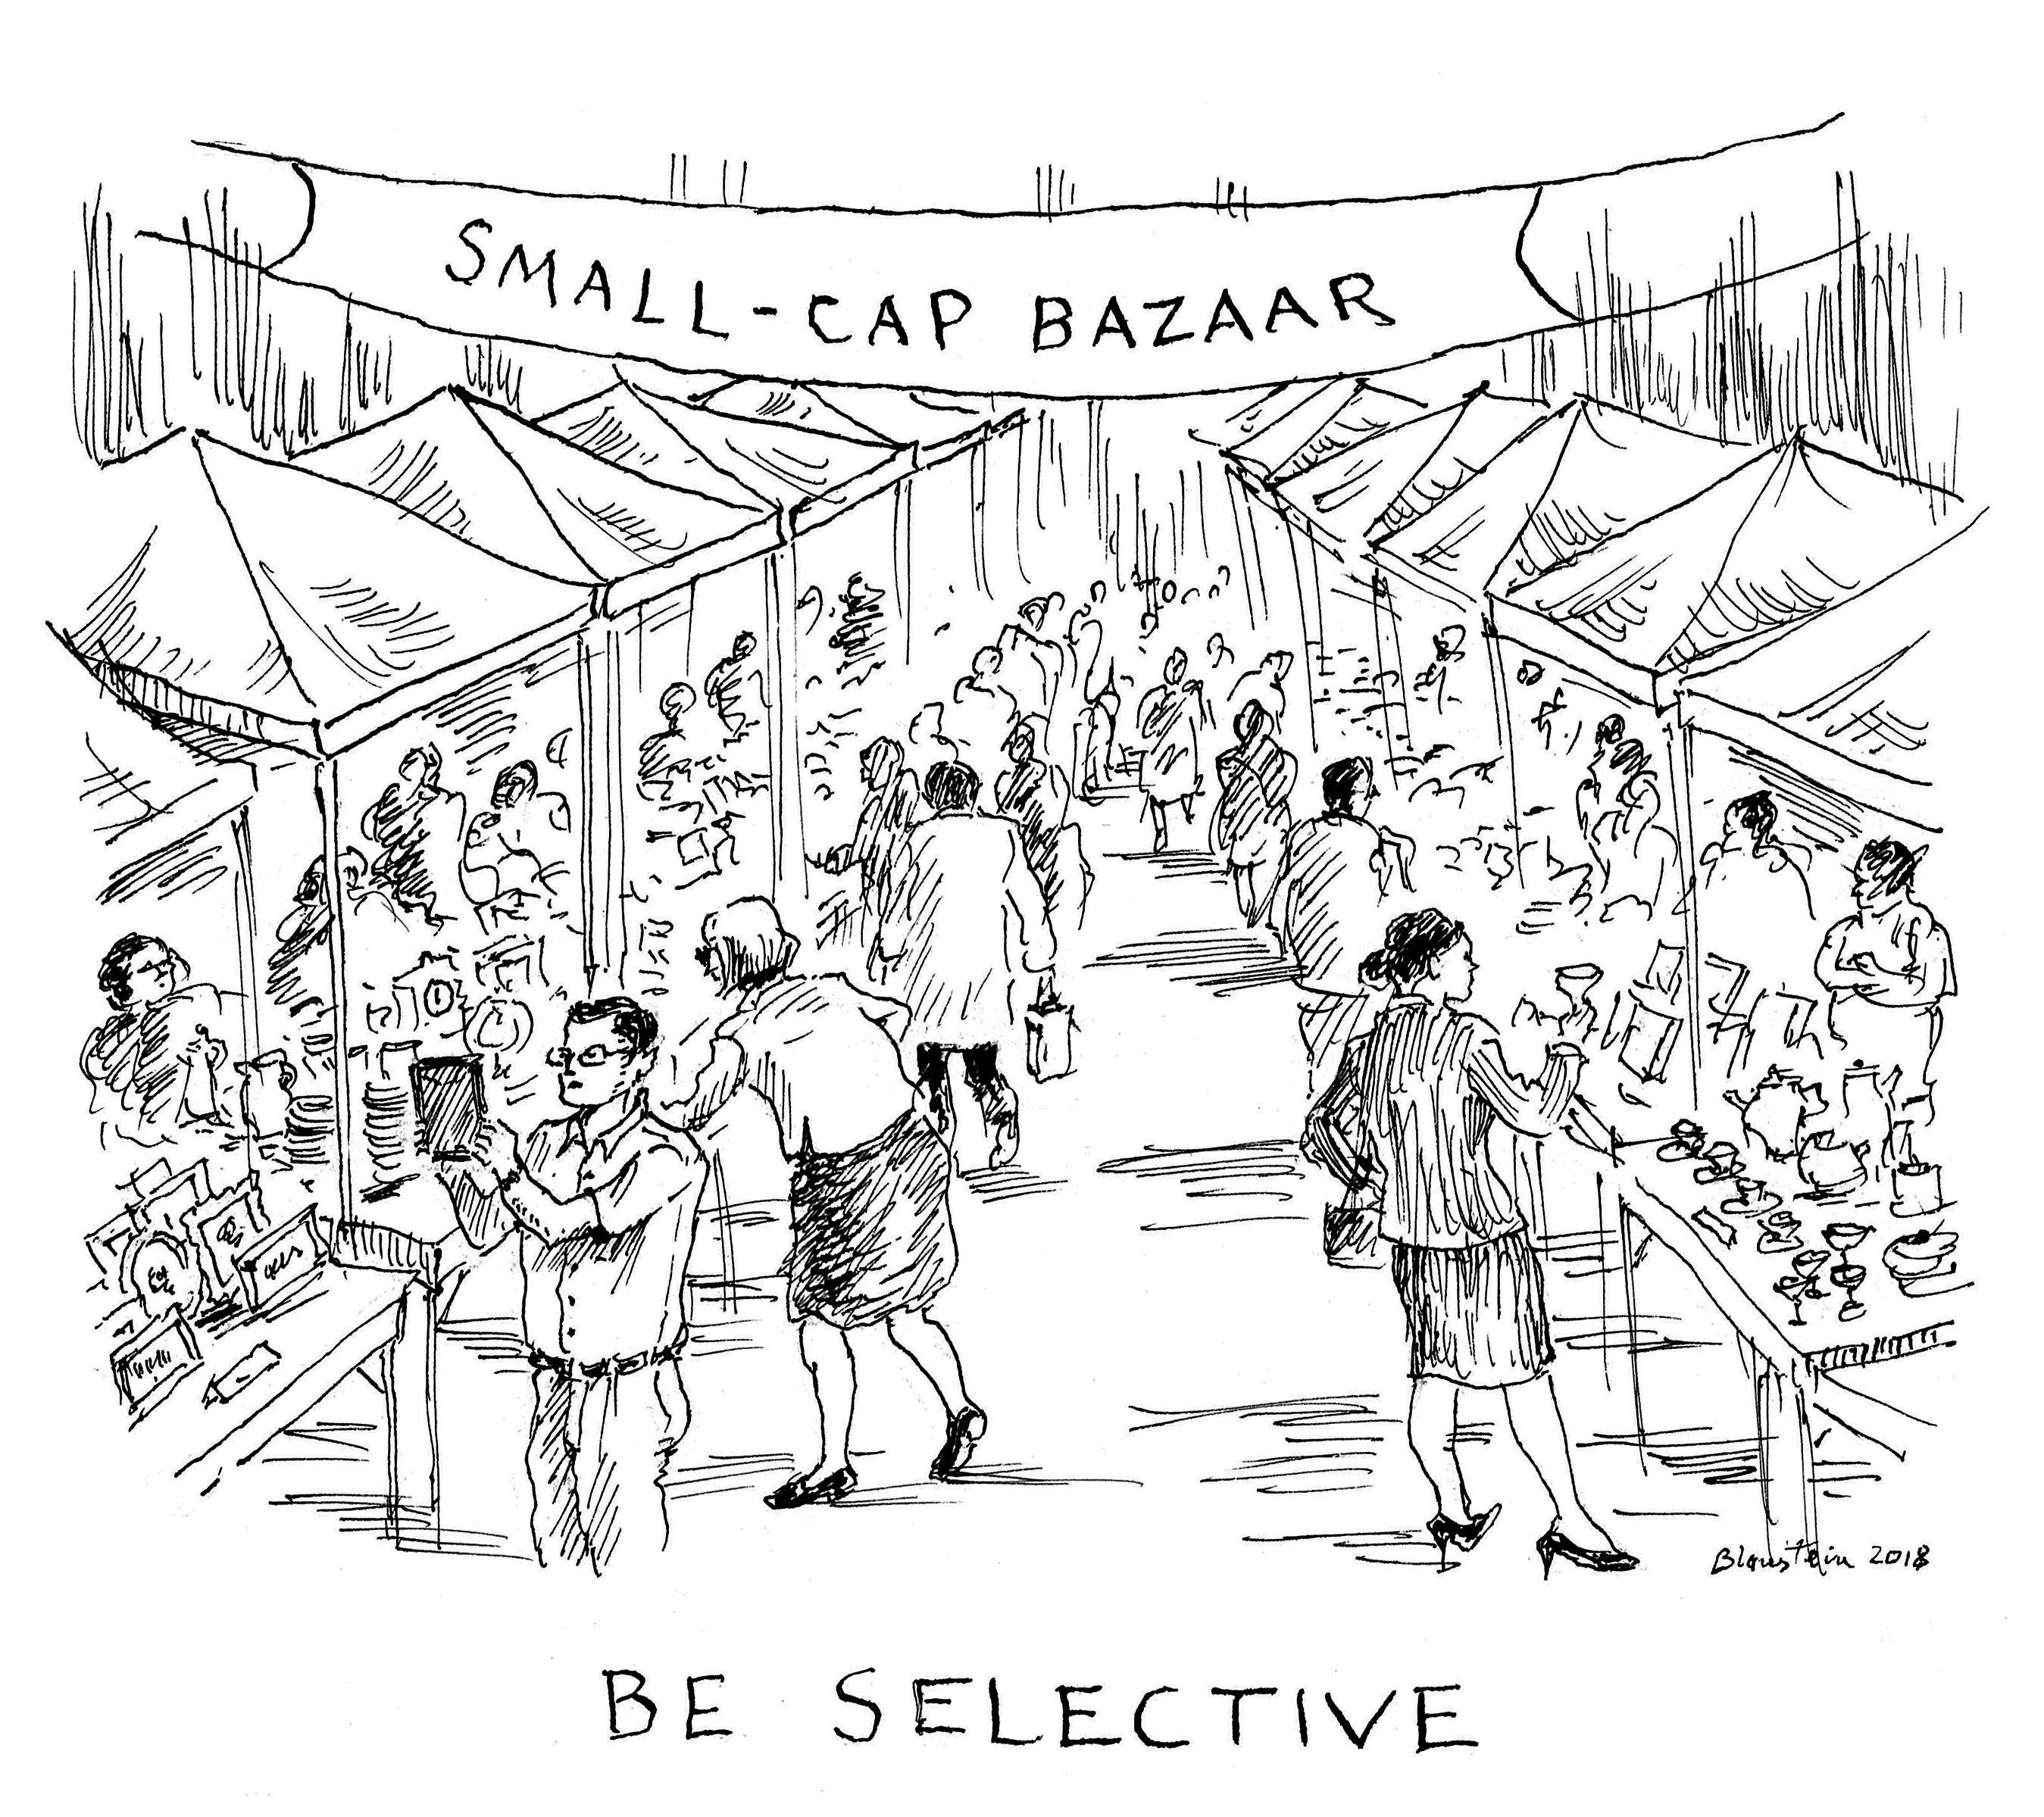
| Its high valuation makes the Russell 2000 Index look risky, but numerous opportunities can still be found in small-cap |
| Based on this view, we believe the opportunity for small-cap investors is not the index itself or the broader asset class as a whole—it’s in select companies in the asset class. In a similar vein, we think that investors should lower their expectations for overall small-cap returns—which is why we believe selectivity has been so critical of late, and why we are increasingly convinced that it will remain so in 2018. Both the lofty state of small-cap valuations at the end of 2017 and recent performance patterns suggest that returns are unlikely to stay as elevated as they have been—for the index, growth stocks, and defensives in particular, but not |
| This page is not part of the 2017 Annual Report to Shareholders | 3 |
LETTER TO OUR SHAREHOLDERS
| necessarily for certain cyclical small-caps. We suspect that success over the next few years will hinge on making careful selections and maintaining discipline—in essence, the time-honored argument for the importance of active small-cap management. |
| A look at five-year results for the Russell 2000 and Russell 2000 Growth best clarifies our thinking, as both exceeded their long-term averages. The small-cap index’s 14.1% five-year average annual total return for the period ended December 31, 2017 ran appreciably higher than its 10.6% monthly rolling five-year average since inception (12/31/78). The spread was even more pronounced for growth—a 15.2% five-year average annual total return for the same period versus its 8.6% monthly rolling five-year average since inception. These higher-than-average returns simply do not look sustainable to us over the long run. To be sure, while we are optimistic about the prospects for select small-cap companies, we remain firm believers in reversion to the mean for the index. |
| Latest Returns Much Higher Than History |

For context, we invite investors to consider how the metrics for the Russell 2000 stack up compared to a fundamentally strong small-cap business with positive earnings and healthy cash flows from operations. At the end of 2017, more than 34% of the companies in the small-cap index had no earnings compared to only 25% at the end of 2007. The index in aggregate also had higher leverage than it did 10 years ago: at the end of 2017, the weighted average long-term debt to capital ratio2 for the Russell 2000 was 35% versus 29% at the end of 2007. Add to all this the fact that small-caps have not seen a pullback greater than 6.4% for nearly two years dating back to the last small-cap trough on February 11, 2016, and the Russell 2000 looks very risky to us, especially compared to the opportunities to |
| be found in individual small-cap businesses. From our perspective as small-cap specialists, all of this makes a small-cap correction look increasingly likely in 2018. Financially sound companies with growing earnings and modest valuations look far better positioned to us for the kind of lower-return market we are anticipating. Our expectation for annual small-cap returns falls in the 5-7% range over the intermediate term. It’s also worth noting that five-year periods in the zone of 5-10% for the small-cap index have been those with the biggest outperformance spread for active managers. |
| Two other points are worth emphasizing. The first is to offer a seemingly counterintuitive word of caution about the expanding global economy. As excited as we are about the current period of synchronized global growth, we have also observed that Main Street and Wall Street do not always walk hand in hand. Market cycles and economic cycles are different animals. As economic news continues to improve, there is no guarantee that the market will match its pace. Ultimately, we see global growth as a positive for stocks. But the market may well deviate from what the economy is doing in the months ahead (which is fairly typical) as investors try to sort things out after an almost 10-year bull market for large-caps and a nearly two-year upswing for small-caps. |
| Our second point is to highlight the enormity and diversity of the U.S. small-cap universe. This goes beyond the more than 2,200 publicly traded companies with market capitalizations between $100 million and $3 billion. It also pertains to performance and valuation. For example, the top two deciles of the Russell 2000 were up 121% and 51% in 2017, while the bottom two fell 55% and 28%. Given such wide dispersion, we believe that we can always find long-term opportunities. |
| Divergence: Russell 2017 Returns |

2 Long-term debt to capital is calculated by dividing a company’s long-term debt by its total capital.
| 4 | This page is not part of the 2017 Annual Report to Shareholders |
LETTER TO OUR SHAREHOLDERS
| THE SMALL-CAP OPPORTUNITY: GLOBAL GROWTH IN CYCLICALS |
| We see leadership coming from small-caps in economically sensitive industries that blend profitability, relatively attractive valuation, and global exposure |
| As confidence in the economy solidifies, the mounting importance of earnings growth or recovery should benefit cyclicals—small-caps in particular—as it has in the past. Cyclical have historically done best in exactly the kind of economic environment in which we now find ourselves. Valuations for small-cap cyclicals also look more attractive relative to defensives. Moreover, it seems that the end has come for the extended, 30-year bull market for bonds. Being far less yield sensitive, cyclicals should face fewer headwinds as rates rise. |
| Go Global |
| 2017 Russell 2000 Returns by Percent of Foreign Sales |  |
We think investors should be focusing on these matters rather than tax cuts or high valuations for indexes. While the reduced corporate tax rate is an undeniable benefit for small-caps, its positive effect is only lasting insofar as it encourages productive capital investment and allocation (the key, in our view, to creating additional growth beyond the reduced rate). As small-cap specialists, we see the accelerating global economy as the more significant development. | |
| Equity Indexes as of December 31, 2017 (%) | ||||||||
| 1-YR | 3-YR | 5-YR | 10-YR | |||||
| Russell 2000 | 14.65 | 9.96 | 14.12 | 8.71 | ||||
| Russell 2000 Value | 7.84 | 9.55 | 13.01 | 8.17 | ||||
| Russell 2000 Growth | 22.17 | 10.28 | 15.21 | 9.19 | ||||
| Russell Midcap | 18.52 | 9.58 | 14.96 | 9.11 | ||||
| Russell Microcap | 13.17 | 8.91 | 14.29 | 7.68 | ||||
| Russell Global ex-U.S. Small Cap | 30.49 | 11.27 | 9.25 | 3.89 | ||||
| For details on The Royce Funds’ performance in the period, please turn to the Managers’ Discussions that begin on page 8. Past performance is no guarantee of future results. |
| Indeed, its effects can already be seen when one looks more closely at 2017’s returns. Companies in the Russell 2000 with no foreign sales were up 12% while those with foreign sales of 30% or greater advanced 19%. So we enter 2018 with a measured confidence, charting a middle course between bullishness and bearishness. Our expectation is for positive small-cap returns that are nonetheless likely to be lower than their long-term historical average. We believe that small-cap performance will be driven by three factors: a preference for profitability, relatively lower valuations for both cyclicals and value stocks, and burgeoning economic strength at home and abroad. Together, these support the leadership case for small-cap companies with global exposure in cyclical industries that also possess quality in the form of high returns on invested capital. Russell 2000 companies with the highest ROIC did quite well in 2017, in fact. These kinds of businesses look best positioned to benefit from increasing economic growth—even in the event of a pullback. With selectivity and discipline being the keys, we see the opportunity for disciplined and select active small-cap strategies to shine in 2018. |
| Sincerely, |
 |  |  | ||
| Charles M. Royce | Christopher D. Clark | Francis D. Gannon | ||
| Chairman, | Chief Executive Officer, and | Co-Chief Investment Officer, | ||
| Royce & Associates, LP | Co-Chief Investment Officer, | Royce & Associates, LP | ||
| Royce & Associates, LP | ||||
| January 31, 2018 |
| This page is not part of the 2017 Annual Report to Shareholders | 5 |
Performance and Expenses
| Performance and Expenses | |||||||||||||||||||||
| ANNUAL OPERATING EXPENSES (%) | ||||||||||||||||||||||||||||
| 1-YR | 5-YR | 10-YR | 15-YR | 20-YR | 45-YR/SINCE INCEPTION | INCEPTION DATE | GROSS | NET | ||||||||||||||||||||
| Royce Dividend Value Fund | 21.66 | 11.30 | 8.88 | N/A | N/A | 9.37 | 5/3/04 | 1.34 | 1.34 | |||||||||||||||||||
| Royce Global Financial Services Fund | 22.46 | 14.12 | 7.69 | N/A | N/A | 8.71 | 12/31/03 | 1.78 | 1.60 | |||||||||||||||||||
| Royce International Discovery Fund | 27.72 | 9.32 | N/A | N/A | N/A | 4.84 | 12/31/10 | 3.35 | 1.64 | |||||||||||||||||||
| Royce International Premier Fund | 39.81 | 11.79 | N/A | N/A | N/A | 8.70 | 12/31/10 | 1.84 | 1.44 | |||||||||||||||||||
| Royce Low-Priced Stock Fund | 9.67 | 4.47 | 3.68 | 7.92 | 8.81 | 10.07 | 12/15/93 | 1.62 | 1.59 | |||||||||||||||||||
| Royce Micro-Cap Fund | 5.43 | 4.94 | 3.75 | 9.17 | 8.48 | 10.83 | 12/31/91 | 1.57 | 1.57 | |||||||||||||||||||
| Royce Micro-Cap Opportunity Fund | 24.99 | 12.32 | N/A | N/A | N/A | 13.91 | 8/31/10 | 1.30 | 1.24 | |||||||||||||||||||
| Royce Opportunity Fund | 21.88 | 14.33 | 9.39 | 12.79 | 12.12 | 12.71 | 11/19/96 | 1.19 | 1.19 | |||||||||||||||||||
| Royce Pennsylvania Mutual Fund | 16.24 | 11.83 | 7.77 | 10.92 | 9.93 | 11.80 | N/A | 0.93 | 0.93 | |||||||||||||||||||
| Royce Premier Fund | 23.77 | 11.68 | 8.78 | 12.27 | 10.96 | 11.94 | 12/31/91 | 1.16 | 1.16 | |||||||||||||||||||
| Royce Small-Cap Leaders Fund | 10.15 | 8.90 | 6.89 | N/A | N/A | 9.73 | 6/30/03 | 1.58 | 1.49 | |||||||||||||||||||
| Royce Small-Cap Value Fund | 5.27 | 7.57 | 5.69 | 11.31 | N/A | 9.59 | 6/14/01 | 1.49 | 1.49 | |||||||||||||||||||
| Royce Small/Mid-Cap Premier Fund | 21.21 | 10.70 | 7.84 | 10.98 | 11.50 | 12.73 | 12/27/95 | 1.30 | 1.30 | |||||||||||||||||||
| Royce Smaller-Companies Growth Fund | 17.80 | 11.74 | 6.07 | 12.43 | N/A | 11.44 | 6/14/01 | 1.51 | 1.49 | |||||||||||||||||||
| Royce Special Equity Fund | 7.87 | 10.33 | 8.82 | 9.69 | N/A | 9.46 | 5/1/98 | 1.17 | 1.17 | |||||||||||||||||||
| Royce Special Equity Multi-Cap Fund | 15.42 | 11.03 | N/A | N/A | N/A | 10.56 | 12/31/10 | 1.34 | 1.24 | |||||||||||||||||||
| Royce Total Return Fund | 13.65 | 12.30 | 7.98 | 10.00 | 9.37 | 11.04 | 12/15/93 | 1.21 | 1.21 | |||||||||||||||||||
| INDEX | ||||||||||||||||||||||||||||
| Russell 2000 | 14.65 | 14.12 | 8.71 | 11.17 | 7.89 | N/A | N/A | N/A | N/A | |||||||||||||||||||
| Russell Microcap | 13.17 | 14.29 | 7.68 | 10.34 | N/A | N/A | N/A | N/A | N/A | |||||||||||||||||||
| Russell 2500 | 16.81 | 14.33 | 9.22 | 11.75 | 9.12 | N/A | N/A | N/A | N/A | |||||||||||||||||||
| Russell 1000 | 21.69 | 15.71 | 8.59 | 10.18 | 7.39 | N/A | N/A | N/A | N/A | |||||||||||||||||||
| Russell Global ex-U.S. Small Cap | 30.49 | 9.25 | 3.89 | 11.84 | 8.41 | N/A | N/A | N/A | N/A | |||||||||||||||||||
Important Performance, Expense, and Risk Information
All performance information in this Review and Report reflects past performance, is presented on a total return basis, reflects the reinvestment of distributions, and does not reflect the deduction of taxes a shareholder would pay on fund distributions or the redemption of fund shares. Past performance is no guarantee of future results. Investment return and principal value of an investment will fluctuate, so that shares may be worth more or less than their original cost when redeemed. Investment and Service Class shares redeemed within 30 days of purchase may be subject to a 1% redemption fee payable to the Fund (2% for Royce International Discovery and International Premier Funds). Redemption fees are not reflected in the performance shown above; if they were, performance would be lower. Current performance may be higher or lower than performance quoted. Current month-end performance may be obtained at www.roycefunds.com. All performance and expense information reflects results of the Funds’ oldest share Class (Investment Class or Service Class, as the case may be). Price and total return information is based on net asset values calculated for shareholder transactions. Certain immaterial adjustments were made to the net assets of Royce Micro-Cap Opportunity and Micro-Cap Funds at 12/31/17 for financial reporting purposes, and as a result the calendar year total returns based on those net assets values differ from the adjusted net values and calendar year total returns reported in the Financial Highlights. Gross annual operating expenses reflect the Fund’s gross total annual operating expenses and include management fees, any 12b-1 distribution and service fees, other expenses, and any applicable acquired fund fees and expenses. Net annual operating expenses reflect contractual fee waivers and/or expense reimbursements. All expense information is reported as of the Fund’s most current prospectus. Royce & Associates has contractually agreed to waive fees and/or reimburse operating expenses, excluding brokerage commissions, taxes, interest litigation expenses, acquired fund fees and expenses, and other expenses not borne in the ordinary course of business, to the extent necessary to maintain net operating expenses at or below: 1.49% for Royce Global Financial Services, Low-Priced Stock, Small-Cap Leaders, and Smaller-Companies Growth Funds; 1.44% for Royce International Premier Fund; 1.24% for Royce Micro-Cap Opportunity and Special Equity Multi-Cap Funds through April 30, 2018; at or below 1.44% for Royce International Discovery Fund through April 19, 2019; at or below: 1.99% for Royce International Discovery Fund through April 30, 2027. Acquired fund fees and expenses reflect the estimated amount of fees and expenses incurred indirectly by the Fund through its investments in mutual funds, hedge funds, private equity funds, and other investment companies.
Service Class shares bear an annual distribution expense that is not borne by the Funds’ Investment Class. If such distribution expenses had been reflected for Funds showing Investment Class performance, returns would have been lower. Investments in securities of micro-cap, small-cap, and/or mid-cap companies may involve considerably more risk than investments in securities of larger-cap companies. (Please see “Primary Risks for Fund Investors” in the prospectus.) Certain Funds invest a significant portion of their respective assets in foreign companies that may be subject to different risks than investments in securities of U.S. companies, including adverse political, social, economic, or other developments that are unique to a particular country or region. (Please see “Investing in Foreign Securities” in the prospectus.) Therefore, the prices of securities of foreign companies in particular countries or regions may, at times, move in a different direction than those of securities of U.S. companies. (Please see “Primary Risk of Fund Investors” in the prospectus.) Certain Funds generally invest a significant portion of their assets in a limited number of stocks, which may involve considerably more risk than a more broadly diversified portfolio because a decline in the value of any of these stocks would cause their overall value to decline to a greater degree. A broadly diversified portfolio, however, does not ensure a profit or guarantee against loss. This Review and Report must be preceded or accompanied by a prospectus. Please read the prospectus carefully before investing or sending money. Russell Investment Group is the source and owner of the trademarks, service marks, and copyrights related to the Russell Indexes. Russell® is a trademark of Russell Investment Group. The Russell 2000 Index is an unmanaged, capitalization-weighted index of domestic small-cap stocks. It measures the performance of the 2,000 smallest publicly traded U.S. companies in the Russell 3000 Index. The Russell Microcap Index includes 1,000 of the smallest securities in the small-cap Russell 2000 Index along with the next smallest eligible securities as determined by Russell. The Russell 2500 is an unmanaged, capitalization-weighted index of the 2,500 smallest publicly traded U.S. companies in the Russell 3000 index. The Russell 1000 is an unmanaged, capitalization-weighted index of domestic large-cap stocks. It measures the performance of the 1,000 largest publicly traded U.S. companies in the Russell 3,000 Index. The Russell Global ex-U.S. Small Cap Index is an index of global small-cap stocks, excluding the United States. The performance of an index does not represent exactly any particular investment as you cannot invest directly in an index. Distributor: Royce Fund Services, LLC.
6 | This page is not part of the 2017 Annual Report to Shareholders
The Royce Funds and Rolling Returns
We believe strongly in the idea that a long-term perspective is crucial for determining the success of an investment approach. Flourishing in an up market is wonderful, but surviving a bear market by losing less (or not at all) is equally desirable. In any case, the true tests of a portfolio’s mettle are results over bull and bear periods. This is why we prefer to examine results that include up and down market phases—primarily by looking at rolling return periods.
| When evaluating fund performance, it is common practice to review results for the most recent year (often the calendar year) along with its related longer-term trailing periods. However, a calendar-year return is not necessarily any more or less important to consider than any other 12-month period (or related trailing period). It is also true that few investors buy mutual funds on New Year’s Eve and then sell exactly five or 10 years later. Of course, the reality is that trailing returns ending last month or last quarter are the most commonly available and easily comparable results, so these otherwise arbitrary periods often drive investor decisions and flows. |
| Keeping in mind that investors will buy and sell at any time throughout any given year, we think it makes sense to examine performance over a larger series of dates. We believe rolling returns offer a more effective measure because they provide a more accurate and in-depth picture of a portfolio’s performance. Rather than “point-in-time” results anchored by the end of the month or quarter, |
| rolling returns account for the fact that investors typically do not invest at the beginning of the current five- or 10-year period but instead are in fact investing over many periods. |
| So instead of assuming that an investment was made on January 1, rolling returns calculate all of the periods starting not only in January, but also in February, March, April, etc. For example, a monthly five-year rolling return accounts for all of the five-year returns beginning at a given inception date and advancing one month sequentially. This method allows an investor to evaluate the consistency of a fund’s performance over time—including the ups and downs of market cycles. |
| We believe that rolling returns provide a particularly robust analytical tool for evaluating manager performance, especially during volatile periods when simply shifting the performance date range one or two months in either direction can paint a very different picture. |
| Royce Funds1 vs. The Benchmark2 |
| Monthly Rolling Average Annual Return Periods and Relative Results Since Fund Inception or Most Recent 20 Years through December 31, 2017 |
| Average Annual 10-Year Rolling Return | Average Annual 5-Year Rolling Return | |||||||||||||||||||||||||||||||||||||||||||
| FUND | PERIODS BEATING THE INDEX | FUND AVG (%)3 | INDEX AVG (%)3 | PERIODS BEATING THE INDEX | FUND AVG (%)3 | INDEX AVG (%)3 | ||||||||||||||||||||||||||||||||||||||
| U.S. EQUITY | ||||||||||||||||||||||||||||||||||||||||||||
| Dividend Value | 32/44 | 73% | 7.8 | 7.4 | 57/104 | 55% | 9.0 | 8.6 | ||||||||||||||||||||||||||||||||||||
| Low-Priced Stock | 60/121 | 50% | 7.6 | 6.7 | 113/181 | 62% | 8.5 | 8.2 | ||||||||||||||||||||||||||||||||||||
| Micro-Cap | 60/91 | 66% | 7.6 | 6.2 | 92/151 | 61% | 8.4 | 8.1 | ||||||||||||||||||||||||||||||||||||
| Opportunity | 96/121 | 79% | 9.2 | 6.7 | 133/181 | 73% | 11.5 | 8.2 | ||||||||||||||||||||||||||||||||||||
| Pennsylvania Mutual | 85/121 | 70% | 8.6 | 6.7 | 121/181 | 67% | 10.1 | 8.2 | ||||||||||||||||||||||||||||||||||||
| Premier | 119/121 | 98% | 10.2 | 6.7 | 125/181 | 69% | 11.1 | 8.2 | ||||||||||||||||||||||||||||||||||||
| Small-Cap Leaders | 25/55 | 45% | 7.9 | 7.7 | 61/115 | 53% | 7.9 | 7.9 | ||||||||||||||||||||||||||||||||||||
| Small-Cap Value | 44/79 | 56% | 8.7 | 7.8 | 76/139 | 55% | 9.6 | 8.9 | ||||||||||||||||||||||||||||||||||||
| Small/Mid-Cap Premier | 93/121 | 77% | 9.0 | 6.7 | 133/181 | 73% | 10.1 | 8.2 | ||||||||||||||||||||||||||||||||||||
| Smaller-Companies Growth | 37/79 | 47% | 8.3 | 7.8 | 54/139 | 39% | 9.8 | 8.9 | ||||||||||||||||||||||||||||||||||||
| Special Equity | 101/116 | 87% | 9.3 | 6.8 | 106/176 | 60% | 10.7 | 8.5 | ||||||||||||||||||||||||||||||||||||
| Total Return | 66/121 | 55% | 7.9 | 6.7 | 109/181 | 60% | 9.5 | 8.2 | ||||||||||||||||||||||||||||||||||||
| GLOBAL/INTERNATIONAL EQUITY | ||||||||||||||||||||||||||||||||||||||||||||
| Global Financial Services | 19/49 | 39% | 7.1 | 7.5 | 34/109 | 31% | 7.5 | 8.0 | ||||||||||||||||||||||||||||||||||||
| 1 Included are all Royce Funds with at least 12 years of history. |
| 2 The Russell 2000 Index is the benchmark for most funds. Royce Micro-Cap Fund is compared to the Russell Microcap Index from the inception of that index. |
| 3 Average return shown is the average of all month-end trailing five- and 10-year total returns. |
| Past performance is no guarantee of future results. For more information on performance please see page 6. |
| This page is not part of the 2017 Annual Report to Shareholders | 7 |
| MANAGERS’ DISCUSSION |
| Royce Dividend Value Fund (RDV) |
 |
| Chuck Royce Jay Kaplan, CFA |
| FUND PERFORMANCE |
| An impressive year on both an absolute and relative basis enabled Royce Dividend Value Fund to extend its relative edge to the one-, three-, 10-year, and since inception (5/3/04) periods ended December 31, 2017. The Fund increased 21.7% in 2017, well ahead of its small-cap benchmark, the Russell 2000 Index, which was up 14.6% for the same period. We were especially pleased to see outperformance during a year in which dividend-paying small-cap strategies faced formidable headwinds—small-caps underperformed mid- and large-caps, small-cap dividend payers trailed small-caps that pay none, and growth beat value up and down the asset class scale. Fortunately, there was also a favorable tailwind (beyond a pervasive stock selection advantage and our mid-cap holdings) in the form of exposure to international companies, as non-U.S. stocks raced ahead of their domestic cousins in 2017. |
| WHAT WORKED... AND WHAT DIDN’T |
| Nine of the portfolio’s 11 equity sectors made positive contributions to calendar-year performance, with pronounced leads for Financials and Industrials. Only a slight negative impact came from the combined detraction of Telecommunication Services and Consumer Staples, two of the portfolio’s smallest sectors. Helping relative results most were significant stock selection advantages in Financials and Industrials while our lower exposure to Health Care, the best-performing sector in the Russell 2000, hampered relative results. Ineffective stock picking in Information Technology had a much lower negative impact. (We also maintain that outperforming the benchmark with very little exposure to its highest-returning sector is an accomplishment worth noting.) |
| At the industry level, the capital markets industry (part of the Financials sector) made by far the biggest positive contribution to performance on both an absolute and relative basis. Alternative asset manager KKR & Co. was both the portfolio’s top contributor and its largest holding at year-end. Its shares were lifted by strong investment performance, improved fee-related earnings, and increased capital inflows that drove asset growth. Other holdings in the group that enjoyed strong results in 2017 included top-25 positions The Carlyle Group, a multi-product global alternative asset management firm, SEI Investments, which provides technology, research, information services, and asset management to financial companies, and U.K.-based emerging market fixed income specialist Ashmore Group. |
| From the Industrials sector, machinery was the portfolio’s second-best performing industry and another source of significant outperformance versus the Russell 2000. Two machinery companies were among the top-five contributors to 2017 performance. IDEX Corporation manufactures industrial pumps, lubrication systems, banding and clamping devices, and rescue tools. Its shares rose on very strong results, as the company announced increases in orders, sales, and earnings per share, along with margin improvement. It was a top-10 position at year-end. Pfeiffer Vacuum Technology, a German firm that makes specialized pumps, benefited from steady growth in the semiconductor and solar industries in China and Europe, which helped the firm to post increased earnings. Elsewhere in the Industrials sector, staffing services business ManpowerGroup benefited from improved employment trends in the U.S. and Europe as well as its optimistic expectations for broad-based global improvement in both hiring trends and economic growth. Recordati is an Italian pharmaceuticals company from an industry that has been one of the few high-growth areas in an otherwise sluggish Italian economy, with drug companies increasing output and exports over the last seven years. Strong revenues and profits were driven by an expanded product line, specifically in its established niche of treating rare diseases. |
| The Fund’s top detractor was ATM provider Diebold Nixdorf, which is still transitioning to a service-based, software-centric business. While recent results showed improvement on a quarter-over-quarter basis, investors remained disappointed, and its near-term prospects looked uncertain to us at year-end, prompting us to sell our stake. Earlier in the year we also opted to sell our shares of footwear, headwear, and sports apparel retailer Genesco as first-quarter results and revised full-year guidance fell well below expectations due to intensified competition and management’s overconfidence that it could rebalance inventory to compensate for a key fashion shift it missed last year in its Journeys footwear chain. Ongoing net losses from declining sales also led us to sell our shares in value-priced fashion retailer The Cato Corporation. |
| Top Contributors to Performance | |||
| For 2017 (%)1 | |||
| KKR & Co. L.P. | 0.88 | ||
| IDEX Corporation | 0.88 | ||
| ManpowerGroup | 0.87 | ||
| Pfeiffer Vacuum Technology | 0.73 | ||
| Recordati | 0.71 | ||
| 1 Includes dividends | |||
| Top Detractors from Performance | |||
| For 2017 (%)2 | |||
| Diebold Nixdorf | -0.31 | ||
| Genesco | -0.25 | ||
| Cato Corporation (The) Cl. A | -0.20 | ||
| Western Union | -0.18 | ||
| Shoe Carnival | -0.17 | ||
| 2 Net of dividends | |||
| CURRENT POSITIONING AND OUTLOOK |
| Our current outlook is mixed. While we are cautious about the prospects for small-cap returns as a whole, we are also optimistic about the portfolio’s return potential as it leans towards three factors that we believe will be rewarded going forward—economically sensitive cyclicals, global exposure, and—in many cases—high profitability. These are the select qualities that we anticipate will drive small-cap leadership. In this environment, we see the opportunity for the Fund to continue outperforming in the years ahead. |
| 8 | The Royce Funds 2017 Annual Report to Shareholders |
| PERFORMANCE AND PORTFOLIO REVIEW | TICKER SYMBOLS RYDVX RDVIX RDIIX RDVCX |
| Performance and Expenses Average Annual Total Return (%) Through 12/31/17 | ||||||||||||
| JUL-DEC 20171 | 1-YR | 3-YR | 5-YR | 10-YR | SINCE INCEPTION (5/3/04) | |||||||
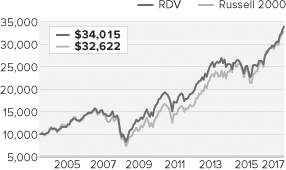
| RDV | 12.94 | 21.66 | 10.10 | 11.30 | 8.88 | 9.37 | ||||||
| Annual Operating Expenses: 1.34% | ||||||||||||
| 1 Not annualized | ||||||||||||
| Relative Risk Adjusted Returns: Monthly Rolling Sharpe Ratios Since Inception Through 12/31/17 On a monthly rolling risk-adjusted basis, the Fund outperformed the Russell 2000 in 100% of all 10-year periods and 63% of all 5-year periods. | ||||||||||||
| PERIODS BEATING THE INDEX | FUND AVG (%)1 | INDEX AVG (%)1 | ||||||||||||
| 10-year | 44/44 | 100% | 0.47 | 0.41 | ||||||||||
| 5-year | 65/104 | 63% | 0.57 | 0.52 | ||||||||||

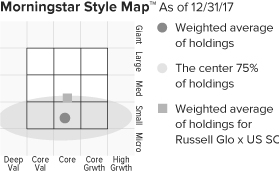
The Morningstar Style Map is the Morningstar Style Box™ with the center 75% of fund holdings plotted as the Morningstar Ownership Zone™. The Morningstar Style Box is designed to reveal a fund’s investment strategy. The Morningstar Ownership Zone provides detail about a portfolio’s investment style by showing the range of stock sizes and styles. The Ownership Zone is derived by plotting each stock in the portfolio within the proprietary Morningstar Style Box. Over time, the shape and location of a fund’s ownership zone may vary. See page 128 for additional information. |
Value of $10,000
| Top 10 Positions | ||
| % of Net Assets | ||
| KKR & Co. L.P. | 2.4 | |
| FLIR Systems | 2.3 | |
| IDEX Corporation | 2.1 | |
| Reliance Steel & Aluminum | 2.1 | |
| DENTSPLY SIRONA | 2.1 | |
| ManpowerGroup | 1.9 | |
| SEI Investments | 1.9 | |
| Donaldson Company | 1.8 | |
| HEICO Corporation Cl. A | 1.7 | |
| AptarGroup | 1.7 | |
| Portfolio Sector Breakdown | ||
| % of Net Assets | ||
| Industrials | 28.5 | |
| Financials | 28.5 | |
| Materials | 12.7 | |
| Consumer Discretionary | 9.1 | |
| Information Technology | 5.4 | |
| Health Care | 4.2 | |
| Energy | 3.5 | |
| Utilities | 1.1 | |
| Consumer Staples | 0.4 | |
| Telecommunication Services | 0.4 | |
| Real Estate | 0.3 | |
| Miscellaneous | 4.0 | |
| Cash and Cash Equivalents | 1.9 | |
| Calendar Year Total Returns (%) | ||
| YEAR | RDV | |
| 2017 | 21.7 | |
| 2016 | 16.4 | |
| 2015 | -5.7 | |
| 2014 | -2.1 | |
| 2013 | 30.7 | |
| 2012 | 16.9 | |
| 2011 | -4.5 | |
| 2010 | 30.1 | |
| 2009 | 37.7 | |
| 2008 | -31.5 | |
| 2007 | -0.0 | |
| 2006 | 19.9 | |
| 2005 | 7.3 | |
| Upside/Downside Capture Ratios | |||
| Periods Ended 12/31/17 (%) | |||
| UPSIDE | DOWNSIDE | |||
| 10-Year | 89 | 81 | ||
| From 6/30/04 (Start of Fund’s First Full Quarter) | 89 | 76 | ||
| Portfolio Diagnostics | |||
| Fund Net Assets | $183 million | ||
| Number of Holdings | 101 | ||
| 2017 Annual Turnover Rate | 16% | ||
| Average Market Capitalization1 | $4,631 million | ||
| Weighted Average P/E Ratio2,3 | 21.0x | ||
| Weighted Average P/B Ratio2 | 2.9x | ||
| Active Share4 | 97% | ||
| U.S. Investments (% of Net Assets) | 70.9% | ||
| Non-U.S. Investments (% of Net Assets) | 27.2% | ||
| 1 | Geometric Average. This weighted calculation uses each portfolio holding’s market cap in a way designed to not skew the effect of very large or small holdings; instead, it aims to better identify the portfolio’s center, which Royce believes offers a more accurate measure of average market cap than a simple mean or median. |
| 2 | Harmonic Average. This weighted calculation evaluates a portfolio as if it were a single stock and measures it overall. It compares the total market value of the portfolio to the portfolio’s share in the earnings or book value, as the case may be, of its underlying stocks. |
| 3 | The Fund’s P/E ratio calculation excludes companies with zero or negative earnings (5% of portfolio holdings as of 12/31/17). |
| 4 | Active Share is the sum of the absolute values of the different weightings of each holding in the Fund versus each holding in the benchmark, divided by two. |
| Important Performance and Expense Information |
All performance information in this Report reflects past performance, is presented on a total return basis, reflects the reinvestment of distributions, and does not reflect the deduction of taxes that a shareholder would pay on fund distributions or the redemption of fund shares. Past performance is no guarantee of future results. Investment return and principal value of an investment will fluctuate, so that shares may be worth more or less than their original cost when redeemed. Shares redeemed within 30 days of purchase may be subject to a 1% redemption fee payable to the Fund, which is not reflected in the performance shown above; if it were, performance would be lower. Current month-end performance may be higher or lower than performance quoted and may be obtained at www.roycefunds.com. All performance and risk information reflects results of the Service Class (its oldest class). Certain immaterial adjustments were made to the net assets of Royce Dividend Value Fund at 6/30/15 for financial reporting purposes, and as a result the net asset values for shareholder transactions on that date and the calendar year Total Returns (%) based on those net asset values differ from the adjusted net asset values and calendar year total returns reported in the Financial Highlights. Operating expenses reflect the Fund’s gross total annual operating expenses for the Service Class as of the Fund’s most current prospectus and include management fees, 12b-1 distribution and service fees, and other expenses. Regarding the “Top Contributors” and “Top Detractors” tables shown above, the sum of all contributors to, and all detractors from, performance for all securities in the portfolio would approximate the Fund’s year-to-date performance for 2017. The Sharpe Ratio is calculated for a specified period by dividing a fund’s annualized excess returns by its annualized standard deviation. The higher the Sharpe ratio, the better the fund’s historical risk-adjusted performance. Upside Capture Ratio measures a manager’s performance in up markets relative to the Fund’s benchmark. It is calculated by measuring the Fund’s performance in quarters when the benchmark went up and dividing it by the benchmark’s return in those quarters. Downside Capture Ratio measures a manager’s performance in down markets relative to the Fund’s benchmark (Russell 2000). It is calculated by measuring the Fund’s performance in quarters when the benchmark goes down and dividing it by the benchmark’s return in those quarters. |
| The Royce Funds 2017 Annual Report to Shareholders | 9 |
| MANAGERS’ DISCUSSION |
| Royce Global Financial Services (RFS) |
 |
| Chuck Royce Chris Flynn |
| FUND PERFORMANCE |
| Royce Global Financial Services Fund delivered strong absolute and relative returns in 2017, posting an impressive 22.5% result, well ahead of the respective gains of 14.6% and 10.5% for its benchmark, the Russell 2000 Index, and the Russell 2500 Financial Services Index. We continue to see greater diversity than many investors seem to realize in both business models and business cycles in financial companies, particularly when the opportunity set includes non-U.S. companies. This approach enables us to find attractive investments, even in a year such as 2017 when Financials significantly lagged the Russell 2000 Index. We also believe some financial business models, including asset managers & custody banks, investment banking & brokerage, and financial exchanges & data companies, are more attractive and tend to produce better results over time. Holdings in these three industries made large contributions to both absolute and relative returns in 2017. |
| WHAT WORKED... AND WHAT DIDN’T |
| Capital markets, the Fund’s largest industry, was its biggest contributor by far to performance. As the global equity markets advanced strongly in 2017, it was not surprising that asset managers and investment banks also enjoyed a good year. Within the asset management group, the Fund has intentionally narrowed its focus towards specialty traditional managers and alternative asset managers, believing that broad-based firms will continue to face headwinds. This focus was rewarded as many of the portfolio’s top performers came from these two categories. Real estate management & development was the second-largest industry contributor, thanks to superior stock selection, as overall industry returns were modest. Banks, the Fund’s second-largest industry, were its third-best contributor. 2017 was mostly disappointing for banks as high expectations at the end of 2016 went largely unfulfilled due to a flatter yield curve for most of the year and subpar loan growth. We think the long-term optimism for banks remains well placed and used stock-price weakness during the year to selectively increase our investments. The two industries that had negative returns for the year—diversified financial services and equity real estate investment trusts—had only minor losses. |
| U.S. Global Investors is a specialty asset manager focused mostly on precious metals. Its shares surged in the second half of the year stemming from the announcement of an investment in a blockchain technology company. Bitcoin enthusiasm saw the stock nearly double in the fourth quarter. We sold a large number of shares during this advance, which we saw as unsustainable. Canada’s FirstService Corporation provides property services and is North America’s largest residential property manager. Its shares advanced most during the first half as earnings and revenue growth consistently exceeded expectations. Ashmore Group is a U.K.-based asset manager specializing in emerging market fixed income. Its shares advanced sharply when the firm reported higher-than-expected net flows while also posting very competitive performance. Two of the three largest individual detractors shared the important connection of exposure to Puerto Rico. MBIA provides financial guarantee insurance and has significant exposure to Puerto Rican bonds, while Popular is one of the largest Puerto Rico-based banks. Both stocks declined through much of the year as concerns increased about Puerto Rico’s economic state. Following September’s hurricanes, investors became increasingly concerned and both stocks fell sharply, though both had rebounded somewhat from their lows by year-end. We held our shares as we believe that each company has a durable franchise and our experience is that the worst expectations are rarely realized. Canada’s Dundee Corporation has operations in wealth management, real estate, and natural resources. The stock declined most in the first half as mounting losses in mining and resource-based activities put downward pressure on its shares. |
| Top Contributors to Performance | |||
| For 2017 (%)1 | |||
| U.S. Global Investors Cl. A | 2.31 | ||
| FirstService Corporation | 1.45 | ||
| Ashmore Group | 1.16 | ||
| Edelweiss Financial Services | 0.97 | ||
| SEI Investments | 0.94 | ||
| 1 Includes dividends | |||
| Top Detractors from Performance | |||
| For 2017 (%)2 | |||
| MBIA | -0.65 | ||
| Dundee Corporation Cl. A | -0.49 | ||
| Popular | -0.45 | ||
| Medley Management Cl. A | -0.25 | ||
| GBST Holdings | -0.21 | ||
| 2 Net of dividends | |||
| CURRENT POSITIONING AND OUTLOOK |
| Our outlook is mixed. We are cautious about the prospective absolute returns for U.S. small-caps, but feel optimistic about the Fund’s relative return prospects as we believe that the market will continue to favor the financial services areas that are well-represented in our portfolio. We believe that a globally synchronized economic expansion will support revenue and profit growth for many financial businesses, particularly our preferred capital markets companies. In the U.S., we have also increased our bank exposure, targeting a handful of companies that we think have differentiated franchises. A steeper yield curve and increased loan demand look likely to foster a very attractive environment. We have increased our exposure to high net worth wealth management in different ways, through banks with significant wealth management divisions and through technology providers to wealth managers. Additionally, we are optimistic about the prospects outside of the U.S. and think the Fund’s international holdings are well positioned to participate. Finally, we believe that increased profits for financial companies should in turn create opportunities for expanded revenue and profits for the specialist vendors who serve them. |
| 10 | The Royce Funds 2017 Annual Report to Shareholders |
| PERFORMANCE AND PORTFOLIO REVIEW | TICKER SYMBOLS RYFSX RGFIX |
| Performance and Expenses Average Annual Total Return (%) Through 12/31/17 | ||||||||||||
| JUL-DEC 20171 | 1-YR | 3-YR | 5-YR | 10-YR | SINCE INCEPTION (12/31/03) | |||||||
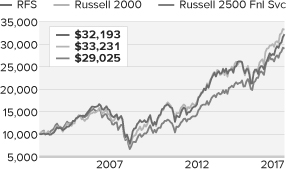
| RFS | 11.49 | 22.46 | 9.63 | 14.12 | 7.69 | 8.71 | ||||||
| Annual Gross Operating Expenses: 1.78% Annual Net Operating Expenses: 1.60% | ||||||||||||
| 1 Not annualized | ||||||||||||

The Morningstar Style Map is the Morningstar Style Box™ with the center 75% of fund holdings plotted as the Morningstar Ownership Zone™. The Morningstar Style Box is designed to reveal a fund’s investment strategy. The Morningstar Ownership Zone provides detail about a portfolio’s investment style by showing the range of stock sizes and styles. The Ownership Zone is derived by plotting each stock in the portfolio within the proprietary Morningstar Style Box. Over time, the shape and location of a fund’s ownership zone may vary. See page 128 for additional information. |
Value of $10,000
| Top 10 Positions | ||
| % of Net Assets | ||
| E-L Financial | 3.0 | |
| FirstService Corporation | 2.6 | |
| Sprott | 2.6 | |
| SEI Investments | 2.6 | |
| First Citizens BancShares Cl. A | 2.4 | |
| Franco-Nevada Corporation | 2.4 | |
| Virtu Financial Cl. A | 2.3 | |
| Ashmore Group | 2.1 | |
| Popular | 2.1 | |
| VZ Holding | 2.0 | |
| Portfolio Industry Breakdown | ||
| % of Net Assets (Subject to Change) | ||
| Capital Markets | 49.7 | |
| Banks | 15.7 | |
| Real Estate Management & Development | 7.3 | |
| Insurance | 6.7 | |
| IT Services | 2.5 | |
| Metals & Mining | 2.4 | |
| Software | 2.2 | |
| Marine | 1.8 | |
| Thrifts & Mortgage Finance | 1.4 | |
| Investment Companies | 1.3 | |
| Professional Services | 1.1 | |
| Hotels, Restaurants & Leisure | 0.7 | |
| Equity Real Estate Investment Trusts (REITs) | 0.6 | |
| Internet Software & Services | 0.6 | |
| Diversified Financial Services | 0.3 | |
| Diversified Consumer Services | 0.1 | |
| Miscellaneous | 4.8 | |
| Cash and Cash Equivalents | 0.8 | |
| Upside/Downside Capture Ratios | |||
| Periods Ended 12/31/17 (%) | |||
| UPSIDE | DOWNSIDE | |||
| 10-Year | 89 | 90 | ||
| Fund’s First Full Quarter (12/31/03) | 88 | 81 | ||
| Calendar Year Total Returns (%) | ||
| YEAR | RFS | |
| 2017 | 22.5 | |
| 2016 | 12.9 | |
| 2015 | -4.7 | |
| 2014 | 3.5 | |
| 2013 | 42.0 | |
| 2012 | 20.7 | |
| 2011 | -11.3 | |
| 2010 | 18.5 | |
| 2009 | 32.1 | |
| 2008 | -35.4 | |
| 2007 | -4.7 | |
| 2006 | 24.8 | |
| 2005 | 12.2 | |
| 2004 | 15.1 | |
| Portfolio Country Breakdown1,2 | |||
| % of Net Assets | |||
| United States | 53.4 | ||
| Canada | 16.9 | ||
| United Kingdom | 9.5 | ||
| Switzerland | 3.9 | ||
| India | 2.7 | ||
| France | 1.8 | ||
| South Africa | 1.8 | ||
| Hong Kong | 1.7 | ||
| Brazil | 1.5 | ||
2 Securities are categorized by the country of their headquarters.
| Portfolio Diagnostics | |||
| Fund Net Assets | $56 million | ||
| Number of Holdings | 95 | ||
| 2017 Annual Turnover Rate | 19% | ||
| Average Market Capitalization1 | $2,195 million | ||
| Weighted Average P/E Ratio2,3 | 19.3x | ||
| Weighted Average P/B Ratio2 | 2.0x | ||
| Active Share4 | 99% | ||
| 1 | Geometric Average. This weighted calculation uses each portfolio holding’s market cap in a way designed to not skew the effect of very large or small holdings; instead, it aims to better identify the portfolio’s center, which Royce believes offers a more accurate measure of average market cap than a simple mean or median. |
| 2 | Harmonic Average. This weighted calculation evaluates a portfolio as if it were a single stock and measures it overall. It compares the total market value of the portfolio to the portfolio’s share in the earnings or book value, as the case may be, of its underlying stocks. |
| 3 | The Fund’s P/E ratio calculation excludes companies with zero or negative earnings (8% of portfolio holdings as of 12/31/17). |
| 4 | Active Share is the sum of the absolute values of the different weightings of each holding in the Fund versus each holding in the benchmark, divided by two. |
| Important Performance and Expense Information |
All performance information in this Report reflects past performance, is presented on a total return basis, reflects the reinvestment of distributions, and does not reflect the deduction of taxes that a shareholder would pay on fund distributions or the redemption of fund shares. Past performance is no guarantee of future results. Investment return and principal value of an investment will fluctuate, so that shares may be worth more or less than their original cost when redeemed. Shares redeemed within 30 days of purchase may be subject to a 1% redemption fee payable to the Fund, which is not reflected in the performance shown above; if it were, performance would be lower. Current month-end performance may be higher or lower than performance quoted and may be obtained at www.roycefunds.com. Gross operating expenses reflect the Fund’s gross total annual operating expenses for the Service Class and include management fees, 12b-1 distribution and service fees, other expenses and acquired fund fees and expenses. Net operating expenses reflect contractual fee waivers and/or expense reimbursements. All expense information is reported as of the Fund’s most current prospectus. Royce & Associates has contractually agreed to waive fees and/or reimburse expenses to the extent necessary to maintain the Fund’s net annual operating expenses, (excluding brokerage commissions, taxes, interest, litigation expenses, acquired fund fees and expenses, and other expenses not borne in the ordinary course of business), at or below 1.49% through April 30, 2018. Acquired fund fees and expenses reflect the estimated amount of the fees and expenses incurred indirectly by the Fund through its investments in mutual funds, hedge funds, private equity funds, and other investment companies. Regarding the “Top Contributors” and “Top Detractors” tables shown above, the sum of all contributors to, and all detractors from, performance for all securities in the portfolio would approximate the Fund’s year-to-date performance for 2017. Upside Capture Ratio measures a manager’s performance in up markets relative to the Fund’s benchmark. It is calculated by measuring the Fund’s performance in quarters when the benchmark went up and dividing it by the benchmark’s return in those quarters. Downside Capture Ratio measures a manager’s performance in down markets relative to the Fund’s benchmark (Russell 2000). It is calculated by measuring the Fund’s performance in quarters when the benchmark goes down and dividing it by the benchmark’s return in those quarters. |
| The Royce Funds 2017 Annual Report to Shareholders | 11 |
| MANAGERS’ DISCUSSION |
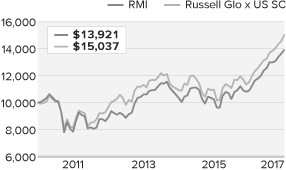
| Royce International Discovery Fund (RMI) (formerly named Royce International Micro-Cap Fund) |
 |
| Jim Harvey, CFA Dilip Badlani, CFA |
| FUND PERFORMANCE |
| The Fund was up 27.7% in 2017 versus an advance of 30.5% for its benchmark, the Russell Global ex-U.S. Small Cap Index, for the same period. The year saw a continuation of the growth and momentum driven market that has characterized much of the last eight years for international small- and micro-cap stocks. In addition, the second half of 2017 proved more challenging than the first as this period accounted for all of the Fund’s relative underperformance. Much of this was keyed by relatively disappointing results for portfolio holdings in the Consumer Discretionary sector—the Fund’s largest and its most significant overweight—in the third and fourth quarter of 2017. |
| WHAT WORKED... AND WHAT DIDN’T |
| Nine of the Fund’s 10 equity sectors made positive contributions to calendar-year performance. Information Technology and Industrials led by a considerable margin, while notable net gains on an absolute basis also came from Consumer Discretionary, Materials, and Real Estate. Energy was the only sector that detracted, but did so modestly. At the industry level, four groups from three different sectors made the biggest positive contributions—IT services (Information Technology), professional services (Industrials), real estate management & development (Real Estate), and semiconductors & semiconductor equipment (also from Information Technology). The impact of detractors at this level was comparably light, led by construction & engineering (Industrials), oil, gas & consumable fuels (Energy), and communications equipment (Information Technology). Relative to the Russell Global ex-U.S. Small Cap, the Fund was hurt most by ineffective stock selection in Consumer Discretionary, especially in the specialty retail and auto components industries, as well as by our cash position. Conversely, savvy stock picks in both Real Estate and Industrials were sources of outperformance versus the benchmark. The countries with the largest positive impact were Japan, the United Kingdom, and South Korea while holdings from Greece and China detracted most. The Fund’s top-contributing position was Conviviality, which is the largest liquor distributor in the U.K., where it also operates franchised off-license and convenience chain stores. Formed through a series of acquisitions that were completed in 2015-16, the company saw the anticipated synergies from the combination bear fruit as the year went on, lifting its stock price. South Korea’s Koh Young Technology makes 3D measurement and inspection equipment that improves accuracy and reliability. Strong macro tailwinds from the technology sector combined with its own disruptive technology to produce solid earnings growth and stock price performance. Japan’s Outsourcing provides those services for manufacturing companies. Its business benefited from a strengthening Japanese economy, which led to low rates of unemployment and strong demand for its services. Taiwan’s TCI saw increased sales for its nutritional supplements, including new products, result in impressive earnings growth. The leading detractor at the position level was Canada’s AGT Food and Ingredients, an exporter of pulses—edible seeds—as well as rice, wheat, and other staples. The company’s key Indian market had higher-than-anticipated pulse output of its own, and thus stopped imports. We chose to sell our shares in November. Earlier in 2017, we did the same with our position in Quintis, an Australian firm that manages and cultivates sandalwood forests to produce sandalwood oil products. The resignation of its CEO and co-founder in March created uncertainty over the pricing of its Chinese contracts, which exerted substantial downward pressure on its shares. We also exited our position in construction company Raubex Group as continued political uncertainty in South Africa delayed bids for construction projects, a situation that did not appear close to being resolved at the end of 2017. |
| Top Contributors to Performance | |||
| For 2017 (%)1 | |||
| Conviviality | 0.98 | ||
| Koh Young Technology | 0.97 | ||
| Outsourcing | 0.86 | ||
| TCI | 0.86 | ||
| Nova Measuring Instruments | 0.77 | ||
| 1 Includes dividends | |||
| Top Detractors from Performance | |||
| For 2017 (%)2 | |||
| AGT Food and Ingredients | -0.57 | ||
| Quintis | -0.42 | ||
| Raubex Group | -0.29 | ||
| KT Skylife | -0.26 | ||
| Aegean Marine Petroleum Network | -0.24 | ||
| 2 Net of dividends | |||
| CURRENT POSITIONING AND OUTLOOK |
| Most global markets are currently sitting at record levels in nominal terms with strong gains over the past year. It seems unlikely that 2018 will see a repeat of this exceptional performance. However, as bottom-up investors, we continue to find stocks that are under the radar and believe our strategy can potentially generate strong absolute returns going forward. In November 2017, the Board of Trustees of The Royce Fund approved a name and investment policy change and a contractual investment advisory fee rate reduction for the Fund that become effective as of February 1, 2018. These changes give the Fund a new non-fundamental investment policy requiring at least 80% of its net assets to be invested in stocks with market caps up to $5 billion. In light of this, the Fund’s name will be changed to Royce International Discovery Fund to better describe this new expanded market cap range. While our investment objective and strategy will not be changing, we believe that the expanded market cap range will substantially broaden the opportunity set of investment ideas and allow for improved marketplace recognition and adoption for the Fund. |
| 12 | The Royce Funds 2017 Annual Report to Shareholders |
| PERFORMANCE AND PORTFOLIO REVIEW | TICKER SYMBOLS ROIMX |
| Performance and Expenses | ||||||||||||||
| Average Annual Total Return (%) Through 12/31/17 | ||||||||||||||
| JUL-DEC 20171 | 1-YR | 3-YR | 5-YR | SINCE INCEPTION (12/31/10) | ||||||||||
| RMI | 10.84 | 27.72 | 10.37 | 9.32 | 4.84 | |||||||||
| Annual Gross Operating Expenses: 3.10% Annual Net Operating Expenses: 1.44% | ||||||||||||||
| 1 Not annualized | ||||||||||||||
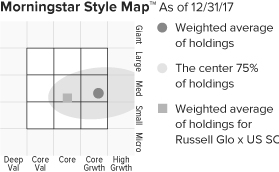
The Morningstar Style Map is the Morningstar Style Box™ with the center 75% of fund holdings plotted as the Morningstar Ownership Zone™. The Morningstar Style Box is designed to reveal a fund’s investment strategy. The Morningstar Ownership Zone provides detail about a portfolio’s investment style by showing the range of stock sizes and styles. The Ownership Zone is derived by plotting each stock in the portfolio within the proprietary Morningstar Style Box. Over time, the shape and location of a fund’s ownership zone may vary. See page 128 for additional information. |
Value of $10,000
| Top 10 Positions | ||
| % of Net Assets | ||
| Atento | 2.0 | |
| Sporton International | 1.5 | |
| Huchems Fine Chemical | 1.5 | |
| Epwin Group | 1.3 | |
| Exco Technologies | 1.3 | |
| Construtora Tenda | 1.3 | |
| eClerx Services | 1.3 | |
| Openjobmetis | 1.2 | |
| Yumeshin Holdings | 1.2 | |
| Proact IT Group | 1.2 | |
| Portfolio Sector Breakdown | ||
| % of Net Assets | ||
| Consumer Discretionary | 22.5 | |
| Industrials | 18.7 | |
| Information Technology | 16.7 | |
| Consumer Staples | 8.3 | |
| Real Estate | 7.0 | |
| Materials | 7.0 | |
| Health Care | 6.1 | |
| Financials | 5.6 | |
| Energy | 1.1 | |
| Telecommunication Services | 0.6 | |
| Cash and Cash Equivalents | 6.4 | |
| Calendar Year Total Returns (%) | ||
| YEAR | RMI | |
| 2017 | 27.7 | |
| 2016 | 6.3 | |
| 2015 | -1.0 | |
| 2014 | -2.4 | |
| 2013 | 18.9 | |
| 2012 | 13.6 | |
| 2011 | -21.5 | |
| Portfolio Country Breakdown1,2 | ||
| % of Net Assets | ||
| Japan | 16.3 | |
| United Kingdom | 10.3 | |
| Taiwan | 8.3 | |
| Canada | 8.0 | |
| South Korea | 5.9 | |
| Hong Kong | 5.5 | |
| India | 4.5 | |
| Sweden | 4.3 | |
| Brazil | 4.3 | |
| Australia | 4.1 | |
| Germany | 3.8 | |
| 1 | Represents countries that are 3% or more of net assets. |
| 2 | Securities are categorized by the country of their headquarters. |
| Portfolio Diagnostics | ||
| Fund Net Assets | $8 million | |
| Number of Holdings | 105 | |
| 2017 Annual Turnover Rate | 90% | |
| Average Market Capitalization1 | $529 million | |
| Weighted Average P/E Ratio2,3 | 14.7x | |
| Weighted Average P/B Ratio2 | 2.0x | |
| Active Share4 | 99% | |
| 1 | Geometric Average. This weighted calculation uses each portfolio holding’s market cap in a way designed to not skew the effect of very large or small holdings; instead, it aims to better identify the portfolio’s center, which Royce believes offers a more accurate measure of average market cap than a simple mean or median. |
| 2 | Harmonic Average. This weighted calculation evaluates a portfolio as if it were a single stock and measures it overall. It compares the total market value of the portfolio to the portfolio’s share in the earnings or book value, as the case may be, of its underlying stocks. |
| 3 | The Fund’s P/E ratio calculation excludes companies with zero or negative earnings (6% of portfolio holdings as of 12/31/17). |
| 4 | Active Share is the sum of the absolute values of the different weightings of each holding in the Fund versus each holding in the benchmark, divided by two. |
| Important Performance and Expense Information All performance information in this Report reflects past performance, is presented on a total return basis, reflects the reinvestment of distributions, and does not reflect the deduction of taxes that a shareholder would pay on fund distributions or the redemption of fund shares. Past performance is no guarantee of future results. Investment return and principal value of an investment will fluctuate, so that shares may be worth more or less than their original cost when redeemed. Shares redeemed within 30 days of purchase may be subject to a 2% redemption fee payable to the Fund, which is not reflected in the performance shown above; if it were, performance would be lower. Current month-end performance may be higher or lower than performance quoted and may be obtained at www.roycefunds.com. Gross operating expenses reflect total gross annual operating expenses and include management fees, 12b-1 distribution and service fees, and other expenses. Net operating expenses reflect contractual fee waivers and/or expense reimbursements. All expense information is reported as of the Fund’s most current prospectus. Royce & Associates has contractually agreed to waive its fees and/or reimburse operating expenses, to the extent necessary to maintain the Fund’s net annual operating expenses, (excluding brokerage commissions, taxes, interest, litigation expenses, acquired fund fees and expenses, and other expenses not borne in the ordinary course of business), at or below 1.44% through April 30, 2019 and at or below 1.99% through April 30, 2027. Regarding the “Top Contributors” and “Top Detractors” tables shown above, the sum of all contributors to, and all detractors from, performance for all securities in the portfolio would approximate the Fund’s year-to-date performance for 2017. |
| The Royce Funds 2017 Annual Report to Shareholders | 13 |
| MANAGERS’ DISCUSSION | ||
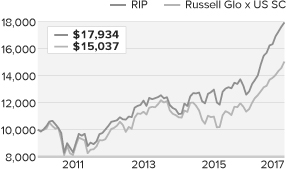
| Royce International Premier Fund (RIP) |
 |
| David Nadel Mark Rayner, CA |
| FUND PERFORMANCE Along with strong stock selection, the rebound for international equities in 2017 helped Royce International Premier Fund to extend its relative advantage for the one-, three-, five-year, and since inception (12/31/10) periods ended December 31, 2017. The Fund gained 39.8% in 2017, well ahead of its benchmark, the Russell Global ex-U.S. Small Cap Index, which was up 30.5% for the same period. All 11 sectors within the international small-cap index had positive returns, and all except Energy posted double-digit performance for the calendar year—thanks largely to an accelerating global economy as well as a number of relatively underwhelming years for non-U.S. stocks. The portfolio’s quality-at-a-reasonable-price (“QARP”) strategy has so far proven to be well suited to this environment. |
| WHAT WORKED... AND WHAT DIDN’T |
| All of the portfolio’s nine equity sectors made positive contributions to performance. Industrials had by far the largest constructive effect, followed by notable gains for Information Technology, Health Care, and Financials. Energy, our lowest sector weighting, made the smallest contribution. Health care equipment & supplies (Health Care) led the Fund’s industry groups by a sizable margin, boosted by a number of holdings such as German ocular product specialist Carl Zeiss Meditec and New Zealand’s Fisher & Paykel Healthcare, which makes products that treat sleep apnea. None of the Fund’s industry groups detracted from 2017 results. The smallest contributions came from Internet & direct marketing retail (Consumer Discretionary) and construction & engineering (Industrials). The countries making the biggest impacts on performance were the United Kingdom, Japan, India, Switzerland, and Germany while South Africa was the only nation that detracted from 2017 results. |
| Relative to the international small-cap benchmark, the portfolio benefited most from superior stock selection in Industrials, particularly in trading companies & distributors and electrical equipment. Also aiding relative performance was strong stock picking in Financials, attributable mostly to the portfolio’s top-contributing position in 2017, Indian consumer finance firm, Bajaj Finance. Stock selection was also a strength in Information Technology, Health Care, and Real Estate. The only significant drag on relative results came from the Fund’s cash position. In Materials, ineffective stock picking created a minor disadvantage versus the benchmark. |
| Shares of Bajaj Finance were lifted by its strong position in India’s nascent credit markets, which we believe have a long runway for growth given the nation’s fast-growing middle class and its low household debt to GDP ratio. Bajaj has also benefited from successfully cross selling services across its many locations, and we were pleased to see net income compounding at impressive levels in 2017. We held a large stake at year-end. Based in Mumbai, Vakrangee is a technology-driven operator of a network of outlets that provide everyday transactional services to mass markets in India, primarily in under-served rural areas. The firm reported sizable increases in revenues and net income for the second half of fiscal 2017 and also announced new business alliances with Indian finance companies that add to its large roster of partnerships with the Indian government. |
| The top detractor at the position level was South African technology business EOH Holdings Limited, Africa’s largest independent information-technology provider, with leading positions in business process outsourcing and SAP implementation across the continent. We were attracted to its rare combination of attractive valuation, strong market position, high growth, and conservative balance sheet. However, we sold our shares when unexplained insider selling and the threat of customer losses compounded the effects of well-publicized accounting and corruption scandals engulfing even some of the blue-chip denizens of South African business. Shares of French veterinary medicine provider Virbac rallied late in 2016 after the U.S. Food & Drug Administration rescinded the warning letter on its St. Louis facility, only to take another hit in mid-March 2017 when an otherwise solid earnings announcement was accompanied by tepid guidance, including an anticipated decline in fiscal first-quarter revenues. After reevaluating this holding, we determined that the time horizon for turning around this family-run business looked too long relative to other attractive opportunities we saw in the market, which led us to exit the position in September. |
| Top Contributors to Performance For 2017 (%)1 | |||
| Bajaj Finance | 2.66 | ||
| Vakrangee | 2.53 | ||
| Relo Group | 1.80 | ||
| XP Power | 1.66 | ||
| Partners Group Holding | 1.45 | ||
| 1 Includes dividends | |||
| Top Detractors from Performance For 2017 (%)2 | |||
| EOH Holdings Limited | -1.02 | ||
| Virbac | -0.39 | ||
| Spotless Group Holdings | -0.10 | ||
| Hexpol | 0.10 | ||
| SH Kelkar & Company | 0.10 | ||
| 2 Net of dividends | |||
| CURRENT POSITIONING AND OUTLOOK |
| The focus of our ‘QARP’ strategy will remain primarily in developed markets, especially in Europe north of the Alps, the U.K., Japan, Australia, New Zealand, and Canada, as well as in select emerging markets. Following several years of below-average returns, we suspect a long—and potentially profitable—period of catch-up could be in the offing. We believe that valuations for select international companies remain attractive, so it’s not surprising that our outlook has not changed radically or that 2017’s performance did not necessitate any significant repositioning in the portfolio. We remain sanguine about both outlook and positioning and believe that our overweights in markets such as the U.K., Australia, and Switzerland may prove timely in 2018 as these markets substantially lagged the index in 2017. |
| 14 | The Royce Funds 2017 Annual Report to Shareholders |
| PERFORMANCE AND PORTFOLIO REVIEW | TICKER SYMBOLS RYIPX RIPNX RINRX RINPX |
| Performance and Expenses | ||||||||||||
| Average Annual Total Return (%) Through 12/31/17 | ||||||||||||
| JUL-DEC 20171 | 1-YR | 3-YR | 5-YR | SINCE INCEPTION (12/31/10) | ||||||||
| RIP | 14.29 | 39.81 | 17.15 | 11.79 | 8.70 | |||||||
| Annual Gross Operating Expenses: 1.84% Annual Net Operating Expenses: 1.44% | ||||||||||||
| 1 Not annualized | ||||||||||||
The Morningstar Style Map is the Morningstar Style Box™ with the center 75% of fund holdings plotted as the Morningstar Ownership Zone™. The Morningstar Style Box is designed to reveal a fund’s investment strategy. The Morningstar Ownership Zone provides detail about a portfolio’s investment style by showing the range of stock sizes and styles. The Ownership Zone is derived by plotting each stock in the portfolio within the proprietary Morningstar Style Box. Over time, the shape and location of a fund’s ownership zone may vary. See page 128 for additional information. |
Value of $10,000
| Top 10 Positions | ||
| % of Net Assets | ||
| VZ Holding | 3.2 | |
| USS | 3.0 | |
| Meitec Corporation | 2.8 | |
| Burkhalter Holding | 2.6 | |
| Partners Group Holding | 2.6 | |
| IPH | 2.5 | |
| Equiniti Group | 2.3 | |
| Hansen Technologies | 2.2 | |
| Vakrangee | 2.2 | |
| Thermador Groupe | 2.2 | |
| Portfolio Sector Breakdown | ||
| % of Net Assets | ||
| Industrials | 24.7 | |
| Information Technology | 18.7 | |
| Health Care | 17.0 | |
| Materials | 13.4 | |
| Financials | 9.1 | |
| Consumer Discretionary | 8.3 | |
| Real Estate | 1.9 | |
| Consumer Staples | 1.9 | |
| Energy | 1.8 | |
| Cash and Cash Equivalents | 3.2 | |
| Upside/Downside Capture Ratios | |||
| Periods Ended 12/31/17 (%) | |||
| UPSIDE | DOWNSIDE | |||
| Fund’s First Full Quarter (12/31/10) | 107 | 83 | ||
| Calendar Year Total Returns (%) | ||
| YEAR | RIP | |
| 2017 | 39.8 | |
| 2016 | -1.1 | |
| 2015 | 16.2 | |
| 2014 | -8.2 | |
| 2013 | 18.3 | |
| 2012 | 23.4 | |
| 2011 | -16.8 | |
| Portfolio Country Breakdown1,2 | ||
| % of Net Assets | ||
| United Kingdom | 17.3 | |
| Japan | 17.0 | |
| Australia | 10.0 | |
| Switzerland | 9.8 | |
| India | 6.2 | |
| Sweden | 5.7 | |
| Germany | 4.7 | |
| France | 3.9 | |
| New Zealand | 3.8 | |
| Canada | 3.6 | |
| Brazil | 3.5 | |
| 1 | Represents countries that are 3% or more of net assets. |
| 2 | Securities are categorized by the country of their headquarters. |
| Portfolio Diagnostics | ||
| Fund Net Assets | $161 million | |
| Number of Holdings | 50 | |
| 2017 Annual Turnover Rate | 41% | |
| Average Market Capitalization1 | $2,190 million | |
| Weighted Average P/E Ratio2,3 | 27.2x | |
| Weighted Average P/B Ratio2 | 4.1x | |
| Active Share4 | 99% | |
| 1 | Geometric Average. This weighted calculation uses each portfolio holding’s market cap in a way designed to not skew the effect of very large or small holdings; instead, it aims to better identify the portfolio’s center, which Royce believes offers a more accurate measure of average market cap than a simple mean or median. |
| 2 | Harmonic Average. This weighted calculation evaluates a portfolio as if it were a single stock and measures it overall. It compares the total market value of the portfolio to the portfolio’s share in the earnings or book value, as the case may be, of its underlying stocks. |
| 3 | The Fund’s P/E ratio calculation excludes companies with zero or negative earnings (2% of portfolio holdings as of 12/31/17). |
| 4 | Active Share is the sum of the absolute values of the different weightings of each holding in the Fund versus each holding in the benchmark, divided by two. |
| Important Performance and Expense Information |
All performance information in this Report reflects past performance, is presented on a total return basis, reflects the reinvestment of distributions, and does not reflect the deduction of taxes that a shareholder would pay on fund distributions or the redemption of fund shares. Past performance is no guarantee of future results. Investment return and principal value of an investment will fluctuate, so that shares may be worth more or less than their original cost when redeemed. Shares redeemed within 30 days of purchase may be subject to a 2% redemption fee payable to the Fund, which is not reflected in the performance shown above; if it were, performance would be lower. Current month-end performance may be higher or lower than performance quoted and may be obtained at www.roycefunds.com. All performance and risk information reflects results of the Service Class (its oldest class). Price and total return information is based on net asset values for shareholder transactions. Certain immaterial adjustments were made to the net assets of Royce International Premier Fund at 6/30/14 for financial reporting purposes, and as a result the calendar year total returns based on those net assets values differ from the adjusted net values and calendar year total returns reported in the Financial Highlights. Gross operating expenses reflect total gross annual operating expenses and include management fees, 12b-1 distribution and service fees, and other expenses. Net operating expenses reflect contractual fee waivers and/or expense reimbursements. All expense information is reported as of the Fund’s most current prospectus. Royce & Associates has contractually agreed to waive its fees and/or reimburse operating expenses to the extent necessary to maintain the Fund’s net annual operating expenses, (excluding brokerage commissions, taxes, interest, litigation expenses, acquired fund fees and expenses, and other expenses not borne in the ordinary course of business), at or below 1.44% through April 30, 2018. Regarding the “Top Contributors” and “Top Detractors” tables shown above, the sum of all contributors to, and all detractors from, performance for all securities in the portfolio would approximate the Fund’s year-to-date performance for 2017. Upside Capture Ratio measures a manager’s performance in up markets relative to the Fund’s benchmark. It is calculated by measuring the Fund’s performance in quarters when the benchmark went up and dividing it by the benchmark’s return in those quarters. Downside Capture Ratio measures a manager’s performance in down markets relative to the Fund’s benchmark (Russell Global ex-U.S. Small Cap). It is calculated by measuring the Fund’s performance in quarters when the benchmark goes down and dividing it by the benchmark’s return in those quarters. |
| The Royce Funds 2017 Annual Report to Shareholders | 15 |
| MANAGER’S DISCUSSION | ||
| Royce Low-Priced Stock Fund (RLP) |
 |
| Jim Stoeffel |
| FUND PERFORMANCE Royce Low-Priced Stock Fund increased 9.7% in 2017, trailing its small-cap benchmark, the Russell 2000 Index, which was up 14.6% for the same period. It was a relatively tough year for small-cap approaches that emphasize valuation and low share prices as large-caps beat small-caps, small-cap growth beat value, and small-caps beat micro-caps. The strength of growth stocks was surprising in light of both the rebound for cyclical industries and value stocks in 2016 and the growing global economy, one in which we would typically expect these areas to excel. |
| WHAT WORKED... AND WHAT DIDN’T |
| Six of the Fund’s 11 equity sectors made positive contributions to 2017 performance. Information Technology made by far the biggest positive impact, with Industrials and Financials also posting notable net gains. None of the sectors that detracted from results had a significant negative effect. The largest net losses came from Consumer Discretionary and Consumer Staples. At the industry level, four groups stood out: electronic equipment, instruments & components, semiconductors & semiconductor equipment (both from Information Technology), metals & mining (Materials), and capital markets (Financials). Two industries in Consumer Discretionary led the groups that detracted—specialty retail and multiline retail, which were followed by less impactful net losses for food products (Consumer Staples) and chemicals (Materials). |
| Relative to the Russell 2000, Consumer Discretionary, particularly the aforementioned specialty retail industry, accounted for a sizable share of the year’s underperformance. As highlighted by a number of the portfolio’s largest stock detractors discussed below, a combination of secular headwinds, compounded in some cases by company-specific operational shortfalls, proved a troublesome combination. The Health Care sector was another significant source of underperformance as results were hampered by our low weighting as well as some stock selection missteps in biotechnology, one of the best-performing industries in the Russell 2000 in 2017. Stock picking also detracted in the large and diverse Industrials sector, most meaningfully in the professional services group. Conversely, Financials were a major positive versus the benchmark, thanks to an underweight in banks, which were laggards in the small-cap index, and savvy stock selection in capital markets, where Ashmore Group, a U.K.-based specialist in emerging market fixed income, and alternative investment manager Hamilton Lane both enjoyed strong years. Also helping relative results were stock selection in Energy (the only Russell 2000 sector to finish 2017 in the red), a combination of a higher weighting and effective stock selection in Information Technology, and lower exposure to Real Estate. |
| The Fund’s top contributor at the position level was Electro Scientific Industries, which manufactures laser and laser drilling systems, test and measurement equipment, and machine vision systems. An ongoing restructuring has significantly lowered break-even points, turning the company around to solid operating profits. We held some shares after taking gains as we see the firm remaining in growth mode. Kirkland Lake Gold is a precious metals exploration and production company with assets in Canada and Australia. The company’s shares benefited from better-than-expected production results at its two main properties along with a relatively benign gold price environment. We held a respectably sized stake at the end of 2017 as the company is well financed and profitable, which we think positioned it to further exploit its key mining properties. |
| We moved on from BioAmber, an industrial biotechnology company that specializes in renewable feedstocks, because of our concerns with start-up issues in a first-of-its-kind fermentation plant and the company’s tight capital structure. Shares of value-priced department store operator Stein Mart were hurt, like those of many retailers, by ongoing sales pressure wrought by the growth of e-commerce, formidable enough challenges that were exacerbated by a series of internal merchandising missteps. Our ongoing concerns about the secular shift to online shopping led us to sell our position in September. We also sold our shares of Ascena Retail Group, which acts as a holding company for a number of mostly women’s apparel retailers, including Ann Taylor, Dress Barn, and Justice. Its shares have been hurt by a combination of the online shift and internal operating miscues. |
| Top Contributors to Performance For 2017 (%)1 | |||
| Electro Scientific Industries | 0.96 | ||
| Kirkland Lake Gold | 0.76 | ||
| QuinStreet | 0.75 | ||
| Novanta | 0.68 | ||
| IXYS Corporation | 0.59 | ||
| 1 Includes dividends | |||
| Top Detractors from Performance For 2017 (%)2 | |||
| BioAmber | -0.63 | ||
| Stein Mart | -0.59 | ||
| Ascena Retail Group | -0.50 | ||
| J.C. Penney Company | -0.46 | ||
| Unique Fabricating | -0.42 | ||
| 2 Net of dividends | |||
| CURRENT POSITIONING AND OUTLOOK |
| We remain generally constructive on the U.S. economy, with tax reform likely to add a favorable tailwind to underlying earnings growth for many cyclical areas in 2018. Our largest weightings at the end of December remained Information Technology, Industrials, and Consumer Discretionary. Along with Energy, these large and diverse cyclical sectors were also our largest overweights versus the Russell 2000. Within the disappointing specialty retail group, our rationale for larger exposure was a combination of intriguingly low valuations with select companies adopting effective omni-channel strategies that we anticipate should help them to emerge as stronger players following the current shakeout in the industry. |
| 16 | The Royce Funds 2017 Annual Report to Shareholders |
| PERFORMANCE AND PORTFOLIO REVIEW | TICKER SYMBOLS RYLPX RLPHX RLPIX RLPRX |
| Performance and Expenses | ||||||||||||||||
| Average Annual Total Return (%) Through 12/31/17 | ||||||||||||||||
| JUL-DEC 20171 | 1-YR | 3-YR | 5-YR | 10-YR | 15-YR | 20-YR | SINCE INCEPTION (12/15/93) | |||||||||
| RLP | 8.61 | 9.67 | 4.48 | 4.47 | 3.68 | 7.92 | 8.81 | 10.07 | ||||||||
| Annual Operating Expenses: 1.62% Annual Net Operating Expenses: 1.59% | ||||||||||||||||
| 1 Not annualized | ||||||||||||||||
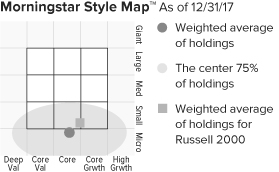
The Morningstar Style Map is the Morningstar Style Box™ with the center 75% of fund holdings plotted as the Morningstar Ownership Zone™. The Morningstar Style Box is designed to reveal a fund’s investment strategy. The Morningstar Ownership Zone provides detail about a portfolio’s investment style by showing the range of stock sizes and styles. The Ownership Zone is derived by plotting each stock in the portfolio within the proprietary Morningstar Style Box. Over time, the shape and location of a fund’s ownership zone may vary. See page 128 for additional information. |
Value of $10,000
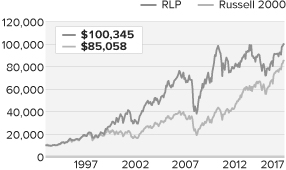
| Top 10 Positions | ||
| % of Net Assets | ||
| Urban Outfitters | 1.1 | |
| Shoe Carnival | 1.1 | |
| American Eagle Outfitters | 1.1 | |
| Hamilton Lane Cl. A | 0.9 | |
| Orbotech | 0.9 | |
| Sprott | 0.9 | |
| Thor Industries | 0.9 | |
| Ashmore Group | 0.9 | |
| DSW Cl. A | 0.9 | |
| Guess? | 0.9 | |
| Portfolio Sector Breakdown | ||
| % of Net Assets | ||
| Information Technology | 22.0 | |
| Industrials | 19.6 | |
| Consumer Discretionary | 18.9 | |
| Financials | 12.6 | |
| Energy | 7.7 | |
| Health Care | 5.6 | |
| Materials | 5.5 | |
| Telecommunication Services | 0.7 | |
| Consumer Staples | 0.6 | |
| Real Estate | 0.5 | |
| Miscellaneous | 4.8 | |
| Cash and Cash Equivalents | 1.5 | |
| Calendar Year Total Returns (%) | ||
| YEAR | RLP | |
| 2017 | 9.7 | |
| 2016 | 16.1 | |
| 2015 | -10.4 | |
| 2014 | -3.4 | |
| 2013 | 12.9 | |
| 2012 | 4.5 | |
| 2011 | -14.6 | |
| 2010 | 31.5 | |
| 2009 | 53.6 | |
| 2008 | -36.0 | |
| 2007 | 2.3 | |
| 2006 | 19.0 | |
| 2005 | 9.7 | |
| 2004 | 13.6 | |
| 2003 | 44.0 | |
| Upside/Downside Capture Ratios | ||||||||||||||
| Periods Ended 12/31/17 (%) | ||||||||||||||
| UPSIDE | DOWNSIDE | |||||||||||||
| 10-Year | 84 | 112 | ||||||||||||
| From 12/31/93 (Start of the Fund’s First Full Quarter) | 100 | 94 | ||||||||||||
| Portfolio Diagnostics | ||
| Fund Net Assets | $269 million | |
| Number of Holdings | 152 | |
| 2017 Annual Turnover Rate | 26% | |
| Average Market Capitalization1 | $798 million | |
| Weighted Average P/B Ratio2 | 2.0x | |
| Weighted Average P/E Ratio2,3 | 22.2x | |
| Active Share4 | 95% | |
| U.S. Investments (% of Net Assets) | 82.5% | |
| Non-U.S. Investments (% of Net Assets) | 16.0% | |
| 1 | Geometric Average. This weighted calculation uses each portfolio holding’s market cap in a way designed to not skew the effect of very large or small holdings; instead, it aims to better identify the portfolio’s center, which Royce believes offers a more accurate measure of average market cap than a simple mean or median. |
| 2 | Harmonic Average. This weighted calculation evaluates a portfolio as if it were a single stock and measures it overall. It compares the total market value of the portfolio to the portfolio’s share in the earnings or book value, as the case may be, of its underlying stocks. |
| 3 | The Fund’s P/E Ratio calculation uses trailing 12-month earnings and excludes companies with zero or negative earnings (25% of portfolio holdings as of 12/31/17). |
| 4 | Active Share is the sum of the absolute values of the different weightings of each holding in the Fund versus each holding in the benchmark, divided by two. |
| Important Performance and Expense Information All performance information in this Report reflects past performance, is presented on a total return basis, reflects the reinvestment of distributions, and does not reflect the deduction of taxes that a shareholder would pay on fund distributions or the redemption of fund shares. Past performance is no guarantee of future results. Investment return and principal value of an investment will fluctuate, so that shares may be worth more or less than their original cost when redeemed. Shares redeemed within 30 days of purchase may be subject to a 1% redemption fee payable to the Fund, which is not reflected in the performance shown above; if it were, performance would be lower. Current month-end performance may be higher or lower than performance quoted and may be obtained at www.roycefunds.com. All performance and risk information reflects results of the Service Class (its oldest class). Price and total return information is based on net asset values for shareholder transactions. Certain immaterial adjustments were made to the net assets of Royce Low-Priced Stock Fund at 6/30/13 for financial reporting purposes, and as a result the calendar year total returns based on those net asset values differ from the adjusted net asset values and calendar year total returns reported in the Financial Highlights. Gross operating expenses reflect the Fund’s total gross annual operating expenses and include management fees, 12b-1 distribution and service fees, other expenses, and acquired fund fees and expenses. Net operating expenses reflect contractual fee waivers and/or expense reimbursements. All expense information is reported as of the Fund’s most current prospectus. Royce & Associates has contractually agreed to waive fees and/or reimburse operating expenses to the extent necessary to maintain the Fund’s net annual operating expenses (excluding brokerage commissions, taxes, interest, litigation expenses, acquired fund fees and expenses, and other expenses not borne in the ordinary course of business) at or below 1.49% through April 30, 2018. Acquired fund fees and expenses reflect the estimated amount of the fees and expenses incurred indirectly by the Fund through its investments in mutual funds, hedge funds, private equity funds, and other investment companies. Regarding the “Top Contributors” and “Top Detractors” tables shown above, the sum of all contributors to, and all detractors from, performance for all securities in the portfolio would approximate the Fund’s year-to-date performance for 2017. Upside Capture Ratio measures a manager’s performance in up markets relative to the Fund’s benchmark. It is calculated by measuring the Fund’s performance in quarters when the benchmark went up and dividing it by the benchmark’s return in those quarters. Downside Capture Ratio measures a manager’s performance in down markets relative to the Fund’s benchmark (Russell 2000). It is calculated by measuring the Fund’s performance in quarters when the benchmark goes down and dividing it by the benchmark’s return in those quarters. |
| The Royce Funds 2017 Annual Report to Shareholders | 17 |
| MANAGERS’ DISCUSSION | ||
| Royce Micro-Cap Fund (RMC) |
 |
| Jim Stoeffel Brendan Hartman |
| FUND PERFORMANCE In 2017, large-caps beat small-caps, small-cap growth beat value, and small-caps beat micro-caps. This created obstacles for our valuation-sensitive approach in Royce Micro-Cap Fund. For the full year, the Fund gained 5.4%, trailing both its benchmark, the Russell Microcap Index, which rose 13.2%, and the Russell 2000 Index, which was up 14.6% for the same period. The strength of growth stocks was surprising in light of both the rebound for cyclical industries and value stocks in 2016 and the growing global economy, one in which we would typically expect these areas to lead. |
| WHAT WORKED... AND WHAT DIDN’T |
| Seven of the portfolio’s 10 equity sectors made positive contributions to performance in 2017, with Industrials leading by a sizable measure, followed by Financials, Information Technology, and Health Care. Of the three sectors that detracted, only Consumer Discretionary had a meaningful negative effect—net losses for Energy and Consumer Staples were far lower. At the industry level, machinery (Industrials) and capital markets (Financials) led decisively while specialty retail (Consumer Discretionary) and electrical equipment (Industrials) headed the list of detractors. Relative to the Russell Microcap, the Fund suffered most in 2017 from ineffective stock picks in two sectors. In Consumer Discretionary, the problem areas were leisure products, textiles, apparel & luxury goods, and specialty retail, while in Information Technology, the electronic equipment, instruments & components group fared worst versus the benchmark. Our lower exposure to Health Care also hurt, mostly due to an underweight in high-flying biotechnology companies, though ineffective stock selection in the sector was an additional factor. Helping relative results, on the other hand, was a balanced combination in Financials, where the Fund had lower exposure to lagging banks and a higher weighting in strong performers within capital markets, such as top-10 positions Canaccord Genuity Group and Silvercrest Asset Management Group. Savvy stock selection in Energy and Real Estate was also a positive in 2017. Capital equipment subsystem provider Ultra Clean Holdings was the Fund’s top contributor at the position level in 2017. The company gained market share through most of the year with critical OEM customers in a generally strong environment for semiconductor capital equipment spending. We were pleased to see earnings growth drive much of the rise for its stock price. Corium International manufactures transdermal patches across a wide range of applications from drug delivery to consumer products. After many years as a contract manufacturer, Corium has been developing generic drugs of its own over the past several years to leverage its delivery expertise. Results in early clinical trials were promising, which helped to send its shares higher. Internet vertical marketing and media specialist QuinStreet benefited from its management’s efforts to expand its reach beyond for-profit education into other industry verticals, including insurance and mortgages. We continued to hold a position as we believe that the firm has just begun to improve its business model. As for those positions that detracted from calendar-year results, we sold our position in value-priced department store operator Stein Mart, the Fund’s largest detractor at the position level, in the wake of ongoing earnings and operational disappointments. Cherokee has a global business marketing and licensing numerous lifestyle brand products. Recent results were hurt by integration issues stemming from a large, transformative acquisition. We trimmed our position pending better visibility into management’s efforts to work through and resolve these challenges. We moved on from BioAmber, an industrial biotechnology company that specializes in renewable feedstocks, because of our concerns with start-up issues in a first-of-its- kind fermentation plant and the company’s tight capital structure. CUI Global offers a unique solution for measuring pipeline gas quality that’s quicker, cheaper, and more accurate than other existing technologies. A longer-than-expected delivery schedule put pressure on its shares, outweighing a respectable number of orders and a solid sales pipeline. However, we believe its technology can ultimately be monetized successfully, which led to our decision to add shares. |
| Top Contributors to Performance For 2017 (%)1 | ||||
| Ultra Clean Holdings | 0.82 | |||
| Corium International | 0.77 | |||
| QuinStreet | 0.73 | |||
| Novanta | 0.62 | |||
| Rogers Corporation | 0.54 | |||
| 1 Includes dividends | ||||
| Top Detractors from Performance For 2017 (%)2 | ||||
| Stein Mart | -0.57 | |||
| Cherokee | -0.53 | |||
| BioAmber | -0.51 | |||
| CUI Global | -0.48 | |||
| Unique Fabricating | -0.40 | |||
| 2 Net of dividends | ||||
| CURRENT POSITIONING AND OUTLOOK |
| During the second half of the year we continued to build positions in financial companies, particularly in banks, where we believe that micro-cap names, given their domestic focus, can benefit from a more relaxed regulatory environment as well as lower corporate tax rates. Despite the repositioning, Financials remained among our largest sector underweights at the end of December. We also maintained our lower exposure to Health Care, although we have been selectively adding to positions in later-stage medical device and biotech companies that we believe have created defensible competitive positions. Our largest weightings at the end of December remained Industrials and Information Technology, with the first of these also reflecting our largest overweight relative to the benchmark. |
| 18 | The Royce Funds 2017 Annual Report to Shareholders |
| PERFORMANCE AND PORTFOLIO REVIEW | TICKER SYMBOLS RYOTX RMCFX RYMCX |
| Performance and Expenses | ||||||||||||||||||
| Average Annual Total Return (%) Through 12/31/17 | ||||||||||||||||||
| JUL-DEC 20171 | 1-YR | 3-YR | 5-YR | 10-YR | 15-YR | 20-YR | 25-YR | SINCE INCEPTION (12/31/91) | ||||||||||
| RMC | 3.35 | 5.43 | 3.05 | 4.94 | 3.75 | 9.17 | 8.48 | 10.14 | 10.83 | |||||||||
| Annual Operating Expenses: 1.57% | ||||||||||||||||||
| 1 Not annualized | ||||||||||||||||||
Relative Returns: Monthly Rolling Average Annual Return Periods
| On a monthly rolling basis, the Fund outperformed the Russell Microcap in 66% of all 10-year periods; 61% of all 5-year periods; and 51% of all 1-year periods. |
| PERIODS BEATING THE INDEX | FUND AVG (%)1 | INDEX AVG (%)1 | ||||||||||||
| 10-year | 60/91 | 66% | 7.6 | 6.2 | ||||||||||
| 5-year | 92/151 | 61% | 8.4 | 8.1 | ||||||||||
| 1-year | 102/199 | 51% | 10.6 | 10.6 | ||||||||||
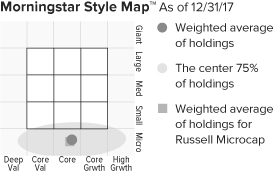
The Morningstar Style Map is the Morningstar Style Box™ with the center 75% of fund holdings plotted as the Morningstar Ownership Zone™. The Morningstar Style Box is designed to reveal a fund’s investment strategy. The Morningstar Ownership Zone provides detail about a portfolio’s investment style by showing the range of stock sizes and styles. The Ownership Zone is derived by plotting each stock in the portfolio within the proprietary Morningstar Style Box. Over time, the shape and location of a fund’s ownership zone may vary. See page 128 for additional information. |
Value of $10,000
Inception) as of 12/31/17 ($)

| Top 10 Positions | ||
| % of Net Assets | ||
| QAD Cl. A | 1.1 | |
| Shoe Carnival | 1.0 | |
| Kadant | 1.0 | |
| Citi Trends | 1.0 | |
| Canaccord Genuity Group | 0.9 | |
| Stoneridge | 0.9 | |
| CryoLife | 0.9 | |
| Silvercrest Asset Management Group Cl. A | 0.9 | |
| Encore Wire | 0.9 | |
| Marten Transport | 0.9 | |
| Portfolio Sector Breakdown | ||
| % of Net Assets | ||
| Industrials | 21.3 | |
| Information Technology | 18.6 | |
| Financials | 14.5 | |
| Consumer Discretionary | 13.8 | |
| Health Care | 7.2 | |
| Energy | 5.8 | |
| Materials | 5.5 | |
| Real Estate | 2.2 | |
| Consumer Staples | 1.3 | |
| Telecommunication Services | 0.7 | |
| Miscellaneous | 4.5 | |
| Cash and Cash Equivalents | 4.6 | |
| Calendar Year Total Returns (%) | ||
| YEAR | RMC | |
| 2017 | 5.4 | |
| 2016 | 19.7 | |
| 2015 | -13.3 | |
| 2014 | -4.1 | |
| 2013 | 21.3 | |
| 2012 | 8.0 | |
| 2011 | -12.1 | |
| 2010 | 30.1 | |
| 2009 | 55.7 | |
| 2008 | -40.9 | |
| 2007 | 7.1 | |
| 2006 | 22.3 | |
| 2005 | 11.5 | |
| 2004 | 15.8 | |
| 2003 | 52.6 | |
| Upside/Downside Capture Ratios | ||||
| Periods Ended 12/31/17 (%) | ||||
| UPSIDE | DOWNSIDE | |||
| 10-Year | 75 | 90 | ||
| From 6/30/00 (Russell Microcap Index Inception) | 89 | 81 | ||
| Portfolio Diagnostics | ||
| Fund Net Assets | $205 million | |
| Number of Holdings | 150 | |
| 2017 Annual Turnover Rate | 26% | |
| Average Market Capitalization1 | $476 million | |
| Weighted Average P/E Ratio2,3 | 23.7x | |
| Weighted Average P/B Ratio2 | 1.9x | |
| Active Share4 | 91% | |
| U.S. Investments (% of Net Assets) | 82.8% | |
| Non-U.S. Investments (% of Net Assets) | 12.6% | |
| 1 | Geometric Average. This weighted calculation uses each portfolio holding’s market cap in a way designed to not skew the effect of very large or small holdings; instead, it aims to better identify the portfolio’s center, which Royce believes offers a more accurate measure of average market cap than a simple mean or median. |
| 2 | Harmonic Average. This weighted calculation evaluates a portfolio as if it were a single stock and measures it overall. It compares the total market value of the portfolio to the portfolio’s share in the earnings or book value, as the case may be, of its underlying stocks. |
| 3 | The Fund’s P/E ratio calculation excludes companies with zero or negative earnings (21% of portfolio holdings as of 12/31/17). |
| 4 | Active Share is the sum of the absolute values of the different weightings of each holding in the Fund versus each holding in the benchmark, divided by two. |
| Important Performance and Expense Information All performance information in this Report reflects past performance, is presented on a total return basis, reflects the reinvestment of distributions, and does not reflect the deduction of taxes that a shareholder would pay on fund distributions or the redemption of fund shares. Past performance is no guarantee of future results. Investment return and principal value of an investment will fluctuate, so that shares may be worth more or less than their original cost when redeemed. Shares redeemed within 30 days of purchase may be subject to a 1% redemption fee payable to the Fund, which is not reflected in the performance shown above; if it were, performance would be lower. Current month-end performance may be higher or lower than performance quoted and may be obtained at www.roycefunds.com. All performance and risk information reflects results of the Investment Class (its oldest class). Price and total return information is based on net asset values calculated for shareholder transactions. Certain immaterial adjustments were made to the net assets of Royce Micro-Cap Fund at 12/31/17 for financial reporting purposes, and as a result the calendar year total returns based on those net assets values differ from the adjusted net values and calendar year total returns reported in the Financial Highlights. Operating expenses reflect the Fund’s total annual operating expenses for the Investment Class as of the Fund’s most current prospectus and include management fees other expenses and acquired fund fees and expenses. Acquired fund fees and expenses reflect the estimated amount of the fees and expenses incurred indirectly by the Fund through its investment in mutual funds, hedge funds, private equity funds, and other investment companies. Regarding the “Top Contributors” and “Top Detractors” tables shown above, the sum of all contributors to, and all detractors from, performance for all securities in the portfolio would approximate the Fund’s year-to-date performance for 2017. Upside Capture Ratio measures a manager’s performance in up markets relative to the Fund’s benchmark. It is calculated by measuring the Fund’s performance in quarters when the benchmark went up and dividing it by the benchmark’s return in those quarters. Downside Capture Ratio measures a manager’s performance in down markets relative to the Fund’s benchmark (Russell Microcap Index). It is calculated by measuring the Fund’s performance in quarters when the benchmark goes down and dividing it by the benchmark’s return in those quarters. |
| The Royce Funds 2017 Annual Report to Shareholders | 19 |
| MANAGERS’ DISCUSSION | ||
| Royce Micro-Cap Opportunity Fund (ROS) |
 |
| Bill Hench Buzz Zaino, CFA |
| FUND PERFORMANCE A second consecutive year of strong absolute and relative performance helped Royce Micro-Cap Opportunity Fund to build a relative advantage over its benchmark, the Russell Microcap Index, for the one- and three-year periods ended December 31, 2017. The Fund gained 25.0% in 2017, well ahead of the Russell Microcap, which was up 13.2% for the same period. Cyclical sectors such as Industrials, Information Technology, and Materials all did well even as they trailed Health Care, the strongest performer in the micro-cap index. |
| WHAT WORKED... AND WHAT DIDN’T |
| The Information Technology sector made by far the biggest positive impact on the Fund’s calendar-year performance, leading a group of five equity sectors that finished the year in the black. Industrials and Materials also posted sizable contributions to performance. Along with Financials, these three were also the strongest sectors versus the Russell Microcap. Those sectors that detracted—Energy, Real Estate, Telecommunication Services, Consumer Staples, and Consumer Discretionary—made only a slight collective negative impact to absolute results in 2017. Ineffective stock picks in Health Care had the biggest negative effect versus the benchmark, most impactfully in the health care providers & services group. The Fund’s cash position also hurt relative results, as did very modest stock-picking disadvantages in Real Estate and Consumer Staples. At the industry level, semiconductors & semiconductor equipment, electronic equipment, instruments & components (both from Information Technology), and chemicals (Materials) contributed most while detractors were comparably modest, led by two groups in Consumer Discretionary—textiles, apparel & luxury goods and specialty retail—and equity real estate investment trusts (Real Estate). |
| The global technology buildout that has been driving widespread innovation and development rolled on through the second half of the year. This led us to sell or trim several technology holdings, many clustered in the previously mentioned semiconductors & semiconductor equipment and electronic equipment, instruments & components groups. While we think demand is likely to remain robust, many holdings reached or exceeded our sell targets in 2017. We continue to watch these companies carefully, with especially close attention to product and valuation cycles. Top contributor KEMET Corporation, a solid tantalum and multilayer ceramic capacitor manufacturer in the electronic equipment, instruments & components groups, is a great example of both the strength and consistency of this run for certain small- and micro-cap tech companies. In addition to its disproportionately strong performance in 2017, KEMET Corporation was the portfolio’s top contributor in 2016’s fourth quarter and in the first half of this year. We reduced our stake slowly and steadily into the fall. |
| CareDx, which specializes in diagnostic testing for transplant recipients, probably qualifies for the year’s most dramatic turnaround. One of the portfolio’s top detractors in the first half of the year, its stock benefited in the second half from the favorable resolution of reimbursement issues that had been hampering results. |
| The Fund’s largest detractor at the position level was cybersecurity specialist KEYW Holding Corporation. The firm’s current CEO came on board in 2015 and has most recently worked to position the company as a cybersecurity expert focused on government contracts, primarily by consolidating its businesses. At year-end, we were confident that these changes would ultimately improve results. Of the four remaining positions that detracted most, each was a potential turnaround in which ongoing disappointments, along with additional stock price declines, led us to exit. Cherokee markets and licenses numerous lifestyle brand products. TravelCenters of America operates a network of hospitality and fuel service stops primarily along U.S. Interstates. Pengrowth Energy is a Canadian oil and gas business, and RAIT Financial Trust is an internally managed real estate investment trust that provides debt financing to commercial real estate owners. |
| Top Contributors to Performance For 2017 (%)1 | ||||
| KEMET Corporation | 2.69 | |||
| CareDx | 2.18 | |||
| Ichor Holdings | 1.38 | |||
| Forterra | 1.33 | |||
| Nimble Storage | 1.29 | |||
| 1 Includes dividends | ||||
| Top Detractors from Performance For 2017 (%)2 | ||||
| KEYW Holding Corporation | -0.99 | |||
| Cherokee | -0.64 | |||
| TravelCenters of America LLC | -0.62 | |||
| Pengrowth Energy | -0.53 | |||
| RAIT Financial Trust | -0.46 | |||
| 2 Net of dividends | ||||
| CURRENT POSITIONING AND OUTLOOK |
| With the global economy accelerating and U.S. GDP rising, it’s possible that positive developments can keep lifting the market in the months ahead. However, there are also risks of inflation and rapidly rising deficits in addition to high equity valuations, rising rates, and a Fed that has already begun to taper. This last development could have the largest impact on stocks, as contracting liquidity crimps the funds available for investment. We are therefore measured in our optimism. While reducing our exposure to technology stocks, we put proceeds to work via investments in industrial and commodity-based businesses in the expectation that global growth will continue to stoke demand. With the recovery of energy prices, nearly all industrial end markets were doing well by year-end. In addition, we hold many companies in cyclical areas where turnarounds were just getting underway or did not occur in 2017, which enhances our cautious optimism for select micro-cap stocks. |
| 20 | The Royce Funds 2017 Annual Report to Shareholders |
| PERFORMANCE AND PORTFOLIO REVIEW | TICKER SYMBOLS ROSFX ROSSX |
| Performance and Expenses | ||||||||||
| Average Annual Total Return (%) Through 12/31/17 | ||||||||||
| JUL-DEC 20171 | 1-YR | 3-YR | 5-YR | SINCE INCEPTION (8/31/10) | ||||||
| ROS | 13.86 | 24.99 | 9.16 | 12.32 | 13.91 | |||||
| Annual Gross Operating Expenses: 1.30% Annual Net Operating Expenses: 1.24% | ||||||||||
| 1 Not annualized | ||||||||||
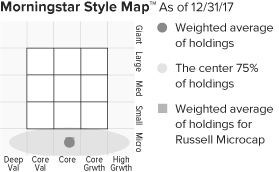
The Morningstar Style Map is the Morningstar Style Box™ with the center 75% of fund holdings plotted as the Morningstar Ownership Zone™. The Morningstar Style Box is designed to reveal a fund’s investment strategy. The Morningstar Ownership Zone provides detail about a portfolio’s investment style by showing the range of stock sizes and styles. The Ownership Zone is derived by plotting each stock in the portfolio within the proprietary Morningstar Style Box. Over time, the shape and location of a fund’s ownership zone may vary. See page 128 for additional information. |
Value of $10,000

| Top 10 Positions | ||
| % of Net Assets | ||
| CareDx | 2.6 | |
| Commercial Vehicle Group | 2.2 | |
| Forterra | 2.2 | |
| Surgery Partners | 2.0 | |
| Ducommun | 2.0 | |
| NMI Holdings Cl. A | 2.0 | |
| Hamilton Lane Cl. A | 1.9 | |
| Basic Energy Services | 1.8 | |
| Intrepid Potash | 1.6 | |
| Gencor Industries | 1.6 | |
| Portfolio Sector Breakdown | ||
| % of Net Assets | ||
| Industrials | 21.2 | |
| Information Technology | 19.0 | |
| Health Care | 14.5 | |
| Financials | 11.3 | |
| Materials | 9.7 | |
| Energy | 6.0 | |
| Consumer Discretionary | 3.3 | |
| Consumer Staples | 2.1 | |
| Real Estate | 0.8 | |
| Telecommunication Services | 0.8 | |
| Miscellaneous | 4.6 | |
| Cash and Cash Equivalents | 6.7 | |
| Calendar Year Total Returns (%) | ||
| YEAR | ROS | |
| 2017 | 25.0 | |
| 2016 | 23.8 | |
| 2015 | -16.0 | |
| 2014 | -5.0 | |
| 2013 | 44.6 | |
| 2012 | 35.1 | |
| 2011 | -17.1 | |
| Portfolio Diagnostics | ||
| Fund Net Assets | $47 million | |
| Number of Holdings | 89 | |
| 2017 Annual Turnover Rate | 70% | |
| Average Market Capitalization1 | $431 million | |
| Weighted Average P/B Ratio2 | 1.9x | |
| Weighted Average P/S Ratio3 | 0.9x | |
| Active Share4 | 94% | |
| U.S. Investments (% of Net Assets) | 91.2% | |
| Non-U.S. Investments (% of Net Assets) | 2.1% | |
| 1 | Geometric Average. This weighted calculation uses each portfolio holding’s market cap in a way designed to not skew the effect of very large or small holdings; instead, it aims to better identify the portfolio’s center, which Royce believes offers a more accurate measure of average market cap than a simple mean or median. |
| 2 | Harmonic Average. This weighted calculation evaluates a portfolio as if it were a single stock and measures it overall. It compares the total market value of the portfolio to the portfolio’s share in the earnings or book value, as the case may be, of its underlying stocks. |
| 3 | Price to Sales is calculated by dividing the company’s market cap by the revenue in the most recent year. |
| 4 | Active Share is the sum of the absolute values of the different weightings of each holding in the Fund versus each holding in the benchmark, divided by two. |
| Important Performance and Expense Information All performance information in this Report reflects past performance, is presented on a total return basis, reflects the reinvestment of distributions, and does not reflect the deduction of taxes that a shareholder would pay on fund distributions or the redemption of fund shares. Past performance is no guarantee of future results. Investment return and principal value of an investment will fluctuate, so that shares may be worth more or less than their original cost when redeemed. Shares redeemed within 30 days of purchase may be subject to a 1% redemption fee, payable to the Fund, which is not reflected in the performance shown above; if it were, performance would be lower. Current month-end performance may be higher or lower than performance quoted and may be obtained at www.roycefunds.com. Certain immaterial adjustments were made to the net assets of Royce Micro-Cap Opportunity Fund at 12/31/17 for financial reporting purposes, and as a result the calendar year total returns based on those net assets values differ from the adjusted net values and calendar year total returns reported in the Financial Highlights. Gross operating expenses reflect the Fund’s total gross annual operating expenses and include management fees and other expenses. Net operating expenses reflect contractual fee waivers and/or expense reimbursements. All expense information is reported as of the Funds most current prospectus. Royce & Associates has contractually agreed to waive fees and/or reimburse operating expenses to the extent necessary to maintain the Fund’s net annual operating expenses, (excluding dividend and interest expenses relating to short sale activities, brokerage commissions, taxes, interest, litigation expenses, acquired fund fees and expenses, and other expenses not borne in the ordinary course of business), at or below 1.24% through April 30, 2018. Regarding the “Top Contributors” and “Top Detractors” tables shown above, the sum of all contributors to, and all detractors from, performance for all securities in the portfolio would approximate the Fund’s year-to-date performance for 2017. |
| The Royce Funds 2017 Annual Report to Shareholders | 21 |
| MANAGERS’ DISCUSSION | ||
| Royce Opportunity Fund (ROF) |
 |
| Buzz Zaino, CFA Bill Hench |
| FUND PERFORMANCE A second consecutive year of stellar absolute and relative performance helped Royce Opportunity Fund to extend its relative advantages over its small-cap benchmark, the Russell 2000 Index, for the one-, three-, five-, 10-, 15-, 20-year, and since inception (11/19/96) periods ended December 31, 2017. The Fund gained 21.9% in 2017, well ahead of the Russell 2000, which was up 14.6% for the same period. Although 2017 was not as favorable for many cyclicals and value stocks as 2016 was, breadth was solid, with cyclical sectors such as Industrials, Information Technology, and Materials doing well even as they trailed Health Care, the strongest performer in the small-cap index largely due to lofty returns from resurgent biotechnology companies. |
| WHAT WORKED... AND WHAT DIDN’T |
| Information Technology and Industrials made by far the biggest positive impact on the Fund’s calendar-year performance, part of a group of seven equity sectors that finished the year in the black. Along with Materials, these two were also the strongest sectors versus the Russell 2000. Those portfolio sectors that detracted on an absolute basis—Telecommunication Services, Consumer Staples, Energy, and Real Estate—made only a slight negative impact. The portfolio’s significant underweight in Health Care was the biggest relative detractor in 2017, due to our lack of exposure to biotechnology. The Fund’s cash position also hurt relative results, as did modest stock-picking disadvantages in Telecommunication Services and Consumer Staples. At the industry level, semiconductors & semiconductor equipment (Information Technology), machinery (Industrials), and electronic equipment, instruments & components (Information Technology) led while detractors were comparably modest, led by energy equipment & services (Energy), IT services (Information Technology), and multiline retail (Consumer Discretionary). |
| The global technology buildout that has been driving widespread innovation and development rolled on through the second half of the year. This led us to sell or trim several technology holdings, many clustered in the previously mentioned semiconductors & semiconductor equipment and electronic equipment, instruments & components groups. While we think demand is likely to remain robust, many holdings reached or exceeded our sell targets in 2017. We continue to watch these companies carefully, with especially close attention to product and valuation cycles. |
| Top contributor KEMET Corporation, a solid tantalum and multilayer ceramic capacitor manufacturer in the electronic equipment, instruments & components groups, is a great example of both the strength and consistency of this run for certain small-cap tech companies. In addition to its disproportionately strong performance in 2017, KEMET was one of the portfolio’s top contributor in 2016’s fourth quarter. We reduced our stake slowly and steadily into the fall. The list of the Fund’s top-five contributors also included three companies in the semiconductors & semiconductor equipment industry, one of which—IXYS Corporation—was a takeover target (as was TRC Companies, an engineering, environmental consulting, and construction management firm in the Industrials sector). Both Brooks Automation, which offers automation-oriented software and hardware for semiconductors, and capital equipment subsystem provider Ultra Clean Holdings benefited from the ongoing high demand for semiconductor equipment. |
| Of the five positions that detracted most from results, each was a “turnaround in waiting” in which we built our stake in 2017. IT consultant Unisys Corporation had underwhelming results that discouraged investors, though we think its large book of business, much of it government related, can allow it to ultimately address its weaknesses. We also believe the new management team at Wesco Aircraft Holdings is well positioned to address the firm’s operational issues and eventually improve results. Telecommunications services provider Windstream Holdings has consolidated operations to improve efficiency, but investors disconnected when expectations for increased sales were not met. |
| Top Contributors to Performance For 2017(%)1 | ||||
| KEMET Corporation | 1.34 | |||
| IXYS Corporation | 0.76 | |||
| Brooks Automation | 0.74 | |||
| Ultra Clean Holdings | 0.71 | |||
| TRC Companies | 0.67 | |||
| 1 Includes dividends | ||||
| Top Detractors from Performance For 2017 (%)2 | ||||
| Unisys Corporation | -0.54 | |||
| Wesco Aircraft Holdings | -0.49 | |||
| Windstream Holdings | -0.48 | |||
| J.C. Penney Company | -0.33 | |||
| Team | -0.33 | |||
| 2 Net of dividends | ||||
| CURRENT POSITIONING AND OUTLOOK |
| With the global economy accelerating and U.S. GDP rising, it’s possible that positive developments can keep lifting the market in the months ahead. However, there are also risks of inflation and rapidly rising deficits in addition to high equity valuations, rising rates, and a Fed that has already begun to taper. This last development could have the largest impact on stocks, as contracting liquidity crimps the funds available for investment. We are therefore measured in our optimism. While reducing our exposure to technology stocks, we put proceeds to work via investments in industrial and commodity-based businesses in the expectation that global growth will continue to stoke demand. With the recovery of energy prices, nearly all industrial end markets were doing well by year-end. In addition, we hold many companies in cyclical areas where turnarounds were just getting underway or did not occur in 2017, which enhances our cautious optimism for select small-cap stocks. |
| 22 | The Royce Funds 2017 Annual Report to Shareholders |
| PERFORMANCE AND PORTFOLIO REVIEW | TICKER SYMBOLS RYPNX RYOFX ROFCX ROFIX ROFRX ROFKX |
| Performance and Expenses | ||||||||||||||||
| Average Annual Total Return (%) Through 12/31/17 | ||||||||||||||||
| JUL-DEC 20171 | 1-YR | 3-YR | 5-YR | 10-YR | 15-YR | 20-YR | SINCE INCEPTION (11/19/96) | |||||||||
| ROF | 12.67 | 21.88 | 11.01 | 14.33 | 9.39 | 12.79 | 12.12 | 12.71 | ||||||||
| Annual Operating Expenses: 1.19% | ||||||||||||||||
| 1 Not annualized | ||||||||||||||||
Relative Returns: Monthly Rolling Average Annual Return Periods
| On a monthly rolling basis, the Fund outperformed the Russell 2000 in 79% of all 10-year periods; 73% of all 5-year periods; and 68% of all 1-year periods. |
| PERIODS BEATING THE INDEX | FUND AVG (%)1 | INDEX AVG (%)1 | ||||||||||||
| 10-year | 96/121 | 79% | 9.2 | 6.7 | ||||||||||
| 5-year | 133/181 | 73% | 11.5 | 8.2 | ||||||||||
| 1-year | 155/229 | 68% | 15.4 | 9.9 | ||||||||||

The Morningstar Style Map is the Morningstar Style Box™ with the center 75% of fund holdings plotted as the Morningstar Ownership Zone™. The Morningstar Style Box is designed to reveal a fund’s investment strategy. The Morningstar Ownership Zone provides detail about a portfolio’s investment style by showing the range of stock sizes and styles. The Ownership Zone is derived by plotting each stock in the portfolio within the proprietary Morningstar Style Box. Over time, the shape and location of a fund’s ownership zone may vary. See page 128 for additional information. |
Value of $10,000

| Top 10 Positions | ||
| % of Net Assets | ||
| Comtech Telecommunications | 1.0 | |
| Carpenter Technology | 1.0 | |
| Dana | 1.0 | |
| Allegheny Technologies | 1.0 | |
| Tower International | 1.0 | |
| Mueller Industries | 0.9 | |
| Microsemi Corporation | 0.8 | |
| Meritor | 0.8 | |
| Enova International | 0.8 | |
| Cree | 0.8 | |
| Portfolio Sector Breakdown | ||
| % of Net Assets | ||
| Industrials | 24.3 | |
| Information Technology | 20.7 | |
| Consumer Discretionary | 15.8 | |
| Materials | 8.6 | |
| Energy | 6.1 | |
| Health Care | 6.1 | |
| Financials | 5.9 | |
| Consumer Staples | 1.6 | |
| Telecommunication Services | 0.7 | |
| Real Estate | 0.3 | |
| Utilities | 0.2 | |
| Miscellaneous | 4.0 | |
| Cash and Cash Equivalents | 5.7 | |
| Calendar Year Total Returns (%) | ||
| YEAR | ROF | |
| 2017 | 21.9 | |
| 2016 | 29.9 | |
| 2015 | -13.6 | |
| 2014 | -0.5 | |
| 2013 | 43.5 | |
| 2012 | 22.6 | |
| 2011 | -13.0 | |
| 2010 | 33.8 | |
| 2009 | 62.1 | |
| 2008 | -45.7 | |
| 2007 | -2.0 | |
| 2006 | 18.8 | |
| 2005 | 4.8 | |
| 2004 | 17.5 | |
| 2003 | 72.9 | |
| Upside/Downside Capture Ratios | ||||
| Periods Ended 12/31/17 (%) | ||||
| UPSIDE | DOWNSIDE | |||
| 10-Year | 120 | 125 | ||
| From 12/31/96 (Start of Fund’s First Full Quarter) | 125 | 110 | ||
| Portfolio Diagnostics | ||
| Fund Net Assets | $1,609 million | |
| Number of Holdings | 256 | |
| 2017 Annual Turnover Rate | 43% | |
| Average Market Capitalization1 | $944 million | |
| Weighted Average P/B Ratio2 | 1.7x | |
| Weighted Average P/S Ratio3 | 0.9x | |
| Active Share4 | 90% | |
| U.S. Investments (% of Net Assets) | 89.2% | |
| Non-U.S. Investments (% of Net Assets) | 5.1% | |
| 1 | Geometric Average. This weighted calculation uses each portfolio holding’s market cap in a way designed to not skew the effect of very large or small holdings; instead, it aims to better identify the portfolio’s center, which Royce believes offers a more accurate measure of average market cap than a simple mean or median. |
| 2 | Harmonic Average. This weighted calculation evaluates a portfolio as if it were a single stock and measures it overall. It compares the total market value of the portfolio to the portfolio’s share in the earnings or book value, as the case may be, of its underlying stocks. |
| 3 | Price to Sales is calculated by dividing the company’s market cap by the revenue in the most recent year. |
| 4 | Active Share is the sum of the absolute values of the different weightings of each holding in the Fund versus each holding in the benchmark, divided by two. |
| Important Performance and Expense Information All performance information in this Report reflects past performance, is presented on a total return basis, reflects the reinvestment of distributions, and does not reflect the deduction of taxes that a shareholder would pay on fund distributions or the redemption of fund shares. Past performance is no guarantee of future results. Investment return and principal value of an investment will fluctuate, so that shares may be worth more or less than their original cost when redeemed. Shares redeemed within 30 days of purchase may be subject to a 1% redemption fee payable to the Fund, which is not reflected in the performance shown above; if it were, performance would be lower. Current month-end performance may be higher or lower than performance quoted and may be obtained at www.roycefunds.com. All performance and risk information reflects results of the Investment Class (its oldest class). Operating expenses reflect the Fund’s total annual operating expenses for the Investment Class as of the Fund’s most current prospectus and include management fees and other expenses. Regarding the “Top Contributors” and “Top Detractors” tables shown above, the sum of all contributors to, and all detractors from, performance for all securities in the portfolio would approximate the Fund’s year-to-date performance for 2017. Upside Capture Ratio measures a manager’s performance in up markets relative to the Fund’s benchmark. It is calculated by measuring the Fund’s performance in quarters when the benchmark went up and dividing it by the benchmark’s return in those quarters. Downside Capture Ratio measures a manager’s performance in down markets relative to the Fund’s benchmark (Russell 2000). It is calculated by measuring the Fund’s performance in quarters when the benchmark goes down and dividing it by the benchmark’s return in those quarters. |
| The Royce Funds 2017 Annual Report to Shareholders | 23 |
| MANAGERS’ DISCUSSION | ||
| Royce Pennsylvania Mutual Fund® (PMF) |
 |
| Chuck Royce Lauren Romeo, CFA Jay Kaplan, CFA |
| FUND PERFORMANCE With a second consecutive year of strong absolute and relative performance, our flagship Royce Pennsylvania Mutual Fund further solidified long-term advantages over its small-cap benchmark, the Russell 2000 Index, outperforming for the one-, 20-, 25-, 30-, and 35-year periods ended December 31, 2017. The Fund advanced 16.2% in 2017, ahead of the 14.6% gain for the Russell 2000. The attributes that investors favored in 2017—growth stocks in industries such as biotechnology and highly leveraged companies most notably—presented headwinds for the Fund’s multidiscipline approach. However, Penn also enjoyed tailwinds later in the year in the form of renewed strength for cyclicals—particularly those with global exposure. All in all, 2017 was a good year, but with its mix of leadership for growth stocks against the backdrop of an accelerating global economy, it was a strange one as well. |
| WHAT WORKED... AND WHAT DIDN’T |
| Eight of the Fund’s 11 equity sectors made positive contributions to 2017 performance. The portfolio’s two largest sectors—Industrials and Information Technology—led by a wide margin, followed by solid net gains for Health Care, which led the Russell 2000, and Financials. Consumer Discretionary and Energy detracted, albeit modestly, while Telecommunication Services and Utilities, the Fund’s smallest sectors were essentially flat. The best relative performance in 2017 came from Financials, where both our lighter weighting in banks and heavier investment in capital markets companies were additive against the benchmark. Savvy stock selection in Information Technology was also an important factor in 2017’s outperformance. The largest relative sector detractor was Consumer Discretionary, where weak stock selection in specialty retail hurt most, while our lower exposure to Health Care also detracted due to the Fund’s significant underweight in biotechnology stocks, one of the top-performing small-cap industries in 2017. At the industry level, the largest contributions on an absolute basis came from electronic equipment, instruments & components (Information Technology) and machinery (Industrials), each from one of the Fund’s leading sectors, while the largest detractors, specialty retail (Consumer Discretionary) and energy equipment & services (Energy), came from its two worst. For many years, the portfolio has invested heavily in companies that increase productivity or otherwise help business operate faster, cheaper, and more effectively. This ‘picks and shovels’ approach often leads us to industrial and technology companies with very interesting—and in many cases ultimately profitable—niche businesses. Over the last few years, there has been a significant amount of innovation in areas such as process automation, robotics, lasers, cloud storage, etc.—all of which need equipment, components, and related technology. This has led us to invest in several companies that specialize in process automation or other innovative ways that boost productivity. Moreover, the long-term outlook for select companies in these areas looks very promising to us as the current global technology build-out continues. It was no surprise, then, that four of the portfolio’s five top-contributing stocks in 2017 were technology stocks and that the fifth came from the Industrials sector. Few holdings exemplify our goal for these kinds of companies more than the Fund’s top contributor in 2017, laser diode and equipment maker Coherent, which also occupied the Fund’s top spot in 2016. Its stock climbed thanks to a record-setting fiscal 2017, which saw sales and earnings growth driven by increasing demand for ramped up OLED (organic light-emitting diode) capacity and service. We reduced our position as its shares rose. Sun Hydraulics is an industrial technology company that develops and manufactures solutions for the hydraulics and electronics markets. Its shares rose on robust sales and earnings as well as management’s cautiously optimistic outlook that included raised revenue guidance. As for positions that detracted, specialized industrial services business Team disappointed as certain expected operational synergies did not materialize. We reduced our position, though we think its exposure to the recovering energy industry can help its business to improve. We also trimmed our stake in CIRCOR International, which makes an array of valves and related flow control products and services. Valve sales to the domestic land-based oil industry improved when the price of oil rallied in the second half of the year, but could not offset the sales declines to large offshore project customers where investments are only now showing signs of bottoming and pricing is intense. |
| Top Contributors to Performance For 2017 (%)1 | ||||
| Coherent | 0.83 | |||
| Sun Hydraulics | 0.82 | |||
| Cognex Corporation | 0.70 | |||
| IPG Photonics | 0.70 | |||
| HEICO Corporation | 0.50 | |||
| 1 Includes dividends | ||||
| Top Detractors from Performance For 2017 (%)2 | ||||
| Team | -0.33 | |||
| CIRCOR International | -0.29 | |||
| Core-Mark Holding Company | -0.26 | |||
| Ethan Allen Interiors | -0.24 | |||
| Matrix Service | -0.22 | |||
| 2 Net of dividends | ||||
| CURRENT POSITIONING AND OUTLOOK |
| Our outlook is mixed. While we are cautious about the prospects for small-cap returns as a whole, we are also optimistic about the portfolio’s return potential as it leans towards three factors that we believe will be rewarded going forward—economically sensitive cyclicals, global exposure, and—in many cases—high profitability. These are the select qualities that we anticipate will drive small-cap leadership. In this environment, we see the opportunity for the Fund to continue outperforming in the years ahead. |
| 24 | The Royce Funds 2017 Annual Report to Shareholders |
| PERFORMANCE AND PORTFOLIO REVIEW | TICKER SYMBOLS PENNX RYPFX RPMIX RYPCX RPMRX RPMKX |
| Performance and Expenses | ||||||||||||||||||||||
| Average Annual Total Return (%) Through 12/31/17 | ||||||||||||||||||||||
| JUL-DEC 20171 | 1-YR | 3-YR | 5-YR | 10-YR | 15-YR | 20-YR | 25-YR | 30-YR | 35-YR | 45-YR | ||||||||||||
| PMF | 10.91 | 16.24 | 9.20 | 11.83 | 7.77 | 10.92 | 9.93 | 10.55 | 11.20 | 11.83 | 11.80 | |||||||||||
| Annual Operating Expenses: 0.93% | ||||||||||||||||||||||
| 1 Not annualized | ||||||||||||||||||||||
Relative Returns: Monthly Rolling Average Annual Return Periods
20 Years Through 12/31/17
| On a monthly rolling basis, the Fund outperformed the Russell 2000 in 70% of all 10-year periods; 67% of all 5-year periods; and 54% of all 1-year periods. |
| PERIODS BEATING THE INDEX | FUND AVG (%)1 | INDEX AVG (%)1 | ||||||||||||
| 10-year | 85/121 | 70% | 8.6 | 6.7 | ||||||||||
| 5-year | 121/181 | 67% | 10.1 | 8.2 | ||||||||||
| 1-year | 124/229 | 54% | 11.4 | 9.9 | ||||||||||
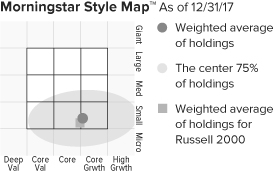
The Morningstar Style Map is the Morningstar Style Box™ with the center 75% of fund holdings plotted as the Morningstar Ownership Zone™. The Morningstar Style Box is designed to reveal a fund’s investment strategy. The Morningstar Ownership Zone provides detail about a portfolio’s investment style by showing the range of stock sizes and styles. The Ownership Zone is derived by plotting each stock in the portfolio within the proprietary Morningstar Style Box. Over time, the shape and location of a fund’s ownership zone may vary. See page 128 for additional information. |
Value of $10,000
as of 12/31/17 ($)
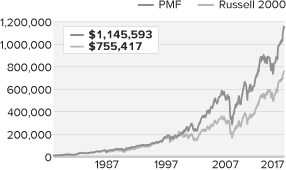
| Top 10 Positions | ||
| % of Net Assets | ||
| Sun Hydraulics | 2.0 | |
| FLIR Systems | 1.8 | |
| Tennant Company | 1.4 | |
| HEICO Corporation | 1.4 | |
| First Citizens BancShares Cl. A | 1.3 | |
| Quaker Chemical | 1.2 | |
| Merit Medical Systems | 1.2 | |
| Bio-Techne | 1.1 | |
| Raven Industries | 1.1 | |
| Valmont Industries | 1.1 | |
| Portfolio Sector Breakdown | ||
| % of Net Assets | ||
| Industrials | 27.6 | |
| Information Technology | 19.5 | |
| Financials | 13.6 | |
| Health Care | 9.5 | |
| Consumer Discretionary | 9.2 | |
| Materials | 8.1 | |
| Energy | 4.0 | |
| Real Estate | 2.5 | |
| Consumer Staples | 1.7 | |
| Telecommunication Services | 0.2 | |
| Utilities | 0.2 | |
| Miscellaneous | 3.1 | |
| Cash and Cash Equivalents | 0.8 | |
| Calendar Year Total Returns (%) | ||
| YEAR | PMF | |
| 2017 | 16.2 | |
| 2016 | 26.5 | |
| 2015 | -11.4 | |
| 2014 | -0.7 | |
| 2013 | 35.3 | |
| 2012 | 14.6 | |
| 2011 | -4.2 | |
| 2010 | 23.9 | |
| 2009 | 36.3 | |
| 2008 | -34.8 | |
| 2007 | 2.8 | |
| 2006 | 14.8 | |
| 2005 | 12.5 | |
| 2004 | 20.2 | |
| 2003 | 40.3 | |
| Upside/Downside Capture Ratios | ||||
| Periods Ended 12/31/17 (%) | ||||
| UPSIDE | DOWNSIDE | |||
| 10-Year | 93 | 96 | ||
| From 12/31/78 (Russell 2000 Inception) | 89 | 71 | ||
| Portfolio Diagnostics | ||
| Fund Net Assets | $2,110 million | |
| Number of Holdings | 331 | |
| 2017 Annual Turnover Rate | 27% | |
| Average Market Capitalization1 | $2,036 million | |
| Weighted Average P/E Ratio2,3 | 24.2x | |
| Weighted Average P/B Ratio2 | 2.5x | |
| Active Share4 | 86% | |
| U.S. Investments (% of Net Assets) | 87.1% | |
| Non-U.S. Investments (% of Net Assets) | 12.1% | |
| 1 | Geometric Average. This weighted calculation uses each portfolio holding’s market cap in a way designed to not skew the effect of very large or small holdings; instead, it aims to better identify the portfolio’s center, which Royce believes offers a more accurate measure of average market cap than a simple mean or median. |
| 2 | Harmonic Average. This weighted calculation evaluates a portfolio as if it were a single stock and measures it overall. It compares the total market value of the portfolio to the portfolio’s share in the earnings or book value, as the case may be, of its underlying stocks. |
| 3 | The Fund’s P/E ratio calculation excludes companies with zero or negative earnings (7% of portfolio holdings as of 12/31/17). |
| 4 | Active Share is the sum of the absolute values of the different weightings of each holding in the Fund versus each holding in the benchmark, divided by two. |
| Important Performance and Expense Information All performance information in this Report reflects past performance, is presented on a total return basis, reflects the reinvestment of distributions, and does not reflect the deduction of taxes that a shareholder would pay on fund distributions or the redemption of fund shares. Past performance is no guarantee of future results. Investment return and principal value of an investment will fluctuate, so that shares may be worth more or less than their original cost when redeemed. Shares redeemed within 30 days of purchase may be subject to a 1% redemption fee payable to the Fund, which is not reflected in the performance shown above; if it were, performance would be lower. Current month-end performance may be higher or lower than performance quoted and may be obtained at www.roycefunds.com. All performance and risk information reflects results of the Investment Class (its oldest class). Operating expenses reflect the Fund’s total annual operating expenses for the Investment Class as of the Fund’s most current prospectus and include management fees, other expenses, and acquired fund fees and expenses. Acquired fund fees and expenses reflect the estimated amount of the fees and expenses incurred indirectly by the Fund through its investment in mutual funds, hedge funds, private equity funds, and other investment companies. Regarding the “Top Contributors” and “Top Detractors” tables shown above, the sum of all contributors to, and all detractors from, performance for all securities in the portfolio would approximate the Fund’s year-to-date performance for 2017. Upside Capture Ratio measures a manager’s performance in up markets relative to the Fund’s benchmark. It is calculated by measuring the Fund’s performance in quarters when the benchmark went up and dividing it by the benchmark’s return in those quarters. Downside Capture Ratio measures a manager’s performance in down markets relative to the Fund’s benchmark (Russell 2000). It is calculated by measuring the Fund’s performance in quarters when the benchmark goes down and dividing it by the benchmark’s return in those quarters. |
| The Royce Funds 2017 Annual Report to Shareholders | 25 |
| MANAGERS’ DISCUSSION | ||
| Royce Premier Fund (RPR) |
 |
| Chuck Royce Lauren Romeo, CFA Steven McBoyle, CPA, CA |
| FUND PERFORMANCE A second consecutive year of strong absolute and relative performance allowed Royce Premier Fund to extend its relative advantages over its small-cap benchmark, the Russell 2000 Index, for the one-, three-, 10-, 15-, 20-, 25-year, and since inception (12/31/91) periods ended December 31, 2017. The Fund gained 23.8% in 2017, comfortably ahead of the Russell 2000, which was up 14.6% for the same period. Breadth was solid in cyclical sectors, with Industrials, Information Technology, and Materials all doing well on an absolute basis. However, these sectors still trailed Health Care, the strongest performer in the small-cap index thanks to resurgent biotechnology companies. |
| WHAT WORKED... AND WHAT DIDN’T |
| Eight of the Fund’s nine equity sectors were positive contributors in 2017. Driven by the global technology buildout that benefited several portfolio holdings, Information Technology made by far the largest contribution, followed by Industrials. (These were also the portfolio’s two largest sector weightings at year-end). Energy detracted, but its negative impact was minor, thanks to some effective stock picking in a slumping area of the market. The Fund’s relative advantage over the Russell 2000 came overwhelmingly from strong stock selection, most notably in Information Technology. Stock picking also provided a significant relative edge in Financials, in large part due to strong results for Ashmore Group, a U.K.-based asset manager specializing in emerging market fixed income. Our underweight in banks also boosted relative results in the sector. Hurting relative results were our low weighting in Health Care, which included no exposure to biotechnology, and the portfolio’s cash position. At the industry level, the electronic equipment, instruments & components group in Information Technology dominated, with two of the portfolio’s top-five contributors coming from this industry. Cognex Corporation is the market leader in machine vision technology, which captures and analyzes visual information to automate tasks that previously relied on human eyesight and is thus a major driver of industrial and process automation. The firm has just begun to move into key end markets, such as consumer electronics, while adoption is expanding to other industries, including a fast-growing logistics segment. With ever-evolving proprietary technology and an unmatched global corps of engineers serving customers, we believe the firm looks poised to sustain its well-above-average returns on invested capital (ROIC) and compound its business value into the future. IPG Photonics is the dominant provider of fiber lasers, which continue to take share from traditional industrial lasers in cutting, marking, and welding. Renewed demand in China fueled further growth in 2017 while Europe’s expanding economy bodes well for 2018. IPG also continually drove down costs while increasing the power of its core fiber lasers. Moreover, three smaller technology acquisitions in 2017 expanded its addressable markets. From the semiconductors & semiconductor equipment group, MKS Instruments is the leading provider of critical components used in semiconductor manufacture. The firm continues to benefit from the transition to new chip architectures that require additional new equipment. As for positions that detracted, CIRCOR International makes an array of valves and provides related flow control products and services. Valve sales to the domestic land-based oil industry improved when the price of oil rallied in the second half of the year, but could not offset the sales declines to large offshore project customers where investments are only now showing signs of bottoming and pricing is intense. We think it can eventually benefit from a recovery in energy prices and the further integration of a recent acquisition, which diversifies its end markets and brings higher margins, differentiated products, and aftermarket service revenue streams, factors that led us to add shares in the second half. We chose to sell our position in MSC Industrial Direct, which supplies metalworking and maintenance and repair parts. Multiples were compressed as gross margins began to reflect pressure from Amazon’s revamped efforts to expand its own industrial distribution business. While its service-intensive metalworking business looked better insulated from the encroaching competition, we had doubts about the sustainability of its previous levels of ROIC for its more standard maintenance and repair operations, which account for about 50% of its business. |
| Top Contributors to Performance For 2017 (%)1 | ||||
| Cognex Corporation | 3.03 | |||
| MKS Instruments | 2.08 | |||
| IPG Photonics | 1.70 | |||
| Copart | 1.52 | |||
| Westlake Chemical | 1.46 | |||
| 1 Includes dividends | ||||
| Top Detractors from Performance For 2017 (%)2 | ||||
| CIRCOR International | -0.51 | |||
| MSC Industrial Direct Cl. A | -0.32 | |||
| Dorman Products | -0.32 | |||
| SEACOR Marine Holdings | -0.27 | |||
| Minerals Technologies | -0.22 | |||
| 2 Net of dividends | ||||
| CURRENT POSITIONING AND OUTLOOK |
| We believe that high-ROIC small-cap companies can continue to outperform, which should benefit our strategy. Many of these companies are in cyclical areas, including Industrials and Information Technology, that we think have relatively more attractive valuations even after the strong run of the last two years. So while we are cautious about the prospects for small-cap returns as whole, we are also optimistic about our portfolio’s return potential as it leans towards three factors we believe will be well-rewarded going forward—high profitability, cyclicality, and global exposure. We trimmed some holdings that appeared extended in 2017, particularly in the technology area, and invested more in high-quality cyclical companies in the paper and chemical industries, which looked well positioned to benefit from accelerating global growth. |
| 26 | The Royce Funds 2017 Annual Report to Shareholders |
| PERFORMANCE AND PORTFOLIO REVIEW | TICKER SYMBOLS RYPRX RPFFX RPFIX RPRCX RPRRX RPRWX |
| Performance and Expenses | ||||||||||||||||||
| Average Annual Total Return (%) Through 12/31/17 | ||||||||||||||||||
| JUL-DEC 20171 | 1-YR | 3-YR | 5-YR | 10-YR | 15-YR | 20-YR | 25-YR | SINCE INCEPTION (12/31/91) | ||||||||||
| RPR | 13.86 | 23.77 | 11.11 | 11.68 | 8.78 | 12.27 | 10.96 | 11.78 | 11.94 | |||||||||
| Annual Operating Expenses: 1.16% | ||||||||||||||||||
| 1 Not annualized | ||||||||||||||||||
Relative Returns: Monthly Rolling Average Annual Return Periods
| On a monthly rolling basis, the Fund outperformed the Russell 2000 in 98% of all 10-year periods; 69% of all 5-year periods; and 63% of all 1-year periods. |
| PERIODS BEATING THE INDEX | FUND AVG (%)1 | INDEX AVG (%)1 | ||||||||||||
| 10-year | 119/121 | 98% | 10.2 | 6.7 | ||||||||||
| 5-year | 125/181 | 69% | 11.1 | 8.2 | ||||||||||
| 1-year | 145/229 | 63% | 12.1 | 9.9 | ||||||||||

The Morningstar Style Map is the Morningstar Style Box™ with the center 75% of fund holdings plotted as the Morningstar Ownership Zone™. The Morningstar Style Box is designed to reveal a fund’s investment strategy. The Morningstar Ownership Zone provides detail about a portfolio’s investment style by showing the range of stock sizes and styles. The Ownership Zone is derived by plotting each stock in the portfolio within the proprietary Morningstar Style Box. Over time, the shape and location of a fund’s ownership zone may vary. See page 128 for additional information. |
Value of $10,000
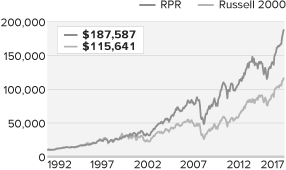
| Top 10 Positions | ||
| % of Net Assets | ||
| Landstar System | 3.1 | |
| Copart | 3.1 | |
| National Instruments | 3.1 | |
| Lincoln Electric Holdings | 3.0 | |
| Woodward | 2.8 | |
| Valmont Industries | 2.7 | |
| Kirby Corporation | 2.7 | |
| Ashmore Group | 2.5 | |
| Alleghany Corporation | 2.4 | |
| Air Lease Cl. A | 2.4 | |
| Portfolio Sector Breakdown | ||
| % of Net Assets | ||
| Industrials | 32.4 | |
| Information Technology | 17.5 | |
| Financials | 12.7 | |
| Consumer Discretionary | 8.6 | |
| Materials | 8.1 | |
| Health Care | 3.3 | |
| Energy | 2.6 | |
| Consumer Staples | 2.2 | |
| Real Estate | 1.0 | |
| Miscellaneous | 1.1 | |
| Cash and Cash Equivalents | 10.5 | |
| Calendar Year Total Returns (%) | ||
| YEAR | RPR | |
| 2017 | 23.8 | |
| 2016 | 23.0 | |
| 2015 | -9.9 | |
| 2014 | -0.9 | |
| 2013 | 27.7 | |
| 2012 | 11.4 | |
| 2011 | -0.9 | |
| 2010 | 26.5 | |
| 2009 | 33.3 | |
| 2008 | -28.3 | |
| 2007 | 12.7 | |
| 2006 | 8.8 | |
| 2005 | 17.1 | |
| 2004 | 22.8 | |
| 2003 | 38.7 | |
| Upside/Downside Capture Ratios | ||||
| Periods Ended 12/31/17 (%) | ||||
| UPSIDE | DOWNSIDE | |||
| 10-Year | 94 | 91 | ||
| From 12/31/91 (Start of Fund’s First Full Quarter) | 93 | 72 | ||
| Portfolio Diagnostics | ||
| Fund Net Assets | $2,360 million | |
| Number of Holdings | 57 | |
| 2017 Annual Turnover Rate | 8% | |
| Average Market Capitalization1 | $3,969 million | |
| Weighted Average P/E Ratio2,3 | 25.4x | |
| Weighted Average P/B Ratio2 | 3.1x | |
| Active Share4 | 97% | |
| U.S. Investments (% of Net Assets) | 79.3% | |
| Non-U.S. Investments (% of Net Assets) | 10.2% | |
| 1 | Geometric Average. This weighted calculation uses each portfolio holding’s market cap in a way designed to not skew the effect of very large or small holdings; instead, it aims to better identify the portfolio’s center, which Royce believes offers a more accurate measure of average market cap than a simple mean or median. |
| 2 | Harmonic Average. This weighted calculation evaluates a portfolio as if it were a single stock and measures it overall. It compares the total market value of the portfolio to the portfolio’s share in the earnings or book value, as the case may be, of its underlying stocks. |
| 3 | The Fund’s P/E ratio calculation excludes companies with zero or negative earnings (4% of portfolio holdings as of 12/31/17). |
| 4 | Active Share is the sum of the absolute values of the different weightings of each holding in the Fund versus each holding in the benchmark, divided by two. |
| Important Performance and Expense Information All performance information in this Report reflects past performance, is presented on a total return basis, reflects the reinvestment of distributions, and does not reflect the deduction of taxes that a shareholder would pay on fund distributions or the redemption of fund shares. Past performance is no guarantee of future results. Investment return and principal value of an investment will fluctuate, so that shares may be worth more or less than their original cost when redeemed. Shares redeemed within 30 days of purchase may be subject to a 1% redemption fee payable to the Fund, which is not reflected in the performance shown above; if it were, performance would be lower. Current month-end performance may be higher or lower than performance quoted and may be obtained at www.roycefunds.com. All performance and risk information reflects results of the Investment Class (its oldest class). Operating expenses reflect the Fund’s total annual operating expenses for the Investment Class as of the Fund’s most current prospectus and include management fees and other expenses. Regarding the “Top Contributors” and “Top Detractors” tables shown above, the sum of all contributors to, and all detractors from, performance for all securities in the portfolio would approximate the Fund’s year-to-date performance for 2017. Upside Capture Ratio measures a manager’s performance in up markets relative to the Fund’s benchmark. It is calculated by measuring the Fund’s performance in quarters when the benchmark went up and dividing it by the benchmark’s return in those quarters. Downside Capture Ratio measures a manager’s performance in down markets relative to the Fund’s benchmark (Russell 2000). It is calculated by measuring the Fund’s performance in quarters when the benchmark goes down and dividing it by the benchmark’s return in those quarters. |
| The Royce Funds 2017 Annual Report to Shareholders | 27 |
| MANAGER’S DISCUSSION | ||
| Royce Small-Cap Leaders Fund (ROH) |
 |
| Lauren Romeo, CFA |
| FUND PERFORMANCE Outperformance by for small-cap growth stocks created some challenges in 2017 for the valuation-sensitive, quality-centric strategy we use in Royce Small-Cap Leaders Fund. The Fund gained 10.1% in 2017, trailing its small-cap benchmark, the Russell 2000 Index, which was up 14.6% for the same period. Investors showed a greater preference for growth stocks and companies without earnings in 2017. There was, however, one potentially important reversal that occurred in the fourth quarter: small-cap cyclicals enjoyed higher returns than defensive stocks. This helped the Fund to outperform the Russell 2000 for the quarter, up 4.4% versus 3.3%. |
| WHAT WORKED... AND WHAT DIDN’T |
| Led by an impressive positive contribution from Financials, six of the portfolio’s nine equity sectors finished 2017 in the black, with Industrials also making a notable impact. Energy—the only Russell 2000 sector with a negative return in 2017—and Consumer Discretionary detracted modestly while Materials was basically flat. At the industry level, capital markets, from the Financials sector, led by a wide margin, followed by machinery (Industrials) and semiconductors & semiconductor equipment (Information Technology). The impact of industries that detracted was comparably minor, with the largest net losses coming from specialty retail (Consumer Discretionary) and energy equipment & services (Energy). Relative to the Russell 2000, the Fund was hurt most by its significant underweight in Health Care, the top-performing small-cap sector in 2017. The disadvantage came mostly from very low exposure to biotechnology, which rebounded strongly after correcting in 2017. Ineffective stock selection hampered results in Consumer Discretionary, particularly in the aforementioned specialty retail group, as well as in Industrials and Information Technology. Conversely, savvy stock picking gave the portfolio a sizable relative edge in Financials, much of it coming from holdings in the previously mentioned capital markets group as well as thrifts & mortgage finance companies. Our underweight in struggling bank stocks was another source of outperformance in the sector. Stock selection was also additive in Consumer Staples, while in Real Estate we benefited from a combination of a strong year for top-10 holding Marcus & Millichap, which provides sales, financing, research, and advisory services in the commercial real estate industry, as well as our low weighting in the sector. Another top-10 position, residential mortgage insurance specialist Genworth MI Canada, was the portfolio’s top contributor. The firm saw below-average insured mortgage loss ratios thanks to stronger oil prices, which led to improved employment and economic growth in energy-driven provinces such as Alberta. Its business also benefited from premium rate increases that offset slower overall market growth due to the higher capital requirements that Canada implemented early in 2017. Artisan Partners Asset Management is another top-10 holding. It led the capital markets group, boosted by strong equity markets, improved performance for key funds, and promising early inflows for the firm’s newer, more differentiated portfolios. All of this seemed to inspire confidence that the company would return to net inflows if these trends can be sustained. Celestica, the Fund’s top detractor at the position level, is another Canadian business. The company manufactures electronic components and has been making strides toward its higher-margin advanced technology solutions segment, which accounts for about one third of its sales, but not at a fast enough clip to offset sluggish near-term trends in its core communications and enterprise business. Additionally, spending in advance of revenue from new programs wins pressured profit margins. We began to rebuild our position in September. Steelcase suffered from choppy demand in its North American business, which exacerbated the headwind of an ongoing shift to open plan office furniture solutions at the expense of layouts geared toward Steelcase’s office and cubicle offerings. While the company has aggressively ramped up new products to meet the trend, they are just now reaching scale where their growth offsets legacy sale declines. Ongoing unprofitability in Europe, caused by temporarily elevated spending and uneven revenues, has further pushed out the unlocking of this earnings power. We reduced our stake in 2017. |
| Top Contributors to Performance For 2017 (%)1 | ||||
| Genworth MI Canada | 1.33 | |||
| Artisan Partners Asset Management Cl. A | 1.14 | |||
| Houlihan Lokey Cl. A | 0.92 | |||
| Kadant | 0.76 | |||
| Lazard Cl. A | 0.72 | |||
| 1 Includes dividends | ||||
| Top Detractors from Performance For 2017 (%)2 | ||||
| Celestica | -0.60 | |||
| Steelcase Cl. A | -0.59 | |||
| CIRCOR International | -0.51 | |||
| Xperi | -0.47 | |||
| Genesco | -0.45 | |||
| 2 Net of dividends | ||||
| CURRENT POSITIONING AND OUTLOOK |
| It remains an open question, of course, if the Fund’s strength toward the end of 2017 marked a temporary shift or if it established a more discerning environment for quality. We think the latter is more likely. In fact, we still believe that growth’s dominance in 2017 was a pause in the long overdue reversion to the mean of small-cap value and quality outperformance that began in 2016. Not only will fiscal (rather than monetary) policy increasingly be the likely top-down focus of investors, but the growing global economy should also reward small-cap cyclicals, as previous accelerations have done. Finally, while second-half—and especially fourth-quarter—performance for many holdings was highly encouraging, several of our more cyclical companies remain more attractively valued after having lagged through the first three quarters of 2017 despite continuing to post in-line financial results and guidance. |
| 28 | The Royce Funds 2017 Annual Report to Shareholders |
| PERFORMANCE AND PORTFOLIO REVIEW | TICKER SYMBOLS RYOHX ROHHX ROHRX |
| Performance and Expenses | ||||||||||||
| Average Annual Total Return (%) Through 12/31/17 | ||||||||||||
| JUL-DEC 20171 | 1-YR | 3-YR | 5-YR | 10-YR | SINCE INCEPTION (6/30/03) | |||||||
| ROH | 8.91 | 10.15 | 6.55 | 8.90 | 6.89 | 9.73 | ||||||
| Annual Gross Operating Expenses: 1.58% Annual Net Operating Expenses: 1.49% | ||||||||||||
| 1 Not annualized | ||||||||||||

The Morningstar Style Map is the Morningstar Style Box™ with the center 75% of fund holdings plotted as the Morningstar Ownership Zone™. The Morningstar Style Box is designed to reveal a fund’s investment strategy. The Morningstar Ownership Zone provides detail about a portfolio’s investment style by showing the range of stock sizes and styles. The Ownership Zone is derived by plotting each stock in the portfolio within the proprietary Morningstar Style Box. Over time, the shape and location of a fund’s ownership zone may vary. See page 128 for additional information. |
Value of $10,000
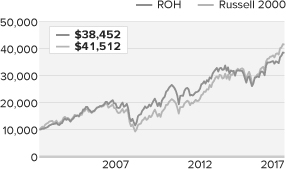
| Top 10 Positions | ||
| % of Net Assets | ||
| Minerals Technologies | 3.1 | |
| Marcus & Millichap | 3.1 | |
| RLI Corp. | 3.0 | |
| Artisan Partners Asset Management Cl. A | 2.9 | |
| Genworth MI Canada | 2.9 | |
| Pason Systems | 2.4 | |
| Caleres | 2.3 | |
| Greenbrier Companies (The) | 2.3 | |
| Bio-Techne | 2.1 | |
| TGS-NOPEC Geophysical | 2.1 | |
| Portfolio Sector Breakdown | ||
| % of Net Assets | ||
| Industrials | 25.8 | |
| Information Technology | 19.2 | |
| Financials | 15.0 | |
| Consumer Discretionary | 10.5 | |
| Consumer Staples | 6.7 | |
| Health Care | 5.4 | |
| Energy | 5.3 | |
| Materials | 4.4 | |
| Real Estate | 3.1 | |
| Miscellaneous | 1.0 | |
| Cash and Cash Equivalents | 3.6 | |
| Calendar Year Total Returns (%) | ||
| YEAR | ROH | |
| 2017 | 10.1 | |
| 2016 | 25.5 | |
| 2015 | -12.5 | |
| 2014 | -3.3 | |
| 2013 | 30.9 | |
| 2012 | 11.5 | |
| 2011 | -6.5 | |
| 2010 | 24.8 | |
| 2009 | 38.0 | |
| 2008 | -29.2 | |
| 2007 | 7.3 | |
| 2006 | 13.7 | |
| 2005 | 14.9 | |
| 2004 | 27.2 | |
| Upside/Downside Capture Ratios | ||||
| Periods Ended 12/31/17 (%) | ||||
| UPSIDE | DOWNSIDE | |||
| 10-Year | 89 | 96 | ||
| From 6/30/03 (Start of Fund’s First Full Quarter) | 93 | 93 | ||
| Portfolio Diagnostics | ||
| Fund Net Assets | $85 million | |
| Number of Holdings | 72 | |
| 2017 Annual Turnover Rate | 74% | |
| Average Market Capitalization1 | $1,842 million | |
| Weighted Average P/E Ratio2,3 | 21.0x | |
| Weighted Average P/B Ratio2 | 2.5x | |
| Active Share4 | 96% | |
| U.S. Investments (% of Net Assets) | 77.7% | |
| Non-U.S. Investments (% of Net Assets) | 18.7% | |
| 1 | Geometric Average. This weighted calculation uses each portfolio holding’s market cap in a way designed to not skew the effect of very large or small holdings; instead, it aims to better identify the portfolio’s center, which Royce believes offers a more accurate measure of average market cap than a simple mean or median. |
| 2 | Harmonic Average. This weighted calculation evaluates a portfolio as if it were a single stock and measures it overall. It compares the total market value of the portfolio to the portfolio’s share in the earnings or book value, as the case may be, of its underlying stocks. |
| 3 | The Fund’s P/E ratio calculation excludes companies with zero or negative earnings (7% of portfolio holdings as of 12/31/17). |
| 4 | Active Share is the sum of the absolute values of the different weightings of each holding in the Fund versus each holding in the benchmark, divided by two. |
| Important Performance and Expense Information All performance information in this Report reflects past performance, is presented on a total return basis, reflects the reinvestment of distributions, and does not reflect the deduction of taxes that a shareholder would pay on fund distributions or the redemption of fund shares. Past performance is no guarantee of future results. Investment return and principal value of an investment will fluctuate, so that shares may be worth more or less than their original cost when redeemed. Shares redeemed within 30 days of purchase may be subject to a 1% redemption fee payable to the Fund, which is not reflected in the performance shown above; if it were, performance would be lower. Current month-end performance may be higher or lower than performance quoted and may be obtained at www.roycefunds.com. All performance and risk information reflects results of the Service Class (its oldest class). Gross operating expenses reflect the Fund’s gross total annual operating expenses for the Service Class and include management fees, 12b-1 distribution and service fees, and other expenses. Net operating expenses reflect contractual fee waivers and/or expense reimbursements. All expense information is reported as of the Fund’s most current prospectus. Royce & Associates has contractually agreed to waive fees and/or reimburse operating expenses to the extent necessary to maintain the Service Class’s net annual operating expenses, (excluding brokerage commissions, taxes, interest, litigation expenses, acquired fund fees and expenses, and other expenses not borne in the ordinary course of business), at or below 1.49% through April 30, 2018. Regarding the “Top Contributors” and “Top Detractors” tables shown above, the sum of all contributors to, and all detractors from, performance for all securities in the portfolio would approximate the Fund’s year-to-date performance for 2017. Upside Capture Ratio measures a manager’s performance in up markets relative to the Fund’s benchmark. It is calculated by measuring the Fund’s performance in quarters when the benchmark went up and dividing it by the benchmark’s return in those quarters. Downside Capture Ratio measures a manager’s performance in down markets relative to the Fund’s benchmark (Russell 2000). It is calculated by measuring the Fund’s performance in quarters when the benchmark goes down and dividing it by the benchmark’s return in those quarters. |
| The Royce Funds 2017 Annual Report to Shareholders | 29 |
| MANAGER’S DISCUSSION | ||
| Royce Small-Cap Value Fund (RVV) |
 |
| Jay Kaplan, CFA |
| FUND PERFORMANCE In a challenging year for value stocks, Royce Small-Cap Value Fund rose 5.3%, trailing the 14.6% advance for its small-cap benchmark, the Russell 2000 Index. This was a disappointing result, even in a year when our contrarian value approach was decidedly out of favor and investors showed a marked preference for growth stocks and companies without earnings. There was, however, a potentially very significant reversal in the year’s fourth quarter: small-cap companies with earnings enjoyed higher returns than those without. It remains an open question, of course, if this was a temporary shift or a sign of a more discerning environment. |
| WHAT WORKED... AND WHAT DIDN’T |
| Six of the Fund’s nine equity sectors made positive contributions to performance in 2017. Industrials and Financials made the largest positive impacts, followed by Information Technology, while Consumer Discretionary, Energy, and Consumer Staples detracted. Four industries made outsized contributions to calendar-year performance—capital markets (Financials), professional services, machinery (both in Industrials), and thrifts & mortgage finance (Financials)—while the biggest detractors were specialty retail (Consumer Discretionary), which led by a wide margin, energy equipment & services (Energy), technology hardware, storage & peripherals (Information Technology), and food & staples retailing (Consumer Staples). Relative to the benchmark, 2017 performance was hurt most by ineffective stock selection in Consumer Discretionary, where the specialty retail group had the biggest negative impact. Similar issues with stock selection affected Information Technology, where holdings in the electronic equipment, instruments & components underperformed. In addition, the portfolio’s limited exposure to Health Care had an adverse effect as the Fund had no holdings in growth stalwarts biotechnology, a leading industry in the small-cap index in 2017. Helping relative results most in 2017 was savvy stock selection in Financials, with strength again coming from capital markets and thrifts & mortgage finance, as well as from insurance. The Fund’s underweight in Real Estate—and a strong result from Marcus & Millichap, which provides investment brokerage and financing services for commercial real estate—were additional positives versus the benchmark, as were our overweight and effective stock picking in Industrials. The Fund’s top contributor in 2017 was kitchen cabinet and vanity manufacturer American Woodmark. Its stock was doing well before the early December announcement that it was acquiring RSI Home Products, a profitable manufacturer of kitchen and bath cabinetry and home storage products. The market quickly decided that this was an accretive purchase, which sent its shares climbing even higher. Genworth MI Canada provides private residential mortgage insurance north of the border. Its shares benefited from losses that came in well below expectations and related overall business strength. Moelis & Company, an investment bank specializing in mergers & acquisitions, had robust business through much of the year. Executive search specialist Korn/Ferry International drew benefits from the acceleration of its recruitment business and the successful integration of its acquisition of Hay Group. We parted ways with each of the portfolio’s top-five detractors, four of which came from the specialty retail industry. Hibbett Sports, Genesco, The Cato Corporation, and Kirkland’s all face ongoing struggles with the secular shift in consumer spending and shopping habits, along with the ensuing margin contraction, that have been created to a large degree by the omnipresence of Amazon. Matrix Service is a contractor to the energy, power, and industrial markets that had to deal with ongoing delays in new project awards and starts, depressed maintenance spending, and increased cost estimates on an electrical infrastructure project, a long string of disappointments that exhausted our patience. |
| Top Contributors to Performance For 2017 (%)1 | ||||
| American Woodmark | 1.13 | |||
| Genworth MI Canada | 1.11 | |||
| Moelis & Company Cl. A | 0.86 | |||
| Korn/Ferry International | 0.79 | |||
| Federated Investors Cl. B | 0.72 | |||
| 1 Includes dividends | ||||
| Top Detractors from Performance For 2017 (%)2 | ||||
| Matrix Service | -1.22 | |||
| Hibbett Sports | -0.95 | |||
| Genesco | -0.66 | |||
| Cato Corporation (The) Cl. A | -0.56 | |||
| Kirkland’s | -0.56 | |||
| 2 Net of dividends | ||||
| CURRENT POSITIONING AND OUTLOOK |
| Valuations continue to run higher than we think is healthy. Over the last two years, much has gone right for stocks versus a near-absence of bad news or negative developments. Equities are now enjoying a growing economy, and, while rates are rising, they are rising slowly and remain at the far low end of their historical range. The recent tax bill provides more good news. As contrarians, we wonder what happens if something goes wrong. What happens if growth stumbles, the yield curve inverts, and/or the deficit balloons? The market has been in a ‘risk-on, can’t lose’ mode for so long, we think investors would have trouble adjusting to new adversities, creating the possibility of a downdraft. So we remain cautious and have chosen to hold companies where operating risk appears low and fundamentals look strong, which helps to compensate for their high valuations, especially given that most of the stocks that screen for low valuation look cheap for very good reasons and thus do not appeal to us. Some exceptions to this include a few small-cap airlines and furniture makers, as well as individual situations in restaurants and insurance. |
| 30 | The Royce Funds 2017 Annual Report to Shareholders |
| PERFORMANCE AND PORTFOLIO REVIEW | TICKER SYMBOLS RYVFX RVVHX RVFIX RVFCX RVVRX RVFKX |
| Performance and Expenses | ||||||||||||||
| Average Annual Total Return (%) Through 12/31/17 | ||||||||||||||
| JUL-DEC 20171 | 1-YR | 3-YR | 5-YR | 10-YR | 15-YR | SINCE INCEPTION (6/14/01) | ||||||||
| RVV | 9.89 | 5.27 | 4.09 | 7.57 | 5.69 | 11.31 | 9.59 | |||||||
| Annual Operating Expenses: 1.49% | ||||||||||||||
| 1 Not annualized | ||||||||||||||

The Morningstar Style Map is the Morningstar Style Box™ with the center 75% of fund holdings plotted as the Morningstar Ownership Zone™. The Morningstar Style Box is designed to reveal a fund’s investment strategy. The Morningstar Ownership Zone provides detail about a portfolio’s investment style by showing the range of stock sizes and styles. The Ownership Zone is derived by plotting each stock in the portfolio within the proprietary Morningstar Style Box. Over time, the shape and location of a fund’s ownership zone may vary. See page 128 for additional information. |
Value of $10,000
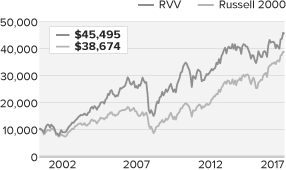
| Top 10 Positions | ||
| % of Net Assets | ||
| Spirit Airlines | 2.7 | |
| Genworth MI Canada | 2.6 | |
| Vishay Intertechnology | 2.6 | |
| Wabash National | 2.3 | |
| Insight Enterprises | 2.3 | |
| PC Connection | 2.1 | |
| Fabrinet | 2.0 | |
| Celestica | 2.0 | |
| Gentex Corporation | 2.0 | |
| Federated Investors Cl. B | 2.0 | |
| Portfolio Sector Breakdown | ||
| % of Net Assets | ||
| Industrials | 24.7 | |
| Information Technology | 23.4 | |
| Financials | 21.3 | |
| Consumer Discretionary | 13.4 | |
| Energy | 2.4 | |
| Health Care | 1.7 | |
| Consumer Staples | 1.5 | |
| Real Estate | 1.5 | |
| Utilities | 1.3 | |
| Miscellaneous | 1.9 | |
| Cash and Cash Equivalents | 6.9 | |
| Calendar Year Total Returns (%) | ||
| YEAR | RVV | |
| 2017 | 5.3 | |
| 2016 | 21.1 | |
| 2015 | -11.5 | |
| 2014 | -0.0 | |
| 2013 | 27.8 | |
| 2012 | 9.6 | |
| 2011 | -7.4 | |
| 2010 | 25.0 | |
| 2009 | 44.7 | |
| 2008 | -34.2 | |
| 2007 | 3.8 | |
| 2006 | 16.8 | |
| 2005 | 17.2 | |
| 2004 | 30.9 | |
| 2003 | 54.3 | |
| Upside/Downside Capture Ratios | ||||
| Periods Ended 12/31/17 (%) | ||||
| UPSIDE | DOWNSIDE | |||
| 10-Year | 82 | 94 | ||
| From 6/30/01 (Start of Fund’s First Full Quarter) | 99 | 91 | ||
| Portfolio Diagnostics | ||
| Fund Net Assets | $252 million | |
| Number of Holdings | 74 | |
| 2017 Annual Turnover Rate | 61% | |
| Average Market Capitalization1 | $1,362 million | |
| Weighted Average P/E Ratio2,3 | 16.9x | |
| Weighted Average P/B Ratio2 | 1.9x | |
| Active Share4 | 97% | |
| U.S. Investments (% of Net Assets) | 81.3% | |
| Non-U.S. Investments (% of Net Assets) | 11.8% | |
| 1 | Geometric Average. This weighted calculation uses each portfolio holding’s market cap in a way designed to not skew the effect of very large or small holdings; instead, it aims to better identify the portfolio’s center, which Royce believes offers a more accurate measure of average market cap than a simple mean or median. |
| 2 | Harmonic Average. This weighted calculation evaluates a portfolio as if it were a single stock and measures it overall. It compares the total market value of the portfolio to the portfolio’s share in the earnings or book value, as the case may be, of its underlying stocks. |
| 3 | The Fund’s P/E ratio calculation excludes companies with zero or negative earnings (4% of portfolio holdings as of 12/31/17). |
| 4 | Active Share is the sum of the absolute values of the different weightings of each holding in the Fund versus each holding in the benchmark, divided by two. |
| Important Performance and Expense Information All performance information in this Report reflects past performance, is presented on a total return basis, reflects the reinvestment of distributions, and does not reflect the deduction of taxes that a shareholder would pay on fund distributions or the redemption of fund shares. Past performance is no guarantee of future results. Investment return and principal value of an investment will fluctuate, so that shares may be worth more or less than their original cost when redeemed. Shares redeemed within 30 days of purchase may be subject to a 1% redemption fee payable to the Fund, which is not reflected in the performance shown above; if it were, performance would be lower. Current month-end performance may be higher or lower than performance quoted and may be obtained at www.roycefunds.com. All performance and risk information reflects results of the Service Class (its oldest class). Certain immaterial adjustments were made to the net assets of Royce Small-Cap Value Fund at 6/30/16 for financial reporting purposes, and as a result the net asset values for shareholder transactions on that date and the calendar year Total Returns (%) based on those net asset values differ from the adjusted net asset values and calendar year total returns reported in the Financial Highlights. Operating expenses reflect the Fund’s total annual operating expenses for the Service Class as of the Fund’s most current prospectus and include management fees, 12b-1 distribution and service fees, and other expenses. Regarding the “Top Contributors” and “Top Detractors” tables shown above, the sum of all contributors to, and all detractors from, performance for all securities in the portfolio would approximate the Fund’s year-to-date performance for 2017. Upside Capture Ratio measures a manager’s performance in up markets relative to the Fund’s benchmark. It is calculated by measuring the Fund’s performance in quarters when the benchmark went up and dividing it by the benchmark’s return in those quarters. Downside Capture Ratio measures a manager’s performance in down markets relative to the Fund’s benchmark (Russell 2000). It is calculated by measuring the Fund’s performance in quarters when the benchmark goes down and dividing it by the benchmark’s return in those quarters. |
| The Royce Funds 2017 Annual Report to Shareholders | 31 |
| MANAGER’S DISCUSSION |
| Royce Small/Mid-Cap Premier Fund (RHF) |
 |
| Steven McBoyle, CPA, CA |
| FUND PERFORMANCE |
| A strong absolute and relative showing in 2017 allowed Royce Small/Mid-Cap Premier Fund to gain relative advantages for the one-, three-, 20-year, and since inception (12/27/95) periods ended December 31, 2017. The Fund advanced 21.2% in 2017, beating both its small- and mid-cap benchmark, the Russell 2500 Index, which was up 16.8%, and the small-cap Russell 2000 Index, which rose 14.6%, for the same period. We shifted the Fund’s benchmark from the Russell 2000 to the Russell 2500 during 2017 to better reflect the portfolio’s small- and mid-cap selection universe, which Royce defines as those with market capitalizations up to $15 billion. The Fund’s investment approach, however, remained unchanged—we continue to seek companies that we consider “premier”—those that we believe have sustainable, moat-like franchises, discernible competitive advantages, a history of prudent capital allocation, and opportunities to profitably reinvest excess cash flow. |
| Breadth was solid in cyclical sectors during 2017, with Industrials, Information Technology, and Materials all doing well. Health Care was the strongest performer in the Russell 2500 largely due to lofty returns from resurgent biotechnology companies. |
| WHAT WORKED... AND WHAT DIDN’T |
| Nine of the portfolio’s 10 equity sectors made positive contributions to calendar-year performance. Industrials led by a significant margin while notable net gains also came from Information Technology, and Consumer Discretionary. Energy made a very modest detraction. Along with Telecommunication Services (where the portfolio had no exposure), Energy was the only sector in the Russell 2500 to finish 2017 in the red. Relative to the Russell 2500, the portfolio drew its largest advantages from superior stock selection in the Industrials and Information Technology sectors. Our very low exposure to Energy, where we had no holdings at year-end, also proved advantageous. Conversely, our significant underweight in Health Care was a source of underperformance, as was the portfolio’s cash position. |
| Driven by the ongoing global technology buildout, the Fund’s top-contributing industry group was electronic equipment, instruments & components, home of its second-largest contributor, IPG Photonics. IPG is the dominant provider of fiber lasers, which continue to take share from traditional industrial lasers in cutting, marking, and welding. Renewed demand in China fueled further growth in 2017 while Europe’s expanding economy bodes well for 2018. IPG also continually drove down costs while increasing the power of its core fiber lasers. Moreover, three smaller technology acquisitions in 2017 expanded its addressable markets. We reduced our position as its shares rose. Westlake Chemical, the portfolio’s biggest holding at year-end, was its top contributor at the position level. The company produces basic chemicals, vinyls, polymers, and fabricated products for a range of consumer and industrial markets. North America’s largest polyethylene producer, Westlake also became the region’s most vertically integrated vinyls manufacturer in 2016 after acquiring Axiall. The company benefited from other synergies related to the acquisition, as well as from a much-improved vinyls cycle. Also making a large positive contribution was Copart, the largest online salvage auction provider in the U.S. Strong sales growth in 2017 was driven by the expansion of sites, favorable price dynamics, share gains among the insurance carriers that are its target customers, and its expansion into Europe. Led by insurance (Financials), only four industry groups had a negative impact on performance, each of them very minor, while two specialty retailers topped the portfolio’s list of detractors. The growing popularity of e-commerce is ushering in greater price transparency and algorithmic-based pricing strategies that are threatening profits across many industries resulting in an even more regular reexamination of our retail holdings. We exited our position in Dicks Sporting Goods in July. The company, which has been cutting costs and streamlining operations, nonetheless continued to report disappointing earnings due to poor sales. Earlier in the year we opted to sell our position in Signet Jewelers, which operates Zales, Jared, and Kay Jewelers, due to our discomfort with the company’s reliance on in-house financing to spur sales and sluggish earnings. |
| Top Contributors to Performance | |||
| For 2017 (%)1 | |||
| Westlake Chemical | 2.23 | ||
| IPG Photonics | 1.90 | ||
| Copart | 1.53 | ||
| NVR | 1.26 | ||
| Thor Industries | 1.20 | ||
| 1 Includes dividends | |||
| Top Detractors from Performance | |||
| For 2017 (%)2 | |||
| Dicks Sporting Goods | -0.69 | ||
| Signet Jewelers | -0.61 | ||
| Standard Motor Products | -0.30 | ||
| Minerals Technologies | -0.27 | ||
| Alleghany Corporation | -0.13 | ||
| 2 Net of dividends | |||
| CURRENT POSITIONING AND OUTLOOK |
| We believe that high-ROIC small-cap companies can continue to outperform. Many of these companies are in cyclical areas, that we think have relatively more attractive valuations even after the strong run of the last two years. So while we are cautious about the prospects for small- and mid-cap returns as a whole, we are also optimistic about our portfolio’s return potential as it leans towards three factors we believe will be well-rewarded going forward—high-quality business models that we think will be able to take advantage of cyclical strength or stress in the economy. During 2017, we reduced our exposure to the technology area while we invested in what we deemed were high-quality cyclical companies in a number of industries that appeared well-positioned to benefit from accelerating global growth. |
| 32 | The Royce Funds 2017 Annual Report to Shareholders |
| PERFORMANCE AND PORTFOLIO REVIEW | TICKER SYMBOLS RGFAX RHFHX RYGCX RHFRX |
| Performance and Expenses Average Annual Total Return (%) Through 12/31/17 | ||||||||||||||||
| JUL-DEC 20171 | 1-YR | 3-YR | 5-YR | 10-YR | 15-YR | 20-YR | SINCE INCEPTION (12/27/95) | |||||||||
| RHF | 14.69 | 21.21 | 10.11 | 10.70 | 7.84 | 10.98 | 11.50 | 12.73 | ||||||||
| Annual Operating Expenses: 1.30% | ||||||||||||||||
| 1 Not annualized | ||||||||||||||||
| Relative Returns: Monthly Rolling Average Annual Return Periods 20 Years Through 12/31/17 On a monthly rolling basis, the Fund outperformed the Russell 2000 in 77% of all 10-year periods; 73% of all 5-year periods; and 58% of all 1-year periods. | ||||||||||||
| PERIODS BEATING THE INDEX | FUND AVG (%)1 | INDEX AVG (%)1 | ||||||||||||
| 10-year | 93/121 | 77% | 9.0 | 6.7 | ||||||||||
| 5-year | 133/181 | 73% | 10.1 | 8.2 | ||||||||||
| 1-year | 132/229 | 58% | 13.2 | 9.9 | ||||||||||

The Morningstar Style Map is the Morningstar Style Box™ with the center 75% of fund holdings plotted as the Morningstar Ownership Zone™. The Morningstar Style Box is designed to reveal a fund’s investment strategy. The Morningstar Ownership Zone provides detail about a portfolio’s investment style by showing the range of stock sizes and styles. The Ownership Zone is derived by plotting each stock in the portfolio within the proprietary Morningstar Style Box. Over time, the shape and location of a fund’s ownership zone may vary. See page 128 for additional information. |
Value of $10,000
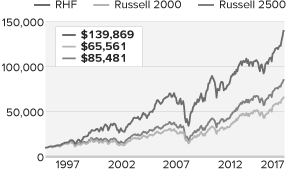
| Top 10 Positions | |||
| % of Net Assets | |||
| Westlake Chemical | 3.8 | ||
| Copart | 3.4 | ||
| LKQ Corporation | 3.3 | ||
| Thor Industries | 3.2 | ||
| ManpowerGroup | 2.9 | ||
| Alleghany Corporation | 2.8 | ||
| Children’s Place | 2.6 | ||
| Valmont Industries | 2.6 | ||
| Affiliated Managers Group | 2.5 | ||
| Minerals Technologies | 2.4 | ||
| Portfolio Sector Breakdown | |||
| % of Net Assets | |||
| Industrials | 28.9 | ||
| Consumer Discretionary | 22.2 | ||
| Materials | 9.1 | ||
| Financials | 8.8 | ||
| Information Technology | 6.0 | ||
| Consumer Staples | 3.6 | ||
| Real Estate | 3.4 | ||
| Health Care | 3.2 | ||
| Utilities | 1.6 | ||
| Miscellaneous | 0.4 | ||
| Cash and Cash Equivalents | 12.8 | ||
| Calendar Year Total Returns (%) | |||
| YEAR | RHF | ||
| 2017 | 21.2 | ||
| 2016 | 17.8 | ||
| 2015 | -6.5 | ||
| 2014 | -1.1 | ||
| 2013 | 26.0 | ||
| 2012 | 14.3 | ||
| 2011 | -9.3 | ||
| 2010 | 27.5 | ||
| 2009 | 51.8 | ||
| 2008 | -36.2 | ||
| 2007 | 1.2 | ||
| 2006 | 22.6 | ||
| 2005 | 8.7 | ||
| 2004 | 20.4 | ||
| 2003 | 38.1 | ||
| Upside/Downside Capture Ratios | |||
| Periods Ended 12/31/17 (%) | |||
| UPSIDE | DOWNSIDE | |||
| 10-Year | 92 | 94 | ||
| From 12/31/95 (Start of Fund’s First Full Quarter) | 109 | 87 | ||
| Portfolio Diagnostics | |||
| Fund Net Assets | $207 million | ||
| Number of Holdings | 64 | ||
| 2017 Annual Turnover Rate | 54% | ||
| Average Market Capitalization1 | $6,219 million | ||
| Weighted Average P/E Ratio2,3 | 23.5x | ||
| Weighted Average P/B Ratio2 | 3.1x | ||
| Active Share4 | 98% | ||
| U.S. Investments (% of Net Assets) | 83.5% | ||
| Non-U.S. Investments (% of Net Assets) | 3.7% | ||
| 1 | Geometric Average. This weighted calculation uses each portfolio holding’s market cap in a way designed to not skew the effect of very large or small holdings; instead, it aims to better identify the portfolio’s center, which Royce believes offers a more accurate measure of average market cap than a simple mean or median. |
| 2 | Harmonic Average. This weighted calculation evaluates a portfolio as if it were a single stock and measures it overall. It compares the total market value of the portfolio to the portfolio’s share in the earnings or book value, as the case may be, of its underlying stocks. |
| 3 | The Fund’s P/E ratio calculation excludes companies with zero or negative earnings (1% of portfolio holdings as of 12/31/17). |
| 4 | Active Share is the sum of the absolute values of the different weightings of each holding in the Fund versus each holding in the benchmark, divided by two. |
| Important Performance and Expense Information |
All performance information in this Report reflects past performance, is presented on a total return basis, reflects the reinvestment of distributions, and does not reflect the deduction of taxes that a shareholder would pay on fund distributions or the redemption of fund shares. Past performance is no guarantee of future results. Investment return and principal value of an investment will fluctuate, so that shares may be worth more or less than their original cost when redeemed. Shares redeemed within 30 days of purchase may be subject to a 1% redemption fee payable to the Fund, which is not reflected in the performance shown above; if it were, performance would be lower. Current month-end performance may be higher or lower than performance quoted and may be obtained at www.roycefunds.com. All performance and risk information reflects results of the Service Class (its oldest class). Price and total return information is based on net asset values calculated for shareholder transactions. Operating expenses reflect the Fund’s total annual operating expenses for the Service Class as of the Fund’s most current prospectus and include management fees, 12b-1 distribution and service fees, and other expenses. Regarding the “Top Contributors” and “Top Detractors” tables shown above, the sum of all contributors to, and all detractors from, performance for all securities in the portfolio would approximate the Fund’s year-to-date performance for 2017. Upside Capture Ratio measures a manager’s performance in up markets relative to the Fund’s benchmark. It is calculated by measuring the Fund’s performance in quarters when the benchmark went up and dividing it by the benchmark’s return in those quarters. Downside Capture Ratio measures a manager’s performance in down markets relative to the Fund’s benchmark (Russell 2000). It is calculated by measuring the Fund’s performance in quarters when the benchmark goes down and dividing it by the benchmark’s return in those quarters. |
| The Royce Funds 2017 Annual Report to Shareholders | 33 |
| MANAGER’S DISCUSSION |
| Royce Smaller-Companies Growth Fund (RVP) |
 |
| Chip Skinner, CFA |
| FUND PERFORMANCE |
| Savvy stock selection and leadership for growth stocks contributed to a strong absolute and relative showing for the ‘GARP’ (“growth-at-a-reasonable price”) strategy we use in Royce Smaller-Companies Growth Fund. The Fund advanced 17.8% in 2017, ahead of the 14.6% gain for its small-cap benchmark, the Russell 2000 Index, for the same period. The year offered an interesting mix of varying measures of strength through every small-cap sector except Energy. The highest returns by far came from Health Care, boosted by biotechnology stocks. |
| WHAT WORKED... AND WHAT DIDN’T |
| The Fund’s strongest sector in 2017, however, was Information Technology—by a factor of more than two. It joined seven more of the Fund’s 10 equity sectors to finish the year in the black. Other notable positive contributions came from Health Care, Materials, and Industrials. Of the sectors that detracted, Energy had the greatest negative impact, with only a minor net loss coming from Consumer Staples. Three groups from the large and diverse Information Technology sector topped the list of contributors at the industry level—electronic equipment, instruments & components, software, and Internet software & services. The sector was also home to the portfolio’s biggest detractor among its industry groups, semiconductors & semiconductor equipment. Other groups making a negative impact included energy equipment & services (Energy) and specialty retail (Consumer Discretionary). Relative to the Russell 2000 in 2017, the Fund’s biggest advantage came unsurprisingly from Information Technology. An enormous stock selection edge, most impactfully in the aforementioned electronic equipment, instruments & components group, drove outperformance. Superior stock picking also keyed relative performance in Materials while a combination of effective stock picking and lower exposure to Real Estate provided an additional edge. Conversely, relative results were hampered by ineffective stock selection in Health Care, especially in biotechnology. Poor stock picking also made a negative impact in the specialty retail and hotels, restaurants & leisure industries within Consumer Discretionary. In addition, our cash position detracted from relative performance. Portfolio holdings involved in technology were helped by the global buildout that’s driving spending and innovation in diverse areas such as process automation, robotics, lasers, and cloud storage. Universal Display, the portfolio’s top-contributing position in 2017, was a beneficiary of these developments. The company and its partners in the United States Display Consortium develop high-resolution, full color, lightweight Organic Light Emitting Diode (OLED) technology, and the growing global demand for this technology drew investors to its shares. IPG Photonics, which produces high-power fiber lasers and amplifiers, also benefited from robust, expanding demand for its wares. Also helping was the company’s proven ability to rapidly scale production and reduce costs in a way that stymied competition. We also like the core businesses of two companies with high-demand technology niches that help small businesses. Square offers mobile payment solutions while Shopify provides a cloud-based, omni-channel e-commerce platform. Rising share prices led us to reduce our stake in each of these four companies. The biggest detractor at the position level was IT consultant Unisys Corporation, which we think has terrific potential. A new CEO came on board two years ago with a proven track record as a turnaround specialist. He continues to work toward better integrating a slate of global businesses in order to boost results. CyberOptics Corporation makes optical process control sensors and inspection systems used in the manufacture of printed circuit boards and semiconductor wafer transport. The company’s often lumpy earnings pattern led to consecutive quarters of disappointing results that discouraged investors. We think it can benefit from the growing need for process automation, especially with its more recent entry into the wafer transport business. We sold our shares of western and work gear retailer Boot Barn Holdings, whose business was hurt by both the travails affecting many retailers and declining energy prices, which slowed its previously strong business in oil-rich states. |
| Top Contributors to Performance | |||
| For 2017 (%)1 | |||
| Universal Display | 1.78 | ||
| IPG Photonics | 1.44 | ||
| Square Cl. A | 1.30 | ||
| Shopify Cl. A | 1.19 | ||
| Orocobre | 0.97 | ||
| 1 Includes dividends | |||
| Top Detractors from Performance | |||
| For 2017 (%)2 | |||
| Unisys Corporation | -1.02 | ||
| CyberOptics Corporation | -1.01 | ||
| Boot Barn Holdings | -0.66 | ||
| Unit Corporation | -0.46 | ||
| Financial Engines | -0.35 | ||
| 2 Net of dividends | |||
| CURRENT POSITIONING AND OUTLOOK |
| One of the potential benefits of using a GARP approach is the flexibility it provides to tilt the portfolio more toward high growth or more valuation-based factors. As 2017 was drawing to a close, we began to gradually lean more toward price-sensitive attributes as we saw stretched valuations for many high multiple names, mostly in tech and healthcare, as well as a potentially rewarding combination of earnings or other growth drivers with more reasonable stock prices. Early in 2018, we began investigating these kinds of opportunities in a diverse number of cyclical areas including energy, other natural resources, financials, retailers, restaurants, transportation, and homebuilding as the quickening pace of global economic growth looks likely to reward more cyclical industries in the months ahead. |
| 34 | The Royce Funds 2017 Annual Report to Shareholders |
| PERFORMANCE AND PORTFOLIO REVIEW | TICKER SYMBOLS RYVPX RVPHX RVPCX RVPIX RVPRX |
| Performance and Expenses | ||||||||||||||||
| Average Annual Total Return (%) Through 12/31/17 | ||||||||||||||||
| JUL-DEC 20171 | 1-YR | 3-YR | 5-YR | 10-YR | 15-YR | SINCE INCEPTION (6/14/01) | ||||||||||
| RVP | 5.88 | 17.80 | 8.15 | 11.74 | 6.07 | 12.43 | 11.44 | |||||||||
| Annual Operating Expenses: 1.51% Annual Net Operating Expenses: 1.49% | ||||||||||||||||
| 1 Not annualized | ||||||||||||||||

The Morningstar Style Map is the Morningstar Style Box™ with the center 75% of fund holdings plotted as the Morningstar Ownership Zone™. The Morningstar Style Box is designed to reveal a fund’s investment strategy. The Morningstar Ownership Zone provides detail about a portfolio’s investment style by showing the range of stock sizes and styles. The Ownership Zone is derived by plotting each stock in the portfolio within the proprietary Morningstar Style Box. Over time, the shape and location of a fund’s ownership zone may vary. See page 128 for additional information. |
Value of $10,000
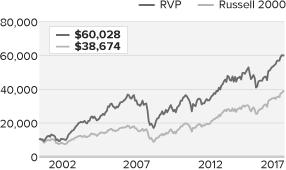
| Top 10 Positions | ||
| % of Net Assets | ||
| QAD Cl. A | 2.2 | |
| Paylocity Holding Corporation | 1.8 | |
| TriState Capital Holdings | 1.8 | |
| Enterprise Financial Services | 1.7 | |
| ePlus | 1.7 | |
| Materialise ADR | 1.7 | |
| Cobalt 27 Capital | 1.6 | |
| Eagle Materials | 1.6 | |
| Clarkson | 1.6 | |
| Atlas Air Worldwide Holdings | 1.5 | |
| Portfolio Sector Breakdown | ||
| % of Net Assets | ||
| Information Technology | 29.6 | |
| Health Care | 18.0 | |
| Financials | 11.1 | |
| Industrials | 10.1 | |
| Materials | 9.0 | |
| Consumer Discretionary | 5.6 | |
| Real Estate | 2.2 | |
| Consumer Staples | 1.7 | |
| Energy | 1.7 | |
| Telecommunication Services | 0.9 | |
| Miscellaneous | 4.4 | |
| Cash and Cash Equivalents | 5.7 | |
| Calendar Year Total Returns (%) | ||
| YEAR | RVP | |
| 2017 | 17.8 | |
| 2016 | 9.4 | |
| 2015 | -1.8 | |
| 2014 | 3.9 | |
| 2013 | 32.5 | |
| 2012 | 15.3 | |
| 2011 | -10.0 | |
| 2010 | 19.7 | |
| 2009 | 41.4 | |
| 2008 | -41.1 | |
| 2007 | 3.2 | |
| 2006 | 19.3 | |
| 2005 | 13.2 | |
| 2004 | 28.2 | |
| 2003 | 79.9 | |
| Upside/Downside Capture Ratios | ||||
| Periods Ended 12/31/17 (%) | ||||
| UPSIDE | DOWNSIDE | |||
| 10-Year | 92 | 107 | ||
| From 6/30/01 (Start of Fund’s First Full Quarter) | 113 | 100 | ||
| Portfolio Diagnostics | ||
| Fund Net Assets | $368 million | |
| Number of Holdings | 124 | |
| 2017 Annual Turnover Rate | 64% | |
| Average Market Capitalization1 | $1,372 million | |
| Weighted Average P/B Ratio2 | 3.4x | |
| 3-5 Year EPS Growth (est.)3 | 22.1% | |
| Active Share4 | 95% | |
| U.S. Investments (% of Net Assets) | 81.0% | |
| Non-U.S. Investments (% of Net Assets) | 13.3% | |
| 1 | Geometric Average. This weighted calculation uses each portfolio holding’s market cap in a way designed to not skew the effect of very large or small holdings; instead, it aims to better identify the portfolio’s center, which Royce believes offers a more accurate measure of average market cap than a simple mean or median. |
| 2 | Harmonic Average. This weighted calculation evaluates a portfolio as if it were a single stock and measures it overall. It compares the total market value of the portfolio to the portfolio’s share in the earnings or book value, as the case may be, of its underlying stocks. |
| 3 | The 3-5 Year EPS Growth (est.) is calculated as a simple weighted average of the pre-calculated mean long-term EPS growth rate estimates by brokerage analysts. Long Term Growth (LTG) is the annual EPS growth that the company can sustain over the next 3 or 5 years. Source: Factset |
| 4 | Active Share is the sum of the absolute values of the different weightings of each holding in the Fund versus each holding in the benchmark, divided by two. |
| Important Performance and Expense Information All performance information in this Report reflects past performance, is presented on a total return basis, reflects the reinvestment of distributions, and does not reflect the deduction of taxes that a shareholder would pay on fund distributions or the redemption of fund shares. Past performance is no guarantee of future results. Investment return and principal value of an investment will fluctuate, so that shares may be worth more or less than their original cost when redeemed. Shares redeemed within 30 days of purchase may be subject to a 1% redemption fee payable to the Fund, which is not reflected in the performance shown above; if it were, performance would be lower. Current month-end performance may be higher or lower than performance quoted and may be obtained at www.roycefunds.com. All performance and risk information reflects results of the Service Class (its oldest class). Gross operating expenses reflect the Fund’s total gross annual operating expenses and include management fees, 12b-1 distribution and service fees, and other expenses. Net operating expenses reflect contractual fee waivers and/or expense reimbursements. All expense information is reported as of the Fund’s most current prospectus. Royce & Associates has contractually agreed to waive fees and/or reimburse operating expenses to the extent necessary to maintain the Fund’s net annual operating expenses (excluding brokerage commissions, taxes, interest, litigation expenses, acquired fund fees and expenses, and other expenses not borne in the ordinary course of business) at or below 1.49% through April 30, 2018. Regarding the “Top Contributors” and “Top Detractors” tables shown above, the sum of all contributors to, and all detractors from, performance for all securities in the portfolio would approximate the Fund’s year-to-date performance for 2017. Upside Capture Ratio measures a manager’s performance in up markets relative to the Fund’s benchmark. It is calculated by measuring the Fund’s performance in quarters when the benchmark went up and dividing it by the benchmark’s return in those quarters. Downside Capture Ratio measures a manager’s performance in down markets relative to the Fund’s benchmark (Russell 2000). It is calculated by measuring the Fund’s performance in quarters when the benchmark goes down and dividing it by the benchmark’s return in those quarters. |
| The Royce Funds 2017 Annual Report to Shareholders | 35 |
| MANAGERS’ DISCUSSION | ||
| Royce Special Equity Fund (RSE) |
 |
| Charlie Dreifus, CFA Steven McBoyle, CPA, CA |
| FUND PERFORMANCE Known more for historical downside outperformance, the classic value strategy we have been using for nearly 20 years in Royce Special Equity Fund performed largely in line with our expectations in a steadily rising small-cap market that also favored growth stocks and companies without earnings in the calendar year. Special Equity held its advantage over the small-cap index for the 10-year and since inception (5/1/98) periods ended December 31, 2017. The Fund gained 7.9% in 2017, trailing its small-cap benchmark, the Russell 2000 Index, which was up 14.6% for the same period. Within the Russell 2000, the highest returns went to companies with the lowest returns on equity, highest foreign sales, no earnings, no dividends, and fastest sales growth as well as the highest betas. |
| WHAT WORKED... AND WHAT DIDN’T |
| Five of the Fund’s six equity sectors made positive contributions to performance in 2017. Information Technology, Consumer Discretionary, and Industrials led while Consumer Staples was the sole detractor. The largest positive contributions at the industry level came from specialty retail—helped by a terrific performance from Children’s Place—and semiconductors & semiconductor equipment, where automatic test equipment maker Teradyne led by a wide margin. The leading detractors in 2017 were food & staples retailing (Consumer Staples), where our sole holding—supermarket chain operator Weis Markets—endured a very tough year. Highlighting the strategy’s patient, low-turnover approach was the fact that nine of the Fund’s top-10 positions at the end of 2016 remained on the same list at the end of 2017—and three of these companies were top contributors to performance—Children’s Place, Teradyne, and AVX Corporation. (We also continued to hold stakes in recreational vehicle maker Winnebago Industries and Kaiser Aluminum as well as shares of wooden and upholstered furniture maker Flexsteel Industries and wire products manufacturer Insteel Industries at year-end.) Lower calendar-year results relative to the Russell 2000 came from less-than-perfect stock selection in Consumer Staples, where our overweight was also a factor. In addition, the portfolio’s lack of exposure to Health Care, the top-performing sector in the small-cap index for the year, hurt relative returns, as did stock picking woes in Consumer Discretionary—most impactfully in household durables and auto components. Conversely, stock selection in Information Technology was a relative strength in 2017, thanks again to Teradyne. Lack of exposure to two lagging sectors—Financials and Energy—also helped performance vis-à-vis the small-cap index. More than 200 companies in the Russell 2000 are “zombie companies,” defined by Cornerstone Macro as those that have been unable to make their interest payments out of cash flow for three straight years. They have to borrow just to make interest payments. Low interest rates and the search for yield have allowed these companies not to die. This is not a sustainable situation—and there are some signs that investors are becoming more concerned about the sustainability of profit growth: companies that reported better-than-expected third-quarter earnings did not receive the usual bounce while those who missed were punished more severely than usual. Moreover, a striking—and potentially very significant—reversal took place in the fourth quarter: small-cap companies with earnings enjoyed higher returns than those without. The Russell 2000 as a whole looks increasingly expensive—and thus more risky—to us, while we believe our portfolio holdings as a group look attractive. Our reasoning is based on the portfolio’s high cap rate, high returns on invested capital, and low leverage. Furthermore, relative performance improved in the fourth quarter when the Fund beat the Russell 2000 (up 4.6% versus 3.3%). With cost pressures mounting and most companies having already squeezed out costs wherever possible, the need for more volume and/or lower costs to maintain or expand margins is increasingly hard to come by. We therefore expect to see more strategic acquisitions in the months ahead. This could create opportunities for select portfolio holdings to become targets for takeovers/business combinations. |
| Top Contributors to Performance For 2017 (%)1 | |||
| Children’s Place | 2.60 | ||
| Teradyne | 2.06 | ||
| Winnebago Industries | 1.52 | ||
| Kaiser Aluminum | 0.87 | ||
| AVX Corporation | 0.82 | ||
| 1 Includes dividends | |||
| Top Detractors from Performance For 2017 (%)2 | |||
| Weis Markets | -1.79 | ||
| Scholastic Corporation | -0.83 | ||
| Standard Motor Products | -0.68 | ||
| Flexsteel Industries | -0.56 | ||
| Insteel Industries | -0.40 | ||
| 2 Net of dividends | |||
| CURRENT POSITIONING AND OUTLOOK |
| It remains an open question if the Fund’s strength in 2017’s final quarter marked a more lasting change. It is clearly possible that a more discerning environment with an emphasis on quality may be upon us. While small-cap stocks did well in 2017, they generally lagged expectations based upon their status as the likely prime beneficiaries of the tax overhaul. The catch, we suspect, is that about one-third of the companies in the Russell 2000 have no income while many others have so much debt that the limits on interest deductibility may actually harm them. The portfolio, on the other hand, appears better-positioned to potentially benefit as it holds profitable companies that generate most of their earnings—and pay the bulk of their taxes—here in the U.S. They also have little debt and thus are not harmed by deductibility limits. We have carefully sifted through the deck and like what we own as we embark on 2018. |
| 36 | The Royce Funds 2017 Annual Report to Shareholders |
| PERFORMANCE AND PORTFOLIO REVIEW | TICKER SYMBOLS RYSEX RSEFX RSEIX RSQCX |
| Performance and Expenses | ||||||||||||||||
| Average Annual Total Return (%) Through 12/31/17 | ||||||||||||||||
| JUL-DEC 20171 | 1-YR | 3-YR | 5-YR | 10-YR | 15-YR | SINCE INCEPTION (5/1/98) | ||||||||||
| RSE | 8.26 | 7.87 | 7.72 | 10.33 | 8.82 | 9.69 | 9.46 | |||||||||
| Annual Operating Expenses: 1.17% | ||||||||||||||||
| 1 Not annualized | ||||||||||||||||
Relative Risk Adjusted Returns: Monthly Rolling Sharpe Ratios
| On a monthly rolling risk-adjusted basis, the Fund outperformed the Russell 2000 in 100% of all 10-year periods and 72% of all 5-year periods. |
| PERIODS BEATING THE INDEX | FUND AVG (%)1 | INDEX AVG (%)1 | ||||||||||||
| 10-year | 116/116 | 100% | 0.55 | 0.34 | ||||||||||
| 5-year | 126/176 | 72% | 0.69 | 0.47 | ||||||||||

The Morningstar Style Map is the Morningstar Style Box™ with the center 75% of fund holdings plotted as the Morningstar Ownership Zone™. The Morningstar Style Box is designed to reveal a fund’s investment strategy. The Morningstar Ownership Zone provides detail about a portfolio’s investment style by showing the range of stock sizes and styles. The Ownership Zone is derived by plotting each stock in the portfolio within the proprietary Morningstar Style Box. Over time, the shape and location of a fund’s ownership zone may vary. See page 128 for additional information. |
Invested on 5/1/98 as of 12/31/17 ($)

| Top 10 Positions | ||
| % of Net Assets | ||
| Children’s Place | 7.4 | |
| UniFirst Corporation | 5.5 | |
| AVX Corporation | 5.4 | |
| Hubbell Cl. A | 4.6 | |
| Meredith Corporation | 4.3 | |
| Scholastic Corporation | 4.3 | |
| Standard Motor Products | 3.9 | |
| Teradyne | 3.5 | |
| Cooper Tire & Rubber | 3.1 | |
| Weis Markets | 3.1 | |
| Portfolio Sector Breakdown | ||
| % of Net Assets | ||
| Consumer Discretionary | 40.3 | |
| Industrials | 21.4 | |
| Information Technology | 16.9 | |
| Consumer Staples | 6.1 | |
| Materials | 2.7 | |
| Real Estate | 2.5 | |
| Cash and Cash Equivalents | 10.1 | |
| Calendar Year Total Returns (%) | ||
| YEAR | RSE | |
| 2017 | 7.9 | |
| 2016 | 32.2 | |
| 2015 | -12.4 | |
| 2014 | 1.1 | |
| 2013 | 29.4 | |
| 2012 | 15.4 | |
| 2011 | 0.1 | |
| 2010 | 19.6 | |
| 2009 | 28.4 | |
| 2008 | -19.6 | |
| 2007 | 4.7 | |
| 2006 | 14.0 | |
| 2005 | -1.0 | |
| 2004 | 13.9 | |
| 2003 | 27.6 | |
| Upside/Downside Capture Ratios | ||||||||||||||
| Periods Ended 12/31/17 (%) | ||||||||||||||
| UPSIDE | DOWNSIDE | |||||||||||||
| 10-Year | 77 | 63 | ||||||||||||
| From 6/30/98 (Start of Fund’s First Full Quarter) | 73 | 48 | ||||||||||||
| Portfolio Diagnostics | ||
| Fund Net Assets | $1,544 million | |
| Number of Holdings | 38 | |
| 2017 Annual Turnover Rate | 15% | |
| Average Market Capitalization1 | $1,496 million | |
| Weighted Average P/E Ratio2,3 | 20.3x | |
| Weighted Average P/B Ratio2 | 2.2x | |
| Active Share4 | 98% | |
| U.S. Investments (% of Net Assets) | 88.5% | |
| Non-U.S. Investments (% of Net Assets) | 1.4% | |
| 1 | Geometric Average. This weighted calculation uses each portfolio holding’s market cap in a way designed to not skew the effect of very large or small holdings; instead, it aims to better identify the portfolio’s center, which Royce believes offers a more accurate measure of average market cap than a simple mean or median. |
| 2 | Harmonic Average. This weighted calculation evaluates a portfolio as if it were a single stock and measures it overall. It compares the total market value of the portfolio to the portfolio’s share in the earnings or book value, as the case may be, of its underlying stocks. |
| 3 | The Fund’s P/E ratio calculation excludes companies with zero or negative earnings (4% of portfolio holdings as of 12/31/17). |
| 4 | Active Share is the sum of the absolute values of the different weightings of each holding in the Fund versus each holding in the benchmark, divided by two. |
| Important Performance and Expense Information |
All performance information in this Report reflects past performance, is presented on a total return basis, reflects the reinvestment of distributions, and does not reflect the deduction of taxes that a shareholder would pay on fund distributions or the redemption of fund shares. Past performance is no guarantee of future results. Investment return and principal value of an investment will fluctuate, so that shares may be worth more or less than their original cost when redeemed. Shares redeemed within 30 days of purchase may be subject to a 1% redemption fee payable to the Fund, which is not reflected in the performance shown above; if it were, performance would be lower. Current month-end performance may be higher or lower than performance quoted and may be obtained at www.roycefunds.com. All performance and risk information reflects results of the Investment Class (its oldest class). Operating expenses reflect the Fund’s total annual operating expenses for the Investment Class as of the Fund’s most current prospectus and include management fees and other expenses. The Sharpe Ratio is calculated for a specified period by dividing a fund’s annualized excess returns by its annualized standard deviation. The higher the Sharpe ratio, the better the fund’s historical risk-adjusted performance. Regarding the “Top Contributors” and “Top Detractors” tables shown above, the sum of all contributors to, and all detractors from, performance for all securities in the portfolio would approximate the Fund’s year-to-date performance for 2017. Upside Capture Ratio measures a manager’s performance in up markets relative to the Fund’s benchmark. It is calculated by measuring the Fund’s performance in quarters when the benchmark went up and dividing it by the benchmark’s return in those quarters. Downside Capture Ratio measures a manager’s performance in down markets relative to the Fund’s benchmark (Russell 2000). It is calculated by measuring the Fund’s performance in quarters when the benchmark goes down and dividing it by the benchmark’s return in those quarters. |
| The Royce Funds 2017 Annual Report to Shareholders | 37 |
| MANAGERS’ DISCUSSION | ||
| Royce Special Equity Multi-Cap Fund (RSM) |
 |
| Charlie Dreifus, CFA Steven McBoyle, CPA, CA |
| FUND PERFORMANCE Royce Special Equity Multi-Cap Fund uses the same classic value strategy that we have been using in its small-cap sibling for almost 20 years. Being designed and constructed more for potential downside protection, as well as potential capital preservation in highly volatile markets, the Fund performed largely in line with our expectations in 2017, and we were pleased with the Fund’s absolute results in a market that favored growth stocks in the calendar year. The Fund advanced 15.4% in 2017 versus a gain of 21.7% for its large-cap benchmark, the Russell 1000 Index, for the same period. |
| WHAT WORKED... AND WHAT DIDN’T |
| Along with the market’s preference for high growth, there was a corresponding relative lack of attention paid to companies with steady earnings and pristine financials. These preferences shifted somewhat in the fourth quarter, allowing the Fund to outpace its benchmark (and pick up half of its calendar-year performance) with a 7.8% advance versus 6.6% for the Russell 1000. The portfolio benefited most in the quarter from five holdings in three different sectors: industrial products and equipment maker Illinois Tool Works, motion control products maker Parker Hannifin (both from Industrials), home improvement business Lowe’s Companies, branded lifestyle apparel and footwear company VF Corporation (each from Consumer Discretionary), and technology behemoth Apple. Each was also among the top contributors to calendar-year performance. The full year also saw five of the Fund’s six equity sectors make positive contributions to performance. Industrials—our largest sector and most significant overweight at year-end—led by a wide margin, followed by notable net gains for Information Technology. The only sector to detract from calendar-year performance was Materials, though its negative impact was quite modest, coming from underwhelming results for petroleum additive specialist NewMarket Corporation, our sole holding in the sector. Within the Russell 1000, the strongest sector by far was Information Technology, which is more weighted toward growth companies. Health Care, which is even more tilted toward growth, was also a source of strength in the large-cap index, as was the economically sensitive cyclical area of Consumer Discretionary. The majority of the Fund’s 2017 underperformance came from ineffective stock selection in this last sector, where advances for VF Corporation, Lowe’s Companies, and McDonald’s could not overcome the relative negative effect of losses for retailer Dicks Sporting Goods, a position we finished selling in September. As an example of the extremes to which many retail companies have gone over the last couple of years, Dicks was the portfolio’s top contributor in 2016. The secular and seismic shifts that Amazon has brought to so many retailers continue to register in highly impactful fashion. We also parted ways with industrial supplies distributor W.W. Grainger and tool manufacturer Snap-on in 2017. The portfolio’s lower exposure to Information Technology also hampered relative performance, as did our cash position. Conversely, stock selection was a significant strength versus the Russell 1000 in Industrials, where a number of holdings did well, including the aforementioned Illinois Tool Works and Parker Hannifin, as well as multiline industrial conglomerate 3M and staffing services business ManpowerGroup. |
| Top Contributors to Performance For 2017 (%)1 | |||
| Apple | 4.24 | ||
| Illinois Tool Works | 2.84 | ||
| Parker Hannifin | 2.45 | ||
| VF Corporation | 1.67 | ||
| Cisco Systems | 1.32 | ||
| 1 Includes dividends | |||
| Top Detractors from Performance For 2017 (%)2 | |||
| Dicks Sporting Goods | -3.57 | ||
| Grainger (W.W.) | -1.00 | ||
| Snap-on | -0.51 | ||
| Avnet | -0.45 | ||
| NewMarket Corporation | -0.14 | ||
| 2 Net of dividends | |||
| CURRENT POSITIONING AND OUTLOOK |
| It remains an open question if the Fund’s strength in 2017’s final quarter marked a more lasting change. While perhaps too early to say for sure, it is clearly possible that a more discerning environment with an emphasis on quality may be upon us. It does not look likely to come without disruption, however. In what looks like a sign of a market increasingly vulnerable to a decline, the yield on the 2-year Treasury was higher than the dividend yield on the S&P 500 at the end of 2017 for the first time in nearly a decade. With rates rising, along with prospective central bank balance sheet run-offs or reduced purchasing, the question is how long the bubble will remain inflated. We believe it will deflate. The only question is whether it will be gradual or sudden. Over the past eight-and-a-half years, the S&P 500 has risen at a 17% average annualized rate off the March 2009 low that followed the Financial Crisis. That return is more than 10% higher on an average annualized basis than the long-term gain for the index. Is this sustainable? Are not lower, even negative, returns soon likely? As Goldman Sachs recently wrote, “Elevated valuations increase the risk of draw-downs for the simple reason that there is less buffer to absorb shocks.” We believe that our highly concentrated portfolio appears well-positioned to benefit from a more volatile and corrective phase as it holds profitable companies that also have little debt. We have carefully sifted through the deck and like what we own as we embark on 2018. |
| 38 | The Royce Funds 2017 Annual Report to Shareholders |
| PERFORMANCE AND PORTFOLIO REVIEW | TICKER SYMBOLS RSEMX RSMCX RMUIX RSMLX |
| Performance and Expenses | ||||||||||||
| Average Annual Total Return (%) Through 12/31/17 | ||||||||||||
| JUL-DEC 20171 | 1-YR | 3-YR | 5-YR | SINCE INCEPTION (12/31/10) | ||||||||
| RSM | 8.93 | 15.42 | 4.26 | 11.03 | 10.56 | |||||||
| Annual Gross Operating Expenses: 1.34% Annual Net Operating Expenses: 1.24% | ||||||||||||
| 1 Not annualized | ||||||||||||
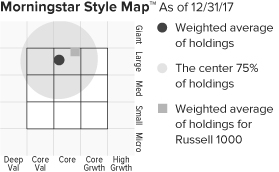
The Morningstar Style Map is the Morningstar Style Box™ with the center 75% of fund holdings plotted as the Morningstar Ownership Zone™. The Morningstar Style Box is designed to reveal a fund’s investment strategy. The Morningstar Ownership Zone provides detail about a portfolio’s investment style by showing the range of stock sizes and styles. The Ownership Zone is derived by plotting each stock in the portfolio within the proprietary Morningstar Style Box. Over time, the shape and location of a fund’s ownership zone may vary. See page 128 for additional information. |
Value of $10,000
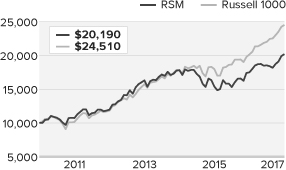
| Top 10 Positions | ||
| % of Net Assets | ||
| Apple | 8.9 | |
| Illinois Tool Works | 8.3 | |
| Genuine Parts | 7.5 | |
| Parker Hannifin | 5.8 | |
| Lowe’s Companies | 5.5 | |
| Cisco Systems | 5.2 | |
| Kimberly-Clark | 5.1 | |
| V.F. Corporation | 4.7 | |
| Procter & Gamble | 4.5 | |
| Carlisle Companies | 4.0 | |
| Portfolio Sector Breakdown | ||
| % of Net Assets | ||
| Industrials | 36.8 | |
| Consumer Discretionary | 24.1 | |
| Information Technology | 14.1 | |
| Consumer Staples | 13.5 | |
| Materials | 2.6 | |
| Financials | 1.4 | |
| Cash and Cash Equivalents | 7.5 | |
| Calendar Year Total Returns (%) | ||
| YEAR | RSM | |
| 2017 | 15.4 | |
| 2016 | 13.7 | |
| 2015 | -13.6 | |
| 2014 | 9.3 | |
| 2013 | 36.3 | |
| 2012 | 11.6 | |
| 2011 | 7.2 | |
| Portfolio Diagnostics | ||
| Fund Net Assets | $108 million | |
| Number of Holdings | 22 | |
| 2017 Annual Turnover Rate | 28% | |
| Average Market Capitalization1 | $49,717 million | |
| Weighted Average P/E Ratio2,3 | 22.1x | |
| Weighted Average P/B Ratio2 | 5.2x | |
| Active Share4 | 92% | |
| U.S. Investments (% of Net Assets) | 92.5% | |
| Non-U.S. Investments (% of Net Assets) | 0.0% | |
| 1 | Geometric Average. This weighted calculation uses each portfolio holding’s market cap in a way designed to not skew the effect of very large or small holdings; instead, it aims to better identify the portfolio’s center, which Royce believes offers a more accurate measure of average market cap than a simple mean or median. |
| 2 | Harmonic Average. This weighted calculation evaluates a portfolio as if it were a single stock and measures it overall. It compares the total market value of the portfolio to the portfolio’s share in the earnings or book value, as the case may be, of its underlying stocks. |
| 3 | The Fund’s P/E ratio calculation excludes companies with zero or negative earnings (0% of portfolio holdings as of 12/31/17). |
| 4 | Active Share is the sum of the absolute values of the different weightings of each holding in the Fund versus each holding in the benchmark, divided by two. |
| Important Performance and Expense Information |
All performance information in this Report reflects past performance, is presented on a total return basis, reflects the reinvestment of distributions, and does not reflect the deduction of taxes that a shareholder would pay on fund distributions or the redemption of fund shares. Past performance is no guarantee of future results. Investment return and principal value of an investment will fluctuate, so that shares may be worth more or less than their original cost when redeemed. Shares redeemed within 30 days of purchase may be subject to a 1% redemption fee payable to the Fund, which is not reflected in the performance shown above; if it were, performance would be lower. Current month-end performance may be higher or lower than performance quoted and may be obtained at www.roycefunds.com. All performance and risk information reflects results of the Service Class (its oldest class). Gross operating expenses reflect gross total annual operating expenses for the Service Class and include management fees, 12b-1 distribution and service fees and other expenses. Net operating expenses reflect contractual fee waivers and/or reimbursements. All expense information is reported as of the Fund’s most current prospectus. Royce & Associates has contractually agreed to waive fees and/or reimburse operating expenses to the extent necessary to maintain the Service Classes’s net annual operating expenses, (excluding brokerage commissions, taxes, interest litigation expenses, acquired fund fees and expenses, and other expenses not borne in the ordinary course of business), at or below 1.24% through April 30, 2018. Regarding the “Top Contributors” and “Top Detractors” tables shown above, the sum of all contributors to, and all detractors from, performance for all securities in the portfolio would approximate the Fund’s year-to-date performance for 2017. |
| The Royce Funds 2017 Annual Report to Shareholders | 39 |
| MANAGERS’ DISCUSSION | ||
| Royce Total Return Fund (RTR) |
 |
| Chuck Royce Jay Kaplan, CFA |
| FUND PERFORMANCE During a year in which growth stocks led and small-caps that pay no dividends outpaced those that do, we were pleased with the calendar-year results for Royce Total Return Fund. The Fund was up 13.7% in 2017 versus 14.6% for its small-cap benchmark, the Russell 2000 Index, for the same period. Our dividend value approach proved most effective in the second half of the year, when the Fund gained 10.6% versus 9.2% for the small-cap index. What was most notable about the Fund’s advantage over this six-month period was that both small-cap dividend payers and value stocks underperformed in the Russell 2000. Fortunately, the portfolio also experienced some favorable tailwinds in the second half in the form of renewed strength for cyclical stocks—particularly those with global exposure. All in all, while 2017 was a good year, its mix of leadership for growth stocks against the backdrop of an accelerating global economy made it a strange one as well. |
| WHAT WORKED... AND WHAT DIDN’T |
| Seven of the Fund’s 11 equity sectors made positive contributions to 2017 performance. Industrials, Financials, and Materials led, the first two by a comfortable margin. The impact of detractors at the sector level was comparably quite modest, with Consumer Staples, Telecommunication Services, and Energy all posting relatively minor net losses. Within the Russell 2000, Health Care was 2017’s top performer, led by biotechnology stocks. Our exposure to the sector was both low and highly selective (as it has been historically) because few healthcare companies pay dividends. Our significant underweight was therefore the largest source of underperformance in 2017. Ineffective stock selection in Consumer Discretionary also detracted, most notably in household durables. Conversely, relative results were helped by our positions in Financials, where sector outperformance was driven primarily by superior stock selection, notably in banks and capital markets. Our underweight in banks, which lagged in 2017, also helped, as did an overweight and savvy stock selection in Materials, where chemical companies were the standouts. Three groups dominated absolute results at the industry level—the aforementioned capital markets and chemicals groups as well as machinery (Industrials). As was the case with sectors, the impact of detractors was lighter, led by specialty retail (Consumer Discretionary), technology hardware, storage & peripherals (Information Technology), and food products (Consumer Staples). Four of the Fund’s top-five contributors were also top-10 positions at year-end. Staffing services business ManpowerGroup benefited from improved employment trends in the U.S. and Europe as well as its optimistic expectations for broad-based global improvement in both hiring trends and economic growth. Albemarle Corporation is a specialty chemicals company that specializes in lithium, which is used to make ion batteries. Their attractive combination of high energy density and relatively low maintenance makes these batteries a popular choice for electric vehicles and local energy storage applications—each a burgeoning technology niche. Growing demand helped to energize Albemarle’s stock price. Recreational vehicle maker Thor Industries gave investors a smooth ride as sales to a widening demographic, which includes Baby Boomers, Gen X-ers, and millennials, paved the way to better-than-expected earnings. As for holdings that detracted from 2017 results, HNI Corporation makes office furniture and hearth products. Its shares fell when the firm announced strong fiscal third-quarter earnings while at the same time reducing its fourth-quarter guidance based on expectations of lower volumes, increased costs, and an unfavorable business and product mix. Although we reduced our position in the second half, we were hopeful at year-end that these were temporary problems. The Cato Corporation is a fashion retailer that struggled with declining same-store sales and the related challenges of competing in an industry increasingly dominated by Amazon’s margin-contracting omnipresence, factors that led us to significantly reduce our stake in 2017. We acted similarly with our position in ATM provider Diebold Nixdorf, which is still transitioning to a service-based, software-centric business. While recent results showed improvement on a quarter-over-quarter basis, investors were disappointed, and its near-term prospects looked uncertain to us at year-end. |
| Top Contributors to Performance For 2017 (%)1 | |||
| ManpowerGroup | 0.61 | ||
| Albemarle Corporation | 0.58 | ||
| Thor Industries | 0.58 | ||
| Teleflex | 0.56 | ||
| MKS Instruments | 0.53 | ||
| 1 Includes dividends | |||
| Top Detractors from Performance For 2017 (%)2 | |||
| HNI Corporation | -0.27 | ||
| Cato Corporation (The) Cl. A | -0.27 | ||
| Diebold Nixdorf | -0.26 | ||
| Ethan Allen Interiors | -0.21 | ||
| Genesco | -0.21 | ||
| 2 Net of dividends | |||
| CURRENT POSITIONING AND OUTLOOK |
| Our outlook is mixed. While we are cautious about the prospects for small-cap returns as a whole, we are also optimistic about the portfolio’s return potential as it leans towards three factors that we believe will be rewarded going forward—economically sensitive cyclicals, global exposure, and—in many cases—high profitability. These are the select qualities that we anticipate will drive small-cap leadership. In this environment, we see the opportunity for the Fund to extend its second-half outperformance into the years ahead. If small-caps experience a correction, then we are hopeful that the Fund’s historical lower volatility profile will help mitigate the effects of a decline. |
| 40 | The Royce Funds 2017 Annual Report to Shareholders |
| PERFORMANCE AND PORTFOLIO REVIEW | TICKER SYMBOLS RYTRX RYTFX RTRIX RYTCX RTRRX RTRKX RTRWX |
| Performance and Expenses | ||||||||||||||||
| Average Annual Total Return (%) Through 12/31/17 | ||||||||||||||||
| JUL-DEC 20171 | 1-YR | 3-YR | 5-YR | 10-YR | 15-YR | 20-YR | SINCE INCEPTION (12/15/93) | |||||||||
| RTR | 10.58 | 13.65 | 9.90 | 12.30 | 7.98 | 10.00 | 9.37 | 11.04 | ||||||||
| Annual Operating Expenses: 1.21% | ||||||||||||||||
| 1Not Annualized | ||||||||||||||||
Relative Risk Adjusted Returns: Monthly Rolling Sharpe Ratios
| On a monthly rolling risk-adjusted basis, the Fund outperformed the Russell 2000 in 98% of all 10-year periods and 91% of all 5-year periods. |
| PERIODS BEATING THE INDEX | FUND AVG (%)1 | INDEX AVG (%)1 | ||||||||||||
| 10-year | 118/121 | 98% | 0.45 | 0.33 | ||||||||||
| 5-year | 165/181 | 91% | 0.64 | 0.45 | ||||||||||
| 1Average of monthly rolling Sharpe Ratios over the specified periods. |
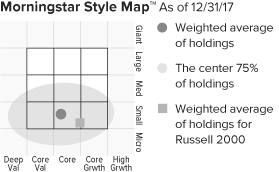
The Morningstar Style Map is the Morningstar Style Box™ with the center 75% of fund holdings plotted as the Morningstar Ownership Zone™. The Morningstar Style Box is designed to reveal a fund’s investment strategy. The Morningstar Ownership Zone provides detail about a portfolio’s investment style by showing the range of stock sizes and styles. The Ownership Zone is derived by plotting each stock in the portfolio within the proprietary Morningstar Style Box. Over time, the shape and location of a fund’s ownership zone may vary. See page 128 for additional information. |
Value of $10,000
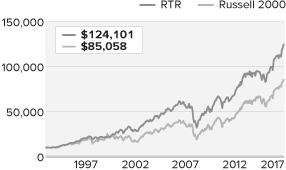
| Top 10 Positions | ||
| % of Net Assets | ||
| Quaker Chemical | 2.0 | |
| E-L Financial | 1.7 | |
| ManpowerGroup | 1.6 | |
| Erie Indemnity Cl. A | 1.6 | |
| Thor Industries | 1.5 | |
| MKS Instruments | 1.4 | |
| Woodward | 1.4 | |
| Tennant Company | 1.3 | |
| Teleflex | 1.2 | |
| Albemarle Corporation | 1.2 | |
| Portfolio Sector Breakdown | ||
| % of Net Assets | ||
| Industrials | 26.7 | |
| Financials | 26.2 | |
| Materials | 13.6 | |
| Consumer Discretionary | 9.6 | |
| Information Technology | 6.4 | |
| Health Care | 3.5 | |
| Energy | 3.4 | |
| Consumer Staples | 3.0 | |
| Utilities | 2.5 | |
| Telecommunication Services | 0.9 | |
| Real Estate | 0.1 | |
| Miscellaneous | 2.3 | |
| Corporate Bond | 0.2 | |
| Cash and Cash Equivalents | 1.6 | |
| Calendar Year Total Returns (%) | ||
| YEAR | RTR | |
| 2017 | 13.7 | |
| 2016 | 25.9 | |
| 2015 | -7.2 | |
| 2014 | 1.3 | |
| 2013 | 32.8 | |
| 2012 | 14.4 | |
| 2011 | -1.7 | |
| 2010 | 23.5 | |
| 2009 | 26.2 | |
| 2008 | -31.2 | |
| 2007 | 2.4 | |
| 2006 | 14.5 | |
| 2005 | 8.2 | |
| 2004 | 17.5 | |
| 2003 | 30.0 | |
| Upside/Downside Capture Ratios | ||||||||||||||
| Periods Ended 12/31/17 (%) | ||||||||||||||
| UPSIDE | DOWNSIDE | |||||||||||||
| 10-Year | 83 | 79 | ||||||||||||
| From 12/31/93 (Start of Fund’s First Full Quarter) | 82 | 55 | ||||||||||||
| Portfolio Diagnostics | ||
| Fund Net Assets | $2,396 million | |
| Number of Holdings | 272 | |
| Turnover Rate | 12% | |
| Average Market Capitalization1 | $2,384 million | |
| Weighted Average P/E Ratio2,3 | 20.6x | |
| Weighted Average P/B Ratio2 | 2.2x | |
| Active Share4 | 90% | |
| U.S. Investments (% of Net Assets) | 85.5% | |
| Non-U.S. Investments (% of Net Assets) | 12.9% | |
| 1 | Geometric Average. This weighted calculation uses each portfolio holding’s market cap in a way designed to not skew the effect of very large or small holdings; instead, it aims to better identify the portfolio’s center, which Royce believes offers a more accurate measure of average market cap than a simple mean or median. |
| 2 | Harmonic Average. This weighted calculation evaluates a portfolio as if it were a single stock and measures it overall. It compares the total market value of the portfolio to the portfolio’s share in the earnings or book value, as the case may be, of its underlying stocks. |
| 3 | The Fund’s P/E ratio calculation excludes companies with zero or negative earnings (5% of portfolio holdings as of 12/31/17). |
| 4 | Active Share is the sum of the absolute values of the different weightings of each holding in the Fund versus each holding in the benchmark, divided by two. |
| Important Performance and Expense Information All performance information in this Report reflects past performance, is presented on a total return basis, reflects the reinvestment of distributions, and does not reflect the deduction of taxes that a shareholder would pay on fund distributions or the redemption of fund shares. Past performance is no guarantee of future results. Investment return and principal value of an investment will fluctuate, so that shares may be worth more or less than their original cost when redeemed. Shares redeemed within 30 days of purchase may be subject to a 1% redemption fee payable to the Fund, which is not reflected in the performance shown above; if it were, performance would be lower. Current month-end performance may be higher or lower than performance quoted and may be obtained at www.roycefunds.com. All performance and risk information reflects results of the Investment Class (its oldest class). Certain immaterial adjustments were made to the net assets of Royce Total Return Fund at 6/30/17 for financial reporting purposes, and as a result the net asset values for shareholder transactions on that date and the calendar year Total Returns (%) based on those net asset values differ from the adjusted net asset values and calendar year total returns reported in the Financial Highlights. Operating expenses reflect the Fund’s total annual operating expenses for the Investment Class as of the Fund’s most current prospectus and include management fees, other expenses, and acquired fund fees and expenses. Acquired fund fees and expenses reflect the estimated amount of the fees and expenses incurred indirectly by the Fund through its investments in mutual funds, hedge funds, private equity funds, and other investment companies. Regarding the “Top Contributors” and “Top Detractors” tables shown above, the sum of all contributors to, and all detractors from, performance for all securities in the portfolio would approximate the Fund’s year-to-date performance for 2017. The Sharpe Ratio is calculated for a specified period by dividing a fund’s annualized excess returns by its annualized standard deviation. The higher the Sharpe ratio, the better the fund’s historical risk-adjusted performance. Upside Capture Ratio measures a manager’s performance in up markets relative to the Fund’s benchmark. It is calculated by measuring the Fund’s performance in quarters when the benchmark went up and dividing it by the benchmark’s return in those quarters. Downside Capture Ratio measures a manager’s performance in down markets relative to the Fund’s benchmark (Russell 2000). It is calculated by measuring the Fund’s performance in quarters when the benchmark goes down and dividing it by the benchmark’s return in those quarters. |
| The Royce Funds 2017 Annual Report to Shareholders | 41 |
| Schedules of Investments |
| Royce Dividend Value Fund | ||||||||
| Common Stocks – 98.1% | ||||||||
| SHARES | VALUE | |||||||
| CONSUMER DISCRETIONARY – 9.1% | ||||||||
| AUTO COMPONENTS - 2.2% | ||||||||
Gentex Corporation | 95,496 | $ | 2,000,641 | |||||
Nokian Renkaat | 44,500 | 2,015,611 | ||||||
| 4,016,252 | ||||||||
| AUTOMOBILES - 1.0% | ||||||||
Thor Industries | 12,840 | 1,935,245 | ||||||
| HOUSEHOLD DURABLES - 1.2% | ||||||||
Hunter Douglas | 25,000 | 2,163,627 | ||||||
| SPECIALTY RETAIL - 3.3% | ||||||||
American Eagle Outfitters | 104,800 | 1,970,240 | ||||||
DSW Cl. A | 91,955 | 1,968,756 | ||||||
Fielmann | 6,400 | 563,254 | ||||||
USS | 70,000 | 1,480,858 | ||||||
| 5,983,108 | ||||||||
| TEXTILES, APPAREL & LUXURY GOODS - 1.4% | ||||||||
HUGO BOSS | 12,300 | 1,043,347 | ||||||
Stella International Holdings | 100,000 | 150,566 | ||||||
Steven Madden 1 | 28,108 | 1,312,643 | ||||||
| 2,506,556 | ||||||||
| Total (Cost $10,310,267) | 16,604,788 | |||||||
| CONSUMER STAPLES – 0.4% | ||||||||
| FOOD & STAPLES RETAILING - 0.2% | ||||||||
FamilyMart UNY Holdings | 6,000 | 420,186 | ||||||
| FOOD PRODUCTS - 0.2% | ||||||||
Industrias Bachoco ADR | 6,100 | 349,530 | ||||||
| Total (Cost $336,214) | 769,716 | |||||||
| ENERGY – 3.5% | ||||||||
| ENERGY EQUIPMENT & SERVICES - 2.7% | ||||||||
Helmerich & Payne | 44,054 | 2,847,650 | ||||||
TGS-NOPEC Geophysical | 90,900 | 2,150,229 | ||||||
| 4,997,879 | ||||||||
| OIL, GAS & CONSUMABLE FUELS - 0.8% | ||||||||
Gaztransport Et Technigaz | 22,700 | 1,364,460 | ||||||
| Total (Cost $5,778,744) | 6,362,339 | |||||||
| FINANCIALS – 28.5% | ||||||||
| BANKS - 4.2% | ||||||||
BGEO Group | 49,400 | 2,367,401 | ||||||
BOK Financial | 21,414 | 1,976,940 | ||||||
City Holding Company | 8,189 | 552,512 | ||||||
First Republic Bank | 32,400 | 2,807,136 | ||||||
| 7,703,989 | ||||||||
| CAPITAL MARKETS - 21.7% | ||||||||
Ashmore Group | 459,000 | 2,509,940 | ||||||
AURELIUS Equity Opportunities | 9,000 | 615,177 | ||||||
B3 | 275,000 | 1,885,101 | ||||||
Bolsa Mexicana de Valores | 1,234,000 | 2,121,884 | ||||||
Carlyle Group L.P. | 122,300 | 2,800,670 | ||||||
Coronation Fund Managers | 192,000 | 1,144,808 | ||||||
Federated Investors Cl. B | 54,700 | 1,973,576 | ||||||
Gluskin Sheff + Associates | 51,700 | 684,809 | ||||||
Houlihan Lokey Cl. A | 8,600 | 390,698 | ||||||
Jupiter Fund Management | 282,000 | 2,391,555 | ||||||
KKR & Co. L.P. | 207,000 | 4,359,420 | ||||||
Lazard Cl. A | 37,000 | 1,942,500 | ||||||
Moelis & Company Cl. A | 32,220 | 1,562,670 | ||||||
Northern Trust | 23,300 | 2,327,437 | ||||||
SEI Investments | 47,400 | 3,406,164 | ||||||
Singapore Exchange | 70,000 | 388,596 | ||||||
Sprott | 735,700 | 1,428,089 | ||||||
State Street | 25,700 | 2,508,577 | ||||||
TD Ameritrade Holding Corporation | 57,900 | 2,960,427 | ||||||
Value Partners Group | 2,272,200 | 2,404,550 | ||||||
| 39,806,648 | ||||||||
| DIVERSIFIED FINANCIAL SERVICES - 1.1% | ||||||||
Leucadia National | 74,600 | 1,976,154 | ||||||
| INSURANCE - 0.6% | ||||||||
Reinsurance Group of America | 7,455 | 1,162,458 | ||||||
| THRIFTS & MORTGAGE FINANCE - 0.9% | ||||||||
Genworth MI Canada | 47,648 | 1,648,917 | ||||||
| Total (Cost $32,966,640) | 52,298,166 | |||||||
| HEALTH CARE – 4.2% | ||||||||
| HEALTH CARE EQUIPMENT & SUPPLIES - 2.1% | ||||||||
DENTSPLY SIRONA | 57,500 | 3,785,225 | ||||||
| HEALTH CARE PROVIDERS & SERVICES - 0.2% | ||||||||
Ensign Group (The) | 18,200 | 404,040 | ||||||
| HEALTH CARE TECHNOLOGY - 0.3% | ||||||||
CompuGroup Medical | 7,300 | 477,987 | ||||||
| PHARMACEUTICALS - 1.6% | ||||||||
Recordati | 48,800 | 2,167,765 | ||||||
Santen Pharmaceutical | 52,000 | 816,389 | ||||||
| 2,984,154 | ||||||||
| Total (Cost $3,950,929) | 7,651,406 | |||||||
| INDUSTRIALS – 28.5% | ||||||||
| AEROSPACE & DEFENSE - 1.7% | ||||||||
HEICO Corporation Cl. A | 40,365 | 3,190,853 | ||||||
| AIR FREIGHT & LOGISTICS - 1.7% | ||||||||
Expeditors International of Washington | 48,300 | 3,124,527 | ||||||
| BUILDING PRODUCTS - 1.9% | ||||||||
Apogee Enterprises | 18,200 | 832,286 | ||||||
Geberit | 1,000 | 440,012 | ||||||
TOTO | 37,000 | 2,181,321 | ||||||
| 3,453,619 | ||||||||
| CONSTRUCTION & ENGINEERING - 2.0% | ||||||||
Comfort Systems USA | 11,600 | 506,340 | ||||||
Jacobs Engineering Group | 9,700 | 639,812 | ||||||
KBR | 132,800 | 2,633,424 | ||||||
| 3,779,576 | ||||||||
| ELECTRICAL EQUIPMENT - 1.2% | ||||||||
Hubbell Cl. B | 15,900 | 2,151,906 | ||||||
| MACHINERY - 11.7% | ||||||||
Alamo Group | 3,408 | 384,661 | ||||||
Donaldson Company | 67,500 | 3,304,125 | ||||||
Federal Signal | 10,229 | 205,501 | ||||||
Flowserve Corporation | 19,500 | 821,535 | ||||||
Graco | 63,000 | 2,848,860 | ||||||
IDEX Corporation | 29,700 | 3,919,509 | ||||||
Lincoln Electric Holdings | 13,150 | 1,204,277 | ||||||
Lindsay Corporation | 26,700 | 2,354,940 | ||||||
Pfeiffer Vacuum Technology | 12,000 | 2,242,646 | ||||||
Spirax-Sarco Engineering | 27,400 | 2,073,714 | ||||||
Wabash National | 94,700 | 2,054,990 | ||||||
| 21,414,758 | ||||||||
| MARINE - 1.3% | ||||||||
Clarkson | 60,700 | 2,343,667 | ||||||
| 42 | The Royce Funds 2017 Annual Report to Shareholders | THE ACCOMPANYING NOTES ARE AN INTEGRAL PART OF THESE FINANCIAL STATEMENTS |
| December 31, 2017 |
| Royce Dividend Value Fund (continued) | ||||||||
| SHARES | VALUE | |||||||
| INDUSTRIALS (continued) | ||||||||
| PROFESSIONAL SERVICES - 3.3% | ||||||||
Korn/Ferry International | 32,601 | $ | 1,349,030 | |||||
ManpowerGroup | 28,300 | 3,568,913 | ||||||
Robert Half International | 21,665 | 1,203,274 | ||||||
| 6,121,217 | ||||||||
| ROAD & RAIL - 2.0% | ||||||||
Amerco | 7,542 | 2,850,197 | ||||||
Werner Enterprises | 21,900 | 846,435 | ||||||
| 3,696,632 | ||||||||
| TRADING COMPANIES & DISTRIBUTORS - 1.7% | ||||||||
Applied Industrial Technologies | 45,600 | 3,105,360 | ||||||
| Total (Cost $27,680,927) | 52,382,115 | |||||||
| INFORMATION TECHNOLOGY – 5.4% | ||||||||
| ELECTRONIC EQUIPMENT, INSTRUMENTS & COMPONENTS - 3.9% | ||||||||
FLIR Systems | 91,500 | 4,265,730 | ||||||
Methode Electronics | 22,365 | 896,837 | ||||||
Vishay Intertechnology | 93,888 | 1,948,176 | ||||||
| 7,110,743 | ||||||||
| IT SERVICES - 0.2% | ||||||||
Convergys Corporation | 439,450 | |||||||
| SEMICONDUCTORS & SEMICONDUCTOR EQUIPMENT - 0.5% | 18,700 | |||||||
MKS Instruments | 917,406 | |||||||
| SOFTWARE - 0.8% | 9,708 | |||||||
Computer Modelling Group | 1,069,212 | |||||||
SimCorp | 140,000 | 398,524 | ||||||
| 7,000 | 1,467,736 | |||||||
| Total (Cost $6,861,902) | 9,935,335 | |||||||
| MATERIALS – 12.7% | ||||||||
| CHEMICALS - 1.9% | ||||||||
Quaker Chemical | 20,500 | 3,091,195 | ||||||
Victrex | 10,000 | 356,174 | ||||||
| 3,447,369 | ||||||||
| CONTAINERS & PACKAGING - 2.0% | ||||||||
AptarGroup | 36,900 | 3,183,732 | ||||||
Greif Cl. A | 7,800 | 472,524 | ||||||
| 3,656,256 | ||||||||
| METALS & MINING - 8.8% | ||||||||
Carpenter Technology | 61,900 | 3,156,281 | ||||||
Compass Minerals International | 35,100 | 2,535,975 | ||||||
Franco-Nevada Corporation | 33,000 | 2,638,350 | ||||||
Reliance Steel & Aluminum | 44,200 | 3,791,918 | ||||||
Royal Gold | 19,300 | 1,584,916 | ||||||
Worthington Industries | 58,500 | 2,577,510 | ||||||
| 16,284,950 | ||||||||
| Total (Cost $14,723,848) | 23,388,575 | |||||||
| REAL ESTATE – 0.3% | ||||||||
| REAL ESTATE MANAGEMENT & DEVELOPMENT - 0.3% | ||||||||
Relo Group | 23,000 | 626,454 | ||||||
| Total (Cost $107,244) | 626,454 | |||||||
| TELECOMMUNICATION SERVICES – 0.4% | ||||||||
| DIVERSIFIED TELECOMMUNICATION SERVICES - 0.4% | ||||||||
Inmarsat | 105,000 | 695,748 | ||||||
| Total (Cost $1,165,014) | 695,748 | |||||||
| UTILITIES – 1.1% | ||||||||
| WATER UTILITIES - 1.1% | ||||||||
Aqua America | 49,800 | 1,953,654 | ||||||
| Total (Cost $1,192,551) | 1,953,654 | |||||||
| MISCELLANEOUS2 – 4.0% | ||||||||
| Total (Cost $6,485,117) | 7,307,286 | |||||||
| TOTAL COMMON STOCKS | ||||||||
| (Cost $111,559,397) | 179,975,582 | |||||||
| REPURCHASE AGREEMENT – 2.0% | ||||||||
| Fixed Income Clearing Corporation, 0.20% dated 12/29/17, due 1/2/18, maturity value $3,733,083 (collateralized by obligations of various U.S. Government Agencies, 1.625% due 4/30/19, valued at $3,812,402) | ||||||||
| (Cost $3,733,000) | 3,733,000 | |||||||
| TOTAL INVESTMENTS – 100.1% | ||||||||
| (Cost $115,292,397) | 183,708,582 | |||||||
| LIABILITIES LESS CASH AND OTHER ASSETS – (0.1)% | (212,103 | ) | ||||||
| NET ASSETS – 100.0% | $ | 183,496,479 | ||||||
| THE ACCOMPANYING NOTES ARE AN INTEGRAL PART OF THESE FINANCIAL STATEMENTS | The Royce Funds 2017 Annual Report to Shareholders | 43 |
| Schedules of Investments |
| Royce Global Financial Services Fund | ||||||||
| Common Stocks – 99.2% | ||||||||
| SHARES | VALUE | |||||||
| BANKS - 15.7% | ||||||||
BankUnited | 4,100 | $ | 166,952 | |||||
BLOM Bank GDR | 8,000 | 101,600 | ||||||
BOK Financial | 11,600 | 1,070,912 | ||||||
Capital City Bank Group | 26,822 | 615,297 | ||||||
Chemung Financial | 14,512 | 698,027 | ||||||
†County Bancorp | 15,895 | 473,035 | ||||||
First Citizens BancShares Cl. A | 3,290 | 1,325,870 | ||||||
First Republic Bank | 8,000 | 693,120 | ||||||
Investors Bancorp | 25,300 | 351,164 | ||||||
Live Oak Bancshares | 22,500 | 536,625 | ||||||
Popular | 32,300 | 1,146,327 | ||||||
State Bank Financial | 12,500 | 373,000 | ||||||
Umpqua Holdings | 17,400 | 361,920 | ||||||
†Webster Financial | 14,600 | 819,936 | ||||||
| Total (Cost $6,242,325) | 8,733,785 | |||||||
| CAPITAL MARKETS - 49.7% | ||||||||
Ares Management L.P. | 49,100 | 982,000 | ||||||
Ashmore Group | 216,000 | 1,181,148 | ||||||
Associated Capital Group Cl. A | 14,084 | 480,264 | ||||||
B3 | 122,400 | 839,041 | ||||||
Canaccord Genuity Group | 133,000 | 613,683 | ||||||
Carlyle Group L.P. | 41,700 | 954,930 | ||||||
Charles Schwab (The) Corporation | 16,900 | 868,153 | ||||||
Citadel Capital 1 | 150,000 | 10,799 | ||||||
Coronation Fund Managers | 61,200 | 364,908 | ||||||
CRISIL | 14,000 | 410,571 | ||||||
Dundee Corporation Cl. A 1 | 90,000 | 181,146 | ||||||
†Edelweiss Financial Services | 155,000 | 720,503 | ||||||
Edmond de Rothschild (Suisse) | 30 | 568,918 | ||||||
Egyptian Financial Group-Hermes Holding | ||||||||
Company | 246,390 | 327,042 | ||||||
Financial Engines | 14,100 | 427,230 | ||||||
Gluskin Sheff + Associates | 63,400 | 839,785 | ||||||
GMP Capital 1 | 108,000 | 298,998 | ||||||
Hellenic Exchanges - Athens Stock Exchange | 50,000 | 315,643 | ||||||
Intermediate Capital Group | 39,111 | 603,072 | ||||||
INTL FCStone 1 | 12,100 | 514,613 | ||||||
IOOF Holdings | 55,000 | 459,008 | ||||||
JSE | 51,000 | 634,210 | ||||||
Jupiter Fund Management | 106,900 | 906,586 | ||||||
KKR & Co. L.P. | 23,900 | 503,334 | ||||||
Lazard Cl. A | 3,700 | 194,250 | ||||||
MarketAxess Holdings | 4,600 | 928,050 | ||||||
MVC Capital | 47,100 | 497,376 | ||||||
Northern Trust | 9,900 | 988,911 | ||||||
NZX | 580,000 | 459,929 | ||||||
Partners Group Holding | 670 | 459,108 | ||||||
Reinet Investments | 7,200 | 148,589 | ||||||
Rothschild & Co | 27,700 | 1,013,853 | ||||||
SEI Investments | 19,900 | 1,430,014 | ||||||
Silvercrest Asset Management Group Cl. A | 41,600 | 667,680 | ||||||
Singapore Exchange | 114,300 | 634,522 | ||||||
Sprott | 750,000 | 1,455,847 | ||||||
TD Ameritrade Holding Corporation | 10,880 | 556,294 | ||||||
Tokai Tokyo Financial Holdings | 9,400 | 60,543 | ||||||
U.S. Global Investors Cl. A | 183,900 | 717,210 | ||||||
UOB-Kay Hian Holdings | 129,000 | 131,141 | ||||||
Value Partners Group | 672,000 | 711,142 | ||||||
Virtu Financial Cl. A | 70,700 | 1,293,810 | ||||||
VZ Holding | 3,350 | 1,136,276 | ||||||
Warsaw Stock Exchange | 19,000 | 256,481 | ||||||
| Total (Cost $21,045,715) | 27,746,611 | |||||||
| DIVERSIFIED CONSUMER SERVICES - 0.1% | ||||||||
H&R Block | 2,000 | 52,440 | ||||||
| Total (Cost $44,290) | 52,440 | |||||||
| DIVERSIFIED FINANCIAL SERVICES - 0.3% | ||||||||
SHUAA Capital 1 | 580,000 | 191,094 | ||||||
| Total (Cost $308,882) | 191,094 | |||||||
| EQUITY REAL ESTATE INVESTMENT TRUSTS (REITS) - 0.6% | ||||||||
†Colony NorthStar Cl. A | 31,500 | 359,415 | ||||||
| Total (Cost $383,891) | 359,415 | |||||||
| HOTELS, RESTAURANTS & LEISURE - 0.7% | ||||||||
Thomas Cook (India) | 94,000 | 379,505 | ||||||
| Total (Cost $270,518) | 379,505 | |||||||
| INSURANCE - 6.7% | ||||||||
E-L Financial | 2,625 | 1,701,572 | ||||||
First American Financial | 3,900 | 218,556 | ||||||
Jardine Lloyd Thompson Group | 11,900 | 223,365 | ||||||
MBIA 1 | 95,300 | 697,596 | ||||||
National Western Life Group Cl. A | 2,750 | 910,305 | ||||||
| Total (Cost $3,365,019) | 3,751,394 | |||||||
| INTERNET SOFTWARE & SERVICES - 0.6% | ||||||||
Envestnet 1 | 6,000 | 299,100 | ||||||
| 223,459 | 15,642 | |||||||
| Total (Cost $357,701) | 314,742 | |||||||
| INVESTMENT COMPANIES - 1.3% | ||||||||
RIT Capital Partners | 28,300 | 748,535 | ||||||
| Total (Cost $610,092) | 748,535 | |||||||
| IT SERVICES - 2.5% | ||||||||
Cass Information Systems | 4,180 | 243,318 | ||||||
DST Systems | 7,600 | 471,732 | ||||||
GBST Holdings | 105,000 | 199,716 | ||||||
PayPal Holdings 1 | 6,400 | 471,168 | ||||||
| Total (Cost $1,237,425) | 1,385,934 | |||||||
| MARINE - 1.8% | ||||||||
Clarkson | 26,000 | 1,003,877 | ||||||
| Total (Cost $928,924) | 1,003,877 | |||||||
| METALS & MINING - 2.4% | ||||||||
Franco-Nevada Corporation | 16,500 | 1,319,175 | ||||||
| Total (Cost $900,426) | 1,319,175 | |||||||
| PROFESSIONAL SERVICES - 1.1% | ||||||||
IHS Markit 1 | 14,000 | 632,100 | ||||||
| Total (Cost $336,000) | 632,100 | |||||||
| REAL ESTATE MANAGEMENT & DEVELOPMENT - 7.3% | ||||||||
Altus Group | 32,000 | 940,143 | ||||||
FirstService Corporation | 20,900 | 1,461,328 | ||||||
| 18,100 | 800,925 | |||||||
| 44 | The Royce Funds 2017 Annual Report to Shareholders | THE ACCOMPANYING NOTES ARE AN INTEGRAL PART OF THESE FINANCIAL STATEMENTS |
| December 31, 2017 |
| Royce Global Financial Services Fund (continued) | ||||||||
| SHARES | VALUE | |||||||
| REAL ESTATE MANAGEMENT & DEVELOPMENT (continued) | ||||||||
Midland Holdings 1 | 800,000 | $ | 231,393 | |||||
Midland IC&I 1 | 400,000 | 20,727 | ||||||
RMR Group Cl. A | 10,000 | 593,000 | ||||||
| Total (Cost $2,886,430) | 4,047,516 | |||||||
| SOFTWARE - 2.2% | ||||||||
Bottomline Technologies 1 | 13,600 | 471,648 | ||||||
Fair Isaac | 5,100 | 781,320 | ||||||
| Total (Cost $514,486) | 1,252,968 | |||||||
| THRIFTS & MORTGAGE FINANCE - 1.4% | ||||||||
BofI Holding 1 | 25,700 | 768,430 | ||||||
| Total (Cost $466,954) | 768,430 | |||||||
| MISCELLANEOUS2 - 4.8% | ||||||||
| Total (Cost $2,098,965) | 2,655,144 | |||||||
| TOTAL COMMON STOCKS | ||||||||
| (Cost $41,998,043) | 55,342,665 | |||||||
| REPURCHASE AGREEMENT – 0.8% | ||||||||
| Fixed Income Clearing Corporation, 0.20% dated 12/29/17, due 1/2/18, maturity value $486,011 (collateralized by obligations of various U.S. Government Agencies, 1.625% due 4/30/19, valued at $499,660) | ||||||||
| (Cost $486,000) | 486,000 | |||||||
| TOTAL INVESTMENTS – 100.0% | ||||||||
| (Cost $42,484,043) | 55,828,665 | |||||||
| LIABILITIES LESS CASH AND OTHER ASSETS – (0.0)% | (23,751 | ) | ||||||
| NET ASSETS – 100.0% | $ | 55,804,914 | ||||||
| Royce International Micro-Cap Fund | ||||||||
| Common Stocks – 93.6% | ||||||||
| SHARES | VALUE | |||||||
| AUSTRALIA – 4.1% | ||||||||
Austal | 46,400 | $ | 65,603 | |||||
†HT&E | 52,300 | 76,652 | ||||||
NetComm Wireless 1 | 70,300 | 65,740 | ||||||
Seeing Machines 1 | 462,700 | 35,135 | ||||||
†Tassal Group | 28,500 | 83,413 | ||||||
| Total (Cost $334,984) | 326,543 | |||||||
| BELGIUM – 0.8% | ||||||||
†Greenyard | 2,500 | 60,297 | ||||||
| Total (Cost $53,669) | 60,297 | |||||||
| BRAZIL – 4.3% | ||||||||
| 16,800 | 101,119 | |||||||
†International Meal Company Alimentacao | 34,600 | 90,023 | ||||||
Minerva | 26,400 | 84,666 | ||||||
T4F Entretenimento | 29,900 | 66,062 | ||||||
| Total (Cost $346,212) | 341,870 | |||||||
| CANADA – 8.0% | ||||||||
Altus Group | 1,900 | 55,821 | ||||||
| 131,400 | 54,358 | |||||||
Exco Technologies | 12,900 | 104,062 | ||||||
| 10,600 | 68,727 | |||||||
Magellan Aerospace | 5,200 | 86,915 | ||||||
Major Drilling Group International 1 | 14,600 | 82,002 | ||||||
†North American Energy Partners | 14,100 | 69,795 | ||||||
Sandstorm Gold 1 | 10,000 | 49,900 | ||||||
Solium Capital 1 | 7,600 | 65,963 | ||||||
| Total (Cost $566,212) | 637,543 | |||||||
| CHINA – 0.9% | ||||||||
Xingda International Holdings | 195,000 | 69,101 | ||||||
| Total (Cost $80,921) | 69,101 | |||||||
| FRANCE – 2.2% | ||||||||
Bigben Interactive 1 | 3,500 | 57,821 | ||||||
HighCo | 10,900 | 63,924 | ||||||
Manutan International | 500 | 53,684 | ||||||
| Total (Cost $111,864) | 175,429 | |||||||
| GERMANY – 3.8% | ||||||||
Amadeus Fire | 700 | 64,769 | ||||||
CANCOM | 1,100 | 91,417 | ||||||
†Surteco | 2,900 | 93,529 | ||||||
VIB Vermoegen | 2,000 | 50,825 | ||||||
| Total (Cost $245,288) | 300,540 | |||||||
| HONG KONG – 5.5% | ||||||||
†CSI Properties | 1,761,800 | 91,230 | ||||||
†HKBN | 38,000 | 48,053 | ||||||
I.T | 224,000 | 95,463 | ||||||
Oriental Watch Holdings | 188,600 | 42,953 | ||||||
Pico Far East Holdings | 153,300 | 60,826 | ||||||
Value Partners Group | 29,700 | 31,430 | ||||||
†Wasion Group Holdings | 130,600 | 63,842 | ||||||
| Total (Cost $410,121) | 433,797 | |||||||
| INDIA – 4.5% | ||||||||
†Allcargo Logistics | 29,600 | 96,487 | ||||||
eClerx Services | 4,100 | 100,274 | ||||||
†Jagran Prakashan | 30,800 | 85,836 | ||||||
| THE ACCOMPANYING NOTES ARE AN INTEGRAL PART OF THESE FINANCIAL STATEMENTS | The Royce Funds 2017 Annual Report to Shareholders | 45 |
| Schedules of Investments |
| Royce International Micro-Cap Fund (continued) | ||||||||
| SHARES | VALUE | |||||||
| INDIA (continued) | ||||||||
†Multi Commodity Exchange of India | 5,300 | $ | 75,774 | |||||
| Total (Cost $344,628) | 358,371 | |||||||
| INDONESIA – 0.7% | ||||||||
Selamat Sempurna | 609,900 | 56,399 | ||||||
| Total (Cost $51,749) | 56,399 | |||||||
| IRELAND – 1.0% | ||||||||
Irish Residential Properties REIT | 44,600 | 80,611 | ||||||
| Total (Cost $57,740) | 80,611 | |||||||
| ISRAEL – 0.4% | ||||||||
Nova Measuring Instruments 1 | 1,200 | 31,092 | ||||||
| Total (Cost $23,836) | 31,092 | |||||||
| ITALY – 1.2% | ||||||||
| 6,400 | 98,877 | |||||||
| Total (Cost $76,692) | 98,877 | |||||||
| JAPAN – 16.3% | ||||||||
†Asia Pile Holdings | 13,800 | 88,822 | ||||||
†Ateam | 2,400 | 57,631 | ||||||
C. Uyemura & Co. | 1,000 | 76,268 | ||||||
†Digital Garage | 2,300 | 60,542 | ||||||
†eGuarantee | 2,300 | 72,284 | ||||||
GCA | 100 | 1,001 | ||||||
G-Tekt | 3,800 | 78,157 | ||||||
†IDOM | 9,100 | 64,478 | ||||||
†Information Services International-Dentsu | 1,700 | 38,451 | ||||||
†Investors Cloud | 3,000 | 44,567 | ||||||
Kenedix | 9,200 | 56,069 | ||||||
Kenko Mayonnaise | 1,800 | 65,104 | ||||||
Leopalace21 | 4,200 | 32,659 | ||||||
NS Solutions | 2,300 | 62,694 | ||||||
Open House | 1,100 | 59,071 | ||||||
Outsourcing | 2,100 | 38,243 | ||||||
Ryobi | 2,040 | 57,971 | ||||||
SPARX Group | 24,200 | 66,904 | ||||||
Sun Frontier Fudousan | 7,300 | 82,910 | ||||||
Tokai Corporation | 4,000 | 91,285 | ||||||
†Yumeshin Holdings | 10,100 | 97,394 | ||||||
| Total (Cost $991,277) | 1,292,505 | |||||||
| MALAYSIA – 1.6% | ||||||||
†AEON Credit Service | 20,950 | 69,589 | ||||||
CB Industrial Product Holding | 127,600 | 56,743 | ||||||
| Total (Cost $114,393) | 126,332 | |||||||
| MEXICO – 1.0% | ||||||||
Rassini | 22,600 | 80,469 | ||||||
| Total (Cost $95,046) | 80,469 | |||||||
| NETHERLANDS – 0.8% | ||||||||
AMG Advanced Metallurgical Group | 1,300 | 65,307 | ||||||
| Total (Cost $39,402) | 65,307 | |||||||
| NORWAY – 1.1% | ||||||||
†Protector Forsikring | 7,900 | 86,594 | ||||||
| Total (Cost $68,322) | 86,594 | |||||||
| SINGAPORE – 1.4% | ||||||||
CSE Global | 216,200 | 58,965 | ||||||
†Duty Free International | 264,800 | 52,468 | ||||||
| 71,500 | 428 | |||||||
| Total (Cost $138,413) | 111,861 | |||||||
| SOUTH AFRICA – 2.0% | ||||||||
†Adcock Ingram Holdings | 17,500 | 82,515 | ||||||
| 56,600 | 74,175 | |||||||
| Total (Cost $143,586) | 156,690 | |||||||
| SOUTH KOREA – 5.9% | ||||||||
Eugene Technology | 3,900 | 76,490 | ||||||
†Huchems Fine Chemical | 5,100 | 116,863 | ||||||
†Interojo Company | 2,244 | 81,442 | ||||||
Koh Young Technology | 900 | 69,195 | ||||||
Modetour Network | 2,000 | 56,950 | ||||||
Samjin Pharmaceutical | 2,100 | 70,270 | ||||||
| Total (Cost $363,603) | 471,210 | |||||||
| SPAIN – 2.0% | ||||||||
Atento | 15,700 | 159,355 | ||||||
| Total (Cost $150,834) | 159,355 | |||||||
| SWEDEN – 4.3% | ||||||||
Byggmax Group | 12,600 | 84,417 | ||||||
Dustin Group | 8,100 | 80,398 | ||||||
Knowit | 4,400 | 83,266 | ||||||
Proact IT Group | 4,400 | 96,844 | ||||||
| Total (Cost $283,272) | 344,925 | |||||||
| TAIWAN – 8.3% | ||||||||
Egis Technology 1 | 8,900 | 67,763 | ||||||
†Formosa Laboratories | 36,800 | 85,296 | ||||||
Posiflex Technology | 7,089 | 32,437 | ||||||
Sinmag Equipment | 16,100 | 91,970 | ||||||
Sitronix Technology | 34,100 | 96,028 | ||||||
Sporton International | 22,826 | 123,059 | ||||||
Taiwan Paiho | 22,600 | 91,877 | ||||||
TCI | 7,641 | 73,822 | ||||||
| Total (Cost $610,646) | 662,252 | |||||||
| UNITED ARAB EMIRATES – 0.7% | ||||||||
Aramex | 47,500 | 55,674 | ||||||
| Total (Cost $23,304) | 55,674 | |||||||
| UNITED KINGDOM – 10.3% | ||||||||
Avon Rubber | 3,000 | 49,423 | ||||||
| 26,100 | 20,826 | |||||||
Connect Group | 52,900 | 79,926 | ||||||
Conviviality | 16,300 | 88,661 | ||||||
dotdigital group | 53,600 | 75,377 | ||||||
EMIS Group | 5,500 | 75,099 | ||||||
Epwin Group | 92,500 | 104,644 | ||||||
Finsbury Food Group | 51,700 | 75,389 | ||||||
Hilton Food Group | 6,500 | 75,521 | ||||||
Norcros | 28,570 | 68,814 | ||||||
Pendragon | 128,600 | 49,531 | ||||||
Rank Group | 17,000 | 55,205 | ||||||
| Total (Cost $758,421) | 818,416 | |||||||
| 46 | The Royce Funds 2017 Annual Report to Shareholders | THE ACCOMPANYING NOTES ARE AN INTEGRAL PART OF THESE FINANCIAL STATEMENTS |
| December 31, 2017 |
| Royce International Micro-Cap Fund (continued) | ||||||||
| SHARES | VALUE | |||||||
| UNITED STATES – 0.5% | ||||||||
Currency Exchange International 1 | 2,100 | $ | 41,783 | |||||
| Total (Cost $47,630) | 41,783 | |||||||
| TOTAL COMMON STOCKS | ||||||||
| (Cost $6,532,065) | 7,443,843 | |||||||
| REPURCHASE AGREEMENT – 7.2% | ||||||||
| Fixed Income Clearing Corporation, 0.20% dated 12/29/17, due 1/2/18, maturity value $570,013 (collateralized by obligations of various U.S. Government Agencies, 1.625% due 4/30/19, valued at $584,602) | ||||||||
| (Cost $570,000) | 570,000 | |||||||
| TOTAL INVESTMENTS – 100.8% | ||||||||
| (Cost $7,102,065) | 8,013,843 | |||||||
| LIABILITIES LESS CASH AND OTHER ASSETS – (0.8)% | (61,124 | ) | ||||||
| NET ASSETS – 100.0% | $ | 7,952,719 | ||||||
| Royce International Premier Fund | ||||||||
| Common Stocks – 96.8% | ||||||||
| SHARES | VALUE | |||||||
| AUSTRALIA – 10.0% | ||||||||
ALS | 572,000 | $ | 3,117,385 | |||||
†Bravura Solutions | 2,000,000 | 2,699,770 | ||||||
Cochlear | 20,000 | 2,670,041 | ||||||
†Hansen Technologies | 1,155,000 | 3,555,026 | ||||||
IPH | 945,000 | 4,052,399 | ||||||
| Total (Cost $14,020,973) | 16,094,621 | |||||||
| AUSTRIA – 1.8% | ||||||||
Mayr-Melnhof Karton | 20,000 | 2,939,619 | ||||||
| Total (Cost $2,374,722) | 2,939,619 | |||||||
| BRAZIL – 3.5% | ||||||||
OdontoPrev | 550,000 | 2,630,758 | ||||||
TOTVS | 340,000 | 3,060,548 | ||||||
| Total (Cost $4,765,157) | 5,691,306 | |||||||
| CANADA – 3.6% | ||||||||
Morneau Shepell | 157,500 | 2,794,153 | ||||||
Winpak | 82,500 | 3,071,599 | ||||||
| Total (Cost $5,439,648) | 5,865,752 | |||||||
| CHINA – 1.9% | ||||||||
TravelSky Technology | 1,010,000 | 3,026,742 | ||||||
| Total (Cost $2,139,064) | 3,026,742 | |||||||
| FRANCE – 3.9% | ||||||||
†Neurones | 82,500 | 2,848,832 | ||||||
Thermador Groupe | 25,595 | 3,485,765 | ||||||
| Total (Cost $5,200,917) | 6,334,597 | |||||||
| GERMANY – 4.7% | ||||||||
Carl Zeiss Meditec | 52,000 | 3,223,379 | ||||||
Fielmann | 25,000 | 2,200,211 | ||||||
STRATEC Biomedical | 26,500 | 2,054,650 | ||||||
| Total (Cost $5,305,369) | 7,478,240 | |||||||
| INDIA – 6.2% | ||||||||
Bajaj Finance | 120,000 | 3,307,793 | ||||||
SH Kelkar & Company | 690,583 | 3,197,438 | ||||||
†Vakrangee | 240,000 | 1,573,522 | ||||||
| 300,000 | 1,969,371 | |||||||
| Total (Cost $5,569,117) | 10,048,124 | |||||||
| ISRAEL – 2.1% | ||||||||
†Frutarom Industries | 36,000 | 3,378,936 | ||||||
| Total (Cost $2,710,378) | 3,378,936 | |||||||
| ITALY – 1.7% | ||||||||
DiaSorin | 30,000 | 2,662,059 | ||||||
| Total (Cost $1,829,336) | 2,662,059 | |||||||
| JAPAN – 17.0% | ||||||||
Ai Holdings | 140,000 | 3,385,460 | ||||||
†As One | 55,000 | 3,437,655 | ||||||
Meitec Corporation | 85,000 | 4,474,950 | ||||||
Nihon Kohden | 123,000 | 2,855,120 | ||||||
Relo Group | 112,500 | 3,064,177 | ||||||
Santen Pharmaceutical | 145,000 | 2,276,470 | ||||||
Sugi Holdings | 60,000 | 3,059,932 | ||||||
USS | 225,000 | 4,759,900 | ||||||
| Total (Cost $23,204,943) | 27,313,664 | |||||||
| THE ACCOMPANYING NOTES ARE AN INTEGRAL PART OF THESE FINANCIAL STATEMENTS | The Royce Funds 2017 Annual Report to Shareholders | 47 |
| Schedules of Investments |
| Royce International Premier Fund (continued) | ||||||||
| SHARES | VALUE | |||||||
| NEW ZEALAND – 3.8% | ||||||||
Fisher & Paykel Healthcare | 276,925 | $ | 2,808,208 | |||||
†Trade Me Group | 960,600 | 3,301,522 | ||||||
| Total (Cost $4,917,462) | 6,109,730 | |||||||
| NORWAY – 1.8% | ||||||||
TGS-NOPEC Geophysical | 120,000 | 2,838,586 | ||||||
| Total (Cost $2,498,595) | 2,838,586 | |||||||
| SINGAPORE – 2.0% | ||||||||
XP Power | 69,000 | 3,194,054 | ||||||
| Total (Cost $2,208,766) | 3,194,054 | |||||||
| SWEDEN – 5.7% | ||||||||
Addtech Cl. B | 125,000 | 2,730,558 | ||||||
Bravida Holding | 466,400 | 3,113,883 | ||||||
†Hexpol | 325,000 | 3,294,156 | ||||||
| Total (Cost $8,320,009) | 9,138,597 | |||||||
| SWITZERLAND – 9.8% | ||||||||
Burkhalter Holding | 32,678 | 4,255,270 | ||||||
LEM Holding | 1,400 | 2,373,254 | ||||||
Partners Group Holding | 6,000 | 4,111,415 | ||||||
VZ Holding | 15,000 | 5,087,801 | ||||||
| Total (Cost $11,631,941) | 15,827,740 | |||||||
| UNITED KINGDOM – 17.3% | ||||||||
Ashmore Group | 400,000 | 2,187,311 | ||||||
Clarkson | 75,000 | 2,895,800 | ||||||
Consort Medical | 170,000 | 2,678,020 | ||||||
Elementis | 750,000 | 2,917,247 | ||||||
Equiniti Group | 944,000 | 3,638,964 | ||||||
Fidessa Group | 60,000 | 2,049,595 | ||||||
ITE Group | 1,230,000 | 3,016,085 | ||||||
Rotork | 635,000 | 2,281,052 | ||||||
Spirax-Sarco Engineering | 45,000 | 3,405,735 | ||||||
Victrex | 77,500 | 2,760,352 | ||||||
| Total (Cost $24,412,894) | 27,830,161 | |||||||
| TOTAL COMMON STOCKS | ||||||||
| (Cost $126,549,291) | 155,772,528 | |||||||
| REPURCHASE AGREEMENT – 4.4% | ||||||||
| Fixed Income Clearing Corporation, 0.20% dated 12/29/17, due 1/2/18, maturity value $7,125,158 (collateralized by obligations of various U.S. Government Agencies, 1.625% due 4/30/19, valued at $7,270,046) | ||||||||
| (Cost $7,125,000) | 7,125,000 | |||||||
| TOTAL INVESTMENTS – 101.2% | ||||||||
| (Cost $133,674,291) | 162,897,528 | |||||||
| LIABILITIES LESS CASH AND OTHER ASSETS – (1.2)% | (1,869,858 | ) | ||||||
| NET ASSETS – 100.0% | $ | 161,027,670 | ||||||
| Royce Low-Priced Stock Fund | ||||||||
| Common Stocks – 98.5% | ||||||||
| SHARES | VALUE | |||||||
| CONSUMER DISCRETIONARY – 18.9% | ||||||||
| AUTO COMPONENTS - 2.9% | ||||||||
Fox Factory Holding 1 | 47,800 | $ | 1,857,030 | |||||
| 101,300 | 2,046,260 | |||||||
Stoneridge 1 | 103,300 | 2,361,438 | ||||||
Unique Fabricating | 202,989 | 1,506,178 | ||||||
| 7,770,906 | ||||||||
| AUTOMOBILES - 0.9% | ||||||||
Thor Industries | 15,803 | 2,381,828 | ||||||
| HOTELS, RESTAURANTS & LEISURE - 0.8% | ||||||||
Century Casinos 1 | 228,800 | 2,088,944 | ||||||
| HOUSEHOLD DURABLES - 1.4% | ||||||||
AV Homes 1 | 97,500 | 1,623,375 | ||||||
| 123,700 | 2,216,704 | |||||||
| 3,840,079 | ||||||||
| LEISURE PRODUCTS - 3.0% | ||||||||
Acushnet Holdings | 96,000 | 2,023,680 | ||||||
| 146,000 | 1,874,640 | |||||||
MCBC Holdings 1 | 100,800 | 2,239,776 | ||||||
Nautilus 1 | 135,213 | 1,805,094 | ||||||
| 7,943,190 | ||||||||
| MEDIA - 0.9% | ||||||||
Harte-Hanks 1 | 284,200 | 269,620 | ||||||
New Media Investment Group | 125,300 | 2,102,534 | ||||||
| 2,372,154 | ||||||||
| SPECIALTY RETAIL - 8.2% | ||||||||
American Eagle Outfitters | 153,100 | 2,878,280 | ||||||
Buckle (The) | 95,975 | 2,279,406 | ||||||
Build-A-Bear Workshop 1 | 174,100 | 1,601,720 | ||||||
Chico’s FAS | 231,300 | 2,040,066 | ||||||
DSW Cl. A | 110,400 | 2,363,664 | ||||||
Finish Line (The) Cl. A | 79,200 | 1,150,776 | ||||||
Guess? | 140,000 | 2,363,200 | ||||||
Kirkland’s 1 | 123,900 | 1,482,464 | ||||||
Shoe Carnival | 108,600 | 2,905,050 | ||||||
| 85,600 | 3,001,136 | |||||||
| 22,065,762 | ||||||||
| TEXTILES, APPAREL & LUXURY GOODS - 0.8% | ||||||||
Vera Bradley 1 | 184,400 | 2,245,992 | ||||||
| Total (Cost $40,388,485) | 50,708,855 | |||||||
| CONSUMER STAPLES – 0.6% | ||||||||
| FOOD PRODUCTS - 0.6% | ||||||||
Landec Corporation 1 | 127,900 | 1,611,540 | ||||||
| Total (Cost $1,668,222) | 1,611,540 | |||||||
| ENERGY – 7.7% | ||||||||
| ENERGY EQUIPMENT & SERVICES - 5.5% | ||||||||
Gulf Island Fabrication | 147,000 | 1,973,475 | ||||||
| 98,500 | 1,933,555 | |||||||
Newpark Resources 1 | 240,800 | 2,070,880 | ||||||
Pason Systems | 103,150 | 1,492,680 | ||||||
Profire Energy 1 | 980,300 | 1,882,176 | ||||||
TGS-NOPEC Geophysical | 72,000 | 1,703,151 | ||||||
Total Energy Services | 178,000 | 2,104,280 | ||||||
Unit Corporation 1 | 78,800 | 1,733,600 | ||||||
| 14,893,797 | ||||||||
| OIL, GAS & CONSUMABLE FUELS - 2.2% | ||||||||
Ardmore Shipping 1 | 274,800 | 2,198,400 | ||||||
Panhandle Oil and Gas Cl. A | 82,000 | 1,685,100 | ||||||
| 48 | The Royce Funds 2017 Annual Report to Shareholders | THE ACCOMPANYING NOTES ARE AN INTEGRAL PART OF THESE FINANCIAL STATEMENTS |
.
| December 31, 2017 |
| Royce Low-Priced Stock Fund (continued) | ||||||||
| SHARES | VALUE | |||||||
| ENERGY (continued) | ||||||||
| OIL, GAS & CONSUMABLE FUELS (continued) | ||||||||
SRC Energy 1 | 236,900 | $ | 2,020,757 | |||||
| 5,904,257 | ||||||||
| Total (Cost $14,792,826) | 20,798,054 | |||||||
| FINANCIALS – 12.6% | ||||||||
| BANKS - 2.9% | ||||||||
Blue Hills Bancorp | 99,500 | 1,999,950 | ||||||
Boston Private Financial Holdings | 120,500 | 1,861,725 | ||||||
Brookline Bancorp | 122,400 | 1,921,680 | ||||||
HarborOne Bancorp 1 | 104,800 | 2,007,968 | ||||||
| 7,791,323 | ||||||||
| CAPITAL MARKETS - 5.8% | ||||||||
Ares Management L.P. | 110,000 | 2,200,000 | ||||||
Ashmore Group | 435,363 | 2,380,686 | ||||||
Dundee Corporation Cl. A 1 | 492,800 | 991,873 | ||||||
†Hamilton Lane Cl. A | 70,888 | 2,508,726 | ||||||
Silvercrest Asset Management Group Cl. A | 144,300 | 2,316,015 | ||||||
Sprott | 1,254,400 | 2,434,953 | ||||||
Value Partners Group | 1,937,600 | 2,050,460 | ||||||
| 200,800 | 781,112 | |||||||
| 15,663,825 | ||||||||
| DIVERSIFIED FINANCIAL SERVICES - 0.4% | ||||||||
GTY Technology Holdings 1 | 100,000 | 1,030,000 | ||||||
| INSURANCE - 0.5% | ||||||||
MBIA 1 | 177,000 | 1,295,640 | ||||||
| THRIFTS & MORTGAGE FINANCE - 3.0% | ||||||||
Beneficial Bancorp | 108,000 | 1,776,600 | ||||||
Genworth MI Canada | 67,500 | 2,335,919 | ||||||
Kearny Financial | 130,800 | 1,890,060 | ||||||
Meridian Bancorp | 96,100 | 1,979,660 | ||||||
| 7,982,239 | ||||||||
| Total (Cost $29,073,710) | 33,763,027 | |||||||
| HEALTH CARE – 5.6% | ||||||||
| BIOTECHNOLOGY - 1.7% | ||||||||
| 82,500 | 1,493,250 | |||||||
Progenics Pharmaceuticals 1 | 226,774 | 1,349,305 | ||||||
| 120,600 | 1,650,810 | |||||||
| 4,493,365 | ||||||||
| HEALTH CARE EQUIPMENT & SUPPLIES - 1.5% | ||||||||
AtriCure 1 | 98,800 | 1,802,112 | ||||||
CryoLife 1 | 120,300 | 2,303,745 | ||||||
| 4,105,857 | ||||||||
| HEALTH CARE TECHNOLOGY - 1.1% | ||||||||
Allscripts Healthcare Solutions 1 | 140,300 | 2,041,365 | ||||||
HMS Holdings 1 | 50,000 | 847,500 | ||||||
| 2,888,865 | ||||||||
| LIFE SCIENCES TOOLS & SERVICES - 0.7% | ||||||||
Harvard Bioscience 1 | 595,600 | 1,965,480 | ||||||
| PHARMACEUTICALS - 0.6% | ||||||||
| 95,100 | 255,819 | |||||||
| 497,500 | 1,467,625 | |||||||
| 1,723,444 | ||||||||
| Total (Cost $12,404,091) | 15,177,011 | |||||||
| INDUSTRIALS – 19.6% | ||||||||
| AEROSPACE & DEFENSE - 1.4% | ||||||||
CPI Aerostructures 1 | 246,766 | 2,208,556 | ||||||
Kratos Defense & Security Solutions 1 | 150,300 | 1,591,677 | ||||||
| 3,800,233 | ||||||||
| BUILDING PRODUCTS - 0.6% | ||||||||
| 86,700 | 1,673,310 | |||||||
| COMMERCIAL SERVICES & SUPPLIES - 2.0% | ||||||||
Atento | 155,600 | 1,579,340 | ||||||
Heritage-Crystal Clean 1 | 75,900 | 1,650,825 | ||||||
Steelcase Cl. A | 141,700 | 2,153,840 | ||||||
| 5,384,005 | ||||||||
| CONSTRUCTION & ENGINEERING - 2.2% | ||||||||
Ameresco Cl. A 1 | 249,500 | 2,145,700 | ||||||
IES Holdings 1 | 79,800 | 1,376,550 | ||||||
KBR | 115,200 | 2,284,416 | ||||||
| 5,806,666 | ||||||||
| ELECTRICAL EQUIPMENT - 0.9% | ||||||||
LSI Industries | 212,300 | 1,460,624 | ||||||
| 116,000 | 870,000 | |||||||
| 2,330,624 | ||||||||
| INDUSTRIAL CONGLOMERATES - 0.6% | ||||||||
Raven Industries | 49,400 | 1,696,890 | ||||||
| MACHINERY - 6.0% | ||||||||
| 150,790 | 1,530,519 | |||||||
FreightCar America 1 | 98,300 | 1,678,964 | ||||||
Harsco Corporation 1 | 106,300 | 1,982,495 | ||||||
| 87,000 | 1,405,050 | |||||||
Mueller Water Products Cl. A | 150,200 | 1,882,006 | ||||||
Porvair | 272,000 | 1,706,012 | ||||||
| 78,500 | 2,042,570 | |||||||
Trinity Industries | 53,200 | 1,992,872 | ||||||
Wabash National | 89,000 | 1,931,300 | ||||||
| 16,151,788 | ||||||||
| MARINE - 0.8% | ||||||||
Clarkson | 55,931 | 2,159,533 | ||||||
| PROFESSIONAL SERVICES - 4.2% | ||||||||
Heidrick & Struggles International | 78,940 | 1,937,977 | ||||||
Kforce | 78,674 | 1,986,519 | ||||||
Korn/Ferry International | 51,840 | 2,145,139 | ||||||
Navigant Consulting 1 | 92,523 | 1,795,871 | ||||||
Resources Connection | 140,200 | 2,166,090 | ||||||
TrueBlue 1 | 49,472 | 1,360,480 | ||||||
| 11,392,076 | ||||||||
| ROAD & RAIL - 0.9% | ||||||||
Werner Enterprises | 60,500 | 2,338,325 | ||||||
| Total (Cost $37,998,264) | 52,733,450 | |||||||
| INFORMATION TECHNOLOGY – 22.0% | ||||||||
| COMMUNICATIONS EQUIPMENT - 2.3% | ||||||||
| 87,500 | 1,780,625 | |||||||
Harmonic 1 | 320,000 | 1,344,000 | ||||||
Oclaro 1 | 258,800 | 1,744,312 | ||||||
| 155,000 | 1,354,700 | |||||||
| 6,223,637 | ||||||||
| ELECTRONIC EQUIPMENT, INSTRUMENTS & COMPONENTS - 6.4% | ||||||||
AVX Corporation | 108,878 | 1,883,589 | ||||||
Electro Scientific Industries 1 | 85,000 | 1,821,550 | ||||||
| 665,000 | 1,476,300 | |||||||
Neonode 1 | 546,799 | 406,326 | ||||||
Novanta 1 | 36,700 | 1,835,000 | ||||||
Orbotech 1 | 49,400 | 2,481,856 | ||||||
| THE ACCOMPANYING NOTES ARE AN INTEGRAL PART OF THESE FINANCIAL STATEMENTS | The Royce Funds 2017 Annual Report to Shareholders | 49 |
| Schedules of Investments |
| Royce Low-Priced Stock Fund (continued) | ||||||||
| SHARES | VALUE | |||||||
| INFORMATION TECHNOLOGY (continued) | ||||||||
| ELECTRONIC EQUIPMENT, INSTRUMENTS & COMPONENTS (continued) | ||||||||
PC Connection | 69,100 | $ | 1,811,111 | |||||
TTM Technologies 1 | 116,458 | 1,824,897 | ||||||
Vishay Intertechnology | 88,250 | 1,831,188 | ||||||
Vishay Precision Group 1 | 74,900 | 1,883,735 | ||||||
| 17,255,552 | ||||||||
| INTERNET SOFTWARE & SERVICES - 2.5% | ||||||||
Amber Road 1 | 260,600 | 1,912,804 | ||||||
| 89,200 | 2,238,920 | |||||||
iPass 1 | 916,500 | 476,488 | ||||||
QuinStreet 1 | 236,642 | 1,983,060 | ||||||
| 6,611,272 | ||||||||
| IT SERVICES - 0.7% | ||||||||
Convergys Corporation | 75,900 | 1,783,650 | ||||||
| SEMICONDUCTORS & SEMICONDUCTOR EQUIPMENT - 8.1% | ||||||||
| 305,000 | 826,550 | |||||||
Brooks Automation | 79,182 | 1,888,491 | ||||||
Cirrus Logic 1 | 31,600 | 1,638,776 | ||||||
Cypress Semiconductor | 103,000 | 1,569,720 | ||||||
FormFactor 1 | 134,900 | 2,111,185 | ||||||
Inphi Corporation 1 | 38,400 | 1,405,440 | ||||||
MKS Instruments | 21,227 | 2,005,951 | ||||||
Nanometrics 1 | 80,192 | 1,998,385 | ||||||
| 82,000 | 1,287,400 | |||||||
Photronics 1 | 188,000 | 1,602,700 | ||||||
Rudolph Technologies 1 | 76,400 | 1,825,960 | ||||||
Teradyne | 44,275 | 1,853,794 | ||||||
| 79,700 | 1,840,273 | |||||||
| 21,854,625 | ||||||||
| SOFTWARE - 1.3% | ||||||||
Computer Modelling Group | 210,900 | 1,610,692 | ||||||
SeaChange International 1 | 471,575 | 1,853,290 | ||||||
| 3,463,982 | ||||||||
| TECHNOLOGY HARDWARE, STORAGE & PERIPHERALS - 0.7% | ||||||||
Super Micro Computer 1 | 92,100 | 1,927,193 | ||||||
| Total (Cost $40,666,084) | 59,119,911 | |||||||
| MATERIALS – 5.5% | ||||||||
| CHEMICALS - 1.5% | ||||||||
Trecora Resources 1 | 143,500 | 1,937,250 | ||||||
Victrex | 56,000 | 1,994,577 | ||||||
| 3,931,827 | ||||||||
| METALS & MINING - 4.0% | ||||||||
Alamos Gold Cl. A | 192,800 | 1,256,191 | ||||||
Commercial Metals | 87,900 | 1,874,028 | ||||||
| 205,763 | 0 | |||||||
Kirkland Lake Gold | 137,004 | 2,100,292 | ||||||
Orocobre 1 | 395,500 | 2,136,418 | ||||||
Pretium Resources 1 | 128,100 | 1,461,379 | ||||||
Schnitzer Steel Industries Cl. A | 61,100 | 2,046,850 | ||||||
| 10,875,158 | ||||||||
| Total (Cost $8,492,814) | 14,806,985 | |||||||
| REAL ESTATE – 0.5% | ||||||||
| REAL ESTATE MANAGEMENT & DEVELOPMENT - 0.5% | ||||||||
Kennedy-Wilson Holdings | 75,460 | 1,309,231 | ||||||
| Total (Cost $741,998) | 1,309,231 | |||||||
| TELECOMMUNICATION SERVICES – 0.7% | ||||||||
| DIVERSIFIED TELECOMMUNICATION SERVICES - 0.7% | ||||||||
ORBCOMM 1 | 172,300 | 1,754,014 | ||||||
| Total (Cost $1,077,316) | 1,754,014 | |||||||
| MISCELLANEOUS2 – 4.8% | ||||||||
| Total (Cost $12,186,898) | 13,008,707 | |||||||
| TOTAL COMMON STOCKS | ||||||||
| (Cost $199,490,708) | 264,790,785 | |||||||
| REPURCHASE AGREEMENT– 1.8% | ||||||||
| Fixed Income Clearing Corporation, 0.20% dated 12/29/17, due 1/2/18, maturity value $4,732,105 (collateralized by obligations of various U.S. Government Agencies, 1.40% due 6/14/19, valued at $4,828,570) | ||||||||
| (Cost $4,732,000) | 4,732,000 | |||||||
| COLLATERAL RECEIVED FOR SECURITIES LOANED – 2.1% | ||||||||
| Money Market Funds | ||||||||
Federated Government Obligations Fund (7 day yield-1.1385%) | 5,522,078 | |||||||
| TOTAL COLLATERAL RECEIVED FOR SECURITIES LOANED | ||||||||
| (Cost $5,522,078) | 5,522,078 | |||||||
| TOTAL INVESTMENTS – 102.4% | ||||||||
| (Cost $209,744,786) | 275,044,863 | |||||||
| LIABILITIES LESS CASH AND OTHER ASSETS – (2.4)% | (6,354,692 | ) | ||||||
| NET ASSETS – 100.0% | $ | 268,690,171 | ||||||
| 50 | The Royce Funds 2017 Annual Report to Shareholders | THE ACCOMPANYING NOTES ARE AN INTEGRAL PART OF THESE FINANCIAL STATEMENTS |
| December 31, 2017 |
| Royce Micro-Cap Fund | ||||||||
| Common Stocks – 95.4% | ||||||||
| SHARES | VALUE | |||||||
| CONSUMER DISCRETIONARY – 13.8% | ||||||||
| AUTO COMPONENTS - 2.9% | ||||||||
Fox Factory Holding 1 | 36,300 | $ | 1,410,255 | |||||
Standard Motor Products | 35,300 | 1,585,323 | ||||||
Stoneridge 1 | 83,100 | 1,899,666 | ||||||
Unique Fabricating | 157,200 | 1,166,424 | ||||||
| 6,061,668 | ||||||||
| HOTELS, RESTAURANTS & LEISURE - 1.4% | ||||||||
Del Taco Restaurants 1 | 98,800 | 1,197,456 | ||||||
| 166,700 | 1,641,995 | |||||||
| 2,839,451 | ||||||||
| HOUSEHOLD DURABLES - 1.2% | ||||||||
AV Homes 1 | 74,350 | 1,237,927 | ||||||
Cavco Industries 1 | 7,810 | 1,191,806 | ||||||
| 2,429,733 | ||||||||
| LEISURE PRODUCTS - 2.2% | ||||||||
American Outdoor Brands 1 | 97,865 | 1,256,587 | ||||||
MCBC Holdings 1 | 79,900 | 1,775,378 | ||||||
| 106,700 | 1,424,445 | |||||||
| 4,456,410 | ||||||||
| MEDIA - 0.8% | ||||||||
New Media Investment Group | 106,500 | 1,787,070 | ||||||
| SPECIALTY RETAIL - 3.8% | ||||||||
Build-A-Bear Workshop 1 | 137,600 | 1,265,920 | ||||||
Citi Trends | 76,724 | 2,030,117 | ||||||
Haverty Furniture | 69,200 | 1,567,380 | ||||||
Kirkland’s 1 | 71,100 | 850,712 | ||||||
Shoe Carnival | 79,411 | 2,124,244 | ||||||
| 7,838,373 | ||||||||
| TEXTILES, APPAREL & LUXURY GOODS - 1.5% | ||||||||
Cherokee 1 | 91,200 | 173,280 | ||||||
Culp | 34,174 | 1,144,829 | ||||||
Vera Bradley 1 | 141,400 | 1,722,252 | ||||||
| 3,040,361 | ||||||||
| Total (Cost $23,564,959) | 28,453,066 | |||||||
| CONSUMER STAPLES – 1.3% | ||||||||
| BEVERAGES - 0.6% | ||||||||
| 96,400 | 1,211,748 | |||||||
| FOOD PRODUCTS - 0.7% | ||||||||
John B. Sanfilippo & Son | 22,000 | 1,391,500 | ||||||
| Total (Cost $2,367,430) | 2,603,248 | |||||||
| ENERGY – 5.8% | ||||||||
| ENERGY EQUIPMENT & SERVICES - 4.3% | ||||||||
Gulf Island Fabrication | 96,518 | 1,295,754 | ||||||
Independence Contract Drilling 1 | 333,586 | 1,327,672 | ||||||
Natural Gas Services Group 1 | 59,587 | 1,561,180 | ||||||
Newpark Resources 1 | 184,600 | 1,587,560 | ||||||
Profire Energy 1 | 750,812 | 1,441,559 | ||||||
Total Energy Services | 139,000 | 1,643,230 | ||||||
| 8,856,955 | ||||||||
| OIL, GAS & CONSUMABLE FUELS - 1.5% | ||||||||
Ardmore Shipping 1 | 213,875 | 1,711,000 | ||||||
Panhandle Oil and Gas Cl. A | 64,000 | 1,315,200 | ||||||
| 3,026,200 | ||||||||
| Total (Cost $9,450,598) | 11,883,155 | |||||||
| FINANCIALS – 14.5% | ||||||||
| BANKS - 4.4% | ||||||||
Blue Hills Bancorp | 79,600 | 1,599,960 | ||||||
Brookline Bancorp | 73,900 | 1,160,230 | ||||||
Caribbean Investment Holdings 1 | 1,858,138 | 577,016 | ||||||
County Bancorp | 56,200 | 1,672,512 | ||||||
HarborOne Bancorp 1 | 80,400 | 1,540,464 | ||||||
| 1,858,170 | 0 | |||||||
TriState Capital Holdings 1 | 53,157 | 1,222,611 | ||||||
†Two River Bancorp | 71,600 | 1,298,108 | ||||||
| 9,070,901 | ||||||||
| CAPITAL MARKETS - 4.2% | ||||||||
Canaccord Genuity Group | 412,800 | 1,904,726 | ||||||
GAIN Capital Holdings | 157,500 | 1,575,000 | ||||||
Gluskin Sheff + Associates | 122,400 | 1,621,289 | ||||||
Silvercrest Asset Management Group Cl. A | 112,300 | 1,802,415 | ||||||
Westwood Holdings Group | 26,772 | 1,772,574 | ||||||
| 8,676,004 | ||||||||
| DIVERSIFIED FINANCIAL SERVICES - 0.4% | ||||||||
| 2,760,000 | 828,000 | |||||||
| INSURANCE - 1.4% | ||||||||
Atlas Financial Holdings 1 | 85,600 | 1,759,080 | ||||||
Blue Capital Reinsurance Holdings | 82,000 | 988,100 | ||||||
| 2,747,180 | ||||||||
| THRIFTS & MORTGAGE FINANCE - 4.1% | ||||||||
Beneficial Bancorp | 66,900 | 1,100,505 | ||||||
Federal Agricultural Mortgage | 20,000 | 1,564,800 | ||||||
Meridian Bancorp | 73,600 | 1,516,160 | ||||||
| 64,700 | 1,232,535 | |||||||
†Territorial Bancorp | 47,100 | 1,453,977 | ||||||
Western New England Bancorp | 140,900 | 1,535,810 | ||||||
| 8,403,787 | ||||||||
| Total (Cost $23,156,620) | 29,725,872 | |||||||
| HEALTH CARE – 7.2% | ||||||||
| BIOTECHNOLOGY - 1.6% | ||||||||
BioSpecifics Technologies 1 | 24,800 | 1,074,584 | ||||||
Progenics Pharmaceuticals 1 | 180,000 | 1,071,000 | ||||||
Zealand Pharma 1 | 92,300 | 1,263,430 | ||||||
| 3,409,014 | ||||||||
| HEALTH CARE EQUIPMENT & SUPPLIES - 2.9% | ||||||||
AtriCure 1 | 75,700 | 1,380,768 | ||||||
CryoLife 1 | 97,555 | 1,868,178 | ||||||
Surmodics 1 | 42,522 | 1,190,616 | ||||||
| 53,500 | 1,550,430 | |||||||
| 5,989,992 | ||||||||
| LIFE SCIENCES TOOLS & SERVICES - 1.4% | ||||||||
Harvard Bioscience 1 | 458,279 | 1,512,321 | ||||||
| 146,200 | 1,295,332 | |||||||
| 2,807,653 | ||||||||
| PHARMACEUTICALS - 1.3% | ||||||||
Agile Therapeutics 1 | 72,582 | 195,246 | ||||||
| 381,600 | 1,125,720 | |||||||
| 139,564 | 1,341,210 | |||||||
| 196,684 | 0 | |||||||
| 2,662,176 | ||||||||
| Total (Cost $11,231,495) | 14,868,835 | |||||||
| INDUSTRIALS – 21.3% | ||||||||
| AEROSPACE & DEFENSE - 1.4% | ||||||||
Astronics Corporation 1 | 30,340 | 1,258,200 | ||||||
| THE ACCOMPANYING NOTES ARE AN INTEGRAL PART OF THESE FINANCIAL STATEMENTS | The Royce Funds 2017 Annual Report to Shareholders | 51 |
| Schedules of Investments |
| Royce Micro-Cap Fund (continued) | ||||||||
| SHARES | VALUE | |||||||
| INDUSTRIALS (continued) | ||||||||
AEROSPACE & DEFENSE (continued) | ||||||||
CPI Aerostructures 1 | 188,818 | $ | 1,689,921 | |||||
| 2,948,121 | ||||||||
| COMMERCIAL SERVICES & SUPPLIES - 1.9% | ||||||||
Acme United | 46,100 | 1,078,740 | ||||||
Heritage-Crystal Clean 1 | 59,974 | 1,304,434 | ||||||
Viad Corporation | 26,100 | 1,445,940 | ||||||
| 3,829,114 | ||||||||
| CONSTRUCTION & ENGINEERING - 0.9% | ||||||||
Northwest Pipe 1 | 91,200 | 1,745,568 | ||||||
| ELECTRICAL EQUIPMENT - 1.7% | ||||||||
| 188,600 | 684,618 | |||||||
Encore Wire | 37,000 | 1,800,050 | ||||||
LSI Industries | 89,236 | 613,944 | ||||||
| 146,000 | 480,340 | |||||||
| 3,578,952 | ||||||||
| INDUSTRIAL CONGLOMERATES - 0.6% | ||||||||
Raven Industries | 37,600 | 1,291,560 | ||||||
| MACHINERY - 8.9% | ||||||||
Alimak Group | 96,000 | 1,497,748 | ||||||
†Exco Technologies | 161,900 | 1,306,019 | ||||||
FreightCar America | 86,309 | 1,474,158 | ||||||
Global Brass and Copper Holdings | 43,000 | 1,423,300 | ||||||
Graham Corporation | 64,488 | 1,349,734 | ||||||
Greenbrier Companies (The) | 24,800 | 1,321,840 | ||||||
Kadant | 20,676 | 2,075,870 | ||||||
| 88,700 | 1,432,505 | |||||||
Lindsay Corporation | 19,500 | 1,719,900 | ||||||
Lydall 1 | 29,400 | 1,492,050 | ||||||
RBC Bearings 1 | 11,169 | 1,411,762 | ||||||
Sun Hydraulics | 26,300 | 1,701,347 | ||||||
| 18,206,233 | ||||||||
| MARINE - 0.8% | ||||||||
Clarkson | 41,200 | 1,590,759 | ||||||
| PROFESSIONAL SERVICES - 4.2% | ||||||||
CRA International | 28,183 | 1,266,826 | ||||||
GP Strategies 1 | 56,118 | 1,301,938 | ||||||
Heidrick & Struggles International | 68,400 | 1,679,220 | ||||||
Kforce | 63,958 | 1,614,939 | ||||||
Navigant Consulting 1 | 61,900 | 1,201,479 | ||||||
Resources Connection | 106,752 | 1,649,318 | ||||||
| 8,713,720 | ||||||||
| ROAD & RAIL - 0.9% | ||||||||
Marten Transport | 88,055 | 1,787,517 | ||||||
| Total (Cost $29,094,875) | 43,691,544 | |||||||
| INFORMATION TECHNOLOGY – 18.6% | ||||||||
| COMMUNICATIONS EQUIPMENT - 1.0% | ||||||||
| 19,600 | 741,272 | |||||||
Digi International 1 | 42,300 | 403,965 | ||||||
EMCORE Corporation 1 | 143,700 | 926,865 | ||||||
| 2,072,102 | ||||||||
| ELECTRONIC EQUIPMENT, INSTRUMENTS & COMPONENTS - 6.3% | ||||||||
CUI Global 1 | 321,474 | 884,054 | ||||||
ePlus 1 | 15,834 | 1,190,717 | ||||||
Fabrinet 1 | 37,749 | 1,083,396 | ||||||
Mesa Laboratories | 9,700 | 1,205,710 | ||||||
| 579,496 | 430,623 | |||||||
Novanta 1 | 27,742 | 1,387,100 | ||||||
Orbotech 1 | 30,600 | 1,537,344 | ||||||
PC Connection | 67,700 | 1,774,417 | ||||||
Rogers Corporation 1 | 10,000 | 1,619,200 | ||||||
Vishay Precision Group 1 | 66,600 | 1,674,990 | ||||||
| 12,787,551 | ||||||||
| INTERNET SOFTWARE & SERVICES - 0.7% | ||||||||
QuinStreet 1 | 179,104 | 1,500,891 | ||||||
| IT SERVICES - 1.2% | ||||||||
Cass Information Systems | 26,180 | 1,523,938 | ||||||
Computer Task Group 1 | 194,810 | 993,531 | ||||||
| 2,517,469 | ||||||||
| SEMICONDUCTORS & SEMICONDUCTOR EQUIPMENT - 5.6% | ||||||||
Brooks Automation | 44,000 | 1,049,400 | ||||||
| 86,300 | 647,250 | |||||||
Nanometrics 1 | 60,700 | 1,512,644 | ||||||
NeoPhotonics Corporation 1 | 211,000 | 1,388,380 | ||||||
| 62,500 | 981,250 | |||||||
Photronics 1 | 163,700 | 1,395,542 | ||||||
Rudolph Technologies 1 | 57,851 | 1,382,639 | ||||||
Silicon Motion Technology ADR | 31,300 | 1,657,648 | ||||||
Ultra Clean Holdings 1 | 64,800 | 1,496,232 | ||||||
| 11,510,985 | ||||||||
| SOFTWARE - 3.0% | ||||||||
Attunity 1 | 201,465 | 1,406,226 | ||||||
Computer Modelling Group | 149,400 | 1,141,002 | ||||||
QAD Cl. A | 59,800 | 2,323,230 | ||||||
SeaChange International 1 | 309,107 | 1,214,791 | ||||||
| 6,085,249 | ||||||||
| TECHNOLOGY HARDWARE, STORAGE & PERIPHERALS - 0.8% | ||||||||
Intevac 1 | 86,200 | 590,470 | ||||||
Super Micro Computer 1 | 51,246 | 1,072,323 | ||||||
| 1,662,793 | ||||||||
| Total (Cost $30,944,546) | 38,137,040 | |||||||
| MATERIALS – 5.5% | ||||||||
| CHEMICALS - 2.0% | ||||||||
FutureFuel Corporation | 81,000 | 1,141,290 | ||||||
Quaker Chemical | 8,660 | 1,305,841 | ||||||
Trecora Resources 1 | 121,400 | 1,638,900 | ||||||
| 4,086,031 | ||||||||
| CONSTRUCTION MATERIALS - 0.8% | ||||||||
U.S. Concrete 1 | 20,300 | 1,698,095 | ||||||
| METALS & MINING - 2.7% | ||||||||
Alamos Gold Cl. A | 119,802 | 780,572 | ||||||
Haynes International | 46,530 | 1,491,287 | ||||||
| 228,400 | 1,282,819 | |||||||
McEwen Mining | 247,704 | 564,765 | ||||||
Schnitzer Steel Industries Cl. A | 42,800 | 1,433,800 | ||||||
| 5,553,243 | ||||||||
| Total (Cost $9,035,167) | 11,337,369 | |||||||
| REAL ESTATE – 2.2% | ||||||||
| EQUITY REAL ESTATE INVESTMENT TRUSTS (REITS) - 0.8% | ||||||||
Community Healthcare Trust | 61,500 | 1,728,150 | ||||||
| REAL ESTATE MANAGEMENT & DEVELOPMENT - 1.4% | ||||||||
FRP Holdings 1 | 25,375 | 1,122,844 | ||||||
Marcus & Millichap 1 | 51,000 | 1,663,110 | ||||||
| 2,785,954 | ||||||||
| Total (Cost $3,047,065) | 4,514,104 | |||||||
| 52 | The Royce Funds 2017 Annual Report to Shareholders | THE ACCOMPANYING NOTES ARE AN INTEGRAL PART OF THESE FINANCIAL STATEMENTS |
| December 31, 2017 |
| Royce Micro-Cap Fund (continued) | ||||||||
| SHARES | VALUE | |||||||
| TELECOMMUNICATION SERVICES – 0.7% | ||||||||
| DIVERSIFIED TELECOMMUNICATION SERVICES - 0.7% | ||||||||
ORBCOMM 1 | 136,800 | $ | 1,392,624 | |||||
| Total (Cost $863,292) | 1,392,624 | |||||||
| MISCELLANEOUS2 – 4.5% | ||||||||
| Total (Cost $8,873,992) | 9,227,835 | |||||||
| TOTAL COMMON STOCKS | ||||||||
| (Cost $151,630,039) | 195,834,692 | |||||||
| REPURCHASE AGREEMENT – 4.7% | ||||||||
| Fixed Income Clearing Corporation, 0.20% dated 12/29/17, due 1/2/18, maturity value $9,677,215 (collateralized by obligations of various U.S. Government Agencies, 1.25% due 10/02/19, valued at $9,871,027) | ||||||||
| (Cost $9,677,000) | 9,677,000 | |||||||
| COLLATERAL RECEIVED FOR SECURITIES LOANED – 2.3% | ||||||||
| Money Market Funds | ||||||||
Federated Government Obligations Fund (7 day yield-1.1385%) | 4,665,240 | |||||||
| TOTAL COLLATERAL RECEIVED FOR SECURITIES LOANED | ||||||||
| (Cost $4,665,240) | 4,665,240 | |||||||
| TOTAL INVESTMENTS – 102.4% | ||||||||
| (Cost $165,972,279) | 210,176,932 | |||||||
| LIABILITIES LESS CASH AND OTHER ASSETS – (2.4)% | (4,965,651 | ) | ||||||
| NET ASSETS – 100.0% | $ | 205,211,281 | ||||||
| Royce Micro-Cap Opportunity Fund | ||||||||
| Common Stocks – 93.3% | ||||||||
| SHARES | VALUE | |||||||
| CONSUMER DISCRETIONARY – 3.3% | ||||||||
| HOUSEHOLD DURABLES - 3.2% | ||||||||
Beazer Homes USA 1 | 33,526 | $ | 644,035 | |||||
Dixie Group 1 | 27,100 | 104,335 | ||||||
New Home 1 | 60,163 | 753,842 | ||||||
| 1,502,212 | ||||||||
| LEISURE PRODUCTS - 0.1% | ||||||||
Clarus Corporation 1 | 10,000 | 78,500 | ||||||
| Total (Cost $1,107,313) | 1,580,712 | |||||||
| CONSUMER STAPLES – 2.1% | ||||||||
| FOOD PRODUCTS - 2.1% | ||||||||
| 16,001 | 514,432 | |||||||
Landec Corporation 1 | 37,028 | 466,553 | ||||||
| Total (Cost $941,962) | 980,985 | |||||||
| ENERGY – 6.0% | ||||||||
| ENERGY EQUIPMENT & SERVICES - 5.3% | ||||||||
Aspen Aerogels 1 | 63,008 | 307,479 | ||||||
Basic Energy Services 1 | 35,257 | 827,482 | ||||||
Helix Energy Solutions Group 1 | 30,083 | 226,826 | ||||||
Newpark Resources 1 | 71,000 | 610,600 | ||||||
| 55,979 | 516,686 | |||||||
| 2,489,073 | ||||||||
| OIL, GAS & CONSUMABLE FUELS - 0.7% | ||||||||
StealthGas 1 | 75,000 | 327,000 | ||||||
| Total (Cost $2,607,729) | 2,816,073 | |||||||
| FINANCIALS – 11.3% | ||||||||
| BANKS - 3.1% | ||||||||
Old Line Bancshares | 22,022 | 648,327 | ||||||
State Bank Financial | 17,000 | 507,280 | ||||||
TriState Capital Holdings 1 | 12,041 | 276,943 | ||||||
| 1,432,550 | ||||||||
| CAPITAL MARKETS - 3.0% | ||||||||
†B. Riley Financial | 30,028 | 543,507 | ||||||
†Hamilton Lane Cl. A | 25,028 | 885,741 | ||||||
| 1,429,248 | ||||||||
| INSURANCE - 2.2% | ||||||||
†Heritage Insurance Holdings | 41,000 | 738,820 | ||||||
James River Group Holdings | 7,506 | 300,315 | ||||||
| 1,039,135 | ||||||||
| THRIFTS & MORTGAGE FINANCE - 3.0% | ||||||||
BofI Holding 1 | 16,000 | 478,400 | ||||||
NMI Holdings Cl. A 1 | 55,063 | 936,071 | ||||||
| 1,414,471 | ||||||||
| Total (Cost $3,361,312) | 5,315,404 | |||||||
| HEALTH CARE – 14.5% | ||||||||
| BIOTECHNOLOGY - 2.6% | ||||||||
CareDx 1 | 165,031 | 1,211,328 | ||||||
| HEALTH CARE EQUIPMENT & SUPPLIES - 3.6% | ||||||||
Accuray 1 | 135,000 | 580,500 | ||||||
Invuity 1 | 94,453 | 585,608 | ||||||
| 52,199 | 528,254 | |||||||
| 1,694,362 | ||||||||
| HEALTH CARE PROVIDERS & SERVICES - 5.9% | ||||||||
| 165,000 | 480,150 | |||||||
Civitas Solutions 1 | 29,088 | 497,405 | ||||||
Cross Country Healthcare 1 | 45,071 | 575,106 | ||||||
Kindred Healthcare | 30,000 | 291,000 | ||||||
| THE ACCOMPANYING NOTES ARE AN INTEGRAL PART OF THESE FINANCIAL STATEMENTS | The Royce Funds 2017 Annual Report to Shareholders | 53 |
| Schedules of Investments |
| Royce Micro-Cap Opportunity Fund (continued) | ||||||||
| SHARES | VALUE | |||||||
| HEALTH CARE (continued) | ||||||||
| HEALTH CARE PROVIDERS & SERVICES (continued) | ||||||||
Surgery Partners 1 | 78,000 | $ | 943,800 | |||||
| 2,787,461 | ||||||||
| HEALTH CARE TECHNOLOGY - 1.5% | ||||||||
Castlight Health Cl. B 1 | 189,009 | 708,784 | ||||||
| PHARMACEUTICALS - 0.9% | ||||||||
Sucampo Pharmaceuticals Cl. A 1 | 24,200 | 434,390 | ||||||
| Total (Cost $6,156,948) | 6,836,325 | |||||||
| INDUSTRIALS – 21.2% | ||||||||
| AEROSPACE & DEFENSE - 3.4% | ||||||||
Ducommun 1 | 33,013 | 939,220 | ||||||
KEYW Holding Corporation 1 | 90,045 | 528,564 | ||||||
Kratos Defense & Security Solutions 1 | 15,011 | 158,967 | ||||||
| 1,626,751 | ||||||||
| AIR FREIGHT & LOGISTICS - 1.1% | ||||||||
Atlas Air Worldwide Holdings 1 | 9,000 | 527,850 | ||||||
| BUILDING PRODUCTS - 1.2% | ||||||||
PGT Innovations 1 | 35,000 | 589,750 | ||||||
| CONSTRUCTION & ENGINEERING - 3.7% | ||||||||
Ameresco Cl. A 1 | 72,549 | 623,921 | ||||||
Great Lakes Dredge & Dock 1 | 72,500 | 391,500 | ||||||
Layne Christensen 1 | 57,000 | 715,350 | ||||||
| 1,730,771 | ||||||||
| ELECTRICAL EQUIPMENT - 1.3% | ||||||||
General Cable | 18,000 | 532,800 | ||||||
| 10,088 | 75,660 | |||||||
| 608,460 | ||||||||
| MACHINERY - 7.2% | ||||||||
Commercial Vehicle Group 1 | 99,024 | 1,058,567 | ||||||
FreightCar America | 22,530 | 384,813 | ||||||
Gencor Industries 1 | 46,056 | 762,227 | ||||||
†Park-Ohio Holdings | 9,552 | 438,914 | ||||||
Spartan Motors | 47,531 | 748,613 | ||||||
| 3,393,134 | ||||||||
| MARINE - 0.8% | ||||||||
Diana Shipping 1 | 87,500 | 356,125 | ||||||
| PROFESSIONAL SERVICES - 0.9% | ||||||||
| 18,032 | 418,342 | |||||||
| ROAD & RAIL - 1.6% | ||||||||
Celadon Group | 115,000 | 736,000 | ||||||
| Total (Cost $7,209,943) | 9,987,183 | |||||||
| INFORMATION TECHNOLOGY – 19.0% | ||||||||
| COMMUNICATIONS EQUIPMENT - 5.4% | ||||||||
Aerohive Networks 1 | 86,400 | 503,712 | ||||||
Comtech Telecommunications | 24,915 | 551,120 | ||||||
EMCORE Corporation 1 | 24,798 | 159,947 | ||||||
| 51,000 | 622,200 | |||||||
| 91,900 | 710,387 | |||||||
| 2,547,366 | ||||||||
| ELECTRONIC EQUIPMENT, INSTRUMENTS & COMPONENTS - 1.5% | ||||||||
KEMET Corporation 1 | 47,582 | 716,585 | ||||||
| INTERNET SOFTWARE & SERVICES - 3.7% | ||||||||
Amber Road 1 | 95,646 | 702,042 | ||||||
| 95,174 | 499,664 | |||||||
Limelight Networks 1 | 50,066 | 220,791 | ||||||
Telaria 1 | 74,983 | 302,181 | ||||||
| 1,724,678 | ||||||||
| SEMICONDUCTORS & SEMICONDUCTOR EQUIPMENT - 5.8% | ||||||||
Alpha & Omega Semiconductor 1 | 38,631 | 632,003 | ||||||
AXT 1 | 40,023 | 348,200 | ||||||
FormFactor 1 | 17,040 | 266,676 | ||||||
Ichor Holdings 1 | 21,075 | 518,445 | ||||||
Kopin Corporation 1 | 90,055 | 288,176 | ||||||
NeoPhotonics Corporation 1 | 40,000 | 263,200 | ||||||
Rudolph Technologies 1 | 18,003 | 430,272 | ||||||
| 2,746,972 | ||||||||
| SOFTWARE - 2.2% | ||||||||
A10 Networks 1 | 22,597 | 174,449 | ||||||
Bottomline Technologies 1 | 9,064 | 314,340 | ||||||
Datawatch Corporation 1 | 55,003 | 522,528 | ||||||
| 1,011,317 | ||||||||
| TECHNOLOGY HARDWARE, STORAGE & PERIPHERALS - 0.4% | ||||||||
Intevac 1 | 28,603 | 195,930 | ||||||
| Total (Cost $6,433,868) | 8,942,848 | |||||||
| MATERIALS – 9.7% | ||||||||
| CHEMICALS - 4.4% | ||||||||
Intrepid Potash 1 | 160,349 | 763,261 | ||||||
Kraton Corporation 1 | 11,576 | 557,616 | ||||||
Schulman (A.) | 19,668 | 732,633 | ||||||
| 2,053,510 | ||||||||
| CONSTRUCTION MATERIALS - 2.2% | ||||||||
| 95,000 | 1,054,500 | |||||||
| METALS & MINING - 2.4% | ||||||||
Haynes International | 11,349 | 363,735 | ||||||
Universal Stainless & Alloy Products 1 | 35,080 | 751,414 | ||||||
| 1,115,149 | ||||||||
| PAPER & FOREST PRODUCTS - 0.7% | ||||||||
Boise Cascade | 8,500 | 339,150 | ||||||
| Total (Cost $2,823,349) | 4,562,309 | |||||||
| REAL ESTATE – 0.8% | ||||||||
| EQUITY REAL ESTATE INVESTMENT TRUSTS (REITS) - 0.8% | ||||||||
†Armada Hoffler Properties | 26,000 | 403,780 | ||||||
| Total (Cost $340,245) | 403,780 | |||||||
| TELECOMMUNICATION SERVICES – 0.8% | ||||||||
| DIVERSIFIED TELECOMMUNICATION SERVICES - 0.8% | ||||||||
| 30,000 | 358,500 | |||||||
| Total (Cost $282,617) | 358,500 | |||||||
| MISCELLANEOUS2 – 4.6% | ||||||||
| Total (Cost $2,182,787) | 2,162,228 | |||||||
| TOTAL COMMON STOCKS | ||||||||
| (Cost $33,448,073) | 43,946,347 | |||||||
| 54 | The Royce Funds 2017 Annual Report to Shareholders | THE ACCOMPANYING NOTES ARE AN INTEGRAL PART OF THESE FINANCIAL STATEMENTS |
| December 31, 2017 |
| Royce Micro-Cap Opportunity Fund (continued) |
| VALUE | ||||||||
| REPURCHASE AGREEMENT – 8.1% | ||||||||
| Fixed Income Clearing Corporation, 0.20% dated 12/29/17, due 1/2/18, maturity value $3,825,085 (collateralized by obligations of various U.S. Government Agencies, 1.625% due 4/30/19, valued at $3,902,341) | ||||||||
| (Cost $3,825,000) | $ | 3,825,000 | ||||||
| TOTAL INVESTMENTS – 101.4% | ||||||||
| (Cost $37,273,073) | 47,771,347 | |||||||
| LIABILITIES LESS CASH AND OTHER ASSETS – (1.4)% | (649,420 | ) | ||||||
| NET ASSETS – 100.0% | $ | 47,121,927 | ||||||
| Royce Opportunity Fund | ||||||||
| Common Stocks – 94.3% | ||||||||
| SHARES | VALUE | |||||||
| CONSUMER DISCRETIONARY – 15.8% | ||||||||
| AUTO COMPONENTS - 4.2% | ||||||||
| 614,845 | $ | 10,470,810 | ||||||
Cooper Tire & Rubber | 264,600 | 9,353,610 | ||||||
Dana | 506,136 | 16,201,413 | ||||||
| 509,900 | 10,299,980 | |||||||
Tower International | 507,761 | 15,512,099 | ||||||
VOXX International Cl. A 1 | 1,052,278 | 5,892,757 | ||||||
| 67,730,669 | ||||||||
| DIVERSIFIED CONSUMER SERVICES - 0.8% | ||||||||
Houghton Mifflin Harcourt 1 | 821,000 | 7,635,300 | ||||||
K12 1 | 330,500 | 5,254,950 | ||||||
| 12,890,250 | ||||||||
| HOTELS, RESTAURANTS & LEISURE - 1.1% | ||||||||
Belmond Cl. A 1 | 554,419 | 6,791,633 | ||||||
Carrols Restaurant Group 1 | 344,005 | 4,179,661 | ||||||
| 261,000 | 3,163,320 | |||||||
| 25,384 | 251,301 | |||||||
| 388,725 | 3,133,123 | |||||||
| 17,519,038 | ||||||||
| HOUSEHOLD DURABLES - 2.7% | ||||||||
Beazer Homes USA 1 | 317,894 | 6,106,744 | ||||||
| 849,935 | 3,272,250 | |||||||
Ethan Allen Interiors | 103,499 | 2,960,072 | ||||||
Libbey | 611,920 | 4,601,638 | ||||||
M.D.C. Holdings | 269,342 | 8,586,623 | ||||||
M/I Homes 1 | 227,900 | 7,839,760 | ||||||
| 242,672 | 4,348,682 | |||||||
William Lyon Homes Cl. A 1 | 175,041 | 5,090,192 | ||||||
| 42,805,961 | ||||||||
| INTERNET & DIRECT MARKETING RETAIL - 0.0% | ||||||||
EVINE Live 1 | 248,643 | 348,100 | ||||||
| LEISURE PRODUCTS - 0.2% | ||||||||
Clarus Corporation 1 | 427,282 | 3,354,164 | ||||||
| MEDIA - 0.5% | ||||||||
Entravision Communications Cl. A | 328,400 | 2,348,060 | ||||||
| 304,605 | 2,720,123 | |||||||
New York Times Cl. A | 175,099 | 3,239,331 | ||||||
| 8,307,514 | ||||||||
| MULTILINE RETAIL - 0.3% | ||||||||
Fred’s Cl. A 5 | 426,469 | 1,727,199 | ||||||
| 1,216,041 | 3,842,690 | |||||||
| 5,569,889 | ||||||||
| SPECIALTY RETAIL - 4.2% | ||||||||
American Eagle Outfitters | 449,000 | 8,441,200 | ||||||
| 1,016,668 | 2,389,170 | |||||||
Barnes & Noble | 867,291 | 5,810,850 | ||||||
| 191,834 | 719,377 | |||||||
Caleres | 135,039 | 4,521,106 | ||||||
Chico’s FAS | 181,900 | 1,604,358 | ||||||
| 126,536 | 4,498,355 | |||||||
DSW Cl. A | 401,300 | 8,591,833 | ||||||
Genesco 1 | 233,300 | 7,582,250 | ||||||
Guess? | 435,800 | 7,356,304 | ||||||
| 149,400 | 2,823,660 | |||||||
Rent-A-Center | 320,118 | 3,553,310 | ||||||
| 388,400 | 7,286,384 | |||||||
| 319,285 | 830,141 | |||||||
Stage Stores | 964,846 | 1,620,941 | ||||||
| 67,629,239 | ||||||||
| THE ACCOMPANYING NOTES ARE AN INTEGRAL PART OF THESE FINANCIAL STATEMENTS | The Royce Funds 2017 Annual Report to Shareholders | 55 |
.
| Schedules of Investments |
| Royce Opportunity Fund (continued) | ||||||||
| SHARES | VALUE | |||||||
| CONSUMER DISCRETIONARY (continued) | ||||||||
| TEXTILES, APPAREL & LUXURY GOODS - 1.8% | ||||||||
| 204,400 | $ | 1,588,188 | ||||||
Perry Ellis International 1 | 204,200 | 5,113,168 | ||||||
| 338,264 | 12,799,910 | |||||||
Unifi 1 | 232,467 | 8,338,591 | ||||||
| 160,799 | 995,346 | |||||||
| 28,835,203 | ||||||||
| Total (Cost $223,460,686) | 254,990,027 | |||||||
| CONSUMER STAPLES – 1.6% | ||||||||
| FOOD & STAPLES RETAILING - 1.0% | ||||||||
Natural Grocers by Vitamin Cottage 1 | 317,368 | 2,834,096 | ||||||
| 398,128 | 8,599,565 | |||||||
| 94,800 | 4,670,796 | |||||||
| 16,104,457 | ||||||||
| FOOD PRODUCTS - 0.6% | ||||||||
Landec Corporation 1 | 534,483 | 6,734,486 | ||||||
SunOpta 1 | 312,752 | 2,423,828 | ||||||
| 9,158,314 | ||||||||
| Total (Cost $24,267,506) | 25,262,771 | |||||||
| ENERGY – 6.1% | ||||||||
| ENERGY EQUIPMENT & SERVICES - 3.0% | ||||||||
Aspen Aerogels 1 | 332,691 | 1,623,532 | ||||||
Basic Energy Services 1 | 449,915 | 10,559,505 | ||||||
| 665,600 | 2,649,088 | |||||||
Matrix Service 1 | 517,104 | 9,204,451 | ||||||
Newpark Resources 1 | 1,233,531 | 10,608,367 | ||||||
Patterson-UTI Energy | 347,000 | 7,984,470 | ||||||
U.S. Silica Holdings | 152,000 | 4,949,120 | ||||||
Willbros Group 1 | 612,109 | 869,195 | ||||||
| 48,447,728 | ||||||||
| OIL, GAS & CONSUMABLE FUELS - 3.1% | ||||||||
Ardmore Shipping 1 | 641,500 | 5,132,000 | ||||||
| 528,800 | 2,712,744 | |||||||
| 802,012 | 6,592,539 | |||||||
| 597,363 | 3,954,543 | |||||||
Matador Resources 1 | 264,400 | 8,230,772 | ||||||
Pengrowth Energy 1 | 1,932,900 | 1,535,882 | ||||||
Scorpio Tankers | 915,726 | 2,792,964 | ||||||
StealthGas 1 | 1,062,221 | 4,631,284 | ||||||
Stone Energy 1 | 293,269 | 9,431,531 | ||||||
| 192,500 | 5,097,400 | |||||||
| 50,111,659 | ||||||||
| Total (Cost $109,502,797) | 98,559,387 | |||||||
| FINANCIALS – 5.9% | ||||||||
| BANKS - 2.6% | ||||||||
Boston Private Financial Holdings | 457,562 | 7,069,333 | ||||||
CenterState Bank | 265,141 | 6,822,078 | ||||||
Guaranty Bancorp | 167,560 | 4,633,034 | ||||||
Hilltop Holdings | 76,900 | 1,947,877 | ||||||
Southern National Bancorp of Virginia | 197,015 | 3,158,150 | ||||||
State Bank Financial | 400,059 | 11,937,761 | ||||||
Umpqua Holdings | 312,600 | 6,502,080 | ||||||
| 42,070,313 | ||||||||
| CONSUMER FINANCE - 0.8% | ||||||||
Enova International 1 | 869,895 | 13,222,404 | ||||||
| INSURANCE - 1.2% | ||||||||
Aspen Insurance Holdings | 154,800 | 6,284,880 | ||||||
Heritage Insurance Holdings | 251,500 | 4,532,030 | ||||||
MBIA 1 | 1,111,176 | 8,133,808 | ||||||
| 18,950,718 | ||||||||
| INVESTMENT COMPANIES - 0.2% | ||||||||
BlackRock Resources & Commodities Strategy | ||||||||
Trust | 239,900 | 2,343,823 | ||||||
| THRIFTS & MORTGAGE FINANCE - 1.1% | ||||||||
| 78,600 | 2,350,140 | |||||||
| 352,885 | 4,979,207 | |||||||
Radian Group | 392,400 | 8,087,364 | ||||||
Walker & Dunlop 1 | 50,337 | 2,391,008 | ||||||
| 17,807,719 | ||||||||
| Total (Cost $65,974,256) | 94,394,977 | |||||||
| HEALTH CARE – 6.1% | ||||||||
| HEALTH CARE EQUIPMENT & SUPPLIES - 2.3% | ||||||||
| 774,500 | 3,330,350 | |||||||
Analogic Corporation | 114,638 | 9,600,932 | ||||||
AngioDynamics 1 | 541,541 | 9,005,827 | ||||||
Invacare Corporation | 760,907 | 12,821,283 | ||||||
RTI Surgical 1 | 376,655 | 1,544,286 | ||||||
| 36,302,678 | ||||||||
| HEALTH CARE PROVIDERS & SERVICES - 2.4% | ||||||||
| 101,700 | 3,318,471 | |||||||
Aceto Corporation | 511,100 | 5,279,663 | ||||||
| 777,700 | 2,263,107 | |||||||
Brookdale Senior Living 1 | 557,160 | 5,404,452 | ||||||
Community Health Systems 1 | 771,300 | 3,285,738 | ||||||
Cross Country Healthcare 1 | 371,472 | 4,739,983 | ||||||
Kindred Healthcare 5 | 194,850 | 1,890,045 | ||||||
Owens & Minor | 376,600 | 7,110,208 | ||||||
| 485,683 | 5,876,764 | |||||||
| 39,168,431 | ||||||||
| HEALTH CARE TECHNOLOGY - 0.7% | ||||||||
Allscripts Healthcare Solutions 1 | 776,736 | 11,301,509 | ||||||
| PHARMACEUTICALS - 0.7% | ||||||||
| 210,000 | 4,737,600 | |||||||
| 345,770 | 6,206,571 | |||||||
| 10,944,171 | ||||||||
| Total (Cost $95,246,658) | 97,716,789 | |||||||
| INDUSTRIALS – 24.3% | ||||||||
| AEROSPACE & DEFENSE - 2.9% | ||||||||
| 387,740 | 12,097,488 | |||||||
Engility Holdings 1 | 265,747 | 7,539,242 | ||||||
KEYW Holding Corporation 1 | 828,357 | 4,862,456 | ||||||
| 77,900 | 5,316,675 | |||||||
Kratos Defense & Security Solutions 1 | 881,566 | 9,335,784 | ||||||
Wesco Aircraft Holdings 1 | 1,014,229 | 7,505,295 | ||||||
| 46,656,940 | ||||||||
| AIR FREIGHT & LOGISTICS - 0.7% | ||||||||
| 186,500 | 10,938,225 | |||||||
| BUILDING PRODUCTS - 3.3% | ||||||||
Builders FirstSource 1 | 200,294 | 4,364,406 | ||||||
Griffon Corporation | 427,300 | 8,695,555 | ||||||
Insteel Industries | 214,568 | 6,076,566 | ||||||
NCI Building Systems 1 | 455,800 | 8,796,940 | ||||||
PGT Innovations 1 | 682,983 | 11,508,264 | ||||||
Ply Gem Holdings 1 | 302,592 | 5,597,952 | ||||||
| 56 | The Royce Funds 2017 Annual Report to Shareholders | THE ACCOMPANYING NOTES ARE AN INTEGRAL PART OF THESE FINANCIAL STATEMENTS |
| December 31, 2017 |
| Royce Opportunity Fund (continued) | ||||||||
| SHARES | VALUE | |||||||
| INDUSTRIALS (continued) | ||||||||
| BUILDING PRODUCTS (continued) | ||||||||
Quanex Building Products | 342,486 | $ | 8,014,172 | |||||
| 53,053,855 | ||||||||
| COMMERCIAL SERVICES & SUPPLIES - 1.8% | ||||||||
Herman Miller | 259,279 | 10,384,124 | ||||||
Interface | 257,364 | 6,472,705 | ||||||
Steelcase Cl. A | 426,742 | 6,486,478 | ||||||
Team 1 | 405,855 | 6,047,239 | ||||||
| 29,390,546 | ||||||||
| CONSTRUCTION & ENGINEERING - 2.2% | ||||||||
Aegion Corporation 1 | 413,536 | 10,516,220 | ||||||
| 479,400 | 2,588,760 | |||||||
Layne Christensen 1 | 984,712 | 12,358,136 | ||||||
| 489,326 | 9,365,700 | |||||||
| 34,828,816 | ||||||||
| ELECTRICAL EQUIPMENT -1.3% | ||||||||
| 306,200 | 1,739,216 | |||||||
Encore Wire | 149,206 | 7,258,872 | ||||||
General Cable | 287,774 | 8,518,110 | ||||||
| 204,505 | 1,533,787 | |||||||
| 582,223 | 1,915,514 | |||||||
| 20,965,499 | ||||||||
| MACHINERY - 9.0% | ||||||||
Astec Industries | 186,461 | 10,907,968 | ||||||
Commercial Vehicle Group 1 | 981,114 | 10,488,109 | ||||||
DMC Global | 370,162 | 9,272,558 | ||||||
Federal Signal | 298,532 | 5,997,508 | ||||||
FreightCar America | 406,720 | 6,946,777 | ||||||
Hardinge | 568,297 | 9,899,734 | ||||||
Hurco Companies | 202,073 | 8,527,481 | ||||||
Hyster-Yale Materials Handling Cl. A | 130,674 | 11,128,198 | ||||||
Meritor 1 | 568,132 | 13,328,377 | ||||||
Mueller Industries | 390,521 | 13,836,159 | ||||||
Mueller Water Products Cl. A | 1,024,476 | 12,836,684 | ||||||
NN | 348,507 | 9,618,793 | ||||||
Spartan Motors | 591,405 | 9,314,629 | ||||||
Westport Fuel Systems 1 | 3,496,690 | 13,147,554 | ||||||
| 145,250,529 | ||||||||
| MARINE - 0.6% | ||||||||
Diana Shipping 1 | 674,280 | 2,744,319 | ||||||
Navios Maritime Holdings 1 | 1,166,749 | 1,400,099 | ||||||
Scorpio Bulkers | 636,890 | 4,712,986 | ||||||
| 8,857,404 | ||||||||
| PROFESSIONAL SERVICES - 0.1% | ||||||||
Korn/Ferry International | 48,800 | 2,019,344 | ||||||
| ROAD & RAIL - 0.4% | ||||||||
Celadon Group | 123,200 | 788,480 | ||||||
Hertz Global Holdings 1 | 286,900 | 6,340,490 | ||||||
| 7,128,970 | ||||||||
| TRADING COMPANIES & DISTRIBUTORS - 2.0% | ||||||||
| 192,766 | 12,069,079 | |||||||
| 462,000 | 9,933,000 | |||||||
| 336,039 | 10,403,768 | |||||||
| 32,405,847 | ||||||||
| Total (Cost $261,134,841) | 391,495,975 | |||||||
| INFORMATION TECHNOLOGY – 20.7% | ||||||||
| COMMUNICATIONS EQUIPMENT - 3.8% | ||||||||
ARRIS International 1 | 373,560 | 9,596,756 | ||||||
Aviat Networks 1 | 229,729 | 3,484,989 | ||||||
| 535,917 | 11,216,743 | |||||||
Comtech Telecommunications | 742,652 | 16,427,462 | ||||||
EMCORE Corporation 1 | 552,213 | 3,561,774 | ||||||
Extreme Networks 1 | 430,256 | 5,386,805 | ||||||
| 269,000 | 5,474,150 | |||||||
Harmonic 1 | 635,119 | 2,667,500 | ||||||
Oclaro 1 | 311,475 | 2,099,342 | ||||||
Westell Technologies Cl. A 1 | 343,003 | 1,286,261 | ||||||
| 61,201,782 | ||||||||
| ELECTRONIC EQUIPMENT, INSTRUMENTS & COMPONENTS - 6.5% | ||||||||
Benchmark Electronics 1 | 170,900 | 4,973,190 | ||||||
Daktronics | 270,925 | 2,473,545 | ||||||
| 230,152 | 1,298,057 | |||||||
| 394,589 | 11,324,704 | |||||||
Frequency Electronics 1 | 227,479 | 2,129,204 | ||||||
Identiv 1 | 666,497 | 2,226,100 | ||||||
II-VI 1 | 204,278 | 9,590,852 | ||||||
KEMET Corporation 1 | 762,784 | 11,487,527 | ||||||
| 572,077 | 8,386,649 | |||||||
Maxwell Technologies 1 | 802,942 | 4,624,946 | ||||||
Park Electrochemical | 203,034 | 3,989,618 | ||||||
PCM 1 | 224,781 | 2,225,332 | ||||||
Perceptron 1 | 413,026 | 4,027,004 | ||||||
Sanmina Corporation 1 | 254,823 | 8,409,159 | ||||||
| 282,757 | 2,867,156 | |||||||
TTM Technologies 1 | 565,825 | 8,866,478 | ||||||
Vishay Intertechnology | 586,023 | 12,159,977 | ||||||
Vishay Precision Group 1 | 131,542 | 3,308,281 | ||||||
| 104,367,779 | ||||||||
| INTERNET SOFTWARE & SERVICES - 1.5% | ||||||||
Amber Road 1 | 287,271 | 2,108,569 | ||||||
Blucora 1 | 357,340 | 7,897,214 | ||||||
Leaf Group 1 | 508,857 | 5,037,684 | ||||||
Limelight Networks 1 | 266,964 | 1,177,311 | ||||||
Marin Software 1 | 129,218 | 1,421,398 | ||||||
QuinStreet 1 | 351,764 | 2,947,782 | ||||||
Telaria 1 | 907,382 | 3,656,750 | ||||||
| 24,246,708 | ||||||||
| IT SERVICES - 0.8% | ||||||||
Computer Task Group 1 | 493,747 | 2,518,110 | ||||||
Perficient 1 | 135,203 | 2,578,321 | ||||||
Unisys Corporation 1 | 955,471 | 7,787,089 | ||||||
Virtusa Corporation 1 | 20,200 | 890,416 | ||||||
| 13,773,936 | ||||||||
| SEMICONDUCTORS & SEMICONDUCTOR EQUIPMENT - 6.5% | ||||||||
Alpha & Omega Semiconductor 1 | 428,494 | 7,010,162 | ||||||
Amtech Systems 1 | 340,550 | 3,429,339 | ||||||
AXT 1 | 379,021 | 3,297,483 | ||||||
Brooks Automation | 90,764 | 2,164,721 | ||||||
Cohu | 134,001 | 2,941,322 | ||||||
| 354,614 | 13,170,364 | |||||||
| 213,218 | 3,198,270 | |||||||
Cypress Semiconductor | 764,900 | 11,657,076 | ||||||
FormFactor 1 | 245,738 | 3,845,800 | ||||||
Kopin Corporation 1 | 1,105,122 | 3,536,390 | ||||||
Kulicke & Soffa Industries 1 | 536,888 | 13,065,170 | ||||||
MaxLinear 1 | 329,222 | 8,698,045 | ||||||
Microsemi Corporation 1 | 258,854 | 13,369,809 | ||||||
Nanometrics 1 | 161,302 | 4,019,646 | ||||||
| THE ACCOMPANYING NOTES ARE AN INTEGRAL PART OF THESE FINANCIAL STATEMENTS | The Royce Funds 2017 Annual Report to Shareholders | 57 |
| Schedules of Investments |
| Royce Opportunity Fund (continued) | ||||||||
| SHARES | VALUE | |||||||
| INFORMATION TECHNOLOGY (continued) | ||||||||
| SEMICONDUCTORS & SEMICONDUCTOR EQUIPMENT (continued) | ||||||||
| 910,126 | $ | 5,988,629 | ||||||
Rudolph Technologies 1 | 138,399 | 3,307,736 | ||||||
Ultra Clean Holdings 1 | 51,138 | 1,180,776 | ||||||
| 103,880,738 | ||||||||
| SOFTWARE - 0.2% | ||||||||
A10 Networks 1 | 422,775 | 3,263,823 | ||||||
| TECHNOLOGY HARDWARE, STORAGE & PERIPHERALS - 1.4% | ||||||||
Avid Technology 1 | 525,198 | 2,830,817 | ||||||
| 300,292 | 7,267,066 | |||||||
Intevac 1 | 611,077 | 4,185,878 | ||||||
| 264,146 | 5,272,354 | |||||||
| 288,000 | 2,488,320 | |||||||
| 22,044,435 | ||||||||
| Total (Cost $259,058,273) | 332,779,201 | |||||||
| MATERIALS – 8.6% | ||||||||
| CHEMICALS - 1.8% | ||||||||
Ferro Corporation 1 | 536,611 | 12,658,653 | ||||||
Kraton Corporation 1 | 124,818 | 6,012,483 | ||||||
Schulman (A.) | 269,819 | 10,050,758 | ||||||
| 28,721,894 | ||||||||
| CONSTRUCTION MATERIALS - 0.4% | ||||||||
| 538,800 | 5,980,680 | |||||||
| METALS & MINING - 6.0% | ||||||||
| 1,112,200 | 6,295,052 | |||||||
| 667,522 | 16,113,981 | |||||||
Carpenter Technology | 319,141 | 16,273,000 | ||||||
Century Aluminum 1 | 423,703 | 8,321,527 | ||||||
Coeur Mining 1 | 454,400 | 3,408,000 | ||||||
Commercial Metals | 616,061 | 13,134,421 | ||||||
Constellium Cl. A 1 | 231,300 | 2,578,995 | ||||||
Haynes International | 298,750 | 9,574,937 | ||||||
| 593,726 | 7,718 | |||||||
Synalloy Corporation | 407,939 | 5,466,383 | ||||||
| 737,705 | 11,205,739 | |||||||
| 196,632 | 4,211,857 | |||||||
| 96,591,610 | ||||||||
| PAPER & FOREST PRODUCTS - 0.4% | ||||||||
Louisiana-Pacific Corporation 1 | 256,409 | 6,733,301 | ||||||
| Total (Cost $90,386,609) | 138,027,485 | |||||||
| REAL ESTATE – 0.3% | ||||||||
| REAL ESTATE MANAGEMENT & DEVELOPMENT - 0.3% | ||||||||
Tejon Ranch 1 | 230,610 | 4,787,464 | ||||||
| Total (Cost $5,396,672) | 4,787,464 | |||||||
| TELECOMMUNICATION SERVICES – 0.7% | ||||||||
| DIVERSIFIED TELECOMMUNICATION SERVICES - 0.7% | ||||||||
| 698,313 | 8,240,094 | |||||||
| 1,402,904 | 2,595,372 | |||||||
| Total (Cost $12,915,521) | 10,835,466 | |||||||
| UTILITIES – 0.2% | ||||||||
| WATER UTILITIES - 0.2% | ||||||||
Pure Cycle 1 | 388,890 | 3,247,231 | ||||||
| Total (Cost $1,625,560) | 3,247,231 | |||||||
| MISCELLANEOUS2 – 4.0% | ||||||||
| Total (Cost $58,473,133) | 64,460,000 | |||||||
| TOTAL COMMON STOCKS | ||||||||
| (Cost $1,207,442,512) | 1,516,556,773 | |||||||
| REPURCHASE AGREEMENT – 5.9% | ||||||||
| Fixed Income Clearing Corporation, 0.20% dated 12/29/17, due 1/2/18, maturity value $95,791,129 (collateralized by obligations of various U.S. Government Agencies, 1.75%- 3.125% due 5/15/19-5/30/19, valued at $97,709,430) | ||||||||
| (Cost $95,789,000) | 95,789,000 | |||||||
| COLLATERAL RECEIVED FOR SECURITIES LOANED – 1.9% | ||||||||
| Money Market Funds | ||||||||
Federated Government Obligations Fund (7 day yield-1.1385%) | 30,458,149 | |||||||
| TOTAL COLLATERAL RECEIVED FOR SECURITIES LOANED | ||||||||
| (Cost $30,458,149) | 30,458,149 | |||||||
| TOTAL INVESTMENTS – 102.1% | ||||||||
| (Cost $1,333,689,661) | 1,642,803,922 | |||||||
| LIABILITIES LESS CASH AND OTHER ASSETS – (2.1)% | (33,879,762 | ) | ||||||
| NET ASSETS – 100.0% | $ | 1,608,924,160 | ||||||
| 58 | The Royce Funds 2017 Annual Report to Shareholders | THE ACCOMPANYING NOTES ARE AN INTEGRAL PART OF THESE FINANCIAL STATEMENTS |
| December 31, 2017 |
| Royce Pennsylvania Mutual Fund | ||||||||
| Common Stocks – 99.2% | ||||||||
| SHARES | VALUE | |||||||
| CONSUMER DISCRETIONARY – 9.2% | ||||||||
| AUTO COMPONENTS - 2.4% | ||||||||
Cooper Tire & Rubber | 47,438 | $ | 1,676,933 | |||||
Dorman Products 1 | 103,506 | 6,328,357 | ||||||
| 40,494 | 1,573,192 | |||||||
Gentex Corporation | 484,731 | 10,155,114 | ||||||
LCI Industries | 111,545 | 14,500,850 | ||||||
| 67,193 | 1,679,153 | |||||||
Standard Motor Products | 82,148 | 3,689,267 | ||||||
STRATTEC SECURITY | 165,787 | 7,220,024 | ||||||
Superior Industries International | 289,293 | 4,296,001 | ||||||
| 51,118,891 | ||||||||
| AUTOMOBILES - 1.0% | ||||||||
Thor Industries | 36,682 | 5,528,711 | ||||||
Winnebago Industries | 285,674 | 15,883,474 | ||||||
| 21,412,185 | ||||||||
| DISTRIBUTORS - 1.1% | ||||||||
Core-Mark Holding Company | 296,243 | 9,355,354 | ||||||
Weyco Group | 452,260 | 13,441,167 | ||||||
| 22,796,521 | ||||||||
| HOTELS, RESTAURANTS & LEISURE - 0.2% | ||||||||
Lindblad Expeditions Holdings 1 | 332,116 | 3,251,416 | ||||||
| HOUSEHOLD DURABLES - 1.5% | ||||||||
AV Homes 1 | 53,528 | 891,241 | ||||||
Bassett Furniture Industries | 41,555 | 1,562,468 | ||||||
Ethan Allen Interiors | 510,494 | 14,600,129 | ||||||
Flexsteel Industries | 81,977 | 3,834,884 | ||||||
La-Z-Boy | 109,947 | 3,430,346 | ||||||
PICO Holdings | 552,191 | 7,068,045 | ||||||
| 31,387,113 | ||||||||
| LEISURE PRODUCTS - 0.3% | ||||||||
| 61,523 | 789,955 | |||||||
MCBC Holdings 1 | 131,384 | 2,919,353 | ||||||
Nautilus 1 | 119,459 | 1,594,778 | ||||||
| 5,304,086 | ||||||||
| MEDIA - 0.4% | ||||||||
E.W. Scripps Company Cl. A 1 | 109,462 | 1,710,891 | ||||||
| 96,651 | 1,922,388 | |||||||
Saga Communications Cl. A | 122,133 | 4,940,280 | ||||||
| 8,573,559 | ||||||||
| SPECIALTY RETAIL - 2.0% | ||||||||
American Eagle Outfitters | 252,707 | 4,750,892 | ||||||
America’s Car-Mart 1 | 268,864 | 12,004,778 | ||||||
AutoCanada | 180,501 | 3,251,028 | ||||||
Barnes & Noble | 77,048 | 516,222 | ||||||
Caleres | 166,752 | 5,582,857 | ||||||
DSW Cl. A | 228,022 | 4,881,951 | ||||||
| 13,796 | 281,438 | |||||||
Kirkland’s 1 | 28,670 | 343,037 | ||||||
Monro | 97,376 | 5,545,563 | ||||||
Shoe Carnival | 211,714 | 5,663,349 | ||||||
| 42,821,115 | ||||||||
| TEXTILES, APPAREL & LUXURY GOODS - 0.3% | ||||||||
Movado Group | 114,675 | 3,692,535 | ||||||
Steven Madden 1 | 60,169 | 2,809,892 | ||||||
| 6,502,427 | ||||||||
| Total (Cost $115,791,691) | 193,167,313 | |||||||
| CONSUMER STAPLES – 1.7% | ||||||||
| FOOD & STAPLES RETAILING - 0.2% | ||||||||
Village Super Market Cl. A | 192,005 | 4,402,675 | ||||||
| FOOD PRODUCTS - 1.0% | ||||||||
Cal-Maine Foods 1 | 117,928 | 5,241,900 | ||||||
Farmer Bros. 1 | 42,805 | 1,376,181 | ||||||
Industrias Bachoco ADR | 62,525 | 3,582,682 | ||||||
John B. Sanfilippo & Son | 17,291 | 1,093,656 | ||||||
Lancaster Colony | 21,072 | 2,722,713 | ||||||
Sanderson Farms | 4,574 | 634,780 | ||||||
Seneca Foods Cl. A 1 | 96,264 | 2,960,118 | ||||||
Seneca Foods Cl. B 1 | 6,448 | 219,232 | ||||||
Tootsie Roll Industries | 75,758 | 2,757,591 | ||||||
| 20,588,853 | ||||||||
| PERSONAL PRODUCTS - 0.5% | ||||||||
Inter Parfums | 273,741 | 11,894,046 | ||||||
| Total (Cost $25,329,217) | 36,885,574 | |||||||
| ENERGY – 4.0% | ||||||||
| ENERGY EQUIPMENT & SERVICES - 3.6% | ||||||||
Era Group 1 | 371,663 | 3,995,377 | ||||||
| 94,668 | 1,472,087 | |||||||
Frank’s International | 199,342 | 1,325,624 | ||||||
Helmerich & Payne | 67,907 | 4,389,509 | ||||||
| 55,547 | 1,090,388 | |||||||
Newpark Resources 1 | 88,696 | 762,786 | ||||||
| 73,355 | 2,075,947 | |||||||
Pason Systems | 1,082,368 | 15,662,907 | ||||||
RPC | 238,412 | 6,086,658 | ||||||
SEACOR Holdings | 243,251 | 11,243,061 | ||||||
| 541,170 | 6,331,689 | |||||||
TGS-NOPEC Geophysical | 687,420 | 16,260,839 | ||||||
Unit Corporation 1 | 257,114 | 5,656,508 | ||||||
| 76,353,380 | ||||||||
| OIL, GAS & CONSUMABLE FUELS - 0.4% | ||||||||
Centennial Resource Development Cl. A 1 | 11,240 | 222,552 | ||||||
San Juan Basin Royalty Trust | 185,484 | 1,528,388 | ||||||
World Fuel Services | 252,170 | 7,096,064 | ||||||
| 8,847,004 | ||||||||
| Total (Cost $67,485,268) | 85,200,384 | |||||||
| FINANCIALS – 13.6% | ||||||||
| BANKS - 4.1% | ||||||||
Ames National | 22,785 | 634,562 | ||||||
Blue Hills Bancorp | 86,536 | 1,739,374 | ||||||
BOK Financial | 134,423 | 12,409,931 | ||||||
Camden National | 105,043 | 4,425,462 | ||||||
City Holding Company | 43,223 | 2,916,256 | ||||||
CNB Financial | 168,620 | 4,424,589 | ||||||
Codorus Valley Bancorp | 25,661 | 706,447 | ||||||
| 21,413 | 1,087,780 | |||||||
First Citizens BancShares Cl. A | 70,666 | 28,478,398 | ||||||
Landmark Bancorp | 16,653 | 482,937 | ||||||
MidWestOne Financial Group | 129,543 | 4,343,577 | ||||||
National Bankshares | 82,603 | 3,754,306 | ||||||
Northrim BanCorp | 89,688 | 3,035,939 | ||||||
Popular | 210,179 | 7,459,253 | ||||||
Unity Bancorp | 38,365 | 757,709 | ||||||
Webster Financial | 171,838 | 9,650,422 | ||||||
| 86,306,942 | ||||||||
| CAPITAL MARKETS - 6.1% | ||||||||
Ares Management L.P. | 315,131 | 6,302,620 | ||||||
Artisan Partners Asset Management Cl. A | 194,975 | 7,701,513 | ||||||
| THE ACCOMPANYING NOTES ARE AN INTEGRAL PART OF THESE FINANCIAL STATEMENTS | The Royce Funds 2017 Annual Report to Shareholders | 59 |
| Schedules of Investments |
| Royce Pennsylvania Mutual Fund (continued) | ||||||||
| SHARES | VALUE | |||||||
| FINANCIALS (continued) | ||||||||
| CAPITAL MARKETS (continued) | ||||||||
Bolsa Mexicana de Valores | 3,251,106 | $ | 5,590,332 | |||||
Cohen & Steers | 43,004 | 2,033,659 | ||||||
Diamond Hill Investment Group | 54,202 | 11,201,385 | ||||||
Federated Investors Cl. B | 277,478 | 10,011,406 | ||||||
Greenhill & Co. | 11,109 | 216,626 | ||||||
Houlihan Lokey Cl. A | 166,069 | 7,544,515 | ||||||
Lazard Cl. A | 101,541 | 5,330,902 | ||||||
Moelis & Company Cl. A | 101,084 | 4,902,574 | ||||||
Morningstar | 91,937 | 8,915,131 | ||||||
Reinet Investments | 213,721 | 4,410,647 | ||||||
Reinet Investments DR | 116,469 | 2,579,309 | ||||||
Rothschild & Co | 262,069 | 9,592,040 | ||||||
SEI Investments | 247,868 | 17,811,794 | ||||||
Sprott | 2,408,853 | 4,675,896 | ||||||
Virtu Financial Cl. A | 308,226 | 5,640,536 | ||||||
Westwood Holdings Group | 208,481 | 13,803,527 | ||||||
| 128,264,412 | ||||||||
| INSURANCE - 2.0% | ||||||||
Alleghany Corporation 1 | 1,066 | 635,432 | ||||||
E-L Financial | 35,657 | 23,113,508 | ||||||
| 763,928 | 5,591,953 | |||||||
ProAssurance Corporation | 26,878 | 1,536,078 | ||||||
Reinsurance Group of America | 24,829 | 3,871,586 | ||||||
RLI Corp. | 127,925 | 7,759,931 | ||||||
| 42,508,488 | ||||||||
| INVESTMENT COMPANIES - 0.0% | ||||||||
RIT Capital Partners | 36,949 | 977,301 | ||||||
| THRIFTS & MORTGAGE FINANCE - 1.4% | ||||||||
| 180,347 | 5,392,375 | |||||||
Genworth MI Canada | 528,469 | 18,288,307 | ||||||
Southern Missouri Bancorp | 9,944 | 373,795 | ||||||
Timberland Bancorp | 37,538 | 996,634 | ||||||
TrustCo Bank Corp. NY | 539,304 | 4,961,597 | ||||||
| 30,012,708 | ||||||||
| Total (Cost $196,073,765) | 288,069,851 | |||||||
| HEALTH CARE – 9.5% | ||||||||
| BIOTECHNOLOGY - 0.3% | ||||||||
| 23,703 | 1,266,214 | |||||||
| 44,795 | 1,121,667 | |||||||
Progenics Pharmaceuticals 1 | 205,882 | 1,224,998 | ||||||
| 162,272 | 2,221,229 | |||||||
| 5,834,108 | ||||||||
| HEALTH CARE EQUIPMENT & SUPPLIES - 3.4% | ||||||||
Analogic Corporation | 135,462 | 11,344,942 | ||||||
Atrion Corporation | 8,512 | 5,367,667 | ||||||
CryoLife 1 | 69,794 | 1,336,555 | ||||||
Hill-Rom Holdings | 46,945 | 3,956,994 | ||||||
| 42,468 | 9,173,088 | |||||||
Masimo Corporation 1 | 66,837 | 5,667,778 | ||||||
Merit Medical Systems 1 | 562,445 | 24,297,624 | ||||||
| 107,536 | 8,840,535 | |||||||
| 73,858 | 2,966,876 | |||||||
| 72,952,059 | ||||||||
| HEALTH CARE PROVIDERS & SERVICES - 2.1% | ||||||||
| 89,593 | 806,337 | |||||||
| 155,366 | 7,651,775 | |||||||
Ensign Group (The) | 93,995 | 2,086,689 | ||||||
| 69,166 | 3,227,286 | |||||||
HealthSouth Corporation | 164,591 | 8,132,441 | ||||||
LHC Group 1 | 13,439 | 823,139 | ||||||
| 80,811 | 2,953,642 | |||||||
U.S. Physical Therapy | 260,263 | 18,790,989 | ||||||
| 44,472,298 | ||||||||
| HEALTH CARE TECHNOLOGY - 1.4% | ||||||||
| 111,005 | 14,768,105 | |||||||
| 219,371 | 13,901,540 | |||||||
| 28,669,645 | ||||||||
| LIFE SCIENCES TOOLS & SERVICES - 2.3% | ||||||||
Bio-Rad Laboratories Cl. A 1 | 43,556 | 10,395,510 | ||||||
Bio-Techne | 186,263 | 24,130,372 | ||||||
ICON 1 | 123,636 | 13,865,777 | ||||||
| 48,391,659 | ||||||||
| Total (Cost $118,079,584) | 200,319,769 | |||||||
| INDUSTRIALS – 27.6% | ||||||||
| AEROSPACE & DEFENSE - 1.8% | ||||||||
HEICO Corporation | 214,483 | 20,236,471 | ||||||
HEICO Corporation Cl. A | 106,781 | 8,441,038 | ||||||
| 55,604 | 10,072,665 | |||||||
| 38,750,174 | ||||||||
| AIR FREIGHT & LOGISTICS - 0.8% | ||||||||
Forward Air | 193,264 | 11,101,084 | ||||||
Hub Group Cl. A 1 | 128,360 | 6,148,444 | ||||||
| 17,249,528 | ||||||||
| AIRLINES - 0.5% | ||||||||
| 205,567 | 9,219,680 | |||||||
| BUILDING PRODUCTS - 0.9% | ||||||||
American Woodmark 1 | 38,766 | 5,049,271 | ||||||
Apogee Enterprises | 175,835 | 8,040,935 | ||||||
Gibraltar Industries 1 | 109,673 | 3,619,209 | ||||||
NCI Building Systems 1 | 131,494 | 2,537,834 | ||||||
| 19,247,249 | ||||||||
| COMMERCIAL SERVICES & SUPPLIES - 2.7% | ||||||||
| 338,602 | 14,624,220 | |||||||
Healthcare Services Group | 185,032 | 9,754,887 | ||||||
Heritage-Crystal Clean 1 | 212,473 | 4,621,288 | ||||||
Herman Miller | 117,667 | 4,712,563 | ||||||
Kimball International Cl. B | 373,611 | 6,975,317 | ||||||
Mobile Mini | 167,318 | 5,772,471 | ||||||
Ritchie Bros. Auctioneers | 40,204 | 1,203,306 | ||||||
Steelcase Cl. A | 114,180 | 1,735,536 | ||||||
Team 1 | 166,713 | 2,484,024 | ||||||
UniFirst Corporation | 22,281 | 3,674,137 | ||||||
Viad Corporation | 11,380 | 630,452 | ||||||
| 56,188,201 | ||||||||
| CONSTRUCTION & ENGINEERING - 1.9% | ||||||||
Comfort Systems USA | 72,949 | 3,184,224 | ||||||
Jacobs Engineering Group | 48,381 | 3,191,211 | ||||||
KBR | 469,936 | 9,318,831 | ||||||
Valmont Industries | 141,871 | 23,529,305 | ||||||
| 39,223,571 | ||||||||
| ELECTRICAL EQUIPMENT - 1.6% | ||||||||
Encore Wire | 163,430 | 7,950,870 | ||||||
EnerSys | 102,794 | 7,157,546 | ||||||
Preformed Line Products 6 | 260,064 | 18,477,547 | ||||||
| 33,585,963 | ||||||||
| 60 | The Royce Funds 2017 Annual Report to Shareholders | THE ACCOMPANYING NOTES ARE AN INTEGRAL PART OF THESE FINANCIAL STATEMENTS |
| December 31, 2017 |
| Royce Pennsylvania Mutual Fund (continued) | ||||||
| SHARES | VALUE | ||||||
| INDUSTRIALS (continued) | |||||||
| INDUSTRIAL CONGLOMERATES - 1.1% | |||||||
Raven Industries | 696,975 | $ | 23,941,091 | ||||
| MACHINERY - 10.8% | |||||||
Alamo Group | 13,820 | 1,559,863 | |||||
CIRCOR International | 374,979 | 18,253,978 | |||||
Colfax Corporation 1 | 66,785 | 2,646,022 | |||||
Federal Signal | 71,738 | 1,441,216 | |||||
Franklin Electric | 263,394 | 12,089,785 | |||||
Graco | 304,377 | 13,763,928 | |||||
Graham Corporation | 29,566 | 618,816 | |||||
Greenbrier Companies (The) | 108,874 | 5,802,984 | |||||
John Bean Technologies | 203,416 | 22,538,493 | |||||
Kadant | 95,756 | 9,613,902 | |||||
Lincoln Electric Holdings | 131,470 | 12,040,023 | |||||
Lindsay Corporation | 109,613 | 9,667,867 | |||||
Lydall 1 | 70,993 | 3,602,895 | |||||
Miller Industries | 209,541 | 5,406,158 | |||||
Mueller Water Products Cl. A | 73,913 | 926,130 | |||||
Nordson Corporation | 80,462 | 11,779,637 | |||||
| 12,639 | 1,301,817 | ||||||
RBC Bearings 1 | 92,032 | 11,632,845 | |||||
Sun Hydraulics | 659,812 | 42,683,238 | |||||
Tennant Company | 395,727 | 28,749,566 | |||||
Wabash National | 524,555 | 11,382,843 | |||||
| 227,502,006 | |||||||
| MARINE - 0.7% | |||||||
Clarkson | 248,797 | 9,606,218 | |||||
Kirby Corporation 1 | 80,729 | 5,392,697 | |||||
| 14,998,915 | |||||||
| PROFESSIONAL SERVICES - 1.7% | |||||||
Exponent | 126,143 | 8,968,767 | |||||
GP Strategies 1 | 40,225 | 933,220 | |||||
Heidrick & Struggles International | 222,970 | 5,473,914 | |||||
Korn/Ferry International | 86,052 | 3,560,832 | |||||
ManpowerGroup | 89,194 | 11,248,255 | |||||
Resources Connection | 49,991 | 772,361 | |||||
Robert Half International | 54,935 | 3,051,090 | |||||
TrueBlue 1 | 93,310 | 2,566,025 | |||||
| 36,574,464 | |||||||
| ROAD & RAIL - 2.0% | |||||||
Landstar System | 214,177 | 22,295,826 | |||||
Marten Transport | 57,638 | 1,170,051 | |||||
Old Dominion Freight Line | 10,830 | 1,424,686 | |||||
Saia 1 | 53,545 | 3,788,309 | |||||
Universal Logistics Holdings | 525,440 | 12,479,200 | |||||
Werner Enterprises | 26,631 | 1,029,288 | |||||
| 42,187,360 | |||||||
| TRADING COMPANIES & DISTRIBUTORS - 1.1% | |||||||
Air Lease Cl. A | 62,173 | 2,989,900 | |||||
Applied Industrial Technologies | 145,391 | 9,901,127 | |||||
MSC Industrial Direct Cl. A | 39,558 | 3,823,676 | |||||
Richelieu Hardware | 262,325 | 7,156,026 | |||||
| 23,870,729 | |||||||
| Total (Cost $279,233,208) | 582,538,931 | ||||||
| INFORMATION TECHNOLOGY – 19.5% | |||||||
| COMMUNICATIONS EQUIPMENT - 0.5% | |||||||
ADTRAN | 55,547 | 1,074,835 | |||||
Digi International 1 | 317,642 | 3,033,481 | |||||
| 62,497 | 3,671,699 | ||||||
NetScout Systems 1 | 101,071 | 3,077,612 | |||||
TESSCO Technologies | 15,409 | 310,491 | |||||
| 11,168,118 | |||||||
| ELECTRONIC EQUIPMENT, INSTRUMENTS & COMPONENTS - 10.4% | |||||||
Badger Meter | 407,668 | 19,486,530 | |||||
Benchmark Electronics 1 | 137,464 | 4,000,202 | |||||
Celestica 1 | 1,040,186 | 10,901,149 | |||||
Cognex Corporation | 204,847 | 12,528,443 | |||||
Coherent 1 | 52,776 | 14,894,443 | |||||
Dolby Laboratories Cl. A | 110,828 | 6,871,336 | |||||
ePlus 1 | 7,168 | 539,034 | |||||
Fabrinet 1 | 407,181 | 11,686,095 | |||||
FARO Technologies 1 | 339,366 | 15,950,202 | |||||
FLIR Systems | 823,762 | 38,403,784 | |||||
HollySys Automation Technologies | 76,780 | 1,709,891 | |||||
Insight Enterprises 1 | 161,458 | 6,182,227 | |||||
IPG Photonics 1 | 63,748 | 13,650,359 | |||||
| 275,584 | 611,796 | ||||||
Mesa Laboratories | 26,910 | 3,344,913 | |||||
Methode Electronics | 142,037 | 5,695,684 | |||||
MTS Systems | 61,616 | 3,308,779 | |||||
National Instruments | 377,171 | 15,701,629 | |||||
Orbotech 1 | 97,445 | 4,895,637 | |||||
PC Connection | 325,237 | 8,524,462 | |||||
Plexus Corporation 1 | 106,052 | 6,439,477 | |||||
Richardson Electronics | 141,153 | 951,371 | |||||
Sanmina Corporation 1 | 123,150 | 4,063,950 | |||||
Vishay Intertechnology | 466,567 | 9,681,265 | |||||
| 220,022,658 | |||||||
| INTERNET SOFTWARE & SERVICES - 1.0% | |||||||
| 95,198 | 2,570,346 | ||||||
| 314,206 | 8,954,871 | ||||||
Etsy 1 | 165,454 | 3,383,534 | |||||
j2 Global | 68,838 | 5,164,915 | |||||
Stamps.com 1 | 9,137 | 1,717,756 | |||||
| 21,791,422 | |||||||
| IT SERVICES - 0.3% | |||||||
Convergys Corporation | 121,971 | 2,866,319 | |||||
DST Systems | 40,000 | 2,482,800 | |||||
| 5,349,119 | |||||||
| SEMICONDUCTORS & SEMICONDUCTOR EQUIPMENT - 4.6% | |||||||
Advanced Energy Industries 1 | 190,821 | 12,876,601 | |||||
Brooks Automation | 399,638 | 9,531,366 | |||||
Cabot Microelectronics | 132,056 | 12,423,829 | |||||
Cirrus Logic 1 | 124,713 | 6,467,616 | |||||
Cohu | 199,319 | 4,375,052 | |||||
Diodes 1 | 212,990 | 6,106,423 | |||||
Entegris | 92,080 | 2,803,836 | |||||
FormFactor 1 | 97,892 | 1,532,010 | |||||
IXYS Corporation 1 | 120,860 | 2,894,597 | |||||
Kulicke & Soffa Industries 1 | 336,257 | 8,182,814 | |||||
MKS Instruments | 154,340 | 14,585,130 | |||||
Nanometrics 1 | 130,187 | 3,244,260 | |||||
| 49,275 | 773,618 | ||||||
Photronics 1 | 133,993 | 1,142,290 | |||||
Rudolph Technologies 1 | 52,833 | 1,262,709 | |||||
Silicon Motion Technology ADR | 126,770 | 6,713,739 | |||||
Ultra Clean Holdings 1 | 38,022 | 877,928 | |||||
| 95,793,818 | |||||||
| THE ACCOMPANYING NOTES ARE AN INTEGRAL PART OF THESE FINANCIAL STATEMENTS | The Royce Funds 2017 Annual Report to Shareholders | 61 |
| Schedules of Investments |
| Royce Pennsylvania Mutual Fund (continued) | |||||||
| SHARES | VALUE | ||||||
| INFORMATION TECHNOLOGY (continued) | |||||||
| SOFTWARE - 2.3% | |||||||
ACI Worldwide 1 | 434,738 | $ | 9,855,511 | ||||
Blackbaud | 83,866 | 7,924,498 | |||||
Computer Modelling Group | 642,550 | 4,907,303 | |||||
Fair Isaac | 60,964 | 9,339,685 | |||||
| 20,608 | 1,530,350 | ||||||
Monotype Imaging Holdings | 498,130 | 12,004,933 | |||||
| 40,945 | 2,488,228 | ||||||
TiVo | 69,109 | 1,078,100 | |||||
| 49,128,608 | |||||||
| TECHNOLOGY HARDWARE, STORAGE & PERIPHERALS - 0.4% | |||||||
| 36,781 | 890,100 | ||||||
Diebold Nixdorf | 172,257 | 2,816,402 | |||||
| 60,473 | 1,207,041 | ||||||
| 186,829 | 3,909,397 | ||||||
| 8,822,940 | |||||||
| Total (Cost $245,640,592) | 412,076,683 | ||||||
| MATERIALS – 8.1% | |||||||
| CHEMICALS - 3.6% | |||||||
Balchem Corporation | 173,177 | 13,958,066 | |||||
Chase Corporation | 15,964 | 1,923,662 | |||||
FutureFuel Corporation | 590,549 | 8,320,836 | |||||
| 22,157 | 1,561,404 | ||||||
Innospec | 92,029 | 6,497,247 | |||||
Minerals Technologies | 133,293 | 9,177,223 | |||||
| 530,108 | 5,258,671 | ||||||
Quaker Chemical | 165,149 | 24,902,818 | |||||
Umicore | 84,217 | 3,979,625 | |||||
| 75,579,552 | |||||||
| CONTAINERS & PACKAGING - 0.6% | |||||||
AptarGroup | 136,834 | 11,806,037 | |||||
| METALS & MINING - 2.8% | |||||||
Compass Minerals International | 106,099 | 7,665,653 | |||||
Franco-Nevada Corporation | 209,124 | 16,719,464 | |||||
Haynes International | 28,575 | 915,829 | |||||
Hecla Mining | 155,264 | 616,398 | |||||
Major Drilling Group International 1 | 1,386,282 | 7,786,118 | |||||
Pretium Resources 1 | 91,922 | 1,048,657 | |||||
Reliance Steel & Aluminum | 165,293 | 14,180,486 | |||||
Schnitzer Steel Industries Cl. A | 52,143 | 1,746,791 | |||||
Worthington Industries | 214,618 | 9,456,069 | |||||
| 60,135,465 | |||||||
| PAPER & FOREST PRODUCTS - 1.1% | |||||||
Stella-Jones | 581,300 | 23,353,739 | |||||
| Total (Cost $89,083,628) | 170,874,793 | ||||||
| REAL ESTATE – 2.5% | |||||||
| REAL ESTATE MANAGEMENT & DEVELOPMENT - 2.5% | |||||||
FirstService Corporation | 47,305 | 3,307,566 | |||||
FRP Holdings 1 | 398,035 | 17,613,049 | |||||
Marcus & Millichap 1 | 401,345 | 13,087,860 | |||||
| 94,070 | 1,697,963 | ||||||
Tejon Ranch 1 | 774,163 | 16,071,624 | |||||
| Total (Cost $44,330,241) | 51,778,062 | ||||||
| TELECOMMUNICATION SERVICES – 0.2% | |||||||
| WIRELESS TELECOMMUNICATION SERVICES - 0.2% | |||||||
Telephone and Data Systems | 145,139 | 4,034,864 | |||||
| Total (Cost $3,942,856) | 4,034,864 | ||||||
| UTILITIES – 0.2% | |||||||
| GAS UTILITIES - 0.2% | |||||||
Star Group L.P. | 341,631 | 3,672,533 | |||||
| Total (Cost $3,593,964) | 3,672,533 | ||||||
| MISCELLANEOUS2 – 3.1% | |||||||
| Total (Cost $56,116,455) | 64,441,466 | ||||||
| TOTAL COMMON STOCKS | |||||||
| (Cost $1,244,700,469) | 2,093,060,223 | ||||||
| REPURCHASE AGREEMENT – 0.9% | |||||||
| Fixed Income Clearing Corporation, 0.20% dated 12/29/17, due 1/2/18, maturity value $18,657,415 (collateralized by obligations of various U.S. Government Agencies, 3.625% due 2/15/20, valued at $19,034,958) | |||||||
| (Cost $18,657,000) | 18,657,000 | ||||||
| COLLATERAL RECEIVED FOR SECURITIES LOANED – 0.5% | |||||||
| Money Market Funds | |||||||
Federated Government Obligations Fund (7 day yield-1.1385%) | 11,440,093 | ||||||
| TOTAL COLLATERAL RECEIVED FOR SECURITIES LOANED | |||||||
| (Cost $11,440,093) | 11,440,093 | ||||||
| TOTAL INVESTMENTS – 100.6% | |||||||
| (Cost $1,274,797,562) | 2,123,157,316 | ||||||
| LIABILITIES LESS CASH AND OTHER ASSETS – (0.6)% | (12,851,168 | ) | |||||
| NET ASSETS – 100.0% | $ | 2,110,306,148 | |||||
| 62 | The Royce Funds 2017 Annual Report to Shareholders | THE ACCOMPANYING NOTES ARE AN INTEGRAL PART OF THESE FINANCIAL STATEMENTS |
| December 31, 2017 |
| Royce Premier Fund | |||||||
| Common Stocks – 89.5% | |||||||
| SHARES | VALUE | ||||||
| CONSUMER DISCRETIONARY – 8.6% | |||||||
| AUTO COMPONENTS - 1.4% | |||||||
Dorman Products 1 | 519,478 | $ | 31,760,885 | ||||
| AUTOMOBILES - 1.5% | |||||||
Thor Industries | 237,665 | 35,820,869 | |||||
| DISTRIBUTORS - 2.0% | |||||||
Core-Mark Holding Company | 497,559 | 15,712,913 | |||||
Pool Corporation | 248,028 | 32,156,830 | |||||
| 47,869,743 | |||||||
| DIVERSIFIED CONSUMER SERVICES - 0.6% | |||||||
| 280,584 | 14,478,134 | ||||||
| SPECIALTY RETAIL - 0.6% | |||||||
Camping World Holdings Cl. A | 327,413 | 14,645,184 | |||||
| TEXTILES, APPAREL & LUXURY GOODS - 2.5% | |||||||
Columbia Sportswear | 430,554 | 30,948,222 | |||||
Wolverine World Wide | 905,200 | 28,857,776 | |||||
| 59,805,998 | |||||||
| Total (Cost $85,422,116) | 204,380,813 | ||||||
| CONSUMER STAPLES – 2.2% | |||||||
| FOOD PRODUCTS - 2.2% | |||||||
Cal-Maine Foods 1 | 599,882 | 26,664,755 | |||||
Sanderson Farms | 182,567 | 25,336,648 | |||||
| Total (Cost $23,443,595) | 52,001,403 | ||||||
| ENERGY – 2.6% | |||||||
| ENERGY EQUIPMENT & SERVICES - 2.6% | |||||||
Pason Systems | 2,516,062 | 36,409,839 | |||||
SEACOR Holdings | 558,236 | 25,801,668 | |||||
| Total (Cost $54,752,769) | 62,211,507 | ||||||
| FINANCIALS – 12.7% | |||||||
| CAPITAL MARKETS - 8.6% | |||||||
Ares Management L.P. | 2,408,400 | 48,168,000 | |||||
Ashmore Group | 10,573,210 | 57,817,254 | |||||
Federated Investors Cl. B | 456,070 | 16,455,006 | |||||
Lazard Cl. A | 562,927 | 29,553,667 | |||||
Morningstar | 394,968 | 38,300,047 | |||||
TMX Group | 212,833 | 11,926,775 | |||||
| 202,220,749 | |||||||
| INSURANCE - 2.4% | |||||||
Alleghany Corporation 1 | 96,063 | 57,262,194 | |||||
| THRIFTS & MORTGAGE FINANCE - 1.7% | |||||||
Genworth MI Canada | 1,138,465 | 39,397,953 | |||||
| Total (Cost $170,399,470) | 298,880,896 | ||||||
| HEALTH CARE – 3.3% | |||||||
| HEALTH CARE EQUIPMENT & SUPPLIES - 1.5% | |||||||
IDEXX Laboratories 1 | 231,604 | 36,218,233 | |||||
| LIFE SCIENCES TOOLS & SERVICES - 1.8% | |||||||
Bio-Techne | 319,494 | 41,390,448 | |||||
| Total (Cost $31,700,569) | 77,608,681 | ||||||
| INDUSTRIALS – 32.4% | |||||||
| AIR FREIGHT & LOGISTICS - 1.6% | |||||||
Forward Air | 647,964 | 37,219,052 | |||||
| BUILDING PRODUCTS - 1.4% | |||||||
Simpson Manufacturing | 567,847 | 32,600,096 | |||||
| COMMERCIAL SERVICES & SUPPLIES - 4.3% | |||||||
| 1,700,610 | 73,449,346 | ||||||
Ritchie Bros. Auctioneers | 957,210 | 28,649,295 | |||||
| 102,098,641 | |||||||
| CONSTRUCTION & ENGINEERING - 2.8% | |||||||
Valmont Industries | 390,764 | 64,808,210 | |||||
| MACHINERY - 13.1% | |||||||
CIRCOR International | 878,443 | 42,762,605 | |||||
†Franklin Electric | 342,175 | 15,705,833 | |||||
Lincoln Electric Holdings | 766,961 | 70,238,288 | |||||
Lindsay Corporation | 506,101 | 44,638,108 | |||||
RBC Bearings 1 | 167,079 | 21,118,786 | |||||
Sun Hydraulics | 771,191 | 49,888,346 | |||||
Woodward | 847,910 | 64,899,031 | |||||
| 309,250,997 | |||||||
| MARINE - 3.7% | |||||||
Clarkson | 659,909 | 25,479,525 | |||||
Kirby Corporation 1 | 936,973 | 62,589,796 | |||||
| 88,069,321 | |||||||
| ROAD & RAIL - 3.1% | |||||||
Landstar System | 708,302 | 73,734,238 | |||||
| TRADING COMPANIES & DISTRIBUTORS - 2.4% | |||||||
Air Lease Cl. A | 1,171,471 | 56,336,041 | |||||
| Total (Cost $346,867,034) | 764,116,596 | ||||||
| INFORMATION TECHNOLOGY – 17.5% | |||||||
| ELECTRONIC EQUIPMENT, INSTRUMENTS & COMPONENTS - 7.8% | |||||||
Anixter International 1 | 295,085 | 22,426,460 | |||||
Cognex Corporation | 787,394 | 48,157,017 | |||||
IPG Photonics 1 | 190,640 | 40,821,743 | |||||
National Instruments | 1,761,658 | 73,337,823 | |||||
| 184,743,043 | |||||||
| IT SERVICES - 3.4% | |||||||
Gartner 1 | 220,165 | 27,113,320 | |||||
Jack Henry & Associates | 443,557 | 51,878,426 | |||||
| 78,991,746 | |||||||
| SEMICONDUCTORS & SEMICONDUCTOR EQUIPMENT - 3.9% | |||||||
Cabot Microelectronics | 374,216 | 35,206,241 | |||||
MKS Instruments | 595,287 | 56,254,622 | |||||
| 91,460,863 | |||||||
| SOFTWARE - 2.4% | |||||||
Fair Isaac | 341,784 | 52,361,309 | |||||
| 92,876 | 4,601,077 | ||||||
| 56,962,386 | |||||||
| Total (Cost $105,593,588) | 412,158,038 | ||||||
| MATERIALS – 8.1% | |||||||
| CHEMICALS - 4.2% | |||||||
Minerals Technologies | 698,494 | 48,091,312 | |||||
Westlake Chemical | 485,009 | 51,668,009 | |||||
| 99,759,321 | |||||||
| METALS & MINING - 2.1% | |||||||
Reliance Steel & Aluminum | 584,337 | 50,130,271 | |||||
| PAPER & FOREST PRODUCTS - 1.8% | |||||||
Stella-Jones | 1,016,749 | 40,847,911 | |||||
| Total (Cost $88,112,076) | 190,737,503 | ||||||
| REAL ESTATE – 1.0% | |||||||
| REAL ESTATE MANAGEMENT & DEVELOPMENT - 1.0% | |||||||
Jones Lang LaSalle | 158,965 | 23,674,658 | |||||
| Total (Cost $4,480,648) | 23,674,658 | ||||||
| THE ACCOMPANYING NOTES ARE AN INTEGRAL PART OF THESE FINANCIAL STATEMENTS | The Royce Funds 2017 Annual Report to Shareholders | 63 |
| Schedules of Investments |
| Royce Premier Fund (continued) |
| VALUE | ||||
| MISCELLANEOUS2 – 1.1% | ||||
| Total (Cost $28,451,332) | $ | 27,044,887 | ||
| TOTAL COMMON STOCKS | ||||
| (Cost $939,223,197) | 2,112,814,982 | |||
| REPURCHASE AGREEMENT – 10.6% | ||||
| Fixed Income Clearing Corporation, 0.20% dated 12/29/17, due 1/2/18, maturity value $249,489,544 (collateralized by obligations of various U.S. Government Agencies, 1.25%-3.375% due 10/02/19-1/21/20, valued at $254,474,403) | ||||
| (Cost $249,484,000) | 249,484,000 | |||
| TOTAL INVESTMENTS – 100.1% | ||||
| (Cost $1,188,707,197) | 2,362,298,982 | |||
| LIABILITIES LESS CASH AND OTHER ASSETS – (0.1)% | (2,486,526 | ) | ||
| NET ASSETS – 100.0% | $ | 2,359,812,456 | ||
| Royce Small-Cap Leaders Fund | |||||||
| Common Stocks – 96.4% | |||||||
| SHARES | VALUE | ||||||
| CONSUMER DISCRETIONARY – 10.5% | |||||||
| AUTO COMPONENTS - 3.3% | |||||||
Cooper Tire & Rubber | 15,600 | $ | 551,460 | ||||
Gentex Corporation | 72,534 | 1,519,587 | |||||
LCI Industries | 5,832 | 758,160 | |||||
| 2,829,207 | |||||||
| HOUSEHOLD DURABLES - 1.3% | |||||||
Ethan Allen Interiors | 18,900 | 540,540 | |||||
PICO Holdings | 45,200 | 578,560 | |||||
| 1,119,100 | |||||||
| LEISURE PRODUCTS - 1.2% | |||||||
MCBC Holdings 1 | 44,300 | 984,346 | |||||
| MEDIA - 0.8% | |||||||
E.W. Scripps Company Cl. A 1 | 41,090 | 642,237 | |||||
| SPECIALTY RETAIL - 2.3% | |||||||
Caleres | 58,800 | 1,968,624 | |||||
| TEXTILES, APPAREL & LUXURY GOODS - 1.6% | |||||||
Movado Group | 42,200 | 1,358,840 | |||||
| Total (Cost $6,510,232) | 8,902,354 | ||||||
| CONSUMER STAPLES – 6.7% | |||||||
| FOOD PRODUCTS - 4.7% | |||||||
Cal-Maine Foods 1 | 38,758 | 1,722,793 | |||||
Industrias Bachoco ADR | 21,090 | 1,208,457 | |||||
Sanderson Farms | 890 | 123,514 | |||||
Tootsie Roll Industries | 24,479 | 891,036 | |||||
| 3,945,800 | |||||||
| PERSONAL PRODUCTS - 2.0% | |||||||
Inter Parfums | 39,029 | 1,695,810 | |||||
| Total (Cost $4,544,534) | 5,641,610 | ||||||
| ENERGY – 5.3% | |||||||
| ENERGY EQUIPMENT & SERVICES - 5.3% | |||||||
| 25,540 | 722,782 | ||||||
Pason Systems | 138,340 | 2,001,913 | |||||
TGS-NOPEC Geophysical | 74,750 | 1,768,202 | |||||
| Total (Cost $3,283,285) | 4,492,897 | ||||||
| FINANCIALS – 15.0% | |||||||
| CAPITAL MARKETS - 9.1% | |||||||
Artisan Partners Asset Management Cl. A | 62,900 | 2,484,550 | |||||
Federated Investors Cl. B | 40,660 | 1,467,013 | |||||
Houlihan Lokey Cl. A | 35,100 | 1,594,593 | |||||
Lazard Cl. A | 32,370 | 1,699,425 | |||||
Westwood Holdings Group | 7,200 | 476,712 | |||||
| 7,722,293 | |||||||
| INSURANCE - 3.0% | |||||||
†RLI Corp. | 41,700 | 2,529,522 | |||||
| THRIFTS & MORTGAGE FINANCE - 2.9% | |||||||
Genworth MI Canada | 71,060 | 2,459,117 | |||||
| Total (Cost $8,551,969) | 12,710,932 | ||||||
| HEALTH CARE – 5.4% | |||||||
| BIOTECHNOLOGY - 1.2% | |||||||
| 8,500 | 454,070 | ||||||
| 41,100 | 562,589 | ||||||
| 1,016,659 | |||||||
| HEALTH CARE PROVIDERS & SERVICES - 1.7% | |||||||
| 28,800 | 1,418,400 | ||||||
| LIFE SCIENCES TOOLS & SERVICES - 2.5% | |||||||
Bio-Rad Laboratories Cl. A 1 | 1,425 | 340,105 | |||||
| 64 | The Royce Funds 2017 Annual Report to Shareholders | THE ACCOMPANYING NOTES ARE AN INTEGRAL PART OF THESE FINANCIAL STATEMENTS |
| December 31, 2017 |
| Royce Small-Cap Leaders Fund (continued) |
| SHARES | VALUE | ||||||
| HEALTH CARE (continued) | |||||||
| LIFE SCIENCES TOOLS & SERVICES (continued) | |||||||
Bio-Techne | 13,694 | $ | 1,774,058 | ||||
| 2,114,163 | |||||||
| Total (Cost $3,416,173) | 4,549,222 | ||||||
| INDUSTRIALS – 25.8% | |||||||
| BUILDING PRODUCTS - 3.5% | |||||||
American Woodmark 1 | 6,000 | 781,500 | |||||
Apogee Enterprises | 28,900 | 1,321,597 | |||||
| 44,900 | 866,570 | ||||||
| 2,969,667 | |||||||
| COMMERCIAL SERVICES & SUPPLIES - 3.5% | |||||||
Kimball International Cl. B | 34,200 | 638,514 | |||||
Ritchie Bros. Auctioneers | 13,800 | 413,034 | |||||
Steelcase Cl. A | 40,900 | 621,680 | |||||
UniFirst Corporation | 7,800 | 1,286,220 | |||||
| 2,959,448 | |||||||
| CONSTRUCTION & ENGINEERING - 2.3% | |||||||
Comfort Systems USA | 12,500 | 545,625 | |||||
Valmont Industries | 8,195 | 1,359,140 | |||||
| 1,904,765 | |||||||
| ELECTRICAL EQUIPMENT - 1.3% | |||||||
†EnerSys | 15,800 | 1,100,154 | |||||
| MACHINERY - 12.2% | |||||||
CIRCOR International | 33,970 | 1,653,660 | |||||
Greenbrier Companies (The) | 36,300 | 1,934,790 | |||||
John Bean Technologies | 6,309 | 699,037 | |||||
Kadant | 11,160 | 1,120,464 | |||||
Lydall 1 | 19,960 | 1,012,970 | |||||
RBC Bearings 1 | 5,980 | 755,872 | |||||
Sun Hydraulics | 21,300 | 1,377,897 | |||||
†Wabash National | 81,100 | 1,759,870 | |||||
| 10,314,560 | |||||||
| ROAD & RAIL - 2.7% | |||||||
Landstar System | 15,420 | 1,605,222 | |||||
Saia 1 | 9,720 | 687,690 | |||||
| 2,292,912 | |||||||
| TRADING COMPANIES & DISTRIBUTORS - 0.3% | |||||||
MSC Industrial Direct Cl. A | 2,777 | 268,425 | |||||
| Total (Cost $15,569,940) | 21,809,931 | ||||||
| INFORMATION TECHNOLOGY – 19.2% | |||||||
| COMMUNICATIONS EQUIPMENT - 1.3% | |||||||
NetScout Systems 1 | 34,300 | 1,044,435 | |||||
| ELECTRONIC EQUIPMENT, INSTRUMENTS & COMPONENTS - 7.7% | |||||||
| 160,300 | 1,679,944 | ||||||
Fabrinet 1 | 59,800 | 1,716,260 | |||||
FARO Technologies 1 | 12,260 | 576,220 | |||||
| 46,200 | 843,150 | ||||||
Methode Electronics | 14,950 | 599,495 | |||||
Orbotech 1 | 6,390 | 321,033 | |||||
Vishay Intertechnology | 38,000 | 788,500 | |||||
| 6,524,602 | |||||||
| INTERNET SOFTWARE & SERVICES - 1.5% | |||||||
j2 Global | 16,724 | 1,254,802 | |||||
| SEMICONDUCTORS & SEMICONDUCTOR EQUIPMENT - 8.7% | |||||||
Cabot Microelectronics | 13,936 | 1,311,099 | |||||
†Cohu | 67,300 | 1,477,235 | |||||
| 50,700 | 1,233,784 | ||||||
MKS Instruments | 8,045 | 760,253 | |||||
Nanometrics 1 | 32,148 | 801,128 | |||||
Rudolph Technologies 1 | 17,900 | 427,810 | |||||
†Silicon Motion Technology ADR | 25,900 | 1,371,664 | |||||
| 7,382,973 | |||||||
| Total (Cost $13,641,865) | 16,206,812 | ||||||
| MATERIALS – 4.4% | |||||||
| CHEMICALS - 3.1% | |||||||
Minerals Technologies | 38,256 | 2,633,926 | |||||
| PAPER & FOREST PRODUCTS - 1.3% | |||||||
†Stella-Jones | 26,300 | 1,056,603 | |||||
| Total (Cost $2,859,911) | 3,690,529 | ||||||
| REAL ESTATE – 3.1% | |||||||
| REAL ESTATE MANAGEMENT & DEVELOPMENT - 3.1% | |||||||
Marcus & Millichap 1 | 80,610 | 2,628,692 | |||||
| Total (Cost $1,741,209) | 2,628,692 | ||||||
| MISCELLANEOUS2 – 1.0% | |||||||
| Total (Cost $790,658) | 857,350 | ||||||
| TOTAL COMMON STOCKS | |||||||
| (Cost $60,909,776) | 81,490,329 | ||||||
| REPURCHASE AGREEMENT– 3.4% | |||||||
| Fixed Income Clearing Corporation, 0.20% dated 12/29/17, due 1/2/18, maturity value $2,934,065 (collateralized by obligations of various U.S. Government Agencies, 1.625% due 4/30/19, valued at $2,992,960) | |||||||
| (Cost $2,934,000) | 2,934,000 | ||||||
| COLLATERAL RECEIVED FOR SECURITIES LOANED – 0.7% | |||||||
| Money Market Funds | |||||||
Federated Government Obligations Fund (7 day yield-1.1385%) | 573,962 | ||||||
| TOTAL COLLATERAL RECEIVED FOR SECURITIES LOANED | |||||||
| (Cost $573,962) | 573,962 | ||||||
| TOTAL INVESTMENTS – 100.5% | |||||||
| (Cost $64,417,738) | 84,998,291 | ||||||
| LIABILITIES LESS CASH AND OTHER ASSETS – (0.5)% | (440,745 | ) | |||||
| NET ASSETS – 100.0% | $ | 84,557,546 | |||||
| THE ACCOMPANYING NOTES ARE AN INTEGRAL PART OF THESE FINANCIAL STATEMENTS | The Royce Funds 2017 Annual Report to Shareholders | 65 |
| Schedules of Investments |
| Royce Small-Cap Value Fund |
| Common Stocks – 93.1% |
| SHARES | VALUE | ||||||
| CONSUMER DISCRETIONARY – 13.4% | |||||||
| AUTO COMPONENTS - 3.4% | |||||||
Gentex Corporation | 241,221 | $ | 5,053,580 | ||||
| 154,273 | 3,526,681 | ||||||
| 8,580,261 | |||||||
| AUTOMOBILES - 0.2% | |||||||
Thor Industries | 2,879 | 433,923 | |||||
| HOUSEHOLD DURABLES - 2.5% | |||||||
Flexsteel Industries | 66,204 | 3,097,023 | |||||
La-Z-Boy | 102,700 | 3,204,240 | |||||
| 6,301,263 | |||||||
| MEDIA - 1.5% | |||||||
Saga Communications Cl. A | 95,436 | 3,860,386 | |||||
| SPECIALTY RETAIL - 4.8% | |||||||
American Eagle Outfitters | 232,245 | 4,366,206 | |||||
DSW Cl. A | 186,091 | 3,984,208 | |||||
Shoe Carnival | 134,715 | 3,603,626 | |||||
| 11,954,040 | |||||||
| TEXTILES, APPAREL & LUXURY GOODS - 1.0% | |||||||
Steven Madden 1 | 55,833 | 2,607,401 | |||||
| Total (Cost $27,954,092) | 33,737,274 | ||||||
| CONSUMER STAPLES – 1.5% | |||||||
| FOOD & STAPLES RETAILING - 1.5% | |||||||
Village Super Market Cl. A | 168,440 | 3,862,329 | |||||
| Total (Cost $5,054,461) | 3,862,329 | ||||||
| ENERGY – 2.4% | |||||||
| ENERGY EQUIPMENT & SERVICES - 2.4% | |||||||
Helmerich & Payne | 54,984 | 3,554,166 | |||||
Unit Corporation 1 | 111,661 | 2,456,542 | |||||
| Total (Cost $5,230,327) | 6,010,708 | ||||||
| FINANCIALS – 21.3% | |||||||
| BANKS - 9.1% | |||||||
Ames National | 81,532 | 2,270,666 | |||||
Camden National | 85,322 | 3,594,616 | |||||
City Holding Company | 34,777 | 2,346,404 | |||||
CNB Financial | 89,867 | 2,358,110 | |||||
Codorus Valley Bancorp | 26,209 | 721,534 | |||||
Landmark Bancorp | 15,569 | 451,501 | |||||
MidWestOne Financial Group | 108,101 | 3,624,627 | |||||
National Bankshares | 80,162 | 3,643,363 | |||||
Northrim BanCorp | 89,829 | 3,040,712 | |||||
Unity Bancorp | 47,878 | 945,590 | |||||
| 22,997,123 | |||||||
| CAPITAL MARKETS - 4.5% | |||||||
Federated Investors Cl. B | 138,898 | 5,011,440 | |||||
Houlihan Lokey Cl. A | 55,196 | 2,507,554 | |||||
Moelis & Company Cl. A | 75,838 | 3,678,143 | |||||
| 11,197,137 | |||||||
| INSURANCE - 2.9% | |||||||
†James River Group Holdings | 92,775 | 3,711,928 | |||||
Reinsurance Group of America | 23,436 | 3,654,375 | |||||
| 7,366,303 | |||||||
| THRIFTS & MORTGAGE FINANCE - 4.8% | |||||||
Genworth MI Canada | 187,889 | 6,502,125 | |||||
Southern Missouri Bancorp | 18,441 | 693,197 | |||||
Timberland Bancorp | 38,071 | 1,010,785 | |||||
TrustCo Bank Corp. NY | 405,712 | 3,732,551 | |||||
| 11,938,658 | |||||||
| Total (Cost $36,716,681) | 53,499,221 | ||||||
| HEALTH CARE – 1.7% | |||||||
| HEALTH CARE PROVIDERS & SERVICES - 1.7% | |||||||
| 51,380 | 2,530,465 | ||||||
Ensign Group (The) | 79,184 | 1,757,885 | |||||
| Total (Cost $3,716,040) | 4,288,350 | ||||||
| INDUSTRIALS – 24.7% | |||||||
| AIRLINES - 5.7% | |||||||
†Allegiant Travel | 22,289 | 3,449,223 | |||||
†Hawaiian Holdings | 100,500 | 4,004,925 | |||||
| 153,312 | 6,876,043 | ||||||
| 14,330,191 | |||||||
| BUILDING PRODUCTS - 2.5% | |||||||
American Woodmark 1 | 19,452 | 2,533,623 | |||||
Apogee Enterprises | 84,026 | 3,842,509 | |||||
| 6,376,132 | |||||||
| COMMERCIAL SERVICES & SUPPLIES - 3.3% | |||||||
†Herman Miller | 96,799 | 3,876,800 | |||||
Kimball International Cl. B | 229,153 | 4,278,286 | |||||
| 8,155,086 | |||||||
| CONSTRUCTION & ENGINEERING - 0.6% | |||||||
Comfort Systems USA | 36,492 | 1,592,876 | |||||
| ELECTRICAL EQUIPMENT - 1.5% | |||||||
†EnerSys | 53,693 | 3,738,644 | |||||
| MACHINERY - 5.1% | |||||||
Alamo Group | 12,633 | 1,425,887 | |||||
Federal Signal | 65,510 | 1,316,096 | |||||
Miller Industries | 169,214 | 4,365,721 | |||||
Wabash National | 266,526 | 5,783,614 | |||||
| 12,891,318 | |||||||
| PROFESSIONAL SERVICES - 4.4% | |||||||
Heidrick & Struggles International | 149,081 | 3,659,939 | |||||
Korn/Ferry International | 60,764 | 2,514,414 | |||||
Robert Half International | 45,507 | 2,527,459 | |||||
TrueBlue 1 | 88,400 | 2,431,000 | |||||
| 11,132,812 | |||||||
| ROAD & RAIL - 1.6% | |||||||
Old Dominion Freight Line | 10,364 | 1,363,384 | |||||
Saia 1 | 22,182 | 1,569,376 | |||||
Werner Enterprises | 24,652 | 952,800 | |||||
| 3,885,560 | |||||||
| Total (Cost $48,511,881) | 62,102,619 | ||||||
| INFORMATION TECHNOLOGY – 23.4% | |||||||
| COMMUNICATIONS EQUIPMENT - 1.0% | |||||||
NETGEAR 1 | 42,446 | 2,493,702 | |||||
| ELECTRONIC EQUIPMENT, INSTRUMENTS & COMPONENTS - 16.4% | |||||||
Benchmark Electronics 1 | 128,774 | 3,747,324 | |||||
| 482,290 | 5,054,399 | ||||||
Fabrinet 1 | 178,161 | 5,113,221 | |||||
Insight Enterprises 1 | 150,406 | 5,759,046 | |||||
Methode Electronics | 93,143 | 3,735,034 | |||||
| 46,546 | 2,338,471 | ||||||
PC Connection | 204,948 | 5,371,687 | |||||
| 115,372 | 3,807,276 | ||||||
| 66 | The Royce Funds 2017 Annual Report to Shareholders | THE ACCOMPANYING NOTES ARE AN INTEGRAL PART OF THESE FINANCIAL STATEMENTS |
| December 31, 2017 |
| Royce Small-Cap Value Fund (continued) | |||||||
| SHARES | VALUE | ||||||
| INFORMATION TECHNOLOGY (continued) | |||||||
| ELECTRONIC EQUIPMENT, INSTRUMENTS & COMPONENTS (continued) | |||||||
Vishay Intertechnology | 311,839 | $ | 6,470,659 | ||||
| 41,397,117 | |||||||
| IT SERVICES - 1.0% | |||||||
Convergys Corporation | 112,132 | 2,635,102 | |||||
| SEMICONDUCTORS & SEMICONDUCTOR EQUIPMENT - 3.7% | |||||||
| 185,000 | 4,501,975 | ||||||
MKS Instruments | 23,180 | 2,190,510 | |||||
†Silicon Motion Technology ADR | 48,001 | 2,542,133 | |||||
| 9,234,618 | |||||||
| TECHNOLOGY HARDWARE, STORAGE & PERIPHERALS - 1.3% | |||||||
Super Micro Computer 1 | 152,187 | 3,184,513 | |||||
| Total (Cost $54,245,127) | 58,945,052 | ||||||
| REAL ESTATE – 1.5% | |||||||
| REAL ESTATE MANAGEMENT & DEVELOPMENT - 1.5% | |||||||
| 117,413 | 3,828,838 | ||||||
| Total (Cost $3,020,452) | 3,828,838 | ||||||
| UTILITIES – 1.3% | |||||||
| GAS UTILITIES - 1.3% | |||||||
Star Group L.P. | 299,068 | 3,214,981 | |||||
| Total (Cost $3,028,632) | 3,214,981 | ||||||
| MISCELLANEOUS2 – 1.9% | |||||||
| Total (Cost $3,877,119) | 4,924,786 | ||||||
| TOTAL COMMON STOCKS | |||||||
| (Cost $191,354,812) | 234,414,158 | ||||||
| REPURCHASE AGREEMENT – 7.2% | |||||||
| Fixed Income Clearing Corporation, 0.20% dated 12/29/17, due 1/2/18, maturity value $18,037,401 (collateralized by obligations of various U.S. Government Agencies, 3.625% due 2/15/20, valued at $18,400,284) | |||||||
| (Cost $18,037,000) | 18,037,000 | ||||||
| TOTAL INVESTMENTS – 100.3% | |||||||
| (Cost $209,391,812) | 252,451,158 | ||||||
| LIABILITIES LESS CASH AND OTHER ASSETS – (0.3)% | (772,772 | ) | |||||
| NET ASSETS – 100.0% | $ | 251,678,386 | |||||
| Royce Small/Mid-Cap Premier Fund | |||||||
| Common Stocks – 87.2% | |||||||
| SHARES | VALUE | ||||||
| CONSUMER DISCRETIONARY – 22.2% | |||||||
| AUTO COMPONENTS - 1.7% | |||||||
Dorman Products 1 | 18,000 | $ | 1,100,520 | ||||
LCI Industries | 17,938 | 2,331,940 | |||||
| 3,432,460 | |||||||
| AUTOMOBILES - 3.2% | |||||||
Thor Industries | 44,286 | 6,674,786 | |||||
| DISTRIBUTORS - 4.4% | |||||||
Core-Mark Holding Company | 66,400 | 2,096,912 | |||||
LKQ Corporation 1 | 169,313 | 6,885,960 | |||||
| 8,982,872 | |||||||
| HOUSEHOLD DURABLES - 2.2% | |||||||
Cavco Industries 1 | 4,000 | 610,400 | |||||
NVR 1 | 1,140 | 3,999,371 | |||||
| 4,609,771 | |||||||
| MEDIA - 2.1% | |||||||
| 102,272 | 0 | ||||||
Meredith Corporation | 45,605 | 3,012,210 | |||||
†Nexstar Media Group Cl. A | 17,131 | 1,339,644 | |||||
| 4,351,854 | |||||||
| MULTILINE RETAIL - 2.2% | |||||||
Dollar Tree 1 | 42,708 | 4,582,995 | |||||
| SPECIALTY RETAIL - 5.8% | |||||||
Camping World Holdings Cl. A | 27,935 | 1,249,533 | |||||
CarMax 1 | 40,922 | 2,624,328 | |||||
Children’s Place | 37,649 | 5,472,282 | |||||
Monro | 35,550 | 2,024,572 | |||||
USS | 33,032 | 698,796 | |||||
| 12,069,511 | |||||||
| TEXTILES, APPAREL & LUXURY GOODS - 0.6% | |||||||
Wolverine World Wide | 38,010 | 1,211,759 | |||||
| Total (Cost $28,645,290) | 45,916,008 | ||||||
| CONSUMER STAPLES – 3.6% | |||||||
| FOOD & STAPLES RETAILING - 1.2% | |||||||
Casey’s General Stores | 23,142 | 2,590,515 | |||||
| FOOD PRODUCTS - 2.4% | |||||||
Cal-Maine Foods 1 | 56,940 | 2,530,983 | |||||
†Hormel Foods | 64,286 | 2,339,368 | |||||
| 4,870,351 | |||||||
| Total (Cost $7,236,591) | 7,460,866 | ||||||
| FINANCIALS – 8.8% | |||||||
| CAPITAL MARKETS - 6.0% | |||||||
Affiliated Managers Group | 24,778 | 5,085,684 | |||||
Lazard Cl. A | 67,550 | 3,546,375 | |||||
Oaktree Capital Group LLC Cl. A | 43,117 | 1,815,226 | |||||
SEI Investments | 26,771 | 1,923,764 | |||||
| 12,371,049 | |||||||
| INSURANCE - 2.8% | |||||||
Alleghany Corporation 1 | 9,835 | 5,862,545 | |||||
| Total (Cost $13,995,681) | 18,233,594 | ||||||
| HEALTH CARE – 3.2% | |||||||
| HEALTH CARE EQUIPMENT & SUPPLIES - 2.7% | |||||||
DENTSPLY SIRONA | 42,685 | 2,809,954 | |||||
Hill-Rom Holdings | 31,797 | 2,680,169 | |||||
| 5,490,123 | |||||||
| LIFE SCIENCES TOOLS & SERVICES - 0.5% | |||||||
Bio-Rad Laboratories Cl. A 1 | 4,750 | 1,133,682 | |||||
| Total (Cost $5,650,535) | 6,623,805 | ||||||
| THE ACCOMPANYING NOTES ARE AN INTEGRAL PART OF THESE FINANCIAL STATEMENTS | The Royce Funds 2017 Annual Report to Shareholders | 67 |
| Schedules of Investments |
| Royce Small/Mid-Cap Premier Fund (continued) |
| SHARES | VALUE | ||||||
| INDUSTRIALS – 28.9% | |||||||
| AEROSPACE & DEFENSE - 3.6% | |||||||
Hexcel Corporation | 42,791 | $ | 2,646,623 | ||||
Teledyne Technologies 1 | 26,850 | 4,863,878 | |||||
| 7,510,501 | |||||||
| BUILDING PRODUCTS - 2.9% | |||||||
Lennox International | 12,485 | 2,600,126 | |||||
Simpson Manufacturing | 60,763 | 3,488,404 | |||||
| 6,088,530 | |||||||
| COMMERCIAL SERVICES & SUPPLIES - 4.1% | |||||||
Cintas Corporation | 7,961 | 1,240,563 | |||||
Copart 1 | 163,903 | 7,078,970 | |||||
Healthcare Services Group | 4,000 | 210,880 | |||||
| 8,530,413 | |||||||
| CONSTRUCTION & ENGINEERING - 2.6% | |||||||
Valmont Industries | 32,660 | 5,416,661 | |||||
| ELECTRICAL EQUIPMENT - 2.9% | |||||||
Generac Holdings 1 | 24,797 | 1,227,948 | |||||
Hubbell Cl. B | 34,516 | 4,671,395 | |||||
| 5,899,343 | |||||||
| INDUSTRIAL CONGLOMERATES - 2.3% | |||||||
Carlisle Companies | 41,181 | 4,680,221 | |||||
| MACHINERY - 1.4% | |||||||
Franklin Electric | 21,960 | 1,007,964 | |||||
Westinghouse Air Brake Technologies | 23,154 | 1,885,430 | |||||
| 2,893,394 | |||||||
| MARINE - 2.1% | |||||||
Kirby Corporation 1 | 63,645 | 4,251,486 | |||||
| PROFESSIONAL SERVICES - 4.9% | |||||||
IHS Markit 1 | 72,304 | 3,264,525 | |||||
ManpowerGroup | 46,825 | 5,905,101 | |||||
Verisk Analytics 1 | 9,150 | 878,400 | |||||
| 10,048,026 | |||||||
| ROAD & RAIL - 0.9% | |||||||
Landstar System | 18,256 | 1,900,449 | |||||
| TRADING COMPANIES & DISTRIBUTORS - 1.2% | |||||||
Diploma | 74,585 | 1,252,552 | |||||
Watsco | 7,300 | 1,241,292 | |||||
| 2,493,844 | |||||||
| Total (Cost $41,677,921) | 59,712,868 | ||||||
| INFORMATION TECHNOLOGY – 6.0% | |||||||
| ELECTRONIC EQUIPMENT, INSTRUMENTS & COMPONENTS - 2.4% | |||||||
AVX Corporation | 185,614 | 3,211,122 | |||||
FLIR Systems | 22,100 | 1,030,302 | |||||
IPG Photonics 1 | 3,583 | 767,228 | |||||
| 5,008,652 | |||||||
| IT SERVICES - 0.5% | |||||||
DST Systems | 16,858 | 1,046,376 | |||||
| SEMICONDUCTORS & SEMICONDUCTOR EQUIPMENT - 3.1% | |||||||
Cabot Microelectronics | 43,700 | 4,111,296 | |||||
Lam Research | 11,936 | 2,197,060 | |||||
| 6,308,356 | |||||||
| Total (Cost $8,746,247) | 12,363,384 | ||||||
| MATERIALS – 9.1% | |||||||
| CHEMICALS - 7.0% | |||||||
Minerals Technologies | 70,846 | 4,877,747 | |||||
†NewMarket Corporation | 2,122 | 843,261 | |||||
Sensient Technologies | 10,985 | 803,553 | |||||
Westlake Chemical | 74,024 | 7,885,777 | ||||
| 14,410,338 | ||||||
| METALS & MINING - 0.9% | ||||||
Reliance Steel & Aluminum | 22,555 | 1,934,994 | ||||
| PAPER & FOREST PRODUCTS - 1.2% | ||||||
Stella-Jones | 61,851 | 2,484,865 | ||||
| Total (Cost $13,328,827) | 18,830,197 | |||||
| REAL ESTATE – 3.4% | ||||||
| REAL ESTATE MANAGEMENT & DEVELOPMENT - 3.4% | ||||||
Jones Lang LaSalle | 26,104 | 3,887,669 | ||||
Realogy Holdings | 120,110 | 3,182,915 | ||||
| Total (Cost $6,350,883) | 7,070,584 | |||||
| UTILITIES – 1.6% | ||||||
| GAS UTILITIES - 1.6% | ||||||
UGI Corporation | 72,142 | 3,387,067 | ||||
| Total (Cost $2,605,342) | 3,387,067 | |||||
| MISCELLANEOUS2 – 0.4% | ||||||
| Total (Cost $634,901) | 711,908 | |||||
| TOTAL COMMON STOCKS | ||||||
| (Cost $128,872,218) | 180,310,281 | |||||
| REPURCHASE AGREEMENT – 13.6% | ||||||
| Fixed Income Clearing Corporation, 0.20% dated 12/29/17, due 1/2/18, maturity value $28,045,623 (collateralized by obligations of various U.S. Government Agencies, 1.625% due 4/30/19, valued at $28,610,503) | ||||||
| (Cost $28,045,000) | 28,045,000 | |||||
| TOTAL INVESTMENTS – 100.8% | ||||||
| (Cost $156,917,218) | 208,355,281 | |||||
| LIABILITIES LESS CASH AND OTHER ASSETS – (0.8)% | (1,750,592 | ) | ||||
| NET ASSETS – 100.0% | $ | 206,604,689 | ||||
| 68 | The Royce Funds 2017 Annual Report to Shareholders | THE ACCOMPANYING NOTES ARE AN INTEGRAL PART OF THESE FINANCIAL STATEMENTS |
| December 31, 2017 |
| Royce Smaller-Companies Growth Fund |
| Common Stocks – 94.3% |
| SHARES | VALUE | ||||||
| CONSUMER DISCRETIONARY – 5.6% | |||||||
| AUTO COMPONENTS - 0.7% | |||||||
LCI Industries | 21,000 | $ | 2,730,000 | ||||
| HOTELS, RESTAURANTS & LEISURE - 2.9% | |||||||
Dave & Busters Entertainment 1 | 59,000 | 3,255,030 | |||||
Del Taco Restaurants 1 | 179,700 | 2,177,964 | |||||
Texas Roadhouse | 98,000 | 5,162,640 | |||||
| 10,595,634 | |||||||
| LEISURE PRODUCTS - 1.0% | |||||||
Callaway Golf | 252,000 | 3,510,360 | |||||
| TEXTILES, APPAREL & LUXURY GOODS - 1.0% | |||||||
Carter’s | 9,900 | 1,163,151 | |||||
Columbia Sportswear | 15,000 | 1,078,200 | |||||
Gildan Activewear | 47,666 | 1,539,612 | |||||
| 3,780,963 | |||||||
| Total (Cost $12,803,398) | 20,616,957 | ||||||
| CONSUMER STAPLES – 1.7% | |||||||
| FOOD PRODUCTS - 1.7% | |||||||
| 110,000 | 3,606,900 | ||||||
| 84,000 | 2,700,600 | ||||||
| Total (Cost $5,740,839) | 6,307,500 | ||||||
| ENERGY – 1.7% | |||||||
| ENERGY EQUIPMENT & SERVICES - 0.8% | |||||||
Pason Systems | 205,000 | 2,966,547 | |||||
| OIL, GAS & CONSUMABLE FUELS - 0.9% | |||||||
Centennial Resource Development Cl. A 1 | 111,000 | 2,197,800 | |||||
| 25,000 | 1,017,000 | ||||||
| 3,214,800 | |||||||
| Total (Cost $3,072,911) | 6,181,347 | ||||||
| FINANCIALS – 11.1% | |||||||
| BANKS - 7.8% | |||||||
†Banc of California | 141,000 | 2,911,650 | |||||
Enterprise Financial Services | 138,500 | 6,253,275 | |||||
Live Oak Bancshares | 60,700 | 1,447,695 | |||||
| 134,000 | 3,378,140 | ||||||
ServisFirst Bancshares | 85,000 | 3,527,500 | |||||
State Bank Financial | 79,500 | 2,372,280 | |||||
TriState Capital Holdings 1 | 283,057 | 6,510,311 | |||||
†Webster Financial | 43,000 | 2,414,880 | |||||
| 28,815,731 | |||||||
| CAPITAL MARKETS - 2.9% | |||||||
Northern Trust | 51,000 | 5,094,390 | |||||
WisdomTree Investments | 431,200 | 5,411,560 | |||||
| 10,505,950 | |||||||
| THRIFTS & MORTGAGE FINANCE - 0.4% | |||||||
OceanFirst Financial | 50,000 | 1,312,500 | |||||
| Total (Cost $27,711,473) | 40,634,181 | ||||||
| HEALTH CARE – 18.0% | |||||||
| BIOTECHNOLOGY - 3.6% | |||||||
Clovis Oncology 1 | 50,000 | 3,400,000 | |||||
Myriad Genetics 1 | 27,000 | 927,315 | |||||
Progenics Pharmaceuticals 1 | 418,200 | 2,488,290 | |||||
| 27,000 | 979,560 | ||||||
| 125,000 | 2,448,750 | ||||||
| 225,000 | 1,352,250 | ||||||
| 122,799 | 1,680,910 | ||||||
| 13,277,075 | |||||||
| HEALTH CARE EQUIPMENT & SUPPLIES - 6.6% | |||||||
ABIOMED 1 | 10,000 | 1,874,100 | |||||
| 658,000 | 1,710,800 | ||||||
| 220,198 | 1,891,501 | ||||||
Entellus Medical 1 | 134,526 | 3,281,089 | |||||
Heska Corporation 1 | 36,000 | 2,887,560 | |||||
Inogen 1 | 18,755 | 2,233,346 | |||||
| 36,000 | 2,485,440 | ||||||
| 160,000 | 3,017,600 | ||||||
Penumbra 1 | 21,000 | 1,976,100 | |||||
| 125,000 | 575,000 | ||||||
West Pharmaceutical Services | 23,000 | 2,269,410 | |||||
| 24,201,946 | |||||||
| HEALTH CARE PROVIDERS & SERVICES - 1.4% | |||||||
BioTelemetry 1 | 143,691 | 4,296,361 | |||||
HealthEquity 1 | 19,000 | 886,540 | |||||
| 5,182,901 | |||||||
| LIFE SCIENCES TOOLS & SERVICES - 1.6% | |||||||
Cambrex Corporation 1 | 37,500 | 1,800,000 | |||||
| 482,000 | 4,270,520 | ||||||
| 6,070,520 | |||||||
| PHARMACEUTICALS - 4.8% | |||||||
| 656,000 | 3,673,600 | ||||||
| 590,000 | 1,740,500 | ||||||
| 137,000 | 2,529,020 | ||||||
Intersect ENT 1 | 94,000 | 3,045,600 | |||||
| 144,000 | 2,577,600 | ||||||
| 99,000 | 3,945,150 | ||||||
| 17,511,470 | |||||||
| Total (Cost $51,571,159) | 66,243,912 | ||||||
| INDUSTRIALS – 10.1% | |||||||
| AEROSPACE & DEFENSE - 0.3% | |||||||
Mercury Systems 1 | 21,749 | 1,116,811 | |||||
| AIR FREIGHT & LOGISTICS - 3.0% | |||||||
| 81,000 | 1,874,340 | ||||||
| 95,000 | 5,571,750 | ||||||
Forward Air | 63,000 | 3,618,720 | |||||
| 11,064,810 | |||||||
| BUILDING PRODUCTS - 0.7% | |||||||
DIRTT Environmental Solutions 1 | 449,000 | 2,407,526 | |||||
| CONSTRUCTION & ENGINEERING - 0.7% | |||||||
NV5 Global 1 | 49,585 | 2,685,028 | |||||
| ELECTRICAL EQUIPMENT - 0.8% | |||||||
| 358,000 | 1,578,780 | ||||||
| 636,000 | 1,532,760 | ||||||
| 3,111,540 | |||||||
| MACHINERY - 1.5% | |||||||
| 16,000 | 1,648,000 | ||||||
Woodward | 50,000 | 3,827,000 | |||||
| 5,475,000 | |||||||
| MARINE - 2.8% | |||||||
Clarkson | 147,976 | 5,713,451 | |||||
†Scorpio Bulkers | 246,000 | 1,820,400 | |||||
| 244,000 | 2,747,440 | ||||||
| 10,281,291 | |||||||
| TRADING COMPANIES & DISTRIBUTORS - 0.3% | |||||||
| 13,000 | 997,100 | ||||||
| Total (Cost $30,264,248) | 37,139,106 | ||||||
| THE ACCOMPANYING NOTES ARE AN INTEGRAL PART OF THESE FINANCIAL STATEMENTS | The Royce Funds 2017 Annual Report to Shareholders | 69 |
| Schedules of Investments |
| Royce Smaller-Companies Growth Fund (continued) |
| SHARES | VALUE | ||||||
| INFORMATION TECHNOLOGY – 29.6% | |||||||
| COMMUNICATIONS EQUIPMENT - 0.5% | |||||||
| 35,000 | $ | 1,711,500 | |||||
| ELECTRONIC EQUIPMENT, INSTRUMENTS & COMPONENTS - 6.6% | |||||||
| 107,411 | 965,625 | ||||||
Cognex Corporation | 9,000 | 550,440 | |||||
ePlus 1 | 81,000 | 6,091,200 | |||||
FLIR Systems | 89,600 | 4,177,152 | |||||
| 63,000 | 2,957,850 | ||||||
IPG Photonics 1 | 11,444 | 2,450,504 | |||||
| 576,000 | 4,014,720 | ||||||
| 20,000 | 293,200 | ||||||
†Universal Display | 16,000 | 2,762,400 | |||||
| 24,263,091 | |||||||
| INTERNET SOFTWARE & SERVICES - 5.4% | |||||||
Amber Road 1 | 90,000 | 660,600 | |||||
| 45,000 | 1,040,400 | ||||||
Carbonite 1 | 137,000 | 3,438,700 | |||||
| 98,071 | 2,795,024 | ||||||
| 69,000 | 2,542,650 | ||||||
| 314,000 | 3,689,500 | ||||||
Shopify Cl. A 1 | 24,000 | 2,424,000 | |||||
2U 1 | 35,348 | 2,280,299 | |||||
| 74,000 | 890,220 | ||||||
| 19,761,393 | |||||||
| IT SERVICES - 1.0% | |||||||
| 30,000 | 1,040,100 | ||||||
Unisys Corporation 1 | 347,000 | 2,828,050 | |||||
| 3,868,150 | |||||||
| SEMICONDUCTORS & SEMICONDUCTOR EQUIPMENT - 6.7% | |||||||
| 62,000 | 2,861,300 | ||||||
| 170,000 | 2,550,000 | ||||||
| 72,000 | 1,771,200 | ||||||
Inphi Corporation 1 | 50,000 | 1,830,000 | |||||
| 76,100 | 2,262,453 | ||||||
| 470,000 | 4,676,500 | ||||||
| 147,000 | 3,078,180 | ||||||
| 29,000 | 2,560,700 | ||||||
†Silicon Motion Technology ADR | 57,000 | 3,018,720 | |||||
| 24,609,053 | |||||||
| SOFTWARE - 8.5% | |||||||
| 20,000 | 478,400 | ||||||
| 108,000 | 3,094,200 | ||||||
HubSpot 1 | 31,000 | 2,740,400 | |||||
| 478,577 | 6,082,713 | ||||||
Paylocity Holding Corporation 1 | 142,786 | 6,733,788 | |||||
QAD Cl. A | 213,000 | 8,275,050 | |||||
RingCentral Cl. A 1 | 83,000 | 4,017,200 | |||||
| 31,421,751 | |||||||
| TECHNOLOGY HARDWARE, STORAGE & PERIPHERALS - 0.9% | |||||||
| 328,000 | 3,198,000 | ||||||
| Total (Cost $76,547,395) | 108,832,938 | ||||||
| MATERIALS – 9.0% | |||||||
| CHEMICALS - 3.1% | |||||||
Albemarle Corporation | 40,000 | 5,115,600 | |||||
| 163,800 | 1,367,730 | ||||||
Kraton Corporation 1 | 103,000 | 4,961,510 | |||||
| 11,444,840 | |||||||
| CONSTRUCTION MATERIALS - 3.0% | |||||||
Eagle Materials | 53,000 | 6,004,900 | |||||
| 156,946 | 4,934,411 | ||||||
| 10,939,311 | |||||||
| METALS & MINING - 2.9% | |||||||
| 620,000 | 6,066,826 | ||||||
Orocobre 1 | 887,000 | 4,791,410 | |||||
| 10,858,236 | |||||||
| Total (Cost $21,000,856) | 33,242,387 | ||||||
| REAL ESTATE – 2.2% | |||||||
| EQUITY REAL ESTATE INVESTMENT TRUSTS (REITS) - 2.2% | |||||||
Community Healthcare Trust | 128,000 | 3,596,800 | |||||
CyrusOne | 78,000 | 4,643,340 | |||||
| Total (Cost $4,924,783) | 8,240,140 | ||||||
| TELECOMMUNICATION SERVICES – 0.9% | |||||||
| DIVERSIFIED TELECOMMUNICATION SERVICES - 0.9% | |||||||
ORBCOMM 1 | 325,000 | 3,308,500 | |||||
| Total (Cost $1,909,714) | 3,308,500 | ||||||
| MISCELLANEOUS2 – 4.4% | |||||||
| Total (Cost $14,139,041) | 16,025,430 | ||||||
| TOTAL COMMON STOCKS | |||||||
| (Cost $249,685,817) | 346,772,398 | ||||||
| REPURCHASE AGREEMENT – 6.2% | |||||||
| Fixed Income Clearing Corporation, 0.20% dated 12/29/17, due 1/2/18, maturity value $22,667,504 (collateralized by obligations of various U.S. Government Agencies, 1.625% due 4/30/19, valued at $23,124,242) | |||||||
| (Cost $22,667,000) | 22,667,000 | ||||||
| COLLATERAL RECEIVED FOR SECURITIES LOANED – 4.7% | |||||||
| Money Market Funds | |||||||
Federated Government Obligations Fund (7 day yield-1.1385%) | 17,341,344 | ||||||
| TOTAL COLLATERAL RECEIVED FOR SECURITIES LOANED | |||||||
| (Cost $17,341,344) | 17,341,344 | ||||||
| TOTAL INVESTMENTS – 105.2% | |||||||
| (Cost $289,694,161) | 386,780,742 | ||||||
| LIABILITIES LESS CASH AND OTHER ASSETS – (5.2)% | (19,000,520 | ) | |||||
| NET ASSETS – 100.0% | $ | 367,780,222 | |||||
| 70 | The Royce Funds 2017 Annual Report to Shareholders | THE ACCOMPANYING NOTES ARE AN INTEGRAL PART OF THESE FINANCIAL STATEMENTS |
| December 31, 2017 |
| Royce Special Equity Fund | ||||||||
| Common Stocks – 89.9% | ||||||||
| SHARES | VALUE | |||||||
| CONSUMER DISCRETIONARY – 40.3% | ||||||||
| AUTO COMPONENTS - 8.2% | ||||||||
Cooper Tire & Rubber | 1,375,000 | $ | 48,606,250 | |||||
Gentex Corporation | 850,000 | 17,807,500 | ||||||
Standard Motor Products 6 | 1,350,000 | 60,628,500 | ||||||
| 127,042,250 | ||||||||
| AUTOMOBILES - 3.1% | ||||||||
Winnebago Industries | 865,000 | 48,094,000 | ||||||
| DIVERSIFIED CONSUMER SERVICES - 3.0% | ||||||||
Capella Education 6 | 588,000 | 45,511,200 | ||||||
| HOTELS, RESTAURANTS & LEISURE - 0.4% | ||||||||
Bowl America Cl. A 6 | 343,000 | 5,145,000 | ||||||
| HOUSEHOLD DURABLES - 8.7% | ||||||||
Bassett Furniture Industries 6 | 781,000 | 29,365,600 | ||||||
CSS Industries 6 | 695,900 | 19,366,897 | ||||||
Ethan Allen Interiors | 392,500 | 11,225,500 | ||||||
Flexsteel Industries 6 | 567,000 | 26,524,260 | ||||||
Hooker Furniture 6 | 1,127,000 | 47,841,150 | ||||||
| 134,323,407 | ||||||||
| MEDIA - 8.6% | ||||||||
Meredith Corporation | 1,010,000 | 66,710,500 | ||||||
Scholastic Corporation | 1,645,000 | 65,980,950 | ||||||
| 132,691,450 | ||||||||
| SPECIALTY RETAIL - 8.3% | ||||||||
Children’s Place | 790,000 | 114,826,500 | ||||||
Haverty Furniture | 600,000 | 13,590,000 | ||||||
| �� | ||||||||
| 128,416,500 | ||||||||
| Total (Cost $392,002,330) | 621,223,807 | |||||||
| CONSUMER STAPLES – 6.1% | ||||||||
| FOOD & STAPLES RETAILING - 3.1% | ||||||||
Weis Markets | 1,173,500 | 48,571,165 | ||||||
| FOOD PRODUCTS - 3.0% | ||||||||
John B. Sanfilippo & Son 6 | 726,500 | 45,951,125 | ||||||
| Total (Cost $84,946,565) | 94,522,290 | |||||||
| INDUSTRIALS – 21.4% | ||||||||
| AEROSPACE & DEFENSE - 3.0% | ||||||||
National Presto Industries 6 | 469,000 | 46,642,050 | ||||||
| BUILDING PRODUCTS - 0.4% | ||||||||
Insteel Industries | 221,080 | 6,260,986 | ||||||
| COMMERCIAL SERVICES & SUPPLIES - 7.8% | ||||||||
Ennis | 372,000 | 7,719,000 | ||||||
Herman Miller | 700,000 | 28,035,000 | ||||||
UniFirst Corporation | 513,000 | 84,593,700 | ||||||
| 120,347,700 | ||||||||
| CONSTRUCTION & ENGINEERING - 0.2% | ||||||||
Argan | 66,000 | 2,970,000 | ||||||
| ELECTRICAL EQUIPMENT - 4.6% | ||||||||
Hubbell Cl. B | 520,000 | 70,376,800 | ||||||
| MACHINERY - 3.7% | ||||||||
| 521,979 | 8,638,752 | |||||||
Hurco Companies 6 | 525,000 | 22,155,000 | ||||||
Wabash National | 1,196,000 | 25,953,200 | ||||||
| 56,746,952 | ||||||||
| PROFESSIONAL SERVICES - 1.5% | ||||||||
Resources Connection | 1,500,000 | 23,175,000 | ||||||
| TRADING COMPANIES & DISTRIBUTORS - 0.2% | ||||||||
Central Steel & Wire 3 | 6,500 | 2,925,000 | ||||||
| Total (Cost $167,763,798) | 329,444,488 | |||||||
| INFORMATION TECHNOLOGY – 16.9% | ||||||||
| ELECTRONIC EQUIPMENT, INSTRUMENTS & COMPONENTS - 9.8% | ||||||||
AVX Corporation | 4,840,000 | 83,732,000 | ||||||
Park Electrochemical 6 | 1,557,000 | 30,595,050 | ||||||
Vishay Intertechnology | 1,790,000 | 37,142,500 | ||||||
| 151,469,550 | ||||||||
| IT SERVICES - 2.3% | ||||||||
| 756,000 | 35,222,040 | |||||||
| SEMICONDUCTORS & SEMICONDUCTOR EQUIPMENT - 4.8% | ||||||||
| 859,000 | 20,903,765 | |||||||
Teradyne | 1,285,000 | 53,802,950 | ||||||
| 74,706,715 | ||||||||
| Total (Cost $176,108,716) | 261,398,305 | |||||||
| MATERIALS – 2.7% | ||||||||
| METALS & MINING - 1.6% | ||||||||
Kaiser Aluminum | 236,000 | 25,216,600 | ||||||
| PAPER & FOREST PRODUCTS - 1.1% | ||||||||
Neenah Paper | 187,000 | 16,951,550 | ||||||
| Total (Cost $26,579,621) | 42,168,150 | |||||||
| REAL ESTATE – 2.5% | ||||||||
| REAL ESTATE MANAGEMENT & DEVELOPMENT - 2.5% | ||||||||
Marcus & Millichap 1 | 1,185,000 | 38,642,850 | ||||||
| Total (Cost $31,101,718) | 38,642,850 | |||||||
| TOTAL COMMON STOCKS | ||||||||
| (Cost $878,502,748) | 1,387,399,890 | |||||||
| REPURCHASE AGREEMENT – 10.2% | ||||||||
| Fixed Income Clearing Corporation, 0.20% dated 12/29/17, due 1/2/18, maturity value $157,804,507 (collateralized by obligations of various U.S. Government Agencies, 1.625%- 3.625% due 1/21/20-2/15/20, valued at $160,958,776) | ||||||||
| (Cost $157,801,000) | 157,801,000 | |||||||
| TOTAL INVESTMENTS – 100.1% | ||||||||
| (Cost $1,036,303,748) | 1,545,200,890 | |||||||
| LIABILITIES LESS CASH AND OTHER ASSETS – (0.1)% | (1,317,853 | ) | ||||||
| NET ASSETS – 100.0% | $ | 1,543,883,037 | ||||||
| THE ACCOMPANYING NOTES ARE AN INTEGRAL PART OF THESE FINANCIAL STATEMENTS | The Royce Funds 2017 Annual Report to Shareholders | 71 |
| Schedules of Investments |
| Royce Special Equity Multi-Cap Fund | ||||||||
| Common Stocks – 92.5% | ||||||||
| SHARES | VALUE | |||||||
| CONSUMER DISCRETIONARY – 24.1% | ||||||||
| DISTRIBUTORS - 7.5% | ||||||||
Genuine Parts | 85,000 | $ | 8,075,850 | |||||
| HOTELS, RESTAURANTS & LEISURE - 3.5% | ||||||||
McDonald’s Corporation | 22,000 | 3,786,640 | ||||||
| HOUSEHOLD DURABLES - 3.0% | ||||||||
Leggett & Platt | 68,000 | 3,245,640 | ||||||
| SPECIALTY RETAIL - 5.4% | ||||||||
Lowe’s Companies | 63,500 | 5,901,690 | ||||||
| TEXTILES, APPAREL & LUXURY GOODS - 4.7% | ||||||||
V.F. Corporation | 68,500 | 5,069,000 | ||||||
| Total (Cost $20,230,875) | 26,078,820 | |||||||
| CONSUMER STAPLES – 13.5% | ||||||||
| FOOD PRODUCTS - 3.8% | ||||||||
Hormel Foods | 112,000 | 4,075,680 | ||||||
| HOUSEHOLD PRODUCTS - 9.7% | ||||||||
Kimberly-Clark | 46,000 | 5,550,360 | ||||||
Procter & Gamble | 53,500 | 4,915,580 | ||||||
| 10,465,940 | ||||||||
| Total (Cost $14,032,094) | 14,541,620 | |||||||
| FINANCIALS – 1.4% | ||||||||
| INSURANCE - 1.4% | ||||||||
Brown & Brown | 29,000 | 1,492,340 | ||||||
| Total (Cost $1,263,976) | 1,492,340 | |||||||
| INDUSTRIALS – 36.8% | ||||||||
| AEROSPACE & DEFENSE - 6.6% | ||||||||
General Dynamics | 18,500 | 3,763,825 | ||||||
United Technologies | 27,000 | 3,444,390 | ||||||
| 7,208,215 | ||||||||
| ELECTRICAL EQUIPMENT - 2.4% | ||||||||
Emerson Electric | 37,000 | 2,578,530 | ||||||
| INDUSTRIAL CONGLOMERATES - 5.6% | ||||||||
Carlisle Companies | 38,500 | 4,375,525 | ||||||
3M | 7,000 | 1,647,590 | ||||||
| 6,023,115 | ||||||||
| MACHINERY - 19.6% | ||||||||
Cummins | 12,600 | 2,225,664 | ||||||
Illinois Tool Works | 53,500 | 8,926,475 | ||||||
Parker Hannifin | 31,500 | 6,286,770 | ||||||
Stanley Black & Decker | 22,500 | 3,818,025 | ||||||
| 21,256,934 | ||||||||
| PROFESSIONAL SERVICES - 2.6% | ||||||||
ManpowerGroup | 22,000 | 2,774,420 | ||||||
| Total (Cost $23,139,411) | 39,841,214 | |||||||
| INFORMATION TECHNOLOGY – 14.1% | ||||||||
| COMMUNICATIONS EQUIPMENT - 5.2% | ||||||||
Cisco Systems | 147,000 | 5,630,100 | ||||||
| TECHNOLOGY HARDWARE, STORAGE & PERIPHERALS - 8.9% | ||||||||
Apple | 57,000 | 9,646,110 | ||||||
| Total (Cost $7,677,284) | 15,276,210 | |||||||
| MATERIALS – 2.6% | ||||||||
| CHEMICALS - 2.6% | ||||||||
NewMarket Corporation | 7,100 | 2,821,469 | ||||||
| Total (Cost $2,976,617) | 2,821,469 | |||||||
| TOTAL COMMON STOCKS | ||||||||
| (Cost $69,320,257) | 100,051,673 | |||||||
| REPURCHASE AGREEMENT – 7.5% | ||||||||
| Fixed Income Clearing Corporation, 0.20% dated 12/29/17, due 1/2/18, maturity value $8,073,179 (collateralized by obligations of various U.S. Government Agencies, 0.875% due 5/15/19, valued at $8,237,101) | ||||||||
| (Cost $8,073,000) | $ | 8,073,000 | ||||||
| TOTAL INVESTMENTS – 100.0% | ||||||||
| (Cost $77,393,257) | 108,124,673 | |||||||
| CASH AND OTHER ASSETS LESS LIABILITIES – 0.0% | 34,754 | |||||||
| NET ASSETS – 100.0% | $ | 108,159,427 | ||||||
| 72 | The Royce Funds 2017 Annual Report to Shareholders | THE ACCOMPANYING NOTES ARE AN INTEGRAL PART OF THESE FINANCIAL STATEMENTS |
| December 31, 2017 |
| Royce Total Return Fund | ||||||||
| Common Stocks – 98.2% | ||||||||
| SHARES | VALUE | |||||||
| CONSUMER DISCRETIONARY – 9.6% | ||||||||
| AUTO COMPONENTS - 1.4% | ||||||||
Cooper Tire & Rubber | 48,022 | $ | 1,697,577 | |||||
Gentex Corporation | 975,441 | 20,435,489 | ||||||
Nokian Renkaat | 148,429 | 6,723,035 | ||||||
Standard Motor Products | 84,156 | 3,779,446 | ||||||
| 32,635,547 | ||||||||
| AUTOMOBILES - 1.5% | ||||||||
Thor Industries | 235,187 | 35,447,385 | ||||||
| DISTRIBUTORS - 0.3% | ||||||||
Weyco Group | 243,324 | 7,231,589 | ||||||
| DIVERSIFIED CONSUMER SERVICES - 0.3% | ||||||||
Capella Education | 30,797 | 2,383,688 | ||||||
Liberty Tax Cl. A | 436,616 | 4,802,776 | ||||||
| 7,186,464 | ||||||||
| HOTELS, RESTAURANTS & LEISURE - 0.4% | ||||||||
Brinker International | 36,370 | 1,412,611 | ||||||
Cheesecake Factory | 168,241 | 8,105,851 | ||||||
Imvescor Restaurant Group | 109,307 | 376,531 | ||||||
| 9,894,993 | ||||||||
| HOUSEHOLD DURABLES - 1.5% | ||||||||
Bassett Furniture Industries | 98,182 | 3,691,643 | ||||||
Ethan Allen Interiors | 593,352 | 16,969,867 | ||||||
Flexsteel Industries | 100,899 | 4,720,055 | ||||||
La-Z-Boy | 385,718 | 12,034,402 | ||||||
| 37,415,967 | ||||||||
| INTERNET & DIRECT MARKETING RETAIL - 0.1% | ||||||||
HSN | 51,674 | 2,085,046 | ||||||
| MEDIA - 1.1% | ||||||||
Gannett Company | 279,717 | 3,241,920 | ||||||
Meredith Corporation | 239,294 | 15,805,369 | ||||||
Saga Communications Cl. A | 183,147 | 7,408,296 | ||||||
| 26,455,585 | ||||||||
| MULTILINE RETAIL - 0.2% | ||||||||
Big Lots | 34,194 | 1,919,993 | ||||||
Dillard’s Cl. A | 33,893 | 2,035,275 | ||||||
| 3,955,268 | ||||||||
| SPECIALTY RETAIL - 2.4% | ||||||||
Aaron’s | 34,765 | 1,385,385 | ||||||
American Eagle Outfitters | 846,437 | 15,913,016 | ||||||
Buckle (The) | 130,266 | 3,093,817 | ||||||
Caleres | 54,843 | 1,836,144 | ||||||
Cato Corporation (The) Cl. A | 147,456 | 2,347,499 | ||||||
Children’s Place | 34,719 | 5,046,407 | ||||||
DSW Cl. A | 639,577 | 13,693,344 | ||||||
GameStop Corporation Cl. A | 77,795 | 1,396,420 | ||||||
Shoe Carnival | 453,093 | 12,120,238 | ||||||
| 56,832,270 | ||||||||
| TEXTILES, APPAREL & LUXURY GOODS - 0.4% | ||||||||
J.G. Boswell Company 3 | 1,048 | 743,032 | ||||||
Movado Group | 73,240 | 2,358,328 | ||||||
Steven Madden 1 | 150,559 | 7,031,105 | ||||||
| 10,132,465 | ||||||||
| Total (Cost $155,036,064) | 229,272,579 | |||||||
| CONSUMER STAPLES – 3.0% | ||||||||
| BEVERAGES - 0.1% | ||||||||
Compania Cervecerias Unidas ADR | 87,717 | 2,594,669 | ||||||
| FOOD & STAPLES RETAILING - 0.5% | ||||||||
Village Super Market Cl. A | 521,937 | 11,968,015 | ||||||
| FOOD PRODUCTS - 2.2% | ||||||||
Flowers Foods | 289,606 | 5,592,292 | ||||||
Fresh Del Monte Produce | 202,233 | 9,640,447 | ||||||
Hershey Creamery 3 | 722 | 2,671,400 | ||||||
Lancaster Colony | 108,770 | 14,054,172 | ||||||
Tootsie Roll Industries | 557,008 | 20,275,091 | ||||||
| 52,233,402 | ||||||||
| HOUSEHOLD PRODUCTS - 0.1% | ||||||||
WD-40 Company | 16,453 | 1,941,454 | ||||||
| PERSONAL PRODUCTS - 0.1% | ||||||||
Nu Skin Enterprises Cl. A | 31,422 | 2,143,923 | ||||||
| Total (Cost $48,068,584) | 70,881,463 | |||||||
| ENERGY – 3.4% | ||||||||
| ENERGY EQUIPMENT & SERVICES - 2.7% | ||||||||
CARBO Ceramics 1 | 99,038 | 1,008,207 | ||||||
| 158,467 | 2,945,901 | |||||||
Helmerich & Payne | 205,749 | 13,299,615 | ||||||
Oceaneering International | 66,211 | 1,399,701 | ||||||
Pason Systems | 926,023 | 13,400,444 | ||||||
SEACOR Holdings | 397,830 | 18,387,703 | ||||||
| 269,802 | 3,156,683 | |||||||
TGS-NOPEC Geophysical | 467,659 | 11,062,419 | ||||||
| 64,660,673 | ||||||||
| OIL, GAS & CONSUMABLE FUELS - 0.7% | ||||||||
Boardwalk Pipeline Partners L.P. | 172,759 | 2,230,319 | ||||||
Dorchester Minerals L.P. | 255,932 | 3,890,166 | ||||||
Permian Basin Royalty Trust | 715,852 | 6,349,607 | ||||||
Sabine Royalty Trust | 9,401 | 419,285 | ||||||
San Juan Basin Royalty Trust | 383,082 | 3,156,596 | ||||||
| 16,045,973 | ||||||||
| Total (Cost $76,621,849) | 80,706,646 | |||||||
| FINANCIALS – 26.2% | ||||||||
| BANKS - 7.8% | ||||||||
Ames National | 263,190 | 7,329,841 | ||||||
Associated Banc-Corp | 425,950 | 10,819,130 | ||||||
Bank of Hawaii | 279,312 | 23,937,038 | ||||||
BLOM Bank GDR | 225,597 | 2,865,082 | ||||||
BOK Financial | 299,604 | 27,659,441 | ||||||
Camden National | 204,690 | 8,623,590 | ||||||
Canadian Western Bank | 560,861 | 17,512,963 | ||||||
City Holding Company | 119,464 | 8,060,236 | ||||||
CNB Financial | 257,320 | 6,752,077 | ||||||
Codorus Valley Bancorp | 38,208 | 1,051,866 | ||||||
Farmers & Merchants Bank of Long Beach 3 | 430 | 3,379,800 | ||||||
First Citizens BancShares Cl. A | 64,839 | 26,130,117 | ||||||
First National Bank Alaska 3 | 2,694 | 5,388,000 | ||||||
Landmark Bancorp | 27,158 | 787,582 | ||||||
MidWestOne Financial Group | 198,541 | 6,657,080 | ||||||
National Bankshares | 147,790 | 6,717,056 | ||||||
Northrim BanCorp | 191,195 | 6,471,951 | ||||||
Peapack-Gladstone Financial | 477,835 | 16,733,782 | ||||||
Unity Bancorp | 59,163 | 1,168,469 | ||||||
| 188,045,101 | ||||||||
| CAPITAL MARKETS - 8.3% | ||||||||
AllianceBernstein Holding L.P. | 391,687 | 9,811,759 | ||||||
Apollo Global Management LLC Cl. A | 266,903 | 8,933,243 | ||||||
Ares Management L.P. | 400,267 | 8,005,340 | ||||||
Ashmore Group | 2,670,196 | 14,601,375 | ||||||
| THE ACCOMPANYING NOTES ARE AN INTEGRAL PART OF THESE FINANCIAL STATEMENTS | The Royce Funds 2017 Annual Report to Shareholders | 73 |
| Schedules of Investments |
| Royce Total Return Fund (continued) | ||||||||
| SHARES | VALUE | |||||||
| FINANCIALS (continued) | ||||||||
| CAPITAL MARKETS (continued) | ||||||||
Associated Capital Group Cl. A | 176,326 | $ | 6,012,717 | |||||
Bolsa Mexicana de Valores | 5,031,182 | 8,651,202 | ||||||
Cohen & Steers | 289,371 | 13,684,355 | ||||||
Coronation Fund Managers | 470,890 | 2,807,702 | ||||||
Edmond de Rothschild (Suisse) | 219 | 4,153,098 | ||||||
Egyptian Financial Group-Hermes Holding | ||||||||
Company | 1,038,708 | 1,378,713 | ||||||
Federated Investors Cl. B | 565,575 | 20,405,946 | ||||||
GAMCO Investors Cl. A | 232,630 | 6,897,479 | ||||||
Houlihan Lokey Cl. A | 101,679 | 4,619,277 | ||||||
KKR & Co. L.P. | 565,863 | 11,917,075 | ||||||
Moelis & Company Cl. A | 178,387 | 8,651,769 | ||||||
Morningstar | 29,992 | 2,908,324 | ||||||
MVC Capital | 313,685 | 3,312,514 | ||||||
Oaktree Specialty Lending | 258,811 | 1,265,586 | ||||||
Och-Ziff Capital Management Group LLC Cl. A | 615,026 | 1,537,565 | ||||||
Oppenheimer Holdings Cl. A | 107,876 | 2,891,077 | ||||||
Rothschild & Co | 501,842 | 18,368,019 | ||||||
Teton Advisors Cl. A 3 | 1,163 | 60,476 | ||||||
TMX Group | 301,961 | 16,921,347 | ||||||
Value Partners Group | 10,033,270 | 10,617,682 | ||||||
Vontobel Holding | 64,993 | 4,101,638 | ||||||
Waddell & Reed Financial Cl. A | 91,564 | 2,045,540 | ||||||
Westwood Holdings Group | 74,329 | 4,921,323 | ||||||
| 199,482,141 | ||||||||
| CONSUMER FINANCE - 0.1% | ||||||||
Nelnet Cl. A | 41,642 | 2,281,149 | ||||||
| DIVERSIFIED FINANCIAL SERVICES - 0.2% | ||||||||
First Pacific | 638,477 | 433,814 | ||||||
Leucadia National | 122,251 | 3,238,429 | ||||||
| 3,672,243 | ||||||||
| INSURANCE - 8.4% | ||||||||
Alleghany Corporation 1 | 45,030 | 26,841,933 | ||||||
American Financial Group | 97,043 | 10,533,047 | ||||||
Assured Guaranty | 287,414 | 9,734,712 | ||||||
Baldwin & Lyons Cl. B | 240,045 | 5,749,078 | ||||||
E-L Financial | 62,118 | 40,266,004 | ||||||
Employers Holdings | 70,161 | 3,115,148 | ||||||
Erie Indemnity Cl. A | 317,895 | 38,732,327 | ||||||
First American Financial | 73,230 | 4,103,809 | ||||||
Gallagher (Arthur J.) & Co. | 117,075 | 7,408,506 | ||||||
Horace Mann Educators | 17,277 | 761,916 | ||||||
Mercury General | 104,383 | 5,578,227 | ||||||
National Western Life Group Cl. A | 7,802 | 2,582,618 | ||||||
Old Republic International | 508,221 | 10,865,765 | ||||||
ProAssurance Corporation | 175,621 | 10,036,740 | ||||||
Reinsurance Group of America | 42,604 | 6,643,242 | ||||||
RLI Corp. | 122,002 | 7,400,641 | ||||||
Selective Insurance Group | 24,241 | 1,422,947 | ||||||
State Auto Financial | 161,323 | 4,697,726 | ||||||
United Fire Group | 25,439 | 1,159,510 | ||||||
Universal Insurance Holdings | 87,285 | 2,387,245 | ||||||
White Mountains Insurance Group | 2,179 | 1,854,939 | ||||||
| 201,876,080 | ||||||||
| INVESTMENT COMPANIES - 0.1% | ||||||||
RIT Capital Partners | 82,361 | 2,178,449 | ||||||
| THRIFTS & MORTGAGE FINANCE - 1.3% | ||||||||
Genworth MI Canada | 548,302 | 18,974,652 | ||||||
Southern Missouri Bancorp | 18,974 | 713,233 | ||||||
Timberland Bancorp | 58,173 | 1,544,493 | ||||||
TrustCo Bank Corp. NY | 975,937 | 8,978,620 | ||||||
| 30,210,998 | ||||||||
| Total (Cost $350,498,172) | 627,746,161 | |||||||
| HEALTH CARE – 3.5% | ||||||||
| HEALTH CARE EQUIPMENT & SUPPLIES - 2.9% | ||||||||
Analogic Corporation | 130,972 | 10,968,905 | ||||||
Atrion Corporation | 8,312 | 5,241,547 | ||||||
Hill-Rom Holdings | 270,359 | 22,788,560 | ||||||
Meridian Bioscience | 141,351 | 1,978,914 | ||||||
Teleflex | 119,313 | 29,687,461 | ||||||
| 70,665,387 | ||||||||
| HEALTH CARE PROVIDERS & SERVICES - 0.4% | ||||||||
Aceto Corporation | 43,150 | 445,739 | ||||||
Chemed Corporation | 18,667 | 4,536,454 | ||||||
Ensign Group (The) | 195,123 | 4,331,731 | ||||||
| 9,313,924 | ||||||||
| PHARMACEUTICALS - 0.2% | ||||||||
Recordati | 94,894 | 4,215,326 | ||||||
| Total (Cost $30,809,606) | 84,194,637 | |||||||
| INDUSTRIALS – 26.7% | ||||||||
| AEROSPACE & DEFENSE - 1.0% | ||||||||
HEICO Corporation | 243,102 | 22,936,674 | ||||||
| AIR FREIGHT & LOGISTICS - 0.9% | ||||||||
Expeditors International of Washington | 334,826 | 21,659,894 | ||||||
| BUILDING PRODUCTS - 1.1% | ||||||||
A. O. Smith Corporation | 308,249 | 18,889,499 | ||||||
Apogee Enterprises | 163,047 | 7,456,139 | ||||||
| 26,345,638 | ||||||||
| COMMERCIAL SERVICES & SUPPLIES - 4.8% | ||||||||
ABM Industries | 462,443 | 17,443,350 | ||||||
Deluxe Corporation | 30,874 | 2,372,358 | ||||||
Ennis | 163,629 | 3,395,302 | ||||||
Herman Miller | 253,122 | 10,137,536 | ||||||
HNI Corporation | 340,396 | 13,129,074 | ||||||
Kimball International Cl. B | 1,126,633 | 21,034,238 | ||||||
McGrath RentCorp | 276,446 | 12,987,433 | ||||||
MSA Safety | 147,813 | 11,458,464 | ||||||
Ritchie Bros. Auctioneers | 642,343 | 19,225,326 | ||||||
Tetra Tech | 20,496 | 986,882 | ||||||
UniFirst Corporation | 19,261 | 3,176,139 | ||||||
| 115,346,102 | ||||||||
| CONSTRUCTION & ENGINEERING - 1.0% | ||||||||
Comfort Systems USA | 221,178 | 9,654,420 | ||||||
EMCOR Group | 51,357 | 4,198,435 | ||||||
KBR | 379,667 | 7,528,796 | ||||||
Valmont Industries | 12,981 | 2,152,899 | ||||||
| 23,534,550 | ||||||||
| ELECTRICAL EQUIPMENT - 2.4% | ||||||||
EnerSys | 132,364 | 9,216,505 | ||||||
Hubbell Cl. B | 209,573 | 28,363,610 | ||||||
LSI Industries | 862,285 | 5,932,521 | ||||||
Preformed Line Products | 202,482 | 14,386,346 | ||||||
| 57,898,982 | ||||||||
| INDUSTRIAL CONGLOMERATES - 0.7% | ||||||||
Raven Industries | 482,462 | 16,572,570 | ||||||
| 74 | The Royce Funds 2017 Annual Report to Shareholders | THE ACCOMPANYING NOTES ARE AN INTEGRAL PART OF THESE FINANCIAL STATEMENTS |
| December 31, 2017 |
| Royce Total Return Fund (continued) | ||||||||
| SHARES | VALUE | |||||||
| INDUSTRIALS (continued) | ||||||||
| MACHINERY - 10.5% | ||||||||
Alamo Group | 28,740 | $ | 3,243,884 | |||||
American Railcar Industries | 202,421 | 8,428,810 | ||||||
Federal Signal | 168,256 | 3,380,263 | ||||||
Franklin Electric | 589,597 | 27,062,502 | ||||||
Gorman-Rupp Company (The) | 411,267 | 12,835,643 | ||||||
Greenbrier Companies (The) | 46,392 | 2,472,693 | ||||||
Hillenbrand | 24,064 | 1,075,661 | ||||||
Kadant | 22,650 | 2,274,060 | ||||||
Lincoln Electric Holdings | 141,715 | 12,978,260 | ||||||
Lindsay Corporation | 143,818 | 12,684,748 | ||||||
Miller Industries | 331,360 | 8,549,088 | ||||||
| 100,714 | 3,927,846 | |||||||
Mueller Industries | 334,321 | 11,844,993 | ||||||
Nordson Corporation | 144,328 | 21,129,619 | ||||||
Standex International | 40,308 | 4,105,370 | ||||||
Starrett (L.S.) Company (The) Cl. A 6 | 439,557 | 3,780,190 | ||||||
Sun Hydraulics | 146,090 | 9,450,562 | ||||||
Tennant Company | 441,245 | 32,056,449 | ||||||
Timken Company (The) | 24,664 | 1,212,236 | ||||||
Trinity Industries | 542,653 | 20,327,781 | ||||||
Wabash National | 764,018 | 16,579,191 | ||||||
Woodward | 422,928 | 32,370,909 | ||||||
| 251,770,758 | ||||||||
| MARINE - 1.1% | ||||||||
Clarkson | 676,971 | 26,138,300 | ||||||
| PROFESSIONAL SERVICES - 2.8% | ||||||||
Exponent | 56,714 | 4,032,365 | ||||||
Forrester Research | 36,977 | 1,634,383 | ||||||
Heidrick & Struggles International | 430,394 | 10,566,173 | ||||||
Insperity | 52,352 | 3,002,387 | ||||||
Korn/Ferry International | 124,452 | 5,149,824 | ||||||
ManpowerGroup | 310,757 | 39,189,565 | ||||||
Resources Connection | 5,012 | 77,435 | ||||||
Robert Half International | 82,549 | 4,584,772 | ||||||
| 68,236,904 | ||||||||
| ROAD & RAIL - 0.3% | ||||||||
Werner Enterprises | 175,598 | 6,786,863 | ||||||
| TRADING COMPANIES & DISTRIBUTORS - 0.1% | ||||||||
Applied Industrial Technologies | 43,150 | 2,938,515 | ||||||
| Total (Cost $268,275,001) | 640,165,750 | |||||||
| INFORMATION TECHNOLOGY – 6.4% | ||||||||
| COMMUNICATIONS EQUIPMENT - 0.2% | ||||||||
ADTRAN | 126,880 | 2,455,128 | ||||||
TESSCO Technologies | 39,149 | 788,852 | ||||||
| 3,243,980 | ||||||||
| ELECTRONIC EQUIPMENT, INSTRUMENTS & COMPONENTS - 3.5% | ||||||||
AVX Corporation | 810,714 | 14,025,352 | ||||||
Bel Fuse Cl. A | 19,293 | 421,166 | ||||||
Methode Electronics | 527,596 | 21,156,600 | ||||||
National Instruments | 239,271 | 9,960,852 | ||||||
PC Connection | 525,053 | 13,761,639 | ||||||
Systemax | 195,338 | 6,498,896 | ||||||
Vishay Intertechnology | 874,603 | 18,148,012 | ||||||
| 83,972,517 | ||||||||
| IT SERVICES - 0.4% | ||||||||
Convergys Corporation | 292,028 | 6,862,658 | ||||||
MAXIMUS | 47,442 | 3,395,898 | ||||||
| 10,258,556 | ||||||||
| SEMICONDUCTORS & SEMICONDUCTOR EQUIPMENT - 1.5% | ||||||||
MKS Instruments | 353,534 | 33,408,963 | ||||||
Xperi | 55,763 | 1,360,617 | ||||||
| 34,769,580 | ||||||||
| SOFTWARE - 0.4% | ||||||||
Ebix | 46,674 | 3,698,915 | ||||||
Fair Isaac | 42,072 | 6,445,430 | ||||||
| 10,144,345 | ||||||||
| TECHNOLOGY HARDWARE, STORAGE & PERIPHERALS - 0.4% | ||||||||
Diebold Nixdorf | 618,934 | 10,119,571 | ||||||
| Total (Cost $101,878,109) | 152,508,549 | |||||||
| MATERIALS – 13.6% | ||||||||
| CHEMICALS - 6.8% | ||||||||
Albemarle Corporation | 231,478 | 29,603,721 | ||||||
Balchem Corporation | 296,400 | 23,889,840 | ||||||
Cabot Corporation | 313,688 | 19,320,044 | ||||||
Chase Corporation | 236,055 | 28,444,627 | ||||||
FutureFuel Corporation | 201,809 | 2,843,489 | ||||||
Innospec | 28,121 | 1,985,343 | ||||||
Quaker Chemical | 309,883 | 46,727,258 | ||||||
Trinseo | 31,709 | 2,302,073 | ||||||
Umicore | 187,280 | 8,849,807 | ||||||
| 163,966,202 | ||||||||
| CONSTRUCTION MATERIALS - 0.7% | ||||||||
Ash Grove Cement 3 | 31,781 | 16,343,379 | ||||||
| CONTAINERS & PACKAGING - 1.8% | ||||||||
AptarGroup | 99,638 | 8,596,767 | ||||||
Greif Cl. A | 190,842 | 11,561,208 | ||||||
Mayr-Melnhof Karton | 51,743 | 7,605,235 | ||||||
Sonoco Products | 282,604 | 15,017,577 | ||||||
| 42,780,787 | ||||||||
| METALS & MINING - 3.4% | ||||||||
Agnico Eagle Mines | 56,937 | 2,629,351 | ||||||
Alamos Gold Cl. A | 207,066 | 1,349,141 | ||||||
| 209,883 | 5,066,576 | |||||||
Ampco-Pittsburgh | 129,724 | 1,608,578 | ||||||
Carpenter Technology | 120,067 | 6,122,216 | ||||||
Compass Minerals International | 211,744 | 15,298,504 | ||||||
Ferroglobe 1 | 491,662 | 7,964,924 | ||||||
| 569,803 | 0 | |||||||
Franco-Nevada Corporation | 69,207 | 5,533,100 | ||||||
Gold Fields ADR | 1,283,616 | 5,519,549 | ||||||
Haynes International | 256,215 | 8,211,691 | ||||||
Reliance Steel & Aluminum | 26,231 | 2,250,357 | ||||||
Royal Gold | 17,277 | 1,418,787 | ||||||
Schnitzer Steel Industries Cl. A | 108,959 | 3,650,126 | ||||||
Worthington Industries | 323,267 | 14,243,144 | ||||||
| 80,866,044 | ||||||||
| PAPER & FOREST PRODUCTS - 0.9% | ||||||||
Deltic Timber | 122,867 | 11,248,474 | ||||||
Domtar Corporation | 101,429 | 5,022,764 | ||||||
Neenah Paper | 33,839 | 3,067,505 | ||||||
Pope Resources L.P. | 12,575 | 876,478 | ||||||
| 86,300 | 953,615 | |||||||
Schweitzer-Mauduit International | 34,824 | 1,579,617 | ||||||
| 22,748,453 | ||||||||
| Total (Cost $136,231,214) | 326,704,865 | |||||||
| THE ACCOMPANYING NOTES ARE AN INTEGRAL PART OF THESE FINANCIAL STATEMENTS | THE Royce Funds 2017 Annual Report to Shareholders | 75 |
| December 31, 2017 |
| Schedules of Investments |
| Royce Total Return Fund (continued) | ||||||||
| SHARES | VALUE | |||||||
| REAL ESTATE – 0.1% | ||||||||
| EQUITY REAL ESTATE INVESTMENT TRUSTS (REITS) - 0.1% | ||||||||
Lexington Realty Trust | 316,111 | $ | 3,050,471 | |||||
| Total (Cost $1,826,355) | 3,050,471 | |||||||
| TELECOMMUNICATION SERVICES – 0.9% | ||||||||
| DIVERSIFIED TELECOMMUNICATION SERVICES - 0.4% | ||||||||
ATN International | 179,785 | 9,934,919 | ||||||
| WIRELESS TELECOMMUNICATION SERVICES - 0.5% | ||||||||
Telephone and Data Systems | 456,558 | 12,692,313 | ||||||
| Total (Cost $15,256,043) | 22,627,232 | |||||||
| UTILITIES – 2.5% | ||||||||
| ELECTRIC UTILITIES - 0.4% | ||||||||
ALLETE | 142,848 | 10,622,177 | ||||||
| GAS UTILITIES - 0.3% | ||||||||
Star Group L.P. | 650,020 | 6,987,715 | ||||||
| WATER UTILITIES - 1.8% | ||||||||
Aqua America | 434,281 | 17,036,844 | ||||||
SJW | 338,575 | 21,611,242 | ||||||
York Water | 143,801 | 4,874,854 | ||||||
| 43,522,940 | ||||||||
| Total (Cost $24,950,137) | 61,132,832 | |||||||
| MISCELLANEOUS2 – 2.3% | ||||||||
| Total (Cost $52,173,113) | 54,838,393 | |||||||
| TOTAL COMMON STOCKS | ||||||||
| (Cost $1,261,624,247) | 2,353,829,578 | |||||||
| PRINCIPAL | ||||||||
| AMOUNT | ||||||||
| CORPORATE BOND – 0.2% | ||||||||
Unit Corporation 6.625% | ||||||||
due 5/15/21 | ||||||||
| (Cost $3,829,096) | $ | 4,411,900 | 4,444,989 | |||||
| REPURCHASE AGREEMENT – 1.4% | ||||||||
| Fixed Income Clearing Corporation, 0.20% dated 12/29/17, due 1/2/18, maturity value $33,008,734 (collateralized by obligations of various U.S. Government Agencies, 0.875%- 1.625% due 4/30/19-5/15/19, valued at $33,669,006) | ||||||||
| (Cost $33,008,000) | $ | 33,008,000 | ||||||
| COLLATERAL RECEIVED FOR SECURITIES LOANED – 0.1% | ||||||||
| Money Market Funds | ||||||||
Federated Government Obligations Fund (7 day yield-1.1385%) | 1,599,553 | |||||||
| TOTAL COLLATERAL RECEIVED FOR SECURITIES LOANED | ||||||||
| (Cost $1,599,553) | 1,599,553 | |||||||
| TOTAL INVESTMENTS – 99.9% | ||||||||
| (Cost $1,300,060,896) | 2,392,882,120 | |||||||
| CASH AND OTHER ASSETS LESS LIABILITIES – 0.1% | 2,975,199 | |||||||
| NET ASSETS – 100.0% | $ | 2,395,857,319 | ||||||
| † | New additions in 2017. |
| 1 | Non-income producing. |
| 2 | Includes securities first acquired in 2017 and less than 1% of net assets. |
| 3 | These securities are defined as Level 2 securities due to fair value being based on quoted prices for similar securities. See Notes to Financial Statements. |
| 4 | Securities for which market quotations are not readily available represent 0.0%, 0.4%, 0.0% and 0.0% of net assets for Royce Low-Priced Stock Fund, Royce Micro-Cap Fund, Royce Small/Mid-Cap Premier Fund and Royce Total Return Fund. These securities have been valued at their fair value under procedures approved by the Fund’s Board of Trustees. These securities are defined as Level 3 securities due to the use of significant unobservable inputs in the determination of fair value. See Notes to Financial Statements. |
| 5 | All or a portion of these securities were on loan at December 31, 2017. |
| 6 | At December 31, 2017, the Fund owned 5% or more of the Company’s outstanding voting securities thereby making the Company an Affiliated Company as that term is defined in the Investment Company Act of 1940. See Notes to Financial Statements. |
| Securities of International Funds are categorized by the country of their headquarters, with the exception of exchange-traded funds. | |
| Bold indicates a Fund’s 20 largest equity holdings in terms of December 31, 2017, market value. |
| 76 | The Royce Funds 2017 Annual Report to Shareholders | THE ACCOMPANYING NOTES ARE AN INTEGRAL PART OF THESE FINANCIAL STATEMENTS |
| Statements of Assets and Liabilities | December 31, 2017 |
| Royce Global | ||||||||||||||||
| Royce Dividend | Financial Services | Royce International | Royce International | |||||||||||||
| Value Fund | Fund | Micro-Cap Fund | Premier Fund | |||||||||||||
| ASSETS: | ||||||||||||||||
| Investments at value | ||||||||||||||||
Non-Affiliated Companies | $ | 179,975,582 | $ | 55,342,665 | $ | 7,443,843 | $ | 155,772,528 | ||||||||
| Repurchase agreements (at cost and value) | 3,733,000 | 486,000 | 570,000 | 7,125,000 | ||||||||||||
| Cash and foreign currency | 417 | 94 | 13,029 | 184,440 | ||||||||||||
| Receivable for investments sold | 225,460 | – | – | 381,680 | ||||||||||||
| Receivable for capital shares sold | 117,154 | 102,687 | 280 | 909,167 | ||||||||||||
| Receivable for dividends and interest | 164,355 | 97,685 | 5,255 | 287,181 | ||||||||||||
| Prepaid expenses and other assets | 1,142 | 520 | 55 | 734 | ||||||||||||
| Total Assets | 184,217,110 | 56,029,651 | 8,032,462 | 164,660,730 | ||||||||||||
| LIABILITIES: | ||||||||||||||||
| Payable for investments purchased | 58,455 | – | 36,504 | 2,862,962 | ||||||||||||
| Payable for capital shares redeemed | 385,384 | 35,308 | 6,864 | 22,452 | ||||||||||||
| Payable for investment advisory fees | 119,926 | 37,983 | – | 123,310 | ||||||||||||
| Payable for trustees’ fees | 5,580 | 1,427 | 195 | 3,587 | ||||||||||||
| Accrued expenses | 151,286 | 75,351 | 35,176 | 207,188 | ||||||||||||
| Deferred capital gains tax | – | 74,668 | 1,004 | 413,561 | ||||||||||||
| Total Liabilities | 720,631 | 224,737 | 79,743 | 3,633,060 | ||||||||||||
| Net Assets | $ | 183,496,479 | $ | 55,804,914 | $ | 7,952,719 | $ | 161,027,670 | ||||||||
| ANALYSIS OF NET ASSETS: | ||||||||||||||||
| Paid-in capital | $ | 109,951,482 | $ | 41,734,382 | $ | 7,043,286 | $ | 202,559,021 | ||||||||
| Undistributed net investment income (loss) | 1 | (704,412 | ) | (38,429 | ) | (2,062,792 | ) | |||||||||
| Accumulated net realized gain (loss) on investments and foreign currency | 5,128,873 | 1,506,050 | 37,013 | (68,266,860 | ) | |||||||||||
Net unrealized appreciation (depreciation) on investments and foreign currency | 68,416,123 | 13,268,894 | 910,849 | 28,798,301 | ||||||||||||
| Net Assets | $ | 183,496,479 | $ | 55,804,914 | $ | 7,952,719 | $ | 161,027,670 | ||||||||
Investment Class | $ | 121,209,281 | $ | 103,031,653 | ||||||||||||
Service Class | 59,640,809 | $ | 47,196,819 | $ | 7,952,719 | 48,641,987 | ||||||||||
Consultant Class | 1,533,886 | 9,281,323 | ||||||||||||||
Institutional Class | 1,112,503 | 8,608,095 | ||||||||||||||
R Class | 72,707 | |||||||||||||||
| SHARES OUTSTANDING (unlimited number of $.001 par value): | ||||||||||||||||
Investment Class | 16,029,255 | 7,880,057 | ||||||||||||||
Service Class | 7,681,187 | 4,466,047 | 632,517 | 3,117,815 | ||||||||||||
Consultant Class | 172,857 | 546,339 | ||||||||||||||
Institutional Class | 149,080 | 633,905 | ||||||||||||||
R Class | 5,804 | |||||||||||||||
| NET ASSET VALUES (Net Assets ÷ Shares Outstanding): | ||||||||||||||||
Investment Class1 | $7.56 | $13.07 | ||||||||||||||
Service Class1 | 7.76 | $10.57 | $12.57 | 15.60 | ||||||||||||
Consultant Class2 | 8.87 | 16.99 | ||||||||||||||
Institutional Class3 | 7.46 | 13.58 | ||||||||||||||
R Class3 | 12.53 | |||||||||||||||
| Investments at identified cost | $ | 111,559,397 | $ | 41,998,043 | $ | 6,532,065 | $ | 126,549,291 | ||||||||
| 1 | Offering and redemption price per share; shares held less than 30 days may be subject to a 1% redemption fee, or a 2% redemption fee (Royce International Micro-Cap Fund and Royce International Premier Fund), payable to the Fund. |
| 2 | Offering and redemption price per share; shares held less than 365 days may be subject to a 1% contingent deferred sales charge, payable to Royce Fund Services, LLC. |
| 3 | Offering and redemption price per share. |
| THE ACCOMPANYING NOTES ARE AN INTEGRAL PART OF THESE FINANCIAL STATEMENTS | The Royce Funds 2017 Annual Report to Shareholders | 77 |
Statements of Assets and Liabilities
| Royce Low-Priced | Royce Micro-Cap | Royce Micro-Cap | Royce Opportunity | |||||||||||||
| Stock Fund | Fund | Opportunity Fund | Fund | |||||||||||||
| ASSETS: | ||||||||||||||||
Investments at value (including collateral on loaned securities)1 | ||||||||||||||||
Non-Affiliated Companies | $ | 270,312,863 | $ | 200,499,932 | $ | 43,946,347 | $ | 1,530,204,041 | ||||||||
Affiliated Companies | – | – | – | 16,810,881 | ||||||||||||
| Repurchase agreements (at cost and value) | 4,732,000 | 9,677,000 | 3,825,000 | 95,789,000 | ||||||||||||
| Cash and foreign currency | 11,889 | 498 | 523 | 1,151 | ||||||||||||
| Receivable for investments sold | 120,106 | 571,787 | 368,344 | 6,253,324 | ||||||||||||
| Receivable for capital shares sold | 32,563 | 202,531 | 62,981 | 1,369,595 | ||||||||||||
| Receivable for dividends and interest | 204,113 | 117,578 | 10,994 | 626,840 | ||||||||||||
| Prepaid expenses and other assets | – | 937 | 560 | 8,352 | ||||||||||||
| Total Assets | 275,413,534 | 211,070,263 | 48,214,749 | 1,651,063,184 | ||||||||||||
| LIABILITIES: | ||||||||||||||||
| Payable for collateral on loaned securities | 5,522,078 | 4,665,240 | – | 30,458,149 | ||||||||||||
| Payable for investments purchased | – | – | 805,363 | 5,679,037 | ||||||||||||
| Payable for capital shares redeemed | 322,715 | 760,339 | 211,036 | 4,079,034 | ||||||||||||
| Payable for investment advisory fees | 230,813 | 220,917 | 40,070 | 1,369,399 | ||||||||||||
| Payable for trustees’ fees | 6,868 | 6,164 | 1,326 | 41,042 | ||||||||||||
| Accrued expenses | 640,889 | 206,322 | 35,027 | 512,363 | ||||||||||||
| Total Liabilities | 6,723,363 | 5,858,982 | 1,092,822 | 42,139,024 | ||||||||||||
| Net Assets | $ | 268,690,171 | $ | 205,211,281 | $ | 47,121,927 | $ | 1,608,924,160 | ||||||||
| ANALYSIS OF NET ASSETS: | ||||||||||||||||
| Paid-in capital | $ | 200,100,194 | $ | 159,398,119 | $ | 34,304,119 | $ | 1,291,303,997 | ||||||||
| Undistributed net investment income (loss) | (836,737 | ) | (391,832 | ) | (170 | ) | (1,476,027 | ) | ||||||||
Accumulated net realized gain (loss) on investments and foreign currency | 4,126,629 | 2,000,301 | 2,319,705 | 9,981,929 | ||||||||||||
Net unrealized appreciation (depreciation) on investments and foreign currency | 65,300,085 | 44,204,693 | 10,498,273 | 309,114,261 | ||||||||||||
| Net Assets | $ | 268,690,171 | $ | 205,211,281 | $ | 47,121,927 | $ | 1,608,924,160 | ||||||||
Investment Class | $ | 52,912,145 | $ | 166,934,712 | $ | 45,991,812 | $ | 805,659,955 | ||||||||
Service Class | 209,368,923 | 13,880,032 | 1,130,115 | 96,663,087 | ||||||||||||
Consultant Class | 24,396,537 | 20,573,689 | ||||||||||||||
Institutional Class | 5,361,374 | 639,056,820 | ||||||||||||||
R Class | 1,047,729 | 39,311,460 | ||||||||||||||
K Class | 7,659,149 | |||||||||||||||
SHARES OUTSTANDING (unlimited number of $.001 par value): | ||||||||||||||||
Investment Class | 6,230,008 | 14,341,256 | 2,327,155 | 59,341,206 | ||||||||||||
Service Class | 24,756,190 | 1,216,975 | 113,751 | 7,637,141 | ||||||||||||
Consultant Class | 2,682,008 | 1,838,670 | ||||||||||||||
Institutional Class | 629,052 | 46,172,309 | ||||||||||||||
R Class | 131,121 | 3,209,469 | ||||||||||||||
K Class | 688,026 | |||||||||||||||
| NET ASSET VALUES (Net Assets ÷ Shares Outstanding): | ||||||||||||||||
Investment Class2 | $8.49 | $11.64 | $19.76 | $13.58 | ||||||||||||
Service Class2 | 8.46 | 11.41 | 9.93 | 12.66 | ||||||||||||
Consultant Class3 | 9.10 | 11.19 | ||||||||||||||
Institutional Class4 | 8.52 | 13.84 | ||||||||||||||
R Class4 | 7.99 | 12.25 | ||||||||||||||
K Class4 | 11.13 | |||||||||||||||
| Investments at identified cost | $ | 205,012,786 | $ | 156,295,279 | $ | 33,448,073 | $ | 1,237,900,661 | ||||||||
| Market value of loaned securities | 13,350,048 | 10,668,311 | – | 110,478,910 | ||||||||||||
| 1 | See Notes to Financial Statements for additional collateral on loaned securities. |
| 2 | Offering and redemption price per share; shares held less than 30 days may be subject to a 1% redemption fee, payable to the Fund. |
| 3 | Offering and redemption price per share; shares held less than 365 days may be subject to a 1% contingent deferred sales charge, payable to Royce Fund Services, LLC. |
| 4 | Offering and redemption price per share. |
| 78 | The Royce Funds 2017 Annual Report to Shareholders | THE ACCOMPANYING NOTES ARE AN INTEGRAL PART OF THESE FINANCIAL STATEMENTS |
| December 31, 2017 |
| Royce Pennsylvania | Royce Small-Cap | Royce Small-Cap | ||||||||||||||
| Mutual Fund | Royce Premier Fund | Leaders Fund | Value Fund | |||||||||||||
| ASSETS: | ||||||||||||||||
Investments at value (including collateral on loaned securities)1 | ||||||||||||||||
Non-Affiliated Companies | $ | 2,086,022,769 | $ | 2,112,814,982 | $ | 82,064,291 | $ | 234,414,158 | ||||||||
Affiliated Companies | 18,477,547 | – | – | – | ||||||||||||
| Repurchase agreements (at cost and value) | 18,657,000 | 249,484,000 | 2,934,000 | 18,037,000 | ||||||||||||
| Cash and foreign currency | 123,546 | 289,843 | 16,524 | 270 | ||||||||||||
| Receivable for investments sold | 2,755,500 | – | 472,457 | 879,357 | ||||||||||||
| Receivable for capital shares sold | 674,772 | 2,478,580 | 198,949 | 61,064 | ||||||||||||
| Receivable for dividends and interest | 1,596,847 | 2,388,602 | 37,061 | 281,683 | ||||||||||||
| Prepaid expenses and other assets | 2,628,858 | 11,649 | 294 | 1,662 | ||||||||||||
| Total Assets | 2,130,936,839 | 2,367,467,656 | 85,723,576 | 253,675,194 | ||||||||||||
| LIABILITIES: | ||||||||||||||||
| Payable for collateral on loaned securities | 11,440,093 | – | 573,962 | – | ||||||||||||
| Payable for investments purchased | 2,043,806 | 1,742,072 | 265,490 | 1,124,341 | ||||||||||||
| Payable for capital shares redeemed | 4,589,761 | 2,230,132 | 134,209 | 356,697 | ||||||||||||
| Payable for investment advisory fees | 1,388,842 | 2,002,878 | 73,025 | 216,344 | ||||||||||||
| Payable for trustees’ fees | 64,261 | 63,122 | 2,848 | 10,032 | ||||||||||||
| Accrued expenses | 1,103,928 | 1,616,996 | 116,496 | 289,394 | ||||||||||||
| Total Liabilities | 20,630,691 | 7,655,200 | 1,166,030 | 1,996,808 | ||||||||||||
| Net Assets | $ | 2,110,306,148 | $ | 2,359,812,456 | $ | 84,557,546 | $ | 251,678,386 | ||||||||
| ANALYSIS OF NET ASSETS: | ||||||||||||||||
| Paid-in capital | $ | 1,205,354,892 | $ | 1,078,540,818 | $ | 60,645,436 | $ | 203,479,891 | ||||||||
| Undistributed net investment income (loss) | (1,135,644 | ) | (2 | ) | (1,148 | ) | 72,017 | |||||||||
Accumulated net realized gain (loss) on investments and foreign currency | 57,724,199 | 107,693,725 | 3,332,648 | 5,067,131 | ||||||||||||
Net unrealized appreciation (depreciation) on investments and foreign currency | 848,362,701 | 1,173,577,915 | 20,580,610 | 43,059,347 | ||||||||||||
| Net Assets | $ | 2,110,306,148 | $ | 2,359,812,456 | $ | 84,557,546 | $ | 251,678,386 | ||||||||
Investment Class | $ | 1,622,523,247 | $ | 1,978,847,046 | $ | 43,875,166 | $ | 66,094,178 | ||||||||
Service Class | 54,937,472 | 54,557,294 | 38,863,462 | 152,231,534 | ||||||||||||
Consultant Class | 361,568,467 | 31,488,950 | 13,111,327 | |||||||||||||
Institutional Class | 53,367,383 | 250,119,472 | 3,658,172 | |||||||||||||
W Class | 31,958,751 | |||||||||||||||
R Class | 15,136,244 | 12,840,943 | 1,818,918 | 14,620,046 | ||||||||||||
K Class | 2,773,335 | 1,963,129 | ||||||||||||||
| SHARES OUTSTANDING (unlimited number of $.001 par value): | ||||||||||||||||
Investment Class | 154,189,700 | 119,188,226 | 6,576,520 | 6,504,132 | ||||||||||||
Service Class | 5,202,743 | 3,377,428 | 5,893,673 | 15,039,343 | ||||||||||||
Consultant Class | 42,740,724 | 2,384,601 | 1,447,254 | |||||||||||||
Institutional Class | 5,060,800 | 14,869,078 | 354,483 | |||||||||||||
W Class | 1,914,784 | |||||||||||||||
R Class | 1,522,521 | 834,323 | 199,183 | 1,499,042 | ||||||||||||
K Class | 320,127 | 280,365 | ||||||||||||||
| NET ASSET VALUES (Net Assets ÷ Shares Outstanding): | ||||||||||||||||
Investment Class2 | $10.52 | $16.60 | $6.67 | $10.16 | ||||||||||||
Service Class2 | 10.56 | 16.15 | 6.59 | 10.12 | ||||||||||||
Consultant Class3 | 8.46 | 13.21 | 9.06 | |||||||||||||
Institutional Class4 | 10.55 | 16.82 | 10.32 | |||||||||||||
W Class4 | 16.69 | |||||||||||||||
R Class4 | 9.94 | 15.39 | 9.13 | 9.75 | ||||||||||||
K Class4 | 8.66 | 7.00 | ||||||||||||||
| Investments at identified cost | $ | 1,256,140,562 | $ | 939,223,197 | $ | 61,483,738 | $ | 191,354,812 | ||||||||
| Market value of loaned securities | 50,769,264 | 13,008,758 | 1,447,486 | 5,571,411 | ||||||||||||
| 1 | See Notes to Financial Statements for additional collateral on loaned securities. |
| 2 | Offering and redemption price per share; shares held less than 30 days may be subject to a 1% redemption fee, payable to the Fund. |
| 3 | Offering and redemption price per share; shares held less than 365 days may be subject to a 1% contingent deferred sales charge, payable to Royce Fund Services, LLC. |
| 4 | Offering and redemption price per share. |
| THE ACCOMPANYING NOTES ARE AN INTEGRAL PART OF THESE FINANCIAL STATEMENTS | The Royce Funds 2017 Annual Report to Shareholders | 79 |
Statements of Assets and Liabilities
| Royce Smaller- | ||||||||||||
| Royce Small/Mid-Cap | Companies Growth | Royce Special Equity | ||||||||||
| Premier Fund | Fund | Fund | ||||||||||
| ASSETS: | ||||||||||||
| Investments at value (including collateral on loaned securities)1 | ||||||||||||
Non-Affiliated Companies | $ | 180,310,281 | $ | 364,113,742 | $ | 972,452,018 | ||||||
Affiliated Companies | – | – | 414,947,872 | |||||||||
| Repurchase agreements (at cost and value) | 28,045,000 | 22,667,000 | 157,801,000 | |||||||||
| Cash and foreign currency | 407 | 24,336 | 926 | |||||||||
| Receivable for investments sold | – | – | 229,386 | |||||||||
| Receivable for capital shares sold | 59,336 | 567,491 | 1,377,124 | |||||||||
| Receivable for dividends and interest | 164,160 | 110,574 | 1,233,013 | |||||||||
| Prepaid expenses and other assets | 1,211 | 1,576 | 8,578 | |||||||||
| Total Assets | 208,580,395 | 387,484,719 | 1,548,049,917 | |||||||||
| LIABILITIES: | ||||||||||||
| Payable for collateral on loaned securities | – | 17,341,344 | – | |||||||||
| Payable for investments purchased | 1,277,660 | 350,985 | 1,198,683 | |||||||||
| Payable for capital shares redeemed | 438,460 | 1,394,471 | 854,755 | |||||||||
| Payable for investment advisory fees | 149,217 | 316,292 | 1,318,559 | |||||||||
| Payable for trustees’ fees | 5,925 | 11,086 | 42,364 | |||||||||
| Accrued expenses | 104,444 | 290,319 | 752,519 | |||||||||
| Total Liabilities | 1,975,706 | 19,704,497 | 4,166,880 | |||||||||
| Net Assets | $ | 206,604,689 | $ | 367,780,222 | $ | 1,543,883,037 | ||||||
| ANALYSIS OF NET ASSETS: | ||||||||||||
| Paid-in capital | $ | 148,825,632 | $ | 239,732,896 | $ | 1,021,238,151 | ||||||
| Undistributed net investment income (loss) | 2,410 | (759,557 | ) | 9,620 | ||||||||
| Accumulated net realized gain (loss) on investments and foreign currency | 6,339,607 | 31,719,874 | 13,738,124 | |||||||||
| Net unrealized appreciation (depreciation) on investments and foreign currency | 51,437,040 | 97,087,009 | 508,897,142 | |||||||||
| Net Assets | $ | 206,604,689 | $ | 367,780,222 | $ | 1,543,883,037 | ||||||
Investment Class | $ | 81,549,185 | $ | 119,744,872 | $ | 1,142,224,311 | ||||||
Service Class | 112,519,968 | 228,008,504 | 108,001,468 | |||||||||
Consultant Class | 10,327,757 | 10,118,692 | 46,653,731 | |||||||||
Institutional Class | 9,315,425 | 247,003,527 | ||||||||||
R Class | 2,207,779 | 592,729 | ||||||||||
| SHARES OUTSTANDING (unlimited number of $.001 par value): | ||||||||||||
Investment Class | 5,208,353 | 10,952,062 | 52,408,398 | |||||||||
Service Class | 7,207,277 | 21,322,272 | 4,963,573 | |||||||||
Consultant Class | 933,939 | 1,090,387 | 2,349,437 | |||||||||
Institutional Class | 842,303 | 11,428,628 | ||||||||||
R Class | 217,557 | 59,583 | ||||||||||
| NET ASSET VALUES (Net Assets ÷ Shares Outstanding): | ||||||||||||
Investment Class2 | $15.66 | $10.93 | $21.79 | |||||||||
Service Class2 | 15.61 | 10.69 | 21.76 | |||||||||
Consultant Class3 | 11.06 | 9.28 | 19.86 | |||||||||
Institutional Class4 | 11.06 | 21.61 | ||||||||||
R Class4 | 10.15 | 9.95 | ||||||||||
| Investments at identified cost | $ | 128,872,218 | $ | 267,027,161 | $ | 878,502,748 | ||||||
| Market value of loaned securities | – | 46,552,572 | – | |||||||||
| 1 | See Notes to Financial Statements for additional collateral on loaned securities. |
| 2 | Offering and redemption price per share; shares held less than 30 days may be subject to a 1% redemption fee, payable to the Fund. |
| 3 | Offering and redemption price per share; shares held less than 365 days may be subject to a 1% contingent deferred sales charge, payable to Royce Fund Services, LLC. |
| 4 | Offering and redemption price per share. |
| 80 | The Royce Funds 2017 Annual Report to Shareholders | THE ACCOMPANYING NOTES ARE AN INTEGRAL PART OF THESE FINANCIAL STATEMENTS |
December 31, 2017
| Royce Special Equity | Royce Total Return | |||||||
| Multi-Cap Fund | Fund | |||||||
| ASSETS: | ||||||||
| Investments at value (including collateral on loaned securities)1 | ||||||||
Non-Affiliated Companies | $ | 100,051,673 | $ | 2,352,166,084 | ||||
Affiliated Companies | – | 7,708,036 | ||||||
| Repurchase agreements (at cost and value) | 8,073,000 | 33,008,000 | ||||||
| Cash and foreign currency | 523 | 106,522 | ||||||
| Receivable for investments sold | – | 5,917,374 | ||||||
| Receivable for capital shares sold | 1,664 | 2,662,214 | ||||||
| Receivable for dividends and interest | 182,410 | 3,391,005 | ||||||
| Prepaid expenses and other assets | 1,028 | 14,778 | ||||||
| Total Assets | 108,310,298 | 2,404,974,013 | ||||||
| LIABILITIES: | ||||||||
| Payable for collateral on loaned securities | – | 1,599,553 | ||||||
| Payable for investments purchased | – | 938,903 | ||||||
| Payable for capital shares redeemed | 20,000 | 3,149,675 | ||||||
| Payable for investment advisory fees | 74,974 | 2,041,415 | ||||||
| Payable for trustees’ fees | 3,049 | 73,756 | ||||||
| Accrued expenses | 52,848 | 1,313,392 | ||||||
| Total Liabilities | 150,871 | 9,116,694 | ||||||
| Net Assets | $ | 108,159,427 | $ | 2,395,857,319 | ||||
| ANALYSIS OF NET ASSETS: | ||||||||
| Paid-in capital | $ | 76,376,191 | $ | 1,276,140,381 | ||||
| Undistributed net investment income (loss) | 253 | 1,717,903 | ||||||
| Accumulated net realized gain (loss) on investments and foreign currency | 1,051,567 | 25,186,633 | ||||||
| Net unrealized appreciation (depreciation) on investments and foreign currency | 30,731,416 | 1,092,812,402 | ||||||
| Net Assets | $ | 108,159,427 | $ | 2,395,857,319 | ||||
Investment Class | $ | 41,080,875 | $ | 1,550,893,238 | ||||
Service Class | 24,182,165 | 97,854,205 | ||||||
Consultant Class | 4,189,956 | 247,914,202 | ||||||
Institutional Class | 38,706,431 | 310,602,542 | ||||||
W Class | 95,955,112 | |||||||
R Class | 54,979,135 | |||||||
K Class | 37,658,885 | |||||||
| SHARES OUTSTANDING (unlimited number of $.001 par value): | ||||||||
Investment Class | 2,628,413 | 114,188,006 | ||||||
Service Class | 1,541,159 | 7,047,802 | ||||||
Consultant Class | 411,021 | 17,768,208 | ||||||
Institutional Class | 2,478,468 | 23,179,754 | ||||||
W Class | 7,076,386 | |||||||
R Class | 3,929,558 | |||||||
K Class | 4,175,637 | |||||||
| NET ASSET VALUES (Net Assets ÷ Shares Outstanding): | ||||||||
Investment Class2 | $15.63 | $13.58 | ||||||
Service Class2 | 15.69 | 13.88 | ||||||
Consultant Class3 | 10.19 | 13.95 | ||||||
Institutional Class4 | 15.62 | 13.40 | ||||||
W Class4 | 13.56 | |||||||
R Class4 | 13.99 | |||||||
K Class4 | 9.02 | |||||||
| Investments at identified cost | $ | 69,320,257 | $ | 1,267,052,896 | ||||
| Market value of loaned securities | – | 5,345,893 | ||||||
| 1 | See Notes to Financial Statements for additional collateral on loaned securities. |
| 2 | Offering and redemption price per share; shares held less than 30 days may be subject to a 1% redemption fee, payable to the Fund. |
| 3 | Offering and redemption price per share; shares held less than 365 days may be subject to a 1% contingent deferred sales charge, payable to Royce Fund Services, LLC. |
| 4 | Offering and redemption price per share. |
| THE ACCOMPANYING NOTES ARE AN INTEGRAL PART OF THESE FINANCIAL STATEMENTS | The Royce Funds 2017 Annual Report to Shareholders | 81 |
Statements of Changes in Net Assets
| Royce Global Financial | Royce International | |||||||||||||||||||||||
| Royce Dividend Value Fund | Services Fund | Micro-Cap Fund | ||||||||||||||||||||||
| Year Ended 12/31/17 | Year Ended 12/31/16 | Year Ended 12/31/17 | Year Ended 12/31/16 | Year Ended 12/31/17 | Year Ended 12/31/16 | |||||||||||||||||||
| INVESTMENT OPERATIONS: | ||||||||||||||||||||||||
| Net investment income (loss) | $ | 2,280,180 | $ | 3,671,006 | $ | 471,327 | $ | 632,883 | $ | 53,380 | $ | 40,959 | ||||||||||||
Net realized gain (loss) on investments and foreign currency | 18,297,291 | 23,693,288 | 2,858,049 | (622,546 | ) | 552,576 | 84,177 | |||||||||||||||||
Net change in unrealized appreciation (depreciation) on investments and foreign currency | 18,224,489 | 8,045,266 | 7,231,886 | 5,831,058 | 1,128,495 | 243,967 | ||||||||||||||||||
Net increase (decrease) in net assets from investment operations | 38,801,960 | 35,409,560 | 10,561,262 | 5,841,395 | 1,734,451 | 369,103 | ||||||||||||||||||
| DISTRIBUTIONS: | ||||||||||||||||||||||||
| Net investment income | ||||||||||||||||||||||||
Investment Class | (1,688,912 | ) | (1,603,952 | ) | ||||||||||||||||||||
Service Class | (846,970 | ) | (1,483,597 | ) | (986,382 | ) | (227,361 | ) | (107,044 | ) | (94,073 | ) | ||||||||||||
Consultant Class | (4,237 | ) | (6,858 | ) | ||||||||||||||||||||
Institutional Class | (18,851 | ) | (12,914 | ) | (167,148 | ) | (48,466 | ) | ||||||||||||||||
Net realized gain on investments and foreign currency | ||||||||||||||||||||||||
Investment Class | (14,477,583 | ) | (9,347,539 | ) | ||||||||||||||||||||
Service Class | (7,304,418 | ) | (10,322,532 | ) | (662,198 | ) | (113,915 | ) | – | – | ||||||||||||||
Consultant Class | (181,382 | ) | (118,406 | ) | ||||||||||||||||||||
Institutional Class | (130,731 | ) | (73,032 | ) | (120,249 | ) | (13,575 | ) | ||||||||||||||||
Return of capital | ||||||||||||||||||||||||
Investment Class | – | – | ||||||||||||||||||||||
Service Class | – | – | – | – | – | (3,148 | ) | |||||||||||||||||
Consultant Class | – | – | ||||||||||||||||||||||
Institutional Class | – | – | – | – | ||||||||||||||||||||
| Total distributions | (24,653,084 | ) | (22,968,830 | ) | (1,935,977 | ) | (403,317 | ) | (107,044 | ) | (97,221 | ) | ||||||||||||
| CAPITAL SHARE TRANSACTIONS: | ||||||||||||||||||||||||
| Net capital share transactions | ||||||||||||||||||||||||
Investment Class | 16,740,068 | (21,449,693 | ) | |||||||||||||||||||||
Service Class | (64,897,762 | ) | (59,138,290 | ) | (3,795,110 | ) | (12,648,330 | ) | 265,620 | (314,555 | ) | |||||||||||||
Consultant Class | (143,060 | ) | (345,496 | ) | ||||||||||||||||||||
Institutional Class | 243,028 | 134,631 | 871,153 | 5,299,129 | ||||||||||||||||||||
| Shareholder redemption fees | ||||||||||||||||||||||||
Investment Class | 685 | 149 | ||||||||||||||||||||||
Service Class | 297 | 306 | 803 | 1,391 | – | 3 | ||||||||||||||||||
Net increase (decrease) in net assets from capital share transactions | (48,056,744 | ) | (80,798,393 | ) | (2,923,154 | ) | (7,347,810 | ) | 265,620 | (314,552 | ) | |||||||||||||
| Net Increase (Decrease) In Net Assets | (33,907,868 | ) | (68,357,663 | ) | 5,702,131 | (1,909,732 | ) | 1,893,027 | (42,670 | ) | ||||||||||||||
| NET ASSETS: | ||||||||||||||||||||||||
| Beginning of year | 217,404,347 | 285,762,010 | 50,102,783 | 52,012,515 | 6,059,692 | 6,102,362 | ||||||||||||||||||
| End of year | $ | 183,496,479 | $ | 217,404,347 | $ | 55,804,914 | $ | 50,102,783 | $ | 7,952,719 | $ | 6,059,692 | ||||||||||||
Undistributed Net Investment Income (Loss) at End of Year | $ | 1 | $ | 493,362 | $ | (704,412 | ) | $ | 24,145 | $ | (38,429 | ) | $ | (15,542 | ) | |||||||||
| 82 | The Royce Funds 2017 Annual Report to Shareholders | THE ACCOMPANYING NOTES ARE AN INTEGRAL PART OF THESE FINANCIAL STATEMENTS |
| Royce International Premier Fund | Royce Low-Priced Stock Fund | Royce Micro-Cap Fund | ||||||||||||||||||||||
| Year Ended 12/31/17 | Year Ended 12/31/16 | Year Ended 12/31/17 | Year Ended 12/31/16 | Year Ended 12/31/17 | Year Ended 12/31/16 | |||||||||||||||||||
| INVESTMENT OPERATIONS: Net investment income (loss) | $ | 237,349 | $ | 440,469 | $ | (291,010 | ) | $ | 563,098 | $ | (942,398 | ) | $ | (315,442 | ) | |||||||||
Net realized gain (loss) on investments and foreign currency | 3,680,377 | 2,017,787 | 15,097,585 | 24,229,523 | 10,296,764 | 24,722,058 | ||||||||||||||||||
Net change in unrealized appreciation (depreciation) on investments and foreign currency | 27,102,687 | 2,859,167 | 10,250,496 | 18,925,368 | 1,327,812 | 16,232,069 | ||||||||||||||||||
Net increase (decrease) in net assets from investment operations | 31,020,413 | 5,317,423 | 25,057,071 | 43,717,989 | 10,682,178 | 40,638,685 | ||||||||||||||||||
| DISTRIBUTIONS: | ||||||||||||||||||||||||
| Net investment income | ||||||||||||||||||||||||
Investment Class | (1,090,465 | ) | (578,473 | ) | (85,079 | ) | (153,381 | ) | (86,233 | ) | (860,802 | ) | ||||||||||||
Service Class | (339,271 | ) | (884,559 | ) | – | (1,280,579 | ) | – | (58,138 | ) | ||||||||||||||
Consultant Class | (16,145 | ) | (74,632 | ) | – | – | ||||||||||||||||||
Institutional Class | – | (77,571 | ) | |||||||||||||||||||||
R Class | (528 | ) | (1,365 | ) | – | (1,471 | ) | |||||||||||||||||
K Class | – | (643 | ) | – | (34,411 | ) | ||||||||||||||||||
Net realized gain on investments and foreign currency | ||||||||||||||||||||||||
Investment Class | – | (22,488 | ) | (3,133,238 | ) | (1,891,699 | ) | (12,264,977 | ) | (19,361,347 | ) | |||||||||||||
Service Class | – | (37,565 | ) | (13,190,619 | ) | (23,339,027 | ) | (1,040,573 | ) | (1,732,575 | ) | |||||||||||||
Consultant Class | – | (4,771 | ) | (1,796,683 | ) | (4,361,373 | ) | |||||||||||||||||
Institutional Class | (510,913 | ) | (1,002,506 | ) | ||||||||||||||||||||
R Class | – | (61 | ) | (63,719 | ) | (92,435 | ) | |||||||||||||||||
K Class | – | (27 | ) | – | (400,675 | ) | ||||||||||||||||||
| Return of capital | ||||||||||||||||||||||||
Investment Class | – | (2,096 | ) | – | – | – | – | |||||||||||||||||
Service Class | – | (3,224 | ) | – | – | – | – | |||||||||||||||||
Consultant Class | – | (282 | ) | – | – | |||||||||||||||||||
Institutional Class | – | – | ||||||||||||||||||||||
R Class | – | (5 | ) | – | – | |||||||||||||||||||
K Class | – | (2 | ) | – | – | |||||||||||||||||||
| Total distributions | (1,446,409 | ) | (1,610,193 | ) | (16,983,568 | ) | (28,273,755 | ) | (15,188,466 | ) | (26,374,235 | ) | ||||||||||||
| CAPITAL SHARE TRANSACTIONS: | ||||||||||||||||||||||||
| Net capital share transactions | ||||||||||||||||||||||||
Investment Class | 70,906,431 | (7,619,217 | ) | 30,348,947 | (7,100,958 | ) | (22,312,303 | ) | (38,591,832 | ) | ||||||||||||||
Service Class | (5,164,114 | ) | (6,346,690 | ) | (80,488,211 | ) | (50,040,199 | ) | (3,223,507 | ) | (4,084,325 | ) | ||||||||||||
Consultant Class | 2,132,432 | (1,615,137 | ) | (8,442,359 | ) | (8,726,715 | ) | |||||||||||||||||
Institutional Class | (7,324,047 | ) | (25,653,966 | ) | ||||||||||||||||||||
R Class | 1,636 | 11,570 | (11,249 | ) | (159,633 | ) | ||||||||||||||||||
K Class | (24,050 | ) | 672 | (1,100,085 | ) | (145,351 | ) | |||||||||||||||||
Value of shares issued in connection with the merger of Royce European Small-Cap Fund and Royce Global Value Fund | 62,822,434 | |||||||||||||||||||||||
| Shareholder redemption fees | ||||||||||||||||||||||||
Investment Class | 124 | 758 | 1 | – | 101 | 70 | ||||||||||||||||||
Service Class | 1,070 | 268 | 1,313 | 69 | 1 | – | ||||||||||||||||||
Net increase (decrease) in net assets from capital share transactions | 67,853,529 | 47,254,658 | (58,573,331 | ) | (83,100,038 | ) | (33,978,067 | ) | (51,402,802 | ) | ||||||||||||||
| Net Increase (Decrease) In Net Assets | 97,427,533 | 50,961,888 | (50,499,828 | ) | (67,655,804 | ) | (38,484,355 | ) | (37,138,352 | ) | ||||||||||||||
| NET ASSETS: | ||||||||||||||||||||||||
| Beginning of year | 63,600,137 | 12,638,249 | 319,189,999 | 386,845,803 | 243,695,636 | 280,833,988 | ||||||||||||||||||
| End of year | $ | 161,027,670 | $ | 63,600,137 | $ | 268,690,171 | $ | 319,189,999 | $ | 205,211,281 | $ | 243,695,636 | ||||||||||||
Undistributed Net Investment Income (Loss) at End of Year | $ | (2,062,792 | ) | $ | (919,994 | ) | $ | (836,737 | ) | $ | (517,803 | ) | $ | (391,832 | ) | $ | (888,336 | ) | ||||||
| THE ACCOMPANYING NOTES ARE AN INTEGRAL PART OF THESE FINANCIAL STATEMENTS | The Royce Funds 2017 Annual Report to Shareholders | 83 |
Statements of Changes in Net Assets
| Royce Micro-Cap Opportunity Fund | Royce Opportunity Fund | Royce Pennsylvania Mutual Fund | ||||||||||||||||||||||
| Year Ended 12/31/17 | Year Ended 12/31/16 | Year Ended 12/31/17 | Year Ended 12/31/16 | Year Ended 12/31/17 | Year Ended 12/31/16 | |||||||||||||||||||
| INVESTMENT OPERATIONS: | ||||||||||||||||||||||||
| Net investment income (loss) | $ | (367,349 | ) | $ | (220,205 | ) | $ | (4,431,770 | ) | $ | (2,560,355 | ) | $ | 6,440,543 | $ | 11,458,260 | ||||||||
Net realized gain (loss) on investments and foreign currency | 7,858,653 | (446,685 | ) | 216,170,387 | 81,399,272 | 488,742,487 | 382,217,946 | |||||||||||||||||
Net change in unrealized appreciation (depreciation) on investments and foreign currency | 3,535,862 | 9,869,805 | 90,098,545 | 286,652,783 | (154,036,247 | ) | 196,021,249 | |||||||||||||||||
Net increase (decrease) in net assets from investment operations | 11,027,166 | 9,202,915 | 301,837,162 | 365,491,700 | 341,146,783 | 589,697,455 | ||||||||||||||||||
| DISTRIBUTIONS: | ||||||||||||||||||||||||
| Net investment income | ||||||||||||||||||||||||
Investment Class | – | – | – | – | (7,987,534 | ) | (5,686,548 | ) | ||||||||||||||||
Service Class | – | – | – | – | – | (89,747 | ) | |||||||||||||||||
Consultant Class | – | – | – | – | ||||||||||||||||||||
Institutional Class | – | – | (388,357 | ) | (1,114,871 | ) | ||||||||||||||||||
R Class | – | – | – | – | ||||||||||||||||||||
K Class | – | – | – | – | ||||||||||||||||||||
Net realized gain on investments and foreign currency | ||||||||||||||||||||||||
Investment Class | (3,626,362 | ) | – | (108,241,208 | ) | (49,065,228 | ) | (285,042,653 | ) | (107,426,917 | ) | |||||||||||||
Service Class | (92,454 | ) | – | (12,864,359 | ) | (5,193,491 | ) | (10,218,444 | ) | (6,455,759 | ) | |||||||||||||
Consultant Class | (2,689,459 | ) | (1,647,105 | ) | (63,150,785 | ) | (31,772,229 | ) | ||||||||||||||||
Institutional Class | (83,520,830 | ) | (37,279,779 | ) | (12,499,024 | ) | (16,986,455 | ) | ||||||||||||||||
R Class | (5,143,569 | ) | (2,795,339 | ) | (2,671,936 | ) | (1,169,369 | ) | ||||||||||||||||
K Class | (1,024,733 | ) | (525,822 | ) | (494,633 | ) | (247,212 | ) | ||||||||||||||||
| Total distributions | (3,718,816 | ) | – | (213,484,158 | ) | (96,506,764 | ) | (382,453,366 | ) | (170,949,107 | ) | |||||||||||||
| CAPITAL SHARE TRANSACTIONS: | ||||||||||||||||||||||||
| Net capital share transactions | ||||||||||||||||||||||||
Investment Class | (6,319,564 | ) | 1,678,178 | 9,573,855 | (130,921,772 | ) | (542,378 | ) | (525,830,125 | ) | ||||||||||||||
Service Class | 3,024 | (400,240 | ) | 18,697,997 | (40,726,682 | ) | (45,893,771 | ) | (14,214,408 | ) | ||||||||||||||
Consultant Class | (1,650,429 | ) | (1,846,769 | ) | (29,481,038 | ) | (70,571,044 | ) | ||||||||||||||||
Institutional Class | 19,603,227 | (125,523,167 | ) | (210,408,701 | ) | (328,652,837 | ) | |||||||||||||||||
R Class | (1,661,406 | ) | (127,892 | ) | (1,566,030 | ) | (4,149,765 | ) | ||||||||||||||||
K Class | 613,559 | (4,132,187 | ) | (330,664 | ) | (1,338,061 | ) | |||||||||||||||||
| Shareholder redemption fees | ||||||||||||||||||||||||
Investment Class | 40 | 412 | 882 | 1,530 | 3,623 | 22,510 | ||||||||||||||||||
Service Class | 268 | 24 | 1,535 | 124 | 3,258 | 2,869 | ||||||||||||||||||
Net increase (decrease) in net assets from capital share transactions | (6,316,232 | ) | 1,278,374 | 45,179,220 | (303,276,815 | ) | (288,215,701 | ) | (944,730,861 | ) | ||||||||||||||
| Net Increase (Decrease) In Net Assets | 992,118 | 10,481,289 | 133,532,224 | (34,291,879 | ) | (329,522,284 | ) | (525,982,513 | ) | |||||||||||||||
| NET ASSETS: | ||||||||||||||||||||||||
| Beginning of year | 46,129,809 | 35,648,520 | 1,475,391,936 | 1,509,683,815 | 2,439,828,432 | 2,965,810,945 | ||||||||||||||||||
| End of year | $ | 47,121,927 | $ | 46,129,809 | $ | 1,608,924,160 | $ | 1,475,391,936 | $ | 2,110,306,148 | $ | 2,439,828,432 | ||||||||||||
Undistributed Net Investment Income (Loss) at End of Year | $ | (170 | ) | $ | – | $ | (1,476,027 | ) | $ | (443,702 | ) | $ | (1,135,644 | ) | $ | (1,728,050 | ) | |||||||
| 84 | The Royce Funds 2017 Annual Report to Shareholders | THE ACCOMPANYING NOTES ARE AN INTEGRAL PART OF THESE FINANCIAL STATEMENTS |
| Royce Premier Fund | Royce Small-Cap Leaders Fund | Royce Small-Cap Value Fund | ||||||||||||||||||||||
| Year Ended 12/31/17 | Year Ended 12/31/16 | Year Ended 12/31/17 | Year Ended 12/31/16 | Year Ended 12/31/17 | Year Ended 12/31/16 | |||||||||||||||||||
| INVESTMENT OPERATIONS: | ||||||||||||||||||||||||
| Net investment income (loss) | $ | (492,893 | ) | $ | 7,651,793 | $ | 416,289 | $ | 479,509 | $ | 847,504 | $ | 2,821,887 | |||||||||||
Net realized gain (loss) on investments and foreign currency | 459,154,057 | 268,086,942 | 13,922,956 | 6,469,616 | 25,191,109 | 10,075,800 | ||||||||||||||||||
Net change in unrealized appreciation (depreciation) on investments and foreign currency | 29,910,588 | 183,886,343 | (5,697,082 | ) | 15,358,937 | (24,332,356 | ) | 77,277,716 | ||||||||||||||||
Net increase (decrease) in net assets from investment operations | 488,571,752 | 459,625,078 | 8,642,163 | 22,308,062 | 1,706,257 | 90,175,403 | ||||||||||||||||||
| DISTRIBUTIONS: | ||||||||||||||||||||||||
| Net investment income | ||||||||||||||||||||||||
Investment Class | (1,809,066 | ) | (4,446,718 | ) | (283,985 | ) | (365,134 | ) | (381,978 | ) | (574,909 | ) | ||||||||||||
Service Class | – | – | (137,349 | ) | (263,257 | ) | (408,089 | ) | (1,164,815 | ) | ||||||||||||||
Consultant Class | – | – | – | – | ||||||||||||||||||||
Institutional Class | (410,543 | ) | (816,383 | ) | (7,395 | ) | (1,204,138 | ) | ||||||||||||||||
W Class | – | (358,070 | ) | |||||||||||||||||||||
R Class | – | – | – | (1,756 | ) | – | (50,816 | ) | ||||||||||||||||
K Class | (36,010 | ) | – | (1,370 | ) | (2,874 | ) | (4,294 | ) | |||||||||||||||
Net realized gain on investments and foreign currency | ||||||||||||||||||||||||
Investment Class | (267,764,787 | ) | (211,537,353 | ) | (6,411,507 | ) | (4,574,543 | ) | (2,247,083 | ) | (3,534,812 | ) | ||||||||||||
Service Class | (7,252,558 | ) | (5,326,941 | ) | (5,651,383 | ) | (4,826,822 | ) | (5,138,678 | ) | (10,330,776 | ) | ||||||||||||
Consultant Class | (4,144,802 | ) | (4,519,182 | ) | (444,590 | ) | (880,547 | ) | ||||||||||||||||
Institutional Class | (33,418,762 | ) | (28,846,485 | ) | (134,011 | ) | (6,259,269 | ) | ||||||||||||||||
W Class | (4,597,603 | ) | (18,160,148 | ) | ||||||||||||||||||||
R Class | (1,727,921 | ) | (1,735,767 | ) | (257,152 | ) | (130,446 | ) | (500,452 | ) | (902,982 | ) | ||||||||||||
K Class | (1,812,751 | ) | – | (34,032 | ) | (68,590 | ) | (206,890 | ) | |||||||||||||||
| Total distributions | (321,126,042 | ) | (277,595,808 | ) | (12,741,376 | ) | (10,197,360 | ) | (9,333,740 | ) | (25,114,248 | ) | ||||||||||||
| CAPITAL SHARE TRANSACTIONS: | ||||||||||||||||||||||||
| Net capital share transactions | ||||||||||||||||||||||||
Investment Class | 81,514,928 | (386,079,798 | ) | (1,951,684 | ) | (7,875,386 | ) | (6,999,180 | ) | (14,802,713 | ) | |||||||||||||
Service Class | 4,336,691 | (19,076,174 | ) | (9,943,272 | ) | (13,442,897 | ) | (61,247,469 | ) | (68,631,289 | ) | |||||||||||||
Consultant Class | (2,058,012 | ) | (3,272,047 | ) | (3,351,678 | ) | (4,054,963 | ) | ||||||||||||||||
Institutional Class | (15,282,802 | ) | (67,646,777 | ) | (115,759,482 | ) | (42,386,309 | ) | ||||||||||||||||
W Class | (133,231,371 | ) | (59,256,198 | ) | ||||||||||||||||||||
R Class | (2,049,376 | ) | (3,305,881 | ) | 34,966 | (27,116 | ) | (3,502,573 | ) | (3,390,856 | ) | |||||||||||||
K Class | (1,330,635 | ) | (507,282 | ) | 98,793 | (1,014,434 | ) | (3,533,475 | ) | |||||||||||||||
| Shareholder redemption fees | ||||||||||||||||||||||||
Investment Class | 1,501 | 7,363 | – | – | 2 | 1,133 | ||||||||||||||||||
Service Class | 210 | – | 9 | 72 | 215 | 559 | ||||||||||||||||||
Net increase (decrease) in net assets from capital share transactions | (66,768,231 | ) | (539,960,147 | ) | (12,367,263 | ) | (21,246,534 | ) | (191,874,599 | ) | (136,797,913 | ) | ||||||||||||
| Net Increase (Decrease) In Net Assets | 100,677,479 | (357,930,877 | ) | (16,466,476 | ) | (9,135,832 | ) | (199,502,082 | ) | (71,736,758 | ) | |||||||||||||
| NET ASSETS: | ||||||||||||||||||||||||
| Beginning of year | 2,259,134,977 | 2,617,065,854 | 101,024,022 | 110,159,854 | 451,180,468 | 522,917,226 | ||||||||||||||||||
| End of year | $ | 2,359,812,456 | $ | 2,259,134,977 | $ | 84,557,546 | $ | 101,024,022 | $ | 251,678,386 | $ | 451,180,468 | ||||||||||||
Undistributed Net Investment Income (Loss) at End of Year | $ | (2 | ) | $ | 214,996 | $ | (1,148 | ) | $ | (1,150 | ) | $ | 72,017 | $ | 118,424 | |||||||||
| THE ACCOMPANYING NOTES ARE AN INTEGRAL PART OF THESE FINANCIAL STATEMENTS | The Royce Funds 2017 Annual Report to Shareholders | 85 |
Statements of Changes in Net Assets
| Royce Smaller-Companies | ||||||||||||||||||||||||
| Royce Small/Mid-Cap Premier Fund | Growth Fund | Royce Special Equity Fund | ||||||||||||||||||||||
| Year Ended 12/31/17 | Year Ended 12/31/16 | Year Ended 12/31/17 | Year Ended 12/31/16 | Year Ended 12/31/17 | Year Ended 12/31/16 | |||||||||||||||||||
| INVESTMENT OPERATIONS: | ||||||||||||||||||||||||
| Net investment income (loss) | $ | 255,723 | $ | 80,363 | $ | (3,551,983 | ) | $ | (3,233,602 | ) | $ | 7,799,885 | $ | 14,034,085 | ||||||||||
Net realized gain (loss) on investments and foreign currency | 27,250,361 | 17,403,296 | 79,279,642 | 43,532,996 | 93,712,628 | 144,372,440 | ||||||||||||||||||
Net change in unrealized appreciation (depreciation) on investments and foreign currency | 12,933,995 | 20,044,069 | (9,991,302 | ) | (8,118,296 | ) | 12,284,811 | 258,157,824 | ||||||||||||||||
Net increase (decrease) in net assets from investment operations | 40,440,079 | 37,527,728 | 65,736,357 | 32,181,098 | 113,797,324 | 416,564,349 | ||||||||||||||||||
| DISTRIBUTIONS: | ||||||||||||||||||||||||
| Net investment income | ||||||||||||||||||||||||
Investment Class | (118,389 | ) | (349,595 | ) | – | – | (5,996,532 | ) | (10,976,670 | ) | ||||||||||||||
Service Class | – | (225,517 | ) | – | – | (342,321 | ) | (927,113 | ) | |||||||||||||||
Consultant Class | – | – | – | – | – | (98,531 | ) | |||||||||||||||||
Institutional Class | – | – | (1,491,423 | ) | (2,208,722 | ) | ||||||||||||||||||
R Class | – | – | – | – | ||||||||||||||||||||
K Class | – | (8,467 | ) | – | – | |||||||||||||||||||
Net realized gain on investments and foreign currency | ||||||||||||||||||||||||
Investment Class | (9,480,846 | ) | (2,986,270 | ) | (21,690,840 | ) | (10,605,399 | ) | (87,581,521 | ) | (77,675,819 | ) | ||||||||||||
Service Class | (13,095,068 | ) | (4,072,137 | ) | (40,468,096 | ) | (30,194,249 | ) | (8,430,728 | ) | (8,070,542 | ) | ||||||||||||
Consultant Class | (1,217,825 | ) | (538,174 | ) | (1,837,925 | ) | (1,333,802 | ) | (3,556,231 | ) | (3,479,624 | ) | ||||||||||||
Institutional Class | (1,658,704 | ) | (2,047,317 | ) | (18,778,224 | ) | (14,305,337 | ) | ||||||||||||||||
R Class | (253,421 | ) | (97,583 | ) | (121,248 | ) | (89,046 | ) | ||||||||||||||||
K Class | – | (203,617 | ) | – | (38,133 | ) | ||||||||||||||||||
| Total distributions | (24,165,549 | ) | (8,481,360 | ) | (65,776,813 | ) | (44,307,946 | ) | (126,176,980 | ) | (117,742,358 | ) | ||||||||||||
| CAPITAL SHARE TRANSACTIONS: | ||||||||||||||||||||||||
| Net capital share transactions | ||||||||||||||||||||||||
Investment Class | (11,893,481 | ) | (13,714,678 | ) | 25,645,877 | (38,505,792 | ) | (73,416,864 | ) | (99,953,704 | ) | |||||||||||||
Service Class | (17,897,723 | ) | (15,044,344 | ) | (60,569,518 | ) | (116,353,750 | ) | (18,993,676 | ) | (6,665,803 | ) | ||||||||||||
Consultant Class | (2,055,396 | ) | (901,650 | ) | (326,137 | ) | (3,295,302 | ) | (3,257,402 | ) | (281,055 | ) | ||||||||||||
Institutional Class | (12,235,750 | ) | (17,982,903 | ) | 41,944,286 | (43,764,912 | ) | |||||||||||||||||
R Class | 140,638 | (613,184 | ) | (199,205 | ) | (63,492 | ) | |||||||||||||||||
K Class | (4,272,121 | ) | (235,717 | ) | (210,263 | ) | (78,318 | ) | ||||||||||||||||
| Shareholder redemption fees | ||||||||||||||||||||||||
Investment Class | 56 | 2 | 2 | 30,251 | 4,736 | 22,992 | ||||||||||||||||||
Service Class | 31 | 8 | 1,059 | 268 | 874 | 1,222 | ||||||||||||||||||
Net increase (decrease) in net assets from capital share transactions | (35,977,996 | ) | (30,509,563 | ) | (47,893,935 | ) | (176,249,038 | ) | (53,718,046 | ) | (150,641,260 | ) | ||||||||||||
| Net Increase (Decrease) In Net Assets | (19,703,466 | ) | (1,463,195 | ) | (47,934,391 | ) | (188,375,886 | ) | (66,097,702 | ) | 148,180,731 | |||||||||||||
| NET ASSETS: | ||||||||||||||||||||||||
| Beginning of year | 226,308,155 | 227,771,350 | 415,714,613 | 604,090,499 | 1,609,980,739 | 1,461,800,008 | ||||||||||||||||||
| End of year | $ | 206,604,689 | $ | 226,308,155 | $ | 367,780,222 | $ | 415,714,613 | $ | 1,543,883,037 | $ | 1,609,980,739 | ||||||||||||
Undistributed Net Investment Income (Loss) at End of Year | $ | 2,410 | $ | (12,969 | ) | $ | (759,557 | ) | $ | 180,029 | $ | 9,620 | $ | 40,011 | ||||||||||
| 86 | The Royce Funds 2017 Annual Report to Shareholders | THE ACCOMPANYING NOTES ARE AN INTEGRAL PART OF THESE FINANCIAL STATEMENTS |
| Royce Special Equity | ||||||||||||||||
| Multi-Cap Fund | Royce Total Return Fund | |||||||||||||||
| Year Ended 12/31/17 | Year Ended 12/31/16 | Year Ended 12/31/17 | Year Ended 12/31/16 | |||||||||||||
| INVESTMENT OPERATIONS: | ||||||||||||||||
| Net investment income (loss) | $ | 971,383 | $ | 1,281,579 | $ | 23,921,732 | $ | 27,331,086 | ||||||||
| Net realized gain (loss) on investments and foreign currency | 3,720,016 | 4,070,033 | 408,831,782 | 283,268,348 | ||||||||||||
Net change in unrealized appreciation (depreciation) on investments and foreign currency | 11,167,655 | 9,868,313 | (108,501,062 | ) | 329,870,012 | |||||||||||
| Net increase (decrease) in net assets from investment operations | 15,859,054 | 15,219,925 | 324,252,452 | 640,469,446 | ||||||||||||
| DISTRIBUTIONS: | ||||||||||||||||
| Net investment income | ||||||||||||||||
Investment Class | (391,717 | ) | (444,817 | ) | (14,671,278 | ) | (28,673,118 | ) | ||||||||
Service Class | (152,606 | ) | (339,957 | ) | (628,984 | ) | (1,495,071 | ) | ||||||||
Consultant Class | (21,715 | ) | (44,532 | ) | – | (99,265 | ) | |||||||||
Institutional Class | (413,349 | ) | (461,530 | ) | (4,157,749 | ) | (7,497,123 | ) | ||||||||
W Class | (752,370 | ) | (1,459,406 | ) | ||||||||||||
R Class | (128,596 | ) | (302,414 | ) | ||||||||||||
K Class | (139,421 | ) | (564,903 | ) | ||||||||||||
| Net realized gain on investments and foreign currency | ||||||||||||||||
Investment Class | (778,005 | ) | – | (185,609,966 | ) | (138,580,935 | ) | |||||||||
Service Class | (455,851 | ) | – | (11,988,461 | ) | (10,479,295 | ) | |||||||||
Consultant Class | (81,754 | ) | – | (29,213,594 | ) | (19,570,898 | ) | |||||||||
Institutional Class | (752,887 | ) | – | (36,590,353 | ) | (31,762,325 | ) | |||||||||
W Class | (11,357,934 | ) | (6,018,247 | ) | ||||||||||||
R Class | (6,415,999 | ) | (3,941,629 | ) | ||||||||||||
K Class | (4,389,812 | ) | (4,383,947 | ) | ||||||||||||
| Total distributions | (3,047,884 | ) | (1,290,836 | ) | (306,044,517 | ) | (254,828,576 | ) | ||||||||
| CAPITAL SHARE TRANSACTIONS: | ||||||||||||||||
| Net capital share transactions | ||||||||||||||||
Investment Class | 1,984,319 | (13,753,944 | ) | (295,781,143 | ) | (250,310,152 | ) | |||||||||
Service Class | (16,693,774 | ) | (14,795,597 | ) | (45,762,084 | ) | (11,414,322 | ) | ||||||||
Consultant Class | (1,317,152 | ) | (2,264,766 | ) | (19,333,580 | ) | (32,394,591 | ) | ||||||||
Institutional Class | (3,303,018 | ) | (3,754,867 | ) | (116,618,839 | ) | (21,328,585 | ) | ||||||||
W Class | 16,885,446 | (53,411,042 | ) | |||||||||||||
R Class | 1,068,022 | (3,978,781 | ) | |||||||||||||
K Class | (3,354,130 | ) | (28,303,584 | ) | ||||||||||||
| Shareholder redemption fees | ||||||||||||||||
Investment Class | 195 | 30 | 1,178 | 3,889 | ||||||||||||
Service Class | 3 | 84 | 3,101 | 614 | ||||||||||||
| Net increase (decrease) in net assets from capital share transactions | (19,329,427 | ) | (34,569,060 | ) | (462,892,029 | ) | (401,136,554 | ) | ||||||||
| Net Increase (Decrease) In Net Assets | (6,518,257 | ) | (20,639,971 | ) | (444,684,094 | ) | (15,495,684 | ) | ||||||||
| NET ASSETS: | ||||||||||||||||
| Beginning of year | 114,677,684 | 135,317,655 | 2,840,541,413 | 2,856,037,097 | ||||||||||||
| End of year | $ | 108,159,427 | $ | 114,677,684 | $ | 2,395,857,319 | $ | 2,840,541,413 | ||||||||
| Undistributed Net Investment Income (Loss) at End of Year | $ | 253 | $ | 8,257 | $ | 1,717,903 | $ | (168,435 | ) | |||||||
| THE ACCOMPANYING NOTES ARE AN INTEGRAL PART OF THESE FINANCIAL STATEMENTS | The Royce Funds 2017 Annual Report to Shareholders | 87 |
Statements of Operations
| Royce Global | ||||||||||||||||
| Royce Dividend | Financial Services | Royce International | Royce International | |||||||||||||
| Value Fund | Fund | Micro-Cap Fund | Premier Fund | |||||||||||||
| INVESTMENT INCOME: | ||||||||||||||||
| INCOME: | ||||||||||||||||
| Dividends | $ | 4,779,591 | $ | 1,284,316 | $ | 184,895 | $ | 1,684,587 | ||||||||
| Foreign withholding tax | (157,144 | ) | (62,547 | ) | (14,479 | ) | (119,441 | ) | ||||||||
| Interest | 24,742 | 1,262 | 511 | 11,372 | ||||||||||||
| Securities lending | 130 | – | – | – | ||||||||||||
| Total income | 4,647,319 | 1,223,031 | 170,927 | 1,576,518 | ||||||||||||
| EXPENSES: | ||||||||||||||||
| Investment advisory fees | 1,699,426 | 526,879 | 89,594 | 972,160 | ||||||||||||
| Distribution fees | 249,458 | 113,190 | 17,919 | 182,299 | ||||||||||||
| Shareholder servicing | 260,629 | 76,447 | 14,205 | 142,892 | ||||||||||||
| Shareholder reports | 70,798 | 12,823 | (1,562 | ) | 22,856 | |||||||||||
| Administrative and office facilities | 58,304 | 14,036 | 1,813 | 20,756 | ||||||||||||
| Audit | 57,725 | 35,756 | 25,997 | 73,257 | ||||||||||||
| Registration | 57,232 | 41,211 | 19,307 | 52,678 | ||||||||||||
| Custody | 55,642 | 36,161 | 48,438 | 78,564 | ||||||||||||
| Trustees’ fees | 21,928 | 5,488 | 722 | 8,481 | ||||||||||||
| Legal | 5,559 | 1,300 | 167 | 1,934 | ||||||||||||
| Other expenses | 15,968 | 6,382 | 1,013 | 6,272 | ||||||||||||
| Total expenses | 2,552,669 | 869,673 | 217,613 | 1,562,149 | ||||||||||||
| Compensating balance credits | (3,022 | ) | (356 | ) | (78 | ) | (848 | ) | ||||||||
| Fees waived by investment adviser and distributor | (148,181 | ) | (83,236 | ) | (96,045 | ) | (56,967 | ) | ||||||||
| Expenses reimbursed by investment adviser | (34,327 | ) | (34,377 | ) | (3,943 | ) | (165,165 | ) | ||||||||
| Net expenses | 2,367,139 | 751,704 | 117,547 | 1,339,169 | ||||||||||||
| Net investment income (loss) | 2,280,180 | 471,327 | 53,380 | 237,349 | ||||||||||||
| REALIZED AND UNREALIZED GAIN (LOSS) ON INVESTMENTS AND FOREIGN CURRENCY: | ||||||||||||||||
| NET REALIZED GAIN (LOSS): | ||||||||||||||||
| Investments | 18,265,339 | 2,856,089 | 557,593 | 3,682,046 | ||||||||||||
| Foreign currency transactions | 31,952 | 1,960 | (5,017 | ) | (1,669 | ) | ||||||||||
| NET CHANGE IN UNREALIZED APPRECIATION (DEPRECIATION): | ||||||||||||||||
| Investments and foreign currency translations | 18,220,002 | 7,305,176 | 1,129,400 | 27,426,689 | ||||||||||||
| Other assets and liabilities denominated in foreign currency | 4,487 | (73,290 | ) | (905 | ) | (324,002 | ) | |||||||||
Net realized and unrealized gain (loss) on investments and foreign currency | 36,521,780 | 10,089,935 | 1,681,071 | 30,783,064 | ||||||||||||
NET INCREASE (DECREASE) IN NET ASSETS FROM INVESTMENT OPERATIONS | $ | 38,801,960 | $ | 10,561,262 | $ | 1,734,451 | $ | 31,020,413 | ||||||||
| 88 | The Royce Funds 2017 Annual Report to Shareholders | THE ACCOMPANYING NOTES ARE AN INTEGRAL PART OF THESE FINANCIAL STATEMENTS |
Year Ended December 31, 2017
| Royce Low-Priced | Royce Micro-Cap | Royce Micro-Cap | Royce Opportunity | |||||||||||||
| Stock Fund | Fund | Opportunity Fund | Fund | |||||||||||||
| INVESTMENT INCOME: | ||||||||||||||||
| INCOME: | ||||||||||||||||
| Dividends | $ | 3,502,846 | $ | 2,332,461 | $ | 237,370 | $ | 12,250,196 | ||||||||
| Foreign withholding tax | 14,471 | (48,527 | ) | – | – | |||||||||||
| Interest | 22,444 | 17,240 | 2,868 | 122,506 | ||||||||||||
| Securities lending | 359,026 | 370,507 | – | 1,231,038 | ||||||||||||
| Total income | 3,898,787 | 2,671,681 | 240,238 | 13,603,740 | ||||||||||||
| EXPENSES: | ||||||||||||||||
| Investment advisory fees | 2,868,000 | 2,766,708 | 487,886 | 15,181,518 | ||||||||||||
| Distribution fees | 631,074 | 323,661 | 2,610 | 629,738 | ||||||||||||
| Shareholder servicing | 424,026 | 253,197 | 51,657 | 1,094,625 | ||||||||||||
| Shareholder reports | 88,614 | 99,211 | 4,127 | 179,167 | ||||||||||||
| Administrative and office facilities | 82,601 | 63,186 | 12,852 | 404,972 | ||||||||||||
| Audit | 39,596 | 69,992 | 27,597 | 41,599 | ||||||||||||
| Registration | 49,137 | 42,585 | 30,102 | 104,822 | ||||||||||||
| Custody | 54,017 | 32,327 | 18,673 | 151,951 | ||||||||||||
| Trustees’ fees | 31,270 | 24,030 | 5,083 | 157,904 | ||||||||||||
| Legal | 8,022 | 6,114 | 1,173 | 51,906 | ||||||||||||
| Other expenses | 19,328 | 14,220 | 3,469 | 80,121 | ||||||||||||
| Total expenses | 4,295,685 | 3,695,231 | 645,229 | 18,078,323 | ||||||||||||
| Compensating balance credits | (3,277 | ) | (3,258 | ) | (179 | ) | (6,543 | ) | ||||||||
| Fees waived by distributor | (50,059 | ) | – | – | – | |||||||||||
| Expenses reimbursed by investment adviser | (52,552 | ) | (77,894 | ) | (37,463 | ) | (36,270 | ) | ||||||||
| Net expenses | 4,189,797 | 3,614,079 | 607,587 | 18,035,510 | ||||||||||||
| Net investment income (loss) | (291,010 | ) | (942,398 | ) | (367,349 | ) | (4,431,770 | ) | ||||||||
| REALIZED AND UNREALIZED GAIN (LOSS) ON INVESTMENTS AND FOREIGN CURRENCY: | ||||||||||||||||
| NET REALIZED GAIN (LOSS): | ||||||||||||||||
| Investments in Non-Affiliated Companies | 15,127,816 | 10,302,963 | 7,858,653 | 223,345,713 | ||||||||||||
| Investments in Affiliated Companies | – | – | – | (7,175,326 | ) | |||||||||||
| Foreign currency transactions | (30,231 | ) | (6,199 | ) | – | – | ||||||||||
| NET CHANGE IN UNREALIZED APPRECIATION (DEPRECIATION): | ||||||||||||||||
| Investments in Non-Affiliated Companies and foreign currency translations | 10,250,411 | 1,310,701 | 3,535,862 | 68,138,587 | ||||||||||||
| Investments in Affiliated Companies | – | – | – | 21,959,958 | ||||||||||||
| Other assets and liabilities denominated in foreign currency | 85 | 17,111 | – | – | ||||||||||||
Net realized and unrealized gain (loss) on investments and foreign currency | 25,348,081 | 11,624,576 | 11,394,515 | 306,268,932 | ||||||||||||
NET INCREASE (DECREASE) IN NET ASSETS FROM INVESTMENT OPERATIONS | $ | 25,057,071 | $ | 10,682,178 | $ | 11,027,166 | $ | 301,837,162 | ||||||||
| THE ACCOMPANYING NOTES ARE AN INTEGRAL PART OF THESE FINANCIAL STATEMENTS | The Royce Funds 2017 Annual Report to Shareholders | 89 |
Statements of Operations
| Royce | ||||||||||||||||
| Pennsylvania | Royce Premier | Royce Small-Cap | Royce Small-Cap | |||||||||||||
| Mutual Fund | Fund | Leaders Fund | Value Fund | |||||||||||||
| INVESTMENT INCOME: | ||||||||||||||||
| INCOME: | ||||||||||||||||
| Dividends | ||||||||||||||||
Non-Affiliated Companies | $ | 31,318,774 | $ | 26,717,401 | $ | 1,693,778 | $ | 5,777,568 | ||||||||
Affiliated Companies | 350,938 | 105,151 | – | – | ||||||||||||
| Foreign withholding tax | (619,141 | ) | (632,066 | ) | (42,516 | ) | (63,772 | ) | ||||||||
| Interest | 397,097 | 235,488 | 6,946 | 32,156 | ||||||||||||
| Securities lending | 294,663 | 223,813 | 24,604 | 11,396 | ||||||||||||
| Total income | 31,742,331 | 26,649,787 | 1,682,812 | 5,757,348 | ||||||||||||
| EXPENSES: | ||||||||||||||||
| Investment advisory fees | 17,541,182 | 22,886,548 | 920,285 | 3,483,606 | ||||||||||||
| Distribution fees | 4,052,416 | 510,265 | 123,373 | 663,985 | ||||||||||||
| Shareholder servicing | 1,840,007 | 1,835,010 | 117,120 | 407,148 | ||||||||||||
| Shareholder reports | 405,068 | 487,807 | 30,915 | 72,853 | ||||||||||||
| Administrative and office facilities | 657,437 | 616,122 | 26,474 | 113,116 | ||||||||||||
| Audit | 52,535 | 92,850 | 27,691 | 35,887 | ||||||||||||
| Registration | 89,190 | 87,940 | 40,214 | 72,089 | ||||||||||||
| Custody | 230,392 | 193,968 | 22,325 | 44,635 | ||||||||||||
| Trustees’ fees | 250,122 | 239,368 | 10,101 | 41,571 | ||||||||||||
| Legal | 62,856 | 99,761 | 2,478 | 10,839 | ||||||||||||
| Other expenses | 137,790 | 123,336 | 8,031 | 26,286 | ||||||||||||
| Total expenses | 25,318,995 | 27,172,975 | 1,329,007 | 4,972,015 | ||||||||||||
| Compensating balance credits | (17,207 | ) | (10,384 | ) | (902 | ) | (2,500 | ) | ||||||||
| Fees waived by distributor | – | – | (9,066 | ) | (17,531 | ) | ||||||||||
| Expenses reimbursed by investment adviser | – | (19,911 | ) | (52,516 | ) | (42,140 | ) | |||||||||
| Net expenses | 25,301,788 | 27,142,680 | 1,266,523 | 4,909,844 | ||||||||||||
| Net investment income (loss) | 6,440,543 | (492,893 | ) | 416,289 | 847,504 | |||||||||||
| REALIZED AND UNREALIZED GAIN (LOSS) ON INVESTMENTS AND FOREIGN CURRENCY: | ||||||||||||||||
| NET REALIZED GAIN (LOSS): | ||||||||||||||||
| Investments in Non-Affiliated Companies | 488,908,893 | 463,074,919 | 13,918,639 | 25,179,016 | ||||||||||||
| Investments in Affiliated Companies | (150,386 | ) | (3,993,433 | ) | – | – | ||||||||||
| Foreign currency transactions | (16,020 | ) | 72,571 | 4,317 | 12,093 | |||||||||||
| NET CHANGE IN UNREALIZED APPRECIATION (DEPRECIATION): | ||||||||||||||||
| Investments in Non-Affiliated Companies and foreign currency translations | (158,576,960 | ) | 41,756,650 | (5,697,059 | ) | (24,332,356 | ) | |||||||||
| Investments in Affiliated Companies | 4,534,027 | (12,056,539 | ) | – | – | |||||||||||
| Other assets and liabilities denominated in foreign currency | 6,686 | 210,477 | (23 | ) | – | |||||||||||
Net realized and unrealized gain (loss) on investments and foreign currency | 334,706,240 | 489,064,645 | 8,225,874 | 858,753 | ||||||||||||
NET INCREASE (DECREASE) IN NET ASSETS FROM INVESTMENT OPERATIONS | $ | 341,146,783 | $ | 488,571,752 | $ | 8,642,163 | $ | 1,706,257 | ||||||||
| 90 | The Royce Funds 2017 Annual Report to Shareholders | THE ACCOMPANYING NOTES ARE AN INTEGRAL PART OF THESE FINANCIAL STATEMENTS |
Year Ended December 31, 2017
| Royce | Royce Smaller- | |||||||||||
| Small/Mid-Cap | Companies Growth | Royce Special | ||||||||||
| Premier Fund | Fund | Equity Fund | ||||||||||
| INVESTMENT INCOME: | ||||||||||||
| INCOME: | ||||||||||||
| Dividends | ||||||||||||
Non-Affiliated Companies | $ | 2,734,197 | $ | 1,639,417 | $ | 15,161,744 | ||||||
Affiliated Companies | – | – | 11,111,681 | |||||||||
| Foreign withholding tax | (290 | ) | (22,239 | ) | – | |||||||
| Interest | 26,529 | 31,780 | 176,001 | |||||||||
| Securities lending | 3,026 | 375,523 | 0 | |||||||||
| Total income | 2,763,462 | 2,024,481 | 26,449,426 | |||||||||
| EXPENSES: | ||||||||||||
| Investment advisory fees | 1,829,246 | 3,953,467 | 15,480,297 | |||||||||
| Distribution fees | 426,383 | 783,915 | 754,892 | |||||||||
| Shareholder servicing | 141,043 | 487,136 | 1,300,817 | |||||||||
| Shareholder reports | 56,427 | 104,438 | 285,143 | |||||||||
| Administrative and office facilities | 61,527 | 112,576 | 427,207 | |||||||||
| Audit | 59,489 | 34,017 | 38,672 | |||||||||
| Registration | 52,536 | 62,407 | 72,971 | |||||||||
| Custody | 32,204 | 43,219 | 129,723 | |||||||||
| Trustees’ fees | 23,575 | 42,441 | 165,515 | |||||||||
| Legal | 5,750 | 10,766 | 39,494 | |||||||||
| Other expenses | 14,648 | 26,392 | 83,926 | |||||||||
| Total expenses | 2,702,828 | 5,660,774 | 18,778,657 | |||||||||
| Compensating balance credits | (3,113 | ) | (3,315 | ) | (9,112 | ) | ||||||
| Fees waived by distributor | (162,703 | ) | (53,787 | ) | – | |||||||
| Expenses reimbursed by investment adviser | (29,273 | ) | (27,208 | ) | (120,004 | ) | ||||||
| Net expenses | 2,507,739 | 5,576,464 | 18,649,541 | |||||||||
| Net investment income (loss) | 255,723 | (3,551,983 | ) | 7,799,885 | ||||||||
| REALIZED AND UNREALIZED GAIN (LOSS) ON INVESTMENTS AND FOREIGN CURRENCY: | ||||||||||||
| NET REALIZED GAIN (LOSS): | ||||||||||||
| Investments in Non-Affiliated Companies | 27,243,094 | 79,215,678 | 93,215,812 | |||||||||
| Investments in Affiliated Companies | – | – | 496,816 | |||||||||
| Foreign currency transactions | 7,267 | 63,964 | – | |||||||||
| NET CHANGE IN UNREALIZED APPRECIATION (DEPRECIATION): | ||||||||||||
| Investments in Non-Affiliated Companies and foreign currency translations | 12,931,077 | (9,991,753 | ) | 25,976,579 | ||||||||
| Investments in Affiliated Companies | – | – | (13,691,768 | ) | ||||||||
| Other assets and liabilities denominated in foreign currency | 2,918 | 451 | – | |||||||||
Net realized and unrealized gain (loss) on investments and foreign currency | 40,184,356 | 69,288,340 | 105,997,439 | |||||||||
NET INCREASE (DECREASE) IN NET ASSETS FROM INVESTMENT OPERATIONS | $ | 40,440,079 | $ | 65,736,357 | $ | 113,797,324 | ||||||
| THE ACCOMPANYING NOTES ARE AN INTEGRAL PART OF THESE FINANCIAL STATEMENTS | The Royce Funds 2017 Annual Report to Shareholders | 91 |
| Statements of Operations | Year Ended December 31, 2017 |
| Royce Special | ||||||||
| Equity Multi-Cap | Royce Total Return | |||||||
| Fund | Fund | |||||||
| INVESTMENT INCOME: | ||||||||
| INCOME: | ||||||||
| Dividends | ||||||||
Non-Affiliated Companies | $ | 2,127,453 | $ | 58,183,537 | ||||
Affiliated Companies | – | 576,453 | ||||||
| Foreign withholding tax | – | (922,085 | ) | |||||
| Interest | 11,669 | 504,111 | ||||||
| Securities lending | – | 93,919 | ||||||
| Total income | 2,139,122 | 58,435,935 | ||||||
| EXPENSES: | ||||||||
| Investment advisory fees | 935,478 | 26,282,169 | ||||||
| Distribution fees | 117,499 | 3,186,461 | ||||||
| Shareholder servicing | 89,990 | 2,712,574 | ||||||
| Shareholder reports | 8,188 | 527,108 | ||||||
| Administrative and office facilities | 30,723 | 768,149 | ||||||
| Audit | 27,421 | 89,841 | ||||||
| Registration | 53,838 | 103,910 | ||||||
| Custody | 17,085 | 274,639 | ||||||
| Trustees’ fees | 11,758 | 293,876 | ||||||
| Legal | 2,903 | 127,034 | ||||||
| Other expenses | 8,651 | 160,433 | ||||||
| Total expenses | 1,303,534 | 34,526,194 | ||||||
| Compensating balance credits | (419 | ) | (11,991 | ) | ||||
| Fees waived by investment adviser and distributor | (72,424 | ) | – | |||||
| Expenses reimbursed by investment adviser | (62,952 | ) | – | |||||
| Net expenses | 1,167,739 | 34,514,203 | ||||||
| Net investment income (loss) | 971,383 | 23,921,732 | ||||||
| REALIZED AND UNREALIZED GAIN (LOSS) ON INVESTMENTS AND FOREIGN CURRENCY: | ||||||||
| NET REALIZED GAIN (LOSS): | ||||||||
| Investments in Non-Affiliated Companies | 3,720,016 | 393,780,834 | ||||||
| Investments in Affiliated Companies | – | 15,014,045 | ||||||
| Foreign currency transactions | – | 36,903 | ||||||
| NET CHANGE IN UNREALIZED APPRECIATION (DEPRECIATION): | ||||||||
| Investments in Non-Affiliated Companies and foreign currency translations | 11,167,655 | (103,528,446 | ) | |||||
| Investments in Affiliated Companies | – | (4,995,588 | ) | |||||
| Other assets and liabilities denominated in foreign currency | – | 22,972 | ||||||
| Net realized and unrealized gain (loss) on investments and foreign currency | 14,887,671 | 300,330,720 | ||||||
| NET INCREASE (DECREASE) IN NET ASSETS FROM INVESTMENT OPERATIONS | $ | 15,859,054 | $ | 324,252,452 | ||||
| 92 | The Royce Funds 2017 Annual Report to Shareholders | THE ACCOMPANYING NOTES ARE AN INTEGRAL PART OF THESE FINANCIAL STATEMENTS |
Financial Highlights
This table is presented to show selected data for a share outstanding throughout each year or other indicated period and to assist shareholders in evaluating a Fund’s performance for the periods presented. Per share amounts have been determined on the basis of the weighted average number of shares outstanding during the period.
| Ratio of Expenses to Average Net Assets | |||||||||||||||||||||||||||||||||||||||||||||||||||||||||||||||
| Net Asset Value, Beginning of Period | Net Investment Income (Loss) | Net Realized and Unrealized Gain (Loss) on Investments and Foreign Currency | Total from Investment Operations | Distributions from Net Investment Income | Distributions from Net Realized Gain on Investments and Foreign Currency | Total Distributions | Shareholder Redemption Fees | Net Asset Value, End of Period | Total Return | Net Assets, End of Period (in thousands) | Prior to Fee Waivers, Expense Reimbursements and Balance Credits | Prior to Fee Waivers and Expense Reimbursements | Net of Fee Waivers and Expense Reimbursements | Ratio of Net Investment Income (Loss) to Average Net Assets | Portfolio Turnover Rate | ||||||||||||||||||||||||||||||||||||||||||||||||
| Royce Dividend Value Fund–Investment Class | |||||||||||||||||||||||||||||||||||||||||||||||||||||||||||||||
| 2017 | $ | 7.18 | $ | 0.10 | $ | 1.43 | $ | 1.53 | $ | (0.13 | ) | $ | (1.02 | ) | $ | (1.15 | ) | $ | – | $ | 7.56 | 21.91 | % | $ | 121,209 | 1.13 | % | 1.13 | % | 1.06 | % | 1.24 | % | 16 | % | ||||||||||||||||||||||||||||
| 2016 | 6.84 | 0.12 | 1.02 | 1.14 | (0.11 | ) | (0.69 | ) | (0.80 | ) | – | 7.18 | 16.75 | 99,462 | 1.16 | 1.16 | 1.11 | 1.64 | 21 | ||||||||||||||||||||||||||||||||||||||||||||
| 2015 | 8.12 | 0.12 | (0.57 | ) | (0.45 | ) | (0.13 | ) | (0.70 | ) | (0.83 | ) | – | 6.84 | (5.54 | ) | 116,053 | 1.24 | 1.24 | 1.22 | 1.49 | 14 | |||||||||||||||||||||||||||||||||||||||||
| 2014 | 8.90 | 0.11 | (0.29 | ) | (0.18 | ) | (0.10 | ) | (0.50 | ) | (0.60 | ) | – | 8.12 | (1.90 | ) | 176,002 | 1.21 | 1.21 | 1.19 | 1.25 | 22 | |||||||||||||||||||||||||||||||||||||||||
| 2013 | 7.29 | 0.09 | 2.15 | 2.24 | (0.10 | ) | (0.53 | ) | (0.63 | ) | – | 8.90 | 31.23 | 211,589 | 1.21 | 1.21 | 1.21 | 1.13 | 36 | ||||||||||||||||||||||||||||||||||||||||||||
| Royce Dividend Value Fund–Service Class | |||||||||||||||||||||||||||||||||||||||||||||||||||||||||||||||
| 2017 | $ | 7.33 | $ | 0.08 | $ | 1.46 | $ | 1.54 | $ | (0.07 | ) | $ | (1.04 | ) | $ | (1.11 | ) | $ | – | $ | 7.76 | 21.66 | % | $ | 59,641 | 1.40 | % | 1.39 | % | 1.31 | % | 1.04 | % | 16 | % | ||||||||||||||||||||||||||||
| 2016 | 6.96 | 0.10 | 1.04 | 1.14 | (0.08 | ) | (0.69 | ) | (0.77 | ) | – | 7.33 | 16.36 | 115,547 | 1.43 | 1.43 | 1.37 | 1.39 | 21 | ||||||||||||||||||||||||||||||||||||||||||||
| 2015 | 8.22 | 0.10 | (0.57 | ) | (0.47 | ) | (0.09 | ) | (0.70 | ) | (0.79 | ) | – | 6.96 | (5.72 | ) | 167,165 | 1.49 | 1.49 | 1.47 | 1.25 | 14 | |||||||||||||||||||||||||||||||||||||||||
| 2014 | 8.98 | 0.09 | (0.29 | ) | (0.20 | ) | (0.06 | ) | (0.50 | ) | (0.56 | ) | – | 8.22 | (2.14 | ) | 295,560 | 1.47 | 1.47 | 1.44 | 0.98 | 22 | |||||||||||||||||||||||||||||||||||||||||
| 2013 | 7.35 | 0.07 | 2.16 | 2.23 | (0.07 | ) | (0.53 | ) | (0.60 | ) | – | 8.98 | 30.74 | 407,599 | 1.48 | 1.48 | 1.46 | 0.87 | 36 | ||||||||||||||||||||||||||||||||||||||||||||
| Royce Dividend Value Fund–Consultant Class a | |||||||||||||||||||||||||||||||||||||||||||||||||||||||||||||||
| 2017 | $ | 8.39 | $ | 0.02 | $ | 1.68 | $ | 1.70 | $ | (0.03 | ) | $ | (1.19 | ) | $ | (1.22 | ) | $ | – | $ | 8.87 | 20.71 | % | $ | 1,534 | 3.26 | % | 3.26 | % | 2.09 | % | 0.23 | % | 16 | % | ||||||||||||||||||||||||||||
| 2016 | 7.90 | 0.05 | 1.17 | 1.22 | (0.04 | ) | (0.69 | ) | (0.73 | ) | – | 8.39 | 15.44 | 1,572 | 3.26 | 3.26 | 2.14 | 0.58 | 21 | ||||||||||||||||||||||||||||||||||||||||||||
| 2015 | 9.22 | 0.04 | (0.63 | ) | (0.59 | ) | (0.03 | ) | (0.70 | ) | (0.73 | ) | – | 7.90 | (6.39 | ) | 1,886 | 3.78 | 3.78 | 2.24 | 0.46 | 14 | |||||||||||||||||||||||||||||||||||||||||
| 2014 | 10.00 | 0.01 | (0.27 | ) | (0.26 | ) | (0.02 | ) | (0.50 | ) | (0.52 | ) | – | 9.22 | (2.43 | )1 | 912 | 9.25 | 2 | 9.25 | 2 | 2.24 | 2 | 0.45 | 2 | 22 | |||||||||||||||||||||||||||||||||||||
| Royce Dividend Value Fund–Institutional Class | |||||||||||||||||||||||||||||||||||||||||||||||||||||||||||||||
| 2017 | $ | 7.09 | $ | 0.11 | $ | 1.42 | $ | 1.53 | $ | (0.15 | ) | $ | (1.01 | ) | $ | (1.16 | ) | $ | – | $ | 7.46 | 22.21 | % | $ | 1,112 | 2.79 | % | 2.79 | % | 0.89 | % | 1.43 | % | 16 | % | ||||||||||||||||||||||||||||
| 2016 | 6.78 | 0.13 | 1.00 | 1.13 | (0.13 | ) | (0.69 | ) | (0.82 | ) | – | 7.09 | 16.70 | 823 | 3.30 | 3.30 | 0.93 | 1.81 | 21 | ||||||||||||||||||||||||||||||||||||||||||||
| 2015 | 8.09 | 0.17 | (0.62 | ) | (0.45 | ) | (0.16 | ) | (0.70 | ) | (0.86 | ) | – | 6.78 | (5.61 | ) | 658 | 1.11 | 1.11 | 1.04 | 1.60 | 14 | |||||||||||||||||||||||||||||||||||||||||
| 2014 | 8.88 | 0.12 | (0.29 | ) | (0.17 | ) | (0.12 | ) | (0.50 | ) | (0.62 | ) | – | 8.09 | (1.76 | ) | 40,942 | 1.10 | 1.10 | 1.04 | 1.42 | 22 | |||||||||||||||||||||||||||||||||||||||||
| 2013 | 7.28 | 0.11 | 2.14 | 2.25 | (0.12 | ) | (0.53 | ) | (0.65 | ) | – | 8.88 | 31.46 | 31,236 | 1.11 | 1.11 | 1.04 | 1.29 | 36 | ||||||||||||||||||||||||||||||||||||||||||||
| Royce Global Financial Services Fund–Service Class | |||||||||||||||||||||||||||||||||||||||||||||||||||||||||||||||
| 2017 | $ | 8.95 | $ | 0.10 | $ | 1.90 | $ | 2.00 | $ | (0.23 | ) | $ | (0.15 | ) | $ | (0.38 | ) | $ | – | $ | 10.57 | 22.46 | % | $ | 47,197 | 1.68 | % | 1.68 | % | 1.49 | % | 0.83 | % | 19 | % | ||||||||||||||||||||||||||||
| 2016 | 7.99 | 0.11 | 0.92 | 1.03 | (0.05 | ) | (0.02 | ) | (0.07 | ) | – | 8.95 | 12.93 | 43,629 | 1.67 | 1.67 | 1.49 | 1.25 | 37 | ||||||||||||||||||||||||||||||||||||||||||||
| 2015 | 9.28 | 0.11 | (0.55 | ) | (0.44 | ) | (0.11 | ) | (0.74 | ) | (0.85 | ) | – | 7.99 | (4.71 | ) | 52,013 | 1.65 | 1.65 | 1.49 | 1.19 | 46 | |||||||||||||||||||||||||||||||||||||||||
| 2014 | 9.68 | 0.09 | 0.22 | 0.31 | (0.06 | ) | (0.65 | ) | (0.71 | ) | – | 9.28 | 3.45 | 53,707 | 1.68 | 1.68 | 1.49 | 0.91 | 41 | ||||||||||||||||||||||||||||||||||||||||||||
| 2013 | 6.83 | 0.04 | 2.82 | 2.86 | (0.02 | ) | – | (0.02 | ) | 0.01 | 9.68 | 42.00 | 47,593 | 1.89 | 1.89 | 1.49 | 0.59 | 23 | |||||||||||||||||||||||||||||||||||||||||||||
| Royce Global Financial Services Fund–Institutional Class b | |||||||||||||||||||||||||||||||||||||||||||||||||||||||||||||||
| 2017 | $ | 11.43 | $ | 0.15 | $ | 2.47 | $ | 2.62 | $ | (0.27 | ) | $ | (0.20 | ) | $ | (0.47 | ) | $ | – | $ | 13.58 | 23.01 | % | $ | 8,608 | 1.44 | % | 1.44 | % | 1.04 | % | 1.29 | % | 19 | % | ||||||||||||||||||||||||||||
| 2016 | 10.00 | 0.18 | 1.36 | 1.54 | (0.09 | ) | (0.02 | ) | (0.11 | ) | – | 11.43 | 15.41 | 1 | 6,474 | 1.85 | 2 | 1.85 | 2 | 1.04 | 2 | 1.82 | 2 | 37 | |||||||||||||||||||||||||||||||||||||||
| THE ACCOMPANYING NOTES ARE AN INTEGRAL PART OF THESE FINANCIAL STATEMENTS | The Royce Funds 2017 Annual Report to Shareholders | 93 |
Financial Highlights
This table is presented to show selected data for a share outstanding throughout each year or other indicated period and to assist shareholders in evaluating a Fund’s performance for the periods presented. Per share amounts have been determined on the basis of the weighted average number of shares outstanding during the period.
| Ratio of Expenses to Average Net Assets | |||||||||||||||||||||||||||||||||||||||||||||||||||||||||||||||
| Net Asset Value, Beginning of Period | Net Investment Income (Loss) | Net Realized and Unrealized Gain (Loss) on Investments and Foreign Currency | Total from Investment Operations | Distributions from Net Investment Income | Distributions from Net Realized Gain on Investments and Foreign Currency | Total Distributions | Shareholder Redemption Fees | Net Asset Value, End of Period | Total Return | Net Assets, End of Period (in thousands) | Prior to Fee Waivers, Expense Reimbursements and Balance Credits | Prior to Fee Waivers and Expense Reimbursements | Net of Fee Waivers and Expense Reimbursements | Ratio of Net Investment Income (Loss) to Average Net Assets | Portfolio Turnover Rate | ||||||||||||||||||||||||||||||||||||||||||||||||
| Royce International Micro-Cap Fund–Service Class | |||||||||||||||||||||||||||||||||||||||||||||||||||||||||||||||
| 2017 | $ | 9.98 | $ | 0.09 | $ | 2.67 | $ | 2.76 | $ | (0.17 | ) | $ | – | $ | (0.17 | ) | $ | – | $ | 12.57 | 27.72 | % | $ | 7,953 | 3.04 | % | 3.04 | % | 1.64 | % | 0.74 | % | 90 | % | |||||||||||||||||||||||||||||
| 2016 | 9.54 | 0.07 | 0.53 | 0.60 | (0.16 | ) | – | (0.16 | ) | – | 9.98 | 6.33 | 6,060 | 3.35 | 3.35 | 1.64 | 0.68 | 113 | |||||||||||||||||||||||||||||||||||||||||||||
| 2015 | 9.66 | 0.04 | (0.14 | ) | (0.10 | ) | (0.02 | ) | – | (0.02 | ) | – | 9.54 | (0.99 | ) | 6,102 | 3.14 | 3.14 | 1.67 | 0.44 | 94 | ||||||||||||||||||||||||||||||||||||||||||
| 2014 | 10.04 | 0.06 | (0.30 | ) | (0.24 | ) | (0.14 | ) | – | (0.14 | ) | – | 9.66 | (2.37 | ) | 6,410 | 3.51 | 3.51 | 1.69 | 0.82 | 91 | ||||||||||||||||||||||||||||||||||||||||||
| 2013 | 8.61 | 0.11 | 1.51 | 1.62 | (0.20 | ) | – | (0.20 | ) | 0.01 | 10.04 | 18.95 | 5,209 | 3.86 | 3.86 | 1.69 | 1.22 | 103 | |||||||||||||||||||||||||||||||||||||||||||||
| Royce International Premier Fund–Investment Class c | |||||||||||||||||||||||||||||||||||||||||||||||||||||||||||||||
| 2017 | $ | 9.44 | $ | (0.10 | ) | $ | 3.88 | $ | 3.78 | $ | (0.15 | ) | $ | – | $ | (0.15 | ) | $ | – | $ | 13.07 | 40.08 | % | $ | 103,032 | 1.37 | % | 1.37 | % | 1.19 | % | 0.32 | % | 41 | % | ||||||||||||||||||||||||||||
| 2016 | 9.82 | 0.10 | (0.19 | ) | (0.09 | ) | (0.28 | ) | (0.01 | ) | (0.29 | ) | – | 9.44 | (0.79 | ) | 19,556 | 1.59 | 1.59 | 1.19 | 0.96 | 67 | |||||||||||||||||||||||||||||||||||||||||
| 2015 | 8.71 | 0.16 | 1.27 | 1.43 | (0.32 | ) | – | (0.32 | ) | – | 9.82 | 16.42 | 3,623 | 2.80 | 2.80 | 1.38 | 1.72 | 67 | |||||||||||||||||||||||||||||||||||||||||||||
| 2014 | 10.00 | 0.03 | (0.85 | ) | (0.82 | ) | (0.16 | ) | (0.31 | ) | (0.47 | ) | – | 8.71 | (8.16 | )1 | 3,481 | 3.17 | 2 | 3.17 | 2 | 1.44 | 2 | 1.00 | 2 | 62 | |||||||||||||||||||||||||||||||||||||
| Royce International Premier Fund–Service Class | |||||||||||||||||||||||||||||||||||||||||||||||||||||||||||||||
| 2017 | $ | 11.24 | $ | 0.05 | $ | 4.42 | $ | 4.47 | $ | (0.11 | ) | $ | – | $ | (0.11 | ) | $ | – | $ | 15.60 | 39.81 | % | $ | 48,642 | 1.65 | % | 1.65 | % | 1.44 | % | 0.28 | % | 41 | % | |||||||||||||||||||||||||||||
| 2016 | 11.64 | 0.06 | (0.19 | ) | (0.13 | ) | (0.26 | ) | (0.01 | ) | (0.27 | ) | – | 11.24 | (1.06 | ) | 38,884 | 1.84 | 1.84 | 1.44 | 0.66 | 67 | |||||||||||||||||||||||||||||||||||||||||
| 2015 | 10.28 | (0.00 | ) | 1.66 | 1.66 | (0.30 | ) | – | (0.30 | ) | – | 11.64 | 16.22 | 9,015 | 2.65 | 2.65 | 1.60 | 1.10 | 67 | ||||||||||||||||||||||||||||||||||||||||||||
| 2014 | 11.67 | 0.17 | (1.13 | ) | (0.96 | ) | (0.12 | ) | (0.31 | ) | (0.43 | ) | – | 10.28 | (8.22 | ) | 4,045 | 2.45 | 2.45 | 1.69 | 1.26 | 62 | |||||||||||||||||||||||||||||||||||||||||
| 2013 | 10.01 | 0.10 | 1.73 | 1.83 | (0.17 | ) | – | (0.17 | ) | – | 11.67 | 18.31 | 9,470 | 2.82 | 2.82 | 1.69 | 1.09 | 51 | |||||||||||||||||||||||||||||||||||||||||||||
| Royce International Premier Fund–Consultant Class d | |||||||||||||||||||||||||||||||||||||||||||||||||||||||||||||||
| 2017 | $ | 12.27 | $ | (0.08 | ) | $ | 4.83 | $ | 4.75 | $ | (0.03 | ) | $ | – | $ | (0.03 | ) | $ | – | $ | 16.99 | 38.73 | % | $ | 9,281 | 2.73 | % | 2.73 | % | 2.19 | % | (0.52 | )% | 41 | % | ||||||||||||||||||||||||||||
| 2016 | 11.59 | 0.01 | 0.85 | 0.86 | (0.17 | ) | (0.01 | ) | (0.18 | ) | – | 12.27 | 7.49 | 1 | 5,086 | 2.70 | 2 | 2.70 | 2 | 2.19 | 2 | (0.04 | )2 | 67 | |||||||||||||||||||||||||||||||||||||||
| Royce International Premier Fund–R Class d | |||||||||||||||||||||||||||||||||||||||||||||||||||||||||||||||
| 2017 | $ | 9.06 | $ | (0.00 | ) | $ | 3.56 | $ | 3.56 | $ | (0.09 | ) | $ | – | $ | (0.09 | ) | $ | – | $ | 12.53 | 39.34 | % | $ | 73 | 16.70 | % | 16.69 | % | 1.74 | % | (0.03 | )% | 41 | % | ||||||||||||||||||||||||||||
| 2016 | 8.64 | (0.02 | ) | 0.70 | 0.68 | (0.25 | ) | (0.01 | ) | (0.26 | ) | – | 9.06 | 7.96 | 1 | 51 | 28.36 | 2 | 28.35 | 2 | 1.74 | 2 | 0.31 | 2 | 67 | ||||||||||||||||||||||||||||||||||||||
| Royce Low-Priced Stock Fund–Investment Class | |||||||||||||||||||||||||||||||||||||||||||||||||||||||||||||||
| 2017 | $ | 8.26 | $ | (0.00 | ) | $ | 0.80 | $ | 0.80 | $ | (0.02 | ) | $ | (0.55 | ) | $ | (0.57 | ) | $ | – | $ | 8.49 | 9.86 | % | $ | 52,912 | 1.30 | % | 1.30 | % | 1.24 | % | 0.12 | % | 26 | % | |||||||||||||||||||||||||||
| 2016 | 7.77 | 0.04 | 1.24 | 1.28 | (0.06 | ) | (0.73 | ) | (0.79 | ) | – | 8.26 | 16.42 | 22,852 | 1.31 | 1.31 | 1.24 | 0.39 | 34 | ||||||||||||||||||||||||||||||||||||||||||||
| 2015 | 9.46 | 0.00 | (0.97 | ) | (0.97 | ) | – | (0.72 | ) | (0.72 | ) | – | 7.77 | (10.21 | ) | 28,732 | 1.28 | 1.28 | 1.24 | 0.03 | 53 | ||||||||||||||||||||||||||||||||||||||||||
| 2014 | 13.60 | 0.06 | (0.58 | ) | (0.52 | ) | (0.01 | ) | (3.61 | ) | (3.62 | ) | – | 9.46 | (3.15 | ) | 50,371 | 1.25 | 1.25 | 1.24 | 0.46 | 29 | |||||||||||||||||||||||||||||||||||||||||
| 2013 | 13.83 | 0.05 | 1.71 | 1.76 | (0.05 | ) | (1.94 | ) | (1.99 | ) | – | 13.60 | 13.17 | 88,568 | 1.37 | 1.37 | 1.24 | 0.18 | 16 | ||||||||||||||||||||||||||||||||||||||||||||
| Royce Low-Priced Stock Fund–Service Class | |||||||||||||||||||||||||||||||||||||||||||||||||||||||||||||||
| 2017 | $ | 8.23 | $ | (0.01 | ) | $ | 0.79 | $ | 0.78 | $ | – | $ | (0.55 | ) | $ | (0.55 | ) | $ | – | $ | 8.46 | 9.67 | % | $ | 209,369 | 1.52 | % | 1.52 | % | 1.49 | % | (0.13 | )% | 26 | % | ||||||||||||||||||||||||||||
| 2016 | 7.75 | 0.02 | 1.23 | 1.25 | (0.04 | ) | (0.73 | ) | (0.77 | ) | – | 8.23 | 16.09 | 281,873 | 1.52 | 1.52 | 1.49 | 0.14 | 34 | ||||||||||||||||||||||||||||||||||||||||||||
| 2015 | 9.46 | (0.02 | ) | (0.97 | ) | (0.99 | ) | – | (0.72 | ) | (0.72 | ) | – | 7.75 | (10.42 | ) | 316,475 | 1.49 | 1.49 | 1.47 | (0.20 | ) | 53 | ||||||||||||||||||||||||||||||||||||||||
| 2014 | 13.62 | 0.03 | (0.58 | ) | (0.55 | ) | – | (3.61 | ) | (3.61 | ) | – | 9.46 | (3.37 | ) | 520,905 | 1.55 | 1.55 | 1.49 | 0.21 | 29 | ||||||||||||||||||||||||||||||||||||||||||
| 2013 | 13.84 | (0.00 | ) | 1.72 | 1.72 | (0.00 | ) | (1.94 | ) | (1.94 | ) | – | 13.62 | 12.91 | 1,008,207 | 1.65 | 1.65 | 1.49 | (0.02 | ) | 16 | ||||||||||||||||||||||||||||||||||||||||||
| 94 | The Royce Funds 2017 Annual Report to Shareholders | THE ACCOMPANYING NOTES ARE AN INTEGRAL PART OF THESE FINANCIAL STATEMENTS |
Financial Highlights
This table is presented to show selected data for a share outstanding throughout each year or other indicated period and to assist shareholders in evaluating a Fund’s performance for the periods presented. Per share amounts have been determined on the basis of the weighted average number of shares outstanding during the period.
| Ratio of Expenses to Average Net Assets | |||||||||||||||||||||||||||||||||||||||||||||||||||||||||||||||
| Net Asset Value, Beginning of Period | Net Investment Income (Loss) | Net Realized and Unrealized Gain (Loss) on Investments and Foreign Currency | Total from Investment Operations | Distributions from Net Investment Income | Distributions from Net Realized Gain on Investments and Foreign Currency | Total Distributions | Shareholder Redemption Fees | Net Asset Value, End of Period | Total Return | Net Assets, End of Period (in thousands) | Prior to Fee Waivers, Expense Reimbursements and Balance Credits | Prior to Fee Waivers and Expense Reimbursements | Net of Fee Waivers and Expense Reimbursements | Ratio of Net Investment Income (Loss) to Average Net Assets | Portfolio Turnover Rate | ||||||||||||||||||||||||||||||||||||||||||||||||
| Royce Low-Priced Stock Fund–Institutional Class | |||||||||||||||||||||||||||||||||||||||||||||||||||||||||||||||
| 2017 | $ | 8.28 | $ | 0.01 | $ | 0.78 | $ | 0.79 | $ | – | $ | (0.55 | ) | $ | (0.55 | ) | $ | – | $ | 8.52 | 9.78 | % | $ | 5,361 | 1.25 | % | 1.25 | % | 1.25 | % | 0.10 | % | 26 | % | |||||||||||||||||||||||||||||
| 2016 | 7.78 | 0.06 | 1.23 | 1.29 | (0.06 | ) | (0.73 | ) | (0.79 | ) | – | 8.28 | 16.50 | 12,336 | 1.21 | 1.21 | 1.21 | 0.41 | 34 | ||||||||||||||||||||||||||||||||||||||||||||
| 2015 | 9.46 | 0.01 | (0.97 | ) | (0.96 | ) | (0.00 | ) | (0.72 | ) | (0.72 | ) | – | 7.78 | (10.05 | ) | 39,004 | 1.11 | 1.11 | 1.11 | 0.14 | 53 | |||||||||||||||||||||||||||||||||||||||||
| 2014 | 13.61 | 0.08 | (0.58 | ) | (0.50 | ) | (0.04 | ) | (3.61 | ) | (3.65 | ) | – | 9.46 | (3.01 | ) | 101,473 | 1.16 | 1.16 | 1.16 | 0.47 | 29 | |||||||||||||||||||||||||||||||||||||||||
| 2013 | 13.84 | 0.05 | 1.71 | 1.76 | (0.05 | ) | (1.94 | ) | (1.99 | ) | – | 13.61 | 13.20 | 345,983 | 1.22 | 1.22 | 1.22 | 0.26 | 16 | ||||||||||||||||||||||||||||||||||||||||||||
| Royce Low-Priced Stock Fund–R Class | |||||||||||||||||||||||||||||||||||||||||||||||||||||||||||||||
| 2017 | $ | 7.81 | $ | (0.04 | ) | $ | 0.74 | $ | 0.70 | $ | – | $ | (0.52 | ) | $ | (0.52 | ) | $ | – | $ | 7.99 | 9.15 | % | $ | 1,048 | 2.95 | % | 2.95 | % | 1.84 | % | (0.48 | )% | 26 | % | ||||||||||||||||||||||||||||
| 2016 | 7.38 | (0.01 | ) | 1.18 | 1.17 | (0.01 | ) | (0.73 | ) | (0.74 | ) | – | 7.81 | 15.83 | 1,036 | 2.82 | 2.82 | 1.84 | (0.21 | ) | 34 | ||||||||||||||||||||||||||||||||||||||||||
| 2015 | 9.08 | (0.05 | ) | (0.93 | ) | (0.98 | ) | – | (0.72 | ) | (0.72 | ) | – | 7.38 | (10.74 | ) | 1,132 | 2.78 | 2.78 | 1.84 | (0.58 | ) | 53 | ||||||||||||||||||||||||||||||||||||||||
| 2014 | 13.27 | (0.02 | ) | (0.56 | ) | (0.58 | ) | – | (3.61 | ) | (3.61 | ) | – | 9.08 | (3.72 | ) | 1,892 | 2.21 | 2.21 | 1.84 | (0.15 | ) | 29 | ||||||||||||||||||||||||||||||||||||||||
| 2013 | 13.58 | (0.05 | ) | 1.68 | 1.63 | – | (1.94 | ) | (1.94 | ) | – | 13.27 | 12.44 | 3,130 | 2.21 | 2.21 | 1.84 | (0.37 | ) | 16 | |||||||||||||||||||||||||||||||||||||||||||
| Royce Micro-Cap Fund–Investment Class | |||||||||||||||||||||||||||||||||||||||||||||||||||||||||||||||
| 2017 | $ | 11.92 | $ | (0.03 | ) | $ | 0.66 | $ | 0.63 | $ | (0.01 | ) | $ | (0.90 | ) | $ | (0.91 | ) | $ | – | $ | 11.64 | 5.43 | % | $ | 166,935 | 1.51 | % | 1.51 | % | 1.49 | % | (0.28 | )% | 26 | % | |||||||||||||||||||||||||||
| 2016 | 11.09 | 0.01 | 2.18 | 2.19 | (0.06 | ) | (1.30 | ) | (1.36 | ) | – | 11.92 | 19.74 | 192,731 | 1.48 | 1.48 | 1.48 | 0.03 | 38 | ||||||||||||||||||||||||||||||||||||||||||||
| 2015 | 14.47 | 0.02 | (1.96 | ) | (1.94 | ) | – | (1.44 | ) | (1.44 | ) | – | 11.09 | (13.32 | ) | 219,272 | 1.51 | 1.51 | 1.51 | 0.15 | 41 | ||||||||||||||||||||||||||||||||||||||||||
| 2014 | 16.68 | (0.08 | ) | (0.65 | ) | (0.73 | ) | – | (1.48 | ) | (1.48 | ) | – | 14.47 | (4.13 | ) | 414,120 | 1.52 | 1.52 | 1.52 | (0.49 | ) | 18 | ||||||||||||||||||||||||||||||||||||||||
| 2013 | 14.78 | (0.08 | ) | 3.19 | 3.11 | (0.02 | ) | (1.19 | ) | (1.21 | ) | – | 16.68 | 21.29 | 650,773 | 1.53 | 1.53 | 1.53 | (0.52 | ) | 22 | ||||||||||||||||||||||||||||||||||||||||||
| Royce Micro-Cap Fund–Service Class | |||||||||||||||||||||||||||||||||||||||||||||||||||||||||||||||
| 2017 | $ | 11.69 | $ | (0.05 | ) | $ | 0.65 | $ | 0.60 | $ | – | $ | (0.88 | ) | $ | (0.88 | ) | $ | – | $ | 11.41 | 5.32 | % | $ | 13,880 | 1.86 | % | 1.86 | % | 1.61 | % | (0.40 | )% | 26 | % | ||||||||||||||||||||||||||||
| 2016 | 10.90 | (0.01 | ) | 2.15 | 2.14 | (0.05 | ) | (1.30 | ) | (1.35 | ) | – | 11.69 | 19.59 | 17,343 | 1.83 | 1.83 | 1.61 | (0.11 | ) | 38 | ||||||||||||||||||||||||||||||||||||||||||
| 2015 | 14.26 | 0.00 | (1.92 | ) | (1.92 | ) | – | (1.44 | ) | (1.44 | ) | – | 10.90 | (13.37 | ) | 20,538 | 1.80 | 1.80 | 1.63 | 0.01 | 41 | ||||||||||||||||||||||||||||||||||||||||||
| 2014 | 16.48 | (0.10 | ) | (0.65 | ) | (0.75 | ) | – | (1.48 | ) | (1.48 | ) | 0.01 | 14.26 | (4.24 | ) | 38,645 | 1.77 | 1.77 | 1.66 | (0.63 | ) | 18 | ||||||||||||||||||||||||||||||||||||||||
| 2013 | 14.61 | (0.10 | ) | 3.16 | 3.06 | – | (1.19 | ) | (1.19 | ) | – | 16.48 | 21.20 | 79,890 | 1.74 | 1.74 | 1.66 | (0.66 | ) | 22 | |||||||||||||||||||||||||||||||||||||||||||
| Royce Micro-Cap Fund–Consultant Class | |||||||||||||||||||||||||||||||||||||||||||||||||||||||||||||||
| 2017 | $ | 9.41 | $ | (0.13 | ) | $ | 0.53 | $ | 0.40 | $ | – | $ | (0.71 | ) | $ | (0.71 | ) | $ | – | $ | 9.10 | 4.35 | % | $ | 24,396 | 2.54 | % | 2.54 | % | 2.54 | % | (1.34 | )% | 26 | % | ||||||||||||||||||||||||||||
| 2016 | 9.04 | (0.09 | ) | 1.76 | 1.67 | – | (1.30 | ) | (1.30 | ) | – | 9.41 | 18.48 | 33,622 | 2.53 | 2.53 | 2.53 | (1.02 | ) | 38 | |||||||||||||||||||||||||||||||||||||||||||
| 2015 | 12.23 | (0.10 | ) | (1.65 | ) | (1.75 | ) | – | (1.44 | ) | (1.44 | ) | – | 9.04 | (14.21 | ) | 41,024 | 2.54 | 2.54 | 2.54 | (0.90 | ) | 41 | ||||||||||||||||||||||||||||||||||||||||
| 2014 | 14.48 | (0.20 | ) | (0.57 | ) | (0.77 | ) | – | (1.48 | ) | (1.48 | ) | – | 12.23 | (5.03 | ) | 75,868 | 2.48 | 2.48 | 2.48 | (1.45 | ) | 18 | ||||||||||||||||||||||||||||||||||||||||
| 2013 | 13.08 | (0.21 | ) | 2.80 | 2.59 | – | (1.19 | ) | (1.19 | ) | – | 14.48 | 20.08 | 117,538 | 2.52 | 2.52 | 2.52 | (1.51 | ) | 22 | |||||||||||||||||||||||||||||||||||||||||||
| Royce Micro-Cap Opportunity Fund–Investment Class | |||||||||||||||||||||||||||||||||||||||||||||||||||||||||||||||
| 2017 | $ | 17.19 | $ | (0.14 | ) | $ | 4.38 | $ | 4.24 | $ | – | $ | (1.67 | ) | $ | (1.67 | ) | $ | – | $ | 19.76 | 24.92 | % | $ | 45,992 | 1.28 | % | 1.28 | % | 1.24 | % | (0.75 | )% | 70 | % | ||||||||||||||||||||||||||||
| 2016 | 13.88 | (0.08 | ) | 3.39 | 3.31 | – | – | – | – | 17.19 | 23.85 | 45,135 | 1.30 | 1.30 | 1.24 | (0.55 | ) | 83 | |||||||||||||||||||||||||||||||||||||||||||||
| 2015 | 16.52 | (0.09 | ) | (2.55 | ) | (2.64 | ) | – | (0.00 | ) | (0.00 | ) | – | 13.88 | (15.98 | ) | 34,437 | 1.39 | 1.39 | 1.25 | (0.58 | ) | 105 | ||||||||||||||||||||||||||||||||||||||||
| 2014 | 17.93 | (0.11 | ) | (0.81 | ) | (0.92 | ) | – | (0.51 | ) | (0.51 | ) | 0.02 | 16.52 | (4.97 | ) | 18,221 | 1.56 | 1.56 | 1.28 | (0.60 | ) | 131 | ||||||||||||||||||||||||||||||||||||||||
| 2013 | 12.81 | (0.13 | ) | 5.79 | 5.66 | – | (0.55 | ) | (0.55 | ) | 0.01 | 17.93 | 44.61 | 17,461 | 1.78 | 1.78 | 1.29 | (0.80 | ) | 129 | |||||||||||||||||||||||||||||||||||||||||||
| THE ACCOMPANYING NOTES ARE AN INTEGRAL PART OF THESE FINANCIAL STATEMENTS | The Royce Funds 2017 Annual Report to Shareholders | 95 |
Financial Highlights
This table is presented to show selected data for a share outstanding throughout each year or other indicated period and to assist shareholders in evaluating a Fund’s performance for the periods presented. Per share amounts have been determined on the basis of the weighted average number of shares outstanding during the period.
| Ratio of Expenses to Average Net Assets | |||||||||||||||||||||||||||||||||||||||||||||||||||||||||||||||
| Net Asset Value, Beginning of Period | Net Investment Income (Loss) | Net Realized and Unrealized Gain (Loss) on Investments and Foreign Currency | Total from Investment Operations | Distributions from Net Investment Income | Distributions from Net Realized Gain on Investments and Foreign Currency | Total Distributions | Shareholder Redemption Fees | Net Asset Value, End of Period | Total Return | Net Assets, End of Period (in thousands) | Prior to Fee Waivers, Expense Reimbursements and Balance Credits | Prior to Fee Waivers and Expense Reimbursements | Net of Fee Waivers and Expense Reimbursements | Ratio of Net Investment Income (Loss) to Average Net Assets | Portfolio Turnover Rate | ||||||||||||||||||||||||||||||||||||||||||||||||
| Royce Micro-Cap Opportunity Fund–Service Class a | |||||||||||||||||||||||||||||||||||||||||||||||||||||||||||||||
| 2017 | $ | 8.66 | $ | (0.09 | ) | $ | 2.20 | $ | 2.11 | $ | – | $ | (0.84 | ) | $ | (0.84 | ) | $ | – | $ | 9.93 | 24.61 | % | $ | 1,130 | 3.36 | % | 3.36 | % | 1.49 | % | (1.00 | )% | 70 | % | ||||||||||||||||||||||||||||
| 2016 | 7.01 | (0.06 | ) | 1.71 | 1.65 | – | – | – | – | 8.66 | 23.54 | 995 | 3.37 | 3.37 | 1.49 | (0.81 | ) | 83 | |||||||||||||||||||||||||||||||||||||||||||||
| 2015 | 8.37 | (0.07 | ) | (1.29 | ) | (1.36 | ) | – | (0.00 | ) | (0.00 | ) | – | 7.01 | (16.24 | ) | 1,212 | 3.22 | 3.22 | 1.51 | (0.86 | ) | 105 | ||||||||||||||||||||||||||||||||||||||||
| 2014 | 10.00 | (0.04 | ) | (1.11 | ) | (1.15 | ) | – | (0.51 | ) | (0.51 | ) | 0.03 | 8.37 | (11.11 | )1 | 939 | 10.50 | 2 | 10.50 | 2 | 1.53 | 2 | (0.65 | )2 | 131 | |||||||||||||||||||||||||||||||||||||
| Royce Opportunity Fund–Investment Class | |||||||||||||||||||||||||||||||||||||||||||||||||||||||||||||||
| 2017 | $ | 12.85 | $ | (0.04 | ) | $ | 2.79 | $ | 2.75 | $ | – | $ | (2.02 | ) | $ | (2.02 | ) | $ | – | $ | 13.58 | 21.88 | % | $ | 805,660 | 1.18 | % | 1.18 | % | 1.18 | % | (0.28 | )% | 43 | % | ||||||||||||||||||||||||||||
| 2016 | 10.57 | (0.02 | ) | 3.19 | 3.17 | – | (0.89 | ) | (0.89 | ) | – | 12.85 | 29.86 | 751,184 | 1.19 | 1.19 | 1.19 | (0.18 | ) | 26 | |||||||||||||||||||||||||||||||||||||||||||
| 2015 | 13.46 | (0.03 | ) | (1.80 | ) | (1.83 | ) | – | (1.06 | ) | (1.06 | ) | – | 10.57 | (13.57 | ) | 746,052 | 1.17 | 1.17 | 1.17 | (0.27 | ) | 27 | ||||||||||||||||||||||||||||||||||||||||
| 2014 | 15.54 | (0.05 | ) | (0.09 | ) | (0.14 | ) | – | (1.94 | ) | (1.94 | ) | – | 13.46 | (0.48 | ) | 1,284,044 | 1.14 | 1.14 | 1.14 | (0.30 | ) | 36 | ||||||||||||||||||||||||||||||||||||||||
| 2013 | 11.95 | (0.05 | ) | 5.18 | 5.13 | – | (1.54 | ) | (1.54 | ) | – | 15.54 | 43.50 | 1,426,214 | 1.16 | 1.16 | 1.16 | (0.36 | ) | 39 | |||||||||||||||||||||||||||||||||||||||||||
| Royce Opportunity Fund–Service Class | |||||||||||||||||||||||||||||||||||||||||||||||||||||||||||||||
| 2017 | $ | 12.02 | $ | (0.08 | ) | $ | 2.61 | $ | 2.53 | $ | – | $ | (1.89 | ) | $ | (1.89 | ) | $ | – | $ | 12.66 | 21.46 | % | $ | 96,663 | 1.53 | % | 1.53 | % | 1.49 | % | (0.61 | )% | 43 | % | ||||||||||||||||||||||||||||
| 2016 | 9.95 | (0.05 | ) | 3.01 | 2.96 | – | (0.89 | ) | (0.89 | ) | – | 12.02 | 29.61 | 73,517 | 1.53 | 1.53 | 1.49 | (0.48 | ) | 26 | |||||||||||||||||||||||||||||||||||||||||||
| 2015 | 12.80 | (0.07 | ) | (1.72 | ) | (1.79 | ) | – | (1.06 | ) | (1.06 | ) | – | 9.95 | (13.96 | ) | 100,918 | 1.49 | 1.49 | 1.49 | (0.59 | ) | 27 | ||||||||||||||||||||||||||||||||||||||||
| 2014 | 14.92 | (0.09 | ) | (0.09 | ) | (0.18 | ) | – | (1.94 | ) | (1.94 | ) | – | 12.80 | (0.74 | ) | 155,085 | 1.47 | 1.47 | 1.47 | (0.64 | ) | 36 | ||||||||||||||||||||||||||||||||||||||||
| 2013 | 11.55 | (0.09 | ) | 5.00 | 4.91 | – | (1.54 | ) | (1.54 | ) | – | 14.92 | 43.10 | 208,237 | 1.47 | 1.47 | 1.47 | (0.67 | ) | 39 | |||||||||||||||||||||||||||||||||||||||||||
| Royce Opportunity Fund–Consultant Class | |||||||||||||||||||||||||||||||||||||||||||||||||||||||||||||||
| 2017 | $ | 10.71 | $ | (0.16 | ) | $ | 2.31 | $ | 2.15 | $ | – | $ | (1.67 | ) | $ | (1.67 | ) | $ | – | $ | 11.19 | 20.50 | % | $ | 20,574 | 2.27 | % | 2.27 | % | 2.27 | % | (1.37 | )% | 43 | % | ||||||||||||||||||||||||||||
| 2016 | 9.01 | (0.12 | ) | 2.71 | 2.59 | – | (0.89 | ) | (0.89 | ) | – | 10.71 | 28.59 | 21,116 | 2.28 | 2.28 | 2.28 | (1.27 | ) | 26 | |||||||||||||||||||||||||||||||||||||||||||
| 2015 | 11.79 | (0.15 | ) | (1.57 | ) | (1.72 | ) | – | (1.06 | ) | (1.06 | ) | – | 9.01 | (14.56 | ) | 19,464 | 2.26 | 2.26 | 2.26 | (1.34 | ) | 27 | ||||||||||||||||||||||||||||||||||||||||
| 2014 | 14.02 | (0.19 | ) | (0.10 | ) | (0.29 | ) | – | (1.94 | ) | (1.94 | ) | – | 11.79 | (1.61 | ) | 20,518 | 2.24 | 2.24 | 2.24 | (1.40 | ) | 36 | ||||||||||||||||||||||||||||||||||||||||
| 2013 | 11.01 | (0.20 | ) | 4.75 | 4.55 | – | (1.54 | ) | (1.54 | ) | – | 14.02 | 41.93 | 18,643 | 2.31 | 2.31 | 2.31 | (1.51 | ) | 39 | |||||||||||||||||||||||||||||||||||||||||||
| Royce Opportunity Fund–Institutional Class | |||||||||||||||||||||||||||||||||||||||||||||||||||||||||||||||
| 2017 | $ | 13.08 | $ | (0.02 | ) | $ | 2.84 | $ | 2.82 | $ | – | $ | (2.06 | ) | $ | (2.06 | ) | $ | – | $ | 13.84 | 22.02 | % | $ | 639,057 | 1.07 | % | 1.07 | % | 1.07 | % | (0.17 | )% | 43 | % | ||||||||||||||||||||||||||||
| 2016 | 10.74 | (0.01 | ) | 3.24 | 3.23 | – | (0.89 | ) | (0.89 | ) | – | 13.08 | 29.94 | 583,975 | 1.07 | 1.07 | 1.07 | (0.06 | ) | 26 | |||||||||||||||||||||||||||||||||||||||||||
| 2015 | 13.64 | (0.02 | ) | (1.82 | ) | (1.84 | ) | – | (1.06 | ) | (1.06 | ) | – | 10.74 | (13.46 | ) | 600,945 | 1.05 | 1.05 | 1.05 | (0.15 | ) | 27 | ||||||||||||||||||||||||||||||||||||||||
| 2014 | 15.71 | (0.03 | ) | (0.10 | ) | (0.13 | ) | – | (1.94 | ) | (1.94 | ) | – | 13.64 | (0.41 | ) | 799,131 | 1.03 | 1.03 | 1.03 | (0.20 | ) | 36 | ||||||||||||||||||||||||||||||||||||||||
| 2013 | 12.06 | (0.03 | ) | 5.23 | 5.20 | (0.01 | ) | (1.54 | ) | (1.55 | ) | – | 15.71 | 43.69 | 853,886 | 1.03 | 1.03 | 1.03 | (0.23 | ) | 39 | ||||||||||||||||||||||||||||||||||||||||||
| Royce Opportunity Fund–R Class | |||||||||||||||||||||||||||||||||||||||||||||||||||||||||||||||
| 2017 | $ | 11.67 | $ | (0.12 | ) | $ | 2.53 | $ | 2.41 | $ | – | $ | (1.83 | ) | $ | (1.83 | ) | $ | – | $ | 12.25 | 21.06 | % | $ | 39,311 | 1.82 | % | 1.82 | % | 1.82 | % | (0.92 | )% | 43 | % | ||||||||||||||||||||||||||||
| 2016 | 9.72 | (0.08 | ) | 2.92 | 2.84 | – | (0.89 | ) | (0.89 | ) | – | 11.67 | 29.08 | 38,902 | 1.82 | 1.82 | 1.82 | (0.81 | ) | 26 | |||||||||||||||||||||||||||||||||||||||||||
| 2015 | 12.56 | (0.11 | ) | (1.67 | ) | (1.78 | ) | – | (1.06 | ) | (1.06 | ) | – | 9.72 | (14.15 | ) | 32,599 | 1.82 | 1.82 | 1.82 | (0.90 | ) | 27 | ||||||||||||||||||||||||||||||||||||||||
| 2014 | 14.73 | (0.13 | ) | (0.10 | ) | (0.23 | ) | – | (1.94 | ) | (1.94 | ) | – | 12.56 | (1.12 | ) | 33,699 | 1.78 | 1.78 | 1.78 | (0.93 | ) | 36 | ||||||||||||||||||||||||||||||||||||||||
| 2013 | 11.46 | (0.14 | ) | 4.95 | 4.81 | – | (1.54 | ) | (1.54 | ) | – | 14.73 | 42.56 | 22,730 | 1.82 | 1.82 | 1.82 | (1.02 | ) | 39 | |||||||||||||||||||||||||||||||||||||||||||
| 96 | The Royce Funds 2017 Annual Report to Shareholders | THE ACCOMPANYING NOTES ARE AN INTEGRAL PART OF THESE FINANCIAL STATEMENTS |
Financial Highlights
This table is presented to show selected data for a share outstanding throughout each year or other indicated period and to assist shareholders in evaluating a Fund’s performance for the periods presented. Per share amounts have been determined on the basis of the weighted average number of shares outstanding during the period.
| Ratio of Expenses to Average Net Assets | |||||||||||||||||||||||||||||||||||||||||||||||||||||||||||||||
| Net Asset Value, Beginning of Period | Net Investment Income (Loss) | Net Realized and Unrealized Gain (Loss) on Investments and Foreign Currency | Total from Investment Operations | Distributions from Net Investment Income | Distributions from Net Realized Gain on Investments and Foreign Currency | Total Distributions | Shareholder Redemption Fees | Net Asset Value, End of Period | Total Return | Net Assets, End of Period (in thousands) | Prior to Fee Waivers, Expense Reimbursements and Balance Credits | Prior to Fee Waivers and Expense Reimbursements | Net of Fee Waivers and Expense Reimbursements | Ratio of Net Investment Income (Loss) to Average Net Assets | Portfolio Turnover Rate | ||||||||||||||||||||||||||||||||||||||||||||||||
| Royce Opportunity Fund–K Class | |||||||||||||||||||||||||||||||||||||||||||||||||||||||||||||||
| 2017 | $ | 10.60 | $ | (0.10 | ) | $ | 2.29 | $ | 2.19 | $ | – | $ | (1.66 | ) | $ | (1.66 | ) | $ | – | $ | 11.13 | 21.08 | % | $ | 7,659 | 1.78 | % | 1.78 | % | 1.78 | % | (0.88 | )% | 43 | % | ||||||||||||||||||||||||||||
| 2016 | 8.88 | (0.07 | ) | 2.68 | 2.61 | – | (0.89 | ) | (0.89 | ) | – | 10.60 | 29.24 | 6,698 | 1.75 | 1.75 | 1.75 | (0.74 | ) | 26 | |||||||||||||||||||||||||||||||||||||||||||
| 2015 | 11.57 | (0.08 | ) | (1.55 | ) | (1.63 | ) | – | (1.06 | ) | (1.06 | ) | – | 8.88 | (14.06 | ) | 9,706 | 1.62 | 1.62 | 1.62 | (0.73 | ) | 27 | ||||||||||||||||||||||||||||||||||||||||
| 2014 | 13.70 | (0.10 | ) | (0.09 | ) | (0.19 | ) | – | (1.94 | ) | (1.94 | ) | – | 11.57 | (0.90 | ) | 22,892 | 1.59 | 1.59 | 1.59 | (0.75 | ) | 36 | ||||||||||||||||||||||||||||||||||||||||
| 2013 | 10.70 | (0.08 | ) | 4.62 | 4.54 | – | (1.54 | ) | (1.54 | ) | – | 13.70 | 43.07 | 17,927 | 1.46 | 1.46 | 1.46 | (0.65 | ) | 39 | |||||||||||||||||||||||||||||||||||||||||||
| Royce Pennsylvania Mutual Fund–Investment Class | |||||||||||||||||||||||||||||||||||||||||||||||||||||||||||||||
| 2017 | $ | 11.02 | $ | 0.06 | $ | 1.68 | $ | 1.74 | $ | (0.06 | ) | $ | (2.18 | ) | $ | (2.24 | ) | $ | – | $ | 10.52 | 16.24 | % | $ | 1,622,523 | 0.92 | % | 0.92 | % | 0.92 | % | 0.47 | % | 27 | % | ||||||||||||||||||||||||||||
| 2016 | 9.33 | 0.07 | 2.41 | 2.48 | (0.04 | ) | (0.75 | ) | (0.79 | ) | – | 11.02 | 26.47 | 1,671,848 | 0.92 | 0.92 | 0.92 | 0.60 | 18 | ||||||||||||||||||||||||||||||||||||||||||||
| 2015 | 13.00 | 0.09 | (1.58 | ) | (1.49 | ) | (0.10 | ) | (2.08 | ) | (2.18 | ) | – | 9.33 | (11.43 | ) | 1,925,419 | 0.92 | 0.92 | 0.92 | 0.58 | 21 | |||||||||||||||||||||||||||||||||||||||||
| 2014 | 14.73 | 0.06 | (0.21 | ) | (0.15 | ) | (0.04 | ) | (1.54 | ) | (1.58 | ) | – | 13.00 | (0.70 | ) | 3,869,579 | 0.91 | 0.91 | 0.91 | 0.35 | 21 | |||||||||||||||||||||||||||||||||||||||||
| 2013 | 11.50 | 0.03 | 3.99 | 4.02 | (0.00 | ) | (0.79 | ) | (0.79 | ) | – | 14.73 | 35.25 | 5,033,318 | 0.92 | 0.92 | 0.92 | 0.24 | 26 | ||||||||||||||||||||||||||||||||||||||||||||
| Royce Pennsylvania Mutual Fund–Service Class | |||||||||||||||||||||||||||||||||||||||||||||||||||||||||||||||
| 2017 | $ | 11.03 | $ | 0.01 | $ | 1.69 | $ | 1.70 | $ | – | $ | (2.17 | ) | $ | (2.17 | ) | $ | – | $ | 10.56 | 15.88 | % | $ | 54,938 | 1.27 | % | 1.27 | % | 1.27 | % | 0.07 | % | 27 | % | |||||||||||||||||||||||||||||
| 2016 | 9.35 | 0.03 | 2.41 | 2.44 | (0.01 | ) | (0.75 | ) | (0.76 | ) | – | 11.03 | 25.99 | 100,598 | 1.26 | 1.26 | 1.26 | 0.27 | 18 | ||||||||||||||||||||||||||||||||||||||||||||
| 2015 | 12.96 | 0.05 | (1.56 | ) | (1.51 | ) | (0.02 | ) | (2.08 | ) | (2.10 | ) | – | 9.35 | (11.57 | ) | 102,341 | 1.23 | 1.23 | 1.23 | 0.29 | 21 | |||||||||||||||||||||||||||||||||||||||||
| 2014 | 14.69 | 0.00 | (0.19 | ) | (0.19 | ) | – | (1.54 | ) | (1.54 | ) | – | 12.96 | (1.04 | ) | 333,548 | 1.23 | 1.23 | 1.23 | 0.03 | 21 | ||||||||||||||||||||||||||||||||||||||||||
| 2013 | 11.51 | (0.01 | ) | 3.98 | 3.97 | – | (0.79 | ) | (0.79 | ) | – | 14.69 | 34.77 | 591,534 | 1.25 | 1.25 | 1.25 | (0.08 | ) | 26 | |||||||||||||||||||||||||||||||||||||||||||
| Royce Pennsylvania Mutual Fund–Consultant Class | |||||||||||||||||||||||||||||||||||||||||||||||||||||||||||||||
| 2017 | $ | 8.90 | $ | (0.05 | ) | $ | 1.35 | $ | 1.30 | $ | – | $ | (1.74 | ) | $ | (1.74 | ) | $ | – | $ | 8.46 | 15.06 | % | $ | 361,569 | 1.93 | % | 1.92 | % | 1.92 | % | (0.54 | )% | 27 | % | ||||||||||||||||||||||||||||
| 2016 | 7.70 | (0.03 | ) | 1.98 | 1.95 | – | (0.75 | ) | (0.75 | ) | – | 8.90 | 25.20 | 402,114 | 1.94 | 1.94 | 1.94 | (0.42 | ) | 18 | |||||||||||||||||||||||||||||||||||||||||||
| 2015 | 11.16 | (0.05 | ) | (1.33 | ) | (1.38 | ) | – | (2.08 | ) | (2.08 | ) | – | 7.70 | (12.31 | ) | 416,862 | 1.94 | 1.94 | 1.94 | (0.44 | ) | 21 | ||||||||||||||||||||||||||||||||||||||||
| 2014 | 12.96 | (0.08 | ) | (0.18 | ) | (0.26 | ) | – | (1.54 | ) | (1.54 | ) | – | 11.16 | (1.72 | ) | 676,347 | 1.91 | 1.91 | 1.91 | (0.64 | ) | 21 | ||||||||||||||||||||||||||||||||||||||||
| 2013 | 10.29 | (0.09 | ) | 3.55 | 3.46 | – | (0.79 | ) | (0.79 | ) | – | 12.96 | 33.94 | 788,017 | 1.94 | 1.94 | 1.94 | (0.78 | ) | 26 | |||||||||||||||||||||||||||||||||||||||||||
| Royce Pennsylvania Mutual Fund–Institutional Class | |||||||||||||||||||||||||||||||||||||||||||||||||||||||||||||||
| 2017 | $ | 11.04 | $ | 0.09 | $ | 1.67 | $ | 1.76 | $ | (0.07 | ) | $ | (2.18 | ) | $ | (2.25 | ) | $ | – | $ | 10.55 | 16.44 | % | $ | 53,367 | 0.83 | % | 0.83 | % | 0.83 | % | 0.42 | % | 27 | % | ||||||||||||||||||||||||||||
| 2016 | 9.34 | 0.09 | 2.41 | 2.50 | (0.05 | ) | (0.75 | ) | (0.80 | ) | – | 11.04 | 26.65 | 245,009 | 0.83 | 0.83 | 0.83 | 0.63 | 18 | ||||||||||||||||||||||||||||||||||||||||||||
| 2015 | 13.02 | 0.11 | (1.60 | ) | (1.49 | ) | (0.11 | ) | (2.08 | ) | (2.19 | ) | – | 9.34 | (11.34 | ) | 498,374 | 0.81 | 0.81 | 0.81 | 0.68 | 21 | |||||||||||||||||||||||||||||||||||||||||
| 2014 | 14.75 | 0.07 | (0.20 | ) | (0.13 | ) | (0.06 | ) | (1.54 | ) | (1.60 | ) | – | 13.02 | (0.58 | ) | 802,517 | 0.79 | 0.79 | 0.79 | 0.48 | 21 | |||||||||||||||||||||||||||||||||||||||||
| 2013 | 11.52 | 0.05 | 3.99 | 4.04 | (0.02 | ) | (0.79 | ) | (0.81 | ) | – | 14.75 | 35.34 | 818,212 | 0.79 | 0.79 | 0.79 | 0.40 | 26 | ||||||||||||||||||||||||||||||||||||||||||||
| Royce Pennsylvania Mutual Fund–R Class | |||||||||||||||||||||||||||||||||||||||||||||||||||||||||||||||
| 2017 | $ | 10.44 | $ | (0.04 | ) | $ | 1.58 | $ | 1.54 | $ | – | $ | (2.04 | ) | $ | (2.04 | ) | $ | – | $ | 9.94 | 15.25 | % | $ | 15,136 | 1.73 | % | 1.73 | % | 1.73 | % | (0.36 | )% | 27 | % | ||||||||||||||||||||||||||||
| 2016 | 8.90 | (0.01 | ) | 2.30 | 2.29 | – | (0.75 | ) | (0.75 | ) | – | 10.44 | 25.62 | 17,059 | 1.63 | 1.63 | 1.63 | (0.11 | ) | 18 | |||||||||||||||||||||||||||||||||||||||||||
| 2015 | 12.50 | (0.02 | ) | (1.50 | ) | (1.52 | ) | – | (2.08 | ) | (2.08 | ) | – | 8.90 | (12.10 | ) | 18,675 | 1.65 | 1.65 | 1.65 | (0.15 | ) | 21 | ||||||||||||||||||||||||||||||||||||||||
| 2014 | 14.26 | (0.03 | ) | (0.19 | ) | (0.22 | ) | – | (1.54 | ) | (1.54 | ) | – | 12.50 | (1.28 | ) | 36,622 | 1.48 | 1.48 | 1.48 | (0.21 | ) | 21 | ||||||||||||||||||||||||||||||||||||||||
| 2013 | 11.22 | (0.05 | ) | 3.88 | 3.83 | – | (0.79 | ) | (0.79 | ) | – | 14.26 | 34.42 | 44,094 | 1.56 | 1.56 | 1.56 | (0.39 | ) | 26 | |||||||||||||||||||||||||||||||||||||||||||
| THE ACCOMPANYING NOTES ARE AN INTEGRAL PART OF THESE FINANCIAL STATEMENTS | The Royce Funds 2017 Semiannual Report to Shareholders | 97 |
Financial Highlights
This table is presented to show selected data for a share outstanding throughout each year or other indicated period and to assist shareholders in evaluating a Fund’s performance for the periods presented. Per share amounts have been determined on the basis of the weighted average number of shares outstanding during the period.
| Ratio of Expenses to Average Net Assets | |||||||||||||||||||||||||||||||||||||||||||||||||||||||||||||||
| Net Asset Value, Beginning of Period | Net Investment Income (Loss) | Net Realized and Unrealized Gain (Loss) on Investments and Foreign Currency | Total from Investment Operations | Distributions from Net Investment Income | Distributions from Net Realized Gain on Investments and Foreign Currency | Total Distributions | Shareholder Redemption Fees | Net Asset Value, End of Period | Total Return | Net Assets, End of Period (in thousands) | Prior to Fee Waivers, Expense Reimbursements and Balance Credits | Prior to Fee Waivers and Expense Reimbursements | Net of Fee Waivers and Expense Reimbursements | Ratio of Net Investment Income (Loss) to Average Net Assets | Portfolio Turnover Rate | ||||||||||||||||||||||||||||||||||||||||||||||||
| Royce Pennsylvania Mutual Fund–K Class | |||||||||||||||||||||||||||||||||||||||||||||||||||||||||||||||
| 2017 | $ | 9.11 | $ | (0.05 | ) | $ | 1.38 | $ | 1.33 | $ | – | $ | (1.78 | ) | $ | (1.78 | ) | $ | – | $ | 8.66 | 15.06 | % | $ | 2,773 | 1.94 | % | 1.94 | % | 1.94 | % | (0.55 | )% | 27 | % | ||||||||||||||||||||||||||||
| 2016 | 7.86 | (0.02 | ) | 2.02 | 2.00 | – | (0.75 | ) | (0.75 | ) | – | 9.11 | 25.32 | 3,200 | 1.81 | 1.81 | 1.81 | (0.28 | ) | 18 | |||||||||||||||||||||||||||||||||||||||||||
| 2015 | 11.30 | (0.00 | ) | (1.36 | ) | (1.36 | ) | – | (2.08 | ) | (2.08 | ) | – | 7.86 | (11.95 | ) | 4,140 | 1.51 | 1.51 | 1.51 | (0.01 | ) | 21 | ||||||||||||||||||||||||||||||||||||||||
| 2014 | 13.04 | (0.02 | ) | (0.18 | ) | (0.20 | ) | – | (1.54 | ) | (1.54 | ) | – | 11.30 | (1.24 | ) | 10,707 | 1.42 | 1.42 | 1.42 | (0.15 | ) | 21 | ||||||||||||||||||||||||||||||||||||||||
| 2013 | 10.29 | (0.02 | ) | 3.56 | 3.54 | – | (0.79 | ) | (0.79 | ) | – | 13.04 | 34.72 | 11,685 | 1.37 | 1.37 | 1.37 | (0.19 | ) | 26 | |||||||||||||||||||||||||||||||||||||||||||
| Royce Premier Fund–Investment Class | |||||||||||||||||||||||||||||||||||||||||||||||||||||||||||||||
| 2017 | $ | 15.51 | $ | 0.00 | $ | 3.63 | $ | 3.63 | $ | (0.02 | ) | $ | (2.52 | ) | $ | (2.54 | ) | $ | – | $ | 16.60 | 23.77 | % | $ | 1,978,847 | 1.16 | % | 1.16 | % | 1.16 | % | 0.00 | % | 8 | % | ||||||||||||||||||||||||||||
| 2016 | 14.28 | 0.06 | 3.25 | 3.31 | (0.04 | ) | (2.04 | ) | (2.08 | ) | – | 15.51 | 23.00 | 1,768,580 | 1.16 | 1.16 | 1.16 | 0.35 | 15 | ||||||||||||||||||||||||||||||||||||||||||||
| 2015 | 19.72 | 0.13 | (2.11 | ) | (1.98 | ) | (0.13 | ) | (3.33 | ) | (3.46 | ) | – | 14.28 | (9.90 | ) | 2,015,905 | 1.13 | 1.13 | 1.13 | 0.49 | 13 | |||||||||||||||||||||||||||||||||||||||||
| 2014 | 22.11 | 0.08 | (0.32 | ) | (0.24 | ) | (0.08 | ) | (2.07 | ) | (2.15 | ) | – | 19.72 | (0.86 | ) | 4,097,961 | 1.10 | 1.10 | 1.10 | 0.34 | 9 | |||||||||||||||||||||||||||||||||||||||||
| 2013 | 19.16 | 0.00 | 5.22 | 5.22 | – | (2.27 | ) | (2.27 | ) | – | 22.11 | 27.73 | 5,096,793 | 1.09 | 1.09 | 1.09 | 0.02 | 11 | |||||||||||||||||||||||||||||||||||||||||||||
| Royce Premier Fund–Service Class | |||||||||||||||||||||||||||||||||||||||||||||||||||||||||||||||
| 2017 | $ | 15.13 | $ | (0.06 | ) | $ | 3.53 | $ | 3.47 | $ | – | $ | (2.45 | ) | $ | (2.45 | ) | $ | – | $ | 16.15 | 23.32 | % | $ | 54,557 | 1.53 | % | 1.53 | % | 1.49 | % | (0.34 | )% | 8 | % | ||||||||||||||||||||||||||||
| 2016 | 13.98 | 0.00 | 3.19 | 3.19 | – | (2.04 | ) | (2.04 | ) | – | 15.13 | 22.63 | 46,550 | 1.50 | 1.50 | 1.49 | 0.02 | 15 | |||||||||||||||||||||||||||||||||||||||||||||
| 2015 | 19.33 | 0.06 | (2.04 | ) | (1.98 | ) | (0.04 | ) | (3.33 | ) | (3.37 | ) | – | 13.98 | (10.13 | ) | 61,969 | 1.44 | 1.43 | 1.43 | 0.23 | 13 | |||||||||||||||||||||||||||||||||||||||||
| 2014 | 21.70 | 0.01 | (0.31 | ) | (0.30 | ) | – | (2.07 | ) | (2.07 | ) | – | 19.33 | (1.16 | ) | 172,810 | 1.38 | 1.38 | 1.38 | 0.05 | 9 | ||||||||||||||||||||||||||||||||||||||||||
| 2013 | 18.89 | (0.07 | ) | 5.15 | 5.08 | – | (2.27 | ) | (2.27 | ) | – | 21.70 | 27.39 | 318,860 | 1.38 | 1.38 | 1.38 | (0.33 | ) | 11 | |||||||||||||||||||||||||||||||||||||||||||
| Royce Premier Fund–Consultant Class | |||||||||||||||||||||||||||||||||||||||||||||||||||||||||||||||
| 2017 | $ | 12.46 | $ | (0.14 | ) | $ | 2.89 | $ | 2.75 | $ | – | $ | (2.00 | ) | $ | (2.00 | ) | $ | – | $ | 13.21 | 22.49 | % | $ | 31,489 | 2.21 | % | 2.21 | % | 2.21 | % | (1.06 | )% | 8 | % | ||||||||||||||||||||||||||||
| 2016 | 11.89 | (0.09 | ) | 2.70 | 2.61 | – | (2.04 | ) | (2.04 | ) | – | 12.46 | 21.72 | 31,353 | 2.22 | 2.22 | 2.22 | (0.72 | ) | 15 | |||||||||||||||||||||||||||||||||||||||||||
| 2015 | 17.09 | (0.09 | ) | (1.78 | ) | (1.87 | ) | – | (3.33 | ) | (3.33 | ) | – | 11.89 | (10.80 | ) | 32,982 | 2.17 | 2.17 | 2.17 | (0.55 | ) | 13 | ||||||||||||||||||||||||||||||||||||||||
| 2014 | 19.58 | (0.13 | ) | (0.29 | ) | (0.42 | ) | – | (2.07 | ) | (2.07 | ) | – | 17.09 | (1.92 | ) | 56,884 | 2.10 | 2.10 | 2.10 | (0.66 | ) | 9 | ||||||||||||||||||||||||||||||||||||||||
| 2013 | 17.35 | (0.20 | ) | 4.70 | 4.50 | – | (2.27 | ) | (2.27 | ) | – | 19.58 | 26.47 | 66,712 | 2.13 | 2.13 | 2.13 | (1.02 | ) | 11 | |||||||||||||||||||||||||||||||||||||||||||
| Royce Premier Fund–Institutional Class | |||||||||||||||||||||||||||||||||||||||||||||||||||||||||||||||
| 2017 | $ | 15.72 | $ | 0.01 | $ | 3.68 | $ | 3.69 | $ | (0.03 | ) | $ | (2.56 | ) | $ | (2.59 | ) | $ | – | $ | 16.82 | 23.85 | % | $ | 250,119 | 1.09 | % | 1.09 | % | 1.09 | % | 0.07 | % | 8 | % | ||||||||||||||||||||||||||||
| 2016 | 14.44 | 0.08 | 3.30 | 3.38 | (0.06 | ) | (2.04 | ) | (2.10 | ) | – | 15.72 | 23.20 | 250,826 | 1.07 | 1.07 | 1.07 | 0.44 | 15 | ||||||||||||||||||||||||||||||||||||||||||||
| 2015 | 19.91 | 0.16 | (2.14 | ) | (1.98 | ) | (0.16 | ) | (3.33 | ) | (3.49 | ) | – | 14.44 | (9.82 | ) | 294,477 | 1.02 | 1.02 | 1.02 | 0.60 | 13 | |||||||||||||||||||||||||||||||||||||||||
| 2014 | 22.31 | 0.12 | (0.34 | ) | (0.22 | ) | (0.11 | ) | (2.07 | ) | (2.18 | ) | – | 19.91 | (0.79 | ) | 594,463 | 0.98 | 0.98 | 0.98 | 0.45 | 9 | |||||||||||||||||||||||||||||||||||||||||
| 2013 | 19.30 | 0.03 | 5.25 | 5.28 | – | (2.27 | ) | (2.27 | ) | – | 22.31 | 27.85 | 989,100 | 0.98 | 0.98 | 0.98 | 0.13 | 11 | |||||||||||||||||||||||||||||||||||||||||||||
| Royce Premier Fund–W Class | |||||||||||||||||||||||||||||||||||||||||||||||||||||||||||||||
| 2017 | $ | 15.57 | $ | (0.01 | ) | $ | 3.66 | $ | 3.65 | $ | – | $ | (2.53 | ) | $ | (2.53 | ) | $ | – | $ | 16.69 | 23.83 | % | $ | 31,959 | 1.18 | % | 1.17 | % | 1.17 | % | (0.08 | )% | 8 | % | ||||||||||||||||||||||||||||
| 2016 | 14.32 | 0.06 | 3.27 | 3.33 | (0.04 | ) | (2.04 | ) | (2.08 | ) | – | 15.57 | 23.06 | 147,937 | 1.17 | 1.17 | 1.17 | 0.34 | 15 | ||||||||||||||||||||||||||||||||||||||||||||
| 2015 | 19.76 | 0.14 | (2.12 | ) | (1.98 | ) | (0.13 | ) | (3.33 | ) | (3.46 | ) | – | 14.32 | (9.88 | ) | 192,785 | 1.12 | 1.12 | 1.12 | 0.51 | 13 | |||||||||||||||||||||||||||||||||||||||||
| 2014 | 22.16 | 0.09 | (0.33 | ) | (0.24 | ) | (0.09 | ) | (2.07 | ) | (2.16 | ) | – | 19.76 | (0.89 | ) | 446,380 | 1.07 | 1.07 | 1.07 | 0.36 | 9 | |||||||||||||||||||||||||||||||||||||||||
| 2013 | 19.20 | 0.00 | 5.23 | 5.23 | – | (2.27 | ) | (2.27 | ) | – | 22.16 | 27.73 | 552,732 | 1.09 | 1.09 | 1.09 | 0.01 | 11 | |||||||||||||||||||||||||||||||||||||||||||||
| 98 | The Royce Funds 2017 Annual Report to Shareholders | THE ACCOMPANYING NOTES ARE AN INTEGRAL PART OF THESE FINANCIAL STATEMENTS |
Financial Highlights
This table is presented to show selected data for a share outstanding throughout each year or other indicated period and to assist shareholders in evaluating a Fund’s performance for the periods presented. Per share amounts have been determined on the basis of the weighted average number of shares outstanding during the period.
| Ratio of Expenses to Average Net Assets | |||||||||||||||||||||||||||||||||||||||||||||||||||||||||||||||
| Net Asset Value, Beginning of Period | Net Investment Income (Loss) | Net Realized and Unrealized Gain (Loss) on Investments and Foreign Currency | Total from Investment Operations | Distributions from Net Investment Income | Distributions from Net Realized Gain on Investments and Foreign Currency | Total Distributions | Shareholder Redemption Fees | Net Asset Value, End of Period | Total Return | Net Assets, End of Period (in thousands) | Prior to Fee Waivers, Expense Reimbursements and Balance Credits | Prior to Fee Waivers and Expense Reimbursements | Net of Fee Waivers and Expense Reimbursements | Ratio of Net Investment Income (Loss) to Average Net Assets | Portfolio Turnover Rate | ||||||||||||||||||||||||||||||||||||||||||||||||
| Royce Premier Fund–R Class | |||||||||||||||||||||||||||||||||||||||||||||||||||||||||||||||
| 2017 | $ | 14.47 | $ | (0.12 | ) | $ | 3.37 | $ | 3.25 | $ | – | $ | (2.33 | ) | $ | (2.33 | ) | $ | – | $ | 15.39 | 22.88 | % | $ | 12,841 | 1.90 | % | 1.90 | % | 1.90 | % | (0.75 | )% | 8 | % | ||||||||||||||||||||||||||||
| 2016 | 13.49 | (0.05 | ) | 3.07 | 3.02 | – | (2.04 | ) | (2.04 | ) | – | 14.47 | 22.18 | 13,889 | 1.84 | 1.84 | 1.84 | (0.33 | ) | 15 | |||||||||||||||||||||||||||||||||||||||||||
| 2015 | 18.82 | (0.03 | ) | (1.97 | ) | (2.00 | ) | – | (3.33 | ) | (3.33 | ) | – | 13.49 | (10.50 | ) | 16,129 | 1.78 | 1.78 | 1.78 | (0.16 | ) | 13 | ||||||||||||||||||||||||||||||||||||||||
| 2014 | 21.25 | (0.06 | ) | (0.30 | ) | (0.36 | ) | – | (2.07 | ) | (2.07 | ) | – | 18.82 | (1.48 | ) | 27,355 | 1.71 | 1.71 | 1.71 | (0.28 | ) | 9 | ||||||||||||||||||||||||||||||||||||||||
| 2013 | 18.61 | (0.13 | ) | 5.04 | 4.91 | – | (2.27 | ) | (2.27 | ) | – | 21.25 | 26.88 | 32,577 | 1.74 | 1.74 | 1.74 | (0.63 | ) | 11 | |||||||||||||||||||||||||||||||||||||||||||
| Royce Small-Cap Leaders Fund–Investment Class | |||||||||||||||||||||||||||||||||||||||||||||||||||||||||||||||
| 2017 | $ | 7.12 | $ | 0.05 | $ | 0.66 | $ | 0.71 | $ | (0.05 | ) | $ | (1.11 | ) | $ | (1.16 | ) | $ | – | $ | 6.67 | 10.47 | % | $ | 43,875 | 1.24 | % | 1.24 | % | 1.24 | % | 0.62 | % | 74 | % | ||||||||||||||||||||||||||||
| 2016 | 6.28 | 0.05 | 1.58 | 1.63 | (0.06 | ) | (0.73 | ) | (0.79 | ) | – | 7.12 | 25.84 | 48,128 | 1.23 | 1.23 | 1.23 | 0.62 | 65 | ||||||||||||||||||||||||||||||||||||||||||||
| 2015 | 8.74 | 0.03 | (1.09 | ) | (1.06 | ) | (0.04 | ) | (1.36 | ) | (1.40 | ) | – | 6.28 | (12.21 | ) | 50,410 | 1.24 | 1.24 | 1.24 | 0.40 | 64 | |||||||||||||||||||||||||||||||||||||||||
| 2014 | 10.11 | (0.00 | ) | (0.32 | ) | (0.32 | ) | – | (1.05 | ) | (1.05 | ) | – | 8.74 | (2.95 | ) | 68,898 | 1.22 | 1.22 | 1.22 | (0.03 | ) | 39 | ||||||||||||||||||||||||||||||||||||||||
| 2013 | 8.85 | (0.00 | ) | 2.71 | 2.71 | (0.03 | ) | (1.42 | ) | (1.45 | ) | – | 10.11 | 31.24 | 60,156 | 1.20 | 1.20 | 1.20 | (0.07 | ) | 31 | ||||||||||||||||||||||||||||||||||||||||||
| Royce Small-Cap Leaders Fund–Service Class | |||||||||||||||||||||||||||||||||||||||||||||||||||||||||||||||
| 2017 | $ | 7.03 | $ | 0.03 | $ | 0.66 | $ | 0.69 | $ | (0.03 | ) | $ | (1.10 | ) | $ | (1.13 | ) | $ | – | $ | 6.59 | 10.15 | % | $ | 38,864 | 1.59 | % | 1.59 | % | 1.49 | % | 0.31 | % | 74 | % | ||||||||||||||||||||||||||||
| 2016 | 6.21 | 0.03 | 1.56 | 1.59 | (0.04 | ) | (0.73 | ) | (0.77 | ) | – | 7.03 | 25.51 | 50,523 | 1.58 | 1.58 | 1.49 | 0.37 | 65 | ||||||||||||||||||||||||||||||||||||||||||||
| 2015 | 8.65 | 0.02 | (1.09 | ) | (1.07 | ) | (0.01 | ) | (1.36 | ) | (1.37 | ) | – | 6.21 | (12.50 | ) | 57,729 | 1.54 | 1.54 | 1.49 | 0.18 | 64 | |||||||||||||||||||||||||||||||||||||||||
| 2014 | 10.05 | (0.04 | ) | (0.31 | ) | (0.35 | ) | – | (1.05 | ) | (1.05 | ) | – | 8.65 | (3.26 | ) | 149,736 | 1.52 | 1.52 | 1.50 | (0.39 | ) | 39 | ||||||||||||||||||||||||||||||||||||||||
| 2013 | 8.81 | (0.04 | ) | 2.70 | 2.66 | (0.00 | ) | (1.42 | ) | (1.42 | ) | – | 10.05 | 30.85 | 231,879 | 1.50 | 1.50 | 1.48 | (0.36 | ) | 31 | ||||||||||||||||||||||||||||||||||||||||||
| Royce Small-Cap Leaders Fund–R Class | |||||||||||||||||||||||||||||||||||||||||||||||||||||||||||||||
| 2017 | $ | 9.73 | $ | (0.00 | ) | $ | 0.92 | $ | 0.92 | $ | – | $ | (1.52 | ) | $ | (1.52 | ) | $ | – | $ | 9.13 | 9.81 | % | $ | 1,819 | 2.61 | % | 2.60 | % | 1.84 | % | (0.03 | )% | 74 | % | ||||||||||||||||||||||||||||
| 2016 | 8.36 | (0.00 | ) | 2.11 | 2.11 | (0.01 | ) | (0.73 | ) | (0.74 | ) | – | 9.73 | 25.18 | 1,871 | 2.74 | 2.74 | 1.84 | (0.01 | ) | 65 | ||||||||||||||||||||||||||||||||||||||||||
| 2015 | 11.14 | (0.02 | ) | (1.40 | ) | (1.42 | ) | – | (1.36 | ) | (1.36 | ) | – | 8.36 | (12.84 | ) | 1,681 | 2.75 | 2.75 | 1.84 | (0.22 | ) | 64 | ||||||||||||||||||||||||||||||||||||||||
| 2014 | 12.67 | (0.09 | ) | (0.39 | ) | (0.48 | ) | – | (1.05 | ) | (1.05 | ) | – | 11.14 | (3.61 | ) | 1,983 | 2.23 | 2.23 | 1.84 | (0.73 | ) | 39 | ||||||||||||||||||||||||||||||||||||||||
| 2013 | 10.84 | (0.09 | ) | 3.34 | 3.25 | – | (1.42 | ) | (1.42 | ) | – | 12.67 | 30.45 | 2,807 | 2.28 | 2.28 | 1.84 | (0.72 | ) | 31 | |||||||||||||||||||||||||||||||||||||||||||
| Royce Small-Cap Value Fund–Investment Class | |||||||||||||||||||||||||||||||||||||||||||||||||||||||||||||||
| 2017 | $ | 10.03 | $ | 0.04 | $ | 0.50 | $ | 0.54 | $ | (0.06 | ) | $ | (0.35 | ) | $ | (0.41 | ) | $ | – | $ | 10.16 | 5.49 | % | $ | 66,094 | 1.26 | % | 1.25 | % | 1.24 | % | 0.44 | % | 61 | % | ||||||||||||||||||||||||||||
| 2016 | 8.74 | 0.08 | 1.79 | 1.87 | (0.08 | ) | (0.50 | ) | (0.58 | ) | – | 10.03 | 21.37 | 72,863 | 1.24 | 1.24 | 1.24 | 0.72 | 56 | ||||||||||||||||||||||||||||||||||||||||||||
| 2015 | 11.81 | 0.10 | (1.43 | ) | (1.33 | ) | (0.09 | ) | (1.65 | ) | (1.74 | ) | – | 8.74 | (11.25 | ) | 77,821 | 1.23 | 1.23 | 1.23 | 0.69 | 60 | |||||||||||||||||||||||||||||||||||||||||
| 2014 | 13.52 | 0.04 | (0.05 | ) | (0.01 | ) | (0.03 | ) | (1.67 | ) | (1.70 | ) | – | 11.81 | 0.27 | 140,163 | 1.18 | 1.18 | 1.18 | 0.32 | 38 | ||||||||||||||||||||||||||||||||||||||||||
| 2013 | 11.37 | 0.02 | 3.13 | 3.15 | (0.03 | ) | (0.97 | ) | (1.00 | ) | – | 13.52 | 28.06 | 196,854 | 1.21 | 1.21 | 1.21 | 0.11 | 51 | ||||||||||||||||||||||||||||||||||||||||||||
| Royce Small-Cap Value Fund–Service Class | |||||||||||||||||||||||||||||||||||||||||||||||||||||||||||||||
| 2017 | $ | 9.98 | $ | 0.02 | $ | 0.50 | $ | 0.52 | $ | (0.03 | ) | $ | (0.35 | ) | $ | (0.38 | ) | $ | – | $ | 10.12 | 5.27 | % | $ | 152,232 | 1.51 | % | 1.51 | % | 1.49 | % | 0.17 | % | 61 | % | ||||||||||||||||||||||||||||
| 2016 | 8.70 | 0.05 | 1.79 | 1.84 | (0.06 | ) | (0.50 | ) | (0.56 | ) | – | 9.98 | 21.06 | 213,067 | 1.49 | 1.49 | 1.48 | 0.48 | 56 | ||||||||||||||||||||||||||||||||||||||||||||
| 2015 | 11.76 | 0.06 | (1.41 | ) | (1.35 | ) | (0.06 | ) | (1.65 | ) | (1.71 | ) | – | 8.70 | (11.51 | ) | 252,814 | 1.48 | 1.48 | 1.48 | 0.45 | 60 | |||||||||||||||||||||||||||||||||||||||||
| 2014 | 13.48 | 0.01 | (0.06 | ) | (0.05 | ) | – | (1.67 | ) | (1.67 | ) | – | 11.76 | (0.02 | ) | 477,999 | 1.45 | 1.45 | 1.45 | 0.04 | 38 | ||||||||||||||||||||||||||||||||||||||||||
| 2013 | 11.34 | (0.02 | ) | 3.13 | 3.11 | – | (0.97 | ) | (0.97 | ) | – | 13.48 | 27.76 | 680,674 | 1.48 | 1.48 | 1.48 | (0.17 | ) | 51 | |||||||||||||||||||||||||||||||||||||||||||
| THE ACCOMPANYING NOTES ARE AN INTEGRAL PART OF THESE FINANCIAL STATEMENTS | The Royce Funds 2017 Annual Report to Shareholders | 99 |
Financial Highlights
This table is presented to show selected data for a share outstanding throughout each year or other indicated period and to assist shareholders in evaluating a Fund’s performance for the periods presented. Per share amounts have been determined on the basis of the weighted average number of shares outstanding during the period.
| Ratio of Expenses to Average Net Assets | |||||||||||||||||||||||||||||||||||||||||||||||||||||||||||||||
| Net Asset Value, Beginning of Period | Net Investment Income (Loss) | Net Realized and Unrealized Gain (Loss) on Investments and Foreign Currency | Total from Investment Operations | Distributions from Net Investment Income | Distributions from Net Realized Gain on Investments and Foreign Currency | Total Distributions | Shareholder Redemption Fees | Net Asset Value, End of Period | Total Return | Net Assets, End of Period (in thousands) | Prior to Fee Waivers, Expense Reimbursements and Balance Credits | Prior to Fee Waivers and Expense Reimbursements | Net of Fee Waivers and Expense Reimbursements | Ratio of Net Investment Income (Loss) to Average Net Assets | Portfolio Turnover Rate | ||||||||||||||||||||||||||||||||||||||||||||||||
| Royce Small-Cap Value Fund–Consultant Class | |||||||||||||||||||||||||||||||||||||||||||||||||||||||||||||||
| 2017 | $ | 8.98 | $ | (0.06 | ) | $ | 0.45 | $ | 0.39 | $ | – | $ | (0.31 | ) | $ | (0.31 | ) | $ | – | $ | 9.06 | 4.44 | % | $ | 13,111 | 2.32 | % | 2.32 | % | 2.32 | % | (0.66 | )% | 61 | % | ||||||||||||||||||||||||||||
| 2016 | 7.89 | (0.03 | ) | 1.62 | 1.59 | – | (0.50 | ) | (0.50 | ) | – | 8.98 | 20.10 | 16,484 | 2.28 | 2.28 | 2.28 | (0.33 | ) | 56 | |||||||||||||||||||||||||||||||||||||||||||
| 2015 | 10.87 | (0.04 | ) | (1.29 | ) | (1.33 | ) | – | (1.65 | ) | (1.65 | ) | – | 7.89 | (12.24 | ) | 18,404 | 2.27 | 2.27 | 2.27 | (0.36 | ) | 60 | ||||||||||||||||||||||||||||||||||||||||
| 2014 | 12.68 | (0.09 | ) | (0.05 | ) | (0.14 | ) | – | (1.67 | ) | (1.67 | ) | – | 10.87 | (0.74 | ) | 26,716 | 2.21 | 2.21 | 2.21 | (0.71 | ) | 38 | ||||||||||||||||||||||||||||||||||||||||
| 2013 | 10.81 | (0.12 | ) | 2.96 | 2.84 | – | (0.97 | ) | (0.97 | ) | – | 12.68 | 26.61 | 31,604 | 2.29 | 2.29 | 2.29 | (0.97 | ) | 51 | |||||||||||||||||||||||||||||||||||||||||||
| Royce Small-Cap Value Fund–Institutional Class | |||||||||||||||||||||||||||||||||||||||||||||||||||||||||||||||
| 2017 | $ | 10.03 | $ | 0.07 | $ | 0.59 | $ | 0.66 | $ | (0.02 | ) | $ | (0.35 | ) | $ | (0.37 | ) | $ | – | $ | 10.32 | 6.72 | % | $ | 3,658 | 1.09 | % | 1.09 | % | 1.09 | % | 0.53 | % | 61 | % | ||||||||||||||||||||||||||||
| 2016 | 8.74 | 0.10 | 1.79 | 1.89 | (0.10 | ) | (0.50 | ) | (0.60 | ) | – | 10.03 | 21.54 | 127,741 | 1.08 | 1.08 | 1.08 | 0.86 | 56 | ||||||||||||||||||||||||||||||||||||||||||||
| 2015 | 11.81 | 0.10 | (1.40 | ) | (1.30 | ) | (0.12 | ) | (1.65 | ) | (1.77 | ) | – | 8.74 | (11.05 | ) | 148,652 | 1.06 | 1.06 | 1.06 | 0.83 | 60 | |||||||||||||||||||||||||||||||||||||||||
| 2014 | 13.53 | 0.06 | (0.06 | ) | 0.00 | (0.05 | ) | (1.67 | ) | (1.72 | ) | – | 11.81 | 0.35 | 196,543 | 1.05 | 1.05 | 1.05 | 0.46 | 38 | |||||||||||||||||||||||||||||||||||||||||||
| 2013 | 11.38 | 0.04 | 3.13 | 3.17 | (0.05 | ) | (0.97 | ) | (1.02 | ) | – | 13.53 | 28.22 | 219,667 | 1.05 | 1.05 | 1.05 | 0.27 | 51 | ||||||||||||||||||||||||||||||||||||||||||||
| Royce Small-Cap Value Fund–R Class | |||||||||||||||||||||||||||||||||||||||||||||||||||||||||||||||
| 2017 | $ | 9.63 | $ | (0.02 | ) | $ | 0.48 | $ | 0.46 | $ | – | $ | (0.34 | ) | $ | (0.34 | ) | $ | – | $ | 9.75 | 4.81 | % | $ | 14,620 | 1.88 | % | 1.88 | % | 1.88 | % | (0.21 | )% | 61 | % | ||||||||||||||||||||||||||||
| 2016 | 8.42 | 0.01 | 1.73 | 1.74 | (0.03 | ) | (0.50 | ) | (0.53 | ) | – | 9.63 | 20.60 | 18,059 | 1.85 | 1.85 | 1.85 | 0.11 | 56 | ||||||||||||||||||||||||||||||||||||||||||||
| 2015 | 11.43 | 0.01 | (1.35 | ) | (1.34 | ) | (0.02 | ) | (1.65 | ) | (1.67 | ) | – | 8.42 | (11.71 | ) | 19,200 | 1.83 | 1.83 | 1.83 | 0.09 | 60 | |||||||||||||||||||||||||||||||||||||||||
| 2014 | 13.19 | (0.03 | ) | (0.06 | ) | (0.09 | ) | – | (1.67 | ) | (1.67 | ) | – | 11.43 | (0.34 | ) | 31,043 | 1.77 | 1.77 | 1.77 | (0.26 | ) | 38 | ||||||||||||||||||||||||||||||||||||||||
| 2013 | 11.16 | (0.06 | ) | 3.06 | 3.00 | – | (0.97 | ) | (0.97 | ) | – | 13.19 | 27.21 | 37,409 | 1.83 | 1.83 | 1.83 | (0.52 | ) | 51 | |||||||||||||||||||||||||||||||||||||||||||
| Royce Small-Cap Value Fund–K Class | |||||||||||||||||||||||||||||||||||||||||||||||||||||||||||||||
| 2017 | $ | 6.93 | $ | (0.02 | ) | $ | 0.34 | $ | 0.32 | $ | (0.01 | ) | $ | (0.24 | ) | $ | (0.25 | ) | $ | – | $ | 7.00 | 4.72 | % | $ | 1,963 | 2.42 | % | 2.41 | % | 1.99 | % | (0.32 | )% | 61 | % | |||||||||||||||||||||||||||
| 2016 | 6.17 | 0.00 | 1.27 | 1.27 | (0.01 | ) | (0.50 | ) | (0.51 | ) | – | 6.93 | 20.52 | 2,966 | 1.95 | 1.95 | 1.95 | (0.04 | ) | 56 | |||||||||||||||||||||||||||||||||||||||||||
| 2015 | 8.90 | 0.02 | (1.06 | ) | (1.04 | ) | (0.04 | ) | (1.65 | ) | (1.69 | ) | – | 6.17 | (11.69 | ) | 6,026 | 1.80 | 1.80 | 1.80 | 0.11 | 60 | |||||||||||||||||||||||||||||||||||||||||
| 2014 | 10.65 | (0.02 | ) | (0.06 | ) | (0.08 | ) | – | (1.67 | ) | (1.67 | ) | – | 8.90 | (0.32 | ) | 9,363 | 1.67 | 1.67 | 1.67 | (0.18 | ) | 38 | ||||||||||||||||||||||||||||||||||||||||
| 2013 | 9.14 | (0.03 | ) | 2.51 | 2.48 | – | (0.97 | ) | (0.97 | ) | – | 10.65 | 27.55 | 16,285 | 1.62 | 1.62 | 1.62 | (0.30 | ) | 51 | |||||||||||||||||||||||||||||||||||||||||||
| Royce Small/Mid-Cap Premier Fund–Investment Class | |||||||||||||||||||||||||||||||||||||||||||||||||||||||||||||||
| 2017 | $ | 14.64 | $ | 0.05 | $ | 3.05 | $ | 3.10 | $ | (0.03 | ) | $ | (2.05 | ) | $ | (2.08 | ) | $ | – | $ | 15.66 | 21.47 | % | $ | 81,549 | 0.99 | % | 0.99 | % | 0.99 | % | 0.29 | % | 54 | % | ||||||||||||||||||||||||||||
| 2016 | 12.87 | 0.04 | 2.30 | 2.34 | (0.06 | ) | (0.51 | ) | (0.57 | ) | – | 14.64 | 18.12 | 88,378 | 1.02 | 1.02 | 1.02 | 0.22 | 67 | ||||||||||||||||||||||||||||||||||||||||||||
| 2015 | 15.21 | 0.12 | (1.09 | ) | (0.97 | ) | (0.11 | ) | (1.26 | ) | (1.37 | ) | – | 12.87 | (6.33 | ) | 89,766 | 1.10 | 1.10 | 1.10 | 0.54 | 66 | |||||||||||||||||||||||||||||||||||||||||
| 2014 | 16.24 | 0.10 | (0.25 | ) | (0.15 | ) | (0.05 | ) | (0.83 | ) | (0.88 | ) | – | 15.21 | (0.81 | ) | 160,558 | 1.09 | 1.09 | 1.09 | 0.66 | 35 | |||||||||||||||||||||||||||||||||||||||||
| 2013 | 14.48 | 0.03 | 3.71 | 3.74 | (0.05 | ) | (1.93 | ) | (1.98 | ) | – | 16.24 | 26.37 | 117,306 | 1.13 | 1.13 | 1.13 | 0.36 | 79 | ||||||||||||||||||||||||||||||||||||||||||||
| Royce Small/Mid-Cap Premier Fund–Service Class | |||||||||||||||||||||||||||||||||||||||||||||||||||||||||||||||
| 2017 | $ | 14.60 | $ | 0.02 | $ | 3.03 | $ | 3.05 | $ | – | $ | (2.04 | ) | $ | (2.04 | ) | $ | – | $ | 15.61 | 21.21 | % | $ | 112,520 | 1.32 | % | 1.32 | % | 1.19 | % | 0.10 | % | 54 | % | |||||||||||||||||||||||||||||
| 2016 | 12.84 | 0.00 | 2.30 | 2.30 | (0.03 | ) | (0.51 | ) | (0.54 | ) | – | 14.60 | 17.84 | 120,254 | 1.36 | 1.36 | 1.25 | (0.01 | ) | 67 | |||||||||||||||||||||||||||||||||||||||||||
| 2015 | 15.17 | 0.05 | (1.05 | ) | (1.00 | ) | (0.07 | ) | (1.26 | ) | (1.33 | ) | – | 12.84 | (6.53 | ) | 120,381 | 1.46 | 1.46 | 1.35 | 0.31 | 66 | |||||||||||||||||||||||||||||||||||||||||
| 2014 | 16.20 | 0.05 | (0.25 | ) | (0.20 | ) | – | (0.83 | ) | (0.83 | ) | – | 15.17 | (1.14 | ) | 175,433 | 1.43 | 1.43 | 1.40 | 0.32 | 35 | ||||||||||||||||||||||||||||||||||||||||||
| 2013 | 14.45 | 0.00 | 3.68 | 3.68 | (0.00 | ) | (1.93 | ) | (1.93 | ) | – | 16.20 | 25.99 | 223,533 | 1.45 | 1.45 | 1.42 | 0.02 | 79 | ||||||||||||||||||||||||||||||||||||||||||||
| 100 | The Royce Funds 2017 Annual Report to Shareholders | THE ACCOMPANYING NOTES ARE AN INTEGRAL PART OF THESE FINANCIAL STATEMENTS |
Financial Highlights
This table is presented to show selected data for a share outstanding throughout each year or other indicated period and to assist shareholders in evaluating a Fund’s performance for the periods presented. Per share amounts have been determined on the basis of the weighted average number of shares outstanding during the period.
| Ratio of Expenses to Average Net Assets | |||||||||||||||||||||||||||||||||||||||||||||||||||||||||||||||
| Net Asset Value, Beginning of Period | Net Investment Income (Loss) | Net Realized and Unrealized Gain (Loss) on Investments and Foreign Currency | Total from Investment Operations | Distributions from Net Investment Income | Distributions from Net Realized Gain on Investments and Foreign Currency | Total Distributions | Shareholder Redemption Fees | Net Asset Value, End of Period | Total Return | Net Assets, End of Period (in thousands) | Prior to Fee Waivers, Expense Reimbursements and Balance Credits | Prior to Fee Waivers and Expense Reimbursements | Net of Fee Waivers and Expense Reimbursements | Ratio of Net Investment Income (Loss) to Average Net Assets | Portfolio Turnover Rate | ||||||||||||||||||||||||||||||||||||||||||||||||
| Royce Small/Mid-Cap Premier Fund–Consultant Class | |||||||||||||||||||||||||||||||||||||||||||||||||||||||||||||||
| 2017 | $ | 10.44 | $ | (0.09 | ) | $ | 2.16 | $ | 2.07 | $ | – | $ | (1.45 | ) | $ | (1.45 | ) | $ | – | $ | 11.06 | 20.10 | % | $ | 10,328 | 2.24 | % | 2.24 | % | 2.09 | % | (0.81 | )% | 54 | % | ||||||||||||||||||||||||||||
| 2016 | 9.37 | (0.09 | ) | 1.67 | 1.58 | – | (0.51 | ) | (0.51 | ) | – | 10.44 | 16.78 | 11,643 | 2.28 | 2.28 | 2.14 | (0.89 | ) | 67 | |||||||||||||||||||||||||||||||||||||||||||
| 2015 | 11.47 | (0.06 | ) | (0.78 | ) | (0.84 | ) | – | (1.26 | ) | (1.26 | ) | – | 9.37 | (7.31 | ) | 11,369 | 2.41 | 2.41 | 2.24 | (0.58 | ) | 66 | ||||||||||||||||||||||||||||||||||||||||
| 2014 | 12.57 | (0.07 | ) | (0.20 | ) | (0.27 | ) | – | (0.83 | ) | (0.83 | ) | – | 11.47 | (2.02 | ) | 13,338 | 2.31 | 2.31 | 2.31 | (0.59 | ) | 35 | ||||||||||||||||||||||||||||||||||||||||
| 2013 | 11.68 | (0.12 | ) | 2.94 | 2.82 | – | (1.93 | ) | (1.93 | ) | – | 12.57 | 24.73 | 15,942 | 2.37 | 2.37 | 2.37 | (0.93 | ) | 79 | |||||||||||||||||||||||||||||||||||||||||||
| Royce Small/Mid-Cap Premier Fund–R Class | |||||||||||||||||||||||||||||||||||||||||||||||||||||||||||||||
| 2017 | $ | 9.54 | $ | (0.04 | ) | $ | 1.98 | $ | 1.94 | $ | – | $ | (1.33 | ) | $ | (1.33 | ) | $ | – | $ | 10.15 | 20.61 | % | $ | 2,208 | 2.25 | % | 2.24 | % | 1.69 | % | (0.41 | )% | 54 | % | ||||||||||||||||||||||||||||
| 2016 | 8.56 | (0.05 | ) | 1.54 | 1.49 | – | (0.51 | ) | (0.51 | ) | – | 9.54 | 17.32 | 1,945 | 2.27 | 2.27 | 1.74 | (0.51 | ) | 67 | |||||||||||||||||||||||||||||||||||||||||||
| 2015 | 10.60 | (0.02 | ) | (0.73 | ) | (0.75 | ) | (0.03 | ) | (1.26 | ) | (1.29 | ) | – | 8.56 | (7.00 | ) | 2,339 | 2.20 | 2.20 | 1.84 | (0.19 | ) | 66 | |||||||||||||||||||||||||||||||||||||||
| 2014 | 11.63 | (0.02 | ) | (0.18 | ) | (0.20 | ) | – | (0.83 | ) | (0.83 | ) | – | 10.60 | (1.59 | ) | 3,727 | 1.89 | 1.89 | 1.84 | (0.14 | ) | 35 | ||||||||||||||||||||||||||||||||||||||||
| 2013 | 10.86 | (0.05 | ) | 2.75 | 2.70 | – | (1.93 | ) | (1.93 | ) | – | 11.63 | 25.51 | 6,805 | 1.90 | 1.90 | 1.84 | (0.39 | ) | 79 | |||||||||||||||||||||||||||||||||||||||||||
| Royce Smaller-Companies Growth Fund–Investment Class | |||||||||||||||||||||||||||||||||||||||||||||||||||||||||||||||
| 2017 | $ | 11.22 | $ | (0.09 | ) | $ | 2.08 | $ | 1.99 | $ | – | $ | (2.28 | ) | $ | (2.28 | ) | $ | – | $ | 10.93 | 18.20 | % | $ | 119,745 | 1.19 | % | 1.19 | % | 1.19 | % | (0.67 | )% | 64 | % | ||||||||||||||||||||||||||||
| 2016 | 11.36 | (0.05 | ) | 1.17 | 1.12 | – | (1.26 | ) | (1.26 | ) | – | 11.22 | 9.67 | 98,962 | 1.15 | 1.15 | 1.15 | (0.41 | ) | 59 | |||||||||||||||||||||||||||||||||||||||||||
| 2015 | 14.36 | (0.06 | ) | (0.19 | ) | (0.25 | ) | – | (2.75 | ) | (2.75 | ) | – | 11.36 | (1.59 | ) | 139,979 | 1.32 | 1.32 | 1.24 | (0.38 | ) | 45 | ||||||||||||||||||||||||||||||||||||||||
| 2014 | 17.03 | (0.07 | ) | 0.68 | 0.61 | – | (3.28 | ) | (3.28 | ) | – | 14.36 | 4.04 | 295,412 | 1.33 | 1.33 | 1.33 | (0.40 | ) | 52 | |||||||||||||||||||||||||||||||||||||||||||
| 2013 | 13.90 | (0.09 | ) | 4.57 | 4.48 | (0.00 | ) | (1.35 | ) | (1.35 | ) | – | 17.03 | 32.59 | 244,269 | 1.37 | 1.37 | 1.37 | (0.59 | ) | 45 | ||||||||||||||||||||||||||||||||||||||||||
| Royce Smaller-Companies Growth Fund–Service Class | |||||||||||||||||||||||||||||||||||||||||||||||||||||||||||||||
| 2017 | $ | 11.01 | $ | (0.12 | ) | $ | 2.03 | $ | 1.91 | $ | – | $ | (2.23 | ) | $ | (2.23 | ) | $ | – | $ | 10.69 | 17.80 | % | $ | 228,008 | 1.49 | % | 1.49 | % | 1.47 | % | (0.96 | )% | 64 | % | ||||||||||||||||||||||||||||
| 2016 | 11.20 | (0.08 | ) | 1.15 | 1.07 | – | (1.26 | ) | (1.26 | ) | – | 11.01 | 9.37 | 284,640 | 1.51 | 1.51 | 1.49 | (0.74 | ) | 59 | |||||||||||||||||||||||||||||||||||||||||||
| 2015 | 14.23 | (0.08 | ) | (0.20 | ) | (0.28 | ) | – | (2.75 | ) | (2.75 | ) | – | 11.20 | (1.82 | ) | 408,744 | 1.47 | 1.47 | 1.45 | (0.58 | ) | 45 | ||||||||||||||||||||||||||||||||||||||||
| 2014 | 16.93 | (0.09 | ) | 0.67 | 0.58 | – | (3.28 | ) | (3.28 | ) | – | 14.23 | 3.89 | 572,899 | 1.44 | 1.44 | 1.42 | (0.51 | ) | 52 | |||||||||||||||||||||||||||||||||||||||||||
| 2013 | 13.83 | (0.11 | ) | 4.56 | 4.45 | – | (1.35 | ) | (1.35 | ) | – | 16.93 | 32.52 | 835,379 | 1.48 | 1.48 | 1.46 | (0.69 | ) | 45 | |||||||||||||||||||||||||||||||||||||||||||
| Royce Smaller-Companies Growth Fund–Consultant Class | |||||||||||||||||||||||||||||||||||||||||||||||||||||||||||||||
| 2017 | $ | 9.63 | $ | (0.18 | ) | $ | 1.77 | $ | 1.59 | $ | – | $ | (1.94 | ) | $ | (1.94 | ) | $ | – | $ | 9.28 | 16.92 | % | $ | 10,119 | 2.36 | % | 2.36 | % | 2.24 | % | (1.73 | )% | 64 | % | ||||||||||||||||||||||||||||
| 2016 | 10.01 | (0.14 | ) | 1.02 | 0.88 | – | (1.26 | ) | (1.26 | ) | – | 9.63 | 8.58 | 10,593 | 2.35 | 2.35 | 2.24 | (1.50 | ) | 59 | |||||||||||||||||||||||||||||||||||||||||||
| 2015 | 13.12 | (0.18 | ) | (0.18 | ) | (0.36 | ) | – | (2.75 | ) | (2.75 | ) | – | 10.01 | (2.61 | ) | 14,411 | 2.32 | 2.32 | 2.24 | (1.36 | ) | 45 | ||||||||||||||||||||||||||||||||||||||||
| 2014 | 15.99 | (0.22 | ) | 0.63 | 0.41 | – | (3.28 | ) | (3.28 | ) | – | 13.12 | 3.05 | 17,158 | 2.29 | 2.29 | 2.29 | (1.37 | ) | 52 | |||||||||||||||||||||||||||||||||||||||||||
| 2013 | 13.24 | (0.24 | ) | 4.34 | 4.10 | – | (1.35 | ) | (1.35 | ) | – | 15.99 | 31.31 | 22,614 | 2.36 | 2.36 | 2.36 | (1.58 | ) | 45 | |||||||||||||||||||||||||||||||||||||||||||
| Royce Smaller-Companies Growth Fund–Institutional Class | |||||||||||||||||||||||||||||||||||||||||||||||||||||||||||||||
| 2017 | $ | 11.35 | $ | (0.09 | ) | $ | 2.11 | $ | 2.02 | $ | – | $ | (2.31 | ) | $ | (2.31 | ) | $ | – | $ | 11.06 | 18.23 | % | $ | 9,315 | 1.21 | % | 1.21 | % | 1.21 | % | (0.70 | )% | 64 | % | ||||||||||||||||||||||||||||
| 2016 | 11.48 | (0.05 | ) | 1.18 | 1.13 | – | (1.26 | ) | (1.26 | ) | – | 11.35 | 9.66 | 20,523 | 1.15 | 1.15 | 1.15 | (0.41 | ) | 59 | |||||||||||||||||||||||||||||||||||||||||||
| 2015 | 14.46 | (0.03 | ) | (0.20 | ) | (0.23 | ) | – | (2.75 | ) | (2.75 | ) | – | 11.48 | (1.45 | ) | 39,763 | 1.10 | 1.10 | 1.10 | (0.22 | ) | 45 | ||||||||||||||||||||||||||||||||||||||||
| 2014 | 17.09 | (0.03 | ) | 0.68 | 0.65 | – | (3.28 | ) | (3.28 | ) | – | 14.46 | 4.26 | 38,718 | 1.06 | 1.06 | 1.06 | (0.16 | ) | 52 | |||||||||||||||||||||||||||||||||||||||||||
| 2013 | 13.94 | (0.03 | ) | 4.57 | 4.54 | (0.04 | ) | (1.35 | ) | (1.39 | ) | – | 17.09 | 32.99 | 142,923 | 1.07 | 1.07 | 1.07 | (0.30 | ) | 45 | ||||||||||||||||||||||||||||||||||||||||||
| THE ACCOMPANYING NOTES ARE AN INTEGRAL PART OF THESE FINANCIAL STATEMENTS | The Royce Funds 2017 Annual Report to Shareholders | 101 |
Financial Highlights
This table is presented to show selected data for a share outstanding throughout each year or other indicated period and to assist shareholders in evaluating a Fund’s performance for the periods presented. Per share amounts have been determined on the basis of the weighted average number of shares outstanding during the period.
| Ratio of Expenses to Average Net Assets | |||||||||||||||||||||||||||||||||||||||||||||||||||||||||||||||
| Net Asset Value, Beginning of Period | Net Investment Income (Loss) | Net Realized and Unrealized Gain (Loss) on Investments and Foreign Currency | Total from Investment Operations | Distributions from Net Investment Income | Distributions from Net Realized Gain on Investments and Foreign Currency | Total Distributions | Shareholder Redemption Fees | Net Asset Value, End of Period | Total Return | Net Assets, End of Period (in thousands) | Prior to Fee Waivers, Expense Reimbursements and Balance Credits | Prior to Fee Waivers and Expense Reimbursements | Net of Fee Waivers and Expense Reimbursements | Ratio of Net Investment Income (Loss) to Average Net Assets | Portfolio Turnover Rate | ||||||||||||||||||||||||||||||||||||||||||||||||
| Royce Smaller-Companies Growth Fund–R Class | |||||||||||||||||||||||||||||||||||||||||||||||||||||||||||||||
| 2017 | $ | 10.28 | $ | (0.15 | ) | $ | 1.90 | $ | 1.75 | $ | – | $ | (2.08 | ) | $ | (2.08 | ) | $ | – | $ | 9.95 | 17.44 | % | $ | 593 | 3.36 | % | 3.35 | % | 1.84 | % | (1.33 | )% | 64 | % | ||||||||||||||||||||||||||||
| 2016 | 10.57 | (0.11 | ) | 1.08 | 0.97 | – | (1.26 | ) | (1.26 | ) | – | 10.28 | 8.97 | 793 | 3.33 | 3.33 | 1.84 | (1.10 | ) | 59 | |||||||||||||||||||||||||||||||||||||||||||
| 2015 | 13.64 | (0.14 | ) | (0.18 | ) | (0.32 | ) | – | (2.75 | ) | (2.75 | ) | – | 10.57 | (2.20 | ) | 886 | 2.99 | 2.99 | 1.84 | (0.97 | ) | 45 | ||||||||||||||||||||||||||||||||||||||||
| 2014 | 16.43 | (0.15 | ) | 0.64 | 0.49 | – | (3.28 | ) | (3.28 | ) | – | 13.64 | 3.45 | 1,360 | 2.35 | 2.35 | 1.84 | (0.93 | ) | 52 | |||||||||||||||||||||||||||||||||||||||||||
| 2013 | 13.51 | (0.16 | ) | 4.43 | 4.27 | – | (1.35 | ) | (1.35 | ) | – | 16.43 | 31.95 | 1,605 | 2.41 | 2.41 | 1.84 | (1.06 | ) | 45 | |||||||||||||||||||||||||||||||||||||||||||
| Royce Special Equity Fund–Investment Class | |||||||||||||||||||||||||||||||||||||||||||||||||||||||||||||||
| 2017 | $ | 22.02 | $ | 0.13 | $ | 1.56 | $ | 1.69 | $ | (0.12 | ) | $ | (1.80 | ) | $ | (1.92 | ) | $ | – | $ | 21.79 | 7.87 | % | $ | 1,142,224 | 1.17 | % | 1.17 | % | 1.17 | % | 0.54 | % | 15 | % | ||||||||||||||||||||||||||||
| 2016 | 17.94 | 0.21 | 5.57 | 5.78 | (0.21 | ) | (1.49 | ) | (1.70 | ) | – | 22.02 | 32.21 | 1,225,095 | 1.17 | 1.17 | 1.17 | 0.99 | 29 | ||||||||||||||||||||||||||||||||||||||||||||
| 2015 | 22.86 | 0.22 | (3.04 | ) | (2.82 | ) | (0.24 | ) | (1.86 | ) | (2.10 | ) | – | 17.94 | (12.36 | ) | 1,098,106 | 1.15 | 1.15 | 1.15 | 0.80 | 15 | |||||||||||||||||||||||||||||||||||||||||
| 2014 | 25.02 | 0.13 | 0.09 | 0.22 | (0.12 | ) | (2.26 | ) | (2.38 | ) | – | 22.86 | 1.09 | 1,950,211 | 1.12 | 1.12 | 1.12 | 0.47 | 21 | ||||||||||||||||||||||||||||||||||||||||||||
| 2013 | 21.13 | 0.03 | 6.09 | 6.12 | (0.03 | ) | (2.20 | ) | (2.23 | ) | – | 25.02 | 29.36 | 2,510,346 | 1.13 | 1.13 | 1.13 | 0.13 | 28 | ||||||||||||||||||||||||||||||||||||||||||||
| Royce Special Equity Fund–Service Class | |||||||||||||||||||||||||||||||||||||||||||||||||||||||||||||||
| 2017 | $ | 21.98 | $ | 0.08 | $ | 1.56 | $ | 1.64 | $ | (0.07 | ) | $ | (1.79 | ) | $ | (1.86 | ) | $ | – | $ | 21.76 | 7.66 | % | $ | 108,001 | 1.50 | % | 1.50 | % | 1.39 | % | 0.32 | % | 15 | % | ||||||||||||||||||||||||||||
| 2016 | 17.92 | 0.16 | 5.56 | 5.72 | (0.17 | ) | (1.49 | ) | (1.66 | ) | – | 21.98 | 31.92 | 128,102 | 1.50 | 1.50 | 1.39 | 0.77 | 29 | ||||||||||||||||||||||||||||||||||||||||||||
| 2015 | 22.81 | 0.17 | (3.03 | ) | (2.86 | ) | (0.17 | ) | (1.86 | ) | (2.03 | ) | – | 17.92 | (12.55 | ) | 112,315 | 1.47 | 1.47 | 1.39 | 0.57 | 15 | |||||||||||||||||||||||||||||||||||||||||
| 2014 | 24.97 | 0.06 | 0.09 | 0.15 | (0.05 | ) | (2.26 | ) | (2.31 | ) | – | 22.81 | 0.80 | 233,791 | 1.44 | 1.44 | 1.39 | 0.20 | 21 | ||||||||||||||||||||||||||||||||||||||||||||
| 2013 | 21.12 | (0.03 | ) | 6.08 | 6.05 | – | (2.20 | ) | (2.20 | ) | – | 24.97 | 29.04 | 335,952 | 1.45 | 1.45 | 1.39 | (0.13 | ) | 28 | |||||||||||||||||||||||||||||||||||||||||||
| Royce Special Equity Fund–Consultant Class | |||||||||||||||||||||||||||||||||||||||||||||||||||||||||||||||
| 2017 | $ | 20.16 | $ | (0.10 | ) | $ | 1.43 | $ | 1.33 | $ | – | $ | (1.63 | ) | $ | (1.63 | ) | $ | – | $ | 19.86 | 6.77 | % | $ | 46,654 | 2.21 | % | 2.20 | % | 2.20 | % | (0.49 | )% | 15 | % | ||||||||||||||||||||||||||||
| 2016 | 16.57 | (0.01 | ) | 5.13 | 5.12 | (0.04 | ) | (1.49 | ) | (1.53 | ) | – | 20.16 | 30.91 | 50,514 | 2.20 | 2.20 | 2.20 | (0.04 | ) | 29 | ||||||||||||||||||||||||||||||||||||||||||
| 2015 | 21.27 | (0.05 | ) | (2.76 | ) | (2.81 | ) | (0.03 | ) | (1.86 | ) | (1.89 | ) | – | 16.57 | (13.23 | ) | 42,427 | 2.18 | 2.18 | 2.18 | (0.24 | ) | 15 | |||||||||||||||||||||||||||||||||||||||
| 2014 | 23.57 | (0.13 | ) | 0.09 | (0.04 | ) | – | (2.26 | ) | (2.26 | ) | – | 21.27 | 0.04 | 63,981 | 2.14 | 2.14 | 2.14 | (0.56 | ) | 21 | ||||||||||||||||||||||||||||||||||||||||||
| 2013 | 20.20 | (0.21 | ) | 5.78 | 5.57 | – | (2.20 | ) | (2.20 | ) | – | 23.57 | 27.97 | 71,333 | 2.17 | 2.17 | 2.17 | (0.90 | ) | 28 | |||||||||||||||||||||||||||||||||||||||||||
| Royce Special Equity Fund–Institutional Class | |||||||||||||||||||||||||||||||||||||||||||||||||||||||||||||||
| 2017 | $ | 21.84 | $ | 0.14 | $ | 1.55 | $ | 1.69 | $ | (0.14 | ) | $ | (1.78 | ) | $ | (1.92 | ) | $ | – | $ | 21.61 | 7.96 | % | $ | 247,004 | 1.09 | % | 1.09 | % | 1.09 | % | 0.60 | % | 15 | % | ||||||||||||||||||||||||||||
| 2016 | 17.80 | 0.23 | 5.53 | 5.76 | (0.23 | ) | (1.49 | ) | (1.72 | ) | – | 21.84 | 32.35 | 206,270 | 1.07 | 1.07 | 1.07 | 1.10 | 29 | ||||||||||||||||||||||||||||||||||||||||||||
| 2015 | 22.71 | 0.33 | (3.12 | ) | (2.79 | ) | (0.26 | ) | (1.86 | ) | (2.12 | ) | – | 17.80 | (12.27 | ) | 208,952 | 1.04 | 1.04 | 1.04 | 1.02 | 15 | |||||||||||||||||||||||||||||||||||||||||
| 2014 | 24.88 | 0.14 | 0.10 | 0.24 | (0.15 | ) | (2.26 | ) | (2.41 | ) | – | 22.71 | 1.17 | 639,723 | 1.02 | 1.02 | 1.02 | 0.56 | 21 | ||||||||||||||||||||||||||||||||||||||||||||
| 2013 | 21.02 | 0.06 | 6.06 | 6.12 | (0.06 | ) | (2.20 | ) | (2.26 | ) | – | 24.88 | 29.51 | 700,200 | 1.01 | 1.01 | 1.01 | 0.26 | 28 | ||||||||||||||||||||||||||||||||||||||||||||
| Royce Special Equity Multi-Cap Fund–Investment Class | |||||||||||||||||||||||||||||||||||||||||||||||||||||||||||||||
| 2017 | $ | 13.90 | $ | 0.14 | $ | 2.04 | $ | 2.18 | $ | (0.15 | ) | $ | (0.30 | ) | $ | (0.45 | ) | $ | – | $ | 15.63 | 15.77 | % | $ | 41,081 | 1.04 | % | 1.04 | % | 0.99 | % | 0.96 | % | 28 | % | ||||||||||||||||||||||||||||
| 2016 | 12.34 | 0.17 | 1.55 | 1.72 | (0.16 | ) | – | (0.16 | ) | – | 13.90 | 13.92 | 34,858 | 1.02 | 1.02 | 0.97 | 1.15 | 50 | |||||||||||||||||||||||||||||||||||||||||||||
| 2015 | 15.55 | 0.40 | (2.48 | ) | (2.08 | ) | (0.35 | ) | (0.78 | ) | (1.13 | ) | – | 12.34 | (13.40 | ) | 43,999 | 1.01 | 1.01 | 0.99 | 1.49 | 31 | |||||||||||||||||||||||||||||||||||||||||
| 2014 | 14.92 | 0.10 | 1.30 | 1.40 | (0.11 | ) | (0.66 | ) | (0.77 | ) | – | 15.55 | 9.53 | 123,545 | 0.97 | 0.97 | 0.96 | 0.95 | 39 | ||||||||||||||||||||||||||||||||||||||||||||
| 2013 | 11.64 | 0.12 | 4.11 | 4.23 | (0.12 | ) | (0.83 | ) | (0.95 | ) | – | 14.92 | 36.62 | 62,387 | 1.16 | 1.16 | 1.15 | 0.93 | 44 | ||||||||||||||||||||||||||||||||||||||||||||
| 102 | The Royce Funds 2017 Annual Report to Shareholders | THE ACCOMPANYING NOTES ARE AN INTEGRAL PART OF THESE FINANCIAL STATEMENTS |
Financial Highlights
This table is presented to show selected data for a share outstanding throughout each year or other indicated period and to assist shareholders in evaluating a Fund’s performance for the periods presented. Per share amounts have been determined on the basis of the weighted average number of shares outstanding during the period.
| Ratio of Expenses to Average Net Assets | ||||||||||||||||||||||||||||||||||||||||||||||||||||||
| Net Asset Value, Beginning of Period | Net Investment Income (Loss) | Net Realized and Unrealized Gain (Loss) on Investments and Foreign Currency | Total from Investment Operations | Distributions from Net Investment Income | Distributions from Net Realized Gain on Investments and Foreign Currency | Total Distributions | Shareholder Redemption Fees | Net Asset Value, End of Period | Total Return | Net Assets, End of Period (in thousands) | Prior to Fee Waivers, Expense Reimbursements and Balance Credits | Prior to Fee Waivers and Expense Reimbursements | Net of Fee Waivers and Expense Reimbursements | Ratio of Net Investment Income (Loss) to Average Net Assets | Portfolio Turnover Rate | |||||||||||||||||||||||||||||||||||||||
| Royce Special Equity Multi-Cap Fund–Service Class | ||||||||||||||||||||||||||||||||||||||||||||||||||||||
| 2017 | $ | 13.95 | $ | 0.12 | $ | 2.02 | $ | 2.14 | $ | (0.10 | ) | $ | (0.30 | ) | $ | (0.40 | ) | $ | – | $ | 15.69 | 15.42 | % | $ | 24,182 | 1.39 | % | 1.39 | % | 1.24 | % | 0.68 | % | 28 | % | |||||||||||||||||||
| 2016 | 12.38 | 0.13 | 1.57 | 1.70 | (0.13 | ) | – | (0.13 | ) | – | 13.95 | 13.69 | 37,495 | 1.34 | 1.34 | 1.23 | 0.89 | 50 | ||||||||||||||||||||||||||||||||||||
| 2015 | 15.60 | 0.26 | (2.39 | ) | (2.13 | ) | (0.31 | ) | (0.78 | ) | (1.09 | ) | – | 12.38 | (13.64 | ) | 47,630 | 1.29 | 1.29 | 1.23 | 1.21 | 31 | ||||||||||||||||||||||||||||||||
| 2014 | 14.96 | 0.10 | 1.27 | 1.37 | (0.07 | ) | (0.66 | ) | (0.73 | ) | – | 15.60 | 9.28 | 94,878 | 1.34 | 1.34 | 1.24 | 0.66 | 39 | |||||||||||||||||||||||||||||||||||
| 2013 | 11.68 | 0.09 | 4.12 | 4.21 | (0.10 | ) | (0.83 | ) | (0.93 | ) | – | 14.96 | 36.26 | 78,233 | 1.61 | 1.61 | 1.38 | 0.69 | 44 | |||||||||||||||||||||||||||||||||||
| Royce Special Equity Multi-Cap Fund–Consultant Class e | ||||||||||||||||||||||||||||||||||||||||||||||||||||||
| 2017 | $ | 9.12 | $ | (0.00 | ) | $ | 1.32 | $ | 1.32 | $ | (0.05 | ) | $ | (0.20 | ) | $ | (0.25 | ) | $ | – | $ | 10.19 | 14.50 | % | $ | 4,190 | 2.73 | % | 2.73 | % | 1.99 | % | (0.06 | )% | 28 | % | ||||||||||||||||||
| 2016 | 8.15 | 0.02 | 1.03 | 1.05 | (0.08 | ) | – | (0.08 | ) | – | 9.12 | 12.89 | 4,986 | 2.38 | 2.38 | 1.99 | 0.12 | 50 | ||||||||||||||||||||||||||||||||||||
| 2015 | 10.72 | 0.09 | (1.63 | ) | (1.54 | ) | (0.25 | ) | (0.78 | ) | (1.03 | ) | – | 8.15 | (14.35 | ) | 6,825 | 2.19 | 2.19 | 1.99 | 0.50 | 31 | ||||||||||||||||||||||||||||||||
| 2014 | 10.00 | (0.04 | ) | 1.48 | 1.44 | (0.06 | ) | (0.66 | ) | (0.72 | ) | – | 10.72 | 14.57 | 1 | 9,223 | 2.54 | 2 | 2.54 | 2 | 1.99 | 2 | (0.05 | )2 | 39 | |||||||||||||||||||||||||||||
| Royce Special Equity Multi-Cap Fund–Institutional Class | ||||||||||||||||||||||||||||||||||||||||||||||||||||||
| 2017 | $ | 13.89 | $ | 0.17 | $ | 2.03 | $ | 2.20 | $ | (0.17 | ) | $ | (0.30 | ) | $ | (0.47 | ) | $ | – | $ | 15.62 | 15.89 | % | $ | 38,706 | 0.99 | % | 0.99 | % | 0.89 | % | 1.06 | % | 28 | % | |||||||||||||||||||
| 2016 | 12.33 | 0.16 | 1.57 | 1.73 | (0.17 | ) | – | (0.17 | ) | – | 13.89 | 14.04 | 37,339 | 0.99 | 0.99 | 0.89 | 1.22 | 50 | ||||||||||||||||||||||||||||||||||||
| 2015 | 15.56 | 0.34 | (2.41 | ) | (2.07 | ) | (0.38 | ) | (0.78 | ) | (1.16 | ) | – | 12.33 | (13.32 | ) | 36,864 | 0.94 | 0.94 | 0.89 | 1.56 | 31 | ||||||||||||||||||||||||||||||||
| 2014 | 14.92 | 0.12 | 1.30 | 1.42 | (0.12 | ) | (0.66 | ) | (0.78 | ) | – | 15.56 | 9.64 | 75,941 | 0.93 | 0.93 | 0.89 | 1.01 | 39 | |||||||||||||||||||||||||||||||||||
| 2013 | 11.64 | 0.15 | 4.10 | 4.25 | (0.14 | ) | (0.83 | ) | (0.97 | ) | – | 14.92 | 36.73 | 48,063 | 1.10 | 1.10 | 1.04 | 1.02 | 44 | |||||||||||||||||||||||||||||||||||
| Royce Total Return Fund–Investment Class | ||||||||||||||||||||||||||||||||||||||||||||||||||||||
| 2017 | $ | 13.68 | $ | 0.14 | $ | 1.67 | $ | 1.81 | $ | (0.12 | ) | $ | (1.79 | ) | $ | (1.91 | ) | $ | – | $ | 13.58 | 13.65 | % | $ | 1,550,893 | 1.19 | % | 1.19 | % | 1.19 | % | 1.00 | % | 12 | % | |||||||||||||||||||
| 2016 | 11.91 | 0.15 | 2.93 | 3.08 | (0.22 | ) | (1.09 | ) | (1.31 | ) | – | 13.68 | 25.86 | 1,835,927 | 1.19 | 1.19 | 1.19 | 1.08 | 16 | |||||||||||||||||||||||||||||||||||
| 2015 | 14.74 | 0.17 | (1.23 | ) | (1.06 | ) | (0.12 | ) | (1.65 | ) | (1.77 | ) | – | 11.91 | (7.19 | ) | 1,850,309 | 1.15 | 1.15 | 1.15 | 1.18 | 11 | ||||||||||||||||||||||||||||||||
| 2014 | 16.47 | 0.17 | 0.00 | 0.17 | (0.28 | ) | (1.62 | ) | (1.90 | ) | – | 14.74 | 1.34 | 3,077,951 | 1.13 | 1.13 | 1.13 | 0.95 | 18 | |||||||||||||||||||||||||||||||||||
| 2013 | 13.63 | 0.16 | 4.24 | 4.40 | (0.14 | ) | (1.42 | ) | (1.56 | ) | – | 16.47 | 32.76 | 3,657,904 | 1.13 | 1.13 | 1.13 | 1.00 | 21 | |||||||||||||||||||||||||||||||||||
| Royce Total Return Fund–Service Class | ||||||||||||||||||||||||||||||||||||||||||||||||||||||
| 2017 | $ | 13.98 | $ | 0.10 | $ | 1.69 | $ | 1.79 | $ | (0.07 | ) | $ | (1.82 | ) | $ | (1.89 | ) | $ | – | $ | 13.88 | 13.24 | % | $ | 97,854 | 1.49 | % | 1.48 | % | 1.48 | % | 0.72 | % | 12 | % | |||||||||||||||||||
| 2016 | 12.12 | 0.11 | 3.00 | 3.11 | (0.16 | ) | (1.09 | ) | (1.25 | ) | – | 13.98 | 25.60 | 142,606 | 1.46 | 1.46 | 1.46 | 0.80 | 16 | |||||||||||||||||||||||||||||||||||
| 2015 | 14.98 | 0.13 | (1.25 | ) | (1.12 | ) | (0.09 | ) | (1.65 | ) | (1.74 | ) | – | 12.12 | (7.48 | ) | 137,594 | 1.43 | 1.43 | 1.43 | 0.90 | 11 | ||||||||||||||||||||||||||||||||
| 2014 | 16.61 | 0.12 | 0.01 | 0.13 | (0.14 | ) | (1.62 | ) | (1.76 | ) | – | 14.98 | 1.08 | 232,814 | 1.42 | 1.42 | 1.42 | 0.60 | 18 | |||||||||||||||||||||||||||||||||||
| 2013 | 13.72 | 0.11 | 4.27 | 4.38 | (0.07 | ) | (1.42 | ) | (1.49 | ) | – | 16.61 | 32.38 | 493,111 | 1.48 | 1.48 | 1.48 | 0.68 | 21 | |||||||||||||||||||||||||||||||||||
| Royce Total Return Fund–Consultant Class | ||||||||||||||||||||||||||||||||||||||||||||||||||||||
| 2017 | $ | 14.07 | $ | 0.01 | $ | 1.70 | $ | 1.71 | $ | – | $ | (1.83 | ) | $ | (1.83 | ) | $ | – | $ | 13.95 | 12.53 | % | $ | 247,914 | 2.16 | % | 2.16 | % | 2.16 | % | 0.04 | % | 12 | % | ||||||||||||||||||||
| 2016 | 12.15 | 0.01 | 3.01 | 3.02 | (0.01 | ) | (1.09 | ) | (1.10 | ) | – | 14.07 | 24.73 | 267,083 | 2.16 | 2.16 | 2.16 | 0.11 | 16 | |||||||||||||||||||||||||||||||||||
| 2015 | 15.05 | 0.03 | (1.26 | ) | (1.23 | ) | (0.02 | ) | (1.65 | ) | (1.67 | ) | – | 12.15 | (8.15 | ) | 262,131 | 2.16 | 2.16 | 2.16 | 0.18 | 11 | ||||||||||||||||||||||||||||||||
| 2014 | 16.68 | (0.00 | ) | 0.02 | 0.02 | (0.03 | ) | (1.62 | ) | (1.65 | ) | – | 15.05 | 0.37 | 356,731 | 2.12 | 2.12 | 2.12 | (0.04 | ) | 18 | |||||||||||||||||||||||||||||||||
| 2013 | 13.81 | (0.00 | ) | 4.29 | 4.29 | – | (1.42 | ) | (1.42 | ) | – | 16.68 | 31.38 | 404,498 | 2.15 | 2.15 | 2.15 | (0.02 | ) | 21 | ||||||||||||||||||||||||||||||||||
| THE ACCOMPANYING NOTES ARE AN INTEGRAL PART OF THESE FINANCIAL STATEMENTS | The Royce Funds 2017 Annual Report to Shareholders | 103 |
Financial Highlights
This table is presented to show selected data for a share outstanding throughout each year or other indicated period and to assist shareholders in evaluating a Fund’s performance for the periods presented. Per share amounts have been determined on the basis of the weighted average number of shares outstanding during the period.
| Ratio of Expenses to Average Net Assets | ||||||||||||||||||||||||||||||||||||||||||||||||||||||
| Net Asset Value, Beginning of Period | Net Investment Income (Loss) | Net Realized and Unrealized Gain (Loss) on Investments and Foreign Currency | Total from Investment Operations | Distributions from Net Investment Income | Distributions from Net Realized Gain on Investments and Foreign Currency | Total Distributions | Shareholder Redemption Fees | Net Asset Value, End of Period | Total Return | Net Assets, End of Period (in thousands) | Prior to Fee Waivers, Expense Reimbursements and Balance Credits | Prior to Fee Waivers and Expense Reimbursements | Net of Fee Waivers and Expense Reimbursements | Ratio of Net Investment Income (Loss) to Average Net Assets | Portfolio Turnover Rate | |||||||||||||||||||||||||||||||||||||||
| Royce Total Return Fund–Institutional Class | ||||||||||||||||||||||||||||||||||||||||||||||||||||||
| 2017 | $ | 13.52 | $ | 0.16 | $ | 1.64 | $ | 1.80 | $ | (0.15 | ) | $ | (1.77 | ) | $ | (1.92 | ) | $ | – | $ | 13.40 | 13.80 | % | $ | 310,603 | 1.06 | % | 1.06 | % | 1.06 | % | 1.13 | % | 12 | % | |||||||||||||||||||
| 2016 | 11.78 | 0.18 | 2.90 | 3.08 | (0.25 | ) | (1.09 | ) | (1.34 | ) | – | 13.52 | 26.13 | 420,375 | 1.05 | 1.05 | 1.05 | 1.22 | 16 | |||||||||||||||||||||||||||||||||||
| 2015 | 14.61 | 0.18 | (1.22 | ) | (1.04 | ) | (0.14 | ) | (1.65 | ) | (1.79 | ) | – | 11.78 | (7.17 | ) | 374,555 | 1.03 | 1.03 | 1.03 | 1.28 | 11 | ||||||||||||||||||||||||||||||||
| 2014 | 16.35 | 0.18 | 0.02 | 0.20 | (0.32 | ) | (1.62 | ) | (1.94 | ) | – | 14.61 | 1.51 | 572,662 | 1.00 | 1.00 | 1.00 | 1.09 | 18 | |||||||||||||||||||||||||||||||||||
| 2013 | 13.55 | 0.18 | 4.21 | 4.39 | (0.17 | ) | (1.42 | ) | (1.59 | ) | – | 16.35 | 32.93 | 621,447 | 1.00 | 1.00 | 1.00 | 1.15 | 21 | |||||||||||||||||||||||||||||||||||
| Royce Total Return Fund–W Class | ||||||||||||||||||||||||||||||||||||||||||||||||||||||
| 2017 | $ | 13.67 | $ | 0.14 | $ | 1.66 | $ | 1.80 | $ | (0.12 | ) | $ | (1.79 | ) | $ | (1.91 | ) | $ | – | $ | 13.56 | 13.59 | % | $ | 95,955 | 1.21 | % | 1.21 | % | 1.21 | % | 1.00 | % | 12 | % | |||||||||||||||||||
| 2016 | 11.88 | 0.17 | 2.91 | 3.08 | (0.20 | ) | (1.09 | ) | (1.29 | ) | – | 13.67 | 25.96 | 79,702 | 1.20 | 1.20 | 1.20 | 1.03 | 16 | |||||||||||||||||||||||||||||||||||
| 2015 | 14.72 | 0.16 | (1.23 | ) | (1.07 | ) | (0.12 | ) | (1.65 | ) | (1.77 | ) | – | 11.88 | (7.28 | ) | 118,167 | 1.18 | 1.18 | 1.18 | 1.17 | 11 | ||||||||||||||||||||||||||||||||
| 2014 | 16.45 | 0.15 | 0.03 | 0.18 | (0.29 | ) | (1.62 | ) | (1.91 | ) | – | 14.72 | 1.35 | 261,829 | 1.13 | 1.13 | 1.13 | 0.97 | 18 | |||||||||||||||||||||||||||||||||||
| 2013 | 13.62 | 0.16 | 4.23 | 4.39 | (0.14 | ) | (1.42 | ) | (1.56 | ) | – | 16.45 | 32.71 | 249,035 | 1.15 | 1.15 | 1.15 | 0.99 | 21 | |||||||||||||||||||||||||||||||||||
| Royce Total Return Fund–R Class | ||||||||||||||||||||||||||||||||||||||||||||||||||||||
| 2017 | $ | 14.09 | $ | 0.06 | $ | 1.71 | $ | 1.77 | $ | (0.03 | ) | $ | (1.84 | ) | $ | (1.87 | ) | $ | – | $ | 13.99 | 12.97 | % | $ | 54,979 | 1.80 | % | 1.80 | % | 1.80 | % | 0.40 | % | 12 | % | |||||||||||||||||||
| 2016 | 12.19 | 0.07 | 3.00 | 3.07 | (0.08 | ) | (1.09 | ) | (1.17 | ) | – | 14.09 | 25.14 | 53,896 | 1.78 | 1.78 | 1.78 | 0.49 | 16 | |||||||||||||||||||||||||||||||||||
| 2015 | 15.07 | 0.08 | (1.25 | ) | (1.17 | ) | (0.06 | ) | (1.65 | ) | (1.71 | ) | – | 12.19 | (7.79 | ) | 50,684 | 1.77 | 1.77 | 1.77 | 0.56 | 11 | ||||||||||||||||||||||||||||||||
| 2014 | 16.73 | 0.07 | 0.01 | 0.08 | (0.12 | ) | (1.62 | ) | (1.74 | ) | – | 15.07 | 0.73 | 65,501 | 1.72 | 1.72 | 1.72 | 0.37 | 18 | |||||||||||||||||||||||||||||||||||
| 2013 | 13.82 | 0.06 | 4.30 | 4.36 | (0.03 | ) | (1.42 | ) | (1.45 | ) | – | 16.73 | 31.95 | 72,541 | 1.75 | 1.75 | 1.75 | 0.39 | 21 | |||||||||||||||||||||||||||||||||||
| Royce Total Return Fund–K Class | ||||||||||||||||||||||||||||||||||||||||||||||||||||||
| 2017 | $ | 9.07 | $ | 0.06 | $ | 1.11 | $ | 1.17 | $ | (0.03 | ) | $ | (1.19 | ) | $ | (1.22 | ) | $ | – | $ | 9.02 | 13.30 | % | $ | 37,659 | 1.56 | % | 1.56 | % | 1.56 | % | 0.64 | % | 12 | % | |||||||||||||||||||
| 2016 | 8.19 | 0.08 | 2.01 | 2.09 | (0.12 | ) | (1.09 | ) | (1.21 | ) | – | 9.07 | 25.41 | 40,952 | 1.55 | 1.55 | 1.55 | 0.67 | 16 | |||||||||||||||||||||||||||||||||||
| 2015 | 10.71 | 0.09 | (0.90 | ) | (0.81 | ) | (0.06 | ) | (1.65 | ) | (1.71 | ) | – | 8.19 | (7.54 | ) | 62,597 | 1.49 | 1.49 | 1.49 | 0.85 | 11 | ||||||||||||||||||||||||||||||||
| 2014 | 12.40 | 0.11 | (0.03 | ) | 0.08 | (0.15 | ) | (1.62 | ) | (1.77 | ) | – | 10.71 | 1.01 | 91,271 | 1.47 | 1.47 | 1.47 | 0.55 | 18 | ||||||||||||||||||||||||||||||||||
| 2013 | 10.53 | 0.07 | 3.27 | 3.34 | (0.05 | ) | (1.42 | ) | (1.47 | ) | – | 12.40 | 32.20 | 196,344 | 1.50 | 1.50 | 1.50 | 0.62 | 21 | |||||||||||||||||||||||||||||||||||
| 1 Not annualized |
| 2 Annualized |
| a The Class commenced operations on March 21, 2014. |
| b The Class commenced operations on January 5, 2016. |
| c The Class commenced operations on January 22, 2014. |
| d The Class commenced operations on February 26, 2016. |
| e The Class commenced operations on January 27, 2014. |
| 104 | The Royce Funds 2017 Annual Report to Shareholders | THE ACCOMPANYING NOTES ARE AN INTEGRAL PART OF THESE FINANCIAL STATEMENTS |
Notes to Financial Statements
Royce Dividend Value Fund, Royce Global Financial Services Fund, Royce International Micro-Cap Fund, Royce International Premier Fund, Royce Low-Priced Stock Fund, Royce Micro-Cap Fund, Royce Micro-Cap Opportunity Fund, Royce Opportunity Fund, Royce Pennsylvania Mutual Fund, Royce Premier Fund, Royce Small-Cap Leaders Fund, Royce Small-Cap Value Fund, Royce Small/Mid-Cap Premier Fund, Royce Smaller-Companies Growth Fund, Royce Special Equity Fund, Royce Special Equity Multi-Cap Fund and Royce Total Return Fund (the “Fund” or “Funds”), are the seventeen series of The Royce Fund (the “Trust”), a diversified open-end management investment company organized as a Delaware statutory trust. Effective May 1, 2017, Royce Heritage Fund became Royce Small/Mid-Cap Premier Fund.
| Royce International Micro-Cap Fund | 52% | ||
| Royce Micro-Cap Opportunity Fund | 18% |
Securities are valued as of the close of trading on the New York Stock Exchange (NYSE) (generally 4:00 p.m. Eastern time) on the valuation date. Securities that trade on an exchange, and securities traded on Nasdaq’s Electronic Bulletin Board, are valued at their last reported sales price or Nasdaq official closing price taken from the primary market in which each security trades or, if no sale is reported for such day, at their highest bid price. Other over-the-counter securities for which market quotations are readily available are valued at their highest bid price, except in the case of some bonds and other fixed income securities which may be valued by reference to other securities with comparable ratings, interest rates and maturities, using established independent pricing services. The Funds value their non-U.S. dollar denominated securities in U.S. dollars daily at the prevailing foreign currency exchange rates as quoted by a major bank. Securities for which market quotations are not readily available are valued at their fair value in accordance with the provisions of the 1940 Act, under procedures approved by the Trust’s Board of Trustees, and are reported as Level 3 securities. As a general principle, the fair value of a security is the amount which the Fund might reasonably expect to receive for the security upon its current sale. However, in light of the judgment involved in fair valuations, there can be no assurance that a fair value assigned to a particular security will be the amount which the Fund might be able to receive upon its current sale. In addition, if, between the time trading ends on a particular security and the close of the customary trading session on the NYSE, events occur that are significant and may make the closing price unreliable, a Fund may fair value the security. The Funds use an independent pricing service to provide fair value estimates for relevant non-U.S. equity securities on days when the U.S. market volatility exceeds a certain threshold. This pricing service uses proprietary correlations it has developed between the movement of prices of non-U.S. equity securities and indices of U.S.-traded securities, futures contracts and other indications to estimate the fair value of relevant non-U.S. securities. When fair value pricing is employed, the prices of securities used by a Fund may differ from quoted or published prices for the same security. Investments in money market funds are valued at net asset value per share.
| Level 1 | – | quoted prices in active markets for identical securities. | ||
| Level 2 | – | other significant observable inputs (including quoted prices for similar securities, foreign securities that may be fair valued and repurchase agreements). The table below includes all Level 2 securities. Level 2 securities with values based on quoted prices for similar securities are noted in the Schedules of Investments. | ||
| Level 3 | – | significant unobservable inputs (including last trade price before trading was suspended, or at a discount thereto for lack of marketability or otherwise, market price information regarding other securities, information received from the company and/or published documents, including SEC filings and financial statements, or other publicly available information). |
| The Royce Funds 2017 Annual Report to Shareholders | 105 |
Notes to Financial Statements (continued)
VALUATION OF INVESTMENTS (continued):
The following is a summary of the inputs used to value each Fund’s investments as of December 31, 2017. For a detailed breakout of common stocks by sector classification or country, please refer to the Schedules of Investments.
| LEVEL 1 | LEVEL 2 | LEVEL 3 | TOTAL | |||||||||||||||
| Royce Dividend Value Fund | ||||||||||||||||||
| Common Stocks | $ | 140,095,916 | $ | 39,879,666 | $ | – | $ | 179,975,582 | ||||||||||
| Cash Equivalents | – | 3,733,000 | – | 3,733,000 | ||||||||||||||
| Royce Global Financial Services Fund | ||||||||||||||||||
| Common Stocks | 40,124,369 | 15,218,296 | – | 55,342,665 | ||||||||||||||
| Cash Equivalents | – | 486,000 | – | 486,000 | ||||||||||||||
| Royce International Micro-Cap Fund | ||||||||||||||||||
| Common Stocks | 950,670 | 6,493,173 | – | 7,443,843 | ||||||||||||||
| Cash Equivalents | – | 570,000 | – | 570,000 | ||||||||||||||
| Royce International Premier Fund | ||||||||||||||||||
| Common Stocks | 5,865,752 | 149,906,776 | – | 155,772,528 | ||||||||||||||
| Cash Equivalents | – | 7,125,000 | – | 7,125,000 | ||||||||||||||
| Royce Low-Priced Stock Fund | ||||||||||||||||||
| Common Stocks | 247,096,995 | 17,693,790 | 0 | 264,790,785 | ||||||||||||||
| Cash Equivalents | 5,522,078 | 4,732,000 | – | 10,254,078 | ||||||||||||||
| Royce Micro-Cap Fund | ||||||||||||||||||
| Common Stocks | 190,654,753 | 4,351,939 | 828,000 | 195,834,692 | ||||||||||||||
| Cash Equivalents | 4,665,240 | 9,677,000 | – | 14,342,240 | ||||||||||||||
| Royce Micro-Cap Opportunity Fund | ||||||||||||||||||
| Common Stocks | 43,870,687 | 75,660 | – | 43,946,347 | ||||||||||||||
| Cash Equivalents | – | 3,825,000 | – | 3,825,000 | ||||||||||||||
| Royce Opportunity Fund | ||||||||||||||||||
| Common Stocks | 1,514,295,889 | 2,260,884 | – | 1,516,556,773 | ||||||||||||||
| Cash Equivalents | 30,458,149 | 95,789,000 | – | 126,247,149 | ||||||||||||||
| Royce Pennsylvania Mutual Fund | ||||||||||||||||||
| Common Stocks | 2,041,468,101 | 51,592,122 | – | 2,093,060,223 | ||||||||||||||
| Cash Equivalents | 11,440,093 | 18,657,000 | – | 30,097,093 | ||||||||||||||
| Royce Premier Fund | ||||||||||||||||||
| Common Stocks | 2,029,518,203 | 83,296,779 | – | 2,112,814,982 | ||||||||||||||
| Cash Equivalents | – | 249,484,000 | – | 249,484,000 | ||||||||||||||
| Royce Small-Cap Leaders Fund | ||||||||||||||||||
| Common Stocks | 79,159,537 | 2,330,792 | – | 81,490,329 | ||||||||||||||
| Cash Equivalents | 573,962 | 2,934,000 | – | 3,507,962 | ||||||||||||||
| Royce Small-Cap Value Fund | ||||||||||||||||||
| Common Stocks | 234,414,158 | – | – | 234,414,158 | ||||||||||||||
| Cash Equivalents | – | 18,037,000 | – | 18,037,000 | ||||||||||||||
| Royce Small/Mid-Cap Premier Fund | ||||||||||||||||||
| Common Stocks | 178,358,933 | 1,951,348 | 0 | 180,310,281 | ||||||||||||||
| Cash Equivalents | – | 28,045,000 | – | 28,045,000 | ||||||||||||||
| Royce Smaller-Companies Growth Fund | ||||||||||||||||||
| Common Stocks | 331,022,885 | 15,749,513 | – | 346,772,398 | ||||||||||||||
| Cash Equivalents | 17,341,344 | 22,667,000 | – | 40,008,344 | ||||||||||||||
| Royce Special Equity Fund | ||||||||||||||||||
| Common Stocks | 1,349,252,850 | 38,147,040 | – | 1,387,399,890 | ||||||||||||||
| Cash Equivalents | – | 157,801,000 | – | 157,801,000 | ||||||||||||||
| Royce Special Equity Multi-Cap Fund | ||||||||||||||||||
| Common Stocks | 100,051,673 | – | – | 100,051,673 | ||||||||||||||
| Cash Equivalents | – | 8,073,000 | – | 8,073,000 | ||||||||||||||
| Royce Total Return Fund | ||||||||||||||||||
| Common Stocks | 2,198,081,033 | 155,748,545 | 0 | 2,353,829,578 | ||||||||||||||
| Corporate Bond | – | 4,444,989 | – | 4,444,989 | ||||||||||||||
| Cash Equivalents | 1,599,553 | 33,008,000 | – | 34,607,553 | ||||||||||||||
| 106 | The Royce Funds 2017 Annual Report to Shareholders |
| TRANSFERS FROM | TRANSFERS FROM | |||||||
| LEVEL 1 TO LEVEL 2 | LEVEL 2 TO LEVEL 1 | |||||||
| Royce Global Financial Services Fund | $ | – | $ | 148,589 | ||||
| Royce Micro-Cap Opportunity Fund | 75,660 | – | ||||||
| Royce Opportunity Fund | 2,253,165 | – | ||||||
| Royce Pennsylvania Mutual Fund | 8,954,871 | 4,410,647 | ||||||
| Royce Smaller-Companies Growth Fund | 2,795,024 | – | ||||||
Level 3 Reconciliation:
| REALIZED | UNREALIZED | |||||||||||||||||||||||
| BALANCE AS OF 12/31/16 | PURCHASES | SALES | GAIN (LOSS) | GAIN (LOSS)1 | BALANCE AS OF 12/31/17 | |||||||||||||||||||
| Royce Low-Priced Stock Fund | ||||||||||||||||||||||||
| Common Stocks | $ | 0 | $ | – | $ | – | $ | – | $ | – | $ | 0 | ||||||||||||
| Royce Micro-Cap Fund | ||||||||||||||||||||||||
| Common Stocks | 865,628 | 0 | 423 | 414 | (37,619 | ) | 828,000 | |||||||||||||||||
| Royce Small/Mid-Cap Premier Fund | ||||||||||||||||||||||||
| Common Stocks | – | 0 | – | – | – | 0 | ||||||||||||||||||
| Royce Total Return Fund | ||||||||||||||||||||||||
| Common Stocks | 0 | – | – | – | – | 0 | ||||||||||||||||||
| 1 | The net change in unrealized appreciation (depreciation) is included in the accompanying Statement of Operations. Change in unrealized appreciation (depreciation) includes net unrealized appreciation (depreciation) resulting from changes in investment values during the reporting period and the reversal of previously recorded unrealized appreciation (depreciation) when gains or losses are realized. Net realized gain (loss) from investments and foreign currency transactions is included in the accompanying Statement of Operations. |
The following table summarizes the valuation techniques used and unobservable inputs approved by the Valuation Committee to determine the fair value of certain Level 3 investments. The table does not include Level 3 investments with values derived utilizing prices from prior transactions or third party pricing information with adjustments (e.g. broker quotes, pricing services, net asset values).
| FAIR VALUE AT | RANGE | IMPACT TO VALUATION FROM | |||||||||||||||||||
| 12/31/17 | VALUATION TECHNIQUE(S) | UNOBSERVABLE INPUT(S) | AVERAGE | AN INCREASE IN INPUT1 | |||||||||||||||||
| Royce Micro-Cap Fund | |||||||||||||||||||||
| Discounted Present Value | |||||||||||||||||||||
| Common Stocks | $ | 828,000 | Balance Sheet Analysis | Liquidity Discount | 30%-40% | Decrease | |||||||||||||||
| 1 | This column represents the directional change in the fair value of the Level 3 investments that would result in an increase from the corresponding unobservable input. A decrease to the unobservable input would have the opposite effect. Significant increases and decreases in these unobservable inputs in isolation could result in significantly higher or lower fair value measurements. |
REPURCHASE AGREEMENTS:
The Funds may enter into repurchase agreements with institutions that the Funds’ investment adviser has determined are creditworthy. Each Fund restricts repurchase agreements to maturities of no more than seven days. Securities pledged as collateral for repurchase agreements, which are held until maturity of the repurchase agreements, are marked-to-market daily and maintained at a value at least equal to the principal amount of the repurchase agreement (including accrued interest). Repurchase agreements could involve certain risks in the event of default or insolvency of the counter-party, including possible delays or restrictions upon the ability of each Fund to dispose of its underlying securities. The remaining contractual maturities of repurchase agreements held by the Funds at December 31, 2017 are overnight and continuous.
FOREIGN CURRENCY:
Net realized foreign exchange gains or losses arise from sales and maturities of short-term securities, sales of foreign currencies, expiration of currency forward contracts, currency gains or losses realized between the trade and settlement dates on securities transactions, and the difference between the amounts of dividends, interest, and foreign withholding taxes recorded on each Fund’s books and the U.S. dollar equivalent of the amounts actually received or paid. Net unrealized foreign exchange gains and losses arise from changes in the value of assets and liabilities, including investments in securities at the end of the reporting period, as a result of changes in foreign currency exchange rates.
SECURITIES LENDING:
The Funds loan securities through a lending agent to qualified institutional investors for the purpose of realizing additional income. Collateral for the Funds on all securities loaned is accepted in cash and cash equivalents and invested temporarily by the custodian, as well as non-cash collateral which includes short and long-term U.S. Treasuries. The collateral maintained is at least 100% of the current
| The Royce Funds 2017 Annual Report to Shareholders | 107 |
Notes to Financial Statements (continued)
SECURITIES LENDING (continued):
market value of the loaned securities. The market value of the loaned securities is determined at the close of business of the Funds and any additional required collateral is delivered to the Funds on the next business day. The Funds retain the risk of any loss on the securities on loan as well as incurring the potential loss on investments purchased with cash collateral received for securities lending. In the event of default or bankruptcy by the other party to the agreement, realization and/or retention of the collateral may be subject to legal proceedings. If the borrower fails to return loaned securities, and cash collateral being maintained by the borrower is insufficient to cover the value of loaned securities and provided such collateral insufficiency is not the result of investment losses, the lending agent has agreed to pay the amount of the shortfall to the Funds or, at the option of the lending agent, to replace the securities. In the event of the bankruptcy of the borrower, the Funds could experience delay in recovering the loaned securities or only recover cash or a security of equivalent value. Loans of securities generally do not have stated maturity dates, and the Funds may recall a security at any time. The Funds’ securities lending income consists of the income earned on investing cash collateral, plus any premium payments received for lending certain securities, less any rebates paid to borrowers and lending agent fees associated with the loan. The lending agent is not affiliated with Royce. The market value of non-cash collateral held by the Funds at December 31, 2017 was as follows:
| Royce Low-Priced Stock Fund | $ | 8,258,939 | Royce Small-Cap Leaders Fund | $ | 934,355 | ||||
| Royce Micro-Cap Fund | 6,477,617 | Royce Small-Cap Value Fund | 5,743,138 | ||||||
| Royce Opportunity Fund | 83,635,568 | Royce Smaller-Companies Growth Fund | 30,759,322 | ||||||
| Royce Pennsylvania Mutual Fund | 41,098,873 | Royce Total Return Fund | 3,953,518 | ||||||
| Royce Premier Fund | 13,380,911 | ||||||||
The following table presents by financial instrument, a Fund’s assets and liabilities net of related collateral held by the Fund at December 31, 2017:
| CASH COLLATERAL1 | SECURITIES ON LOAN COLLATERALIZED BY CASH COLLATERAL | NET AMOUNT | ||||||||||
| Royce Low-Priced Stock Fund | ||||||||||||
| Collateral on Loaned Securities/Securities on Loan | $ | 5,522,078 | $ | (5,303,987) | $ | 218,091 | ||||||
| Royce Micro-Cap Fund | ||||||||||||
| Collateral on Loaned Securities/Securities on Loan | 4,665,240 | (4,452,202) | 213,038 | |||||||||
| Royce Opportunity Fund | ||||||||||||
| Collateral on Loaned Securities/Securities on Loan | 30,458,149 | (29,236,447) | 1,221,702 | |||||||||
| Royce Pennsylvania Mutual Fund | ||||||||||||
| Collateral on Loaned Securities/Securities on Loan | 11,440,093 | (11,035,105) | 404,988 | |||||||||
| Royce Small-Cap Leaders Fund | ||||||||||||
| Collateral on Loaned Securities/Securities on Loan | 573,962 | (535,486) | 38,476 | |||||||||
| Royce Smaller-Companies Growth Fund | ||||||||||||
| Collateral on Loaned Securities/Securities on Loan | 17,341,344 | (16,511,185) | 830,159 | |||||||||
| Royce Total Return Fund | ||||||||||||
| Collateral on Loaned Securities/Securities on Loan | 1,599,553 | (1,565,036) | 34,517 | |||||||||
| 1 | Absent an event of default, assets and liabilities are presented gross and not offset in the Statements of Assets and Liabilities. The remaining contractual maturity of cash collateral is overnight and continuous. |
As qualified regulated investment companies under Subchapter M of the Internal Revenue Code, the Funds are not subject to income taxes to the extent that each Fund distributes substantially all of its taxable income for its fiscal year.
| 108 | The Royce Funds 2017 Annual Report to Shareholders |
Capital Share Transactions (in dollars):
| SHARES ISSUED FOR | ||||||||||||||||||||||||||||||||||||||||
| REINVESTMENT | NET INCREASE (DECREASE) FROM | |||||||||||||||||||||||||||||||||||||||
| SHARES SOLD | OF DISTRIBUTIONS | SHARES REDEEMED | SHARE CLASS CONVERSION | CAPITAL SHARE TRANSACTIONS | ||||||||||||||||||||||||||||||||||||
| Year Ended | Period Ended | Year Ended | Period Ended | Year Ended | Period Ended | Year Ended | Period Ended | Year Ended | Period Ended | |||||||||||||||||||||||||||||||
| 12/31/17 | 12/31/16 | 12/31/17 | 12/31/16 | 12/31/17 | 12/31/16 | 12/31/171 | 12/31/162 | 12/31/17 | 12/31/16 | |||||||||||||||||||||||||||||||
| Royce Dividend Value Fund | ||||||||||||||||||||||||||||||||||||||||
| Investment Class | $ | 33,358,164 | $ | 18,958,290 | $ | 14,559,845 | $ | 9,175,565 | $ | (34,756,532 | ) | $ | (49,583,548 | ) | $ | 3,578,591 | $ | 16,740,068 | $ | (21,449,693 | ) | |||||||||||||||||||
| Service Class | 4,595,603 | 7,065,296 | 6,925,218 | 9,959,042 | (72,839,992 | ) | (76,162,628 | ) | (3,578,591 | ) | (64,897,762 | ) | (59,138,290 | ) | ||||||||||||||||||||||||||
| Consultant Class | 43,403 | 145,757 | 179,517 | 121,151 | (365,980 | ) | (612,404 | ) | (143,060 | ) | (345,496 | ) | ||||||||||||||||||||||||||||
| Institutional Class | 156,698 | 73,405 | 149,582 | 85,945 | (63,252 | ) | (24,719 | ) | 243,028 | 134,631 | ||||||||||||||||||||||||||||||
| Royce Global Financial Services Fund | ||||||||||||||||||||||||||||||||||||||||
| Service Class | 19,803,777 | 10,004,674 | 1,524,105 | 314,467 | (25,122,992 | ) | (22,967,471 | ) | (3,795,110 | ) | (12,648,330 | ) | ||||||||||||||||||||||||||||
| Institutional Class | 1,030,249 | 5,237,088 | 287,397 | 62,041 | (446,493 | ) | – | 871,153 | 5,299,129 | |||||||||||||||||||||||||||||||
| Royce International Micro-Cap Fund | ||||||||||||||||||||||||||||||||||||||||
| Service Class | 625,802 | 187,420 | 102,614 | 92,479 | (462,796 | ) | (594,454 | ) | 265,620 | (314,555 | ) | |||||||||||||||||||||||||||||
| Royce International Premier Fund | ||||||||||||||||||||||||||||||||||||||||
| Investment Class | 68,809,358 | 6,174,749 | 879,967 | 405,500 | (9,492,960 | ) | (14,199,466 | ) | 10,710,066 | 70,906,431 | (7,619,217 | ) | ||||||||||||||||||||||||||||
| Service Class | 15,361,047 | 4,838,193 | 309,552 | 841,078 | (10,148,697 | ) | (12,025,961 | ) | (10,686,016 | ) | (5,164,114 | ) | (6,346,690 | ) | ||||||||||||||||||||||||||
| Consultant Class | 2,900,964 | 378,145 | 13,784 | 69,250 | (782,316 | ) | (2,062,532 | ) | 2,132,432 | (1,615,137 | ) | |||||||||||||||||||||||||||||
| R Class | 1,108 | 10,139 | 528 | 1,431 | – | – | 1,636 | 11,570 | ||||||||||||||||||||||||||||||||
| K Class | – | – | – | 672 | – | – | (24,050 | ) | (24,050 | ) | 672 | |||||||||||||||||||||||||||||
| Royce Low-Priced Stock Fund | ||||||||||||||||||||||||||||||||||||||||
| Investment Class | 4,827,741 | 1,971,123 | 3,042,673 | 1,820,228 | (7,679,466 | ) | (10,892,309 | ) | 30,157,999 | 30,348,947 | (7,100,958 | ) | ||||||||||||||||||||||||||||
| Service Class | 5,359,019 | 7,067,276 | 12,483,625 | 23,428,229 | (69,244,052 | ) | (80,535,704 | ) | (29,086,803 | ) | (80,488,211 | ) | (50,040,199 | ) | ||||||||||||||||||||||||||
| Institutional Class | 315,958 | 583,934 | 499,044 | 1,067,221 | (8,139,049 | ) | (27,305,121 | ) | (7,324,047 | ) | (25,653,966 | ) | ||||||||||||||||||||||||||||
| R Class | 98,627 | 162,573 | 63,719 | 89,653 | (173,595 | ) | (411,859 | ) | (11,249 | ) | (159,633 | ) | ||||||||||||||||||||||||||||
| K Class | 13,656 | 107,931 | – | 434,240 | (42,545 | ) | (687,522 | ) | (1,071,196 | ) | (1,100,085 | ) | (145,351 | ) | ||||||||||||||||||||||||||
| Royce Micro-Cap Fund | ||||||||||||||||||||||||||||||||||||||||
| Investment Class | 8,604,513 | 9,466,655 | 11,026,347 | 18,015,282 | (42,144,313 | ) | (66,073,769 | ) | 201,150 | (22,312,303 | ) | (38,591,832 | ) | |||||||||||||||||||||||||||
| Service Class | 3,672,153 | 4,842,797 | 937,168 | 1,576,589 | (7,631,678 | ) | (10,503,711 | ) | (201,150 | ) | (3,223,507 | ) | (4,084,325 | ) | ||||||||||||||||||||||||||
| Consultant Class | 466,511 | 1,293,781 | 1,683,462 | 4,079,826 | (10,592,332 | ) | (14,100,322 | ) | (8,442,359 | ) | (8,726,715 | ) | ||||||||||||||||||||||||||||
| Royce Micro-Cap Opportunity Fund | ||||||||||||||||||||||||||||||||||||||||
| Investment Class | 2,803,349 | 6,820,847 | 3,283,146 | – | (12,453,128 | ) | (5,142,669 | ) | 47,069 | (6,319,564 | ) | 1,678,178 | ||||||||||||||||||||||||||||
| Service Class | 368,449 | 291,194 | 82,715 | – | (401,071 | ) | (691,434 | ) | (47,069 | ) | 3,024 | (400,240 | ) | |||||||||||||||||||||||||||
| The Royce Funds 2017 Annual Report to Shareholders | 109 |
| Notes to Financial Statements (continued) |
Capital Share Transactions (in dollars) (continued):
| SHARES ISSUED FOR | ||||||||||||||||||||||||||||||||||||||||
| REINVESTMENT | NET INCREASE (DECREASE) FROM | |||||||||||||||||||||||||||||||||||||||
| SHARES SOLD | OF DISTRIBUTIONS | SHARES REDEEMED | SHARE CLASS CONVERSIONS | CAPITAL SHARE TRANSACTIONS | ||||||||||||||||||||||||||||||||||||
| Year Ended | Period Ended | Year Ended | Period Ended | Year Ended | Period Ended | Year Ended | Period Ended | Year Ended | Period Ended | |||||||||||||||||||||||||||||||
| 12/31/17 | 12/31/16 | 12/31/17 | 12/31/16 | 12/31/17 | 12/31/16 | 12/31/171 | 12/31/162 | 12/31/17 | 12/31/16 | |||||||||||||||||||||||||||||||
| Royce Opportunity Fund | ||||||||||||||||||||||||||||||||||||||||
| Investment Class | $ | 95,914,276 | $ | 81,034,611 | $ | 89,555,952 | $ | 41,705,217 | $ | (176,705,384 | ) | $ | (253,661,600 | ) | $ | 809,011 | $ | 9,573,855 | $ | (130,921,772 | ) | |||||||||||||||||||
| Service Class | 50,250,124 | 16,933,706 | 11,529,769 | 4,661,818 | (42,272,885 | ) | (62,322,206 | ) | (809,011 | ) | 18,697,997 | (40,726,682 | ) | |||||||||||||||||||||||||||
| Consultant Class | 1,258,054 | 2,287,388 | 2,481,422 | 1,568,020 | (5,389,905 | ) | (5,702,177 | ) | (1,650,429 | ) | (1,846,769 | ) | ||||||||||||||||||||||||||||
| Institutional Class | 65,630,056 | 58,740,553 | 77,029,241 | 35,837,134 | (123,056,070 | ) | (220,100,854 | ) | 19,603,227 | (125,523,167 | ) | |||||||||||||||||||||||||||||
| R Class | 7,407,124 | 5,262,774 | 5,142,835 | 2,794,912 | (14,211,365 | ) | (8,185,578 | ) | (1,661,406 | ) | (127,892 | ) | ||||||||||||||||||||||||||||
| K Class | 3,768,309 | 2,688,304 | 1,024,733 | 525,822 | (4,179,483 | ) | (7,346,313 | ) | 613,559 | (4,132,187 | ) | |||||||||||||||||||||||||||||
| Royce Pennsylvania Mutual Fund | ||||||||||||||||||||||||||||||||||||||||
| Investment Class | 108,329,916 | 101,656,002 | 254,272,581 | 98,152,740 | (364,099,258 | ) | (725,638,867 | ) | 954,383 | (542,378 | ) | (525,830,125 | ) | |||||||||||||||||||||||||||
| Service Class | 21,525,651 | 27,866,036 | 6,601,511 | 5,127,006 | (73,066,550 | ) | (47,207,450 | ) | (954,383 | ) | (45,893,771 | ) | (14,214,408 | ) | ||||||||||||||||||||||||||
| Consultant Class | 6,858,381 | 9,509,567 | 59,284,622 | 29,743,347 | (95,624,041 | ) | (109,823,958 | ) | (29,481,038 | ) | (70,571,044 | ) | ||||||||||||||||||||||||||||
| Institutional Class | 174,059,170 | 135,118,511 | 12,113,429 | 18,093,080 | (396,581,300 | ) | (481,864,428 | ) | (210,408,701 | ) | (328,652,837 | ) | ||||||||||||||||||||||||||||
| R Class | 2,869,674 | 2,588,691 | 2,671,302 | 1,140,459 | (7,107,006 | ) | (7,878,915 | ) | (1,566,030 | ) | (4,149,765 | ) | ||||||||||||||||||||||||||||
| K Class | 356,892 | 507,920 | 494,633 | 247,212 | (1,182,189 | ) | (2,093,193 | ) | (330,664 | ) | (1,338,061 | ) | ||||||||||||||||||||||||||||
| Royce Premier Fund | ||||||||||||||||||||||||||||||||||||||||
| Investment Class | 241,047,460 | 132,149,740 | 223,171,515 | 179,639,115 | (382,949,395 | ) | (697,868,653 | ) | 245,348 | 81,514,928 | (386,079,798 | ) | ||||||||||||||||||||||||||||
| Service Class | 14,869,157 | 10,158,965 | 6,885,399 | 5,025,159 | (17,172,517 | ) | (36,123,462 | ) | (245,348 | ) | $ | 1,863,164 | 4,336,691 | (19,076,174 | ) | |||||||||||||||||||||||||
| Consultant Class | 2,882,510 | 1,657,648 | 3,994,852 | 4,316,806 | (8,935,374 | ) | (9,246,501 | ) | (2,058,012 | ) | (3,272,047 | ) | ||||||||||||||||||||||||||||
| Institutional Class | 261,675,152 | 80,363,260 | 33,768,589 | 29,595,890 | (310,726,543 | ) | (177,605,927 | ) | (15,282,802 | ) | (67,646,777 | ) | ||||||||||||||||||||||||||||
| W Class | 10,076,719 | 11,616,780 | 2,010,290 | 14,836,924 | (145,318,380 | ) | (85,709,902 | ) | (133,231,371 | ) | (59,256,198 | ) | ||||||||||||||||||||||||||||
| R Class | 690,774 | 452,451 | 1,724,204 | 1,728,030 | (4,464,354 | ) | (5,486,362 | ) | (2,049,376 | ) | (3,305,881 | ) | ||||||||||||||||||||||||||||
| K Class | 1,217,490 | 1,845,074 | (2,530,035 | ) | (1,863,164 | ) | (1,330,635 | ) | ||||||||||||||||||||||||||||||||
| Royce Small-Cap Leaders Fund | ||||||||||||||||||||||||||||||||||||||||
| Investment Class | 3,821,850 | 2,943,260 | 5,604,193 | 4,254,065 | (15,331,606 | ) | (15,072,711 | ) | 3,953,879 | (1,951,684 | ) | (7,875,386 | ) | |||||||||||||||||||||||||||
| Service Class | 2,089,523 | 2,746,867 | 5,365,200 | 4,672,613 | (13,946,182 | ) | (20,862,377 | ) | (3,451,813 | ) | (9,943,272 | ) | (13,442,897 | ) | ||||||||||||||||||||||||||
| R Class | 626,596 | 390,342 | 257,152 | 132,202 | (848,782 | ) | (549,660 | ) | 34,966 | (27,116 | ) | |||||||||||||||||||||||||||||
| K Class | 8,625 | 124,715 | – | 35,143 | (13,841 | ) | (61,065 | ) | (502,066 | ) | (507,282 | ) | 98,793 | |||||||||||||||||||||||||||
| Royce Small-Cap Value Fund | ||||||||||||||||||||||||||||||||||||||||
| Investment Class | 7,212,852 | 15,238,437 | 2,298,668 | 3,520,923 | (27,843,241 | ) | (33,562,073 | ) | 11,332,541 | (6,999,180 | ) | (14,802,713 | ) | |||||||||||||||||||||||||||
| Service Class | 5,782,230 | 8,438,818 | 4,963,542 | 10,369,371 | (60,660,700 | ) | (87,439,478 | ) | (11,332,541 | ) | (61,247,469 | ) | (68,631,289 | ) | ||||||||||||||||||||||||||
| Consultant Class | 528,340 | 923,536 | 419,883 | 835,891 | (4,299,901 | ) | (5,814,390 | ) | (3,351,678 | ) | (4,054,963 | ) | ||||||||||||||||||||||||||||
| Institutional Class | 5,715,018 | 51,211,150 | 135,010 | 7,164,497 | (121,609,510 | ) | (100,761,956 | ) | (115,759,482 | ) | (42,386,309 | ) | ||||||||||||||||||||||||||||
| R Class | 2,325,469 | 2,883,464 | 486,662 | 953,798 | (6,314,704 | ) | (7,228,118 | ) | (3,502,573 | ) | (3,390,856 | ) | ||||||||||||||||||||||||||||
| K Class | 515,109 | 1,184,756 | 71,464 | 211,184 | (1,601,007 | ) | (4,929,415 | ) | (1,014,434 | ) | (3,533,475 | ) | ||||||||||||||||||||||||||||
| Royce Small/Mid-Cap Premier Fund | ||||||||||||||||||||||||||||||||||||||||
| Investment Class | 2,802,152 | 3,678,000 | 9,333,591 | 3,292,053 | (38,615,198 | ) | (20,684,731 | ) | 14,585,974 | (11,893,481 | ) | (13,714,678 | ) | |||||||||||||||||||||||||||
| Service Class | 2,862,831 | 1,980,974 | 12,670,685 | 4,133,928 | (23,075,898 | ) | (21,159,246 | ) | (10,355,341 | ) | (17,897,723 | ) | (15,044,344 | ) | ||||||||||||||||||||||||||
| Consultant Class | 203,495 | 550,259 | 1,168,599 | 519,489 | (3,427,490 | ) | (1,971,398 | ) | (2,055,396 | ) | (901,650 | ) | ||||||||||||||||||||||||||||
| R Class | 325,929 | 240,334 | 253,421 | 97,399 | (438,712 | ) | (950,917 | ) | 140,638 | (613,184 | ) | |||||||||||||||||||||||||||||
| K Class | 73,214 | 524,089 | – | 212,068 | (114,702 | ) | (971,874 | ) | (4,230,633 | ) | (4,272,121 | ) | (235,717 | ) | ||||||||||||||||||||||||||
| Royce Smaller-Companies Growth Fund | ||||||||||||||||||||||||||||||||||||||||
| Investment Class | 8,568,833 | 9,036,660 | 17,465,075 | 8,163,119 | (31,336,604 | ) | (55,705,571 | ) | 30,948,573 | 25,645,877 | (38,505,792 | ) | ||||||||||||||||||||||||||||
| Service Class | 7,939,518 | 14,663,751 | 37,667,971 | 28,201,863 | (75,375,930 | ) | (159,219,364 | ) | (30,801,077 | ) | (60,569,518 | ) | (116,353,750 | ) | ||||||||||||||||||||||||||
| Consultant Class | 436,581 | 170,036 | 1,736,168 | 1,256,839 | (2,498,886 | ) | (4,722,177 | ) | (326,137 | ) | (3,295,302 | ) | ||||||||||||||||||||||||||||
| Institutional Class | 2,292,066 | 4,456,412 | 1,401,477 | 1,910,324 | (15,929,293 | ) | (24,349,639 | ) | (12,235,750 | ) | (17,982,903 | ) | ||||||||||||||||||||||||||||
| R Class | 253,510 | 212,289 | 121,248 | 89,046 | (573,963 | ) | (364,827 | ) | (199,205 | ) | (63,492 | ) | ||||||||||||||||||||||||||||
| K Class | 10,337 | 24,433 | – | 38,133 | (73,104 | ) | (140,884 | ) | (147,496 | ) | (210,263 | ) | (78,318 | ) | ||||||||||||||||||||||||||
| Royce Special Equity Fund | ||||||||||||||||||||||||||||||||||||||||
| Investment Class | 135,718,687 | 179,392,659 | 78,155,944 | 75,160,317 | (287,748,016 | ) | (354,506,680 | ) | 456,521 | (73,416,864 | ) | (99,953,704 | ) | |||||||||||||||||||||||||||
| Service Class | 17,484,310 | 30,335,347 | 7,079,422 | 6,662,481 | (43,100,887 | ) | (43,663,631 | ) | (456,521 | ) | (18,993,676 | ) | (6,665,803 | ) | ||||||||||||||||||||||||||
| Consultant Class | 3,664,645 | 5,012,148 | 3,280,685 | 3,309,705 | (10,202,732 | ) | (8,602,908 | ) | (3,257,402 | ) | (281,055 | ) | ||||||||||||||||||||||||||||
| Institutional Class | 119,222,833 | 45,055,283 | 18,780,245 | 15,454,797 | (96,058,792 | ) | (104,274,992 | ) | 41,944,286 | (43,764,912 | ) | |||||||||||||||||||||||||||||
| 110 | The Royce Funds 2017 Annual Report to Shareholders |
Capital Share Transactions (in dollars) (continued):
| SHARES ISSUED FOR | ||||||||||||||||||||||||||||||||||||||||
| REINVESTMENT | NET INCREASE (DECREASE) FROM | |||||||||||||||||||||||||||||||||||||||
| SHARES SOLD | OF DISTRIBUTIONS | SHARES REDEEMED | SHARE CLASS CONVERSIONS | CAPITAL SHARE TRANSACTIONS | ||||||||||||||||||||||||||||||||||||
| Year Ended | Period Ended | Year Ended | Period Ended | Year Ended | Period Ended | Year Ended | Period Ended | Year Ended | Period Ended | |||||||||||||||||||||||||||||||
| 12/31/17 | 12/31/16 | 12/31/17 | 12/31/16 | 12/31/17 | 12/31/16 | 12/31/171 | 12/31/162 | 12/31/17 | 12/31/16 | |||||||||||||||||||||||||||||||
| Royce Special Equity Multi-Cap Fund | ||||||||||||||||||||||||||||||||||||||||
| Investment Class | $ | 2,451,602 | $ | 9,065,075 | $ | 1,040,135 | $ | 361,721 | $ | (5,918,178 | ) | $ | (23,180,740 | ) | $ | 4,410,760 | $ | 1,984,319 | $ | (13,753,944 | ) | |||||||||||||||||||
| Service Class | 1,980,085 | 1,179,738 | 546,406 | 291,900 | (14,809,505 | ) | (16,267,235 | ) | (4,410,760 | ) | (16,693,774 | ) | (14,795,597 | ) | ||||||||||||||||||||||||||
| Consultant Class | 246,555 | 563,388 | 93,069 | 37,877 | (1,656,776 | ) | (2,866,031 | ) | (1,317,152 | ) | (2,264,766 | ) | ||||||||||||||||||||||||||||
| Institutional Class | 241,566 | 175,067 | 1,120,943 | 461,530 | (4,665,527 | ) | (4,391,464 | ) | (3,303,018 | ) | (3,754,867 | ) | ||||||||||||||||||||||||||||
| Royce Total Return Fund | ||||||||||||||||||||||||||||||||||||||||
| Investment Class | 165,438,966 | 294,955,069 | 160,024,214 | 136,990,355 | (621,860,725 | ) | (682,255,576 | ) | 616,402 | (295,781,143 | ) | (250,310,152 | ) | |||||||||||||||||||||||||||
| Service Class | 37,626,452 | 36,092,000 | 10,955,024 | 10,591,744 | (93,727,158 | ) | (58,098,066 | ) | (616,402 | ) | (45,762,084 | ) | (11,414,322 | ) | ||||||||||||||||||||||||||
| Consultant Class | 7,849,294 | 10,401,986 | 26,542,808 | 17,832,355 | (53,725,682 | ) | (60,628,932 | ) | (19,333,580 | ) | (32,394,591 | ) | ||||||||||||||||||||||||||||
| Institutional Class | 267,365,781 | 293,147,555 | 34,156,423 | 34,001,932 | (418,141,043 | ) | (348,478,072 | ) | (116,618,839 | ) | (21,328,585 | ) | ||||||||||||||||||||||||||||
| W Class | 23,629,518 | 25,598,918 | 9,432,413 | 5,366,667 | (16,176,485 | ) | (84,376,627 | ) | 16,885,446 | (53,411,042 | ) | |||||||||||||||||||||||||||||
| R Class | 13,477,855 | 7,424,801 | 6,544,516 | 4,240,875 | (18,954,349 | ) | (15,644,457 | ) | 1,068,022 | (3,978,781 | ) | |||||||||||||||||||||||||||||
| K Class | 10,702,334 | 22,509,661 | 4,529,233 | 4,948,018 | (18,585,697 | ) | (55,761,263 | ) | (3,354,130 | ) | (28,303,584 | ) | ||||||||||||||||||||||||||||
Capital Share Transactions (in shares):
| SHARES ISSUED FOR | ||||||||||||||||||||||||||||||||||||||||
| REINVESTMENT | NET INCREASE (DECREASE) IN | |||||||||||||||||||||||||||||||||||||||
| SHARES SOLD | OF DISTRIBUTIONS | SHARES REDEEMED | SHARE CLASS CONVERSIONS | SHARES OUTSTANDING | ||||||||||||||||||||||||||||||||||||
| Year Ended | Period Ended | Year Ended | Period Ended | Year Ended | Period Ended | Year Ended | Period Ended | Year Ended | Period Ended | |||||||||||||||||||||||||||||||
| 12/31/17 | 12/31/16 | 12/31/17 | 12/31/16 | 12/31/17 | 12/31/16 | 12/31/171 | 12/31/162 | 12/31/17 | 12/31/16 | |||||||||||||||||||||||||||||||
| Royce Dividend Value Fund | ||||||||||||||||||||||||||||||||||||||||
| Investment Class | 4,298,687 | 2,660,858 | 1,985,078 | 1,266,523 | (4,549,529 | ) | (7,026,219 | ) | 436,413 | 2,170,649 | (3,098,838 | ) | ||||||||||||||||||||||||||||
| Service Class | 593,367 | 982,932 | 919,198 | 1,347,129 | (9,162,991 | ) | (10,577,464 | ) | (427,550 | ) | (8,077,976 | ) | (8,247,403 | ) | ||||||||||||||||||||||||||
| Consultant Class | 4,932 | 18,781 | 20,882 | 14,300 | (40,367 | ) | (84,343 | ) | (14,553 | ) | (51,262 | ) | ||||||||||||||||||||||||||||
| Institutional Class | 20,750 | 10,503 | 20,657 | 11,998 | (8,312 | ) | (3,669 | ) | 33,095 | 18,832 | ||||||||||||||||||||||||||||||
| Royce Global Financial Services Fund | ||||||||||||||||||||||||||||||||||||||||
| Service Class | 2,011,114 | 1,190,188 | 147,399 | 35,333 | (2,568,417 | ) | (2,858,179 | ) | (409,904 | ) | (1,632,658 | ) | ||||||||||||||||||||||||||||
| Institutional Class | 82,514 | 560,952 | 21,641 | 5,461 | (36,663 | ) | – | 67,492 | 566,413 | |||||||||||||||||||||||||||||||
| Royce International Micro-Cap Fund | ||||||||||||||||||||||||||||||||||||||||
| Service Class | 57,050 | 20,043 | 8,425 | 9,360 | (40,290 | ) | (61,674 | ) | 25,185 | (32,271 | ) | |||||||||||||||||||||||||||||
| Royce International Premier Fund | ||||||||||||||||||||||||||||||||||||||||
| Investment Class3 | 5,700,233 | 3,108,605 | 69,180 | 44,220 | (801,879 | ) | (1,449,841 | ) | 840,664 | 5,808,198 | 1,702,984 | |||||||||||||||||||||||||||||
| Service Class3 | 1,104,260 | 3,645,178 | 20,392 | 77,022 | (760,763 | ) | (1,037,673 | ) | (704,906 | ) | (341,017 | ) | 2,684,527 | |||||||||||||||||||||||||||
| Consultant Class3 | 185,684 | 572,065 | 834 | 5,809 | (54,788 | ) | (163,265 | ) | 131,730 | 414,609 | ||||||||||||||||||||||||||||||
| R Class3 | 103 | 5,494 | 44 | 163 | – | – | 147 | 5,657 | ||||||||||||||||||||||||||||||||
| K Class3 | – | 2,473 | – | 78 | – | – | (2,551 | ) | (2,551 | ) | 2,551 | |||||||||||||||||||||||||||||
| Royce Low-Priced Stock Fund | ||||||||||||||||||||||||||||||||||||||||
| Investment Class | 577,375 | 256,929 | 367,917 | 219,834 | (915,749 | ) | (1,408,310 | ) | 3,434,852 | 3,464,395 | (931,547 | ) | ||||||||||||||||||||||||||||
| Service Class | 640,080 | 908,878 | 1,515,003 | 2,839,785 | (8,306,853 | ) | (10,354,471 | ) | (3,325,309 | ) | (9,477,079 | ) | (6,605,808 | ) | ||||||||||||||||||||||||||
| Institutional Class | 37,701 | 75,466 | 60,126 | 128,581 | (959,231 | ) | (3,729,447 | ) | (861,404 | ) | (3,525,400 | ) | ||||||||||||||||||||||||||||
| R Class | 12,437 | 22,201 | 8,190 | 11,450 | (22,168 | ) | (54,355 | ) | (1,541 | ) | (20,704 | ) | ||||||||||||||||||||||||||||
| K Class | 9,447 | 57,659 | – | 301,555 | (29,290 | ) | (381,680) | (741,056 | ) | (760,899 | ) | (22,466 | ) | |||||||||||||||||||||||||||
| Royce Micro-Cap Fund | ||||||||||||||||||||||||||||||||||||||||
| Investment Class | 715,505 | 849,276 | 965,522 | 1,510,082 | (3,519,967 | ) | (5,962,181 | ) | 16,447 | (1,822,493 | ) | (3,602,823 | ) | |||||||||||||||||||||||||||
| Service Class | 314,908 | 435,709 | 83,750 | 134,751 | (648,355 | ) | (971,095 | ) | (16,790 | ) | (266,487 | ) | (400,635 | ) | ||||||||||||||||||||||||||
| Consultant Class | 49,719 | 148,907 | 188,517 | 433,103 | (1,128,904 | ) | (1,547,295 | ) | (890,668 | ) | (965,285 | ) | ||||||||||||||||||||||||||||
| Royce Micro-Cap Opportunity Fund | ||||||||||||||||||||||||||||||||||||||||
| Investment Class | 148,676 | 499,875 | 171,086 | – | (620,649 | ) | (354,864 | ) | 2,287 | (298,600 | ) | 145,011 | ||||||||||||||||||||||||||||
| Service Class | 37,846 | 40,382 | 8,572 | – | (42,970 | ) | (98,358 | ) | (4,548 | ) | (1,100 | ) | (57,976 | ) | ||||||||||||||||||||||||||
| Royce Opportunity Fund | ||||||||||||||||||||||||||||||||||||||||
| Investment Class | 6,866,763 | 7,169,819 | 6,779,406 | 3,210,563 | (12,814,149 | ) | (22,519,005 | ) | 53,934 | 885,954 | (12,138,623 | ) | ||||||||||||||||||||||||||||
| Service Class | 3,856,271 | 1,582,515 | 935,858 | 383,689 | (3,215,595 | ) | (5,985,363 | ) | (57,828 | ) | 1,518,706 | (4,019,159 | ) | |||||||||||||||||||||||||||
| Consultant Class | 108,753 | 254,530 | 227,862 | 144,785 | (470,217 | ) | (586,237 | ) | (133,602 | ) | (186,922 | ) | ||||||||||||||||||||||||||||
| Institutional Class | 4,638,535 | 5,099,929 | 5,718,577 | 2,708,778 | (8,815,496 | ) | (19,157,014 | ) | 1,541,616 | (11,348,307 | ) | |||||||||||||||||||||||||||||
| R Class | 578,202 | 525,049 | 431,446 | 236,853 | (1,134,320 | ) | (781,985 | ) | (124,672 | ) | (20,083 | ) | ||||||||||||||||||||||||||||
| K Class | 331,425 | 280,506 | 94,533 | 49,097 | (370,027 | ) | (790,088 | ) | 55,931 | (460,485 | ) | |||||||||||||||||||||||||||||
| The Royce Funds 2017 Annual Report to Shareholders | 111 |
| Notes to Financial Statements (continued) |
Capital Share Transactions (in shares) (continued):
| SHARES ISSUED FOR | |||||||||||||||||||||||||||||||||||||||||
| REINVESTMENT | NET INCREASE (DECREASE) IN | ||||||||||||||||||||||||||||||||||||||||
| SHARES SOLD | OF DISTRIBUTIONS | SHARES REDEEMED | SHARE CLASS CONVERSIONS | SHARES OUTSTANDING | |||||||||||||||||||||||||||||||||||||
| Year Ended | Period Ended | Year Ended | Period Ended | Year Ended | Period Ended | Year Ended | Period Ended | Year Ended | Period Ended | ||||||||||||||||||||||||||||||||
| 12/31/17 | 12/31/16 | 12/31/17 | 12/31/16 | 12/31/17 | 12/31/16 | 12/31/171 | 12/31/162 | 12/31/17 | 12/31/16 | ||||||||||||||||||||||||||||||||
| Royce Pennsylvania Mutual Fund | |||||||||||||||||||||||||||||||||||||||||
| Investment Class | 9,353,969 | 10,226,806 | 24,734,687 | 8,810,839 | (31,659,681 | ) | (73,784,191 | ) | 76,842 | 2,505,817 | (54,746,546 | ) | |||||||||||||||||||||||||||||
| Service Class | 1,905,268 | 2,531,009 | 639,681 | 459,821 | (6,382,646 | ) | (4,824,673 | ) | (77,029 | ) | (3,914,726 | ) | (1,833,843 | ) | |||||||||||||||||||||||||||
| Consultant Class | 752,114 | 1,165,040 | 7,168,636 | 3,308,492 | (10,375,300 | ) | (13,450,271 | ) | (2,454,550 | ) | (8,976,739 | ) | |||||||||||||||||||||||||||||
| Institutional Class | 14,104,272 | 13,478,552 | 1,176,061 | 1,622,698 | (32,419,747 | ) | (46,263,535 | ) | (17,139,414 | ) | (31,162,285 | ) | |||||||||||||||||||||||||||||
| R Class | 268,144 | 265,258 | 275,108 | 108,100 | (655,493 | ) | (837,492 | ) | (112,241 | ) | (464,134 | ) | |||||||||||||||||||||||||||||
| K Class | 38,113 | 59,680 | 58,398 | 26,841 | (127,563 | ) | (262,303 | ) | (31,052 | ) | (175,782 | ) | |||||||||||||||||||||||||||||
| Royce Premier Fund | |||||||||||||||||||||||||||||||||||||||||
| Investment Class | 14,016,958 | 8,812,203 | 13,759,039 | 11,434,739 | (22,598,666 | ) | (47,449,896 | ) | 13,233 | 5,190,564 | (27,202,954 | ) | |||||||||||||||||||||||||||||
| Service Class | 901,293 | 683,834 | 436,337 | 328,013 | (1,023,456 | ) | (2,490,902 | ) | (13,608 | ) | 122,015 | 300,566 | (1,357,040 | ) | |||||||||||||||||||||||||||
| Consultant Class | 217,332 | 132,228 | 309,679 | 342,061 | (658,762 | ) | (732,856 | ) | (131,751 | ) | (258,567 | ) | |||||||||||||||||||||||||||||
| Institutional Class | 15,121,922 | 4,672,420 | 2,055,301 | 1,859,039 | (18,265,426 | ) | (10,964,670 | ) | (1,088,203 | ) | (4,433,211 | ) | |||||||||||||||||||||||||||||
| W Class | 609,443 | 769,454 | 123,331 | 940,832 | (8,321,109 | ) | (5,671,662 | ) | (7,588,335 | ) | (3,961,376 | ) | |||||||||||||||||||||||||||||
| R Class | 44,412 | 31,848 | 114,717 | 117,873 | (284,373 | ) | (385,875 | ) | (125,244 | ) | (236,154 | ) | |||||||||||||||||||||||||||||
| K Class | 766,591 | 61,502,453 | (1,403,182 | ) | (62,522,285 | ) | (1,656,423 | ) | |||||||||||||||||||||||||||||||||
| Royce Small-Cap Leaders Fund | |||||||||||||||||||||||||||||||||||||||||
| Investment Class | 535,267 | 429,323 | 862,183 | 594,974 | (2,108,703 | ) | (2,292,098 | ) | 524,387 | (186,866 | ) | (1,267,801 | ) | ||||||||||||||||||||||||||||
| Service Class | 296,333 | 411,724 | 834,401 | 661,844 | (1,966,267 | ) | (3,183,253 | ) | (461,537 | ) | (1,297,070 | ) | (2,109,685 | ) | |||||||||||||||||||||||||||
| R Class | 64,228 | 42,261 | 28,894 | 13,532 | (86,349 | ) | (64,382 | ) | 6,773 | (8,589 | ) | ||||||||||||||||||||||||||||||
| K Class | 860 | 13,532 | – | 3,507 | (1,392 | ) | (6,453 | ) | (49,764 | ) | (50,296 | ) | 10,586 | ||||||||||||||||||||||||||||
| Royce Small-Cap Value Fund | |||||||||||||||||||||||||||||||||||||||||
| Investment Class | 741,807 | 1,706,503 | 231,721 | 347,918 | (2,868,196 | ) | (3,693,241 | ) | 1,133,254 | (761,414 | ) | (1,638,820 | ) | ||||||||||||||||||||||||||||
| Service Class | 576,985 | 918,639 | 502,382 | 1,028,707 | (6,244,261 | ) | (9,655,060 | ) | (1,140,095 | ) | (6,304,989 | ) | (7,707,714 | ) | |||||||||||||||||||||||||||
| Consultant Class | 59,530 | 112,192 | 47,444 | 92,160 | (494,608 | ) | (700,893 | ) | (387,634 | ) | (496,541 | ) | |||||||||||||||||||||||||||||
| Institutional Class | 580,786 | 6,021,934 | 13,407 | 707,954 | (12,978,342 | ) | (11,003,947 | ) | (12,384,149 | ) | (4,274,059 | ) | |||||||||||||||||||||||||||||
| R Class | 248,260 | 319,737 | 51,120 | 98,127 | (676,071 | ) | (823,181 | ) | (376,691 | ) | (405,317 | ) | |||||||||||||||||||||||||||||
| K Class | 75,821 | 173,952 | 10,448 | 30,169 | (233,932 | ) | (752,641 | ) | (147,663 | ) | (548,520 | ) | |||||||||||||||||||||||||||||
| Royce Small/Mid-Cap Premier Fund | |||||||||||||||||||||||||||||||||||||||||
| Investment Class | 180,885 | 281,846 | 609,640 | 222,737 | (2,481,762 | ) | (1,440,664 | ) | 862,565 | (828,672 | ) | (936,081 | ) | ||||||||||||||||||||||||||||
| Service Class | 186,926 | 149,122 | 829,776 | 280,456 | (1,456,138 | ) | (1,565,689 | ) | (589,610 | ) | (1,029,046 | ) | (1,136,111 | ) | |||||||||||||||||||||||||||
| Consultant Class | 18,648 | 55,903 | 108,003 | 49,287 | (308,411 | ) | (203,096 | ) | (181,760 | ) | (97,906 | ) | |||||||||||||||||||||||||||||
| R Class | 31,664 | 27,042 | 25,521 | 10,114 | (43,525 | ) | (106,425 | ) | 13,660 | (69,269 | ) | ||||||||||||||||||||||||||||||
| K Class | 7,418 | 56,896 | – | 21,750 | (11,712 | ) | (107,350 | ) | (419,319 | ) | (423,613 | ) | (28,704 | ) | |||||||||||||||||||||||||||
| Royce Smaller-Companies Growth Fund | |||||||||||||||||||||||||||||||||||||||||
| Investment Class | 726,175 | 847,388 | 1,632,250 | 717,953 | (2,610,111 | ) | (5,074,410 | ) | 2,386,166 | 2,134,480 | (3,509,069 | ) | |||||||||||||||||||||||||||||
| Service Class | 667,456 | 1,409,846 | 3,597,705 | 2,529,315 | (6,376,008 | ) | (14,572,615 | ) | (2,426,035 | ) | (4,536,882 | ) | (10,633,454 | ) | |||||||||||||||||||||||||||
| Consultant Class | 42,850 | 18,168 | 190,998 | 128,775 | (243,879 | ) | (486,078 | ) | (10,031 | ) | (339,135 | ) | |||||||||||||||||||||||||||||
| Institutional Class | 186,029 | 412,595 | 129,407 | 166,115 | (1,280,636 | ) | (2,234,312 | ) | (965,200 | ) | (1,655,602 | ) | |||||||||||||||||||||||||||||
| R Class | 22,294 | 20,463 | 12,448 | 8,546 | (52,310 | ) | (35,661 | ) | (17,568 | ) | (6,652 | ) | |||||||||||||||||||||||||||||
| K Class | 1,824 | 4,217 | – | 6,933 | (13,381 | ) | (23,979 | ) | (25,935 | ) | (37,492 | ) | (12,829 | ) | |||||||||||||||||||||||||||
| Royce Special Equity Fund | |||||||||||||||||||||||||||||||||||||||||
| Investment Class | 6,201,776 | 9,260,512 | 3,671,017 | 3,410,178 | (13,116,344 | ) | (18,239,504 | ) | 20,317 | (3,223,234 | ) | (5,568,814 | ) | ||||||||||||||||||||||||||||
| Service Class | 799,233 | 1,557,578 | 332,993 | 302,840 | (1,975,892 | ) | (2,299,540 | ) | (20,390 | ) | (864,056 | ) | (439,122 | ) | |||||||||||||||||||||||||||
| Consultant Class | 185,121 | 271,702 | 169,107 | 164,009 | (510,780 | ) | (489,570 | ) | (156,552 | ) | (53,859 | ) | |||||||||||||||||||||||||||||
| Institutional Class | 5,531,768 | 2,367,916 | 889,637 | 706,990 | (4,436,735 | ) | (5,367,357 | ) | 1,984,670 | (2,292,451 | ) | ||||||||||||||||||||||||||||||
| Royce Special Equity Multi-Cap Fund | |||||||||||||||||||||||||||||||||||||||||
| Investment Class | 165,273 | 704,106 | 67,983 | 25,618 | (402,101 | ) | (1,787,819 | ) | 290,182 | 121,337 | (1,058,095 | ) | |||||||||||||||||||||||||||||
| Service Class | 135,187 | 92,500 | 35,573 | 20,600 | (1,028,167 | ) | (1,271,369 | ) | (289,800 | ) | (1,147,207 | ) | (1,158,269 | ) | |||||||||||||||||||||||||||
| Consultant Class | 25,805 | 64,759 | 9,326 | 4,086 | (171,041 | ) | (358,839 | ) | (135,910 | ) | (289,994 | ) | |||||||||||||||||||||||||||||
| Institutional Class | 16,730 | 14,101 | 73,360 | 32,709 | (299,588 | ) | (348,109 | ) | (209,498 | ) | (301,299 | ) | |||||||||||||||||||||||||||||
| 112 | The Royce Funds 2017 Annual Report to Shareholders |
Capital Share Transactions (in shares) (continued):
| SHARES ISSUED FOR | |||||||||||||||||||||||||||||||||||||||||
| REINVESTMENT | NET INCREASE (DECREASE) IN | ||||||||||||||||||||||||||||||||||||||||
| SHARES SOLD | OF DISTRIBUTIONS | SHARES REDEEMED | SHARE CLASS CONVERSIONS | SHARES OUTSTANDING | |||||||||||||||||||||||||||||||||||||
| Year Ended | Period Ended | Year Ended | Period Ended | Year Ended | Period Ended | Year Ended | Period Ended | Year Ended | Period Ended | ||||||||||||||||||||||||||||||||
| 12/31/17 | 12/31/16 | 12/31/17 | 12/31/16 | 12/31/17 | 12/31/16 | 12/31/171 | 12/31/162 | 12/31/17 | 12/31/16 | ||||||||||||||||||||||||||||||||
| Royce Total Return Fund | |||||||||||||||||||||||||||||||||||||||||
| Investment Class | 11,868,856 | 23,095,630 | 12,067,778 | 9,965,626 | (43,955,697 | ) | (54,300,006 | ) | 41,593 | (19,977,470 | ) | (21,238,750 | ) | ||||||||||||||||||||||||||||
| Service Class | 2,650,293 | 2,651,956 | 808,230 | 752,701 | (6,572,028 | ) | (4,555,567 | ) | (40,740 | ) | (3,154,245 | ) | (1,150,910 | ) | |||||||||||||||||||||||||||
| Consultant Class | 544,363 | 809,896 | 1,953,113 | 1,253,650 | (3,711,048 | ) | (4,654,549 | ) | (1,213,572 | ) | (2,591,003 | ) | |||||||||||||||||||||||||||||
| Institutional Class | 18,520,572 | 22,240,210 | 2,608,378 | 2,503,885 | (29,035,003 | ) | (25,442,830 | ) | (7,906,053 | ) | (698,735 | ) | |||||||||||||||||||||||||||||
| W Class | 1,674,617 | 2,022,318 | 713,915 | 391,422 | (1,143,414 | ) | (6,527,081 | ) | 1,245,118 | (4,113,341 | ) | ||||||||||||||||||||||||||||||
| R Class | 934,952 | 561,428 | 480,019 | 298,296 | (1,309,309 | ) | (1,194,084 | ) | 105,662 | (334,360 | ) | ||||||||||||||||||||||||||||||
| K Class | 1,143,530 | 2,544,929 | 515,092 | 540,978 | (1,995,811 | ) | (6,214,250 | ) | (337,189 | ) | (3,128,343 | ) | |||||||||||||||||||||||||||||
| 1 | Royce International Premier Fund K Class shares converted to Service Class shares on February 7, 2017. On February 24, 2017, K Class shares converted to Service Class shares for the following funds: Royce Low-Priced Stock Fund, Royce Small-Cap Leaders Fund, Royce Small/Mid-Cap Premier Fund and Royce Smaller-Companies Growth Fund. On November 10, 2017, the following funds had certain shares in the Service Class covert to Investment Class shares: Royce Dividend Value Fund, Royce International Premier Fund, Royce Low-Priced Stock Fund, Royce Micro-Cap Fund, Royce Micro-Cap Opportunity Fund, Royce Opportunity Fund, Royce Pennsylvania Mutual Fund, Royce Premier Fund, Royce Small-Cap Leaders Fund, Royce Small-Cap Value Fund, Royce Small/Mid-Cap Premier Fund, Royce Smaller-Companies Growth Fund, Royce Special Equity Fund, Royce Special Equity Multi-Cap Fund and Royce Total Return Fund. |
| 2 | Royce Premier Fund K Class shares converted to Service Class shares on December 16, 2016. |
| 3 | Includes shares issued in connection with the merger of Royce European Small-Cap Fund and Royce Global Value Fund (2,460,873 for Investment Class, 3,226,058 for Service Class, 542,120 for Consultant Class, 4,452 for R Class and 2,473 for K Class, for the period ended 12/31/16). |
| ANNUAL CONTRACTUAL | YEAR ENDED | |||||||||||||||||||||||||||||||||||||||||||
| ADVISORY FEE AS A | COMMITTED NET ANNUAL OPERATING EXPENSE RATIO CAP 3 | DECEMBER 31, 2017 | ||||||||||||||||||||||||||||||||||||||||||
| PERCENTAGE OF AVERAGE | Investment | Service | Consultant | Institutional | Net | Advisory fees | ||||||||||||||||||||||||||||||||||||||
| NET ASSETS1 | Class3 | Class3 | Class3 | Class3 | W Class3 | R Class3 | K Class3 | advisory fees | waived | |||||||||||||||||||||||||||||||||||
| Royce Dividend Value Fund | 0.85% | 1.09% | 1.34% | 2.09% | 0.89% | N/A | N/A | N/A | $ | 1,560,613 | $ | 138,813 | ||||||||||||||||||||||||||||||||
| Royce Global Financial Services Fund | 1.00% | N/A | 1.49% | N/A | 1.04% | N/A | N/A | N/A | 448,171 | 78,708 | ||||||||||||||||||||||||||||||||||
| Royce International Micro-Cap Fund | 1.25% | N/A | 1.64% | N/A | N/A | N/A | N/A | N/A | – | 89,594 | ||||||||||||||||||||||||||||||||||
| Royce International Premier Fund | 1.00% | 1.19% | 1.44% | 2.19% | N/A | N/A | 1.74% | 1.49% | 961,894 | 10,266 | ||||||||||||||||||||||||||||||||||
| Royce Low-Priced Stock Fund | 1.00% | 1.24% | 1.49% | N/A | N/A | N/A | 1.84% | 1.59% | 2,868,000 | – | ||||||||||||||||||||||||||||||||||
| Royce Micro-Cap Fund | 1.25% | 1.49% | 1.61% | N/A | N/A | N/A | N/A | N/A | 2,766,708 | – | ||||||||||||||||||||||||||||||||||
| Royce Micro-Cap Opportunity Fund | 1.00% | 1.24% | 1.49% | N/A | N/A | N/A | N/A | N/A | 487,886 | – | ||||||||||||||||||||||||||||||||||
| Royce Opportunity Fund | 1.00% | N/A | 1.49% | N/A | N/A | N/A | N/A | N/A | 15,181,518 | – | ||||||||||||||||||||||||||||||||||
| Royce Pennsylvania Mutual Fund | 0.76%2 | N/A | N/A | N/A | N/A | N/A | N/A | N/A | 17,541,182 | – | ||||||||||||||||||||||||||||||||||
| Royce Premier Fund | 0.99% | N/A | 1.49% | N/A | N/A | N/A | N/A | N/A | 22,886,548 | – | ||||||||||||||||||||||||||||||||||
| Royce Small-Cap Leaders Fund | 1.00% | 1.24% | 1.49% | N/A | N/A | N/A | 1.84% | 1.59% | 920,285 | – | ||||||||||||||||||||||||||||||||||
| Royce Small-Cap Value Fund | 1.00% | 1.24% | 1.49% | N/A | N/A | N/A | N/A | 1.99% | 3,483,606 | – | ||||||||||||||||||||||||||||||||||
| Royce Small/Mid-Cap Premier Fund | 0.85% | N/A | N/A | 2.09% | N/A | N/A | 1.69% | 1.44% | 1,829,246 | – | ||||||||||||||||||||||||||||||||||
| Royce Smaller-Companies Growth Fund | 1.00% | N/A | N/A | 2.24% | N/A | N/A | 1.84% | 1.59% | 3,953,467 | – | ||||||||||||||||||||||||||||||||||
| Royce Special Equity Fund | 1.00% | N/A | 1.39% | N/A | N/A | N/A | N/A | N/A | 15,480,297 | – | ||||||||||||||||||||||||||||||||||
| Royce Special Equity Multi-Cap Fund | 0.85% | N/A | 1.24% | 1.99% | 0.89% | N/A | N/A | N/A | 880,394 | 55,084 | ||||||||||||||||||||||||||||||||||
| Royce Total Return Fund | 0.99% | N/A | N/A | N/A | N/A | N/A | N/A | N/A | 26,282,169 | – | ||||||||||||||||||||||||||||||||||
| 1 | Effective July 1, 2017, from a base annual rate of 1.00% (0.85% for Royce Dividend Value Fund, Royce Small/Mid-Cap Premier Fund and Royce Special Equity Multi-Cap Fund and 1.25% for Royce International Micro-Cap Fund and Royce Micro-Cap Fund), the annual rates of investment advisory fees payable by each of the Funds, other than Royce Pennsylvania Mutual Fund, are reduced by the indicated amount at the following breakpoints applicable to a Fund’s net assets in excess of $2 billion: more than $2 billion to $3 billion – .05% per annum; more than $3 billion to $4 billion – .10% per annum; over $4 billion – .15% per annum. Prior to July 1, 2017, breakpoints were: more than $2 billion to $4 billion – .05% per annum; more than $4 billion to $6 billion – .10% per annum; over $6 billion – .15% per annum. |
| 2 | Royce Pennsylvania Mutual Fund’s fees are calculated at the annual rate of 1.00% of the first $50 million of the Fund’s average net assets, 0.875% of the next $50 million of average net assets and 0.75% of average net assets in excess of $100 million. |
| 3 | Committed net annual operating expense ratio cap excludes acquired fund fees and expenses. |
| The Royce Funds 2017 Annual Report to Shareholders | 113 |
| Notes to Financial Statements (continued) |
| ANNUAL CONTRACTUAL DISTRIBUTION FEE AS A | YEAR ENDED DECEMBER 31, 2017 | |||||||||||||||||||||||
| PERCENTAGE OF AVERAGE NET ASSETS | Net distribution fees | Distribution fees waived | ||||||||||||||||||||||
| Royce Dividend Value Fund – Service Class | 0.25% | $ | 224,836 | $ | 9,368 | |||||||||||||||||||
| Royce Dividend Value Fund – Consultant Class | 1.00% | 15,254 | – | |||||||||||||||||||||
| Royce Global Financial Services Fund – Service Class | 0.25% | 108,662 | 4,528 | |||||||||||||||||||||
| Royce International Micro-Cap Fund – Service Class | 0.25% | 11,468 | 6,451 | |||||||||||||||||||||
| Royce International Premier Fund – Service Class | 0.25% | 70,051 | 46,701 | |||||||||||||||||||||
| Royce International Premier Fund – Consultant Class | 1.00% | 65,228 | – | |||||||||||||||||||||
| Royce International Premier Fund – R Class | 0.50% | 313 | – | |||||||||||||||||||||
| Royce International Premier Fund – K Class | 0.25% | 6 | – | |||||||||||||||||||||
| Royce Low-Priced Stock Fund – Service Class | 0.25% | 575,679 | 50,059 | |||||||||||||||||||||
| Royce Low-Priced Stock Fund – R Class | 0.50% | 4,927 | – | |||||||||||||||||||||
| Royce Low-Priced Stock Fund – K Class | 0.25% | 409 | – | |||||||||||||||||||||
| Royce Micro-Cap Fund – Service Class | 0.25% | 40,976 | – | |||||||||||||||||||||
| Royce Micro-Cap Fund – Consultant Class | 1.00% | 282,685 | – | |||||||||||||||||||||
| Royce Micro-Cap Opportunity Fund – Service Class | 0.25% | 2,610 | – | |||||||||||||||||||||
| Royce Opportunity Fund – Service Class | 0.25% | 217,360 | – | |||||||||||||||||||||
| Royce Opportunity Fund – Consultant Class | 1.00% | 204,021 | – | |||||||||||||||||||||
| Royce Opportunity Fund – R Class | 0.50% | 190,732 | – | |||||||||||||||||||||
| Royce Opportunity Fund – K Class | 0.25% | 17,625 | – | |||||||||||||||||||||
| Royce Pennsylvania Mutual Fund – Service Class | 0.25% | 197,108 | – | |||||||||||||||||||||
| Royce Pennsylvania Mutual Fund – Consultant Class | 1.00% | 3,767,251 | – | |||||||||||||||||||||
| Royce Pennsylvania Mutual Fund – R Class | 0.50% | 81,187 | – | |||||||||||||||||||||
| Royce Pennsylvania Mutual Fund – K Class | 0.25% | 6,870 | – | |||||||||||||||||||||
| Royce Premier Fund – Service Class | 0.25% | 129,718 | – | |||||||||||||||||||||
| Royce Premier Fund – Consultant Class | 1.00% | 314,423 | – | |||||||||||||||||||||
| Royce Premier Fund – R Class | 0.50% | 66,124 | – | |||||||||||||||||||||
| Royce Small-Cap Leaders Fund – Service Class | 0.25% | 104,256 | 9,066 | |||||||||||||||||||||
| Royce Small-Cap Leaders Fund – R Class | 0.50% | 9,862 | – | |||||||||||||||||||||
| Royce Small-Cap Leaders Fund – K Class | 0.25% | 189 | – | |||||||||||||||||||||
| Royce Small-Cap Value Fund – Service Class | 0.25% | 420,739 | 17,531 | |||||||||||||||||||||
| Royce Small-Cap Value Fund – Consultant Class | 1.00% | 142,592 | – | |||||||||||||||||||||
| Royce Small-Cap Value Fund – R Class | 0.50% | 77,850 | – | |||||||||||||||||||||
| Royce Small-Cap Value Fund – K Class | 0.25% | 5,273 | – | |||||||||||||||||||||
| Royce Small/Mid-Cap Premier Fund – Service Class | 0.25% | 144,188 | 162,703 | |||||||||||||||||||||
| Royce Small/Mid-Cap Premier Fund – Consultant Class | 1.00% | 108,048 | – | |||||||||||||||||||||
| Royce Small/Mid-Cap Premier Fund – R Class | 0.50% | 9,885 | – | |||||||||||||||||||||
| Royce Small/Mid-Cap Premier Fund – K Class | 0.25% | 1,559 | – | |||||||||||||||||||||
| Royce Smaller-Companies Growth Fund – Service Class | 0.25% | 618,550 | 53,787 | |||||||||||||||||||||
| Royce Smaller-Companies Growth Fund – Consultant Class | 1.00% | 107,655 | – | |||||||||||||||||||||
| Royce Smaller-Companies Growth Fund – R Class | 0.50% | 3,869 | – | |||||||||||||||||||||
| Royce Smaller-Companies Growth Fund – K Class | 0.25% | 54 | – | |||||||||||||||||||||
| Royce Special Equity Fund – Service Class | 0.25% | 280,389 | – | |||||||||||||||||||||
| Royce Special Equity Fund – Consultant Class | 1.00% | 474,503 | – | |||||||||||||||||||||
| Royce Special Equity Multi-Cap Fund – Service Class | 0.25% | 54,911 | 17,340 | |||||||||||||||||||||
| Royce Special Equity Multi-Cap Fund – Consultant Class | 1.00% | 45,248 | – | |||||||||||||||||||||
| Royce Total Return Fund – Service Class | 0.25% | 307,427 | – | |||||||||||||||||||||
| Royce Total Return Fund – Consultant Class | 1.00% | 2,520,549 | – | |||||||||||||||||||||
| Royce Total Return Fund – R Class | 0.50% | 265,194 | – | |||||||||||||||||||||
| Royce Total Return Fund – K Class | 0.25% | 93,291 | – | |||||||||||||||||||||
| 114 | The Royce Funds 2017 Annual Report to Shareholders |
| PURCHASES | SALES1 | |||||||
| Royce Dividend Value Fund | $ | 31,830,733 | $ | 99,967,749 | ||||
| Royce Global Financial Services Fund | 9,523,013 | 11,283,244 | ||||||
| Royce International Micro-Cap Fund | 6,152,580 | 5,985,682 | ||||||
| Royce International Premier Fund | 101,106,923 | 38,034,556 | ||||||
| Royce Low-Priced Stock Fund | 73,532,691 | 141,202,878 | ||||||
| Royce Micro-Cap Fund | 55,339,500 | 95,091,116 | ||||||
| Royce Micro-Cap Opportunity Fund | 32,024,862 | 42,052,348 | ||||||
| Royce Opportunity Fund | 607,969,970 | 769,491,320 | ||||||
| Royce Pennsylvania Mutual Fund | 620,849,146 | 1,023,994,097 | ||||||
| Royce Premier Fund | 163,220,194 | 590,941,327 | ||||||
| Royce Small-Cap Leaders Fund | 63,626,378 | 86,554,924 | ||||||
| Royce Small-Cap Value Fund | 189,728,577 | 279,008,467 | ||||||
| Royce Small/Mid-Cap Premier Fund | 101,771,864 | 123,337,923 | ||||||
| Royce Smaller-Companies Growth Fund | 235,704,337 | 359,751,768 | ||||||
| Royce Special Equity Fund | 199,785,785 | 344,818,711 | ||||||
| Royce Special Equity Multi-Cap Fund | 27,196,977 | 45,769,709 | ||||||
| Royce Total Return Fund | 314,937,918 | 783,725,775 | ||||||
| 1Excludes the value of securities delivered as a result of redemptions-in-kind. |
Cross trades were executed by the Funds pursuant to Rule 17a-7 under the 1940 Act. Cross trading is the buying or selling of portfolio securities between funds to which Royce serves as investment adviser. At its regularly scheduled quarterly meetings, the Board reviews such transactions as of the most recent calendar quarter for compliance with the requirements and restrictions set forth by Rule 17a-7. Cross trades for the year ended December 31, 2017, were as follows:
| COST OF PURCHASES | PROCEEDS FROM SALES | REALIZED GAIN (LOSS) | ||||||||||
| Royce Dividend Value Fund | $ | – | $ | 13,763,919 | $ | 486,027 | ||||||
| Royce Low-Priced Stock Fund | – | 79,237 | 25,944 | |||||||||
| Royce Micro-Cap Fund | 56,817 | 174,983 | 6,301 | |||||||||
| Royce Micro-Cap Opportunity Fund | – | 1,151,000 | (52,124 | ) | ||||||||
| Royce Opportunity Fund | 2,765,328 | 954,900 | (3,275,520 | ) | ||||||||
| Royce Pennsylvania Mutual Fund | 8,811,391 | 13,400,250 | (2,362,382 | ) | ||||||||
| Royce Premier Fund | 4,683,549 | 12,300,836 | (3,575,191 | ) | ||||||||
| Royce Small-Cap Leaders Fund | – | 419,655 | (116,820 | ) | ||||||||
| Royce Smaller-Companies Growth Fund | – | 3,580,339 | (3,603,152 | ) | ||||||||
| Royce Total Return Fund | 13,763,919 | 5,145,400 | (5,175,727 | ) | ||||||||
| PROCEEDS | REALIZED GAIN | |||||||
| Royce Pennsylvania Mutual Fund | $ | 244,204,351 | $ | 127,020,390 | ||||
| Royce Premier Fund | 187,753,419 | 109,046,738 | ||||||
| Royce Small-Cap Value Fund | 79,674,120 | 13,424,454 | ||||||
| Royce Small/Mid-Cap Premier Fund | 17,276,740 | 5,430,476 | ||||||
| Royce Total Return Fund | 268,294,368 | 144,084,621 | ||||||
| CLASS LEVEL | ||||||||||||||||||||||||||||
| EXPENSES | ||||||||||||||||||||||||||||
| REIMBURSED BY | ||||||||||||||||||||||||||||
| NET DISTRIBUTION | SHAREHOLDER | SHAREHOLDER | TRANSFER AGENT | INVESTMENT | ||||||||||||||||||||||||
| FEES | SERVICING | REPORTS | REGISTRATION | BALANCE CREDITS | TOTAL | ADVISER | ||||||||||||||||||||||
| Royce Dividend Value Fund – | ||||||||||||||||||||||||||||
Investment Class | $ | – | $ | 124,602 | $ | 31,030 | $ | 17,507 | $ | (181 | ) | $ | 172,958 | $ | – | |||||||||||||
| Royce Dividend Value Fund – Service Class | 224,836 | 122,610 | 38,716 | 16,768 | (2,804 | ) | 400,126 | – | ||||||||||||||||||||
| Royce Dividend Value Fund – | ||||||||||||||||||||||||||||
Consultant Class | 15,254 | 7,217 | 969 | 11,640 | (31 | ) | 35,049 | 16,733 | ||||||||||||||||||||
| Royce Dividend Value Fund – | ||||||||||||||||||||||||||||
Institutional Class | – | 6,200 | 83 | 11,317 | (6 | ) | 17,594 | 17,594 | ||||||||||||||||||||
| 240,090 | 260,629 | 70,798 | 57,232 | (3,022 | ) | 34,327 | ||||||||||||||||||||||
| The Royce Funds 2017 Annual Report to Shareholders | 115 |
Notes to Financial Statements (continued)
Class Specific Expenses (continued):
| CLASS LEVEL | ||||||||||||||||||||||||||||
| EXPENSES | ||||||||||||||||||||||||||||
| REIMBURSED BY | ||||||||||||||||||||||||||||
| NET DISTRIBUTION | SHAREHOLDER | SHAREHOLDER | TRANSFER AGENT | INVESTMENT | ||||||||||||||||||||||||
| FEES | SERVICING | REPORTS | REGISTRATION | BALANCE CREDITS | TOTAL | ADVISER | ||||||||||||||||||||||
Royce Global Financial Services Fund – Service Class | $ | 108,662 | $ | 70,185 | $ | 12,754 | $ | 28,914 | $ | (348 | ) | $ | 220,167 | $ | 15,757 | |||||||||||||
Royce Global Financial Services Fund – Institutional Class | – | 6,262 | 69 | 12,297 | (8 | ) | 18,620 | 18,620 | ||||||||||||||||||||
| 108,662 | 76,447 | 12,823 | 41,211 | (356 | ) | 34,377 | ||||||||||||||||||||||
Royce International Premier Fund – Investment Class | – | 49,112 | 6,224 | 19,330 | (71 | ) | 74,595 | 74,595 | ||||||||||||||||||||
Royce International Premier Fund – | 70,051 | 65,746 | 14,442 | 16,783 | (658 | ) | 166,364 | 44,373 | ||||||||||||||||||||
Royce International Premier Fund – Consultant Class | 65,228 | 21,179 | 2,187 | 11,387 | (108 | ) | 99,873 | 34,205 | ||||||||||||||||||||
| Royce International Premier Fund – R Class | 313 | 6,169 | 3 | 3,239 | (3 | ) | 9,721 | 9,369 | ||||||||||||||||||||
| Royce International Premier Fund – K Class | 6 | 686 | – | 1,939 | – | 2,631 | 2,623 | |||||||||||||||||||||
| 135,598 | 142,892 | 22,856 | 52,678 | (840 | ) | 165,165 | ||||||||||||||||||||||
Royce Low-Priced Stock Fund – | – | 34,795 | 5,889 | 11,962 | (106 | ) | 52,540 | 15,572 | ||||||||||||||||||||
Royce Low-Priced Stock Fund – | 575,679 | 373,113 | 82,208 | 19,644 | (2,943 | ) | 1,047,701 | 23,654 | ||||||||||||||||||||
Royce Low-Priced Stock Fund – Institutional Class | – | 6,563 | (312 | ) | 11,604 | (14 | ) | 17,841 | – | |||||||||||||||||||
| Royce Low-Priced Stock Fund – R Class | 4,927 | 8,284 | 765 | 4,407 | (20 | ) | 18,363 | 10,901 | ||||||||||||||||||||
| Royce Low-Priced Stock Fund – K Class | 409 | 1,271 | 64 | 1,520 | (1 | ) | 3,263 | 2,425 | ||||||||||||||||||||
| 581,015 | 424,026 | 88,614 | 49,137 | (3,084 | ) | 52,552 | ||||||||||||||||||||||
Royce Micro-Cap Fund – Investment Class | – | 193,645 | 84,545 | 17,957 | (2,794 | ) | 293,353 | 37,106 | ||||||||||||||||||||
Royce Micro-Cap Fund – Service Class | 40,976 | 26,142 | 5,286 | 11,948 | (68 | ) | 84,284 | 40,788 | ||||||||||||||||||||
Royce Micro-Cap Fund – Consultant Class | 282,685 | 33,410 | 9,380 | 12,680 | (284 | ) | 337,871 | – | ||||||||||||||||||||
| 323,661 | 253,197 | 99,211 | 42,585 | (3,146 | ) | 77,894 | ||||||||||||||||||||||
Royce Micro-Cap Opportunity Fund – Investment Class | – | 42,883 | 3,774 | 18,677 | (111 | ) | 65,223 | 17,942 | ||||||||||||||||||||
Royce Micro-Cap Opportunity Fund – Service Class | 2,610 | 8,774 | 353 | 11,425 | (11 | ) | 23,151 | 19,521 | ||||||||||||||||||||
| 2,610 | 51,657 | 4,127 | 30,102 | (122 | ) | 37,463 | ||||||||||||||||||||||
Royce Opportunity Fund – | – | 819,877 | 111,586 | 30,206 | (4,449 | ) | 957,220 | – | ||||||||||||||||||||
Royce Opportunity Fund – Service Class | 217,360 | 135,202 | 35,047 | 23,038 | (260 | ) | 410,387 | 36,270 | ||||||||||||||||||||
Royce Opportunity Fund – | 204,021 | 26,218 | 4,927 | 11,475 | (269 | ) | 246,372 | – | ||||||||||||||||||||
Royce Opportunity Fund – | – | 7,947 | 21,737 | 17,959 | (92 | ) | 47,551 | – | ||||||||||||||||||||
| Royce Opportunity Fund – R Class | 190,732 | 84,420 | 5,083 | 10,825 | (117 | ) | 290,943 | – | ||||||||||||||||||||
| Royce Opportunity Fund – K Class | 17,625 | 20,961 | 787 | 11,319 | (68 | ) | 50,624 | – | ||||||||||||||||||||
| 629,738 | 1,094,625 | 179,167 | 104,822 | (5,255 | ) | 36,270 | ||||||||||||||||||||||
Royce Pennsylvania Mutual Fund – Investment Class | – | 1,346,359 | 277,786 | 25,491 | (13,120 | ) | 1,636,516 | – | ||||||||||||||||||||
Royce Pennsylvania Mutual Fund – | 197,108 | 127,539 | 21,741 | 14,481 | (368 | ) | 360,501 | – | ||||||||||||||||||||
Royce Pennsylvania Mutual Fund – Consultant Class | 3,767,251 | 291,190 | 95,356 | 16,773 | (2,739 | ) | 4,167,831 | – | ||||||||||||||||||||
Royce Pennsylvania Mutual Fund – Institutional Class | – | 8,505 | 5,670 | 12,596 | (165 | ) | 26,606 | – | ||||||||||||||||||||
Royce Pennsylvania Mutual Fund – R Class | 81,187 | 54,288 | 3,799 | 8,596 | (191 | ) | 147,679 | – | ||||||||||||||||||||
Royce Pennsylvania Mutual Fund – K Class | 6,870 | 12,126 | 716 | 11,253 | (31 | ) | 30,934 | – | ||||||||||||||||||||
| 4,052,416 | 1,840,007 | 405,068 | 89,190 | (16,614 | ) | – | ||||||||||||||||||||||
| Royce Premier Fund – Investment Class | – | 1,572,226 | 359,669 | 27,426 | (7,398 | ) | 1,951,923 | – | ||||||||||||||||||||
| Royce Premier Fund – Service Class | 129,718 | 85,094 | 19,442 | 13,013 | (555 | ) | 246,712 | 19,911 | ||||||||||||||||||||
| Royce Premier Fund – Consultant Class | 314,423 | 30,936 | 6,621 | 12,578 | (221 | ) | 364,337 | – | ||||||||||||||||||||
| Royce Premier Fund – Institutional Class | – | 8,629 | 67,409 | 15,885 | (94 | ) | 91,829 | – | ||||||||||||||||||||
| Royce Premier Fund – W Class | – | 97,823 | 33,636 | 14,185 | (692 | ) | 144,952 | – | ||||||||||||||||||||
| Royce Premier Fund – R Class | 66,124 | 40,302 | 1,030 | 4,853 | (45 | ) | 112,264 | – | ||||||||||||||||||||
| 510,265 | 1,835,010 | 487,807 | 87,940 | (9,005 | ) | 19,911 | ||||||||||||||||||||||
| 116 | The Royce Funds 2017 Annual Report to Shareholders |
Class Specific Expenses (continued):
| CLASS LEVEL | ||||||||||||||||||||||||||||
| EXPENSES | ||||||||||||||||||||||||||||
| REIMBURSED BY | ||||||||||||||||||||||||||||
| NET DISTRIBUTION | SHAREHOLDER | SHAREHOLDER | TRANSFER AGENT | INVESTMENT | ||||||||||||||||||||||||
| FEES | SERVICING | REPORTS | REGISTRATION | BALANCE CREDITS | TOTAL | ADVISER | ||||||||||||||||||||||
Royce Small-Cap Leaders Fund – Investment Class | $ | – | $ | 29,892 | $ | 13,895 | $ | 16,097 | $ | (133 | ) | $ | 59,751 | $ | 22 | |||||||||||||
Royce Small-Cap Leaders Fund – Service Class | 104,256 | 74,841 | 14,921 | 16,005 | (527 | ) | 209,496 | 34,819 | ||||||||||||||||||||
| Royce Small-Cap Leaders Fund – R Class | 9,862 | 11,324 | 1,789 | 6,624 | (127 | ) | 29,472 | 14,996 | ||||||||||||||||||||
| Royce Small-Cap Leaders Fund – K Class | 189 | 1,063 | 310 | 1,488 | (1 | ) | 3,049 | 2,679 | ||||||||||||||||||||
| 114,307 | 117,120 | 30,915 | 40,214 | (788 | ) | 52,516 | ||||||||||||||||||||||
Royce Small-Cap Value Fund – Investment Class | – | 81,482 | 12,037 | 12,856 | (174 | ) | 106,201 | 9,105 | ||||||||||||||||||||
Royce Small-Cap Value Fund – Service Class | 420,739 | 251,004 | 54,174 | 16,110 | (1,669 | ) | 740,358 | 24,083 | ||||||||||||||||||||
Royce Small-Cap Value Fund – Consultant Class | 142,592 | 19,323 | 3,504 | 11,720 | (128 | ) | 177,011 | – | ||||||||||||||||||||
Royce Small-Cap Value Fund – Institutional Class | – | 6,595 | (247 | ) | 14,706 | (28 | ) | 21,026 | – | |||||||||||||||||||
| Royce Small-Cap Value Fund – R Class | 77,850 | 38,639 | 1,941 | 5,381 | (112 | ) | 123,699 | – | ||||||||||||||||||||
| Royce Small-Cap Value Fund – K Class | 5,273 | 10,105 | 1,444 | 11,316 | (24 | ) | 28,114 | 8,952 | ||||||||||||||||||||
| 646,454 | 407,148 | 72,853 | 72,089 | (2,135 | ) | 42,140 | ||||||||||||||||||||||
Royce Small/Mid-Cap Premier Fund – Investment Class | – | 18,355 | 2,931 | 14,715 | (87 | ) | 35,914 | – | ||||||||||||||||||||
Royce Small/Mid-Cap Premier Fund – Service Class | 144,188 | 95,143 | 47,290 | 19,461 | (2,499 | ) | 303,583 | – | ||||||||||||||||||||
Royce Small/Mid-Cap Premier Fund – Consultant Class | 108,048 | 15,094 | 5,232 | 12,023 | (224 | ) | 140,173 | 16,068 | ||||||||||||||||||||
| Royce Small/Mid-Cap Premier Fund – R Class | 9,885 | 10,379 | 791 | 4,712 | (36 | ) | 25,731 | 10,951 | ||||||||||||||||||||
| Royce Small/Mid-Cap Premier Fund – K Class | 1,559 | 2,072 | 183 | 1,625 | – | 5,439 | 2,254 | |||||||||||||||||||||
| 263,680 | 141,043 | 56,427 | 52,536 | (2,846 | ) | 29,273 | ||||||||||||||||||||||
Royce Smaller-Companies Growth Fund – Investment Class | – | 74,922 | 32,403 | 13,120 | (246 | ) | 120,199 | – | ||||||||||||||||||||
Royce Smaller-Companies Growth Fund – Service Class | 618,550 | 379,881 | 65,982 | 19,424 | (2,471 | ) | 1,081,366 | – | ||||||||||||||||||||
Royce Smaller-Companies Growth Fund – Consultant Class | 107,655 | 16,426 | 3,506 | 11,731 | (132 | ) | 139,186 | 13,048 | ||||||||||||||||||||
Royce Smaller-Companies Growth Fund – Institutional Class | – | 6,907 | 1,751 | 11,579 | (21 | ) | 20,216 | – | ||||||||||||||||||||
Royce Smaller-Companies Growth Fund – R Class | 3,869 | 7,998 | 780 | 5,065 | (25 | ) | 17,687 | 11,714 | ||||||||||||||||||||
Royce Smaller-Companies Growth Fund – K Class | 54 | 1,002 | 16 | 1,488 | – | 2,560 | 2,446 | |||||||||||||||||||||
| 730,128 | 487,136 | 104,438 | 62,407 | (2,895 | ) | 27,208 | ||||||||||||||||||||||
| Royce Special Equity Fund – Investment Class | – | 1,080,730 | 177,125 | 30,940 | (4,374 | ) | 1,284,421 | – | ||||||||||||||||||||
| Royce Special Equity Fund – Service Class | 280,389 | 162,043 | 40,891 | 13,225 | (2,496 | ) | 494,052 | 120,004 | ||||||||||||||||||||
| Royce Special Equity Fund – Consultant Class | 474,503 | 48,168 | 9,759 | 12,312 | (335 | ) | 544,407 | – | ||||||||||||||||||||
Royce Special Equity Fund – Institutional Class | – | 9,876 | 57,368 | 16,494 | (205 | ) | 83,533 | – | ||||||||||||||||||||
| 754,892 | 1,300,817 | 285,143 | 72,971 | (7,410 | ) | 120,004 | ||||||||||||||||||||||
Royce Special Equity Multi-Cap Fund – Investment Class | – | 20,794 | 2,389 | 14,194 | (114 | ) | 37,263 | – | ||||||||||||||||||||
Royce Special Equity Multi-Cap Fund – Service Class | 54,911 | 40,079 | 4,706 | 13,786 | (236 | ) | 113,246 | 11,489 | ||||||||||||||||||||
Royce Special Equity Multi-Cap Fund – Consultant Class | 45,248 | 22,837 | 1,042 | 11,961 | (49 | ) | 81,039 | 31,242 | ||||||||||||||||||||
Royce Special Equity Multi-Cap Fund – Institutional Class | – | 6,280 | 51 | 13,897 | (7 | ) | 20,221 | 20,221 | ||||||||||||||||||||
| 100,159 | 89,990 | 8,188 | 53,838 | (406 | ) | 62,952 | ||||||||||||||||||||||
| The Royce Funds 2017 Annual Report to Shareholders | 117 |
Notes to Financial Statements (continued)
Class Specific Expenses (continued):
| CLASS LEVEL | ||||||||||||||||||||||||||||
| EXPENSES | ||||||||||||||||||||||||||||
| REIMBURSED BY | ||||||||||||||||||||||||||||
| NET DISTRIBUTION | SHAREHOLDER | SHAREHOLDER | TRANSFER AGENT | INVESTMENT | ||||||||||||||||||||||||
| FEES | SERVICING | REPORTS | REGISTRATION | BALANCE CREDITS | TOTAL | ADVISER | ||||||||||||||||||||||
| Royce Total Return Fund – Investment Class | $ | – | $ | 2,043,797 | $ | 374,596 | $ | 27,057 | $ | (7,680 | ) | $ | 2,437,770 | $ | – | |||||||||||||
| Royce Total Return Fund – Service Class | 307,427 | 185,649 | 27,993 | 13,626 | (282 | ) | 534,413 | – | ||||||||||||||||||||
| Royce Total Return Fund – Consultant Class | 2,520,549 | 196,705 | 54,897 | 15,699 | (1,500 | ) | 2,786,350 | – | ||||||||||||||||||||
| Royce Total Return Fund – Institutional Class | – | 11,104 | 11,445 | 14,308 | (187 | ) | 36,670 | – | ||||||||||||||||||||
| Royce Total Return Fund – W Class | – | 81,722 | 41,292 | 15,339 | (121 | ) | 138,232 | – | ||||||||||||||||||||
| Royce Total Return Fund – R Class | 265,194 | 118,689 | 8,466 | 6,432 | (394 | ) | 398,387 | – | ||||||||||||||||||||
| Royce Total Return Fund – K Class | 93,291 | 74,908 | 8,419 | 11,449 | (141 | ) | 187,926 | – | ||||||||||||||||||||
| 3,186,461 | 2,712,574 | 527,108 | 103,910 | (10,305 | ) | – | ||||||||||||||||||||||
| NET UNREALIZED | GROSS UNREALIZED | |||||||||||||||||||||||||||
| TAX BASIS COST | APPRECIATION (DEPRECIATION) | Appreciation | Depreciation | |||||||||||||||||||||||||
| Royce Dividend Value Fund | $ | 115,324,868 | $ | 68,383,714 | $ | 72,474,600 | $ | 4,090,886 | ||||||||||||||||||||
| Royce Global Financial Services Fund | 43,516,615 | 12,312,050 | 14,294,719 | 1,982,669 | ||||||||||||||||||||||||
| Royce International Micro-Cap Fund | 7,163,251 | 850,592 | 1,096,760 | 246,168 | ||||||||||||||||||||||||
| Royce International Premier Fund | 136,047,103 | 26,850,425 | 26,986,338 | 135,913 | ||||||||||||||||||||||||
| Royce Low-Priced Stock Fund | 211,036,753 | 64,008,110 | 76,854,579 | 12,846,469 | ||||||||||||||||||||||||
| Royce Micro-Cap Fund | 167,091,885 | 43,085,047 | 56,016,037 | 12,930,990 | ||||||||||||||||||||||||
| Royce Micro-Cap Opportunity Fund | 37,359,819 | 10,411,528 | 11,414,921 | 1,003,393 | ||||||||||||||||||||||||
| Royce Opportunity Fund | 1,351,791,225 | 291,012,697 | 423,020,668 | 132,007,971 | ||||||||||||||||||||||||
| Royce Pennsylvania Mutual Fund | 1,279,552,065 | 843,605,251 | 895,746,525 | 52,141,274 | ||||||||||||||||||||||||
| Royce Premier Fund | 1,186,798,325 | 1,175,500,657 | 1,179,057,462 | 3,556,805 | ||||||||||||||||||||||||
| Royce Small-Cap Leaders Fund | 64,825,778 | 20,172,513 | 21,074,796 | 902,283 | ||||||||||||||||||||||||
| Royce Small-Cap Value Fund | 209,344,959 | 43,106,199 | 51,054,312 | 7,948,113 | ||||||||||||||||||||||||
| Royce Small/Mid-Cap Premier Fund | 156,986,262 | 51,369,019 | 52,375,731 | 1,006,712 | ||||||||||||||||||||||||
| Royce Smaller-Companies Growth Fund | 290,774,253 | 96,006,489 | 102,251,719 | 6,245,230 | ||||||||||||||||||||||||
| Royce Special Equity Fund | 1,036,350,316 | 508,850,574 | 513,873,262 | 5,022,688 | ||||||||||||||||||||||||
| Royce Special Equity Multi-Cap Fund | 77,393,257 | 30,731,416 | 30,964,014 | 232,598 | ||||||||||||||||||||||||
| Royce Total Return Fund | 1,302,906,957 | 1,089,975,163 | 1,136,968,428 | 46,993,265 | ||||||||||||||||||||||||
The primary causes of the differences between book and tax basis cost are the timing of the recognition of losses on securities sold, investments in Real Estate Investment Trusts, investments in publicly traded partnerships and Trusts, underlying investments and mark-to-market of Passive Foreign Investment Companies.
Distributions during the years ended December 31, 2017 and 2016, were characterized as follows for tax purposes:
| ORDINARY INCOME | LONG-TERM CAPITAL GAINS | RETURN OF CAPITAL | ||||||||||||||||||||||||||
| 2017 | 2016 | 2017 | 2016 | 2017 | 2016 | |||||||||||||||||||||||
| Royce Dividend Value Fund | $ | 3,294,788 | $ | 3,107,321 | $ | 21,358,296 | $ | 19,861,509 | $ | – | $ | – | ||||||||||||||||
| Royce Global Financial Services Fund | 1,153,530 | 308,608 | 782,447 | 94,709 | – | – | ||||||||||||||||||||||
| Royce International Micro-Cap Fund | 107,044 | 94,073 | – | – | – | 3,148 | ||||||||||||||||||||||
| Royce International Premier Fund | 1,445,419 | 1,604,584 | – | – | 990 | 5,609 | ||||||||||||||||||||||
| Royce Low-Priced Stock Fund | 1,232,346 | 1,547,413 | 15,751,222 | 26,726,342 | – | – | ||||||||||||||||||||||
| Royce Micro-Cap Fund | 1,597,877 | 918,940 | 13,590,589 | 25,455,295 | – | – | ||||||||||||||||||||||
| Royce Micro-Cap Opportunity Fund | – | – | 3,718,816 | – | – | – | ||||||||||||||||||||||
| Royce Opportunity Fund | 14,009,998 | – | 199,474,160 | 96,506,764 | – | – | ||||||||||||||||||||||
| Royce Pennsylvania Mutual Fund | 8,375,891 | 6,891,166 | 374,077,475 | 164,057,941 | – | – | ||||||||||||||||||||||
| Royce Premier Fund | 2,214,026 | 5,657,181 | 318,912,016 | 271,938,627 | – | – | ||||||||||||||||||||||
| Royce Small-Cap Leaders Fund | 420,604 | 630,647 | 12,320,772 | 9,566,713 | – | – | ||||||||||||||||||||||
| Royce Small-Cap Value Fund | 800,336 | 2,998,972 | 8,533,404 | 22,115,276 | – | – | ||||||||||||||||||||||
| Royce Small/Mid-Cap Premier Fund | 3,852,864 | 583,579 | 20,312,685 | 7,897,781 | – | – | ||||||||||||||||||||||
| Royce Smaller-Companies Growth Fund | 1,788,092 | 159,281 | 63,988,721 | 44,148,665 | – | – | ||||||||||||||||||||||
| Royce Special Equity Fund | 10,664,189 | 14,211,036 | 115,512,791 | 103,531,322 | – | – | ||||||||||||||||||||||
| Royce Special Equity Multi-Cap Fund | 979,387 | 1,290,836 | 2,068,497 | – | – | – | ||||||||||||||||||||||
| Royce Total Return Fund | 22,791,657 | 40,091,300 | 283,252,860 | 214,737,276 | – | – | ||||||||||||||||||||||
| 118 | The Royce Funds 2017 Annual Report to Shareholders |
| Tax Information (continued): The tax basis components of distributable earnings at December 31, 2017, were as follows: |
| UNDISTRIBUTED | QUALIFIED | |||||||||||||||||||||||
| LONG-TERM | LATE YEAR | |||||||||||||||||||||||
| UNDISTRIBUTED | CAPITAL GAINS OR | NET UNREALIZED | ORDINARY AND | TOTAL | CAPITAL LOSS | |||||||||||||||||||
| ORDINARY INCOME | (CAPITAL LOSS CARRYFORWARD) | APPRECIATION (DEPRECIATION)1 | POST-OCTOBER LOSS DEFERRALS2 | DISTRIBUTABLE EARNINGS | CARRYFORWARD UTILIZED | |||||||||||||||||||
| Royce Dividend Value Fund | $ | 403,753 | $ | 4,757,593 | $ | 68,383,651 | $ | – | $ | 73,544,997 | $ | – | ||||||||||||
| Royce Global Financial Services Fund | 312,727 | 1,521,480 | 12,236,325 | – | 14,070,532 | 109,235 | ||||||||||||||||||
| Royce International Micro-Cap Fund | 59,772 | – | 849,661 | – | 909,433 | 471,931 | ||||||||||||||||||
| Royce International Premier Fund | – | (67,554,798 | )3 | 26,425,844 | (402,397 | ) | (41,531,351 | ) | 3,582,451 | |||||||||||||||
| Royce Low-Priced Stock Fund | 326,648 | 4,262,286 | 64,008,120 | (7,077 | ) | 68,589,977 | – | |||||||||||||||||
| Royce Micro-Cap Fund | – | 2,787,470 | 43,085,084 | (59,392 | ) | 45,813,162 | – | |||||||||||||||||
| Royce Micro-Cap Opportunity Fund | 255,220 | 2,151,057 | 10,411,531 | – | 12,817,808 | 1,311,985 | ||||||||||||||||||
| Royce Opportunity Fund | 4,288,180 | 22,650,200 | 291,012,696 | (330,913 | ) | 317,620,163 | – | |||||||||||||||||
| Royce Pennsylvania Mutual Fund | 327,742 | 61,015,318 | 843,608,196 | – | 904,951,256 | – | ||||||||||||||||||
| Royce Premier Fund | – | 105,784,852 | 1,175,486,786 | – | 1,281,271,638 | – | ||||||||||||||||||
| Royce Small-Cap Leaders Fund | – | 3,740,689 | 20,172,569 | (1,148 | ) | 23,912,110 | – | |||||||||||||||||
| Royce Small-Cap Value Fund | 72,018 | 5,020,278 | 43,106,199 | – | 48,198,495 | – | ||||||||||||||||||
| Royce Small/Mid-Cap Premier Fund | 2,981,417 | 3,429,657 | 51,367,997 | (14 | ) | 57,779,057 | – | |||||||||||||||||
| Royce Smaller-Companies Growth Fund | 10,270,006 | 21,739,538 | 96,005,022 | 32,760 | 128,047,326 | – | ||||||||||||||||||
| Royce Special Equity Fund | 356,317 | 13,437,996 | 508,850,573 | – | 522,644,886 | – | ||||||||||||||||||
| Royce Special Equity Multi-Cap Fund | 252 | 1,051,566 | 30,731,418 | – | 31,783,236 | 596,357 | ||||||||||||||||||
| Royce Total Return Fund | 836,237 | 29,760,689 | 1,089,966,351 | (846,339 | ) | 1,119,716,938 | – | |||||||||||||||||
| 1 | Includes timing differences on foreign currency, recognition of losses on securities sold, investments in Real Estate Investment Trusts, investments in publicly traded partnerships and Trusts, underlying investments and mark-to-market of Passive Foreign Investment Companies. |
| 2 | Under the current tax law, capital losses and qualified late year ordinary losses incurred after October 31 may be deferred and treated as occurring on the first day of the following fiscal year. This column also includes passive activity losses and 857 (b)(9) adjustments. |
| 3 | The entire amount is comprised of capital loss carryforwards from business combinations, which may be limited in future years under the Internal Revenue Code Sections 381-384. |
For financial reporting purposes, capital accounts and distributions to shareholders are adjusted to reflect the tax character of permanent book/tax differences. For the year ended December 31, 2017, the Funds recorded the following permanent reclassifications, which relate primarily to current net operating losses, distribution reclassifications, investments in Real Estate Investment Trusts, publicly traded partnerships and Trusts, foreign currency transactions, foreign capital gains tax, redemptions-in-kind, non-deductible excise taxes paid, market timing payments, return of capital distributions and gains from the sale of Passive Foreign Investment Companies. Results of operations and net assets were not affected by these reclassifications.
| UNDISTRIBUTED | ACCUMULATED | |||||||||||
| NET INVESTMENT | NET REALIZED | PAID-IN | ||||||||||
| INCOME (LOSS) | GAIN (LOSS) | CAPITAL | ||||||||||
| Royce Dividend Value Fund | $ | (214,571 | ) | $ | 510,653 | $ | (296,082 | ) | ||||
| Royce Global Financial Services Fund | (46,354 | ) | 58,647 | (12,293 | ) | |||||||
| Royce International Micro-Cap Fund | 30,778 | (30,778 | ) | – | ||||||||
| Royce International Premier Fund | 66,261 | (65,271 | ) | (990 | ) | |||||||
| Royce Low-Priced Stock Fund | 57,156 | (57,156 | ) | – | ||||||||
| Royce Micro-Cap Fund | 1,525,135 | (1,399,068 | ) | (126,067 | ) | |||||||
| Royce Micro-Cap Opportunity Fund | 367,179 | (367,179 | ) | – | ||||||||
| Royce Opportunity Fund | 3,399,445 | (3,391,847 | ) | (7,598 | ) | |||||||
| Royce Pennsylvania Mutual Fund | 2,527,754 | (129,336,197 | ) | 126,808,443 | ||||||||
| Royce Premier Fund | 2,497,505 | (106,249,061 | ) | 103,751,556 | ||||||||
| Royce Small-Cap Leaders Fund | 5,047 | (5,047 | ) | – | ||||||||
| Royce Small-Cap Value Fund | (93,574 | ) | (12,850,982 | ) | 12,944,556 | |||||||
| Royce Small/Mid-Cap Premier Fund | (121,955 | ) | (5,171,219 | ) | 5,293,174 | |||||||
| Royce Smaller-Companies Growth Fund | 2,612,397 | (2,778,813 | ) | 166,416 | ||||||||
| Royce Special Equity Fund | – | – | – | |||||||||
| Royce Special Equity Multi-Cap Fund | – | – | – | |||||||||
| Royce Total Return Fund | (1,556,997 | ) | (141,684,664 | ) | 143,241,661 | |||||||
Management has analyzed the Funds’ tax positions taken on federal income tax returns for all open tax years (2014 – 2017) and has concluded that as of December 31, 2017, no provision for income tax is required in the Funds’ financial statements.
| The Royce Funds 2017 Annual Report to Shareholders | 119 |
| Notes to Financial Statements (continued) |
| Transactions in Affiliated Companies: |
| An “Affiliated Company,” as defined in the Investment Company Act of 1940, is a company in which a fund owns 5% or more of the company’s outstanding voting securities at any time during the period. The following transactions were effected in shares of such companies for the year ended December 31, 2017: |
| CHANGE IN NET | ||||||||||||||||||||||||||||||||||||
| MARKET | UNREALIZED | REALIZED | MARKET | |||||||||||||||||||||||||||||||||
| SHARES | VALUE | COST OF | PROCEEDS | APPRECIATION | GAIN | DIVIDEND | SHARES | VALUE | ||||||||||||||||||||||||||||
| AFFILIATED COMPANY | 12/31/16 | 12/31/16 | PURCHASES | FROM SALES | (DEPRECIATION) | (LOSS) | INCOME | 12/31/17 | 12/31/17 | |||||||||||||||||||||||||||
| Royce Opportunity Fund | ||||||||||||||||||||||||||||||||||||
| Amtech Systems1 | 697,399 | $ | 2,963,946 | $ | – | $ | 3,631,966 | $ | 7,728,452 | $ | (3,631,093 | ) | $ | – | ||||||||||||||||||||||
| Dixie Group | 839,935 | 3,023,766 | 38,863 | – | 209,621 | – | – | 849,935 | $ | 3,272,250 | ||||||||||||||||||||||||||
| Echelon Corporation | 230,152 | 1,081,714 | – | – | 216,343 | – | – | 230,152 | 1,298,057 | |||||||||||||||||||||||||||
| Layne Christensen1 | 978,512 | 10,636,425 | 522,131 | 420,754 | 1,767,578 | (147,244 | ) | – | ||||||||||||||||||||||||||||
| LMI Aerospace1 | 831,730 | 7,169,513 | – | 11,369,995 | 6,890,852 | (2,690,370 | ) | – | ||||||||||||||||||||||||||||
| Noranda Aluminum Holding Corporation | 593,726 | 14,131 | – | – | (6,413 | ) | – | – | 593,726 | 7,718 | ||||||||||||||||||||||||||
| Northwest Pipe | 461,994 | 7,955,537 | 469,114 | 28,255 | 982,435 | (13,131 | ) | – | 489,326 | 9,365,700 | ||||||||||||||||||||||||||
| SigmaTron International | 344,772 | 1,630,772 | – | 543,206 | 2,095,062 | (315,472 | ) | – | 282,757 | 2,867,156 | ||||||||||||||||||||||||||
| VOXX International Cl. A1 | 1,283,078 | 6,030,467 | 564,304 | 2,400,026 | 2,076,028 | (378,016 | ) | – | ||||||||||||||||||||||||||||
| 40,506,271 | 21,959,958 | (7,175,326 | ) | – | 16,810,881 | |||||||||||||||||||||||||||||||
| Royce Pennsylvania Mutual Fund | ||||||||||||||||||||||||||||||||||||
| Preformed Line Products | 290,278 | 16,870,957 | – | 2,202,225 | 1,849,908 | 1,958,907 | 226,180 | 260,064 | 18,477,547 | |||||||||||||||||||||||||||
| STRATTEC SECURITY1 | 245,247 | 9,883,454 | – | 3,238,256 | 2,684,119 | (2,109,293 | ) | 124,758 | ||||||||||||||||||||||||||||
| 26,754,411 | 4,534,027 | (150,386 | ) | 350,938 | 18,477,547 | |||||||||||||||||||||||||||||||
| Royce Premier Fund | ||||||||||||||||||||||||||||||||||||
| CIRCOR International1 | 651,632 | 42,277,884 | 18,565,441 | 7,566,946 | (12,056,539 | ) | 1,542,765 | 105,151 | ||||||||||||||||||||||||||||
| SEACOR Marine Holdings1 | 23,003,321 | 17,467,123 | – | (5,536,198 | ) | – | ||||||||||||||||||||||||||||||
| 42,277,884 | (12,056,539 | ) | (3,993,433 | ) | 105,151 | |||||||||||||||||||||||||||||||
| Royce Special Equity Fund | ||||||||||||||||||||||||||||||||||||
| Bassett Furniture Industries | 735,000 | 22,344,000 | 1,738,408 | 787,036 | 5,943,226 | 127,002 | 598,468 | 781,000 | 29,365,600 | |||||||||||||||||||||||||||
| Bowl America Cl. A | 343,000 | 5,916,750 | – | – | (771,750 | ) | – | 233,240 | 343,000 | 5,145,000 | ||||||||||||||||||||||||||
| Capella Education | 577,700 | 50,722,060 | 5,551,009 | 5,335,368 | (6,609,083 | ) | 1,182,582 | 959,147 | 588,000 | 45,511,200 | ||||||||||||||||||||||||||
| Computer Services | 739,862 | 28,743,639 | 693,343 | – | 5,785,058 | – | 888,196 | 756,000 | 35,222,040 | |||||||||||||||||||||||||||
| CSS Industries | 885,000 | 23,956,950 | – | 5,230,190 | 199,045 | 441,092 | 696,620 | 695,900 | 19,366,897 | |||||||||||||||||||||||||||
| Flexsteel Industries | 536,000 | 33,055,120 | 1,527,037 | – | (8,057,897 | ) | – | 472,448 | 567,000 | 26,524,260 | ||||||||||||||||||||||||||
| Hooker Furniture | 1,110,000 | 42,124,500 | 750,111 | – | 4,966,539 | – | 556,400 | 1,127,000 | 47,841,150 | |||||||||||||||||||||||||||
| Hurco Companies | 525,000 | 17,377,500 | – | – | 4,777,500 | – | 157,500 | 525,000 | 22,155,000 | |||||||||||||||||||||||||||
| John B. Sanfilippo & Son | 507,500 | 35,722,925 | 14,223,725 | – | (3,995,525 | ) | – | 1,702,500 | 726,500 | 45,951,125 | ||||||||||||||||||||||||||
| National Presto Industries | 450,000 | 47,880,000 | 1,889,630 | – | (3,127,580 | ) | – | 2,475,000 | 469,000 | 46,642,050 | ||||||||||||||||||||||||||
| Park Electrochemical | 1,950,000 | 36,367,500 | 84,004 | 7,337,956 | 5,008,013 | (3,526,511 | ) | 720,200 | 1,557,000 | 30,595,050 | ||||||||||||||||||||||||||
| Resources Connection1 | 1,580,000 | 30,415,000 | 3,159,120 | 5,212,375 | (5,813,635 | ) | 626,890 | 678,782 | ||||||||||||||||||||||||||||
| Standard Motor Products | 1,295,000 | 68,919,900 | 6,141,686 | 4,083,168 | (11,995,679 | ) | 1,645,761 | 973,180 | 1,350,000 | 60,628,500 | ||||||||||||||||||||||||||
| 443,545,844 | (13,691,768 | ) | 496,816 | 11,111,681 | 414,947,872 | |||||||||||||||||||||||||||||||
| Royce Total Return Fund | ||||||||||||||||||||||||||||||||||||
| Landauer1 | 496,600 | 23,886,460 | – | 33,063,016 | (6,094,883 | ) | 15,271,439 | 386,620 | ||||||||||||||||||||||||||||
| Mueller (Paul) Company | 112,500 | 3,127,500 | – | 390,557 | 1,157,815 | 33,088 | – | 100,714 | 3,927,846 | |||||||||||||||||||||||||||
| Starrett (L.S.) Company (The) Cl. A | 491,000 | 4,566,300 | – | 437,108 | (58,520 | ) | (290,482 | ) | 189,833 | 439,557 | 3,780,190 | |||||||||||||||||||||||||
| 31,580,260 | (4,995,588 | ) | 15,014,045 | 576,453 | 7,708,036 | |||||||||||||||||||||||||||||||
| 1 Not an Affiliated Company at December 31, 2017. |
| 120 | The Royce Funds 2017 Annual Report to Shareholders |
| The Royce Funds 2017 Annual Report to Shareholders | 121 |
To the Board of Trustees of The Royce Fund and Shareholders of Royce Dividend Value Fund, Royce Global Financial Services Fund, Royce International Discovery Fund, Royce International Premier Fund, Royce Low-Priced Stock Fund, Royce Micro-Cap Fund, Royce Micro-Cap Opportunity Fund, Royce Opportunity Fund, Royce Pennsylvania Mutual Fund, Royce Premier Fund, Royce Small-Cap Leaders Fund, Royce Small-Cap Value Fund, Royce Small/Mid-Cap Premier Fund, Royce Smaller-Companies Growth Fund, Royce Special Equity Fund, Royce Special Equity Multi-Cap Fund and Royce Total Return Fund:
Opinions on the Financial Statements
We have audited the accompanying statements of assets and liabilities, including the schedules of investments, of Royce Dividend Value Fund, Royce Global Financial Services Fund, Royce International Micro-Cap Fund, Royce International Premier Fund, Royce Low-Priced Stock Fund, Royce Micro-Cap Fund, Royce Micro-Cap Opportunity Fund, Royce Opportunity Fund, Royce Pennsylvania Mutual Fund, Royce Premier Fund, Royce Small-Cap Leaders Fund, Royce Small-Cap Value Fund, Royce Small/Mid-Cap Premier Fund, Royce Smaller-Companies Growth Fund, Royce Special Equity Fund, Royce Special Equity Multi-Cap Fund and Royce Total Return Fund (constituting The Royce Fund, hereafter collectively referred to as the “Funds”) as of December 31, 2017, the related statements of operations for the year ended December 31, 2017, the statements of changes in net assets for each of the two years in the period ended December 31, 2017, including the related notes, and the financial highlights for each of the periods indicated therein (collectively referred to as the “financial statements”). In our opinion, the financial statements present fairly, in all material respects, the financial position of each of the Funds as of December 31, 2017, the results of each of their operations for the year then ended, the changes in each of their net assets for each of the two years in the period ended December 31, 2017 and each of the financial highlights for each of the periods indicated therein in conformity with accounting principles generally accepted in the United States of America.
Basis for Opinions
These financial statements are the responsibility of the Funds’ management. Our responsibility is to express an opinion on the Funds’ financial statements based on our audits. We are a public accounting firm registered with the Public Company Accounting Oversight Board (United States) (“PCAOB”) and are required to be independent with respect to the Funds in accordance with the U.S. federal securities laws and the applicable rules and regulations of the Securities and Exchange Commission and the PCAOB.
We conducted our audits of these financial statements in accordance with the standards of the PCAOB. Those standards require that we plan and perform the audit to obtain reasonable assurance about whether the financial statements are free of material misstatement, whether due to error or fraud.
Our audits included performing procedures to assess the risks of material misstatement of the financial statements, whether due to error or fraud, and performing procedures that respond to those risks. Such procedures included examining, on a test basis, evidence regarding the amounts and disclosures in the financial statements. Our audits also included evaluating the accounting principles used and significant estimates made by management, as well as evaluating the overall presentation of the financial statements. Our procedures included confirmation of securities owned as of December 31, 2017 by correspondence with the custodian and brokers; when replies were not received from brokers, we performed other auditing procedures. We believe that our audits provide a reasonable basis for our opinions.
/s/PricewaterhouseCoopers LLP
Baltimore, MD
February 20, 2018
We have served as the auditor of one or more investment companies in the Royce investment company group since at least 1967. We have not determined the specific year we began serving as auditor.
| 122 | The Royce Funds 2017 Annual Report to Shareholders |
Understanding Your Fund’s Expenses (unaudited)
As a shareholder of a mutual fund, you pay ongoing expenses, including management fees and other Fund expenses including, for some funds, distribution and/or service (12b-1) fees. Using the information below, you can estimate how these ongoing expenses (in dollars) affect your investment and compare them with the ongoing expenses of other funds. You may also incur one-time transaction expenses, including redemption fees, which are not shown in this section and would result in higher total costs. The example is based on an investment of $1,000 invested at July 1, 2017, and held for the entire six-month period ended December 31, 2017. Service, Consultant, R and K Class shares are generally available only through certain brokers or retirement plan administrators who receive distribution and/or service fees from the Fund for services that they perform. Institutional and W Class shares are generally available only to institutions or intermediaries with a minimum account size of $1 million.
Please note that the expenses shown in the table are meant to highlight your ongoing costs only and do not reflect any transactional costs, such as sales charges (loads), redemption fees, or exchange fees. Therefore, this section is useful in comparing ongoing costs only, and will not help you determine the relative total costs of owning different funds. In addition, if these transactional costs were included, your costs would have been higher.
| ACTUAL | HYPOTHETICAL (5% PER YEAR BEFORE EXPENSES) | |||||||||||||||||||||||||||
| Beginning Account | Ending Account Value | Expenses Paid During | Beginning Account | Ending Account Value | Expenses Paid During | Annualized | ||||||||||||||||||||||
| Value 7/1/17 | 12/31/17 | the Period1 | Value 7/1/17 | 12/31/17 | the Period1 | Expense Ratio2 | ||||||||||||||||||||||
| Investment Class | ||||||||||||||||||||||||||||
| Royce Dividend Value Fund | $ | 1,000.00 | $ | 1,130.77 | $ | 5.64 | $ | 1,000.00 | $ | 1,019.91 | $ | 5.35 | 1.05% | |||||||||||||||
| Royce International Premier Fund | 1,000.00 | 1,143.88 | 6.43 | 1,000.00 | 1,019.21 | 6.06 | 1.19% | |||||||||||||||||||||
| Royce Low-Priced Stock Fund | 1,000.00 | 1,086.74 | 6.52 | 1,000.00 | 1,018.95 | 6.31 | 1.24% | |||||||||||||||||||||
| Royce Micro-Cap Fund | 1,000.00 | 1,033.46 | 7.64 | 1,000.00 | 1,017.69 | 7.58 | 1.49% | |||||||||||||||||||||
| Royce Micro-Cap Opportunity Fund | 1,000.00 | 1,138.02 | 6.68 | 1,000.00 | 1,018.95 | 6.31 | 1.24% | |||||||||||||||||||||
| Royce Opportunity Fund | 1,000.00 | 1,126.71 | 6.33 | 1,000.00 | 1,019.26 | 6.01 | 1.18% | |||||||||||||||||||||
| Royce Pennsylvania Mutual Fund | 1,000.00 | 1,109.08 | 4.84 | 1,000.00 | 1,020.62 | 4.63 | 0.91% | |||||||||||||||||||||
| Royce Premier Fund | 1,000.00 | 1,138.60 | 6.25 | 1,000.00 | 1,019.36 | 5.90 | 1.16% | |||||||||||||||||||||
| Royce Small-Cap Leaders Fund | 1,000.00 | 1,090.87 | 6.53 | 1,000.00 | 1,018.95 | 6.31 | 1.24% | |||||||||||||||||||||
| Royce Small-Cap Value Fund | 1,000.00 | 1,101.02 | 6.57 | 1,000.00 | 1,018.95 | 6.31 | 1.24% | |||||||||||||||||||||
| Royce Small/Mid-Cap Premier Fund3 | 1,000.00 | 1,148.78 | 5.42 | 1,000.00 | 1,020.16 | 5.09 | 1.00% | |||||||||||||||||||||
| Royce Smaller-Companies Growth Fund | 1,000.00 | 1,061.01 | 5.97 | 1,000.00 | 1,019.41 | 5.85 | 1.15% | |||||||||||||||||||||
| Royce Special Equity Fund | 1,000.00 | 1,082.63 | 6.19 | 1,000.00 | 1,019.26 | 6.01 | 1.18% | |||||||||||||||||||||
| Royce Special Equity Multi-Cap Fund | 1,000.00 | 1,090.99 | 5.22 | 1,000.00 | 1,020.21 | 5.04 | 0.99% | |||||||||||||||||||||
| Royce Total Return Fund | 1,000.00 | 1,106.59 | 6.37 | 1,000.00 | 1,019.16 | 6.11 | 1.20% | |||||||||||||||||||||
| Service Class | ||||||||||||||||||||||||||||
| Royce Dividend Value Fund | 1,000.00 | 1,129.39 | 6.87 | 1,000.00 | 1,018.75 | 6.51 | 1.28% | |||||||||||||||||||||
| Royce Global Financial Services Fund | 1,000.00 | 1,114.94 | 7.94 | 1,000.00 | 1,017.69 | 7.58 | 1.49% | |||||||||||||||||||||
| Royce International Micro-Cap Fund | 1,000.00 | 1,108.43 | 8.72 | 1,000.00 | 1,016.94 | 8.34 | 1.64% | |||||||||||||||||||||
| Royce International Premier Fund | 1,000.00 | 1,142.86 | 7.78 | 1,000.00 | 1,017.95 | 7.32 | 1.44% | |||||||||||||||||||||
| Royce Low-Priced Stock Fund | 1,000.00 | 1,086.10 | 7.83 | 1,000.00 | 1,017.69 | 7.58 | 1.49% | |||||||||||||||||||||
| Royce Micro-Cap Fund | 1,000.00 | 1,033.74 | 8.25 | 1,000.00 | 1,017.09 | 8.19 | 1.61% | |||||||||||||||||||||
| Royce Micro-Cap Opportunity Fund | 1,000.00 | 1,135.92 | 8.02 | 1,000.00 | 1,017.69 | 7.58 | 1.49% | |||||||||||||||||||||
| Royce Opportunity Fund | 1,000.00 | 1,124.79 | 7.98 | 1,000.00 | 1,017.69 | 7.58 | 1.49% | |||||||||||||||||||||
| Royce Pennsylvania Mutual Fund | 1,000.00 | 1,107.63 | 6.85 | 1,000.00 | 1,018.70 | 6.56 | 1.29% | |||||||||||||||||||||
| Royce Premier Fund | 1,000.00 | 1,136.97 | 8.03 | 1,000.00 | 1,017.69 | 7.58 | 1.49% | |||||||||||||||||||||
| Royce Small-Cap Leaders Fund | 1,000.00 | 1,089.07 | 7.85 | 1,000.00 | 1,017.69 | 7.58 | 1.49% | |||||||||||||||||||||
| Royce Small-Cap Value Fund | 1,000.00 | 1,098.92 | 7.88 | 1,000.00 | 1,017.69 | 7.58 | 1.49% | |||||||||||||||||||||
| Royce Small/Mid-Cap Premier Fund3 | 1,000.00 | 1,146.87 | 6.33 | 1,000.00 | 1,019.31 | 5.96 | 1.17% | |||||||||||||||||||||
| Royce Smaller-Companies Growth Fund | 1,000.00 | 1,058.80 | 7.52 | 1,000.00 | 1,017.90 | 7.37 | 1.45% | |||||||||||||||||||||
| Royce Special Equity Fund | 1,000.00 | 1,082.05 | 7.29 | 1,000.00 | 1,018.20 | 7.07 | 1.39% | |||||||||||||||||||||
| Royce Special Equity Multi-Cap Fund | 1,000.00 | 1,089.35 | 6.53 | 1,000.00 | 1,018.95 | 6.31 | 1.24% | |||||||||||||||||||||
| Royce Total Return Fund | 1,000.00 | 1,104.32 | 7.90 | 1,000.00 | 1,017.69 | 7.58 | 1.49% | |||||||||||||||||||||
| The Royce Funds 2017 Annual Report to Shareholders | 123 |
| Understanding Your Fund’s Expenses (unaudited) (continued) |
| ACTUAL | HYPOTHETICAL (5% PER YEAR BEFORE EXPENSES) | |||||||||||||||||||||||||||
| Beginning Account Value 7/1/17 | Ending Account Value 12/31/17 | Expenses Paid During the Period1 | Beginning Account Value 7/1/17 | Ending Account Value 12/31/17 | Expenses Paid During the Period1 | Annualized Expense Ratio2 | ||||||||||||||||||||||
| Consultant Class | ||||||||||||||||||||||||||||
| Royce Dividend Value Fund | $ | 1,000.00 | $ | 1,124.61 | $ | 11.19 | $ | 1,000.00 | $ | 1,014.67 | $ | 10.61 | 2.09 | % | ||||||||||||||
| Royce International Premier Fund | 1,000.00 | 1,138.60 | 11.81 | 1,000.00 | 1,014.17 | 11.12 | 2.19 | % | ||||||||||||||||||||
| Royce Micro-Cap Fund | 1,000.00 | 1,029.26 | 12.68 | 1,000.00 | 1,012.70 | 12.58 | 2.48 | % | ||||||||||||||||||||
| Royce Opportunity Fund | 1,000.00 | 1,120.26 | 12.08 | 1,000.00 | 1,013.81 | 11.47 | 2.26 | % | ||||||||||||||||||||
| Royce Pennsylvania Mutual Fund | 1,000.00 | 1,104.68 | 10.08 | 1,000.00 | 1,015.63 | 9.65 | 1.90 | % | ||||||||||||||||||||
| Royce Premier Fund | 1,000.00 | 1,133.03 | 11.83 | 1,000.00 | 1,014.12 | 11.17 | 2.20 | % | ||||||||||||||||||||
| Royce Small-Cap Value Fund | 1,000.00 | 1,095.65 | 12.31 | 1,000.00 | 1,013.46 | 11.82 | 2.33 | % | ||||||||||||||||||||
| Royce Small/Mid-Cap Premier Fund3 | 1,000.00 | 1,141.92 | 11.28 | 1,000.00 | 1,014.67 | 10.61 | 2.09 | % | ||||||||||||||||||||
| Royce Smaller-Companies Growth Fund | 1,000.00 | 1,055.25 | 11.60 | 1,000.00 | 1,013.91 | 11.37 | 2.24 | % | ||||||||||||||||||||
| Royce Special Equity Fund | 1,000.00 | 1,077.34 | 11.68 | 1,000.00 | 1,013.96 | 11.32 | 2.23 | % | ||||||||||||||||||||
| Royce Special Equity Multi-Cap Fund | 1,000.00 | 1,085.50 | 10.46 | 1,000.00 | 1,015.17 | 10.11 | 1.99 | % | ||||||||||||||||||||
| Royce Total Return Fund | 1,000.00 | 1,101.01 | 11.39 | 1,000.00 | 1,014.37 | 10.92 | 2.15 | % | ||||||||||||||||||||
| Institutional Class | ||||||||||||||||||||||||||||
| Royce Dividend Value Fund | 1,000.00 | 1,131.02 | 4.78 | 1,000.00 | 1,020.72 | 4.53 | 0.89 | % | ||||||||||||||||||||
| Royce Global Financial Services Fund | 1,000.00 | 1,116.76 | 5.55 | 1,000.00 | 1,019.96 | 5.30 | 1.04 | % | ||||||||||||||||||||
| Royce Low-Priced Stock Fund | 1,000.00 | 1,087.25 | 6.31 | 1,000.00 | 1,019.16 | 6.11 | 1.20 | % | ||||||||||||||||||||
| Royce Opportunity Fund | 1,000.00 | 1,127.15 | 5.74 | 1,000.00 | 1,019.81 | 5.45 | 1.07 | % | ||||||||||||||||||||
| Royce Pennsylvania Mutual Fund | 1,000.00 | 1,111.02 | 4.36 | 1,000.00 | 1,021.07 | 4.18 | 0.82 | % | ||||||||||||||||||||
| Royce Premier Fund | 1,000.00 | 1,139.19 | 5.93 | 1,000.00 | 1,019.66 | 5.60 | 1.10 | % | ||||||||||||||||||||
| Royce Small-Cap Value Fund | 1,000.00 | 1,112.69 | 5.80 | 1,000.00 | 1,019.71 | 5.55 | 1.09 | % | ||||||||||||||||||||
| Royce Smaller-Companies Growth Fund | 1,000.00 | 1,060.76 | 6.49 | 1,000.00 | 1,018.90 | 6.36 | 1.25 | % | ||||||||||||||||||||
| Royce Special Equity Fund | 1,000.00 | 1,083.08 | 5.83 | 1,000.00 | 1,019.61 | 5.65 | 1.11 | % | ||||||||||||||||||||
| Royce Special Equity Multi-Cap Fund | 1,000.00 | 1,092.03 | 4.69 | 1,000.00 | 1,020.72 | 4.53 | 0.89 | % | ||||||||||||||||||||
| Royce Total Return Fund | 1,000.00 | 1,106.87 | 5.68 | 1,000.00 | 1,019.81 | 5.45 | 1.07 | % | ||||||||||||||||||||
| W Class | ||||||||||||||||||||||||||||
| Royce Premier Fund | 1,000.00 | 1,140.19 | 6.26 | 1,000.00 | 1,019.36 | 5.90 | 1.16 | % | ||||||||||||||||||||
| Royce Total Return Fund | 1,000.00 | 1,106.38 | 6.26 | 1,000.00 | 1,019.26 | 6.01 | 1.18 | % | ||||||||||||||||||||
| R Class | ||||||||||||||||||||||||||||
| Royce International Premier Fund | 1,000.00 | 1,141.42 | 9.39 | 1,000.00 | 1,016.43 | 8.84 | 1.74 | % | ||||||||||||||||||||
| Royce Low-Priced Stock Fund | 1,000.00 | 1,083.16 | 9.66 | 1,000.00 | 1,015.93 | 9.35 | 1.84 | % | ||||||||||||||||||||
| Royce Opportunity Fund | 1,000.00 | 1,122.14 | 9.84 | 1,000.00 | 1,015.93 | 9.35 | 1.84 | % | ||||||||||||||||||||
| Royce Pennsylvania Mutual Fund | 1,000.00 | 1,104.91 | 9.60 | 1,000.00 | 1,016.08 | 9.20 | 1.81 | % | ||||||||||||||||||||
| Royce Premier Fund | 1,000.00 | 1,134.66 | 10.49 | 1,000.00 | 1,015.38 | 9.91 | 1.95 | % | ||||||||||||||||||||
| Royce Small-Cap Leaders Fund | 1,000.00 | 1,086.94 | 9.68 | 1,000.00 | 1,015.93 | 9.35 | 1.84 | % | ||||||||||||||||||||
| Royce Small-Cap Value Fund | 1,000.00 | 1,097.09 | 9.94 | 1,000.00 | 1,015.73 | 9.55 | 1.88 | % | ||||||||||||||||||||
| Royce Small/Mid-Cap Premier Fund | 1,000.00 | 1,144.90 | 9.14 | 1,000.00 | 1,016.69 | 8.59 | 1.69 | % | ||||||||||||||||||||
| Royce Smaller-Companies Growth Fund | 1,000.00 | 1,057.18 | 9.54 | 1,000.00 | 1,015.93 | 9.35 | 1.84 | % | ||||||||||||||||||||
| Royce Total Return Fund | 1,000.00 | 1,103.07 | 9.65 | 1,000.00 | 1,016.03 | 9.25 | 1.82 | % | ||||||||||||||||||||
| K Class | ||||||||||||||||||||||||||||
| Royce Opportunity Fund | 1,000.00 | 1,122.92 | 9.58 | 1,000.00 | 1,016.18 | 9.10 | 1.79 | % | ||||||||||||||||||||
| Royce Pennsylvania Mutual Fund | 1,000.00 | 1,103.39 | 10.34 | 1,000.00 | 1,015.38 | 9.91 | 1.95 | % | ||||||||||||||||||||
| Royce Small-Cap Value Fund | 1,000.00 | 1,096.22 | 10.51 | 1,000.00 | 1,015.17 | 10.11 | 1.99 | % | ||||||||||||||||||||
| Royce Total Return Fund | 1,000.00 | 1,104.37 | 7.90 | 1,000.00 | 1,017.69 | 7.58 | 1.49 | % | ||||||||||||||||||||
| 1 | Expenses are equal to the Fund’s annualized expense ratio multiplied by the average account value for the period, multiplied by 184 days in the most recent fiscal half-year divided by 365 days (to reflect the half-year period). |
| 2 | Annualized expense ratio used to derive figures in the table is based on the most recent fiscal half-year. |
| 3 | GiftShare accounts pay an annual $50 trustee fee to Alliance Trust Company, as trustee. If these fees were included above, your costs would be higher. |
| 124 | The Royce Funds 2017 Annual Report to Shareholders |
Federal Tax Information
In January 2018, taxable shareholders were mailed a Form 1099-DIV reporting the federal tax status of all distributions paid during the calendar year 2017.
2017 Supplemental Tax Information:
| LONG-TERM CAPITAL | ||||||||||||||||
| % INCOME | GAIN DISTRIBUTION OR | |||||||||||||||
| FUND | % QDI | % U.S. GOVT INCOME | QUALIFYING FOR DRD | MAXIMUM ALLOWABLE (OOO’S) | ||||||||||||
| Royce Dividend Value Fund | 100.00% | N/A | 77.06% | $ | 21,358 | |||||||||||
| Royce Global Financial Services Fund | 100.00% | N/A | 33.83% | 782 | ||||||||||||
| Royce International Micro-Cap Fund | 92.94% | N/A | 0.00% | – | ||||||||||||
| Royce International Premier Fund | 100.00% | N/A | 0.00% | – | ||||||||||||
| Royce Low-Priced Stock Fund | 100.00% | N/A | 100.00% | 15,751 | ||||||||||||
| Royce Micro-Cap Fund | 100.00% | N/A | 100.00% | 13,591 | ||||||||||||
| Royce Micro-Cap Opportunity Fund | 0.00% | N/A | 0.00% | 3,719 | ||||||||||||
| Royce Opportunity Fund | 84.98% | N/A | 84.20% | 199,474 | ||||||||||||
| Royce Pennsylvania Mutual Fund | 100.00% | N/A | 100.00% | 374,077 | ||||||||||||
| Royce Premier Fund | 100.00% | N/A | 100.00% | 318,912 | ||||||||||||
| Royce Small-Cap Leaders Fund | 100.00% | N/A | 100.00% | 12,321 | ||||||||||||
| Royce Small-Cap Value Fund | 100.00% | N/A | 100.00% | 8,533 | ||||||||||||
| Royce Small/Mid-Cap Premier Fund | 100.00% | N/A | 53.30% | 20,313 | ||||||||||||
| Royce Smaller-Companies Growth Fund | 75.11% | N/A | 58.15% | 63,989 | ||||||||||||
| Royce Special Equity Fund | 100.00% | N/A | 100.00% | 115,513 | ||||||||||||
| Royce Special Equity Multi-Cap Fund | 100.00% | N/A | 100.00% | 2,068 | ||||||||||||
| Royce Total Return Fund | 100.00% | N/A | 100.00% | 283,253 | ||||||||||||
DEFINITIONS:
% QDI: Qualified Dividend Income; % of net investment income and/or short-term capital gains distributions that qualify for treatment at long-term capital gain rates.
% U.S. Govt Income: % of investment income paid from U.S. Government obligations.
% Income Qualifying for DRD: % of investment income eligible for the corporate dividend received deduction.
Foreign Tax Credit:
For the year ended December 31, 2017, the following funds had elected to pass through the credit for tax paid in foreign countries. The net foreign source income and foreign tax per share outstanding on the dividend distribution date are as follows:
| NET FOREIGN | NET FOREIGN SOURCE | |||||||||||||||
| FUND | SOURCE INCOME | INCOME PER SHARE | FOREIGN TAX | FOREIGN TAX PER SHARE | ||||||||||||
| Royce International Micro-Cap Fund | $ | 67,670 | $ | 0.1084 | $ | 14,475 | $ | 0.0232 | ||||||||
| Royce International Premier Fund | 342,820 | 0.0315 | 118,956 | 0.0109 | ||||||||||||
| The Royce Funds 2017 Annual Report to Shareholders | 125 |
Trustees and Officers
All Trustees and Officers may be reached c/o The Royce Funds, 745 Fifth Avenue, New York, NY 10151
Charles M. Royce, Trustee1
Age: 78 | Number of Funds Overseen: 22 | Tenure: Since 1982
Non-Royce Directorships: Director of TICC Capital Corp.
Principal Occupation(s) During Past Five Years: Chairman of the Board of Managers of Royce & Associates, LP (“Royce”), the Trust’s investment adviser; Chief Executive Officer (1972–June 2016), President (1972-June 2014) of Royce.
Christopher D. Clark, Trustee1, President
Age: 52 | Number of Funds Overseen: 22 | Tenure: Since 2014
Principal Occupation(s) During Past Five Years: Chief Executive Officer (since July 2016), President (since July 2014), Co-Chief Investment Officer (Since January 2014), Managing Director of Royce, a Member of the Board of Managers of Royce, having been employed by Royce since May 2007.
Patricia W. Chadwick, Trustee
Age: 69 | Number of Funds Overseen: 22 | Tenure: Since 2009
Non-Royce Directorships: Trustee of ING Mutual Funds and Director of Wisconsin Energy Corp.
Principal Occupation(s) During Past 5 Years: Consultant and President of Ravengate Partners LLC (since 2000).
Christopher C. Grisanti, Trustee
Age: 56 | Number of Funds Overseen: 22 | Tenure: Since 2017
Non-Royce Directorships: None
Principal Occupation(s) During Past Five Years: Co-Founder and Chief Executive Officer of Grisanti Capital Management LLC, an investment advisory firm (since 1999). Mr. Grisanti’s prior business experience includes serving as Director of Research and Portfolio Manager at Spears Benzak, Salomon & Farrell (from 1994 to 1999) and a senior associate at the law firm of Simpson, Thacher & Bartlett (from 1988 to 1994).
Stephen L. Isaacs, Trustee
Age: 78 | Number of Funds Overseen: 22 | Tenure: Since 1989
Non-Royce Directorships: None
Principal Occupation(s) During Past Five Years: Attorney and President of Health Policy Associates, Inc., consultants. Mr. Isaacs’s prior business experience includes having served as President of the Center for Health and Social Policy (from 1996 to 2012); Director of Columbia University Development Law and Policy Program and Professor at Columbia University (until August 1996).
Arthur S. Mehlman, Trustee
Age: 75 | Number of Funds Overseen: 40 | Tenure: Since 2004
Non-Royce Directorships: Director/Trustee of registered investment companies constituting the 18 Legg Mason Funds.
Principal Occupation(s) During Past Five Years: Director of The League for People with Disabilities, Inc.; Director of University of Maryland Foundation (non-profits). Formerly: Director of Municipal Mortgage & Equity, LLC (from October 2004 to April 1, 2011); Director of University of Maryland College Park Foundation (non-profit) (from 1998 to 2005); Partner, KPMG LLP (international accounting firm) (from 1972 to 2002); Director of Maryland Business Roundtable for Education (from July 1984 to June 2002).
David L. Meister, Trustee
Age: 78 | Number of Funds Overseen: 22 | Tenure: Since 1982
Non-Royce Directorships: None
Principal Occupation(s) During Past Five Years: Consultant. Chairman and Chief Executive Officer of The Tennis Channel (from June 2000 to March 2005). Mr. Meister’s prior business experience includes having served as Chief Executive Officer of Seniorlife.com, a consultant to the communications industry, President of Financial News Network, Senior Vice President of HBO, President of Time-Life Films, and Head of Broadcasting for Major League Baseball.
G. Peter O’Brien, Trustee
Age: 72 | Number of Funds Overseen: 40 | Tenure: Since 2001
Non-Royce Directorships: Director/Trustee of registered investment companies constituting the 18 Legg Mason Funds; Director of TICC Capital Corp.
Principal Occupation(s) During Past Five Years: Trustee Emeritus of Colgate University (since 2005); Board Member of Hill House, Inc. (since 1999); Formerly: Trustee of Colgate University (from 1996 to 2005), President of Hill House, Inc. (from 2001 to 2005) and Managing Director/Equity Capital Markets Group of Merrill Lynch & Co. (from 1971 to 1999).
Michael K. Shields, Trustee
Age: 59 | Number of Funds Overseen: 22 | Tenure: Since 2015
Principal Occupation(s) During Past Five Years: President and Chief Executive Officer of Piedmont Trust Company, a private North Carolina trust company (since May 2012). Mr. Shields’s prior business experience includes owning Shields Advisors, an investment consulting firm (from April 2010 to June 2012).
Francis D. Gannon, Vice President
Age: 50 | Tenure: Since 2014
Principal Occupation(s) During Past Five Years: Co-Chief Investment Officer (since January 2014) and Managing Director of Royce, having been employed by Royce since September 2006.
Daniel A. O’Byrne, Vice President
Age: 55 | Tenure: Since 1994
Principal Occupation(s) During Past Five Years: Principal and Vice President of Royce, having been employed by Royce since October 1986.
Peter K. Hoglund, Treasurer
Age: 51 | Tenure: Since 2015
Principal Occupation(s) During Past Five Years: Chief Financial Officer, Chief Administrative Officer, and Managing Director of Royce, having been employed by Royce since December 2014. Prior to joining Royce, Mr. Hoglund spent more than 20 years with Munder Capital Management in Birmingham, MI, serving as Managing Director and Chief Financial Officer and overseeing all financial aspects of the firm. He began his career at Munder as a portfolio manager.
John E. Denneen, Secretary and Chief Legal Officer
Age: 50 | Tenure: 1996-2001 and Since 2002
Principal Occupation(s) During Past Five Years: General Counsel, Managing Director, and, since June 2015, a Member of the Board of Managers of Royce. Chief Legal and Compliance Officer and Secretary of Royce.
Lisa Curcio, Chief Compliance Officer
Age: 58 | Tenure: Since 2004
Principal Occupation(s) During Past Five Years: Chief Compliance Officer of The Royce Funds (since October 2004) and Compliance Officer of Royce (since June 2004).
| 126 | The Royce Funds 2017 Annual Report to Shareholders |
Board Approval of Investment Advisory Agreement
At meetings held on November 20, 2017 and December 11-12, 2017, the Board of Trustees (the “Board”) of The Royce Fund (“TRF”), including all of the non-interested trustees, approved an amended and restated investment advisory agreement (the “Amended and Restated Agreement”) between Royce & Associates, LP (“R&A”) and TRF relating to Royce International Discovery Fund (formerly named Royce International Micro-Cap Fund) (the “Fund”). The Amended and Restated Agreement is identical in all respects to the investment advisory agreement (the “Original Agreement”) between R&A and TRF relating to the Fund that was approved by the Board at meetings held on June 5-6, 2017 except that the Amended and Restated Agreement contains a lower investment advisory fee rate than the Original Agreement. A description of the material factors and the conclusions with respect thereto that formed the basis for the Board’s approval of the Original Agreement is included in TRF’s Semiannual Report to the Shareholders of the Fund for the six-month period ended June 30, 2017.
| The Royce Funds 2017 Annual Report to Shareholders | 127 |
Notes to Performance and Other Important Information
This material contains forward-looking statements within the meaning of the Securities Exchange Act of 1934, as amended (the “Exchange Act”), that involve risks and uncertainties, including, among others, statements as to:
| • | the Funds’ future operating results, |
| • | the prospects of the Funds’ portfolio companies, |
| • | the impact of investments that the Funds have made or may make, the dependence of the Funds’ future success on the general economy and its impact on the companies and industries in which the Funds invest, and |
| • | the ability of the Funds’ portfolio companies to achieve their objectives. |
A copy of the policies and procedures that The Royce Funds use to determine how to vote proxies relating to portfolio securities and information regarding how each of The Royce Funds voted proxies relating to portfolio securities during the most recent 12-month period ended June 30 is available, without charge, on The Royce Funds’ website at www.roycefunds.com, by calling (800) 221-4268 (toll-free) and on the website of the Securities and Exchange Commission (“SEC”) at www.sec.gov.
The Funds file their complete schedules of investments with the SEC for the first and third quarters of each fiscal year on Form N-Q. The Funds’ Forms N-Q are available on the SEC’s website at www.sec.gov. The Royce Funds’ holdings are also on the Funds’ website approximately 15 to 20 days after each calendar quarter end and remain available until the next quarter’s holdings are posted. The Funds’ Forms N-Q may also be reviewed and copied at the SEC’s Public Reference Room in Washington, D.C. To find out more about this public service, call the SEC at (202) 942-8090. The Funds’ complete schedules of investments are updated quarterly and are available at www.roycefunds.com.
| 128 | The Royce Funds 2017 Annual Report to Shareholders |
| |
 | |||||
| About The Royce Funds | Contact Us | ||||
| Unparalleled Knowledge + Experience Pioneers in small-cap investing, with 40+ years of experience, depth of knowledge, and focus. Independent Thinking The confidence to go against consensus, the insight to uncover opportunities others might miss, and the tenacity to stay the course through market cycles. | GENERAL INFORMATION General Royce Funds information including: • How to open an account • An overview of our firm and Funds • Ordering literature including Prospectuses (800) 221-4268 | ||||
Specialized Approaches Strategies that use value, core, or growth investment approaches to select micro-cap, small-cap, and mid-cap companies. | ACCOUNT INFORMATION Speak with a representative about: • Your account, transactions, and forms (800) 841-1180 | ||||
Unwavering Commitment | |||||
| Our team of 17 portfolio managers have significant personal investments in the strategies they manage. | FINANCIAL ADVISORS, CONSULTANTS, AND INSTITUTIONS Speak with your regional Royce contact regarding: • Scheduling a meeting or call • Information about our firm, strategies, and funds • Resources for financial professionals, such as portfolio attribution reports (800) 337-6923 | ||||
| AUTOMATED ACCOUNT INFORMATION 24-hour Automated Telephone Service (800) 878-6923 | |||||
 |  |  | |||
Item 2. Code(s) of Ethics. As of the end of the period covered by this report, the Registrant had adopted a code of ethics, as defined in Item 2 of Form N-CSR, applicable to its principal executive officer, principal financial officer, principal accounting officer or controller, or persons performing similar functions. A copy of this code of ethics is filed as an exhibit to this Form N-CSR. No substantive amendments were approved or waivers were granted to this code of ethics during the period covered by this report.
Item 3. Audit Committee Financial Expert.
| (a)(1) | The Board of Trustees of the Registrant has determined that it has an audit committee financial expert. |
| (a)(2) | Arthur S. Mehlman and Patricia W. Chadwick were designated by the Board of Trustees as the Registrant’s Audit Committee Financial Experts, effective April 15, 2004 and April 8, 2010, respectively. Mr. Mehlman and Ms. Chadwick are “independent” as defined under Item 3 of Form N-CSR. |
Item 4. Principal Accountant Fees and Services.
| (a) | Audit Fees: |
Year ended December 31, 2017 - $380,325
Year ended December 31, 2016 - $390,287
| (b) | Audit-Related Fees: |
Year ended December 31, 2017 - $0
Year ended December 31, 2016 - $0
| (c) | Tax Fees: |
Year ended December 31, 2017 - $170,800 – Preparation of tax returns and excise tax review
Year ended December 31, 2016 - $186,960 – Preparation of tax returns and excise tax review
| (d) | All Other Fees: |
Year ended December 31, 2017 - $0
Year ended December 31, 2016 - $0
(e)(1) Annual Pre-Approval: On an annual basis, the Registrant’s independent auditor submits to the Audit Committee a schedule of proposed audit, audit-related, tax and other non-audit services to be rendered to the Registrant and/or investment adviser(s) for the following year that require pre-approval by the Audit Committee. This schedule provides a description of each type of service that is expected to require pre-approval and the maximum fees that can be paid for each such service without further Audit Committee approval. The Audit Committee then reviews and determines whether to approve the types of scheduled services and the projected fees for them. Any subsequent revision to already pre-approved services or fees (including fee increases) are presented for consideration at the next regularly scheduled Audit Committee meeting, as needed.
If subsequent to the annual pre-approval of services and fees by the Audit Committee, the Registrant or one of its affiliates determines that it would like to engage the Registrant’s independent auditor to perform a service not already pre-approved, the request is to be submitted to the Registrant’s Chief Financial Officer, and if he or she determines that the service fits within the independence guidelines (e.g., it is not a prohibited service), he or she will then arrange for a discussion of the proposed service and fee to be included on the agenda for the next regularly scheduled Audit Committee meeting so that pre-approval can be considered.
Interim Pre-Approval: If, in the judgment of the Registrant's Chief Financial Officer, a proposed engagement needs to commence before the next regularly scheduled Audit Committee meeting, he or she shall submit a written summary of the proposed engagement to all members of the Audit Committee, outlining the services, the estimated maximum cost, the category of the services (e.g., audit, audit-related, tax or other) and the rationale for engaging the Registrant’s independent auditor to perform the services. To the extent the proposed engagement involves audit, audit-related or tax services, any individual member of the Audit Committee who is an independent Board member is authorized to pre-approve the engagement. To the extent the proposed engagement involves non-audit services other than audit-related or tax, the Chairman of the Audit Committee is authorized to
pre-approve the engagement. The Registrant’s Chief Financial Officer will arrange for this interim review and coordinate with the appropriate member(s) of the Committee. The independent auditor may not commence the engagement under consideration until the Registrant’s Chief Financial Officer has informed the auditor in writing that pre-approval has been obtained from the Audit Committee or an individual member who is an independent Board member. The member of the Audit Committee who pre-approves any engagements in between regularly scheduled Audit Committee meetings is to report, for informational purposes only, any pre-approval decisions to the Audit Committee at its next regularly scheduled meeting.
(e)(2) Not Applicable
(f) Not Applicable
(g) Year ended December 31, 2017 - $170,800
Year ended December 31, 2016 - $186,960
(h) No such services were rendered during 2017 or 2016.
Item 5. Audit Committee of Listed Registrants. Not Applicable.
Item 6. Investments.
(a) See Item 1.
(b) Not Applicable
Item 7. Disclosure of Proxy Voting Policies and Procedures for Closed-End Management Investment Companies. Not Applicable.
Item 8. Portfolio Managers of Closed-End Management Investment Companies. Not Applicable.
Item 9. Purchases of Equity Securities by Closed-End Management Investment Company and Affiliated Purchasers. Not Applicable
Item 10. Submission of Matters to a Vote of Security Holders. Not Applicable.
Item 11. Controls and Procedures.
(a) Disclosure Controls and Procedures. The Principal Executive and Financial Officers concluded that the Registrant's Disclosure Controls and Procedures are effective based on their evaluation of the Disclosure Controls and Procedures as of a date within 90 days of the filing date of this report.
(b) Internal Control over Financial Reporting. There were no significant changes in Registrant's internal control over financial reporting or in other factors that could significantly affect this control subsequent to the date of the evaluation, including any corrective actions with regard to significant deficiencies and material weaknesses during the second fiscal quarter of the period covered by this report.
Item 12. Exhibits. Attached hereto.
(a)(1) The Registrant’s code of ethics pursuant to Item 2 of Form N-CSR.
(a)(2) Separate certifications by the Registrant’s Principal Executive Officer and Principal Financial Officer as required by Rule 30a-2(a) under the Investment Company Act of 1940.
(a)(3) Not Applicable
(b) Separate certifications by the Registrant’s Principal Executive Officer and Principal Financial Officer, pursuant to Section 906 of the Sarbanes-Oxley Act of 2002 and required by Rule 30a-2(b) under the Investment Company Act of 1940.
Pursuant to the requirements of the Securities Exchange Act of 1934 and the Investment Company Act of 1940, the registrant has duly caused this report to be signed on its behalf by the undersigned, thereunto duly authorized.
THE ROYCE FUND
BY: /s/ Christopher D. Clark
Christopher D. Clark
President
Date: February 28, 2018
Pursuant to the requirements of the Securities Exchange Act of 1934 and the Investment Company Act of 1940, this report has been signed below by the following persons on behalf of the registrant and in the capacities and on the dates indicated.
| THE ROYCE FUND | THE ROYCE FUND | ||
| BY:/s/ Christopher D. Clark | BY: /s/ Peter K. Hoglund | ||
| Christopher D. Clark | Peter K. Hoglund | ||
| President | Treasurer | ||
| Date: February 28, 2018 | Date: February 28, 2018 | ||