UNITED STATES
SECURITIES AND EXCHANGE COMMISSION
Washington, D.C. 20549
FORM N-CSR
CERTIFIED SHAREHOLDER REPORT
OF
REGISTERED MANAGEMENT INVESTMENT COMPANIES
Investment Company Act File Number: 811-03599
Name of Registrant: The Royce Fund
Address of Registrant: 745 Fifth Avenue
New York, NY 10151
Name and address of agent for service: John E. Denneen, Esq. 745 Fifth Avenue New York, NY 10151 |
Registrant's telephone number, including area code: (212) 508-4500
Date of fiscal year end: December 31, 2023
Date of reporting period: January 1, 2023 – June 30, 2023
Item 1. Reports to Shareholders.

royceinvest.com
The Royce Funds 2023 Semiannual
Review and Report to Shareholders
June 30, 2023
Royce Dividend Value Fund
Royce Global Financial Services Fund
Royce International Premier Fund
Royce Micro-Cap Fund
Royce Pennsylvania Mutual Fund
Royce Premier Fund
Royce Small-Cap Opportunity Fund
Royce Small-Cap Special Equity Fund
Royce Small-Cap Total Return Fund
Royce Small-Cap Value Fund
Royce Smaller-Companies Growth Fund

Table of Contents

This page is not part of the The Royce Funds 2023 Semiannual Report to Shareholders | 1
Letter to Our Shareholders

THE BIGGER THE BETTER?
U.S. stocks finished the first six months of 2023 in strong shape, with all the major domestic indexes squarely in the black at the end of June. Several factors seemed to play a role in fostering a more optimistic mindset: returns in April and May were low for the large-cap Russell 1000 Index and negative for the small-cap Russell 2000 Index, which likely encouraged some investors to give equities a fresh look. Investors may also have begun looking past concerns about inflation and recession toward a more stable, perhaps even vibrant period of economic growth. Employment stayed strong while recession talk moderated in terms of both coverage and volume. Both were encouraging developments, though the Fed’s decision to skip an interest rate hike in June, even as the central bank all but promised increases in July and September, was almost certainly an even bigger factor.
How well stocks performed during 2023’s first half varied considerably depending on where one looked along the market capitalization spectrum. In general, the farther upward one traveled, the higher the returns ran. Interestingly (and somewhat frustratingly), 2023 began with an advantage for
small-cap stocks. It was short-lived, however, lasting only until this year’s high for the Russell 2000 on Groundhog Day (2/2/23) before giving way to a rather dramatic reversal. As of 1/31/23, the small-cap index was 300 basis points ahead of the Russell 1000 for the year-to-date period (+9.7% versus +6.7%). At the end of June, however, the Russell 2000 was running 859 basis points behind the Russell 1000 for the year-to-date period ended 6/30/23.
Returns for the Russell Microcap, Russell 2000, Russell 1000, and Russell Top 50
Year-to-Date through 6/30/23

Past performance is no guarantee of future results.
2 | This page is not part of the The Royce Funds 2023 Semiannual Report to Shareholders
LETTER TO OUR SHAREHOLDERS
And although returns were lower, large-cap outperformance was also the pattern among non-U.S. stocks, with the difference being that the year-to-date spread was much narrower: the MSCI ACWI ex USA Small Cap Index rose 6.8% in 2023’s first half while the MSCI ACWI ex USA Large Cap Index increased 9.8%.
ARTIFICIAL INTELLIGENCE: A MARKET-SHAPING FORCE?
We think a couple of related observations are relevant from the standpoint of small-cap specialists like us: first, two factors affected the shift in leadership between U.S. small- and large-cap stocks, one that disproportionately hurt small caps and another that disproportionately helped a few mega-cap names. Small caps bore the brunt of the damage from the banking crisis, which had its most adverse effects on the share prices of smaller regional players. (It came as no surprise to us that banks were the top-detracting industry in the Russell 2000 for 2023’s first half.) The factor that helped large cap, and in our view the primary driver of that asset class’s higher returns in the first half of the year, was the promise of artificial intelligence (“AI”), a major secular trend whose impacts have just begun to register.
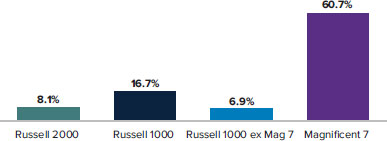
Widespread positive performance masked how top heavy and tightly concentrated returns have become since stocks began rallying near the end of 2022. Looking closer at first-half results reveals the degree to which the prospects for AI drove large-cap performance, which was dominated by impressive results for “The Magnificent Seven,” a handful of mostly familiar behemoths: Alphabet, Amazon, Apple, Meta Platforms, Microsoft, NVIDIA, and Tesla. The combined market capitalizations of these seven companies accounted for 25.1% of the Russell 1000’s total market capitalization at the end of June. To get an additional sense of how enormous they are: Apple, the largest of them as of June 30, had a market cap of $3.05 trillion—which was more than the market cap of the entire Russell 2000 as of that
same date. Considering there are more than 4,000 publicly traded companies in the U.S., this is an almost absurd level of concentration, one that appears unsustainable to us. It is a level of concentration the market has not seen since the ‘Nifty Fifty’ market of the early to mid 1970s. Each of “The Magnificent Seven” is considered one of the primary beneficiaries of AI’s vast untapped potential. Without them, the Russell 2000 would have beaten the Russell 1000 in the first half of 2023. (We feel it’s also worth mentioning that the fall of the Nifty Fifty, all of them established large-cap stocks at the time, precipitated a long run of small-cap outperformance.)
The Russell 2000 Beat the Russell 1000, Excluding the “Magnificent Seven”
Year-to Date Performance for the Russell 2000, Russell 1000, Russell 1000 ex. the Magnificent 7, and the Magnificent 7
Past performance is no guarantee of future results.
ARE SMALL CAPS MOVING FROM BEAR TO BULL?
Unlike their bigger siblings, small caps remained in a bear market at the end of June. The Russell 2000 was down -20.8% from its last peak on 11/8/21, though a positive 7/31/23 brought it out of bear territory—a decline of at least -20.0% from its prior peak. By way of contrast, the Russell 1000 was down only -6.2% from its last peak on 1/3/22, and the tech-heavy Nasdaq fell just -12.9% from its most recent high on 11/19/21, through 6/30/23. Yet we are optimistic both in spite of the relative disadvantage of small-caps and, in some ways, because of it.
The average stock in the Russell 2000 was -28% off its 52-week high at the end of June, which gives
some sense of the opportunity set that exists within small cap—and with it, the potential for improved
performance going forward. Our expectation is that this potential will be realized over the next few years.
This page is not part of the The Royce Funds 2023 Semiannual Report to Shareholders | 3
LETTER TO OUR SHAREHOLDERS
First, significant multiple compression has occurred over the last several months among small caps, particularly small-cap value stocks. The result is that valuations looked highly favorable for the Russell 2000, on both an absolute basis and relative to the Russell 1000, where they remain close to a 20-year low, based on our preferred valuation metric, enterprise value over earnings before interest & taxes (“EV/EBIT”). Unsurprisingly in light of how it has recently lagged growth, the Russell 2000 Value Index finished June much more attractively valued than the Russell 2000 Growth Index, based on that same EV/EBIT metric. It is also worth noting that concerns about elevated valuations in the overall market have played out in an inflationary climate with rising interest rates and widespread anxiety that the economy is about to slip into a recession. We suspect that these concerns will continue to recede as economic news continues to skew more positively. Of course, we are more focused on the absolute valuations of individual companies, which in many instances look appealingly inexpensive to us. The average stock in the Russell 2000 was -28% off its 52-week high at the end of June, which gives some sense of the opportunity set that exists within small cap—and with it, the potential for improved performance going forward. Our expectation is that this potential will be realized over the next few years.
LISTENING TO CLIO, OR A SMALL-CAP HISTORY IN 3 CHARTS
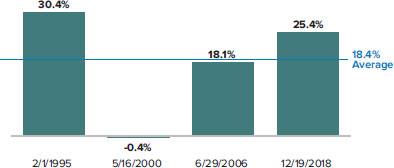
We also see history (and Clio is the Muse of that discipline) showing several reasons why small-cap investors may currently have reasons to be cheerful. We are of course mindful of the fact that history seldom repeats itself. But it often rhymes—and always offers valuable lessons for those of us who take the time to examine previous performance patterns. We began with an analysis of what has happened at the end of past rate hike cycles. While our current era has seen the fastest pace of interest rate hikes on record, there have been other interest rate increase cycles. We looked at the subsequent one-year returns for small cap over four previous rate hike cycles, going back to 1993. The Russell 2000 had positive performance in three of the four periods, and in each of those three, returns were in the double digits. Over all four periods, the small-cap index averaged an impressive 18.4% gain.
Historical Performance Post Final Fed Rate Hikes
Subsequent Average Annual 1-Year Returns for the Russell 2000 Following Final Rate Hikes from 3/31/93 through 6/30/23
Past performance is no guarantee of future results.
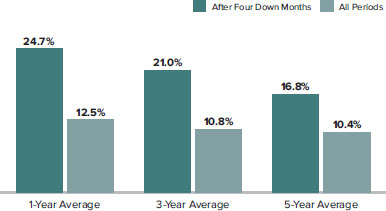
Looking more closely at the present, we find that January and June were the only months so far in 2023 when the Russell 2000 had positive returns. There were four straight down months in between, a rare occurrence that has happened only nine times since the inception of the index on 12/31/78. We wanted to see what shape performance took over the subsequent one-, three-, and five-year spans. What we found was very encouraging, with each period coming in comfortably above the one-, three-, and five-year monthly rolling averages for the Russell 2000 since inception. For the eight periods for which we have data, subsequent one-year returns averaged 24.7%; subsequent three-year returns averaged 21.0%; and subsequent five-year returns averaged 16.8%.
Russell 2000 Average Returns Following Four Consecutive Months with Negative Returns
From Russell 2000 Inception (12/31/78) through 6/30/23
Past performance is no guarantee of future results.
The Russell 2000 has had four consecutive down months in 9 out 534 periods.
4 | This page is not part of the The Royce Funds 2023 Semiannual Report to Shareholders
LETTER TO OUR SHAREHOLDERS
We are all hoping for a robust rebound for the U.S. economy for many reasons, not the
least of which is that small caps, in particular the cyclical industries that mostly populate our
portfolios, tend to do especially well in a thriving economy.
We also looked at data that demonstrates how strong and lasting a rebound small caps have enjoyed after low annualized five-year periods such as we had at the end of June, when the small-cap index’s average annualized 5-year return was a paltry 4.2%. The Russell 2000 had positive annualized five-year returns 100% of the time—in all 81 five-year periods—averaging an impressive 14.9%, which was well above its monthly rolling five-year return since inception of 10.4%.
Why Better Small-Cap Performance May Be Ahead
Subsequent Average Annualized 5-Year Performance for the Russell 2000 Following 5-Year Annualized Return Ranges of Less Than 5% from 12/31/83 through 6/30/23

Past performance is no guarantee of future results.
It appears to us that history is on the side of strong small-cap performance going forward.
THE FUTURE’S SO BRIGHT?
We are all hoping for a robust rebound for the U.S. economy for many reasons, not the least of which is that small caps, in particular the cyclical industries that mostly populate our portfolios, tend to do especially well in a thriving economy. And while some data points remain concerning—most notably higher rates, wobbly industrial production, and a stubbornly inverted yield curve—there are also many signs that the economy is inching closer to recovery. To be sure, a soft landing looks more and more likely to us, while the kind of deep and potentially lengthy recession many have been anticipating since late 2021 looks less and less likely. As Neil
Dutta at Renaissance Macro recently put it, “The statute of limitations has now kicked in” regarding a recession in the U.S.
The U.S. Commerce Department reported a 0.9% seasonally adjusted increase in construction spending for May, which included a significant jump in spending on new manufacturing facilities. There was a 76.3% increase from a year earlier, as well as a 1% advance in May over April. The Commerce Department also showed that spending on manufacturing construction accounted for almost 0.5% of first-quarter GDP, its largest share since 1991. And its second-quarter share of GDP is expected to be even higher. Homebuilding rose by 21.7% in May, a record monthly surge that defied expectations of a slowdown. CapEx has been steady and has shown signs of improving, with the ISM services index re-accelerating in June. Durable goods orders rose for the fourth consecutive month in that same month, hitting a record high for nondefense capital goods (excluding aircraft or core capital goods, a proxy for business equipment investment). Moreover, retail and vehicle sales rose in June while the University of Michigan’s consumer sentiment measure rose in July. Most important, however, was that second-quarter GDP came in higher than expected, thanks to resilient consumers and robust business investment, as inflation continued to moderate, rising at the slowest rate in more than two years. We think investors should also keep in mind that rate hikes and inflation will likely be sunsetting over the next year or so, when the positive impacts of reshoring, the infrastructure bill, and the CHIPs Act will begin to take effect.
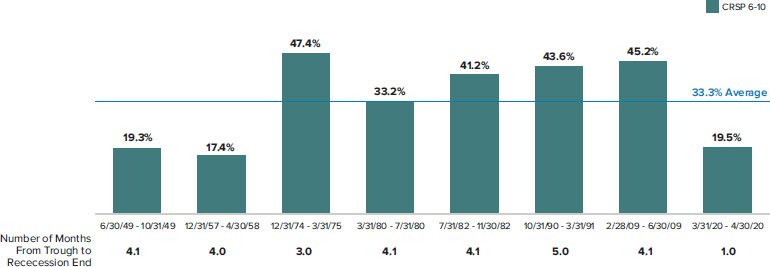
All this encouraging news may be of special relevance to small-cap investors. We looked at data going back to the 1940s, using the Center for Research in Securities Prices data where the CRSP 6-10 is the small-cap proxy, to see what happened to small caps in recessionary periods. The historical pattern is that small caps tend to trough before recessions end, advancing 33.3% on average from the small-cap trough to the end of the recession. As we have said previously, investors typically pay a steep price for waiting, whether for the market to bottom or a recession to end. And a recession remains a possibility, despite recent developments.
This page is not part of the The Royce Funds 2023 Semiannual Report to Shareholders | 5
LETTER TO OUR SHAREHOLDERS
The Price of Waiting for Recessions to End
Average Small-Cap Return from Market Trough to Recession’s End Was 33.3% from 6/30/49 through 4/30/20
Past performance is no guarantee of future results.
Ultimately, of course, we are bottom-up stock pickers. Our knowledge and experience lie in analyzing companies and managing portfolios. So, as important as we think all this data is, we put more trust into what we are hearing from company management teams. In our conversations, there continues to be a sense of cautious optimism—which was reflected in generally solid earnings for many holdings for
the second quarter and few, if any, profit warnings so far for the third. All of this is consistent with our contention that small caps are due—arguably overdue—for a breakout in the coming months. Our confidence in the prospects for disciplined and patient active management within small cap remains high.
Sincerely,
 |  |  |
| | | |
| Charles M. Royce | Christopher D. Clark | Francis D. Gannon |
| Chairman, | Chief Executive Officer, and | Co-Chief Investment Officer, |
| Royce Investment Partners | Co-Chief Investment Officer, | Royce Investment Partners |
| | Royce Investment Partners | |
| July 31, 2023 | | |
6 | This page is not part of the The Royce Funds 2023 Semiannual Report to Shareholders
Performance and Expenses
Performance and Expenses
As of June 30, 2023
| | | | | AVERAGE ANNUAL TOTAL RETURNS (%) | | | ANNUAL OPERATING
EXPENSES (%) |
| | YTD 1 | 1-YR | 3-YR | 5-YR | 10-YR | 15-YR | 20-YR | SINCE
INCEPTION | INCEPTION
DATE | GROSS | NET |
| Royce Dividend Value Fund | 11.92 | 22.44 | 12.85 | 6.12 | 7.34 | 8.14 | N/A | 8.15 | 5/3/04 | 1.623 | 1.343 |
| Royce Global Financial Services Fund | 3.51 | 6.04 | 7.11 | 3.67 | 7.18 | 7.53 | N/A | 7.31 | 12/31/03 | 1.983 | 1.573 |
| Royce International Premier Fund | 4.45 | 4.16 | 0.18 | 2.38 | 6.17 | N/A | N/A | 5.51 | 12/31/10 | 1.59 3 | 1.44 3 |
| Royce Micro-Cap Fund | 9.41 | 17.63 | 16.07 | 6.71 | 6.53 | 5.91 | 8.15 | 10.33 | 12/31/91 | 1.24 | 1.24 |
| Royce Pennsylvania Mutual Fund | 15.37 | 21.50 | 15.51 | 7.58 | 9.09 | 8.47 | 9.69 | 12.892 | N/A | 0.96 | 0.96 |
| Royce Premier Fund | 14.31 | 19.60 | 13.07 | 7.99 | 9.27 | 8.41 | 10.62 | 11.19 | 12/31/91 | 1.18 | 1.18 |
| Royce Small-Cap Opportunity Fund | 13.16 | 20.42 | 23.76 | 8.91 | 10.14 | 10.39 | 10.83 | 11.91 | 11/19/96 | 1.23 | 1.23 |
| Royce Small-Cap Special Equity Fund | 7.85 | 15.89 | 13.89 | 6.25 | 6.98 | 8.52 | 8.40 | 8.60 | 5/1/98 | 1.21 | 1.21 |
| Royce Small-Cap Total Return Fund | 8.95 | 9.42 | 14.29 | 5.81 | 7.76 | 7.73 | 8.40 | 9.97 | 12/15/93 | 1.26 | 1.26 |
| Royce Small-Cap Value Fund | 8.40 | 20.91 | 17.60 | 3.68 | 5.48 | 4.96 | 8.53 | 8.33 | 6/14/01 | 1.593 | 1.493 |
| Royce Smaller-Companies Growth Fund | 15.33 | 22.28 | 7.10 | 4.76 | 8.00 | 6.91 | 9.45 | 10.11 | 6/14/01 | 1.553 | 1.493 |
| INDEX | | | | | | | | | | | |
| Russell 2000 Index | 8.09 | 12.31 | 10.82 | 4.21 | 8.26 | 8.43 | 8.89 | N/A | N/A | N/A | N/A |
| Russell Microcap Index | 2.32 | 6.63 | 9.09 | 2.07 | 7.29 | 7.70 | 7.55 | N/A | N/A | N/A | N/A |
| Russell 2000 Value Index | 2.50 | 6.01 | 15.43 | 3.54 | 7.29 | 7.72 | 8.29 | N/A | N/A | N/A | N/A |
| Russell 2000 Growth Index | 13.55 | 18.53 | 6.10 | 4.22 | 8.83 | 8.85 | 9.23 | N/A | N/A | N/A | N/A |
| Russell 2500 Index | 8.79 | 13.58 | 12.29 | 6.55 | 9.38 | 9.32 | 9.86 | N/A | N/A | N/A | N/A |
| MSCI ACWI ex USA Small Cap Index | 6.84 | 10.93 | 8.15 | 2.62 | 5.75 | 4.71 | 8.49 | N/A | N/A | N/A | N/A |
| MSCI ACWI Small Cap Index | 8.02 | 13.02 | 10.83 | 4.53 | 7.62 | 7.20 | 9.35 | N/A | N/A | N/A | N/A |
1 Not annualized.
2 For Royce Pennsylvania Mutual Fund, the average annual total return shown is for the 50-year period ended 6/30/23.
3 Reflects Service Class expenses which include a 25bps distribution and/or service fee.
Important Performance, Expense, and Risk Information
All performance information in this Review and Report reflects past performance, is presented on a total return basis, reflects the reinvestment of distributions, and does not reflect the deduction of taxes a shareholder would pay on Fund distributions or the redemption of Fund shares. Past performance is no guarantee of future results. Investment return and principal value of an investment will fluctuate, so that shares may be worth more or less than their original cost when redeemed. Investment and Service Class shares redeemed within 30 days of purchase may be subject to a 1% redemption fee payable to the Fund (2% for Royce International Premier Fund). Redemption fees are not reflected in the performance shown above; if they were, performance would be lower. Current performance may be higher or lower than performance quoted. Current month-end performance may be obtained at www.royceinvest.com. All performance and expense information reflects results of the Funds’ oldest share Class (Investment Class or Service Class, as the case may be). Price and total return information is based on net asset values calculated for shareholder transactions. Annual gross operating expenses reflect the Fund’s gross total annual operating expenses and include management fees, any 12b-1 distribution and/or service fees, other expenses, and any applicable acquired fund fees and expenses. Annual net operating expenses reflect contractual fee waivers and/or expense reimbursements. All expense information is reported as of the Fund’s most current prospectus. Royce & Associates has contractually agreed to waive fees and/or reimburse operating expenses, excluding brokerage commissions, taxes, interest, litigation expenses, acquired fund fees and expenses, and other expenses not borne in the ordinary course of business, to the extent necessary to maintain net operating expenses at or below: 1.34% for Royce Dividend Value Fund; 1.44% for Royce International Premier Fund; and 1.49% for each the Royce Global Financial Services, Small-Cap Value, and Smaller-Companies Growth Funds through April 30, 2024. Acquired fund fees and expenses reflect the estimated amount of the fees and expenses incurred indirectly by the Fund through its investments in mutual funds and other investment companies.
Service Class shares bear an annual distribution expense that is not borne by the Funds’ Investment Class. If such distribution expenses had been reflected for Funds showing Investment Class performance, returns would have been lower. Each series of The Royce Fund is subject to market risk–the possibility that common stock prices will decline, sometimes sharply and unpredictably, over short or extended periods of time. Such declines may be caused by various factors, including market, financial, and economic conditions, governmental or central bank actions, and other factors, such as the recent Covid pandemic, that may not be directly related to the issuer of a security held by a Fund. This pandemic could adversely affect global market, financial, and economic conditions in ways that cannot necessarily be foreseen. Investments in securities of micro-cap, small-cap, and/or mid-cap companies may involve considerably more risk than investments in securities of larger-cap companies. Certain Funds invest a significant portion of their respective assets in foreign companies that may be subject to different risks than investments in securities of U.S. companies, including adverse political, social, economic, or other developments that are unique to a particular country or region. Therefore, the prices of securities of foreign companies in particular countries or regions may, at times, move in a different direction than those of securities of U.S. companies. Because such investments are usually denominated in foreign currencies and such Funds do not intend to hedge their foreign currency exposures, the U.S. dollar value of such investments may be harmed by declines in the value of foreign currencies in relation to the U.S. dollar. Certain Funds invest a significant portion of their assets in a limited number of stocks or focus their investments in a particular sector or industry, which may involve considerably more risk than a more broadly diversified portfolio because they may be more susceptible to any single corporate, economic, political, regulatory, or market event. A broadly diversified portfolio, however, does not ensure a profit or guarantee against loss. (Please see “Primary Risks for Fund Investors” and “Investing in Foreign Securities” in the prospectus.) This Review and Report must be preceded or accompanied by a prospectus. Please read the prospectus carefully before investing or sending money. Source: MSCI. MSCI makes no express or implied warranties or representations and shall have no liability whatsoever with respect to any MSCI data contained herein. The MSCI data may not be further redistributed or used as a basis for other indexes or any securities or financial products. This report is not approved, endorsed, reviewed or produced by MSCI. None of the MSCI data is intended to constitute investment advice or a recommendation to make (or refrain from making) any kind of investment decision and may not be relied on as such. Russell Investment Group is the source and owner of the trademarks, service marks, and copyrights related to the Russell Indexes. Russell® is a trademark of Russell Investment Group. The Russell 2000 Index is an unmanaged, capitalization-weighted index of domestic small-cap stocks. It measures the performance of the 2,000 smallest publicly traded U.S. companies in the Russell 3000 Index. The Russell Microcap Index includes 1,000 of the smallest securities in the small-cap Russell 2000 Index along with the next smallest eligible securities as determined by Russell. The Russell 2000 Value and Growth Indexes consist of the respective value and growth stocks within the Russell 2000 as determined by Russell Investments. The Russell 2500 is an unmanaged, capitalization-weighted index of the 2,500 smallest publicly traded U.S. companies in the Russell 3000 index. The MSCI ACWI ex USA Small Cap Index is an unmanaged, capitalization-weighted index of global small-cap stocks, excluding the United States. The MSCI ACWI Small Cap Index is an unmanaged, capitalization-weighted index of global small-cap stocks. Index returns include net reinvested dividends and/or interest income. The performance of an index does not represent exactly any particular investment as you cannot invest directly in an index. Distributor: Royce Fund Services, LLC.
This page is not part of the The Royce Funds 2023 Semiannual Report to Shareholders | 7
MANAGER’S DISCUSSION (UNAUDITED)
Royce Dividend Value Fund (RDV)

Chuck Royce
FUND PERFORMANCE
Royce Dividend Value Fund was up 11.9% for the year-to-date period ended 6/30/23, outperforming its benchmark, the Russell 2500 Index, which rose 8.8% for the same period. The Fund also outpaced its benchmark for the 1- and 3-year periods ended 6/30/23.
WHAT WORKED… AND WHAT DIDN’T
Six of the portfolio’s eight equity sectors made a positive impact on performance for the year-to-date period ended 6/30/23. The sectors making the largest positive contributions were Industrials, Financials, and Materials, while the only negative impacts came from Real Estate and Energy. Health Care made the smallest contribution. At the industry level, metals & mining (Materials), capital markets, and banks (both from Financials) made the biggest positive contributions while the biggest detractors were real estate management & development (Real Estate), insurance (Financials), and oil, gas & consumable fuels (Energy).
The top-contributing position in 2023’s first half was First Citizens BancShares, which we’ve owned for many years, due mostly to its strong liquidity position and stellar deposit franchise. Its valuation looked attractive to us in late 2022, when we began adding shares that were trading at roughly 5x earnings per share. More recently, First Citizens was chosen by the FDIC to acquire Silicon Valley Bank, most likely owing to its long history of buying failed banks. Silicon Valley’s travails notwithstanding, the purchase was accretive to First Citizens’ tangible book value and earnings, helping to spur a sharp rise in its stock. Hubbell Incorporated manufactures plugs, receptacles, connectors, lighting fixtures, high voltage test and measurement equipment, and voice and data signal processing components. During 2023’s first half, growing demand for grid modernization and electrification drove earnings and revenue growth, trends that the company expects to continue.
The Fund’s top detractor in 2023’s first half was Lindsay Corporation, which provides center pivot irrigation systems for commercial agriculture. Lindsay’s stock retreated as corn and wheat prices came off highs and farm income was forecasted to decline from peak levels. The company also faces difficult year-over-year comparisons later this year because several severe storms in 2022 drove higher pivot-replacement demand. Internationally, Lindsay has faced irrigation order delays in the high growth Brazilian market due to a political transition that pushed out implementation of a government financing program for agricultural products growers. BOK Financial is an Oklahoma-based bank holding company. Its shares were caught up in the widespread declines that affected many smaller regional banks in the wake of Silicon Valley and Signature Banks failing as well as fiscal first-quarter results that saw declines in net income from the same quarter in 2022 and declines in average deposits. Confident in its long-term prospects, we held our shares at the end of June.
| | Top Contributors to Performance | | Top Detractors from Performance | |
| | Year-to-Date Through 6/30/23 (%)1 | | Year-to-Date Through 6/30/23 (%)2 | |
| | First Citizens BancShares Cl. A | 1.83 | | Lindsay Corporation | -0.97 | |
| | Hubbell Incorporated | 1.16 | | BOK Financial | -0.61 | |
| | Worthington Industries | 1.06 | | RMR Group (The) Cl. A | -0.30 | |
| | Lincoln Electric Holdings | 0.89 | | Assured Guaranty | -0.11 | |
| | Graco | 0.86 | | State Street | -0.09 | |
| | 1 Includes dividends | | | 2 Net of dividends | | |
The Fund’s advantage over the Russell 2500 was attributable to stock selection in 2023’s first half. This was most impactful in the Financials sector, where First Citizens BancShares, Artisan Partners Asset Management, and Brazilian stock exchange B3-Brasil, Bolsa, Balcao drove our relative edge. Stock picks were also additive in Materials, as was our much lower weighting in Energy. Conversely, our much lower exposures to resurgent Information Technology and Consumer Discretionary stocks, as well as our lack of exposure to Communication Services, detracted from relative results.
CURRENT POSITIONING AND OUTLOOK
We see an array of potential triggers that could possibly jumpstart small- and mid-cap performance in the coming months. First, a soft landing looks more and more likely to us, and a recession—specifically the kind of deep and potentially lengthy contraction many have been anticipating since late 2021—looks less and less likely. We have already seen promising developments that seem to suggest a nascently robust economy: durable goods orders rose for the fourth consecutive month in June—and hit a record high for nondefense capital goods (excluding aircraft or core capital goods, a proxy for business equipment investment)—while homebuilding rose by 21.7% in May, a record monthly surge that also defied expectations for a slowdown. Even more important, in our view, is the ongoing sense of cautious optimism we have been hearing from many management teams—which was reflected by generally solid earnings for many holdings for the second quarter. Amid the difficulties of bear markets and periods of economic uncertainty, we think it’s crucial to remind investors of the opportunity to build their small- and/or mid-cap allocation at attractively low prices. History shows that investors who had the necessary patience and discipline to stay invested during periods of sluggish or negative performance have been rewarded. We continue to see the currently unsettled period as an opportune time to invest in select small- and mid-caps for the long run.
8 | The Royce Funds 2023 Semiannual Report to Shareholders
| PERFORMANCE AND PORTFOLIO REVIEW (UNAUDITED) | TICKER SYMBOLS RYDVX RDVIX |
Performance and Expenses
Average Annual Total Return (%) Through 6/30/23
| | JAN-JUN 20231 | 1-YR | 3-YR | 5-YR | 10-YR | 15-YR | SINCE INCEPTION (5/3/04) |
| RDV | 11.92 | 22.44 | 12.85 | 6.12 | 7.34 | 8.14 | 8.15 |
| Annual Gross Operating Expenses: 1.62% Annual Net Operating Expenses: 1.34% | |
| 1 Not annualized | | | | | | | |
Morningstar Style Map™ As of 6/30/23

The Morningstar Style Map is the Morningstar Style Box™ with the center 75% of fund holdings plotted as the Morningstar Ownership Zone™. The Morningstar Style Box is designed to reveal a fund’s investment strategy. The Morningstar Ownership Zone provides detail about a portfolio’s investment style by showing the range of stock sizes and styles. The Ownership Zone is derived by plotting each stock in the portfolio within the proprietary Morningstar Style Box. Over time, the shape and location of a fund’s ownership zone may vary. See page 89 for additional information.
Value of $10,000
Invested on 5/3/04 as of 6/30/23 ($)

Top 10 Positions
% of Net Assets
| KBR | 4.5 |
| HEICO Corporation Cl. A | 4.2 |
| Carlyle Group | 3.9 |
| AptarGroup | 3.8 |
| Franco-Nevada | 3.8 |
| Hubbell Incorporated | 3.7 |
| SEI Investments | 3.6 |
| Graco | 3.5 |
| Worthington Industries | 3.3 |
| Royal Gold | 3.2 |
Portfolio Sector Breakdown
% of Net Assets
| Industrials | 35.6 |
| Financials | 30.0 |
| Materials | 19.2 |
| Consumer Discretionary | 4.3 |
| Health Care | 3.3 |
| Information Technology | 2.7 |
| Real Estate | 2.1 |
| Energy | 1.3 |
| Cash and Cash Equivalents | 1.5 |
| Calendar Year Total Returns (%) | |
| YEAR | RDV |
| 2022 | -13.6 |
| 2021 | 20.1 |
| 2020 | 4.5 |
| 2019 | 29.8 |
| 2018 | -16.2 |
| 2017 | 21.7 |
| 2016 | 16.4 |
| 2015 | -5.7 |
| 2014 | -2.1 |
| 2013 | 30.7 |
| 2012 | 16.9 |
| 2011 | -4.5 |
| 2010 | 30.1 |
| 2009 | 37.7 |
| 2008 | -31.5 |
| Upside/Downside Capture Ratios | |
| Periods Ended 6/30/23 (%) | | |
| | UPSIDE | DOWNSIDE |
| 10-Year | 92 | 104 |
| From 6/30/04 (Start of Fund’s First Full Quarter) | 92 | 92 |
| Portfolio Diagnostics | |
| Fund Net Assets | $63 million |
| Number of Holdings | 50 |
| Turnover Rate | 13% |
| Average Market Capitalization 1 | $6,433 million |
| Weighted Average P/E Ratio 2,3 | 14.6x |
| Weighted Average P/B Ratio 2 | 2.7x |
| Active Share 4 | 97% |
| U.S. Investments (% of Net Assets) | 75.1% |
| Non-U.S. Investments (% of Net Assets) | 23.4% |
| 1 | Geometric Average. This weighted calculation uses each portfolio holding’s market cap in a way designed to not skew the effect of very large or small holdings; instead, it aims to better identify the portfolio’s center, which Royce believes offers a more accurate measure of average market cap than a simple mean or median. |
| 2 | Harmonic Average. This weighted calculation evaluates a portfolio as if it were a single stock and measures it overall. It compares the total market value of the portfolio to the portfolio’s share in the earnings or book value, as the case may be, of its underlying stocks. |
| 3 | The Fund’s P/E Ratio calculation excludes companies with zero or negative earnings (7% of portfolio holdings as of 6/30/23). |
| 4 | Active Share is the sum of the absolute values of the different weightings of each holding in the Fund versus each holding in the benchmark, divided by two. |
Important Performance and Expense Information
All performance information in this Report reflects past performance, is presented on a total return basis, reflects the reinvestment of distributions, and does not reflect the deduction of taxes that a shareholder would pay on Fund distributions or the redemption of Fund shares. Past performance is no guarantee of future results. Investment return and principal value of an investment will fluctuate, so that shares may be worth more or less than their original cost when redeemed. Shares redeemed within 30 days of purchase may be subject to a 1% redemption fee payable to the Fund, which is not reflected in the performance shown above; if it were, performance would be lower. Current month-end performance may be higher or lower than performance quoted and may be obtained at www.royceinvest.com. All performance and risk information reflects results of the Service Class (its oldest class). Annual gross operating expenses reflect the total gross operating expenses for the Fund’s Service Class and include management fees, 12b-1 distribution and/or service fees, and other expenses. Annual net operating expenses reflect contractual fee waivers and/or expense reimbursements. All expense information is reported as of the Fund’s most current prospectus. Royce & Associates has contractually agreed, without right of termination, to waive fees and/or reimburse expenses to the extent necessary to maintain the Service Class’s annual net operating expenses (excluding brokerage commissions, taxes, interest, litigation expenses, acquired fund fees and expenses, and other expenses not borne in the ordinary course of business) at or below 1.34% through April 30, 2024. Regarding the “Top Contributors” and “Top Detractors” tables shown above, the sum of all contributors to, and all detractors from, performance for all securities in the portfolio would approximate the Fund’s year-to-date performance for 2023. Upside Capture Ratio measures a manager’s performance in up markets relative to the Fund’s benchmark. It is calculated by measuring the Fund’s performance in quarters when the primary benchmark went up and dividing it by such benchmark’s return in those quarters. Downside Capture Ratio measures a manager’s performance in down markets relative to the Fund’s primary benchmark. It is calculated by measuring the Fund’s performance in quarters when the primary benchmark goes down and dividing it by such benchmark’s return in those quarters.
The Royce Funds 2023 Semiannual Report to Shareholders | 9
MANAGER’S DISCUSSION (UNAUDITED)
Royce Global Financial Services Fund (RFS)

Chuck Royce
FUND PERFORMANCE
Royce Global Financial Services Fund increased 3.5% for the year-to-date period ended 6/30/23, lagging its broad-based global benchmark, the MSCI ACWI Small Cap Index, which was up 8.0% for the same period.
WHAT WORKED… AND WHAT DIDN’T
During the first half of 2023, the Fund had investments in five equity sectors, four of which made positive contributions to performance. Financials led by a wide margin, followed by Real Estate and Industrials. Information Technology was the only detractor while Materials made the smallest contribution. At the industry level, capital markets (Financials), real estate management & development (Real Estate), and financial services (Financials) contributed most for the year-to-date period. Banks (Financials) and software (Information Technology) were the only detractors while professional services (Industrials) was flat for the year-to-date period ended 6/30/23. At the country level, Canada, the U.S., and the United Kingdom contributed most for the year-to-date period, while Israel, Bermuda, and South Africa were the largest detractors.
The top-contributing position in 2023’s first half was First Citizens BancShares, which we’ve owned for many years, due mostly to its strong liquidity position and stellar deposit franchise. Its valuation looked attractive to us in late 2022, when we began adding shares that were trading at roughly 5x earnings per share. More recently, First Citizens was chosen by the FDIC to acquire Silicon Valley Bank, most likely owing to its long history of buying failed banks. Silicon Valley’s travails notwithstanding, the purchase was accretive to First Citizens’ tangible book value and earnings, and helped spur a sharp rise in its stock. Ares Management is an alternative asset manager which also has a business development company that lends money to companies for long-term growth initiatives. It raises capital of its own at attractive rates before lending it at higher ones. With most of its loans in variable rate arrangements, it can generate more interest income as rates rise. Ares’s first-quarter results included a more than 35% year-over-year increase in core earnings per share.
| | | | | |
| | Top Contributors to Performance | | Top Detractors from Performance | |
| | Year-to-Date Through 6/30/23 (%)1 | | Year-to-Date Through 6/30/23 (%)2 | |
| | First Citizens BancShares Cl. A | 2.68 | | First Republic Bank | -1.73 | |
| | Ares Management Cl. A | 1.02 | | Charles Schwab | -1.49 | |
| | FirstService Corporation | 0.98 | | BOK Financial | -0.87 | |
| | Canaccord Genuity Group | 0.87 | | Tel Aviv Stock Exchange | -0.79 | |
| | Intermediate Capital Group | 0.63 | | Altus Group | -0.67 | |
| | 1 Includes dividends | | | 2 Net of dividends | | |
| | | | | | | |
The top-detracting position was San Francisco-based regional bank, First Republic Bank. It was the third bank to declare insolvency in 2023 (following Silicon Valley and Signature Banks) and the second-largest failure since the fall of Washington Mutual in the 2008 Financial Crisis. It was hurt by having too many uninsured deposits and too many reserves in long-term debt instruments, which began losing value when interest rates began to rise. The result was a bailout by JPMorgan Chase in May. The banking crisis helped drive down the shares of financial services specialist, Charles Schwab, which has a banking business in addition to its discount brokerage.
The portfolio’s relative performance will often hinge not just on the performance of financial stocks—which were once more underwater within the MSCI ACWI Small Cap in the first half of 2023—but also on those sectors where we have little or no exposure relative to our broad-based global benchmark. The Fund’s much greater exposure to Financials hurt relative results, even as stock selection in the sector was additive, as was our much lower weighting in resurgent Information Technology and Industrials. Conversely, stock selection was additive in Real Estate, as was our lack of exposure to Energy and Utilities.
CURRENT POSITIONING AND OUTLOOK
Fears of a global recession receded somewhat in June, led by positive economic data in the U.S. and a pause of interest rate increases by the Federal Reserve. Of course, economic data out of Europe, as well as geopolitical tensions and a sluggish Chinese economy, all continued to weigh on the global economic outlook at the end of June. In this context, the near-term forecast for equities remains as unclear as any we can recall, though over the long term we also still see better weather on the horizon, especially for global small-cap stocks. Indeed, throughout 2022 and into 2023, we have been struck by the contrast between the more confident—albeit cautious—outlooks from the many management teams we met with, and the fatalistic headlines seen almost every day. Of course, the Fund’s companies boast generally strong long-term growth prospects, low debt, positive free cash flows, high returns on invested capital, and/or proven management expertise. Overall, we believe they appear well positioned for a market that is more focused on fundamentals and/or from a reaccelerating global economy. And while recession remains a reality or possibility (depending on geography), none of us knows how long it will last or how deep it will go. What we do know is that history shows us that any recession—like any bear market—is ultimately finite and will be followed by a recovery. It’s worth keeping in mind that history also shows that small caps will likely begin an upward move before many of us know for sure that the economy is rebounding in earnest. For this and other reasons, we would welcome any degree of increased scrutiny of company fundamentals.
10 | The Royce Funds 2023 Semiannual Report to Shareholders
| PERFORMANCE AND PORTFOLIO REVIEW (UNAUDITED) | TICKER SYMBOLS RYFSX RGFIX |
Performance and Expenses
Average Annual Total Return (%) Through 6/30/23
| | JAN-JUN 20231 | 1-YR | 3-YR | 5-YR | 10-YR | 15-YR | SINCE INCEPTION (12/31/03) |
| RFS | 3.51 | 6.04 | 7.11 | 3.67 | 7.18 | 7.53 | 7.31 |
| Annual Gross Operating Expenses: 1.98% Annual Net Operating Expenses: 1.57% |
| 1 Not annualized | | | | | | |
Morningstar Style Map™ As of 6/30/23

The Morningstar Style Map is the Morningstar Style Box™ with the center 75% of fund holdings plotted as the Morningstar Ownership Zone™. The Morningstar Style Box is designed to reveal a fund’s investment strategy. The Morningstar Ownership Zone provides detail about a portfolio’s investment style by showing the range of stock sizes and styles. The Ownership Zone is derived by plotting each stock in the portfolio within the proprietary Morningstar Style Box. Over time, the shape and location of a fund’s ownership zone may vary. See page 89 for additional information.
Portfolio Country Breakdown 1,2
% of Net Assets
| United States | 46.6 |
| Canada | 25.1 |
| Bermuda | 5.5 |
| Israel | 4.6 |
| India | 2.7 |
| France | 2.7 |
| United Kingdom | 2.6 |
| Panama | 2.2 |
| Brazil | 2.1 |
| New Zealand | 1.6 |
¹ Represents countries that are 1.5% or more of net assets.
² Securities are categorized by the country of their headquarters.
Top 10 Positions
% of Net Assets
| First Citizens BancShares Cl. A | 5.2 |
| Franco-Nevada | 4.7 |
| Tel Aviv Stock Exchange | 4.6 |
| Sprott | 4.5 |
| FirstService Corporation | 4.4 |
| E-L Financial | 3.5 |
| Popular | 3.4 |
| KKR & Co. | 3.1 |
| Altus Group | 3.0 |
| BOK Financial | 2.9 |
Portfolio Industry Breakdown
% of Net Assets
| Capital Markets | 50.5 |
| Banks | 15.3 |
| Real Estate Management & Development | 9.2 |
| Insurance | 8.5 |
| Financial Services | 4.8 |
| Metals & Mining | 4.6 |
| Machinery | 1.4 |
| Software | 1.4 |
| Trading Companies & Distributors | 1.2 |
| Closed-End Funds | 1.0 |
| Professional Services | 0.2 |
| Cash and Cash Equivalents | 1.9 |
Value of $10,000
Invested on 12/31/03 as of 6/30/23 ($)

| Calendar Year Total Returns (%) | |
| YEAR | RFS |
| 2022 | -20.3 |
| 2021 | 20.3 |
| 2020 | 15.3 |
| 2019 | 24.2 |
| 2018 | -13.4 |
| 2017 | 22.5 |
| 2016 | 12.9 |
| 2015 | -4.7 |
| 2014 | 3.5 |
| 2013 | 42.0 |
| 2012 | 20.7 |
| 2011 | -11.3 |
| 2010 | 18.5 |
| 2009 | 32.1 |
| 2008 | -35.4 |
| | |
| Portfolio Diagnostics | |
| Fund Net Assets | $26 million |
| Number of Holdings | 56 |
| Turnover Rate | 9% |
| Average Market Capitalization 1 | $3,242 million |
| Weighted Average P/E Ratio 2,3 | 10.2x |
| Weighted Average P/B Ratio 2 | 1.6x |
| Active Share 4 | 99% |
| 1 | Geometric Average. This weighted calculation uses each portfolio holding’s market cap in a way designed to not skew the effect of very large or small holdings; instead, it aims to better identify the portfolio’s center, which Royce believes offers a more accurate measure of average market cap than a simple mean or median. |
| 2 | Harmonic Average. This weighted calculation evaluates a portfolio as if it were a single stock and measures it overall. It compares the total market value of the portfolio to the portfolio’s share in the earnings or book value, as the case may be, of its underlying stocks. |
| 3 | The Fund’s P/E Ratio calculation excludes companies with zero or negative earnings (10% of portfolio holdings as of 6/30/23). |
| 4 | Active Share is the sum of the absolute values of the different weightings of each holding in the Fund versus each holding in the benchmark, divided by two. |
Upside/Downside Capture Ratios
Periods Ended 6/30/23 (%)
| | UPSIDE | DOWNSIDE |
| 10-Year | 91 | 90 |
| Fund’s First Full Quarter (12/31/03) | 87 | 86 |
Important Performance and Expense Information
All performance information in this Report reflects past performance, is presented on a total return basis, reflects the reinvestment of distributions, and does not reflect the deduction of taxes that a shareholder would pay on Fund distributions or the redemption of Fund shares. Past performance is no guarantee of future results. Investment return and principal value of an investment will fluctuate, so that shares may be worth more or less than their original cost when redeemed. Shares redeemed within 30 days of purchase may be subject to a 1% redemption fee payable to the Fund, which is not reflected in the performance shown above; if it were, performance would be lower. Current month-end performance may be higher or lower than performance quoted and may be obtained at www.royceinvest.com. Annual gross operating expenses reflect the total gross operating expenses for the Fund’s Service Class and include management fees, 12b-1 distribution and/or service fees, other expenses and acquired fund fees and expenses. Annual net operating expenses reflect contractual fee waivers and/or expense reimbursements. All expense information is reported as of the Fund’s most current prospectus. Royce & Associates has contractually agreed to waive fees and/or reimburse expenses to the extent necessary to maintain the Fund’s annual net operating expenses, (excluding brokerage commissions, taxes, interest, litigation expenses, acquired fund fees and expenses, and other expenses not borne in the ordinary course of business), at or below 1.49% through April 30, 2024. Acquired fund fees and expenses reflect the estimated amount of the fees and expenses incurred indirectly by the Fund through its investments in mutual funds and other investment companies. Regarding the “Top Contributors” and “Top Detractors” tables shown above, the sum of all contributors to, and all detractors from, performance for all securities in the portfolio would approximate the Fund’s year-to-date performance for 2023. Certain Funds invest a significant portion of their respective assets in foreign companies that may be subject to different risks than investments in securities of U.S. companies, including adverse political, social, economic, or other developments that are unique to a particular country or region. Therefore, the prices of securities of foreign companies in particular countries or regions may, at times, move in a different direction than those of securities of U.S. companies. Because such investments are usually denominated in foreign currencies and such Funds do not intend to hedge their foreign currency exposures, the U.S. dollar value of such investments may be harmed by declines in the value of foreign currencies in relation to the U.S. dollar. Upside Capture Ratio measures a manager’s performance in up markets relative to the Fund’s primary benchmark. It is calculated by measuring the Fund’s performance in quarters when the primary benchmark went up and dividing it by such benchmark’s return in those quarters. Downside Capture Ratio measures a manager’s performance in down markets relative to the Fund’s primary benchmark. It is calculated by measuring the Fund’s performance in quarters when the primary benchmark goes down and dividing it by such benchmark’s return in those quarters.
The Royce Funds 2023 Semiannual Report to Shareholders | 11
MANAGERS’ DISCUSSION (UNAUDITED)
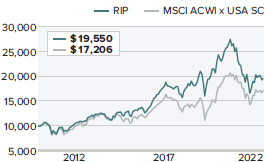
Royce International Premier Fund (RIP)

Mark Rayner, CA, Mark Fischer
FUND PERFORMANCE
Royce International Premier Fund advanced 4.5% for the year-to-date period ended 6/30/23, trailing its benchmark, the MSCI ACWI ex USA Small Cap Index, which was up 6.8% for the same period. The Fund beat its benchmark, however, for the 10-year and since inception (12/31/10) periods ended 6/30/23.
WHAT WORKED… AND WHAT DIDN’T
Five of the Fund’s eight equity sectors made positive contributions to performance in 2023’s first half, led by Information Technology, Industrials (its two largest sectors), and Financials, while Communication Services, Health Care, and Real Estate detracted.
The Fund’s biggest contributor at the position level was Odontoprev, Brazil’s largest provider of corporate dental care plans. We like Odontoprev’s high margin yet asset-light business model, which enables it to generate strong cash flows and returns on invested capital, as well as structural growth prospects supported by Brazil’s expanding middle class. Compared to almost 80% in the U.S., we estimate that only 14% of Brazilians have private dental coverage today. Its stock appeared to benefit earlier in the year from its perception as a quality stock, as Brazilian investors flocked to more defensive companies. Given the expectations for sustained high interest rates in Brazil, the market has been gravitating to companies with lower debt, making Odontoprev’s strong net cash position particularly appealing to local investors. In mid-May, the company’s share price also rose on first-quarter 2023 results, which saw an 11% year-on-year growth in revenues, with demand especially strong among small- to mid-sized businesses. Along with the lower-than-expected costs of providing dental services, adjusted earnings before interest, taxes, depreciation & amortization jumped by 22%.
Canada’s Open Text is the global market leader in enterprise content management software that collects, cleans, and analyzes unstructured data, including emails, PDFs, and human resources records. Its rising share price was mostly driven by better-than-expected results for 2023’s fiscal third quarter, released in May. Management also confirmed that a recent acquisition was progressing ahead of schedule, with cost synergies already bearing fruit and deleveraging underway, resulting in management raising full-year guidance.
| | | | | |
| | Top Contributors to Performance | | Top Detractors from Performance | |
| | Year-to-Date Through 6/30/23 (%)1 | | Year-to-Date Through 6/30/23 (%)2 | |
| | Odontoprev | 1.01 | | Restore | -0.75 | |
| | Open Text | 0.69 | | BML | -0.57 | |
| | Alimak Group | 0.65 | | Learning Technologies Group | -0.48 | |
| | SimCorp | 0.54 | | Norva24 Group | -0.43 | |
| | Marlowe | 0.54 | | NICE Information Service | -0.42 | |
| | 1 Includes dividends | | | 2 Net of dividends | | |
| | | | | | | |
Restore, the Fund’s biggest detractor, is a UK-based support services company, with roughly 70% of group operating profit coming from its Records Management segment, which provides storage and retrieval solutions to around 6,000 clients. Restore’s share price came under pressure in mid-May when it released a trading statement that showed 4% revenue growth year over year while also reducing full-year 2023 profit before tax guidance, primarily as a result of weakness in its office IT recycling business. In mid-June, the company’s CFO announced his intention to step down. Despite these headwinds, we remain confident in Restore’s long-term prospects. BML is Japan’s leading diagnostics testing service provider, with a diversified ‘B2B’ customer-base of 30,000 clinics and 1,000 hospitals. BML’s share price fell due to negative short-term earnings growth momentum associated with the phase-out of COVID-related testing revenues as well as cost inflation in testing consumables. We believe these pressures are transitory. With net cash equal to roughly 80% of its market capitalization, BML trades at what we think is a very attractive valuation. We also believe that this discount will narrow over time as earnings momentum recovers.
The Fund’s relative disadvantage versus the MSCI ACWI ex USA Small Cap came from stock selection. Stock picks in Industrials, Communication Services, and Health Care hurt most. In addition, each of the Fund’s five biggest detractors hampered both absolute and relative results. Conversely, our much lower exposure to Real Estate, stock selection in Financials, and lack of exposure to Energy were all additive relative to the benchmark.
CURRENT POSITIONING AND OUTLOOK
In 2023’s second quarter, we observed what we think was a meaningful operational stress test for many of our holdings. Companies across various regions and industries have been experiencing more cautious customer demand in the face of an uncertain macroeconomic climate, while inflation continues to be a persistent issue in many market segments. While near-term growth expectations may have slowed, we have found that our companies have solidly passed this operational stress test. Their customers remain loyal while their balance sheets are robust, they continue to create shareholder value, and our conviction in their ability to create value over the long run is unchanged. Many less steadfast market participants, however, have penalized businesses for even just a small miss on growth or margin expectations. This volatility offered us a window of opportunity to deploy cash at an accelerated rate during the quarter by building positions in existing holdings that are out-of-favor and by initiating four new positions. Economic uncertainty may well linger for the next several quarters, with share prices possibly behaving erratically as a result. But we are as optimistic about the future of our strategy as ever and believe we are well-positioned to capitalize on the inevitable dislocations between value creation and valuation. By investing in businesses with above-average returns trading at reasonable valuations, we believe the Fund should also achieve above-average performance over time.
12 | The Royce Funds 2023 Semiannual Report to Shareholders
| PERFORMANCE AND PORTFOLIO REVIEW (UNAUDITED) | TICKER SYMBOLS RYIPX RIPNX RIPIX |
Performance and Expenses
Average Annual Total Return (%) Through 6/30/23
| | JAN-JUN 20231 | 1-YR | 3-YR | 5-YR | 10-YR | SINCE INCEPTION (12/31/10) |
| RIP | 4.45 | 4.16 | 0.18 | 2.38 | 6.17 | 5.51 |
| Annual Gross Operating Expenses: 1.59% Annual Net Operating Expenses: 1.44% |
| 1 Not annualized | | |
Relative Returns: Monthly Rolling Average Annual Return Periods
Since Inception Through 6/30/23
On a monthly rolling basis, The Fund outperformed the MSCI ACWI x USA SC in 100% of all 10-year periods; 99% of all 5-year periods; and 60% of all 1-year periods.
| | PERIODS BEATING THE INDEX | | FUND AVG (%) 1 | INDEX AVG (%) 1 |
| 10-year | 31/31 | 100% | 8.4 | 6.6 |
| 5-year | 90/91 | 99% | 8.7 | 5.8 |
| 1-year | 83/139 | 60% | 7.2 | 6.0 |
1Average of monthly rolling average annual total returns over the specified periods.
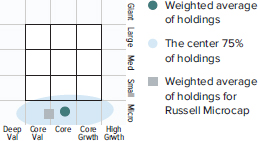
Morningstar Style Map™ As of 6/30/23

The Morningstar Style Map is the Morningstar Style Box™ with the center 75% of fund holdings plotted as the Morningstar Ownership Zone™. The Morningstar Style Box is designed to reveal a fund’s investment strategy. The Morningstar Ownership Zone provides detail about a portfolio’s investment style by showing the range of stock sizes and styles. The Ownership Zone is derived by plotting each stock in the portfolio within the proprietary Morningstar Style Box. Over time, the shape and location of a fund’s ownership zone may vary. See page 89 for additional information.
Value of $10,000
Invested on 12/31/10 as of 6/30/23 ($)
Top 10 Positions
% of Net Assets
| Hansen Technologies | 3.3 |
| IPH | 2.8 |
| TKC Corporation | 2.8 |
| Restore | 2.6 |
| BML | 2.5 |
| Marlowe | 2.3 |
| Intertek Group | 2.2 |
| Loomis | 2.1 |
| Odontoprev | 2.1 |
| Riken Keiki | 2.1 |
Portfolio Sector Breakdown
% of Net Assets
| Industrials | 39.9 |
| Information Technology | 24.4 |
| Health Care | 9.6 |
| Financials | 6.0 |
| Materials | 5.0 |
| Communication Services | 3.5 |
| Consumer Discretionary | 2.7 |
| Real Estate | 0.5 |
| Preferred Stock | 1.8 |
| Cash and Cash Equivalents | 6.6 |
Upside/Downside Capture Ratios
Periods Ended 6/30/23 (%)
| | UPSIDE | DOWNSIDE |
| 10-Year | 99 | 95 |
| Fund’s First Full Quarter (12/31/10) | 99 | 90 |
| Calendar Year Total Returns (%) | |
| YEAR | RIP |
| 2022 | -27.2 |
| 2021 | 5.8 |
| 2020 | 15.7 |
| 2019 | 34.2 |
| 2018 | -12.8 |
| 2017 | 39.8 |
| 2016 | -1.1 |
| 2015 | 16.2 |
| 2014 | -8.2 |
| 2013 | 18.3 |
| 2012 | 23.4 |
| 2011 | -16.8 |
| Portfolio Country Breakdown 1,2 | |
| % of Net Assets | |
| | |
| Japan | 23.9 |
| United Kingdom | 20.9 |
| Sweden | 6.6 |
| Australia | 6.2 |
| Switzerland | 5.0 |
| Germany | 5.0 |
| Canada | 4.4 |
| Brazil | 3.6 |
| Italy | 3.5 |
¹ Represents countries that are 3% or more of net assets.
² Securities are categorized by the country of their headquarters.
Portfolio Diagnostics
| Fund Net Assets | $815 million |
| Number of Holdings | 59 |
| Turnover Rate | 18% |
| Average Market Capitalization 1 | $1,562 million |
| Weighted Average P/E Ratio 2,3 | 21.5x |
| Weighted Average P/B Ratio 2 | 2.4x |
| Active Share 4 | 99% |
| 1 | Geometric Average. This weighted calculation uses each portfolio holding’s market cap in a way designed to not skew the effect of very large or small holdings; instead, it aims to better identify the portfolio’s center, which Royce believes offers a more accurate measure of average market cap than a simple mean or median. |
| 2 | Harmonic Average. This weighted calculation evaluates a portfolio as if it were a single stock and measures it overall. It compares the total market value of the portfolio to the portfolio’s share in the earnings or book value, as the case may be, of its underlying stocks. |
| 3 | The Fund’s P/E Ratio calculation excludes companies with zero or negative earnings (6% of portfolio holdings as of 6/30/23). |
| 4 | Active Share is the sum of the absolute values of the different weightings of each holding in the Fund versus each holding in the benchmark, divided by two. |
Important Performance and Expense Information
All performance information in this Report reflects past performance, is presented on a total return basis, reflects the reinvestment of distributions, and does not reflect the deduction of taxes that a shareholder would pay on Fund distributions or the redemption of Fund shares. Past performance is no guarantee of future results. Investment return and principal value of an investment will fluctuate, so that shares may be worth more or less than their original cost when redeemed. Shares redeemed within 30 days of purchase may be subject to a 2% redemption fee payable to the Fund, which is not reflected in the performance shown above; if it were, performance would be lower. Current month-end performance may be higher or lower than performance quoted and may be obtained at www.royceinvest.com. All performance and risk information reflects results of the Service Class (its oldest class). Price and total return information is based on net asset values for shareholder transactions. Certain immaterial adjustments were made to the net assets of Royce International Premier Fund at 12/31/19 and 12/31/20 for financial reporting purposes, and as a result the calendar year total returns based on those net asset values differ from the adjusted net asset values and calendar year total returns reported in the Financial Highlights. Annual gross operating expenses reflect the total gross operating expenses for the Fund’s Service Class and include management fees, 12b-1 distribution and/or service fees, and other expenses. Annual net operating expenses reflect contractual fee waivers and/or expense reimbursements. All expense information is reported as of the Fund’s most current prospectus. Royce & Associates has contractually agreed to waive its fees and/or reimburse operating expenses to the extent necessary to maintain the Fund’s annual net operating expenses, (excluding brokerage commissions, taxes, interest, litigation expenses, acquired fund fees and expenses, and other expenses not borne in the ordinary course of business), at or below 1.44% through April 30, 2024. Regarding the “Top Contributors” and “Top Detractors” tables shown above, the sum of all contributors to, and all detractors from, performance for all securities in the portfolio would approximate the Fund’s year-to-date performance for 2023. Upside Capture Ratio measures a manager’s performance in up markets relative to the Fund’s primary benchmark. It is calculated by measuring the Fund’s performance in quarters when the primary benchmark went up and dividing it by such benchmark’s return in those quarters. Downside Capture Ratio measures a manager’s performance in down markets relative to the Fund’s primary benchmark. It is calculated by measuring the Fund’s performance in quarters when the primary benchmark goes down and dividing it by such benchmark’s return in those quarters.
The Royce Funds 2023 Semiannual Report to Shareholders | 13
MANAGERS’ DISCUSSION (UNAUDITED)
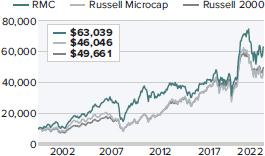
Royce Micro-Cap Fund (RMC)

Jim Stoeffel, Brendan Hartman
FUND PERFORMANCE
Royce Micro-Cap Fund beat its primary benchmark, the Russell Microcap Index, and its secondary benchmark, the Russell 2000 Index, for the 1-, 3-, and 5-year periods ended 6/30/23. The Fund also outperformed the Russell 2000 for the 25-, 30-year, and since inception (12/31/91) periods ended 6/30/23 (data for the Russell Microcap only goes back to 2000). For the year-to-date period ended 6/30/23, the Fund advanced 9.4%, outpacing both the Russell Microcap, which was up 2.3%, and the Russell 2000, which gained 8.1%, for the same period.
WHAT WORKED… AND WHAT DIDN’T
Seven of the Fund’s 10 equity sectors made a positive contribution to performance in the first half of 2023, led by Information Technology, Industrials, and Health Care. Financials and Communications Services detracted while Real Estate made the smallest contribution. The top-contributing industries were semiconductors & semiconductor equipment (Information Technology), machinery (Industrials), and electronic equipment, instruments & components (Information Technology), while banks (Financials), specialty retail (Consumer Discretionary), and professional services (Industrials) were the biggest detractors.
The Fund’s two top contributing positions in 2023’s first half are benefiting from the growing significance of silicon carbide semiconductors in electric vehicles. While we have been selling shares of each, we continue to hold solid positions because we believe this is a secular trend in its early stages. Axcelis Technologies makes and services ion implantation, dry strip, thermal processing, and curing equipment used in semiconductor chip fabrication. Axcelis is a predominant player in providing ion implantation systems for the semiconductor industry, which is becoming increasingly important as power management devices become critical in numerous industries. Aehr Test Systems has unique semiconductor testing systems that address processes where the cost of chip failure is especially high. Arlo Technologies provides home security cameras and related security monitoring services. For the past year or so, Arlo has been transforming its business from a legacy, low margin hardware focus to a subscription model with recurring revenues and high margins. We believe the stock hit an inflection point in this transition during the second quarter of 2023 when the superior economics of the subscription model and its impact on growth and margins became evident to investors.
| | | | | |
| | Top Contributors to Performance | | Top Detractors from Performance | |
| | Year-to-Date Through 6/30/23 (%)1 | | Year-to-Date Through 6/30/23 (%)2 | |
| | Axcelis Technologies | 1.16 | | Cutera | -0.65 | |
| | Aehr Test Systems | 0.94 | | Investar Holding Corporation | -0.61 | |
| | Arlo Technologies | 0.80 | | DZS | -0.60 | |
| | CIRCOR International | 0.80 | | Western New England Bancorp | -0.55 | |
| | Universal Stainless & Alloy Products | 0.79 | | Territorial Bancorp | -0.53 | |
| | 1 Includes dividends | | | 2 Net of dividends | | |
| | | | | | | |
The top detractor was aesthetic medical device maker, Cutera, which suffered through an earnings guidance cut as its core business slowed. An ensuing boardroom battle resulted in the firing of the well regarded CEO and Chair, creating more uncertainty. This individual has since rejoined the company as an advisor while the Board looks for a permanent CEO. We held shares as we believe there is significant asset value in the business that, once stabilized by new management, should make it an appealing part of a larger company. Regional bank Investar Holding Corporation was hurt by the recent banking crisis and concerns about increased credit losses in a slowing economy. However, we think these risks are outweighed by its longer-term prospects in a growing economy. DZS manufactures communications network equipment that helps deliver high speed fiber access. DZS lowered earnings guidance and was also in non-compliance with loan covenants that it is working with lenders to renegotiate while also dealing with a revenue recognition issue that DZS described as a one-off discovered during the collection process. We held a small position at the end of June.
Relative to the Russell Microcap, both sector allocation and stock selection were additive to Fund performance. The combination of our larger weighting and stock picks in Information Technology and Industrials helped most, along with our lower exposure to Financials. Offsetting our relative edge somewhat were lower exposure to Health Care, stock selection and our higher weight in Communication Services, and stock picks in Consumer Discretionary.
CURRENT POSITIONING AND OUTLOOK
While Artificial Intelligence (“AI”) has seen ample hype, we see it as one more secular trend that is driving demand for semiconductors and processing bandwidth. This plays into our portfolio positioning as select smaller technology names are providing critical components in this value chain. We view our technology companies as “picks and shovel” providers into a myriad of long-term technology trends while many of our industrial companies appear to possess similar characteristics. We also expect many industrial companies to benefit from the increasing use of AI to drive efficiencies in their operations. More significantly, however, we believe many of these large macro trends require substantial infrastructure investments and have underlying government support, one example being the shift to green energy, which requires significant investments in electrical transmission capabilities. While we are excited about our positioning in the intermediate term, we are also cognizant of short-term market pressures, most notably the unprecedented pace of Fed rate hikes. Although inflationary pressures have meaningfully moderated, the Fed remains in a hawkish mode. These pressures are likely to be exacerbated by commercial banks tightening lending standards. Likewise, the attempted coup in Russia highlighted the ever present black swan risks that are hard to underwrite. That said, we believe the intermediate-term opportunities outweigh the short-term risks, and our outlook remains constructive.
14 | The Royce Funds 2023 Semiannual Report to Shareholders
| PERFORMANCE AND PORTFOLIO REVIEW (UNAUDITED) | TICKER SYMBOLS RYOTX RMCFX RYMCX |
Performance and Expenses
Average Annual Total Return (%) Through 6/30/23
| | JAN-JUN 20231 | 1-YR | 3-YR | 5-YR | 10-YR | 15-YR | 20-YR | 25-YR | 30-YR | SINCE INCEPTION (12/31/91) |
| RMC | 9.41 | 17.63 | 16.07 | 6.71 | 6.53 | 5.91 | 8.15 | 8.28 | 9.58 | 10.33 |
| Annual Operating Expenses: 1.24% | | | | |
| 1 Not annualized | | | | | | | |
Morningstar Style Map™ As of 6/30/23
The Morningstar Style Map is the Morningstar Style Box™ with the center 75% of fund holdings plotted as the Morningstar Ownership Zone™. The Morningstar Style Box is designed to reveal a fund’s investment strategy. The Morningstar Ownership Zone provides detail about a portfolio’s investment style by showing the range of stock sizes and styles. The Ownership Zone is derived by plotting each stock in the portfolio within the proprietary Morningstar Style Box. Over time, the shape and location of a fund’s ownership zone may vary. See page 89 for additional information.
Value of $10,000
Invested on 6/30/00 (Russell Microcap Index Inception) as of 6/30/23 ($)
Top 10 Positions
% of Net Assets
| Photronics | 1.5 |
| Universal Stainless & Alloy Products | 1.4 |
| Newpark Resources | 1.4 |
| Modine Manufacturing | 1.4 |
| Distribution Solutions Group | 1.3 |
| Axcelis Technologies | 1.3 |
| Aehr Test Systems | 1.2 |
| Quanex Building Products | 1.2 |
| Cohu | 1.2 |
| PDF Solutions | 1.2 |
Portfolio Sector Breakdown
% of Net Assets
| Information Technology | 27.8 |
| Industrials | 25.1 |
| Consumer Discretionary | 12.5 |
| Financials | 11.5 |
| Health Care | 8.1 |
| Materials | 5.0 |
| Communication Services | 4.1 |
| Energy | 3.0 |
| Real Estate | 0.6 |
| Cash and Cash Equivalents | 2.3 |
| Calendar Year Total Returns (%) |
| YEAR | RMC |
| 2022 | -22.6 |
| 2021 | 31.0 |
| 2020 | 24.5 |
| 2019 | 21.2 |
| 2018 | -8.9 |
| 2017 | 5.4 |
| 2016 | 19.7 |
| 2015 | -13.3 |
| 2014 | -4.1 |
| 2013 | 21.3 |
| 2012 | 8.0 |
| 2011 | -12.1 |
| 2010 | 30.1 |
| 2009 | 55.7 |
| 2008 | -40.9 |
| Upside/Downside Capture Ratios |
| Periods Ended 6/30/23 (%) | | |
| | UPSIDE | DOWNSIDE |
| 10-Year | 87 | 86 |
| From 6/30/00 (Russell Microcap Index Inception) | 93 | 82 |
| Portfolio Diagnostics | |
| Fund Net Assets | $305 million |
| Number of Holdings | 125 |
| Turnover Rate | 9% |
| Average Market Capitalization 1 | $547 million |
| Weighted Average P/B Ratio 2 | 1.7x |
| Active Share 3 | 90% |
| U.S. Investments (% of Net Assets) | 87.0% |
| Non-U.S. Investments (% of Net Assets) | 10.7% |
| 1 | Geometric Average. This weighted calculation uses each portfolio holding’s market cap in a way designed to not skew the effect of very large or small holdings; instead, it aims to better identify the portfolio’s center, which Royce believes offers a more accurate measure of average market cap than a simple mean or median. |
| 2 | Harmonic Average. This weighted calculation evaluates a portfolio as if it were a single stock and measures it overall. It compares the total market value of the portfolio to the portfolio’s share in the earnings or book value, as the case may be, of its underlying stocks. |
| 3 | Active Share is the sum of the absolute values of the different weightings of each holding in the Fund versus each holding in the benchmark, divided by two. |
Important Performance and Expense Information
All performance information in this Report reflects past performance, is presented on a total return basis, reflects the reinvestment of distributions, and does not reflect the deduction of taxes that a shareholder would pay on Fund distributions or the redemption of Fund shares. Past performance is no guarantee of future results. Investment return and principal value of an investment will fluctuate, so that shares may be worth more or less than their original cost when redeemed. Shares redeemed within 30 days of purchase may be subject to a 1% redemption fee payable to the Fund, which is not reflected in the performance shown above; if it were, performance would be lower. Current month-end performance may be higher or lower than performance quoted and may be obtained at www.royceinvest.com. All performance and risk information reflects results of the Investment Class (its oldest class). Price and total return information is based on net asset values calculated for shareholder transactions. Annual operating expenses reflect the total gross operating expenses for the Fund’s Investment Class as of the Fund’s most current prospectus and include management fees and other expenses. Regarding the “Top Contributors” and “Top Detractors” tables shown above, the sum of all contributors to, and all detractors from, performance for all securities in the portfolio would approximate the Fund’s year-to-date performance for 2023. Upside Capture Ratio measures a manager’s performance in up markets relative to the Fund’s primary benchmark. It is calculated by measuring the Fund’s performance in quarters when the primary benchmark went up and dividing it by such benchmark’s return in those quarters. Downside Capture Ratio measures a manager’s performance in down markets relative to the Fund’s primary benchmark. It is calculated by measuring the Fund’s performance in quarters when the primary benchmark goes down and dividing it by such benchmark’s return in those quarters.
The Royce Funds 2023 Semiannual Report to Shareholders | 15
MANAGERS’ DISCUSSION (UNAUDITED)
Royce Pennsylvania Mutual Fund® (PMF)

Steven McBoyle, Jay Kaplan, CFA®, Chuck Royce, Miles Lewis, CFA®, Andrew Palen, Lauren Romeo, CFA®
FUND PERFORMANCE
Royce Pennsylvania Mutual Fund beat its small-cap benchmark, the Russell 2000 Index, for the 1-, 3-, 5-, 10-, 15-, 20-, 25-, 30-, 35-, and 40-year periods ended 6/30/23. The Fund’s average annual total return for the 50 years through the end of June was 12.9%. The Fund also gained 15.4% for the year-to-date period ended 6/30/23, well ahead of the Russell 2000, which was up 8.1% for the same period.
WHAT WORKED… AND WHAT DIDN’T
Nine of the Fund’s 10 equity sectors contributed to 2023’s first-half results, led by Industrials, Information Technology, and Consumer Discretionary. Communication Services detracted while Energy and Health Care contributed least. The top-contributing industries were semiconductors & semiconductor equipment (Information Technology), followed by machinery and building products (both in Industrials). Interactive media & services (Communication Services) detracted most, followed by biotechnology and pharmaceuticals (both in Health Care).
The top-contributing position in 2023’s first half was First Citizens BancShares, which the Fund has owned for many years due mostly to its strong liquidity position and stellar deposit franchise. Its valuation looked attractive to us in late 2022, when we began adding shares that were trading at roughly 5x earnings per share. More recently, First Citizens was chosen by the FDIC to acquire Silicon Valley Bank, most likely owing to its long history of buying failed banks. Silicon Valley’s travails notwithstanding, the purchase was accretive to First Citizens’ tangible book value and earnings, and helped spur a sharp rise in its stock. Builders FirstSource manufactures building products for professional homebuilders. It has been helped by its merger with BMC Stock Holdings, which expanded both its value-added product footprint in fast growing markets and share gains in key product categories. Preformed Line Products makes products for overhead or underground networks for the energy, telecom, and cable industries. Increased activity in these markets, notably the U.S. transmission and distribution market, has driven increased demand, record backlogs, and increased investor interest, which helped the company report record quarterly financial results in March and May.
| | | | | |
| | Top Contributors to Performance | | Top Detractors from Performance | |
| | Year-to-Date Through 6/30/23 (%)1 | | Year-to-Date Through 6/30/23 (%)2 | |
| | First Citizens BancShares Cl A | 1.50 | | Independent Bank Group | -0.20 | |
| | Builders FirstSource | 0.95 | | Pason Systems | -0.19 | |
| | Preformed Line Products | 0.68 | | FARO Technologies | -0.19 | |
| | Arcosa | 0.59 | | Lindsay Corporation | -0.18 | |
| | Onto Innovation | 0.55 | | Forrester Research | -0.16 | |
| | 1 Includes dividends | | | 2 Net of dividends | | |
| | | | | | | |
The Fund’s top detractor was Texas-based Independent Bank Group. The shares of most regional banks declined due to the failure of Silicon Valley and Signature Banks. However, our conviction for Independent Bank remains strong because we believe the strength of its local relationships will not be replaced outside the regional banking system. Pason Systems has a dominant market share in Electronic Drilling Recorders, a network of sensors, software, and displays that are integrated into the workflow on oil rigs and are low-cost, mission critical features for drillers. Although Pason reported strong financial results in March and May, its shares were caught up in the broad downturn for energy stocks. FARO Technologies is a global leader in 3D measuring equipment and software for industrial and construction applications. Early in 2023, FARO announced a costly convertible debt offering and additional restructuring actions to bolster liquidity and help with the cost of two acquisitions. In 2Q23 the stock plunged again when the CEO announced his plan to retire on July 1. He had been the architect of FARO’s plan to move toward a more software and subscription-driven model, which was proving more complex and time-consuming than initially thought. Unsure of its subsequent direction, we reduced our stake in June.
Both stock selection and sector allocation drove the Fund’s outperformance relative to the benchmark in 2023’s first half. Stock selection in Financials, stock picks and a much higher weighting in Industrials, and greater exposure to the resurgent Information Technology sector contributed most to relative results. Conversely, stock picks hurt in Health Care and Communication Services.
CURRENT POSITIONING AND OUTLOOK
We see an array of potential triggers that could possibly jumpstart small-cap performance in the coming months. First, a soft landing looks more and more likely to us, and a recession—specifically the kind of deep and potentially lengthy contraction many have been anticipating since late 2021—looks less likely. We have already seen promising developments that seem to suggest a nascently robust economy: durable goods orders rose for the fourth consecutive month in June—and hit a record high for nondefense capital goods (excluding aircraft or core capital goods, a proxy for business equipment investment)—while homebuilding rose by 21.7% in May, a record monthly surge that also defied expectations for a slowdown. Importantly, in our view, is the ongoing sense of cautious optimism we have been hearing from many management teams—which was reflected by generally solid earnings for many holdings for the second quarter. Amid the difficulties of bear markets and periods of economic uncertainty, we think it’s crucial to remind investors of the opportunity to build their small-cap allocation at attractively low prices. History shows that investors who had the necessary patience and discipline to stay invested during periods of sluggish or negative performance have been rewarded. We continue to see the currently unsettled period as an opportune time to invest in select small-caps for the long run.
16 | The Royce Funds 2023 Semiannual Report to Shareholders
| PERFORMANCE AND PORTFOLIO REVIEW (UNAUDITED) | TICKER SYMBOLS PENNX RYPFX RPMIX RYPCX |
Performance and Expenses
Average Annual Total Return (%) Through 6/30/23
| | JAN-JUN 20231 | 1-YR | 3-YR | 5-YR | 10-YR | 15-YR | 20-YR | 25-YR | 30-YR | 35-YR | 50-YR |
| PMF | 15.37 | 21.50 | 15.51 | 7.58 | 9.09 | 8.47 | 9.69 | 9.33 | 10.11 | 10.23 | 12.89 |
Annual Operating Expenses: 0.96%
1 Not annualized
Morningstar Style Map™ As of 6/30/23

The Morningstar Style Map is the Morningstar Style Box™ with the center 75% of fund holdings plotted as the Morningstar Ownership Zone™. The Morningstar Style Box is designed to reveal a fund’s investment strategy. The Morningstar Ownership Zone provides detail about a portfolio’s investment style by showing the range of stock sizes and styles. The Ownership Zone is derived by plotting each stock in the portfolio within the proprietary Morningstar Style Box. Over time, the shape and location of a fund’s ownership zone may vary. See page 89 for additional information.
Value of $10,000
Invested on 12/29/78 (Russell 2000 Inception) as of 6/30/23 ($)

Top 10 Positions
% of Net Assets
| First Citizens BancShares Cl. A | 2.3 |
| Arcosa | 1.8 |
| Haemonetics Corporation | 1.5 |
| Builders FirstSource | 1.5 |
| Air Lease Cl. A | 1.4 |
| Lincoln Electric Holdings | 1.2 |
| Element Solutions | 1.2 |
| SEI Investments | 1.2 |
| Kadant | 1.1 |
| Ziff Davis | 1.1 |
Portfolio Sector Breakdown
% of Net Assets
| Industrials | 31.6 |
| Financials | 16.9 |
| Information Technology | 16.5 |
| Consumer Discretionary | 10.3 |
| Materials | 7.7 |
| Health Care | 6.1 |
| Energy | 2.6 |
| Real Estate | 2.3 |
| Communication Services | 1.9 |
| Consumer Staples | 1.1 |
| Cash and Cash Equivalents | 3.0 |
| Calendar Year Total Returns (%) |
| YEAR | PMF |
| 2022 | -17.1 |
| 2021 | 22.0 |
| 2020 | 14.1 |
| 2019 | 26.6 |
| 2018 | -9.7 |
| 2017 | 16.2 |
| 2016 | 26.5 |
| 2015 | -11.4 |
| 2014 | -0.7 |
| 2013 | 35.3 |
| 2012 | 14.6 |
| 2011 | -4.2 |
| 2010 | 23.9 |
| 2009 | 36.3 |
| 2008 | -34.8 |
Upside/Downside Capture Ratios
Periods Ended 6/30/23 (%)
| | UPSIDE | DOWNSIDE |
| 10-Year | 97 | 89 |
From 12/31/78
(Russell 2000 Inception) | 91 | 75 |
| Portfolio Diagnostics | |
| Fund Net Assets | $1,742 million |
| Number of Holdings | 297 |
| Turnover Rate | 17% |
| Average Market Capitalization 1 | $3,049 million |
| Weighted Average P/E Ratio 2,3 | 12.7x |
| Weighted Average P/B Ratio 2 | 2.0x |
| Active Share 4 | 87% |
| U.S. Investments (% of Net Assets) | 84.0% |
| Non-U.S. Investments (% of Net Assets) | 13.0% |
| 1 | Geometric Average. This weighted calculation uses each portfolio holding’s market cap in a way designed to not skew the effect of very large or small holdings; instead, it aims to better identify the portfolio’s center, which Royce believes offers a more accurate measure of average market cap than a simple mean or median. |
| 2 | Harmonic Average. This weighted calculation evaluates a portfolio as if it were a single stock and measures it overall. It compares the total market value of the portfolio to the portfolio’s share in the earnings or book value, as the case may be, of its underlying stocks. |
| 3 | The Fund’s P/E Ratio calculation excludes companies with zero or negative earnings (10% of portfolio holdings as of 6/30/23). |
| 4 | Active Share is the sum of the absolute values of the different weightings of each holding in the Fund versus each holding in the benchmark, divided by two. |
Important Performance and Expense Information
All performance information in this Report reflects past performance, is presented on a total return basis, reflects the reinvestment of distributions, and does not reflect the deduction of taxes that a shareholder would pay on Fund distributions or the redemption of Fund shares. Past performance is no guarantee of future results. Investment return and principal value of an investment will fluctuate, so that shares may be worth more or less than their original cost when redeemed. Shares redeemed within 30 days of purchase may be subject to a 1% redemption fee payable to the Fund, which is not reflected in the performance shown above; if it were, performance would be lower. Current month-end performance may be higher or lower than performance quoted and may be obtained at www.royceinvest.com. All performance and risk information reflects results of the Investment Class (its oldest class). Annual operating expenses reflect the total gross operating expenses for the Fund’s Investment Class as of the Fund’s most current prospectus and include management fees, other expenses, and acquired fund fees and expenses. Acquired fund fees and expenses reflect the estimated amount of the fees and expenses incurred indirectly by the Fund through its investments in mutual funds and other investment companies. Regarding the “Top Contributors” and “Top Detractors” tables shown above, the sum of all contributors to, and all detractors from, performance for all securities in the portfolio would approximate the Fund’s year-to-date performance for 2023. Upside Capture Ratio measures a manager’s performance in up markets relative to the Fund’s primary benchmark. It is calculated by measuring the Fund’s performance in quarters when the primary benchmark went up and dividing it by such benchmark’s return in those quarters. Downside Capture Ratio measures a manager’s performance in down markets relative to the Fund’s primary benchmark. It is calculated by measuring the Fund’s performance in quarters when the primary benchmark goes down and dividing it by such benchmark’s return in those quarters.
The Royce Funds 2023 Semiannual Report to Shareholders | 17
MANAGERS’ DISCUSSION (UNAUDITED)
Royce Premier Fund (RPR)

Andrew Palen, Lauren Romeo, CFA®, Chuck Royce, Steven McBoyle
FUND PERFORMANCE
Royce Premier Fund outperformed its small-cap benchmark, the Russell 2000 Index, for the 1-, 3-, 5-, 10-, 20-, 25-, 30-year, and since inception (12/31/91) periods ended 6/30/23. The Fund also decisively beat its benchmark for the year-to-date period ended 6/30/23, increasing 14.3% versus a gain of 8.1% for the Russell 2000.
WHAT WORKED… AND WHAT DIDN’T
Eight of the Fund’s nine equity sectors made positive contributions to performance in 2023’s first half, led by Industrials, Information Technology, and Materials. Communication Services was the lone detractor while Health Care and Financials made the smallest contributions.
Stella-Jones was the portfolio’s top contributor at the position level in 2023’s first half. The company dominates the railway tie and wood utility pole markets and has a growing residential treated lumber business. Stella-Jones has benefited from strong lumber prices and healthy home repair/remodel activity, while demand for its rail ties remains largely recession-resistant as some percentage of the installed base is replaced annually as part of railroad track maintenance. Finally, it is seeing a dramatic upswing in utility pole demand, its largest segment, as broadband network expansion, renewable energy, and electric vehicle adoption are secular drivers of electricity usage and the need for utilities to harden their grids. Welding and cutting products manufacturer Lincoln Electric Holdings has enjoyed vibrant demand in its core business, including its fast-growing welding automation business, which is seeing demand from continued investment in robotics. Arcosa is a leading provider of construction aggregates in the southwestern U.S. Its Engineered Structures segment has been seeing robust demand for its utility support and telecom structures as customers invest in electricity grid hardening and ongoing 5G telecom network expansion. Arcosa’s wind tower business is seeing orders surge after new legislation passed that should keep a key production tax credit in place for 10 years, improving wind project economics amid strong demand for renewable energy sources.
The Fund’s top detractor in 2023’s first half was Lindsay Corporation, which provides center pivot irrigation systems for commercial agriculture. Lindsay’s stock retreated as corn and wheat prices came off highs and farm income is forecasted to decline from peak levels. The company also faces difficult year-over-year comparisons later this year because several severe storms in 2022 drove higher pivot-replacement demand. Internationally, Lindsay has faced irrigation order delays in the high growth Brazilian market due to a political transition that pushed out implementation of a government financing program for agricultural products growers. Forrester Research is a technology research firm whose clients use its proprietary reports, real-time survey data, and consulting services to analyze the technology trends impacting their businesses and determine the strategies and IT investments needed to stay competitive or harness those technologies to their advantage. Its shares began to slip in 2022’s second half after it failed to meet sales targets due to economic uncertainty, inflation, recession worries, and a slowdown in technology. Valmont Industries manufactures fabricated metal products, metal and concrete pole and tower structures, and mechanized irrigation systems. Following a strong performance in 2022, its stock fell through most of the first half, hurt by declines in farm income and rising capital environment costs.
| | | | | |
| | Top Contributors to Performance | | Top Detractors from Performance | |
| | Year-to-Date Through 6/30/23 (%)1 | | Year-to-Date Through 6/30/23 (%)2 | |
| | Stella-Jones | 1.21 | | Lindsay Corporation | -0.69 | |
| | Lincoln Electric Holdings | 1.05 | | Forrester Research | -0.42 | |
| | Arcosa | 0.99 | | Valmont Industries | -0.36 | |
| | Inter Parfums | 0.97 | | Ziff Davis | -0.24 | |
| | National Instruments | 0.87 | | Morningstar | -0.19 | |
| | 1 Includes dividends | | | 2 Net of dividends | | |
| | | | | | | |
The portfolio’s advantage over its benchmark was primarily attributable to sector allocation in 2023’s first half. Financials, Materials and Consumer Staples made the most significant positive impact versus the benchmark while Communication Services and Health Care were the only detractors from relative results.
CURRENT POSITIONING AND OUTLOOK
The outlook remains cloudy with further rate increases designed to curb falling but persistent inflation, continued recession fears, and a banking crisis still memorable to most investors. Cloudy outlooks, however, tend to provide opportunities for the Fund’s all-weather approach given our investments in durable business models that, in our view, have strong histories of persistent high returns on invested capital, consistent free cash flow generation, and strong balance sheets. While the debate rages on about when the most predicted recession in our history will begin, evidence of decelerating inflation and Fed commentary on the prospect of a more measured pace of rate increases appeared to shift sentiment toward the view that any recession is likely to be mild. Accordingly in June, consistent with the market being a discounting mechanism, investors appeared to take steps to position for an eventual recovery. Given the Fund’s focus on bottom-up stock selection (as opposed to macro-led portfolio construction), our only forecast is that whatever economic environment prevails in the second half of 2023, we believe that the high-quality business models the Fund owns should continue to compound shareholder value. We also anticipate that, as this market cycle progresses, investors will increasingly focus on business fundamentals and valuations. We expect our companies to perform well during this period by leveraging their competitive advantages to pursue strategies such as gaining market share, expanding geographically, and/or consolidating via acquisitions during this uncertain time, as they have done in previous periods of uncertainty.
18 | The Royce Funds 2023 Semiannual Report to Shareholders
| PERFORMANCE AND PORTFOLIO REVIEW (UNAUDITED) | TICKER SYMBOLS RYPRX RPFFX RPFIX RPRCX |
Performance and Expenses
Average Annual Total Return (%) Through 6/30/23
| | JAN-JUN 20231 | 1-YR | 3-YR | 5-YR | 10-YR | 15-YR | 20-YR | 25-YR | 30-YR | SINCE INCEPTION (12/31/91) |
| RPR | 14.31 | 19.60 | 13.07 | 7.99 | 9.27 | 8.41 | 10.62 | 10.11 | 10.93 | 11.19 |
| Annual Operating Expenses: 1.18% | | | | |
| 1 Not annualized | | | | | | | |
Relative Returns: Monthly Rolling Average Annual Return Periods
25 Years Through 6/30/23
On a monthly rolling basis, The Fund outperformed the Russell 2000 in 67% of all 10-year periods; 68% of all 5-year periods; and 63% of all 1-year periods.
| | PERIODS BEATING THE INDEX | | FUND AVG (%)1 | INDEX AVG (%)1 |
| 10-year | 121/181 | | | 67% | 10.1 | 8.3 |
| 5-year | 164/241 | | | 68% | 10.8 | 8.7 |
| 1-year | 182/289 | | | 63% | 11.8 | 9.9 |
1Average of monthly rolling average annual total returns over the specified periods.
Morningstar Style Map™ As of 6/30/23
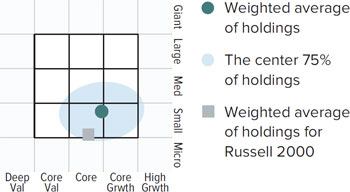
The Morningstar Style Map is the Morningstar Style Box™ with the center 75% of fund holdings plotted as the Morningstar Ownership Zone™. The Morningstar Style Box is designed to reveal a fund’s investment strategy. The Morningstar Ownership Zone provides detail about a portfolio’s investment style by showing the range of stock sizes and styles. The Ownership Zone is derived by plotting each stock in the portfolio within the proprietary Morningstar Style Box. Over time, the shape and location of a fund’s ownership zone may vary. See page 89 for additional information.
Value of $10,000
Invested on 12/31/91 as of 6/30/23 ($)

Top 10 Positions
% of Net Assets
| Stella-Jones | 3.4 |
| Lincoln Electric Holdings | 3.3 |
| Reliance Steel & Aluminum | 3.0 |
| Arcosa | 2.9 |
| MKS Instruments | 2.8 |
| Innospec | 2.7 |
| Kennedy-Wilson Holdings | 2.7 |
| SEI Investments | 2.7 |
| FirstService Corporation | 2.6 |
| Quaker Houghton | 2.6 |
Portfolio Sector Breakdown
% of Net Assets
| Industrials | 34.8 |
| Information Technology | 14.2 |
| Materials | 11.8 |
| Consumer Discretionary | 10.0 |
| Financials | 8.5 |
| Real Estate | 7.6 |
| Health Care | 5.3 |
| Consumer Staples | 1.7 |
| Communication Services | 1.7 |
| Cash and Cash Equivalents | 4.4 |
| Calendar Year Total Returns (%) |
| YEAR | RPR |
| 2022 | -15.5 |
| 2021 | 16.4 |
| 2020 | 11.5 |
| 2019 | 34.1 |
| 2018 | -10.4 |
| 2017 | 23.8 |
| 2016 | 23.0 |
| 2015 | -9.9 |
| 2014 | -0.9 |
| 2013 | 27.7 |
| 2012 | 11.4 |
| 2011 | -0.9 |
| 2010 | 26.5 |
| 2009 | 33.3 |
| 2008 | -28.3 |
| Upside/Downside Capture Ratios |
| Periods Ended 6/30/23 (%) | | |
| | UPSIDE | DOWNSIDE |
| 10-Year | 94 | 83 |
| From 12/31/91 (Start of Fund’s First Full Quarter) | 94 | 75 |
| Portfolio Diagnostics | |
| Fund Net Assets | $1,383 million |
| Number of Holdings | 50 |
| Turnover Rate | 5% |
| Average Market Capitalization 1 | $4,838 million |
| Weighted Average P/E Ratio 2,3 | 23.5x |
| Weighted Average P/B Ratio 2 | 2.8x |
| Active Share 4 | 98% |
| U.S. Investments (% of Net Assets) | 84.1% |
| Non-U.S. Investments (% of Net Assets) | 11.5% |
| 1 | Geometric Average. This weighted calculation uses each portfolio holding’s market cap in a way designed to not skew the effect of very large or small holdings; instead, it aims to better identify the portfolio’s center, which Royce believes offers a more accurate measure of average market cap than a simple mean or median. |
| 2 | Harmonic Average. This weighted calculation evaluates a portfolio as if it were a single stock and measures it overall. It compares the total market value of the portfolio to the portfolio’s share in the earnings or book value, as the case may be, of its underlying stocks. |
| 3 | The Fund’s P/E Ratio calculation excludes companies with zero or negative earnings (7% of portfolio holdings as of 6/30/23). |
| 4 | Active Share is the sum of the absolute values of the different weightings of each holding in the Fund versus each holding in the benchmark, divided by two. |
Important Performance and Expense Information
All performance information in this Report reflects past performance, is presented on a total return basis, reflects the reinvestment of distributions, and does not reflect the deduction of taxes that a shareholder would pay on Fund distributions or the redemption of Fund shares. Past performance is no guarantee of future results. Investment return and principal value of an investment will fluctuate, so that shares may be worth more or less than their original cost when redeemed. Shares redeemed within 30 days of purchase may be subject to a 1% redemption fee payable to the Fund, which is not reflected in the performance shown above; if it were, performance would be lower. Current month-end performance may be higher or lower than performance quoted and may be obtained at www.royceinvest.com. All performance and risk information reflects results of the Investment Class (its oldest class). Annual operating expenses reflect the total gross operating expenses for the Fund’s Investment Class as of the Fund’s most current prospectus and include management fees and other expenses. Regarding the “Top Contributors” and “Top Detractors” tables shown above, the sum of all contributors to, and all detractors from, performance for all securities in the portfolio would approximate the Fund’s year-to-date performance for 2023. Upside Capture Ratio measures a manager’s performance in up markets relative to the Fund’s primary benchmark. It is calculated by measuring the Fund’s performance in quarters when the primary benchmark went up and dividing it by such benchmark’s return in those quarters. Downside Capture Ratio measures a manager’s performance in down markets relative to the Fund’s primary benchmark. It is calculated by measuring the Fund’s performance in quarters when the primary benchmark goes down and dividing it by such benchmark’s return in those quarters.
The Royce Funds 2023 Semiannual Report to Shareholders | 19
MANAGERS’ DISCUSSION (UNAUDITED)
Royce Small-Cap Opportunity Fund (ROF)

Jim Harvey, CFA®, Kavitha Venkatraman, Jim Stoeffel, Brendan Hartman
FUND PERFORMANCE
Royce Small-Cap Opportunity Fund beat both its primary benchmark, the Russell 2000 Value Index, and its secondary benchmark, the Russell 2000 Index, for the 1-, 3-, 5-, 10-, 15-, 20-, 25-year, and since inception (11/19/96) periods ended 6/30/23. The Fund also decisively outperformed both indexes for the year-to-date period ended 6/30/23, up 13.2% versus respective gains of 2.5% and 8.1% for the Russell 2000 Value and Russell 2000.
WHAT WORKED… AND WHAT DIDN’T
Nine of the Fund’s 10 equity sectors contributed to 2023’s first-half results, with Industrials, Consumer Discretionary, and Information Technology leading. Energy was the only sector that detracted while Communication Services and Real Estate made the smallest contributions. At the industry level, two areas in Information Technology—semiconductors & semiconductor equipment and electronic equipment, instruments & components—contributed most, along with construction & engineering (Industrials). Communications equipment (Information Technology), interactive media & services (Communication Services), and energy equipment & services (Energy) were the biggest detractors.
The Fund’s top contributor at the position level in 2023’s first half was commercial contractor Limbach Holdings, which has been moving from acting as a general contractor to having more direct relationships with its customers, resulting in higher gross margins for each contract. This has become a larger portion of Limbach’s business, one that allows the company to be more selective about pricing, which has been recognized by other investors. Modine Manufacturing provides heat transfer systems that provide benefits across numerous end markets such as electric vehicles and data center applications. In the midst of a multi-year business transformation that has focused on driving higher returns and growth across its end markets, Modine was our largest holding at the end of June because we believe its business improvements are in the early stages and its valuation still looked attractive to us.
The top detractor in 2023’s first half was DZS, which manufactures communications network equipment that helps deliver high speed fiber access. DZS lowered earnings guidance and was in noncompliance with loan covenants that are being renegotiated while also dealing with a revenue recognition issue. We held a small position at the end of June. QuinStreet is a digital performance marketing company with broad diversification across financial services verticals, but with a strong presence in the auto insurance industry—which has been challenged by underlying inflation pressures as higher costs have led to higher claims losses while pricing is subject to the inherent inertia associated with governmental insurance agencies. However, we expect this negative environment to reverse in the intermediate term and added slightly to our position in 2023’s first half.
| | | | | |
| | Top Contributors to Performance | | Top Detractors from Performance | |
| | Year-to-Date Through 6/30/23 (%)1 | | Year-to-Date Through 6/30/23 (%)2 | |
| | Limbach Holdings | 0.56 | | DZS | -0.54 | |
| | Modine Manufacturing | 0.50 | | QuinStreet | -0.33 | |
| | Arlo Technologies | 0.46 | | Victoria’s Secret & Co. | -0.29 | |
| | Astronics Corporation | 0.44 | | Mammoth Energy Services | -0.28 | |
| | CIRCOR International | 0.42 | | EverQuote Cl A | -0.28 | |
| | 1 Includes dividends | | | 2 Net of dividends | | |
| | | | | | | |
Sector allocation decisions primarily drove the Fund’s outperformance versus the Russell 2000 Value in 2023’s first half. Our meaningfully lower exposure to Financials and much higher weighting in Industrials contributed most to relative results, along with stock selection in Health Care. Conversely, stock picks hurt in Energy, while both our higher weighting and stock selection detracted in Communication Services, as did our substantially lower exposure to Real Estate.
CURRENT POSITIONING AND OUTLOOK
We believe we have not yet seen the full impact of the Fed’s rate hikes. Moreover, as the attempted coup in Russia showed, the world remains subject to potential black swan events. That said, we believe the Fed is closer to the end of this rate cycle as inflation continues to moderate. While employment is another lagging indicator, the trends also remain relatively constructive. In this context, we have a positive outlook for small-cap value stocks, which we believe remain attractively valued relative to the rest of the market. We also see several trends that we think should favor our domestically focused portfolio. For example, the portfolio remained overweight in both Industrials and Information Technology at the end of June. While there’s been considerable hype around Artificial Intelligence (“AI”), we see it as one more long-term trend driving widespread semiconductor adoption. Many of our technology positions look well positioned to benefit from the infrastructure build-out that’s necessary to support AI. We’ve also been adding to positions in advertising technology companies, which are using AI directly to gain market share as media spending moves from TV to more digitally oriented media consumption. We also anticipate that AI will help certain industrial positions as these companies harness this technology to drive operating efficiency gains. In addition, we believe many industrial companies should benefit from the ongoing re-shoring of industrial production closer to or in the U.S., a shift that should be further boosted by fiscal spending on infrastructure. Finally, we have been looking at select financial companies outside banking that, to us, appear poised to benefit as interest rates stabilize and capital markets activity resumes, as well as at telecommunications equipment companies where we feel the backdrop remains favorable even as many stocks have been hit hard.
20 | The Royce Funds 2023 Semiannual Report to Shareholders
| PERFORMANCE AND PORTFOLIO REVIEW (UNAUDITED) | TICKER SYMBOLS RYPNX RYOFX ROFIX ROFCX ROFRX |
Performance and Expenses
Average Annual Total Return (%) Through 6/30/23
| | | | | | | | | SINCE INCEPTION |
| | JAN-JUN 20231 | 1-YR | 3-YR | 5-YR | 10-YR | 15-YR | 20-YR | 25-YR | (11/19/96) |
| ROF | 13.16 | 20.42 | 23.76 | 8.91 | 10.14 | 10.39 | 10.83 | 11.32 | 11.91 |
| Annual Operating Expenses: 1.23% | | | | | | |
| 1 Not annualized | | | | | | |
Relative Returns: Monthly Rolling Average Annual Return Periods
25 Years Through 6/30/23
On a monthly rolling basis, The Fund outperformed the Russell 2000 Value in 99% of all 10-year periods; 76% of all 5-year periods; and 55% of all 1-year periods.
| | PERIODS BEATING THE INDEX | | FUND AVG (%)1 | INDEX AVG (%)1 |
| 10-year | 180/181 | | 99% | 9.9 | 8.2 |
| 5-year | 184/241 | | 76% | 11.1 | 9.0 |
| 1-year | 159/289 | | | 55% | 15.4 | 10.5 |
1Average of monthly rolling average annual total returns over the specified periods.
Morningstar Style Map™ As of 6/30/23

The Morningstar Style Map is the Morningstar Style Box™ with the center 75% of fund holdings plotted as the Morningstar Ownership Zone™. The Morningstar Style Box is designed to reveal a fund’s investment strategy. The Morningstar Ownership Zone provides detail about a portfolio’s investment style by showing the range of stock sizes and styles. The Ownership Zone is derived by plotting each stock in the portfolio within the proprietary Morningstar Style Box. Over time, the shape and location of a fund’s ownership zone may vary. See page 89 for additional information.
Value of $10,000
Invested on 11/19/96 as of 6/30/23 ($)
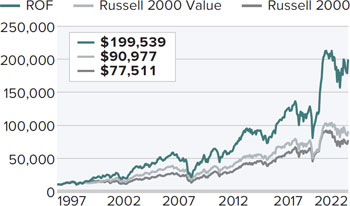
Top 10 Positions
% of Net Assets
| Modine Manufacturing | 0.9 |
| Commercial Vehicle Group | 0.8 |
| Astronics Corporation | 0.8 |
| Ichor Holdings | 0.7 |
| Ultra Clean Holdings | 0.7 |
| Carpenter Technology | 0.7 |
| Veeco Instruments | 0.7 |
| Herc Holdings | 0.7 |
| Advanced Energy Industries | 0.7 |
| Cohu | 0.7 |
Portfolio Sector Breakdown
% of Net Assets
| Industrials | 30.5 |
| Information Technology | 19.5 |
| Consumer Discretionary | 14.3 |
| Materials | 8.0 |
| Health Care | 5.9 |
| Energy | 5.9 |
| Communication Services | 5.6 |
| Financials | 5.4 |
| Consumer Staples | 1.1 |
| Real Estate | 0.1 |
| Cash and Cash Equivalents | 3.7 |
| Calendar Year Total Returns (%) |
| YEAR | ROF |
| 2022 | -17.1 |
| 2021 | 30.8 |
| 2020 | 26.5 |
| 2019 | 28.2 |
| 2018 | -20.0 |
| 2017 | 21.9 |
| 2016 | 29.9 |
| 2015 | -13.6 |
| 2014 | -0.5 |
| 2013 | 43.5 |
| 2012 | 22.6 |
| 2011 | -13.0 |
| 2010 | 33.8 |
| 2009 | 62.1 |
| 2008 | -45.7 |
| Upside/Downside Capture Ratios |
| Periods Ended 6/30/23 (%) | | |
| | UPSIDE | DOWNSIDE |
| 10-Year | 120 | 108 |
| From 12/31/96 (Start of Fund’s First Full Quarter) | 126 | 116 |
| Portfolio Diagnostics | |
| Fund Net Assets | $1,292 million |
| Number of Holdings | 251 |
| Turnover Rate | 17% |
| Average Market Capitalization 1 | $1,156 million |
| Weighted Average P/B Ratio 2 | 1.6x |
| Weighted Average P/S Ratio 3 | 0.8x |
| Active Share 4 | 87% |
| U.S. Investments (% of Net Assets) | 90.9% |
| Non-U.S. Investments (% of Net Assets) | 5.4% |
| 1 | Geometric Average. This weighted calculation uses each portfolio holding’s market cap in a way designed to not skew the effect of very large or small holdings; instead, it aims to better identify the portfolio’s center, which Royce believes offers a more accurate measure of average market cap than a simple mean or median. |
| 2 | Harmonic Average. This weighted calculation evaluates a portfolio as if it were a single stock and measures it overall. It compares the total market value of the portfolio to the portfolio’s share in the earnings or book value, as the case may be, of its underlying stocks. |
| 3 | Price to Sales is calculated by dividing the company’s market cap by the revenue in the most recent year. |
| 4 | Active Share is the sum of the absolute values of the different weightings of each holding in the Fund versus each holding in the benchmark, divided by two. |
Important Performance and Expense Information
All performance information in this Report reflects past performance, is presented on a total return basis, reflects the reinvestment of distributions, and does not reflect the deduction of taxes that a shareholder would pay on Fund distributions or the redemption of Fund shares. Past performance is no guarantee of future results. Investment return and principal value of an investment will fluctuate, so that shares may be worth more or less than their original cost when redeemed. Shares redeemed within 30 days of purchase may be subject to a 1% redemption fee payable to the Fund, which is not reflected in the performance shown above; if it were, performance would be lower. Current month-end performance may be higher or lower than performance quoted and may be obtained at www.royceinvest.com. All performance and risk information reflects results of the Investment Class (its oldest class). Annual operating expenses reflect the total gross operating expenses for the Fund’s Investment Class as of the Fund’s most current prospectus and include management fees and other expenses. Regarding the “Top Contributors” and “Top Detractors” tables shown above, the sum of all contributors to, and all detractors from, performance for all securities in the portfolio would approximate the Fund’s year-to-date performance for 2023. Upside Capture Ratio measures a manager’s performance in up markets relative to the Fund’s primary benchmark. It is calculated by measuring the Fund’s performance in quarters when the primary benchmark went up and dividing it by such benchmark’s return in those quarters. Downside Capture Ratio measures a manager’s performance in down markets relative to the Fund’s primary benchmark. It is calculated by measuring the Fund’s performance in quarters when the primary benchmark goes down and dividing it by such benchmark’s return in those quarters.
The Royce Funds 2023 Semiannual Report to Shareholders | 21
MANAGERS’ DISCUSSION (UNAUDITED)
Royce Small-Cap Special Equity Fund (RSE)

Charlie Dreifus, CFA®, Steven McBoyle
FUND PERFORMANCE
Royce Small-Cap Special Equity Fund beat both its primary benchmark, the Russell 2000 Value Index, and its secondary benchmark, the Russell 2000 Index, for the 1-, 5-, 15-, 25-year, and since inception (5/1/98) periods ended 6/30/23. The Fund also decidedly outperformed the Russell 2000 Value for the year-to-date period ended 6/30/23, up 7.9% versus 2.5%.
WHAT WORKED… AND WHAT DIDN’T
Led by Industrials, Information Technology, and Materials, the Fund had four of its eight equity sectors make positive contributions to performance in 2023’s first half. The biggest detractors were Communication Services, Consumer Discretionary, and Real Estate. At the industry level, the largest contributions came from electrical equipment (Industrials), food products (Consumer Staples), and semiconductors & semiconductor equipment (Information Technology), while consumer staples distribution & retail (Consumer Staples), media (Communication Services), and broadline retail (Consumer Discretionary) detracted most.
The Fund’s top contributor at the position level was John B. Sanfilippo & Son, which processes and distributes nut products. The company posted excellent results in the first half, introduced promising products to the market, and appears to be more focused on investor communications to raise awareness of its attributes. Vishay Intertechnology manufactures a broad line of active and passive electronic components. Its shares increased on better-than-anticipated results reported in early May alongside an overall boost for many semiconductor stocks. Its shares may also have risen in part due to Vishay’s diverse product base in light of escalating U.S./China tensions in the semiconductor supply chain. NVE Corporation specializes in magnetically sensitive materials with integrated circuits such as sensors and isolators. Its shares spiked in early May after the company reported record revenue and earnings in the quarter, aided by the tech rally that spanned much of 2023’s first half. Encore Wire manufactures electrical building wire. Its stock rose significantly following strong results announced in February. It regained momentum more recently on improved sentiment supporting building products. United States Lime & Minerals, a supplier of lime and limestone, saw its shares rally in the latter half of the second quarter on optimism around favorable macro data points and improving construction end markets. Each of these companies was also a top portfolio contributor relative to the Russell 2000 Value.
| | | | | |
| | Top Contributors to Performance | | Top Detractors from Performance | |
| | Year-to-Date Through 6/30/23 (%)1 | | Year-to-Date Through 6/30/23 (%)2 | |
| | John B. Sanfilippo & Son | 1.97 | | Ingles Markets Cl. A | -1.08 | |
| | Vishay Intertechnology | 1.81 | | TEGNA | -0.94 | |
| | NVE Corporation | 1.76 | | Macy’s | -0.62 | |
| | Encore Wire | 1.66 | | Movado Group | -0.46 | |
| | United States Lime & Minerals | 1.22 | | Sylvamo Corporation | -0.36 | |
| | 1 Includes dividends | | | 2 Net of dividends | | |
| | | | | | | |
The top detractor at the position level was Ingles Markets, a regional grocery in the Southeastern U.S. whose stock declined following quarterly results reported in early May, which showed stagnating revenue growth and deteriorating margins due to cost inflation and raw material shortages. The acquisition of television broadcasting company, TEGNA, by Standard General was effectively blocked by the FCC at the end of February, removing the stock’s acquisition premium. Omnichannel retailer Macy’s saw its shares pressured throughout 2023’s first half by concerns over consumer spending levels and peer’s earnings reports in the second quarter that did not inspire confidence in consumer demand. Shares of Movado Group, which makes watches and jewelry, fell following worse-than-expected results in mid-March and have remained under pressure amid worries surrounding U.S. consumers. Sylvamo Corporation manufactures bulk paper and pulp products. Its shares moved lower as demand slackened while capacity permanently exited the industry following a post-Covid spike in demand and pricing. All five of these stocks were among the Fund’s top detractors relative to the Russell 2000 Value.
The Fund’s advantage over the Russell 2000 Value was attributable to sector allocation decisions in the first half of 2023. Our much lower exposure to Financials—including no exposure to underperforming banks—did most to boost relative performance. The Fund’s higher weighting, as well as a smaller advantage from stock selection, was additive in Industrials, while both stock picks and a higher weighting helped in Information Technology. Conversely, stock selection detracted in Consumer Discretionary, Communication Services, and Real Estate.
CURRENT POSITIONING AND OUTLOOK
The rally off the lows reached in the fall of 2022 seemed unsupported by fundamentals. It was therefore not a big surprise to us that most of 2023’s first-half advance was caused by only a few stocks. Related to this is our observation that the equity markets are much more optimistic than the Fed regarding the pace and degree of inflation falling. In our estimation, the markets have priced in a near impossibility of inflation meeting the Fed’s 2% target soon. One market pundit described this error pithily by saying that investors are still anticipating “an immaculate disinflation.” Too many equity prices appear to have left much of the market with no margin of safety, a characteristic we insist be present in our own holdings and new purchases. We believe that this insistence has served our clients well over the years. Our better down market results, for example, have typically been rooted in this insistence on absolute, as opposed to relative, valuations. We are prepared to use the cash in the portfolio when we can purchase securities on these terms, a strategy that we think has worked well in the past.
22 | The Royce Funds 2023 Semiannual Report to Shareholders
| PERFORMANCE AND PORTFOLIO REVIEW (UNAUDITED) | TICKER SYMBOLS RYSEX RSEFX RSEIX RSQCX |
Performance and Expenses
Average Annual Total Return (%) Through 6/30/23
| | JAN-JUN 20231 | 1-YR | 3-YR | 5-YR | 10-YR | 15-YR | 20-YR | 25-YR | SINCE INCEPTION (5/1/98) |
| RSE | 7.85 | 15.89 | 13.89 | 6.25 | 6.98 | 8.52 | 8.40 | 8.71 | 8.60 |
Annual Operating Expenses: 1.21%
1 Not annualized
Relative Risk Adjusted Returns: Monthly Rolling Sharpe Ratios
20 Years Through 6/30/23
On a monthly rolling risk-adjusted basis, the Fund outperformed the Russell 2000 Value in 74% of all 10-year periods and 65% of all 5-year periods.
| | PERIODS BEATING THE INDEX | | FUND AVG1 | INDEX AVG1 |
| 10-year | 89/121 | | | 74% | 0.55 | 0.48 |
| 5-year | 117/181 | | | 65% | 0.49 | 0.43 |
1Average of monthly rolling Sharpe Ratios over the specified periods.
Morningstar Style Map™ As of 6/30/23

The Morningstar Style Map is the Morningstar Style Box™ with the center 75% of fund holdings plotted as the Morningstar Ownership Zone™. The Morningstar Style Box is designed to reveal a fund’s investment strategy. The Morningstar Ownership Zone provides detail about a portfolio’s investment style by showing the range of stock sizes and styles. The Ownership Zone is derived by plotting each stock in the portfolio within the proprietary Morningstar Style Box. Over time, the shape and location of a fund’s ownership zone may vary. See page 89 for additional information.
Value of $10,000
Invested on 5/1/98 as of 6/30/23 ($)

Top 10 Positions
% of Net Assets
| Encore Wire | 6.4 |
| Vishay Intertechnology | 5.8 |
| Ingles Markets Cl. A | 5.8 |
| John B. Sanfilippo & Son | 4.5 |
| NVE Corporation | 4.0 |
| Standard Motor Products | 4.0 |
| TEGNA | 3.9 |
| Marcus & Millichap | 3.6 |
| Movado Group | 3.3 |
| United States Lime & Minerals | 3.3 |
Portfolio Sector Breakdown
% of Net Assets
| Industrials | 24.6 |
| Consumer Discretionary | 13.9 |
| Consumer Staples | 10.5 |
| Information Technology | 9.8 |
| Materials | 9.0 |
| Financials | 5.0 |
| Communication Services | 3.9 |
| Real Estate | 3.6 |
| Energy | 0.8 |
| Cash and Cash Equivalents | 18.9 |
| Calendar Year Total Returns (%) |
| YEAR | RSE |
| 2022 | -6.3 |
| 2021 | 22.5 |
| 2020 | 7.4 |
| 2019 | 12.6 |
| 2018 | -9.9 |
| 2017 | 7.9 |
| 2016 | 32.2 |
| 2015 | -12.4 |
| 2014 | 1.1 |
| 2013 | 29.4 |
| 2012 | 15.4 |
| 2011 | 0.1 |
| 2010 | 19.6 |
| 2009 | 28.4 |
| 2008 | -19.6 |
Upside/Downside Capture Ratios
Periods Ended 6/30/23 (%)
| | UPSIDE | DOWNSIDE |
| 10-Year | 79 | 70 |
From 6/30/98 (Start of
Fund’s First Full Quarter | 81 | 65 |
| Portfolio Diagnostics | |
| Fund Net Assets | $805 million |
| Number of Holdings | 32 |
| Turnover Rate | 9% |
| Average Market Capitalization 1 | $1,563 million |
| Weighted Average P/E Ratio 2,3 | 9.2x |
| Weighted Average P/B Ratio 2 | 1.7x |
| Active Share 4 | 98% |
| U.S. Investments (% of Net Assets) | 81.1% |
| Non-U.S. Investments (% of Net Assets) | 0.0% |
| 1 | Geometric Average. This weighted calculation uses each portfolio holding’s market cap in a way designed to not skew the effect of very large or small holdings; instead, it aims to better identify the portfolio’s center, which Royce believes offers a more accurate measure of average market cap than a simple mean or median. |
| 2 | Harmonic Average. This weighted calculation evaluates a portfolio as if it were a single stock and measures it overall. It compares the total market value of the portfolio to the portfolio’s share in the earnings or book value, as the case may be, of its underlying stocks. |
| 3 | The Fund’s P/E Ratio calculation excludes companies with zero or negative earnings (0% of portfolio holdings as of 6/30/23). |
| 4 | Active Share is the sum of the absolute values of the different weightings of each holding in the Fund versus each holding in the benchmark, divided by two. |
Important Performance and Expense Information
All performance information in this Report reflects past performance, is presented on a total return basis, reflects the reinvestment of distributions, and does not reflect the deduction of taxes that a shareholder would pay on Fund distributions or the redemption of Fund shares. Past performance is no guarantee of future results. Investment return and principal value of an investment will fluctuate, so that shares may be worth more or less than their original cost when redeemed. Shares redeemed within 30 days of purchase may be subject to a 1% redemption fee payable to the Fund, which is not reflected in the performance shown above; if it were, performance would be lower. Current month-end performance may be higher or lower than performance quoted and may be obtained at www.royceinvest.com. All performance and risk information reflects results of the Investment Class (its oldest class). Annual operating expenses reflect the total gross operating expenses for the Fund’s Investment Class as of the Fund’s most current prospectus and include management fees and other expenses. The Sharpe Ratio is calculated for a specified period by dividing a fund’s annualized excess returns by its annualized standard deviation. The higher the Sharpe Ratio, the better the fund’s historical risk-adjusted performance. Regarding the “Top Contributors” and “Top Detractors” tables shown above, the sum of all contributors to, and all detractors from, performance for all securities in the portfolio would approximate the Fund’s year-to-date performance for 2023. Upside Capture Ratio measures a manager’s performance in up markets relative to the Fund’s primary benchmark. It is calculated by measuring the Fund’s performance in quarters when the primary benchmark went up and dividing it by such benchmark’s return in those quarters. Downside Capture Ratio measures a manager’s performance in down markets relative to the Fund’s primary benchmark. It is calculated by measuring the Fund’s performance in quarters when the primary benchmark goes down and dividing it by such benchmark’s return in those quarters.
The Royce Funds 2023 Semiannual Report to Shareholders | 23
MANAGERS’ DISCUSSION (UNAUDITED)
Royce Small-Cap Total Return Fund (RTR)

Joe Hintz, CFA®, Chuck Royce, Miles Lewis, CFA®
FUND PERFORMANCE
Royce Small-Cap Total Return Fund gained 8.9% for the year-to-date period ended 6/30/23, beating its primary benchmark, the Russell 2000 Value Index, which was up 2.5%, and its secondary benchmark, the Russell 2000 Index, which was up 8.1% for the same period. The Fund also outperformed the Russell 2000 Value for the 1-, 5-, 10-, 15-, 20-, 25-year, and since inception (12/15/93) periods ended 6/30/23 while also beating the Russell 2000 for the 3-, 5-, 25-year, and since inception periods through the end of June.
WHAT WORKED… AND WHAT DIDN’T
Five of the portfolio’s nine equity sectors made positive impacts on 2023’s first half performance, led by Information Technology, Industrials, and Consumer Discretionary. The largest negative impacts came from Financials, Energy, and Communication Services. At the industry level, electronic equipment, instruments & components (Information Technology), software (Information Technology), and trading companies & distributors (Industrials) contributed most, while the largest detractors were banks (Financials), energy equipment & services (Energy), and interactive media & services (Communication Services).
First Citizens BancShares was the top contributor at the position level and also the winning bidder for Silicon Valley Bank, a deal that was considerably accretive to the company’s tangible book value. Silicon Valley’s travails notwithstanding, the purchase also enhanced First Citizens’ earnings, helping spur a sharp rise in its stock. We are confident in its ability to merge the acquired company given its long and successful track record of acquiring failed banks. Aircraft leasing company FTAI Aviation focuses mostly on engine leasing and aircraft engine maintenance. FTAI is competitively advantaged due to several key strategic decisions that allow it to provide engine maintenance with much faster turnaround and lower cost than its competitors. Previously, the company had been combined with another unrelated infrastructure asset, but the two businesses were separated in 2022, when the aviation business looked attractively undervalued to us. Its stock rose in 2023’s first half as its value began to be realized. Vontier Corporation has a mixture of businesses with a focus on technical equipment for gas pumps’ and convenience stores’ support infrastructure, such as the software used at the pump, in the store, and in any attached car wash systems. Its shares suffered in 2022 as investors focused on revenue declines tied to increased spending on gas pump payment terminals. As the payment terminal issue receded from investor attention, the stock responded well as Vontier’s fundamental strength became clear.
| | | | | |
| | Top Contributors to Performance | | Top Detractors from Performance | |
| | Year-to-Date Through 6/30/23 (%)1 | | Year-to-Date Through 6/30/23 (%)2 | |
| | First Citizens BancShares Cl. A | 1.65 | | Independent Bank Group | -0.94 | |
| | FTAI Aviation | 1.49 | | BankUnited | -0.55 | |
| | Vontier Corporation | 1.36 | | Pason Systems | -0.53 | |
| | Teradata Corporation | 1.06 | | Valley National Bancorp | -0.49 | |
| | Sapiens International | 0.92 | | Dril-Quip | -0.32 | |
| | 1 Includes dividends | | | 2 Net of dividends | | |
| | | | | | | |
As for the detractors, Independent Bank Group, BankUnited, and Valley National Bancorp are each located in an attractive geography with a growing economy, have solid management teams and strong credit underwriting skills, and invest in differentiated service areas. We remain confident that the integral role these banks play in the communities they serve—relationships that drive the majority of their respective businesses—will not be replaced outside the regional banking system. Pason Systems has a dominant market share in Electronic Drilling Recorders, a network of sensors, software, and displays that are integrated into the workflow on oil rigs and are low-cost, mission critical features for drillers. Although Pason reported strong financial results in March and May, its shares were caught up in the broad downturn for energy stocks.
The Fund’s relative advantage in 2023’s first half came mostly from stock selection. At the sector level, both our markedly higher weighting and stock picks boosted relative performance in Information Technology. Stock selection was also additive in Financials, as were our higher weighting and, to a lesser extent, stock selection in Industrials. Conversely, stock picks detracted from relative results in Energy, Materials, and Communication Services.
CURRENT POSITIONING AND OUTLOOK
The first half of 2023 saw continued volatility in regional bank stocks, particularly in May, and we used this volatility to establish new positions, each of which presented us with an opportunity to purchase what we see as strong franchises at or near record low valuations. From a top-down perspective, we were pleased with the ongoing fundamental strength in our holdings. Despite these strong fundamentals, however, the portfolio in aggregate continues to trade at historically low multiples. Of course, storm clouds remain visible on the horizon, and it seems probable that the economy will succumb to the impact of higher interest rates in the future. Though that may sound ominous, it excites us as owners of quality businesses, some of which also may be acquired. We hold several cash generative businesses with strong balance sheets and, most important, capital allocation prowess that we believe will enable these companies to act opportunistically in a difficult environment. These opportunities range from hiring teams of lenders amid the market disruption caused by failed banks (i.e., market share gains) to acquiring competitors and other assets at discounted valuations across a variety of industries. We believe that capital allocation skill is key to the ability to drive superior, risk-adjusted returns for our investors.
24 | The Royce Funds 2023 Semiannual Report to Shareholders
| PERFORMANCE AND PORTFOLIO REVIEW (UNAUDITED) | TICKER SYMBOLS RYTRX RYTFX RTRIX RYTCX RTRRX |
Performance and Expenses
Average Annual Total Return (%) Through 6/30/23
| | JAN-JUN 20231 | 1-YR | 3-YR | 5-YR | 10-YR | 15-YR | 20-YR | 25-YR | SINCE INCEPTION (12/15/93) |
| RTR | 8.95 | 9.42 | 14.29 | 5.81 | 7.76 | 7.73 | 8.40 | 8.37 | 9.97 |
| Annual Operating Expenses: 1.26% | | | | |
| 1 Not annualized | | | | | | | |
Relative Risk Adjusted Returns: Monthly Rolling Sharpe Ratios
20 Years Through 6/30/23
On a monthly rolling risk-adjusted basis, the Fund outperformed the Russell 2000 Value in 99% of all 10-year periods and 91% of all 5-year periods.
| | PERIODS BEATING THE INDEX | | FUND AVG1 | INDEX AVG1 |
| 10-year | 120/121 | | | 99% | 0.54 | 0.48 |
| 5-year | 165/181 | | | 91% | 0.49 | 0.43 |
1Average of monthly rolling Sharpe Ratios over the specified periods.
Morningstar Style Map™ As of 6/30/23

The Morningstar Style Map is the Morningstar Style Box™ with the center 75% of fund holdings plotted as the Morningstar Ownership Zone™. The Morningstar Style Box is designed to reveal a fund’s investment strategy. The Morningstar Ownership Zone provides detail about a portfolio’s investment style by showing the range of stock sizes and styles. The Ownership Zone is derived by plotting each stock in the portfolio within the proprietary Morningstar Style Box. Over time, the shape and location of a fund’s ownership zone may vary. See page 89 for additional information.
Value of $10,000
Invested on 12/15/93 as of 6/30/23 ($)
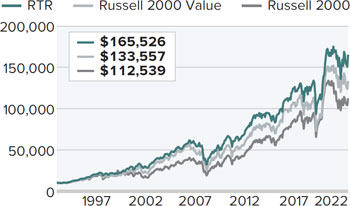
Top 10 Positions
% of Net Assets
| Vontier Corporation | 2.8 |
| International General Insurance Holdings | 2.7 |
| FTAI Aviation | 2.4 |
| Air Lease Cl. A | 2.1 |
| Teradata Corporation | 2.1 |
| Hackett Group (The) | 2.1 |
| Silgan Holdings | 2.1 |
| Kyndryl Holdings | 2.0 |
| Helen of Troy | 2.0 |
| Element Solutions | 2.0 |
Portfolio Sector Breakdown
% of Net Assets
| Financials | 36.5 |
| Industrials | 20.3 |
| Information Technology | 15.0 |
| Consumer Discretionary | 8.4 |
| Materials | 6.1 |
| Energy | 5.2 |
| Real Estate | 3.0 |
| Communication Services | 1.9 |
| Preferred Stock | 0.4 |
| Cash and Cash Equivalents | 3.2 |
| Calendar Year Total Returns (%) |
| YEAR | RTR |
| 2022 | -13.3 |
| 2021 | 25.8 |
| 2020 | 3.8 |
| 2019 | 23.5 |
| 2018 | -12.5 |
| 2017 | 13.7 |
| 2016 | 25.9 |
| 2015 | -7.2 |
| 2014 | 1.3 |
| 2013 | 32.8 |
| 2012 | 14.4 |
| 2011 | -1.7 |
| 2010 | 23.5 |
| 2009 | 26.2 |
| 2008 | -31.2 |
| Upside/Downside Capture Ratios |
| Periods Ended 6/30/23 (%) | | |
| | UPSIDE | DOWNSIDE |
| 10-Year | 90 | 82 |
| From 12/31/93 (Start of Fund’s First Full Quarter) | 87 | 72 |
| Portfolio Diagnostics | |
| Fund Net Assets | $967 million |
| Number of Holdings | 82 |
| Turnover Rate | 38% |
| Average Market Capitalization 1 | $2,214 million |
| Weighted Average P/E Ratio 2,3 | 13.6x |
| Weighted Average P/B Ratio 2 | 1.6x |
| Active Share 4 | 96% |
| U.S. Investments (% of Net Assets) | 79.2% |
| Non-U.S. Investments (% of Net Assets) | 17.6% |
| 1 | Geometric Average. This weighted calculation uses each portfolio holding’s market cap in a way designed to not skew the effect of very large or small holdings; instead, it aims to better identify the portfolio’s center, which Royce believes offers a more accurate measure of average market cap than a simple mean or median. |
| 2 | Harmonic Average. This weighted calculation evaluates a portfolio as if it were a single stock and measures it overall. It compares the total market value of the portfolio to the portfolio’s share in the earnings or book value, as the case may be, of its underlying stocks. |
| 3 | The Fund’s P/E Ratio calculation excludes companies with zero or negative earnings (12% of portfolio holdings as of 6/30/23). |
| 4 | Active Share is the sum of the absolute values of the different weightings of each holding in the Fund versus each holding in the benchmark, divided by two. |
Important Performance and Expense Information
All performance information in this Report reflects past performance, is presented on a total return basis, reflects the reinvestment of distributions, and does not reflect the deduction of taxes that a shareholder would pay on Fund distributions or the redemption of Fund shares. Past performance is no guarantee of future results. Investment return and principal value of an investment will fluctuate, so that shares may be worth more or less than their original cost when redeemed. Shares redeemed within 30 days of purchase may be subject to a 1% redemption fee payable to the Fund, which is not reflected in the performance shown above; if it were, performance would be lower. Current month-end performance may be higher or lower than performance quoted and may be obtained at www.royceinvest.com. All performance and risk information reflects results of the Investment Class (its oldest class). Annual operating expenses reflect the total gross operating expenses for the Fund’s Investment Class as of the Fund’s most current prospectus and include management fees, other expenses, and acquired fund fees and expenses. Acquired fund fees and expenses reflect the estimated amount of the fees and expenses incurred indirectly by the Fund through its investments in mutual funds and other investment companies. Regarding the “Top Contributors” and “Top Detractors” tables shown above, the sum of all contributors to, and all detractors from, performance for all securities in the portfolio would approximate the Fund’s year-to-date performance for 2023. The Sharpe Ratio is calculated for a specified period by dividing a fund’s annualized excess returns by its annualized standard deviation. The higher the Sharpe Ratio, the better the fund’s historical risk-adjusted performance. Upside Capture Ratio measures a manager’s performance in up markets relative to the Fund’s primary benchmark. It is calculated by measuring the Fund’s performance in quarters when the primary benchmark went up and dividing it by such benchmark’s return in those quarters. Downside Capture Ratio measures a manager’s performance in down markets relative to the Fund’s primary benchmark. It is calculated by measuring the Fund’s performance in quarters when the primary benchmark goes down and dividing it by such benchmark’s return in those quarters.
The Royce Funds 2023 Semiannual Report to Shareholders | 25
MANAGER’S DISCUSSION (UNAUDITED)
Royce Small-Cap Value Fund (RVV)

Jay Kaplan, CFA®
FUND PERFORMANCE
Royce Small-Cap Value Fund gained 8.4% for the year-to-date period ended 6/30/23, beating the 2.5% gain for its primary benchmark, the Russell 2000 Value Index, and the 8.1% advance for its secondary benchmark, the Russell 2000 Index, for the same period. The Fund also outperformed the Russell 2000 Value for the 1-, 3-, 5-, 20-year, and since inception (6/14/01) periods ended 6/30/23 while also beating the Russell 2000 for the 1-year, 3-year, and since inception periods through the end of June.
WHAT WORKED… AND WHAT DIDN’T
Six of the portfolio’s 10 equity sectors made a positive impact on performance in 2023’s first half. The sectors making the largest positive contributions were Information Technology, Industrials, and Consumer Discretionary while the largest negative impacts came from Financials, Health Care, and Consumer Staples. At the industry level, electronic equipment, instruments & components (Information Technology), household durables (Consumer Discretionary), and oil, gas & consumable fuels (Energy) contributed most while banks (Financials), biotechnology (Health Care), and professional services (Industrials) were the largest detractors.
The portfolio’s top contributor at the position level in 2023’s first half was Sterling Infrastructure, which provides advanced, large-scale site development services for data centers, manufacturing facilities, and e-commerce distribution centers. Sterling began to reposition itself six years ago, moving from a highly levered highway builder to its current businesses. Its first quarter 2023 earnings release highlighted double-digit revenue growth and gross margin expansion. Preformed Line Products manufactures products that support, protect, connect, and secure cables and wires for the energy, communications, cable provider, and information industries. The company passed on price increases as raw material costs climbed, which led to improved profitability, as demonstrated by its record earnings per share in 2023’s first quarter. Jabil provides digital prototyping, printed electronics, device integration, circuit designing, and volume board assembly services for the automotive, energy, and defense and aerospace industries. As outsourced manufacturing has grown more detailed and specialized, the company’s business has grown, as have profit margins.
| | | | | |
| | Top Contributors to Performance | | Top Detractors from Performance | |
| | Year-to-Date Through 6/30/23 (%)1 | | Year-to-Date Through 6/30/23 (%)2 | |
| | Sterling Infrastructure | 1.10 | | Timberland Bancorp | -0.41 | |
| | Preformed Line Products | 0.96 | | Western New England Bancorp | -0.35 | |
| | Jabil | 0.94 | | CNB Financial | -0.33 | |
| | PulteGroup | 0.85 | | SIGA Technologies | -0.30 | |
| | M/I Homes | 0.70 | | Catalyst Pharmaceuticals | -0.29 | |
| | 1 Includes dividends | | | 2 Net of dividends | | |
| | | | | | | |
The Fund’s top three detractors at the position level were banks. While the challenges faced by small-cap banks were exacerbated by the failure of Silicon Valley Bank and Signature Bank earlier this year, earnings and profits are being pressured to a greater degree, in our estimation, by the stubbornly inverted yield curve and the higher yields offered by money markets. However, credit appears to be in good shape, and we see attributes in each of these positions that should help them when the industry rebounds. Timberland Bancorp is a profitable and in our view well-managed bank based in Washington state. Western New England Bancorp has been making an effective transition from a thrift to a more commercial bank, while CNB Financial has been expanding successfully—and in an interesting and creative way by setting up local banks in small and mid-sized cities.
The Fund’s advantage over the Russell 2000 Value in 2023’s first half came from sector allocation decisions. At the sector level, much higher exposure to the resurgent Information Technology sector, a lower weighting in Financials (particularly in banks), and a bigger weighting in Consumer Discretionary did most to boost relative results while stock selection in Health Care and Real Estate, along with a much lower weighting in Materials, detracted most from performance relative to the Fund’s primary benchmark.
CURRENT POSITIONING AND OUTLOOK
The current environment is uncertain and has so far not been great for small-cap stocks relative to their large-cap peers. The second quarter saw continued strength for the Nasdaq, especially its mega-cap stocks, which helped companies in the Russell 2000 Growth Index more than those in the Russell 2000 Value Index. Both indexes, however, significantly underperformed large-cap indexes and those that are more broadly based in terms of market capitalization. This extends a trend that began earlier this year, and it’s worth noting that the Russell 2000 remained in a bear market at the end of June, down -20.8% from its most recent peak on 11/8/21. In spite of the skip in June, the Fed remains committed to raising rates until inflation comes down to its 2% target. In addition, as long as employment remains as strong as it has been over the last couple of years, we believe the Fed will stay hawkish. We saw a pronounced falloff in volumes for trucking and transportation companies as economic activity cooled in 2Q23, which strongly suggests that we are still shy of any widespread recovery for cyclicals. Therefore, we believe the bond market correctly reflects current economic conditions, while valuations within the overall equity market–including within small-cap–still appear stretched to us. In this light, portfolio positioning has not appreciably changed, though we trimmed some semiconductor capital equipment positions and bought a few bulk shipping companies, which looked inexpensive to us from a long-term perspective.
26 | The Royce Funds 2023 Semiannual Report to Shareholders
| PERFORMANCE AND PORTFOLIO REVIEW (UNAUDITED) | TICKER SYMBOLS RYVFX RVVHX |
Performance and Expenses
Average Annual Total Return (%) Through 6/30/23
| | JAN-JUN 20231 | 1-YR | 3-YR | 5-YR | 10-YR | 15-YR | 20-YR | SINCE INCEPTION (6/14/01) |
| RVV | 8.40 | 20.91 | 17.60 | 3.68 | 5.48 | 4.96 | 8.53 | 8.33 |
| Annual Gross Operating Expenses: 1.59% Annual Net Operating Expenses: 1.49% |
| 1 Not annualized | | | | | | | |
Morningstar Style Map™ As of 6/30/23
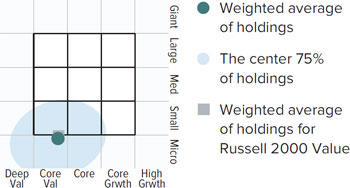
The Morningstar Style Map is the Morningstar Style Box™ with the center 75% of fund holdings plotted as the Morningstar Ownership Zone™. The Morningstar Style Box is designed to reveal a fund’s investment strategy. The Morningstar Ownership Zone provides detail about a portfolio’s investment style by showing the range of stock sizes and styles. The Ownership Zone is derived by plotting each stock in the portfolio within the proprietary Morningstar Style Box. Over time, the shape and location of a fund’s ownership zone may vary. See page 89 for additional information.
Value of $10,000
Invested on 6/14/01 as of 6/30/23 ($)

Top 10 Positions
% of Net Assets
| Vishay Intertechnology | 2.0 |
| Jabil | 2.0 |
| Sterling Infrastructure | 2.0 |
| Flex | 2.0 |
| PulteGroup | 1.9 |
| Evercore Cl. A | 1.8 |
| Kimball Electronics | 1.8 |
| Schneider National Cl. B | 1.8 |
| Bloomin’ Brands | 1.7 |
| Sanmina Corporation | 1.7 |
Portfolio Sector Breakdown
% of Net Assets
| Information Technology | 21.5 |
| Industrials | 21.0 |
| Consumer Discretionary | 19.4 |
| Financials | 13.4 |
| Energy | 9.5 |
| Health Care | 5.7 |
| Communication Services | 2.8 |
| Consumer Staples | 2.4 |
| Materials | 1.4 |
| Real Estate | 1.0 |
| Cash and Cash Equivalents | 1.9 |
| Calendar Year Total Returns (%) |
| YEAR | RVV |
| 2022 | -10.1 |
| 2021 | 28.2 |
| 2020 | -6.5 |
| 2019 | 18.2 |
| 2018 | -7.2 |
| 2017 | 5.3 |
| 2016 | 21.1 |
| 2015 | -11.5 |
| 2014 | -0.0 |
| 2013 | 27.8 |
| 2012 | 9.6 |
| 2011 | -7.4 |
| 2010 | 25.0 |
| 2009 | 44.7 |
| 2008 | -34.2 |
| Upside/Downside Capture Ratios |
| Periods Ended 6/30/23 (%) | | |
| | UPSIDE | DOWNSIDE |
| 10-Year | 86 | 93 |
| From 6/30/01 (Start of Fund’s First Full Quarter) | 96 | 91 |
| Portfolio Diagnostics | |
| Fund Net Assets | $110 million |
| Number of Holdings | 89 |
| Turnover Rate | 20% |
| Average Market Capitalization 1 | $1,425 million |
| Weighted Average P/E Ratio 2,3 | 7.9x |
| Weighted Average P/B Ratio 2 | 1.6x |
| Active Share 4 | 94% |
| U.S. Investments (% of Net Assets) | 97.9% |
| Non-U.S. Investments (% of Net Assets) | 0.2% |
| 1 | Geometric Average. This weighted calculation uses each portfolio holding’s market cap in a way designed to not skew the effect of very large or small holdings; instead, it aims to better identify the portfolio’s center, which Royce believes offers a more accurate measure of average market cap than a simple mean or median. |
| 2 | Harmonic Average. This weighted calculation evaluates a portfolio as if it were a single stock and measures it overall. It compares the total market value of the portfolio to the portfolio’s share in the earnings or book value, as the case may be, of its underlying stocks. |
| 3 | The Fund’s P/E Ratio calculation excludes companies with zero or negative earnings (3% of portfolio holdings as of 6/30/23). |
| 4 | Active Share is the sum of the absolute values of the different weightings of each holding in the Fund versus each holding in the benchmark, divided by two. |
Important Performance and Expense Information
All performance information in this Report reflects past performance, is presented on a total return basis, reflects the reinvestment of distributions, and does not reflect the deduction of taxes that a shareholder would pay on Fund distributions or the redemption of Fund shares. Past performance is no guarantee of future results. Investment return and principal value of an investment will fluctuate, so that shares may be worth more or less than their original cost when redeemed. Shares redeemed within 30 days of purchase may be subject to a 1% redemption fee payable to the Fund, which is not reflected in the performance shown above; if it were, performance would be lower. Current month-end performance may be higher or lower than performance quoted and may be obtained at www.royceinvest.com. All performance and risk information reflects results of the Service Class (its oldest class). Annual gross operating expenses reflect the total gross operating expenses for the Fund’s Service Class and include management fees, 12b-1 distribution and/or service fees, and other expenses. Annual net operating expenses reflect contractual fee waivers and/or expense reimbursements. All expense information is reported as of the Fund’s most current prospectus. Royce & Associates has contractually agreed, without right of termination, to waive fees and/or reimburse expenses to the extent necessary to maintain the Service Class’s annual net operating expenses (excluding brokerage commissions, taxes, interest, litigation expenses, acquired fund fees and expenses, and other expenses not borne in the ordinary course of business) at or below 1.49% through April 30, 2024. Regarding the “Top Contributors” and “Top Detractors” tables shown above, the sum of all contributors to, and all detractors from, performance for all securities in the portfolio would approximate the Fund’s year-to-date performance for 2023. Upside Capture Ratio measures a manager’s performance in up markets relative to the Fund’s primary benchmark. It is calculated by measuring the Fund’s performance in quarters when the primary benchmark went up and dividing it by such benchmark’s return in those quarters. Downside Capture Ratio measures a manager’s performance in down markets relative to the Fund’s primary benchmark. It is calculated by measuring the Fund’s performance in quarters when the primary benchmark goes down and dividing it by such benchmark’s return in those quarters.
The Royce Funds 2023 Semiannual Report to Shareholders | 27
MANAGER’S DISCUSSION (UNAUDITED)
Royce Smaller-Companies Growth Fund (RVP)

Chip Skinner, CFA®
FUND PERFORMANCE
Royce Smaller-Companies Growth Fund advanced 15.3% for the year-to-date period ended 6/30/23, beating both its primary benchmark, the Russell 2000 Growth Index, which was up 13.6%, and its secondary benchmark, the Russell 2000 Index, which was up 8.1% for the same period. The Fund also outperformed the Russell 2000 Growth for the 1-, 3-, 5-, 20-year, and since inception (6/14/01) periods ended 6/30/23 and outpaced the Russell 2000 for each of these periods, except the 3-year span.
WHAT WORKED… AND WHAT DIDN’T
Nine of the portfolio’s 10 equity sectors made a positive impact on 2023’s first half performance, led by Industrials, Information Technology, and Health Care. Financials made the only negative impact, while the smallest contributions came from Real Estate and Energy. At the industry level, health care equipment & supplies (Health Care), machinery (Industrials), and commercial services & supplies (Industrials) contributed most while banks (Financials), biotechnology (Health Care), and communications equipment (Information Technology) were the largest detractors.
The Fund’s top contributing position was Aehr Test Systems, a semiconductor capital equipment company that focuses on emerging and fast-growing compound semiconductor materials. Aehr’s current product addresses a rapidly growing market for silicon carbide, which is used in higher end, mission critical applications in electric vehicles, clean energy, and power semiconductors. The company is also involved in other emerging end markets for gallium nitride semiconductors and silicon photonics solutions aimed at 5-G communications and data centers. Several large, key customers wins so far in 2023 have proved the importance of its system and drove rapid revenue growth. ACV Auctions, the technology leader in digital/online wholesale used car auctions, has invested heavily over the last few years to gain a nearly national presence in the U.S., as the industry shifts from physical/live auctions to online. ACV is gaining share, though the entire industry was hit in 2022 with soaring used car prices and low transaction volumes due to the lack of new cars available (which drives trade-ins that a dealer would then need to auction). Despite this, ACV has demonstrated it can take market share and outperform its industry. We have also seen signs of improved industry conditions in the past 3-4 months.
| | | | | |
| | Top Contributors to Performance | | Top Detractors from Performance | |
| | Year-to-Date Through 6/30/23 (%)1 | | Year-to-Date Through 6/30/23 (%)2 | |
| | Aehr Test Systems | 1.91 | | ViewRay | -1.36 | |
| | ACV Auctions Cl. A | 1.55 | | Halozyme Therapeutics | -0.95 | |
| | Atlas Technical Consultants Cl. A | 1.48 | | Clearfield | -0.73 | |
| | TransMedics Group | 1.35 | | Western Alliance Bancorp | -0.58 | |
| | Distribution Solutions Group | 1.19 | | Impinj | -0.48 | |
| | 1 Includes dividends | | | 2 Net of dividends | | |
| | | | | | | |
ViewRay, the Fund’s top detractor for 2023’s first half, markets a medical system that combines real-time MRI imaging and cancer radiation treatment, resulting in superior patient outcomes, fewer treatment sessions, and fewer side effects. Unfortunately, despite improved sales results in 2022, the sales cycles lengthened recently, stretching cash flow deficits further, which led to concerns over its financial viability. ViewRay has announced it is exploring alternatives that will likely result in the business being sold. Halozyme Therapeutics has a biotechnology licensing platform that enables large pharmaceutical companies to convert IV therapeutics to subcutaneous injections via its ENHANZE technology. Following success with its lead product, revenues have fallen below expectations in 2023, as investors await new product approvals and launches. Concerns have also emerged regarding generic competition and approaching formulation technology patent expiration, which has led to valuation compression. We finished exiting our position in May.
The Fund’s advantage relative to its primary benchmark came mostly from sector allocation decisions. At the sector level, the Fund benefited most from stock selection in Industrials. Our lack of exposure to Energy and stock selection in Consumer Staples were also additive versus the Russell 2000 Growth. Conversely, stock picks detracted in Information Technology, Financials, and Health Care.
CURRENT POSITIONING AND OUTLOOK
U.S. mega-cap tech stocks continued to lead the market into the second quarter, with the Nasdaq up 32.3% for the year-to-date period ended 6/30/23. The robust performance of Nvidia—the maker of powerful graphics processing unit chips that power data centers—spurred further market excitement over the potential (and pitfalls) of Artificial Intelligence applications and contributed to the recovery in tech stocks following an abysmal 2022. The Federal Reserve continued to promise additional interest rate increases despite pausing in June, suggesting continued concerns over inflation and a tight labor market. Further signs of a potential recession, regional bank jitters, and geopolitical worries, however, were not enough to prevent the broader market’s nearly 15% return in the first half of 2023. Anticipating the market’s moves over the next 12 months is particularly difficult, especially with further delays in peak interest rates and the impact on corporate earnings that a potential recession would bring. We are still of a mind that markets will rally ahead of a Fed pause or reversal of rate hikes and that we are due for a reversion to the mean after 2022’s negative returns, but it is not certain whether a recession will occur and/or what its depth and duration will be. We believe there are positives regarding federal, state, and local infrastructure spending as well as continued innovation, despite funding risk for early stage companies. At the end of June, the Fund remained overweight in Information Technology and Health Care while being underweight in Financials, Energy, and Real Estate.
28 | The Royce Funds 2023 Semiannual Report to Shareholders
| PERFORMANCE AND PORTFOLIO REVIEW (UNAUDITED) | TICKER SYMBOLS RYVPX RVPHX |
Performance and Expenses
Average Annual Total Return (%) Through 6/30/23
| | JAN-JUN 20231 | 1-YR | 3-YR | 5-YR | 10-YR | 15-YR | 20-YR | SINCE INCEPTION (6/14/01) |
| RVP | 15.33 | 22.28 | 7.10 | 4.76 | 8.00 | 6.91 | 9.45 | 10.11 |
Annual Gross Operating Expenses: 1.55% Annual Net Operating Expenses: 1.49%
1 Not annualized
Morningstar Style Map™ As of 6/30/23
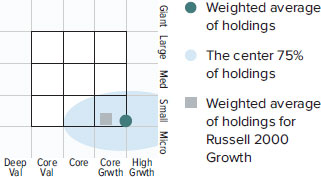
The Morningstar Style Map is the Morningstar Style Box™ with the center 75% of fund holdings plotted as the Morningstar Ownership Zone™. The Morningstar Style Box is designed to reveal a fund’s investment strategy. The Morningstar Ownership Zone provides detail about a portfolio’s investment style by showing the range of stock sizes and styles. The Ownership Zone is derived by plotting each stock in the portfolio within the proprietary Morningstar Style Box. Over time, the shape and location of a fund’s ownership zone may vary. See page 89 for additional information.
Value of $10,000
Invested on 6/14/01 as of 6/30/23 ($)

Top 10 Positions
% of Net Assets
| Distribution Solutions Group | 3.9 |
| Celsius Holdings | 3.4 |
| TransMedics Group | 3.4 |
| Alphatec Holdings | 3.2 |
| NAPCO Security Technologies | 3.0 |
| Aehr Test Systems | 2.9 |
| ACV Auctions Cl. A | 2.8 |
| Inspire Medical Systems | 2.8 |
| ATS Corporation | 2.7 |
| AMG Critical Materials | 2.5 |
Portfolio Sector Breakdown
% of Net Assets
| Health Care | 25.0 |
| Industrials | 23.8 |
| Information Technology | 23.5 |
| Consumer Discretionary | 7.4 |
| Consumer Staples | 6.4 |
| Financials | 5.5 |
| Materials | 3.9 |
| Energy | 1.7 |
| Real Estate | 0.5 |
| Cash and Cash Equivalents | 2.3 |
Calendar Year Total Returns (%)
| YEAR | RVP |
| 2022 | -32.4 |
| 2021 | 7.8 |
| 2020 | 49.3 |
| 2019 | 23.7 |
| 2018 | -10.2 |
| 2017 | 17.8 |
| 2016 | 9.4 |
| 2015 | -1.8 |
| 2014 | 3.9 |
| 2013 | 32.5 |
| 2012 | 15.3 |
| 2011 | -10.0 |
| 2010 | 19.7 |
| 2009 | 41.4 |
| 2008 | -41.1 |
Upside/Downside Capture Ratios
Periods Ended 6/30/23 (%)
| | UPSIDE | DOWNSIDE |
| 10-Year | 101 | 107 |
| From 6/30/01 (Start of | | |
| Fund’s First Full Quarter) | 106 | 92 |
Portfolio Diagnostics
| Fund Net Assets | $193 million |
| Number of Holdings | 72 |
| Turnover Rate | 31% |
| Average Market Capitalization1 | $2,258 million |
| Weighted Average P/B Ratio 2 | 3.5x |
| 3-5 Year EPS Growth (est.)3 | 22.9% |
| Active Share 4 | 94% |
| U.S. Investments (% of Net Assets) | 84.2% |
| Non-U.S. Investments (% of Net Assets) | 13.5% |
| 1 | Geometric Average. This weighted calculation uses each portfolio holding’s market cap in a way designed to not skew the effect of very large or small holdings; instead, it aims to better identify the portfolio’s center, which Royce believes offers a more accurate measure of average market cap than a simple mean or median. |
| 2 | Harmonic Average. This weighted calculation evaluates a portfolio as if it were a single stock and measures it overall. It compares the total market value of the portfolio to the portfolio’s share in the earnings or book value, as the case may be, of its underlying stocks. |
| 3 | The 3-5 Year EPS Growth (est.) is calculated as a simple weighted average of the pre-calculated mean long-term EPS growth rate estimates by brokerage analysts. Long Term Growth (LTG) is the annual EPS growth that the company can sustain over the next 3 or 5 years. Source: Factset |
| 4 | Active Share is the sum of the absolute values of the different weightings of each holding in the Fund versus each holding in the benchmark, divided by two. |
Important Performance and Expense Information
All performance information in this Report reflects past performance, is presented on a total return basis, reflects the reinvestment of distributions, and does not reflect the deduction of taxes that a shareholder would pay on Fund distributions or the redemption of Fund shares. Past performance is no guarantee of future results. Investment return and principal value of an investment will fluctuate, so that shares may be worth more or less than their original cost when redeemed. Shares redeemed within 30 days of purchase may be subject to a 1% redemption fee payable to the Fund, which is not reflected in the performance shown above; if it were, performance would be lower. Current month-end performance may be higher or lower than performance quoted and may be obtained at www.royceinvest.com. All performance and risk information reflects results of the Service Class (its oldest class). Annual gross operating expenses reflect the total gross operating expenses for the Fund’s Service Class and include management fees, 12b-1 distribution and/or service fees, and other expenses. Annual net operating expenses reflect contractual fee waivers and/or expense reimbursements. All expense information is reported as of the Fund’s most current prospectus. Royce & Associates has contractually agreed, without right of termination, to waive fees and/or reimburse expenses to the extent necessary to maintain the Service Class’s annual net operating expenses (excluding brokerage commissions, taxes, interest, litigation expenses, acquired fund fees and expenses, and other expenses not borne in the ordinary course of business) at or below 1.49% through April 30, 2024. Regarding the “Top Contributors” and “Top Detractors” tables shown above, the sum of all contributors to, and all detractors from, performance for all securities in the portfolio would approximate the Fund’s year-to-date performance for 2023. Upside Capture Ratio measures a manager’s performance in up markets relative to the Fund’s primary benchmark. It is calculated by measuring the Fund’s performance in quarters when the primary benchmark went up and dividing it by such benchmark’s return in those quarters. Downside Capture Ratio measures a manager’s performance in down markets relative to the Fund’s primary benchmark. It is calculated by measuring the Fund’s performance in quarters when the primary benchmark goes down and dividing it by such benchmark’s return in those quarters.
The Royce Funds 2023 Semiannual Report to Shareholders | 29
Schedules of Investments
Royce Dividend Value Fund
Common Stocks – 98.5%
| | | SHARES | | | VALUE |
| CONSUMER DISCRETIONARY – 4.3% | | | | | | | |
| HOTELS, RESTAURANTS & LEISURE - 0.2% | | | | | | | |
| †Travel + Leisure | | | 3,100 | | | $ | 125,054 |
| HOUSEHOLD DURABLES - 1.0% | | | | | | | |
| Vistry Group 1 | | | 77,500 | | | | 652,202 |
| SPECIALTY RETAIL - 3.1% | | | | | | | |
| Franchise Group Cl. A | | | 34,900 | | | | 999,536 |
| USS 1 | | | 56,000 | | | | 928,108 |
| | | | | | | | 1,927,644 |
| Total (Cost $2,045,340) | | | | | | | 2,704,900 |
| | | | | | | | |
| ENERGY – 1.3% | | | | | | | |
| OIL, GAS & CONSUMABLE FUELS - 1.3% | | | | | | | |
| Gaztransport Et Technigaz 1 | | | 7,800 | | | | 794,263 |
| Total (Cost $491,861) | | | | | | | 794,263 |
| | | | | | | | |
| FINANCIALS – 30.0% | | | | | | | |
| BANKS - 4.7% | | | | | | | |
| BOK Financial | | | 15,414 | | | | 1,245,143 |
| †First Citizens BancShares Cl. A | | | 1,314 | | | | 1,686,453 |
| | | | | | | | 2,931,596 |
| CAPITAL MARKETS - 22.1% | | | | | | | |
| Artisan Partners Asset Management Cl. A | | | 25,600 | | | | 1,006,336 |
| B3-Brasil, Bolsa, Balcao | | | 336,600 | | | | 1,027,051 |
| Bolsa Mexicana de Valores | | | 444,000 | | | | 922,914 |
| Carlyle Group | | | 76,020 | | | | 2,428,839 |
| Evercore Cl. A | | | 13,500 | | | | 1,668,465 |
| KKR & Co. | | | 19,138 | | | | 1,071,728 |
| Moelis & Company Cl. A | | | 19,359 | | | | 877,737 |
| SEI Investments | | | 37,900 | | | | 2,259,598 |
| Sprott | | | 45,280 | | | | 1,465,982 |
| State Street | | | 15,120 | | | | 1,106,482 |
| | | | | | | | 13,835,132 |
| FINANCIAL SERVICES - 1.6% | | | | | | | |
| †NewtekOne | | | 60,500 | | | | 961,950 |
| INSURANCE - 1.6% | | | | | | | |
| Assured Guaranty | | | 17,900 | | | | 998,820 |
| Total (Cost $11,052,906) | | | | | | | 18,727,498 |
| | | | | | | | |
| HEALTH CARE – 3.3% | | | | | | | |
| HEALTH CARE PROVIDERS & SERVICES - 0.9% | | | | | | | |
| Ensign Group (The) | | | 5,951 | | | | 568,082 |
| PHARMACEUTICALS - 2.4% | | | | | | | |
| Recordati Industria Chimica e Farmaceutica 1 | | | 24,210 | | | | 1,157,135 |
| Santen Pharmaceutical 1 | | | 41,600 | | | | 353,786 |
| | | | | | | | 1,510,921 |
| Total (Cost $626,526) | | | | | | | 2,079,003 |
| | | | | | | | |
| INDUSTRIALS – 35.6% | | | | | | | |
| AEROSPACE & DEFENSE - 4.2% | | | | | | | |
| HEICO Corporation Cl. A | | | 18,800 | | | | 2,643,280 |
| BUILDING PRODUCTS - 0.7% | | | | | | | |
| Geberit 1 | | | 800 | | | | 418,842 |
| CONSTRUCTION & ENGINEERING - 2.4% | | | | | | | |
| Comfort Systems USA | | | 8,959 | | | | 1,471,068 |
| ELECTRICAL EQUIPMENT - 3.7% | | | | | | | |
| Hubbell Incorporated | | | 7,060 | | | | 2,340,814 |
| GROUND TRANSPORTATION - 0.6% | | | | | | | |
| Werner Enterprises | | | 8,643 | | | | 381,848 |
| MACHINERY - 9.9% | | | | | | | |
| Graco | | | 25,224 | | | | 2,178,092 |
| Lincoln Electric Holdings | | | 9,020 | | | | 1,791,642 |
| Lindsay Corporation | | | 3,843 | | | | 458,624 |
| Spirax-Sarco Engineering 1 | | | 13,478 | | | | 1,775,318 |
| | | | | | | | 6,203,676 |
| MARINE TRANSPORTATION - 2.1% | | | | | | | |
| Clarkson 1 | | | 35,040 | | | | 1,317,241 |
| PROFESSIONAL SERVICES - 8.3% | | | | | | | |
| KBR | | | 42,860 | | | | 2,788,472 |
| Korn Ferry | | | 10,023 | | | | 496,539 |
| ManpowerGroup | | | 19,300 | | | | 1,532,420 |
| Robert Half International | | | 4,794 | | | | 360,605 |
| | | | | | | | 5,178,036 |
| TRADING COMPANIES & DISTRIBUTORS - 3.7% | | | | | | | |
| Applied Industrial Technologies | | | 13,642 | | | | 1,975,771 |
| †FTAI Aviation | | | 10,000 | | | | 316,600 |
| | | | | | | | 2,292,371 |
| Total (Cost $5,793,163) | | | | | | | 22,247,176 |
| INFORMATION TECHNOLOGY – 2.7% | | | | | | | |
| ELECTRONIC EQUIPMENT, INSTRUMENTS & COMPONENTS - 2.0% | | | | | | | |
| Vishay Intertechnology | | | 42,497 | | | | 1,249,412 |
| SOFTWARE - 0.7% | | | | | | | |
| SimCorp 1 | | | 4,200 | | | | 445,020 |
| Total (Cost $680,418) | | | | | | | 1,694,432 |
| MATERIALS – 19.2% | | | | | | | |
| CHEMICALS - 2.4% | | | | | | | |
| Quaker Houghton | | | 6,122 | | | | 1,193,178 |
| †Scotts Miracle-Gro Cl. A | | | 5,000 | | | | 313,450 |
| | | | | | | | 1,506,628 |
| CONTAINERS & PACKAGING - 3.8% | | | | | | | |
| AptarGroup | | | 20,396 | | | | 2,363,081 |
| METALS & MINING - 13.0% | | | | | | | |
| Franco-Nevada | | | 16,500 | | | | 2,352,900 |
| Reliance Steel & Aluminum | | | 6,228 | | | | 1,691,462 |
| Royal Gold | | | 17,500 | | | | 2,008,650 |
| Worthington Industries | | | 30,000 | | | | 2,084,100 |
| | | | | | | | 8,137,112 |
| Total (Cost $4,200,436) | | | | | | | 12,006,821 |
| | | | | | | | |
| REAL ESTATE – 2.1% | | | | | | | |
| REAL ESTATE MANAGEMENT & DEVELOPMENT - 1.7% | | | | | | | |
| Kennedy-Wilson Holdings | | | 17,000 | | | | 277,610 |
| †RMR Group (The) Cl. A | | | 32,700 | | | | 757,659 |
| | | | | | | | 1,035,269 |
| SPECIALIZED REITS - 0.4% | | | | | | | |
| †OUTFRONT Media | | | 17,900 | | | | 281,388 |
| Total (Cost $1,496,367) | | | | | | | 1,316,657 |
| TOTAL COMMON STOCKS | | | | | | | |
| (Cost $26,387,017) | | | | | | | 61,570,750 |
| 30 | The Royce Funds 2023 Semiannual Report to Shareholders | THE ACCOMPANYING NOTES ARE AN INTEGRAL PART OF THESE FINANCIAL STATEMENTS |
June 30, 2023 (unaudited)
Royce Dividend Value Fund (continued)
| | | VALUE |
| REPURCHASE AGREEMENT– 0.2% | | | |
Fixed Income Clearing Corporation, 3.00% dated 6/30/23, due 7/3/23, maturity value $109,378 (collateralized by obligations of U.S. Government Agencies, 3.75% due 5/31/30, valued at $111,554) | | | |
| (Cost $109,350) | | $ | 109,350 |
| TOTAL INVESTMENTS – 98.7% | | | |
| (Cost $26,496,367) | | | 61,680,100 |
| | | | |
| CASH AND OTHER ASSETS LESS LIABILITIES – 1.3% | | | 825,617 |
| | | | |
| NET ASSETS – 100.0% | | $ | 62,505,717 |
Royce Global Financial Services Fund
Common Stocks – 96.1%
| | | SHARES | | | VALUE |
| BANKS - 15.3% | | | | | | | |
| Bank of N.T. Butterfield & Son | | | 5,805 | | | $ | 158,825 |
| BankUnited | | | 1,000 | | | | 21,550 |
| BOK Financial | | | 9,405 | | | | 759,736 |
| Capital City Bank Group | | | 16,988 | | | | 520,512 |
| †Columbia Banking System | | | 10,366 | | | | 210,222 |
| †First Bancorp | | | 1,000 | | | | 29,750 |
| First Citizens BancShares Cl. A | | | 1,056 | | | | 1,355,323 |
| †Independent Bank Group | | | 1,000 | | | | 34,530 |
| Popular | | | 14,626 | | | | 885,166 |
| †Valley National Bancorp | | | 5,000 | | | | 38,750 |
| †Veritex Holdings | | | 1,000 | | | | 17,930 |
| Total (Cost $2,158,875) | | | | | | | 4,032,294 |
| CAPITAL MARKETS - 50.5% | | | | | | | |
| Ares Management Cl. A | | | 4,442 | | | | 427,987 |
| Artisan Partners Asset Management Cl. A | | | 7,512 | | | | 295,297 |
| B3-Brasil, Bolsa, Balcao | | | 183,000 | | | | 558,379 |
| Carlyle Group | | | 21,185 | | | | 676,861 |
| Charles Schwab | | | 10,270 | | | | 582,103 |
| Coronation Fund Managers 1,2 | | | 30,600 | | | | 53,157 |
| CRISIL 1 | | | 14,000 | | | | 665,579 |
| †Donnelley Financial Solutions 2 | | | 5,128 | | | | 233,478 |
| Egyptian Financial Group-Hermes Holding | | | | | | | |
| Company 1,2 | | | 221,749 | | | | 134,915 |
| GCM Grosvenor Cl. A | | | 21,300 | | | | 160,602 |
| Intermediate Capital Group 1 | | | 39,111 | | | | 685,389 |
| JSE 1 | | | 51,000 | | | | 247,001 |
| KKR & Co. | | | 14,508 | | | | 812,448 |
| MarketAxess Holdings | | | 1,423 | | | | 372,001 |
| MarketWise Cl. A | | | 88,300 | | | | 176,600 |
| Morningstar | | | 1,199 | | | | 235,088 |
| NZX 1 | | | 580,000 | | | | 414,155 |
| Onex Corporation | | | 11,615 | | | | 641,532 |
| †Rand Capital | | | 5,000 | | | | 65,050 |
| Raymond James Financial | | | 2,320 | | | | 240,746 |
| Rothschild & Co 1 | | | 13,900 | | | | 706,073 |
| SEI Investments | | | 9,540 | | | | 568,775 |
| Silvercrest Asset Management Group Cl. A | | | 27,612 | | | | 559,143 |
| Sprott | | | 36,450 | | | | 1,180,102 |
| StoneX Group 2 | | | 7,975 | | | | 662,563 |
| Tel Aviv Stock Exchange 1,2 | | | 232,705 | | | | 1,201,396 |
| U.S. Global Investors Cl. A | | | 165,500 | | | | 506,430 |
| Warsaw Stock Exchange 1 | | | 23,169 | | | | 216,940 |
| Total (Cost $7,974,951) | | | | | | | 13,279,790 |
| FINANCIAL SERVICES - 3.8% | | | | | | | |
| Banco Latinoamericano de Comercio | | | | | | | |
| Exterior Cl. E | | | 25,700 | | | | 566,942 |
| ECN Capital | | | 100,000 | | | | 201,548 |
| PayPal Holdings 2 | | | 3,466 | | | | 231,286 |
| Total (Cost $735,194) | | | | | | | 999,776 |
| INSURANCE - 8.5% | | | | | | | |
| Assured Guaranty | | | 7,594 | | | | 423,745 |
| Axis Capital Holdings | | | 11,554 | | | | 621,952 |
| E-L Financial | | | 1,327 | | | | 928,023 |
| James River Group Holdings | | | 13,700 | | | | 250,162 |
| Total (Cost $2,005,330) | | | | | | | 2,223,882 |
| THE ACCOMPANYING NOTES ARE AN INTEGRAL PART OF THESE FINANCIAL STATEMENTS | The Royce Funds 2023 Semiannual Report to Shareholders | 31 |
Schedules of Investments
Royce Global Financial Services Fund (continued)
| | | SHARES | | | VALUE |
| | | | | | |
| MACHINERY - 1.4% | | | | | |
| †Crane NXT | | | 6,500 | | | $ | 366,860 |
| Total (Cost $260,788) | | | | | | | 366,860 |
| METALS & MINING - 4.6% | | | | | | | |
| Franco-Nevada | | | 8,571 | | | | 1,222,225 |
| Total (Cost $373,656) | | | | | | | 1,222,225 |
| PROFESSIONAL SERVICES - 0.2% | | | | | | | |
| Quess Corp 1,2 | | | 8,900 | | | | 48,782 |
| Total (Cost $40,822) | | | | | | | 48,782 |
| REAL ESTATE MANAGEMENT & DEVELOPMENT - 9.2% | | | | | | | |
| Altus Group | | | 23,760 | | | | 787,905 |
| FirstService Corporation | | | 7,541 | | | | 1,161,992 |
| Real Matters 2 | | | 100,000 | | | | 457,445 |
| Total (Cost $1,236,206) | | | | | | | 2,407,342 |
| SOFTWARE - 1.4% | | | | | | | |
| Envestnet 2 | | | 6,000 | | | | 356,100 |
| Total (Cost $256,690) | | | | | | | 356,100 |
| TRADING COMPANIES & DISTRIBUTORS - 1.2% | | | | | | | |
| †FTAI Aviation | | | 10,000 | | | | 316,600 |
| Total (Cost $259,576) | | | | | | | 316,600 |
| TOTAL COMMON STOCKS | | | | | | | |
| (Cost $15,302,088) | | | | | | | 25,253,651 |
| DIVERSIFIED INVESTMENT COMPANIES – 2.0% | | | | | | | |
| CLOSED-END FUNDS - 1.0% | | | | | | | |
| Eagle Point Income | | | 19,341 | | | | 255,108 |
| Total (Cost $384,692) | | | | | | | 255,108 |
| FINANCIAL SERVICES - 1.0% | | | | | | | |
| †Financial Select Sector SPDR Fund | | | 8,022 | | | | 270,421 |
| Total (Cost $245,082) | | | | | | | 270,421 |
| TOTAL DIVERSIFIED INVESTMENT COMPANIES | | | | | | | |
| (Cost $629,774) | | | | | | | 525,529 |
REPURCHASE AGREEMENT– 1.4%
Fixed Income Clearing Corporation, 3.00% dated 6/30/23, due 7/3/23, maturity value
$369,733 (collateralized by obligations of U.S. Government Agencies, 4.25%
due 11/15/40, valued at $377,070)
| (Cost $369,640) | | | 369,640 |
| TOTAL INVESTMENTS – 99.5% | | | |
| (Cost $16,301,502) | | | 26,148,820 |
| CASH AND OTHER ASSETS LESS LIABILITIES – 0.5% | | | 125,790 |
| | | | |
| NET ASSETS – 100.0% | | $ | 26,274,610 |
Royce International Premier Fund
Common Stocks – 91.6%
| | | SHARES | | | VALUE |
| AUSTRALIA – 6.2% | | | | | |
| Hansen Technologies 1 | | | 7,853,561 | | | $ | 27,170,324 |
| IPH 1 | | | 4,411,524 | | | | 23,077,065 |
| Total (Cost $38,835,756) | | | | | | | 50,247,389 |
| BELGIUM – 1.7% | | | | | | | |
| †Azelis Group 1 | | | 608,100 | | | | 13,894,570 |
| Total (Cost $14,637,286) | | | | | | | 13,894,570 |
| BRAZIL – 3.6% | | | | | | | |
| Odontoprev | | | 6,481,500 | | | | 16,988,185 |
| TOTVS | | | 2,001,700 | | | | 12,533,095 |
| Total (Cost $23,700,524) | | | | | | | 29,521,280 |
| CANADA – 4.4% | | | | | | | |
| Altus Group | | | 113,700 | | | | 3,770,403 |
| Enghouse Systems | | | 680,200 | | | | 16,528,128 |
| Open Text | | | 364,200 | | | | 15,148,081 |
| Total (Cost $37,992,407) | | | | | | | 35,446,612 |
| FRANCE – 2.6% | | | | | | | |
| †Antin Infrastructure Partners 1 | | | 624,865 | | | | 10,143,881 |
| Lectra 1 | | | 374,348 | | | | 11,153,201 |
| Total (Cost $22,207,738) | | | | | | | 21,297,082 |
| GERMANY – 3.2% | | | | | | | |
| Amadeus Fire 1 | | | 56,198 | | | | 6,861,393 |
| New Work 1 | | | 102,699 | | | | 13,824,967 |
| Norma Group 1 | | | 284,200 | | | | 5,247,299 |
| Total (Cost $37,019,821) | | | | | | | 25,933,659 |
| ICELAND – 2.8% | | | | | | | |
| Marel 1 | | | 4,817,170 | | | | 15,355,528 |
| Ossur 1,2 | | | 1,498,647 | | | | 7,062,143 |
| Total (Cost $28,315,211) | | | | | | | 22,417,671 |
| ITALY – 3.5% | | | | | | | |
| Carel Industries 1 | | | 216,154 | | | | 6,518,993 |
| DiaSorin 1 | | | 111,563 | | | | 11,610,711 |
| GVS 1,2 | | | 1,709,551 | | | | 10,338,489 |
| Total (Cost $36,946,706) | | | | | | | 28,468,193 |
| JAPAN – 23.9% | | | | | | | |
| As One 1 | | | 307,600 | | | | 12,196,400 |
| Benefit One 1 | | | 743,200 | | | | 7,617,004 |
| BML 1 | | | 1,006,500 | | | | 20,282,407 |
| Fukui Computer Holdings 1 | | | 470,900 | | | | 9,151,239 |
| JCU 1 | | | 614,400 | | | | 14,633,838 |
| Maruwa 1 | | | 92,700 | | | | 14,383,999 |
| Meitec Corporation 1 | | | 767,500 | | | | 13,245,271 |
| †Miura 1 | | | 401,000 | | | | 10,484,824 |
| NSD 1 | | | 574,900 | | | | 11,571,174 |
| OBIC Business Consultants 1 | | | 431,500 | | | | 15,817,519 |
| Riken Keiki 1 | | | 417,100 | | | | 16,757,070 |
| TKC Corporation 1 | | | 836,400 | | | | 22,637,851 |
| USS 1 | | | 698,500 | | | | 11,576,489 |
| Zuken 1 | | | 543,400 | | | | 14,752,347 |
| Total (Cost $198,722,358) | | | | | | | 195,107,432 |
| NETHERLANDS – 1.5% | | | | | | | |
| IMCD 1 | | | 85,800 | | | | 12,341,422 |
| Total (Cost $6,711,934) | | | | | | | 12,341,422 |
| 32 | The Royce Funds 2023 Semiannual Report to Shareholders | THE ACCOMPANYING NOTES ARE AN INTEGRAL PART OF THESE FINANCIAL STATEMENTS |
June 30, 2023 (unaudited)
Royce International Premier Fund (continued)
| | | SHARES | | | VALUE |
| POLAND – 1.8% | | | | | |
| Asseco Poland 1 | | | 752,800 | | | $ | 14,865,566 |
| Total (Cost $14,965,287) | | | | | | | 14,865,566 |
| SINGAPORE – 1.7% | | | | | | | |
| XP Power 1 | | | 555,219 | | | | 13,908,442 |
| Total (Cost $14,836,513) | | | | | | | 13,908,442 |
| SOUTH KOREA – 2.2% | | | | | | | |
| Douzone Bizon 1 | | | 188,887 | | | | 4,463,436 |
| NICE Information Service 1 | | | 1,761,806 | | | | 13,692,963 |
| Total (Cost $43,341,691) | | | | | | | 18,156,399 |
| SWEDEN – 6.6% | | | | | | | |
| Alimak Group 1 | | | 1,466,778 | | | | 11,468,672 |
| Karnov Group 1,2 | | | 3,203,322 | | | | 14,610,892 |
| Loomis 1 | | | 599,000 | | | | 17,491,883 |
| Norva24 Group 1,2 | | | 4,458,010 | | | | 10,291,286 |
| Total (Cost $58,480,011) | | | | | | | 53,862,733 |
| SWITZERLAND – 5.0% | | | | | | | |
| dormakaba Holding 1 | | | 9,400 | | | | 4,226,236 |
| Kardex Holding 1 | | | 44,900 | | | | 10,097,529 |
| Partners Group Holding 1 | | | 10,500 | | | | 9,886,721 |
| VZ Holding 1 | | | 175,685 | | | | 16,188,849 |
| Total (Cost $25,639,148) | | | | | | | 40,399,335 |
| UNITED KINGDOM – 20.9% | | | | | | | |
| Ashmore Group 1 | | | 1,359,150 | | | | 3,593,059 |
| †Auction Technology Group 1,2 | | | 1,115,749 | | | | 10,594,425 |
| Croda International 1 | | | 167,200 | | | | 11,949,573 |
| †CVS Group 1 | | | 411,300 | | | | 10,336,700 |
| Diploma 1 | | | 356,398 | | | | 13,532,539 |
| DiscoverIE Group 1 | | | 1,453,814 | | | | 15,509,294 |
| Intertek Group 1 | | | 329,300 | | | | 17,874,432 |
| Learning Technologies Group 1 | | | 13,938,400 | | | | 14,692,424 |
| Marlowe 1,2 | | | 2,588,633 | | | | 18,413,070 |
| Mortgage Advice Bureau Holdings 1 | | | 1,153,702 | | | | 8,671,594 |
| Restore 1,3 | | | 7,118,523 | | | | 21,162,870 |
| Spirax-Sarco Engineering 1 | | | 78,500 | | | | 10,339,995 |
| Victrex 1 | | | 793,145 | | | | 14,018,231 |
| Total (Cost $181,159,810) | | | | | | | 170,688,206 |
| TOTAL COMMON STOCKS | | | | | | | |
| (Cost $783,512,201) | | | | | | | 746,555,991 |
| PREFERRED STOCK – 1.8% | | | | | | | |
| GERMANY – 1.8% | | | | | | | |
| FUCHS PETROLUB1 | | | 365,000 | | | | 14,420,803 |
| (Cost $15,166,482) | | | | | | | 14,420,803 |
REPURCHASE AGREEMENT– 6.6%
Fixed Income Clearing Corporation, 3.00% dated 6/30/23, due 7/3/23, maturity value
$54,355,861 (collateralized by obligations of U.S. Government Agencies, 4.375%
due 5/15/41, valued at $55,429,213)
| (Cost $54,342,275) | | $ | 54,342,275 |
| | | | |
| TOTAL INVESTMENTS – 100.0% | | | |
| (Cost $853,020,958) | | | 815,319,069 |
| LIABILITIES LESS CASH AND OTHER ASSETS – (0.0)% | | | (62,574) |
| | | | |
| NET ASSETS – 100.0% | | $ | 815,256,495 |
| THE ACCOMPANYING NOTES ARE AN INTEGRAL PART OF THESE FINANCIAL STATEMENTS | The Royce Funds 2023 Semiannual Report to Shareholders | 33 |
Schedules of Investments
Royce Micro-Cap Fund
Common Stocks – 97.7%
| | | SHARES | | | VALUE |
| COMMUNICATION SERVICES – 4.1% | | | | | |
| ENTERTAINMENT - 1.2% | | | | | |
| Chicken Soup for the Soul Entertainment Cl. A 2 | | | 427,121 | | | $ | 506,139 |
| Gaia Cl. A 2 | | | 166,968 | | | | 385,696 |
| IMAX Corporation 2 | | | 166,100 | | | | 2,822,039 |
| | | | | | | | 3,713,874 |
| INTERACTIVE MEDIA & SERVICES - 0.7% | | | | | | | |
| QuinStreet 2 | | | 243,546 | | | | 2,150,511 |
| MEDIA - 2.2% | | | | | | | |
| †Entravision Communications Cl. A | | | 191,600 | | | | 841,124 |
| †Innovid Corp. 2 | | | 474,400 | | | | 517,096 |
| Magnite 2 | | | 220,900 | | | | 3,015,285 |
| Thryv Holdings 2 | | | 97,704 | | | | 2,403,518 |
| | | | | | | | 6,777,023 |
| Total (Cost $15,367,685) | | | | | | | 12,641,408 |
| | | | | | | | |
| CONSUMER DISCRETIONARY – 12.5% | | | | | | | |
| AUTOMOBILE COMPONENTS - 2.3% | | | | | | | |
| Modine Manufacturing 2 | | | 126,100 | | | | 4,163,822 |
| Stoneridge 2 | | | 147,400 | | | | 2,778,490 |
| | | | | | | | 6,942,312 |
| DIVERSIFIED CONSUMER SERVICES - 0.3% | | | | | | | |
| Lincoln Educational Services 2 | | | 113,027 | | | | 761,802 |
| HOTELS, RESTAURANTS & LEISURE - 1.7% | | | | | | | |
| Century Casinos 2 | | | 346,100 | | | | 2,457,310 |
| Lindblad Expeditions Holdings 2,4 | | | 261,100 | | | | 2,840,768 |
| | | | | | | | 5,298,078 |
| HOUSEHOLD DURABLES - 2.0% | | | | | | | |
| †Hovnanian Enterprises Cl. A 2 | | | 35,400 | | | | 3,512,034 |
| Legacy Housing 2 | | | 117,973 | | | | 2,735,794 |
| | | | | | | | 6,247,828 |
| LEISURE PRODUCTS - 1.5% | | | | | | | |
| American Outdoor Brands 2,4 | | | 231,138 | | | | 2,006,278 |
| MasterCraft Boat Holdings 2 | | | 85,300 | | | | 2,614,445 |
| | | | | | | | 4,620,723 |
| SPECIALTY RETAIL - 3.8% | | | | | | | |
| Barnes & Noble Education 2 | | | 105,300 | | | | 132,678 |
| Chico's FAS 2 | | | 495,100 | | | | 2,648,785 |
| Citi Trends 2 | | | 136,124 | | | | 2,403,950 |
| JOANN 2 | | | 217,326 | | | | 189,943 |
| OneWater Marine Cl. A 2 | | | 45,600 | | | | 1,652,544 |
| Shoe Carnival | | | 109,322 | | | | 2,566,881 |
| Zumiez 2 | | | 123,900 | | | | 2,064,174 |
| | | | | | | | 11,658,955 |
| TEXTILES, APPAREL & LUXURY GOODS - 0.9% | | | | | | | |
| Fossil Group 2 | | | 409,800 | | | | 1,053,186 |
| Vera Bradley 2 | | | 243,100 | | | | 1,553,409 |
| | | | | | | | 2,606,595 |
| Total (Cost $32,715,695) | | | | | | | 38,136,293 |
| ENERGY – 3.0% | | | | | | | |
| ENERGY EQUIPMENT & SERVICES - 3.0% | | | | | | | |
| Natural Gas Services Group 2 | | | 296,113 | | | | 2,931,519 |
| Newpark Resources 2 | | | 825,500 | | | | 4,317,365 |
| Profire Energy 2 | | | 1,410,332 | | | | 1,734,708 |
| Total (Cost $6,992,045) | | | | | | | 8,983,592 |
| | | | | | | | |
| FINANCIALS – 11.5% | | | | | | | |
| BANKS - 6.9% | | | | | | | |
| BayCom Corporation | | | 155,542 | | | | 2,594,441 |
| †Customers Bancorp 2 | | | 72,500 | | | | 2,193,850 |
| HarborOne Bancorp | | | 251,253 | | | $ | 2,180,876 |
| HBT Financial | | | 174,011 | | | | 3,208,763 |
| HomeTrust Bancshares | | | 120,000 | | | | 2,506,800 |
| Investar Holding Corporation | | | 185,600 | | | | 2,247,616 |
| Midway Investments 2,5 | | | 1,858,170 | | | | 0 |
| Stellar Bancorp | | | 99,377 | | | | 2,274,739 |
| Territorial Bancorp | | | 122,408 | | | | 1,503,170 |
| Western New England Bancorp | | | 398,436 | | | | 2,326,866 |
| | | | | | | | 21,037,121 |
| CAPITAL MARKETS - 3.8% | | | | | | | |
| B. Riley Financial | | | 54,500 | | | | 2,505,910 |
| Canaccord Genuity Group | | | 166,700 | | | | 1,050,723 |
| Silvercrest Asset Management Group Cl. A | | | 170,773 | | | | 3,458,153 |
| Sprott | | | 70,380 | | | | 2,278,617 |
| StoneX Group 2 | | | 29,400 | | | | 2,442,552 |
| | | | | | | | 11,735,955 |
| FINANCIAL SERVICES - 0.8% | | | | | | | |
| Cass Information Systems | | | 60,216 | | | | 2,335,177 |
| Total (Cost $35,229,758) | | | | | | | 35,108,253 |
| | | | | | | | |
| HEALTH CARE – 8.1% | | | | | | | |
| BIOTECHNOLOGY - 2.1% | | | | | | | |
| †ARS Pharmaceuticals 2 | | | 171,100 | | | | 1,146,370 |
| CareDx 2 | | | 151,700 | | | | 1,289,450 |
| Dynavax Technologies 2 | | | 198,000 | | | | 2,558,160 |
| MeiraGTx Holdings 2 | | | 222,200 | | | | 1,493,184 |
| | | | | | | | 6,487,164 |
| HEALTH CARE EQUIPMENT & SUPPLIES - 4.4% | | | | | | | |
| Apyx Medical 2 | | | 479,327 | | | | 2,411,015 |
| Artivion 2 | | | 183,955 | | | | 3,162,186 |
| AtriCure 2 | | | 40,700 | | | | 2,008,952 |
| Cutera 2 | | | 49,000 | | | | 741,370 |
| OrthoPediatrics Corp. 2 | | | 50,400 | | | | 2,210,040 |
| Profound Medical 2 | | | 227,300 | | | | 2,911,705 |
| | | | | | | | 13,445,268 |
| LIFE SCIENCES TOOLS & SERVICES - 1.1% | | | | | | | |
| Harvard Bioscience 2 | | | 601,559 | | | | 3,302,559 |
| PHARMACEUTICALS - 0.5% | | | | | | | |
| †Harrow Health 2 | | | 76,400 | | | | 1,454,656 |
| Total (Cost $20,227,256) | | | | | | | 24,689,647 |
| | | | | | | | |
| INDUSTRIALS – 25.1% | | | | | | | |
| AEROSPACE & DEFENSE - 2.1% | | | | | | | |
| Astronics Corporation 2 | | | 139,000 | | | | 2,760,540 |
| Cadre Holdings | | | 111,032 | | | | 2,420,498 |
| CPI Aerostructures 2 | | | 343,190 | | | | 1,335,009 |
| | | | | | | | 6,516,047 |
| BUILDING PRODUCTS - 1.2% | | | | | | | |
| Quanex Building Products | | | 135,200 | | | | 3,630,120 |
| COMMERCIAL SERVICES & SUPPLIES - 3.5% | | | | | | | |
| Acme United | | | 80,930 | | | | 2,018,394 |
| †CECO Environmental 2 | | | 166,000 | | | | 2,217,760 |
| Heritage-Crystal Clean 2 | | | 76,174 | | | | 2,878,615 |
| VSE Corporation | | | 64,700 | | | | 3,538,443 |
| | | | | | | | 10,653,212 |
| CONSTRUCTION & ENGINEERING - 3.9% | | | | | | | |
| Concrete Pumping Holdings 2 | | | 300,400 | | | | 2,412,212 |
| Construction Partners Cl. A 2 | | | 111,600 | | | | 3,503,124 |
| IES Holdings 2 | | | 59,800 | | | | 3,401,424 |
| 34 | The Royce Funds 2023 Semiannual Report to Shareholders | THE ACCOMPANYING NOTES ARE AN INTEGRAL PART OF THESE FINANCIAL STATEMENTS |
June 30, 2023 (unaudited)
Royce Micro-Cap Fund (continued)
| | | SHARES | | | VALUE |
| INDUSTRIALS (continued) | | | | | | | |
| CONSTRUCTION & ENGINEERING (continued) | | | | | | | |
| Northwest Pipe 2 | | | 91,900 | | | $ | 2,779,056 |
| | | | | | | | 12,095,816 |
| ELECTRICAL EQUIPMENT - 0.8% | | | | | | | |
| American Superconductor 2 | | | 392,100 | | | | 2,454,546 |
| MACHINERY - 5.9% | | | | | | | |
| Alimak Group 1 | | | 196,200 | | | | 1,534,079 |
| Commercial Vehicle Group 2 | | | 248,400 | | | | 2,757,240 |
| Graham Corporation 2 | | | 246,516 | | | | 3,273,733 |
| Luxfer Holdings | | | 162,200 | | | | 2,308,106 |
| Porvair 1 | | | 320,800 | | | | 2,584,855 |
| Shyft Group (The) | | | 93,700 | | | | 2,067,022 |
| Wabash National | | | 131,700 | | | | 3,376,788 |
| | | | | | | | 17,901,823 |
| MARINE TRANSPORTATION - 1.0% | | | | | | | |
| Clarkson 1 | | | 78,924 | | | | 2,966,951 |
| PROFESSIONAL SERVICES - 4.4% | | | | | | | |
| CRA International | | | 27,783 | | | | 2,833,866 |
| Forrester Research 2 | | | 74,300 | | | | 2,161,387 |
| Kforce | | | 42,732 | | | | 2,677,587 |
| NV5 Global 2 | | | 24,400 | | | | 2,702,788 |
| Resources Connection | | | 196,452 | | | | 3,086,261 |
| | | | | | | | 13,461,889 |
| TRADING COMPANIES & DISTRIBUTORS - 2.3% | | | | | | | |
| Distribution Solutions Group 2 | | | 73,874 | | | | 3,845,880 |
| Transcat 2 | | | 36,774 | | | | 3,137,190 |
| | | | | | | | 6,983,070 |
| Total (Cost $52,783,466) | | | | | | | 76,663,474 |
| INFORMATION TECHNOLOGY – 27.8% | | | | | | | |
| COMMUNICATIONS EQUIPMENT - 5.3% | | | | | | | |
| Applied Optoelectronics 2 | | | 543,100 | | | | 3,236,876 |
| Clearfield 2,4 | | | 55,300 | | | | 2,618,455 |
| Comtech Telecommunications | | | 152,602 | | | | 1,394,782 |
| Digi International 2 | | | 76,100 | | | | 2,997,579 |
| DZS 2 | | | 260,109 | | | | 1,032,633 |
| EMCORE Corporation 2 | | | 547,300 | | | | 411,898 |
| Genasys 2 | | | 474,222 | | | | 1,232,977 |
| Harmonic 2 | | | 201,200 | | | | 3,253,404 |
| | | | | | | | 16,178,604 |
| ELECTRONIC EQUIPMENT, INSTRUMENTS & COMPONENTS - 6.5% | | | | | | | |
| Arlo Technologies 2 | | | 298,500 | | | | 3,256,635 |
| FARO Technologies 2 | | | 90,845 | | | | 1,471,689 |
| LightPath Technologies Cl. A 2 | | | 852,684 | | | | 1,151,123 |
| Luna Innovations 2 | | | 345,700 | | | | 3,152,784 |
| nLIGHT 2 | | | 217,250 | | | | 3,349,995 |
| PAR Technology 2 | | | 79,600 | | | | 2,621,228 |
| PowerFleet 2 | | | 374,908 | | | | 1,124,724 |
| VIA optronics ADR 2 | | | 261,857 | | | | 691,303 |
| Vishay Precision Group 2 | | | 83,200 | | | | 3,090,880 |
| | | | | | | | 19,910,361 |
| IT SERVICES - 0.8% | | | | | | | |
| Computer Task Group 2 | | | 336,226 | | | | 2,558,680 |
| SEMICONDUCTORS & SEMICONDUCTOR EQUIPMENT - 12.8% | | | | | | | |
| Aehr Test Systems 2,4 | | | 89,659 | | | | 3,698,434 |
| Amtech Systems 2 | | | 184,511 | | | | 1,763,925 |
| Axcelis Technologies 2 | | | 20,900 | | | | 3,831,597 |
| AXT 2 | | | 476,600 | | | | 1,639,504 |
| Camtek 2 | | | 95,900 | | | | 3,416,917 |
| Cohu 2 | | | 86,400 | | | | 3,590,784 |
| Ichor Holdings 2 | | | 85,900 | | | | 3,221,250 |
| Nova 2 | | | 26,100 | | | | 3,061,530 |
| NVE Corporation | | | 35,916 | | | | 3,499,655 |
| PDF Solutions 2 | | | 79,500 | | | | 3,585,450 |
| Photronics 2 | | | 175,600 | | | | 4,528,724 |
| Ultra Clean Holdings 2 | | | 82,300 | | | | 3,165,258 |
| | | | | | | | 39,003,028 |
| SOFTWARE - 0.9% | | | | | | | |
| Agilysys 2 | | | 38,121 | | | | 2,616,625 |
| TECHNOLOGY HARDWARE, STORAGE & PERIPHERALS - 1.5% | | | | | | | |
| AstroNova 2 | | | 205,250 | | | | 2,976,125 |
| Intevac 2 | | | 451,213 | | | | 1,692,049 |
| | | | | | | | 4,668,174 |
| Total (Cost $57,069,745) | | | | | | | 84,935,472 |
| MATERIALS – 5.0% | | | | | | | |
| CHEMICALS - 0.4% | | | | | | | |
| Aspen Aerogels 2 | | | 168,500 | | | | 1,329,465 |
| METALS & MINING - 4.6% | | | | | | | |
| Altius Minerals | | | 114,900 | | | | 1,899,460 |
| Ferroglobe 2 | | | 290,300 | | | | 1,384,731 |
| Haynes International | | | 62,530 | | | | 3,177,775 |
| Major Drilling Group International 2 | | | 456,400 | | | | 3,148,893 |
| Universal Stainless & Alloy Products 2 | | | 309,933 | | | | 4,342,161 |
| | | | | | | | 13,953,020 |
| Total (Cost $11,165,099) | | | | | | | 15,282,485 |
| REAL ESTATE – 0.6% | | | | | | | |
| REAL ESTATE MANAGEMENT & DEVELOPMENT - 0.6% | | | | | | | |
| FRP Holdings 2 | | | 29,575 | | | | 1,702,633 |
| Total (Cost $534,936) | | | | | | | 1,702,633 |
| TOTAL COMMON STOCKS | | | | | | | |
| (Cost $232,085,685) | | | | | | | 298,143,257 |
| | | | | | | | |
| REPURCHASE AGREEMENT– 2.7% | | | | | | | |
| Fixed Income Clearing Corporation, 3.00% dated 6/30/23, due 7/3/23, maturity value | | | | | | | |
| $8,140,370 (collateralized by obligations of U.S. Government Agencies, 4.25% | | | | | | | |
| due 11/15/40, valued at $8,301,145) | | | | | | | |
| (Cost $8,138,336) | | | | | | | 8,138,336 |
COLLATERAL RECEIVED FOR SECURITIES LOANED – 1.2%
Money Market Funds
Federated Hermes Government Obligations Fund - Institutional Shares (7 day yield-4.92%)
| (Cost $3,649,742) | | | 3,649,742 | | | | 3,649,742 |
TOTAL INVESTMENTS – 101.6% | | | | | | | |
| (Cost $243,873,763) | | | | | | | 309,931,335 |
LIABILITIES LESS CASH AND OTHER ASSETS – (1.6)% | | | | | | | (4,750,116) |
| | | | | | | | |
| NET ASSETS – 100.0% | | | | | | $ | 305,181,219 |
| THE ACCOMPANYING NOTES ARE AN INTEGRAL PART OF THESE FINANCIAL STATEMENTS | The Royce Funds 2023 Semiannual Report to Shareholders | 35 |
Schedules of Investments
Royce Pennsylvania Mutual Fund
Common Stocks – 97.0%
| | | SHARES | | | VALUE |
| | | | | | |
| COMMUNICATION SERVICES – 1.9% | | | | | | | |
| DIVERSIFIED TELECOMMUNICATION SERVICES - 0.1% | | | | | | | |
| Cogent Communications Holdings | | | 6,790 | | | $ | 456,899 |
| Liberty Latin America Cl. C 2 | | | 187,820 | | | | 1,619,008 |
| | | | | | | | 2,075,907 |
| ENTERTAINMENT - 0.2% | | | | | | | |
| Chicken Soup for the Soul Entertainment Cl. A 2 | | | 33,785 | | | | 40,035 |
| IMAX Corporation 2 | | | 240,219 | | | | 4,081,321 |
| | | | | | | | 4,121,356 |
| INTERACTIVE MEDIA & SERVICES - 1.4% | | | | | | | |
| QuinStreet 2 | | | 77,243 | | | | 682,056 |
| Ziff Davis 2 | | | 271,285 | | | | 19,006,227 |
| ZipRecruiter Cl. A 2,4 | | | 12,315 | | | | 218,714 |
| †ZoomInfo Technologies 2 | | | 137,520 | | | | 3,491,633 |
| | | | | | | | 23,398,630 |
| MEDIA - 0.2% | | | | | | | |
| Cable One | | | 1,200 | | | | 788,496 |
| †TEGNA | | | 179,900 | | | | 2,921,576 |
| | | | | | | | 3,710,072 |
| Total (Cost $41,276,649) | | | | | | | 33,305,965 |
| | | | | | | | |
| CONSUMER DISCRETIONARY – 10.3% | | | | | | | |
| AUTOMOBILE COMPONENTS - 2.8% | | | | | | | |
| †Atmus Filtration Technologies 2 | | | 54,000 | | | | 1,185,840 |
| Dorman Products 2 | | | 155,868 | | | | 12,287,074 |
| Fox Factory Holding Corporation 2 | | | 69,200 | | | | 7,508,892 |
| Gentex Corporation | | | 339,956 | | | | 9,947,113 |
| LCI Industries | | | 97,950 | | | | 12,376,962 |
| Modine Manufacturing 2 | | | 50,000 | | | | 1,651,000 |
| Stoneridge 2 | | | 57,057 | | | | 1,075,524 |
| †Vitesco Technologies Group 1,2 | | | 35,187 | | | | 2,897,464 |
| | | | | | | | 48,929,869 |
| DISTRIBUTORS - 0.2% | | | | | | | |
| LKQ Corporation | | | 60,000 | | | | 3,496,200 |
| Pool Corporation | | | 1,028 | | | | 385,130 |
| | | | | | | | 3,881,330 |
| DIVERSIFIED CONSUMER SERVICES - 0.2% | | | | | | | |
| H&R Block | | | 4,767 | | | | 151,925 |
| Lincoln Educational Services 2 | | | 375,149 | | | | 2,528,504 |
| | | | | | | | 2,680,429 |
| HOTELS, RESTAURANTS & LEISURE - 0.5% | | | | | | | |
| Bloomin’ Brands | | | 114,400 | | | | 3,076,216 |
| Century Casinos 2 | | | 515,834 | | | | 3,662,421 |
| Denny’s Corporation 2 | | | 126,664 | | | | 1,560,501 |
| | | | | | | | 8,299,138 |
| HOUSEHOLD DURABLES - 1.3% | | | | | | | |
| Helen of Troy 2 | | | 51,783 | | | | 5,593,600 |
| †Installed Building Products | | | 5,750 | | | | 805,920 |
| Legacy Housing 2 | | | 97,929 | | | | 2,270,973 |
| M/I Homes 2 | | | 40,168 | | | | 3,502,248 |
| PulteGroup | | | 43,422 | | | | 3,373,021 |
| Skyline Champion 2 | | | 75,510 | | | | 4,942,129 |
| TopBuild Corp. 2 | | | 5,550 | | | | 1,476,411 |
| | | | | | | | 21,964,302 |
| LEISURE PRODUCTS - 1.0% | | | | | | | |
| Brunswick Corporation | | | 99,769 | | | | 8,643,986 |
| Malibu Boats Cl. A 2 | | | 44,383 | | | | 2,603,507 |
| MasterCraft Boat Holdings 2 | | | 92,745 | | | | 2,842,634 |
| YETI Holdings 2 | | | 80,913 | | | | 3,142,661 |
| | | | | | | | 17,232,788 |
| SPECIALTY RETAIL - 3.0% | | | | | |
| Asbury Automotive Group 2 | | | 70,832 | | | | 17,029,429 |
| CarMax 2 | | | 18,799 | | | | 1,573,476 |
| Chico’s FAS 2 | | | 542,536 | | | | 2,902,568 |
| †Destination XL Group 2 | | | 545,700 | | | | 2,673,930 |
| Five Below 2,4 | | | 4,592 | | | | 902,512 |
| Floor & Decor Holdings Cl. A 2 | | | 6,625 | | | | 688,735 |
| Murphy USA | | | 16,314 | | | | 5,075,449 |
| OneWater Marine Cl. A 2 | | | 196,802 | | | | 7,132,105 |
| Shoe Carnival | | | 287,578 | | | | 6,752,331 |
| Signet Jewelers | | | 45,100 | | | | 2,943,226 |
| †Valvoline 2 | | | 42,110 | | | | 1,579,546 |
| Williams-Sonoma | | | 31,365 | | | | 3,925,016 |
| | | | | | | | 53,178,323 |
| TEXTILES, APPAREL & LUXURY GOODS - 1.3% | | | | | | | |
| Carter’s | | | 72,884 | | | | 5,291,378 |
| Kontoor Brands | | | 68,400 | | | | 2,879,640 |
| Movado Group | | | 205,101 | | | | 5,502,860 |
| Ralph Lauren Cl. A | | | 40,881 | | | | 5,040,627 |
| Steven Madden | | | 82,800 | | | | 2,706,732 |
| Wolverine World Wide | | | 90,292 | | | | 1,326,390 |
| | | | | | | | 22,747,627 |
| Total (Cost $130,968,200) | | | | | | | 178,913,806 |
| | | | | | | | |
| CONSUMER STAPLES – 1.1% | | | | | | | |
| FOOD PRODUCTS - 0.5% | | | | | | | |
| John B. Sanfilippo & Son | | | 10,090 | | | | 1,183,254 |
| Nomad Foods 2 | | | 430,865 | | | | 7,548,755 |
| | | | | | | | 8,732,009 |
| PERSONAL CARE PRODUCTS - 0.6% | | | | | | | |
| Inter Parfums | | | 81,233 | | | | 10,985,139 |
| Total (Cost $10,121,748) | | | | | | | 19,717,148 |
| | | | | | | | |
| ENERGY – 2.6% | | | | | | | |
| ENERGY EQUIPMENT & SERVICES - 1.6% | | | | | | | |
| Computer Modelling Group | | | 2,652,180 | | | | 13,333,473 |
| Core Laboratories | | | 129,116 | | | | 3,001,947 |
| Pason Systems | | | 1,247,553 | | | | 10,820,445 |
| RPC | | | 11,000 | | | | 78,650 |
| | | | | | | | 27,234,515 |
| OIL, GAS & CONSUMABLE FUELS - 1.0% | | | | | | | |
| Chord Energy | | | 20,346 | | | | 3,129,215 |
| Civitas Resources | | | 41,500 | | | | 2,878,855 |
| Magnolia Oil & Gas Cl. A | | | 66,450 | | | | 1,388,805 |
| Matador Resources | | | 59,900 | | | | 3,133,968 |
| Northern Oil and Gas | | | 42,100 | | | | 1,444,872 |
| †Range Resources | | | 46,630 | | | | 1,370,922 |
| SilverBow Resources 2,4 | | | 112,841 | | | | 3,285,930 |
| †Sitio Royalties Cl. A | | | 58,550 | | | | 1,538,108 |
| | | | | | | | 18,170,675 |
| Total (Cost $38,216,799) | | | | | | | 45,405,190 |
| | | | | | | | |
| FINANCIALS – 16.9% | | | | | | | |
| BANKS - 6.1% | | | | | | | |
| Bank of N.T. Butterfield & Son | | | 303,159 | | | | 8,294,430 |
| BankUnited | | | 272,686 | | | | 5,876,383 |
| BOK Financial | | | 40,738 | | | | 3,290,816 |
| First Bancshares (The) | | | 154,207 | | | | 3,984,709 |
| First Citizens BancShares Cl. A | | | 30,947 | | | | 39,718,927 |
| First Hawaiian | | | 252,895 | | | | 4,554,639 |
| 36 | The Royce Funds 2023 Semiannual Report to Shareholders | THE ACCOMPANYING NOTES ARE AN INTEGRAL PART OF THESE FINANCIAL STATEMENTS |
June 30, 2023 (unaudited)
| Royce Pennsylvania Mutual Fund (continued) | | | | | | | |
| | | | | | | | |
| | | SHARES | | | VALUE |
| FINANCIALS (continued) | | | | | | | |
| BANKS (continued) | | | | | | | |
| †Hingham Institution for Savings | | | 11,029 | | | $ | 2,351,162 |
| Home BancShares | | | 175,334 | | | | 3,997,615 |
| Independent Bank Group | | | 149,054 | | | | 5,146,835 |
| Origin Bancorp | | | 102,630 | | | | 3,007,059 |
| Popular | | | 189,632 | | | | 11,476,529 |
| Timberland Bancorp | | | 99,201 | | | | 2,537,561 |
| Triumph Financial 2 | | | 96,832 | | | | 5,879,639 |
| TrustCo Bank Corp NY | | | 25,090 | | | | 717,825 |
| †Valley National Bancorp | | | 246,171 | | | | 1,907,825 |
| Western Alliance Bancorp | | | 86,762 | | | | 3,164,210 |
| | | | | | | | 105,906,164 |
| CAPITAL MARKETS - 5.2% | | | | | | | |
| Artisan Partners Asset Management Cl. A | | | 405,999 | | | | 15,959,821 |
| B. Riley Financial | | | 37,902 | | | | 1,742,734 |
| Evercore Cl. A | | | 25,117 | | | | 3,104,210 |
| GCM Grosvenor Cl. A | | | 961,176 | | | | 7,247,267 |
| Houlihan Lokey Cl. A | | | 64,115 | | | | 6,303,146 |
| Lazard Cl. A | | | 82,388 | | | | 2,636,416 |
| Morningstar | | | 40,288 | | | | 7,899,268 |
| SEI Investments | | | 345,707 | | | | 20,611,051 |
| Sprott | | | 244,764 | | | | 7,924,460 |
| TMX Group | | | 529,420 | | | | 11,913,199 |
| Tradeweb Markets Cl. A | | | 70,905 | | | | 4,855,574 |
| | | | | | | | 90,197,146 |
| CONSUMER FINANCE - 0.1% | | | | | | | |
| PRA Group 2 | | | 80,134 | | | | 1,831,062 |
| FINANCIAL SERVICES - 0.7% | | | | | | | |
| Compass Diversified Holdings | | | 143,741 | | | | 3,117,742 |
| International Money Express 2 | | | 117,944 | | | | 2,893,166 |
| NewtekOne | | | 169,583 | | | | 2,696,370 |
| Repay Holdings Cl. A 2,4 | | | 519,797 | | | | 4,070,011 |
| | | | | | | | 12,777,289 |
| INSURANCE - 4.8% | | | | | | | |
| AMERISAFE | | | 58,072 | | | | 3,096,399 |
| Assured Guaranty | | | 271,025 | | | | 15,123,195 |
| Axis Capital Holdings | | | 67,663 | | | | 3,642,299 |
| E-L Financial | | | 23,618 | | | | 16,517,000 |
| First American Financial | | | 24,673 | | | | 1,406,855 |
| International General Insurance Holdings | | | 591,204 | | | | 5,279,452 |
| James River Group Holdings | | | 471,644 | | | | 8,612,220 |
| RenaissanceRe Holdings | | | 40,898 | | | | 7,628,295 |
| RLI Corp. | | | 51,047 | | | | 6,966,384 |
| Safety Insurance Group | | | 68,754 | | | | 4,931,037 |
| Stewart Information Services | | | 55,095 | | | | 2,266,608 |
| Tiptree | | | 206,320 | | | | 3,096,863 |
| White Mountains Insurance Group | | | 4,276 | | | | 5,938,979 |
| | | | | | | | 84,505,586 |
| Total (Cost $241,010,746) | | | | | | | 295,217,247 |
| | | | | | | | |
| HEALTH CARE – 6.1% | | | | | | | |
| BIOTECHNOLOGY - 0.3% | | | | | | | |
| CareDx 2 | | | 200,005 | | | | 1,700,042 |
| Catalyst Pharmaceuticals 2 | | | 242,647 | | | | 3,261,176 |
| MeiraGTx Holdings 2 | | | 95,578 | | | | 642,284 |
| | | | | | | | 5,603,502 |
| HEALTH CARE EQUIPMENT & SUPPLIES - 3.1% | | | | | | | |
| AtriCure 2 | | | 24,482 | | | | 1,208,432 |
| Atrion Corporation | | | 8,442 | | | | 4,775,639 |
| Cutera 2 | | | 32,300 | | | | 488,699 |
| Enovis Corporation 2 | | | 276,062 | | | | 17,701,095 |
| Haemonetics Corporation 2 | | | 300,046 | | | | 25,545,916 |
| OrthoPediatrics Corp. 2 | | | 55,623 | | | | 2,439,069 |
| Profound Medical 2 | | | 52,098 | | | | 667,374 |
| Surmodics 2 | | | 42,305 | | | | 1,324,570 |
| | | | | | | | 54,150,794 |
| HEALTH CARE PROVIDERS & SERVICES - 0.7% | | | | | | | |
| AMN Healthcare Services 2 | | | 44,635 | | | | 4,870,571 |
| Cross Country Healthcare 2 | | | 117,076 | | | | 3,287,494 |
| Molina Healthcare 2 | | | 14,439 | | | | 4,349,605 |
| | | | | | | | 12,507,670 |
| HEALTH CARE TECHNOLOGY - 0.3% | | | | | | | |
| Certara 2 | | | 115,785 | | | | 2,108,445 |
| Doximity Cl. A 2,4 | | | 42,265 | | | | 1,437,855 |
| Simulations Plus | | | 39,205 | | | | 1,698,753 |
| | | | | | | | 5,245,053 |
| LIFE SCIENCES TOOLS & SERVICES - 1.5% | | | | | | | |
| Azenta 2 | | | 129,518 | | | | 6,045,900 |
| Bio-Techne | | | 83,367 | | | | 6,805,248 |
| Harvard Bioscience 2 | | | 121,940 | | | | 669,451 |
| Mesa Laboratories | | | 53,106 | | | | 6,824,121 |
| Quanterix Corporation 2 | | | 16,148 | | | | 364,137 |
| Stevanato Group | | | 132,486 | | | | 4,289,897 |
| | | | | | | | 24,998,754 |
| PHARMACEUTICALS - 0.2% | | | | | | | |
| Harmony Biosciences Holdings 2 | | | 38,894 | | | | 1,368,680 |
| †Pacira BioSciences 2 | | | 40,050 | | | | 1,604,803 |
| | | | | | | | 2,973,483 |
| Total (Cost $94,171,747) | | | | | | | 105,479,256 |
| | | | | | | | |
| INDUSTRIALS – 31.6% | | | | | | | |
| AEROSPACE & DEFENSE - 1.2% | | | | | | | |
| HEICO Corporation | | | 80,074 | | | | 14,168,293 |
| Leonardo DRS 2,4 | | | 383,500 | | | | 6,649,890 |
| | | | | | | | 20,818,183 |
| AIR FREIGHT & LOGISTICS - 1.5% | | | | | | | |
| Forward Air | | | 151,581 | | | | 16,084,260 |
| Hub Group Cl. A 2 | | | 131,490 | | | | 10,561,277 |
| | | | | | | | 26,645,537 |
| BUILDING PRODUCTS - 3.6% | | | | | | | |
| AAON | | | 13,600 | | | | 1,289,416 |
| Advanced Drainage Systems | | | 32,075 | | | | 3,649,493 |
| Builders FirstSource 2 | | | 186,128 | | | | 25,313,408 |
| Carlisle Companies | | | 10,973 | | | | 2,814,904 |
| CSW Industrials | | | 9,200 | | | | 1,528,948 |
| Hayward Holdings 2 | | | 22,552 | | | | 289,793 |
| Quanex Building Products | | | 169,345 | | | | 4,546,913 |
| Simpson Manufacturing | | | 73,187 | | | | 10,136,400 |
| UFP Industries | | | 139,967 | | | | 13,583,797 |
| | | | | | | | 63,153,072 |
| COMMERCIAL SERVICES & SUPPLIES - 2.0% | | | | | | | |
| Brady Corporation Cl. A | | | 80,700 | | | | 3,838,899 |
| Deluxe Corporation | | | 43,365 | | | | 758,020 |
| Driven Brands Holdings 2 | | | 227,505 | | | | 6,156,285 |
| GFL Environmental | | | 130,530 | | | | 5,064,564 |
| Healthcare Services Group 2 | | | 467,397 | | | | 6,978,237 |
| Heritage-Crystal Clean 2 | | | 207,187 | | | | 7,829,597 |
| RB Global | | | 77,462 | | | | 4,647,720 |
| | | | | | | | 35,273,322 |
| THE ACCOMPANYING NOTES ARE AN INTEGRAL PART OF THESE FINANCIAL STATEMENTS | The Royce Funds 2023 Semiannual Report to Shareholders | 37 |
Schedules of Investments
| Royce Pennsylvania Mutual Fund (continued) | | | | | |
| | | | | | |
| | | SHARES | | | VALUE |
| | | | | | |
| INDUSTRIALS (continued) | | | | | | | |
| CONSTRUCTION & ENGINEERING - 4.1% | | | | | | | |
| Arcosa | | | 410,062 | | | $ | 31,070,398 |
| Construction Partners Cl. A 2 | | | 141,106 | | | | 4,429,317 |
| EMCOR Group | | | 47,395 | | | | 8,757,648 |
| Great Lakes Dredge & Dock 2 | | | 186,853 | | | | 1,524,720 |
| Northwest Pipe 2 | | | 75,074 | | | | 2,270,238 |
| Sterling Infrastructure 2 | | | 60,504 | | | | 3,376,123 |
| Valmont Industries | | | 47,290 | | | | 13,763,755 |
| WillScot Mobile Mini Holdings Corp. 2 | | | 111,740 | | | | 5,340,055 |
| | | | | | | | 70,532,254 |
| ELECTRICAL EQUIPMENT - 1.8% | | | | | | | |
| American Superconductor 2 | | | 93,326 | | | | 584,221 |
| Atkore 2 | | | 24,615 | | | | 3,838,463 |
| Encore Wire | | | 38,669 | | | | 7,189,727 |
| GrafTech International | | | 133,111 | | | | 670,879 |
| Preformed Line Products | | | 101,976 | | | | 15,918,454 |
| †Vertiv Holdings Cl. A | | | 100,870 | | | | 2,498,550 |
| | | | | | | | 30,700,294 |
| GROUND TRANSPORTATION - 1.2% | | | | | | | |
| ArcBest Corporation | | | 32,753 | | | | 3,235,996 |
| Landstar System | | | 72,423 | | | | 13,944,325 |
| Schneider National Cl. B | | | 129,975 | | | | 3,732,882 |
| | | | | | | | 20,913,203 |
| MACHINERY - 7.9% | | | | | | | |
| Allison Transmission Holdings | | | 11,094 | | | | 626,367 |
| Chart Industries 2,4 | | | 30,515 | | | | 4,875,992 |
| Crane NXT | | | 123,691 | | | | 6,981,120 |
| Douglas Dynamics | | | 103,446 | | | | 3,090,966 |
| EnPro Industries | | | 79,735 | | | | 10,647,015 |
| ESAB Corporation | | | 203,622 | | | | 13,549,008 |
| ESCO Technologies | | | 104,144 | | | | 10,792,443 |
| Graham Corporation 2 | | | 91,849 | | | | 1,219,755 |
| Helios Technologies | | | 69,419 | | | | 4,587,902 |
| Hurco Companies | | | 9,000 | | | | 194,850 |
| John Bean Technologies | | | 113,607 | | | | 13,780,529 |
| Kadant | | | 87,873 | | | | 19,516,593 |
| Lincoln Electric Holdings | | | 104,811 | | | | 20,818,609 |
| Lindsay Corporation | | | 30,078 | | | | 3,589,508 |
| Miller Industries | | | 215,462 | | | | 7,642,437 |
| RBC Bearings 2 | | | 73,332 | | | | 15,947,510 |
| Westport Fuel Systems 2,4 | | | 11,598 | | | | 89,305 |
| | | | | | | | 137,949,909 |
| MARINE TRANSPORTATION - 0.9% | | | | | | | |
| Clarkson 1 | | | 30,004 | | | | 1,127,926 |
| †Genco Shipping & Trading | | | 206,101 | | | | 2,891,597 |
| Kirby Corporation 2 | | | 159,639 | | | | 12,284,221 |
| | | | | | | | 16,303,744 |
| PASSENGER AIRLINES - 0.3% | | | | | | | |
| Sun Country Airlines Holdings 2 | | | 194,570 | | | | 4,373,934 |
| PROFESSIONAL SERVICES - 2.9% | | | | | | | |
| Barrett Business Services | | | 33,256 | | | | 2,899,923 |
| CBIZ 2 | | | 24,401 | | | | 1,300,085 |
| Dun & Bradstreet Holdings | | | 357,600 | | | | 4,137,432 |
| †First Advantage 2 | | | 14,145 | | | | 217,975 |
| Forrester Research 2 | | | 352,823 | | | | 10,263,621 |
| FTI Consulting 2 | | | 20,490 | | | | 3,897,198 |
| KBR | | | 265,508 | | | | 17,273,951 |
| Korn Ferry | | | 117,252 | | | | 5,808,664 |
| NV5 Global 2 | | | 10,870 | | | | 1,204,070 |
| †Paycor HCM 2,4 | | | 8,690 | | | | 205,692 |
| Resources Connection | | | 184,185 | | | | 2,893,546 |
| | | | | | | | 50,102,157 |
| TRADING COMPANIES & DISTRIBUTORS - 4.2% | | | | | | | |
| Air Lease Cl. A | | | 602,634 | | | | 25,220,233 |
| Applied Industrial Technologies | | | 73,043 | | | | 10,578,817 |
| †Core & Main Cl. A 2 | | | 47,670 | | | | 1,493,978 |
| Distribution Solutions Group 2 | | | 47,751 | | | | 2,485,917 |
| EVI Industries 2,4 | | | 342,790 | | | | 7,541,380 |
| FTAI Aviation | | | 134,583 | | | | 4,260,898 |
| Hudson Technologies 2 | | | 179,360 | | | | 1,725,443 |
| MSC Industrial Direct Cl. A | | | 16,639 | | | | 1,585,364 |
| Richelieu Hardware | | | 322,291 | | | | 10,193,616 |
| Transcat 2 | | | 96,894 | | | | 8,266,027 |
| | | | | | | | 73,351,673 |
| Total (Cost $319,459,749) | | | | | | | 550,117,282 |
| | | | | | | | |
| INFORMATION TECHNOLOGY – 16.5% | | | | | | | |
| COMMUNICATIONS EQUIPMENT - 1.4% | | | | | | | |
| Aviat Networks 2 | | | 88,904 | | | | 2,966,727 |
| Calix 2 | | | 97,203 | | | | 4,851,402 |
| Digi International 2 | | | 303,783 | | | | 11,966,012 |
| Harmonic 2 | | | 312,300 | | | | 5,049,891 |
| | | | | | | | 24,834,032 |
| ELECTRONIC EQUIPMENT, INSTRUMENTS & COMPONENTS - 6.2% | | | | | |
| Cognex Corporation | | | 99,061 | | | | 5,549,397 |
| Coherent 2 | | | 40,117 | | | | 2,045,165 |
| ePlus 2 | | | 77,100 | | | | 4,340,730 |
| Fabrinet 2 | | | 128,792 | | | | 16,727,505 |
| FARO Technologies 2 | | | 158,314 | | | | 2,564,687 |
| Flex 2 | | | 120,400 | | | | 3,327,856 |
| Jabil | | | 31,659 | | | | 3,416,956 |
| Kimball Electronics 2 | | | 279,772 | | | | 7,730,100 |
| Littelfuse | | | 30,402 | | | | 8,856,406 |
| Luna Innovations 2 | | | 766,388 | | | | 6,989,458 |
| nLIGHT 2 | | | 70,802 | | | | 1,091,767 |
| PAR Technology 2 | | | 320,975 | | | | 10,569,707 |
| PC Connection | | | 14,307 | | | | 645,246 |
| PowerFleet 2 | | | 155,315 | | | | 465,945 |
| Rogers Corporation 2 | | | 9,223 | | | | 1,493,480 |
| Sanmina Corporation 2 | | | 52,026 | | | | 3,135,607 |
| TD SYNNEX | | | 29,391 | | | | 2,762,754 |
| Teledyne Technologies 2 | | | 7,470 | | | | 3,070,992 |
| Vishay Intertechnology | | | 113,747 | | | | 3,344,162 |
| Vishay Precision Group 2 | | | 112,126 | | | | 4,165,481 |
| Vontier Corporation | | | 510,416 | | | | 16,440,499 |
| | | | | | | | 108,733,900 |
| IT SERVICES - 0.6% | | | | | |
| Hackett Group (The) | | | 177,648 | | | | 3,970,433 |
| Kyndryl Holdings 2 | | | 524,834 | | | | 6,969,795 |
| | | | | | | | 10,940,228 |
| SEMICONDUCTORS & SEMICONDUCTOR EQUIPMENT - 6.0% | | | | | | | |
| Alpha and Omega Semiconductor 2 | | | 62,824 | | | | 2,060,627 |
| Amkor Technology | | | 83,462 | | | | 2,482,995 |
| Axcelis Technologies 2 | | | 36,767 | | | | 6,740,494 |
| Camtek 2 | | | 79,224 | | | | 2,822,751 |
| Cirrus Logic 2 | | | 155,992 | | | | 12,636,912 |
| Cohu 2 | | | 85,391 | | | | 3,548,850 |
| FormFactor 2 | | | 396,702 | | | | 13,575,143 |
| Ichor Holdings 2 | | | 29,770 | | | | 1,116,375 |
| 38 | The Royce Funds 2023 Semiannual Report to Shareholders | THE ACCOMPANYING NOTES ARE AN INTEGRAL PART OF THESE FINANCIAL STATEMENTS |
June 30, 2023 (unaudited)
| Royce Pennsylvania Mutual Fund (continued) | | | | | |
| | | | | | |
| | | SHARES | | | VALUE |
| | | | | | |
| INFORMATION TECHNOLOGY (continued) | | | | | |
| SEMICONDUCTORS & SEMICONDUCTOR EQUIPMENT (continued) | | | | | | | |
| Kulicke & Soffa Industries | | | 107,607 | | | $ | 6,397,236 |
| MKS Instruments | | | 102,427 | | | | 11,072,359 |
| Nova 2 | | | 52,494 | | | | 6,157,546 |
| NVE Corporation | | | 25,461 | | | | 2,480,920 |
| Onto Innovation 2 | | | 153,366 | | | | 17,862,538 |
| Photronics 2 | | | 132,417 | | | | 3,415,034 |
| Power Integrations | | | 6,520 | | | | 617,248 |
| Rambus 2 | | | 64,780 | | | | 4,156,933 |
| SiTime Corporation 2 | | | 28,028 | | | | 3,306,463 |
| Ultra Clean Holdings 2 | | | 84,806 | | | | 3,261,639 |
| | | | | | | | 103,712,063 |
| SOFTWARE - 1.8% | | | | | | | |
| Adeia | | | 302,416 | | | | 3,329,600 |
| Agilysys 2 | | | 56,407 | | | | 3,871,776 |
| Alkami Technology 2 | | | 303,635 | | | | 4,976,578 |
| †AppLovin Corporation Cl. A 2 | | | 16,145 | | | | 415,411 |
| Dolby Laboratories Cl. A | | | 66,887 | | | | 5,597,104 |
| nCino 2,4 | | | 8,910 | | | | 268,369 |
| PROS Holdings 2 | | | 61,186 | | | | 1,884,529 |
| Sapiens International | | | 149,996 | | | | 3,989,894 |
| Teradata Corporation 2 | | | 81,298 | | | | 4,342,126 |
| †Workiva Cl. A 2 | | | 29,030 | | | | 2,951,190 |
| | | | | | | | 31,626,577 |
| TECHNOLOGY HARDWARE, STORAGE & PERIPHERALS - 0.5% | | | | | | | |
| AstroNova 2 | | | 81,672 | | | | 1,184,244 |
| Avid Technology 2 | | | 265,376 | | | | 6,767,088 |
| | | | | | | | 7,951,332 |
| Total (Cost $183,478,429) | | | | | | | 287,798,132 |
| | | | | | | | |
| MATERIALS – 7.7% | | | | | | | |
| CHEMICALS - 4.3% | | | | | | | |
| Aspen Aerogels 2 | | | 77,281 | | | | 609,747 |
| Balchem Corporation | | | 68,346 | | | | 9,213,724 |
| Element Solutions | | | 1,079,711 | | | | 20,730,451 |
| Innospec | | | 179,213 | | | | 18,000,154 |
| Minerals Technologies | | | 187,536 | | | | 10,818,952 |
| Quaker Houghton | | | 75,894 | | | | 14,791,741 |
| †Scotts Miracle-Gro Cl. A | | | 22,225 | | | | 1,393,285 |
| | | | | | | | 75,558,054 |
| CONTAINERS & PACKAGING - 0.2% | | | | | | | |
| Graphic Packaging Holding Company | | | 105,775 | | | | 2,541,773 |
| Silgan Holdings | | | 29,061 | | | | 1,362,670 |
| | | | | | | | 3,904,443 |
| METALS & MINING - 1.8% | | | | | | | |
| Alamos Gold Cl. A | | | 1,393,592 | | | | 16,600,024 |
| Haynes International | | | 62,674 | | | | 3,185,093 |
| Materion Corporation | | | 50,000 | | | | 5,710,000 |
| Reliance Steel & Aluminum | | | 19,702 | | | | 5,350,866 |
| | | | | | | | 30,845,983 |
| PAPER & FOREST PRODUCTS - 1.4% | | | | | | | |
| Louisiana-Pacific | | | 92,263 | | | | 6,917,880 |
| Stella-Jones | | | 321,861 | | | | 16,574,718 |
| | | | | | | | 23,492,598 |
| Total (Cost $66,107,927) | | | | | | | 133,801,078 |
| | | | | | | | |
| REAL ESTATE – 2.3% | | | | | | | |
| REAL ESTATE MANAGEMENT & DEVELOPMENT - 2.3% | | | | | | | |
| Colliers International Group | | | 39,025 | | | | 3,831,865 |
| DigitalBridge Group Cl. A | | | 223,235 | | | | 3,283,787 |
| FirstService Corporation | | | 27,782 | | | | 4,280,928 |
| FRP Holdings 2 | | | 90,363 | | | | 5,202,198 |
| Kennedy-Wilson Holdings | | | 845,184 | | | | 13,801,855 |
| Marcus & Millichap | | | 227,578 | | | | 7,170,983 |
| RMR Group (The) Cl. A | | | 124,760 | | | | 2,890,689 |
| Total (Cost $35,399,924) | | | | | | | 40,462,305 |
| | | | | | | | |
| TOTAL COMMON STOCKS | | | | | | | |
| (Cost $1,160,211,918) | | | | | | | 1,690,217,409 |
| REPURCHASE AGREEMENT– 2.7% | | |
Fixed Income Clearing Corporation, 3.00% dated 6/30/23, due 7/3/23, maturity value $46,931,320 (collateralized by obligations of U.S. Government Agencies, 4.375% due 5/15/41, valued at $47,858,057) |
| (Cost $46,919,590) | | | 46,919,590 |
| COLLATERAL RECEIVED FOR SECURITIES LOANED – 0.2% | | | | | |
| Money Market Funds | | | | | |
| Federated Hermes Government Obligations Fund - Institutional Shares (7 day yield-4.92%) | | | | | |
| (Cost $2,396,835) | | | 2,396,835 | | | | 2,396,835 |
| | | | | | | | |
| TOTAL INVESTMENTS – 99.9% | | | | | | | |
| (Cost $1,209,528,343) | | | | | | | 1,739,533,834 |
| | | | | | | | |
| CASH AND OTHER ASSETS LESS LIABILITIES – 0.1% | | | | | | | 2,462,913 |
| | | | | | | | |
| NET ASSETS – 100.0% | | | | | | $ | 1,741,996,747 |
| THE ACCOMPANYING NOTES ARE AN INTEGRAL PART OF THESE FINANCIAL STATEMENTS | The Royce Funds 2023 Semiannual Report to Shareholders | 39 |
Schedules of Investments
| Royce Premier Fund | | | | | |
| Common Stocks – 95.6% | | | | | | | |
| | | SHARES | | | VALUE |
| | | | | | | | |
| COMMUNICATION SERVICES – 1.7% | | | | | | | |
| INTERACTIVE MEDIA & SERVICES - 1.7% | | | | | | | |
| Ziff Davis 2 | | | 329,300 | | | $ | 23,070,758 |
| Total (Cost $30,325,308) | | | | | | | 23,070,758 |
| | | | | | | | |
| CONSUMER DISCRETIONARY – 10.0% | | | | | | | |
| AUTOMOBILE COMPONENTS - 4.2% | | | | | | | |
| Dorman Products 2 | | | 292,151 | | | | 23,030,263 |
| †Fox Factory Holding Corporation 2 | | | 125,900 | | | | 13,661,409 |
| LCI Industries | | | 174,538 | | | | 22,054,622 |
| | | | | | | | 58,746,294 |
| DISTRIBUTORS - 1.4% | | | | | | | |
| Pool Corporation | | | 50,355 | | | | 18,864,997 |
| LEISURE PRODUCTS - 2.0% | | | | | | | |
| Brunswick Corporation | | | 313,291 | | | | 27,143,532 |
| TEXTILES, APPAREL & LUXURY GOODS - 2.4% | | | | | | | |
| Ralph Lauren Cl. A | | | 274,740 | | | | 33,875,442 |
| Total (Cost $97,074,876) | | | | | | | 138,630,265 |
| | | | | | | | |
| CONSUMER STAPLES – 1.7% | | | | | | | |
| PERSONAL CARE PRODUCTS - 1.7% | | | | | | | |
| Inter Parfums | | | 177,189 | | | | 23,961,269 |
| Total (Cost $7,805,069) | | | | | | | 23,961,269 |
| | | | | | | | |
| FINANCIALS – 8.5% | | | | | | | |
| CAPITAL MARKETS - 8.5% | | | | | | | |
| Ares Management Cl. A | | | 226,393 | | | | 21,812,966 |
| Lazard Cl. A | | | 357,401 | | | | 11,436,832 |
| Morningstar | | | 135,516 | | | | 26,570,622 |
| SEI Investments | | | 615,771 | | | | 36,712,267 |
| TMX Group | | | 972,915 | | | | 21,892,882 |
| Total (Cost $60,974,388) | | | | | | | 118,425,569 |
| | | | | | | | |
| HEALTH CARE – 5.3% | | | | | | | |
| HEALTH CARE EQUIPMENT & SUPPLIES - 3.9% | | | | | | | |
| Enovis Corporation 2 | | | 336,857 | | | | 21,599,271 |
| Haemonetics Corporation 2 | | | 380,779 | | | | 32,419,524 |
| | | | | | | | 54,018,795 |
| LIFE SCIENCES TOOLS & SERVICES - 1.4% | | | | | | | |
| Bio-Techne | | | 234,692 | | | | 19,157,908 |
| Total (Cost $49,923,069) | | | | | | | 73,176,703 |
| | | | | | | | |
| INDUSTRIALS – 34.8% | | | | | | | |
| AEROSPACE & DEFENSE - 2.0% | | | | | | | |
| Woodward | | | 232,215 | | | | 27,612,686 |
| AIR FREIGHT & LOGISTICS - 2.4% | | | | | | | |
| Forward Air | | | 313,138 | | | | 33,227,073 |
| BUILDING PRODUCTS - 1.8% | | | | | | | |
| Simpson Manufacturing | | | 181,103 | | | | 25,082,765 |
| COMMERCIAL SERVICES & SUPPLIES - 2.3% | | | | | | | |
| RB Global | | | 520,453 | | | | 31,227,180 |
| CONSTRUCTION & ENGINEERING - 5.2% | | | | | | | |
| Arcosa | | | 534,820 | | | | 40,523,311 |
| Valmont Industries | | | 108,399 | | | | 31,549,529 |
| | | | | | | | 72,072,840 |
| GROUND TRANSPORTATION - 2.2% | | | | | | | |
| Landstar System | | | 161,303 | | | | 31,057,280 |
| MACHINERY - 14.5% | | | | | | | |
| ESAB Corporation | | | 245,591 | | | | 16,341,625 |
| ESCO Technologies | | | 268,953 | | | | 27,871,600 |
| John Bean Technologies | | | 281,250 | | | | 34,115,625 |
| Kadant | | | 151,302 | | | | 33,604,174 |
| Lincoln Electric Holdings | | | 231,311 | | | | 45,945,304 |
| Lindsay Corporation | | | 177,011 | | | | 21,124,493 |
| RBC Bearings 2 | | | 99,294 | | | | 21,593,466 |
| | | | | | | | 200,596,287 |
| PROFESSIONAL SERVICES - 2.5% | | | | | | | |
| Forrester Research 2 | | | 760,962 | | | | 22,136,384 |
| Korn Ferry | | | 241,331 | | | | 11,955,538 |
| | | | | | | | 34,091,922 |
| TRADING COMPANIES & DISTRIBUTORS - 1.9% | | | | | | | |
| Air Lease Cl. A | | | 627,000 | | | | 26,239,950 |
| Total (Cost $210,295,141) | | | | | | | 481,207,983 |
| | | | | | | | |
| INFORMATION TECHNOLOGY – 14.2% | | | | | | | |
| ELECTRONIC EQUIPMENT, INSTRUMENTS & COMPONENTS - 4.5% | | | | | | | |
| Cognex Corporation | | | 354,946 | | | | 19,884,075 |
| †Littelfuse | | | 24,300 | | | | 7,078,833 |
| National Instruments | | | 398,275 | | | | 22,860,985 |
| Rogers Corporation 2 | | | 78,500 | | | | 12,711,505 |
| | | | | | | | 62,535,398 |
| SEMICONDUCTORS & SEMICONDUCTOR EQUIPMENT - 6.2% | | | | | | | |
| Cirrus Logic 2 | | | 233,095 | | | | 18,883,026 |
| FormFactor 2 | | | 826,000 | | | | 28,265,720 |
| MKS Instruments | | | 352,500 | | | | 38,105,250 |
| | | | | | | | 85,253,996 |
| SOFTWARE - 1.9% | | | | | | | |
| Fair Isaac 2 | | | 32,143 | | | | 26,010,437 |
| TECHNOLOGY HARDWARE, STORAGE & PERIPHERALS - 1.6% | | | | | | | |
| Avid Technology 2 | | | 875,684 | | | | 22,329,942 |
| Total (Cost $99,382,068) | | | | | | | 196,129,773 |
| | | | | | | | |
| MATERIALS – 11.8% | | | | | | | |
| CHEMICALS - 5.3% | | | | | | | |
| Innospec | | | 374,276 | | | | 37,592,281 |
| Quaker Houghton | | | 182,413 | | | | 35,552,294 |
| | | | | | | | 73,144,575 |
| METALS & MINING - 3.1% | | | | | | | |
| Reliance Steel & Aluminum | | | 154,812 | | | | 42,045,391 |
| PAPER & FOREST PRODUCTS - 3.4% | | | | | | | |
| Stella-Jones | | | 923,631 | | | | 47,563,772 |
| Total (Cost $82,050,588) | | | | | | | 162,753,738 |
| | | | | | | | |
| REAL ESTATE – 7.6% | | | | | | | |
| REAL ESTATE MANAGEMENT & DEVELOPMENT - 7.6% | | | | | | | |
| Colliers International Group | | | 226,700 | | | | 22,259,673 |
| FirstService Corporation | | | 231,300 | | | | 35,641,017 |
| Kennedy-Wilson Holdings | | | 2,250,335 | | | | 36,747,971 |
| Marcus & Millichap | | | 322,000 | | | | 10,146,220 |
| Total (Cost $103,737,699) | | | | | | | 104,794,881 |
| | | | | | | | |
| TOTAL COMMON STOCKS | | | | | | | |
| (Cost $741,568,206) | | | | | | | 1,322,150,939 |
| 40 | The Royce Funds 2023 Semiannual Report to Shareholders | THE ACCOMPANYING NOTES ARE AN INTEGRAL PART OF THESE FINANCIAL STATEMENTS |
June 30, 2023 (unaudited)
| Royce Premier Fund (continued) | | |
| | | |
| | | VALUE |
| | | |
| REPURCHASE AGREEMENT– 4.4% | | |
Fixed Income Clearing Corporation, 3.00% dated 6/30/23, due 7/3/23, maturity value $60,580,928 (collateralized by obligations of U.S. Government Agencies, 4.375% due 5/15/41, valued at $61,777,141) |
| (Cost $60,565,786) | | $ | 60,565,786 |
| | | | |
| TOTAL INVESTMENTS – 100.0% | | | |
| (Cost $802,133,992) | | | 1,382,716,725 |
| | | | |
| LIABILITIES LESS CASH AND OTHER ASSETS – (0.0)% | | | (107,613) |
| | | | |
| NET ASSETS – 100.0% | | $ | 1,382,609,112 |
Royce Small-Cap Opportunity Fund
Common Stocks – 96.3%
| | | SHARES | | | VALUE |
| COMMUNICATION SERVICES – 5.6% | | | | | | | |
| DIVERSIFIED TELECOMMUNICATION SERVICES - 0.6% | | | | | | | |
| Ooma 2 | | | 500,003 | | | $ | 7,485,045 |
| ENTERTAINMENT - 0.7% | | | | | | | |
| IMAX Corporation 2 | | | 216,200 | | | | 3,673,238 |
| Marcus Corporation (The) | | | 378,729 | | | | 5,616,551 |
| | | | | | | | 9,289,789 |
| INTERACTIVE MEDIA & SERVICES - 2.2% | | | | | | | |
| Cars.com 2 | | | 301,200 | | | | 5,969,784 |
| DHI Group 2,4 | | | 1,173,228 | | | | 4,493,463 |
| EverQuote Cl. A 2 | | | 496,300 | | | | 3,225,950 |
| IAC 2 | | | 135,766 | | | | 8,526,105 |
| QuinStreet 2 | | | 685,300 | | | | 6,051,199 |
| | | | | | | | 28,266,501 |
| MEDIA - 2.1% | | | | | | | |
| comScore 2 | | | 1,273,062 | | | | 1,031,180 |
| †Criteo ADR 2 | | | 143,000 | | | | 4,824,820 |
| Entravision Communications Cl. A | | | 1,037,900 | | | | 4,556,381 |
| †Innovid Corp. 2 | | | 1,345,500 | | | | 1,466,595 |
| Magnite 2 | | | 645,200 | | | | 8,806,980 |
| Thryv Holdings 2 | | | 259,338 | | | | 6,379,715 |
| | | | | | | | 27,065,671 |
| Total (Cost $75,783,756) | | | | | | | 72,107,006 |
| | | | | | | | |
| CONSUMER DISCRETIONARY – 14.3% | | | | | | | |
| AUTOMOBILE COMPONENTS - 3.7% | | | | | | | |
| Adient 2 | | | 151,500 | | | | 5,805,480 |
| Dana | | | 302,953 | | | | 5,150,201 |
| Garrett Motion 2,4 | | | 907,285 | | | | 6,868,148 |
| Goodyear Tire & Rubber 2 | | | 339,600 | | | | 4,645,728 |
| Modine Manufacturing 2 | | | 345,463 | | | | 11,407,188 |
| Patrick Industries | | | 64,600 | | | | 5,168,000 |
| Stoneridge 2 | | | 446,857 | | | | 8,423,254 |
| | | | | | | | 47,467,999 |
| BROADLINE RETAIL - 1.0% | | | | | | | |
| Dillard’s Cl. A | | | 24,733 | | | | 8,069,883 |
| Nordstrom | | | 272,600 | | | | 5,580,122 |
| | | | | | | | 13,650,005 |
| DIVERSIFIED CONSUMER SERVICES - 0.3% | | | | | | | |
| Adtalem Global Education 2 | | | 71,400 | | | | 2,451,876 |
| †Udemy 2,4 | | | 197,500 | | | | 2,119,175 |
| | | | | | | | 4,571,051 |
| HOTELS, RESTAURANTS & LEISURE - 1.0% | | | | | | | |
| Carrols Restaurant Group 2 | | | 781,868 | | | | 3,940,615 |
| Century Casinos 2 | | | 287,694 | | | | 2,042,627 |
| Krispy Kreme | | | 166,989 | | | | 2,459,748 |
| Noodles & Company Cl. A 2 | | | 1,198,254 | | | | 4,050,099 |
| | | | | | | | 12,493,089 |
| HOUSEHOLD DURABLES - 3.2% | | | | | | | |
| Beazer Homes USA 2 | | | 177,806 | | | | 5,030,132 |
| Cavco Industries 2 | | | 20,100 | | | | 5,929,500 |
| Century Communities | | | 50,600 | | | | 3,876,972 |
| Helen of Troy 2 | | | 5,100 | | | | 550,902 |
| M/I Homes 2 | | | 37,200 | | | | 3,243,468 |
| Skyline Champion 2 | | | 112,700 | | | | 7,376,215 |
| Taylor Morrison Home 2 | | | 132,054 | | | | 6,440,273 |
| Toll Brothers | | | 49,586 | | | | 3,920,765 |
| Tri Pointe Homes 2 | | | 136,706 | | | | 4,492,159 |
| | | | | | | | 40,860,386 |
| SPECIALTY RETAIL - 4.1% | | | | | | | |
| Asbury Automotive Group 2 | | | 32,800 | | | | 7,885,776 |
| THE ACCOMPANYING NOTES ARE AN INTEGRAL PART OF THESE FINANCIAL STATEMENTS | The Royce Funds 2023 Semiannual Report to Shareholders | 41 |
Schedules of Investments
| Royce Small-Cap Opportunity Fund (continued) | | | | | | | |
| | | | | | | | |
| | | SHARES | | | VALUE |
| | | | | | | | |
| CONSUMER DISCRETIONARY (continued) | | | | | | | |
| SPECIALTY RETAIL (continued) | | | | | | | |
| Barnes & Noble Education 2 | | | 967,032 | | | $ | 1,218,460 |
| Caleres | | | 343,500 | | | | 8,219,955 |
| Chico’s FAS 2 | | | 737,192 | | | | 3,943,977 |
| Designer Brands Cl. A | | | 623,879 | | | | 6,301,178 |
| Express 2 | | | 1,210,900 | | | | 718,548 |
| J.Jill 2,4 | | | 251,239 | | | | 5,384,052 |
| JOANN 2 | | | 24,711 | | | | 21,597 |
| MarineMax 2 | | | 89,900 | | | | 3,070,984 |
| †OneWater Marine Cl. A 2 | | | 86,700 | | | | 3,142,008 |
| Overstock.com 2 | | | 227,700 | | | | 7,416,189 |
| Sportsman’s Warehouse Holdings 2,4 | | | 470,000 | | | | 2,679,000 |
| Victoria’s Secret & Co. 2 | | | 151,129 | | | | 2,634,179 |
| | | | | | | | 52,635,903 |
| TEXTILES, APPAREL & LUXURY GOODS - 1.0% | | | | | | | |
| Fossil Group 2 | | | 707,800 | | | | 1,819,046 |
| Lakeland Industries 3 | | | 372,979 | | | | 5,367,168 |
| Rocky Brands | | | 165,541 | | | | 3,476,361 |
| Vera Bradley 2 | | | 304,502 | | | | 1,945,768 |
| | | | | | | | 12,608,343 |
| Total (Cost $155,074,522) | | | | | | | 184,286,776 |
| | | | | | | | |
| CONSUMER STAPLES – 1.1% | | | | | | | |
| FOOD PRODUCTS - 0.4% | | | | | | | |
| SunOpta 2 | | | 678,600 | | | | 4,539,834 |
| HOUSEHOLD PRODUCTS - 0.4% | | | | | | | |
| Spectrum Brands Holdings | | | 66,000 | | | | 5,151,300 |
| PERSONAL CARE PRODUCTS - 0.3% | | | | | | | |
| Inter Parfums | | | 32,772 | | | | 4,431,758 |
| Total (Cost $11,520,280) | | | | | | | 14,122,892 |
| | | | | | | | |
| ENERGY – 5.9% | | | | | | | |
| ENERGY EQUIPMENT & SERVICES - 2.1% | | | | | | | |
| Archrock | | | 657,600 | | | | 6,740,400 |
| DMC Global 2 | | | 218,300 | | | | 3,877,008 |
| Mammoth Energy Services 2 | | | 823,117 | | | | 3,975,655 |
| Newpark Resources 2 | | | 176,500 | | | | 923,095 |
| Ranger Energy Services Cl. A 2,4 | | | 345,556 | | | | 3,538,494 |
| †Select Water Solutions Cl. A | | | 374,900 | | | | 3,036,690 |
| †Solaris Oilfield Infrastructure Cl. A | | | 557,700 | | | | 4,645,641 |
| | | | | | | | 26,736,983 |
| OIL, GAS & CONSUMABLE FUELS - 3.8% | | | | | | | |
| Ardmore Shipping | | | 441,593 | | | | 5,453,673 |
| Baytex Energy 2 | | | 943,900 | | | | 3,077,114 |
| Chesapeake Energy | | | 54,600 | | | | 4,568,928 |
| Earthstone Energy Cl. A 2 | | | 543,572 | | | | 7,767,644 |
| Matador Resources | | | 150,183 | | | | 7,857,575 |
| Navigator Holdings 2 | | | 465,884 | | | | 6,061,151 |
| Northern Oil and Gas | | | 192,700 | | | | 6,613,464 |
| Scorpio Tankers | | | 81,750 | | | | 3,861,052 |
| Southwestern Energy 2 | | | 644,681 | | | | 3,874,533 |
| | | | | | | | 49,135,134 |
| Total (Cost $51,088,286) | | | | | | | 75,872,117 |
| | | | | | | | |
| FINANCIALS – 5.4% | | | | | | | |
| BANKS - 2.5% | | | | | | | |
| Axos Financial 2 | | | 97,900 | | | | 3,861,176 |
| BankUnited | | | 77,000 | | | | 1,659,350 |
| BayCom Corporation | | | 224,551 | | | | 3,745,511 |
| †Business First Bancshares | | | 124,475 | | | | 1,875,838 |
| †CapStar Financial Holdings | | | 130,400 | | | | 1,600,008 |
| First Bancshares (The) | | | 85,600 | | | | 2,211,904 |
| †Hanmi Financial | | | 150,900 | | | | 2,252,937 |
| Hilltop Holdings | | | 194,308 | | | | 6,112,930 |
| New York Community Bancorp | | | 202,700 | | | | 2,278,348 |
| Seacoast Banking Corporation of Florida | | | 176,350 | | | | 3,897,335 |
| Western Alliance Bancorp | | | 75,700 | | | | 2,760,779 |
| | | | | | | | 32,256,116 |
| CAPITAL MARKETS - 2.2% | | | | | | | |
| Artisan Partners Asset Management Cl. A | | | 115,100 | | | | 4,524,581 |
| B. Riley Financial | | | 191,067 | | | | 8,785,260 |
| Canaccord Genuity Group | | | 304,900 | | | | 1,921,808 |
| †GCM Grosvenor Cl. A | | | 136,800 | | | | 1,031,472 |
| Moelis & Company Cl. A | | | 121,426 | | | | 5,505,455 |
| †P10 Cl. A | | | 386,400 | | | | 4,366,320 |
| †Perella Weinberg Partners Cl. A | | | 222,600 | | | | 1,854,258 |
| | | | | | | | 27,989,154 |
| FINANCIAL SERVICES - 0.1% | | | | | | | |
| †Acacia Research 2 | | | 365,900 | | | | 1,522,144 |
| INSURANCE - 0.6% | | | | | | | |
| Brighthouse Financial 2 | | | 168,000 | | | | 7,954,800 |
| Total (Cost $61,619,140) | | | | | | | 69,722,214 |
| | | | | | | | |
| HEALTH CARE – 5.9% | | | | | | | |
| BIOTECHNOLOGY - 0.4% | | | | | | | |
| CareDx 2 | | | 174,600 | | | | 1,484,100 |
| MiMedx Group 2 | | | 561,200 | | | | 3,709,532 |
| | | | | | | | 5,193,632 |
| HEALTH CARE EQUIPMENT & SUPPLIES - 2.4% | | | | | | | |
| Accuray 2 | | | 1,859,608 | | | | 7,196,683 |
| Apyx Medical 2 | | | 585,100 | | | | 2,943,053 |
| Artivion 2 | | | 402,300 | | | | 6,915,537 |
| Tactile Systems Technology 2 | | | 250,200 | | | | 6,237,486 |
| Varex Imaging 2 | | | 359,946 | | | | 8,483,927 |
| | | | | | | | 31,776,686 |
| HEALTH CARE PROVIDERS & SERVICES - 2.1% | | | | | | | |
| Community Health Systems 2 | | | 727,614 | | | | 3,201,501 |
| Cross Country Healthcare 2 | | | 172,320 | | | | 4,838,746 |
| NeoGenomics 2 | | | 279,800 | | | | 4,496,386 |
| †Quipt Home Medical 2,4 | | | 337,300 | | | | 1,801,182 |
| RadNet 2 | | | 226,300 | | | | 7,381,906 |
| Select Medical Holdings | | | 153,800 | | | | 4,900,068 |
| | | | | | | | 26,619,789 |
| HEALTH CARE TECHNOLOGY - 0.2% | | | | | | | |
| LifeMD 2,4 | | | 645,900 | | | | 2,809,665 |
| LIFE SCIENCES TOOLS & SERVICES - 0.3% | | | | | | | |
| Azenta 2 | | | 73,800 | | | | 3,444,984 |
| PHARMACEUTICALS - 0.5% | | | | | | | |
| Organon & Co | | | 233,903 | | | | 4,867,522 |
| Societal CDMO 2 | | | 1,620,753 | | | | 1,782,828 |
| | | | | | | | 6,650,350 |
| Total (Cost $58,064,710) | | | | | | | 76,495,106 |
| | | | | | | | |
| INDUSTRIALS – 30.5% | | | | | | | |
| AEROSPACE & DEFENSE - 5.6% | | | | | | | |
| AAR Corporation 2 | | | 148,200 | | | | 8,560,032 |
| Astronics Corporation 2 | | | 493,631 | | | | 9,803,512 |
| BWX Technologies | | | 113,600 | | | | 8,130,352 |
| Ducommun 2 | | | 173,686 | | | | 7,567,499 |
| 42 | The Royce Funds 2023 Semiannual Report to Shareholders | THE ACCOMPANYING NOTES ARE AN INTEGRAL PART OF THESE FINANCIAL STATEMENTS |
June 30, 2023 (unaudited)
| Royce Small-Cap Opportunity Fund (continued) | | | | | | | |
| | | | | | | | |
| | | SHARES | | | VALUE |
| | | | | | | | |
| INDUSTRIALS (continued) | | | | | | | |
| AEROSPACE & DEFENSE (continued) | | | | | | | |
| Kaman Corporation | | | 134,806 | | | $ | 3,279,830 |
| Kratos Defense & Security Solutions 2 | | | 349,000 | | | | 5,004,660 |
| Leonardo DRS 2,4 | | | 403,776 | | | | 7,001,476 |
| Mercury Systems 2 | | | 91,300 | | | | 3,158,067 |
| Spirit AeroSystems Holdings Cl. A 2 | | | 218,100 | | | | 6,366,339 |
| Terran Orbital 2,4 | | | 706,600 | | | | 1,059,900 |
| Triumph Group 2 | | | 616,716 | | | | 7,628,777 |
| †V2X 2 | | | 110,894 | | | | 5,495,906 |
| | | | | | | | 73,056,350 |
| AIR FREIGHT & LOGISTICS - 1.1% | | | | | | | |
| Hub Group Cl. A 2 | | | 112,700 | | | | 9,052,064 |
| Radiant Logistics 2 | | | 724,469 | | | | 4,868,432 |
| | | | | | | | 13,920,496 |
| BUILDING PRODUCTS - 1.9% | | | | | | | |
| Gibraltar Industries 2 | | | 115,600 | | | | 7,273,552 |
| Griffon Corporation | | | 170,367 | | | | 6,865,790 |
| Insteel Industries | | | 191,633 | | | | 5,963,619 |
| Resideo Technologies 2 | | | 263,216 | | | | 4,648,395 |
| | | | | | | | 24,751,356 |
| COMMERCIAL SERVICES & SUPPLIES - 2.4% | | | | | | | |
| ACV Auctions Cl. A 2 | | | 253,500 | | | | 4,377,945 |
| CECO Environmental 2 | | | 372,700 | | | | 4,979,272 |
| Healthcare Services Group 2 | | | 590,600 | | | | 8,817,658 |
| Heritage-Crystal Clean 2 | | | 93,588 | | | | 3,536,691 |
| VSE Corporation | | | 164,032 | | | | 8,970,910 |
| | | | | | | | 30,682,476 |
| CONSTRUCTION & ENGINEERING - 4.7% | | | | | | | |
| Arcosa | | | 42,906 | | | | 3,250,988 |
| Argan | | | 125,000 | | | | 4,926,250 |
| Comfort Systems USA | | | 18,310 | | | | 3,006,502 |
| Concrete Pumping Holdings 2 | | | 966,297 | | | | 7,759,365 |
| Construction Partners Cl. A 2 | | | 266,559 | | | | 8,367,287 |
| Limbach Holdings 2 | | | 297,131 | | | | 7,348,050 |
| Matrix Service 2 | | | 847,146 | | | | 4,989,690 |
| Northwest Pipe 2 | | | 182,545 | | | | 5,520,161 |
| Orion Group Holdings 2 | | | 1,221,266 | | | | 3,431,757 |
| Primoris Services | | | 255,780 | | | | 7,793,616 |
| Sterling Infrastructure 2 | | | 84,700 | | | | 4,726,260 |
| | | | | | | | 61,119,926 |
| ELECTRICAL EQUIPMENT - 1.4% | | | | | | | |
| American Superconductor 2 | | | 705,173 | | | | 4,414,383 |
| Babcock & Wilcox Enterprises 2 | | | 1,316,895 | | | | 7,769,680 |
| Power Solutions International 1,2 | | | 343,740 | | | | 934,973 |
| TPI Composites 2,4 | | | 461,800 | | | | 4,788,866 |
| | | | | | | | 17,907,902 |
| GROUND TRANSPORTATION - 0.5% | | | | | | | |
| Daseke 2 | | | 858,500 | | | | 6,121,105 |
| MACHINERY - 5.5% | | | | | | | |
| Barnes Group | | | 128,600 | | | | 5,425,634 |
| Commercial Vehicle Group 2 | | | 886,957 | | | | 9,845,223 |
| EnPro Industries | | | 48,400 | | | | 6,462,852 |
| Evercel 1,2 | | | 203,243 | | | | 186,984 |
| Helios Technologies | | | 61,900 | | | | 4,090,971 |
| Hurco Companies | | | 71,251 | | | | 1,542,584 |
| Luxfer Holdings | | | 486,700 | | | | 6,925,741 |
| Manitex International 2 | | | 944,262 | | | | 5,061,244 |
| Mayville Engineering 2 | | | 214,300 | | | | 2,670,178 |
| Shyft Group (The) | | | 272,938 | | | | 6,021,012 |
| Terex Corporation | | | 72,500 | | | | 4,337,675 |
| Trinity Industries | | | 273,624 | | | | 7,034,873 |
| Twin Disc 2 | | | 277,752 | | | | 3,127,487 |
| Wabash National | | | 335,400 | | | | 8,599,656 |
| | | | | | | | 71,332,114 |
| MARINE TRANSPORTATION - 0.2% | | | | | | | |
| Diana Shipping | | | 553,510 | | | | 2,042,452 |
| OceanPal 2 | | | 16,579 | | | | 27,189 |
| | | | | | | | 2,069,641 |
| PASSENGER AIRLINES - 0.8% | | | | | | | |
| Alaska Air Group 2 | | | 107,600 | | | | 5,722,168 |
| Allegiant Travel 2 | | | 29,225 | | | | 3,690,533 |
| Mesa Air Group 2 | | | 343,909 | | | | 876,968 |
| | | | | | | | 10,289,669 |
| PROFESSIONAL SERVICES - 2.9% | | | | | | | |
| Conduent 2 | | | 1,162,800 | | | | 3,953,520 |
| HireRight Holdings 2 | | | 245,600 | | | | 2,777,736 |
| Korn Ferry | | | 100,545 | | | | 4,980,999 |
| Mistras Group 2 | | | 809,121 | | | | 6,246,414 |
| Resources Connection | | | 407,764 | | | | 6,405,972 |
| Sterling Check 2 | | | 247,900 | | | | 3,039,254 |
| TrueBlue 2 | | | 266,636 | | | | 4,722,124 |
| TTEC Holdings | | | 174,400 | | | | 5,901,696 |
| | | | | | | | 38,027,715 |
| TRADING COMPANIES & DISTRIBUTORS - 3.5% | | | | | | | |
| Air Lease Cl. A | | | 211,238 | | | | 8,840,311 |
| BlueLinx Holdings 2 | | | 47,000 | | | | 4,407,660 |
| Herc Holdings | | | 67,819 | | | | 9,281,030 |
| Hudson Technologies 2 | | | 735,618 | | | | 7,076,645 |
| MRC Global 2 | | | 556,200 | | | | 5,600,934 |
| NOW 2 | | | 387,800 | | | | 4,017,608 |
| WESCO International | | | 35,004 | | | | 6,267,816 |
| | | | | | | | 45,492,004 |
| Total (Cost $328,973,328) | | | | | | | 394,770,754 |
| | | | | | | | |
| INFORMATION TECHNOLOGY – 19.5% | | | | | | | |
| COMMUNICATIONS EQUIPMENT - 3.4% | | | | | | | |
| ADTRAN Holdings | | | 438,700 | | | | 4,619,511 |
| Applied Optoelectronics 2 | | | 144,300 | | | | 860,028 |
| Aviat Networks 2 | | | 218,251 | | | | 7,283,036 |
| Cambium Networks 2,4 | | | 276,581 | | | | 4,209,563 |
| †Clearfield 2,4 | | | 77,100 | | | | 3,650,685 |
| Comtech Telecommunications | | | 511,517 | | | | 4,675,265 |
| Digi International 2 | | | 144,002 | | | | 5,672,239 |
| DZS 2,4 | | | 886,729 | | | | 3,520,314 |
| Infinera Corporation 2,4 | | | 545,046 | | | | 2,632,572 |
| PCTEL 3 | | | 1,035,154 | | | | 4,963,563 |
| Ribbon Communications 2 | | | 674,900 | | | | 1,882,971 |
| | | | | | | | 43,969,747 |
| ELECTRONIC EQUIPMENT, INSTRUMENTS & COMPONENTS - 6.4% | | | | | | | |
| Advanced Energy Industries | | | 81,853 | | | | 9,122,517 |
| Arlo Technologies 2,4 | | | 727,300 | | | | 7,934,843 |
| Avnet | | | 52,300 | | | | 2,638,535 |
| Benchmark Electronics | | | 305,600 | | | | 7,893,648 |
| Coherent 2 | | | 151,100 | | | | 7,703,078 |
| CTS Corporation | | | 190,214 | | | | 8,108,823 |
| Fabrinet 2 | | | 48,229 | | | | 6,263,982 |
| Frequency Electronics | | | 271,693 | | | | 1,798,608 |
| Identiv 2 | | | 556,651 | | | | 4,681,435 |
| Knowles Corporation 2 | | | 377,720 | | | | 6,821,623 |
| THE ACCOMPANYING NOTES ARE AN INTEGRAL PART OF THESE FINANCIAL STATEMENTS | The Royce Funds 2023 Semiannual Report to Shareholders | 43 |
Schedules of Investments
| Royce Small-Cap Opportunity Fund (continued) | | |
| | | |
| | | SHARES | | | VALUE |
| | | | | | |
| INFORMATION TECHNOLOGY (continued) | | | | | |
| ELECTRONIC EQUIPMENT, INSTRUMENTS & COMPONENTS (continued) | | | | | | | |
| nLIGHT 2 | | | 551,000 | | | $ | 8,496,420 |
| †SmartRent Cl. A 2,4 | | | 442,400 | | | | 1,694,392 |
| VIA optronics ADR 2 | | | 802,732 | | | | 2,119,212 |
| Vishay Intertechnology | | | 109,909 | | | | 3,231,325 |
| Vishay Precision Group 2 | | | 95,388 | | | | 3,543,664 |
| | | | | | | | 82,052,105 |
| IT SERVICES - 0.5% | | | | | | | |
| Kyndryl Holdings 2 | | | 444,400 | | | | 5,901,632 |
| SEMICONDUCTORS & SEMICONDUCTOR EQUIPMENT - 6.5% | | | | | | | |
| Alpha and Omega Semiconductor 2 | | | 199,313 | | | | 6,537,466 |
| Amkor Technology | | | 252,040 | | | | 7,498,190 |
| Amtech Systems 2 | | | 669,084 | | | | 6,396,443 |
| Cohu 2 | | | 218,176 | | | | 9,067,395 |
| FormFactor 2 | | | 221,113 | | | | 7,566,487 |
| Ichor Holdings 2 | | | 255,994 | | | | 9,599,775 |
| inTEST Corporation 2 | | | 107,900 | | | | 2,833,454 |
| Kulicke & Soffa Industries | | | 134,365 | | | | 7,987,999 |
| Onto Innovation 2 | | | 67,719 | | | | 7,887,232 |
| Ultra Clean Holdings 2 | | | 248,827 | | | | 9,569,887 |
| Veeco Instruments 2 | | | 365,687 | | | | 9,390,842 |
| | | | | | | | 84,335,170 |
| SOFTWARE - 1.2% | | | | | | | |
| A10 Networks | | | 350,426 | | | | 5,112,715 |
| †LiveRamp Holdings 2 | | | 128,900 | | | | 3,681,384 |
| Marin Software 2 | | | 595,767 | | | | 351,503 |
| SecureWorks Corp. Cl. A 2 | | | 641,191 | | | | 4,635,811 |
| †Viant Technology Cl. A 2 | | | 483,100 | | | | 2,227,091 |
| | | | | | | | 16,008,504 |
| TECHNOLOGY HARDWARE, STORAGE & PERIPHERALS - 1.5% | | | | | | | �� |
| Avid Technology 2 | | | 252,635 | | | | 6,442,192 |
| Immersion Corporation | | | 672,647 | | | | 4,762,341 |
| Intevac 2 | | | 1,123,302 | | | | 4,212,383 |
| †Xerox Holdings | | | 267,173 | | | | 3,978,206 |
| | | | | | | | 19,395,122 |
| Total (Cost $191,125,001) | | | | | | | 251,662,280 |
| | | | | | | | |
| MATERIALS – 8.0% | | | | | | | |
| CHEMICALS - 1.7% | | | | | | | |
| Aspen Aerogels 2 | | | 260,800 | | | | 2,057,712 |
| Huntsman Corporation | | | 194,100 | | | | 5,244,582 |
| Livent Corporation 2,4 | | | 270,200 | | | | 7,411,586 |
| †Mativ Holdings | | | 251,000 | | | | 3,795,120 |
| Tronox Holdings | | | 263,100 | | | | 3,344,001 |
| | | | | | | | 21,853,001 |
| CONSTRUCTION MATERIALS - 0.7% | | | | | | | |
| Summit Materials Cl. A 2 | | | 232,500 | | | | 8,800,125 |
| CONTAINERS & PACKAGING - 0.4% | | | | | | | |
| TriMas Corporation | | | 197,810 | | | | 5,437,797 |
| METALS & MINING - 5.2% | | | | | | | |
| ATI 2 | | | 200,414 | | | | 8,864,311 |
| †Capstone Copper 2 | | | 462,100 | | | | 2,096,411 |
| Carpenter Technology | | | 170,242 | | | | 9,555,684 |
| Century Aluminum 2 | | | 270,810 | | | | 2,361,463 |
| Cleveland-Cliffs 2 | | | 356,949 | | | | 5,982,465 |
| Commercial Metals | | | 126,300 | | | | 6,650,958 |
| Ferroglobe 2 | | | 1,327,171 | | | | 6,330,606 |
| Haynes International | | | 161,861 | | | | 8,225,776 |
| Major Drilling Group International 2 | | | 790,200 | | | | 5,451,918 |
| Noranda Aluminum Holding Corporation 2,5 | | | 488,157 | | | | 0 |
| Olympic Steel | | | 63,022 | | | | 3,088,078 |
| TimkenSteel Corporation 2 | | | 420,000 | | | | 9,059,400 |
| | | | | | | | 67,667,070 |
| Total (Cost $62,212,764) | | | | | | | 103,757,993 |
| | | | | | | | |
| REAL ESTATE – 0.1% | | | | | | | |
| REAL ESTATE MANAGEMENT & DEVELOPMENT - 0.1% | | | | | | | |
| Fathom Holdings 2 | | | 274,462 | | | | 1,959,659 |
| Total (Cost $1,292,775) | | | | | | | 1,959,659 |
| | | | | | | | |
| TOTAL COMMON STOCKS | | | | | | | |
| (Cost $996,754,562) | | | | | | | 1,244,756,797 |
| | | | | | | | |
| REPURCHASE AGREEMENT– 3.7% | | | | | | | |
Fixed Income Clearing Corporation, 3.00% dated 6/30/23, due 7/3/23, maturity value $47,618,107 (collateralized by obligations of U.S. Government Agencies, 3.75% due 5/31/30, valued at $48,558,391) |
| (Cost $47,606,205) | | | | | | | 47,606,205 |
| | | | | | | | |
| COLLATERAL RECEIVED FOR SECURITIES LOANED – 0.2% | | | | | | | |
| Money Market Funds | | | | | | | |
| Federated Hermes Government Obligations Fund - Institutional Shares (7 day yield-4.92%) | | | | | | | |
| (Cost $2,926,187) | | | 2,926,187 | | | | 2,926,187 |
| | | | | | | | |
| TOTAL INVESTMENTS – 100.2% | | | | | | | |
| (Cost $1,047,286,954) | | | | | | | 1,295,289,189 |
| | | | | | | | |
| LIABILITIES LESS CASH AND OTHER ASSETS – (0.2)% | | | (2,950,362) |
| | | | |
| NET ASSETS – 100.0% | | $ | 1,292,338,827 |
| 44 | The Royce Funds 2023 Semiannual Report to Shareholders | THE ACCOMPANYING NOTES ARE AN INTEGRAL PART OF THESE FINANCIAL STATEMENTS |
June 30, 2023 (unaudited)
Royce Small-Cap Special Equity Fund
Common Stocks – 81.1%
| | | SHARES | | | VALUE |
| | | | | | |
| COMMUNICATION SERVICES – 3.9% | | | | | | | |
| MEDIA - 3.9% | | | | | | | |
| TEGNA | | | 1,917,000 | | | $ | 31,132,080 |
| Total (Cost $37,254,385) | | | | | | | 31,132,080 |
| | | | | | | | |
| CONSUMER DISCRETIONARY – 13.9% | | | | | | | |
| AUTOMOBILE COMPONENTS - 4.0% | | | | | | | |
| Standard Motor Products | | | 850,000 | | | | 31,892,000 |
| BROADLINE RETAIL - 2.8% | | | | | | | |
| Macy’s | | | 1,424,000 | | | | 22,855,200 |
| DIVERSIFIED CONSUMER SERVICES - 2.3% | | | | | | | |
| H&R Block | | | 584,000 | | | | 18,612,080 |
| HOTELS, RESTAURANTS & LEISURE - 0.2% | | | | | | | |
| Nathan’s Famous | | | 22,100 | | | | 1,735,734 |
| HOUSEHOLD DURABLES - 1.0% | | | | | | | |
| Ethan Allen Interiors | | | 280,000 | | | | 7,918,400 |
| SPECIALTY RETAIL - 0.3% | | | | | | | |
| †ODP Corporation (The) 2 | | | 51,000 | | | | 2,387,820 |
| TEXTILES, APPAREL & LUXURY GOODS - 3.3% | | | | | | | |
| Movado Group | | | 988,500 | | | | 26,521,455 |
| Total (Cost $104,303,571) | | | | | | | 111,922,689 |
| | | | | | | | |
| CONSUMER STAPLES – 10.5% | | | | | | | |
| CONSUMER STAPLES DISTRIBUTION & RETAIL - 5.8% | | | | | | | |
| Ingles Markets Cl. A | | | 565,000 | | | | 46,697,250 |
| FOOD PRODUCTS - 4.5% | | | | | | | |
| John B. Sanfilippo & Son | | | 311,500 | | | | 36,529,605 |
| HOUSEHOLD PRODUCTS - 0.2% | | | | | | | |
| Oil-Dri Corporation of America | | | 25,900 | | | | 1,527,841 |
| Total (Cost $55,469,847) | | | | | | | 84,754,696 |
| | | | | | | | |
| ENERGY – 0.8% | | | | | | | |
| ENERGY EQUIPMENT & SERVICES - 0.8% | | | | | | | |
| RPC | | | 950,000 | | | | 6,792,500 |
| Total (Cost $7,738,166) | | | | | | | 6,792,500 |
| | | | | | | | |
| FINANCIALS – 5.0% | | | | | | | |
| CAPITAL MARKETS - 5.0% | | | | | | | |
| Diamond Hill Investment Group | | | 138,800 | | | | 23,776,440 |
| Federated Hermes Cl. B | | | 290,000 | | | | 10,396,500 |
| GAMCO Investors Cl. A 1 | | | 313,600 | | | | 6,008,576 |
| Total (Cost $31,051,786) | | | | | | | 40,181,516 |
| | | | | | | | |
| INDUSTRIALS – 24.6% | | | | | | | |
| BUILDING PRODUCTS - 3.1% | | | | | | | |
| Insteel Industries | | | 412,400 | | | | 12,833,888 |
| UFP Industries | | | 126,000 | | | | 12,228,300 |
| | | | | | | | 25,062,188 |
| COMMERCIAL SERVICES & SUPPLIES - 3.2% | | | | | | | |
| Ennis | | | 1,276,000 | | | | 26,004,880 |
| ELECTRICAL EQUIPMENT - 11.3% | | | | | | | |
| Atkore 2 | | | 127,000 | | | | 19,804,380 |
| Encore Wire | | | 279,000 | | | | 51,874,470 |
| Preformed Line Products | | | 125,500 | | | | 19,590,550 |
| | | | | | | | 91,269,400 |
| MACHINERY - 6.0% | | | | | | | |
| Gencor Industries 2,3 | | | 910,000 | | | | 14,177,800 |
| Hurco Companies 3 | | | 439,800 | | | | 9,521,670 |
| Mueller Industries | | | 279,500 | | | | 24,394,760 |
| | | | | | | | 48,094,230 |
| PROFESSIONAL SERVICES - 1.0% | | | | | | | |
| Resources Connection | | | 488,500 | | | | 7,674,335 |
| Total (Cost $131,565,521) | | | | | | | 198,105,033 |
| | | | | | | | |
| INFORMATION TECHNOLOGY – 9.8% | | | | | | | |
| ELECTRONIC EQUIPMENT, INSTRUMENTS & COMPONENTS - 5.8% | | | | | | | |
| Vishay Intertechnology | | | 1,600,000 | | | | 47,040,000 |
| SEMICONDUCTORS & SEMICONDUCTOR EQUIPMENT - 4.0% | | | | | | | |
| NVE Corporation 3 | | | 330,500 | | | | 32,203,920 |
| Total (Cost $43,121,503) | | | | | | | 79,243,920 |
| | | | | | | | |
| MATERIALS – 9.0% | | | | | | | |
| CHEMICALS - 3.3% | | | | | | | |
| Huntsman Corporation | | | 969,000 | | | | 26,182,380 |
| CONSTRUCTION MATERIALS - 3.3% | | | | | | | |
| United States Lime & Minerals | | | 126,000 | | | | 26,320,140 |
| METALS & MINING - 0.6% | | | | | | | |
| TimkenSteel Corporation 2 | | | 240,000 | | | | 5,176,800 |
| PAPER & FOREST PRODUCTS - 1.8% | | | | | | | |
| Sylvamo Corporation | | | 364,000 | | | | 14,723,800 |
| Total (Cost $48,763,424) | | | | | | | 72,403,120 |
| | | | | | | | |
| REAL ESTATE – 3.6% | | | | | | | |
| REAL ESTATE MANAGEMENT & DEVELOPMENT - 3.6% | | | | | | | |
| Marcus & Millichap | | | 907,000 | | | | 28,579,570 |
| Total (Cost $26,207,783) | | | | | | | 28,579,570 |
| | | | | | | | |
| TOTAL COMMON STOCKS | | | | | | | |
| (Cost $485,475,986) | | | | | | | 653,115,124 |
| | | |
| REPURCHASE AGREEMENT– 19.1% | | |
Fixed Income Clearing Corporation, 3.00% dated 6/30/23, due 7/3/23, maturity value $153,766,075 (collateralized by obligations of various U.S. Government Agencies, 4.25%-4.375% due 11/15/40-5/15/41, valued at $156,802,204) | | |
| (Cost $153,727,643) | | | 153,727,643 |
| | | | |
| TOTAL INVESTMENTS – 100.2% | | | |
| (Cost $639,203,629) | | | 806,842,767 |
| | | | |
| LIABILITIES LESS CASH AND OTHER ASSETS – (0.2)% | | | (1,960,184) |
| | | | |
| NET ASSETS – 100.0% | | $ | 804,882,583 |
| THE ACCOMPANYING NOTES ARE AN INTEGRAL PART OF THESE FINANCIAL STATEMENTS | The Royce Funds 2023 Semiannual Report to Shareholders | 45 |
Schedules of Investments
Royce Small-Cap Total Return Fund
Common Stocks – 96.4%
| | | SHARES | | | VALUE |
| | | | | | |
| COMMUNICATION SERVICES – 1.9% | | | | | | | |
| INTERACTIVE MEDIA & SERVICES - 1.9% | | | | | | | |
| Ziff Davis 2 | | | 267,200 | | | $ | 18,720,032 |
| Total (Cost $21,231,431) | | | | | | | 18,720,032 |
| | | | | | | | |
| CONSUMER DISCRETIONARY – 8.4% | | | | | | | |
| AUTOMOBILE COMPONENTS - 1.8% | | | | | | | |
| Vitesco Technologies Group 1,2 | | | 212,600 | | | | 17,506,490 |
| HOTELS, RESTAURANTS & LEISURE - 1.0% | | | | | | | |
| Denny’s Corporation 2 | | | 795,300 | | | | 9,798,096 |
| HOUSEHOLD DURABLES - 2.1% | | | | | | | |
| Helen of Troy 2 | | | 182,495 | | | | 19,713,110 |
| LEISURE PRODUCTS - 1.2% | | | | | | | |
| YETI Holdings 2,4 | | | 302,200 | | | | 11,737,448 |
| SPECIALTY RETAIL - 1.8% | | | | | | | |
| JOANN 2 | | | 3,105 | | | | 2,714 |
| OneWater Marine Cl. A 2 | | | 488,875 | | | | 17,716,830 |
| | | | | | | | 17,719,544 |
| TEXTILES, APPAREL & LUXURY GOODS - 0.5% | | | | | | | |
| Levi Strauss & Co. Cl. A | | | 304,247 | | | | 4,390,284 |
| Total (Cost $68,615,099) | | | | | | | 80,864,972 |
| | | | | | | | |
| ENERGY – 5.2% | | | | | | | |
| ENERGY EQUIPMENT & SERVICES - 5.2% | | | | | | | |
| Cactus Cl. A | | | 317,659 | | | | 13,443,329 |
| Core Laboratories | | | 468,100 | | | | 10,883,325 |
| †Dril-Quip 2 | | | 493,900 | | | | 11,493,053 |
| Oceaneering International 2 | | | 139,833 | | | | 2,614,877 |
| Pason Systems | | | 1,374,076 | | | | 11,917,821 |
| Total (Cost $48,353,448) | | | | | | | 50,352,405 |
| | | | | | | | |
| FINANCIALS – 36.5% | | | | | | | |
| BANKS - 14.0% | | | | | | | |
| Atlantic Union Bankshares | | | 247,446 | | | | 6,421,224 |
| Bank of N.T. Butterfield & Son | | | 85,229 | | | | 2,331,865 |
| BankUnited | | | 848,190 | | | | 18,278,494 |
| BOK Financial | | | 82,801 | | | | 6,688,665 |
| First Bancorp | | | 49,190 | | | | 1,463,402 |
| First Bancshares (The) | | | 236,403 | | | | 6,108,654 |
| First Citizens BancShares Cl. A | | | 2,660 | | | | 3,413,977 |
| HBT Financial | | | 205,972 | | | | 3,798,124 |
| †Hingham Institution for Savings | | | 39,741 | | | | 8,471,986 |
| Home BancShares | | | 681,267 | | | | 15,532,888 |
| Independent Bank Group | | | 311,221 | | | | 10,746,461 |
| Origin Bancorp | | | 384,280 | | | | 11,259,404 |
| †Seacoast Banking Corporation of Florida | | | 283,971 | | | | 6,275,759 |
| TowneBank | | | 345,548 | | | | 8,030,536 |
| Valley National Bancorp | | | 1,599,886 | | | | 12,399,117 |
| Western Alliance Bancorp | | | 195,307 | | | | 7,122,846 |
| †Wintrust Financial | | | 101,663 | | | | 7,382,767 |
| | | | | | | | 135,726,169 |
| CAPITAL MARKETS - 3.4% | | | | | | | |
| Artisan Partners Asset Management Cl. A | | | 78,203 | | | | 3,074,160 |
| Moelis & Company Cl. A | | | 139,237 | | | | 6,313,005 |
| Tel Aviv Stock Exchange 1,2 | | | 3,400,700 | | | | 17,556,947 |
| TMX Group | | | 274,020 | | | | 6,166,096 |
| | | | | | | | 33,110,208 |
| CONSUMER FINANCE - 1.3% | | | | | | | |
| †Encore Capital Group 2,4 | | | 89,138 | | | | 4,333,889 |
| PRA Group 2 | | | 362,700 | | | | 8,287,695 |
| | | | | | | | 12,621,584 |
| FINANCIAL SERVICES - 5.2% | | | | | | | |
| Compass Diversified Holdings | | | 725,170 | | | | 15,728,937 |
| NewtekOne | | | 1,037,158 | | | | 16,490,812 |
| Repay Holdings Cl. A 2 | | | 2,255,674 | | | | 17,661,928 |
| | | | | | | | 49,881,677 |
| INSURANCE - 12.6% | | | | | | | |
| AMERISAFE | | | 78,297 | | | | 4,174,796 |
| Assured Guaranty | | | 341,700 | | | | 19,066,860 |
| Axis Capital Holdings | | | 352,897 | | | | 18,996,445 |
| First American Financial | | | 304,145 | | | | 17,342,348 |
| International General Insurance Holdings 3 | | | 2,921,863 | | | | 26,092,237 |
| James River Group Holdings | | | 47,503 | | | | 867,405 |
| RenaissanceRe Holdings | | | 101,791 | | | | 18,986,057 |
| †Skyward Specialty Insurance Group 2,4 | | | 454,200 | | | | 11,536,680 |
| Stewart Information Services | | | 115,404 | | | | 4,747,721 |
| | | | | | | | 121,810,549 |
| Total (Cost $322,307,221) | | | | | | | 353,150,187 |
| | | | | | | | |
| INDUSTRIALS – 20.3% | | | | | | | |
| BUILDING PRODUCTS - 2.8% | | | | | | | |
| Simpson Manufacturing | | | 76,100 | | | | 10,539,850 |
| UFP Industries | | | 169,399 | | | | 16,440,173 |
| | | | | | | | 26,980,023 |
| COMMERCIAL SERVICES & SUPPLIES - 1.4% | | | | | | | |
| Healthcare Services Group 2 | | | 873,556 | | | | 13,042,191 |
| MACHINERY - 4.7% | | | | | | | |
| Allison Transmission Holdings | | | 133,857 | | | | 7,557,566 |
| Crane NXT | | | 147,139 | | | | 8,304,525 |
| Douglas Dynamics | | | 521,779 | | | | 15,590,757 |
| Lincoln Electric Holdings | | | 10,666 | | | | 2,118,588 |
| Timken Company (The) | | | 127,574 | | | | 11,676,848 |
| | | | | | | | 45,248,284 |
| PROFESSIONAL SERVICES - 2.5% | | | | | | | |
| Barrett Business Services | | | 163,027 | | | | 14,215,954 |
| KBR | | | 151,754 | | | | 9,873,115 |
| | | | | | | | 24,089,069 |
| TRADING COMPANIES & DISTRIBUTORS - 8.9% | | | | | | | |
| Air Lease Cl. A | | | 490,400 | | | | 20,523,240 |
| Applied Industrial Technologies | | | 80,660 | | | | 11,681,988 |
| FTAI Aviation | | | 727,800 | | | | 23,042,148 |
| Global Industrial | | | 232,064 | | | | 6,444,417 |
| †MRC Global 2 | | | 299,100 | | | | 3,011,937 |
| MSC Industrial Direct Cl. A | | | 83,610 | | | | 7,966,361 |
| NOW 2,4 | | | 1,333,000 | | | | 13,809,880 |
| | | | | | | | 86,479,971 |
| Total (Cost $141,025,011) | | | | | | | 195,839,538 |
| | | | | | | | |
| INFORMATION TECHNOLOGY – 15.0% | | | | | | | |
| ELECTRONIC EQUIPMENT, INSTRUMENTS & COMPONENTS - 3.7% | | | | | | | |
| Avnet | | | 133,709 | | | | 6,745,619 |
| †Coherent 2,4 | | | 49,700 | | | | 2,533,706 |
| Vontier Corporation | | | 829,653 | | | | 26,723,123 |
| | | | | | | | 36,002,448 |
| IT SERVICES - 4.1% | | | | | | | |
| Hackett Group (The) | | | 898,909 | | | | 20,090,616 |
| Kyndryl Holdings 2 | | | 1,490,651 | | | | 19,795,846 |
| | | | | | | | 39,886,462 |
| SEMICONDUCTORS & SEMICONDUCTOR EQUIPMENT - 3.1% | | | | | | | |
| Kulicke & Soffa Industries | | | 195,684 | | | | 11,633,414 |
| 46 | The Royce Funds 2023 Semiannual Report to Shareholders | THE ACCOMPANYING NOTES ARE AN INTEGRAL PART OF THESE FINANCIAL STATEMENTS |
June 30, 2023 (unaudited)
Royce Small-Cap Total Return Fund (continued)
| | | SHARES | | | VALUE |
| | | | | | |
| INFORMATION TECHNOLOGY (continued) | | | | | |
| SEMICONDUCTORS & SEMICONDUCTOR EQUIPMENT (continued) | | | | | | | |
| MKS Instruments | | | 169,684 | | | $ | 18,342,840 |
| | | | | | | | 29,976,254 |
| SOFTWARE - 4.1% | | | | | | | |
| Sapiens International | | | 719,677 | | | | 19,143,408 |
| Teradata Corporation 2 | | | 381,467 | | | | 20,374,153 |
| | | | | | | | 39,517,561 |
| Total (Cost $111,792,102) | | | | | | | 145,382,725 |
| | | | | | | | |
| MATERIALS – 6.1% | | | | | | | |
| CHEMICALS - 2.7% | | | | | | | |
| Element Solutions | | | 1,018,098 | | | | 19,547,482 |
| Minerals Technologies | | | 110,880 | | | | 6,396,667 |
| | | | | | | | 25,944,149 |
| CONTAINERS & PACKAGING - 3.4% | | | | | | | |
| Graphic Packaging Holding Company | | | 375,860 | | | | 9,031,916 |
| Silgan Holdings | | | 428,254 | | | | 20,080,830 |
| TriMas Corporation | | | 139,459 | | | | 3,833,728 |
| | | | | | | | 32,946,474 |
| Total (Cost $48,421,739) | | | | | | | 58,890,623 |
| | | | | | | | |
| REAL ESTATE – 3.0% | | | | | | | |
| OFFICE REITS - 1.3% | | | | | | | |
| Equity Commonwealth | | | 615,121 | | | | 12,462,351 |
| REAL ESTATE MANAGEMENT & DEVELOPMENT - 1.7% | | | | | | | |
| Kennedy-Wilson Holdings | | | 993,197 | | | | 16,218,907 |
| Total (Cost $30,743,600) | | | | | | | 28,681,258 |
| | | | | | | | |
| TOTAL COMMON STOCKS | | | | | | | |
| (Cost $792,489,651) | | | | | | | 931,881,740 |
| | | | | | | | |
| PREFERRED STOCK - 0.4% | | | | | | | |
| INFORMATION TECHNOLOGY – 0.4% | | | | | | | |
| ELECTRONIC EQUIPMENT, INSTRUMENTS & COMPONENTS - 0.4% | | | | | | | |
| Coherent Series A Conv. | | | 18,824 | | | | 4,274,554 |
| (Cost $3,399,144) | | | | | | | 4,274,554 |
| REPURCHASE AGREEMENT– 3.0% | | |
Fixed Income Clearing Corporation, 3.00% dated 6/30/23, due 7/3/23, maturity value $29,221,971 (collateralized by obligations of U.S. Government Agencies, 4.25% due 11/15/40, valued at $29,799,017) |
| (Cost $29,214,667) | | | 29,214,667 |
| | | | | | |
| COLLATERAL RECEIVED FOR SECURITIES LOANED – 0.3% | | | | | |
| Money Market Funds | | | | | |
| Federated Hermes Government Obligations Fund - Institutional Shares (7 day yield-4.92%) | | | | | |
| (Cost $2,560,374) | | | 2,560,374 | | | | 2,560,374 |
| | | | | | | | |
| TOTAL INVESTMENTS – 100.1% | | | | | | | |
| (Cost $827,663,836) | | | | | | | 967,931,335 |
| | | | | | | | |
| LIABILITIES LESS CASH AND OTHER ASSETS – (0.1)% | | | | | | | (890,110) |
| | | | | | | | |
| NET ASSETS – 100.0% | | | | | | $ | 967,041,225 |
Royce Small-Cap Value Fund
Common Stocks – 98.1%
| | | SHARES | | | VALUE |
| | | | | | |
| COMMUNICATION SERVICES – 2.8% | | | | | | | |
| MEDIA - 2.8% | | | | | | | |
| Entravision Communications Cl. A | | | 128,970 | | | $ | 566,178 |
| Saga Communications Cl. A | | | 54,104 | | | | 1,155,662 |
| †TEGNA | | | 83,500 | | | | 1,356,040 |
| Total (Cost $3,531,678) | | | | | | | 3,077,880 |
| | | | | | | | |
| CONSUMER DISCRETIONARY – 19.4% | | | | | | | |
| DIVERSIFIED CONSUMER SERVICES - 0.8% | | | | | | | |
| Lincoln Educational Services 2 | | | 138,477 | | | | 933,335 |
| HOTELS, RESTAURANTS & LEISURE - 1.7% | | | | | | | |
| Bloomin’ Brands | | | 69,700 | | | | 1,874,233 |
| HOUSEHOLD DURABLES - 3.4% | | | | | | | |
| M/I Homes 2 | | | 18,321 | | | | 1,597,408 |
| PulteGroup | | | 27,200 | | | | 2,112,896 |
| | | | | | | | 3,710,304 |
| LEISURE PRODUCTS - 1.1% | | | | | | | |
| Malibu Boats Cl. A 2 | | | 13,190 | | | | 773,725 |
| MasterCraft Boat Holdings 2 | | | 15,967 | | | | 489,389 |
| | | | | | | | 1,263,114 |
| SPECIALTY RETAIL - 6.9% | | | | | | | |
| Buckle (The) | | | 28,077 | | | | 971,464 |
| †Chico’s FAS 2 | | | 168,100 | | | | 899,335 |
| †Destination XL Group 2 | | | 189,600 | | | | 929,040 |
| Haverty Furniture | | | 28,615 | | | | 864,745 |
| OneWater Marine Cl. A 2 | | | 22,688 | | | | 822,213 |
| Shoe Carnival | | | 61,583 | | | | 1,445,969 |
| †Signet Jewelers | | | 12,200 | | | | 796,172 |
| Williams-Sonoma | | | 6,700 | | | | 838,438 |
| | | | | | | | 7,567,376 |
| TEXTILES, APPAREL & LUXURY GOODS - 5.5% | | | | | | | |
| Carter’s | | | 20,300 | | | | 1,473,780 |
| Kontoor Brands | | | 31,400 | | | | 1,321,940 |
| Movado Group | | | 28,401 | | | | 761,999 |
| Steven Madden | | | 40,900 | | | | 1,337,021 |
| Tapestry | | | 28,300 | | | | 1,211,240 |
| | | | | | | | 6,105,980 |
| Total (Cost $16,909,320) | | | | | | | 21,454,342 |
| | | | | | | | |
| CONSUMER STAPLES – 2.4% | | | | | | | |
| CONSUMER STAPLES DISTRIBUTION & RETAIL - 2.4% | | | | | | | |
| Ingles Markets Cl. A | | | 15,775 | | | | 1,303,804 |
| Village Super Market Cl. A | | | 60,899 | | | | 1,389,715 |
| Total (Cost $2,753,549) | | | | | | | 2,693,519 |
| | | | | | | | |
| ENERGY – 9.5% | | | | | | | |
| OIL, GAS & CONSUMABLE FUELS - 9.5% | | | | | | | |
| †Berry Corporation | | | 113,841 | | | | 783,226 |
| Chord Energy | | | 12,052 | | | | 1,853,598 |
| Civitas Resources | | | 25,100 | | | | 1,741,187 |
| Dorchester Minerals L.P. | | | 55,104 | | | | 1,650,916 |
| Matador Resources | | | 27,100 | | | | 1,417,872 |
| Riley Exploration Permian | | | 42,053 | | | | 1,502,133 |
| SilverBow Resources 2 | | | 53,996 | | | | 1,572,363 |
| Total (Cost $8,559,843) | | | | | | | 10,521,295 |
| | | | | | | | |
| FINANCIALS – 13.4% | | | | | | | |
| BANKS - 8.5% | | | | | | | |
| Citizens Community Bancorp | | | 78,561 | | | | 695,265 |
| CNB Financial | | | 68,758 | | | | 1,213,579 |
| Landmark Bancorp | | | 13,246 | | | | 288,763 |
| Mid Penn Bancorp | | | 42,804 | | | | 945,112 |
| THE ACCOMPANYING NOTES ARE AN INTEGRAL PART OF THESE FINANCIAL STATEMENTS | The Royce Funds 2023 Semiannual Report to Shareholders | 47 |
Schedules of Investments
| Royce Small-Cap Value Fund (continued) | | |
| | | |
| | | SHARES | | | VALUE |
| FINANCIALS (continued) | | | | | | | |
| BANKS (continued) | | | | | | | |
| National Bankshares | | | 8,635 | | | $ | 252,055 |
| Princeton Bancorp | | | 29,649 | | | | 810,011 |
| Riverview Bancorp | | | 116,183 | | | | 585,562 |
| Timberland Bancorp | | | 53,249 | | | | 1,362,109 |
| TrustCo Bank Corp NY | | | 37,234 | | | | 1,065,265 |
| Unity Bancorp | | | 56,935 | | | | 1,343,097 |
| Western New England Bancorp | | | 131,467 | | | | 767,767 |
| | | | | | | | 9,328,585 |
| CAPITAL MARKETS - 2.1% | | | | | | | |
| Evercore Cl. A | | | 16,442 | | | | 2,032,067 |
| Houlihan Lokey Cl. A | | | 2,790 | | | | 274,285 |
| | | | | | | | 2,306,352 |
| FINANCIAL SERVICES - 1.2% | | | | | | | |
| †International Money Express 2 | | | 55,500 | | | | 1,361,415 |
| INSURANCE - 1.6% | | | | | | | |
| Tiptree | | | 118,696 | | | | 1,781,627 |
| Total (Cost $14,260,316) | | | | | | | 14,777,979 |
| | | | | | | | |
| HEALTH CARE – 5.7% | | | | | | | |
| BIOTECHNOLOGY - 1.3% | | | | | | | |
| Catalyst Pharmaceuticals 2 | | | 106,249 | | | | 1,427,987 |
| HEALTH CARE PROVIDERS & SERVICES - 3.2% | | | | | | | |
| Cross Country Healthcare 2 | | | 58,957 | | | | 1,655,512 |
| Ensign Group (The) | | | 2,791 | | | | 266,429 |
| Molina Healthcare 2 | | | 5,240 | | | | 1,578,498 |
| | | | | | | | 3,500,439 |
| PHARMACEUTICALS - 1.2% | | | | | | | |
| SIGA Technologies | | | 260,263 | | | | 1,314,328 |
| Total (Cost $5,161,733) | | | | | | | 6,242,754 |
| | | | | | | | |
| INDUSTRIALS – 21.0% | | | | | | | |
| AIR FREIGHT & LOGISTICS - 1.3% | | | | | | | |
| Hub Group Cl. A 2 | | | 17,212 | | | | 1,382,468 |
| BUILDING PRODUCTS - 3.1% | | | | | | | |
| Insteel Industries | | | 15,152 | | | | 471,530 |
| Quanex Building Products | | | 57,095 | | | | 1,533,001 |
| UFP Industries | | | 14,800 | | | | 1,436,340 |
| | | | | | | | 3,440,871 |
| CONSTRUCTION & ENGINEERING - 3.1% | | | | | | | |
| Northwest Pipe 2 | | | 39,369 | | | | 1,190,518 |
| Sterling Infrastructure 2 | | | 39,466 | | | | 2,202,203 |
| | | | | | | | 3,392,721 |
| ELECTRICAL EQUIPMENT - 1.3% | | | | | | | |
| Preformed Line Products | | | 9,462 | | | | 1,477,018 |
| GROUND TRANSPORTATION - 4.5% | | | | | | | |
| ArcBest Corporation | | | 18,428 | | | | 1,820,686 |
| Schneider National Cl. B | | | 69,850 | | | | 2,006,092 |
| †Universal Logistics Holdings | | | 28,334 | | | | 816,302 |
| Werner Enterprises | | | 6,676 | | | | 294,946 |
| | | | | | | | 4,938,026 |
| MARINE TRANSPORTATION - 1.8% | | | | | |
| †Genco Shipping & Trading | | | 91,758 | | | | 1,287,365 |
| †Pangaea Logistics Solutions | | | 104,578 | | | | 707,993 |
| | | | | | | | 1,995,358 |
| PROFESSIONAL SERVICES - 4.8% | | | | | |
| Barrett Business Services | | | 16,394 | | | | 1,429,557 |
| IBEX 2 | | | 60,819 | | | | 1,291,187 |
| Kforce | | | 4,395 | | | | 275,391 |
| Korn Ferry | | | 18,164 | | | | 899,845 |
| Resources Connection | | | 91,851 | | | | 1,442,979 |
| | | | | | | | 5,338,959 |
| TRADING COMPANIES & DISTRIBUTORS - 1.1% | | | | | | | |
| †Veritiv | | | 9,893 | | | | 1,242,660 |
| Total (Cost $16,788,291) | | | | | | | 23,208,081 |
| | | | | | | | |
| INFORMATION TECHNOLOGY – 21.5% | | | | | | | |
| COMMUNICATIONS EQUIPMENT - 1.3% | | | | | | | |
| Aviat Networks 2 | | | 41,342 | | | | 1,379,582 |
| ELECTRONIC EQUIPMENT, INSTRUMENTS & COMPONENTS - 14.8% | | | | | | | |
| ePlus 2 | | | 29,607 | | | | 1,666,874 |
| Flex 2 | | | 78,881 | | | | 2,180,271 |
| Insight Enterprises 2 | | | 11,307 | | | | 1,654,666 |
| Jabil | | | 20,475 | | | | 2,209,867 |
| Kimball Electronics 2 | | | 72,867 | | | | 2,013,315 |
| PC Connection | | | 28,015 | | | | 1,263,476 |
| Sanmina Corporation 2 | | | 30,940 | | | | 1,864,754 |
| TD SYNNEX | | | 13,366 | | | | 1,256,404 |
| Vishay Intertechnology | | | 75,404 | | | | 2,216,878 |
| | | | | | | | 16,326,505 |
| IT SERVICES - 0.9% | | | | | | | |
| Computer Task Group 2 | | | 136,616 | | | | 1,039,648 |
| SEMICONDUCTORS & SEMICONDUCTOR EQUIPMENT - 2.8% | | | | | | | |
| Alpha and Omega Semiconductor 2 | | | 33,700 | | | | 1,105,360 |
| Amkor Technology | | | 40,457 | | | | 1,203,596 |
| Cohu 2 | | | 6,708 | | | | 278,785 |
| Kulicke & Soffa Industries | | | 4,665 | | | | 277,334 |
| Ultra Clean Holdings 2 | | | 7,251 | | | | 278,873 |
| | | | | | | | 3,143,948 |
| SOFTWARE - 1.7% | | | | | | | |
| Adeia | | | 166,619 | | | | 1,834,475 |
| Total (Cost $14,823,270) | | | | | | | 23,724,158 |
| | | | | | | | |
| MATERIALS – 1.4% | | | | | | | |
| METALS & MINING - 1.4% | | | | | | | |
| †Ryerson Holding Corporation | | | 35,855 | | | | 1,555,390 |
| Total (Cost $1,303,178) | | | | | | | 1,555,390 |
| | | | | | | | |
| REAL ESTATE – 1.0% | | | | | | | |
| REAL ESTATE MANAGEMENT & DEVELOPMENT - 1.0% | | | | | | | |
| RMR Group (The) Cl. A | | | 46,865 | | | | 1,085,862 |
| Total (Cost $1,345,118) | | | | | | | 1,085,862 |
| | | | | | | | |
| TOTAL COMMON STOCKS | | | | | | | |
| (Cost $85,436,296) | | | | | | | 108,341,260 |
| | | | | | | | |
| REPURCHASE AGREEMENT– 2.0% | | | | | | | |
Fixed Income Clearing Corporation, 3.00% dated 6/30/23, due 7/3/23, maturity value $2,237,595 (collateralized by obligations of U.S. Government Agencies, 3.75% due 5/31/30, valued at $2,281,858) |
| (Cost $2,237,036) | | | | | | | 2,237,036 |
| | | |
| TOTAL INVESTMENTS – 100.1% | | |
| (Cost $87,673,332) | | | 110,578,296 |
| LIABILITIES LESS CASH AND OTHER ASSETS – (0.1)% | | | (147,047) |
| | | | |
| NET ASSETS – 100.0% | | $ | 110,431,249 |
| | | | |
| 48 | The Royce Funds 2023 Semiannual Report to Shareholders | THE ACCOMPANYING NOTES ARE AN INTEGRAL PART OF THESE FINANCIAL STATEMENTS |
June 30, 2023 (unaudited)
Royce Smaller-Companies Growth Fund
Common Stocks – 97.7%
| | | SHARES | | | VALUE |
| | | | | | |
| CONSUMER DISCRETIONARY – 7.4% | | | | | | | |
| BROADLINE RETAIL - 1.8% | | | | | | | |
| Ollie’s Bargain Outlet Holdings 2 | | | 59,000 | | | $ | 3,417,870 |
| HOTELS, RESTAURANTS & LEISURE - 3.3% | | | | | | | |
| Bragg Gaming Group 2 | | | 396,000 | | | | 1,222,600 |
| DraftKings Cl. A 2 | | | 83,000 | | | | 2,205,310 |
| Texas Roadhouse | | | 26,000 | | | | 2,919,280 |
| | | | | | | | 6,347,190 |
| HOUSEHOLD DURABLES - 0.8% | | | | | | | |
| †Installed Building Products | | | 11,000 | | | | 1,541,760 |
| LEISURE PRODUCTS - 1.5% | | | | | | | |
| Topgolf Callaway Brands 2 | | | 145,000 | | | | 2,878,250 |
| Total (Cost $11,958,740) | | | | | | | 14,185,070 |
| | | | | | | | |
| CONSUMER STAPLES – 6.4% | | | | | | | |
| BEVERAGES - 4.1% | | | | | | | |
| Celsius Holdings 2 | | | 44,000 | | | | 6,564,360 |
| MGP Ingredients | | | 13,000 | | | | 1,381,640 |
| | | | | | | | 7,946,000 |
| FOOD PRODUCTS - 2.3% | | | | | | | |
| Freshpet 2 | | | 67,000 | | | | 4,409,270 |
| Total (Cost $8,623,616) | | | | | | | 12,355,270 |
| | | | | | | | |
| ENERGY – 1.7% | | | | | | | |
| ENERGY EQUIPMENT & SERVICES - 1.7% | | | | | | | |
| †Cactus Cl. A | | | 54,000 | | | | 2,285,280 |
| †Select Water Solutions Cl. A | | | 123,000 | | | | 996,300 |
| Total (Cost $3,193,364) | | | | | | | 3,281,580 |
| | | | | | | | |
| FINANCIALS – 5.5% | | | | | | | |
| BANKS - 3.6% | | | | | | | |
| Atlantic Union Bankshares | | | 58,000 | | | | 1,505,100 |
| Seacoast Banking Corporation of Florida | | | 125,000 | | | | 2,762,500 |
| Webster Financial | | | 70,000 | | | | 2,642,500 |
| | | | | | | | 6,910,100 |
| CAPITAL MARKETS - 0.6% | | | | | | | |
| †Open Lending 2,4 | | | 119,000 | | | | 1,250,690 |
| FINANCIAL SERVICES - 1.3% | | | | | | | |
| Cantaloupe 2 | | | 314,000 | | | | 2,499,440 |
| Total (Cost $10,813,120) | | | | | | | 10,660,230 |
| | | | | | | | |
| HEALTH CARE – 25.0% | | | | | | | |
| BIOTECHNOLOGY - 3.6% | | | | | | | |
| †ARS Pharmaceuticals 2,4 | | | 217,000 | | | | 1,453,900 |
| Avid Bioservices 2 | | | 125,000 | | | | 1,746,250 |
| MeiraGTx Holdings 2 | | | 146,337 | | | | 983,385 |
| PureTech Health 1,2 | | | 1,046,000 | | | | 2,873,021 |
| | | | | | | | 7,056,556 |
| HEALTH CARE EQUIPMENT & SUPPLIES - 16.2% | | | | | | | |
| Alphatec Holdings 2 | | | 346,000 | | | | 6,221,080 |
| Axonics 2 | | | 28,000 | | | | 1,413,160 |
| †CVRx 2 | | | 64,000 | | | | 988,160 |
| InMode 2 | | | 110,000 | | | | 4,108,500 |
| Inspire Medical Systems 2 | | | 16,488 | | | | 5,352,664 |
| Lantheus Holdings 2 | | | 23,000 | | | | 1,930,160 |
| SI-BONE 2 | | | 132,000 | | | | 3,561,360 |
| STAAR Surgical 2,4 | | | 15,000 | | | | 788,550 |
| TransMedics Group 2 | | | 78,000 | | | | 6,550,440 |
| ViewRay 2 | | | 968,000 | | | | 340,930 |
| | | | | | | | 31,255,004 |
| HEALTH CARE PROVIDERS & SERVICES - 3.6% | | | | | |
| †DocGo 2 | | | 249,000 | | | | 2,333,130 |
| Hims & Hers Health Cl. A 2 | | | 220,000 | | | | 2,068,000 |
| Privia Health Group 2 | | | 97,000 | | | | 2,532,670 |
| | | | | | | | 6,933,800 |
| LIFE SCIENCES TOOLS & SERVICES - 0.9% | | | | | | | |
| CryoPort 2 | | | 34,198 | | | | 589,916 |
| MaxCyte 2,4 | | | 250,000 | | | | 1,147,500 |
| | | | | | | | 1,737,416 |
| PHARMACEUTICALS - 0.7% | | | | | | | |
| †Harrow Health 2 | | | 73,000 | | | | 1,389,920 |
| Total (Cost $36,371,683) | | | | | | | 48,372,696 |
| | | | | | | | |
| INDUSTRIALS – 23.8% | | | | | | | |
| AEROSPACE & DEFENSE - 1.3% | | | | | | | |
| AeroVironment 2 | | | 25,000 | | | | 2,557,000 |
| AIR FREIGHT & LOGISTICS - 2.4% | | | | | | | |
| GXO Logistics 2 | | | 73,000 | | | | 4,585,860 |
| COMMERCIAL SERVICES & SUPPLIES - 4.7% | | | | | | | |
| ACV Auctions Cl. A 2 | | | 318,000 | | | | 5,491,860 |
| VSE Corporation | | | 66,000 | | | | 3,609,540 |
| | | | | | | | 9,101,400 |
| ELECTRICAL EQUIPMENT - 2.4% | | | | | | | |
| Enovix Corporation 2,4 | | | 86,000 | | | | 1,551,440 |
| Shoals Technologies Group Cl. A 2 | | | 118,000 | | | | 3,016,080 |
| | | | | | | | 4,567,520 |
| MACHINERY - 5.6% | | | | | | | |
| ATS Corporation 2 | | | 113,000 | | | | 5,198,981 |
| Chart Industries 2 | | | 28,000 | | | | 4,474,120 |
| Energy Recovery 2 | | | 24,000 | | | | 670,800 |
| Symbotic Cl. A 2,4 | | | 9,500 | | | | 406,695 |
| | | | | | | | 10,750,596 |
| PROFESSIONAL SERVICES - 0.7% | | | | | | | |
| Paylocity Holding Corporation 2 | | | 7,786 | | | | 1,436,751 |
| TRADING COMPANIES & DISTRIBUTORS - 6.7% | | | | | | | |
| Distribution Solutions Group 2 | | | 143,070 | | | | 7,448,224 |
| †FTAI Aviation | | | 104,000 | | | | 3,292,640 |
| †Herc Holdings | | | 8,000 | | | | 1,094,800 |
| Xometry Cl. A 2,4 | | | 57,000 | | | | 1,207,260 |
| | | | | | | | 13,042,924 |
| Total (Cost $31,786,578) | | | | | | | 46,042,051 |
| | | | | | | | |
| INFORMATION TECHNOLOGY – 23.5% | | | | | | | |
| ELECTRONIC EQUIPMENT, INSTRUMENTS & COMPONENTS - 5.2% | | | | | | | |
| †Evolv Technologies Holdings 2,4 | | | 329,000 | | | | 1,974,000 |
| Iteris 2,4 | | | 568,474 | | | | 2,251,157 |
| NAPCO Security Technologies | | | 166,000 | | | | 5,751,900 |
| | | | | | | | 9,977,057 |
| SEMICONDUCTORS & SEMICONDUCTOR EQUIPMENT - 8.6% | | | | | | | |
| Aehr Test Systems 2,4 | | | 135,000 | | | | 5,568,750 |
| Credo Technology Group Holding 2 | | | 78,000 | | | | 1,352,520 |
| Impinj 2 | | | 53,555 | | | | 4,801,206 |
| indie Semiconductor Cl. A 2,4 | | | 209,000 | | | | 1,964,600 |
| Silicon Laboratories 2,4 | | | 19,000 | | | | 2,997,060 |
| | | | | | | | 16,684,136 |
| SOFTWARE - 9.1% | | | | | | | |
| Agilysys 2 | | | 53,000 | | | | 3,637,920 |
| †CyberArk Software 2 | | | 3,000 | | | | 468,990 |
| Descartes Systems Group (The) 2 | | | 35,033 | | | | 2,806,493 |
| JFrog 2 | | | 171,000 | | | | 4,736,700 |
| THE ACCOMPANYING NOTES ARE AN INTEGRAL PART OF THESE FINANCIAL STATEMENTS | The Royce Funds 2023 Semiannual Report to Shareholders | 49 |
| Schedules of Investments | June 30, 2023 (unaudited) |
Royce Smaller-Companies Growth Fund (continued)
| | | SHARES | | | VALUE |
| INFORMATION TECHNOLOGY (continued) | | | | | | | |
| SOFTWARE (continued) | | | | | | | |
| †NextNav 2,4 | | | 335,000 | | | $ | 984,900 |
| †SoundHound AI Cl. A 2,4 | | | 260,000 | | | | 1,183,000 |
| Sprout Social Cl. A 2,4 | | | 54,000 | | | | 2,492,640 |
| †Vertex Cl. A 2 | | | 71,000 | | | | 1,384,500 |
| | | | | | | | 17,695,143 |
| TECHNOLOGY HARDWARE, STORAGE & PERIPHERALS - 0.6% | | | | | | | |
| Stratasys 2 | | | 61,000 | | | | 1,083,360 |
| Total (Cost $32,047,623) | | | | | | | 45,439,696 |
| | | | | | | | |
| MATERIALS – 3.9% | | | | | | | |
| CHEMICALS - 1.3% | | | | | | | |
| Bioceres Crop Solutions 2,4 | | | 180,000 | | | | 2,404,800 |
| METALS & MINING - 2.6% | | | | | | | |
| AMG Critical Materials 1 | | | 93,589 | | | | 4,847,402 |
| †Lithium Royalty 2 | | | 25,000 | | | | 249,293 |
| | | | | | | | 5,096,695 |
| Total (Cost $5,346,631) | | | | | | | 7,501,495 |
| | | | | | | | |
| REAL ESTATE – 0.5% | | | | | | | |
| OFFICE REITS - 0.5% | | | | | | | |
| Postal Realty Trust Cl. A | | | 70,000 | | | | 1,029,700 |
| Total (Cost $1,130,446) | | | | | | | 1,029,700 |
| | | | | | | | |
| TOTAL COMMON STOCKS | | | | | | | |
| (Cost $141,271,801) | | | | | | | 188,867,788 |
| REPURCHASE AGREEMENT– 2.4% | | |
Fixed Income Clearing Corporation, 3.00% dated 6/30/23, due 7/3/23, maturity value $4,607,010 (collateralized by obligations of U.S. Government Agencies, 3.75% due 5/31/30, valued at $4,697,994) | | |
| (Cost $4,605,858) | | | 4,605,858 |
| | | | |
| COLLATERAL RECEIVED FOR SECURITIES LOANED – 7.4% | | | | | |
| Money Market Funds | | | | | |
| Federated Hermes Government Obligations Fund - Institutional Shares (7 day yield-4.92%) | | | | | |
| (Cost $14,418,841) | | | 14,418,841 | | | | 14,418,841 |
| | | | | | | | |
| TOTAL INVESTMENTS – 107.5% | | | | | | | |
| (Cost $160,296,500) | | | | | | | 207,892,487 |
| | | | | | | | |
| LIABILITIES LESS CASH AND OTHER ASSETS – (7.5)% | | | | | | | (14,552,534) |
| | | | | | | | |
| NET ASSETS – 100.0% | | | | | | $ | 193,339,953 |
ADR- American Depository Receipt
| 1 | These securities are defined as Level 2 securities due to fair value being based on quoted prices for similar securities and/or due to the application of fair value factors. See Notes to Financial Statements. |
| 3 | As of June 30, 2023, the Fund owned 5% or more of the Company’s outstanding voting securities thereby making the Company an Affiliated Company as that term is defined in the Investment Company Act of 1940. See Notes to Financial Statements. |
| 4 | All or a portion of these securities were on loan as of June 30, 2023. |
| 5 | Securities for which market quotations are not readily available represent 0.0% and 0.0% of net assets for Royce Micro-Cap Fund and Royce Small-Cap Opportunity Fund. These securities have been valued at their fair value under procedures approved by the Fund’s Board of Trustees. These securities are defined as Level 3 securities due to the use of significant unobservable inputs in the determination of fair value. See Notes to Financial Statements. |
Securities of Royce International Premier Fund are categorized by the country of their headquarters.
Bold indicates a Fund’s 20 largest equity holdings in terms of June 30, 2023, market value.
| 50 | The Royce Funds 2023 Semiannual Report to Shareholders | THE ACCOMPANYING NOTES ARE AN INTEGRAL PART OF THESE FINANCIAL STATEMENTS |
| Statements of Assets and Liabilities | June 30, 2023 (unaudited) |
| | | Royce Dividend
Value Fund | | | Royce Global
Financial Services
Fund | | | Royce International
Premier Fund | | | Royce Micro-Cap
Fund | |
| ASSETS: | | | | | | | | | | | | |
| Investments at value (including collateral on loaned securities)1 | | | | | | | | | | | | |
| Non-Affiliated Companies | | $ | 61,570,750 | | | $ | 25,779,180 | | | $ | 739,813,924 | | | $ | 301,792,999 | |
| Affiliated Companies | | | - | | | | - | | | | 21,162,870 | | | | - | |
| Repurchase agreements (at cost and value) | | | 109,350 | | | | 369,640 | | | | 54,342,275 | | | | 8,138,336 | |
| Foreign currency2 | | | - | | | | 645 | | | | 437,730 | | | | 5,898 | |
| Receivable for investments sold | | | 891,390 | | | | 208,495 | | | | - | | | | 219,396 | |
| Receivable for capital shares sold | | | 55,632 | | | | 1,021 | | | | 2,454,913 | | | | 147,697 | |
| Receivable for dividends and interest | | | 74,100 | | | | 55,010 | | | | 3,601,824 | | | | 47,352 | |
| Receivable for securities lending income | | | - | | | | - | | | | - | | | | 385 | |
| Prepaid expenses and other assets | | | 1,602 | | | | 806 | | | | 25,801 | | | | 8,971 | |
| Total Assets | | | 62,702,824 | | | | 26,414,797 | | | | 821,839,337 | | | | 310,361,034 | |
| LIABILITIES: | | | | | | | | | | | | | | | | |
| Payable for collateral on loaned securities | | | - | | | | - | | | | - | | | | 3,649,742 | |
| Payable for investments purchased | | | - | | | | - | | | | 4,795,055 | | | | 799,517 | |
| Payable for capital shares redeemed | | | 31,077 | | | | 956 | | | | 378,539 | | | | 171,729 | |
| Payable for investment advisory fees | | | 42,819 | | | | 21,504 | | | | 620,351 | | | | 246,000 | |
| Payable for trustees’ fees | | | 2,581 | | | | 1,199 | | | | 35,995 | | | | 12,642 | |
| Accrued expenses | | | 120,630 | | | | 97,243 | | | | 752,902 | | | | 300,185 | |
| Deferred capital gains tax | | | - | | | | 19,285 | | | | - | | | | - | |
| Total Liabilities | | | 197,107 | | | | 140,187 | | | | 6,582,842 | | | | 5,179,815 | |
| Net Assets | | $ | 62,505,717 | | | $ | 26,274,610 | | | $ | 815,256,495 | | | $ | 305,181,219 | |
| ANALYSIS OF NET ASSETS: | | | | | | | | | | | | | | | | |
| Paid-in capital | | $ | 21,580,929 | | | $ | 15,497,767 | | | $ | 895,330,025 | | | $ | 224,009,144 | |
| Total distributable earnings (loss) | | | 40,924,788 | | | | 10,776,843 | | | | (80,073,530 | ) | | | 81,172,075 | |
| Net Assets | | $ | 62,505,717 | | | $ | 26,274,610 | | | $ | 815,256,495 | | | $ | 305,181,219 | |
| Investment Class | | $ | 45,340,367 | | | | | | | $ | 308,603,728 | | | $ | 160,282,343 | |
| Service Class | | | 17,165,350 | | | $ | 18,612,684 | | | | 36,790,329 | | | | 134,437,696 | |
| Consultant Class | | | | | | | | | | | | | | | 10,461,180 | |
| Institutional Class | | | | | | | 7,661,926 | | | | 469,862,438 | | | | | |
| SHARES OUTSTANDING (unlimited number of $.001 par value): | | | | | | | | | | | | | | | | |
| Investment Class | | | 7,425,369 | | | | | | | | 23,554,838 | | | | 14,831,054 | |
| Service Class | | | 2,697,165 | | | | 1,911,067 | | | | 2,342,530 | | | | 12,831,733 | |
| Consultant Class | | | | | | | | | | | | | | | 1,319,972 | |
| Institutional Class | | | | | | | 600,920 | | | | 35,840,658 | | | | | |
| NET ASSET VALUES (Net Assets ÷ Shares Outstanding): | | | | | | | | | | | | | | | | |
| Investment Class3 | | | $6.11 | | | | | | | | $13.10 | | | | $10.81 | |
| Service Class3 | | | 6.36 | | | | $ 9.74 | | | | 15.71 | | | | 10.48 | |
| Consultant Class4 | | | | | | | | | | | | | | | 7.93 | |
| Institutional Class5 | | | | | | | 12.75 | | | | 13.11 | | | | | |
| Investments at identified cost - Non-Affiliated Companies | | $ | 26,387,017 | | | $ | 15,931,862 | | | $ | 770,178,190 | | | $ | 235,735,427 | |
| Investments at identified cost - Affiliated Companies | | | - | | | | - | | | | 28,500,493 | | | | - | |
| Market value of loaned securities6 | | | - | | | | - | | | | - | | | | 6,404,428 | |
| 1 | See Notes to Financial Statements for information on non-cash collateral on loaned securities. |
| 2 | The cost of foreign currency is $645 for Royce Global Financial Services Fund, $436,683 for Royce International Premier Fund and $5,897 for Royce Micro-Cap Fund. |
| 3 | Offering and redemption price per share; shares held less than 30 days may be subject to a 1% redemption fee, or a 2% redemption fee (Royce International Premier Fund), payable to the Fund. |
| 4 | Offering and redemption price per share; shares held less than 365 days may be subject to a 1% contingent deferred sales charge, payable to Royce Fund Services, LLC. |
| 5 | Offering and redemption price per share. |
| 6 | Market value of loaned securities backed by non-cash collateral is as of prior business day. |
| THE ACCOMPANYING NOTES ARE AN INTEGRAL PART OF THESE FINANCIAL STATEMENTS | The Royce Funds 2023 Semiannual Report to Shareholders | 51 |
Statements of Assets and Liabilities
| | | Royce Pennsylvania
Mutual Fund | | | Royce Premier Fund | | | Royce Small-Cap
Opportunity Fund | | | Royce Small-Cap
Special Equity Fund | |
| ASSETS: | | | | | | | | | | | | |
| Investments at value (including collateral on loaned securities)1 | | | | | | | | | | | | |
| Non-Affiliated Companies | | $ | 1,692,614,244 | | | $ | 1,322,150,939 | | | $ | 1,237,352,253 | | | $ | 597,211,734 | |
| Affiliated Companies | | | - | | | | - | | | | 10,330,731 | | | | 55,903,390 | |
| Repurchase agreements (at cost and value) | | | 46,919,590 | | | | 60,565,786 | | | | 47,606,205 | | | | 153,727,643 | |
| Foreign currency2 | | | 93,196 | | | | - | | | | - | | | | - | |
| Receivable for investments sold | | | 12,839,842 | | | | - | | | | 3,303,821 | | | | - | |
| Receivable for capital shares sold | | | 1,039,085 | | | | 1,740,444 | | | | 1,884,319 | | | | 734,928 | |
| Receivable for dividends and interest | | | 894,887 | | | | 1,177,537 | | | | 491,884 | | | | 688,131 | |
| Receivable for securities lending income | | | 1,234 | | | | - | | | | 9,355 | | | | - | |
| Prepaid expenses and other assets | | | 1,801,837 | | | | 37,940 | | | | 40,266 | | | | 23,287 | |
| Total Assets | | | 1,756,203,915 | | | | 1,385,672,646 | | | | 1,301,018,834 | | | | 808,289,113 | |
| LIABILITIES: | | | | | | | | | | | | | | | | |
| Payable for collateral on loaned securities | | | 2,396,835 | | | | - | | | | 2,926,187 | | | | - | |
| Payable to custodian for cash and foreign currency overdrawn | | | - | | | | - | | | | 190 | | | | - | |
| Payable for investments purchased | | | 7,879,068 | | | | - | | | | 2,821,491 | | | | 1,794,703 | |
| Payable for capital shares redeemed | | | 1,806,504 | | | | 1,168,527 | | | | 847,420 | | | | 391,549 | |
| Payable for investment advisory fees | | | 1,057,114 | | | | 1,098,717 | | | | 1,022,743 | | | | 649,972 | |
| Payable for trustees’ fees | | | 69,358 | | | | 56,786 | | | | 55,231 | | | | 33,991 | |
| Accrued expenses | | | 998,289 | | | | 739,504 | | | | 1,006,745 | | | | 536,315 | |
| Total Liabilities | | | 14,207,168 | | | | 3,063,534 | | | | 8,680,007 | | | | 3,406,530 | |
| Net Assets | | $ | 1,741,996,747 | | | $ | 1,382,609,112 | | | $ | 1,292,338,827 | | | $ | 804,882,583 | |
| ANALYSIS OF NET ASSETS: | | | | | | | | | | | | | | | | |
| Paid-in capital | | $ | 1,167,427,249 | | | $ | 748,023,686 | | | $ | 1,031,814,939 | | | $ | 606,406,727 | |
| Total distributable earnings (loss) | | | 574,569,498 | | | | 634,585,426 | | | | 260,523,888 | | | | 198,475,856 | |
| Net Assets | | $ | 1,741,996,747 | | | $ | 1,382,609,112 | | | $ | 1,292,338,827 | | | $ | 804,882,583 | |
| Investment Class | | $ | 1,301,416,173 | | | $ | 1,104,883,664 | | | $ | 920,126,700 | | | $ | 621,183,987 | |
| Service Class | | | 68,865,647 | | | | 34,527,541 | | | | 72,411,702 | | | | 35,637,529 | |
| Consultant Class | | | 190,962,983 | | | | 11,982,909 | | | | 12,978,638 | | | | 15,840,909 | |
| Institutional Class | | | 180,751,944 | | | | 231,214,998 | | | | 243,599,707 | | | | 132,220,158 | |
| R Class | | | | | | | | | | | 43,222,080 | | | | | |
| SHARES OUTSTANDING (unlimited number of $.001 par value): | | | | | | | | | | | | | | | | |
| Investment Class | | | 148,304,850 | | | | 96,048,630 | | | | 61,496,928 | | | | 36,186,512 | |
| Service Class | | | 7,903,667 | | | | 3,108,715 | | | | 5,308,930 | | | | 2,079,379 | |
| Consultant Class | | | 28,279,118 | | | | 1,374,057 | | | | 1,116,227 | | | | 1,019,607 | |
| Institutional Class | | | 20,517,989 | | | | 19,776,258 | | | | 15,835,517 | | | | 7,771,382 | |
| R Class | | | | | | | | | | | 3,301,863 | | | | | |
| NET ASSET VALUES (Net Assets ÷ Shares Outstanding): | | | | | | | | | | | | | | | | |
| Investment Class3 | | | $8.78 | | | | $11.50 | | | | $14.96 | | | | $17.17 | |
| Service Class3 | | | 8.71 | | | | 11.11 | | | | 13.64 | | | | 17.14 | |
| Consultant Class4 | | | 6.75 | | | | 8.72 | | | | 11.63 | | | | 15.54 | |
| Institutional Class5 | | | 8.81 | | | | 11.69 | | | | 15.38 | | | | 17.01 | |
| R Class5 | | | | | | | | | | | 13.09 | | | | | |
| Investments at identified cost - Non-Affiliated Companies | | $ | 1,162,608,753 | | | $ | 741,568,206 | | | $ | 988,595,933 | | | $ | 442,502,554 | |
| Investments at identified cost - Affiliated Companies | | | - | | | | - | | | | 11,084,816 | | | | 42,973,432 | |
| Market value of loaned securities6 | | | 13,409,171 | | | | - | | | | 23,671,494 | | | | - | |
| 1 | See Notes to Financial Statements for information on non-cash collateral on loaned securities. |
| 2 | The cost of foreign currency is $93,189 for Royce Pennsylvania Mutual Fund. |
| 3 | Offering and redemption price per share; shares held less than 30 days may be subject to a 1% redemption fee, payable to the Fund. |
| 4 | Offering and redemption price per share; shares held less than 365 days may be subject to a 1% contingent deferred sales charge, payable to Royce Fund Services, LLC. |
| 5 | Offering and redemption price per share. |
| 6 | Market value of loaned securities backed by non-cash collateral is as of prior business day. |
| 52 | The Royce Funds 2023 Semiannual Report to Shareholders | THE ACCOMPANYING NOTES ARE AN INTEGRAL PART OF THESE FINANCIAL STATEMENTS |
June 30, 2023 (unaudited)
| | | Royce Small-Cap
Total Return Fund | | | Royce Small-Cap
Value Fund | | | Royce Smaller-
Companies Growth
Fund | |
| ASSETS: | | | | | | | | | |
| Investments at value (including collateral on loaned securities)1 | | | | | | | | | |
| Non-Affiliated Companies | | $ | 912,624,431 | | | $ | 108,341,260 | | | $ | 203,286,629 | |
| Affiliated Companies | | | 26,092,237 | | | | - | | | | - | |
| Repurchase agreements (at cost and value) | | | 29,214,667 | | | | 2,237,036 | | | | 4,605,858 | |
| Foreign currency2 | | | 105,798 | | | | - | | | | 245,518 | |
| Receivable for investments sold | | | 3,819,355 | | | | 156,497 | | | | 242,128 | |
| Receivable for capital shares sold | | | 398,822 | | | | 7,441 | | | | 32,938 | |
| Receivable for dividends and interest | | | 1,126,798 | | | | 39,114 | | | | 384 | |
| Receivable for securities lending income | | | 220 | | | | - | | | | 17,183 | |
| Prepaid expenses and other assets | | | 29,199 | | | | 3,112 | | | | 5,603 | |
| Total Assets | | | 973,411,527 | | | | 110,784,460 | | | | 208,436,241 | |
| LIABILITIES: | | | | | | | | | | | | |
| Payable for collateral on loaned securities | | | 2,560,374 | | | | - | | | | 14,418,841 | |
| Payable for investments purchased | | | 1,275,181 | | | | 69,906 | | | | 245,518 | |
| Payable for capital shares redeemed | | | 938,044 | | | | 23,247 | | | | 57,087 | |
| Payable for investment advisory fees | | | 781,237 | | | | 88,910 | | | | 156,592 | |
| Payable for trustees’ fees | | | 43,746 | | | | 4,709 | | | | 8,318 | |
| Accrued expenses | | | 771,720 | | | | 166,439 | | | | 209,932 | |
| Total Liabilities | | | 6,370,302 | | | | 353,211 | | | | 15,096,288 | |
| Net Assets | | $ | 967,041,225 | | | $ | 110,431,249 | | | $ | 193,339,953 | |
| ANALYSIS OF NET ASSETS: | | | | | | | | | | | | |
| Paid-in capital | | $ | 806,450,819 | | | $ | 83,101,564 | | | $ | 169,323,333 | |
| Total distributable earnings (loss) | | | 160,590,406 | | | | 27,329,685 | | | | 24,016,620 | |
| Net Assets | | $ | 967,041,225 | | | $ | 110,431,249 | | | $ | 193,339,953 | |
| Investment Class | | $ | 613,314,443 | | | $ | 34,780,177 | | | $ | 69,085,787 | |
| Service Class | | | 58,017,042 | | | | 75,651,072 | | | | 119,163,782 | |
| Consultant Class | | | 84,986,396 | | | | | | | | | |
| Institutional Class | | | 189,779,350 | | | | | | | | 5,090,384 | |
| R Class | | | 20,943,994 | | | | | | | | | |
| SHARES OUTSTANDING (unlimited number of $.001 par value): | | | | | | | | | | | | |
| Investment Class | | | 86,277,743 | | | | 3,616,953 | | | | 10,532,293 | |
| Service Class | | | 7,868,290 | | | | 7,920,447 | | | | 18,855,791 | |
| Consultant Class | | | 11,380,123 | | | | | | | | | |
| Institutional Class | | | 27,234,814 | | | | | | | | 763,982 | |
| R Class | | | 2,791,815 | | | | | | | | | |
| NET ASSET VALUES (Net Assets ÷ Shares Outstanding): | | | | | | | | | | | | |
| Investment Class3 | | | $7.11 | | | | $9.62 | | | | $6.56 | |
| Service Class3 | | | 7.37 | | | | 9.55 | | | | 6.32 | |
| Consultant Class4 | | | 7.47 | | | | | | | | | |
| Institutional Class5 | | | 6.97 | | | | | | | | 6.66 | |
| R Class5 | | | 7.50 | | | | | | | | | |
| Investments at identified cost - Non-Affiliated Companies | | $ | 774,094,461 | | | $ | 85,436,296 | | | $ | 155,690,642 | |
| Investments at identified cost - Affiliated Companies | | | 24,354,708 | | | | - | | | | - | |
| Market value of loaned securities6 | | | 2,546,807 | | | | - | | | | 17,426,692 | |
| 1 | See Notes to Financial Statements for information on non-cash collateral on loaned securities. |
| 2 | The cost of foreign currency is $105,790 for Royce Small-Cap Total Return Fund and $245,741 for Royce Smaller-Companies Growth Fund. |
| 3 | Offering and redemption price per share; shares held less than 30 days may be subject to a 1% redemption fee, payable to the Fund. |
| 4 | Offering and redemption price per share; shares held less than 365 days may be subject to a 1% contingent deferred sales charge, payable to Royce Fund Services, LLC. |
| 5 | Offering and redemption price per share. |
| 6 | Market value of loaned securities backed by non-cash collateral is as of prior business day. |
| THE ACCOMPANYING NOTES ARE AN INTEGRAL PART OF THESE FINANCIAL STATEMENTS | The Royce Funds 2023 Semiannual Report to Shareholders | 53 |
Statements of Operations
| | | Royce Dividend
Value Fund | | | Royce Global
Financial Services
Fund | | | Royce International
Premier Fund | | | Royce Micro-Cap
Fund | |
| INVESTMENT INCOME: | | | | | | | | | | | | |
| INCOME: | | | | | | | | | | | | |
| Dividends | | | | | | | | | | | | |
| Non-Affiliated Companies | | $ | 722,702 | | | $ | 330,860 | | | $ | 11,811,563 | | | $ | 1,101,830 | |
| Affiliated Companies | | | - | | | | - | | | | 428,871 | | | | - | |
| Foreign withholding tax | | | (21,448 | ) | | | (19,526 | ) | | | (1,207,223 | ) | | | (12,611 | ) |
| Interest | | | 11,322 | | | | 2,102 | | | | 651,188 | | | | 96,096 | |
| Securities lending | | | - | | | | - | | | | - | | | | 10,970 | |
| Total income | | | 712,576 | | | | 313,436 | | | | 11,684,399 | | | | 1,196,285 | |
| EXPENSES: | | | | | | | | | | | | | | | | |
| Investment advisory fees | | | 256,083 | | | | 132,562 | | | | 3,924,901 | | | | 1,474,759 | |
| Distribution fees | | | 24,419 | | | | 23,770 | | | | 59,499 | | | | 215,559 | |
| Shareholder servicing | | | 53,536 | | | | 19,713 | | | | 311,887 | | | | 192,924 | |
| Registration | | | 31,983 | | | | 15,509 | | | | 41,686 | | | | 22,856 | |
| Administrative and office facilities | | | 24,141 | | | | 16,429 | | | | 214,216 | | | | 85,041 | |
| Audit | | | 17,292 | | | | 17,499 | | | | 24,643 | | | | 17,920 | |
| Custody | | | 15,219 | | | | 16,512 | | | | 159,779 | | | | 19,875 | |
| Trustees’ fees | | | 5,057 | | | | 2,327 | | | | 67,377 | | | | 25,380 | |
| Shareholder reports | | | 4,364 | | | | 1,738 | | | | 56,508 | | | | 24,560 | |
| Legal | | | 1,052 | | | | 490 | | | | 13,979 | | | | 5,360 | |
| Other expenses | | | 4,136 | | | | 1,955 | | | | 35,276 | | | | 12,592 | |
| Total expenses | | | 437,282 | | | | 248,504 | | | | 4,909,751 | | | | 2,096,826 | |
| Compensating balance credits | | | (605 | ) | | | (301 | ) | | | (26,740 | ) | | | (4,866 | ) |
| Fees waived by investment adviser and distributor | | | - | | | | (3,803 | ) | | | (357,068 | ) | | | - | |
| Expenses reimbursed by investment adviser | | | (83,928 | ) | | | (46,883 | ) | | | (174,892 | ) | | | (42,062 | ) |
| Net expenses | | | 352,749 | | | | 197,517 | | | | 4,351,051 | | | | 2,049,898 | |
| Net investment income (loss) | | | 359,827 | | | | 115,919 | | | | 7,333,348 | | | | (853,613 | ) |
| REALIZED AND UNREALIZED GAIN (LOSS) ON INVESTMENTS AND FOREIGN CURRENCY: | |
| NET REALIZED GAIN (LOSS): | |
| Investments | | | 5,717,622 | | | | 1,740,340 | | | | (18,575,681 | ) | | | 16,491,999 | |
| Foreign currency transactions | | | 1,456 | | | | (3,861 | ) | | | (45,643 | ) | | | (67 | ) |
| NET CHANGE IN UNREALIZED APPRECIATION (DEPRECIATION): | | | | | | | | | | | | | | | | |
| Investments in Non-Affiliated Companies | | | 842,402 | | | | (905,775 | ) | | | 50,189,195 | | | | 10,951,098 | |
| Investments in Affiliated Companies | | | - | | | | - | | | | (6,366,094 | ) | | | - | |
| Other assets and liabilities denominated in foreign currency | | | 740 | | | | (19,304 | ) | | | 69,200 | | | | (10 | ) |
| Net realized and unrealized gain (loss) on investments and foreign currency | | | 6,562,220 | | | | 811,400 | | | | 25,270,977 | | | | 27,443,020 | |
| NET INCREASE (DECREASE) IN NET ASSETS FROM INVESTMENT OPERATIONS | | $ | 6,922,047 | | | $ | 927,319 | | | $ | 32,604,325 | | | $ | 26,589,407 | |
| 54 | The Royce Funds 2023 Semiannual Report to Shareholders | THE ACCOMPANYING NOTES ARE AN INTEGRAL PART OF THESE FINANCIAL STATEMENTS |
Six Months Ended June 30, 2023 (unaudited)
| | | Royce
Pennsylvania
Mutual Fund | | | Royce Premier
Fund | | | Royce Small-Cap
Opportunity Fund | | | Royce Small-Cap
Special Equity Fund | |
| INVESTMENT INCOME: | | | | | | | | | | | | |
| INCOME: | | | | | | | | | | | | |
| Dividends | | | | | | | | | | | | |
| Non-Affiliated Companies | | $ | 9,687,258 | | | $ | 8,042,628 | | | $ | 7,034,155 | | | $ | 6,562,947 | |
| Affiliated Companies | | | - | | | | - | | | | 134,428 | | | | 1,521,913 | |
| Foreign withholding tax | | | (191,244 | ) | | | (195,809 | ) | | | (1,089 | ) | | | - | |
| Interest | | | 176,848 | | | | 695,836 | | | | 413,052 | | | | 1,514,165 | |
| Securities lending | | | 18,243 | | | | - | | | | 113,004 | | | | - | |
| Total income | | | 9,691,105 | | | | 8,542,655 | | | | 7,693,550 | | | | 9,599,025 | |
| EXPENSES: | | | | | | | | | | | | | | | | |
| Investment advisory fees | | | 6,241,708 | | | | 6,576,534 | | | | 6,311,190 | | | | 3,877,614 | |
| Distribution fees | | | 1,002,453 | | | | 104,576 | | | | 247,927 | | | | 120,940 | |
| Shareholder servicing | | | 593,927 | | | | 502,935 | | | | 688,769 | | | | 383,219 | |
| Registration | | | 38,921 | | | | 35,365 | | | | 44,644 | | | | 32,875 | |
| Administrative and office facilities | | | 415,581 | | | | 338,436 | | | | 344,713 | | | | 207,989 | |
| Audit | | | 25,339 | | | | 21,628 | | | | 25,163 | | | | 20,422 | |
| Custody | | | 79,697 | | | | 50,339 | | | | 70,091 | | | | 32,861 | |
| Trustees’ fees | | | 137,941 | | | | 111,446 | | | | 110,630 | | | | 66,356 | |
| Shareholder reports | | | 93,273 | | | | 67,977 | | | | 70,634 | | | | 40,191 | |
| Legal | | | 28,793 | | | | 23,295 | | | | 23,250 | | | | 13,998 | |
| Other expenses | | | 64,130 | | | | 52,554 | | | | 54,056 | | | | 32,598 | |
| Total expenses | | | 8,721,763 | | | | 7,885,085 | | | | 7,991,067 | | | | 4,829,063 | |
| Compensating balance credits | | | (20,908 | ) | | | (7,452 | ) | | | (10,663 | ) | | | (7,236 | ) |
| Fees waived by distributor | | | (3,122 | ) | | | - | | | | - | | | | - | |
| Expenses reimbursed by investment adviser | | | (15,714 | ) | | | (21,093 | ) | | | (21,474 | ) | | | (19,864 | ) |
| Net expenses | | | 8,682,019 | | | | 7,856,540 | | | | 7,958,930 | | | | 4,801,963 | |
| Net investment income (loss) | | | 1,009,086 | | | | 686,115 | | | | (265,380 | ) | | | 4,797,062 | |
| REALIZED AND UNREALIZED GAIN (LOSS) ON INVESTMENTS AND FOREIGN CURRENCY: | |
| NET REALIZED GAIN (LOSS): | |
| Investments in Non-Affiliated Companies | | | 56,016,322 | | | | 44,953,706 | | | | 22,242,343 | | | | 17,131,359 | |
| Investments in Affiliated Companies | | | - | | | | - | | | | 2,820,119 | | | | (3,708,198 | ) |
| Foreign currency transactions | | | (17,428 | ) | | | 646 | | | | (2,996 | ) | | | - | |
| NET CHANGE IN UNREALIZED APPRECIATION (DEPRECIATION): | | | | | | | | | | | | | | | | |
| Investments in Non-Affiliated Companies | | | 178,303,044 | | | | 131,541,371 | | | | 126,465,717 | | | | 18,161,169 | |
| Investments in Affiliated Companies | | | - | | | | - | | | | 4,578,031 | | | | 21,891,031 | |
| Other assets and liabilities denominated in foreign currency | | | 91 | | | | - | | | | (58 | ) | | | - | |
| Net realized and unrealized gain (loss) on investments and foreign currency | | | 234,302,029 | | | | 176,495,723 | | | | 156,103,156 | | | | 53,475,361 | |
| NET INCREASE (DECREASE) IN NET ASSETS FROM INVESTMENT OPERATIONS | | $ | 235,311,115 | | | $ | 177,181,838 | | | $ | 155,837,776 | | | $ | 58,272,423 | |
| THE ACCOMPANYING NOTES ARE AN INTEGRAL PART OF THESE FINANCIAL STATEMENTS | The Royce Funds 2023 Semiannual Report to Shareholders | 55 |
| Statements of Operations | Six Months Ended June 30, 2023 (unaudited) |
| | | Royce Small-Cap
Total Return Fund | | | Royce Small-Cap
Value Fund | | | Royce Smaller-
Companies Growth
Fund | |
| INVESTMENT INCOME: | | | | | | | | | |
| INCOME: | | | | | | | | | |
| Dividends | | | | | | | | | |
| Non-Affiliated Companies | | $ | 9,069,162 | | | $ | 1,274,273 | | | $ | 295,230 | |
| Affiliated Companies | | | 287,827 | | | | - | | | | - | |
| Foreign withholding tax | | | (120,675 | ) | | | - | | | | (6,185 | ) |
| Interest | | | 321,367 | | | | 35,377 | | | | 64,216 | |
| Securities lending | | | 5,042 | | | | 867 | | | | 64,357 | |
| Total income | | | 9,562,723 | | | | 1,310,517 | | | | 417,618 | |
| EXPENSES: | | | | | | | | | | | | |
| Investment advisory fees | | | 4,732,525 | | | | 559,092 | | | | 926,341 | |
| Distribution fees | | | 545,937 | | | | 108,005 | | | | 154,037 | |
| Shareholder servicing | | | 423,549 | | | | 92,946 | | | | 125,226 | |
| Registration | | | 39,677 | | | | 30,493 | | | | 33,005 | |
| Administrative and office facilities | | | 262,226 | | | | 37,383 | | | | 56,962 | |
| Audit | | | 24,185 | | | | 15,829 | | | | 16,079 | |
| Custody | | | 70,307 | | | | 15,045 | | | | 14,117 | |
| Trustees’ fees | | | 83,288 | | | | 9,584 | | | | 15,838 | |
| Shareholder reports | | | 65,554 | | | | 7,841 | | | | 14,216 | |
| Legal | | | 17,403 | | | | 2,025 | | | | 3,160 | |
| Other expenses | | | 43,908 | | | | 5,757 | | | | 9,168 | |
| Total expenses | | | 6,308,559 | | | | 884,000 | | | | 1,368,149 | |
| Compensating balance credits | | | (7,958 | ) | | | (1,337 | ) | | | (2,396 | ) |
| Expenses reimbursed by investment adviser | | | (24,898 | ) | | | (62,029 | ) | | | (64,435 | ) |
| Net expenses | | | 6,275,703 | | | | 820,634 | | | | 1,301,318 | |
| Net investment income (loss) | | | 3,287,020 | | | | 489,883 | | | | (883,700 | ) |
| REALIZED AND UNREALIZED GAIN (LOSS) ON INVESTMENTS AND FOREIGN CURRENCY: | | | | | | | |
| NET REALIZED GAIN (LOSS): | | | | | | | | | | | | |
| Investments in Non-Affiliated Companies | | | 18,011,902 | | | | 3,532,563 | | | | (488,763 | ) |
| Investments in Affiliated Companies | | | (679,078 | ) | | | - | | | | - | |
| Foreign currency transactions | | | 4,924 | | | | - | | | | (4,070 | ) |
| NET CHANGE IN UNREALIZED APPRECIATION (DEPRECIATION): | | | | | | | | | | | | |
| Investments in Non-Affiliated Companies | | | 57,552,272 | | | | 4,759,866 | | | | 27,636,955 | |
| Investments in Affiliated Companies | | | 2,915,315 | | | | - | | | | - | |
| Other assets and liabilities denominated in foreign currency | | | (12,530 | ) | | | - | | | | (19 | ) |
| Net realized and unrealized gain (loss) on investments and foreign currency | | | 77,792,805 | | | | 8,292,429 | | | | 27,144,103 | |
| NET INCREASE (DECREASE) IN NET ASSETS FROM INVESTMENT OPERATIONS | | $ | 81,079,825 | | | $ | 8,782,312 | | | $ | 26,260,403 | |
| 56 | The Royce Funds 2023 Semiannual Report to Shareholders | THE ACCOMPANYING NOTES ARE AN INTEGRAL PART OF THESE FINANCIAL STATEMENTS |
Statements of Changes in Net Assets
| | | Royce Dividend Value Fund | | | Royce Global Financial Services Fund | | | Royce International Premier Fund | |
| | | Six Months Ended 6/30/23 (unaudited) | | | Year Ended 12/31/22 | | | Six Months Ended 6/30/23 (unaudited) | | | Year Ended 12/31/22 | | | Six Months Ended 6/30/23 (unaudited) | | | Year Ended 12/31/22 | |
| INVESTMENT OPERATIONS: | | | | | | | | | | | | | | | | | | | | | | | | |
| Net investment income (loss) | | $ | 359,827 | | | $ | 449,227 | | | $ | 115,919 | | | $ | 214,633 | | | $ | 7,333,348 | | | $ | 8,874,179 | |
| Net realized gain (loss) on investments and | | | | | | | | | | | | | | | | | | | | | | | | |
| foreign currency | | | 5,719,078 | | | | 350,360 | | | | 1,736,479 | | | | (324,504 | ) | | | (18,621,324 | ) | | | (31,109,554 | ) |
| Net change in unrealized appreciation (depreciation) | | | | | | | | | | | | | | | | | | | | | | | | |
| on investments and foreign currency | | | 843,142 | | | | (11,012,658 | ) | | | (925,079 | ) | | | (7,294,143 | ) | | | 43,892,301 | | | | (312,277,825 | ) |
| Net increase (decrease) in net assets from | | | | | | | | | | | | | | | | | | | | | | | | |
| investment operations | | | 6,922,047 | | | | (10,213,071 | ) | | | 927,319 | | | | (7,404,014 | ) | | | 32,604,325 | | | | (334,513,200 | ) |
| DISTRIBUTIONS: | | | | | | | | | | | | | | | | | | | | | | | | |
| Total distributable earnings | | | | | | | | | | | | | | | | | | | | | | | | |
| Investment Class | | | (298,371 | ) | | | (459,825 | ) | | | | | | | | | | | - | | | | (9,009,895 | ) |
| Service Class | | | (79,187 | ) | | | (84,861 | ) | | | - | | | | (399,279 | ) | | | - | | | | (1,026,583 | ) |
| Consultant Class | | | - | | | | (3,174 | ) | | | | | | | | | | | - | | | | (126,023 | ) |
| Institutional Class | | | (248 | ) | | | (4,561 | ) | | | - | | | | (136,659 | ) | | | - | | | | (17,241,958 | ) |
| Total distributions | | | (377,806 | ) | | | (552,421 | ) | | | - | | | | (535,938 | ) | | | - | | | | (27,404,459 | ) |
| CAPITAL SHARE TRANSACTIONS: | | | | | | | | | | | | | | | | | | | | | | | | |
| Net capital share transactions | | | | | | | | | | | | | | | | | | | | | | | | |
| Investment Class | | | (2,704,771 | ) | | | (3,483,571 | ) | | | | | | | | | | | 50,341,933 | | | | (96,556,648 | ) |
| Service Class | | | 1,443,002 | | | | (2,803,992 | ) | | | (1,490,849 | ) | | | (3,264,882 | ) | | | 2,195,401 | | | | (9,925,065 | ) |
| Consultant Class | | | (1,669,602 | ) | | | 467,815 | | | | | | | | | | | | (5,029,442 | ) | | | (1,238,324 | ) |
| Institutional Class | | | (135,683 | ) | | | (686,375 | ) | | | (96,269 | ) | | | (144,030 | ) | | | (4,758,451 | ) | | | (43,429,085 | ) |
| Shareholder redemption fees | | | | | | | | | | | | | | | | | | | | | | | | |
| Investment Class | | | 211 | | | | 73 | | | | | | | | | | | | 194 | | | | 24,429 | |
| Service Class | | | - | | | | - | | | | 30 | | | | 3 | | | | 2,955 | | | | 77 | |
| Net increase (decrease) in net assets from capital | | | | | | | | | | | | | | | | | | | | | | | | |
| share transactions | | | (3,066,843 | ) | | | (6,506,050 | ) | | | (1,587,088 | ) | | | (3,408,909 | ) | | | 42,752,590 | | | | (151,124,616 | ) |
| Net Increase (Decrease) In Net Assets | | | 3,477,398 | | | | (17,271,542 | ) | | | (659,769 | ) | | | (11,348,861 | ) | | | 75,356,915 | | | | (513,042,275 | ) |
| NET ASSETS: | | | | | | | | | | | | | | | | | | | | | | | | |
| Beginning of period | | | 59,028,319 | | | | 76,299,861 | | | | 26,934,379 | | | | 38,283,240 | | | | 739,899,580 | | | | 1,252,941,855 | |
| End of period | | $ | 62,505,717 | | | $ | 59,028,319 | | | $ | 26,274,610 | | | $ | 26,934,379 | | | $ | 815,256,495 | | | $ | 739,899,580 | |
| THE ACCOMPANYING NOTES ARE AN INTEGRAL PART OF THESE FINANCIAL STATEMENTS | The Royce Funds 2023 Semiannual Report to Shareholders | 57 |
Statements of Changes in Net Assets
| | | Royce Micro-Cap Fund | | | Royce Pennsylvania Mutual Fund | | | Royce Premier Fund | |
| | | Six Months Ended
6/30/23 (unaudited) | | | Year Ended 12/31/22 | | | Six Months Ended
6/30/23 (unaudited) | | | Year Ended 12/31/22 | | | Six Months Ended
6/30/23 (unaudited) | | | Year Ended 12/31/22 | |
| INVESTMENT OPERATIONS: | | | | | | | | | | | | | | | | | | | | | | | | |
| Net investment income (loss) | | $ | (853,613 | ) | | $ | (2,107,683 | ) | | $ | 1,009,086 | | | $ | 3,079,768 | | | $ | 686,115 | | | $ | (416,685 | ) |
| Net realized gain (loss) on investments and | | | | | | | | | | | | | | | | | | | | | | | | |
| foreign currency | | | 16,491,932 | | | | 1,594,469 | | | | 55,998,894 | | | | 25,462,152 | | | | 44,954,352 | | | | 93,957,652 | |
| Net change in unrealized appreciation (depreciation) | | | | | | | | | | | | | | | | | | | | | | | | |
| on investments and foreign currency | | | 10,951,088 | | | | (93,507,037 | ) | | | 178,303,135 | | | | (394,795,614 | ) | | | 131,541,371 | | | | (357,293,399 | ) |
| Net increase (decrease) in net assets from | | | | | | | | | | | | | | | | | | | | | | | | |
| investment operations | | | 26,589,407 | | | | (94,020,251 | ) | | | 235,311,115 | | | | (366,253,694 | ) | | | 177,181,838 | | | | (263,752,432 | ) |
| DISTRIBUTIONS: | | | | | | | | | | | | | | | | | | | | | | | | |
| Total distributable earnings | | | | | | | | | | | | | | | | | | | | | | | | |
| Investment Class | | | - | | | | (7,366,380 | ) | | | - | | | | (59,541,547 | ) | | | - | | | | (84,853,039 | ) |
| Service Class | | | - | | | | (6,478,764 | ) | | | - | | | | (2,986,880 | ) | | | - | | | | (2,108,066 | ) |
| Consultant Class | | | - | | | | (509,147 | ) | | | - | | | | (8,814,162 | ) | | | - | | | | (947,447 | ) |
| Institutional Class | | | | | | | | | | | - | | | | (6,715,538 | ) | | | - | | | | (17,404,485 | ) |
| R Class | | | | | | | | | | | - | | | | (345,932 | ) | | | - | | | | (509,268 | ) |
| Total distributions | | | - | | | | (14,354,291 | ) | | | - | | | | (78,404,059 | ) | | | - | | | | (105,822,305 | ) |
| CAPITAL SHARE TRANSACTIONS: | | | | | | | | | | | | | | | | | | | | | | | | |
| Net capital share transactions | | | | | | | | | | | | | | | | | | | | | | | | |
| Investment Class | | | (3,436,429 | ) | | | (5,409,081 | ) | | | (69,387,387 | ) | | | (82,899,142 | ) | | | (38,667,036 | ) | | | (102,448,486 | ) |
| Service Class | | | (9,642,157 | ) | | | (14,429,642 | ) | | | 1,797,057 | | | | (8,699,031 | ) | | | 5,687,665 | | | | (3,824,328 | ) |
| Consultant Class | | | (757,979 | ) | | | (1,259,829 | ) | | | (10,264,858 | ) | | | (21,132,136 | ) | | | (790,664 | ) | | | (1,226,087 | ) |
| Institutional Class | | | | | | | | | | | 25,333,874 | | | | (24,377,993 | ) | | | (5,356,989 | ) | | | (7,385,423 | ) |
| R Class | | | | | | | | | | | (7,470,321 | ) | | | (377,644 | ) | | | (6,605,757 | ) | | | (158,880 | ) |
| Shareholder redemption fees | | | | | | | | | | | | | | | | | | | | | | | | |
| Investment Class | | | - | | | | 2,824 | | | | 279 | | | | 532 | | | | 37 | | | | 646 | |
| Service Class | | | 21 | | | | 586 | | | | 25 | | | | 37 | | | | - | | | | 245 | |
| Net increase (decrease) in net assets from capital | | | | | | | | | | | | | | | | | | | | | | | | |
| share transactions | | | (13,836,544 | ) | | | (21,095,142 | ) | | | (59,991,331 | ) | | | (137,485,377 | ) | | | (45,732,744 | ) | | | (115,042,313 | ) |
| Net Increase (Decrease) In Net Assets | | | 12,752,863 | | | | (129,469,684 | ) | | | 175,319,784 | | | | (582,143,130 | ) | | | 131,449,094 | | | | (484,617,050 | ) |
| NET ASSETS: | | | | | | | | | | | | | | | | | | | | | | | | |
| Beginning of period | | | 292,428,356 | | | | 421,898,040 | | | | 1,566,676,963 | | | | 2,148,820,093 | | | | 1,251,160,018 | | | | 1,735,777,068 | |
| End of period | | $ | 305,181,219 | | | $ | 292,428,356 | | | $ | 1,741,996,747 | | | $ | 1,566,676,963 | | | $ | 1,382,609,112 | | | $ | 1,251,160,018 | |
| 58 | The Royce Funds 2023 Semiannual Report to Shareholders | THE ACCOMPANYING NOTES ARE AN INTEGRAL PART OF THESE FINANCIAL STATEMENTS |
| | | Royce Small-Cap Opportunity Fund | | | Royce Small-Cap Special Equity Fund | | | Royce Small-Cap Total Return Fund | |
| | | Six Months Ended 6/30/23 (unaudited) | | | Year Ended 12/31/22 | | | Six Months Ended 6/30/23 (unaudited) | | | Year Ended 12/31/22 | | | Six Months Ended 6/30/23 (unaudited) | | | Year Ended 12/31/22 | |
| INVESTMENT OPERATIONS: | | | | | | | | | | | | | | | | | | | | | | | | |
| Net investment income (loss) | | $ | (265,380 | ) | | $ | 153,538 | | | $ | 4,797,062 | | | $ | 8,460,718 | | | $ | 3,287,020 | | | $ | 9,690,626 | |
| Net realized gain (loss) on investments and | | | | | | | | | | | | | | | | | | | | | | | | |
| foreign currency | | | 25,059,466 | | | | 473,845 | | | | 13,423,161 | | | | 43,215,219 | | | | 17,337,748 | | | | 78,077,877 | |
| Net change in unrealized appreciation (depreciation) | | | | | | | | | | | | | | | | | | | | | | | | |
| on investments and foreign currency | | | 131,043,690 | | | | (301,654,969 | ) | | | 40,052,200 | | | | (119,148,828 | ) | | | 60,455,057 | | | | (263,722,163 | ) |
| Net increase (decrease) in net assets from | | | | | | | | | | | | | | | | | | | | | | | | |
| investment operations | | | 155,837,776 | | | | (301,027,586 | ) | | | 58,272,423 | | | | (67,472,891 | ) | | | 81,079,825 | | | | (175,953,660 | ) |
| DISTRIBUTIONS: | | | | | | | | | | | | | | | | | | | | | | | | |
| Total distributable earnings | | | | | | | | | | | | | | | | | | | | | | | | |
| Investment Class | | | - | | | | (45,279,449 | ) | | | - | | | | (67,152,279 | ) | | | (3,072,996 | ) | | | (84,408,846 | ) |
| Service Class | | | - | | | | (3,382,755 | ) | | | - | | | | (3,804,020 | ) | | | (200,209 | ) | | | (7,882,450 | ) |
| Consultant Class | | | - | | | | (558,361 | ) | | | - | | | | (1,537,324 | ) | | | - | | | | (10,861,139 | ) |
| Institutional Class | | | - | | | | (10,695,245 | ) | | | - | | | | (13,788,855 | ) | | | (970,928 | ) | | | (25,579,974 | ) |
| R Class | | | - | | | | (1,917,058 | ) | | | | | | | | | | | (28,503 | ) | | | (2,507,527 | ) |
| Total distributions | | | - | | | | (61,832,868 | ) | | | - | | | | (86,282,478 | ) | | | (4,272,636 | ) | | | (131,239,936 | ) |
| CAPITAL SHARE TRANSACTIONS: | | | | | | | | | | | | | | | | | | | | | | | | |
| Net capital share transactions | | | | | | | | | | | | | | | | | | | | | | | | |
| Investment Class | | | (103,702,162 | ) | | | (151,490,562 | ) | | | (11,361,908 | ) | | | (52,903,109 | ) | | | (27,086,191 | ) | | | (227,485,345 | ) |
| Service Class | | | (4,473,561 | ) | | | (20,199,622 | ) | | | (1,672,208 | ) | | | (14,674,150 | ) | | | (5,333,710 | ) | | | (3,697,202 | ) |
| Consultant Class | | | 159,963 | | | | (322,670 | ) | | | (425,301 | ) | | | (6,601,167 | ) | | | (6,229,132 | ) | | | (1,904,964 | ) |
| Institutional Class | | | 370,480 | | | | (18,386,325 | ) | | | 6,503,030 | | | | (95,455,503 | ) | | | (6,632,748 | ) | | | (38,430,721 | ) |
| R Class | | | (747,540 | ) | | | (1,746,516 | ) | | | | | | | | | | | (888,803 | ) | | | (893,138 | ) |
| Shareholder redemption fees | | | | | | | | | | | | | | | | | | | | | | | | |
| Investment Class | | | 8,002 | | | | 30,160 | | | | 1,058 | | | | 844 | | | | 646 | | | | 724 | |
| Service Class | | | 992 | | | | 2,437 | | | | 10 | | | | 214 | | | | - | | | | 24 | |
| Net increase (decrease) in net assets from capital | | | | | | | | | | | | | | | | | | | | | | | | |
| share transactions | | | (108,383,826 | ) | | | (192,113,098 | ) | | | (6,955,319 | ) | | | (169,632,871 | ) | | | (46,169,938 | ) | | | (272,410,622 | ) |
| Net Increase (Decrease) In Net Assets | | | 47,453,950 | | | | (554,973,552 | ) | | | 51,317,104 | | | | (323,388,240 | ) | | | 30,637,251 | | | | (579,604,218 | ) |
| NET ASSETS: | | | | | | | | | | | | | | | | | | | | | | | | |
| Beginning of period | | | 1,244,884,877 | | | | 1,799,858,429 | | | | 753,565,479 | | | | 1,076,953,719 | | | | 936,403,974 | | | | 1,516,008,192 | |
| End of period | | $ | 1,292,338,827 | | | $ | 1,244,884,877 | | | $ | 804,882,583 | | | $ | 753,565,479 | | | $ | 967,041,225 | | | $ | 936,403,974 | |
| THE ACCOMPANYING NOTES ARE AN INTEGRAL PART OF THESE FINANCIAL STATEMENTS | The Royce Funds 2023 Semiannual Report to Shareholders | 59 |
Statements of Changes in Net Assets
| | | Royce Small-Cap Value Fund | | | Royce Smaller-Companies Growth Fund | |
| | | Six Months Ended 6/30/23 (unaudited) | | | Year Ended 12/31/22 | | | Six Months Ended 6/30/23 (unaudited) | | | Year Ended 12/31/22 | |
| INVESTMENT OPERATIONS: | | | | | | | | | | | | | | | | |
| Net investment income (loss) | | $ | 489,883 | | | $ | 615,800 | | | $ | (883,700 | ) | | $ | (2,357,212 | ) |
| Net realized gain (loss) on investments and foreign currency | | | 3,532,563 | | | | 3,877,777 | | | | (492,833 | ) | | | (20,942,461 | ) |
| Net change in unrealized appreciation (depreciation) on investments and foreign currency | | | 4,759,866 | | | | (18,825,234 | ) | | | 27,636,936 | | | | (71,120,031 | ) |
| Net increase (decrease) in net assets from investment operations | | | 8,782,312 | | | | (14,331,657 | ) | | | 26,260,403 | | | | (94,419,704 | ) |
| DISTRIBUTIONS: | | | | | | | | | | | | | | | | |
| Total distributable earnings | | | | | | | | | | | | | | | | |
| Investment Class | | | - | | | | (2,107,308 | ) | | | - | | | | (2,603,831 | ) |
| Service Class | | | - | | | | (3,950,446 | ) | | | - | | | | (4,447,234 | ) |
| Consultant Class | | | - | | | | (175,045 | ) | | | - | | | | (183,821 | ) |
| Institutional Class | | | | | | | | | | | - | | | | (182,340 | ) |
| R Class | | | - | | | | (317,866 | ) | | | | | | | | |
| Total distributions | | | - | | | | (6,550,665 | ) | | | - | | | | (7,417,226 | ) |
| CAPITAL SHARE TRANSACTIONS: | | | | | | | | | | | | | | | | |
| Net capital share transactions | | | | | | | | | | | | | | | | |
| Investment Class | | | (3,572,387 | ) | | | (2,457,198 | ) | | | (1,362,521 | ) | | | (8,834,564 | ) |
| Service Class | | | 987,723 | | | | (1,118,738 | ) | | | (2,450,802 | ) | | | (12,386,941 | ) |
| Consultant Class | | | (3,079,281 | ) | | | (1,230,672 | ) | | | (4,414,617 | ) | | | (776,959 | ) |
| Institutional Class | | | | | | | | | | | 18,389 | | | | (572,961 | ) |
| R Class | | | (5,632,125 | ) | | | (1,190,060 | ) | | | | | | | | |
| Shareholder redemption fees | | | | | | | | | | | | | | | | |
| Investment Class | | | 503 | | | | 382 | | | | - | | | | 323 | |
| Service Class | | | 368 | | | | 1 | | | | 2,570 | | | | 426 | |
| Net increase (decrease) in net assets from capital share transactions | | | (11,295,199 | ) | | | (5,996,285 | ) | | | (8,206,981 | ) | | | (22,570,676 | ) |
| Net Increase (Decrease) In Net Assets | | | (2,512,887 | ) | | | (26,878,607 | ) | | | 18,053,422 | | | | (124,407,606 | ) |
| NET ASSETS: | | | | | | | | | | | | | | | | |
| Beginning of period | | | 112,944,136 | | | | 139,822,743 | | | | 175,286,531 | | | | 299,694,137 | |
| End of period | | $ | 110,431,249 | | | $ | 112,944,136 | | | $ | 193,339,953 | | | $ | 175,286,531 | |
| 60 | The Royce Funds 2023 Semiannual Report to Shareholders | THE ACCOMPANYING NOTES ARE AN INTEGRAL PART OF THESE FINANCIAL STATEMENTS |
Financial Highlights
This table is presented to show selected data for a share outstanding throughout each year or other indicated period and to assist shareholders in evaluating a Fund’s performance for the periods presented. Per share amounts have been determined on the basis of the weighted average number of shares outstanding during the period.
| | | | | | | | | | | | | | | | | | Distributions | | | | | | | | | | | | | | | Ratio of Expenses to Average Net Assets | | | Ratio of Net | | | | |
| | | | Net Asset | | | | | Net Realized and | | | | | | Distributions | | | from Net | | | | | | | | | | | | | | | Prior to Fee | | | Prior to Fee | | | Net of Fee | | | Investment | | | | |
| | | | Value, | | | | | Unrealized Gain (Loss) | | | Total from | | | from Net | | | Realized Gain on | | | | | | | | | | | | Net Assets, | | | Waivers, Expense | | | Waivers and | | | Waivers and | | | Income (Loss) to | | | Portfolio | |
| | | | Beginning | | Net Investment | | | on Investments and | | | Investment | | | Investment | | | Investments and | | | Total | | | Net Asset Value, | | | | | | End of Period | | | Reimbursements and | | | Expense | | | Expense | | | Average Net | | | Turnover | |
| | | | of Period | | Income (Loss) | | | Foreign Currency | | | Operations | | | Income | | | Foreign Currency | | | Distributions | | | End of Period | | | Total Return | | | (in thousands) | | | Balance Credits | | | Reimbursements | | | Reimbursements | | | Assets | | | Rate | |
| Royce Dividend Value Fund–Investment Class |
| 2023† | | $ | 5.48 | | $ | 0.04 | | | $ | 0.63 | | | $ | 0.67 | | | $ | (0.04 | ) | | $ | – | | | $ | (0.04 | ) | | $ | 6.11 | | | | 12.25 | %1 | | $ | 45,341 | | | | 1.27 | %2 | | | 1.27 | %2 | | | 1.09 | %2 | | | 1.27 | %2 | | | 13 | % |
| 2022 | | | 6.40 | | | 0.04 | | | | (0.90 | ) | | | (0.86 | ) | | | (0.05 | ) | | | (0.01) | | | | (0.06 | ) | | | 5.48 | | | | (13.45 | ) | | | 43,264 | | | | 1.27 | | | | 1.27 | | | | 1.09 | | | | 0.80 | | | | 3 | |
| 2021 | | | 6.11 | | | 0.05 | | | | 1.17 | | | | 1.22 | | | | (0.06 | ) | | | (0.87) | | | | (0.93 | ) | | | 6.40 | | | | 20.47 | | | | 54,466 | | | | 1.21 | | | | 1.21 | | | | 1.09 | | | | 0.76 | | | | 0 | |
| 2020 | | | 6.21 | | | 0.07 | | | | 0.20 | | | | 0.27 | | | | (0.11 | ) | | | (0.26) | | | | (0.37 | ) | | | 6.11 | | | | 4.57 | | | | 53,421 | | | | 1.26 | | | | 1.26 | | | | 1.09 | | | | 1.27 | | | | 4 | |
| 2019 | | | 5.56 | | | 0.09 | | | | 1.58 | | | | 1.67 | | | | (0.10 | ) | | | (0.92) | | | | (1.02 | ) | | | 6.21 | | | | 30.34 | | | | 76,273 | | | | 1.21 | | | | 1.20 | | | | 1.09 | | | | 1.37 | | | | 8 | |
| 2018 | | | 7.56 | | | 0.10 | | | | (1.27 | ) | | | (1.17 | ) | | | (0.10 | ) | | | (0.73) | | | | (0.83 | ) | | | 5.56 | | | | (16.06 | ) | | | 88,036 | | | | 1.13 | | | | 1.13 | | | | 1.04 | | | | 1.29 | | | | 13 | |
| Royce Dividend Value Fund–Service Class |
| 2023† | | $ | 5.71 | | $ | 0.03 | | | $ | 0.65 | | | $ | 0.68 | | | $ | (0.03 | ) | | $ | – | | | $ | (0.03 | ) | | $ | 6.36 | | | | 11.92 | %1 | | $ | 17,165 | | | | 1.63 | %2 | | | 1.63 | %2 | | | 1.34 | %2 | | | 1.07 | %2 | | | 13 | % |
| 2022 | | | 6.65 | | | 0.03 | | | | (0.94 | ) | | | (0.91 | ) | | | (0.02 | ) | | | (0.01) | | | | (0.03 | ) | | | 5.71 | | | | (13.62 | ) | | | 14,005 | | | | 1.62 | | | | 1.62 | | | | 1.34 | | | | 0.55 | | | | 3 | |
| 2021 | | | 6.34 | | | 0.04 | | | | 1.21 | | | | 1.25 | | | | (0.04 | ) | | | (0.90) | | | | (0.94 | ) | | | 6.65 | | | | 20.11 | | | | 19,518 | | | | 1.54 | | | | 1.54 | | | | 1.34 | | | | 0.51 | | | | 0 | |
| 2020 | | | 6.42 | | | 0.06 | | | | 0.21 | | | | 0.27 | | | | (0.08 | ) | | | (0.27) | | | | (0.35 | ) | | | 6.34 | | | | 4.47 | | | | 19,687 | | | | 1.60 | | | | 1.60 | | | | 1.34 | | | | 1.02 | | | | 4 | |
| 2019 | | | 5.73 | | | 0.08 | | | | 1.61 | | | | 1.69 | | | | (0.06 | ) | | | (0.94) | | | | (1.00 | ) | | | 6.42 | | | | 29.78 | | | | 25,256 | | | | 1.53 | | | | 1.52 | | | | 1.34 | | | | 1.14 | | | | 8 | |
| 2018 | | | 7.76 | | | 0.07 | | | | (1.29 | ) | | | (1.22 | ) | | | (0.06 | ) | | | (0.75) | | | | (0.81 | ) | | | 5.73 | | | | (16.24 | ) | | | 28,120 | | | | 1.43 | | | | 1.43 | | | | 1.34 | | | | 1.01 | | | | 13 | |
| Royce Global Financial Services Fund–Service Class |
| 2023† | | $ | 9.41 | | $ | 0.04 | | | $ | 0.29 | | | $ | 0.33 | | | $ | – | | | $ | – | | | $ | – | | | $ | 9.74 | | | | 3.51 | %1 | | $ | 18,613 | | | | 1.95 | %2 | | | 1.95 | %2 | | | 1.49 | %2 | | | 0.87 | %2 | | | 9 | % |
| 2022 | | | 12.06 | | | 0.07 | | | | (2.52 | ) | | | (2.45 | ) | | | (0.08 | ) | | | (0.12) | | | | (0.20 | ) | | | 9.41 | | | | (20.32 | ) | | | 19,443 | | | | 1.90 | | | | 1.90 | | | | 1.49 | | | | 0.71 | | | | 10 | |
| 2021 | | | 10.66 | | | 0.23 | | 3 | | 1.91 | | | | 2.14 | | | | (0.39 | ) | | | (0.35) | | | | (0.74 | ) | | | 12.06 | | | | 20.27 | | | | 28,574 | | | | 1.78 | | | | 1.78 | | | | 1.49 | | | | 1.84 | 3 | | | 5 | |
| 2020 | | | 9.91 | | | 0.07 | | | | 1.42 | | | | 1.49 | | | | (0.04 | ) | | | (0.70) | | | | (0.74 | ) | | | 10.66 | | | | 15.25 | | | | 25,919 | | | | 1.88 | | | | 1.88 | | | | 1.49 | | | | 0.80 | | | | 4 | |
| 2019 | | | 8.18 | | | 0.10 | | | | 1.87 | | | | 1.97 | | | | (0.15 | ) | | | (0.09) | | | | (0.24 | ) | | | 9.91 | | | | 24.17 | | | | 30,202 | | | | 1.82 | | | | 1.81 | | | | 1.49 | | | | 0.86 | | | | 5 | |
| 2018 | | | 10.57 | | | 0.07 | | | | (1.45 | ) | | | (1.38 | ) | | | (0.09 | ) | | | (0.92) | | | | (1.01 | ) | | | 8.18 | | | | (13.41 | ) | | | 32,113 | | | | 1.68 | | | | 1.68 | | | | 1.49 | | | | 0.61 | | | | 8 | |
| Royce Global Financial Services Fund–Institutional Class |
| 2023† | | $ | 12.32 | | $ | 0.06 | | | $ | 0.37 | | | $ | 0.43 | | | $ | – | | | $ | – | | | $ | – | | | $ | 12.75 | | | | 3.49 | %1 | | $ | 7,662 | | | | 1.69 | %2 | | | 1.69 | %2 | | | 1.49 | %2 | | | 0.89 | %2 | | | 9 | % |
| 2022 | | | 15.76 | | | 0.10 | | | | (3.31 | ) | | | (3.21 | ) | | | (0.08 | ) | | | (0.15) | | | | (0.23 | ) | | | 12.32 | | | | (20.35 | ) | | | 7,491 | | | | 1.64 | | | | 1.64 | | | | 1.49 | | | | 0.72 | | | | 10 | |
| 2021 | | | 13.81 | | | 0.32 | | 3 | | 2.47 | | | | 2.79 | | | | (0.39 | ) | | | (0.45) | | | | (0.84 | ) | | | 15.76 | | | | 20.35 | | | | 9,709 | | | | 1.51 | | | | 1.51 | | | | 1.49 | | | | 1.98 | 3 | | | 5 | |
| 2020 | | | 12.83 | | | 0.10 | | | | 1.82 | | | | 1.92 | | | | (0.04 | ) | | | (0.90) | | | | (0.94 | ) | | | 13.81 | | | | 15.18 | | | | 7,746 | | | | 1.67 | | | | 1.67 | | | | 1.49 | | | | 0.81 | | | | 4 | |
| 2019 | | | 10.55 | | | 0.14 | | | | 2.42 | | | | 2.56 | | | | (0.16 | ) | | | (0.12) | | | | (0.28 | ) | | | 12.83 | | | | 24.35 | | | | 6,738 | | | | 1.60 | | | | 1.60 | | | | 1.33 | | | | 1.04 | | | | 5 | |
| 2018 | | | 13.58 | | | 0.15 | | | | (1.85 | ) | | | (1.70 | ) | | | (0.14 | ) | | | (1.19) | | | | (1.33 | ) | | | 10.55 | | | | (12.87 | ) | | | 6,951 | | | | 1.43 | | | | 1.43 | | | | 1.04 | | | | 1.06 | | | | 8 | |
| Royce International Premier Fund–Investment Class |
| 2023† | | $ | 12.54 | | $ | 0.12 | | | $ | 0.44 | | | $ | 0.56 | | | $ | – | | | $ | – | | | $ | – | | | $ | 13.10 | | | | 4.47 | %1 | | $ | 308,604 | | | | 1.26 | %2 | | | 1.26 | %2 | | | 1.17 | %2 | | | 1.84 | %2 | | | 18 | % |
| 2022 | | | 17.81 | | | 0.13 | | | | (4.94 | ) | | | (4.81 | ) | | | (0.13 | ) | | | (0.33) | | | | (0.46 | ) | | | 12.54 | | | | (26.96 | ) | | | 248,170 | | | | 1.26 | | | | 1.26 | | | | 1.17 | | | | 0.95 | | | | 31 | |
| 2021 | | | 17.64 | | | 0.06 | | | | 0.99 | | | | 1.05 | | | | (0.07 | ) | | | (0 81) | | | | (0.88 | ) | | | 17.81 | | | | 6.06 | | | | 480,550 | | | | 1.23 | | | | 1.23 | | | | 1.16 | | | | 0.33 | | | | 32 | |
| 2020 | | | 15.25 | | | 0.04 | | | | 2.40 | | | | 2.44 | | | | (0.05 | ) | | | – | | | | (0.05 | ) | | | 17.64 | | | | 15.99 | | | | 486,378 | | | | 1.26 | | | | 1.26 | | | | 1.19 | | | | 0.30 | | | | 21 | |
| 2019 | | | 11.39 | | | 0.11 | | | | 3.82 | | | | 3.93 | | | | (0.07 | ) | | | – | | | | (0.07 | ) | | | 15.25 | | | | 34.49 | | | | 360,623 | | | | 1.26 | | | | 1.26 | | | | 1.18 | | | | 0.74 | | | | 40 | |
| 2018 | | | 13 07 | | | 0.09 | | | | (1.72 | ) | | | (1.63 | ) | | | (0.05 | ) | | | – | | | | (0.05 | ) | | | 11.39 | | | | (12.45 | ) | | | 285,065 | | | | 1.27 | | | | 1.26 | | | | 1.16 | | | | 1.00 | | | | 65 | |
| THE ACCOMPANYING NOTES ARE AN INTEGRAL PART OF THESE FINANCIAL STATEMENTS | The Royce Funds 2023 Semiannual Report to Shareholders | 61 |
Financial Highlights
This table is presented to show selected data for a share outstanding throughout each year or other indicated period and to assist shareholders in evaluating a Fund’s performance for the periods presented. Per share amounts have been determined on the basis of the weighted average number of shares outstanding during the period.
| | | | | | | | | | | | | | | | | | Distributions | | | | | | | | | | | | | | | Ratio of Expenses to Average Net Assets | | | Ratio of Net | | | | |
| | | | Net Asset | | | | | Net Realized and | | | | | | Distributions | | | from Net | | | | | | | | | | | | | | | Prior to Fee | | | Prior to Fee | | | Net of Fee | | | Investment | | | | |
| | | | Value, | | | | | Unrealized Gain (Loss) | | | Total from | | | from Net | | | Realized Gain on | | | | | | | | | | | | Net Assets, | | | Waivers, Expense | | | Waivers and | | | Waivers and | | | Income (Loss) to | | | Portfolio | |
| | | | Beginning | | Net Investment | | | on Investments and | | | Investment | | | Investment | | | Investments and | | | Total | | | Net Asset Value, | | | | | | End of Period | | | Reimbursements and | | | Expense | | | Expense | | | Average Net | | | Turnover | |
| | | | of Period | | Income (Loss) | | | Foreign Currency | | | Operations | | | Income | | | Foreign Currency | | | Distributions | | | End of Period | | | Total Return | | | (in thousands) | | | Balance Credits | | | Reimbursements | | | Reimbursements | | | Assets | | | Rate | |
| Royce International Premier Fund–Service Class |
| 2023† | | $ | 15.04 | | $ | 0.12 | | | $ | 0.55 | | | $ | 0.67 | | | $ | – | | | $ | – | | | $ | – | | | $ | 15.71 | | | | 4.45 | %1 | | $ | 36,790 | | | | 1.59 | %2 | | | 1.59 | %2 | | | 1.44 | %2 | | | 1.58 | %2 | | | 18 | % |
| 2022 | | | 21.33 | | | 0.11 | | | | (5.92 | ) | | | (5.81 | ) | | | (0.08 | ) | | | (0.40) | | | | (0.48 | ) | | | 15.04 | | | | (27.21 | ) | | | 33,163 | | | | 1.59 | | | | 1.59 | | | | 1.44 | | | | 0.63 | | | | 31 | |
| 2021 | | | 21.10 | | | 0.01 | | | | 1.18 | | | | 1.19 | | | | – | | | | (0.96) | | | | (0.96 | ) | | | 21.33 | | | | 5.78 | | | | 59,258 | | | | 1.54 | | | | 1.54 | | | | 1.44 | | | | 0.05 | | | | 32 | |
| 2020 | | | 18.24 | | | 0.01 | | | | 2.85 | | | | 2.86 | | | | – | | | | – | | | | – | | | | 21.10 | | | | 15.68 | | | | 69,153 | | | | 1.57 | | | | 1.57 | | | | 1.44 | | | | 0.04 | | | | 21 | |
| 2019 | | | 13.61 | | | 0.10 | | | | 4.57 | | | | 4.67 | | | | (0.04 | ) | | | – | | | | (0.04 | ) | | | 18.24 | | | | 34.29 | | | | 71,350 | | | | 1.58 | | | | 1.58 | | | | 1.41 | | | | 0.63 | | | | 40 | |
| 2018 | | | 15.60 | | | 0.11 | | | | (2.10 | ) | | | (1.99 | ) | | | – | | | | – | | | | – | | | | 13.61 | | | | (12.76 | ) | | | 36,303 | | | | 1.59 | | | | 1.59 | | | | 1.44 | | | | 0.71 | | | | 65 | |
| Royce International Premier Fund–Institutional Class a |
| 2023† | | $ | 12.53 | | $ | 0.13 | | | $ | 0.45 | | | $ | 0.58 | | | $ | – | | | $ | – | | | $ | – | | | $ | 13.11 | | | | 4.63 | %1 | | $ | 469,862 | | | | 1.20 | %2 | | | 1.19 | %2 | | | 1.04 | %2 | | | 1.92 | %2 | | | 18 | % |
| 2022 | | | 17.82 | | | 0.14 | | | | (4.95 | ) | | | (4.81 | ) | | | (0.15 | ) | | | (0.33) | | | | (0.48 | ) | | | 12.53 | | | | (26.92 | ) | | | 453,793 | | | | 1.20 | | | | 1.19 | | | | 1.04 | | | | 1.03 | | | | 31 | |
| 2021 | | | 17.64 | | | 0.08 | | | | 0.99 | | | | 1.07 | | | | (0.09 | ) | | | (0.80) | | | | (0.89 | ) | | | 17.82 | | | | 6.23 | | | | 704,714 | | | | 1.16 | | | | 1.16 | | | | 1.04 | | | | 0.44 | | | | 32 | |
| 2020 | | | 15.25 | | | 0.06 | | | | 2.39 | | | | 2.45 | | | | (0.06 | ) | | | – | | | | (0.06 | ) | | | 17.64 | | | | 16.12 | | | | 567,878 | | | | 1.20 | | | | 1.20 | | | | 1.04 | | | | 0.44 | | | | 21 | |
| 2019 | | | 11.39 | | | (0.03 | ) | | | 3.98 | | | | 3.95 | | | | (0.09 | ) | | | – | | | | (0.09 | ) | | | 15.25 | | | | 34.68 | | | | 366,870 | | | | 1.19 | | | | 1.19 | | | | 1.04 | | | | 0.57 | | | | 40 | |
| 2018 | | | 12.98 | | | (0.00 | ) | | | (1.53 | ) | | | (1.53 | ) | | | (0.06 | ) | | | – | | | | (0.06 | ) | | | 11.39 | | | | (11.78 | )1 | | | 32,340 | | | | 1.34 | 2 | | | 1.34 | 2 | | | 1.04 | 2 | | | 0.84 | 2 | | | 65 | |
| Royce Micro-Cap Fund–Investment Class |
| 2023† | | $ | 9.88 | | $ | (0.02 | ) | | $ | 0.95 | | | $ | 0.93 | | | $ | – | | | $ | – | | | $ | – | | | $ | 10.81 | | | | 9.41 | %1 | | $ | 160,282 | | | | 1.25 | %2 | | | 1.24 | %2 | | | 1.24 | %2 | | | (0.43 | )%2 | | | 9 | % |
| 2022 | | | 13.41 | | | (0.05 | ) | | | (2.98 | ) | | | (3.03 | ) | | | – | | | | (0.50) | | | | (0.50 | ) | | | 9.88 | | | | (22.55 | ) | | | 149,934 | | | | 1.25 | | | | 1.24 | | | | 1.24 | | | | (0.50 | ) | | | 13 | |
| 2021 | | | 12.74 | | | (0.07 | ) | | | 3.84 | | | | 3.77 | | | | – | | | | (3.10) | | | | (3.10 | ) | | | 13.41 | | | | 31.02 | | | | 209,032 | | | | 1.20 | | | | 1.20 | | | | 1.20 | | | | (0.43 | ) | | | 26 | |
| 2020 | | | 11.02 | | | (0.05 | ) | | | 2.71 | | | | 2.66 | | | | – | | | | (0.94) | | | | (0.94 | ) | | | 12.74 | | | | 24.50 | | | | 174,339 | | | | 1.29 | | | | 1.29 | | | | 1.24 | | | | (0.46 | ) | | | 25 | |
| 2019 | | | 9.35 | | | (0.05 | ) | | | 2.02 | | | | 1.97 | | | | – | | | | (0.30) | | | | (0.30 | ) | | | 11.02 | | | | 21.16 | | | | 158,112 | | | | 1.51 | | | | 1.50 | | | | 1.36 | | | | (0.46 | ) | | | 21 | |
| 2018 | | | 11.64 | | | (0.05 | ) | | | (0.94 | ) | | | (0.99 | ) | | | – | | | | (1.30) | | | | (1.30 | ) | | | 9.35 | | | | (8.94 | ) | | | 117,040 | | | | 1.50 | | | | 1.50 | | | | 1.49 | | | | (0.43 | ) | | | 24 | |
| Royce Micro-Cap Fund–Service Class |
| 2023† | | $ | 9.59 | | $ | (0.03 | ) | | $ | 0.92 | | | $ | 0.89 | | | $ | – | | | $ | – | | | $ | – | | | $ | 10.48 | | | | 9.28 | %1 | | $ | 134,438 | | | | 1.55 | %2 | | | 1.55 | %2 | | | 1.49 | %2 | | | (0.68 | )%2 | | | 9 | % |
| 2022 | | | 13.05 | | | (0.08 | ) | | | (2.89 | ) | | | (2.97 | ) | | | – | | | | (0.49) | | | | (0.49 | ) | | | 9.59 | | | | (22.76 | ) | | | 132,133 | | | | 1.54 | | | | 1.54 | | | | 1.49 | | | | (0.75 | ) | | | 13 | |
| 2021 | | | 12.45 | | | (0.11 | ) | | | 3.74 | | | | 3.63 | | | | – | | | | (3.03) | | | | (3.03 | ) | | | 13.05 | | | | 30.64 | | | | 197,089 | | | | 1.51 | | | | 1.51 | | | | 1.49 | | | | (0.73 | ) | | | 26 | |
| 2020 | | | 10.79 | | | (0.07 | ) | | | 2.65 | | | | 2.58 | | | | – | | | | (0.92) | | | | (0.92 | ) | | | 12.45 | | | | 24.26 | | | | 168,285 | | | | 1.60 | | | | 1.60 | | | | 1.49 | | | | (0.71 | ) | | | 25 | |
| 2019 | | | 9.15 | | | (0.01 | ) | | | 1.94 | | | | 1.93 | | | | – | | | | (0.29) | | | | (0.29 | ) | | | 10.79 | | | | 21.22 | | | | 164,956 | | | | 1.51 | | | | 1.51 | | | | 1.50 | | | | (0.09 | ) | | | 21 | |
| 2018 | | | 11.41 | | | (0.07 | ) | | | (0.91 | ) | | | (0.98 | ) | | | – | | | | (1.28) | | | | (1.28 | ) | | | 9.15 | | | | (9.09 | ) | | | 8,053 | | | | 1.90 | | | | 1.89 | | | | 1.61 | | | | (0.56 | ) | | | 24 | |
| Royce Micro-Cap Fund–Consultant Class |
| 2023† | | $ | 7.29 | | $ | (0.06 | ) | | $ | 0.70 | | | $ | 0.64 | | | $ | – | | | $ | – | | | $ | – | | | $ | 7.93 | | | | 8.78 | %1 | | $ | 10,461 | | | | 2.41 | %2 | | | 2.41 | %2 | | | 2.35 | %2 | | | (1.54 | )%2 | | | 9 | % |
| 2022 | | | 10.00 | | | (0.13 | ) | | | (2.21 | ) | | | (2.34 | ) | | | – | | | | (0.37) | | | | (0.37 | ) | | | 7.29 | | | | (23.37 | ) | | | 10,361 | | | | 2.37 | | | | 2.37 | | | | 2.37 | | | | (1.63 | ) | | | 13 | |
| 2021 | | | 9.62 | | | (0.18 | ) | | | 2.89 | | | | 2.71 | | | | – | | | | (2.33) | | | | (2.33 | ) | | | 10.00 | | | | 29.56 | | | | 15,777 | | | | 2.30 | | | | 2.30 | | | | 2.30 | | | | (1.53 | ) | | | 26 | |
| 2020 | | | 8.42 | | | (0.13 | ) | | | 2.04 | | | | 1.91 | | | | – | | | | (0.71) | | | | (0.71 | ) | | | 9.62 | | | | 23.04 | | | | 14,025 | | | | 2.41 | | | | 2.41 | | | | 2.41 | | | | (1.63 | ) | | | 25 | |
| 2019 | | | 7.23 | | | (0.13 | ) | | | 1.55 | | | | 1.42 | | | | – | | | | (0.23) | | | | (0.23 | ) | | | 8.42 | | | | 19.72 | | | | 14,204 | | | | 2.59 | | | | 2.59 | | | | 2.58 | | | | (1.69 | ) | | | 21 | |
| 2018 | | | 9.10 | | | (0.14 | ) | | | (0.72 | ) | | | (0.86 | ) | | | – | | | | (1.01) | | | | (1.01 | ) | | | 7.23 | | | | (9.93 | ) | | | 16,680 | | | | 2.56 | | | | 2.56 | | | | 2.56 | | | | (1.50 | ) | | | 24 | |
| 62 | The Royce Funds 2023 Semiannual Report to Shareholders | THE ACCOMPANYING NOTES ARE AN INTEGRAL PART OF THESE FINANCIAL STATEMENTS |
Financial Highlights
This table is presented to show selected data for a share outstanding throughout each year or other indicated period and to assist shareholders in evaluating a Fund’s performance for the periods presented. Per share amounts have been determined on the basis of the weighted average number of shares outstanding during the period.
| | | | | | | | | | | | | | | | | | Distributions | | | | | | | | | | | | | | | Ratio of Expenses to Average Net Assets | | | Ratio of Net | | | | |
| | | | Net Asset | | | | | Net Realized and | | | | | | Distributions | | | from Net | | | | | | | | | | | | | | | Prior to Fee | | | Prior to Fee | | | Net of Fee | | | Investment | | | | |
| | | | Value, | | | | | Unrealized Gain (Loss) | | | Total from | | | from Net | | | Realized Gain on | | | | | | | | | | | | Net Assets, | | | Waivers, Expense | | | Waivers and | | | Waivers and | | | Income (Loss) to | | | Portfolio | |
| | | | Beginning | | Net Investment | | | on Investments and | | | Investment | | | Investment | | | Investments and | | | Total | | | Net Asset Value, | | | | | | End of Period | | | Reimbursements and | | | Expense | | | Expense | | | Average Net | | | Turnover | |
| | | | of Period | | Income (Loss) | | | Foreign Currency | | | Operations | | | Income | | | Foreign Currency | | | Distributions | | | End of Period | | | Total Return | | | (in thousands) | | | Balance Credits | | | Reimbursements | | | Reimbursements | | | Assets | | | Rate | |
| Royce Pennsylvania Mutual Fund–Investment Class |
| 2023† | | $ | 7.61 | | $ | 0.01 | | | $ | 1.16 | | | $ | 1.17 | | | $ | – | | | $ | – | | | $ | – | | | $ | 8.78 | | | | 15.37 | %1 | | $ | 1,301,416 | | | | 0.94 | %2 | | | 0.94 | %2 | | | 0.94 | %2 | | | 0.24 | %2 | | | 17 | % |
| 2022 | | | 9.65 | | | 0.03 | | | | (1.68 | ) | | | (1.65 | ) | | | (0.00 | ) | | | (0.39) | | | | (0.39 | ) | | | 7.61 | | | | (17.06 | ) | | | 1,191,941 | | | | 0.94 | | | | 0.94 | | | | 0.94 | | | | 0.31 | | | | 45 | |
| 2021 | | | 10.24 | | | 0.02 | | | | 2.11 | | | | 2.13 | | | | (0.01 | ) | | | (2.71) | | | | (2.72 | ) | | | 9.65 | | | | 22.05 | | | | 1,605,587 | | | | 0.91 | | | | 0.91 | | | | 0.91 | | | | 0.15 | | | | 60 | |
| 2020 | | | 9.44 | | | 0.03 | | | | 1.29 | | | | 1.32 | | | | (0.06 | ) | | | (0.46) | | | | (0.52 | ) | | | 10.24 | | | | 14.08 | | | | 1,426,472 | | | | 0.95 | | | | 0.95 | | | | 0.95 | | | | 0.37 | | | | 32 | |
| 2019 | | | 7.75 | | | 0.04 | | | | 2.01 | | | | 2.05 | | | | (0.02 | ) | | | (0.34) | | | | (0.36 | ) | | | 9.44 | | | | 26.56 | | | | 1,429,042 | | | | 0.95 | | | | 0.94 | | | | 0.94 | | | | 0.39 | | | | 30 | |
| 2018 | | | 10.52 | | | 0.04 | | | | (0.97 | ) | | | (0.93 | ) | | | (0.02 | ) | | | (1.82) | | | | (1.84 | ) | | | 7.75 | | | | (9.66 | ) | | | 1,203,967 | | | | 0.92 | | | | 0.92 | | | | 0.92 | | | | 0.33 | | | | 35 | |
| Royce Pennsylvania Mutual Fund–Service Class |
| 2023† | | $ | 7.56 | | $ | (0.00 | ) | | $ | 1.15 | | | $ | 1.15 | | | $ | – | | | $ | – | | | $ | – | | | $ | 8.71 | | | | 15.21 | %1 | | $ | 68,866 | | | | 1.30 | %2 | | | 1.29 | %2 | | | 1.25 | %2 | | | (0.06 | )%2 | | | 17 | % |
| 2022 | | | 9.62 | | | (0.00 | ) | | | (1.67 | ) | | | (1.67 | ) | | | �� | | | | (0.39) | | | | (0.39 | ) | | | 7.56 | | | | (17.41 | ) | | | 58,043 | | | | 1.30 | | | | 1.30 | | | | 1.25 | | | | (0.01 | ) | | | 45 | |
| 2021 | | | 10.23 | | | (0.02 | ) | | | 2.11 | | | | 2.09 | | | | – | | | | (2.70) | | | | (2.70 | ) | | | 9.62 | | | | 21.64 | | | | 84,060 | | | | 1.27 | | | | 1.27 | | | | 1.27 | | | | (0.22 | ) | | | 60 | |
| 2020 | | | 9.42 | | | 0.02 | | | | 1.28 | | | | 1.30 | | | | (0.03 | ) | | | (0.46) | | | | (0.49 | ) | | | 10.23 | | | | 13.88 | | | | 78,789 | | | | 1.25 | | | | 1.24 | | | | 1.13 | | | | 0.23 | | | | 32 | |
| 2019 | | | 7.77 | | | (0.00 | ) | | | 2.00 | | | | 2.00 | | | | (0.01 | ) | | | (0.34) | | | | (0.35 | ) | | | 9.42 | | | | 25.75 | | | | 142,864 | | | | 1.31 | | | | 1.30 | | | | 1.30 | | | | (0.01 | ) | | | 30 | |
| 2018 | | | 10.56 | | | (0.01 | ) | | | (0.96 | ) | | | (0.97 | ) | | | – | | | | (1.82) | | | | (1.82 | ) | | | 7.77 | | | | (9.96 | ) | | | 32,191 | | | | 1.30 | | | | 1.30 | | | | 1.30 | | | | (0.07 | ) | | | 35 | |
| Royce Pennsylvania Mutual Fund–Consultant Class |
| 2023† | | $ | 5.88 | | $ | (0.02 | ) | | $ | 0.89 | | | $ | 0.87 | | | $ | – | | | $ | – | | | $ | – | | | $ | 6.75 | | | | 14.80 | %1 | | $ | 190,963 | | | | 1.95 | %2 | | | 1.95 | %2 | | | 1.95 | %2 | | | (0.77 | )%2 | | | 17 | % |
| 2022 | | | 7.53 | | | (0.04 | ) | | | (1.31 | ) | | | (1.35 | ) | | | – | | | | (0.30) | | | | (0.30 | ) | | | 5.88 | | | | (17.94 | ) | | | 175,956 | | | | 1.94 | | | | 1.94 | | | | 1.94 | | | | (0.70 | ) | | | 45 | |
| 2021 | | | 8.07 | | | (0.08 | ) | | | 1.66 | | | | 1.58 | | | | – | | | | (2.12) | | | | (2.12 | ) | | | 7.53 | | | | 20.78 | | | | 249,816 | | | | 1.92 | | | | 1.92 | | | | 1.92 | | | | (0.86 | ) | | | 60 | |
| 2020 | | | 7.47 | | | (0.04 | ) | | | 1.00 | | | | 0.96 | | | | – | | | | (0.36) | | | | (0.36 | ) | | | 8.07 | | | | 12.94 | | | | 238,595 | | | | 1.96 | | | | 1.96 | | | | 1.96 | | | | (0.64 | ) | | | 32 | |
| 2019 | | | 6.18 | | | (0.04 | ) | | | 1.60 | | | | 1.56 | | | | – | | | | (0.27) | | | | (0.27 | ) | | | 7.47 | | | | 25.25 | | | | 262,007 | | | | 1.96 | | | | 1.95 | | | | 1.95 | | | | (0.62 | ) | | | 30 | |
| 2018 | | | 8.46 | | | (0.06 | ) | | | (0.77 | ) | | | (0.83 | ) | | | – | | | | (1.45) | | | | (1.45 | ) | | | 6.18 | | | | (10.56 | ) | | | 249,004 | | | | 1.93 | | | | 1.93 | | | | 1.93 | | | | (0.69 | ) | | | 35 | |
| Royce Pennsylvania Mutual Fund–Institutional Class |
| 2023† | | $ | 7.63 | | $ | 0.01 | | | $ | 1.17 | | | $ | 1.18 | | | $ | – | | | $ | – | | | $ | – | | | $ | 8.81 | | | | 15.47 | %1 | | $ | 180,752 | | | | 0.90 | %2 | | | 0.90 | %2 | | | 0.90 | %2 | | | 0.30 | %2 | | | 17 | % |
| 2022 | | | 9.68 | | | 0.03 | | | | (1.68 | ) | | | (1.65 | ) | | | (0.01 | ) | | | (0.39) | | | | (0.40 | ) | | | 7.63 | | | | (17.07 | ) | | | 133,606 | | | | 0.90 | | | | 0.90 | | | | 0.90 | | | | 0.33 | | | | 45 | |
| 2021 | | | 10.27 | | | 0.03 | | | | 2.12 | | | | 2.15 | | | | (0.01 | ) | | | (2.73) | | | | (2.74 | ) | | | 9.68 | | | | 22.10 | | | | 199,842 | | | | 0.86 | | | | 0.86 | | | | 0.86 | | | | 0.21 | | | | 60 | |
| 2020 | | | 9.47 | | | 0.04 | | | | 1.28 | | | | 1.32 | | | | (0.06 | ) | | | (0.46) | | | | (0.52 | ) | | | 10.27 | | | | 14.10 | | | | 163,944 | | | | 0.89 | | | | 0.89 | | | | 0.89 | | | | 0.42 | | | | 32 | |
| 2019 | | | 7.78 | | | 0.04 | | | | 2.02 | | | | 2.06 | | | | (0.03 | ) | | | (0.34) | | | | (0.37 | ) | | | 9.47 | | | | 26.53 | | | | 106,564 | | | | 0.89 | | | | 0.89 | | | | 0.89 | | | | 0.45 | | | | 30 | |
| 2018 | | | 10.55 | | | 0.04 | | | | (0.97 | ) | | | (0.93 | ) | | | (0.02 | ) | | | (1.82) | | | | (1.84 | ) | | | 7.78 | | | | (9.56 | ) | | | 83,908 | | | | 0.88 | | | | 0.88 | | | | 0.88 | | | | 0.40 | | | | 35 | |
| Royce Premier Fund–Investment Class |
| 2023† | | $ | 10.06 | | $ | 0.01 | | | $ | 1.43 | | | $ | 1.44 | | | $ | – | | | $ | – | | | $ | – | | | $ | 11.50 | | | | 14.31 | %1 | | $ | 1,104,884 | | | | 1.19 | %2 | | | 1.19 | %2 | | | 1.19 | %2 | | | 0.11 | %2 | | | 5 | % |
| 2022 | | | 12.97 | | | (0.00 | ) | | | (2.00 | ) | | | (2.00 | ) | | | – | | | | (0.91) | | | | (0.91 | ) | | | 10.06 | | | | (15.46 | ) | | | 1,001,894 | | | | 1.18 | | | | 1.18 | | | | 1.18 | | | | (0.02 | ) | | | 23 | |
| 2021 | | | 13.59 | | | (0.03 | ) | | | 2.16 | | | | 2.13 | | | | (0.01 | ) | | | (2.74) | | | | (2.75 | ) | | | 12.97 | | | | 16.36 | | | | 1,401,347 | | | | 1.17 | | | | 1.17 | | | | 1.17 | | | | (0.19 | ) | | | 20 | |
| 2020 | | | 12.88 | | | 0.05 | | | | 1.41 | | | | 1.46 | | | | (0.12 | ) | | | (0.63) | | | | (0.75 | ) | | | 13.59 | | | | 11.50 | | | | 1,414,718 | | | | 1.21 | | | | 1.21 | | | | 1.21 | | | | 0.41 | | | | 23 | |
| 2019 | | | 11.62 | | | 0.05 | | | | 3.87 | | | | 3.92 | | | | (0.05 | ) | | | (2.61) | | | | (2.66 | ) | | | 12.88 | | | | 34.13 | | | | 1,505,821 | | | | 1.20 | | | | 1.19 | | | | 1.19 | | | | 0.32 | | | | 19 | |
| 2018 | | | 16.60 | | | 0.02 | | | | (1.60 | ) | | | (1.58 | ) | | | (0.01 | ) | | | (3.39) | | | | (3.40 | ) | | | 11.62 | | | | (10.40 | ) | | | 1,398,965 | | | | 1.17 | | | | 1.17 | | | | 1.17 | | | | 0.11 | | | | 23 | |
| THE ACCOMPANYING NOTES ARE AN INTEGRAL PART OF THESE FINANCIAL STATEMENTS | The Royce Funds 2023 Semiannual Report to Shareholders | 63 |
Financial Highlights
This table is presented to show selected data for a share outstanding throughout each year or other indicated period and to assist shareholders in evaluating a Fund’s performance for the periods presented. Per share amounts have been determined on the basis of the weighted average number of shares outstanding during the period.
| | | | | | | | | | | | | | | | | | Distributions | | | | | | | | | | | | | | | Ratio of Expenses to Average Net Assets | | | Ratio of Net | | | | |
| | | | Net Asset | | | | | Net Realized and | | | | | | Distributions | | | from Net | | | | | | | | | | | | | | | Prior to Fee | | | Prior to Fee | | | Net of Fee | | | Investment | | | | |
| | | | Value, | | | | | Unrealized Gain (Loss) | | | Total from | | | from Net | | | Realized Gain on | | | | | | | | | | | | Net Assets, | | | Waivers, Expense | | | Waivers and | | | Waivers and | | | Income (Loss) to | | | Portfolio | |
| | | | Beginning | | Net Investment | | | on Investments and | | | Investment | | | Investment | | | Investments and | | | Total | | | Net Asset Value, | | | | | | End of Period | | | Reimbursements and | | | Expense | | | Expense | | | Average Net | | | Turnover | |
| | | | of Period | | Income (Loss) | | | Foreign Currency | | | Operations | | | Income | | | Foreign Currency | | | Distributions | | | End of Period | | | Total Return | | | (in thousands) | | | Balance Credits | | | Reimbursements | | | Reimbursements | | | Assets | | | Rate | |
| Royce Premier Fund–Service Class |
| 2023† | | $ | 9.72 | | $ | (0.01 | ) | | $ | 1.40 | | | $ | 1.39 | | | $ | – | | | $ | – | | | $ | – | | | $ | 11.11 | | | | 14.30 | %1 | | $ | 34,528 | | | | 1.59 | %2 | | | 1.59 | %2 | | | 1.49 | %2 | | | (0.17 | )%2 | | | 5 | % |
| 2022 | | | 12.58 | | | (0.04 | ) | | | (1.95 | ) | | | (1.99 | ) | | | – | | | | (0.87) | | | | (0.87 | ) | | | 9.72 | | | | (15.79 | ) | | | 24,968 | | | | 1.59 | | | | 1.59 | | | | 1.49 | | | | (0.33 | ) | | | 23 | |
| 2021 | | | 13.22 | | | (0.07 | ) | | | 2.09 | | | | 2.02 | | | | – | | | | (2.66) | | | | (2.66 | ) | | | 12.58 | | | | 15.98 | | | | 36,488 | | | | 1.56 | | | | 1.56 | | | | 1.49 | | | | (0.50 | ) | | | 20 | |
| 2020 | | | 12.54 | | | 0.01 | | | | 1.37 | | | | 1.38 | | | | (0.09 | ) | | | (0.61) | | | | (0.70 | ) | | | 13.22 | | | | 11.16 | | | | 29,588 | | | | 1.57 | | | | 1.57 | | | | 1.49 | | | | 0.12 | | | | 23 | |
| 2019 | | | 11.31 | | | (0.01 | ) | | | 3.78 | | | | 3.77 | | | | – | | | | (2.54) | | | | (2.54 | ) | | | 12.54 | | | | 33.65 | | | | 29,696 | | | | 1.57 | | | | 1.57 | | | | 1.46 | | | | (0.06 | ) | | | 19 | |
| 2018 | | | 16.15 | | | (0.03 | ) | | | (1.55 | ) | | | (1.58 | ) | | | – | | | | (3.26) | | | | (3.26 | ) | | | 11.31 | | | | (10.66 | ) | | | 41,738 | | | | 1.52 | | | | 1.52 | | | | 1.48 | | | | (0.19 | ) | | | 23 | |
| Royce Premier Fund–Consultant Class |
| 2023† | | $ | 7.67 | | $ | (0.04 | ) | | $ | 1.09 | | | $ | 1.05 | | | $ | – | | | $ | – | | | $ | – | | | $ | 8.72 | | | | 13.69 | %1 | | $ | 11,983 | | | | 2.35 | %2 | | | 2.35 | %2 | | | 2.31 | %2 | | | (1.02 | )%2 | | | 5 | % |
| 2022 | | | 10.00 | | | (0.10 | ) | | | (1.53 | ) | | | (1.63 | ) | | | – | | | | (0.70) | | | | (0.70 | ) | | | 7.67 | | | | (16.36 | ) | | | 11,265 | | | | 2.33 | | | | 2.33 | | | | 2.33 | | | | (1.17 | ) | | | 23 | |
| 2021 | | | 10.60 | | | (0.15 | ) | | | 1.67 | | | | 1.52 | | | | – | | | | (2.12) | | | | (2.12 | ) | | | 10.00 | | | | 15.01 | | | | 16,016 | | | | 2.29 | | | | 2.29 | | | | 2.29 | | | | (1.30 | ) | | | 20 | |
| 2020 | | | 10.09 | | | (0.07 | ) | | | 1.09 | | | | 1.02 | | | | (0.02 | ) | | | (0.49) | | | | (0.51 | ) | | | 10.60 | | | | 10.19 | | | | 15,686 | | | | 2.34 | | | | 2.34 | | | | 2.34 | | | | (0.72 | ) | | | 23 | |
| 2019 | | | 9.17 | | | (0.10 | ) | | | 3.05 | | | | 2.95 | | | | – | | | | (2.03) | | | | (2.03 | ) | | | 10.09 | | | | 32.55 | | | | 17,585 | | | | 2.26 | | | | 2.26 | | | | 2.26 | | | | (0.91 | ) | | | 19 | |
| 2018 | | | 13.21 | | | (0.12 | ) | | | (1.27 | ) | | | (1.39 | ) | | | – | | | | (2.65) | | | | (2.65 | ) | | | 9.17 | | | | (11.41 | ) | | | 21,370 | | | | 2.21 | | | | 2.21 | | | | 2.21 | | | | (0.93 | ) | | | 23 | |
| Royce Premier Fund–Institutional Class |
| 2023† | | $ | 10.22 | | $ | 0.01 | | | $ | 1.46 | | | $ | 1.47 | | | $ | – | | | $ | – | | | $ | – | | | $ | 11.69 | | | | 14.38 | %1 | | $ | 231,215 | | | | 1.12 | %2 | | | 1.12 | %2 | | | 1.12 | %2 | | | 0.18 | %2 | | | 5 | % |
| 2022 | | | 13.16 | | | 0.01 | | | | (2.03 | ) | | | (2.02 | ) | | | – | | | | (0.92) | | | | (0.92 | ) | | | 10.22 | | | | (15.37 | ) | | | 206,916 | | | | 1.11 | | | | 1.11 | | | | 1.11 | | | | 0.05 | | | | 23 | |
| 2021 | | | 13.80 | | | (0.02 | ) | | | 2.19 | | | | 2.17 | | | | (0.02 | ) | | | (2.79) | | | | (2.81 | ) | | | 13.16 | | | | 16.39 | | | | 273,853 | | | | 1.09 | | | | 1.09 | | | | 1.09 | | | | (0.11 | ) | | | 20 | |
| 2020 | | | 13.08 | | | 0.05 | | | | 1.44 | | | | 1.49 | | | | (0.13 | ) | | | (0.64) | | | | (0.77 | ) | | | 13.80 | | | | 11.53 | | | | 266,587 | | | | 1.15 | | | | 1.15 | | | | 1.15 | | | | 0.44 | | | | 23 | |
| 2019 | | | 11.79 | | | 0.05 | | | | 3.94 | | | | 3.99 | | | | (0.05 | ) | | | (2.65) | | | | (2.70 | ) | | | 13.08 | | | | 34.23 | | | | 244,343 | | | | 1.15 | | | | 1.15 | | | | 1.15 | | | | 0.33 | | | | 19 | |
| 2018 | | | 16.82 | | | 0.03 | | | | (1.63 | ) | | | (1.60 | ) | | | (0.02 | ) | | | (3.41) | | | | (3.43 | ) | | | 11.79 | | | | (10.41 | ) | | | 197,697 | | | | 1.12 | | | | 1.12 | | | | 1.12 | | | | 0.16 | | | | 23 | |
| Royce Small-Cap Opportunity Fund–Investment Class |
| 2023† | | $ | 13.22 | | $ | (0.00 | ) | | $ | 1.74 | | | $ | 1.74 | | | $ | – | | | $ | – | | | $ | – | | | $ | 14.96 | | | | 13.16 | %1 | | $ | 920,127 | | | | 1.24 | %2 | | | 1.24 | %2 | | | 1.24 | %2 | | | (0.02 | )%2 | | | 17 | % |
| 2022 | | | 16.76 | | | 0.00 | | | | (2.86 | ) | | | (2.86 | ) | | | – | | | | (0.68) | | | | (0.68 | ) | | | 13.22 | | | | (17.08 | ) | | | 911,802 | | | | 1.23 | | | | 1.23 | | | | 1.23 | | | | 0.03 | | | | 35 | |
| 2021 | | | 15.84 | | | (0.06 | ) | | | 4.75 | | | | 4.69 | | | | – | | | | (3.77) | | | | (3.77 | ) | | | 16.76 | | | | 30.85 | | | | 1,332,050 | | | | 1.21 | | | | 1.21 | | | | 1.21 | | | | (0.30 | ) | | | 69 | |
| 2020 | | | 12.52 | | | (0.03 | ) | | | 3.35 | | | | 3.32 | | | | – | | | | – | | | | – | | | | 15.84 | | | | 26.52 | | | | 786,849 | | | | 1.24 | | | | 1.23 | | | | 1.23 | | | | (0.28 | ) | | | 53 | |
| 2019 | | | 9.92 | | | (0.06 | ) | | | 2.86 | | | | 2.80 | | | | – | | | | (0.20) | | | | (0.20 | ) | | | 12.52 | | | | 28.21 | | | | 609,316 | | | | 1.23 | | | | 1.22 | | | | 1.22 | | | | (0.50 | ) | | | 47 | |
| 2018 | | | 13.58 | | | (0.04 | ) | | | (2.61 | ) | | | (2.65 | ) | | | – | | | | (1.01) | | | | (1.01 | ) | | | 9.92 | | | | (19.97 | ) | | | 557,003 | | | | 1.20 | | | | 1.20 | | | | 1.20 | | | | (0.30 | ) | | | 47 | |
| Royce Small-Cap Opportunity Fund–Service Class |
| 2023† | | $ | 12.07 | | $ | (0.02 | ) | | $ | 1.59 | | | $ | 1.57 | | | $ | – | | | $ | – | | | $ | – | | | $ | 13.64 | | | | 13.01 | %1 | | $ | 72,412 | | | | 1.55 | %2 | | | 1.55 | %2 | | | 1.49 | %2 | | | (0.27 | )%2 | | | 17 | % |
| 2022 | | | 15.34 | | | (0.03 | ) | | | (2.62 | ) | | | (2.65 | ) | | | – | | | | (0.62) | | | | (0.62 | ) | | | 12.07 | | | | (17.28 | ) | | | 68,292 | | | | 1.54 | | | | 1.54 | | | | 1.49 | | | | (0.23 | ) | | | 35 | |
| 2021 | | | 14.66 | | | (0.11 | ) | | | 4.39 | | | | 4.28 | | | | – | | | | (3.60) | | | | (3.60 | ) | | | 15.34 | | | | 30.43 | | | | 109,440 | | | | 1.50 | | | | 1.50 | | | | 1.49 | | | | (0.61 | ) | | | 69 | |
| 2020 | | | 11.61 | | | (0.06 | ) | | | 3.11 | | | | 3.05 | | | | – | | | | – | | | | – | | | | 14.66 | | | | 26.27 | | | | 131,725 | | | | 1.54 | | | | 1.54 | | | | 1.49 | | | | (0.54 | ) | | | 53 | |
| 2019 | | | 9.23 | | | (0.09 | ) | | | 2.65 | | | | 2.56 | | | | – | | | | (0.18) | | | | (0.18 | ) | | | 11.61 | | | | 27.79 | | | | 46,032 | | | | 1.55 | | | | 1.55 | | | | 1.49 | | | | (0.77 | ) | | | 47 | |
| 2018 | | | 12.66 | | | (0.07 | ) | | | (2.42 | ) | | | (2.49 | ) | | | – | | | | (0.94) | | | | (0.94 | ) | | | 9.23 | | | | (20.14 | ) | | | 48,797 | | | | 1.52 | | | | 1.52 | | | | 1.49 | | | | (0.59 | ) | | | 47 | |
| 64 | The Royce Funds 2023 Semiannual Report to Shareholders | THE ACCOMPANYING NOTES ARE AN INTEGRAL PART OF THESE FINANCIAL STATEMENTS |
Financial Highlights
This table is presented to show selected data for a share outstanding throughout each year or other indicated period and to assist shareholders in evaluating a Fund’s performance for the periods presented. Per share amounts have been determined on the basis of the weighted average number of shares outstanding during the period.
| | | | | | | | | | | | | | | | | | Distributions | | | | | | | | | | | | | | | Ratio of Expenses to Average Net Assets | | | Ratio of Net | | | | |
| | | | Net Asset | | | | | Net Realized and | | | | | | Distributions | | | from Net | | | | | | | | | | | | | | | Prior to Fee | | | Prior to Fee | | | Net of Fee | | | Investment | | | | |
| | | | Value, | | | | | Unrealized Gain (Loss) | | | Total from | | | from Net | | | Realized Gain on | | | | | | | | | | | | Net Assets, | | | Waivers, Expense | | | Waivers and | | | Waivers and | | | Income (Loss) to | | | Portfolio | |
| | | | Beginning | | Net Investment | | | on Investments and | | | Investment | | | Investment | | | Investments and | | | Total | | | Net Asset Value, | | | | | | End of Period | | | Reimbursements and | | | Expense | | | Expense | | | Average Net | | | Turnover | |
| | | | of Period | | Income (Loss) | | | Foreign Currency | | | Operations | | | Income | | | Foreign Currency | | | Distributions | | | End of Period | | | Total Return | | | (in thousands) | | | Balance Credits | | | Reimbursements | | | Reimbursements | | | Assets | | | Rate | |
| Royce Small-Cap Opportunity Fund–Consultant Class |
| 2023† | | $ | 10.33 | | $ | (0.06 | ) | | $ | 1.36 | | | $ | 1.30 | | | $ | – | | | $ | – | | | $ | – | | | $ | 11.63 | | | | 12.58 | %1 | | $ | 12,979 | | | | 2.35 | %2 | | | 2.34 | %2 | | | 2.31 | %2 | | | (1.09 | )%2 | | | 17 | % |
| 2022 | | | 13.24 | | | (0.12 | ) | | | (2.26 | ) | | | (2.38 | ) | | | – | | | | (0.53) | | | | (0.53 | ) | | | 10.33 | | | | (17.98 | ) | | | 11,396 | | | | 2.35 | | | | 2.35 | | | | 2.35 | | | | (1.07 | ) | | | 35 | |
| 2021 | | | 12.61 | | | (0.21 | ) | | | 3.78 | | | | 3.57 | | | | – | | | | (2.94) | | | | (2.94 | ) | | | 13.24 | | | | 29.46 | | | | 14,871 | | | | 2.26 | | | | 2.26 | | | | 2.26 | | | | (1.35 | ) | | | 69 | |
| 2020 | | | 10.09 | | | (0.14 | ) | | | 2.66 | | | | 2.52 | | | | – | | | | – | | | | – | | | | 12.61 | | | | 24.98 | | | | 13,477 | | | | 2.45 | | | | 2.45 | | | | 2.45 | | | | (1.50 | ) | | | 53 | |
| 2019 | | | 8.09 | | | (0.16 | ) | | | 2.32 | | | | 2.16 | | | | – | | | | (0.16) | | | | (0.16 | ) | | | 10.09 | | | | 26.70 | | | | 8,621 | | | | 2.41 | | | | 2.41 | | | | 2.41 | | | | (1.67 | ) | | | 47 | |
| 2018 | | | 11.19 | | | (0.16 | ) | | | (2.12 | ) | | | (2.28 | ) | | | – | | | | (0.82) | | | | (0.82 | ) | | | 8.09 | | | | (20.81 | ) | | | 9,831 | | | | 2.30 | | | | 2.29 | | | | 2.29 | | | | (1.39 | ) | | | 47 | |
| Royce Small-Cap Opportunity Fund–Institutional Class |
| 2023† | | $ | 13.59 | | $ | 0.01 | | | $ | 1.78 | | | $ | 1.79 | | | $ | – | | | $ | – | | | $ | – | | | $ | 15.38 | | | | 13.17 | %1 | | $ | 243,600 | | | | 1.12 | %2 | | | 1.12 | %2 | | | 1.12 | %2 | | | 0.10 | %2 | | | 17 | % |
| 2022 | | | 17.21 | | | 0.02 | | | | (2.94 | ) | | | (2.92 | ) | | | – | | | | (0.70) | | | | (0.70 | ) | | | 13.59 | | | | (16.94 | ) | | | 214,424 | | | | 1.12 | | | | 1.12 | | | | 1.12 | | | | 0.15 | | | | 35 | |
| 2021 | | | 16.22 | | | (0.03 | ) | | | 4.84 | | | | 4.81 | | | | – | | | | (3.82) | | | | (3.82 | ) | | | 17.21 | | | | 30.89 | | | | 291,961 | | | | 1.08 | | | | 1.08 | | | | 1.08 | | | | (0.18 | ) | | | 69 | |
| 2020 | | | 12.80 | | | (0.02 | ) | | | 3.44 | | | | 3.42 | | | | – | | | | – | | | | – | | | | 16.22 | | | | 26.72 | | | | 340,877 | | | | 1.12 | | | | 1.12 | | | | 1.12 | | | | (0.17 | ) | | | 53 | |
| 2019 | | | 10.13 | | | (0.05 | ) | | | 2.92 | | | | 2.87 | | | | – | | | | (0.20) | | | | (0.20 | ) | | | 12.80 | | | | 28.36 | | | | 230,439 | | | | 1.12 | | | | 1.12 | | | | 1.12 | | | | (0.39 | ) | | | 47 | |
| 2018 | | | 13.84 | | | (0.02 | ) | | | (2.66 | ) | | | (2.68 | ) | | | – | | | | (1.03) | | | | (1.03 | ) | | | 10.13 | | | | (19.83 | ) | | | 227,261 | | | | 1.08 | | | | 1.08 | | | | 1.08 | | | | (0.17 | ) | | | 47 | |
| Royce Small-Cap Opportunity Fund–R Class | | | | | | | | | | | | | | | | | | | | | | | | | | | | | | | | | | | | | | | | | | | | | | | | | | | | | | | | | | | |
| 2023† | | $ | 11.61 | | $ | (0.04 | ) | | $ | 1.52 | | | $ | 1.48 | | | $ | – | | | $ | – | | | $ | – | | | $ | 13.09 | | | | 12.75 | %1 | | $ | 43,222 | | | | 1.85 | %2 | | | 1.85 | %2 | | | 1.85 | %2 | | | (0.63 | )%2 | | | 17 | % |
| 2022 | | | 14.80 | | | (0.07 | ) | | | (2.53 | ) | | | (2.60 | ) | | | – | | | | (0.59) | | | | (0.59 | ) | | | 11.61 | | | | (17.54 | ) | | | 38,971 | | | | 1.85 | | | | 1.85 | | | | 1.85 | | | | (0.57 | ) | | | 35 | |
| 2021 | | | 14.03 | | | (0.16 | ) | | | 4.20 | | | | 4.04 | | | | – | | | | (3.27) | | | | (3.27 | ) | | | 14.80 | | | | 30.01 | | | | 51,537 | | | | 1.81 | | | | 1.81 | | | | 1.81 | | | | (0.90 | ) | | | 69 | |
| 2020 | | | 11.16 | | | (0.09 | ) | | | 2.96 | | | | 2.87 | | | | – | | | | – | | | | – | | | | 14.03 | | | | 25.72 | | | | 36,065 | | | | 1.88 | | | | 1.87 | | | | 1.87 | | | | (0.93 | ) | | | 53 | |
| 2019 | | | 8.90 | | | (0.12 | ) | | | 2.55 | | | | 2.43 | | | | – | | | | (0.17) | | | | (0.17 | ) | | | 11.16 | | | | 27.38 | | | | 31,230 | | | | 1.86 | | | | 1.85 | | | | 1.85 | | | | (1.13 | ) | | | 47 | |
| 2018 | | | 12.25 | | | (0.11 | ) | | | (2.33 | ) | | | (2.44 | ) | | | – | | | | (0.91) | | | | (0.91 | ) | | | 8.90 | | | | (20.42 | ) | | | 26,337 | | | | 1.84 | | | | 1.84 | | | | 1.84 | | | | (0.93 | ) | | | 47 | |
| Royce Small-Cap Special Equity Fund–Investment Class |
| 2023† | | $ | 15.92 | | $ | 0.10 | | | $ | 1.15 | | | $ | 1.25 | | | $ | – | | | $ | – | | | $ | – | | | $ | 17.17 | | | | 7.85 | %1 | | $ | 621,184 | | | | 1.22 | %2 | | | 1.22 | %2 | | | 1.22 | %2 | | | 1.26 | %2 | | | 9 | % |
| 2022 | | | 19.09 | | | 0.18 | | | | (1.39 | ) | | | (1.21 | ) | | | (0.19 | ) | | | (1.77) | | | | (1.96 | ) | | | 15.92 | | | | (6.33 | ) | | | 587,346 | | | | 1.21 | | | | 1.21 | | | | 1.21 | | | | 1.01 | | | | 23 | |
| 2021 | | | 18.22 | | | 0.17 | | | | 3.86 | | | | 4.03 | | | | (0.20 | ) | | | (2.96) | | | | (3.16 | ) | | | 19.09 | | | | 22.50 | | | | 755,338 | | | | 1.20 | | | | 1.20 | | | | 1.20 | | | | 0.82 | | | | 42 | |
| 2020 | | | 17.59 | | | 0.27 | | | | 1.03 | | | | 1.30 | | | | (0.26 | ) | | | (0.41) | | | | (0.67 | ) | | | 18.22 | | | | 7.43 | | | | 702,556 | | | | 1.23 | | | | 1.23 | | | | 1.23 | | | | 1.68 | | | | 39 | |
| 2019 | | | 17.43 | | | 0.21 | | | | 1.98 | | | | 2.19 | | | | (0.21 | ) | | | (1.82) | | | | (2.03 | ) | | | 17.59 | | | | 12.63 | | | | 819,015 | | | | 1.21 | | | | 1.21 | | | | 1.21 | | | | 0.99 | | | | 20 | |
| 2018 | | | 21.79 | | | 0.23 | | | | (2.31 | ) | | | (2.08 | ) | | | (0.22 | ) | | | (2.06) | | | | (2.28 | ) | | | 17.43 | | | | (9.86 | ) | | | 909,113 | | | | 1.18 | | | | 1.18 | | | | 1.18 | | | | 1.04 | | | | 21 | |
| Royce Small-Cap Special Equity Fund–Service Class |
| 2023† | | $ | 15.92 | | $ | 0.08 | | | $ | 1.14 | | | $ | 1.22 | | | $ | – | | | $ | – | | | $ | – | | | $ | 17.14 | | | | 7.66 | %1 | | $ | 35,638 | | | | 1.58 | %2 | | | 1.58 | %2 | | | 1.49 | %2 | | | 0.98 | %2 | | | 9 | % |
| 2022 | | | 19.06 | | | 0.12 | | | | (1.37 | ) | | | (1.25 | ) | | | (0.13 | ) | | | (1.76) | | | | (1.89 | ) | | | 15.92 | | | | (6.56 | ) | | | 34,729 | | | | 1.57 | | | | 1.57 | | | | 1.49 | | | | 0.70 | | | | 23 | |
| 2021 | | | 18.19 | | | 0.12 | | | | 3.85 | | | | 3.97 | | | | (0.16 | ) | | | (2.94) | | | | (3.10 | ) | | | 19.06 | | | | 22.19 | | | | 57,738 | | | | 1.54 | | | | 1.54 | | | | 1.46 | | | | 0.57 | | | | 42 | |
| 2020 | | | 17.56 | | | 0.24 | | | | 1.04 | | | | 1.28 | | | | (0.24 | ) | | | (0.41) | | | | (0.65 | ) | | | 18.19 | | | | 7.29 | | | | 46,671 | | | | 1.60 | | | | 1.60 | | | | 1.39 | | | | 1.49 | | | | 39 | |
| 2019 | | | 17.41 | | | 0.16 | | | | 1.99 | | | | 2.15 | | | | (0.17 | ) | | | (1.83) | | | | (2.00 | ) | | | 17.56 | | | | 12.40 | | | | 60,070 | | | | 1.58 | | | | 1.58 | | | | 1.39 | | | | 0.80 | | | | 20 | |
| 2018 | | | 21 .76 | | | 0.20 | | | | (2.33 | ) | | | (2.13 | ) | | | (0.18 | ) | | | (2.04) | | | | (2.22 | ) | | | 17.41 | | | | (10.13 | ) | | | 62,706 | | | | 1.51 | | | | 1.50 | | | | 1.39 | | | | 0.88 | | | | 21 | |
| THE ACCOMPANYING NOTES ARE AN INTEGRAL PART OF THESE FINANCIAL STATEMENTS | The Royce Funds 2023 Semiannual Report to Shareholders | 65 |
Financial Highlights
This table is presented to show selected data for a share outstanding throughout each year or other indicated period and to assist shareholders in evaluating a Fund’s performance for the periods presented. Per share amounts have been determined on the basis of the weighted average number of shares outstanding during the period.
| | | | | | | | | | | | | | | | | | Distributions | | | | | | | | | | | | | | | Ratio of Expenses to Average Net Assets | | | Ratio of Net | | | | |
| | | | Net Asset | | | | | Net Realized and | | | | | | Distributions | | | from Net | | | | | | | | | | | | | | | Prior to Fee | | | Prior to Fee | | | Net of Fee | | | Investment | | | | |
| | | | Value, | | | | | Unrealized Gain (Loss) | | | Total from | | | from Net | | | Realized Gain on | | | | | | | | | | | | Net Assets, | | | Waivers, Expense | | | Waivers and | | | Waivers and | | | Income (Loss) to | | | Portfolio | |
| | | | Beginning | | Net Investment | | | on Investments and | | | Investment | | | Investment | | | Investments and | | | Total | | | Net Asset Value, | | | | | | End of Period | | | Reimbursements and | | | Expense | | | Expense | | | Average Net | | | Turnover | |
| | | | of Period | | Income (Loss) | | | Foreign Currency | | | Operations | | | Income | | | Foreign Currency | | | Distributions | | | End of Period | | | Total Return | | | (in thousands) | | | Balance Credits | | | Reimbursements | | | Reimbursements | | | Assets | | | Rate | |
| Royce Small-Cap Special Equity Fund–Consultant Class |
| 2023† | | $ | 14.49 | | $ | 0.01 | | | $ | 1.04 | | | $ | 1.05 | | | $ | – | | | $ | – | | | $ | – | | | $ | 15.54 | | | | 7.25 | %1 | | $ | 15,841 | | | | 2.44 | %2 | | | 2.43 | %2 | | | 2.39 | %2 | | | 0.08 | %2 | | | 9 | % |
| 2022 | | | 17.37 | | | (0.04 | ) | | | (1.25 | ) | | | (1.29 | ) | | | – | | | | (1.59) | | | | (1.59 | ) | | | 14.49 | | | | (7.43 | ) | | | 15,189 | | | | 2.40 | | | | 2.40 | | | | 2.40 | | | | (0.23 | ) | | | 23 | |
| 2021 | | | 16.60 | | | (0.05 | ) | | | 3.50 | | | | 3.45 | | | | (0.01 | ) | | | (2.67) | | | | (2.68 | ) | | | 17.37 | | | | 21.16 | | | | 25,068 | | | | 2.31 | | | | 2.31 | | | | 2.31 | | | | (0.29 | ) | | | 42 | |
| 2020 | | | 16.05 | | | 0.09 | | | | 0.92 | | | | 1.01 | | | | (0.09 | ) | | | (0.37) | | | | (0.46 | ) | | | 16.60 | | | | 6.27 | | | | 18,852 | | | | 2.31 | | | | 2.31 | | | | 2.31 | | | | 0.59 | | | | 39 | |
| 2019 | | | 15.90 | | | (0.02 | ) | | | 1.82 | | | | 1.80 | | | | (0.00 | ) | | | (1.65) | | | | (1.65 | ) | | | 16.05 | | | | 11.38 | | | | 24,793 | | | | 2.25 | | | | 2.25 | | | | 2.25 | | | | (0.12 | ) | | | 20 | |
| 2018 | | | 19.86 | | | 0.01 | | | | (2.10 | ) | | | (2.09 | ) | | | (0.01 | ) | | | (1.86) | | | | (1.87 | ) | | | 15.90 | | | | (10.83 | ) | | | 30,234 | | | | 2.19 | | | | 2.19 | | | | 2.19 | | | | 0.04 | | | | 21 | |
| Royce Small-Cap Special Equity Fund–Institutional Class |
| 2023† | | $ | 15.77 | | $ | 0.11 | | | $ | 1.13 | | | $ | 1.24 | | | $ | – | | | $ | – | | | $ | – | | | $ | 17.01 | | | | 7.86 | %1 | | $ | 132,220 | | | | 1.13 | %2 | | | 1.13 | %2 | | | 1.13 | %2 | | | 1.36 | %2 | | | 9 | % |
| 2022 | | | 18.92 | | | 0.19 | | | | (1.37 | ) | | | (1.18 | ) | | | (0.21 | ) | | | (1.76) | | | | (1.97 | ) | | | 15.77 | | | | (6.27 | ) | | | 116,301 | | | | 1.12 | | | | 1.12 | | | | 1.12 | | | | 1.08 | | | | 23 | |
| 2021 | | | 18.06 | | | 0.19 | | | | 3.82 | | | | 4.01 | | | | (0.22 | ) | | | (2.93) | | | | (3.15 | ) | | | 18.92 | | | | 22.63 | | | | 238,810 | | | | 1.11 | | | | 1.11 | | | | 1.11 | | | | 0.92 | | | | 42 | |
| 2020 | | | 17.43 | | | 0.30 | | | | 1.01 | | | | 1.31 | | | | (0.28 | ) | | | (0.40) | | | | (0.68 | ) | | | 18.06 | | | | 7.52 | | | | 194,911 | | | | 1.15 | | | | 1.15 | | | | 1.15 | | | | 1.84 | | | | 39 | |
| 2019 | | | 17.28 | | | 0.22 | | | | 1.96 | | | | 2.18 | | | | (0.22 | ) | | | (1.81) | | | | (2.03 | ) | | | 17.43 | | | | 12.65 | | | | 187,785 | | | | 1.14 | | | | 1.14 | | | | 1.14 | | | | 1.04 | | | | 20 | |
| 2018 | | | 21.61 | | | 0.25 | | | | (2.30 | ) | | | (2.05 | ) | | | (0.24 | ) | | | (2.04) | | | | (2.28 | ) | | | 17.28 | | | | (9.81 | ) | | | 202,317 | | | | 1.11 | | | | 1.11 | | | | 1.11 | | | | 1.14 | | | | 21 | |
| Royce Small-Cap Total Return Fund–Investment Class |
| 2023† | | $ | 6.56 | | $ | 0.03 | | | $ | 0.56 | | | $ | 0.59 | | | $ | (0.04 | ) | | $ | – | | | $ | (0.04 | ) | | $ | 7.11 | | | | 8.95 | %1 | | $ | 613,314 | | | | 1.22 | %2 | | | 1.22 | %2 | | | 1.22 | %2 | | | 0.80 | %2 | | | 38 | % |
| 2022 | | | 8.78 | | | 0.08 | | | | (1.25 | ) | | | (1.17 | ) | | | (0.11 | ) | | | (0.94) | | | | (1.05 | ) | | | 6.56 | | | | (13.25 | ) | | | 591,730 | | | | 1.22 | | | | 1.22 | | | | 1.22 | | | | 0.97 | | | | 62 | |
| 2021 | | | 9.34 | | | 0.12 | | | | 2.21 | | | | 2.33 | | | | (0.13 | ) | | | (2.76) | | | | (2.89 | ) | | | 8.78 | | | | 25.78 | | | | 1,016,331 | | | | 1.20 | | | | 1.20 | | | | 1.20 | | | | 1.09 | | | | 64 | |
| 2020 | | | 10.93 | | | 0.17 | | | | 0.19 | | | | 0.36 | | | | (0.21 | ) | | | (1.74) | | | | (1.95 | ) | | | 9.34 | | | | 3.82 | | | | 893,868 | | | | 1.24 | | | | 1.24 | | | | 1.24 | | | | 1.88 | | | | 61 | |
| 2019 | | | 9.71 | | | 0.16 | | | | 2.10 | | | | 2.26 | | | | (0.15 | ) | | | (0.89) | | | | (1.04 | ) | | | 10.93 | | | | 23.45 | | | | 1,026,074 | | | | 1.21 | | | | 1.21 | | | | 1.21 | | | | 1.42 | | | | 21 | |
| 2018 | | | 13.58 | | | 0.20 | | | | (1.78 | ) | | | (1.58 | ) | | | (0.19 | ) | | | (2.10) | | | | (2.29 | ) | | | 9.71 | | | | (12.46 | ) | | | 1,036,211 | | | | 1.18 | | | | 1.18 | | | | 1.18 | | | | 1.45 | | | | 22 | |
| Royce Small-Cap Total Return Fund–Service Class |
| 2023† | | $ | 6.80 | | $ | 0.02 | | | $ | 0.58 | | | $ | 0.60 | | | $ | (0.03 | ) | | $ | – | | | $ | (0.03 | ) | | $ | 7.37 | | | | 8.76 | %1 | | $ | 58,017 | | | | 1.58 | %2 | | | 1.58 | %2 | | | 1.49 | %2 | | | 0.53 | %2 | | | 38 | % |
| 2022 | | | 9.08 | | | 0.06 | | | | (1.30 | ) | | | (1.24 | ) | | | (0.07 | ) | | | (0.97) | | | | (1.04 | ) | | | 6.80 | | | | (13.54 | ) | | | 58,571 | | | | 1.57 | | | | 1.57 | | | | 1.49 | | | | 0.74 | | | | 62 | |
| 2021 | | | 9.62 | | | 0.09 | | | | 2.28 | | | | 2.37 | | | | (0.07 | ) | | | (2.84) | | | | (2.91 | ) | | | 9.08 | | | | 25.54 | | | | 80,478 | | | | 1.52 | | | | 1.52 | | | | 1.49 | | | | 0.78 | | | | 64 | |
| 2020 | | | 11.27 | | | 0.16 | | | | 0.18 | | | | 0.34 | | | | (0.19 | ) | | | (1.80) | | | | (1.99 | ) | | | 9.62 | | | | 3.51 | | | | 69,634 | | | | 1.55 | | | | 1.55 | | | | 1.49 | | | | 1.64 | | | | 61 | |
| 2019 | | | 9.97 | | | 0.13 | | | | 2.16 | | | | 2.29 | | | | (0.08 | ) | | | (0.91) | | | | (0.99 | ) | | | 11.27 | | | | 23.08 | | | | 77,177 | | | | 1.52 | | | | 1.52 | | | | 1.49 | | | | 1.13 | | | | 21 | |
| 2018 | | | 13.88 | | | 0.16 | | | | (1.82 | ) | | | (1.66 | ) | | | (0.11 | ) | | | (2.14) | | | | (2.25 | ) | | | 9.97 | | | | (12.71 | ) | | | 83,368 | | | | 1.52 | | | | 1.52 | | | | 1.48 | | | | 1.15 | | | | 22 | |
| Royce Small-Cap Total Return Fund–Consultant Class |
| 2023† | | $ | 6.89 | | $ | (0.01 | ) | | $ | 0.59 | | | $ | 0.58 | | | $ | – | | | $ | – | | | $ | – | | | $ | 7.47 | | | | 8.42 | %1 | | $ | 84,986 | | | | 2.24 | %2 | | | 2.24 | %2 | | | 2.24 | %2 | | | (0.22 | )%2 | | | 38 | % |
| 2022 | | | 9.18 | | | 0.00 | | | | (1.31 | ) | | | (1.31 | ) | | | – | | | | (0.98) | | | | (0.98 | ) | | | 6.89 | | | | (14.15 | ) | | | 84,448 | | | | 2.23 | | | | 2.23 | | | | 2.23 | | | | 0.01 | | | | 62 | |
| 2021 | | | 9.75 | | | 0.01 | | | | 2.31 | | | | 2.32 | | | | (0.01 | ) | | | (2.88) | | | | (2.89 | ) | | | 9.18 | | | | 24.63 | | | | 112,649 | | | | 2.18 | | | | 2.18 | | | | 2.18 | | | | 0.09 | | | | 64 | |
| 2020 | | | 11.31 | | | 0.09 | | | | 0.18 | | | | 0.27 | | | | (0.03 | ) | | | (1.80) | | | | (1.83 | ) | | | 9.75 | | | | 2.76 | | | | 110,179 | | | | 2.22 | | | | 2.22 | | | | 2.22 | | | | 0.88 | | | | 61 | |
| 2019 | | | 10.02 | | | 0.05 | | | | 2.17 | | | | 2.22 | | | | (0.02 | ) | | | (0.91) | | | | (0.93 | ) | | | 11.31 | | | | 22.18 | | | | 150,175 | | | | 2.20 | | | | 2.20 | | | | 2.20 | | | | 0.43 | | | | 21 | |
| 2018 | | | 13.95 | | | 0.06 | | | | (1.82 | ) | | | (1.76 | ) | | | (0.02 | ) | | | (2.15) | | | | (2.17 | ) | | | 10.02 | | | | (13.26 | ) | | | 160,540 | | | | 2.17 | | | | 2.17 | | | | 2.17 | | | | 0.45 | | | | 22 | |
| 66 | The Royce Funds 2023 Semiannual Report to Shareholders | THE ACCOMPANYING NOTES ARE AN INTEGRAL PART OF THESE FINANCIAL STATEMENTS |
Financial Highlights
This table is presented to show selected data for a share outstanding throughout each year or other indicated period and to assist shareholders in evaluating a Fund’s performance for the periods presented. Per share amounts have been determined on the basis of the weighted average number of shares outstanding during the period.
| | | | | | | | | | | | | | | | | | Distributions | | | | | | | | | | | | | | | Ratio of Expenses to Average Net Assets | | | Ratio of Net | | | | |
| | | | Net Asset | | | | | Net Realized and | | | | | | Distributions | | | from Net | | | | | | | | | | | | | | | Prior to Fee | | | Prior to Fee | | | Net of Fee | | | Investment | | | | |
| | | | Value, | | | | | Unrealized Gain (Loss) | | | Total from | | | from Net | | | Realized Gain on | | | | | | | | | | | | Net Assets, | | | Waivers, Expense | | | Waivers and | | | Waivers and | | | Income (Loss) to | | | Portfolio | |
| | | | Beginning | | Net Investment | | | on Investments and | | | Investment | | | Investment | | | Investments and | | | Total | | | Net Asset Value, | | | | | | End of Period | | | Reimbursements and | | | Expense | | | Expense | | | Average Net | | | Turnover | |
| | | | of Period | | Income (Loss) | | | Foreign Currency | | | Operations | | | Income | | | Foreign Currency | | | Distributions | | | End of Period | | | Total Return | | | (in thousands) | | | Balance Credits | | | Reimbursements | | | Reimbursements | | | Assets | | | Rate | |
| Royce Small-Cap Total Return Fund–Institutional Class |
| 2023† | | $ | 6.43 | | $ | 0.03 | | | $ | 0.55 | | | $ | 0.58 | | | $ | (0.04 | ) | | $ | – | | | $ | (0.04 | ) | | $ | 6.97 | | | | 8.97 | %1 | | $ | 189,779 | | | | 1.14 | %2 | | | 1.14 | %2 | | | 1.14 | %2 | | | 0.89 | %2 | | | 38 | % |
| 2022 | | | 8.61 | | | 0.08 | | | | (1.22 | ) | | | (1.14 | ) | | | (0.12 | ) | | | (0.92) | | | | (1.04 | ) | | | 6.43 | | | | (13.13 | ) | | | 181,476 | | | | 1.14 | | | | 1.14 | | | | 1.14 | | | | 1.07 | | | | 62 | |
| 2021 | | | 9.17 | | | 0.13 | | | | 2.17 | | | | 2.30 | | | | (0.14 | ) | | | (2.72) | | | | (2.86 | ) | | | 8.61 | | | | 25.91 | | | | 279,510 | | | | 1.10 | | | | 1.10 | | | | 1.10 | | | | 1.19 | | | | 64 | |
| 2020 | | | 10.77 | | | 0.18 | | | | 0.18 | | | | 0.36 | | | | (0.24 | ) | | | (1.72) | | | | (1.96 | ) | | | 9.17 | | | | 3.87 | | | | 208,605 | | | | 1.13 | | | | 1.13 | | | | 1.13 | | | | 1.98 | | | | 61 | |
| 2019 | | | 9.58 | | | 0.17 | | | | 2.07 | | | | 2.24 | | | | (0.18 | ) | | | (0.87) | | | | (1.05 | ) | | | 10.77 | | | | 23.59 | | | | 232,479 | | | | 1.13 | | | | 1.13 | | | | 1.13 | | | | 1.49 | | | | 21 | |
| 2018 | | | 13.40 | | | 0.21 | | | | (1.76 | ) | | | (1.55 | ) | | | (0.21 | ) | | | (2.06) | | | | (2.27 | ) | | | 9.58 | | | | (12.39 | ) | | | 218,268 | | | | 1.09 | | | | 1.09 | | | | 1.09 | | | | 1.53 | | | | 22 | |
| Royce Small-Cap Total Return Fund–R Class |
| 2023† | | $ | 6.92 | | $ | 0.00 | | | $ | 0.59 | | | $ | 0.59 | | | $ | (0.01 | ) | | $ | – | | | $ | (0.01 | ) | | $ | 7.50 | | | | 8.53 | %1 | | $ | 20,944 | | | | 1.92 | %2 | | | 1.91 | %2 | | | 1.91 | %2 | | | 0.11 | %2 | | | 38 | % |
| 2022 | | | 9.20 | | | 0.03 | | | | (1.32 | ) | | | (1.29 | ) | | | (0.01 | ) | | | (0.98) | | | | (0.99 | ) | | | 6.92 | | | | (13.87 | ) | | | 20,180 | | | | 1.91 | | | | 1.91 | | | | 1.91 | | | | 0.32 | | | | 62 | |
| 2021 | | | 9.76 | | | 0.05 | | | | 2.31 | | | | 2.36 | | | | (0.04 | ) | | | (2.88) | | | | (2.92 | ) | | | 9.20 | | | | 25.01 | | | | 27,040 | | | | 1.85 | | | | 1.85 | | | | 1.85 | | | | 0.42 | | | | 64 | |
| 2020 | | | 11.38 | | | 0.12 | | | | 0.18 | | | | 0.30 | | | | (0.12 | ) | | | (1.80) | | | | (1.92 | ) | | | 9.76 | | | | 3.08 | | | | 30,027 | | | | 1.89 | | | | 1.88 | | | | 1.88 | | | | 1.23 | | | | 61 | |
| 2019 | | | 10.06 | | | 0.09 | | | | 2.18 | | | | 2.27 | | | | (0.03 | ) | | | (0.92) | | | | (0.95 | ) | | | 11.38 | | | | 22.66 | | | | 36,345 | | | | 1.85 | | | | 1.84 | | | | 1.84 | | | | 0.76 | | | | 21 | |
| 2018 | | | 13.99 | | | 0.11 | | | | (1.83 | ) | | | (1.72 | ) | | | (0.06 | ) | | | (2.15) | | | | (2.21 | ) | | | 10.06 | | | | (12.96 | ) | | | 45,145 | | | | 1.81 | | | | 1.81 | | | | 1.81 | | | | 0.82 | | | | 22 | |
| Royce Small-Cap Value Fund–Investment Class |
| 2023† | | $ | 8.85 | | $ | 0.05 | | | $ | 0.72 | | | $ | 0.77 | | | $ | – | | | $ | – | | | $ | – | | | $ | 9.62 | | | | 8.70 | %1 | | $ | 34,780 | | | | 1.35 | %2 | | | 1.35 | %2 | | | 1.24 | %2 | | | 1.11 | %2 | | | 20 | % |
| 2022 | | | 10.43 | | | 0.07 | | | | (1.09 | ) | | | (1.02 | ) | | | (0.05 | ) | | | (0.51) | | | | (0.56 | ) | | | 8.85 | | | | (9.87 | ) | | | 35,545 | | | | 1.35 | | | | 1.35 | | | | 1.24 | | | | 0.76 | | | | 62 | |
| 2021 | | | 8.61 | | | 0.02 | | | | 2.41 | | | | 2.43 | | | | (0.01 | ) | | | (0.60) | | | | (0.61 | ) | | | 10.43 | | | | 28.48 | | | | 44,621 | | | | 1.31 | | | | 1.31 | | | | 1.24 | | | | 0.20 | | | | 53 | |
| 2020 | | | 9.57 | | | 0.06 | | | | (0.66 | ) | | | (0.60 | ) | | | (0.17 | ) | | | (0.19) | | | | (0.36 | ) | | | 8.61 | | | | (6.25 | ) | | | 34,523 | | | | 1.39 | | | | 1.39 | | | | 1.24 | | | | 0.76 | | | | 61 | |
| 2019 | | | 8.35 | | | 0.09 | | | | 1.46 | | | | 1.55 | | | | (0.08 | ) | | | (0.25) | | | | (0.33 | ) | | | 9.57 | | | | 18.60 | | | | 53,234 | | | | 1.30 | | | | 1.30 | | | | 1.24 | | | | 0.84 | | | | 64 | |
| 2018 | | | 10.16 | | | 0.05 | | | | (0.73 | ) | | | (0.68 | ) | | | (0.04 | ) | | | (1.09) | | | | (1.13 | ) | | | 8.35 | | | | (7.05 | ) | | | 56,433 | | | | 1.26 | | | | 1.26 | | | | 1.24 | | | | 0.45 | | | | 64 | |
| Royce Small-Cap Value Fund–Service Class |
| 2023† | | $ | 8.81 | | $ | 0.04 | | | $ | 0.70 | | | $ | 0.74 | | | $ | – | | | $ | – | | | $ | – | | | $ | 9.55 | | | | 8.40 | %1 | | $ | 75,651 | | | | 1.59 | %2 | | | 1.59 | %2 | | | 1.49 | %2 | | | 0.88 | %2 | | | 20 | % |
| 2022 | | | 10.38 | | | 0.05 | | | | (1.09 | ) | | | (1.04 | ) | | | (0.03 | ) | | | (0.50) | | | | (0.53 | ) | | | 8.81 | | | | (10.06 | ) | | | 68,455 | | | | 1.59 | | | | 1.59 | | | | 1.49 | | | | 0.52 | | | | 62 | |
| 2021 | | | 8.58 | | | (0.01 | ) | | | 2.41 | | | | 2.40 | | | | | | | | (0.60) | | | | (0.60 | ) | | | 10.38 | | | | 28.24 | | | | 81,840 | | | | 1.55 | | | | 1.55 | | | | 1.49 | | | | (0.06 | ) | | | 53 | |
| 2020 | | | 9.54 | | | 0.04 | | | | (0.66 | ) | | | (0.62 | ) | | | (0.15 | ) | | | (0.19) | | | | (0.34 | ) | | | 8.58 | | | | (6.47 | ) | | | 75,502 | | | | 1.62 | | | | 1.62 | | | | 1.49 | | | | 0.50 | | | | 61 | |
| 2019 | | | 8.33 | | | 0.07 | | | | 1.44 | | | | 1.51 | | | | (0.05 | ) | | | (0.25) | | | | (0.30 | ) | | | 9.54 | | | | 18.21 | | | | 102,465 | | | | 1.56 | | | | 1.55 | | | | 1.49 | | | | 0.65 | | | | 64 | |
| 2018 | | | 10.12 | | | 0.02 | | | | (0.72 | ) | | | (0.70 | ) | | | (0.01 | ) | | | (1.08) | | | | (1.09 | ) | | | 8.33 | | | | (7.17 | ) | | | 111,855 | | | | 1.53 | | | | 1.53 | | | | 1.49 | | | | 0.19 | | | | 64 | |
| Royce Smaller-Companies Growth Fund–Investment Class |
| 2023† | | $ | 5.69 | | $ | (0.02 | ) | | $ | 0.89 | | | $ | 0.87 | | | $ | – | | | $ | – | | | $ | – | | | $ | 6.56 | | | | 15.29 | %1 | | $ | 69,086 | | | | 1.26 | %2 | | | 1.26 | %2 | | | 1.24 | %2 | | | (0.79 | )%2 | | | 31 | % |
| 2022 | | | 8.74 | | | (0.06 | ) | | | (2.74 | ) | | | (2.80 | ) | | | – | | | | (0.25) | | | | (0.25 | ) | | | 5.69 | | | | (32.07 | ) | | | 61,107 | | | | 1.26 | | | | 1.26 | | | | 1.24 | | | | (0.97 | ) | | | 66 | |
| 2021 | | | 11.06 | | | (0.11 | ) | | | 0.83 | | | | 0.72 | | | | – | | | | (3.04) | | | | (3.04 | ) | | | 8.74 | | | | 8.09 | | | | 106,318 | | | | 1.19 | | | | 1.19 | | | | 1.19 | | | | (0.91 | ) | | | 50 | |
| 2020 | | | 8.21 | | | (0.07 | ) | | | 4.06 | | | | 3.99 | | | | – | | | | (1.14) | | | | (1.14 | ) | | | 11.06 | | | | 49.61 | | | | 112,668 | | | | 1.25 | | | | 1.25 | | | | 1.24 | | | | (0.86 | ) | | | 61 | |
| 2019 | | | 6.86 | | | (0.05 | ) | | | 1.68 | | | | 1.63 | | | | – | | | | (0.28) | | | | (0.28 | ) | | | 8.21 | | | | 23.92 | | | | 91,670 | | | | 1.25 | | | | 1.24 | | | | 1.24 | | | | (0.69 | ) | | | 53 | |
| 2018 | | | 10.93 | | | (0.07 | ) | | | (0.86 | ) | | | (0.93 | ) | | | – | | | | (3.14) | | | | (3.14 | ) | | | 6.86 | | | | (9.94 | ) | | | 87,213 | | | | 1.21 | | | | 1.21 | | | | 1.21 | | | | (0.62 | ) | | | 61 | |
| THE ACCOMPANYING NOTES ARE AN INTEGRAL PART OF THESE FINANCIAL STATEMENTS | The Royce Funds 2023 Semiannual Report to Shareholders | 67 |
Financial Highlights
This table is presented to show selected data for a share outstanding throughout each year or other indicated period and to assist shareholders in evaluating a Fund’s performance for the periods presented. Per share amounts have been determined on the basis of the weighted average number of shares outstanding during the period.
| | | | | | | | | | | | | | | | | | Distributions | | | | | | | | | | | | | | | Ratio of Expenses to Average Net Assets | | | Ratio of Net | | | | |
| | | | Net Asset | | | | | Net Realized and | | | | | | Distributions | | | from Net | | | | | | | | | | | | | | | Prior to Fee | | | Prior to Fee | | | Net of Fee | | | Investment | | | | |
| | | | Value, | | | | | Unrealized Gain (Loss) | | | Total from | | | from Net | | | Realized Gain on | | | | | | | | | | | | Net Assets, | | | Waivers, Expense | | | Waivers and | | | Waivers and | | | Income (Loss) to | | | Portfolio | |
| | | | Beginning | | Net Investment | | | on Investments and | | | Investment | | | Investment | | | Investments and | | | Total | | | Net Asset Value, | | | | | | End of Period | | | Reimbursements and | | | Expense | | | Expense | | | Average Net | | | Turnover | |
| | | | of Period | | Income (Loss) | | | Foreign Currency | | | Operations | | | Income | | | Foreign Currency | | | Distributions | | | End of Period | | | Total Return | | | (in thousands) | | | Balance Credits | | | Reimbursements | | | Reimbursements | | | Assets | | | Rate | |
| Royce Smaller-Companies Growth Fund–Service Class |
| 2023† | | $ | 5.48 | | $ | (0.03 | ) | | $ | 0.87 | | | $ | 0.84 | | | $ | – | | | $ | – | | | $ | – | | | $ | 6.32 | | | | 15.33 | %1 | | $ | 119,164 | | | | 1.55 | %2 | | | 1.55 | %2 | | | 1.49 | %2 | | | (1.03 | )%2 | | | 31 | % |
| 2022 | | | 8.45 | | | (0.08 | ) | | | (2.65 | ) | | | (2.73 | ) | | | – | | | | (0.24) | | | | (0.24 | ) | | | 5.48 | | | | (32.37 | ) | | | 105,585 | | | | 1.55 | | | | 1.55 | | | | 1.49 | | | | (1.22 | ) | | | 66 | |
| 2021 | | | 10.74 | | | (0.15 | ) | | | 0.82 | | | | 0.67 | | | | – | | | | (2.96) | | | | (2.96 | ) | | | 8.45 | | | | 7.78 | | | | 178,553 | | | | 1.51 | | | | 1.51 | | | | 1.49 | | | | (1.21 | ) | | | 50 | |
| 2020 | | | 7.99 | | | (0.09 | ) | | | 3.95 | | | | 3.86 | | | | – | | | | (1.11) | | | | (1.11 | ) | | | 10.74 | | | | 49.26 | | | | 181,591 | | | | 1.54 | | | | 1.54 | | | | 1.49 | | | | (1.11 | ) | | | 61 | |
| 2019 | | | 6.69 | | | (0.07 | ) | | | 1.65 | | | | 1.58 | | | | – | | | | (0.28) | | | | (0.28 | ) | | | 7.99 | | | | 23.67 | | | | 154,236 | | | | 1.55 | | | | 1.54 | | | | 1.49 | | | | (0.93 | ) | | | 53 | |
| 2018 | | | 10.69 | | | (0.10 | ) | | | (0.85 | ) | | | (0.95 | ) | | | – | | | | (3.05) | | | | (3.05 | ) | | | 6.69 | | | | (10.22 | ) | | | 156,057 | | | | 1.52 | | | | 1.52 | | | | 1.49 | | | | (0.90 | ) | | | 61 | |
| Royce Smaller-Companies Growth Fund–Institutional Class |
| 2023† | | $ | 5.77 | | $ | (0.02 | ) | | $ | 0.91 | | | $ | 0.89 | | | $ | – | | | $ | – | | | $ | – | | | $ | 6.66 | | | | 15.42 | %1 | | $ | 5,090 | | | | 1.53 | %2 | | | 1.53 | %2 | | | 1.19 | %2 | | | (0.73 | )%2 | | | 31 | % |
| 2022 | | | 8.87 | | | (0.06 | ) | | | (2.79 | ) | | | (2.85 | ) | | | – | | | | (0.25) | | | | (0.25 | ) | | | 5.77 | | | | (32.17 | ) | | | 4,400 | | | | 1.53 | | | | 1.53 | | | | 1.16 | | | | (0.89 | ) | | | 66 | |
| 2021 | | | 11.23 | | | (0.11 | ) | | | 0.85 | | | | 0.74 | | | | – | | | | (3.10) | | | | (3.10 | ) | | | 8.87 | | | | 8.16 | | | | 7,278 | | | | 1.41 | | | | 1.41 | | | | 1.16 | | | | (0.88 | ) | | | 50 | |
| 2020 | | | 8.33 | | | (0.07 | ) | | | 4.13 | | | | 4.06 | | | | – | | | | (1.16) | | | | (1.16 | ) | | | 11.23 | | | | 49.70 | | | | 5,646 | | | | 1.44 | | | | 1.44 | | | | 1.23 | | | | (0.85 | ) | | | 61 | |
| 2019 | | | 6.95 | | | (0.05 | ) | | | 1.72 | | | | 1.67 | | | | – | | | | (0.29) | | | | (0.29 | ) | | | 8.33 | | | | 24.10 | | | | 8,021 | | | | 1.35 | | | | 1.35 | | | | 1.17 | | | | (0.62 | ) | | | 53 | |
| 2018 | | | 11.06 | | | (0.06 | ) | | | (0.88 | ) | | | (0.94 | ) | | | – | | | | (3.17) | | | | (3.17 | ) | | | 6.95 | | | | (9.94 | ) | | | 7,165 | | | | 1.28 | | | | 1.28 | | | | 1.08 | | | | (0.49 | ) | | | 61 | |
| † | Six months ended June 30, 2023 (unaudited). |
| 3 | For Royce Global Financial Services Fund, a special distribution from ECN Capital resulted in an increase in net investment income (loss) per share of $0.12 and an increase in the ratio of net investment income (loss) to average net assets of 1.00% for the Service Class, and $0.18 per share and 1.14% for the Institutional Class. |
| a | The Class commenced operations on May 2, 2018. |
| 68 | The Royce Funds 2023 Semiannual Report to Shareholders | THE ACCOMPANYING NOTES ARE AN INTEGRAL PART OF THESE FINANCIAL STATEMENTS |
Notes to Financial Statements (unaudited)
Summary of Significant Accounting Policies:
Royce Dividend Value Fund, Royce Global Financial Services Fund, Royce International Premier Fund, Royce Micro-Cap Fund, Royce Pennsylvania Mutual Fund, Royce Premier Fund, Royce Small-Cap Opportunity Fund, Royce Small-Cap Special Equity Fund, Royce Small-Cap Total Return Fund, Royce Small-Cap Value Fund and Royce Smaller-Companies Growth Fund (the “Fund” or “Funds”), are the eleven series of The Royce Fund (the “Trust”), an open-end management investment company organized as a Delaware statutory trust.
Classes of shares have equal rights as to earnings and assets, except that each class may bear different fees and expenses for distribution, shareholder servicing, registration and shareholder reports, and receive different transfer agent balance credits and expense reimbursements. Investment income, realized and unrealized capital gains or losses on investments and foreign currency, and expenses other than those attributable to a specific class are allocated to each class of shares based on its relative net assets.
The preparation of financial statements in conformity with accounting principles generally accepted in the United States of America requires management to make estimates and assumptions that affect the reported amounts of assets and liabilities and the disclosure of contingent assets and liabilities at the date of the financial statements and the reported amounts of income and expenses during the reporting period. Actual results could differ from those estimates.
Each Fund is an investment company and accordingly follows the investment company accounting and reporting guidance of the Financial Accounting Standards Board (FASB) Accounting Standard Codification Topic 946 “Financial Services-Investment Companies.”
Royce & Associates, LP, the Funds’ investment adviser, is a majority-owned subsidiary of Franklin Resources, Inc. and primarily conducts business using the name Royce Investment Partners (“Royce”). As of June 30, 2023, officers and employees of Royce, Fund trustees, the Royce retirement plans and other affiliates owned more than 10% of the following Fund:
Royce Global Financial Services Fund 13%
VALUATION OF INVESTMENTS:
Portfolio securities held by the Funds are valued as of the close of trading on the New York Stock Exchange (“NYSE”) (generally 4:00 p.m. Eastern time) on the valuation date. Investments in money market funds are valued at net asset value per share. Values for non-U.S. dollar denominated equity securities are converted to U.S. dollars daily based upon prevailing foreign currency exchange rates as quoted by a major bank.
Equity securities that are listed on an exchange or Nasdaq, or traded on OTC Market Group Inc.’s OTC Link ATS or other alternative trading system, are valued: (i) on the basis of their last reported sales prices or official closing prices, as applicable, on a valuation date; or (ii) at their highest reported bid prices in the event such equity securities did not trade on a valuation date. Such inputs are generally referred to as “Level 1” inputs because they represent reliable quoted prices in active markets for identical securities.
If the value of a portfolio security held by a Fund cannot be determined solely by reference to Level 1 inputs, such portfolio security will be “fair valued.” The Trust’s Board of Trustees has designated Royce as valuation designee to perform fair value determinations for such portfolio securities in accordance with Rule 2a-5 under the Investment Company Act of 1940 (“Rule 2a-5”). Pursuant to Rule 2a-5, fair values are determined in accordance with policies and procedures approved by the Trust’s Board of Trustees and policies and procedures adopted by Royce in its capacity as valuation designee for the Trust. Fair valued securities are reported as either “Level 2” or “Level 3” securities.
As a general principle, the fair value of a security is the amount which a Fund might reasonably expect to receive for the security upon its current sale. However, in light of the judgment involved in fair valuations, no assurance can be given that a fair value assigned to a particular portfolio security will be the amount which the Fund might be able to receive upon its current sale. When a fair value pricing methodology is used, the fair value prices used by the Fund for such securities will likely differ from the quoted or published prices for the same securities.
Level 2 inputs are other significant observable inputs (e.g., dealer bid side quotes and quoted prices for securities with comparable characteristics). Examples of situations in which Level 2 inputs are used to fair value portfolio securities held by the Funds on a particular valuation date include:
| ● | Over-the-counter equity securities other than those traded on OTC Market Group Inc.’s OTC Link ATS or other alternative trading system (collectively referred to herein as “Other OTC Equity Securities”) are fair valued at their highest bid price when Royce receives at least two bid side quotes from dealers who make markets in such securities; |
| ● | Certain bonds and other fixed income securities may be fair valued by reference to other securities with comparable ratings, interest rates, and maturities in accordance with valuation methodologies maintained by certain independent pricing services; and |
| ● | The Funds use an independent pricing service to fair value certain non-U.S. equity securities when U.S. market volatility exceeds a certain threshold. This pricing service uses proprietary correlations it has developed between the movement of prices of non-U.S. equity securities and indices of U.S.-traded securities, futures contracts, and other indications to estimate the fair value of such non-U.S. securities. |
The Royce Funds 2023 Semiannual Report to Shareholders | 69
Notes to Financial Statements (unaudited) (continued)
VALUATION OF INVESTMENTS (continued):
Level 3 inputs are significant unobservable inputs. Examples of Level 3 inputs include (without limitation) the last trade price for a security before trading was suspended or terminated; discounts to last trade price for lack of marketability or otherwise; market price information regarding other securities; information received from the issuer and/or published documents, including SEC filings and financial statements; and other publicly available information. Pursuant to the above-referenced policies and procedures, Royce may use various techniques in making fair value determinations based upon Level 3 inputs, which techniques may include (without limitation): (i) workout valuation methods (e.g., earnings multiples, discounted cash flows, liquidation values, derivations of book value, firm or probable offers from qualified buyers for the issuer’s ongoing business, etc.); (ii) discount or premium from market, or compilation of other observable market information, for other similar freely traded securities; (iii) conversion from the readily available market price of a security into which an affected security is convertible or exchangeable; and (iv) pricing models or other formulas. In the case of restricted securities, fair value determinations generally start with the inherent or intrinsic worth of the relevant security, without regard to the restrictive feature, and are reduced for any diminution in value resulting from the restrictive feature. Due to the inherent uncertainty of such valuations, these fair values may differ significantly from the values that would have been used had an active market existed.
A security that is valued by reference to Level 1 or Level 2 inputs may drop to Level 3 on a particular valuation date for several reasons, including if:
| ● | an equity security that is listed on an exchange or Nasdaq, or traded on OTC Market Group Inc.’s OTC Link ATS or other alternative trading system, has not traded and there are no bids; |
| ● | Royce does not receive at least two bid side quotes for an Other OTC Equity Security; |
| ● | the independent pricing services are unable to supply fair value prices; or |
| ● | the Level 1 or Level 2 inputs become otherwise unreliable for any reason (e.g., a significant event occurs after the close of trading for a security but prior to the time a Fund prices its shares). |
The table below shows the aggregate value of the various Level 1, Level 2, and Level 3 securities held by the Funds as of June 30, 2023. Any Level 2 or Level 3 securities held by a Fund are noted in its Schedule of Investments. The inputs or methodology used for valuing securities are not necessarily an indication of the risk associated with owning those securities.
| | LEVEL 1 | LEVEL 2 | LEVEL 3 | TOTAL |
| Royce Dividend Value Fund | | | | |
| Common Stocks | $ 53,728,834 | $ 7,841,916 | $ – | $ 61,570,750 |
| Repurchase Agreement | – | 109,350 | – | 109,350 |
| Royce Global Financial Services Fund | | | | |
| Common Stocks | 20,880,264 | 4,373,387 | – | 25,253,651 |
| Diversified Investment Companies | 525,529 | – | – | 525,529 |
| Repurchase Agreement | – | 369,640 | – | 369,640 |
| Royce International Premier Fund | | | | |
| Common Stocks | 64,967,891 | 681,588,100 | – | 746,555,991 |
| Preferred Stocks | – | 14,420,803 | – | 14,420,803 |
| Repurchase Agreement | – | 54,342,275 | – | 54,342,275 |
| Royce Micro-Cap Fund | | | | |
| Common Stocks | 291,057,372 | 7,085,885 | 0 | 298,143,257 |
| Repurchase Agreement | – | 8,138,336 | – | 8,138,336 |
| Money Market Fund/Collateral Received for Securities Loaned | 3,649,742 | – | – | 3,649,742 |
| Royce Pennsylvania Mutual Fund | | | | |
| Common Stocks | 1,686,192,019 | 4,025,390 | – | 1,690,217,409 |
| Repurchase Agreement | – | 46,919,590 | – | 46,919,590 |
| Money Market Fund/Collateral Received for Securities Loaned | 2,396,835 | – | – | 2,396,835 |
| Royce Premier Fund | | | | |
| Common Stocks | 1,322,150,939 | – | – | 1,322,150,939 |
| Repurchase Agreement | – | 60,565,786 | – | 60,565,786 |
| Royce Small-Cap Opportunity Fund | | | | |
| Common Stocks | 1,243,634,840 | 1,121,957 | 0 | 1,244,756,797 |
| Repurchase Agreement | – | 47,606,205 | – | 47,606,205 |
| Money Market Fund/Collateral Received for Securities Loaned | 2,926,187 | – | – | 2,926,187 |
| Royce Small-Cap Special Equity Fund | | | | |
| Common Stocks | 647,106,548 | 6,008,576 | – | 653,115,124 |
| Repurchase Agreement | – | 153,727,643 | – | 153,727,643 |
70 | The Royce Funds 2023 Semiannual Report to Shareholders
VALUATION OF INVESTMENTS (continued):
| | LEVEL 1 | LEVEL 2 | LEVEL 3 | TOTAL |
| Royce Small-Cap Total Return Fund | | | | |
| Common Stocks | $896,818,303 | $35,063,437 | $ – | $931,881,740 |
| Preferred Stocks | 4,274,554 | – | – | 4,274,554 |
| Repurchase Agreement | – | 29,214,667 | – | 29,214,667 |
| Money Market Fund/Collateral Received for Securities Loaned | 2,560,374 | – | – | 2,560,374 |
| Royce Small-Cap Value Fund | | | | |
| Common Stocks | 108,341,260 | – | – | 108,341,260 |
| Repurchase Agreement | – | 2,237,036 | – | 2,237,036 |
| Royce Smaller-Companies Growth Fund | | | | |
| Common Stocks | 181,147,364 | 7,720,424 | – | 188,867,788 |
| Repurchase Agreement | – | 4,605,858 | – | 4,605,858 |
| Money Market Fund/Collateral Received for Securities Loaned | 14,418,841 | – | – | 14,418,841 |
Level 3 Reconciliation:
| | | | | | | | | | | UNREALIZED GAIN (LOSS) 1 | |
| | BALANCE AS OF
12/31/22 | PURCHASES | CORPORATE
ACTIONS | SALES | REALIZED GAIN
(LOSS) 1 | CURRENTLY HELD
SECURITIES | SECURITIES NO
LONGER HELD | BALANCE AS OF
6/30/23 |
| Royce Micro-Cap Fund | | | | | | | | | | | | |
| Common Stocks | $ | 0 | $ | – | $ | – | $ | – | $ | – | $ | 0 | $ | – | $ | 0 |
| Royce Small-Cap Opportunity Fund | | | | | | | | | | | | |
| Common Stocks | | 0 | | – | | – | | – | | – | | 0 | | – | | 0 |
| 1 | The net change in unrealized appreciation (depreciation) is included in the accompanying Statement of Operations. Change in unrealized appreciation (depreciation) includes net unrealized appreciation (depreciation) resulting from changes in investment values during the reporting period and the reversal of previously recorded unrealized appreciation (depreciation) when gains or losses are realized. Net realized gain (loss) from investments and foreign currency transactions is included in the accompanying Statement of Operations. |
REPURCHASE AGREEMENTS:
The Funds may enter into repurchase agreements with institutions that the Funds’ investment adviser has determined are creditworthy. Each Fund restricts repurchase agreements to maturities of no more than seven days. Securities pledged as collateral for repurchase agreements, which are held until maturity of the repurchase agreements, are marked-to-market daily and maintained at a value at least equal to the principal amount of the repurchase agreement (including accrued interest). Repurchase agreements could involve certain risks in the event of default or insolvency of the counter-party, including possible delays or restrictions upon the ability of each Fund to dispose of its underlying securities. The remaining contractual maturities of repurchase agreements held by the Funds as of June 30, 2023, are next business day and continuous.
FOREIGN CURRENCY:
Net realized foreign exchange gains or losses arise from sales and maturities of short-term securities, sales of foreign currencies, expiration of currency forward contracts, currency gains or losses realized between the trade and settlement dates on securities transactions, and the difference between the amounts of dividends, interest, and foreign withholding taxes recorded on each Fund’s books and the U.S. dollar equivalent of the amounts actually received or paid. Net unrealized foreign exchange gains and losses arise from changes in the value of assets and liabilities, other than investments in securities at the end of the reporting period, as a result of changes in foreign currency exchange rates.
The Funds do not isolate that portion of the results of operations resulting from fluctuations in foreign exchange rates on investments from the fluctuations arising from changes in market prices of securities held. Such fluctuations are included with the net realized and unrealized gain or loss on investments.
Certain Funds invest a significant portion of their respective assets in foreign companies that may be subject to different risks than investments in securities of U.S. companies, including adverse political, social, economic, or other developments that are unique to a particular country or region. Therefore, the prices of securities of foreign companies in particular countries or regions may, at times, move in a different direction than those of securities of U.S. companies. Because such investments in securities of foreign companies are usually denominated in foreign currencies and such Funds do not intend to hedge their foreign currency exposures, the U.S. dollar value of such investments may be harmed by declines in the value of foreign currencies in relation to the U.S. dollar.
SECURITIES LENDING:
The Funds loan securities through a lending agent, State Street Bank and Trust Company, to qualified institutional investors for the purpose of earning additional income. The lending agent receives and holds collateral from such borrowers to secure their obligations to the Funds. Such loans must be secured at all times by collateral in an amount at least equal to the market value of the loaned securities. The market values of the loaned securities and the collateral fluctuate and are determined at the close of each business day by the lending agent. Borrowers are required to post additional collateral to the lending agent on the next succeeding business day in the event of a collateral shortfall. Counterparty risk is further reduced by loaning securities only to parties that participate in a Global Securities
The Royce Funds 2023 Semiannual Report to Shareholders | 71
Notes to Financial Statements (unaudited) (continued)
SECURITIES LENDING (continued):
Lending Program organized and monitored by the lending agent and that are deemed by it to satisfy its requirements and by having the lending agent enter into securities lending agreements with such borrowers. The lending agent is not affiliated with Royce.
Collateral may be in the form of cash or U.S. Treasuries. Cash collateral is invested in certain money market pooled investment vehicles. The Funds record a liability in their respective Statements of Assets and Liabilities for the return of such cash collateral during periods in which securities are on loan. The Funds bear the risk of loss for any decrease in the market value of the loaned securities or the investments purchased with cash collateral received from the borrowers.
Pursuant to the agreement in place between the Funds and the lending agent, if a borrower fails to return loaned securities, and the cash collateral being maintained by the lending agent on behalf of such borrower is insufficient to cover the value of loaned securities and provided such collateral insufficiency is not the result of investment losses, the lending agent shall, at its option, either replace the loaned securities or pay the amount of the shortfall to the Funds. In the event of the bankruptcy of a borrower, the Funds could experience delay in recovering the loaned securities or only recover cash or a security of equivalent value.
Loans of securities generally do not have stated maturity dates, and the Funds may recall a security at any time. The Funds’ securities lending income consists of the income earned on investing cash collateral, plus any premium payments received for lending certain securities, less any rebates paid to borrowers and lending agent fees associated with the loan. Pursuant to the agreement in place between the Funds and the lending agent, the Funds are responsible for any shortfall in the event the value of the investments purchased with cash collateral is insufficient to pay the rebate fee to the borrower.
The following table presents cash collateral and the market value of securities on loan collateralized by cash collateral held by the Funds as of June 30, 2023:
| | CASH COLLATERAL1 | SECURITIES ON LOAN COLLATERALIZED
BY CASH COLLATERAL | NET AMOUNT |
| Royce Micro-Cap Fund | $ 3,649,742 | $ (3,671,849) | $ (22,107) |
| Royce Pennsylvania Mutual Fund | 2,396,835 | (2,433,006) | (36,171) |
| Royce Small-Cap Opportunity Fund | 2,926,187 | (2,803,041) | 123,146 |
| Royce Small-Cap Total Return Fund | 2,560,374 | (2,546,807) | 13,567 |
| Royce Smaller-Companies Growth Fund | 14,418,841 | (14,146,810) | 272,031 |
| 1 | Absent an event of default, assets and liabilities are presented gross and not offset in the Statements of Assets and Liabilities. The contractual maturity of cash collateral is overnight and continuous. |
The following table presents non-cash collateral and the market value of securities on loan collateralized by non-cash collateral held by the Funds’ custodian as of June 30, 2023:
| | NON-CASH COLLATERAL | SECURITIES ON LOAN COLLATERALIZED
BY NON-CASH COLLATERAL | NET AMOUNT |
| Royce Micro-Cap Fund | $ 2,968,151 | $ (2,732,579) | $ 235,572 |
| Royce Pennsylvania Mutual Fund | 11,280,793 | (10,976,165) | 304,628 |
| Royce Small-Cap Opportunity Fund | 21,444,698 | (20,868,453) | 576,245 |
| Royce Smaller-Companies Growth Fund | 3,369,319 | (3,279,882) | 89,437 |
DISTRIBUTIONS AND TAXES:
As qualified regulated investment companies under Subchapter M of the Internal Revenue Code, the Funds are not subject to income taxes to the extent that each Fund distributes substantially all of its taxable income for its fiscal year.
Royce Dividend Value Fund and Royce Small-Cap Total Return Fund pay any dividends from net investment income quarterly and make any distributions from net realized gains annually in December. The other Funds pay any dividends and capital gain distributions annually in December. Dividends from net investment income and distributions from capital gains are determined at a class level. Because federal income tax regulations differ from generally accepted accounting principles, income and capital gain distributions determined in accordance with tax regulations may differ from net investment income and realized gains recognized for financial reporting purposes. Accordingly, the character of distributions and composition of net assets for tax purposes differ from those reflected in the accompanying financial statements.
CAPITAL GAINS TAXES:
The Funds may be subject to a tax imposed on capital gains on securities of issuers domiciled in certain countries. The Funds record an estimated deferred tax liability for gains in these securities that have been held for less than one year. This amount, if any, is reported as deferred capital gains tax in the accompanying Statements of Assets and Liabilities, assuming those positions were disposed of at the end of the period, and accounted for as a reduction in the market value of the security.
INVESTMENT TRANSACTIONS AND RELATED INVESTMENT INCOME:
Investment transactions are accounted for on the trade date. Dividend income is recorded on the ex-dividend date. Non-cash dividend income is recorded at the fair market value of the securities received. Interest income is recorded on an accrual basis. Premiums and discounts on debt securities are amortized using the effective yield-to-maturity method. Realized gains and losses from investment transactions are determined on the basis of identified cost for book and tax purposes.
72 | The Royce Funds 2023 Semiannual Report to Shareholders
EXPENSES:
The Funds incur direct and indirect expenses. Expenses directly attributable to a Fund are charged to the Fund, while expenses applicable to more than one of the Royce Funds are allocated equitably. Certain personnel, occupancy costs and other administrative expenses related to all of the Royce Funds are allocated by Royce under an administration agreement and are included in administrative and office facilities and legal expenses.
COMPENSATING BALANCE CREDITS:
The Funds have an arrangement with their transfer agent, whereby a portion of the transfer agent’s fee is paid indirectly by credits earned on a Fund’s cash on deposit with the transfer agent.
LINE OF CREDIT:
The Funds, along with certain other Royce Funds, participate in a $65 million line of credit (“Credit Agreement”) with State Street Bank and Trust Company to be used for temporary or emergency purposes. This revolving Credit Agreement expires on October 6, 2023. Pursuant to the Credit Agreement, each participating Fund is liable for a portion of the commitment fee for the credit facility (i.e., 0.25% of any unused portion of the line of credit) and for principal and interest payments related to borrowings made by that Fund. Borrowings under the Credit Agreement bear interest at a variable rate equal to the Applicable Rate plus the Applicable Margin. The term Applicable Rate means, for any day, a rate equal to the sum of (a) 0.10%, plus (b) the higher of (i) the Federal Funds Effective Rate for such day, or (ii) the Overnight Bank Funding Rate for such day. The term Applicable Margin means 1.25%. The Funds did not utilize the line of credit during the six months ended June 30, 2023.
Capital Share Transactions (in dollars):
| | | SHARES SOLD | | SHARES ISSUED FOR
REINVESTMENT OF DISTRIBUTIONS | | SHARES REDEEMED | | SHARE CLASS CONVERSIONS | | NET INCREASE (DECREASE) FROM
CAPITAL SHARE TRANSACTIONS |
| | | Six Months Ended
6/30/23
(unaudited) | | Year Ended
12/31/22 | | Six Months Ended
6/30/23
(unaudited) | | Year Ended
12/31/22 | | Six Months Ended
6/30/23
(unaudited) | | Year Ended
12/31/22 | | Six Months Ended
6/30/23
(unaudited)1 | | Year Ended
12/31/22 | | Six Months Ended
6/30/23
(unaudited) | | Year Ended
12/31/22 |
| Royce Dividend Value Fund | | | | | | | | | | | | |
| Investment Class | | $ 1,844,111 | | | $ 5,462,654 | | | $ 258,220 | | | $ 398,478 | | | $ (4,945,694 | ) | | $ (9,344,703 | ) | | $ 138,592 | | | | | | $(2,704,771 | ) | | $ (3,483,571 | ) |
| Service Class | | 540,828 | | | 343,158 | | | 63,650 | | | 71,850 | | | (975,799 | ) | | (3,219,000 | ) | | 1,814,323 | | | | | | 1,443,002 | | | (2,803,992 | ) |
| Consultant Class | | 210,152 | | | 503,470 | | | – | | | 2,987 | | | (65,431 | ) | | (38,642 | ) | | (1,814,323 | ) | | | | | (1,669,602 | ) | | 467,815 | |
| Institutional Class | | 3,063 | | | 26,893 | | | 226 | | | 4,475 | | | (380 | ) | | (717,743 | ) | | (138,592 | ) | | | | | (135,683 | ) | | (686,375 | ) |
| Royce Global Financial Services Fund | | | | | | | | | | | | | | | | | | | | | | |
| Service Class | | 262,897 | | | 519,913 | | | – | | | 363,123 | | | (1,753,746 | ) | | (4,147,918 | ) | | | | | | | | (1,490,849 | ) | | (3,264,882 | ) |
| Institutional Class | | 954 | | | 2,957 | | | – | | | 136,659 | | | (97,223 | ) | | (283,646 | ) | | | | | | | | (96,269 | ) | | (144,030 | ) |
| Royce International Premier Fund | | | | | | | | | | | | | | | | | | | | | | |
| Investment Class | | 82,445,427 | | | 76,204,270 | | | – | | | 6,751,294 | | | (32,103,494 | ) | | (179,512,212 | ) | | | | | | | | 50,341,933 | | | (96,556,648 | ) |
| Service Class | | 970,601 | | | 2,997,323 | | | – | | | 914,665 | | | (3,473,362 | ) | | (13,837,053 | ) | | 4,698,162 | | | | | | 2,195,401 | | | (9,925,065 | ) |
| Consultant Class | | 30,324 | | | 149,330 | | | – | | | 105,632 | | | (361,604 | ) | | (1,493,286 | ) | | (4,698,162 | ) | | | | | (5,029,442 | ) | | (1,238,324 | ) |
| Institutional Class | | 28,898,808 | | | 99,085,388 | | | – | | | 11,395,192 | | | (33,657,259 | ) | | (153,909,665 | ) | | | | | | | | (4,758,451 | ) | | (43,429,085 | ) |
| Royce Micro-Cap Fund | | | | | | | | | | | | | | | | | | | | | | |
| Investment Class | | 7,294,973 | | | 9,965,275 | | | – | | | 6,703,670 | | | (10,731,402 | ) | | (22,078,026 | ) | | | | | | | | (3,436,429 | ) | | (5,409,081 | ) |
| Service Class | | 793,313 | | | 1,724,500 | | | – | | | 5,984,514 | | | (10,435,470 | ) | | (22,138,656 | ) | | | | | | | | (9,642,157 | ) | | (14,429,642 | ) |
| Consultant Class | | 14,148 | | | 41,889 | | | – | | | 477,041 | | | (772,127 | ) | | (1,778,759 | ) | | | | | | | | (757,979 | ) | | (1,259,829 | ) |
| Royce Pennsylvania Mutual Fund | | | | | | | | | | | | | | |
| Investment Class | | 25,438,686 | | | 65,094,251 | | | – | | | 53,749,475 | | | (94,826,073 | ) | | (201,742,868 | ) | | | | | | | | (69,387,387 | ) | | (82,899,142 | ) |
| Service Class | | 5,075,076 | | | 5,348,597 | | | – | | | 2,664,829 | | | (5,287,563 | ) | | (16,712,457 | ) | | 2,009,544 | | | | | | 1,797,057 | | | (8,699,031 | ) |
| Consultant Class | | 1,033,268 | | | 2,842,618 | | | – | | | 8,180,229 | | | (11,298,126 | ) | | (32,154,983 | ) | | | | | | | | (10,264,858 | ) | | (21,132,136 | ) |
| Institutional Class | | 35,519,583 | | | 20,667,714 | | | – | | | 6,645,063 | | | (10,185,709 | ) | | (51,690,770 | ) | | | | | | | | 25,333,874 | | | (24,377,993 | ) |
| R Class | | 158,917 | | | 578,197 | | | – | | | 345,904 | | | (5,619,694 | ) | | (1,301,745 | ) | | (2,009,544 | ) | | | | | (7,470,321 | ) | | (377,644 | ) |
| Royce Premier Fund | | | | | | | | | | | | | | | | | | | | | | |
| Investment Class | | 57,351,981 | | | 87,824,319 | | | – | | | 68,480,604 | | | (96,019,017 | ) | | (258,753,409 | ) | | | | | | | | (38,667,036 | ) | | (102,448,486 | ) |
| Service Class | | 8,735,305 | | | 5,324,371 | | | – | | | 1,942,373 | | | (3,549,989 | ) | | (11,091,072 | ) | | 502,349 | | | | | | 5,687,665 | | | (3,824,328 | ) |
| Consultant Class | | 84,739 | | | 532,280 | | | – | | | 895,363 | | | (875,403 | ) | | (2,653,730 | ) | | | | | | | | (790,664 | ) | | (1,226,087 | ) |
| Institutional Class | | 17,586,829 | | | 32,203,696 | | | – | | | 16,488,407 | | | (22,943,818 | ) | | (56,077,526 | ) | | | | | | | | (5,356,989 | ) | | (7,385,423 | ) |
| R Class | | 183,825 | | | 212,423 | | | – | | | 509,268 | | | (6,287,233 | ) | | (880,571 | ) | | (502,349 | ) | | | | | (6,605,757 | ) | | (158,880 | ) |
| Royce Small-Cap Opportunity Fund | | | | | | | | | | | | | | | | | | | | | | |
| Investment Class | | 88,354,362 | | | 318,411,947 | | | – | | | 38,901,508 | | | (192,056,524 | ) | | (508,804,017 | ) | | | | | | | | (103,702,162 | ) | | (151,490,562 | ) |
| Service Class | | 6,728,883 | | | 20,170,973 | | | – | | | 3,244,630 | | | (11,202,444 | ) | | (43,615,225 | ) | | | | | | | | (4,473,561 | ) | | (20,199,622 | ) |
| Consultant Class | | 995,457 | | | 2,341,420 | | | – | | | 507,115 | | | (835,494 | ) | | (3,171,205 | ) | | | | | | | | 159,963 | | | (322,670 | ) |
| Institutional Class | | 27,521,400 | | | 61,510,399 | | | – | | | 7,698,601 | | | (27,150,920 | ) | | (87,595,325 | ) | | | | | | | | 370,480 | | | (18,386,325 | ) |
| R Class | | 2,865,612 | | | 4,362,167 | | | – | | | 1,917,055 | | | (3,613,152 | ) | | (8,025,738 | ) | | | | | | | | (747,540 | ) | | (1,746,516 | ) |
The Royce Funds 2023 Semiannual Report to Shareholders | 73
Notes to Financial Statements (unaudited) (continued)
Capital Share Transactions (in dollars) (continued):
| | | SHARES SOLD | | SHARES ISSUED FOR REINVESTMENT
OF DISTRIBUTIONS | | SHARES REDEEMED | | SHARE CLASS CONVERSIONS | | NET INCREASE (DECREASE) FROM
CAPITAL SHARE TRANSACTIONS |
| | | Six Months Ended
6/30/23
(unaudited) | | Year Ended
12/31/22 | | Six Months Ended
6/30/23
(unaudited) | | Year Ended
12/31/22 | | Six Months Ended
6/30/23
(unaudited) | | Year Ended
12/31/22 | | Six Months Ended
6/30/23
(unaudited)1 | | Year Ended
12/31/22 | | Six Months Ended
6/30/23
(unaudited) | | Year Ended
12/31/22 |
| Royce Small-Cap Special Equity Fund | | | | | | | | | | | | | | | | | | | | | | |
| Investment Class | | $51,867,920 | | | $74,793,750 | | | $ – | | | $57,163,323 | �� | | $(63,229,828 | ) | | $(184,860,182 | ) | | | | | | | | $(11,361,908 | ) | | $(52,903,109 | ) |
| Service Class | | 2,717,311 | | | 6,968,245 | | | – | | | 3,021,117 | | | (4,389,519 | ) | | (24,663,512 | ) | | | | | | | | (1,672,208 | ) | | (14,674,150 | ) |
| Consultant Class | | 221,245 | | | 1,652,880 | | | – | | | 1,374,559 | | | (646,546 | ) | | (9,628,606 | ) | | | | | | | | (425,301 | ) | | (6,601,167 | ) |
| Institutional Class | | 26,121,692 | | | 32,007,338 | | | – | | | 9,529,968 | | | (19,618,662 | ) | | (136,992,809 | ) | | | | | | | | 6,503,030 | | | (95,455,503 | ) |
| Royce Small-Cap Total Return Fund | | | | | | | | | | | | | | | | | | | | | | |
| Investment Class | | 26,565,859 | | | 67,023,280 | | | 2,632,705 | | | 73,842,790 | | | (56,284,755 | ) | | (368,351,415 | ) | | | | | | | | (27,086,191 | ) | | (227,485,345 | ) |
| Service Class | | 3,338,251 | | | 11,930,918 | | | 185,590 | | | 7,431,362 | | | (8,857,551 | ) | | (23,059,482 | ) | | | | | | | | (5,333,710 | ) | | (3,697,202 | ) |
| Consultant Class | | 874,819 | | | 6,136,234 | | | – | | | 9,977,238 | | | (7,103,951 | ) | | (18,018,436 | ) | | | | | | | | (6,229,132 | ) | | (1,904,964 | ) |
| Institutional Class | | 12,979,114 | | | 90,024,255 | | | 965,497 | | | 25,398,176 | | | (20,577,359 | ) | | (153,853,152 | ) | | | | | | | | (6,632,748 | ) | | (38,430,721 | ) |
| R Class | | 1,369,252 | | | 2,628,567 | | | 28,503 | | | 2,507,527 | | | (2,286,558 | ) | | (6,029,232 | ) | | | | | | | | (888,803 | ) | | (893,138 | ) |
| Royce Small-Cap Value Fund | | | | | | | | | | | | | | | | | | | | | | |
| Investment Class | | 900,610 | | | 4,143,624 | | | – | | | 1,987,585 | | | (4,472,997 | ) | | (8,588,407 | ) | | | | | | | | (3,572,387 | ) | | (2,457,198 | ) |
| Service Class | | 3,163,761 | | | 3,414,009 | | | – | | | 3,640,221 | | | (8,865,124 | ) | | (8,172,968 | ) | | $6,689,086 | | | | | | 987,723 | | | (1,118,738 | ) |
| Consultant Class | | 897 | | | 537,262 | | | – | | | 166,877 | | | (190,820 | ) | | (1,934,811 | ) | | (2,889,358 | ) | | | | | (3,079,281 | ) | | (1,230,672 | ) |
| R Class | | 274,078 | | | 634,416 | | | – | | | 317,866 | | | (2,106,475 | ) | | (2,142,342 | ) | | (3,799,728 | ) | | | | | (5,632,125 | ) | | (1,190,060 | ) |
| Royce Smaller-Companies Growth Fund | | | | | | | | | | | | | | | | | | | | | | |
| Investment Class | | 3,063,350 | | | 7,127,233 | | | – | | | 1,870,679 | | | (4,425,871 | ) | | (17,832,476 | ) | | | | | | | | (1,362,521 | ) | | (8,834,564 | ) |
| Service Class | | 2,178,576 | | | 2,229,200 | | | – | | | 4,255,864 | | | (8,583,112 | ) | | (18,872,005 | ) | | 3,953,734 | | | | | | (2,450,802 | ) | | (12,386,941 | ) |
| Consultant Class | | 7,157 | | | 77,046 | | | – | | | 179,296 | | | (468,040 | ) | | (1,033,301 | ) | | (3,953,734 | ) | | | | | (4,414,617 | ) | | (776,959 | ) |
| Institutional Class | | 284,167 | | | 1,561,613 | | | – | | | 180,637 | | | (265,778 | ) | | (2,315,211 | ) | | | | | | | | 18,389 | | | (572,961 | ) |
Capital Share Transactions (in shares):
| | | SHARES SOLD | | SHARES ISSUED FOR
REINVESTMENT OF DISTRIBUTIONS | | SHARES REDEEMED | | SHARE CLASS CONVERSIONS | | NET INCREASE (DECREASE) IN
SHARES OUTSTANDING |
| | | Six Months Ended
6/30/23
(unaudited) | | Year Ended
12/31/22 | | Six Months Ended
6/30/23
(unaudited) | | Year Ended
12/31/22 | | Six Months Ended
6/30/23
(unaudited) | | Year Ended
12/31/22 | | Six Months Ended
6/30/23
(unaudited)1 | | Year Ended
12/31/22 | | Six Months Ended
6/30/23
(unaudited) | | Year Ended
12/31/22 |
| Royce Dividend Value Fund | | | | | | | | | | |
| Investment Class | | 318,873 | | | 987,739 | | | 43,200 | | | 74,537 | | | (851,090 | ) | | (1,686,240 | ) | | 24,530 | | | | | | (464,487 | ) | | (623,964 | ) |
| Service Class | | 89,147 | | | 59,649 | | | 10,281 | | | 13,282 | | | (162,743 | ) | | (556,523 | ) | | 308,035 | | | | | | 244,720 | | | (483,592 | ) |
| Consultant Class | | 30,591 | | | 75,541 | | | – | | | 460 | | | (9,600 | ) | | (5,405 | ) | | (270,888 | ) | | | | | (249,897 | ) | | 70,596 | |
| Institutional Class | | 539 | | | 4,889 | | | 41 | | | 859 | | | (66 | ) | | (132,627 | ) | | (24,934 | ) | | | | | (24,420 | ) | | (126,879 | ) |
| Royce Global Financial Services Fund | | | | | | | | | | | | | | | | | | | | | | |
| Service Class | | 28,371 | | | 48,678 | | | – | | | 39,172 | | | (184,133 | ) | | (389,775 | ) | | | | | | | | (155,762 | ) | | (301,925 | ) |
| Institutional Class | | 74 | | | 223 | | | – | | | 11,257 | | | (7,445 | ) | | (19,358 | ) | | | | | | | | (7,371 | ) | | (7,878 | ) |
| Royce International Premier Fund | | | | | | | | | | | | | | | | | | | | | | |
| Investment Class | | 6,173,969 | | | 5,289,428 | | | – | | | 548,440 | | | (2,417,196 | ) | | (13,017,673 | ) | | | | | | | | 3,756,773 | | | (7,179,805 | ) |
| Service Class | | 61,085 | | | 182,020 | | | – | | | 61,921 | | | (218,682 | ) | | (817,074 | ) | | 295,668 | | | | | | 138,071 | | | (573,133 | ) |
| Consultant Class | | 1,803 | | | 9,100 | | | – | | | 6,767 | | | (21,630 | ) | | (88,299 | ) | | (280,651 | ) | | | | | (300,478 | ) | | (72,432 | ) |
| Institutional Class | | 2,171,002 | | | 7,050,212 | | | – | | | 925,686 | | | (2,539,666 | ) | | (11,306,819 | ) | | | | | | | | (368,664 | ) | | (3,330,921 | ) |
| Royce Micro-Cap Fund | | | | | | | | | | | | | | | | | | | | | | |
| Investment Class | | 680,437 | | | 919,547 | | | – | | | 680,575 | | | (1,017,291 | ) | | (2,020,079 | ) | | | | | | | | (336,854 | ) | | (419,957 | ) |
| Service Class | | 80,175 | | | 159,057 | | | – | | | 625,341 | | | (1,019,820 | ) | | (2,117,819 | ) | | | | | | | | (939,645 | ) | | (1,333,421 | ) |
| Consultant Class | | 1,912 | | | 4,950 | | | – | | | 65,618 | | | (103,406 | ) | | (226,642 | ) | | | | | | | | (101,494 | ) | | (156,074 | ) |
| Royce Pennsylvania Mutual Fund | | | | | | | | | | | | | | | | | | | | | | |
| Investment Class | | 3,108,198 | | | 7,884,090 | | | – | | | 7,044,491 | | | (11,518,283 | ) | | (24,619,020 | ) | | | | | | | | (8,410,085 | ) | | (9,690,439 | ) |
| Service Class | | 620,828 | | | 636,726 | | | – | | | 351,097 | | | (649,533 | ) | | (2,054,556 | ) | | 257,965 | | | | | | 229,260 | | | (1,066,733 | ) |
| Consultant Class | | 164,002 | | | 446,394 | | | – | | | 1,384,133 | | | (1,798,441 | ) | | (5,085,840 | ) | | | | | | | | (1,634,439 | ) | | (3,255,313 | ) |
| Institutional Class | | 4,254,708 | | | 2,479,284 | | | – | | | 867,502 | | | (1,238,983 | ) | | (6,483,597 | ) | | | | | | | | 3,015,725 | | | (3,136,811 | ) |
| R Class | | 21,258 | | | 75,395 | | | – | | | 49,204 | | | (760,823 | ) | | (169,561 | ) | | (279,491 | ) | | | | | (1,019,056 | ) | | (44,962 | ) |
| Royce Premier Fund | | | | | | | | | | | | | | | | | | | | | | |
| Investment Class | | 5,247,818 | | | 7,856,376 | | | – | | | 6,800,457 | | | (8,830,574 | ) | | (23,106,332 | ) | | | | | | | | (3,582,756 | ) | | (8,449,499 | ) |
| Service Class | | 829,697 | | | 490,501 | | | – | | | 199,422 | | | (337,958 | ) | | (1,023,836 | ) | | 49,298 | | | | | | 541,037 | | | (333,913 | ) |
| Consultant Class | | 10,329 | | | 64,613 | | | – | | | 116,584 | | | (105,673 | ) | | (312,726 | ) | | | | | | | | (95,344 | ) | | (131,529 | ) |
| Institutional Class | | 1,592,053 | | | 2,774,442 | | | – | | | 1,611,770 | | | (2,068,000 | ) | | (4,940,162 | ) | | | | | | | | (475,947 | ) | | (553,950 | ) |
| R Class | | 18,464 | | | 20,583 | | | – | | | 55,841 | | | (637,782 | ) | | (86,589 | ) | | (52,611 | ) | | | | | (671,929 | ) | | (10,165 | ) |
74 | The Royce Funds 2023 Semiannual Report to Shareholders
Capital Share Transactions (in shares) (continued):
| | | SHARES SOLD | | SHARES ISSUED FOR
REINVESTMENT OF DISTRIBUTIONS | | SHARES REDEEMED | | SHARE CLASS CONVERSIONS | | NET INCREASE (DECREASE) IN
SHARES OUTSTANDING |
| | | Six Months Ended
6/30/23
(unaudited) | | Year Ended
12/31/22 | | Six Months Ended
6/30/23
(unaudited) | | Year Ended
12/31/22 | | Six Months Ended
6/30/23
(unaudited) | | Year Ended
12/31/22 | | Six Months Ended
6/30/23
(unaudited)1 | | Year Ended
12/31/22 | | Six Months Ended
6/30/23
(unaudited) | | Year Ended
12/31/22 |
| Royce Small-Cap Opportunity Fund | | | | | | | | | | | | | | | | | | | | | | |
| Investment Class | | 6,244,955 | | | 21,261,017 | | | – | | | 2,947,084 | | | (13,697,611 | ) | | (34,745,434 | ) | | | | | | | | (7,452,656 | ) | | (10,537,333 | ) |
| Service Class | | 514,004 | | | 1,497,972 | | | – | | | 269,264 | | | (863,002 | ) | | (3,245,880 | ) | | | | | | | | (348,998 | ) | | (1,478,644 | ) |
| Consultant Class | | 88,171 | | | 208,534 | | | – | | | 49,139 | | | (75,020 | ) | | (277,875 | ) | | | | | | | | 13,151 | | | (20,202 | ) |
| Institutional Class | | 1,922,360 | | | 4,054,020 | | | – | | | 567,743 | | | (1,866,587 | ) | | (5,805,365 | ) | | | | | | | | 55,773 | | | (1,183,602 | ) |
| R Class | | 233,317 | | | 333,870 | | | – | | | 165,406 | | | (289,539 | ) | | (624,233 | ) | | | | | | | | (56,222 | ) | | (124,957 | ) |
| Royce Small-Cap Special Equity Fund | | | | | | | | | | | | | | | | | | | | | | |
| Investment Class | | 3,146,834 | | | 4,274,293 | | | – | | | 3,583,907 | | | (3,848,679 | ) | | (10,534,392 | ) | | | | | | | | (701,845 | ) | | (2,676,192 | ) |
| Service Class | | 165,304 | | | 390,359 | | | – | | | 189,412 | | | (267,612 | ) | | (1,426,751 | ) | | | | | | | | (102,308 | ) | | (846,980 | ) |
| Consultant Class | | 14,744 | | | 104,981 | | | – | | | 94,602 | | | (43,086 | ) | | (594,479 | ) | | | | | | | | (28,342 | ) | | (394,896 | ) |
| Institutional Class | | 1,585,616 | | | 1,808,501 | | | – | | | 603,162 | | | (1,187,151 | ) | | (7,662,116 | ) | | | | | | | | 398,465 | | | (5,250,453 | ) |
| Royce Small-Cap Total Return Fund | | | | | | | | | | | | | | | | | | | | | | |
| Investment Class | | 3,864,849 | | | 8,441,346 | | | 389,801 | | | 11,291,465 | | | (8,198,350 | ) | | (45,260,446 | ) | | | | | | | | (3,943,700 | ) | | (25,527,635 | ) |
| Service Class | | 475,589 | | | 1,449,780 | | | 25,922 | | | 1,099,407 | | | (1,245,765 | ) | | (2,802,333 | ) | | | | | | | | (744,254 | ) | | (253,146 | ) |
| Consultant Class | | 121,738 | | | 758,766 | | | – | | | 1,465,086 | | | (999,809 | ) | | (2,239,607 | ) | | | | | | | | (878,071 | ) | | (15,755 | ) |
| Institutional Class | | 1,913,588 | | | 11,078,565 | | | 146,087 | | | 3,957,140 | | | (3,063,237 | ) | | (19,251,358 | ) | | | | | | | | (1,003,562 | ) | | (4,215,653 | ) |
| R Class | | 189,655 | | | 322,555 | | | 3,979 | | | 366,132 | | | (318,404 | ) | | (711,510 | ) | | | | | | | | (124,770 | ) | | (22,823 | ) |
| Royce Small-Cap Value Fund | | | | | | | | | | | | | | | | | | | | | | |
| Investment Class | | 98,922 | | | 451,885 | | | – | | | 222,325 | | | (496,300 | ) | | (937,108 | ) | | | | | | | | (397,378 | ) | | (262,898 | ) |
| Service Class | | 351,822 | | | 363,428 | | | – | | | 409,474 | | | (989,186 | ) | | (886,422 | ) | | 784,184 | | | | | | 146,820 | | | (113,520 | ) |
| Consultant Class | | 114 | | | 62,235 | | | – | | | 21,700 | | | (23,761 | ) | | (247,539 | ) | | (394,479 | ) | | | | | (418,126 | ) | | (163,604 | ) |
| R Class | | 31,309 | | | 72,512 | | | – | | | 37,662 | | | (250,388 | ) | | (240,352 | ) | | (469,746 | ) | | | | | (688,825 | ) | | (130,178 | ) |
| Royce Smaller-Companies Growth Fund | | | | | | | | | | | | | | | | | | | | | | |
| Investment Class | | 497,043 | | | 1,080,273 | | | – | | | 325,335 | | | (711,518 | ) | | (2,821,049 | ) | | | | | | | | (214,475 | ) | | (1,415,441 | ) |
| Service Class | | 363,433 | | | 363,858 | | | – | | | 766,823 | | | (1,443,220 | ) | | (3,012,840 | ) | | 685,222 | | | | | | (394,565 | ) | | (1,882,159 | ) |
| Consultant Class | | 1,523 | | | 13,619 | | | – | | | 38,808 | | | (94,490 | ) | | (198,445 | ) | | (825,397 | ) | | | | | (918,364 | ) | | (146,018 | ) |
| Institutional Class | | 44,113 | | | 242,144 | | | – | | | 30,931 | | | (42,199 | ) | | (331,936 | ) | | | | | | | | 1,914 | | | (58,861 | ) |
| 1 | On April 26, 2023, Institutional Class shares converted to Investment Class shares for Royce Dividend Value Fund; Consultant Class shares converted to Service Class shares for the following funds: Royce Dividend Value Fund, Royce International Premier Fund, Royce Small-Cap Value Fund and Royce Smaller-Companies Growth Fund; and R Class shares converted to Service Class shares for the following funds: Royce Pennsylvania Mutual Fund, Royce Premier Fund and Royce Small-Cap Value Fund. |
The Royce Funds 2023 Semiannual Report to Shareholders | 75
Notes to Financial Statements (unaudited) (continued)
Investment Adviser and Distributor:
INVESTMENT ADVISER:
Under the Trust’s investment advisory agreements with Royce, Royce is entitled to receive investment advisory fees in respect of each Fund that are computed daily and payable monthly. Royce has contractually agreed, without right of termination, to waive fees and/or reimburse expenses (excluding brokerage commissions, taxes, interest, litigation expenses, acquired fund fees and expenses, and other expenses not borne in the ordinary course of business) to the extent necessary to maintain certain Funds’ net annual operating expense ratios at specified levels through April 30, 2024. To the extent that they impacted net expenses for the six months ended June 30, 2023, the effects of those arrangements are shown below. See the Prospectuses for contractual waivers and expiration dates for all classes of all Funds.
| | ANNUAL CONTRACTUAL
ADVISORY FEE AS A | COMMITTED NET ANNUAL OPERATING EXPENSE RATIO CAP | | SIX MONTHS ENDED
JUNE 30, 2023 (UNAUDITED) |
| | PERCENTAGE OF AVERAGE | Investment | Service | Consultant | Institutional | | | | Advisory fees |
| | NET ASSETS1 | Class | Class | Class | Class | R Class | Net advisory fees | waived |
| Royce Dividend Value Fund | 0.85% | 1.09% | 1.34% | 2.09% | 1.09% | N/A | $ | 256,083 | $ | – |
| Royce Global Financial Services Fund | 1.00% | N/A | 1.49%3 | N/A | 1.49%3 | N/A | | 132,562 | | – |
| Royce International Premier Fund | 1.00% | 1.19% | 1.44% | 2.19% | 1.04% | N/A | | 3,567,833 | | 357,068 |
| Royce Micro-Cap Fund | 1.00% | 1.24% | 1.49% | 2.24%4 | N/A | N/A | | 1,474,759 | | – |
| Royce Pennsylvania Mutual Fund | 0.76%2 | N/A | 1.25%3 | N/A | N/A | 1.75%3 | | 6,241,708 | | – |
| Royce Premier Fund | 1.00% | N/A | 1.49% | 2.24%4 | N/A | 1.99% | | 6,576,534 | | – |
| Royce Small-Cap Opportunity Fund | 1.00% | N/A | 1.49% | 2.24%4 | N/A | N/A | | 6,311,190 | | – |
| Royce Small-Cap Special Equity Fund | 1.00% | N/A | 1.49% | 2.24%4 | N/A | N/A | | 3,877,614 | | – |
| Royce Small-Cap Total Return Fund | 1.00% | N/A | 1.49%3 | N/A | N/A | N/A | | 4,732,525 | | – |
| Royce Small-Cap Value Fund | 1.00% | 1.24% | 1.49% | N/A | N/A | 1.99% | | 559,092 | | – |
| Royce Smaller-Companies Growth Fund | 1.00% | 1.24% | 1.49% | 2.24% | 1.24%5 | N/A | | 926,341 | | – |
| 1 | From a base annual rate of 1.00% (0.85% for Royce Dividend Value Fund), the annual rates of investment advisory fees payable by each of the Funds, other than Royce Pennsylvania Mutual Fund, are reduced by the indicated amount at the following breakpoints applicable to a Fund’s net assets in excess of $2 billion: more than $2 billion to $3 billion – .05% per annum; more than $3 billion to $4 billion – .10% per annum; over $4 billion – .15% per annum. |
| 2 | Royce Pennsylvania Mutual Fund’s fees are calculated at the annual rate of 1.00% of the first $50 million of the Fund’s average net assets, 0.875% of the next $50 million of average net assets and 0.75% of average net assets in excess of $100 million. |
| 3 | Committed net annual operating expense ratio cap excludes acquired fund fees and expenses. |
| 4 | For Royce Micro-Cap Fund, Royce Premier Fund, Royce Small-Cap Opportunity Fund and Royce Small-Cap Special Equity Fund, the committed net annual operating expense ratio cap is 2.24% for Consultant Class, effective May 1, 2023. |
| 5 | Royce Smaller-Companies Growth Fund’s committed net annual operating expense ratio cap was increased from 1.16% to 1.24% for Institutional Class, effective May 1, 2023. |
DISTRIBUTOR:
Royce Fund Services, LLC (“RFS”), the distributor of the Trust’s shares, is a wholly owned subsidiary of Royce. RFS is entitled to receive distribution fees that are computed daily and payable monthly.
| | ANNUAL CONTRACTUAL DISTRIBUTION FEE AS A | SIX MONTHS ENDED JUNE 30, 2023 (UNAUDITED) |
| | PERCENTAGE OF AVERAGE NET ASSETS | Net distribution fees | Distribution fees waived |
| Royce Dividend Value Fund – Service Class | 0.25% | $ 18,883 | $ – |
| Royce Dividend Value Fund – Consultant Class | 1.00% | 5,536 | – |
| Royce Global Financial Services Fund – Service Class | 0.25% | 19,967 | 3,803 |
| Royce International Premier Fund – Service Class | 0.25% | 43,787 | – |
| Royce International Premier Fund – Consultant Class | 1.00% | 15,712 | – |
| Royce Micro-Cap Fund – Service Class | 0.25% | 163,812 | – |
| Royce Micro-Cap Fund – Consultant Class | 1.00% | 51,747 | – |
| Royce Pennsylvania Mutual Fund – Service Class | 0.25% | 74,916 | 3,122 |
| Royce Pennsylvania Mutual Fund – Consultant Class | 1.00% | 912,777 | – |
| Royce Pennsylvania Mutual Fund – R Class | 0.50% | 11,638 | – |
| Royce Premier Fund – Service Class | 0.25% | 36,053 | – |
| Royce Premier Fund – Consultant Class | 1.00% | 58,506 | – |
| Royce Premier Fund – R Class | 0.50% | 10,017 | – |
| Royce Small-Cap Opportunity Fund – Service Class | 0.25% | 87,220 | – |
| Royce Small-Cap Opportunity Fund – Consultant Class | 1.00% | 59,423 | – |
| Royce Small-Cap Opportunity Fund – R Class | 0.50% | 101,284 | – |
| Royce Small-Cap Special Equity Fund – Service Class | 0.25% | 43,940 | – |
| Royce Small-Cap Special Equity Fund – Consultant Class | 1.00% | 77,000 | – |
| Royce Small-Cap Total Return Fund – Service Class | 0.25% | 71,538 | – |
| Royce Small-Cap Total Return Fund – Consultant Class | 1.00% | 423,223 | – |
| Royce Small-Cap Total Return Fund – R Class | 0.50% | 51,176 | – |
76 | The Royce Funds 2023 Semiannual Report to Shareholders
DISTRIBUTOR (continued):
| | ANNUAL CONTRACTUAL DISTRIBUTION FEE AS A | SIX MONTHS ENDED JUNE 30, 2023 (UNAUDITED) |
| | PERCENTAGE OF AVERAGE NET ASSETS | Net distribution fees | Distribution fees waived |
| Royce Small-Cap Value Fund – Service Class | 0.25% | $ 88,160 | $ – |
| Royce Small-Cap Value Fund – Consultant Class | 1.00% | 10,273 | – |
| Royce Small-Cap Value Fund – R Class | 0.50% | 9,572 | – |
| Royce Smaller-Companies Growth Fund – Service Class | 0.25% | 140,032 | – |
| Royce Smaller-Companies Growth Fund – Consultant Class | 1.00% | 14,005 | – |
Purchases and Sales of Investment Securities:
For the six months ended June 30, 2023, the costs of purchases and the proceeds from sales of investment securities, other than short-term securities and collateral received for securities loaned, were as follows:
| | PURCHASES | SALES |
| Royce Dividend Value Fund | $ | 7,415,900 | $ | 8,095,075 |
| Royce Global Financial Services Fund | | 2,392,840 | | 4,349,640 |
| Royce International Premier Fund | | 171,193,673 | | 130,732,509 |
| Royce Micro-Cap Fund | | 26,825,789 | | 42,359,329 |
| Royce Pennsylvania Mutual Fund | | 283,236,831 | | 378,617,256 |
| Royce Premier Fund | | 63,741,948 | | 124,178,634 |
| Royce Small-Cap Opportunity Fund | | 210,218,036 | | 318,274,051 |
| Royce Small-Cap Special Equity Fund | | 55,042,243 | | 81,731,871 |
| Royce Small-Cap Total Return Fund | | 352,832,603 | | 412,423,299 |
| Royce Small-Cap Value Fund | | 21,716,486 | | 30,933,385 |
| Royce Smaller-Companies Growth Fund | | 56,272,938 | | 64,485,351 |
Cross trades were executed by the Funds pursuant to Rule 17a-7 under the 1940 Act. Cross trading is the buying or selling of portfolio securities between funds to which Royce or an affiliate of Franklin Resources, Inc. serves as investment adviser. The Trust’s Chief Compliance Officer reviews such transactions each quarter for compliance with the requirements and restrictions set forth by Rule 17a-7, and reports the results of that review to the Board of Trustees. Cross trades for the six months ended June 30, 2023, were as follows:
| | | COSTS OF PURCHASES | | PROCEEDS FROM SALES | | REALIZED GAIN (LOSS) |
| Royce Pennsylvania Mutual Fund | | $ – | | | $1,795,290 | | | $(3,258,506 | ) |
| Royce Small-Cap Special Equity Fund | | 622,480 | | | – | | | – | |
| Royce Small-Cap Total Return Fund | | – | | | 244,300 | | | (123,056 | ) |
Class Specific Expenses:
Class specific expense were as follows for the six months ended June 30, 2023:
| | NET DISTRIBUTION FEES | SHAREHOLDER SERVICING | SHAREHOLDER REPORTS | REGISTRATION | TRANSFER AGENT BALANCE CREDITS | TOTAL | CLASS LEVEL EXPENSES REIMBURSED BY INVESTMENT ADVISER |
| | | | | | | | | | | | | | | |
| Royce Dividend Value Fund – Investment Class | $ | – | $ | 31,260 | $ | 3,270 | $ | 8,788 | $ | (381) | $ | 42,937 | $ | 38,970 |
| Royce Dividend Value Fund – Service Class | | 18,883 | | 14,791 | | 1,062 | | 7,278 | | (194) | | 41,820 | | 21,668 |
| Royce Dividend Value Fund – Consultant Class | | 5,536 | | 3,893 | | 20 | | 11,293 | | (17) | | 20,725 | | 15,084 |
| Royce Dividend Value Fund – Institutional Class | | – | | 3,592 | | 12 | | 4,624 | | (13) | | 8,215 | | 8,206 |
| | | 24,419 | | 53,536 | | 4,364 | | 31,983 | | (605) | | | | 83,928 |
| Royce Global Financial Services Fund – Service Class | | 19,967 | | 16,376 | | 1,726 | | 8,804 | | (297) | | 46,576 | | 39,561 |
| Royce Global Financial Services Fund – Institutional Class | | – | | 3,337 | | 12 | | 6,705 | | (4) | | 10,050 | | 7,322 |
| | | 19,967 | | 19,713 | | 1,738 | | 15,509 | | (301) | | | | 46,883 |
| Royce International Premier Fund – Investment Class | | – | | 152,967 | | 15,716 | | 12,070 | | (861) | | 179,892 | | – |
| Royce International Premier Fund – Service Class | | 43,787 | | 28,707 | | 2,212 | | 6,390 | | (174) | | 80,922 | | 10,955 |
| Royce International Premier Fund – Consultant Class | | 15,712 | | 5,635 | | 87 | | 11,295 | | (50) | | 32,679 | | 14,590 |
| Royce International Premier Fund – Institutional Class | | – | | 124,578 | | 38,493 | | 11,931 | | (25,655) | | 149,347 | | 149,347 |
| | | 59,499 | | 311,887 | | 56,508 | | 41,686 | | (26,740) | | | | 174,892 |
The Royce Funds 2023 Semiannual Report to Shareholders | 77
Notes to Financial Statements (unaudited) (continued)
Class Specific Expenses (continued):
| | NET DISTRIBUTION FEES | SHAREHOLDER SERVICING | SHAREHOLDER REPORTS | REGISTRATION | TRANSFER AGENT BALANCE CREDITS | TOTAL | CLASS LEVEL EXPENSES REIMBURSED BY INVESTMENT ADVISER |
| Royce Micro-Cap Fund – Investment Class | $ | – | $ | 78,111 | $ | 15,808 | $ | 8,514 | $ | (4,237) | $ | 98,196 | $ | 607 |
| Royce Micro-Cap Fund – Service Class | | 163,812 | | 106,472 | | 7,780 | | 8,245 | | (472) | | 285,837 | | 38,447 |
| Royce Micro-Cap Fund – Consultant Class | | 51,747 | | 8,341 | | 972 | | 6,097 | | (157) | | 67,000 | | 3,008 |
| | | 215,559 | | 192,924 | | 24,560 | | 22,856 | | (4,866) | | | | 42,062 |
| Royce Pennsylvania Mutual Fund – Investment Class | | – | | 445,429 | | 68,364 | | 13,272 | | (14,347) | | 512,718 | | – |
| Royce Pennsylvania Mutual Fund – Service Class | | 74,916 | | 47,978 | | 5,657 | | 6,362 | | (551) | | 134,362 | | 10,568 |
| Royce Pennsylvania Mutual Fund – Consultant Class | | 912,777 | | 68,910 | | 10,708 | | 7,663 | | (1,875) | | 998,183 | | – |
| Royce Pennsylvania Mutual Fund – Institutional Class | | – | | 20,842 | | 8,112 | | 8,138 | | (3,978) | | 33,114 | | – |
| Royce Pennsylvania Mutual Fund – R Class | | 11,638 | | 10,768 | | 432 | | 3,486 | | (157) | | 26,167 | | 5,146 |
| | | 999,331 | | 593,927 | | 93,273 | | 38,921 | | (20,908) | | | | 15,714 |
| Royce Premier Fund – Investment Class | | – | | 454,351 | | 45,810 | | 12,918 | | (6,415) | | 506,664 | | – |
| Royce Premier Fund – Service Class | | 36,053 | | 24,415 | | 5,329 | | 6,211 | | (500) | | 71,508 | | 14,154 |
| Royce Premier Fund – Consultant Class | | 58,506 | | 8,781 | | 679 | | 5,859 | | (130) | | 73,695 | | 2,285 |
| Royce Premier Fund – Institutional Class | | – | | 6,107 | | 16,022 | | 6,910 | | (366) | | 28,673 | | – |
| Royce Premier Fund – R Class | | 10,017 | | 9,281 | | 137 | | 3,467 | | (41) | | 22,861 | | 4,654 |
| | | 104,576 | | 502,935 | | 67,977 | | 35,365 | | (7,452) | | | | 21,093 |
| Royce Small-Cap Opportunity Fund – Investment Class | | – | | 569,740 | | 57,015 | | 18,518 | | (9,303) | | 635,970 | | – |
| Royce Small-Cap Opportunity Fund – Service Class | | 87,220 | | 54,859 | | 6,428 | | 7,327 | | (231) | | 155,603 | | 19,269 |
| Royce Small-Cap Opportunity Fund – Consultant Class | | 59,423 | | 7,822 | | 851 | | 5,984 | | (109) | | 73,971 | | 2,205 |
| Royce Small-Cap Opportunity Fund – Institutional Class | | – | | 11,294 | | 5,372 | | 7,440 | | (853) | | 23,253 | | – |
| Royce Small-Cap Opportunity Fund – R Class | | 101,284 | | 45,054 | | 968 | | 5,375 | | (167) | | 152,514 | | – |
| | | 247,927 | | 688,769 | | 70,634 | | 44,644 | | (10,663) | | | | 21,474 |
| Royce Small-Cap Special Equity Fund – Investment Class | | – | | 322,585 | | 28,560 | | 12,908 | | (4,921) | | 359,132 | | – |
| Royce Small-Cap Special Equity Fund – Service Class | | 43,940 | | 32,530 | | 2,565 | | 6,620 | | (168) | | 85,487 | | 16,311 |
| Royce Small-Cap Special Equity Fund – Consultant Class | | 77,000 | | 15,806 | | 4,491 | | 6,289 | | (620) | | 102,966 | | 3,553 |
| Royce Small-Cap Special Equity Fund – Institutional Class | | – | | 12,298 | | 4,575 | | 7,058 | | (1,527) | | 22,404 | | – |
| | | 120,940 | | 383,219 | | 40,191 | | 32,875 | | (7,236) | | | | 19,864 |
| Royce Small-Cap Total Return Fund – Investment Class | | – | | 298,029 | | 38,368 | | 13,012 | | (5,835) | | 343,574 | | – |
| Royce Small-Cap Total Return Fund – Service Class | | 71,538 | | 51,641 | | 4,614 | | 7,364 | | (342) | | 134,815 | | 24,898 |
| Royce Small-Cap Total Return Fund – Consultant Class | | 423,223 | | 41,803 | | 6,073 | | 8,404 | | (1,330) | | 478,173 | | – |
| Royce Small-Cap Total Return Fund – Institutional Class | | – | | 5,869 | | 14,773 | | 7,124 | | (208) | | 27,558 | | – |
| Royce Small-Cap Total Return Fund – R Class | | 51,176 | | 26,207 | | 1,726 | | 3,773 | | (243) | | 82,639 | | – |
| | | 545,937 | | 423,549 | | 65,554 | | 39,677 | | (7,958) | | | | 24,898 |
78 | The Royce Funds 2023 Semiannual Report to Shareholders
Class Specific Expenses (continued):
| | NET DISTRIBUTION FEES | SHAREHOLDER SERVICING | SHAREHOLDER REPORTS | REGISTRATION | TRANSFER AGENT BALANCE CREDITS | TOTAL | CLASS LEVEL EXPENSES REIMBURSED BY INVESTMENT ADVISER |
| Royce Small-Cap Value Fund – Investment Class | $ | – | $ | 25,241 | $ | 2,985 | $ | 7,145 | $ | (820) | $ | 34,551 | $ | 19,181 |
| Royce Small-Cap Value Fund – Service Class | | 88,160 | | 52,751 | | 4,539 | | 9,509 | | (355) | | 154,604 | | 36,261 |
| Royce Small-Cap Value Fund – Consultant Class | | 10,273 | | 5,372 | | 68 | | 10,377 | | (66) | | 26,024 | | – |
| Royce Small-Cap Value Fund – R Class | | 9,572 | | 9,582 | | 249 | | 3,462 | | (96) | | 22,769 | | 6,587 |
| | | 108,005 | | 92,946 | | 7,841 | | 30,493 | | (1,337) | | | | 62,029 |
| Royce Smaller-Companies Growth Fund – Investment Class | | – | | 31,479 | | 6,740 | | 7,654 | | (1,813) | | 44,060 | | 6,201 |
| Royce Smaller-Companies Growth Fund – Service Class | | 140,032 | | 84,808 | | 7,155 | | 9,074 | | (465) | | 240,604 | | 35,905 |
| Royce Smaller-Companies Growth Fund – Consultant Class | | 14,005 | | 5,242 | | 98 | | 10,535 | | (80) | | 29,800 | | 14,186 |
| Royce Smaller-Companies Growth Fund – Institutional Class | | – | | 3,697 | | 223 | | 5,742 | | (38) | | 9,624 | | 8,143 |
| | | 154,037 | | 125,226 | | 14,216 | | 33,005 | | (2,396) | | | | 64,435 |
Tax Information:
As of June 30, 2023, net unrealized appreciation (depreciation) based on identified cost for tax purposes was as follows:
| | | | | | NET UNREALIZED | | GROSS UNREALIZED | |
| | | TAX BASIS COST | | APPRECIATION (DEPRECIATION) | | Appreciation | | (Depreciation) |
| Royce Dividend Value Fund | | $ 26,553,465 | | | $ 35,126,635 | | | $ 35,378,377 | | | $ 251,742 | |
| Royce Global Financial Services Fund | | 16,301,517 | | | 9,847,303 | | | 11,100,367 | | | 1,253,064 | |
| Royce International Premier Fund | | 857,103,950 | | | (41,784,881 | ) | | 85,769,751 | | | 127,554,632 | |
| Royce Micro-Cap Fund | | 243,990,130 | | | 65,941,205 | | | 103,427,599 | | | 37,486,394 | |
| Royce Pennsylvania Mutual Fund | | 1,215,153,877 | | | 524,379,957 | | | 581,994,522 | | | 57,614,565 | |
| Royce Premier Fund | | 803,549,059 | | | 579,167,666 | | | 598,473,762 | | | 19,306,096 | |
| Royce Small-Cap Opportunity Fund | | 1,053,502,705 | | | 241,786,484 | | | 352,028,833 | | | 110,242,349 | |
| Royce Small-Cap Special Equity Fund | | 639,215,732 | | | 167,627,035 | | | 183,187,708 | | | 15,560,673 | |
| Royce Small-Cap Total Return Fund | | 832,345,469 | | | 135,585,866 | | | 159,757,177 | | | 24,171,311 | |
| Royce Small-Cap Value Fund | | 87,773,711 | | | 22,804,585 | | | 26,503,676 | | | 3,699,091 | |
| Royce Smaller-Companies Growth Fund | | 160,296,581 | | | 47,595,906 | | | 57,119,474 | | | 9,523,568 | |
The primary cause of the difference between book and tax basis cost is the timing of the recognition of losses on securities sold.
Transactions in Affiliated Companies:
An “Affiliated Company,” as defined in the 1940 Act, is a company in which a Fund owns 5% or more of the company’s outstanding voting securities at any time during the period. The following transactions were effected in shares of such companies for the six months ended June 30, 2023:
| AFFILIATED COMPANY 1 | SHARES
12/31/22 | MARKET
VALUE
12/31/22 | COSTS OF
PURCHASES | PROCEEDS
FROM SALES | REALIZED
GAIN
(LOSS) | CHANGE IN NET
UNREALIZED
APPRECIATION
(DEPRECIATION) | DIVIDEND
INCOME | SHARES
6/30/23 | MARKET
VALUE
6/30/23 |
| Royce International Premier Fund | | | | | | | | | | | |
| UNITED KINGDOM – 2.6% | | | | | | | | | | | |
| Restore 2,3 | 4,729,458 | $18,868,340 | $ 8,660,624 | $ | – | $ | – | $ (6,366,094) | $ 428,871 | 7,118,523 | $21,162,870 |
| | | 18,868,340 | | | | | – | (6,366,094) | 428,871 | | 21,162,870 |
| Royce Small-Cap Opportunity Fund | | | | | | | | | | | |
| CONSUMER DISCRETIONARY – 0.4% | | | | | | | | | | | |
| TEXTILES, APPAREL & LUXURY GOODS – 0.4% | | | | | | | | | | | |
| Lakeland Industries 2 | 273,810 | 3,641,673 | 1,332,428 | | – | | – | 393,067 | 19,391 | 372,979 | 5,367,168 |
| | | 3,641,673 | | | | | – | 393,067 | 19,391 | | 5,367,168 |
| INDUSTRIALS – 0.6% | | | | | | | | | | | |
| CONSTRUCTION & ENGINEERING – 0.6% | | | | | | | | | | | |
| Limbach Holdings 4,5 | 654,981 | 6,818,352 | – | 5,958,176 | | 2,837,088 | 3,650,786 | – | n/a | n/a |
| | | 6,818,352 | | | | 2,837,088 | 3,650,786 | – | | |
The Royce Funds 2023 Semiannual Report to Shareholders | 79
Notes to Financial Statements (unaudited) (continued)
Transactions in Affiliated Companies (continued):
| AFFILIATED COMPANY 1 | SHARES
12/31/22 | MARKET
VALUE
12/31/22 | COSTS OF
PURCHASES | PROCEEDS
FROM SALES | REALIZED
GAIN
(LOSS) | CHANGE IN NET
UNREALIZED
APPRECIATION
(DEPRECIATION) | DIVIDEND
INCOME | SHARES
6/30/23 | MARKET
VALUE
6/30/23 |
| Royce Small-Cap Opportunity Fund (continued) | | | | | | | | | |
| INFORMATION TECHNOLOGY – 0.4% | | | | | | | | | | |
| COMMUNICATIONS EQUIPMENT – 0.4% | | | | | | | | | | |
| PCTEL 2 | 1,044,693 | $ 4,492,180 | $ 5,255 | $ | 51,081 | $ | (16,969) | $ 534,178 | $ 115,037 | 1,035,154 | $ 4,963,563 |
| | | 4,492,180 | | | | (16,969) | 534,178 | 115,037 | | 4,963,563 |
| | | 14,952,205 | | | | 2,820,119 | 4,578,031 | 134,428 | | 10,330,731 |
| Royce Small-Cap Special Equity Fund | | | | | | | | | | |
| CONSUMER DISCRETIONARY– 4.0% | | | | | | | | | | |
| AUTO COMPONENTS – 4.0% | | | | | | | | | | |
| Standard Motor Products 4 | 1,188,000 | 41,342,400 | – | | 12,617,777 | (1,819,969) | 4,987,346 | 620,745 | n/a | n/a |
| | | 41,342,400 | | | | (1,819,969) | 4,987,346 | 620,745 | | |
| INDUSTRIALS – 2.9% | | | | | | | | | | |
| MACHINERY – 2.9% | | | | | | | | | | |
| Gencor Industries 2,5 | 1,066,000 | 10,766,600 | – | | 2,259,411 | (327,983) | 5,998,594 | – | 910,000 | 14,177,800 |
| Hurco Companies 2 | 580,000 | 15,155,400 | – | | 3,090,078 | (2,374,709) | (168,943) | 163,168 | 439,800 | 9,521,670 |
| | | 25,922,000 | | | | (2,702,692) | 5,829,651 | 163,168 | | 23,699,470 |
| INFORMATION TECHNOLOGY – 4.0% | | | | | | | | | | |
| SEMICONDUCTORS & SEMICONDUCTOR EQUIPMENT – 4.0% | | | | | | | | | | |
| NVE Corporation 2 | 371,500 | 24,054,625 | – | | 3,739,202 | 814,463 | 11,074,034 | 738,000 | 330,500 | 32,203,920 |
| | | 24,054,625 | | | | 814,463 | 11,074,034 | 738,000 | | 32,203,920 |
| | | 91,319,025 | | | | (3,708,198) | 21,891,031 | 1,521,913 | | 55,903,390 |
| Royce Small-Cap Total Return Fund FINANCIALS – 4.4% | | | | | | | | | | |
| FINANCIAL SERVICES – 1.7% | | | | | | | | | | |
| NewtekOne 4 | 471,100 | 7,655,375 | 14,341,030 | | 5,131,478 | (679,078) | 304,963 | 231,939 | n/a | n/a |
| | | 7,655,375 | | | | (679,078) | 304,963 | 231,939 | | |
| INSURANCE – 2.7% | | | | | | | | | | |
| International General Insurance Holdings 2 | 2,747,997 | 21,983,976 | 1,497,909 | | – | – | 2,610,352 | 55,888 | 2,921,863 | 26,092,237 |
| | | 21,983,976 | | | | – | 2,610,352 | 55,888 | | 26,092,237 |
| | | 29,639,351 | | | | (679,078) | 2,915,315 | 287,827 | | 26,092,237 |
| 1 | Percentages represent the percentages of the investments in the Affiliated Companies of the Fund’s net assets. |
| 2 | As of June 30, 2023, the Fund owned 5% or more of the Company’s outstanding voting securities thereby making the Company an Affiliated Company as that term is defined in the Investment Company Act of 1940. |
| 3 | This security is defined as a Level 2 security due to fair value being based on quoted prices for similar securities and/or due to the application of fair value factors. |
| 4 | Not an Affiliated Company as of June 30, 2023. |
Subsequent Events:
Subsequent events have been evaluated through the date the financial statements were issued and it has been determined that no events have occurred that require disclosure.
80 | The Royce Funds 2023 Semiannual Report to Shareholders
Understanding Your Fund’s Expenses (unaudited)
As a shareholder of a mutual fund, you pay ongoing expenses, including management fees and other Fund expenses including, for some funds, distribution and/or service (12b-1) fees. Using the information below, you can estimate how these ongoing expenses (in dollars) affect your investment and compare them with the ongoing expenses of other funds. You may also incur one-time transaction expenses, including redemption fees, which are not shown in this section and would result in higher total costs. The example is based on an investment of $1,000 invested at January 1, 2023, and held for the entire six-month period ended June 30, 2023. Service, Consultant and R Class shares are generally available only through certain brokers or retirement plan administrators who receive distribution and/or service fees from the Fund for services that they perform. Institutional Class shares are generally available only to institutions or intermediaries with a minimum account size of $1 million.
Actual Expenses
The first part of the table below provides information about actual account values and actual expenses. You may use the information in this section, together with the amount you invested, to estimate the expenses that you paid over the period. Simply divide your account value at June 30, 2023, by $1,000 (for example, an $8,600 account value divided by $1,000 = 8.6), then multiply the result by the number under the heading entitled “Expenses Paid During the Period” to estimate the expenses you paid on your account during this period.
Hypothetical Example for Comparison Purposes
The second part of the table below provides information about hypothetical account values and hypothetical expenses based on the Fund’s actual expense ratio and an assumed rate of return of 5% per year before expenses, which is not the Fund’s actual return. The hypothetical account values and expenses may not be used to estimate the actual ending account balance or expenses you paid for the period. You may use this information to compare the ongoing costs of investing in the Fund and other funds. To do so, compare this 5% hypothetical example with the 5% hypothetical examples that appear in the shareholder reports of the other funds.
Please note that the expenses shown in the table are meant to highlight your ongoing costs only and do not reflect any transactional costs, such as sales charges (loads), redemption fees, or exchange fees. Therefore, this section is useful in comparing ongoing costs only, and will not help you determine the relative total costs of owning different funds. In addition, if these transactional costs were included, your costs would have been higher.
| | | | | ACTUAL | | | | HYPOTHETICAL (5% PER YEAR BEFORE EXPENSES) |
| | | Beginning Account Value 1/1/23 | | Ending Account Value 6/30/23 | | Expenses Paid During the Period1 | | Beginning Account Value 1/1/23 | | Ending Account Value 6/30/23 | | Expenses Paid During the Period1 | Net Annualized Operating Expense Ratio2 |
| Investment Class | | | | | | | | | | | | | |
| Royce Dividend Value Fund | $ | 1,000.00 | $ | 1,122.45 | $ | 5.74 | $ | 1,000.00 | $ | 1,019.39 | $ | 5.46 | 1.09% |
| Royce International Premier Fund | | 1,000.00 | | 1,044.66 | | 5.93 | | 1,000.00 | | 1,018.99 | | 5.86 | 1.17% |
| Royce Micro-Cap Fund | | 1,000.00 | | 1,094.13 | | 6.44 | | 1,000.00 | | 1,018.65 | | 6.21 | 1.24% |
| Royce Pennsylvania Mutual Fund3 | | 1,000.00 | | 1,153.75 | | 5.02 | | 1,000.00 | | 1,020.13 | | 4.71 | 0.94% |
| Royce Premier Fund | | 1,000.00 | | 1,143.14 | | 6.32 | | 1,000.00 | | 1,018.89 | | 5.96 | 1.19% |
| Royce Small-Cap Opportunity Fund | | 1,000.00 | | 1,131.62 | | 6.55 | | 1,000.00 | | 1,018.65 | | 6.21 | 1.24% |
| Royce Small-Cap Special Equity Fund | | 1,000.00 | | 1,078.52 | | 6.29 | | 1,000.00 | | 1,018.74 | | 6.11 | 1.22% |
| Royce Small-Cap Total Return Fund | | 1,000.00 | | 1,089.47 | | 6.32 | | 1,000.00 | | 1,018.74 | | 6.11 | 1.22% |
| Royce Small-Cap Value Fund | | 1,000.00 | | 1,087.01 | | 6.42 | | 1,000.00 | | 1,018.65 | | 6.21 | 1.24% |
| Royce Smaller-Companies Growth Fund | | 1,000.00 | | 1,152.90 | | 6.62 | | 1,000.00 | | 1,018.65 | | 6.21 | 1.24% |
| Service Class | | | | | | | | | | | | | |
| Royce Dividend Value Fund | | 1,000.00 | | 1,119.17 | | 7.04 | | 1,000.00 | | 1,018.15 | | 6.71 | 1.34% |
| Royce Global Financial Services Fund | | 1,000.00 | | 1,035.07 | | 7.52 | | 1,000.00 | | 1,017.41 | | 7.45 | 1.49% |
| Royce International Premier Fund | | 1,000.00 | | 1,044.55 | | 7.30 | | 1,000.00 | | 1,017.65 | | 7.20 | 1.44% |
| Royce Micro-Cap Fund | | 1,000.00 | | 1,092.81 | | 7.73 | | 1,000.00 | | 1,017.41 | | 7.45 | 1.49% |
| Royce Pennsylvania Mutual Fund3 | | 1,000.00 | | 1,152.12 | | 6.67 | | 1,000.00 | | 1,018.60 | | 6.26 | 1.25% |
| Royce Premier Fund | | 1,000.00 | | 1,143.00 | | 7.92 | | 1,000.00 | | 1,017.41 | | 7.45 | 1.49% |
| Royce Small-Cap Opportunity Fund | | 1,000.00 | | 1,130.07 | | 7.87 | | 1,000.00 | | 1,017.41 | | 7.45 | 1.49% |
| Royce Small-Cap Special Equity Fund | | 1,000.00 | | 1,076.63 | | 7.67 | | 1,000.00 | | 1,017.41 | | 7.45 | 1.49% |
| Royce Small-Cap Total Return Fund | | 1,000.00 | | 1,087.64 | | 7.71 | | 1,000.00 | | 1,017.41 | | 7.45 | 1.49% |
| Royce Small-Cap Value Fund | | 1,000.00 | | 1,084.00 | | 7.70 | | 1,000.00 | | 1,017.41 | | 7.45 | 1.49% |
| Royce Smaller-Companies Growth Fund | | 1,000.00 | | 1,153.28 | | 7.96 | | 1,000.00 | | 1,017.41 | | 7.45 | 1.49% |
| Consultant Class | | | | | | | | | | | | | |
| Royce Micro-Cap Fund | | 1,000.00 | | 1,087.79 | | 12.16 | | 1,000.00 | | 1,013.14 | | 11.73 | 2.35% |
| Royce Pennsylvania Mutual Fund3 | | 1,000.00 | | 1,147.96 | | 10.39 | | 1,000.00 | | 1,015.12 | | 9.74 | 1.95% |
| Royce Premier Fund | | 1,000.00 | | 1,136.90 | | 12.24 | | 1,000.00 | | 1,013.34 | | 11.53 | 2.31% |
| Royce Small-Cap Opportunity Fund | | 1,000.00 | | 1,125.85 | | 12.18 | | 1,000.00 | | 1,013.34 | | 11.53 | 2.31% |
| Royce Small-Cap Special Equity Fund | | 1,000.00 | | 1,072.46 | | 12.28 | | 1,000.00 | | 1,012.94 | | 11.93 | 2.39% |
| Royce Small-Cap Total Return Fund | | 1,000.00 | | 1,084.18 | | 11.58 | | 1,000.00 | | 1,013.69 | | 11.18 | 2.24% |
The Royce Funds 2023 Semiannual Report to Shareholders | 81
Understanding Your Fund’s Expenses (unaudited) (continued)
| | | | | ACTUAL | | | | HYPOTHETICAL (5% PER YEAR BEFORE EXPENSES) |
| | | Beginning Account Value 1/1/23 | | Ending Account Value 6/30/23 | | Expenses Paid During the Period1 | | Beginning Account Value 1/1/23 | | Ending Account Value 6/30/23 | | Expenses Paid During the Period1 | Net Annualized Operating Expense Ratio2 |
| Institutional Class | | | | | | | | | | | | | |
| Royce Global Financial Services Fund | $ | 1,000.00 | $ | 1,034.90 | $ | 7.52 | $ | 1,000.00 | $ | 1,017.41 | $ | 7.45 | 1.49% |
| Royce International Premier Fund | | 1,000.00 | | 1,046.29 | | 5.28 | | 1,000.00 | | 1,019.64 | | 5.21 | 1.04% |
| Royce Pennsylvania Mutual Fund | | 1,000.00 | | 1,154.65 | | 4.81 | | 1,000.00 | | 1,020.33 | | 4.51 | 0.90% |
| Royce Premier Fund | | 1,000.00 | | 1,143.84 | | 5.95 | | 1,000.00 | | 1,019.24 | | 5.61 | 1.12% |
| Royce Small-Cap Opportunity Fund | | 1,000.00 | | 1,131.71 | | 5.92 | | 1,000.00 | | 1,019.24 | | 5.61 | 1.12% |
| Royce Small-Cap Special Equity Fund | | 1,000.00 | | 1,078.63 | | 5.82 | | 1,000.00 | | 1,019.19 | | 5.66 | 1.13% |
| Royce Small-Cap Total Return Fund | | 1,000.00 | | 1,089.73 | | 5.91 | | 1,000.00 | | 1,019.14 | | 5.71 | 1.14% |
| Royce Smaller-Companies Growth Fund | | 1,000.00 | | 1,154.25 | | 6.36 | | 1,000.00 | | 1,018.89 | | 5.96 | 1.19% |
| R Class | | | | | | | | | | | | | |
| Royce Small-Cap Opportunity Fund | | 1,000.00 | | 1,127.48 | | 9.76 | | 1,000.00 | | 1,015.62 | | 9.25 | 1.85% |
| Royce Small-Cap Total Return Fund | | 1,000.00 | | 1,085.33 | | 9.88 | | 1,000.00 | | 1,015.32 | | 9.54 | 1.91% |
| 1 | Expenses are equal to the Fund’s net annualized operating expense ratio multiplied by the average account value for the period, multiplied by 181 days in the most recent fiscal half-year divided by 365 days (to reflect the half-year period). |
| 2 | Net annualized operating expense ratio used to derive figures in the table is based on the most recent fiscal half-year. |
| 3 | GiftShare accounts pay an annual $50 trustee fee to Alliance Trust Company, as trustee. If these fees were included above, your costs would be higher. |
82 | The Royce Funds 2023 Semiannual Report to Shareholders
Trustees and Officers
All Trustees and Officers may be reached c/o The Royce Funds, 745 Fifth Avenue, New York, NY 10151
Christopher D. Clark, Trustee1, President
Age: 58 | Number of Funds Overseen: 16 | Tenure: Since 2014
Principal Occupation(s) During Past Five Years: Chief Executive Officer (since July 2016), President (since July 2014), Co-Chief Investment Officer (since January 2014), Managing Director of Royce, a Member of the Board of Managers of Royce, having been employed by Royce since May 2007.
Patricia W. Chadwick, Trustee
Age: 74 | Number of Funds Overseen: 16 | Tenure: Since 2009
Non-Royce Directorships: Trustee of Voya Mutual Funds
Principal Occupation(s) During Past 5 Years: Consultant and President, Ravengate Partners LLC (since 2000). Formerly Director, Wisconsin Energy Corp. (until 2022).
Christopher C. Grisanti, Trustee
Age: 61 | Number of Funds Overseen: 16 | Tenure: Since 2017
Non-Royce Directorships: None
Principal Occupation(s) During Past Five Years: Chief Equity Strategist and Senior Portfolio Manager, MAI Capital Management LLC (investment advisory firm) (since May 2020). Formerly Co-Founder and Chief Executive Officer, Grisanti Capital Management LLC (investment advisory firm) (from 1999 to 2020); Director of Research and Portfolio Manager, Spears Benzak, Salomon & Farrell (from 1994 to 1999); and Senior Associate, Simpson, Thacher & Bartlett (law firm) (from 1988 to 1994).
Cecile B. Harper, Trustee
Age: 60 | Number of Funds Overseen: 16 | Tenure: Since 2020
Non-Royce Directorships: None
Principal Occupation(s) During Past Five Years: Chief Financial Officer and Chief Operating Officer, College Foundation at the University of Virginia (since October 2019). Formerly Board Member, Pyramid Peak Foundation (January 2012 to 2022); Board Member, Regional One Health Foundation (from June 2013 to September 2019); and Principal, Southeastern Asset Management (from December 1993 to September 2019).
Arthur S. Mehlman, Trustee
Age: 81 | Number of Funds Overseen: 16 | Tenure: Since 2004
Non-Royce Directorships: None
Principal Occupation(s) During Past Five Years: Director, University of Maryland Foundation (non-profits). Formerly Director/Trustee, registered investment companies constituting the Legg Mason Funds (from 2002 to June 2021); Director, The League for People with Disabilities, Inc. (from June 2003 to June 2018); Director, Municipal Mortgage & Equity, LLC (from October 2004 to April 2011); Director, University of Maryland College Park Foundation (non-profit) (from 1998 to 2005); Director, Maryland Business Roundtable for Education (from July 1984 to June 2002); and Partner, KPMG LLP (international accounting firm) (from 1972 to 2002).
G. Peter O’Brien, Trustee
Age: 77 | Number of Funds Overseen: 72 | Tenure: Since 2001
Non-Royce Directorships: Director/Trustee of registered investment companies constituting the 56 Legg Mason Funds.
Principal Occupation(s) During Past Five Years: Trustee Emeritus, Colgate University (since 2005); and Emeritus Board Member, Hill House, Inc. (since 2019). Formerly Director, TICC Capital Corp. (from 2003-2017); Trustee, Colgate University (from 1996 to 2005); President, Hill House, Inc. (from 2001 to 2005); Board Member, Hill House, Inc. (from 1999 to 2019); Director, Bridges School (from 2006 to 2018); and Managing Director/ Equity Capital Markets Group, Merrill Lynch & Co. (from 1971 to 1999).
Julia W. Poston, Trustee2
Age: 63 | Number of Funds Overseen: 16 | Tenure: Since 2023
Non-Royce Directorships: Ohio National Fund, Inc. and The James Advantage Funds
Principal Occupation(s) During Past Five Years: Director, Member of Nominating/Governance Committee, and Chair of Audit Committee, Al. Neyer Corporation (since 2020); Director, Member of Governance Committee, and Chair of Audit Committee, Master Fluid Solutions (since 2021); Trustee and Chair of Finance/Audit Committee, Cincinnati Museum Center (non-profit) (since 2015); and Director and Founder, Cincinnati Women’s Executive Forum (non-profit) (since 2010). Formerly Senior Client Partner (2002-2020) and Assurance Practice Group Leader for Ohio Valley Region (2014-2019), Ernst & Young, LLP (international accounting and services firm); and Audit Partner, Arthur Andersen LLP (international accounting and services firm) (1982-2002).
Michael K. Shields, Trustee
Age: 65 | Number of Funds Overseen: 16 | Tenure: Since 2015
Non-Royce Directorships: None
Principal Occupation(s) During Past Five Years: President and Chief Executive Officer, Piedmont Trust Company (privately-owned North Carolina trust company) (since February 2012); Chairman, UNC Charlotte Investment Fund Board (since February 2016); and Chairman, Halftime Carolinas Board (since February 2011). Formerly Owner, Shields Advisors (investment consulting firm) (from April 2010 to June 2012); President and Chief Executive Officer, Eastover Capital Management (2005-2007); President and Chief Executive Officer, Campbell, Cowperthwait (investment subsidiary of U.S. Trust Corporation) (1997-2002); and equity portfolio manager and co-manager of Quality Growth Team, Scudder, Stevens and Clark (1992-1997).
Francis D. Gannon, Vice President
Age: 55 | Tenure: Since 2014
Principal Occupation(s) During Past Five Years: Co-Chief Investment Officer (since January 2014) and Managing Director of Royce, having been employed by Royce since September 2006.
Daniel A. O’Byrne, Vice President
Age: 61 | Tenure: Since 1994
Principal Occupation(s) During Past Five Years: Principal and Vice President of Royce, having been employed by Royce since October 1986.
Peter K. Hoglund, Treasurer
Age: 57 | Tenure: Since 2015
Principal Occupation(s) During Past Five Years: Chief Financial Officer, Chief Administrative Officer, and Managing Director of Royce, having been employed by Royce since December 2014. Prior to joining Royce, Mr. Hoglund spent more than 20 years with Munder Capital Management in Birmingham, MI, serving as Managing Director and Chief Financial Officer and overseeing all financial aspects of the firm. He began his career at Munder as a portfolio manager.
John E. Denneen, Secretary and Chief Legal Officer
Age: 56 | Tenure: 1996-2001 and Since 2002
Principal Occupation(s) During Past Five Years: General Counsel, Managing Director, and, since June 2015, a Member of the Board of Managers of Royce. Chief Legal and Compliance Officer and Secretary of Royce.
John P. Schwartz, Chief Compliance Officer
Age: 52 | Tenure: Since 2022
Principal Occupation(s) During Past Five Years: Chief Compliance Officer of The Royce Funds (since May 2022) and Associate General Counsel and Compliance Officer of Royce (since March 2013).
| 2 | Became a Trustee effective as of the close of business on July 12, 2023. |
Trustees will hold office until their successors have been duly elected and qualified or until their earlier resignation or removal. The Statement of Additional Information, which contains additional information about the Trust’s trustees and officers, is available and can be obtained without charge at www.royceinvest.com or by calling (800) 221-4268.
The Royce Funds 2023 Semiannual Report to Shareholders | 83
Board Approval of Investment Advisory Agreements
At meetings held on June 14-15, 2023, the Board of Trustees of The Royce Fund (the “Board”), including all of the non-interested trustees, approved the continuation of the investment advisory agreements between Royce & Associates, LP (“Royce”) and The Royce Fund (“TRF”) relating to each of Royce Pennsylvania Mutual Fund, Royce Micro-Cap Fund, Royce Premier Fund, Royce Total Return Fund, Royce Opportunity Fund, Royce Special Equity Fund, Royce Small-Cap Value Fund, Royce Smaller-Companies Growth Fund, Royce Dividend Value Fund, Royce Global Financial Services Fund, and Royce International Premier Fund (each, an “Agreement” and collectively, the “Agreements”). In reaching these decisions, the Board reviewed the materials provided by Royce, which included, among other things, information prepared internally by Royce and independently by Broadridge Financial Solutions, Inc. (“Broadridge”) using the database and methodology of Morningstar Associates, LLC (“Morningstar”) containing detailed investment advisory fee, expense ratio, and investment performance comparisons for each series of TRF listed above (each, a “ Fund” and collectively, the “Funds”) with other mutual funds in its “peer group” and “category”, information regarding the past performance of the Funds and other registered investment companies managed by Royce and a memorandum outlining the legal duties of the Board prepared by independent counsel to the non-interested trustees. Royce also provided the trustees with an analysis of its profitability with respect to providing investment advisory services to each of the Funds. In addition, the Board took into account information furnished throughout the year at regular Board meetings, including reports on investment performance, shareholder services, distribution fees and expenses, regulatory compliance, brokerage commissions and research, brokerage and other execution products and services provided to the Funds. The Board also took into account information furnished by Royce in response to various trustee questions regarding Royce operations and the Funds. The Board also considered other matters it deemed important to the approval process such as allocation of brokerage commissions, “soft dollar” research services Royce receives, payments made to affiliates of Royce, as well as payments made by Royce relating to the distribution of Fund shares, and other direct and indirect benefits Royce and its affiliates receive from their relationship with the Funds. The trustees also met throughout the year with investment advisory personnel from Royce. The Board also noted Royce’s efforts to provide enhanced analytical tools to its investment staff along with the ongoing meetings conducted by Royce’s Co-Chief Investment Officers with portfolio managers experiencing performance challenges in an attempt to address such challenges. The Board, in its deliberations, recognized that, for many of the Funds’ shareholders, the decision to purchase shares of one or more of the Funds included a decision to select Royce as the investment adviser and that there was a strong association in the minds of such shareholders between Royce and each Fund. In considering factors relating to the approval of the continuance of the Agreement for each Fund, the non-interested trustees received assistance and advice from, and met separately with, their independent legal counsel. While continuation of the investment advisory and administrative arrangements for each Fund was considered at the same Board meeting, the trustees considered the circumstances and interests of each Fund separately. Among other factors, the trustees noted that they considered the following:
The nature, extent and quality of services provided by Royce
The Board considered the following factors to be of fundamental importance to its consideration of whether to approve the continuance of the Agreement for each Fund: (i) Royce’s more than 50 years of value investing experience and track record; (ii) the history of long-tenured Royce portfolio managers managing many of the Funds; (iii) Royce’s focus on micro-, small-, and mid-cap value investing; (iv) the consistency of Royce’s approach to managing each Fund, other open-end mutual funds, and closed-end funds over more than 50 years; (v) the integrity and high ethical standards adhered to at Royce; (vi) Royce’s specialized experience in the area of trading small- and micro-cap securities; (vii) Royce’s historical ability to attract and retain portfolio management, research, and analytical talent (and, in this regard, considered the effort and resources Royce had committed to acquiring portfolio management, research, and analytical talent during the preceding few years); and (viii) Royce’s focus on shareholder interests as exemplified by capping expenses on smaller funds, temporarily closing various Funds to new investors when Royce believed such temporary closings were in the best interests of existing shareholders, liquidating share classes for certain Funds that did not attract sufficient assets to make them viable on a long-term basis or, when appropriate under the Fund’s Rule 18f-3 Plan, converting shares of such Funds into shares of other share classes that had lower net annualized operating expense ratios, establishing breakpoints for a number of Funds and providing expansive shareholder reporting and communications. The Board also noted that Royce’s compensation policy arrangements strongly encourage portfolio manager investment in each Fund that they manage. The Board reviewed the services that Royce provides to the Funds, including, but not limited to, managing each Fund’s investments in accordance with the stated policies of each Fund. The Board considered the fact that Royce provided certain administrative services to the Funds at cost, pursuant to the Administration Agreement between Royce and TRF, on behalf of each Fund. The Board determined that the services to be provided to each Fund by Royce would be the same as those that it previously provided to each Fund. The Board also took into consideration the histories, reputations and backgrounds of Royce’s portfolio managers for each Fund, finding that these would likely have an impact on the continued success of such Fund. The Board concluded that the investment advisory services provided by Royce to each Fund compared favorably to services provided by Royce to other Royce client accounts, including other funds, in both nature and quality, and that the scope of services provided by Royce continues to be suitable for each Fund.
Investment performance of the Funds and Royce
Royce generally emphasizes a risk-averse approach in managing the Funds. In light of that approach, the Board believes that risk-adjusted performance continues to be an appropriate measure of each Fund’s investment performance. One measure of risk-adjusted performance the trustees have historically used in their review of each Fund’s performance is the Sharpe Ratio. The Sharpe Ratio is a risk-adjusted measure of performance developed by Nobel Laureate William Sharpe. It is calculated by dividing a fund’s annualized excess returns by its annualized standard deviation to determine reward per unit of risk. The higher the Sharpe Ratio, the better a fund’s historical risk-adjusted performance. The Board attaches importance to risk-adjusted performance over relatively long periods of time, typically 3 to 10 years, because such periods tend to encompass different market environments and cycles, unlike shorter time periods.
Small- and large-cap stocks confronted a variety of bearish macro factors in 2022, including high inflation, a hawkish Fed which ushered in much higher interest rates, and the ongoing war in Ukraine, and experienced a decidedly difficult year in the process. The Russell 2000 Index fell -20.4% for the year, its third-worst calendar year performance on record, trailing only 2008, during the Financial Crisis, and 2002, the worst year, which followed the peak of the Internet Bubble. The Board noted that large-cap companies had a similarly negative experience in 2022, with the Russell 1000 Index falling -19.1% during the period. Within the small-cap market, the Board noted that small-cap value stocks fared better than small-cap growth stocks (falling -14.5% and -26.4%, respectively) over the period. The Board also noted that 2022’s double-digit losses were not limited to equities,
84 | The Royce Funds 2023 Semiannual Report to Shareholders
Board Approval of Investment Advisory Agreements (continued)
as the Bloomberg Barclays U.S. Aggregate Bond Index fell -13.0% while its global counterpart, the Bloomberg Barclays Global Aggregate Bond Index, declined -16.2%.
The Board noted that seven of the eleven Funds (63.6%) ranked in the 1st or the 2nd Sharpe Ratio quartile within their respective Morningstar categories for the 1-year period ended December 31, 2022. The Board further noted that four of the seven largest Funds ranked in the 1st or the 2nd Sharpe Ratio quartile within their respective Morningstar categories for the same 1-year period while five of the seven largest Funds ranked in such Sharpe Ratio quartiles within their respective Morningstar categories for the 5-year period ended December 31, 2022.
A large portion of the post-2008 market period was marked by historically low interest rates and significant U.S. Federal Reserve market intervention. During this period, highly leveraged, non-earning companies and yield-oriented securities (e.g., master limited partnerships, real estate investment trusts, and utilities) generally outperformed those companies with more conservative balance sheets, low leverage, the ability to generate and effectively allocate free cash flow, and strong returns on invested capital and cyclical companies generally favored by the Funds.
Each of Royce Pennsylvania Mutual Fund (“PMF”) and Royce International Premier Fund (“RIP”) produced relative risk-adjusted performance within its Morningstar category that mirrored the performance trends that were exhibited by the other large Funds, as described above. In particular, the Board noted that PMF produced stronger relative risk-adjusted performance during the 1- and 5-year (2nd quartile in both instances) periods ended December 31, 2022, and weaker relative risk-adjusted performance during the 3- and 10-year (3rd quartile in both instances) periods ended December 31, 2022. The Board similarly noted that RIP produced stronger relative risk-adjusted performance during the 1- and 5-year (2nd quartile in both instances) periods ended December 31, 2022, and weaker relative risk-adjusted performance during the 3-year (4th quartile) period ended December 31, 2022. (The relevant share class of RIP did not have ten full calendar years of performance as of December 31, 2022. As a result, Broadridge did not include the relevant performance information for RIP for the 10-year period ended December 31, 2022, in the materials that were provided to the Board.)
The Board noted that each of Royce Small-Cap Special Equity Fund (“RSE”) and Royce Small-Cap Opportunity Fund (“ROF”) produced relative risk-adjusted performance within its Morningstar category that differed from the performance trends described above. In particular, RSE ranked in the 1st quartile within its Morningstar category for the 1-year period ended December 31, 2022, and in the 2nd quartile within its Morningstar category for each of the 3-, 5-, and 10-year periods ended December 31, 2022, while ROF produced stronger relative risk-adjusted performance during the 3-, 5-, and 10-year periods ended December 31, 2022 (1st quartile in all three of those instances) and weaker relative risk adjusted performance during the 1-year period ended December 31, 2022 (3rd quartile).
Each of Royce Premier Fund (“RPR”), Royce Smaller-Companies Growth Fund (“RVP”), Royce Small-Cap Value Fund (“RVV”), and Royce Dividend Value Fund (“RDV”) produced relative risk-adjusted performance within its Morningstar category that mirrored the broader performance trends that were exhibited by all eleven Funds, as described above. In particular, the Board noted that RPR, RVP, RVV, and RDV exhibited stronger relative risk-adjusted performance during the 1-year period ended December 31, 2022 (1st, 2nd, 1st, and 2nd quartiles, respectively), and weaker relative risk-adjusted performance during the 3-, 5- and 10-year periods ended December 31, 2022, with all four Funds ranking in the 3rd or 4th quartile within its Morningstar category for such periods.
The Sharpe Ratio quartile rankings for Royce Micro-Cap Fund (“RMC”), Royce Small-Cap Total Return Fund (“RTR”), and Royce Global Financial Services Fund (“RFS”) differed from all of the performance patterns described above. Although each of these Funds ranked in the 4th quartile within its Morningstar category for the 1-year period ended December 31, 2022, they generally produced stronger relative risk adjusted performance during the 3-, 5-, and 10-year periods ended December 31, 2022, (RMC: 2nd, 2nd, and 4th quartiles, respectively; RTR: 4th, 3rd, and 2nd quartiles, respectively, RFS: 3rd, 3rd, and 2nd quartiles, respectively).
The Board also received an analysis that compared the Sharpe Ratio of each Fund with the Sharpe Ratio of its primary benchmark index and the arithmetic average of the Sharpe Ratios of the funds within its Morningstar category for each of the 1-, 3-, 5-, and 10-year periods ended December 31, 2022. The Board noted that the Sharpe Ratios of the ten Funds for which the relevant share class had at least ten full calendar years of performance as of December 31, 2022 equaled or exceeded the Sharpe Ratios of their respective primary benchmark indexes and the arithmetic averages of the Sharpe Ratios of the funds within their respective Morningstar categories as follows: (i) all four time periods (RSE); (ii) three of the four time periods (PMF, RPR, ROF, and RFS); (ii) two of the four time periods (RMC, RTR, and RVP); and (iv) one of the four time periods (RVV and RDV). Thus, five of those ten Funds had Sharpe Ratios that equaled or exceeded the Sharpe Ratios of their respective primary benchmark indexes and the arithmetic averages of the Sharpe Ratios of the funds within their respective Morningstar categories during at least three of the four applicable time periods, while eight of those ten Funds had Sharpe Ratios that equaled or exceeded the Sharpe Ratios of their respective primary benchmark indexes and the arithmetic averages of the Sharpe Ratios of the funds within their respective Morningstar categories during at least two of the four applicable time periods. The Sharpe Ratio of RIP, the lone Fund for which the relevant share class did not have at least ten full calendar years of performance as of December 31, 2022, exceeded the Sharpe Ratio of its primary benchmark index and the arithmetic average of the Sharpe Ratios of the funds within its Morningstar category in one of the three applicable time periods.
The Board also noted that the peer groups included in the Broadridge materials provided to them for a number of Funds may not be appropriate for performance comparisons and that Royce had augmented the data provided to the Board throughout the years by including performance information for other funds that Royce believes are more comparable to those Funds.
In addition to the relative risk–adjusted performance of each Fund, the Board also reviewed and considered each Fund’s absolute total returns, down market performance, and, for Funds in existence for such periods, long-term performance records over periods of 10 years or longer. In connection therewith, the Board received detailed information from Royce indicating that the average annualized total returns of: (i) multiple Funds compared favorably to those of their respective benchmarks indexes for various short-term and extended performance periods ended March 31, 2023 and (ii) a majority of the Funds ranked in the 1st or the 2nd quartile within their respective Morningstar categories for the year-to-date, 1-year, and 5-year periods ended March 31, 2023. The Board also noted that the average annualized total returns for seven of the eleven Funds ranked in the 1st or 2nd quartile within their respective Morningstar categories for the period February 20, 2020 (i.e., a date prior to the beginning of various Covid-related declines) through March 31, 2023.
The Board also considered it important to look beyond “snapshot” performance as of December 31, 2022, and therefore examined monthly rolling average returns for each Fund relative to its benchmark for the 3-, 5-, and 10-year periods ended March 31, 2023. The Board also noted that eight of the Funds outperformed their
The Royce Funds 2023 Semiannual Report to Shareholders | 85
Board Approval of Investment Advisory Agreements (continued)
respective benchmark indexes for at least a majority of the monthly rolling average annual return periods during at least one of the 3-, 5-, and 10-year periods ended March 31, 2023, with five Funds outperforming their respective benchmark indexes for at least a majority of the monthly rolling average annual return periods during at least two of the 3-, 5-, and 10-year periods ended March 31, 2023.
The Board noted that Royce manages a number of funds that invest in micro-cap, small-cap, and mid-cap issuers, many of which had outperformed their benchmark indexes and their competitors during the periods prior to the U.S. Federal Reserve’s near zero interest rate policy and related market interventions that followed the 2008 financial crisis as well as in more recent periods, as referenced above. Although the Board recognized that past performance is not necessarily an indicator of future results, it found that Royce had the necessary qualifications, experience and track record in managing equity mutual funds to manage each Fund. The Board determined that Royce continues to be an appropriate investment adviser for each Fund.
Cost of the services provided and profits realized by Royce from its relationship with each Fund
The Board considered the cost of the services provided by Royce and profits realized by Royce from its relationship with each Fund. As part of the analysis, the Board discussed with Royce its methodology in allocating its costs to each Fund and concluded that Royce’s allocations were reasonable. The Board noted that at times in the past Royce had temporarily closed certain of the Funds to new investors because of the rate of growth in Fund assets. The Board concluded that Royce’s profits with respect to each Fund during the year ended December 31, 2022, were reasonable in relation to the nature and quality of services provided.
The extent to which economies of scale would be realized as the Funds grow and whether fee levels would reflect such economies of scale
While acknowledging that the presence or absence of economies of scale in fund management businesses can be debated and is in any event difficult to measure and directly assess, the Board considered whether there have been economies of scale in respect of the management of each Fund, whether each Fund has appropriately benefited from any economies of scale and whether there is potential for realization of any further economies of scale. The Board noted the time and effort involved in managing portfolios of small- and micro-cap stocks and that they did not involve the same efficiencies as do portfolios of large-cap stocks. The Board also noted that in 2004 breakpoints were added to the investment advisory fees for all of the then-existing Funds except PMF (PMF’s fee schedule already had breakpoints) and that the investment advisory fees for all Funds organized since 2004 included breakpoints. The Board further noted the reduced contractual breakpoint levels for each Fund other than PMF that became effective as of July 1, 2017. The Board concluded that the current fee structure for each Fund is reasonable and that the relevant shareholders sufficiently participated in economies of scale (while again noting the various potential issues with assessing such economies of scale both in general and under the facts at hand) and that no changes were currently necessary.
Comparison of services to be rendered and fees to be paid to those under other investment advisory contracts, such as contracts of the same and other investment advisers or other clients
The Board reviewed the investment advisory fee paid by each Fund and compared both the services to be rendered and the fees to be paid under the Agreements to other contracts of Royce and to contracts of other investment advisers to registered investment companies investing in micro- and small-cap stocks, as provided by Broadridge. The Board noted that, except for PMF, the contractual advisory fee rate for each Fund exceeded the median of its Broadridge-assigned peers. The Board noted the importance of the net annual operating expense ratio in measuring a fund’s efficiency, particularly in light of the variations in the mutual fund industry as to which entity is responsible for particular types of expenses.
The Board noted that the net annual operating expense ratio for RMC ranked in the 2nd quintile among its Broadridge-assigned peers. The Board further noted that the net annual operating expense ratios for ROF, RSE, RVV, and RIP ranked in the middle quintile among their respective Broadridge-assigned peers.
In addition, the Board noted that although the net annual operating expense ratio for PMF ranked in the 4th quintile among its Broadridge-assigned peers, it was only four (4) basis points higher than its peer group median, well within range of such peer group median.
The Board further noted the net annual operating expense ratio for the remaining Funds (i.e., RPR, RTR, RVP, RDV and RFS) ranked in the 5th quintile among their respective Broadridge-assigned peers. Although these rankings can be attributed in large part to the investment advisory fees for these Funds, such fees are also consistent with those of other Royce-advised open-end funds.
While the Board noted that the net annual operating expense ratios of RPR and RTR were 26 and 25 basis points higher, respectively, than the median of their Broadridge-assigned peer groups, they also noted that such net annual operating expense ratios were only 6 and 10 basis points, respectively, higher than the average net annual operating expense ratio for the 214 small-cap funds in the Morningstar small-cap category (oldest share class only, non-institutional, non-index, non-ETF funds with Rule 12b-1 fees of 0.25% or less). Additionally, the Board noted that although the net annual operating expense ratios of RVP and RDV were 9 and 14 basis points higher, respectively, than their Broadridge-assigned peer groups, such net annual operating expense ratios were only 12 basis points higher and 3 basis points lower, respectively, than the average net annual operating expense ratio for the 214 small-cap funds in the Morningstar small-cap category (oldest share class only, non-institutional, non-index, non-ETF funds with Rule 12b-1 fees of 0.25% or less). The trustees also noted that RDV’s average net assets and weighted average market capitalization for the period were also significantly lower than the relevant peer group medians. Although RFS’s net annual operating expense ratio was 18 basis points higher than the median of its Broadridge-assigned peer group, the trustees noted that the peer group consisted of only nine funds and that RFS’s average net assets and weighted average market capitalization for the period were also significantly lower than the relevant peer group medians.
The Board further noted that the contractual investment advisory fee rate for each of RPR, RTR, RVP, RDV, and RFS is consistent with those of other Funds that invest primarily in micro-cap and small-cap equity securities. After taking into consideration that the level of work necessary to invest in domestic and/or international micro-cap and small-cap equity securities is significantly greater than that necessary to invest in larger-cap securities, the Board noted that the basis point differentials in investment advisory fees, which in large measure give rise to the generally higher net annual operating expense ratios for RPR, RTR, RVP, RDV, and RFS were appropriate for those Funds.
The Board also noted that Royce manages each Fund in an active fashion. The industry accepted metric for measuring how actively an equity portfolio is managed is called “active share.” In particular, active share measures how much the holdings of an equity portfolio differ from the holdings of its appropriate passive benchmark index. At the extremes, a portfolio with no holdings in common with the benchmark would have 100% active share, while a portfolio that
86 | The Royce Funds 2023 Semiannual Report to Shareholders
Board Approval of Investment Advisory Agreements (continued)
is identical to the benchmark would have 0% active share. Royce presented several analyses to the Board which demonstrated that mutual funds with high active share scores had higher expense ratios than mutual funds with lower active share scores due to the resources required for the active management of those funds. The Board noted that each of PMF had an active share of 88%, ROF had an active share of 90%, RMC had an active share of 91%, RVP had an active share of 93%, and the remaining seven Funds had active shares of 96% or greater for the year ended December 31, 2022.
The Board further noted that Royce has waived, both during the year ended December 31, 2022, and during earlier periods, investment advisory fees for numerous Funds in order to maintain expense ratios at competitive levels and acknowledged Royce’s intention to continue this expense limitation practice. The Board also noted lower contractual asset breakpoints for each Fund other than PMF became effective as of July 1, 2017. The Board also considered fees charged by Royce to institutional and other clients and noted that, given the greater levels of services that Royce provides to registered investment companies such as the Funds as compared to other accounts, each Fund’s advisory fees compared favorably to these other accounts.
No single factor was cited as determinative to the decision of the Board. Rather, after weighing all of the considerations and conclusions discussed above, the entire Board, including all the non-interested trustees, determined to approve the continuation of the existing Agreement for each Fund, concluding that a contract continuation on the existing terms for each Fund is in the best interests of the shareholders of each Fund and that each Fund’s investment advisory fee rate is reasonable in relation to the services provided.
The Royce Funds 2023 Semiannual Report to Shareholders | 87
Liquidity Risk Management Program
The Securities and Exchange Commission adopted Rule 22e-4 under the Investment Company Act of 1940 (the “Liquidity Rule”) to promote effective liquidity risk management throughout the open-end investment company industry, thereby reducing the risk that funds will be unable to meet their redemption obligations and mitigating dilution of the interests of fund shareholders. As required by the Liquidity Rule, The Royce Fund (the “Trust”) adopted and implemented a written Liquidity Risk Management Program (as amended from time to time, the “LRMP”) which took effect on December 1, 2018.
The LRMP is designed to assess and manage the liquidity risk of each series of the Trust (each, a “Fund” and collectively, the “Funds”), taking into consideration each Fund’s: (i) investment strategy and the liquidity of its portfolio investments during normal and reasonably foreseeable stressed conditions; (ii) short and long-term cash flow projections; (iii) holdings of cash and cash equivalents; and (iv) access to other funding sources, including custodian overdrafts and the Funds’ line of credit. In this context, liquidity risk refers to the risk that a Fund could not meet requests to redeem its shares without significant dilution of remaining investors’ interests in the Fund.
The Board of Trustees of the Trust (the “Board”) approved the designation of the Chief Risk Officer of Royce Investment Partners (“Royce”) as the administrator of the LRMP (in such capacity, the “Administrator”). The Administrator reports directly to the Board and serves at its pleasure in her capacity as Administrator. Such person also reports directly to Royce’s Chief Executive Officer in her capacity as Royce’s Chief Risk Officer. The members of Royce’s Risk Management Committee and its Legal & Compliance Department serve the Administrator in an advisory capacity. The Administrator may also consult with Royce’s portfolio management, administration, and trading personnel to the extent such person deems it necessary or appropriate to carry out the duties assigned to the Administrator under the LRMP. The Trust has retained a third-party liquidity vendor that performs various functions in connection with the administration of the LRMP, including classifying the liquidity of each Fund investment.
In accordance with the requirements of the Liquidity Rule and the LRMP, each Fund must classify each of its investments into one of four liquidity categories described below based on a determination of a reasonable expectation for how long it would take to convert the investment to cash (or sell or dispose of the investment) without significantly changing its market value.
| • | Highly liquid investments – cash or convertible to cash within three business days or less. |
| • | Moderately liquid investments – convertible to cash in three to seven calendar days. |
| • | Less liquid investments – can be sold or disposed of, but not settled, within seven calendar days. |
| • | Illiquid investments – cannot not be sold or disposed of within seven calendar days. |
In addition, the LRMP prohibits a Fund from acquiring any illiquid investment if, immediately after such acquisition, it would have invested more than 15% of its net assets in illiquid investments. Liquidity classification determinations take into account a variety of factors, including various market, trading and investment-specific considerations, as well as market depth, and generally utilize analysis from the third-party liquidity vendor.
Each Fund has been classified as a “primarily highly liquid fund” under the LRMP. For these purposes, a primarily highly liquid fund must hold more than 50% of its net assets in highly liquid investments. A Fund would cease to be a primarily highly liquid fund if its highly liquid investments fell to 50% or less of its net assets as of the end of any calendar month.
The Administrator presented a report to the Board at its meeting on February 16, 2023 that addressed the adequacy and effectiveness of the LRMP during the period January 1, 2022 to December 31, 2022 (the “covered period”). Among other things, the report provided summary information regarding overall market liquidity and the Funds’ compliance with various liquidity-related requirements along with examples of how the Administrator, Royce’s Risk Management Committee, and the relevant portfolio managers monitored and reacted to changes in liquidity profiles during the covered period. The report concluded that:
| • | each Fund remained a primarily highly liquid fund during the covered period; |
| • | no Fund breached the 15% limit on illiquid investments during the covered period; |
| • | the LRMP remains reasonably designed and implemented to assess and manage each Fund’s liquidity risk; and |
| • | each Fund was able to meet requests for redemption without significant dilution of remaining investors’ interests in the Fund during the covered period. |
No assurance can be given that the LRMP will achieve its objectives in the future. Please refer to the Trust’s statutory prospectuses for more information regarding each Fund’s exposure to liquidity risk and other principal risks and a description of how the Funds expect to satisfy redemption requests.
88 | The Royce Funds 2023 Semiannual Report to Shareholders
Notes to Performance and Other Important Information
The thoughts expressed in this report concerning recent market movements and future prospects for small company stocks are solely the opinion of Royce at June 30, 2023, and, of course, historical market trends are not necessarily indicative of future market movements. Statements regarding the future prospects for particular securities held in the Funds’ portfolios and Royce’s investment intentions with respect to those securities reflect Royce’s opinions as of June 30, 2023 and are subject to change at any time without notice. There can be no assurance that securities mentioned in this report will be included in any Royce-managed portfolio in the future.
Sector weightings are determined using the Global Industry Classification Standard (“GICS”). GICS was developed by, and is the exclusive property of, Standard & Poor’s Financial Services LLC (“S&P”) and MSCI Inc. (“MSCI”). GICS is the trademark of S&P and MSCI. “Global Industry Classification Standard (GICS)” and “GICS Direct” are service marks of S&P and MSCI.
All indexes referenced are unmanaged and capitalization weighted. Each index’s returns include net reinvested dividends and/or interest income. Frank Russell Company (“Russell”) is the source and owner of the trademarks, service marks and copyrights related to the Russell Indexes. Russell® is a trademark of Frank Russell Company. Neither Russell nor its licensors accept any liability for any errors or omissions in the Russell Indexes and/or Russell ratings or underlying data and no party may rely on any Russell Indexes and/or Russell ratings and/ or underlying data contained in this communication. No further distribution of Russell Data is permitted without Russell’s express written consent. Russell does not promote, sponsor or endorse the content of this communication. The Russell 2000 is an index of domestic small-cap stocks. It measures the performance of the 2,000 smallest publicly traded U.S. companies in the Russell 3000 Index. The Russell 2000 Value and Growth Indexes consist of the respective value and growth stocks within the Russell 2000 as determined by Russell Investments. The Russell Microcap Index includes 1,000 of the smallest securities in the small-cap Russell 2000 Index along with the next smallest eligible securities as determined by Russell. The Russell 2500 Index is an index of the 2,500 smallest publicly traded U.S. companies in the Russell 3000 index. The Russell 1000 Index is an index of domestic large-cap stocks. It measures the performance of the largest 1,000 publicly traded U.S. companies in the Russell 3000 Index. The Russell Top 50 Index is an index of domestic large-cap stocks. It measures the performance of approximately 50 of the largest publicly traded companies in the Russell 3000 Index. Securities are weighted based on their style score. Source: MSCI. MSCI makes no express or implied warranties or representations and shall have no liability whatsoever with respect to any MSCI data contained herein. The MSCI data may not be further redistributed or used as a basis for other indexes or any securities or financial products. This material is not approved, endorsed, reviewed or produced by MSCI. None of the MSCI data is intended to constitute investment advice or a recommendation to make (or refrain from making) any kind of investment decision and may not be relied on as such. The MSCI ACWI Small Cap Index is an unmanaged, capitalization-weighted index of global small-cap stocks. The MSCI ACWI ex USA Small Cap Index is an unmanaged, capitalization weighted index of global small-cap stocks, excluding the United States. MSCI ACWI ex USA Large Cap Index is an unmanaged, capitalization weighted index of global large-cap stocks, excluding the United States. The Nasdaq Composite Index is a market capitalization-weighted index of more than 3,700 stocks listed on the Nasdaq stock exchange. The CBOE S&P 500 Volatility Index (VIX) measures market expectations of near-term volatility conveyed by S&P 500 stock index option prices. It is the square root of the risk-neutral expectation of the S&P 500 variance over the next 30 calendar days and is quoted as an annualized standard deviation. The Center for Research in Securities Prices (CRSP) equally divides the companies listed on the NYSE into 10 deciles based on market capitalization. Deciles 1-5 represent the largest domestic equity companies and Deciles 6-10 represent the smallest. CRSP then sorts all listed domestic equity companies based on these market cap ranges. By way of comparison, the CRSP 1-5 would have similar capitalization parameters to the S&P 500 and the CRSP 6-10 would have similar capitalization parameters to those of the Russell 2000. The Purchasing Managers’ Index (PMI) is an index of the prevailing direction of economic trends in the manufacturing and service sectors. The purpose of the PMI is to provide information about current and future business conditions to company decision makers, analysts, and investors. The performance of an index does not represent exactly any particular investment, as you cannot invest directly in an index. Returns for the market indexes used in this report were based on information supplied to Royce by Russell Investments. Royce has not independently verified the above described information.
The Price-Earnings, or P/E, Ratio is calculated by dividing a company’s share price by its trailing 12-month earnings-per-share (EPS). The Price-to-Book, or P/B, Ratio is calculated by dividing a company’s share price by its book value per share. Standard deviation is a statistical measure within which a fund’s total returns have varied over time. The greater the standard deviation, the greater a fund’s volatility. Beta is a measure of the volatility or risk of an investment compared to the market as a whole. Alpha describes an investment strategy’s ability to beat the market. The Morningstar Style Map uses proprietary scores of a stock’s value and growth characteristics to determine its placement in one of the five categories listed on the horizontal axis. These characteristics are then compared to those of other stocks within the same market capitalization band. Each is scored from zero to 100 for both value and growth attributes. The value score is subtracted from the growth score to determine the overall style score. For the vertical, market cap axis, Morningstar subdivides into size groups. Giant-cap stocks are defined as those that account for the top 40% of the capitalization of each style zone; large-cap stocks represent the next 30%; mid-cap stocks the next 20%; small-cap stocks the next 7%; micro-cap stocks the smallest 3%. For the Morningstar Small Blend Category: ©2023 Morningstar. All Rights Reserved. The information regarding the category in this piece is: (1) is proprietary to Morningstar and/or its content providers; (2) may not be copied or distributed; and (3) is not warranted to be accurate, complete or timely. Neither Morningstar nor its content providers are responsible for any damages or losses arising from any use of this information. Cyclical and Defensive are defined as follows: Cyclical: Communication Services, Consumer Discretionary, Energy, Financials, Industrials, Information Technology, and Materials. Defensive: Consumer Staples, Health Care, Real Estate, and Utilities. Return on Invested Capital is calculated by dividing a company’s past 12 months of operating income (earnings before interest and taxes) by its average invested capital (total equity, less cash and cash equivalents, plus total debt, minority interest, and preferred stock). Investments in securities of micro-cap, small-cap, and/or mid-cap companies may involve considerably more risk than investments in securities of larger-cap companies. Certain Funds invest a significant portion of their respective assets in foreign companies that may be subject to different risks than investments in securities of U.S. companies. Therefore, the prices of securities of foreign companies in particular countries or regions may, at times, move in a different direction than those of securities of U.S. companies. Because such investments are usually denominated in foreign currencies and such Funds do not intend to hedge their foreign currency exposures, the U.S. dollar value of such investments may be harmed by declines in the value of foreign currencies in relation to the U.S. dollar. Certain Funds invest a significant portion of their assets in a limited number of stocks
The Royce Funds 2023 Semiannual Report to Shareholders | 89
Notes to Performance and Other Important Information (continued)
or focus their investments in a particular sector or industry, which may involve considerably more risk than a more broadly diversified portfolio because they may be more susceptible to any single corporate, economic, political, regulatory, or market event. (Please see “Primary Risks for Fund Investors” and “Investing in Foreign Securities” in the prospectus.) A broadly diversified portfolio does not, however, ensure a profit for a Fund or guarantee against loss. Please read the prospectus carefully before investing or sending money. A copy of the Funds’ current prospectus and Statement of Additional Information may be obtained by calling (800) 221-4268 or by visiting www.royceinvest.com. All publicly released material Fund information is disclosed by the Funds on their website at www.royceinvest.com. The Royce Funds is a service mark of The Royce Fund Distributor: Royce Fund Services, LLC.
Forward-Looking Statements
This material contains forward-looking statements within the meaning of the Securities Exchange Act of 1934, as amended (the “Exchange Act”), that involve risks and uncertainties, including, among others, statements as to:
| • | the Funds’ future operating results, |
| • | the prospects of the Funds’ portfolio companies, |
| • | the impact of investments that the Funds have made or may make, the dependence of the Funds’ future success on the general economy and its impact on the companies and industries in which the Funds invest, and |
| • | the ability of the Funds’ portfolio companies to achieve their objectives. |
This review and report use words such as “anticipates,” “believes,” “expects,” “future,” “intends,” and similar expressions to identify forward-looking statements. Actual results may differ materially from those projected in the forward-looking statements for any reason.
The Royce Funds have based the forward-looking statements included in this review and report on information available to us on the date of the report, and we assume no obligation to update any such forward-looking statements. Although The Royce Funds undertake no obligation to revise or update any forward-looking statements, whether as a result of new information, future events, or otherwise, you are advised to consult any additional disclosures that we may make through future shareholder communications or reports.
Proxy Voting
A copy of the policies and procedures that The Royce Funds use to determine how to vote proxies relating to portfolio securities and information regarding how each of The Royce Funds voted proxies relating to portfolio securities during the most recent 12-month period ended June 30 is available, without charge, on The Royce Funds’ website at www.royceinvest.com, by calling (800) 221-4268 (tollfree), and on the website of the Securities and Exchange Commission (“SEC”) at www.sec.gov.
Disclosure of Portfolio Holdings
The Funds’ complete portfolio holdings are also available on Exhibit F to Form N-PORT, which filings are made with the SEC within 60 days of the end of the first and third fiscal quarters. The Funds’ Form N-PORT filings are available on the SEC’s website at http://www.sec.gov.
90 | The Royce Funds 2023 Semiannual Report to Shareholders
This page is intentionally left blank.
The Royce Funds 2023 Semiannual Report to Shareholders | 91
This page is intentionally left blank.
92 | The Royce Funds 2023 Semiannual Report to Shareholders


About Royce Investment Partners
Unparalleled Knowledge + Experience
Pioneers in small-cap investing, with 50+ years
of experience, depth of knowledge, and focus.
Independent Thinking
The confidence to go against consensus, the insight
to uncover opportunities others might miss, and the
tenacity to stay the course through market cycles.
Specialized Approaches
U.S., international, and global investment strategies
that pursue approaches with different risk profiles.
Unwavering Commitment
Our team of 17 portfolio managers has significant
personal investments in the strategies they manage.
Contact Us
GENERAL INFORMATION
General Royce Funds information including:
| • | An overview of our firm and Funds |
| • | Ordering literature including Prospectuses |
(800) 221-4268
ACCOUNT INFORMATION
Speak with a representative about:
| • | Your account, transactions, and forms |
(800) 841-1180
FINANCIAL ADVISORS, CONSULTANTS,
AND INSTITUTIONS
Speak with your regional Royce contact regarding:
| • | Scheduling a meeting or call |
| • | Information about our firm, strategies, and Funds |
| • | Resources for financial professionals, such as
portfolio attribution reports |
(800) 337-6923
AUTOMATED ACCOUNT INFORMATION
24-hour Automated Telephone Service
(800) 787-6923
OE-REP-0623
Item 2. Code(s) of Ethics. Not applicable to this semi-annual report.
Item 3. Audit Committee Financial Expert. Not applicable to this semi-annual report.
Item 4. Principal Accountant Fees and Services. Not applicable to this semi-annual report.
Item 5. Audit Committee of Listed Registrants. Not Applicable.
Item 6. Investments.
(a) See Item 1.
(b) Not Applicable.
Item 7. Disclosure of Proxy Voting Policies and Procedures for Closed-End Management Investment Companies. Not Applicable.
Item 8. Portfolio Managers of Closed-End Management Investment Companies. Not Applicable.
Item 9. Purchases of Equity Securities by Closed-End Management Investment Company and Affiliated Purchasers. Not Applicable.
Item 10. Submission of Matters to a Vote of Security Holders. Not Applicable.
Item 11. Controls and Procedures.
(a) Disclosure Controls and Procedures. The Principal Executive and Financial Officers concluded that the Registrant's Disclosure Controls and Procedures are effective based on their evaluation of the Disclosure Controls and Procedures as of a date within 90 days of the filing date of this report.
(b) Internal Control over Financial Reporting. There were no significant changes in Registrant's internal control over financial reporting or in other factors that could significantly affect this control subsequent to the date of the evaluation, including any corrective actions with regard to significant deficiencies and material weaknesses during the period covered by this report.
Item 12. Exhibits. Attached hereto.
(a)(1) Not applicable to this semi-annual report.
(a)(2) Separate certifications by the Registrant’s Principal Executive Officer and Principal Financial Officer as required by Rule 30a-2(a) under the Investment Company Act of 1940.
(a)(3) Not Applicable.
(b) Separate certifications by the Registrant’s Principal Executive Officer and Principal Financial Officer, pursuant to Section 906 of the Sarbanes-Oxley Act of 2002 and required by Rule 30a-2(b) under the Investment Company Act of 1940.
Pursuant to the requirements of the Securities Exchange Act of 1934 and the Investment Company Act of 1940, the registrant has duly caused this report to be signed on its behalf by the undersigned, thereunto duly authorized.
THE ROYCE FUND
| BY: | /s/ Christopher D. Clark | |
Christopher D. Clark
President
Date: August 10, 2023
Pursuant to the requirements of the Securities Exchange Act of 1934 and the Investment Company Act of 1940, this report has been signed below by the following persons on behalf of the registrant and in the capacities and on the dates indicated.
| THE ROYCE FUND | | THE ROYCE FUND | |
| | | | | | |
| BY: | /s/ Christopher D. Clark | | BY: | /s/ Peter K. Hoglund | |
| Christopher D. Clark | | Peter K. Hoglund | |
| President | | Chief Financial Officer | |
| | | | |
| Date: August 10, 2023 | | Date: August 10, 2023 | |