UNITED STATES
SECURITIES AND EXCHANGE COMMISSION
Washington, D.C. 20549
FORM N-CSR
CERTIFIED SHAREHOLDER REPORT
OF
REGISTERED MANAGEMENT INVESTMENT COMPANIES
Investment Company Act File Number: 811-03599
Name of Registrant: The Royce Fund
Address of Registrant: 745 Fifth Avenue
New York, NY 10151
Name and address of agent for service: John E. Denneen, Esq.
745 Fifth Avenue
New York, NY 10151
Registrant's telephone number, including area code: (212) 508-4500
Date of fiscal year end: December 31, 2022
Date of reporting period: January 1, 2022 – June 30, 2022

The Royce Funds 2022 Semiannual
Review and Report to Shareholders
June 30, 2022
Royce Dividend Value Fund
Royce Global Financial Services Fund
Royce International Premier Fund
Royce Micro-Cap Fund
Royce Pennsylvania Mutual Fund
Royce Premier Fund
Royce Small-Cap Opportunity Fund
Royce Small-Cap Special Equity Fund
Royce Small-Cap Total Return Fund
Royce Small-Cap Value Fund
Royce Smaller-Companies Growth Fund

Table of Contents
Semiannual Review

This page is not part of the The Royce Funds 2022 Semiannual Report to Shareholders | 1
Letter to Our Shareholders

THE FIRST HALF OF 2022: A SEASON OF WORSTS FOR THE CAPITAL MARKETS
The first half of 2022—in particular its more tumultuous second quarter—offered few if any safe havens for investors, regardless of the investment focus. To be sure, the list of negative superlatives is long. As measured by the Russell Indexes, for example, it was the worst calendar first half since the shared 12/31/78 inception dates for the large-cap Russell 1000 Index (-20.9%), the Russell Midcap Index (-21.6), the small-cap Russell 2000 Index (-23.4%), and the Russell Microcap Index (-25.1% and whose start goes back to 6/30/00). For the large-cap S&P 500 Index, its 20.0% decline marked its worst first half return since 1970 and its most volatile first six months since 2009. Using Center for Research in Securities Prices (CRSP) data that dates back to 1926 shows that the small-cap proxy, the CRSP 6-10 Index, had its fourth-worst first half in nearly 100 years. The three others occurred in 1932 (during the depth of the Great Depression), 1970, and 1973. For the CRSP 1-5—the large-cap cohort—it was the third-worst first half, with only 1932 and 1962 (during the “Kennedy Slide” that followed a decade of rising share prices) faring worse.
Outside the U.S., the results were equally grim. The MSCI ACWI Small Cap (-22.3%) and MSCI ACWI exUSA Small Cap (-22.9%) Indexes each suffered their worst first half since their 1994 inception while the MSCI Emerging Market Index (-17.9%) turned in its second worst. And the damage was not limited to equities. Bonds also posted negative returns in the
first half, declining in both the first and second quarters. This is especially notable because stocks and bonds seldom decline in tandem. They have both had negative returns in just 20 quarters since 1976 (a period that encompasses 186 quarters) and have experienced negative returns for two consecutive quarters only five times—as was the case in 2022—since that same year. In addition, cryptocurrencies are estimated to have lost roughly $2 trillion in value during 2022’s first half, while it is estimated that the amount of wealth in the U.S. has shrunk by as much as $5 trillion so far in 2022. The first half of 2022 saw a significant resetting of asset values on a global scale in a series of deep and broad-based declines that offered, in the words of the Motown classic, “nowhere to run to, nowhere to hide.”
The reasons for this extensive simultaneous swoon have been well rehearsed: Inflation, rising interest rates, an aggressively tightening Fed (with central banks through much of the developed world following suit), lingering supply chain issues, ongoing Covid variants, a sluggish Chinese economy, and the war in Ukraine. Many of these developments are interrelated, with continued Covid outbreaks hampering both a resolution to supply chain delays and growth in China while the war and supply chain delays are exacerbating inflation. The headwinds can be seen in recent economic data, with behemoths such as Walmart, a bellwether for moderate-and low-income U.S. consumers, reporting lower-than-anticipated quarterly earnings and underwhelming near-term prospects while the J.P. Morgan Global Manufacturing PMI™ hit a
2 | This page is not part of the The Royce Funds 2022 Semiannual Report to Shareholders
LETTER TO OUR SHAREHOLDERS
22-month low at the end of June. The U.S. manufacturing PMI new orders component ended June at 49.2—and any number below 50 signals a contraction in activity. However, U.S. home and durable good sales rose in June, while as of this writing the U.S. labor market remains strong—and surprisingly resilient in the face of so much dire news. An added positive came from recent bank results, which included reassuring news about the health of consumer credit, as well as the banks’ own balance sheets. The shared health of banks and household balance sheets is important from our perspective as it bolsters the view that any U.S. slowdown seems likely to be both shallow and short-lived. Other dynamics create a different picture outside of the U.S., where a global slowdown looks more worrisome in Europe than in Asia, with the U.S. in between. Regardless of the near-term economic forecast, however, we have examined several small-cap data points that point to potentially better times ahead for investors with the fortitude to remain invested. Much of our case rests on an admittedly counterintuitive and somewhat ironic reason: Improved results for small-cap stocks are rooted in the fact that the environment has been so difficult.
SMALL-CAP IS A DIFFERENT WORLD
Throughout our five decades of investing, we have found that there are two critical features about the overall small-cap market that many investors miss or forget: First, small-cap operates in its own way—frequently diverging from large-cap. This is borne out not only by the differences—often significant—in long-term performance, but also in the varying market cycles,
responses to various economic and monetary regimes and sector and industry concentrations. Second, small-cap is a highly heterogeneous asset class. Its roughly 3,000 publicly traded companies can be found in ample supply in every sector and industry and are involved in almost every imaginable kind of business. Equally important, the depth and breadth of the universe means that there are nearly always potential opportunities for disciplined and discerning investors with the requisite patience for long-term investing.
So, while we can appreciate that investors may feel more comfortable focusing on large-caps in these anxious times, we would counsel resisting that temptation, particularly in the current environment. For example, one of the primary differences between small- and large-cap stocks at the end of June was the radically different valuation picture for each asset class. Despite the dramatic decline in stock prices so far during 2022—which might lead some to believe that valuations throughout the U.S. equity market have been falling to attractively inexpensive levels—large-cap stocks on average remain expensive. And this is true not only in light of their own history, but also versus small-caps. In fact, there has been little change in the extreme valuation gap between the Russell 2000 and Russell 1000 since late 2020. On 6/30/22 the Russell 2000 was at a 20% discount—which marked its lowest relative valuation versus the large-cap index in more than two decades. This stands in stark contrast to the past 20 years, a period in which small-caps have averaged a 3% premium to their larger siblings.
Russell 2000 vs. Russell 1000 Median LTM EV/EBIT1 (ex. Negative EBIT Companies)
From 6/30/02 to 6/30/22
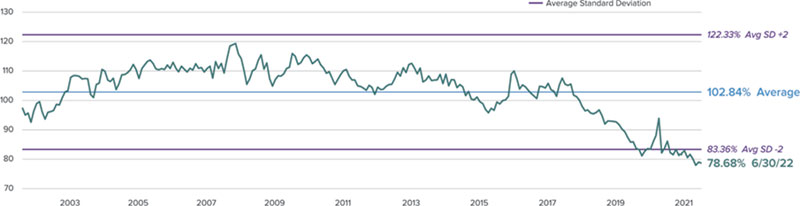
1Earnings before interest and taxes.
The average standard deviation (+/-2) shows how extreme the relative valuation of the indexes is from the average relative valuation over the period shown. Average standard deviation +2 indicates the highest 2.5% of relative valuation observations (i.e., small-caps are relatively expensive), while the average standard deviation -2 indicates the lowest 2.5% of relative valuation observations (i.e., small-caps are relatively inexpensive).
This page is not part of the The Royce Funds 2022 Semiannual Report to Shareholders | 3
LETTER TO OUR SHAREHOLDERS
Median EV/EBIT1 (ex-Negative EBIT) Levels for Russell Indexes
As of 6/30/22
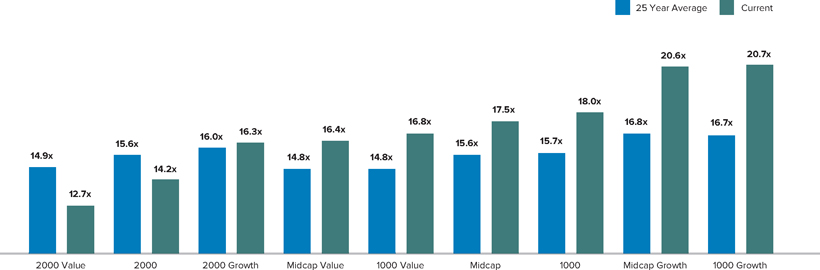
1Enterprise value divided by earnings before interest and taxes.
WHEN VALUATION IS A MATTER OF STYLE
Within small-cap, valuations continue to favor value, even as the Russell 2000 Value Index continued to outpace the Russell 2000 Growth Index in small-cap’s miserable first half—in this case by losing less, down 17.3% versus 29.5% for the year-to-date period ended 6/30/22. There were four additional observations from the chart above that we found equally relevant when comparing valuations for the various segments of the U.S. equity market:
| 1. | Small-Cap Value and Small-Cap Core were the cheapest segments of U.S. equities as of 6/30/22. |
| 2. | These segments were the only ones that were below their 25-year average valuation. |
| 3. | While all three value segments (Small-Cap, Mid-Cap, and Large-Cap) had nearly identical 25-year average valuations, their valuations at the end of June were vastly different. |
| 4. | Large-Cap and Mid-Cap Growth valuations remained well above their 25-year average valuations at the end of 2022’s first half. |
These valuation disparities are particularly pertinent now because it seems likely that U.S. equity valuations, at least for some asset classes or styles, may take years to surpass their earlier respective peaks. Our view is that an environment featuring somewhat higher interest rates and inflation, along with a less accommodative Federal Reserve and
increased geopolitical rivalries, will combine for a greater risk environment. (It will also be nearly the reverse of the period from 2009-2021, which saw unprecedented levels of liquidity and near-zero interest rates.) We believe that we will therefore probably see somewhat lower equity valuations in the new climate than we have seen over much of the last 10 years. We think that one important consequence of this shifting and uncertain environment is that investors should consider allocating away from higher valuation assets, which may have stiff headwinds to appreciation, into lower valuation assets, which may receive help from at least a neutral environment or perhaps modest tailwinds. Small-caps in general, and small-cap value specifically, look relatively attractive in this context.
SO BAD IT’S GOOD? REASONS FOR LONG-TERM SMALL-CAP OPTIMISM
Even with a more attractive valuation than large-caps—and a further valuation advantage for small-cap value—we can appreciate that investors may be reticent to put fresh capital to work in the asset class or its value style subset, having just endured the worst first half in the more than 40-year history of the Russell 2000 Index. We also understand their weariness and anxiety as they survey the litany of challenges we have reviewed above. No one, it would seem, needs a reason not to invest these days. Yet that negative perception—substantiated by record lows in both investor and consumer sentiment—is exactly why
4 | This page is not part of the The Royce Funds 2022 Semiannual Report to Shareholders
LETTER TO OUR SHAREHOLDERS
we are so emphatic that this looks like a genuinely attractive time to invest in small-caps. We think the case is even stronger, particularly if an investor uses large-cap stocks—with their relatively much higher valuations—as a source of funds.
A little-known dynamic exists between large-and small-cap stock performance as investors’ fears wax and wane. We have found it useful to watch the CBOE S&P 500 Volatility Index (VIX) as a barometer for risk tolerance. (The VIX measures 500 stock index option prices.) Risk tolerance tends to ebb and flow with events. However, regardless of the specific event (e.g., Long-Term Capital Management’s 1998 meltdown, 9/11, the Great Financial Crisis of 2008-09, the Greek Debt Crisis in 2011, 2020’s Covid shutdown), risk tolerance initially plummets before investors show their resilience and acclimatize to the new development, leading to a normalizing of risk tolerance.
This pattern forms the history of markets. Yet there is another revealing and consistent pattern within U.S. equities: In general, small-cap stocks have absorbed a greater proportion of heightened fear than large-caps as overall stock prices fall—which paradoxically creates an opportunity, as the chart below shows. Using above-average VIX levels as a proxy for markets in the grip of high anxiety shows that these periods have historically supplied two attractive elements for small-cap investors: strong absolute subsequent returns and, equally compelling, often excellent entry points for small-cap outperformance over large-caps. When the VIX has had an average monthly reading of 25 or more, as it did in June 2022, the subsequent three-year annualized returns for the Russell 2000 have averaged 14.1%, compared with 9.4% for the Russell 1000. Even more striking than the spread of outperformance has been the 83% frequency with which small-caps have beaten large-caps over the subsequent three years from similar starting points of higher-than-average volatility. We think of small-caps as being like a coiled spring in these periods of high investor anxiety, contracting more as fear builds and bouncing robustly back as fear recedes.
Subsequent Average Annualized Three-Year Return for the Russell 2000 Starting in Monthly Rolling VIX Return Ranges
From 12/31/89 to 6/30/22
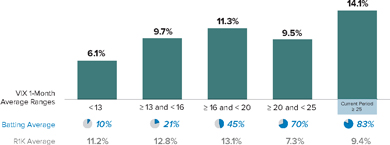
Past performance is no guarantee of future results. Batting Average refers to the percentage of monthly three-year periods in which the Russell 2000 Index outperformed the Russell 1000 Index. The monthly average VIX from 12/31/89-6/30/22 was 19.6. Higher VIX readings occur when market volatility is higher.
THE VALUE OF STAYING INVESTED
We are certainly in what we would call a “sum of all fears” environment, with war, inflation, slower growth, and rising rates all understandably frightening investors. The anxious realities of our current conditions notwithstanding, we would challenge investors to think about whether our present moment is markedly worse than previous periods—including the Internet Bubble era, the months following the attacks on 9/11, and the Great Financial Crisis. In other words, we would argue against the current sentiment.
More importantly, we have found that the most opportune times to invest are when fear is high and trailing returns are low. Subsequent returns from these levels have been attractive for those investors with the discipline to stay invested. For instance, the annualized three-year return for the Russell 2000 at the end of June was 4.2% compared to its three-year monthly rolling average since inception of 10.9%. Subsequent annualized three-year returns for small-cap from comparable trailing low-return entry points have been positive 97% of the time since the Russell 2000’s inception, averaging 11.9%. Coming off a record negative first half and enduring what may well be a late stage of the bear market, the current period looks, to us, like a pretty good entry point for long-term small-cap returns going forward. We think all of this makes a very convincing argument for ongoing small-cap investment.
We think of small-caps as being like a coiled spring in these periods of high investor anxiety,
contracting more as fear builds and bouncing robustly back as fear recedes.
This page is not part of the The Royce Funds 2022 Semiannual Report to Shareholders | 5
LETTER TO OUR SHAREHOLDERS
Subsequent Average Annualized 3-Year Performance for the Russell 2000 Following 3-Year Annualized Return Ranges of 0-5%
From 12/31/78-6/30/22

Past performance is no guarantee of future results.
We have one final observation—which is that small-cap recoveries have historically happened very quickly, so investors who miss even a few months would have forfeited a sizable share of their return. We looked at the one-year results coming off market bottoms—declines of at least 15% from the previous peak—and then tracked the average returns for investors who missed the first one, two, or three months of each one-year recovery. The results were striking. On average, if an investor were to miss only the first month of the
recovery, their one-year return was on average about one third lower than if they had been investing throughout the trough (+63.8% vs. +41.8%). For an investor who missed the first three months of the recovery, their subsequent one-year return was less than half of what investors experienced by investing at the bottom (+63.8% vs. +31.2%).
Average Returns for the Russell 2000 During the First 12 Months of a Recovery Depending on Entry Point
From 12/31/78-6/30/22

Past performance is no guarantee of future results. Royce defines the starting date of a recovery as the market cycle trough of a decline of 15% or more from the index’s prior historical high.
Our final counsel then, is to follow the wisdom of the investment maxim, “Be fearful when others are greedy and greedy when others are fearful.”
Sincerely,
 |  |  |
Charles M. Royce
Chairman,
Royce Investment Partners | Christopher D. Clark
Chief Executive Officer, and
Co-Chief Investment Officer,
Royce Investment Partners | Francis D. Gannon
Co-Chief Investment Officer,
Royce Investment Partners |
| July 29, 2022 | | |
| 6 | This page is not part of the The Royce Funds 2022 Semiannual Report to Shareholders | Past performance is no guarantee of future results. |
Performance and Expenses
Performance and Expenses
As of June 30, 2022
| | AVERAGE ANNUAL TOTAL RETURNS (%) | ANNUAL OPERATING
EXPENSES (%) |
| | YTD1 | 1-YR | 3-YR | 5-YR | 10-YR | 15-YR | 20-YR | SINCE INCEPTION | INCEPTION DATE | GROSS | NET |
| Royce Dividend Value Fund | -21.05 | -18.87 | 2.12 | 3.99 | 7.45 | 5.89 | N/A | 7.41 | 5/3/04 | 1.543 | 1.343 |
| Royce Global Financial Services Fund | -22.22 | -20.54 | 4.81 | 5.26 | 9.61 | 5.65 | N/A | 7.38 | 12/31/03 | 1.823 | 1.533 |
| Royce International Premier Fund | -27.00 | -27.43 | -0.39 | 3.64 | 7.58 | N/A | N/A | 5.63 | 12/31/10 | 1.543 | 1.443 |
| Royce Micro-Cap Fund | -27.96 | -24.66 | 8.78 | 6.02 | 5.67 | 4.08 | 7.21 | 10.09 | 12/31/91 | 1.20 | 1.20 |
| Royce Pennsylvania Mutual Fund | -21.24 | -17.56 | 5.61 | 6.81 | 9.22 | 6.23 | 8.59 | 12.382 | N/A | 0.92 | 0.92 |
| Royce Premier Fund | -19.20 | -14.82 | 4.94 | 7.48 | 9.04 | 7.30 | 9.94 | 10.93 | 12/31/91 | 1.17 | 1.17 |
| Royce Small-Cap Opportunity Fund | -22.08 | -22.09 | 12.67 | 8.32 | 11.04 | 7.17 | 9.77 | 11.59 | 11/19/96 | 1.21 | 1.21 |
| Royce Small-Cap Special Equity Fund | -12.83 | -6.47 | 7.30 | 4.74 | 7.56 | 6.45 | 7.81 | 8.31 | 5/1/98 | 1.20 | 1.20 |
| Royce Small-Cap Total Return Fund | -13.63 | -9.32 | 6.49 | 6.15 | 9.11 | 6.21 | 8.10 | 9.99 | 12/15/93 | 1.25 | 1.25 |
| Royce Small-Cap Value Fund | -19.36 | -15.98 | 1.64 | 3.12 | 5.47 | 3.54 | 8.24 | 7.77 | 6/14/01 | 1.553 | 1.493 |
| Royce Smaller-Companies Growth Fund | -36.21 | -42.18 | 1.58 | 3.82 | 8.00 | 4.30 | 9.14 | 9.57 | 6/14/01 | 1.513 | 1.493 |
| INDEX | | | | | | | | | | | |
| Russell 2000 Index | -23.43 | -25.20 | 4.21 | 5.17 | 9.35 | 6.33 | 8.17 | N/A | N/A | N/A | N/A |
| Russell Microcap Index | -25.11 | -30.73 | 5.05 | 4.55 | 9.04 | 5.16 | 7.45 | N/A | N/A | N/A | N/A |
| Russell 2000 Value Index | -17.31 | -16.28 | 6.18 | 4.89 | 9.05 | 5.58 | 7.77 | N/A | N/A | N/A | N/A |
| Russell 2000 Growth Index | -29.45 | -33.43 | 1.40 | 4.80 | 9.30 | 6.80 | 8.34 | N/A | N/A | N/A | N/A |
| Russell 2500 Index | -21.81 | -21.00 | 5.91 | 7.04 | 10.49 | 7.29 | 9.24 | N/A | N/A | N/A | N/A |
| MSCI ACWI ex USA Small Cap Index | -22.92 | -22.45 | 2.94 | 2.55 | 6.22 | 2.79 | 8.16 | N/A | N/A | N/A | N/A |
| MSCI ACWI Small Cap Index | -22.27 | -21.82 | 4.40 | 4.68 | 8.33 | 5.17 | 8.87 | N/A | N/A | N/A | N/A |
1Not Annualized.
2For Royce Pennsylvania Mutual Fund, the average annual total return shown is for the 45-year period ended 6/30/22.
3Reflects Service Class expenses which include a 25bps distribution fee.
Important Performance, Expense, and Risk Information
All performance information in this Review and Report reflects past performance, is presented on a total return basis, reflects the reinvestment of distributions, and does not reflect the deduction of taxes a shareholder would pay on fund distributions or the redemption of fund shares. Past performance is no guarantee of future results. Investment return and principal value of an investment will fluctuate, so that shares may be worth more or less than their original cost when redeemed. Investment and Service Class shares redeemed within 30 days of purchase may be subject to a 1% redemption fee payable to the Fund (2% for Royce International Premier Fund). Redemption fees are not reflected in the performance shown above; if they were, performance would be lower. Current performance may be higher or lower than performance quoted. Current month-end performance may be obtained at www.royceinvest.com. All performance and expense information reflects results of the Funds’ oldest share Class (Investment Class or Service Class, as the case may be). Price and total return information is based on net asset values calculated for shareholder transactions. Annual gross operating expenses reflect the Fund’s gross total annual operating expenses and include management fees, any 12b-1 distribution and service fees, other expenses, and any applicable acquired fund fees and expenses. Annual net operating expenses reflect contractual fee waivers and/or expense reimbursements. All expense information is reported as of the Fund’s most current prospectus. Royce & Associates has contractually agreed to waive fees and/or reimburse operating expenses, excluding brokerage commissions, taxes, interest, litigation expenses, acquired fund fees and expenses, and other expenses not borne in the ordinary course of business, to the extent necessary to maintain net operating expenses at or below: 1.34% for Royce Dividend Value Fund; 1.44% for Royce International Premier Fund; and 1.49% for each the Royce Global Financial Services, Small-Cap Value, and Smaller-Companies Growth Funds through April 30, 2023. Acquired fund fees and expenses reflect the estimated amount of the fees and expenses incurred indirectly by the Fund through its investments in mutual funds, hedge funds, private equity funds, and other investment companies.
Service Class shares bear an annual distribution expense that is not borne by the Funds’ Investment Class. If such distribution expenses had been reflected for Funds showing Investment Class performance, returns would have been lower. Each series of The Royce Fund is subject to market risk–the possibility that common stock prices will decline, sometimes sharply and unpredictably, over short or extended periods of time. Such declines may be caused by various factors, including market, financial, and economic conditions, governmental or central bank actions, and other factors, such as the recent Covid pandemic, that may not be directly related to the issuer of a security held by a Fund. This pandemic could adversely affect global market, financial, and economic conditions in ways that cannot necessarily be foreseen. Investments in securities of micro-cap, small-cap, and/or mid-cap companies may involve considerably more risk than investments in securities of larger-cap companies. (Please see “Primary Risks for Fund Investors” in the prospectus.) Certain Funds invest a significant portion of their respective assets in foreign companies that may be subject to different risks than investments in securities of U.S. companies, including adverse political, social, economic, or other developments that are unique to a particular country or region. (Please see “Investing in Foreign Securities” in the prospectus.) Therefore, the prices of securities of foreign companies in particular countries or regions may, at times, move in a different direction than those of securities of U.S. companies. (Please see “Primary Risk of Fund Investors” in the prospectus.) Certain Funds generally invest a significant portion of their assets in a limited number of stocks, which may involve considerably more risk than a more broadly diversified portfolio because a decline in the value of any of these stocks would cause their overall value to decline to a greater degree. A broadly diversified portfolio, however, does not ensure a profit or guarantee against loss. This Review and Report must be preceded or accompanied by a prospectus. Please read the prospectus carefully before investing or sending money. Source: MSCI. MSCI makes no express or implied warranties or representations and shall have no liability whatsoever with respect to any MSCI data contained herein. The MSCI data may not be further redistributed or used as a basis for other indexes or any securities or financial products. This report is not approved, endorsed, reviewed or produced by MSCI. None of the MSCI data is intended to constitute investment advice or a recommendation to make (or refrain from making) any kind of investment decision and may not be relied on as such. Russell Investment Group is the source and owner of the trademarks, service marks, and copyrights related to the Russell Indexes. Russell® is a trademark of Russell Investment Group. The Russell 2000 Index is an unmanaged, capitalization-weighted index of domestic small-cap stocks. It measures the performance of the 2,000 smallest publicly traded U.S. companies in the Russell 3000 Index. The Russell Microcap Index includes 1,000 of the smallest securities in the small-cap Russell 2000 Index along with the next smallest eligible securities as determined by Russell. The Russell 2000 Value and Growth Indexes consist of the respective value and growth stocks within the Russell 2000 as determined by Russell Investments. The Russell 2500 is an unmanaged, capitalization-weighted index of the 2,500 smallest publicly traded U.S. companies in the Russell 3000 index. The MSCI ACWI ex USA Small Cap Index is an unmanaged, capitalization-weighted index of global small-cap stocks, excluding the United States. The MSCI ACWI Small Cap Index is an unmanaged, capitalization-weighted index of global small-cap stocks. Index returns include net reinvested dividends and/or interest income. The performance of an index does not represent exactly any particular investment as you cannot invest directly in an index. Distributor: Royce Fund Services, LLC.
This page is not part of the The Royce Funds 2022 Semiannual Report to Shareholders | 7
MANAGER’S DISCUSSION (UNAUDITED)
Royce Dividend Value Fund (RDV)

Chuck Royce
FUND PERFORMANCE
Royce Dividend Value Fund lost less than its primary benchmark, the Russell 2500 Index, for the year-to-date period ended 06/30/22, down 21.0% versus 21.8%, and also lost less than the Russell 2000 Index, its secondary benchmark, which fell 23.4% for the same period. The portfolio also outperformed both the Russell 2500 and Russell 2000 for the one-year period ended 6/30/22. It was the worst first-half performance for both indexes in their more than 40-year history.
WHAT WORKED… AND WHAT DIDN’T
Six of the portfolio’s seven equity sectors had a negative impact on year-to-date performance. The sectors making the largest detractions were Financials, Industrials, and Materials while the only positive impact came from Energy. Information Technology and Health Care detracted least. At the industry level, capital markets (Financials), machinery (Industrials), and banks (Financials) detracted most in 2022’s first half. Oil, gas & consumable fuels and energy equipment & services (both from Energy) contributed while commercial services & supplies (Industrials) was flat.
The Fund’s top-detracting position in 2022’s first half was Carlyle Group, a global investment firm that manages vehicles across four segments, including corporate private equity, real assets, global credit, and investment solutions. The company reported solid results in April that nonetheless fell below analysts’ estimates. In addition, as the Fed continued to tighten in the first half, financing conditions became stricter and borrowing costs rose, which particularly hurt companies involved in private equity. Spirax-Sarco Engineering is a British manufacturer of steam management systems, peristaltic pumps, and other fluid control technologies for a global customer base. The firm reported strong organic revenue and earnings for fiscal 2021 in March and announced optimistic guidance in a late April trading update. However, general recessionary fears appeared to matter more than the company’s results, and its shares tumbled through most of the first half. Rent-A-Center operates rent-to-own stores. Investors shied away from its stock after the company said that both the end of Covid relief funds and rising inflation would likely hurt its customers’ ability to buy and/or make payments. We were equally concerned about how the company’s 2021 acquisition of lease-to-own solutions provider Acima Holdings put leverage on Rent-A-Center’s balance sheet while also adding credit losses to recent financial results. We held shares in the portfolio at the end of June in the hope that the company could engineer a turnaround.
| | | | | |
| | Top Contributors to Performance | | Top Detractors from Performance | |
| | Year-to-Date Through 6/30/22 (%)1 | | Year-to-Date Through 6/30/22 (%)2 | |
| | Gaztransport Et Technigaz | 0.34 | | Carlyle Group | -1.91 | |
| | KBR | 0.20 | | Spirax-Sarco Engineering | -1.66 | |
| | USS | 0.14 | | Rent-A-Center | -1.35 | |
| | Reliance Steel & Aluminum | 0.03 | | Triumph Bancorp | -1.10 | |
| | TGS | 0.02 | | Sprott | -0.89 | |
| | 1 Includes dividends | | | 2 Net of dividends | | |
| | | | | | | |
The portfolio’s top contributor at the position level for the year-to-date period was Gaztransport Et Technigaz, a French multinational naval engineering company that specializes in membrane containment systems that are used to transport and store liquefied gas. While results reported in April were mixed, the company’s order book was robust and expected to remain strong into 2023. Although some exposure to Russia could slow its momentum, investors were happy to keep its share price rising through most of the first half. KBR is a global engineering & construction company that supports the energy, petrochemicals, and civil infrastructure industries. The company reported strong earnings growth for 2022’s fiscal first quarter while also raising fiscal 2022 guidance for revenue, earnings, and cash flow from operations thanks in large part to strong tailwinds in select global end markets that favor the company’s technological capabilities. USS is the leading Japanese operator of second-hand auto auction houses, serving a customer base of 48,000 B2B car dealers. In May, USS reported solid operational performance in which operating earnings grew more than 6% year over year. Despite constrained volumes, USS also continued to gain market share, reaching record highs for both vehicle consignments and completions. The company also provided a positive outlook for the fiscal year ended March 2023.
The Fund’s advantage over its benchmark was attributable to sector allocation decisions in the year-to-date period. At the sector level, stock selection in Industrials, our substantially lower weight in Information Technology, and our higher weighing in Materials had the biggest positive impact versus the benchmark. Conversely, stock picks in Financials, our much lower weighting in Energy, and having no exposure to Utilities detracted most from relative results.
CURRENT POSITIONING AND OUTLOOK
We are currently in what we would describe as a “sum of all fears” environment. War, inflation, slower growth, and rising rates are all understandably frightening investors. Both consumer and investor sentiment are near historic lows, and volatility has been high. We would challenge investors to think about whether our present moment is markedly worse than previous periods—including the Internet Bubble era, the months following the attacks on 9/11, and the Great Financial Crisis. We would argue against this current sentiment, in other words. We have found that the most opportune times to invest are when fear is high and trailing returns are low. Historically, subsequent returns from these levels have been attractive—but only for investors who possessed the necessary fortitude. Coming off a record negative first half during what may well be a late stage of the bear market, the current period looks like a pretty good entry point for prospective long-term small-cap returns.
8 | The Royce Funds 2022 Semiannual Report to Shareholders
| PERFORMANCE AND PORTFOLIO REVIEW (UNAUDITED) | TICKER SYMBOLS RYDVX RDVIX RDIIX RDVCX |
Performance and Expenses
Average Annual Total Return (%) Through 6/30/22
| | JAN-JUN 20221 | 1-YR | 3-YR | 5-YR | 10-YR | 15-YR | SINCE INCEPTION (5/3/04) |
| RDV | -21.05 | -18.87 | 2.12 | 3.99 | 7.45 | 5.89 | 7.41 |
Annual Gross Operating Expenses: 1.54% Annual Net Operating Expenses: 1.34%
1 Not annualized
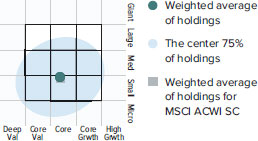
Morningstar Style Map™ As of 6/30/22

The Morningstar Style Map is the Morningstar Style Box™ with the center 75% of fund holdings plotted as the Morningstar Ownership Zone™. The Morningstar Style Box is designed to reveal a fund’s investment strategy. The Morningstar Ownership Zone provides detail about a portfolio’s investment style by showing the range of stock sizes and styles. The Ownership Zone is derived by plotting each stock in the portfolio within the proprietary Morningstar Style Box. Over time, the shape and location of a fund’s ownership zone may vary. See page 88 for additional information.
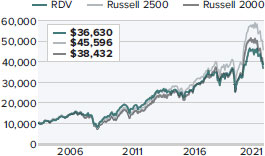
Value of $10,000
Invested on 5/3/04 as of 6/30/22 ($)
Top 10 Positions
% of Net Assets
| KBR | 5.5 |
| Applied Industrial Technologies | 5.3 |
| HEICO Corporation Cl. A | 4.3 |
| Franco-Nevada | 4.2 |
| Lindsay Corporation | 4.1 |
| AptarGroup | 3.7 |
| SEI Investments | 3.6 |
| Sprott | 3.6 |
| Worthington Industries | 3.5 |
| Carlyle Group | 3.4 |
Portfolio Sector Breakdown
% of Net Assets
| Industrials | 39.7 |
| Financials | 26.0 |
| Materials | 18.3 |
| Consumer Discretionary | 4.0 |
| Health Care | 3.2 |
| Information Technology | 1.9 |
| Energy | 1.7 |
| Cash and Cash Equivalents | 5.2 |
Calendar Year Total Returns (%)
| YEAR | RDV |
| 2021 | 20.1 |
| 2020 | 4.5 |
| 2019 | 29.8 |
| 2018 | -16.2 |
| 2017 | 21.7 |
| 2016 | 16.4 |
| 2015 | -5.7 |
| 2014 | -2.1 |
| 2013 | 30.7 |
| 2012 | 16.9 |
| 2011 | -4.5 |
| 2010 | 30.1 |
| 2009 | 37.7 |
| 2008 | -31.5 |
| 2007 | -0.0 |
Upside/Downside Capture Ratios
Periods Ended 6/30/22 (%)
| | UPSIDE | DOWNSIDE |
| 10-Year | 87 | 102 |
| From 6/30/04 (Start of Fund’s First Full Quarter) | 89 | 91 |
Portfolio Diagnostics
| Fund Net Assets | $57 million |
| Number of Holdings | 46 |
| Turnover Rate | 0% |
| Average Market Capitalization1 | $5,004 million |
| Weighted Average P/E Ratio 2,3 | 12.7x |
| Weighted Average P/B Ratio 2 | 2.6x |
| Active Share 4 | 98% |
| U.S. Investments (% of Net Assets) | 69.4% |
| Non-U.S. Investments (% of Net Assets) | 25.4% |
| 1 | Geometric Average. This weighted calculation uses each portfolio holding’s market cap in a way designed to not skew the effect of very large or small holdings; instead, it aims to better identify the portfolio’s center, which Royce believes offers a more accurate measure of average market cap than a simple mean or median. |
| 2 | Harmonic Average. This weighted calculation evaluates a portfolio as if it were a single stock and measures it overall. It compares the total market value of the portfolio to the portfolio’s share in the earnings or book value, as the case may be, of its underlying stocks. |
| 3 | The Fund’s P/E ratio calculation excludes companies with zero or negative earnings (6% of portfolio holdings as of 6/30/22). |
| 4 | Active Share is the sum of the absolute values of the different weightings of each holding in the Fund versus each holding in the benchmark, divided by two. |
Important Performance and Expense Information
All performance information in this Report reflects past performance, is presented on a total return basis, reflects the reinvestment of distributions, and does not reflect the deduction of taxes that a shareholder would pay on fund distributions or the redemption of fund shares. Past performance is no guarantee of future results. Investment return and principal value of an investment will fluctuate, so that shares may be worth more or less than their original cost when redeemed. Shares redeemed within 30 days of purchase may be subject to a 1% redemption fee payable to the Fund, which is not reflected in the performance shown above; if it were, performance would be lower. Current month-end performance may be higher or lower than performance quoted and may be obtained at www.royceinvest.com. All performance and risk information reflects results of the Service Class (its oldest class). Gross operating expenses reflect the Fund’s total gross annual operating expenses for the Service Class and include management fees, 12b-1 distribution and service fees, and other expenses. Net operating expenses reflect contractual fee waivers and/or expense reimbursements. All expense information is reported as of the Fund’s most current prospectus. Royce & Associates has contractually agreed, without right of termination, to waive fees and/or reimburse expenses to the extent necessary to maintain the Service Class’s net annual operating expenses (excluding brokerage commissions, taxes, interest, litigation expenses, acquired fund fees and expenses, and other expenses not borne in the ordinary course of business) at or below 1.34% through April 30, 2023. Regarding the “Top Contributors” and “Top Detractors” tables shown above, the sum of all contributors to, and all detractors from, performance for all securities in the portfolio would approximate the Fund’s year-to-date performance for 2022. The Sharpe Ratio is calculated for a specified period by dividing a fund’s annualized excess returns by its annualized standard deviation. The higher the Sharpe ratio, the better the fund’s historical risk-adjusted performance. Upside Capture Ratio measures a manager’s performance in up markets relative to the Fund’s benchmark (Russell 2500). It is calculated by measuring the Fund’s performance in quarters when the benchmark went up and dividing it by the benchmark’s return in those quarters. Downside Capture Ratio measures a manager’s performance in down markets relative to the Fund’s benchmark. It is calculated by measuring the Fund’s performance in quarters when the benchmark goes down and dividing it by the benchmark’s return in those quarters.
The Royce Funds 2022 Semiannual Report to Shareholders | 9
MANAGER’S DISCUSSION (UNAUDITED)
Royce Global Financial Services Fund (RFS)

Chuck Royce
FUND PERFORMANCE
Royce Global Financial Services Fund lost 22.2% for the year-to-date period ended 6/30/22, losing marginally less than its primary benchmark, the MSCI ACWI Small Cap Index, which was down 22.3% for the same period. Even this slight relative edge helped the Fund to maintain its longer-term advantage over its benchmark. The portfolio outperformed its benchmark for the one-, three-, five-, 10-, and 15-year periods ended 6/30/22. It was the worst first-half performance for the MSCI ACWI Small Cap in its nearly 30-year history.
WHAT WORKED… AND WHAT DIDN’T
The Fund had investments in five sectors during 2022’s first half, all of which detracted from performance: Financials, Real Estate, Information Technology, Materials, and Industrials. At the industry level, capital markets (Financials), real estate management & development (Real Estate), and banks (Financials) detracted most for the year-to-date period, while thrifts & mortgage finance (Financials), professional services (Industrials), and diversified financial services (Financials) detracted least. At the country level, the U.S., Canada, and the United Kingdom detracted the most for 2022’s first half while Bermuda, India, and Poland contributed most.
Canaccord Genuity Group, Canada’s largest independent investment dealer, was the top detractor at the position level in the first half. The company specializes in wealth management and brokerage in capital markets. Results for 2022’s fiscal fourth quarter, which ended on 3/31/22, saw declines in revenue and earnings from 2021’s fiscal fourth quarter. Along with a volatile investment banking climate, the news sent its shares downward. FirstService Corporation is another Canadian business, which offers real estate services for residential and commercial buildings. Results so far in 2022 have been positive, but the stock’s valuation was admittedly stretched after enjoying a stellar 2021, which hurt its shares in the first half of 2022. Sprott is a third Canadian business, providing portfolio management, broker-dealer activities, and consulting services to its clients, primarily in the precious metals area. The portfolio’s top contributor in both 2021 and 1Q22, Sprott’s shares began to fall in March as precious metals prices corrected. Each company was a significant holding in the Fund at the end of June, reflecting our confidence in the long-term prospects for all three.
| | | | | |
| | Top Contributors to Performance | | Top Detractors from Performance | |
| | Year-to-Date Through 6/30/22 (%)1 | | Year-to-Date Through 6/30/22 (%)2 | |
| | StoneX Group | 0.42 | | Canaccord Genuity Group | -1.73 | |
| | Capital City Bank Group | 0.11 | | FirstService Corporation | -1.44 | |
| | Axis Capital Holdings | 0.10 | | Sprott | -1.33 | |
| | CRISIL | 0.09 | | Carlyle Group | -1.31 | |
| | FRP Holdings | 0.09 | | Intermediate Capital Group | -1.27 | |
| | 1 Includes dividends | | | 2 Net of dividends | | |
| | | | | | | |
The Fund’s top contributor was New York City-based financial services firm StoneX Group, which benefited from the robust operating environment in its global payments business and strong margin growth rooted in the effective management of its cost structure. Rising interest rates have also benefited the company’s asset sensitivity. Capital City Bank Group is a Florida based full-service bank. Its shares rose again after the company announced solid second-quarter results that were driven by loan growth, credit quality, rising rates, wealth management, and lower expenses. With headquarters in Bermuda, Axis Capital Holdings offers property, workers compensation, professional liability, casualty, and marine and aviation insurance to a global customer base. The company reported strong 1Q22 results in April, with 20% premium growth based on double-digit rate increases, along with record new business, particularly in its Excess & Surplus, Wholesale, and Specialty channels.
The portfolio’s narrow advantage over the MSCI ACWI Small Cap was attributable to sector allocation in the year-to-date period, with a lack of exposure to Consumer Discretionary and Health Care helping most—as did the Fund’s cash holdings. Conversely, our lack of exposure to Energy, stock selection in Real Estate, and lack of exposure to Utilities detracted most from relative results in the first half.
CURRENT POSITIONING AND OUTLOOK
With anxieties around inflation, interest rates, energy prices, and recession, we appear to be at a “sum of all fears” moment. In this light, we have found that the most opportune times to invest are when fear is high and trailing returns are low. The VIX—the index that tracks volatility for the S&P 500 Index—is currently flashing a fear signal, ending June in the top 20% of its highest average monthly readings since its inception. Moreover, the annualized three-year return for the MSCI ACWI Small Cap Index at the end of June was 4.4%—almost half the level of its three-year monthly rolling average since inception of 8.3%. Historically, subsequent returns from these levels have been attractive—but only for investors who possessed the necessary fortitude to act. Financial stocks have performed in line with the market decline, when they have often dropped more in prior declines. We anticipate that when investor anxiety dissipates and optimism returns, financial stocks may also outperform in the recovery as the assets under management for asset managers rebounds, securities underwriting recovers, and bank lending increases.
10 | The Royce Funds 2022 Semiannual Report to Shareholders
| PERFORMANCE AND PORTFOLIO REVIEW (UNAUDITED) | TICKER SYMBOLS RYFSX RGFIX |
Performance and Expenses
Average Annual Total Return (%) Through 6/30/22
| | JAN-JUN 20221 | 1-YR | 3-YR | 5-YR | 10-YR | 15-YR | SINCE INCEPTION (12/31/03) |
| RFS | -22.22 | -20.54 | 4.81 | 5.26 | 9.61 | 5.65 | 7.38 |
Annual Gross Operating Expenses: 1.82% Annual Net Operating Expenses: 1.53%
1 Not annualized
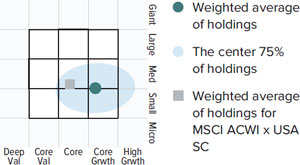
Morningstar Style Map™ As of 6/30/22
The Morningstar Style Map is the Morningstar Style Box™ with the center 75% of fund holdings plotted as the Morningstar Ownership Zone™. The Morningstar Style Box is designed to reveal a fund’s investment strategy. The Morningstar Ownership Zone provides detail about a portfolio’s investment style by showing the range of stock sizes and styles. The Ownership Zone is derived by plotting each stock in the portfolio within the proprietary Morningstar Style Box. Over time, the shape and location of a fund’s ownership zone may vary. See page 88 for additional information.
Value of $10,000
Invested on 12/31/03 as of 6/30/22 ($)

Top 10 Positions
% of Net Assets
| Sprott | 5.2 |
| Popular | 5.1 |
| Franco-Nevada | 4.6 |
| Tel Aviv Stock Exchange | 4.5 |
| First Citizens BancShares Cl. A | 4.2 |
| FirstService Corporation | 3.7 |
| E-L Financial | 3.7 |
| Charles Schwab | 3.4 |
| Altus Group | 3.0 |
| BOK Financial | 2.9 |
Portfolio Industry Breakdown
% of Net Assets
| Capital Markets | 50.7 |
| Banks | 17.3 |
| Real Estate Management & Development | 8.5 |
| Insurance | 7.3 |
| Metals & Mining | 4.6 |
| Diversified Financial Services | 2.4 |
| Software | 1.5 |
| Thrifts & Mortgage Finance | 1.4 |
| Electronic Equipment, Instruments & Components | 1.1 |
| Closed-End Funds | 1.1 |
| IT Services | 0.9 |
| Professional Services | 0.5 |
| Cash and Cash Equivalents | 2.7 |
Upside/Downside Capture Ratios
Periods Ended 6/30/22 (%)
| | UPSIDE | DOWNSIDE |
| 10-Year | 98 | 86 |
| Fund’s First Full Quarter (12/31/03) | 88 | 87 |
Calendar Year Total Returns (%)
| YEAR | RFS |
| 2021 | 20.3 |
| 2020 | 15.3 |
| 2019 | 24.2 |
| 2018 | -13.4 |
| 2017 | 22.5 |
| 2016 | 12.9 |
| 2015 | -4.7 |
| 2014 | 3.5 |
| 2013 | 42.0 |
| 2012 | 20.7 |
| 2011 | -11.3 |
| 2010 | 18.5 |
| 2009 | 32.1 |
| 2008 | -35.4 |
| 2007 | -4.7 |
Portfolio Country Breakdown1,2
% of Net Assets
| United States | 48.5 |
| Canada | 25.2 |
| Israel | 4.6 |
| Bermuda | 3.7 |
| United Kingdom | 3.0 |
| India | 2.6 |
| France | 1.7 |
| New Zealand | 1.6 |
| South Africa | 1.6 |
¹ Represents countries that are 1.5% or more of net assets.
² Securities are categorized by the country of their headquarters.
Portfolio Diagnostics
| Fund Net Assets | $27 million |
| Number of Holdings | 51 |
| Turnover Rate | 2% |
| Average Market Capitalization1 | $2,646 million |
| Weighted Average P/E Ratio 2,3 | 9.8x |
| Weighted Average P/B Ratio 2 | 1.8x |
| Active Share 4 | 99% |
| 1 | Geometric Average. This weighted calculation uses each portfolio holding’s market cap in a way designed to not skew the effect of very large or small holdings; instead, it aims to better identify the portfolio’s center, which Royce believes offers a more accurate measure of average market cap than a simple mean or median. |
| 2 | Harmonic Average. This weighted calculation evaluates a portfolio as if it were a single stock and measures it overall. It compares the total market value of the portfolio to the portfolio’s share in the earnings or book value, as the case may be, of its underlying stocks. |
| 3 | The Fund’s P/E ratio calculation excludes companies with zero or negative earnings (5% of portfolio holdings as of 6/30/22). |
| 4 | Active Share is the sum of the absolute values of the different weightings of each holding in the Fund versus each holding in the benchmark, divided by two. |
Important Performance and Expense Information
All performance information in this Report reflects past performance, is presented on a total return basis, reflects the reinvestment of distributions, and does not reflect the deduction of taxes that a shareholder would pay on fund distributions or the redemption of fund shares. Past performance is no guarantee of future results. Investment return and principal value of an investment will fluctuate, so that shares may be worth more or less than their original cost when redeemed. Shares redeemed within 30 days of purchase may be subject to a 1% redemption fee payable to the Fund, which is not reflected in the performance shown above; if it were, performance would be lower. Current month-end performance may be higher or lower than performance quoted and may be obtained at www.royceinvest.com. Gross operating expenses reflect the Fund’s gross total annual operating expenses for the Service Class and include management fees, 12b-1 distribution and service fees, other expenses and acquired fund fees and expenses. Net operating expenses reflect contractual fee waivers and/or expense reimbursements. All expense information is reported as of the Fund’s most current prospectus. Royce & Associates has contractually agreed to waive fees and/or reimburse expenses to the extent necessary to maintain the Fund’s net annual operating expenses, (excluding brokerage commissions, taxes, interest, litigation expenses, acquired fund fees and expenses, and other expenses not borne in the ordinary course of business), at or below 1.49% through April 30, 2023. Acquired fund fees and expenses reflect the estimated amount of the fees and expenses incurred indirectly by the Fund through its investments in mutual funds, hedge funds, private equity funds, and other investment companies. Regarding the “Top Contributors” and “Top Detractors” tables shown above, the sum of all contributors to, and all detractors from, performance for all securities in the portfolio would approximate the Fund’s year-to-date performance for 2022. Upside Capture Ratio measures a manager’s performance in up markets relative to the Fund’s benchmark (MSCI ACWI SC). It is calculated by measuring the Fund’s performance in quarters when the benchmark went up and dividing it by the benchmark’s return in those quarters. Downside Capture Ratio measures a manager’s performance in down markets relative to the Fund’s benchmark. It is calculated by measuring the Fund’s performance in quarters when the benchmark goes down and dividing it by the benchmark’s return in those quarters.
The Royce Funds 2022 Semiannual Report to Shareholders | 11
MANAGERS’ DISCUSSION (UNAUDITED)
Royce International Premier Fund (RIP)

Mark Rayner, CA, Mark Fischer
FUND PERFORMANCE
Royce International Premier Fund was down 27.0% for the year-to-date period ended 06/30/22 versus a decline of 22.9% for its benchmark, the MSCI ACWI ex USA Small Cap Index. Longer-term relative results were better—the portfolio outperformed its benchmark for the five-, 10-year, and since inception (12/31/10) periods ended 6/30/22.
WHAT WORKED… AND WHAT DIDN’T
Seven of the portfolio’s eight sectors made a negative impact on year-to-date performance, with Industrials, Information Technology, and Materials having the largest negative effect. The only positive contribution came from Consumer Discretionary (and the impact of cash was incrementally positive) while Real Estate and Communication Services detracted least. At the industry level, software (Information Technology), machinery (Industrials), and chemicals (Materials) detracted most in 2022’s first half while specialty retail (Consumer Discretionary), where we held only USS, was the only positive contributor. Electronic equipment, instruments & components (Information Technology) and real estate management & development (Real Estate)—where our sole position was Canada’s Altus Group—detracted least. The United Kingdom, Japan, and Germany detracted most from first-half results at the country level while India, Brazil, and Poland were the top contributors.
The portfolio’s top detractor at the position level was Australia’s Bravura Solutions, which provides software solutions for the wealth management and fund administration industries. Sonata, its primary product, is a front-to-back-office platform that allows customers to quickly and easily develop and distribute new products, engage more intelligently with their customers, and navigate an increasingly complex regulatory environment. Its shares have been hampered by significant pandemic-related project deferrals that, when coupled with wage inflation, resulted in a revised near-term growth outlook. The combination of more muted near-term expectations and uncertainty around recent management departures led investors to avoid the stock. While we like the company’s strong balance sheet and its historically low earnings multiple, we decided to trim our position during 2Q22. Listed in the U.K., Learning Technologies Group provides professional services and digital tools to help companies recruit, train, manage, and retain their employees via a ‘Content & Services’ segment, which provides bespoke and often complex training to larger organizations, and a ‘Software & Platforms’ segment that offers software that helps companies hire, manage performance, administer and track learning, and handle organizational issues. After reporting positive results in April, the company delayed the release of full-year results by a week to sort out an accounting adjustment from the prior year that nonetheless caused a sell-off, even as it had no effect on net assets, cash flow, or the P&L, and was of inconsequential proportions. We added shares in the aftermath.
| | | | | | | |
| | Top Contributors to Performance | | | Top Detractors from Performance | | |
| | Year-to-Date Through 6/30/22 (%)1 | | | Year-to-Date Through 6/30/22 (%)2 | | |
| | | | | | | |
| | LifeWorks | 0.86 | | Bravura Solutions | -1.13 | |
| | USS | 0.19 | | Learning Technologies Group | -0.95 | |
| | AIA Engineering | 0.15 | | DiscoverIE Group | -0.91 | |
| | TOTVS | 0.05 | | New Work | -0.87 | |
| | Zuken | 0.02 | | XP Power | -0.87 | |
| | 1 Includes dividends | | | 2 Net of dividends | | |
| | | | | | | |
The Fund’s top contributor was LifeWorks, a Canada-based global leader that offers solutions for employee well-being. Its technology-enabled services include confidential counselling and therapy, employee engagement tools, health programs, and even outsourced design and administration of pension and benefit plans. The need for such services is vast, with nearly half of Americans, for example, expressing the need for mental health support and an increasing proportion at risk of anxiety disorders since the pandemic. We were attracted to LifeWorks due to its provision of a low-cost but mission-critical solution to a diversified customer base. Its shares rose sharply in mid-June when Telus, one of Canada’s three largest telecom firms, agreed to acquire the company at a significant premium. USS is the leading Japanese operator of second-hand auto auction houses, serving a customer base of 48,000 B2B car dealers. In May, USS reported solid operational performance in which operating earnings grew more than 6% year over year. Despite constrained volumes, USS also continued to gain market share, reaching record highs for both vehicle consignments and completions. In addition, the company provided a positive outlook for the fiscal year ending March 2023.
CURRENT POSITIONING AND OUTLOOK
The international small-cap market has been driven by inflation, rising interest rates, supply chain disruptions, consumers under pressure, and the war in Ukraine. As long-term investors, we do not attempt to anticipate how these issues may affect stock prices over the short term. As we have previously noted, however, we also believe that our holdings remain comparatively well positioned to maintain their profitability against these interrelated challenges via our focus on asset-light, B2B companies with high returns on invested capital (ROIC) and strong balance sheets that also enjoy resilient demand, enduring pricing power, and superior operating efficiency. More recently, a sixth issue has gained prominence in investors’ minds—the possibility of recession in the world’s main economies. Very few companies are truly acyclical, and ours will not be immune to an economic downturn. At the same time, we think that resilient demand, pricing power, operating efficiency, cash flow generation, and strong balance sheets are all factors that should help companies better weather economic headwinds. As always, we are sticking to our knitting while also noting that the negative returns of the last two quarters gave us the opportunity to invest in premier companies within our extensive hand-picked database at what we think are attractive earnings multiples.
12 | The Royce Funds 2022 Semiannual Report to Shareholders
| PERFORMANCE AND PORTFOLIO REVIEW (UNAUDITED) | TICKER SYMBOLS RYIPX RIPNX RINPX RIPIX |
Performance and Expenses
Average Annual Total Return (%) Through 6/30/22
| | JAN-JUN 20221 | 1-YR | 3-YR | 5-YR | 10-YR | SINCE INCEPTION (12/31/10) |
| RIP | -27.00 | -27.43 | -0.39 | 3.64 | 7.58 | 5.63 |
| Annual Gross Operating Expenses: 1.54% Annual Net Operating Expenses: 1.44% |
1 Not annualized
Relative Returns: Monthly Rolling Average Annual Return Periods
Since Inception Through 6/30/22
On a monthly rolling basis, The Fund outperformed the MSCI ACWI x USA SC in 100% of all 10-year periods; 100% of all 5-year periods; and 64% of all 1-year periods.
| PERIODS BEATING THE INDEX | FUND AVG (%)1 | INDEX AVG (%)1 |
| 10-year | 19/19 | | 100% | 9.6 | 7.3 |
| 5-year | 79/79 | | 100% | 9.8 | 6.5 |
| 1-year | 81/127 | | 64% | 9.5 | 7.8 |
1Average of monthly rolling average annual total returns over the specified periods.
Morningstar Style Map™ As of 6/30/22
The Morningstar Style Map is the Morningstar Style Box™ with the center 75% of fund holdings plotted as the Morningstar Ownership Zone™. The Morningstar Style Box is designed to reveal a fund’s investment strategy. The Morningstar Ownership Zone provides detail about a portfolio’s investment style by showing the range of stock sizes and styles. The Ownership Zone is derived by plotting each stock in the portfolio within the proprietary Morningstar Style Box. Over time, the shape and location of a fund’s ownership zone may vary. See page 88 for additional information.
Value of $10,000
Invested on 12/31/10 as of 6/30/22 ($)

| Top 10 Positions | |
| % of Net Assets | |
| | |
| Hansen Technologies | 3.2 |
| IPH | 3.1 |
| TKC Corporation | 2.9 |
| OBIC Business Consultants | 2.9 |
| Loomis | 2.8 |
| Restore | 2.5 |
| Victrex | 2.5 |
| BML | 2.5 |
| GVS | 2.4 |
| DiaSorin | 2.3 |
| Portfolio Sector Breakdown | |
| % of Net Assets | |
| | |
| Industrials | 39.2 |
| Information Technology | 26.0 |
| Health Care | 10.4 |
| Materials | 7.5 |
| Communication Services | 4.2 |
| Financials | 4.1 |
| Real Estate | 1.3 |
| Consumer Discretionary | 1.1 |
| Preferred Stock | 2.1 |
| Cash and Cash Equivalents | 4.1 |
| Upside/Downside Capture Ratios | |
| Periods Ended 6/30/22 (%) | | |
| | | |
| | UPSIDE | DOWNSIDE |
| 10-Year | 99 | 88 |
| Fund’s First Full Quarter (12/31/10) | 100 | 87 |
| Calendar Year Total Returns (%) | |
| YEAR | RIP |
| 2021 | 5.8 |
| 2020 | 15.7 |
| 2019 | 34.2 |
| 2018 | -12.8 |
| 2017 | 39.8 |
| 2016 | -1.1 |
| 2015 | 16.2 |
| 2014 | -8.2 |
| 2013 | 18.3 |
| 2012 | 23.4 |
| 2011 | -16.8 |
| Portfolio Country Breakdown 1,2 | |
| % of Net Assets | |
| Japan | 19.8 |
| United Kingdom | 16.8 |
| Sweden | 9.7 |
| Australia | 8.6 |
| Germany | 6.8 |
| Switzerland | 6.2 |
| Italy | 5.7 |
| Canada | 4.1 |
| South Korea | 3.5 |
¹ Represents countries that are 3% or more of net assets.
² Securities are categorized by the country of their headquarters.
| Portfolio Diagnostics | |
| Fund Net Assets | $840 million |
| Number of Holdings | 59 |
| Turnover Rate | 16% |
| Average Market Capitalization1 | $1,546 million |
| Weighted Average P/E Ratio 2,3 | 19.0x |
| Weighted Average P/B Ratio 2 | 2.7x |
| Active Share 4 | 99% |
| 1 | Geometric Average. This weighted calculation uses each portfolio holding’s market cap in a way designed to not skew the effect of very large or small holdings; instead, it aims to better identify the portfolio’s center, which Royce believes offers a more accurate measure of average market cap than a simple mean or median. |
| 2 | Harmonic Average. This weighted calculation evaluates a portfolio as if it were a single stock and measures it overall. It compares the total market value of the portfolio to the portfolio’s share in the earnings or book value, as the case may be, of its underlying stocks. |
| 3 | The Fund’s P/E ratio calculation excludes companies with zero or negative earnings (0% of portfolio holdings as of 6/30/22). |
| 4 | Active Share is the sum of the absolute values of the different weightings of each holding in the Fund versus each holding in the benchmark, divided by two. |
Important Performance and Expense Information
All performance information in this Report reflects past performance, is presented on a total return basis, reflects the reinvestment of distributions, and does not reflect the deduction of taxes that a shareholder would pay on fund distributions or the redemption of fund shares. Past performance is no guarantee of future results. Investment return and principal value of an investment will fluctuate, so that shares may be worth more or less than their original cost when redeemed. Shares redeemed within 30 days of purchase may be subject to a 2% redemption fee payable to the Fund, which is not reflected in the performance shown above; if it were, performance would be lower. Current month-end performance may be higher or lower than performance quoted and may be obtained at www.royceinvest.com. All performance and risk information reflects results of the Service Class (its oldest class). Price and total return information is based on net asset values for shareholder transactions. Certain immaterial adjustments were made to the net assets of Royce International Premier Fund at 12/31/19 and 12/31/20 for financial reporting purposes, and as a result the calendar year total returns based on those net asset values differ from the adjusted net asset values and calendar year total returns reported in the Financial Highlights. Gross operating expenses reflect total gross annual operating expenses for the Service Class and include management fees, 12b-1 distribution and service fees, and other expenses. Net operating expenses reflect contractual fee waivers and/or expense reimbursements. All expense information is reported as of the Fund’s most current prospectus. Royce & Associates has contractually agreed to waive its fees and/or reimburse operating expenses to the extent necessary to maintain the Fund’s net annual operating expenses, (excluding brokerage commissions, taxes, interest, litigation expenses, acquired fund fees and expenses, and other expenses not borne in the ordinary course of business), at or below 1.44% through April 30, 2023. Regarding the “Top Contributors” and “Top Detractors” tables shown above, the sum of all contributors to, and all detractors from, performance for all securities in the portfolio would approximate the Fund’s year-to-date performance for 2022. Upside Capture Ratio measures a manager’s performance in up markets relative to the Fund’s benchmark (MSCI ACWI x USA SC). It is calculated by measuring the Fund’s performance in quarters when the benchmark went up and dividing it by the benchmark’s return in those quarters. Downside Capture Ratio measures a manager’s performance in down markets relative to the Fund’s benchmark. It is calculated by measuring the Fund’s performance in quarters when the benchmark goes down and dividing it by the benchmark’s return in those quarters.
The Royce Funds 2022 Semiannual Report to Shareholders | 13
MANAGERS’ DISCUSSION (UNAUDITED)
Royce Micro-Cap Fund (RMC)

Jim Stoeffel, Brendan Hartman
FUND PERFORMANCE
Royce Micro-Cap Fund was down 28.0% for the year-to-date period ended 06/30/22, versus a loss of 25.1% for its primary benchmark, the Russell Microcap Index, and a 23.4% loss for the small-cap Russell 2000 Index, its secondary benchmark. The portfolio outperformed the Russell Microcap for the one, three-, and five-year periods ended 6/30/22 while also beating the Russell 2000 for the one-, three-, five-, 25-, and 30-year periods ended 6/30/22.
WHAT WORKED… AND WHAT DIDN’T
Seven of the portfolio’s nine sectors had a negative impact on year-to-date performance. Information Technology, Industrials, and Consumer Discretionary detracted most at the sector level, while the only positive impact came from Energy and Real Estate—as well as the Fund’s cash holdings. Semiconductors & semiconductor equipment (Information Technology), specialty retail (Consumer Discretionary), and machinery (Industrials) detracted most for the year-to-date period at the industry level, while software (Information Technology), energy equipment & services (Energy), and real estate management & development (Real Estate) were the largest contributors.
The Fund’s top detractor at the position level was value-priced apparel retailer Citi Trends. The company reduced its second-half outlook given inflationary pressures that are crimping the spending patterns of its core customer base. We think its shares offered attractive value at the end of June in light of the successful turnaround engineered by current management and the long-term outlook for continued growth in its niche markets. Although Aspen Aerogels has enjoyed success winning new customers in the electric vehicle original equipment manufacturer (OEM) space for its unique automotive battery insulation materials, its stock fell when the company announced an equity and debt offering to fund a doubling of capacity. The offering was subsequently pulled while the company explored alternative financing options. MeiraGTx Holdings develops ocular gene therapy and has a partnership with Johnson & Johnson. The two companies continue to make progress on a drug that treats retinitis pigmentosa, and data from recent clinical studies was positive. Its shares nonetheless sold off along with many in the Health Care sector when valuations compressed.
| | | | | | | |
| | Top Contributors to Performance | | | Top Detractors from Performance | | |
| | Year-to-Date Through 6/30/22 (%)1 | | | Year-to-Date Through 6/30/22 (%)2 | | |
| | | | | | | |
| | StoneX Group | 0.19 | | Citi Trends | -0.82 | |
| | Resources Connection | 0.19 | | Aspen Aerogels | -0.82 | |
| | Investar Holding Corporation | 0.18 | | MeiraGTx Holdings | -0.73 | |
| | Agilysys | 0.14 | | Shyft Group (The) | -0.70 | |
| | Profire Energy | 0.12 | | Bioventus Cl. A | -0.66 | |
| | 1 Includes dividends | | | 2 Net of dividends | | |
| | | | | | | |
The Fund’s top contributor was financial services firm StoneX Group, which benefited from the robust operating environment in its global payments business and strong margin growth rooted in the effective management of its cost structure. Rising interest rates have also benefited the company’s asset sensitivity. Resources Connection is a professional services and consulting firm whose turnaround efforts and execution have been solid in a strong demand climate for its mid-level finance and accounting professionals. Investar Holding Corporation owns Investar Bank. The company successfully reduced costs while favorable loan growth and expanding net interest margin have been driving earnings growth.
The portfolio’s disadvantage versus the Russell Microcap Index came from both stock selection and sector allocation in 2022’s first half. A lower weight in Energy, stock picks in Consumer Discretionary, and much greater exposure to Information Technology had the biggest negative impact versus the primary benchmark. Conversely, our substantially lower weight in Health Care, large weight in Industrials, and the Fund’s cash holdings contributed to relative results.
CURRENT POSITIONING AND OUTLOOK
The ongoing war, rising interest rates, and inflationary pressures presented challenges in the first half. How much the Fed tightens into a slowing economy and whether we enter a recession appear to be the key determinants as to when stock prices recover. There is a strong possibility inflation peaked in 2Q22, as yields and energy prices reached highs in mid-June. Consumer confidence is at an all-time low—which is remarkable, considering it is lower than during the crash of the dot com bubble, the Financial Crisis, and Covid. Current uncertainties notwithstanding, we remain confident in what we are holding. Many of our micro-cap holdings boast strong balance sheets that should help them weather whatever economic slowdown or recession we ultimately endure, as well as help them gain market share and acquire attractive assets as seller expectations are reset. We have been trimming some inflation beneficiaries, most notably in areas such as basic materials. Infrastructure and construction firms continue to benefit from steady demand for steel and other materials to build roads and bridges, and we expect the federal infrastructure bill to begin positively impacting spend in the next several quarters. We also remain constructive on the aerospace OEM build cycle for narrow-body aircraft, which is seeing strong demand. The global need for communications equipment has not diminished, despite current conditions. The same is generally true for many healthcare companies—so we are adding to existing names and researching potential new ideas. Conversely, we see Consumer Discretionary as likely to remain weak, at least until it is clear that inflation is stabilizing. Given the sharp market selloff, we are also looking for new investment opportunities among small-cap companies that have fallen into the micro-cap universe, particularly hard hit small-cap growth companies. As always, we seek companies that we believe offer the best combination of attractively low valuations with strong long-term growth potential.
14 | The Royce Funds 2022 Semiannual Report to Shareholders
| PERFORMANCE AND PORTFOLIO REVIEW (UNAUDITED) | TICKER SYMBOLS RYOTX RMCFX RYMCX |
Performance and Expenses
Average Annual Total Return (%) Through 6/30/22
| | JAN-JUN 20221 | 1-YR | 3-YR | 5-YR | 10-YR | 15-YR | 20-YR | 25-YR | 30-YR | SINCE INCEPTION (12/31/91) |
| RMC | -27.96 | -24.66 | 8.78 | 6.02 | 5.67 | 4.08 | 7.21 | 8.38 | 10.02 | 10.09 |
| Annual Operating Expenses: 1.20% |
1 Not annualized
Morningstar Style Map™ As of 6/30/22
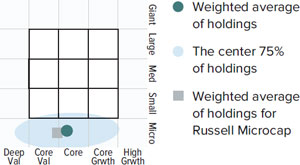
The Morningstar Style Map is the Morningstar Style Box™ with the center 75% of fund holdings plotted as the Morningstar Ownership Zone™. The Morningstar Style Box is designed to reveal a fund’s investment strategy. The Morningstar Ownership Zone provides detail about a portfolio’s investment style by showing the range of stock sizes and styles. The Ownership Zone is derived by plotting each stock in the portfolio within the proprietary Morningstar Style Box. Over time, the shape and location of a fund’s ownership zone may vary. See page 88 for additional information.
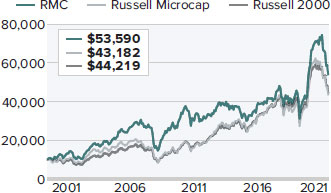
Value of $10,000
Invested on 6/30/00 (Russell Microcap Index Inception) as of 6/30/22 ($)
| Top 10 Positions | |
| % of Net Assets | |
| | |
| Digi International | 1.5 |
| Photronics | 1.4 |
| Northwest Pipe | 1.4 |
| Resources Connection | 1.4 |
| Investar Holding Corporation | 1.4 |
| Distribution Solutions Group | 1.3 |
| HarborOne Bancorp | 1.2 |
| HBT Financial | 1.2 |
| BayCom Corporation | 1.2 |
| Heritage-Crystal Clean | 1.2 |
| Portfolio Sector Breakdown | |
| % of Net Assets | |
| | |
| Information Technology | 26.2 |
| Industrials | 24.8 |
| Financials | 14.1 |
| Consumer Discretionary | 10.2 |
| Health Care | 9.5 |
| Materials | 4.4 |
| Communication Services | 4.3 |
| Energy | 2.8 |
| Real Estate | 0.6 |
| Cash and Cash Equivalents | 3.1 |
| Calendar Year Total Returns (%) | |
| YEAR | RMC |
| 2021 | 31.0 |
| 2020 | 24.5 |
| 2019 | 21.2 |
| 2018 | -8.9 |
| 2017 | 5.4 |
| 2016 | 19.7 |
| 2015 | -13.3 |
| 2014 | -4.1 |
| 2013 | 21.3 |
| 2012 | 8.0 |
| 2011 | -12.1 |
| 2010 | 30.1 |
| 2009 | 55.7 |
| 2008 | -40.9 |
| 2007 | 7.1 |
Upside/Downside Capture Ratios
Periods Ended 6/30/22 (%)
| | UPSIDE | DOWNSIDE |
| 10-Year | 77 | 87 |
| From 6/30/00 (Russell Microcap Index Inception) | 91 | 83 |
| Portfolio Diagnostics | |
| Fund Net Assets | $288 million |
| Number of Holdings | 131 |
| Turnover Rate | 7% |
| Average Market Capitalization1 | $450 million |
| Weighted Average P/B Ratio 2 | 1.6x |
| Active Share 3 | 92% |
| U.S. Investments (% of Net Assets) | 86.1% |
| Non-U.S. Investments (% of Net Assets) | 10.8% |
| 1 | Geometric Average. This weighted calculation uses each portfolio holding’s market cap in a way designed to not skew the effect of very large or small holdings; instead, it aims to better identify the portfolio’s center, which Royce believes offers a more accurate measure of average market cap than a simple mean or median. |
| 2 | Harmonic Average. This weighted calculation evaluates a portfolio as if it were a single stock and measures it overall. It compares the total market value of the portfolio to the portfolio’s share in the earnings or book value, as the case may be, of its underlying stocks. |
| 3 | Active Share is the sum of the absolute values of the different weightings of each holding in the Fund versus each holding in the benchmark, divided by two. |
Important Performance and Expense Information
All performance information in this Report reflects past performance, is presented on a total return basis, reflects the reinvestment of distributions, and does not reflect the deduction of taxes that a shareholder would pay on fund distributions or the redemption of fund shares. Past performance is no guarantee of future results. Investment return and principal value of an investment will fluctuate, so that shares may be worth more or less than their original cost when redeemed. Shares redeemed within 30 days of purchase may be subject to a 1% redemption fee payable to the Fund, which is not reflected in the performance shown above; if it were, performance would be lower. Current month-end performance may be higher or lower than performance quoted and may be obtained at www.royceinvest.com. All performance and risk information reflects results of the Investment Class (its oldest class). Price and total return information is based on net asset values calculated for shareholder transactions. Operating expenses reflect the Fund’s total annual operating expenses for the Investment Class as of the Fund’s most current prospectus and include management fees and other expenses. Regarding the “Top Contributors” and “Top Detractors” tables shown above, the sum of all contributors to, and all detractors from, performance for all securities in the portfolio would approximate the Fund’s year-to-date performance for 2022. Upside Capture Ratio measures a manager’s performance in up markets relative to the Fund’s benchmark (Russell Microcap Index). It is calculated by measuring the Fund’s performance in quarters when the benchmark went up and dividing it by the benchmark’s return in those quarters. Downside Capture Ratio measures a manager’s performance in down markets relative to the Fund’s benchmark. It is calculated by measuring the Fund’s performance in quarters when the benchmark goes down and dividing it by the benchmark’s return in those quarters.
The Royce Funds 2022 Semiannual Report to Shareholders | 15
MANAGERS’ DISCUSSION (UNAUDITED)
Royce Pennsylvania Mutual Fund® (PMF)

Steven McBoyle, Jay Kaplan, CFA®,
Chuck Royce, Miles Lewis, CFA®,
Andrew Palen, Lauren Romeo, CFA®
FUND PERFORMANCE
Even in a highly challenging market, our flagship portfolio, Royce Pennsylvania Mutual Fund, maintained its long-term advantages over its small-cap benchmark, the Russell 2000 Index, outperforming the small-cap index for the one-, three-, five-, 20, 25-, 30-, 35-, and 40-year periods ended 6/30/22. The Fund also lost less than its benchmark for the year-to-date period ended 6/30/22, down 21.2% versus a decline of 23.4% for the Russell 2000. It was the worst first-half performance for the small-cap benchmark in its more than 40-year history.
WHAT WORKED… AND WHAT DIDN’T
Nine of the 10 equity sectors in which the Fund held investments detracted from 2022’s first-half performance, with the biggest negative impacts coming from Industrials, Information Technology, and Financials. Energy made a small positive contribution while the smallest detractions came from Consumer Staples and Real Estate. At the industry level, two areas in Information Technology—semiconductors & semiconductor equipment and electronic equipment, instruments & components—detracted most, followed by banks from Financials. Each was among the Fund’s four largest industry weightings for the year-to-date period ended 6/30/22 (while the two industries from Information Technology were also significantly overweight versus the Russell 2000). These sizable exposures indicate our high long-term confidence in spite of recent stock price declines. The top-contributing industries were energy equipment & services (Energy), containers & packaging (Materials), and pharmaceuticals (Health Care).
The top detractor at the position level was Triumph Bancorp. The company’s payment platform has been changing how payments and invoices are handled in the trucking industry by better connecting carriers, shippers, factoring companies, and freight brokers in a way that allows much more efficient handling of invoices and other payments. A stellar 2021 share price run led to significant multiple expansion—and higher multiple stocks were hit hard in the first half of 2022 by rising rates. However, its fundamentals remain strong, and at the end of June we thought its shares were attractively valued. Mesa Laboratories develops and manufactures electronic measurement instruments for industrial and hemodialysis customers, including pipeline flow meters and calibration instruments. The company’s relatively strong operating performance was undone by underperformance for much of the Health Care sector and more specifically by supply chain, procurement, and other impediments to its operations, particularly the two-month Shanghai-area shutdown. We held a position at the end of June, seeing its challenges as transitory.
| | | | | |
| | Top Contributors to Performance | | Top Detractors from Performance | |
| | Year-to-Date Through 6/30/22 (%)1 | | Year-to-Date Through 6/30/22 (%)2 | |
| | | | | |
| | Meridian Bioscience | 0.22 | | Triumph Bancorp | -0.41 | |
| | Haemonetics Corporation | 0.16 | | Mesa Laboratories | -0.40 | |
| | Intertape Polymer Group | 0.13 | | Element Solutions | -0.37 | |
| | Antero Resources | 0.13 | | Builders FirstSource | -0.37 | |
| | Pason Systems | 0.12 | | FARO Technologies | -0.34 | |
| | 1 Includes dividends | | | 2 Net of dividends | | |
| | | | | | | |
The Fund’s top contributor at the position level was Meridian Bioscience, a profitable health care company that manufactures consumable reagents used in in-vitro diagnostic (IVD) tests and develops IVD tests and instruments. The company has a particularly strong niche position in various gastrointestinal diseases. Following a 27% gain in 1Q22 on a reacceleration in its diagnostic test volume growth and new product-driven share gains in reagents, its stock rose 17% in 2Q22 despite very little public, company-specific news. The reason behind its rise was revealed on 7/7/22, when Meridian announced an agreement to be acquired by SD Biosensor, a South Korean healthcare company, and its private equity partner for $34 per share in cash. While this was a minimal premium to the current price, it was 32% higher than Meridian’s stock price at the time the initial offer was made privately a few months earlier. Blood and plasma supplies and services provider Haemonetics Corporation also contributed at the position level. The company reported encouraging fiscal 4Q22 results in mid-May, including improved revenues, earnings, and margins driven by growth in its hospital business, donor resilience in blood centers, and the rollout of Persona, a proprietary integrated plasma collection solution built upon the company’s NexSys platform that is designed to improve plasma yields.
The Fund’s relative advantage over its benchmark came entirely from stock selection in 2022’s first half, with eight equity sectors contributing to outperformance. At the sector level, stock picks and our lower exposure to Health Care both made positive impacts while stock selection drove the Fund’s relative advantage in Consumer Discretionary. The portfolio’s cash position also helped versus the benchmark. Conversely, the portfolio’s relative results were hurt by our lower exposure to Energy, lack of exposure to Utilities, and a combination of stock picks and our lower weighting in Consumer Staples.
CURRENT POSITIONING AND OUTLOOK
We are currently in what we would call a “sum of all fears” environment. War, inflation, slower growth, and rising rates are all understandably frightening investors. Both consumer and investor sentiment are near historic lows. Perhaps counterintuitively, then, history shows that the most opportune times to invest are when fear is high and trailing returns are low. The annualized three-year return for the Russell 2000 at the end of June was 4.2% compared to its three-year monthly rolling average since inception of 10.9%. Subsequent returns from these levels historically have been attractive. Coming off a record negative first half during what appears to be a late stage of the bear market, the current period looks like a solid entry point for prospective long-term small-cap returns.
16 | The Royce Funds 2022 Semiannual Report to Shareholders
| PERFORMANCE AND PORTFOLIO REVIEW (UNAUDITED) | TICKER SYMBOLS PENNX RYPFX RPMIX RYPCX RPMRX |
Performance and Expenses
Average Annual Total Return (%) Through 6/30/22
| | JAN-JUN 20221 | 1-YR | 3-YR | 5-YR | 10-YR | 15-YR | 20-YR | 25-YR | 30-YR | 35-YR | 45-YR |
| PMF | -21.24 | -17.56 | 5.61 | 6.81 | 9.22 | 6.23 | 8.59 | 9.28 | 9.92 | 9.82 | 12.38 |
| Annual Operating Expenses: 0.92% |
1 Not annualized
Morningstar Style Map™ As of 6/30/22
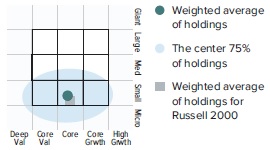
The Morningstar Style Map is the Morningstar Style Box™ with the center 75% of fund holdings plotted as the Morningstar Ownership Zone™. The Morningstar Style Box is designed to reveal a fund’s investment strategy. The Morningstar Ownership Zone provides detail about a portfolio’s investment style by showing the range of stock sizes and styles. The Ownership Zone is derived by plotting each stock in the portfolio within the proprietary Morningstar Style Box. Over time, the shape and location of a fund’s ownership zone may vary. See page 88 for additional information.
Value of $10,000
Invested on 12/29/78 (Russell 2000 Inception)
as of 6/30/22 ($)
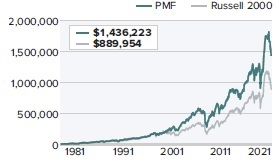
Top 10 Positions
| % of Net Assets | |
| First Citizens BancShares Cl. A | 1.8 |
| KBR | 1.6 |
| Innospec | 1.3 |
| Arcosa | 1.3 |
| Forward Air | 1.3 |
| Air Lease Cl. A | 1.3 |
| Kadant | 1.3 |
| Element Solutions | 1.3 |
| Ziff Davis | 1.1 |
| Haemonetics Corporation | 1.1 |
Portfolio Sector Breakdown
% of Net Assets | |
| Industrials | 27.7 |
| Financials | 19.1 |
| Information Technology | 16.4 |
| Consumer Discretionary | 10.4 |
| Health Care | 8.2 |
| Materials | 7.8 |
| Real Estate | 3.0 |
| Communication Services | 2.5 |
| Energy | 2.2 |
| Consumer Staples | 1.5 |
| Cash and Cash Equivalents | 1.2 |
Calendar Year Total Returns (%)
YEAR | PMF |
| 2021 | 22.0 |
| 2020 | 14.1 |
| 2019 | 26.6 |
| 2018 | -9.7 |
| 2017 | 16.2 |
| 2016 | 26.5 |
| 2015 | -11.4 |
| 2014 | -0.7 |
| 2013 | 35.3 |
| 2012 | 14.6 |
| 2011 | -4.2 |
| 2010 | 23.9 |
| 2009 | 36.3 |
| 2008 | -34.8 |
| 2007 | 2.8 |
Upside/Downside Capture Ratios
| Periods Ended 6/30/22 (%) | | |
| UPSIDE | DOWNSIDE |
| | | |
| 10-Year | 91 | 87 |
| From 12/31/78 | | |
| (Russell 2000 Inception) | 90 | 74 |
Portfolio Diagnostics
| Fund Net Assets | $1,585 million |
| Number of Holdings | 288 |
| Turnover Rate | 27% |
| Average Market Capitalization 1 | $2,384 million |
| Weighted Average P/E Ratio 2,3 | 12.3x |
| Weighted Average P/B Ratio 2 | 2.0x |
| Active Share 4 | 89% |
| U.S. Investments (% of Net Assets) | 88.0% |
| Non-U.S. Investments (% of Net Assets) | 10.8% |
| 1 | Geometric Average. This weighted calculation uses each portfolio holding’s market cap in a way designed to not skew the effect of very large or small holdings; instead, it aims to better identify the portfolio’s center, which Royce believes offers a more accurate measure of average market cap than a simple mean or median. |
| 2 | Harmonic Average. This weighted calculation evaluates a portfolio as if it were a single stock and measures it overall. It compares the total market value of the portfolio to the portfolio’s share in the earnings or book value, as the case may be, of its underlying stocks. |
| 3 | The Fund’s P/E ratio calculation excludes companies with zero or negative earnings (11% of portfolio holdings as of 6/30/22). |
| 4 | Active Share is the sum of the absolute values of the different weightings of each holding in the Fund versus each holding in the benchmark, divided by two. |
Important Performance and Expense Information
All performance information in this Report reflects past performance, is presented on a total return basis, reflects the reinvestment of distributions, and does not reflect the deduction of taxes that a shareholder would pay on fund distributions or the redemption of fund shares. Past performance is no guarantee of future results. Investment return and principal value of an investment will fluctuate, so that shares may be worth more or less than their original cost when redeemed. Shares redeemed within 30 days of purchase may be subject to a 1% redemption fee payable to the Fund, which is not reflected in the performance shown above; if it were, performance would be lower. Current month-end performance may be higher or lower than performance quoted and may be obtained at www.royceinvest.com. All performance and risk information reflects results of the Investment Class (its oldest class). Certain immaterial adjustments were made to the net assets of Royce Pennsylvania Mutual Fund at 6/30/19 for financial reporting purposes, and as a result the net asset values shareholder transactions on that date and the calendar year total returns (%) based on those net asset values differ from the adjusted net asset values and calendar year total returns reported in the Financial Highlights. Operating expenses reflect the Fund’s total annual operating expenses for the Investment Class as of the Fund’s most current prospectus and include management fees, other expenses, and acquired fund fees and expenses. Acquired fund fees and expenses reflect the estimated amount of the fees and expenses incurred indirectly by the Fund through its investments in mutual funds, hedge funds, private equity funds, and other investment companies. Regarding the “Top Contributors” and “Top Detractors” tables shown above, the sum of all contributors to, and all detractors from, performance for all securities in the portfolio would approximate the Fund’s year-to-date performance for 2022. Upside Capture Ratio measures a manager’s performance in up markets relative to the Fund’s benchmark (Russell 2000). It is calculated by measuring the Fund’s performance in quarters when the benchmark went up and dividing it by the benchmark’s return in those quarters. Downside Capture Ratio measures a manager’s performance in down markets relative to the Fund’s benchmark. It is calculated by measuring the Fund’s performance in quarters when the benchmark goes down and dividing it by the benchmark’s return in those quarters.
The Royce Funds 2022 Semiannual Report to Shareholders | 17
MANAGERS’ DISCUSSION (UNAUDITED)
Royce Premier Fund (RPR)

Andrew Palen, Lauren Romeo, CFA®,
Chuck Royce, Steven McBoyle
FUND PERFORMANCE
Royce Premier Fund held onto its long-term relative advantages during a bearish first half, beating its small-cap benchmark, the Russell 2000 Index, for the one-, three-, five, 15-, 20-, 25-, 30-year, and since inception (12/31/91) periods ended 6/30/22. The Fund outperformed the small-cap index for the year-to-date period ended 6/30/22, down 19.2% versus a 23.4% decline for the Russell 2000.
WHAT WORKED… AND WHAT DIDN’T
Given the “nowhere to run to, nowhere to hide” tenor of the first half, widespread sector weakness was not a surprise. Each of the portfolio’s nine sectors detracted from first-half performance, with Information Technology, Industrials, and Consumer Discretionary making the biggest negative effect while the smallest came from Communication Services, Real Estate, and Consumer Staples. At the industry level, electronic equipment, instruments & components (Information Technology), capital markets (Financials), and machinery (Industrials) detracted most for the year-to-date period while insurance (Financials), metals & mining (Materials), and marine (Industrials) were the largest contributors.
Premier’s top detracting position was MKS Instruments, which makes equipment that’s used to control and analyze gases in the semiconductor manufacturing process. Its shares fell more than 30% in the second quarter, reflecting in part the general sell-off in semiconductor capital equipment stocks, which is rooted in growing evidence that inflation has begun to blunt spending on discretionary items, including smartphones and other consumer electronics. MKS also faced ongoing delays in getting approval from China’s regulator for its proposed acquisition of Atotech, a global leader in electroplating chemicals used in the chip and printed circuit board manufacturing processes. Despite the recent pullback and rising near-term cyclical headwinds—which include a possible digestion phase for semiconductor capital equipment—we believe MKS’s leadership in critical semiconductor capital equipment components and its efforts to replicate its successful strategies in adjacent markets both position the company to benefit from long-term secular growth drivers, such as the proliferation of semiconductors, and increased miniaturization in microelectronics. FARO Technologies, which develops computer-aided coordinate measurement devices and software, saw its stock fall after an earnings miss as component shortages continued to limit certain product shipments. Shanghai’s Covid-driven lockdowns also hurt the company’s intra-China logistics while European 3D laser scanner sales stalled as customers anticipated the release of FARO’s next generation scanner. Confident in rebounds, we held shares in both companies at the end of June.
| | | | | |
| | Top Contributors to Performance | | Top Detractors from Performance | |
| | Year-to-Date Through 6/30/22 (%)1 | | Year-to-Date Through 6/30/22 (%)2 | |
| | | | | |
| | Meridian Bioscience | 0.53 | | MKS Instruments | -1.17 | |
| | Alleghany Corporation | 0.42 | | FARO Technologies | -0.93 | |
| | Haemonetics Corporation | 0.33 | | Mesa Laboratories | -0.92 | |
| | Ritchie Bros. Auctioneers | 0.14 | | Morningstar | -0.86 | |
| | Dorman Products | 0.11 | | Computer Services | -0.79 | |
| | 1 Includes dividends | | | 2 Net of dividends | | |
| | | | | | | |
The Fund’s top contributing position was Meridian Bioscience, a profitable health care company that manufactures consumable reagents used in in-vitro diagnostic (IVD) tests and develops IVD tests and instruments. The company has a particularly strong niche position in various gastrointestinal diseases. Following a 27% gain in 1Q22, its stock rose 17% in 2Q22 despite very little public company-specific news. A potential reason behind its rise was revealed on 7/7/22, when Meridian announced an agreement to be acquired by SD Biosensor, a South Korean healthcare company, and its private equity partner for $34 per share in cash. While a minimal premium to the current price, the offer was 32% higher than Meridian’s stock price at the time of the initial offer, which was made privately a few months earlier. Property & casualty insurer Alleghany Corporation was also subject to the “urge to merge” when it agreed to be acquired by Berkshire Hathaway for a 25% premium in March.
Relative to the Russell 2000, the Fund’s advantage came exclusively from stock selection in the year-to-date period, with stock picking especially effective in Health Care, Industrials, and Consumer Discretionary, which made the most significant relative positive impacts. Conversely, Energy and Utilities detracted due to our lack of exposure, while Consumer Staples hurt relative results due to both stock selection and our underweight in the sector.
CURRENT POSITIONING AND OUTLOOK
It appears that near-term market sentiment will continue to be dominated by fear and uncertainty in the face of inflation, rising rates, and a slowing economy. We believe these conditions will continue to favor small-cap quality as investors seek shelter in companies with durable business models, strong balance sheets, and consistent free cash flow generation. The financial flexibility to self-fund growth irrespective of near-term cyclical trends positions quality companies to capitalize on secular opportunities that are growth tailwinds for many of our companies—for example, those involved in automation, digital transformation, infrastructure spending, and semiconductor capital intensity. While our holdings aren’t immune from recessions, their strong financial characteristics should give them the ability not only to survive difficult macro conditions, but also to emerge stronger when conditions improve. We believe they should be able to take market share from weaker, more highly leveraged competitors and/or acquire them at attractive multiples. Within small-cap, high quality stocks—as measured by high returns on invested capital (ROIC)—continue to trade at a discount to the Russell 2000. We believe this combination of durable business models and attractive valuations makes the portfolio a potentially attractive way to achieve attractive long-term returns on an absolute and relative basis.
18 | The Royce Funds 2022 Semiannual Report to Shareholders
| PERFORMANCE AND PORTFOLIO REVIEW (UNAUDITED) | TICKER SYMBOLS RYPRX RPFFX RPFIX RPRCX RPRRX |
Performance and Expenses
Average Annual Total Return (%) Through 6/30/22
| | | JAN-JUN 20221 | | 1-YR | | 3-YR | | 5-YR | | 10-YR | | 15-YR | | 20-YR | | 25-YR | | 30-YR | | SINCE INCEPTION (12/31/91) |
| RPR | | -19.20 | | -14.82 | | 4.94 | | 7.48 | | 9.04 | | 7.30 | | 9.94 | | 9.82 | | 11.07 | | 10.93 |
| Annual Operating Expenses: 1.17% |
1 Not annualized
Relative Returns: Monthly Rolling Average Annual Return Periods
20 Years Through 6/30/22
On a monthly rolling basis, The Fund outperformed the Russell 2000 in 56% of all 10-year periods; 57% of all 5-year periods; and 58% of all 1-year periods.
| | | PERIODS BEATING THE INDEX | | FUND AVG (%)1 | | INDEX AVG (%)1 |
| | | | | | | | | | |
| 10-year | | 68/121 | | | 56% | | 9.9 | | 9.6 |
| | | | | | | | | | |
| | | | | | | | | | |
| 5-year | | 104/181 | | | 57% | | 10.0 | | 9.0 |
| | | | | | | | | | |
| | | | | | | | | | |
| 1-year | | 132/229 | | | 58% | | 13.1 | | 12.6 |
1Average of monthly rolling average annual total returns over the specified periods.
Morningstar Style Map™ As of 6/30/22
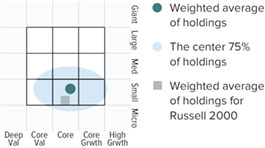
The Morningstar Style Map is the Morningstar Style Box™ with the center 75% of fund holdings plotted as the Morningstar Ownership Zone™. The Morningstar Style Box is designed to reveal a fund’s investment strategy. The Morningstar Ownership Zone provides detail about a portfolio’s investment style by showing the range of stock sizes and styles. The Ownership Zone is derived by plotting each stock in the portfolio within the proprietary Morningstar Style Box. Over time, the shape and location of a fund’s ownership zone may vary. See page 88 for additional information.
Value of $10,000
Invested on 12/31/91 as of 6/30/22 ($)
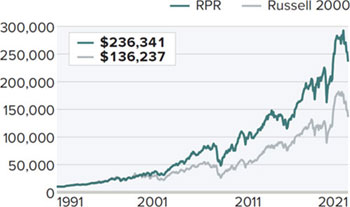
Top 10 Positions
% of Net Assets
| Innospec | | 3.5 |
| Dorman Products | | 3.1 |
| Kennedy-Wilson Holdings | | 3.0 |
| Valmont Industries | | 2.9 |
| Lincoln Electric Holdings | | 2.8 |
| Forward Air | | 2.8 |
| FormFactor | | 2.7 |
| Forrester Research | | 2.6 |
| John Bean Technologies | | 2.5 |
| SEI Investments | | 2.5 |
Portfolio Sector Breakdown
% of Net Assets
| Industrials | | 35.4 |
| Information Technology | | 17.5 |
| Consumer Discretionary | | 9.9 |
| Materials | | 9.7 |
| Financials | | 9.5 |
| Health Care | | 8.2 |
| Real Estate | | 4.0 |
| Consumer Staples | | 2.3 |
| Communication Services | | 1.9 |
| Cash and Cash Equivalents | | 1.6 |
Calendar Year Total Returns (%)
| YEAR | | RPR |
| 2021 | | 16.4 |
| 2020 | | 11.5 |
| 2019 | | 34.1 |
| 2018 | | -10.4 |
| 2017 | | 23.8 |
| 2016 | | 23.0 |
| 2015 | | -9.9 |
| 2014 | | -0.9 |
| 2013 | | 27.7 |
| 2012 | | 11.4 |
| 2011 | | -0.9 |
| 2010 | | 26.5 |
| 2009 | | 33.3 |
| 2008 | | -28.3 |
| 2007 | | 12.7 |
Upside/Downside Capture Ratios
Periods Ended 6/30/22 (%)
| | | UPSIDE | | DOWNSIDE |
| 10-Year | | 87 | | 81 |
| From 12/31/91 (Start of Fund’s First Full Quarter) | | 92 | | 74 |
Portfolio Diagnostics
| Fund Net Assets | $1,306 million |
| Number of Holdings | | 53 |
| Turnover Rate | | 12% |
| Average Market Capitalization1 | $3,397 million |
| Weighted Average P/E Ratio2,3 | | 17.4x |
| Weighted Average P/B Ratio2 | | 2.6x |
| Active Share4 | | 97% |
| U.S. Investments (% of Net Assets) | | 92.3% |
| Non-U.S. Investments (% of Net Assets) | 6.1% |
| 1 | Geometric Average. This weighted calculation uses each portfolio holding’s market cap in a way designed to not skew the effect of very large or small holdings; instead, it aims to better identify the portfolio’s center, which Royce believes offers a more accurate measure of average market cap than a simple mean or median. |
| 2 | Harmonic Average. This weighted calculation evaluates a portfolio as if it were a single stock and measures it overall. It compares the total market value of the portfolio to the portfolio’s share in the earnings or book value, as the case may be, of its underlying stocks. |
| 3 | The Fund’s P/E ratio calculation excludes companies with zero or negative earnings (3% of portfolio holdings as of 6/30/22). |
| 4 | Active Share is the sum of the absolute values of the different weightings of each holding in the Fund versus each holding in the benchmark, divided by two. |
Important Performance and Expense Information
All performance information in this Report reflects past performance, is presented on a total return basis, reflects the reinvestment of distributions, and does not reflect the deduction of taxes that a shareholder would pay on fund distributions or the redemption of fund shares. Past performance is no guarantee of future results. Investment return and principal value of an investment will fluctuate, so that shares may be worth more or less than their original cost when redeemed. Shares redeemed within 30 days of purchase may be subject to a 1% redemption fee payable to the Fund, which is not reflected in the performance shown above; if it were, performance would be lower. Current month-end performance may be higher or lower than performance quoted and may be obtained at www.royceinvest.com. All performance and risk information reflects results of the Investment Class (its oldest class). Certain immaterial adjustments were made to the net assets of Royce Premier Fund at 6/30/19 for financial reporting purposes, and as a result the net asset values shareholder transactions on that date and the calendar year total returns (%) based on those net asset values differ from the adjusted net asset values and calendar year total returns reported in the Financial Highlights. Operating expenses reflect the Fund’s total annual operating expenses for the Investment Class as of the Fund’s most current prospectus and include management fees and other expenses. Regarding the “Top Contributors” and “Top Detractors” tables shown above, the sum of all contributors to, and all detractors from, performance for all securities in the portfolio would approximate the Fund’s year-to-date performance for 2022. Upside Capture Ratio measures a manager’s performance in up markets relative to the Fund’s benchmark (Russell 2000). It is calculated by measuring the Fund’s performance in quarters when the benchmark went up and dividing it by the benchmark’s return in those quarters. Downside Capture Ratio measures a manager’s performance in down markets relative to the Fund’s benchmark. It is calculated by measuring the Fund’s performance in quarters when the benchmark goes down and dividing it by the benchmark’s return in those quarters.
The Royce Funds 2022 Semiannual Report to Shareholders | 19
MANAGERS’ DISCUSSION (UNAUDITED)
Royce Small-Cap Opportunity Fund (ROF)

Jim Harvey, CFA®, Kavitha
Venkatraman, Jim Stoeffel,
Brendan Hartman
FUND PERFORMANCE
Royce Small-Cap Opportunity Fund outpaced its primary benchmark, the Russell 2000 Value Index, for the three-, five, 10-, 15-, 20-, 25-year, and since inception (11/19/96) periods ended 6/30/22, while also beating the Russell 2000 Index, its secondary benchmark, for each of these periods and the year-to-date and one-year periods ended 6/30/22. The Fund was down 22.1% for the year-to-date period ended 6/30/22 versus respective losses of 17.3% and 23.4% for the Russell 2000 Value and Russell 2000 for the same period. First-half results were consistent with the Fund’s history. When the portfolio has underperformed in previous down markets, it has outperformed through subsequent rebounds.
WHAT WORKED… AND WHAT DIDN’T
Nine of the 10 equity sectors in which the Fund held investments detracted from year-to-date performance, led by Industrials, Information Technology, and Consumer Discretionary. Energy made the only positive contribution—along with a marginal gain from cash—while Consumer Staples had the smallest negative effect. At the industry level, semiconductors & semiconductor equipment (Information Technology) machinery (Industrials), and specialty retail (Consumer Discretionary) detracted most. Each was also among our four largest weightings at the end of June because we like each group’s long-term prospects. On the positive side, oil, gas & consumable fuels (Energy), chemicals (Materials), and pharmaceuticals (Health Care) were the top contributors.
Horizon Global manufactures custom-engineered equipment for towing, trailering, and other related uses. Its shares fell due to ongoing supply chain issues that hampered its efforts to obtain inventory, coupled with disruptions to its auto and trucking customers’ production schedules, which created the need for additional working capital. The Shyft Group makes commercial vehicles, including trucks and trailers. Earnings for its fiscal first quarter came in below consensus estimates and included a cautious near-term outlook, leading its shares downward. B. Riley Financial operates across various financial areas such as investment banking and wealth management while also managing the companies it acquires. The company reported significant declines in revenues and earnings for 1Q22 amid an inhospitable climate for both its underwriting business and its investment portfolios. Management nonetheless offered a confident outlook for its M&A, capital management, and direct lending activities. At the end of June, we thought that all three top detractors possessed both attractive valuations and robust long-term growth prospects.
| | | | | |
| | Top Contributors to Performance | | Top Detractors from Performance | |
| | Year-to-Date Through 6/30/22 (%)1 | | | Year-to-Date Through 6/30/22 (%)2 | | |
| | Scorpio Tankers | 0.44 | | Horizon Global | -0.41 | |
| | LSB Industries | 0.26 | | Shyft Group (The) | -0.41 | |
| | Intrepid Potash | 0.25 | | B. Riley Financial | -0.38 | |
| | Ardmore Shipping | 0.22 | | Avaya Holdings | -0.36 | |
| | Allegheny Technologies | 0.21 | | Comtech Telecommunications | -0.36 | |
| | 1 Includes dividends | | | 2 Net of dividends | | |
Two of the Fund’s top contributing positions—Scorpio Tankers and Ardmore Shipping—ship refined petroleum products. Shares of both companies benefited from rising freight rates amid global disruptions to fuel supplies that led to increased shipping activity. The lack of new vessel builds helped reinforce the improved rate environment. LSB Industries benefited from higher prices for domestic chemicals and fertilizers caused, in part, by rising natural gas prices in Europe and the resulting global fertilizer shortages during a high-demand period that saw higher grain prices and low inventories (as did Intrepid Potash).
The Fund’s relative disadvantage versus its primary benchmark for 2022’s first half came almost entirely from sector allocation—stock selection had a marginally negative effect. Our greater relative exposure to Information Technology and Consumer Discretionary detracted, as did stock selection in Industrials. However, stock picking was a strength in Materials, as was our substantially lower exposure to Health Care and our cash position.
CURRENT POSITIONING AND OUTLOOK
The ongoing war, rising interest rates, and inflationary pressures presented challenges in the first half. How much the Fed tightens into a slowing economy and whether we enter a recession appear to be the key determinants as to when stock prices recover. There is a strong possibility that inflation peaked in 2Q22, as yields and energy prices reached highs in mid-June. Consumer confidence is at an all-time low—which is remarkable, considering it is lower than during the crash of the dot com bubble, the Financial Crisis, and Covid. Current uncertainties notwithstanding, we remain confident in what we are holding, with many positions having low-debt balance sheets, one of the main factors that should help businesses contend with the current tumultuous environment—even if inflation proves increasingly persistent. We have been trimming some inflation beneficiaries, most notably in areas such as materials and shipping. Infrastructure names continue to benefit from steady demand for steel and other materials to build roads and bridges, as well as to repair and maintain aircraft. We have also seen shares of homebuilders tumble as interest rates rise, but many of these companies are very well run, and we think opportunities will emerge. The global need for communications equipment has not diminished, despite current conditions. The same is generally true for many healthcare companies—so we are adding to existing names and researching potential new ideas. Conversely, we see Consumer Discretionary as likely to remain weak, at least until it is clear that inflation is stabilizing. Of our four investment themes, we continue to look most closely at undervalued growth stocks as many such companies have been trading at 52-week lows. As always, we seek companies that we believe offer the best combination of attractively low valuations with strong long-term growth potential.
20 | The Royce Funds 2022 Semiannual Report to Shareholders
| PERFORMANCE AND PORTFOLIO REVIEW (UNAUDITED) | TICKER SYMBOLS RYPNX RYOFX ROFCX ROFIX ROFRX |
Performance and Expenses
Average Annual Total Return (%) Through 6/30/22
| | | JAN-JUN 20221 | | 1-YR | | 3-YR | | 5-YR | | 10-YR | | 15-YR | | 20-YR | | 25-YR | | SINCE INCEPTION
(11/19/96) |
| ROF | | -22.08 | | -22.09 | | 12.67 | | 8.32 | | 11.04 | | 7.17 | | 9.77 | | 11.22 | | 11.59 |
| Annual Operating Expenses: 1.21% |
1 Not annualized
Relative Returns: Monthly Rolling Average Annual Return Periods
20 Years Through 6/30/22
On a monthly rolling basis, The Fund outperformed the Russell 2000 Value in 99% of all 10-year periods; 74% of all 5-year periods; and 58% of all 1-year periods.
| | | PERIODS BEATING THE INDEX | | | FUND AVG (%)1 | | INDEX AVG (%)1 |
| | | | | | | | | | | |
| 10-year | | 120/121 | | | | 99% | | 10.1 | | 8.5 |
| | | | | | | | | | | |
| | | | | | | | | | | |
| 5-year | | 134/181 | | | | 74% | | 9.6 | | 7.9 |
| | | | | | | | | | | |
| | | | | | | | | | | |
| 1-year | | 132/229 | | | | 58% | | 16.5 | | 12.1 |
| | | | | | | | | | | |
1 Average of monthly rolling average annual total returns over the specified periods.
Morningstar Style Map™ As of 6/30/22

The Morningstar Style Map is the Morningstar Style Box™ with the center 75% of fund holdings plotted as the Morningstar Ownership Zone™. The Morningstar Style Box is designed to reveal a fund’s investment strategy. The Morningstar Ownership Zone provides detail about a portfolio’s investment style by showing the range of stock sizes and styles. The Ownership Zone is derived by plotting each stock in the portfolio within the proprietary Morningstar Style Box. Over time, the shape and location of a fund’s ownership zone may vary. See page 88 for additional information.
Value of $10,000
Invested on 11/19/96 as of 6/30/22 ($)
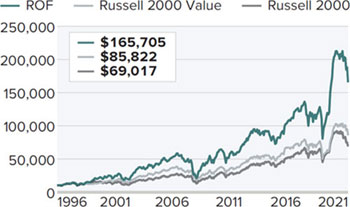
Top 10 Positions
% of Net Assets
| Digi International | | 0.9 |
| Modine Manufacturing | | 0.8 |
| Northwest Pipe | | 0.8 |
| DZS | | 0.8 |
| Cohu | | 0.8 |
| Griffon Corporation | | 0.8 |
| AAR Corporation | | 0.7 |
| VSE Corporation | | 0.7 |
| Stoneridge | | 0.7 |
| Sierra Wireless | | 0.7 |
Portfolio Sector Breakdown
% of Net Assets
| Industrials | | 30.8 |
| Information Technology | | 19.5 |
| Consumer Discretionary | | 16.2 |
| Materials | | 7.4 |
| Energy | | 5.8 |
| Health Care | | 5.0 |
| Financials | | 4.3 |
| Communication Services | | 3.3 |
| Real Estate | | 2.0 |
| Consumer Staples | | 2.0 |
| Cash and Cash Equivalents | | 3.7 |
Calendar Year Total Returns (%)
| YEAR | | ROF |
| 2021 | | 30.8 |
| 2020 | | 26.5 |
| 2019 | | 28.2 |
| 2018 | | -20.0 |
| 2017 | | 21.9 |
| 2016 | | 29.9 |
| 2015 | | -13.6 |
| 2014 | | -0.5 |
| 2013 | | 43.5 |
| 2012 | | 22.6 |
| 2011 | | -13.0 |
| 2010 | | 33.8 |
| 2009 | | 62.1 |
| 2008 | | -45.7 |
| 2007 | | -2.0 |
Upside/Downside Capture Ratios
Periods Ended 6/30/22 (%)
| | | UPSIDE | | DOWNSIDE |
| 10-Year | | 118 | | 114 |
| From 12/31/96 (Start of Fund’s First Full Quarter) | | 125 | | 118 |
Portfolio Diagnostics
| Fund Net Assets | $1,285 million |
| Number of Holdings | | 249 |
| Turnover Rate | | 20% |
| Average Market Capitalization1 | $1,001 million |
| Weighted Average P/B Ratio2 | | 1.5x |
| Weighted Average P/S Ratio3 | | 0.8x |
| Active Share4 | | 90% |
| U.S. Investments (% of Net Assets) | | 90.9% |
| Non-U.S. Investments (% of Net Assets) | 5.4% |
| 1 | Geometric Average. This weighted calculation uses each portfolio holding’s market cap in a way designed to not skew the effect of very large or small holdings; instead, it aims to better identify the portfolio’s center, which Royce believes offers a more accurate measure of average market cap than a simple mean or median. |
| 2 | Harmonic Average. This weighted calculation evaluates a portfolio as if it were a single stock and measures it overall. It compares the total market value of the portfolio to the portfolio’s share in the earnings or book value, as the case may be, of its underlying stocks. |
| 3 | Price to Sales is calculated by dividing the company’s market cap by the revenue in the most recent year. |
| 4 | Active Share is the sum of the absolute values of the different weightings of each holding in the Fund versus each holding in the benchmark, divided by two. |
Important Performance and Expense Information
All performance information in this Report reflects past performance, is presented on a total return basis, reflects the reinvestment of distributions, and does not reflect the deduction of taxes that a shareholder would pay on fund distributions or the redemption of fund shares. Past performance is no guarantee of future results. Investment return and principal value of an investment will fluctuate, so that shares may be worth more or less than their original cost when redeemed. Shares redeemed within 30 days of purchase may be subject to a 1% redemption fee payable to the Fund, which is not reflected in the performance shown above; if it were, performance would be lower. Current month-end performance may be higher or lower than performance quoted and may be obtained at www.royceinvest.com. All performance and risk information reflects results of the Investment Class (its oldest class). Operating expenses reflect the Fund’s total annual operating expenses for the Investment Class as of the Fund’s most current prospectus and include management fees and other expenses. Regarding the “Top Contributors” and “Top Detractors” tables shown above, the sum of all contributors to, and all detractors from, performance for all securities in the portfolio would approximate the Fund’s year-to-date performance for 2022. Upside Capture Ratio measures a manager’s performance in up markets relative to the Fund’s benchmark (Russell 2000 Value). It is calculated by measuring the Fund’s performance in quarters when the benchmark went up and dividing it by the benchmark’s return in those quarters. Downside Capture Ratio measures a manager’s performance in down markets relative to the Fund’s benchmark. It is calculated by measuring the Fund’s performance in quarters when the benchmark goes down and dividing it by the benchmark’s return in those quarters.
The Royce Funds 2022 Semiannual Report to Shareholders | 21
MANAGERS’ DISCUSSION (UNAUDITED)
Royce Small-Cap Special Equity Fund (RSE)

Charlie Dreifus, CFA®, Steven McBoyle
FUND PERFORMANCE
A strong down market performance in 2022’s first half was instrumental in helping Royce Small-Cap Special Equity Fund to outperform both its primary benchmark, the Russell 2000 Value Index, and its secondary benchmark, the Russell 2000 Index for the one, three-, 15-, and since inception (5/1/98) periods ended 6/30/22. The Fund was down 12.8% for the year-to-date period ended 6/30/22 versus respective declines of 17.3% and 23.4% for the small-cap value and overall small-cap indexes. It was the worst calendar first half since inception (12/31/78) for the Russell 2000 and the second-worst for the Russell 2000 Value.
WHAT WORKED... AND WHAT DIDN’T
Seven of the portfolio’s eight sectors made a negative impact on year-to-date performance. The sectors making the largest negative impact were Information Technology, Industrials, and Consumer Discretionary. The only positive impact came from Communication Services, as well as the Fund’s cash holdings, while Financials detracted least. Semiconductors & semiconductor equipment (Information Technology), leisure products (Consumer Discretionary), and machinery (Industrials) detracted most at the industry level for the year-to-date period, while diversified consumer services (Consumer Discretionary), media (Communication Services), and commercial services & supplies (Industrials) were the largest contributors.
Johnson Outdoors, which makes outdoor recreational products, was the top detractor at the position level in 2022’s first half. The company reported margins well below expectations in early May, primarily due to supply chain disruptions, resulting in a significant share decline. Kulicke & Soffa Industries, a semiconductor packaging equipment manufacturer, has faced a decelerating demand environment following a Covid boom that has been compounded by concerns regarding the overall health of the consumer electronics end market. Specialty chemical manufacturer Huntsman Corporation faced concerns that a more aggressive Federal Reserve will dampen its end market demand in core markets such as housing. Energy costs and consumer demand concerns in Europe also weighed on its stock price. Huntsman Corporation and Kulicke & Soffa were top-10 holdings, while Johnson Outdoors was our eleventh largest at the end of June.
| | | | | |
| | Top Contributors to Performance | | Top Detractors from Performance | |
| | Year-to-Date Through 6/30/22 (%)1 | | | Year-to-Date Through 6/30/22 (%)2 | | |
| | H&R Block | 2.06 | | Johnson Outdoors Cl. A | -1.43 | |
| | TEGNA | 0.33 | | Kulicke & Soffa Industries | -1.31 | |
| | Ennis | 0.24 | | Huntsman Corporation | -1.22 | |
| | Resources Connection | 0.11 | | Marcus & Millichap | -1.08 | |
| | Ingles Markets Cl. A | 0.09 | | Encore Wire | -0.94 | |
| | 1 Includes dividends | | | 2 Net of dividends | | |
The Fund’s top contributor at the position level for the year-to-date period ended 6/30/22 was H&R Block, a leading tax preparation business. The company reported better-than-expected results, driven by the increasing complexity of tax filings and its ability to raise prices due to improving product quality. Its consistent and sizable cash flow generation also garnered more attention in the first half ’s challenging market. It was the Fund’s fourth-biggest position at the end of June. Shares of broadcast company TEGNA began to rise following the late February announcement that the company had agreed to be acquired by a Standard General affiliate for $24 per share, a 39% premium to the pre-announcement share price. Following our previous successful investment in Meredith Corporation, a similar broadcasting business that sold its TV assets to Gray Television, we were attracted to TEGNA due to its cheap valuation and strong cash flow, as well as our view that TEGNA was as an attractive asset in a consolidating industry. Shares of Ennis, which prints business forms and printed electronic media, presentation products, envelopes, and other custom products, rallied in June after the company reported a more upbeat outlook for demand as current market conditions have benefited companies that have proven capable of navigating the paper shortage. Ennis was the portfolio’s thirteenth-largest holding at the end of June.
The portfolio’s advantage over the Russell 2000 Value (its primary benchmark) for the year-to-date period was entirely attributable to stock selection. At the sector level, stock picks in Consumer Discretionary and Communication Services, a lack of exposure to Health Care, and the Fund’s cash position all had a positive impact versus the benchmark. Conversely, our lack of exposure to Energy and Utilities, as well as a higher weighting in Information Technology, detracted most from relative results in 2022’s first half.
CURRENT POSITIONING AND OUTLOOK
There seems to be a case building for dividend payers and growers. This likely stems from lower expected forward returns. The wherewithal to take such corporate actions stems from those fundamental attributes we strive to have in our holdings, including strong free cash flows, little debt, and pricing power. Should this trend continue, we would expect our names to become more attractive to buyers. We would also expect our performance to improve, as has been the case historically, when high yield spreads grow wider as the economy faces higher interest rates and less favorable activity, and quality is rewarded. If one combines this dynamic with more attractive valuations and high-quality financial metrics, it is probable that a subset of small-caps make attractive investment candidates. Companies with strong financials, little debt, and ample free cash flow—hallmarks of our investing style captured by the term “quality”—have historically done well during times that resemble the current environment. We believe the portfolio is well represented with such companies.
| 22 | The Royce Funds 2022 Semiannual Report to Shareholders |
| PERFORMANCE AND PORTFOLIO REVIEW (UNAUDITED) | TICKER SYMBOLS RYSEX RSEFX RSEIX RSQCX |
| Performance and Expenses |
| Average Annual Total Return (%) Through 6/30/22 |
| | JAN-JUN 20221 | 1-YR | 3-YR | 5-YR | 10-YR | 15-YR | 20-YR | SINCE INCEPTION (5/1/98) |
| RSE | -12.83 | -6.47 | 7.30 | 4.74 | 7.56 | 6.45 | 7.81 | 8.31 |
| Annual Operating Expenses: 1.20% |
| | | | | | | | | |
| 1 Not annualized | | | | | | | | |
Relative Risk Adjusted Returns: Monthly Rolling Sharpe Ratios
20 Years Through 6/30/22
On a monthly rolling risk-adjusted basis, the Fund outperformed the Russell 2000 Value in 77% of all 10-year periods and 59% of all 5-year periods.
| | PERIODS BEATING THE INDEX | | FUND AVG1 | INDEX AVG1 |
| | | | | | |
| 10-year | 93/121 | | 77% | 0.56 | 0.48 |
| | | | | | |
| | | | | | |
| 5-year | 106/181 | | 59% | 0.52 | 0.48 |
| | | | | | |
| 1Average of monthly rolling Sharpe Ratios over the specified periods. | | |
| Morningstar Style Map™ As of 6/30/22 |

The Morningstar Style Map is the Morningstar Style Box™ with the center 75% of fund holdings plotted as the Morningstar Ownership Zone™. The Morningstar Style Box is designed to reveal a fund’s investment strategy. The Morningstar Ownership Zone provides detail about a portfolio’s investment style by showing the range of stock sizes and styles. The Ownership Zone is derived by plotting each stock in the portfolio within the proprietary Morningstar Style Box. Over time, the shape and location of a fund’s ownership zone may vary. See page 88 for additional information.
Value of $10,000
Invested on 5/1/98 as of 6/30/22 ($)

| Top 10 Positions | | | |
| % of Net Assets | | | |
| Ingles Markets Cl. A | | 7.0 | |
| Standard Motor Products | | 6.7 | |
| Huntsman Corporation | | 5.7 | |
| H&R Block | | 4.9 | |
| John B. Sanfilippo & Son | | 4.3 | |
| TEGNA | | 4.1 | |
| Kulicke & Soffa Industries | | 4.0 | |
| Vishay Intertechnology | | 3.9 | |
| Marcus & Millichap | | 3.8 | |
| Mueller Industries | | 3.7 | |
| Portfolio Sector Breakdown | | | |
| % of Net Assets | | | |
| Industrials | | 18.5 | |
| Consumer Discretionary | | 18.4 | |
| Consumer Staples | | 11.2 | |
| Information Technology | | 10.2 | |
| Materials | | 9.0 | |
| Financials | | 5.3 | |
| Communication Services | | 4.1 | |
| Real Estate | | 3.8 | |
| Cash and Cash Equivalents | | 19.5 | |
| Calendar Year Total Returns (%) | | | |
| YEAR | | RSE | |
| 2021 | | 22.5 | |
| 2020 | | 7.4 | |
| 2019 | | 12.6 | |
| 2018 | | -9.9 | |
| 2017 | | 7.9 | |
| 2016 | | 32.2 | |
| 2015 | | -12.4 | |
| 2014 | | 1.1 | |
| 2013 | | 29.4 | |
| 2012 | | 15.4 | |
| 2011 | | 0.1 | |
| 2010 | | 19.6 | |
| 2009 | | 28.4 | |
| 2008 | | -19.6 | |
| 2007 | | 4.7 | |
| Upside/Downside Capture Ratios | | | | | |
| Periods Ended 6/30/22 (%) | | | | | |
| | | UPSIDE | | DOWNSIDE | |
| 10-Year | | 77 | | 74 | |
| From 6/30/98 (Start of | | | | | |
| Fund’s First Full Quarter) | | 80 | | 66 | |
| Portfolio Diagnostics | | |
| Fund Net Assets | | $796 million |
| Number of Holdings | | 29 |
| Turnover Rate | | 9% |
| Average Market Capitalization 1 | | $1,511 million |
| Weighted Average P/E Ratio 2,3 | | 7.7x |
| Weighted Average P/B Ratio 2 | | 1.8x |
| Active Share 4 | | 98% |
| U.S. Investments (% of Net Assets) | | 76.5% |
| Non-U.S. Investments (% of Net Assets) | | 4.0% |
| 1 | Geometric Average. This weighted calculation uses each portfolio holding’s market cap in a way designed to not skew the effect of very large or small holdings; instead, it aims to better identify the portfolio’s center, which Royce believes offers a more accurate measure of average market cap than a simple mean or median. |
| 2 | Harmonic Average. This weighted calculation evaluates a portfolio as if it were a single stock and measures it overall. It compares the total market value of the portfolio to the portfolio’s share in the earnings or book value, as the case may be, of its underlying stocks. |
| 3 | The Fund’s P/E ratio calculation excludes companies with zero or negative earnings (0% of portfolio holdings as of 6/30/22). |
| 4 | Active Share is the sum of the absolute values of the different weightings of each holding in the Fund versus each holding in the benchmark, divided by two. |
Important Performance and Expense Information
All performance information in this Report reflects past performance, is presented on a total return basis, reflects the reinvestment of distributions, and does not reflect the deduction of taxes that a shareholder would pay on fund distributions or the redemption of fund shares. Past performance is no guarantee of future results. Investment return and principal value of an investment will fluctuate, so that shares may be worth more or less than their original cost when redeemed. Shares redeemed within 30 days of purchase may be subject to a 1% redemption fee payable to the Fund, which is not reflected in the performance shown above; if it were, performance would be lower. Current month-end performance may be higher or lower than performance quoted and may be obtained at www.royceinvest.com. All performance and risk information reflects results of the Investment Class (its oldest class). Operating expenses reflect the Fund’s total annual operating expenses for the Investment Class as of the Fund’s most current prospectus and include management fees and other expenses. The Sharpe Ratio is calculated for a specified period by dividing a fund’s annualized excess returns by its annualized standard deviation. The higher the Sharpe ratio, the better the fund’s historical risk-adjusted performance. Regarding the “Top Contributors” and “Top Detractors” tables shown above, the sum of all contributors to, and all detractors from, performance for all securities in the portfolio would approximate the Fund’s year-to-date performance for 2022. Upside Capture Ratio measures a manager’s performance in up markets relative to the Fund’s benchmark (Russell 2000 Value). It is calculated by measuring the Fund’s performance in quarters when the benchmark went up and dividing it by the benchmark’s return in those quarters. Downside Capture Ratio measures a manager’s performance in down markets relative to the Fund’s benchmark. It is calculated by measuring the Fund’s performance in quarters when the benchmark goes down and dividing it by the benchmark’s return in those quarters.
| The Royce Funds 2022 Semiannual Report to Shareholders | 23 |
MANAGERS’ DISCUSSION (UNAUDITED)
Royce Small-Cap Total Return Fund (RTR)

Joe Hintz, CFA®, Chuck Royce,
Miles Lewis, CFA®
FUND PERFORMANCE
Royce Small-Cap Total Return Fund outperformed its primary benchmark, the Russell 2000 Value Index, for the one-, three, five-, 10-, 15-, 20-, 25-year, and since inception (12/15/93) periods ended 6/30/22 while also beating the Russell 2000 Index, its secondary benchmark, for each of these spans except the 10-, 15-, and 20-year periods. As has historically been the case, a better down-market performance helped the Fund, which was down 13.6% for the year-to-date period ended 6/30/22, to outpace both the Russell 2000 Value, which fell 17.3%, and the Russell 2000, which declined 23.4% for the same period.
WHAT WORKED… AND WHAT DIDN’T
Unsurprisingly in light of the widespread bearish environment, seven of the portfolio’s 10 sectors made a negative impact on year-to-date performance, with the largest detractions coming from Financials, Industrials, and Consumer Discretionary. Energy, Materials, and Health Care were the only sectors to finish the first half in the black. At the industry level, banks, insurance (both in Financials), and machinery (Industrials) detracted most for the year-to-date period, while containers & packaging (Materials), energy equipment & services (Energy), and entertainment (Communication Services) were the largest contributors.
The Fund’s top-detracting position was GrafTech International, which makes natural and synthetic graphite and carbon-based electrodes and other products. Although the company, in our view, delivered a solid fiscal first quarter that showed ongoing improvements in pricing and volumes for graphite electrodes, the market was disappointed with a lack of commentary on expected pricing. Investors also seemed to fear that GrafTech’s steel-producer customers will experience reduced utilization, thus hurting demand. We believe, however, that pricing will improve because input costs are rising, which will force producers to raise prices. At the end of June, the company looked attractively valued, to us, at roughly four times earnings, suggesting to us that a lot of bad news had already been priced in. Franchise Group owns four consumer businesses: The Vitamin Shoppe, Pet Supplies Plus, and two discount furniture retailers. Its shares suffered after its plans to acquire retailer Kohl’s—a deal that would likely have been highly accretive for Franchise Group—fell through. Its stock has also experienced the same weakness that recessionary concerns have inflicted on most retailers. Our view is that its core assets are uncommonly resilient and therefore likely to see limited impact from a recession, specifically the Vitamin Shoppe and Pet Supplies Plus, which account for the majority of the firm’s earnings.
| | | | | |
| | Top Contributors to Performance | | Top Detractors from Performance | |
| | Year-to-Date Through 6/30/22 (%)1 | | Year-to-Date Through 6/30/22 (%)2 | |
| | Intertape Polymer Group | 1.35 | | GrafTech International | -0.80 | |
| | CDK Global | 0.45 | | Franchise Group Cl. A | -0.67 | |
| | Pason Systems | 0.35 | | Vontier Corporation | -0.58 | |
| | Cactus Cl. A | 0.27 | | Element Solutions | -0.56 | |
| | World Wrestling Entertainment Cl. A | 0.27 | | Denny’s Corporation | -0.54 | |
| | 1 Includes dividends | | | 2 Net of dividends | | |
| | | | | | | |
| | | | | | | |
The Fund’s top two contributors were both acquisition targets. Industrial packaging company Intertape Polymer Group makes Water Activated Tape, the black tape on Amazon boxes. When we first invested, we saw an industrial packaging company that was an effective backdoor play on e-commerce trading at a deeply discounted multiple. Our research and due diligence were validated in early March when Intertape agreed to be taken private by a private equity buyer at an 82% premium to its prior close. CDK Global provides technology and software as a service (SaaS) solutions that help dealers and auto manufacturers run their businesses more effectively. In April, CDK agreed to be acquired by a private equity firm, Brookfield Business Partners, at a sizable premium.
The portfolio’s advantage over the Russell 2000 Value (its primary benchmark) was attributable entirely to stock selection in the year-to-date period, with stock picks helping most in Materials and Communication Services. The Fund’s significantly lower exposure to Health Care also boosted results versus the benchmark. Conversely, our low weighting in Energy, lack of exposure to Utilities, and stock picks in Consumer Staples detracted most from relative year-to-date results.
CURRENT POSITIONING AND OUTLOOK
We are highly constructive on the outlook for small-cap value stocks in general—and our holdings in particular. We believe the market’s steep, swift decline set the stage for potentially strong returns, particularly given what we see as attractive valuations through much of our asset class. We believe that forward estimates, at least for companies with pricing power, will prove more resilient than the market seems to think. We suspect this will be true even in the event of a recession, as corporate revenues and earnings are calculated in nominal, not real, terms, so that companies with pricing power should see more earnings stability, if not perhaps growth, during a contraction. Our screens, watchlists, and other sources of idea generation are turning up far more candidates than usual, resulting in the addition of seven new names in 2Q22 alone. We have been adding to companies that appear poised to disproportionately capitalize on the current environment—those with the balance sheet health and cash flows that enable them to be opportunistic. This opportunism may manifest itself in the form of acquisitions and can also mean that companies can use their financial clout to take market share when competitors are struggling. The portfolio finished June with its highest average returns on invested capital (ROIC) in more than five years and cheapest valuations in more than 10. We think that is a potent combination that positions Small-Cap Total Return well for the years ahead, regardless of the economic backdrop.
24 | The Royce Funds 2022 Semiannual Report to Shareholders
| PERFORMANCE AND PORTFOLIO REVIEW (UNAUDITED) | TICKER SYMBOLS RYTRX RYTFX RTRIX RYTCX RTRRX |
| Performance and Expenses |
| Average Annual Total Return (%) Through 6/30/22 |
| | JAN-JUN 20221 | 1-YR | 3-YR | 5-YR | 10-YR | 15-YR | 20-YR | 25-YR | SINCE INCEPTION (12/15/93) |
| RTR | -13.63 | -9.32 | 6.49 | 6.15 | 9.11 | 6.21 | 8.10 | 8.68 | 9.99 |
| Annual Operating Expenses: 1.25% | | | | | | | |
| 1 Not annualized | | | | | | | | |
Relative Risk Adjusted Returns: Monthly Rolling Sharpe Ratios
20 Years Through 6/30/22
On a monthly rolling risk-adjusted basis, the Fund outperformed the Russell 2000 Value in 100% of all 10-year periods and 93% of all 5-year periods.
| | PERIODS BEATING THE INDEX | | FUND AVG1 | INDEX AVG1 |
| | | | | | | |
| 10-year | 121/121 | | | 100% | 0.55 | 0.48 |
| | | | | | | |
| | | | | | | |
| 5-year | 168/181 | | 93% | 0.55 | 0.48 |
| 1Average of monthly rolling Sharpe Ratios over the specified periods. | | |
| Morningstar Style Map™ As of 6/30/22 |
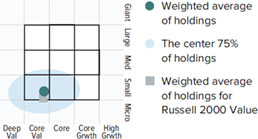
The Morningstar Style Map is the Morningstar Style Box™ with the center 75% of fund holdings plotted as the Morningstar Ownership Zone™. The Morningstar Style Box is designed to reveal a fund’s investment strategy. The Morningstar Ownership Zone provides detail about a portfolio’s investment style by showing the range of stock sizes and styles. The Ownership Zone is derived by plotting each stock in the portfolio within the proprietary Morningstar Style Box. Over time, the shape and location of a fund’s ownership zone may vary. See page 88 for additional information.
Value of $10,000
Invested on 12/15/93 as of 6/30/22 ($)

| Top 10 Positions | | | |
| % of Net Assets | | | |
| Franchise Group Cl. A | | 2.7 | |
| Vontier Corporation | | 2.4 | |
| Compass Diversified Holdings | | 2.0 | |
| Axis Capital Holdings | | 2.0 | |
| Teradata Corporation | | 1.9 | |
| Home BancShares | | 1.9 | |
| RenaissanceRe Holdings | | 1.9 | |
| Ziff Davis | | 1.9 | |
| Spectrum Brands Holdings | | 1.8 | |
| Element Solutions | | 1.8 | |
| Portfolio Sector Breakdown | | | |
| % of Net Assets | | | |
| Financials | | 36.3 | |
| Industrials | | 24.6 | |
| Information Technology | | 10.1 | |
| Materials | | 8.1 | |
| Consumer Discretionary | | 7.3 | |
| Energy | | 3.6 | |
| Real Estate | | 2.7 | |
| Communication Services | | 2.2 | |
| Consumer Staples | | 2.1 | |
| Health Care | | 0.5 | |
| Preferred Stock | | 1.7 | |
| Cash and Cash Equivalents | | 0.8 | |
| Calendar Year Total Returns (%) | | | |
| YEAR | | RTR | |
| 2021 | | 25.8 | |
| 2020 | | 3.8 | |
| 2019 | | 23.5 | |
| 2018 | | -12.5 | |
| 2017 | | 13.7 | |
| 2016 | | 25.9 | |
| 2015 | | -7.2 | |
| 2014 | | 1.3 | |
| 2013 | | 32.8 | |
| 2012 | | 14.4 | |
| 2011 | | -1.7 | |
| 2010 | | 23.5 | |
| 2009 | | 26.2 | |
| 2008 | | -31.2 | |
| 2007 | | 2.4 | |
| Upside/Downside Capture Ratios | | | | | |
| Periods Ended 6/30/22 (%) | | | | | |
| | | UPSIDE | | DOWNSIDE | |
| 10-Year | | 87 | | 79 | |
| From 12/31/93 (Start of | | | | | |
| Fund’s First Full Quarter) | | 86 | | 71 | |
| Portfolio Diagnostics | | | |
| Fund Net Assets | | $1,002 million | |
| Number of Holdings | | 87 | |
| Turnover Rate | | 32% | |
| Average Market Capitalization 1 | | $2,280 million | |
| Weighted Average P/E Ratio 2,3 | | 10.4x | |
| Weighted Average P/B Ratio 2 | | 1.8x | |
| Active Share 4 | | 96% | |
| U.S. Investments (% of Net Assets) | | 85.6% | |
| Non-U.S. Investments (% of Net Assets) | | 13.6% | |
| 1 | Geometric Average. This weighted calculation uses each portfolio holding’s market cap in a way designed to not skew the effect of very large or small holdings; instead, it aims to better identify the portfolio’s center, which Royce believes offers a more accurate measure of average market cap than a simple mean or median. |
| 2 | Harmonic Average. This weighted calculation evaluates a portfolio as if it were a single stock and measures it overall. It compares the total market value of the portfolio to the portfolio’s share in the earnings or book value, as the case may be, of its underlying stocks. |
| 3 | The Fund’s P/E ratio calculation excludes companies with zero or negative earnings (10% of portfolio holdings as of 6/30/22). |
| 4 | Active Share is the sum of the absolute values of the different weightings of each holding in the Fund versus each holding in the benchmark, divided by two. |
Important Performance and Expense Information
All performance information in this Report reflects past performance, is presented on a total return basis, reflects the reinvestment of distributions, and does not reflect the deduction of taxes that a shareholder would pay on fund distributions or the redemption of fund shares. Past performance is no guarantee of future results. Investment return and principal value of an investment will fluctuate, so that shares may be worth more or less than their original cost when redeemed. Shares redeemed within 30 days of purchase may be subject to a 1% redemption fee payable to the Fund, which is not reflected in the performance shown above; if it were, performance would be lower. Current month-end performance may be higher or lower than performance quoted and may be obtained at www.royceinvest.com. All performance and risk information reflects results of the Investment Class (its oldest class). Operating expenses reflect the Fund’s total annual operating expenses for the Investment Class as of the Fund’s most current prospectus and include management fees, other expenses, and acquired fund fees and expenses. Acquired fund fees and expenses reflect the estimated amount of the fees and expenses incurred indirectly by the Fund through its investments in mutual funds, hedge funds, private equity funds, and other investment companies. Regarding the “Top Contributors” and “Top Detractors” tables shown above, the sum of all contributors to, and all detractors from, performance for all securities in the portfolio would approximate the Fund’s year-to-date performance for 2022. The Sharpe Ratio is calculated for a specified period by dividing a fund’s annualized excess returns by its annualized standard deviation. The higher the Sharpe ratio, the better the fund’s historical risk-adjusted performance. Upside Capture Ratio measures a manager’s performance in up markets relative to the Fund’s benchmark (Russell 2000 Value). It is calculated by measuring the Fund’s performance in quarters when the benchmark went up and dividing it by the benchmark’s return in those quarters. Downside Capture Ratio measures a manager’s performance in down markets relative to the Fund’s benchmark. It is calculated by measuring the Fund’s performance in quarters when the benchmark goes down and dividing it by the benchmark’s return in those quarters.
| The Royce Funds 2022 Semiannual Report to Shareholders | 25 |
MANAGER’S DISCUSSION (UNAUDITED)
Royce Small-Cap Value Fund (RVV)

Jay Kaplan, CFA®
FUND PERFORMANCE
Royce Small-Cap Value Fund fell 19.4% for the year-to-date period ended 6/30/22 versus a 17.3% decline for its primary benchmark, the Russell 2000 Value Index, and a loss of 23.4% for the Russell 2000, its secondary benchmark, for the same period. The portfolio outperformed both small-cap indexes for the one- and 20-year periods ended 6/30/22. In addition, its relative performance improved through the first half of 2022. After substantially trailing the Russell 2000 Value in 1Q22—down 9.3% versus a loss of 2.4%—the Fund fell 11.1% versus a decline of 15.3% for its primary benchmark in 2Q22.
WHAT WORKED… AND WHAT DIDN’T
Seven of the portfolio’s nine equity sectors had a negative impact on year-to-date performance. The sectors making the largest detractions were Consumer Discretionary, Information Technology, and Industrials. Health Care and Consumer Staples (along with a contribution from the Fund’s cash holdings) made the only positive impact while Communication Services had the smallest negative effect. At the industry level, specialty retail, household durables (both in Consumer Discretionary), and electronic equipment, instruments & components (Information Technology) detracted most for the year-to-date period, while pharmaceuticals (Health Care), entertainment (Communication Services), and IT services (Information Technology) were the largest contributors.
The portfolio’s top detractor at the position level in the first half of 2022 was family footwear retailer Shoe Carnival. We believe the company continues to execute well, in particular compared to its competitors, by reducing costs, opening new stores, and renovating older sites. Shoe Carnival also released strong 1Q22 earnings in May and maintained its top-line guidance, but saw its shares fall amidst the inhospitable climate for retailers. We held shares at the end of June. Rent-A-Center operates rent-to-own stores. Investors shied away from its stock after the company said that both the end of Covid relief funds and rising inflation would likely hurt its customers’ ability to buy and/or make payments. We were equally concerned about how the company’s 2021 acquisition of lease-to-own solutions provider Acima Holdings put leverage on Rent-A-Center’s balance sheet while also adding credit losses to recent financial results. We sold the last of our shares in March.
| | | | | |
| | Top Contributors to Performance | | Top Detractors from Performance | |
| | Year-to-Date Through 6/30/22 (%)1 | | Year-to-Date Through 6/30/22 (%)2 | |
| | SIGA Technologies | 0.69 | | Shoe Carnival | -0.94 | |
| | BioDelivery Sciences International | 0.64 | | Rent-A-Center | -0.92 | |
| | Resources Connection | 0.28 | | OneWater Marine Cl. A | -0.91 | |
| | IBEX | 0.16 | | American Eagle Outfitters | -0.80 | |
| | SciPlay Corporation Cl. A | 0.14 | | ArcBest | -0.71 | |
| | 1 Includes dividends | | | 2 Net of dividends | | |
| | | | | | | |
The top contributor at the position level was SIGA Technologies, which sells a treatment for smallpox that has also been approved in some countries to treat monkey pox. Its growth has historically been lumpy, driven by government contracts by which purchases of SIGA’s TPOXX smallpox treatment are made in large amounts to stockpile. More recently, however, the monkey pox outbreak has attracted a fresh round of investor interest in its shares. We trimmed our stake in the first half. BioDelivery Sciences International is a specialty pharmaceutical company that makes pain management and neurology products that treat patients living with serious and complex conditions such as chronic pain and acute migraines. In February, Collegium Pharmaceutical, which we also hold, and which also specializes in pain management medicines, announced it would acquire BioDelivery at a sizable premium, leading us to begin selling our position.
The portfolio’s disadvantage versus the Russell 2000 Value Index (its primary benchmark) came entirely from sector allocation in the year-to-date period; stock selection was additive, though not enough to outweigh the effects of sector positioning. Both our substantially larger exposure and stock picks hurt relative results in Consumer Discretionary. Our low weighting in Energy and lack of exposure to Utilities also made an appreciable negative impact versus the benchmark. Conversely, savvy stock selection boosted relative performance in Health Care. Stock picking and our lower weighting in Communication Services also helped results versus the small-cap value index, as did stock selection in Information Technology.
CURRENT POSITIONING AND OUTLOOK
We typically adhere to the wisdom in the adage, “Don’t fight the Fed.” However, as the Fed continues to raise rates—and may do so even more aggressively in its attempts to curb inflation—the yield curve has been flipping back and forth from inversion and ended June nearly flat. In addition, credit spreads keep widening, commodity prices have softened, and the bond market is signaling that the economy may be headed for recession—though we may already be there. Needless to say, this has made for a highly challenging investment environment, made even more difficult by the market’s downward moves, which are casting doubt on many earnings estimates. We will be paying especially close attention to any changes in guidance from last quarter once earnings announcements begin in mid-July. With the economic outlook unpromising, several small-cap companies with what seems like transitory issues to us have become attractively inexpensive. We have been focusing primarily on those that combine strong fundamentals—particularly low-debt balance sheets and positive cash flows—with effective operations and execution as well as tangible evidence of efforts to improve their business through the current uncertain period. During the first half, we increased our exposure to certain areas in Information Technology—most notably semiconductor and component makers and contract manufacturers—and Energy while reducing our weightings in big-ticket consumer areas such as boats and housing.
26 | The Royce Funds 2022 Semiannual Report to Shareholders
| PERFORMANCE AND PORTFOLIO REVIEW (UNAUDITED) | TICKER SYMBOLS RYVFX RVVHX RVFCX RVVRX |
Performance and Expenses
Average Annual Total Return (%) Through 6/30/22
| | JAN-JUN 20221 | 1-YR | 3-YR | 5-YR | 10-YR | 15-YR | 20-YR | SINCE INCEPTION (6/14/01) |
| RVV | -19.36 | -15.98 | 1.64 | 3.12 | 5.47 | 3.54 | 8.24 | 7.77 |
Annual Gross Operating Expenses: 1.55% Annual Net Operating Expenses: 1.49%
1 Not annualized
Morningstar Style Map™ As of 6/30/22

The Morningstar Style Map is the Morningstar Style Box™ with the center 75% of fund holdings plotted as the Morningstar Ownership Zone™. The Morningstar Style Box is designed to reveal a fund’s investment strategy. The Morningstar Ownership Zone provides detail about a portfolio’s investment style by showing the range of stock sizes and styles. The Ownership Zone is derived by plotting each stock in the portfolio within the proprietary Morningstar Style Box. Over time, the shape and location of a fund’s ownership zone may vary. See page 88 for additional information.
Value of $10,000
Invested on 6/14/01 as of 6/30/22 ($)
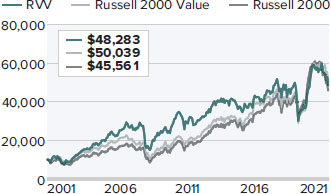
Top 10 Positions
% of Net Assets
| Resources Connection | 1.7 |
| Lincoln Educational Services | 1.6 |
| Catalyst Pharmaceuticals | 1.6 |
| Sanmina Corporation | 1.6 |
| Kimball Electronics | 1.6 |
| Schneider National Cl. B | 1.6 |
| ArcBest | 1.5 |
| TD SYNNEX | 1.5 |
| Vishay Intertechnology | 1.5 |
| Amkor Technology | 1.5 |
Portfolio Sector Breakdown
% of Net Assets
| Information Technology | 23.4 |
| Financials | 20.3 |
| Industrials | 18.6 |
| Consumer Discretionary | 13.8 |
| Health Care | 8.2 |
| Energy | 6.2 |
| Communication Services | 2.9 |
| Consumer Staples | 1.8 |
| Real Estate | 1.5 |
| Cash and Cash Equivalents | 3.3 |
Calendar Year Total Returns (%)
| YEAR | RVV |
| 2021 | 28.2 |
| 2020 | -6.5 |
| 2019 | 18.2 |
| 2018 | -7.2 |
| 2017 | 5.3 |
| 2016 | 21.1 |
| 2015 | -11.5 |
| 2014 | -0.0 |
| 2013 | 27.8 |
| 2012 | 9.6 |
| 2011 | -7.4 |
| 2010 | 25.0 |
| 2009 | 44.7 |
| 2008 | -34.2 |
| 2007 | 3.8 |
Upside/Downside Capture Ratios
Periods Ended 6/30/22 (%)
| | UPSIDE | DOWNSIDE |
| 10-Year | 82 | 99 |
| From 6/30/01 (Start of Fund’s First Full Quarter) | 95 | 94 |
Portfolio Diagnostics
| Fund Net Assets | $107 million |
| Number of Holdings | 97 |
| Turnover Rate | 37% |
| Average Market Capitalization1 | $1,070 million |
| Weighted Average P/E Ratio2,3 | 7.8x |
| Weighted Average P/B Ratio2 | 1.5x |
| Active Share4 | 96% |
| U.S. Investments (% of Net Assets) | 94.2% |
| Non-U.S. Investments (% of Net Assets) | 2.5% |
| 1 | Geometric Average. This weighted calculation uses each portfolio holding’s market cap in a way designed to not skew the effect of very large or small holdings; instead, it aims to better identify the portfolio’s center, which Royce believes offers a more accurate measure of average market cap than a simple mean or median. |
| 2 | Harmonic Average. This weighted calculation evaluates a portfolio as if it were a single stock and measures it overall. It compares the total market value of the portfolio to the portfolio’s share in the earnings or book value, as the case may be, of its underlying stocks. |
| 3 | The Fund’s P/E ratio calculation excludes companies with zero or negative earnings (3% of portfolio holdings as of 6/30/22). |
| 4 | Active Share is the sum of the absolute values of the different weightings of each holding in the Fund versus each holding in the benchmark, divided by two. |
Important Performance and Expense Information
All performance information in this Report reflects past performance, is presented on a total return basis, reflects the reinvestment of distributions, and does not reflect the deduction of taxes that a shareholder would pay on fund distributions or the redemption of fund shares. Past performance is no guarantee of future results. Investment return and principal value of an investment will fluctuate, so that shares may be worth more or less than their original cost when redeemed. Shares redeemed within 30 days of purchase may be subject to a 1% redemption fee payable to the Fund, which is not reflected in the performance shown above; if it were, performance would be lower. Current month-end performance may be higher or lower than performance quoted and may be obtained at www.royceinvest.com. All performance and risk information reflects results of the Service Class (its oldest class). Gross operating expenses reflect the Fund’s gross total annual operating expenses for the Service Class and include management fees, 12b-1 distribution and service fees, and other expenses. Net operating expenses reflect contractual fee waivers and/or expense reimbursements. All expense information is reported as of the Fund’s most current prospectus. Royce & Associates has contractually agreed, without right of termination, to waive fees and/or reimburse expenses to the extent necessary to maintain the Service Class’s net annual operating expenses (excluding brokerage commissions, taxes, interest, litigation expenses, acquired fund fees and expenses, and other expenses not borne in the ordinary course of business) at or below 1.49% through April 30, 2023. Regarding the “Top Contributors” and “Top Detractors” tables shown above, the sum of all contributors to, and all detractors from, performance for all securities in the portfolio would approximate the Fund’s year-to-date performance for 2022. Upside Capture Ratio measures a manager’s performance in up markets relative to the Fund’s benchmark (Russell 2000 Value). It is calculated by measuring the Fund’s performance in quarters when the benchmark went up and dividing it by the benchmark’s return in those quarters. Downside Capture Ratio measures a manager’s performance in down markets relative to the Fund’s benchmark. It is calculated by measuring the Fund’s performance in quarters when the benchmark goes down and dividing it by the benchmark’s return in those quarters.
The Royce Funds 2022 Semiannual Report to Shareholders | 27
MANAGER’S DISCUSSION (UNAUDITED)
Royce Smaller-Companies Growth Fund (RVP)

Chip Skinner, CFA®
FUND PERFORMANCE
Royce Smaller-Companies Growth Fund fell 36.2% for the year-to-date period ended 6/30/22, lagging its primary benchmark, the Russell 2000 Growth Index, which lost 29.5%, and the Russell 2000 Index, its secondary benchmark, which declined 23.4% for the same period. The portfolio outperformed the Russell 2000 Growth Index for the three-, 20-year, and since inception (6/14/01) periods ended 6/30/22.
WHAT WORKED… AND WHAT DIDN’T
Consistent with the dismal first half of the year for growth stocks—the worst in the history of the Russell 2000 Growth—it was not surprising that all of the portfolio’s nine equity sectors detracted from year-to-date performance. The Fund’s three biggest sector weights—Information Technology, Health Care, and Industrials—detracted most while the smallest negative impact came from Real Estate, Consumer Staples, and Communication Services. Software, semiconductors & semiconductor equipment (both in Information Technology), and biotechnology (Health Care) detracted most at the industry level while beverages (Consumer Staples), trading companies & distributors (Industrials), and multiline retail (Consumer Discretionary) were the largest contributors.
Ambarella, which manufactures machine vision sensor and semiconductor modules, was the biggest detractor at the position level. The company struggled with supply-chain challenges—especially those related to China’s Covid-driven shutdowns—and production issues among its major auto manufacturer customers. While valuations have compressed for most semiconductor makers, we believe in Ambarella’s management and in its applications for the Internet of Things. Its new CV3 chip solutions, for example, sell at much higher prices than the current versions due to key improvements that provide the automotive industry’s highest AI processing performance. While growth in the first half and guidance for the second half of 2022 were tepid, management expects its computer vision products to improve fiscal 2023 revenues.
Freshpet, a pioneer and market share leader in the fresh/refrigerated dog and cat food market, also made a sizable detraction. The company has struggled to keep up with robust order volumes over the last few years while incurring higher costs for ingredients, shipping, and labor that resulted in problems meeting demand. While there were signs earlier in 2022 that production efficiencies were improving, the firm later announced a large—and dilutive—equity offering to fund future growth that caught investors by surprise and sent its shares downward immediately after 1Q22 results were reported. While management’s credibility has clearly suffered from the decision to build capacity ahead of supply growth, we believe the company has a long runway for growth—and could, in our view, end up in a global consumer brand’s portfolio at some point.
| | | | | | | |
| | Top Contributors to Performance | | | Top Detractors from Performance | | |
| | Year-to-Date Through 6/30/22 (%)1 | | | Year-to-Date Through 6/30/22 (%)2 | | |
| | | | | | | |
| | TransMedics Group | 0.57 | | Ambarella | -2.00 | |
| | Celsius Holdings | 0.38 | | Freshpet | -1.41 | |
| | Lantheus Holdings | 0.26 | | InMode | -1.36 | |
| | AeroVironment | 0.25 | | Matterport Cl. A | -1.29 | |
| | Distribution Solutions Group | 0.23 | | Atlas Technical Consultants Cl. A | -0.97 | |
| | 1 Includes dividends | | | 2 Net of dividends | | |
| | | | | | | |
The Fund’s top contributor was TransMedics Group, which is building an end-to-end donor organ transportation business, starting with an innovative organ perfusion transport system that supplies blood to the organs while in transit. This is a more effective method than a simple ice cooler, providing healthier organs with a lower discard rate. TransMedics has won FDA approval for lung, heart, and liver transport and is investing in a national network of service providers for further adoption. We think the company may have reached a revenue growth inflection point in the first calendar quarter that we hope will continue for the foreseeable future. Celsius Holdings makes caffeinated and other energy beverages that have roots in the sports enthusiast, gym, and health food markets. Following a pullback in its valuation from late 2021 into early 2022, we reinitiated a position in 2022, having enjoyed a profitable experience with the stock in the past. Celsius has continued to expand into new retail areas, including Costco, while also beginning to gain access to the convenience store channel, which represents close to half the overall market for energy drinks. In addition, the company has continued to report impressively high organic revenue growth rates.
The portfolio’s disadvantage versus the Russell 2000 Growth (its primary benchmark) was attributable to stock selection for the year-to-date period, as our sector allocation decisions were modestly additive. Stock picks in Health Care and Information Technology detracted most, followed by our lack of exposure to Energy, which was the top-contributing sector in the small-cap growth index. Conversely, both stock selection and lower weightings in both Consumer Discretionary and Real Estate contributed to relative results during the first half, as did the portfolio’s cash holdings.
CURRENT POSITIONING AND OUTLOOK
The disappointments of 2022’s first half notwithstanding, we are very bullish. First, valuations for small-cap growth companies are significantly lower compared to their levels a year ago, which has allowed us to purchase several companies at what we believe were attractively inexpensive prices. More generally, small-cap market drawdowns of 30% or more have historically been followed by positive absolute returns. We also believe that the Fed has several options at its disposal to control inflation—and has the will to do so. Additionally, economic deceleration was already impacting commodity prices at the end of June. With investor pessimism running high—and assuming no further major Covid outbreaks or other exogenous factors—we anticipate that both sentiment and share prices will have improved a year from now.
28 | The Royce Funds 2022 Semiannual Report to Shareholders
| PERFORMANCE AND PORTFOLIO REVIEW (UNAUDITED) | TICKER SYMBOLS RYVPX RVPHX RVPCX RVPIX |
Performance and Expenses
Average Annual Total Return (%) Through 6/30/22
| | JAN-JUN 20221 | 1-YR | 3-YR | 5-YR | 10-YR | 15-YR | 20-YR | SINCE INCEPTION (6/14/01) |
| RVP | -36.21 | -42.18 | 1.58 | 3.82 | 8.00 | 4.30 | 9.14 | 9.57 |
| Annual Gross Operating Expenses: 1.51% Annual Net Operating Expenses: 1.49% |
1 Not annualized
Morningstar Style Map™ As of 6/30/22
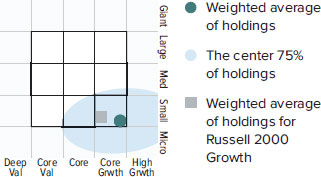
The Morningstar Style Map is the Morningstar Style Box™ with the center 75% of fund holdings plotted as the Morningstar Ownership Zone™. The Morningstar Style Box is designed to reveal a fund’s investment strategy. The Morningstar Ownership Zone provides detail about a portfolio’s investment style by showing the range of stock sizes and styles. The Ownership Zone is derived by plotting each stock in the portfolio within the proprietary Morningstar Style Box. Over time, the shape and location of a fund’s ownership zone may vary. See page 88 for additional information.
Value of $10,000
Invested on 6/14/01 as of 6/30/22 ($)

Top 10 Positions
% of Net Assets
| Distribution Solutions Group | 4.7 |
| Impinj | 3.0 |
| Axonics | 2.8 |
| Inspire Medical Systems | 2.8 |
| Halozyme Therapeutics | 2.3 |
| Chart Industries | 2.3 |
| TransMedics Group | 2.3 |
| Silicon Laboratories | 2.3 |
| Clearfield | 2.1 |
| STAAR Surgical | 2.0 |
Portfolio Sector Breakdown
% of Net Assets
| Information Technology | 27.8 |
| Health Care | 26.7 |
| Industrials | 19.0 |
| Consumer Discretionary | 10.5 |
| Consumer Staples | 5.7 |
| Materials | 2.7 |
| Financials | 1.9 |
| Communication Services | 1.1 |
| Real Estate | 0.6 |
| Cash and Cash Equivalents | 4.0 |
Calendar Year Total Returns (%)
| YEAR | RVP |
| 2021 | 7.8 |
| 2020 | 49.3 |
| 2019 | 23.7 |
| 2018 | -10.2 |
| 2017 | 17.8 |
| 2016 | 9.4 |
| 2015 | -1.8 |
| 2014 | 3.9 |
| 2013 | 32.5 |
| 2012 | 15.3 |
| 2011 | -10.0 |
| 2010 | 19.7 |
| 2009 | 41.4 |
| 2008 | -41.1 |
| 2007 | 3.2 |
Upside/Downside Capture Ratios
Periods Ended 6/30/22 (%)
| | | |
| | UPSIDE | DOWNSIDE |
| 10-Year | 98 | 107 |
| From 6/30/01 (Start of Fund’s First Full Quarter) | 106 | 92 |
Portfolio Diagnostics
| | |
| Fund Net Assets | $180 million |
| Number of Holdings | 82 |
| Turnover Rate | 41% |
| Average Market Capitalization1 | $1,570 million |
| Weighted Average P/B Ratio2 | 3.0x |
| 3-5 Year EPS Growth (est.)3 | 25.4% |
| Active Share4 | 96% |
| U.S. Investments (% of Net Assets) | 83.7% |
| Non-U.S. Investments (% of Net Assets) | 12.3% |
| 1 | Geometric Average. This weighted calculation uses each portfolio holding’s market cap in a way designed to not skew the effect of very large or small holdings; instead, it aims to better identify the portfolio’s center, which Royce believes offers a more accurate measure of average market cap than a simple mean or median. |
| 2 | Harmonic Average. This weighted calculation evaluates a portfolio as if it were a single stock and measures it overall. It compares the total market value of the portfolio to the portfolio’s share in the earnings or book value, as the case may be, of its underlying stocks. |
| 3 | The 3-5 Year EPS Growth (est.) is calculated as a simple weighted average of the pre-calculated mean long-term EPS growth rate estimates by brokerage analysts. Long Term Growth (LTG) is the annual EPS growth that the company can sustain over the next 3 or 5 years. Source: Factset |
| 4 | Active Share is the sum of the absolute values of the different weightings of each holding in the Fund versus each holding in the benchmark, divided by two. |
Important Performance and Expense Information
All performance information in this Report reflects past performance, is presented on a total return basis, reflects the reinvestment of distributions, and does not reflect the deduction of taxes that a shareholder would pay on fund distributions or the redemption of fund shares. Past performance is no guarantee of future results. Investment return and principal value of an investment will fluctuate, so that shares may be worth more or less than their original cost when redeemed. Shares redeemed within 30 days of purchase may be subject to a 1% redemption fee payable to the Fund, which is not reflected in the performance shown above; if it were, performance would be lower. Current month-end performance may be higher or lower than performance quoted and may be obtained at www.royceinvest.com. All performance and risk information reflects results of the Service Class (its oldest class). Gross operating expenses reflect the Fund’s gross total operating expenses for the Service Class and include management fees, 12b-1 distribution and service fees, and other expenses. Net operating expenses reflect contractual fee waivers and/or expense reimbursements. All expense information is reported as of the Fund’s most current prospectus. Royce & Associates has contractually agreed, without right of termination, to waive fees and/or reimburse expenses to the extent necessary to maintain the Service Class’s net annual operating expenses (excluding brokerage commissions, taxes, interest, litigation expenses, acquired fund fees and expenses, and other expenses not borne in the ordinary course of business) at or below 1.49% through April 30, 2023. Regarding the “Top Contributors” and “Top Detractors” tables shown above, the sum of all contributors to, and all detractors from, performance for all securities in the portfolio would approximate the Fund’s year-to-date performance for 2022. Upside Capture Ratio measures a manager’s performance in up markets relative to the Fund’s benchmark (Russell 2000 Growth). It is calculated by measuring the Fund’s performance in quarters when the benchmark went up and dividing it by the benchmark’s return in those quarters. Downside Capture Ratio measures a manager’s performance in down markets relative to the Fund’s benchmark. It is calculated by measuring the Fund’s performance in quarters when the benchmark goes down and dividing it by the benchmark’s return in those quarters.
The Royce Funds 2022 Semiannual Report to Shareholders | 29
Schedules of Investments
Royce Dividend Value Fund
Common Stocks – 94.8%
| | | SHARES | | | VALUE | |
| | | | | | | | | |
| CONSUMER DISCRETIONARY – 4.0% | | | | | | | | |
| AUTO COMPONENTS - 0.3% | | | | | | | | |
| Nokian Renkaat | | | 18,000 | | | $ | 196,742 | |
| HOUSEHOLD DURABLES - 0.8% | | | | | | | | |
| PulteGroup | | | 10,900 | | | | 431,967 | |
| SPECIALTY RETAIL - 2.9% | | | | | | | | |
| Rent-A-Center | | | 36,466 | | | | 709,264 | |
| USS | | | 56,000 | | | | 969,516 | |
| | | | | | | | 1,678,780 | |
| Total (Cost $2,093,256) | | | | | | | 2,307,489 | |
| | | | | | | | | |
| ENERGY – 1.7% | | | | | | | | |
| OIL, GAS & CONSUMABLE FUELS - 1.7% | | | | | | | | |
| Gaztransport Et Technigaz | | | 7,800 | | | | 976,794 | |
| Total (Cost $491,861) | | | | | | | 976,794 | |
| | | | | | | | | |
| FINANCIALS – 26.0% | | | | | | | | |
| BANKS - 3.8% | | | | | | | | |
| BOK Financial | | | 15,414 | | | | 1,164,990 | |
| Triumph Bancorp 1 | | | 15,750 | | | | 985,320 | |
| | | | | | | | 2,150,310 | |
| CAPITAL MARKETS - 22.2% | | | | | | | | |
| Ashmore Group | | | 244,300 | | | | 659,603 | |
| B3-Brasil, Bolsa, Balcao | | | 336,600 | | | | 704,915 | |
| Bolsa Mexicana de Valores | | | 444,000 | | | | 783,809 | |
| Carlyle Group | | | 60,820 | | | | 1,925,561 | |
| Coronation Fund Managers | | | 153,700 | | | | 309,124 | |
| Evercore Cl. A | | | 13,500 | | | | 1,263,735 | |
| Jupiter Fund Management | | | 225,700 | | | | 406,897 | |
| KKR & Co. | | | 14,738 | | | | 682,222 | |
| Moelis & Company Cl. A | | | 19,359 | | | | 761,777 | |
| SEI Investments | | | 37,900 | | | | 2,047,358 | |
| Sprott | | | 58,860 | | | | 2,044,918 | |
| State Street | | | 16,800 | | | | 1,035,720 | |
| | | | | | | | 12,625,639 | |
| Total (Cost $10,339,195) | | | | | | | 14,775,949 | |
| | | | | | | | | |
| HEALTH CARE – 3.2% | | | | | | | | |
| HEALTH CARE PROVIDERS & SERVICES - 0.8% | | | | | | | | |
| Ensign Group (The) | | | 5,951 | | | | 437,220 | |
| PHARMACEUTICALS - 2.4% | | | | | | | | |
| Recordati Industria Chimica e Farmaceutica | | | 24,210 | | | | 1,053,145 | |
| Santen Pharmaceutical | | | 41,600 | | | | 326,226 | |
| | | | | | | | 1,379,371 | |
| Total (Cost $626,526) | | | | | | | 1,816,591 | |
| | | | | | | | | |
| INDUSTRIALS – 39.7% | | | | | | | | |
| AEROSPACE & DEFENSE - 4.3% | | | | | | | | |
| HEICO Corporation Cl. A | | | 23,259 | | | | 2,451,033 | |
| BUILDING PRODUCTS - 0.7% | | | | | | | | |
| Geberit | | | 800 | | | | 384,476 | |
| COMMERCIAL SERVICES & SUPPLIES - 0.5% | | | | | | | | |
| Healthcare Services Group | | | 15,700 | | | | 273,337 | |
| CONSTRUCTION & ENGINEERING - 1.3% | | | | | | | | |
| Comfort Systems USA | | | 8,959 | | | | 744,941 | |
| ELECTRICAL EQUIPMENT - 3.3% | | | | | | | | |
| Hubbell Incorporated | | | 10,362 | | | | 1,850,446 | |
| MACHINERY - 11.7% | | | | | | | | |
| Graco | | | 25,224 | | | | 1,498,558 | |
| Lincoln Electric Holdings | | | 10,022 | | | | 1,236,314 | |
| Lindsay Corporation | | | 17,400 | | | | 2,311,068 | |
| Spirax-Sarco Engineering | | | 13,478 | | | | 1,620,661 | |
| | | | | | | | 6,666,601 | |
| MARINE - 2.3% | | | | | | | | |
| Clarkson | | | 35,040 | | | | 1,283,892 | |
| PROFESSIONAL SERVICES - 9.7% | | | | | | | | |
| KBR | | | 64,590 | | | | 3,125,510 | |
| Korn Ferry | | | 10,023 | | | | 581,534 | |
| ManpowerGroup | | | 19,300 | | | | 1,474,713 | |
| Robert Half International | | | 4,794 | | | | 359,023 | |
| | | | | | | | 5,540,780 | |
| ROAD & RAIL - 0.6% | | | | | | | | |
| Werner Enterprises | | | 8,643 | | | | 333,101 | |
| TRADING COMPANIES & DISTRIBUTORS - 5.3% | | | | | | | | |
| Applied Industrial Technologies | | | 31,294 | | | | 3,009,544 | |
| Total (Cost $7,869,555) | | | | | | | 22,538,151 | |
| | | | | | | | | |
| INFORMATION TECHNOLOGY – 1.9% | | | | | | | | |
| ELECTRONIC EQUIPMENT, INSTRUMENTS & COMPONENTS - 1.3% | | | | | | | | |
| Vishay Intertechnology | | | 42,497 | | | | 757,297 | |
| SOFTWARE - 0.6% | | | | | | | | |
| SimCorp | | | 4,200 | | | | 304,871 | |
| Total (Cost $680,418) | | | | | | | 1,062,168 | |
| | | | | | | | | |
| MATERIALS – 18.3% | | | | | | | | |
| CHEMICALS - 1.6% | | | | | | | | |
| Quaker Chemical | | | 6,122 | | | | 915,362 | |
| CONTAINERS & PACKAGING - 3.7% | | | | | | | | |
| AptarGroup | | | 20,396 | | | | 2,105,071 | |
| METALS & MINING - 13.0% | | | | | | | | |
| Franco-Nevada | | | 18,335 | | | | 2,412,519 | |
| Reliance Steel & Aluminum | | | 10,288 | | | | 1,747,520 | |
| Royal Gold | | | 11,600 | | | | 1,238,648 | |
| Worthington Industries | | | 44,460 | | | | 1,960,686 | |
| | | | | | | | 7,359,373 | |
| Total (Cost $3,679,857) | | | | | | | 10,379,806 | |
| | | | | | | | | |
| TOTAL COMMON STOCKS | | | | | | | | |
| (Cost $25,780,668) | | | | | | | 53,856,948 | |
| | | | | | | | | |
| REPURCHASE AGREEMENT– 5.2% | | | | | | | | |
| Fixed Income Clearing Corporation, 0.24% dated 6/30/22, due 7/1/22, maturity value $2,991,987 (collateralized by obligations of various U.S. Government Agencies, 0.125% due 4/15/27, valued at $3,051,825) | |
| (Cost $2,991,967) | | | | | | | 2,991,967 | |
| | | | | | | | | |
| TOTAL INVESTMENTS – 100.0% | | | | | | | | |
| (Cost $28,772,635) | | | | | | | 56,848,915 | |
| | | | | | | | | |
| LIABILITIES LESS CASH AND OTHER ASSETS – (0.0)% | | | | | | | (21,765 | ) |
| | | | | | | | | |
| NET ASSETS – 100.0% | | | | | | $ | 56,827,150 | |
| 30 | The Royce Funds 2022 Semiannual Report to Shareholders | THE ACCOMPANYING NOTES ARE AN INTEGRAL PART OF THESE FINANCIAL STATEMENTS |
June 30, 2022 (unaudited)
Royce Global Financial Services Fund
Common Stocks – 97.3%
| | | SHARES | | | VALUE | |
| | | | | | | |
| BANKS - 17.3% | | | | | | |
| BOK Financial | | | 10,450 | | | $ | 789,811 | |
| Cadence Bank | | | 11,120 | | | | 261,098 | |
| Capital City Bank Group | | | 16,988 | | | | 473,795 | |
| First Citizens BancShares Cl. A | | | 1,737 | | | | 1,135,616 | |
| First Republic Bank | | | 2,599 | | | | 374,776 | |
| Popular | | | 18,057 | | | | 1,389,125 | |
| Umpqua Holdings | | | 17,400 | | | | 291,798 | |
| Total (Cost $2,376,379) | | | | | | | 4,716,019 | |
| | | | | | | | | |
| CAPITAL MARKETS - 50.7% | | | | | | | | |
| Ares Management Cl. A | | | 12,337 | | | | 701,482 | |
| B3-Brasil, Bolsa, Balcao | | | 183,000 | | | | 383,242 | |
| Canaccord Genuity Group | | | 113,715 | | | | 744,731 | |
| Carlyle Group | | | 21,185 | | | | 670,717 | |
| Charles Schwab | | | 14,671 | | | | 926,914 | |
| Coronation Fund Managers | | | 61,200 | | | | 123,086 | |
| CRISIL | | | 14,000 | | | | 582,000 | |
| Egyptian Financial Group-Hermes Holding Company 1 | | | 184,791 | | | | 117,264 | |
| Hellenic Exchanges - Athens Stock Exchange | | | 50,000 | | | | 165,052 | |
| Insignia Financial | | | 55,000 | | | | 102,122 | |
| Intermediate Capital Group | | | 39,111 | | | | 623,213 | |
| JSE | | | 51,000 | | | | 315,146 | |
| Jupiter Fund Management | | | 106,900 | | | | 192,722 | |
| KKR & Co. | | | 16,120 | | | | 746,195 | |
| MarketAxess Holdings | | | 1,581 | | | | 404,752 | |
| MarketWise Cl. A 1 | | | 88,300 | | | | 317,880 | |
| NZX | | | 580,000 | | | | 445,554 | |
| Raymond James Financial | | | 2,900 | | | | 259,289 | |
| RF Capital Group 1 | | | 10,800 | | | | 120,569 | |
| Rothschild & Co | | | 13,900 | | | | 469,770 | |
| SEI Investments | | | 7,950 | | | | 429,459 | |
| Silvercrest Asset Management Group Cl. A | | | 27,612 | | | | 453,113 | |
| Sprott | | | 40,500 | | | | 1,407,054 | |
| StoneX Group 1 | | | 9,846 | | | | 768,677 | |
| Tel Aviv Stock Exchange | | | 273,000 | | | | 1,241,140 | |
| U.S. Global Investors Cl. A | | | 165,500 | | | | 724,890 | |
| Warsaw Stock Exchange | | | 23,169 | | | | 194,186 | |
| Westaim Corporation (The) 1 | | | 105,000 | | | | 197,405 | |
| Total (Cost $9,308,083) | | | | | | | 13,827,624 | |
| | | | | | | | | |
| CLOSED-END FUNDS - 1.1% | | | | | | | | |
| Eagle Point Income | | | 19,341 | | | | 299,012 | |
| Total (Cost $384,692) | | | | | | | 299,012 | |
| | | | | | | | | |
| DIVERSIFIED FINANCIAL SERVICES - 2.4% | | | | | | | | |
| Banco Latinoamericano de Comercio Exterior Cl. E | | | 25,700 | | | | 341,039 | |
| ECN Capital | | | 75,000 | | | | 321,046 | |
| Total (Cost $557,932) | | | | | | | 662,085 | |
| | | | | | | | | |
| ELECTRONIC EQUIPMENT, INSTRUMENTS & COMPONENTS - 1.1% | | | | | | | | |
| †Vontier Corporation | | | 13,600 | | | | 312,664 | |
| Total (Cost $414,811) | | | | | | | 312,664 | |
| | | | | | | | | |
| INSURANCE - 7.3% | | | | | | | | |
| Axis Capital Holdings | | | 11,554 | | | | 659,618 | |
| E-L Financial | | | 1,638 | | | | 1,005,298 | |
| James River Group Holdings | | | 13,700 | | | | 339,486 | |
| Total (Cost $1,755,926) | | | | | | | 2,004,402 | |
| IT SERVICES - 0.9% | | | | | | | | |
| PayPal Holdings 1 | | | 3,466 | | | | 242,065 | |
| Total (Cost $122,211) | | | | | | | 242,065 | |
| | | | | | | | | |
| METALS & MINING - 4.6% | | | | | | | | |
| Franco-Nevada | | | 9,523 | | | | 1,253,036 | |
| Total (Cost $430,881) | | | | | | | 1,253,036 | |
| | | | | | | | | |
| PROFESSIONAL SERVICES - 0.5% | | | | | | | | |
| Quess Corp | | | 17,756 | | | | 138,275 | |
| Total (Cost $153,190) | | | | | | | 138,275 | |
| | | | | | | | | |
| REAL ESTATE MANAGEMENT & DEVELOPMENT - 8.5% | | | | | | | | |
| Altus Group | | | 23,760 | | | | 823,072 | |
| FirstService Corporation | | | 8,379 | | | | 1,015,535 | |
| FRP Holdings 1 | | | 7,957 | | | | 480,205 | |
| Total (Cost $1,125,800) | | | | | | | 2,318,812 | |
| | | | | | | | | |
| SOFTWARE - 1.5% | | | | | | | | |
| Benefitfocus 1 | | | 10,600 | | | | 82,468 | |
| Envestnet 1 | | | 6,000 | | | | 316,620 | |
| Total (Cost $542,198) | | | | | | | 399,088 | |
| | | | | | | | | |
| THRIFTS & MORTGAGE FINANCE - 1.4% | | | | | | | | |
| Provident Bancorp | | | 25,000 | | | | 392,500 | |
| Total (Cost $313,394) | | | | | | | 392,500 | |
| | | | | | | | | |
| TOTAL COMMON STOCKS | | | | | | | | |
| (Cost $17,485,497) | | | | | | | 26,565,582 | |
| | | | | | | | | |
| REPURCHASE AGREEMENT– 2.8% | | | | | | | | |
| Fixed Income Clearing Corporation, 0.24% dated 6/30/22, due 7/1/22, maturity value $745,603 (collateralized by obligations of various U.S. Government Agencies, 0.125% due 4/15/27, valued at $760,596) | |
| (Cost $745,598) | | | | | | | 745,598 | |
| | | | | | | | | |
| TOTAL INVESTMENTS – 100.1% | | | | | | | | |
| (Cost $18,231,095) | | | | | | | 27,311,180 | |
| | | | | | | | | |
| LIABILITIES LESS CASH AND OTHER ASSETS – (0.1)% | | | | | | | (15,319 | ) |
| | | | | | | | | |
| NET ASSETS – 100.0% | | | | | | $ | 27,295,861 | |
| THE ACCOMPANYING NOTES ARE AN INTEGRAL PART OF THESE FINANCIAL STATEMENTS | The Royce Funds 2022 Semiannual Report to Shareholders | 31 |
Schedules of Investments
Royce International Premier Fund
Common Stocks – 93.8%
| | | SHARES | | | VALUE | |
| | | | | | | |
| AUSTRALIA – 8.6% | | | | | | |
| Bravura Solutions 2 | | | 14,651,071 | | | $ | 14,309,761 | |
| Cochlear | | | 35,400 | | | | 4,855,206 | |
| Hansen Technologies | | | 7,372,946 | | | | 26,463,723 | |
| IPH | | | 4,662,724 | | | | 26,262,521 | |
| Total (Cost $76,843,499) | | | | | | | 71,891,211 | |
| | | | | | | | | |
| BRAZIL – 2.5% | | | | | | | | |
| Odontoprev | | | 8,424,300 | | | | 15,050,723 | |
| TOTVS | | | 1,367,600 | | | | 6,078,280 | |
| Total (Cost $27,931,899) | | | | | | | 21,129,003 | |
| | | | | | | | | |
| CANADA – 4.1% | | | | | | | | |
| Altus Group | | | 324,700 | | | | 11,247,959 | |
| Enghouse Systems | | | 677,500 | | | | 14,963,739 | |
| †Open Text | | | 227,400 | | | | 8,601,699 | |
| Total (Cost $42,915,700) | | | | | | | 34,813,397 | |
| | | | | | | | | |
| DENMARK – 2.4% | | | | | | | | |
| Chr. Hansen Holding | | | 118,700 | | | | 8,639,660 | |
| SimCorp | | | 160,700 | | | | 11,664,961 | |
| Total (Cost $21,484,925) | | | | | | | 20,304,621 | |
| | | | | | | | | |
| GERMANY – 4.7% | | | | | | | | |
| Amadeus Fire | | | 62,798 | | | | 7,831,290 | |
| New Work | | | 126,702 | | | | 17,978,055 | |
| Norma Group | | | 608,201 | | | | 13,575,858 | |
| Total (Cost $61,231,349) | | | | | | | 39,385,203 | |
| | | | | | | | | |
| ICELAND – 3.0% | | | | | | | | |
| Marel | | | 3,303,770 | | | | 15,075,564 | |
| Ossur 1 | | | 2,300,247 | | | | 9,722,709 | |
| Total (Cost $29,453,566) | | | | | | | 24,798,273 | |
| | | | | | | | | |
| INDIA – 1.0% | | | | | | | | |
| AIA Engineering | | | 292,111 | | | | 8,183,066 | |
| Total (Cost $6,527,630) | | | | | | | 8,183,066 | |
| | | | | | | | | |
| ITALY – 5.7% | | | | | | | | |
| Carel Industries | | | 470,204 | | | | 9,342,545 | |
| DiaSorin | | | 144,863 | | | | 19,006,510 | |
| GVS 1 | | | 2,437,012 | | | | 19,869,083 | |
| Total (Cost $61,532,854) | | | | | | | 48,218,138 | |
| | | | | | | | | |
| JAPAN – 19.8% | | | | | | | | |
| As One | | | 264,400 | | | | 10,425,560 | |
| Benefit One | | | 564,100 | | | | 7,583,420 | |
| BML | | | 796,600 | | | | 20,695,865 | |
| Fukui Computer Holdings | | | 750,700 | | | | 18,894,756 | |
| †JCU | | | 516,500 | | | | 12,885,853 | |
| Meitec Corporation | | | 1,104,000 | | | | 17,795,165 | |
| NSD | | | 658,300 | | | | 11,474,643 | |
| OBIC Business Consultants | | | 713,400 | | | | 24,528,383 | |
| TKC Corporation | | | 1,021,600 | | | | 24,771,993 | |
| USS | | | 541,500 | | | | 9,374,878 | |
| †Zuken | | | 359,100 | | | | 8,085,573 | |
| Total (Cost $185,827,743) | | | | | | | 166,516,089 | |
| | | | | | | | | |
| NETHERLANDS – 1.5% | | | | | | | | |
| IMCD | | | 89,300 | | | | 12,254,554 | |
| Total (Cost $5,982,710) | | | | | | | 12,254,554 | |
| NEW ZEALAND – 0.9% | | | | | | |
| Fisher & Paykel Healthcare | | | 605,000 | | | | 7,549,497 | |
| Total (Cost $4,868,369) | | | | | | | 7,549,497 | |
| | | | | | | | | |
| POLAND – 1.7% | | | | | | | | |
| Asseco Poland | | | 848,400 | | | | 14,293,346 | |
| Total (Cost $19,452,466) | | | | | | | 14,293,346 | |
| | | | | | | | | |
| SINGAPORE – 1.7% | | | | | | | | |
| XP Power | | | 403,369 | | | | 13,994,104 | |
| Total (Cost $13,052,649) | | | | | | | 13,994,104 | |
| | | | | | | | | |
| SOUTH KOREA – 3.5% | | | | | | | | |
| Douzone Bizon | | | 390,700 | | | | 10,983,171 | |
| NICE Information Service | | | 1,662,500 | | | | 18,438,078 | |
| Total (Cost $56,987,463) | | | | | | | 29,421,249 | |
| | | | | | | | | |
| SWEDEN – 9.7% | | | | | | | | |
| Alimak Group | | | 1,818,800 | | | | 13,761,345 | |
| Bravida Holding | | | 1,390,028 | | | | 12,106,992 | |
| Hexpol | | | 1,182,300 | | | | 10,060,775 | |
| Karnov Group 1 | | | 2,827,108 | | | | 16,885,681 | |
| Loomis | | | 950,800 | | | | 23,124,616 | |
| †Norva24 Group 1 | | | 1,769,200 | | | | 5,895,748 | |
| Total (Cost $92,330,395) | | | | | | | 81,835,157 | |
| | | | | | | | | |
| SWITZERLAND – 6.2% | | | | | | | | |
| dormakaba Holding | | | 26,600 | | | | 11,605,196 | |
| Kardex Holding | | | 75,100 | | | | 12,476,677 | |
| LEM Holding | | | 3,791 | | | | 7,243,266 | |
| Partners Group Holding | | | 10,400 | | | | 9,371,057 | |
| VZ Holding | | | 158,885 | | | | 11,517,145 | |
| Total (Cost $43,373,461) | | | | | | | 52,213,341 | |
| | | | | | | | | |
| UNITED KINGDOM – 16.8% | | | | | | | | |
| Ashmore Group | | | 5,074,850 | | | | 13,701,953 | |
| Croda International | | | 134,900 | | | | 10,627,918 | |
| Diploma | | | 347,698 | | | | 9,430,074 | |
| DiscoverIE Group | | | 1,884,826 | | | | 14,225,275 | |
| †Intertek Group | | | 162,400 | | | | 8,314,823 | |
| Learning Technologies Group | | | 11,797,500 | | | | 16,113,154 | |
| Marlowe 1 | | | 1,776,845 | | | | 16,005,859 | |
| Restore | | | 4,013,939 | | | | 21,254,835 | |
| Spirax-Sarco Engineering | | | 87,700 | | | | 10,545,480 | |
| Victrex | | | 971,145 | | | | 21,030,894 | |
| Total (Cost $156,266,404) | | | | | | | 141,250,265 | |
| | | | | | | | | |
| TOTAL COMMON STOCKS | | | | | | | | |
| (Cost $906,063,082) | | | | | | | 788,050,514 | |
| | | | | | | | | |
| PREFERRED STOCK – 2.1% | | | | | | | | |
| GERMANY – 2.1% | | | | | | | | |
| FUCHS PETROLUB | | | 637,400 | | | | 17,767,824 | |
| (Cost $28,424,085) | | | | | | | 17,767,824 | |
| 32 | The Royce Funds 2022 Semiannual Report to Shareholders | THE ACCOMPANYING NOTES ARE AN INTEGRAL PART OF THESE FINANCIAL STATEMENTS |
June 30, 2022 (unaudited)
Royce International Premier Fund (continued)
| | | VALUE | |
| | | | |
| REPURCHASE AGREEMENT– 4.0% | | | |
| Fixed Income Clearing Corporation, 0.24% dated 6/30/22, due 7/1/22, maturity value $33,602,150 (collateralized by obligations of various U.S. Government Agencies, 0.125%-2.50% due 3/31/27-4/15/27, valued at $34,274,029) | |
| (Cost $33,601,926) | | $ | 33,601,926 | |
| | | | | |
| TOTAL INVESTMENTS – 99.9% | | | | |
| (Cost $968,089,093) | | | 839,420,264 | |
| | | | | |
| CASH AND OTHER ASSETS LESS LIABILITIES – 0.1% | | | 493,504 | |
| | | | | |
| NET ASSETS – 100.0% | | $ | 839,913,768 | |
Royce Micro-Cap Fund
Common Stocks – 96.9%
| | | SHARES | | | VALUE | |
| | | | | | | | | |
| COMMUNICATION SERVICES – 4.3% | | | | | | | | |
| ENTERTAINMENT - 2.2% | | | | | | | | |
| Chicken Soup for the Soul Entertainment Cl. A 1 | | | 227,221 | | | $ | 1,683,708 | |
| Gaia Cl. A 1 | | | 348,700 | | | | 1,481,975 | |
| IMAX Corporation 1 | | | 176,300 | | | | 2,977,707 | |
| | | | | | | | 6,143,390 | |
| INTERACTIVE MEDIA & SERVICES - 1.1% | | | | | | | | |
| Enthusiast Gaming Holdings 1 | | | 426,200 | | | | 844,321 | |
| QuinStreet 1 | | | 238,846 | | | | 2,402,791 | |
| | | | | | | | 3,247,112 | |
| MEDIA - 1.0% | | | | | | | | |
| Magnite 1 | | | 79,500 | | | | 705,960 | |
| Thryv Holdings 1 | | | 97,704 | | | | 2,187,592 | |
| | | | | | | | 2,893,552 | |
| Total (Cost $16,804,954) | | | | | | | 12,284,054 | |
| | | | | | | | | |
| CONSUMER DISCRETIONARY – 10.2% | | | | | | | | |
| AUTO COMPONENTS - 2.2% | | | | | | | | |
| Modine Manufacturing 1 | | | 296,500 | | | | 3,122,145 | |
| Stoneridge 1 | | | 152,600 | | | | 2,617,090 | |
| Unique Fabricating 1 | | | 362,851 | | | | 493,477 | |
| | | | | | | | 6,232,712 | |
| HOTELS, RESTAURANTS & LEISURE - 1.5% | | | | | | | | |
| Century Casinos 1 | | | 346,100 | | | | 2,491,920 | |
| Lindblad Expeditions Holdings 1,3 | | | 215,400 | | | | 1,744,740 | |
| | | | | | | | 4,236,660 | |
| HOUSEHOLD DURABLES - 0.5% | | | | | | | | |
| Legacy Housing 1 | | | 123,473 | | | | 1,611,323 | |
| LEISURE PRODUCTS - 0.8% | | | | | | | | |
| MasterCraft Boat Holdings 1 | | | 110,800 | | | | 2,332,340 | |
| SPECIALTY RETAIL - 4.2% | | | | | | | | |
| Barnes & Noble Education 1 | | | 293,200 | | | | 859,076 | |
| Chico’s FAS 1 | | | 481,300 | | | | 2,392,061 | |
| Citi Trends 1 | | | 86,224 | | | | 2,039,198 | |
| †JOANN | | | 147,100 | | | | 1,140,025 | |
| OneWater Marine Cl. A 1 | | | 58,200 | | | | 1,923,510 | |
| Shoe Carnival | | | 112,322 | | | | 2,427,278 | |
| Zumiez 1 | | | 54,900 | | | | 1,427,400 | |
| | | | | | | | 12,208,548 | |
| TEXTILES, APPAREL & LUXURY GOODS - 1.0% | | | | | | | | |
| Fossil Group 1 | | | 196,700 | | | | 1,016,939 | |
| Vera Bradley 1 | | | 422,300 | | | | 1,832,782 | |
| | | | | | | | 2,849,721 | |
| Total (Cost $33,851,264) | | | | | | | 29,471,304 | |
| | | | | | | | | |
| ENERGY – 2.8% | | | | | | | | |
| ENERGY EQUIPMENT & SERVICES - 2.8% | | | | | | | | |
| Natural Gas Services Group 1 | | | 292,613 | | | | 3,218,743 | |
| Newpark Resources 1 | | | 875,100 | | | | 2,704,059 | |
| Profire Energy 1 | | | 1,410,332 | | | | 2,030,878 | |
| Total (Cost $7,145,269) | | | | | | | 7,953,680 | |
| | | | | | | | | |
| FINANCIALS – 14.1% | | | | | | | | |
| BANKS - 7.2% | | | | | | | | |
| Allegiance Bancshares | | | 73,800 | | | | 2,786,688 | |
| BayCom Corporation | | | 167,842 | | | | 3,470,972 | |
| Caribbean Investment Holdings 1,4 | | | 1,858,138 | | | | 371,628 | |
| HarborOne Bancorp | | | 255,953 | | | | 3,529,592 | |
| HBT Financial | | | 195,400 | | | | 3,491,798 | |
| HomeTrust Bancshares | | | 125,600 | | | | 3,140,000 | |
| Investar Holding Corporation | | | 180,900 | | | | 3,961,710 | |
| THE ACCOMPANYING NOTES ARE AN INTEGRAL PART OF THESE FINANCIAL STATEMENTS | The Royce Funds 2022 Semiannual Report to Shareholders | 33 |
Schedules of Investments
Royce Micro-Cap Fund (continued)
| | | SHARES | | | VALUE | |
| FINANCIALS (continued) | | | | | | |
| BANKS (continued) | | | | | | |
| Midway Investments 1,4 | | | 1,858,170 | | | $ | 0 | |
| | | | | | | | 20,752,388 | |
| CAPITAL MARKETS - 4.6% | | | | | | | | |
| B. Riley Financial | | | 54,500 | | | | 2,302,625 | |
| Canaccord Genuity Group | | | 345,760 | | | | 2,264,417 | |
| Silvercrest Asset Management Group Cl. A | | | 177,500 | | | | 2,912,775 | |
| Sprott | | | 74,280 | | | | 2,580,641 | |
| StoneX Group 1 | | | 42,500 | | | | 3,317,975 | |
| | | | | | | | 13,378,433 | |
| THRIFTS & MORTGAGE FINANCE - 2.3% | | | | | | | | |
| PCSB Financial | | | 38,396 | | | | 732,979 | |
| Territorial Bancorp | | | 122,408 | | | | 2,552,207 | |
| Western New England Bancorp | | | 428,400 | | | | 3,195,864 | |
| | | | | | | | 6,481,050 | |
| Total (Cost $34,537,633) | | | | | | | 40,611,871 | |
| | | | | | | | | |
| HEALTH CARE – 9.5% | | | | | | | | |
| BIOTECHNOLOGY - 1.6% | | | | | | | | |
| CareDx 1 | | | 32,200 | | | | 691,656 | |
| Dynavax Technologies 1 | | | 198,000 | | | | 2,492,820 | |
| MeiraGTx Holdings 1 | | | 198,900 | | | | 1,505,673 | |
| | | | | | | | 4,690,149 | |
| HEALTH CARE EQUIPMENT & SUPPLIES - 6.0% | | | | | | | | |
| Apyx Medical 1 | | | 301,927 | | | | 1,769,292 | |
| Artivion 1 | | | 176,555 | | | | 3,333,358 | |
| AtriCure 1 | | | 42,800 | | | | 1,748,808 | |
| Bioventus Cl. A 1 | | | 298,364 | | | | 2,034,843 | |
| Cutera 1,3 | | | 55,700 | | | | 2,088,750 | |
| OrthoPediatrics Corp. 1 | | | 53,900 | | | | 2,325,785 | |
| Profound Medical 1 | | | 203,000 | | | | 1,482,443 | |
| Surmodics 1 | | | 63,822 | | | | 2,376,093 | |
| | | | | | | | 17,159,372 | |
| HEALTH CARE PROVIDERS & SERVICES - 0.3% | | | | | | | | |
| Sharps Compliance 1 | | | 338,000 | | | | 986,960 | |
| LIFE SCIENCES TOOLS & SERVICES - 1.6% | | | | | | | | |
| Harvard Bioscience 1 | | | 666,652 | | | | 2,399,947 | |
| Inotiv 1,3 | | | 49,300 | | | | 473,280 | |
| NeoGenomics 1 | | | 43,900 | | | | 357,785 | |
| Quanterix Corporation 1 | | | 75,400 | | | | 1,220,726 | |
| | | | | | | | 4,451,738 | |
| Total (Cost $25,290,802) | | | | | | | 27,288,219 | |
| | | | | | | | | |
| INDUSTRIALS – 24.8% | | | | | | | | |
| AEROSPACE & DEFENSE - 1.9% | | | | | | | | |
| Astronics Corporation 1 | | | 237,400 | | | | 2,414,358 | |
| Cadre Holdings | | | 125,500 | | | | 2,468,585 | |
| CPI Aerostructures 1,5 | | | 468,290 | | | | 749,264 | |
| | | | | | | | 5,632,207 | |
| BUILDING PRODUCTS - 1.1% | | | | | | | | |
| Quanex Building Products | | | 136,400 | | | | 3,103,100 | |
| COMMERCIAL SERVICES & SUPPLIES - 2.9% | | | | | | | | |
| Acme United | | | 72,400 | | | | 2,292,908 | |
| Heritage-Crystal Clean 1 | | | 124,474 | | | | 3,355,819 | |
| VSE Corporation | | | 71,000 | | | | 2,668,180 | |
| | | | | | | | 8,316,907 | |
| CONSTRUCTION & ENGINEERING - 4.8% | | | | | | | | |
| Concrete Pumping Holdings 1 | | | 269,600 | | | | 1,633,776 | |
| Construction Partners Cl. A 1 | | | 149,300 | | | | 3,126,342 | |
| IES Holdings 1 | | | 59,800 | | | | 1,804,166 | |
| Northwest Pipe 1 | | | 135,800 | | | | 4,065,852 | |
| NV5 Global 1 | | | 26,200 | | | | 3,058,588 | |
| | | | | | | | 13,688,724 | |
| ELECTRICAL EQUIPMENT - 0.6% | | | | | | | | |
| American Superconductor 1 | | | 280,500 | | | | 1,452,990 | |
| Power Solutions International 1,5 | | | 89,900 | | | | 157,325 | |
| | | | | | | | 1,610,315 | |
| MACHINERY - 5.0% | | | | | | | | |
| Alimak Group | | | 196,200 | | | | 1,484,482 | |
| CIRCOR International 1 | | | 83,200 | | | | 1,363,648 | |
| †Commercial Vehicle Group 1 | | | 154,500 | | | | 902,280 | |
| Graham Corporation 1 | | | 225,003 | | | | 1,557,021 | |
| Luxfer Holdings | | | 162,200 | | | | 2,452,464 | |
| Porvair | | | 320,800 | | | | 2,116,564 | |
| Shyft Group (The) | | | 93,700 | | | | 1,741,883 | |
| Wabash National | | | 209,800 | | | | 2,849,084 | |
| Westport Fuel Systems 1 | | | 41,200 | | | | 41,612 | |
| | | | | | | | 14,509,038 | |
| MARINE - 1.0% | | | | | | | | |
| Clarkson | | | 78,024 | | | | 2,858,857 | |
| PROFESSIONAL SERVICES - 5.3% | | | | | | | | |
| CRA International | | | 33,883 | | | | 3,026,430 | |
| Forrester Research 1 | | | 59,200 | | | | 2,832,128 | |
| Heidrick & Struggles International | | | 80,740 | | | | 2,612,746 | |
| Kforce | | | 42,732 | | | | 2,621,181 | |
| Resources Connection | | | 198,152 | | | | 4,036,356 | |
| | | | | | | | 15,128,841 | |
| TRADING COMPANIES & DISTRIBUTORS - 2.2% | | | | | | | | |
| Distribution Solutions Group 1 | | | 71,265 | | | | 3,662,308 | |
| Transcat 1 | | | 48,474 | | | | 2,753,808 | |
| | | | | | | | 6,416,116 | |
| Total (Cost $59,524,320) | | | | | | | 71,264,105 | |
| | | | | | | | | |
| INFORMATION TECHNOLOGY – 26.2% | | | | | | | | |
| COMMUNICATIONS EQUIPMENT - 4.8% | | | | | | | | |
| Clearfield 1 | | | 40,400 | | | | 2,502,780 | |
| Comtech Telecommunications | | | 109,202 | | | | 990,462 | |
| Digi International 1 | | | 175,600 | | | | 4,253,032 | |
| EMCORE Corporation 1 | | | 453,800 | | | | 1,393,166 | |
| Genasys 1 | | | 536,001 | | | | 1,742,003 | |
| Harmonic 1 | | | 306,600 | | | | 2,658,222 | |
| Sierra Wireless 1 | | | 13,100 | | | | 306,540 | |
| | | | | | | | 13,846,205 | |
| ELECTRONIC EQUIPMENT, INSTRUMENTS & COMPONENTS - 5.3% | | | | | | | | |
| Arlo Technologies 1 | | | 204,300 | | | | 1,280,961 | |
| FARO Technologies 1 | | | 70,645 | | | | 2,177,986 | |
| LightPath Technologies Cl. A 1 | | | 828,984 | | | | 1,019,650 | |
| Luna Innovations 1 | | | 463,800 | | | | 2,703,954 | |
| nLIGHT 1 | | | 155,650 | | | | 1,590,743 | |
| PAR Technology 1 | | | 58,500 | | | | 2,193,165 | |
| PowerFleet 1 | | | 551,219 | | | | 1,196,145 | |
| VIA optronics ADR 1 | | | 144,268 | | | | 305,848 | |
| Vishay Precision Group 1 | | | 97,100 | | | | 2,828,523 | |
| | | | | | | | 15,296,975 | |
| IT SERVICES - 1.7% | | | | | | | | |
| Cass Information Systems | | | 63,916 | | | | 2,160,361 | |
| Computer Task Group 1 | | | 328,626 | | | | 2,813,038 | |
| | | | | | | | 4,973,399 | |
| 34 | The Royce Funds 2022 Semiannual Report to Shareholders | THE ACCOMPANYING NOTES ARE AN INTEGRAL PART OF THESE FINANCIAL STATEMENTS |
June 30, 2022 (unaudited)
Royce Micro-Cap Fund (continued)
| | | SHARES | | | VALUE | |
| | | | | | | |
| INFORMATION TECHNOLOGY (continued) | | | | | | |
| SEMICONDUCTORS & SEMICONDUCTOR EQUIPMENT - 11.8% | | | | | | | | |
| Aehr Test Systems 1 | | | 194,659 | | | $ | 1,459,943 | |
| Amtech Systems 1 | | | 160,711 | | | | 1,173,190 | |
| Axcelis Technologies 1 | | | 48,900 | | | | 2,681,676 | |
| AXT 1 | | | 462,100 | | | | 2,707,906 | |
| Camtek 1 | | | 95,900 | | | | 2,384,074 | |
| Cohu 1 | | | 94,000 | | | | 2,608,500 | |
| CyberOptics Corporation 1 | | | 73,537 | | | | 2,569,383 | |
| FormFactor 1 | | | 70,400 | | | | 2,726,592 | |
| Ichor Holdings 1 | | | 85,900 | | | | 2,231,682 | |
| Nova 1 | | | 27,700 | | | | 2,452,281 | |
| NVE Corporation | | | 44,216 | | | | 2,061,350 | |
| PDF Solutions 1 | | | 110,500 | | | | 2,376,855 | |
| Photronics 1 | | | 209,000 | | | | 4,071,320 | |
| Ultra Clean Holdings 1 | | | 82,300 | | | | 2,450,071 | |
| | | | | | | | 33,954,823 | |
| SOFTWARE - 1.2% | | | | | | | | |
| Agilysys 1 | | | 70,321 | | | | 3,324,074 | |
| TECHNOLOGY HARDWARE, STORAGE & PERIPHERALS - 1.4% | | | | | | | | |
| AstroNova 1 | | | 222,276 | | | | 2,662,866 | |
| Intevac 1 | | | 271,200 | | | | 1,312,608 | |
| | | | | | | | 3,975,474 | |
| Total (Cost $60,840,605) | | | | | | | 75,370,950 | |
| | | | | | | | | |
| MATERIALS – 4.4% | | | | | | | | |
| CHEMICALS - 0.4% | | | | | | | | |
| Aspen Aerogels 1 | | | 109,400 | | | | 1,080,872 | |
| METALS & MINING - 4.0% | | | | | | | | |
| Altius Minerals | | | 128,800 | | | | 1,815,128 | |
| Ferroglobe 1 | | | 206,800 | | | | 1,228,392 | |
| Haynes International | | | 87,630 | | | | 2,871,635 | |
| Major Drilling Group International 1 | | | 449,600 | | | | 3,154,046 | |
| Universal Stainless & Alloy Products 1 | | | 342,900 | | | | 2,537,460 | |
| | | | | | | | 11,606,661 | |
| Total (Cost $12,158,987) | | | | | | | 12,687,533 | |
| | | | | | | | | |
| REAL ESTATE – 0.6% | | | | | | | | |
| REAL ESTATE MANAGEMENT & DEVELOPMENT - 0.6% | | | | | | | | |
| FRP Holdings 1 | | | 29,575 | | | | 1,784,851 | |
| Total (Cost $534,936) | | | | | | | 1,784,851 | |
| | | | | | | | | |
| TOTAL COMMON STOCKS | | | | | | | | |
| (Cost $250,688,770) | | | | | | | 278,716,567 | |
REPURCHASE AGREEMENT– 3.5%
Fixed Income Clearing Corporation, 0.24% dated 6/30/22, due 7/1/22, maturity value $10,105,437 (collateralized by obligations of various U.S. Government Agencies, 3.25% due 6/30/27, valued at $10,307,493)
| (Cost $10,105,370) | | | 10,105,370 | |
| | | | | |
| TOTAL INVESTMENTS – 100.4% | | | | |
| (Cost $260,794,140) | | | 288,821,937 | |
| | | | | |
| LIABILITIES LESS CASH AND OTHER ASSETS – (0.4)% | | | (1,101,796 | ) |
| | | | | |
| NET ASSETS – 100.0% | | $ | 287,720,141 | |
Royce Pennsylvania Mutual Fund
Common Stocks – 98.8%
| | | SHARES | | | VALUE | |
| | | | | | | | | |
| COMMUNICATION SERVICES – 2.5% | | | | | | | | |
| DIVERSIFIED TELECOMMUNICATION SERVICES - 0.2% | | | | | | | | |
| Liberty Latin America Cl. C 1 | | | 375,620 | | | $ | 2,926,080 | |
| ENTERTAINMENT - 0.3% | | | | | | | | |
| Chicken Soup for the Soul Entertainment Cl. A 1 | | | 33,785 | | | | 250,347 | |
| IMAX Corporation 1 | | | 240,219 | | | | 4,057,299 | |
| | | | | | | | 4,307,646 | |
| INTERACTIVE MEDIA & SERVICES - 1.3% | | | | | | | | |
| QuinStreet 1 | | | 78,343 | | | | 788,130 | |
| Ziff Davis 1 | | | 237,221 | | | | 17,680,081 | |
| †ZipRecruiter Cl. A 1,3 | | | 176,006 | | | | 2,608,409 | |
| | | | | | | | 21,076,620 | |
| MEDIA - 0.7% | | | | | | | | |
| †Cable One | | | 6,017 | | | | 7,757,838 | |
| †TechTarget 1,3 | | | 58,150 | | | | 3,821,618 | |
| | | | | | | | 11,579,456 | |
| Total (Cost $51,684,548) | | | | | | | 39,889,802 | |
| | | | | | | | | |
| CONSUMER DISCRETIONARY – 10.4% | | | | | | | | |
| AUTO COMPONENTS - 2.5% | | | | | | | | |
| Dorman Products 1 | | | 146,577 | | | | 16,080,963 | |
| Fox Factory Holding Corporation 1 | | | 60,700 | | | | 4,888,778 | |
| Gentex Corporation | | | 294,056 | | | | 8,224,746 | |
| LCI Industries | | | 76,958 | | | | 8,610,061 | |
| Standard Motor Products | | | 29,568 | | | | 1,330,264 | |
| Stoneridge 1 | | | 58,757 | | | | 1,007,683 | |
| | | | | | | | 40,142,495 | |
| DISTRIBUTORS - 0.3% | | | | | | | | |
| LKQ Corporation | | | 76,921 | | | | 3,776,052 | |
| DIVERSIFIED CONSUMER SERVICES - 0.3% | | | | | | | | |
| H&R Block | | | 40,712 | | | | 1,437,948 | |
| Lincoln Educational Services 1 | | | 460,051 | | | | 2,902,922 | |
| | | | | | | | 4,340,870 | |
| HOTELS, RESTAURANTS & LEISURE - 0.8% | | | | | | | | |
| †Bloomin’ Brands | | | 149,700 | | | | 2,488,014 | |
| Century Casinos 1 | | | 517,941 | | | | 3,729,175 | |
| †Denny’s Corporation 1 | | | 92,194 | | | | 800,244 | |
| Light & Wonder 1 | | | 122,847 | | | | 5,772,581 | |
| | | | | | | | 12,790,014 | |
| HOUSEHOLD DURABLES - 1.1% | | | | | | | | |
| La-Z-Boy | | | 76,489 | | | | 1,813,554 | |
| Legacy Housing 1 | | | 97,929 | | | | 1,277,973 | |
| M/I Homes 1 | | | 48,023 | | | | 1,904,592 | |
| PulteGroup | | | 69,622 | | | | 2,759,120 | |
| Skyline Champion 1 | | | 216,214 | | | | 10,252,868 | |
| | | | | | | | 18,008,107 | |
| INTERNET & DIRECT MARKETING RETAIL - 0.0% | | | | | | | | |
| 1-800-FLOWERS.COM Cl. A 1 | | | 23,842 | | | | 226,737 | |
| LEISURE PRODUCTS - 1.1% | | | | | | | | |
| Brunswick Corporation | | | 90,469 | | | | 5,914,863 | |
| Malibu Boats Cl. A 1 | | | 46,083 | | | | 2,429,035 | |
| MasterCraft Boat Holdings 1 | | | 295,185 | | | | 6,213,644 | |
| †YETI Holdings 1 | | | 52,572 | | | | 2,274,791 | |
| | | | | | | | 16,832,333 | |
| MULTILINE RETAIL - 0.4% | | | | | | | | |
| Franchise Group Cl. A | | | 192,049 | | | | 6,735,158 | |
| SPECIALTY RETAIL - 2.6% | | | | | | | | |
| Aaron’s Company (The) | | | 42,224 | | | | 614,359 | |
| American Eagle Outfitters | | | 166,669 | | | | 1,863,359 | |
| Asbury Automotive Group 1 | | | 92,672 | | | | 15,693,077 | |
| †Five Below 1 | | | 22,302 | | | | 2,529,716 | |
| THE ACCOMPANYING NOTES ARE AN INTEGRAL PART OF THESE FINANCIAL STATEMENTS | The Royce Funds 2022 Semiannual Report to Shareholders | 35 |
Schedules of Investments
Royce Pennsylvania Mutual Fund (continued)
| | | SHARES | | | VALUE | |
| | | | | | | |
| CONSUMER DISCRETIONARY (continued) | | | | | | |
| SPECIALTY RETAIL (continued) | | | | | | |
| Haverty Furniture | | | 74,630 | | | $ | 1,729,923 | |
| †JOANN | | | 257,088 | | | | 1,992,432 | |
| Lazydays Holdings 1,3 | | | 175,386 | | | | 2,066,047 | |
| Murphy USA | | | 23,514 | | | | 5,475,705 | |
| OneWater Marine Cl. A 1 | | | 103,310 | | | | 3,414,396 | |
| Shoe Carnival | | | 262,978 | | | | 5,682,955 | |
| | | | | | | | 41,061,969 | |
| TEXTILES, APPAREL & LUXURY GOODS - 1.3% | | | | | | | | |
| Carter’s | | | 68,084 | | | | 4,798,560 | |
| Levi Strauss & Co. Cl. A | | | 163,938 | | | | 2,675,468 | |
| Movado Group | | | 98,001 | | | | 3,031,171 | |
| Ralph Lauren Cl. A | | | 77,272 | | | | 6,927,435 | |
| Wolverine World Wide | | | 187,347 | | | | 3,776,916 | |
| | | | | | | | 21,209,550 | |
| Total (Cost $148,234,597) | | | | | | | 165,123,285 | |
| | | | | | | | | |
| CONSUMER STAPLES – 1.5% | | | | | | | | |
| FOOD PRODUCTS - 0.7% | | | | | | | | |
| Nomad Foods 1 | | | 430,865 | | | | 8,612,991 | |
| Seneca Foods Cl. A 1 | | | 52,340 | | | | 2,906,964 | |
| | | | | | | | 11,519,955 | |
| HOUSEHOLD PRODUCTS - 0.2% | | | | | | | | |
| Spectrum Brands Holdings | | | 33,137 | | | | 2,717,897 | |
| PERSONAL PRODUCTS - 0.6% | | | | | | | | |
| Inter Parfums | | | 144,733 | | | | 10,574,193 | |
| Total (Cost $15,726,618) | | | | | | | 24,812,045 | |
| | | | | | | | | |
| ENERGY – 2.2% | | | | | | | | |
| ENERGY EQUIPMENT & SERVICES - 1.3% | | | | | | | | |
| Computer Modelling Group | | | 2,652,180 | | | | 10,013,669 | |
| Pason Systems | | | 942,530 | | | | 10,683,276 | |
| | | | | | | | 20,696,945 | |
| OIL, GAS & CONSUMABLE FUELS - 0.9% | | | | | | | | |
| Antero Resources 1 | | | 81,055 | | | | 2,484,336 | |
| †Chord Energy | | | 13,800 | | | | 1,678,770 | |
| †Northern Oil and Gas | | | 100,800 | | | | 2,546,208 | |
| PDC Energy | | | 39,358 | | | | 2,424,846 | |
| †Southwestern Energy 1 | | | 384,800 | | | | 2,405,000 | |
| Whiting Petroleum | | | 34,200 | | | | 2,326,626 | |
| | | | | | | | 13,865,786 | |
| Total (Cost $29,761,039) | | | | | | | 34,562,731 | |
| | | | | | | | | |
| FINANCIALS – 19.1% | | | | | | | | |
| BANKS - 6.4% | | | | | | | | |
| Bank of N.T. Butterfield & Son | | | 258,200 | | | | 8,053,258 | |
| BankUnited | | | 138,360 | | | | 4,921,465 | |
| BOK Financial | | | 40,738 | | | | 3,078,978 | |
| First Bancshares (The) | | | 148,113 | | | | 4,236,032 | |
| First Citizens BancShares Cl. A | | | 42,524 | | | | 27,801,341 | |
| First Hawaiian | | | 314,363 | | | | 7,139,184 | |
| Home BancShares | | | 244,095 | | | | 5,069,853 | |
| Independent Bank Group | | | 112,540 | | | | 7,642,591 | |
| National Bankshares | | | 63,800 | | | | 2,003,320 | |
| Origin Bancorp | | | 90,332 | | | | 3,504,881 | |
| Popular | | | 189,632 | | | | 14,588,390 | |
| Texas Capital Bancshares 1 | | | 16,601 | | | | 873,877 | |
| Triumph Bancorp 1 | | | 193,404 | | | | 12,099,354 | |
| | | | | | | | 101,012,524 | |
| CAPITAL MARKETS - 5.9% | | | | | | |
| Ares Management Cl. A | | | 115,176 | | | | 6,548,907 | |
| Artisan Partners Asset Management Cl. A | | | 356,199 | | | | 12,669,999 | |
| B. Riley Financial | | | 33,802 | | | | 1,428,135 | |
| Evercore Cl. A | | | 32,717 | | | | 3,062,638 | |
| GCM Grosvenor Cl. A | | | 1,389,778 | | | | 9,519,979 | |
| Houlihan Lokey Cl. A | | | 109,871 | | | | 8,672,118 | |
| Lazard Cl. A | | | 55,848 | | | | 1,810,034 | |
| MarketWise Cl. A 1 | | | 500,000 | | | | 1,800,000 | |
| Moelis & Company Cl. A | | | 79,434 | | | | 3,125,728 | |
| Morningstar | | | 40,288 | | | | 9,742,847 | |
| Newtek Business Services | | | 85,315 | | | | 1,615,013 | |
| SEI Investments | | | 320,707 | | | | 17,324,592 | |
| Silvercrest Asset Management Group Cl. A | | | 100,135 | | | | 1,643,215 | |
| Sprott | | | 244,764 | | | | 8,503,610 | |
| TMX Group | | | 56,620 | | | | 5,762,290 | |
| | | | | | | | 93,229,105 | |
| DIVERSIFIED FINANCIAL SERVICES - 0.3% | | | | | | | | |
| Compass Diversified Holdings | | | 207,157 | | | | 4,437,303 | |
| INSURANCE - 6.2% | | | | | | | | |
| Alleghany Corporation 1 | | | 11,642 | | | | 9,698,950 | |
| AMERISAFE | | | 86,440 | | | | 4,495,745 | |
| Assured Guaranty | | | 106,823 | | | | 5,959,655 | |
| Axis Capital Holdings | | | 74,942 | | | | 4,278,439 | |
| E-L Financial | | | 24,818 | | | | 15,231,681 | |
| Employers Holdings | | | 63,224 | | | | 2,648,453 | |
| First American Financial | | | 31,619 | | | | 1,673,278 | |
| International General Insurance Holdings | | | 288,478 | | | | 2,201,087 | |
| James River Group Holdings | | | 589,717 | | | | 14,613,187 | |
| ProAssurance Corporation | | | 288,189 | | | | 6,809,906 | |
| RenaissanceRe Holdings | | | 31,884 | | | | 4,985,701 | |
| RLI Corp. | | | 60,047 | | | | 7,000,880 | |
| Safety Insurance Group | | | 72,354 | | | | 7,025,573 | |
| Stewart Information Services | | | 43,738 | | | | 2,175,966 | |
| Tiptree | | | 251,820 | | | | 2,674,328 | |
| Trean Insurance Group 1 | | | 453,801 | | | | 2,827,180 | |
| White Mountains Insurance Group | | | 4,036 | | | | 5,029,381 | |
| | | | | | | | 99,329,390 | |
| THRIFTS & MORTGAGE FINANCE - 0.3% | | | | | | | | |
| Timberland Bancorp | | | 99,201 | | | | 2,480,025 | |
| TrustCo Bank Corp NY | | | 67,663 | | | | 2,086,727 | |
| | | | | | | | 4,566,752 | |
| Total (Cost $261,481,495) | | | | | | | 302,575,074 | |
| | | | | | | | | |
| HEALTH CARE – 8.2% | | | | | | | | |
| BIOTECHNOLOGY - 0.8% | | | | | | | | |
| CareDx 1 | | | 100,005 | | | | 2,148,107 | |
| Catalyst Pharmaceuticals 1 | | | 440,847 | | | | 3,090,338 | |
| Ironwood Pharmaceuticals Cl. A 1 | | | 601,500 | | | | 6,935,295 | |
| MeiraGTx Holdings 1 | | | 95,578 | | | | 723,525 | |
| | | | | | | | 12,897,265 | |
| HEALTH CARE EQUIPMENT & SUPPLIES - 4.1% | | | | | | | | |
| AtriCure 1 | | | 24,482 | | | | 1,000,335 | |
| Atrion Corporation | | | 8,442 | | | | 5,308,836 | |
| Bioventus Cl. A 1,3 | | | 331,782 | | | | 2,262,753 | |
| Cutera 1,3 | | | 46,800 | | | | 1,755,000 | |
| Enovis Corporation 1 | | | 166,332 | | | | 9,148,260 | |
| Haemonetics Corporation 1 | | | 269,866 | | | | 17,589,866 | |
| Meridian Bioscience 1 | | | 318,593 | | | | 9,691,599 | |
| Mesa Laboratories | | | 53,106 | | | | 10,830,438 | |
| 36 | The Royce Funds 2022 Semiannual Report to Shareholders | THE ACCOMPANYING NOTES ARE AN INTEGRAL PART OF THESE FINANCIAL STATEMENTS |
June 30, 2022 (unaudited)
Royce Pennsylvania Mutual Fund (continued)
| | | SHARES | | | VALUE | |
| | | | | | | |
| HEALTH CARE (continued) | | | | | | |
| HEALTH CARE EQUIPMENT & SUPPLIES (continued) | | | | | | |
| OrthoPediatrics Corp. 1,3 | | | 55,623 | | | $ | 2,400,132 | |
| Profound Medical 1 | | | 52,098 | | | | 380,455 | |
| QuidelOrtho 1 | | | 31,000 | | | | 3,012,580 | |
| Surmodics 1 | | | 42,305 | | | | 1,575,015 | |
| | | | | | | | 64,955,269 | |
| HEALTH CARE PROVIDERS & SERVICES - 0.7% | | | | | | | | |
| Cross Country Healthcare 1 | | | 158,876 | | | | 3,309,387 | |
| Molina Healthcare 1 | | | 14,039 | | | | 3,925,445 | |
| Sharps Compliance 1 | | | 142,196 | | | | 415,212 | |
| †Tenet Healthcare 1 | | | 61,800 | | | | 3,248,208 | |
| | | | | | | | 10,898,252 | |
| HEALTH CARE TECHNOLOGY - 0.4% | | | | | | | | |
| †Doximity Cl. A 1,3 | | | 43,600 | | | | 1,518,152 | |
| Simulations Plus | | | 98,305 | | | | 4,849,386 | |
| | | | | | | | 6,367,538 | |
| LIFE SCIENCES TOOLS & SERVICES - 1.7% | | | | | | | | |
| Azenta 1 | | | 79,518 | | | | 5,733,248 | |
| Bio-Techne | | | 10,568 | | | | 3,663,291 | |
| Harvard Bioscience 1 | | | 243,940 | | | | 878,184 | |
| †Maravai LifeSciences Holdings Cl. A 1 | | | 157,000 | | | | 4,460,370 | |
| Quanterix Corporation 1 | | | 30,848 | | | | 499,429 | |
| †Repligen Corporation 1,3 | | | 47,200 | | | | 7,665,280 | |
| †Stevanato Group | | | 292,101 | | | | 4,618,117 | |
| | | | | | | | 27,517,919 | |
| PHARMACEUTICALS - 0.5% | | | | | | | | |
| †Collegium Pharmaceutical 1,3 | | | 175,000 | | | | 3,101,000 | |
| Harmony Biosciences Holdings 1,3 | | | 62,594 | | | | 3,052,710 | |
| Supernus Pharmaceuticals 1,3 | | | 41,033 | | | | 1,186,674 | |
| | | | | | | | 7,340,384 | |
| Total (Cost $122,249,896) | | | | | | | 129,976,627 | |
| | | | | | | | | |
| INDUSTRIALS – 27.7% | | | | | | | | |
| AEROSPACE & DEFENSE - 0.7% | | | | | | | | |
| HEICO Corporation | | | 80,074 | | | | 10,499,303 | |
| AIR FREIGHT & LOGISTICS - 1.7% | | | | | | | | |
| Forward Air | | | 220,401 | | | | 20,268,076 | |
| Hub Group Cl. A 1 | | | 95,106 | | | | 6,746,820 | |
| | | | | | | | 27,014,896 | |
| AIRLINES - 0.2% | | | | | | | | |
| Sun Country Airlines Holdings 1 | | | 146,370 | | | | 2,684,426 | |
| BUILDING PRODUCTS - 3.1% | | | | | | | | |
| Builders FirstSource 1 | | | 251,833 | | | | 13,523,432 | |
| Carlisle Companies | | | 16,563 | | | | 3,952,097 | |
| Gibraltar Industries 1 | | | 56,046 | | | | 2,171,783 | |
| †Hayward Holdings 1,3 | | | 286,580 | | | | 4,123,886 | |
| Quanex Building Products | | | 174,245 | | | | 3,964,074 | |
| Simpson Manufacturing | | | 84,287 | | | | 8,480,115 | |
| UFP Industries | | | 139,120 | | | | 9,479,637 | |
| Zurn Elkay Water Solutions | | | 154,708 | | | | 4,214,246 | |
| | | | | | | | 49,909,270 | |
| COMMERCIAL SERVICES & SUPPLIES - 2.1% | | | | | | | | |
| Deluxe Corporation | | | 175,875 | | | | 3,811,211 | |
| †Driven Brands Holdings 1 | | | 201,300 | | | | 5,543,802 | |
| Healthcare Services Group | | | 411,110 | | | | 7,157,425 | |
| Heritage-Crystal Clean 1 | | | 210,987 | | | | 5,688,210 | |
| IAA 1 | | | 330,905 | | | | 10,843,757 | |
| | | | | | | | 33,044,405 | |
| CONSTRUCTION & ENGINEERING - 3.6% | | | | | | | | |
| Arcosa | | | 452,398 | | | | 21,004,839 | |
| Construction Partners Cl. A 1 | | | 141,106 | | | | 2,954,760 | |
| EMCOR Group | | | 13,338 | | | | 1,373,280 | |
| Great Lakes Dredge & Dock 1 | | | 370,876 | | | | 4,862,184 | |
| Northwest Pipe 1 | | | 69,774 | | | | 2,089,034 | |
| NV5 Global 1 | | | 10,870 | | | | 1,268,964 | |
| Primoris Services | | | 117,607 | | | | 2,559,128 | |
| Sterling Infrastructure 1 | | | 145,004 | | | | 3,178,488 | |
| Valmont Industries | | | 78,041 | | | | 17,530,350 | |
| | | | | | | | 56,821,027 | |
| ELECTRICAL EQUIPMENT - 1.1% | | | | | | | | |
| American Superconductor 1 | | | 93,326 | | | | 483,429 | |
| Encore Wire | | | 37,509 | | | | 3,897,935 | |
| GrafTech International | | | 595,522 | | | | 4,210,340 | |
| Preformed Line Products | | | 141,776 | | | | 8,719,224 | |
| | | | | | | | 17,310,928 | |
| MACHINERY - 6.5% | | | | | | | | |
| Allison Transmission Holdings | | | 54,461 | | | | 2,094,025 | |
| CIRCOR International 1 | | | 143,897 | | | | 2,358,472 | |
| Crane Holdings | | | 12,478 | | | | 1,092,574 | |
| †Douglas Dynamics | | | 92,197 | | | | 2,649,742 | |
| †ESAB Corporation | | | 206,256 | | | | 9,023,700 | |
| ESCO Technologies | | | 99,639 | | | | 6,812,318 | |
| Graham Corporation 1 | | | 91,849 | | | | 635,595 | |
| Helios Technologies | | | 69,419 | | | | 4,599,009 | |
| Hurco Companies | | | 31,802 | | | | 786,781 | |
| John Bean Technologies | | | 109,207 | | | | 12,058,637 | |
| Kadant | | | 110,028 | | | | 20,063,606 | |
| Lincoln Electric Holdings | | | 123,611 | | | | 15,248,653 | |
| Lindsay Corporation | | | 67,056 | | | | 8,906,378 | |
| Middleby Corporation (The) 1 | | | 5,551 | | | | 695,873 | |
| Miller Industries | | | 266,562 | | | | 6,042,961 | |
| Mueller Industries | | | 41,132 | | | | 2,191,924 | |
| RBC Bearings 1 | | | 45,377 | | | | 8,392,476 | |
| Westport Fuel Systems 1 | | | 165,989 | | | | 167,649 | |
| | | | | | | | 103,820,373 | |
| MARINE - 0.4% | | | | | | | | |
| Clarkson | | | 30,004 | | | | 1,099,369 | |
| Kirby Corporation 1 | | | 97,974 | | | | 5,960,738 | |
| | | | | | | | 7,060,107 | |
| PROFESSIONAL SERVICES - 3.4% | | | | | | | | |
| CBIZ 1 | | | 12,641 | | | | 505,134 | |
| Forrester Research 1 | | | 341,418 | | | | 16,333,437 | |
| Heidrick & Struggles International | | | 154,512 | | | | 5,000,008 | |
| KBR | | | 513,108 | | | | 24,829,296 | |
| Korn Ferry | | | 116,372 | | | | 6,751,904 | |
| | | | | | | | 53,419,779 | |
| ROAD & RAIL - 1.5% | | | | | | | | |
| ArcBest | | | 44,153 | | | | 3,107,047 | |
| Landstar System | | | 81,623 | | | | 11,869,617 | |
| Saia 1 | | | 2,945 | | | | 553,660 | |
| Schneider National Cl. B | | | 162,875 | | | | 3,645,142 | |
| Werner Enterprises | | | 34,247 | | | | 1,319,879 | |
| XPO Logistics 1 | | | 53,900 | | | | 2,595,824 | |
| | | | | | | | 23,091,169 | |
| TRADING COMPANIES & DISTRIBUTORS - 3.4% | | | | | | | | |
| Air Lease Cl. A | | | 601,694 | | | | 20,114,631 | |
| Applied Industrial Technologies | | | 74,355 | | | | 7,150,720 | |
| Distribution Solutions Group 1 | | | 29,194 | | | | 1,500,280 | |
| EVI Industries 1 | | | 332,790 | | | | 3,324,572 | |
| THE ACCOMPANYING NOTES ARE AN INTEGRAL PART OF THESE FINANCIAL STATEMENTS | The Royce Funds 2022 Semiannual Report to Shareholders | 37 |
Schedules of Investments
Royce Pennsylvania Mutual Fund (continued)
| | | SHARES | | | VALUE | |
| | | | | | | | | |
| INDUSTRIALS (continued) | | | | | | | | |
| TRADING COMPANIES & DISTRIBUTORS (continued) | | | | | | | | |
| †Fortress Transportation and Infrastructure Investors Cl. A | | | 96,701 | | | $ | 1,870,197 | |
| †Hudson Technologies 1 | | | 210,500 | | | | 1,580,855 | |
| MSC Industrial Direct Cl. A | | | 30,762 | | | | 2,310,534 | |
| Richelieu Hardware | | | 355,741 | | | | 9,308,077 | |
| Transcat 1 | | | 127,794 | | | | 7,259,977 | |
| | | | | | | | 54,419,843 | |
| Total (Cost $327,480,649) | | | | | | | 439,095,526 | |
| | | | | | | | | |
| INFORMATION TECHNOLOGY – 16.4% | | | | | | | | |
| COMMUNICATIONS EQUIPMENT - 0.9% | | | | | | | | |
| Aviat Networks 1 | | | 59,660 | | | | 1,493,886 | |
| Calix 1 | | | 174,347 | | | | 5,952,207 | |
| Digi International 1 | | | 304,883 | | | | 7,384,266 | |
| | | | | | | | 14,830,359 | |
| ELECTRONIC EQUIPMENT, INSTRUMENTS & COMPONENTS - 5.5% | | | | | | | | |
| Belden | | | 40,797 | | | | 2,173,256 | |
| Cognex Corporation | | | 89,061 | | | | 3,786,874 | |
| ePlus 1 | | | 69,100 | | | | 3,670,592 | |
| Fabrinet 1 | | | 92,947 | | | | 7,538,002 | |
| FARO Technologies 1 | | | 236,914 | | | | 7,304,059 | |
| Flex 1 | | | 213,200 | | | | 3,085,004 | |
| II-VI 1 | | | 73,746 | | | | 3,757,359 | |
| Jabil | | | 60,059 | | | | 3,075,621 | |
| Kimball Electronics 1 | | | 329,472 | | | | 6,622,387 | |
| Littelfuse | | | 10,402 | | | | 2,642,524 | |
| Luna Innovations 1,3 | | | 766,388 | | | | 4,468,042 | |
| nLIGHT 1 | | | 55,802 | | | | 570,296 | |
| PAR Technology 1 | | | 231,475 | | | | 8,677,998 | |
| PowerFleet 1 | | | 155,315 | | | | 337,034 | |
| Sanmina Corporation 1 | | | 75,526 | | | | 3,076,174 | |
| TD SYNNEX | | | 33,591 | | | | 3,060,140 | |
| Teledyne Technologies 1 | | | 6,300 | | | | 2,363,193 | |
| Vishay Intertechnology | | | 178,447 | | | | 3,179,926 | |
| Vishay Precision Group 1 | | | 139,826 | | | | 4,073,131 | |
| Vontier Corporation | | | 570,053 | | | | 13,105,518 | |
| | | | | | | | 86,567,130 | |
| IT SERVICES - 0.7% | | | | | | | | |
| Computer Services 5 | | | 161,363 | | | | 5,946,227 | |
| Hackett Group (The) | | | 103,181 | | | | 1,957,344 | |
| Repay Holdings Cl. A 1 | | | 185,405 | | | | 2,382,454 | |
| Shift4 Payments Cl. A 1,3 | | | 323 | | | | 10,678 | |
| | | | | | | | 10,296,703 | |
| SEMICONDUCTORS & SEMICONDUCTOR EQUIPMENT - 7.0% | | | | | | | | |
| Amkor Technology | | | 180,762 | | | | 3,063,916 | |
| Axcelis Technologies 1 | | | 80,992 | | | | 4,441,601 | |
| Camtek 1 | | | 79,224 | | | | 1,969,509 | |
| Cirrus Logic 1 | | | 173,392 | | | | 12,577,856 | |
| CMC Materials | | | 1,151 | | | | 200,838 | |
| Cohu 1 | | | 346,685 | | | | 9,620,509 | |
| CyberOptics Corporation 1 | | | 144,226 | | | | 5,039,256 | |
| FormFactor 1 | | | 316,762 | | | | 12,268,192 | |
| Ichor Holdings 1 | | | 29,770 | | | | 773,425 | |
| Kulicke & Soffa Industries | | | 293,871 | | | | 12,580,617 | |
| MKS Instruments | | | 90,173 | | | | 9,254,455 | |
| Nova 1,3 | | | 69,867 | | | | 6,185,325 | |
| NVE Corporation | | | 43,178 | | | | 2,012,958 | |
| Onto Innovation 1 | | | 206,846 | | | | 14,425,440 | |
| Photronics 1 | | | 132,417 | | | | 2,579,483 | |
| Power Integrations | | | 54,700 | | | | 4,103,047 | |
| †Rambus 1 | | | 168,100 | | | | 3,612,469 | |
| SiTime Corporation 1 | | | 23,123 | | | | 3,769,743 | |
| Ultra Clean Holdings 1 | | | 84,806 | | | | 2,524,675 | |
| | | | | | | | 111,003,314 | |
| SOFTWARE - 1.8% | | | | | | | | |
| Agilysys 1 | | | 56,407 | | | | 2,666,359 | |
| Avalara 1 | | | 85,700 | | | | 6,050,420 | |
| ChannelAdvisor Corporation 1 | | | 139,494 | | | | 2,033,823 | |
| Consensus Cloud Solutions 1 | | | 78,108 | | | | 3,411,757 | |
| Dolby Laboratories Cl. A | | | 85,227 | | | | 6,098,844 | |
| PagerDuty 1,3 | | | 134,244 | | | | 3,326,566 | |
| Teradata Corporation 1 | | | 81,699 | | | | 3,023,680 | |
| Xperi Holding Corporation | | | 168,800 | | | | 2,435,784 | |
| | | | | | | | 29,047,233 | |
| TECHNOLOGY HARDWARE, STORAGE & PERIPHERALS - 0.5% | | | | | | | | |
| AstroNova 1 | | | 81,672 | | | | 978,431 | |
| Avid Technology 1 | | | 296,473 | | | | 7,693,474 | |
| | | | | | | | 8,671,905 | |
| Total (Cost $236,198,532) | | | | | | | 260,416,644 | |
| | | | | | | | | |
| MATERIALS – 7.8% | | | | | | | | |
| CHEMICALS - 5.1% | | | | | | | | |
| Aspen Aerogels 1 | | | 126,230 | | | | 1,247,152 | |
| Balchem Corporation | | | 68,346 | | | | 8,867,210 | |
| Element Solutions | | | 1,121,225 | | | | 19,957,805 | |
| Huntsman Corporation | | | 183,077 | | | | 5,190,233 | |
| Innospec | | | 220,979 | | | | 21,167,578 | |
| Minerals Technologies | | | 210,719 | | | | 12,925,504 | |
| Quaker Chemical | | | 76,549 | | | | 11,445,607 | |
| | | | | | | | 80,801,089 | |
| CONTAINERS & PACKAGING - 0.4% | | | | | | | | |
| Graphic Packaging Holding Company | | | 175,627 | | | | 3,600,354 | |
| Silgan Holdings | | | 61,001 | | | | 2,522,391 | |
| | | | | | | | 6,122,745 | |
| METALS & MINING - 1.5% | | | | | | | | |
| Alamos Gold Cl. A | | | 1,272,092 | | | | 8,924,014 | |
| Haynes International | | | 62,674 | | | | 2,053,827 | |
| Materion Corporation | | | 50,000 | | | | 3,686,500 | |
| Reliance Steel & Aluminum | | | 48,802 | | | | 8,289,507 | |
| | | | | | | | 22,953,848 | |
| PAPER & FOREST PRODUCTS - 0.8% | | | | | | | | |
| Louisiana-Pacific | | | 110,698 | | | | 5,801,682 | |
| Stella-Jones | | | 297,177 | | | | 7,503,304 | |
| | | | | | | | 13,304,986 | |
| Total (Cost $79,526,666) | | | | | | | 123,182,668 | |
| | | | | | | | | |
| REAL ESTATE – 3.0% | | | | | | | | |
| REAL ESTATE MANAGEMENT & DEVELOPMENT - 3.0% | | | | | | | | |
| Colliers International Group | | | 50,430 | | | | 5,532,675 | |
| Cushman & Wakefield 1,3 | | | 133,602 | | | | 2,036,095 | |
| †DigitalBridge Group Cl. A 1 | | | 472,000 | | | | 2,303,360 | |
| FirstService Corporation | | | 17,250 | | | | 2,090,700 | |
| FRP Holdings 1 | | | 163,864 | | | | 9,889,192 | |
| Kennedy-Wilson Holdings | | | 759,736 | | | | 14,389,400 | |
| Marcus & Millichap | | | 222,328 | | | | 8,223,913 | |
| 38 | The Royce Funds 2022 Semiannual Report to Shareholders | THE ACCOMPANYING NOTES ARE AN INTEGRAL PART OF THESE FINANCIAL STATEMENTS |
June 30, 2022 (unaudited)
Royce Pennsylvania Mutual Fund (continued)
| | | SHARES | | | VALUE | |
| | | | | | | |
| REAL ESTATE (continued) | | | | | | |
| REAL ESTATE MANAGEMENT & DEVELOPMENT (continued) | | | | | | | | |
| RMR Group (The) Cl. A | | | 91,260 | | | $ | 2,587,221 | |
| Total (Cost $37,261,251) | | | | | | | 47,052,556 | |
| | | | | | | | | |
| TOTAL COMMON STOCKS | | | | | | | | |
| (Cost $1,309,605,291) | | | | | | | 1,566,686,958 | |
REPURCHASE AGREEMENT– 0.7%
Fixed Income Clearing Corporation, 0.24% dated 6/30/22, due 7/1/22, maturity value $10,715,426 (collateralized by obligations of various U.S. Government Agencies, 3.25% due 6/30/27, valued at $10,929,699)
| (Cost $10,715,355) | 10,715,355 | |
COLLATERAL RECEIVED FOR SECURITIES LOANED – 0.4%
Money Market Funds
Federated Government Obligations Fund - Institutional Shares (7 day yield-1.36%)
| (Cost $5,589,377) | | | 5,589,377 | | | | 5,589,377 | |
| | | | | | | | | |
| TOTAL INVESTMENTS – 99.9% | | | | | | | | |
| (Cost $1,325,910,023) | | | | | | | 1,582,991,690 | |
| | | | | | | | | |
| CASH AND OTHER ASSETS LESS LIABILITIES – 0.1% | | | | | | | 2,166,720 | |
| | | | | | | | | |
| NET ASSETS – 100.0% | | | | | | $ | 1,585,158,410 | |
| Royce Premier Fund |
| Common Stocks – 98.4% |
| | | SHARES | | | VALUE | |
| | | | | | | | | |
| COMMUNICATION SERVICES – 1.9% | | | | | | | | |
| INTERACTIVE MEDIA & SERVICES - 1.9% | | | | | | | | |
| †Ziff Davis 1 | | | 336,700 | | | $ | 25,094,251 | |
| Total (Cost $34,306,309) | | | | | | | 25,094,251 | |
| | | | | | | | | |
| CONSUMER DISCRETIONARY – 9.9% | | | | | | | | |
| AUTO COMPONENTS - 4.3% | | | | | | | | |
| Dorman Products 1 | | | 371,044 | | | | 40,707,237 | |
| LCI Industries | | | 134,738 | | | | 15,074,488 | |
| | | | | | | | 55,781,725 | |
| DISTRIBUTORS - 1.3% | | | | | | | | |
| Pool Corporation | | | 50,355 | | | | 17,686,187 | |
| LEISURE PRODUCTS - 1.9% | | | | | | | | |
| Brunswick Corporation | | | 380,091 | | | | 24,850,349 | |
| TEXTILES, APPAREL & LUXURY GOODS - 2.4% | | | | | | | | |
| Ralph Lauren Cl. A | | | 344,940 | | | | 30,923,871 | |
| Total (Cost $100,907,917) | | | | | | | 129,242,132 | |
| | | | | | | | | |
| CONSUMER STAPLES – 2.3% | | | | | | | | |
| PERSONAL PRODUCTS - 2.3% | | | | | | | | |
| Inter Parfums | | | 419,403 | | | | 30,641,583 | |
| Total (Cost $20,571,736) | | | | | | | 30,641,583 | |
| | | | | | | | | |
| FINANCIALS – 9.5% | | | | | | | | |
| CAPITAL MARKETS - 9.5% | | | | | | | | |
| Ares Management Cl. A | | | 226,393 | | | | 12,872,706 | |
| GCM Grosvenor Cl. A | | | 1,932,319 | | | | 13,236,385 | |
| Lazard Cl. A | | | 394,401 | | | | 12,782,536 | |
| Morningstar | | | 135,516 | | | | 32,771,834 | |
| SEI Investments | | | 615,771 | | | | 33,263,950 | |
| TMX Group | | | 194,583 | | | | 19,802,962 | |
| Total (Cost $82,691,049) | | | | | | | 124,730,373 | |
| | | | | | | | | |
| HEALTH CARE – 8.2% | | | | | | | | |
| HEALTH CARE EQUIPMENT & SUPPLIES - 6.7% | | | | | | | | |
| Enovis Corporation 1 | | | 202,257 | | | | 11,124,135 | |
| Haemonetics Corporation 1 | | | 418,479 | | | | 27,276,461 | |
| Meridian Bioscience 1 | | | 732,304 | | | | 22,276,688 | |
| Mesa Laboratories | | | 130,364 | | | | 26,586,434 | |
| | | | | | | | 87,263,718 | |
| LIFE SCIENCES TOOLS & SERVICES - 1.5% | | | | | | | | |
| Bio-Techne | | | 56,148 | | | | 19,463,143 | |
| Total (Cost $91,570,655) | | | | | | | 106,726,861 | |
| | | | | | | | | |
| INDUSTRIALS – 35.4% | | | | | | | | |
| AEROSPACE & DEFENSE - 1.7% | | | | | | | | |
| Woodward | | | 232,215 | | | | 21,477,565 | |
| AIR FREIGHT & LOGISTICS - 2.8% | | | | | | | | |
| Forward Air | | | 395,138 | | | | 36,336,891 | |
| BUILDING PRODUCTS - 1.8% | | | | | | | | |
| Simpson Manufacturing | | | 238,603 | | | | 24,005,848 | |
| COMMERCIAL SERVICES & SUPPLIES - 3.0% | | | | | | | | |
| †IAA 1 | | | 534,900 | | | | 17,528,673 | |
| Ritchie Bros. Auctioneers | | | 336,521 | | | | 21,894,056 | |
| | | | | | | | 39,422,729 | |
| CONSTRUCTION & ENGINEERING - 5.4% | | | | | | | | |
| Arcosa | | | 705,620 | | | | 32,761,937 | |
| Valmont Industries | | | 170,599 | | | | 38,321,653 | |
| | | | | | | | 71,083,590 | |
| MACHINERY - 14.1% | | | | | | | | |
| †ESAB Corporation | | | 289,257 | | | | 12,654,994 | |
| ESCO Technologies | | | 302,017 | | | | 20,648,902 | |
| THE ACCOMPANYING NOTES ARE AN INTEGRAL PART OF THESE FINANCIAL STATEMENTS | The Royce Funds 2022 Semiannual Report to Shareholders | 39 |
Schedules of Investments
Royce Premier Fund (continued)
| | | SHARES | | | VALUE |
| | | | | | |
| INDUSTRIALS (continued) | | | | | | | |
| MACHINERY (continued) | | | | | | | |
| John Bean Technologies | | | 301,650 | | | $ | 33,308,193 |
| Kadant | | | 165,402 | | | | 30,161,055 |
| Lincoln Electric Holdings | | | 297,211 | | | | 36,663,949 |
| Lindsay Corporation | | | 241,511 | | | | 32,077,491 |
| RBC Bearings 1 | | | 99,294 | | | | 18,364,425 |
| | | | | | | | 183,879,009 |
| PROFESSIONAL SERVICES - 2.6% | | | | | | | |
| Forrester Research 1 | | | 721,762 | | | | 34,529,094 |
| ROAD & RAIL - 2.2% | | | | | | | |
| Landstar System | | | 194,103 | | | | 28,226,458 |
| TRADING COMPANIES & DISTRIBUTORS - 1.8% | | | | | | | |
| Air Lease Cl. A | | | 683,635 | | | | 22,853,918 |
| Total (Cost $250,518,550) | | | | | | | 461,815,102 |
| | | | | | | | |
| INFORMATION TECHNOLOGY – 17.5% | | | | | | | |
| ELECTRONIC EQUIPMENT, INSTRUMENTS & COMPONENTS - 5.3% | | | | | | | |
| Cognex Corporation | | | 333,546 | | | | 14,182,376 |
| FARO Technologies 1 | | | 418,082 | | | | 12,889,468 |
| National Instruments | | | 539,875 | | | | 16,860,297 |
| Rogers Corporation 1 | | | 19,356 | | | | 5,073,014 |
| Vontier Corporation | | | 852,176 | | | | 19,591,526 |
| | | | | | | | 68,596,681 |
| IT SERVICES - 1.9% | | | | | | | |
| Computer Services 5 | | | 687,800 | | | | 25,345,430 |
| SEMICONDUCTORS & SEMICONDUCTOR EQUIPMENT - 7.0% | | | | | | | |
| Cirrus Logic 1 | | | 287,595 | | | | 20,862,141 |
| CMC Materials | | | 29,110 | | | | 5,079,404 |
| FormFactor 1 | | | 915,376 | | | | 35,452,512 |
| MKS Instruments | | | 297,841 | | | | 30,567,422 |
| | | | | | | | 91,961,479 |
| SOFTWARE - 1.1% | | | | | | | |
| Fair Isaac 1 | | | 35,443 | | | | 14,209,099 |
| TECHNOLOGY HARDWARE, STORAGE & PERIPHERALS - 2.2% | | | | | | | |
| Avid Technology 1 | | | 1,093,384 | | | | 28,373,315 |
| Total (Cost $205,868,229) | | | | | | | 228,486,004 |
| | | | | | | | |
| MATERIALS – 9.7% | | | | | | | |
| CHEMICALS - 5.3% | | | | | | | |
| Innospec | | | 470,794 | | | | 45,097,357 |
| Quaker Chemical | | | 157,813 | | | | 23,596,200 |
| | | | | | | | 68,693,557 |
| METALS & MINING - 2.4% | | | | | | | |
| Reliance Steel & Aluminum | | | 188,312 | | | | 31,986,676 |
| PAPER & FOREST PRODUCTS - 2.0% | | | | | | | |
| Stella-Jones | | | 1,012,691 | | | | 25,569,032 |
| Total (Cost $90,883,726) | | | | | | | 126,249,265 |
| | | | | | | | |
| REAL ESTATE – 4.0% | | | | | | | |
| REAL ESTATE MANAGEMENT & DEVELOPMENT - 4.0% | | | | | | | |
| †FirstService Corporation | | | 104,400 | | | | 12,653,280 |
| Kennedy-Wilson Holdings | | | 2,099,335 | | | | 39,761,405 |
| Total (Cost $49,919,788) | | | | | | | 52,414,685 |
| | | | | | | | |
| TOTAL COMMON STOCKS | | | | | | | |
| (Cost $927,237,959) | | | | | | | 1,285,400,256 |
| | | | | | |
| REPURCHASE AGREEMENT– 1.6% | | | | | | | |
| Fixed Income Clearing Corporation, 0.24% dated 6/30/22, due 7/1/22, maturity value $20,505,324 (collateralized by obligations of various U.S. Government Agencies, 3.25% due 6/30/27, valued at $20,915,340) |
| (Cost $20,505,187) | | | | | | $ | 20,505,187 |
| | | | | | | | |
| TOTAL INVESTMENTS – 100.0% | | | | | | | |
| (Cost $947,743,146) | | | | | | | 1,305,905,443 |
| | | | | | | | |
| CASH AND OTHER ASSETS LESS LIABILITIES – 0.0% | | | | | | | 316,634 |
| | | | | | | | |
| NET ASSETS – 100.0% | | | | | | $ | 1,306,222,077 |
| | | | | | | | |
| 40 | The Royce Funds 2022 Semiannual Report to Shareholders | THE ACCOMPANYING NOTES ARE AN INTEGRAL PART OF THESE FINANCIAL STATEMENTS |
June 30, 2022 (unaudited)
Royce Small-Cap Opportunity Fund
Common Stocks – 96.3%
| | | SHARES | | | VALUE |
| | | | | | |
| COMMUNICATION SERVICES – 3.3% | | | | | | | |
| DIVERSIFIED TELECOMMUNICATION SERVICES - 0.3% | | | | | | | |
| Ooma 1 | | | 377,878 | | | $ | 4,474,076 |
| ENTERTAINMENT - 0.4% | | | | | | | |
| Marcus Corporation (The) 1 | | | 380,629 | | | | 5,621,890 |
| INTERACTIVE MEDIA & SERVICES - 1.2% | | | | | | | |
| Cars.com 1 | | | 288,900 | | | | 2,724,327 |
| DHI Group 1 | | | 612,428 | | | | 3,043,767 |
| EverQuote Cl. A 1 | | | 184,700 | | | | 1,632,748 |
| QuinStreet 1 | | | 787,800 | | | | 7,925,268 |
| | | | | | | | 15,326,110 |
| MEDIA - 1.4% | | | | | | | |
| comScore 1 | | | 1,943,562 | | | | 4,003,738 |
| Entravision Communications Cl. A | | | 1,054,400 | | | | 4,808,064 |
| Magnite 1 | | | 257,700 | | | | 2,288,376 |
| Thryv Holdings 1,3 | | | 278,338 | | | | 6,231,988 |
| | | | | | | | 17,332,166 |
| Total (Cost $55,482,767) | | | | | | | 42,754,242 |
| | | | | | | | |
| CONSUMER DISCRETIONARY – 16.2% | | | | | | | |
| AUTO COMPONENTS - 3.2% | | | | | | | |
| †Adient 1 | | | 85,400 | | | | 2,530,402 |
| Dana | | | 415,453 | | | | 5,845,424 |
| Garrett Motion 1 | | | 833,485 | | | | 6,442,839 |
| †Goodyear Tire & Rubber 1 | | | 371,200 | | | | 3,975,552 |
| Horizon Global 1 | | | 1,214,620 | | | | 1,979,831 |
| Modine Manufacturing 1 | | | 989,763 | | | | 10,422,204 |
| Stoneridge 1 | | | 554,580 | | | | 9,511,047 |
| | | | | | | | 40,707,299 |
| DIVERSIFIED CONSUMER SERVICES - 1.1% | | | | | | | |
| Adtalem Global Education 1 | | | 142,100 | | | | 5,111,337 |
| American Public Education 1 | | | 410,200 | | | | 6,628,832 |
| Regis Corporation 1 | | | 64,127 | | | | 69,257 |
| Zovio 1 | | | 1,647,688 | | | | 1,598,422 |
| | | | | | | | 13,407,848 |
| HOTELS, RESTAURANTS & LEISURE - 1.3% | | | | | | | |
| Carrols Restaurant Group | | | 960,892 | | | | 1,941,002 |
| Century Casinos 1 | | | 287,694 | | | | 2,071,397 |
| Krispy Kreme | | | 290,889 | | | | 3,956,090 |
| Noodles & Company Cl. A 1 | | | 756,654 | | | | 3,556,274 |
| Ruth's Hospitality Group | | | 335,410 | | | | 5,453,766 |
| | | | | | | | 16,978,529 |
| HOUSEHOLD DURABLES - 2.5% | | | | | | | |
| Beazer Homes USA 1 | | | 226,406 | | | | 2,732,720 |
| Cavco Industries 1 | | | 20,400 | | | | 3,998,196 |
| Century Communities | | | 73,400 | | | | 3,300,798 |
| Dixie Group (The) 1 | | | 435,106 | | | | 556,936 |
| GoPro Cl. A 1 | | | 635,400 | | | | 3,513,762 |
| Skyline Champion 1 | | | 145,700 | | | | 6,909,094 |
| Taylor Morrison Home 1 | | | 197,954 | | | | 4,624,205 |
| Toll Brothers | | | 74,986 | | | | 3,344,376 |
| Tri Pointe Homes 1 | | | 198,906 | | | | 3,355,544 |
| | | | | | | | 32,335,631 |
| INTERNET & DIRECT MARKETING RETAIL - 0.5% | | | | | | | |
| iMedia Brands 1,3 | | | 627,960 | | | | 759,832 |
| Overstock.com 1 | | | 231,000 | | | | 5,777,310 |
| | | | | | | | 6,537,142 |
| MULTILINE RETAIL - 0.8% | | | | | | | |
| Dillard's Cl. A | | | 25,833 | | | | 5,697,985 |
| Nordstrom | | | 240,200 | | | | 5,075,426 |
| | | | | | | | 10,773,411 |
| SPECIALTY RETAIL - 5.1% | | | | | | | |
| †Aaron's Company (The) | | | 172,200 | | | | 2,505,510 |
| Asbury Automotive Group 1 | | | 53,400 | | | | 9,042,756 |
| Barnes & Noble Education 1 | | | 624,532 | | | | 1,829,879 |
| Caleres | | | 329,800 | | | | 8,653,952 |
| Chico's FAS 1 | | | 679,992 | | | | 3,379,560 |
| Designer Brands Cl. A | | | 537,879 | | | | 7,024,700 |
| Express 1 | | | 1,149,900 | | | | 2,253,804 |
| Guess? | | | 165,094 | | | | 2,814,853 |
| J.Jill 1 | | | 276,889 | | | | 5,064,300 |
| JOANN | | | 628,605 | | | | 4,871,689 |
| Kirkland's 1 | | | 39,055 | | | | 137,473 |
| LL Flooring Holdings 1 | | | 385,200 | | | | 3,609,324 |
| Sonic Automotive Cl. A | | | 152,200 | | | | 5,575,086 |
| †Sportsman's Warehouse Holdings 1 | | | 381,500 | | | | 3,658,585 |
| Victoria's Secret & Co. 1 | | | 183,329 | | | | 5,127,712 |
| | | | | | | | 65,549,183 |
| TEXTILES, APPAREL & LUXURY GOODS - 1.7% | | | | | | | |
| Fossil Group 1 | | | 136,100 | | | | 703,637 |
| Rocky Brands | | | 177,200 | | | | 6,056,696 |
| Skechers U.S.A. Cl. A 1 | | | 138,622 | | | | 4,932,171 |
| Unifi 1 | | | 495,400 | | | | 6,965,324 |
| Vera Bradley 1 | | | 672,602 | | | | 2,919,092 |
| | | | | | | | 21,576,920 |
| Total (Cost $253,837,867) | | | | | | | 207,865,963 |
| | | | | | | | |
| CONSUMER STAPLES – 2.0% | | | | | | | |
| FOOD PRODUCTS - 0.8% | | | | | | | |
| Calavo Growers | | | 162,141 | | | | 6,764,523 |
| SunOpta 1 | | | 389,700 | | | | 3,031,866 |
| | | | | | | | 9,796,389 |
| HOUSEHOLD PRODUCTS - 0.9% | | | | | | | |
| Central Garden & Pet Cl. A 1 | | | 63,300 | | | | 2,532,633 |
| Spectrum Brands Holdings | | | 110,100 | | | | 9,030,402 |
| | | | | | | | 11,563,035 |
| PERSONAL PRODUCTS - 0.3% | | | | | | | |
| †Inter Parfums | | | 41,900 | | | | 3,061,214 |
| †LifeMD 1,3 | | | 381,000 | | | | 777,240 |
| | | | | | | | 3,838,454 |
| Total (Cost $26,337,274) | | | | | | | 25,197,878 |
| | | | | | | | |
| ENERGY – 5.8% | | | | | | | |
| ENERGY EQUIPMENT & SERVICES - 1.0% | | | | | | | |
| Archrock | | | 509,900 | | | | 4,216,873 |
| DMC Global 1 | | | 235,700 | | | | 4,249,671 |
| Mammoth Energy Services 1 | | | 822,195 | | | | 1,808,829 |
| Ranger Energy Services Cl. A 1 | | | 268,256 | | | | 2,720,116 |
| | | | | | | | 12,995,489 |
| OIL, GAS & CONSUMABLE FUELS - 4.8% | | | | | | | |
| Ardmore Shipping 1 | | | 814,393 | | | | 5,676,319 |
| Baytex Energy 1,5 | | | 766,100 | | | | 3,715,585 |
| Chesapeake Energy | | | 96,800 | | | | 7,850,480 |
| Dorian LPG | | | 554,692 | | | | 8,431,319 |
| Earthstone Energy Cl. A 1 | | | 523,672 | | | | 7,148,123 |
| Matador Resources | | | 152,783 | | | | 7,118,160 |
| Navigator Holdings 1 | | | 562,884 | | | | 6,354,960 |
| †Northern Oil and Gas | | | 176,300 | | | | 4,453,338 |
| Scorpio Tankers | | | 201,700 | | | | 6,960,667 |
| THE ACCOMPANYING NOTES ARE AN INTEGRAL PART OF THESE FINANCIAL STATEMENTS | The Royce Funds 2022 Semiannual Report to Shareholders | 41 |
Schedules of Investments
Royce Small-Cap Opportunity Fund (continued)
| | | SHARES | | | VALUE |
| | | | | | |
| ENERGY (continued) | | | | | | | |
| OIL, GAS & CONSUMABLE FUELS (continued) | | | | | | | |
| Southwestern Energy 1 | | | 658,081 | | | $ | 4,113,006 |
| | | | | | | | 61,821,957 |
| Total (Cost $51,085,079) | | | | | | | 74,817,446 |
| | | | | | | | |
| FINANCIALS – 4.3% | | | | | | | |
| BANKS - 2.3% | | | | | | | |
| †BayCom Corporation | | | 262,059 | | | | 5,419,380 |
| †First Bancshares (The) | | | 178,800 | | | | 5,113,680 |
| First Foundation | | | 243,400 | | | | 4,984,832 |
| Hilltop Holdings | | | 235,708 | | | | 6,283,975 |
| Seacoast Banking Corporation of Florida | | | 251,650 | | | | 8,314,516 |
| | | | | | | | 30,116,383 |
| CAPITAL MARKETS - 1.0% | | | | | | | |
| B. Riley Financial | | | 218,567 | | | | 9,234,456 |
| Moelis & Company Cl. A | | | 93,026 | | | | 3,660,573 |
| | | | | | | | 12,895,029 |
| INSURANCE - 0.5% | | | | | | | |
| Brighthouse Financial 1 | | | 141,200 | | | | 5,792,024 |
| THRIFTS & MORTGAGE FINANCE - 0.5% | | | | | | | |
| Axos Financial 1 | | | 164,700 | | | | 5,904,495 |
| Total (Cost $50,249,624) | | | | | | | 54,707,931 |
| | | | | | | | |
| HEALTH CARE – 5.0% | | | | | | | |
| HEALTH CARE EQUIPMENT & SUPPLIES - 1.8% | | | | | | | |
| Accuray 1 | | | 1,700,708 | | | | 3,333,388 |
| †Artivion 1 | | | 379,600 | | | | 7,166,848 |
| Bioventus Cl. A 1,3 | | | 610,815 | | | | 4,165,758 |
| Orthofix Medical 1 | | | 101,596 | | | | 2,391,570 |
| Varex Imaging 1 | | | 279,946 | | | | 5,988,045 |
| | | | | | | | 23,045,609 |
| HEALTH CARE PROVIDERS & SERVICES - 2.4% | | | | | | | |
| ATI Physical Therapy Cl. A 1,3 | | | 947,000 | | | | 1,335,270 |
| Community Health Systems 1 | | | 470,514 | | | | 1,764,427 |
| †Covetrus 1 | | | 500 | | | | 10,375 |
| Cross Country Healthcare 1 | | | 424,920 | | | | 8,851,084 |
| †InnovAge Holding Corp. 1,3 | | | 378,800 | | | | 1,659,144 |
| Option Care Health 1 | | | 221,071 | | | | 6,143,563 |
| Owens & Minor | | | 66,207 | | | | 2,082,210 |
| RadNet 1 | | | 195,700 | | | | 3,381,696 |
| Select Medical Holdings | | | 218,100 | | | | 5,151,522 |
| | | | | | | | 30,379,291 |
| LIFE SCIENCES TOOLS & SERVICES - 0.2% | | | | | | | |
| †NeoGenomics 1 | | | 315,800 | | | | 2,573,770 |
| PHARMACEUTICALS - 0.6% | | | | | | | |
| Organon & Co | | | 247,403 | | | | 8,349,851 |
| Total (Cost $60,990,512) | | | | | | | 64,348,521 |
| | | | | | | | |
| INDUSTRIALS – 30.8% | | | | | | | |
| AEROSPACE & DEFENSE - 4.8% | | | | | | | |
| AAR Corporation 1 | | | 230,200 | | | | 9,631,568 |
| Aerojet Rocketdyne Holdings 1 | | | 158,700 | | | | 6,443,220 |
| Astronics Corporation 1 | | | 799,400 | | | | 8,129,898 |
| †BWX Technologies | | | 120,900 | | | | 6,660,381 |
| Ducommun 1 | | | 205,786 | | | | 8,857,029 |
| Hexcel Corporation | | | 165,400 | | | | 8,652,074 |
| Spirit AeroSystems Holdings Cl. A | | | 198,700 | | | | 5,821,910 |
| Triumph Group 1 | | | 607,516 | | | | 8,073,888 |
| | | | | | | | 62,269,968 |
| AIR FREIGHT & LOGISTICS - 1.3% | | | | | | | |
| Atlas Air Worldwide Holdings 1 | | | 89,136 | | | | 5,500,583 |
| Hub Group Cl. A 1 | | | 77,400 | | | | 5,490,756 |
| Radiant Logistics 1 | | | 701,169 | | | | 5,202,674 |
| | | | | | | | 16,194,013 |
| AIRLINES - 0.9% | | | | | | | |
| Alaska Air Group 1 | | | 118,000 | | | | 4,725,900 |
| Allegiant Travel 1 | | | 39,625 | | | | 4,481,191 |
| Mesa Air Group 1 | | | 1,227,346 | | | | 2,687,888 |
| | | | | | | | 11,894,979 |
| BUILDING PRODUCTS - 2.8% | | | | | | | |
| Apogee Enterprises | | | 79,500 | | | | 3,117,990 |
| Gibraltar Industries 1 | | | 129,900 | | | | 5,033,625 |
| Griffon Corporation | | | 345,167 | | | | 9,675,031 |
| Insteel Industries | | | 86,433 | | | | 2,910,199 |
| JELD-WEN Holding 1 | | | 354,313 | | | | 5,169,427 |
| PGT Innovations 1 | | | 174,643 | | | | 2,906,059 |
| Resideo Technologies 1 | | | 349,216 | | | | 6,781,775 |
| | | | | | | | 35,594,106 |
| COMMERCIAL SERVICES & SUPPLIES - 4.2% | | | | | | | |
| †Healthcare Services Group | | | 419,600 | | | | 7,305,236 |
| Heritage-Crystal Clean 1 | | | 296,188 | | | | 7,985,228 |
| †IAA 1 | | | 189,800 | | | | 6,219,746 |
| Interface | | | 480,567 | | | | 6,026,310 |
| KAR Auction Services 1 | | | 190,280 | | | | 2,810,436 |
| MillerKnoll | | | 259,400 | | | | 6,814,438 |
| Pitney Bowes | | | 357,594 | | | | 1,294,490 |
| Steelcase Cl. A | | | 594,400 | | | | 6,377,912 |
| VSE Corporation | | | 256,032 | | | | 9,621,683 |
| | | | | | | | 54,455,479 |
| CONSTRUCTION & ENGINEERING - 4.2% | | | | | | | |
| Arcosa | | | 183,906 | | | | 8,538,755 |
| Comfort Systems USA | | | 52,610 | | | | 4,374,521 |
| Concrete Pumping Holdings 1 | | | 913,597 | | | | 5,536,398 |
| Construction Partners Cl. A 1 | | | 350,859 | | | | 7,346,987 |
| Limbach Holdings 1,2 | | | 732,017 | | | | 3,908,971 |
| Matrix Service 1 | | | 803,746 | | | | 4,066,955 |
| Northwest Pipe 1 | | | 334,140 | | | | 10,004,152 |
| Orion Group Holdings 1,3 | | | 896,853 | | | | 2,044,825 |
| Primoris Services | | | 349,380 | | | | 7,602,509 |
| | | | | | | | 53,424,073 |
| ELECTRICAL EQUIPMENT - 1.0% | | | | | | | |
| Babcock & Wilcox Enterprises 1 | | | 1,374,795 | | | | 8,290,014 |
| LSI Industries | | | 154,511 | | | | 953,333 |
| Power Solutions International 1,5 | | | 343,740 | | | | 601,545 |
| †TPI Composites 1 | | | 253,800 | | | | 3,172,500 |
| | | | | | | | 13,017,392 |
| MACHINERY - 5.3% | | | | | | | |
| Barnes Group | | | 243,600 | | | | 7,585,704 |
| CIRCOR International 1 | | | 255,303 | | | | 4,184,416 |
| Commercial Vehicle Group 1 | | | 914,457 | | | | 5,340,429 |
| EnPro Industries | | | 96,300 | | | | 7,889,859 |
| Evercel 1,5 | | | 203,243 | | | | 308,929 |
| Hurco Companies | | | 77,351 | | | | 1,913,664 |
| Luxfer Holdings | | | 475,300 | | | | 7,186,536 |
| Manitex International 1 | | | 929,924 | | | | 6,035,207 |
| NN 1 | | | 1,322,065 | | | | 3,344,825 |
| Shyft Group (The) | | | 279,738 | | | | 5,200,329 |
| Trinity Industries | | | 320,424 | | | | 7,760,669 |
| Twin Disc 1 | | | 312,253 | | | | 2,829,012 |
| 42 | The Royce Funds 2022 Semiannual Report to Shareholders | THE ACCOMPANYING NOTES ARE AN INTEGRAL PART OF THESE FINANCIAL STATEMENTS |
June 30, 2022 (unaudited)
Royce Small-Cap Opportunity Fund (continued)
| | | SHARES | | | VALUE |
| | | | | | |
| INDUSTRIALS (continued) | | | | | | | |
| MACHINERY (continued) | | | | | | | |
| Wabash National | | | 677,000 | | | $ | 9,193,660 |
| | | | | | | | 68,773,239 |
| MARINE - 0.2% | | | | | | | |
| Diana Shipping | | | 600,510 | | | | 2,876,443 |
| PROFESSIONAL SERVICES - 2.2% | | | | | | | |
| Heidrick & Struggles International | | | 136,065 | | | | 4,403,063 |
| †HireRight Holdings 1 | | | 70,900 | | | | 1,007,489 |
| Korn Ferry | | | 112,445 | | | | 6,524,059 |
| Mistras Group 1 | | | 788,707 | | | | 4,684,920 |
| †Resources Connection | | | 243,300 | | | | 4,956,021 |
| †Sterling Check 1,3 | | | 64,500 | | | | 1,051,995 |
| TrueBlue 1 | | | 282,736 | | | | 5,060,974 |
| | | | | | | | 27,688,521 |
| ROAD & RAIL - 0.4% | | | | | | | |
| Daseke 1 | | | 698,200 | | | | 4,461,498 |
| U.S. Xpress Enterprises Cl. A 1,3 | | | 93,328 | | | | 250,119 |
| | | | | | | | 4,711,617 |
| TRADING COMPANIES & DISTRIBUTORS - 3.5% | | | | | | | |
| Air Lease Cl. A | | | 242,938 | | | | 8,121,417 |
| BlueLinx Holdings 1 | | | 77,800 | | | | 5,197,818 |
| Herc Holdings | | | 63,819 | | | | 5,753,283 |
| Hudson Technologies 1 | | | 746,018 | | | | 5,602,595 |
| †MRC Global 1 | | | 335,700 | | | | 3,343,572 |
| Univar Solutions 1 | | | 340,300 | | | | 8,463,261 |
| WESCO International 1 | | | 76,904 | | | | 8,236,419 |
| | | | | | | | 44,718,365 |
| Total (Cost $413,744,364) | | | | | | | 395,618,195 |
| | | | | | | | |
| INFORMATION TECHNOLOGY – 19.5% | | | | | | | |
| COMMUNICATIONS EQUIPMENT - 5.3% | | | | | | | |
| ADTRAN | | | 513,000 | | | | 8,992,890 |
| Aviat Networks 1 | | | 282,778 | | | | 7,080,761 |
| CalAmp Corporation 1 | | | 1,011,300 | | | | 4,217,121 |
| Cambium Networks 1 | | | 262,281 | | | | 3,842,417 |
| Ceragon Networks 1 | | | 28,966 | | | | 74,443 |
| Comtech Telecommunications | | | 533,117 | | | | 4,835,371 |
| Digi International 1 | | | 456,202 | | | | 11,049,212 |
| DZS 1 | | | 599,929 | | | | 9,760,845 |
| Infinera Corporation 1,3 | | | 729,846 | | | | 3,911,975 |
| PCTEL 2 | | | 1,051,393 | | | | 4,300,197 |
| Sierra Wireless 1 | | | 406,091 | | | | 9,502,529 |
| | | | | | | | 67,567,761 |
| ELECTRONIC EQUIPMENT, INSTRUMENTS & COMPONENTS - 5.2% | | | | | | | |
| Advanced Energy Industries | | | 126,653 | | | | 9,243,136 |
| Arlo Technologies 1 | | | 512,700 | | | | 3,214,629 |
| Avnet | | | 118,100 | | | | 5,064,128 |
| Benchmark Electronics | | | 272,600 | | | | 6,149,856 |
| CTS Corporation | | | 241,114 | | | | 8,209,932 |
| Fabrinet 1 | | | 80,029 | | | | 6,490,352 |
| Frequency Electronics 1 | | | 289,393 | | | | 2,112,569 |
| Identiv 1 | | | 267,920 | | | | 3,102,513 |
| Knowles Corporation 1 | | | 494,420 | | | | 8,568,299 |
| †nLIGHT 1 | | | 423,300 | | | | 4,326,126 |
| VIA optronics ADR 1 | | | 777,932 | | | | 1,649,216 |
| Vishay Intertechnology | | | 407,509 | | | | 7,261,810 |
| Vishay Precision Group 1 | | | 68,700 | | | | 2,001,231 |
| | | | | | | | 67,393,797 |
| IT SERVICES - 1.1% | | | | | | | |
| Conduent 1 | | | 949,000 | | | | 4,099,680 |
| Edgio 1 | | | 603,000 | | | | 1,392,930 |
| †TTEC Holdings | | | 135,000 | | | | 9,165,150 |
| | | | | | | | 14,657,760 |
| SEMICONDUCTORS & SEMICONDUCTOR EQUIPMENT - 5.7% | | | | | | | |
| Alpha & Omega Semiconductor 1 | | | 148,013 | | | | 4,934,753 |
| Amkor Technology | | | 434,540 | | | | 7,365,453 |
| Amtech Systems 1 | | | 652,784 | | | | 4,765,323 |
| Cohu 1 | | | 349,876 | | | | 9,709,059 |
| FormFactor 1 | | | 218,013 | | | | 8,443,644 |
| Ichor Holdings 1 | | | 316,894 | | | | 8,232,906 |
| Kulicke & Soffa Industries | | | 145,665 | | | | 6,235,919 |
| Onto Innovation 1 | | | 85,819 | | | | 5,985,017 |
| Ultra Clean Holdings 1 | | | 285,027 | | | | 8,485,254 |
| Veeco Instruments 1 | | | 458,687 | | | | 8,898,528 |
| | | | | | | | 73,055,856 |
| SOFTWARE - 1.2% | | | | | | | |
| A10 Networks | | | 457,126 | | | | 6,573,472 |
| Kaleyra 1,3 | | | 148,812 | | | | 303,576 |
| Marin Software 1 | | | 493,567 | | | | 814,386 |
| ON24 1 | | | 277,200 | | | | 2,630,628 |
| SecureWorks Corp. Cl. A 1 | | | 441,402 | | | | 4,793,626 |
| | | | | | | | 15,115,688 |
| TECHNOLOGY HARDWARE, STORAGE & PERIPHERALS - 1.0% | | | | | | | |
| Avid Technology 1 | | | 210,185 | | | | 5,454,301 |
| Immersion Corporation 1 | | | 724,800 | | | | 3,870,432 |
| Intevac 1 | | | 860,102 | | | | 4,162,893 |
| | | | | | | | 13,487,626 |
| Total (Cost $236,620,292) | | | | | | | 251,278,488 |
| | | | | | | | |
| MATERIALS – 7.4% | | | | | | | |
| CHEMICALS - 1.5% | | | | | | | |
| AdvanSix | | | 12 | | | | 401 |
| Huntsman Corporation | | | 250,500 | | | | 7,101,675 |
| Livent Corporation 1,3 | | | 238,100 | | | | 5,402,489 |
| LSB Industries 1 | | | 93,662 | | | | 1,298,155 |
| Tronox Holdings | | | 321,000 | | | | 5,392,800 |
| | | | | | | | 19,195,520 |
| CONSTRUCTION MATERIALS - 0.2% | | | | | | | |
| †Summit Materials Cl. A 1 | | | 96,700 | | | | 2,252,143 |
| CONTAINERS & PACKAGING - 0.5% | | | | | | | |
| TriMas Corporation | | | 246,610 | | | | 6,828,631 |
| METALS & MINING - 5.0% | | | | | | | |
| Allegheny Technologies 1 | | | 385,714 | | | | 8,759,565 |
| Carpenter Technology | | | 253,742 | | | | 7,081,939 |
| Century Aluminum 1 | | | 293,010 | | | | 2,159,484 |
| Cleveland-Cliffs 1 | | | 339,449 | | | | 5,217,331 |
| Coeur Mining 1 | | | 509,632 | | | | 1,549,281 |
| Commercial Metals | | | 209,000 | | | | 6,917,900 |
| Ferroglobe 1 | | | 1,292,671 | | | | 7,678,466 |
| Haynes International | | | 260,461 | | | | 8,535,307 |
| Major Drilling Group International 1 | | | 722,000 | | | | 5,064,994 |
| Noranda Aluminum Holding Corporation 1,4 | | | 488,157 | | | | 0 |
| Olympic Steel | | | 127,827 | | | | 3,291,545 |
| TimkenSteel Corporation 1 | | | 418,400 | | | | 7,828,264 |
| | | | | | | | 64,084,076 |
| PAPER & FOREST PRODUCTS - 0.2% | | | | | | | |
| Glatfelter Corporation | | | 456,345 | | | | 3,139,654 |
| Total (Cost $73,851,595) | | | | | | | 95,500,024 |
| THE ACCOMPANYING NOTES ARE AN INTEGRAL PART OF THESE FINANCIAL STATEMENTS | The Royce Funds 2022 Semiannual Report to Shareholders | 43 |
Schedules of Investments
Royce Small-Cap Opportunity Fund (continued)
| | | SHARES | | | VALUE |
| | | | | | |
| REAL ESTATE – 2.0% | | | | | |
| EQUITY REAL ESTATE INVESTMENT TRUSTS (REITS) - 1.8% | | | | | | | |
| Alexander & Baldwin | | | 277,400 | | | $ | 4,979,330 |
| Braemar Hotels & Resorts | | | 489,753 | | | | 2,101,040 |
| Chatham Lodging Trust 1 | | | 236,900 | | | | 2,475,605 |
| Macerich Company | | | 517,200 | | | | 4,504,812 |
| Ryman Hospitality Properties 1 | | | 40,271 | | | | 3,061,804 |
| Tanger Factory Outlet Centers | | | 400,500 | | | | 5,695,110 |
| | | | | | | | 22,817,701 |
| REAL ESTATE MANAGEMENT & DEVELOPMENT - 0.2% | | | | | | | |
| Anywhere Real Estate 1 | | | 258,320 | | | | 2,539,286 |
| Total (Cost $22,346,150) | | | | | | | 25,356,987 |
| | | | | | | | |
| TOTAL COMMON STOCKS | | | | | | | |
| (Cost $1,244,545,524) | | | | | | | 1,237,445,675 |
| | | | | | | | |
| REPURCHASE AGREEMENT– 4.1% | | | | | | | |
| Fixed Income Clearing Corporation, 0.24% dated 6/30/22, due 7/1/22, maturity value $52,529,693 (collateralized by obligations of various U.S. Government Agencies, 3.25% due 6/30/27, valued at $53,579,976) |
| (Cost $52,529,343) | | | | | | | 52,529,343 |
| | | | | | | | |
| COLLATERAL RECEIVED FOR SECURITIES LOANED – 0.3% | | | | | | | |
| Money Market Funds | | | | | | | |
| Federated Government Obligations Fund - Institutional Shares (7 day yield-1.36%) | | | | | | | |
| (Cost $3,656,275) | | | 3,656,275 | | | | 3,656,275 |
| | | | | | | | |
| TOTAL INVESTMENTS – 100.7% | | | | | | | |
| (Cost $1,300,731,142) | | | | | | | 1,293,631,293 |
| | | | | | | | |
| LIABILITIES LESS CASH AND OTHER ASSETS – (0.7)% | | | | | | | (8,784,722) |
| | | | | | | | |
| NET ASSETS – 100.0% | | | | | | $ | 1,284,846,571 |
Royce Small-Cap Special Equity Fund
Common Stocks – 80.5%
| | | SHARES | | | VALUE |
| | | | | | |
| COMMUNICATION SERVICES – 4.1% | | | | | | | |
| MEDIA - 4.1% | | | | | | | |
| TEGNA | | | 1,551,000 | | | $ | 32,524,470 |
| Total (Cost $31,309,403) | | | | | | | 32,524,470 |
| | | | | | | | |
| CONSUMER DISCRETIONARY – 18.4% | | | | | | | |
| AUTO COMPONENTS - 6.7% | | | | | | | |
| Standard Motor Products 2 | | | 1,181,500 | | | | 53,155,685 |
| DIVERSIFIED CONSUMER SERVICES - 4.9% | | | | | | | |
| H&R Block | | | 1,106,000 | | | | 39,063,920 |
| HOUSEHOLD DURABLES - 0.6% | | | | | | | |
| Ethan Allen Interiors | | | 229,000 | | | | 4,628,090 |
| LEISURE PRODUCTS - 3.4% | | | | | | | |
| Johnson Outdoors Cl. A | | | 450,500 | | | | 27,552,580 |
| TEXTILES, APPAREL & LUXURY GOODS - 2.8% | | | | | | | |
| Movado Group | | | 728,300 | | | | 22,526,319 |
| Total (Cost $123,731,177) | | | | | | | 146,926,594 |
| | | | | | | | |
| CONSUMER STAPLES – 11.2% | | | | | | | |
| FOOD & STAPLES RETAILING - 7.0% | | | | | | | |
| Ingles Markets Cl. A | | | 641,500 | | | | 55,650,125 |
| FOOD PRODUCTS - 4.2% | | | | | | | |
| John B. Sanfilippo & Son | | | 467,000 | | | | 33,852,830 |
| Total (Cost $71,114,107) | | | | | | | 89,502,955 |
| | | | | | | | |
| FINANCIALS – 5.3% | | | | | | | |
| CAPITAL MARKETS - 5.3% | | | | | | | |
| BrightSphere Investment Group | | | 175,500 | | | | 3,160,755 |
| Diamond Hill Investment Group | | | 136,000 | | | | 23,615,040 |
| Federated Hermes Cl. B | | | 481,500 | | | | 15,306,885 |
| Total (Cost $35,589,693) | | | | | | | 42,082,680 |
| | | | | | | | |
| INDUSTRIALS – 18.5% | | | | | | | |
| BUILDING PRODUCTS - 3.0% | | | | | | | |
| Insteel Industries | | | 329,000 | | | | 11,077,430 |
| UFP Industries | | | 190,000 | | | | 12,946,600 |
| | | | | | | | 24,024,030 |
| COMMERCIAL SERVICES & SUPPLIES - 3.1% | | | | | | | |
| Ennis | | | 1,227,000 | | | | 24,822,210 |
| CONSTRUCTION & ENGINEERING - 0.5% | | | | | | | |
| MYR Group 1 | | | 41,000 | | | | 3,613,330 |
| ELECTRICAL EQUIPMENT - 3.4% | | | | | | | |
| Encore Wire | | | 260,500 | | | | 27,071,160 |
| MACHINERY - 7.8% | | | | | | | |
| Gencor Industries 1,2 | | | 1,066,000 | | | | 10,830,560 |
| †Hillenbrand | | | 188,500 | | | | 7,720,960 |
| Hurco Companies 2 | | | 580,000 | | | | 14,349,200 |
| Mueller Industries | | | 551,500 | | | | 29,389,435 |
| | | | | | | | 62,290,155 |
| PROFESSIONAL SERVICES - 0.7% | | | | | | | |
| Resources Connection | | | 255,000 | | | | 5,194,350 |
| Total (Cost $129,310,857) | | | | | | | 147,015,235 |
| | | | | | | | |
| INFORMATION TECHNOLOGY – 10.2% | | | | | | | |
| ELECTRONIC EQUIPMENT, INSTRUMENTS & COMPONENTS - 3.9% | | | | | | | |
| Vishay Intertechnology | | | 1,742,000 | | | | 31,042,440 |
| IT SERVICES - 0.2% | | | | | | | |
| Computer Services 5 | | | 33,200 | | | | 1,223,420 |
| SEMICONDUCTORS & SEMICONDUCTOR EQUIPMENT - 6.1% | | | | | | | |
| Kulicke & Soffa Industries | | | 746,500 | | | | 31,957,665 |
| 44 | The Royce Funds 2022 Semiannual Report to Shareholders | THE ACCOMPANYING NOTES ARE AN INTEGRAL PART OF THESE FINANCIAL STATEMENTS |
June 30, 2022 (unaudited)
Royce Small-Cap Special Equity Fund (continued)
| | | SHARES | | | VALUE |
| | | | | | |
| INFORMATION TECHNOLOGY (continued) | | | | | |
| SEMICONDUCTORS & SEMICONDUCTOR EQUIPMENT (continued) | | | | | | | |
| NVE Corporation 2 | | | 358,000 | | | $ | 16,689,960 |
| | | | | | | | 48,647,625 |
| Total (Cost $70,111,656) | | | | | | | 80,913,485 |
| | | | | | | | |
| MATERIALS – 9.0% | | | | | | | |
| CHEMICALS - 5.7% | | | | | | | |
| Huntsman Corporation | | | 1,600,000 | | | | 45,360,000 |
| CONSTRUCTION MATERIALS - 1.7% | | | | | | | |
| United States Lime & Minerals | | | 131,000 | | | | 13,833,600 |
| PAPER & FOREST PRODUCTS - 1.6% | | | | | | | |
| Louisiana-Pacific | | | 245,500 | | | | 12,866,655 |
| Total (Cost $62,905,031) | | | | | | | 72,060,255 |
| | | | | | | | |
| REAL ESTATE – 3.8% | | | | | | | |
| REAL ESTATE MANAGEMENT & DEVELOPMENT - 3.8% | | | | | | | |
| Marcus & Millichap | | | 814,000 | | | | 30,109,860 |
| Total (Cost $22,900,450) | | | | | | | 30,109,860 |
| | | | | | | | |
| TOTAL COMMON STOCKS | | | | | | | |
| (Cost $546,972,374) | | | | | | | 641,135,534 |
| | | | | | | | |
| REPURCHASE AGREEMENT– 19.6% | | | | | | | |
| Fixed Income Clearing Corporation, 0.24% dated 6/30/22, due 7/1/22, maturity value $155,842,125 (collateralized by obligations of various U.S. Government Agencies, 0.125%-3.25% due 4/15/27-6/30/27, valued at $158,957,993) |
| (Cost $155,841,086) | | | | | | | 155,841,086 |
| | | | | | | | |
| TOTAL INVESTMENTS – 100.1% | | | | | | | |
| (Cost $702,813,460) | | | | | | | 796,976,620 |
| | | | | | | | |
| LIABILITIES LESS CASH AND OTHER ASSETS – (0.1)% | | | | | | | (1,068,370) |
| | | | | | | | |
| NET ASSETS – 100.0% | | | | | | $ | 795,908,250 |
Royce Small-Cap Total Return Fund
Common Stocks – 97.5%
| | | SHARES | | | VALUE |
| | | | | | |
| COMMUNICATION SERVICES – 2.2% | | | | | | | |
| ENTERTAINMENT - 0.3% | | | | | | | |
| World Wrestling Entertainment Cl. A | | | 50,248 | | | $ | 3,139,997 |
| INTERACTIVE MEDIA & SERVICES - 1.9% | | | | | | | |
| Ziff Davis 1 | | | 251,020 | | | | 18,708,521 |
| Total (Cost $25,338,470) | | | | | | | 21,848,518 |
| | | | | | | | |
| CONSUMER DISCRETIONARY – 7.3% | | | | | | | |
| HOTELS, RESTAURANTS & LEISURE - 0.4% | | | | | | | |
| Denny's Corporation 1 | | | 506,500 | | | | 4,396,420 |
| LEISURE PRODUCTS - 0.4% | | | | | | | |
| †YETI Holdings 1 | | | 83,900 | | | | 3,630,353 |
| MULTILINE RETAIL - 2.7% | | | | | | | |
| Franchise Group Cl. A | | | 764,001 | | | | 26,793,515 |
| SPECIALTY RETAIL - 1.2% | | | | | | | |
| †JOANN | | | 1,182,619 | | | | 9,165,297 |
| †OneWater Marine Cl. A 1 | | | 103,500 | | | | 3,420,675 |
| | | | | | | | 12,585,972 |
| TEXTILES, APPAREL & LUXURY GOODS - 2.6% | | | | | | | |
| Levi Strauss & Co. Cl. A | | | 757,447 | | | | 12,361,535 |
| Ralph Lauren Cl. A | | | 154,145 | | | | 13,819,100 |
| | | | | | | | 26,180,635 |
| Total (Cost $75,350,499) | | | | | | | 73,586,895 |
| | | | | | | | |
| CONSUMER STAPLES – 2.1% | | | | | | | |
| HOUSEHOLD PRODUCTS - 2.1% | | | | | | | |
| Reynolds Consumer Products | | | 93,222 | | | | 2,542,164 |
| Spectrum Brands Holdings | | | 223,284 | | | | 18,313,754 |
| Total (Cost $14,666,836) | | | | | | | 20,855,918 |
| | | | | | | | |
| ENERGY – 3.6% | | | | | | | |
| ENERGY EQUIPMENT & SERVICES - 3.6% | | | | | | | |
| Cactus Cl. A | | | 228,759 | | | | 9,212,125 |
| ChampionX Corporation | | | 148,037 | | | | 2,938,535 |
| Oceaneering International 1 | | | 621,733 | | | | 6,640,108 |
| Pason Systems | | | 1,497,676 | | | | 16,975,678 |
| Total (Cost $29,385,403) | | | | | | | 35,766,446 |
| | | | | | | | |
| FINANCIALS – 36.3% | | | | | | | |
| BANKS - 18.4% | | | | | | | |
| Bank of N.T. Butterfield & Son | | | 506,123 | | | | 15,785,976 |
| BankUnited | | | 371,547 | | | | 13,215,927 |
| BOK Financial | | | 124,601 | | | | 9,417,344 |
| First Bancshares (The) | | | 394,409 | | | | 11,280,097 |
| First Citizens BancShares Cl. A | | | 21,682 | | | | 14,175,258 |
| First Hawaiian | | | 319,261 | | | | 7,250,417 |
| HBT Financial | | | 423,672 | | | | 7,571,019 |
| Home BancShares | | | 925,567 | | | | 19,224,027 |
| Independent Bank Group | | | 251,599 | | | | 17,086,088 |
| Origin Bancorp | | | 337,928 | | | | 13,111,606 |
| Preferred Bank | | | 57,616 | | | | 3,919,040 |
| QCR Holdings | | | 124,183 | | | | 6,704,640 |
| TowneBank | | | 291,248 | | | | 7,907,383 |
| Triumph Bancorp 1 | | | 144,592 | | | | 9,045,676 |
| UMB Financial | | | 110,070 | | | | 9,477,027 |
| Valley National Bancorp | | | 1,237,521 | | | | 12,882,594 |
| †Western Alliance Bancorp | | | 88,100 | | | | 6,219,860 |
| | | | | | | | 184,273,979 |
| CAPITAL MARKETS - 2.6% | | | | | | | |
| Artisan Partners Asset Management Cl. A | | | 280,703 | | | | 9,984,605 |
| Moelis & Company Cl. A | | | 249,637 | | | | 9,823,216 |
| THE ACCOMPANYING NOTES ARE AN INTEGRAL PART OF THESE FINANCIAL STATEMENTS | The Royce Funds 2022 Semiannual Report to Shareholders | 45 |
Schedules of Investments
Royce Small-Cap Total Return Fund (continued)
| | | SHARES | | | VALUE |
| | | | | | |
| FINANCIALS (continued) | | | | | |
| CAPITAL MARKETS (continued) | | | | | |
| TMX Group | | 62,804 | | $ | 6,391,644 |
| | | | | | 26,199,465 |
| DIVERSIFIED FINANCIAL SERVICES - 2.0% | | | | | |
| Compass Diversified Holdings | | 954,512 | | | 20,445,647 |
| INSURANCE - 13.3% | | | | | |
| AMERISAFE | | 190,409 | | | 9,903,172 |
| Axis Capital Holdings | | 353,097 | | | 20,158,308 |
| First American Financial | | 160,345 | | | 8,485,457 |
| International General Insurance Holdings | | 2,116,797 | | | 16,151,161 |
| James River Group Holdings | | 473,403 | | | 11,730,926 |
| ProAssurance Corporation | | 686,665 | | | 16,225,894 |
| RenaissanceRe Holdings | | 122,491 | | | 19,153,918 |
| Stewart Information Services | | 276,104 | | | 13,736,174 |
| Trean Insurance Group 1,2 | | 2,783,989 | | | 17,344,252 |
| | | | | | 132,889,262 |
| Total (Cost $320,812,949) | | | | | 363,808,353 |
| | | | | | |
| HEALTH CARE – 0.5% | | | | | |
| HEALTH CARE PROVIDERS & SERVICES - 0.5% | | | | | |
| Patterson Companies | | 149,591 | | | 4,532,607 |
| Total (Cost $2,362,179) | | | | | 4,532,607 |
| | | | | | |
| INDUSTRIALS – 24.6% | | | | | |
| BUILDING PRODUCTS - 3.0% | | | | | |
| Fortune Brands Home & Security | | 138,167 | | | 8,273,440 |
| Simpson Manufacturing | | 88,400 | | | 8,893,924 |
| UFP Industries | | 185,299 | | | 12,626,274 |
| | | | | | 29,793,638 |
| COMMERCIAL SERVICES & SUPPLIES - 3.4% | | | | | |
| Deluxe Corporation | | 443,973 | | | 9,620,895 |
| Healthcare Services Group | | 941,675 | | | 16,394,562 |
| †Loomis | | 324,000 | | | 7,880,075 |
| | | | | | 33,895,532 |
| ELECTRICAL EQUIPMENT - 2.9% | | | | | |
| GrafTech International | | 2,331,521 | | | 16,483,854 |
| nVent Electric | | 392,134 | | | 12,285,558 |
| | | | | | 28,769,412 |
| MACHINERY - 5.7% | | | | | |
| †Allison Transmission Holdings | | 285,800 | | | 10,989,010 |
| Crane Holdings | | 77,039 | | | 6,745,535 |
| Douglas Dynamics | | 569,079 | | | 16,355,330 |
| Lincoln Electric Holdings | | 53,966 | | | 6,657,246 |
| Timken Company (The) | | 310,513 | | | 16,472,715 |
| | | | | | 57,219,836 |
| PROFESSIONAL SERVICES - 2.4% | | | | | |
| Barrett Business Services | | 167,527 | | | 12,207,692 |
| KBR | | 251,954 | | | 12,192,054 |
| | | | | | 24,399,746 |
| TRADING COMPANIES & DISTRIBUTORS - 7.2% | | | | | |
| Air Lease Cl. A | | 482,800 | | | 16,140,004 |
| Applied Industrial Technologies | | 122,860 | | | 11,815,446 |
| †Fortress Transportation and Infrastructure Investors Cl. A | | 600,800 | | | 11,619,472 |
| Global Industrial | | 379,939 | | | 12,830,540 |
| MSC Industrial Direct Cl. A | | 150,110 | | | 11,274,762 |
| †NOW 1 | | 932,800 | | | 9,122,784 |
| | | | | | 72,803,008 |
| Total (Cost $243,109,605) | | | | | 246,881,172 |
| | | | | | |
| INFORMATION TECHNOLOGY – 10.1% | | | | | |
| ELECTRONIC EQUIPMENT, INSTRUMENTS & COMPONENTS - 3.3% | | | |
| Avnet | | 159,409 | | | 6,835,458 |
| PC Connection | | 50,534 | | | 2,226,023 |
| Vontier Corporation | | 1,048,953 | | | 24,115,429 |
| | | | | | 33,176,910 |
| IT SERVICES - 2.3% | | | | | |
| EVERTEC | | 279,489 | | | 10,307,554 |
| Hackett Group (The) | | 659,509 | | | 12,510,886 |
| | | | | | 22,818,440 |
| SEMICONDUCTORS & SEMICONDUCTOR EQUIPMENT - 1.4% | | | |
| Kulicke & Soffa Industries | | 198,584 | | | 8,501,381 |
| MKS Instruments | | 57,105 | | | 5,860,686 |
| | | | | | 14,362,067 |
| SOFTWARE - 3.1% | | | | | |
| †Consensus Cloud Solutions 1 | | 217,300 | | | 9,491,664 |
| †Sapiens International | | 76,035 | | | 1,839,287 |
| Teradata Corporation 1 | | 524,367 | | | 19,406,823 |
| | | | | | 30,737,774 |
| Total (Cost $105,419,322) | | | | | 101,095,191 |
| | | | | | |
| MATERIALS – 8.1% | | | | | |
| CHEMICALS - 4.0% | | | | | |
| Element Solutions | | 1,016,266 | | | 18,089,535 |
| Innospec | | 53,857 | | | 5,158,962 |
| Minerals Technologies | | 275,980 | | | 16,928,613 |
| | | | | | 40,177,110 |
| CONTAINERS & PACKAGING - 4.1% | | | | | |
| Graphic Packaging Holding Company | | 728,360 | | | 14,931,380 |
| Silgan Holdings | | 372,271 | | | 15,393,406 |
| TriMas Corporation | | 395,940 | | | 10,963,578 |
| | | | | | 41,288,364 |
| Total (Cost $70,600,229) | | | | | 81,465,474 |
| | | | | | |
| REAL ESTATE – 2.7% | | | | | |
| REAL ESTATE MANAGEMENT & DEVELOPMENT - 2.7% | | | | | |
| Cushman & Wakefield 1 | | 727,444 | | | 11,086,247 |
| Kennedy-Wilson Holdings | | 830,997 | | | 15,739,083 |
| Total (Cost $29,969,588) | | | | | 26,825,330 |
| | | | | | |
| TOTAL COMMON STOCKS | | | | | |
| (Cost $917,015,080) | | | | | 976,665,904 |
| | | | | | |
| PREFERRED STOCK - 1.7% | | | | | |
| INFORMATION TECHNOLOGY – 1.7% | | | | | |
| ELECTRONIC EQUIPMENT, INSTRUMENTS & COMPONENTS - 1.7% | | | |
| II-VI Series A Conv. | | 82,224 | | | 17,688,849 |
| (Cost $20,813,039) | | | | | 17,688,849 |
| | | | | | |
| REPURCHASE AGREEMENT– 1.0% |
| Fixed Income Clearing Corporation, 0.24% dated 6/30/22, due 7/1/22, maturity value $9,816,582 (collateralized by obligations of various U.S. Government Agencies, 3.25% due 6/30/27, valued at $10,012,864) |
| (Cost $9,816,517) | | | | | 9,816,517 |
| | | | | | |
| TOTAL INVESTMENTS – 100.2% | | | | | |
| (Cost $947,644,636) | | | | | 1,004,171,270 |
| | | | | | |
| LIABILITIES LESS CASH AND OTHER ASSETS – (0.2)% | | | | | (2,221,908) |
| | | | | | |
| NET ASSETS – 100.0% | | | | $ | 1,001,949,362 |
| 46 | The Royce Funds 2022 Semiannual Report to Shareholders | THE ACCOMPANYING NOTES ARE AN INTEGRAL PART OF THESE FINANCIAL STATEMENTS |
June 30, 2022 (unaudited)
Royce Small-Cap Value Fund
Common Stocks – 96.7%
| | | SHARES | | | VALUE |
| | | | | | |
| COMMUNICATION SERVICES – 2.9% | | | | | |
| ENTERTAINMENT - 1.2% | | | | | |
| SciPlay Corporation Cl. A 1 | | 87,368 | | $ | 1,220,531 |
| MEDIA - 1.7% | | | | | |
| Entravision Communications Cl. A | | 232,508 | | | 1,060,236 |
| Saga Communications Cl. A | | 31,901 | | | 792,740 |
| | | | | | 1,852,976 |
| Total (Cost $3,486,287) | | | | | 3,073,507 |
| | | | | | |
| CONSUMER DISCRETIONARY – 13.8% | | | | | |
| DIVERSIFIED CONSUMER SERVICES - 1.6% | | | | | |
| Lincoln Educational Services 1 | | 278,737 | | | 1,758,831 |
| HOTELS, RESTAURANTS & LEISURE - 1.1% | | | | | |
| †Bloomin’ Brands | | 69,700 | | | 1,158,414 |
| HOUSEHOLD DURABLES - 3.0% | | | | | |
| La-Z-Boy | | 28,531 | | | 676,470 |
| M/I Homes 1 | | 16,998 | | | 674,141 |
| Meritage Homes 1 | | 6,405 | | | 464,362 |
| PulteGroup | | 34,700 | | | 1,375,161 |
| | | | | | 3,190,134 |
| LEISURE PRODUCTS - 1.3% | | | | | |
| Malibu Boats Cl. A 1 | | 12,190 | | | 642,535 |
| MasterCraft Boat Holdings 1 | | 35,667 | | | 750,790 |
| | | | | | 1,393,325 |
| SPECIALTY RETAIL - 5.1% | | | | | |
| Aaron’s Company (The) | | 21,436 | | | 311,894 |
| American Eagle Outfitters | | 71,761 | | | 802,288 |
| Container Store Group (The) 1 | | 115,667 | | | 720,605 |
| Haverty Furniture | | 29,285 | | | 678,826 |
| Lazydays Holdings 1,3 | | 78,466 | | | 924,330 |
| OneWater Marine Cl. A 1 | | 19,488 | | | 644,078 |
| Shoe Carnival | | 60,883 | | | 1,315,682 |
| | | | | | 5,397,703 |
| TEXTILES, APPAREL & LUXURY GOODS - 1.7% | | | | | |
| Carter’s | | 15,500 | | | 1,092,440 |
| †Skechers U.S.A. Cl. A 1 | | 21,600 | | | 768,528 |
| | | | | | 1,860,968 |
| Total (Cost $16,674,241) | | | | | 14,759,375 |
| | | | | | |
| CONSUMER STAPLES – 1.8% | | | | | |
| FOOD & STAPLES RETAILING - 1.8% | | | | | |
| †Ingles Markets Cl. A | | 10,000 | | | 867,500 |
| Village Super Market Cl. A | | 48,291 | | | 1,101,518 |
| Total (Cost $1,975,024) | | | | | 1,969,018 |
| | | | | | |
| ENERGY – 6.2% | | | | | |
| OIL, GAS & CONSUMABLE FUELS - 6.2% | | | | | |
| †Chord Energy | | 8,900 | | | 1,082,685 |
| Civitas Resources | | 22,700 | | | 1,186,983 |
| Dorchester Minerals L.P. | | 55,104 | | | 1,314,230 |
| †Matador Resources | | 19,100 | | | 889,869 |
| †SilverBow Resources 1 | | 37,896 | | | 1,074,731 |
| †Whiting Petroleum | | 16,200 | | | 1,102,086 |
| Total (Cost $6,763,856) | | | | | 6,650,584 |
| | | | | | |
| FINANCIALS – 20.3% | | | | | |
| BANKS - 8.2% | | | | | |
| Ames National | | 8,733 | | | 193,698 |
| †Bank of Princeton | | 28,712 | | | 788,432 |
| Camden National | | 4,160 | | | 183,248 |
| Chemung Financial | | 13,757 | | | 646,579 |
| Citizens Community Bancorp | | 60,897 | | | 842,205 |
| CNB Financial | | 33,581 | | | 812,324 |
| Financial Institutions | | 30,529 | | | 794,365 |
| Landmark Bancorp | | 21,775 | | | 551,778 |
| †Mid Penn Bancorp | | 31,259 | | | 843,055 |
| MidWestOne Financial Group | | 19,504 | | | 579,659 |
| National Bankshares | | 42,142 | | | 1,323,259 |
| Unity Bancorp | | 45,247 | | | 1,198,141 |
| | | | | | 8,756,743 |
| CAPITAL MARKETS - 3.5% | | | | | |
| Evercore Cl. A | | 17,142 | | | 1,604,662 |
| Houlihan Lokey Cl. A | | 10,090 | | | 796,404 |
| Moelis & Company Cl. A | | 33,382 | | | 1,313,582 |
| | | | | | 3,714,648 |
| INSURANCE - 4.8% | | | | | |
| CNO Financial Group | | 56,590 | | | 1,023,713 |
| Employers Holdings | | 38,177 | | | 1,599,234 |
| James River Group Holdings | | 44,729 | | | 1,108,385 |
| Tiptree | | 137,988 | | | 1,465,433 |
| | | | | | 5,196,765 |
| THRIFTS & MORTGAGE FINANCE - 3.8% | | | | | |
| Southern Missouri Bancorp | | 18,206 | | | 824,003 |
| Timberland Bancorp | | 54,119 | | | 1,352,975 |
| TrustCo Bank Corp NY | | 36,034 | | | 1,111,289 |
| †Western New England Bancorp | | 101,876 | | | 759,995 |
| | | | | | 4,048,262 |
| Total (Cost $20,098,708) | | | | | 21,716,418 |
| | | | | | |
| HEALTH CARE – 8.2% | | | | | |
| BIOTECHNOLOGY - 3.2% | | | | | |
| Catalyst Pharmaceuticals 1 | | 249,006 | | | 1,745,532 |
| Ironwood Pharmaceuticals Cl. A 1 | | 139,551 | | | 1,609,023 |
| Vanda Pharmaceuticals 1 | | 9,016 | | | 98,275 |
| | | | | | 3,452,830 |
| HEALTH CARE PROVIDERS & SERVICES - 3.3% | | | | | |
| Cross Country Healthcare 1 | | 75,857 | | | 1,580,101 |
| Ensign Group (The) | | 6,491 | | | 476,894 |
| Molina Healthcare 1 | | 5,140 | | | 1,437,195 |
| | | | | | 3,494,190 |
| PHARMACEUTICALS - 1.7% | | | | | |
| Collegium Pharmaceutical 1 | | 75,792 | | | 1,343,034 |
| SIGA Technologies | | 40,223 | | | 465,783 |
| | | | | | 1,808,817 |
| Total (Cost $7,402,191) | | | | | 8,755,837 |
| | | | | | |
| INDUSTRIALS – 18.6% | | | | | |
| BUILDING PRODUCTS - 2.7% | | | | | |
| Builders FirstSource 1 | | 9,241 | | | 496,242 |
| Quanex Building Products | | 61,195 | | | 1,392,186 |
| UFP Industries | | 15,000 | | | 1,022,100 |
| | | | | | 2,910,528 |
| CONSTRUCTION & ENGINEERING - 3.5% | | | | | |
| Northwest Pipe 1 | | 28,034 | | | 839,338 |
| Primoris Services | | 62,099 | | | 1,351,274 |
| Sterling Infrastructure 1 | | 73,056 | | | 1,601,388 |
| | | | | | 3,792,000 |
| ELECTRICAL EQUIPMENT - 0.8% | | | | | |
| †Preformed Line Products | | 13,223 | | | 813,214 |
| PROFESSIONAL SERVICES - 6.8% | | | | | |
| Barrett Business Services | | 15,994 | | | 1,165,483 |
| THE ACCOMPANYING NOTES ARE AN INTEGRAL PART OF THESE FINANCIAL STATEMENTS | The Royce Funds 2022 Semiannual Report to Shareholders | 47 |
Schedules of Investments
Royce Small-Cap Value Fund (continued)
| | | SHARES | | | VALUE |
| | | | | | |
| INDUSTRIALS (continued) | | | | | |
| PROFESSIONAL SERVICES (continued) | | | | | |
| Heidrick & Struggles International | | 47,671 | | $ | 1,542,634 |
| Kforce | | 18,195 | | | 1,116,081 |
| Korn Ferry | | 20,664 | | | 1,198,925 |
| †Mastech Digital 1 | | 28,532 | | | 423,985 |
| Resources Connection | | 88,215 | | | 1,796,940 |
| | | | | | 7,244,048 |
| ROAD & RAIL - 4.8% | | | | | |
| ArcBest | | 23,528 | | | 1,655,665 |
| Heartland Express | | 58,862 | | | 818,771 |
| Schneider National Cl. B | | 74,750 | | | 1,672,905 |
| Werner Enterprises | | 25,776 | | | 993,407 |
| | | | | | 5,140,748 |
| Total (Cost $17,233,230) | | | | | 19,900,538 |
| | | | | | |
| INFORMATION TECHNOLOGY – 23.4% | | | | | |
| COMMUNICATIONS EQUIPMENT - 1.0% | | | | | |
| †Aviat Networks 1 | | 44,393 | | | 1,111,601 |
| ELECTRONIC EQUIPMENT, INSTRUMENTS & COMPONENTS - 12.8% | | | |
| ePlus 1 | | 30,307 | | | 1,609,908 |
| Flex 1 | | 107,181 | | | 1,550,909 |
| Insight Enterprises 1 | | 12,707 | | | 1,096,360 |
| Jabil | | 30,975 | | | 1,586,230 |
| Kimball Electronics 1 | | 85,636 | | | 1,721,283 |
| PC Connection | | 25,315 | | | 1,115,126 |
| Sanmina Corporation 1 | | 42,340 | | | 1,724,508 |
| TD SYNNEX | | 17,966 | | | 1,636,703 |
| Vishay Intertechnology | | 90,904 | | | 1,619,909 |
| | | | | | 13,660,936 |
| IT SERVICES - 1.8% | | | | | |
| †Computer Task Group 1 | | 90,530 | | | 774,937 |
| IBEX 1 | | 67,414 | | | 1,137,274 |
| | | | | | 1,912,211 |
| SEMICONDUCTORS & SEMICONDUCTOR EQUIPMENT - 6.7% | | | |
| †Alpha & Omega Semiconductor 1 | | 25,300 | | | 843,502 |
| Amkor Technology | | 95,357 | | | 1,616,301 |
| Cohu 1 | | 53,509 | | | 1,484,875 |
| Kulicke & Soffa Industries | | 36,365 | | | 1,556,786 |
| MKS Instruments | | 7,180 | | | 736,883 |
| †Ultra Clean Holdings 1 | | 30,251 | | | 900,572 |
| | | | | | 7,138,919 |
| SOFTWARE - 1.1% | | | | | |
| †Xperi Holding Corporation | | 78,800 | | | 1,137,084 |
| Total (Cost $22,461,177) | | | | | 24,960,751 |
| | | | | | |
| REAL ESTATE – 1.5% | | | | | |
| REAL ESTATE MANAGEMENT & DEVELOPMENT - 1.5% | | | | | |
| Marcus & Millichap | | 21,689 | | | 802,276 |
| †RMR Group (The) Cl. A | | 28,284 | | | 801,851 |
| Total (Cost $1,595,856) | | | | | 1,604,127 |
| | | | | | |
| TOTAL COMMON STOCKS | | | | | |
| (Cost $97,690,570) | | | | | 103,390,155 |
| | | | | | |
| REPURCHASE AGREEMENT– 3.4% | | | | | |
| Fixed Income Clearing Corporation, 0.24% dated 6/30/22, due 7/1/22, maturity value $3,676,441 (collateralized by obligations of various U.S. Government Agencies, 0.125% due 4/15/27, valued at $3,750,042) |
| (Cost $3,676,417) | | | | $ | 3,676,417 |
| | | | | | |
| COLLATERAL RECEIVED FOR SECURITIES LOANED – 0.2% | | | | | |
| Money Market Funds | | | | | |
| Federated Government Obligations Fund - Institutional Shares (7 day yield-1.36%) | |
| (Cost $168,972) | | 168,972 | | | 168,972 |
| | | | | | |
| TOTAL INVESTMENTS – 100.3% | | | | | |
| (Cost $101,535,959) | | | | | 107,235,544 |
| | | | | | |
| LIABILITIES LESS CASH AND OTHER ASSETS – (0.3)% | | | | | (320,384) |
| | | | | | |
| NET ASSETS – 100.0% | | | | $ | 106,915,160 |
| 48 | The Royce Funds 2022 Semiannual Report to Shareholders | THE ACCOMPANYING NOTES ARE AN INTEGRAL PART OF THESE FINANCIAL STATEMENTS |
June 30, 2022 (unaudited)
Royce Smaller-Companies Growth Fund
Common Stocks – 96.0%
| | | SHARES | | | VALUE |
| | | | | | |
| COMMUNICATION SERVICES – 1.1% | | | | | |
| INTERACTIVE MEDIA & SERVICES - 1.1% | | | | | |
| Enthusiast Gaming Holdings 1 | | 999,100 | | $ | 1,979,261 |
| Total (Cost $1,163,337) | | | | | 1,979,261 |
| | | | | | |
| CONSUMER DISCRETIONARY – 10.5% | | | | | |
| HOTELS, RESTAURANTS & LEISURE - 3.0% | | | | | |
| Bragg Gaming Group 1 | | 227,000 | | | 1,047,530 |
| Papa John's International | | 27,000 | | | 2,255,040 |
| Texas Roadhouse | | 28,000 | | | 2,049,600 |
| | | | | | 5,352,170 |
| HOUSEHOLD DURABLES - 1.0% | | | | | |
| Lovesac Company (The) 1,3 | | 66,666 | | | 1,833,315 |
| INTERNET & DIRECT MARKETING RETAIL - 1.3% | | | | | |
| CarParts.com 1,3 | | 220,000 | | | 1,526,800 |
| †Xometry Cl. A 1,3 | | 27,000 | | | 916,110 |
| | | | | | 2,442,910 |
| LEISURE PRODUCTS - 1.4% | | | | | |
| Callaway Golf 1 | | 126,000 | | | 2,570,400 |
| MULTILINE RETAIL - 1.8% | | | | | |
| Ollies Bargain Outlet Holdings 1 | | 54,000 | | | 3,172,500 |
| SPECIALTY RETAIL - 2.0% | | | | | |
| Lithia Motors | | 13,000 | | | 3,572,530 |
| Total (Cost $19,747,334) | | | | | 18,943,825 |
| | | | | | |
| CONSUMER STAPLES – 5.7% | | | | | |
| BEVERAGES - 3.0% | | | | | |
| Celsius Holdings 1 | | 54,000 | | | 3,524,040 |
| MGP Ingredients | | 19,000 | | | 1,901,710 |
| | | | | | 5,425,750 |
| FOOD PRODUCTS - 1.9% | | | | | |
| Freshpet 1,3 | | 67,000 | | | 3,476,630 |
| HOUSEHOLD PRODUCTS - 0.8% | | | | | |
| Central Garden & Pet Cl. A 1 | | 34,000 | | | 1,360,340 |
| Total (Cost $11,252,510) | | | | | 10,262,720 |
| | | | | | |
| FINANCIALS – 1.9% | | | | | |
| BANKS - 1.5% | | | | | |
| Seacoast Banking Corporation of Florida | | 82,000 | | | 2,709,280 |
| CAPITAL MARKETS - 0.4% | | | | | |
| MarketAxess Holdings | | 3,000 | | | 768,030 |
| Total (Cost $2,358,944) | | | | | 3,477,310 |
| | | | | | |
| HEALTH CARE – 26.7% | | | | | |
| BIOTECHNOLOGY - 6.4% | | | | | |
| Avid Bioservices 1,3 | | 104,000 | | | 1,587,040 |
| BiomX 1,3 | | 328,655 | | | 239,918 |
| CareDx 1 | | 39,000 | | | 837,720 |
| †Halozyme Therapeutics 1 | | 96,000 | | | 4,224,000 |
| MeiraGTx Holdings 1 | | 157,000 | | | 1,188,490 |
| Oxford Biomedica 1 | | 224,000 | | | 1,237,946 |
| PureTech Health 1 | | 846,000 | | | 1,765,139 |
| Synlogic 1 | | 434,041 | | | 499,147 |
| | | | | | 11,579,400 |
| HEALTH CARE EQUIPMENT & SUPPLIES - 13.7% | | | | | |
| Alphatec Holdings 1 | | 279,000 | | | 1,824,660 |
| Axonics 1,3 | | 89,000 | | | 5,043,630 |
| CryoPort 1 | | 48,198 | | | 1,493,174 |
| CytoSorbents Corporation 1 | | 349,000 | | | 764,310 |
| InMode 1 | | 97,000 | | | 2,173,770 |
| †Lantheus Holdings 1 | | 51,000 | | | 3,367,530 |
| Profound Medical 1 | | 73,000 | | | 533,095 |
| SI-BONE 1 | | 82,000 | | | 1,082,400 |
| STAAR Surgical 1 | | 51,000 | | | 3,617,430 |
| TransMedics Group 1 | | 131,000 | | | 4,119,950 |
| ViewRay 1 | | 200,000 | | | 530,000 |
| | | | | | 24,549,949 |
| HEALTH CARE PROVIDERS & SERVICES - 1.4% | | | | | |
| Pennant Group 1 | | 95,083 | | | 1,218,013 |
| Progyny 1,3 | | 46,000 | | | 1,336,300 |
| | | | | | 2,554,313 |
| HEALTH CARE TECHNOLOGY - 3.5% | | | | | |
| Inspire Medical Systems 1 | | 27,488 | | | 5,021,233 |
| †OptimizeRx Corporation 1 | | 44,000 | | | 1,205,160 |
| | | | | | 6,226,393 |
| LIFE SCIENCES TOOLS & SERVICES - 0.8% | | | | | |
| †MaxCyte 1 | | 113,000 | | | 534,490 |
| West Pharmaceutical Services | | 3,000 | | | 907,110 |
| | | | | | 1,441,600 |
| PHARMACEUTICALS - 0.9% | | | | | |
| †Harmony Biosciences Holdings 1,3 | | 35,000 | | | 1,706,950 |
| Total (Cost $49,837,079) | | | | | 48,058,605 |
| | | | | | |
| INDUSTRIALS – 19.0% | | | | | |
| AEROSPACE & DEFENSE - 1.1% | | | | | |
| AeroVironment 1 | | 24,000 | | | 1,972,800 |
| COMMERCIAL SERVICES & SUPPLIES - 3.0% | | | | | |
| ACV Auctions Cl. A 1 | | 330,000 | | | 2,158,200 |
| VSE Corporation | | 88,000 | | | 3,307,040 |
| | | | | | 5,465,240 |
| CONSTRUCTION & ENGINEERING - 1.0% | | | | | |
| Ameresco Cl. A 1 | | 41,000 | | | 1,867,960 |
| ELECTRICAL EQUIPMENT - 2.0% | | | | | |
| American Superconductor 1 | | 226,349 | | | 1,172,488 |
| EnerSys | | 29,000 | | | 1,709,840 |
| Enovix Corporation 1,3 | | 80,000 | | | 712,800 |
| | | | | | 3,595,128 |
| MACHINERY - 4.3% | | | | | |
| ATS Automation Tooling Systems 1 | | 128,000 | | | 3,515,227 |
| Chart Industries 1,3 | | 25,000 | | | 4,184,500 |
| | | | | | 7,699,727 |
| PROFESSIONAL SERVICES - 2.9% | | | | | |
| ASGN 1 | | 35,000 | | | 3,158,750 |
| Atlas Technical Consultants Cl. A 1 | | 376,000 | | | 1,977,760 |
| | | | | | 5,136,510 |
| TRADING COMPANIES & DISTRIBUTORS - 4.7% | | | | | |
| Distribution Solutions Group 1 | | 163,000 | | | 8,376,570 |
| Total (Cost $33,126,421) | | | | | 34,113,935 |
| | | | | | |
| INFORMATION TECHNOLOGY – 27.8% | | | | | |
| COMMUNICATIONS EQUIPMENT - 2.9% | | | | | |
| †Clearfield 1 | | 62,000 | | | 3,840,900 |
| Genasys 1 | | 404,000 | | | 1,313,000 |
| | | | | | 5,153,900 |
| ELECTRONIC EQUIPMENT, INSTRUMENTS & COMPONENTS - 1.4% | | | |
| Iteris 1,3 | | 844,474 | | | 2,440,530 |
| IT SERVICES - 4.2% | | | | | |
| Cantaloupe 1 | | 453,996 | | | 2,542,377 |
| †DigitalOcean Holdings 1 | | 35,000 | | | 1,447,600 |
| †DLocal Cl. A 1,3 | | 102,000 | | | 2,677,500 |
| THE ACCOMPANYING NOTES ARE AN INTEGRAL PART OF THESE FINANCIAL STATEMENTS | The Royce Funds 2022 Semiannual Report to Shareholders | 49 |
| Schedules of Investments | June 30, 2022 (unaudited) |
Royce Smaller-Companies Growth Fund (continued)
| | | SHARES | | | VALUE |
| | | | | | |
| INFORMATION TECHNOLOGY (continued) | | | | | |
| IT SERVICES (continued) | | | | | |
| †Edgio 1 | | 361,000 | | $ | 833,910 |
| | | | | | 7,501,387 |
| SEMICONDUCTORS & SEMICONDUCTOR EQUIPMENT - 10.2% | | | |
| Ambarella 1 | | 50,000 | | | 3,273,000 |
| AXT 1 | | 216,400 | | | 1,268,104 |
| Canadian Solar 1,3 | | 53,000 | | | 1,650,420 |
| CyberOptics Corporation 1 | | 30,000 | | | 1,048,200 |
| Impinj 1 | | 92,555 | | | 5,430,202 |
| Onto Innovation 1 | | 23,000 | | | 1,604,020 |
| Silicon Laboratories 1,3 | | 29,000 | | | 4,066,380 |
| | | | | | 18,340,326 |
| SOFTWARE - 7.7% | | | | | |
| Agilysys 1 | | 40,000 | | | 1,890,800 |
| Descartes Systems Group (The) 1 | | 51,033 | | | 3,167,108 |
| Digital Turbine 1 | | 59,000 | | | 1,030,730 |
| Paylocity Holding Corporation 1 | | 7,786 | | | 1,358,034 |
| Ping Identity Holding Corp. 1 | | 154,000 | | | 2,793,560 |
| Sprout Social Cl. A 1 | | 49,000 | | | 2,845,430 |
| Workiva Cl. A 1 | | 13,000 | | | 857,870 |
| | | | | | 13,943,532 |
| TECHNOLOGY HARDWARE, STORAGE & PERIPHERALS - 1.4% | | | |
| Stratasys 1 | | 133,000 | | | 2,492,420 |
| Total (Cost $49,307,031) | | | | | 49,872,095 |
| | | | | | |
| MATERIALS – 2.7% | | | | | |
| CHEMICALS - 1.5% | | | | | |
| †Aspen Aerogels 1 | | 101,000 | | | 997,880 |
| †Bioceres Crop Solutions 1,3 | | 68,000 | | | 932,280 |
| NanoXplore 1 | | 289,000 | | | 738,665 |
| | | | | | 2,668,825 |
| METALS & MINING - 1.2% | | | | | |
| †AMG Advanced Metallurgical Group | | 34,000 | | | 876,506 |
| Core Lithium 1 | | 1,996,202 | | | 1,315,874 |
| | | | | | 2,192,380 |
| Total (Cost $5,895,386) | | | | | 4,861,205 |
| | | | | | |
| REAL ESTATE – 0.6% | | | | | |
| EQUITY REAL ESTATE INVESTMENT TRUSTS (REITS) - 0.6% | | | |
| Postal Realty Trust Cl. A | | 70,000 | | | 1,043,000 |
| Total (Cost $1,130,446) | | | | | 1,043,000 |
| | | | | | |
| TOTAL COMMON STOCKS | | | | | |
| (Cost $173,818,488) | | | | | 172,611,956 |
| | | | | | |
| REPURCHASE AGREEMENT– 4.2% | | | | | |
| Fixed Income Clearing Corporation, 0.24% dated 6/30/22, due 7/1/22, maturity value $7,569,652 (collateralized by obligations of various U.S. Government Agencies, 0.125% due 4/15/27, valued at $7,721,071) |
| (Cost $7,569,602) | | | | $ | 7,569,602 |
| | | | | | |
| COLLATERAL RECEIVED FOR SECURITIES LOANED – 1.2% | | | | | |
| Money Market Funds | | | | | |
| Federated Government Obligations Fund - Institutional Shares (7 day yield-1.36%) | | | | | |
| (Cost $2,127,650) | | 2,127,650 | | | 2,127,650 |
| | | | | | |
| TOTAL INVESTMENTS – 101.4% | | | | | |
| (Cost $183,515,740) | | | | | 182,309,208 |
| | | | |
| LIABILITIES LESS CASH AND OTHER ASSETS – (1.4)% | | | (2,505,549) |
| | | | | | |
| NET ASSETS – 100.0% | | | | $ | 179,803,659 |
ADR- American Depository Receipt
| 2 | At June 30, 2022, the Fund owned 5% or more of the Company's outstanding voting securities thereby making the Company an Affiliated Company as that term is defined in the Investment Company Act of 1940. See Notes to Financial Statements. |
| 3 | All or a portion of these securities were on loan as of June 30, 2022. |
| 4 | Securities for which market quotations are not readily available represent 0.1% and 0.0% of net assets for Royce Micro-Cap Fund and Royce Small-Cap Opportunity Fund. These securities have been valued at their fair value under procedures approved by the Fund's Board of Trustees. These securities are defined as Level 3 securities due to the use of significant unobservable inputs in the determination of fair value. See Notes to Financial Statements. |
| 5 | These securities are defined as Level 2 securities due to fair value being based on quoted prices for similar securities and/or due to the application of fair value factors. See Notes to Financial Statements. |
Securities of Royce International Premier Fund are categorized by the country of their headquarters.
Bold indicates a Fund’s 20 largest equity holdings in terms of June 30, 2022, market value.
| 50 | The Royce Funds 2022 Semiannual Report to Shareholders | THE ACCOMPANYING NOTES ARE AN INTEGRAL PART OF THESE FINANCIAL STATEMENTS |
| Statements of Assets and Liabilities | June 30, 2022 (unaudited) |
| | | Royce Dividend
Value Fund | | | Royce Global
Financial Services
Fund | | | Royce International
Premier Fund | | | Royce Micro-Cap
Fund | |
| ASSETS: | | | | | | | | | | | | |
| Investments at value1 | | | | | | | | | | | | | | | | |
| Non-Affiliated Companies | | $ | 53,856,948 | | | $ | 26,565,582 | | | $ | 791,508,577 | | | $ | 278,716,567 | |
| Affiliated Companies | | | – | | | | – | | | | 14,309,761 | | | | – | |
| Repurchase agreements (at cost and value) | | | 2,991,967 | | | | 745,598 | | | | 33,601,926 | | | | 10,105,370 | |
| Cash and foreign currency2 | | | 4,987 | | | | 9,460 | | | | 758,522 | | | | 25,317 | |
| Receivable for investments sold | | | – | | | | – | | | | 1,972,276 | | | | – | |
| Receivable for capital shares sold | | | 5,128 | | | | 1,018 | | | | 626,209 | | | | 43,932 | |
| Receivable for dividends and interest | | | 87,421 | | | | 76,180 | | | | 2,980,967 | | | | 34,877 | |
| Receivable for securities lending income | | | – | | | | – | | | | – | | | | 386 | |
| Prepaid expenses and other assets | | | 1,478 | | | | 789 | | | | 26,186 | | | | 8,507 | |
| Total Assets | | | 56,947,929 | | | | 27,398,627 | | | | 845,784,424 | | | | 288,934,956 | |
| LIABILITIES: | | | | | | | | | | | | | | | | |
| Payable for investments purchased | | | – | | | | – | | | | 3,565,240 | | | | 158,762 | |
| Payable for capital shares redeemed | | | 11,438 | | | | 3,663 | | | | 1,033,937 | | | | 595,310 | |
| Payable for investment advisory fees | | | 41,124 | | | | 23,490 | | | | 640,360 | | | | 249,420 | |
| Payable for trustees’ fees | | | 2,657 | | | | 1,329 | | | | 41,332 | | | | 13,757 | |
| Accrued expenses | | | 65,560 | | | | 64,343 | | | | 566,640 | | | | 197,566 | |
| Deferred capital gains tax | | | – | | | | 9,941 | | | | 23,147 | | | | – | |
| Total Liabilities | | | 120,779 | | | | 102,766 | | | | 5,870,656 | | | | 1,214,815 | |
| Net Assets | | $ | 56,827,150 | | | $ | 27,295,861 | | | $ | 839,913,768 | | | $ | 287,720,141 | |
| ANALYSIS OF NET ASSETS: | | | | | | | | | | | | | | | | |
| Paid-in capital | | $ | 27,394,609 | | | $ | 17,996,046 | | | $ | 921,109,723 | | | $ | 242,207,604 | |
| Total distributable earnings (loss) | | | 29,432,541 | | | | 9,299,815 | | | | (81,195,955 | ) | | | 45,512,537 | |
| Net Assets | | $ | 56,827,150 | | | $ | 27,295,861 | | | $ | 839,913,768 | | | $ | 287,720,141 | |
| Investment Class | | $ | 40,816,282 | | | | | | | $ | 301,903,304 | | | $ | 144,976,317 | |
| Service Class | | | 14,212,317 | | | $ | 19,955,983 | | | | 35,816,338 | | | | 132,124,973 | |
| Consultant Class | | | 1,066,798 | | | | | | | | 5,647,782 | | | | 10,618,851 | |
| Institutional Class | | | 731,753 | | | | 7,339,878 | | | | 496,546,344 | | | | | |
| SHARES OUTSTANDING (unlimited number of $.001 par value): | | | | | | | | | | | | | | | | |
| Investment Class | | | 8,109,097 | | | | | | | | 23,192,633 | | | | 15,009,025 | |
| Service Class | | | 2,713,052 | | | | 2,126,946 | | | | 2,300,261 | | | | 14,075,343 | |
| Consultant Class | | | 178,328 | | | | | | | | 344,055 | | | | 1,482,280 | |
| Institutional Class | | | 147,783 | | | | 598,923 | | | | 38,098,294 | | | | | |
| NET ASSET VALUES (Net Assets ÷ Shares Outstanding): | | | | | | | | | | | | | | | | |
| Investment Class3 | | | $5.03 | | | | | | | | $13.02 | | | | $9.66 | |
| Service Class3 | | | 5.24 | | | | $ 9.38 | | | | 15.57 | | | | 9.39 | |
| Consultant Class4 | | | 5.98 | | | | | | | | 16.42 | | | | 7.16 | |
| Institutional Class5 | | | 4.95 | | | | 12.26 | | | | 13.03 | | | | | |
| Investments at identified cost - Non-Affiliated Companies | | $ | 25,780,668 | | | $ | 17,485,497 | | | $ | 899,644,321 | | | $ | 250,688,770 | |
| Investments at identified cost - Affiliated Companies | | | – | | | | – | | | | 34,842,846 | | | | – | |
| Market value of loaned securities6 | | | – | | | | – | | | | – | | | | 3,331,107 | |
| 1 | See Notes to Financial Statements for information on non-cash collateral on loaned securities. |
| 2 | The cost of foreign currency is $6,868 for Royce Global Financial Services Fund, $756,083 for Royce International Premier Fund and $25,310 for Royce Micro-Cap Fund. |
| 3 | Offering and redemption price per share; shares held less than 30 days may be subject to a 1% redemption fee, or a 2% redemption fee (Royce International Premier Fund), payable to the Fund. |
| 4 | Offering and redemption price per share; shares held less than 365 days may be subject to a 1% contingent deferred sales charge, payable to Royce Fund Services, LLC. |
| 5 | Offering and redemption price per share. |
| 6 | Market value of loaned securities backed by non-cash collateral is as of prior business day. |
| THE ACCOMPANYING NOTES ARE AN INTEGRAL PART OF THESE FINANCIAL STATEMENTS | The Royce Funds 2022 Semiannual Report to Shareholders | 51 |
Statements of Assets and Liabilities
| | | Royce Pennsylvania
Mutual Fund | | | Royce Premier Fund | | | Royce Small-Cap
Opportunity Fund | | | Royce Small-Cap
Special Equity Fund | |
| ASSETS: | | | | | | | | | | | | |
| Investments at value (including collateral on loaned securities)1 | | | | | | | | | | | | | | | | |
| Non-Affiliated Companies | | $ | 1,572,276,335 | | | $ | 1,285,400,256 | | | $ | 1,232,892,782 | | | $ | 546,110,129 | |
| Affiliated Companies | | | – | | | | – | | | | 8,209,168 | | | | 95,025,405 | |
| Repurchase agreements (at cost and value) | | | 10,715,355 | | | | 20,505,187 | | | | 52,529,343 | | | | 155,841,086 | |
| Cash and foreign currency2 | | | 111,973 | | | | – | | | | – | | | | – | |
| Receivable for investments sold | | | 12,862,174 | | | | 570,613 | | | | 5,851,942 | | | | 761,820 | |
| Receivable for capital shares sold | | | 558,126 | | | | 781,343 | | | | 2,389,624 | | | | 1,955,679 | |
| Receivable for dividends and interest | | | 1,071,209 | | | | 1,230,641 | | | | 500,532 | | | | 665,609 | |
| Receivable for securities lending income | | | 3,258 | | | | – | | | | 7,231 | | | | – | |
| Prepaid expenses and other assets | | | 3,592,317 | | | | 35,924 | | | | 40,571 | | | | 21,575 | |
| Total Assets | | | 1,601,190,747 | | | | 1,308,523,964 | | | | 1,302,421,193 | | | | 800,381,303 | |
| LIABILITIES: | | | | | | | | | | | | | | | | |
| Payable for collateral on loaned securities | | | 5,589,377 | | | | – | | | | 3,656,275 | | | | – | |
| Payable for investments purchased | | | 7,756,190 | | | | – | | | | 3,758,065 | | | | 994,006 | |
| Payable for capital shares redeemed | | | 862,734 | | | | 662,268 | | | | 8,259,072 | | | | 2,430,613 | |
| Payable for investment advisory fees | | | 1,028,719 | | | | 1,101,779 | | | | 1,145,230 | | | | 675,502 | |
| Payable for trustees’ fees | | | 74,037 | | | | 61,121 | | | | 63,278 | | | | 36,954 | |
| Accrued expenses | | | 721,280 | | | | 476,719 | | | | 692,702 | | | | 335,978 | |
| Total Liabilities | | | 16,032,337 | | | | 2,301,887 | | | | 17,574,622 | | | | 4,473,053 | |
| Net Assets | | $ | 1,585,158,410 | | | $ | 1,306,222,077 | | | $ | 1,284,846,571 | | | $ | 795,908,250 | |
| ANALYSIS OF NET ASSETS: | | | | | | | | | | | | | | | | |
| Paid-in capital | | $ | 1,249,464,409 | | | $ | 804,193,907 | | | $ | 1,200,936,733 | | | $ | 627,599,764 | |
| Total distributable earnings (loss) | | | 335,694,001 | | | | 502,028,170 | | | | 83,909,838 | | | | 168,308,486 | |
| Net Assets | | $ | 1,585,158,410 | | | $ | 1,306,222,077 | | | $ | 1,284,846,571 | | | $ | 795,908,250 | |
| Investment Class | | $ | 1,204,326,616 | | | $ | 1,050,882,253 | | | $ | 946,838,075 | | | $ | 603,831,597 | |
| Service Class | | | 60,554,409 | | | | 27,071,161 | | | | 72,841,706 | | | | 43,587,326 | |
| Consultant Class | | | 183,660,454 | | | | 11,814,957 | | | | 11,016,505 | | | | 19,772,860 | |
| Institutional Class | | | 129,771,465 | | | | 210,278,103 | | | | 215,630,962 | | | | 128,716,467 | |
| R Class | | | 6,845,466 | | | | 6,175,603 | | | | 38,519,323 | | | | | |
| SHARES OUTSTANDING (unlimited number of $.001 par value): | | | | | | | | | | | | | | | | |
| Investment Class | | | 158,514,614 | | | | 100,306,407 | | | | 72,513,136 | | | | 36,286,331 | |
| Service Class | | | 8,011,308 | | | | 2,668,223 | | | | 6,103,609 | | | | 2,626,644 | |
| Consultant Class | | | 31,123,845 | | | | 1,469,899 | | | | 1,073,724 | | | | 1,313,216 | |
| Institutional Class | | | 17,014,160 | | | | 19,763,908 | | | | 16,068,831 | | | | 7,801,384 | |
| R Class | | | 976,084 | | | | 648,330 | | | | 3,351,264 | | | | | |
| NET ASSET VALUES (Net Assets ÷ Shares Outstanding): | | | | | | | | | | | | | | | | |
| Investment Class3 | | | $7.60 | | | | $10.48 | | | | $13.06 | | | | $16.64 | |
| Service Class3 | | | 7.56 | | | | 10.15 | | | | 11.93 | | | | 16.59 | |
| Consultant Class4 | | | 5.90 | | | | 8.04 | | | | 10.26 | | | | 15.06 | |
| Institutional Class5 | | | 7.63 | | | | 10.64 | | | | 13.42 | | | | 16.50 | |
| R Class5 | | | 7.01 | | | | 9.53 | | | | 11.49 | | | | | |
| Investments at identified cost - Non-Affiliated Companies | | $ | 1,315,194,668 | | | $ | 927,237,959 | | | $ | 1,235,435,529 | | | $ | 455,439,486 | |
| Investments at identified cost - Affiliated Companies | | | – | | | | – | | | | 12,766,270 | | | | 91,532,888 | |
| Market value of loaned securities6 | | | 27,094,834 | | | | – | | | | 14,717,596 | | | | – | |
| 1 | See Notes to Financial Statements for information on non-cash collateral on loaned securities. |
| 2 | The cost of foreign currency is $50,829 for Royce Pennsylvania Mutual Fund. |
| 3 | Offering and redemption price per share; shares held less than 30 days may be subject to a 1% redemption fee, payable to the Fund. |
| 4 | Offering and redemption price per share; shares held less than 365 days may be subject to a 1% contingent deferred sales charge, payable to Royce Fund Services, LLC. |
| 5 | Offering and redemption price per share. |
| 6 | Market value of loaned securities backed by non-cash collateral is as of prior business day. |
| 52 | The Royce Funds 2022 Semiannual Report to Shareholders | THE ACCOMPANYING NOTES ARE AN INTEGRAL PART OF THESE FINANCIAL STATEMENTS |
June 30, 2022 (unaudited)
| | | Royce Small-Cap
Total Return Fund | | | Royce Small-Cap
Value Fund | | | Royce Smaller-
Companies Growth
Fund | |
| ASSETS: | | | | | | | | | |
| Investments at value (including collateral on loaned securities)1 | | | | | | | | | | | | |
| Non-Affiliated Companies | | $ | 977,010,501 | | | $ | 103,559,127 | | | $ | 174,739,606 | |
| Affiliated Companies | | | 17,344,252 | | | | – | | | | – | |
| Repurchase agreements (at cost and value) | | | 9,816,517 | | | | 3,676,417 | | | | 7,569,602 | |
| Foreign currency2 | | | 79,119 | | | | – | | | | – | |
| Receivable for investments sold | | | 8,754,667 | | | | 158,437 | | | | 642,825 | |
| Receivable for capital shares sold | | | 387,669 | | | | 6,174 | | | | 48,216 | |
| Receivable for dividends and interest | | | 1,890,356 | | | | 62,969 | | | | 51 | |
| Receivable for securities lending income | | | 176,919 | | | | 80 | | | | 6,189 | |
| Prepaid expenses and other assets | | | 30,136 | | | | 2,726 | | | | 6,888 | |
| Total Assets | | | 1,015,490,136 | | | | 107,465,930 | | | | 183,013,377 | |
| LIABILITIES: | | | | | | | | | | | | |
| Payable for collateral on loaned securities | | | – | | | | 168,972 | | | | 2,127,650 | |
| Payable for investments purchased | | | 8,422,828 | | | | 80,404 | | | | 765,121 | |
| Payable for capital shares redeemed | | | 3,596,157 | | | | 101,128 | | | | 9,512 | |
| Payable for investment advisory fees | | | 856,947 | | | | 92,471 | | | | 152,052 | |
| Payable for trustees’ fees | | | 51,749 | | | | 4,787 | | | | 10,768 | |
| Accrued expenses | | | 613,093 | | | | 103,008 | | | | 144,615 | |
| Total Liabilities | | | 13,540,774 | | | | 550,770 | | | | 3,209,718 | |
| Net Assets | | $ | 1,001,949,362 | | | $ | 106,915,160 | | | $ | 179,803,659 | |
| ANALYSIS OF NET ASSETS: | | | | | | | | | | | | |
| Paid-in capital | | $ | 785,383,656 | | | $ | 93,849,941 | | | $ | 190,590,049 | |
| Total distributable earnings (loss) | | | 216,565,706 | | | | 13,065,219 | | | | (10,786,390 | ) |
| Net Assets | | $ | 1,001,949,362 | | | $ | 106,915,160 | | | $ | 179,803,659 | |
| Investment Class | | $ | 640,520,808 | | | $ | 34,084,355 | | | $ | 64,644,261 | |
| Service Class | | | 64,714,626 | | | | 63,353,924 | | | | 106,333,535 | |
| Consultant Class | | | 89,393,785 | | | | 3,560,917 | | | | 4,478,051 | |
| Institutional Class | | | 186,864,650 | | | | | | | | 4,347,812 | |
| R Class | | | 20,455,493 | | | | 5,915,964 | | | | | |
| SHARES OUTSTANDING (unlimited number of $.001 par value): | | | | | | | | | | | | |
| Investment Class | | | 84,885,003 | | | | 4,044,422 | | | | 11,571,278 | |
| Service Class | | | 8,290,017 | | | | 7,567,400 | | | | 19,716,936 | |
| Consultant Class | | | 11,338,890 | | | | 490,141 | | | | 993,522 | |
| Institutional Class | | | 25,232,679 | | | | | | | | 767,164 | |
| R Class | | | 2,584,839 | | | | 743,837 | | | | | |
| NET ASSET VALUES (Net Assets ÷ Shares Outstanding): | | | | | | | | | | | | |
| Investment Class3 | | | $7.55 | | | | $8.43 | | | | $5.59 | |
| Service Class3 | | | 7.81 | | | | 8.37 | | | | 5.39 | |
| Consultant Class4 | | | 7.88 | | | | 7.27 | | | | 4.51 | |
| Institutional Class5 | | | 7.41 | | | | | | | | 5.67 | |
| R Class5 | | | 7.91 | | | | 7.95 | | | | | |
| Investments at identified cost - Non-Affiliated Companies | | $ | 908,764,658 | | | $ | 97,859,542 | | | $ | 175,946,138 | |
| Investments at identified cost - Affiliated Companies | | | 29,063,461 | | | | – | | | | – | |
| Market value of loaned securities6 | | | – | | | | 165,874 | | | | 20,241,928 | |
| 1 | See Notes to Financial Statements for information on non-cash collateral on loaned securities. |
| 2 | The cost of foreign currency is $78,960 for Royce Small-Cap Total Return Fund. |
| 3 | Offering and redemption price per share; shares held less than 30 days may be subject to a 1% redemption fee, payable to the Fund. |
| 4 | Offering and redemption price per share; shares held less than 365 days may be subject to a 1% contingent deferred sales charge, payable to Royce Fund Services, LLC. |
| 5 | Offering and redemption price per share. |
| 6 | Market value of loaned securities backed by non-cash collateral is as of prior business day. |
| THE ACCOMPANYING NOTES ARE AN INTEGRAL PART OF THESE FINANCIAL STATEMENTS | The Royce Funds 2022 Semiannual Report to Shareholders | 53 |
Statements of Operations
| | | Royce Dividend
Value Fund | Royce Global
Financial Services
Fund | Royce International
Premier Fund | Royce Micro-Cap
Fund |
| INVESTMENT INCOME: | | | | | | | | | | | | | | | | |
| INCOME: | | | | | | | | | | | | | | | | |
| Dividends | | | | | | | | | | | | | | | | |
| Non-Affiliated Companies | | $ | 686,269 | | | $ | 433,206 | | | $ | 15,334,835 | | | $ | 1,249,656 | |
| Affiliated Companies | | | – | | | | – | | | | 440,705 | | | | – | |
| Foreign withholding tax | | | (26,171 | ) | | | (37,184 | ) | | | (1,594,308 | ) | | | (25,249 | ) |
| Interest | | | 511 | | | | 115 | | | | 6,399 | | | | 1,808 | |
| Securities lending | | | – | | | | – | | | | – | | | | 18,382 | |
| Total income | | | 660,609 | | | | 396,137 | | | | 14,187,631 | | | | 1,244,597 | |
| EXPENSES: | | | | | | | | | | | | | | | | |
| Investment advisory fees | | | 280,245 | | | | 162,840 | | | | 5,062,483 | | | | 1,711,129 | |
| Distribution fees | | | 26,968 | | | | 30,017 | | | | 89,580 | | | | 263,241 | |
| Shareholder servicing | | | 59,120 | | | | 25,862 | | | | 399,804 | | | | 241,058 | |
| Registration | | | 27,392 | | | | 15,766 | | | | 39,247 | | | | 25,400 | |
| Administrative and office facilities | | | 24,001 | | | | 17,112 | | | | 253,304 | | | | 90,159 | |
| Audit | | | 16,525 | | | | 16,315 | | | | 21,391 | | | | 17,771 | |
| Custody | | | 15,771 | | | | 18,467 | | | | 226,583 | | | | 23,606 | |
| Trustees’ fees | | | 4,600 | | | | 2,335 | | | | 73,434 | | | | 24,524 | |
| Shareholder reports | | | 3,779 | | | | 2,497 | | | | 46,766 | | | | 22,634 | |
| Legal | | | 1,595 | | | | 884 | | | | 32,278 | | | | 9,450 | |
| Other expenses | | | 4,139 | | | | 4,681 | | | | 38,116 | | | | 12,564 | |
| Total expenses | | | 464,135 | | | | 296,776 | | | | 6,282,986 | | | | 2,441,536 | |
| Compensating balance credits | | | (30 | ) | | | (12 | ) | | | (990 | ) | | | (184 | ) |
| Fees waived by investment adviser and distributor | | | – | | | | (3,602 | ) | | | (443,783 | ) | | | – | |
| Expenses reimbursed by investment adviser | | | (77,764 | ) | | | (50,530 | ) | | | (168,761 | ) | | | (48,995 | ) |
| Net expenses | | | 386,341 | | | | 242,632 | | | | 5,669,452 | | | | 2,392,357 | |
| Net investment income (loss) | | | 274,268 | | | | 153,505 | | | | 8,518,179 | | | | (1,147,760 | ) |
| REALIZED AND UNREALIZED GAIN (LOSS) ON INVESTMENTS AND FOREIGN CURRENCY: | |
| NET REALIZED GAIN (LOSS): | | | | | | | | | | | | | | | | |
| Investments in Non-Affiliated Companies | | | 1,533,392 | | | | 756,523 | | | | 23,248,782 | | | | 6,400,646 | |
| Investments in Affiliated Companies | | | – | | | | – | | | | (2,121,729 | ) | | | – | |
| Foreign currency transactions | | | (7,148 | ) | | | 1,993 | | | | (578,569 | ) | | | (521 | ) |
| NET CHANGE IN UNREALIZED APPRECIATION (DEPRECIATION): | | | | | | | | | | | | | | | | |
| Investments in Non-Affiliated Companies | | | (17,275,858 | ) | | | (8,971,349 | ) | | | (348,354,980 | ) | | | (120,585,662 | ) |
| Investments in Affiliated Companies | | | – | | | | – | | | | (11,017,320 | ) | | | – | |
| Other assets and liabilities denominated in foreign currency | | | (2,752 | ) | | | (5,342 | ) | | | (130,122 | ) | | | (44 | ) |
| Net realized and unrealized gain (loss) on investments and foreign currency | | | (15,752,366 | ) | | | (8,218,175 | ) | | | (338,953,938 | ) | | | (114,185,581 | ) |
| NET INCREASE (DECREASE) IN NET ASSETS FROM INVESTMENT OPERATIONS | | $ | (15,478,098 | ) | | $ | (8,064,670 | ) | | $ | (330,435,759 | ) | | $ | (115,333,341 | ) |
| 54 | The Royce Funds 2022 Semiannual Report to Shareholders | THE ACCOMPANYING NOTES ARE AN INTEGRAL PART OF THESE FINANCIAL STATEMENTS |
Six Months Ended June 30, 2022 (unaudited)
| | | Royce
Pennsylvania
Mutual Fund | Royce Premier
Fund | Royce Small-Cap
Opportunity Fund | Royce Small-Cap
Special Equity Fund |
| INVESTMENT INCOME: | | | | | | | | | | | | | | | | |
| INCOME: | | | | | | | | | | | | | | | | |
| Dividends | | | | | | | | | | | | | | | | |
| Non-Affiliated Companies | | $ | 10,768,391 | | | $ | 8,760,751 | | | $ | 8,827,009 | | | $ | 6,946,222 | |
| Affiliated Companies | | | – | | | | – | | | | – | | | | 1,848,936 | |
| Foreign withholding tax | | | (227,148 | ) | | | (114,509 | ) | | | – | | | | – | |
| Interest | | | 3,264 | | | | 3,394 | | | | 8,874 | | | | 25,925 | |
| Securities lending | | | 42,286 | | | | 964 | | | | 133,589 | | | | – | |
| Total income | | | 10,586,793 | | | | 8,650,600 | | | | 8,969,472 | | | | 8,821,083 | |
| EXPENSES: | | | | | | | | | | | | | | | | |
| Investment advisory fees | | | 6,966,739 | | | | 7,467,093 | | | | 7,918,071 | | | | 4,637,831 | |
| Distribution fees | | | 1,166,763 | | | | 123,829 | | | | 294,151 | | | | 174,080 | |
| Shareholder servicing | | | 714,772 | | | | 618,139 | | | | 909,644 | | | | 461,348 | |
| Registration | | | 47,987 | | | | 35,879 | | | | 62,101 | | | | 36,025 | |
| Administrative and office facilities | | | 436,873 | | | | 352,175 | | | | 404,355 | | | | 221,760 | |
| Audit | | | 24,897 | | | | 20,608 | | | | 22,284 | | | | 19,502 | |
| Custody | | | 97,699 | | | | 59,442 | | | | 85,721 | | | | 42,138 | |
| Trustees’ fees | | | 129,819 | | | | 105,684 | | | | 113,237 | | | | 65,782 | |
| Shareholder reports | | | 88,641 | | | | 69,694 | | | | 78,322 | | | | 46,444 | |
| Legal | | | 49,013 | | | | 38,414 | | | | 48,491 | | | | 24,170 | |
| Other expenses | | | 64,660 | | | | 55,211 | | | | 52,182 | | | | 33,310 | |
| Total expenses | | | 9,787,863 | | | | 8,946,168 | | | | 9,988,559 | | | | 5,762,390 | |
| Compensating balance credits | | | (862 | ) | | | (335 | ) | | | (539 | ) | | | (377 | ) |
| Fees waived by distributor | | | (3,517 | ) | | | – | | | | – | | | | – | |
| Expenses reimbursed by investment adviser | | | (1,785 | ) | | | (17,230 | ) | | | (29,465 | ) | | | (20,207 | ) |
| Net expenses | | | 9,781,699 | | | | 8,928,603 | | | | 9,958,555 | | | | 5,741,806 | |
| Net investment income (loss) | | | 805,094 | | | | (278,003 | ) | | | (989,083 | ) | | | 3,079,277 | |
| REALIZED AND UNREALIZED GAIN (LOSS) ON INVESTMENTS AND FOREIGN CURRENCY: | |
| NET REALIZED GAIN (LOSS): | | | | | | | | | | | | | | | | |
| Investments in Non-Affiliated Companies | | | 38,387,044 | | | | 123,950,833 | | | | 40,724,605 | | | | 47,884,556 | |
| Investments in Affiliated Companies | | | – | | | | – | | | | 2,355,413 | | | | (24,041,543 | ) |
| Foreign currency transactions | | | 23,312 | | | | 791 | | | | 299 | | | | – | |
| NET CHANGE IN UNREALIZED APPRECIATION (DEPRECIATION): | | | | | | | | | | | | | | | | |
| Investments in Non-Affiliated Companies | | | (487,429,401 | ) | | | (448,172,463 | ) | | | (423,010,829 | ) | | | (140,195,806 | ) |
| Investments in Affiliated Companies | | | – | | | | – | | | | (2,702,477 | ) | | | (12,376,800 | ) |
| Other assets and liabilities denominated in foreign currency | | | (290 | ) | | | – | | | | – | | | | – | |
| Net realized and unrealized gain (loss) on investments and foreign currency | | | (449,019,335 | ) | | | (324,220,839 | ) | | | (382,632,989 | ) | | | (128,729,593 | ) |
| NET INCREASE (DECREASE) IN NET ASSETS FROM INVESTMENT OPERATIONS | | $ | (448,214,241 | ) | | $ | (324,498,842 | ) | | $ | (383,622,072 | ) | | $ | (125,650,316 | ) |
| THE ACCOMPANYING NOTES ARE AN INTEGRAL PART OF THESE FINANCIAL STATEMENTS | The Royce Funds 2022 Semiannual Report to Shareholders | 55 |
| Statements of Operations | Six Months Ended June 30, 2022 (unaudited) |
| | | Royce Small-Cap
Total Return Fund | | Royce Small-Cap
Value Fund | | Royce Smaller-
Companies Growth
Fund |
| INVESTMENT INCOME: | | | | | | | | | | | | |
| INCOME: | | | | | | | | | | | | |
| Dividends | | $ | 12,625,102 | | | $ | 1,039,045 | | | $ | 175,566 | |
| Foreign withholding tax | | | (101,722 | ) | | | – | | | | (1,616 | ) |
| Interest | | | 2,023 | | | | 523 | | | | 1,331 | |
| Securities lending | | | 213,976 | | | | 396 | | | | 118,663 | |
| Total income | | | 12,739,379 | | | | 1,039,964 | | | | 293,944 | |
| EXPENSES: | | | | | | | | | | | | |
| Investment advisory fees | | | 6,046,671 | | | | 608,218 | | | | 1,102,763 | |
| Distribution fees | | | 658,615 | | | | 129,510 | | | | 190,847 | |
| Shareholder servicing | | | 592,659 | | | | 105,045 | | | | 169,791 | |
| Registration | | | 42,509 | | | | 26,256 | | | | 31,499 | |
| Administrative and office facilities | | | 305,163 | | | | 36,553 | | | | 71,580 | |
| Audit | | | 22,822 | | | | 15,095 | | | | 15,763 | |
| Custody | | | 61,919 | | | | 18,127 | | | | 16,907 | |
| Trustees’ fees | | | 89,771 | | | | 8,442 | | | | 17,548 | |
| Shareholder reports | | | 102,447 | | | | 8,621 | | | | 14,823 | |
| Legal | | | 33,523 | | | | 3,062 | | | | 7,311 | |
| Other expenses | | | 49,637 | | | | 5,610 | | | | 10,887 | |
| Total expenses | | | 8,005,736 | | | | 964,539 | | | | 1,649,719 | |
| Compensating balance credits | | | (298 | ) | | | (55 | ) | | | (100 | ) |
| Expenses reimbursed by investment adviser | | | (24,624 | ) | | | (62,343 | ) | | | (93,293 | ) |
| Net expenses | | | 7,980,814 | | | | 902,141 | | | | 1,556,326 | |
| Net investment income (loss) | | | 4,758,565 | | | | 137,823 | | | | (1,262,382 | ) |
| REALIZED AND UNREALIZED GAIN (LOSS) ON INVESTMENTS AND FOREIGN CURRENCY: | |
| NET REALIZED GAIN (LOSS): | | | | | | | | | | | | |
| Investments in Non-Affiliated Companies | | | 109,293,345 | | | | 4,732,656 | | | | (12,268,390 | ) |
| Investments in Affiliated Companies | | | (6,225,805 | ) | | | – | | | | – | |
| Foreign currency transactions | | | 233,109 | | | | – | | | | 9,320 | |
| NET CHANGE IN UNREALIZED APPRECIATION (DEPRECIATION): | | | | | | | | | | | | |
| Investments in Non-Affiliated Companies | | | (287,871,026 | ) | | | (31,270,748 | ) | | | (92,285,373 | ) |
| Investments in Affiliated Companies | | | 879,139 | | | | – | | | | – | |
| Other assets and liabilities denominated in foreign currency | | | (8,040 | ) | | | – | | | | – | |
| Net realized and unrealized gain (loss) on investments and foreign currency | | | (183,699,278 | ) | | | (26,538,092 | ) | | | (104,544,443 | ) |
| NET INCREASE (DECREASE) IN NET ASSETS FROM INVESTMENT OPERATIONS | | $ | (178,940,713 | ) | | $ | (26,400,269 | ) | | $ | (105,806,825 | ) |
| 56 | The Royce Funds 2022 Semiannual Report to Shareholders | THE ACCOMPANYING NOTES ARE AN INTEGRAL PART OF THESE FINANCIAL STATEMENTS |
Statements of Changes in Net Assets
| | | Royce Dividend Value Fund | | | Royce Global Financial
Services Fund | | | Royce International Premier Fund | |
| | | Six Months Ended 6/30/22 (unaudited) | | | Year Ended 12/31/21 | | | Six Months Ended
6/30/22 (unaudited) | | | Year Ended 12/31/21 | | | Six Months Ended
6/30/22 (unaudited) | | | Year Ended 12/31/21 | |
| INVESTMENT OPERATIONS: | | | | | | | | | | | | | | | | | | | | | | | | |
| Net investment income (loss) | | $ | 274,268 | | | $ | 529,141 | | | $ | 153,505 | | | $ | 744,041 | | | $ | 8,518,179 | | | $ | 4,563,554 | |
| Net realized gain (loss) on investments and foreign currency | | | 1,526,244 | | | | 7,611,984 | | | | 758,516 | | | | 1,050,527 | | | | 20,548,484 | | | | 112,803,814 | |
| Net change in unrealized appreciation (depreciation) on investments and foreign currency | | | (17,278,610 | ) | | | 5,963,833 | | | | (8,976,691 | ) | | | 5,109,397 | | | | (359,502,422 | ) | | | (44,640,890 | ) |
| Net increase (decrease) in net assets from investment operations | | | (15,478,098 | ) | | | 14,104,958 | | | | (8,064,670 | ) | | | 6,903,965 | | | | (330,435,759 | ) | | | 72,726,478 | |
| DISTRIBUTIONS: | | | | | | | | | | | | | | | | | | | | | | | | |
| Total distributable earnings | | | | | | | | | | | | | | | | | | | | | | | | |
| Investment Class | | | (204,635 | ) | | | (7,025,655 | ) | | | | | | | | | | | – | | | | (22,789,281 | ) |
| Service Class | | | (27,098 | ) | | | (2,453,636 | ) | | | – | | | | (1,668,236 | ) | | | – | | | | (2,605,039 | ) |
| Consultant Class | | | – | | | | (163,702 | ) | | | | | | | | | | | – | | | | (367,166 | ) |
| Institutional Class | | | (3,667 | ) | | | (122,395 | ) | | | – | | | | (490,070 | ) | | | – | | | | (34,239,175 | ) |
| Total distributions | | | (235,400 | ) | | | (9,765,388 | ) | | | – | | | | (2,158,306 | ) | | | – | | | | (60,000,661 | ) |
| CAPITAL SHARE TRANSACTIONS: | | | | | | | | | | | | | | | | | | | | | | | | |
| Net capital share transactions | | | | | | | | | | | | | | | | | | | | | | | | |
| Investment Class | | | (2,397,853 | ) | | | (2,013,993 | ) | | | | | | | | | | | (53,662,222 | ) | | | (12,468,633 | ) |
| Service Class | | | (1,332,715 | ) | | | (1,344,558 | ) | | | (2,664,991 | ) | | | (1,005,797 | ) | | | (8,497,345 | ) | | | (11,025,900 | ) |
| Consultant Class | | | (6,990 | ) | | | 69,045 | | | | | | | | | | | | (517,325 | ) | | | (896,223 | ) |
| Institutional Class | | | (21,661 | ) | | | 137,821 | | | | (257,720 | ) | | | 876,025 | | | | (19,931,317 | ) | | | 132,006,580 | |
| Shareholder redemption fees | | | | | | | | | | | | | | | | | | | | | | | | |
| Investment Class | | | 6 | | | | 154 | | | | | | | | | | | | 15,873 | | | | 7,525 | |
| Service Class | | | – | | | | 4 | | | | 2 | | | | 2,234 | | | | 8 | | | | 1,675 | |
| Net increase (decrease) in net assets from capital share transactions | | | (3,759,213 | ) | | | (3,151,527 | ) | | | (2,922,709 | ) | | | (127,538 | ) | | | (82,592,328 | ) | | | 107,625,024 | |
| Net Increase (Decrease) In Net Assets | | | (19,472,711 | ) | | | 1,188,043 | | | | (10,987,379 | ) | | | 4,618,121 | | | | (413,028,087 | ) | | | 120,350,841 | |
| NET ASSETS: | | | | | | | | | | | | | | | | | | | | | | | | |
| Beginning of period | | | 76,299,861 | | | | 75,111,818 | | | | 38,283,240 | | | | 33,665,119 | | | | 1,252,941,855 | | | | 1,132,591,014 | |
| End of period | | $ | 56,827,150 | | | $ | 76,299,861 | | | $ | 27,295,861 | | | $ | 38,283,240 | | | $ | 839,913,768 | | | $ | 1,252,941,855 | |
| THE ACCOMPANYING NOTES ARE AN INTEGRAL PART OF THESE FINANCIAL STATEMENTS | The Royce Funds 2022 Semiannual Report to Shareholders | 57 |
Statements of Changes in Net Assets
| | | Royce Micro-Cap Fund | | | Royce Pennsylvania Mutual Fund | | | Royce Premier Fund | |
| | | Six Months Ended 6/30/22 (unaudited) | | | Year Ended 12/31/21 | | | Six Months Ended
6/30/22 (unaudited) | | | Year Ended 12/31/21 | | | Six Months Ended
6/30/22 (unaudited) | | | Year Ended 12/31/21 | |
| INVESTMENT OPERATIONS: | | | | | | | | | | | | | | | | | | | | | | | | |
| Net investment income (loss) | | $ | (1,147,760 | ) | | $ | (2,524,821 | ) | | $ | 805,094 | | | $ | 374,058 | | | $ | (278,003 | ) | | $ | (3,517,815 | ) |
| Net realized gain (loss) on investments and foreign currency | | | 6,400,125 | | | | 90,610,373 | | | | 38,410,356 | | | | 514,781,507 | | | | 123,951,624 | | | | 310,335,119 | |
| Net change in unrealized appreciation (depreciation) on investments and foreign currency | | | (120,585,706 | ) | | | 16,728,861 | | | | (487,429,691 | ) | | | (102,219,678 | ) | | | (448,172,463 | ) | | | (36,690,666 | ) |
| Net increase (decrease) in net assets from investment operations | | | (115,333,341 | ) | | | 104,814,413 | | | | (448,214,241 | ) | | | 412,935,887 | | | | (324,498,842 | ) | | | 270,126,638 | |
| DISTRIBUTIONS: | | | | | | | | | | | | | | | | | | | | | | | | |
| Total distributable earnings | | | | | | | | | | | | | | | | | | | | | | | | |
| Investment Class | | | – | | | | (40,188,397 | ) | | | – | | | | (359,795,213 | ) | | | – | | | | (254,117,355 | ) |
| Service Class | | | – | | | | (37,503,482 | ) | | | – | | | | (18,850,717 | ) | | | – | | | | (6,510,568 | ) |
| Consultant Class | | | – | | | | (3,014,349 | ) | | | – | | | | (55,761,614 | ) | | | – | | | | (2,839,443 | ) |
| Institutional Class | | | | | | | | | | | – | | | | (43,586,641 | ) | | | – | | | | (48,578,890 | ) |
| R Class | | | | | | | | | | | – | | | | (2,135,655 | ) | | | – | | | | (1,430,819 | ) |
| Total distributions | | | – | | | | (80,706,228 | ) | | | – | | | | (480,129,840 | ) | | | – | | | | (313,477,075 | ) |
| CAPITAL SHARE TRANSACTIONS: | | | | | | | | | | | | | | | | | | | | | | | | |
| Net capital share transactions | | | | | | | | | | | | | | | | | | | | | | | | |
| Investment Class | | | (6,917,834 | ) | | | 23,749,676 | | | | (67,033,335 | ) | | | 229,480,577 | | | | (89,107,065 | ) | | | 20,274,064 | |
| Service Class | | | (11,154,579 | ) | | | 16,625,148 | | | | (6,227,959 | ) | | | 5,763,904 | | | | (2,634,622 | ) | | | 8,433,761 | |
| Consultant Class | | | (774,810 | ) | | | 765,475 | | | | (13,452,844 | ) | | | 19,154,129 | | | | (1,166,033 | ) | | | 895,780 | |
| Institutional Class | | | | | | | | | | | (28,057,157 | ) | | | 43,861,946 | | | | (11,797,543 | ) | | | 14,733,388 | |
| R Class | | | | | | | | | | | (676,581 | ) | | | 1,818,834 | | | | (351,398 | ) | | | (1,206,906 | ) |
| Shareholder redemption fees | | | | | | | | | | | | | | | | | | | | | | | | |
| Investment Class | | | 2,079 | | | | 851 | | | | 397 | | | | 1,394 | | | | 512 | | | | 797 | |
| Service Class | | | 586 | | | | 39 | | | | 37 | | | | 11,839 | | | | – | | | | 2 | |
| Net increase (decrease) in net assets from capital share transactions | | | (18,844,558 | ) | | | 41,141,189 | | | | (115,447,442 | ) | | | 300,092,623 | | | | (105,056,149 | ) | | | 43,130,886 | |
| Net Increase (Decrease) In Net Assets | | | (134,177,899 | ) | | | 65,249,374 | | | | (563,661,683 | ) | | | 232,898,670 | | | | (429,554,991 | ) | | | (219,551 | ) |
| NET ASSETS: | | | | | | | | | | | | | | | | | | | | | | | | |
| Beginning of period | | | 421,898,040 | | | | 356,648,666 | | | | 2,148,820,093 | | | | 1,915,921,423 | | | | 1,735,777,068 | | | | 1,735,996,619 | |
| End of period | | $ | 287,720,141 | | | $ | 421,898,040 | | | $ | 1,585,158,410 | | | $ | 2,148,820,093 | | | $ | 1,306,222,077 | | | $ | 1,735,777,068 | |
| 58 | The Royce Funds 2022 Semiannual Report to Shareholders | THE ACCOMPANYING NOTES ARE AN INTEGRAL PART OF THESE FINANCIAL STATEMENTS |
| | | | Royce Small-Cap Opportunity Fund | | | | Royce Small-Cap Special
Equity Fund | | | | Royce Small-Cap Total Return Fund | |
| | | Six Months Ended
6/30/22 (unaudited) | | | Year Ended 12/31/21 | | | Six Months Ended
6/30/22 (unaudited) | | | Year Ended 12/31/21 | | | Six Months Ended
6/30/22 (unaudited) | | | Year Ended 12/31/21 | |
| INVESTMENT OPERATIONS: | | | | | | | | | | | | | | | | | | | | | | | | |
| Net investment income (loss) | | $ | (989,083 | ) | | $ | (6,255,416 | ) | | $ | 3,079,277 | | | $ | 8,728,848 | | | $ | 4,758,565 | | | $ | 15,178,871 | |
| Net realized gain (loss) on investments and foreign currency | | | 43,080,317 | | | | 410,541,948 | | | | 23,843,013 | | | | 180,557,276 | | | | 103,300,649 | | | | 394,147,843 | |
| Net change in unrealized appreciation (depreciation)on investments and foreign currency | | | (425,713,306 | ) | | | 28,335,835 | | | | (152,572,606 | ) | | | 23,728,401 | | | | (286,999,927 | ) | | | (75,267,763 | ) |
| Net increase (decrease) in net assets from investment operations | | | (383,622,072 | ) | | | 432,622,367 | | | | (125,650,316 | ) | | | 213,014,525 | | | | (178,940,713 | ) | | | 334,058,951 | |
| DISTRIBUTIONS: | | | | | | | | | | | | | | | | | | | | | | | | |
| Total distributable earnings | | | | | | | | | | | | | | | | | | | | | | | | |
| Investment Class | | | – | | | | (253,497,536 | ) | | | – | | | | (110,703,898 | ) | | | (3,028,099 | ) | | | (260,605,655 | ) |
| Service Class | | | – | | | | (20,814,959 | ) | | | – | | | | (8,484,724 | ) | | | (167,268 | ) | | | (19,720,772 | ) |
| Consultant Class | | | – | | | | (2,744,573 | ) | | | – | | | | (3,392,907 | ) | | | – | | | | (28,195,237 | ) |
| Institutional Class | | | – | | | | (69,978,355 | ) | | | – | | | | (34,779,856 | ) | | | (991,627 | ) | | | (70,461,595 | ) |
| R Class | | | – | | | | (9,575,942 | ) | | | | | | | | | | | – | | | | (6,650,410 | ) |
| Total distributions | | | – | | | | (356,611,365 | ) | | | – | | | | (157,361,385 | ) | | | (4,186,994 | ) | | | (385,633,669 | ) |
| CAPITAL SHARE TRANSACTIONS: | | | | | | | | | | | | | | | | | | | | | | | | |
| Net capital share transactions | | | | | | | | | | | | | | | | | | | | | | | | |
| Investment Class | | | (101,315,572 | ) | | | 525,739,965 | | | | (58,556,236 | ) | | | 9,907,666 | | | | (257,772,151 | ) | | | 154,834,034 | |
| Service Class | | | (14,348,774 | ) | | | (41,632,774 | ) | | | (7,147,100 | ) | | | 9,185,477 | | | | (5,018,238 | ) | | | 13,568,408 | |
| Consultant Class | | | (611,780 | ) | | | 238,523 | | | | (2,114,344 | ) | | | 5,591,804 | | | | (7,995,302 | ) | | | 4,839,213 | |
| Institutional Class | | | (13,411,498 | ) | | | (83,562,703 | ) | | | (87,578,018 | ) | | | 33,619,039 | | | | (57,041,693 | ) | | | 85,362,325 | |
| R Class | | | (1,721,115 | ) | | | 14,012,071 | | | | | | | | | | | | (3,103,783 | ) | | | (3,336,971 | ) |
| Shareholder redemption fees | | | | | | | | | | | | | | | | | | | | | | | | |
| Investment Class | | | 16,527 | | | | 32,624 | | | | 331 | | | | 3,575 | | | | 43 | | | | 2,371 | |
| Service Class | | | 2,426 | | | | 25,893 | | | | 214 | | | | 3,095 | | | | 1 | | | | 2,104 | |
| Net increase (decrease) in net assets from capital share transactions | | | (131,389,786 | ) | | | 414,853,599 | | | | (155,395,153 | ) | | | 58,310,656 | | | | (330,931,123 | ) | | | 255,271,484 | |
| Net Increase (Decrease) In Net Assets | | | (515,011,858 | ) | | | 490,864,601 | | | | (281,045,469 | ) | | | 113,963,796 | | | | (514,058,830 | ) | | | 203,696,766 | |
| NET ASSETS: | | | | | | | | | | | | | | | | | | | | | | | | |
| Beginning of period | | | 1,799,858,429 | | | | 1,308,993,828 | | | | 1,076,953,719 | | | | 962,989,923 | | | | 1,516,008,192 | | | | 1,312,311,426 | |
| End of period | | $ | 1,284,846,571 | | | $ | 1,799,858,429 | | | $ | 795,908,250 | | | $ | 1,076,953,719 | | | $ | 1,001,949,362 | | | $ | 1,516,008,192 | |
| THE ACCOMPANYING NOTES ARE AN INTEGRAL PART OF THESE FINANCIAL STATEMENTS | The Royce Funds 2022 Semiannual Report to Shareholders | 59 |
Statements of Changes in Net Assets
| | | Royce Small-Cap Value Fund | | | Royce Smaller-Companies
Growth Fund | |
| | | Six Months Ended
6/30/22 (unaudited) | | | Year Ended 12/31/21 | | | Six Months Ended
6/30/22 (unaudited) | | | Year Ended 12/31/21 | |
| INVESTMENT OPERATIONS: | | | | | | | | | | | | | | | | |
| Net investment income (loss) | | $ | 137,823 | | | $ | (57,611 | ) | | $ | (1,262,382 | ) | | $ | (3,790,013 | ) |
| Net realized gain (loss) on investments and foreign currency | | | 4,732,656 | | | | 26,822,412 | | | | (12,259,070 | ) | | | 63,175,041 | |
| Net change in unrealized appreciation (depreciation) on investments and foreign currency | | | (31,270,748 | ) | | | 6,630,576 | | | | (92,285,373 | ) | | | (33,250,563 | ) |
| Net increase (decrease) in net assets from investment operations | | | (26,400,269 | ) | | | 33,395,377 | | | | (105,806,825 | ) | | | 26,134,465 | |
| DISTRIBUTIONS: | | | | | | | | | | | | | | | | |
| Total distributable earnings | | | | | | | | | | | | | | | | |
| Investment Class | | | – | | | | (2,477,475 | ) | | | – | | | | (27,701,937 | ) |
| Service Class | | | – | | | | (4,508,382 | ) | | | – | | | | (46,351,836 | ) |
| Consultant Class | | | – | | | | (272,817 | ) | | | – | | | | (1,990,024 | ) |
| Institutional Class | | | | | | | | | | | – | | | | (1,864,715 | ) |
| R Class | | | – | | | | (466,939 | ) | | | | | | | | |
| Total distributions | | | – | | | | (7,725,613 | ) | | | – | | | | (77,908,512 | ) |
| CAPITAL SHARE TRANSACTIONS: | | | | | | | | | | | | | | | | |
| Net capital share transactions | | | | | | | | | | | | | | | | |
| Investment Class | | | (2,154,887 | ) | | | 2,304,788 | | | | (3,682,078 | ) | | | 11,179,225 | |
| Service Class | | | (2,995,845 | ) | | | (9,385,293 | ) | | | (9,448,263 | ) | | | 28,379,873 | |
| Consultant Class | | | (686,975 | ) | | | 605,718 | | | | (413,521 | ) | | | 827,458 | |
| Institutional Class | | | | | | | | | | | (540,540 | ) | | | 3,093,038 | |
| R Class | | | (669,793 | ) | | | (438,074 | ) | | | | | | | | |
| Shareholder redemption fees | | | | | | | | | | | | | | | | |
| Investment Class | | | 185 | | | | 103 | | | | 323 | | | | 1,340 | |
| Service Class | | | 1 | | | | 220 | | | | 426 | | | | 2,633 | |
| Net increase (decrease) in net assets from capital share transactions | | | (6,507,314 | ) | | | (6,912,538 | ) | | | (14,083,653 | ) | | | 43,483,567 | |
| Net Increase (Decrease) In Net Assets | | | (32,907,583 | ) | | | 18,757,226 | | | | (119,890,478 | ) | | | (8,290,480 | ) |
| NET ASSETS: | | | | | | | | | | | | | | | | |
| Beginning of period | | | 139,822,743 | | | | 121,065,517 | | | | 299,694,137 | | | | 307,984,617 | |
| End of period | | $ | 106,915,160 | | | $ | 139,822,743 | | | $ | 179,803,659 | | | $ | 299,694,137 | |
| 60 | The Royce Funds 2022 Semiannual Report to Shareholders | THE ACCOMPANYING NOTES ARE AN INTEGRAL PART OF THESE FINANCIAL STATEMENTS |
Financial Highlights
This table is presented to show selected data for a share outstanding throughout each year or other indicated period and to assist shareholders in evaluating a Fund’s performance for the periods presented. Per share amounts have been determined on the basis of the weighted average number of shares outstanding during the period.
| | | | | | | | | | | | | | | | | | | | | | | Ratio of Expenses to Average Net Assets | | | | | | |
| | | Net Asset
Value,
Beginning of
Period | | Net
Investment
Income (Loss) | | Net Realized and
Unrealized Gain (Loss)
on Investments and
Foreign Currency | | Total from
Investment
Operations | | Distributions
from Net
Investment
Income | | Distributions
from Net
Realized Gain on
Investments and
Foreign Currency | | Total
Distributions | | Net Asset Value,
End of Period | | Total Return | Net Assets,
End of Period (in thousands) | | Prior to Fee
Waivers, Expense
Reimbursements
and Balance Credits | | Prior to Fee
Waivers and
Expense
Reimbursements | | Net of Fee
Waivers and
Expense
Reimbursements | | Ratio of Net
Investment
Income (Loss) to
Average Net
Assets | | | Portfolio
Turnover
Rate | |
| Royce Dividend Value Fund–Investment Class | | |
| 2022† | | $ | 6.40 | | $ | 0.03 | | $ | (1.37 | ) | $ | (1.34 | ) | $ | (0.03 | ) | $ | – | | $ | (0.03) | | $ | 5.03 | | | (21.03 | )%1 | $ | 40,816 | | | 1.25 | %2 | | 1.25 | %2 | | 1.09 | %2 | | 0.91 | %2 | | 0 | % |
| 2021 | | | 6.11 | | | 0.05 | | | 1.17 | | | 1.22 | | | (0.06 | ) | | (0.87 | ) | | (0.93) | | | 6.40 | | | 20.47 | | | 54,466 | | | 1.21 | | | 1.21 | | | 1.09 | | | 0.76 | | | 0 | |
| 2020 | | | 6.21 | | | 0.07 | | | 0.20 | | | 0.27 | | | (0.11 | ) | | (0.26 | ) | | (0.37) | | | 6.11 | | | 4.57 | | | 53,421 | | | 1.26 | | | 1.26 | | | 1.09 | | | 1.27 | | | 4 | |
| 2019 | | | 5.56 | | | 0.09 | | | 1.58 | | | 1.67 | | | (0.10 | ) | | (0.92 | ) | | (1.02) | | | 6.21 | | | 30.34 | | | 76,273 | | | 1.21 | | | 1.20 | | | 1.09 | | | 1.37 | | | 8 | |
| 2018 | | | 7.56 | | | 0.10 | | | (1.27 | ) | | (1.17 | ) | | (0.10 | ) | | (0.73 | ) | | (0.83) | | | 5.56 | | | (16.06 | ) | | 88,036 | | | 1.13 | | | 1.13 | | | 1.04 | | | 1.29 | | | 13 | |
| 2017 | | | 7.18 | | | 0.10 | | | 1.43 | | | 1.53 | | | (0.13 | ) | | (1.02 | ) | | (1.15) | | | 7.56 | | | 21.91 | | | 121,209 | | | 1.13 | | | 1.13 | | | 1.06 | | | 1.24 | | | 16 | |
| Royce Dividend Value Fund–Service Class | | |
| 2022† | | $ | 6.65 | | $ | 0.02 | | $ | (1.42 | ) | $ | (1.40 | ) | $ | (0.01 | ) | $ | – | | $ | (0.01) | | $ | 5.24 | | | (21.05 | )%1 | $ | 14,212 | | | 1.60 | %2 | | 1.60 | %2 | | 1.34 | %2 | | 0.66 | %2 | | 0 | % |
| 2021 | | | 6.34 | | | 0.04 | | | 1.21 | | | 1.25 | | | (0.04 | ) | | (0.90 | ) | | (0.94) | | | 6.65 | | | 20.11 | | | 19,518 | | | 1.54 | | | 1.54 | | | 1.34 | | | 0.51 | | | 0 | |
| 2020 | | | 6.42 | | | 0.06 | | | 0.21 | | | 0.27 | | | (0.08 | ) | | (0.27 | ) | | (0.35) | | | 6.34 | | | 4.47 | | | 19,687 | | | 1.60 | | | 1.60 | | | 1.34 | | | 1.02 | | | 4 | |
| 2019 | | | 5.73 | | | 0.08 | | | 1.61 | | | 1.69 | | | (0.06 | ) | | (0.94 | ) | | (1.00) | | | 6.42 | | | 29.78 | | | 25,256 | | | 1.53 | | | 1.52 | | | 1.34 | | | 1.14 | | | 8 | |
| 2018 | | | 7.76 | | | 0.07 | | | (1.29 | ) | | (1.22 | ) | | (0.06 | ) | | (0.75 | ) | | (0.81) | | | 5.73 | | | (16.24 | ) | | 28,120 | | | 1.43 | | | 1.43 | | | 1.34 | | | 1.01 | | | 13 | |
| 2017 | | | 7.33 | | | 0.08 | | | 1.46 | | | 1.54 | | | (0.07 | ) | | (1.04 | ) | | (1.11) | | | 7.76 | | | 21.66 | | | 59,641 | | | 1.40 | | | 1.39 | | | 1.31 | | | 1.04 | | | 16 | |
| Royce Dividend Value Fund–Consultant Class | | |
| 2022† | | $ | 7.61 | | $ | (0.00 | ) | $ | (1.63 | ) | $ | (1.63 | ) | $ | – | | $ | – | | $ | – | | $ | 5.98 | | | (21.42 | )%1 | $ | 1,067 | | | 3.55 | %2 | | 3.55 | %2 | | 2.09 | %2 | | (0.07 | )%2 | | 0 | % |
| 2021 | | | 7.27 | | | (0.02 | ) | | 1.39 | | | 1.37 | | | – | | | (1.03 | ) | | (1.03) | | | 7.61 | | | 19.28 | | | 1,364 | | | 3.47 | | | 3.47 | | | 2.09 | | | (0.23 | ) | | 0 | |
| 2020 | | | 7.33 | | | 0.02 | | | 0.23 | | | 0.25 | | | (0.01 | ) | | (0.30 | ) | | (0.31) | | | 7.27 | | | 3.55 | | | 1,228 | | | 3.32 | | | 3.32 | | | 2.09 | | | 0.30 | | | 4 | |
| 2019 | | | 6.53 | | | 0.03 | | | 1.85 | | | 1.88 | | | (0.01 | ) | | (1.07 | ) | | (1.08) | | | 7.33 | | | 29.03 | | | 1,621 | | | 3.30 | | | 3.29 | | | 2.09 | | | 0.40 | | | 8 | |
| 2018 | | | 8.87 | | | 0.02 | | | (1.48 | ) | | (1.46 | ) | | (0.03 | ) | | (0.85 | ) | | (0.88) | | | 6.53 | | | (16.93 | ) | | 1,349 | | | 3.44 | | | 3.44 | | | 2.09 | | | 0.24 | | | 13 | |
| 2017 | | | 8.39 | | | 0.02 | | | 1.68 | | | 1.70 | | | (0.03 | ) | | (1.19 | ) | | (1.22) | | | 8.87 | | | 20.71 | | | 1,534 | | | 3.26 | | | 3.26 | | | 2.09 | | | 0.23 | | | 16 | |
| Royce Dividend Value Fund–Institutional Class | |
| 2022† | | $ | 6.29 | | $ | 0.03 | | $ | (1.34 | ) | $ | (1.31 | ) | $ | (0.03 | ) | $ | – | | $ | (0.03) | | $ | 4.95 | | | (20.93 | )%1 | $ | 732 | | | 3.21 | %2 | | 3.21 | %2 | | 1.09 | %2 | | 0.92 | %2 | | 0 | % |
| 2021 | | | 6.02 | | | 0.05 | | | 1.14 | | | 1.19 | | | (0.06 | ) | | (0.86 | ) | | (0.92) | | | 6.29 | | | 20.18 | | | 952 | | | 3.02 | | | 3.02 | | | 1.09 | | | 0.78 | | | 0 | |
| 2020 | | | 6.10 | | | 0.07 | | | 0.21 | | | 0.28 | | | (0.11 | ) | | (0.25 | ) | | (0.36) | | | 6.02 | | | 4.82 | | | 776 | | | 3.75 | | | 3.75 | | | 1.09 | | | 1.27 | | | 4 | |
| 2019 | | | 5.48 | | | 0.15 | | | 1.48 | | | 1.63 | | | (0.11 | ) | | (0.90 | ) | | (1.01) | | | 6.10 | | | 30.08 | | | 883 | | | 1.98 | | | 1.98 | | | 0.97 | | | 1.62 | | | 8 | |
| 2018 | | | 7.46 | | | 0.09 | | | (1.23 | ) | | (1.14 | ) | | (0.12 | ) | | (0.72 | ) | | (0.84) | | | 5.48 | | | (15.94 | ) | | 3,016 | | | 1.89 | | | 1.89 | | | 0.89 | | | 1.28 | | | 13 | |
| 2017 | | | 7.09 | | | 0.11 | | | 1.42 | | | 1.53 | | | (0.15 | ) | | (1.01 | ) | | (1.16) | | | 7.46 | | | 22.21 | | | 1,112 | | | 2.79 | | | 2.79 | | | 0.89 | | | 1.43 | | | 16 | |
| Royce Global Financial Services Fund–Service Class | |
| 2022† | | $ | 12.06 | | $ | 0.05 | | $ | (2.73 | ) | $ | (2.68 | ) | $ | – | | $ | – | | $ | – | | $ | 9.38 | | | (22.22 | )%1 | $ | 19,956 | | | 1.90 | %2 | | 1.90 | %2 | | 1.49 | %2 | | 0.93 | %2 | | 2 | % |
| 2021 | | | 10.66 | | | 0.23 | 3 | | 1.91 | | | 2.14 | | | (0.39 | ) | | (0.35 | ) | | (0.74) | | | 12.06 | | | 20.27 | | | 28,574 | | | 1.78 | | | 1.78 | | | 1.49 | | | 1.84 | 3 | | 5 | |
| 2020 | | | 9.91 | | | 0.07 | | | 1.42 | | | 1.49 | | | (0.04 | ) | | (0.70 | ) | | (0.74) | | | 10.66 | | | 15.25 | | | 25,919 | | | 1.88 | | | 1.88 | | | 1.49 | | | 0.80 | | | 4 | |
| 2019 | | | 8.18 | | | 0.10 | | | 1.87 | | | 1.97 | | | (0.15 | ) | | (0.09 | ) | | (0.24) | | | 9.91 | | | 24.17 | | | 30,202 | | | 1.82 | | | 1.81 | | | 1.49 | | | 0.86 | | | 5 | |
| 2018 | | | 10.57 | | | 0.07 | | | (1.45 | ) | | (1.38 | ) | | (0.09 | ) | | (0.92 | ) | | (1.01) | | | 8.18 | | | (13.41 | ) | | 32,113 | | | 1.68 | | | 1.68 | | | 1.49 | | | 0.61 | | | 8 | |
| 2017 | | | 8.95 | | | 0.10 | | | 1.90 | | | 2.00 | | | (0.23 | ) | | (0.15 | ) | | (0.38) | | | 10.57 | | | 22.46 | | | 47,197 | | | 1.68 | | | 1.68 | | | 1.49 | | | 0.83 | | | 19 | |
| THE ACCOMPANYING NOTES ARE AN INTEGRAL PART OF THESE FINANCIAL STATEMENTS | The Royce Funds 2022 Semiannual Report to Shareholders | 61 |
Financial Highlights
This table is presented to show selected data for a share outstanding throughout each year or other indicated period and to assist shareholders in evaluating a Fund’s performance for the periods presented. Per share amounts have been determined on the basis of the weighted average number of shares outstanding during the period.
| | | | | | | | | | | | | | | | | | | | | | | Ratio of Expenses to Average Net Assets | | | | | | |
| | | Net Asset
Value,
Beginning of
Period | | Net
Investment
Income (Loss) | | Net Realized and
Unrealized Gain (Loss)
on Investments and
Foreign Currency | | Total from
Investment
Operations | | Distributions
from Net
Investment
Income | | Distributions
from Net
Realized Gain on
Investments and
Foreign Currency | | Total
Distributions | | Net Asset Value,
End of Period | | Total Return | Net Assets,
End of Period (in thousands) | | Prior to Fee
Waivers, Expense
Reimbursements
and Balance Credits | | Prior to Fee
Waivers and
Expense
Reimbursements | | Net of Fee
Waivers and
Expense
Reimbursements | | Ratio of Net
Investment
Income (Loss) to
Average Net
Assets | | | Portfolio
Turnover
Rate | |
| Royce Global Financial Services Fund–Institutional Class | |
| 2022† | | $ | 15.76 | | $ | 0.07 | | $ | (3.57 | ) | $ | (3.50 | ) | $ | – | | $ | – | | $ | – | | $ | 12.26 | | | (22.21 | )%1 | $ | 7,340 | | | 1.60 | %2 | | 1.60 | %2 | | 1.49 | %2 | | 0.97 | %2 | | 2 | % |
| 2021 | | | 13.81 | | | 0.32 | 3 | | 2.47 | | | 2.79 | | | (0.39 | ) | | (0.45 | ) | | (0.84) | | | 15.76 | | | 20.35 | | | 9,709 | | | 1.51 | | | 1.51 | | | 1.49 | | | 1.98 | 3 | | 5 | |
| 2020 | | | 12.83 | | | 0.10 | | | 1.82 | | | 1.92 | | | (0.04 | ) | | (0.90 | ) | | (0.94) | | | 13.81 | | | 15.18 | | | 7,746 | | | 1.67 | | | 1.67 | | | 1.49 | | | 0.81 | | | 4 | |
| 2019 | | | 10.55 | | | 0.14 | | | 2.42 | | | 2.56 | | | (0.16 | ) | | (0.12 | ) | | (0.28) | | | 12.83 | | | 24.35 | | | 6,738 | | | 1.60 | | | 1.60 | | | 1.33 | | | 1.04 | | | 5 | |
| 2018 | | | 13.58 | | | 0.15 | | | (1.85 | ) | | (1.70 | ) | | (0.14 | ) | | (1.19 | ) | | (1.33) | | | 10.55 | | | (12.87 | ) | | 6,951 | | | 1.43 | | | 1.43 | | | 1.04 | | | 1.06 | | | 8 | |
| 2017 | | | 11.43 | | | 0.15 | | | 2.47 | | | 2.62 | | | (0.27 | ) | | (0.20 | ) | | (0.47) | | | 13.58 | | | 23.01 | | | 8,608 | | | 1.44 | | | 1.44 | | | 1.04 | | | 1.29 | | | 19 | |
| Royce International Premier Fund–Investment Class | | |
| 2022† | | $ | 17.81 | | $ | 0.12 | | $ | (4.91 | ) | $ | (4.79 | ) | $ | – | | $ | – | | $ | – | | $ | 13.02 | | | (26.90 | )%1 | $ | 301,903 | | | 1.27 | %2 | | 1.27 | %2 | | 1.18 | %2 | | 1.61 | %2 | | 16 | % |
| 2021 | | | 17.64 | | | 0.06 | | | 0.99 | | | 1.05 | | | (0.07 | ) | | (0.81 | ) | | (0.88) | | | 17.81 | | | 6.06 | | | 480,550 | | | 1.23 | | | 1.23 | | | 1.16 | | | 0.33 | | | 32 | |
| 2020 | | | 15.25 | | | 0.04 | | | 2.40 | | | 2.44 | | | (0.05 | ) | | – | | | (0.05) | | | 17.64 | | | 15.99 | | | 486,378 | | | 1.26 | | | 1.26 | | | 1.19 | | | 0.30 | | | 21 | |
| 2019 | | | 11.39 | | | 0.11 | | | 3.82 | | | 3.93 | | | (0.07 | ) | | – | | | (0.07) | | | 15.25 | | | 34.49 | | | 360,623 | | | 1.26 | | | 1.26 | | | 1.18 | | | 0.74 | | | 40 | |
| 2018 | | | 13.07 | | | 0.09 | | | (1.72 | ) | | (1.63 | ) | | (0.05 | ) | | – | | | (0.05) | | | 11.39 | | | (12.45 | ) | | 285,065 | | | 1.27 | | | 1.26 | | | 1.16 | | | 1.00 | | | 65 | |
| 2017 | | | 9.44 | | | (0.10 | ) | | 3.88 | | | 3.78 | | | (0.15 | ) | | – | | | (0.15) | | | 13.07 | | | 40.08 | | | 103,032 | | | 1.37 | | | 1.37 | | | 1.19 | | | 0.32 | | | 41 | |
| Royce International Premier Fund–Service Class | | |
| 2022† | | $ | 21.33 | | $ | 0.12 | | $ | (5.88 | ) | $ | (5.76 | ) | $ | – | | $ | – | | $ | – | | $ | 15.57 | | | (27.00 | )%1 | $ | 35,816 | | | 1.61 | %2 | | 1.61 | %2 | | 1.44 | %2 | | 1.31 | %2 | | 16 | % |
| 2021 | | | 21.10 | | | 0.01 | | | 1.18 | | | 1.19 | | | – | | | (0.96 | ) | | (0.96) | | | 21.33 | | | 5.78 | | | 59,258 | | | 1.54 | | | 1.54 | | | 1.44 | | | 0.05 | | | 32 | |
| 2020 | | | 18.24 | | | 0.01 | | | 2.85 | | | 2.86 | | | – | | | – | | | – | | | 21.10 | | | 15.68 | | | 69,153 | | | 1.57 | | | 1.57 | | | 1.44 | | | 0.04 | | | 21 | |
| 2019 | | | 13.61 | | | 0.10 | | | 4.57 | | | 4.67 | | | (0.04 | ) | | – | | | (0.04) | | | 18.24 | | | 34.29 | | | 71,350 | | | 1.58 | | | 1.58 | | | 1.41 | | | 0.63 | | | 40 | |
| 2018 | | | 15.60 | | | 0.11 | | | (2.10 | ) | | (1.99 | ) | | – | | | – | | | – | | | 13.61 | | | (12.76 | ) | | 36,303 | | | 1.59 | | | 1.59 | | | 1.44 | | | 0.71 | | | 65 | |
| 2017 | | | 11.24 | | | 0.05 | | | 4.42 | | | 4.47 | | | (0.11 | ) | | – | | | (0.11) | | | 15.60 | | | 39.81 | | | 48,642 | | | 1.65 | | | 1.65 | | | 1.44 | | | 0.28 | | | 41 | |
| Royce International Premier Fund–Consultant Class | | |
| 2022† | | $ | 22.58 | | $ | 0.06 | | $ | (6.22 | ) | $ | (6.16 | ) | $ | – | | $ | – | | $ | – | | $ | 16.42 | | | (27.28 | )%1 | $ | 5,648 | | | 2.50 | %2 | | 2.50 | %2 | | 2.19 | %2 | | 0.61 | %2 | | 16 | % |
| 2021 | | | 22.50 | | | (0.16 | ) | | 1.26 | | | 1.10 | | | – | | | (1.02 | ) | | (1.02) | | | 22.58 | | | 5.02 | | | 8,419 | | | 2.38 | | | 2.38 | | | 2.19 | | | (0.69 | ) | | 32 | |
| 2020 | | | 19.60 | | | (0.13 | ) | | 3.03 | | | 2.90 | | | – | | | – | | | – | | | 22.50 | | | 14.80 | | | 9,182 | | | 2.42 | | | 2.41 | | | 2.19 | | | (0.70 | ) | | 21 | |
| 2019 | | | 14.71 | | | (0.03 | ) | | 4.92 | | | 4.89 | | | – | | | – | | | – | | | 19.60 | | | 33.24 | | | 9,894 | | | 2.41 | | | 2.41 | | | 2.18 | | | (0.17 | ) | | 40 | |
| 2018 | | | 16.99 | | | (0.00 | ) | | (2.28 | ) | | (2.28 | ) | | – | | | – | | | – | | | 14.71 | | | (13.42 | ) | | 8,546 | | | 2.33 | | | 2.32 | | | 2.19 | | | (0.00 | ) | | 65 | |
| 2017 | | | 12.27 | | | (0.08 | ) | | 4.83 | | | 4.75 | | | (0.03 | ) | | – | | | (0.03) | | | 16.99 | | | 38.73 | | | 9,281 | | | 2.73 | | | 2.73 | | | 2.19 | | | (0.52 | ) | | 41 | |
| Royce International Premier Fund–Institutional Class a | | |
| 2022† | | $ | 17.82 | | $ | 0.13 | | $ | (4.92 | ) | $ | (4.79 | ) | $ | – | | $ | – | | $ | – | | $ | 13.03 | | | (26.88 | )%1 | $ | 496,547 | | | 1.18 | %2 | | 1.18 | %2 | | 1.04 | %2 | | 1.77 | %2 | | 16 | % |
| 2021 | | | 17.64 | | | 0.08 | | | 0.99 | | | 1.07 | | | (0.09 | ) | | (0.80 | ) | | (0.89) | | | 17.82 | | | 6.23 | | | 704,714 | | | 1.16 | | | 1.16 | | | 1.04 | | | 0.44 | | | 32 | |
| 2020 | | | 15.25 | | | 0.06 | | | 2.39 | | | 2.45 | | | (0.06 | ) | | – | | | (0.06) | | | 17.64 | | | 16.12 | | | 567,878 | | | 1.20 | | | 1.20 | | | 1.04 | | | 0.44 | | | 21 | |
| 2019 | | | 11.39 | | | (0.03 | ) | | 3.98 | | | 3.95 | | | (0.09 | ) | | – | | | (0.09) | | | 15.25 | | | 34.68 | | | 366,870 | | | 1.19 | | | 1.19 | | | 1.04 | | | 0.57 | | | 40 | |
| 2018 | | | 12.98 | | | (0.00 | ) | | (1.53 | ) | | (1.53 | ) | | (0.06 | ) | | – | | | (0.06) | | | 11.39 | | | (11.78 | )1 | | 32,340 | | | 1.34 | 2 | | 1.34 | 2 | | 1.04 | 2 | | 0.84 | 2 | | 65 | |
| 62 | The Royce Funds 2022 Semiannual Report to Shareholders | THE ACCOMPANYING NOTES ARE AN INTEGRAL PART OF THESE FINANCIAL STATEMENTS |
Financial Highlights
This table is presented to show selected data for a share outstanding throughout each year or other indicated period and to assist shareholders in evaluating a Fund’s performance for the periods presented. Per share amounts have been determined on the basis of the weighted average number of shares outstanding during the period.
| | | | | | | | | | | | | | | | | | | | | | | Ratio of Expenses to Average Net Assets | | | | | | |
| | | Net Asset
Value,
Beginning of
Period | | Net
Investment
Income (Loss) | | Net Realized and
Unrealized Gain (Loss)
on Investments and
Foreign Currency | | Total from
Investment
Operations | | Distributions
from Net
Investment
Income | | Distributions
from Net
Realized Gain on
Investments and
Foreign Currency | | Total
Distributions | | Net Asset Value,
End of Period | | Total Return | Net Assets,
End of Period (in thousands) | | Prior to Fee
Waivers, Expense
Reimbursements
and Balance Credits | | Prior to Fee
Waivers and
Expense
Reimbursements | | Net of Fee
Waivers and
Expense
Reimbursements | | Ratio of Net
Investment
Income (Loss) to
Average Net
Assets | | | Portfolio
Turnover
Rate | |
| Royce Micro-Cap Fund–Investment Class | |
| 2022† | | $ | 13.41 | | $ | (0.03 | ) | $ | (3.72 | ) | $ | (3.75 | ) | $ | – | | $ | – | | $ | – | | $ | 9.66 | | | (27.96 | )%1 | $ | 144,976 | | | 1.24 | %2 | | 1.24 | %2 | | 1.24 | %2 | | (0.51 | )%2 | | 7 | % |
| 2021 | | | 12.74 | | | (0.07 | ) | | 3.84 | | | 3.77 | | | – | | | (3.10 | ) | | (3.10) | | | 13.41 | | | 31.02 | | | 209,032 | | | 1.20 | | | 1.20 | | | 1.20 | | | (0.43 | ) | | 26 | |
| 2020 | | | 11.02 | | | (0.05 | ) | | 2.71 | | | 2.66 | | | – | | | (0.94 | ) | | (0.94) | | | 12.74 | | | 24.50 | | | 174,339 | | | 1.29 | | | 1.29 | | | 1.24 | | | (0.46 | ) | | 25 | |
| 2019 | | | 9.35 | | | (0.05 | ) | | 2.02 | | | 1.97 | | | – | | | (0.30 | ) | | (0.30) | | | 11.02 | | | 21.16 | | | 158,112 | | | 1.51 | | | 1.50 | | | 1.36 | | | (0.46 | ) | | 21 | |
| 2018 | | | 11.64 | | | (0.05 | ) | | (0.94 | ) | | (0.99 | ) | | – | | | (1.30 | ) | | (1.30) | | | 9.35 | | | (8.94 | ) | | 117,040 | | | 1.50 | | | 1.50 | | | 1.49 | | | (0.43 | ) | | 24 | |
| 2017 | | | 11.92 | | | (0.03 | ) | | 0.66 | | | 0.63 | | | (0.01 | ) | | (0.90 | ) | | (0.91) | | | 11.64 | | | 5.43 | | | 166,935 | | | 1.51 | | | 1.51 | | | 1.49 | | | (0.28 | ) | | 26 | |
| Royce Micro-Cap Fund–Service Class | | |
| 2022† | | $ | 13.05 | | $ | (0.04 | ) | $ | (3.62 | ) | $ | (3.66 | ) | $ | – | | $ | – | | $ | – | | $ | 9.39 | | | (28.05 | )%1 | $ | 132,125 | | | 1.55 | %2 | | 1.55 | %2 | | 1.49 | %2 | | (0.77 | )%2 | | 7 | % |
| 2021 | | | 12.45 | | | (0.11 | ) | | 3.74 | | | 3.63 | | | – | | | (3.03 | ) | | (3.03) | | | 13.05 | | | 30.64 | | | 197,089 | | | 1.51 | | | 1.51 | | | 1.49 | | | (0.73 | ) | | 26 | |
| 2020 | | | 10.79 | | | (0.07 | ) | | 2.65 | | | 2.58 | | | – | | | (0.92 | ) | | (0.92) | | | 12.45 | | | 24.26 | | | 168,285 | | | 1.60 | | | 1.60 | | | 1.49 | | | (0.71 | ) | | 25 | |
| 2019 | | | 9.15 | | | (0.01 | ) | | 1.94 | | | 1.93 | | | – | | | (0.29 | ) | | (0.29) | | | 10.79 | | | 21.22 | | | 164,956 | | | 1.51 | | | 1.51 | | | 1.50 | | | (0.09 | ) | | 21 | |
| 2018 | | | 11.41 | | | (0.07 | ) | | (0.91 | ) | | (0.98 | ) | | – | | | (1.28 | ) | | (1.28) | | | 9.15 | | | (9.09 | ) | | 8,053 | | | 1.90 | | | 1.89 | | | 1.61 | | | (0.56 | ) | | 24 | |
| 2017 | | | 11.69 | | | (0.05 | ) | | 0.65 | | | 0.60 | | | – | | | (0.88 | ) | | (0.88) | | | 11.41 | | | 5.32 | | | 13,880 | | | 1.86 | | | 1.86 | | | 1.61 | | | (0.40 | ) | | 26 | |
| Royce Micro-Cap Fund–Consultant Class | | |
| 2022† | | $ | 10.00 | | $ | (0.07 | ) | $ | (2.77 | ) | $ | (2.84 | ) | $ | – | | $ | – | | $ | – | | $ | 7.16 | | | (28.40 | )%1 | $ | 10,619 | | | 2.36 | %2 | | 2.36 | %2 | | 2.36 | %2 | | (1.63 | )%2 | | 7 | % |
| 2021 | | | 9.62 | | | (0.18 | ) | | 2.89 | | | 2.71 | | | – | | | (2.33 | ) | | (2.33) | | | 10.00 | | | 29.56 | | | 15,777 | | | 2.30 | | | 2.30 | | | 2.30 | | | (1.53 | ) | | 26 | |
| 2020 | | | 8.42 | | | (0.13 | ) | | 2.04 | | | 1.91 | | | – | | | (0.71 | ) | | (0.71) | | | 9.62 | | | 23.04 | | | 14,025 | | | 2.41 | | | 2.41 | | | 2.41 | | | (1.63 | ) | | 25 | |
| 2019 | | | 7.23 | | | (0.13 | ) | | 1.55 | | | 1.42 | | | – | | | (0.23 | ) | | (0.23) | | | 8.42 | | | 19.72 | | | 14,204 | | | 2.59 | | | 2.59 | | | 2.58 | | | (1.69 | ) | | 21 | |
| 2018 | | | 9.10 | | | (0.14 | ) | | (0.72 | ) | | (0.86 | ) | | – | | | (1.01 | ) | | (1.01) | | | 7.23 | | | (9.93 | ) | | 16,680 | | | 2.56 | | | 2.56 | | | 2.56 | | | (1.50 | ) | | 24 | |
| 2017 | | | 9.41 | | | (0.13 | ) | | 0.53 | | | 0.40 | | | – | | | (0.71 | ) | | (0.71) | | | 9.10 | | | 4.35 | | | 24,396 | | | 2.54 | | | 2.54 | | | 2.54 | | | (1.34 | ) | | 26 | |
| Royce Pennsylvania Mutual Fund–Investment Class | | |
| 2022† | | $ | 9.65 | | $ | 0.01 | | $ | (2.06 | ) | $ | (2.05 | ) | $ | – | | $ | – | | $ | – | | $ | 7.60 | | | (21.24 | )%1 | $ | 1,204,327 | | | 0.94 | %2 | | 0.94 | %2 | | 0.94 | %2 | | 0.22 | %2 | | 27 | % |
| 2021 | | | 10.24 | | | 0.02 | | | 2.11 | | | 2.13 | | | (0.01 | ) | | (2.71 | ) | | (2.72) | | | 9.65 | | | 22.05 | | | 1,605,587 | | | 0.91 | | | 0.91 | | | 0.91 | | | 0.15 | | | 60 | |
| 2020 | | | 9.44 | | | 0.03 | | | 1.29 | | | 1.32 | | | (0.06 | ) | | (0.46 | ) | | (0.52) | | | 10.24 | | | 14.08 | | | 1,426,472 | | | 0.95 | | | 0.95 | | | 0.95 | | | 0.37 | | | 32 | |
| 2019 | | | 7.75 | | | 0.04 | | | 2.01 | | | 2.05 | | | (0.02 | ) | | (0.34 | ) | | (0.36) | | | 9.44 | | | 26.56 | | | 1,429,042 | | | 0.95 | | | 0.94 | | | 0.94 | | | 0.39 | | | 30 | |
| 2018 | | | 10.52 | | | 0.04 | | | (0.97 | ) | | (0.93 | ) | | (0.02 | ) | | (1.82 | ) | | (1.84) | | | 7.75 | | | (9.66 | ) | | 1,203,967 | | | 0.92 | | | 0.92 | | | 0.92 | | | 0.33 | | | 35 | |
| 2017 | | | 11.02 | | | 0.06 | | | 1.68 | | | 1.74 | | | (0.06 | ) | | (2.18 | ) | | (2.24) | | | 10.52 | | | 16.24 | | | 1,622,523 | | | 0.92 | | | 0.92 | | | 0.92 | | | 0.47 | | | 27 | |
| Royce Pennsylvania Mutual Fund–Service Class | | |
| 2022† | | $ | 9.62 | | $ | (0.01 | ) | $ | (2.05 | ) | $ | (2.06 | ) | $ | – | | $ | – | | $ | – | | $ | 7.56 | | | (21.41 | )%1 | $ | 60,554 | | | 1.31 | %2 | | 1.31 | %2 | | 1.30 | %2 | | (0.15 | )%2 | | 27 | % |
| 2021 | | | 10.23 | | | (0.02 | ) | | 2.11 | | | 2.09 | | | – | | | (2.70 | ) | | (2.70) | | | 9.62 | | | 21.64 | | | 84,060 | | | 1.27 | | | 1.27 | | | 1.27 | | | (0.22 | ) | | 60 | |
| 2020 | | | 9.42 | | | 0.02 | | | 1.28 | | | 1.30 | | | (0.03 | ) | | (0.46 | ) | | (0.49) | | | 10.23 | | | 13.88 | | | 78,789 | | | 1.25 | | | 1.24 | | | 1.13 | | | 0.23 | | | 32 | |
| 2019 | | | 7.77 | | | (0.00 | ) | | 2.00 | | | 2.00 | | | (0.01 | ) | | (0.34 | ) | | (0.35) | | | 9.42 | | | 25.75 | | | 142,864 | | | 1.31 | | | 1.30 | | | 1.30 | | | (0.01 | ) | | 30 | |
| 2018 | | | 10.56 | | | (0.01 | ) | | (0.96 | ) | | (0.97 | ) | | – | | | (1.82 | ) | | (1.82) | | | 7.77 | | | (9.96 | ) | | 32,191 | | | 1.30 | | | 1.30 | | | 1.30 | | | (0.07 | ) | | 35 | |
| 2017 | | | 11.03 | | | 0.01 | | | 1.69 | | | 1.70 | | | – | | | (2.17 | ) | | (2.17) | | | 10.56 | | | 15.88 | | | 54,938 | | | 1.27 | | | 1.27 | | | 1.27 | | | 0.07 | | | 27 | |
| THE ACCOMPANYING NOTES ARE AN INTEGRAL PART OF THESE FINANCIAL STATEMENTS | The Royce Funds 2022 Semiannual Report to Shareholders | 63 |
Financial Highlights
This table is presented to show selected data for a share outstanding throughout each year or other indicated period and to assist shareholders in evaluating a Fund’s performance for the periods presented. Per share amounts have been determined on the basis of the weighted average number of shares outstanding during the period.
| | | | | | | | | | | | | | | | | | | | | | | Ratio of Expenses to Average Net Assets | | | | | | |
| | | Net Asset
Value,
Beginning of
Period | | Net
Investment
Income (Loss) | | Net Realized and
Unrealized Gain (Loss)
on Investments and
Foreign Currency | | Total from
Investment
Operations | | Distributions
from Net
Investment
Income | | Distributions
from Net
Realized Gain on
Investments and
Foreign Currency | | Total
Distributions | | Net Asset Value,
End of Period | | Total Return | Net Assets,
End of Period (in thousands) | | Prior to Fee
Waivers, Expense
Reimbursements
and Balance Credits | | Prior to Fee
Waivers and
Expense
Reimbursements | | Net of Fee
Waivers and
Expense
Reimbursements | | Ratio of Net
Investment
Income (Loss) to
Average Net
Assets | | | Portfolio
Turnover
Rate | |
| Royce Pennsylvania Mutual Fund–Consultant Class | |
| 2022† | | $ | 7.53 | | $ | (0.03 | ) | $ | (1.60 | ) | $ | (1.63 | ) | $ | – | | $ | – | | $ | – | | $ | 5.90 | | | (21.65 | )%1 | $ | 183,660 | | | 1.95 | %2 | | 1.95 | %2 | | 1.95 | %2 | | (0.79 | )%2 | | 27 | % |
| 2021 | | | 8.07 | | | (0.08 | ) | | 1.66 | | | 1.58 | | | – | | | (2.12 | ) | | (2.12) | | | 7.53 | | | 20.78 | | | 249,816 | | | 1.92 | | | 1.92 | | | 1.92 | | | (0.86 | ) | | 60 | |
| 2020 | | | 7.47 | | | (0.04 | ) | | 1.00 | | | 0.96 | | | – | | | (0.36 | ) | | (0.36) | | | 8.07 | | | 12.94 | | | 238,595 | | | 1.96 | | | 1.96 | | | 1.96 | | | (0.64 | ) | | 32 | |
| 2019 | | | 6.18 | | | (0.04 | ) | | 1.60 | | | 1.56 | | | – | | | (0.27 | ) | | (0.27) | | | 7.47 | | | 25.25 | | | 262,007 | | | 1.96 | | | 1.95 | | | 1.95 | | | (0.62 | ) | | 30 | |
| 2018 | | | 8.46 | | | (0.06 | ) | | (0.77 | ) | | (0.83 | ) | | – | | | (1.45 | ) | | (1.45) | | | 6.18 | | | (10.56 | ) | | 249,004 | | | 1.93 | | | 1.93 | | | 1.93 | | | (0.69 | ) | | 35 | |
| 2017 | | | 8.90 | | | (0.05 | ) | | 1.35 | | | 1.30 | | | – | | | (1.74 | ) | | (1.74) | | | 8.46 | | | 15.06 | | | 361,569 | | | 1.93 | | | 1.92 | | | 1.92 | | | (0.54 | ) | | 27 | |
| Royce Pennsylvania Mutual Fund–Institutional Class | |
| 2022† | | $ | 9.68 | | $ | 0.01 | | $ | (2.06 | ) | $ | (2.05 | ) | $ | – | | $ | – | | $ | – | | $ | 7.63 | | | (21.18 | )%1 | $ | 129,771 | | | 0.89 | %2 | | 0.89 | %2 | | 0.89 | %2 | | 0.24 | %2 | | 27 | % |
| 2021 | | | 10.27 | | | 0.03 | | | 2.12 | | | 2.15 | | | (0.01 | ) | | (2.73 | ) | | (2.74) | | | 9.68 | | | 22.10 | | | 199,842 | | | 0.86 | | | 0.86 | | | 0.86 | | | 0.21 | | | 60 | |
| 2020 | | | 9.47 | | | 0.04 | | | 1.28 | | | 1.32 | | | (0.06 | ) | | (0.46 | ) | | (0.52) | | | 10.27 | | | 14.10 | | | 163,944 | | | 0.89 | | | 0.89 | | | 0.89 | | | 0.42 | | | 32 | |
| 2019 | | | 7.78 | | | 0.04 | | | 2.02 | | | 2.06 | | | (0.03 | ) | | (0.34 | ) | | (0.37) | | | 9.47 | | | 26.53 | | | 106,564 | | | 0.89 | | | 0.89 | | | 0.89 | | | 0.45 | | | 30 | |
| 2018 | | | 10.55 | | | 0.04 | | | (0.97 | ) | | (0.93 | ) | | (0.02 | ) | | (1.82 | ) | | (1.84) | | | 7.78 | | | (9.56 | ) | | 83,908 | | | 0.88 | | | 0.88 | | | 0.88 | | | 0.40 | | | 35 | |
| 2017 | | | 11.04 | | | 0.09 | | | 1.67 | | | 1.76 | | | (0.07 | ) | | (2.18 | ) | | (2.25) | | | 10.55 | | | 16.44 | | | 53,367 | | | 0.83 | | | 0.83 | | | 0.83 | | | 0.42 | | | 27 | |
| Royce Pennsylvania Mutual Fund–R Class | |
| 2022† | | $ | 8.94 | | $ | (0.02 | ) | $ | (1.91 | ) | $ | (1.93 | ) | $ | – | | $ | – | | $ | – | | $ | 7.01 | | | (21.59 | )%1 | $ | 6,845 | | | 1.79 | %2 | | 1.79 | %2 | | 1.75 | %2 | | (0.60 | )%2 | | 27 | % |
| 2021 | | | 9.56 | | | (0.07 | ) | | 1.96 | | | 1.89 | | | – | | | (2.51 | ) | | (2.51) | | | 8.94 | | | 21.00 | | | 9,515 | | | 1.73 | | | 1.73 | | | 1.73 | | | (0.66 | ) | | 60 | |
| 2020 | | | 8.84 | | | (0.04 | ) | | 1.19 | | | 1.15 | | | – | | | (0.43 | ) | | (0.43) | | | 9.56 | | | 13.07 | | | 8,121 | | | 1.83 | | | 1.83 | | | 1.83 | | | (0.51 | ) | | 32 | |
| 2019 | | | 7.30 | | | (0.03 | ) | | 1.89 | | | 1.86 | | | – | | | (0.32 | ) | | (0.32) | | | 8.84 | | | 25.48 | | | 8,853 | | | 1.75 | | | 1.74 | | | 1.74 | | | (0.41 | ) | | 30 | |
| 2018 | | | 9.94 | | | (0.03 | ) | | (0.91 | ) | | (0.94 | ) | | – | | | (1.70 | ) | | (1.70) | | | 7.30 | | | (10.15 | ) | | 10,014 | | | 1.58 | | | 1.57 | | | 1.57 | | | (0.34 | ) | | 35 | |
| 2017 | | | 10.44 | | | (0.04 | ) | | 1.58 | | | 1.54 | | | – | | | (2.04 | ) | | (2.04) | | | 9.94 | | | 15.25 | | | 15,136 | | | 1.73 | | | 1.73 | | | 1.73 | | | (0.36 | ) | | 27 | |
| Royce Premier Fund–Investment Class | |
| 2022† | | $ | 12.97 | | $ | (0.00 | ) | $ | (2.49 | ) | $ | (2.49 | ) | $ | – | | $ | – | | $ | – | | $ | 10.48 | | | (19.20 | )%1 | $ | 1,050,882 | | | 1.19 | %2 | | 1.19 | %2 | | 1.19 | %2 | | (0.03 | )%2 | | 12 | % |
| 2021 | | | 13.59 | | | (0.03 | ) | | 2.16 | | | 2.13 | | | (0.01 | ) | | (2.74 | ) | | (2.75) | | | 12.97 | | | 16.36 | | | 1,401,347 | | | 1.17 | | | 1.17 | | | 1.17 | | | (0.19 | ) | | 20 | |
| 2020 | | | 12.88 | | | 0.05 | | | 1.41 | | | 1.46 | | | (0.12 | ) | | (0.63 | ) | | (0.75) | | | 13.59 | | | 11.50 | | �� | 1,414,718 | | | 1.21 | | | 1.21 | | | 1.21 | | | 0.41 | | | 23 | |
| 2019 | | | 11.62 | | | 0.05 | | | 3.87 | | | 3.92 | | | (0.05 | ) | | (2.61 | ) | | (2 .66) | | | 12.88 | | | 34.13 | | | 1,505,821 | | | 1.20 | | | 1.19 | | | 1.19 | | | 0.32 | | | 19 | |
| 2018 | | | 16.60 | | | 0.02 | | | (1.60 | ) | | (1.58 | ) | | (0.01 | ) | | (3.39 | ) | | (3.40) | | | 11.62 | | | (10.40 | ) | | 1,398,965 | | | 1.17 | | | 1.17 | | | 1.17 | | | 0.11 | | | 23 | |
| 2017 | | | 15.51 | | | 0.00 | | | 3.63 | | | 3.63 | | | (0.02 | ) | | (2.52 | ) | | (2.54) | | | 16.60 | | | 23.77 | | | 1,978,847 | | | 1.16 | | | 1.16 | | | 1.16 | | | 0.00 | | | 8 | |
| Royce Premier Fund–Service Class | |
| 2022† | | $ | 12.58 | | $ | (0.02 | ) | $ | (2.41 | ) | $ | (2.43 | ) | $ | – | | $ | – | | $ | – | | $ | 10.15 | | | (19.32 | )%1 | $ | 27,071 | | | 1.60 | %2 | | 1.60 | %2 | | 1.49 | %2 | | (0.33 | )%2 | | 12 | % |
| 2021 | | | 13.22 | | | (0.07 | ) | | 2.09 | | | 2.02 | | | – | | | (2.66 | ) | | (2.66) | | | 12.58 | | | 15.98 | | | 36,488 | | | 1.56 | | | 1.56 | | | 1.49 | | | (0.50 | ) | | 20 | |
| 2020 | | | 12.54 | | | 0.01 | | | 1.37 | | | 1.38 | | | (0.09 | ) | | (0.61 | ) | | (0.70) | | | 13.22 | | | 11.16 | | | 29,588 | | | 1.57 | | | 1.57 | | | 1.49 | | | 0.12 | | | 23 | |
| 2019 | | | 11.31 | | | (0.01 | ) | | 3.78 | | | 3.77 | | | – | | | (2.54 | ) | | (2.54) | | | 12.54 | | | 33.65 | | | 29,696 | | | 1.57 | | | 1.57 | | | 1.46 | | | (0.06 | ) | | 19 | |
| 2018 | | | 16.15 | | | (0.03 | ) | | (1.55 | ) | | (1.58 | ) | | – | | | (3.26 | ) | | (3.26) | | | 11.31 | | | (10.66 | ) | | 41,738 | | | 1.52 | | | 1.52 | | | 1.48 | | | (0.19 | ) | | 23 | |
| 2017 | | | 15.13 | | | (0.06 | ) | | 3.53 | | | 3.47 | | | – | | | (2.45 | ) | | (2.45) | | | 16.15 | | | 23.32 | | | 54,557 | | | 1.53 | | | 1.53 | | | 1.49 | | | (0.34 | ) | | 8 | |
| 64 | The Royce Funds 2022 Semiannual Report to Shareholders | THE ACCOMPANYING NOTES ARE AN INTEGRAL PART OF THESE FINANCIAL STATEMENTS |
Financial Highlights
This table is presented to show selected data for a share outstanding throughout each year or other indicated period and to assist shareholders in evaluating a Fund’s performance for the periods presented. Per share amounts have been determined on the basis of the weighted average number of shares outstanding during the period.
| | | | | | | | | | | | | | | | | | | | | | | Ratio of Expenses to Average Net Assets | | | | | | |
| | | Net Asset
Value,
Beginning of
Period | | Net
Investment
Income (Loss) | | Net Realized and
Unrealized Gain (Loss)
on Investments and
Foreign Currency | | Total from
Investment
Operations | | Distributions
from Net
Investment
Income | | Distributions
from Net
Realized Gain on
Investments and
Foreign Currency | | Total
Distributions | | Net Asset Value,
End of Period | | Total Return | Net Assets,
End of Period (in thousands) | | Prior to Fee
Waivers, Expense
Reimbursements
and Balance Credits | | Prior to Fee
Waivers and
Expense
Reimbursements | | Net of Fee
Waivers and
Expense
Reimbursements | | Ratio of Net
Investment
Income (Loss) to
Average Net
Assets | | | Portfolio
Turnover
Rate | |
| Royce Premier Fund–Consultant Class | | |
| 2022† | | $ | 10.00 | | $ | (0.05 | ) | $ | (1.91 | ) | $ | (1.96 | ) | $ | – | | $ | – | | $ | – | | $ | 8.04 | | | (19.60 | )%1 | $ | 11,815 | | | 2.33 | %2 | | 2.33 | %2 | | 2.33 | %2 | | (1.17 | )%2 | | 12 | % |
| 2021 | | | 10.60 | | | (0.15 | ) | | 1.67 | | | 1.52 | | | – | | | (2.12 | ) | | (2.12) | | | 10.00 | | | 15.01 | | | 16,016 | | | 2.29 | | | 2.29 | | | 2.29 | | | (1.30 | ) | | 20 | |
| 2020 | | | 10.09 | | | (0.07 | ) | | 1.09 | | | 1.02 | | | (0.02 | ) | | (0.49 | ) | | (0.51) | | | 10.60 | | | 10.19 | | | 15,686 | | | 2.34 | | | 2.34 | | | 2.34 | | | (0.72 | ) | | 23 | |
| 2019 | | | 9.17 | | | (0.10 | ) | | 3.05 | | | 2.95 | | | – | | | (2.03 | ) | | (2.03) | | | 10.09 | | | 32.55 | | | 17,585 | | | 2.26 | | | 2.26 | | | 2.26 | | | (0.91 | ) | | 19 | |
| 2018 | | | 13.21 | | | (0.12 | ) | | (1.27 | ) | | (1.39 | ) | | – | | | (2.65 | ) | | (2.65) | | | 9.17 | | | (11.41 | ) | | 21,370 | | | 2.21 | | | 2.21 | | | 2.21 | | | (0.93 | ) | | 23 | |
| 2017 | | | 12.46 | | | (0.14 | ) | | 2.89 | | | 2.75 | | | – | | | (2.00 | ) | | (2.00) | | | 13.21 | | | 22.49 | | | 31,489 | | | 2.21 | | | 2.21 | | | 2.21 | | | (1.06 | ) | | 8 | |
| Royce Premier Fund–Institutional Class | | | |
| 2022† | | $ | 13.16 | | $ | 0.00 | | $ | (2.52 | ) | $ | (2.52 | ) | $ | – | | $ | – | | $ | – | | $ | 10.64 | | | (19.15 | )%1 | $ | 210,278 | | | 1.11 | %2 | | 1.11 | %2 | | 1.11 | %2 | | 0.05 | %2 | | 12 | % |
| 2021 | | | 13.80 | | | (0.02 | ) | | 2.19 | | | 2.17 | | | (0.02 | ) | | (2.79 | ) | | (2.81) | | | 13.16 | | | 16.39 | | | 273,853 | | | 1.09 | | | 1.09 | | | 1.09 | | | (0.11 | ) | | 20 | |
| 2020 | | | 13.08 | | | 0.05 | | | 1.44 | | | 1.49 | | | (0.13 | ) | | (0.64 | ) | | (0.77) | | | 13.80 | | | 11.53 | | | 266,587 | | | 1.15 | | | 1.15 | | | 1.15 | | | 0.44 | | | 23 | |
| 2019 | | | 11.79 | | | 0.05 | | | 3.94 | | | 3.99 | | | (0.05 | ) | | (2.65 | ) | | (2.70) | | | 13.08 | | | 34.23 | | | 244,343 | | | 1.15 | | | 1.15 | | | 1.15 | | | 0.33 | | | 19 | |
| 2018 | | | 16.82 | | | 0.03 | | | (1.63 | ) | | (1.60 | ) | | (0.02 | ) | | (3.41 | ) | | (3.43) | | | 11.79 | | | (10.41 | ) | | 197,697 | | | 1.12 | | | 1.12 | | | 1.12 | | | 0.16 | | | 23 | |
| 2017 | | | 15.72 | | | 0.01 | | | 3.68 | | | 3.69 | | | (0.03 | ) | | (2.56 | ) | | (2.59) | | | 16.82 | | | 23.85 | | | 250,119 | | | 1.09 | | | 1.09 | | | 1.09 | | | 0.07 | | | 8 | |
| Royce Premier Fund–R Class | | | | | |
| 2022† | | $ | 11.84 | | $ | (0.04 | ) | $ | (2.27 | ) | $ | (2.31 | ) | $ | – | | $ | – | | $ | – | | $ | 9.53 | | | (19.51 | )%1 | $ | 6,176 | | | 2.00 | %2 | | 2.00 | %2 | | 1.99 | %2 | | (0.83 | )%2 | | 12 | % |
| 2021 | | | 12.49 | | | (0.13 | ) | | 1.99 | | | 1.86 | | | – | | | (2.51 | ) | | (2.51) | | | 11.84 | | | 15.51 | | | 8,073 | | | 1.93 | | | 1.93 | | | 1.93 | | | (0.95 | ) | | 20 | |
| 2020 | | | 11.86 | | | (0.04 | ) | | 1.29 | | | 1.25 | | | (0.04 | ) | | (0.58 | ) | | (0.62) | | | 12.49 | | | 10.64 | | | 9,418 | | | 1.95 | | | 1.95 | | | 1.95 | | | (0.33 | ) | | 23 | |
| 2019 | | | 10.73 | | | (0.05 | ) | | 3.57 | | | 3.52 | | | – | | | (2.39 | ) | | (2.39) | | | 11.86 | | | 33.17 | | | 10,949 | | | 1.90 | | | 1.90 | | | 1.90 | | | (0.43 | ) | | 19 | |
| 2018 | | | 15.39 | | | (0.08 | ) | | (1.48 | ) | | (1.56 | ) | | – | | | (3.10 | ) | | (3.10) | | | 10.73 | | | (11.01 | ) | | 9,715 | | | 1.80 | | | 1.80 | | | 1.80 | | | (0.52 | ) | | 23 | |
| 2017 | | | 14.47 | | | (0.12 | ) | | 3.37 | | | 3.25 | | | – | | | (2.33 | ) | | (2.33) | | | 15.39 | | | 22.88 | | | 12,841 | | | 1.90 | | | 1.90 | | | 1.90 | | | (0.75 | ) | | 8 | |
| Royce Small-Cap Opportunity Fund–Investment Class | | | |
| 2022† | | $ | 16.76 | | $ | (0.01 | ) | $ | (3.69 | ) | $ | (3.70 | ) | $ | – | | $ | – | | $ | – | | $ | 13.06 | | | (22.08 | )%1 | $ | 946,838 | | | 1.24 | %2 | | 1.24 | %2 | | 1.24 | %2 | | (0.10 | )%2 | | 20 | % |
| 2021 | | | 15.84 | | | (0.06 | ) | | 4.75 | | | 4.69 | | | – | | | (3.77 | ) | | (3.77) | | | 16.76 | | | 30.85 | | | 1,332,050 | | | 1.21 | | | 1.21 | | | 1.21 | | | (0.30 | ) | | 69 | |
| 2020 | | | 12.52 | | | (0.03 | ) | | 3.35 | | | 3.32 | | | – | | | – | | | – | | | 15.84 | | | 26.52 | | | 786,849 | | | 1.24 | | | 1.23 | | | 1.23 | | | (0.28 | ) | | 53 | |
| 2019 | | | 9.92 | | | (0.06 | ) | | 2.86 | | | 2.80 | | | – | | | (0.20 | ) | | (0.20) | | | 12.52 | | | 28.21 | | | 609,316 | | | 1.23 | | | 1.22 | | | 1.22 | | | (0.50 | ) | | 47 | |
| 2018 | | | 13.58 | | | (0.04 | ) | | (2.61 | ) | | (2.65 | ) | | – | | | (1.01 | ) | | (1.01) | | | 9.92 | | | (19.97 | ) | | 557,003 | | | 1.20 | | | 1.20 | | | 1.20 | | | (0.30 | ) | | 47 | |
| 2017 | | | 12.85 | | | (0.04 | ) | | 2.79 | | | 2.75 | | | – | | | (2.02 | ) | | (2.02) | | | 13.58 | | | 21.88 | | | 805,660 | | | 1.18 | | | 1.18 | | | 1.18 | | | (0.28 | ) | | 43 | |
| Royce Small-Cap Opportunity Fund–Service Class | | |
| 2022† | | $ | 15.34 | | $ | (0.03 | ) | $ | (3.38 | ) | $ | (3.41 | ) | $ | – | | $ | – | | $ | – | | $ | 11.93 | | | (22.23 | )%1 | $ | 72,842 | | | 1.55 | %2 | | 1.55 | %2 | | 1.49 | %2 | | (0.36 | )%2 | | 20 | % |
| 2021 | | | 14.66 | | | (0.11 | ) | | 4.39 | | | 4.28 | | | – | | | (3.60 | ) | | (3.60) | | | 15.34 | | | 30.43 | | | 109,440 | | | 1.50 | | | 1.50 | | | 1.49 | | | (0.61 | ) | | 69 | |
| 2020 | | | 11.61 | | | (0.06 | ) | | 3.11 | | | 3.05 | | | – | | | – | | | – | | | 14.66 | | | 26.27 | | | 131,725 | | | 1.54 | | | 1.54 | | | 1.49 | | | (0.54 | ) | | 53 | |
| 2019 | | | 9.23 | | | (0.09 | ) | | 2.65 | | | 2.56 | | | – | | | (0.18 | ) | | (0.18) | | | 11.61 | | | 27.79 | | | 46,032 | | | 1.55 | | | 1.55 | | | 1.49 | | | (0.77 | ) | | 47 | |
| 2018 | | | 12.66 | | | (0.07 | ) | | (2.42 | ) | | (2.49 | ) | | – | | | (0.94 | ) | | (0.94) | | | 9.23 | | | (20.14 | ) | | 48,797 | | | 1.52 | | | 1.52 | | | 1.49 | | | (0.59 | ) | | 47 | |
| 2017 | | | 12.02 | | | (0.08 | ) | | 2.61 | | | 2.53 | | | – | | | (1.89 | ) | | (1.89) | | | 12.66 | | | 21.46 | | | 96,663 | | | 1.53 | | | 1.53 | | | 1.49 | | | (0.61 | ) | | 43 | |
| THE ACCOMPANYING NOTES ARE AN INTEGRAL PART OF THESE FINANCIAL STATEMENTS | The Royce Funds 2022 Semiannual Report to Shareholders | 65 |
Financial Highlights
This table is presented to show selected data for a share outstanding throughout each year or other indicated period and to assist shareholders in evaluating a Fund’s performance for the periods presented. Per share amounts have been determined on the basis of the weighted average number of shares outstanding during the period.
| | | | | | | | | | | | | | | | | | | | | | | Ratio of Expenses to Average Net Assets | | | | | | |
| | | Net Asset
Value,
Beginning of
Period | | Net
Investment
Income (Loss) | | Net Realized and
Unrealized Gain (Loss)
on Investments and
Foreign Currency | | Total from
Investment
Operations | | Distributions
from Net
Investment
Income | | Distributions
from Net
Realized Gain on
Investments and
Foreign Currency | | Total
Distributions | | Net Asset Value,
End of Period | | Total Return | Net Assets,
End of Period (in thousands) | | Prior to Fee
Waivers, Expense
Reimbursements
and Balance Credits | | Prior to Fee
Waivers and
Expense
Reimbursements | | Net of Fee
Waivers and
Expense
Reimbursements | | Ratio of Net
Investment
Income (Loss) to
Average Net
Assets | | | Portfolio
Turnover
Rate | |
| Royce Small-Cap Opportunity Fund–Consultant Class | | |
| 2022† | | $ | 13.24 | | $ | (0.07 | ) | $ | (2.91 | ) | $ | (2.98 | ) | $ | – | | $ | – | | $ | – | | $ | 10.26 | | | (22.51 | )%1 | $ | 11,017 | | | 2.32 | %2 | | 2.32 | %2 | | 2.32 | %2 | | (1.18 | )%2 | | 20 | % |
| 2021 | | | 12.61 | | | (0.21 | ) | | 3.78 | | | 3.57 | | | – | | | (2.94 | ) | | (2.94) | | | 13.24 | | | 29.46 | | | 14,871 | | | 2.26 | | | 2.26 | | | 2.26 | | | (1.35 | ) | | 69 | |
| 2020 | | | 10.09 | | | (0.14 | ) | | 2.66 | | | 2.52 | | | – | | | – | | | – | | | 12.61 | | | 24.98 | | | 13,477 | | | 2.45 | | | 2.45 | | | 2.45 | | | (1.50 | ) | | 53 | |
| 2019 | | | 8.09 | | | (0.16 | ) | | 2.32 | | | 2.16 | | | – | | | (0.16 | ) | | (0.16) | | | 10.09 | | | 26.70 | | | 8,621 | | | 2.41 | | | 2.41 | | | 2.41 | | | (1.67 | ) | | 47 | |
| 2018 | | | 11.19 | | | (0.16 | ) | | (2.12 | ) | | (2.28 | ) | | – | | | (0.82 | ) | | (0.82) | | | 8.09 | | | (20.81 | ) | | 9,831 | | | 2.30 | | | 2.29 | | | 2.29 | | | (1.39 | ) | | 47 | |
| 2017 | | | 10.71 | | | (0.16 | ) | | 2.31 | | | 2.15 | | | – | | | (1.67 | ) | | (1.67) | | | 11.19 | | | 20.50 | | | 20,574 | | | 2.27 | | | 2.27 | | | 2.27 | | | (1.37 | ) | | 43 | |
| Royce Small-Cap Opportunity Fund–Institutional Class | | |
| 2022† | | $ | 17.21 | | $ | 0.00 | | $ | (3.79 | ) | $ | (3.79 | ) | $ | – | | $ | – | | $ | – | | $ | 13.42 | | | (22.02 | )%1 | $ | 215,631 | | | 1.11 | %2 | | 1.11 | %2 | | 1.11 | %2 | | 0.02 | %2 | | 20 | % |
| 2021 | | | 16.22 | | | (0.03 | ) | | 4.84 | | | 4.81 | | | – | | | (3.82 | ) | | (3.82) | | | 17.21 | | | 30.89 | | | 291,961 | | | 1.08 | | | 1.08 | | | 1.08 | | | (0.18 | ) | | 69 | |
| 2020 | | | 12.80 | | | (0.02 | ) | | 3.44 | | | 3.42 | | | – | | | – | | | – | | | 16.22 | | | 26.72 | | | 340,877 | | | 1.12 | | | 1.12 | | | 1.12 | | | (0.17 | ) | | 53 | |
| 2019 | | | 10.13 | | | (0.05 | ) | | 2.92 | | | 2.87 | | | – | | | (0.20 | ) | | (0.20) | | | 12.80 | | | 28.36 | | | 230,439 | | | 1.12 | | | 1.12 | | | 1.12 | | | (0.39 | ) | | 47 | |
| 2018 | | | 13.84 | | | (0.02 | ) | | (2.66 | ) | | (2.68 | ) | | – | | | (1.03 | ) | | (1.03) | | | 10.13 | | | (19.83 | ) | | 227,261 | | | 1.08 | | | 1.08 | | | 1.08 | | | (0.17 | ) | | 47 | |
| 2017 | | | 13.08 | | | (0.02 | ) | | 2.84 | | | 2.82 | | | – | | | (2.06 | ) | | (2.06) | | | 13.84 | | | 22.02 | | | 639,057 | | | 1.07 | | | 1.07 | | | 1.07 | | | (0.17 | ) | | 43 | |
| Royce Small-Cap Opportunity Fund–R Class | | |
| 2022† | | $ | 14.80 | | $ | (0.05 | ) | $ | (3.26 | ) | $ | (3.31 | ) | $ | – | | $ | – | | $ | – | | $ | 11.49 | | | (22.36 | )%1 | $ | 38,519 | | | 1.85 | %2 | | 1.85 | %2 | | 1.85 | %2 | | (0.71 | )%2 | | 20 | % |
| 2021 | | | 14.03 | | | (0.16 | ) | | 4.20 | | | 4.04 | | | – | | | (3.27 | ) | | (3.27) | | | 14.80 | | | 30.01 | | | 51,537 | | | 1.81 | | | 1.81 | | | 1.81 | | | (0.90 | ) | | 69 | |
| 2020 | | | 11.16 | | | (0.09 | ) | | 2.96 | | | 2.87 | | | – | | | – | | | – | | | 14.03 | | | 25.72 | | | 36,065 | | | 1.88 | | | 1.87 | | | 1.87 | | | (0.93 | ) | | 53 | |
| 2019 | | | 8.90 | | | (0.12 | ) | | 2.55 | | | 2.43 | | | – | | | (0.17 | ) | | (0.17) | | | 11.16 | | | 27.38 | | | 31,230 | | | 1.86 | | | 1.85 | | | 1.85 | | | (1.13 | ) | | 47 | |
| 2018 | | | 12.25 | | | (0.11 | ) | | (2.33 | ) | | (2.44 | ) | | – | | | (0.91 | ) | | (0.91) | | | 8.90 | | | (20.42 | ) | | 26,337 | | | 1.84 | | | 1.84 | | | 1.84 | | | (0.93 | ) | | 47 | |
| 2017 | | | 11.67 | | | (0.12 | ) | | 2.53 | | | 2.41 | | | – | | | (1.83 | ) | | (1.83) | | | 12.25 | | | 21.06 | | | 39,311 | | | 1.82 | | | 1.82 | | | 1.82 | | | (0.92 | ) | | 43 | |
| Royce Small-Cap Special Equity Fund–Investment Class | | |
| 2022† | | $ | 19.09 | | $ | 0.06 | | $ | (2.51 | ) | $ | (2.45 | ) | $ | – | | $ | – | | $ | – | | $ | 16.64 | | | (12.83 | )%1 | $ | 603,832 | | | 1.22 | %2 | | 1.22 | %2 | | 1.22 | %2 | | 0.68 | %2 | | 9 | % |
| 2021 | | | 18.22 | | | 0.17 | | | 3.86 | | | 4.03 | | | (0.20 | ) | | (2.96 | ) | | (3.16) | | | 19.09 | | | 22.50 | | | 755,338 | | | 1.20 | | | 1.20 | | | 1.20 | | | 0.82 | | | 42 | |
| 2020 | | | 17.59 | | | 0.27 | | | 1.03 | | | 1.30 | | | (0.26 | ) | | (0.41 | ) | | (0.67) | | | 18.22 | | | 7.43 | | | 702,556 | | | 1.23 | | | 1.23 | | | 1.23 | | | 1.68 | | | 39 | |
| 2019 | | | 17.43 | | | 0.21 | | | 1.98 | | | 2.19 | | | (0.21 | ) | | (1.82 | ) | | (2.03) | | | 17.59 | | | 12.63 | | | 819,015 | | | 1.21 | | | 1.21 | | | 1.21 | | | 0.99 | | | 20 | |
| 2018 | | | 21.79 | | | 0.23 | | | (2.31 | ) | | (2.08 | ) | | (0.22 | ) | | (2.06 | ) | | (2.28) | | | 17.43 | | | (9.86 | ) | | 909,113 | | | 1.18 | | | 1.18 | | | 1.18 | | | 1.04 | | | 21 | |
| 2017 | | | 22.02 | | | 0.13 | | | 1.56 | | | 1.69 | | | (0.12 | ) | | (1.80 | ) | | (1.92) | | | 21.79 | | | 7.87 | | | 1,142,224 | | | 1.17 | | | 1.17 | | | 1.17 | | | 0.54 | | | 15 | |
| Royce Small-Cap Special Equity Fund–Service Class | | |
| 2022† | | $ | 19.06 | | $ | 0.04 | | $ | (2.51 | ) | $ | (2.47 | ) | $ | – | | $ | – | | $ | – | | $ | 16.59 | | | (12.96 | )%1 | $ | 43,587 | | | 1.57 | %2 | | 1.57 | %2 | | 1.49 | %2 | | 0.40 | %2 | | 9 | % |
| 2021 | | | 18.19 | | | 0.12 | | | 3.85 | | | 3.97 | | | (0.16 | ) | | (2.94 | ) | | (3.10) | | | 19.06 | | | 22.19 | | | 57,738 | | | 1.54 | | | 1.54 | | | 1.46 | | | 0.57 | | | 42 | |
| 2020 | | | 17.56 | | | 0.24 | | | 1.04 | | | 1.28 | | | (0.24 | ) | | (0.41 | ) | | (0.65) | | | 18.19 | | | 7.29 | | | 46,671 | | | 1.60 | | | 1.60 | | | 1.39 | | | 1.49 | | | 39 | |
| 2019 | | | 17.41 | | | 0.16 | | | 1.99 | | | 2.15 | | | (0.17 | ) | | (1.83 | ) | | (2.00) | | | 17.56 | | | 12.40 | | | 60,070 | | | 1.58 | | | 1.58 | | | 1.39 | | | 0.80 | | | 20 | |
| 2018 | | | 21.76 | | | 0.20 | | | (2.33 | ) | | (2.13 | ) | | (0.18 | ) | | (2.04 | ) | | (2.22) | | | 17.41 | | | (10.13 | ) | | 62,706 | | | 1.51 | | | 1.50 | | | 1.39 | | | 0.88 | | | 21 | |
| 2017 | | | 21.98 | | | 0.08 | | | 1.56 | | | 1.64 | | | (0.07 | ) | | (1.79 | ) | | (1.86) | | | 21.76 | | | 7.66 | | | 108,001 | | | 1.50 | | | 1.50 | | | 1.39 | | | 0.32 | | | 15 | |
| 66 | The Royce Funds 2022 Semiannual Report to Shareholders | THE ACCOMPANYING NOTES ARE AN INTEGRAL PART OF THESE FINANCIAL STATEMENTS |
Financial Highlights
This table is presented to show selected data for a share outstanding throughout each year or other indicated period and to assist shareholders in evaluating a Fund’s performance for the periods presented. Per share amounts have been determined on the basis of the weighted average number of shares outstanding during the period.
| | | | | | | | | | | | | | | | | | | | | | | Ratio of Expenses to Average Net Assets | | | | | | |
| | | Net Asset
Value,
Beginning of
Period | | Net
Investment
Income (Loss) | | Net Realized and
Unrealized Gain (Loss)
on Investments and
Foreign Currency | | Total from
Investment
Operations | | Distributions
from Net
Investment
Income | | Distributions
from Net
Realized Gain on
Investments and
Foreign Currency | | Total
Distributions | | Net Asset Value,
End of Period | | Total Return | Net Assets,
End of Period (in thousands) | | Prior to Fee
Waivers, Expense
Reimbursements
and Balance Credits | | Prior to Fee
Waivers and
Expense
Reimbursements | | Net of Fee
Waivers and
Expense
Reimbursements | | Ratio of Net
Investment
Income (Loss) to
Average Net
Assets | | | Portfolio
Turnover
Rate | |
| Royce Small-Cap Special Equity Fund–Consultant Class | | |
| 2022† | | $ | 17.37 | | $ | (0.04 | ) | $ | (2.27 | ) | $ | (2.31 | ) | $ | – | | $ | – | | $ | – | | $ | 15.06 | | | (13.30 | )%1 | $ | 19,773 | | | 2.37 | %2 | | 2.37 | %2 | | 2.37 | %2 | | (0.48 | )%2 | | 9 | % |
| 2021 | | | 16.60 | | | (0.05 | ) | | 3.50 | | | 3.45 | | | (0.01 | ) | | (2.67 | ) | | (2.68) | | | 17.37 | | | 21.16 | | | 25,068 | | | 2.31 | | | 2.31 | | | 2.31 | | | (0.29 | ) | | 42 | |
| 2020 | | | 16.05 | | | 0.09 | | | 0.92 | | | 1.01 | | | (0.09 | ) | | (0.37 | ) | | (0.46) | | | 16.60 | | | 6.27 | | | 18,852 | | | 2.31 | | | 2.31 | | | 2.31 | | | 0.59 | | | 39 | |
| 2019 | | | 15.90 | | | (0.02 | ) | | 1.82 | | | 1.80 | | | (0.00 | ) | | (1.65 | ) | | (1.65) | | | 16.05 | | | 11.38 | | | 24,793 | | | 2.25 | | | 2.25 | | | 2.25 | | | (0.12 | ) | | 20 | |
| 2018 | | | 19.86 | | | 0.01 | | | (2.10 | ) | | (2.09 | ) | | (0.01 | ) | | (1.86 | ) | | (1.87) | | | 15.90 | | | (10.83 | ) | | 30,234 | | | 2.19 | | | 2.19 | | | 2.19 | | | 0.04 | | | 21 | |
| 2017 | | | 20.16 | | | (0.10 | ) | | 1.43 | | | 1.33 | | | – | | | (1.63 | ) | | (1.63) | | | 19.86 | | | 6.77 | | | 46,654 | | | 2.21 | | | 2.20 | | | 2.20 | | | (0.49 | ) | | 15 | |
| Royce Small-Cap Special Equity Fund–Institutional Class | | |
| 2022† | | $ | 18.92 | | $ | 0.07 | | $ | (2.49 | ) | $ | (2.42 | ) | $ | – | | $ | – | | $ | – | | $ | 16.50 | | | (12.79 | )%1 | $ | 128,716 | | | 1.11 | %2 | | 1.11 | %2 | | 1.11 | %2 | | 0.83 | %2 | | 9 | % |
| 2021 | | | 18.06 | | | 0.19 | | | 3.82 | | | 4.01 | | | (0.22 | ) | | (2.93 | ) | | (3.15) | | | 18.92 | | | 22.63 | | | 238,810 | | | 1.11 | | | 1.11 | | | 1.11 | | | 0.92 | | | 42 | |
| 2020 | | | 17.43 | | | 0.30 | | | 1.01 | | | 1.31 | | | (0.28 | ) | | (0.40 | ) | | (0.68) | | | 18.06 | | | 7.52 | | | 194,911 | | | 1.15 | | | 1.15 | | | 1.15 | | | 1.84 | | | 39 | |
| 2019 | | | 17.28 | | | 0.22 | | | 1.96 | | | 2.18 | | | (0.22 | ) | | (1.81 | ) | | (2.03) | | | 17.43 | | | 12.65 | | | 187,785 | | | 1.14 | | | 1.14 | | | 1.14 | | | 1.04 | | | 20 | |
| 2018 | | | 21.61 | | | 0.25 | | | (2.30 | ) | | (2.05 | ) | | (0.24 | ) | | (2.04 | ) | | (2.28) | | | 17.28 | | | (9.81 | ) | | 202,317 | | | 1.11 | | | 1.11 | | | 1.11 | | | 1.14 | | | 21 | |
| 2017 | | | 21.84 | | | 0.14 | | | 1.55 | | | 1.69 | | | (0.14 | ) | | (1.78 | ) | | (1.92) | | | 21.61 | | | 7.96 | | | 247,004 | | | 1.09 | | | 1.09 | | | 1.09 | | | 0.60 | | | 15 | |
| Royce Small-Cap Total Return Fund–Investment Class | | |
| 2022† | | $ | 8.78 | | $ | 0.04 | | $ | (1.23 | ) | $ | (1.19 | ) | $ | (0.04 | ) | $ | – | | $ | (0.04) | | $ | 7.55 | | | (13.63 | )%1 | $ | 640,521 | | | 1.23 | %2 | | 1.23 | %2 | | 1.23 | %2 | | 0.86 | %2 | | 32 | % |
| 2021 | | | 9.34 | | | 0.12 | | | 2.21 | | | 2.33 | | | (0.13 | ) | | (2.76 | ) | | (2.89) | | | 8.78 | | | 25.78 | | | 1,016,331 | | | 1.20 | | | 1.20 | | | 1.20 | | | 1.09 | | | 64 | |
| 2020 | | | 10.93 | | | 0.17 | | | 0.19 | | | 0.36 | | | (0.21 | ) | | (1.74 | ) | | (1.95) | | | 9.34 | | | 3.82 | | | 893,868 | | | 1.24 | | | 1.24 | | | 1.24 | | | 1.88 | | | 61 | |
| 2019 | | | 9.71 | | | 0.16 | | | 2.10 | | | 2.26 | | | (0.15 | ) | | (0.89 | ) | | (1.04) | | | 10.93 | | | 23.45 | | | 1,026,074 | | | 1.21 | | | 1.21 | | | 1.21 | | | 1.42 | | | 21 | |
| 2018 | | | 13.58 | | | 0.20 | | | (1.78 | ) | | (1.58 | ) | | (0.19 | ) | | (2.10 | ) | | (2.29) | | | 9.71 | | | (12.46 | ) | | 1,036,211 | | | 1.18 | | | 1.18 | | | 1.18 | | | 1.45 | | | 22 | |
| 2017 | | | 13.68 | | | 0.14 | | | 1.67 | | | 1.81 | | | (0.12 | ) | | (1.79 | ) | | (1.91) | | | 13.58 | | | 13.65 | | | 1,550,893 | | | 1.19 | | | 1.19 | | | 1.19 | | | 1.00 | | | 12 | |
| Royce Small-Cap Total Return Fund–Service Class | | |
| 2022† | | $ | 9.08 | | $ | 0.03 | | $ | (1.28 | ) | $ | (1.25 | ) | $ | (0.02 | ) | $ | – | | $ | (0.02) | | $ | 7.81 | | | (13.78 | )%1 | $ | 64,715 | | | 1.56 | %2 | | 1.56 | %2 | | 1.49 | %2 | | 0.67 | %2 | | 32 | % |
| 2021 | | | 9.62 | | | 0.09 | | | 2.28 | | | 2.37 | | | (0.07 | ) | | (2.84 | ) | | (2.91) | | | 9.08 | | | 25.54 | | | 80,478 | | | 1.52 | | | 1.52 | | | 1.49 | | | 0.78 | | | 64 | |
| 2020 | | | 11.27 | | | 0.16 | | | 0.18 | | | 0.34 | | | (0.19 | ) | | (1.80 | ) | | (1.99) | | | 9.62 | | | 3.51 | | | 69,634 | | | 1.55 | | | 1.55 | | | 1.49 | | | 1.64 | | | 61 | |
| 2019 | | | 9.97 | | | 0.13 | | | 2.16 | | | 2.29 | | | (0.08 | ) | | (0.91 | ) | | (0.99) | | | 11.27 | | | 23.08 | | | 77,177 | | | 1.52 | | | 1.52 | | | 1.49 | | | 1.13 | | | 21 | |
| 2018 | | | 13.88 | | | 0.16 | | | (1.82 | ) | | (1.66 | ) | | (0.11 | ) | | (2.14 | ) | | (2.25) | | | 9.97 | | | (12.71 | ) | | 83,368 | | | 1.52 | | | 1.52 | | | 1.48 | | | 1.15 | | | 22 | |
| 2017 | | | 13.98 | | | 0.10 | | | 1.69 | | | 1.79 | | | (0.07 | ) | | (1.82 | ) | | (1.89) | | | 13.88 | | | 13.24 | | | 97,854 | | | 1.49 | | | 1.48 | | | 1.48 | | | 0.72 | | | 12 | |
| Royce Small-Cap Total Return Fund–Consultant Class | |
| 2022† | | $ | 9.18 | | $ | (0.00 | ) | $ | (1.30 | ) | $ | (1.30 | ) | $ | – | | $ | – | | $ | – | | $ | 7.88 | | | (14.16 | )%1 | $ | 89,394 | | | 2.21 | %2 | | 2.21 | %2 | | 2.21 | %2 | | (0.05 | )%2 | | 32 | % |
| 2021 | | | 9.75 | | | 0.01 | | | 2.31 | | | 2.32 | | | (0.01 | ) | | (2.88 | ) | | (2.89) | | | 9.18 | | | 24.63 | | | 112,649 | | | 2.18 | | | 2.18 | | | 2.18 | | | 0.09 | | | 64 | |
| 2020 | | | 11.31 | | | 0.09 | | | 0.18 | | | 0.27 | | | (0.03 | ) | | (1.80 | ) | | (1.83) | | | 9.75 | | | 2.76 | | | 110,179 | | | 2.22 | | | 2.22 | | | 2.22 | | | 0.88 | | | 61 | |
| 2019 | | | 10.02 | | | 0.05 | | | 2.17 | | | 2.22 | | | (0.02 | ) | | (0.91 | ) | | (0.93) | | | 11.31 | | | 22.18 | | | 150,175 | | | 2.20 | | | 2.20 | | | 2.20 | | | 0.43 | | | 21 | |
| 2018 | | | 13.95 | | | 0.06 | | | (1.82 | ) | | (1.76 | ) | | (0.02 | ) | | (2.15 | ) | | (2.17) | | | 10.02 | | | (13.26 | ) | | 160,540 | | | 2.17 | | | 2.17 | | | 2.17 | | | 0.45 | | | 22 | |
| 2017 | | | 14.07 | | | 0.01 | | | 1.70 | | | 1.71 | | | – | | | (1.83 | ) | | (1.83) | | | 13.95 | | | 12.53 | | | 247,914 | | | 2.16 | | | 2.16 | | | 2.16 | | | 0.04 | | | 12 | |
| THE ACCOMPANYING NOTES ARE AN INTEGRAL PART OF THESE FINANCIAL STATEMENTS | The Royce Funds 2022 Semiannual Report to Shareholders | 67 |
Financial Highlights
This table is presented to show selected data for a share outstanding throughout each year or other indicated period and to assist shareholders in evaluating a Fund’s performance for the periods presented. Per share amounts have been determined on the basis of the weighted average number of shares outstanding during the period.
| | | | | | | | | | | | | | | | | | | | | | | Ratio of Expenses to Average Net Assets | | | | | | |
| | | Net Asset
Value,
Beginning of
Period | | Net
Investment
Income (Loss) | | Net Realized and
Unrealized Gain (Loss)
on Investments and
Foreign Currency | | Total from
Investment
Operations | | Distributions
from Net
Investment
Income | | Distributions
from Net
Realized Gain on
Investments and
Foreign Currency | | Total
Distributions | | Net Asset Value,
End of Period | | Total Return | Net Assets,
End of Period (in thousands) | | Prior to Fee
Waivers, Expense
Reimbursements
and Balance Credits | | Prior to Fee
Waivers and
Expense
Reimbursements | | Net of Fee
Waivers and
Expense
Reimbursements | | Ratio of Net
Investment
Income (Loss) to
Average Net
Assets | | | Portfolio
Turnover
Rate | |
| Royce Small-Cap Total Return Fund–Institutional Class | | | |
| 2022† | | $ | 8.61 | | $ | 0.04 | | $ | (1.20 | ) | $ | (1.16 | ) | $ | (0.04 | ) | $ | – | | $ | (0.04) | | $ | 7.41 | | | (13.55 | )%1 | $ | 186,865 | | | 1.12 | %2 | | 1.12 | %2 | | 1.12 | %2 | | 1.01 | %2 | | 32 | % |
| 2021 | | | 9.17 | | | 0.13 | | | 2.17 | | | 2.30 | | | (0.14 | ) | | (2.72 | ) | | (2.86) | | | 8.61 | | | 25.91 | | | 279,510 | | | 1.10 | | | 1.10 | | | 1.10 | | | 1.19 | | | 64 | |
| 2020 | | | 10.77 | | | 0.18 | | | 0.18 | | | 0.36 | | | (0.24 | ) | | (1.72 | ) | | (1.96) | | | 9.17 | | | 3.87 | | | 208,605 | | | 1.13 | | | 1.13 | | | 1.13 | | | 1.98 | | | 61 | |
| 2019 | | | 9.58 | | | 0.17 | | | 2.07 | | | 2.24 | | | (0.18 | ) | | (0.87 | ) | | (1.05) | | | 10.77 | | | 23.59 | | | 232,479 | | | 1.13 | | | 1.13 | | | 1.13 | | | 1.49 | | | 21 | |
| 2018 | | | 13.40 | | | 0.21 | | | (1.76 | ) | | (1.55 | ) | | (0.21 | ) | | (2.06 | ) | | (2.27) | | | 9.58 | | | (12.39 | ) | | 218,268 | | | 1.09 | | | 1.09 | | | 1.09 | | | 1.53 | | | 22 | |
| 2017 | | | 13.52 | | | 0.16 | | | 1.64 | | | 1.80 | | | (0.15 | ) | | (1.77 | ) | | (1.92) | | | 13.40 | | | 13.80 | | | 310,603 | | | 1.06 | | | 1.06 | | | 1.06 | | | 1.13 | | | 12 | |
| Royce Small-Cap Total Return Fund–R Class | | |
| 2022† | | $ | 9.20 | | $ | 0.01 | | $ | (1.30 | ) | $ | (1.29 | ) | $ | – | | $ | – | | $ | – | | $ | 7.91 | | | (14.02 | )%1 | $ | 20,455 | | | 1.91 | %2 | | 1.91 | %2 | | 1.91 | %2 | | 0.24 | %2 | | 32 | % |
| 2021 | | | 9.76 | | | 0.05 | | | 2.31 | | | 2.36 | | | (0.04 | ) | | (2.88 | ) | | (2.92) | | | 9.20 | | | 25.01 | | | 27,040 | | | 1.85 | | | 1.85 | | | 1.85 | | | 0.42 | | | 64 | |
| 2020 | | | 11.38 | | | 0.12 | | | 0.18 | | | 0.30 | | | (0.12 | ) | | (1.80 | ) | | (1.92) | | | 9.76 | | | 3.08 | | | 30,027 | | | 1.89 | | | 1.88 | | | 1.88 | | | 1.23 | | | 61 | |
| 2019 | | | 10.06 | | | 0.09 | | | 2.18 | | | 2.27 | | | (0.03 | ) | | (0.92 | ) | | (0.95) | | | 11.38 | | | 22.66 | | | 36,345 | | | 1.85 | | | 1.84 | | | 1.84 | | | 0.76 | | | 21 | |
| 2018 | | | 13.99 | | | 0.11 | | | (1.83 | ) | | (1.72 | ) | | (0.06 | ) | | (2.15 | ) | | (2.21) | | | 10.06 | | | (12.96 | ) | | 45,145 | | | 1.81 | | | 1.81 | | | 1.81 | | | 0.82 | | | 22 | |
| 2017 | | | 14.09 | | | 0.06 | | | 1.71 | | | 1.77 | | | (0.03 | ) | | (1.84 | ) | | (1.87) | | | 13.99 | | | 12.97 | | | 54,979 | | | 1.80 | | | 1.80 | | | 1.80 | | | 0.40 | | | 12 | |
| Royce Small-Cap Value Fund–Investment Class | | |
| 2022† | | $ | 10.43 | | $ | 0.02 | | $ | (2.02 | ) | $ | (2.00 | ) | $ | – | | $ | – | | $ | – | | $ | 8.43 | | | (19.18 | )%1 | $ | 34,084 | | | 1.35 | %2 | | 1.35 | %2 | | 1.24 | %2 | | 0.47 | %2 | | 37 | % |
| 2021 | | | 8.61 | | | 0.02 | | | 2.41 | | | 2.43 | | | (0.01 | ) | | (0.60 | ) | | (0.61) | | | 10.43 | | | 28.48 | | | 44,621 | | | 1.31 | | | 1.31 | | | 1.24 | | | 0.20 | | | 53 | |
| 2020 | | | 9.57 | | | 0.06 | | | (0.66 | ) | | (0.60 | ) | | (0.17 | ) | | (0.19 | ) | | (0.36) | | | 8.61 | | | (6.25 | ) | | 34,523 | | | 1.39 | | | 1.39 | | | 1.24 | | | 0.76 | | | 61 | |
| 2019 | | | 8.35 | | | 0.09 | | | 1.46 | | | 1.55 | | | (0.08 | ) | | (0.25 | ) | | (0.33) | | | 9.57 | | | 18.60 | | | 53,234 | | | 1.30 | | | 1.30 | | | 1.24 | | | 0.84 | | | 64 | |
| 2018 | | | 10.16 | | | 0.05 | | | (0.73 | ) | | (0.68 | ) | | (0.04 | ) | | (1.09 | ) | | (1.13) | | | 8.35 | | | (7.05 | ) | | 56,433 | | | 1.26 | | | 1.26 | | | 1.24 | | | 0.45 | | | 64 | |
| 2017 | | | 10.03 | | | 0.04 | | | 0.50 | | | 0.54 | | | (0.06 | ) | | (0.35 | ) | | (0.41) | | | 10.16 | | | 5.49 | | | 66,094 | | | 1.26 | | | 1.25 | | | 1.24 | | | 0.44 | | | 61 | |
| Royce Small-Cap Value Fund–Service Class | | |
| 2022† | | $ | 10.38 | | $ | 0.01 | | $ | (2.02 | ) | $ | (2.01 | ) | $ | – | | $ | – | | $ | – | | $ | 8.37 | | | (19.36 | )%1 | $ | 63,354 | | | 1.59 | %2 | | 1.59 | %2 | | 1.49 | %2 | | 0.22 | %2 | | 37 | % |
| 2021 | | | 8.58 | | | (0.01 | ) | | 2.41 | | | 2.40 | | | – | | | (0.60 | ) | | (0.60) | | | 10.38 | | | 28.24 | | | 81,840 | | | 1.55 | | | 1.55 | | | 1.49 | | | (0.06 | ) | | 53 | |
| 2020 | | | 9.54 | | | 0.04 | | | (0.66 | ) | | (0.62 | ) | | (0.15 | ) | | (0.19 | ) | | (0.34) | | | 8.58 | | | (6.47 | ) | | 75,502 | | | 1.62 | | | 1.62 | | | 1.49 | | | 0.50 | | | 61 | |
| 2019 | | | 8.33 | | | 0.07 | | | 1.44 | | | 1.51 | | | (0.05 | ) | | (0.25 | ) | | (0.30) | | | 9.54 | | | 18.21 | | | 102,465 | | | 1.56 | | | 1.55 | | | 1.49 | | | 0.65 | | | 64 | |
| 2018 | | | 10.12 | | | 0.02 | | | (0.72 | ) | | (0.70 | ) | | (0.01 | ) | | (1.08 | ) | | (1.09) | | | 8.33 | | | (7.17 | ) | | 111,855 | | | 1.53 | | | 1.53 | | | 1.49 | | | 0.19 | | | 64 | |
| 2017 | | | 9.98 | | | 0.02 | | | 0.50 | | | 0.52 | | | (0.03 | ) | | (0.35 | ) | | (0.38) | | | 10.12 | | | 5.27 | | | 152,232 | | | 1.51 | | | 1.51 | | | 1.49 | | | 0.17 | | | 61 | |
| Royce Small-Cap Value Fund–Consultant Class | | |
| 2022† | | $ | 9.06 | | $ | (0.04 | ) | $ | (1.75 | ) | $ | (1.79 | ) | $ | – | | $ | – | | $ | – | | $ | 7.27 | | | (19.76 | )%1 | $ | 3,561 | | | 2.67 | %2 | | 2.67 | %2 | | 2.67 | %2 | | (0.97 | )%2 | | 37 | % |
| 2021 | | | 7.57 | | | (0.11 | ) | | 2.11 | | | 2.00 | | | – | | | (0.51 | ) | | (0.51) | | | 9.06 | | | 26.75 | | | 5,269 | | | 2.66 | | | 2.66 | | | 2.66 | | | (1.22 | ) | | 53 | |
| 2020 | | | 8.44 | | | (0.05 | ) | | (0.60 | ) | | (0.65 | ) | | (0.06 | ) | | (0.16 | ) | | (0.22) | | | 7.57 | | | (7.71 | ) | | 3,899 | | | 2.74 | | | 2.73 | | | 2.73 | | | (0.71 | ) | | 61 | |
| 2019 | | | 7.40 | | | (0.04 | ) | | 1.30 | | | 1.26 | | | – | | | (0.22 | ) | | (0.22) | | | 8.44 | | | 17.03 | | | 7,486 | | | 2.44 | | | 2.44 | | | 2.44 | | | (0.50 | ) | | 64 | |
| 2018 | | | 9.06 | | | (0.06 | ) | | (0.64 | ) | | (0.70 | ) | | – | | | (0.96 | ) | | (0.96) | | | 7.40 | | | (8.07 | ) | | 9,641 | | | 2.35 | | | 2.34 | | | 2.34 | | | (0.66 | ) | | 64 | |
| 2017 | | | 8.98 | | | (0.06 | ) | | 0.45 | | | 0.39 | | | – | | | (0.31 | ) | | (0.31) | | | 9.06 | | | 4.44 | | | 13,111 | | | 2.32 | | | 2.32 | | | 2.32 | | | (0.66 | ) | | 61 | |
| 68 | The Royce Funds 2022 Semiannual Report to Shareholders | THE ACCOMPANYING NOTES ARE AN INTEGRAL PART OF THESE FINANCIAL STATEMENTS |
Financial Highlights
This table is presented to show selected data for a share outstanding throughout each year or other indicated period and to assist shareholders in evaluating a Fund’s performance for the periods presented. Per share amounts have been determined on the basis of the weighted average number of shares outstanding during the period.
| | | | | | | | | | | | | | | | | | | | | | | Ratio of Expenses to Average Net Assets | | | | | | |
| | | Net Asset
Value,
Beginning of
Period | | Net
Investment
Income (Loss) | | Net Realized and
Unrealized Gain (Loss)
on Investments and
Foreign Currency | | Total from
Investment
Operations | | Distributions
from Net
Investment
Income | | Distributions
from Net
Realized Gain on
Investments and
Foreign Currency | | Total
Distributions | | Net Asset Value,
End of Period | | Total Return | Net Assets,
End of Period (in thousands) | | Prior to Fee
Waivers, Expense
Reimbursements
and Balance Credits | | Prior to Fee
Waivers and
Expense
Reimbursements | | Net of Fee
Waivers and
Expense
Reimbursements | | Ratio of Net
Investment
Income (Loss) to
Average Net
Assets | | | Portfolio
Turnover
Rate | |
| Royce Small-Cap Value Fund–R Class | | |
| 2022† | | $ | 9.88 | | $ | (0.01 | ) | $ | (1.92 | ) | $ | (1.93 | ) | $ | – | | $ | – | | $ | – | | $ | 7.95 | | | (19.53 | )%1 | $ | 5,916 | | | 2.12 | %2 | | 2.12 | %2 | | 1.99 | %2 | | (0.29 | )%2 | | 37 | % |
| 2021 | | | 8.22 | | | (0.05 | ) | | 2.29 | | | 2.24 | | | – | | | (0.58 | ) | | (0.58) | | | 9.88 | | | 27.51 | | | 8,093 | | | 2.03 | | | 2.03 | | | 1.99 | | | (0.54 | ) | | 53 | |
| 2020 | | | 9.16 | | | (0.00 | ) | | (0.64 | ) | | (0.64 | ) | | (0.12 | ) | | (0.18 | ) | | (0.30) | | | 8.22 | | | (6.95 | ) | | 7,142 | | | 2.10 | | | 2.10 | | | 1.99 | | | (0.02 | ) | | 61 | |
| 2019 | | | 8.00 | | | 0.01 | | | 1.40 | | | 1.41 | | | (0.01 | ) | | (0.24 | ) | | (0.25) | | | 9.16 | | | 17.68 | | | 8,083 | | | 1.98 | | | 1.98 | | | 1.97 | | | 0.11 | | | 64 | |
| 2018 | | | 9.75 | | | (0.03 | ) | | (0.68 | ) | | (0.71 | ) | | – | | | (1.04 | ) | | (1.04) | | | 8.00 | | | (7.62 | ) | | 8,254 | | | 1.92 | | | 1.92 | | | 1.92 | | | (0.26 | ) | | 64 | |
| 2017 | | | 9.63 | | | (0.02 | ) | | 0.48 | | | 0.46 | | | – | | | (0.34 | ) | | (0 .34) | | | 9.75 | | | 4.81 | | | 14,620 | | | 1.88 | | | 1.88 | | | 1.88 | | | (0.21 | ) | | 61 | |
| Royce Smaller-Companies Growth Fund–Investment Class | | | |
| 2022† | | $ | 8.74 | | $ | (0.03 | ) | $ | (3.12 | ) | $ | (3.15 | ) | $ | – | | $ | – | | $ | – | | $ | 5.59 | | | (36.04 | )%1 | $ | 64,644 | | | 1.27 | %2 | | 1.27 | %2 | | 1.24 | %2 | | (0.97 | )%2 | | 41 | % |
| 2021 | | | 11.06 | | | (0.11 | ) | | 0.83 | | | 0.72 | | | – | | | (3.04 | ) | | (3.04) | | | 8.74 | | | 8.09 | | | 106,318 | | | 1.19 | | | 1.19 | | | 1.19 | | | (0.91 | ) | | 50 | |
| 2020 | | | 8.21 | | | (0.07 | ) | | 4.06 | | | 3.99 | | | – | | | (1.14 | ) | | (1.14) | | | 11.06 | | | 49.61 | | | 112,668 | | | 1.25 | | | 1.25 | | | 1.24 | | | (0.86 | ) | | 61 | |
| 2019 | | | 6.86 | | | (0.05 | ) | | 1.68 | | | 1.63 | | | – | | | (0.28 | ) | | (0.28) | | | 8.21 | | | 23.92 | | | 91,670 | | | 1.25 | | | 1.24 | | | 1.24 | | | (0.69 | ) | | 53 | |
| 2018 | | | 10.93 | | | (0.07 | ) | | (0.86 | ) | | (0.93 | ) | | – | | | (3.14 | ) | | (3.14) | | | 6.86 | | | (9.94 | ) | | 87,213 | | | 1.21 | | | 1.21 | | | 1.21 | | | (0.62 | ) | | 61 | |
| 2017 | | | 11.22 | | | (0.09 | ) | | 2.08 | | | 1.99 | | | – | | | (2.28 | ) | | (2.28) | | | 10.93 | | | 18.20 | | | 119,745 | | | 1.19 | | | 1.19 | | | 1.19 | | | (0.67 | ) | | 64 | |
| Royce Smaller-Companies Growth Fund–Service Class | | | |
| 2022† | | $ | 8.45 | | $ | (0.04 | ) | $ | (3.02 | ) | $ | (3.06 | ) | $ | – | | $ | – | | $ | – | | $ | 5.39 | | | (36.21 | )%1 | $ | 106,334 | | | 1.59 | %2 | | 1.59 | %2 | | 1.49 | %2 | | (1.22 | )%2 | | 41 | % |
| 2021 | | | 10.74 | | | (0.15 | ) | | 0.82 | | | 0.67 | | | – | | | (2.96 | ) | | (2.96) | | | 8.45 | | | 7.78 | | | 178,553 | | | 1.51 | | | 1.51 | | | 1.49 | | | (1.21 | ) | | 50 | |
| 2020 | | | 7.99 | | | (0.09 | ) | | 3.95 | | | 3.86 | | | – | | | (1.11 | ) | | (1.11) | | | 10.74 | | | 49.26 | | | 181,591 | | | 1.54 | | | 1.54 | | | 1.49 | | | (1.11 | ) | | 61 | |
| 2019 | | | 6.69 | | | (0.07 | ) | | 1.65 | | | 1.58 | | | – | | | (0.28 | ) | | (0.28) | | | 7.99 | | | 23.67 | | | 154,236 | | | 1.55 | | | 1.54 | | | 1.49 | | | (0.93 | ) | | 53 | |
| 2018 | | | 10.69 | | | (0.10 | ) | | (0.85 | ) | | (0.95 | ) | | – | | | (3.05 | ) | | (3.05) | | | 6.69 | | | (10.22 | ) | | 156,057 | | | 1.52 | | | 1.52 | | | 1.49 | | | (0.90 | ) | | 61 | |
| 2017 | | | 11.01 | | | (0.12 | ) | | 2.03 | | | 1.91 | | | – | | | (2.23 | ) | | (2.23) | | | 10.69 | | | 17.80 | | | 228,008 | | | 1.49 | | | 1.49 | | | 1.47 | | | (0.96 | ) | | 64 | |
| Royce Smaller-Companies Growth Fund–Consultant Class | | | |
| 2022† | | $ | 7.09 | | $ | (0.05 | ) | $ | (2.53 | ) | $ | (2.58 | ) | $ | – | | $ | – | | $ | – | | $ | 4.51 | | | (36.39 | )%1 | $ | 4,478 | | | 2.58 | %2 | | 2.58 | %2 | | 2.24 | %2 | | (1.97 | )%2 | | 41 | % |
| 2021 | | | 9.08 | | | (0.20 | ) | | 0.69 | | | 0.49 | | | – | | | (2.48 | ) | | (2.48) | | | 7.09 | | | 6.97 | | | 7,544 | | | 2.40 | | | 2.40 | | | 2.24 | | | (1.96 | ) | | 50 | |
| 2020 | | | 6.81 | | | (0.13 | ) | | 3.34 | | | 3.21 | | | – | | | (0.94 | ) | | (0.94) | | | 9.08 | | | 48.05 | | | 8,080 | | | 2.54 | | | 2.54 | | | 2.24 | | | (1.86 | ) | | 61 | |
| 2019 | | | 5.74 | | | (0.11 | ) | | 1.42 | | | 1.31 | | | – | | | (0.24 | ) | | (0.24) | | | 6.81 | | | 22.85 | | | 6,298 | | | 2.52 | | | 2.51 | | | 2.11 | | | (1.71 | ) | | 53 | |
| 2018 | | | 9.28 | | | (0.16 | ) | | (0.72 | ) | | (0.88 | ) | | – | | | (2.66 | ) | | (2.66) | | | 5.74 | | | (10.95 | ) | | 6,328 | | | 2.40 | | | 2.40 | | | 2.24 | | | (1.66 | ) | | 61 | |
| 2017 | | | 9.63 | | | (0.18 | ) | | 1.77 | | | 1.59 | | | – | | | (1.94 | ) | | (1.94) | | | 9.28 | | | 16.92 | | | 10,119 | | | 2.36 | | | 2.36 | | | 2.24 | | | (1.73 | ) | | 64 | |
| Royce Smaller-Companies Growth Fund–Institutional Class | | | |
| 2022† | | $ | 8.87 | | $ | (0.03 | ) | $ | (3.17 | ) | $ | (3.20 | ) | $ | – | | $ | – | | $ | – | | $ | 5.67 | | | (36.08 | )%1 | $ | 4,348 | | | 1.52 | %2 | | 1.52 | %2 | | 1.16 | %2 | | (0.90 | )%2 | | 41 | % |
| 2021 | | | 11.23 | | | (0.11 | ) | | 0.85 | | | 0.74 | | | – | | | (3.10 | ) | | (3.10) | | | 8.87 | | | 8.16 | | | 7,278 | | | 1.41 | | | 1.41 | | | 1.16 | | | (0.88 | ) | | 50 | |
| 2020 | | | 8.33 | | | (0.07 | ) | | 4.13 | | | 4.06 | | | – | | | (1.16 | ) | | (1.16) | | | 11.23 | | | 49.70 | | | 5,646 | | | 1.44 | | | 1.44 | | | 1.23 | | | (0.85 | ) | | 61 | |
| 2019 | | | 6.95 | | | (0.05 | ) | | 1.72 | | | 1.67 | | | – | | | (0.29 | ) | | (0.29) | | | 8.33 | | | 24.10 | | | 8,021 | | | 1.35 | | | 1.35 | | | 1.17 | | | (0.62 | ) | | 53 | |
| 2018 | | | 11.06 | | | (0.06 | ) | | (0.88 | ) | | (0.94 | ) | | – | | | (3.17 | ) | | (3.17) | | | 6.95 | | | (9.94 | ) | | 7,165 | | | 1.28 | | | 1.28 | | | 1.08 | | | (0.49 | ) | | 61 | |
| 2017 | | | 11.35 | | | (0.09 | ) | | 2.11 | | | 2.02 | | | – | | | (2.31 | ) | | (2.31) | | | 11.06 | | | 18.23 | | | 9,315 | | | 1.21 | | | 1.21 | | | 1.21 | | | (0.70 | ) | | 64 | |
| † | Six months ended June 30, 2022 (unaudited). |
| 3 | For Royce Global Financial Services Fund, a special distribution from ECN Capital resulted in an increase in net investment income (loss) per share of $0.12 per share and an increase in the ratio of net investment income (loss) to average net assets of 1.00% for the Service Class, and $0.18 per share and 1.14% for the Institutional Class. |
| a | The class commenced operations on May 2, 2018. |
| THE ACCOMPANYING NOTES ARE AN INTEGRAL PART OF THESE FINANCIAL STATEMENTS | The Royce Funds 2022 Semiannual Report to Shareholders | 69 |
Notes to Financial Statements (unaudited)
Summary of Significant Accounting Policies:
Royce Dividend Value Fund, Royce Global Financial Services Fund, Royce International Premier Fund, Royce Micro-Cap Fund, Royce Pennsylvania Mutual Fund, Royce Premier Fund, Royce Small-Cap Opportunity Fund, Royce Small-Cap Special Equity Fund, Royce Small-Cap Total Return Fund, Royce Small-Cap Value Fund and Royce Smaller-Companies Growth Fund (the “Fund” or “Funds”), are the eleven series of The Royce Fund (the “Trust”), an open-end management investment company organized as a Delaware statutory trust.
Classes of shares have equal rights as to earnings and assets, except that each class may bear different fees and expenses for distribution, shareholder servicing, registration and shareholder reports, and receive different compensating balance credits and expense reimbursements. Investment income, realized and unrealized capital gains or losses on investments and foreign currency, and expenses other than those attributable to a specific class are allocated to each class of shares based on its relative net assets.
The preparation of financial statements in conformity with accounting principles generally accepted in the United States requires management to make estimates and assumptions that affect the reported amounts of assets and liabilities and the disclosure of contingent assets and liabilities at the date of the financial statements and the reported amounts of income and expenses during the reporting period. Actual results could differ from those estimates.
Each Fund is an investment company and accordingly follows the investment company accounting and reporting guidance of the Financial Accounting Standards Board (FASB) Accounting Standard Codification Topic 946 “Financial Services-Investment Companies.”
Royce & Associates, LP, the Funds’ investment adviser, is a majority-owned subsidiary of Franklin Resources, Inc. and primarily conducts business using the name Royce Investment Partners (“Royce”). At June 30, 2022, officers and employees of Royce, Fund trustees, the Royce retirement plans and other affiliates owned more than 10% of the following Fund:
Royce Global Financial Services Fund 13%
VALUATION OF INVESTMENTS:
Securities are valued as of the close of trading on the New York Stock Exchange (“NYSE”) (generally 4:00 p.m. Eastern time) on the valuation date. Securities that trade on an exchange, and securities traded on Nasdaq’s Electronic Bulletin Board, are valued at their last reported sales price or Nasdaq official closing price taken from the primary market in which each security trades or, if no sale is reported for such day, at their highest bid price. Other over-the-counter securities for which market quotations are readily available are valued at their highest bid price, except in the case of some bonds and other fixed income securities which may be valued by reference to other securities with comparable ratings, interest rates and maturities, using established independent pricing services. The Funds value their non-U.S. dollar denominated securities in U.S. dollars daily at the prevailing foreign currency exchange rates as quoted by a major bank. Securities for which market quotations are not readily available are valued at their fair value in accordance with the provisions of the Investment Company Act of 1940 (“1940 Act”), under procedures approved by the Trust’s Board of Trustees, and are reported as Level 3 securities. As a general principle, the fair value of a security is the amount which the Fund might reasonably expect to receive for the security upon its current sale. However, in light of the judgment involved in fair valuations, there can be no assurance that a fair value assigned to a particular security will be the amount which the Fund might be able to receive upon its current sale. In addition, if, between the time trading ends on a particular security and the close of the customary trading session on the NYSE, events occur that are significant and may make the closing price unreliable, a Fund may fair value the security. The Funds use an independent pricing service to provide fair value estimates for relevant non-U.S. equity securities on days when the U.S. market volatility exceeds a certain threshold. This pricing service uses proprietary correlations it has developed between the movement of prices of non-U.S. equity securities and indices of U.S.-traded securities, futures contracts and other indications to estimate the fair value of relevant non-U.S. securities. When fair value pricing is employed, the prices of securities used by a Fund may differ from quoted or published prices for the same security. Investments in money market funds are valued at net asset value per share.
Various inputs are used in determining the value of each Fund’s investments, as noted above. These inputs are summarized in the three broad levels below:
| | Level 1 – | quoted prices in active markets for identical securities. |
| | Level 2 – | other significant observable inputs (including quoted prices for similar securities, foreign securities that may be fair valued and repurchase agreements). The table below includes all Level 2 securities. Level 2 securities with values based on quoted prices for similar securities and/or foreign securities that were fair valued are noted in the Schedules of Investments. |
| | Level 3 – | significant unobservable inputs (including last trade price before trading was suspended, or at a discount thereto for lack of marketability or otherwise, market price information regarding other securities, information received from the company and/or published documents, including SEC filings and financial statements, or other publicly available information). |
The inputs or methodology used for valuing securities are not necessarily an indication of the risk associated with investing in those securities.
70 | The Royce Funds 2022 Semiannual Report to Shareholders
VALUATION OF INVESTMENTS (continued):
The following is a summary of the inputs used to value each Fund’s investments as of June 30, 2022. For a detailed breakout of common stocks by sector classification or country, please refer to the Schedules of Investments.
| | | LEVEL 1 | | LEVEL 2 | | LEVEL 3 | | TOTAL |
| Royce Dividend Value Fund | | | | | | | | | | | | | | | | |
| Common Stocks | | $ | 53,856,948 | | | $ | – | | | $ | – | | | $ | 53,856,948 | |
| Repurchase Agreement | | | – | | | | 2,991,967 | | | | – | | | | 2,991,967 | |
| Royce Global Financial Services Fund | | | | | | | | | | | | | | | | |
| Common Stocks | | | 26,565,582 | | | | – | | | | – | | | | 26,565,582 | |
| Repurchase Agreement | | | – | | | | 745,598 | | | | – | | | | 745,598 | |
| Royce International Premier Fund | | | | | | | | | | | | | | | | |
| Common Stocks | | | 788,050,514 | | | | – | | | | – | | | | 788,050,514 | |
| Preferred Stocks | | | 17,767,824 | | | | – | | | | – | | | | 17,767,824 | |
| Repurchase Agreement | | | – | | | | 33,601,926 | | | | – | | | | 33,601,926 | |
| Royce Micro-Cap Fund | | | | | | | | | | | | | | | | |
| Common Stocks | | | 277,438,350 | | | | 906,589 | | | | 371,628 | | | | 278,716,567 | |
| Repurchase Agreement | | | – | | | | 10,105,370 | | | | – | | | | 10,105,370 | |
| Royce Pennsylvania Mutual Fund | | | | | | | | | | | | | | | | |
| Common Stocks | | | 1,560,740,731 | | | | 5,946,227 | | | | – | | | | 1,566,686,958 | |
| Repurchase Agreement | | | – | | | | 10,715,355 | | | | – | | | | 10,715,355 | |
| Money Market Fund/Collateral Received for Securities Loaned | | | 5,589,377 | | | | – | | | | – | | | | 5,589,377 | |
| Royce Premier Fund | | | | | | | | | | | | | | | | |
| Common Stocks | | | 1,260,054,826 | | | | 25,345,430 | | | | – | | | | 1,285,400,256 | |
| Repurchase Agreement | | | – | | | | 20,505,187 | | | | – | | | | 20,505,187 | |
| Royce Small-Cap Opportunity Fund | | | | | | | | | | | | | | | | |
| Common Stocks | | | 1,232,819,615 | | | | 4,626,060 | | | | 0 | | | | 1,237,445,675 | |
| Repurchase Agreement | | | – | | | | 52,529,343 | | | | – | | | | 52,529,343 | |
| Money Market Fund/Collateral Received for Securities Loaned | | | 3,656,275 | | | | – | | | | – | | | | 3,656,275 | |
| Royce Small-Cap Special Equity Fund | | | | | | | | | | | | | | | | |
| Common Stocks | | | 639,912,114 | | | | 1,223,420 | | | | – | | | | 641,135,534 | |
| Repurchase Agreement | | | – | | | | 155,841,086 | | | | – | | | | 155,841,086 | |
| Royce Small-Cap Total Return Fund | | | | | | | | | | | | | | | | |
| Common Stocks | | | 976,665,904 | | | | – | | | | – | | | | 976,665,904 | |
| Preferred Stocks | | | 17,688,849 | | | | – | | | | – | | | | 17,688,849 | |
| Repurchase Agreement | | | – | | | | 9,816,517 | | | | – | | | | 9,816,517 | |
| Royce Small-Cap Value Fund | | | | | | | | | | | | | | | | |
| Common Stocks | | | 103,390,155 | | | | – | | | | – | | | | 103,390,155 | |
| Repurchase Agreement | | | – | | | | 3,676,417 | | | | – | | | | 3,676,417 | |
| Money Market Fund/Collateral Received for Securities Loaned | | | 168,972 | | | | – | | | | – | | | | 168,972 | |
| Royce Smaller-Companies Growth Fund | | | | | | | | | | | | | | | | |
| Common Stocks | | | 172,611,956 | | | | – | | | | – | | | | 172,611,956 | |
| Repurchase Agreement | | | – | | | | 7,569,602 | | | | – | | | | 7,569,602 | |
| Money Market Fund/Collateral Received for Securities Loaned | | | 2,127,650 | | | | – | | | | – | | | | 2,127,650 | |
Level 3 Reconciliation:
| | | BALANCE AS OF
12/31/21 | PURCHASES | CORPORATE
ACTIONS | SALES | REALIZED
GAIN (LOSS) 1 | UNREALIZED
GAIN (LOSS) 1 | BALANCE AS OF
6/30/22 |
| Royce Micro-Cap Fund | | | | | | | | | | | | | | |
| Common Stocks | | $ | 666,497 | | | $ | – | | | $ | – | | | $ | 966,000 | | | $ | 319,352 | | | $ | 351,779 | | | $ | 371,628 | |
| Royce Pennsylvania Mutual Fund | | | | | | | | | | | | | | | | | | | | | | | | | | | | |
| Common Stocks | | | 0 | | | | – | | | | (10,862 | ) | | | – | | | | 10,862 | | | | – | | | | – | |
| Royce Small-Cap Opportunity Fund | | | | | | | | | | | | | | | | | | | | | | | | | | | | |
| Common Stocks | | | 49 | | | | – | | | | – | | | | – | | | | – | | | | (49 | ) | | | 0 | |
| Royce Small-Cap Total Return Fund | | | | | | | | | | | | | | | | | | | | | | | | | | | | |
| Common Stocks | | | 0 | | | | – | | | | – | | | | 0 | | | | 0 | | | | – | | | | – | |
| 1 | The net change in unrealized appreciation (depreciation) is included in the accompanying Statement of Operations. Change in unrealized appreciation (depreciation) includes net unrealized appreciation (depreciation) resulting from changes in investment values during the reporting period and the reversal of previously recorded unrealized appreciation (depreciation) when gains or losses are realized. Net realized gain (loss) from investments and foreign currency transactions is included in the accompanying Statement of Operations. |
The Royce Funds 2022 Semiannual Report to Shareholders | 71
Notes to Financial Statements (unaudited) (continued)
REPURCHASE AGREEMENTS:
The Funds may enter into repurchase agreements with institutions that the Funds’ investment adviser has determined are creditworthy. Each Fund restricts repurchase agreements to maturities of no more than seven days. Securities pledged as collateral for repurchase agreements, which are held until maturity of the repurchase agreements, are marked-to-market daily and maintained at a value at least equal to the principal amount of the repurchase agreement (including accrued interest). Repurchase agreements could involve certain risks in the event of default or insolvency of the counter-party, including possible delays or restrictions upon the ability of each Fund to dispose of its underlying securities. The remaining contractual maturities of repurchase agreements held by the Funds at June 30, 2022 are overnight and continuous.
FOREIGN CURRENCY:
Net realized foreign exchange gains or losses arise from sales and maturities of short-term securities, sales of foreign currencies, expiration of currency forward contracts, currency gains or losses realized between the trade and settlement dates on securities transactions, and the difference between the amounts of dividends, interest, and foreign withholding taxes recorded on each Fund’s books and the U.S. dollar equivalent of the amounts actually received or paid. Net unrealized foreign exchange gains and losses arise from changes in the value of assets and liabilities, other than investments in securities at the end of the reporting period, as a result of changes in foreign currency exchange rates.
The Funds do not isolate that portion of the results of operations resulting from fluctuations in foreign exchange rates on investments from the fluctuations arising from changes in market prices of securities held. Such fluctuations are included with the net realized and unrealized gain or loss on investments.
SECURITIES LENDING:
The Funds loan securities through a lending agent, State Street Bank and Trust Company, to qualified institutional investors for the purpose of earning additional income. The lending agent receives and holds collateral from such borrowers to secure their obligations to the Funds. Such loans must be secured at all times by collateral in an amount at least equal to the market value of the loaned securities. The market values of the loaned securities and the collateral fluctuate and are determined at the close of each business day by the lending agent. Borrowers are required to post additional collateral to the lending agent on the next succeeding business day in the event of a collateral shortfall. Counterparty risk is further reduced by loaning securities only to parties that participate in a Global Securities Lending Program organized and monitored by the lending agent and that are deemed by it to satisfy its requirements and by having the lending agent enter into securities lending agreements with such borrowers. The lending agent is not affiliated with Royce.
Collateral may be in the form of cash or U.S. Treasuries. Cash collateral is invested in certain money market pooled investment vehicles. The Funds record a liability in their respective Statements of Assets and Liabilities for the return of such cash collateral during periods in which securities are on loan. The Funds bear the risk of loss for any decrease in the market value of the loaned securities or the investments purchased with cash collateral received from the borrowers.
Pursuant to the agreement in place between the Funds and the lending agent, if a borrower fails to return loaned securities, and the cash collateral being maintained by the lending agent on behalf of such borrower is insufficient to cover the value of loaned securities and provided such collateral insufficiency is not the result of investment losses, the lending agent shall, at its option, either replace the loaned securities or pay the amount of the shortfall to the Funds. In the event of the bankruptcy of a borrower, the Funds could experience delay in recovering the loaned securities or only recover cash or a security of equivalent value.
Loans of securities generally do not have stated maturity dates, and the Funds may recall a security at any time. The Funds’ securities lending income consists of the income earned on investing cash collateral, plus any premium payments received for lending certain securities, less any rebates paid to borrowers and lending agent fees associated with the loan. Pursuant to the agreement in place between the Funds and the lending agent, the Funds are responsible for any shortfall in the event the value of the investments purchased with cash collateral is insufficient to pay the rebate fee to the borrower.
The following table presents cash collateral and the market value of securities on loan collateralized by cash collateral held by the Funds at June 30, 2022:
| | | CASH COLLATERAL1 | | SECURITIES ON LOAN COLLATERALIZED
BY CASH COLLATERAL | | NET AMOUNT |
| Royce Pennsylvania Mutual Fund | | | $ 5,589,377 | | | | $ (5,291,692 | ) | | | $ 297,685 | |
| Royce Small-Cap Opportunity Fund | | | 3,656,275 | | | | (3,483,760 | ) | | | 172,515 | |
| Royce Small-Cap Value Fund | | | 168,972 | | | | (165,874 | ) | | | 3,098 | |
| Royce Smaller-Companies Growth Fund | | | 2,127,650 | | | | (2,092,361 | ) | | | 35,289 | |
| 1 | Absent an event of default, assets and liabilities are presented gross and not offset in the Statements of Assets and Liabilities. The contractual maturity of cash collateral is overnight and continuous. |
72 | The Royce Funds 2022 Semiannual Report to Shareholders
SECURITIES LENDING (continued):
The following table presents non-cash collateral and the market value of securities on loan collateralized by non-cash collateral held by the Funds’ custodian at June 30, 2022:
| | | | | SECURITIES ON LOAN COLLATERALIZED | | |
| | NON-CASH COLLATERAL | | BY NON-CASH COLLATERAL | | NET AMOUNT |
| Royce Micro-Cap Fund | | $ | 3,406,652 | | | $ | (3,331,107 | ) | | $ | 75,545 | |
| Royce Pennsylvania Mutual Fund | | | 22,287,547 | | | | (21,803,142 | ) | | | 484,405 | |
| Royce Small-Cap Opportunity Fund | | | 12,363,500 | | | | (11,233,836 | ) | | | 1,129,664 | |
| Royce Smaller-Companies Growth Fund | | | 18,544,531 | | | | (18,149,567 | ) | | | 394,964 | |
DISTRIBUTIONS AND TAXES:
As qualified regulated investment companies under Subchapter M of the Internal Revenue Code, the Funds are not subject to income taxes to the extent that each Fund distributes substantially all of its taxable income for its fiscal year.
Royce Dividend Value Fund and Royce Small-Cap Total Return Fund pay any dividends from net investment income quarterly and make any distributions from net realized gains annually in December. The other Funds pay any dividends and capital gain distributions annually in December. Dividends from net investment income and distributions from capital gains are determined at a class level. Because federal income tax regulations differ from generally accepted accounting principles, income and capital gain distributions determined in accordance with tax regulations may differ from net investment income and realized gains recognized for financial reporting purposes. Accordingly, the character of distributions and composition of net assets for tax purposes differ from those reflected in the accompanying financial statements.
CAPITAL GAINS TAXES:
The Funds may be subject to a tax imposed on capital gains on securities of issuers domiciled in certain countries. The Funds record an estimated deferred tax liability for gains in these securities that have been held for less than one year. This amount, if any, is reported as deferred capital gains tax in the accompanying Statements of Assets and Liabilities, assuming those positions were disposed of at the end of the period, and accounted for as a reduction in the market value of the security.
INVESTMENT TRANSACTIONS AND RELATED INVESTMENT INCOME:
Investment transactions are accounted for on the trade date. Dividend income is recorded on the ex-dividend date. Non-cash dividend income is recorded at the fair market value of the securities received. Interest income is recorded on an accrual basis. Premiums and discounts on debt securities are amortized using the effective yield-to-maturity method. Realized gains and losses from investment transactions are determined on the basis of identified cost for book and tax purposes.
EXPENSES:
The Funds incur direct and indirect expenses. Expenses directly attributable to a Fund are charged to the Fund’s operations, while expenses applicable to more than one of the Royce Funds are allocated equitably. Certain personnel, occupancy costs and other administrative expenses related to all of the Royce Funds are allocated by Royce under an administration agreement and are included in administrative and office facilities and legal expenses.
COMPENSATING BALANCE CREDITS:
The Funds have arrangements with their custodian bank and transfer agent, whereby a portion of the custodian’s fee and transfer agent’s fee is paid indirectly by credits earned on a Fund’s cash on deposit with the bank and transfer agent. These deposit arrangements are an alternative to purchasing overnight investments. Conversely, a Fund pays interest to the custodian on any cash overdrafts, to the extent they are not offset by credits earned on positive cash balances.
LINE OF CREDIT:
The Funds, along with certain other Royce Funds, participate in a $65 million line of credit (“Credit Agreement”) with State Street Bank and Trust Company to be used for temporary or emergency purposes. This revolving Credit Agreement expires on October 7, 2022. Pursuant to the Credit Agreement, each participating Fund is liable for a portion of the commitment fee for the credit facility and for principal and interest payments related to borrowings made by that Fund. Borrowings under the Credit Agreement bear interest at a variable rate equal to the Applicable Rate plus the Applicable Margin. The term Applicable Rate means, for any day, a rate equal to the sum of (a) 0.10%, plus (b) the higher of (i) the Federal Funds Effective Rate for such day, or (ii) the Overnight Bank Funding Rate for such day. The term Applicable Margin means 1.25%. The Funds did not utilize the line of credit during the six months ended June 30, 2022.
The Royce Funds 2022 Semiannual Report to Shareholders | 73
Notes to Financial Statements (unaudited) (continued)
Capital Share Transactions (in dollars):
| | | | | | | | | | | | | | | | | |
| | | | | | | SHARES ISSUED FOR | | | | | | | | |
| | | | | | | REINVESTMENT | | | | | | NET INCREASE (DECREASE) FROM |
| | | SHARES SOLD | | OF DISTRIBUTIONS | | SHARES REDEEMED | | CAPITAL SHARE TRANSACTIONS |
| | | Six Months Ended | | | | Six Months Ended | | | | Six Months Ended | | | | Six Months Ended | | |
| | | 6/30/22 | | Year Ended | | 6/30/22 | | Year Ended | | 6/30/22 | | Year Ended | | 6/30/22 | | Year Ended |
| | | (unaudited) | | 12/31/21 | | (unaudited) | | 12/31/21 | | (unaudited) | | 12/31/21 | | (unaudited) | | 12/31/21 |
| Royce Dividend Value Fund | | | | | | | | | | | | | |
| Investment Class | | $ | 1,824,062 | | | $ | 4,059,720 | | | $ | 175,669 | | | $ | 6,255,221 | | | $ | (4,397,584 | ) | | $ | (12,328,934 | ) | | $ | (2,397,853 | ) | | $ | (2,013,993 | ) |
| Service Class | | | 63,335 | | | | 624,759 | | | | 22,523 | | | | 2,121,953 | | | | (1,418,573 | ) | | | (4,091,270 | ) | | | (1,332,715 | ) | | | (1,344,558 | ) |
| Consultant Class | | | 24,229 | | | | 17,465 | | | | – | | | | 149,739 | | | | (31,219 | ) | | | (98,159 | ) | | | (6,990 | ) | | | 69,045 | |
| Institutional Class | | | 19,357 | | | | 59,431 | | | | 3,612 | | | | 122,259 | | | | (44,630 | ) | | | (43,869 | ) | | | (21,661 | ) | | | 137,821 | |
| Royce Global Financial Services Fund | | | | | | | | | | | | | | | | | | | | | | | | | | | | | |
| Service Class | | | 364,390 | | | | 6,577,740 | | | | – | | | | 1,493,301 | | | | (3,029,381 | ) | | | (9,076,838 | ) | | | (2,664,991 | ) | | | (1,005,797 | ) |
| Institutional Class | | | 1,343 | | | | 392,172 | | | | – | | | | 490,070 | | | | (259,063 | ) | | | (6,217 | ) | | | (257,720 | ) | | | 876,025 | |
| Royce International Premier Fund | | | | | | | | | | | | | | | | | | | | | | | | | | | | | |
| Investment Class | | | 52,728,094 | | | | 116,385,707 | | | | – | | | | 17,304,166 | | | | (106,390,316 | ) | | | (146,158,506 | ) | | | (53,662,222 | ) | | | (12,468,633 | ) |
| Service Class | | | 1,868,827 | | | | 8,681,331 | | | | – | | | | 2,320,181 | | | | (10,366,172 | ) | | | (22,027,412 | ) | | | (8,497,345 | ) | | | (11,025,900 | ) |
| Consultant Class | | | 33,513 | | | | 238,697 | | | | – | | | | 302,929 | | | | (550,838 | ) | | | (1,437,849 | ) | | | (517,325 | ) | | | (896,223 | ) |
| Institutional Class | | | 53,816,422 | | | | 191,546,144 | | | | – | | | | 21,236,509 | | | | (73,747,739 | ) | | | (80,776,073 | ) | | | (19,931,317 | ) | | | 132,006,580 | |
| Royce Micro-Cap Fund | | | | | | | | | | | | | | | | | | | | | | | | | | | | | |
| Investment Class | | | 7,635,063 | | | | 26,166,336 | | | | – | | | | 35,324,986 | | | | (14,552,897 | ) | | | (37,741,646 | ) | | | (6,917,834 | ) | | | 23,749,676 | |
| Service Class | | | 1,237,122 | | | | 5,902,180 | | | | – | | | | 34,403,989 | | | | (12,391,701 | ) | | | (23,681,021 | ) | | | (11,154,579 | ) | | | 16,625,148 | |
| Consultant Class | | | 35,280 | | | | 91,238 | | | | – | | | | 2,788,315 | | | | (810,090 | ) | | | (2,114,078 | ) | | | (774,810 | ) | | | 765,475 | |
| Royce Pennsylvania Mutual Fund | | | | | | | | | | | | | | | | | | | | | | | | | | | | | |
| Investment Class | | | 32,171,673 | | | | 133,236,353 | | | | – | | | | 321,945,640 | | | | (99,205,008 | ) | | | (225,701,416 | ) | | | (67,033,335 | ) | | | 229,480,577 | |
| Service Class | | | 1,826,719 | | | | 77,966,809 | | | | – | | | | 16,976,489 | | | | (8,054,678 | ) | | | (89,179,394 | ) | | | (6,227,959 | ) | | | 5,763,904 | |
| Consultant Class | | | 931,423 | | | | 2,796,661 | | | | – | | | | 51,391,322 | | | | (14,384,267 | ) | | | (35,033,854 | ) | | | (13,452,844 | ) | | | 19,154,129 | |
| Institutional Class | | | 12,072,488 | | | | 108,306,266 | | | | – | | | | 43,369,949 | | | | (40,129,645 | ) | | | (107,814,269 | ) | | | (28,057,157 | ) | | | 43,861,946 | |
| R Class | | | 356,558 | | | | 1,794,969 | | | | – | | | | 2,135,458 | | | | (1,033,139 | ) | | | (2,111,593 | ) | | | (676,581 | ) | | | 1,818,834 | |
| Royce Premier Fund | | | | | | | | | | | | | | | | | | | | | | | | | | | | | |
| Investment Class | | | 43,259,019 | | | | 106,716,414 | | | | – | | | | 201,105,839 | | | | (132,366,084 | ) | | | (287,548,189 | ) | | | (89,107,065 | ) | | | 20,274,064 | |
| Service Class | | | 3,055,453 | | | | 14,435,396 | | | | – | | | | 6,046,944 | | | | (5,690,075 | ) | | | (12,048,579 | ) | | | (2,634,622 | ) | | | 8,433,761 | |
| Consultant Class | | | 102,246 | | | | 118,942 | | | | – | | | | 2,688,134 | | | | (1,268,279 | ) | | | (1,911,296 | ) | | | (1,166,033 | ) | | | 895,780 | |
| Institutional Class | | | 15,907,451 | | | | 88,840,619 | | | | – | | | | 46,812,431 | | | | (27,704,994 | ) | | | (120,919,662 | ) | | | (11,797,543 | ) | | | 14,733,388 | |
| R Class | | | 171,785 | | | | 333,549 | | | | – | | | | 1,430,819 | | | | (523,183 | ) | | | (2,971,274 | ) | | | (351,398 | ) | | | (1,206,906 | ) |
| Royce Small-Cap Opportunity Fund | | | | | | | | | | | | | | | | | | | | | | | | | | | | | |
| Investment Class | | | 214,209,778 | | | | 909,585,405 | | | | – | | | | 212,409,964 | | | | (315,525,350 | ) | | | (596,255,404 | ) | | | (101,315,572 | ) | | | 525,739,965 | |
| Service Class | | | 13,590,371 | | | | 115,744,785 | | | | – | | | | 19,323,015 | | | | (27,939,145 | ) | | | (176,700,574 | ) | | | (14,348,774 | ) | | | (41,632,774 | ) |
| Consultant Class | | | 1,090,024 | | | | 2,520,066 | | | | – | | | | 2,576,218 | | | | (1,701,804 | ) | | | (4,857,761 | ) | | | (611,780 | ) | | | 238,523 | |
| Institutional Class | | | 39,224,990 | | | | 187,501,000 | | | | – | | | | 54,524,149 | | | | (52,636,488 | ) | | | (325,587,852 | ) | | | (13,411,498 | ) | | | (83,562,703 | ) |
| R Class | | | 3,297,520 | | | | 19,167,914 | | | | – | | | | 9,409,270 | | | | (5,018,635 | ) | | | (14,565,113 | ) | | | (1,721,115 | ) | | | 14,012,071 | |
| Royce Small-Cap Special Equity Fund | | | | | | | | | | | | | | | | | | | | | | | | | | | | | |
| Investment Class | | | 36,260,762 | | | | 121,262,899 | | | | – | | | | 93,229,234 | | | | (94,816,998 | ) | | | (204,584,467 | ) | | | (58,556,236 | ) | | | 9,907,666 | |
| Service Class | | | 2,790,525 | | | | 17,100,065 | | | | – | | | | 7,161,186 | | | | (9,937,625 | ) | | | (15,075,774 | ) | | | (7,147,100 | ) | | | 9,185,477 | |
| Consultant Class | | | 635,386 | | | | 7,651,086 | | | | – | | | | 3,066,063 | | | | (2,749,730 | ) | | | (5,125,345 | ) | | | (2,114,344 | ) | | | 5,591,804 | |
| Institutional Class | | | 22,574,473 | | | | 56,739,669 | | | | – | | | | 23,784,552 | | | | (110,152,491 | ) | | | (46,905,182 | ) | | | (87,578,018 | ) | | | 33,619,039 | |
| Royce Small-Cap Total Return Fund | | | | | | | | | | | | | | | | | | | | | | | | | | | | | |
| Investment Class | | | 37,882,954 | | | | 165,781,541 | | | | 2,578,738 | | | | 229,840,473 | | | | (298,233,843 | ) | | | (240,787,980 | ) | | | (257,772,151 | ) | | | 154,834,034 | |
| Service Class | | | 7,655,089 | | | | 26,413,084 | | | | 153,000 | | | | 18,522,033 | | | | (12,826,327 | ) | | | (31,366,709 | ) | | | (5,018,238 | ) | | | 13,568,408 | |
| Consultant Class | | | 868,914 | | | | 1,295,728 | | | | – | | | | 25,379,612 | | | | (8,864,216 | ) | | | (21,836,127 | ) | | | (7,995,302 | ) | | | 4,839,213 | |
| Institutional Class | | | 82,027,985 | | | | 102,146,125 | | | | 971,618 | | | | 67,746,029 | | | | (140,041,296 | ) | | | (84,529,829 | ) | | | (57,041,693 | ) | | | 85,362,325 | |
| R Class | | | 1,572,535 | | | | 4,675,698 | | | | – | | | | 6,650,410 | | | | (4,676,318 | ) | | | (14,663,079 | ) | | | (3,103,783 | ) | | | (3,336,971 | ) |
| Royce Small-Cap Value Fund | | | | | | | | | | | | | | | | | | | | | | | | | | | | | |
| Investment Class | | | 1,063,749 | | | | 6,525,775 | | | | – | | | | 2,309,669 | | | | (3,218,636 | ) | | | (6,530,656 | ) | | | (2,154,887 | ) | | | 2,304,788 | |
| Service Class | | | 1,112,545 | | | | 2,982,199 | | | | – | | | | 4,167,486 | | | | (4,108,390 | ) | | | (16,534,978 | ) | | | (2,995,845 | ) | | | (9,385,293 | ) |
| Consultant Class | | | 491,061 | | | | 860,233 | | | | – | | | | 255,409 | | | | (1,178,036 | ) | | | (509,924 | ) | | | (686,975 | ) | | | 605,718 | |
| R Class | | | 443,946 | | | | 2,441,657 | | | | – | | | | 466,938 | | | | (1,113,739 | ) | | | (3,346,669 | ) | | | (669,793 | ) | | | (438,074 | ) |
| Royce Smaller-Companies Growth Fund | | | | | | | | | | | | | | | | | | | | | | | | | | | | | |
| Investment Class | | | 4,283,578 | | | | 31,489,085 | | | | – | | | | 19,936,818 | | | | (7,965,656 | ) | | | (40,246,678 | ) | | | (3,682,078 | ) | | | 11,179,225 | |
| Service Class | | | 1,418,452 | | | | 17,231,454 | | | | – | | | | 44,252,911 | | | | (10,866,715 | ) | | | (33,104,492 | ) | | | (9,448,263 | ) | | | 28,379,873 | |
| Consultant Class | | | 68,084 | | | | 23,195 | | | | – | | | | 1,908,240 | | | | (481,605 | ) | | | (1,103,977 | ) | | | (413,521 | ) | | | 827,458 | |
| Institutional Class | | | 1,452,396 | | | | 2,728,335 | | | | – | | | | 1,851,226 | | | | (1,992,936 | ) | | | (1,486,523 | ) | | | (540,540 | ) | | | 3,093,038 | |
74 | The Royce Funds 2022 Semiannual Report to Shareholders
Capital Share Transactions (in shares):
| | | | | | | SHARES ISSUED FOR | | | | | | | | |
| | | | | | | REINVESTMENT | | | | | | NET INCREASE (DECREASE) IN |
| | | SHARES SOLD | | OF DISTRIBUTIONS | | SHARES REDEEMED | | SHARES OUTSTANDING |
| | | Six Months Ended | | | | Six Months Ended | | | | Six Months Ended | | | | Six Months Ended | | |
| | | 6/30/22 | | Year Ended | | 6/30/22 | | Year Ended | | 6/30/22 | | Year Ended | | 6/30/22 | | Year Ended |
| | | (unaudited) | | 12/31/21 | | (unaudited) | | 12/31/21 | | (unaudited) | | 12/31/21 | | (unaudited) | | 12/31/21 |
| Royce Dividend Value Fund | | | | | | | | | | | | | |
| Investment Class | | | 321,761 | | | | 597,759 | | | | 33,133 | | | | 1,004,092 | | | | (759,617 | ) | | | (1,826,156 | ) | | | (404,723 | ) | | | (224,305 | ) |
| Service Class | | | 10,621 | | | | 87,469 | | | | 4,419 | | | | 327,936 | | | | (238,025 | ) | | | (583,911 | ) | | | (222,985 | ) | | | (168,506 | ) |
| Consultant Class | | | 3,298 | | | | 2,301 | | | | – | | | | 20,290 | | | | (4,271 | ) | | | (12,152 | ) | | | (973 | ) | | | 10,439 | |
| Institutional Class | | | 3,437 | | | | 8,971 | | | | 694 | | | | 19,950 | | | | (7,647 | ) | | | (6,700 | ) | | | (3,516 | ) | | | 22,221 | |
| Royce Global Financial Services Fund | | | | | | | | | | | | | | | | | | | | | | | | | | | | | |
| Service Class | | | 32,530 | | | | 529,857 | | | | – | | | | 127,089 | | | | (274,338 | ) | | | (720,226 | ) | | | (241,808 | ) | | | (63,280 | ) |
| Institutional Class | | | 94 | | | | 23,717 | | | | – | | | | 31,926 | | | | (17,340 | ) | | | (404 | ) | | | (17,246 | ) | | | 55,239 | |
| Royce International Premier Fund | | | | | | | | | | | | | | | | | | | | | | | | | | | | | |
| Investment Class | | | 3,453,447 | | | | 6,404,093 | | | | – | | | | 997,991 | | | | (7,238,684 | ) | | | (8,000,230 | ) | | | (3,785,237 | ) | | | (598,146 | ) |
| Service Class | | | 107,734 | | | | 399,923 | | | | – | | | | 111,708 | | | | (585,065 | ) | | | (1,011,419 | ) | | | (477,331 | ) | | | (499,788 | ) |
| Consultant Class | | | 1,771 | | | | 10,355 | | | | – | | | | 13,782 | | | | (30,626 | ) | | | (59,363 | ) | | | (28,855 | ) | | | (35,226 | ) |
| Institutional Class | | | 3,559,691 | | | | 10,502,184 | | | | – | | | | 1,224,006 | | | | (5,001,640 | ) | | | (4,372,610 | ) | | | (1,441,949 | ) | | | 7,353,580 | |
| Royce Micro-Cap Fund | | | | | | | | | | | | | | | | | | | | | | | | | | | | | |
| Investment Class | | | 694,721 | | | | 1,679,399 | | | | – | | | | 2,790,283 | | | | (1,273,561 | ) | | | (2,562,221 | ) | | | (578,840 | ) | | | 1,907,461 | |
| Service Class | | | 110,054 | | | | 390,449 | | | | – | | | | 2,792,531 | | | | (1,139,510 | ) | | | (1,591,829 | ) | | | (1,029,456 | ) | | | 1,591,151 | |
| Consultant Class | | | 4,057 | | | | 8,029 | | | | – | | | | 295,059 | | | | (99,317 | ) | | | (182,910 | ) | | | (95,260 | ) | | | 120,178 | |
| Royce Pennsylvania Mutual Fund | | | | | | | | | | | | | | | | | | | | | | | | | | | | | |
| Investment Class | | | 3,751,983 | | | | 11,535,799 | | | | – | | | | 34,918,649 | | | | (11,642,743 | ) | | | (19,375,279 | ) | | | (7,890,760 | ) | | | 27,079,169 | |
| Service Class | | | 214,257 | | | | 6,771,205 | | | | – | | | | 1,847,279 | | | | (944,089 | ) | | | (7,579,796 | ) | | | (729,832 | ) | | | 1,038,688 | |
| Consultant Class | | | 135,654 | | | | 313,298 | | | | – | | | | 7,137,684 | | | | (2,180,679 | ) | | | (3,852,945 | ) | | | (2,045,025 | ) | | | 3,598,037 | |
| Institutional Class | | | 1,392,875 | | | | 9,058,325 | | | | – | | | | 4,683,580 | | | | (5,017,790 | ) | | | (9,060,627 | ) | | | (3,624,915 | ) | | | 4,681,278 | |
| R Class | | | 44,640 | | | | 167,145 | | | | – | | | | 249,761 | | | | (132,574 | ) | | | (202,597 | ) | | | (87,934 | ) | | | 214,309 | |
| Royce Premier Fund | | | | | | | | | | | | | | | | | | | | | | | | | | | | | |
| Investment Class | | | 3,674,248 | | | | 7,384,195 | | | | – | | | | 16,011,612 | | | | (11,448,726 | ) | | | (19,450,154 | ) | | | (7,774,478 | ) | | | 3,945,653 | |
| Service Class | | | 272,722 | | | | 1,003,487 | | | | – | | | | 496,465 | | | | (506,090 | ) | | | (837,328 | ) | | | (233,368 | ) | | | 662,624 | |
| Consultant Class | | | 11,531 | | | | 10,306 | | | | – | | | | 277,413 | | | | (142,562 | ) | | | (166,627 | ) | | | (131,031 | ) | | | 121,092 | |
| Institutional Class | | | 1,323,758 | | | | 5,715,214 | | | | – | | | | 3,671,563 | | | | (2,366,005 | ) | | | (7,905,009 | ) | | | (1,042,247 | ) | | | 1,481,768 | |
| R Class | | | 16,486 | | | | 24,599 | | | | – | | | | 124,745 | | | | (50,250 | ) | | | (221,309 | ) | | | (33,764 | ) | | | (71,965 | ) |
| Royce Small-Cap Opportunity Fund | | | | | | | | | | | | | | | | | | | | | | | | | | | | | |
| Investment Class | | | 13,750,149 | | | | 46,829,638 | | | | – | | | | 13,325,594 | | | | (20,723,930 | ) | | | (30,327,827 | ) | | | (6,973,781 | ) | | | 29,827,405 | |
| Service Class | | | 988,230 | | | | 6,458,725 | | | | – | | | | 1,324,401 | | | | (2,021,193 | ) | | | (9,633,721 | ) | | | (1,032,963 | ) | | | (1,850,595 | ) |
| Consultant Class | | | 91,832 | | | | 165,086 | | | | – | | | | 204,462 | | | | (141,386 | ) | | | (314,729 | ) | | | (49,554 | ) | | | 54,819 | |
| Institutional Class | | | 2,453,998 | | | | 9,437,181 | | | | – | | | | 3,330,736 | | | | (3,348,513 | ) | | | (16,826,206 | ) | | | (894,515 | ) | | | (4,058,289 | ) |
| R Class | | | 244,632 | | | | 1,097,275 | | | | – | | | | 668,272 | | | | (376,410 | ) | | | (853,589 | ) | | | (131,778 | ) | | | 911,958 | |
| Royce Small-Cap Special Equity Fund | | | | | | | | | | | | | | | | | | | | | | | | | | | | | |
| Investment Class | | | 2,021,388 | | | | 5,959,352 | | | | – | | | | 4,996,208 | | | | (5,299,606 | ) | | | (9,958,593 | ) | | | (3,278,218 | ) | | | 996,967 | |
| Service Class | | | 154,781 | | | | 822,632 | | | | – | | | | 384,184 | | | | (556,804 | ) | | | (744,037 | ) | | | (402,023 | ) | | | 462,779 | |
| Consultant Class | | | 39,051 | | | | 400,306 | | | | – | | | | 180,463 | | | | (168,680 | ) | | | (273,618 | ) | | | (129,629 | ) | | | 307,151 | |
| Institutional Class | | | 1,260,963 | | | | 2,827,346 | | | | – | | | | 1,286,347 | | | | (6,082,949 | ) | | | (2,284,477 | ) | | | (4,821,986 | ) | | | 1,829,216 | |
| Royce Small-Cap Total Return Fund | | | | | | | | | | | | | | | | | | | | | | | | | | | | | |
| Investment Class | | | 4,540,341 | | | | 15,913,267 | | | | 322,451 | | | | 26,713,010 | | | | (35,726,867 | ) | | | (22,616,714 | ) | | | (30,864,075 | ) | | | 20,009,563 | |
| Service Class | | | 880,533 | | | | 2,344,739 | | | | 18,722 | | | | 2,085,738 | | | | (1,474,928 | ) | | | (2,801,404 | ) | | | (575,673 | ) | | | 1,629,073 | |
| Consultant Class | | | 100,807 | | | | 116,620 | | | | – | | | | 2,839,663 | | | | (1,035,866 | ) | | | (1,983,657 | ) | | | (935,059 | ) | | | 972,626 | |
| Institutional Class | | | 9,973,801 | | | | 9,428,489 | | | | 123,214 | | | | 8,018,807 | | | | (17,318,365 | ) | | | (7,744,779 | ) | | | (7,221,350 | ) | | | 9,702,517 | |
| R Class | | | 182,105 | | | | 409,104 | | | | – | | | | 740,127 | | | | (536,674 | ) | | | (1,286,978 | ) | | | (354,569 | ) | | | (137,747 | ) |
| Royce Small-Cap Value Fund | | | | | | | | | | | | | | | | | | | | | | | | | | | | | |
| Investment Class | | | 111,465 | | | | 669,061 | | | | – | | | | 230,276 | | | | (344,272 | ) | | | (630,400 | ) | | | (232,807 | ) | | | 268,937 | |
| Service Class | | | 119,171 | | | | 289,142 | | | | – | | | | 417,584 | | | | (438,918 | ) | | | (1,615,922 | ) | | | (319,747 | ) | | | (909,196 | ) |
| Consultant Class | | | 56,615 | | | | 94,431 | | | | – | | | | 29,324 | | | | (148,204 | ) | | | (56,758 | ) | | | (91,589 | ) | | | 66,997 | |
| R Class | | | 50,396 | | | | 246,103 | | | | – | | | | 49,151 | | | | (125,562 | ) | | | (344,878 | ) | | | (75,166 | ) | | | (49,624 | ) |
| Royce Smaller-Companies Growth Fund | | | | | | | | | | | | | | | | | | | | | | | | | | | | | |
| Investment Class | | | 604,823 | | | | 2,901,010 | | | | – | | | | 2,413,659 | | | | (1,195,754 | ) | | | (3,340,198 | ) | | | (590,931 | ) | | | 1,974,471 | |
| Service Class | | | 226,828 | | | | 1,426,653 | | | | – | | | | 5,538,537 | | | | (1,642,407 | ) | | | (2,744,346 | ) | | | (1,415,579 | ) | | | 4,220,844 | |
| Consultant Class | | | 11,692 | | | | 2,323 | | | | – | | | | 284,812 | | | | (82,552 | ) | | | (112,984 | ) | | | (70,860 | ) | | | 174,151 | |
| Institutional Class | | | 224,236 | | | | 214,208 | | | | – | | | | 220,910 | | | | (278,001 | ) | | | (117,034 | ) | | | (53,765 | ) | | | 318,084 | |
The Royce Funds 2022 Semiannual Report to Shareholders | 75
Notes to Financial Statements (unaudited) (continued)
Investment Adviser and Distributor:
INVESTMENT ADVISER:
Under the Trust’s investment advisory agreements with Royce, Royce is entitled to receive investment advisory fees in respect of each Fund that are computed daily and payable monthly. Royce has contractually agreed, without right of termination, to waive fees and/or reimburse expenses (excluding brokerage commissions, taxes, interest, litigation expenses, acquired fund fees and expenses, and other expenses not borne in the ordinary course of business) to the extent necessary to maintain certain Funds’ net annual operating expense ratios at specified levels through April 30, 2023. To the extent that they impacted net expenses for the six months ended June 30, 2022, the effects of those arrangements are shown below. See the Prospectuses for contractual waivers and expiration dates for all classes of all Funds.
| | | ANNUAL CONTRACTUAL | | | | | | | SIX MONTHS ENDED | |
| | | ADVISORY FEE AS A | COMMITTED NET ANNUAL OPERATING EXPENSE RATIO CAP | | JUNE 30, 2022 (UNAUDITED) | |
| | | PERCENTAGE OF AVERAGE | Investment | Service | Consultant | Institutional | | | | | Advisory fees | |
| | | NET ASSETS1 | Class | Class | Class | Class | R Class | Net advisory fees | | waived | |
| Royce Dividend Value Fund | | 0.85% | 1.09% | 1.34% | 2.09% | 1.09% | N/A | $ | 280,245 | | $ | – | |
| Royce Global Financial Services Fund | | 1.00% | N/A | 1.49%3 | N/A | 1.49%3 | N/A | | 162,840 | | | – | |
| Royce International Premier Fund | | 1.00% | 1.19% | 1.44% | 2.19% | 1.04% | N/A | | 4,618,700 | | | 443,783 | |
| Royce Micro-Cap Fund | | 1.00% | N/A | 1.49% | N/A | N/A | N/A | | 1,711,129 | | | – | |
| Royce Pennsylvania Mutual Fund | | 0.76%2 | N/A | N/A | N/A | N/A | 1.75%3 | | 6,966,739 | | | – | |
| Royce Premier Fund | | 1.00% | N/A | 1.49% | N/A | N/A | 1.99% | | 7,467,093 | | | – | |
| Royce Small-Cap Opportunity Fund | | 1.00% | N/A | 1.49% | N/A | N/A | N/A | | 7,918,071 | | | – | |
| Royce Small-Cap Special Equity Fund | | 1.00% | N/A | 1.49% | N/A | N/A | N/A | | 4,637,831 | | | – | |
| Royce Small-Cap Total Return Fund | | 1.00% | N/A | 1.49%3 | N/A | N/A | N/A | | 6,046,671 | | | – | |
| Royce Small-Cap Value Fund | | 1.00% | 1.24% | 1.49% | N/A | N/A | 1.99% | | 608,218 | | | – | |
| Royce Smaller-Companies Growth Fund | | 1.00% | 1.24% | 1.49% | 2.24% | 1.16% | N/A | | 1,102,763 | | | – | |
| 1 | From a base annual rate of 1.00% (0.85% for Royce Dividend Value Fund), the annual rates of investment advisory fees payable by each of the Funds, other than Royce Pennsylvania Mutual Fund, are reduced by the indicated amount at the following breakpoints applicable to a Fund’s net assets in excess of $2 billion: more than $2 billion to $3 billion – .05% per annum; more than $3 billion to $4 billion – .10% per annum; over $4 billion – .15% per annum. |
| 2 | Royce Pennsylvania Mutual Fund’s fees are calculated at the annual rate of 1.00% of the first $50 million of the Fund’s average net assets, 0.875% of the next $50 million of average net assets and 0.75% of average net assets in excess of $100 million. |
| 3 | Committed net annual operating expense ratio cap excludes acquired fund fees and expenses. |
DISTRIBUTOR:
Royce Fund Services, LLC (“RFS”), the distributor of the Trust’s shares, is a wholly owned subsidiary of Royce. RFS is entitled to receive distribution fees that are computed daily and payable monthly.
| | | ANNUAL CONTRACTUAL DISTRIBUTION FEE AS A | | SIX MONTHS ENDED JUNE 30, 2022 (UNAUDITED) |
| | | PERCENTAGE OF AVERAGE NET ASSETS | | Net distribution fees | | Distribution fees waived |
| Royce Dividend Value Fund – Service Class | | 0.25% | | $ | 20,933 | | | $ | – | |
| Royce Dividend Value Fund – Consultant Class | | 1.00% | | | 6,035 | | | | – | |
| Royce Global Financial Services Fund – Service Class | | 0.25% | | | 26,415 | | | | 3,602 | |
| Royce International Premier Fund – Service Class | | 0.25% | | | 55,695 | | | | – | |
| Royce International Premier Fund – Consultant Class | | 1.00% | | | 33,885 | | | | – | |
| Royce Micro-Cap Fund – Service Class | | 0.25% | | | 199,058 | | | | – | |
| Royce Micro-Cap Fund – Consultant Class | | 1.00% | | | 64,183 | | | | – | |
| Royce Pennsylvania Mutual Fund – Service Class | | 0.25% | | | 84,412 | | | | 3,517 | |
| Royce Pennsylvania Mutual Fund – Consultant Class | | 1.00% | | | 1,058,576 | | | | – | |
| Royce Pennsylvania Mutual Fund – R Class | | 0.50% | | | 20,258 | | | | – | |
| Royce Premier Fund – Service Class | | 0.25% | | | 38,391 | | | | – | |
| Royce Premier Fund – Consultant Class | | 1.00% | | | 67,980 | | | | – | |
| Royce Premier Fund – R Class | | 0.50% | | | 17,458 | | | | – | |
| Royce Small-Cap Opportunity Fund – Service Class | | 0.25% | | | 114,223 | | | | – | |
| Royce Small-Cap Opportunity Fund – Consultant Class | | 1.00% | | | 64,925 | | | | – | |
| Royce Small-Cap Opportunity Fund – R Class | | 0.50% | | | 115,003 | | | | – | |
| Royce Small-Cap Special Equity Fund – Service Class | | 0.25% | | | 62,758 | | | | – | |
| Royce Small-Cap Special Equity Fund – Consultant Class | | 1.00% | | | 111,322 | | | | – | |
| Royce Small-Cap Total Return Fund – Service Class | | 0.25% | | | 90,091 | | | | – | |
| Royce Small-Cap Total Return Fund – Consultant Class | | 1.00% | | | 509,552 | | | | – | |
| Royce Small-Cap Total Return Fund – R Class | | 0.50% | | | 58,972 | | | | – | |
| Royce Small-Cap Value Fund – Service Class | | 0.25% | | | 89,152 | | | | – | |
| Royce Small-Cap Value Fund – Consultant Class | | 1.00% | | | 23,224 | | | | – | |
| Royce Small-Cap Value Fund – R Class | | 0.50% | | | 17,134 | | | | – | |
| Royce Smaller-Companies Growth Fund – Service Class | | 0.25% | | | 163,539 | | | | – | |
| Royce Smaller-Companies Growth Fund – Consultant Class | | 1.00% | | | 27,308 | | | | – | |
76 | The Royce Funds 2022 Semiannual Report to Shareholders
Purchases and Sales of Investment Securities:
For the six months ended June 30, 2022, the costs of purchases and the proceeds from sales of investment securities, other than short-term securities and collateral received for securities loaned, were as follows:
| | | PURCHASES | | SALES1 |
| Royce Dividend Value Fund | | $ | 74,519 | | | $ | 4,073,959 | |
| Royce Global Financial Services Fund | | | 1,083,341 | | | | 764,176 | |
| Royce International Premier Fund | | | 155,941,469 | | | | 205,486,397 | |
| Royce Micro-Cap Fund | | | 23,540,221 | | | | 38,325,059 | |
| Royce Pennsylvania Mutual Fund | | | 499,357,739 | | | | 588,285,679 | |
| Royce Premier Fund | | | 183,157,565 | | | | 246,717,376 | |
| Royce Small-Cap Opportunity Fund | | | 308,328,547 | | | | 442,011,106 | |
| Royce Small-Cap Special Equity Fund | | | 66,490,785 | | | | 207,474,603 | |
| Royce Small-Cap Total Return Fund | | | 380,979,875 | | | | 654,097,480 | |
| Royce Small-Cap Value Fund | | | 44,219,938 | | | | 49,365,682 | |
| Royce Smaller-Companies Growth Fund | | | 89,088,675 | | | | 90,792,180 | |
| 1 | Excludes the value of securities delivered as a result of redemptions-in-kind. |
Cross trades were executed by the Funds pursuant to Rule 17a-7 under the 1940 Act. Cross trading is the buying or selling of portfolio securities between funds to which Royce serves as investment adviser. The Trust’s Chief Compliance Officer reviews such transactions each quarter for compliance with the requirements and restrictions set forth by Rule 17a-7, and reports the results of that review to the Board of Trustees. Cross trades for the six months ended June 30, 2022, were as follows:
| | | COSTS OF PURCHASES | | PROCEEDS FROM SALES | | REALIZED GAIN (LOSS) |
| Royce Pennsylvania Mutual Fund | | $ | 1,223,790 | | | $ | 7,811,024 | | | $ | 1,302,050 | |
| Royce Premier Fund | | | 408,000 | | | | – | | | | – | |
| Royce Small-Cap Special Equity Fund | | | – | | | | 492,947 | | | | 281,015 | |
| Royce Small-Cap Total Return Fund | | | – | | | | 8,318,213 | | | | (465,942 | ) |
| Royce Smaller-Companies Growth Fund | | | – | | | | 332,304 | | | | (364,554 | ) |
Redemptions-In-Kind:
The Funds may make payment for Fund shares redeemed wholly or in part by distributing portfolio securities to shareholders. The net realized gain will not be realized for tax purposes. For the six months ended June 30, 2022, the following fund had redemptions-in-kind:
| | | AMOUNT REDEEMED IN-KIND | | REALIZED GAIN |
| Royce Small-Cap Total Return Fund | | $ | 60,509,570 | | | $ | 17,406,328 | |
Class Specific Expenses:
Class specific expenses were as follows for the six months ended June 30, 2022:
| | | | | | | | | | | | | | | CLASS LEVEL |
| | | | | | | | | | | | | | | EXPENSES |
| | | | | | | | | | | | | | | | | | | | | | | | | | | REIMBURSED BY |
| | | NET DISTRIBUTION | | SHAREHOLDER | | SHAREHOLDER | | | | | | TRANSFER AGENT | | | | | | INVESTMENT |
| | | FEES | | SERVICING | | REPORTS | | REGISTRATION | | BALANCE CREDITS | | TOTAL | | ADVISER |
| Royce Dividend Value Fund – | | | | | | | | | | | | | | | | | | | | | | | | | | | | |
| Investment Class | | $ | – | | | $ | 35,057 | | | $ | 3,196 | | | $ | 9,007 | | | $ | (16 | ) | | $ | 47,244 | | | $ | 38,315 | |
Royce Dividend Value Fund –
Service Class | | | 20,933 | | | | 17,153 | | | | 1,018 | | | | 6,790 | | | | (9 | ) | | | 45,885 | | | | 21,762 | |
| Royce Dividend Value Fund – | | | | | | | | | | | | | | | | | | | | | | | | | | | | |
| Consultant Class | | | 6,035 | | | | 3,553 | | | | (465 | ) | | | 5,964 | | | | (1 | ) | | | 15,086 | | | | 8,827 | |
| Royce Dividend Value Fund – | | | | | | | | | | | | | | | | | | | | | | | | | | | | |
| Institutional Class | | | – | | | | 3,357 | | | | 30 | | | | 5,631 | | | | (1 | ) | | | 9,017 | | | | 8,860 | |
| | | | 26,968 | | | | 59,120 | | | | 3,779 | | | | 27,392 | | | | (27 | ) | | | | | | | 77,764 | |
| Royce Global Financial Services Fund – | | | | | | | | | | | | | | | | | | | | | | | | | | | | |
| Service Class | | | 26,415 | | | | 22,553 | | | | 2,478 | | | | 9,155 | | | | (12 | ) | | | 60,589 | | | | 45,787 | |
| Royce Global Financial Services Fund – | | | | | | | | | | | | | | | | | | | | | | | | | | | | |
| Institutional Class | | | – | | | | 3,309 | | | | 19 | | | | 6,611 | | | | – | | | | 9,939 | | | | 4,743 | |
| | | | 26,415 | | | | 25,862 | | | | 2,497 | | | | 15,766 | | | | (12 | ) | | | | | | | 50,530 | |
| Royce International Premier Fund – | | | | | | | | | | | | | | | | | | | | | | | | | | | | |
| Investment Class | | | – | | | | 246,976 | | | | 16,603 | | | | 13,750 | | | | (32 | ) | | | 277,297 | | | | – | |
| Royce International Premier Fund – | | | | | | | | | | | | | | | | | | | | | | | | | | | | |
| Service Class | | | 55,695 | | | | 43,681 | | | | 2,454 | | | | 6,504 | | | | (7 | ) | | | 108,327 | | | | 18,950 | |
| Royce International Premier Fund – | | | | | | | | | | | | | | | | | | | | | | | | | | | | |
| Consultant Class | | | 33,885 | | | | 6,265 | | | | 484 | | | | 5,949 | | | | (1 | ) | | | 46,582 | | | | 7,610 | |
| Royce International Premier Fund – | | | | | | | | | | | | | | | | | | | | | | | | | | | | |
| Institutional Class | | | – | | | | 102,882 | | | | 27,225 | | | | 13,044 | | | | (950 | ) | | | 142,201 | | | | 142,201 | |
| | | | 89,580 | | | | 399,804 | | | | 46,766 | | | | 39,247 | | | | (990 | ) | | | | | | | 168,761 | |
The Royce Funds 2022 Semiannual Report to Shareholders | 77
Notes to Financial Statements (unaudited) (continued)
Class Specific Expenses (continued):
| | | NET DISTRIBUTION
FEES | | SHAREHOLDER
SERVICING | | SHAREHOLDER
REPORTS | | REGISTRATION | | TRANSFER AGENT
BALANCE CREDITS | | TOTAL | | CLASS LEVEL
EXPENSES
REIMBURSED BY
INVESTMENT
ADVISER |
| Royce Micro-Cap Fund – Investment Class | | $ | – | | | $ | 91,878 | | | $ | 14,045 | | | $ | 9,332 | | | $ | (161 | ) | | $ | 115,094 | | | $ | – | |
| Royce Micro-Cap Fund – Service Class | | | 199,058 | | | | 139,868 | | | | 7,625 | | | | 9,973 | | | | (18 | ) | | | 356,506 | | | | 48,995 | |
| Royce Micro-Cap Fund – Consultant Class | | | 64,183 | | | | 9,312 | | | | 964 | | | | 6,095 | | | | (5 | ) | | | 80,549 | | | | – | |
| | | | 263,241 | | | | 241,058 | | | | 22,634 | | | | 25,400 | | | | (184 | ) | | | | | | | 48,995 | |
| Royce Pennsylvania Mutual Fund – Investment Class | | | – | | | | 538,544 | | | | 65,376 | | | | 16,490 | | | | (627 | ) | | | 619,783 | | | | – | |
| Royce Pennsylvania Mutual Fund – Service Class | | | 84,412 | | | | 60,944 | | | | 6,108 | | | | 8,717 | | | | (21 | ) | | | 160,160 | | | | – | |
| Royce Pennsylvania Mutual Fund – Consultant Class | | | 1,058,576 | | | | 83,845 | | | | 10,509 | | | | 8,818 | | | | (74 | ) | | | 1,161,674 | | | | – | |
| Royce Pennsylvania Mutual Fund – Institutional Class | | | – | | | | 18,393 | | | | 5,824 | | | | 9,730 | | | | (134 | ) | | | 33,813 | | | | – | |
| Royce Pennsylvania Mutual Fund – R Class | | | 20,258 | | | | 13,046 | | | | 824 | | | | 4,232 | | | | (6 | ) | | | 38,354 | | | | 1,785 | |
| | | | 1,163,246 | | | | 714,772 | | | | 88,641 | | | | 47,987 | | | | (862 | ) | | | | | | | 1,785 | |
| Royce Premier Fund – Investment Class | | | – | | | | 561,418 | | | | 47,660 | | | | 13,526 | | | | (290 | ) | | | 622,314 | | | | – | |
| Royce Premier Fund – Service Class | | | 38,391 | | | | 30,001 | | | | 4,504 | | | | 6,430 | | | | (20 | ) | | | 79,306 | | | | 17,042 | |
| Royce Premier Fund – Consultant Class | | | 67,980 | | | | 9,861 | | | | 764 | | | | 6,010 | | | | (5 | ) | | | 84,610 | | | | – | |
| Royce Premier Fund – Institutional Class | | | – | | | | 5,802 | | | | 15,920 | | | | 7,469 | | | | (19 | ) | | | 29,172 | | | | – | |
| Royce Premier Fund – R Class | | | 17,458 | | | | 11,057 | | | | 846 | | | | 2,444 | | | | (1 | ) | | | 31,804 | | | | 188 | |
| | | | 123,829 | | | | 618,139 | | | | 69,694 | | | | 35,879 | | | | (335 | ) | | | | | | | 17,230 | |
| Royce Small-Cap Opportunity Fund – Investment Class | | | – | | | | 759,729 | | | | 61,704 | | | | 31,274 | | | | (487 | ) | | | 852,220 | | | | – | |
| Royce Small-Cap Opportunity Fund – Service Class | | | 114,223 | | | | 79,154 | | | | 9,142 | | | | 9,222 | | | | (9 | ) | | | 211,732 | | | | 29,465 | |
| Royce Small-Cap Opportunity Fund – Consultant Class | | | 64,925 | | | | 8,123 | | | | 748 | | | | 5,911 | | | | (3 | ) | | | 79,704 | | | | – | |
| Royce Small-Cap Opportunity Fund – Institutional Class | | | – | | | | 9,542 | | | | 5,737 | | | | 10,186 | | | | (34 | ) | | | 25,431 | | | | – | |
| Royce Small-Cap Opportunity Fund – R Class | | | 115,003 | | | | 53,096 | | | | 991 | | | | 5,508 | | | | (6 | ) | | | 174,592 | | | | – | |
| | | | 294,151 | | | | 909,644 | | | | 78,322 | | | | 62,101 | | | | (539 | ) | | | | | | | 29,465 | |
| Royce Small-Cap Special Equity Fund – Investment Class | | | – | | | | 382,284 | | | | 28,018 | | | | 14,516 | | | | (238 | ) | | | 424,580 | | | | – | |
| Royce Small-Cap Special Equity Fund – Service Class | | | 62,758 | | | | 48,280 | | | | 2,706 | | | | 7,241 | | | | (7 | ) | | | 120,978 | | | | 20,207 | |
| Royce Small-Cap Special Equity Fund – Consultant Class | | | 111,322 | | | | 19,728 | | | | 5,893 | | | | 6,013 | | | | (44 | ) | | | 142,912 | | | | – | |
| Royce Small-Cap Special Equity Fund – Institutional Class | | | – | | | | 11,056 | | | | 9,827 | | | | 8,255 | | | | (88 | ) | | | 29,050 | | | | – | |
| | | | 174,080 | | | | 461,348 | | | | 46,444 | | | | 36,025 | | | | (377 | ) | | | | | | | 20,207 | |
| Royce Small-Cap Total Return Fund – Investment Class | | | – | | | | 446,147 | | | | 78,199 | | | | 15,647 | | | | (227 | ) | | | 539,766 | | | | – | |
| Royce Small-Cap Total Return Fund – Service Class | | | 90,091 | | | | 65,134 | | | | 3,568 | | | | 7,710 | | | | (24 | ) | | | 166,479 | | | | 24,624 | |
| Royce Small-Cap Total Return Fund – Consultant Class | | | 509,552 | | | | 44,035 | | | | 4,915 | | | | 7,183 | | | | (29 | ) | | | 565,656 | | | | – | |
| Royce Small-Cap Total Return Fund – Institutional Class | | | – | | | | 5,269 | | | | 14,126 | | | | 8,210 | | | | (8 | ) | | | 27,597 | | | | – | |
| Royce Small-Cap Total Return Fund – R Class | | | 58,972 | | | | 32,074 | | | | 1,639 | | | | 3,759 | | | | (10 | ) | | | 96,434 | | | | – | |
| | | | 658,615 | | | | 592,659 | | | | 102,447 | | | | 42,509 | | | | (298 | ) | | | | | | | 24,624 | |
| Royce Small-Cap Value Fund – Investment Class | | | – | | | | 29,258 | | | | 2,878 | | | | 7,401 | | | | (33 | ) | | | 39,504 | | | | 20,635 | |
| Royce Small-Cap Value Fund – Service Class | | | 89,152 | | | | 57,963 | | | | 4,844 | | | | 9,141 | | | | (15 | ) | | | 161,085 | | | | 37,362 | |
| Royce Small-Cap Value Fund – Consultant Class | | | 23,224 | | | | 5,947 | | | | 339 | | | | 5,883 | | | | (3 | ) | | | 35,390 | | | | – | |
| Royce Small-Cap Value Fund – R Class | | | 17,134 | | | | 11,877 | | | | 560 | | | | 3,831 | | | | (4 | ) | | | 33,398 | | | | 4,346 | |
| | | | 129,510 | | | | 105,045 | | | | 8,621 | | | | 26,256 | | | | (55 | ) | | | | | | | 62,343 | |
78 | The Royce Funds 2022 Semiannual Report to Shareholders
Class Specific Expenses (continued):
| | |
NET DISTRIBUTION
FEES | | SHAREHOLDER
SERVICING | | SHAREHOLDER
REPORTS | | REGISTRATION | | TRANSFER AGENT
BALANCE CREDITS | | TOTAL | | CLASS LEVEL
EXPENSES
REIMBURSED BY
INVESTMENT
ADVISER |
| Royce Smaller-Companies Growth Fund – Investment Class | | $ | – | | | $ | 40,249 | | | $ | 7,064 | | | $ | 8,533 | | | $ | (78 | ) | | $ | 55,768 | | | $ | 10,910 | |
| Royce Smaller-Companies Growth Fund – Service Class | | | 163,539 | | | | 120,135 | | | | 7,049 | | | | 11,047 | | | | (18 | ) | | | 301,752 | | | | 64,234 | |
| Royce Smaller-Companies Growth Fund – Consultant Class | | | 27,308 | | | | 5,860 | | | | 494 | | | | 6,027 | | | | (3 | ) | | | 39,686 | | | | 9,290 | |
| Royce Smaller-Companies Growth Fund – Institutional Class | | | – | | | | 3,547 | | | | 216 | | | | 5,892 | | | | (1 | ) | | | 9,654 | | | | 8,859 | |
| | | | 190,847 | | | | 169,791 | | | | 14,823 | | | | 31,499 | | | | (100 | ) | | | | | | | 93,293 | |
Tax Information:
At June 30, 2022, net unrealized appreciation (depreciation) based on identified cost for tax purposes was as follows:
| | | | | | | NET UNREALIZED APPRECIATION | | GROSS UNREALIZED |
| | | TAX BASIS COST | | (DEPRECIATION) | | Appreciation | | (Depreciation) |
| Royce Dividend Value Fund | | $ | 28,834,143 | | | $ | 28,014,772 | | | $ | 29,238,691 | | | $ | 1,223,919 | |
| Royce Global Financial Services Fund | | | 18,231,107 | | | | 9,080,073 | | | | 11,265,618 | | | | 2,185,545 | |
| Royce International Premier Fund | | | 969,199,254 | | | | (129,778,990 | ) | | | 75,469,090 | | | | 205,248,080 | |
| Royce Micro-Cap Fund | | | 260,867,119 | | | | 27,954,818 | | | | 74,227,885 | | | | 46,273,067 | |
| Royce Pennsylvania Mutual Fund | | | 1,330,705,097 | | | | 252,286,593 | | | | 374,250,570 | | | | 121,963,977 | |
| Royce Premier Fund | | | 948,070,043 | | | | 357,835,400 | | | | 438,961,678 | | | | 81,126,278 | |
| Royce Small-Cap Opportunity Fund | | | 1,304,907,015 | | | | (11,275,722 | ) | | | 202,160,439 | | | | 213,436,161 | |
| Royce Small-Cap Special Equity Fund | | | 702,823,085 | | | | 94,153,535 | | | | 116,583,958 | | | | 22,430,423 | |
| Royce Small-Cap Total Return Fund | | | 951,058,834 | | | | 53,112,436 | | | | 137,514,407 | | | | 84,401,971 | |
| Royce Small-Cap Value Fund | | | 101,785,971 | | | | 5,449,573 | | | | 12,912,418 | | | | 7,462,845 | |
| Royce Smaller-Companies Growth Fund | | | 183,634,744 | | | | (1,325,536 | ) | | | 29,152,535 | | | | 30,478,071 | |
The primary cause of the difference between book and tax basis cost is the timing of the recognition of losses on securities sold.
Transactions in Affiliated Companies:
An “Affiliated Company,” as defined in the 1940 Act, is a company in which a Fund owns 5% or more of the company’s outstanding voting securities at any time during the period. The following transactions were effected in shares of such companies for the six months ended June 30, 2022:
| AFFILIATED COMPANY 1 | | SHARES
12/31/21 | | MARKET
VALUE
12/31/21 | | COSTS OF
PURCHASES | | PROCEEDS
FROM SALES | | REALIZED
GAIN
(LOSS) | | | CHANGE IN NET
UNREALIZED
APPRECIATION
(DEPRECIATION) | | DIVIDEND
INCOME | | SHARES
6/30/22 | | MARKET
VALUE
6/30/22 | |
| Royce International Premier Fund | | | | | | | | | | | | | | | | | | | | | | | | | | | | |
| AUSTRALIA – 1.7% | | | | | | | | | | | | | | | | | | | | | | | | | | | | |
| Bravura Solutions 2 | | | 15,808,630 | | $ | 28,408,875 | | $ | 736,853 | | $ | 1,696,918 | | $ | (2,121,729 | ) | $ | (11,017,320 | ) | $ | 440,705 | | | 14,651,071 | | $ | 14,309,761 | |
| | | | | | | 28,408,875 | | | | | | | | | (2,121,729 | ) | | (11,017,320 | ) | | 440,705 | | | | | | 14,309,761 | |
| Royce Small-Cap Opportunity Fund | | | | | | | | | | | | | | | | | | | | | | | | | | | | |
| HEALTH CARE – 0.0% | | | | | | | | | | | | | | | | | | | | | | | | | | | | |
| HEALTH CARE EQUIPMENT & SUPPLIES – 0.0% | | | | | | | | | | | | | | | | | | | | | | | | | | | | |
| IntriCon Corporation 3,4 | | | 486,447 | | | 7,865,848 | | | – | | | 11,579,543 | | | 2,355,413 | | | 1,358,282 | | | – | | | | | | | |
| | | | | | | 7,865,848 | | | | | | | | | 2,355,413 | | | 1,358,282 | | | – | | | | | | | |
| INDUSTRIALS – 0.3% | | | | | | | | | | | | | | | | | | | | | | | | | | | | |
| CONSTRUCTION & ENGINEERING – 0.3% | | | | | | | | | | | | | | | | | | | | | | | | | | | | |
| Limbach Holdings 2,3 | | | 635,423 | | | 5,718,807 | | | 645,910 | | | – | | | – | | | (2,455,746 | ) | | – | | | 732,017 | | | 3,908,971 | |
| | | | | | | 5,718,807 | | | | | | | | | – | | | (2,455,746 | ) | | – | | | | | | 3,908,971 | |
| INFORMATION TECHNOLOGY – 0.3% | | | | | | | | | | | | | | | | | | | | | | | | | | | | |
| COMMUNICATIONS EQUIPMENT – 0.3% | | | | | | | | | | | | | | | | | | | | | | | | | | | | |
| PCTEL 2,3 | | | 1,000,593 | | | 5,673,362 | | | 231,848 | | | – | | | – | | | (1,605,013 | ) | | – | | | 1,051,393 | | | 4,300,197 | |
| | | | | | | 5,673,362 | | | | | | | | | – | | | (1,605,013 | ) | | – | | | | | | 4,300,197 | |
| | | | | | | 19,258,017 | | | | | | | | | 2,355,413 | | | (2,702,477 | ) | | – | | | | | | 8,209,168 | |
| Royce Small-Cap Special Equity Fund | | | | | | | | | | | | | | | | | | | | | | | | | | | | |
| CONSUMER DISCRETIONARY– 6.7% | | | | | | | | | | | | | | | | | | | | | | | | | | | | |
| AUTO COMPONENTS – 6.7% | | | | | | | | | | | | | | | | | | | | | | | | | | | | |
| Standard Motor Products 2 | | | 1,171,500 | | | 61,374,885 | | | 421,740 | | | – | | | – | | | (8,640,940 | ) | | 634,230 | | | 1,181,500 | | | 53,155,685 | |
The Royce Funds 2022 Semiannual Report to Shareholders | 79
Notes to Financial Statements (unaudited) (continued)
Transactions in Affiliated Companies (continued):
| AFFILIATED COMPANY 1 | SHARES 12/31/21 | | MARKET VALUE 12/31/21 | | COSTS OF PURCHASES | | PROCEEDS FROM SALES | | REALIZED GAIN (LOSS) | | CHANGE IN NET UNREALIZED APPRECIATION (DEPRECIATION) | | DIVIDEND INCOME | | SHARES 6/30/22 | | MARKET VALUE 6/30/22 | |
| Royce Small-Cap Special Equity Fund (continued) | | | | | | | | | | | | | | | | | | | | | | | | |
| CONSUMER DISCRETIONARY (continued) | | | | | | | | | | | | | | | | | | | | | | | | | | |
| HOUSEHOLD DURABLES – 0.0% | | | | | | | | | | | | | | | | | | | | | | | | | | |
| Flexsteel Industries 4 | | 767,500 | | $ | 20,615,050 | | $ | – | | $ | 14,352,219 | | $ | (13,061,794 | ) | $ | 6,798,963 | | $ | – | | | | | | |
| Hooker Furnishings 4 | | 1,137,000 | | | 26,469,360 | | | – | | | 21,153,315 | | | (7,013,961 | ) | | 1,697,916 | | | 220,000 | | | | | | |
| | | | | | 47,084,410 | | | | | | | | | (20,075,755 | ) | | 8,496,879 | | | 220,000 | | | | | | |
| | | | | | 108,459,295 | | | | | | | | | (20,075,755 | ) | | (144,061 | ) | | 854,230 | | | | $ | 53,155,685 | |
| INDUSTRIALS – 3.2% | | | | | | | | | | | | | | | | | | | | | | | | | | |
| MACHINERY – 3.2% | | | | | | | | | | | | | | | | | | | | | | | | | | |
| Gencor Industries 2,3 | | 1,066,000 | | | 12,290,980 | | | – | | | – | | | – | | | (1,460,420 | ) | | – | | 1,066,000 | | | 10,830,560 | |
| Hurco Companies 2 | | 580,000 | | | 17,226,000 | | | – | | | – | | | – | | | (2,876,800 | ) | | 174,000 | | 580,000 | | | 14,349,200 | |
| Miller Industries 4 | | 754,000 | | | 25,183,600 | | | 316,992 | | | 20,509,497 | | | (3,965,788 | ) | | (1,025,307 | ) | | 167,706 | | | | | | |
| | | | | | 54,700,580 | | | | | | | | | (3,965,788 | ) | | (5,362,527 | ) | | 341,706 | | | | | 25,179,760 | |
| INFORMATION TECHNOLOGY – 2.1% | | | | | | | | | | | | | | | | | | | | | | | | | | |
| SEMICONDUCTORS & SEMICONDUCTOR | | | | | | | | | | | | | | | | | | | | | | | | | | |
| EQUIPMENT – 2.1% | | | | | | | | | | | | | | | | | | | | | | | | | | |
| NVE Corporation 2 | | 300,100 | | | 20,496,830 | | | 3,063,342 | | | – | | | – | | | (6,870,212 | ) | | 653,000 | | 358,000 | | | 16,689,960 | |
| | | | | | 20,496,830 | | | | | | | | | – | | | (6,870,212 | ) | | 653,000 | | | | | 16,689,960 | |
| | | | | | 183,656,705 | | | | | | | | | (24,041,543 | ) | | (12,376,800 | ) | | 1,848,936 | | | | | 95,025,405 | |
| Royce Small-Cap Total Return Fund | | | | | | | | | | | | | | | | | | | | | | | | | | |
| FINANCIALS – 1.7% | | | | | | | | | | | | | | | | | | | | | | | | | | |
| INSURANCE – 1.7% | | | | | | | | | | | | | | | | | | | | | | | | | | |
| Trean Insurance Group 2,3 | | 2,821,597 | | | 25,140,429 | | | 4,172,397 | | | 6,621,908 | | | (6,225,805 | ) | | 879,139 | | | – | | 2,783,989 | | | 17,344,252 | |
| | | | | | 25,140,429 | | | | | | | | | (6,225,805 | ) | | 879,139 | | | – | | | | | 17,344,252 | |
| 1 | Percentages represent the percentages of the investments in the Affiliated Companies of the Fund’s net assets. |
| 2 | At June 30, 2022, the Fund owned 5% or more of the Company's outstanding voting securities thereby making the Company an Affiliated Company as that term is defined in the Investment Company Act of 1940. |
| 4 | Not an Affiliated Company as of June 30, 2022. |
Subsequent Events:
Subsequent events have been evaluated through the date the financial statements were issued.
Effective July 1, 2022, Royce Opportunity Fund became Royce Small-Cap Opportunity Fund, Royce Special Equity Fund became Royce Small-Cap Special Equity Fund and Royce Total Return Fund became Royce Small-Cap Total Return Fund. These name changes are reflected in the accompanying financial statements.
80 | The Royce Funds 2022 Semiannual Report to Shareholders
Understanding Your Fund’s Expenses (unaudited)
As a shareholder of a mutual fund, you pay ongoing expenses, including management fees and other Fund expenses including, for some funds, distribution and/or service (12b-1) fees. Using the information below, you can estimate how these ongoing expenses (in dollars) affect your investment and compare them with the ongoing expenses of other funds. You may also incur one-time transaction expenses, including redemption fees, which are not shown in this section and would result in higher total costs. The example is based on an investment of $1,000 invested at January 1, 2022, and held for the entire six-month period ended June 30, 2022. Service, Consultant and R Class shares are generally available only through certain brokers or retirement plan administrators who receive distribution and/or service fees from the Fund for services that they perform. Institutional Class shares are generally available only to institutions or intermediaries with a minimum account size of $1 million.
Actual Expenses
The first part of the table below provides information about actual account values and actual expenses. You may use the information in this section, together with the amount you invested, to estimate the expenses that you paid over the period. Simply divide your account value at June 30, 2022, by $1,000 (for example, an $8,600 account value divided by $1,000 = 8.6), then multiply the result by the number under the heading entitled “Expenses Paid During the Period” to estimate the expenses you paid on your account during this period.
Hypothetical Example for Comparison Purposes
The second part of the table below provides information about hypothetical account values and hypothetical expenses based on the Fund’s actual expense ratio and an assumed rate of return of 5% per year before expenses, which is not the Fund’s actual return. The hypothetical account values and expenses may not be used to estimate the actual ending account balance or expenses you paid for the period. You may use this information to compare the ongoing costs of investing in the Fund and other funds. To do so, compare this 5% hypothetical example with the 5% hypothetical examples that appear in the shareholder reports of the other funds.
Please note that the expenses shown in the table are meant to highlight your ongoing costs only and do not reflect any transactional costs, such as sales charges (loads), redemption fees, or exchange fees. Therefore, this section is useful in comparing ongoing costs only, and will not help you determine the relative total costs of owning different funds. In addition, if these transactional costs were included, your costs would have been higher.
| | | ACTUAL | | HYPOTHETICAL (5% PER YEAR BEFORE EXPENSES) | |
| | | Beginning Account
Value 1/1/22 | | Ending Account
Value 6/30/22 | | Expenses Paid
During the Period1 | | Beginning Account
Value 1/1/22 | | Ending Account
Value 6/30/22 | | Expenses Paid
During the Period1 | | Annualized
Expense Ratio2 |
| Investment Class | | | | | | | | | | | | | | | | | | | | | | |
| Royce Dividend Value Fund | | $ | 1,000.00 | | $ | 789.65 | | $ | 4.84 | | $ | 1,000.00 | | $ | 1,019.39 | | $ | 5.46 | | | 1.09 | % |
| Royce International Premier Fund | | | 1,000.00 | | | 731.05 | | | 5.06 | | | 1,000.00 | | | 1,018.94 | | | 5.91 | | | 1.18 | % |
| Royce Micro-Cap Fund | | | 1,000.00 | | | 720.36 | | | 5.29 | | | 1,000.00 | | | 1,018.65 | | | 6.21 | | | 1.24 | % |
| Royce Pennsylvania Mutual Fund3 | | | 1,000.00 | | | 787.56 | | | 4.17 | | | 1,000.00 | | | 1,020.13 | | | 4.71 | | | 0.94 | % |
| Royce Premier Fund | | | 1,000.00 | | | 808.02 | | | 5.33 | | | 1,000.00 | | | 1,018.89 | | | 5.96 | | | 1.19 | % |
| Royce Small-Cap Opportunity Fund | | | 1,000.00 | | | 779.24 | | | 5.47 | | | 1,000.00 | | | 1,018.65 | | | 6.21 | | | 1.24 | % |
| Royce Small-Cap Special Equity Fund | | | 1,000.00 | | | 871.66 | | | 5.66 | | | 1,000.00 | | | 1,018.74 | | | 6.11 | | | 1.22 | % |
| Royce Small-Cap Total Return Fund | | | 1,000.00 | | | 863.68 | | | 5.68 | | | 1,000.00 | | | 1,018.70 | | | 6.16 | | | 1.23 | % |
| Royce Small-Cap Value Fund | | | 1,000.00 | | | 808.25 | | | 5.56 | | | 1,000.00 | | | 1,018.65 | | | 6.21 | | | 1.24 | % |
| Royce Smaller-Companies Growth Fund | | | 1,000.00 | | | 639.59 | | | 5.04 | | | 1,000.00 | | | 1,018.65 | | | 6.21 | | | 1.24 | % |
| Service Class | | | | | | | | | | | | | | | | | | | | | | |
| Royce Dividend Value Fund | | | 1,000.00 | | | 789.51 | | | 5.95 | | | 1,000.00 | | | 1,018.15 | | | 6.71 | | | 1.34 | % |
| Royce Global Financial Services Fund | | | 1,000.00 | | | 777.78 | | | 6.57 | | | 1,000.00 | | | 1,017.41 | | | 7.45 | | | 1.49 | % |
| Royce International Premier Fund | | | 1,000.00 | | | 729.96 | | | 6.18 | | | 1,000.00 | | | 1,017.65 | | | 7.20 | | | 1.44 | % |
| Royce Micro-Cap Fund | | | 1,000.00 | | | 719.54 | | | 6.35 | | | 1,000.00 | | | 1,017.41 | | | 7.45 | | | 1.49 | % |
| Royce Pennsylvania Mutual Fund3 | | | 1,000.00 | | | 785.86 | | | 5.76 | | | 1,000.00 | | | 1,018.35 | | | 6.51 | | | 1.30 | % |
| Royce Premier Fund | | | 1,000.00 | | | 806.84 | | | 6.68 | | | 1,000.00 | | | 1,017.41 | | | 7.45 | | | 1.49 | % |
| Royce Small-Cap Opportunity Fund | | | 1,000.00 | | | 777.71 | | | 6.57 | | | 1,000.00 | | | 1,017.41 | | | 7.45 | | | 1.49 | % |
| Royce Small-Cap Special Equity Fund | | | 1,000.00 | | | 870.41 | | | 6.91 | | | 1,000.00 | | | 1,017.41 | | | 7.45 | | | 1.49 | % |
| Royce Small-Cap Total Return Fund | | | 1,000.00 | | | 862.24 | | | 6.88 | | | 1,000.00 | | | 1,017.41 | | | 7.45 | | | 1.49 | % |
| Royce Small-Cap Value Fund | | | 1,000.00 | | | 806.36 | | | 6.67 | | | 1,000.00 | | | 1,017.41 | | | 7.45 | | | 1.49 | % |
| Royce Smaller-Companies Growth Fund | | | 1,000.00 | | | 637.87 | | | 6.05 | | | 1,000.00 | | | 1,017.41 | | | 7.45 | | | 1.49 | % |
| Consultant Class | | | | | | | | | | | | | | | | | | | | | | |
| Royce Dividend Value Fund | | | 1,000.00 | | | 785.81 | | | 9.25 | | | 1,000.00 | | | 1,014.43 | | | 10.44 | | | 2.09 | % |
| Royce International Premier Fund | | | 1,000.00 | | | 727.19 | | | 9.38 | | | 1,000.00 | | | 1,013.93 | | | 10.94 | | | 2.19 | % |
| Royce Micro-Cap Fund | | | 1,000.00 | | | 716.00 | | | 10.04 | | | 1,000.00 | | | 1,013.09 | | | 11.78 | | | 2.36 | % |
| Royce Pennsylvania Mutual Fund3 | | | 1,000.00 | | | 783.53 | | | 8.62 | | | 1,000.00 | | | 1,015.12 | | | 9.74 | | | 1.95 | % |
| Royce Premier Fund | | | 1,000.00 | | | 804.00 | | | 10.42 | | | 1,000.00 | | | 1,013.24 | | | 11.63 | | | 2.33 | % |
| Royce Small-Cap Opportunity Fund | | | 1,000.00 | | | 774.92 | | | 10.21 | | | 1,000.00 | | | 1,013.29 | | | 11.58 | | | 2.32 | % |
| Royce Small-Cap Special Equity Fund | | | 1,000.00 | | | 867.01 | | | 10.97 | | | 1,000.00 | | | 1,013.04 | | | 11.83 | | | 2.37 | % |
| Royce Small-Cap Total Return Fund | | | 1,000.00 | | | 858.39 | | | 10.18 | | | 1,000.00 | | | 1,013.84 | | | 11.03 | | | 2.21 | % |
| Royce Small-Cap Value Fund | | | 1,000.00 | | | 802.43 | | | 11.93 | | | 1,000.00 | | | 1,011.55 | | | 13.32 | | | 2.67 | % |
| Royce Smaller-Companies Growth Fund | | | 1,000.00 | | | 636.11 | | | 9.09 | | | 1,000.00 | | | 1,013.69 | | | 11.18 | | | 2.24 | % |
The Royce Funds 2022 Semiannual Report to Shareholders | 81
Understanding Your Fund’s Expenses (unaudited) (continued)
| | | ACTUAL | | HYPOTHETICAL (5% PER YEAR BEFORE EXPENSES) | |
| | | Beginning Account
Value 1/1/22 | | Ending Account
Value 6/30/22 | | Expenses Paid
During the Period1 | | Beginning Account
Value 1/1/22 | | Ending Account
Value 6/30/22 | | Expenses Paid
During the Period1 | | Annualized
Expense Ratio2 |
| Institutional Class | | | | | | | | | | | | | | | | | | | | | | |
| Royce Dividend Value Fund | | $ | 1,000.00 | | $ | 790.75 | | $ | 4.84 | | $ | 1,000.00 | | $ | 1,019.39 | | $ | 5.46 | | | 1.09 | % |
| Royce Global Financial Services Fund | | | 1,000.00 | | | 777.92 | | | 6.57 | | | 1,000.00 | | | 1,017.41 | | | 7.45 | | | 1.49 | % |
| Royce International Premier Fund | | | 1,000.00 | | | 731.20 | | | 4.46 | | | 1,000.00 | | | 1,019.64 | | | 5.21 | | | 1.04 | % |
| Royce Pennsylvania Mutual Fund | | | 1,000.00 | | | 788.22 | | | 3.95 | | | 1,000.00 | | | 1,020.38 | | | 4.46 | | | 0.89 | % |
| Royce Premier Fund | | | 1,000.00 | | | 808.51 | | | 4.98 | | | 1,000.00 | | | 1,019.29 | | | 5.56 | | | 1.11 | % |
| Royce Small-Cap Opportunity Fund | | | 1,000.00 | | | 779.78 | | | 4.90 | | | 1,000.00 | | | 1,019.29 | | | 5.56 | | | 1.11 | % |
| Royce Small-Cap Special Equity Fund | | | 1,000.00 | | | 872.09 | | | 5.15 | | | 1,000.00 | | | 1,019.29 | | | 5.56 | | | 1.11 | % |
| Royce Small-Cap Total Return Fund | | | 1,000.00 | | | 864.47 | | | 5.18 | | | 1,000.00 | | | 1,019.24 | | | 5.61 | | | 1.12 | % |
| Royce Smaller-Companies Growth Fund | | | 1,000.00 | | | 639.23 | | | 4.71 | | | 1,000.00 | | | 1,019.04 | | | 5.81 | | | 1.16 | % |
| R Class | | | | | | | | | | | | | | | | | | | | | | |
| Royce Pennsylvania Mutual Fund | | | 1,000.00 | | | 784.12 | | | 7.74 | | | 1,000.00 | | | 1,016.12 | | | 8.75 | | | 1.75 | % |
| Royce Premier Fund | | | 1,000.00 | | | 804.90 | | | 8.91 | | | 1,000.00 | | | 1,014.93 | | | 9.94 | | | 1.99 | % |
| Royce Small-Cap Opportunity Fund | | | 1,000.00 | | | 776.35 | | | 8.15 | | | 1,000.00 | | | 1,015.62 | | | 9.25 | | | 1.85 | % |
| Royce Small-Cap Total Return Fund | | | 1,000.00 | | | 859.78 | | | 8.81 | | | 1,000.00 | | | 1,015.32 | | | 9.54 | | | 1.91 | % |
| Royce Small-Cap Value Fund | | | 1,000.00 | | | 804.66 | | | 8.90 | | | 1,000.00 | | | 1,014.93 | | | 9.94 | | | 1.99 | % |
| 1 | Expenses are equal to the Fund's annualized expense ratio multiplied by the average account value for the period, multiplied by 181 days in the most recent fiscal half-year divided by 365 days (to reflect the half-year period). |
| 2 | Annualized expense ratio used to derive figures in the table is based on the most recent fiscal half-year. |
| 3 | GiftShare accounts pay an annual $50 trustee fee to Alliance Trust Company, as trustee. If these fees were included above, your costs would be higher. |
82 | The Royce Funds 2022 Semiannual Report to Shareholders
Trustees and Officers
All Trustees and Officers may be reached c/o The Royce Funds, 745 Fifth Avenue, New York, NY 10151
Christopher D. Clark, Trustee 1, President
Age: 57 | Number of Funds Overseen: 16 | Tenure: Since 2014
Principal Occupation(s) During Past Five Years: Chief Executive Officer (since July 2016), President (since July 2014), Co-Chief Investment Officer (since January 2014), Managing Director of Royce, a Member of the Board of Managers of Royce, having been employed by Royce since May 2007.
Patricia W. Chadwick, Trustee
Age: 73 | Number of Funds Overseen: 16 | Tenure: Since 2009
Non-Royce Directorships: Trustee of Voya Mutual Funds
Principal Occupation(s) During Past 5 Years: Consultant and President, Ravengate Partners LLC (since 2000). Formerly Director, Wisconsin Energy Corp. (until 2022).
Christopher C. Grisanti, Trustee
Age: 60 | Number of Funds Overseen: 16 | Tenure: Since 2017
Non-Royce Directorships: None
Principal Occupation(s) During Past Five Years: Chief Equity Strategist and Senior Portfolio Manager, MAI Capital Management LLC (investment advisory firm) (since May 2020). Formerly Co-Founder and Chief Executive Officer, Grisanti Capital Management LLC (investment advisory firm) (from 1999 to 2020); Director of Research and Portfolio Manager, Spears Benzak, Salomon & Farrell (from 1994 to 1999); and Senior Associate, Simpson, Thacher & Bartlett (law firm) (from 1988 to 1994).
Cecile B. Harper, Trustee
Age: 59 | Number of Funds Overseen: 16 | Tenure: Since 2020
Non-Royce Directorships: None
Principal Occupation(s) During Past Five Years: Chief Financial Officer and Chief Operating Officer, College Foundation at the University of Virginia (since October 2019). Formerly Board Member, Pyramid Peak Foundation (January 2012 to 2022); Board Member, Regional One Health Foundation (from June 2013 to September 2019); and Principal, Southeastern Asset Management (from December 1993 to September 2019).
Arthur S. Mehlman, Trustee
Age: 80 | Number of Funds Overseen: 16 | Tenure: Since 2004
Non-Royce Directorships: None
Principal Occupation(s) During Past Five Years: Director, University of Maryland Foundation (non-profits). Formerly Director/Trustee, registered investment companies constituting the Legg Mason Funds (from 2002 to June 2021); Director, The League for People with Disabilities, Inc. (from June 2003 to June 2018); Director, Municipal Mortgage & Equity, LLC (from October 2004 to April 2011); Director, University of Maryland College Park Foundation (non-profit) (from 1998 to 2005); Director, Maryland Business Roundtable for Education (from July 1984 to June 2002); and Partner, KPMG LLP (international accounting firm) (from 1972 to 2002).
G. Peter O’Brien, Trustee
Age: 76 | Number of Funds Overseen: 75 | Tenure: Since 2001
Non-Royce Directorships: Director/Trustee of registered investment companies constituting the 59 Legg Mason Funds.
Principal Occupation(s) During Past Five Years: Trustee Emeritus, Colgate University (since 2005); and Emeritus Board Member, Hill House, Inc. (since 2019). Formerly Director, TICC Capital Corp. (from 2003-2017); Trustee, Colgate University (from 1996 to 2005); President, Hill House, Inc. (from 2001 to 2005); Board Member, Hill House, Inc. (from 1999 to 2019); Director, Bridges School (from 2006 to 2018); and Managing Director/Equity Capital Markets Group, Merrill Lynch & Co. (from 1971 to 1999).
Michael K. Shields, Trustee
Age: 64 | Number of Funds Overseen: 16 | Tenure: Since 2015
Non-Royce Directorships: None
Principal Occupation(s) During Past Five Years: President and Chief Executive Officer, Piedmont Trust Company (privately-owned North Carolina trust company) (since February 2012); Chairman, UNC Charlotte Investment Fund Board (since February 2016); and Chairman, Halftime Carolinas Board (since February 2011). Formerly Owner, Shields Advisors (investment consulting firm) (from April 2010 to June 2012); President and Chief Executive Officer, Eastover Capital Management (2005-2007); President and Chief Executive Officer, Campbell, Cowperthwait (investment subsidiary of U.S. Trust Corporation) (1997-2002); and equity portfolio manager and co-manager of Quality Growth Team, Scudder, Stevens and Clark (1992-1997).
Francis D. Gannon, Vice President
Age: 54 | Tenure: Since 2014
Principal Occupation(s) During Past Five Years: Co-Chief Investment Officer (since January 2014) and Managing Director of Royce, having been employed by Royce since September 2006.
Daniel A. O’Byrne, Vice President
Age: 60 | Tenure: Since 1994
Principal Occupation(s) During Past Five Years: Principal and Vice President of Royce, having been employed by Royce since October 1986.
Peter K. Hoglund, Treasurer
Age: 56 | Tenure: Since 2015
Principal Occupation(s) During Past Five Years: Chief Financial Officer, Chief Administrative Officer, and Managing Director of Royce, having been employed by Royce since December 2014. Prior to joining Royce, Mr. Hoglund spent more than 20 years with Munder Capital Management in Birmingham, MI, serving as Managing Director and Chief Financial Officer and overseeing all financial aspects of the firm. He began his career at Munder as a portfolio manager.
John E. Denneen, Secretary and Chief Legal Officer
Age: 55 | Tenure: 1996-2001 and Since 2002
Principal Occupation(s) During Past Five Years: General Counsel, Managing Director, and, since June 2015, a Member of the Board of Managers of Royce. Chief Legal and Compliance Officer and Secretary of Royce.
John P. Schwartz, Chief Compliance Officer
Age: 51 | Tenure: Since 2022
Principal Occupation(s) During Past Five Years: Chief Compliance Officer of The Royce Funds (since May 2022) and Associate General Counsel and Compliance Officer of Royce (since March 2013).
| 1 | Interested Trustee. |
| | | Trustees will hold office until their successors have been duly elected and qualified or until their earlier resignation or removal. The Statement of Additional Information, which contains additional information about the Trust’s trustees and officers, is available and can be obtained without charge at www.royceinvest.com or by calling (800) 221-4268. |
The Royce Funds 2022 Semiannual Report to Shareholders | 83
Board Approval of Investment Advisory Agreements
At meetings held on June 9-10, 2022, the Board of Trustees of The Royce Fund (the “Board”), including all of the non-interested trustees, approved the continuation of the investment advisory agreements between Royce & Associates, LP (“Royce”) and The Royce Fund (“TRF”) relating to each of Royce Pennsylvania Mutual Fund, Royce Micro-Cap Fund, Royce Premier Fund, Royce Total Return Fund, Royce Opportunity Fund, Royce Special Equity Fund, Royce Small-Cap Value Fund, Royce Smaller-Companies Growth Fund, Royce Dividend Value Fund, Royce Global Financial Services Fund, and Royce International Premier Fund (each, an “Agreement” and collectively, the “Agreements”). In reaching these decisions, the Board reviewed the materials provided by Royce, which included, among other things, information prepared internally by Royce and independently by Broadridge Financial Solutions, Inc. (“Broadridge”) using the database and methodology of Morningstar Associates, LLC (“Morningstar”) containing detailed investment advisory fee, expense ratio, and investment performance comparisons for each series of TRF listed above (each, a “Fund” and collectively, the “Funds”) with other mutual funds in its “peer group” and “category”, information regarding the past performance of the Funds and other registered investment companies managed by Royce and a memorandum outlining the legal duties of the Board prepared by independent counsel to the non-interested trustees. Royce also provided the trustees with an analysis of its profitability with respect to providing investment advisory services to each of the Funds. In addition, the Board took into account information furnished throughout the year at regular Board meetings, including reports on investment performance, shareholder services, distribution fees and expenses, regulatory compliance, brokerage commissions and research, brokerage and other execution products and services provided to the Funds. The Board also considered other matters it deemed important to the approval process such as allocation of brokerage commissions, “soft dollar” research services Royce receives, payments made to affiliates of Royce, as well as payments made by Royce, relating to distribution of Fund shares, and other direct and indirect benefits to Royce and its affiliates, from their relationship with the Funds. The trustees also met throughout the year with investment advisory personnel from Royce. The Board also noted Royce’s efforts to provide enhanced analytical tools to its investment staff along with the ongoing meetings conducted by Royce’s Co-Chief Investment Officers with portfolio managers experiencing performance challenges in an attempt to address such challenges. The Board, in its deliberations, recognized that, for many of the Funds’ shareholders, the decision to purchase Fund shares included a decision to select Royce as the investment adviser and that there was a strong association in the minds of Fund shareholders between Royce and each Fund. In considering factors relating to the approval of the continuance of the Agreement for each Fund, the non-interested trustees received assistance and advice from, and met separately with, their independent legal counsel. While continuation of the investment advisory and administrative arrangements for each Fund was considered at the same Board meeting, the trustees considered the circumstances and interests of each Fund separately. Among other factors, the trustees noted that they considered the following:
The nature, extent and quality of services provided by Royce
The Board considered the following factors to be of fundamental importance to their consideration of whether to approve the continuance of the Agreement for each Fund: (i) Royce’s more than 45 years of value investing experience and track record; (ii) the history of long-tenured Royce portfolio managers managing the Funds; (iii) Royce’s focus on mid-cap, small-cap and micro-cap value investing; (iv) the consistency of Royce’s approach to managing each Fund, other open-end mutual funds, and closed-end funds over more than 45 years; (v) the integrity and high ethical standards adhered to at Royce; (vi) Royce’s specialized experience in the area of trading small-and micro-cap securities; (vii) Royce’s historical ability to attract and retain portfolio management, research, and analytical talent (and, in this regard, considered the effort and resources Royce had committed to acquiring portfolio management, research, and analytical talent during the preceding few years); and (viii) Royce’s focus on shareholder interests as exemplified by capping expenses on smaller funds, closing funds to new investors when Royce believed such closings were in the best interests of existing shareholders, establishing breakpoints for a number of funds and providing expansive shareholder reporting and communications. The Board also noted that Royce’s compensation policy arrangements strongly encourage portfolio manager investment in each fund that they manage. The Board reviewed the services that Royce provides to the Funds, including, but not limited to, managing each Fund’s investments in accordance with the stated policies of each Fund. The Board considered the fact that Royce provided certain administrative services to the Funds at cost pursuant to the Administration Agreement between Royce and TRF, on behalf of each Fund. The Board determined that the services to be provided to each Fund by Royce would be the same as those that it previously provided to each Fund. The Board also took into consideration the histories, reputations and backgrounds of Royce’s portfolio managers for each Fund, finding that these would likely have an impact on the continued success of such Fund. The Board concluded that the investment advisory services provided by Royce to each Fund compared favorably to services provided by Royce to other Royce client accounts, including other funds, in both nature and quality, and that the scope of services provided by Royce continues to be suitable for each Fund.
Investment performance of the Funds and Royce
Although the various registered investment companies managed by Royce emphasize different attributes in the portfolio companies in which they primarily invest, Royce generally emphasizes a risk-averse approach in managing such funds. In light of that approach, the trustees believe that risk-adjusted performance continues to be the most appropriate measure of each Fund’s investment performance. One measure of risk-adjusted performance the trustees have historically used in their review of each Fund’s performance is the Sharpe Ratio. The Sharpe Ratio is a risk-adjusted measure of performance developed by Nobel Laureate William Sharpe. It is calculated by dividing a fund’s annualized excess returns by its annualized standard deviation to determine reward per unit of risk. The higher the Sharpe Ratio, the better a fund’s historical risk-adjusted performance. The Board attaches primary importance to risk-adjusted performance over relatively long periods of time, typically 3 to 10 years, because such periods tend to encompass different market environments and cycles, unlike shorter time periods.
Following a 2020 that was fraught with volatility and extremes as a result of the COVID-19 pandemic, the Board noted that 2021 was a year of decelerating optimism for many small-cap investors, as performance momentum slowed as the weeks passed between April and December. After beginning the year with a 12.7% increase in the first quarter, the small-cap Russell 2000 Index gained only 1.9% from the second through the fourth quarter of 2021. When all was said and done, the small-cap index was up 14.8% for the calendar year. Within the small-cap market, the Board noted that small-cap value stocks outperformed small-cap growth stocks (rising 28.3% and 2.8%, respectively) over the period.
The Board noted that a majority of the Funds outperformed the funds in their respective Morningstar categories on a Sharpe Ratio basis during the 3- and 5-year periods ended December 31, 2021. In particular, the Board noted that 7 of the 11 Funds (63.6%) ranked within the 1st or the 2nd Sharpe Ratio quartile in their respective Morningstar
84 | The Royce Funds 2022 Semiannual Report to Shareholders
Board Approval of Investment Advisory Agreements (continued)
categories for the 3- and 5-year periods ended December 31, 2021. The Board further noted that 4 of the 6 largest Funds ranked within the 1st Sharpe Ratio quartile in their respective Morningstar categories for the same 5-year period. The Board also noted that the Funds generally underperformed the funds in their respective Morningstar categories on a Sharpe Ratio basis during the 1- and 10-year periods ended December 31, 2021.
A large portion of this post-2008 market period was marked by historically low interest rates and significant U.S. Federal Reserve market intervention. During this period, highly leveraged, non-earning companies and yield-oriented securities (e.g., master limited partnerships, real estate investment trusts, and utilities) generally outperformed the companies with more conservative balance sheets, low leverage, the ability to generate and effectively allocate free cash flow, and strong returns on invested capital and cyclical companies generally favored by the Funds.
PMF was the lone Fund that produced relative risk-adjusted performance within its Morningstar category that mirrored the broader performance trends that were exhibited by the various Funds, as described above. The Board noted that PMF produced stronger relative risk-adjusted performance during the 3-year (2nd quartile) and 5-year (1st quartile) periods ended December 31, 2021, and weaker relative risk-adjusted performance during the 1-and 10-year periods ended December 31, 2021 (3rd quartile in both instances).
RTR, ROF, RSE, RFS exhibited stronger 3-, 5-, and 10-year relative risk-adjusted performance and weaker 1-year relative risk-adjusted performance. In particular, the Sharpe Ratio for each of ROF and RFS ranked in the 3rd, 1st, 1st, and 1st quartile in its Morningstar category for the 1-, 3-, 5-, and 10-year periods, respectively, ended December 31, 2021, while the Sharpe Ratio for RSE ranked in the 3rd, 2nd, 2nd, and 2nd quartile in its Morningstar category during such periods. Similarly, the Sharpe Ratio for RTR ranked within the 4th, 2nd, 1st, and 1st quartile in its Morningstar category for the 1-, 3-, 5-, and 10-year periods, respectively, ended December 31, 2021. Although RIP has been in existence for less than 10 years, it generally mirrored the performance patterns of RTR, ROF, RSE, and RFS by exhibiting stronger 3-year (2nd quartile) and 5-year (1st quartile) relative risk-adjusted performance and weaker 1-year (4th quartile) relative risk-adjusted performance for the relevant periods.
RMC exhibited stronger relative risk-adjusted performance during the 1-year (2nd quartile), 3-year (1st quartile), and 5-year (2nd quartile) periods ended December 31, 2021, and weaker relative risk-adjusted performance during the 10-year period ended December 31, 2021, ranking in the 4th quartile in its Morningstar category in such instance.
RPR, on the other hand, produced stronger relative risk-adjusted performance during the 1-year period ended December 31, 2021 (1st quartile), and weaker relative risk adjusted performance during the 3-, 5-, and 10-year periods ended December 31, 2021, ranking in the 4th quartile in its Morningstar category in all three of those instances.
The Sharpe Ratio quartile rankings for RVP, RVV, and RDV differed from all of the performance patterns described above. RVP ranked in the 3rd quartile for the 1-and 3-year periods ended December 31, 2021, and in the 4th quartile for the 5- and 10-year periods ended December 31, 2021, while both RVV and RDV ranked in the 4th quartile for all such time periods.
The Board also noted that the peer groups included in the Broadridge materials provided to them for a number of Funds may not be appropriate for performance comparisons and that Royce had augmented the data provided to the Board throughout the years by including performance information for other funds that Royce believes are more comparable to those Funds.
In addition to the relative risk–adjusted performance of each Fund, the Board also reviewed and considered each Fund’s absolute total returns, down market performance, and, for Funds in existence for such periods, long-term performance records over periods of 10 years or longer. The Board also considered it important to look beyond the current snapshot of performance as of December 31, 2021, and therefore examined extended performance histories for each Fund using monthly rolling average return periods through March 31, 2022. The Board also noted that seven Funds outperformed their respective benchmark indices for at least a majority of the monthly rolling average annual return periods during at least one of the 3-, 5-, and 10-year periods ended March 31, 2022, with five Funds outperforming their respective benchmark indices for at least a majority of the monthly rolling average annual return periods during at least two of the 3-, 5-, and 10-year periods ended March 31, 2022. The Board noted that Royce manages a number of funds that invest in micro-cap, small-cap, and mid-cap issuers, many of which had outperformed their benchmark indices and their competitors during the periods prior to the U.S. Federal Reserve’s near zero interest rate policy and related market interventions that followed the 2008 financial crisis as well as in more recent periods, as referenced above. Although the Board recognized that past performance is not necessarily an indicator of future results, it found that Royce had the necessary qualifications, experience and track record in managing equity mutual funds to manage each Fund. The Board determined that Royce continues to be an appropriate investment adviser for each Fund.
Cost of the services provided and profits realized by Royce from its relationship with each Fund
The Board considered the cost of the services provided by Royce and the profits realized by Royce from its relationship with each Fund. As part of the analysis, the Board discussed with Royce its methodology in allocating its costs to each Fund and concluded that Royce’s allocations were reasonable. The Board noted that at times in the past Royce had closed certain of the Funds because of the rate of growth in Fund assets. The Board concluded that Royce’s profits with respect to each Fund during the year ended December 31, 2021, were reasonable in relation to the nature and quality of services provided.
The extent to which economies of scale would be realized as the Funds grow and whether fee levels would reflect such economies of scale
While acknowledging that the presence or absence of economies of scale in fund management businesses can be debated and is in any event difficult to measure and directly assess, the Board considered whether there have been economies of scale in respect of the management of each Fund, whether each Fund has appropriately benefited from any economies of scale and whether there is potential for realization of any further economies of scale. The Board noted the time and effort involved in managing portfolios of small-and micro-cap stocks and that they did not involve the same efficiencies as do portfolios of large-cap stocks. The Board also noted that in 2004 breakpoints were added to the investment advisory fees for all of the then-existing Funds except PMF (PMF’s fee schedule already had breakpoints) and that the investment advisory fees for all Funds organized since 2004 included breakpoints. The Board further noted the reduced contractual breakpoint levels for each Fund other than PMF that became effective as of July 1, 2017. The Board concluded that the current fee structure for each Fund is reasonable and that the relevant shareholders sufficiently participated in economies of scale (while again noting the various potential issues with assessing such economies of scale both in general and under the facts at hand) and that no changes were currently necessary.
The Royce Funds 2022 Semiannual Report to Shareholders | 85
Board Approval of Investment Advisory Agreements (continued)
Comparison of services to be rendered and fees to be paid to those under other investment advisory contracts, such as contracts of the same and other investment advisers or other clients
The Board reviewed the investment advisory fee paid by each Fund and compared both the services to be rendered and the fees to be paid under the relevant Agreement to other contracts of Royce and to contracts of other investment advisers to registered investment companies investing in small-, mid-, and micro-cap stocks, as provided by Broadridge. The Board noted that, except for PMF, the contractual advisory fee rate for each Fund exceeded the median of its Broadridge-assigned peers. The Board noted the importance of the net annual operating expense ratio in measuring a fund’s efficiency, particularly in light of the variations in the mutual fund industry as to which entity is responsible for particular types of expenses.
The Board noted that the net annual operating expense ratio for RMC and RVV ranked within the 2nd quintile among their respective Broadridge-assigned peers. The Board further noted that the net annual operating expense ratios for PMF, ROF, RSE, and RIP ranked within the middle quintile among their respective Broadridge-assigned peers.
The Board noted that although the net annual operating expense ratios for RPR, RVP, and RDV were in the 4th quintile, only 14, 10, and 7 basis points higher, respectively, than their respective peer group medians. The Board further noted that the net annual operating expense ratios for RPR and RVP were only 6 and 8 basis points higher, respectively, than the average expense ratio for the 222 small-cap funds in the Morningstar small-cap category (oldest share class only, non-institutional, non-index, non-ETF funds with Rule 12b-1 fees of 0.25% or less) while the net annual operating expense ratios for RDV was actually 2 basis points lower than such average. As a result, the Board noted that, from a peer comparison standpoint, these Funds were well within the range of median expense ratios.
The Board noted that the remaining Funds (i.e., RTR and RFS) had 5th quintile net annual operating expense ratios among their respective Broadridge-assigned peers. Although these rankings can be attributed in large part to the investment advisory fees for these Funds, such fees are also consistent with those of other Royce-advised open-end funds.
While the Board noted that RTR’s net annual operating expense ratio of 1.20% was 20 basis points higher than the median of its Broadridge-assigned peer group, they noted that such net annual operating expense ratio was only 9 basis points higher than the average net annual operating expense ratio for the 222 small-cap funds in the Morningstar small-cap category (oldest share class only, non-institutional, non-index, non-ETF funds with Rule 12b-1 fees of 0.25% or less). Although the 1.49% net annual operating expense ratio of RFS was 20 basis points higher than the median of its respective Broadridge-assigned peer group, the trustees noted that the peer group consisted of a small sample size, with only 8 of the funds including 12b-1 fees. The Board further noted that the contractual investment advisory fee rate for each of RTR and RFS is consistent with those of other Funds that invest primarily in micro-cap and small-cap equity securities. After taking into consideration that the level of work necessary to invest in domestic and/or international micro-cap and small-cap equity securities is significantly greater than that necessary to invest in larger-cap securities, the Board noted that the basis point differentials in investment advisory fees, which in large measure give rise to the generally higher net annual operating expense ratios for RPR and RFS, were appropriate for those Funds.
The Board also noted that Royce manages each Fund in an active fashion. The industry accepted metric for measuring how actively an equity portfolio is managed is called “active share.” In particular, active share measures how much the holdings of an equity portfolio differ from the holdings of its appropriate passive benchmark index. At the extremes, a portfolio with no holdings in common with the benchmark would have 100% active share, while a portfolio that is identical to the benchmark would have 0% active share. Royce presented several analyses to the Board which demonstrated that mutual funds with high active share scores had higher expense ratios than mutual funds with lower active share scores due to the resources required for the active management of those funds. The Board noted that PMF had an active share of 87%, ROF had an active share of 89%, RMC had an active share of 91%, RVP had an active share of 95%, and the remaining seven Funds had active shares of 96% or greater for the year ended December 31, 2021.
The Board further noted that Royce had, from time to time, waived, both during the year ended December 31, 2021, and during earlier periods, investment advisory fees for numerous Funds in order to maintain expense ratios at competitive levels and acknowledged Royce’s intention to continue this expense limitation practice. The Board also noted lower contractual asset breakpoints for each Fund other than PMF became effective as of July 1, 2017. The Board also considered fees charged by Royce to institutional and other clients and noted that, given the greater level of services that Royce provides to registered investment companies such as the Funds as compared to other accounts, each Fund’s advisory fees compared favorably to these other accounts.
No single factor was cited as determinative to the decision of the Board. Rather, after weighing all of the considerations and conclusions discussed above, the entire Board, including all of the non-interested trustees, determined to approve the continuation of the Agreement for each Fund, concluding that continuation of the Agreement for each Fund is in the best interest of the shareholders of each Fund and that each Fund’s investment advisory fee rate is reasonable in relation to the services provided.
86 | The Royce Funds 2022 Semiannual Report to Shareholders
Liquidity Risk Management Program
Liquidity Risk Management Program
The Securities and Exchange Commission adopted Rule 22e-4 under the Investment Company Act of 1940 (the “Liquidity Rule”) to promote effective liquidity risk management throughout the open-end investment company industry, thereby reducing the risk that funds will be unable to meet their redemption obligations and mitigating dilution of the interests of fund shareholders. As required by the Liquidity Rule, Royce Capital Fund (the “Trust”) adopted and implemented a written Liquidity Risk Management Program (as amended from time to time, the “LRMP”) which took effect on December 1, 2018.
The LRMP is designed to assess and manage the liquidity risk of each of Royce Micro-Cap Portfolio and Royce Small-Cap Portfolio (each, a “Fund” and together, the “Funds”), taking into consideration each Fund’s: (i) investment strategy and the liquidity of its portfolio investments during normal and reasonably foreseeable stressed conditions; (ii) short and long-term cash flow projections; (iii) holdings of cash and cash equivalents; and (iv) access to other funding sources, including custodian overdrafts and the Funds’ line of credit. In this context, liquidity risk refers to the risk that a Fund could not meet requests to redeem its shares without significant dilution of remaining investors’ interests in the Fund.
The Board of Trustees of the Trust (the “Board”) approved the designation of the Chief Risk Officer of Royce Investment Partners (“Royce”) as the administrator of the LRMP (in such capacity, the “Administrator”). The Administrator reports directly to the Board and serves at its pleasure in her capacity as Administrator. Such person also reports directly to Royce’s Chief Executive Officer in her capacity as Royce’s Chief Risk Officer. The members of Royce’s Risk Management Committee and its Legal & Compliance Department serve the Administrator in an advisory capacity. The Administrator may also consult with Royce’s portfolio management, administration, and trading personnel to the extent such person deems it necessary or appropriate to carry out the duties assigned to the Administrator under the LRMP. The Trust has retained a third-party liquidity vendor that performs various functions in connection with the administration of the LRMP, including classifying the liquidity of each Fund investment.
In accordance with the requirements of the Liquidity Rule and the LRMP, each Fund must classify each of its investments into one of four liquidity categories described below based on a determination of a reasonable expectation for how long it would take to convert the investment to cash (or sell or dispose of the investment) without significantly changing its market value.
| ● | Highly liquid investments – cash or convertible to cash within three business days or less. |
| ● | Moderately liquid investments – convertible to cash in three to seven calendar days. |
| ● | Less liquid investments – can be sold or disposed of, but not settled, within seven calendar days. |
| ● | Illiquid investments – cannot not be sold or disposed of within seven calendar days. |
In addition, the LRMP prohibits a Fund from acquiring any illiquid investment if, immediately after such acquisition, it would have invested more than 15% of its net assets in illiquid investments. Liquidity classification determinations take into account a variety of factors, including various market, trading and investment-specific considerations, as well as market depth, and generally utilize analysis from the third-party liquidity vendor.
Each Fund has been classified as a “primarily highly liquid fund” under the LRMP. For these purposes, a primarily highly liquid fund must hold more than 50% of its net assets in highly liquid investments. A Fund would cease to be a primarily highly liquid fund if its highly liquid investments fell to 50% or less of its net assets as of the end of any calendar month.
The Administrator presented a report to the Board at its meeting on February 18, 2022, that addressed the adequacy and effectiveness of the LRMP during the period January 1, 2021, to December 31, 2021, (the “covered period”). Among other things, the report provided summary information regarding overall market liquidity and the Funds’ compliance with various liquidity-related requirements along with examples of how the Administrator, Royce’s Risk Management Committee, and the relevant portfolio managers monitored and reacted to changes in liquidity profiles during the covered period. The report also addressed certain enhancements that were made to the methodology used for calculating each Fund’s reasonable anticipated trade size, an important metric used in evaluating each Fund’s potential liquidity risk. The report concluded that:
| ● | each Fund remained a primarily highly liquid fund during the covered period; |
| ● | neither Fund breached the 15% limit on illiquid investments during the covered period; |
| ● | the LRMP remains reasonably designed and implemented to assess and manage each Fund’s liquidity risk; and |
| ● | each Fund was able to meet requests for redemption without significant dilution of remaining investors’ interests in the Fund during the covered period. |
No assurance can be given that the LRMP will achieve its objectives in the future. Please refer to the Trust’s statutory prospectus for more information regarding each Fund’s exposure to liquidity risk and other principal risks and a description of how the Funds expect to satisfy redemption requests.
The Royce Funds 2022 Semiannual Report to Shareholders | 87
Notes to Performance and Other Important Information
The thoughts expressed in this report concerning recent market movements and future prospects for small company stocks are solely the opinion of Royce at June 30, 2022, and, of course, historical market trends are not necessarily indicative of future market movements. Statements regarding the future prospects for particular securities held in the Funds’ portfolios and Royce’s investment intentions with respect to those securities reflect Royce’s opinions as of June 30, 2022, and are subject to change at any time without notice. There can be no assurance that securities mentioned in this report will be included in any Royce-managed portfolio in the future.
Sector weightings are determined using the Global Industry classification Standard (“GICS”). GICS was developed by, and is the exclusive property of, Standard & Poor’s Financial Services LLC (“S&P”) and MSCI Inc. (“MSCI”). GICS is the trademark of S&P and MSCI. “Global Industry classification Standard (GICS)” and “GICS Direct” are service marks of S&P and MSCI.
All indexes referenced are unmanaged and capitalization weighted. Each index’s returns include net reinvested dividends and/or interest income. Frank Russell Company (“Russell”) is the source and owner of the trademarks, service marks and copyrights related to the Russell Indexes. Russell® is a trademark of Frank Russell Company. Neither Russell nor its licensors accept any liability for any errors or omissions in the Russell Indexes and/or Russell ratings or underlying data and no party may rely on any Russell Indexes and/or Russell ratings and/or underlying data contained in this communication. No further distribution of Russell Data is permitted without Russell’s express written consent. Russell does not promote, sponsor or endorse the content of this communication. The Russell 2000 is an index of domestic small-cap stocks. It measures the performance of the 2,000 smallest publicly traded U.S. companies in the Russell 3000 Index. The Russell 2000 Value and Growth Indexes consist of the respective value and growth stocks within the Russell 2000 as determined by Russell Investments. The Russell Microcap Index includes 1,000 of the smallest securities in the small-cap Russell 2000 Index along with the next smallest eligible securities as determined by Russell. The Russell 2500 is an unmanaged, capitalization-weighted index of the 2,500 smallest publicly traded U.S. companies in the Russell 3000 index. The Russell Midcap Index consists of the 800 smallest publicly traded U.S. companies in the Russell 1000 Index. The Russell Midcap Value and Growth Indexes consist of the respective value and growth stocks within the Russell Midcap as determined by Russell Investments. The Russell 1000 Index is an index of domestic large-cap stocks. It measures the performance of the 1,000 publicly traded U.S. companies in the Russell 3000 Index. The Russell 1000 Value and Growth Indexes consist of the respective value and growth stocks within the Russell 1000 as determined by Russell Investments. Securities are weighted based on their style score. Source: MSCI. MSCI makes no express or implied warranties or representations and shall have no liability whatsoever with respect to any MSCI data contained herein. The MSCI data may not be further redistributed or used as a basis for other indexes or any securities or financial products. This material is not approved, endorsed, reviewed or produced by MSCI. None of the MSCI data is intended to constitute investment advice or a recommendation to make (or refrain from making) any kind of investment decision and may not be relied on as such. The MSCI ACWI Small Cap Index is an unmanaged, capitalization-weighted index of global small-cap stocks. The MSCI ACWI ex USA Small Cap Index is an unmanaged, capitalization weighted index of global small-cap stocks, excluding the United States. The MSCI Emerging Markets Index is an unmanaged, capitalization-weighted index of stocks in emerging markets countries. The CBOE S&P 500 Volatility Index (VIX) measures market expectations of near-term volatility conveyed by S&P 500 stock index option prices. It is the square root of the risk-neutral expectation of the S&P 500 variance over the next 30 calendar days and is quoted as an annualized standard deviation. The Center for Research in Securities Prices (CRSP) equally divides the companies listed on the NYSE into 10 deciles based on market capitalization. Deciles 1-5 represent the largest domestic equity companies and Deciles 6-10 represent the smallest. CRSP then sorts all listed domestic equity companies based on these market cap ranges. By way of comparison, the CRSP 1-5 would have similar capitalization parameters to the S&P 500 and the CRSP 6-10 would have similar capitalization parameters to those of the Russell 2000. The performance of an index does not represent exactly any particular investment, as you cannot invest directly in an index. The Purchasing Managers’ Index (PMI) is an index of the prevailing direction of economic trends in the manufacturing and service sectors. The purpose of the PMI is to provide information about current and future business conditions to company decision makers, analysts, and investors. The performance of an index does not represent exactly any particular investment, as you cannot invest directly in an index. Returns for the market indexes used in this report were based on information supplied to Royce by Russell Investments. Royce has not independently verified the above described information.
The Price-Earnings, or P/E, Ratio is calculated by dividing a company’s share price by its trailing 12-month earnings-per-share (EPS). The Price-to-Book, or P/B, Ratio is calculated by dividing a company’s share price by its book value per share. Standard deviation is a statistical measure within which a fund’s total returns have varied over time. The greater the standard deviation, the greater a fund’s volatility. Beta is a measure of the volatility or risk of an investment compared to the market as a whole. Alpha describes an investment strategy’s ability to beat the market. The Morningstar Style Map uses proprietary scores of a stock’s value and growth characteristics to determine its placement in one of the five categories listed on the horizontal axis. These characteristics are then compared to those of other stocks within the same market capitalization band. Each is scored from zero to 100 for both value and growth attributes. The value score is subtracted from the growth score to determine the overall style score. For the vertical, market cap axis, Morningstar subdivides into size groups. Giant-cap stocks are defined as those that account for the top 40% of the capitalization of each style zone; large-cap stocks represent the next 30%; mid-cap stocks the next 20%; small-cap stocks the next 7%; micro-cap stocks the smallest 3%. For the Morningstar Small Blend Category: ©2022 Morningstar. All Rights Reserved. The information regarding the category in this piece is: (1) is proprietary to Morningstar and/or its content providers; (2) may not be copied or distributed; and (3) is not warranted to be accurate, complete or timely. Neither Morningstar nor its content providers are responsible for any damages or losses arising from any use of this information. Cyclical and Defensive are defined as follows: Cyclical: Communication Services, Consumer Discretionary, Energy, Financials, Industrials, Information Technology, and Materials. Defensive: Consumer Staples, Health Care, Real Estate, and Utilities. Investments in securities of micro-cap, small-cap, and/or mid-cap companies may involve considerably more risk than investments in securities of larger-cap companies. (Please see “Primary Risks for Fund Investors” in the prospectus.) Investments in foreign securities, which generally may involve political, economic, currency, and other risks not encountered in U.S. investments. (Please see “Investing in Foreign Securities” in the prospectus.) A Fund that invests a significant portion of its assets in a limited number of stocks may be subject to considerably more risk than a more broadly diversified Fund because a decline in the value of any of these stocks would cause that Fund’s overall value to decline to a greater degree. A broadly diversified portfolio does not, however, ensure a profit for a Fund or guarantee against loss. Please read
88 | The Royce Funds 2022 Semiannual Report to Shareholders
Notes to Performance and Other Important Information (continued)
the prospectus carefully before investing or sending money. A copy of the Funds’ current prospectus and Statement of Additional Information may be obtained by calling (800) 221-4268 or by visiting www.royceinvest.com. All publicly released material Fund information is disclosed by the Funds on their website at www.royceinvest.com. The Royce Funds is a service mark of The Royce Funds. Distributor: Royce Fund Services, LLC.
Forward-Looking Statements
This material contains forward-looking statements within the meaning of the Securities Exchange Act of 1934, as amended (the “Exchange Act”), that involve risks and uncertainties, including, among others, statements as to:
| ● | the Funds’ future operating results, |
| ● | the prospects of the Funds’ portfolio companies, |
| ● | the impact of investments that the Funds have made or may make, the dependence of the Funds’ future success on the general economy and its impact on the companies and industries in which the Funds invest, and |
| ● | the ability of the Funds’ portfolio companies to achieve their objectives. |
This review and report use words such as “anticipates,” “believes,” “expects,” “future,” “intends,” and similar expressions to identify forward-looking statements. Actual results may differ materially from those projected in the forward-looking statements for any reason.
The Royce Funds have based the forward-looking statements included in this review and report on information available to us on the date of the report, and we assume no obligation to update any such forward-looking statements. Although The Royce Funds undertake no obligation to revise or update any forward-looking statements, whether as a result of new information, future events, or otherwise, you are advised to consult any additional disclosures that we may make through future shareholder communications or reports.
Disclosure of Portfolio Holdings
The Funds’ complete portfolio holdings are also available on Exhibit F to Form N-PORT, which filings are made with the SEC within 60 days of the end of the first and third fiscal quarters. The Funds’ Form N-PORT filings are available on the SEC’s website at http://www.sec.gov.
The Royce Funds 2022 Semiannual Report to Shareholders | 89

About Royce Investment Partners
Unparalleled Knowledge + Experience
Pioneers in small-cap investing, with 45+ years
of experience, depth of knowledge, and focus.
Independent Thinking
The confidence to go against consensus, the insight
to uncover opportunities others might miss, and the
tenacity to stay the course through market cycles.
Specialized Approaches
U.S., international, and global investment strategies
that pursue approaches with different risk profiles.
Unwavering Commitment
Our team of 17 portfolio managers has significant
personal investments in the strategies they manage.
Contact Us
GENERAL INFORMATION
General Royce Funds information including:
• How to open an account
• An overview of our firm and Funds
• Ordering literature including Prospectuses
(800) 221-4268
ACCOUNT INFORMATION
Speak with a representative about:
• Your account, transactions, and forms
(800) 841-1180
FINANCIAL ADVISORS, CONSULTANTS,
AND INSTITUTIONS
Speak with your regional Royce contact regarding:
• Scheduling a meeting or call
• Information about our firm, strategies, and funds
• Resources for financial professionals, such as
portfolio attribution reports
(800) 337-6923
AUTOMATED ACCOUNT INFORMATION
24-hour Automated Telephone Service
(800) 787-6923
Item 1. Reports to Shareholders.
Item 2. Code(s) of Ethics. Not applicable to this semi-annual report.
Item 3. Audit Committee Financial Expert. Not applicable to this semi-annual report.
Item 4. Principal Accountant Fees and Services. Not applicable to this semi-annual report.
Item 5. Audit Committee of Listed Registrants. Not Applicable.
Item 6. Investments.
(a) See Item 1.
(b) Not Applicable.
Item 7. Disclosure of Proxy Voting Policies and Procedures for Closed-End Management Investment Companies. Not Applicable.
Item 8. Portfolio Managers of Closed-End Management Investment Companies. Not Applicable.
Item 9. Purchases of Equity Securities by Closed-End Management Investment Company and Affiliated Purchasers. Not Applicable.
Item 10. Submission of Matters to a Vote of Security Holders. Not Applicable.
Item 11. Controls and Procedures.
(a) Disclosure Controls and Procedures. The Principal Executive and Financial Officers concluded that the Registrant's Disclosure Controls and Procedures are effective based on their evaluation of the Disclosure Controls and Procedures as of a date within 90 days of the filing date of this report.
(b) Internal Control over Financial Reporting. There were no significant changes in Registrant's internal control over financial reporting or in other factors that could significantly affect this control subsequent to the date of the evaluation, including any corrective actions with regard to significant deficiencies and material weaknesses during the period covered by this report.
Item 12. Exhibits. Attached hereto.
(a)(1) Not applicable to this semi-annual report.
(a)(2) Separate certifications by the Registrant’s Principal Executive Officer and Principal Financial Officer as required by Rule 30a-2(a) under the Investment Company Act of 1940.
(a)(3) Not Applicable.
(b) Separate certifications by the Registrant’s Principal Executive Officer and Principal Financial Officer, pursuant to Section 906 of the Sarbanes-Oxley Act of 2002 and required by Rule 30a-2(b) under the Investment Company Act of 1940.
Pursuant to the requirements of the Securities Exchange Act of 1934 and the Investment Company Act of 1940, the registrant has duly caused this report to be signed on its behalf by the undersigned, thereunto duly authorized.
| THE ROYCE FUND | |
| | | |
| BY: | /s/ Christopher D. Clark | |
| Christopher D. Clark | |
| President | |
| | | |
| Date: August 11, 2022 | |
| | | |
Pursuant to the requirements of the Securities Exchange Act of 1934 and the Investment Company Act of 1940, this report has been signed below by the following persons on behalf of the registrant and in the capacities and on the dates indicated.
| THE ROYCE FUND | | THE ROYCE FUND | |
| | | | | | |
| BY: | /s/ Christopher D. Clark | | BY: | /s/ Peter K. Hoglund | |
| Christopher D. Clark | | Peter K. Hoglund | |
| President | | Chief Financial Officer | |
| | | | | | |
| Date: August 11, 2022 | | Date: August 11, 2022 | |
| | | | | | |