UNITED STATES
SECURITIES AND EXCHANGE COMMISSION
Washington, D.C. 20549
FORM N-CSR
CERTIFIED SHAREHOLDER REPORT
OF
REGISTERED MANAGEMENT INVESTMENT COMPANIES
Investment Company Act File Number: 811-03599
Name of Registrant: The Royce Fund
Address of Registrant: 745 Fifth Avenue
New York, NY 10151
Name and address of agent for service:
John E. Denneen, Esq. 745 Fifth Avenue New York, NY 10151 |
Registrant's telephone number, including area code: (212) 508-4500
Date of fiscal year end: December 31, 2019
Date of reporting period: January 1, 2019 – June 30, 2019
Item 1. Reports to Shareholders.
| | | JUNE 30, 2019 |
| | | |
| | | |
| | | |
| | | 2019 Semiannual |
| | | Review and Report to Shareholders |
| | | |
| | | |
| | | |
| | | |
| | | | |
| | | | |
| | | | |
| | | Royce Dividend Value Fund |
| | | | | |
| | | Royce Global Financial Services Fund |
| | | | | |
| | | Royce International Premier Fund |
| | | | | |
| | | Royce Low-Priced Stock Fund |
| | | | | |
| | | Royce Micro-Cap Fund |
| | | | | |
| | | Royce Opportunity Fund |
| | | | | |
| | | Royce Pennsylvania Mutual Fund |
| | | | | |
| | | Royce Premier Fund |
| | | | | |
| | | Royce Small-Cap Value Fund |
| | | | | |
| | | Royce Smaller-Companies Growth Fund |
| | | | | |
| | | Royce Special Equity Fund |
| | | | | |
| | | Royce Total Return Fund |
| | | | | |
| | | | | |
| | | | | |
| | | | | |
| | | | | |
| | | | | |
| | | | | |
| | | | | |
| | | Beginning on January 1, 2021, as permitted by regulations adopted by the U.S. Securities and Exchange Commission, paper copies of the Funds’ shareholder reports like this one will no longer be sent by mail, unless you specifically request paper copies of the reports from the Funds or from your financial intermediary (such as a broker-dealer or bank). Instead, the reports will be made available on the Funds’ website (www.roycefunds.com), and you will be notified by mail each time a report is posted and provided with a website link to access the report. If you already elected to receive shareholder reports electronically, you will not be affected by this change and you need not take any action. You may elect to receive shareholder reports and other communications from the Funds electronically anytime by contacting your financial intermediary or, if you are a direct investor with the Funds, by calling 1-800-841-1180. Beginning on January 1, 2019, you may elect to receive all future reports in paper free of charge. If you invest through a financial intermediary, you can contact your financial intermediary to request that you continue to receive paper copies of your shareholder reports. If you invest directly with the Funds, you can call 1-800-841-1180 to let the Funds know you wish to continue receiving paper copies of your shareholder reports. Your election to receive reports in paper will apply to all Funds held in your account if you invest through your financial intermediary or all Funds held with our fund complex if you invest directly with the Funds. | |
| | | | | |
| | | | | |
| | | roycefunds.com |  |
| | | | | |
| | | | | |
| | | | | |
| | | | | |
| | | | | |
| Table of Contents | | | |
| | | | |
| | | | |
| Semiannual Review | | | |
| | | | |
| Letter to Our Shareholders | | 2 | |
| | | | |
| Performance and Expenses | | 6 | |
| | | | |
| The Royce Funds and Relative Risk-Adjusted Rolling Returns | | 7 | |
| | | | |
| Semiannual Report to Shareholders | | | |
| | | | |
| Managers’ Discussions of Fund Performance | | | |
| | | | |
Royce Dividend Value Fund | | 8 | |
| | | | |
Royce Global Financial Services Fund | | 10 | |
| | | | |
Royce International Premier Fund | | 12 | |
| | | | |
Royce Low-Priced Stock Fund | | 14 | |
| | | | |
Royce Micro-Cap Fund | | 16 | |
| | | | |
Royce Opportunity Fund | | 18 | |
| | | | |
Royce Pennsylvania Mutual Fund | | 20 | |
| | | | |
Royce Premier Fund | | 22 | |
| | | | |
Royce Small-Cap Value Fund | | 24 | |
| | | | |
Royce Smaller-Companies Growth Fund | | 26 | |
| | | | |
Royce Special Equity Fund | | 28 | |
| | | | |
Royce Total Return Fund | | 30 | |
| | | | |
| Schedules of Investments and Financial Statements | | 32 | |
| | | | |
| Notes to Financial Statements | | 78 | |
| | | | |
| Understanding Your Fund’s Expenses | | 90 | |
| | | | |
| Trustees and Officers | | 92 | |
| | | | |
| Board Approval of Investment Advisory Agreements | | 93 | |
| | | | |
| Results of Shareholders Meetings | | 96 | |
| | | | |
| Notes to Performance and Other Important Information | | 97 | |

| This page is not part of the 2019 Semiannual Report to Shareholders | 1 |
Letter to Our Shareholders

A SMOOTH ASCENT AMID HIGH ANXIETY
The first six months of 2019 offered equity investors almost everything they could have hoped for following the high anxiety of a recession scare and the bearish fourth quarter of 2018, when the small-cap Russell 2000 Index fell 20.2%. Stocks immediately showed great resilience, and then some, by roaring back in the first half of the year. A highly welcome double-digit rebound in the first quarter was followed by a seesawing second quarter that saw more motion than progress. This was an understandable pause that gave the market time to digest the prior advance. The upshot was a solid advance rise in the year’s first six months, a period that saw low trading volumes and little volatility, which was mostly confined to a small decline in May. During the first half, the Russell 2000 advanced 17.0% while its large-cap sibling, the Russell 1000 Index, was even better, up 18.8%. In fact, performance in the first half generally trended higher the further up the market capitalization scale you traveled.
|
Equity Indexes
Total Returns
Year-to-Date
through 6/30/19 | 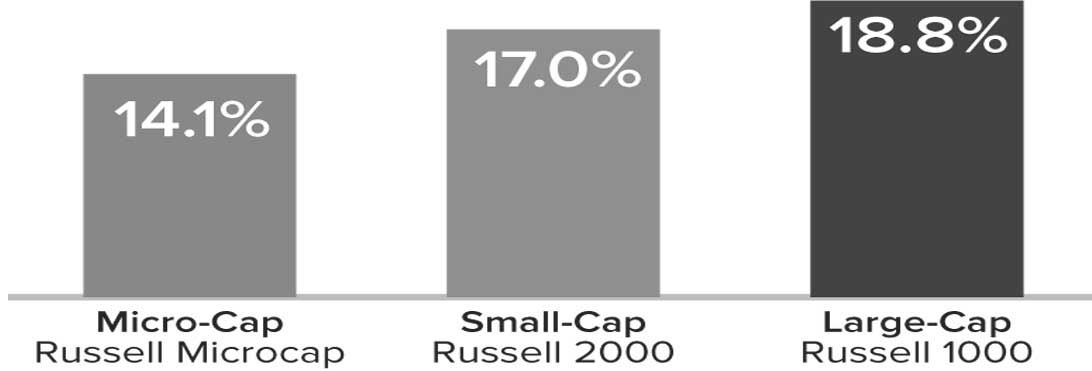 |
Some questioned the substance of this rally, observing that the same risks that fueled last year’s decline were still with us. The list is long and, by now, familiar. Most of the anxiety continues to circulate around the issue of global growth—or the widely rumored imminent lack of it—and its probable negative impact on corporate profits. There wasn’t much in the way of fresh answers to these concerns at the end of June beyond the admittedly consequential Fed pivot to a more dovish stance (as well as subsequent and similar actions promised from the European Central Bank). Yet, while the Fed’s words and actions went some way to reassuring investors that it was prepared to give the markets a dose of stimulus, the effect on economic growth was pretty much nil. Moreover, the increasing tensions around trade and tariffs remain an issue at this writing. With no resolution forthcoming, many companies were lowering expectations and/or offering a more muted outlook, with predictably negative effects on the stocks of many economically sensitive businesses.
It’s not surprising, then, that equity investors showed a marked preference for safety in the form of large-cap stocks, or chose to bet on better times further down the road by vacuuming up shares of growth issues regardless of capitalization size. Some additional context is also important: large-caps, growth stocks, and defensive areas (that is, bond proxies) have historically done better in low or declining interest rate environments, an atmosphere that has characterized much of the decade following the Financial Crisis, with its record-low interest rates (and the |
For details on The Royce Funds’ performance in the period, please turn to the Managers’ Discussions that begin on page 8. Past performance is no guarantee of future results.
| 2 | This page is not part of the 2019 Semiannual Report to Shareholders |
LETTER TO OUR SHAREHOLDERS
| ‘easy money’ that came with them). With rates still near historic lows, these same stocks have led the market over the last two-plus years. All of this notwithstanding, we believe that the long-term case for small-cap stocks is strong, as we will explain through the course of this letter. |
| |
| PESSIMISTS, OPTIMISTS—AND US |
| By periodically inverting the otherwise mostly flat yield curve, the bond market maintained its saturnine insistence that the economy was slowing and potentially, perhaps inevitably, moving toward recession. To be sure, many observers point to the inverted yield curve as iron-clad proof that the current slackening momentum in the pace of growth in the U.S., along with the advanced age of the expansion, is a prelude to a recession. More optimistic voices argue that large-cap stocks spent much of the first half making new all-time highs, that the labor market continues to strengthen, and that the economy continues to expand in spite of a raft of dismal headlines. |
| Our own cautiously constructive view is rooted not so much in the macro factors that dominate the headlines but in our own research into companies, their industry dynamics, and our conversations with management teams. We do, however, agree with those who think the U.S. economy is not heading toward recession; we see periodic slowdowns and accelerations in the pace of growth as historically typical. As for the yield curve, the market appears to have figured out before the Fed that persistently low inflation exerts a powerful flattening effect on the curve. To make our case, we have taken up arms—or at least data points—against this sea of troubles to argue for the long-term appeal of fundamentally sound small-cap cyclicals. We see good reasons for investors to be optimistic about the prospects for small-cap stocks, specifically those cyclical areas that populate our portfolios. |
| THE CASE FOR SMALL-CAP LEADERSHIP |
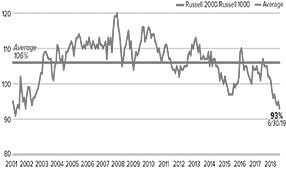
| Our first argument is in favor of small-cap returning to market leadership. We make it on the grounds of reversion to the mean, one of our longest-held investment principles. Looking at first-half performance, the resilience of small-cap stocks seemed both apropos and encouraging to us given that we continue to see solid fundamentals for many companies, attractively joined with historically average, or below average, valuation levels. However, small-caps lagged large-caps not only in the first half but also for the one-year period ended June 30, 2019, when the Russell 2000 fell 3.3% versus a gain of 10.0% for the large-cap index. This performance divergence has created a historical oddity that can be seen in the spread between small- and large-cap |
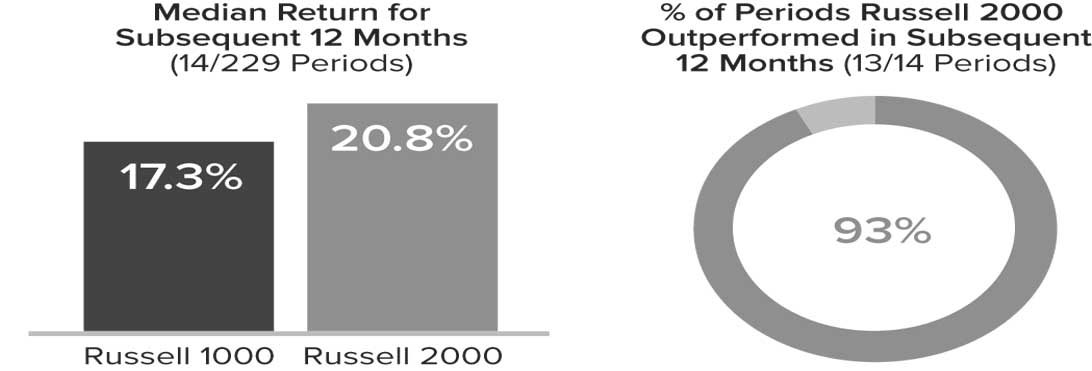
returns. It rarely happens over the course of a 12-month period that small-caps are in the red while large-caps are in the black. In fact, it’s happened less than 7% of the time over the past 20 years—in 16 out of 229 monthly rolling 12-month periods.
What are the implications of this peculiar divergence in performance? In 93% of the following 12-month periods—only 13 of the 14 currently have subsequent periods to measure—small-caps bounced back to outpace large-caps. It’s true that small-caps have historically tended to lag their large-cap siblings when yields are falling—and have often done the same when economic growth is slowing. The resumption of small-cap leadership, then, is contingent on these conditions changing. When rates rise (or simply normalize) and/or the economy reaccelerates, and history strongly suggests that both should, we would expect small-cap to recapture leadership. |
| |
What Happened After 12-Month Periods When Large-Caps Rose and Small-Caps Fell?
16 out of 229 Trailing 1-Year Periods from 6/30/99 to 6/30/19 |
One additional observation on relative performance: From December 31, 1978 through June 30, 2019, the five-year monthly rolling average return was 10.6% for the Russell 2000 and 11.7% for the Russell 1000, while the five-year average annual total returns for the small- and large-cap indexes for the period ended June 30, 2019 were 7.1% and 10.5%, respectively. With small-caps well below their long-term average, we expect performance to improve to a greater degree than for large-caps, which finished June much closer to their long-term average.
Our confidence in mean reversion is further grounded in the relative valuation spread between the Russell 2000 and the Russell 1000 at the end of June, which was significantly below its long-term average based on each index’s median last 12-months’ EV/EBIT (enterprise value over earnings before interest and taxes). In fact, small-caps have lagged large-caps for such an extended period of time that they finished June at their cheapest relative to large-caps since 2001. |
| This page is not part of the 2019 Semiannual Report to Shareholders | 3 |
LETTER TO OUR SHAREHOLDERS
| So while no one thinks that stocks are currently bargain priced, it’s also true that the vast and diverse universe of small-cap stocks contains a considerable number of attractive risk/reward opportunities based on the combination of reasonable to attractive valuations (again measured by median EV/EBIT) and profitability. |
| |
THE VALUATION SITUATION
When looking for investment candidates, we typically survey the small-cap market for what looks to us like excess pessimism—which is precisely what we’ve been seeing in certain cyclical areas over the last couple of years. Our practice is to then investigate how much of that negative sentiment is already reflected in the current stock price of a given company. So it was significant that at the end of June, cyclical stocks were selling at a greater discount to the Russell 2000 than they had during the fall of 2008—in the teeth of the Financial Crisis. To us, that is the very definition of excess pessimism. |
| |
Small-Cap Cyclical Discount
Russell 2000 Relative Median
EV/EBIT1 (Ex Negative EBIT)
Cyclical/Russell 2000 |
Source: FactSet
| We suspect that these relatively inexpensive valuations are in large part the result of investors placing undue emphasis on daily macro headlines when trying to understand or anticipate small-cap market movements. (The frequently missed distinction between slower economic growth and a recession is an example of the trouble this can lead to.) We think that investors often fail to fully appreciate the “reaction function,” the response of businesses, central banks, and governments to slowdowns. While we are by no means macro forecasters, it would not surprise us if the global economy grew a little faster over the next year. If history is any guide, this reacceleration could boost small-cap stocks, which have done well on both an absolute and relative basis, especially versus large-caps, when the ISM Manufacturing Index (a common proxy for economic conditions) is on the rise. As unlikely as it currently seems, additional growth could come from a U.S.-China |
| |
Small-Cap’s Relative Valuation Is Significantly Below Its Long-Term Average
Russell 2000 vs. Russell 1000 Median LTM EV/EBIT1 (ex. Negative EBIT Companies) from 12/31/01 to 6/30/19 |
Source: FactSet
trade deal that addresses tariffs and stokes even modest growth in China, which would likely spur increased activity in Europe as well.
Moreover, we expect profitable companies in select cyclical areas to do better regardless of which route the global economy takes in the short term. For example, and in spite of reports of revisions, earnings prospects for the second half of 2019 look solid for many of our small-cap cyclical holdings, especially given the relatively weaker third and fourth quarters of 2018 with which 2019’s two second-half quarters will be compared.
We often seek to identify opportunities at the intersection of quality and value—that is, companies with average or better profitability and lower-than-average valuations. There were three cyclical sectors that had higher-than-average profitability and lower-than-average valuations at the end of June—Industrials, Consumer Discretionary, and Materials.2 The relative attractiveness of these and other cyclical areas dovetails nicely with our bottom-up approaches, where the search for fundamentally sound, well-managed companies with solid growth potential has more recently led us overwhelmingly to cyclical businesses. |
SMALL-CAP STOCKS AND THE URGE TO MERGE
The appeal of small-cap stocks can also be seen in recent merger & acquisition (M&A) activity. The number of small-cap M&A deals in the U.S. hit a 10-year high in June, with 503 transactions announced for the trailing four quarters through the end of that month, according to Bloomberg data. This is the largest number of deals in the asset class since before the Financial Crisis. We anticipate that this trend will |
| 1 | Enterprise Value/Earnings before interest and taxes. |
| 2 | Based on the relation between each sector’s average return on equity (ROE) for the five years ended 6/30/19 (excluding companies with negative ROE) and median EV/EBIT (excluding companies with negative earnings). |
| Cyclicals are defined as follows: Communication Services, Consumer Discretionary, Energy, Financials, Industrials, Information Technology, and Materials. |
| 4 | This page is not part of the 2019 Semiannual Report to Shareholders |
LETTER TO OUR SHAREHOLDERS
continue for a variety of reasons. CEO’s are under relentless pressure to grow profits. If they believe organic growth opportunities are limited, then inorganic paths such as acquisitions begin to make sense. Along similar lines, the CEO of a small-cap company might look more favorably on a buyout offer at a significant stock price premium if he or she sees limited opportunities for their own organic growth. However paradoxical, we can see how a further deceleration in economic growth could lead to an acceleration in M&A deals. With their attractive relative valuations, many small-cap companies should continue to be attractive takeover targets. We also think that many better-managed small-cap businesses will continue to be active as acquirers. We meet with many management teams that run companies with strong balance sheets and are eager to find ways to grow. With interest rates so low, many acquisitions are likely to be accretive, which increases their attraction to a potential buyer.
THE NEXT LEG OF THE JOURNEY
Disagreements about the condition of the market and state of the economy have created opportunities for active managers and other discerning stock pickers because there’s so little consensus about what constitutes value or quality. Somewhat counterintuitively, this has made us generally quite comfortable with what we’re holding in each of our strategies.
Of course, our overall cyclical tilt would not immunize any of our portfolios from a recession. However, the market has provided opportunities to build portfolios that we think are not only inexpensive, but that we think should also provide healthy returns going forward in our most valuation-sensitive strategies. We also expect that many of our high-quality holdings (specifically those in Industrials and Information Technology) could outperform cyclicals in general in the event of a recession thanks to their status as market leaders in global niches as opposed to being one of many players in a highly fragmented commodity business.
Across all of our strategies, we’ve been adding or holding positions in areas such as technology, industrials, and many other areas that we |
think should do well under present or improved conditions. Equally important, many of these holdings already have valuations that seem to reflect a high probability of an imminent recession. Any economic news that shows improvement—or simply the absence of worsening conditions—may lift these stocks.
In framing this promising picture of the long-term possibilities for small-cap cyclicals, we also recognize that the lengthy list of current risks is creating an even higher level of uncertainty than usual. However, having done this for as long as we have—four decades and counting—we are also highly aware that the markets seldom do what’s most expected. Given today’s widespread concerns about slowing growth, increasing trade tensions, and the extended economic cycle, the most surprising outcome—as we’ve suggested—might be a rally catalyzed by improved growth.
When looking forward, we believe it’s appropriate to be humble about our own forecasts and respectful of those that differ from ours. With what seems like ever increasing tariff and trade tensions, there is a plausible negative scenario of slowing Chinese growth that tips languishing European economies into recession and pushes global yields even lower. This would in all likelihood lead to greater instability in global financial markets as well as breeding heightened risk aversion. While we think this outcome is less likely than others, we also believe that investors should remain mindful of the reaction function we mentioned earlier. Additionally, environments that feature increased uncertainty, turbulence, and market volatility often provide opportunities for companies with leading market positions and strong balance sheets to solidify or expand market share. Volatile environments have also been historically favorable for active small-cap managers. We also see four favorable factors in the current market environment—low inflation, modest valuations, moderate growth, and increased access to capital—that we think support solid-to-strong small-cap performance in the intermediate term regardless of current anxieties. These four factors paint an attractive picture in our view, one that small-cap investors might be at risk of missing if they pay more attention to the macro picture than to company fundamentals, where we think the real action is. |
 | |  | |  |
| Charles M. Royce | | Christopher D. Clark | | Francis D. Gannon |
| Chairman, | | Chief Executive Officer, and | | Co-Chief Investment Officer, |
| Royce & Associates, LP | | Co-Chief Investment Officer, | | Royce & Associates, LP |
| | | Royce & Associates, LP | | |
| | | | | |
| July 31, 2019 | | | | |
| This page is not part of the 2019 Semiannual Report to Shareholders | 5 |
Performance and Expenses
| |
| Performance and Expenses | | | | | | | | | | | | | |
| | | | | | | | | | | | | | ANNUAL OPERATING EXPENSES (%) |
| | | YTD1 | | 1-YR | | 5-YR | | 10-YR | | 15-YR | | 20-YR | | 45-YR/SINCE
INCEPTION | | INCEPTION DATE | | | GROSS | | NET |
| |
| Royce Dividend Value Fund | | 20.71 | | 3.19 | | 5.02 | | 11.97 | | 8.54 | | N/A | | 8.49 | | 5/3/04 | | | 1.43 | | 1.34 |
| |
| Royce Global Financial Services Fund | | 16.26 | | -1.92 | | 5.78 | | 11.11 | | 8.08 | | N/A | | 7.88 | | 12/31/03 | | | 1.77 | | 1.58 |
| |
| Royce International Premier Fund | | 21.38 | | 9.26 | | 8.64 | | N/A | | N/A | | N/A | | 7.84 | | 12/31/10 | | | 1.59 | | 1.44 |
| |
| Royce Low-Priced Stock Fund | | 14.53 | | -5.00 | | 0.98 | | 7.14 | | 5.20 | | 8.16 | | 9.61 | | 12/15/93 | | | 1.53 | | 1.49 |
| |
| Royce Micro-Cap Fund | | 10.59 | | -8.64 | | 0.90 | | 7.31 | | 5.74 | | 8.55 | | 10.24 | | 12/31/91 | | | 1.25 | | 1.24 |
| |
| Royce Opportunity Fund | | 15.63 | | -11.06 | | 4.11 | | 13.38 | | 7.69 | | 10.63 | | 11.44 | | 11/19/96 | | | 1.20 | | 1.20 |
| |
| Royce Pennsylvania Mutual Fund | | 17.81 | | 0.68 | | 6.16 | | 12.29 | | 8.32 | | 9.77 | | 14.14 | | N/A | | | 0.92 | | 0.92 |
| |
| Royce Premier Fund | | 21.69 | | 6.28 | | 6.68 | | 12.47 | | 9.59 | | 10.70 | | 11.60 | | 12/31/91 | | | 1.17 | | 1.17 |
| |
| Royce Small-Cap Value Fund | | 8.88 | | -5.64 | | 1.96 | | 8.76 | | 7.30 | | N/A | | 8.82 | | 6/14/01 | | | 1.53 | | 1.49 |
| |
| Royce Smaller-Companies Growth Fund | | 21.08 | | -1.53 | | 6.54 | | 11.09 | | 7.79 | | N/A | | 10.95 | | 6/14/01 | | | 1.52 | | 1.49 |
| |
| Royce Special Equity Fund | | 4.59 | | -5.42 | | 3.53 | | 9.66 | | 6.89 | | 9.25 | | 8.46 | | 5/1/98 | | | 1.18 | | 1.18 |
| |
| Royce Total Return Fund | | 15.32 | | 0.36 | | 5.74 | | 11.83 | | 7.72 | | 9.06 | | 10.40 | | 12/15/93 | | | 1.20 | | 1.20 |
| |
| |
| INDEX | | | | | | | | | | | | | | | | | | | | | |
| Russell 2000 | | 16.98 | | -3.31 | | 7.06 | | 13.45 | | 8.15 | | 7.77 | | N/A | | N/A | | | N/A | | N/A |
| |
| Russell Microcap | | 14.15 | | -10.39 | | 5.52 | | 12.54 | | 6.28 | | N/A | | N/A | | N/A | | | N/A | | N/A |
| |
| Russell 2000 Value | | 13.47 | | -6.24 | | 5.39 | | 12.40 | | 7.28 | | 8.64 | | N/A | | N/A | | | N/A | | N/A |
| |
| Russell 2500 | | 19.25 | | 1.77 | | 7.66 | | 14.44 | | 9.07 | | 8.92 | | N/A | | N/A | | | N/A | | N/A |
| |
| MSCI ACWI ex USA Small Cap | | 11.60 | | -5.94 | | 2.77 | | 8.48 | | 7.40 | | 6.89 | | N/A | | N/A | | | N/A | | N/A |
| |
Important Performance, Expense, and Risk Information
All performance information in this Review and Report reflects past performance, is presented on a total return basis, reflects the reinvestment of distributions, and does not reflect the deduction of taxes a shareholder would pay on fund distributions or the redemption of fund shares. Past performance is no guarantee of future results. Investment return and principal value of an investment will fluctuate, so that shares may be worth more or less than their original cost when redeemed. Investment and Service Class shares redeemed within 30 days of purchase may be subject to a 1% redemption fee payable to the Fund (2% for Royce International Premier Fund). Redemption fees are not reflected in the performance shown above; if they were, performance would be lower. Current performance may be higher or lower than performance quoted. Current month-end performance may be obtained at www.roycefunds.com. All performance and expense information reflects results of the Funds’ oldest share Class (Investment Class or Service Class, as the case may be). Price and total return information is based on net asset values calculated for shareholder transactions. Certain immaterial adjustments were made to the net assets of Royce Pennsylvania Mutual and Premier Funds at 6/30/19 for financial reporting purposes, and as a result the calendar year total returns based on those net assets values differ from the adjusted net values and calendar year total returns reported in the Financial Highlights. Gross annual operating expenses reflect the Fund’s gross total annual operating expenses and include management fees, any 12b-1 distribution and service fees, other expenses, and any applicable acquired fund fees and expenses. Net annual operating expenses reflect contractual fee waivers and/or expense reimbursements. All expense information is reported as of the Fund’s most current prospectus. Royce & Associates has contractually agreed to waive fees and/or reimburse operating expenses, excluding brokerage commissions, taxes, interest, litigation expenses, acquired fund fees and expenses, and other expenses not borne in the ordinary course of business, to the extent necessary to maintain net operating expenses at or below: 1.24% for Royce Micro-Cap Fund; 1.34% for Royce Dividend Value Fund; 1.44% for Royce International Premier Fund; 1.49% for Royce Global Financial Services, Low-Priced Stock, Small-Cap Value, and Smaller-Companies Growth Funds through April 30, 2020.
Service Class shares bear an annual distribution expense that is not borne by the Funds’ Investment Class. If such distribution expenses had been reflected for Funds showing Investment Class performance, returns would have been lower. Investments in securities of micro-cap, small-cap, and/or mid-cap companies may involve considerably more risk than investments in securities of larger-cap companies. (Please see “Primary Risks for Fund Investors” in the prospectus.) Certain Funds invest a significant portion of their respective assets in foreign companies that may be subject to different risks than investments in securities of U.S. companies, including adverse political, social, economic, or other developments that are unique to a particular country or region. (Please see “Investing in Foreign Securities” in the prospectus.) Therefore, the prices of securities of foreign companies in particular countries or regions may, at times, move in a different direction than those of securities of U.S. companies. (Please see “Primary Risk of Fund Investors” in the prospectus.) Certain Funds generally invest a significant portion of their assets in a limited number of stocks, which may involve considerably more risk than a more broadly diversified portfolio because a decline in the value of any of these stocks would cause their overall value to decline to a greater degree. A broadly diversified portfolio, however, does not ensure a profit or guarantee against loss. This Review and Report must be preceded or accompanied by a prospectus. Please read the prospectus carefully before investing or sending money. Source: MSCI. MSCI makes no express or implied warranties or representations and shall have no liability whatsoever with respect to any MSCI data contained herein. The MSCI data may not be further redistributed or used as a basis for other indexes or any securities or financial products. This report is not approved, endorsed, reviewed or produced by MSCI. None of the MSCI data is intended to constitute investment advice or a recommendation to make (or refrain from making) any kind of investment decision and may not be relied on as such. Russell Investment Group is the source and owner of the trademarks, service marks, and copyrights related to the Russell Indexes. Russell® is a trademark of Russell Investment Group. The Russell 2000 Index is an unmanaged, capitalization-weighted index of domestic small-cap stocks. It measures the performance of the 2,000 smallest publicly traded U.S. companies in the Russell 3000 Index. The Russell Microcap Index includes 1,000 of the smallest securities in the small-cap Russell 2000 Index along with the next smallest eligible securities as determined by Russell. The Russell 2000 Value Index consists of the respective value stocks within the Russell 2000 as determined by Russell Investments. The Russell 2500 is an unmanaged, capitalization-weighted index of the 2,500 smallest publicly traded U.S. companies in the Russell 3000 index. The Russell 1000 is an unmanaged, capitalization-weighted index of domestic large-cap stocks. It measures the performance of the 1,000 largest publicly traded U.S. companies in the Russell 3,000 Index. The MSCI ACWI ex USA Small Cap Index is an unmanaged, capitalization-weighted index of global small-cap stocks, excluding the United States. The performance of an index does not represent exactly any particular investment as you cannot invest directly in an index. Distributor: Royce Fund Services, LLC.
| 6 | This page is not part of the 2019 Semiannual Report to Shareholders |
The Royce Funds and Relative Risk-Adjusted Rolling Returns
We have always believed that a long-term perspective is crucial for determining the success of an investment approach.
| Flourishing in an up market is wonderful, but surviving a bear market by losing less (or not at all) is equally desirable, making results over bull and bear periods the true tests of a portfolio’s mettle. This is why we prefer to examine results that include up and down market phases—primarily by looking at rolling return periods. |
| Our rationale for using long-term rolling periods is based on the fact that investors buy and sell at many times throughout any given year. In our view, examining performance over a larger series of dates using rolling returns provides a more comprehensive picture of performance, providing a more in-depth measure than calendar-based annualized periods. This allows an investor to evaluate the consistency of performance over time—including the ups and downs of market cycles. |
| Closely related to this preference for rolling period analysis is the idea that the success of an investment approach should also be evaluated based on the return it generates compared with the amount |
| of risk taken. We aim to achieve strong, long-term absolute and relative returns on both a traditional and risk-adjusted basis. We use Sharpe ratios, a widely used measure of return per unit of risk that measures the volatility of returns to gauge how our major domestic strategies with more than 20 years of history have fared versus their benchmark, the Russell 2000 Index. We calculate the Sharpe Ratio for each relevant Fund and the index for each rolling five- and 10-year period over the past 20 years and then show both the average Sharpe ratio for these periods as well as each Fund’s batting average—that is, the number and percentage of times the Fund beat the index over the total number of periods—as a measure of that Fund’s success. |
| We are very pleased that on a monthly rolling risk-adjusted basis, our four largest Funds had higher average Sharpe Ratios than the Russell 2000 for the majority of both the 10- and 5-year periods for the 20 years ended 6/30/19. |
| |
| Royce Funds Relative Risk Adjusted Returns: Monthly Rolling Sharpe Ratios |
| 5- and 10-Year Monthly Rolling Sharpe Ratios–20 Years through 6/30/19 |
| FUND | | PERIODS BEATING THE INDEX | | | FUND
AVERAGE | | RUSSELL 2000
AVERAGE |
| |
| Royce Special Equity Fund |
| |
| 10-Year | | 114/121 | | | | | | | | | | | | 94% | | | | 0.58 | | 0.41 |
| |
| 5-Year | | 113/181 | | | | | | | | | | | | 62% | | | | 0.65 | | 0.51 |
| |
| Royce Total Return Fund |
| |
| 10-Year | | 112/121 | | | | | | | | | | | | 93% | | | | 0.49 | | 0.41 |
| |
| 5-Year | | 147/181 | | | | | | | | | | | | 81% | | | | 0.64 | | 0.51 |
| |
| Royce Premier Fund |
| |
| 10-Year | | 105/121 | | | | | | | | | | | | 87% | | | | 0.55 | | 0.41 |
| |
| 5-Year | | 115/181 | | | | | | | | | | | | 64% | | | | 0.65 | | 0.51 |
| |
| Royce Pennsylvania Mutual Fund |
| |
| 10-Year | | 67/121 | | | | | | | | | | | | 55% | | | | 0.47 | | 0.41 |
| |
| 5-Year | | 106/181 | | | | | | | | | | | | 59% | | | | 0.59 | | 0.51 |
| |
| Royce Opportunity Fund |
| |
| 10-Year | | 53/121 | | | | | | | | | | | | 44% | | | | 0.43 | | 0.41 |
| |
| 5-Year | | 106/181 | | | | | | | | | | | | 59% | | | | 0.53 | | 0.51 |
| |
| Included are all Royce Funds benchmarked against the Russell 2000 with at least 20 years of history. |
| |
| TheSharpe Ratio is calculated for a specified period by dividing the fund or index’s average excess returns by its annualized standard deviation. The higher the Sharpe Ratio, the better the fund or index’s historical risk-adjusted performance.Standard Deviation is a statistical measure within which a fund or index’s total returns have varied over time. The greater the standard deviation, the greater a fund or index’s volatility. The performance of an index does not represent exactly any particular investment, as you cannot invest directly in an index. |
Past performance is no guarantee of future results. For more information on performance please see page 6. |
| This page is not part of the 2019 Semiannual Report to Shareholders | 7 |
| MANAGERS’ DISCUSSION |
| |
| Royce Dividend Value Fund (RDV) |
 |
Chuck Royce
Jay Kaplan, CFA |
| FUND PERFORMANCE |
| Royce Dividend Value Fund gained 20.7% for the year-to-date period ended June 30, 2019, outperforming its benchmarks, the Russell 2000 and Russell 2500 Indexes, which rose 17.0% and 19.2%, respectively, for the same period. |
| |
| WHAT WORKED... AND WHAT DIDN’T |
| Nine of the 10 equity sectors in which the Fund had investments finished the first half in the black. Industrials and Financials were the portfolio’s biggest sectors at the end of June, accounting for nearly 60% of its total assets. Unsurprisingly, then, they were also the top-contributing sectors for 2019’s first half by a comfortable margin. Materials and Information Technology also made solid positive impacts, while Consumer Staples detracted modestly, and Utilities and Real Estate made the smallest contribution. |
| At the industry level, we were happy to see sector diversity among the largest contributors, with the top five groups coming from four different sectors. Capital markets (Financials) made an outsized impact consistent with its status as our largest industry weight during the first half. Machinery and aerospace & defense (both from Industrials), metals & mining (Materials), and electronic equipment, instruments & components (Information Technology) followed. Only two of the portfolio’s 36 industries detracted from performance—food & staples retailing (Consumer Staples) and specialty retail (Consumer Discretionary) while a third—hotels, restaurants & leisure (also from Consumer Discretionary)—was essentially flat. |
Each of the Fund’s five top-contributing positions finished June as one if its 10 biggest holdings. HEICO Corporation, which manufacturers replacement aerospace parts, saw its shares reach higher altitudes after the company reported strong organic sales and expanding margins, lifted by strength in its flight support and electronics segments. These developments led HEICO to raise guidance for the rest of the year. Technology and services provider KBR operates in three segments: Government Services, Technology, and Hydrocarbons Services. Its shares benefited from improved revenues that were chiefly driven by its government-facing and technology businesses. Consumer dispensing systems specialist AptarGroup acquired a packing technology company late in 2018. Along with impressive growth in its core business, the acquisition has helped the company to post improved sales and earnings so far in 2019.
Agricultural equipment supplier Lindsay Corporation was the only one of the portfolio’s nine machinery holdings to finish the first half in the red. The company faced several challenges, including lower farming incomes that have crimped capital spending and led to ongoing weakness in its core market, excess rainfall and flooding in the Midwest, and tariff and trade war woes. In early July, however, Lindsay noted an uptick in domestic irrigation sales, while recent improvement in key crop prices such as corn have brightened agricultural sentiment. In addition, the outlook for international irrigation demand remains favorable. We trimmed our stake in the first half. We acted similarly with our position in FamilyMart UNY Holdings, a Japanese convenience store franchise chain. While the Japanese economy has been improving, its pace has not been vigorous enough to help many retailers. Intensifying competition, skittish consumer confidence, and labor shortages at stores and in logistics also played a role in the decline of its shares during the first half. The stock of footwear manufacturer and retailer Caleres was itself hurt by several factors, including reduced traffic and same-store sales growth at the firm’s Famous Footwear retailer. Our long-term perspective and high regard for its stable of well-known brands, such as Sam Edelman and Allen-Edmonds, led us to begin adding shares in June.
Relative to the Russell 2000, the Fund’s advantage came almost entirely from stock selection, though sector allocation made a small contribution. Boosted mostly by stock picking (with our overweight helping to a lesser degree), Industrials was the biggest source of outperformance in the first half. Stock selection in aerospace & defense was especially additive. Financials followed with an advantage driven by stock selection in capital markets. Conversely, our cash position was the largest source of underperformance. With equity returns running high, even the Fund’s 3.0% average weight was enough to hamper relative results. Consumer Discretionary also detracted, as ineffective stock picks in household durables and specialty retail hurt results versus the Russell 2000. |
| Top Contributors to Performance | | | |
| Year-to-Date Through 6/30/191 | | | |
| | | | |
| HEICO Corporation Cl. A | | 1.87 | |
| |
| KBR | | 1.07 | |
| |
| AptarGroup | | 0.90 | |
| |
| KKR & Co. Cl. A | | 0.84 | |
| |
| IDEX Corporation | | 0.84 | |
| |
| 1 Includes dividends | | | |
| Top Detractors from Performance | | | |
| Year-to-Date Through 6/30/192 | | | |
| | | | |
| Lindsay Corporation | | -0.31 | |
| |
| FamilyMart UNY Holdings | | -0.15 | |
| |
| Caleres | | -0.10 | |
| |
| State Street | | -0.08 | |
| |
| American Eagle Outfitters | | -0.07 | |
| |
| 2 Net of dividends | | | |
| CURRENT POSITIONING AND OUTLOOK |
| Markets are very good at surprising most investors. Today, given widespread concerns about slowing growth, increasing trade tensions, and the extended economic cycle, the most surprising outcome might be a rally. We see four favorable factors in the current market environment—low inflation, modest valuations, moderate growth, and increasing liquidity. When taken together, we see these factors as painting an attractive picture for small-cap investors. With so much attention on negative macro issues, we think investors may be missing this positive picture. We see highly promising select opportunities in dividend-paying small-cap cyclicals, particularly in Industrials, Financials, and Materials. |
| 8 | The Royce Funds 2019 Semiannual Report to Shareholders |
| PERFORMANCE AND PORTFOLIO REVIEW | | TICKER SYMBOLS RYDVX RDVIX RDIIX RDVCX |
| |
Performance and Expenses
Average Annual Total Return (%) Through 6/30/19 |
| | | JAN-JUN 20191 | | 1-YR | | 3-YR | | 5-YR | | 10-YR | | 15-YR | | SINCE INCEPTION (5/3/04) |
| |
| RDV | | 20.71 | | 3.19 | | 11.09 | | 5.02 | | 11.97 | | 8.54 | | 8.49 |
| |
| Annual Gross Operating Expenses: 1.43% Annual Net Operating Expenses: 1.34% |
| |
| 1 Not annualized | | | | | | | | | | | | | | |
| |
Relative Risk Adjusted Returns: Monthly Rolling Sharpe Ratios
Since Inception Through 6/30/19
On a monthly rolling risk-adjusted basis, the Fund outperformed the Russell 2000 in 94% of all 10-year periods and 53% of all 5-year periods. |
| |
| | | PERIODS BEATING THE INDEX | | | | | FUND AVG (%)1 | | INDEX AVG (%)1 |
| |
| 10-year | | 58/62 | | | | | | 94% | | 0.53 | | 0.49 |
| |
| 5-year | | 65/122 | | | | | | 53% | | 0.57 | | 0.54 |
| |
1Average of monthly rolling Sharpe Ratios over the specified periods.

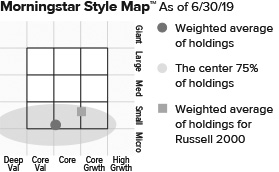
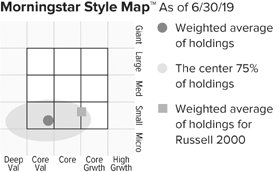
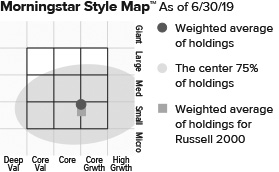
The Morningstar Style Map is the Morningstar Style BoxTM with the center 75% of fund holdings plotted as the Morningstar Ownership ZoneTM. The Morningstar Style Box is designed to reveal a fund’s investment strategy. The Morningstar Ownership Zone provides detail about a portfolio’s investment style by showing the range of stock sizes and styles. The Ownership Zone is derived by plotting each stock in the portfolio within the proprietary Morningstar Style Box. Over time, the shape and location of a fund’s ownership zone may vary. See page 97 for additional information. |
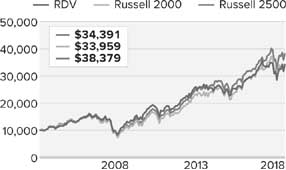
Value of $10,000Invested on 5/3/04 as of 6/30/19 ($)
|
| Top 10 Positions | | |
| % of Net Assets | | |
| | | |
| HEICO Corporation Cl. A | | 4.3 |
| |
| AptarGroup | | 3.3 |
| |
| FLIR Systems | | 3.2 |
| |
| KKR & Co. Cl. A | | 3.1 |
| |
| Quaker Chemical | | 3.0 |
| |
| IDEX Corporation | | 2.7 |
| |
| Reliance Steel & Aluminum | | 2.4 |
| |
| KBR | | 2.4 |
| |
| Spirax-Sarco Engineering | | 2.3 |
| |
| Graco | | 2.3 |
| |
| |
| Portfolio Sector Breakdown | | |
| % of Net Assets | | |
| | | |
| Industrials | | 29.3 |
| |
| Financials | | 28.2 |
| |
| Materials | | 14.3 |
| |
| Information Technology | | 9.0 |
| |
| Consumer Discretionary | | 7.3 |
| |
| Energy | | 6.2 |
| |
| Health Care | | 2.2 |
| |
| Utilities | | 1.5 |
| |
| Real Estate | | 0.4 |
| |
| Consumer Staples | | 0.4 |
| |
| Cash and Cash Equivalents | | 1.2 |
| |
| |
| Calendar Year Total Returns (%) | | |
| | | |
| YEAR | | RDV |
| |
| 2018 | | -16.2 |
| |
| 2017 | | 21.7 |
| |
| 2016 | | 16.4 |
| |
| 2015 | | -5.7 |
| |
| 2014 | | -2.1 |
| |
| 2013 | | 30.7 |
| |
| 2012 | | 16.9 |
| |
| 2011 | | -4.5 |
| |
| 2010 | | 30.1 |
| |
| 2009 | | 37.7 |
| |
| 2008 | | -31.5 |
| |
| 2007 | | -0.0 |
| |
| 2006 | | 19.9 |
| |
| 2005 | | 7.3 |
| |
| |
| Upside/Downside Capture Ratios |
| Periods Ended 6/30/19 (%) |
| | | UPSIDE | | DOWNSIDE |
| |
| 10-Year | | 87 | | 84 |
| |
| From 6/30/04 (Start of Fund’s First Full Quarter) | | 89 | | 78 |
| |
| |
| Portfolio Diagnostics | | | |
| | | | |
| Fund Net Assets | | $110 million | |
| |
| Number of Holdings | | 86 | |
| |
| Turnover Rate | | 6% | |
| |
| Average Market Capitalization1 | | $4,420 million | |
| |
| Weighted Average P/E Ratio2,3 | | 17.4x | |
| |
| Weighted Average P/B Ratio2 | | 2.6x | |
| |
| Active Share4 | | 97% | |
| |
| U.S. Investments (% of Net Assets) | | 67.6% | |
| |
| Non-U.S. Investments (% of Net Assets) | | 31.2% | |
| |
| 1 | Geometric Average. This weighted calculation uses each portfolio holding’s market cap in a way designed to not skew the effect of very large or small holdings; instead, it aims to better identify the portfolio’s center, which Royce believes offers a more accurate measure of average market cap than a simple mean or median. |
| 2 | Harmonic Average. This weighted calculation evaluates a portfolio as if it were a single stock and measures it overall. It compares the total market value of the portfolio to the portfolio’s share in the earnings or book value, as the case may be, of its underlying stocks. |
| 3 | The Fund’s P/E ratio calculation excludes companies with zero or negative earnings (2% of portfolio holdings as of 6/30/19). |
| 4 | Active Share is the sum of the absolute values of the different weightings of each holding in the Fund versus each holding in the benchmark, divided by two. |
| Important Performance and Expense Information |
All performance information in this Report reflects past performance, is presented on a total return basis, reflects the reinvestment of distributions, and does not reflect the deduction of taxes that a shareholder would pay on fund distributions or the redemption of fund shares. Past performance is no guarantee of future results. Investment return and principal value of an investment will fluctuate, so that shares may be worth more or less than their original cost when redeemed. Shares redeemed within 30 days of purchase may be subject to a 1% redemption fee payable to the Fund, which is not reflected in the performance shown above; if it were, performance would be lower. Current month-end performance may be higher or lower than performance quoted and may be obtained at www.roycefunds.com. All performance and risk information reflects results of the Service Class (its oldest class). Certain immaterial adjustments were made to the net assets of Royce Dividend Value Fund at 6/30/15 for financial reporting purposes, and as a result the net asset values for shareholder transactions on that date and the calendar year Total Returns (%) based on those net asset values differ from the adjusted net asset values and calendar year total returns reported in the Financial Highlights. Gross operating expenses reflect the Fund’s total gross annual operating expenses for the Service Class and include management fees, 12b-1 distribution and service fees, and other expenses. Net operating expenses reflect contractual fee waivers and/or expense reimbursements. All expense information is reported as of the Fund’s most current prospectus. Royce & Associates has contractually agreed, without right of termination, to waive fees and/or reimburse expenses to the extent necessary to maintain the Service Class’s net annual operating expenses (excluding brokerage commissions, taxes, interest, litigation expenses, acquired fund fees and expenses, and other expenses not borne in the ordinary course of business) at or below 1.34% through April 30, 2020. Regarding the “Top Contributors” and “Top Detractors” tables shown above, the sum of all contributors to, and all detractors from, performance for all securities in the portfolio would approximate the Fund’s year-to-date performance for 2019. The Sharpe Ratio is calculated for a specified period by dividing a fund’s annualized excess returns by its annualized standard deviation. The higher the Sharpe ratio, the better the fund’s historical risk-adjusted performance. Upside Capture Ratio measures a manager’s performance in up markets relative to the Fund’s benchmark. It is calculated by measuring the Fund’s performance in quarters when the benchmark went up and dividing it by the benchmark’s return in those quarters. Downside Capture Ratio measures a manager’s performance in down markets relative to the Fund’s benchmark (Russell 2000). It is calculated by measuring the Fund’s performance in quarters when the benchmark goes down and dividing it by the benchmark’s return in those quarters.
|
| The Royce Funds 2019 Semiannual Report to Shareholders | 9 |
| MANAGERS’ DISCUSSION |
| |
| Royce Global Financial Services Fund (RFS) |
 |
Chuck Royce
Chris Flynn |
| FUND PERFORMANCE |
| Royce Global Financial Services Fund enjoyed a strong first half on an absolute basis, though it trailed its benchmarks for the period. For the year-to-date period ended June 30, 2019, the Fund increased 16.3%, while its U.S.-based benchmarks, the Russell 2000 Index and the Russell 2500 Financial Services Index, posted respective gains of 17.0% and 17.5% for the same period. For additional context in light of the Fund’s global embrace, the MSCI ACWI Small Cap Index was up 15.0% in the first half of 2019. |
| |
| WHAT WORKED... AND WHAT DIDN’T |
| Relative results notwithstanding, we were pleased that gains were widespread through the portfolio. Seventeen of the 22 subindustries in which the Fund had investments contributed to year-to-date returns. As is often the case, the two largest subindustries, asset management & custody banks and regional banks, were the two largest contributors. At the other end of the scale, application software and diversified capital markets were the largest subindustry detractors. A somewhat similar level of broad gains could be found at the country level, where 12 of 18 countries made positive contributions to first-half returns. Outside the U.S.—our largest weighting and the biggest contributor by country— notable positive impacts came from holdings headquartered in Canada and the U.K. while positions headquartered in France, India, and South Africa detracted most, though on a modest scale. |
MarketAxess Holdings, which operates an electronic, multi-dealer trading platform for investment grade and high-yield corporate and emerging market bonds, was the largest contributor at the position level in the first half. Recent results demonstrated an acceleration in market share gains in high-yield and emerging market bonds, which suggested that the company’s total addressable market may be larger than previously thought. The next two contributors reflected the Fund’s positioning pivot a few years ago within asset management stocks. Seeing certain seismic shifts in the industry, we trained our sights on traditional managers with specialties that we thought were sustainable over the long term while also beginning to research and investigate alternative asset management companies. An example of the latter, Ares Management is a market leader in managing private credit pools. Its stock advanced during the first half as it continued to benefit from strong fundraising and yield-hungry investors favoring investments that deliver attractive amounts in a period with generally low interest rates. Based in London but with a global investment reach, Ashmore Group is the leader in emerging market debt investing and an example of a specialist asset manager with a core business that we really like. So far this year, the company has seen strong inflows for its products while also benefiting from an investment rebound in its asset class.
Benefitfocus, a cloud-based software provider of benefits solutions to employers and brokers, was the largest detractor for the year-to-date period. The company reported two consecutive disappointing quarters, particularly regarding expectations in achieving profitability. Along with a large insider sale and the resignation of the CFO, all of this spooked investors. We retained our shares because we are optimistic about the company’s long-term prospects to help its customers manage benefits costs efficiently. Virtu Financial, a market maker and liquidity provider, suffered through a difficult market environment for its business model, which tends to do best when equity trading volumes are rising and volatility levels are moderate to high, which was precisely the opposite of what happened in the first half, which featured both low trading volumes and (aside from May) low volatility. We expect these market conditions to normalize, ultimately supporting growing profits for Virtu. National Western Life Group, a life insurer, also detracted. The company reported a decline in fourth-quarter revenue due to shuttering their international insurance operations. |
| Top Contributors to Performance | | | |
| Year-to-Date Through 6/30/19 (%)1 | | | |
| | | | |
| MarketAxess Holdings | | 1.30 | |
| |
| Ares Management Cl. A | | 0.97 | |
| |
| Ashmore Group | | 0.97 | |
| |
| Sprott | | 0.96 | |
| |
| FirstService Corporation | | 0.95 | |
| |
| 1 Includes dividends | | | |
| Top Detractors from Performance | | | |
| Year-to-Date Through 6/30/19 (%)2 | | | |
| | | | |
| Benefitfocus | | -0.48 | |
| |
| Virtu Financial Cl. A | | -0.42 | |
| |
| National Western Life Group Cl. A | | -0.22 | |
| |
| Rothschild & Co | | -0.16 | |
| |
| JSE | | -0.13 | |
| |
| 2 Net of dividends | | | |
| CURRENT POSITIONING AND OUTLOOK |
| The financial sector is undergoing meaningful change due to the convergence of several important factors, such as persistently low interest rates, the increasing popularity of passive investment vehicles, low equity market volatility, and low equity trading volumes. These conditions have created difficulties for many traditional financial business models, including banks, insurers, brokerages, and traditional asset managers. As a result, we have evolved our positioning to include companies that we believe can prosper if current conditions persist. One example is the preference we mentioned earlier for both traditional asset managers with a sustainable specialty and alternative asset managers. We are also attracted to certain specialty lenders that look capable of thriving in the current low-rate environment and selected service companies that are using technology to deliver superior service or lower prices. While we still expect an eventual return to normalization, one that will include higher rates and higher volatility that should benefit many of the Fund’s holdings, we also want to own stocks that can do well if “normal” takes a longer time to arrive than we initially anticipated. |
| 10 | The Royce Funds 2019 Semiannual Report to Shareholders |
| PERFORMANCE AND PORTFOLIO REVIEW | | TICKER SYMBOLS RYFSX RGFIX |
| Performance and Expenses |
| Average Annual Total Return (%) Through 6/30/19 |
| | | JAN-JUN 20191 | | 1-YR | | 3-YR | | 5-YR | | 10-YR | | 15-YR | | SINCE INCEPTION (12/31/03) |
| |
| RFS | | 16.26 | | -1.92 | | 11.47 | | 5.78 | | 11.11 | | 8.08 | | 7.88 |
| |
| Annual Gross Operating Expenses: 1.77% Annual Net Operating Expenses: 1.58% |
| |
| 1 Not annualized | | | | | | | | | | | | |
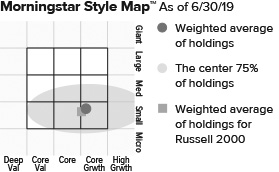
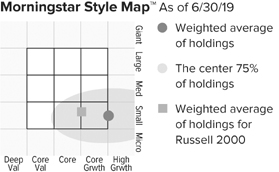
The Morningstar Style Map is the Morningstar Style BoxTM with the center 75% of fund holdings plotted as the Morningstar Ownership ZoneTM. The Morningstar Style Box is designed to reveal a fund’s investment strategy. The Morningstar Ownership Zone provides detail about a portfolio’s investment style by showing the range of stock sizes and styles. The Ownership Zone is derived by plotting each stock in the portfolio within the proprietary Morningstar Style Box. Over time, the shape and location of a fund’s ownership zone may vary. See page 97 for additional information. |
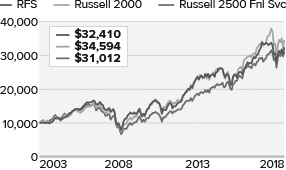
Value of $10,000Invested on 12/31/03 as of 6/30/19 ($)
|
| Top 10 Positions | | |
| % of Net Assets | | |
| | | |
| MarketAxess Holdings | | 3.6 |
| |
| Franco-Nevada | | 3.6 |
| |
| Sprott | | 3.3 |
| |
| Popular | | 3.2 |
| |
| FirstService Corporation | | 3.1 |
| |
| First Citizens BancShares Cl. A | | 2.9 |
| |
| E-L Financial | | 2.6 |
| |
| Virtu Financial Cl. A | | 2.6 |
| |
| Ares Management Cl. A | | 2.6 |
| |
| Ashmore Group | | 2.6 |
| |
|
| Portfolio Industry Breakdown | | |
| % of Net Assets (Subject to Change) | | |
| | | |
| Capital Markets | | 48.6 |
| |
| Banks | | 18.8 |
| |
| Real Estate Management & Development | | 7.4 |
| |
| Insurance | | 6.6 |
| |
| Metals & Mining | | 3.5 |
| |
| Software | | 2.9 |
| |
| Professional Services | | 2.5 |
| |
| Trading Companies & Distributors | | 2.0 |
| |
| IT Services | | 1.8 |
| |
| Diversified Financial Services | | 1.4 |
| |
| Hotels, Restaurants & Leisure | | 0.8 |
| |
| Consumer Finance | | 0.5 |
| |
| Cash and Cash Equivalents | | 3.2 |
| |
|
| Upside/Downside Capture Ratios | | | | |
| Periods Ended 6/30/19 (%) | | | | |
| | | UPSIDE | | DOWNSIDE |
| |
| 10-Year | | 83 | | 85 |
| |
| Fund’s First Full Quarter (12/31/03) | | 85 | | 78 |
| |
|
| Calendar Year Total Returns (%) | | |
| | | |
| YEAR | | RFS |
| |
| 2018 | | -13.4 |
| |
| 2017 | | 22.5 |
| |
| 2016 | | 12.9 |
| |
| 2015 | | -4.7 |
| |
| 2014 | | 3.5 |
| |
| 2013 | | 42.0 |
| |
| 2012 | | 20.7 |
| |
| 2011 | | -11.3 |
| |
| 2010 | | 18.5 |
| |
| 2009 | | 32.1 |
| |
| 2008 | | -35.4 |
| |
| 2007 | | -4.7 |
| |
| 2006 | | 24.8 |
| |
| 2005 | | 12.2 |
| |
| 2004 | | 15.1 |
| |
|
| Portfolio Country Breakdown1,2 | | |
| % of Net Assets | | |
| | | |
| |
| United States | | 55.3 |
| |
| Canada | | 19.8 |
| |
| United Kingdom | | 7.7 |
| |
| India | | 2.6 |
| |
| France | | 2.3 |
| |
| South Africa | | 1.8 |
| |
| Brazil | | 1.5 |
| |
| 1 | Represents countries that are 1.5% or more of net assets. |
| 2 | Securities are categorized by the country of their headquarters. |
|
| Portfolio Diagnostics | | |
| | | |
| Fund Net Assets | | $39 million |
| |
| Number of Holdings | | 70 |
| |
| Turnover Rate | | 1% |
| |
| Average Market Capitalization1 | | $2,205 million |
| |
| Weighted Average P/E Ratio2,3 | | 14.7x |
| |
| Weighted Average P/B Ratio2 | | 1.8x |
| |
| Active Share4 | | 99% |
| |
| 1 | Geometric Average. This weighted calculation uses each portfolio holding’s market cap in a way designed to not skew the effect of very large or small holdings; instead, it aims to better identify the portfolio’s center, which Royce believes offers a more accurate measure of average market cap than a simple mean or median. |
| 2 | Harmonic Average. This weighted calculation evaluates a portfolio as if it were a single stock and measures it overall. It compares the total market value of the portfolio to the portfolio’s share in the earnings or book value, as the case may be, of its underlying stocks. |
| 3 | The Fund’s P/E ratio calculation excludes companies with zero or negative earnings (11% of portfolio holdings as of 6/30/19). |
| 4 | Active Share is the sum of the absolute values of the different weightings of each holding in the Fund versus each holding in the benchmark, divided by two. |
| Important Performance and Expense Information
All performance information in this Report reflects past performance, is presented on a total return basis, reflects the reinvestment of distributions, and does not reflect the deduction of taxes that a shareholder would pay on fund distributions or the redemption of fund shares. Past performance is no guarantee of future results. Investment return and principal value of an investment will fluctuate, so that shares may be worth more or less than their original cost when redeemed. Shares redeemed within 30 days of purchase may be subject to a 1% redemption fee payable to the Fund, which is not reflected in the performance shown above; if it were, performance would be lower. Current month-end performance may be higher or lower than performance quoted and may be obtained at www.roycefunds.com. Gross operating expenses reflect the Fund’s gross total annual operating expenses for the Service Class and include management fees, 12b-1 distribution and service fees, other expenses and acquired fund fees and expenses. Net operating expenses reflect contractual fee waivers and/or expense reimbursements. All expense information is reported as of the Fund’s most current prospectus. Royce & Associates has contractually agreed to waive fees and/or reimburse expenses to the extent necessary to maintain the Fund’s net annual operating expenses, (excluding brokerage commissions, taxes, interest, litigation expenses, acquired fund fees and expenses, and other expenses not borne in the ordinary course of business), at or below 1.49% through April 30, 2020. Acquired fund fees and expenses reflect the estimated amount of the fees and expenses incurred indirectly by the Fund through its investments in mutual funds, hedge funds, private equity funds, and other investment companies. Regarding the “Top Contributors” and “Top Detractors” tables shown above, the sum of all contributors to, and all detractors from, performance for all securities in the portfolio would approximate the Fund’s year-to-date performance for 2019. Upside Capture Ratio measures a manager’s performance in up markets relative to the Fund’s benchmark. It is calculated by measuring the Fund’s performance in quarters when the benchmark went up and dividing it by the benchmark’s return in those quarters. Downside Capture Ratio measures a manager’s performance in down markets relative to the Fund’s benchmark (Russell 2000). It is calculated by measuring the Fund’s performance in quarters when the benchmark goes down and dividing it by the benchmark’s return in those quarters.
|
| The Royce Funds 2019 Semiannual Report to Shareholders | 11 |
| | | MANAGERS’ DISCUSSION |
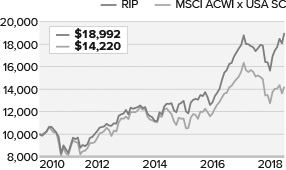
| Royce International Premier Fund (RIP) | | |
 |
David Nadel
Mark Rayner, CA |
FUND PERFORMANCE
Royce International Premier Fund gained 21.4% for the year-to-date period ended June 30, 2019, significantly ahead of its benchmark, the MSCI ACWI ex-US Small Cap Index, which was up 11.6% for the same period. This strong absolute and relative performance helped our Quality-at-a-Reasonable-Price strategy to outpace the benchmark for the one-, three-, five-year, and since inception (12/31/10) periods ended June 30, 2019. |
| |
| WHAT WORKED... AND WHAT DIDN’T |
| All eight equity sectors in which the Fund had investments made a positive impact on first-half returns, as did 16 of 18 countries. Industrials was by far the top-contributing sector, followed by Information Technology, while Materials and Consumer Discretionary contributed least. Based on each country’s headquarters, stocks in Japan and Switzerland made the largest contributions, while only China and India detracted from portfolio returns. |
Based in Brazil—and buoyed in part by that nation’s economic and market recoveries—TOTVS provides enterprise resource planning and supply chain management software solutions. The company made the biggest positive contribution to first-half returns on the position level as analysts showed more confidence in its growth opportunities in FinTech. In addition, TOTVS recently completed a follow-on equity raise that strengthened its seemingly fortress-like balance sheet, providing the company with more-than-ample capital for strategic acquisitions. Kardex is a Swiss intralogistics company that manufactures automated storage and materials handling systems. Its stock began to climb in early March following the report of strong full-year earnings, which helped its shares to recover from a steep price decline in 2018’s fourth quarter. Spirax-Sarco is a U.K. company that makes steam management systems and peristaltic pumps whose outstanding record of consistent long-term organic growth and profitability first drew our attention. Its shares rose in May when it announced impressive organic growth rates so far in 2019 despite some softening in global industrial production.
The Fund’s top detractor in the first half was TravelSky Technology, a Hong Kong listed company that dominates Global Distribution Systems (GDS) services to the Chinese aviation and travel industry primarily by connecting airline ticket suppliers, hotels, rental cars, etc. with the agencies making customer reservations. The company announced disappointing earnings for fiscal 2018 in March. While its revenues grew robustly, net profits were disappointing due to increased costs. Thinking that these were solvable, short-term issues, we added shares. Consort Medical is a U.K.-based Contract Development & Manufacturing Organization that makes high-volume, disposable drug delivery devices primarily for respiratory treatments. Full-year results announced in June showed revenues and operating profits both down, but in line with the reduced expectations set by management in December 2018. The company has also reported mixed news on the development of a relatively narrow, though expanding, portfolio of commercialized and in-development projects, which has made the stock disappointingly volatile for some time. Adding to its challenges was an explosion in its Northumberland facility in July, though we began to reduce our position in June. We chose to exit our position in SH Kelkar & Company, as this India-based, family-run fragrance producer continued to struggle.
The Fund’s outperformance versus the MSCI ACWI ex USA Small Cap came largely from stock selection, though sector allocation was also positive. Industrials contributed most, with professional services as its leading industry. Information Technology also had a notably strong impact on first-half outperformance, courtesy of strong results for the software industry, where the Fund had seven holdings and was significantly overweight versus the benchmark. The Fund’s cash position was the largest source of relative underperformance. While our 5.7% average cash level in the first half was not high, almost any amount is a meaningful drag on performance when returns are as strong as they were. Materials also detracted from relative returns, as stock selection had a negative impact. |
| | Top Contributors to Performance
Year-to-Date Through 6/30/19 (%)1 | | |
| | | |
| TOTVS | | 1.12 |
| |
| Kardex | | 1.11 |
| |
| Spirax-Sarco Engineering | | 0.92 |
| |
| IMCD | | 0.89 |
| |
| Partners Group Holding | | 0.83 |
| |
| 1 Includes dividends | | |
| | Top Detractors from Performance
Year-to-Date Through 6/30/19 (%)2 | | |
| | | |
| TravelSky Technology | | -0.40 |
| |
| Consort Medical | | -0.15 |
| |
| SH Kelkar & Company | | -0.15 |
| |
| Burkhalter Holding | | -0.04 |
| |
| Croda International | | -0.01 |
| |
| 2 Net of dividends | | |
| CURRENT POSITIONING AND OUTLOOK |
| After peaking in January 2018, the MSCI ACWI ex USA Small Cap Index declined to a point 15% shy of its prior high at the end of June. Global Manufacturing PMI’s were in decline over this same period, and sat at less than 50 on June 30, reflecting a contraction in global manufacturing. While we are grateful that the Fund delivered a modest positive return during this difficult 18-month period, we would also welcome more hospitable conditions for international small-cap stocks. That scenario may be approaching. Central banks appear ready to resume their accommodative positions, which will likely include increasing financial market liquidity, a development that should help small-caps. It seemed reasonable at the end of June to conclude that most, if not all, of the recent macroeconomic pessimism is fully reflected in valuations. In the absence of worsening global macroeconomic conditions, we suspect that the combination of increased central bank support, continued modest inflation, and low interest rates may all be supportive for international small-caps. |
| 12 | The Royce Funds 2019 Semiannual Report to Shareholders | |
| PERFORMANCE AND PORTFOLIO REVIEW | | TICKER SYMBOLS RYIPX RIPNX RINPX RIPIX |
| Performance and Expenses |
| Average Annual Total Return (%) Through 6/30/19 |
| | | JAN-JUN 20191 | | 1-YR | | 3-YR | | 5-YR | | SINCE INCEPTION (12/31/10) |
| |
| RIP | | 21.38 | | 9.26 | | 13.28 | | 8.64 | | 7.84 |
| |
| Annual Gross Operating Expenses: 1.59% Annual Net Operating Expenses: 1.44% |
| |
| 1 Not annualized | | | | | | | | | | |
| |
Relative Returns: Monthly Rolling Average Annual Return Periods
Since Inception Through 6/30/19
On a monthly rolling basis, the Fund outperformed the MSCI ACWI x USA SC in 100% of all 5-year periods; 84% of all 3-year periods; and 69% of all 1-year periods. |
| |
| | | PERIODS BEATING THE INDEX | | | | | FUND AVG (%)1 | | INDEX AVG (%)1 |
| |
| 5-year | | 43/43 | | | | | | 100% | | 8.5 | | 6.1 |
| |
| 3-year | | 56/67 | | | | | | 84% | | 9.1 | | 6.8 |
| |
| 1-year | | 63/91 | | | | | | 69% | | 8.6 | | 5.9 |
| |
1Average of monthly rolling average annual total returns over the specified periods.
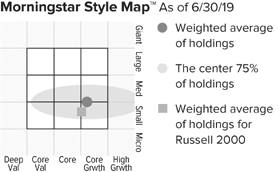
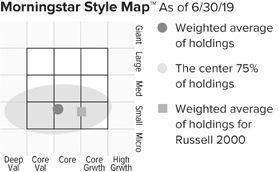
The Morningstar Style Map is the Morningstar Style BoxTM with the center 75% of fund holdings plotted as the Morningstar Ownership ZoneTM. The Morningstar Style Box is designed to reveal a fund’s investment strategy. The Morningstar Ownership Zone provides detail about a portfolio’s investment style by showing the range of stock sizes and styles. The Ownership Zone is derived by plotting each stock in the portfolio within the proprietary Morningstar Style Box. Over time, the shape and location of a fund’s ownership zone may vary. See page 97 for additional information. |
Value of $10,000Invested on 12/31/10 as of 6/30/19 ($)
|
| Top 10 Positions | | |
| % of Net Assets | | |
| | | |
| IMCD | | 3.0 |
| |
| Meitec Corporation | | 2.9 |
| |
| Partners Group Holding | | 2.8 |
| |
| Victrex | | 2.7 |
| |
| Daifuku | | 2.7 |
| |
| Hexpol | | 2.7 |
| |
| Intertrust | | 2.5 |
| |
| Spirax-Sarco Engineering | | 2.4 |
| |
| Loomis Cl. B | | 2.4 |
| |
| TKC Corporation | | 2.3 |
| |
|
| Portfolio Sector Breakdown | | |
| % of Net Assets | | |
| | | |
| Industrials | | 36.9 |
| |
| Information Technology | | 22.0 |
| |
| Health Care | | 13.0 |
| |
| Materials | | 7.4 |
| |
| Financials | | 7.0 |
| |
| Energy | | 4.2 |
| |
| Real Estate | | 3.6 |
| |
| Preferred Stock | | 2.1 |
| |
| Cash and Cash Equivalents | | 3.8 |
| |
|
| Upside/Downside Capture Ratios | | | | |
| Periods Ended 6/30/19 (%) | | | | |
| | | UPSIDE | | DOWNSIDE |
| |
| Fund’s First Full Quarter (12/31/10) | | 108 | | 76 |
| |
|
| Calendar Year Total Returns (%) | | |
| | | |
| YEAR | | RIP |
| |
| 2018 | | -12.8 |
| |
| 2017 | | 39.8 |
| |
| 2016 | | -1.1 |
| |
| 2015 | | 16.2 |
| |
| 2014 | | -8.2 |
| |
| 2013 | | 18.3 |
| |
| 2012 | | 23.4 |
| |
| 2011 | | -16.8 |
| |
|
| Portfolio Country Breakdown1,2 | | |
| % of Net Assets | | |
| |
| Japan | | 18.1 |
| |
| United Kingdom | | 11.7 |
| |
| Switzerland | | 8.8 |
| |
| Australia | | 8.7 |
| |
| Sweden | | 8.5 |
| |
| Germany | | 7.3 |
| |
| Canada | | 5.9 |
| |
| Netherlands | | 5.5 |
| |
| France | | 4.7 |
| |
| Brazil | | 4.4 |
| |
| 1 | Represents countries that are 3% or more of net assets. |
| 2 | Securities are categorized by the country of their headquarters. |
|
| Portfolio Diagnostics | | |
| | | |
| Fund Net Assets | | $606 million |
| |
| Number of Holdings | | 51 |
| |
| Turnover Rate | | 14% |
| |
| Average Market Capitalization1 | | $2,042 million |
| |
| Weighted Average P/E Ratio2,3 | | 24.7x |
| |
| Weighted Average P/B Ratio2 | | 3.7x |
| |
| Active Share4 | | 99% |
| |
| 1 | Geometric Average. This weighted calculation uses each portfolio holding’s market cap in a way designed to not skew the effect of very large or small holdings; instead, it aims to better identify the portfolio’s center, which Royce believes offers a more accurate measure of average market cap than a simple mean or median. |
| 2 | Harmonic Average. This weighted calculation evaluates a portfolio as if it were a single stock and measures it overall. It compares the total market value of the portfolio to the portfolio’s share in the earnings or book value, as the case may be, of its underlying stocks. |
| 3 | The Fund’s P/E ratio calculation excludes companies with zero or negative earnings (2% of portfolio holdings as of 6/30/19). |
| 4 | Active Share is the sum of the absolute values of the different weightings of each holding in the Fund versus each holding in the benchmark, divided by two. |
| Important Performance and Expense Information
All performance information in this Report reflects past performance, is presented on a total return basis, reflects the reinvestment of distributions, and does not reflect the deduction of taxes that a shareholder would pay on fund distributions or the redemption of fund shares. Past performance is no guarantee of future results. Investment return and principal value of an investment will fluctuate, so that shares may be worth more or less than their original cost when redeemed. Shares redeemed within 30 days of purchase may be subject to a 2% redemption fee payable to the Fund, which is not reflected in the performance shown above; if it were, performance would be lower. Current month-end performance may be higher or lower than performance quoted and may be obtained at www.roycefunds.com. All performance and risk information reflects results of the Service Class (its oldest class). Price and total return information is based on net asset values for shareholder transactions. Certain immaterial adjustments were made to the net assets of Royce International Premier Fund at 6/30/14 for financial reporting purposes, and as a result the calendar year total returns based on those net assets values differ from the adjusted net values and calendar year total returns reported in the Financial Highlights. Gross operating expenses reflect total gross annual operating expenses for the Service Class and include management fees, 12b-1 distribution and service fees, and other expenses. Net operating expenses reflect contractual fee waivers and/or expense reimbursements. All expense information is reported as of the Fund’s most current prospectus. Royce & Associates has contractually agreed to waive its fees and/or reimburse operating expenses to the extent necessary to maintain the Fund’s net annual operating expenses, (excluding brokerage commissions, taxes, interest, litigation expenses, acquired fund fees and expenses, and other expenses not borne in the ordinary course of business), at or below 1.44% through April 30, 2020. Regarding the “Top Contributors” and “Top Detractors” tables shown above, the sum of all contributors to, and all detractors from, performance for all securities in the portfolio would approximate the Fund’s year-to-date performance for 2019. Upside Capture Ratio measures a manager’s performance in up markets relative to the Fund’s benchmark. It is calculated by measuring the Fund’s performance in quarters when the benchmark went up and dividing it by the benchmark’s return in those quarters. Downside Capture Ratio measures a manager’s performance in down markets relative to the Fund’s benchmark (MSCI ACWI ex USA Small Cap). It is calculated by measuring the Fund’s performance in quarters when the benchmark goes down and dividing it by the benchmark’s return in those quarters.
|
| The Royce Funds 2019 Semiannual Report to Shareholders | 13 |
| | | MANAGER’S DISCUSSION |
| Royce Low-Priced Stock Fund (RLP) | | |
 |
| Jim Stoeffel |
IMPORTANT NEWS FOR SHAREHOLDERS
The shareholders of Royce Low-Priced Stock Fund approved a reorganization plan that combined that Fund with Royce Micro-Cap Fund. As part of the reorganization, all of the assets and liabilities of Low-Priced Stock were exchanged for shares of Micro-Cap, with all values expected to be determined as of the closing of the NYSE (generally 4:00 pm) on Friday, July 12, 2019. Upon completion of the reorganization, shareholders of Low-Priced Stock became shareholders of Micro-Cap.
FUND PERFORMANCE
For the year-to-date period ended June 30, 2019, Royce Low-Priced Stock Fund underperformed its benchmark, gaining 14.5%, while the Russell 2000 Index advanced 17.0% for the same period. |
| |
| WHAT WORKED... AND WHAT DIDN’T |
Six of the Fund’s 10 equity sectors finished 2019’s first half in the black. Our historic overweight in Information Technology worked in our favor as it was the top contributor in the portfolio. We also saw strong performance by Industrials and Health Care. Consumer Staples, however, was the top detractor for the year-to-date period ended June 30, 2019. The other three sectors that detracted—Real Estate, Communication Services, and Energy—did so modestly.
At the industry level, the largest positive contribution came from semiconductors & semiconductor equipment (Information Technology), mostly due to strong results for data movement interconnect specialist Inphi Corporation. Machinery (Industrials) and pharmaceuticals (Health Care) followed as top contributors. The portfolio’s top contributor overall was pharmaceutical company Axsome Therapeutics, which develops therapies for neurological disorders. Its shares grew healthy on news of solid clinical results for a drug that treats major depressive disorder (MDD), which led the FDA to give this treatment Breakthrough Therapy Designation, which speeds its pace to market. Quanterix Corporation is a medical technology provider that offers ultra-high sensitivity immunoassay platforms used in testing protein biomarkers. Its stock benefited from the company’s leading edge technology, which drove significant growth in critical life sciences research applications in areas such neurology, oncology, and cardiology, among others.
Conversely, specialty retail and leisure products, both in Consumer Discretionary, were the largest detractors at the industry level. Health and fitness company Nautilus suffered through two consecutive failed product launches, with a resulting decision to remove the CEO. This led the company to be the largest detracting position for the first half of 2019. While we like a number of the strategic decisions made by the company over the past several years, we sold our position as we expect it will take at least a year to rebuild its new product pipeline. Equally important, our confidence in management’s ability to effectively navigate the rapidly changing fitness markets was shaken. Oil field services company Mammoth Energy Services was the next top detracting position, as depressed revenues and earnings and an uncertain outlook for its industry hurt its stock. |
| | Top Contributors to Performance
Year-to-Date Through 6/30/19 (%)1 | | | |
| | | |
| Axsome Therapeutics | | 2.24 |
| |
| Quanterix Corporation | | 0.81 |
| |
| ASV Holdings | | 0.74 |
| |
| Kornit Digital | | 0.74 |
| |
| Amber Road | | 0.70 | |
| |
| 1 Includes dividends | | |
| | Top Detractors from Performance
Year-to-Date Through 6/30/19 (%)2 | | | |
| | | |
| Nautilus | | -0.55 |
| |
| Mammoth Energy Services | | -0.42 |
| |
| Kirkland’s | | -0.41 |
| |
| Harvard Bioscience | | -0.29 |
| |
| Dynavax Technologies | | -0.28 | |
| |
| 2 Net of dividends | | | |
Relative to the Russell 2000 Index, poor stock selection was the source of first-half underperformance—sector allocation contributed modestly. Consumer Discretionary was the largest detractor due to poor stock picking in specialty retail and leisure products. Energy also hampered results due to our stock selection in energy equipment & services. Our cash position also detracted from overall relative performance as almost any amount of cash in a strong market will create a drag on relative performance.
Health Care generated the strongest relative results, mostly driven by our savvy stock selection in pharmaceuticals. Industrials boasted the next-best positive result. This was particularly driven by machinery where we saw strong results for ASV Holdings, a company that engineers compact truck loads and skid steers.
If you would like to know more about James P. Stoeffel’s outlook on the market, please read the Manager’s Discussion for Royce Micro-Cap Fund on page 16. |
| 14 | The Royce Funds 2019 Semiannual Report to Shareholders | |
| PERFORMANCE AND PORTFOLIO REVIEW | | TICKER SYMBOLS RYLPX RLPHX |
|
| Performance and Expenses |
| Average Annual Total Return (%) Through 6/30/19 |
| | | JAN-JUN 20191 | | 1-YR | | 3-YR | | 5-YR | | 10-YR | | 15-YR | | 20-YR | | SINCE INCEPTION (12/15/93) |
| |
| RLP | | 14.53 | | -5.00 | | 10.67 | | 0.98 | | 7.14 | | 5.20 | | 8.16 | | 9.61 |
| |
| Annual Operating Expenses: 1.53% Annual Net Operating Expenses: 1.49% | | | | | | |
| |
| 1 Not annualized | | | | | | | | | | | | | | | | |
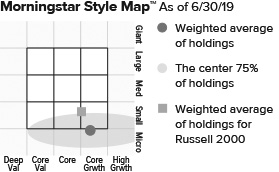
The Morningstar Style Map is the Morningstar Style BoxTM with the center 75% of fund holdings plotted as the Morningstar Ownership ZoneTM. The Morningstar Style Box is designed to reveal a fund’s investment strategy. The Morningstar Ownership Zone provides detail about a portfolio’s investment style by showing the range of stock sizes and styles. The Ownership Zone is derived by plotting each stock in the portfolio within the proprietary Morningstar Style Box. Over time, the shape and location of a fund’s ownership zone may vary. See page 97 for additional information. |
Value of $10,000Invested on 12/15/93 as of 6/30/19 ($)
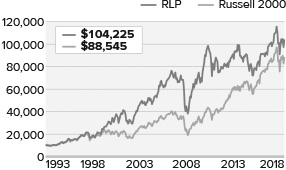
|
| Top 10 Positions | | |
| % of Net Assets | | |
| | | |
| Stoneridge | | 1.8 |
| |
| Century Casinos | | 1.7 |
| |
| Northwest Pipe | | 1.5 |
| |
| FormFactor | | 1.4 |
| |
| Axsome Therapeutics | | 1.4 |
| |
| Quanterix Corporation | | 1.4 |
| |
| Ameresco Cl. A | | 1.4 |
| |
| Kornit Digital | | 1.3 |
| |
| Rudolph Technologies | | 1.3 |
| |
| QAD Cl. A | | 1.3 |
| |
|
| Portfolio Sector Breakdown | | |
| % of Net Assets | | |
| | | |
| Information Technology | | 23.9 |
| |
| Industrials | | 20.1 |
| |
| Consumer Discretionary | | 13.5 |
| |
| Health Care | | 11.7 |
| |
| Financials | | 11.6 |
| |
| Energy | | 4.9 |
| |
| Communication Services | | 2.9 |
| |
| Materials | | 2.3 |
| |
| Consumer Staples | | 1.1 |
| |
| Real Estate | | 0.5 |
| |
| Cash and Cash Equivalents | | 7.5 |
| |
|
| Calendar Year Total Returns (%) | | |
| | | |
| YEAR | | RLP |
| |
| 2018 | | -9.3 |
| |
| 2017 | | 9.7 |
| |
| 2016 | | 16.1 |
| |
| 2015 | | -10.4 |
| |
| 2014 | | -3.4 |
| |
| 2013 | | 12.9 |
| |
| 2012 | | 4.5 |
| |
| 2011 | | -14.6 |
| |
| 2010 | | 31.5 |
| |
| 2009 | | 53.6 |
| |
| 2008 | | -36.0 |
| |
| 2007 | | 2.3 |
| |
| 2006 | | 19.0 |
| |
| 2005 | | 9.7 |
| |
| 2004 | | 13.6 |
| |
|
| Upside/Downside Capture Ratios | | | | |
| Periods Ended 6/30/19 (%) | | | | |
| | | UPSIDE | | DOWNSIDE |
| |
| 10-Year | | 79 | | 115 |
| |
| From 12/31/93 (Start of the Fund’s First Full Quarter) | | 100 | | 93 |
| |
|
| Portfolio Diagnostics | | |
| | | |
| Fund Net Assets | | $213 million |
| |
| Number of Holdings | | 115 |
| |
| Turnover Rate | | 8% |
| |
| Average Market Capitalization1 | | $539 million |
| |
| Weighted Average P/B Ratio2 | | 2.0x |
| |
| Active Share3 | | 97% |
| |
| U.S. Investments (% of Net Assets) | | 79.8% |
| |
| Non-U.S. Investments (% of Net Assets) | | 12.7% |
| |
| 1 | Geometric Average. This weighted calculation uses each portfolio holding’s market cap in a way designed to not skew the effect of very large or small holdings; instead, it aims to better identify the portfolio’s center, which Royce believes offers a more accurate measure of average market cap than a simple mean or median. |
| 2 | Harmonic Average. This weighted calculation evaluates a portfolio as if it were a single stock and measures it overall. It compares the total market value of the portfolio to the portfolio’s share in the earnings or book value, as the case may be, of its underlying stocks. |
| 3 | Active Share is the sum of the absolute values of the different weightings of each holding in the Fund versus each holding in the benchmark, divided by two. |
| Important Performance and Expense Information
All performance information in this Report reflects past performance, is presented on a total return basis, reflects the reinvestment of distributions, and does not reflect the deduction of taxes that a shareholder would pay on fund distributions or the redemption of fund shares. Past performance is no guarantee of future results. Investment return and principal value of an investment will fluctuate, so that shares may be worth more or less than their original cost when redeemed. Shares redeemed within 30 days of purchase may be subject to a 1% redemption fee payable to the Fund, which is not reflected in the performance shown above; if it were, performance would be lower. Current month-end performance may be higher or lower than performance quoted and may be obtained at www.roycefunds.com. All performance and risk information reflects results of the Service Class (its oldest class). Price and total return information is based on net asset values for shareholder transactions. Certain immaterial adjustments were made to the net assets of Royce Low-Priced Stock Fund at 6/30/13 for financial reporting purposes, and as a result the calendar year total returns based on those net asset values differ from the adjusted net asset values and calendar year total returns reported in the Financial Highlights. Gross operating expenses reflect the Fund’s total gross annual operating expenses for the Service Class and include management fees, 12b-1 distribution and service fees and other expenses. Net operating expenses reflect contractual fee waivers and/or expense reimbursements. All expense information is reported as of the Fund’s most current prospectus. Royce & Associates has contractually agreed to waive fees and/ or reimburse operating expenses to the extent necessary to maintain the Fund’s net annual operating expenses (excluding brokerage commissions, taxes, interest, litigation expenses, acquired fund fees and expenses, and other expenses not borne in the ordinary course of business) at or below 1.49% through April 30, 2020. Regarding the “Top Contributors” and “Top Detractors” tables shown above, the sum of all contributors to, and all detractors from, performance for all securities in the portfolio would approximate the Fund’s year-to-date performance for 2019. Upside Capture Ratio measures a manager’s performance in up markets relative to the Fund’s benchmark. It is calculated by measuring the Fund’s performance in quarters when the benchmark went up and dividing it by the benchmark’s return in those quarters. Downside Capture Ratio measures a manager’s performance in down markets relative to the Fund’s benchmark (Russell 2000). It is calculated by measuring the Fund’s performance in quarters when the benchmark goes down and dividing it by the benchmark’s return in those quarters.
|
| The Royce Funds 2019 Semiannual Report to Shareholders | 15 |
| | | MANAGERS’ DISCUSSION |
| Royce Micro-Cap Fund (RMC) | | |
 |
Jim Stoeffel
Brendan Hartman |
FUND PERFORMANCE
Royce Micro-Cap Fund underperformed its benchmarks for the year-to-date period ended June 30, 2019. The Fund returned 10.6% while the Russell Microcap and Russell 2000 Indexes returned 14.1% and 17.0%, respectively, for the same period. We were pleased, however, that the Fund outpaced the micro-cap index for the one-year period ended June 30, 2019. |
| |
| WHAT WORKED... AND WHAT DIDN’T |
| Eight of the Fund’s 10 equity sectors generated positive returns in 2019’s first half. Our persistently large weighting in Information Technology worked in our favor as it was the top contributor at the sector level, followed by Industrials and Health Care. Conversely, Communication Services and Consumer Staples detracted, though only by a modest amount. At the industry level, semiconductors & semiconductor equipment (Information Technology) provided the biggest positive contribution, with positive results for Adesto Technologies, which was the second-largest contributing position in the overall portfolio. Adesto has transformed itself from a niche memory provider to a more comprehensive systems provider targeting industrial “Internet-of-Things” applications through a series of acquisitions. Recent results have exceeded expectations as management has successfully integrated its acquisitions and is beginning to garner new product wins. We maintained our position in the shares as we believe the transformation is in the very early stages. |
| We also saw positive results from machinery (Industrials) and software (Information Technology) in the first half. The Fund’s top performing position for the year-to-date period was Quanterix Corporation, a medical technology provider that offers ultra-high sensitivity immunoassay platforms used in testing protein biomarkers. Its stock benefited as the company’s leading edge technology drove significant growth in critical life sciences research applications in areas such neurology, oncology, and cardiology, among others. In addition, we got a strong contribution from machinery company Kornit Digital, a digital printing specialist for the apparel and textile industries that reported record revenue growth in the first half. |
Specialty retail and leisure products, both in Consumer Discretionary, were the largest detractors at the industry level. After a series of successful new product offerings, health and fitness company Nautilus suffered through two consecutive failed product launches, with a resulting decision to remove the CEO. While we like a number of the strategic decisions made by the company over the past several years, we sold our position as we expect it will take at least a year to rebuild its new product pipeline. Equally important, our confidence in management’s ability to effectively navigate the rapidly changing fitness markets was shaken. Independence Contract Drilling operates a fleet of state-of the-art drilling rigs throughout North America. Its shares have been hurt by the ongoing slowdown in drilling activity in the U.S. While the outlook for the industry remains cloudy given volatile oil prices, we held our position as we believe its shares trade well below the underlying asset value of its high-end rigs.
Relative to the Russell Microcap, both our poor stock picking and sector allocation detracted from first-half results. Health Care was the largest detractor from performance both because of poor stock selection, most notably in biotechnology, and our underexposure, particularly in pharmaceuticals. Consumer Discretionary was the next largest detractor, almost entirely due to ineffective stock picking. Within the sector, specialty retail hampered results most, as Kirkland’s suffered a setback in its efforts to redefine itself as an omnichannel retailer capable of competing with the likes of Amazon and Wayfair. While we believe there is an opportunity for well-managed retailers to effectively reimagine their business models in the e-commerce age, we moved on from Kirkland’s given the struggles management has endured to execute toward their vision. The Fund’s top contributor to relative returns in the first half was Information Technology because of our overweight in the sector, most notably in semiconductors & semiconductor equipment. Industrials followed, with construction & engineering the strongest industry due to savvy stock selection. |
| | Top Contributors to Performance
Year-to-Date Through 6/30/19 (%)1 | | | |
| | | |
| Quanterix Corporation | | 0.63 |
| |
| Adesto Technologies | | 0.58 |
| |
| Kornit Digital | | 0.57 |
| |
| NeoGenomics | | 0.56 |
| |
| Zealand Pharma | | 0.54 |
| |
| 1 Includes dividends | | |
| | Top Detractors from Performance
Year-to-Date Through 6/30/19 (%)2 | | | |
| | | |
| Nautilus | | -0.46 |
| |
| Kirkland’s | | -0.41 |
| |
| Independence Contract Drilling | | -0.32 |
| |
| Harvard Bioscience | | -0.27 |
| |
| NeoPhotonics Corporation | | -0.24 |
| |
| 2 Net of dividends | | |
| CURRENT POSITIONING AND OUTLOOK |
| Despite the increasing uncertainty around trade and late cycle economic concerns, we remain generally constructive on the U.S. economy, a stance that gained additional support via the recent end of the Fed tightening cycle. We think this should help portfolio holdings that we think have underlying growth potential and attractive valuations, especially in our overweight sectors—Information Technology and Industrials—as well as for certain pockets of medical technology, where we have been increasingly active. We also continued to incrementally build our exposure to Information Technology in the first half. In fact, we remain optimistic about the overall prospects for micro-cap stocks in the current environment. Anticipating better growth in the U.S. relative to the rest of the globe, we stayed primarily focused on companies that derive most of their revenues from domestic activities. |
| 16 | The Royce Funds 2019 Semiannual Report to Shareholders | |
| PERFORMANCE AND PORTFOLIO REVIEW | TICKER SYMBOLS RYOTX RMCFX RYMCX |
|
| Performance and Expenses |
| Average Annual Total Return (%) Through 6/30/19 |
| | | JAN-JUN 20191 | | 1-YR | | 3-YR | | 5-YR | | 10-YR | | 15-YR | | 20-YR | | 25-YR | | SINCE INCEPTION (12/31/91) |
| |
| RMC | | 10.59 | | -8.64 | | 8.59 | | 0.90 | | 7.31 | | 5.74 | | 8.55 | | 9.28 | | 10.24 |
| |
| Annual Gross Operating Expenses: 1.25% Annual Net Operating Expenses: 1.24% |
| |
| 1 Not annualized | | | | | | | | | | | | | | | | | | |
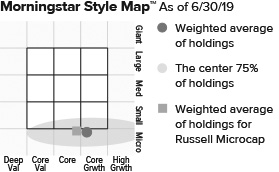
The Morningstar Style Map is the Morningstar Style BoxTM with the center 75% of fund holdings plotted as theMorningstar Ownership ZoneTM. The Morningstar Style Box is designed to reveal a fund’s investment strategy. The Morningstar Ownership Zone provides detail about a portfolio’s investment style by showing the range of stock sizes and styles. The Ownership Zone is derived by plotting each stock in the portfolio within the proprietary Morningstar Style Box. Over time, the shape and location of a fund’s ownership zone may vary. See page 97 for additional information. |
Value of $10,000Invested on 6/30/00 (Russell Microcap Index Inception) as of 6/30/19 ($)

|
| Top 10 Positions | | |
| % of Net Assets | | |
| | | |
| Stoneridge | | 1.4 |
| |
| NeoGenomics | | 1.3 |
| |
| Adesto Technologies | | 1.2 |
| |
| Northwest Pipe | | 1.2 |
| |
| Quanterix Corporation | | 1.1 |
| |
| Ultra Clean Holdings | | 1.1 |
| |
| Rudolph Technologies | | 1.1 |
| |
| B. Riley Financial | | 1.1 |
| |
| Construction Partners Cl. A | | 1.0 |
| |
| Kornit Digital | | 1.0 |
| |
|
| Portfolio Sector Breakdown | | |
| % of Net Assets | | |
| | | |
| Industrials | | 22.7 |
| |
| Information Technology | | 21.6 |
| |
| Financials | | 14.2 |
| |
| Health Care | | 12.5 |
| |
| Consumer Discretionary | | 10.4 |
| |
| Energy | | 4.3 |
| |
| Materials | | 4.2 |
| |
| Real Estate | | 3.1 |
| |
| Communication Services | | 2.6 |
| |
| Consumer Staples | | 2.0 |
| |
| Cash and Cash Equivalents | | 2.4 |
| |
|
| Calendar Year Total Returns (%) | |
| | | |
| YEAR | | RMC |
| |
| 2018 | | -8.9 |
| |
| 2017 | | 5.4 |
| |
| 2016 | | 19.7 |
| |
| 2015 | | -13.3 |
| |
| 2014 | | -4.1 |
| |
| 2013 | | 21.3 |
| |
| 2012 | | 8.0 |
| |
| 2011 | | -12.1 |
| |
| 2010 | | 30.1 |
| |
| 2009 | | 55.7 |
| |
| 2008 | | -40.9 |
| |
| 2007 | | 7.1 |
| |
| 2006 | | 22.3 |
| |
| 2005 | | 11.5 |
| |
| 2004 | | 15.8 |
| |
|
| Upside/Downside Capture Ratios | | | | |
| Periods Ended 6/30/19 (%) | | | | |
| | | UPSIDE | | DOWNSIDE |
| |
| 10-Year | | 73 | | 90 |
| |
| From 6/30/00 (Russell Microcap Index Inception) | | 90 | | 82 |
| |
|
| Portfolio Diagnostics | | |
| | | |
| Fund Net Assets | | $135 million |
| |
| Number of Holdings | | 140 |
| |
| Turnover Rate | | 6% |
| |
| Average Market Capitalization1 | | $455 million |
| |
| Weighted Average P/E Ratio2, 3 | | 17.9x |
| |
| Weighted Average P/B Ratio2 | | 1.8x |
| |
| Active Share4 | | 90% |
| |
| U.S. Investments (% of Net Assets) | | 84.7% |
| |
| Non-U.S. Investments (% of Net Assets) | | 12.9% |
| |
| |
| 1 | Geometric Average. This weighted calculation uses each portfolio holding’s market cap in a way designed to not skew the effect of very large or small holdings; instead, it aims to better identify the portfolio’s center, which Royce believes offers a more accurate measure of average market cap than a simple mean or median. |
| 2 | Harmonic Average. This weighted calculation evaluates a portfolio as if it were a single stock and measures it overall. It compares the total market value of the portfolio to the portfolio’s share in the earnings or book value, as the case may be, of its underlying stocks. |
| 3 | The Fund’s P/E ratio calculation excludes companies with zero or negative earnings (23% of portfolio holdings as of 6/30/19). |
| 4 | Active Share is the sum of the absolute values of the different weightings of each holding in the Fund versus each holding in the benchmark, divided by two. |
| Important Performance and Expense Information |
All performance information in this Report reflects past performance, is presented on a total return basis, reflects the reinvestment of distributions, and does not reflect the deduction of taxes that a shareholder would pay on fund distributions or the redemption of fund shares. Past performance is no guarantee of future results. Investment return and principal value of an investment will fluctuate, so that shares may be worth more or less than their original cost when redeemed. Shares redeemed within 30 days of purchase may be subject to a 1% redemption fee payable to the Fund, which is not reflected in the performance shown above; if it were, performance would be lower. Current month-end performance may be higher or lower than performance quoted and may be obtained at www.roycefunds.com. All performance and risk information reflects results of the Investment Class (its oldest class). Price and total return information is based on net asset values calculated for shareholder transactions. Certain immaterial adjustments were made to the net assets of Royce Micro-Cap Fund at 12/31/17 for financial reporting purposes, and as a result the calendar year total returns based on those net assets values differ from the adjusted net values and calendar year total returns reported in the Financial Highlights. Gross operating expenses reflect the Fund’s total gross annual operating expenses for the Investment Class and include management fee and other expenses. Net operating expenses reflect contractual fee waivers and/or expense reimbursements. All expense information is reported as of the Fund’s most current prospectus. Royce & Associates has contractually agreed, without right of termination, to waive fees and/or reimburse expenses to the extent necessary to maintain the Investment Class’s net annual operating expenses (excluding brokerage commissions, taxes, interest, litigation expenses, acquired fund fees and expenses, and other expenses not borne in the ordinary course of business) at or below 1.24% through April 30, 2020. Regarding the “Top Contributors” and “Top Detractors” tables shown above, the sum of all contributors to, and all detractors from, performance for all securities in the portfolio would approximate the Fund’s year-to-date performance for 2019. Upside Capture Ratio measures a manager’s performance in up markets relative to the Fund’s benchmark. It is calculated by measuring the Fund’s performance in quarters when the benchmark went up and dividing it by the benchmark’s return in those quarters. Downside Capture Ratio measures a manager’s performance in down markets relative to the Fund’s benchmark (Russell Microcap Index). It is calculated by measuring the Fund’s performance in quarters when the benchmark goes down and dividing it by the benchmark’s return in those quarters.
|
| | | The Royce Funds 2019 Semiannual Report to Shareholders | 17 |
| | | MANAGERS’ DISCUSSION |
| Royce Opportunity Fund (ROF) | | |
 |
Bill Hench
Suzanne Franks
Rob Kosowsky, CFA |
FUND PERFORMANCE
Our deep value strategy performed well on an absolute basis in 2019’s first half, though it lagged one of its benchmarks. Royce Opportunity Fund advanced 15.6% for the year-to-date period ended June 30, 2019, compared to respective gains of 17.0% and 13.5% for its small-cap benchmarks, the Russell 2000 and Russell 2000 Value Indexes, for the same period. The portfolio’s consistent and time-tested deep value approach gave it an advantage over the small-cap value index for the three-, 10-, 15-, 20-year, and since inception (11/19/96) periods ended June 30, 2019. The Fund also beat the Russell 2000 for the three-, 20-year, and since inception periods ended June 30, 2019, while finishing even with it for the 10-year period. |
| |
| WHAT WORKED... AND WHAT DIDN’T |
| Ten of the Fund’s 11 equity sectors finished the first half in the black, led by our two largest weightings, Industrials—which made an outsized positive contribution—and Information Technology. Only Real Estate detracted, doing so on a very minor scale, while the smallest positive contribution came from Utilities, our lowest sector weighting at the end of June and one to which we’ve had very little exposure historically. At the industry level, machinery (Industrials) made the biggest contribution to first-half results, followed by semiconductors & semiconductor equipment (Information Technology) and aerospace & defense (Industrials). |
The top-contributing position was Herc Holdings, a large equipment rental company in the Industrial sector’s trading companies & distributors group. After finishing 2018 as one of the Fund’s biggest detractors, Herc rebounded in the first half, reporting increased revenues, improved pricing, and an optimistic outlook for the rest of 2019. It was the Fund’s largest holding at the end of June. Two other top contributors were takeover targets: cosmetics company Avon Products was bought by a large Brazilian competitor, while Cray, which provides high-end supercomputing and data solutions, was acquired by Hewlett Packard Enterprises. They joined nine other holdings that were M&A targets during the first half.
The largest detractors at the industry level were media (Communication Services) and hotels, restaurants & leisure (Consumer Discretionary), though their impact was modest. Evolent Health, which we first purchased late in 2018, detracted most at the position level. This medical technology specialist partners with providers and health plans to offer clinical and financial assistance and mitigate financial risk. An acquisition in May was greeted with skepticism—and a flurry of selling—as investors seemed unconvinced of its accretive value. We, on the other hand, continued to add shares before and after the purchase, consistent with our interest in a number of healthcare companies that are trying to bend the cost curve. We chose a different course with turnaround candidate Tupperware Brands, a global direct seller of consumer products, and began to exit our position in March. Reductions in its sales force and weakness in non-U.S. consumer markets, especially in the emerging markets that have become key to its business, led us to reevaluate its long-term prospects. We also sold our position in oilfield services company Mammoth Energy Services. Depressed revenues and earnings, an uncertain outlook for its industry, and what we saw as better values elsewhere in the market all influenced our decision. |
| Relative to the Russell 2000, stock selection in Health Care and in several industries within Information Technology hurt performance most, as did our cash position. However, savvy stock selection and an overweight helped to drive outperformance in Industrials, where aerospace & defense and trading companies & distributors contributed most. We also saw outperformance on a smaller, but still notable, scale from Consumer Staples, helped by both stock selection and our underweight in the sector. |
| | Top Contributors to Performance
Year-to-Date Through 6/30/19 (%)1 | | | |
| | | |
| Herc Holdings | | 0.54 |
| |
| Avon Products | | 0.43 |
| |
| Triumph Group | | 0.42 |
| |
| Cray | | 0.42 |
| |
| Westport Fuel Systems | | 0.39 | |
| |
| 1 Includes dividends | | |
| | Top Detractors from Performance
Year-to-Date Through 6/30/19 (%)2 | | | |
| | | |
| Evolent Health Cl. A | | -0.22 |
| |
| Tupperware Brands | | -0.22 |
| |
| Mammoth Energy Services | | -0.19 |
| |
| Owens & Minor | | -0.18 |
| |
| NeoPhotonics Corporation | | -0.15 | |
| |
| 2 Net of dividends | | | |
| CURRENT POSITIONING AND OUTLOOK |
| Another quarter passed with a familiar ring as macro issues regarding trade, growth, and central bank interventions dominated the headlines. In the U.S. market, growth continued to outpace value, and now more and more players are hinting of a “permanent” change in which value would be a perennial underperformer. Needless to say, we differ. We see the world of small-cap value as one full of companies with very attractive valuations and terrific growth prospects. Strategic and financial buyers appear to agree—M&A activity continues unabated, with healthy premiums being paid. Investors, pundits, and strategists continue to warn about the length of the recovery in the U.S. while the market continues to humble those with such fears by providing consumers and companies alike with ever lower interest rates, cheap energy, and ample public spending. The market has provided us with the opportunity to build a portfolio of stocks that we think are not only cheap, but that we think should also provide healthy returns going forward. We’ve added positions in areas such as health care, consumer, and a host of others that we think should do well under present conditions. We have no idea what will bring better fortune to value investing, but do believe that disciplined stock picking in the small- and micro-cap equity market will pay off in the future. |
| 18 | The Royce Funds 2019 Semiannual Report to Shareholders | |
| PERFORMANCE AND PORTFOLIO REVIEW | | TICKER SYMBOLS RYPNX RYOFX ROFCX ROFIX ROFRX |
| Performance and Expenses |
Average Annual Total Return (%) Through 6/30/19
|
| | | JAN-JUN 20191 | | 1-YR | | 3-YR | | 5-YR | | 10-YR | | 15-YR | | 20-YR | | SINCE INCEPTION (11/19/96) |
| |
| ROF | | 15.63 | | -11.06 | | 12.37 | | 4.11 | | 13.38 | | 7.69 | | 10.63 | | 11.44 |
| |
| Annual Operating Expenses: 1.20% | | | | | | | | | | | |
| |
| 1 Not annualized | | | | | | | | | | | | | | | | |
Relative Returns: Monthly Rolling Average Annual Return Periods20 Years Through 6/30/19
| On a monthly rolling basis, the Fund outperformed the Russell 2000 in 78% of all 10-year periods; 64% of all 5-year periods; and 62% of all 1-year periods. |
| |
| | | PERIODS BEATING THE INDEX | | | | FUND AVG (%)1 | | INDEX AVG (%)1 |
| |
| 10-year | | 94/121 | | | | | 78% | | 9.4 | | 7.8 |
| |
| 5-year | | 115/181 | | | | | 64% | | 10.5 | | 8.8 |
| |
| 1-year | | 143/229 | | | | | 62% | | 13.7 | | 9.6 |
| |
1Average of monthly rolling average annual total returns over the specified periods.
The Morningstar Style Map is the Morningstar Style BoxTM with the center 75% of fund holdings plotted as the Morningstar Ownership ZoneTM. The Morningstar Style Box is designed to reveal a fund’s investment strategy. The Morningstar Ownership Zone provides detail about a portfolio’s investment style by showing the range of stock sizes and styles. The Ownership Zone is derived by plotting each stock in the portfolio within the proprietary Morningstar Style Box. Over time, the shape and location of a fund’s ownership zone may vary. See page 97 for additional information. |
Value of $10,000Invested on 11/19/96 as of 6/30/19 ($)
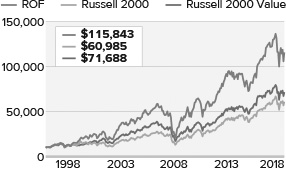
| |
| Top 10 Positions | | |
| % of Net Assets | | |
| | | |
| Herc Holdings | | 1.0 |
| |
| Comtech Telecommunications | | 0.9 |
| |
| Air Lease Cl. A | | 0.9 |
| |
| Kraton Corporation | | 0.9 |
| |
| Northwest Pipe | | 0.9 |
| |
| LGI Homes | | 0.9 |
| |
| Alpha & Omega Semiconductor | | 0.8 |
| |
| frontdoor | | 0.8 |
| |
| Granite Construction | | 0.8 |
| |
| M.D.C. Holdings | | 0.8 |
| |
| |
| Portfolio Sector Breakdown | | |
| % of Net Assets | | |
| | | |
| Industrials | | 24.9 |
| |
| Information Technology | | 20.0 |
| |
| Consumer Discretionary | | 10.6 |
| |
| Health Care | | 9.7 |
| |
| Materials | | 8.3 |
| |
| Financials | | 7.8 |
| |
| Energy | | 7.4 |
| |
| Communication Services | | 1.1 |
| |
| Real Estate | | 0.8 |
| |
| Consumer Staples | | 0.6 |
| |
| Utilities | | 0.3 |
| |
| Cash and Cash Equivalents | | 8.5 |
| |
| |
| Calendar Year Total Returns (%) | | |
| | | |
| YEAR | | ROF |
| |
| 2018 | | -20.0 |
| |
| 2017 | | 21.9 |
| |
| 2016 | | 29.9 |
| |
| 2015 | | -13.6 |
| |
| 2014 | | -0.5 |
| |
| 2013 | | 43.5 |
| |
| 2012 | | 22.6 |
| |
| 2011 | | -13.0 |
| |
| 2010 | | 33.8 |
| |
| 2009 | | 62.1 |
| |
| 2008 | | -45.7 |
| |
| 2007 | | -2.0 |
| |
| 2006 | | 18.8 |
| |
| 2005 | | 4.8 |
| |
| 2004 | | 17.5 |
| |
| |
| Upside/Downside Capture Ratios | | | | |
| Periods Ended 6/30/19 (%) | | | | |
| | | UPSIDE | | DOWNSIDE |
| |
| 10-Year | | 112 | | 127 |
| |
| From 12/31/96 (Start of Fund’s First Full Quarter) | | 122 | | 111 |
| |
| |
| Portfolio Diagnostics | | |
| | | |
| Fund Net Assets | | $939 million |
| |
| Number of Holdings | | 259 |
| |
| Turnover Rate | | 22% |
| |
| Average Market Capitalization1 | | $854 million |
| |
| Weighted Average P/B Ratio2 | | 1.4x |
| |
| Weighted Average P/S Ratio3 | | 0.8x |
| |
| Active Share4 | | 91% |
| |
| U.S. Investments (% of Net Assets) | | 87.7% |
| |
| Non-U.S. Investments (% of Net Assets) | | 3.8% |
| |
| 1 | Geometric Average. This weighted calculation uses each portfolio holding’s market cap in a way designed to not skew the effect of very large or small holdings; instead, it aims to better identify the portfolio’s center, which Royce believes offers a more accurate measure of average market cap than a simple mean or median. |
| 2 | Harmonic Average. This weighted calculation evaluates a portfolio as if it were a single stock and measures it overall. It compares the total market value of the portfolio to the portfolio’s share in the earnings or book value, as the case may be, of its underlying stocks. |
| 3 | Price to Sales is calculated by dividing the company’s market cap by the revenue in the most recent year. |
| 4 | Active Share is the sum of the absolute values of the different weightings of each holding in the Fund versus each holding in the benchmark, divided by two. |
| Important Performance and Expense Information
All performance information in this Report reflects past performance, is presented on a total return basis, reflects the reinvestment of distributions, and does not reflect the deduction of taxes that a shareholder would pay on fund distributions or the redemption of fund shares. Past performance is no guarantee of future results. Investment return and principal value of an investment will fluctuate, so that shares may be worth more or less than their original cost when redeemed. Shares redeemed within 30 days of purchase may be subject to a 1% redemption fee payable to the Fund, which is not reflected in the performance shown above; if it were, performance would be lower. Current month-end performance may be higher or lower than performance quoted and may be obtained at www.roycefunds.com. All performance and risk information reflects results of the Investment Class (its oldest class). Operating expenses reflect the Fund’s total annual operating expenses for the Investment Class as of the Fund’s most current prospectus and include management fees and other expenses. Regarding the “Top Contributors” and “Top Detractors” tables shown above, the sum of all contributors to, and all detractors from, performance for all securities in the portfolio would approximate the Fund’s year-to-date performance for 2019. Upside Capture Ratio measures a manager’s performance in up markets relative to the Fund’s benchmark. It is calculated by measuring the Fund’s performance in quarters when the benchmark went up and dividing it by the benchmark’s return in those quarters. Downside Capture Ratio measures a manager’s performance in down markets relative to the Fund’s benchmark (Russell 2000). It is calculated by measuring the Fund’s performance in quarters when the benchmark goes down and dividing it by the benchmark’s return in those quarters.
|
| The Royce Funds 2019 Semiannual Report to Shareholders | 19 |
| | | MANAGERS’ DISCUSSION |
| Royce Pennsylvania Mutual Fund® (PMF) | | |
 |
Chuck Royce
Jay Kaplan, CFA
Lauren Romeo, CFA
Steven McBoyle |
FUND PERFORMANCE
Royce Pennsylvania Mutual Fund advanced 17.8% in the first half of 2019, nosing ahead of its small-cap benchmark, the Russell 2000 Index, which was up 17.0% for the same period. Penn also outperformed the small-cap index for the one-, three-, 15-, 20-, 25-, 30-, 35-, 40-year, and since index inception (12/31/78) periods ended June 30, 2019. The Fund’s average annual total return for the 45-year period ended June 30, 2019—all under the management of Chuck Royce—was 14.1%, a long-term record in which we take great pride. |
| |
| WHAT WORKED... AND WHAT DIDN’T |
The portfolio’s breadth of advance was evidenced by each of its 11 sectors contributing to first-half performance. The Fund’s two largest—Industrials and Information Technology—which accounted for almost half of its assets at the end of June, were also its top contributors. Similarly, its two smallest sectors, Utilities and Consumer Staples, delivered the most modest contributions. Machinery (Industrials) was the top contributor at the industry level, followed by electronic equipment, instruments & components, semiconductors & semiconductor equipment (both from Information Technology), and aerospace & defense (Industrials).
HEICO Corporation, the Fund’s top contributor, manufacturers replacement aerospace parts. Its shares reached higher altitudes in June, after the company reported strong organic sales and expanding margins, boosted by strength in its flight support and electronics segments. These developments led HEICO to raise guidance for the rest of the year. Helios Technologies (a machinery company formerly known as Sun Hydraulics), which manufactures hydraulic and electronic controls systems for industrial and recreational equipment, reported a 51% increase in sales over 2018’s first quarter, driven by its Faster and Custom Fluidpower (or CFP) acquisitions. From the tech sector’s electronic equipment, instruments & components group, FLIR Systems has a global business manufacturing thermal imaging and infrared camera systems. In late April, the company announced increased bookings, strong year-over-year margin expansion, and double-digit earnings growth. It also expects revenues to remain robust through the end of 2019. Shares of CIRCOR International, which makes precision valves, rose sharply after receiving a takeover offer from a larger industrial company. We were very pleased to see strong results from these and many other cyclical holdings in the first half.
Textiles, apparel & luxury goods and leisure products, both from Consumer Dictionary, were among a small group of industries that detracted in 2019’s first half. They did so on a comparatively minor scale. In fact, the four largest industry detractors came from Consumer Discretionary, demonstrating the widespread disruption that continues to create challenges in this diverse sector. Interestingly, of the portfolio’s five positions that detracted most, only the fifth came from Consumer Discretionary—footwear manufacturer and distributor Caleres. The Fund’s top-detracting position in the first half was FutureFuel, which provides custom chemicals and biofuels. The company reported solid results for its chemical business but disappointing ones for its biofuels segment, which was hurt by both falling energy prices and an anticipated tax credit that remained stalled in Congress. Wary of its long-term prospects, we sold our position during June. We took the opposite tack with Virtu Financial, adding shares of this company that uses its technology to act as a market maker and liquidity provider to the global financial markets. Its business endured a recent slump, which we see as short term. We also like a recent acquisition Virtu made. We chose to hold our stake in Lindsay Corporation. A rare detractor in the machinery group, the company supplies agricultural equipment. It faced ongoing weakness in its core market and the negative impact of floods in the Midwest, both of which put pressure on its stock.
The Fund’s first-half relative outperformance was driven by sector allocation. Industrials was the biggest source of strength, due to both our overweight and savvy stock selection. Health Care was another source of outperformance as we avoided struggling pharmaceuticals and benefited from stock selection and an overweight in life sciences tools & services. Conversely, Real Estate detracted from relative results in the first half period, largely due to the share price decline for commercial real estate broker Marcus & Millichap. Ineffective stock picking also hurt in Consumer Discretionary, where six of 11 industries detracted, led by household durables and auto components. |
| | Top Contributors to Performance
Year-to-Date Through 6/30/19 (%)1 | | | |
| | | |
| HEICO Corporation | | 0.86 |
| |
| Helios Technologies | | 0.49 |
| |
| FLIR Systems | | 0.47 |
| |
| CIRCOR International | | 0.47 |
| |
| Ares Management Cl. A | | 0.45 |
| |
| 1 Includes dividends | | |
| | Top Detractors from Performance
Year-to-Date Through 6/30/19 (%)2 | | | |
| | | |
| FutureFuel Corporation | | -0.16 |
| |
| Virtu Financial Cl. A | | -0.11 |
| |
| Lindsay Corporation | | -0.11 |
| |
| ArcBest | | -0.09 |
| |
| Caleres | | -0.08 |
| |
| 2 Net of dividends | | |
| CURRENT POSITIONING AND OUTLOOK |
| Markets are very good at surprising most investors. Today, with widespread concerns about slowing growth, increasing trade tensions, and the extended economic cycle, the most surprising outcome might be a rally. We see four favorable factors in the current market environment—low inflation, modest valuations, moderate growth, and increasing liquidity. When taken together, we see these factors as painting an attractive picture for small-cap investors. With so much attention on negative macro issues, we think investors may be missing this positive picture, especially with regard to profitable cyclical businesses. |
| 20 | The Royce Funds 2019 Semiannual Report to Shareholders | |
| PERFORMANCE AND PORTFOLIO REVIEW | | TICKER SYMBOLS PENNX RYPFX RPMIX RYPCX RPMRX |
| Performance and Expenses |
Average Annual Total Return (%) Through 6/30/19
|
| | | JAN-JUN 20191 | | 1-YR | | 3-YR | | 5-YR | | 10-YR | | 15-YR | | 20-YR | | 25-YR | | 30-YR | | 35-YR | | 45-YR |
| |
| PMF | | 17.81 | | 0.68 | | 13.29 | | 6.16 | | 12.29 | | 8.32 | | 9.77 | | 10.50 | | 10.16 | | 11.09 | | 14.14 |
| |
| Annual Operating Expenses: 0.92% |
| |
| 1 Not annualized | | | | | | | | | | | | | | | | | | | | | | |
The Morningstar Style Map is the Morningstar Style BoxTM with the center 75% of fund holdings plotted as the Morningstar Ownership ZoneTM. The Morningstar Style Box is designed to reveal a fund’s investment strategy. The Morningstar Ownership Zone provides detail about a portfolio’s investment style by showing the range of stock sizes and styles. The Ownership Zone is derived by plotting each stock in the portfolio within the proprietary Morningstar Style Box. Over time, the shape and location of a fund’s ownership zone may vary. See page 97 for additional information. |
Value of $10,000Invested on 12/29/78 (Russell 2000 Inception) as of 6/30/19 ($)

|
| |
| Top 10 Positions | | |
| % of Net Assets | | |
| | | |
| HEICO Corporation | | 2.4 |
| |
| FLIR Systems | | 1.9 |
| |
| Helios Technologies | | 1.3 |
| |
| Stella-Jones | | 1.3 |
| |
| Quaker Chemical | | 1.2 |
| |
| SEACOR Holdings | | 1.2 |
| |
| First Citizens BancShares Cl. A | | 1.1 |
| |
| MKS Instruments | | 1.1 |
| |
| Ares Management Cl. A | | 1.0 |
| |
| Meritor | | 1.0 |
| |
|
| |
| Portfolio Sector Breakdown | | |
| % of Net Assets | | |
| | | |
| Industrials | | 27.4 |
| |
| Information Technology | | 20.6 |
| |
| Financials | | 14.9 |
| |
| Materials | | 8.4 |
| |
| Consumer Discretionary | | 7.5 |
| |
| Health Care | | 7.1 |
| |
| Energy | | 3.9 |
| |
| Real Estate | | 2.8 |
| |
| Communication Services | | 1.4 |
| |
| Consumer Staples | | 1.2 |
| |
| Utilities | | 0.1 |
| |
| Cash and Cash Equivalents | | 4.7 |
| |
| |
| Calendar Year Total Returns (%) | | |
| | | |
| YEAR | | PMF |
| |
| 2018 | | -9.7 |
| |
| 2017 | | 16.2 |
| |
| 2016 | | 26.5 |
| |
| 2015 | | -11.4 |
| |
| 2014 | | -0.7 |
| |
| 2013 | | 35.3 |
| |
| 2012 | | 14.6 |
| |
| 2011 | | -4.2 |
| |
| 2010 | | 23.9 |
| |
| 2009 | | 36.3 |
| |
| 2008 | | -34.8 |
| |
| 2007 | | 2.8 |
| |
| 2006 | | 14.8 |
| |
| 2005 | | 12.5 |
| |
| 2004 | | 20.2 |
| |
| |
| Upside/Downside Capture Ratios | | | | |
| Periods Ended 6/30/19 (%) | | | | |
| | | UPSIDE | | DOWNSIDE |
| |
| 10-Year | | 91 | | 92 |
| |
| From 12/31/78 (Russell 2000 Inception) | | 89 | | 71 |
| |
| |
| Portfolio Diagnostics | | |
| | | |
| Fund Net Assets | | $1,963 million |
| |
| Number of Holdings | | 295 |
| |
| Turnover Rate | | 13% |
| |
| Average Market Capitalization1 | | $2,248 million |
| |
| Weighted Average P/E Ratio2,3 | | 19.6x |
| |
| Weighted Average P/B Ratio2 | | 2.3x |
| |
| Active Share4 | | 88% |
| |
| U.S. Investments (% of Net Assets) | | 85.8% |
| |
| Non-U.S. Investments (% of Net Assets) | | 9.5% |
| |
| 1 | Geometric Average. This weighted calculation uses each portfolio holding’s market cap in a way designed to not skew the effect of very large or small holdings; instead, it aims to better identify the portfolio’s center, which Royce believes offers a more accurate measure of average market cap than a simple mean or median. |
| 2 | Harmonic Average. This weighted calculation evaluates a portfolio as if it were a single stock and measures it overall. It compares the total market value of the portfolio to the portfolio’s share in the earnings or book value, as the case may be, of its underlying stocks. |
| 3 | The Fund’s P/E ratio calculation excludes companies with zero or negative earnings (7% of portfolio holdings as of 6/30/19). |
| 4 | Active Share is the sum of the absolute values of the different weightings of each holding in the Fund versus each holding in the benchmark, divided by two. |
| Important Performance and Expense Information
All performance information in this Report reflects past performance, is presented on a total return basis, reflects the reinvestment of distributions, and does not reflect the deduction of taxes that a shareholder would pay on fund distributions or the redemption of fund shares. Past performance is no guarantee of future results. Investment return and principal value of an investment will fluctuate, so that shares may be worth more or less than their original cost when redeemed. Shares redeemed within 30 days of purchase may be subject to a 1% redemption fee payable to the Fund, which is not reflected in the performance shown above; if it were, performance would be lower. Current month-end performance may be higher or lower than performance quoted and may be obtained at www.roycefunds.com. All performance and risk information reflects results of the Investment Class (its oldest class). Certain immaterial adjustments were made to the net assets of Royce Pennsylvania Mutual Fund at 6/30/19 for financial reporting purposes, and as a result the net asset values shareholder transactions on that date and the calendar year total returns (%) based on those net asset values differ from the adjusted net asset values and calendar year total returns reported in the Financial Highlights. Operating expenses reflect the Fund’s total annual operating expenses for the Investment Class as of the Fund’s most current prospectus and include management fees and other expenses. Regarding the “Top Contributors” and “Top Detractors” tables shown above, the sum of all contributors to, and all detractors from, performance for all securities in the portfolio would approximate the Fund’s year-to-date performance for 2019. Upside Capture Ratio measures a manager’s performance in up markets relative to the Fund’s benchmark. It is calculated by measuring the Fund’s performance in quarters when the benchmark went up and dividing it by the benchmark’s return in those quarters. Downside Capture Ratio measures a manager’s performance in down markets relative to the Fund’s benchmark (Russell 2000). It is calculated by measuring the Fund’s performance in quarters when the benchmark goes down and dividing it by the benchmark’s return in those quarters.
|
| The Royce Funds 2019 Semiannual Report to Shareholders | 21 |
| | | MANAGERS’ DISCUSSION |
| Royce Premier Fund (RPR) | | |
 |
Chuck Royce
Lauren Romeo, CFA
Steven McBoyle |
FUND PERFORMANCE
Royce Premier Fund stayed ahead of its small-cap benchmark, the Russell 2000 Index, for the year-to-date, one-, three-, 15-, 20-, 25-year, and since inception (12/31/91) periods ended June 30, 2019. The Fund increased 21.7% in the first half of 2019, outperforming the Russell 2000, which gained 17.0% for the same period. In spite of challenges for some cyclical sectors and most value stocks, our quality strategy has performed well over the last few years. |
| |
| WHAT WORKED... AND WHAT DIDN’T |
We were pleased to see all nine of the portfolio’s equity sectors and, perhaps more impressively, each of its 29 industries contribute to positive first-half returns. The Fund’s largest sector weighting at the end of June—Industrials– also made the largest positive impact on first-half performance by a sizable margin. Information Technology and Financials also made notable positive contributions, while Real Estate and Consumer Staples had the smallest positive effect. Machinery (Industrials) and capital markets (Financials), the Fund’s two largest industry weights, contributed most with market-beating returns, while two groups from these same two sectors, industrial conglomerates and insurance, contributed least.
Fair Isaac was the portfolio’s top contributor at the position level. The company continues to reap the rewards of recent initiatives that have reaccelerated revenue growth in its core, high-margin credit score business, the ubiquitous, industry-standard FICO score. Fair Isaac is also broadening its addressable market, which is aimed at assessing the creditworthiness of borrowers with little or no credit history, while also growing its financial software business. Precision valve maker CIRCOR International benefited from some global recession fears receding with the result that, by mid-May, CIRCOR’s stock price had rallied 47% from the multi-year low with which it began 2019. Its shares then spiked again in May after a takeover offer from a larger engineered industrial products company. Before the end of June, this company raised its equity offer, and we continue to evaluate the situation.
The Fund’s biggest detractor at the position level was agricultural equipment supplier, Lindsay Corporation, the only one of the portfolio’s 10 machinery holdings to finish the first half in the red. The company faced several challenges, including lower farming incomes that have crimped capital spending and led to ongoing weakness in its core market, excess rainfall and flooding in the Midwest, and tariff and trade war woes. In early July, however, Lindsay noted an uptick in domestic irrigation sales, while recent improvement in key crop prices such as corn have improved agricultural sentiment. In addition, the outlook for international irrigation demand remains favorable. We trimmed our stake slightly in the first half. We did the same with National Instruments, which supplies instrumentation hardware and software products for engineers and scientists. The company posted disappointing first-quarter sales, with broad weakness across much of its global business, including softening demand in Europe. The company is focusing its resources on higher-growth applications benefiting from key technology trends such as 5G and Advanced Driver Assist Systems, but it will take time for these initiatives to manifest in accelerated revenue growth and margin expansion—and we are prepared to be patient.
Industrials was the largest source of relative outperformance in the year-to-date period, with both our overweight and superior stock selection boosting performance. Financials also contributed as alternative asset manager Ares Management gained steadily throughout the first half. A market leader in managing private credit pools, Ares continues to benefit from strong fundraising, as investors favor investments delivering attractive yields in a period with generally low interest rates. The largest source of relative underperformance was the Fund’s cash holdings. The average level of cash in the first half was not high at 3%, but in a period with strong absolute returns, almost any amount is a meaningful drag on performance. The second-biggest relative detractor was Real Estate, where the Fund’s lack of exposure to the equity REIT industry hampered relative results, as this was an index-beating group within the overall small-cap market in the first half. |
| | Top Contributors to Performance
Year-to-Date Through 6/30/19 (%)1 | | | |
| | | |
| Fair Isaac | | 1.55 |
| |
| CIRCOR International | | 1.40 |
| |
| John Bean Technologies | | 1.33 |
| |
| Ares Management Cl. A | | 1.28 |
| |
| Woodward | | 1.20 |
| |
| 1 Includes dividends | | |
| | Top Detractors from Performance
Year-to-Date Through 6/30/19 (%)2 | | | |
| | | |
| Lindsay Corporation | | -0.41 |
| |
| National Instruments | | -0.16 |
| |
| Wolverine World Wide | | -0.11 |
| |
| Dorman Products | | -0.10 |
| |
| nLIGHT | | -0.08 |
| |
| 2 Net of dividends | | |
| CURRENT POSITIONING AND OUTLOOK |
| With much of the portfolio invested in cyclical sectors, it would not be immune to a further global economic slowdown or recession. However, in the event of a recession we would expect many of these holdings, specifically those in Industrials and Information Technology, to outperform cyclicals in general because of their status as market leaders in global niches as opposed to being one of many players in a highly fragmented commodity business. Many are also asset light companies, such as those in commercial and professional services, and so do not face the same degree of margin contraction if their sales decline. Additionally, several of our cyclical holdings generate a meaningful percentage of their revenues from after-market sales, which tend to be more recurring and thus better at surviving a slowdown or contraction. Finally, valuations for many of our holdings have already discounted some level of concern about the pace of global growth and thus still look reasonably valued. |
| 22 | The Royce Funds 2019 Semiannual Report to Shareholders | |
| PERFORMANCE AND PORTFOLIO REVIEW | | TICKER SYMBOLS RYPRX RPFFX RPFIX RPRCX RPRRX |
| Performance and Expenses |
Average Annual Total Return (%) Through 6/30/19
|
| | | JAN-JUN 20191 | | 1-YR | | 3-YR | | 5-YR | | 10-YR | | 15-YR | | 20-YR | | 25-YR | | SINCE INCEPTION (12/31/91) |
| |
| RPR | | 21.69 | | 6.28 | | 15.94 | | 6.68 | | 12.47 | | 9.59 | | 10.70 | | 11.41 | | 11.60 |
| |
| Annual Operating Expenses: 1.17% |
| |
| 1 Not annualized | | | | | | | | | | | | | | | | | | |
Relative Returns: Monthly Rolling Average Annual Return Periods20 Years Through 6/30/19
| On a monthly rolling basis, the Fund outperformed the Russell 2000 in 84% of all 10-year periods; 59% of all 5-year periods; and 64% of all 1-year periods. |
| |
| | | PERIODS BEATING THE INDEX | | | | FUND AVG (%)1 | | INDEX AVG (%)1 |
| |
| 10-year | | 102/121 | | | | | 84% | | 10.2 | | 7.8 |
| |
| 5-year | | 107/181 | | | | | 59% | | 10.8 | | 8.8 |
| |
| 1-year | | 146/229 | | | | | 64% | | 12.2 | | 9.6 |
| |
1Average of monthly rolling average annual total returns over the specified periods.
The Morningstar Style Map is the Morningstar Style BoxTM with the center 75% of fund holdings plotted as the Morningstar Ownership ZoneTM. The Morningstar Style Box is designed to reveal a fund’s investment strategy. The Morningstar Ownership Zone provides detail about a portfolio’s investment style by showing the range of stock sizes and styles. The Ownership Zone is derived by plotting each stock in the portfolio within the proprietary Morningstar Style Box. Over time, the shape and location of a fund’s ownership zone may vary. See page 97 for additional information. |
Value of $10,000Invested on 12/31/91 as of 6/30/19 ($)
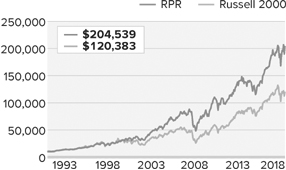
| |
| Top 10 Positions | | |
| % of Net Assets | | |
| | | |
| Air Lease Cl. A | | 3.3 |
| |
| Kirby Corporation | | 2.9 |
| |
| John Bean Technologies | | 2.9 |
| |
| Lincoln Electric Holdings | | 2.8 |
| |
| Fair Isaac | | 2.7 |
| |
| Woodward | | 2.7 |
| |
| Ashmore Group | | 2.7 |
| |
| Ares Management Cl. A | | 2.6 |
| |
| Morningstar | | 2.6 |
| |
| Manhattan Associates | | 2.5 |
| |
| |
| Portfolio Sector Breakdown | | |
| % of Net Assets | | |
| | | |
| Industrials | | 34.4 |
| |
| Information Technology | | 18.7 |
| |
| Financials | | 14.5 |
| |
| Materials | | 8.8 |
| |
| Consumer Discretionary | | 5.8 |
| |
| Energy | | 4.2 |
| |
| Health Care | | 2.6 |
| |
| Real Estate | | 1.2 |
| |
| Consumer Staples | | 1.1 |
| |
| Cash and Cash Equivalents | | 8.7 |
| |
| |
| Calendar Year Total Returns (%) | | |
| | | |
| YEAR | | RPR |
| |
| 2018 | | -10.4 |
| |
| 2017 | | 23.8 |
| |
| 2016 | | 23.0 |
| |
| 2015 | | -9.9 |
| |
| 2014 | | -0.9 |
| |
| 2013 | | 27.7 |
| |
| 2012 | | 11.4 |
| |
| 2011 | | -0.9 |
| |
| 2010 | | 26.5 |
| |
| 2009 | | 33.3 |
| |
| 2008 | | -28.3 |
| |
| 2007 | | 12.7 |
| |
| 2006 | | 8.8 |
| |
| 2005 | | 17.1 |
| |
| 2004 | | 22.8 |
| |
| |
| Upside/Downside Capture Ratios | | | | |
| Periods Ended 6/30/19 (%) | | | | |
| | | UPSIDE | | DOWNSIDE |
| |
| 10-Year | | 91 | | 89 |
| |
| From 12/31/91 (Start of Fund’s First Full Quarter) | | 93 | | 72 |
| |
| |
| Portfolio Diagnostics | | |
| | | |
| Fund Net Assets | | $1,864 million |
| |
| Number of Holdings | | 56 |
| |
| Turnover Rate | | 7% |
| |
| Average Market Capitalization1 | | $3,442 million |
| |
| Weighted Average P/E Ratio2,3 | | 22.4x |
| |
| Weighted Average P/B Ratio2 | | 2.6x |
| |
| Active Share4 | | 97% |
| |
| U.S. Investments (% of Net Assets) | | 78.7% |
| |
| Non-U.S. Investments (% of Net Assets) | | 12.6% |
| |
| 1 | Geometric Average. This weighted calculation uses each portfolio holding’s market cap in a way designed to not skew the effect of very large or small holdings; instead, it aims to better identify the portfolio’s center, which Royce believes offers a more accurate measure of average market cap than a simple mean or median. |
| 2 | Harmonic Average. This weighted calculation evaluates a portfolio as if it were a single stock and measures it overall. It compares the total market value of the portfolio to the portfolio’s share in the earnings or book value, as the case may be, of its underlying stocks. |
| 3 | The Fund’s P/E ratio calculation excludes companies with zero or negative earnings (1% of portfolio holdings as of 6/30/19). |
| 4 | Active Share is the sum of the absolute values of the different weightings of each holding in the Fund versus each holding in the benchmark, divided by two. |
| Important Performance and Expense Information
All performance information in this Report reflects past performance, is presented on a total return basis, reflects the reinvestment of distributions, and does not reflect the deduction of taxes that a shareholder would pay on fund distributions or the redemption of fund shares. Past performance is no guarantee of future results. Investment return and principal value of an investment will fluctuate, so that shares may be worth more or less than their original cost when redeemed. Shares redeemed within 30 days of purchase may be subject to a 1% redemption fee payable to the Fund, which is not reflected in the performance shown above; if it were, performance would be lower. Current month-end performance may be higher or lower than performance quoted and may be obtained at www.roycefunds.com. All performance and risk information reflects results of the Investment Class (its oldest class). Certain immaterial adjustments were made to the net assets of Royce Premier Fund at 6/30/19 for financial reporting purposes, and as a result the net asset values shareholder transactions on that date and the calendar year total returns (%) based on those net asset values differ from the adjusted net asset values and calendar year total returns reported in the Financial Highlights. Operating expenses reflect the Fund’s total annual operating expenses for the Investment Class as of the Fund’s most current prospectus and include management fees and other expenses. Regarding the “Top Contributors” and “Top Detractors” tables shown above, the sum of all contributors to, and all detractors from, performance for all securities in the portfolio would approximate the Fund’s year-to-date performance for 2019. Upside Capture Ratio measures a manager’s performance in up markets relative to the Fund’s benchmark. It is calculated by measuring the Fund’s performance in quarters when the benchmark went up and dividing it by the benchmark’s return in those quarters. Downside Capture Ratio measures a manager’s performance in down markets relative to the Fund’s benchmark (Russell 2000). It is calculated by measuring the Fund’s performance in quarters when the benchmark goes down and dividing it by the benchmark’s return in those quarters.
|
| The Royce Funds 2019 Semiannual Report to Shareholders | 23 |
| | | MANAGER’S DISCUSSION |
| Royce Small-Cap Value Fund (RVV) | | |
 |
| Jay Kaplan, CFA |
FUND PERFORMANCE
Royce Small-Cap Value Fund increased 8.9% for the year-to-date period ended June 30, 2019, trailing respective gains of 17.0% and 13.5% for its small-cap benchmarks, the Russell 2000 and Russell 2000 Value Indexes, for the same period. |
| |
| WHAT WORKED... AND WHAT DIDN’T |
Five of the portfolio’s 11 equity sectors finished the year-to-date period in the black. Industrials, Information Technology, and Financials were the strongest contributors, while Materials and Health Care were more muted. Five sectors finished in the red, with Consumer Discretionary making the biggest detraction, followed by much smaller negative impacts from Energy, Communication Services, Consumer Staples, and Real Estate. (Utilities was essentially flat.)
At the industry level, electronic equipment, instruments & components (Information Technology) was the strongest positive contributor in 2019’s first half. The rising shares of Insight Enterprises, which provides information technology hardware and software for large and small enterprises, helped both this industry and the portfolio as a whole. Investors seemed drawn to its improved margins and earnings, along with its solid outlook for the rest of the year. We took some gains as its stock rose. Machinery (Industrials) was the second-biggest industry contributor, boosted by Meritor, which supplies drivetrain, braking, and other aftermarket solutions for commercial and industrial vehicles. Improved revenues and better-than-expected earnings were driven largely by higher North American truck production. It was the portfolio’s second-largest holding at the end of June.
Specialty retail (Consumer Discretionary) detracted most at the industry level, due in part to poor performance from Caleres and top-10 holding, Shoe Carnival. Several factors hurt Caleres, such as reduced traffic and same-store sales growth at the firm’s Famous Footwear retailer (which accounts for about half of its profits); near-term margin pressure from having to clear excess inventory at hefty discounts in advance of new, much improved back-to-school styles from Famous Footwear’s largest vendor; and the negative impact that the threatened next round of U.S. tariffs on China-made goods would have on consumer prices and demand. Few retailers were immune from these anxieties, but it seemed to us that the shares of apparel and footwear companies, which also included Shoe Carnival, were among the hardest hit. Ever contrarian and always thinking about the long run, we began to build our stake in Caleres in late June.
G-III Apparel Group lost most in the textiles, apparel & luxury goods group, the second-biggest industry detractor. Its stock suffered from the same tariff worries that helped hurt Caleres and Shoe Carnival, as well as from poor results in its retail arm. We like that G-III is preparing to move some production out of China. It also maintains a strong wholesale business, powered by popular brands such as DKNY, Donna Karan, and Tommy Hilfiger. ArcBest is a freight and logistics solutions specialist that saw its business stall in the first quarter. Believing in its long-term prospects and thinking that its shares were punished disproportionately by recession fears, we held our position at the end of June.
Relative to the Russell 2000, poor stock picking was the main source of first-half underperformance. Stock selection in Consumer Discretionary hurt most, particularly in specialty retail. Stock selection also hurt in Information Technology, primarily in electronic equipment, instruments & components, and in Industrials, where professional services and road & rail detracted most. Materials was the sole source of first-half outperformance, thanks mostly to savvy stock selection in metals & mining—the only industry in this sector where we had exposure. |
| | Top Contributors to Performance
Year-to-Date Through 6/30/19 (%)1 | | | |
| | | |
| Insight Enterprises | | 0.91 |
| |
| Meritor | | 0.86 |
| |
| Advanced Energy Industries | | 0.51 |
| |
| Camden National | | 0.51 |
| |
| Apogee Enterprises | | 0.50 |
| |
| 1 Includes dividends | | |
| | Top Detractors from Performance
Year-to-Date Through 6/30/19 (%)2 | | | |
| | | |
| G-III Apparel Group | | -0.62 |
| |
| ArcBest | | -0.53 |
| |
| Caleres | | -0.39 |
| |
| Tower International | | -0.33 |
| |
| Shoe Carnival | | -0.32 |
| |
| 2 Net of dividends | | |
| CURRENT POSITIONING AND OUTLOOK |
| There’s been an ongoing slugfest among investors: in one corner, large-cap indexes have been routinely reaching new highs, the labor market is strong, and the economy is growing; on the opposite side of the ring, small-caps have been lagging large-caps—which seldom happens in a vibrant economy—the yield curve was flat or inverted through much of the first half, and economies outside the U.S. are slowing more quickly and appreciably than our own. So optimism, including the more cautious variety, is facing off against a pessimism that sees recession as imminent. Needless to say, only one of these combatants will be able to claim victory. For our part, we are squarely in the guarded optimism camp. The first half saw widespread concerns over trade tensions, the extended economic cycle, and slowing growth. There was also talk that the Fed would continue to lower rates—possibly later this year—which the market seemed to price in immediately. And while the Fed has historically reduced rates when the economy is slowing, we see growth slowing at a marginal pace—and certainly not contracting, which is the key distinction. Many of our holdings finished June at prices that looked to us like a recession had already been priced in. We have therefore been adding to positions in select cyclical areas such as trucking, trucks and automobile components, and footwear manufactures and retailers. We have not found many new opportunities, however, due to the otherwise mostly elevated state of many small-cap valuations. Recent relative performance challenges notwithstanding, we are comfortable with how we’ve positioned the portfolio in the face of ongoing uncertainty. |
| 24 | The Royce Funds 2019 Semiannual Report to Shareholders | |
| PERFORMANCE AND PORTFOLIO REVIEW | | TICKER SYMBOLS RYVFX RVVHX RVFCX RVVRX |
| Performance and Expenses |
Average Annual Total Return (%) Through 6/30/19
|
| | | JAN-JUN 20191 | | 1-YR | | 3-YR | | 5-YR | | 10-YR | | 15-YR | | SINCE INCEPTION (6/14/01) |
| |
| RVV | | 8.88 | | -5.64 | | 7.62 | | 1.96 | | 8.76 | | 7.30 | | 8.82 |
| |
| Annual Gross Operating Expenses: 1.53% Annual Net Operating Expenses: 1.49% |
| |
| 1 Not annualized | | | | | | | | | | | | | | |
The Morningstar Style Map is the Morningstar Style BoxTM with the center 75% of fund holdings plotted as the Morningstar Ownership ZoneTM. The Morningstar Style Box is designed to reveal a fund’s investment strategy. The Morningstar Ownership Zone provides detail about a portfolio’s investment style by showing the range of stock sizes and styles. The Ownership Zone is derived by plotting each stock in the portfolio within the proprietary Morningstar Style Box. Over time, the shape and location of a fund’s ownership zone may vary. See page 97 for additional information. |
Value of $10,000Invested on 6/14/01 as of 6/30/19 ($)

| |
| Top 10 Positions | | |
| % of Net Assets | | |
| | | |
| Miller Industries | | 2.5 |
| |
| Meritor | | 2.5 |
| |
| Insight Enterprises | | 2.5 |
| |
| Designer Brands Cl. A | | 2.2 |
| |
| Allegiant Travel | | 2.2 |
| |
| Hilton Grand Vacations | | 2.2 |
| |
| Shoe Carnival | | 2.1 |
| |
| Camden National | | 2.0 |
| |
| WSFS Financial | | 2.0 |
| |
| Kulicke & Soffa Industries | | 1.9 |
| |
| |
| Portfolio Sector Breakdown | | |
| % of Net Assets | | |
| | | |
| Industrials | | 30.2 |
| |
| Financials | | 25.0 |
| |
| Information Technology | | 15.4 |
| |
| Consumer Discretionary | | 14.8 |
| |
| Energy | | 2.6 |
| |
| Consumer Staples | | 1.5 |
| |
| Communication Services | | 1.2 |
| |
| Health Care | | 1.0 |
| |
| Real Estate | | 1.0 |
| |
| Materials | | 0.5 |
| |
| Cash and Cash Equivalents | | 6.8 |
| |
| |
| Calendar Year Total Returns (%) | | |
| | | |
| YEAR | | RVV |
| |
| 2018 | | -7.2 |
| |
| 2017 | | 5.3 |
| |
| 2016 | | 21.1 |
| |
| 2015 | | -11.5 |
| |
| 2014 | | -0.0 |
| |
| 2013 | | 27.8 |
| |
| 2012 | | 9.6 |
| |
| 2011 | | -7.4 |
| |
| 2010 | | 25.0 |
| |
| 2009 | | 44.7 |
| |
| 2008 | | -34.2 |
| |
| 2007 | | 3.8 |
| |
| 2006 | | 16.8 |
| |
| 2005 | | 17.2 |
| |
| 2004 | | 30.9 |
| |
| |
| Upside/Downside Capture Ratios | | | | |
| Periods Ended 6/30/19 (%) | | | | |
| | | UPSIDE | | DOWNSIDE |
| |
| 10-Year | | 74 | | 86 |
| |
| From 6/30/01 (Start of Fund’s First Full Quarter) | | 96 | | 89 |
| |
| |
| Portfolio Diagnostics | | |
| | | |
| Fund Net Assets | | $179 million |
| |
| Number of Holdings | | 81 |
| |
| Turnover Rate | | 38% |
| |
| Average Market Capitalization1 | | $1,118 million |
| |
| Weighted Average P/E Ratio2,3 | | 12.4x |
| |
| Weighted Average P/B Ratio2 | | 1.7x |
| |
| Active Share4 | | 96% |
| |
| U.S. Investments (% of Net Assets) | | 86.6% |
| |
| Non-U.S. Investments (% of Net Assets) | | 6.6% |
| |
| 1 | Geometric Average. This weighted calculation uses each portfolio holding’s market cap in a way designed to not skew the effect of very large or small holdings; instead, it aims to better identify the portfolio’s center, which Royce believes offers a more accurate measure of average market cap than a simple mean or median. |
| 2 | Harmonic Average. This weighted calculation evaluates a portfolio as if it were a single stock and measures it overall. It compares the total market value of the portfolio to the portfolio’s share in the earnings or book value, as the case may be, of its underlying stocks. |
| 3 | The Fund’s P/E ratio calculation excludes companies with zero or negative earnings (4% of portfolio holdings as of 6/30/19). |
| 4 | Active Share is the sum of the absolute values of the different weightings of each holding in the Fund versus each holding in the benchmark, divided by two. |
| Important Performance and Expense Information
All performance information in this Report reflects past performance, is presented on a total return basis, reflects the reinvestment of distributions, and does not reflect the deduction of taxes that a shareholder would pay on fund distributions or the redemption of fund shares. Past performance is no guarantee of future results. Investment return and principal value of an investment will fluctuate, so that shares may be worth more or less than their original cost when redeemed. Shares redeemed within 30 days of purchase may be subject to a 1% redemption fee payable to the Fund, which is not reflected in the performance shown above; if it were, performance would be lower. Current month-end performance may be higher or lower than performance quoted and may be obtained at www.roycefunds.com. All performance and risk information reflects results of the Service Class (its oldest class). Certain immaterial adjustments were made to the net assets of Royce Small-Cap Value Fund at 6/30/16 for financial reporting purposes, and as a result the net asset values for shareholder transactions on that date and the calendar year Total Returns (%) based on those net asset values differ from the adjusted net asset values and calendar year total returns reported in the Financial Highlights. Gross operating expenses reflect the Fund’s gross total annual operating expenses for the Service Class and include management fees, 12b-1 distribution and service fees, and other expenses. Net operating expenses reflect contractual fee waivers and/or expense reimbursements. All expense information is reported as of the Fund’s most current prospectus. Royce & Associates has contractually agreed, without right of termination, to waive fees and/or reimburse expenses to the extent necessary to maintain the Service Class’s net annual operating expenses (excluding brokerage commissions, taxes, interest, litigation expenses, acquired fund fees and expenses, and other expenses not borne in the ordinary course of business) at or below 1.49% through April 30, 2020. Regarding the “Top Contributors” and “Top Detractors” tables shown above, the sum of all contributors to, and all detractors from, performance for all securities in the portfolio would approximate the Fund’s year-to-date performance for 2019. Upside Capture Ratio measures a manager’s performance in up markets relative to the Fund’s benchmark. It is calculated by measuring the Fund’s performance in quarters when the benchmark went up and dividing it by the benchmark’s return in those quarters. Downside Capture Ratio measures a manager’s performance in down markets relative to the Fund’s benchmark (Russell 2000). It is calculated by measuring the Fund’s performance in quarters when the benchmark goes down and dividing it by the benchmark’s return in those quarters.
|
| The Royce Funds 2019 Semiannual Report to Shareholders | 25 |
| MANAGER’S DISCUSSION |
| |
| Royce Smaller-Companies Growth Fund (RVP) |
 |
| Chip Skinner, CFA |
| FUND PERFORMANCE |
| The strength of small-cap growth stocks in the first half was reflected in strong absolute and relative performance for our GARP (“Growth at a Reasonable Price”) strategy. For the year-to-date period ended June 30, 2019, Royce Smaller-Companies Growth Fund gained 21.1%, outpacing the Russell 2000 Index, its small-cap benchmark, which was up 17.0% for the same period. This impressive result also helped the Fund to outperform the small-cap index for the one-, three-year, and since inception (6/14/01) periods ended June 30, 2019. |
| |
| WHAT WORKED... AND WHAT DIDN’T |
Eight of the portfolio’s 10 equity sectors finished the first half of 2019 in the black. The most significant positive contribution by far came from Information Technology, our largest sector and biggest overweight versus the Russell 2000 at the end of June. Health Care and Industrials also made notable positive impacts on performance while Materials and Energy detracted, but only marginally.
Some of the largest contributions at the industry level came from three groups in Information Technology—software (which led by a wide margin), semiconductors & semiconductor equipment, and electronic equipment, instruments & components. Three groups in Health Care were also sizable contributors—biotechnology, health care equipment & supplies, and life sciences tools & services. They were joined by strong gains from aerospace & defense (Industrials). Only 11 of the Fund’s 44 industries had a negative impact on performance, led by health care technology and pharmaceuticals (both in Health Care), as well as Internet & direct marketing retail (Consumer Discretionary). The remaining eight groups, including electrical equipment (Industrials), insurance (Financials), and personal products (Consumer Staples), detracted at more modest levels.
The top-contributing position in the first half was Veracyte, a global genomic diagnostics company. In April, the company reported substantial growth in product revenue and genomic volume as well as a positive Medicare coverage decision for its Envisia Genomic Classifier. It was therefore no surprise that its CEO gave a favorable outlook for short- and long-term growth. Paylocity Holding Corporation, another top contributor, makes cloud-based human resources software primarily for smaller businesses’ payroll applications. With its SaaS (software as a service) model and expertise in user-friendly products, the firm continues to take market share in a growing industry primarily by executing more effectively than its larger competitors and newer players. In our view, this gives Paylocity ongoing growth opportunities. It was the portfolio’s top holding at the end of June. KeyW Holding Corporation is an intelligence, cyber and mission IT, and analytics solutions provider that agreed to a buyout offer in April, which led us to begin selling our stake at an attractive gain.
In March, we initiated a position in the portfolio’s biggest first-half detractor, Waitr Holdings. We proceeded to build our stake as its stock price was cut in half. Waitr runs an on-demand food ordering and delivery business that serves smaller markets in the U.S. A former SPAC—special purpose acquisition company—the firm reported terrific revenue growth in May but also faces competition from more established players such as Door Dash and Uber. We think its beachhead in smaller, underserved markets should help it survive, perhaps as a takeover target. Inogen makes portable oxygen concentrators for people suffering from chronic respiratory conditions. After growing robustly for a number of years, its shares fell sharply after the company significantly lowered its expectations for net income growth, which led us to exit our position.
Relative outperformance in the first half came largely from stock selection, though sector allocation also contributed. Stock picks in Information Technology were the biggest drivers, most notably in the semiconductors & semiconductor equipment and electronic equipment, instruments & components groups. Our significant overweight in software also boosted relative results, as did stock picking in the Communication Services sector. Conversely, our cash position was the largest source of underperformance. With equity returns so strong, even our modest 5.1% average weight was enough to drag relative results. Ineffective stock selection in Materials also hurt in the first half. |
| | Top Contributors to Performance | | | |
| | Year-to-Date Through 6/30/19 (%)1 | | | |
| | | | | |
| | Veracyte | | 1.41 |
| |
| | Paylocity Holding Corporation | | 1.15 |
| |
| | KEYW Holding Corporation | | 1.09 |
| |
| | uniQure | | 1.09 |
| |
| | Quanterix Corporation | | 1.05 |
| |
| | 1 Includes dividends | | | |
| | Top Detractors from Performance | | | |
| | Year-to-Date Through 6/30/19 (%)2 | | | |
| | | | | |
| | Waitr Holdings | | -0.37 |
| |
| | Inogen | | -0.33 |
| |
| | Unisys Corporation | | -0.29 |
| |
| | Evolus | | -0.28 |
| |
| | Apyx Medical | | -0.24 |
| |
| | 2 Net of dividends | | | |
| CURRENT POSITIONING AND OUTLOOK |
| The risks for stocks remain real, and mostly unchanged from the end of 2018: weakness in China and Europe, the extended economic cycle here in the U.S., and slowing growth. We can add to this list the related item of intensified rhetoric around trade wars and tariffs, which we suspect has done as much to erode confidence as the tariffs themselves. One likely outcome of this, which we’ve already seen in some instances, is decelerating earnings growth and/or downward-trending guidance. Still, we’re reasonably confident that the U.S. economy will continue to grow, however slowly, with the consequence that select small-caps can keep running. We are especially confident in the ongoing long-term prospects for other SaaS holdings such as Everbridge, Avalara, and Coupa Software, as well positions involved in genetic diagnostics and drug discovery. In other areas, we continue to find companies that we believe look capable of ongoing earnings growth on a stock-by-stock basis. While some of these names carried high multiples at the end of June, we think their steady growth makes them worth holding. |
| 26 | The Royce Funds 2019 Semiannual Report to Shareholders |
| PERFORMANCE AND PORTFOLIO REVIEW | | TICKER SYMBOLS RYVPX RVPHX RVPCX RVPIX |
| Performance and Expenses |
| Average Annual Total Return (%) Through 6/30/19 |
| | | JAN-JUN 20191 | | 1-YR | | 3-YR | | 5-YR | | 10-YR | | 15-YR | | SINCE INCEPTION (6/14/01) |
| |
| RVP | | 21.08 | | -1.53 | | 13.21 | | 6.54 | | 11.09 | | 7.79 | | 10.95 |
| |
| Annual Gross Operating Expenses: 1.52% Annual Net Operating Expenses: 1.49% |
| |
| 1 Not annualized |
The Morningstar Style Map is the Morningstar Style BoxTM with the center 75% of fund holdings plotted as the Morningstar Ownership ZoneTM. The Morningstar Style Box is designed to reveal a fund’s investment strategy. The Morningstar Ownership Zone provides detail about a portfolio’s investment style by showing the range of stock sizes and styles. The Ownership Zone is derived by plotting each stock in the portfolio within the proprietary Morningstar Style Box. Over time, the shape and location of a fund’s ownership zone may vary. See page 97 for additional information. |
Value of $10,000
Invested on 6/14/01 as of 6/30/19 ($)
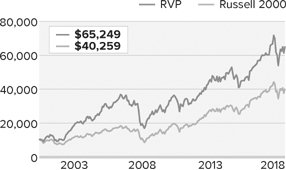
|
| Top 10 Positions | | |
| % of Net Assets | | |
| | | |
| Paylocity Holding Corporation | | 2.9 |
| |
| Iteris | | 2.9 |
| |
| GP Strategies | | 2.1 |
| |
| Quanterix Corporation | | 2.1 |
| |
| Monro | | 1.8 |
| |
| Materialise ADR | | 1.8 |
| |
| Lovesac Company (The) | | 1.8 |
| |
| TriState Capital Holdings | | 1.8 |
| |
| Community Healthcare Trust | | 1.8 |
| |
| Veracyte | | 1.7 |
| |
|
| Portfolio Sector Breakdown | | |
| % of Net Assets | | |
| | | |
| Information Technology | | 36.1 |
| |
| Health Care | | 24.0 |
| |
| Consumer Discretionary | | 10.1 |
| |
| Industrials | | 8.6 |
| |
| Financials | | 7.5 |
| |
| Communication Services | | 2.8 |
| |
| Real Estate | | 2.6 |
| |
| Consumer Staples | | 1.6 |
| |
| Energy | | 0.9 |
| |
| Cash and Cash Equivalents | | 5.8 |
| |
|
| Calendar Year Total Returns (%) | | |
| | | |
| YEAR | | RVP |
| |
| 2018 | | -10.2 |
| |
| 2017 | | 17.8 |
| |
| 2016 | | 9.4 |
| |
| 2015 | | -1.8 |
| |
| 2014 | | 3.9 |
| |
| 2013 | | 32.5 |
| |
| 2012 | | 15.3 |
| |
| 2011 | | -10.0 |
| |
| 2010 | | 19.7 |
| |
| 2009 | | 41.4 |
| |
| 2008 | | -41.1 |
| |
| 2007 | | 3.2 |
| |
| 2006 | | 19.3 |
| |
| 2005 | | 13.2 |
| |
| 2004 | | 28.2 |
| |
|
| Upside/Downside Capture Ratios | | | | |
| Periods Ended 6/30/19 (%) | | | | |
| | | UPSIDE | | DOWNSIDE |
| |
| 10-Year | | 94 | | 109 |
| |
| From 6/30/01 (Start of Fund’s First Full Quarter) | | 114 | | 101 |
| |
|
| Portfolio Diagnostics | | |
| | | |
| Fund Net Assets | | $287 million |
| |
| Number of Holdings | | 113 |
| |
| Turnover Rate | | 32% |
| |
| Average Market Capitalization1 | | $1,429 million |
| |
| Weighted Average P/B Ratio2 | | 3.9x |
| |
| 3-5 Year EPS Growth (est.)3 | | 21.7% |
| |
| Active Share4 | | 94% |
| |
| U.S. Investments (% of Net Assets) | | 85.9% |
| |
| Non-U.S. Investments (% of Net Assets) | | 8.3% |
| |
| 1 | Geometric Average. This weighted calculation uses each portfolio holding’s market cap in a way designed to not skew the effect of very large or small holdings; instead, it aims to better identify the portfolio’s center, which Royce believes offers a more accurate measure of average market cap than a simple mean or median. |
| 2 | Harmonic Average. This weighted calculation evaluates a portfolio as if it were a single stock and measures it overall. It compares the total market value of the portfolio to the portfolio’s share in the earnings or book value, as the case may be, of its underlying stocks. |
| 3 | The 3-5 Year EPS Growth (est.) is calculated as a simple weighted average of the pre-calculated mean long-term EPS growth rate estimates by brokerage analysts. Long Term Growth (LTG) is the annual EPS growth that the company can sustain over the next 3 or 5 years. Source: Factset |
| 4 | Active Share is the sum of the absolute values of the different weightings of each holding in the Fund versus each holding in the benchmark, divided by two. |
| Important Performance and Expense Information
All performance information in this Report reflects past performance, is presented on a total return basis, reflects the reinvestment of distributions, and does not reflect the deduction of taxes that a shareholder would pay on fund distributions or the redemption of fund shares. Past performance is no guarantee of future results. Investment return and principal value of an investment will fluctuate, so that shares may be worth more or less than their original cost when redeemed. Shares redeemed within 30 days of purchase may be subject to a 1% redemption fee payable to the Fund, which is not reflected in the performance shown above; if it were, performance would be lower. Current month-end performance may be higher or lower than performance quoted and may be obtained at www.roycefunds.com. All performance and risk information reflects results of the Service Class (its oldest class). Gross operating expenses reflect the Fund’s gross total operating expenses for the Service Class and include management fees, 12b-1 distribution and service fees, and other expenses. Net operating expenses reflect contractual fee waivers and/or expense reimbursements. All expense information is reported as of the Fund’s most current prospectus. Royce & Associates has contractually agreed, without right of termination, to waive fees and/or reimburse expenses to the extent necessary to maintain the Service Class’s net annual operating expenses (excluding brokerage commissions, taxes, interest, litigation expenses, acquired fund fees and expenses, and other expenses not borne in the ordinary course of business) at or below 1.49% through April 30, 2020. Regarding the “Top Contributors” and “Top Detractors” tables shown above, the sum of all contributors to, and all detractors from, performance for all securities in the portfolio would approximate the Fund’s year-to-date performance for 2019. Upside Capture Ratio measures a manager’s performance in up markets relative to the Fund’s benchmark. It is calculated by measuring the Fund’s performance in quarters when the benchmark went up and dividing it by the benchmark’s return in those quarters. Downside Capture Ratio measures a manager’s performance in down markets relative to the Fund’s benchmark (Russell 2000). It is calculated by measuring the Fund’s performance in quarters when the benchmark goes down and dividing it by the benchmark’s return in those quarters.
|
| The Royce Funds 2019 Semiannual Report to Shareholders | 27 |
| | | MANAGERS’ DISCUSSION |
| Royce Special Equity Fund (RSE) | | |
 |
Charlie Dreifus, CFA
Steven McBoyle |
FUND PERFORMANCE
Royce Special Equity Fund rose 4.6% for the year-to-date period ended June 30, 2019, trailing its small-cap benchmarks, the Russell 2000 and Russell 2000 Value Indexes, which advanced 17.0% and 13.5%, respectively, over the same period. Much of this underperformance was the result of ineffective stock selection and sector allocation, as investors largely ignored those companies and industries that we like best. Below, we detail how we think this can change.
The more dovish Fed stance that resulted in lower interest rates has not created any real economic benefits, and this has boosted growth stocks. The Fed’s pivot also caused a record drop in volatility. We have on occasion shared information about how the portfolio has underperformed when volatility is low and done better when it is high. Additionally—and likely related to these factors—for the quarter, year-to-date, and one-year periods ended June 30, 2019, investors favored fast-growing companies, which are underrepresented in our portfolio because of our exacting valuation constraints. |
| |
| WHAT WORKED... AND WHAT DIDN’T |
Five of the Fund’s eight equity sectors finished the first half in the black. Information Technology made by far the biggest positive contribution, with Industrials and Consumer Staples following. While its negative impact was comparatively small, Communication Services detracted most, followed by even more modest detractions from Real Estate and Energy. With the market’s strong rebound, the Fund’s cash level again rose during the first half in light of what we saw as elevated valuations throughout much of the asset class.
Snack food company John B. Sanfilippo & Son was the biggest positive contributor at the position level, followed by Computer Services—which offers bank, payment processing, and related services—and Hubbell Incorporated, which manufactures, designs, and sells electrical and electronic products. Children’s publishing company Scholastic Corporation was the top detractor, followed by supermarket operator Weis Markets, diversified manufacturing company National Presto Industries, and furniture maker Hooker Furniture.
Ineffective stock selection drove underperformance relative to the Russell 2000 in the first half of 2019, though sector allocation also detracted. Consumer Discretionary hurt results most, largely due to poor stock picking in household durables and auto components as well as our larger sector exposure. Industrials also hampered results, largely due to poor stock selection in aerospace & defense. The media group in the Communications Services sector was another notable source of underperformance while the portfolio received a relative advantage from our lack of exposure to Financials, which lagged the Russell 2000 as a whole. Our lack of exposure to Utilities was a second source of outperformance, albeit a very modest one. |
| | Top Contributors to Performance
Year-to-Date Through 6/30/19 (%)1 | | |
| | | |
| John B. Sanfilippo & Son | | 1.73 |
| |
| Computer Services | | 1.47 |
| |
| Hubbell Incorporated | | 1.37 |
| |
| AVX Corporation | | 0.66 |
| |
| Winnebago Industries | | 0.59 |
| |
| 1 Includes dividends | | |
| | Top Detractors from Performance
Year-to-Date Through 6/30/19 (%)2 | | |
| | | |
| Scholastic Corporation | | -0.85 |
| |
| Weis Markets | | -0.75 |
| |
| National Presto Industries | | -0.57 |
| |
| Hooker Furniture | | -0.53 |
| |
| Marcus & Millichap | | -0.27 |
| |
| 2 Net of dividends | | |
| CURRENT POSITIONING AND OUTLOOK |
The state of our economy remains the center of attention. Most forward-looking measures are flashing at least yellow. The lack of inflation clearly remains a major concern for the Fed. The core personal consumption expenditures (PCE) price index—the Fed’s favorite indicator of inflation—is running at 1.5%. The U.S. is not alone; other central banks have remained accommodative with the result that $13 trillion of negative yielding debt is currently outstanding. While virtually all asset classes seem richly priced, lower interest rates could allow them to climb higher until the day of reckoning arrives. Excess liquidity is driving asset prices up again. Volatility has been low, and speculators are betting on this continuing. The current sentiment is similar to January and September of 2018 before market declines—more evidence of the complacency that’s so common these days. We must remember that if the economy experiences a substantial downturn, policymakers are starting from a weaker position in terms of response. They’ve already used rate and tax cuts to little or no avail.
We believe that more fiscal actions, such as infrastructure spending and targeted tax incentives for housing or automobile purchases, are necessary to help the economy grow, make interest rates rise, and push inflation higher. These actions would also have a potentially positive impact on our portfolio. We see two other potential catalysts for higher returns. The first would be if the economy continues its modest growth track. Profit margins would come under pressure as they are already at all-time highs, and most if not all costs that could be removed were removed following the Great Financial Crisis. In this modest growth environment, we would likely see more intra-industry transactions. Our holdings would be prime targets as we believe they offer incremental earnings due to their low valuation, synergistic opportunities to improve earnings, and (unique to our holdings) the ability of the acquirer to use the strength and resources of our holdings to finance their own acquisition. The second would be a move toward tightening regulations regarding the use of non-GAAP earnings. If the Public Companies Accounting Oversight Board (PCAOB) and the SEC were to restrict the use of this pernicious form of reporting and implementation, we believe our portfolio would benefit because investors would seek out non-abusers such as our holdings. (Something similar occurred in 2002 after the Enron episode.) We like what we own and remain optimistic about the future results for the strategy. |
| 28 | The Royce Funds 2019 Semiannual Report to Shareholders | |
| PERFORMANCE AND PORTFOLIO REVIEW | TICKER SYMBOLS RYSEX RSEFX RSEIX RSQCX |
|
| Performance and Expenses |
| Average Annual Total Return (%) Through 6/30/19 |
| | | JAN-JUN 20191 | | 1-YR | | 3-YR | | 5-YR | | 10-YR | | 15-YR | | 20-YR | | SINCE INCEPTION (5/1/98) | | |
|
| RSE | | 4.59 | | -5.42 | | 7.47 | | 3.53 | | 9.66 | | 6.89 | | 9.25 | | 8.46 | | |
| |
| Annual Operating Expenses: 1.18% |
| |
| 1 Not annualized |
Relative Risk Adjusted Returns: Monthly Rolling Sharpe Ratios20 Years Through 6/30/19
| On a monthly rolling risk-adjusted basis, the Fund outperformed the Russell 2000 in 94% of all 10-year periods and 62% of all 5-year periods. |
| |
| | | PERIODS BEATING THE INDEX | | | | | FUND AVG (%)1 | | INDEX AVG (%)1 |
| |
| 10-year | | 114/121 | | | | | | 94% | | 0.58 | | 0.41 |
| |
| 5-year | | 113/181 | | | | | | 62% | | 0.65 | | 0.51 |
| |
1Average of monthly rolling Sharpe Ratios over the specified periods.
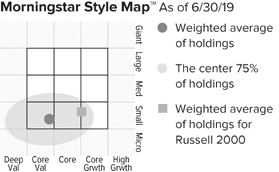
The Morningstar Style Map is the Morningstar Style BoxTM with the center 75% of fund holdings plotted as the Morningstar Ownership ZoneTM. The Morningstar Style Box is designed to reveal a fund’s investment strategy. The Morningstar Ownership Zone provides detail about a portfolio’s investment style by showing the range of stock sizes and styles. The Ownership Zone is derived by plotting each stock in the portfolio within the proprietary Morningstar Style Box. Over time, the shape and location of a fund’s ownership zone may vary. See page 97 for additional information. |
Value of $10,000
Invested on 5/1/98 as of 6/30/19 ($)
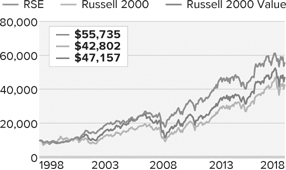
|
| Top 10 Positions | | |
| % of Net Assets | | |
| | | |
| Meredith Corporation | | 6.1 |
| |
| Hubbell Incorporated | | 5.7 |
| |
| John B. Sanfilippo & Son | | 5.6 |
| |
| Standard Motor Products | | 5.2 |
| |
| Computer Services | | 4.9 |
| |
| Scholastic Corporation | | 4.4 |
| |
| Marcus & Millichap | | 3.5 |
| |
| National Presto Industries | | 3.3 |
| |
| AVX Corporation | | 3.3 |
| |
| Weis Markets | | 2.9 |
| |
|
| Portfolio Sector Breakdown | | |
| % of Net Assets | | |
| | | |
| Consumer Discretionary | | 20.0 |
| |
| Industrials | | 17.9 |
| |
| Information Technology | | 12.9 |
| |
| Communication Services | | 10.5 |
| |
| Consumer Staples | | 8.5 |
| |
| Materials | | 5.3 |
| |
| Real Estate | | 3.5 |
| |
| Energy | | 0.6 |
| |
| Cash and Cash Equivalents | | 20.8 |
| |
|
| Calendar Year Total Returns (%) | |
| | | |
| YEAR | | RSE |
| |
| 2018 | | -9.9 |
| |
| 2017 | | 7.9 |
| |
| 2016 | | 32.2 |
| |
| 2015 | | -12.4 |
| |
| 2014 | | 1.1 |
| |
| 2013 | | 29.4 |
| |
| 2012 | | 15.4 |
| |
| 2011 | | 0.1 |
| |
| 2010 | | 19.6 |
| |
| 2009 | | 28.4 |
| |
| 2008 | | -19.6 |
| |
| 2007 | | 4.7 |
| |
| 2006 | | 14.0 |
| |
| 2005 | | -1.0 |
| |
| 2004 | | 13.9 |
| |
|
| Upside/Downside Capture Ratios | | | | |
| Periods Ended 6/30/19 (%) | | | | |
| | | UPSIDE | | DOWNSIDE |
| |
| 10-Year | | 73 | | 75 |
| |
| From 6/30/98 (Start of Fund’s First Full Quarter) | | 71 | | 50 |
| |
|
| Portfolio Diagnostics | | |
| | | |
| Fund Net Assets | | $1,210 million |
| |
| Number of Holdings | | 35 |
| |
| Turnover Rate | | 8% |
| |
| Average Market Capitalization1 | | $1,207 million |
| |
| Weighted Average P/E Ratio2,3 | | 15.0x |
| |
| Weighted Average P/B Ratio2 | | 1.7x |
| |
| Active Share4 | | 99% |
| |
| U.S. Investments (% of Net Assets) | | 76.5% |
| |
| Non-U.S. Investments (% of Net Assets) | | 2.7% |
| |
| |
| 1 | Geometric Average. This weighted calculation uses each portfolio holding’s market cap in a way designed to not skew the effect of very large or small holdings; instead, it aims to better identify the portfolio’s center, which Royce believes offers a more accurate measure of average market cap than a simple mean or median. |
| 2 | Harmonic Average. This weighted calculation evaluates a portfolio as if it were a single stock and measures it overall. It compares the total market value of the portfolio to the portfolio’s share in the earnings or book value, as the case may be, of its underlying stocks. |
| 3 | The Fund’s P/E ratio calculation excludes companies with zero or negative earnings (9% of portfolio holdings as of 6/30/19). |
| 4 | Active Share is the sum of the absolute values of the different weightings of each holding in the Fund versus each holding in the benchmark, divided by two. |
| Important Performance and Expense Information |
All performance information in this Report reflects past performance, is presented on a total return basis, reflects the reinvestment of distributions, and does not reflect the deduction of taxes that a shareholder would pay on fund distributions or the redemption of fund shares. Past performance is no guarantee of future results. Investment return and principal value of an investment will fluctuate, so that shares may be worth more or less than their original cost when redeemed. Shares redeemed within 30 days of purchase may be subject to a 1% redemption fee payable to the Fund, which is not reflected in the performance shown above; if it were, performance would be lower. Current month-end performance may be higher or lower than performance quoted and may be obtained at www.roycefunds.com. All performance and risk information reflects results of the Investment Class (its oldest class). Operating expenses reflect the Fund’s total annual operating expenses for the Investment Class as of the Fund’s most current prospectus and include management fees and other expenses. The Sharpe Ratio is calculated for a specified period by dividing a fund’s annualized excess returns by its annualized standard deviation. The higher the Sharpe ratio, the better the fund’s historical risk-adjusted performance. Regarding the “Top Contributors” and “Top Detractors” tables shown above, the sum of all contributors to, and all detractors from, performance for all securities in the portfolio would approximate the Fund’s year-to-date performance for 2019. Upside Capture Ratio measures a manager’s performance in up markets relative to the Fund’s benchmark. It is calculated by measuring the Fund’s performance in quarters when the benchmark went up and dividing it by the benchmark’s return in those quarters. Downside Capture Ratio measures a manager’s performance in down markets relative to the Fund’s benchmark (Russell 2000). It is calculated by measuring the Fund’s performance in quarters when the benchmark goes down and dividing it by the benchmark’s return in those quarters.
|
| | | The Royce Funds 2019 Semiannual Report to Shareholders | 29 |
| | | MANAGERS’ DISCUSSION |
| Royce Total Return Fund (RTR) | | |
 |
Chuck Royce
Jay Kaplan, CFA |
FUND PERFORMANCE
For the year-to-date period ended June 30, 2019, Royce Total Return Fund rose 15.3%, trailing the Russell 2000 Index, which was up 17.0% for the same period. In contrast, Total Return’s historic pattern of delivering better relative returns in difficult periods for stocks was evident in the trailing one-year period, when the Fund advanced 0.4% while the small-cap index declined 3.3%. |
| |
| WHAT WORKED... AND WHAT DIDN’T |
At the end of June, Financials and Industrials were the portfolio’s biggest sectors, accounting for more than half of its total assets. Unsurprisingly, then, they were the top-contributing sectors for 2019’s first half—and by a wide margin, leading 10 of the Fund’s 11 equity sectors that made positive impacts on performance. Only Communication Services detracted from results—and did so marginally—while Consumer Staples and Health Care made the smallest contributions. All three were among our lowest sector weightings at the end of June.
The industries which made the three biggest positive contributions came from Financials—capital markets, the portfolio’s second-largest industry weighting at the end of June; insurance, its third largest; and banks, its biggest. Following these, four of the next five top-contributing industries were in Industrials—machinery, commercial services & supplies, aerospace & defense, and professional services. We were pleased to see such widespread strength from mostly cyclical areas, many of which did best in the more volatile second quarter, a period that also saw dividend-paying small-caps outpace non-dividend payers, 3.2% versus 1.0%. Detractions at the industry level were modest in comparison and included only eight groups. Specialty retail (Consumer Discretionary), diversified telecommunication services (Communication Services), road & rail (Industrials), and distributors (Consumer Discretionary) detracted most. Their combined effect, however, was decidedly modest.
Similarly, individual positions that detracted made a comparatively minor impact on performance. Lancaster Colony produces specialty foods and other products for the retail and food service markets. While sales and earnings remained positive in the first half, expectations were for fatter margins and higher earnings. Its shares fell most precipitously in January following the announcement of fiscal second-quarter results. We reduced our stake in the first half. Agricultural equipment supplier Lindsay Corporation was the only one of the portfolio’s 19 machinery holdings to finish the first half in the red. The company faced several challenges, including lower farming incomes that have crimped capital spending and led to ongoing weakness in its core market, excess rainfall and flooding in the Midwest, and tariff and trade war woes. In early July, however, Lindsay noted an uptick in domestic irrigation sales, while recent improvement in key crop prices such as corn have improved agricultural sentiment. We trimmed our stake slightly in the first half.
The Fund’s top contributor at the position level was Erie Indemnity, a property and casualty insurer with an attractive and uncommon corporate structure. Erie Insurance Exchange, an affiliated policyholder-owned company, issues and owns the policies, while Erie Indemnity provides management services to the Exchange. This gives it little direct liability, so it has low capital requirements and high returns on capital. Erie’s stock advanced steadily through the first half year as the company reported consistent growth and expanding margins. HEICO Corporation, which manufacturers replacement aerospace parts, saw its shares reach higher altitudes in June, after the company reported strong organic sales and expanding margins, boosted by strength in its flight support and electronics segments. These developments led HEICO to raise guidance for the rest of the year.
The Fund lagged its benchmark mostly due to sector allocation, though stock selection was also slightly negative in the first half. Information Technology detracted most as both our underweight and stock selection miscues hampered relative results in this top-performing sector, where dividend-paying companies are scarce in many areas. Our overweight in Consumer Staples, along with some lagging stock selection in the food products industry, detracted from relative returns, though to a lesser degree, as did stock selection in Consumer Discretionary. The largest source of outperformance in the year-to-date period came from Financials and was entirely due to superior stock selection, as overweighting this sector detracted. Health Care also contributed positively—and quite modestly—to relative results. |
| | Top Contributors to Performance
Year-to-Date Through 6/30/19 (%)1 | | |
| | | |
| Erie Indemnity Cl. A | | 1.49 |
| |
| HEICO Corporation | | 0.71 |
| |
| Ares Management Cl. A | | 0.65 |
| |
| ManpowerGroup | | 0.53 |
| |
| Cohen & Steers | | 0.34 |
| |
| 1Includes dividends | | |
| | Top Detractors from Performance
Year-to-Date Through 6/30/19 (%)2 | | |
| | | |
| Lancaster Colony | | -0.15 |
| |
| Lindsay Corporation | | -0.13 |
| |
| ATN International | | -0.12 |
| |
| ArcBest | | -0.11 |
| |
| Caleres | | -0.10 |
| |
| 2Net of dividends | | |
| CURRENT POSITIONING AND OUTLOOK |
| Markets are very good at surprising most investors. Today, given widespread concerns about slowing growth, increasing trade tensions, and the extended economic cycle, the most surprising outcome might be a rally. We see four favorable factors in the current market environment—low inflation, modest valuations, moderate growth, and increasing liquidity. When taken together, we see these factors as painting an attractive picture for small-cap investors. With so much attention on negative macro issues, we think investors may be missing this positive picture. We see highly promising select opportunities in dividend-paying small-cap cyclicals, particularly in Financials, Industrials, and Materials. |
| 30 | The Royce Funds 2019 Semiannual Report to Shareholders | |
| PERFORMANCE AND PORTFOLIO REVIEW | | TICKER SYMBOLS RYTRX RYTFX RTRIX RYTCX RTRRX |
| Performance and Expenses |
| Average Annual Total Return (%) Through 6/30/19 |
| | | JAN-JUN 20191 | | 1-YR | | 3-YR | | 5-YR | | 10-YR | | 15-YR | | 20-YR | | SINCE INCEPTION (12/15/93) |
| |
| RTR | | 15.32 | | 0.36 | | 9.95 | | 5.74 | | 11.83 | | 7.72 | | 9.06 | | 10.40 |
| |
| Annual Operating Expenses: 1.20% |
| |
| 1Not annualized |
Relative Risk Adjusted Returns: Monthly Rolling Sharpe Ratios20 Years Through 6/30/19
| On a monthly rolling risk-adjusted basis, the Fund outperformed the Russell 2000 in 93% of all 10-year periods and 81% of all 5-year periods. |
| |
| | | PERIODS BEATING THE INDEX | | | | | FUND AVG (%)1 | | INDEX AVG (%)1 |
| |
| 10-year | | 112/121 | | | | | | 93% | | 0.49 | | 0.41 |
| |
| 5-year | | 147/181 | | | | | | 81% | | 0.64 | | 0.51 |
| |
1Average of monthly rolling Sharpe Ratios over the specified periods.
The Morningstar Style Map is the Morningstar Style Box™ with the center 75% of fund holdings plotted as the Morningstar Ownership Zone™. The Morningstar Style Box is designed to reveal a fund’s investment strategy. The Morningstar Ownership Zone provides detail about a portfolio’s investment style by showing the range of stock sizes and styles. The Ownership Zone is derived by plotting each stock in the portfolio within the proprietary Morningstar Style Box. Over time, the shape and location of a fund’s ownership zone may vary. See page 97 for additional information. |
Value of $10,000Invested on 12/15/93 as of 6/30/19 ($)
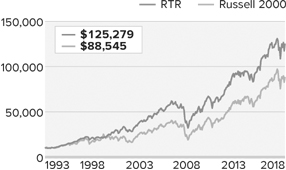
|
| Top 10 Positions | | |
| % of Net Assets | | |
| | | |
| Erie Indemnity Cl. A | | 2.8 |
| |
| Quaker Chemical | | 1.9 |
| |
| First Citizens BancShares Cl. A | | 1.7 |
| |
| Ares Management Cl. A | | 1.7 |
| |
| HEICO Corporation | | 1.6 |
| |
| E-L Financial | | 1.5 |
| |
| Bank of Hawaii | | 1.3 |
| |
| Hubbell Incorporated | | 1.3 |
| |
| BOK Financial | | 1.3 |
| |
| Meredith Corporation | | 1.2 |
| |
|
| Portfolio Sector Breakdown | | |
| % of Net Assets | | |
| | | |
| Financials | | 34.5 |
| |
| Industrials | | 25.9 |
| |
| Materials | | 10.4 |
| |
| Consumer Discretionary | | 6.2 |
| |
| Information Technology | | 5.4 |
| |
| Consumer Staples | | 3.9 |
| |
| Energy | | 3.7 |
| |
| Utilities | | 3.1 |
| |
| Communication Services | | 2.4 |
| |
| Health Care | | 1.3 |
| |
| Real Estate | | 1.2 |
| |
| Corporate Bonds | | 0.3 |
| |
| Cash and Cash Equivalents | | 1.7 |
| |
|
| Calendar Year Total Returns (%) | | |
| | | |
| YEAR | | RTR |
| |
| 2018 | | -12.5 |
| |
| 2017 | | 13.7 |
| |
| 2016 | | 25.9 |
| |
| 2015 | | -7.2 |
| |
| 2014 | | 1.3 |
| |
| 2013 | | 32.8 |
| |
| 2012 | | 14.4 |
| |
| 2011 | | -1.7 |
| |
| 2010 | | 23.5 |
| |
| 2009 | | 26.2 |
| |
| 2008 | | -31.2 |
| |
| 2007 | | 2.4 |
| |
| 2006 | | 14.5 |
| |
| 2005 | | 8.2 |
| |
| 2004 | | 17.5 |
| |
|
| Upside/Downside Capture Ratios | | | | |
| Periods Ended 6/30/19 (%) | | | | |
| | | UPSIDE | | DOWNSIDE |
| |
| 10-Year | | 82 | | 75 |
| |
| From 12/31/93 (Start of Fund’s First Full Quarter) | | 81 | | 57 |
| |
|
| Portfolio Diagnostics | | |
| | | |
| Fund Net Assets | | $1,558 million |
| |
| Number of Holdings | | 241 |
| |
| Turnover Rate | | 7% |
| |
| Average Market Capitalization1 | | $2,139 million |
| |
| Weighted Average P/E Ratio2,3 | | 17.2x |
| |
| Weighted Average P/B Ratio2 | | 1.9x |
| |
| Active Share4 | | 91% |
| |
| U.S. Investments (% of Net Assets) | | 84.2% |
| |
| Non-U.S. Investments (% of Net Assets) | | 14.1% |
| |
| 1 | Geometric Average. This weighted calculation uses each portfolio holding’s market cap in a way designed to not skew the effect of very large or small holdings; instead, it aims to better identify the portfolio’s center, which Royce believes offers a more accurate measure of average market cap than a simple mean or median. |
| 2 | Harmonic Average. This weighted calculation evaluates a portfolio as if it were a single stock and measures it overall. It compares the total market value of the portfolio to the portfolio’s share in the earnings or book value, as the case may be, of its underlying stocks. |
| 3 | The Fund’s P/E ratio calculation excludes companies with zero or negative earnings (4% of portfolio holdings as of 6/30/19). |
| 4 | Active Share is the sum of the absolute values of the different weightings of each holding in the Fund versus each holding in the benchmark, divided by two. |
| Important Performance and Expense Information
All performance information in this Report reflects past performance, is presented on a total return basis, reflects the reinvestment of distributions, and does not reflect the deduction of taxes that a shareholder would pay on fund distributions or the redemption of fund shares. Past performance is no guarantee of future results. Investment return and principal value of an investment will fluctuate, so that shares may be worth more or less than their original cost when redeemed. Shares redeemed within 30 days of purchase may be subject to a 1% redemption fee payable to the Fund, which is not reflected in the performance shown above; if it were, performance would be lower. Current month-end performance may be higher or lower than performance quoted and may be obtained at www.roycefunds.com. All performance and risk information reflects results of the Investment Class (its oldest class). Certain immaterial adjustments were made to the net assets of Royce Total Return Fund at 6/30/17 for financial reporting purposes, and as a result the net asset values for shareholder transactions on that date and the calendar year Total Returns (%) based on those net asset values differ from the adjusted net asset values and calendar year total returns reported in the Financial Highlights. Operating expenses reflect the Fund’s total annual operating expenses for the Investment Class as of the Fund’s most current prospectus and include management fees, other expenses, and acquired fund fees and expenses. Acquired fund fees and expenses reflect the estimated amount of the fees and expenses incurred indirectly by the Fund through its investments in mutual funds, hedge funds, private equity funds, and other investment companies. Regarding the “Top Contributors” and “Top Detractors” tables shown above, the sum of all contributors to, and all detractors from, performance for all securities in the portfolio would approximate the Fund’s year-to-date performance for 2019. The Sharpe Ratio is calculated for a specified period by dividing a fund’s annualized excess returns by its annualized standard deviation. The higher the Sharpe ratio, the better the fund’s historical risk-adjusted performance. Upside Capture Ratio measures a manager’s performance in up markets relative to the Fund’s benchmark. It is calculated by measuring the Fund’s performance in quarters when the benchmark went up and dividing it by the benchmark’s return in those quarters. Downside Capture Ratio measures a manager’s performance in down markets relative to the Fund’s benchmark (Russell 2000). It is calculated by measuring the Fund’s performance in quarters when the benchmark goes down and dividing it by the benchmark’s return in those quarters.
|
| The Royce Funds 2019 Semiannual Report to Shareholders | 31 |
Schedules of Investments
| |
| Royce Dividend Value Fund | | | | | | | |
| Common Stocks – 98.8% | | | | | | | |
| | | | SHARES | | | VALUE | |
| |
| | | | | | | | |
| CONSUMER DISCRETIONARY – 7.3% | | | | | | | |
| AUTO COMPONENTS - 1.3% | | | | | | | |
Gentex Corporation | | | 12,196 | | $ | 300,143 | |
Nokian Renkaat | | | 35,600 | | | 1,111,602 | |
| | | | | | | |
| | | | | | | 1,411,745 | |
| | | | | | | |
| HOTELS, RESTAURANTS & LEISURE - 0.1% | | | | | | | |
Cheesecake Factory | | | 2,329 | | | 101,824 | |
| | | | | | | |
| HOUSEHOLD DURABLES - 1.5% | | | | | | | |
Hunter Douglas | | | 20,000 | | | 1,396,359 | |
La-Z-Boy | | | 8,415 | | | 258,004 | |
| | | | | | | |
| | | | | | | 1,654,363 | |
| | | | | | | |
| SPECIALTY RETAIL - 3.7% | | | | | | | |
American Eagle Outfitters | | | 43,231 | | | 730,604 | |
Caleres | | | 53,778 | | | 1,071,258 | |
Designer Brands Cl. A | | | 59,215 | | | 1,135,151 | |
USS | | | 56,000 | | | 1,102,704 | |
| | | | | | | |
| | | | | | | 4,039,717 | |
| | | | | | | |
| TEXTILES, APPAREL & LUXURY GOODS - 0.7% | | | | | | | |
HUGO BOSS | | | 9,800 | | | 651,900 | |
Steven Madden | | | 2,978 | | | 101,103 | |
| | | | | | | |
| | | | | | | 753,003 | |
| |
| Total (Cost $6,384,322) | | | | | | 7,960,652 | |
| |
| | | | | | | | |
| CONSUMER STAPLES – 0.4% | | | | | | | |
| FOOD & STAPLES RETAILING - 0.4% | | | | | | | |
FamilyMart UNY Holdings | | | 19,200 | | | 458,029 | |
| |
| Total (Cost $179,751) | | | | | | 458,029 | |
| |
| | | | | | | | |
| ENERGY – 6.2% | | | | | | | |
| ENERGY EQUIPMENT & SERVICES - 3.2% | | | | | | | |
Helmerich & Payne | | | 29,504 | | | 1,493,492 | |
TGS-NOPEC Geophysical | | | 72,700 | | | 2,038,561 | |
| | | | | | | |
| | | | | | | 3,532,053 | |
| | | | | | | |
| OIL, GAS & CONSUMABLE FUELS - 3.0% | | | | | | | |
†Alliance Resource Partners L.P. | | | 25,464 | | | 432,379 | |
Cimarex Energy | | | 17,300 | | | 1,026,409 | |
Gaztransport Et Technigaz | | | 18,200 | | | 1,824,284 | |
| | | | | | | |
| | | | | | | 3,283,072 | |
| |
| Total (Cost $6,309,149) | | | | | | 6,815,125 | |
| |
| | | | | | | | |
| FINANCIALS – 28.2% | | | | | | | |
| BANKS - 2.2% | | | | | | | |
Bank of Georgia Group | | | 39,500 | | | 751,442 | |
BOK Financial | | | 17,114 | | | 1,291,765 | |
City Holding Company | | | 4,289 | | | 327,079 | |
| | | | | | | |
| | | | | | | 2,370,286 | |
| | | | | | | |
| CAPITAL MARKETS - 22.2% | | | | | | | |
Ashmore Group | | | 367,200 | | | 2,375,928 | |
AURELIUS Equity Opportunities | | | 7,200 | | | 341,894 | |
B3-Brasil, Bolsa, Balcao | | | 220,000 | | | 2,146,174 | |
Bolsa Mexicana de Valores | | | 987,300 | | | 1,863,107 | |
Carlyle Group L.P. | | | 97,800 | | | 2,211,258 | |
Coronation Fund Managers | | | 153,700 | | | 487,780 | |
Federated Investors Cl. B | | | 33,200 | | | 1,079,000 | |
Houlihan Lokey Cl. A | | | 2,334 | | | 103,933 | |
Jupiter Fund Management | | | 225,700 | | | 1,211,001 | |
KKR & Co. Cl. A | | | 132,500 | | | 3,348,275 | |
Lazard Cl. A | | | 23,700 | | | 815,043 | |
Moelis & Company Cl. A | | | 21,059 | | | 736,012 | |
Northern Trust | | | 18,600 | | | 1,674,000 | |
SEI Investments | | | 37,900 | | | 2,126,190 | |
Sprott | | | 588,600 | | | 1,514,705 | |
State Street | | | 18,600 | | | 1,042,716 | |
Value Partners Group | | | 1,818,100 | | | 1,212,579 | |
| | | | | | | |
| | | | | | | 24,289,595 | |
| | | | | | | |
| DIVERSIFIED FINANCIAL SERVICES - 1.0% | | | | | | | |
Jefferies Financial Group | | | 59,700 | | | 1,148,031 | |
| | | | | | | |
| | | | | | | | |
| INSURANCE - 0.9% | | | | | | | |
Reinsurance Group of America | | | 6,305 | | | 983,769 | |
| | | | | | | |
| | | | | | | | |
| THRIFTS & MORTGAGE FINANCE - 1.9% | | | | | | | |
Genworth MI Canada | | | 33,348 | | | 1,055,280 | |
WSFS Financial | | | 25,901 | | | 1,069,711 | |
| | | | | | | |
| | | | | | | 2,124,991 | |
| |
| Total (Cost $21,412,960) | | | | | | 30,916,672 | |
| |
| | | | | | | | |
| HEALTH CARE – 2.2% | | | | | | | |
| HEALTH CARE PROVIDERS & SERVICES - 0.1% | | | | | | | |
Ensign Group (The) | | | 2,151 | | | 122,435 | |
| | | | | | | |
| | | | | | | | |
| PHARMACEUTICALS - 2.1% | | | | | | | |
Recordati | | | 39,100 | | | 1,629,926 | |
Santen Pharmaceutical | | | 41,600 | | | 688,735 | |
| | | | | | | |
| | | | | | | 2,318,661 | |
| |
| Total (Cost $608,345) | | | | | | 2,441,096 | |
| |
| | | | | | | | |
| INDUSTRIALS – 29.3% | | | | | | | |
| AEROSPACE & DEFENSE - 4.3% | | | | | | | |
HEICO Corporation Cl. A | | | 45,420 | | | 4,695,065 | |
| | | | | | | |
| | | | | | | | |
| AIRLINES - 2.0% | | | | | | | |
Allegiant Travel | | | 7,371 | | | 1,057,739 | |
Hawaiian Holdings | | | 40,156 | | | 1,101,479 | |
| | | | | | | |
| | | | | | | 2,159,218 | |
| | | | | | | |
| BUILDING PRODUCTS - 1.6% | | | | | | | |
Apogee Enterprises | | | 5,400 | | | 234,576 | |
Geberit | | | 800 | | | 373,694 | |
TOTO | | | 29,600 | | | 1,168,186 | |
| | | | | | | |
| | | | | | | 1,776,456 | |
| | | | | | | |
| COMMERCIAL SERVICES & SUPPLIES - 0.5% | | | | | | | |
Herman Miller | | | 11,276 | | | 504,037 | |
| | | | | | | |
| | | | | | | | |
| CONSTRUCTION & ENGINEERING - 0.1% | | | | | | | |
Comfort Systems USA | | | 2,092 | | | 106,671 | |
| | | | | | | |
| | | | | | | | |
| ELECTRICAL EQUIPMENT - 1.7% | | | | | | | |
EnerSys | | | 3,256 | | | 223,036 | |
Hubbell Incorporated | | | 12,700 | | | 1,656,080 | |
| | | | | | | |
| | | | | | | 1,879,116 | |
| | | | | | | |
| MACHINERY - 12.3% | | | | | | | |
Alamo Group | | | 1,088 | | | 108,724 | |
Federal Signal | | | 3,929 | | | 105,100 | |
Graco | | | 50,400 | | | 2,529,072 | |
IDEX Corporation | | | 17,100 | | | 2,943,594 | |
Lincoln Electric Holdings | | | 10,550 | | | 868,476 | |
Lindsay Corporation | | | 21,400 | | | 1,759,294 | |
Pfeiffer Vacuum Technology | | | 9,600 | | | 1,408,185 | |
Spirax-Sarco Engineering | | | 21,900 | | | 2,554,522 | |
Wabash National | | | 71,392 | | | 1,161,548 | |
| | | | | | | |
| | | | | | | 13,438,515 | |
| | | | | | | |
| MARINE - 1.4% | | | | | | | |
Clarkson | | | 48,600 | | | 1,549,160 | |
| | | | | | | |
| | | | | | | | |
| PROFESSIONAL SERVICES - 2.5% | | | | | | | |
Korn Ferry | | | 8,001 | | | 320,600 | |
ManpowerGroup | | | 22,600 | | | 2,183,160 | |
| 32 | The Royce Funds 2019 Semiannual Report to Shareholders | | THE ACCOMPANYING NOTES ARE AN INTEGRAL PART OF THESE FINANCIAL STATEMENTS |
| June 30, 2019 (unaudited) |
| |
| Royce Dividend Value Fund (continued) | | | | | | | |
| | | | | | | | |
| | | | SHARES | | | VALUE | |
| |
| | | | | | | | |
| INDUSTRIALS (continued) | | | | | | | |
| PROFESSIONAL SERVICES (continued) | | | | | | | |
Robert Half International | | | 3,994 | | $ | 227,698 | |
| | | | | | | |
| | | | | | | 2,731,458 | |
| | | | | | | |
| ROAD & RAIL - 0.9% | | | | | | | |
Old Dominion Freight Line | | | 700 | | | 104,482 | |
Werner Enterprises | | | 29,343 | | | 911,981 | |
| | | | | | | |
| | | | | | | 1,016,463 | |
| | | | | | | |
| TRADING COMPANIES & DISTRIBUTORS - 2.0% | | | | | | | |
Applied Industrial Technologies | | | 36,500 | | | 2,245,845 | |
| |
| Total (Cost $15,579,109) | | | | | | 32,102,004 | |
| |
| | | | | | | | |
| INFORMATION TECHNOLOGY – 9.0% | | | | | | | |
| ELECTRONIC EQUIPMENT, INSTRUMENTS & COMPONENTS - 5.2% | | | | | | | |
Benchmark Electronics | | | 4,268 | | | 107,212 | |
FLIR Systems | | | 65,800 | | | 3,559,780 | |
Methode Electronics | | | 32,838 | | | 938,182 | |
Vishay Intertechnology | | | 66,917 | | | 1,105,469 | |
| | | | | | | |
| | | | | | | 5,710,643 | |
| | | | | | | |
| IT SERVICES - 2.4% | | | | | | | |
KBR | | | 106,200 | | | 2,648,628 | |
| | | | | | | |
| SEMICONDUCTORS & SEMICONDUCTOR EQUIPMENT - 0.9% | | | | | | | |
MKS Instruments | | | 12,622 | | | 983,128 | |
| | | | | | | |
| SOFTWARE - 0.5% | | | | | | | |
SimCorp | | | 5,600 | | | 541,730 | |
| |
| Total (Cost $7,084,123) | | | | | | 9,884,129 | |
| |
| | | | | | | | |
| MATERIALS – 14.3% | | | | | | | |
| CHEMICALS - 3.1% | | | | | | | |
Quaker Chemical | | | 16,400 | | | 3,327,232 | |
| | | | | | | |
| | | | | | | | |
| CONTAINERS & PACKAGING - 3.5% | | | | | | | |
AptarGroup | | | 29,500 | | | 3,668,030 | |
Greif Cl. A | | | 6,300 | | | 205,065 | |
| | | | | | | |
| | | | | | | 3,873,095 | |
| | | | | | | |
| METALS & MINING - 7.7% | | | | | | | |
Franco-Nevada | | | 26,400 | | | 2,240,832 | |
Reliance Steel & Aluminum | | | 28,300 | | | 2,677,746 | |
Royal Gold | | | 15,500 | | | 1,588,595 | |
Worthington Industries | | | 46,800 | | | 1,884,168 | |
| | | | | | | |
| | | | | | | 8,391,341 | |
| |
| Total (Cost $6,412,041) | | | | | | 15,591,668 | |
| |
| | | | | | | | |
| REAL ESTATE – 0.4% | | | | | | | |
| REAL ESTATE MANAGEMENT & DEVELOPMENT - 0.4% | | | | | | | |
Relo Group | | | 18,400 | | | 463,008 | |
| |
| Total (Cost $85,795) | | | | | | 463,008 | |
| |
| | | | | | | | |
| UTILITIES – 1.5% | | | | | | | |
| WATER UTILITIES - 1.5% | | | | | | | |
Aqua America | | | 39,800 | | | 1,646,526 | |
| |
| Total (Cost $953,083) | | | | | | 1,646,526 | |
| |
| | | | | | | | |
| TOTAL COMMON STOCKS | | | | | | | |
| |
| (Cost $65,008,678) | | | | | | 108,278,909 | |
| |
| | | | | | | | |
| REPURCHASE AGREEMENT – 1.2% | | | | | | | |
Fixed Income Clearing Corporation, 0.50% dated 6/28/19, due 7/1/19, maturity value
$1,286,054 (collateralized by obligations of various U.S. Government Agencies, 1.75%
due 5/31/22, valued at $1,312,112) |
| |
| (Cost $1,286,000) | | | | | | 1,286,000 | |
| |
| | | | | | | | |
| TOTAL INVESTMENTS – 100.0% | | | | | | | |
| |
| (Cost $66,294,678) | | | | | | 109,564,909 | |
| |
| | | | | | | | |
| LIABILITIES LESS CASH AND OTHER ASSETS – (0.0)% | | | | | | (20,635 | ) |
| | | | | | | |
| | | | | | | | |
| |
| NET ASSETS – 100.0% | | | | | $ | 109,544,274 | |
| |
| THE ACCOMPANYING NOTES ARE AN INTEGRAL PART OF THESE FINANCIAL STATEMENTS | | The Royce Funds 2019 Semiannual Report to Shareholders | 33 |
| |
| Royce Global Financial Services Fund |
| Common Stocks – 96.8% |
| | | SHARES | | VALUE |
| |
| | | | | | | | | |
| BANKS - 18.8% |
BOK Financial | | | 10,450 | | | $ | 788,766 | |
Bryn Mawr Bank | | | 10,000 | | | | 373,200 | |
†Cadence Bancorporation Cl. A | | | 15,887 | | | | 330,450 | |
Canadian Western Bank | | | 14,000 | | | | 319,331 | |
Capital City Bank Group | | | 25,481 | | | | 633,203 | |
Chemung Financial | | | 14,512 | | | | 701,510 | |
County Bancorp | | | 15,895 | | | | 271,645 | |
First Citizens BancShares Cl. A | | | 2,538 | | | | 1,142,785 | |
First Republic Bank | | | 6,498 | | | | 634,530 | |
Live Oak Bancshares | | | 22,500 | | | | 385,875 | |
Popular | | | 23,465 | | | | 1,272,742 | |
TriState Capital Holdings 1 | | | 11,600 | | | | 247,544 | |
Umpqua Holdings | | | 17,400 | | | | 288,666 | |
| |
| Total (Cost $5,394,543) | | | | | | | 7,390,247 | |
| |
| | | | | | | | | |
| CAPITAL MARKETS - 48.6% |
Ares Management Cl. A | | | 38,950 | | | | 1,019,321 | |
Ashmore Group | | | 157,000 | | | | 1,015,852 | |
Associated Capital Group Cl. A | | | 7,000 | | | | 261,800 | |
B3-Brasil, Bolsa, Balcao | | | 61,000 | | | | 595,075 | |
Bolsa Mexicana de Valores | | | 174,000 | | | | 328,351 | |
Canaccord Genuity Group | | | 133,000 | | | | 609,370 | |
Carlyle Group L.P. | | | 33,400 | | | | 755,174 | |
Charles Schwab | | | 8,400 | | | | 337,596 | |
Coronation Fund Managers | | | 61,200 | | | | 194,224 | |
CRISIL | | | 14,000 | | | | 298,345 | |
Edelweiss Financial Services | | | 155,000 | | | | 381,956 | |
Egyptian Financial Group-Hermes | | | | | | | | |
Holding Company | | | 307,987 | | | | 317,303 | |
GMP Capital | | | 108,000 | | | | 187,209 | |
Great Elm Capital Group 1 | | | 115,545 | | | | 496,843 | |
Hamilton Lane Cl. A | | | 11,500 | | | | 656,190 | |
Hellenic Exchanges - Athens Stock Exchange | | | 50,000 | | | | 278,590 | |
Intermediate Capital Group | | | 39,111 | | | | 685,929 | |
INTL FCStone 1 | | | 12,870 | | | | 509,523 | |
IOOF Holdings | | | 55,000 | | | | 199,628 | |
JSE | | | 51,000 | | | | 506,922 | |
Jupiter Fund Management | | | 106,900 | | | | 573,576 | |
KKR & Co. Cl. A | | | 23,900 | | | | 603,953 | |
MarketAxess Holdings | | | 4,370 | | | | 1,404,605 | |
Northern Trust | | | 3,770 | | | | 339,300 | |
NZX | | | 580,000 | | | | 436,401 | |
Rothschild & Co | | | 27,700 | | | | 897,684 | |
SEI Investments | | | 7,950 | | | | 445,995 | |
Silvercrest Asset Management Group Cl. A | | | 41,600 | | | | 583,648 | |
Sprott | | | 500,000 | | | | 1,286,702 | |
TD Ameritrade Holding Corporation | | | 8,680 | | | | 433,306 | |
U.S. Global Investors Cl. A | | | 183,900 | | | | 332,859 | |
Value Partners Group | | | 772,000 | | | | 514,884 | |
Virtu Financial Cl. A | | | 47,400 | | | | 1,032,372 | |
Warsaw Stock Exchange | | | 19,000 | | | | 218,566 | |
Westaim Corporation 1 | | | 105,000 | | | | 212,478 | |
WisdomTree Investments | | | 27,100 | | | | 167,207 | |
| |
| Total (Cost $13,618,140) | | | | | | | 19,118,737 | |
| |
| | | | | | | | | |
| CONSUMER FINANCE - 0.5% |
Currency Exchange International 1 | | | 13,000 | | | | 218,495 | |
| |
| Total (Cost $268,728) | | | | | | | 218,495 | |
| |
| | | | | | | | | |
| DIVERSIFIED FINANCIAL SERVICES - 1.4% |
ECN Capital | | | 75,000 | | | | 241,686 | |
Onex Corporation | | | 5,000 | | | | 301,592 | |
| |
| Total (Cost $570,788) | | | | | | | 543,278 | |
| |
| | | | | | | | | |
| HOTELS, RESTAURANTS & LEISURE - 0.8% |
Thomas Cook (India) | | | 94,000 | | | | 330,775 | |
| |
| Total (Cost $270,518) | | | | | | | 330,775 | |
| |
| | | | | | | | | |
| INSURANCE - 6.6% |
E-L Financial | | | 1,820 | | | | 1,035,394 | |
First American Financial | | | 3,900 | | | | 209,430 | |
MBIA 1 | | | 95,300 | | | | 887,243 | |
National Western Life Group Cl. A | | | 1,782 | | | | 457,974 | |
| |
| Total (Cost $2,362,021) | | | | | | | 2,590,041 | |
| |
| | | | | | | | | |
| IT SERVICES - 1.8% |
Cass Information Systems | | | 5,016 | | | | 243,175 | |
PayPal Holdings 1 | | | 4,054 | | | | 464,021 | |
| |
| Total (Cost $357,571) | | | | | | | 707,196 | |
| |
| | | | | | | | | |
| METALS & MINING - 3.5% |
Franco-Nevada | | | 16,500 | | | | 1,400,520 | |
| |
| Total (Cost $900,426) | | | | | | | 1,400,520 | |
| |
| | | | | | | | | |
| PROFESSIONAL SERVICES - 2.5% |
IHS Markit 1 | | | 11,900 | | | | 758,268 | |
People Corporation 1 | | | 35,000 | | | | 216,487 | |
| |
| Total (Cost $412,944) | | | | | | | 974,755 | |
| |
| | | | | | | | | |
| REAL ESTATE MANAGEMENT & DEVELOPMENT - 7.4% |
Altus Group | | | 32,000 | | | | 783,658 | |
FirstService Corporation | | | 12,600 | | | | 1,208,592 | |
FRP Holdings 1 | | | 7,957 | | | | 443,762 | |
RMR Group (The) Cl. A | | | 10,000 | | | | 469,800 | |
| |
| Total (Cost $1,804,823) | | | | | | | 2,905,812 | |
| |
| | | | | | | | | |
| SOFTWARE - 2.9% |
Benefitfocus 1 | | | 10,600 | | | | 287,790 | |
Bottomline Technologies 1 | | | 9,800 | | | | 433,552 | |
Envestnet 1 | | | 6,000 | | | | 410,220 | |
| |
| Total (Cost $836,700) | | | | | | | 1,131,562 | |
| |
| | | | | | | | | |
| TRADING COMPANIES & DISTRIBUTORS - 2.0% |
Air Lease Cl. A | | | 19,500 | | | | 806,130 | |
| |
| Total (Cost $854,965) | | | | | | | 806,130 | |
| |
| | | | | | | | | |
| TOTAL COMMON STOCKS |
| |
| (Cost $27,652,167) | | | | | | | 38,117,548 | |
| |
| | | | | | | | | |
| REPURCHASE AGREEMENT – 3.2% |
Fixed Income Clearing Corporation, 0.50% dated 6/28/19, due 7/1/19, maturity value
$1,238,052 (collateralized by obligations of various U.S. Government Agencies, 1.75%
due 5/31/22, valued at $1,267,039) |
| |
| (Cost $1,238,000) | | | | | | | 1,238,000 | |
| |
| | | | | | | | | |
| TOTAL INVESTMENTS – 100.0% |
| |
| (Cost $28,890,167) | | | | | | | 39,355,548 | |
| |
| | | | | | | | | |
| CASH AND OTHER ASSETS LESS LIABILITIES – 0.0% | | | | | | | 15,710 | |
| | | | | | | | |
| | | | | | | | | |
| |
| NET ASSETS – 100.0% | | | | | | $ | 39,371,258 | |
| |
| 34 | The Royce Funds 2019 Semiannual Report to Shareholders | | THE ACCOMPANYING NOTES ARE AN INTEGRAL PART OF THESE FINANCIAL STATEMENTS |
| June 30, 2019 (unaudited) |
| |
| Royce International Premier Fund |
| Common Stocks – 94.1% |
| | | SHARES | | VALUE |
| |
| | | | | | | | | |
| AUSTRALIA – 8.7% |
Bravura Solutions | | | 2,830,000 | | | $ | 9,655,855 | |
Cochlear | | | 72,500 | | | | 10,527,871 | |
Hansen Technologies | | | 4,750,000 | | | | 13,105,518 | |
IPH | | | 1,900,000 | | | | 9,950,857 | |
Technology One | | | 1,740,000 | | | | 9,625,948 | |
| |
| Total (Cost $40,603,148) | | | | | | | 52,866,049 | |
| |
| | | | | | | | | |
| BRAZIL – 4.4% |
OdontoPrev | | | 2,642,950 | | | | 12,567,941 | |
TOTVS | | | 1,203,000 | | | | 13,775,156 | |
| |
| Total (Cost $20,369,113) | | | | | | | 26,343,097 | |
| |
| | | | | | | | | |
| CANADA – 5.9% |
Altus Group | | | 518,000 | | | | 12,685,472 | |
Computer Modelling Group | | | 2,300,000 | | | | 12,786,072 | |
Morneau Shepell | | | 462,000 | | | | 10,432,087 | |
| |
| Total (Cost $34,165,490) | | | | | | | 35,903,631 | |
| |
| | | | | | | | | |
| CHINA – 1.8% |
TravelSky Technology | | | 5,525,000 | | | | 11,104,177 | |
| |
| Total (Cost $13,059,271) | | | | | | | 11,104,177 | |
| |
| | | | | | | | | |
| DENMARK – 1.7% |
SimCorp | | | 104,000 | | | | 10,060,709 | |
| |
| Total (Cost $7,490,349) | | | | | | | 10,060,709 | |
| |
| | | | | | | | | |
| FRANCE – 4.7% |
Lectra | | | 377,000 | | | | 9,666,886 | |
Neurones | | | 346,300 | | | | 8,623,734 | |
Thermador Groupe | | | 158,590 | | | | 10,315,031 | |
| |
| Total (Cost $27,187,026) | | | | | | | 28,605,651 | |
| |
| | | | | | | | | |
| GERMANY – 5.2% |
Amadeus Fire | | | 81,154 | | | | 11,055,171 | |
Carl Zeiss Meditec | | | 103,000 | | | | 10,160,274 | |
†Norma Group | | | 250,000 | | | | 10,358,983 | |
| |
| Total (Cost $26,670,889) | | | | | | | 31,574,428 | |
| |
| | | | | | | | | |
| INDIA – 1.9% |
AIA Engineering 1 | | | 390,000 | | | | 10,147,260 | |
†Cyient | | | 149,000 | | | | 1,167,997 | |
| |
| Total (Cost $10,533,503) | | | | | | | 11,315,257 | |
| |
| | | | | | | | | |
| ITALY – 1.8% |
DiaSorin | | | 94,000 | | | | 10,913,205 | |
| |
| Total (Cost $8,022,158) | | | | | | | 10,913,205 | |
| |
| | | | | | | | | |
| JAPAN – 18.1% |
As One | | | 135,000 | | | | 11,206,697 | |
Benefit One | | | 625,000 | | | | 10,770,765 | |
Cosel | | | 1,100,000 | | | | 11,722,859 | |
Daifuku | | | 287,000 | | | | 16,104,902 | |
EPS Holdings | | | 94,900 | | | | 1,471,713 | |
Medikit | | | 104,800 | | | | 5,754,450 | |
Meitec Corporation | | | 340,000 | | | | 17,439,132 | |
NSD | | | 400,000 | | | | 11,556,833 | |
Relo Group | | | 370,000 | | | | 9,310,485 | |
TKC Corporation | | | 320,400 | | | | 14,175,282 | |
| |
| Total (Cost $96,258,252) | | | | | | | 109,513,118 | |
| |
| | | | | | | | | |
| NETHERLANDS – 5.5% |
IMCD | | | 198,000 | | | | 18,146,754 | |
Intertrust | | | 725,000 | | | | 14,979,305 | |
| |
| Total (Cost $28,360,385) | | | | | | | 33,126,059 | |
| |
| | | | | | | | | |
| NEW ZEALAND – 1.6% |
Fisher & Paykel Healthcare | | | 950,000 | | | | 9,866,728 | |
| |
| Total (Cost $8,116,335) | | | | | | | 9,866,728 | |
| |
| | | | | | | | | |
| NORWAY – 2.0% |
TGS-NOPEC Geophysical | | | 440,000 | | | | 12,337,919 | |
| |
| Total (Cost $12,117,915) | | | | | | | 12,337,919 | |
| |
| | | | | | | | | |
| SINGAPORE – 1.8% |
XP Power | | | 377,000 | | | | 10,580,837 | |
| |
| Total (Cost $11,526,418) | | | | | | | 10,580,837 | |
| |
| | | | | | | | | |
| SWEDEN – 8.5% |
Bravida Holding | | | 1,270,000 | | | | 11,255,580 | |
Hexpol | | | 1,970,000 | | | | 16,048,685 | |
Lagercrantz Group | | | 700,000 | | | | 9,995,531 | |
Loomis Cl. B | | | 415,000 | | | | 14,265,115 | |
| |
| Total (Cost $47,936,674) | | | | | | | 51,564,911 | |
| |
| | | | | | | | | |
| SWITZERLAND – 8.8% |
Kardex | | | 70,000 | | | | 12,218,808 | |
LEM Holding | | | 7,500 | | | | 10,540,873 | |
Partners Group Holding | | | 21,500 | | | | 16,892,542 | |
VZ Holding | | | 50,000 | | | | 13,701,086 | |
| |
| Total (Cost $45,450,075) | | | | | | | 53,353,309 | |
| |
| | | | | | | | | |
| UNITED KINGDOM – 11.7% |
Ashmore Group | | | 1,845,000 | | | | 11,937,873 | |
Consort Medical | | | 600,000 | | | | 6,476,741 | |
Croda International | | | 195,000 | | | | 12,679,174 | |
†Restore | | | 1,745,000 | | | | 8,864,246 | |
Spirax-Sarco Engineering | | | 125,000 | | | | 14,580,606 | |
Victrex | | | 595,000 | | | | 16,351,613 | |
| |
| Total (Cost $64,740,401) | | | | | | | 70,890,253 | |
| |
| | | | | | | | | |
| TOTAL COMMON STOCKS |
| |
| (Cost $502,607,402) | | | | | | | 569,919,338 | |
| |
| | | | | | | | | |
| PREFERRED STOCK – 2.1% |
| GERMANY – 2.1% |
FUCHS PETROLUB | | | 330,000 | | | | 12,975,905 | |
| |
| (Cost $14,481,005) | | | | | | | 12,975,905 | |
| |
| | | | | | | | | |
| REPURCHASE AGREEMENT – 4.9% |
Fixed Income Clearing Corporation, 0.50% dated 6/28/19, due 7/1/19, maturity value
$29,374,224 (collateralized by obligations of various U.S. Government Agencies, 1.75%
due 5/31/22, valued at $29,963,223) |
| |
| (Cost $29,373,000) | | | | | | | 29,373,000 | |
| |
| | | | | | | | | |
| TOTAL INVESTMENTS – 101.1% |
| |
| (Cost $546,461,407) | | | | | | | 612,268,243 | |
| |
| | | | | | | | | |
| LIABILITIES LESS CASH AND OTHER ASSETS – (1.1)% | | | | | | | (6,735,690 | ) |
| | | | | | | | |
| | | | | | | | | |
| |
| NET ASSETS – 100.0% | | | | | | $ | 605,532,553 | |
| |
| THE ACCOMPANYING NOTES ARE AN INTEGRAL PART OF THESE FINANCIAL STATEMENTS | | The Royce Funds 2019 Semiannual Report to Shareholders | 35 |
| |
| Royce Low-Priced Stock Fund |
| Common Stocks – 92.5% |
| | | SHARES | | VALUE |
| |
| | | | | | | | | |
| COMMUNICATION SERVICES – 2.9% |
| DIVERSIFIED TELECOMMUNICATION SERVICES - 0.8% |
ORBCOMM 1 | | | 214,500 | | | $ | 1,555,125 | |
| | | | | | | | |
| ENTERTAINMENT - 0.6% |
Gaia Cl. A 1 | | | 166,500 | | | | 1,262,070 | |
| | | | | | | | |
| INTERACTIVE MEDIA & SERVICES - 1.0% |
QuinStreet 1 | | | 137,042 | | | | 2,172,116 | |
| | | | | | | | |
| MEDIA - 0.5% |
Marchex Cl. B 1 | | | 232,700 | | | | 1,093,690 | |
| |
| Total (Cost $5,356,450) | | | | | | | 6,083,001 | |
| |
| | | | | | | | | |
| CONSUMER DISCRETIONARY – 13.5% |
| AUTO COMPONENTS - 4.4% |
Fox Factory Holding 1,2 | | | 28,800 | | | | 2,376,288 | |
Modine Manufacturing 1 | | | 183,900 | | | | 2,631,609 | |
Stoneridge 1 | | | 122,500 | | | | 3,864,875 | |
Unique Fabricating 1 | | | 216,141 | | | | 585,742 | |
| | | | | | | | |
| | | | | | | | 9,458,514 | |
| | | | | | | | |
| HOTELS, RESTAURANTS & LEISURE - 3.5% |
Century Casinos 1 | | | 368,300 | | | | 3,572,510 | |
Lindblad Expeditions Holdings 1 | | | 114,000 | | | | 2,046,300 | |
Red Lion Hotels 1,2 | | | 265,400 | | | | 1,886,994 | |
| | | | | | | | |
| | | | | | | | 7,505,804 | |
| | | | | | | | |
| HOUSEHOLD DURABLES - 0.9% |
Lovesac Company (The) 1,2 | | | 61,100 | | | | 1,898,377 | |
| | | | | | | | |
| INTERNET & DIRECT MARKETING RETAIL - 1.2% |
Rubicon Project (The) 1 | | | 388,500 | | | | 2,470,860 | |
| | | | | | | | |
| LEISURE PRODUCTS - 0.7% |
MasterCraft Boat Holdings 1 | | | 76,700 | | | | 1,502,553 | |
| | | | | | | | |
| SPECIALTY RETAIL - 2.1% |
Buckle (The) | | | 62,675 | | | | 1,084,904 | |
Designer Brands Cl. A | | | 85,400 | | | | 1,637,118 | |
Shoe Carnival | | | 63,100 | | | | 1,741,560 | |
| | | | | | | | |
| | | | | | | | 4,463,582 | |
| | | | | | | | |
| TEXTILES, APPAREL & LUXURY GOODS - 0.7% |
Vera Bradley 1,2 | | | 130,200 | | | | 1,562,400 | |
| |
| Total (Cost $21,666,301) | | | | | | | 28,862,090 | |
| |
| | | | | | | | | |
| CONSUMER STAPLES – 1.1% |
| BEVERAGES - 0.7% |
Primo Water 1,2 | | | 124,500 | | | | 1,531,350 | |
| | | | | | | | |
| FOOD PRODUCTS - 0.4% |
Farmer Bros. 1 | | | 54,739 | | | | 896,077 | |
| |
| Total (Cost $3,391,478) | | | | | | | 2,427,427 | |
| |
| | | | | | | | | |
| ENERGY – 4.9% |
| ENERGY EQUIPMENT & SERVICES - 4.1% |
Gulf Island Fabrication 1 | | | 51,375 | | | | 364,763 | |
Natural Gas Services Group 1 | | | 90,800 | | | | 1,498,200 | |
Newpark Resources 1 | | | 276,800 | | | | 2,053,856 | |
Pason Systems | | | 70,250 | | | | 1,018,170 | |
Profire Energy 1 | | | 684,920 | | | | 1,034,229 | |
TGS-NOPEC Geophysical | | | 52,000 | | | | 1,458,118 | |
Total Energy Services | | | 215,500 | | | | 1,359,268 | |
| | | | | | | | |
| | | | | | | | 8,786,604 | |
| | | | | | | | |
| OIL, GAS & CONSUMABLE FUELS - 0.8% |
Ardmore Shipping 1 | | | 194,600 | | | | 1,585,990 | |
| |
| Total (Cost $9,412,206) | | | | | | | 10,372,594 | |
| |
| | | | | | | | | |
| FINANCIALS – 11.6% |
| BANKS - 4.1% |
Allegiance Bancshares 1,2 | | | 45,200 | | | | 1,506,968 | |
BayCom Corporation 1 | | | 62,000 | | | | 1,357,800 | |
County Bancorp | | | 17,300 | | | | 295,657 | |
HarborOne Bancorp 1 | | | 97,600 | | | | 1,828,048 | |
Investar Holding | | | 73,000 | | | | 1,741,050 | |
TriState Capital Holdings 1 | | | 90,700 | | | | 1,935,538 | |
†Two River Bancorp | | | 14,700 | | | | 211,092 | |
| | | | | | | | |
| | | | | | | | 8,876,153 | |
| | | | | | | | |
| CAPITAL MARKETS - 4.9% |
B. Riley Financial | | | 109,400 | | | | 2,282,084 | |
†Canaccord Genuity Group | | | 295,600 | | | | 1,354,358 | |
Hamilton Lane Cl. A | | | 34,488 | | | | 1,967,885 | |
Silvercrest Asset Management Group Cl. A | | | 164,300 | | | | 2,305,129 | |
Sprott | | | 971,000 | | | | 2,498,775 | |
| | | | | | | | |
| | | | | | | | 10,408,231 | |
| | | | | | | | |
| INSURANCE - 0.5% |
Health Insurance Innovations Cl. A 1,2 | | | 40,000 | | | | 1,036,800 | |
| | | | | | | | |
| THRIFTS & MORTGAGE FINANCE - 2.1% |
Meridian Bancorp | | | 23,400 | | | | 418,626 | |
PCSB Financial | | | 114,600 | | | | 2,320,650 | |
Western New England Bancorp | | | 187,800 | | | | 1,754,052 | |
| | | | | | | | |
| | | | | | | | 4,493,328 | |
| |
| Total (Cost $24,219,823) | | | | | | | 24,814,512 | |
| |
| | | | | | | | | |
| HEALTH CARE – 11.7% |
| BIOTECHNOLOGY - 2.7% |
Heron Therapeutics 1 | | | 70,000 | | | | 1,301,300 | |
Progenics Pharmaceuticals 1 | | | 310,074 | | | | 1,913,156 | |
Zealand Pharma 1 | | | 119,400 | | | | 2,595,672 | |
| | | | | | | | |
| | | | | | | | 5,810,128 | |
| | | | | | | | |
| HEALTH CARE EQUIPMENT & SUPPLIES - 4.2% |
†Apyx Medical 1,2 | | | 28,200 | | | | 189,504 | |
AtriCure 1 | | | 83,100 | | | | 2,479,704 | |
CryoLife 1 | | | 82,700 | | | | 2,475,211 | |
OrthoPediatrics Corporation 1,2 | | | 59,100 | | | | 2,304,900 | |
Surmodics 1 | | | 36,600 | | | | 1,580,022 | |
| | | | | | | | |
| | | | | | | | 9,029,341 | |
| | | | | | | | |
| HEALTH CARE TECHNOLOGY - 0.2% |
†HTG Molecular Diagnostics 1,2 | | | 197,900 | | | | 328,514 | |
| | | | | | | | |
| LIFE SCIENCES TOOLS & SERVICES - 3.1% |
Harvard Bioscience 1 | | | 562,400 | | | | 1,124,800 | |
NeoGenomics 1 | | | 117,300 | | | | 2,573,562 | |
Quanterix Corporation 1 | | | 87,300 | | | | 2,949,867 | |
| | | | | | | | |
| | | | | | | | 6,648,229 | |
| | | | | | | | |
| PHARMACEUTICALS - 1.5% |
Axsome Therapeutics 1 | | | 114,700 | | | | 2,953,525 | |
Paratek Pharmaceuticals 1 | | | 46,100 | | | | 183,939 | |
| | | | | | | | |
| | | | | | | | 3,137,464 | |
| |
| Total (Cost $15,653,470) | | | | | | | 24,953,676 | |
| |
| | | | | | | | | |
| INDUSTRIALS – 20.1% |
| AEROSPACE & DEFENSE - 2.1% |
CPI Aerostructures 1 | | | 246,766 | | | | 2,075,302 | |
Kratos Defense & Security Solutions 1 | | | 105,700 | | | | 2,419,473 | |
| | | | | | | | |
| | | | | | | | 4,494,775 | |
| | | | | | | | |
| COMMERCIAL SERVICES & SUPPLIES - 0.7% |
Heritage-Crystal Clean 1 | | | 60,000 | | | | 1,578,600 | |
| | | | | | | | |
| CONSTRUCTION & ENGINEERING - 4.4% |
Ameresco Cl. A 1 | | | 199,500 | | | | 2,938,635 | |
| 36 | The Royce Funds 2019 Semiannual Report to Shareholders | | THE ACCOMPANYING NOTES ARE AN INTEGRAL PART OF THESE FINANCIAL STATEMENTS |
| June 30, 2019 (unaudited) |
| |
| Royce Low-Priced Stock Fund (continued) |
| | | | | | | | | |
| | | SHARES | | VALUE |
| |
| | | | | | | | | |
| INDUSTRIALS (continued) |
| CONSTRUCTION & ENGINEERING (continued) |
Construction Partners Cl. A 1 | | | 104,700 | | | $ | 1,572,594 | |
IES Holdings 1 | | | 89,800 | | | | 1,692,730 | |
Northwest Pipe 1 | | | 122,000 | | | | 3,145,160 | |
| | | | | | | | |
| | | | | | | | 9,349,119 | |
| | | | | | | | |
| ELECTRICAL EQUIPMENT - 0.6% |
American Superconductor 1 | | | 39,400 | | | | 365,632 | |
Power Solutions International 1,3 | | | 99,900 | | | | 969,030 | |
| | | | | | | | |
| | | | | | | | 1,334,662 | |
| | | | | | | | |
| INDUSTRIAL CONGLOMERATES - 0.8% |
Raven Industries | | | 45,300 | | | | 1,625,364 | |
| | | | | | | | |
| MACHINERY - 7.3% |
ASV Holdings 1 | | | 146,390 | | | | 1,002,771 | |
Graham Corporation | | | 126,900 | | | | 2,564,649 | |
Kornit Digital 1,2 | | | 88,900 | | | | 2,814,574 | |
Luxfer Holdings | | | 68,900 | | | | 1,689,428 | |
Lydall 1 | | | 54,000 | | | | 1,090,800 | |
Porvair | | | 344,400 | | | | 2,545,497 | |
Spartan Motors | | | 139,100 | | | | 1,524,536 | |
Wabash National | | | 140,500 | | | | 2,285,935 | |
| | | | | | | | |
| | | | | | | | 15,518,190 | |
| | | | | | | | |
| MARINE - 0.9% |
Clarkson | | | 60,931 | | | | 1,942,220 | |
| | | | | | | | |
| PROFESSIONAL SERVICES - 3.3% |
GP Strategies 1 | | | 122,500 | | | | 1,847,300 | |
Heidrick & Struggles International | | | 36,640 | | | | 1,098,101 | |
Kforce | | | 53,674 | | | | 1,883,421 | |
Resources Connection | | | 144,700 | | | | 2,316,647 | |
| | | | | | | | |
| | | | | | | | 7,145,469 | |
| |
| Total (Cost $29,628,511) | | | | | | | 42,988,399 | |
| |
| | | | | | | | | |
| INFORMATION TECHNOLOGY – 23.9% |
| COMMUNICATIONS EQUIPMENT - 1.6% |
Digi International 1 | | | 139,200 | | | | 1,765,056 | |
Harmonic 1 | | | 282,400 | | | | 1,567,320 | |
| | | | | | | | |
| | | | | | | | 3,332,376 | |
| | | | | | | | |
| ELECTRONIC EQUIPMENT, INSTRUMENTS & COMPONENTS - 5.1% |
Fabrinet 1 | | | 36,200 | | | | 1,798,054 | |
LightPath Technologies Cl. A 1 | | | 890,384 | | | | 810,249 | |
nLIGHT 1 | | | 84,300 | | | | 1,618,560 | |
Novanta 1 | | | 22,500 | | | | 2,121,750 | |
PC Connection | | | 60,800 | | | | 2,126,784 | |
Vishay Precision Group 1 | | | 59,900 | | | | 2,433,737 | |
| | | | | | | | |
| | | | | | | | 10,909,134 | |
| | | | | | | | |
| IT SERVICES - 1.1% |
Carbonite 1 | | | 92,200 | | | | 2,400,888 | |
| | | | | | | | |
| SEMICONDUCTORS & SEMICONDUCTOR EQUIPMENT - 13.6% |
Adesto Technologies 1,2 | | | 197,400 | | | | 1,608,810 | |
Aehr Test Systems 1,2 | | | 590,400 | | | | 974,160 | |
AXT 1 | | | 237,200 | | | | 939,312 | |
Brooks Automation | | | 66,582 | | | | 2,580,053 | |
†Camtek | | | 49,800 | | | | 420,810 | |
Cirrus Logic 1 | | | 31,600 | | | | 1,380,920 | |
Cohu | | | 89,900 | | | | 1,387,157 | |
CyberOptics Corporation 1 | | | 58,700 | | | | 952,701 | |
FormFactor 1 | | | 191,500 | | | | 3,000,805 | |
†Ichor Holdings 1 | | | 56,700 | | | | 1,340,388 | |
Inphi Corporation 1 | | | 48,400 | | | | 2,424,840 | |
NeoPhotonics Corporation 1 | | | 171,400 | | | | 716,452 | |
Nova Measuring Instruments 1,2 | | | 86,300 | | | | 2,208,417 | |
PDF Solutions 1 | | | 123,200 | | | | 1,616,384 | |
Photronics 1 | | | 270,000 | | | | 2,214,000 | |
Rudolph Technologies 1 | | | 100,500 | | | | 2,776,815 | |
Ultra Clean Holdings 1 | | | 182,500 | | | | 2,540,400 | |
| | | | | | | | |
| | | | | | | | 29,082,424 | |
| | | | | | | | |
| SOFTWARE - 2.5% |
Agilysys 1 | | | 121,000 | | | | 2,597,870 | |
QAD Cl. A | | | 66,513 | | | | 2,674,488 | |
| | | | | | | | |
| | | | | | | | 5,272,358 | |
| |
| Total (Cost $38,167,373) | | | | | | | 50,997,180 | |
| |
| | | | | | | | | |
| MATERIALS – 2.3% |
| CHEMICALS - 0.8% |
Trecora Resources 1 | | | 168,401 | | | | 1,611,598 | |
| | | | | | | | |
| METALS & MINING - 1.5% |
Ferroglobe (Warranty Insurance Trust) 1,4 | | | 205,763 | | | | 0 | |
Major Drilling Group International 1 | | | 468,500 | | | | 1,513,310 | |
Superior Gold 1 | | | 532,000 | | | | 292,497 | |
Universal Stainless & Alloy Products 1,2 | | | 86,200 | | | | 1,379,200 | |
| | | | | | | | |
| | | | | | | | 3,185,007 | |
| |
| Total (Cost $6,533,044) | | | | | | | 4,796,605 | |
| |
| | | | | | | | | |
| REAL ESTATE – 0.5% |
| EQUITY REAL ESTATE INVESTMENT TRUSTS (REITS) - 0.5% |
†Postal RealtyTrust Cl. A | | | 72,600 | | | | 1,143,450 | |
| |
| Total (Cost $1,206,970) | | | | | | | 1,143,450 | |
| |
| | | | | | | | | |
| TOTAL COMMON STOCKS |
| |
| (Cost $155,235,626) | | | | | | | 197,438,934 | |
| |
| | | | | | | | | |
| REPURCHASE AGREEMENT – 6.8% |
Fixed Income Clearing Corporation, 0.50% dated 6/28/19, due 7/1/19, maturity value
$14,612,609 (collateralized by obligations of various U.S. Government Agencies, 1.75%
due 5/31/22, valued at $14,908,995) |
| |
| (Cost $14,612,000) | | | | | | | 14,612,000 | |
| |
| | | | | | | | | |
| COLLATERAL RECEIVED FOR SECURITIES LOANED – 0.8% |
| Money Market Funds | | | | | | | | |
Federated Government Obligations Fund (7 day yield-2.2655%) | | | | | | | | |
| |
| (Cost $1,601,437) | | | | | | | 1,601,437 | |
| |
| | | | | | | | | |
| TOTAL INVESTMENTS – 100.1% |
| |
| (Cost $171,449,063) | | | | | | | 213,652,371 | |
| |
| | | | | | | | | |
| LIABILITIES LESS CASH AND OTHER ASSETS – (0.1)% | | | | (274,765 | ) |
| | | | | | | | |
| | | | | | | | | |
| |
| NET ASSETS – 100.0% | | | $ | 213,377,606 | |
| |
| THE ACCOMPANYING NOTES ARE AN INTEGRAL PART OF THESE FINANCIAL STATEMENTS | | The Royce Funds 2019 Semiannual Report to Shareholders | 37 |
| |
| Royce Micro-Cap Fund |
| Common Stocks – 97.6% |
| | | SHARES | | VALUE |
| |
| | | | | | | | | |
| COMMUNICATION SERVICES – 2.6% |
| DIVERSIFIED TELECOMMUNICATION SERVICES - 0.6% |
ORBCOMM 1 | | | 115,300 | | | $ | 835,925 | |
| | | | | | | | |
| ENTERTAINMENT - 0.6% |
Gaia Cl. A 1 | | | 102,900 | | | | 779,982 | |
| | | | | | | | |
| INTERACTIVE MEDIA & SERVICES - 1.0% |
QuinStreet 1 | | | 83,904 | | | | 1,329,878 | |
| | | | | | | | |
| MEDIA - 0.4% |
Marchex Cl. B 1 | | | 111,500 | | | | 524,050 | |
| |
| Total (Cost $2,784,817) | | | | | | | 3,469,835 | |
| |
| | | | | | | | | |
| CONSUMER DISCRETIONARY – 10.4% |
| AUTO COMPONENTS - 2.6% |
Fox Factory Holding 1 | | | 14,800 | | | | 1,221,148 | |
Stoneridge 1 | | | 58,600 | | | | 1,848,830 | |
Unique Fabricating 1 | | | 172,900 | | | | 468,559 | |
| | | | | | | | |
| | | | | | | | 3,538,537 | |
| | | | | | | | |
| HOTELS, RESTAURANTS & LEISURE - 2.5% |
Century Casinos 1 | | | 121,800 | | | | 1,181,460 | |
Lindblad Expeditions Holdings 1 | | | 62,500 | | | | 1,121,875 | |
Red Lion Hotels 1,2 | | | 152,300 | | | | 1,082,853 | |
| | | | | | | | |
| | | | | | | | 3,386,188 | |
| | | | | | | | |
| HOUSEHOLD DURABLES - 1.5% |
Cavco Industries 1 | | | 5,210 | | | | 820,783 | |
Lovesac Company (The) 1 | | | 37,200 | | | | 1,155,804 | |
| | | | | | | | |
| | | | | | | | 1,976,587 | |
| | | | | | | | |
| LEISURE PRODUCTS - 0.8% |
MasterCraft Boat Holdings 1 | | | 55,500 | | | | 1,087,245 | |
| | | | | | | | |
| SPECIALTY RETAIL - 1.8% |
Citi Trends | | | 48,724 | | | | 712,345 | |
Haverty Furniture | | | 48,500 | | | | 825,955 | |
Shoe Carnival | | | 35,111 | | | | 969,064 | |
| | | | | | | | |
| | | | | | | | 2,507,364 | |
| | | | | | | | |
| TEXTILES, APPAREL & LUXURY GOODS - 1.2% |
Culp | | | 31,474 | | | | 598,006 | |
Vera Bradley 1 | | | 87,600 | | | | 1,051,200 | |
| | | | | | | | |
| | | | | | | | 1,649,206 | |
| |
| Total (Cost $10,472,257) | | | | | | | 14,145,127 | |
| |
| | | | | | | | | |
| CONSUMER STAPLES – 2.0% |
| BEVERAGES - 0.6% |
Primo Water 1,2 | | | 70,600 | | | | 868,380 | |
| | | | | | | | |
| FOOD PRODUCTS - 1.4% |
Farmer Bros. 1 | | | 44,500 | | | | 728,465 | |
John B. Sanfilippo & Son | | | 14,100 | | | | 1,123,629 | |
| | | | | | | | |
| | | | | | | | 1,852,094 | |
| |
| Total (Cost $2,881,726) | | | | | | | 2,720,474 | |
| |
| | | | | | | | | |
| ENERGY – 4.3% |
| ENERGY EQUIPMENT & SERVICES - 3.6% |
Gulf Island Fabrication 1 | | | 96,518 | | | | 685,278 | |
Independence Contract Drilling 1 | | | 305,386 | | | | 482,510 | |
Natural Gas Services Group 1 | | | 56,187 | | | | 927,085 | |
Newpark Resources 1 | | | 157,200 | | | | 1,166,424 | |
Profire Energy 1 | | | 485,812 | | | | 733,576 | |
Total Energy Services | | | 131,900 | | | | 831,961 | |
| | | | | | | | |
| | | | | | | | 4,826,834 | |
| | | | | | | | |
| OIL, GAS & CONSUMABLE FUELS - 0.7% |
Ardmore Shipping 1 | | | 125,275 | | | | 1,020,991 | |
| |
| Total (Cost $6,409,912) | | | | | | | 5,847,825 | |
| |
| | | | | | | | | |
| FINANCIALS – 14.2% |
| BANKS - 6.5% |
Allegiance Bancshares 1 | | | 29,700 | | | | 990,198 | |
BayCom Corporation 1 | | | 41,900 | | | | 917,610 | |
Caribbean Investment Holdings 1 | | | 1,858,138 | | | | 377,559 | |
County Bancorp | | | 54,200 | | | | 926,278 | |
HarborOne Bancorp 1 | | | 61,500 | | | | 1,151,895 | |
HomeTrust Bancshares | | | 45,500 | | | | 1,143,870 | |
Investar Holding | | | 47,600 | | | | 1,135,260 | |
Midway Investments 1,4 | | | 1,858,170 | | | | 0 | |
TriState Capital Holdings 1 | | | 52,757 | | | | 1,125,834 | |
Two River Bancorp | | | 71,100 | | | | 1,020,996 | |
| | | | | | | | |
| | | | | | | | 8,789,500 | |
| | | | | | | | |
| CAPITAL MARKETS - 3.7% |
B. Riley Financial | | | 68,400 | | | | 1,426,824 | |
Canaccord Genuity Group | | | 252,000 | | | | 1,154,595 | |
INTL FCStone 1,2 | | | 12,000 | | | | 475,080 | |
Silvercrest Asset Management Group Cl. A | | | 84,700 | | | | 1,188,341 | |
Westwood Holdings Group | | | 22,572 | | | | 794,535 | |
| | | | | | | | |
| | | | | | | | 5,039,375 | |
| | | | | | | | |
| DIVERSIFIED FINANCIAL SERVICES - 0.6% |
Waterloo Investment Holdings 1,4 | | | 2,760,000 | | | | 828,000 | |
| | | | | | | | |
| INSURANCE - 0.6% |
Health Insurance Innovations Cl. A 1,2 | | | 27,800 | | | | 720,576 | |
| | | | | | | | |
| THRIFTS & MORTGAGE FINANCE - 2.8% |
Meridian Bancorp | | | 15,800 | | | | 282,662 | |
PCSB Financial | | | 56,700 | | | | 1,148,175 | |
Territorial Bancorp | | | 40,800 | | | | 1,260,720 | |
Western New England Bancorp | | | 119,300 | | | | 1,114,262 | |
| | | | | | | | |
| | | | | | | | 3,805,819 | |
| |
| Total (Cost $17,960,413) | | | | | | | 19,183,270 | |
| |
| | | | | | | | | |
| HEALTH CARE – 12.5% |
| BIOTECHNOLOGY - 3.0% |
BioSpecifics Technologies 1,2 | | | 20,300 | | | | 1,212,113 | |
Dynavax Technologies 1 | | | 64,000 | | | | 255,360 | |
Progenics Pharmaceuticals 1 | | | 205,900 | | | | 1,270,403 | |
Zealand Pharma 1 | | | 62,700 | | | | 1,363,054 | |
| | | | | | | | |
| | | | | | | | 4,100,930 | |
| | | | | | | | |
| HEALTH CARE EQUIPMENT & SUPPLIES - 5.6% |
†Apyx Medical 1 | | | 19,300 | | | | 129,696 | |
AtriCure 1 | | | 37,400 | | | | 1,116,016 | |
Chembio Diagnostics 1 | | | 136,053 | | | | 828,563 | |
CryoLife 1 | | | 38,455 | | | | 1,150,958 | |
Mesa Laboratories | | | 4,700 | | | | 1,148,398 | |
OrthoPediatrics Corporation 1 | | | 32,000 | | | | 1,248,000 | |
Surmodics 1 | | | 24,822 | | | | 1,071,566 | |
Tactile Systems Technology 1 | | | 14,800 | | | | 842,416 | |
| | | | | | | | |
| | | | | | | | 7,535,613 | |
| | | | | | | | |
| HEALTH CARE TECHNOLOGY - 0.2% |
†HTG Molecular Diagnostics 1,2 | | | 135,500 | | | | 224,930 | |
| | | | | | | | |
| LIFE SCIENCES TOOLS & SERVICES - 3.0% |
Harvard Bioscience 1 | | | 348,079 | | | | 696,158 | |
NeoGenomics 1 | | | 81,000 | | | | 1,777,140 | |
Quanterix Corporation 1 | | | 45,800 | | | | 1,547,582 | |
| | | | | | | | |
| | | | | | | | 4,020,880 | |
| | | | | | | | |
| PHARMACEUTICALS - 0.7% |
Correvio Pharma 1 | | | 252,700 | | | | 545,832 | |
Paratek Pharmaceuticals 1 | | | 91,600 | | | | 365,484 | |
| 38 | The Royce Funds 2019 Semiannual Report to Shareholders | | THE ACCOMPANYING NOTES ARE AN INTEGRAL PART OF THESE FINANCIAL STATEMENTS |
| June 30, 2019 (unaudited) |
| |
| Royce Micro-Cap Fund (continued) |
| | | | | | | | | |
| | | SHARES | | VALUE |
| |
| | | | | | | | | |
| HEALTH CARE (continued) |
| PHARMACEUTICALS (continued) |
Tetraphase Pharmaceuticals 1,2 | | | 253,300 | | | $ | 121,660 | |
| | | | | | | | |
| | | | | | | | 1,032,976 | |
| |
| Total (Cost $12,697,276) | | | | | | | 16,915,329 | |
| |
| | | | | | | | | |
| INDUSTRIALS – 22.7% |
| AEROSPACE & DEFENSE - 1.8% |
Astronics Corporation 1 | | | 28,091 | | | | 1,129,820 | |
CPI Aerostructures 1 | | | 159,018 | | | | 1,337,341 | |
| | | | | | | | |
| | | | | | | | 2,467,161 | |
| | | | | | | | |
| COMMERCIAL SERVICES & SUPPLIES - 1.6% |
Acme United | | | 49,800 | | | | 1,124,484 | |
Heritage-Crystal Clean 1 | | | 41,774 | | | | 1,099,074 | |
| | | | | | | | |
| | | | | | | | 2,223,558 | |
| | | | | | | | |
| CONSTRUCTION & ENGINEERING - 2.2% |
Construction Partners Cl. A 1 | | | 94,200 | | | | 1,414,884 | |
Northwest Pipe 1 | | | 61,600 | | | | 1,588,048 | |
| | | | | | | | |
| | | | | | | | 3,002,932 | |
| | | | | | | | |
| ELECTRICAL EQUIPMENT - 1.7% |
American Superconductor 1 | | | 114,400 | | | | 1,061,632 | |
Encore Wire | | | 20,200 | | | | 1,183,316 | |
| | | | | | | | |
| | | | | | | | 2,244,948 | |
| | | | | | | | |
| INDUSTRIAL CONGLOMERATES - 0.6% |
Raven Industries | | | 23,700 | | | | 850,356 | |
| | | | | | | | |
| MACHINERY - 9.2% |
Alimak Group | | | 78,200 | | | | 1,200,855 | |
Exco Technologies | | | 143,300 | | | | 848,059 | |
FreightCar America 1 | | | 86,209 | | | | 506,047 | |
Graham Corporation | | | 59,388 | | | | 1,200,231 | |
Greenbrier Companies (The) | | | 15,800 | | | | 480,320 | |
Helios Technologies | | | 19,100 | | | | 886,431 | |
Kadant | | | 12,276 | | | | 1,114,784 | |
Kornit Digital 1,2 | | | 44,100 | | | | 1,396,206 | |
Lindsay Corporation | | | 12,000 | | | | 986,520 | |
Luxfer Holdings | | | 46,500 | | | | 1,140,180 | |
Lydall 1 | | | 38,100 | | | | 769,620 | |
Spartan Motors | | | 94,500 | | | | 1,035,720 | |
Westport Fuel Systems 1 | | | 314,800 | | | | 853,108 | |
| | | | | | | | |
| | | | | | | | 12,418,081 | |
| | | | | | | | |
| MARINE - 0.9% |
Clarkson | | | 36,500 | | | | 1,163,464 | |
| | | | | | | | |
| PROFESSIONAL SERVICES - 3.8% |
CRA International | | | 20,183 | | | | 773,614 | |
GP Strategies 1 | | | 84,218 | | | | 1,270,008 | |
Heidrick & Struggles International | | | 23,500 | | | | 704,295 | |
Kforce | | | 30,258 | | | | 1,061,753 | |
Resources Connection | | | 80,952 | | | | 1,296,042 | |
| | | | | | | | |
| | | | | | | | 5,105,712 | |
| | | | | | | | |
| ROAD & RAIL - 0.7% |
Marten Transport | | | 50,955 | | | | 924,833 | |
| | | | | | | | |
| TRADING COMPANIES & DISTRIBUTORS - 0.2% |
†Transcat 1 | | | 10,300 | | | | 263,577 | |
| |
| Total (Cost $22,160,870) | | | | | | | 30,664,622 | |
| |
| | | | | | | | | |
| INFORMATION TECHNOLOGY – 21.6% |
| COMMUNICATIONS EQUIPMENT - 1.4% |
Digi International 1 | | | 95,900 | | | | 1,216,012 | |
EMCORE Corporation 1 | | | 146,800 | | | | 482,972 | |
Harmonic 1 | | | 24,200 | | | | 134,310 | |
| | | | | | | | |
| | | | | | | | 1,833,294 | |
| | | | | | | | |
| ELECTRONIC EQUIPMENT, INSTRUMENTS & COMPONENTS - 5.0% |
ePlus 1 | | | 12,734 | | | | 877,882 | |
Fabrinet 1 | | | 22,549 | | | | 1,120,009 | |
†LightPath Technologies Cl. A 1 | | | 225,600 | | | | 205,296 | |
†Luna Innovations 1 | | | 28,100 | | | | 126,450 | |
nLIGHT 1 | | | 43,400 | | | | 833,280 | |
Novanta 1 | | | 11,442 | | | | 1,078,980 | |
PC Connection | | | 33,300 | | | | 1,164,834 | |
Vishay Precision Group 1 | | | 33,800 | | | | 1,373,294 | |
| | | | | | | | |
| | | | | | | | 6,780,025 | |
| | | | | | | | |
| IT SERVICES - 0.9% |
Cass Information Systems | | | 24,216 | | | | 1,173,992 | |
| | | | | | | | |
| SEMICONDUCTORS & SEMICONDUCTOR EQUIPMENT - 11.7% |
Adesto Technologies 1 | | | 200,800 | | | | 1,636,520 | |
Aehr Test Systems 1 | | | 279,300 | | | | 460,845 | |
AXT 1 | | | 146,100 | | | | 578,556 | |
Brooks Automation | | | 27,800 | | | | 1,077,250 | |
†Camtek | | | 50,300 | | | | 425,035 | |
Cohu | | | 46,100 | | | | 711,323 | |
CyberOptics Corporation 1 | | | 35,200 | | | | 571,296 | |
Everspin Technologies 1,2 | | | 97,900 | | | | 638,308 | |
†Ichor Holdings 1 | | | 32,900 | | | | 777,756 | |
Nanometrics 1 | | | 8,600 | | | | 298,506 | |
NeoPhotonics Corporation 1 | | | 190,500 | | | | 796,290 | |
Nova Measuring Instruments 1 | | | 52,200 | | | | 1,335,798 | |
PDF Solutions 1 | | | 88,700 | | | | 1,163,744 | |
Photronics 1 | | | 150,000 | | | | 1,230,000 | |
Rudolph Technologies 1 | | | 53,451 | | | | 1,476,851 | |
Silicon Motion Technology ADR | | | 25,800 | | | | 1,145,004 | |
Ultra Clean Holdings 1 | | | 106,500 | | | | 1,482,480 | |
| | | | | | | | |
| | | | | | | | 15,805,562 | |
| | | | | | | | |
| SOFTWARE - 1.8% |
Agilysys 1 | | | 62,000 | | | | 1,331,140 | |
QAD Cl. A | | | 29,200 | | | | 1,174,132 | |
| | | | | | | | |
| | | | | | | | 2,505,272 | |
| | | | | | | | |
| TECHNOLOGY HARDWARE, STORAGE & PERIPHERALS - 0.8% |
AstroNova | | | 43,100 | | | | 1,113,704 | |
| |
| Total (Cost $22,048,411) | | | | | | | 29,211,849 | |
| |
| | | | | | | | | |
| MATERIALS – 4.2% |
| CHEMICALS - 2.1% |
FutureFuel Corporation | | | 62,500 | | | | 730,625 | |
Quaker Chemical | | | 5,260 | | | | 1,067,149 | |
Trecora Resources 1 | | | 113,900 | | | | 1,090,023 | |
| | | | | | | | |
| | | | | | | | 2,887,797 | |
| | | | | | | | |
| METALS & MINING - 2.1% |
Haynes International | | | 35,430 | | | | 1,127,028 | |
Major Drilling Group International 1 | | | 241,700 | | | | 780,719 | |
Universal Stainless & Alloy Products 1 | | | 58,200 | | | | 931,200 | |
| | | | | | | | |
| | | | | | | | 2,838,947 | |
| |
| Total (Cost $5,910,984) | | | | | | | 5,726,744 | |
| |
| | | | | | | | | |
| REAL ESTATE – 3.1% |
| EQUITY REAL ESTATE INVESTMENT TRUSTS (REITS) - 1.4% |
Community Healthcare Trust | | | 28,600 | | | | 1,127,126 | |
†Postal Realty Trust Cl. A | | | 47,500 | | | | 748,125 | |
| | | | | | | | |
| | | | | | | | 1,875,251 | |
| | | | | | | | |
| REAL ESTATE MANAGEMENT & DEVELOPMENT - 1.7% |
FRP Holdings 1 | | | 22,975 | | | | 1,281,316 | |
| THE ACCOMPANYING NOTES ARE AN INTEGRAL PART OF THESE FINANCIAL STATEMENTS | | The Royce Funds 2019 Semiannual Report to Shareholders | 39 |
| |
| Royce Micro-Cap Fund (continued) |
| | | | | | | | | |
| | | SHARES | | VALUE |
| |
| | | | | | | | | |
| REAL ESTATE (continued) |
| REAL ESTATE MANAGEMENT & DEVELOPMENT (continued) |
Marcus & Millichap 1 | | | 33,800 | | | $ | 1,042,730 | |
| | | | | | | | |
| | | | | | | | 2,324,046 | |
| |
| Total (Cost $2,498,150) | | | | | | | 4,199,297 | |
| |
| | | | | | | | | |
| TOTAL COMMON STOCKS |
| |
| (Cost $105,824,816) | | | | | | | 132,084,372 | |
| |
| | | | | | | | | |
| REPURCHASE AGREEMENT – 2.9% |
Fixed Income Clearing Corporation, 0.50% dated 6/28/19, due 7/1/19, maturity value
$3,919,163 (collateralized by obligations of various U.S. Government Agencies, 1.75% due
5/31/22, valued at $4,001,440) |
| |
| (Cost $3,919,000) | | | | | | | 3,919,000 | |
| |
| | | | | | | | | |
| COLLATERAL RECEIVED FOR SECURITIES LOANED – 0.9% |
| Money Market Funds | | | | | | | | |
Federated Government Obligations Fund (7 day yield-2.2655%) | | | | | | | | |
| |
| (Cost $1,260,590) | | | | | | | 1,260,590 | |
| |
| | | | | | | | | |
| TOTAL INVESTMENTS – 101.4% |
| |
| (Cost $111,004,406) | | | | | | | 137,263,962 | |
| |
| | | | | | | | | |
| LIABILITIES LESS CASH AND OTHER ASSETS – (1.4)% | | | | (1,947,026 | ) |
| | | | | | | | |
| | | | | | | | | |
| |
| NET ASSETS – 100.0% | | | $ | 135,316,936 | |
| |
| |
| Royce Opportunity Fund |
| Common Stocks – 91.5% |
| | | SHARES | | VALUE |
| |
| | | | | | | | | |
| COMMUNICATION SERVICES – 1.1% |
| DIVERSIFIED TELECOMMUNICATION SERVICES - 0.5% |
Iridium Communications 1,2 | | | 106,693 | | | $ | 2,481,679 | |
Ooma 1 | | | 214,078 | | | | 2,243,538 | |
| | | | | | | | |
| | | | | | | | 4,725,217 | |
| | | | | | | | |
| INTERACTIVE MEDIA & SERVICES - 0.6% |
†Eventbrite Cl. A 1,2 | | | 136,500 | | | | 2,211,300 | |
EverQuote Cl. A 1,2 | | | 250,000 | | | | 3,250,000 | |
| | | | | | | | |
| | | | | | | | 5,461,300 | |
| | | | | | | | |
| MEDIA - 0.0% |
†comScore 1 | | | 118,800 | | | | 613,008 | |
| |
| Total (Cost $8,285,031) | | | | | | | 10,799,525 | |
| |
| | | | | | | | | |
| CONSUMER DISCRETIONARY – 10.6% |
| AUTO COMPONENTS - 1.1% |
Dana | | | 66,135 | | | | 1,318,732 | |
Horizon Global 1,2 | | | 940,871 | | | | 3,377,727 | |
Modine Manufacturing 1 | | | 398,737 | | | | 5,705,926 | |
| | | | | | | | |
| | | | | | | | 10,402,385 | |
| | | | | | | | |
| AUTOMOBILES - 0.3% |
Winnebago Industries | | | 80,600 | | | | 3,115,190 | |
| | | | | | | | |
| DIVERSIFIED CONSUMER SERVICES - 0.8% |
frontdoor 1 | | | 173,999 | | | | 7,577,657 | |
| | | | | | | | |
| HOTELS, RESTAURANTS & LEISURE - 1.4% |
Carrols Restaurant Group 1 | | | 566,995 | | | | 5,119,965 | |
Century Casinos 1 | | | 218,140 | | | | 2,115,958 | |
El Pollo Loco Holdings 1,2 | | | 241,406 | | | | 2,573,388 | |
†Playa Hotels & Resorts 1 | | | 129,851 | | | | 1,001,151 | |
†Scientific Games 1,2 | | | 112,600 | | | | 2,231,732 | |
| | | | | | | | |
| | | | | | | | 13,042,194 | |
| | | | | | | | |
| HOUSEHOLD DURABLES - 4.7% |
Beazer Homes USA 1 | | | 597,641 | | | | 5,743,330 | |
†Century Communities 1,2 | | | 124,900 | | | | 3,319,842 | |
LGI Homes 1,2 | | | 116,800 | | | | 8,343,024 | |
Libbey 1 | | | 701,798 | | | | 1,305,344 | |
M.D.C. Holdings | | | 219,716 | | | | 7,202,290 | |
M/I Homes 1 | | | 201,148 | | | | 5,740,764 | |
New Home 1,2 | | | 235,150 | | | | 905,328 | |
TRI Pointe Group 1,2 | | | 200,206 | | | | 2,396,466 | |
Tupperware Brands | | | 115,900 | | | | 2,205,577 | |
VOXX International Cl. A 1 | | | 546,954 | | | | 2,275,329 | |
William Lyon Homes Cl. A 1 | | | 256,519 | | | | 4,676,341 | |
| | | | | | | | |
| | | | | | | | 44,113,635 | |
| | | | | | | | |
| INTERNET & DIRECT MARKETING RETAIL - 0.5% |
Leaf Group 1 | | | 137,972 | | | | 1,022,372 | |
Rubicon Project (The) 1 | | | 555,266 | | | | 3,531,492 | |
| | | | | | | | |
| | | | | | | | 4,553,864 | |
| | | | | | | | |
| MULTILINE RETAIL - 0.1% |
Tuesday Morning 1 | | | 346,949 | | | | 586,344 | |
| | | | | | | | |
| SPECIALTY RETAIL - 0.9% |
Lumber Liquidators Holdings 1,2 | | | 317,066 | | | | 3,662,113 | |
†Party City Holdco 1,2 | | | 262,400 | | | | 1,923,392 | |
RTW Retailwinds 1,2 | | | 564,423 | | | | 959,519 | |
Stage Stores 1 | | | 882,334 | | | | 679,397 | |
Zumiez 1 | | | 60,700 | | | | 1,584,270 | |
| | | | | | | | |
| | | | | | | | 8,808,691 | |
| | | | | | | | |
| TEXTILES, APPAREL & LUXURY GOODS - 0.8% |
Fossil Group 1,2 | | | 102,900 | | | | 1,183,350 | |
Jerash Holdings (US) | | | 61,704 | | | | 442,418 | |
Unifi 1 | | | 236,854 | | | | 4,303,637 | |
| 40 | The Royce Funds 2019 Semiannual Report to Shareholders | | THE ACCOMPANYING NOTES ARE AN INTEGRAL PART OF THESE FINANCIAL STATEMENTS |
| June 30, 2019 (unaudited) |
| |
| Royce Opportunity Fund (continued) |
| | | | | | | | | |
| | | SHARES | | VALUE |
| |
| | | | | | | | | |
| CONSUMER DISCRETIONARY (continued) |
| TEXTILES, APPAREL & LUXURY GOODS (continued) |
Vince Holding 1 | | | 101,496 | | | $ | 1,415,869 | |
| | | | | | | | |
| | | | | | | | 7,345,274 | |
| |
| Total (Cost $97,187,583) | | | | | | | 99,545,234 | |
| |
| | | | | | | | | |
| CONSUMER STAPLES – 0.6% |
| BEVERAGES - 0.1% |
†Eastside Distilling 1 | | | 67,850 | | | | 305,325 | |
†Reed’s 1 | | | 251,903 | | | | 952,193 | |
| | | | | | | | |
| | | | | | | | 1,257,518 | |
| | | | | | | | |
| FOOD & STAPLES RETAILING - 0.1% |
United Natural Foods 1 | | | 75,154 | | | | 674,131 | |
| | | | | | | | |
| FOOD PRODUCTS - 0.4% |
Landec Corporation 1 | | | 134,110 | | | | 1,256,611 | |
SunOpta 1 | | | 701,727 | | | | 2,308,682 | |
| | | | | | | | |
| | | | | | | | 3,565,293 | |
| |
| Total (Cost $9,966,152) | | | | | | | 5,496,942 | |
| |
| | | | | | | | | |
| ENERGY – 7.4% |
| ENERGY EQUIPMENT & SERVICES - 2.8% |
Archrock | | | 286,800 | | | | 3,040,080 | |
Aspen Aerogels 1 | | | 342,019 | | | | 2,438,595 | |
Independence Contract Drilling 1,2 | | | 686,060 | | | | 1,083,975 | |
KLX Energy Services Holdings 1,2 | | | 161,626 | | | | 3,302,019 | |
Newpark Resources 1 | | | 958,668 | | | | 7,113,317 | |
Patterson-UTI Energy | | | 297,785 | | | | 3,427,505 | |
Ranger Energy Services Cl. A 1 | | | 163,254 | | | | 1,314,195 | |
U.S. Silica Holdings | | | 361,201 | | | | 4,619,761 | |
| | | | | | | | |
| | | | | | | | 26,339,447 | |
| | | | | | | | |
| OIL, GAS & CONSUMABLE FUELS - 4.6% |
Ardmore Shipping 1 | | | 444,399 | | | | 3,621,852 | |
Baytex Energy 1 | | | 697,000 | | | | 1,073,380 | |
Bonanza Creek Energy 1 | | | 85,500 | | | | 1,785,240 | |
Dorian LPG 1,2 | | | 753,124 | | | | 6,793,178 | |
GasLog | | | 245,404 | | | | 3,533,818 | |
GasLog Partners L.P. | | | 168,580 | | | | 3,578,953 | |
Matador Resources 1 | | | 313,783 | | | | 6,238,006 | |
Navigator Holdings 1 | | | 445,184 | | | | 4,166,922 | |
StealthGas 1 | | | 167,340 | | | | 575,650 | |
Talos Energy 1 | | | 200,823 | | | | 4,829,793 | |
Teekay LNG Partners L.P. | | | 318,800 | | | | 4,495,080 | |
Whiting Petroleum 1 | | | 115,568 | | | | 2,158,810 | |
| | | | | | | | |
| | | | | | | | 42,850,682 | |
| |
| Total (Cost $82,137,894) | | | | | | | 69,190,129 | |
| |
| | | | | | | | | |
| FINANCIALS – 7.8% |
| BANKS - 4.5% |
Allegiance Bancshares 1 | | | 59,100 | | | | 1,970,394 | |
CenterState Bank | | | 246,766 | | | | 5,683,021 | |
First Foundation | | | 193,300 | | | | 2,597,952 | |
Franklin Financial Network | | | 161,514 | | | | 4,499,780 | |
Hilltop Holdings | | | 338,599 | | | | 7,202,001 | |
Independent Bank Group | | | 111,135 | | | | 6,107,979 | |
Renasant Corporation | | | 14,400 | | | | 517,536 | |
Seacoast Banking Corporation of Florida 1 | | | 125,400 | | | | 3,190,176 | |
Southern National Bancorp of Virginia | | | 170,190 | | | | 2,605,609 | |
Texas Capital Bancshares 1 | | | 58,300 | | | | 3,577,871 | |
TriState Capital Holdings 1 | | | 107,161 | | | | 2,286,816 | |
Umpqua Holdings | | | 123,582 | | | | 2,050,225 | |
| | | | | | | | |
| | | | | | | | 42,289,360 | |
| | | | | | | | |
| CAPITAL MARKETS - 0.5% |
B. Riley Financial | | | 207,017 | | | | 4,318,375 | |
| | | | | | | | |
| INSURANCE - 1.2% |
HCI Group | | | 77,876 | | | | 3,151,641 | |
Heritage Insurance Holdings | | | 318,007 | | | | 4,900,488 | |
MBIA 1 | | | 370,500 | | | | 3,449,355 | |
| | | | | | | | |
| | | | | | | | 11,501,484 | |
| | | | | | | | |
| THRIFTS & MORTGAGE FINANCE - 1.6% |
Axos Financial 1 | | | 29,200 | | | | 795,700 | |
MGIC Investment 1 | | | 112,572 | | | | 1,479,196 | |
NMI Holdings Cl. A 1 | | | 21,763 | | | | 617,852 | |
Radian Group | | | 222,498 | | | | 5,084,079 | |
Walker & Dunlop | | | 127,628 | | | | 6,791,086 | |
| | | | | | | | |
| | | | | | | | 14,767,913 | |
| |
| Total (Cost $67,794,149) | | | | | | | 72,877,132 | |
| |
| | | | | | | | | |
| HEALTH CARE – 9.7% |
| BIOTECHNOLOGY - 0.9% |
AMAG Pharmaceuticals 1 | | | 216,000 | | | | 2,157,840 | |
†CareDx 1,2 | | | 15,241 | | | | 548,524 | |
†Emergent BioSolutions 1 | | | 104,531 | | | | 5,049,893 | |
†Flexion Therapeutics 1,2 | | | 46,424 | | | | 571,015 | |
| | | | | | | | |
| | | | | | | | 8,327,272 | |
| | | | | | | | |
| HEALTH CARE EQUIPMENT & SUPPLIES - 2.2% |
Accuray 1,2 | | | 691,002 | | | | 2,674,178 | |
Alphatec Holdings 1 | | | 163,600 | | | | 742,744 | |
AngioDynamics 1 | | | 282,312 | | | | 5,558,723 | |
†Conformis 1,2 | | | 18,920 | | | | 82,491 | |
†GenMark Diagnostics 1 | | | 45,000 | | | | 292,050 | |
Invacare Corporation | | | 933,616 | | | | 4,845,467 | |
†RA Medical Systems 1,2 | | | 114,300 | | | | 413,766 | |
RTI Surgical Holdings 1 | | | 342,428 | | | | 1,455,319 | |
†SeaSpine Holdings 1 | | | 17,088 | | | | 226,416 | |
Varex Imaging 1 | | | 151,600 | | | | 4,646,540 | |
| | | | | | | | |
| | | | | | | | 20,937,694 | |
| | | | | | | | |
| HEALTH CARE PROVIDERS & SERVICES - 4.4% |
AAC Holdings 1 | | | 750,465 | | | | 645,400 | |
Acadia Healthcare 1,2 | | | 166,579 | | | | 5,821,936 | |
†Addus HomeCare 1 | | | 36,989 | | | | 2,772,326 | |
BioScrip 1 | | | 1,020,345 | | | | 2,652,897 | |
†BioTelemetry 1 | | | 11,100 | | | | 534,465 | |
Brookdale Senior Living 1 | | | 251,509 | | | | 1,813,380 | |
Community Health Systems 1 | | | 978,714 | | | | 2,613,166 | |
Cross Country Healthcare 1 | | | 620,441 | | | | 5,819,737 | |
†Fulgent Genetics 1 | | | 40,961 | | | | 273,619 | |
Owens & Minor | | | 824,923 | | | | 2,639,754 | |
R1 RCM 1,2 | | | 440,418 | | | | 5,540,458 | |
RadNet 1 | | | 231,900 | | | | 3,197,901 | |
Select Medical Holdings 1 | | | 183,200 | | | | 2,907,384 | |
Surgery Partners 1,2 | | | 539,875 | | | | 4,394,582 | |
| | | | | | | | |
| | | | | | | | 41,627,005 | |
| | | | | | | | |
| HEALTH CARE TECHNOLOGY - 1.5% |
Allscripts Healthcare Solutions 1 | | | 344,628 | | | | 4,008,024 | |
Castlight Health Cl. B 1 | | | 840,597 | | | | 2,715,128 | |
Evolent Health Cl. A 1,2 | | | 320,600 | | | | 2,548,770 | |
†Tabula Rasa HealthCare 1,2 | | | 98,300 | | | | 4,908,119 | |
| | | | | | | | |
| | | | | | | | 14,180,041 | |
| | | | | | | | |
| LIFE SCIENCES TOOLS & SERVICES - 0.7% |
Cambrex Corporation 1 | | | 137,420 | | | | 6,432,630 | |
| |
| Total (Cost $111,243,730) | | | | | | | 91,504,642 | |
| |
| THE ACCOMPANYING NOTES ARE AN INTEGRAL PART OF THESE FINANCIAL STATEMENTS | | The Royce Funds 2019 Semiannual Report to Shareholders | 41 |
| |
| Royce Opportunity Fund (continued) |
| | | | | | | | | |
| | | SHARES | | VALUE |
| |
| | | | | | | | | |
| INDUSTRIALS – 24.9% |
| AEROSPACE & DEFENSE - 1.9% |
Aerojet Rocketdyne Holdings 1,2 | | | 26,154 | | | $ | 1,170,915 | |
Kratos Defense & Security Solutions 1 | | | 197,113 | | | | 4,511,916 | |
Triumph Group | | | 249,101 | | | | 5,704,413 | |
Wesco Aircraft Holdings 1 | | | 544,420 | | | | 6,043,062 | |
| | | | | | | | |
| | | | | | | | 17,430,306 | |
| | | | | | | | |
| AIR FREIGHT & LOGISTICS - 0.4% |
Atlas Air Worldwide Holdings 1,2 | | | 94,804 | | | | 4,232,051 | |
| | | | | | | | |
| AIRLINES - 0.4% |
Hawaiian Holdings | | | 81,600 | | | | 2,238,288 | |
Mesa Air Group 1 | | | 126,200 | | | | 1,153,468 | |
| | | | | | | | |
| | | | | | | | 3,391,756 | |
| | | | | | | | |
| BUILDING PRODUCTS - 3.8% |
American Woodmark 1 | | | 69,400 | | | | 5,872,628 | |
Apogee Enterprises | | | 104,566 | | | | 4,542,347 | |
Builders FirstSource 1 | | | 100,795 | | | | 1,699,404 | |
Cornerstone Building Brands 1 | | | 213,194 | | | | 1,242,921 | |
Griffon Corporation | | | 345,159 | | | | 5,840,090 | |
Insteel Industries | | | 174,611 | | | | 3,635,401 | |
PGT Innovations 1 | | | 192,995 | | | | 3,226,877 | |
Quanex Building Products | | | 275,888 | | | | 5,211,524 | |
Resideo Technologies 1 | | | 211,400 | | | | 4,633,888 | |
| | | | | | | | |
| | | | | | | | 35,905,080 | |
| | | | | | | | |
| COMMERCIAL SERVICES & SUPPLIES - 1.1% |
Herman Miller | | | 34,033 | | | | 1,521,275 | |
Interface | | | 164,495 | | | | 2,521,708 | |
Pitney Bowes | | | 481,700 | | | | 2,061,676 | |
Team 1 | | | 294,486 | | | | 4,511,526 | |
| | | | | | | | |
| | | | | | | | 10,616,185 | |
| | | | | | | | |
| CONSTRUCTION & ENGINEERING - 3.8% |
Aegion Corporation 1 | | | 241,285 | | | | 4,439,644 | |
Ameresco Cl. A 1 | | | 295,176 | | | | 4,347,942 | |
Arcosa | | | 119,300 | | | | 4,489,259 | |
Construction Partners Cl. A 1 | | | 171,579 | | | | 2,577,117 | |
Granite Construction | | | 150,074 | | | | 7,230,565 | |
Great Lakes Dredge & Dock 1 | | | 142,916 | | | | 1,577,793 | |
Northwest Pipe 1 | | | 326,600 | | | | 8,419,748 | |
†Primoris Services | | | 115,900 | | | | 2,425,787 | |
| | | | | | | | |
| | | | | | | | 35,507,855 | |
| | | | | | | | |
| ELECTRICAL EQUIPMENT - 1.3% |
†Bloom Energy Cl. A 1,2 | | | 379,400 | | | | 4,655,238 | |
†Generac Holdings 1 | | | 86,900 | | | | 6,031,729 | |
†LSI Industries | | | 45,613 | | | | 166,487 | |
Power Solutions International 1,3 | | | 146,143 | | | | 1,417,587 | |
| | | | | | | | |
| | | | | | | | 12,271,041 | |
| | | | | | | | |
| MACHINERY - 8.0% |
Astec Industries | | | 211,835 | | | | 6,897,348 | |
Commercial Vehicle Group 1 | | | 596,374 | | | | 4,782,919 | |
FreightCar America 1 | | | 405,687 | | | | 2,381,383 | |
†Gencor Industries 1 | | | 26,199 | | | | 340,587 | |
Hurco Companies | | | 88,997 | | | | 3,164,733 | |
Hyster-Yale Materials Handling Cl. A | | | 98,413 | | | | 5,438,302 | |
Lydall 1 | | | 118,918 | | | | 2,402,144 | |
†Manitex International 1 | | | 131,300 | | | | 802,243 | |
Meritor 1 | | | 153,108 | | | | 3,712,869 | |
Milacron Holdings 1,2 | | | 404,688 | | | | 5,584,694 | |
Mueller Industries | | | 123,237 | | | | 3,607,147 | |
Mueller Water Products | | | 513,072 | | | | 5,038,367 | |
NN | | | 544,391 | | | | 5,313,256 | |
Park-Ohio Holdings | | | 46,590 | | | | 1,518,368 | |
Spartan Motors | | | 462,838 | | | | 5,072,704 | |
TriMas Corporation 1 | | | 216,110 | | | | 6,692,927 | |
Trinity Industries | | | 142,500 | | | | 2,956,875 | |
Wabash National | | | 188,300 | | | | 3,063,641 | |
Westport Fuel Systems 1 | | | 2,339,974 | | | | 6,341,330 | |
| | | | | | | | |
| | | | | | | | 75,111,837 | |
| | | | | | | | |
| MARINE - 0.4% |
Diana Shipping 1 | | | 99,652 | | | | 329,848 | |
Eagle Bulk Shipping 1 | | | 316,433 | | | | 1,658,109 | |
Scorpio Bulkers | | | 321,028 | | | | 1,476,729 | |
| | | | | | | | |
| | | | | | | | 3,464,686 | |
| | | | | | | | |
| PROFESSIONAL SERVICES - 0.3% |
†GP Strategies 1 | | | 51,845 | | | | 781,823 | |
†Mistras Group 1 | | | 110,100 | | | | 1,582,137 | |
| | | | | | | | |
| | | | | | | | 2,363,960 | |
| | | | | | | | |
| ROAD & RAIL - 0.6% |
Celadon Group 1,3 | | | 482,331 | | | | 569,151 | |
Hertz Global Holdings 1,2 | | | 344,565 | | | | 5,499,257 | |
| | | | | | | | |
| | | | | | | | 6,068,408 | |
| | | | | | | | |
| TRADING COMPANIES & DISTRIBUTORS - 2.9% |
Air Lease Cl. A | | | 208,538 | | | | 8,620,961 | |
CAI International 1,2 | | | 145,038 | | | | 3,599,843 | |
†General Finance 1 | | | 49,925 | | | | 417,872 | |
Herc Holdings 1 | | | 207,598 | | | | 9,514,216 | |
Textainer Group Holdings 1 | | | 124,330 | | | | 1,253,247 | |
Univar 1,2 | | | 190,252 | | | | 4,193,154 | |
| | | | | | | | |
| | | | | | | | 27,599,293 | |
| |
| Total (Cost $207,181,809) | | | | | | | 233,962,458 | |
| |
| | | | | | | | | |
| INFORMATION TECHNOLOGY – 20.0% |
| COMMUNICATIONS EQUIPMENT - 3.0% |
Applied Optoelectronics 1,2 | | | 213,300 | | | | 2,192,724 | |
Aviat Networks 1 | | | 57,099 | | | | 782,256 | |
Ciena Corporation 1 | | | 120,373 | | | | 4,950,941 | |
Comtech Telecommunications | | | 309,660 | | | | 8,704,543 | |
Digi International 1 | | | 156,300 | | | | 1,981,884 | |
EMCORE Corporation 1 | | | 157,316 | | | | 517,570 | |
Finisar Corporation 1 | | | 170,607 | | | | 3,901,782 | |
Infinera Corporation 1,2 | | | 408,300 | | | | 1,188,153 | |
PCTEL | | | 77,291 | | | | 342,399 | |
Ribbon Communications 1,2 | | | 686,885 | | | | 3,358,868 | |
| | | | | | | | |
| | | | | | | | 27,921,120 | |
| | | | | | | | |
| ELECTRONIC EQUIPMENT, INSTRUMENTS & COMPONENTS - 3.0% |
Fabrinet 1 | | | 44,505 | | | | 2,210,563 | |
Frequency Electronics 1 | | | 273,194 | | | | 3,111,680 | |
Identiv 1 | | | 480,837 | | | | 2,461,885 | |
II-VI 1 | | | 150,168 | | | | 5,490,142 | |
KEMET Corporation | | | 369,505 | | | | 6,950,389 | |
Perceptron 1 | | | 226,146 | | | | 1,006,350 | |
SigmaTron International 1 | | | 9,774 | | | | 24,924 | |
TTM Technologies 1 | | | 188,657 | | | | 1,924,301 | |
Vishay Intertechnology | | | 271,524 | | | | 4,485,577 | |
| | | | | | | | |
| | | | | | | | 27,665,811 | |
| | | | | | | | |
| IT SERVICES - 1.4% |
†CoreLogic 1 | | | 113,700 | | | | 4,756,071 | |
Limelight Networks 1 | | | 546,457 | | | | 1,475,434 | |
Perspecta | | | 302,400 | | | | 7,079,184 | |
| | | | | | | | |
| | | | | | | | 13,310,689 | |
| | | | | | | | |
| 42 | The Royce Funds 2019 Semiannual Report to Shareholders | | THE ACCOMPANYING NOTES ARE AN INTEGRAL PART OF THESE FINANCIAL STATEMENTS |
| June 30, 2019 (unaudited) |
| |
| Royce Opportunity Fund (continued) | | | | | | | | |
| | | | | | | | | |
| | | SHARES | | VALUE |
| |
| | | | | | | | | |
| INFORMATION TECHNOLOGY (continued) |
| SEMICONDUCTORS & SEMICONDUCTOR EQUIPMENT - 8.0% |
Advanced Energy Industries 1 | | | 50,000 | | | $ | 2,813,500 | |
Alpha & Omega Semiconductor 1,2 | | | 816,892 | | | | 7,629,771 | |
Amkor Technology 1 | | | 286,400 | | | | 2,136,544 | |
Amtech Systems 1 | | | 369,775 | | | | 2,033,762 | |
AXT 1 | | | 652,514 | | | | 2,583,955 | |
Brooks Automation | | | 97,920 | | | | 3,794,400 | |
Cohu | | | 172,176 | | | | 2,656,676 | |
Cypress Semiconductor | | | 295,961 | | | | 6,582,173 | |
FormFactor 1 | | | 415,513 | | | | 6,511,089 | |
Ichor Holdings 1 | | | 200,094 | | | | 4,730,222 | |
Kulicke & Soffa Industries | | | 274,965 | | | | 6,200,461 | |
MACOM Technology Solutions Holdings 1,2 | | | 437,285 | | | | 6,616,122 | |
Nanometrics 1 | | | 126,264 | | | | 4,382,623 | |
NeoPhotonics Corporation 1 | | | 80,461 | | | | 336,327 | |
Rudolph Technologies 1 | | | 233,555 | | | | 6,453,125 | |
Ultra Clean Holdings 1 | | | 366,727 | | | | 5,104,840 | |
Veeco Instruments 1,2 | | | 373,687 | | | | 4,566,455 | |
| | | | | | | | |
| | | | | | | | 75,132,045 | |
| | | | | | | | |
| SOFTWARE - 2.2% |
A10 Networks 1 | | | 654,626 | | | | 4,464,550 | |
†Asure Software 1 | | | 317,349 | | | | 2,611,782 | |
Avaya Holdings 1,2 | | | 401,754 | | | | 4,784,890 | |
†eGain Corporation 1 | | | 15,080 | | | | 122,751 | |
SecureWorks Corporation Cl. A 1,2 | | | 260,428 | | | | 3,461,088 | |
Telaria 1 | | | 750,867 | | | | 5,646,520 | |
| | | | | | | | |
| | | | | | | | 21,091,581 | |
| | | | | | | | |
| TECHNOLOGY HARDWARE, STORAGE & PERIPHERALS - 2.4% |
Avid Technology 1 | | | 697,491 | | | | 6,361,118 | |
Cray 1 | | | 68,018 | | | | 2,368,387 | |
Intevac 1 | | | 618,230 | | | | 2,992,233 | |
NCR Corporation 1 | | | 146,600 | | | | 4,559,260 | |
Stratasys 1,2 | | | 144,726 | | | | 4,250,603 | |
3D Systems 1 | | | 217,662 | | | | 1,980,724 | |
| | | | | | | | |
| | | | | | | | 22,512,325 | |
| |
| Total (Cost $152,830,736) | | | | | | | 187,633,571 | |
| |
| | | | | | | | | |
| MATERIALS – 8.3% |
| CHEMICALS - 3.2% |
†Cabot Corporation | | | 68,100 | | | | 3,249,051 | |
Ferro Corporation 1 | | | 298,866 | | | | 4,722,083 | |
Huntsman Corporation | | | 235,600 | | | | 4,815,664 | |
Intrepid Potash 1 | | | 996,400 | | | | 3,347,904 | |
Kraton Corporation 1 | | | 274,545 | | | | 8,530,113 | �� |
LSB Industries 1 | | | 123,671 | | | | 482,317 | |
Olin Corporation | | | 176,500 | | | | 3,867,115 | |
†Trecora Resources 1 | | | 136,740 | | | | 1,308,602 | |
| | | | | | | | |
| | | | | | | | 30,322,849 | |
| | | | | | | | |
| CONSTRUCTION MATERIALS - 0.5% |
Forterra 1,2 | | | 945,037 | | | | 4,696,834 | |
| | | | | | | | |
| METALS & MINING - 4.4% |
AK Steel Holding Corporation 1 | | | 226,885 | | | | 537,717 | |
Allegheny Technologies 1 | | | 119,014 | | | | 2,999,153 | |
Carpenter Technology | | | 99,912 | | | | 4,793,778 | |
Century Aluminum 1 | | | 434,160 | | | | 3,000,045 | |
Cleveland-Cliffs | | | 477,752 | | | | 5,097,614 | |
Commercial Metals | | | 310,509 | | | | 5,542,586 | |
Ferroglobe 1 | | | 853,000 | | | | 1,450,100 | |
Haynes International | | | 206,116 | | | | 6,556,550 | |
Noranda Aluminum Holding Corporation 1,3 | | | 488,157 | | | | 5,614 | |
Synalloy Corporation | | | 346,522 | | | | 5,412,674 | |
TimkenSteel Corporation 1 | | | 294,735 | | | | 2,396,195 | |
Universal Stainless & Alloy Products 1 | | | 227,941 | | | | 3,647,056 | |
| | | | | | | | |
| | | | | | | | 41,439,082 | |
| | | | | | | | |
| PAPER & FOREST PRODUCTS - 0.2% |
Glatfelter (P. H.) | | | 84,300 | | | | 1,422,984 | |
| |
| Total (Cost $71,305,922) | | | | | | | 77,881,749 | |
| |
| | | | | | | | | |
| REAL ESTATE – 0.8% |
| EQUITY REAL ESTATE INVESTMENT TRUSTS (REITS) - 0.3% |
†Armada Hoffler Properties | | | 76,563 | | | | 1,267,118 | |
CatchMark Timber Trust Cl. A | | | 158,700 | | | | 1,658,415 | |
| | | | | | | | |
| | | | | | | | 2,925,533 | |
| | | | | | | | |
| REAL ESTATE MANAGEMENT & DEVELOPMENT - 0.5% |
†Realogy Holdings | | | 291,200 | | | | 2,108,288 | |
Tejon Ranch 1 | | | 167,106 | | | | 2,772,288 | |
| | | | | | | | |
| | | | | | | | 4,880,576 | |
| |
| Total (Cost $9,300,281) | | | | | | | 7,806,109 | |
| |
| | | | | | | | | |
| UTILITIES – 0.3% |
| WATER UTILITIES - 0.3% |
Pure Cycle 1 | | | 232,499 | | | | 2,464,489 | |
| |
| Total (Cost $971,846) | | | | | | | 2,464,489 | |
| |
| | | | | | | | | |
| TOTAL COMMON STOCKS |
| |
| (Cost $818,205,133) | | | | | | | 859,161,980 | |
| |
| | | | | | | | | |
| REPURCHASE AGREEMENT – 8.5% |
Fixed Income Clearing Corporation, 0.50% dated 6/28/19, due 7/1/19, maturity value
$79,842,327 (collateralized by obligations of various U.S. Government Agencies, 1.75%
due 5/31/22, valued at $81,436,064) |
| |
| (Cost $79,839,000) | | | | | | | 79,839,000 | |
| |
| | | | | | | | | |
| COLLATERAL RECEIVED FOR SECURITIES LOANED – 3.0% |
| Money Market Funds | | | | | | | | |
Federated Government Obligations Fund (7 day yield-2.2655%) | | | | | | | | |
| |
| (Cost $28,337,338) | | | | | | | 28,337,338 | |
| |
| | | | | | | | | |
| TOTAL INVESTMENTS – 103.0% |
| |
| (Cost $926,381,471) | | | | | | | 967,338,318 | |
| |
| | | | | | | | | |
| LIABILITIES LESS CASH AND OTHER ASSETS – (3.0)% | | | | | | | (28,586,304 | ) |
| | | | | | | | |
| | | | | | | | | |
| |
| NET ASSETS – 100.0% | | | | | | $ | 938,752,014 | |
| |
| THE ACCOMPANYING NOTES ARE AN INTEGRAL PART OF THESE FINANCIAL STATEMENTS | | The Royce Funds 2019 Semiannual Report to Shareholders | 43 |
| |
| Royce Pennsylvania Mutual Fund |
| Common Stocks – 95.3% |
| | | SHARES | | VALUE |
| |
| | | | | | | | | |
| COMMUNICATION SERVICES – 1.4% |
| DIVERSIFIED TELECOMMUNICATION SERVICES - 0.2% |
†Bandwidth Cl. A 1 | | | 53,400 | | | $ | 4,006,068 | |
| | | | | | | | |
| MEDIA - 1.2% |
Liberty Latin America Cl. C 1 | | | 282,593 | | | | 4,857,774 | |
†Media General (Rights) 1,4 | | | 102,272 | | | | 0 | |
Meredith Corporation | | | 213,891 | | | | 11,776,838 | |
†Nexstar Media Group Cl. A | | | 26,260 | | | | 2,652,260 | |
Saga Communications Cl. A | | | 116,258 | | | | 3,631,900 | |
| | | | | | | | |
| | | | | | | | 22,918,772 | |
| |
| Total (Cost $26,633,204) | | | | | | | 26,924,840 | |
| |
| | | | | | | | | |
| CONSUMER DISCRETIONARY – 7.5% |
| AUTO COMPONENTS - 2.2% |
Dorman Products 1 | | | 123,893 | | | | 10,796,036 | |
Gentex Corporation | | | 270,439 | | | | 6,655,504 | |
LCI Industries | | | 129,535 | | | | 11,658,150 | |
Standard Motor Products | | | 129,987 | | | | 5,893,610 | |
Stoneridge 1 | | | 162,263 | | | | 5,119,398 | |
†Tower International | | | 176,442 | | | | 3,440,619 | |
| | | | | | | | |
| | | | | | | | 43,563,317 | |
| | | | | | | | |
| AUTOMOBILES - 0.3% |
Winnebago Industries | | | 158,610 | | | | 6,130,276 | |
| | | | | | | | |
| DISTRIBUTORS - 0.4% |
LKQ Corporation 1 | | | 132,000 | | | | 3,512,520 | |
Weyco Group | | | 161,705 | | | | 4,319,141 | |
| | | | | | | | |
| | | | | | | | 7,831,661 | |
| | | | | | | | |
| HOTELS, RESTAURANTS & LEISURE - 1.0% |
†Aramark | | | 65,750 | | | | 2,370,945 | |
†Century Casinos 1 | | | 338,300 | | | | 3,281,510 | |
Hilton Grand Vacations 1,2 | | | 266,562 | | | | 8,482,003 | |
Lindblad Expeditions Holdings 1 | | | 367,713 | | | | 6,600,448 | |
| | | | | | | | |
| | | | | | | | 20,734,906 | |
| | | | | | | | |
| HOUSEHOLD DURABLES - 0.4% |
Ethan Allen Interiors | | | 14,000 | | | | 294,840 | |
La-Z-Boy | | | 103,321 | | | | 3,167,822 | |
†LGI Homes 1,2 | | | 51,500 | | | | 3,678,645 | |
| | | | | | | | |
| | | | | | | | 7,141,307 | |
| | | | | | | | |
| INTERNET & DIRECT MARKETING RETAIL - 0.4% |
Etsy 1 | | | 80,389 | | | | 4,933,473 | |
zooplus 1 | | | 15,983 | | | | 2,177,278 | |
| | | | | | | | |
| | | | | | | | 7,110,751 | |
| | | | | | | | |
| LEISURE PRODUCTS - 0.2% |
Johnson Outdoors Cl. A | | | 3,600 | | | | 268,452 | |
MasterCraft Boat Holdings 1 | | | 193,114 | | | | 3,783,103 | |
| | | | | | | | |
| | | | | | | | 4,051,555 | |
| | | | | | | | |
| SPECIALTY RETAIL - 2.2% |
American Eagle Outfitters | | | 196,313 | | | | 3,317,690 | |
America’s Car-Mart 1 | | | 95,536 | | | | 8,223,739 | |
†Asbury Automotive Group 1 | | | 50,000 | | | | 4,217,000 | |
Caleres | | | 179,692 | | | | 3,579,464 | |
CarMax 1 | | | 70,400 | | | | 6,112,832 | |
Children’s Place | | | 26,878 | | | | 2,563,624 | |
Designer Brands Cl. A | | | 179,394 | | | | 3,438,983 | |
Monro | | | 73,379 | | | | 6,259,229 | |
Shoe Carnival | | | 218,806 | | | | 6,039,045 | |
| | | | | | | | |
| | | | | | | | 43,751,606 | |
| | | | | | | | |
| TEXTILES, APPAREL & LUXURY GOODS - 0.4% |
G-III Apparel Group 1 | | | 29,340 | | | | 863,183 | |
Movado Group | | | 15,000 | | | | 405,000 | |
Steven Madden | | | 46,506 | | | | 1,578,879 | |
Wolverine World Wide | | | 159,145 | | | | 4,382,853 | |
| | | | | | | | |
| | | | | | | | 7,229,915 | |
| |
| Total (Cost $102,387,941) | | | | | | | 147,545,294 | |
| |
| | | | | | | | | |
| CONSUMER STAPLES – 1.2% |
| FOOD PRODUCTS - 0.6% |
Cal-Maine Foods | | | 51,014 | | | | 2,128,304 | |
Industrias Bachoco ADR Cl. B | | | 9,000 | | | | 456,030 | |
John B. Sanfilippo & Son | | | 20,126 | | | | 1,603,841 | |
Nomad Foods 1 | | | 171,173 | | | | 3,656,255 | |
Seneca Foods Cl. A 1 | | | 105,072 | | | | 2,924,154 | |
Tootsie Roll Industries | | | 14,099 | | | | 520,676 | |
| | | | | | | | |
| | | | | | | | 11,289,260 | |
| | | | | | | | |
| PERSONAL PRODUCTS - 0.6% |
Inter Parfums | | | 186,442 | | | | 12,396,529 | |
| |
| Total (Cost $11,090,289) | | | | | | | 23,685,789 | |
| |
| | | | | | | | | |
| ENERGY – 3.9% |
| ENERGY EQUIPMENT & SERVICES - 3.6% |
†Core Laboratories | | | 25,000 | | | | 1,307,000 | |
Era Group 1 | | | 547,711 | | | | 4,567,910 | |
Helmerich & Payne | | | 101,880 | | | | 5,157,166 | |
Oil States International 1 | | | 9,800 | | | | 179,340 | |
Pason Systems | | | 1,098,349 | | | | 15,918,952 | |
RPC | | | 260,074 | | | | 1,875,133 | |
SEACOR Holdings 1 | | | 502,939 | | | | 23,894,632 | |
SEACOR Marine Holdings 1 | | | 481,549 | | | | 7,203,973 | |
TGS-NOPEC Geophysical | | | 381,270 | | | | 10,691,087 | |
| | | | | | | | |
| | | | | | | | 70,795,193 | |
| | | | | | | | |
| OIL, GAS & CONSUMABLE FUELS - 0.3% |
†Alliance Resource Partners L.P. | | | 178,000 | | | | 3,022,440 | |
†Brigham Minerals Cl. A 1,2 | | | 100,000 | | | | 2,146,000 | |
| | | | | | | | |
| | | | | | | | 5,168,440 | |
| |
| Total (Cost $60,122,594) | | | | | | | 75,963,633 | |
| |
| | | | | | | | | |
| FINANCIALS – 14.9% |
| BANKS - 4.5% |
Bar Harbor Bankshares | | | 48,324 | | | | 1,284,935 | |
BOK Financial | | | 98,634 | | | | 7,444,894 | |
Camden National | | | 125,182 | | | | 5,742,098 | |
City Holding Company | | | 46,054 | | | | 3,512,078 | |
CNB Financial | | | 194,335 | | | | 5,488,020 | |
Financial Institutions | | | 101,588 | | | | 2,961,290 | |
First Citizens BancShares Cl. A | | | 47,277 | | | | 21,287,415 | |
MidWestOne Financial Group | | | 96,140 | | | | 2,688,074 | |
National Bankshares | | | 119,455 | | | | 4,650,383 | |
Northrim BanCorp | | | 94,983 | | | | 3,387,094 | |
Popular | | | 205,102 | | | | 11,124,733 | |
TriState Capital Holdings 1 | | | 99,069 | | | | 2,114,133 | |
Unity Bancorp | | | 61,075 | | | | 1,386,403 | |
Webster Financial | | | 321,555 | | | | 15,360,682 | |
| | | | | | | | |
| | | | | | | | 88,432,232 | |
| | | | | | | | |
| CAPITAL MARKETS - 5.4% |
Ares Management Cl. A | | | 781,781 | | | | 20,459,209 | |
Artisan Partners Asset Management Cl. A | | | 117,533 | | | | 3,234,508 | |
B. Riley Financial | | | 70,017 | | | | 1,460,555 | |
Diamond Hill Investment Group | | | 47,318 | | | | 6,705,907 | |
Houlihan Lokey Cl. A | | | 279,619 | | | | 12,451,434 | |
Lazard Cl. A | | | 176,685 | | | | 6,076,197 | |
| 44 | The Royce Funds 2019 Semiannual Report to Shareholders | | THE ACCOMPANYING NOTES ARE AN INTEGRAL PART OF THESE FINANCIAL STATEMENTS |
| June 30, 2019 (unaudited) |
| |
| Royce Pennsylvania Mutual Fund (continued) |
| | | | | | | | | |
| | | SHARES | | VALUE |
| |
| | | | | | | | | |
| FINANCIALS (continued) |
| CAPITAL MARKETS (continued) |
Moelis & Company Cl. A | | | 132,970 | | | $ | 4,647,301 | |
Morningstar | | | 92,494 | | | | 13,378,332 | |
Oaktree Capital Group LLC Cl. A | | | 32,700 | | | | 1,619,958 | |
Pzena Investment Management Cl. A | | | 83,089 | | | | 713,735 | |
SEI Investments | | | 196,176 | | | | 11,005,474 | |
Sprott | | | 1,716,948 | | | | 4,418,399 | |
†Tradeweb Markets Cl. A | | | 134,500 | | | | 5,892,445 | |
Virtu Financial Cl. A | | | 653,654 | | | | 14,236,584 | |
| | | | | | | | |
| | | | | | | | 106,300,038 | |
| | | | | | | | |
| INSURANCE - 3.1% |
Alleghany Corporation 1 | | | 8,820 | | | | 6,007,390 | |
Berkley (W.R.) | | | 30,465 | | | | 2,008,558 | |
eHealth 1,2 | | | 51,800 | | | | 4,459,980 | |
E-L Financial | | | 26,318 | | | | 14,972,250 | |
†FBL Financial Group Cl. A | | | 1,400 | | | | 89,320 | |
James River Group Holdings | | | 32,536 | | | | 1,525,938 | |
Kingstone Companies | | | 209,656 | | | | 1,813,524 | |
MBIA 1 | | | 692,387 | | | | 6,446,123 | |
ProAssurance Corporation | | | 290,713 | | | | 10,497,647 | |
RLI Corp. | | | 69,108 | | | | 5,923,247 | |
Trupanion 1,2 | | | 154,792 | | | | 5,592,635 | |
| | | | | | | | |
| | | | | | | | 59,336,612 | |
| | | | | | | | |
| INVESTMENT COMPANIES - 0.1% |
Social Capital Hedosophia Holdings (Units) 1 | | | 177,515 | | | | 1,895,860 | |
| | | | | | | | |
| THRIFTS & MORTGAGE FINANCE - 1.8% |
Axos Financial 1,2 | | | 167,208 | | | | 4,556,418 | |
Genworth MI Canada | | | 488,229 | | | | 15,449,742 | |
Southern Missouri Bancorp | | | 41,188 | | | | 1,434,578 | |
Timberland Bancorp | | | 96,733 | | | | 2,890,382 | |
TrustCo Bank Corp. NY | | | 764,730 | | | | 6,056,662 | |
WSFS Financial | | | 120,855 | | | | 4,991,311 | |
| | | | | | | | |
| | | | | | | | 35,379,093 | |
| |
| Total (Cost $228,363,705) | | | | | | | 291,343,835 | |
| |
| | | | | | | | | |
| HEALTH CARE – 7.1% |
| BIOTECHNOLOGY - 0.2% |
Eagle Pharmaceuticals 1,2 | | | 7,400 | | | | 412,032 | |
†Pfenex 1 | | | 19,700 | | | | 132,778 | |
Progenics Pharmaceuticals 1 | | | 230,365 | | | | 1,421,352 | |
Zealand Pharma 1 | | | 84,222 | | | | 1,830,927 | |
| | | | | | | | |
| | | | | | | | 3,797,089 | |
| | | | | | | | |
| HEALTH CARE EQUIPMENT & SUPPLIES - 2.8% |
AtriCure 1 | | | 165,859 | | | | 4,949,232 | |
Atrion Corporation | | | 8,486 | | | | 7,236,352 | |
†BioLife Solutions 1 | | | 186,655 | | | | 3,163,802 | |
Cardiovascular Systems 1 | | | 77,117 | | | | 3,310,633 | |
CryoLife 1 | | | 198,217 | | | | 5,932,635 | |
Hill-Rom Holdings | | | 45,811 | | | | 4,792,747 | |
Lantheus Holdings 1 | | | 122,532 | | | | 3,467,656 | |
Merit Medical Systems 1 | | | 203,088 | | | | 12,095,921 | |
Mesa Laboratories | | | 42,404 | | | | 10,360,993 | |
| | | | | | | | |
| | | | | | | | 55,309,971 | |
| | | | | | | | |
| HEALTH CARE PROVIDERS & SERVICES - 1.9% |
AMN Healthcare Services 1,2 | | | 89,566 | | | | 4,858,956 | |
Encompass Health | | | 121,685 | | | | 7,709,962 | |
Ensign Group (The) | | | 29,764 | | | | 1,694,167 | |
HealthEquity 1 | | | 42,628 | | | | 2,787,871 | |
National Research | | | 126,613 | | | | 7,291,643 | |
R1 RCM 1 | | | 40,000 | | | | 503,200 | |
Tivity Health 1,2 | | | 77,826 | | | | 1,279,459 | |
U.S. Physical Therapy | | | 95,172 | | | | 11,665,232 | |
| | | | | | | | |
| | | | | | | | 37,790,490 | |
| | | | | | | | |
| HEALTH CARE TECHNOLOGY - 0.4% |
Medidata Solutions 1 | | | 48,070 | | | | 4,350,816 | |
†Simulations Plus | | | 16,826 | | | | 480,550 | |
†Tabula Rasa HealthCare 1,2 | | | 50,000 | | | | 2,496,500 | |
| | | | | | | | |
| | | | | | | | 7,327,866 | |
| | | | | | | | |
| LIFE SCIENCES TOOLS & SERVICES - 1.8% |
Bio-Rad Laboratories Cl. A 1 | | | 36,579 | | | | 11,434,230 | |
Bio-Techne | | | 66,391 | | | | 13,841,859 | |
ICON 1 | | | 31,848 | | | | 4,903,636 | |
NeoGenomics 1 | | | 62,403 | | | | 1,369,122 | |
Quanterix Corporation 1,2 | | | 130,130 | | | | 4,397,093 | |
| | | | | | | | |
| | | | | | | | 35,945,940 | |
| |
| Total (Cost $68,827,199) | | | | | | | 140,171,356 | |
| |
| | | | | | | | | |
| INDUSTRIALS – 27.4% |
| AEROSPACE & DEFENSE - 2.8% |
HEICO Corporation | | | 245,668 | | | | 32,872,835 | |
HEICO Corporation Cl. A | | | 138,234 | | | | 14,289,249 | |
Hexcel Corporation | | | 40,540 | | | | 3,278,875 | |
Magellan Aerospace | | | 150,171 | | | | 1,869,182 | |
Teledyne Technologies 1 | | | 6,600 | | | | 1,807,542 | |
| | | | | | | | |
| | | | | | | | 54,117,683 | |
| | | | | | | | |
| AIR FREIGHT & LOGISTICS - 0.7% |
Forward Air | | | 157,115 | | | | 9,293,352 | |
Hub Group Cl. A 1 | | | 108,475 | | | | 4,553,781 | |
| | | | | | | | |
| | | | | | | | 13,847,133 | |
| | | | | | | | |
| AIRLINES - 0.6% |
Allegiant Travel | | | 31,895 | | | | 4,576,932 | |
Hawaiian Holdings | | | 60,700 | | | | 1,665,001 | |
Spirit Airlines 1,2 | | | 97,830 | | | | 4,669,426 | |
| | | | | | | | |
| | | | | | | | 10,911,359 | |
| | | | | | | | |
| BUILDING PRODUCTS - 1.3% |
Apogee Enterprises | | | 165,037 | | | | 7,169,207 | |
Gibraltar Industries 1 | | | 166,576 | | | | 6,723,008 | |
Patrick Industries 1 | | | 92,300 | | | | 4,540,237 | |
Simpson Manufacturing | | | 115,492 | | | | 7,675,598 | |
| | | | | | | | |
| | | | | | | | 26,108,050 | |
| | | | | | | | |
| COMMERCIAL SERVICES & SUPPLIES - 1.9% |
Copart 1 | | | 37,600 | | | | 2,810,224 | |
Healthcare Services Group | | | 164,656 | | | | 4,992,370 | |
Heritage-Crystal Clean 1 | | | 155,079 | | | | 4,080,128 | |
Kimball International Cl. B | | | 440,057 | | | | 7,670,194 | |
Mobile Mini | | | 83,234 | | | | 2,532,811 | |
PICO Holdings 1 | | | 326,703 | | | | 3,796,289 | |
Ritchie Bros. Auctioneers | | | 39,233 | | | | 1,303,320 | |
Steelcase Cl. A | | | 16,316 | | | | 279,004 | |
Team 1 | | | 60,710 | | | | 930,077 | |
UniFirst Corporation | | | 44,988 | | | | 8,483,387 | |
| | | | | | | | |
| | | | | | | | 36,877,804 | |
| | | | | | | | |
| CONSTRUCTION & ENGINEERING - 1.5% |
Arcosa | | | 398,038 | | | | 14,978,170 | |
Comfort Systems USA | | | 24,200 | | | | 1,233,958 | |
†Construction Partners Cl. A 1,2 | | | 53,438 | | | | 802,639 | |
Sterling Construction 1 | | | 9,014 | | | | 120,968 | |
Valmont Industries | | | 103,145 | | | | 13,079,817 | |
| | | | | | | | |
| | | | | | | | 30,215,552 | |
| | | | | | | | |
| THE ACCOMPANYING NOTES ARE AN INTEGRAL PART OF THESE FINANCIAL STATEMENTS | | The Royce Funds 2019 Semiannual Report to Shareholders | 45 |
| |
| Royce Pennsylvania Mutual Fund (continued) |
| | | | | | | | | |
| | | SHARES | | VALUE |
| |
| | | | | | | | | |
| INDUSTRIALS (continued) |
| ELECTRICAL EQUIPMENT - 1.0% |
Encore Wire | | | 80,517 | | | $ | 4,716,686 | |
EnerSys | | | 700 | | | | 47,950 | |
Hubbell Incorporated | | | 12,600 | | | | 1,643,040 | |
Preformed Line Products | | | 219,278 | | | | 12,174,314 | |
Sensata Technologies Holding 1,2 | | | 16,000 | | | | 784,000 | |
| | | | | | | | |
| | | | | | | | 19,365,990 | |
| | | | | | | | |
| INDUSTRIAL CONGLOMERATES - 1.2% |
Carlisle Companies | | | 36,500 | | | | 5,124,965 | |
Raven Industries | | | 520,810 | | | | 18,686,663 | |
| | | | | | | | |
| | | | | | | | 23,811,628 | |
| | | | | | | | |
| MACHINERY - 9.5% |
Alamo Group | | | 15,365 | | | | 1,535,424 | |
†Allison Transmission Holdings | | | 9,000 | | | | 417,150 | |
CIRCOR International 1 | | | 144,635 | | | | 6,653,210 | |
Colfax Corporation 1,2 | | | 411,864 | | | | 11,544,548 | |
Franklin Electric | | | 218,223 | | | | 10,365,592 | |
Graco | | | 181,933 | | | | 9,129,398 | |
Graham Corporation | | | 44,465 | | | | 898,638 | |
Greenbrier Companies (The) | | | 900 | | | | 27,360 | |
Helios Technologies | | | 570,464 | | | | 26,475,234 | |
John Bean Technologies | | | 126,681 | | | | 15,344,870 | |
Kadant | | | 124,366 | | | | 11,293,676 | |
Kennametal | | | 118,740 | | | | 4,392,193 | |
Kornit Digital 1,2 | | | 44,926 | | | | 1,422,357 | |
Lincoln Electric Holdings | | | 162,250 | | | | 13,356,420 | |
Lindsay Corporation | | | 119,403 | | | | 9,816,121 | |
Meritor 1 | | | 772,748 | | | | 18,739,139 | |
Miller Industries | | | 218,218 | | | | 6,710,203 | |
Nordson Corporation | | | 67,360 | | | | 9,518,642 | |
Proto Labs 1 | | | 13,000 | | | | 1,508,260 | |
RBC Bearings 1 | | | 57,718 | | | | 9,627,940 | |
Tennant Company | | | 224,274 | | | | 13,725,569 | |
Wabash National | | | 209,020 | | | | 3,400,755 | |
| | | | | | | | |
| | | | | | | | 185,902,699 | |
| | | | | | | | |
| MARINE - 1.4% |
Clarkson | | | 405,000 | | | | 12,909,670 | |
Eagle Bulk Shipping 1 | | | 379,836 | | | | 1,990,340 | |
Kirby Corporation 1 | | | 166,433 | | | | 13,148,207 | |
| | | | | | | | |
| | | | | | | | 28,048,217 | |
| | | | | | | | |
| PROFESSIONAL SERVICES - 1.7% |
Exponent | | | 184,649 | | | | 10,809,353 | |
GP Strategies 1 | | | 80,727 | | | | 1,217,363 | |
Heidrick & Struggles International | | | 261,069 | | | | 7,824,238 | |
Kforce | | | 76,476 | | | | 2,683,543 | |
Korn Ferry | | | 107,843 | | | | 4,321,269 | |
ManpowerGroup | | | 15,800 | | | | 1,526,280 | |
Resources Connection | | | 191,040 | | | | 3,058,550 | |
TrueBlue 1 | | | 70,534 | | | | 1,555,980 | |
| | | | | | | | |
| | | | | | | | 32,996,576 | |
| | | | | | | | |
| ROAD & RAIL - 2.1% |
ArcBest | | | 182,612 | | | | 5,133,223 | |
Landstar System | | | 151,427 | | | | 16,352,602 | |
Saia 1 | | | 95,905 | | | | 6,202,176 | |
Universal Logistics Holdings | | | 432,495 | | | | 9,718,163 | |
Werner Enterprises | | | 147,896 | | | | 4,596,608 | |
| | | | | | | | |
| | | | | | | | 42,002,772 | |
| | | | | | | | |
| TRADING COMPANIES & DISTRIBUTORS - 1.7% |
Air Lease Cl. A | | | 392,767 | | | | 16,236,988 | |
Applied Industrial Technologies | | | 121,716 | | | | 7,489,185 | |
†BMC Stock Holdings 1 | | | 129,041 | | | | 2,735,669 | |
†Diploma | | | 13,585 | | | | 264,305 | |
Richelieu Hardware | | | 280,741 | | | | 4,731,361 | |
Watsco | | | 9,900 | | | | 1,618,947 | |
| | | | | | | | |
| | | | | | | | 33,076,455 | |
| |
| Total (Cost $315,206,917) | | | | | | | 537,281,918 | |
| |
| | | | | | | | | |
| INFORMATION TECHNOLOGY – 20.6% |
| COMMUNICATIONS EQUIPMENT - 0.2% |
ADTRAN | | | 61,782 | | | | 942,176 | |
Digi International 1 | | | 288,675 | | | | 3,660,399 | |
NetScout Systems 1,2 | | | 12,000 | | | | 304,680 | |
| | | | | | | | |
| | | | | | | | 4,907,255 | |
| | | | | | | | |
| ELECTRONIC EQUIPMENT, INSTRUMENTS & COMPONENTS - 9.2% |
Badger Meter | | | 245,792 | | | | 14,671,324 | |
Benchmark Electronics | | | 62,542 | | | | 1,571,055 | |
Cognex Corporation | | | 157,547 | | | | 7,559,105 | |
Coherent 1 | | | 117,069 | | | | 15,964,699 | |
Dolby Laboratories Cl. A | | | 95,028 | | | | 6,138,809 | |
Fabrinet 1 | | | 175,887 | | | | 8,736,307 | |
FARO Technologies 1 | | | 293,203 | | | | 15,416,614 | |
FLIR Systems | | | 677,961 | | | | 36,677,690 | |
HollySys Automation Technologies | | | 71,900 | | | | 1,366,100 | |
Insight Enterprises 1 | | | 189,378 | | | | 11,021,800 | |
IPG Photonics 1 | | | 42,449 | | | | 6,547,758 | |
Kimball Electronics 1 | | | 187,454 | | | | 3,044,253 | |
Littelfuse | | | 13,000 | | | | 2,299,830 | |
Methode Electronics | | | 10,100 | | | | 288,557 | |
MTS Systems | | | 43,935 | | | | 2,571,516 | |
National Instruments | | | 306,234 | | | | 12,858,766 | |
nLIGHT 1,2 | | | 536,192 | | | | 10,294,886 | |
PC Connection | | | 207,190 | | | | 7,247,506 | |
Sanmina Corporation 1 | | | 188,213 | | | | 5,699,090 | |
Vishay Intertechnology | | | 362,545 | | | | 5,989,243 | |
Vishay Precision Group 1 | | | 99,879 | | | | 4,058,084 | |
| | | | | | | | |
| | | | | | | | 180,022,992 | |
| | | | | | | | |
| IT SERVICES - 0.8% |
†Computer Services 3 | | | 600 | | | | 22,140 | |
KBR | | | 470,489 | | | | 11,733,996 | |
†Switch Cl. A | | | 246,000 | | | | 3,220,140 | |
†WEX 1 | | | 4,215 | | | | 877,141 | |
| | | | | | | | |
| | | | | | | | 15,853,417 | |
| | | | | | | | |
| SEMICONDUCTORS & SEMICONDUCTOR EQUIPMENT - 6.4% |
Advanced Energy Industries 1 | | | 187,070 | | | | 10,526,429 | |
†Axcelis Technologies 1 | | | 23,800 | | | | 358,190 | |
Brooks Automation | | | 394,652 | | | | 15,292,765 | |
Cabot Microelectronics | | | 150,027 | | | | 16,514,972 | |
Cirrus Logic 1 | | | 305,910 | | | | 13,368,267 | |
Cohu | | | 258,282 | | | | 3,985,291 | |
Diodes 1 | | | 196,302 | | | | 7,139,504 | |
Entegris | | | 292,999 | | | | 10,934,723 | |
FormFactor 1 | | | 184,111 | | | | 2,885,020 | |
Kulicke & Soffa Industries | | | 424,035 | | | | 9,561,989 | |
MKS Instruments | | | 272,357 | | | | 21,213,887 | |
Nanometrics 1 | | | 75,608 | | | | 2,624,354 | |
Nova Measuring Instruments 1,2 | | | 80,704 | | | | 2,065,215 | |
Photronics 1 | | | 168,861 | | | | 1,384,660 | |
Silicon Motion Technology ADR | | | 145,939 | | | | 6,476,773 | |
| 46 | The Royce Funds 2019 Semiannual Report to Shareholders | | THE ACCOMPANYING NOTES ARE AN INTEGRAL PART OF THESE FINANCIAL STATEMENTS |
| June 30, 2019 (unaudited) |
| |
| Royce Pennsylvania Mutual Fund (continued) |
| | | | | | | | | |
| | | SHARES | | VALUE |
| |
| | | | | | | | | |
| INFORMATION TECHNOLOGY (continued) |
| SEMICONDUCTORS & SEMICONDUCTOR EQUIPMENT (continued) |
Ultra Clean Holdings 1 | | | 101,433 | | | $ | 1,411,947 | |
| | | | | | | | |
| | | | | | | | 125,743,986 | |
| | | | | | | | |
| SOFTWARE - 4.0% |
ACI Worldwide 1 | | | 349,413 | | | | 11,998,842 | |
Altair Engineering Cl. A 1,2 | | | 109,654 | | | | 4,428,925 | |
Benefitfocus 1,2 | | | 63,000 | | | | 1,710,450 | |
Descartes Systems Group (The) 1 | | | 170,362 | | | | 6,294,876 | |
Everbridge 1 | | | 46,744 | | | | 4,179,849 | |
Fair Isaac 1 | | | 40,164 | | | | 12,612,299 | |
Five9 1,2 | | | 79,616 | | | | 4,083,505 | |
j2 Global 1 | | | 80,063 | | | | 7,116,800 | |
Manhattan Associates 1 | | | 88,430 | | | | 6,130,852 | |
QAD Cl. A | | | 46,077 | | | | 1,852,756 | |
Qualys 1 | | | 44,664 | | | | 3,889,341 | |
Upland Software 1,2 | | | 170,718 | | | | 7,772,791 | |
Varonis Systems 1 | | | 44,227 | | | | 2,739,420 | |
†Zuora Cl. A 1,2 | | | 248,000 | | | | 3,799,360 | |
| | | | | | | | |
| | | | | | | | 78,610,066 | |
| |
| Total (Cost $262,288,626) | | | | | | | 405,137,716 | |
| |
| | | | | | | | | |
| MATERIALS – 8.4% |
| CHEMICALS - 4.2% |
Balchem Corporation | | | 136,488 | | | | 13,644,705 | |
Element Solutions 1 | | | 858,846 | | | | 8,880,468 | |
Ingevity Corporation 1 | | | 70,197 | | | | 7,382,619 | |
Innospec | | | 131,901 | | | | 12,034,647 | |
Minerals Technologies | | | 220,664 | | | | 11,807,731 | |
Quaker Chemical | | | 119,990 | | | | 24,343,571 | |
Sensient Technologies | | | 31,342 | | | | 2,303,010 | |
Westlake Chemical | | | 38,600 | | | | 2,681,156 | |
| | | | | | | | |
| | | | | | | | 83,077,907 | |
| | | | | | | | |
| CONSTRUCTION MATERIALS - 0.1% |
Imerys | | | 40,000 | | | | 2,120,465 | |
| | | | | | | | |
| CONTAINERS & PACKAGING - 0.7% |
AptarGroup | | | 94,539 | | | | 11,754,979 | |
†Packaging Corporation of America | | | 16,100 | | | | 1,534,652 | |
| | | | | | | | |
| | | | | | | | 13,289,631 | |
| | | | | | | | |
| METALS & MINING - 2.1% |
Alamos Gold Cl. A | | | 2,135,448 | | | | 12,882,318 | |
Franco-Nevada | | | 93,216 | | | | 7,912,174 | |
Haynes International | | | 37,643 | | | | 1,197,424 | |
IAMGOLD Corporation 1 | | | 800,000 | | | | 2,704,000 | |
†Mayville Engineering 1,2 | | | 82,639 | | | | 1,140,418 | |
Pretium Resources 1 | | | 89,701 | | | | 896,633 | |
Reliance Steel & Aluminum | | | 141,877 | | | | 13,424,402 | |
| | | | | | | | |
| | | | | | | | 40,157,369 | |
| | | | | | | | |
| PAPER & FOREST PRODUCTS - 1.3% |
Stella-Jones | | | 731,301 | | | | 26,391,726 | |
| |
| Total (Cost $87,572,648) | | | | | | | 165,037,098 | |
| |
| | | | | | | | | |
| REAL ESTATE – 2.8% |
| REAL ESTATE MANAGEMENT & DEVELOPMENT - 2.8% |
FRP Holdings 1 | | | 256,203 | | | | 14,288,441 | |
Jones Lang LaSalle | | | 16,600 | | | | 2,335,454 | |
Kennedy-Wilson Holdings | | | 693,000 | | | | 14,255,010 | |
Marcus & Millichap 1 | | | 444,470 | | | | 13,711,899 | |
St. Joe Company (The) 1 | | | 247,725 | | | | 4,280,688 | |
Tejon Ranch 1 | | | 409,408 | | | | 6,792,079 | |
| |
| Total (Cost $46,083,622) | | | | | | | 55,663,571 | |
| |
| | | | | | | | | |
| UTILITIES – 0.1% |
| GAS UTILITIES - 0.1% |
UGI Corporation | | | 34,300 | | | | 1,831,963 | |
| |
| Total (Cost $1,012,504) | | | | | | | 1,831,963 | |
| |
| | | | | | | | | |
| TOTAL COMMON STOCKS |
| |
| (Cost $1,209,589,249) | | | | | | | 1,870,587,013 | |
| |
| | | | | | | | | |
| REPURCHASE AGREEMENT – 4.9% |
Fixed Income Clearing Corporation, 0.50% dated 6/28/19, due 7/1/19, maturity value
$95,121,963 (collateralized by obligations of various U.S. Government Agencies, 0.125%
due 4/15/22, valued at $97,022,494) |
| |
| (Cost $95,118,000) | | | | | | | 95,118,000 | |
| |
| | | | | | | | | |
| COLLATERAL RECEIVED FOR SECURITIES LOANED – 0.3% |
| Money Market Funds | | | | | | | | |
Federated Government Obligations Fund (7 day yield-2.2655%) | | | | | | | | |
| |
| (Cost $6,580,014) | | | | | | | 6,580,014 | |
| |
| | | | | | | | | |
| TOTAL INVESTMENTS – 100.5% |
| |
| (Cost $1,311,287,263) | | | | | | | 1,972,285,027 | |
| |
| | | | | | | | | |
| LIABILITIES LESS CASH AND OTHER ASSETS – (0.5)% | | | | | | | (9,447,297 | ) |
| | | | | | | | |
| | | | | | | | | |
| |
| NET ASSETS – 100.0% | | | | | | $ | 1,962,837,730 | |
| |
| THE ACCOMPANYING NOTES ARE AN INTEGRAL PART OF THESE FINANCIAL STATEMENTS | | The Royce Funds 2019 Semiannual Report to Shareholders | 47 |
| |
| Royce Premier Fund |
| Common Stocks – 91.3% |
| | | | SHARES | | | | VALUE | |
| |
| | | | | | | | | |
| CONSUMER DISCRETIONARY – 5.8% |
| AUTO COMPONENTS - 2.7% |
Dorman Products 1 | | | 344,003 | | | $ | 29,976,421 | |
LCI Industries | | | 227,740 | | | | 20,496,600 | |
| | | | | | | | |
| | | | | | | | 50,473,021 | |
| | | | | | | | |
| DISTRIBUTORS - 1.3% |
Pool Corporation | | | 122,400 | | | | 23,378,400 | |
| | | | | | | | |
| DIVERSIFIED CONSUMER SERVICES - 0.3% |
Sotheby’s 1 | | | 100,000 | | | | 5,813,000 | |
| | | | | | | | |
| TEXTILES, APPAREL & LUXURY GOODS - 1.5% |
Columbia Sportswear | | | 126,600 | | | | 12,680,256 | |
Wolverine World Wide | | | 586,100 | | | | 16,141,194 | |
| | | | | | | | |
| | | | | | | | 28,821,450 | |
| |
| Total (Cost $51,480,794) | | | | | | | 108,485,871 | |
| |
| | | | | | | | | |
| CONSUMER STAPLES – 1.1% |
| FOOD PRODUCTS - 1.1% |
Cal-Maine Foods | | | 511,100 | | | | 21,323,092 | |
| |
| Total (Cost $14,752,280) | | | | | | | 21,323,092 | |
| |
| | | | | | | | | |
| ENERGY – 4.2% |
| ENERGY EQUIPMENT & SERVICES - 4.2% |
Pason Systems | | | 2,695,145 | | | | 39,062,160 | |
SEACOR Holdings 1 | | | 603,935 | | | | 28,692,952 | |
TGS-NOPEC Geophysical | | | 350,000 | | | | 9,814,254 | |
| |
| Total (Cost $70,581,141) | | | | | | | 77,569,366 | |
| |
| | | | | | | | | |
| FINANCIALS – 14.5% |
| CAPITAL MARKETS - 9.7% |
Ares Management Cl. A | | | 1,886,400 | | | | 49,367,088 | |
Ashmore Group | | | 7,820,400 | | | | 50,601,052 | |
Lazard Cl. A | | | 537,316 | | | | 18,478,297 | |
Morningstar | | | 330,647 | | | | 47,824,782 | |
TMX Group | | | 203,694 | | | | 14,170,153 | |
| | | | | | | | |
| | | | | | | | 180,441,372 | |
| | | | | | | | |
| INSURANCE - 3.0% |
Alleghany Corporation 1 | | | 53,143 | | | | 36,196,229 | |
ProAssurance Corporation | | | 547,865 | | | | 19,783,405 | |
| | | | | | | | |
| | | | | | | | 55,979,634 | |
| | | | | | | | |
| THRIFTS & MORTGAGE FINANCE - 1.8% |
Genworth MI Canada | | | 1,092,965 | | | | 34,586,285 | |
| |
| Total (Cost $148,167,916) | | | | | | | 271,007,291 | |
| |
| | | | | | | | | |
| HEALTH CARE – 2.6% |
| HEALTH CARE TECHNOLOGY - 1.1% |
Medidata Solutions 1 | | | 217,346 | | | | 19,671,986 | |
| | | | | | | | |
| LIFE SCIENCES TOOLS & SERVICES - 1.5% |
Bio-Techne | | | 138,500 | | | | 28,875,865 | |
| |
| Total (Cost $27,562,227) | | | | | | | 48,547,851 | |
| |
| | | | | | | | | |
| INDUSTRIALS – 34.4% |
| AIR FREIGHT & LOGISTICS - 1.7% |
Forward Air | | | 538,549 | | | | 31,855,173 | |
| | | | | | | | |
| BUILDING PRODUCTS - 1.7% |
Simpson Manufacturing | | | 479,400 | | | | 31,860,924 | |
| | | | | | | | |
| COMMERCIAL SERVICES & SUPPLIES - 1.6% |
Ritchie Bros. Auctioneers | | | 879,509 | | | | 29,217,289 | |
| | | | | | | | |
| CONSTRUCTION & ENGINEERING - 1.6% |
Valmont Industries | | | 242,800 | | | | 30,789,468 | |
| | | | | | | | |
| INDUSTRIAL CONGLOMERATES - 0.9% |
†Raven Industries | | | 456,100 | | | | 16,364,868 | |
| | | | | | | | |
| MACHINERY - 18.1% |
CIRCOR International 1 | | | 499,287 | | | | 22,967,202 | |
†Colfax Corporation 1,2 | | | 1,243,500 | | | | 34,855,305 | |
Franklin Electric | | | 261,983 | | | | 12,444,192 | |
Helios Technologies | | | 757,372 | | | | 35,149,635 | |
John Bean Technologies | | | 445,623 | | | | 53,978,314 | |
Kadant | | | 157,444 | | | | 14,297,490 | |
Lincoln Electric Holdings | | | 643,117 | | | | 52,941,391 | |
Lindsay Corporation | | | 419,570 | | | | 34,492,850 | |
RBC Bearings 1 | | | 145,900 | | | | 24,337,579 | |
Woodward | | | 450,786 | | | | 51,010,944 | |
| | | | | | | | |
| | | | | | | | 336,474,902 | |
| | | | | | | | |
| MARINE - 3.8% |
Clarkson | | | 510,106 | | | | 16,260,000 | |
Kirby Corporation 1 | | | 684,400 | | | | 54,067,600 | |
| | | | | | | | |
| | | | | | | | 70,327,600 | |
| | | | | | | | |
| ROAD & RAIL - 1.7% |
Landstar System | | | 287,700 | | | | 31,068,723 | |
| | | | | | | | |
| TRADING COMPANIES & DISTRIBUTORS - 3.3% |
Air Lease Cl. A | | | 1,504,800 | | | | 62,208,432 | |
| |
| Total (Cost $362,202,819) | | | | | | | 640,167,379 | |
| |
| | | | | | | | | |
| INFORMATION TECHNOLOGY – 18.7% |
| ELECTRONIC EQUIPMENT, INSTRUMENTS & COMPONENTS - 7.9% |
Anixter International 1 | | | 231,882 | | | | 13,845,674 | |
Cognex Corporation | | | 572,394 | | | | 27,463,464 | |
Coherent 1 | | | 271,145 | | | | 36,976,044 | |
IPG Photonics 1 | | | 114,024 | | | | 17,588,202 | |
National Instruments | | | 959,700 | | | | 40,297,803 | |
†nLIGHT 1 | | | 615,844 | | | | 11,824,205 | |
| | | | | | | | |
| | | | | | | | 147,995,392 | |
| | | | | | | | |
| IT SERVICES - 1.0% |
Jack Henry & Associates | | | 140,763 | | | | 18,850,981 | |
| | | | | | | | |
| SEMICONDUCTORS & SEMICONDUCTOR EQUIPMENT - 4.6% |
Cabot Microelectronics | | | 406,583 | | | | 44,756,657 | |
MKS Instruments | | | 513,769 | | | | 40,017,467 | |
| | | | | | | | |
| | | | | | | | 84,774,124 | |
| | | | | | | | |
| SOFTWARE - 5.2% |
Fair Isaac 1 | | | 162,711 | | | | 51,094,508 | |
Manhattan Associates 1 | | | 663,400 | | | | 45,993,522 | |
| | | | | | | | |
| | | | | | | | 97,088,030 | |
| |
| Total (Cost $155,348,534) | | | | | | | 348,708,527 | |
| |
| | | | | | | | | |
| MATERIALS – 8.8% |
| CHEMICALS - 4.5% |
†Innospec | | | 177,030 | | | | 16,152,217 | |
Minerals Technologies | | | 481,785 | | | | 25,780,315 | |
Quaker Chemical | | | 207,579 | | | | 42,113,628 | |
| | | | | | | | |
| | | | | | | | 84,046,160 | |
| | | | | | | | |
| METALS & MINING - 2.0% |
Reliance Steel & Aluminum | | | 401,528 | | | | 37,992,580 | |
| | | | | | | | |
| PAPER & FOREST PRODUCTS - 2.3% |
Stella-Jones | | | 1,163,000 | | | | 41,971,196 | |
| |
| Total (Cost $116,477,848) | | | | | | | 164,009,936 | |
| |
| 48 | The Royce Funds 2019 Semiannual Report to Shareholders | | THE ACCOMPANYING NOTES ARE AN INTEGRAL PART OF THESE FINANCIAL STATEMENTS |
| June 30, 2019 (unaudited) |
| |
| Royce Premier Fund (continued) |
| | | | | | | | | |
| | | SHARES | | VALUE |
| |
| | | | | | | | | |
| REAL ESTATE – 1.2% |
| REAL ESTATE MANAGEMENT & DEVELOPMENT - 1.2% |
Kennedy-Wilson Holdings | | | 1,057,100 | | | $ | 21,744,547 | |
| |
| Total (Cost $19,986,735) | | | | | | | 21,744,547 | |
| |
| | | | | | | | | |
| TOTAL COMMON STOCKS |
| |
| (Cost $966,560,294) | | | | | | | 1,701,563,860 | |
| |
| | | | | | | | | |
| REPURCHASE AGREEMENT – 8.5% |
Fixed Income Clearing Corporation, 0.50% dated 6/28/19, due 7/1/19, maturity value
$158,700,612 (collateralized by obligations of various U.S. Government Agencies, 1.75%-
1.875% due 4/30/22-5/31/22, valued at $161,870,673) |
| |
| (Cost $158,694,000) | | | | | | | 158,694,000 | |
| |
| | | | | | | | | |
| TOTAL INVESTMENTS – 99.8% |
| |
| (Cost $1,125,254,294) | | | | | | | 1,860,257,860 | |
| |
| | | | | | | | | |
| CASH AND OTHER ASSETS LESS LIABILITIES – 0.2% | | | | | | | 3,458,102 | |
| | | | | | | | |
| | | | | | | | | |
| |
| NET ASSETS – 100.0% | | | | | | $ | 1,863,715,962 | |
| |
| |
| Royce Small-Cap Value Fund |
| Common Stocks – 93.2% |
| | | SHARES | | VALUE |
| |
| | | | | | | | | |
| COMMUNICATION SERVICES – 1.2% |
| MEDIA - 1.2% |
Saga Communications Cl. A | | | 66,959 | | | $ | 2,091,799 | |
| |
| Total (Cost $2,987,385) | | | | | | | 2,091,799 | |
| |
| | | | | | | | | |
| CONSUMER DISCRETIONARY – 14.8% |
| AUTO COMPONENTS - 2.8% |
Gentex Corporation | | | 57,927 | | | | 1,425,583 | |
Stoneridge 1 | | | 26,798 | | | | 845,477 | |
†Tower International | | | 141,108 | | | | 2,751,606 | |
| | | | | | | | |
| | | | | | | | 5,022,666 | |
| | | | | | | | |
| HOTELS, RESTAURANTS & LEISURE - 2.6% |
Cheesecake Factory | | | 19,200 | | | | 839,424 | |
Hilton Grand Vacations 1 | | | 121,423 | | | | 3,863,680 | |
| | | | | | | | |
| | | | | | | | 4,703,104 | |
| | | | | | | | |
| HOUSEHOLD DURABLES - 0.5% |
La-Z-Boy | | | 29,498 | | | | 904,409 | |
| | | | | | | | |
| INTERNET & DIRECT MARKETING RETAIL - 0.2% |
†Points International 1 | | | 22,700 | | | | 280,345 | |
| | | | | | | | |
| SPECIALTY RETAIL - 6.4% |
American Eagle Outfitters | | | 113,645 | | | | 1,920,600 | |
Caleres | | | 90,091 | | | | 1,794,613 | |
Designer Brands Cl. A | | | 204,240 | | | | 3,915,281 | |
Shoe Carnival | | | 138,920 | | | | 3,834,192 | |
| | | | | | | | |
| | | | | | | | 11,464,686 | |
| | | | | | | | |
| TEXTILES, APPAREL & LUXURY GOODS - 2.3% |
G-III Apparel Group 1 | | | 111,000 | | | | 3,265,620 | |
Steven Madden | | | 26,049 | | | | 884,363 | |
| | | | | | | | |
| | | | | | | | 4,149,983 | |
| |
| Total (Cost $28,219,105) | | | | | | | 26,525,193 | |
| |
| | | | | | | | | |
| CONSUMER STAPLES – 1.5% |
| FOOD & STAPLES RETAILING - 1.5% |
Village Super Market Cl. A | | | 100,115 | | | | 2,654,049 | |
| |
| Total (Cost $2,858,090) | | | | | | | 2,654,049 | |
| |
| | | | | | | | | |
| ENERGY – 2.6% |
| ENERGY EQUIPMENT & SERVICES - 1.4% |
Helmerich & Payne | | | 48,584 | | | | 2,459,322 | |
| | | | | | | | |
| OIL, GAS & CONSUMABLE FUELS - 1.2% |
†Alliance Resource Partners L.P. | | | 131,792 | | | | 2,237,828 | |
| |
| Total (Cost $3,557,496) | | | | | | | 4,697,150 | |
| |
| | | | | | | | | |
| FINANCIALS – 25.0% |
| BANKS - 12.1% |
Ames National | | | 98,189 | | | | 2,660,922 | |
Bar Harbor Bankshares | | | 41,471 | | | | 1,102,714 | |
Camden National | | | 78,721 | | | | 3,610,932 | |
City Holding Company | | | 23,242 | | | | 1,772,435 | |
CNB Financial | | | 97,401 | | | | 2,750,604 | |
Codorus Valley Bancorp | | | 35,165 | | | | 808,795 | |
Financial Institutions | | | 44,425 | | | | 1,294,989 | |
Landmark Bancorp | | | 24,629 | | | | 589,865 | |
MidWestOne Financial Group | | | 31,993 | | | | 894,524 | |
National Bankshares | | | 64,363 | | | | 2,505,652 | |
Northrim BanCorp | | | 54,688 | | | | 1,950,174 | |
Unity Bancorp | | | 72,512 | | | | 1,646,022 | |
| | | | | | | | |
| | | | | | | | 21,587,628 | |
| | | | | | | | |
| CAPITAL MARKETS - 2.9% |
Houlihan Lokey Cl. A | | | 19,036 | | | | 847,673 | |
Moelis & Company Cl. A | | | 74,495 | | | | 2,603,600 | |
| THE ACCOMPANYING NOTES ARE AN INTEGRAL PART OF THESE FINANCIAL STATEMENTS | | The Royce Funds 2019 Semiannual Report to Shareholders | 49 |
| |
| Royce Small-Cap Value Fund (continued) |
| | | | | | | | | |
| | | SHARES | | VALUE |
| |
| | | | | | | | | |
| FINANCIALS (continued) |
| CAPITAL MARKETS (continued) |
Pzena Investment Management Cl. A | | | 206,553 | | | $ | 1,774,291 | |
| | | | | | | | |
| | | | | | | | 5,225,564 | |
| | | | | | | | |
| INSURANCE - 2.6% |
James River Group Holdings | | | 18,622 | | | | 873,372 | |
Kingstone Companies | | | 136,623 | | | | 1,181,789 | |
Reinsurance Group of America | | | 17,036 | | | | 2,658,127 | |
| | | | | | | | |
| | | | | | | | 4,713,288 | |
| | | | | | | | |
| THRIFTS & MORTGAGE FINANCE - 7.4% |
Genworth MI Canada | | | 109,389 | | | | 3,461,555 | |
Southern Missouri Bancorp | | | 46,154 | | | | 1,607,544 | |
Timberland Bancorp | | | 51,174 | | | | 1,529,079 | |
TrustCo Bank Corp. NY | | | 397,150 | | | | 3,145,428 | |
WSFS Financial | | | 85,226 | | | | 3,519,834 | |
| | | | | | | | |
| | | | | | | | 13,263,440 | |
| |
| Total (Cost $35,982,318) | | | | | | | 44,789,920 | |
| |
| | | | | | | | | |
| HEALTH CARE – 1.0% |
| HEALTH CARE PROVIDERS & SERVICES - 1.0% |
AMN Healthcare Services 1 | | | 14,817 | | | | 803,822 | |
Ensign Group (The) | | | 19,165 | | | | 1,090,872 | |
| |
| Total (Cost $1,014,421) | | | | | | | 1,894,694 | |
| |
| | | | | | | | | |
| INDUSTRIALS – 30.2% |
| AEROSPACE & DEFENSE - 0.9% |
Magellan Aerospace | | | 127,700 | | | | 1,589,485 | |
| | | | | | | | |
| AIRLINES - 5.3% |
Allegiant Travel | | | 27,080 | | | | 3,885,980 | |
Hawaiian Holdings | | | 103,714 | | | | 2,844,875 | |
Spirit Airlines 1,2 | | | 58,198 | | | | 2,777,791 | |
| | | | | | | | |
| | | | | | | | 9,508,646 | |
| | | | | | | | |
| BUILDING PRODUCTS - 1.1% |
Apogee Enterprises | | | 44,487 | | | | 1,932,515 | |
| | | | | | | | |
| COMMERCIAL SERVICES & SUPPLIES - 2.6% |
Herman Miller | | | 46,399 | | | | 2,074,035 | |
Kimball International Cl. B | | | 149,574 | | | | 2,607,075 | |
| | | | | | | | |
| | | | | | | | 4,681,110 | |
| | | | | | | | |
| CONSTRUCTION & ENGINEERING - 0.5% |
Comfort Systems USA | | | 17,138 | | | | 873,867 | |
| | | | | | | | |
| ELECTRICAL EQUIPMENT - 1.0% |
EnerSys | | | 26,920 | | | | 1,844,020 | |
| | | | | | | | |
| MACHINERY - 7.4% |
Alamo Group | | | 8,663 | | | | 865,694 | |
†Commercial Vehicle Group 1 | | | 316,315 | | | | 2,536,846 | |
Federal Signal | | | 32,810 | | | | 877,667 | |
Meritor 1 | | | 182,168 | | | | 4,417,574 | |
Miller Industries | | | 144,301 | | | | 4,437,256 | |
Wabash National | | | 3,626 | | | | 58,995 | |
| | | | | | | | |
| | | | | | | | 13,194,032 | |
| | | | | | | | |
| PROFESSIONAL SERVICES - 5.7% |
Heidrick & Struggles International | | | 85,545 | | | | 2,563,784 | |
Kforce | | | 42,541 | | | | 1,492,764 | |
Korn Ferry | | | 63,293 | | | | 2,536,150 | |
Resources Connection | | | 106,885 | | | | 1,711,229 | |
Robert Half International | | | 18,416 | | | | 1,049,896 | |
TrueBlue 1 | | | 39,500 | | | | 871,370 | |
| | | | | | | | |
| | | | | | | | 10,225,193 | |
| | | | | | | | |
| ROAD & RAIL - 4.7% |
ArcBest | | | 99,756 | | | | 2,804,141 | |
Old Dominion Freight Line | | | 5,964 | | | | 890,187 | |
Saia 1 | | | 28,041 | | | | 1,813,412 | |
Werner Enterprises | | | 91,154 | | | | 2,833,066 | |
| | | | | | | | |
| | | | | | | | 8,340,806 | |
| | | | | | | | |
| TRADING COMPANIES & DISTRIBUTORS - 1.0% |
†BMC Stock Holdings 1 | | | 86,207 | | | | 1,827,588 | |
| |
| Total (Cost $46,680,385) | | | | | | | 54,017,262 | |
| |
| | | | | | | | | |
| INFORMATION TECHNOLOGY – 15.4% |
| ELECTRONIC EQUIPMENT, INSTRUMENTS & COMPONENTS - 10.1% |
Benchmark Electronics | | | 35,084 | | | | 881,310 | |
Fabrinet 1 | | | 32,454 | | | | 1,611,990 | |
Insight Enterprises 1 | | | 75,583 | | | | 4,398,931 | |
PC Connection | | | 86,676 | | | | 3,031,927 | |
Sanmina Corporation 1 | | | 109,941 | | | | 3,329,013 | |
Vishay Intertechnology | | | 188,939 | | | | 3,121,272 | |
†Vishay Precision Group 1 | | | 44,981 | | | | 1,827,578 | |
| | | | | | | | |
| | | | | | | | 18,202,021 | |
| | | | | | | | |
| SEMICONDUCTORS & SEMICONDUCTOR EQUIPMENT - 5.3% |
Advanced Energy Industries 1 | | | 34,852 | | | | 1,961,122 | |
Kulicke & Soffa Industries | | | 154,469 | | | | 3,483,276 | |
MKS Instruments | | | 43,980 | | | | 3,425,602 | |
Silicon Motion Technology ADR | | | 13,001 | | | | 576,985 | |
| | | | | | | | |
| | | | | | | | 9,446,985 | |
| |
| Total (Cost $20,764,117) | | | | | | | 27,649,006 | |
| |
| | | | | | | | | |
| MATERIALS – 0.5% |
| METALS & MINING - 0.5% |
†Mayville Engineering 1 | | | 63,574 | | | | 877,321 | |
| |
| Total (Cost $917,999) | | | | | | | 877,321 | |
| |
| | | | | | | | | |
| REAL ESTATE – 1.0% |
| REAL ESTATE MANAGEMENT & DEVELOPMENT - 1.0% |
Marcus & Millichap 1 | | | 57,900 | | | | 1,786,215 | |
| |
| Total (Cost $1,669,470) | | | | | | | 1,786,215 | |
| |
| | | | | | | | | |
| TOTAL COMMON STOCKS |
| |
| (Cost $144,650,786) | | | | | | | 166,982,609 | |
| |
| | | | | | | | | |
| REPURCHASE AGREEMENT – 6.7% |
Fixed Income Clearing Corporation, 0.50% dated 6/28/19, due 7/1/19, maturity value
$11,918,497 (collateralized by obligations of various U.S. Government Agencies, 1.75%
due 5/31/22, valued at $12,159,570) |
| |
| (Cost $11,918,000) | | | | | | | 11,918,000 | |
| |
| | | | | | | | | |
| TOTAL INVESTMENTS – 99.9% |
| |
| (Cost $156,568,786) | | | | | | | 178,900,609 | |
| |
| | | | | | | | | |
| CASH AND OTHER ASSETS LESS LIABILITIES – 0.1% | | | | | | | 194,514 | |
| | | | | | | | |
| | | | | | | | | |
| |
| NET ASSETS – 100.0% | | | | | | $ | 179,095,123 | |
| |
| 50 | The Royce Funds 2019 Semiannual Report to Shareholders | | THE ACCOMPANYING NOTES ARE AN INTEGRAL PART OF THESE FINANCIAL STATEMENTS |
| June 30, 2019 (unaudited) |
| |
| Royce Smaller-Companies Growth Fund |
| Common Stocks – 94.2% |
| | | SHARES | | VALUE |
| |
| | | | | | | | | |
| COMMUNICATION SERVICES – 2.8% |
| DIVERSIFIED TELECOMMUNICATION SERVICES - 0.9% |
Bandwidth Cl. A 1 | | | 35,000 | | | $ | 2,625,700 | |
| | | | | | | | |
| ENTERTAINMENT - 1.2% |
†Sea Cl. A ADR 1,2 | | | 108,000 | | | | 3,587,760 | |
| | | | | | | | |
| MEDIA - 0.7% |
Marchex Cl. B 1 | | | 413,099 | | | | 1,941,565 | |
| |
| Total (Cost $3,575,056) | | | | | | | 8,155,025 | |
| |
| | | | | | | | | |
| CONSUMER DISCRETIONARY – 10.1% |
| DIVERSIFIED CONSUMER SERVICES - 0.8% |
†Bright Horizons Family Solutions 1 | | | 15,000 | | | | 2,263,050 | |
| | | | | | | | |
| HOTELS, RESTAURANTS & LEISURE - 0.7% |
Texas Roadhouse | | | 36,000 | | | | 1,932,120 | |
| | | | | | | | |
| HOUSEHOLD DURABLES - 3.1% |
†Cavco Industries 1 | | | 10,000 | | | | 1,575,400 | |
Lovesac Company (The) 1 | | | 167,666 | | | | 5,209,383 | |
†Skyline Champion 1 | | | 72,000 | | | | 1,971,360 | |
| | | | | | | | |
| | | | | | | | 8,756,143 | |
| | | | | | | | |
| INTERNET & DIRECT MARKETING RETAIL - 1.1% |
†Etsy 1 | | | 32,000 | | | | 1,963,840 | |
†Waitr Holdings 1,2 | | | 189,400 | | | | 1,191,326 | |
| | | | | | | | |
| | | | | | | | 3,155,166 | |
| | | | | | | | |
| LEISURE PRODUCTS - 0.5% |
Callaway Golf | | | 85,000 | | | | 1,458,600 | |
| | | | | | | | |
| MULTILINE RETAIL - 0.5% |
Ollies Bargain Outlet Holdings 1 | | | 16,000 | | | | 1,393,760 | |
| | | | | | | | |
| SPECIALTY RETAIL - 2.9% |
Carvana Cl. A 1,2 | | | 28,000 | | | | 1,752,520 | |
Five Below 1 | | | 11,000 | | | | 1,320,220 | |
Monro | | | 62,000 | | | | 5,288,600 | |
| | | | | | | | |
| | | | | | | | 8,361,340 | |
| | | | | | | | |
| TEXTILES, APPAREL & LUXURY GOODS - 0.5% |
Columbia Sportswear | | | 15,000 | | | | 1,502,400 | |
| |
| Total (Cost $22,043,699) | | | | | | | 28,822,579 | |
| |
| | | | | | | | | |
| CONSUMER STAPLES – 1.6% |
| FOOD PRODUCTS - 1.2% |
Freshpet 1,2 | | | 73,000 | | | | 3,322,230 | |
| | | | | | | | |
| PERSONAL PRODUCTS - 0.4% |
†CV Sciences 1,2,3 | | | 300,000 | | | | 1,221,000 | |
| |
| Total (Cost $2,814,464) | | | | | | | 4,543,230 | |
| |
| | | | | | | | | |
| ENERGY – 0.9% |
| OIL, GAS & CONSUMABLE FUELS - 0.9% |
Magnolia Oil & Gas Cl. A 1,2 | | | 128,000 | | | | 1,482,240 | |
Viper Energy Partners L.P. | | | 35,000 | | | | 1,078,700 | |
| |
| Total (Cost $2,619,610) | | | | | | | 2,560,940 | |
| |
| | | | | | | | | |
| FINANCIALS – 7.5% |
| BANKS - 3.9% |
Enterprise Financial Services | | | 41,500 | | | | 1,726,400 | |
Seacoast Banking Corporation of Florida 1 | | | 82,000 | | | | 2,086,080 | |
Southern National Bancorp of Virginia | | | 59,000 | | | | 903,290 | |
TriState Capital Holdings 1 | | | 240,057 | | | | 5,122,816 | |
Webster Financial | | | 26,000 | | | | 1,242,020 | |
| | | | | | | | |
| | | | | | | | 11,080,606 | |
| | | | | | | | |
| CAPITAL MARKETS - 2.0% |
MarketAxess Holdings | | | 9,000 | | | | 2,892,780 | |
Northern Trust | | | 22,000 | | | | 1,980,000 | |
PJT Partners Cl. A | | | 18,000 | | | | 729,360 | |
| | | | | | | | |
| | | | | | | | 5,602,140 | |
| | | | | | | | |
| DIVERSIFIED FINANCIAL SERVICES - 0.2% |
†Black Ridge Acquisition 1,2 | | | 68,000 | | | | 698,360 | |
| | | | | | | | |
| THRIFTS & MORTGAGE FINANCE - 1.4% |
LendingTree 1 | | | 8,000 | | | | 3,360,240 | |
OceanFirst Financial | | | 29,000 | | | | 720,650 | |
| | | | | | | | |
| | | | | | | | 4,080,890 | |
| |
| Total (Cost $15,921,544) | | | | | | | 21,461,996 | |
| |
| | | | | | | | | |
| HEALTH CARE – 24.0% |
| BIOTECHNOLOGY - 8.1% |
†Avid Bioservices 1 | | | 300,000 | | | | 1,680,000 | |
CareDx 1 | | | 25,000 | | | | 899,750 | |
Myriad Genetics 1 | | | 176,000 | | | | 4,889,280 | |
†Natera 1,2 | | | 37,000 | | | | 1,020,460 | |
Oxford Biomedica 1 | | | 224,000 | | | | 1,965,678 | |
REGENXBIO 1,2 | | | 60,000 | | | | 3,082,200 | |
uniQure 1 | | | 60,000 | | | | 4,689,000 | |
Veracyte 1 | | | 172,150 | | | | 4,907,997 | |
| | | | | | | | |
| | | | | | | | 23,134,365 | |
| | | | | | | | |
| HEALTH CARE EQUIPMENT & SUPPLIES - 6.7% |
Apyx Medical 1 | | | 272,415 | | | | 1,830,629 | |
CONMED Corporation | | | 29,000 | | | | 2,481,530 | |
CryoPort 1 | | | 240,198 | | | | 4,400,427 | |
Penumbra 1 | | | 17,000 | | | | 2,720,000 | |
ViewRay 1 | | | 463,000 | | | | 4,079,030 | |
West Pharmaceutical Services | | | 29,000 | | | | 3,629,350 | |
| | | | | | | | |
| | | | | | | | 19,140,966 | |
| | | | | | | | |
| HEALTH CARE PROVIDERS & SERVICES - 3.9% |
Addus HomeCare 1 | | | 30,000 | | | | 2,248,500 | |
†Ensign Group (The) | | | 25,000 | | | | 1,423,000 | |
HealthEquity 1 | | | 19,000 | | | | 1,242,600 | |
†Joint Corp. (The) 1 | | | 140,000 | | | | 2,548,000 | |
PetIQ Cl. A 1,2 | | | 77,000 | | | | 2,537,920 | |
†Providence Service 1 | | | 22,000 | | | | 1,261,480 | |
| | | | | | | | |
| | | | | | | | 11,261,500 | |
| | | | | | | | |
| HEALTH CARE TECHNOLOGY - 0.2% |
Tabula Rasa HealthCare 1,2 | | | 15,000 | | | | 748,950 | |
| | | | | | | | |
| LIFE SCIENCES TOOLS & SERVICES - 3.8% |
Fluidigm Corporation 1,2 | | | 185,400 | | | | 2,284,128 | |
Harvard Bioscience 1 | | | 508,600 | | | | 1,017,200 | |
†Medpace Holdings 1 | | | 4,000 | | | | 261,680 | |
†PureTech Health 1 | | | 492,170 | | | | 1,425,070 | |
Quanterix Corporation 1 | | | 177,600 | | | | 6,001,104 | |
| | | | | | | | |
| | | | | | | | 10,989,182 | |
| | | | | | | | |
| PHARMACEUTICALS - 1.3% |
†Evolus 1,2 | | | 128,000 | | | | 1,871,360 | |
Intersect ENT 1 | | | 77,000 | | | | 1,752,520 | |
| | | | | | | | |
| | | | | | | | 3,623,880 | |
| |
| Total (Cost $51,073,883) | | | | | | | 68,898,843 | |
| |
| | | | | | | | | |
| INDUSTRIALS – 8.6% |
| AEROSPACE & DEFENSE - 1.7% |
| AeroVironment 1,2 | | | 9,500 | | | | 539,315 | |
| BWX Technologies | | | 33,000 | | | | 1,719,300 | |
| Cubic Corporation | | | 43,000 | | | | 2,772,640 | |
| | | | | | | | |
| | | | | | | | 5,031,255 | |
| | | | | | | | |
| THE ACCOMPANYING NOTES ARE AN INTEGRAL PART OF THESE FINANCIAL STATEMENTS | | The Royce Funds 2019 Semiannual Report to Shareholders | 51 |
| |
| Royce Smaller-Companies Growth Fund (continued) |
| | | | | | | | | |
| | | SHARES | | VALUE |
| |
| | | | | | | | | |
| INDUSTRIALS (continued) |
| AIR FREIGHT & LOGISTICS - 0.7% |
Atlas Air Worldwide Holdings 1 | | | 43,000 | | | $ | 1,919,520 | |
| | | | | | | | |
| BUILDING PRODUCTS - 0.8% |
DIRTT Environmental Solutions 1 | | | 388,000 | | | | 2,207,323 | |
| | | | | | | | |
| ELECTRICAL EQUIPMENT - 0.9% |
American Superconductor 1 | | | 202,349 | | | | 1,877,799 | |
†Vicor 1 | | | 22,000 | | | | 683,100 | |
| | | | | | | | |
| | | | | | | | 2,560,899 | |
| | | | | | | | |
| MACHINERY - 0.9% |
Proto Labs 1 | | | 7,000 | | | | 812,140 | |
Woodward | | | 15,000 | | | | 1,697,400 | |
| | | | | | | | |
| | | | | | | | 2,509,540 | |
| | | | | | | | |
| MARINE - 0.5% |
Clarkson | | | 46,976 | | | | 1,497,394 | |
| | | | | | | | |
| PROFESSIONAL SERVICES - 2.1% |
GP Strategies 1 | | | 398,282 | | | | 6,006,093 | |
| | | | | | | | |
| TRADING COMPANIES & DISTRIBUTORS - 1.0% |
Lawson Products 1 | | | 83,000 | | | | 3,048,590 | |
| |
| Total (Cost $23,326,872) | | | | | | | 24,780,614 | |
| |
| | | | | | | | | |
| INFORMATION TECHNOLOGY – 36.1% |
| COMMUNICATIONS EQUIPMENT - 1.2% |
Lumentum Holdings 1,2 | | | 63,000 | | | | 3,364,830 | |
| | | | | | | | |
| ELECTRONIC EQUIPMENT, INSTRUMENTS & COMPONENTS - 6.2% |
Airgain 1,2 | | | 156,411 | | | | 2,213,216 | |
FLIR Systems | | | 48,600 | | | | 2,629,260 | |
Iteris 1,2 | | | 1,607,000 | | | | 8,308,190 | |
Knowles Corporation 1,2 | | | 132,000 | | | | 2,416,920 | |
Rogers Corporation 1 | | | 5,000 | | | | 862,900 | |
†Vishay Precision Group 1 | | | 36,000 | | | | 1,462,680 | |
| | | | | | | | |
| | | | | | | | 17,893,166 | |
| | | | | | | | |
| IT SERVICES - 3.1% |
Twilio Cl. A 1,2 | | | 10,000 | | | | 1,363,500 | |
Unisys Corporation 1 | | | 503,000 | | | | 4,889,160 | |
USA Technologies 1 | | | 345,000 | | | | 2,563,350 | |
| | | | | | | | |
| | | | | | | | 8,816,010 | |
| | | | | | | | |
| SEMICONDUCTORS & SEMICONDUCTOR EQUIPMENT - 7.6% |
Ambarella 1 | | | 14,000 | | | | 617,820 | |
AXT 1 | | | 393,000 | | | | 1,556,280 | |
Brooks Automation | | | 81,000 | | | | 3,138,750 | |
CyberOptics Corporation 1 | | | 137,000 | | | | 2,223,510 | |
Enphase Energy 1,2 | | | 139,000 | | | | 2,533,970 | |
†First Solar 1,2 | | | 23,000 | | | | 1,510,640 | |
MagnaChip Semiconductor 1 | | | 249,961 | | | | 2,587,096 | |
†Nanometrics 1 | | | 61,000 | | | | 2,117,310 | |
Silicon Laboratories 1 | | | 29,000 | | | | 2,998,600 | |
Universal Display | | | 13,000 | | | | 2,444,780 | |
| | | | | | | | |
| | | | | | | | 21,728,756 | |
| | | | | | | | |
| SOFTWARE - 18.0% |
Alarm.com Holdings 1,2 | | | 32,000 | | | | 1,712,000 | |
Avalara 1 | | | 38,000 | | | | 2,743,600 | |
†Blue Prism Group 1 | | | 38,000 | | | | 666,927 | |
†Coupa Software 1,2 | | | 27,000 | | | | 3,418,470 | |
†Descartes Systems Group (The) 1 | | | 38,000 | | | | 1,404,100 | |
Envestnet 1,2 | | | 22,000 | | | | 1,504,140 | |
Everbridge 1 | | | 41,000 | | | | 3,666,220 | |
Five9 1 | | | 40,000 | | | | 2,051,600 | |
ForeScout Technologies 1 | | | 59,000 | | | | 1,997,740 | |
LivePerson 1 | | | 90,000 | | | | 2,523,600 | |
Manhattan Associates 1 | | | 42,000 | | | | 2,911,860 | |
Materialise ADR 1,2 | | | 270,577 | | | | 5,281,663 | |
†Mimecast 1 | | | 31,000 | | | | 1,448,010 | |
†Mitek Systems 1,2 | | | 206,000 | | | | 2,047,640 | |
Paylocity Holding Corporation 1 | | | 89,786 | | | | 8,423,722 | |
Pluralsight Cl. A 1,2 | | | 65,000 | | | | 1,970,800 | |
QAD Cl. A | | | 45,000 | | | | 1,809,450 | |
RingCentral Cl. A 1 | | | 31,000 | | | | 3,562,520 | |
†Workiva Cl. A 1 | | | 28,000 | | | | 1,626,520 | |
Yext 1,2 | | | 47,000 | | | | 944,230 | |
| | | | | | | | |
| | | | | | | | 51,714,812 | |
| |
| Total (Cost $74,904,576) | | | | | | | 103,517,574 | |
| |
| | | | | | | | | |
| REAL ESTATE – 2.6% |
| EQUITY REAL ESTATE INVESTMENT TRUSTS (REITS) - 2.6% |
Community Healthcare Trust | | | 128,000 | | | | 5,044,480 | |
†Postal Realty Trust Cl. A | | | 155,000 | | | | 2,441,250 | |
| |
| Total (Cost $4,718,217) | | | | | | | 7,485,730 | |
| |
| | | | | | | | | |
| TOTAL COMMON STOCKS |
| |
| (Cost $200,997,921) | | | | | | | 270,226,531 | |
| |
| | | | | | | | | |
| REPURCHASE AGREEMENT – 6.7% |
Fixed Income Clearing Corporation, 0.50% dated 6/28/19, due 7/1/19, maturity value
$19,267,803 (collateralized by obligations of various U.S. Government Agencies, 1.75%
due 5/31/22, valued at $19,656,636) |
| |
| (Cost $19,267,000) | | | | | | | 19,267,000 | |
| |
| | | | | | | | | |
| COLLATERAL RECEIVED FOR SECURITIES LOANED – 3.9% |
| Money Market Funds | | | | | | | | |
Federated Government Obligations Fund (7 day yield-2.2655%) | | | | | | | | |
| |
| (Cost $11,043,679) | | | | | | | 11,043,679 | |
| |
| | | | | | | | | |
| TOTAL INVESTMENTS – 104.8% |
| |
| (Cost $231,308,600) | | | | | | | 300,537,210 | |
| |
| | | | | | | | | |
| LIABILITIES LESS CASH AND OTHER ASSETS – (4.8)% | | | | (13,629,391 | ) |
| | | | | | | | |
| | | | | | | | | |
| |
| NET ASSETS – 100.0% | | | | | | $ | 286,907,819 | |
| |
| 52 | The Royce Funds 2019 Semiannual Report to Shareholders | | THE ACCOMPANYING NOTES ARE AN INTEGRAL PART OF THESE FINANCIAL STATEMENTS |
| June 30, 2019 (unaudited) |
| |
| Royce Special Equity Fund |
| Common Stocks – 79.2% |
| | | SHARES | | VALUE |
| |
| | | | | | | | | |
| COMMUNICATION SERVICES – 10.5% |
| MEDIA - 10.5% |
Meredith Corporation | | | 1,350,000 | | | $ | 74,331,000 | |
Scholastic Corporation | | | 1,590,000 | | | | 52,851,600 | |
| |
| Total (Cost $99,960,281) | | | | | | | 127,182,600 | |
| |
| | | | | | | | | |
| CONSUMER DISCRETIONARY – 20.0% |
| AUTO COMPONENTS - 9.9% |
Cooper Tire & Rubber | | | 1,005,000 | | | | 31,707,750 | |
Gentex Corporation | | | 1,020,000 | | | | 25,102,200 | |
Standard Motor Products 5 | | | 1,380,000 | | | | 62,569,200 | |
| | | | | | | | |
| | | | | | | | 119,379,150 | |
| | | | | | | | |
| AUTOMOBILES - 1.3% |
Winnebago Industries | | | 420,000 | | | | 16,233,000 | |
| | | | | | | | |
| HOTELS, RESTAURANTS & LEISURE - 0.5% |
Bowl America Cl. A 5 | | | 375,000 | | | | 5,962,500 | |
| | | | | | | | |
| HOUSEHOLD DURABLES - 3.7% |
Bassett Furniture Industries | | | 511,000 | | | | 7,792,750 | |
Flexsteel Industries 5 | | | 775,000 | | | | 13,221,500 | |
Hooker Furniture 5 | | | 1,155,000 | | | | 23,816,100 | |
| | | | | | | | |
| | | | | | | | 44,830,350 | |
| | | | | | | | |
| LEISURE PRODUCTS - 0.9% |
Johnson Outdoors Cl. A | | | 146,845 | | | | 10,950,232 | |
| | | | | | | | |
| SPECIALTY RETAIL - 3.7% |
Children’s Place | | | 325,000 | | | | 30,998,500 | |
Haverty Furniture | | | 811,000 | | | | 13,811,330 | |
| | | | | | | | |
| | | | | | | | 44,809,830 | |
| |
| Total (Cost $219,661,445) | | | | | | | 242,165,062 | |
| |
| | | | | | | | | |
| CONSUMER STAPLES – 8.5% |
| FOOD & STAPLES RETAILING - 2.9% |
Weis Markets | | | 955,000 | | | | 34,771,550 | |
| | | | | | | | |
| FOOD PRODUCTS - 5.6% |
John B. Sanfilippo & Son 5 | | | 845,000 | | | | 67,338,050 | |
| |
| Total (Cost $83,051,551) | | | | | | | 102,109,600 | |
| |
| | | | | | | | | |
| ENERGY – 0.6% |
| ENERGY EQUIPMENT & SERVICES - 0.6% |
RPC | | | 1,048,300 | | | | 7,558,243 | |
| |
| Total (Cost $14,156,500) | | | | | | | 7,558,243 | |
| |
| | | | | | | | | |
| INDUSTRIALS – 17.9% |
| AEROSPACE & DEFENSE - 3.3% |
National Presto Industries 5 | | | 423,000 | | | | 39,461,670 | |
| | | | | | | | |
| BUILDING PRODUCTS - 1.9% |
Insteel Industries 5 | | | 1,094,417 | | | | 22,785,762 | |
| | | | | | | | |
| COMMERCIAL SERVICES & SUPPLIES - 1.4% |
Ennis | | | 850,900 | | | | 17,460,468 | |
| | | | | | | | |
| CONSTRUCTION & ENGINEERING - 1.0% |
Argan | | | 312,500 | | | | 12,675,000 | |
| | | | | | | | |
| ELECTRICAL EQUIPMENT - 5.7% |
Hubbell Incorporated | | | 529,000 | | | | 68,981,600 | |
| | | | | | | | |
| MACHINERY - 3.9% |
Gencor Industries 1,5 | | | 1,148,225 | | | | 14,926,925 | |
Hurco Companies 5 | | | 630,000 | | | | 22,402,800 | |
Miller Industries | | | 316,000 | | | | 9,717,000 | |
| | | | | | | | |
| | | | | | | | 47,046,725 | |
| | | | | | | | |
| PROFESSIONAL SERVICES - 0.7% |
Resources Connection | | | 529,269 | | | | 8,473,596 | |
| |
| Total (Cost $142,753,442) | | | | | | | 216,884,821 | |
| |
| | | | | | | | | |
| INFORMATION TECHNOLOGY – 12.9% |
| ELECTRONIC EQUIPMENT, INSTRUMENTS & COMPONENTS - 5.1% |
AVX Corporation | | | 2,370,000 | | | | 39,342,000 | |
Vishay Intertechnology | | | 1,355,000 | | | | 22,384,600 | |
| | | | | | | | |
| | | | | | | | 61,726,600 | |
| | | | | | | | |
| IT SERVICES - 4.9% |
Computer Services 3,5 | | | 1,600,000 | | | | 59,040,000 | |
| | | | | | | | |
| SEMICONDUCTORS & SEMICONDUCTOR EQUIPMENT - 2.9% |
Axcelis Technologies 1 | | | 502,500 | | | | 7,562,625 | |
Kulicke & Soffa Industries | | | 1,200,000 | | | | 27,060,000 | |
| | | | | | | | |
| | | | | | | | 34,622,625 | |
| |
| Total (Cost $109,040,540) | | | | | | | 155,389,225 | |
| |
| | | | | | | | | |
| MATERIALS – 5.3% |
| CHEMICALS - 2.2% |
Huntsman Corporation | | | 1,295,000 | | | | 26,469,800 | |
| | | | | | | | |
| PAPER & FOREST PRODUCTS - 3.1% |
Louisiana-Pacific | | | 650,000 | | | | 17,043,000 | |
†Mercer International | | | 340,000 | | | | 5,259,800 | |
†Verso Corporation Cl. A 1 | | | 820,000 | | | | 15,621,000 | |
| | | | | | | | |
| | | | | | | | 37,923,800 | |
| |
| Total (Cost $63,461,917) | | | | | | | 64,393,600 | |
| |
| | | | | | | | | |
| REAL ESTATE – 3.5% |
| REAL ESTATE MANAGEMENT & DEVELOPMENT - 3.5% |
Marcus & Millichap 1 | | | 1,375,000 | | | | 42,418,750 | |
| |
| Total (Cost $37,589,909) | | | | | | | 42,418,750 | |
| |
| | | | | | | | | |
| TOTAL COMMON STOCKS |
| |
| (Cost $769,675,585) | | | | | | | 958,101,901 | |
| |
| | | | | | | | | |
| REPURCHASE AGREEMENT – 20.8% |
Fixed Income Clearing Corporation, 0.50% dated 6/28/19, due 7/1/19, maturity value
$251,974,499 (collateralized by obligations of various U.S. Government Agencies, 1.75%
due 5/31/22, valued at $257,003,623) |
| |
| (Cost $251,964,000) | | | | | | | 251,964,000 | |
| |
| | | | | | | | | |
| TOTAL INVESTMENTS – 100.0% |
| |
| (Cost $1,021,639,585) | | | | | | | 1,210,065,901 | |
| |
| | | | | | | | | |
| LIABILITIES LESS CASH AND OTHER ASSETS – (0.0)% | | | | | | | (418,609 | ) |
| | | | | | | | |
| | | | | | | | | |
| |
| NET ASSETS – 100.0% | | | | | | $ | 1,209,647,292 | |
| |
| THE ACCOMPANYING NOTES ARE AN INTEGRAL PART OF THESE FINANCIAL STATEMENTS | | The Royce Funds 2019 Semiannual Report to Shareholders | 53 |
| |
| Royce Total Return Fund |
| Common Stocks – 98.0% |
| | | SHARES | | VALUE |
| |
| | | | | | | | | |
| COMMUNICATION SERVICES – 2.4% |
| DIVERSIFIED TELECOMMUNICATION SERVICES - 0.6% |
ATN International | | | 153,681 | | | $ | 8,872,004 | |
IDT Corporation Cl. B 1 | | | 113,033 | | | | 1,070,423 | |
| | | | | | | | |
| | | | | | | | 9,942,427 | |
| | | | | | | | |
| MEDIA - 1.7% |
Gannett Company | | | 179,006 | | | | 1,460,689 | |
Meredith Corporation | | | 352,935 | | | | 19,432,601 | |
Saga Communications Cl. A | | | 170,341 | | | | 5,321,453 | |
| | | | | | | | |
| | | | | | | | 26,214,743 | |
| | | | | | | | |
| WIRELESS TELECOMMUNICATION SERVICES - 0.1% |
Telephone and Data Systems | | | 46,859 | | | | 1,424,513 | |
| |
| Total (Cost $32,782,544) | | | | | | | 37,581,683 | |
| |
| | | | | | | | | |
| CONSUMER DISCRETIONARY – 6.2% |
| AUTO COMPONENTS - 2.2% |
Gentex Corporation | | | 568,414 | | | | 13,988,669 | |
LCI Industries | | | 86,470 | | | | 7,782,300 | |
Nokian Renkaat | | | 142,529 | | | | 4,450,435 | |
Standard Motor Products | | | 75,682 | | | | 3,431,422 | |
Superior Industries International | | | 118,569 | | | | 410,249 | |
†Tower International | | | 205,758 | | | | 4,012,281 | |
| | | | | | | | |
| | | | | | | | 34,075,356 | |
| | | | | | | | |
| AUTOMOBILES - 0.3% |
Thor Industries | | | 82,313 | | | | 4,811,195 | |
| | | | | | | | |
| DISTRIBUTORS - 0.4% |
†Core-Mark Holding | | | 16,260 | | | | 645,847 | |
Weyco Group | | | 218,847 | | | | 5,845,404 | |
| | | | | | | | |
| | | | | | | | 6,491,251 | |
| | | | | | | | |
| HOTELS, RESTAURANTS & LEISURE - 0.1% |
Cheesecake Factory | | | 58,439 | | | | 2,554,953 | |
| | | | | | | | |
| HOUSEHOLD DURABLES - 0.8% |
Ethan Allen Interiors | | | 404,341 | | | | 8,515,421 | |
La-Z-Boy | | | 122,733 | | | | 3,762,994 | |
| | | | | | | | |
| | | | | | | | 12,278,415 | |
| | | | | | | | |
| MULTILINE RETAIL - 0.1% |
Big Lots | | | 14,422 | | | | 412,613 | |
Dillard’s Cl. A | | | 12,385 | | | | 771,338 | |
| | | | | | | | |
| | | | | | | | 1,183,951 | |
| | | | | | | | |
| SPECIALTY RETAIL - 2.1% |
Aaron’s | | | 32,580 | | | | 2,000,738 | |
American Eagle Outfitters | | | 251,623 | | | | 4,252,429 | |
Bed Bath & Beyond | | | 129,024 | | | | 1,499,259 | |
Buckle (The) | | | 91,404 | | | | 1,582,203 | |
Caleres | | | 270,145 | | | | 5,381,288 | |
Cato Corporation (The) Cl. A | | | 67,507 | | | | 831,686 | |
Chico’s FAS | | | 132,453 | | | | 446,367 | |
Designer Brands Cl. A | | | 321,519 | | | | 6,163,519 | |
Penske Automotive Group | | | 89,968 | | | | 4,255,486 | |
Shoe Carnival | | | 222,341 | | | | 6,136,612 | |
| | | | | | | | |
| | | | | | | | 32,549,587 | |
| | | | | | | | |
| TEXTILES, APPAREL & LUXURY GOODS - 0.2% |
J.G. Boswell Company 3 | | | 982 | | | | 588,218 | |
Movado Group | | | 40,033 | | | | 1,080,891 | |
Steven Madden | | | 42,651 | | | | 1,448,001 | |
| | | | | | | | |
| | | | | | | | 3,117,110 | |
| |
| Total (Cost $81,704,231) | | | | | | | 97,061,818 | |
| |
| | | | | | | | | |
| CONSUMER STAPLES – 3.9% |
| BEVERAGES - 0.1% |
Compania Cervecerias Unidas ADR | | | 82,206 | | | | 2,322,320 | |
| | | | | | | | |
| FOOD & STAPLES RETAILING - 1.0% |
Village Super Market Cl. A | | | 564,625 | | | | 14,968,209 | |
| | | | | | | | |
| FOOD PRODUCTS - 2.6% |
Flowers Foods | | | 260,538 | | | | 6,062,720 | |
Fresh Del Monte Produce | | | 181,935 | | | | 4,903,148 | |
Hershey Creamery 3 | | | 677 | | | | 2,775,700 | |
Lancaster Colony | | | 47,107 | | | | 7,000,100 | |
Tootsie Roll Industries | | | 514,354 | | | | 18,995,093 | |
| | | | | | | | |
| | | | | | | | 39,736,761 | |
| | | | | | | | |
| HOUSEHOLD PRODUCTS - 0.1% |
WD-40 Company | | | 9,107 | | | | 1,448,377 | |
| | | | | | | | |
| PERSONAL PRODUCTS - 0.1% |
Nu Skin Enterprises Cl. A | | | 29,448 | | | | 1,452,375 | |
| |
| Total (Cost $40,072,549) | | | | | | | 59,928,042 | |
| |
| | | | | | | | | |
| ENERGY – 3.7% |
| ENERGY EQUIPMENT & SERVICES - 2.5% |
Core Laboratories | | | 47,800 | | | | 2,498,984 | |
Helmerich & Payne | | | 149,331 | | | | 7,559,135 | |
Pason Systems | | | 598,496 | | | | 8,674,319 | |
RPC | | | 166,558 | | | | 1,200,883 | |
SEACOR Marine Holdings 1 | | | 252,849 | | | | 3,782,621 | |
TGS-NOPEC Geophysical | | | 530,159 | | | | 14,866,043 | |
| | | | | | | | |
| | | | | | | | 38,581,985 | |
| | | | | | | | |
| OIL, GAS & CONSUMABLE FUELS - 1.2% |
Alliance Resource Partners L.P. | | | 245,211 | | | | 4,163,683 | |
†Arch Coal | | | 9,444 | | | | 889,719 | |
†Brigham Minerals Cl. A 1 | | | 50,000 | | | | 1,073,000 | |
Dorchester Minerals L.P. | | | 249,438 | | | | 4,567,210 | |
PBF Energy Cl. A | | | 69,310 | | | | 2,169,403 | |
Permian Basin Royalty Trust | | | 659,344 | | | | 4,015,405 | |
Sabine Royalty Trust | | | 8,810 | | | | 424,378 | |
San Juan Basin Royalty Trust | | | 534,344 | | | | 2,046,537 | |
| | | | | | | | |
| | | | | | | | 19,349,335 | |
| |
| Total (Cost $56,067,564) | | | | | | | 57,931,320 | |
| |
| | | | | | | | | |
| FINANCIALS – 34.5% |
| BANKS - 11.9% |
Ames National | | | 256,157 | | | | 6,941,855 | |
Associated Banc-Corp | | | 375,194 | | | | 7,931,601 | |
Bank of Hawaii | | | 238,655 | | | | 19,786,886 | |
Bank of N.T. Butterfield & Son | | | 46,729 | | | | 1,586,917 | |
Bank OZK | | | 111,620 | | | | 3,358,646 | |
Bar Harbor Bankshares | | | 159,013 | | | | 4,228,156 | |
BLOM Bank Cl. B GDR | | | 225,597 | | | | 1,635,578 | |
BOK Financial | | | 259,091 | | | | 19,556,189 | |
†Cadence Bancorporation Cl. | | | 45,902 | | | | 954,762 | |
Camden National | | | 177,950 | | | | 8,162,567 | |
Canadian Western Bank | | | 498,441 | | | | 11,369,121 | |
City Holding Company | | | 56,435 | | | | 4,303,733 | |
CNB Financial | | | 208,572 | | | | 5,890,073 | |
Codorus Valley Bancorp | | | 105,097 | | | | 2,417,231 | |
Farmers & Merchants Bank of Long Beach 3 | | | 403 | | | | 3,344,900 | |
Financial Institutions | | | 172,953 | | | | 5,041,580 | |
First Citizens BancShares Cl. A | | | 58,797 | | | | 26,474,525 | |
First National Bank Alaska 3 | | | 24,310 | | | | 5,737,160 | |
First of Long Island (The) | | | 82,656 | | | | 1,659,733 | |
Hanmi Financial | | | 113,832 | | | | 2,535,039 | |
Landmark Bancorp | | | 97,118 | | | | 2,325,976 | |
MidWestOne Financial Group | | | 120,865 | | | | 3,379,385 | |
| 54 | The Royce Funds 2019 Semiannual Report to Shareholders | | THE ACCOMPANYING NOTES ARE AN INTEGRAL PART OF THESE FINANCIAL STATEMENTS |
| June 30, 2019 (unaudited) |
| |
| Royce Total Return Fund (continued) |
| | | | | | | | | |
| | | SHARES | | VALUE |
| |
| | | | | | | | | |
| FINANCIALS (continued) |
| BANKS (continued) |
National Bankshares | | | 123,865 | | | $ | 4,822,064 | |
Northrim BanCorp | | | 128,900 | | | | 4,596,574 | |
Peapack-Gladstone Financial | | | 403,576 | | | | 11,348,557 | |
Popular | | | 223,226 | | | | 12,107,778 | |
Unity Bancorp | | | 153,942 | | | | 3,494,483 | |
| | | | | | | | |
| | | | | | | | 184,991,069 | |
| | | | | | | | |
| CAPITAL MARKETS - 10.8% |
AllianceBernstein Holding L.P. | | | 371,187 | | | | 11,031,678 | |
Ares Management Cl. A | | | 1,007,713 | | | | 26,371,849 | |
Artisan Partners Asset Management Cl. A | | | 179,935 | | | | 4,951,811 | |
Ashmore Group | | | 2,259,996 | | | | 14,623,060 | |
Associated Capital Group Cl. A | | | 158,592 | | | | 5,931,341 | |
Bolsa Mexicana de Valores | | | 4,831,182 | | | | 9,116,791 | |
Cohen & Steers | | | 301,740 | | | | 15,521,506 | |
Coronation Fund Managers | | | 470,890 | | | | 1,494,411 | |
Egyptian Financial Group-Hermes Holding Company | | | 1,298,385 | | | | 1,337,659 | |
Federated Investors Cl. B | | | 318,615 | | | | 10,354,988 | |
GAMCO Investors Cl. A | | | 155,498 | | | | 2,980,897 | |
Houlihan Lokey Cl. A | | | 31,068 | | | | 1,383,458 | |
Moelis & Company Cl. A | | | 125,643 | | | | 4,391,223 | |
Morningstar | | | 10,252 | | | | 1,482,849 | |
MVC Capital | | | 271,389 | | | | 2,499,493 | |
Och-Ziff Capital Management Group Cl. A | | | 57,638 | | | | 1,323,368 | |
Pzena Investment Management Cl. A | | | 369,841 | | | | 3,176,934 | |
Rothschild & Co | | | 56,542 | | | | 1,832,377 | |
Sprott | | | 3,448,362 | | | | 8,874,025 | |
TMX Group | | | 266,024 | | | | 18,506,194 | |
Value Partners Group | | | 9,631,870 | | | | 6,423,959 | |
Virtu Financial Cl. A | | | 373,089 | | | | 8,125,878 | |
Vontobel Holding | | | 64,993 | | | | 3,615,161 | |
Waddell & Reed Financial Cl. A | | | 85,811 | | | | 1,430,469 | |
Westwood Holdings Group | | | 34,794 | | | | 1,224,749 | |
| | | | | | | | |
| | | | | | | | 168,006,128 | |
| | | | | | | | |
| DIVERSIFIED FINANCIAL SERVICES - 0.2% |
First Pacific | | | 638,477 | | | | 259,095 | |
Jefferies Financial Group | | | 163,003 | | | | 3,134,547 | |
| | | | | | | | |
| | | | | | | | 3,393,642 | |
| | | | | | | | |
| INSURANCE - 9.3% |
Alleghany Corporation 1 | | | 24,880 | | | | 16,946,017 | |
Assured Guaranty | | | 254,266 | | | | 10,699,513 | |
E-L Financial | | | 41,252 | | | | 23,468,168 | |
Employers Holdings | | | 65,753 | | | | 2,779,379 | |
Erie Indemnity Cl. A | | | 171,214 | | | | 43,536,296 | |
First American Financial | | | 65,911 | | | | 3,539,421 | |
Horace Mann Educators | | | 16,191 | | | | 652,335 | |
James River Group Holdings | | | 29,569 | | | | 1,386,786 | |
Kingstone Companies | | | 213,240 | | | | 1,844,526 | |
Mercury General | | | 61,295 | | | | 3,830,938 | |
National Western Life Group Cl. A | | | 5,120 | | | | 1,315,840 | |
ProAssurance Corporation | | | 306,323 | | | | 11,061,324 | |
Reinsurance Group of America | | | 27,754 | | | | 4,330,457 | |
RLI Corp. | | | 109,744 | | | | 9,406,158 | |
State Auto Financial | | | 170,867 | | | | 5,980,345 | |
Universal Insurance Holdings | | | 43,073 | | | | 1,201,737 | |
White Mountains Insurance Group | | | 2,042 | | | | 2,085,821 | |
| | | | | | | | |
| | | | | | | | 144,065,061 | |
| | | | | | | | |
| THRIFTS & MORTGAGE FINANCE - 2.3% |
Genworth MI Canada | | | 341,750 | | | | 10,814,494 | |
New York Community Bancorp | | | 380,167 | | | | 3,794,067 | |
Southern Missouri Bancorp | | | 109,788 | | | | 3,823,916 | |
Timberland Bancorp | | | 149,242 | | | | 4,459,351 | |
TrustCo Bank Corp. NY | | | 882,333 | | | | 6,988,077 | |
WSFS Financial | | | 161,188 | | | | 6,657,064 | |
| | | | | | | | |
| | | | | | | | 36,536,969 | |
| |
| Total (Cost $339,724,858) | | | | | | | 536,992,869 | |
| |
| | | | | | | | | |
| HEALTH CARE – 1.3% |
| HEALTH CARE EQUIPMENT & SUPPLIES - 1.0% |
Atrion Corporation | | | 5,195 | | | | 4,429,984 | |
Hill-Rom Holdings | | | 96,796 | | | | 10,126,798 | |
Meridian Bioscience 1 | | | 70,141 | | | | 833,275 | |
| | | | | | | | |
| | | | | | | | 15,390,057 | |
| | | | | | | | |
| HEALTH CARE PROVIDERS & SERVICES - 0.3% |
Chemed Corporation | | | 7,870 | | | | 2,839,811 | |
Ensign Group (The) | | | 29,849 | | | | 1,699,005 | |
| | | | | | | | |
| | | | | | | | 4,538,816 | |
| |
| Total (Cost $6,342,070) | | | | | | | 19,928,873 | |
| |
| | | | | | | | | |
| INDUSTRIALS – 25.9% |
| AEROSPACE & DEFENSE - 1.8% |
HEICO Corporation | | | 186,333 | | | | 24,933,219 | |
Magellan Aerospace | | | 206,621 | | | | 2,571,816 | |
| | | | | | | | |
| | | | | | | | 27,505,035 | |
| | | | | | | | |
| AIRLINES - 0.8% |
Allegiant Travel | | | 47,808 | | | | 6,860,448 | |
Hawaiian Holdings | | | 197,734 | | | | 5,423,844 | |
| | | | | | | | |
| | | | | | | | 12,284,292 | |
| | | | | | | | |
| BUILDING PRODUCTS - 0.2% |
Apogee Enterprises | | | 71,874 | | | | 3,122,206 | |
| | | | | | | | |
| COMMERCIAL SERVICES & SUPPLIES - 5.9% |
ABM Industries | | | 335,937 | | | | 13,437,480 | |
†ACCO Brands | | | 102,401 | | | | 805,896 | |
Ennis | | | 79,697 | | | | 1,635,383 | |
Herman Miller | | | 73,660 | | | | 3,292,602 | |
HNI Corporation | | | 302,138 | | | | 10,689,642 | |
Kimball International Cl. B | | | 789,026 | | | | 13,752,723 | |
McGrath RentCorp | | | 233,734 | | | | 14,526,568 | |
MSA Safety | | | 110,691 | | | | 11,665,725 | |
Ritchie Bros. Auctioneers | | | 548,937 | | | | 18,235,687 | |
Tetra Tech | | | 19,208 | | | | 1,508,788 | |
UniFirst Corporation | | | 14,196 | | | | 2,676,940 | |
| | | | | | | | |
| | | | | | | | 92,227,434 | |
| | | | | | | | |
| CONSTRUCTION & ENGINEERING - 1.4% |
Arcosa | | | 159,334 | | | | 5,995,738 | |
Argan | | | 175,250 | | | | 7,108,140 | |
Comfort Systems USA | | | 87,414 | | | | 4,457,240 | |
EMCOR Group | | | 48,130 | | | | 4,240,253 | |
| | | | | | | | |
| | | | | | | | 21,801,371 | |
| | | | | | | | |
| ELECTRICAL EQUIPMENT - 2.0% |
EnerSys | | | 43,556 | | | | 2,983,586 | |
†GrafTech International | | | 70,887 | | | | 815,201 | |
Hubbell Incorporated | | | 150,653 | | | | 19,645,151 | |
Preformed Line Products | | | 144,119 | | | | 8,001,487 | |
| | | | | | | | |
| | | | | | | | 31,445,425 | |
| | | | | | | | |
| INDUSTRIAL CONGLOMERATES - 0.9% | | | | | | | | |
Raven Industries | | | 383,640 | | | | 13,765,003 | |
| | | | | | | | |
| THE ACCOMPANYING NOTES ARE AN INTEGRAL PART OF THESE FINANCIAL STATEMENTS | | The Royce Funds 2019 Semiannual Report to Shareholders | 55 |
| |
| Royce Total Return Fund (continued) |
| | | | | | | | | |
| | | SHARES | | VALUE |
| |
| | | | | | | | | |
| INDUSTRIALS (continued) |
| MACHINERY - 8.5% |
Alamo Group | | | 20,373 | | | $ | 2,035,874 | |
Federal Signal | | | 52,872 | | | | 1,414,326 | |
Franklin Electric | | | 329,956 | | | | 15,672,910 | |
Gorman-Rupp Company (The) | | | 289,740 | | | | 9,512,164 | |
Helios Technologies | | | 131,474 | | | | 6,101,708 | |
Hillenbrand | | | 22,552 | | | | 892,383 | |
Kadant | | | 21,227 | | | | 1,927,624 | |
Lincoln Electric Holdings | | | 125,101 | | | | 10,298,314 | |
Lindsay Corporation | | | 134,781 | | | | 11,080,346 | |
Miller Industries | | | 279,767 | | | | 8,602,835 | |
Mueller Industries | | | 217,867 | | | | 6,376,967 | |
Nordson Corporation | | | 33,295 | | | | 4,704,917 | |
Standex International | | | 29,164 | | | | 2,133,055 | |
Starrett (L.S.) Company (The) Cl. A 1 | | | 300,499 | | | | 1,989,303 | |
Tennant Company | | | 246,943 | | | | 15,112,912 | |
Trinity Industries | | | 478,003 | | | | 9,918,562 | |
Wabash National | | | 599,192 | | | | 9,748,854 | |
Woodward | | | 135,353 | | | | 15,316,546 | |
| | | | | | | | |
| | | | | | | | 132,839,600 | |
| | | | | | | | |
| MARINE - 1.0% |
Clarkson | | | 473,771 | | | | 15,101,795 | |
| | | | | | | | |
| PROFESSIONAL SERVICES - 2.1% |
Exponent | | | 29,651 | | | | 1,735,769 | |
Forrester Research 1 | | | 28,805 | | | | 1,354,699 | |
Heidrick & Struggles International | | | 172,748 | | | | 5,177,258 | |
Kforce | | | 66,394 | | | | 2,329,765 | |
Korn Ferry | | | 113,041 | | | | 4,529,553 | |
ManpowerGroup | | | 123,533 | | | | 11,933,288 | |
Resources Connection | | | 172,665 | | | | 2,764,367 | |
Robert Half International | | | 50,585 | | | | 2,883,851 | |
| | | | | | | | |
| | | | | | | | 32,708,550 | |
| | | | | | | | |
| ROAD & RAIL - 0.6% |
ArcBest | | | 194,138 | | | | 5,457,219 | |
Werner Enterprises | | | 144,436 | | | | 4,489,071 | |
| | | | | | | | |
| | | | | | | | 9,946,290 | |
| | | | | | | | |
| TRADING COMPANIES & DISTRIBUTORS - 0.7% |
Air Lease Cl. A | | | 108,346 | | | | 4,479,024 | |
Applied Industrial Technologies | | | 38,846 | | | | 2,390,194 | |
Systemax | | | 175,754 | | | | 3,894,709 | |
| | | | | | | | |
| | | | | | | | 10,763,927 | |
| |
| Total (Cost $187,769,034) | | | | | | | 403,510,928 | |
| |
| | | | | | | | | |
| INFORMATION TECHNOLOGY – 5.4% |
| COMMUNICATIONS EQUIPMENT - 0.1% |
ADTRAN | | | 118,908 | | | | 1,813,347 | |
| | | | | | | | |
| ELECTRONIC EQUIPMENT, INSTRUMENTS & COMPONENTS - 3.4% |
AVX Corporation | | | 781,325 | | | | 12,969,995 | |
Bel Fuse Cl. A | | | 18,080 | | | | 265,776 | |
Benchmark Electronics | | | 57,483 | | | | 1,443,973 | |
Methode Electronics | | | 497,870 | | | | 14,224,146 | |
National Instruments | | | 210,741 | | | | 8,849,014 | |
PC Connection | | | 175,961 | | | | 6,155,116 | |
Vishay Intertechnology | | | 511,605 | | | | 8,451,715 | |
| | | | | | | | |
| | | | | | | | 52,359,735 | |
| | | | | | | | |
| IT SERVICES - 0.8% |
KBR | | | 428,746 | | | | 10,692,925 | |
MAXIMUS | | | 34,023 | | | | 2,468,029 | |
| | | | | | | | |
| | | | | | | | 13,160,954 | |
| | | | | | | | |
| SEMICONDUCTORS & SEMICONDUCTOR EQUIPMENT - 0.7% |
Kulicke & Soffa Industries | | | 223,826 | | | | 5,047,276 | |
MKS Instruments | | | 56,852 | | | | 4,428,202 | |
Silicon Motion Technology ADR | | | 33,921 | | | | 1,505,414 | |
| | | | | | | | |
| | | | | | | | 10,980,892 | |
| | | | | | | | |
| SOFTWARE - 0.4% |
Ebix | | | 32,270 | | | | 1,620,599 | |
j2 Global 1 | | | 53,039 | | | | 4,714,637 | |
| | | | | | | | |
| | | | | | | | 6,335,236 | |
| |
| Total (Cost $58,067,577) | | | | | | | 84,650,164 | |
| |
| | | | | | | | | |
| MATERIALS – 10.4% |
| CHEMICALS - 5.5% |
Albemarle Corporation | | | 89,218 | | | | 6,281,839 | |
Balchem Corporation | | | 117,521 | | | | 11,748,574 | |
Cabot Corporation | | | 276,359 | | | | 13,185,088 | |
Chase Corporation | | | 123,178 | | | | 13,258,880 | |
FutureFuel Corporation | | | 86,343 | | | | 1,009,350 | |
Minerals Technologies | | | 175,307 | | | | 9,380,678 | |
Quaker Chemical | | | 144,546 | | | | 29,325,493 | |
Trinseo | | | 41,027 | | | | 1,737,083 | |
| | | | | | | | |
| | | | | | | | 85,926,985 | |
| | | | | | | | |
| CONTAINERS & PACKAGING - 1.8% |
AptarGroup | | | 70,061 | | | | 8,711,385 | |
Mayr-Melnhof Karton | | | 40,544 | | | | 5,098,946 | |
Sonoco Products | | | 230,885 | | | | 15,086,026 | |
| | | | | | | | |
| | | | | | | | 28,896,357 | |
| | | | | | | | |
| METALS & MINING - 2.6% |
Carpenter Technology | | | 108,024 | | | | 5,182,991 | |
Ferroglobe (Warranty Insurance Trust) 1,4 | | | 569,803 | | | | 0 | |
Franco-Nevada | | | 64,859 | | | | 5,505,232 | |
Gold Fields ADR | | | 1,181,593 | | | | 6,392,418 | |
Haynes International | | | 225,684 | | | | 7,179,008 | |
Royal Gold | | | 16,191 | | | | 1,659,416 | |
Schnitzer Steel Industries Cl. A | | | 97,989 | | | | 2,564,372 | |
Worthington Industries | | | 284,773 | | | | 11,464,961 | |
| | | | | | | | |
| | | | | | | | 39,948,398 | |
| | | | | | | | |
| PAPER & FOREST PRODUCTS - 0.5% |
Domtar Corporation | | | 91,213 | | | | 4,061,715 | |
Neenah | | | 31,558 | | | | 2,131,743 | |
Schweitzer-Mauduit International | | | 42,551 | | | | 1,411,842 | |
| | | | | | | | |
| | | | | | | | 7,605,300 | |
| |
| Total (Cost $76,624,801) | | | | | | | 162,377,040 | |
| |
| | | | | | | | | |
| REAL ESTATE – 1.2% |
| EQUITY REAL ESTATE INVESTMENT TRUSTS (REITS) - 0.2% |
Lexington Realty Trust | | | 284,440 | | | | 2,676,580 | |
| | | | | | | | |
| REAL ESTATE MANAGEMENT & DEVELOPMENT - 1.0% |
Kennedy-Wilson Holdings | | | 779,908 | | | | 16,042,708 | |
| |
| Total (Cost $16,740,467) | | | | | | | 18,719,288 | |
| |
| | | | | | | | | |
| UTILITIES – 3.1% |
| ELECTRIC UTILITIES - 0.7% |
ALLETE | | | 125,812 | | | | 10,468,816 | |
†Spark Energy Cl. A | | | 72,101 | | | | 806,810 | |
| | | | | | | | |
| | | | | | | | 11,275,626 | |
| | | | | | | | |
| WATER UTILITIES - 2.4% |
Aqua America | | | 356,185 | | | | 14,735,373 | |
SJW Group | | | 286,362 | | | | 17,402,219 | |
| 56 | The Royce Funds 2019 Semiannual Report to Shareholders | | THE ACCOMPANYING NOTES ARE AN INTEGRAL PART OF THESE FINANCIAL STATEMENTS |
| June 30, 2019 (unaudited) |
| |
| Royce Total Return Fund (continued) |
| | | | | | | | | |
| | | SHARES | | VALUE |
| |
| | | | | | | | | |
| UTILITIES (continued) |
| WATER UTILITIES (continued) |
York Water | | | 129,330 | | | $ | 4,619,668 | |
| | | | | | | | |
| | | | | | | | 36,757,260 | |
| |
| Total (Cost $16,202,043) | | | | | | | 48,032,886 | |
| |
| | | | | | | | | |
| TOTAL COMMON STOCKS |
| |
| (Cost $912,097,738) | | | | | | | 1,526,714,911 | |
| |
| | | PRINCIPAL | | | | |
| | | AMOUNT | | | | |
| |
| | | | | | | | | |
| CORPORATE BONDS – 0.3% |
Meritor 6.25% | | | | | | | | |
due 2/15/24 | | $ | 825,000 | | | | 848,719 | |
Unit Corporation 6.625% | | | | | | | | |
due 5/15/21 | | | 4,269,155 | | | | 3,863,585 | |
| | | | | | | | |
| TOTAL CORPORATE BONDS |
| |
| (Cost $4,734,733) | | | | | | | 4,712,304 | |
| |
| | | | | | | | | |
| REPURCHASE AGREEMENT – 1.6% |
Fixed Income Clearing Corporation, 0.50% dated 6/28/19, due 7/1/19, maturity value
$24,773,032 (collateralized by obligations of various U.S. Government Agencies, 1.75%
due 5/31/22, valued at $25,270,671) |
| |
| (Cost $24,772,000) | | | | | | | 24,772,000 | |
| |
| | | | | | | | | |
| TOTAL INVESTMENTS – 99.9% |
| |
| (Cost $941,604,471) | | | | | | | 1,556,199,215 | |
| |
| | | | | | | | | |
| CASH AND OTHER ASSETS LESS LIABILITIES – 0.1% | | | | | | | 1,583,620 | |
| | | | | | | | |
| | | | | | | | | |
| |
| NET ASSETS – 100.0% | | | | | | $ | 1,557,782,835 | |
| |
| ADR- American Depository Receipt |
| | |
| † | New additions in 2019. |
| 1 | Non-income producing. |
| 2 | All or a portion of these securities were on loan at June 30, 2019. |
| 3 | These securities are defined as Level 2 securities due to fair value being based on quoted prices for similar securities. See Notes to Financial Statements. |
| 4 | Securities for which market quotations are not readily available represent 0.0%, 0.6%, 0.0% and 0.0% of net assets for Royce Low-Priced Stock Fund, Royce Micro-Cap Fund, Royce Pennsylvania Mututal Fund and Royce Total Return Fund. These securities have been valued at their fair value under procedures approved by the Fund’s Board of Trustees. These securities are defined as Level 3 securities due to the use of significant unobservable inputs in the determination of fair value. See Notes to Financial Statements. |
| 5 | At June 30, 2019, the Fund owned 5% or more of the Company’s outstanding voting securities thereby making the Company an Affiliated Company as that term is defined in the Investment Company Act of 1940. See Notes to Financial Statements. |
| | |
| | Securities of Royce International Premier Fund are categorized by the country of their headquarters, with the exception of exchange-traded funds. |
| | |
| | Bold indicates a Fund’s 20 largest equity holdings in terms of June 30, 2019, market value. |
| THE ACCOMPANYING NOTES ARE AN INTEGRAL PART OF THESE FINANCIAL STATEMENTS | | The Royce Funds 2019 Semiannual Report to Shareholders | 57 |
Statements of Assets and Liabilities
| | | | | | | Royce Global | | | | | | | | |
| | | Royce Dividend | | Financial Services | | Royce International | | Royce Low-Priced |
| | | Value Fund | | Fund | | Premier Fund | | Stock Fund |
| |
| ASSETS: | | | | | | | | | | | | | | | | |
| Investments at value (including collateral on loaned securities)1 |
| |
Non-Affiliated Companies | | $ | 108,278,909 | | | $ | 38,117,548 | | | $ | 582,895,243 | | | $ | 199,040,371 | |
| |
| Repurchase agreements (at cost and value) | | | 1,286,000 | | | | 1,238,000 | | | | 29,373,000 | | | | 14,612,000 | |
| |
| Cash and foreign currency2 | | | 45,263 | | | | 27 | | | | 141,189 | | | | 8,394 | |
| |
| Receivable for investments sold | | | 13,973 | | | | – | | | | 5,182,957 | | | | 2,099,600 | |
| |
| Receivable for capital shares sold | | | 21,336 | | | | 9,776 | | | | 10,586,181 | | | | 8,105 | |
| |
| Receivable for dividends and interest | | | 131,537 | | | | 116,135 | | | | 1,105,887 | | | | 80,091 | |
| |
| Receivable for securities lending income | | | – | | | | – | | | | – | | | | 28,796 | |
| |
| Prepaid expenses and other assets | | | 2,161 | | | | 1,184 | | | | 5,784 | | | | – | |
| |
| Total Assets | | | 109,779,179 | | | | 39,482,670 | | | | 629,290,241 | | | | 215,877,357 | |
| |
| LIABILITIES: | | | | | | | | | | | | | | | | |
| Payable for collateral on loaned securities | | | – | | | | – | | | | – | | | | 1,601,437 | |
| |
| Payable for investments purchased | | | – | | | | – | | | | 22,996,137 | | | | – | |
| |
| Payable for capital shares redeemed | | | 78,772 | | | | 31,147 | | | | 251,693 | | | | 153,519 | |
| |
| Payable for investment advisory fees | | | 74,297 | | | | 31,623 | | | | 432,779 | | | | 170,076 | |
| |
| Payable for trustees’ fees | | | 6,007 | | | | 1,930 | | | | 14,273 | | | | 8,617 | |
| |
| Accrued expenses | | | 75,829 | | | | 46,712 | | | | 62,806 | | | | 566,102 | |
| |
| Total Liabilities | | | 234,905 | | | | 111,412 | | | | 23,757,688 | | | | 2,499,751 | |
| |
| Net Assets | | $ | 109,544,274 | | | $ | 39,371,258 | | | $ | 605,532,553 | | | $ | 213,377,606 | |
| |
| ANALYSIS OF NET ASSETS: | | | | | | | | | | | | | | | | |
| Paid-in capital | | $ | 56,206,138 | | | $ | 29,928,904 | | | $ | 600,647,682 | | | $ | 171,237,632 | |
| |
| Total distributable earnings (loss) | | | 53,338,136 | | | | 9,442,354 | | | | 4,884,871 | | | | 42,139,974 | |
| |
| Net Assets | | $ | 109,544,274 | | | $ | 39,371,258 | | | $ | 605,532,553 | | | $ | 213,377,606 | |
| |
Investment Class | | $ | 80,163,063 | | | | | | | $ | 374,280,682 | | | $ | 50,438,997 | |
| |
Service Class | | | 27,046,786 | | | $ | 33,063,154 | | | | 59,628,996 | | | | 162,938,609 | |
| |
Consultant Class | | | 1,556,251 | | | | | | | | 9,620,893 | | | | | |
| |
Institutional Class | | | 778,174 | | | | 6,308,104 | | | | 162,001,982 | | | | | |
| |
| SHARES OUTSTANDING (unlimited number of $.001 par value): |
Investment Class | | | 11,992,917 | | | | | | | | 27,042,126 | | | | 6,905,293 | |
| |
Service Class | | | 3,923,914 | | | | 3,476,578 | | | | 3,609,942 | | | | 22,475,937 | |
| |
Consultant Class | | | 198,221 | | | | | | | | 540,948 | | | | | |
| |
Institutional Class | | | 118,266 | | | | 513,604 | | | | 11,697,686 | | | | | |
| |
| NET ASSET VALUES (Net Assets ÷ Shares Outstanding): |
Investment Class3 | | $ | 6.68 | | | | | | | $ | 13.84 | | | $ | 7.30 | |
| |
Service Class3 | | | 6.89 | | | $ | 9.51 | | | | 16.52 | | | | 7.25 | |
| |
Consultant Class4 | | | 7.85 | | | | | | | | 17.79 | | | | | |
| |
Institutional Class5 | | | 6.58 | | | | 12.28 | | | | 13.85 | | | | | |
| |
| Investments at identified cost | | $ | 65,008,678 | | | $ | 27,652,167 | | | $ | 517,088,407 | | | $ | 156,837,063 | |
| |
| Market value of loaned securities6 | | | – | | | | – | | | | – | | | | 9,782,086 | |
| |
| 1 | See Notes to Financial Statements for information on non-cash collateral on loaned securities. |
| 2 | Royce International Premier Fund includes $626 in cash and $140,563 (cost $140,482) in foreign currency. |
| 3 | Offering and redemption price per share; shares held less than 30 days may be subject to a 1% redemption fee, or a 2% redemption fee (Royce International Premier Fund), payable to the Fund. |
| 4 | Offering and redemption price per share; shares held less than 365 days may be subject to a 1% contingent deferred sales charge, payable to Royce Fund Services, LLC. |
| 5 | Offering and redemption price per share. |
| 6 | Market value of loaned securities backed by non-cash collateral is as of prior business day. |
| 58 | The Royce Funds 2019 Semiannual Report to Shareholders | | THE ACCOMPANYING NOTES ARE AN INTEGRAL PART OF THESE FINANCIAL STATEMENTS |
June 30, 2019 (unaudited)
| | | Royce Micro-Cap | | Royce Opportunity | | Royce Pennsylvania | | | Royce | |
| | | Fund | | Fund | | Mutual Fund | | Premier Fund |
| |
| ASSETS: | | | | | | | | | | | | | | | | |
| Investments at value (including collateral on loaned securities)1 |
| |
Non-Affiliated Companies | | $ | 133,344,962 | | | $ | 887,499,318 | | | $ | 1,877,167,027 | | | $ | 1,701,563,860 | |
| |
| Repurchase agreements (at cost and value) | | | 3,919,000 | | | | 79,839,000 | | | | 95,118,000 | | | | 158,694,000 | |
| |
| Cash and foreign currency | | | 9,681 | | | | – | | | | 786,406 | | | | 1,999,839 | |
| |
| Receivable for investments sold | | | 27,802 | | | | 5,530,250 | | | | 1,459,859 | | | | 3,213,685 | |
| |
| Receivable for capital shares sold | | | 24,172 | | | | 782,486 | | | | 443,258 | | | | 444,950 | |
| |
| Receivable for dividends and interest | | | 106,900 | | | | 302,450 | | | | 1,276,606 | | | | 2,313,862 | |
| |
| Receivable for securities lending income | | | 15,757 | | | | 31,192 | | | | 32,838 | | | | 3,124 | |
| |
| Prepaid expenses and other assets | | | 192 | | | | 19,407 | | | | 2,884,097 | | | | 10,281 | |
| |
| Total Assets | | | 137,448,466 | | | | 974,004,103 | | | | 1,979,168,091 | | | | 1,868,243,601 | |
| |
| LIABILITIES: | | | | | | | | | | | | | | | | |
| Payable for collateral on loaned securities | | | 1,260,590 | | | | 28,337,338 | | | | 6,580,014 | | | | – | |
| |
| Payable to custodian for cash and foreign currency overdrawn | | | – | | | | 502,303 | | | | – | | | | – | |
| |
| Payable for investments purchased | | | 244,801 | | | | 4,223,363 | | | | 5,340,269 | | | | – | |
| |
| Payable for capital shares redeemed | | | 357,629 | | | | 988,193 | | | | 2,249,886 | | | | 1,616,676 | |
| |
| Payable for investment advisory fees | | | 144,531 | | | | 744,280 | | | | 1,201,120 | | | | 1,495,745 | |
| |
| Payable for trustees’ fees | | | 7,010 | | | | 48,174 | | | | 85,394 | | | | 82,959 | |
| |
| Accrued expenses | | | 116,969 | | | | 408,438 | | | | 873,678 | | | | 1,332,259 | |
| |
| Total Liabilities | | | 2,131,530 | | | | 35,252,089 | | | | 16,330,361 | | | | 4,527,639 | |
| |
| Net Assets | | $ | 135,316,936 | | | $ | 938,752,014 | | | $ | 1,962,837,730 | | | $ | 1,863,715,962 | |
| |
| ANALYSIS OF NET ASSETS: | | | | | | | | | | | | | | | | |
| Paid-in capital | | $ | 104,774,909 | | | $ | 896,141,578 | | | $ | 1,258,095,182 | | | $ | 865,172,708 | |
| |
| Total distributable earnings (loss) | | | 30,542,027 | | | | 42,610,436 | | | | 704,742,548 | | | | 998,543,254 | |
| |
| Net Assets | | $ | 135,316,936 | | | $ | 938,752,014 | | | $ | 1,962,837,730 | | | $ | 1,863,715,962 | |
| |
Investment Class | | $ | 112,886,916 | | | $ | 607,774,932 | | | $ | 1,429,922,501 | | | $ | 1,559,791,497 | |
| |
Service Class | | | 6,010,070 | | | | 47,581,976 | | | | 150,084,900 | | | | 42,551,676 | |
| |
Consultant Class | | | 16,419,950 | | | | 9,033,911 | | | | 275,503,281 | | | | 23,321,898 | |
| |
Institutional Class | | | | | | | 244,398,577 | | | | 97,577,941 | | | | 226,798,370 | |
| |
R Class | | | | | | | 29,962,618 | | | | 9,749,107 | | | | 11,252,521 | |
| |
| SHARES OUTSTANDING (unlimited number of $.001 par value): |
Investment Class | | | 10,921,916 | | | | 52,980,519 | | | | 156,495,734 | | | | 110,201,116 | |
| |
Service Class | | | 594,498 | | | | 4,466,239 | | | | 16,451,312 | | | | 3,093,511 | |
| |
Consultant Class | | | 2,067,401 | | | | 971,599 | | | | 38,009,918 | | | | 2,098,135 | |
| |
Institutional Class | | | | | | | 20,849,923 | | | | 10,640,694 | | | | 15,779,692 | |
| |
R Class | | | | | | | 2,922,040 | | | | 1,138,410 | | | | 863,597 | |
| |
| NET ASSET VALUES (Net Assets ÷ Shares Outstanding): | | | | | | | | | | | | | | | | |
Investment Class2 | | $ | 10.34 | | | $ | 11.47 | | | $ | 9.14 | | | $ | 14.15 | |
| |
Service Class2 | | | 10.11 | | | | 10.65 | | | | 9.12 | | | | 13.76 | |
| |
Consultant Class3 | | | 7.94 | | | | 9.30 | | | | 7.25 | | | | 11.12 | |
| |
Institutional Class4 | | | | | | | 11.72 | | | | 9.17 | | | | 14.37 | |
| |
R Class4 | | | | | | | 10.25 | | | | 8.56 | | | | 13.03 | |
| |
| Investments at identified cost | | $ | 107,085,406 | | | $ | 846,542,471 | | | $ | 1,216,169,263 | | | $ | 966,560,294 | |
| |
| Market value of loaned securities5 | | | 2,153,391 | | | | 80,792,482 | | | | 43,183,798 | | | | 32,262,973 | |
| |
| 1 | See Notes to Financial Statements for information on non-cash collateral on loaned securities. |
| 2 | Offering and redemption price per share; shares held less than 30 days may be subject to a 1% redemption fee, payable to the Fund. |
| 3 | Offering and redemption price per share; shares held less than 365 days may be subject to a 1% contingent deferred sales charge, payable to Royce Fund Services, LLC. |
| 4 | Offering and redemption price per share. |
| 5 | Market value of loaned securities backed by non-cash collateral is as of prior business day. |
| THE ACCOMPANYING NOTES ARE AN INTEGRAL PART OF THESE FINANCIAL STATEMENTS | | The Royce Funds 2019 Semiannual Report to Shareholders | 59 |
| Statements of Assets and Liabilities | | June 30, 2019 (unaudited) |
| | | | | | | | | | | | | | | |
| | | Royce Small-Cap | | Royce Smaller-Companies Growth | | Royce Special Equity | | Royce Total Return |
| | | Value Fund | | Fund | | Fund | | Fund |
| |
| ASSETS: | | | | | | | | | | | | | | | | |
| Investments at value (including collateral on loaned securities)1 | | | | | | | | | | | | | | | | |
| |
Non-Affiliated Companies | | $ | 166,982,609 | | | $ | 281,270,210 | | | $ | 626,577,394 | | | $ | 1,531,427,215 | |
| |
Affiliated Companies | | | – | | | | – | | | | 331,524,507 | | | | – | |
| |
| Repurchase agreements (at cost and value) | | | 11,918,000 | | | | 19,267,000 | | | | 251,964,000 | | | | 24,772,000 | |
| |
| Cash and foreign currency | | | 37,207 | | | | 527 | | | | 503 | | | | 179,583 | |
| |
| Receivable for investments sold | | | 951,437 | | | | 296,970 | | | | – | | | | 2,779,184 | |
| |
| Receivable for capital shares sold | | | 26,039 | | | | 98,345 | | | | 1,734,466 | | | | 583,950 | |
| |
| Receivable for dividends and interest | | | 172,773 | | | | 22,190 | | | | 661,986 | | | | 1,759,231 | |
| |
| Receivable for securities lending income | | | 169 | | | | 28,479 | | | | – | | | | 32 | |
| |
| Prepaid expenses and other assets | | | 109 | | | | 323 | | | | 18,453 | | | | 21,495 | |
| |
| Total Assets | | | 180,088,343 | | | | 300,984,044 | | | | 1,212,481,309 | | | | 1,561,522,690 | |
| |
| LIABILITIES: | | | | | | | | | | | | | | | | |
| Payable for collateral on loaned securities | | | – | | | | 11,043,679 | | | | – | | | | – | |
| |
| Payable for investments purchased | | | 183,011 | | | | 2,165,978 | | | | 44,217 | | | | 129,537 | |
| |
| Payable for capital shares redeemed | | | 480,683 | | | | 434,030 | | | | 1,257,123 | | | | 1,423,982 | |
| |
| Payable for investment advisory fees | | | 146,318 | | | | 231,187 | | | | 979,447 | | | | 1,280,782 | |
| |
| Payable for trustees’ fees | | | 9,437 | | | | 13,060 | | | | 54,922 | | | | 78,684 | |
| |
| Accrued expenses | | | 173,771 | | | | 188,291 | | | | 498,308 | | | | 826,870 | |
| |
| Total Liabilities | | | 993,220 | | | | 14,076,225 | | | | 2,834,017 | | | | 3,739,855 | |
| |
| Net Assets | | $ | 179,095,123 | | | $ | 286,907,819 | | | $ | 1,209,647,292 | | | $ | 1,557,782,835 | |
| |
| ANALYSIS OF NET ASSETS: | | | | | | | | | | | | | | | | |
| Paid-in capital | | $ | 150,923,079 | | | $ | 215,849,442 | | | $ | 920,779,935 | | | $ | 811,412,726 | |
| |
| Total distributable earnings (loss) | | | 28,172,044 | | | | 71,058,377 | | | | 288,867,357 | | | | 746,370,109 | |
| |
| Net Assets | | $ | 179,095,123 | | | $ | 286,907,819 | | | $ | 1,209,647,292 | | | $ | 1,557,782,835 | |
| |
Investment Class | | $ | 55,789,393 | | | $ | 98,628,230 | | | $ | 899,182,678 | | | $ | 1,051,106,924 | |
| |
Service Class | | | 105,538,299 | | | | 173,068,116 | | | | 59,871,454 | | | | 81,604,145 | |
| |
Consultant Class | | | 9,327,709 | | | | 6,800,853 | | | | 28,087,281 | | | | 160,492,952 | |
| |
Institutional Class | | | | | | | 8,410,620 | | | | 222,505,879 | | | | 227,957,705 | |
| |
R Class | | | 8,439,722 | | | | | | | | | | | | 36,621,109 | |
| |
| SHARES OUTSTANDING (unlimited number of $.001 par value): | | | | | | | | | | | | | | | | |
Investment Class | | | 6,121,018 | | | | 11,866,396 | | | | 49,327,356 | | | | 94,496,331 | |
| |
Service Class | | | 11,634,652 | | | | 21,372,064 | | | | 3,290,031 | | | | 7,144,069 | |
| |
Consultant Class | | | 1,161,836 | | | | 982,222 | | | | 1,697,352 | | | | 13,982,148 | |
| |
Institutional Class | | | | | | | 997,305 | | | | 12,307,335 | | | | 20,783,123 | |
| |
R Class | | | 970,695 | | | | | | | | | | | | 3,177,912 | |
| |
| NET ASSET VALUES (Net Assets ÷ Shares Outstanding): | | | | | | | | | | | | | | | | |
Investment Class2 | | $ | 9.11 | | | $ | 8.31 | | | $ | 18.23 | | | $ | 11.12 | |
| |
Service Class2 | | | 9.07 | | | | 8.10 | | | | 18.20 | | | | 11.42 | |
| |
Consultant Class3 | | | 8.03 | | | | 6.92 | | | | 16.55 | | | | 11.48 | |
| |
Institutional Class4 | | | | | | | 8.43 | | | | 18.08 | | | | 10.97 | |
| |
R Class4 | | | 8.69 | | | | | | | | | | | | 11.52 | |
| |
| Investments at identified cost | | $ | 144,650,786 | | | $ | 212,041,600 | | | $ | 769,675,585 | | | $ | 916,832,471 | |
| |
| Market value of loaned securities5 | | | 211,745 | | | | 33,711,858 | | | | – | | | | – | |
| |
| 1 | See Notes to Financial Statements for information on non-cash collateral on loaned securities. |
| 2 | Offering and redemption price per share; shares held less than 30 days may be subject to a 1% redemption fee, payable to the Fund. |
| 3 | Offering and redemption price per share; shares held less than 365 days may be subject to a 1% contingent deferred sales charge, payable to Royce Fund Services, LLC. |
| 4 | Offering and redemption price per share. |
| 5 | Market value of loaned securities backed by non-cash collateral is as of prior business day. |
| 60 | The Royce Funds 2019 Semiannual Report to Shareholders | | THE ACCOMPANYING NOTES ARE AN INTEGRAL PART OF THESE FINANCIAL STATEMENTS |
Statements of Changes in Net Assets
| | | Royce Dividend Value Fund | | Royce Global Financial
Services Fund | | Royce International Premier Fund |
| | | Six Months Ended | | | | | | Six Months Ended | | | | | | Six Months Ended | | | | |
| | | 6/30/19 (unaudited) | | Year Ended 12/31/18 | | 6/30/19 (unaudited) | | Year Ended 12/31/18 | | 6/30/19 (unaudited) | | Year Ended 12/31/18 |
| |
| INVESTMENT OPERATIONS: | | | | | | | | | | | | | | | | | | | | | | | | |
| Net investment income (loss) | | $ | 846,346 | | | $ | 2,012,643 | | | $ | 243,167 | | | $ | 367,171 | | | $ | 3,917,536 | | | $ | 2,263,660 | |
| |
Net realized gain (loss) on investments and foreign currency | | | 7,213,833 | | | | 12,616,968 | | | | (936,073 | ) | | | 2,979,071 | | | | (3,322,726 | ) | | | 8,070,741 | |
| |
Net change in unrealized appreciation (depreciation) on investments and foreign currency | | | 15,039,059 | | | | (40,185,073 | ) | | | 6,724,407 | | | | (9,527,242 | ) | | | 86,870,673 | | | | (49,866,583 | ) |
| |
Net increase (decrease) in net assets from investment operations | | | 23,099,238 | | | | (25,555,462 | ) | | | 6,031,501 | | | | (6,181,000 | ) | | | 87,465,483 | | | | (39,532,182 | ) |
| |
| DISTRIBUTIONS: | | | | | | | | | | | | | | | | | | | | | | | | |
| Total distributable earnings | | | | | | | | | | | | | | | | | | | | | | | | |
| |
Investment Class | | | (524,861 | ) | | | (12,605,262 | ) | | | | | | | | | | | – | | | | (1,380,251 | ) |
| |
Service Class | | | (106,981 | ) | | | (3,997,819 | ) | | | – | | | | (3,729,655 | ) | | | – | | | | – | |
| |
Consultant Class | | | (1,993 | ) | | | (122,078 | ) | | | | | | | | | | | – | | | | – | |
| |
Institutional Class | | | (11,171 | ) | | | (380,526 | ) | | | – | | | | (783,011 | ) | | | – | | | | (136,828 | ) |
| |
R Class | | | | | | | | | | | | | | | | | | | | | | | – | |
| |
| Total distributions | | | (645,006 | ) | | | (17,105,685 | ) | | | – | | | | (4,512,666 | ) | | | – | | | | (1,517,079 | ) |
| |
| CAPITAL SHARE TRANSACTIONS: | | | | | | | | | | | | | | | | |
| Net capital share transactions | | | | | | | | | | | | | | | | | | | | | | | | |
| |
Investment Class | | | (24,268,349 | ) | | | (1,874,541 | ) | | | | | | | | | | | 26,360,286 | | | | 213,971,721 | |
| |
Service Class | | | (6,433,011 | ) | | | (21,458,903 | ) | | | (4,037,465 | ) | | | (6,175,338 | ) | | | 13,974,736 | | | | (6,987,199 | ) |
| |
Consultant Class | | | (65,733 | ) | | | 146,686 | | | | | | | | | | | | (653,522 | ) | | | 613,402 | |
| |
Institutional Class | | | (2,665,105 | ) | | | 2,872,340 | | | | (1,686,897 | ) | | | 126,326 | | | | 116,129,797 | | | | 34,743,935 | |
| |
R Class | | | | | | | | | | | | | | | | | | | | | | | (72,570 | ) |
| |
| Shareholder redemption fees | | | | | | | | | | | | | | | | | | | | | | | | |
| |
Investment Class | | | 907 | | | | 354 | | | | | | | | | | | | 1,694 | | | | 2,207 | |
| |
Service Class | | | – | | | | 65 | | | | 113 | | | | 1,770 | | | | 125 | | | | 4,049 | |
| |
Net increase (decrease) in net assets from capital share transactions | | | (33,431,291 | ) | | | (20,313,999 | ) | | | (5,724,249 | ) | | | (6,047,242 | ) | | | 155,813,116 | | | | 242,275,545 | |
| |
| Net Increase (Decrease) In Net Assets | | | (10,977,059 | ) | | | (62,975,146 | ) | | | 307,252 | | | | (16,740,908 | ) | | | 243,278,599 | | | | 201,226,284 | |
| |
| NET ASSETS: | | | | | | | | | | | | | | | | | | | | | | | | |
| |
| Beginning of period | | | 120,521,333 | | | | 183,496,479 | | | | 39,064,006 | | | | 55,804,914 | | | | 362,253,954 | | | | 161,027,670 | |
| |
| End of period | | $ | 109,544,274 | | | $ | 120,521,333 | | | $ | 39,371,258 | | | $ | 39,064,006 | | | $ | 605,532,553 | | | $ | 362,253,954 | |
| |
| THE ACCOMPANYING NOTES ARE AN INTEGRAL PART OF THESE FINANCIAL STATEMENTS | | The Royce Funds 2019 Semiannual Report to Shareholders | 61 |
Statements of Changes in Net Assets
| | | Royce Low-Priced Stock Fund | | Royce Micro-Cap Fund | | Royce Opportunity Fund |
| | | Six Months Ended | | | | | | Six Months Ended | | | | | | Six Months Ended | | | | |
| | | 6/30/19 (unaudited) | | Year Ended 12/31/18 | | 6/30/19 (unaudited) | | Year Ended 12/31/18 | | 6/30/19 (unaudited) | | Year Ended 12/31/18 |
| |
| INVESTMENT OPERATIONS: | | | | | | | | | | | | | | | | | | | | | | | | |
| Net investment income (loss) | | $ | (686,424 | ) | | $ | (1,133,831 | ) | | $ | (591,978 | ) | | $ | (1,071,296 | ) | | $ | (2,379,745 | ) | | $ | (4,033,771 | ) |
| |
Net realized gain (loss) on investments and foreign currency | | | (440,755 | ) | | | 35,163,344 | | | | 4,106,315 | | | | 17,269,067 | | | | (404,998 | ) | | | 191,294,014 | |
| |
Net change in unrealized appreciation (depreciation) on investments and foreign currency | | | 29,886,433 | | | | (52,982,915 | ) | | | 10,987,322 | | | | (28,935,176 | ) | | | 138,749,730 | | | | (410,163,454 | ) |
| |
Net increase (decrease) in net assets from investment operations | | | 28,759,254 | | | | (18,953,402 | ) | | | 14,501,659 | | | | (12,737,405 | ) | | | 135,964,987 | | | | (222,903,211 | ) |
| |
| DISTRIBUTIONS: | | | | | | | | | | | | | | | | | | | | | | | | |
| Total distributable earnings | | | | | | | | | | | | | | | | | | | | | | | | |
| |
Investment Class | | | – | | | | (8,649,166 | ) | | | – | | | | (14,965,777 | ) | | | – | | | | (54,326,168 | ) |
| |
Service Class | | | – | | | | (28,763,572 | ) | | | – | | | | (1,066,109 | ) | | | – | | | | (4,760,005 | ) |
| |
Consultant Class | | | | | | | | | | | – | | | | (2,112,496 | ) | | | – | | | | (996,034 | ) |
| |
Institutional Class | | | | | | | – | | | | | | | | | | | | – | | | | (22,358,870 | ) |
| |
R Class | | | | | | | – | | | | | | | | | | | | – | | | | (2,423,347 | ) |
| |
K Class | | | | | | | | | | | | | | | | | | | | | | | – | |
| |
| Total distributions | | | – | | | | (37,412,738 | ) | | | – | | | | (18,144,382 | ) | | | – | | | | (84,864,424 | ) |
| |
| CAPITAL SHARE TRANSACTIONS: | | | | | | | | | | | | | | | | |
| Net capital share transactions | | | | | | | | | | | | | | | | | | | | | | | | |
| |
Investment Class | | | (2,653,256 | ) | | | 7,272,812 | | | | (16,222,475 | ) | | | (24,536,300 | ) | | | (54,498,884 | ) | | | (48,887,275 | ) |
| |
Service Class | | | (14,754,534 | ) | | | (10,675,180 | ) | | | (2,842,292 | ) | | | (4,025,626 | ) | | | (8,578,781 | ) | | | (30,180,961 | ) |
| |
Consultant Class | | | | | | | | | | | (1,892,462 | ) | | | (3,995,491 | ) | | | (2,228,435 | ) | | | (6,974,656 | ) |
| |
Institutional Class | | | | | | | (5,851,516 | ) | | | | | | | | | | | (18,039,277 | ) | | | (334,335,230 | ) |
| |
R Class | | | | | | | (1,044,390 | ) | | | | | | | | | | | (433,101 | ) | | | (3,932,968 | ) |
| |
K Class | | | | | | | | | | | | | | | | | | | | | | | (7,623,085 | ) |
| |
Value of shares issued in connection with the merger of Royce Micro-Cap Opportunity Fund | | | | | | | | | | | | | | | | | | | 17,332,098 | | | | | |
| |
| Shareholder redemption fees | | | | | | | | | | | | | | | | | | | | | | | | |
| |
Investment Class | | | – | | | | – | | | | 4 | | | | 25 | | | | 4,333 | | | | 1,927 | |
| |
Service Class | | | 14 | | | | 371 | | | | – | | | | 400 | | | | 542 | | | | 4,255 | |
| |
Net increase (decrease) in net assets from capital share transactions | | | (17,407,776 | ) | | | (10,297,903 | ) | | | (20,957,225 | ) | | | (32,556,992 | ) | | | (66,441,505 | ) | | | (431,927,993 | ) |
| |
| Net Increase (Decrease) In Net Assets | | | 11,351,478 | | | | (66,664,043 | ) | | | (6,455,566 | ) | | | (63,438,779 | ) | | | 69,523,482 | | | | (739,695,628 | ) |
| |
| NET ASSETS: | | | | | | | | | | | | | | | | | | | | | | | | |
| |
| Beginning of period | | | 202,026,128 | | | | 268,690,171 | | | | 141,772,502 | | | | 205,211,281 | | | | 869,228,532 | | | | 1,608,924,160 | |
| |
| End of period | | $ | 213,377,606 | | | $ | 202,026,128 | | | $ | 135,316,936 | | | $ | 141,772,502 | | | $ | 938,752,014 | | | $ | 869,228,532 | |
| |
| 62 | The Royce Funds 2019 Semiannual Report to Shareholders | | THE ACCOMPANYING NOTES ARE AN INTEGRAL PART OF THESE FINANCIAL STATEMENTS |
| | | Royce Pennsylvania Mutual Fund | | Royce Premier Fund | | Royce Small-Cap Value Fund |
| | | Six Months Ended | | | | | | Six Months Ended | | | | | | Six Months Ended | | | | |
| | | 6/30/19 (unaudited) | | Year Ended 12/31/18 | | 6/30/19 (unaudited) | | Year Ended 12/31/18 | | 6/30/19 (unaudited) | | Year Ended 12/31/18 |
| |
| INVESTMENT OPERATIONS: | | | | | | | | | | | | | | | | | | | | | | | | |
| Net investment income (loss) | | $ | 1,975,606 | | | $ | 2,940,631 | | | $ | 1,059,114 | | | $ | 2,121,899 | | | $ | 637,154 | | | $ | 447,552 | |
| |
Net realized gain (loss) on investments and foreign currency | | | 20,485,696 | | | | 300,733,207 | | | | 166,315,337 | | | | 429,412,796 | | | | 1,750,935 | | | | 20,466,232 | |
| |
Net change in unrealized appreciation (depreciation) on investments and foreign currency | | | 262,052,631 | | | | (476,364,644 | ) | | | 191,070,696 | | | | (629,691,624 | ) | | | 14,107,171 | | | | (34,834,657 | ) |
| |
Net increase (decrease) in net assets from investment operations | | | 284,513,933 | | | | (172,690,806 | ) | | | 358,445,147 | | | | (198,156,929 | ) | | | 16,495,260 | | | | (13,920,873 | ) |
| |
| DISTRIBUTIONS: | | | | | | | | | | | | | | | | | | | | | | | | |
| Total distributable earnings | | | | | | | | | | | | | | | | | | | | | | | | |
| |
Investment Class | | | – | | | | (250,290,314 | ) | | | – | | | | (343,875,339 | ) | | | – | | | | (7,078,045 | ) |
| |
Service Class | | | – | | | | (6,860,517 | ) | | | – | | | | (9,798,555 | ) | | | – | | | | (13,404,578 | ) |
| |
Consultant Class | | | – | | | | (50,324,521 | ) | | | – | | | | (4,962,544 | ) | | | – | | | | (1,153,070 | ) |
| |
Institutional Class | | | – | | | | (12,015,566 | ) | | | – | | | | (45,506,838 | ) | | | | | | | – | |
| |
W Class | | | | | | | | | | | | | | | – | | | | | | | | | |
| |
R Class | | | – | | | | (1,931,480 | ) | | | – | | | | (2,176,396 | ) | | | – | | | | (944,360 | ) |
| |
K Class | | | | | | | – | | | | | | | | | | | | | | | | – | |
| |
| Total distributions | | | – | | | | (321,422,398 | ) | | | – | | | | (406,319,672 | ) | | | – | | | | (22,580,053 | ) |
| |
| CAPITAL SHARE TRANSACTIONS: | | | | | | | | | | | | | | | | |
| Net capital share transactions | | | | | | | | | | | | | | | | |
| |
Investment Class | | | (76,098,598 | ) | | | (35,970,327 | ) | | | (139,835,574 | ) | | | (68,385,184 | ) | | | (5,669,080 | ) | | | 2,085,467 | |
| |
Service Class | | | (9,057,330 | ) | | | (12,430,134 | ) | | | (7,779,993 | ) | | | 1,871,516 | | | | (16,242,792 | ) | | | (19,031,191 | ) |
| |
Consultant Class | | | (22,710,138 | ) | | | (33,550,757 | ) | | | (2,452,657 | ) | | | (2,498,476 | ) | | | (1,125,035 | ) | | | (1,459,212 | ) |
| |
Institutional Class | | | (1,180,264 | ) | | | 49,826,835 | | | | (13,656,511 | ) | | | 15,591,155 | | | | | | | | (3,864,348 | ) |
| |
W Class | | | | | | | | | | | | | | | (32,627,052 | ) | | | | | | | | |
| |
R Class | | | (1,880,543 | ) | | | (2,160,705 | ) | | | (514,255 | ) | | | 192,909 | | | | (545,873 | ) | | | (4,756,940 | ) |
| |
K Class | | | | | | | (2,826,318 | ) | | | | | | | | | | | | | | | (1,969,073 | ) |
| |
Value of shares issued in connection with the mergers of Royce Small-Cap Leaders Fund and Royce Small/Mid-Cap Premier Fund | | | 210,165,813 | | | | | | | | | | | | | | | | | | | | | |
| |
| Shareholder redemption fees | | | | | | | | | | | | | | | | | | | | | | | | |
| |
Investment Class | | | 695 | | | | 1,208 | | | | 25,139 | | | | 3,844 | | | | – | | | | 2 | |
| |
Service Class | | | – | | | | 1,416 | | | | 62 | | | | 37 | | | | 5 | | | | 473 | |
| |
Net increase (decrease) in net assets from capital share transactions | | | 99,239,635 | | | | (37,108,782 | ) | | | (164,213,789 | ) | | | (85,851,251 | ) | | | (23,582,775 | ) | | | (28,994,822 | ) |
| |
| Net Increase (Decrease) In Net Assets | | | 383,753,568 | | | | (531,221,986 | ) | | | 194,231,358 | | | | (690,327,852 | ) | | | (7,087,515 | ) | | | (65,495,748 | ) |
| |
| NET ASSETS: | | | | | | | | | | | | | | | | | | | | | | | | |
| |
| Beginning of period | | | 1,579,084,162 | | | | 2,110,306,148 | | | | 1,669,484,604 | | | | 2,359,812,456 | | | | 186,182,638 | | | | 251,678,386 | |
| |
| End of period | | $ | 1,962,837,730 | | | $ | 1,579,084,162 | | | $ | 1,863,715,962 | | | $ | 1,669,484,604 | | | $ | 179,095,123 | | | $ | 186,182,638 | |
| |
| THE ACCOMPANYING NOTES ARE AN INTEGRAL PART OF THESE FINANCIAL STATEMENTS | | The Royce Funds 2019 Semiannual Report to Shareholders | 63 |
Statements of Changes in Net Assets
| | | Royce Smaller-Companies Growth Fund | | Royce Special Equity Fund | | Royce Total Return Fund |
| | | Six Months Ended | | | | | | Six Months Ended | | | | | | Six Months Ended | | | | |
| | | 6/30/19 (unaudited) | | Year Ended 12/31/18 | | 6/30/19 (unaudited) | | Year Ended 12/31/18 | | 6/30/19 (unaudited) | | Year Ended 12/31/18 |
| |
| INVESTMENT OPERATIONS: | | | | | | | | | | | | | | | | | | | | | | | | |
| Net investment income (loss) | | $ | (1,277,212 | ) | | $ | (2,871,983 | ) | | $ | 5,813,778 | | | $ | 14,296,007 | | | $ | 10,891,450 | | | $ | 28,615,219 | |
| |
Net realized gain (loss) on investments and foreign currency | | | (1,431,557 | ) | | | 59,623,708 | | | | 84,558,110 | | | | 128,379,606 | | | | 75,397,372 | | | | 350,348,950 | |
| |
Net change in unrealized
appreciation (depreciation) on
investments and foreign
currency | | | 55,861,277 | | | | (83,719,682 | ) | | | (33,637,494 | ) | | | (286,833,332 | ) | | | 144,137,679 | | | | (622,350,876 | ) |
| |
Net increase (decrease) in net assets from investment operations | | | 53,152,508 | | | | (26,967,957 | ) | | | 56,734,394 | | | | (144,157,719 | ) | | | 230,426,501 | | | | (243,386,707 | ) |
| |
| DISTRIBUTIONS: | | | | | | | | | | | | | | | | | | | | | | | | |
| Total distributable earnings | | | | | | | | | | | | | | | | | | | | | | | | |
| |
Investment Class | | | – | | | | (29,890,884 | ) | | | – | | | | (113,623,179 | ) | | | (7,542,058 | ) | | | (225,309,236 | ) |
| |
Service Class | | | – | | | | (51,970,195 | ) | | | – | | | | (7,307,745 | ) | | | (461,954 | ) | | | (16,161,811 | ) |
| |
Consultant Class | | | – | | | | (2,217,718 | ) | | | – | | | | (3,348,220 | ) | | | (219,864 | ) | | | (31,360,737 | ) |
| |
Institutional Class | | | – | | | | (2,394,890 | ) | | | – | | | | (22,075,060 | ) | | | (1,787,602 | ) | | | (44,088,716 | ) |
| |
W Class | | | | | | | | | | | | | | | | | | | | | | | (278,190 | ) |
| |
R Class | | | | | | | – | | | | | | | | | | | | (129,512 | ) | | | (8,404,156 | ) |
| |
K Class | | | | | | | | | | | | | | | | | | | | | | | (58,255 | ) |
| |
| Total distributions | | | – | | | | (86,473,687 | ) | | | – | | | | (146,354,204 | ) | | | (10,140,990 | ) | | | (325,661,101 | ) |
| |
| CAPITAL SHARE TRANSACTIONS: | | | | | | | | | | | | | | | | |
| Net capital share transactions | | | | | | | | | | | | | | | | |
| |
Investment Class | | | (6,888,965 | ) | | | 6,715,178 | | | | (53,618,278 | ) | | | (11,589,585 | ) | | | (133,102,141 | ) | | | (123,762,427 | ) |
| |
Service Class | | | (15,078,539 | ) | | | (3,929,820 | ) | | | (5,992,781 | ) | | | (29,107,261 | ) | | | (13,903,577 | ) | | | 13,551,539 | |
| |
Consultant Class | | | (790,391 | ) | | | (834,711 | ) | | | (3,440,177 | ) | | | (8,996,204 | ) | | | (22,945,601 | ) | | | (28,831,097 | ) |
| |
Institutional Class | | | (250,406 | ) | | | 1,069,284 | | | | 11,591,020 | | | | 686,503 | | | | (20,970,340 | ) | | | (14,128,910 | ) |
| |
W Class | | | | | | | | | | | | | | | | | | | | | | | (98,540,528 | ) |
| |
R Class | | | | | | | (595,855 | ) | | | | | | | | | | | (15,112,786 | ) | | | 5,579,991 | |
| |
K Class | | | | | | | | | | | | | | | | | | | | | | | (37,154,510 | ) |
| |
| Shareholder redemption fees | | | | | | | | | | | | | | | | | | | | | | | | |
| |
Investment Class | | | 493 | | | | – | | | | 2,390 | | | | 4,643 | | | | 136 | | | | 1,812 | |
| |
Service Class | | | 95 | | | | 370 | | | | 499 | | | | 1,015 | | | | 8 | | | | 6,244 | |
| |
Net increase (decrease) in net assets from capital share transactions | | | (23,007,713 | ) | | | 2,424,446 | | | | (51,457,327 | ) | | | (49,000,889 | ) | | | (206,034,301 | ) | | | (283,277,886 | ) |
| |
| Net Increase (Decrease) In Net Assets | | | 30,144,795 | | | | (111,017,198 | ) | | | 5,277,067 | | | | (339,512,812 | ) | | | 14,251,210 | | | | (852,325,694 | ) |
| |
| NET ASSETS: | | | | | | | | | | | | | | | | | | | | | | | | |
| |
| Beginning of period | | | 256,763,024 | | | | 367,780,222 | | | | 1,204,370,225 | | | | 1,543,883,037 | | | | 1,543,531,625 | | | | 2,395,857,319 | |
| |
| End of period | | $ | 286,907,819 | | | $ | 256,763,024 | | | $ | 1,209,647,292 | | | $ | 1,204,370,225 | | | $ | 1,557,782,835 | | | $ | 1,543,531,625 | |
| |
| 64 | The Royce Funds 2019 Semiannual Report to Shareholders | | THE ACCOMPANYING NOTES ARE AN INTEGRAL PART OF THESE FINANCIAL STATEMENTS |
| Statements of Operations | | Six Months Ended June 30, 2019 (unaudited) |
| | | | | | | | | | | | | | | |
| | | Royce Dividend | | Royce Global Financial Services | | Royce International | | Royce Low-Priced |
| | | Value Fund | | Fund | | Premier Fund | | Stock Fund |
| |
| INVESTMENT INCOME: | | | | | | | | | | | | | | | | |
| INCOME: | | | | | | | | | | | | | | | | |
| |
| Dividends | | $ | 1,597,815 | | | $ | 571,500 | | | $ | 7,391,802 | | | $ | 786,368 | |
| |
| Foreign withholding tax | | | (80,071 | ) | | | (44,657 | ) | | | (789,889 | ) | | | (25,005 | ) |
| |
| Interest | | | 4,196 | | | | 1,693 | | | | 66,423 | | | | 23,487 | |
| |
| Securities lending | | | – | | | | – | | | | – | | | | 65,525 | |
| |
| Total income | | | 1,521,940 | | | | 528,536 | | | | 6,668,336 | | | | 850,375 | |
| |
| EXPENSES: | | | | | | | | | | | | | | | | |
| |
| Investment advisory fees | | | 494,396 | | | | 199,099 | | | | 2,348,819 | | | | 1,073,172 | |
| |
| Distribution fees | | | 43,841 | | | | 40,615 | | | | 110,597 | | | | 206,065 | |
| |
| Shareholder servicing | | | 101,595 | | | | 33,923 | | | | 172,122 | | | | 180,590 | |
| |
| Administrative and office facilities | | | 35,063 | | | | 15,450 | | | | 74,316 | | | | 53,018 | |
| |
| Registration | | | 26,981 | | | | 15,452 | | | | 54,285 | | | | 17,471 | |
| |
| Custody | | | 23,981 | | | | 20,795 | | | | 87,701 | | | | 16,100 | |
| |
| Shareholder reports | | | 20,594 | | | | 6,300 | | | | 28,757 | | | | 34,861 | |
| |
| Audit | | | 16,499 | | | | 14,891 | | | | 21,341 | | | | 14,017 | |
| |
| Trustees’ fees | | | 10,227 | | | | 3,312 | | | | 28,242 | | | | 17,116 | |
| |
| Legal | | | 2,659 | | | | 854 | | | | 6,012 | | | | 4,423 | |
| |
| Other expenses | | | 7,208 | | | | 2,578 | | | | 10,864 | | | | 97,442 | |
| |
| Total expenses | | | 783,044 | | | | 353,269 | | | | 2,943,056 | | | | 1,714,275 | |
| |
| Compensating balance credits | | | (1,090 | ) | | | (507 | ) | | | (1,389 | ) | | | (4,245 | ) |
| |
| Fees waived by investment adviser and distributor | | | (48,190 | ) | | | (35,824 | ) | | | (157,190 | ) | | | – | |
| |
| Expenses reimbursed by investment adviser | | | (58,170 | ) | | | (31,569 | ) | | | (33,677 | ) | | | (173,231 | ) |
| |
| Net expenses | | | 675,594 | | | | 285,369 | | | | 2,750,800 | | | | 1,536,799 | |
| |
| Net investment income (loss) | | | 846,346 | | | | 243,167 | | | | 3,917,536 | | | | (686,424 | ) |
| |
| REALIZED AND UNREALIZED GAIN (LOSS) ON INVESTMENTS AND FOREIGN CURRENCY: | | | | | | | | | | | | | | | | |
| NET REALIZED GAIN (LOSS): | | | | | | | | | | | | | | | | |
| |
| Investments | | | 7,196,611 | | | | (939,373 | ) | | | (3,214,405 | ) | | | (438,562 | ) |
| |
| Foreign currency transactions | | | 17,222 | | | | 3,300 | | | | (108,321 | ) | | | (2,193 | ) |
| |
| NET CHANGE IN UNREALIZED APPRECIATION (DEPRECIATION): | | | | | | | | | | | | | | | | |
| |
| Investments | | | 15,039,027 | | | | 6,723,283 | | | | 86,850,126 | | | | 29,886,387 | |
| |
| Other assets and liabilities denominated in foreign currency | | | 32 | | | | 1,124 | | | | 20,547 | | | | 46 | |
| |
| Net realized and unrealized gain (loss) on investments and foreign currency | | | 22,252,892 | | | | 5,788,334 | | | | 83,547,947 | | | | 29,445,678 | |
| |
| NET INCREASE (DECREASE) IN NET ASSETS FROM INVESTMENT OPERATIONS | | $ | 23,099,238 | | | $ | 6,031,501 | | | $ | 87,465,483 | | | $ | 28,759,254 | |
| |
| THE ACCOMPANYING NOTES ARE AN INTEGRAL PART OF THESE FINANCIAL STATEMENTS | | The Royce Funds 2019 Semiannual Report to Shareholders | 65 |
Statements of Operations
| | | | | | | | | | | Royce | | | | |
| | | Royce Micro-Cap | | Royce Opportunity | | Pennsylvania | | Royce Premier |
| | | Fund | | Fund | | Mutual Fund | | Fund |
| |
| INVESTMENT INCOME: | | | | | | | | | | | | | | | | |
| INCOME: | | | | | | | | | | | | | | | | |
| |
| Dividends | | $ | 570,551 | | | $ | 3,287,091 | | | $ | 11,713,688 | | | $ | 12,569,748 | |
| |
| Foreign withholding tax | | | (13,822 | ) | | | – | | | | (261,534 | ) | | | (399,369 | ) |
| |
| Interest | | | 12,013 | | | | 141,906 | | | | 123,336 | | | | 128,457 | |
| |
| Securities lending | | | 44,784 | | | | 150,781 | | | | 142,224 | | | | 11,360 | |
| |
| Total income | | | 613,526 | | | | 3,579,778 | | | | 11,717,714 | | | | 12,310,196 | |
| |
| EXPENSES: | | | | | | | | | | | | | | | | |
| |
| Investment advisory fees | | | 918,619 | | | | 4,759,960 | | | | 6,634,155 | | | | 9,204,817 | |
| |
| Distribution fees | | | 94,285 | | | | 187,229 | | | | 1,422,261 | | | | 196,608 | |
| |
| Shareholder servicing | | | 89,398 | | | | 471,623 | | | | 763,493 | | | | 855,361 | |
| |
| Administrative and office facilities | | | 39,596 | | | | 230,327 | | | | 374,795 | | | | 404,261 | |
| |
| Registration | | | 21,244 | | | | 37,225 | | | | 39,006 | | | | 38,091 | |
| |
| Custody | | | 12,568 | | | | 60,775 | | | | 88,994 | | | | 81,847 | |
| |
| Shareholder reports | | | 36,891 | | | | 80,844 | | | | 163,556 | | | | 216,936 | |
| |
| Audit | | | 13,769 | | | | 20,284 | | | | 20,980 | | | | 20,293 | |
| |
| Trustees’ fees | | | 12,052 | | | | 79,643 | | | | 135,459 | | | | 145,301 | |
| |
| Legal | | | 3,135 | | | | 20,668 | | | | 33,827 | | | | 36,614 | |
| |
| Other expenses | | | 95,063 | | | | 47,104 | | | | 87,675 | | | | 78,609 | |
| |
| Total expenses | | | 1,336,620 | | | | 5,995,682 | | | | 9,764,201 | | | | 11,278,738 | |
| |
| Compensating balance credits | | | (6,139 | ) | | | (8,455 | ) | | | (22,093 | ) | | | (11,294 | ) |
| |
| Fees waived by investment adviser and distributor | | | (359 | ) | | | – | | | | – | | | | (10,737 | ) |
| |
| Expenses reimbursed by investment adviser | | | (124,618 | ) | | | (27,704 | ) | | | – | | | | (5,625 | ) |
| |
| Net expenses | | | 1,205,504 | | | | 5,959,523 | | | | 9,742,108 | | | | 11,251,082 | |
| |
| Net investment income (loss) | | | (591,978 | ) | | | (2,379,745 | ) | | | 1,975,606 | | | | 1,059,114 | |
| |
| REALIZED AND UNREALIZED GAIN (LOSS) ON INVESTMENTS AND FOREIGN CURRENCY: | | | | | | | | | | | | | | | | |
| NET REALIZED GAIN (LOSS): | | | | | | | | | | | | | | | | |
| |
| Investments in Non-Affiliated Companies | | | 4,105,982 | | | | (404,998 | ) | | | 20,488,196 | | | | 171,695,460 | |
| |
| Investments in Affiliated Companies | | | – | | | | – | | | | – | | | | (5,330,368 | ) |
| |
| Foreign currency transactions | | | 333 | | | | – | | | | (2,500 | ) | | | (49,755 | ) |
| |
| NET CHANGE IN UNREALIZED APPRECIATION (DEPRECIATION): | | | | | | | | | | | | | | | | |
| |
| Investments in Non-Affiliated Companies | | | 10,987,853 | | | | 138,749,730 | | | | 262,053,434 | | | | 162,706,111 | |
| |
| Investments in Affiliated Companies | | | – | | | | – | | | | – | | | | 28,372,793 | |
| |
| Other assets and liabilities denominated in foreign currency | | | (531 | ) | | | – | | | | (803 | ) | | | (8,208 | ) |
| |
| Net realized and unrealized gain (loss) on investments and foreign currency | | | 15,093,637 | | | | 138,344,732 | | | | 282,538,327 | | | | 357,386,033 | |
| |
| NET INCREASE (DECREASE) IN NET ASSETS FROM INVESTMENT OPERATIONS | | $ | 14,501,659 | | | $ | 135,964,987 | | | $ | 284,513,933 | | | $ | 358,445,147 | |
| |
| 66 | The Royce Funds 2019 Semiannual Report to Shareholders | | THE ACCOMPANYING NOTES ARE AN INTEGRAL PART OF THESE FINANCIAL STATEMENTS |
Six Months Ended June 30, 2019 (unaudited)
| | | | | | | Royce Smaller- | | | | | | | | |
| | | Royce Small-Cap | | Companies Growth | | Royce Special | | Royce Total Return |
| | | Value Fund | | Fund | | Equity Fund | | Fund |
| |
| INVESTMENT INCOME: | | | | | | | | | | | | | | | | |
| INCOME: | | | | | | | | | | | | | | | | |
| |
| Dividends | | | | | | | | | | | | | | | | |
| |
Non-Affiliated Companies | | $ | 2,064,953 | | | $ | 481,634 | | | $ | 8,185,157 | | | $ | 22,160,916 | |
| |
Affiliated Companies | | | – | | | | – | | | | 4,802,239 | | | | – | |
| |
| Foreign withholding tax | | | (20,568 | ) | | | (23 | ) | | | – | | | | (594,292 | ) |
| |
| Interest | | | 38,531 | | | | 35,772 | | | | 556,343 | | | | 286,776 | |
| |
| Securities lending | | | 401 | | | | 187,058 | | | | – | | | | 588 | |
| |
| Total income | | | 2,083,317 | | | | 704,441 | | | | 13,543,739 | | | | 21,853,988 | |
| |
| EXPENSES: | | | | | | | | | | | | | | | | |
| |
| Investment advisory fees | | | 975,433 | | | | 1,410,763 | | | | 6,303,636 | | | | 8,120,928 | |
| |
| Distribution fees | | | 216,782 | | | | 246,932 | | | | 231,080 | | | | 1,057,110 | |
| |
| Shareholder servicing | | | 159,904 | | | | 200,764 | | | | 572,820 | | | | 851,255 | |
| |
| Administrative and office facilities | | | 49,209 | | | | 67,971 | | | | 273,706 | | | | 380,517 | |
| |
| Registration | | | 23,834 | | | | 29,314 | | | | 37,170 | | | | 36,316 | |
| |
| Custody | | | 18,977 | | | | 18,763 | | | | 55,048 | | | | 102,246 | |
| |
| Shareholder reports | | | 23,878 | | | | 42,042 | | | | 124,967 | | | | 192,453 | |
| |
| Audit | | | 14,493 | | | | 16,419 | | | | 18,612 | | | | 22,328 | |
| |
| Trustees’ fees | | | 15,842 | | | | 22,443 | | | | 99,072 | | | | 134,015 | |
| |
| Legal | | | 3,913 | | | | 5,686 | | | | 24,358 | | | | 34,540 | |
| |
| Other expenses | | | 9,499 | | | | 12,961 | | | | 48,136 | | | | 79,464 | |
| |
| Total expenses | | | 1,511,764 | | | | 2,074,058 | | | | 7,788,605 | | | | 11,011,172 | |
| |
| Compensating balance credits | | | (2,459 | ) | | | (3,906 | ) | | | (10,421 | ) | | | (12,197 | ) |
| |
| Fees waived by investment adviser and distributor | | | – | | | | (19,380 | ) | | | – | | | | – | |
| |
| Expenses reimbursed by investment adviser | | | (63,142 | ) | | | (69,119 | ) | | | (48,223 | ) | | | (36,437 | ) |
| |
| Net expenses | | | 1,446,163 | | | | 1,981,653 | | | | 7,729,961 | | | | 10,962,538 | |
| |
| Net investment income (loss) | | | 637,154 | | | | (1,277,212 | ) | | | 5,813,778 | | | | 10,891,450 | |
| |
| REALIZED AND UNREALIZED GAIN (LOSS) ON INVESTMENTS AND FOREIGN CURRENCY: | | | | | | | | | | | | | | | | |
| NET REALIZED GAIN (LOSS): | | | | | | | | | | | | | | | | |
| |
| Investments in Non-Affiliated Companies | | | 1,751,905 | | | | (1,442,479 | ) | | | 84,021,286 | | | | 76,362,860 | |
| |
| Investments in Affiliated Companies | | | – | | | | – | | | | 536,824 | | | | (951,302 | ) |
| |
| Foreign currency transactions | | | (970 | ) | | | 10,922 | | | | – | | | | (14,186 | ) |
| |
| NET CHANGE IN UNREALIZED APPRECIATION (DEPRECIATION): | | | | | | | | | | | | | | | | |
| |
| Investments in Non-Affiliated Companies | | | 14,107,226 | | | | 55,861,282 | | | | (48,899,174 | ) | | | 142,536,899 | |
| |
| Investments in Affiliated Companies | | | – | | | | – | | | | 15,261,680 | | | | 1,597,675 | |
| |
| Other assets and liabilities denominated in foreign currency | | | (55 | ) | | | (5 | ) | | | – | | | | 3,105 | |
| |
| Net realized and unrealized gain (loss) on investments and foreign currency | | | 15,858,106 | | | | 54,429,720 | | | | 50,920,616 | | | | 219,535,051 | |
| |
| NET INCREASE (DECREASE) IN NET ASSETS FROM INVESTMENT OPERATIONS | | $ | 16,495,260 | | | $ | 53,152,508 | | | $ | 56,734,394 | | | $ | 230,426,501 | |
| |
| THE ACCOMPANYING NOTES ARE AN INTEGRAL PART OF THESE FINANCIAL STATEMENTS | | The Royce Funds 2019 Semiannual Report to Shareholders | 67 |
Financial Highlights
This table is presented to show selected data for a share outstanding throughout each year or other indicated period and to assist shareholders in evaluating a Fund’s performance for the periods presented. Per share amounts have been determined on the basis of the weighted average number of shares outstanding during the period.
| | | | | | | | | | | | | | | | | | | | | | | | | | | | | | | | | | | | | | | | | | | | | | Ratio of Expenses to Average Net Assets | | | | | | |
| | | | | | | | | | | | | | | | | | | | | | | | | | | | | | | | | | | | | | | | | | | | | | | | | | | | | | |
| | Net Asset
Value,
Beginning of
Period | | Net Investment
Income (Loss) | | Net Realized and
Unrealized Gain (Loss)
on Investments and
Foreign Currency | | Total from
Investment
Operations | | Distributions
from Net
Investment
Income | | Distributions from
Net Realized Gain on
Investments and
Foreign Currency | | Total
Distributions | | Shareholder
Redemption
Fees | | Net Asset
Value, End of
Period | | Total Return | | Net Assets,
End of Period
(in thousands) | | Prior to Fee
Waivers,
Expense
Reimbursements
and Balance
Credits | | Prior to Fee
Waivers and
Expense
Reimbursements | | Net of Fee
Waivers and
Expense
Reimbursements | | Ratio of Net
Investment
Income (Loss) to
Average Net
Assets | | Portfolio
Turnover Rate |
| |
| Royce Dividend Value Fund–Investment Class |
| 2019† | $ | 5.56 | | | $ | 0.05 | | | $ | 1.11 | | | $ | 1.16 | | | $ | (0.04 | ) | | $ | – | | | $ | (0.04 | ) | | $ | – | | | $ | 6.68 | | | | 20.90 | %1 | | $ | 80,163 | | | | 1.22 | %2 | | | 1.22 | %2 | | | 1.09 | %2 | | | 1.52 | %2 | | | 6 | % |
| |
| 2018 | | 7.56 | | | | 0.10 | | | | (1.27 | ) | | | (1.17 | ) | | | (0.10 | ) | | | (0.73 | ) | | | (0.83 | ) | | | – | | | | 5.56 | | | | (16.06 | ) | | | 88,036 | | | | 1.13 | | | | 1.13 | | | | 1.04 | | | | 1.29 | | | | 13 | |
| |
| 2017 | | 7.18 | | | | 0.10 | | | | 1.43 | | | | 1.53 | | | | (0.13 | ) | | | (1.02 | ) | | | (1.15 | ) | | | – | | | | 7.56 | | | | 21.91 | | | | 121,209 | | | | 1.13 | | | | 1.13 | | | | 1.06 | | | | 1.24 | | | | 16 | |
| |
| 2016 | | 6.84 | | | | 0.12 | | | | 1.02 | | | | 1.14 | | | | (0.11 | ) | | | (0.69 | ) | | | (0.80 | ) | | | – | | | | 7.18 | | | | 16.75 | | | | 99,462 | | | | 1.16 | | | | 1.16 | | | | 1.11 | | | | 1.64 | | | | 21 | |
| |
| 2015 | | 8.12 | | | | 0.12 | | | | (0.57 | ) | | | (0.45 | ) | | | (0.13 | ) | | | (0.70 | ) | | | (0.83 | ) | | | – | | | | 6.84 | | | | (5.54 | ) | | | 116,053 | | | | 1.24 | | | | 1.24 | | | | 1.22 | | | | 1.49 | | | | 14 | |
| |
| 2014 | | 8.90 | | | | 0.11 | | | | (0.29 | ) | | | (0.18 | ) | | | (0.10 | ) | | | (0.50 | ) | | | (0.60 | ) | | | – | | | | 8.12 | | | | (1.90 | ) | | | 176,002 | | | | 1.21 | | | | 1.21 | | | | 1.19 | | | | 1.25 | | | | 22 | |
| |
| Royce Dividend Value Fund–Service Class |
| 2019† | $ | 5.73 | | | $ | 0.04 | | | $ | 1.15 | | | $ | 1.19 | | | $ | (0.03 | ) | | $ | – | | | $ | (0.03 | ) | | $ | – | | | $ | 6.89 | | | | 20.71 | %1 | | $ | 27,047 | | | | 1.58 | %2 | | | 1.57 | %2 | | | 1.34 | %2 | | | 1.29 | %2 | | | 6 | % |
| |
| 2018 | | 7.76 | | | | 0.07 | | | | (1.29 | ) | | | (1.22 | ) | | | (0.06 | ) | | | (0.75 | ) | | | (0.81 | ) | | | – | | | | 5.73 | | | | (16.24 | ) | | | 28,120 | | | | 1.43 | | | | 1.43 | | | | 1.34 | | | | 1.01 | | | | 13 | |
| |
| 2017 | | 7.33 | | | | 0.08 | | | | 1.46 | | | | 1.54 | | | | (0.07 | ) | | | (1.04 | ) | | | (1.11 | ) | | | – | | | | 7.76 | | | | 21.66 | | | | 59,641 | | | | 1.40 | | | | 1.39 | | | | 1.31 | | | | 1.04 | | | | 16 | |
| |
| 2016 | | 6.96 | | | | 0.10 | | | | 1.04 | | | | 1.14 | | | | (0.08 | ) | | | (0.69 | ) | | | (0.77 | ) | | | – | | | | 7.33 | | | | 16.36 | | | | 115,547 | | | | 1.43 | | | | 1.43 | | | | 1.37 | | | | 1.39 | | | | 21 | |
| |
| 2015 | | 8.22 | | | | 0.10 | | | | (0.57 | ) | | | (0.47 | ) | | | (0.09 | ) | | | (0.70 | ) | | | (0.79 | ) | | | – | | | | 6.96 | | | | (5.72 | ) | | | 167,165 | | | | 1.49 | | | | 1.49 | | | | 1.47 | | | | 1.25 | | | | 14 | |
| |
| 2014 | | 8.98 | | | | 0.09 | | | | (0.29 | ) | | | (0.20 | ) | | | (0.06 | ) | | | (0.50 | ) | | | (0.56 | ) | | | – | | | | 8.22 | | | | (2.14 | ) | | | 295,560 | | | | 1.47 | | | | 1.47 | | | | 1.44 | | | | 0.98 | | | | 22 | |
| |
| Royce Dividend Value Fund–Consultant Class a |
| 2019† | $ | 6.53 | | | $ | 0.02 | | | $ | 1.31 | | | $ | 1.33 | | | $ | (0.01 | ) | | $ | – | | | $ | (0.01 | ) | | $ | – | | | $ | 7.85 | | | | 20.37 | %1 | | $ | 1,556 | | | | 3.28 | %2 | | | 3.28 | %2 | | | 2.09 | %2 | | | 0.58 | %2 | | | 6 | % |
| |
| 2018 | | 8.87 | | | | 0.02 | | | | (1.48 | ) | | | (1.46 | ) | | | (0.03 | ) | | | (0.85 | ) | | | (0.88 | ) | | | – | | | | 6.53 | | | | (16.93 | ) | | | 1,349 | | | | 3.44 | | | | 3.44 | | | | 2.09 | | | | 0.24 | | | | 13 | |
| |
| 2017 | | 8.39 | | | | 0.02 | | | | 1.68 | | | | 1.70 | | | | (0.03 | ) | | | (1.19 | ) | | | (1.22 | ) | | | – | | | | 8.87 | | | | 20.71 | | | | 1,534 | | | | 3.26 | | | | 3.26 | | | | 2.09 | | | | 0.23 | | | | 16 | |
| |
| 2016 | | 7.90 | | | | 0.05 | | | | 1.17 | | | | 1.22 | | | | (0.04 | ) | | | (0.69 | ) | | | (0.73 | ) | | | – | | | | 8.39 | | | | 15.44 | | | | 1,572 | | | | 3.26 | | | | 3.26 | | | | 2.14 | | | | 0.58 | | | | 21 | |
| |
| 2015 | | 9.22 | | | | 0.04 | | | | (0.63 | ) | | | (0.59 | ) | | | (0.03 | ) | | | (0.70 | ) | | | (0.73 | ) | | | – | | | | 7.90 | | | | (6.39 | ) | | | 1,886 | | | | 3.78 | | | | 3.78 | | | | 2.24 | | | | 0.46 | | | | 14 | |
| |
| 2014 | | 10.00 | | | | 0.01 | | | | (0.27 | ) | | | (0.26 | ) | | | (0.02 | ) | | | (0.50 | ) | | | (0.52 | ) | | | – | | | | 9.22 | | | | (2.43 | )1 | | | 912 | | | | 9.25 | 2 | | | 9.25 | 2 | | | 2.24 | 2 | | | 0.45 | 2 | | | 22 | |
| |
| Royce Dividend Value Fund–Institutional Class |
| 2019† | $ | 5.48 | | | $ | 0.07 | | | $ | 1.07 | | | $ | 1.14 | | | $ | (0.04 | ) | | $ | – | | | $ | (0.04 | ) | | $ | – | | | $ | 6.58 | | | | 20.85 | %1 | | $ | 778 | | | | 1.62 | %2 | | | 1.62 | %2 | | | 0.94 | %2 | | | 1.73 | %2 | | | 6 | % |
| |
| 2018 | | 7.46 | | | | 0.09 | | | | (1.23 | ) | | | (1.14 | ) | | | (0.12 | ) | | | (0.72 | ) | | | (0.84 | ) | | | – | | | | 5.48 | | | | (15.94 | ) | | | 3,016 | | | | 1.89 | | | | 1.89 | | | | 0.89 | | | | 1.28 | | | | 13 | |
| |
| 2017 | | 7.09 | | | | 0.11 | | | | 1.42 | | | | 1.53 | | | | (0.15 | ) | | | (1.01 | ) | | | (1.16 | ) | | | – | | | | 7.46 | | | | 22.21 | | | | 1,112 | | | | 2.79 | | | | 2.79 | | | | 0.89 | | | | 1.43 | | | | 16 | |
| |
| 2016 | | 6.78 | | | | 0.13 | | | | 1.00 | | | | 1.13 | | | | (0.13 | ) | | | (0.69 | ) | | | (0.82 | ) | | | – | | | | 7.09 | | | | 16.70 | | | | 823 | | | | 3.30 | | | | 3.30 | | | | 0.93 | | | | 1.81 | | | | 21 | |
| |
| 2015 | | 8.09 | | | | 0.17 | | | | (0.62 | ) | | | (0.45 | ) | | | (0.16 | ) | | | (0.70 | ) | | | (0.86 | ) | | | – | | | | 6.78 | | | | (5.61 | ) | | | 658 | | | | 1.11 | | | | 1.11 | | | | 1.04 | | | | 1.60 | | | | 14 | |
| |
| 2014 | | 8.88 | | | | 0.12 | | | | (0.29 | ) | | | (0.17 | ) | | | (0.12 | ) | | | (0.50 | ) | | | (0.62 | ) | | | – | | | | 8.09 | | | | (1.76 | ) | | | 40,942 | | | | 1.10 | | | | 1.10 | | | | 1.04 | | | | 1.42 | | | | 22 | |
| |
| Royce Global Financial Services Fund–Service Class |
| 2019† | $ | 8.18 | | | $ | 0.05 | | | $ | 1.28 | | | $ | 1.33 | | | $ | – | | | $ | – | | | $ | – | | | $ | – | | | $ | 9.51 | | | | 16.26 | %1 | | $ | 33,063 | | | | 1.83 | %2 | | | 1.82 | %2 | | | 1.49 | %2 | | | 1.17 | %2 | | | 1 | % |
| |
| 2018 | | 10.57 | | | | 0.07 | | | | (1.45 | ) | | | (1.38 | ) | | | (0.09 | ) | | | (0.92 | ) | | | (1.01 | ) | | | – | | | | 8.18 | | | | (13.41 | ) | | | 32,113 | | | | 1.68 | | | | 1.68 | | | | 1.49 | | | | 0.61 | | | | 8 | |
| |
| 2017 | | 8.95 | | | | 0.10 | | | | 1.90 | | | | 2.00 | | | | (0.23 | ) | | | (0.15 | ) | | | (0.38 | ) | | | – | | | | 10.57 | | | | 22.46 | | | | 47,197 | | | | 1.68 | | | | 1.68 | | | | 1.49 | | | | 0.83 | | | | 19 | |
| |
| 2016 | | 7.99 | | | | 0.11 | | | | 0.92 | | | | 1.03 | | | | (0.05 | ) | | | (0.02 | ) | | | (0.07 | ) | | | – | | | | 8.95 | | | | 12.93 | | | | 43,629 | | | | 1.67 | | | | 1.67 | | | | 1.49 | | | | 1.25 | | | | 37 | |
| |
| 2015 | | 9.28 | | | | 0.11 | | | | (0.55 | ) | | | (0.44 | ) | | | (0.11 | ) | | | (0.74 | ) | | | (0.85 | ) | | | – | | | | 7.99 | | | | (4.71 | ) | | | 52,013 | | | | 1.65 | | | | 1.65 | | | | 1.49 | | | | 1.19 | | | | 46 | |
| |
| 2014 | | 9.68 | | | | 0.09 | | | | 0.22 | | | | 0.31 | | | | (0.06 | ) | | | (0.65 | ) | | | (0.71 | ) | | | – | | | | 9.28 | | | | 3.45 | | | | 53,707 | | | | 1.68 | | | | 1.68 | | | | 1.49 | | | | 0.91 | | | | 41 | |
| |
| 68 | The Royce Funds 2019 Semiannual Report to Shareholders | | THE ACCOMPANYING NOTES ARE AN INTEGRAL PART OF THESE FINANCIAL STATEMENTS |
Financial Highlights
This table is presented to show selected data for a share outstanding throughout each year or other indicated period and to assist shareholders in evaluating a Fund’s performance for the periods presented. Per share amounts have been determined on the basis of the weighted average number of shares outstanding during the period.
| | | | | | | | | | | | | | | | | | | | | | | | | | | | | | | | | | | | | | | | | | | | | | Ratio of Expenses to Average Net Assets | | | | | | |
| | | | | | | | | | | | | | | | | | | | | | | | | | | | | | | | | | | | | | | | | | | | | | | | | | | | | | |
| | Net Asset
Value,
Beginning of
Period | | Net Investment
Income (Loss) | | Net Realized and
Unrealized Gain (Loss)
on Investments and
Foreign Currency | | Total from
Investment
Operations | | Distributions
from Net
Investment
Income | | Distributions from
Net Realized Gain on
Investments and
Foreign Currency | | Total
Distributions | | Shareholder
Redemption
Fees | | Net Asset
Value, End of
Period | | Total Return | | Net Assets,
End of Period
(in thousands) | | Prior to Fee
Waivers,
Expense
Reimbursements
and Balance
Credits | | Prior to Fee
Waivers and
Expense
Reimbursements | | Net of Fee
Waivers and
Expense
Reimbursements | | Ratio of Net
Investment
Income (Loss) to
Average Net
Assets | | Portfolio
Turnover Rate |
| |
| Royce Global Financial Services Fund–Institutional Class b |
| 2019† | $ | 10.55 | | | $ | 0.09 | | | $ | 1.64 | | | $ | 1.73 | | | $ | – | | | $ | – | | | $ | – | | | $ | – | | | $ | 12.28 | | | | 16.40 | %1 | | $ | 6,308 | | | | 1.55 | %2 | | | 1.55 | %2 | | | 1.18 | %2 | | | 1.47 | %2 | | | 1 | % |
| |
| 2018 | | 13.58 | | | | 0.15 | | | | (1.85 | ) | | | (1.70 | ) | | | (0.14 | ) | | | (1.19 | ) | | | (1.33 | ) | | | – | | | | 10.55 | | | | (12.87 | ) | | | 6,951 | | | | 1.43 | | | | 1.43 | | | | 1.04 | | | | 1.06 | | | | 8 | |
| |
| 2017 | | 11.43 | | | | 0.15 | | | | 2.47 | | | | 2.62 | | | | (0.27 | ) | | | (0.20 | ) | | | (0.47 | ) | | | – | | | | 13.58 | | | | 23.01 | | | | 8,608 | | | | 1.44 | | | | 1.44 | | | | 1.04 | | | | 1.29 | | | | 19 | |
| |
| 2016 | | 10.00 | | | | 0.18 | | | | 1.36 | | | | 1.54 | | | | (0.09 | ) | | | (0.02 | ) | | | (0.11 | ) | | | – | | | | 11.43 | | | | 15.41 | 1 | | | 6,474 | | | | 1.85 | 2 | | | 1.85 | 2 | | | 1.04 | 2 | | | 1.82 | 2 | | | 37 | |
| |
| Royce International Premier Fund–Investment Class c |
| 2019† | $ | 11.39 | | | $ | 0.11 | | | $ | 2.34 | | | $ | 2.45 | | | $ | – | | | $ | – | | | $ | – | | | $ | – | | | $ | 13.84 | | | | 21.51 | %1 | | $ | 374,281 | | | | 1.20 | %2 | | | 1.20 | %2 | | | 1.13 | %2 | | | 1.66 | %2 | | | 14 | % |
| |
| 2018 | | 13.07 | | | | 0.09 | | | | (1.72 | ) | | | (1.63 | ) | | | (0.05 | ) | | | – | | | | (0.05 | ) | | | – | | | | 11.39 | | | | (12.45 | ) | | | 285,065 | | | | 1.27 | | | | 1.26 | | | | 1.16 | | | | 1.00 | | | | 65 | |
| |
| 2017 | | 9.44 | | | | (0.10 | ) | | | 3.88 | | | | 3.78 | | | | (0.15 | ) | | | – | | | | (0.15 | ) | | | – | | | | 13.07 | | | | 40.08 | | | | 103,032 | | | | 1.37 | | | | 1.37 | | | | 1.19 | | | | 0.32 | | | | 41 | |
| |
| 2016 | | 9.82 | | | | 0.10 | | | | (0.19 | ) | | | (0.09 | ) | | | (0.28 | ) | | | (0.01 | ) | | | (0.29 | ) | | | – | | | | 9.44 | | | | (0.79 | ) | | | 19,556 | | | | 1.59 | | | | 1.59 | | | | 1.19 | | | | 0.96 | | | | 67 | |
| |
| 2015 | | 8.71 | | | | 0.16 | | | | 1.27 | | | | 1.43 | | | | (0.32 | ) | | | – | | | | (0.32 | ) | | | – | | | | 9.82 | | | | 16.42 | | | | 3,623 | | | | 2.80 | | | | 2.80 | | | | 1.38 | | | | 1.72 | | | | 67 | |
| |
| 2014 | | 10.00 | | | | 0.03 | | | | (0.85 | ) | | | (0.82 | ) | | | (0.16 | ) | | | (0.31 | ) | | | (0.47 | ) | | | – | | | | 8.71 | | | | (8.16 | )1 | | | 3,481 | | | | 3.17 | 2 | | | 3.17 | 2 | | | 1.44 | 2 | | | 1.00 | 2 | | | 62 | |
| |
| Royce International Premier Fund–Service Class |
| 2019† | $ | 13.61 | | | $ | 0.11 | | | $ | 2.80 | | | $ | 2.91 | | | $ | – | | | $ | – | | | $ | – | | | $ | – | | | $ | 16.52 | | | | 21.38 | %1 | | $ | 59,629 | | | | 1.54 | %2 | | | 1.54 | %2 | | | 1.44 | %2 | | | 1.47 | %2 | | | 14 | % |
| |
| 2018 | | 15.60 | | | | 0.11 | | | | (2.10 | ) | | | (1.99 | ) | | | – | | | | – | | | | – | | | | – | | | | 13.61 | | | | (12.76 | ) | | | 36,303 | | | | 1.59 | | | | 1.59 | | | | 1.44 | | | | 0.71 | | | | 65 | |
| |
| 2017 | | 11.24 | | | | 0.05 | | | | 4.42 | | | | 4.47 | | | | (0.11 | ) | | | – | | | | (0.11 | ) | | | – | | | | 15.60 | | | | 39.81 | | | | 48,642 | | | | 1.65 | | | | 1.65 | | | | 1.44 | | | | 0.28 | | | | 41 | |
| |
| 2016 | | 11.64 | | | | 0.06 | | | | (0.19 | ) | | | (0.13 | ) | | | (0.26 | ) | | | (0.01 | ) | | | (0.27 | ) | | | – | | | | 11.24 | | | | (1.06 | ) | | | 38,884 | | | | 1.84 | | | | 1.84 | | | | 1.44 | | | | 0.66 | | | | 67 | |
| |
| 2015 | | 10.28 | | | | (0.00 | ) | | | 1.66 | | | | 1.66 | | | | (0.30 | ) | | | – | | | | (0.30 | ) | | | – | | | | 11.64 | | | | 16.22 | | | | 9,015 | | | | 2.65 | | | | 2.65 | | | | 1.60 | | | | 1.10 | | | | 67 | |
| |
| 2014 | | 11.67 | | | | 0.17 | | | | (1.13 | ) | | | (0.96 | ) | | | (0.12 | ) | | | (0.31 | ) | | | (0.43 | ) | | | – | | | | 10.28 | | | | (8.22 | ) | | | 4,045 | | | | 2.45 | | | | 2.45 | | | | 1.69 | | | | 1.26 | | | | 62 | |
| |
| Royce International Premier Fund–Consultant Class d |
| 2019† | $ | 14.71 | | | $ | 0.05 | | | $ | 3.03 | | | $ | 3.08 | | | $ | – | | | $ | – | | | $ | – | | | $ | – | | | $ | 17.79 | | | | 20.94 | %1 | | $ | 9,621 | | | | 2.40 | %2 | | | 2.40 | %2 | | | 2.19 | %2 | | | 0.60 | %2 | | | 14 | % |
| |
| 2018 | | 16.99 | | | | (0.00 | ) | | | (2.28 | ) | | | (2.28 | ) | | | – | | | | – | | | | – | | | | – | | | | 14.71 | | | | (13.42 | ) | | | 8,546 | | | | 2.33 | | | | 2.32 | | | | 2.19 | | | | (0.00 | ) | | | 65 | |
| |
| 2017 | | 12.27 | | | | (0.08 | ) | | | 4.83 | | | | 4.75 | | | | (0.03 | ) | | | – | | | | (0.03 | ) | | | – | | | | 16.99 | | | | 38.73 | | | | 9,281 | | | | 2.73 | | | | 2.73 | | | | 2.19 | | | | (0.52 | ) | | | 41 | |
| |
| 2016 | | 11.59 | | | | 0.01 | | | | 0.85 | | | | 0.86 | | | | (0.17 | ) | | | (0.01 | ) | | | (0.18 | ) | | | – | | | | 12.27 | | | | 7.49 | 1 | | | 5,086 | | | | 2.70 | 2 | | | 2.70 | 2 | | | 2.19 | 2 | | | (0.04 | )2 | | | 67 | |
| |
| Royce International Premier Fund–Institutional Class e |
| 2019† | $ | 11.39 | | | $ | 0.12 | | | $ | 2.34 | | | $ | 2.46 | | | $ | – | | | $ | – | | | $ | – | | | $ | – | | | $ | 13.85 | | | | 21.60 | %1 | | $ | 162,002 | | | | 1.16 | %2 | | | 1.16 | %2 | | | 1.04 | %2 | | | 1.94 | %2 | | | 14 | % |
| |
| 2018 | | 12.98 | | | | (0.00 | ) | | | (1.53 | ) | | | (1.53 | ) | | | (0.06 | ) | | | – | | | | (0.06 | ) | | | – | | | | 11.39 | | | | (11.78 | )1 | | | 32,340 | | | | 1.34 | 2 | | | 1.34 | 2 | | | 1.04 | 2 | | | 0.84 | 2 | | | 65 | |
| |
| Royce Low-Priced Stock Fund–Investment Class |
| 2019† | $ | 6.37 | | | $ | (0.02 | ) | | $ | 0.95 | | | $ | 0.93 | | | $ | – | | | $ | – | | | $ | – | | | $ | – | | | $ | 7.30 | | | | 14.60 | %1 | | $ | 50,439 | | | | 1.42 | %2 | | | 1.41 | %2 | | | 1.24 | %2 | | | (0.45 | )%2 | | | 8 | % |
| |
| 2018 | | 8.49 | | | | (0.02 | ) | | | (0.70 | ) | | | (0.72 | ) | | | – | | | | (1.40 | ) | | | (1.40 | ) | | | – | | | | 6.37 | | | | (9.04 | ) | | | 46,430 | | | | 1.32 | | | | 1.31 | | | | 1.24 | | | | (0.27 | ) | | | 58 | |
| |
| 2017 | | 8.26 | | | | (0.00 | ) | | | 0.80 | | | | 0.80 | | | | (0.02 | ) | | | (0.55 | ) | | | (0.57 | ) | | | – | | | | 8.49 | | | | 9.86 | | | | 52,912 | | | | 1.30 | | | | 1.30 | | | | 1.24 | | | | 0.12 | | | | 26 | |
| |
| 2016 | | 7.77 | | | | 0.04 | | | | 1.24 | | | | 1.28 | | | | (0.06 | ) | | | (0.73 | ) | | | (0.79 | ) | | | – | | | | 8.26 | | | | 16.42 | | | | 22,852 | | | | 1.31 | | | | 1.31 | | | | 1.24 | | | | 0.39 | | | | 34 | |
| |
| 2015 | | 9.46 | | | | 0.00 | | | | (0.97 | ) | | | (0.97 | ) | | | – | | | | (0.72 | ) | | | (0.72 | ) | | | – | | | | 7.77 | | | | (10.21 | ) | | | 28,732 | | | | 1.28 | | | | 1.28 | | | | 1.24 | | | | 0.03 | | | | 53 | |
| |
| 2014 | | 13.60 | | | | 0.06 | | | | (0.58 | ) | | | (0.52 | ) | | | (0.01 | ) | | | (3.61 | ) | | | (3.62 | ) | | | – | | | | 9.46 | | | | (3.15 | ) | | | 50,371 | | | | 1.25 | | | | 1.25 | | | | 1.24 | | | | 0.46 | | | | 29 | |
| |
| THE ACCOMPANYING NOTES ARE AN INTEGRAL PART OF THESE FINANCIAL STATEMENTS | | The Royce Funds 2019 Semiannual Report to Shareholders | 69 |
Financial Highlights
This table is presented to show selected data for a share outstanding throughout each year or other indicated period and to assist shareholders in evaluating a Fund’s performance for the periods presented. Per share amounts have been determined on the basis of the weighted average number of shares outstanding during the period.
| | | | | | | | | | | | | | | | | | | | | | | | | | | | | | | | | | | | | | | | | | | | | | Ratio of Expenses to Average Net Assets | | | | | | |
| | | | | | | | | | | | | | | | | | | | | | | | | | | | | | | | | | | | | | | | | | | | | | | | | | | | | | |
| | Net Asset
Value,
Beginning of
Period | | Net Investment
Income (Loss) | | Net Realized and
Unrealized Gain (Loss)
on Investments and
Foreign Currency | | Total from
Investment
Operations | | Distributions
from Net
Investment
Income | | Distributions from
Net Realized Gain on
Investments and
Foreign Currency | | Total
Distributions | | Shareholder
Redemption
Fees | | Net Asset
Value, End of
Period | | Total Return | | Net Assets,
End of Period
(in thousands) | | Prior to Fee
Waivers,
Expense
Reimbursements
and Balance
Credits | | Prior to Fee
Waivers and
Expense
Reimbursements | | Net of Fee
Waivers and
Expense
Reimbursements | | Ratio of Net
Investment
Income (Loss) to
Average Net
Assets | | Portfolio
Turnover Rate |
| |
| Royce Low-Priced Stock Fund–Service Class |
| 2019† | $ | 6.33 | | | $ | (0.02 | ) | | $ | 0.94 | | | $ | 0.92 | | | $ | – | | | $ | – | | | $ | – | | | $ | – | | | $ | 7.25 | | | | 14.53 | %1 | | $ | 162,939 | | | | 1.65 | %2 | | | 1.65 | %2 | | | 1.49 | %2 | | | (0.70 | )%2 | | | 8 | % |
| |
| 2018 | | 8.46 | | | | (0.04 | ) | | | (0.70 | ) | | | (0.74 | ) | | | – | | | | (1.39 | ) | | | (1.39 | ) | | | – | | | | 6.33 | | | | (9.31 | ) | | | 155,596 | | | | 1.53 | | | | 1.53 | | | | 1.49 | | | | (0.49 | ) | | | 58 | |
| |
| 2017 | | 8.23 | | | | (0.01 | ) | | | 0.79 | | | | 0.78 | | | | – | | | | (0.55 | ) | | | (0.55 | ) | | | – | | | | 8.46 | | | | 9.67 | | | | 209,369 | | | | 1.52 | | | | 1.52 | | | | 1.49 | | | | (0.13 | ) | | | 26 | |
| |
| 2016 | | 7.75 | | | | 0.02 | | | | 1.23 | | | | 1.25 | | | | (0.04 | ) | | | (0.73 | ) | | | (0.77 | ) | | | – | | | | 8.23 | | | | 16.09 | | | | 281,873 | | | | 1.52 | | | | 1.52 | | | | 1.49 | | | | 0.14 | | | | 34 | |
| |
| 2015 | | 9.46 | | | | (0.02 | ) | | | (0.97 | ) | | | (0.99 | ) | | | – | | | | (0.72 | ) | | | (0.72 | ) | | | – | | | | 7.75 | | | | (10.42 | ) | | | 316,475 | | | | 1.49 | | | | 1.49 | | | | 1.47 | | | | (0.20 | ) | | | 53 | |
| |
| 2014 | | 13.62 | | | | 0.03 | | | | (0.58 | ) | | | (0.55 | ) | | | – | | | | (3.61 | ) | | | (3.61 | ) | | | – | | | | 9.46 | | | | (3.37 | ) | | | 520,905 | | | | 1.55 | | | | 1.55 | | | | 1.49 | | | | 0.21 | | | | 29 | |
| |
| Royce Micro-Cap Fund–Investment Class |
| 2019† | $ | 9.35 | | | $ | (0.03 | ) | | $ | 1.02 | | | $ | 0.99 | | | $ | – | | | $ | – | | | $ | – | | | $ | – | | | $ | 10.34 | | | | 10.59 | %1 | | $ | 112,887 | | | | 1.67 | %2 | | | 1.66 | %2 | | | 1.49 | %2 | | | (0.65 | )%2 | | | 6 | % |
| |
| 2018 | | 11.64 | | | | (0.05 | ) | | | (0.94 | ) | | | (0.99 | ) | | | – | | | | (1.30 | ) | | | (1.30 | ) | | | – | | | | 9.35 | | | | (8.94 | ) | | | 117,040 | | | | 1.50 | | | | 1.50 | | | | 1.49 | | | | (0.43 | ) | | | 24 | |
| |
| 2017 | | 11.92 | | | | (0.03 | ) | | | 0.66 | | | | 0.63 | | | | (0.01 | ) | | | (0.90 | ) | | | (0.91 | ) | | | – | | | | 11.64 | | | | 5.43 | | | | 166,935 | | | | 1.51 | | | | 1.51 | | | | 1.49 | | | | (0.28 | ) | | | 26 | |
| |
| 2016 | | 11.09 | | | | 0.01 | | | | 2.18 | | | | 2.19 | | | | (0.06 | ) | | | (1.30 | ) | | | (1.36 | ) | | | – | | | | 11.92 | | | | 19.74 | | | | 192,731 | | | | 1.48 | | | | 1.48 | | | | 1.48 | | | | 0.03 | | | | 38 | |
| |
| 2015 | | 14.47 | | | | 0.02 | | | | (1.96 | ) | | | (1.94 | ) | | | – | | | | (1.44 | ) | | | (1.44 | ) | | | – | | | | 11.09 | | | | (13.32 | ) | | | 219,272 | | | | 1.51 | | | | 1.51 | | | | 1.51 | | | | 0.15 | | | | 41 | |
| |
| 2014 | | 16.68 | | | | (0.08 | ) | | | (0.65 | ) | | | (0.73 | ) | | | – | | | | (1.48 | ) | | | (1.48 | ) | | | – | | | | 14.47 | | | | (4.13 | ) | | | 414,120 | | | | 1.52 | | | | 1.52 | | | | 1.52 | | | | (0.49 | ) | | | 18 | |
| |
| Royce Micro-Cap Fund–Service Class |
| 2019† | $ | 9.15 | | | $ | (0.04 | ) | | $ | 1.00 | | | $ | 0.96 | | | $ | – | | | $ | – | | | $ | – | | | $ | – | | | $ | 10.11 | | | | 10.49 | %1 | | $ | 6,010 | | | | 2.21 | %2 | | | 2.21 | %2 | | | 1.61 | %2 | | | (0.80 | )%2 | | | 6 | % |
| |
| 2018 | | 11.41 | | | | (0.07 | ) | | | (0.91 | ) | | | (0.98 | ) | | | – | | | | (1.28 | ) | | | (1.28 | ) | | | – | | | | 9.15 | | | | (9.09 | ) | | | 8,053 | | | | 1.90 | | | | 1.89 | | | | 1.61 | | | | (0.56 | ) | | | 24 | |
| |
| 2017 | | 11.69 | | | | (0.05 | ) | | | 0.65 | | | | 0.60 | | | | – | | | | (0.88 | ) | | | (0.88 | ) | | | – | | | | 11.41 | | | | 5.32 | | | | 13,880 | | | | 1.86 | | | | 1.86 | | | | 1.61 | | | | (0.40 | ) | | | 26 | |
| |
| 2016 | | 10.90 | | | | (0.01 | ) | | | 2.15 | | | | 2.14 | | | | (0.05 | ) | | | (1.30 | ) | | | (1.35 | ) | | | – | | | | 11.69 | | | | 19.59 | | | | 17,343 | | | | 1.83 | | | | 1.83 | | | | 1.61 | | | | (0.11 | ) | | | 38 | |
| |
| 2015 | | 14.26 | | | | 0.00 | | | | (1.92 | ) | | | (1.92 | ) | | | – | | | | (1.44 | ) | | | (1.44 | ) | | | – | | | | 10.90 | | | | (13.37 | ) | | | 20,538 | | | | 1.80 | | | | 1.80 | | | | 1.63 | | | | 0.01 | | | | 41 | |
| |
| 2014 | | 16.48 | | | | (0.10 | ) | | | (0.65 | ) | | | (0.75 | ) | | | – | | | | (1.48 | ) | | | (1.48 | ) | | | 0.01 | | | | 14.26 | | | | (4.24 | ) | | | 38,645 | | | | 1.77 | | | | 1.77 | | | | 1.66 | | | | (0.63 | ) | | | 18 | |
| |
| Royce Micro-Cap Fund–Consultant Class |
| 2019† | $ | 7.23 | | | $ | (0.07 | ) | | $ | 0.78 | | | $ | 0.71 | | | $ | – | | | $ | – | | | $ | – | | | $ | – | | | $ | 7.94 | | | | 9.82 | %1 | | $ | 16,420 | | | | 2.74 | %2 | | | 2.73 | %2 | | | 2.73 | %2 | | | (1.90 | )%2 | | | 6 | % |
| |
| 2018 | | 9.10 | | | | (0.14 | ) | | | (0.72 | ) | | | (0.86 | ) | | | – | | | | (1.01 | ) | | | (1.01 | ) | | | – | | | | 7.23 | | | | (9.93 | ) | | | 16,680 | | | | 2.56 | | | | 2.56 | | | | 2.56 | | | | (1.50 | ) | | | 24 | |
| |
| 2017 | | 9.41 | | | | (0.13 | ) | | | 0.53 | | | | 0.40 | | | | – | | | | (0.71 | ) | | | (0.71 | ) | | | – | | | | 9.10 | | | | 4.35 | | | | 24,396 | | | | 2.54 | | | | 2.54 | | | | 2.54 | | | | (1.34 | ) | | | 26 | |
| |
| 2016 | | 9.04 | | | | (0.09 | ) | | | 1.76 | | | | 1.67 | | | | – | | | | (1.30 | ) | | | (1.30 | ) | | | – | | | | 9.41 | | | | 18.48 | | | | 33,622 | | | | 2.53 | | | | 2.53 | | | | 2.53 | | | | (1.02 | ) | | | 38 | |
| |
| 2015 | | 12.23 | | | | (0.10 | ) | | | (1.65 | ) | | | (1.75 | ) | | | – | | | | (1.44 | ) | | | (1.44 | ) | | | – | | | | 9.04 | | | | (14.21 | ) | | | 41,024 | | | | 2.54 | | | | 2.54 | | | | 2.54 | | | | (0.90 | ) | | | 41 | |
| |
| 2014 | | 14.48 | | | | (0.20 | ) | | | (0.57 | ) | | | (0.77 | ) | | | – | | | | (1.48 | ) | | | (1.48 | ) | | | – | | | | 12.23 | | | | (5.03 | ) | | | 75,868 | | | | 2.48 | | | | 2.48 | | | | 2.48 | | | | (1.45 | ) | | | 18 | |
| |
| Royce Opportunity Fund–Investment Class |
| 2019† | $ | 9.92 | | | $ | (0.03 | ) | | $ | 1.58 | | | $ | 1.55 | | | $ | – | | | $ | – | | | $ | – | | | $ | – | | | $ | 11.47 | | | | 15.63 | %1 | | $ | 607,775 | | | | 1.24 | %2 | | | 1.24 | %2 | | | 1.24 | %2 | | | (0.49 | )%2 | | | 22 | % |
| |
| 2018 | | 13.58 | | | | (0.04 | ) | | | (2.61 | ) | | | (2.65 | ) | | | – | | | | (1.01 | ) | | | (1.01 | ) | | | – | | | | 9.92 | | | | (19.97 | ) | | | 557,003 | | | | 1.20 | | | | 1.20 | | | | 1.20 | | | | (0.30 | ) | | | 47 | |
| |
| 2017 | | 12.85 | | | | (0.04 | ) | | | 2.79 | | | | 2.75 | | | | – | | | | (2.02 | ) | | | (2.02 | ) | | | – | | | | 13.58 | | | | 21.88 | | | | 805,660 | | | | 1.18 | | | | 1.18 | | | | 1.18 | | | | (0.28 | ) | | | 43 | |
| |
| 2016 | | 10.57 | | | | (0.02 | ) | | | 3.19 | | | | 3.17 | | | | – | | | | (0.89 | ) | | | (0.89 | ) | | | – | | | | 12.85 | | | | 29.86 | | | | 751,184 | | | | 1.19 | | | | 1.19 | | | | 1.19 | | | | (0.18 | ) | | | 26 | |
| |
| 2015 | | 13.46 | | | | (0.03 | ) | | | (1.80 | ) | | | (1.83 | ) | | | – | | | | (1.06 | ) | | | (1.06 | ) | | | – | | | | 10.57 | | | | (13.57 | ) | | | 746,052 | | | | 1.17 | | | | 1.17 | | | | 1.17 | | | | (0.27 | ) | | | 27 | |
| |
| 2014 | | 15.54 | | | | (0.05 | ) | | | (0.09 | ) | | | (0.14 | ) | | | – | | | | (1.94 | ) | | | (1.94 | ) | | | – | | | | 13.46 | | | | (0.48 | ) | | | 1,284,044 | | | | 1.14 | | | | 1.14 | | | | 1.14 | | | | (0.30 | ) | | | 36 | |
| |
| 70 | The Royce Funds 2019 Semiannual Report to Shareholders | | THE ACCOMPANYING NOTES ARE AN INTEGRAL PART OF THESE FINANCIAL STATEMENTS |
Financial Highlights
This table is presented to show selected data for a share outstanding throughout each year or other indicated period and to assist shareholders in evaluating a Fund’s performance for the periods presented. Per share amounts have been determined on the basis of the weighted average number of shares outstanding during the period.
| | | | | | | | | | | | | | | | | | | | | | | | | | | | | | | | | | | | | | | | | | | | | | Ratio of Expenses to Average Net Assets | | | | | | |
| | | | | | | | | | | | | | | | | | | | | | | | | | | | | | | | | | | | | | | | | | | | | | | | | | | | | | |
| | Net Asset
Value,
Beginning of
Period | | Net Investment
Income (Loss) | | Net Realized and
Unrealized Gain (Loss)
on Investments and
Foreign Currency | | Total from
Investment
Operations | | Distributions
from Net
Investment
Income | | Distributions from
Net Realized Gain on
Investments and
Foreign Currency | | Total
Distributions | | Shareholder
Redemption
Fees | | Net Asset
Value, End of
Period | | Total Return | | Net Assets,
End of Period
(in thousands) | | Prior to Fee
Waivers,
Expense
Reimbursements
and Balance
Credits | | Prior to Fee
Waivers and
Expense
Reimbursements | | Net of Fee
Waivers and
Expense
Reimbursements | | Ratio of Net
Investment
Income (Loss) to
Average Net
Assets | | Portfolio
Turnover Rate |
| |
| Royce Opportunity Fund–Service Class |
| 2019† | $ | 9.23 | | | $ | (0.04 | ) | | $ | 1.46 | | | $ | 1.42 | | | $ | – | | | $ | – | | | $ | – | | | $ | – | | | $ | 10.65 | | | | 15.38 | %1 | | $ | 47,582 | | | | 1.60 | %2 | | | 1.60 | %2 | | | 1.49 | %2 | | | (0.74 | )%2 | | | 22 | % |
| |
| 2018 | | 12.66 | | | | (0.07 | ) | | | (2.42 | ) | | | (2.49 | ) | | | – | | | | (0.94 | ) | | | (0.94 | ) | | | – | | | | 9.23 | | | | (20.14 | ) | | | 48,797 | | | | 1.52 | | | | 1.52 | | | | 1.49 | | | | (0.59 | ) | | | 47 | |
| |
| 2017 | | 12.02 | | | | (0.08 | ) | | | 2.61 | | | | 2.53 | | | | – | | | | (1.89 | ) | | | (1.89 | ) | | | – | | | | 12.66 | | | | 21.46 | | | | 96,663 | | | | 1.53 | | | | 1.53 | | | | 1.49 | | | | (0.61 | ) | | | 43 | |
| |
| 2016 | | 9.95 | | | | (0.05 | ) | | | 3.01 | | | | 2.96 | | | | – | | | | (0.89 | ) | | | (0.89 | ) | | | – | | | | 12.02 | | | | 29.61 | | | | 73,517 | | | | 1.53 | | | | 1.53 | | | | 1.49 | | | | (0.48 | ) | | | 26 | |
| |
| 2015 | | 12.80 | | | | (0.07 | ) | | | (1.72 | ) | | | (1.79 | ) | | | – | | | | (1.06 | ) | | | (1.06 | ) | | | – | | | | 9.95 | | | | (13.96 | ) | | | 100,918 | | | | 1.49 | | | | 1.49 | | | | 1.49 | | | | (0.59 | ) | | | 27 | |
| |
| 2014 | | 14.92 | | | | (0.09 | ) | | | (0.09 | ) | | | (0.18 | ) | | | – | | | | (1.94 | ) | | | (1.94 | ) | | | – | | | | 12.80 | | | | (0.74 | ) | | | 155,085 | | | | 1.47 | | | | 1.47 | | | | 1.47 | | | | (0.64 | ) | | | 36 | |
| |
| Royce Opportunity Fund–Consultant Class |
| 2019† | $ | 8.09 | | | $ | (0.08 | ) | | $ | 1.29 | | | $ | 1.21 | | | $ | – | | | $ | – | | | $ | – | | | $ | – | | | $ | 9.30 | | | | 14.96 | %1 | | $ | 9,034 | | | | 2.44 | %2 | | | 2.44 | %2 | | | 2.44 | %2 | | | (1.69 | )%2 | | | 22 | % |
| |
| 2018 | | 11.19 | | | | (0.16 | ) | | | (2.12 | ) | | | (2.28 | ) | | | – | | | | (0.82 | ) | | | (0.82 | ) | | | – | | | | 8.09 | | | | (20.81 | ) | | | 9,831 | | | | 2.30 | | | | 2.29 | | | | 2.29 | | | | (1.39 | ) | | | 47 | |
| |
| 2017 | | 10.71 | | | | (0.16 | ) | | | 2.31 | | | | 2.15 | | | | – | | | | (1.67 | ) | | | (1.67 | ) | | | – | | | | 11.19 | | | | 20.50 | | | | 20,574 | | | | 2.27 | | | | 2.27 | | | | 2.27 | | | | (1.37 | ) | | | 43 | |
| |
| 2016 | | 9.01 | | | | (0.12 | ) | | | 2.71 | | | | 2.59 | | | | – | | | | (0.89 | ) | | | (0.89 | ) | | | – | | | | 10.71 | | | | 28.59 | | | | 21,116 | | | | 2.28 | | | | 2.28 | | | | 2.28 | | | | (1.27 | ) | | | 26 | |
| |
| 2015 | | 11.79 | | | | (0.15 | ) | | | (1.57 | ) | | | (1.72 | ) | | | – | | | | (1.06 | ) | | | (1.06 | ) | | | – | | | | 9.01 | | | | (14.56 | ) | | | 19,464 | | | | 2.26 | | | | 2.26 | | | | 2.26 | | | | (1.34 | ) | | | 27 | |
| |
| 2014 | | 14.02 | | | | (0.19 | ) | | | (0.10 | ) | | | (0.29 | ) | | | – | | | | (1.94 | ) | | | (1.94 | ) | | | – | | | | 11.79 | | | | (1.61 | ) | | | 20,518 | | | | 2.24 | | | | 2.24 | | | | 2.24 | | | | (1.40 | ) | | | 36 | |
| |
| Royce Opportunity Fund–Institutional Class |
| 2019† | $ | 10.13 | | | $ | (0.02 | ) | | $ | 1.61 | | | $ | 1.59 | | | $ | – | | | $ | – | | | $ | – | | | $ | – | | | $ | 11.72 | | | | 15.70 | %1 | | $ | 244,398 | | | | 1.11 | %2 | | | 1.11 | %2 | | | 1.11 | %2 | | | (0.36 | )%2 | | | 22 | % |
| |
| 2018 | | 13.84 | | | | (0.02 | ) | | | (2.66 | ) | | | (2.68 | ) | | | – | | | | (1.03 | ) | | | (1.03 | ) | | | – | | | | 10.13 | | | | (19.83 | ) | | | 227,261 | | | | 1.08 | | | | 1.08 | | | | 1.08 | | | | (0.17 | ) | | | 47 | |
| |
| 2017 | | 13.08 | | | | (0.02 | ) | | | 2.84 | | | | 2.82 | | | | – | | | | (2.06 | ) | | | (2.06 | ) | | | – | | | | 13.84 | | | | 22.02 | | | | 639,057 | | | | 1.07 | | | | 1.07 | | | | 1.07 | | | | (0.17 | ) | | | 43 | |
| |
| 2016 | | 10.74 | | | | (0.01 | ) | | | 3.24 | | | | 3.23 | | | | – | | | | (0.89 | ) | | | (0.89 | ) | | | – | | | | 13.08 | | | | 29.94 | | | | 583,975 | | | | 1.07 | | | | 1.07 | | | | 1.07 | | | | (0.06 | ) | | | 26 | |
| |
| 2015 | | 13.64 | | | | (0.02 | ) | | | (1.82 | ) | | | (1.84 | ) | | | – | | | | (1.06 | ) | | | (1.06 | ) | | | – | | | | 10.74 | | | | (13.46 | ) | | | 600,945 | | | | 1.05 | | | | 1.05 | | | | 1.05 | | | | (0.15 | ) | | | 27 | |
| |
| 2014 | | 15.71 | | | | (0.03 | ) | | | (0.10 | ) | | | (0.13 | ) | | | – | | | | (1.94 | ) | | | (1.94 | ) | | | – | | | | 13.64 | | | | (0.41 | ) | | | 799,131 | | | | 1.03 | | | | 1.03 | | | | 1.03 | | | | (0.20 | ) | | | 36 | |
| |
| Royce Opportunity Fund–R Class |
| 2019† | $ | 8.90 | | | $ | (0.06 | ) | | $ | 1.41 | | | $ | 1.35 | | | $ | – | | | $ | – | | | $ | – | | | $ | – | | | $ | 10.25 | | | | 15.17 | %1 | | $ | 29,963 | | | | 1.88 | %2 | | | 1.88 | %2 | | | 1.88 | %2 | | | (1.12 | )%2 | | | 22 | % |
| |
| 2018 | | 12.25 | | | | (0.11 | ) | | | (2.33 | ) | | | (2.44 | ) | | | – | | | | (0.91 | ) | | | (0.91 | ) | | | – | | | | 8.90 | | | | (20.42 | ) | | | 26,337 | | | | 1.84 | | | | 1.84 | | | | 1.84 | | | | (0.93 | ) | | | 47 | |
| |
| 2017 | | 11.67 | | | | (0.12 | ) | | | 2.53 | | | | 2.41 | | | | – | | | | (1.83 | ) | | | (1.83 | ) | | | – | | | | 12.25 | | | | 21.06 | | | | 39,311 | | | | 1.82 | | | | 1.82 | | | | 1.82 | | | | (0.92 | ) | | | 43 | |
| |
| 2016 | | 9.72 | | | | (0.08 | ) | | | 2.92 | | | | 2.84 | | | | – | | | | (0.89 | ) | | | (0.89 | ) | | | – | | | | 11.67 | | | | 29.08 | | | | 38,902 | | | | 1.82 | | | | 1.82 | | | | 1.82 | | | | (0.81 | ) | | | 26 | |
| |
| 2015 | | 12.56 | | | | (0.11 | ) | | | (1.67 | ) | | | (1.78 | ) | | | – | | | | (1.06 | ) | | | (1.06 | ) | | | – | | | | 9.72 | | | | (14.15 | ) | | | 32,599 | | | | 1.82 | | | | 1.82 | | | | 1.82 | | | | (0.90 | ) | | | 27 | |
| |
| 2014 | | 14.73 | | | | (0.13 | ) | | | (0.10 | ) | | | (0.23 | ) | | | – | | | | (1.94 | ) | | | (1.94 | ) | | | – | | | | 12.56 | | | | (1.12 | ) | | | 33,699 | | | | 1.78 | | | | 1.78 | | | | 1.78 | | | | (0.93 | ) | | | 36 | |
| |
| Royce Pennsylvania Mutual Fund–Investment Class |
| 2019† | $ | 7.75 | | | $ | 0.02 | | | $ | 1.37 | | | $ | 1.39 | | | $ | – | | | $ | – | | | $ | – | | | $ | – | | | $ | 9.14 | | | | 17.94 | %1 | | $ | 1,429,923 | | | | 0.95 | %2 | | | 0.95 | %2 | | | 0.95 | %2 | | | 0.39 | %2 | | | 13 | % |
| |
| 2018 | | 10.52 | | | | 0.04 | | | | (0.97 | ) | | | (0.93 | ) | | | (0.02 | ) | | | (1.82 | ) | | | (1.84 | ) | | | – | | | | 7.75 | | | | (9.66 | ) | | | 1,203,967 | | | | 0.92 | | | | 0.92 | | | | 0.92 | | | | 0.33 | | | | 35 | |
| |
| 2017 | | 11.02 | | | | 0.06 | | | | 1.68 | | | | 1.74 | | | | (0.06 | ) | | | (2.18 | ) | | | (2.24 | ) | | | – | | | | 10.52 | | | | 16.24 | | | | 1,622,523 | | | | 0.92 | | | | 0.92 | | | | 0.92 | | | | 0.47 | | | | 27 | |
| |
| 2016 | | 9.33 | | | | 0.07 | | | | 2.41 | | | | 2.48 | | | | (0.04 | ) | | | (0.75 | ) | | | (0.79 | ) | | | – | | | | 11.02 | | | | 26.47 | | | | 1,671,848 | | | | 0.92 | | | | 0.92 | | | | 0.92 | | | | 0.60 | | | | 18 | |
| |
| 2015 | | 13.00 | | | | 0.09 | | | | (1.58 | ) | | | (1.49 | ) | | | (0.10 | ) | | | (2.08 | ) | | | (2.18 | ) | | | – | | | | 9.33 | | | | (11.43 | ) | | | 1,925,419 | | | | 0.92 | | | | 0.92 | | | | 0.92 | | | | 0.58 | | | | 21 | |
| |
| 2014 | | 14.73 | | | | 0.06 | | | | (0.21 | ) | | | (0.15 | ) | | | (0.04 | ) | | | (1.54 | ) | | | (1.58 | ) | | | – | | | | 13.00 | | | | (0.70 | ) | | | 3,869,579 | | | | 0.91 | | | | 0.91 | | | | 0.91 | | | | 0.35 | | | | 21 | |
| |
| THE ACCOMPANYING NOTES ARE AN INTEGRAL PART OF THESE FINANCIAL STATEMENTS | | The Royce Funds 2019 Semiannual Report to Shareholders | 71 |
Financial Highlights
This table is presented to show selected data for a share outstanding throughout each year or other indicated period and to assist shareholders in evaluating a Fund’s performance for the periods presented. Per share amounts have been determined on the basis of the weighted average number of shares outstanding during the period.
| | | | | | | | | | | | | | | | | | | | | | | | | | | | | | | | | | | | | | | | | | | | | | Ratio of Expenses to Average Net Assets | | | | | | |
| | | | | | | | | | | | | | | | | | | | | | | | | | | | | | | | | | | | | | | | | | | | | | | | | | | | | | |
| | Net Asset
Value,
Beginning of
Period | | Net Investment
Income (Loss) | | Net Realized and
Unrealized Gain (Loss)
on Investments and
Foreign Currency | | Total from
Investment
Operations | | Distributions
from Net
Investment
Income | | Distributions from
Net Realized Gain on
Investments and
Foreign Currency | | Total
Distributions | | Shareholder
Redemption
Fees | | Net Asset
Value, End of
Period | | Total Return | | Net Assets,
End of Period
(in thousands) | | Prior to Fee
Waivers,
Expense
Reimbursements
and Balance
Credits | | Prior to Fee
Waivers and
Expense
Reimbursements | | Net of Fee
Waivers and
Expense
Reimbursements | | Ratio of Net
Investment
Income (Loss) to
Average Net
Assets | | Portfolio
Turnover Rate |
| |
| Royce Pennsylvania Mutual Fund–Service Class |
| 2019† | $ | 7.77 | | | $ | (0.00 | ) | | $ | 1.35 | | | $ | 1.35 | | | $ | – | | | $ | – | | | $ | – | | | $ | – | | | $ | 9.12 | | | | 17.37 | %1 | | $ | 150,085 | | | | 1.32 | %2 | | | 1.32 | %2 | | | 1.32 | %2 | | | (0.09 | )%2 | | | 13 | % |
| |
| 2018 | | 10.56 | | | | (0.01 | ) | | | (0.96 | ) | | | (0.97 | ) | | | – | | | | (1.82 | ) | | | (1.82 | ) | | | – | | | | 7.77 | | | | (9.96 | ) | | | 32,191 | | | | 1.30 | | | | 1.30 | | | | 1.30 | | | | (0.07 | ) | | | 35 | |
| |
| 2017 | | 11.03 | | | | 0.01 | | | | 1.69 | | | | 1.70 | | | | – | | | | (2.17 | ) | | | (2.17 | ) | | | – | | | | 10.56 | | | | 15.88 | | | | 54,938 | | | | 1.27 | | | | 1.27 | | | | 1.27 | | | | 0.07 | | | | 27 | |
| |
| 2016 | | 9.35 | | | | 0.03 | | | | 2.41 | | | | 2.44 | | | | (0.01 | ) | | | (0.75 | ) | | | (0.76 | ) | | | – | | | | 11.03 | | | | 25.99 | | | | 100,598 | | | | 1.26 | | | | 1.26 | | | | 1.26 | | | | 0.27 | | | | 18 | |
| |
| 2015 | | 12.96 | | | | 0.05 | | | | (1.56 | ) | | | (1.51 | ) | | | (0.02 | ) | | | (2.08 | ) | | | (2.10 | ) | | | – | | | | 9.35 | | | | (11.57 | ) | | | 102,341 | | | | 1.23 | | | | 1.23 | | | | 1.23 | | | | 0.29 | | | | 21 | |
| |
| 2014 | | 14.69 | | | | 0.00 | | | | (0.19 | ) | | | (0.19 | ) | | | – | | | | (1.54 | ) | | | (1.54 | ) | | | – | | | | 12.96 | | | | (1.04 | ) | | | 333,548 | | | | 1.23 | | | | 1.23 | | | | 1.23 | | | | 0.03 | | | | 21 | |
| |
| Royce Pennsylvania Mutual Fund–Consultant Class |
| 2019† | $ | 6.18 | | | $ | (0.02 | ) | | $ | 1.09 | | | $ | 1.07 | | | $ | – | | | $ | – | | | $ | – | | | $ | – | | | $ | 7.25 | | | | 17.31 | %1 | | $ | 275,503 | | | | 1.96 | %2 | | | 1.96 | %2 | | | 1.96 | %2 | | | (0.61 | )%2 | | | 13 | % |
| |
| 2018 | | 8.46 | | | | (0.06 | ) | | | (0.77 | ) | | | (0.83 | ) | | | – | | | | (1.45 | ) | | | (1.45 | ) | | | – | | | | 6.18 | | | | (10.56 | ) | | | 249,004 | | | | 1.93 | | | | 1.93 | | | | 1.93 | | | | (0.69 | ) | | | 35 | |
| |
| 2017 | | 8.90 | | | | (0.05 | ) | | | 1.35 | | | | 1.30 | | | | – | | | | (1.74 | ) | | | (1.74 | ) | | | – | | | | 8.46 | | | | 15.06 | | | | 361,569 | | | | 1.93 | | | | 1.92 | | | | 1.92 | | | | (0.54 | ) | | | 27 | |
| |
| 2016 | | 7.70 | | | | (0.03 | ) | | | 1.98 | | | | 1.95 | | | | – | | | | (0.75 | ) | | | (0.75 | ) | | | – | | | | 8.90 | | | | 25.20 | | | | 402,114 | | | | 1.94 | | | | 1.94 | | | | 1.94 | | | | (0.42 | ) | | | 18 | |
| |
| 2015 | | 11.16 | | | | (0.05 | ) | | | (1.33 | ) | | | (1.38 | ) | | | – | | | | (2.08 | ) | | | (2.08 | ) | | | – | | | | 7.70 | | | | (12.31 | ) | | | 416,862 | | | | 1.94 | | | | 1.94 | | | | 1.94 | | | | (0.44 | ) | | | 21 | |
| |
| 2014 | | 12.96 | | | | (0.08 | ) | | | (0.18 | ) | | | (0.26 | ) | | | – | | | | (1.54 | ) | | | (1.54 | ) | | | – | | | | 11.16 | | | | (1.72 | ) | | | 676,347 | | | | 1.91 | | | | 1.91 | | | | 1.91 | | | | (0.64 | ) | | | 21 | |
| |
| Royce Pennsylvania Mutual Fund–Institutional Class |
| 2019† | $ | 7.78 | | | $ | 0.02 | | | $ | 1.37 | | | $ | 1.39 | | | $ | – | | | $ | – | | | $ | – | | | $ | – | | | $ | 9.17 | | | | 17.87 | %1 | | $ | 97,578 | | | | 0.88 | %2 | | | 0.88 | %2 | | | 0.88 | %2 | | | 0.47 | %2 | | | 13 | % |
| |
| 2018 | | 10.55 | | | | 0.04 | | | | (0.97 | ) | | | (0.93 | ) | | | (0.02 | ) | | | (1.82 | ) | | | (1.84 | ) | | | – | | | | 7.78 | | | | (9.56 | ) | | | 83,908 | | | | 0.88 | | | | 0.88 | | | | 0.88 | | | | 0.40 | | | | 35 | |
| |
| 2017 | | 11.04 | | | | 0.09 | | | | 1.67 | | | | 1.76 | | | | (0.07 | ) | | | (2.18 | ) | | | (2.25 | ) | | | – | | | | 10.55 | | | | 16.44 | | | | 53,367 | | | | 0.83 | | | | 0.83 | | | | 0.83 | | | | 0.42 | | | | 27 | |
| |
| 2016 | | 9.34 | | | | 0.09 | | | | 2.41 | | | | 2.50 | | | | (0.05 | ) | | | (0.75 | ) | | | (0.80 | ) | | | – | | | | 11.04 | | | | 26.65 | | | | 245,009 | | | | 0.83 | | | | 0.83 | | | | 0.83 | | | | 0.63 | | | | 18 | |
| |
| 2015 | | 13.02 | | | | 0.11 | | | | (1.60 | ) | | | (1.49 | ) | | | (0.11 | ) | | | (2.08 | ) | | | (2.19 | ) | | | – | | | | 9.34 | | | | (11.34 | ) | | | 498,374 | | | | 0.81 | | | | 0.81 | | | | 0.81 | | | | 0.68 | | | | 21 | |
| |
| 2014 | | 14.75 | | | | 0.07 | | | | (0.20 | ) | | | (0.13 | ) | | | (0.06 | ) | | | (1.54 | ) | | | (1.60 | ) | | | – | | | | 13.02 | | | | (0.58 | ) | | | 802,517 | | | | 0.79 | | | | 0.79 | | | | 0.79 | | | | 0.48 | | | | 21 | |
| |
| Royce Pennsylvania Mutual Fund–R Class |
| 2019† | $ | 7.30 | | | $ | (0.02 | ) | | $ | 1.28 | | | $ | 1.26 | | | $ | – | | | $ | – | | | $ | – | | | $ | – | | | $ | 8.56 | | | | 17.26 | %1 | | $ | 9,749 | | | | 1.76 | %2 | | | 1.75 | %2 | | | 1.75 | %2 | | | (0.42 | )%2 | | | 13 | % |
| |
| 2018 | | 9.94 | | | | (0.03 | ) | | | (0.91 | ) | | | (0.94 | ) | | | – | | | | (1.70 | ) | | | (1.70 | ) | | | – | | | | 7.30 | | | | (10.15 | ) | | | 10,014 | | | | 1.58 | | | | 1.57 | | | | 1.57 | | | | (0.34 | ) | | | 35 | |
| |
| 2017 | | 10.44 | | | | (0.04 | ) | | | 1.58 | | | | 1.54 | | | | – | | | | (2.04 | ) | | | (2.04 | ) | | | – | | | | 9.94 | | | | 15.25 | | | | 15,136 | | | | 1.73 | | | | 1.73 | | | | 1.73 | | | | (0.36 | ) | | | 27 | |
| |
| 2016 | | 8.90 | | | | (0.01 | ) | | | 2.30 | | | | 2.29 | | | | – | | | | (0.75 | ) | | | (0.75 | ) | | | – | | | | 10.44 | | | | 25.62 | | | | 17,059 | | | | 1.63 | | | | 1.63 | | | | 1.63 | | | | (0.11 | ) | | | 18 | |
| |
| 2015 | | 12.50 | | | | (0.02 | ) | | | (1.50 | ) | | | (1.52 | ) | | | – | | | | (2.08 | ) | | | (2.08 | ) | | | – | | | | 8.90 | | | | (12.10 | ) | | | 18,675 | | | | 1.65 | | | | 1.65 | | | | 1.65 | | | | (0.15 | ) | | | 21 | |
| |
| 2014 | | 14.26 | | | | (0.03 | ) | | | (0.19 | ) | | | (0.22 | ) | | | – | | | | (1.54 | ) | | | (1.54 | ) | | | – | | | | 12.50 | | | | (1.28 | ) | | | 36,622 | | | | 1.48 | | | | 1.48 | | | | 1.48 | | | | (0.21 | ) | | | 21 | |
| |
| Royce Premier Fund–Investment Class |
| 2019† | $ | 11.62 | | | $ | 0.01 | | | $ | 2.52 | | | $ | 2.53 | | | $ | – | | | $ | – | | | $ | – | | | $ | – | | | $ | 14.15 | | | | 21.77 | %1 | | $ | 1,559,791 | | | | 1.21 | %2 | | | 1.21 | %2 | | | 1.21 | %2 | | | 0.13 | %2 | | | 7 | % |
| |
| 2018 | | 16.60 | | | | 0.02 | | | | (1.60 | ) | | | (1.58 | ) | | | (0.01 | ) | | | (3.39 | ) | | | (3.40 | ) | | | – | | | | 11.62 | | | | (10.40 | ) | | | 1,398,965 | | | | 1.17 | | | | 1.17 | | | | 1.17 | | | | 0.11 | | | | 23 | |
| |
| 2017 | | 15.51 | | | | 0.00 | | | | 3.63 | | | | 3.63 | | | | (0.02 | ) | | | (2.52 | ) | | | (2.54 | ) | | | – | | | | 16.60 | | | | 23.77 | | | | 1,978,847 | | | | 1.16 | | | | 1.16 | | | | 1.16 | | | | 0.00 | | | | 8 | |
| |
| 2016 | | 14.28 | | | | 0.06 | | | | 3.25 | | | | 3.31 | | | | (0.04 | ) | | | (2.04 | ) | | | (2.08 | ) | | | – | | | | 15.51 | | | | 23.00 | | | | 1,768,580 | | | | 1.16 | | | | 1.16 | | | | 1.16 | | | | 0.35 | | | | 15 | |
| |
| 2015 | | 19.72 | | | | 0.13 | | | | (2.11 | ) | | | (1.98 | ) | | | (0.13 | ) | | | (3.33 | ) | | | (3.46 | ) | | | – | | | | 14.28 | | | | (9.90 | ) | | | 2,015,905 | | | | 1.13 | | | | 1.13 | | | | 1.13 | | | | 0.49 | | | | 13 | |
| |
| 2014 | | 22.11 | | | | 0.08 | | | | (0.32 | ) | | | (0.24 | ) | | | (0.08 | ) | | | (2.07 | ) | | | (2.15 | ) | | | – | | | | 19.72 | | | | (0.86 | ) | | | 4,097,961 | | | | 1.10 | | | | 1.10 | | | | 1.10 | | | | 0.34 | | | | 9 | |
| |
| 72 | The Royce Funds 2019 Semiannual Report to Shareholders | | THE ACCOMPANYING NOTES ARE AN INTEGRAL PART OF THESE FINANCIAL STATEMENTS |
Financial Highlights
This table is presented to show selected data for a share outstanding throughout each year or other indicated period and to assist shareholders in evaluating a Fund’s performance for the periods presented. Per share amounts have been determined on the basis of the weighted average number of shares outstanding during the period.
| | | | | | | | | | | | | | | | | | | | | | | | | | | | | | | | | | | | | | | | | | | | | | Ratio of Expenses to Average Net Assets | | | | | | |
| | | | | | | | | | | | | | | | | | | | | | | | | | | | | | | | | | | | | | | | | | | | | | | | | | | | | | |
| | Net Asset
Value,
Beginning of
Period | | Net Investment
Income (Loss) | | Net Realized and
Unrealized Gain (Loss)
on Investments and
Foreign Currency | | Total from
Investment
Operations | | Distributions
from Net
Investment
Income | | Distributions from Net
Realized Gain on
Investments and
Foreign Currency | | Total
Distributions | | Shareholder
Redemption
Fees | | Net Asset Value,
End of Period | | Total Return | | Net Assets,
End of Period
(in thousands) | | Prior to Fee
Waivers,
Expense
Reimbursements
and Balance
Credits | | Prior to Fee
Waivers and
Expense
Reimbursements | | Net of Fee
Waivers and
Expense
Reimbursements | | Ratio of Net
Investment
Income (Loss) to
Average Net
Assets | | Portfolio
Turnover Rate |
| |
| Royce Premier Fund–Service Class |
| 2019† | $ | 11.31 | | | $ | (0.01 | ) | | $ | 2.46 | | | $ | 2.45 | | | $ | – | | | $ | – | | | $ | – | | | $ | – | | | $ | 13.76 | | | | 21.66 | %1 | | $ | 42,552 | | | | 1.57 | %2 | | | 1.57 | %2 | | | 1.49 | %2 | | | (0.16 | )%2 | | | 7 | % |
| |
| 2018 | | 16.15 | | | | (0.03 | ) | | | (1.55 | ) | | | (1.58 | ) | | | – | | | | (3.26 | ) | | | (3.26 | ) | | | – | | | | 11.31 | | | | (10.66 | ) | | | 41,738 | | | | 1.52 | | | | 1.52 | | | | 1.48 | | | | (0.19 | ) | | | 23 | |
| |
| 2017 | | 15.13 | | | | (0.06 | ) | | | 3.53 | | | | 3.47 | | | | – | | | | (2.45 | ) | | | (2.45 | ) | | | – | | | | 16.15 | | | | 23.32 | | | | 54,557 | | | | 1.53 | | | | 1.53 | | | | 1.49 | | | | (0.34 | ) | | | 8 |
| |
| 2016 | | 13.98 | | | | 0.00 | | | | 3.19 | | | | 3.19 | | | | – | | | | (2.04 | ) | | | (2.04 | ) | | | – | | | | 15.13 | | | | 22.63 | | | | 46,550 | | | | 1.50 | | | | 1.50 | | | | 1.49 | | | | 0.02 | | | | 15 |
| |
| 2015 | | 19.33 | | | | 0.06 | | | | (2.04 | ) | | | (1.98 | ) | | | (0.04 | ) | | | (3.33 | ) | | | (3.37 | ) | | | – | | | | 13.98 | | | | (10.13 | ) | | | 61,969 | | | | 1.44 | | | | 1.43 | | | | 1.43 | | | | 0.23 | | | | 13 |
| |
| 2014 | | 21.70 | | | | 0.01 | | | | (0.31 | ) | | | (0.30 | ) | | | – | | | | (2.07 | ) | | | (2.07 | ) | | | – | | | | 19.33 | | | | (1.16 | ) | | | 172,810 | | | | 1.38 | | | | 1.38 | | | | 1.38 | | | | 0.05 | | | | 9 |
| |
| Royce Premier Fund–Consultant Class |
| 2019† | $ | 9.17 | | | $ | (0.05 | ) | | $ | 2.00 | | | $ | 1.95 | | | $ | – | | | $ | – | | | $ | – | | | $ | – | | | $ | 11.12 | | | | 21.26 | %1 | | $ | 23,322 | | | | 2.26 | %2 | | | 2.26 | %2 | | | 2.26 | %2 | | | (0.92 | )%2 | | | 7 | % |
| |
| 2018 | | 13.21 | | | | (0.12 | ) | | | (1.27 | ) | | | (1.39 | ) | | | – | | | | (2.65 | ) | | | (2.65 | ) | | | – | | | �� | 9.17 | | | | (11.41 | ) | | | 21,370 | | | | 2.21 | | | | 2.21 | | | | 2.21 | | | | (0.93 | ) | | | 23 | |
| |
| 2017 | | 12.46 | | | | (0.14 | ) | | | 2.89 | | | | 2.75 | | | | – | | | | (2.00 | ) | | | (2.00 | ) | | | – | | | | 13.21 | | | | 22.49 | | | | 31,489 | | | | 2.21 | | | | 2.21 | | | | 2.21 | | | | (1.06 | ) | | | 8 |
| |
| 2016 | | 11.89 | | | | (0.09 | ) | | | 2.70 | | | | 2.61 | | | | – | | | | (2.04 | ) | | | (2.04 | ) | | | – | | | | 12.46 | | | | 21.72 | | | | 31,353 | | | | 2.22 | | | | 2.22 | | | | 2.22 | | | | (0.72 | ) | | | 15 |
| |
| 2015 | | 17.09 | | | | (0.09 | ) | | | (1.78 | ) | | | (1.87 | ) | | | – | | | | (3.33 | ) | | | (3.33 | ) | | | – | | | | 11.89 | | | | (10.80 | ) | | | 32,982 | | | | 2.17 | | | | 2.17 | | | | 2.17 | | | | (0.55 | ) | | | 13 |
| |
| 2014 | | 19.58 | | | | (0.13 | ) | | | (0.29 | ) | | | (0.42 | ) | | | – | | | | (2.07 | ) | | | (2.07 | ) | | | – | | | | 17.09 | | | | (1.92 | ) | | | 56,884 | | | | 2.10 | | | | 2.10 | | | | 2.10 | | | | (0.66 | ) | | | 9 |
| |
| Royce Premier Fund–Institutional Class |
| 2019† | $ | 11.79 | | | $ | 0.01 | | | $ | 2.57 | | | $ | 2.58 | | | $ | – | | | $ | – | | | $ | – | | | $ | – | | | $ | 14.37 | | | | 21.88 | %1 | | $ | 226,798 | | | | 1.15 | %2 | | | 1.15 | %2 | | | 1.15 | %2 | | | 0.20 | %2 | | | 7 | % |
| |
| 2018 | | 16.82 | | | | 0.03 | | | | (1.63 | ) | | | (1.60 | ) | | | (0.02 | ) | | | (3.41 | ) | | | (3.43 | ) | | | – | | | | 11.79 | | | | (10.41 | ) | | | 197,697 | | | | 1.12 | | | | 1.12 | | | | 1.12 | | | | 0.16 | | | | 23 | |
| |
| 2017 | | 15.72 | | | | 0.01 | | | | 3.68 | | | | 3.69 | | | | (0.03 | ) | | | (2.56 | ) | | | (2.59 | ) | | | – | | | | 16.82 | | | | 23.85 | | | | 250,119 | | | | 1.09 | | | | 1.09 | | | | 1.09 | | | | 0.07 | | | | 8 |
| |
| 2016 | | 14.44 | | | | 0.08 | | | | 3.30 | | | | 3.38 | | | | (0.06 | ) | | | (2.04 | ) | | | (2.10 | ) | | | – | | | | 15.72 | | | | 23.20 | | | | 250,826 | | | | 1.07 | | | | 1.07 | | | | 1.07 | | | | 0.44 | | | | 15 |
| |
| 2015 | | 19.91 | | | | 0.16 | | | | (2.14 | ) | | | (1.98 | ) | | | (0.16 | ) | | | (3.33 | ) | | | (3.49 | ) | | | – | | | | 14.44 | | | | (9.82 | ) | | | 294,477 | | | | 1.02 | | | | 1.02 | | | | 1.02 | | | | 0.60 | | | | 13 |
| |
| 2014 | | 22.31 | | | | 0.12 | | | | (0.34 | ) | | | (0.22 | ) | | | (0.11 | ) | | | (2.07 | ) | | | (2.18 | ) | | | – | | | | 19.91 | | | | (0.79 | ) | | | 594,463 | | | | 0.98 | | | | 0.98 | | | | 0.98 | | | | 0.45 | | | | 9 |
| |
| Royce Premier Fund–R Class |
| 2019† | $ | 10.73 | | | $ | (0.03 | ) | | $ | 2.33 | | | $ | 2.30 | | | $ | – | | | $ | – | | | $ | – | | | $ | – | | | $ | 13.03 | | | | 21.44 | %1 | | $ | 11,253 | | | | 1.91 | %2 | | | 1.91 | %2 | | | 1.91 | %2 | | | (0.56 | )%2 | | | 7 | % |
| |
| 2018 | | 15.39 | | | | (0.08 | ) | | | (1.48 | ) | | | (1.56 | ) | | | – | | | | (3.10 | ) | | | (3.10 | ) | | | – | | | | 10.73 | | | | (11.01 | ) | | | 9,715 | | | | 1.80 | | | | 1.80 | | | | 1.80 | | | | (0.52 | ) | | | 23 | |
| |
| 2017 | | 14.47 | | | | (0.12 | ) | | | 3.37 | | | | 3.25 | | | | – | | | | (2.33 | ) | | | (2.33 | ) | | | – | | | | 15.39 | | | | 22.88 | | | | 12,841 | | | | 1.90 | | | | 1.90 | | | | 1.90 | | | | (0.75 | ) | | | 8 |
| |
| 2016 | | 13.49 | | | | (0.05 | ) | | | 3.07 | | | | 3.02 | | | | – | | | | (2.04 | ) | | | (2.04 | ) | | | – | | | | 14.47 | | | | 22.18 | | | | 13,889 | | | | 1.84 | | | | 1.84 | | | | 1.84 | | | | (0.33 | ) | | | 15 |
| |
| 2015 | | 18.82 | | | | (0.03 | ) | | | (1.97 | ) | | | (2.00 | ) | | | – | | | | (3.33 | ) | | | (3.33 | ) | | | – | | | | 13.49 | | | | (10.50 | ) | | | 16,129 | | | | 1.78 | | | | 1.78 | | | | 1.78 | | | | (0.16 | ) | | | 13 |
| |
| 2014 | | 21.25 | | | | (0.06 | ) | | | (0.30 | ) | | | (0.36 | ) | | | – | | | | (2.07 | ) | | | (2.07 | ) | | | – | | | | 18.82 | | | | (1.48 | ) | | | 27,355 | | | | 1.71 | | | | 1.71 | | | | 1.71 | | | | (0.28 | ) | | | 9 |
| |
| Royce Small-Cap Value Fund–Investment Class |
| 2019† | $ | 8.35 | | | $ | 0.04 | | | $ | 0.72 | | | $ | 0.76 | | | $ | – | | | $ | – | | | $ | – | | | $ | – | | | $ | 9.11 | | | | 9.10 | %1 | | $ | 55,789 | | | | 1.30 | %2 | | | 1.30 | %2 | | | 1.24 | %2 | | | 0.90 | %2 | | | 38 | % |
| |
| 2018 | | 10.16 | | | | 0.05 | | | | (0.73 | ) | | | (0.68 | ) | | | (0.04 | ) | | | (1.09 | ) | | | (1.13 | ) | | | – | | | | 8.35 | | | | (7.05 | ) | | $ | 56,433 | | | | 1.26 | | | | 1.26 | | | | 1.24 | | | | 0.45 | | | | 64 | |
| |
| 2017 | | 10.03 | | | | 0.04 | | | | 0.50 | | | | 0.54 | | | | (0.06 | ) | | | (0.35 | ) | | | (0.41 | ) | | | – | | | | 10.16 | | | | 5.49 | | | | 66,094 | | | | 1.26 | | | | 1.25 | | | | 1.24 | | | | 0.44 | | | | 61 |
| |
| 2016 | | 8.74 | | | | 0.08 | | | | 1.79 | | | | 1.87 | | | | (0.08 | ) | | | (0.50 | ) | | | (0.58 | ) | | | – | | | | 10.03 | | | | 21.37 | | | | 72,863 | | | | 1.24 | | | | 1.24 | | | | 1.24 | | | | 0.72 | | | | 56 |
| |
| 2015 | | 11.81 | | | | 0.10 | | | | (1.43 | ) | | | (1.33 | ) | | | (0.09 | ) | | | (1.65 | ) | | | (1.74 | ) | | | – | | | | 8.74 | | | | (11.25 | ) | | | 77,821 | | | | 1.23 | | | | 1.23 | | | | 1.23 | | | | 0.69 | | | | 60 |
| |
| 2014 | | 13.52 | | | | 0.04 | | | | (0.05 | ) | | | (0.01 | ) | | | (0.03 | ) | | | (1.67 | ) | | | (1.70 | ) | | | – | | | | 11.81 | | | | 0.27 | | | | 140,163 | | | | 1.18 | | | | 1.18 | | | | 1.18 | | | | 0.32 | | | | 38 |
| |
| THE ACCOMPANYING NOTES ARE AN INTEGRAL PART OF THESE FINANCIAL STATEMENTS | | The Royce Funds 2019 Semiannual Report to Shareholders | 73 |
Financial Highlights
This table is presented to show selected data for a share outstanding throughout each year or other indicated period and to assist shareholders in evaluating a Fund’s performance for the periods presented. Per share amounts have been determined on the basis of the weighted average number of shares outstanding during the period.
| | | | | | | | | | | | | | | | | | | | | | | | | | | | | | | | | | | | | | | | | | | | | | Ratio of Expenses to Average Net Assets | | | | | | |
| | | | | | | | | | | | | | | | | | | | | | | | | | | | | | | | | | | | | | | | | | | | | | | | | | | | | | |
| | Net Asset
Value,
Beginning of
Period | | Net Investment
Income (Loss) | | Net Realized and
Unrealized Gain (Loss)
on Investments and
Foreign Currency | | Total from
Investment
Operations | | Distributions
from Net
Investment
Income | | Distributions from Net
Realized Gain on
Investments and
Foreign Currency | | Total
Distributions | | Shareholder
Redemption
Fees | | Net Asset Value,
End of Period | | Total Return | | Net Assets,
End of Period
(in thousands) | | Prior to Fee
Waivers,
Expense
Reimbursements
and Balance
Credits | | Prior to Fee
Waivers and
Expense
Reimbursements | | Net of Fee
Waivers and
Expense
Reimbursements | | Ratio of Net
Investment
Income (Loss) to
Average Net
Assets | | Portfolio
Turnover Rate |
| |
| Royce Small-Cap Value Fund–Service Class |
| 2019† | $ | 8.33 | | | $ | 0.03 | | | $ | 0.71 | | | $ | 0.74 | | | $ | – | | | $ | – | | | $ | – | | | $ | – | | | $ | 9.07 | | | | 8.88 | %1 | | $ | 105,538 | | | | 1.57 | %2 | | | 1.57 | %2 | | | 1.49 | %2 | | | 0.65 | %2 | | | 38 | % |
| |
| 2018 | | 10.12 | | | | 0.02 | | | | (0.72 | ) | | | (0.70 | ) | | | (0.01 | ) | | | (1.08 | ) | | | (1.09 | ) | | | – | | | | 8.33 | | | | (7.17 | ) | | | 111,855 | | | | 1.53 | | | | 1.53 | | | | 1.49 | | | | 0.19 | | | | 64 | |
| |
| 2017 | | 9.98 | | | | 0.02 | | | | 0.50 | | | | 0.52 | | | | (0.03 | ) | | | (0.35 | ) | | | (0.38 | ) | | | – | | | | 10.12 | | | | 5.27 | | | | 152,232 | | | | 1.51 | | | | 1.51 | | | | 1.49 | | | | 0.17 | | | | 61 |
| |
| 2016 | | 8.70 | | | | 0.05 | | | | 1.79 | | | | 1.84 | | | | (0.06 | ) | | | (0.50 | ) | | | (0.56 | ) | | | – | | | | 9.98 | | | | 21.06 | | | | 213,067 | | | | 1.49 | | | | 1.49 | | | | 1.48 | | | | 0.48 | | | | 56 |
| |
| 2015 | | 11.76 | | | | 0.06 | | | | (1.41 | ) | | | (1.35 | ) | | | (0.06 | ) | | | (1.65 | ) | | | (1.71 | ) | | | – | | | | 8.70 | | | | (11.51 | ) | | | 252,814 | | | | 1.48 | | | | 1.48 | | | | 1.48 | | | | 0.45 | | | | 60 |
| |
| 2014 | | 13.48 | | | | 0.01 | | | | (0.06 | ) | | | (0.05 | ) | | | – | | | | (1.67 | ) | | | (1.67 | ) | | | – | | | | 11.76 | | | | (0.02 | ) | | | 477,999 | | | | 1.45 | | | | 1.45 | | | | 1.45 | | | | 0.04 | | | | 38 |
| |
| Royce Small-Cap Value Fund–Consultant Class |
| 2019† | $ | 7.40 | | | $ | (0.01 | ) | | $ | 0.64 | | | $ | 0.63 | | | $ | – | | | $ | – | | | $ | – | | | $ | – | | | $ | 8.03 | | | | 8.51 | %1 | | $ | 9,328 | | | | 2.42 | %2 | | | 2.42 | %2 | | | 2.42 | %2 | | | (0.29 | )%2 | | | 38 | % |
| |
| 2018 | | 9.06 | | | | (0.06 | ) | | | (0.64 | ) | | | (0.70 | ) | | | – | | | | (0.96 | ) | | | (0.96 | ) | | | – | | | | 7.40 | | | | (8.07 | ) | | | 9,641 | | | | 2.35 | | | | 2.34 | | | | 2.34 | | | | (0.66 | ) | | | 64 | |
| |
| 2017 | | 8.98 | | | | (0.06 | ) | | | 0.45 | | | | 0.39 | | | | – | | | | (0.31 | ) | | | (0.31 | ) | | | – | | | | 9.06 | | | | 4.44 | | | | 13,111 | | | | 2.32 | | | | 2.32 | | | | 2.32 | | | | (0.66 | ) | | | 61 |
| |
| 2016 | | 7.89 | | | | (0.03 | ) | | | 1.62 | | | | 1.59 | | | | – | | | | (0.50 | ) | | | (0.50 | ) | | | – | | | | 8.98 | | | | 20.10 | | | | 16,484 | | | | 2.28 | | | | 2.28 | | | | 2.28 | | | | (0.33 | ) | | | 56 |
| |
| 2015 | | 10.87 | | | | (0.04 | ) | | | (1.29 | ) | | | (1.33 | ) | | | – | | | | (1.65 | ) | | | (1.65 | ) | | | – | | | | 7.89 | | | | (12.24 | ) | | | 18,404 | | | | 2.27 | | | | 2.27 | | | | 2.27 | | | | (0.36 | ) | | | 60 |
| |
| 2014 | | 12.68 | | | | (0.09 | ) | | | (0.05 | ) | | | (0.14 | ) | | | – | | | | (1.67 | ) | | | (1.67 | ) | | | – | | | | 10.87 | | | | (0.74 | ) | | | 26,716 | | | | 2.21 | | | | 2.21 | | | | 2.21 | | | | (0.71 | ) | | | 38 |
| |
| Royce Small-Cap Value Fund–R Class |
| 2019† | $ | 8.00 | | | $ | 0.01 | | | $ | 0.68 | | | $ | 0.69 | | | $ | – | | | $ | – | | | $ | – | | | $ | – | | | $ | 8.69 | | | | 8.63 | %1 | | $ | 8,440 | | | | 2.00 | %2 | | | 1.99 | %2 | | | 1.99 | %2 | | | 0.15 | %2 | | | 38 | % |
| |
| 2018 | | 9.75 | | | | (0.03 | ) | | | (0.68 | ) | | | (0.71 | ) | | | – | | | | (1.04 | ) | | | (1.04 | ) | | | – | | | | 8.00 | | | | (7.62 | ) | | | 8,254 | | | | 1.92 | | | | 1.92 | | | | 1.92 | | | | (0.26 | ) | | | 64 | |
| |
| 2017 | | 9.63 | | | | (0.02 | ) | | | 0.48 | | | | 0.46 | | | | – | | | | (0.34 | ) | | | (0.34 | ) | | | – | | | | 9.75 | | | | 4.81 | | | | 14,620 | | | | 1.88 | | | | 1.88 | | | | 1.88 | | | | (0.21 | ) | | | 61 |
| |
| 2016 | | 8.42 | | | | 0.01 | | | | 1.73 | | | | 1.74 | | | | (0.03 | ) | | | (0.50 | ) | | | (0.53 | ) | | | – | | | | 9.63 | | | | 20.60 | | | | 18,059 | | | | 1.85 | | | | 1.85 | | | | 1.85 | | | | 0.11 | | | | 56 |
| |
| 2015 | | 11.43 | | | | 0.01 | | | | (1.35 | ) | | | (1.34 | ) | | | (0.02 | ) | | | (1.65 | ) | | | (1.67 | ) | | | – | | | | 8.42 | | | | (11.71 | ) | | | 19,200 | | | | 1.83 | | | | 1.83 | | | | 1.83 | | | | 0.09 | | | | 60 |
| |
| 2014 | | 13.19 | | | | (0.03 | ) | | | (0.06 | ) | | | (0.09 | ) | | | – | | | | (1.67 | ) | | | (1.67 | ) | | | – | | | | 11.43 | | | | (0.34 | ) | | | 31,043 | | | | 1.77 | | | | 1.77 | | | | 1.77 | | | | (0.26 | ) | | | 38 |
| |
| Royce Smaller-Companies Growth Fund–Investment Class |
| 2019† | $ | 6.86 | | | $ | (0.03 | ) | | $ | 1.48 | | | $ | 1.45 | | | $ | – | | | $ | – | | | $ | – | | | $ | – | | | $ | 8.31 | | | | 21.14 | %1 | | $ | 98,628 | | | | 1.24 | %2 | | | 1.23 | %2 | | | 1.22 | %2 | | | (0.72 | )%2 | | | 32 | % |
| |
| 2018 | | 10.93 | | | | (0.07 | ) | | | (0.86 | ) | | | (0.93 | ) | | | – | | | | (3.14 | ) | | | (3.14 | ) | | | – | | | | 6.86 | | | | (9.94 | ) | | | 87,213 | | | | 1.21 | | | | 1.21 | | | | 1.21 | | | | (0.62 | ) | | | 61 | |
| |
| 2017 | | 11.22 | | | | (0.09 | ) | | | 2.08 | | | | 1.99 | | | | – | | | | (2.28 | ) | | | (2.28 | ) | | | – | | | | 10.93 | | | | 18.20 | | | | 119,745 | | | | 1.19 | | | | 1.19 | | | | 1.19 | | | | (0.67 | ) | | | 64 |
| |
| 2016 | | 11.36 | | | | (0.05 | ) | | | 1.17 | | | | 1.12 | | | | – | | | | (1.26 | ) | | | (1.26 | ) | | | – | | | | 11.22 | | | | 9.67 | | | | 98,962 | | | | 1.15 | | | | 1.15 | | | | 1.15 | | | | (0.41 | ) | | | 59 |
| |
| 2015 | | 14.36 | | | | (0.06 | ) | | | (0.19 | ) | | | (0.25 | ) | | | – | | | | (2.75 | ) | | | (2.75 | ) | | | – | | | | 11.36 | | | | (1.59 | ) | | | 139,979 | | | | 1.32 | | | | 1.32 | | | | 1.24 | | | | (0.38 | ) | | | 45 |
| |
| 2014 | | 17.03 | | | | (0.07 | ) | | | 0.68 | | | | 0.61 | | | | – | | | | (3.28 | ) | | | (3.28 | ) | | | – | | | | 14.36 | | | | 4.04 | | | | 295,412 | | | | 1.33 | | | | 1.33 | | | | 1.33 | | | | (0.40 | ) | | | 52 |
| |
| Royce Smaller-Companies Growth Fund–Service Class |
| 2019† | $ | 6.69 | | | $ | (0.04 | ) | | $ | 1.45 | | | $ | 1.41 | | | $ | – | | | $ | – | | | $ | – | | | $ | – | | | $ | 8.10 | | | | 21.08 | %1 | | $ | 173,068 | | | | 1.57 | %2 | | | 1.57 | %2 | | | 1.49 | %2 | | | (0.99 | )%2 | | | 32 | % |
| |
| 2018 | | 10.69 | | | | (0.10 | ) | | | (0.85 | ) | | | (0.95 | ) | | | – | | | | (3.05 | ) | | | (3.05 | ) | | | – | | | | 6.69 | | | | (10.22 | ) | | | 156,057 | | | | 1.52 | | | | 1.52 | | | | 1.49 | | | | (0.90 | ) | | | 61 | |
| |
| 2017 | | 11.01 | | | | (0.12 | ) | | | 2.03 | | | | 1.91 | | | | – | | | | (2.23 | ) | | | (2.23 | ) | | | – | | | | 10.69 | | | | 17.80 | | | | 228,008 | | | | 1.49 | | | | 1.49 | | | | 1.47 | | | | (0.96 | ) | | | 64 |
| |
| 2016 | | 11.20 | | | | (0.08 | ) | | | 1.15 | | | | 1.07 | | | | – | | | | (1.26 | ) | | | (1.26 | ) | | | – | | | | 11.01 | | | | 9.37 | | | | 284,640 | | | | 1.51 | | | | 1.51 | | | | 1.49 | | | | (0.74 | ) | | | 59 |
| |
| 2015 | | 14.23 | | | | (0.08 | ) | | | (0.20 | ) | | | (0.28 | ) | | | – | | | | (2.75 | ) | | | (2.75 | ) | | | – | | | | 11.20 | | | | (1.82 | ) | | | 408,744 | | | | 1.47 | | | | 1.47 | | | | 1.45 | | | | (0.58 | ) | | | 45 |
| |
| 2014 | | 16.93 | | | | (0.09 | ) | | | 0.67 | | | | 0.58 | | | | – | | | | (3.28 | ) | | | (3.28 | ) | | | – | | | | 14.23 | | | | 3.89 | | | | 572,899 | | | | 1.44 | | | | 1.44 | | | | 1.42 | | | | (0.51 | ) | | | 52 |
| |
| 74 | The Royce Funds 2019 Semiannual Report to Shareholders | | THE ACCOMPANYING NOTES ARE AN INTEGRAL PART OF THESE FINANCIAL STATEMENTS |
Financial Highlights
This table is presented to show selected data for a share outstanding throughout each year or other indicated period and to assist shareholders in evaluating a Fund’s performance for the periods presented. Per share amounts have been determined on the basis of the weighted average number of shares outstanding during the period.
| | | | | | | | | | | | | | | | | | | | | | | | | | | | | | | | | | | | | | | | | | | | | | Ratio of Expenses to Average Net Assets | | | | | | |
| | | | | | | | | | | | | | | | | | | | | | | | | | | | | | | | | | | | | | | | | | | | | | | | | | | | | | |
| | Net Asset
Value,
Beginning of
Period | | Net Investment
Income (Loss) | | Net Realized and
Unrealized Gain (Loss)
on Investments and
Foreign Currency | | Total from
Investment
Operations | | Distributions
from Net
Investment
Income | | Distributions from Net
Realized Gain on
Investments and
Foreign Currency | | Total
Distributions | | Shareholder
Redemption
Fees | | Net Asset Value,
End of Period | | Total Return | | Net Assets,
End of Period
(in thousands) | | Prior to Fee
Waivers,
Expense
Reimbursements
and Balance
Credits | | Prior to Fee
Waivers and
Expense
Reimbursements | | Net of Fee
Waivers and
Expense
Reimbursements | | Ratio of Net
Investment
Income (Loss) to
Average Net
Assets | | Portfolio
Turnover Rate |
| |
| Royce Smaller-Companies Growth Fund–Consultant Class |
| 2019† | $ | 5.74 | | | $ | (0.06 | ) | | $ | 1.24 | | | $ | 1.18 | | | $ | – | | | $ | – | | | $ | – | | | $ | – | | | $ | 6.92 | | | | 20.56 | %1 | | $ | 6,801 | | | | 2.52 | %2 | | | 2.51 | %2 | | | 2.24 | %2 | | | (1.74 | )%2 | | | 32 | % |
| |
| 2018 | | 9.28 | | | | (0.16 | ) | | | (0.72 | ) | | | (0.88 | ) | | | – | | | | (2.66 | ) | | | (2.66 | ) | | | – | | | | 5.74 | | | | (10.95 | ) | | | 6,328 | | | | 2.40 | | | | 2.40 | | | | 2.24 | | | | (1.66 | ) | | | 61 | |
| |
| 2017 | | 9.63 | | | | (0.18 | ) | | | 1.77 | | | | 1.59 | | | | – | | | | (1.94 | ) | | | (1.94 | ) | | | – | | | | 9.28 | | | | 16.92 | | | | 10,119 | | | | 2.36 | | | | 2.36 | | | | 2.24 | | | | (1.73 | ) | | | 64 |
| |
| 2016 | | 10.01 | | | | (0.14 | ) | | | 1.02 | | | | 0.88 | | | | – | | | | (1.26 | ) | | | (1.26 | ) | | | – | | | | 9.63 | | | | 8.58 | | | | 10,593 | | | | 2.35 | | | | 2.35 | | | | 2.24 | | | | (1.50 | ) | | | 59 |
| |
| 2015 | | 13.12 | | | | (0.18 | ) | | | (0.18 | ) | | | (0.36 | ) | | | – | | | | (2.75 | ) | | | (2.75 | ) | | | – | | | | 10.01 | | | | (2.61 | ) | | | 14,411 | | | | 2.32 | | | | 2.32 | | | | 2.24 | | | | (1.36 | ) | | | 45 |
| |
| 2014 | | 15.99 | | | | (0.22 | ) | | | 0.63 | | | | 0.41 | | | | – | | | | (3.28 | ) | | | (3.28 | ) | | | – | | | | 13.12 | | | | 3.05 | | | | 17,158 | | | | 2.29 | | | | 2.29 | | | | 2.29 | | | | (1.37 | ) | | | 52 |
| |
| Royce Smaller-Companies Growth Fund–Institutional Class |
| 2019† | $ | 6.95 | | | $ | (0.02 | ) | | $ | 1.50 | | | $ | 1.48 | | | $ | – | | | $ | – | | | $ | – | | | $ | – | | | $ | 8.43 | | | | 21.29 | %1 | | $ | 8,411 | | | | 1.34 | %2 | | | 1.34 | %2 | | | 1.13 | %2 | | | (0.62 | )%2 | | | 32 | % |
| |
| 2018 | | 11.06 | | | | (0.06 | ) | | | (0.88 | ) | | | (0.94 | ) | | | – | | | | (3.17 | ) | | | (3.17 | ) | | | – | | | | 6.95 | | | | (9.94 | ) | | | 7,165 | | | | 1.28 | | | | 1.28 | | | | 1.08 | | | | (0.49 | ) | | | 61 | |
| |
| 2017 | | 11.35 | | | | (0.09 | ) | | | 2.11 | | | | 2.02 | | | | – | | | | (2.31 | ) | | | (2.31 | ) | | | – | | | | 11.06 | | | | 18.23 | | | | 9,315 | | | | 1.21 | | | | 1.21 | | | | 1.21 | | | | (0.70 | ) | | | 64 |
| |
| 2016 | | 11.48 | | | | (0.05 | ) | | | 1.18 | | | | 1.13 | | | | – | | | | (1.26 | ) | | | (1.26 | ) | | | – | | | | 11.35 | | | | 9.66 | | | | 20,523 | | | | 1.15 | | | | 1.15 | | | | 1.15 | | | | (0.41 | ) | | | 59 |
| |
| 2015 | | 14.46 | | | | (0.03 | ) | | | (0.20 | ) | | | (0.23 | ) | | | – | | | | (2.75 | ) | | | (2.75 | ) | | | – | | | | 11.48 | | | | (1.45 | ) | | | 39,763 | | | | 1.10 | | | | 1.10 | | | | 1.10 | | | | (0.22 | ) | | | 45 |
| |
| 2014 | | 17.09 | | | | (0.03 | ) | | | 0.68 | | | | 0.65 | | | | – | | | | (3.28 | ) | | | (3.28 | ) | | | – | | | | 14.46 | | | | 4.26 | | | | 38,718 | | | | 1.06 | | | | 1.06 | | | | 1.06 | | | | (0.16 | ) | | | 52 |
| |
| Royce Special Equity Fund–Investment Class |
| 2019† | $ | 17.43 | | | $ | 0.09 | | | $ | 0.71 | | | $ | 0.80 | | | $ | – | | | $ | – | | | $ | – | | | $ | – | | | $ | 18.23 | | | | 4.59 | %1 | | $ | 899,183 | | | | 1.21 | %2 | | | 1.21 | %2 | | | 1.21 | %2 | | | 0.94 | %2 | | | 8 | % |
| |
| 2018 | | 21.79 | | | | 0.23 | | | | (2.31 | ) | | | (2.08 | ) | | | (0.22 | ) | | | (2.06 | ) | | | (2.28 | ) | | | – | | | | 17.43 | | | | (9.86 | ) | | | 909,113 | | | | 1.18 | | | | 1.18 | | | | 1.18 | | | | 1.04 | | | | 21 | |
| |
| 2017 | | 22.02 | | | | 0.13 | | | | 1.56 | | | | 1.69 | | | | (0.12 | ) | | | (1.80 | ) | | | (1.92 | ) | | | – | | | | 21.79 | | | | 7.87 | | | | 1,142,224 | | | | 1.17 | | | | 1.17 | | | | 1.17 | | | | 0.54 | | | | 15 |
| |
| 2016 | | 17.94 | | | | 0.21 | | | | 5.57 | | | | 5.78 | | | | (0.21 | ) | | | (1.49 | ) | | | (1.70 | ) | | | – | | | | 22.02 | | | | 32.21 | | | | 1,225,095 | | | | 1.17 | | | | 1.17 | | | | 1.17 | | | | 0.99 | | | | 29 |
| |
| 2015 | | 22.86 | | | | 0.22 | | | | (3.04 | ) | | | (2.82 | ) | | | (0.24 | ) | | | (1.86 | ) | | | (2.10 | ) | | | – | | | | 17.94 | | | | (12.36 | ) | | | 1,098,106 | | | | 1.15 | | | | 1.15 | | | | 1.15 | | | | 0.80 | | | | 15 |
| |
| 2014 | | 25.02 | | | | 0.13 | | | | 0.09 | | | | 0.22 | | | | (0.12 | ) | | | (2.26 | ) | | | (2.38 | ) | | | – | | | | 22.86 | | | | 1.09 | | | | 1,950,211 | | | | 1.12 | | | | 1.12 | | | | 1.12 | | | | 0.47 | | | | 21 |
| |
| Royce Special Equity Fund–Service Class |
| 2019† | $ | 17.41 | | | $ | 0.07 | | | $ | 0.72 | | | $ | 0.79 | | | $ | – | | | $ | – | | | $ | – | | | $ | – | | | $ | 18.20 | | | | 4.54 | %1 | | $ | 59,871 | | | | 1.55 | %2 | | | 1.55 | %2 | | | 1.39 | %2 | | | 0.77 | %2 | | | 8 | % |
| |
| 2018 | | 21.76 | | | | 0.20 | | | | (2.33 | ) | | | (2.13 | ) | | | (0.18 | ) | | | (2.04 | ) | | | (2.22 | ) | | | – | | | | 17.41 | | | | (10.13 | ) | | | 62,706 | | | | 1.51 | | | | 1.50 | | | | 1.39 | | | | 0.88 | | | | 21 | |
| |
| 2017 | | 21.98 | | | | 0.08 | | | | 1.56 | | | | 1.64 | | | | (0.07 | ) | | | (1.79 | ) | | | (1.86 | ) | | | – | | | | 21.76 | | | | 7.66 | | | | 108,001 | | | | 1.50 | | | | 1.50 | | | | 1.39 | | | | 0.32 | | | | 15 |
| |
| 2016 | | 17.92 | | | | 0.16 | | | | 5.56 | | | | 5.72 | | | | (0.17 | ) | | | (1.49 | ) | | | (1.66 | ) | | | – | | | | 21.98 | | | | 31.92 | | | | 128,102 | | | | 1.50 | | | | 1.50 | | | | 1.39 | | | | 0.77 | | | | 29 |
| |
| 2015 | | 22.81 | | | | 0.17 | | | | (3.03 | ) | | | (2.86 | ) | | | (0.17 | ) | | | (1.86 | ) | | | (2.03 | ) | | | – | | | | 17.92 | | | | (12.55 | ) | | | 112,315 | | | | 1.47 | | | | 1.47 | | | | 1.39 | | | | 0.57 | | | | 15 |
| |
| 2014 | | 24.97 | | | | 0.06 | | | | 0.09 | | | | 0.15 | | | | (0.05 | ) | | | (2.26 | ) | | | (2.31 | ) | | | – | | | | 22.81 | | | | 0.80 | | | | 233,791 | | | | 1.44 | | | | 1.44 | | | | 1.39 | | | | 0.20 | | | | 21 |
| |
| Royce Special Equity Fund–Consultant Class |
| 2019† | $ | 15.90 | | | $ | (0.01 | ) | | $ | 0.66 | | | $ | 0.65 | | | $ | – | | | $ | – | | | $ | – | | | $ | – | | | $ | 16.55 | | | | 4.09 | %1 | | $ | 28,087 | | | | 2.25 | %2 | | | 2.25 | %2 | | | 2.25 | %2 | | | (0.10 | )%2 | | | 8 | % |
| |
| 2018 | | 19.86 | | | | 0.01 | | | | (2.10 | ) | | | (2.09 | ) | | | (0.01 | ) | | | (1.86 | ) | | | (1.87 | ) | | | – | | | | 15.90 | | | | (10.83 | ) | | | 30,234 | | | | 2.19 | | | | 2.19 | | | | 2.19 | | | | 0.04 | | | | 21 | |
| |
| 2017 | | 20.16 | | | | (0.10 | ) | | | 1.43 | | | | 1.33 | | | | – | | | | (1.63 | ) | | | (1.63 | ) | | | – | | | | 19.86 | | | | 6.77 | | | | 46,654 | | | | 2.21 | | | | 2.20 | | | | 2.20 | | | | (0.49 | ) | | | 15 |
| |
| 2016 | | 16.57 | | | | (0.01 | ) | | | 5.13 | | | | 5.12 | | | | (0.04 | ) | | | (1.49 | ) | | | (1.53 | ) | | | – | | | | 20.16 | | | | 30.91 | | | | 50,514 | | | | 2.20 | | | | 2.20 | | | | 2.20 | | | | (0.04 | ) | | | 29 |
| |
| 2015 | | 21.27 | | | | (0.05 | ) | | | (2.76 | ) | | | (2.81 | ) | | | (0.03 | ) | | | (1.86 | ) | | | (1.89 | ) | | | – | | | | 16.57 | | | | (13.23 | ) | | | 42,427 | | | | 2.18 | | | | 2.18 | | | | 2.18 | | | | (0.24 | ) | | | 15 |
| |
| 2014 | | 23.57 | | | | (0.13 | ) | | | 0.09 | | | | (0.04 | ) | | | – | | | | (2.26 | ) | | | (2.26 | ) | | | – | | | | 21.27 | | | | 0.04 | | | | 63,981 | | | | 2.14 | | | | 2.14 | | | | 2.14 | | | | (0.56 | ) | | | 21 |
| |
| THE ACCOMPANYING NOTES ARE AN INTEGRAL PART OF THESE FINANCIAL STATEMENTS | | The Royce Funds 2019 Semiannual Report to Shareholders | 75 |
Financial Highlights
This table is presented to show selected data for a share outstanding throughout each year or other indicated period and to assist shareholders in evaluating a Fund’s performance for the periods presented. Per share amounts have been determined on the basis of the weighted average number of shares outstanding during the period.
| | | | | | | | | | | | | | | | | | | | | | | | | | | | | | | | | | | | | | | | | | | | | | Ratio of Expenses to Average Net Assets | | | | | | |
| | | | | | | | | | | | | | | | | | | | | | | | | | | | | | | | | | | | | | | | | | | | | | | | | | | | | | |
| | Net Asset
Value,
Beginning of
Period | | Net Investment
Income (Loss) | | Net Realized and
Unrealized Gain (Loss)
on Investments and
Foreign Currency | | Total from
Investment
Operations | | Distributions
from Net
Investment
Income | | Distributions from Net
Realized Gain on
Investments and
Foreign Currency | | Total
Distributions | | Shareholder
Redemption
Fees | | Net Asset Value,
End of Period | | Total Return | | Net Assets,
End of Period
(in thousands) | | Prior to Fee
Waivers,
Expense
Reimbursements
and Balance
Credits | | Prior to Fee
Waivers and
Expense
Reimbursements | | Net of Fee
Waivers and
Expense
Reimbursements | | Ratio of Net
Investment
Income (Loss) to
Average Net
Assets | | Portfolio
Turnover Rate |
| |
| Royce Special Equity Fund–Institutional Class |
| 2019† | $ | 17.28 | | | $ | 0.09 | | | $ | 0.71 | | | $ | 0.80 | | | $ | – | | | $ | – | | | $ | – | | | $ | – | | | $ | 18.08 | | | | 4.63 | %1 | | $ | 222,506 | | | | 1.13 | %2 | | | 1.12 | %2 | | | 1.12 | %2 | | | 1.04 | %2 | | | 8 | % |
| |
| 2018 | | 21.61 | | | | 0.25 | | | | (2.30 | ) | | | (2.05 | ) | | | (0.24 | ) | | | (2.04 | ) | | | (2.28 | ) | | | – | | | | 17.28 | | | | (9.81 | ) | | | 202,317 | | | | 1.11 | | | | 1.11 | | | | 1.11 | | | | 1.14 | | | | 21 | |
| |
| 2017 | | 21.84 | | | | 0.14 | | | | 1.55 | | | | 1.69 | | | | (0.14 | ) | | | (1.78 | ) | | | (1.92 | ) | | | – | | | | 21.61 | | | | 7.96 | | | | 247,004 | | | | 1.09 | | | | 1.09 | | | | 1.09 | | | | 0.60 | | | | 15 |
| |
| 2016 | | 17.80 | | | | 0.23 | | | | 5.53 | | | | 5.76 | | | | (0.23 | ) | | | (1.49 | ) | | | (1.72 | ) | | | – | | | | 21.84 | | | | 32.35 | | | | 206,270 | | | | 1.07 | | | | 1.07 | | | | 1.07 | | | | 1.10 | | | | 29 |
| |
| 2015 | | 22.71 | | | | 0.33 | | | | (3.12 | ) | | | (2.79 | ) | | | (0.26 | ) | | | (1.86 | ) | | | (2.12 | ) | | | – | | | | 17.80 | | | | (12.27 | ) | | | 208,952 | | | | 1.04 | | | | 1.04 | | | | 1.04 | | | | 1.02 | | | | 15 |
| |
| 2014 | | 24.88 | | | | 0.14 | | | | 0.10 | | | | 0.24 | | | | (0.15 | ) | | | (2.26 | ) | | | (2.41 | ) | | | – | | | | 22.71 | | | | 1.17 | | | | 639,723 | | | | 1.02 | | | | 1.02 | | | | 1.02 | | | | 0.56 | | | | 21 |
| |
| Royce Total Return Fund–Investment Class |
| 2019† | $ | 9.71 | | | $ | 0.08 | | | $ | 1.41 | | | $ | 1.49 | | | $ | (0.08 | ) | | $ | – | | | $ | (0.08 | ) | | $ | – | | | $ | 11.12 | | | | 15.32 | %1 | | $ | 1,051,107 | | | | 1.23 | %2 | | | 1.23 | %2 | | | 1.23 | %2 | | | 1.46 | %2 | | | 7 | % |
| |
| 2018 | | 13.58 | | | | 0.20 | | | | (1.78 | ) | | | (1.58 | ) | | | (0.19 | ) | | | (2.10 | ) | | | (2.29 | ) | | | – | | | | 9.71 | | | | (12.46 | ) | | | 1,036,211 | | | | 1.18 | | | | 1.18 | | | | 1.18 | | | | 1.45 | | | | 22 | |
| |
| 2017 | | 13.68 | | | | 0.14 | | | | 1.67 | | | | 1.81 | | | | (0.12 | ) | | | (1.79 | ) | | | (1.91 | ) | | | – | | | | 13.58 | | | | 13.65 | | | | 1,550,893 | | | | 1.19 | | | | 1.19 | | | | 1.19 | | | | 1.00 | | | | 12 |
| |
| 2016 | | 11.91 | | | | 0.15 | | | | 2.93 | | | | 3.08 | | | | (0.22 | ) | | | (1.09 | ) | | | (1.31 | ) | | | – | | | | 13.68 | | | | 25.86 | | | | 1,835,927 | | | | 1.19 | | | | 1.19 | | | | 1.19 | | | | 1.08 | | | | 16 |
| |
| 2015 | | 14.74 | | | | 0.17 | | | | (1.23 | ) | | | (1.06 | ) | | | (0.12 | ) | | | (1.65 | ) | | | (1.77 | ) | | | – | | | | 11.91 | | | | (7.19 | ) | | | 1,850,309 | | | | 1.15 | | | | 1.15 | | | | 1.15 | | | | 1.18 | | | | 11 |
| |
| 2014 | | 16.47 | | | | 0.17 | | | | 0.00 | | | | 0.17 | | | | (0.28 | ) | | | (1.62 | ) | | | (1.90 | ) | | | – | | | | 14.74 | | | | 1.34 | | | | 3,077,951 | | | | 1.13 | | | | 1.13 | | | | 1.13 | | | | 0.95 | | | | 18 |
| |
| Royce Total Return Fund–Service Class |
| 2019† | $ | 9.97 | | | $ | 0.07 | | | $ | 1.44 | | | $ | 1.51 | | | $ | (0.06 | ) | | $ | – | | | $ | (0.06 | ) | | $ | – | | | $ | 11.42 | | | | 15.17 | %1 | | $ | 81,604 | | | | 1.57 | %2 | | | 1.57 | %2 | | | 1.49 | %2 | | | 1.19 | %2 | | | 7 | % |
| |
| 2018 | | 13.88 | | | | 0.16 | | | | (1.82 | ) | | | (1.66 | ) | | | (0.11 | ) | | | (2.14 | ) | | | (2.25 | ) | | | – | | | | 9.97 | | | | (12.71 | ) | | | 83,368 | | | | 1.52 | | | | 1.52 | | | | 1.48 | | | | 1.15 | | | | 22 | |
| |
| 2017 | | 13.98 | | | | 0.10 | | | | 1.69 | | | | 1.79 | | | | (0.07 | ) | | | (1.82 | ) | | | (1.89 | ) | | | – | | | | 13.88 | | | | 13.24 | | | | 97,854 | | | | 1.49 | | | | 1.48 | | | | 1.48 | | | | 0.72 | | | | 12 |
| |
| 2016 | | 12.12 | | | | 0.11 | | | | 3.00 | | | | 3.11 | | | | (0.16 | ) | | | (1.09 | ) | | | (1.25 | ) | | | – | | | | 13.98 | | | | 25.60 | | | | 142,606 | | | | 1.46 | | | | 1.46 | | | | 1.46 | | | | 0.80 | | | | 16 |
| |
| 2015 | | 14.98 | | | | 0.13 | | | | (1.25 | ) | | | (1.12 | ) | | | (0.09 | ) | | | (1.65 | ) | | | (1.74 | ) | | | – | | | | 12.12 | | | | (7.48 | ) | | | 137,594 | | | | 1.43 | | | | 1.43 | | | | 1.43 | | | | 0.90 | | | | 11 |
| |
| 2014 | | 16.61 | | | | 0.12 | | | | 0.01 | | | | 0.13 | | | | (0.14 | ) | | | (1.62 | ) | | | (1.76 | ) | | | – | | | | 14.98 | | | | 1.08 | | | | 232,814 | | | | 1.42 | | | | 1.42 | | | | 1.42 | | | | 0.60 | | | | 18 |
| |
| Royce Total Return Fund–Consultant Class |
| 2019† | $ | 10.02 | | | $ | 0.03 | | | $ | 1.45 | | | $ | 1.48 | | | $ | (0.02 | ) | | $ | – | | | $ | (0.02 | ) | | $ | – | | | $ | 11.48 | | | | 14.73 | %1 | | $ | 160,493 | | | | 2.22 | %2 | | | 2.21 | %2 | | | 2.21 | %2 | | | 0.48 | %2 | | | 7 | % |
| |
| 2018 | | 13.95 | | | | 0.06 | | | | (1.82 | ) | | | (1.76 | ) | | | (0.02 | ) | | | (2.15 | ) | | | (2.17 | ) | | | – | | | | 10.02 | | | | (13.26 | ) | | | 160,540 | | | | 2.17 | | | | 2.17 | | | | 2.17 | | | | 0.45 | | | | 22 | |
| |
| 2017 | | 14.07 | | | | 0.01 | | | | 1.70 | | | | 1.71 | | | | – | | | | (1.83 | ) | | | (1.83 | ) | | | – | | | | 13.95 | | | | 12.53 | | | | 247,914 | | | | 2.16 | | | | 2.16 | | | | 2.16 | | | | 0.04 | | | | 12 |
| |
| 2016 | | 12.15 | | | | 0.01 | | | | 3.01 | | | | 3.02 | | | | (0.01 | ) | | | (1.09 | ) | | | (1.10 | ) | | | – | | | | 14.07 | | | | 24.73 | | | | 267,083 | | | | 2.16 | | | | 2.16 | | | | 2.16 | | | | 0.11 | | | | 16 |
| |
| 2015 | | 15.05 | | | | 0.03 | | | | (1.26 | ) | | | (1.23 | ) | | | (0.02 | ) | | | (1.65 | ) | | | (1.67 | ) | | | – | | | | 12.15 | | | | (8.15 | ) | | | 262,131 | | | | 2.16 | | | | 2.16 | | | | 2.16 | | | | 0.18 | | | | 11 |
| |
| 2014 | | 16.68 | | | | (0.00 | ) | | | 0.02 | | | | 0.02 | | | | (0.03 | ) | | | (1.62 | ) | | | (1.65 | ) | | | – | | | | 15.05 | | | | 0.37 | | | | 356,731 | | | | 2.12 | | | | 2.12 | | | | 2.12 | | | | (0.04 | ) | | | 18 |
| |
| Royce Total Return Fund–Institutional Class |
| 2019† | $ | 9.58 | | | $ | 0.08 | | | $ | 1.40 | | | $ | 1.48 | | | $ | (0.09 | ) | | $ | – | | | $ | (0.09 | ) | | $ | – | | | $ | 10.97 | | | | 15.43 | %1 | | $ | 227,958 | | | | 1.13 | %2 | | | 1.13 | %2 | | | 1.13 | %2 | | | 1.55 | %2 | | | 7 | % |
| |
| 2018 | | 13.40 | | | | 0.21 | | | | (1.76 | ) | | | (1.55 | ) | | | (0.21 | ) | | | (2.06 | ) | | | (2.27 | ) | | | – | | | | 9.58 | | | | (12.39 | ) | | | 218,268 | | | | 1.09 | | | | 1.09 | | | | 1.09 | | | | 1.53 | | | | 22 | |
| |
| 2017 | | 13.52 | | | | 0.16 | | | | 1.64 | | | | 1.80 | | | | (0.15 | ) | | | (1.77 | ) | | | (1.92 | ) | | | – | | | | 13.40 | | | | 13.80 | | | | 310,603 | | | | 1.06 | | | | 1.06 | | | | 1.06 | | | | 1.13 | | | | 12 |
| |
| 2016 | | 11.78 | | | | 0.18 | | | | 2.90 | | | | 3.08 | | | | (0.25 | ) | | | (1.09 | ) | | | (1.34 | ) | | | – | | | | 13.52 | | | | 26.13 | | | | 420,375 | | | | 1.05 | | | | 1.05 | | | | 1.05 | | | | 1.22 | | | | 16 |
| |
| 2015 | | 14.61 | | | | 0.18 | | | | (1.22 | ) | | | (1.04 | ) | | | (0.14 | ) | | | (1.65 | ) | | | (1.79 | ) | | | – | | | | 11.78 | | | | (7.17 | ) | | | 374,555 | | | | 1.03 | | | | 1.03 | | | | 1.03 | | | | 1.28 | | | | 11 |
| |
| 2014 | | 16.35 | | | | 0.18 | | | | 0.02 | | | | 0.20 | | | | (0.32 | ) | | | (1.62 | ) | | | (1.94 | ) | | | – | | | | 14.61 | | | | 1.51 | | | | 572,662 | | | | 1.00 | | | | 1.00 | | | | 1.00 | | | | 1.09 | | | | 18 |
| |
| 76 | The Royce Funds 2019 Semiannual Report to Shareholders | | THE ACCOMPANYING NOTES ARE AN INTEGRAL PART OF THESE FINANCIAL STATEMENTS |
Financial Highlights
This table is presented to show selected data for a share outstanding throughout each year or other indicated period and to assist shareholders in evaluating a Fund’s performance for the periods presented. Per share amounts have been determined on the basis of the weighted average number of shares outstanding during the period.
| | | | | | | | | | | | | | | | | | | | | | | | | | | | | | | | | | | | | | | | | | | | | | Ratio of Expenses to Average Net Assets | | | | | | |
| | | | | | | | | | | | | | | | | | | | | | | | | | | | | | | | | | | | | | | | | | | | | | | | | | | | | | |
| | Net Asset
Value,
Beginning of
Period | | Net Investment
Income (Loss) | | Net Realized and
Unrealized Gain (Loss)
on Investments and
Foreign Currency | | Total from
Investment
Operations | | Distributions
from Net
Investment
Income | | Distributions from Net
Realized Gain on
Investments and
Foreign Currency | | Total
Distributions | | Shareholder
Redemption
Fees | | Net Asset Value,
End of Period | | Total Return | | Net Assets,
End of Period
(in thousands) | | Prior to Fee
Waivers,
Expense
Reimbursements
and Balance
Credits | | Prior to Fee
Waivers and
Expense
Reimbursements | | Net of Fee
Waivers and
Expense
Reimbursements | | Ratio of Net
Investment
Income (Loss) to
Average Net
Assets | | Portfolio
Turnover Rate |
| |
| Royce Total Return Fund–R Class |
| 2019† | $ | 10.06 | | | $ | 0.05 | | | $ | 1.45 | | | $ | 1.50 | | | $ | (0.04 | ) | | $ | – | | | $ | (0.04 | ) | | $ | – | | | $ | 11.52 | | | | 14.87 | %1 | | $ | 36,621 | | | | 1.88 | %2 | | | 1.88 | %2 | | | 1.88 | %2 | | | 0.78 | %2 | | | 7 | % |
| |
| 2018 | | 13.99 | | | | 0.11 | | | | (1.83 | ) | | | (1.72 | ) | | | (0.06 | ) | | | (2.15 | ) | | | (2.21 | ) | | | – | | | | 10.06 | | | | (12.96 | ) | | | 45,145 | | | | 1.81 | | | | 1.81 | | | | 1.81 | | | | 0.82 | | | | 22 | |
| |
| 2017 | | 14.09 | | | | 0.06 | | | | 1.71 | | | | 1.77 | | | | (0.03 | ) | | | (1.84 | ) | | | (1.87 | ) | | | – | | | | 13.99 | | | | 12.97 | | | | 54,979 | | | | 1.80 | | | | 1.80 | | | | 1.80 | | | | 0.40 | | | | 12 |
| |
| 2016 | | 12.19 | | | | 0.07 | | | | 3.00 | | | | 3.07 | | | | (0.08 | ) | | | (1.09 | ) | | | (1.17 | ) | | | – | | | | 14.09 | | | | 25.14 | | | | 53,896 | | | | 1.78 | | | | 1.78 | | | | 1.78 | | | | 0.49 | | | | 16 |
| |
| 2015 | | 15.07 | | | | 0.08 | | | | (1.25 | ) | | | (1.17 | ) | | | (0.06 | ) | | | (1.65 | ) | | | (1.71 | ) | | | – | | | | 12.19 | | | | (7.79 | ) | | | 50,684 | | | | 1.77 | | | | 1.77 | | | | 1.77 | | | | 0.56 | | | | 11 |
| |
| 2014 | | 16.73 | | | | 0.07 | | | | 0.01 | | | | 0.08 | | | | (0.12 | ) | | | (1.62 | ) | | | (1.74 | ) | | | – | | | | 15.07 | | | | 0.73 | | | | 65,501 | | | | 1.72 | | | | 1.72 | | | | 1.72 | | | | 0.37 | | | | 18 |
| |
| |
| † Six months ended June 30, 2019 (unaudited). |
| 1 Not annualized |
| 2 Annualized |
| a The Class commenced operations on March 21, 2014. |
| b The Class commenced operations on January 5, 2016. |
| c The Class commenced operations on January 22, 2014. |
| d The Class commenced operations on February 26, 2016. |
| e The Class commenced operations on May 2, 2018. |
| THE ACCOMPANYING NOTES ARE AN INTEGRAL PART OF THESE FINANCIAL STATEMENTS | | The Royce Funds 2019 Semiannual Report to Shareholders | 77 |
Notes to Financial Statements (unaudited)
| Summary of Significant Accounting Policies: |
| Royce Dividend Value Fund, Royce Global Financial Services Fund, Royce International Premier Fund, Royce Low-Priced Stock Fund, Royce Micro-Cap Fund, Royce Opportunity Fund, Royce Pennsylvania Mutual Fund, Royce Premier Fund, Royce Small-Cap Value Fund, Royce Smaller-Companies Growth Fund, Royce Special Equity Fund and Royce Total Return Fund (the “Fund” or “Funds”), are the twelve series of The Royce Fund (the “Trust”), an open-end management investment company organized as a Delaware statutory trust. |
| Classes of shares have equal rights as to earnings and assets, except that each class may bear different fees and expenses for distribution, shareholder servicing, registration and shareholder reports, and receive different compensating balance credits and expense reimbursements. Investment income, realized and unrealized capital gains or losses on investments and foreign currency, and expenses other than those attributable to a specific class are allocated to each class of shares based on its relative net assets. |
| The preparation of financial statements in conformity with accounting principles generally accepted in the United States requires management to make estimates and assumptions that affect the reported amounts of assets and liabilities and the disclosure of contingent assets and liabilities at the date of the financial statements and the reported amounts of income and expenses during the reporting period. Actual results could differ from those estimates. |
| Each Fund is an investment company and accordingly follows the investment company accounting and reporting guidance of the Financial Accounting Standards Board (FASB) Accounting Standard Codification Topic 946 “Financial Services-Investment Companies”. |
| At June 30, 2019, officers, employees of Royce & Associates (“Royce”), Fund trustees, the Royce retirement plans and other affiliates owned more than 10% of the following Funds: |
Royce Global Financial Services Fund 10% |
| |
| VALUATION OF INVESTMENTS: |
| Securities are valued as of the close of trading on the New York Stock Exchange (NYSE) (generally 4:00 p.m. Eastern time) on the valuation date. Securities that trade on an exchange, and securities traded on Nasdaq’s Electronic Bulletin Board, are valued at their last reported sales price or Nasdaq official closing price taken from the primary market in which each security trades or, if no sale is reported for such day, at their highest bid price. Other over-the-counter securities for which market quotations are readily available are valued at their highest bid price, except in the case of some bonds and other fixed income securities which may be valued by reference to other securities with comparable ratings, interest rates and maturities, using established independent pricing services. The Funds value their non-U.S. dollar denominated securities in U.S. dollars daily at the prevailing foreign currency exchange rates as quoted by a major bank. Securities for which market quotations are not readily available are valued at their fair value in accordance with the provisions of the 1940 Act, under procedures approved by the Trust’s Board of Trustees, and are reported as Level 3 securities. As a general principle, the fair value of a security is the amount which the Fund might reasonably expect to receive for the security upon its current sale. However, in light of the judgment involved in fair valuations, there can be no assurance that a fair value assigned to a particular security will be the amount which the Fund might be able to receive upon its current sale. In addition, if, between the time trading ends on a particular security and the close of the customary trading session on the NYSE, events occur that are significant and may make the closing price unreliable, a Fund may fair value the security. The Funds use an independent pricing service to provide fair value estimates for relevant non-U.S. equity securities on days when the U.S. market volatility exceeds a certain threshold. This pricing service uses proprietary correlations it has developed between the movement of prices of non-U.S. equity securities and indices of U.S.-traded securities, futures contracts and other indications to estimate the fair value of relevant non-U.S. securities. When fair value pricing is employed, the prices of securities used by a Fund may differ from quoted or published prices for the same security. Investments in money market funds are valued at net asset value per share. |
| Various inputs are used in determining the value of each Fund’s investments, as noted above. These inputs are summarized in the three broad levels below: |
| | | Level 1 | – | quoted prices in active markets for identical securities. |
| | | Level 2 | – | other significant observable inputs (including quoted prices for similar securities, foreign securities that may be fair valued and repurchase agreements). The table below includes all Level 2 securities. Level 2 securities with values based on quoted prices for similar securities are noted in the Schedules of Investments. |
| | | Level 3 | – | significant unobservable inputs (including last trade price before trading was suspended, or at a discount thereto for lack of marketability or otherwise, market price information regarding other securities, information received from the company and/or published documents, including SEC filings and financial statements, or other publicly available information). |
| The inputs or methodology used for valuing securities are not necessarily an indication of the risk associated with investing in those securities. |
| 78 | The Royce Funds 2019 Semiannual Report to Shareholders |
| VALUATION OF INVESTMENTS (continued): |
| The following is a summary of the inputs used to value each Fund’s investments as of June 30, 2019. For a detailed breakout of common stocks by sector classification or country, please refer to the Schedules of Investments. |
| | | LEVEL 1 | | LEVEL 2 | | LEVEL 3 | | TOTAL |
| |
| Royce Dividend Value Fund | | | | | | | | | | | | | | | |
| Common Stocks | | $ | 108,278,909 | | | $ | – | | | $ | – | | | $ | 108,278,909 |
| |
| Repurchase Agreement | | | – | | | | 1,286,000 | | | | – | | | | 1,286,000 |
| |
| Royce Global Financial Services Fund | | | | | | | | | | | | | | | |
| Common Stocks | | | 38,117,548 | | | | – | | | | – | | | | 38,117,548 |
| |
| Repurchase Agreement | | | – | | | | 1,238,000 | | | | – | | | | 1,238,000 |
| |
| Royce International Premier Fund | | | | | | | | | | | | | | | |
| Common Stocks | | | 569,919,338 | | | | – | | | | – | | | | 569,919,338 |
| |
| Preferred Stocks | | | 12,975,905 | | | | – | | | | – | | | | 12,975,905 |
| |
| Repurchase Agreement | | | – | | | | 29,373,000 | | | | – | | | | 29,373,000 |
| |
| Royce Low-Priced Stock Fund | | | | | | | | | | | | | | | |
| Common Stocks | | | 196,469,904 | | | | 969,030 | | | | 0 | | | | 197,438,934 |
| |
| Repurchase Agreement | | | – | | | | 14,612,000 | | | | – | | | | 14,612,000 |
| |
| Money Market Fund/Collateral Received for Securities Loaned | | | 1,601,437 | | | | – | | | | – | | | | 1,601,437 |
| |
| Royce Micro-Cap Fund | | | | | | | | | | | | | | | |
| Common Stocks | | | 131,256,372 | | | | – | | | | 828,000 | | | | 132,084,372 |
| |
| Repurchase Agreement | | | – | | | | 3,919,000 | | | | – | | | | 3,919,000 |
| |
| Money Market Fund/Collateral Received for Securities Loaned | | | 1,260,590 | | | | – | | | | – | | | | 1,260,590 |
| |
| Royce Opportunity Fund | | | | | | | | | | | | | | | |
| Common Stocks | | | 857,169,629 | | | | 1,992,351 | | | | – | | | | 859,161,980 |
| |
| Repurchase Agreement | | | – | | | | 79,839,000 | | | | – | | | | 79,839,000 |
| |
| Money Market Fund/Collateral Received for Securities Loaned | | | 28,337,338 | | | | – | | | | – | | | | 28,337,338 |
| |
| Royce Pennsylvania Mutual Fund | | | | | | | | | | | | | | | |
| Common Stocks | | | 1,870,564,873 | | | | 22,140 | | | | 0 | | | | 1,870,587,013 |
| |
| Repurchase Agreement | | | – | | | | 95,118,000 | | | | – | | | | 95,118,000 |
| |
| Money Market Fund/Collateral Received for Securities Loaned | | | 6,580,014 | | | | – | | | | – | | | | 6,580,014 |
| |
| Royce Premier Fund | | | | | | | | | | | | | | | |
| Common Stocks | | | 1,701,563,860 | | | | – | | | | – | | | | 1,701,563,860 |
| |
| Repurchase Agreement | | | – | | | | 158,694,000 | | | | – | | | | 158,694,000 |
| |
| Royce Small-Cap Value Fund | | | | | | | | | | | | | | | |
| Common Stocks | | | 166,982,609 | | | | – | | | | – | | | | 166,982,609 |
| |
| Repurchase Agreement | | | – | | | | 11,918,000 | | | | – | | | | 11,918,000 |
| |
| Royce Smaller-Companies Growth Fund | | | | | | | | | | | | | | | |
| Common Stocks | | | 269,005,531 | | | | 1,221,000 | | | | – | | | | 270,226,531 |
| |
| Repurchase Agreement | | | – | | | | 19,267,000 | | | | – | | | | 19,267,000 |
| |
| Money Market Fund/Collateral Received for Securities Loaned | | | 11,043,679 | | | | – | | | | – | | | | 11,043,679 |
| |
| Royce Special Equity Fund | | | | | | | | | | | | | | | |
| Common Stocks | | | 899,061,901 | | | | 59,040,000 | | | | – | | | | 958,101,901 |
| |
| Repurchase Agreement | | | – | | | | 251,964,000 | | | | – | | | | 251,964,000 |
| |
| Royce Total Return Fund | | | �� | | | | | | | | | | | | |
| Common Stocks | | | 1,514,268,933 | | | | 12,445,978 | | | | 0 | | | | 1,526,714,911 |
| |
| Corporate Bonds | | | – | | | | 4,712,304 | | | | – | | | | 4,712,304 |
| |
| Repurchase Agreement | | | – | | | | 24,772,000 | | | | – | | | | 24,772,000 |
| |
Level 3 Reconciliation:
| | | | | | | | | | | | | | | REALIZED | | UNREALIZED | | | | |
| | | BALANCE AS OF 12/31/18 | | PURCHASES | | SALES | | GAIN (LOSS) | | GAIN (LOSS)1 | | BALANCE AS OF 6/30/19 |
| |
| Royce Low-Priced Stock Fund | | | | | | | | | | | | | | | | | | | | | | | | |
| |
| Common Stocks | | $ | 0 | | | $ | – | | | $ | – | | | $ | – | | | $ | – | | | $ | 0 | |
| |
| Royce Micro-Cap Fund | | | | | | | | | | | | | | | | | | | | | | | | |
| |
| Common Stocks | | | 828,000 | | | | – | | | | – | | | | – | | | | – | | | | 828,000 | |
| |
| Royce Pennsylvania Mutual Fund | | | | | | | | | | | | | | | | | | | | | | | | |
| |
| Common Stocks | | | – | | | | 0 | | | | – | | | | – | | | | – | | | | 0 | |
| |
| Royce Total Return Fund | | | | | | | | | | | | | | | | | | | | | | | | |
| |
| Common Stocks | | | 0 | | | | – | | | | – | | | | – | | | | – | | | | 0 | |
| |
| 1 | The net change in unrealized appreciation (depreciation) is included in the accompanying Statement of Operations. Change in unrealized appreciation (depreciation) includes net unrealized appreciation (depreciation) resulting from changes in investment values during the reporting period and the reversal of previously recorded unrealized appreciation (depreciation) when gains or losses are realized. Net realized gain (loss) from investments and foreign currency transactions is included in the accompanying Statement of Operations. |
| The Royce Funds 2019 Semiannual Report to Shareholders | 79 |
Notes to Financial Statements (unaudited) (continued)
VALUATION OF INVESTMENTS (continued):
The following table summarizes the valuation techniques used and unobservable inputs approved by the Valuation Committee to determine the fair value of certain Level 3 investments. The table does not include Level 3 investments with values derived utilizing prices from prior transactions or third party pricing information with adjustments (e.g. broker quotes, pricing services, net asset values).
| | | | FAIR VALUE AT | | | | | | | | | | | | IMPACT TO VALUATION FROM |
| | | | 6/30/19 | | | VALUATION TECHNIQUE(S) | | | UNOBSERVABLE INPUT(S) | | | RANGE AVERAGE | | | AN INCREASE IN INPUT1 |
| |
| Royce Micro-Cap Fund | | | | | | | | | | | | | | | |
| |
| Common Stocks | | | $828,000 | | | Discounted Present Value
Balance Sheet Analysis | | | Liquidity Discount | | | 30%-40% | | | Decrease |
| |
| 1 | This column represents the directional change in the fair value of the Level 3 investments that would result in an increase from the corresponding unobservable input. A decrease to the unobservable input would have the opposite effect. Significant increases and decreases in these unobservable inputs in isolation could result in significantly higher or lower fair value measurements. |
| REPURCHASE AGREEMENTS: |
| The Funds may enter into repurchase agreements with institutions that the Funds’ investment adviser has determined are creditworthy. Each Fund restricts repurchase agreements to maturities of no more than seven days. Securities pledged as collateral for repurchase agreements, which are held until maturity of the repurchase agreements, are marked-to-market daily and maintained at a value at least equal to the principal amount of the repurchase agreement (including accrued interest). Repurchase agreements could involve certain risks in the event of default or insolvency of the counter-party, including possible delays or restrictions upon the ability of each Fund to dispose of its underlying securities. The remaining contractual maturities of repurchase agreements held by the Funds at June 30, 2019 are overnight and continuous. |
| |
| FOREIGN CURRENCY: |
| Net realized foreign exchange gains or losses arise from sales and maturities of short-term securities, sales of foreign currencies, expiration of currency forward contracts, currency gains or losses realized between the trade and settlement dates on securities transactions, and the difference between the amounts of dividends, interest, and foreign withholding taxes recorded on each Fund’s books and the U.S. dollar equivalent of the amounts actually received or paid. Net unrealized foreign exchange gains and losses arise from changes in the value of assets and liabilities, other than investments in securities at the end of the reporting period, as a result of changes in foreign currency exchange rates. |
| The Funds do not isolate that portion of the results of operations resulting from fluctuations in foreign exchange rates on investments from the fluctuations arising from changes in market prices of securities held. Such fluctuations are included with the net realized and unrealized gain or loss on investments. |
| |
| SECURITIES LENDING: |
| The Funds loan securities through a lending agent to qualified institutional investors for the purpose of realizing additional income. Collateral for the Funds on all securities loaned is accepted in cash and cash equivalents, which are invested temporarily by the custodian, as well as non-cash collateral, which includes short and long-term U.S. Treasuries. The collateral maintained is at least 100% of the current market value of the loaned securities. The market value of the loaned securities is determined at the close of business of the Funds and any additional required collateral is delivered to the Funds on the next business day. The Funds retain the risk of any loss on the securities on loan as well as incurring the potential loss on investments purchased with cash collateral received for securities lending. In the event of default or bankruptcy by the other party to the agreement, realization and/or retention of the collateral may be subject to legal proceedings. If the borrower fails to return loaned securities, and cash collateral being maintained by the borrower is insufficient to cover the value of loaned securities and provided such collateral insufficiency is not the result of investment losses, the lending agent has agreed to pay the amount of the shortfall to the Funds or, at the option of the lending agent, to replace the securities. In the event of the bankruptcy of the borrower, the Funds could experience delay in recovering the loaned securities or only recover cash or a security of equivalent value. Loans of securities generally do not have stated maturity dates, and the Funds may recall a security at any time. The Funds’ securities lending income consists of the income earned on investing cash collateral, plus any premium payments received for lending certain securities, less any rebates paid to borrowers and lending agent fees associated with the loan. The lending agent is not affiliated with Royce. The following table presents cash collateral and the market value of securities on loan collateralized by cash collateral held by the Funds at June 30, 2019: |
| | | CASH COLLATERAL1 | | SECURITIES ON LOAN
COLLATERALIZED BY CASH COLLATERAL | | | NET AMOUNT |
| |
| Royce Low-Priced Stock Fund | | $ | 1,601,437 | | | $ | (1,598,444) | | | | $ | 2,993 | |
| |
| Royce Micro-Cap Fund | | | 1,260,590 | | | | (1,190,465) | | | | | 70,125 | |
| |
| Royce Opportunity Fund | | | 28,337,338 | | | | (27,526,906) | | | | | 810,432 | |
| |
| Royce Pennsylvania Mutual Fund | | | 6,580,014 | | | | (6,645,048) | | | | | (65,034) | |
| |
| Royce Smaller-Companies Growth Fund | | | 11,043,679 | | | | (11,147,221) | | | | | (103,542) | |
| |
| 1 Absent an event of default, assets and liabilities are presented gross and not offset in the Statements of Assets and Liabilities. The remaining contractual maturity of cash collateral is overnight and continuous. |
| 80 | The Royce Funds 2019 Semiannual Report to Shareholders |
| SECURITIES LENDING (continued): |
| The following table presents non-cash collateral and the market value of securities on loan collateralized by non-cash collateral held by the Funds’ custodian at June 30, 2019: |
| | | | | | | SECURITIES ON LOAN | | | | |
| | | NON-CASH COLLATERAL | | COLLATERALIZED BY NON-CASH COLLATERAL | | NET AMOUNT |
| |
| Royce Low-Priced Stock Fund | | $ | 8,363,068 | | | $ | (8,183,642) | | | $ | 179,426 | |
| |
| Royce Micro-Cap Fund | | | 982,284 | | | | (962,926) | | | | 19,358 | |
| |
| Royce Opportunity Fund | | | 54,405,031 | | | | (53,265,576) | | | | 1,139,455 | |
| |
| Royce Pennsylvania Mutual Fund | | | 37,298,730 | | | | (36,538,750) | | | | 759,980 | |
| |
| Royce Premier Fund | | | 32,914,911 | | | | (32,262,973) | | | | 651,938 | |
| |
| Royce Small-Cap Value Fund | | | 216,024 | | | | (211,745) | | | | 4,279 | |
| |
| Royce Smaller-Companies Growth Fund | | | 23,037,821 | | | | (22,564,637) | | | | 473,184 | |
| |
| DISTRIBUTIONS AND TAXES: |
| As qualified regulated investment companies under Subchapter M of the Internal Revenue Code, the Funds are not subject to income taxes to the extent that each Fund distributes substantially all of its taxable income for its fiscal year. |
| Royce Dividend Value Fund and Royce Total Return Fund pay any dividends from net investment income quarterly and make any distributions from net realized gains annually in December. The other Funds pay any dividends and capital gain distributions annually in December. Dividends from net investment income and distributions from capital gains are determined at a class level. Because federal income tax regulations differ from generally accepted accounting principles, income and capital gain distributions determined in accordance with tax regulations may differ from net investment income and realized gains recognized for financial reporting purposes. Accordingly, the character of distributions and composition of net assets for tax purposes differ from those reflected in the accompanying financial statements. |
| |
| CAPITAL GAINS TAXES: |
| The Funds are subject to a tax imposed on short-term capital gains on securities of issuers domiciled in certain countries. The Funds record an estimated deferred tax liability for gains in these securities that have been held for less than one year. This amount, if any, is reported as deferred capital gains tax in the accompanying Statements of Assets and Liabilities, assuming those positions were disposed of at the end of the period, and accounted for as a reduction in the market value of the security. |
| |
| INVESTMENT TRANSACTIONS AND RELATED INVESTMENT INCOME: |
| Investment transactions are accounted for on the trade date. Dividend income is recorded on the ex-dividend date. Non-cash dividend income is recorded at the fair market value of the securities received. Interest income is recorded on an accrual basis. Premiums and discounts on debt securities are amortized using the effective yield-to-maturity method. Realized gains and losses from investment transactions are determined on the basis of identified cost for book and tax purposes. |
| |
| EXPENSES: |
| The Funds incur direct and indirect expenses. Expenses directly attributable to a Fund are charged to the Fund’s operations, while expenses applicable to more than one of the Royce Funds are allocated equitably. Certain personnel, occupancy costs and other administrative expenses related to the Funds are allocated by Royce under an administration agreement and are included in administrative and office facilities and legal expenses. The Trust has adopted a deferred fee agreement that allows the Trustees to defer the receipt of all or a portion of trustees’ fees otherwise payable. The deferred fees are invested in certain Royce Funds until distributed in accordance with the agreement. |
| |
| COMPENSATING BALANCE CREDITS: |
| The Funds have arrangements with their custodian bank and transfer agent, whereby a portion of the custodian’s fee and transfer agent’s fee is paid indirectly by credits earned on a Fund’s cash on deposit with the bank and transfer agent. These deposit arrangements are an alternative to purchasing overnight investments. Conversely, a Fund pays interest to the custodian on any cash overdrafts, to the extent they are not offset by credits earned on positive cash balances. |
| |
| LINE OF CREDIT: |
| The Funds, along with certain other Royce Funds, participate in a $65 million line of credit (“Credit Agreement”) with State Street Bank and Trust Company to be used for temporary or emergency purposes. This revolving Credit Agreement expires on October 11, 2019. Pursuant to the Credit Agreement, each participating Fund is liable for a portion of the commitment fee for the credit facility and for principal and interest payments related to borrowings made by that Fund. Borrowings under the Credit Agreement bear interest at a rate equal to the higher of the federal funds rate or One-Month LIBOR rate, plus 1.25%. The Funds did not utilize the line of credit during the six months ended June 30, 2019. |
| The Royce Funds 2019 Semiannual Report to Shareholders | 81 |
Notes to Financial Statements (unaudited) (continued)
Capital Share Transactions (in dollars):
| | | | | | | | | | | SHARES ISSUED FOR | | | | | | | | | | | | | | | | | | | | | | | | |
| | | | | | | | | | | REINVESTMENT | | | | | | | | | | | | | | | | | | NET INCREASE (DECREASE) FROM |
| | | SHARES SOLD | | OF DISTRIBUTIONS | | SHARES REDEEMED | | SHARE CLASS CONVERSIONS | | CAPITAL SHARE TRANSACTIONS |
| | | |
| | | Six Months | | | | | | Six Months | | | | | | Six Months | | | | | | Six Months | | | | | | Six Months | | | | |
| | | Ended 6/30/19 | | Period Ended | | Ended 6/30/19 | | Period Ended | | Ended 6/30/19 | | Period Ended | | Ended 6/30/19 | | Period Ended | | Ended 6/30/19 | | Period Ended |
| | | (unaudited) | | 12/31/18 | | (unaudited) | | 12/31/18 | | (unaudited) | | 12/31/18 | | (unaudited) | | 12/31/181 | | (unaudited) | | 12/31/18 |
| |
| Royce Dividend Value Fund |
| Investment Class | | $ | 10,715,755 | | | $ | 25,972,222 | | | $ | 437,325 | | | $ | 11,367,989 | | | $ | (35,421,429 | ) | | $ | (39,214,752 | ) | | | | | | | | | | $ | (24,268,349 | ) | | $ | (1,874,541 | ) |
| |
| Service Class | | | 304,161 | | | | 1,385,407 | | | | 91,815 | | | | 3,493,185 | | | | (6,828,987 | ) | | | (26,337,495 | ) | | | | | | | | | | | (6,433,011 | ) | | | (21,458,903 | ) |
| |
| Consultant Class | | | 60,887 | | | | 493,061 | | | | 1,822 | | | | 114,313 | | | | (128,442 | ) | | | (460,688 | ) | | | | | | | | | | | (65,733 | ) | | | 146,686 | |
| |
| Institutional Class | | | 35,315 | | | | 2,912,358 | | | | 11,171 | | | | 380,526 | | | | (2,711,591 | ) | | | (420,544 | ) | | | | | | | | | | | (2,665,105 | ) | | | 2,872,340 | |
| |
| Royce Global Financial Services Fund |
| Service Class | | | 2,823,122 | | | | 11,314,172 | | | | – | | | | 3,421,029 | | | | (6,860,587 | ) | | | (20,910,539 | ) | | | | | | | | | | | (4,037,465 | ) | | | (6,175,338 | ) |
| |
| Institutional Class | | | – | | | | 4,000 | | | | – | | | | 783,011 | | | | (1,686,897 | ) | | | (660,685 | ) | | | | | | | | | | | (1,686,897 | ) | | | 126,326 | |
| |
| Royce International Premier Fund |
| Investment Class | | | 113,005,289 | | | | 285,246,637 | | | | – | | | | 848,230 | | | | (86,645,003 | ) | | | (72,123,146 | ) | | | | | | | | | | | 26,360,286 | | | | 213,971,721 | |
| |
| Service Class | | | 20,558,785 | | | | 21,039,927 | | | | – | | | | – | | | | (6,584,049 | ) | | | (28,042,214 | ) | | | | | | $ | 15,088 | | | | 13,974,736 | | | | (6,987,199 | ) |
| |
| Consultant Class | | | 614,879 | | | | 3,320,267 | | | | – | | | | – | | | | (1,268,401 | ) | | | (2,706,865 | ) | | | | | | | | | | | (653,522 | ) | | | 613,402 | |
| |
| Institutional Class | | | 120,164,804 | | | | 35,603,235 | | | | – | | | | 62,839 | | | | (4,035,007 | ) | | | (922,139 | ) | | | | | | | | | | | 116,129,797 | | | | 34,743,935 | |
| |
| R Class | | | | | | | 200 | | | | | | | | – | | | | | | | | (57,682 | ) | | | | | | | (15,088 | ) | | | | | | | (72,570 | ) |
| |
| Royce Low-Priced Stock Fund |
| Investment Class | | | 1,487,833 | | | | 5,908,132 | | | | – | | | | 8,242,747 | | | | (4,141,089 | ) | | | (11,942,721 | ) | | | | | | | 5,064,654 | | | | (2,653,256 | ) | | | 7,272,812 | |
| |
| Service Class | | | 1,071,925 | | | | 5,416,151 | | | | – | | | | 27,201,978 | | | | (15,826,459 | ) | | | (43,586,859 | ) | | | | | | | 293,550 | | | | (14,754,534 | ) | | | (10,675,180 | ) |
| |
| Institutional Class | | | | | | | 247,714 | | | | | | | | – | | | | | | | | (1,034,576 | ) | | | | | | | (5,064,654 | ) | | | | | | | (5,851,516 | ) |
| |
| R Class | | | | | | | 15,465 | | | | | | | | – | | | | | | | | (766,305 | ) | | | | | | | (293,550 | ) | | | | | | | (1,044,390 | ) |
| |
| Royce Micro-Cap Fund |
| Investment Class | | | 1,668,332 | | | | 5,230,274 | | | | – | | | | 13,468,098 | | | | (17,890,807 | ) | | | (43,234,672 | ) | | | | | | | | | | | (16,222,475 | ) | | | (24,536,300 | ) |
| |
| Service Class | | | 386,630 | | | | 3,844,992 | | | | – | | | | 957,677 | | | | (3,228,922 | ) | | | (8,828,295 | ) | | | | | | | | | | | (2,842,292 | ) | | | (4,025,626 | ) |
| |
| Consultant Class | | | 44,621 | | | | 190,964 | | | | – | | | | 1,971,129 | | | | (1,937,083 | ) | | | (6,157,584 | ) | | | | | | | | | | | (1,892,462 | ) | | | (3,995,491 | ) |
| |
| Royce Opportunity Fund |
| Investment Class | | | 37,926,915 | | | | 93,500,228 | | | | – | | | | 46,105,025 | | | | (92,425,799 | ) | | | (188,492,528 | ) | | | | | | | | | | | (54,498,884 | ) | | | (48,887,275 | ) |
| |
| Service Class | | | 6,866,673 | | | | 27,214,604 | | | | – | | | | 4,309,945 | | | | (15,445,454 | ) | | | (69,306,409 | ) | | | | | | | 7,600,899 | | | | (8,578,781 | ) | | | (30,180,961 | ) |
| |
| Consultant Class | | | 267,335 | | | | 991,331 | | | | – | | | | 888,800 | | | | (2,495,770 | ) | | | (8,854,787 | ) | | | | | | | | | | | (2,228,435 | ) | | | (6,974,656 | ) |
| |
| Institutional Class | | | 24,645,163 | | | | 43,463,191 | | | | – | | | | 18,881,233 | | | | (42,684,440 | ) | | | (396,679,654 | ) | | | | | | | | | | | (18,039,277 | ) | | | (334,335,230 | ) |
| |
| R Class | | | 1,575,009 | | | | 3,509,170 | | | | – | | | | 2,423,347 | | | | (2,008,110 | ) | | | (9,865,485 | ) | | | | | | | | | | | (433,101 | ) | | | (3,932,968 | ) |
| |
| K Class | | | | | | | 748,866 | | | | | | | | – | | | | | | | | (771,052 | ) | | | | | | | (7,600,899 | ) | | | | | | | (7,623,085 | ) |
| |
| Royce Pennsylvania Mutual Fund |
| Investment Class | | | 37,538,151 | | | | 92,452,580 | | | | – | | | | 222,270,728 | | | | (113,636,749 | ) | | | (350,693,635 | ) | | | | | | | | | | | (76,098,598 | ) | | | (35,970,327 | ) |
| |
| Service Class | | | 2,401,749 | | | | 8,411,192 | | | | – | | | | 4,802,081 | | | | (11,459,079 | ) | | | (27,674,585 | ) | | | | | | | 2,031,178 | | | | (9,057,330 | ) | | | (12,430,134 | ) |
| |
| Consultant Class | | | 3,042,289 | | | | 7,715,097 | | | | – | | | | 47,076,762 | | | | (25,752,427 | ) | | | (88,342,616 | ) | | | | | | | | | | | (22,710,138 | ) | | | (33,550,757 | ) |
| |
| Institutional Class | | | 8,799,524 | | | | 97,962,498 | | | | – | | | | 11,826,618 | | | | (9,979,788 | ) | | | (59,962,281 | ) | | | | | | | | | | | (1,180,264 | ) | | | 49,826,835 | |
| |
| R Class | | | 693,267 | | | | 1,591,148 | | | | – | | | | 1,930,873 | | | | (2,573,810 | ) | | | (5,682,726 | ) | | | | | | | | | | | (1,880,543 | ) | | | (2,160,705 | ) |
| |
| K Class | | | | | | | 55,427 | | | | | | | | – | | | | | | | | (850,567 | ) | | | | | | | (2,031,178 | ) | | | | | | | (2,826,318 | ) |
| |
| Royce Premier Fund |
| Investment Class | | | 96,267,259 | | | | 151,864,129 | | | | – | | | | 282,874,055 | | | | (236,102,833 | ) | | | (523,969,418 | ) | | | | | | | 20,846,050 | | | | (139,835,574 | ) | | | (68,385,184 | ) |
| |
| Service Class | | | 4,516,168 | | | | 12,416,438 | | | | – | | | | 8,910,292 | | | | (12,296,161 | ) | | | (19,455,214 | ) | | | | | | | | | | | (7,779,993 | ) | | | 1,871,516 | |
| |
| Consultant Class | | | 408,318 | | | | 1,534,237 | | | | – | | | | 4,818,150 | | | | (2,860,975 | ) | | | (8,850,863 | ) | | | | | | | | | | | (2,452,657 | ) | | | (2,498,476 | ) |
| |
| Institutional Class | | | 12,147,545 | | | | 104,457,137 | | | | – | | | | 45,360,949 | | | | (25,804,056 | ) | | | (134,226,931 | ) | | | | | | | | | | | (13,656,511 | ) | | | 15,591,155 | |
| |
| W Class | | | | | | | 152,877 | | | | | | | | – | | | | | | | | (11,933,879 | ) | | | | | | | (20,846,050 | ) | | | | | | | (32,627,052 | ) |
| |
| R Class | | | 367,384 | | | | 692,268 | | | | – | | | | 2,176,396 | | | | (881,639 | ) | | | (2,675,755 | ) | | | | | | | | | | | (514,255 | ) | | | 192,909 | |
| |
| Royce Small-Cap Value Fund |
| Investment Class | | | 2,438,140 | | | | 7,444,311 | | | | – | | | | 6,296,922 | | | | (8,107,220 | ) | | | (15,135,406 | ) | | | | | | | 3,479,640 | | | | (5,669,080 | ) | | | 2,085,467 | |
| |
| Service Class | | | 1,316,765 | | | | 4,541,944 | | | | – | | | | 11,996,003 | | | | (17,559,557 | ) | | | (37,125,376 | ) | | | | | | | 1,556,238 | | | | (16,242,792 | ) | | | (19,031,191 | ) |
| |
| Consultant Class | | | 57,311 | | | | 466,673 | | | | – | | | | 1,108,696 | | | | (1,182,346 | ) | | | (3,034,581 | ) | | | | | | | | | | | (1,125,035 | ) | | | (1,459,212 | ) |
| |
| Institutional Class | | | | | | | 172,026 | | | | | | | | – | | | | | | | | (556,734 | ) | | | | | | | (3,479,640 | ) | | | | | | | (3,864,348 | ) |
| |
| R Class | | | 555,813 | | | | 1,381,891 | | | | – | | | | 944,360 | | | | (1,101,686 | ) | | | (7,083,191 | ) | | | | �� | | | | | | | (545,873 | ) | | | (4,756,940 | ) |
| |
| K Class | | | | | | | 323,211 | | | | | | | | – | | | | | | | | (736,046 | ) | | | | | | | (1,556,238 | ) | | | | | | | (1,969,073 | ) |
| |
| 82 | The Royce Funds 2019 Semiannual Report to Shareholders |
Capital Share Transactions (in dollars) (continued):
| | | | | | | | | | | SHARES ISSUED FOR | | | | | | | | | | | | | | | | | | | | | | | | |
| | | | | | | | | | | REINVESTMENT | | | | | | | | | | | | | | | | | | NET INCREASE (DECREASE) FROM |
| | | SHARES SOLD | | OF DISTRIBUTIONS | | SHARES REDEEMED | | SHARE CLASS CONVERSIONS | | CAPITAL SHARE TRANSACTIONS |
| | | |
| | | Six Months | | | | | | Six Months | | | | | | Six Months | | | | | | Six Months | | | | | | Six Months | | | | |
| | | Ended 6/30/19 | | Period Ended | | Ended 6/30/19 | | Period Ended | | Ended 6/30/19 | | Period Ended | | Ended 6/30/19 | | Period Ended | | Ended 6/30/19 | | Period Ended |
| | | (unaudited) | | 12/31/18 | | (unaudited) | | 12/31/18 | | (unaudited) | | 12/31/18 | | (unaudited) | | 12/31/181 | | (unaudited) | | 12/31/18 |
| |
| Royce Smaller-Companies Growth Fund |
| Investment Class | | $ | 4,118,882 | | | $ | 14,761,046 | | | $ | – | | | $ | 24,904,985 | | | $ | (11,007,847 | ) | | $ | (32,950,853 | ) | | | | | | | | | | $ | (6,888,965 | ) | | $ | 6,715,178 | |
| |
| Service Class | | | 2,732,766 | | | | 8,483,893 | | | | – | | | | 49,014,107 | | | | (17,811,305 | ) | | | (62,051,370 | ) | | | | | | $ | 623,550 | | | | (15,078,539 | ) | | | (3,929,820 | ) |
| |
| Consultant Class | | | 16,287 | | | | 339,101 | | | | – | | | | 2,118,800 | | | | (806,678 | ) | | | (3,292,612 | ) | | | | | | | | | | | (790,391 | ) | | | (834,711 | ) |
| |
| Institutional Class | | | 217,359 | | | | 898,827 | | | | – | | | | 2,073,085 | | | | (467,765 | ) | | | (1,902,628 | ) | | | | | | | | | | | (250,406 | ) | | | 1,069,284 | |
| |
| R Class | | | | | | | 139,588 | | | | | | | | – | | | | | | | | (111,893 | ) | | | | | | | (623,550 | ) | | | | | | | (595,855 | ) |
| |
| Royce Special Equity Fund |
| Investment Class | | | 89,446,430 | | | | 222,486,956 | | | | – | | | | 94,473,851 | | | | (143,064,708 | ) | | | (328,550,392 | ) | | | | | | | | | | | (53,618,278 | ) | | | (11,589,585 | ) |
| |
| Service Class | | | 8,661,718 | | | | 43,284,766 | | | | – | | | | 6,535,526 | | | | (14,654,499 | ) | | | (78,927,553 | ) | | | | | | | | | | | (5,992,781 | ) | | | (29,107,261 | ) |
| |
| Consultant Class | | | 532,476 | | | | 2,381,819 | | | | – | | | | 3,028,564 | | | | (3,972,653 | ) | | | (14,406,587 | ) | | | | | | | | | | | (3,440,177 | ) | | | (8,996,204 | ) |
| |
| Institutional Class | | | 44,975,939 | | | | 77,996,165 | | | | – | | | | 20,150,304 | | | | (33,384,919 | ) | | | (97,459,966 | ) | | | | | | | | | | | 11,591,020 | | | | 686,503 | |
| |
| Royce Total Return Fund |
| Investment Class | | | 46,649,151 | | | | 172,331,070 | | | | 6,156,953 | | | | 185,080,886 | | | | (185,908,245 | ) | | | (486,165,820 | ) | | | | | | | 4,991,437 | | | | (133,102,141 | ) | | | (123,762,427 | ) |
| |
| Service Class | | | 7,827,029 | | | | 17,605,970 | | | | 420,685 | | | | 14,354,667 | | | | (22,151,291 | ) | | | (53,275,300 | ) | | | | | | | 34,866,202 | | | | (13,903,577 | ) | | | 13,551,539 | |
| |
| Consultant Class | | | 2,225,477 | | | | 7,766,358 | | | | 193,688 | | | | 28,157,591 | | | | (25,364,766 | ) | | | (64,755,046 | ) | | | | | | | | | | | (22,945,601 | ) | | | (28,831,097 | ) |
| |
| Institutional Class | | | 66,945,545 | | | | 133,802,754 | | | | 1,676,619 | | | | 38,645,065 | | | | (89,592,504 | ) | | | (186,576,729 | ) | | | | | | | | | | | (20,970,340 | ) | | | (14,128,910 | ) |
| |
| W Class | | | | | | | 3,384,456 | | | | | | | | 153,879 | | | | | | | | (97,087,426 | ) | | | | | | | (4,991,437 | ) | | | | | | | (98,540,528 | ) |
| |
| R Class | | | 3,591,194 | | | | 11,526,424 | | | | 129,512 | | | | 8,367,129 | | | | (18,833,492 | ) | | | (14,313,562 | ) | | | | | | | | | | | (15,112,786 | ) | | | 5,579,991 | |
| |
| K Class | | | | | | | 4,184,983 | | | | | | | | 58,255 | | | | | | | | (6,531,546 | ) | | | | | | | (34,866,202 | ) | | | | | | | (37,154,510 | ) |
| |
Capital Share Transactions (in shares):
| | | | | | | | | | | SHARES ISSUED FOR | | | | | | | | | | | | | | | | | | | | | | | | |
| | | | | | | | | | | REINVESTMENT | | | | | | | | | | | | | | | | | | NET INCREASE (DECREASE) IN |
| | | SHARES SOLD | | OF DISTRIBUTIONS | | SHARES REDEEMED | | SHARE CLASS CONVERSIONS | | SHARES OUTSTANDING |
| | | |
| | | Six Months | | | | | | Six Months | | | | | | Six Months | | | | | | Six Months | | | | | | Six Months | | | | |
| | | Ended 6/30/19 | | Period Ended | | Ended 6/30/19 | | Period Ended | | Ended 6/30/19 | | Period Ended | | Ended 6/30/19 | | Period Ended | | Ended 6/30/19 | | Period Ended |
| | | (unaudited) | | 12/31/18 | | (unaudited) | | 12/31/18 | | (unaudited) | | 12/31/18 | | (unaudited) | | 12/31/181 | | (unaudited) | | 12/31/18 |
| |
| Royce Dividend Value Fund |
| Investment Class | | | 1,721,039 | | | | 3,612,556 | | | | 72,201 | | | | 1,926,261 | | | | (5,628,336 | ) | | | (5,740,059 | ) | | | | | | | | | | | (3,835,096 | ) | | | (201,242 | ) |
| |
| Service Class | | | 47,486 | | | | 182,554 | | | | 14,621 | | | | 572,558 | | | | (1,046,129 | ) | | | (3,528,363 | ) | | | | | | | | | | | (984,022 | ) | | | (2,773,251 | ) |
| |
| Consultant Class | | | 8,708 | | | | 72,025 | | | | 243 | | | | 16,665 | | | | (17,204 | ) | | | (55,073 | ) | | | | | | | | | | | (8,253 | ) | | | 33,617 | |
| |
| Institutional Class | | | 5,664 | | | | 389,716 | | | | 1,805 | | | | 66,051 | | | | (439,123 | ) | | | (54,927 | ) | | | | | | | | | | | (431,654 | ) | | | 400,840 | |
| |
| Royce Global Financial Services Fund |
| Service Class | | | 312,501 | | | | 1,032,931 | | | | – | | | | 402,001 | | | | (759,601 | ) | | | (1,977,301 | ) | | | | | | | | | | | (447,100 | ) | | | (542,369 | ) |
| |
| Institutional Class | | | – | | | | 281 | | | | – | | | | 71,378 | | | | (145,047 | ) | | | (46,913 | ) | | | | | | | | | | | (145,047 | ) | | | 24,746 | |
| |
| Royce International Premier Fund |
| Investment Class | | | 8,764,661 | | | | 22,969,262 | | | | – | | | | 72,747 | | | | (6,758,309 | ) | | | (5,886,292 | ) | | | | | | | | | | | 2,006,352 | | | | 17,155,717 | |
| |
| Service Class | | | 1,363,861 | | | | 1,367,064 | | | | – | | | | – | | | | (421,346 | ) | | | (1,818,416 | ) | | | | | | | 964 | | | | 942,515 | | | | (450,388 | ) |
| |
| Consultant Class | | | 37,226 | | | | 203,769 | | | | – | | | | – | | | | (77,295 | ) | | | (169,091 | ) | | | | | | | | | | | (40,069 | ) | | | 34,678 | |
| |
| Institutional Class | | | 9,168,420 | | | | 2,916,865 | | | | – | | | | 5,389 | | | | (310,338 | ) | | | (82,650 | ) | | | | | | | | | | | 8,858,082 | | | | 2,839,604 | |
| |
| R Class | | | | | | | 16 | | | | | | | | – | | | | | | | | (4,618 | ) | | | | | | | (1,202 | ) | | | | | | | (5,804 | ) |
| |
| Royce Low-Priced Stock Fund |
| Investment Class | | | 206,599 | | | | 664,694 | | | | – | | | | 1,247,011 | | | | (584,818 | ) | | | (1,402,203 | ) | | | | | | | 544,002 | | | | (378,219 | ) | | | 1,053,504 | |
| |
| Service Class | | | 152,831 | | | | 627,095 | | | | – | | | | 4,140,332 | | | | (2,239,641 | ) | | | (4,994,573 | ) | | | | | | | 33,703 | | | | (2,086,810 | ) | | | (193,443 | ) |
| |
| Institutional Class | | | | | | | 28,573 | | | | | | | | – | | | | | | | | (114,370 | ) | | | | | | | (543,255 | ) | | | | | | | (629,052 | ) |
| |
| R Class | | | | | | | 1,925 | | | | | | | | – | | | | | | | | (97,337 | ) | | | | | | | (35,709 | ) | | | | | | | (131,121 | ) |
| |
| Royce Micro-Cap Fund |
| Investment Class | | | 162,106 | | | | 442,085 | | | | – | | | | 1,379,928 | | | | (1,752,892 | ) | | | (3,650,567 | ) | | | | | | | | | | | (1,590,786 | ) | | | (1,828,554 | ) |
| |
| Service Class | | | 38,488 | | | | 312,618 | | | | – | | | | 100,175 | | | | (323,625 | ) | | | (750,133 | ) | | | | | | | | | | | (285,137 | ) | | | (337,340 | ) |
| |
| Consultant Class | | | 5,618 | | | | 20,513 | | | | – | | | | 261,077 | | | | (244,575 | ) | | | (657,240 | ) | | | | | | | | | | | (238,957 | ) | | | (375,650 | ) |
| |
| Royce Opportunity Fund |
| Investment Class2 | | | 4,934,772 | | | | 7,069,808 | | | | – | | | | 4,353,638 | | | | (8,077,290 | ) | | | (14,641,615 | ) | | | | | | | | | | | (3,142,518 | ) | | | (3,218,169 | ) |
| |
| Service Class | | | 654,179 | | | | 2,128,949 | | | | – | | | | 437,558 | | | | (1,475,746 | ) | | | (5,517,655 | ) | | | | | | | 601,813 | | | | (821,567 | ) | | | (2,349,335 | ) |
| |
| Consultant Class | | | 28,948 | | | | 97,465 | | | | – | | | | 102,870 | | | | (272,182 | ) | | | (824,172 | ) | | | | | | | | | | | (243,234 | ) | | | (623,837 | ) |
| |
| Institutional Class | | | 2,158,669 | | | | 3,124,242 | | | | – | | | | 1,745,031 | | | | (3,733,171 | ) | | | (28,617,157 | ) | | | | | | | | | | | (1,574,502 | ) | | | (23,747,884 | ) |
| |
| R Class | | | 159,157 | | | | 289,556 | | | | – | | | | 255,089 | | | | (196,617 | ) | | | (794,614 | ) | | | | | | | | | | | (37,460 | ) | | | (249,969 | ) |
| |
| K Class | | | | | | | 66,744 | | | | | | | | – | | | | | | | | (70,091 | ) | | | | | | | (684,679 | ) | | | | | | | (688,026 | ) |
| |
| The Royce Funds 2019 Semiannual Report to Shareholders | 83 |
Notes to Financial Statements (unaudited) (continued)
Capital Share Transactions (in shares) (continued):
| | | | | | | | | | | SHARES ISSUED FOR | | | | | | | | | | | | | | | | | | | | | | | | |
| | | | | | | | | | | REINVESTMENT | | | | | | | | | | | | | | | | | | NET INCREASE (DECREASE) IN |
| | | SHARES SOLD | | OF DISTRIBUTIONS | | SHARES REDEEMED | | SHARE CLASS CONVERSIONS | | SHARES OUTSTANDING |
| | | |
| | | Six Months | | | | | | Six Months | | | | | | Six Months | | | | | | Six Months | | | | | | Six Months | | | | |
| | | Ended 6/30/19 | | Period Ended | | Ended 6/30/19 | | Period Ended | | Ended 6/30/19 | | Period Ended | | Ended 6/30/19 | | Period Ended | | Ended 6/30/19 | | Period Ended |
| | | (unaudited) | | 12/31/18 | | (unaudited) | | 12/31/18 | | (unaudited) | | 12/31/18 | | (unaudited) | | 12/31/181 | | (unaudited) | | 12/31/18 |
| |
| Royce Pennsylvania Mutual Fund |
| Investment Class3 | | | 14,080,965 | | | | 9,032,724 | | | | – | | | | 27,406,995 | | | | (12,862,069 | ) | | | (35,352,581 | ) | | | | | | | | | | | 1,218,896 | | | | 1,087,138 | |
| |
| Service Class3 | | | 13,602,644 | | | | 758,686 | | | | – | | | | 591,389 | | | | (1,295,657 | ) | | | (2,597,089 | ) | | | | | | | 188,596 | | | | 12,306,987 | | | | (1,058,418 | ) |
| |
| Consultant Class3 | | | 1,410,978 | | | | 1,042,114 | | | | – | | | | 7,276,161 | | | | (3,686,429 | ) | | | (10,773,630 | ) | | | | | | | | | | | (2,275,451 | ) | | | (2,455,355 | ) |
| |
| Institutional Class | | | 993,086 | | | | 10,176,610 | | | | – | | | | 1,454,689 | | | | (1,140,057 | ) | | | (5,904,434 | ) | | | | | | | | | | | (146,971 | ) | | | 5,726,865 | |
| |
| R Class | | | 86,167 | | | | 154,050 | | | | – | | | | 253,063 | | | | (320,435 | ) | | | (556,956 | ) | | | | | | | | | | | (234,268 | ) | | | (149,843 | ) |
| |
| K Class | | | | | | | 6,293 | | | | | | | | – | | | | | | | | (96,193 | ) | | | | | | | (230,227 | ) | | | | | | | (320,127 | ) |
| |
| Royce Premier Fund |
| Investment Class | | | 7,273,205 | | | | 9,774,025 | | | | – | | | | 23,300,993 | | | | (17,493,401 | ) | | | (33,088,705 | ) | | | | | | | 1,246,773 | | | | (10,220,196 | ) | | | 1,233,086 | |
| |
| Service Class | | | 347,683 | | | | 762,638 | | | | – | | | | 753,832 | | | | (945,949 | ) | | | (1,202,121 | ) | | | | | | | | | | | (598,266 | ) | | | 314,349 | |
| |
| Consultant Class | | | 40,140 | | | | 132,860 | | | | – | | | | 502,414 | | | | (272,115 | ) | | | (689,765 | ) | | | | | | | | | | | (231,975 | ) | | | (54,491 | ) |
| |
| Institutional Class | | | 907,218 | | | | 6,477,889 | | | | – | | | | 3,678,909 | | | | (1,890,846 | ) | | | (8,262,556 | ) | | | | | | | | | | | (983,628 | ) | | | 1,894,242 | |
| |
| W Class | | | | | | | 8,969 | | | | | | | | – | | | | | | | | (683,832 | ) | | | | | | | (1,239,921 | ) | | | | | | | (1,914,784 | ) |
| |
| R Class | | | 28,951 | | | | 49,442 | | | | – | | | | 193,975 | | | | (70,574 | ) | | | (172,520 | ) | | | | | | | | | | | (41,623 | ) | | | 70,897 | |
| |
| Royce Small-Cap Value Fund |
| Investment Class | | | 267,405 | | | | 720,316 | | | | – | | | | 732,200 | | | | (901,228 | ) | | | (1,521,627 | ) | | | | | | | 319,820 | | | | (633,823 | ) | | | 250,709 | |
| |
| Service Class | | | 142,974 | | | | 433,604 | | | | – | | | | 1,399,767 | | | | (1,944,226 | ) | | | (3,589,532 | ) | | | | | | | 152,722 | | | | (1,801,252 | ) | | | (1,603,439 | ) |
| |
| Consultant Class | | | 6,974 | | | | 56,074 | | | | – | | | | 145,498 | | | | (147,457 | ) | | | (346,507 | ) | | | | | | | | | | | (140,483 | ) | | | (144,935 | ) |
| |
| Institutional Class | | | | | | | 16,201 | | | | | | | | – | | | | | | | | (54,436 | ) | | | | | | | (316,248 | ) | | | | | | | (354,483 | ) |
| |
| R Class | | | 64,187 | | | | 138,804 | | | | – | | | | 114,607 | | | | (125,363 | ) | | | (720,582 | ) | | | | | | | | | | | (61,176 | ) | | | (467,171 | ) |
| |
| K Class | | | | | | | 46,711 | | | | | | | | – | | | | | | | | (106,029 | ) | | | | | | | (221,047 | ) | | | | | | | (280,365 | ) |
| |
| Royce Smaller-Companies Growth Fund |
| Investment Class | | | 540,538 | | | | 1,409,407 | | | | – | | | | 3,454,228 | | | | (1,391,949 | ) | | | (3,097,890 | ) | | | | | | | | | | | (851,411 | ) | | | 1,765,745 | |
| |
| Service Class | | | 355,574 | | | | 746,094 | | | | – | | | | 6,972,135 | | | | (2,309,693 | ) | | | (5,772,215 | ) | | | | | | | 57,897 | | | | (1,954,119 | ) | | | 2,003,911 | |
| |
| Consultant Class | | | 2,533 | | | | 47,341 | | | | – | | | | 350,795 | | | | (122,502 | ) | | | (386,332 | ) | | | | | | | | | | | (119,969 | ) | | | 11,804 | |
| |
| Institutional Class | | | 27,481 | | | | 74,788 | | | | – | | | | 283,596 | | | | (60,340 | ) | | | (170,523 | ) | | | | | | | | | | | (32,859 | ) | | | 187,861 | |
| |
| R Class | | | | | | | 13,782 | | | | | | | | – | | | | | | | | (11,097 | ) | | | | | | | (62,268 | ) | | | | | | | (59,583 | ) |
| |
| Royce Special Equity Fund |
| |
| Investment Class | | | 4,798,706 | | | | 10,606,597 | | | | – | | | | 5,245,633 | | | | (7,635,617 | ) | | | (16,096,361 | ) | | | | | | | | | | | (2,836,911 | ) | | | (244,131 | ) |
| |
| Service Class | | | 468,162 | | | | 2,028,507 | | | | – | | | | 363,287 | | | | (779,109 | ) | | | (3,754,389 | ) | | | | | | | | | | | (310,947 | ) | | | (1,362,595 | ) |
| |
| Consultant Class | | | 31,527 | | | | 129,355 | | | | – | | | | 184,219 | | | | (235,360 | ) | | | (761,826 | ) | | | | | | | | | | | (203,833 | ) | | | (448,252 | ) |
| |
| Institutional Class | | | 2,393,390 | | | | 3,801,951 | | | | – | | | | 1,128,868 | | | | (1,795,639 | ) | | | (4,649,863 | ) | | | | | | | | | | | 597,751 | | | | 280,956 | |
| |
| Royce Total Return Fund |
| Investment Class | | | 4,350,591 | | | | 13,088,971 | | | | 582,234 | | | | 17,953,975 | | | | (17,121,038 | ) | | | (38,922,836 | ) | | | | | | | 376,428 | | | | (12,188,213 | ) | | | (7,503,462 | ) |
| |
| Service Class | | | 721,977 | | | | 1,289,618 | | | | 39,025 | | | | 1,367,521 | | | | (1,977,185 | ) | | | (3,895,252 | ) | | | | | | | 2,550,563 | | | | (1,216,183 | ) | | | 1,312,450 | |
| |
| Consultant Class | | | 199,850 | | | | 621,031 | | | | 17,436 | | | | 2,684,766 | | | | (2,263,984 | ) | | | (5,045,159 | ) | | | | | | | | | | | (2,046,698 | ) | | | (1,739,362 | ) |
| |
| Institutional Class | | | 6,196,478 | | | | 10,380,153 | | | | 157,869 | | | | 3,797,631 | | | | (8,350,652 | ) | | | (14,578,110 | ) | | | | | | | | | | | (1,996,305 | ) | | | (400,326 | ) |
| |
| W Class | | | | | | | 248,431 | | | | | | | | 11,258 | | | | | | | | (6,960,700 | ) | | | | | | | (375,375 | ) | | | | | | | (7,076,386 | ) |
| |
| R Class | | | 323,923 | | | | 834,627 | | | | 11,594 | | | | 791,987 | | | | (1,646,945 | ) | | | (1,066,832 | ) | | | | | | | | | | | (1,311,428 | ) | | | 559,782 | |
| |
| K Class | | | | | | | 468,780 | | | | | | | | 6,516 | | | | | | | | (724,647 | ) | | | | | | | (3,926,286 | ) | | | | | | | (4,175,637 | ) |
| |
| 1 | On April 13, 2018, R Class shares converted to Service Class shares for the following funds: Royce Low-Priced Stock Fund and Royce Smaller-Companies Growth Fund and K Class shares converted to Service Class shares for the following funds: Royce Opportunity Fund, Royce Pennsylvania Mutual Fund, Royce Small-Cap Value Fund and Royce Total Return Fund. On April 16, 2018, Royce International Premier Fund R Class shares converted to Service Class shares. On June 27, 2018, Institutional Class shares converted to Investment Class shares for Royce Low-Priced Stock Fund and Royce Small-Cap Value Fund. On October 10, 2018, W Class shares converted to Investment Class shares for Royce Premier Fund and Royce Total Return Fund. |
| 2 | Includes shares issued in connection with the merger of Royce Micro-Cap Opportunity Fund (1,587,186 for Investment Class) for the six months ended 6/30/19. |
| 3 | Includes shares issued in connection with the mergers of Royce Small-Cap Leaders Fund and Royce Small/Mid-Cap Premier Fund (9,793,096 for Investment Class, 13,319,368 for Service Class and 969,311 for Consultant Class) for the six months ended 6/30/19. |
| 84 | The Royce Funds 2019 Semiannual Report to Shareholders |
Investment Adviser and Distributor:
INVESTMENT ADVISER:
Under the Trust’s investment advisory agreements with Royce, Royce is entitled to receive investment advisory fees in respect of each Fund that are computed daily and payable monthly. Royce has contractually agreed, without right of termination, to waive fees and/or reimburse expenses (excluding brokerage commissions, taxes, interest, litigation expenses, acquired fund fees and expenses, and other expenses not borne in the ordinary course of business) to the extent necessary to maintain certain Funds’ net annual operating expense ratios at specified levels through April 30, 2020, and is shown below to the extent that it impacted net expenses for the six months ended June 30, 2019. See the Prospectus for contractual waiver expiration dates.
| | | ANNUAL CONTRACTUAL
ADVISORY FEE AS A | | | COMMITTED NET ANNUAL OPERATING EXPENSE RATIO CAP4 | | | | SIX MONTHS ENDED
JUNE 30, 2019 |
| | | | | | | |
| | | PERCENTAGE OF AVERAGE
NET ASSETS1 | | Investment
Class4 | | Service
Class4 | | Consultant
Class4 | | Institutional
Class4 | | R Class4 | | Net advisory fees | | Advisory fees
waived |
| |
| Royce Dividend Value Fund | | | 0.85 | % | | | 1.09 | % | | | 1.34 | % | | | 2.09 | % | | | 1.09 | %7 | | | N/A | | | $ | 446,206 | | $ | 48,190 | |
| |
| Royce Global Financial Services Fund | | | 1.00 | % | | | N/A | | | | 1.49 | % | | | N/A | | | | 1.49 | %8 | | | N/A | | | | 166,524 | | | 32,575 | |
| |
| Royce International Premier Fund | | | 1.00 | % | | | 1.19 | % | | | 1.44 | % | | | 2.19 | % | | | 1.04 | % | | | N/A | | | | 2,191,629 | | | 157,190 | |
| |
| Royce Low-Priced Stock Fund | | | 1.00 | % | | | 1.24 | % | | | 1.49 | % | | | N/A | | | | N/A | | | | N/A | | | | 1,073,172 | | | – | |
| |
| Royce Micro-Cap Fund | | | 1.25 | %2 | | | 1.49 | %5 | | | 1.61 | %6 | | | N/A | | | | N/A | | | | N/A | | | | 918,260 | | | 359 | |
| |
| Royce Opportunity Fund | | | 1.00 | % | | | N/A | | | | 1.49 | % | | | N/A | | | | N/A | | | | N/A | | | | 4,759,960 | | | – | |
| |
| Royce Pennsylvania Mutual Fund | | | 0.76 | %3 | | | N/A | | | | N/A | | | | N/A | | | | N/A | | | | N/A | | | | 6,634,155 | | | – | |
| |
| Royce Premier Fund | | | 1.00 | % | | | N/A | | | | 1.49 | % | | | N/A | | | | N/A | | | | N/A | | | | 9,204,817 | | | – | |
| |
| Royce Small-Cap Value Fund | | | 1.00 | % | | | 1.24 | % | | | 1.49 | % | | | N/A | | | | N/A | | | | 1.99 | % | | | 975,433 | | | – | |
| |
| Royce Smaller-Companies Growth Fund | | | 1.00 | % | | | N/A | | | | 1.49 | % | | | 2.24 | % | | | 1.21 | %9 | | | N/A | | | | 1,391,383 | | | 19,380 | |
| |
| Royce Special Equity Fund | | | 1.00 | % | | | N/A | | | | 1.39 | % | | | N/A | | | | N/A | | | | N/A | | | | 6,303,636 | | | – | |
| |
| Royce Total Return Fund | | | 1.00 | % | | | N/A | | | | 1.49 | % | | | N/A | | | | N/A | | | | N/A | | | | 8,120,928 | | | – | |
| |
| 1 | From a base annual rate of 1.00% (0.85% for Royce Dividend Value Fund and 1.25% for Royce Micro-Cap Fund), the annual rates of investment advisory fees payable by each of the Funds, other than Royce Pennsylvania Mutual Fund, are reduced by the indicated amount at the following breakpoints applicable to a Fund’s net assets in excess of $2 billion: more than $2 billion to $3 billion – .05% per annum; more than $3 billion to $4 billion – .10% per annum; over $4 billion – .15% per annum. |
| 2 | Royce Micro-Cap Fund’s base annual contractual advisory fee was reduced from 1.25% to 1.00%, effective July 15, 2019. |
| 3 | Royce Pennsylvania Mutual Fund’s fees are calculated at the annual rate of 1.00% of the first $50 million of the Fund’s average net assets, 0.875% of the next $50 million of average net assets and 0.75% of average net assets in excess of $100 million. |
| 4 | Committed net annual operating expense ratio cap excludes acquired fund fees and expenses. |
| 5 | Royce Micro-Cap Fund’s committed net annual operating expense ratio cap was reduced from 1.49% to 1.24% for Investment Class, effective July 15, 2019. |
| 6 | Royce Micro-Cap Fund’s committed net annual operating expense ratio cap was reduced from 1.61% to 1.49% for Service Class, effective July 15, 2019. |
| 7 | Royce Dividend Value Fund’s committed net annual operating expense ratio cap was increased from 0.89% to 1.09% for Institutional Class, effective May 1, 2019. |
| 8 | Royce Global Financial Services Fund’s committed net annual operating expense ratio cap was eliminated from 1.04% for Institutional Class, effective May 1, 2019. |
| 9 | Royce Smaller-Companies Growth Fund’s committed net annual operating expense ratio cap was increased from 1.08% to 1.21% for Institutional Class, effective May 1, 2019. |
DISTRIBUTOR:
Royce Fund Services, LLC (“RFS”), the distributor of the Trust’s shares, is a wholly owned subsidiary of Royce. RFS is entitled to receive distribution fees that are computed daily and payable monthly.
| | | | ANNUAL CONTRACTUAL DISTRIBUTION FEE AS A | | | | SIX MONTHS ENDED JUNE 30, 2019 |
| | | | | | | | |
| | | | PERCENTAGE OF AVERAGE NET ASSETS | | Net distribution fees | | Distribution fees waived |
| |
| Royce Dividend Value Fund – Service Class | | | | 0.25 | % | | | $ | 36,139 | | | | $ | – | |
| |
| Royce Dividend Value Fund – Consultant Class | | | | 1.00 | % | | | | 7,702 | | | | | – | |
| |
| Royce Global Financial Services Fund – Service Class | | | | 0.25 | % | | | | 37,366 | | | | | 3,249 | |
| |
| Royce International Premier Fund – Service Class | | | | 0.25 | % | | | | 64,945 | | | | | – | |
| |
| Royce International Premier Fund – Consultant Class | | | | 1.00 | % | | | | 45,652 | | | | | – | |
| |
| Royce Low-Priced Stock Fund – Service Class | | | | 0.25 | % | | | | 206,065 | | | | | – | |
| |
| Royce Micro-Cap Fund – Service Class | | | | 0.25 | % | | | | 8,647 | | | | | – | |
| |
| Royce Micro-Cap Fund – Consultant Class | | | | 1.00 | % | | | | 85,638 | | | | | – | |
| |
| Royce Opportunity Fund – Service Class | | | | 0.25 | % | | | | 63,869 | | | | | – | |
| |
| Royce Opportunity Fund – Consultant Class | | | | 1.00 | % | | | | 48,858 | | | | | – | |
| |
| Royce Opportunity Fund – R Class | | | | 0.50 | % | | | | 74,502 | | | | | – | |
| |
| Royce Pennsylvania Mutual Fund – Service Class | | | | 0.25 | % | | | | 52,795 | | | | | – | |
| |
| Royce Pennsylvania Mutual Fund – Consultant Class | | | | 1.00 | % | | | | 1,343,561 | | | | | – | |
| |
| Royce Pennsylvania Mutual Fund – R Class | | | | 0.50 | % | | | | 25,905 | | | | | – | |
| |
| Royce Premier Fund – Service Class | | | | 0.25 | % | | | | 42,949 | | | | | 10,737 | |
| |
| Royce Premier Fund – Consultant Class | | | | 1.00 | % | | | | 115,903 | | | | | – | |
| |
| Royce Premier Fund – R Class | | | | 0.50 | % | | | | 27,019 | | | | | – | |
| |
| Royce Small-Cap Value Fund – Service Class | | | | 0.25 | % | | | | 145,570 | | | | | – | |
| |
| Royce Small-Cap Value Fund – Consultant Class | | | | 1.00 | % | | | | 49,333 | | | | | – | |
| |
| Royce Small-Cap Value Fund ��� R Class | | | | 0.50 | % | | | | 21,879 | | | | | – | |
| |
| The Royce Funds 2019 Semiannual Report to Shareholders | 85 |
Notes to Financial Statements (unaudited) (continued)
DISTRIBUTOR (continued):
| | | | ANNUAL CONTRACTUAL DISTRIBUTION FEE AS A | | | | SIX MONTHS ENDED JUNE 30, 2019 |
| | | | | | | | |
| | | | PERCENTAGE OF AVERAGE NET ASSETS | | Net distribution fees | | Distribution fees waived |
| |
| Royce Smaller-Companies Growth Fund – Service Class | | | | 0.25 | % | | | $ | 213,093 | | | | $ | – | |
| |
| Royce Smaller-Companies Growth Fund – Consultant Class | | | | 1.00 | % | | | | 33,839 | | | | | – | |
| |
| Royce Special Equity Fund – Service Class | | | | 0.25 | % | | | | 77,457 | | | | | – | |
| |
| Royce Special Equity Fund – Consultant Class | | | | 1.00 | % | | | | 153,623 | | | | | – | |
| |
| Royce Total Return Fund – Service Class | | | | 0.25 | % | | | | 109,708 | | | | | – | |
| |
| Royce Total Return Fund – Consultant Class | | | | 1.00 | % | | | | 835,638 | | | | | – | |
| |
| Royce Total Return Fund – R Class | | | | 0.50 | % | | | | 111,764 | | | | | – | |
| |
Purchases and Sales of Investment Securities:
For the six months ended June 30, 2019, the costs of purchases and the proceeds from sales of investment securities, other than short-term securities and collateral received for securities loaned, were as follows:
| | | | PURCHASES | | SALES1 |
| |
| Royce Dividend Value Fund | | | $ | 6,246,392 | | | $ | 35,159,925 | |
| |
| Royce Global Financial Services Fund | | | | 201,966 | | | | 5,942,099 | |
| |
| Royce International Premier Fund | | | | 218,779,973 | | | | 61,899,451 | |
| |
| Royce Low-Priced Stock Fund | | | | 16,972,468 | | | | 40,282,529 | |
| |
| Royce Micro-Cap Fund | | | | 9,060,421 | | | | 30,135,647 | |
| |
| Royce Opportunity Fund | | | | 192,087,164 | | | | 313,764,787 | |
| |
| Royce Pennsylvania Mutual Fund | | | | 224,438,860 | | | | 359,887,098 | |
| |
| Royce Premier Fund | | | | 125,248,810 | | | | 421,154,786 | |
| |
| Royce Small-Cap Value Fund | | | | 67,617,520 | | | | 97,509,924 | |
| |
| Royce Smaller-Companies Growth Fund | | | | 86,167,919 | | | | 118,765,982 | |
| |
| Royce Special Equity Fund | | | | 83,642,175 | | | | 269,266,416 | |
| |
| Royce Total Return Fund | | | | 108,482,049 | | | | 282,524,772 | |
| |
| 1Excludes the value of securities delivered as a result of redemptions-in-kind. |
Cross trades were executed by the Funds pursuant to Rule 17a-7 under the 1940 Act. Cross trading is the buying or selling of portfolio securities between funds to which Royce serves as investment adviser. The Trust’s Chief Compliance Officer reviews such transactions each quarter for compliance with the requirements and restrictions set forth by Rule 17a-7, and reports the results of her review to the Board of Trustees. Cross trades for the six months ended June 30, 2019, were as follows:
| | | COSTS OF PURCHASES | | PROCEEDS FROM SALES | | REALIZED GAIN (LOSS) |
| |
| Royce Dividend Value Fund | | | $ | – | | | | $ | 339,662 | | | | $ | (703,063 | ) |
| |
| Royce International Premier Fund | | | | 606,363 | | | | | – | | | | | – | |
| |
| Royce Pennsylvania Mutual Fund | | | | – | | | | | 19,546,992 | | | | | (12,951,825 | ) |
| |
| Royce Premier Fund | | | | 2,809,632 | | | | | – | | | | | – | |
| |
| Royce Total Return Fund | | | | 2,574,721 | | | | | 8,429,871 | | | | | (2,026,061 | ) |
| |
Redemptions-In-Kind:
The Funds may make payment for Fund shares redeemed wholly or in part by distributing portfolio securities to shareholders. The net realized gain will not be realized for tax purposes. For the six months ended June 30, 2019, the following fund had redemptions in kind:
| | | PROCEEDS | | REALIZED GAIN |
| |
| Royce Total Return Fund | | $ | 45,131,138 | | | $ | 22,359,398 | |
| |
Class Specific Expenses:
Class specific expenses were as follows for the six months ended June 30, 2019:
| | | NET DISTRIBUTION
FEES | | SHAREHOLDER
SERVICING | | SHAREHOLDER
REPORTS | | REGISTRATION | | TRANSFER AGENT
BALANCE CREDITS | | TOTAL | | CLASS LEVEL
EXPENSES
REIMBURSED BY
INVESTMENT
ADVISER |
| |
Royce Dividend Value Fund –
Investment Class | | $ | – | | | $ | 62,228 | | | $ | 14,677 | | | $ | 8,673 | | | $ | (525 | ) | | $ | 85,053 | | | $ | 19,226 | |
| |
Royce Dividend Value Fund –
Service Class | | | 36,139 | | | | 32,691 | | | | 5,371 | | | | 6,899 | | | | (526 | ) | | | 80,574 | | | | 21,808 | |
| |
Royce Dividend Value Fund –
Consultant Class | | | 7,702 | | | | 3,484 | | | | 484 | | | | 5,751 | | | | (29 | ) | | | 17,392 | | | | 8,508 | |
| |
Royce Dividend Value Fund –
Institutional Class | | | – | | | | 3,192 | | | | 62 | | | | 5,658 | | | | (10 | ) | | | 8,902 | | | | 8,628 | |
| |
| | | | 43,841 | | | | 101,595 | | | | 20,594 | | | | 26,981 | | | | (1,090 | ) | | | | | | | 58,170 | |
| |
| 86 | The Royce Funds 2019 Semiannual Report to Shareholders |
Class Specific Expenses (continued):
| | | NET DISTRIBUTION
FEES | | SHAREHOLDER
SERVICING | | SHAREHOLDER
REPORTS | | REGISTRATION | | TRANSFER AGENT
BALANCE CREDITS | | TOTAL | | CLASS LEVEL
EXPENSES
REIMBURSED BY
INVESTMENT
ADVISER |
| |
Royce Global Financial Services Fund –
Service Class | | $ | 37,366 | | | $ | 30,753 | | | $ | 6,252 | | | $ | 9,224 | | | $ | (499 | ) | | $ | 83,096 | | | $ | 24,248 | |
| |
Royce Global Financial Services Fund –
Institutional Class | | | – | | | | 3,170 | | | | 48 | | | | 6,228 | | | | (8 | ) | | | 9,438 | | | | 7,321 | |
| |
| | | | 37,366 | | | | 33,923 | | | | 6,300 | | | | 15,452 | | | | (507 | ) | | | | | | | 31,569 | |
| |
Royce International Premier Fund –
Investment Class | | | – | | | | 128,330 | | | | 20,396 | | | | 23,336 | | | | (826 | ) | | | 171,236 | | | | – | |
| |
Royce International Premier Fund –
Service Class | | | 64,945 | | | | 33,570 | | | | 4,194 | | | | 12,176 | | | | (264 | ) | | | 114,621 | | | | 8,107 | |
| |
Royce International Premier Fund –
Consultant Class | | | 45,652 | | | | 7,070 | | | | 1,016 | | | | 5,864 | | | | (69 | ) | | | 59,533 | | | | 6,444 | |
| |
Royce International Premier Fund –
Institutional Class | | | – | | | | 3,152 | | | | 3,151 | | | | 12,909 | | | | (86 | ) | | | 19,126 | | | | 19,126 | |
| |
| | | | 110,597 | | | | 172,122 | | | | 28,757 | | | | 54,285 | | | | (1,245 | ) | | | | | | | 33,677 | |
| |
Royce Low-Priced Stock Fund –
Investment Class | | | – | | | | 36,954 | | | | 14,365 | | | | 6,835 | | | | (3,305 | ) | | | 54,849 | | | | 42,170 | |
| |
Royce Low-Priced Stock Fund –
Service Class | | | 206,065 | | | | 143,636 | | | | 20,496 | | | | 10,636 | | | | (887 | ) | | | 379,946 | | | | 131,061 | |
| |
| | | | 206,065 | | | | 180,590 | | | | 34,861 | | | | 17,471 | | | | (4,192 | ) | | | | | | | 173,231 | |
| |
Royce Micro-Cap Fund – Investment Class | | | – | | | | 68,790 | | | | 31,704 | | | | 9,131 | | | | (5,806 | ) | | | 103,819 | | | | 103,819 | |
| |
Royce Micro-Cap Fund – Service Class | | | 8,647 | | | | 8,820 | | | | 2,079 | | | | 5,888 | | | | (45 | ) | | | 25,389 | | | | 20,799 | |
| |
Royce Micro-Cap Fund – Consultant Class | | | 85,638 | | | | 11,788 | | | | 3,108 | | | | 6,225 | | | | (271 | ) | | | 106,488 | | | | – | |
| |
| | | | 94,285 | | | | 89,398 | | | | 36,891 | | | | 21,244 | | | | (6,122 | ) | | | | | | | 124,618 | |
| |
Royce Opportunity Fund – Investment Class | | | – | | | | 371,020 | | | | 62,112 | | | | 11,413 | | | | (6,517 | ) | | | 438,028 | | | | – | |
| |
Royce Opportunity Fund – Service Class | | | 63,869 | | | | 51,411 | | | | 6,745 | | | | 6,728 | | | | (306 | ) | | | 128,447 | | | | 27,704 | |
| |
Royce Opportunity Fund – Consultant Class | | | 48,858 | | | | 9,384 | | | | 1,891 | | | | 5,697 | | | | (266 | ) | | | 65,564 | | | | – | |
| |
Royce Opportunity Fund – Institutional Class | | | – | | | | 4,096 | | | | 8,842 | | | | 8,475 | | | | (202 | ) | | | 21,211 | | | | – | |
| |
Royce Opportunity Fund – R Class | | | 74,502 | | | | 35,712 | | | | 1,254 | | | | 4,912 | | | | (168 | ) | | | 116,212 | | | | – | |
| |
| | | | 187,229 | | | | 471,623 | | | | 80,844 | | | | 37,225 | | | | (7,459 | ) | | | | | | | 27,704 | |
| |
Royce Pennsylvania Mutual Fund – Investment Class | | | – | | | | 591,105 | | | | 119,457 | | | | 13,300 | | | | (18,065 | ) | | | 705,797 | | | | – | |
| |
Royce Pennsylvania Mutual Fund –
Service Class | | | 52,795 | | | | 36,929 | | | | 6,839 | | | | 6,409 | | | | (286 | ) | | | 102,686 | | | | – | |
| |
Royce Pennsylvania Mutual Fund – Consultant Class | | | 1,343,561 | | | | 115,807 | | | | 30,986 | | | | 7,817 | | | | (3,231 | ) | | | 1,494,940 | | | | – | |
| |
Royce Pennsylvania Mutual Fund – Institutional Class | | | – | | | | 4,228 | | | | 4,631 | | | | 7,262 | | | | (251 | ) | | | 15,870 | | | | – | |
| |
Royce Pennsylvania Mutual Fund – R Class | | | 25,905 | | | | 15,424 | | | | 1,643 | | | | 4,218 | | | | (260 | ) | | | 46,930 | | | | – | |
| |
| | | | 1,422,261 | | | | 763,493 | | | | 163,556 | | | | 39,006 | | | | (22,093 | ) | | | | | | | – | |
| |
Royce Premier Fund – Investment Class | | | – | | | | 785,137 | | | | 152,273 | | | | 15,902 | | | | (10,586 | ) | | | 942,726 | | | | – | |
| |
Royce Premier Fund – Service Class | | | 42,949 | | | | 38,854 | | | | 5,102 | | | | 6,543 | | | | (234 | ) | | | 93,214 | | | | 5,625 | |
| |
Royce Premier Fund – Consultant Class | | | 115,903 | | | | 12,600 | | | | 2,344 | | | | 5,786 | | | | (242 | ) | | | 136,391 | | | | – | |
| |
Royce Premier Fund – Institutional Class | | | – | | | | 4,269 | | | | 56,615 | | | | 7,501 | | | | (163 | ) | | | 68,222 | | | | – | |
| |
Royce Premier Fund – R Class | | | 27,019 | | | | 14,501 | | | | 602 | | | | 2,359 | | | | (69 | ) | | | 44,412 | | | | – | |
| |
| | | | 185,871 | | | | 855,361 | | | | 216,936 | | | | 38,091 | | | | (11,294 | ) | | | | | | | 5,625 | |
| |
Royce Small-Cap Value Fund –
Investment Class | | | – | | | | 40,898 | | | | 7,819 | | | | 6,868 | | | | (1,310 | ) | | | 54,275 | | | | 16,681 | |
| |
Royce Small-Cap Value Fund –
Service Class | | | 145,570 | | | | 97,782 | | | | 13,936 | | | | 8,423 | | | | (754 | ) | | | 264,957 | | | | 46,331 | |
| |
Royce Small-Cap Value Fund –
Consultant Class | | | 49,333 | | | | 8,048 | | | | 1,321 | | | | 5,881 | | | | (163 | ) | | | 64,420 | | | | – | |
| |
Royce Small-Cap Value Fund –
R Class | | | 21,879 | | | | 13,176 | | | | 802 | | | | 2,662 | | | | (137 | ) | | | 38,382 | | | | 130 | |
| |
| | | | 216,782 | | | | 159,904 | | | | 23,878 | | | | 23,834 | | | | (2,364 | ) | | | | | | | 63,142 | |
| |
| The Royce Funds 2019 Semiannual Report to Shareholders | 87 |
Notes to Financial Statements (unaudited) (continued)
Class Specific Expenses (continued):
| | | NET DISTRIBUTION
FEES | | SHAREHOLDER
SERVICING | | SHAREHOLDER
REPORTS | | REGISTRATION | | TRANSFER AGENT
BALANCE CREDITS | | TOTAL | | CLASS LEVEL
EXPENSES
REIMBURSED BY
INVESTMENT
ADVISER |
| |
Royce Smaller-Companies Growth Fund –
Investment Class | | $ | – | | | $ | 38,989 | | | $ | 19,534 | | | $ | 7,485 | | | $ | (2,582 | ) | | $ | 63,426 | | | $ | – | |
| |
Royce Smaller-Companies Growth Fund –
Service Class | | | 213,093 | | | | 151,718 | | | | 20,618 | | | | 10,254 | | | | (847 | ) | | | 394,836 | | | | 52,367 | |
| |
Royce Smaller-Companies Growth Fund –
Consultant Class | | | 33,839 | | | | 6,786 | | | | 1,415 | | | | 5,851 | | | | (162 | ) | | | 47,729 | | | | 8,742 | |
| |
Royce Smaller-Companies Growth Fund –
Institutional Class | | | – | | | | 3,271 | | | | 475 | | | | 5,724 | | | | (36 | ) | | | 9,434 | | | | 8,010 | |
| |
| | | | 246,932 | | | | 200,764 | | | | 42,042 | | | | 29,314 | | | | (3,627 | ) | | | | | | | 69,119 | |
| |
Royce Special Equity Fund – Investment Class | | | – | | | | 498,977 | | | | 81,851 | | | | 15,349 | | | | (8,360 | ) | | | 587,817 | | | | – | |
| |
Royce Special Equity Fund – Service Class | | | 77,457 | | | | 51,734 | | | | 9,004 | | | | 6,164 | | | | (686 | ) | | | 143,673 | | | | 48,223 | |
| |
Royce Special Equity Fund – Consultant Class | | | 153,623 | | | | 16,895 | | | | 3,580 | | | | 5,922 | | | | (509 | ) | | | 179,511 | | | | – | |
| |
Royce Special Equity Fund – Institutional Class | | | – | | | | 5,214 | | | | 30,532 | | | | 9,735 | | | | (559 | ) | | | 44,922 | | | | – | |
| |
| | | | 231,080 | | | | 572,820 | | | | 124,967 | | | | 37,170 | | | | (10,114 | ) | | | | | | | 48,223 | |
| |
Royce Total Return Fund – Investment Class | | | – | | | | 631,040 | | | | 129,942 | | | | 12,807 | | | | (9,373 | ) | | | 764,416 | | | | – | |
| |
Royce Total Return Fund – Service Class | | | 109,708 | | | | 80,901 | | | | 14,739 | | | | 6,024 | | | | (426 | ) | | | 210,946 | | | | 36,437 | |
| |
Royce Total Return Fund – Consultant Class | | | 835,638 | | | | 77,192 | | | | 17,930 | | | | 7,535 | | | | (1,500 | ) | | | 936,795 | | | | – | |
| |
Royce Total Return Fund – Institutional Class | | | – | | | | 5,012 | | | | 26,330 | | | | 6,473 | | | | (308 | ) | | | 37,507 | | | | – | |
| |
Royce Total Return Fund – R Class | | | 111,764 | | | | 57,110 | | | | 3,512 | | | | 3,477 | | | | (590 | ) | | | 175,273 | | | | – | |
| |
| | | | 1,057,110 | | | | 851,255 | | | | 192,453 | | | | 36,316 | | | | (12,197 | ) | | | | | | | 36,437 | |
| |
Tax Information:
At June 30, 2019, net unrealized appreciation (depreciation) based on identified cost for tax purposes was as follows:
| | | | | | | NET UNREALIZED | | GROSS UNREALIZED |
| | | | | | | | | | | |
| | | TAX BASIS COST | | APPRECIATION (DEPRECIATION) | | Appreciation | | Depreciation |
| | |
| Royce Dividend Value Fund | | $ | 66,528,448 | | | $ | 43,036,461 | | | $ | 45,457,950 | | | $ | 2,421,489 | |
| | |
| Royce Global Financial Services Fund | | | 28,890,175 | | | | 10,465,373 | | | | 11,840,543 | | | | 1,375,170 | |
| | |
| Royce International Premier Fund | | | 546,602,329 | | | | 65,665,914 | | | | 76,444,118 | | | | 10,778,204 | |
| | |
| Royce Low-Priced Stock Fund | | | 171,749,912 | | | | 41,902,459 | | | | 56,124,563 | | | | 14,222,104 | |
| | |
| Royce Micro-Cap Fund | | | 111,011,170 | | | | 26,252,792 | | | | 40,383,781 | | | | 14,130,989 | |
| | |
| Royce Opportunity Fund | | | 928,075,146 | | | | 39,263,172 | | | | 146,749,821 | | | | 107,486,649 | |
| | |
| Royce Pennsylvania Mutual Fund | | | 1,312,564,525 | | | | 659,720,502 | | | | 695,672,740 | | | | 35,952,238 | |
| | |
| Royce Premier Fund | | | 1,126,125,912 | | | | 734,131,948 | | | | 747,368,230 | | | | 13,236,282 | |
| | |
| Royce Small-Cap Value Fund | | | 156,936,281 | | | | 21,964,328 | | | | 29,589,583 | | | | 7,625,255 | |
| | |
| Royce Smaller-Companies Growth Fund | | | 232,047,113 | | | | 68,490,097 | | | | 76,965,540 | | | | 8,475,443 | |
| | |
| Royce Special Equity Fund | | | 1,021,900,017 | | | | 188,165,884 | | | | 239,293,602 | | | | 51,127,718 | |
| | |
| Royce Total Return Fund | | | 943,381,113 | | | | 612,818,102 | | | | 652,947,289 | | | | 40,129,187 | |
| | |
The primary cause of the difference between book and tax basis cost is the timing of the recognition of losses on securities sold.
| 88 | The Royce Funds 2019 Semiannual Report to Shareholders |
Transactions in Affiliated Companies:
An “Affiliated Company,” as defined in the Investment Company Act of 1940, is a company in which a fund owns 5% or more of the company’s outstanding voting securities at any time during the period. The following transactions were effected in shares of such companies for the six months ended June 30, 2019:
| AFFILIATED COMPANY | | SHARES
12/31/18 | | MARKET
VALUE
12/31/18 | | COSTS OF
PURCHASES | | PROCEEDS
FROM SALES | | REALIZED
GAIN
(LOSS) | | CHANGE IN NET
UNREALIZED
APPRECIATION
(DEPRECIATION) | | DIVIDEND
INCOME | | SHARES
6/30/19 | | MARKET
VALUE
6/30/19 |
| |
Royce Premier Fund
CIRCOR International1 | | | 1,024,687 | | | $ | 21,825,833 | | | $ | – | | | $ | 21,901,056 | | | $ | (5,330,368 | ) | | $ | 28,372,793 | | | $ | – | | | | | | | | | |
| |
| | | | | | | | 21,825,833 | | | | | | | | | | | | (5,330,368 | ) | | | 28,372,793 | | | | – | | | | | | | | | |
| |
Royce Special Equity Fund
Bowl America Cl. A | | | 343,000 | | | | 5,230,750 | | | | 456,501 | | | | – | | | | – | | | | 275,249 | | | | 120,050 | | | | 375,000 | | | $ | 5,962,500 | |
| |
| Computer Services | | | 779,000 | | | | 38,950,000 | | | | 1,461,346 | | | | – | | | | – | | | | 18,628,654 | | | | 561,947 | | | | 1,600,000 | | | | 59,040,000 | |
| |
| Flexsteel Industries | | | 775,000 | | | | 17,112,000 | | | | – | | | | – | | | | – | | | | (3,890,500 | ) | | | 341,000 | | | | 775,000 | | | | 13,221,500 | |
| |
| Gencor Industries | | | 1,033,500 | | | | 11,337,495 | | | | 1,338,656 | | | | – | | | | – | | | | 2,250,774 | | | | – | | | | 1,148,225 | | | | 14,926,925 | |
| |
| Hooker Furniture | | | 1,155,000 | | | | 30,422,700 | | | | – | | | | – | | | | – | | | | (6,606,600 | ) | | | 346,500 | | | | 1,155,000 | | | | 23,816,100 | |
| |
| Hurco Companies | | | 580,400 | | | | 20,720,280 | | | | 1,827,921 | | | | – | | | | – | | | | (145,401 | ) | | | 209,092 | | | | 630,000 | | | | 22,402,800 | |
| |
| Insteel Industries | | | 605,500 | | | | 14,701,540 | | | | 10,461,049 | | | | – | | | | – | | | | (2,376,827 | ) | | | 58,050 | | | | 1,094,417 | | | | 22,785,762 | |
| |
| John B. Sanfilippo & Son | | | 911,500 | | | | 50,734,090 | | | | – | | | | 5,306,204 | | | | 536,824 | | | | 21,373,340 | | | | – | | | | 845,000 | | | | 67,338,050 | |
| |
| National Presto Industries | | | 421,800 | | | | 49,316,856 | | | | 127,623 | | | | – | | | | – | | | | (9,982,809 | ) | | | 2,530,800 | | | | 423,000 | | | | 39,461,670 | |
| |
| Standard Motor Products | | | 1,380,000 | | | | 66,833,400 | | | | – | | | | – | | | | – | | | | (4,264,200 | ) | | | 634,800 | | | | 1,380,000 | | | | 62,569,200 | |
| |
| | | | | | | | 305,359,111 | | | | | | | | | | | | 536,824 | | | | 15,261,680 | | | | 4,802,239 | | | | | | | | 331,524,507 | |
| |
Royce Total Return Fund
Starrett (L.S.) Company (The) Cl. A1 | | | 387,817 | | | | 2,028,283 | | | | – | | | | 685,353 | | | | (951,302 | ) | | | 1,597,675 | | | | – | | | | | | | | | |
| |
| | | | | | | | 2,028,283 | | | | | | | | | | | | (951,302 | ) | | | 1,597,675 | | | | – | | | | | | | | | |
| |
| 1 Not an Affiliated Company at June 30, 2019. |
Merger Information:
As of the close of business on the New York Stock Exchange on June 14, 2019, Royce Opportunity Fund acquired all of the assets and assumed all of the liabilities of Royce Micro-Cap Opportunity Fund. Based on the opinion of counsel delivered to Royce Opportunity Fund, the acquisition, which was approved by shareholders of Royce Micro-Cap Opportunity Fund on May 28, 2019, qualified as a tax-free reorganization for federal income tax purposes with no gain or loss recognized to the Funds or their shareholders. Royce Micro-Cap Opportunity Fund’s net assets of $17,332,098, including $3,256,310 of unrealized appreciation, were combined with Royce Opportunity Fund for total net assets after the acquisition of $903,239,970.
As of the close of business on the New York Stock Exchange on June 14, 2019, Royce Pennsylvania Mutual Fund acquired all of the assets and assumed all of the liabilities of Royce Small-Cap Leaders Fund and Royce Small/Mid-Cap Premier Fund. Based on the opinions of counsel delivered to Royce Pennsylvania Mutual Fund, the acquisitions, which were approved by shareholders of Royce Small-Cap Leaders Fund and Royce Small/Mid-Cap Premier Fund on May 28, 2019, qualified as tax-free reorganizations for federal income tax purposes with no gain or loss recognized to the Funds or their respective shareholders. Royce Small-Cap Leaders Fund’s net assets of $44,751,244, including $9,113,761 of unrealized appreciation, and Royce Small/Mid-Cap Premier Fund’s net assets of $165,414,569, including $17,832,090 of unrealized appreciation, were combined with Royce Pennsylvania Mutual Fund for total net assets after the acquisition of $1,907,630,569.
Subsequent Events:
As of the close of business on the New York Stock Exchange on July 12, 2019, Royce Micro-Cap Fund acquired all of the assets and assumed all of the liabilities of Royce Low-Priced Stock Fund. Based on the opinion of counsel delivered to Royce Micro-Cap Fund, the acquisition, which was approved by shareholders of Royce Low-Priced Stock Fund at a special meeting that was originally opened on May 28, 2019 and adjourned to June 27, 2019, qualified as a tax-free reorganization for federal income tax purposes with no gain or loss recognized to the Funds or their shareholders. Royce Low-Priced Stock Fund’s net assets of $209,887,857, including $41,559,475 of unrealized appreciation, were combined with Royce Micro-Cap Fund for total net assets after the acquisition of $344,553,391.
| The Royce Funds 2019 Semiannual Report to Shareholders | 89 |
Understanding Your Fund’s Expenses (unaudited)
As a shareholder of a mutual fund, you pay ongoing expenses, including management fees and other Fund expenses including, for some funds, distribution and/or service (12b-1) fees. Using the information below, you can estimate how these ongoing expenses (in dollars) affect your investment and compare them with the ongoing expenses of other funds. You may also incur one-time transaction expenses, including redemption fees, which are not shown in this section and would result in higher total costs. The example is based on an investment of $1,000 invested at January 1, 2019, and held for the entire six-month period ended June 30, 2019. Service, Consultant and R Class shares are generally available only through certain brokers or retirement plan administrators who receive distribution and/or service fees from the Fund for services that they perform. Institutional Class shares are generally available only to institutions or intermediaries with a minimum account size of $1 million.
Actual Expenses
The first part of the table below provides information about actual account values and actual expenses. You may use the information in this section, together with the amount you invested, to estimate the expenses that you paid over the period. Simply divide your account value at June 30, 2019, by $1,000 (for example, an $8,600 account value divided by $1,000 = 8.6), then multiply the result by the number under the heading entitled “Expenses Paid During the Period” to estimate the expenses you paid on your account during this period.
Hypothetical Example for Comparison Purposes
The second part of the table below provides information about hypothetical account values and hypothetical expenses based on the Fund’s actual expense ratio and an assumed rate of return of 5% per year before expenses, which is not the Fund’s actual return. The hypothetical account values and expenses may not be used to estimate the actual ending account balance or expenses you paid for the period. You may use this information to compare the ongoing costs of investing in the Fund and other funds. To do so, compare this 5% hypothetical example with the 5% hypothetical examples that appear in the shareholder reports of the other funds.
Please note that the expenses shown in the table are meant to highlight your ongoing costs only and do not reflect any transactional costs, such as sales charges (loads), redemption fees, or exchange fees. Therefore, this section is useful in comparing ongoing costs only, and will not help you determine the relative total costs of owning different funds. In addition, if these transactional costs were included, your costs would have been higher.
| | | ACTUAL | | | HYPOTHETICAL (5% PER YEAR BEFORE EXPENSES) |
| | | |
| | | Beginning Account
Value 1/1/19 | | Ending Account Value
6/30/19 | | Expenses Paid During
the Period1 | | Beginning Account
Value 1/1/19 | | Ending Account Value
6/30/19 | | Expenses Paid During
the Period1 | | Annualized Expense
Ratio2 |
| |
| Investment Class | | | | | | | | | | | | | | | | | | | | | | | | | | | | |
| Royce Dividend Value Fund | | $ | 1,000.00 | | | $ | 1,209.05 | | | $ | 5.97 | | | $ | 1,000.00 | | | $ | 1,019.39 | | | $ | 5.46 | | | | 1.09% | |
| |
| Royce International Premier Fund | | | 1,000.00 | | | | 1,215.10 | | | | 6.21 | | | | 1,000.00 | | | | 1,019.19 | | | | 5.66 | | | | 1.13% | |
| |
| Royce Low-Priced Stock Fund | | | 1,000.00 | | | | 1,146.00 | | | | 6.60 | | | | 1,000.00 | | | | 1,018.65 | | | | 6.21 | | | | 1.24% | |
| |
| Royce Micro-Cap Fund | | | 1,000.00 | | | | 1,105.88 | | | | 7.78 | | | | 1,000.00 | | | | 1,017.41 | | | | 7.45 | | | | 1.49% | |
| |
| Royce Opportunity Fund | | | 1,000.00 | | | | 1,156.25 | | | | 6.63 | | | | 1,000.00 | | | | 1,018.65 | | | | 6.21 | | | | 1.24% | |
| |
| Royce Pennsylvania Mutual Fund3 | | | 1,000.00 | | | | 1,179.35 | | | | 5.13 | | | | 1,000.00 | | | | 1,020.08 | | | | 4.76 | | | | 0.95% | |
| |
| Royce Premier Fund | | | 1,000.00 | | | | 1,217.73 | | | | 6.65 | | | | 1,000.00 | | | | 1,018.79 | | | | 6.06 | | | | 1.21% | |
| |
| Royce Small-Cap Value Fund | | | 1,000.00 | | | | 1,091.02 | | | | 6.43 | | | | 1,000.00 | | | | 1,018.65 | | | | 6.21 | | | | 1.24% | |
| |
| Royce Smaller-Companies Growth Fund | | | 1,000.00 | | | | 1,211.37 | | | | 6.69 | | | | 1,000.00 | | | | 1,018.74 | | | | 6.11 | | | | 1.22% | |
| |
| Royce Special Equity Fund | | | 1,000.00 | | | | 1,045.90 | | | | 6.14 | | | | 1,000.00 | | | | 1,018.79 | | | | 6.06 | | | | 1.21% | |
| |
| Royce Total Return Fund | | | 1,000.00 | | | | 1,153.20 | | | | 6.57 | | | | 1,000.00 | | | | 1,018.70 | | | | 6.16 | | | | 1.23% | |
| |
| Service Class | | | | | | | | | | | | | | | | | | | | | | | | | | | | |
| Royce Dividend Value Fund | | | 1,000.00 | | | | 1,207.06 | | | | 7.33 | | | | 1,000.00 | | | | 1,018.15 | | | | 6.71 | | | | 1.34% | |
| |
| Royce Global Financial Services Fund | | | 1,000.00 | | | | 1,162.59 | | | | 7.99 | | | | 1,000.00 | | | | 1,017.41 | | | | 7.45 | | | | 1.49% | |
| |
| Royce International Premier Fund | | | 1,000.00 | | | | 1,213.81 | | | | 7.90 | | | | 1,000.00 | | | | 1,017.65 | | | | 7.20 | | | | 1.44% | |
| |
| Royce Low-Priced Stock Fund | | | 1,000.00 | | | | 1,145.34 | | | | 7.93 | | | | 1,000.00 | | | | 1,017.41 | | | | 7.45 | | | | 1.49% | |
| |
| Royce Micro-Cap Fund | | | 1,000.00 | | | | 1,104.92 | | | | 8.40 | | | | 1,000.00 | | | | 1,016.81 | | | | 8.05 | | | | 1.61% | |
| |
| Royce Opportunity Fund | | | 1,000.00 | | | | 1,153.85 | | | | 7.96 | | | | 1,000.00 | | | | 1,017.41 | | | | 7.45 | | | | 1.49% | |
| |
| Royce Pennsylvania Mutual Fund3 | | | 1,000.00 | | | | 1,173.75 | | | | 7.11 | | | | 1,000.00 | | | | 1,018.25 | | | | 6.61 | | | | 1.32% | |
| |
| Royce Premier Fund | | | 1,000.00 | | | | 1,216.62 | | | | 8.19 | | | | 1,000.00 | | | | 1,017.41 | | | | 7.45 | | | | 1.49% | |
| |
| Royce Small-Cap Value Fund | | | 1,000.00 | | | | 1,088.84 | | | | 7.72 | | | | 1,000.00 | | | | 1,017.41 | | | | 7.45 | | | | 1.49% | |
| |
| Royce Smaller-Companies Growth Fund | | | 1,000.00 | | | | 1,210.76 | | | | 8.17 | | | | 1,000.00 | | | | 1,017.41 | | | | 7.45 | | | | 1.49% | |
| |
| Royce Special Equity Fund | | | 1,000.00 | | | | 1,045.38 | | | | 7.05 | | | | 1,000.00 | | | | 1,017.90 | | | | 6.95 | | | | 1.39% | |
| |
| Royce Total Return Fund | | | 1,000.00 | | | | 1,151.66 | | | | 7.95 | | | | 1,000.00 | | | | 1,017.41 | | | | 7.45 | | | | 1.49% | |
| |
| Consultant Class | | | | | | | | | | | | | | | | | | | | | | | | | | | | |
| Royce Dividend Value Fund | | | 1,000.00 | | | | 1,203.75 | | | | 11.42 | | | | 1,000.00 | | | | 1,014.43 | | | | 10.44 | | | | 2.09% | |
| |
| Royce International Premier Fund | | | 1,000.00 | | | | 1,209.38 | | | | 12.00 | | | | 1,000.00 | | | | 1,013.93 | | | | 10.94 | | | | 2.19% | |
| |
| Royce Micro-Cap Fund | | | 1,000.00 | | | | 1,098.20 | | | | 14.20 | | | | 1,000.00 | | | | 1,011.26 | | | | 13.61 | | | | 2.73% | |
| |
| Royce Opportunity Fund | | | 1,000.00 | | | | 1,149.57 | | | | 13.00 | | | | 1,000.00 | | | | 1,012.69 | | | | 12.18 | | | | 2.44% | |
| |
| Royce Pennsylvania Mutual Fund3 | | | 1,000.00 | | | | 1,173.14 | | | | 10.56 | | | | 1,000.00 | | | | 1,015.08 | | | | 9.79 | | | | 1.96% | |
| |
| Royce Premier Fund | | | 1,000.00 | | | | 1,212.65 | | | | 12.40 | | | | 1,000.00 | | | | 1,013.59 | | | | 11.28 | | | | 2.26% | |
| |
| Royce Small-Cap Value Fund | | | 1,000.00 | | | | 1,085.14 | | | | 12.51 | | | | 1,000.00 | | | | 1,012.79 | | | | 12.08 | | | | 2.42% | |
| |
| Royce Smaller-Companies Growth Fund | | | 1,000.00 | | | | 1,205.57 | | | | 12.25 | | | | 1,000.00 | | | | 1,013.69 | | | | 11.18 | | | | 2.24% | |
| |
| Royce Special Equity Fund | | | 1,000.00 | | | | 1,040.88 | | | | 11.39 | | | | 1,000.00 | | | | 1,013.64 | | | | 11.23 | | | | 2.25% | |
| |
| Royce Total Return Fund | | | 1,000.00 | | | | 1,147.26 | | | | 11.77 | | | | 1,000.00 | | | | 1,013.84 | | | | 11.04 | | | | 2.21% | |
| |
| 90 | The Royce Funds 2019 Semiannual Report to Shareholders |
| | | ACTUAL | | | HYPOTHETICAL (5% PER YEAR BEFORE EXPENSES) |
| | | |
| | | Beginning Account
Value 1/1/19 | | Ending Account Value
6/30/19 | | Expenses Paid During
the Period1 | | Beginning Account
Value 1/1/19 | | Ending Account Value
6/30/19 | | Expenses Paid During
the Period1 | | Annualized Expense
Ratio2 |
| |
| Institutional Class | | | | | | | | | | | | | | | | | | | | | | | | | | | | |
| Royce Dividend Value Fund | | $ | 1,000.00 | | | $ | 1,208.45 | | | $ | 5.15 | | | $ | 1,000.00 | | | $ | 1,020.13 | | | $ | 4.71 | | | | 0.94% | |
| |
| Royce Global Financial Services Fund | | | 1,000.00 | | | | 1,163.98 | | | | 6.33 | | | | 1,000.00 | | | | 1,018.94 | | | | 5.91 | | | | 1.18% | |
| |
| Royce International Premier Fund | | | 1,000.00 | | | | 1,215.98 | | | | 5.71 | | | | 1,000.00 | | | | 1,019.64 | | | | 5.21 | | | | 1.04% | |
| |
| Royce Opportunity Fund | | | 1,000.00 | | | | 1,156.96 | | | | 5.94 | | | | 1,000.00 | | | | 1,019.29 | | | | 5.56 | | | | 1.11% | |
| |
| Royce Pennsylvania Mutual Fund | | | 1,000.00 | | | | 1,178.66 | | | | 4.75 | | | | 1,000.00 | | | | 1,020.43 | | | | 4.41 | | | | 0.88% | |
| |
| Royce Premier Fund | | | 1,000.00 | | | | 1,218.83 | | | | 6.33 | | | | 1,000.00 | | | | 1,019.09 | | | | 5.76 | | | | 1.15% | |
| |
| Royce Smaller-Companies Growth Fund | | | 1,000.00 | | | | 1,212.95 | | | | 6.20 | | | | 1,000.00 | | | | 1,019.19 | | | | 5.66 | | | | 1.13% | |
| |
| Royce Special Equity Fund | | | 1,000.00 | | | | 1,046.30 | | | | 5.68 | | | | 1,000.00 | | | | 1,019.24 | | | | 5.61 | | | | 1.12% | |
| |
| Royce Total Return Fund | | | 1,000.00 | | | | 1,154.28 | | | | 6.04 | | | | 1,000.00 | | | | 1,019.19 | | | | 5.66 | | | | 1.13% | |
| |
| R Class | | | | | | | | | | | | | | | | | | | | | | | | | | | | |
| Royce Opportunity Fund | | | 1,000.00 | | | | 1,151.69 | | | | 10.03 | | | | 1,000.00 | | | | 1,015.47 | | | | 9.39 | | | | 1.88% | |
| |
| Royce Pennsylvania Mutual Fund | | | 1,000.00 | | | | 1,172.60 | | | | 9.43 | | | | 1,000.00 | | | | 1,016.12 | | | | 8.75 | | | | 1.75% | |
| |
| Royce Premier Fund | | | 1,000.00 | | | | 1,214.35 | | | | 10.49 | | | | 1,000.00 | | | | 1,015.32 | | | | 9.54 | | | | 1.91% | |
| |
| Royce Small-Cap Value Fund | | | 1,000.00 | | | | 1,086.25 | | | | 10.29 | | | | 1,000.00 | | | | 1,014.93 | | | | 9.94 | | | | 1.99% | |
| |
| Royce Total Return Fund | | | 1,000.00 | | | | 1,148.72 | | | | 10.02 | | | | 1,000.00 | | | | 1,015.47 | | | | 9.39 | | | | 1.88% | |
| |
| 1 | Expenses are equal to the Fund’s annualized expense ratio multiplied by the average account value for the period, multiplied by 181 days in the most recent fiscal half-year divided by 365 days (to reflect the half-year period). |
| 2 | Annualized expense ratio used to derive figures in the table is based on the most recent fiscal half-year. |
| 3 | GiftShare accounts pay an annual $50 trustee fee to Alliance Trust Company, as trustee. If these fees were included above, your costs would be higher. |
| The Royce Funds 2019 Semiannual Report to Shareholders | 91 |
Trustees and Officers
All Trustees and Officers may be reached c/o The Royce Funds, 745 Fifth Avenue, New York, NY 10151
| Charles M. Royce, Trustee1 |
| Age: 79 | Number of Funds Overseen: 16 | Tenure: Since 1982 |
| Non-Royce Directorships: Director of Oxford Square Capital Corp. |
| Principal Occupation(s) During Past Five Years: A member of the Board of Managers of Royce & Associates, LP (“Royce”), the Trust’s investment adviser; Chief Executive Officer (1972–June 2016), President (1972-June 2014) of Royce. |
| |
| Christopher D. Clark, Trustee1, President |
| Age: 54 | Number of Funds Overseen: 16 | Tenure: Since 2014 |
| Principal Occupation(s) During Past Five Years: Chief Executive Officer (since July 2016), President (since July 2014), Co-Chief Investment Officer (Since January 2014), Managing Director of Royce, a Member of the Board of Managers of Royce, having been employed by Royce since May 2007. |
| |
| |
| |
| Patricia W. Chadwick, Trustee |
| Age: 70 | Number of Funds Overseen: 16 | Tenure: Since 2009 |
| Non-Royce Directorships: Trustee of Voya Mutual Funds and Director of Wisconsin Energy Corp. |
| Principal Occupation(s) During Past 5 Years: Consultant and President of Ravengate Partners LLC (since 2000). |
| |
| Christopher C. Grisanti, Trustee |
| Age: 57 | Number of Funds Overseen: 16 | Tenure: Since 2017 |
| Non-Royce Directorships: None |
| Principal Occupation(s) During Past Five Years: Co-Founder and Chief Executive Officer of Grisanti Capital Management LLC, an investment advisory firm (since 1999). Mr. Grisanti’s prior business experience includes serving as Director of Research and Portfolio Manager at Spears Benzak, Salomon & Farrell (from 1994 to 1999) and a senior associate at the law firm of Simpson, Thacher & Bartlett (from 1988 to 1994). |
| |
| Stephen L. Isaacs, Trustee |
| Age: 79 | Number of Funds Overseen: 16 | Tenure: Since 1989 |
| Non-Royce Directorships: None |
| Principal Occupation(s) During Past Five Years: Attorney and President of Health Policy Associates, Inc., consultants Mr. Isaacs’s prior business experience includes having served as President of the Center for Health and Social Policy (from 1996 to 2012); Director of Columbia University Development Law and Policy Program and Professor at Columbia University (until August 1996). |
| |
| Arthur S. Mehlman, Trustee |
| Age: 76 | Number of Funds Overseen: 36 | Tenure: Since 2004 |
Non-Royce Directorships: Director/Trustee of registered investment companies constituting the 20 Legg Mason Funds.
Principal Occupation(s) During Past Five Years: Director of The League for People with Disabilities, Inc.; Director of University of Maryland Foundation (non-profits). Formerly: Director of Municipal Mortgage & Equity, LLC (from October 2004 to April 1, 2011); Director of University of Maryland College Park Foundation (non-profit) (from 1998 to 2005); Partner, KPMG LLP (international accounting firm) (from 1972 to 2002); Director of Maryland Business Roundtable for Education (from July 1984 to June 2002). |
| |
| David L. Meister, Trustee |
| Age: 79 | Number of Funds Overseen: 16 | Tenure: Since 1982 |
| Non-Royce Directorships: None |
| Principal Occupation(s) During Past Five Years: Consultant Chairman and Chief Executive Officer of The Tennis Channel (from June 2000 to March 2005). Mr. Meister’s prior business experience includes having served as Chief Executive Officer of Seniorlife.com, a consultant to the communications industry, President of Financial News Network, Senior Vice President of HBO, President of Time-Life Films, and Head of Broadcasting for Major League Baseball. |
| |
| G. Peter O’Brien, Trustee |
| Age: 73 | Number of Funds Overseen: 36 | Tenure: Since 2001 |
| Non-Royce Directorships: Director/Trustee of registered investment companies constituting the 20 Legg Mason Funds. |
| Principal Occupation(s) During Past Five Years: Trustee Emeritus of Colgate University (since 2005); Board Member of Hill House, Inc. (since 1999); Formerly Director of TICC Capital Corp (from 2003-2017): Trustee of Colgate University (from 1996 to 2005), President of Hill House, Inc. (from 2001 to 2005) and Managing Director/Equity Capital Markets Group of Merrill Lynch & Co. (from 1971 to 1999). |
| |
| Michael K. Shields, Trustee |
| Age: 61 | Number of Funds Overseen: 16 | Tenure: Since 2015 |
| Principal Occupation(s) During Past Five Years: President and Chief Executive Officer of Piedmont Trust Company, a private North Carolina trust company (since May 2012). Mr. Shields’s prior business experience includes owning Shields Advisors, an investment consulting firm (from April 2010 to June 2012). |
| |
| |
| |
| Francis D. Gannon, Vice President |
| Age: 51 | Tenure: Since 2014 |
Principal Occupation(s) During Past Five Years: Co-Chief Investment Officer (since January 2014) and Managing Director of Royce, having been employed by Royce since September 2006.
Daniel A. O’Byrne, Vice President
Age: 57 | Tenure: Since 1994
Principal Occupation(s) During Past Five Years: Principal and Vice President of Royce, having been employed by Royce since October 1986. |
| |
| Peter K. Hoglund, Treasurer |
| Age: 53 | Tenure: Since 2015 |
| Principal Occupation(s) During Past Five Years: Chief Financial Officer, Chief Administrative Officer, and Managing Director of Royce, having been employed by Royce since December 2014. Prior to joining Royce, Mr. Hoglund spent more than 20 years with Munder Capital Management in Birmingham, MI, serving as Managing Director and Chief Financial Officer and overseeing all financial aspects of the firm. He began his career at Munder as a portfolio manager. |
| |
| John E. Denneen, Secretary and Chief Legal Officer |
| Age: 52 | Tenure: 1996-2001 and Since 2002 |
| Principal Occupation(s) During Past Five Years: General Counsel, Managing Director, and, since June 2015, a Member of the Board of Managers of Royce. Chief Legal and Compliance Officer and Secretary of Royce. |
| |
| Lisa Curcio, Chief Compliance Officer |
| Age: 59 | Tenure: Since 2004 |
| Principal Occupation(s) During Past Five Years: Chief Compliance Officer of The Royce Funds (since October 2004) and Compliance Officer of Royce (since June 2004). |
| 1 Interested Trustee. |
| Trustees will hold office until their successors have been duly elected and qualified or until their earlier resignation or removal. The Statement of Additional Information, which contains additional information about the Trust’s trustees and officers, is available and can be obtained without charge at www.roycefunds.com or by calling (800) 221-4268. |
| 92 | The Royce Funds 2019 Semiannual Report to Shareholders |
Board Approval of Investment Advisory Agreements
| At meetings held on June 4-5, 2019, the Board of Trustees of The Royce Fund (the “Board”), including all of the non-interested trustees, approved the continuation of investment advisory agreements between Royce & Associates, LP (“R&A”) and The Royce Fund (“TRF”) relating to each of Royce Pennsylvania Mutual Fund, Royce Micro-Cap Fund, Royce Premier Fund, Royce Low-Priced Stock Fund1, Royce Total Return Fund, Royce Opportunity Fund, Royce Special Equity Fund, Royce Small-Cap Value Fund, Royce Smaller-Companies Growth Fund, Royce Dividend Value Fund, Royce Global Financial Services Fund, and Royce International Premier Fund (each, an “Investment Advisory Agreement” and collectively, the “Investment Advisory Agreements”) In reaching these decisions, the Board reviewed, among other things, information prepared internally by R&A and independently by Broadridge Financial Solutions, Inc. (“Broadridge”) using the database and methodology of Morningstar Associates, LLC (“Morningstar”) containing detailed investment advisory fee, expense ratio, and investment performance comparisons for each series of TRF listed above (each, a “Fund” and collectively, the “Funds”) with other mutual funds in its “peer group” and “category”, information regarding the past performance of the Funds and other registered investment companies managed by R&A and a memorandum outlining the legal duties of the Board prepared by independent counsel to the non-interested trustees. R&A also provided the trustees with an analysis of its profitability with respect to providing investment advisory services to each Fund. In addition, the Board took into account information furnished throughout the year at regular Board meetings, including reports on investment performance, shareholder services, distribution fees and expenses, regulatory compliance, brokerage commissions and research, brokerage and other execution products and services provided to the Funds. The Board also considered other matters it deemed important to the approval process, such as allocation of Fund brokerage commissions, “soft dollar” research services R&A receives, payments made to affiliates of R&A, as well as payments made by R&A relating to distribution of Fund shares and other direct and indirect benefits to R&A and its affiliates from their relationship with the Funds. The trustees also met throughout the year with investment advisory personnel from R&A. The Board also noted R&A’s efforts to provide enhanced analytical tools to its investment staff along with the ongoing meetings conducted by R&A’s Co-Chief Investment Officers with portfolio managers experiencing performance challenges in an attempt to address such challenges. The Board, in its deliberations, recognized that, for many of the Funds’ shareholders, the decision to purchase Fund shares included a decision to select R&A as the investment adviser and that there was a strong association in the minds of Fund shareholders between R&A and each of the Funds. In considering factors relating to the approval of the continuance of the Investment Advisory Agreement for each Fund, the non-interested trustees received assistance and advice from, and met separately with, their independent legal counsel. While continuation of the investment advisory and administrative arrangements for each Fund was considered at the same Board meeting, the trustees dealt with each Fund separately. Among other factors, the trustees considered the following: |
| |
| The nature, extent and quality of services provided by R&A: |
| The Board considered the following factors to be of fundamental importance to its consideration of whether to approve the continuance of the Investment Advisory Agreement for each Fund: (i) R&A’s more than 40 years of value investing experience and track record; (ii) the history of long-tenured R&A portfolio managers managing many of the Funds; (iii) R&A’s focus on mid-cap, small-cap and micro-cap value investing; (iv) the consistency of R&A’s approach to managing each Fund, other open-end mutual funds, and closed-end funds over more than 40 years; (v) the integrity and high ethical standards adhered to at R&A; (vi) R&A’s specialized experience in the area of trading small- and micro-cap securities; (vii) R&A’s historical ability to attract and retain portfolio management talent; and (viii) R&A’s focus on shareholder interests as exemplified by capping expenses on smaller funds, closing funds to new investors when R&A believed such closings were in the best interests of existing shareholders, establishing breakpoints for a number of funds and providing expansive shareholder reporting and communications. The Board also noted that R&A’s compensation policy arrangements strongly encourage portfolio manager investment in each Fund that they manage. The Board also reviewed the services that R&A provides to each Fund, including, but not limited to, managing each Fund’s investments in accordance with the stated policies of each Fund. The Board considered the fact that R&A provided certain administrative services to the Funds at cost pursuant to the Administration Agreement between TRF and R&A. The Board determined that the services to be provided to the Funds by R&A would be the same as those that it previously provided to the Funds. The Board also took into consideration the histories, reputations and backgrounds of R&A’s portfolio managers for each Fund, finding that these would likely have an impact on the continued success of such Fund. The Board also noted R&A’s ability to attract and retain qualified and experienced personnel. Lastly, the Board noted that R&A officers, employees, and their families had substantial amounts invested in various Funds. The Board concluded that the investment advisory services provided by R&A to each Fund compared favorably to services provided by R&A to other R&A client accounts, including other funds, in both nature and quality, and that the scope of services provided by R&A would continue to be suitable for each Fund. |
| |
| Investment performance of the Funds and R&A: |
Although the Funds currently span a wider risk spectrum than they have historically, R&A generally emphasizes a risk-averse approach to investing. In light of that approach, the trustees believe that risk-adjusted performance continues to be the most appropriate measure of each Fund’s investment performance. One measure of risk-adjusted performance the trustees have historically used in their review of each Fund’s performance is the Sharpe Ratio. The Sharpe Ratio is a risk-adjusted measure of performance developed by Nobel Laureate William Sharpe. It is calculated by dividing a Fund’s annualized excess returns by its annualized standard deviation to determine reward per unit of risk. The higher the Sharpe Ratio, the better a Fund’s historical risk-adjusted performance. The Board attaches primary importance to risk-adjusted performance over relatively long periods of time, typically 3 to 10 years.
The Board noted that 2018 proved to be a turbulent year for financial markets in general and for the small-cap equity market in particular. For much of 2018, the small-cap market experienced positive returns and low volatility, with the Russell 2000 Index reaching an all-time high on August 31, 2018. Small-cap markets then experienced declines along with increased volatility from September through mid-December. Those declines accelerated from mid-December through the end of 2018. Overall, the Russell 2000 Index declined 11.01% in 2018. Within the small-cap market, the Board noted that value stocks outperformed growth stocks, dividend payers outperformed non-dividend payers, earners held up better than non-earners, and defensive stocks outpaced cyclical stocks in 2018. Notwithstanding the overall decline within the small-cap market in 2018, the Board noted that: (i) six Funds (50%) ranked within the 1st Sharpe Ratio quartile in their respective Morningstar categories for the 1-year period ended December 31, 2018; (ii) nine Funds (75%) ranked within the 1st or 2nd Sharpe Ratio quartile in their respective Morningstar categories for the 3-year period ended December 31, 2018; and (iii) ten Funds (83.3%) had improved Sharpe Ratio percentile rankings within their respective Morningstar categories for the 3-year period ended December 31, 2018 compared to the 3-year period ended December 31, 2017, with many of those Funds achieving significant improvements. Overall, the average 3-year Morningstar percentile rank across the Funds improved by 16.3 percentile points on a year-over-year comparison basis. The average 3-year Morningstar percentile rank for the five largest Funds improved by 24 percentile points on a year-over-year comparison basis. These improvements are on top of percentile rank improvements of 14 basis points and 22 basis points, respectively, that were recorded for the various Funds during the 3-year period |
| 1 Royce Low-Priced Stock Fund was reorganized into Royce Micro-Cap Fund, effective July 15, 2019. |
| The Royce Funds 2019 Semiannual Report to Shareholders | 93 |
Board Approval of Investment Advisory Agreements
ended December 31, 2017. The Board noted that the last few years have been marked by increased return dispersion, declining correlation, and a steepening yield curve. While not dispositive, the trustees noted that such improved relative risk-adjusted performance during the more historically customary market environment that has recently prevailed was also not insignificant.
The Board further noted that the Funds also generally underperformed their peers, as evidenced by their respective Sharpe Ratios, from approximately March 2009 through the end of 2015. This post-2008 market period was marked by historically low interest rates and significant U.S. Federal Reserve market intervention. During this period, highly leveraged, non-earning companies and yield-oriented securities (e.g., master limited partnerships, real estate investment trusts, and utilities) generally outperformed the higher quality companies (e.g., those with solid balance sheets, low leverage, the ability to generate and effectively allocate free cash flow, and strong returns on invested capital) and cyclical companies generally favored by the Funds. The trustees also noted, however, that the relative performance for certain Funds during the more historically customary market cycle preceding the 2008 financial crisis was quite strong.
The general trend of stronger 1-year and 3-year relative risk-adjusted performance and weaker 5-year and 10-year relative risk-adjusted performance manifested itself for Royce Pennsylvania Mutual Fund (“PMF”), Royce Small-Cap Value Fund (“RVV”), Royce Micro-Cap Fund (“RMC”), and Royce Low-Priced Stock Fund (“RLP”). For example, the Sharpe Ratios for PMF ranked in the 1st, 1st, 3rd, and 3rd quartiles in its Morningstar category for the 1-year, 3-year, 5-year, and 10-year periods, respectively, ended December 31, 2018. In addition, the Sharpe Ratios for RVV ranked in the 1st, 2nd, 4th, and 4th quartiles in its Morningstar category during the applicable time periods. Finally, the Sharpe Ratios for both RMC and RLP ranked in the 1st, 3rd, 4th, and 4th quartiles in their respective Morningstar categories for the 1-year, 3-year, 5-year, and 10-year periods, respectively, ended December 31, 2018.
Royce Special Equity Fund (“RSE”), on the other hand, produced strong relative risk-adjusted performance during each of the 1-year, 3-year, 5-year, and 10-year periods ended December 31, 2018, ranking within the 1st Sharpe Ratio quartile in its Morningstar category for the applicable 1-year and 3-year periods and within the 2nd Sharpe Ratio quartile in its Morningstar category for the applicable 5-year and 10-year periods.
Royce Total Return Fund (“RTR”) and Royce Opportunity Fund (“ROF”) differed from the general trend by producing weaker relative risk-adjusted performance during the 1-year period (RTR: 3rd quartile; ROF: 4th quartile) ended December 31, 2018 and stronger relative risk-adjusted performance during the 3-year (RTR and ROF: 1st quartile), 5-year (RTR: 2nd quartile; ROF: 3rd quartile), and 10-year (RTR and ROF: 2nd quartile) periods ended December 31, 2018.
Royce Global Financial Services Fund (“RFS”) also differed from the general trend by producing stronger relative risk-adjusted performance during the 3-year and 10-year periods (i.e., 1st quartile) ended December 31, 2018 and weaker relative risk-adjusted performance during the 1-year and 5-year periods (i.e., 3rd quartile) ended December 31, 2018.
Royce Premier Fund (“RPR”) and Royce Dividend Value Fund (“RDV”) produced stronger relative risk-adjusted performance during the 3-year period (RPR: 1st quartile; RDV: 2nd quartile) ended December 31, 2018 and weaker relative risk-adjusted performance during the 1-year (RPR and RDV: 4th quartile), 5-year (RPR: 3rd quartile; RDV: 4th quartile), and 10-year periods (RPR: 4th quartile; RDV: 3rd quartile) ended December 31, 2018.
Royce Smaller-Companies Growth Fund (“RVP”) also differed from the above-referenced trends, with its Sharpe Ratio ranking in the 4th quartile in its Morningstar category for the 1-year, 3-year, 5-year, and 10-year periods ended December 31, 2018.
Although Royce International Premier Fund (“RIP”) has been in existence for less than 10 years, it demonstrated extremely strong relative risk-adjusted performance for the 1-year, 3-year, and 5-year periods ended December 31, 2018, with its Sharpe Ratio ranking within the 1st quartile in its Morningstar category during such periods. |
The Board also noted that the peer groups included in the Broadridge materials provided to them for a number of Funds may not be appropriate for performance comparisons and that R&A had augmented the data provided to the Board throughout the years by including performance information for other funds that R&A believes are more comparable to those Funds.
In addition to the risk–adjusted performance of each Fund, the Board also reviewed and considered the absolute total returns for each Fund, down market performance and, for Funds in existence for such periods, long-term performance records over periods of 10 years or longer. The Board also considered it important to look beyond the current snapshot of performance as of December 31, 2018 and therefore examined extended performance histories for each Fund using monthly rolling average return periods through March 31, 2019. The Board also noted that a majority of the Funds outperformed their respective benchmarks for at least a majority of the monthly rolling average annual return periods during the 3-year, 5-year, and 10-year periods ended March 31, 2019.
The Board noted that R&A manages a number of funds that invest in micro-cap, small-cap, and mid-cap issuers, many of which had outperformed their benchmark indexes and their competitors during the periods prior to the U.S. Federal Reserve’s near zero interest rate policy and related market interventions as well as in more recent periods as referenced above. Although the Board recognized that past performance is not necessarily an indicator of future results, it found that R&A had the necessary qualifications, experience and track record in managing equity mutual funds to manage each Fund. The Board determined that R&A continued to be an appropriate investment adviser for each Fund and concluded that the performance of PMF supported the approval of the continuance of the Investment Advisory Agreement for each Fund. |
| |
| Cost of the services provided and profits realized by R&A from its relationship with each Fund: |
| The Board considered the cost of the services provided by R&A and the profits realized by R&A from its relationship with each Fund. As part of the analysis, the Board discussed with R&A its methodology in allocating its costs to each Fund and concluded that R&A’s allocations were reasonable. The Board noted that at times in the past R&A had closed certain of the Funds to new investors because of the rate of growth in Fund assets. The Board concluded that R&A’s profits with respect to each Fund were reasonable in relation to the nature and quality of services provided. |
| |
| The extent to which economies of scale would be realized as the Funds grow and whether fee levels would reflect such economies of scale: |
| The Board considered whether there have been economies of scale in respect of the management of each Fund, whether each Fund has appropriately benefited from any economies of scale and whether there is potential for realization of any further economies of scale. The Board noted the time and effort involved in managing portfolios of small- and micro-cap stocks and that they did not involve the same efficiencies as do portfolios of large-cap stocks. The Board also noted that in 2004 breakpoints were added to the investment advisory fees for all of the then-existing Funds except PMF (PMF’s fee schedule already had breakpoints) and that the investment advisory fees for all Funds organized since 2004 included breakpoints. The Board further noted the reduced contractual breakpoint levels for each Fund, other than PMF, that became effective as of July 1, 2017. The trustees concluded that the current fee structure for each Fund was reasonable and that the relevant shareholders sufficiently participated in economies of scale. |
| |
| Comparison of services to be rendered and fees to be paid to those under other investment advisory contracts, such as contracts of the same and other investment advisers or other clients: |
| The Board reviewed the investment advisory fee paid by each Fund and compared both the services to be rendered and the fees to be paid under the Investment Advisory Agreements to other contracts |
| 94 | The Royce Funds 2019 Semiannual Report to Shareholders |
Board Approval of Investment Advisory Agreements
of R&A and to contracts of other investment advisers to registered investment companies investing in micro-, small-, and mid-cap stocks, as provided by Broadridge. The trustees noted that, except for PMF and RIP, the contractual advisory fee rate for each Fund exceeded the median of its Broadridge-assigned peers. The Board noted the importance of the net expense ratio in measuring a fund’s efficiency, particularly in light of the variations in the mutual fund industry as to which entity is responsible for particular types of expenses.
The Board noted that the net expense ratios for RLP, RDV, and RIP ranked within the 2nd quintile among their respective Broadridge-assigned peers. The trustees further noted that the net expense ratios for PMF and ROF ranked within the middle quintile among their respective Broadridge-assigned peers.
Although the net expense ratio for the Investment Class shares for RTR, RSE, RVP, and RVV fell within the 4th quintile among their respective Broadridge-assigned peers, the trustees noted that the net expense ratios for RTR (6 basis points), RSE (9 basis points), and RVV (11 basis points) were not significantly higher than their respective peer group medians. The trustees further noted that the average net expense ratio for the 274 small-cap funds in the Morningstar small-cap category (oldest share class only, non-institutional, non-index, non-ETF funds with Rule 12b-1 fees of 0.25% or less) was 1.17%. Such average net expense ratio was only 1 basis point lower than those of RTR and RSE, 4 basis points lower than that of RVP, and 7 basis points lower than that of RVV. Overall, the trustees believed that the net expense ratios for these 4th quintile Funds were reasonable in light of these factors.
The Board noted that the remaining Funds (i.e., RPR, RMC, and RFS) had 5th quintile net expense ratios among their respective Broadridge-assigned peers. Although these rankings can be attributed in large part to the investment advisory fees for these Funds, such fees are consistent with those of other R&A-advised open-end funds.
While the trustees noted that RPR’s net expense ratio of 1.17% was 16 basis points higher than the median of its Broadridge-assigned peer group, they emphasized that such net expense ratio was actually equal to the average net expense ratio for the 274 small-cap funds in the Morningstar small-cap category (oldest share class only, non-institutional, non-index, non-ETF funds with Rule 12b-1 fees of 0.25% or less). With respect to RMC, the Board noted that its net expense ratio of 1.49% was 21 basis points higher than the median of its Broadridge-assigned peer group but only 8 basis points higher than the average net expense ratio for the 35 non-institutional, non-ETF, domestic funds with weighted average market capitalizations of less than $1 billion within the Morningstar database. With respect to RFS, the trustees noted that its net expense ratio of 1.49% was 21 basis points higher than the median of its Broadridge-assigned peer group. The trustees further noted that RFS was the only Fund that did not offer Investment Class shares and that the Service Class shares used for purposes of this expense analysis are subject to a Rule 12b-1 fee of 25 basis points, which skews the resulting comparisons. In light of the foregoing, the trustees noted that the net expense ratio of RFS was very much in line with those of its Broadridge-assigned peers. The Board further noted that the contractual investment advisory fee rate for each of RPR, RMC, and RFS is consistent with those of other Funds that invest primarily in small-cap equity securities. After taking into consideration that the level of work necessary to invest in domestic and/or international micro-cap and small-cap equity securities is significantly greater than that necessary to invest in larger-cap securities, the Board noted that the basis point differentials in investment advisory fees, which in large measure give rise to the generally higher net expense ratios for RPR, RMC, and RFS, were appropriate for those Funds.
The Board also noted that R&A manages each Fund in an active fashion. The industry accepted metric for measuring how actively an equity portfolio is managed is called “active share.” In particular, active share measures how much the holdings of an equity portfolio differ from the holdings of its appropriate passive benchmark index. At the extremes, a portfolio with no holdings in common with the benchmark would have 100% active share, while a portfolio that is identical to the benchmark would have 0% active share. R&A presented several analyses to the Board which demonstrated that mutual funds with high active share scores had higher expense ratios than mutual funds with lower active share scores due to the resources required for the active management of those funds. The trustees noted that PMF had an active share of 88%, four Funds had active shares between 90% and 94%, and seven Funds had active shares of 96% or greater for the year ended December 31, 2018.
The Board further noted that R&A has waived, both during the year ended December 31, 2018 and during earlier periods, investment advisory fees for numerous Funds in order to maintain expense ratios at competitive levels and acknowledged R&A’s intention to continue this expense limitation practice. The Board also noted lower contractual asset breakpoints for each Fund other than PMF became effective as of July 1, 2017. The trustees also considered fees charged by R&A to institutional and other clients and noted that, given the greater levels of services that R&A provides to registered investment companies such as the Funds as compared to other accounts, each Fund’s advisory fees compared favorably to these other accounts.
No single factor was cited as determinative to the decision of the trustees. Rather, after weighing all of the considerations and conclusions discussed above, the entire Board, including all the non-interested trustees, determined to approve the continuation of the Investment Advisory Agreement for each Fund, concluding that a contract continuation on the existing terms for each Fund was in the best interests of the shareholders of each Fund and that each Fund’s investment advisory fee rate was reasonable in relation to the services provided. |
| The Royce Funds 2019 Semiannual Report to Shareholders | 95 |
Results of Shareholders Meetings
Royce Micro-Cap Opportunity Fund
At a Special Meeting of Shareholders held on May 28, 2019, Royce Micro-Cap Opportunity Fund’s (“Micro-Cap Opportunity”) shareholders approved the following:
| PROPOSAL | FOR | AGAINST | ABSTAIN |
| to approve a Plan of Reorganization of The Royce Fund, on behalf of Micro-Cap Opportunity and Royce Opportunity Fund (“Opportunity”), whereby all of the assets of Micro-Cap Opportunity would be transferred to Opportunity in exchange for Opportunity’s assumption of all of the liabilities of Micro-Cap Opportunity and Opportunity’s issuance to Micro-Cap Opportunity of shares of beneficial interest of Opportunity. | 808,688 | 600 | 4,978 |
Royce Small-Cap Leaders Fund
At a Special Meeting of Shareholders held on May 28, 2019, Royce Small-Cap Leaders Fund’s (“Small-Cap Leaders”) shareholders approved the following:
| PROPOSAL | FOR | AGAINST | ABSTAIN |
| to approve a Plan of Reorganization of The Royce Fund, on behalf of Small-Cap Leaders and Royce Pennsylvania Mutual Fund (“Pennsylvania Mutual”), whereby all of the assets of Small-Cap Leaders would be transferred to Pennsylvania Mutual in exchange for Pennsylvania Mutual’s assumption of all of the liabilities of Small-Cap Leaders and Pennsylvania Mutual’s issuance to Small-Cap Leaders of shares of beneficial interest of Pennsylvania Mutual. | 4,073,109 | 686,796 | 133,059 |
Royce Small/Mid-Cap Premier Fund
At a Special Meeting of Shareholders held on May 28, 2019, Royce Small/Mid-Cap Premier Fund’s (“Small/Mid-Cap Premier”) shareholders approved the following:
| PROPOSAL | FOR | AGAINST | ABSTAIN |
| to approve a Plan of Reorganization of The Royce Fund, on behalf of Small/Mid-Cap Premier and Royce Pennsylvania Mutual Fund (“Pennsylvania Mutual”), whereby all of the assets of Small/Mid-Cap Premier would be transferred to Pennsylvania Mutual in exchange for Pennsylvania Mutual’s assumption of all of the liabilities of Small/Mid-Cap Premier and Pennsylvania Mutual’s issuance to Small/Mid-Cap Premier of shares of beneficial interest of Pennsylvania Mutual. | 7,155,817 | 93,139 | 415,423 |
Royce Low-Priced Stock Fund
At a Special Meeting of Shareholders that was originally opened on May 28, 2019 and adjourned to June 27, 2019, Royce Low-Priced Stock Fund’s (“Low-Priced Stock”) shareholders approved the following:
| PROPOSAL | FOR | AGAINST | ABSTAIN |
| to approve a Plan of Reorganization of The Royce Fund, on behalf of Low-Priced Stock and Royce Micro-Cap Fund (“Micro-Cap”), whereby all of the assets of Low-Priced Stock would be transferred to Micro-Cap in exchange for Micro-Cap’s assumption of all of the liabilities of Low-Priced Stock and Micro-Cap’s issuance to Low-Priced Stock of shares of beneficial interest of Micro-Cap. | 12,464,159 | 1,372,300 | 1,993,730 |
| 96 | The Royce Funds 2019 Semiannual Report to Shareholders |
Notes to Performance and Other Important Information
The thoughts expressed in this report concerning recent market movements and future prospects for small company stocks are solely the opinion of Royce at June 30, 2019, and, of course, historical market trends are not necessarily indicative of future market movements. Statements regarding the future prospects for particular securities held in the Funds’ portfolios and Royce’s investment intentions with respect to those securities reflect Royce’s opinions as of June 30, 2019 and are subject to change at any time without notice. There can be no assurance that securities mentioned in this report will be included in any Royce-managed portfolio in the future.
Sector weightings are determined using the Global Industry Classification Standard (“GICS”). GICS was developed by, and is the exclusive property of, Standard & Poor’s Financial Services LLC (“S&P”) and MSCI Inc. (“MSCI”). GICS is the trademark of S&P and MSCI. “Global Industry Classification Standard (GICS)” and “GICS Direct” are service marks of S&P and MSCI.
All indexes referred to are unmanaged and capitalization weighted. Each index’s returns include net reinvested dividends and/or interest income. Frank Russell Company (“Russell”) is the source and owner of the trademarks, service marks and copyrights related to the Russell Indexes. Russell® is a trademark of Frank Russell Company. Neither Russell nor its licensors accept any liability for any errors or omissions in the Russell Indexes and /or Russell ratings or underlying data and no party may rely on any Russell Indexes and / or Russell ratings and / or underlying data contained in this communication. No further distribution of Russell Data is permitted without Russell’s express written consent. Russell does not promote, sponsor or endorse the content of this communication. The Russell 2000 Index is an index of domestic small-cap stocks. It measures the performance of the 2,000 smallest publicly traded U.S. companies in the Russell 3000 Index. The Russell 2000 Value and Growth Indexes consist of the respective value and growth stocks within the Russell 2000 as determined by Russell Investments. The Russell 1000 Index is an index of domestic large-cap stocks. It measures the performance of the 1,000 largest publicly traded U.S. companies in the Russell 3000 Index. The Russell Microcap Index includes 1,000 of the smallest securities in the Russell 2000 Index, along with the next smallest eligible securities as determined by Russell. The Russell 2500 is an unmanaged, capitalization-weighted index of the 2,500 smallest publicly traded U.S. companies in the Russell 3000 index. Source: MSCI. MSCI makes no express or implied warranties or representations and shall have no liability whatsoever with respect to any MSCI data contained herein. The MSCI data may not be further redistributed or used as a basis for other indexes or any securities or financial products. This report is not approved, endorsed, reviewed or produced by MSCI. None of the MSCI data is intended to constitute investment advice or a recommendation to make (or refrain from making) any kind of investment decision and may not be relied on as such. The MSCI ACWI Small Cap Index is an unmanaged, capitalization-weighted index of global small-cap stocks. Index returns include net reinvested dividends and/or interest income. The MSCI ACWI ex USA Large Cap Index is an unmanaged, capitalization-weighted index of global large-cap stocks, excluding the United States. Index returns include net reinvested dividends and/or interest income. The performance of an index does not represent exactly any particular investment, as you cannot invest directly in an index. Returns for the Russell market indexes used in this report were based on information supplied to Royce by Russell Investments. Royce has not independently verified the above described information.
The Price-Earnings, or P/E, Ratio is calculated by dividing a company’s share price by its trailing 12-month earnings-per share (EPS). The Price-to-Book, or P/B, Ratio is calculated by dividing a company’s share price by its book value per share. Standard deviation is a statistical measure within which a fund’s total returns have varied over time. The greater the standard deviation, the greater a fund’s volatility. For the Morningstar Small Blend Category: © 2019 Morningstar. All Rights Reserved. The information regarding the category in this piece is: (1) is proprietary to Morningstar and/ or its content providers; (2) may not be copied or distributed; and (3) is not warranted to be accurate, complete or timely. Neither Morningstar nor its content providers are responsible for any damages or losses arising from any use of this information. The Morningstar Style Map uses proprietary scores of a stock’s value and growth characteristics to determine its placement in one of the five categories listed on the horizontal axis. These characteristics are then compared to those of other stocks within the same market capitalization band. Each is scored from zero to 100 for both value and growth attributes. The value score is subtracted from the growth score to determine the overall style score. For the vertical, market cap axis, Morningstar subdivides into size groups. Giant-cap stocks are defined as those that account for the top 40% of the capitalization of each style zone; large-cap stocks represent the next 30%; mid-cap stocks the next 20%; small-cap stocks the next 7%; micro-cap stocks the smallest 3%. Investments in securities of micro-cap, small-cap, and/or mid-cap companies may involve considerably more risk than investments in securities of larger-cap companies. (Please see “Primary Risks for Fund Investors” in the prospectus.) Investments in foreign securities, which generally may involve political, economic, currency, and other risks not encountered in U.S. investments. (Please see “Investing in Foreign Securities” in the prospectus.) A Fund that invests a significant portion of its assets in a limited number of stocks may be subject to considerably more risk than a more broadly diversified Fund because a decline in the value of any of these stocks would cause that Fund’s overall value to decline to a greater degree. A broadly diversified portfolio does not, however, ensure a profit for a Fund or guarantee against loss. Please read the prospectus carefully before investing or sending money. A copy of the Funds’ current prospectus and Statement of Additional Information may be obtained by calling (800) 221-4268 or by visiting www.roycefunds.com. All publicly released material Fund information is disclosed by the Funds on their website at www.roycefunds.com. The Royce Funds is a service mark of The Royce Funds. Distributor: Royce Fund Services, LLC.
Forward-Looking Statements
This material contains forward-looking statements within the meaning of the Securities Exchange Act of 1934, as amended (the “Exchange Act”), that involve risks and uncertainties, including, among others, statements as to:
| • | the Funds’ future operating results, |
| • | the prospects of the Funds’ portfolio companies, |
| • | the impact of investments that the Funds have made or may make, the dependence of the Funds’ future success on the general economy and its impact on the companies and industries in which the Funds invest, and |
| • | the ability of the Funds’ portfolio companies to achieve their objectives. |
This review and report use words such as “anticipates,” “believes,” “expects,” “future,” “intends,” and similar expressions to identify forward-looking statements. Actual results may differ materially from those projected in the forward-looking statements for any reason.
The Royce Funds have based the forward-looking statements included in this review and report on information available to us on the date of the report, and we assume no obligation to update any such forward-looking statements. Although The Royce Funds undertake no obligation to revise or update any forward-looking statements, whether as a result of new information, future events, or otherwise, you are advised to consult any additional disclosures that we may make through future shareholder communications or reports.
Disclosure of Portfolio Holdings
The Funds’ complete portfolio holdings are also available on Exhibit F to Form N-PORT, which filings are made with the SEC within 60 days of the end of the first and third fiscal quarters. The Funds’ Form N-PORT filings are available on the SEC’s website at http://www.sec.gov.
| The Royce Funds 2019 Semiannual Report to Shareholders | 97 |
This page is intentionally left blank.
| 98 | This page is not part of the 2019 Semiannual Report to Shareholders |
This page is intentionally left blank.
| This page is not part of the 2019 Semiannual Report to Shareholders | 99 |
This page is intentionally left blank.
| 100 | This page is not part of the 2019 Semiannual Report to Shareholders |
| | | | | | |
| |
 | |
| | | | | | |
| | | | | | |
| | | | | | |
| | About The Royce Funds | | | Contact Us | |
| | | | | | |
| | | | | | |
| | Unparalleled Knowledge + Experience
Pioneers in small-cap investing, with 45+ years of experience, depth of knowledge, and focus.
Independent Thinking
The confidence to go against consensus, the insight to uncover opportunities others might miss, and the tenacity to stay the course through market cycles. | | | GENERAL INFORMATION
General Royce Funds information including:
• How to open an account
• An overview of our firm and Funds
• Ordering literature including Prospectuses
(800) 221-4268 | |
| | | | | | |
| | Specialized Approaches
US, international, and global investment strategies that pursue approaches with different risk profiles.
Unwavering Commitment
Our team of 18 portfolio managers have significant personal investments in the strategies they manage. | | | ACCOUNT INFORMATION
Speak with a representative about:
• Your account, transactions, and forms
(800) 841-1180
| |
| | | | | |
| | | | FINANCIAL ADVISORS, CONSULTANTS,
AND INSTITUTIONS
Speak with your regional Royce contact regarding:
• Scheduling a meeting or call
• Information about our firm, strategies, and funds
• Resources for financial professionals, such as
portfolio attribution reports
(800) 337-6923 | |
| |
| | | | | | |
| | | | | AUTOMATED ACCOUNT INFORMATION
24-hour Automated Telephone Service
(800) 787-6923 | |
| | | | | | |
| | | | | | |
| | | | | | |
| |  | | |  |  |
| | | | | | |
| | | | | | |
Item 2. Code(s) of Ethics.Not applicable to this semi-annual report.
Item 3. Audit Committee Financial Expert.Not applicable to this semi-annual report.
Item 4. Principal Accountant Fees and Services.Not applicable to this semi-annual report.
Item 5. Audit Committee of Listed Registrants.Not Applicable.
Item 6. Investments.
(a) See Item 1.
(b) Not Applicable
Item 7. Disclosure of Proxy Voting Policies and Procedures for Closed-End Management Investment Companies.Not Applicable.
Item 8. Portfolio Managers of Closed-End Management Investment Companies.Not Applicable.
Item 9. Purchases of Equity Securities by Closed-End Management Investment Company and Affiliated Purchasers.Not Applicable
Item 10. Submission of Matters to a Vote of Security Holders.Not Applicable.
Item 11. Controls and Procedures.
(a) Disclosure Controls and Procedures. The Principal Executive and Financial Officers concluded that the Registrant's Disclosure Controls and Procedures are effective based on their evaluation of the Disclosure Controls and Procedures as of a date within 90 days of the filing date of this report.
(b) Internal Control over Financial Reporting. There were no significant changes in Registrant's internal control over financial reporting or in other factors that could significantly affect this control subsequent to the date of the evaluation, including any corrective actions with regard to significant deficiencies and material weaknesses during the period covered by this report.
Item 12. Exhibits.Attached hereto.
(a)(1) Not applicable to this semi-annual report.
(a)(2) Separate certifications by the Registrant’s Principal Executive Officer and Principal Financial Officer as required by Rule 30a-2(a) under the Investment Company Act of 1940.
(a)(3) Not Applicable
(b) Separate certifications by the Registrant’s Principal Executive Officer and Principal Financial Officer, pursuant to Section 906 of the Sarbanes-Oxley Act of 2002 and required by Rule 30a-2(b) under the Investment Company Act of 1940.
Pursuant to the requirements of the Securities Exchange Act of 1934 and the Investment Company Act of 1940, the registrant has duly caused this report to be signed on its behalf by the undersigned, thereunto duly authorized.
THE ROYCE FUND
BY:/s/ Christopher D. Clark
Christopher D. Clark
President
Date: August 27, 2019
Pursuant to the requirements of the Securities Exchange Act of 1934 and the Investment Company Act of 1940, this report has been signed below by the following persons on behalf of the registrant and in the capacities and on the dates indicated.
| THE ROYCE FUND | THE ROYCE FUND |
| BY: /s/ Christopher D. Clark | BY: /s/ Peter K. Hoglund |
| Christopher D. Clark | Peter K. Hoglund |
| President | Chief Financial Officer |
| Date: August 27, 2019 | Date: August 27, 2019 |