| UNITED STATES |
| SECURITIES AND EXCHANGE COMMISSION |
| Washington, D.C. 20549 |
| FORM N-CSR |
| CERTIFIED SHAREHOLDER REPORT |
| OF |
| REGISTERED MANAGEMENT INVESTMENT COMPANIES |
| Investment Company Act file number: 811-03599 |
| Name of Registrant: The Royce Fund |
| Address of Registrant: 745 Fifth Avenue |
| New York, NY 10151 |
| Name and address of agent for service | John E. Denneen, Esq. 745 Fifth Avenue New York, NY 10151 |
Registrant’s telephone number, including area code: (212) 508-4500
Date of fiscal year end: December 31, 2018
Date of reporting period: January 1, 2018 – June 30, 2018
Item 1. Reports to Shareholders.
 |
| JUNE 30, 2018 | ||
| 2018 Semiannual | ||
| Review and Report to Shareholders | ||
| Royce Dividend Value Fund | |||
| Royce Global Financial Services Fund | |||
| Royce International Discovery Fund (formerly named Royce International Micro-Cap Fund) | |||
| Royce International Premier Fund | |||
| Royce Low-Priced Stock Fund | |||
| Royce Micro-Cap Fund | |||
| Royce Micro-Cap Opportunity Fund | |||
| Royce Opportunity Fund | |||
| Royce Pennsylvania Mutual Fund | |||
| Royce Premier Fund | |||
| Royce Small-Cap Leaders Fund | |||
| Royce Small-Cap Value Fund | |||
| Royce Small/Mid-Cap Premier Fund | |||
| Royce Smaller-Companies Growth Fund | |||
| Royce Special Equity Fund | |||
| Royce Special Equity Multi-Cap Fund | |||
| Royce Total Return Fund | |||
| roycefunds.com |  | ||
| Table of Contents | |||
| Semiannual Review | |||
| Letter to Our Shareholders | 2 | ||
| Performance and Expenses | 6 | ||
| The Royce Funds and Rolling Returns | 7 | ||
| Semiannual Report to Shareholders | |||
| Managers’ Discussions of Fund Performance | |||
Royce Dividend Value Fund | 8 | ||
Royce Global Financial Services Fund | 10 | ||
Royce International Discovery Fund (formerly named Royce International Micro-Cap Fund) | 12 | ||
Royce International Premier Fund | 14 | ||
Royce Low-Priced Stock Fund | 16 | ||
Royce Micro-Cap Fund | 18 | ||
Royce Micro-Cap Opportunity Fund | 20 | ||
Royce Opportunity Fund | 22 | ||
Royce Pennsylvania Mutual Fund | 24 | ||
Royce Premier Fund | 26 | ||
Royce Small-Cap Leaders Fund | 28 | ||
Royce Small-Cap Value Fund | 30 | ||
Royce Small/Mid-Cap Premier Fund | 32 | ||
Royce Smaller-Companies Growth Fund | 34 | ||
Royce Special Equity Fund | 36 | ||
Royce Special Equity Multi-Cap Fund | 38 | ||
Royce Total Return Fund | 40 | ||
| Schedules of Investments and Financial Statements | 42 | ||
| Notes to Financial Statements | 104 | ||
| Understanding Your Fund’s Expenses | 119 | ||
| Trustees and Officers | 121 | ||
| Board Approval of Investment Advisory Agreements | 122 | ||
| Notes to Performance and Other Important Information | 125 |

| This page is not part of the 2018 Semiannual Report to Shareholders | 1 |
Letter to Our Shareholders

| During the first six months of 2018, small-cap stocks enjoyed the good times bred by a bull market that at this writing has not yet slowed down. Although the first half began with higher volatility and stalled equities prices—and ended with a series of wild days that made the bullish second quarter feel more tumultuous than it was—the overall direction of U.S. markets has remained positive, particularly for smaller stocks. For the year-to-date period ended June 30, 2018, the small-cap Russell 2000 Index gained 7.7%, well ahead of both the large-cap Russell 1000 (+2.9%) and S&P 500 (+2.6%) Indexes, while making a new historical high on June 20. Returns were even higher for micro-cap stocks—the Russell Microcap Index advanced 10.7% for the same period. This mostly welcome absolute and relative performance took place against the backdrop of an accelerating U.S. economy, a strong job |
| market, and, in many cases, sterling corporate profit growth while at the same time global economic progress slowed, most notably in China and other large emerging markets. The major non-U.S. indexes slipped deeper into negative territory during the first half, as the combination of slower international growth, rising emerging market instability, a stronger dollar, and heightened trade war worries led investors to prefer all things domestic. (In fact, 35 of the 45 non-U.S. small-cap markets that we follow had declines in the first half of 2018, though only 26 were negative when measured in local currencies.) Still, growth continued to skew positive outside the U.S., with the important economies of Japan and Germany continuing to look solid. In this context, then, you would expect a small-cap specialist to be quite content, if not happy. This might especially be the case considering that small-caps—as well as micro-caps—have been true to their historical habit of outpacing larger companies through an economic expansion. Yet as much as we were pleased with first-half |
Equity Indexes Average Annual Total Return as of 6/30/18 (%)
| YEAR-TO-DATE1 | 1-YEAR | 5-YEAR | |||||||||||||||||||||||||
| Micro-Cap | 10.7 | Small-Cap Growth | 21.9 | Small-Cap Growth | 13.6 | ||||||||||||||||||||||
| Small-Cap Growth | 9.7 | Micro-Cap | 20.2 | Large-Cap | 13.4 | ||||||||||||||||||||||
| Small-Cap | 7.7 | Small-Cap | 17.6 | Micro-Cap | 12.8 | ||||||||||||||||||||||
| Small-Cap Value | 5.4 | Large-Cap | 14.5 | Small-Cap | 12.5 | ||||||||||||||||||||||
| Large-Cap | 2.9 | Small-Cap Value | 13.1 | Small-Cap Value | 11.2 | ||||||||||||||||||||||
1 Not annualized.
Small-Cap is represented by Russell 2000; Small-Cap Value is represented by Russell 2000 Value, Small-Cap Growth is represented by Russell 2000 Growth, Large-Cap is represented by Russell 1000, Micro-Cap is represented by Russell Microcap. For details on The Royce Funds’ performance in the period, please turn to the Managers’ Discussions that begin on page 8. Past performance is no guarantee of future results.
| 2 | This page is not part of the 2018 Semiannual Report to Shareholders |
LETTER TO OUR SHAREHOLDERS
| results, we find ourselves far from blissful. A closer look at small-cap performance in the first half reveals some genuine historical oddities in spite of all looking well on the surface. Our main concern is the disconnect between the confidence of the management teams we’ve been meeting with and the relatively underwhelming performance for many cyclical industries. We anticipated that stocks in these industries would do better owing to their recent earnings strength and ongoing prospects as well as to the healthy state of the U.S. economy (each, of course, being related to the other). |
| OBSTACLE ON THE TRACK The Troublesome 10-Year Treasury Yield |
| Another related concern is the way in which the ongoing weakness of the 10-year Treasury yield is at odds with the quickened pace of U.S. economic growth—when the 10-year has been sluggish in the past, it’s often been seen as a symptom of economic weakness, and not without some justification. The fact that the economy has arguably been some distance down the road to normal for at least a couple of years remains a source of concern to us. |
| Road to Normalization: Economy vs Markets |
 |
| 1 Quarterly data. Source: Bloomberg |
| We invite you to consider the following five points: through the end of June, the U.S. economy had grown for 109 consecutive months, GDP growth has converged with its long-term average, unemployment reached an 18-year low in June, personal consumption expenditure inflation hit the Fed’s 2% target in May, and short rates were rising. Additionally, we’re also seeing the early signs of inflation. Most are registering in increased commodity, raw material, and other input costs, which is historically familiar economic territory. History also shows, however, that these developments are also typically coincident with rising interest rates. So far, though, the 10-year Treasury yield has stubbornly refused to acquiesce to history—making the 10-year the major obstacle on the path back to normal in our view. |
| From our perspective as highly active, valuation-sensitive small-cap specialists, the most frustrating have been those periods when the 10-year yield has fallen back. It seems to us that nearly every time it has declined over the last 18 months, the market has witnessed a subsequent flight to high yielding or growth stocks while value and economically sensitive issues struggled to keep pace. It almost seems as if investors became temporarily convinced that we had slipped back into the 2010-2015 era of quantitative easing and zero interest rates. We think it bears emphasizing that, for all its uncertainty, the current environment could not be more different. Yet the disconnect persisted into June. The critical question, then, is, what happens next? More pertinently for our investors, the question can be phrased in a more specific way as, are we likely to see a shift in small-cap style and sector leadership? We believe that we will. The second quarter saw an admittedly short-term sign when the Russell 2000 Value Index shook off five straight quarters of underperformance to outpace its small-cap growth counterpart, up 8.3% versus 7.2%. But exactly when, and under what conditions, a longer-running shift materializes remains to be seen, of course. To be sure, the kind of leadership change that we expect—from growth to value and from defensives to cyclicals—seldom occurs without a fair bit of volatility. SMALL-CAP HIGHS Returns, Valuations–and Risks Putting the issue of market turbulence aside for a moment, the timing does seem apt to us for a change. First, the two-year cumulative return at the end of June for the Russell 2000 was 46.5%—which is a wonderful, but sadly not a sustainable, pace. Second, the one-, five-, and 10-year average annual total returns for the small-cap index for the period ended June 30, 2018 were all comfortably ahead of their long-term monthly rolling averages. |
| Recent Small-Cap Returns Higher Than History Russell 2000 through 6/30/18 |
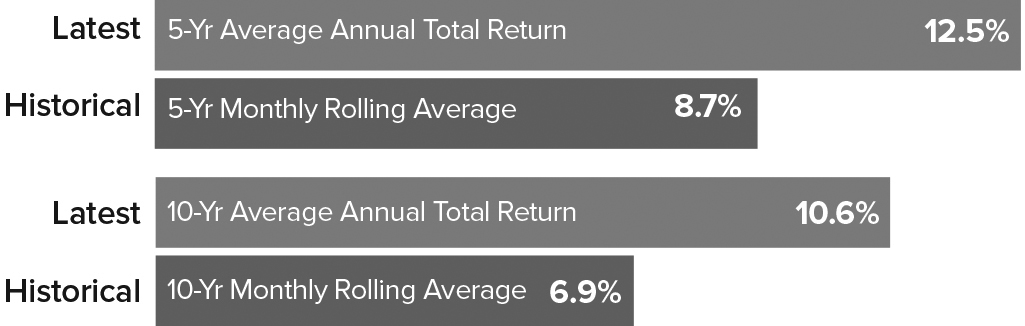
| This page is not part of the 2018 Semiannual Report to Shareholders | 3 |
| When we look at the same information for the Russell 2000 Growth Index, the contrast is even more stark, with its latest five-year return significantly in excess of its historical rolling average (+13.6% vs. +8.6%). This is one important reason why we expect a leadership shift in the form of a reversion to the mean that would favor small-cap value outperforming small-cap growth over the next five years. |
| The state of small-cap valuations also looks unsustainably high to us, particularly if we see a continued, and more consistent, rise in the 10-year yield. While the P/E ratio for the Russell 2000 did not look especially rich at the end of June, another valuation metric, the last twelve months enterprise value to earnings before interest and taxes (EV/EBIT)—which we use most frequently when examining companies—tells a different story, one that reveals higher-than-average historical valuations. The currently elevated state of returns and valuations could mean that we are entering a longish period of multiple compression, which is one reason why we prefer select small-caps with strong earnings prospects and/or modest valuations. If we see increased volatility over the balance of the year, these types of stocks look better positioned to cope with it effectively. |
| Cyclicals Cheaper than Defensives Median LTM EV/EBIT1 Ex. Negative EBIT for Russell 2000 as of 6/30/18 |
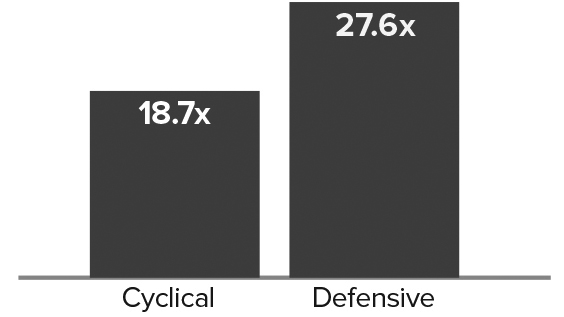 |
| Based on earnings and cash flow quality—as well as confident management teams—we are seeing superior fundamentals in selected cyclical areas that other investors are avoiding. For example, the supply/demand dynamics in a number of industries, such as semiconductors & semiconductor equipment, transportation, and chemicals, look favorable to us and do not appear to us to be fully reflected in their current valuations. Many cyclical companies appear much better positioned for intermediate-term growth than defensive and/or growth stocks. While many cyclical stocks have lagged the field over the last 18 months, they are also more reasonably priced than defensives based on EV to EBIT. We remain convinced that fundamentally strong small-cap companies, especially those with attractive-to-reasonable valuations, will become more appealing to investors as confidence in the U.S. economy continues to build. |
| 1 Last Twelve Months Enterprise Value/Earnings Before Interest and Taxes |
| Many Small-Caps Sell at a Significant Discount Bottom Three Deciles in Russell 2000 Median LTM EV/EBIT1 Ex. Negative EBIT as of 6/30/18 |

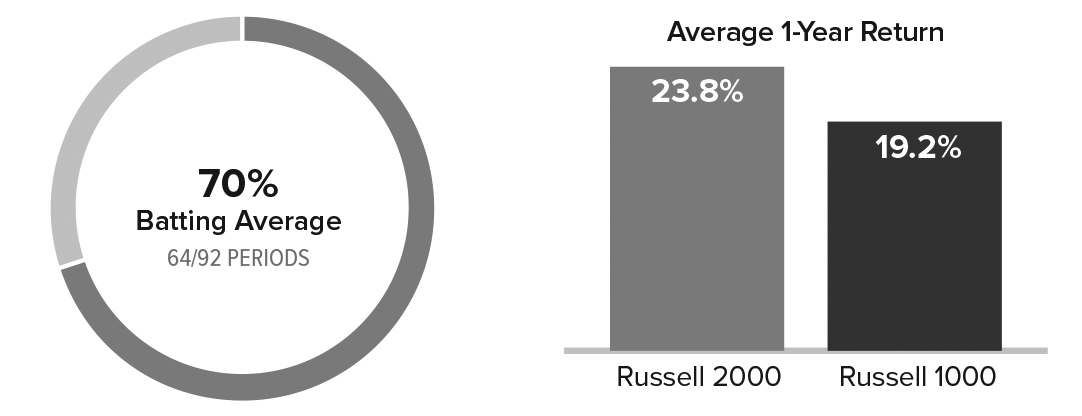
| There’s a related point that may be equally important when considering valuations: The sheer size and diversity of the small-cap asset class means that there are almost always opportunities to find what we think are promising or quality businesses trading at attractive discounts. Based on EV/EBIT, the bottom three deciles of the Russell 2000 were trading at sizable discounts compared to the median for the index as a whole at the end of June. VOLATILITY AND INTEREST RATES Both On the Rise During the first quarter, the Russell 2000 moved 1% or more in 33% of its trading days compared to 18% in all of 2017. Another volatility measure, the CBOE Russell 2000 Volatility Index (“RVX”), measures market expectations of near-term volatility conveyed by Russell 2000 stock index option prices. The RVX has averaged 24.0% per year since its inception on January 2, 2004 through June 30, 2018. Its average in 2017 was 15.9%, and its year-to-date average through the end of June 2018 was 17.5%. Eighteen months of lower volatility suggests—strongly to us—that increased volatility is likely. We also believe that the upward trend in rates is under way—and suspect that the 10-year yield will begin to move up more consistently over the next year. We see both rising rates and increased volatility as healthy. In fact, looking once more at history, we find that periods of rising rates have been favorable for small-cap stocks on both an absolute and relative basis. When the 10-Year Treasury yield was rising, the Russell 2000 outperformed the large-cap Russell 1000 in 70% of monthly rolling one-year periods for the 20-year period ended June 30, 2018 with an average one-year return of 23.8% versus 19.2% for large-cap. Our expectations for small-cap returns are more modest, though we do expect this historical relative return spread pattern to hold up. |
| 4 | This page is not part of the 2018 Semiannual Report to Shareholders |
LETTER TO OUR SHAREHOLDERS
| How Have Small-Caps Performed When Rates Were Rising? Russell 2000 vs Russell 1000 Trailing Monthly Rolling 1-Year Returns When 10-Year Treasury Yield was Rising From 6/30/98 through 6/30/18 | |
 | |
| 10-Year Treasury Yield rose in 92 of 229 periods | |
| More specifically, we see rising rates as a phenomenon that should also be helpful to risk-conscious active managers in the small-cap space—primarily because it fosters an environment where better balance sheet companies are likely to be rewarded for their fiscal prudence. In other words, risk management matters. This is relevant today because of the increased leverage—specifically financial leverage—within the Russell 2000. And as rates continue to move up, the overall small-cap index looks increasingly risky. As active managers, we have the ability to screen and scrutinize small-cap businesses with better balance sheets and shy away from those that we see as having excess financial leverage. (It is worth mentioning that the market has largely ignored better balance sheet companies for much of the last 10 years.) Most of our strategies gravitate toward companies with low debt. We would rather focus on companies that have great operating leverage—but not financial leverage. With rising rates, inflation, and economic growth becoming established, the market seems to be transitioning into an environment that will favor similar qualities. | |
REASONS TO BE CHEERFUL | |
| We are therefore of two minds about the current cycle. On the one hand, we think that we could see some consolidation or a correction—the latter certainly seems more probable now than it did | |
| a year ago. Yet we remain optimistic about small-cap earnings growth and like the fundamentals of our holdings across our strategies in terms of balance sheets, cash flows, and earnings strength. It is in cyclical areas, including Industrials, the more cyclical precincts of technology, and Materials, and that we have most often uncovered what we judge to be the best combination of value, quality, and/ or growth prospects. And this has always been a function of our bottom-up process rather than a top down view of the economy. This is why many of our portfolios have had perennially higher weightings in those sectors (and while others we manage have had high weightings in Financials and Consumer Discretionary). We also long ago developed the practice of leaning into those areas of the asset class where we see excess pessimism. Investments in industries that the rest of the market is abandoning have often borne fruit, though we have learned through decades of small-cap asset management that it usually requires a great deal of patience—measured in years in many cases—before the arrival of a bountiful harvest. We think it’s worth noting that the three changes in the market environment that we expect—lower returns, higher volatility, and value/cyclical leadership—have all historically been coincident with leadership for active management. We see signs of progress that in our view place us squarely on the road to normalization, which was evident in the modest increases in bond yields and the reemergence of value’s leadership in 2018’s second quarter. We saw other equally positive signs in July, including stabilizing macro indicators from outside the U.S., a welcome rebound in the performance of many industrial companies, and ongoing earnings strength for several cyclical areas. We expect to see more signs of normalizing markets to emerge as the year goes on. |
| Sincerely, |
 |  |  | ||
| Charles M. Royce | Christopher D. Clark | Francis D. Gannon | ||
| Chairman, | Chief Executive Officer, and | Co-Chief Investment Officer, | ||
| Royce & Associates, LP | Co-Chief Investment Officer, | Royce & Associates, LP | ||
| Royce & Associates, LP | ||||
| July 30, 2018 |
| This page is not part of the 2018 Semiannual Report to Shareholders | 5 |
Performance and Expenses
| Performance and Expenses | |||||||||||||||||||||
| ANNUAL OPERATING EXPENSES (%) | |||||||||||||||||||||
| YTD1 | 1-YR | 5-YR | 10-YR | 15-YR | 20-YR | 45-YR/SINCE INCEPTION | INCEPTION DATE | GROSS | NET | ||||||||||||
| Royce Dividend Value Fund | -2.02 | 10.66 | 8.57 | 9.16 | N/A | N/A | 8.87 | 5/3/04 | 1.39 | 1.34 | |||||||||||
| Royce Global Financial Services Fund | 2.65 | 14.45 | 10.82 | 9.51 | N/A | N/A | 8.59 | 12/31/03 | 1.77 | 1.58 | |||||||||||
| Royce International Discovery Fund | -6.21 | 3.96 | 8.03 | N/A | N/A | N/A | 3.62 | 12/31/10 | 2.79 | 1.44 | |||||||||||
| Royce International Premier Fund | -3.08 | 10.77 | 10.10 | N/A | N/A | N/A | 7.65 | 12/31/10 | 1.65 | 1.44 | |||||||||||
| Royce Low-Priced Stock Fund | 9.34 | 18.75 | 6.61 | 4.82 | 7.51 | 8.52 | 10.25 | 12/15/93 | 1.61 | 1.58 | |||||||||||
| Royce Micro-Cap Fund | 10.22 | 13.91 | 6.36 | 5.52 | 8.64 | 8.67 | 11.02 | 12/31/91 | 1.60 | 1.58 | |||||||||||
| Royce Micro-Cap Opportunity Fund | 7.79 | 22.73 | 10.32 | N/A | N/A | N/A | 14.07 | 8/31/10 | 1.28 | 1.24 | |||||||||||
| Royce Opportunity Fund | 4.05 | 17.23 | 11.40 | 11.15 | 11.48 | 11.93 | 12.61 | 11/19/96 | 1.18 | 1.18 | |||||||||||
| Royce Pennsylvania Mutual Fund | 5.70 | 17.23 | 10.63 | 8.92 | 10.40 | 9.77 | 13.50 | N/A | 0.92 | 0.92 | |||||||||||
| Royce Premier Fund | 2.59 | 16.81 | 10.56 | 8.62 | 11.51 | 10.64 | 11.81 | 12/31/91 | 1.16 | 1.16 | |||||||||||
| Royce Small-Cap Leaders Fund | 3.64 | 12.87 | 7.50 | 7.99 | 9.66 | N/A | 9.66 | 6/30/03 | 1.59 | 1.49 | |||||||||||
| Royce Small-Cap Value Fund | 7.11 | 17.71 | 7.30 | 5.61 | 10.20 | N/A | 9.74 | 6/14/01 | 1.51 | 1.49 | |||||||||||
| Royce Small/Mid-Cap Premier Fund | -3.14 | 11.09 | 8.04 | 8.84 | 9.83 | 10.64 | 12.28 | 12/27/95 | 1.32 | 1.32 | |||||||||||
| Royce Smaller-Companies Growth Fund | 10.38 | 16.87 | 11.34 | 8.00 | 11.05 | N/A | 11.73 | 6/14/01 | 1.49 | 1.49 | |||||||||||
| Royce Special Equity Fund | -0.32 | 7.92 | 7.71 | 9.67 | 9.13 | 9.33 | 9.20 | 5/1/98 | 1.17 | 1.17 | |||||||||||
| Royce Special Equity Multi-Cap Fund | -5.67 | 2.76 | 6.20 | N/A | N/A | N/A | 8.97 | 12/31/10 | 1.39 | 1.24 | |||||||||||
| Royce Total Return Fund | 0.59 | 11.23 | 9.75 | 8.70 | 9.28 | 9.01 | 10.83 | 12/15/93 | 1.21 | 1.21 | |||||||||||
| INDEX | |||||||||||||||||||||
| Russell 2000 | 7.66 | 17.57 | 12.46 | 10.60 | 10.50 | 8.03 | N/A | N/A | N/A | N/A | |||||||||||
| Russell Microcap | 10.71 | 20.21 | 12.78 | 10.63 | 9.44 | N/A | N/A | N/A | N/A | N/A | |||||||||||
| Russell 2000 Value | 5.44 | 13.10 | 11.18 | 9.88 | 9.93 | 8.67 | N/A | N/A | N/A | N/A | |||||||||||
| Russell 2500 | 5.46 | 16.24 | 12.29 | 10.74 | 10.99 | 9.11 | N/A | N/A | N/A | N/A | |||||||||||
| Russell 1000 | 2.85 | 14.54 | 13.37 | 10.20 | 9.54 | 6.74 | N/A | N/A | N/A | N/A | |||||||||||
| Russell Global ex-U.S. Small Cap | -3.78 | 9.17 | 8.03 | 4.97 | 10.21 | 7.72 | N/A | N/A | N/A | N/A | |||||||||||
Important Performance, Expense, and Risk Information
All performance information in this Review and Report reflects past performance, is presented on a total return basis, reflects the reinvestment of distributions, and does not reflect the deduction of taxes a shareholder would pay on fund distributions or the redemption of fund shares. Past performance is no guarantee of future results. Investment return and principal value of an investment will fluctuate, so that shares may be worth more or less than their original cost when redeemed. Investment and Service Class shares redeemed within 30 days of purchase may be subject to a 1% redemption fee payable to the Fund (2% for Royce International Discovery and International Premier Funds). Redemption fees are not reflected in the performance shown above; if they were, performance would be lower. Current performance may be higher or lower than performance quoted. Current month-end performance may be obtained at www.roycefunds.com. All performance and expense information reflects results of the Funds’ oldest share Class (Investment Class or Service Class, as the case may be). Price and total return information is based on net asset values calculated for shareholder transactions. Gross annual operating expenses reflect the Fund’s gross total annual operating expenses and include management fees, any 12b-1 distribution and service fees, other expenses, and any applicable acquired fund fees and expenses. Net annual operating expenses reflect contractual fee waivers and/or expense reimbursements. All expense information is reported as of the Fund’s most current prospectus. Royce & Associates has contractually agreed to waive fees and/or reimburse operating expenses, excluding brokerage commissions, taxes, interest, litigation expenses, acquired fund fees and expenses, and other expenses not borne in the ordinary course of business, to the extent necessary to maintain net operating expenses at or below: 1.24% for Royce Micro-Cap Opportunity and Special Equity Multi-Cap Funds; 1.34% for Royce Dividend Value Fund; 1.44% for Royce International Discovery and International Premier Funds; 1.49% for Royce Global Financial Services, Low-Priced Stock, Micro-Cap, Small-Cap Leaders, and Small-Cap Value Funds through April 30, 2019; at or below 1.99% for Royce International Discovery Fund through April 30, 2028. Acquired fund fees and expenses reflect the estimated amount of fees and expenses incurred indirectly by the Fund through its investments in mutual funds, hedge funds, private equity funds, and other investment companies.
Service Class shares bear an annual distribution expense that is not borne by the Funds’ Investment Class. If such distribution expenses had been reflected for Funds showing Investment Class performance, returns would have been lower. Investments in securities of micro-cap, small-cap, and/or mid-cap companies may involve considerably more risk than investments in securities of larger-cap companies. (Please see “Primary Risks for Fund Investors” in the prospectus.) Certain Funds invest a significant portion of their respective assets in foreign companies that may be subject to different risks than investments in securities of U.S. companies, including adverse political, social, economic, or other developments that are unique to a particular country or region. (Please see “Investing in Foreign Securities” in the prospectus.) Therefore, the prices of securities of foreign companies in particular countries or regions may, at times, move in a different direction than those of securities of U.S. companies. (Please see “Primary Risk of Fund Investors” in the prospectus.) Certain Funds generally invest a significant portion of their assets in a limited number of stocks, which may involve considerably more risk than a more broadly diversified portfolio because a decline in the value of any of these stocks would cause their overall value to decline to a greater degree. A broadly diversified portfolio, however, does not ensure a profit or guarantee against loss. This Review and Report must be preceded or accompanied by a prospectus. Please read the prospectus carefully before investing or sending money. Russell Investment Group is the source and owner of the trademarks, service marks, and copyrights related to the Russell Indexes. Russell® is a trademark of Russell Investment Group. The Russell 2000 Index is an unmanaged, capitalization-weighted index of domestic small-cap stocks. It measures the performance of the 2,000 smallest publicly traded U.S. companies in the Russell 3000 Index. The Russell Microcap Index includes 1,000 of the smallest securities in the small-cap Russell 2000 Index along with the next smallest eligible securities as determined by Russell. The Russell 2000 Value Index consists of the respective value stocks within the Russell 2000 as determined by Russell Investments. The Russell 2500 is an unmanaged, capitalization-weighted index of the 2,500 smallest publicly traded U.S. companies in the Russell 3000 index. The Russell 1000 is an unmanaged, capitalization-weighted index of domestic large-cap stocks. It measures the performance of the 1,000 largest publicly traded U.S. companies in the Russell 3,000 Index. The Russell Global ex-U.S. Small Cap Index is an index of global small-cap stocks, excluding the United States. The performance of an index does not represent exactly any particular investment as you cannot invest directly in an index. Distributor: Royce Fund Services, LLC.
| 6 | This page is not part of the 2018 Semiannual Report to Shareholders |
The Royce Funds and Rolling Returns
We believe strongly in the idea that a long-term perspective is crucial for determining the success of an investment approach. Flourishing in an up market is wonderful, but surviving a bear market by losing less (or not at all) is equally desirable. In any case, the true tests of a portfolio’s mettle are results over bull and bear periods. This is why we prefer to examine results that include up and down market phases—primarily by looking at rolling return periods.
| When evaluating fund performance, it is common practice to review results for the most recent year (often the calendar year) along with its related longer-term trailing periods. However, a calendar-year return is not necessarily any more or less important to consider than any other 12-month period (or related trailing period). It is also true that few investors buy mutual funds on New Year’s Eve and then sell exactly five or 10 years later. Of course, the reality is that trailing returns ending last month or last quarter are the most commonly available and easily comparable results, so these otherwise arbitrary periods often drive investor decisions and flows. |
| Keeping in mind that investors will buy and sell at any time throughout any given year, we think it makes sense to examine performance over a larger series of dates. We believe rolling returns offer a more effective measure because they provide a more accurate and in-depth picture of a portfolio’s performance. Rather than “point-in-time” results anchored by the end of the month or quarter, |
| rolling returns account for the fact that investors typically do not invest at the beginning of the current five- or 10-year period but instead are in fact investing over many periods. |
| So instead of assuming that an investment was made on January 1, rolling returns calculate all of the periods starting not only in January, but also in February, March, April, etc. For example, a monthly five-year rolling return accounts for all of the five-year returns beginning at a given inception date and advancing one month sequentially. This method allows an investor to evaluate the consistency of a fund’s performance over time—including the ups and downs of market cycles. |
| We believe that rolling returns provide a particularly robust analytical tool for evaluating manager performance, especially during volatile periods when simply shifting the performance date range one or two months in either direction can paint a very different picture. |
| Royce Funds1 vs. The Benchmark2 |
| Monthly Rolling Average Annual Return Periods and Relative Results Since Fund Inception or Most Recent 20 Years through June 30, 2018 |
| Average Annual 10-Year Rolling Return | Average Annual 5-Year Rolling Return | |||||||||||||||||||||||||||||||||||||||||||
| FUND | PERIODS BEATING THE INDEX | FUND AVG (%)3 | INDEX AVG (%)3 | PERIODS BEATING THE INDEX | FUND AVG (%)3 | INDEX AVG (%)3 | ||||||||||||||||||||||||||||||||||||||
| U.S. EQUITY | ||||||||||||||||||||||||||||||||||||||||||||
| Low-Priced Stock | 54/121 | 45% | 7.2 | 6.9 | 107/181 | 59% | 8.3 | 8.7 | ||||||||||||||||||||||||||||||||||||
| Micro-Cap | 60/97 | 62% | 7.5 | 6.4 | 92/157 | 59% | 8.3 | 8.3 | ||||||||||||||||||||||||||||||||||||
| Opportunity | 96/121 | 79% | 9.0 | 6.9 | 127/181 | 70% | 11.6 | 8.7 | ||||||||||||||||||||||||||||||||||||
| Pennsylvania Mutual | 79/121 | 65% | 8.4 | 6.9 | 115/181 | 64% | 10.3 | 8.7 | ||||||||||||||||||||||||||||||||||||
| Premier | 114/121 | 94% | 10.0 | 6.9 | 119/181 | 66% | 11.2 | 8.7 | ||||||||||||||||||||||||||||||||||||
| Small/Mid-Cap Premier | 68/121 | 56% | 8.7 | 7.9 | 119/181 | 66% | 10.0 | 9.7 | ||||||||||||||||||||||||||||||||||||
| Special Equity | 100/121 | 83% | 9.2 | 6.9 | 105/181 | 58% | 10.6 | 8.7 | ||||||||||||||||||||||||||||||||||||
| Total Return | 60/121 | 50% | 7.8 | 6.9 | 103/181 | 57% | 9.6 | 8.7 | ||||||||||||||||||||||||||||||||||||
| 1 Included are all Royce Funds with at least 20 years of history. |
| 2 The Russell 2000 Index is the benchmark for most funds. Royce Micro-Cap Fund is compared to the Russell Microcap Index from the inception of that index. Royce Small/Mid-Cap Premier Fund is compared to the Russell 2500 Index. |
| 3 Average return shown is the average of all month-end trailing five- and 10-year total returns. |
| Past performance is no guarantee of future results. For more information on performance please see page 6. |
| This page is not part of the 2018 Semiannual Report to Shareholders | 7 |
| MANAGERS’ DISCUSSION |
| Royce Dividend Value Fund (RDV) |
 |
| Chuck Royce Jay Kaplan, CFA |
| FUND PERFORMANCE |
| The first half of 2018 was another period of lower-than-average volatility in which small-cap growth stocks beat small-cap value, and small-cap companies that pay no dividends outpaced those that do. Additionally, the Fund’s preference for more economically cyclical dividend-paying stocks, as opposed to those more sensitive to interest rates, worked doubly against it in the more bullish second quarter, when the former group lagged while the latter rallied. Finally, investors responded to tariff and trade war talk by selling off many non-U.S. stocks, which hurt Fund performance because more than a quarter of the portfolio was invested in companies headquartered outside the U.S. at the end of the first half. Needless to say, this made for a less than ideal environment for our risk-conscious dividend value approach. Royce Dividend Value Fund was down 2.0% for the year-to-date period ended June 30, 2018, significantly trailing its small-cap benchmark, the Russell 2000 Index, which gained 7.7% for the same period. |
| WHAT WORKED... AND WHAT DIDN’T |
| Seven of the Fund’s 11 equity sectors finished the first half in the red, with the most significant detractions coming from Financials and Industrials, the portfolio’s two largest sectors and its most substantial overweights versus the Russell 2000. The capital markets group (Financials)—also a significant overweight in the Fund—detracted most at the industry level. A perennial area of concentration for the portfolio owing to the number of dividend-paying asset management companies within it, the group saw disappointing performances from several holdings, most prominently Federated Investors, where outflows from a large equity mutual fund as well increased competition in money market funds—resulting in downward pressure on fees—helped to keep investors selling. We chose to hold our shares in the expectation that the firm will be able to rebound. DENTSPLY SIRONA, a dental equipment and consumables manufacturer from the Health Care sector, was the biggest detractor at the position level as the company remained in the midst of turnaround efforts aimed at improving topline growth and operating margins. We were content to be patient at the end of June. |
| Global staffing and services company Manpower Group detracted most in the Industrials sector, and second most in the portfolio overall. Earnings remained positive in 2018’s first half, prospects in a still-tightening global labor market appear strong, and recent acquisitions expanded its global footprint. Its shares fell mostly on a change in a tax subsidy rate in France for companies that provide temporary labor and loftier expectations for growth than even strong earnings earlier in the year could meet. We remained confident in its core global business at the end of June. Thor Industries is a leading manufacturer of RVs (recreational vehicles) and has emerged as an innovative industry leader over the last several years. The firm announced record fiscal second-quarter sales in March, but also reported higher raw material and commodity costs. Along with concerns that its industry may have hit a sales peak, this was enough to drive investors away. We held our stake at the end of June. |
| As for positions that made positive contributions to first-half results, the leader was Norway’s TGS-NOPEC Geophysical, which provides geoscience data to oil and gas companies worldwide. Its revenue and earnings were boosted by improving exploration and production spending, higher oil prices, and the longer-term need for energy companies to replenish reserves, which is driving increased spending on seismic data. A top contributor from 2017, alternative asset manager KKR & Co. was a happy exception in the capital markets industry. The firm announced in May that it would make the switch from being a limited partnership to a corporation—one that pays dividends—news that encouraged additional investment in its stock. Relative to the Russell 2000, three sectors hurt results most. Poor stock picks were the culprits in the Financial sector, while in Health Care, a combination of lower exposure and stock selection miscues detracted. In Industrials, a mix of higher exposure and ineffective stock picks also hurt relative results. Conversely, a more modest positive contribution on a relative basis came from superior stock selection in Energy. |
| Top Contributors to Performance | |||
| Year-to-Date Through 6/30/18 (%)1 | |||
| TGS-NOPEC Geophysical | 0.70 | ||
| KKR & Co. L.P. | 0.47 | ||
| HEICO Corporation Cl. A | 0.34 | ||
| FLIR Systems | 0.29 | ||
| Expeditors International of Washington | 0.26 | ||
| 1 Includes dividends | |||
| Top Detractors from Performance | |||
| Year-to-Date Through 6/30/18 (%)2 | |||
| DENTSPLY SIRONA | -0.69 | ||
| ManpowerGroup | -0.61 | ||
| Federated Investors Cl. B | -0.39 | ||
| Thor Industries | -0.36 | ||
| Jupiter Fund Management | -0.35 | ||
| 2 Net of dividends | |||
| CURRENT POSITIONING AND OUTLOOK |
| The market’s behavior is curious to us. On the one hand, we hear optimism and solid progress from the management teams we meet with, see solid earnings reports, and observe consistently strong macroeconomic data. On the other hand, small-cap market leadership has stubbornly remained with defensive and yield-oriented stocks, while cyclicals have lagged. Despite new highs for the Russell 2000, we are therefore far from ebullient. We are continuing to reduce the portfolio’s exposure to companies with higher valuations and expectations while modestly raising cash levels. We do anticipate a change in market leadership to more cyclical stocks, but admit that changes in leadership seldom occur without turbulence. If higher volatility reemerges, we aim to be able to take advantage of what may be temporarily lower prices. |
| 8 | The Royce Funds 2018 Semiannual Report to Shareholders |
| PERFORMANCE AND PORTFOLIO REVIEW | TICKER SYMBOLS RYDVX RDVIX RDIIX RDVCX |
| Performance and Expenses Average Annual Total Return (%) Through 6/30/18 | ||||||||||||
| JAN-JUN 20181 | 1-YR | 3-YR | 5-YR | 10-YR | SINCE INCEPTION (5/3/04) | |||||||
| RDV | -2.02 | 10.66 | 8.44 | 8.57 | 9.16 | 8.87 | ||||||
| Annual Gross Operating Expenses: 1.39% Annual Net Operating Expenses: 1.34% | ||||||||||||
| 1 Not annualized | ||||||||||||
| Relative Risk Adjusted Returns: Monthly Rolling Sharpe Ratios Since Inception Through 6/30/18 On a monthly rolling risk-adjusted basis, the Fund outperformed the Russell 2000 in 96% of all 10-year periods and 59% of all 5-year periods. | ||||||||||||
| PERIODS BEATING THE INDEX | FUND AVG (%)1 | INDEX AVG (%)1 | ||||||||||||
| 10-year | 48/50 | 96% | 0.48 | 0.43 | ||||||||||
| 5-year | 65/110 | 59% | 0.58 | 0.54 | ||||||||||

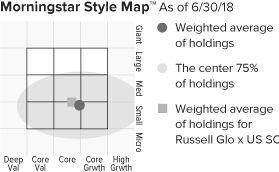
The Morningstar Style Map is the Morningstar Style Box™ with the center 75% of fund holdings plotted as the Morningstar Ownership Zone™. The Morningstar Style Box is designed to reveal a fund’s investment strategy. The Morningstar Ownership Zone provides detail about a portfolio’s investment style by showing the range of stock sizes and styles. The Ownership Zone is derived by plotting each stock in the portfolio within the proprietary Morningstar Style Box. Over time, the shape and location of a fund’s ownership zone may vary. See page 125 for additional information. |
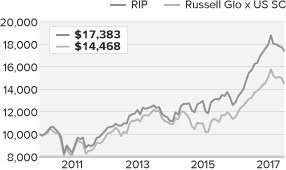
Value of $10,000

| Top 10 Positions | ||
| % of Net Assets | ||
| FLIR Systems | 2.9 | |
| KKR & Co. L.P. | 2.5 | |
| Reliance Steel & Aluminum | 2.3 | |
| HEICO Corporation Cl. A | 2.1 | |
| AptarGroup | 2.1 | |
| TGS-NOPEC Geophysical | 2.0 | |
| IDEX Corporation | 2.0 | |
| Applied Industrial Technologies | 1.9 | |
| Expeditors International of Washington | 1.9 | |
| Quaker Chemical | 1.9 | |
| Portfolio Sector Breakdown | ||
| % of Net Assets | ||
| Industrials | 29.3 | |
| Financials | 28.6 | |
| Materials | 13.9 | |
| Consumer Discretionary | 9.2 | |
| Information Technology | 7.1 | |
| Energy | 4.9 | |
| Health Care | 3.7 | |
| Utilities | 1.0 | |
| Consumer Staples | 0.6 | |
| Real Estate | 0.4 | |
| Cash and Cash Equivalents | 1.3 | |
| Calendar Year Total Returns (%) | ||
| YEAR | RDV | |
| 2017 | 21.7 | |
| 2016 | 16.4 | |
| 2015 | -5.7 | |
| 2014 | -2.1 | |
| 2013 | 30.7 | |
| 2012 | 16.9 | |
| 2011 | -4.5 | |
| 2010 | 30.1 | |
| 2009 | 37.7 | |
| 2008 | -31.5 | |
| 2007 | -0.0 | |
| 2006 | 19.9 | |
| 2005 | 7.3 | |
| Upside/Downside Capture Ratios | |||
| Periods Ended 6/30/18 (%) | |||
| UPSIDE | DOWNSIDE | |||
| 10-Year | 86 | 86 | ||
| From 6/30/04 (Start of Fund’s First Full Quarter) | 86 | 77 | ||
| Portfolio Diagnostics | |||
| Fund Net Assets | $166 million | ||
| Number of Holdings | 97 | ||
| Turnover Rate | 7% | ||
| Average Market Capitalization1 | $4,121 million | ||
| Weighted Average P/E Ratio2,3 | 16.8x | ||
| Weighted Average P/B Ratio2 | 2.7x | ||
| Active Share4 | 97% | ||
| U.S. Investments (% of Net Assets) | 72.0% | ||
| Non-U.S. Investments (% of Net Assets) | 26.7% | ||
| 1 | Geometric Average. This weighted calculation uses each portfolio holding’s market cap in a way designed to not skew the effect of very large or small holdings; instead, it aims to better identify the portfolio’s center, which Royce believes offers a more accurate measure of average market cap than a simple mean or median. |
| 2 | Harmonic Average. This weighted calculation evaluates a portfolio as if it were a single stock and measures it overall. It compares the total market value of the portfolio to the portfolio’s share in the earnings or book value, as the case may be, of its underlying stocks. |
| 3 | The Fund’s P/E ratio calculation excludes companies with zero or negative earnings (5% of portfolio holdings as of 6/30/18). |
| 4 | Active Share is the sum of the absolute values of the different weightings of each holding in the Fund versus each holding in the benchmark, divided by two. |
| Important Performance and Expense Information |
All performance information in this Report reflects past performance, is presented on a total return basis, reflects the reinvestment of distributions, and does not reflect the deduction of taxes that a shareholder would pay on fund distributions or the redemption of fund shares. Past performance is no guarantee of future results. Investment return and principal value of an investment will fluctuate, so that shares may be worth more or less than their original cost when redeemed. Shares redeemed within 30 days of purchase may be subject to a 1% redemption fee payable to the Fund, which is not reflected in the performance shown above; if it were, performance would be lower. Current month-end performance may be higher or lower than performance quoted and may be obtained at www.roycefunds.com. All performance and risk information reflects results of the Service Class (its oldest class). Certain immaterial adjustments were made to the net assets of Royce Dividend Value Fund at 6/30/15 for financial reporting purposes, and as a result the net asset values for shareholder transactions on that date and the calendar year Total Returns (%) based on those net asset values differ from the adjusted net asset values and calendar year total returns reported in the Financial Highlights. Gross operating expenses reflect the Fund’s total gross annual operating expenses for the Service Class and include management fees, 12b-1 distribution and service fees, and other expenses. Net operating expenses reflect contractual fee waivers and/or expense reimbursements. All expense information is reported as of the Fund’s most current prospectus. Royce & Associates has contractually agreed, without right of termination, to waive fees and/or reimburse expenses to the extent necessary to maintain the Service Class’s net annual operating expenses (excluding brokerage commissions, taxes, interest, litigation expenses, acquired fund fees and expenses, and other expenses not borne in the ordinary course of business) at or below 1.34% through April 30, 2019. Regarding the “Top Contributors” and “Top Detractors” tables shown above, the sum of all contributors to, and all detractors from, performance for all securities in the portfolio would approximate the Fund’s year-to-date performance for 2018. The Sharpe Ratio is calculated for a specified period by dividing a fund’s annualized excess returns by its annualized standard deviation. The higher the Sharpe ratio, the better the fund’s historical risk-adjusted performance. Upside Capture Ratio measures a manager’s performance in up markets relative to the Fund’s benchmark. It is calculated by measuring the Fund’s performance in quarters when the benchmark went up and dividing it by the benchmark’s return in those quarters. Downside Capture Ratio measures a manager’s performance in down markets relative to the Fund’s benchmark (Russell 2000). It is calculated by measuring the Fund’s performance in quarters when the benchmark goes down and dividing it by the benchmark’s return in those quarters. |
| The Royce Funds 2018 Semiannual Report to Shareholders | 9 |
| MANAGERS’ DISCUSSION |
| Royce Global Financial Services (RFS) |
 |
| Chuck Royce Chris Flynn |
| FUND PERFORMANCE |
| After returning more than 22% in 2017, it was not surprising that the Fund saw a moderation in its pace of gains in the first half. Moreover, two elements that supported performance last year— international holdings and high weighting in asset management companies—both detracted from first-half returns. Additionally, there were significant reversals among individual holdings, as two of 2017’s winners gave back some returns and landed among the bottom five detractors, while another holding made the opposite journey, bouncing back from being one of 2017’s laggards to one of the first half’s top contributors. Royce Global Financial Services posted a modest gain of 2.6% for the first half of 2018, which trailed both the Russell 2000, which advanced 7.7%, and the Russell 25000 Financial Services Indexes, which was up 4.6%. |
| WHAT WORKED... AND WHAT DIDN’T |
| The company making the biggest positive contribution to first-half performance was Virtu Financial, which uses its technology to act as a market maker and liquidity provider to the global financial markets. Based in New York City, the firm announced impressive first-quarter results in profits and earnings, thanks to increased volatility, high trading volumes, and better-than-expected progress integrating a large acquisition. In our view, the company’s business model is well positioned to benefit from the increased volatility in financial markets that we expect to see in the coming years. We discussed Popular, one of the largest Puerto Rico-based banks, in our 2017 commentary, providing our rationale for sticking with this holding, even though it lagged in that year. Strong earnings so far in 2018, along with an opportunistic, accretive acquisition, have led the stock to outperform as there are more signs of Puerto Rico recovering from last year’s devastating hurricanes. |
| As for positions that detracted, U.S. Global Investors is a specialty asset manager focused mostly on emerging markets, precious metals, and, more recently, digital currencies. Its shares surged in 2017 after its investment in a blockchain technology company. We were wary of this enthusiasm and sold nearly half our position, which proved prescient as its stock declined significantly in the first half of 2018 when the price of the highly volatile cryptocurrency Ethereum collapsed in March. Jupiter Fund Management, a U.K. based asset manager, fell after strong appreciation in 2017 as investors became concerned about ongoing investments in the business which will lead to cost increases in excess of revenue growth, along with continued fee declines and outflows for their funds. We held our position this year as we see a strong, well-managed franchise positioning its business for long-term growth. The Fund’s relative results are often driven by the fortunes of international versus U.S. stocks and asset managers versus the overall financial sector. Both factors hampered relative returns in the first half. As a result of stock price declines in local markets for most countries, which were exacerbated by a stronger dollar, holdings in only one of the 20 non-U.S. geographies where the Fund has investments contributed to returns. This marked a stark reversal from 2017, when holdings in 14 of 20 countries contributed. The Fund’s perennially large concentration in asset management & custody banks also detracted, though most came from international based asset managers due to the factors referenced above. However, most of our alternative asset management holdings, an area we have been emphasizing over the past few years, saw solid gains during the first half. |
| Top Contributors to Performance | |||
| Year-to-Date Through 6/30/18 (%)1 | |||
| Virtu Financial Cl. A | 1.44 | ||
| FRP Holdings | 0.64 | ||
| Sprott | 0.60 | ||
| Popular | 0.57 | ||
| BofI Holding | 0.49 | ||
| 1 Includes dividends | |||
| Top Detractors from Performance | |||
| Year-to-Date Through 6/30/18 (%)2 | |||
| U.S. Global Investors Cl. A | -0.67 | ||
| Jupiter Fund Management | -0.43 | ||
| Altus Group | -0.38 | ||
| Clarkson | -0.34 | ||
| SEI Investments | -0.30 | ||
| 2 Net of dividends | |||
| CURRENT POSITIONING AND OUTLOOK |
| We began the year anticipating increased volatility, lower overall returns for small-cap stocks, rising interest rates, and strength for those global financial businesses that appeared best positioned to operate effectively in this type of environment. We saw little in the first half—either at the company or macro levels—that led us to significantly alter this view. Despite some short-term reversals, we remain firmly committed to global investing for this Fund, particularly as we believe our investors can participate in the long-term growth of some of the leading niche financial companies outside the U.S., many of which are relatively unknown to domestic investors. Moreover, we anticipate that in the coming years, the current wide valuation disparity between U.S. and international stocks will narrow, favoring international stock performance. The largest portion of the portfolio remains invested in asset management companies where we see sustained positive trends for the specialty traditional asset managers, alternative asset managers, and wealth managers we hold. The second largest area is regional banks, generally those where we see a differentiated franchise. Our exposure to banks has grown larger because we see an unusually supportive environment, including accelerating loan growth, widening interest margins, decreasing regulatory burdens, and continued low credit losses. While we remain guardedly optimistic about small-cap returns, we think the portfolio is well positioned to take advantage of the undervalued opportunities within the financial services sector. |
| 10 | The Royce Funds 2018 Semiannual Report to Shareholders |
| PERFORMANCE AND PORTFOLIO REVIEW | TICKER SYMBOLS RYFSX RGFIX |
| Performance and Expenses | ||||||||||||||
| Average Annual Total Return (%) Through 6/30/18 | ||||||||||||||
| JAN-JUN 20181 | 1-YR | 3-YR | 5-YR | 10-YR | SINCE INCEPTION (12/31/03) | |||||||||
| RFS | 2.65 | 14.45 | 8.05 | 10.82 | 9.51 | 8.59 | ||||||||
| Annual Gross Operating Expenses: 1.77% Annual Net Operating Expenses: 1.58% | ||||||||||||||
| 1 Not annualized | ||||||||||||||

The Morningstar Style Map is the Morningstar Style Box™ with the center 75% of fund holdings plotted as the Morningstar Ownership Zone™. The Morningstar Style Box is designed to reveal a fund’s investment strategy. The Morningstar Style Box is designed to reveal a fund’s investment strategy. The Morningstar Ownership Zone provides detail about a portfolio’s investment style by showing the range of stock sizes and styles. The Ownership Zone is derived by plotting each stock in the portfolio within the proprietary Morningstar Style Box. Over time, the shape and location of a fund’s ownership zone may vary. See page 125 for additional information. |
Value of $10,000
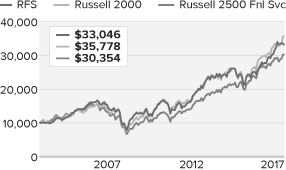
| Top 10 Positions | ||
| % of Net Assets | ||
| E-L Financial | 2.9 | |
| Popular | 2.6 | |
| First Citizens BancShares Cl. A | 2.3 | |
| Virtu Financial Cl. A | 2.2 | |
| Franco-Nevada Corporation | 2.1 | |
| FRP Holdings | 2.1 | |
| Sprott | 2.0 | |
| BOK Financial | 1.9 | |
| FirstService Corporation | 1.9 | |
| Ashmore Group | 1.9 | |
| Portfolio Industry Breakdown | ||
| % of Net Assets (Subject to Change) | ||
| Capital Markets | 45.4 | |
| Banks | 19.4 | |
| Real Estate Management & Development | 7.0 | |
| Insurance | 6.6 | |
| Metals & Mining | 2.1 | |
| Thrifts & Mortgage Finance | 1.9 | |
| IT Services | 1.7 | |
| Professional Services | 1.7 | |
| Trading Companies & Distributors | 1.4 | |
| Marine | 1.4 | |
| Internet Software & Services | 1.2 | |
| Software | 1.2 | |
| Investment Companies | 0.9 | |
| Hotels, Restaurants & Leisure | 0.6 | |
| Diversified Financial Services | 0.6 | |
| Consumer Finance | 0.5 | |
| Equity Real Estate Investment Trusts (REITs) | 0.3 | |
| Health Care Providers & Services | 0.0 | |
| Cash and Cash Equivalents | 6.1 | |
| Upside/Downside Capture Ratios | ||||
| Periods Ended 6/30/18 (%) | ||||
| UPSIDE | DOWNSIDE | |||
| 10-Year | 87 | 86 | ||
| Fund’s First Full Quarter (12/31/03) | 85 | 79 | ||
| Calendar Year Total Returns (%) | ||
| YEAR | RFS | |
| 2017 | 22.5 | |
| 2016 | 12.9 | |
| 2015 | -4.7 | |
| 2014 | 3.5 | |
| 2013 | 42.0 | |
| 2012 | 20.7 | |
| 2011 | -11.3 | |
| 2010 | 18.5 | |
| 2009 | 32.1 | |
| 2008 | -35.4 | |
| 2007 | -4.7 | |
| 2006 | 24.8 | |
| 2005 | 12.2 | |
| 2004 | 15.1 | |
| Portfolio Country Breakdown1,2 | ||
| % of Net Assets | ||
| United States | 54.0 | |
| Canada | 15.3 | |
| United Kingdom | 7.9 | |
| Switzerland | 3.6 | |
| India | 2.5 | |
| France | 1.6 | |
| South Africa | 1.5 | |
| Hong Kong | 1.5 | |
| 1 | Represents countries that are 1.5% or more of net assets. |
| 2 | Securities are categorized by the country of their headquarters. |
| Portfolio Diagnostics | ||
| Fund Net Assets | $57 million | |
| Number of Holdings | 96 | |
| Turnover Rate | 5% | |
| Average Market Capitalization1 | $2,121 million | |
| Weighted Average P/E Ratio2,3 | 16.1x | |
| Weighted Average P/B Ratio2 | 1.9x | |
| Active Share4 | 99% | |
| 1 | Geometric Average. This weighted calculation uses each portfolio holding’s market cap in a way designed to not skew the effect of very large or small holdings; instead, it aims to better identify the portfolio’s center, which Royce believes offers a more accurate measure of average market cap than a simple mean or median. |
| 2 | Harmonic Average. This weighted calculation evaluates a portfolio as if it were a single stock and measures it overall. It compares the total market value of the portfolio to the portfolio’s share in the earnings or book value, as the case may be, of its underlying stocks. |
| 3 | The Fund’s P/E ratio calculation excludes companies with zero or negative earnings (7% of portfolio holdings as of 6/30/18). |
| 4 | Active Share is the sum of the absolute values of the different weightings of each holding in the Fund versus each holding in the benchmark, divided by two. |
| Important Performance and Expense Information All performance information in this Report reflects past performance, is presented on a total return basis, reflects the reinvestment of distributions, and does not reflect the deduction of taxes that a shareholder would pay on fund distributions or the redemption of fund shares. Past performance is no guarantee of future results. Investment return and principal value of an investment will fluctuate, so that shares may be worth more or less than their original cost when redeemed. Shares redeemed within 30 days of purchase may be subject to a 1% redemption fee payable to the Fund, which is not reflected in the performance shown above; if it were, performance would be lower. Current month-end performance may be higher or lower than performance quoted and may be obtained at www.roycefunds.com. Gross operating expenses reflect the Fund’s gross total annual operating expenses for the Service Class and include management fees, 12b-1 distribution and service fees, other expenses and acquired fund fees and expenses. Net operating expenses reflect contractual fee waivers and/or expense reimbursements. All expense information is reported as of the Fund’s most current prospectus. Royce & Associates has contractually agreed to waive fees and/or reimburse expenses to the extent necessary to maintain the Fund’s net annual operating expenses, (excluding brokerage commissions, taxes, interest, litigation expenses, acquired fund fees and expenses, and other expenses not borne in the ordinary course of business), at or below 1.49% through April 30, 2019. Acquired fund fees and expenses reflect the estimated amount of the fees and expenses incurred indirectly by the Fund through its investments in mutual funds, hedge funds, private equity funds, and other investment companies. Regarding the “Top Contributors” and “Top Detractors” tables shown above, the sum of all contributors to, and all detractors from, performance for all securities in the portfolio would approximate the Fund’s year-to-date performance for 2018. Upside Capture Ratio measures a manager’s performance in up markets relative to the Fund’s benchmark. It is calculated by measuring the Fund’s performance in quarters when the benchmark went up and dividing it by the benchmark’s return in those quarters. Downside Capture Ratio measures a manager’s performance in down markets relative to the Fund’s benchmark (Russell 2000). It is calculated by measuring the Fund’s performance in quarters when the benchmark goes down and dividing it by the benchmark’s return in those quarters. |
| The Royce Funds 2018 Semiannual Report to Shareholders | 11 |
| MANAGERS’ DISCUSSION | ||
| Royce International Discovery Fund (RMI) (formerly named Royce International Micro-Cap Fund) | ||
 |
| Jim Harvey, CFA |
| FUND PERFORMANCE Tariff and trade war talk, a strengthening dollar, and market and economic softness in China and Europe all had a dampening effect on non-U.S. stocks of all sizes in the first half of 2018. Royce International Discovery Fund was down 6.2% for the year-to-date period ended June 30, 2018, underperforming its benchmark, the Russell Global ex-U.S. Small Cap Index, which declined 3.8% for the same period. |
| WHAT WORKED... AND WHAT DIDN’T |
| Of the Fund’s 10 equity sectors, six detracted from first-half results, with the largest negative impacts coming overwhelmingly from Industrials and Consumer Discretionary, its two largest sectors at the end of June. Industrials was also a substantial overweight relative to the benchmark. At the position level, three of the portfolio’s five biggest detractors came from this same sector. Atento is Latin America’s largest provider of customer relationship management and business process outsourcing (“CRM BPO”) services. Its stock price suffered in late 2017 after a secondary offering of shares was poorly received. In March of 2018, its shares again slipped when it reported a quarterly loss. While its Latin American end markets remain volatile, Atento is the dominant player in these markets and was also trading at a hefty discount to its global peers. This led us to add shares in the first half. Asian Granito India is one of India’s top tile manufacturers. Profit and revenue growth were not enough to offset a falling rupee, rising oil prices, and the slowing pace of global growth—all of which turned market sentiment negative, with Indian small-caps hit especially hard. Uncertain about its prospects in this climate, we sold our shares in June. We also exited our position in Magellan Aerospace, a Canadian company that manufactures engine and other components for customers in Canada, the U.S., and Europe. In early May, the company reported weaker-than-expected results rooted mostly in the expense of building a new manufacturing facility and a volatile British pound. Outside of Industrials, we built our position in Eugene Technology when uneven quarterly revenue growth and concerns that the semiconductor cycle had peaked combined to bring down its share price. Based in South Korea, Eugene is a semiconductor equipment maker that specializes in single-wafer type thermal insulation equipment. We like its niche and expect a revival in demand for its products. |
| The Fund’s top contributor at the position level in 2017, Conviviality fell to being by far its most significant detractor in the first half of 2018. The firm is a liquor distributor in the U.K. that also operates franchised off-license and convenience chain stores. Conviviality unraveled in short order in 2018, after it issued a pair of profit warnings, admitted to having a large, previously undiscovered tax bill, and unsuccessfully attempted to raise capital from investors to stave off liquidation. Needless to say, its management proved to be far less capable than investors had thought during its period of early success. |
| The top contributor at the position level was Hua Hong Semiconductor, a manufacturer of 200 millimeter wafers for specialized applications. Its shares benefited from impressive sales and earnings growth as well as the Chinese government’s push to source native semiconductor production. We reduced our position as its stock rose. TCI is a Taiwanese contract manufacturer of dietary supplements, health drinks, and skin care. Its shares were nourished by strong sales and earnings growth driven mostly by Chinese consumer demand and the company’s near-term positive outlook. Norway’s Leroy Seafood Group produces and distributes seafood around the globe, with a core business producing salmon, trout, and whitefish. Concerns that salmon prices were peaking allowed us to purchase shares at historically low multiples early in 2018. When subsequent earnings were better than expected accompanied by a more positive outlook on salmon prices, its shares jumped more than 60% from previous lows, which prompted us to sell our shares. |
| Relative to the benchmark year-to-date, the portfolio’s largest disadvantage came from ineffective stock selection in the Consumer Staples and Consumer Discretionary sectors, while it benefited from better stock picking in Financials, Telecommunication Services, and Materials. |
| Top Contributors to Performance Year-to-Date Through 6/30/18 (%)1 | |||
| Hua Hong Semiconductor | 0.77 | ||
| TCI | 0.45 | ||
| Leroy Seafood Group | 0.41 | ||
| China Resources Cement Holdings | 0.36 | ||
| HT&E | 0.35 | ||
| 1 Includes dividends | |||
| Top Detractors from Performance Year-to-Date Through 6/30/18 (%)2 | |||
| Conviviality | -1.24 | ||
| Atento | -0.58 | ||
| Asian Granito India | -0.45 | ||
| Eugene Technology | -0.36 | ||
| Magellan Aerospace | -0.35 | ||
| 2 Net of dividends | |||
| CURRENT POSITIONING AND OUTLOOK |
| The combination of a modest slowdown in international growth, rising emerging market instability, a stronger dollar, and heightened trade war concerns led investors to prefer a more limited menu of domestic offerings in the first half. In fact, 35 of the 45 non-U.S. small-cap markets that we follow had declines in the first half of 2018 (though only 26 were negative when measured in local currencies). Non-U.S. companies therefore faced major challenges, particularly in emerging market economies where fears of potential currency declines drove many investors to pull money out of these geographies. From a valuation standpoint, the U.S. market remained one of the most expensive in the world at the end of June, a distinction it has held for the better part of the past 10 years. In this environment, we continue to find attractive investment opportunities in both developed as well as emerging markets, where companies in India, Brazil, and Indonesia looked particularly interesting to us at June 30. |
| 12 | The Royce Funds 2018 Semiannual Report to Shareholders |
| PERFORMANCE AND PORTFOLIO REVIEW | TICKER SYMBOLS ROIMX |
| Performance and Expenses | ||||||||||||
| Average Annual Total Return (%) Through 6/30/18 | ||||||||||||
| JAN-JUN 20181 | 1-YR | 3-YR | 5-YR | SINCE INCEPTION (12/31/10) | ||||||||
| RMI | -6.21 | 3.96 | 5.48 | 8.03 | 3.62 | |||||||
| Annual Gross Operating Expenses: 2.79% Annual Net Operating Expenses: 1.44% | ||||||||||||
| 1 Not annualized | ||||||||||||
The Morningstar Style Map is the Morningstar Style Box™ with the center 75% of fund holdings plotted as the Morningstar Ownership Zone™. The Morningstar Style Box is designed to reveal a fund’s investment strategy. The Morningstar Ownership Zone provides detail about a portfolio’s investment style by showing the range of stock sizes and styles. The Ownership Zone is derived by plotting each stock in the portfolio within the proprietary Morningstar Style Box. Over time, the shape and location of a fund’s ownership zone may vary. See page 125 for additional information. |
Value of $10,000

| Top 10 Positions | ||
| % of Net Assets | ||
| Sonae SGPS | 2.6 | |
| DFDS | 2.5 | |
| Nilfisk Holding | 2.3 | |
| Outsourcing | 2.3 | |
| Biffa | 2.3 | |
| Kyowa Exeo | 2.1 | |
| Restore | 2.1 | |
| Zenkoku Hosho | 2.1 | |
| Hilton Food Group | 2.0 | |
| Atento | 1.9 | |
| Portfolio Sector Breakdown | ||
| % of Net Assets | ||
| Industrials | 24.5 | |
| Consumer Discretionary | 13.8 | |
| Information Technology | 13.1 | |
| Financials | 13.1 | |
| Materials | 8.1 | |
| Consumer Staples | 7.3 | |
| Real Estate | 6.5 | |
| Health Care | 4.0 | |
| Energy | 3.7 | |
| Telecommunication Services | 2.0 | |
| Cash and Cash Equivalents | 3.9 | |
| Calendar Year Total Returns (%) | ||
| YEAR | RMI | |
| 2017 | 27.7 | |
| 2016 | 6.3 | |
| 2015 | -1.0 | |
| 2014 | -2.4 | |
| 2013 | 18.9 | |
| 2012 | 13.6 | |
| 2011 | -21.5 | |
| Portfolio Country Breakdown1,2 | ||
| % of Net Assets | ||
| Japan | 20.0 | |
| United Kingdom | 10.4 | |
| Canada | 5.9 | |
| South Korea | 5.5 | |
| Denmark | 4.8 | |
| China | 4.8 | |
| Hong Kong | 4.4 | |
| Taiwan | 4.1 | |
| Brazil | 3.9 | |
| Australia | 3.4 | |
| 1 | Represents countries that are 3% or more of net assets. |
| 2 | Securities are categorized by the country of their headquarters. |
| Portfolio Diagnostics | ||
| Fund Net Assets | $8 million | |
| Number of Holdings | 81 | |
| Turnover Rate | 112% | |
| Average Market Capitalization1 | $1,221 million | |
| Weighted Average P/E Ratio2,3 | 16.4x | |
| Weighted Average P/B Ratio2 | 2.1x | |
| Active Share4 | 98% | |
| 1 | Geometric Average. This weighted calculation uses each portfolio holding’s market cap in a way designed to not skew the effect of very large or small holdings; instead, it aims to better identify the portfolio’s center, which Royce believes offers a more accurate measure of average market cap than a simple mean or median. |
| 2 | Harmonic Average. This weighted calculation evaluates a portfolio as if it were a single stock and measures it overall. It compares the total market value of the portfolio to the portfolio’s share in the earnings or book value, as the case may be, of its underlying stocks. |
| 3 | The Fund’s P/E ratio calculation excludes companies with zero or negative earnings (5% of portfolio holdings as of 6/30/18). |
| 4 | Active Share is the sum of the absolute values of the different weightings of each holding in the Fund versus each holding in the benchmark, divided by two. |
| Important Performance and Expense Information |
All performance information in this Report reflects past performance, is presented on a total return basis, reflects the reinvestment of distributions, and does not reflect the deduction of taxes that a shareholder would pay on fund distributions or the redemption of fund shares. Past performance is no guarantee of future results. Investment return and principal value of an investment will fluctuate, so that shares may be worth more or less than their original cost when redeemed. Shares redeemed within 30 days of purchase may be subject to a 2% redemption fee payable to the Fund, which is not reflected in the performance shown above; if it were, performance would be lower. Current month-end performance may be higher or lower than performance quoted and may be obtained at www.roycefunds.com. Gross operating expenses reflect total gross annual operating expenses and include management fees, 12b-1 distribution and service fees, and other expenses. Net operating expenses reflect contractual fee waivers and/or expense reimbursements. All expense information is reported as of the Fund’s most current prospectus. Royce & Associates has contractually agreed to waive its fees and/or reimburse operating expenses, to the extent necessary to maintain the Fund’s net annual operating expenses, (excluding brokerage commissions, taxes, interest, litigation expenses, acquired fund fees and expenses, and other expenses not borne in the ordinary course of business), at or below 1.44% through April 30, 2019 and at or below 1.99% through April 30, 2028. Regarding the “Top Contributors” and “Top Detractors” tables shown above, the sum of all contributors to, and all detractors from, performance for all securities in the portfolio would approximate the Fund’s year-to-date performance for 2018. |
| The Royce Funds 2018 Semiannual Report to Shareholders | 13 |
| MANAGERS’ DISCUSSION | ||
| Royce International Premier Fund (RIP) |
 |
| David Nadel Mark Rayner, CA |
| FUND PERFORMANCE Tariff and trade war talk, a strengthening dollar, market and economic softness in China, and slower growth in Europe all had a dampening effect on non-U.S. stocks in the first half of 2018. In spite of these challenges, the Fund maintained its advantage over its benchmark, the Russell Global ex-U.S. Small Cap Index, outpacing the index for the one, three-, five-year, and since inception (12/31/10) periods ended June 30, 2018. Royce International Premier Fund fell 3.1% for the year-to-date period ended June 30, 2018, losing slightly less than the Russell Global ex-U.S. Small Cap Index, which declined 3.8% for the same period. Most international indexes slipped into negative territory during 2018’s first six months due to the combination of the modest slowdown in international growth, rising emerging market instability, a stronger dollar, and heightened trade war concerns. However, we were encouraged that several holdings continued to execute well in the first half, and several saw otherwise positive stock market performances in their respective currencies undone by U.S. dollar strength. |
| WHAT WORKED... AND WHAT DIDN’T |
| During the first half, the sectors making the largest negative impact on performance were Information Technology (the portfolio’s second-largest weighting at the end of June) and Consumer Discretionary. Only three of the portfolio’s nine equity sectors made positive contributions to year-to-date results, and only Health Care had a meaningful effect. |
| At the industry level, IT services (Information Technology) detracted most, followed by the construction & engineering group (Industrials). The portfolio’s top two detractors at the position level came from these two respective industries. They were also chiefly responsible for India and Switzerland having the first- and second-biggest negative effects on performance at the country level. Vakrangee is an Indian company that operates a network of outlets providing everyday transactional services to mostly rural consumers, primarily in under-served areas. During the first quarter, the company faced questions about corporate governance and its internal investment policy, among other issues. Although Vakrangee refuted these allegations, the cloud overhanging the firm’s credibility gave us pause, and we exited our position in April. Burkhalter Holding is the leading provider of electrical engineering services in Switzerland. Its stock price was hurt by increasing talk that competition would pressure pricing. Seeing these issues as more temporal than structural, we added shares in the first half. Two companies in the software industry contributed most in the first half. Bravura Solutions is an Australian funds-management software business. Following several high-profile contract signings and the successful monetization off its innovative Sonata platform, Bravura benefited from several broker upgrades, which helped solidify its status as the industry leader in one of the world’s most attractive pension markets. We trimmed our position slightly in the first half. SimCorp is a Danish company that provides software to the asset management industry. Its shares advanced in mid-May on the release of fiscal first-quarter results that showed a 23% advance in revenue with 26% operating margins. With the shares re-rated far more quickly than we anticipated, we began to exit our position as its stock climbed. |
| Relative to the benchmark year-to-date, the portfolio’s overall advantage came from sector allocation. However, the Fund also gained an edge from stock selection in Health Care, in addition to our overweight in the sector. Superior stock picks gave the portfolio another advantage in Industrials, most meaningfully in machinery and commercial services & supplies. Finally, the strength of the U.S. dollar also gave the Fund’s cash position a relative advantage. Conversely, stock selection was a detractor versus the international small-cap index in Information Technology, especially in the software, IT services, and electronic equipment, instruments & components groups. The Fund’s significantly lower exposure, as well as ineffective stock picks, hurt relative results in Real Estate, while stock selection was an issue in Consumer Discretionary. |
| Top Contributors to Performance Year-to-Date Through 6/30/18 (%)1 | |||
| Bravura Solutions | 1.09 | ||
| SimCorp | 0.53 | ||
| TGS-NOPEC Geophysical | 0.53 | ||
| Sartorius Stedim Biotech | 0.41 | ||
| DiaSorin | 0.39 | ||
| 1 Includes dividends | |||
| Top Detractors from Performance Year-to-Date Through 6/30/18 (%)2 | |||
| Vakrangee | -0.90 | ||
| Burkhalter Holding | -0.80 | ||
| SH Kelkar & Company | -0.61 | ||
| OdontoPrev | -0.54 | ||
| ITE Group | -0.49 | ||
| 2 Net of dividends | |||
| CURRENT POSITIONING AND OUTLOOK |
| At the end of June, the bulk of the portfolio’s assets remained invested in four sectors—Industrials, Information Technology, Health Care, and Materials—with the first two groups accounting for more than half of its assets. With the pace of non-U.S. growth having slowed in the first half, we used our Quality at a Reasonable Price (‘QARP’) approach to find high-quality companies trading at what we thought were low or reasonable valuations. Our goal, as always, is to find businesses that look well-positioned to deliver high returns over full market cycles. Our focus is on companies that are market leaders, typically with global reach and/or expertise, attributes that we suspect will prove timely in a period of growing U.S. dollar strength. In the first half, we added three new holdings: EPS Holdings, a Japanese clinical testing services business, ITE Group, a U.K.-based company that organizes trade exhibitions and conferences worldwide, and Kardex, a Swiss firm with a global business that offers intra-logistic services as well as automated storage solutions and material handling systems. |
| 14 | The Royce Funds 2018 Semiannual Report to Shareholders |
| PERFORMANCE AND PORTFOLIO REVIEW | TICKER SYMBOLS RYIPX RIPNX RINPX RIPIX |
| Performance and Expenses | ||||||||||
| Average Annual Total Return (%) Through 6/30/18 | ||||||||||
| JAN-JUN 20181 | 1-YR | 3-YR | 5-YR | SINCE INCEPTION (12/31/10) | ||||||
| RIP | -3.08 | 10.77 | 11.07 | 10.10 | 7.65 | |||||
| Annual Gross Operating Expenses: 1.65% Annual Net Operating Expenses: 1.44% | ||||||||||
| 1 Not annualized | ||||||||||

The Morningstar Style Map is the Morningstar Style Box™ with the center 75% of fund holdings plotted as the Morningstar Ownership Zone™. The Morningstar Style Box is designed to reveal a fund’s investment strategy. The Morningstar Ownership Zone provides detail about a portfolio’s investment style by showing the range of stock sizes and styles. The Ownership Zone is derived by plotting each stock in the portfolio within the proprietary Morningstar Style Box. Over time, the shape and location of a fund’s ownership zone may vary. See page 125 for additional information. |
Value of $10,000
| Top 10 Positions | ||
| % of Net Assets | ||
| USS | 3.0 | |
| VZ Holding | 2.9 | |
| Partners Group Holding | 2.8 | |
| Meitec Corporation | 2.7 | |
| IPH | 2.3 | |
| Equiniti Group | 2.3 | |
| TOTVS | 2.3 | |
| OdontoPrev | 2.3 | |
| TravelSky Technology | 2.3 | |
| As One | 2.2 | |
| Portfolio Sector Breakdown | ||
| % of Net Assets | ||
| Industrials | 26.2 | |
| Information Technology | 22.8 | |
| Health Care | 17.2 | |
| Materials | 9.3 | |
| Financials | 7.6 | |
| Consumer Discretionary | 6.5 | |
| Real Estate | 4.0 | |
| Energy | 2.2 | |
| Cash and Cash Equivalents | 4.2 | |
| Upside/Downside Capture Ratios | ||||||||||||||
| Periods Ended 6/30/18 (%) | ||||||||||||||
| UPSIDE | DOWNSIDE | |||||||||||||
| Fund’s First Full Quarter (12/31/10) | 107 | 83 | ||||||||||||
| Calendar Year Total Returns (%) | ||
| YEAR | RIP | |
| 2017 | 39.8 | |
| 2016 | -1.1 | |
| 2015 | 16.2 | |
| 2014 | -8.2 | |
| 2013 | 18.3 | |
| 2012 | 23.4 | |
| 2011 | -16.8 | |
| Portfolio Country Breakdown1,2 | ||
| % of Net Assets | ||
| Japan | 17.1 | |
| United Kingdom | 14.4 | |
| Australia | 11.4 | |
| Switzerland | 9.9 | |
| Sweden | 6.2 | |
| Canada | 5.8 | |
| France | 5.4 | |
| Brazil | 4.6 | |
| New Zealand | 4.1 | |
| Germany | 3.7 | |
| India | 3.6 | |
| 1 | Represents countries that are 3% or more of net assets. |
| 2 | Securities are categorized by the country of their headquarters. |
| Portfolio Diagnostics | ||
| Fund Net Assets | $233 million | |
| Number of Holdings | 50 | |
| Turnover Rate | 30% | |
| Average Market Capitalization1 | $1,687 million | |
| Weighted Average P/E Ratio2,3 | 23.3x | |
| Weighted Average P/B Ratio2 | 3.6x | |
| Active Share4 | 99% | |
| 1 | Geometric Average. This weighted calculation uses each portfolio holding’s market cap in a way designed to not skew the effect of very large or small holdings; instead, it aims to better identify the portfolio’s center, which Royce believes offers a more accurate measure of average market cap than a simple mean or median. |
| 2 | Harmonic Average. This weighted calculation evaluates a portfolio as if it were a single stock and measures it overall. It compares the total market value of the portfolio to the portfolio’s share in the earnings or book value, as the case may be, of its underlying stocks. |
| 3 | The Fund’s P/E ratio calculation excludes companies with zero or negative earnings (1% of portfolio holdings as of 6/30/18). |
| 4 | Active Share is the sum of the absolute values of the different weightings of each holding in the Fund versus each holding in the benchmark, divided by two. |
| Important Performance and Expense Information All performance information in this Report reflects past performance, is presented on a total return basis, reflects the reinvestment of distributions, and does not reflect the deduction of taxes that a shareholder would pay on fund distributions or the redemption of fund shares. Past performance is no guarantee of future results. Investment return and principal value of an investment will fluctuate, so that shares may be worth more or less than their original cost when redeemed. Shares redeemed within 30 days of purchase may be subject to a 2% redemption fee payable to the Fund, which is not reflected in the performance shown above; if it were, performance would be lower. Current month-end performance may be higher or lower than performance quoted and may be obtained at www.roycefunds.com. All performance and risk information reflects results of the Service Class (its oldest class). Price and total return information is based on net asset values for shareholder transactions. Certain immaterial adjustments were made to the net assets of Royce International Premier Fund at 6/30/14 for financial reporting purposes, and as a result the calendar year total returns based on those net assets values differ from the adjusted net values and calendar year total returns reported in the Financial Highlights. Gross operating expenses reflect total gross annual operating expenses for the Service Class and include management fees, 12b-1 distribution and service fees, and other expenses. Net operating expenses reflect contractual fee waivers and/or expense reimbursements. All expense information is reported as of the Fund’s most current prospectus. Royce & Associates has contractually agreed to waive its fees and/or reimburse operating expenses to the extent necessary to maintain the Fund’s net annual operating expenses, (excluding brokerage commissions, taxes, interest, litigation expenses, acquired fund fees and expenses, and other expenses not borne in the ordinary course of business), at or below 1.44% through April 30, 2019. Regarding the “Top Contributors” and “Top Detractors” tables shown above, the sum of all contributors to, and all detractors from, performance for all securities in the portfolio would approximate the Fund’s year-to-date performance for 2018. Upside Capture Ratio measures a manager’s performance in up markets relative to the Fund’s benchmark. It is calculated by measuring the Fund’s performance in quarters when the benchmark went up and dividing it by the benchmark’s return in those quarters. Downside Capture Ratio measures a manager’s performance in down markets relative to the Fund’s benchmark (Russell Global ex-U.S. Small Cap). It is calculated by measuring the Fund’s performance in quarters when the benchmark goes down and dividing it by the benchmark’s return in those quarters. |
| The Royce Funds 2018 Semiannual Report to Shareholders | 15 |
| MANAGER’S DISCUSSION | ||
| Royce Low-Priced Stock Fund (RLP) |
 |
| Jim Stoeffel |
| FUND PERFORMANCE Royce Low-Priced Stock Fund outperformed the Russell 2000 Index, its small-cap benchmark, in the first half of 2018. The Fund increased 9.3% while the Russell 2000 was up 7.7% for the year-to-date period ended June 30, 2018. The Fund also outpaced the benchmark for the one-, 20-year, and since inception (12/15/93) periods ended June 30, 2018. The portfolio boasts a generous number of micro-cap stocks, which was the top-performing domestic asset class in the first half. U.S. economic growth continued to accelerate, and many companies continued to post strong earnings, aided by lower tax rates. Their greater reliance on U.S. growth left small- and micro-cap stocks better positioned than large-caps through most of the first half. The strengthening dollar, which tends to historically coincide with relatively stronger small-cap results, also benefited small-cap performance. |
| WHAT WORKED... AND WHAT DIDN’T |
| The Fund had strong contributions from the Information Technology, Consumer Discretionary, Health Care, and Energy sectors. Health care equipment & supplies (Health Care) was the top contributor at the industry level, and specialty retail (Consumer Discretionary) and energy equipment & services (Energy) followed closely behind. The portfolio’s top contributor at the position level was biotechnology company Heron Therapeutics, which had strong Phase 3 results during the second quarter for a key product focused on post-operative pain management. With the potential for an “opioid sparing” label, we believe this product has blockbuster potential across a number of applications. Although we sold part of our stake as its stock rose, we maintained a position at the end of June. Profire Energy—an oil field technology company specializing in burner management systems—benefited from a resurgence in field activity fueled by rising oil prices. We sold almost a third of our stake during the first half, maintaining a position because the company is investing heavily in R&D to expand applications outside of oil field services, which has significantly increased its addressable markets. Stoneridge, which supplies electrical components to cars and trucks, was also among the Fund’s top performers, as the company saw its shares positively reflect its success in winning new business across several product lines. Stoneridge is gaining traction with its MirrorEye camera system, which offers safety and fuel economy benefits by replacing side mirrors on trucks. We maintained our stake in the position because we think its new product pipeline remains strong and could potentially drive above-average growth in the years to come. Our position in Paratek Pharmaceuticals detracted on both an absolute and relative basis. Its shares fell due to concerns over incremental FDA approval scrutiny, the potential for a slow commercial ramp up, and a capital raise in April. We increased our position in the first half because of the large market opportunity for a new antibiotic associated with the increased human resistance to older varieties. ASV Holdings, which provides skid steers and loading equipment for the construction and agriculture markets, disappointed when the company missed fiscal first-quarter earnings expectations, the result of changes in its parts distribution strategy and higher raw materials prices that crimped gross margins. We view these issues as transitory, so we built our position as its stock price tumbled. Metals & mining (Materials) and pharmaceuticals (Health Care) detracted most at the industry level from portfolio performance—and detracted versus the Russell 2000—while the Fund’s significant underweight in the Health Care sector created the biggest headwind to relative results. Stock selection was the primary culprit in the relative disadvantage for Materials, with mining companies Orocobre and Pretium being notable detractors. Consumer Discretionary, Energy, and Financials were the areas with the strongest relative contributions. The portfolio’s edge in all three areas was driven primarily by broad-based stock selection. In addition to Stoneridge in Consumer Discretionary, Mammoth Energy Services, which offers oil field services as well as engineering and construction services, was a notable standout. During the year, the company was awarded significant follow-on contracts related to hurricane damage in Puerto Rico. We reduced our position as its stock price continued to rise. Although we thought it remained attractively valued, we wanted more clarity as to how sustainable the company’s business in Puerto Rico will be. |
| Top Contributors to Performance Year-to-Date Through 6/30/18 (%)1 | ||||
| Heron Therapeutics | 0.63 | |||
| Profire Energy | 0.60 | |||
| Stoneridge | 0.53 | |||
| Mammoth Energy Services | 0.50 | |||
| AtriCure | 0.45 | |||
| 1 Includes dividends | ||||
| Top Detractors from Performance Year-to-Date Through 6/30/18 (%)2 | ||||
| Paratek Pharmaceuticals | -0.32 | |||
| ASV Holdings | -0.27 | |||
| Gulf Island Fabrication | -0.27 | |||
| Electro Scientific Industries | -0.26 | |||
| Total Energy Services | -0.25 | |||
| 2 Net of dividends | ||||
| CURRENT POSITIONING AND OUTLOOK |
| We did not make any major changes to the portfolio positioning in the first half of 2018. Our largest sector weightings at the end of June were Information Technology, Industrials, and Consumer Discretionary. Health Care, particularly biotechnology, continued to be among our largest underweights. We remain cautiously optimistic in anticipation of an increasingly less restrictive regulatory environment. Considering the accelerating pace of the U.S. economy growth, lower corporate tax rates, and the slower pace of global economic growth, we are particularly focused on small- and micro-cap companies that have most of their exposure to the U.S. economy. |
| 16 | The Royce Funds 2018 Semiannual Report to Shareholders |
| PERFORMANCE AND PORTFOLIO REVIEW | TICKER SYMBOLS RYLPX RLPHX |
| Performance and Expenses | ||||||||||||||||
| Average Annual Total Return (%) Through 6/30/18 | ||||||||||||||||
| JAN-JUN 20181 | 1-YR | 3-YR | 5-YR | 10-YR | 15-YR | 20-YR | SINCE INCEPTION (12/15/93) | |||||||||
| RLP | 9.34 | 18.75 | 6.70 | 6.61 | 4.82 | 7.51 | 8.52 | 10.25 | ||||||||
| Annual Operating Expenses: 1.61% Annual Net Operating Expenses: 1.58% | ||||||||||||||||
| 1 Not annualized | ||||||||||||||||
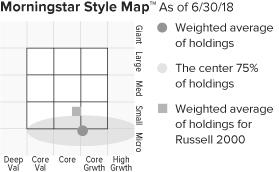
The Morningstar Style Map is the Morningstar Style Box™ with the center 75% of fund holdings plotted as the Morningstar Ownership Zone™. The Morningstar Style Box is designed to reveal a fund’s investment strategy. The Morningstar Ownership Zone provides detail about a portfolio’s investment style by showing the range of stock sizes and styles. The Ownership Zone is derived by plotting each stock in the portfolio within the proprietary Morningstar Style Box. Over time, the shape and location of a fund’s ownership zone may vary. See page 125 for additional information. |
Value of $10,000
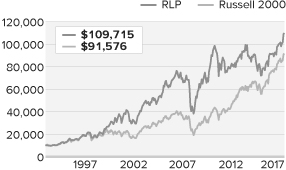
| Top 10 Positions | ||
| % of Net Assets | ||
| Natural Gas Services Group | 1.4 | |
| Shoe Carnival | 1.4 | |
| Westwood Holdings Group | 1.4 | |
| Stoneridge | 1.3 | |
| FormFactor | 1.3 | |
| AtriCure | 1.3 | |
| CryoLife | 1.2 | |
| Kornit Digital | 1.2 | |
| Graham Corporation | 1.2 | |
| Ameresco Cl. A | 1.2 | |
| Portfolio Sector Breakdown | ||
| % of Net Assets | ||
| Information Technology | 21.2 | |
| Industrials | 17.7 | |
| Consumer Discretionary | 17.2 | |
| Financials | 11.6 | |
| Health Care | 10.4 | |
| Energy | 9.3 | |
| Materials | 4.9 | |
| Consumer Staples | 2.9 | |
| Telecommunication Services | 0.8 | |
| Cash and Cash Equivalents | 4.0 | |
| Calendar Year Total Returns (%) | ||
| YEAR | RLP | |
| 2017 | 9.7 | |
| 2016 | 16.1 | |
| 2015 | -10.4 | |
| 2014 | -3.4 | |
| 2013 | 12.9 | |
| 2012 | 4.5 | |
| 2011 | -14.6 | |
| 2010 | 31.5 | |
| 2009 | 53.6 | |
| 2008 | -36.0 | |
| 2007 | 2.3 | |
| 2006 | 19.0 | |
| 2005 | 9.7 | |
| 2004 | 13.6 | |
| 2003 | 44.0 | |
| Upside/Downside Capture Ratios | ||||
| Periods Ended 6/30/18 (%) | ||||
| UPSIDE | DOWNSIDE | |||
| 10-Year | 83 | 117 | ||
| From 12/31/93 (Start of the Fund’s First Full Quarter) | 101 | 94 | ||
| Portfolio Diagnostics | ||
| Fund Net Assets | $270 million | |
| Number of Holdings | 119 | |
| Turnover Rate | 44% | |
| Average Market Capitalization1 | $515 million | |
| Weighted Average P/B Ratio2 | 2.1x | |
| Active Share3 | 97% | |
| U.S. Investments (% of Net Assets) | 81.7% | |
| Non-U.S. Investments (% of Net Assets) | 14.3% | |
| 1 | Geometric Average. This weighted calculation uses each portfolio holding’s market cap in a way designed to not skew the effect of very large or small holdings; instead, it aims to better identify the portfolio’s center, which Royce believes offers a more accurate measure of average market cap than a simple mean or median. |
| 2 | Harmonic Average. This weighted calculation evaluates a portfolio as if it were a single stock and measures it overall. It compares the total market value of the portfolio to the portfolio’s share in the earnings or book value, as the case may be, of its underlying stocks. |
| 3 | Active Share is the sum of the absolute values of the different weightings of each holding in the Fund versus each holding in the benchmark, divided by two. |
| Important Performance and Expense Information All performance information in this Report reflects past performance, is presented on a total return basis, reflects the reinvestment of distributions, and does not reflect the deduction of taxes that a shareholder would pay on fund distributions or the redemption of fund shares. Past performance is no guarantee of future results. Investment return and principal value of an investment will fluctuate, so that shares may be worth more or less than their original cost when redeemed. Shares redeemed within 30 days of purchase may be subject to a 1% redemption fee payable to the Fund, which is not reflected in the performance shown above; if it were, performance would be lower. Current month-end performance may be higher or lower than performance quoted and may be obtained at www.roycefunds.com. All performance and risk information reflects results of the Service Class (its oldest class). Price and total return information is based on net asset values for shareholder transactions. Certain immaterial adjustments were made to the net assets of Royce Low-Priced Stock Fund at 6/30/13 for financial reporting purposes, and as a result the calendar year total returns based on those net asset values differ from the adjusted net asset values and calendar year total returns reported in the Financial Highlights. Gross operating expenses reflect the Fund’s total gross annual operating expenses for the Service Class and include management fees, 12b-1 distribution and service fees, other expenses, and acquired fund fees and expenses. Net operating expenses reflect contractual fee waivers and/or expense reimbursements. All expense information is reported as of the Fund’s most current prospectus. Royce & Associates has contractually agreed to waive fees and/or reimburse operating expenses to the extent necessary to maintain the Fund’s net annual operating expenses (excluding brokerage commissions, taxes, interest, litigation expenses, acquired fund fees and expenses, and other expenses not borne in the ordinary course of business) at or below 1.49% through April 30, 2019. Acquired fund fees and expenses reflect the estimated amount of the fees and expenses incurred indirectly by the Fund through its investments in mutual funds, hedge funds, private equity funds, and other investment companies. Regarding the “Top Contributors” and “Top Detractors” tables shown above, the sum of all contributors to, and all detractors from, performance for all securities in the portfolio would approximate the Fund’s year-to-date performance for 2018. Upside Capture Ratio measures a manager’s performance in up markets relative to the Fund’s benchmark. It is calculated by measuring the Fund’s performance in quarters when the benchmark went up and dividing it by the benchmark’s return in those quarters. Downside Capture Ratio measures a manager’s performance in down markets relative to the Fund’s benchmark (Russell 2000). It is calculated by measuring the Fund’s performance in quarters when the benchmark goes down and dividing it by the benchmark’s return in those quarters. |
| The Royce Funds 2018 Semiannual Report to Shareholders | 17 |
| MANAGERS’ DISCUSSION | ||
| Royce Micro-Cap Fund (RMC) |
 |
| Jim Stoeffel Brendan Hartman |
| FUND PERFORMANCE Royce Micro-Cap Fund increased 10.2% for the year-to-date period ended June 30, 2018, ahead of the small-cap Russell 2000 Index, which was up 7.7%, but narrowly behind its benchmark, the Russell Microcap Index, which increased 10.7% for the same period. Micro-cap stocks were the top-performing U.S. asset class in the first half of the year, as the greater reliance on U.S. growth left small- and micro-cap stocks better positioned for superior performance relative to large-caps in the first half of the year. |
| WHAT WORKED... AND WHAT DIDN’T |
| The Fund boasted strong sector contributions from Information Technology, Health Care, and Consumer Discretionary, while two healthcare companies made strong positive impacts at the position level. Tactile Systems, which makes medical devices used to treat lymphedema, grew its sales force and introduced new products, such as its system targeted at head and neck lymphedema. Seeing low market penetration and a favorable competitive environment, we continued to hold shares after making modest trims as its stock price rose. Medical device company Surmodics, which specializes in coronary stents and catheters, was another notable pick for the portfolio. A recent agreement gave Abbot Laboratories exclusive global commercialization rights for the company’s SurVeil drug. We saw an extended pipeline of interesting products and therefore maintained our position in the company’s shares. |
| We reduced our stake in Profire Energy, an oilfield technology specialist in burner management systems that was the portfolio’s top contributor overall. It benefited from the resurgence in oil field activity fueled by higher oil prices. We held our stock in Attunity, a leading provider of data management software, because we saw an increased adoption of its core software platform across an ever increasing number of enterprises. The company’s software addresses new paradigms in data management, which we believed were in the very early stages of adoption. Stoneridge, which supplies electrical components to cars and trucks, was winning new business across several product lines, such as its MirrorEye camera system that offers safety and fuel economy benefits by replacing side mirrors on trucks. We sold a portion of our shares as its share price rose steadily. We also saw positive contributions to return on these positions in relation to the Russell Microcap. |
| Thanks to effective stock selection, Consumer Discretionary and Information Technology were the areas that contributed most to performance versus the benchmark, while Energy and Financials were the largest detractors—both due to poor stock picking. One position significantly detracted from performance on both an absolute and relative basis: Basic Energy Services, a leading provider of well site services in the oil and gas industry, saw increased pricing pressure as well as project delays in certain markets. We increased our stake slightly within the first six months of the year based on the belief that these pressures were transitory given ongoing strength in underlying energy prices. Gulf Island Fabrication makes specialized structures and marine vessels used in the energy sector. Its shares have been pressured as its off-shore oil well platform business remained sluggish while it also experienced cost overruns on a major marine vessel contract. Atlas Financial, which provides insurance for taxis, limos, ride share services, and paratransit transportation firms, was another impactful detractor on an absolute and relative basis. For a second year in a row, Atlas recorded a surprise fourth-quarter loss due to an increase in loss reserves for prior year accidents. Our belief that the first surprise loss was an anomaly and that the company’s market niche could provide high returns on equity was proven incorrect. We sold all of our shares as a result. Shares of Paratek Pharmaceuticals fell due to concerns over incremental FDA approval scrutiny, the potential for a slow commercial ramp up, and a capital raise in April. We increased our position in the first half because of the large market opportunity for a new antibiotic associated with the increased human resistance to older varieties. We chose to trim our position in U.S. Concrete, which saw its shares pressured as poor weather impacted certain large markets and the company had some early execution shortfalls digesting a large acquisition. |
| Top Contributors to Performance Year-to-Date Through 6/30/18 (%)1 | ||||
| Profire Energy | 0.61 | |||
| Tactile Systems Technology | 0.58 | |||
| Surmodics | 0.58 | |||
| Attunity | 0.55 | |||
| Stoneridge | 0.49 | |||
| 1 Includes dividends | ||||
| Top Detractors from Performance Year-to-Date Through 6/30/18 (%)2 | ||||
| Atlas Financial Holdings | -0.46 | |||
| Basic Energy Services | -0.37 | |||
| U.S. Concrete | -0.29 | |||
| Paratek Pharmaceuticals | -0.27 | |||
| Gulf Island Fabrication | -0.24 | |||
| 2 Net of dividends | ||||
| CURRENT POSITIONING AND OUTLOOK |
| We did not make any major changes to portfolio positioning in the first half of 2018. Despite the increasing uncertainty around trade, we remained generally constructive on the U.S. economy, which supported underlying growth and valuations in our overweight sectors, such as Information Technology, Industrials, and Consumer Discretionary. These sectors were also our largest overweights relative to the Russell Microcap. Health Care, particularly biotechnology, continued to be among our largest underweights. We remained optimistic about micro-cap stocks in anticipation of an increasingly less restrictive regulatory environment. Considering the accelerated pace of U.S. economic growth, lower corporate tax rates, and the slower pace of global economic growth, we were particularly focused on micro-cap companies that had a disproportionate exposure to the U.S. economy. |
| 18 | The Royce Funds 2018 Semiannual Report to Shareholders |
| PERFORMANCE AND PORTFOLIO REVIEW | TICKER SYMBOLS RYOTX RMCFX RYMCX |
| Performance and Expenses | ||||||||||||||||||
| Average Annual Total Return (%) Through 6/30/18 | ||||||||||||||||||
| JAN-JUN 20181 | 1-YR | 3-YR | 5-YR | 10-YR | 15-YR | 20-YR | 25-YR | SINCE INCEPTION (12/31/91) | ||||||||||
| RMC | 10.22 | 13.91 | 6.94 | 6.36 | 5.52 | 8.64 | 8.67 | 10.16 | 11.02 | |||||||||
| Annual Gross Operating Expenses: 1.60% Annual Net Operating Expenses: 1.58% | ||||||||||||||||||
| 1 Not annualized | ||||||||||||||||||
Relative Returns: Monthly Rolling Average Annual Return Periods
| On a monthly rolling basis, the Fund outperformed the Russell Microcap in 62% of all 10-year periods; 59% of all 5-year periods; and 50% of all 1-year periods. |
| PERIODS BEATING THE INDEX | FUND AVG (%)1 | INDEX AVG (%)1 | ||||||||||||
| 10-year | 60/97 | 62% | 7.5 | 6.4 | ||||||||||
| 5-year | 92/157 | 59% | 8.3 | 8.3 | ||||||||||
| 1-year | 102/205 | 50% | 10.5 | 10.8 | ||||||||||
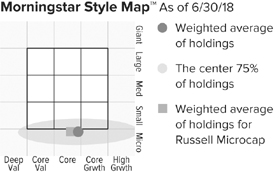
The Morningstar Style Map is the Morningstar Style BoxTM with the center 75% of fund holdings plotted as the Morningstar Ownership ZoneTM. The Morningstar Style Box is designed to reveal a fund’s investment strategy. The Morningstar Ownership Zone provides detail about a portfolio’s investment style by showing the range of stock sizes and styles. The Ownership Zone is derived by plotting each stock in the portfolio within the proprietary Morningstar Style Box. Over time, the shape and location of a fund’s ownership zone may vary. See page 125 for additional information. |
Value of $10,000
Inception) as of 6/30/18 ($)
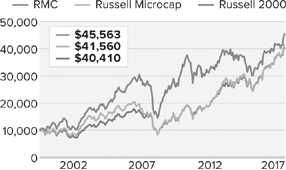
| Top 10 Positions | ||
| % of Net Assets | ||
| AtriCure | 1.1 | |
| Attunity | 1.1 | |
| Stoneridge | 1.1 | |
| Shoe Carnival | 1.1 | |
| Surmodics | 1.1 | |
| CryoLife | 1.1 | |
| Red Lion Hotels | 1.0 | |
| Vera Bradley | 1.0 | |
| PC Connection | 1.0 | |
| Mesa Laboratories | 1.0 | |
| Portfolio Sector Breakdown | ||
| % of Net Assets | ||
| Information Technology | 19.7 | |
| Industrials | 19.3 | |
| Financials | 15.3 | |
| Consumer Discretionary | 14.3 | |
| Health Care | 11.3 | |
| Energy | 6.3 | |
| Materials | 4.5 | |
| Real Estate | 2.5 | |
| Consumer Staples | 2.4 | |
| Telecommunication Services | 0.6 | |
| Cash and Cash Equivalents | 3.8 | |
| Calendar Year Total Returns (%) | ||
| YEAR | RMC | |
| 2017 | 5.4 | |
| 2016 | 19.7 | |
| 2015 | -13.3 | |
| 2014 | -4.1 | |
| 2013 | 21.3 | |
| 2012 | 8.0 | |
| 2011 | -12.1 | |
| 2010 | 30.1 | |
| 2009 | 55.7 | |
| 2008 | -40.9 | |
| 2007 | 7.1 | |
| 2006 | 22.3 | |
| 2005 | 11.5 | |
| 2004 | 15.8 | |
| 2003 | 52.6 | |
| Upside/Downside Capture Ratios | ||||||||||||||
| Periods Ended 6/30/18 (%) | ||||||||||||||
| UPSIDE | DOWNSIDE | |||||||||||||
| 10-Year | 76 | 97 | ||||||||||||
| From 6/30/00 (Russell Microcap Index Inception) | 90 | 81 | ||||||||||||
| Portfolio Diagnostics | ||
| Fund Net Assets | $197 million | |
| Number of Holdings | 145 | |
| Turnover Rate | 11% | |
| Average Market Capitalization1 | $485 million | |
| Weighted Average P/E Ratio2,3 | 23.5x | |
| Weighted Average P/B Ratio2 | 2.1x | |
| Active Share4 | 90% | |
| U.S. Investments (% of Net Assets) | 84.4% | |
| Non-U.S. Investments (% of Net Assets) | 11.8% | |
| 1 | Geometric Average. This weighted calculation uses each portfolio holding’s market cap in a way designed to not skew the effect of very large or small holdings; instead, it aims to better identify the portfolio’s center, which Royce believes offers a more accurate measure of average market cap than a simple mean or median. |
| 2 | Harmonic Average. This weighted calculation evaluates a portfolio as if it were a single stock and measures it overall. It compares the total market value of the portfolio to the portfolio’s share in the earnings or book value, as the case may be, of its underlying stocks. |
| 3 | The Fund’s P/E ratio calculation excludes companies with zero or negative earnings (27% of portfolio holdings as of 6/30/18). |
| 4 | Active Share is the sum of the absolute values of the different weightings of each holding in the Fund versus each holding in the benchmark, divided by two. |
| Important Performance and Expense Information |
All performance information in this Report reflects past performance, is presented on a total return basis, reflects the reinvestment of distributions, and does not reflect the deduction of taxes that a shareholder would pay on fund distributions or the redemption of fund shares. Past performance is no guarantee of future results. Investment return and principal value of an investment will fluctuate, so that shares may be worth more or less than their original cost when redeemed. Shares redeemed within 30 days of purchase may be subject to a 1% redemption fee payable to the Fund, which is not reflected in the performance shown above; if it were, performance would be lower. Current month-end performance may be higher or lower than performance quoted and may be obtained at www.roycefunds.com. All performance and risk information reflects results of the Investment Class (its oldest class). Price and total return information is based on net asset values calculated for shareholder transactions. Certain immaterial adjustments were made to the net assets of Royce Micro-Cap Fund at 12/31/17 for financial reporting purposes, and as a result the calendar year total returns based on those net assets values differ from the adjusted net values and calendar year total returns reported in the Financial Highlights. Gross operating expenses reflect the Fund’s total gross annual operating expenses for the Investment Class and include management fees, other expenses, and acquired fund fees and expenses. Net operating expenses reflect contractual fee waivers and/or expense reimbursements. All expense information is reported as of the Fund’s most current prospectus. Royce & Associates has contractually agreed, without right of termination, to waive fees and/or reimburse expenses to the extent necessary to maintain the Investment Class’s net annual operating expenses (excluding brokerage commissions, taxes, interest, litigation expenses, acquired fund fees and expenses, and other expenses not borne in the ordinary course of business) at or below 1.49% through April 30, 2019. Acquired fund fees and expenses reflect the estimated amount of the fees and expenses incurred indirectly by the Fund through its investment in mutual funds, hedge funds, private equity funds, and other investment companies. Regarding the “Top Contributors” and “Top Detractors” tables shown above, the sum of all contributors to, and all detractors from, performance for all securities in the portfolio would approximate the Fund’s year-to-date performance for 2018. Upside Capture Ratio measures a manager’s performance in up markets relative to the Fund’s benchmark. It is calculated by measuring the Fund’s performance in quarters when the benchmark went up and dividing it by the benchmark’s return in those quarters. Downside Capture Ratio measures a manager’s performance in down markets relative to the Fund’s benchmark (Russell Microcap Index). It is calculated by measuring the Fund’s performance in quarters when the benchmark goes down and dividing it by the benchmark’s return in those quarters. |
| The Royce Funds 2018 Semiannual Report to Shareholders | 19 |
| MANAGERS’ DISCUSSION | ||
| Royce Micro-Cap Opportunity Fund (ROS) |
 |
| Bill Hench Buzz Zaino, CFA |
| FUND PERFORMANCE After two consecutive years of strong absolute and relative performance, we were not terribly surprised to see a moderation in the pace of gains for our deep value approach to micro-cap stocks in the first half of 2018, and we were pleased that the Fund outperformed its benchmark for the one-year period ended June 30, 2018. Royce Micro-Cap Opportunity Fund increased 7.8% for the year-to-date period ended June 30, 2018, trailing its benchmark, the Russell Microcap Index, which rose 10.7% for the same period. |
| WHAT WORKED... AND WHAT DIDN’T |
| Information Technology led a group of eight (out of 10) equity sectors with positive contributions, followed by Health Care and Financials. The first of these three had an outsized impact on results in the first half, while net losses in Consumer Discretionary and Real Estate made only a minor collective impact. The top portfolio industry by a wide margin was Internet software & services (Information Technology). eGain Corporation, which specializes in cloud-based customer engagement software primarily for ecommerce applications, was the top contributor in this group and in the portfolio as a whole. It was also the portfolio’s second-largest holding at the end of June. Growing acceptance of ecommerce solutions and important customer wins helped to push its stock price up. And even with its accelerating share values, eGain still looked relatively inexpensive to us compared to others in its group at June 30th. |
| From the Health Care sector, CareDx specializes in diagnostic testing for transplant recipients. The Fund’s largest position at the end of June, it was one of the portfolio’s top detractors in the first half of 2017 before rebounding to finish as a top contributor for the full year. Its success extended into the first half of 2018, as it continued to benefit from the favorable resolution of reimbursement issues and stayed well ahead of the competitors in its niche. KEMET Corporation is a solid tantalum and multilayer ceramic capacitor manufacturer with a strong position in its own niche that has been on a remarkably successful run of its own—it was among the Fund’s best performers in 2016 and 2017. We have acted opportunistically with its shares, buying late in 2017 when its price fell on what looked to us like a minor earnings disappointment and trimming in 2018 when its stock recovered. |
| The position that detracted most was Basic Energy Services, which provides oil and gas companies with well site services, such as well maintenance, pumping, and contract drilling. It emerged from bankruptcy before we bought shares. During the first half of 2018, earnings were hurt by more weakness than was expected outside its core markets. We, on the other hand, think its key end markets are still attractive, so we built our stake as its shares fell. Celadon Group is a trucking and transportation services business with newer management, which has been handling issues that involve restating several years’ of financial results. Certain investors, ourselves excluded, were expecting resolution of these issues at some point in the first half and began to abandon the stock when it failed to materialize. As with Basic Energy, we chose a different course and added shares. |
| Relative to the benchmark, the Fund was hurt most by poor stock selection and—to a lesser degree—our large overweight in Industrials, where holdings in the road & rail, electrical equipment, and machinery groups underperformed. Ineffective stock selection detracted in Energy while our lower exposure to Health Care, as well as a few stock picking mishaps, also had a negative impact. Conversely, stock selection was a major advantage versus the micro-cap index in Financials—most notably in capital markets—though our underweight also contributed. Smaller relative advantages came from the portfolio’s lower weightings in Consumer Discretionary and Real Estate. |
| Top Contributors to Performance Year-to-Date Through 6/30/18 (%)1 | ||||
| eGain Corporation | 2.31 | |||
| CareDx | 1.79 | |||
| KEMET Corporation | 0.86 | |||
| Mammoth Energy Services | 0.70 | |||
| Surgery Partners | 0.65 | |||
| 1 Includes dividends | ||||
| Top Detractors from Performance Year-to-Date Through 6/30/18 (%)2 | ||||
| Basic Energy Services | -1.06 | |||
| Celadon Group | -1.01 | |||
| Commercial Vehicle Group | -0.74 | |||
| Invuity | -0.50 | |||
| Babcock & Wilcox Enterprises | -0.48 | |||
| 2 Net of dividends | ||||
| CURRENT POSITIONING AND OUTLOOK |
| The U.S. economy continues to strengthen, which we see as a positive for many holdings, in particular those in Information Technology and Industrials. We saw the negative effect of tariffs and trade disruption on many industrial holdings that had performed well previously before giving back some of their gains in the first half, creating a curious situation in which the stocks showed weakness even as the companies reported strong results. We think the ultimate resolution of these issues should provide recovery in this sector. We like industrial businesses with exposure to aerospace & defense, energy, and infrastructure. In technology, automation, cloud storage, and other innovations are moving forward with the consequence that companies must adopt newer technologies out of necessity, which should create ongoing, though cyclical—and at times volatile—demand for companies involved in semiconductor and capital equipment manufacturing, as well as other related industries. These positions, along with still recovering holdings in Consumer Discretionary and Energy, make us pleased with how the portfolio is positioned as we anticipate ongoing economic growth. |
| Effective October 1, 2018, Bill Hench will be the Fund’s sole portfolio manager. Portfolio Manager Buzz Zaino will stay on at Royce as a Senior Adviser to the portfolio team. |
| 20 | The Royce Funds 2018 Semiannual Report to Shareholders |
| PERFORMANCE AND PORTFOLIO REVIEW | TICKER SYMBOLS ROSFX ROSSX |
| Performance and Expenses | ||||||||||
| Average Annual Total Return (%) Through 6/30/18 | ||||||||||
| JAN-JUN 20181 | 1-YR | 3-YR | 5-YR | SINCE INCEPTION (8/31/10) | ||||||
| ROS | 7.79 | 22.73 | 10.36 | 10.32 | 14.07 | |||||
| Annual Gross Operating Expenses: 1.28% Annual Net Operating Expenses: 1.24% | ||||||||||
| 1 Not annualized | ||||||||||
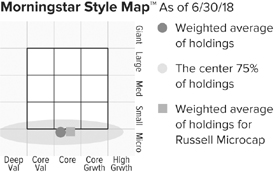
The Morningstar Style Map is the Morningstar Style Box™ with the center 75% of fund holdings plotted as the Morningstar Ownership Zone™. The Morningstar Style Box is designed to reveal a fund’s investment strategy. The Morningstar Ownership Zone provides detail about a portfolio’s investment style by showing the range of stock sizes and styles. The Ownership Zone is derived by plotting each stock in the portfolio within the proprietary Morningstar Style Box. Over time, the shape and location of a fund’s ownership zone may vary. See page 125 for additional information. |
Value of $10,000

| Top 10 Positions | ||
| % of Net Assets | ||
| CareDx | 2.9 | |
| eGain Corporation | 2.1 | |
| Ducommun | 2.0 | |
| KEMET Corporation | 1.9 | |
| Forterra | 1.9 | |
| Castlight Health Cl. B | 1.9 | |
| Ameresco Cl. A | 1.9 | |
| Ribbon Communications | 1.9 | |
| Hamilton Lane Cl. A | 1.7 | |
| Alpha & Omega Semiconductor | 1.7 | |
| Portfolio Sector Breakdown | ||
| % of Net Assets | ||
| Information Technology | 25.0 | |
| Industrials | 18.1 | |
| Health Care | 14.8 | |
| Financials | 9.6 | |
| Energy | 8.6 | |
| Materials | 8.2 | |
| Consumer Discretionary | 7.0 | |
| Consumer Staples | 2.7 | |
| Telecommunication Services | 0.9 | |
| Real Estate | 0.7 | |
| Cash and Cash Equivalents | 4.4 | |
| Calendar Year Total Returns (%) | ||
| YEAR | ROS | |
| 2017 | 25.0 | |
| 2016 | 23.8 | |
| 2015 | -16.0 | |
| 2014 | -5.0 | |
| 2013 | 44.6 | |
| 2012 | 35.1 | |
| 2011 | -17.1 | |
| Portfolio Diagnostics | ||
| Fund Net Assets | $48 million | |
| Number of Holdings | 100 | |
| Turnover Rate | 33% | |
| Average Market Capitalization1 | $431 million | |
| Weighted Average P/B Ratio2 | 1.7x | |
| Weighted Average P/S Ratio3 | 1.0x | |
| Active Share4 | 93% | |
| U.S. Investments (% of Net Assets) | 94.1% | |
| Non-U.S. Investments (% of Net Assets) | 1.5% | |
| 1 | Geometric Average. This weighted calculation uses each portfolio holding’s market cap in a way designed to not skew the effect of very large or small holdings; instead, it aims to better identify the portfolio’s center, which Royce believes offers a more accurate measure of average market cap than a simple mean or median. |
| 2 | Harmonic Average. This weighted calculation evaluates a portfolio as if it were a single stock and measures it overall. It compares the total market value of the portfolio to the portfolio’s share in the earnings or book value, as the case may be, of its underlying stocks. |
| 3 | Price to Sales is calculated by dividing the company’s market cap by the revenue in the most recent year. |
| 4 | Active Share is the sum of the absolute values of the different weightings of each holding in the Fund versus each holding in the benchmark, divided by two. |
| Important Performance and Expense Information All performance information in this Report reflects past performance, is presented on a total return basis, reflects the reinvestment of distributions, and does not reflect the deduction of taxes that a shareholder would pay on fund distributions or the redemption of fund shares. Past performance is no guarantee of future results. Investment return and principal value of an investment will fluctuate, so that shares may be worth more or less than their original cost when redeemed. Shares redeemed within 30 days of purchase may be subject to a 1% redemption fee, payable to the Fund, which is not reflected in the performance shown above; if it were, performance would be lower. Current month-end performance may be higher or lower than performance quoted and may be obtained at www.roycefunds.com. All performance and risk information reflects results of the Investment Class (its oldest share class). Certain immaterial adjustments were made to the net assets of Royce Micro-Cap Opportunity Fund at 12/31/17 for financial reporting purposes, and as a result the calendar year total returns based on those net assets values differ from the adjusted net values and calendar year total returns reported in the Financial Highlights. Gross operating expenses reflect the Fund’s total gross annual operating expenses for the Investment Class and include management fees and other expenses. Net operating expenses reflect contractual fee waivers and/or expense reimbursements. All expense information is reported as of the Funds most current prospectus. Royce & Associates has contractually agreed to waive fees and/or reimburse operating expenses to the extent necessary to maintain the Fund’s net annual operating expenses, (excluding dividend and interest expenses relating to short sale activities, brokerage commissions, taxes, interest, litigation expenses, acquired fund fees and expenses, and other expenses not borne in the ordinary course of business), at or below 1.24% through April 30, 2019. Regarding the “Top Contributors” and “Top Detractors” tables shown above, the sum of all contributors to, and all detractors from, performance for all securities in the portfolio would approximate the Fund’s year-to-date performance for 2018. |
| The Royce Funds 2018 Semiannual Report to Shareholders | 21 |
| MANAGERS’ DISCUSSION | ||
| Royce Opportunity Fund (ROF) |
 |
| Buzz Zaino, CFA Bill Hench |
| FUND PERFORMANCE After two consecutive years of strong absolute and relative performance, we were not terribly surprised to see the pace of returns moderate for our small-cap deep value approach in the first half of 2018. Royce Opportunity Fund increased 4.1% for the year-to-date period ended June 30, 2018, trailing both of its small-cap benchmarks, the Russell 2000 Index, which rose 7.7%, and the Russell 2000 Value Index, which was up 5.4%, for the same period. However, the Fund outperformed both indexes for the three-, 10-, 15-, 20-year, and since inception (11/19/96) periods ended June 30, 2018 and was also ahead of the small-cap value index for the one- and five-year periods ended June 30, 2018. |
| WHAT WORKED... AND WHAT DIDN’T |
| Information Technology led a group of eight (out of 11) equity sectors with positive contributions in the first half, followed by Financials. Net losses from Consumer Discretionary, Health Care, and Industrials made just a minor collective impact. The top industry by a considerable margin was the electronic equipment, instruments & components group, which has been a consistent performance driver over the last two years. KEMET Corporation, a solid tantalum and multilayer ceramic capacitor manufacturer, has been a large part of its success. We have acted opportunistically with its shares, buying late in 2017 when its price fell on what looked to us like a minor earnings disappointment and trimming in 2018 when its stock recovered. Elsewhere in the tech sector, Comtech Telecommunications saw improved demand for its advanced communications applications in its commercial and, to an even greater extent, military end markets. KEMET and Comtech were also the portfolio’s two largest holdings at the end of June. From the Consumer Discretionary sector, Enova International is a payday lender that expanded its roster of offerings to include installment loans and lines of credit that are not subject to banking regulations. High demand for these services helped to drive its shares higher, which led us to reduce our position. |
| In the case of Basic Energy Services, a tumbling stock price presented opportunities to build our position in the expectation of an eventual turnaround. Basic Energy provides oil and gas companies with well site services, such as well maintenance, pumping, and contract drilling. It emerged from bankruptcy before we bought shares. During the first half of 2018, earnings were hurt by more weakness than was expected outside its core markets. We, on the other hand, think its key end markets are still attractive. We held our shares of automotive products and services company Dana in the belief that it could continue to execute successfully. We chose to do the same with Westport Fuel Systems, which offers alternative fuel systems and components for the transportation and industrial markets worldwide. Delays in the expected uptick in revenues from newer business in European markets led to an aggressive sell off that we anticipate will reverse. |
| Relative to the benchmark, the Fund’s biggest trouble spots were poor stock selection and much lower exposure to Health Care and ineffective stock picks in Consumer Discretionary. Our large overweight in Industrials, along with some stock selection difficulties, also hurt relative results in the first half of 2018. Conversely, stock selection was a major advantage versus the Russell 2000 in Financials, where our underweight also contributed and where the consumer finance industry provided a source of relative outperformance. Slighter relative advantages came from a stock selection edge in Materials and the portfolio’s much lower weightings in Real Estate and Utilities. |
| Top Contributors to Performance Year-to-Date Through 6/30/18 (%)1 | ||||
| Enova International | 0.56 | |||
| Comtech Telecommunications | 0.46 | |||
| KEMET Corporation | 0.44 | |||
| DMC Global | 0.38 | |||
| Whiting Petroleum | 0.34 | |||
| 1 Includes dividends | ||||
| Top Detractors from Performance Year-to-Date Through 6/30/18 (%)2 | ||||
| Basic Energy Services | -0.41 | |||
| Dana | -0.35 | |||
| Westport Fuel Systems | -0.27 | |||
| MaxLinear | -0.26 | |||
| Aceto Corporation | -0.24 | |||
| 2 Net of dividends | ||||
| CURRENT POSITIONING AND OUTLOOK |
| The U.S. economy continues to strengthen, which we see as a positive for many holdings, in particular those in Information Technology and Industrials. We saw the negative effect of tariffs and trade disruption on many industrial holdings that had performed well previously before giving back some of their gains in the first half, creating a curious situation in which the stocks showed weakness even as the companies reported strong results. We think the ultimate resolution of these issues should provide recovery in this sector. We like industrial businesses with exposure to aerospace & defense, energy, and infrastructure. In technology, automation, cloud storage, and other innovations are moving forward with the consequence that companies must adopt newer technologies out of necessity, which should create ongoing, though cyclical—and at times volatile—demand for companies involved in semiconductor and capital equipment manufacturing, as well as other related industries. These positions, along with still recovering holdings in Consumer Discretionary and Energy, make us pleased with how the portfolio is positioned as we anticipate ongoing economic growth. |
| On October 1, 2018, Boniface A. ‘Buzz’ Zaino will step down as the Lead Portfolio Manager of the Fund, which he has managed since joining Royce in April 1998. Bill Hench, who has worked with Buzz since 2002 and has long been designated as Buzz’s successor, will become the Fund’s sole portfolio manager effective on that same date. Bill has managed the Fund with Buzz since 2013 after serving as assistant portfolio manager from 2004-2013. Buzz will stay on at Royce as a Senior Adviser to the portfolio team. |
| 22 | The Royce Funds 2018 Semiannual Report to Shareholders |
| PERFORMANCE AND PORTFOLIO REVIEW | TICKER SYMBOLS RYPNX RYOFX ROFCX ROFIX ROFRX |
| Performance and Expenses | ||||||||||||||||
| Average Annual Total Return (%) Through 6/30/18 | ||||||||||||||||
| JAN-JUN 20181 | 1-YR | 3-YR | 5-YR | 10-YR | 15-YR | 20-YR | SINCE INCEPTION (11/19/96) | |||||||||
| ROF | 4.05 | 17.23 | 12.24 | 11.40 | 11.15 | 11.48 | 11.93 | 12.61 | ||||||||
| Annual Operating Expenses: 1.18% | ||||||||||||||||
| 1 Not annualized | ||||||||||||||||
Relative Returns: Monthly Rolling Average Annual Return Periods
| On a monthly rolling basis, the Fund outperformed the Russell 2000 in 79% of all 10-year periods; 70% of all 5-year periods; and 68% of all 1-year periods. |
| PERIODS BEATING THE INDEX | FUND AVG (%)1 | INDEX AVG (%)1 | |||||||||
| 10-year | 96/121 | 79% | 9.0 | 6.9 | |||||||
| 5-year | 127/181 | 70% | 11.6 | 8.7 | |||||||
| 1-year | 155/229 | 68% | 16.0 | 10.4 | |||||||
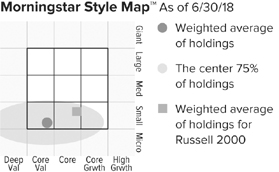
The Morningstar Style Map is the Morningstar Style Box™ with the center 75% of fund holdings plotted as the Morningstar Ownership Zone™. The Morningstar Style Box is designed to reveal a fund’s investment strategy. The Morningstar Ownership Zone provides detail about a portfolio’s investment style by showing the range of stock sizes and styles. The Ownership Zone is derived by plotting each stock in the portfolio within the proprietary Morningstar Style Box. Over time, the shape and location of a fund’s ownership zone may vary. See page 125 for additional information. |
Value of $10,000

| Top 10 Positions | ||
| % of Net Assets | ||
| KEMET Corporation | 1.1 | |
| Comtech Telecommunications | 1.0 | |
| Ciena Corporation | 0.9 | |
| Granite Construction | 0.9 | |
| Carpenter Technology | 0.9 | |
| Invacare Corporation | 0.9 | |
| Kulicke & Soffa Industries | 0.9 | |
| Allegheny Technologies | 0.9 | |
| Fabrinet | 0.8 | |
| Vishay Intertechnology | 0.8 | |
| Portfolio Sector Breakdown | ||
| % of Net Assets | ||
| Industrials | 24.3 | |
| Information Technology | 23.6 | |
| Consumer Discretionary | 14.3 | |
| Energy | 7.8 | |
| Materials | 7.8 | |
| Financials | 5.9 | |
| Health Care | 5.3 | |
| Consumer Staples | 2.3 | |
| Telecommunication Services | 0.9 | |
| Real Estate | 0.3 | |
| Utilities | 0.2 | |
| Cash and Cash Equivalents | 7.3 | |
| Calendar Year Total Returns (%) | ||
| YEAR | ROF | |
| 2017 | 21.9 | |
| 2016 | 29.9 | |
| 2015 | -13.6 | |
| 2014 | -0.5 | |
| 2013 | 43.5 | |
| 2012 | 22.6 | |
| 2011 | -13.0 | |
| 2010 | 33.8 | |
| 2009 | 62.1 | |
| 2008 | -45.7 | |
| 2007 | -2.0 | |
| 2006 | 18.8 | |
| 2005 | 4.8 | |
| 2004 | 17.5 | |
| 2003 | 72.9 | |
| Upside/Downside Capture Ratios | ||||
| Periods Ended 6/30/18 (%) | ||||
| UPSIDE | DOWNSIDE | |||
| 10-Year | 120 | 130 | ||
| From 12/31/96 (Start of Fund’s First Full Quarter) | 124 | 111 | ||
| Portfolio Diagnostics | ||
| Fund Net Assets | $1,289 million | |
| Number of Holdings | 258 | |
| Turnover Rate | 21% | |
| Average Market Capitalization1 | $938 million | |
| Weighted Average P/B Ratio2 | 1.7x | |
| Weighted Average P/S Ratio3 | 0.9x | |
| Active Share4 | 91% | |
| U.S. Investments (% of Net Assets) | 87.3% | |
| Non-U.S. Investments (% of Net Assets) | 5.4% | |
| 1 | Geometric Average. This weighted calculation uses each portfolio holding’s market cap in a way designed to not skew the effect of very large or small holdings; instead, it aims to better identify the portfolio’s center, which Royce believes offers a more accurate measure of average market cap than a simple mean or median. |
| 2 | Harmonic Average. This weighted calculation evaluates a portfolio as if it were a single stock and measures it overall. It compares the total market value of the portfolio to the portfolio’s share in the earnings or book value, as the case may be, of its underlying stocks. |
| 3 | Price to Sales is calculated by dividing the company’s market cap by the revenue in the most recent year. |
| 4 | Active Share is the sum of the absolute values of the different weightings of each holding in the Fund versus each holding in the benchmark, divided by two. |
| Important Performance and Expense Information All performance information in this Report reflects past performance, is presented on a total return basis, reflects the reinvestment of distributions, and does not reflect the deduction of taxes that a shareholder would pay on fund distributions or the redemption of fund shares. Past performance is no guarantee of future results. Investment return and principal value of an investment will fluctuate, so that shares may be worth more or less than their original cost when redeemed. Shares redeemed within 30 days of purchase may be subject to a 1% redemption fee payable to the Fund, which is not reflected in the performance shown above; if it were, performance would be lower. Current month-end performance may be higher or lower than performance quoted and may be obtained at www.roycefunds.com. All performance and risk information reflects results of the Investment Class (its oldest class). Operating expenses reflect the Fund’s total annual operating expenses for the Investment Class as of the Fund’s most current prospectus and include management fees and other expenses. Regarding the “Top Contributors” and “Top Detractors” tables shown above, the sum of all contributors to, and all detractors from, performance for all securities in the portfolio would approximate the Fund’s year-to-date performance for 2018. Upside Capture Ratio measures a manager’s performance in up markets relative to the Fund’s benchmark. It is calculated by measuring the Fund’s performance in quarters when the benchmark went up and dividing it by the benchmark’s return in those quarters. Downside Capture Ratio measures a manager’s performance in down markets relative to the Fund’s benchmark (Russell 2000). It is calculated by measuring the Fund’s performance in quarters when the benchmark goes down and dividing it by the benchmark’s return in those quarters. |
| The Royce Funds 2018 Semiannual Report to Shareholders | 23 |
| MANAGERS’ DISCUSSION | ||
| Royce Pennsylvania Mutual Fund® (PMF) |
 |
| Chuck Royce Lauren Romeo, CFA Jay Kaplan, CFA |
| FUND PERFORMANCE Following two consecutive years of strong absolute and relative performance, our flagship portfolio fell behind the Russell 2000 Index, its small-cap benchmark, in the first half of 2018. Royce Pennsylvania Mutual Fund advanced 5.7% for the year-to-date period ended June 30, 2018, trailing the Russell 2000, which rose 7.7% for the same period. The Fund maintained its longer-term relative advantages, outperforming the benchmark for the three-, 20-, 25-, 30-, and 35-year periods ended June 30, 2018. (Additionally, Penn lagged the small-cap index by only a narrow margin for the one-year period ended June 30, 2018.) |
| WHAT WORKED... AND WHAT DIDN’T |
| During the first half the market favored higher growth, lower quality, and more yield-sensitive equities. Health Care, a key growth-stock sector, continued the run that kicked off in 2017 as the best-performing sector in the Russell 2000. Information Technology followed in second and saw the lion’s share of its strength coming from two growth-oriented industries—Internet software & services and software. These same two sectors also made the largest positive contributions to the Fund’s first-half results, while Industrials and Utilities detracted very modestly. At the industry level, the top contributor was energy equipment & services (Energy) as the rebound for oil prices fed through to improved prospects for these businesses. Norway’s TGS-NOPEC Geophysical, which provides geoscience data to oil and gas companies worldwide, was the largest contributor in this industry and in the portfolio overall. Its revenue and earnings were boosted by improving exploration and production spending, higher oil prices, and the longer-term need for energy companies to replenish reserves, which is driving increased spending on seismic data. SEACOR Marine Holdings, which provides global marine and support transportation services to the energy industry, was another top performer from the same industry. Stronger operating results coming from nearly all of its geographic markets helped its shares to rise. Outside of energy, the shares of commercial and industrial real estate developer FRP Holdings rose on news of robust sales growth, and U.S. Physical Therapy, which owns and operates outpatient physical therapy clinics, saw growth in its core business as well as in its industrial injury prevention initiatives. The largest negative effect on relative returns came from Industrials and Information Technology. In fact, a large share of Penn’s underperformance versus the Russell 2000 at the industry level came from the machinery group, which was also home to three of the Fund’s five largest detractors at the position level. Several holdings in this group reported disappointing earnings and lackluster guidance, due partially to margin compression caused by higher input costs. Our analysis suggests some of these margin issues should prove transitory as manufacturers must first absorb these increased costs before realizing higher product prices. In a robust economy, we are comfortable that our companies can successfully put through price increases and see margins rebound. We built our respective stakes in machinery companies Sun Hydraulics and CIRCOR International, which makes valves and flow control products, while making only a modest trim to our position in John Bean Technologies, which produces specialized products and services for food storage and transport. A closer examination of Sun Hydraulics, which makes hydraulic and electronic valves, controls, and instruments for industrial machinery and off-highway vehicles, offers a good example of our thinking about select holdings in this industry. Despite robust sales growth, the company’s margins and earnings have been weaker than expected due to operating inefficiencies incurred by a ramp up to meet strong demand, as well as higher materials and commodity costs. We expect a reversal as the impact of management’s corrective actions—which include price increases, new supply agreements to ease constraints, and reduced temporary and overtime labor—to take effect. We also have a favorable view of the strategies the company has been implementing that could help lead to revenue and operating profit growth over the long term. After finishing as Penn’s top-contributing holding in both 2016 and 2017, laser diode and equipment maker Coherent’s shares underwent a correction in the first half, which led us to reduce our position. |
| Top Contributors to Performance Year-to-Date Through 6/30/18 (%)1 | ||||
| TGS-NOPEC Geophysical | 0.42 | |||
| FRP Holdings | 0.39 | |||
| U.S. Physical Therapy | 0.32 | |||
| SEACOR Marine Holdings | 0.29 | |||
| FLIR Systems | 0.24 | |||
| 1 Includes dividends | ||||
| Top Detractors from Performance Year-to-Date Through 6/30/18 (%)2 | ||||
| Sun Hydraulics | -0.53 | |||
| Coherent | -0.25 | |||
| John Bean Technologies | -0.22 | |||
| CIRCOR International | 0.21 | |||
| LCI Industries | -0.18 | |||
| 2 Net of dividends | ||||
| CURRENT POSITIONING AND OUTLOOK |
| The market’s recent behavior looks curious to us. We hear optimism and solid progress from the management teams we meet with, see solid earnings reports, and observe consistently strong macroeconomic data. On the other hand, small-cap market leadership has stubbornly remained with defensive and yield-oriented stocks, while cyclicals have lagged. Despite new highs for the Russell 2000, we are therefore far from ebullient, as we anticipate that increased volatility will accompany a shift in market leadership to value/cyclical leadership. We are also mindful that these shifts rarely occur without some turbulence. On balance, we are raising cash levels modestly and actively adjusting portfolio weightings by culling some smaller holdings and putting increased weight behind what we think are the most timely opportunities. |
| 24 | The Royce Funds 2018 Semiannual Report to Shareholders |
| PERFORMANCE AND PORTFOLIO REVIEW | TICKER SYMBOLS PENNX RYPFX RPMIX RYPCX RPMRX |
| Performance and Expenses | ||||||||||||||||||||||
| Average Annual Total Return (%) Through 6/30/18 | ||||||||||||||||||||||
| JAN-JUN 20181 | 1-YR | 3-YR | 5-YR | 10-YR | 15-YR | 20-YR | 25-YR | 30-YR | 35-YR | 45-YR | ||||||||||||
| PMF | 5.70 | 17.23 | 11.21 | 10.63 | 8.92 | 10.40 | 9.77 | 10.62 | 10.68 | 10.97 | 13.50 | |||||||||||
| Annual Operating Expenses: 0.92% | ||||||||||||||||||||||
| 1 Not annualized | ||||||||||||||||||||||
Relative Returns: Monthly Rolling Average Annual Return Periods
20 Years Through 6/30/18
| On a monthly rolling basis, the Fund outperformed the Russell 2000 in 65% of all 10-year periods; 64% of all 5-year periods; and 55% of all 1-year periods. |
| PERIODS BEATING THE INDEX | FUND AVG (%)1 | INDEX AVG (%)1 | |||||||||
| 10-year | 79/121 | 65% | 8.4 | 6.9 | |||||||
| 5-year | 115/181 | 64% | 10.3 | 8.7 | |||||||
| 1-year | 125/229 | 55% | 12.0 | 10.4 | |||||||
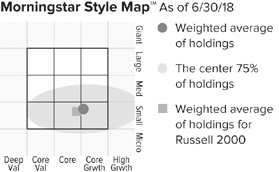
The Morningstar Style Map is the Morningstar Style Box™ with the center 75% of fund holdings plotted as the Morningstar Ownership Zone™. The Morningstar Style Box is designed to reveal a fund’s investment strategy. The Morningstar Ownership Zone provides detail about a portfolio’s investment style by showing the range of stock sizes and styles. The Ownership Zone is derived by plotting each stock in the portfolio within the proprietary Morningstar Style Box. Over time, the shape and location of a fund’s ownership zone may vary. See page 125 for additional information. |
Value of $10,000
as of 6/30/18 ($)
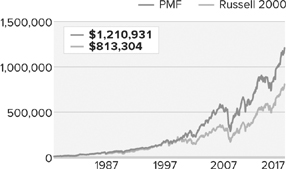
| Top 10 Positions | ||
| % of Net Assets | ||
| FLIR Systems | 1.9 | |
| Sun Hydraulics | 1.5 | |
| HEICO Corporation | 1.4 | |
| First Citizens BancShares Cl. A | 1.3 | |
| FRP Holdings | 1.2 | |
| Raven Industries | 1.2 | |
| Bio-Techne | 1.1 | |
| Tennant Company | 1.1 | |
| Preformed Line Products | 1.1 | |
| Quaker Chemical | 1.0 | |
| Portfolio Sector Breakdown | ||
| % of Net Assets | ||
| Industrials | 26.7 | |
| Information Technology | 18.8 | |
| Financials | 14.6 | |
| Health Care | 9.5 | |
| Consumer Discretionary | 8.2 | |
| Materials | 8.2 | |
| Energy | 4.3 | |
| Real Estate | 2.8 | |
| Consumer Staples | 1.7 | |
| Cash and Cash Equivalents | 5.2 | |
| Calendar Year Total Returns (%) | ||
| YEAR | PMF | |
| 2017 | 16.2 | |
| 2016 | 26.5 | |
| 2015 | -11.4 | |
| 2014 | -0.7 | |
| 2013 | 35.3 | |
| 2012 | 14.6 | |
| 2011 | -4.2 | |
| 2010 | 23.9 | |
| 2009 | 36.3 | |
| 2008 | -34.8 | |
| 2007 | 2.8 | |
| 2006 | 14.8 | |
| 2005 | 12.5 | |
| 2004 | 20.2 | |
| 2003 | 40.3 | |
| Upside/Downside Capture Ratios | ||||
| Periods Ended 6/30/18 (%) | ||||
| UPSIDE | DOWNSIDE | |||
| 10-Year | 91 | 98 | ||
| From 12/31/78 (Russell 2000 Inception) | 89 | 70 | ||
| Portfolio Diagnostics | ||
| Fund Net Assets | $2,067 million | |
| Number of Holdings | 318 | |
| Turnover Rate | 13% | |
| Average Market Capitalization1 | $2,043 million | |
| Weighted Average P/E Ratio2,3 | 20.6x | |
| Weighted Average P/B Ratio2 | 2.4x | |
| Active Share4 | 88% | |
| U.S. Investments (% of Net Assets) | 83.4% | |
| Non-U.S. Investments (% of Net Assets) | 11.4% | |
| 1 | Geometric Average. This weighted calculation uses each portfolio holding’s market cap in a way designed to not skew the effect of very large or small holdings; instead, it aims to better identify the portfolio’s center, which Royce believes offers a more accurate measure of average market cap than a simple mean or median. |
| 2 | Harmonic Average. This weighted calculation evaluates a portfolio as if it were a single stock and measures it overall. It compares the total market value of the portfolio to the portfolio’s share in the earnings or book value, as the case may be, of its underlying stocks. |
| 3 | The Fund’s P/E ratio calculation excludes companies with zero or negative earnings (11% of portfolio holdings as of 6/30/18). |
| 4 | Active Share is the sum of the absolute values of the different weightings of each holding in the Fund versus each holding in the benchmark, divided by two. |
| Important Performance and Expense Information All performance information in this Report reflects past performance, is presented on a total return basis, reflects the reinvestment of distributions, and does not reflect the deduction of taxes that a shareholder would pay on fund distributions or the redemption of fund shares. Past performance is no guarantee of future results. Investment return and principal value of an investment will fluctuate, so that shares may be worth more or less than their original cost when redeemed. Shares redeemed within 30 days of purchase may be subject to a 1% redemption fee payable to the Fund, which is not reflected in the performance shown above; if it were, performance would be lower. Current month-end performance may be higher or lower than performance quoted and may be obtained at www.roycefunds.com. All performance and risk information reflects results of the Investment Class (its oldest class). Operating expenses reflect the Fund’s total annual operating expenses for the Investment Class as of the Fund’s most current prospectus and include management fees and other expenses. Regarding the “Top Contributors” and “Top Detractors” tables shown above, the sum of all contributors to, and all detractors from, performance for all securities in the portfolio would approximate the Fund’s year-to-date performance for 2018. Upside Capture Ratio measures a manager’s performance in up markets relative to the Fund’s benchmark. It is calculated by measuring the Fund’s performance in quarters when the benchmark went up and dividing it by the benchmark’s return in those quarters. Downside Capture Ratio measures a manager’s performance in down markets relative to the Fund’s benchmark (Russell 2000). It is calculated by measuring the Fund’s performance in quarters when the benchmark goes down and dividing it by the benchmark’s return in those quarters. |
| The Royce Funds 2018 Semiannual Report to Shareholders | 25 |
| MANAGERS’ DISCUSSION | ||
| Royce Premier Fund (RPR) |
 |
| Chuck Royce Lauren Romeo, CFA Steven McBoyle, CPA, CA |
| FUND PERFORMANCE Although the first half was challenging for quality-oriented cyclical small-caps, our high-quality small-cap core offering held its advantage over its small-cap benchmark for the three-, 15-, 20-, 25-year, and since inception (12/31/91) periods ended June 30, 2018. After two calendar years with 20%-plus returns, a moderation in the pace of returns seemed reasonable. Royce Premier Fund advanced 2.6% for the year-to-date period ended June 30, 2018, underperforming its benchmark, the Russell 2000 Index, which rose 7.7% for the same period. |
| WHAT WORKED... AND WHAT DIDN’T |
| Of the Fund’s nine equity sectors, seven made positive contributions to first-half performance. Health Care and Information Technology were the top contributors, while Consumer Discretionary and Consumer Staples had modest negative results. Two holdings from two different groups in Industrials made the biggest positive impact of all the Fund’s holdings. Copart is the largest online salvage auction provider in the U.S. The company saw higher volumes and revenue per car as market conditions remained robust in the first half. Copart’s continuous improvement of its virtual bidding platform is expanding the pool of potential buyers, auction participants, and bids per car. A shift within its non-insurance auto auction business toward dealers and financial institutions has been lifting both average selling prices and gross margins higher. Finally, the company has been supplementing its expanding European footprint with the acquisition of a salvage operation in Finland, augmenting its buyer base in Russia and the Baltic States. Kirby Corporation has the largest inland and coastal tank barge fleet in the U.S. and also draws revenue from servicing and distributing industrial engines, transmissions, parts, and oil field services equipment. The tank barge markets seem to be recovering well, thanks to retirements of older barges, limited new builds, and solid utilization rates. Kirby has also benefited from two recent acquisitions over the last 18 months that are allowing it to drive industry consolidation. In addition, higher land drilling activity resulting from rising oil prices has been stoking demand for new and remanufactured hydraulic fracturing units. It was the portfolio’s largest position at the end of June. Among positions that detracted, Sun Hydraulics makes hydraulic and electronic valves, controls, and instruments for industrial machinery and off-highway vehicles. Despite robust sales growth, the company’s margins and earnings have been weaker than expected due to operating inefficiencies incurred by a ramp up to meet strong demand, as well as higher materials and commodity costs. We expect a reversal as the impact of management’s corrective actions—which include price increases, new supply agreements to ease constraints, and reduced temporary and overtime labor—to take effect. CIRCOR International makes an array of valves and related flow control products and services. Solid fiscal first-quarter results, strong orders, and margin improvement potential across its core and newly acquired businesses led to an April recovery that was undone in June due to the secondary offering by Colfax (a recent acquisition) of CIRCOR shares, combined with tariff- and trade war-driven underperformance by global industrials. A multi-year contributor to performance, Cognex Corporation has a dominant position as the global leader in machine vision technology. It was hurt by slackening demand in its consumer electronics market, in particular by iPhone sales that were well below expectations. On a relative basis, the biggest sector detractor was Information Technology, as multiple factors contributed, including overweights in lagging industries, such as electronic equipment instruments & components, and having no holdings in Internet software & services. The previously mentioned weakness for Cognex also hurt. Industrials was another source of underperformance, largely the result of being the Fund’s largest sector, as well as increasing investor concerns about the prospects for economic cyclicals. The largest relative positive contribution came from Energy, where superior stock selection among energy equipment & services stocks provided a relative edge, while Real Estate saw a benefit from having no exposure to REITs, which lagged. |
| Top Contributors to Performance Year-to-Date Through 6/30/18 (%)1 | ||||
| Copart | 0.79 | |||
| Kirby Corporation | 0.70 | |||
| Fair Isaac | 0.56 | |||
| Morningstar | 0.54 | |||
| IDEXX Laboratories | 0.50 | |||
| 1 Includes dividends | ||||
| Top Detractors from Performance Year-to-Date Through 6/30/18 (%)2 | ||||
| Sun Hydraulics | -0.53 | |||
| CIRCOR International | -0.49 | |||
| Cognex Corporation | -0.48 | |||
| Camping World Holdings Cl. A | -0.44 | |||
| Thor Industries | -0.44 | |||
| 2 Net of dividends | ||||
| CURRENT POSITIONING AND OUTLOOK |
| The small-cap market looks curious to us, an observation that extends beyond our disappointing performance in the first half. While the market’s preference for lower-quality stocks was frustrating, we are confident in the long-term efficacy of the Fund’s high-quality approach. More troubling is the disconnect between the solid fundamentals we see—optimism from management teams, solid earnings reports, and consistently strong macroeconomic data—contrasted with market behavior we observe that looks odd in this context—leadership from defensive and yield-oriented stocks, lagging cyclicals, and a modestly rising 10-year yield. We do anticipate a shift in the market environment to one with greater volatility and more value/cyclical leadership, though we are also mindful that these shifts rarely occur without some turbulence. In this environment, we are on balance raising cash levels modestly. We are also actively re-populating the portfolio, having added seven new names over the past three quarters. |
| 26 | The Royce Funds 2018 Semiannual Report to Shareholders |
| PERFORMANCE AND PORTFOLIO REVIEW | TICKER SYMBOLS RYPRX RPFFX RPFIX RPRCX RPRRX RPRWX |
| Performance and Expenses | ||||||||||||||||||
| Average Annual Total Return (%) Through 6/30/18 | ||||||||||||||||||
| JAN-JUN 20181 | 1-YR | 3-YR | 5-YR | 10-YR | 15-YR | 20-YR | 25-YR | SINCE INCEPTION (12/31/91) | ||||||||||
| RPR | 2.59 | 16.81 | 11.45 | 10.56 | 8.62 | 11.51 | 10.64 | 11.53 | 11.81 | |||||||||
| Annual Operating Expenses: 1.16% | ||||||||||||||||||
| 1 Not annualized | ||||||||||||||||||
Relative Returns: Monthly Rolling Average Annual Return Periods
| On a monthly rolling basis, the Fund outperformed the Russell 2000 in 94% of all 10-year periods; 66% of all 5-year periods; and 62% of all 1-year periods. |
| PERIODS BEATING THE INDEX | FUND AVG (%)1 | INDEX AVG (%)1 | |||||||||
| 10-year | 114/121 | 94% | 10.0 | 6.9 | |||||||
| 5-year | 119/181 | 66% | 11.2 | 8.7 | |||||||
| 1-year | 143/229 | 62% | 12.7 | 10.4 | |||||||
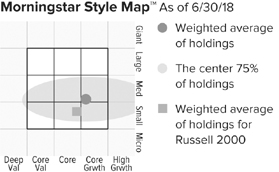
The Morningstar Style Map is the Morningstar Style Box™ with the center 75% of fund holdings plotted as the Morningstar Ownership Zone™. The Morningstar Style Box is designed to reveal a fund’s investment strategy. The Morningstar Ownership Zone provides detail about a portfolio’s investment style by showing the range of stock sizes and styles. The Ownership Zone is derived by plotting each stock in the portfolio within the proprietary Morningstar Style Box. Over time, the shape and location of a fund’s ownership zone may vary. See page 125 for additional information. |
Value of $10,000
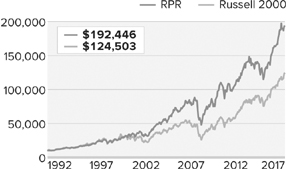
| Top 10 Positions | ||
| % of Net Assets | ||
| Kirby Corporation | 3.6 | |
| Lincoln Electric Holdings | 3.0 | |
| Landstar System | 2.9 | |
| Air Lease Cl. A | 2.8 | |
| Minerals Technologies | 2.8 | |
| Fair Isaac | 2.8 | |
| Valmont Industries | 2.6 | |
| Alleghany Corporation | 2.4 | |
| Jack Henry & Associates | 2.3 | |
| National Instruments | 2.3 | |
| Portfolio Sector Breakdown | ||
| % of Net Assets | ||
| Industrials | 32.6 | |
| Information Technology | 16.5 | |
| Financials | 13.6 | |
| Consumer Discretionary | 10.6 | |
| Materials | 9.9 | |
| Health Care | 4.8 | |
| Energy | 3.6 | |
| Consumer Staples | 2.3 | |
| Real Estate | 1.7 | |
| Cash and Cash Equivalents | 4.4 | |
| Calendar Year Total Returns (%) | ||
| YEAR | RPR | |
| 2017 | 23.8 | |
| 2016 | 23.0 | |
| 2015 | -9.9 | |
| 2014 | -0.9 | |
| 2013 | 27.7 | |
| 2012 | 11.4 | |
| 2011 | -0.9 | |
| 2010 | 26.5 | |
| 2009 | 33.3 | |
| 2008 | -28.3 | |
| 2007 | 12.7 | |
| 2006 | 8.8 | |
| 2005 | 17.1 | |
| 2004 | 22.8 | |
| 2003 | 38.7 | |
| Upside/Downside Capture Ratios | ||||
| Periods Ended 6/30/18 (%) | ||||
| UPSIDE | DOWNSIDE | |||
| 10-Year | 89 | 96 | ||
| From 12/31/91 (Start of Fund’s First Full Quarter) | 92 | 71 | ||
| Portfolio Diagnostics | ||
| Fund Net Assets | $2,277 million | |
| Number of Holdings | 59 | |
| Turnover Rate | 11% | |
| Average Market Capitalization1 | $3,672 million | |
| Weighted Average P/E Ratio2,3 | 20.9x | |
| Weighted Average P/B Ratio2 | 2.8x | |
| Active Share4 | 98% | |
| U.S. Investments (% of Net Assets) | 84.8% | |
| Non-U.S. Investments (% of Net Assets) | 10.8% | |
| 1 | Geometric Average. This weighted calculation uses each portfolio holding’s market cap in a way designed to not skew the effect of very large or small holdings; instead, it aims to better identify the portfolio’s center, which Royce believes offers a more accurate measure of average market cap than a simple mean or median. |
| 2 | Harmonic Average. This weighted calculation evaluates a portfolio as if it were a single stock and measures it overall. It compares the total market value of the portfolio to the portfolio’s share in the earnings or book value, as the case may be, of its underlying stocks. |
| 3 | The Fund’s P/E ratio calculation excludes companies with zero or negative earnings (2% of portfolio holdings as of 6/30/18). |
| 4 | Active Share is the sum of the absolute values of the different weightings of each holding in the Fund versus each holding in the benchmark, divided by two. |
| Important Performance and Expense Information All performance information in this Report reflects past performance, is presented on a total return basis, reflects the reinvestment of distributions, and does not reflect the deduction of taxes that a shareholder would pay on fund distributions or the redemption of fund shares. Past performance is no guarantee of future results. Investment return and principal value of an investment will fluctuate, so that shares may be worth more or less than their original cost when redeemed. Shares redeemed within 30 days of purchase may be subject to a 1% redemption fee payable to the Fund, which is not reflected in the performance shown above; if it were, performance would be lower. Current month-end performance may be higher or lower than performance quoted and may be obtained at www.roycefunds.com. All performance and risk information reflects results of the Investment Class (its oldest class). Operating expenses reflect the Fund’s total annual operating expenses for the Investment Class as of the Fund’s most current prospectus and include management fees and other expenses. Regarding the “Top Contributors” and “Top Detractors” tables shown above, the sum of all contributors to, and all detractors from, performance for all securities in the portfolio would approximate the Fund’s year-to-date performance for 2018. Upside Capture Ratio measures a manager’s performance in up markets relative to the Fund’s benchmark. It is calculated by measuring the Fund’s performance in quarters when the benchmark went up and dividing it by the benchmark’s return in those quarters. Downside Capture Ratio measures a manager’s performance in down markets relative to the Fund’s benchmark (Russell 2000). It is calculated by measuring the Fund’s performance in quarters when the benchmark goes down and dividing it by the benchmark’s return in those quarters. |
| The Royce Funds 2018 Semiannual Report to Shareholders | 27 |
| MANAGER’S DISCUSSION | ||
| Royce Small-Cap Leaders Fund (ROH) |
 |
| Lauren Romeo, CFA |
| FUND PERFORMANCE Royce Small-Cap Leaders Fund gained 3.6% for the year-to-date period ended June 30, 2018, underperforming its small-cap benchmark, the Russell 2000 Index, which was up 7.7% for the same period. It was disappointing that the portfolio’s bottom-up, cyclical bias, which focuses on finding what we think are attractively valued, high-quality small-cap companies, was out of favor in the year’s first half. In this somewhat inhospitable climate, we worked to take advantage of company-specific issues that appeared temporary to us in order to build existing holdings that became even more attractively valued in the first six months of 2018. Increased volatility in the first quarter and worrisome macro headlines throughout the first half hit small-cap companies with above-average international exposure hard—but also created buying opportunities in new and existing names. |
| WHAT WORKED... AND WHAT DIDN’T |
| Seven of the Fund’s nine equity sectors finished the first half in the black, led by Information Technology and Energy, which rebounded significantly in the second quarter. The leading detractor at the sector level was Industrials, the portfolio’s largest and one of its most significant overweights versus the Russell 2000. Financials also had a negative impact on first-half results. At the position level, the largest contributor by a comfortable margin was Norway’s TGS-NOPEC Geophysical, which provides geoscience data to oil and gas companies worldwide. Its revenue and earnings were boosted by improving exploration and production spending, higher oil prices, and the longer-term need for energy companies to replenish reserves, which is driving increased spending on seismic data. We held a good-sized stake at the end of June. Fabrinet offers outsourced manufacturing services for complex, differentiated products, primarily for optical communications equipment. The company posted better-than-expected results despite choppy near-term trends for optical equipment spending. We like its niche in optical products as well as the potential drivers of future growth, including possible share gains with its largest customer and further diversification into non-optical areas, such as lasers, sensors, and medical equipment. Artisan Partners Asset Management detracted most as its shares fell in the first quarter in the face of heightened market volatility, despite posting solid results. With much of its assets under management invested in equities, investors seemed to fear that the long-awaited return to positive net flows might be mitigated by ongoing fee pressures on active equity managers. Liking its potential to rebound, we added shares in the first half. We acted in similar fashion with CIRCOR International, which makes an array of valves and related flow control products and services. Solid fiscal first-quarter results, strong orders, and margin improvement potential across its core and newly acquired businesses led to an April recovery for its stock that was undone—and then some—in June due to the secondary offering of CIRCOR shares by Colfax—a recent acquisition—that were received as part of the acquisition price. Its stock also felt the effects of the tariff and trade war talk that led to widespread underperformance for global industrials. Relative to the Russell 2000, first-half results were impaired most by ineffective stock selection, as well as our overweight, in Industrials, most meaningfully in the machinery group, which includes CIRCOR and Sun Hydraulics. The struggles of Artisan and Federated Investors drove underperformance in Financials, while in Health Care—the top-performing sector for the Russell 2000 in the first half—our substantial underweight hurt most. Helping relative results most was savvy stock selection in Energy, fueled by TGS-NOPEC’s strength. Stock picking was also a strength in Real Estate, where our sole position, Marcus & Millichap, which provides sales, financing, research, and advisory services in the commercial real estate industry, enjoyed a strong first half. |
| Top Contributors to Performance Year-to-Date Through 6/30/18 (%)1 | ||||
| TGS-NOPEC Geophysical | 0.89 | |||
| Fabrinet | 0.74 | |||
| Movado Group | 0.65 | |||
| Marcus & Millichap | 0.52 | |||
| Inter Parfums | 0.46 | |||
| 1 Includes dividends | ||||
| Top Detractors from Performance Year-to-Date Through 6/30/18 (%)2 | ||||
| Artisan Partners Asset Management Cl. A | -0.62 | |||
| CIRCOR International | -0.54 | |||
| Sun Hydraulics | -0.48 | |||
| Federated Investors Cl. B | -0.46 | |||
| LCI Industries | -0.30 | |||
| 2 Net of dividends | ||||
| CURRENT POSITIONING AND OUTLOOK |
| We were pleased with our positioning at the end of June. Valuations for many holdings appear to have priced in the negative macro headlines and look to be trading on the questionable assumption that short-term profit pressures will not abate. We see things much differently, as financial reports and our meetings with managements both reveal consistently positive evidence in sales and order trends, along with specific actions being taken to improve margins, e.g., price increases and investments in automation. These businesses performed far better than their stocks did in the first half. If they deliver earnings growth, then we believe a strong case can be made for rotation into these names, especially since they offer both attractive growth prospects and the potential for multiple expansion. Several holdings looked not only well-positioned to us for a sustained improvement on existing growth trends, but many also appeared poised to benefit from a rebound for cyclical sectors, such as Industrials, large swaths of Information Technology, and Financials. Many holdings in these sectors continued to trade at steeper-than-normal discounts to defensives at the end of the first half, despite strong fundamentals and earnings growth outlooks. This gave us encouragement about the portfolio’s prospects going forward. |
| 28 | The Royce Funds 2018 Semiannual Report to Shareholders |
| PERFORMANCE AND PORTFOLIO REVIEW | TICKER SYMBOLS RYOHX ROHHX |
| Performance and Expenses | ||||||||||||
| Average Annual Total Return (%) Through 6/30/18 | ||||||||||||
| JAN-JUN 20181 | 1-YR | 3-YR | 5-YR | 10-YR | SINCE INCEPTION (6/30/03) | |||||||
| ROH | 3.64 | 12.87 | 7.87 | 7.50 | 7.99 | 9.66 | ||||||
| Annual Gross Operating Expenses: 1.59% Annual Net Operating Expenses: 1.49% | ||||||||||||
| 1 Not annualized | ||||||||||||
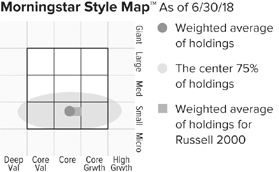
The Morningstar Style Map is the Morningstar Style Box™ with the center 75% of fund holdings plotted as the Morningstar Ownership Zone™. The Morningstar Style Box is designed to reveal a fund’s investment strategy. The Morningstar Ownership Zone provides detail about a portfolio’s investment style by showing the range of stock sizes and styles. The Ownership Zone is derived by plotting each stock in the portfolio within the proprietary Morningstar Style Box. Over time, the shape and location of a fund’s ownership zone may vary. See page 125 for additional information. |
Value of $10,000
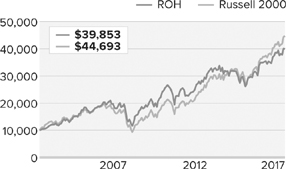
| Top 10 Positions | ||
| % of Net Assets | ||
| Minerals Technologies | 3.1 | |
| Genworth MI Canada | 3.1 | |
| Artisan Partners Asset Management Cl. A | 2.8 | |
| Greenbrier Companies (The) | 2.8 | |
| Pason Systems | 2.7 | |
| Fabrinet | 2.6 | |
| RLI Corp. | 2.6 | |
| CIRCOR International | 2.3 | |
| Cohu | 2.3 | |
| Sun Hydraulics | 2.3 | |
| Portfolio Sector Breakdown | ||
| % of Net Assets | ||
| Industrials | 28.1 | |
| Information Technology | 20.8 | |
| Financials | 13.3 | |
| Consumer Discretionary | 8.7 | |
| Consumer Staples | 5.0 | |
| Energy | 5.0 | |
| Materials | 4.4 | |
| Health Care | 4.3 | |
| Real Estate | 2.2 | |
| Cash and Cash Equivalents | 8.2 | |
| Calendar Year Total Returns (%) | ||
| YEAR | ROH | |
| 2017 | 10.1 | |
| 2016 | 25.5 | |
| 2015 | -12.5 | |
| 2014 | -3.3 | |
| 2013 | 30.9 | |
| 2012 | 11.5 | |
| 2011 | -6.5 | |
| 2010 | 24.8 | |
| 2009 | 38.0 | |
| 2008 | -29.2 | |
| 2007 | 7.3 | |
| 2006 | 13.7 | |
| 2005 | 14.9 | |
| 2004 | 27.2 | |
| Upside/Downside Capture Ratios | ||||
| Periods Ended 6/30/18 (%) | ||||
| UPSIDE | DOWNSIDE | |||
| 10-Year | 87 | 98 | ||
| From 6/30/03 (Start of Fund’s First Full Quarter) | 92 | 93 | ||
| Portfolio Diagnostics | ||
| Fund Net Assets | $80 million | |
| Number of Holdings | 77 | |
| Turnover Rate | 24% | |
| Average Market Capitalization1 | $1,757 million | |
| Weighted Average P/E Ratio2,3 | 18.2x | |
| Weighted Average P/B Ratio2 | 2.5x | |
| Active Share4 | 96% | |
| U.S. Investments (% of Net Assets) | 73.7% | |
| Non-U.S. Investments (% of Net Assets) | 18.1% | |
| 1 | Geometric Average. This weighted calculation uses each portfolio holding’s market cap in a way designed to not skew the effect of very large or small holdings; instead, it aims to better identify the portfolio’s center, which Royce believes offers a more accurate measure of average market cap than a simple mean or median. |
| 2 | Harmonic Average. This weighted calculation evaluates a portfolio as if it were a single stock and measures it overall. It compares the total market value of the portfolio to the portfolio’s share in the earnings or book value, as the case may be, of its underlying stocks. |
| 3 | The Fund’s P/E ratio calculation excludes companies with zero or negative earnings (7% of portfolio holdings as of 6/30/18). |
| 4 | Active Share is the sum of the absolute values of the different weightings of each holding in the Fund versus each holding in the benchmark, divided by two. |
| Important Performance and Expense Information All performance information in this Report reflects past performance, is presented on a total return basis, reflects the reinvestment of distributions, and does not reflect the deduction of taxes that a shareholder would pay on fund distributions or the redemption of fund shares. Past performance is no guarantee of future results. Investment return and principal value of an investment will fluctuate, so that shares may be worth more or less than their original cost when redeemed. Shares redeemed within 30 days of purchase may be subject to a 1% redemption fee payable to the Fund, which is not reflected in the performance shown above; if it were, performance would be lower. Current month-end performance may be higher or lower than performance quoted and may be obtained at www.roycefunds.com. All performance and risk information reflects results of the Service Class (its oldest class). Gross operating expenses reflect the Fund’s gross total annual operating expenses for the Service Class and include management fees, 12b-1 distribution and service fees, and other expenses. Net operating expenses reflect contractual fee waivers and/or expense reimbursements. All expense information is reported as of the Fund’s most current prospectus. Royce & Associates has contractually agreed to waive fees and/or reimburse operating expenses to the extent necessary to maintain the Service Class’s net annual operating expenses (excluding brokerage commissions, taxes, interest, litigation expenses, acquired fund fees and expenses, and other expenses not borne in the ordinary course of business), at or below 1.49% through April 30, 2019. Regarding the “Top Contributors” and “Top Detractors” tables shown above, the sum of all contributors to, and all detractors from, performance for all securities in the portfolio would approximate the Fund’s year-to-date performance for 2018. Upside Capture Ratio measures a manager’s performance in up markets relative to the Fund’s benchmark. It is calculated by measuring the Fund’s performance in quarters when the benchmark went up and dividing it by the benchmark’s return in those quarters. Downside Capture Ratio measures a manager’s performance in down markets relative to the Fund’s benchmark (Russell 2000). It is calculated by measuring the Fund’s performance in quarters when the benchmark goes down and dividing it by the benchmark’s return in those quarters. |
| The Royce Funds 2018 Semiannual Report to Shareholders | 29 |
| MANAGER’S DISCUSSION | ||
| Royce Small-Cap Value Fund (RVV) |
 |
| Jay Kaplan, CFA |
| FUND PERFORMANCE Royce Small-Cap Value Fund rose 7.1% for the year-to-date period ended June 30, 2018, narrowly trailing its small-cap benchmark, the Russell 2000 Index, which was up 7.7% for the same period. The Fund narrowly outpaced the small-cap index, however, for the one-year period ended June 30, 2018, up 17.7% versus 17.6%. |
| WHAT WORKED... AND WHAT DIDN’T |
| Information Technology and Consumer Discretionary were the top-contributing sectors by a wide margin, while Utilities, where we typically have very little exposure, detracted modestly. The portfolio’s two leading industry groups—electronic equipment, instruments & components and specialty retail—came from its two top-contributing sectors. The airlines group detracted most at the industry level, followed by commercial services & supplies—both groups are in the Industrials sector. Three of the portfolio’s top five positive contributors came from the electronic instruments & components industry. Two more top-10 holdings from that same group—Vishay Intertechnology, which makes semiconductor and passive component equipment, and Celestica, a contract manufacturer that offers manufacturing, hardware platform, and supply chain solutions—were also strong performers. Another contract manufacturer, Fabrinet specializes mostly in optical components. Its shares tend to be highly volatile, so we always try to trade effectively around its occasionally extreme moves. The company’s recent growth has been strong, spurred by the ongoing adoption of cloud storage solutions, which require optical components. Insight Enterprises and PC Connection are value-add distributors that provide a wide range of IT products and solutions. Global demand has been on the rise, which has kept revenues and earnings for both companies healthy. Moving from tech to transportation, the portfolio also saw a strong contribution from Stoneridge, a manufacturer of highly engineered electrical and electronic components, modules, and systems for the commercial vehicle, automotive, and agricultural vehicle markets. New management, which joined the firm a few years ago, has rolled out new products, including MirrorEye, a camera monitor system that replaces the rear- and side-view mirrors on trucks. In May, the company reported increased 2018 guidance for sales and adjusted earnings per share while also reaffirming previous margin estimates. All of this combined to keep its shares rolling. Asset management business Federated Investors detracted most at the position level, as outflows from a large equity mutual fund as well increased competition in money market funds helped to keep investors selling. We chose to hold our shares in the expectation that the firm will be able to rebound. We built our position in low-cost carrier Spirit Airlines, one of three holdings in the airline industry that disappointed in the first half. Spirit saw weakness in fares, to which its stock has historically been vulnerable, through much of 2018’s first six months. We like its profitability and long-term prospects and were also encouraged by a recent reversal in the direction of fares. We also chose to hold our position in truck trailer manufacturer Wabash National in the first half. The company reported strong overall demand and greater-than-anticipated new trailer shipments in April, but earnings were short of expectations, which drove its stock price down. First-half performance versus the benchmark suffered most from sector allocation—stock selection was a strength against the Russell 2000. The portfolio’s much lower weighting in Health Care, the top performer in the Russell 2000, hurt most, while ineffective stock selection in Financials, particularly in the capital markets and insurance industries, also had a negative impact, as did our greater exposure to Industrials, largely due to our overweight in airlines, where, in addition to Spirit, Allegiant Travel and Hawaiian Holdings also disappointed. Stock selection strength could be seen in a number of sectors, with the largest positive impact coming from holdings in Consumer Discretionary, with notable outperformance in the auto components industry. Holdings in Consumer Staples and Real Estate also contributed positively to relative results in the first half, with our lower weighting in the latter sector also helping. |
| Top Contributors to Performance Year-to-Date Through 6/30/18 (%)1 | ||||
| Fabrinet | 0.75 | |||
| Stoneridge | 0.73 | |||
| Insight Enterprises | 0.63 | |||
| PC Connection | 0.62 | |||
| Village Super Market Cl. A | 0.52 | |||
| 1 Includes dividends | ||||
| Top Detractors from Performance Year-to-Date Through 6/30/18 (%)2 | ||||
| Federated Investors Cl. B | -0.77 | |||
| Spirit Airlines | -0.40 | |||
| Wabash National | -0.29 | |||
| Electro Scientific Industries | -0.26 | |||
| Kimball International Cl. B | -0.24 | |||
| 2 Net of dividends | ||||
| CURRENT POSITIONING AND OUTLOOK |
| As interest rates continue to rise—and rise more consistently—valuations become more and more important. Most looked high to us at the end of June, especially with current and imminent challenges, some of which investors may be overlooking. In addition to a flattened yield curve and trade war noise, we have a more challenging climate for earnings growth now that the tax cuts have been reflected and a lack of quality in earnings can be discerned in many cases throughout the small-cap market. The approaching mid-term elections could generate a great deal of noise—and market volatility—all on their own. So while in general we see more that is worth selling than buying, we have also seen pockets of value within technology in semiconductor and capital equipment makers, distributors, and contract manufacturers, as well as in banks. Moreover, with the expectation of increased volatility, we see a reasonable environment for our contrarian value approach taking shape. |
| 30 | The Royce Funds 2018 Semiannual Report to Shareholders |
| PERFORMANCE AND PORTFOLIO REVIEW | TICKER SYMBOLS RYVFX RVVHX RVFCX RVVRX |
| Performance and Expenses | ||||||||||||||
| Average Annual Total Return (%) Through 6/30/18 | ||||||||||||||
| JAN-JUN 20181 | 1-YR | 3-YR | 5-YR | 10-YR | 15-YR | SINCE INCEPTION (6/14/01) | ||||||||
| RVV | 7.11 | 17.71 | 6.14 | 7.30 | 5.61 | 10.20 | 9.74 | |||||||
| Annual Gross Operating Expenses: 1.51% Annual Net Operating Expenses: 1.49% | ||||||||||||||
| 1 Not annualized | ||||||||||||||
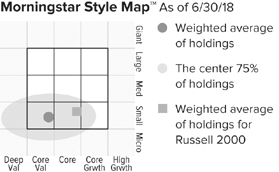
The Morningstar Style Map is the Morningstar Style Box™ with the center 75% of fund holdings plotted as the Morningstar Ownership Zone™. The Morningstar Style Box is designed to reveal a fund’s investment strategy. The Morningstar Ownership Zone provides detail about a portfolio’s investment style by showing the range of stock sizes and styles. The Ownership Zone is derived by plotting each stock in the portfolio within the proprietary Morningstar Style Box. Over time, the shape and location of a fund’s ownership zone may vary. See page 125 for additional information. |
Value of $10,000

| Top 10 Positions | ||
| % of Net Assets | ||
| PC Connection | 2.5 | |
| Kulicke & Soffa Industries | 2.5 | |
| Insight Enterprises | 2.5 | |
| Genworth MI Canada | 2.4 | |
| Spirit Airlines | 2.3 | |
| Vishay Intertechnology | 2.2 | |
| Celestica | 2.2 | |
| Fabrinet | 2.0 | |
| Village Super Market Cl. A | 2.0 | |
| Hawaiian Holdings | 2.0 | |
| Portfolio Sector Breakdown | ||
| % of Net Assets | ||
| Information Technology | 25.7 | |
| Industrials | 22.2 | |
| Financials | 21.7 | |
| Consumer Discretionary | 13.4 | |
| Energy | 2.3 | |
| Consumer Staples | 2.0 | |
| Real Estate | 1.5 | |
| Health Care | 1.4 | |
| Utilities | 0.5 | |
| Cash and Cash Equivalents | 9.3 | |
| Calendar Year Total Returns (%) | ||
| YEAR | RVV | |
| 2017 | 5.3 | |
| 2016 | 21.1 | |
| 2015 | -11.5 | |
| 2014 | -0.0 | |
| 2013 | 27.8 | |
| 2012 | 9.6 | |
| 2011 | -7.4 | |
| 2010 | 25.0 | |
| 2009 | 44.7 | |
| 2008 | -34.2 | |
| 2007 | 3.8 | |
| 2006 | 16.8 | |
| 2005 | 17.2 | |
| 2004 | 30.9 | |
| 2003 | 54.3 | |
| Upside/Downside Capture Ratios | ||||
| Periods Ended 6/30/18 (%) | ||||
| UPSIDE | DOWNSIDE | |||
| 10-Year | 79 | 103 | ||
| From 6/30/01 (Start of Fund’s First Full Quarter) | 99 | 91 | ||
| Portfolio Diagnostics | ||
| Fund Net Assets | $238 million | |
| Number of Holdings | 79 | |
| Turnover Rate | 22% | |
| Average Market Capitalization1 | $1,306 million | |
| Weighted Average P/E Ratio2,3 | 15.1x | |
| Weighted Average P/B Ratio2 | 2.0x | |
| Active Share4 | 96% | |
| U.S. Investments (% of Net Assets) | 79.1% | |
| Non-U.S. Investments (% of Net Assets) | 11.6% | |
| 1 | Geometric Average. This weighted calculation uses each portfolio holding’s market cap in a way designed to not skew the effect of very large or small holdings; instead, it aims to better identify the portfolio’s center, which Royce believes offers a more accurate measure of average market cap than a simple mean or median. |
| 2 | Harmonic Average. This weighted calculation evaluates a portfolio as if it were a single stock and measures it overall. It compares the total market value of the portfolio to the portfolio’s share in the earnings or book value, as the case may be, of its underlying stocks. |
| 3 | The Fund’s P/E ratio calculation excludes companies with zero or negative earnings (6% of portfolio holdings as of 6/30/18). |
| 4 | Active Share is the sum of the absolute values of the different weightings of each holding in the Fund versus each holding in the benchmark, divided by two. |
| Important Performance and Expense Information All performance information in this Report reflects past performance, is presented on a total return basis, reflects the reinvestment of distributions, and does not reflect the deduction of taxes that a shareholder would pay on fund distributions or the redemption of fund shares. Past performance is no guarantee of future results. Investment return and principal value of an investment will fluctuate, so that shares may be worth more or less than their original cost when redeemed. Shares redeemed within 30 days of purchase may be subject to a 1% redemption fee payable to the Fund, which is not reflected in the performance shown above; if it were, performance would be lower. Current month-end performance may be higher or lower than performance quoted and may be obtained at www.roycefunds.com. All performance and risk information reflects results of the Service Class (its oldest class). Certain immaterial adjustments were made to the net assets of Royce Small-Cap Value Fund at 6/30/16 for financial reporting purposes, and as a result the net asset values for shareholder transactions on that date and the calendar year Total Returns (%) based on those net asset values differ from the adjusted net asset values and calendar year total returns reported in the Financial Highlights. Gross operating expenses reflect the Fund’s gross total annual operating expenses for the Service Class and include management fees, 12b-1 distribution and service fees, and other expenses. Net operating expenses reflect contractual fee waivers and/or expense reimbursements. All expense information is reported as of the Fund’s most current prospectus. Royce & Associates has contractually agreed, without right of termination, to waive fees and/or reimburse expenses to the extent necessary to maintain the Service Class’s net annual operating expenses (excluding brokerage commissions, taxes, interest, litigation expenses, acquired fund fees and expenses, and other expenses not borne in the ordinary course of business) at or below 1.49% through April 30, 2019. Regarding the “Top Contributors” and “Top Detractors” tables shown above, the sum of all contributors to, and all detractors from, performance for all securities in the portfolio would approximate the Fund’s year-to-date performance for 2018. Upside Capture Ratio measures a manager’s performance in up markets relative to the Fund’s benchmark. It is calculated by measuring the Fund’s performance in quarters when the benchmark went up and dividing it by the benchmark’s return in those quarters. Downside Capture Ratio measures a manager’s performance in down markets relative to the Fund’s benchmark (Russell 2000). It is calculated by measuring the Fund’s performance in quarters when the benchmark goes down and dividing it by the benchmark’s return in those quarters. |
| The Royce Funds 2018 Semiannual Report to Shareholders | 31 |
| MANAGER’S DISCUSSION |
| Royce Small/Mid-Cap Premier Fund (RHF) |
 |
| Steven McBoyle, CPA, CA |
| FUND PERFORMANCE |
| Royce Small/Mid-Cap Premier Fund fell 3.1% for the year-to-date period ended June 30, 2018, underperforming its small- and mid-cap benchmark, the Russell 2500 Index, which was up 5.5% for the same period. |
| WHAT WORKED... AND WHAT DIDN’T |
| Four of the Fund’s nine equity sectors finished the first half in the red, with Consumer Discretionary having by far the biggest negative impact on performance. In this sector, the recreational vehicle industry coped with fears—which then proceeded to materialize—of an inventory correction. This was the primary cause of first-half decline for the stocks of both Thor Industries—the U.S.’s largest RV manufacturer—and Camping World Holdings—its largest retailer. With RV sales growing at a healthy clip for eight consecutive years and unit shipments topping a record of more than 500,000 in 2017, retailers ordered aggressively heading into 2018. Concurrently, producers began to add capacity before the longer-than-usual winter delayed the beginning of this year’s RV sales season. As a result, excess retail inventory needed to be worked off, and orders were cut back. While this inventory rebalancing has slowed near-term results, the age of retail inventory being cleared is relatively young. And while demand has slowed, it is still growing off peak levels thanks to favorable RV-buyer demographic trends and generally solid consumer discretionary spending. We held shares in both companies at the end of June. |
| Manpower Group is a Milwaukee-based temporary staffing business. Earnings remained positive in 2018’s first half, its prospects in a still-tightening global labor market appeared strong, and recent acquisitions expanded its global footprint. Its shares fell mostly on a change in a tax subsidy rate in France for companies that provide temporary labor and loftier expectations for growth than even strong earnings earlier in the year could match. We remained confident enough in its core global business to keep it among the portfolio’s top-12 holdings at the end of June. LKQ Corporation, which distributes automotive replacement parts, saw its shares tumble in April when the company reduced its full year guidance. Thinking that its long-term ability to execute remains strong, we held a large position. As for companies that did well, Copart is the largest online auto salvage auction provider in the U.S. The company saw higher volumes and revenue per car as market conditions remained robust in the first half. Copart’s continuous improvement of its virtual bidding platform is expanding the pool of potential buyers, auction participants, and bids per car. A shift within its non-insurance auto auction business toward dealers and financial institutions has been lifting both average selling prices and gross margins higher. Finally, the company has been supplementing its expanding European footprint with the acquisition of a salvage operation in Finland, augmenting its buyer base in Russia and the Baltic States. Kirby Corporation has the largest inland and coastal tank barge fleet in the U.S. and also draws revenue from servicing and distributing industrial engines, transmissions, parts, and oil field services equipment. The tank barge markets seem to be recovering well, thanks to retirements of older barges, limited new builds, and solid utilization rates. Kirby has also benefited from two recent acquisitions over the last 18 months that are allowing it to drive industry consolidation. In addition, higher land drilling activity resulting from rising oil prices has been stoking demand for new and remanufactured hydraulic fracturing units. It was the portfolio’s fifth-largest position at the end of June. Relative to the Russell 2500, first-half results were impaired most by ineffective stock selection in the Consumer Discretionary sector, particularly in the distributors and specialty retail groups. Both our position in DENTSPLY SIRONA, a dental equipment and consumables manufacturer, and our significantly lower sector exposure were headwinds in Health Care, which was the best performer among the 11 sectors in the Russell 2500, while results in Financials were hurt most by our position in asset management business Affiliated Managers Group. Conversely, we derived smaller relative benefits from our underweight in Utilities and from a combination of having no exposure to lagging REITs and effective stock selection in the Real Estate sector’s real estate management & development group. |
| Top Contributors to Performance | ||||
| Year-to-Date Through 6/30/18 (%)1 | ||||
| Copart | 0.97 | |||
| Kirby Corporation | 0.51 | |||
| UGI Corporation | 0.36 | |||
| CarMax | 0.27 | |||
| Cabot Microelectronics | 0.25 | |||
| 1 Includes dividends | ||||
| Top Detractors from Performance | ||||
| Year-to-Date Through 6/30/18 (%)2 | ||||
| Thor Industries | -0.88 | |||
| Camping World Holdings Cl. A | -0.80 | |||
| ManpowerGroup | -0.77 | |||
| LKQ Corporation | -0.77 | |||
| Affiliated Managers Group | -0.60 | |||
| 2 Net of dividends | ||||
| CURRENT POSITIONING AND OUTLOOK |
| Our outlook is guarded. While we have not made any significant alterations to positioning or sector weights, our cash position is higher than typical. This is the consequence of seeing a dearth of high-quality opportunities trading for what we believe are fair prices. We see additional risk in the run-off effects of tax cuts and deregulation that will begin to challenge earnings growth over the next two quarters. The rate of change in global growth has also diminished, with global PMIs (the Purchasing Managers’ Index, an indicator of economic health for manufacturing and service sectors) slowing, while the effects of tariffs are just now registering—and are only likely to intensify. All of this raises the degree of difficulty for equities to maintain their recent performance pace. We also believe, however, that the portfolio holds companies that are well prepared to execute effectively in a more challenging period. |
| 32 | The Royce Funds 2018 Semiannual Report to Shareholders |
| PERFORMANCE AND PORTFOLIO REVIEW | TICKER SYMBOLS RGFAX RHFHX RYGCX |
| Performance and Expenses Average Annual Total Return (%) Through 6/30/18 | ||||||||||||||||
| JAN-JUN 20181 | 1-YR | 3-YR | 5-YR | 10-YR | 15-YR | 20-YR | SINCE INCEPTION (12/27/95) | |||||||||
| RHF | -3.14 | 11.09 | 8.54 | 8.04 | 8.84 | 9.83 | 10.64 | 12.28 | ||||||||
| Annual Operating Expenses: 1.32% | ||||||||||||||||
| 1 Not annualized | ||||||||||||||||
| Relative Returns: Monthly Rolling Average Annual Return Periods 20 Years Through 6/30/18 On a monthly rolling basis, the Fund outperformed the Russell 2500 in 56% of all 10-year periods; 66% of all 5-year periods; and 48% of all 1-Year periods. | ||||||||||||
| PERIODS BEATING THE INDEX | FUND AVG (%)1 | INDEX AVG (%)1 | ||||||||||||
| 10-year | 68/121 | 56% | 8.7 | 7.9 | ||||||||||
| 5-year | 119/181 | 66% | 10.0 | 9.7 | ||||||||||
| 1-year | 111/229 | 48% | 13.4 | 11.5 | ||||||||||
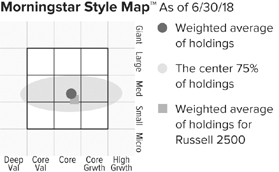
The Morningstar Style Map is the Morningstar Style Box™ with the center 75% of fund holdings plotted as the Morningstar Ownership Zone™. The Morningstar Style Box is designed to reveal a fund’s investment strategy. The Morningstar Ownership Zone provides detail about a portfolio’s investment style by showing the range of stock sizes and styles. The Ownership Zone is derived by plotting each stock in the portfolio within the proprietary Morningstar Style Box. Over time, the shape and location of a fund’s ownership zone may vary. See page 125 for additional information. |
Value of $10,000

| Top 10 Positions | |||
| % of Net Assets | |||
| Minerals Technologies | 3.0 | ||
| Westlake Chemical | 2.8 | ||
| LKQ Corporation | 2.8 | ||
| Alleghany Corporation | 2.8 | ||
| Kirby Corporation | 2.6 | ||
| Valmont Industries | 2.6 | ||
| Carlisle Companies | 2.4 | ||
| Lincoln Electric Holdings | 2.3 | ||
| Reliance Steel & Aluminum | 2.3 | ||
| UGI Corporation | 2.2 | ||
| Portfolio Sector Breakdown | |||
| % of Net Assets | |||
| Industrials | 28.5 | ||
| Consumer Discretionary | 18.8 | ||
| Materials | 13.0 | ||
| Financials | 8.2 | ||
| Information Technology | 6.3 | ||
| Health Care | 4.4 | ||
| Real Estate | 2.8 | ||
| Utilities | 2.2 | ||
| Consumer Staples | 1.1 | ||
| Cash and Cash Equivalents | 14.7 | ||
| Calendar Year Total Returns (%) | |||
| YEAR | RHF | ||
| 2017 | 21.2 | ||
| 2016 | 17.8 | ||
| 2015 | -6.5 | ||
| 2014 | -1.1 | ||
| 2013 | 26.0 | ||
| 2012 | 14.3 | ||
| 2011 | -9.3 | ||
| 2010 | 27.5 | ||
| 2009 | 51.8 | ||
| 2008 | -36.2 | ||
| 2007 | 1.2 | ||
| 2006 | 22.6 | ||
| 2005 | 8.7 | ||
| 2004 | 20.4 | ||
| 2003 | 38.1 | ||
| Upside/Downside Capture Ratios | |||
| Periods Ended 6/30/18 (%) | |||
| UPSIDE | DOWNSIDE | |||
| 10-Year | 93 | 103 | ||
| From 12/31/95 (Start of Fund’s First Full Quarter) | 107 | 97 | ||
| Portfolio Diagnostics | |||
| Fund Net Assets | $191 million | ||
| Number of Holdings | 70 | ||
| Turnover Rate | 33% | ||
| Average Market Capitalization1 | $5,293 million | ||
| Weighted Average P/E Ratio2,3 | 17.9x | ||
| Weighted Average P/B Ratio2 | 2.5x | ||
| Active Share4 | 95% | ||
| U.S. Investments (% of Net Assets) | 82.2% | ||
| Non-U.S. Investments (% of Net Assets) | 3.1% | ||
| 1 | Geometric Average. This weighted calculation uses each portfolio holding’s market cap in a way designed to not skew the effect of very large or small holdings; instead, it aims to better identify the portfolio’s center, which Royce believes offers a more accurate measure of average market cap than a simple mean or median. |
| 2 | Harmonic Average. This weighted calculation evaluates a portfolio as if it were a single stock and measures it overall. It compares the total market value of the portfolio to the portfolio’s share in the earnings or book value, as the case may be, of its underlying stocks. |
| 3 | The Fund’s P/E ratio calculation excludes companies with zero or negative earnings (2% of portfolio holdings as of 6/30/18). |
| 4 | Active Share is the sum of the absolute values of the different weightings of each holding in the Fund versus each holding in the benchmark, divided by two. |
| Important Performance and Expense Information |
All performance information in this Report reflects past performance, is presented on a total return basis, reflects the reinvestment of distributions, and does not reflect the deduction of taxes that a shareholder would pay on fund distributions or the redemption of fund shares. Past performance is no guarantee of future results. Investment return and principal value of an investment will fluctuate, so that shares may be worth more or less than their original cost when redeemed. Shares redeemed within 30 days of purchase may be subject to a 1% redemption fee payable to the Fund, which is not reflected in the performance shown above; if it were, performance would be lower. Current month-end performance may be higher or lower than performance quoted and may be obtained at www.roycefunds.com. All performance and risk information reflects results of the Service Class (its oldest class). Price and total return information is based on net asset values calculated for shareholder transactions. Operating expenses reflect the Fund’s total annual operating expenses for the Service Class as of the Fund’s most current prospectus and include management fees, 12b-1 distribution and service fees, and other expenses. Regarding the “Top Contributors” and “Top Detractors” tables shown above, the sum of all contributors to, and all detractors from, performance for all securities in the portfolio would approximate the Fund’s year-to-date performance for 2018. Upside Capture Ratio measures a manager’s performance in up markets relative to the Fund’s benchmark. It is calculated by measuring the Fund’s performance in quarters when the benchmark went up and dividing it by the benchmark’s return in those quarters. Downside Capture Ratio measures a manager’s performance in down markets relative to the Fund’s benchmark (Russell 2500). It is calculated by measuring the Fund’s performance in quarters when the benchmark goes down and dividing it by the benchmark’s return in those quarters. |
| The Royce Funds 2018 Semiannual Report to Shareholders | 33 |
| MANAGER’S DISCUSSION |
| Royce Smaller-Companies Growth Fund (RVP) |
 |
| Chip Skinner, CFA |
| FUND PERFORMANCE |
| As was the case in 2017, Royce Smaller-Companies Growth Fund benefited from a hospitable climate for its ‘GARP’ (growth-at-a-reasonable price) strategy in the first half of 2018, as small-cap growth stocks once again outperformed their value counterparts. The Fund advanced 10.4% for the year-to-date period ended June 30, 2018, ahead of its benchmark, the Russell 2000 Index, which was up 7.7% for the same period. Improved market breadth in the second quarter helped the Fund to solidify its first-half advantage over the small-cap index, as six of its nine equity sectors exceeded quarterly returns for those sectors in the Russell 2000. |
| WHAT WORKED... AND WHAT DIDN’T |
| Given the recent strength of growth stocks, the ongoing advantages for Information Technology and Health Care holdings in the portfolio came as no surprise. These two sectors dominated first-half results, with respectable gains also coming from Industrials and Consumer Discretionary. Materials and Telecommunication Services were the only two sectors that detracted, and only the first had a meaningful negative impact. Two groups led at the industry level by wide margins, paralleling sector results. Positive contributions in the Internet software & services group came from a number of holdings, including top-10 position LivePerson, which develops products and applications for online messaging, marketing, and analytics. Health care equipment & supplies was also home to several holdings that made notable contributions, including ABIOMED, which is quickly gaining market share with Impella, a minimally invasive heart pump that reroutes blood through a catheter then back into the patient’s heart. We took some gains as its shares climbed. Elsewhere in Health Care, we had success with companies involved in gene therapy. REGENXBIO has 25 therapeutic programs in its pipeline that treat retinal, metabolic, and neurodegenerative diseases, with 12 of these at the clinical trial stage. As its stock rose well past our initial targets, we reduced our stake. uniQure is developing new disease modifying therapies for patients with serious genetic diseases and also offers ongoing clinical programs in hemophilia B and a pre-clinical proof-of-concept treatment for Huntington’s disease. We took some gains in the first half as its shares moved up. Both of these companies began as small portfolio positions given the higher-risk, higher-reward nature of biotech companies. We remain very interested in the potential of gene therapy and the prospects for the companies that specialize in it, even as many valuations for this group looked stretched to us at the end of June. Given the radical effect it is having on the drug discovery front, we believe gene therapy looks likely to remain a critical area of innovation and growth in the years ahead, and we will be investigating opportunities carefully. Outside of Health Care, and coming from the electrical equipment group in Industrials, Enphase Energy is an energy technology company and the world’s leading supplier of solar microinverters, a key solar panel component. The company’s shares rose on news of increasing sales volumes and management’s optimism about future margin growth. As for holdings that disappointed, vTv Therapeutics saw a late stage treatment for Alzheimer’s disease stall, which led many investors, including us, to sell their shares. We felt more confident in the long-term prospects for top-20 holding Cobalt 27 Capital, a leading electric metals investment vehicle that gives investors access to those integral to the electric vehicle and battery energy storage markets. Based in Toronto, the company’s stock tends to track closely with cobalt commodity prices. We anticipate that as electric vehicles gain more popularity, its shares should see a benefit. Relative to the Russell 2000, the Fund drew performance advantages from superior stock selection, as well as our overweights, in three sectors—Information Technology, where the Internet software & services group again stood out, Industrials, thanks to strong results in several groups, and Health Care, where health care equipment & supplies did best versus the small-cap index. The only significant detractor was Materials, where our position in Cobalt 27 Capital did most to dampen relative results. Much more modest detractions came from our underweight in Energy and ineffective stock selection in Financials. |
| Top Contributors to Performance | ||||
| Year-to-Date Through 6/30/18 (%)1 | ||||
| REGENXBIO | 0.88 | |||
| Enphase Energy | 0.78 | |||
| ABIOMED | 0.71 | |||
| uniQure | 0.69 | |||
| Unisys Corporation | 0.65 | |||
| 1 Includes dividends | ||||
| Top Detractors from Performance | ||||
| Year-to-Date Through 6/30/18 (%)2 | ||||
| vTv Therapeutics Cl. A | -0.61 | |||
| Cobalt 27 Capital | -0.58 | |||
| Universal Display | -0.48 | |||
| Axsome Therapeutics | -0.46 | |||
| Orocobre | -0.41 | |||
| 2 Net of dividends | ||||
| CURRENT POSITIONING AND OUTLOOK |
| We continue to see potential in discrete special situations where the potential for high growth looks promising and valuations still appear reasonable. Otherwise, valuations appear high to us through much of the small-cap market, particularly the fastest growing companies. So while the last few years of strong returns have been welcome, we are increasingly concerned that the small-cap market has not seen any significant readjustment of valuations since early 2016. That long an absence is historically atypical, which is causing us to proceed with caution. So far in 2018, we have reduced weightings in holdings where the valuations looked most vulnerable to correction and have sold or trimmed other positions that exceeded our price targets. However, we are guardedly optimistic about the strength of the U.S. economy and suspect that many fast-growing companies will remain well-positioned to keep accelerating along with improved GDP growth. |
| 34 | The Royce Funds 2018 Semiannual Report to Shareholders |
| PERFORMANCE AND PORTFOLIO REVIEW | TICKER SYMBOLS RYVPX RVPHX RVPCX RVPIX |
| Performance and Expenses | ||||||||||||||||
| Average Annual Total Return (%) Through 6/30/18 | ||||||||||||||||
| JAN-JUN 20181 | 1-YR | 3-YR | 5-YR | 10-YR | 15-YR | SINCE INCEPTION (6/14/01) | ||||||||||
| RVP | 10.38 | 16.87 | 8.63 | 11.34 | 8.00 | 11.05 | 11.73 | |||||||||
| Annual Operating Expenses: 1.49% | ||||||||||||||||
| 1 Not annualized | ||||||||||||||||
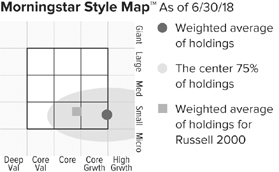
The Morningstar Style Map is the Morningstar Style Box™ with the center 75% of fund holdings plotted as the Morningstar Ownership Zone™. The Morningstar Style Box is designed to reveal a fund’s investment strategy. The Morningstar Ownership Zone provides detail about a portfolio’s investment style by showing the range of stock sizes and styles. The Ownership Zone is derived by plotting each stock in the portfolio within the proprietary Morningstar Style Box. Over time, the shape and location of a fund’s ownership zone may vary. See page 125 for additional information. |
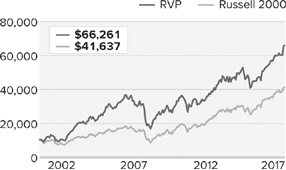
| Top 10 Positions | ||
| % of Net Assets | ||
| Enterprise Financial Services | 2.0 | |
| TriState Capital Holdings | 2.0 | |
| Atlas Air Worldwide Holdings | 1.9 | |
| QAD Cl. A | 1.7 | |
| Paylocity Holding Corporation | 1.7 | |
| Unisys Corporation | 1.7 | |
| USA Technologies | 1.6 | |
| Materialise ADR | 1.5 | |
| LivePerson | 1.5 | |
| Iteris | 1.5 | |
| Portfolio Sector Breakdown | ||
| % of Net Assets | ||
| Information Technology | 31.2 | |
| Health Care | 17.7 | |
| Financials | 13.6 | |
| Industrials | 12.5 | |
| Consumer Discretionary | 8.2 | |
| Materials | 5.6 | |
| Real Estate | 2.0 | |
| Consumer Staples | 1.7 | |
| Energy | 1.8 | |
| Cash and Cash Equivalents | 5.7 | |
| Calendar Year Total Returns (%) | ||
| YEAR | RVP | |
| 2017 | 17.8 | |
| 2016 | 9.4 | |
| 2015 | -1.8 | |
| 2014 | 3.9 | |
| 2013 | 32.5 | |
| 2012 | 15.3 | |
| 2011 | -10.0 | |
| 2010 | 19.7 | |
| 2009 | 41.4 | |
| 2008 | -41.1 | |
| 2007 | 3.2 | |
| 2006 | 19.3 | |
| 2005 | 13.2 | |
| 2004 | 28.2 | |
| 2003 | 79.9 | |
| Upside/Downside Capture Ratios | ||||
| Periods Ended 6/30/18 (%) | ||||
| UPSIDE | DOWNSIDE | |||
| 10-Year | 93 | 108 | ||
| From 6/30/01 (Start of Fund’s First Full Quarter) | 113 | 100 | ||
| Portfolio Diagnostics | ||
| Fund Net Assets | $367 million | |
| Number of Holdings | 131 | |
| Turnover Rate | 27% | |
| Average Market Capitalization1 | $1,377 million | |
| Weighted Average P/B Ratio2 | 3.1x | |
| 3-5 Year EPS Growth (est.)3 | 20.8% | |
| Active Share4 | 94% | |
| U.S. Investments (% of Net Assets) | 82.5% | |
| Non-U.S. Investments (% of Net Assets) | 11.8% | |
| 1 | Geometric Average. This weighted calculation uses each portfolio holding’s market cap in a way designed to not skew the effect of very large or small holdings; instead, it aims to better identify the portfolio’s center, which Royce believes offers a more accurate measure of average market cap than a simple mean or median. |
| 2 | Harmonic Average. This weighted calculation evaluates a portfolio as if it were a single stock and measures it overall. It compares the total market value of the portfolio to the portfolio’s share in the earnings or book value, as the case may be, of its underlying stocks. |
| 3 | The 3-5 Year EPS Growth (est.) is calculated as a simple weighted average of the pre-calculated mean long-term EPS growth rate estimates by brokerage analysts. Long Term Growth (LTG) is the annual EPS growth that the company can sustain over the next 3 or 5 years. Source: Factset |
| 4 | Active Share is the sum of the absolute values of the different weightings of each holding in the Fund versus each holding in the benchmark, divided by two. |
| Important Performance and Expense Information All performance information in this Report reflects past performance, is presented on a total return basis, reflects the reinvestment of distributions, and does not reflect the deduction of taxes that a shareholder would pay on fund distributions or the redemption of fund shares. Past performance is no guarantee of future results. Investment return and principal value of an investment will fluctuate, so that shares may be worth more or less than their original cost when redeemed. Shares redeemed within 30 days of purchase may be subject to a 1% redemption fee payable to the Fund, which is not reflected in the performance shown above; if it were, performance would be lower. Current month-end performance may be higher or lower than performance quoted and may be obtained at www.roycefunds.com. All performance and risk information reflects results of the Service Class (its oldest class). Operating expenses reflect the Fund’s total annual operating expenses for the Service Class as of the Fund’s most current prospectus and include management fees, 12b-1 distribution and service fees, and other expenses. Regarding the “Top Contributors” and “Top Detractors” tables shown above, the sum of all contributors to, and all detractors from, performance for all securities in the portfolio would approximate the Fund’s year-to-date performance for 2018. Upside Capture Ratio measures a manager’s performance in up markets relative to the Fund’s benchmark. It is calculated by measuring the Fund’s performance in quarters when the benchmark went up and dividing it by the benchmark’s return in those quarters. Downside Capture Ratio measures a manager’s performance in down markets relative to the Fund’s benchmark (Russell 2000). It is calculated by measuring the Fund’s performance in quarters when the benchmark goes down and dividing it by the benchmark’s return in those quarters. |
| The Royce Funds 2018 Semiannual Report to Shareholders | 35 |
| MANAGERS’ DISCUSSION | ||
| Royce Special Equity Fund (RSE) |
 |
| Charlie Dreifus, CFA Steven McBoyle, CPA, CA |
| FUND PERFORMANCE For the year-to-date period ended June 30, 2018, Royce Special Equity Fund was down 0.3%, lagging its small-cap benchmark, the Russell 2000 Index, which was up 7.7% for the same period. This was a disappointing period, in which small-cap growth again outperformed small-cap value, while defensive sectors outpaced their cyclical counterparts. And in spite of higher volatility in the first quarter and a wild finish to the second, overall volatility (as measured by the percentage of trading days in which the Russell 2000 moved 1% or more) was substantially lower during the first half of 2018 than its historical average. Altogether, it was not an environment conducive to Special Equity’s classic value approach. We were, however, encouraged by the portfolio’s improved performance in May and June, which hopefully portended a more lasting shift to value stocks. |
| WHAT WORKED... AND WHAT DIDN’T |
| Consumer Staples was the Fund’s top-contributing sector by a significant margin in the first half of the year while Consumer Discretionary made an even larger negative impact. The latter sector was home to six of the portfolio’s 10 largest detractors and four of its top five. The biggest negative impact came from retailer The Children’s Place, which was the Fund’s second-largest holding at the end of June. Elsewhere in the sector, we added shares of diversified media company Meredith Corporation and replacement tire manufacturer Cooper Tire & Rubber, while trimming our stake in recreational vehicle maker Winnebago Industries. Outside of Consumer Discretionary, we also held a sizable stake in Hubbell, which makes electrical and electronic products. The Consumer Staples sector was buoyed by an impressive rebound for supermarket operator Weis Markets and nut specialist John B. Sanfilippo & Son, while in the Industrials sector a strong showing in June lifted the shares of National Presto Industries, which manufactures everything from defense products to housewares and small appliances. Two holdings in Consumer Discretionary rounded out the top five positive contributors—for-profit education business Capella Education and children’s book publisher Scholastic Corporation. Each was a top-10 position at June 30th. Relative to the Russell 2000 in the first half, the Fund was substantially disadvantaged by poor stock picks in Consumer Discretionary, where The Children’s Place hurt most, and Information Technology, where 2017’s top contributor, automatic test equipment maker Teradyne, pulled back. Our lack of exposure to Health Care, the top-performing sector in the Russell 2000, also detracted meaningfully. Superior stock selection helped year-to-date relative results in Consumer Staples and Real Estate, while a lack of exposure to Financials was also a positive factor. |
| Top Contributors to Performance Year-to-Date Through 6/30/18 (%)1 | |||
| Weis Markets | 1.18 | ||
| National Presto Industries | 1.05 | ||
| Capella Education | 0.91 | ||
| John B. Sanfilippo & Son | 0.68 | ||
| Scholastic Corporation | 0.62 | ||
| 1 Includes dividends | |||
| Top Detractors from Performance Year-to-Date Through 6/30/18 (%)2 | |||
| Children’s Place | -1.14 | ||
| Hubbell Cl. B | -1.07 | ||
| Meredith Corporation | -0.99 | ||
| Cooper Tire & Rubber | -0.98 | ||
| Winnebago Industries | -0.83 | ||
| 2 Net of dividends | |||
| CURRENT POSITIONING AND OUTLOOK |
| We liked the way the portfolio was positioned at the end of June. It remains highly concentrated with 37 holdings and more than half of its assets invested in two cyclical sectors, Consumer Discretionary and Industrials. The stronger dollar and growing concerns about economies outside the U.S. should continue to favor small-caps. This, we believe, will be a particularly favorable environment for our low-debt, cash-rich holdings as weaker companies that benefited from quantitative easing begin to struggle with quantitative tightening (QT). Indeed, QT has broader unknown consequences. After nearly 10 years of propping up assets, the Fed is changing direction—and no one knows for sure what the ramifications will be. However, it is reasonable to assume that those companies that were helped in the past 10 years will at least see smaller benefits, while those neglected or harmed look likely to recover. Among those most likely to be adversely affected are growth stocks in general. Small-cap growth has outperformed small-cap value for most of the last decade, 2016 being among the most recent, quite welcome, exceptions. Moreover, despite the improved performance of value names in the second quarter, the valuation spread between growth and value remained historically wide at the end of the first half. Until recently, most of the post-2008 era of anemic economic growth favored growth stocks. But growth is no longer scarce in the U.S., so investors need not pay up for it. Absent a major policy error by the White House or the Fed, we expect U.S. economic growth to continue, though perhaps at a slower pace, with a developing advantage for less expensive value stocks over more expensive growth issues. Much of what is coming out of Washington—in both words and actions—has caused us all to feel badly despite things being good. Too much strong rhetoric has raised anxiety and stoked volatility, creating a tug-of-war between solid fundamentals and policy uncertainty. Our old standby is that rate of return is a function of entry level—which in general are not too appealing for equities these days. Along with the uncertainty surrounding us, this makes a risk vs. reward approach seem sensible, which leads us to favor investments that have a good historical record during drawdowns. We remain proud of the Fund’s long-term history of low volatility and better risk-adjusted returns than the Russell 2000. |
| 36 | The Royce Funds 2018 Semiannual Report to Shareholders |
| PERFORMANCE AND PORTFOLIO REVIEW | TICKER SYMBOLS RYSEX RSEFX RSEIX RSQCX |
| Performance and Expenses | ||||||||||||||||||
| Average Annual Total Return (%) Through 6/30/18 | ||||||||||||||||||
| JAN-JUN 20181 | 1-YR | 3-YR | 5-YR | 10-YR | 15-YR | 20-YR | SINCE INCEPTION (5/1/98) | |||||||||||
| RSE | -0.32 | 7.92 | 7.79 | 7.71 | 9.67 | 9.13 | 9.33 | 9.20 | ||||||||||
| Annual Operating Expenses: 1.17% | ||||||||||||||||||
| 1 Not annualized | ||||||||||||||||||
Relative Risk Adjusted Returns: Monthly Rolling Sharpe Ratios
| On a monthly rolling risk-adjusted basis, the Fund outperformed the Russell 2000 in 100% of all 10-year periods and 69% of all 5-year periods. |
| PERIODS BEATING THE INDEX | FUND AVG (%)1 | INDEX AVG (%)1 | ||||||||||||
| 10-year | 121/121 | 100% | 0.55 | 0.35 | ||||||||||
| 5-year | 125/181 | 69% | 0.69 | 0.49 | ||||||||||

The Morningstar Style Map is the Morningstar Style Box™ with the center 75% of fund holdings plotted as the Morningstar Ownership Zone™. The Morningstar Style Box is designed to reveal a fund’s investment strategy. The Morningstar Ownership Zone provides detail about a portfolio’s investment style by showing the range of stock sizes and styles. The Ownership Zone is derived by plotting each stock in the portfolio within the proprietary Morningstar Style Box. Over time, the shape and location of a fund’s ownership zone may vary. See page 125 for additional information. |
Invested on 5/1/98 as of 6/30/18 ($)
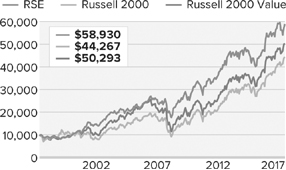
| Top 10 Positions | ||
| % of Net Assets | ||
| UniFirst Corporation | 5.6 | |
| Children’s Place | 5.4 | |
| Scholastic Corporation | 5.1 | |
| AVX Corporation | 4.9 | |
| Standard Motor Products | 4.9 | |
| Meredith Corporation | 4.2 | |
| John B. Sanfilippo & Son | 4.0 | |
| Hooker Furniture | 3.8 | |
| Capella Education | 3.8 | |
| Hubbell Cl. B | 3.7 | |
| Portfolio Sector Breakdown | ||
| % of Net Assets | ||
| Consumer Discretionary | 37.3 | |
| Industrials | 21.5 | |
| Information Technology | 16.1 | |
| Consumer Staples | 8.0 | |
| Real Estate | 3.0 | |
| Materials | 0.9 | |
| Energy | 0.6 | |
| Cash and Cash Equivalents | 12.6 | |
| Calendar Year Total Returns (%) | ||
| YEAR | RSE | |
| 2017 | 7.9 | |
| 2016 | 32.2 | |
| 2015 | -12.4 | |
| 2014 | 1.1 | |
| 2013 | 29.4 | |
| 2012 | 15.4 | |
| 2011 | 0.1 | |
| 2010 | 19.6 | |
| 2009 | 28.4 | |
| 2008 | -19.6 | |
| 2007 | 4.7 | |
| 2006 | 14.0 | |
| 2005 | -1.0 | |
| 2004 | 13.9 | |
| 2003 | 27.6 | |
| Upside/Downside Capture Ratios | ||||||||||||||
| Periods Ended 6/30/18 (%) | ||||||||||||||
| UPSIDE | DOWNSIDE | |||||||||||||
| 10-Year | 79 | 69 | ||||||||||||
| From 6/30/98 (Start of Fund’s First Full Quarter) | 73 | 50 | ||||||||||||
| Portfolio Diagnostics | ||
| Fund Net Assets | $1,399 million | |
| Number of Holdings | 37 | |
| Turnover Rate | 5% | |
| Average Market Capitalization1 | $1,439 million | |
| Weighted Average P/E Ratio2,3 | 22.5x | |
| Weighted Average P/B Ratio2 | 2.1x | |
| Active Share4 | 99% | |
| U.S. Investments (% of Net Assets) | 85.9% | |
| Non-U.S. Investments (% of Net Assets) | 1.5% | |
| 1 | Geometric Average. This weighted calculation uses each portfolio holding’s market cap in a way designed to not skew the effect of very large or small holdings; instead, it aims to better identify the portfolio’s center, which Royce believes offers a more accurate measure of average market cap than a simple mean or median. |
| 2 | Harmonic Average. This weighted calculation evaluates a portfolio as if it were a single stock and measures it overall. It compares the total market value of the portfolio to the portfolio’s share in the earnings or book value, as the case may be, of its underlying stocks. |
| 3 | The Fund’s P/E ratio calculation excludes companies with zero or negative earnings (4% of portfolio holdings as of 6/30/18). |
| 4 | Active Share is the sum of the absolute values of the different weightings of each holding in the Fund versus each holding in the benchmark, divided by two. |
| Important Performance and Expense Information |
All performance information in this Report reflects past performance, is presented on a total return basis, reflects the reinvestment of distributions, and does not reflect the deduction of taxes that a shareholder would pay on fund distributions or the redemption of fund shares. Past performance is no guarantee of future results. Investment return and principal value of an investment will fluctuate, so that shares may be worth more or less than their original cost when redeemed. Shares redeemed within 30 days of purchase may be subject to a 1% redemption fee payable to the Fund, which is not reflected in the performance shown above; if it were, performance would be lower. Current month-end performance may be higher or lower than performance quoted and may be obtained at www.roycefunds.com. All performance and risk information reflects results of the Investment Class (its oldest class). Operating expenses reflect the Fund’s total annual operating expenses for the Investment Class as of the Fund’s most current prospectus and include management fees and other expenses. The Sharpe Ratio is calculated for a specified period by dividing a fund’s annualized excess returns by its annualized standard deviation. The higher the Sharpe ratio, the better the fund’s historical risk-adjusted performance. Regarding the “Top Contributors” and “Top Detractors” tables shown above, the sum of all contributors to, and all detractors from, performance for all securities in the portfolio would approximate the Fund’s year-to-date performance for 2018. Upside Capture Ratio measures a manager’s performance in up markets relative to the Fund’s benchmark. It is calculated by measuring the Fund’s performance in quarters when the benchmark went up and dividing it by the benchmark’s return in those quarters. Downside Capture Ratio measures a manager’s performance in down markets relative to the Fund’s benchmark (Russell 2000). It is calculated by measuring the Fund’s performance in quarters when the benchmark goes down and dividing it by the benchmark’s return in those quarters. |
| The Royce Funds 2018 Semiannual Report to Shareholders | 37 |
| MANAGERS’ DISCUSSION | ||
| Royce Special Equity Multi-Cap Fund (RSM) |
 |
| Charlie Dreifus, CFA Steven McBoyle, CPA, CA |
| FUND PERFORMANCE For the year-to-date period ended June 30, 2018, Royce Special Equity Multi-Cap Fund was down 5.7%, lagging its large-cap benchmark, the Russell 1000 Index, which was up 2.9% for the same period. This was a disappointing period, in which growth again outperformed value, while defensive sectors outpaced their cyclical counterparts. And in spite of higher volatility in the first quarter and a wild finish to the second, overall volatility was substantially lower during the first half than its historical average. Altogether, it was not an environment conducive to Special Equity Multi-Cap’s classic value approach. However, we cannot, and will not, invest in securities where valuations do not matter. |
| WHAT WORKED... AND WHAT DIDN’T |
| For the year-to-date period ended June 30, 2018, Information Technology was the Fund’s top-contributing sector by a significant margin. However, Industrials and Consumer Discretionary made much larger negative impacts. Industrials was home to each of the Fund’s top-five detractors, and seven of its top 10. The largest negative impact came from industrial products and equipment maker Illinois Tool Works, the portfolio’s largest position at the end of June—and one of its top contributors in 2017. Parker Hannifin, which manufactures motion control products, was another strong 2017 contributor and top-10 position that endured a difficult first half, as did temporary staffing and services specialist ManpowerGroup and tools specialist Stanley Black & Decker. Consumer technology giant Apple —the world’s biggest company by market capitalization—was the portfolio’s top contributor in the first half and its second-largest position at June 30th. Cisco Systems, which manufactures networking and other IT and communications products, gave the tech sector another positive contribution from a top-10 holding, while two Consumer Discretionary holdings also contributed— major home improvement retailer Lowe’s Companies and V.F. Corporation, which operates a slate of popular retail brands including The North Face, Vans, Timberland, and JanSport. Relative to the Russell 1000 in the first half, the Fund was substantially disadvantaged by poor stock picks—as well as our significant overweight—in Industrials. Ineffective stock selection also hurt in Consumer Discretionary, as did our underweight in Information Technology, most meaningfully in the software, IT services, and Internet software & services industries. Conversely, the portfolio’s very low exposure to the lagging Financials sector was an advantage, as was stock selection in Materials, though to a lower degree. |
| Top Contributors to Performance Year-to-Date Through 6/30/18 (%)1 | |||
| Apple | 0.75 | ||
| Cisco Systems | 0.68 | ||
| V.F. Corporation | 0.27 | ||
| Lowe’s Companies | 0.20 | ||
| Brown & Brown | 0.13 | ||
| 1 Includes dividends | |||
| Top Detractors from Performance Year-to-Date Through 6/30/18 (%)2 | |||
| Illinois Tool Works | -1.54 | ||
| Parker Hannifin | -1.15 | ||
| ManpowerGroup | -0.84 | ||
| Stanley Black & Decker | -0.63 | ||
| Cummins | -0.63 | ||
| 2 Net of dividends | |||
| CURRENT POSITIONING AND OUTLOOK |
| We like the way the portfolio was positioned at the end of June. It remained very highly concentrated, with just 20 positions and more than half of its assets invested in two cyclical sectors, Industrials and Consumer Discretionary. The stronger dollar and growing concerns about economies outside the U.S. should help our low-debt, cash-rich holdings as weaker companies that benefited from quantitative easing begin to struggle with quantitative tightening (QT). Indeed, QT has broader unknown consequences. After nearly 10 years of propping up assets, the Fed is changing direction—and no one knows for sure what the ramifications will be. However, it is reasonable to assume that those companies that were helped in the past 10 years will at least see smaller benefits, while those neglected or harmed look likely to recover. Among those most likely to be adversely affected are growth stocks in general. Growth has outperformed value now for a record 134 months—or 11 years, a stretch not seen since the 1930s. Moreover, despite the improved performance of value names in the second quarter, the valuation spread between growth and value remained wide at the end of the first half. Absent a major policy error by the White House or the Fed, we expect U.S. economic growth to continue, though perhaps at a slower pace, with a developing advantage for less expensive value stocks over more expensive growth issues. Much of what is coming out of Washington—in both words and actions—has caused us all to feel badly despite things being good. Too much strong rhetoric has raised anxiety and stoked volatility, creating a tug-of-war between solid fundamentals and policy uncertainty. The wide valuation spread between value and growth is not surprising. Until recently, the preference for growth over value has characterized most of the post-2008 era of anemic economic growth. However, growth is no longer scarce in the U.S., so investors need not pay up for it. Our old standby is that rate of return is a function of entry level—which in general do not look too appealing for equities these days. Along with the uncertainty surrounding us, this makes a risk vs. reward approach seem sensible, which leads us to favor investments that have a good historical record during drawdowns. |
| 38 | The Royce Funds 2018 Semiannual Report to Shareholders |
| PERFORMANCE AND PORTFOLIO REVIEW | TICKER SYMBOL RSEMX RSMCX RMUIX RSMLX |
| Performance and Expenses | ||||||||||||
| Average Annual Total Return (%) Through 6/30/18 | ||||||||||||
| JAN-JUN 20181 | 1-YR | 3-YR | 5-YR | SINCE INCEPTION (12/31/10) | ||||||||
| RSM | -5.67 | 2.76 | 3.34 | 6.20 | 8.97 | |||||||
| Annual Gross Operating Expenses: 1.39% Annual Net Operating Expenses: 1.24% | ||||||||||||
| 1 Not annualized | ||||||||||||
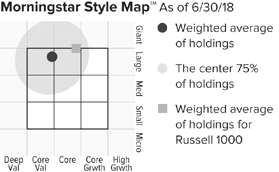
The Morningstar Style Map is the Morningstar Style Box™ with the center 75% of fund holdings plotted as the Morningstar Ownership Zone™. The Morningstar Style Box is designed to reveal a fund’s investment strategy. The Morningstar Ownership Zone provides detail about a portfolio’s investment style by showing the range of stock sizes and styles. The Ownership Zone is derived by plotting each stock in the portfolio within the proprietary Morningstar Style Box. Over time, the shape and location of a fund’s ownership zone may vary. See page 125 for additional information. |
Value of $10,000
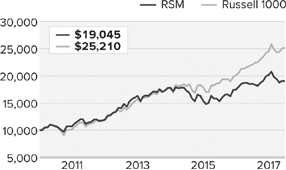
| Top 10 Positions | ||
| % of Net Assets | ||
| Illinois Tool Works | 8.5 | |
| Apple | 8.0 | |
| Genuine Parts | 7.4 | |
| Lowe’s Companies | 6.7 | |
| Cisco Systems | 6.6 | |
| Parker Hannifin | 4.7 | |
| Kimberly-Clark | 4.7 | |
| Carlisle Companies | 4.6 | |
| Procter & Gamble | 4.6 | |
| General Dynamics | 3.6 | |
| Portfolio Sector Breakdown | ||
| % of Net Assets | ||
| Industrials | 35.2 | |
| Consumer Discretionary | 21.2 | |
| Information Technology | 14.7 | |
| Consumer Staples | 9.3 | |
| Materials | 3.0 | |
| Financials | 1.8 | |
| Cash and Cash Equivalents | 14.8 | |
| Calendar Year Total Returns (%) | ||
| YEAR | RSM | |
| 2017 | 15.4 | |
| 2016 | 13.7 | |
| 2015 | -13.6 | |
| 2014 | 9.3 | |
| 2013 | 36.3 | |
| 2012 | 11.6 | |
| 2011 | 7.2 | |
| Portfolio Diagnostics | ||
| Fund Net Assets | $67 million | |
| Number of Holdings | 20 | |
| Turnover Rate | 2% | |
| Average Market Capitalization1 | $48,861 million | |
| Weighted Average P/E Ratio2,3 | 21.1x | |
| Weighted Average P/B Ratio2 | 4.8x | |
| Active Share4 | 92% | |
| U.S. Investments (% of Net Assets) | 85.2% | |
| Non-U.S. Investments (% of Net Assets) | 0.0% | |
| 1 | Geometric Average. This weighted calculation uses each portfolio holding’s market cap in a way designed to not skew the effect of very large or small holdings; instead, it aims to better identify the portfolio’s center, which Royce believes offers a more accurate measure of average market cap than a simple mean or median. |
| 2 | Harmonic Average. This weighted calculation evaluates a portfolio as if it were a single stock and measures it overall. It compares the total market value of the portfolio to the portfolio’s share in the earnings or book value, as the case may be, of its underlying stocks. |
| 3 | The Fund’s P/E ratio calculation excludes companies with zero or negative earnings (0% of portfolio holdings as of 6/30/18). |
| 4 | Active Share is the sum of the absolute values of the different weightings of each holding in the Fund versus each holding in the benchmark, divided by two. |
| Important Performance and Expense Information |
All performance information in this Report reflects past performance, is presented on a total return basis, reflects the reinvestment of distributions, and does not reflect the deduction of taxes that a shareholder would pay on fund distributions or the redemption of fund shares. Past performance is no guarantee of future results. Investment return and principal value of an investment will fluctuate, so that shares may be worth more or less than their original cost when redeemed. Shares redeemed within 30 days of purchase may be subject to a 1% redemption fee payable to the Fund, which is not reflected in the performance shown above; if it were, performance would be lower. Current month-end performance may be higher or lower than performance quoted and may be obtained at www.roycefunds.com. All performance and risk information reflects results of the Service Class (its oldest class). Gross operating expenses reflect gross total annual operating expenses for the Service Class and include management fees, 12b-1 distribution and service fees and other expenses. Net operating expenses reflect contractual fee waivers and/or reimbursements. All expense information is reported as of the Fund’s most current prospectus. Royce & Associates has contractually agreed to waive fees and/or reimburse operating expenses to the extent necessary to maintain the Service Classes’s net annual operating expenses, (excluding brokerage commissions, taxes, interest litigation expenses, acquired fund fees and expenses, and other expenses not borne in the ordinary course of business), at or below 1.24% through April 30, 2019. Regarding the “Top Contributors” and “Top Detractors” tables shown above, the sum of all contributors to, and all detractors from, performance for all securities in the portfolio would approximate the Fund’s year-to-date performance for 2018. |
| The Royce Funds 2018 Semiannual Report to Shareholders | 39 |
| MANAGERS’ DISCUSSION | ||
| Royce Total Return Fund (RTR) |
 |
| Chuck Royce Jay Kaplan, CFA |
| FUND PERFORMANCE Like 2017, the first half of 2018 was a period of lower-than-average volatility in which small-cap growth stocks beat small-cap value, and small-cap companies that pay no dividends outpaced those that do. Non-dividend payers were up 11.8% for the year-to-date period ended June 30, 2018, finishing well ahead of small-cap dividend payers in the Russell 2000, which rose only 3.8% over the same period. Additionally, the Fund’s preference for more economically cyclical dividend-paying stocks, as opposed to those more sensitive to interest rates, worked doubly against it in the more bullish second quarter, when the former group lagged while the latter rallied. Finally, Health Care and Information Technology—the two best-performing sectors in the Russell 2000 during the first half—have been persistent portfolio underweights owing to their relative lack of dividend payers. Needless to say, this made for a less than ideal environment for our risk-conscious dividend value approach. Royce Total Return Fund advanced 0.6% for the year-to-date period ended June 30, 2018, significantly trailing its small-cap benchmark, the Russell 2000 Index, which gained 7.7% for the same period. |
| WHAT WORKED... AND WHAT DIDN’T |
| Six of the Fund’s 11 equity sectors finished the first half in the black. Energy, where our exposure was low and slightly underweighted, led by a considerable margin, followed by Health Care, another very low weighting. The collective impact of the five detracting sectors was modest, but unfortunately included the Fund’s two largest—Financials and Industrials. At the industry level, the energy equipment & services (Energy) and specialty retail (Consumer Discretionary) groups led. The first was lifted by the rebound for oil prices. The largest positive contributor in this industry–and in the portfolio overall—was Norway’s TGS-NOPEC Geophysical, which provides geoscience data to oil and gas companies worldwide. Its revenue and earnings were boosted by improving exploration and production spending, higher oil prices, and the longer-term need for energy companies to replenish reserves, which is driving increased spending on seismic data. Specialty retail has been a fairly consistent trouble spot in the market over the previous three-plus years as retailers have struggled with near constantly contracting margins in the face of online competition and related changes in shopping patterns. This began to shift for a select number of businesses in the second quarter when sales began to recover. We took some gains in footwear retailers Shoe Carnival and DSW as well as in casual clothing business American Eagle Outfitters. Manpower Group is a Milwaukee-based temporary staffing business. Earnings remained positive in 2018’s first half, its prospects in a still-tightening global labor market appear strong, and recent acquisitions expanded its global footprint. Its shares fell mostly on a change in tax subsidy rate in France for companies that provide temporary labor and loftier expectations for growth than even strong earnings earlier in the year could meet. We remained confident enough in its core global business to keep it among the portfolio’s top-10 holdings at the end of June. Thor Industries is a leading manufacturer of RVs (recreational vehicles) and has emerged as an innovative industry leader over the last several years. The firm announced record fiscal second-quarter sales in March, but also reported higher raw material and commodity costs. Along with concerns that its industry may have hit a sales peak, this was enough to drive investors away. We trimmed our stake but were holding shares at the end of June. Relative to the Russell 2000, the Financials sector detracted most in the first half of 2018. Ineffective stock selection in that sector’s insurance and capital markets groups was the major source of underperformance, though our overweight also hurt. Our lower exposure made Health Care the portfolio’s second-largest relative detractor, as it was small-cap’s top-performer, while our underweight and poor stock selection created a relative disadvantage in Information Technology. Conversely, Energy’s positive effect was driven by superior stock selection in energy equipment & services holdings, while Real Estate benefited from the portfolio’s underweight as the sector underperformed in the first half. |
| Top Contributors to Performance Year-to-Date Through 6/30/18 (%)1 | |||
| TGS-NOPEC Geophysical | 0.33 | ||
| McGrath RentCorp | 0.21 | ||
| HEICO Corporation | 0.19 | ||
| MKS Instruments | 0.17 | ||
| Shoe Carnival | 0.17 | ||
| 1 Includes dividends | |||
| Top Detractors from Performance Year-to-Date Through 6/30/18 (%)2 | |||
| ManpowerGroup | -0.51 | ||
| Thor Industries | -0.36 | ||
| Federated Investors Cl. B | -0.32 | ||
| Hubbell Cl. B | -0.26 | ||
| Clarkson | -0.25 | ||
| 2 Net of dividends | |||
| CURRENT POSITIONING AND OUTLOOK |
| The market’s behavior is curious to us. On the one hand, we hear optimism and solid progress from the management teams we meet with, see solid earnings reports, and observe consistently strong macroeconomic data. On the other hand, small-cap market leadership has stubbornly remained with defensive and yield-oriented stocks, while cyclicals have lagged. Despite new highs for the Russell 2000, we are therefore far from ebullient. We are continuing to reduce the portfolio’s exposure to companies with higher valuations and expectations while modestly raising cash levels. We do anticipate a change in market leadership to more cyclical stocks, but admit that changes in leadership seldom occur without turbulence. If higher volatility reemerges, we aim to be able to take advantage of what may be temporarily lower prices. |
| 40 | The Royce Funds 2018 Semiannual Report to Shareholders |
| PERFORMANCE AND PORTFOLIO REVIEW | TICKER SYMBOLS RYTRX RYTFX RTRIX RYTCX RTRRX RTRWX |
| Performance and Expenses | ||||||||||||||||
| Average Annual Total Return (%) Through 6/30/18 | ||||||||||||||||
| JAN-JUN 20181 | 1-YR | 3-YR | 5-YR | 10-YR | 15-YR | 20-YR | SINCE INCEPTION (12/15/93) | |||||||||
| RTR | 0.59 | 11.23 | 9.85 | 9.75 | 8.70 | 9.28 | 9.01 | 10.83 | ||||||||
| Annual Operating Expenses: 1.21% | ||||||||||||||||
| 1Not annualized | ||||||||||||||||
Relative Risk Adjusted Returns: Monthly Rolling Sharpe Ratios
| On a monthly rolling risk-adjusted basis, the Fund outperformed the Russell 2000 in 93% of all 10-year periods and 88% of all 5-year periods. |
| PERIODS BEATING THE INDEX | FUND AVG (%)1 | INDEX AVG (%)1 | ||||||||||||
| 10-year | 113/121 | 93% | 0.45 | 0.35 | ||||||||||
| 5-year | 159/181 | 88% | 0.66 | 0.49 | ||||||||||

The Morningstar Style Map is the Morningstar Style Box™ with the center 75% of fund holdings plotted as the Morningstar Ownership Zone™. The Morningstar Style Box is designed to reveal a fund’s investment strategy. The Morningstar Ownership Zone provides detail about a portfolio’s investment style by showing the range of stock sizes and styles. The Ownership Zone is derived by plotting each stock in the portfolio within the proprietary Morningstar Style Box. Over time, the shape and location of a fund’s ownership zone may vary. See page 125 for additional information. |
Value of $10,000

| Top 10 Positions | ||
| % of Net Assets | ||
| Quaker Chemical | 1.6 | |
| Erie Indemnity Cl. A | 1.6 | |
| E-L Financial | 1.2 | |
| BOK Financial | 1.2 | |
| First Citizens BancShares Cl. A | 1.1 | |
| Alleghany Corporation | 1.1 | |
| Chase Corporation | 1.1 | |
| Methode Electronics | 1.1 | |
| ManpowerGroup | 1.1 | |
| Franklin Electric | 1.1 | |
| Portfolio Sector Breakdown | ||
| % of Net Assets | ||
| Financials | 28.4 | |
| Industrials | 25.5 | |
| Materials | 10.9 | |
| Consumer Discretionary | 8.8 | |
| Information Technology | 6.2 | |
| Energy | 4.7 | |
| Consumer Staples | 3.1 | |
| Utilities | 2.4 | |
| Health Care | 1.9 | |
| Real Estate | 1.4 | |
| Telecommunication Services | 0.7 | |
| Corporate Bond | 0.2 | |
| Cash and Cash Equivalents | 5.8 | |
| Calendar Year Total Returns (%) | ||
| YEAR | RTR | |
| 2017 | 13.7 | |
| 2016 | 25.9 | |
| 2015 | -7.2 | |
| 2014 | 1.3 | |
| 2013 | 32.8 | |
| 2012 | 14.4 | |
| 2011 | -1.7 | |
| 2010 | 23.5 | |
| 2009 | 26.2 | |
| 2008 | -31.2 | |
| 2007 | 2.4 | |
| 2006 | 14.5 | |
| 2005 | 8.2 | |
| 2004 | 17.5 | |
| 2003 | 30.0 | |
| Upside/Downside Capture Ratios | ||||||||||||||
| Periods Ended 6/30/18 (%) | ||||||||||||||
| UPSIDE | DOWNSIDE | |||||||||||||
| 10-Year | 82 | 83 | ||||||||||||
| From 12/31/93 (Start of Fund’s First Full Quarter) | 81 | 56 | ||||||||||||
| Portfolio Diagnostics | ||
| Fund Net Assets | $2,217 million | |
| Number of Holdings | 270 | |
| Turnover Rate | 11% | |
| Average Market Capitalization1 | $2,191 million | |
| Weighted Average P/E Ratio2,3 | 18.3x | |
| Weighted Average P/B Ratio2 | 2.1x | |
| Active Share4 | 90% | |
| U.S. Investments (% of Net Assets) | 80.6% | |
| Non-U.S. Investments (% of Net Assets) | 13.6% | |
| 1 | Geometric Average. This weighted calculation uses each portfolio holding’s market cap in a way designed to not skew the effect of very large or small holdings; instead, it aims to better identify the portfolio’s center, which Royce believes offers a more accurate measure of average market cap than a simple mean or median. |
| 2 | Harmonic Average. This weighted calculation evaluates a portfolio as if it were a single stock and measures it overall. It compares the total market value of the portfolio to the portfolio’s share in the earnings or book value, as the case may be, of its underlying stocks. |
| 3 | The Fund’s P/E ratio calculation excludes companies with zero or negative earnings (5% of portfolio holdings as of 6/30/18). |
| 4 | Active Share is the sum of the absolute values of the different weightings of each holding in the Fund versus each holding in the benchmark, divided by two. |
| Important Performance and Expense Information All performance information in this Report reflects past performance, is presented on a total return basis, reflects the reinvestment of distributions, and does not reflect the deduction of taxes that a shareholder would pay on fund distributions or the redemption of fund shares. Past performance is no guarantee of future results. Investment return and principal value of an investment will fluctuate, so that shares may be worth more or less than their original cost when redeemed. Shares redeemed within 30 days of purchase may be subject to a 1% redemption fee payable to the Fund, which is not reflected in the performance shown above; if it were, performance would be lower. Current month-end performance may be higher or lower than performance quoted and may be obtained at www.roycefunds.com. All performance and risk information reflects results of the Investment Class (its oldest class). Certain immaterial adjustments were made to the net assets of Royce Total Return Fund at 6/30/17 for financial reporting purposes, and as a result the net asset values for shareholder transactions on that date and the calendar year Total Returns (%) based on those net asset values differ from the adjusted net asset values and calendar year total returns reported in the Financial Highlights. Operating expenses reflect the Fund’s total annual operating expenses for the Investment Class as of the Fund’s most current prospectus and include management fees, other expenses, and acquired fund fees and expenses. Acquired fund fees and expenses reflect the estimated amount of the fees and expenses incurred indirectly by the Fund through its investments in mutual funds, hedge funds, private equity funds, and other investment companies. Regarding the “Top Contributors” and “Top Detractors” tables shown above, the sum of all contributors to, and all detractors from, performance for all securities in the portfolio would approximate the Fund’s year-to-date performance for 2018. The Sharpe Ratio is calculated for a specified period by dividing a fund’s annualized excess returns by its annualized standard deviation. The higher the Sharpe ratio, the better the fund’s historical risk-adjusted performance. Upside Capture Ratio measures a manager’s performance in up markets relative to the Fund’s benchmark. It is calculated by measuring the Fund’s performance in quarters when the benchmark went up and dividing it by the benchmark’s return in those quarters. Downside Capture Ratio measures a manager’s performance in down markets relative to the Fund’s benchmark (Russell 2000). It is calculated by measuring the Fund’s performance in quarters when the benchmark goes down and dividing it by the benchmark’s return in those quarters. |
| The Royce Funds 2018 Semiannual Report to Shareholders | 41 |
Schedules of Investments
| Royce Dividend Value Fund |
| Common Stocks – 98.7% |
| SHARES | VALUE | |||||||
| CONSUMER DISCRETIONARY – 9.2% | ||||||||
| AUTO COMPONENTS - 2.1% | ||||||||
Gentex Corporation | 73,696 | $ | 1,696,482 | |||||
Nokian Renkaat | 44,500 | 1,758,567 | ||||||
| 3,455,049 | ||||||||
| AUTOMOBILES - 0.7% | ||||||||
Thor Industries | 12,840 | 1,250,487 | ||||||
| HOTELS, RESTAURANTS & LEISURE - 0.1% | ||||||||
Cheesecake Factory | 3,329 | 183,295 | ||||||
| HOUSEHOLD DURABLES - 2.0% | ||||||||
Hunter Douglas | 25,000 | 1,839,285 | ||||||
La-Z-Boy | 46,048 | 1,409,069 | ||||||
| 3,248,354 | ||||||||
| SPECIALTY RETAIL - 3.3% | ||||||||
American Eagle Outfitters | 78,031 | 1,814,221 | ||||||
DSW Cl. A | 71,640 | 1,849,745 | ||||||
Fielmann | 6,400 | 443,203 | ||||||
USS | 70,000 | 1,332,791 | ||||||
| 5,439,960 | ||||||||
| TEXTILES, APPAREL & LUXURY GOODS - 1.0% | ||||||||
HUGO BOSS | 12,300 | 1,116,940 | ||||||
Steven Madden | 10,619 | 563,869 | ||||||
| 1,680,809 | ||||||||
| Total (Cost $9,912,402) | 15,257,954 | |||||||
| CONSUMER STAPLES – 0.6% | ||||||||
| FOOD & STAPLES RETAILING - 0.4% | ||||||||
FamilyMart UNY Holdings | 6,000 | 631,893 | ||||||
| FOOD PRODUCTS - 0.2% | ||||||||
Industrias Bachoco ADR | 6,100 | 351,543 | ||||||
| Total (Cost $336,214) | 983,436 | |||||||
| ENERGY – 4.9% | ||||||||
| ENERGY EQUIPMENT & SERVICES - 3.6% | ||||||||
Helmerich & Payne | 41,954 | 2,674,987 | ||||||
TGS-NOPEC Geophysical | 90,900 | 3,348,333 | ||||||
| 6,023,320 | ||||||||
| OIL, GAS & CONSUMABLE FUELS - 1.3% | ||||||||
Cimarex Energy | 7,700 | 783,398 | ||||||
Gaztransport Et Technigaz | 22,700 | 1,391,726 | ||||||
| 2,175,124 | ||||||||
| Total (Cost $6,482,056) | 8,198,444 | |||||||
| FINANCIALS – 28.6% | ||||||||
| BANKS - 4.2% | ||||||||
Bank of Georgia Group | 49,400 | 1,228,938 | ||||||
BOK Financial | 21,414 | 2,013,130 | ||||||
City Holding Company | 7,789 | 585,967 | ||||||
First Republic Bank | 32,400 | 3,135,996 | ||||||
| 6,964,031 | ||||||||
| CAPITAL MARKETS - 21.4% | ||||||||
Ashmore Group | 459,000 | 2,259,505 | ||||||
AURELIUS Equity Opportunities | 9,000 | 534,969 | ||||||
B3 | 275,000 | 1,451,009 | ||||||
Bolsa Mexicana de Valores | 1,234,000 | 2,077,145 | ||||||
Carlyle Group L.P. | 122,300 | 2,604,990 | ||||||
Coronation Fund Managers | 192,000 | 816,149 | ||||||
Federated Investors Cl. B | 56,600 | 1,319,912 | ||||||
| 49,400 | 671,515 | |||||||
Gluskin Sheff + Associates | 51,700 | 645,734 | ||||||
Houlihan Lokey Cl. A | 7,200 | 368,784 | ||||||
Jupiter Fund Management | 282,000 | 1,659,877 | ||||||
KKR & Co. L.P. | 165,600 | 4,115,160 | ||||||
Lazard Cl. A | 29,600 | 1,447,736 | ||||||
Moelis & Company Cl. A | 24,020 | 1,408,773 | ||||||
Northern Trust | 23,300 | 2,397,337 | ||||||
SEI Investments | 47,400 | 2,963,448 | ||||||
Singapore Exchange | 70,000 | 368,367 | ||||||
Sprott | 735,700 | 1,701,235 | ||||||
State Street | 23,200 | 2,159,688 | ||||||
TD Ameritrade Holding Corporation | 52,100 | 2,853,517 | ||||||
Value Partners Group | 2,272,200 | 1,795,610 | ||||||
| 35,620,460 | ||||||||
| DIVERSIFIED FINANCIAL SERVICES - 1.0% | ||||||||
Jefferies Financial Group | 74,600 | 1,696,404 | ||||||
| INSURANCE - 1.1% | ||||||||
Reinsurance Group of America | 13,805 | 1,842,691 | ||||||
| THRIFTS & MORTGAGE FINANCE - 0.9% | ||||||||
Genworth MI Canada | 47,548 | 1,547,259 | ||||||
| Total (Cost $32,725,255) | 47,670,845 | |||||||
| HEALTH CARE – 3.7% | ||||||||
| HEALTH CARE EQUIPMENT & SUPPLIES - 1.5% | ||||||||
DENTSPLY SIRONA | 57,500 | 2,516,775 | ||||||
| HEALTH CARE PROVIDERS & SERVICES - 0.2% | ||||||||
Ensign Group (The) | 10,051 | 360,027 | ||||||
| HEALTH CARE TECHNOLOGY - 0.3% | ||||||||
CompuGroup Medical | 7,300 | 375,098 | ||||||
| PHARMACEUTICALS - 1.7% | ||||||||
Recordati | 48,800 | 1,941,033 | ||||||
Santen Pharmaceutical | 52,000 | 906,941 | ||||||
| 2,847,974 | ||||||||
| Total (Cost $3,776,623) | 6,099,874 | |||||||
| INDUSTRIALS – 29.3% | ||||||||
| AEROSPACE & DEFENSE - 2.1% | ||||||||
HEICO Corporation Cl. A | 56,820 | 3,463,179 | ||||||
| AIR FREIGHT & LOGISTICS - 1.9% | ||||||||
Expeditors International of Washington | 43,500 | 3,179,850 | ||||||
| AIRLINES - 2.0% | ||||||||
Allegiant Travel | 10,900 | 1,514,555 | ||||||
Hawaiian Holdings | 51,720 | 1,859,334 | ||||||
| 3,373,889 | ||||||||
| BUILDING PRODUCTS - 2.1% | ||||||||
Apogee Enterprises | 27,900 | 1,343,943 | ||||||
Geberit | 1,000 | 430,071 | ||||||
TOTO | 37,000 | 1,717,744 | ||||||
| 3,491,758 | ||||||||
| COMMERCIAL SERVICES & SUPPLIES - 1.1% | ||||||||
Herman Miller | 53,276 | 1,806,056 | ||||||
| CONSTRUCTION & ENGINEERING - 1.6% | ||||||||
Comfort Systems USA | 4,092 | 187,414 | ||||||
KBR | 132,800 | 2,379,776 | ||||||
| 2,567,190 | ||||||||
| ELECTRICAL EQUIPMENT - 1.7% | ||||||||
EnerSys | 14,950 | 1,115,868 | ||||||
Hubbell Cl. B | 15,900 | 1,681,266 | ||||||
| 2,797,134 | ||||||||
| MACHINERY - 11.7% | ||||||||
Alamo Group | 2,108 | 190,479 | ||||||
| 42 | The Royce Funds 2018 Semiannual Report to Shareholders | THE ACCOMPANYING NOTES ARE AN INTEGRAL PART OF THESE FINANCIAL STATEMENTS |
| June 30, 2018 (unaudited) |
| Royce Dividend Value Fund (continued) |
| SHARES | VALUE | |||||||
| INDUSTRIALS (continued) | ||||||||
| MACHINERY (continued) | ||||||||
Donaldson Company | 67,500 | $ | 3,045,600 | |||||
Federal Signal | 7,929 | 184,666 | ||||||
Graco | 63,000 | 2,848,860 | ||||||
IDEX Corporation | 23,800 | 3,248,224 | ||||||
Lincoln Electric Holdings | 13,150 | 1,154,044 | ||||||
Lindsay Corporation | 26,700 | 2,589,633 | ||||||
Pfeiffer Vacuum Technology | 12,000 | 1,974,516 | ||||||
Spirax-Sarco Engineering | 27,400 | 2,357,708 | ||||||
Wabash National | 98,692 | 1,841,593 | ||||||
| 19,435,323 | ||||||||
| MARINE - 1.1% | ||||||||
Clarkson | 60,700 | 1,842,504 | ||||||
| PROFESSIONAL SERVICES - 1.9% | ||||||||
Korn/Ferry International | 6,001 | 371,642 | ||||||
ManpowerGroup | 28,300 | 2,435,498 | ||||||
Robert Half International | 5,564 | 362,216 | ||||||
| 3,169,356 | ||||||||
| ROAD & RAIL - 0.2% | ||||||||
Werner Enterprises | 10,250 | 384,888 | ||||||
| TRADING COMPANIES & DISTRIBUTORS - 1.9% | ||||||||
Applied Industrial Technologies | 45,600 | 3,198,840 | ||||||
| Total (Cost $29,021,944) | 48,709,967 | |||||||
| INFORMATION TECHNOLOGY – 7.1% | ||||||||
| ELECTRONIC EQUIPMENT, INSTRUMENTS & COMPONENTS - 5.7% | ||||||||
†Benchmark Electronics | 50,506 | 1,472,250 | ||||||
FLIR Systems | 91,500 | 4,755,255 | ||||||
Methode Electronics | 35,242 | 1,420,253 | ||||||
Vishay Intertechnology | 78,955 | 1,831,756 | ||||||
| 9,479,514 | ||||||||
| SEMICONDUCTORS & SEMICONDUCTOR EQUIPMENT - 1.0% | ||||||||
MKS Instruments | 17,922 | 1,715,135 | ||||||
| SOFTWARE - 0.4% | ||||||||
SimCorp | 7,000 | 567,246 | ||||||
| Total (Cost $7,694,934) | 11,761,895 | |||||||
| MATERIALS – 13.9% | ||||||||
| CHEMICALS - 2.1% | ||||||||
Quaker Chemical | 20,500 | 3,174,835 | ||||||
Victrex | 10,000 | 384,575 | ||||||
| 3,559,410 | ||||||||
| CONTAINERS & PACKAGING - 2.3% | ||||||||
AptarGroup | 36,900 | 3,445,722 | ||||||
Greif Cl. A | 7,800 | 412,542 | ||||||
| 3,858,264 | ||||||||
| METALS & MINING - 9.5% | ||||||||
Carpenter Technology | 55,800 | 2,933,406 | ||||||
Compass Minerals International | 35,100 | 2,307,825 | ||||||
Franco-Nevada Corporation | 33,000 | 2,409,660 | ||||||
Reliance Steel & Aluminum | 44,200 | 3,869,268 | ||||||
Royal Gold | 19,300 | 1,791,812 | ||||||
Worthington Industries | 58,500 | 2,455,245 | ||||||
| 15,767,216 | ||||||||
| Total (Cost $14,367,791) | 23,184,890 | |||||||
| REAL ESTATE – 0.4% | ||||||||
| REAL ESTATE MANAGEMENT & DEVELOPMENT - 0.4% | ||||||||
Relo Group | 23,000 | 607,433 | ||||||
| Total (Cost $107,244) | 607,433 | |||||||
| UTILITIES – 1.0% | ||||||||
| WATER UTILITIES - 1.0% | ||||||||
Aqua America | 49,800 | 1,751,964 | ||||||
| Total (Cost $1,192,551) | 1,751,964 | |||||||
| TOTAL COMMON STOCKS | ||||||||
| (Cost $105,617,014) | 164,226,702 | |||||||
| REPURCHASE AGREEMENT– 1.4% | ||||||||
| Fixed Income Clearing Corporation, 0.35% dated 6/29/18, due 7/2/18, maturity value $2,288,067 (collateralized by obligations of various U.S. Government Agencies, 1.125% due 9/30/21, valued at $2,336,376) | ||||||||
| (Cost $2,288,000) | 2,288,000 | |||||||
| TOTAL INVESTMENTS – 100.1% | ||||||||
| (Cost $107,905,014) | 166,514,702 | |||||||
| LIABILITIES LESS CASH AND OTHER ASSETS – (0.1)% | (106,950 | ) | ||||||
| NET ASSETS – 100.0% | $ | 166,407,752 | ||||||
| THE ACCOMPANYING NOTES ARE AN INTEGRAL PART OF THESE FINANCIAL STATEMENTS | The Royce Funds 2018 Semiannual Report to Shareholders | 43 |
Schedules of Investments
| Royce Global Financial Services Fund |
| Common Stocks – 93.9% |
| SHARES | VALUE | |||||||
| BANKS - 19.4% | ||||||||
Bank of Princeton 1 | 5,000 | $ | 166,250 | |||||
†Bank of the Ozarks | 5,900 | 265,736 | ||||||
BankUnited | 4,100 | 167,485 | ||||||
BLOM Bank Cl. B GDR | 8,000 | 84,000 | ||||||
BOK Financial | 11,600 | 1,090,516 | ||||||
Bryn Mawr Bank | 10,000 | 463,000 | ||||||
†Canadian Western Bank | 14,000 | 368,996 | ||||||
Capital City Bank Group | 26,822 | 633,804 | ||||||
Chemung Financial | 14,512 | 727,196 | ||||||
County Bancorp | 15,895 | 437,112 | ||||||
First Citizens BancShares Cl. A | 3,290 | 1,326,857 | ||||||
First Republic Bank | 8,000 | 774,320 | ||||||
Investors Bancorp | 25,300 | 323,587 | ||||||
Live Oak Bancshares | 22,500 | 689,625 | ||||||
Popular | 32,300 | 1,460,283 | ||||||
State Bank Financial | 12,500 | 417,500 | ||||||
| 11,600 | 302,760 | |||||||
Umpqua Holdings | 17,400 | 393,066 | ||||||
Webster Financial | 14,600 | 930,020 | ||||||
| Total (Cost $7,870,521) | 11,022,113 | |||||||
| CAPITAL MARKETS - 45.4% | ||||||||
Ares Management L.P. | 32,900 | 681,030 | ||||||
Ashmore Group | 216,000 | 1,063,297 | ||||||
Associated Capital Group Cl. A | 14,084 | 534,488 | ||||||
B3 | 61,000 | 321,860 | ||||||
Bolsa Mexicana de Valores | 174,000 | 292,888 | ||||||
Canaccord Genuity Group | 133,000 | 734,477 | ||||||
Carlyle Group L.P. | 41,700 | 888,210 | ||||||
Cboe Global Markets | 2,226 | 231,660 | ||||||
Charles Schwab (The) Corporation | 8,400 | 429,240 | ||||||
Coronation Fund Managers | 61,200 | 260,147 | ||||||
CRISIL | 14,000 | 365,351 | ||||||
Dundee Corporation Cl. A 1 | 90,000 | 108,166 | ||||||
Edelweiss Financial Services | 155,000 | 671,670 | ||||||
Edmond de Rothschild (Suisse) | 30 | 518,025 | ||||||
Egyptian Financial Group-Hermes | ||||||||
Holding Company 1 | 246,390 | 317,869 | ||||||
Financial Engines | 14,100 | 633,090 | ||||||
Gluskin Sheff + Associates | 63,400 | 791,867 | ||||||
GMP Capital | 108,000 | 235,774 | ||||||
Great Elm Capital Group 1 | 115,545 | 415,962 | ||||||
Hamilton Lane Cl. A | 11,500 | 551,655 | ||||||
Hellenic Exchanges - Athens Stock Exchange | 50,000 | 271,513 | ||||||
Intermediate Capital Group | 39,111 | 568,817 | ||||||
INTL FCStone 1 | 15,100 | 780,821 | ||||||
IOOF Holdings | 55,000 | 365,918 | ||||||
JSE | 51,000 | 602,705 | ||||||
Jupiter Fund Management | 106,900 | 629,223 | ||||||
KKR & Co. L.P. | 23,900 | 593,915 | ||||||
Lazard Cl. A | 3,700 | 180,967 | ||||||
MarketAxess Holdings | 4,600 | 910,156 | ||||||
MVC Capital | 47,100 | 447,450 | ||||||
Northern Trust | 6,600 | 679,074 | ||||||
NZX | 580,000 | 443,902 | ||||||
Partners Group Holding | 670 | 492,199 | ||||||
Rothschild & Co | 27,700 | 936,476 | ||||||
SEI Investments | 15,900 | 994,068 | ||||||
Silvercrest Asset Management Group Cl. A | 41,600 | 678,080 | ||||||
Singapore Exchange | 114,300 | 601,491 | ||||||
Sprott | 500,000 | 1,156,201 | ||||||
TD Ameritrade Holding Corporation | 10,880 | 595,898 | ||||||
Tokai Tokyo Financial Holdings | 9,400 | 60,111 | ||||||
U.S. Global Investors Cl. A | 183,900 | 296,079 | ||||||
UOB-Kay Hian Holdings | 129,000 | 120,242 | ||||||
Value Partners Group | 772,000 | 610,074 | ||||||
Virtu Financial Cl. A | 47,400 | 1,258,470 | ||||||
VZ Holding | 3,350 | 1,055,438 | ||||||
Warsaw Stock Exchange | 19,000 | 185,655 | ||||||
Westaim Corporation 1 | 105,000 | 257,179 | ||||||
| Total (Cost $20,267,088) | 25,818,848 | |||||||
| CONSUMER FINANCE - 0.5% | ||||||||
Currency Exchange International 1 | 13,000 | 298,634 | ||||||
| Total (Cost $268,728) | 298,634 | |||||||
| DIVERSIFIED FINANCIAL SERVICES - 0.6% | ||||||||
ECN Capital | 75,000 | 201,384 | ||||||
SHUAA Capital 1 | 580,000 | 162,640 | ||||||
| Total (Cost $539,926) | 364,024 | |||||||
| EQUITY REAL ESTATE INVESTMENT TRUSTS (REITS) - 0.3% | ||||||||
Colony Capital Cl. A | 31,500 | 196,560 | ||||||
| Total (Cost $383,890) | 196,560 | |||||||
| HEALTH CARE PROVIDERS & SERVICES - 0.0% | ||||||||
| 223,459 | 6,704 | |||||||
| Total (Cost $101,010) | 6,704 | |||||||
| HOTELS, RESTAURANTS & LEISURE - 0.6% | ||||||||
Thomas Cook (India) | 94,000 | 364,805 | ||||||
| Total (Cost $270,518) | 364,805 | |||||||
| INSURANCE - 6.6% | ||||||||
E-L Financial | 2,625 | 1,637,298 | ||||||
First American Financial | 3,900 | 201,708 | ||||||
Jardine Lloyd Thompson Group | 11,900 | 201,024 | ||||||
MBIA 1 | 95,300 | 861,512 | ||||||
National Western Life Group Cl. A | 2,750 | 844,965 | ||||||
| Total (Cost $3,365,019) | 3,746,507 | |||||||
| INTERNET SOFTWARE & SERVICES - 1.2% | ||||||||
| 10,600 | 356,160 | |||||||
Envestnet 1 | 6,000 | 329,700 | ||||||
| Total (Cost $542,198) | 685,860 | |||||||
| INVESTMENT COMPANIES - 0.9% | ||||||||
RIT Capital Partners | 19,000 | 517,804 | ||||||
| Total (Cost $373,495) | 517,804 | |||||||
| IT SERVICES - 1.7% | ||||||||
Cass Information Systems | 4,180 | 287,668 | ||||||
GBST Holdings | 105,000 | 164,735 | ||||||
PayPal Holdings 1 | 6,400 | 532,928 | ||||||
| Total (Cost $765,866) | 985,331 | |||||||
| MARINE - 1.4% | ||||||||
Clarkson | 26,000 | 789,211 | ||||||
| Total (Cost $928,924) | 789,211 | |||||||
| 44 | The Royce Funds 2018 Semiannual Report to Shareholders | THE ACCOMPANYING NOTES ARE AN INTEGRAL PART OF THESE FINANCIAL STATEMENTS |
| June 30, 2018 (unaudited) |
| Royce Global Financial Services Fund (continued) |
| SHARES | VALUE | |||||||
| METALS & MINING - 2.1% | ||||||||
Franco-Nevada Corporation | 16,500 | $ | 1,204,830 | |||||
| Total (Cost $900,426) | 1,204,830 | |||||||
| PROFESSIONAL SERVICES - 1.7% | ||||||||
IHS Markit 1 | 14,000 | 722,260 | ||||||
People Corporation 1 | 35,000 | 216,712 | ||||||
| Total (Cost $463,344) | 938,972 | |||||||
| REAL ESTATE MANAGEMENT & DEVELOPMENT - 7.0% | ||||||||
Altus Group | 32,000 | 713,437 | ||||||
FirstService Corporation | 14,000 | 1,064,560 | ||||||
FRP Holdings 1 | 18,100 | 1,171,975 | ||||||
Midland Holdings | 800,000 | 216,172 | ||||||
Midland IC&I 1 | 400,000 | 16,570 | ||||||
RMR Group Cl. A | 10,000 | 784,500 | ||||||
| Total (Cost $2,608,621) | 3,967,214 | |||||||
| SOFTWARE - 1.2% | ||||||||
Bottomline Technologies 1 | 13,600 | 677,688 | ||||||
| Total (Cost $408,696) | 677,688 | |||||||
| THRIFTS & MORTGAGE FINANCE - 1.9% | ||||||||
BofI Holding 1 | 25,700 | 1,051,387 | ||||||
| Total (Cost $466,954) | 1,051,387 | |||||||
| TRADING COMPANIES & DISTRIBUTORS - 1.4% | ||||||||
Air Lease Cl. A | 19,500 | 818,415 | ||||||
| Total (Cost $854,965) | 818,415 | |||||||
| TOTAL COMMON STOCKS | ||||||||
| (Cost $41,380,189) | 53,454,907 | |||||||
| REPURCHASE AGREEMENT– 6.2% | ||||||||
| Fixed Income Clearing Corporation, 0.35% dated 6/29/18, due 7/2/18, maturity value $3,525,103 (collateralized by obligations of various U.S. Government Agencies, 1.125% due 9/30/21, valued at $3,597,732) | ||||||||
| (Cost $3,525,000) | 3,525,000 | |||||||
| TOTAL INVESTMENTS – 100.1% | ||||||||
| (Cost $44,905,189) | 56,979,907 | |||||||
| LIABILITIES LESS CASH AND OTHER ASSETS – (0.1)% | (49,532 | ) | ||||||
| NET ASSETS – 100.0% | $ | 56,930,375 | ||||||
| Royce International Discovery Fund |
| Common Stocks – 96.1% |
| SHARES | VALUE | |||||||
| AUSTRALIA – 3.4% | ||||||||
†Ausdrill | 72,500 | $ | 98,455 | |||||
†Bingo Industries | 44,800 | 88,853 | ||||||
HT&E | 46,800 | 86,932 | ||||||
| Total (Cost $274,169) | 274,240 | |||||||
| BRAZIL – 3.9% | ||||||||
Construtora Tenda 1 | 13,200 | 81,024 | ||||||
International Meal Company Alimentacao | 62,600 | 128,083 | ||||||
T4F Entretenimento | 25,200 | 51,366 | ||||||
†Tegma Gestao Logistica | 11,900 | 47,314 | ||||||
| Total (Cost $360,008) | 307,787 | |||||||
| CANADA – 5.9% | ||||||||
| 17,200 | 73,005 | |||||||
†Canadian Western Bank | 5,200 | 137,056 | ||||||
Major Drilling Group International 1 | 5,500 | 29,034 | ||||||
| 6,700 | 126,493 | |||||||
Solium Capital 1 | 4,500 | 39,398 | ||||||
Western Forest Products | 31,300 | 63,807 | ||||||
| Total (Cost $454,746) | 468,793 | |||||||
| CHINA – 4.8% | ||||||||
†China Communications Services | 104,400 | 66,135 | ||||||
†China Lesso Group Holdings | 87,500 | 55,541 | ||||||
†China Medical System Holdings | 34,100 | 68,151 | ||||||
†Hua Hong Semiconductor | 23,200 | 79,693 | ||||||
†Xiabuxiabu Catering Management | ||||||||
(China) Holdings | 51,500 | 113,167 | ||||||
| Total (Cost $341,695) | 382,687 | |||||||
| DENMARK – 4.8% | ||||||||
†DFDS | 3,100 | 197,955 | ||||||
| 3,800 | 185,534 | |||||||
| Total (Cost $364,077) | 383,489 | |||||||
| EGYPT – 1.6% | ||||||||
†Egyptian Financial Group-Hermes | ||||||||
Holding Company 1 | 96,700 | 124,753 | ||||||
| Total (Cost $120,329) | 124,753 | |||||||
| GERMANY – 1.2% | ||||||||
VIB Vermoegen | 3,800 | 97,184 | ||||||
| Total (Cost $88,929) | 97,184 | |||||||
| GREECE – 1.0% | ||||||||
| 6,300 | 81,018 | |||||||
| Total (Cost $83,175) | 81,018 | |||||||
| HONG KONG – 4.4% | ||||||||
†China Resources Cement Holdings | 35,600 | 36,074 | ||||||
CSI Properties | 1,188,900 | 69,707 | ||||||
HKBN | 58,700 | 90,381 | ||||||
†Texhong Textile Group | 40,600 | 61,271 | ||||||
Value Partners Group | 120,600 | 95,304 | ||||||
| Total (Cost $319,829) | 352,737 | |||||||
| INDIA – 2.9% | ||||||||
†Dewan Housing Finance | 10,300 | 95,611 | ||||||
†Edelweiss Financial Services | 12,500 | 54,167 | ||||||
†Time Technoplast | 47,300 | 80,634 | ||||||
| Total (Cost $248,255) | 230,412 | |||||||
| THE ACCOMPANYING NOTES ARE AN INTEGRAL PART OF THESE FINANCIAL STATEMENTS | The Royce Funds 2018 Semiannual Report to Shareholders | 45 |
Schedules of Investments
| Royce International Discovery Fund (continued) |
| SHARES | VALUE | |||||||
| IRELAND – 2.7% | ||||||||
| 22,800 | $ | 70,292 | ||||||
Irish Residential Properties REIT | 91,700 | 147,781 | ||||||
| Total (Cost $222,123) | 218,073 | |||||||
| ISRAEL – 1.2% | ||||||||
Nova Measuring Instruments 1 | 3,500 | 95,375 | ||||||
| Total (Cost $81,551) | 95,375 | |||||||
| ITALY – 1.7% | ||||||||
†Cerved Group | 7,900 | 84,876 | ||||||
Openjobmetis 1 | 4,800 | 53,924 | ||||||
| Total (Cost $150,262) | 138,800 | |||||||
| JAPAN – 20.0% | ||||||||
†Ain Holdings | 1,500 | 110,690 | ||||||
†Amano Corporation | 3,900 | 92,221 | ||||||
eGuarantee | 3,500 | 63,731 | ||||||
†Financial Products Group | 6,000 | 77,442 | ||||||
†H.I.S. | 2,600 | 78,436 | ||||||
†Horiba | 1,400 | 97,999 | ||||||
Information Services International-Dentsu | 1,900 | 57,232 | ||||||
†Kyowa Exeo | 6,500 | 170,785 | ||||||
NS Solutions | 5,100 | 128,657 | ||||||
Open House | 2,100 | 124,428 | ||||||
Outsourcing | 9,800 | 181,988 | ||||||
TATERU | 3,800 | 62,776 | ||||||
Tokai Corporation | 4,500 | 97,019 | ||||||
Yumeshin Holdings | 8,400 | 88,086 | ||||||
†Zenkoku Hosho | 3,600 | 163,555 | ||||||
| Total (Cost $1,454,884) | 1,595,045 | |||||||
| MALAYSIA – 2.1% | ||||||||
AEON Credit Service | 22,250 | 79,317 | ||||||
Kossan Rubber Industries | 42,000 | 87,753 | ||||||
| Total (Cost $140,780) | 167,070 | |||||||
| MEXICO – 1.6% | ||||||||
†Corp Inmobiliaria Vesta | 14,569 | 19,073 | ||||||
†Industrias Bachoco | 13,600 | 65,185 | ||||||
†Megacable Holdings (Units) | 11,100 | 45,735 | ||||||
| Total (Cost $142,727) | 129,993 | |||||||
| NETHERLANDS – 2.8% | ||||||||
AMG Advanced Metallurgical Group | 1,600 | 90,061 | ||||||
| 64,200 | 134,209 | |||||||
| Total (Cost $199,227) | 224,270 | |||||||
| PHILIPPINES – 1.5% | ||||||||
†International Container Terminal Services | 81,000 | 117,324 | ||||||
| Total (Cost $144,851) | 117,324 | |||||||
| PORTUGAL – 2.6% | ||||||||
†Sonae SGPS | 170,500 | 205,083 | ||||||
| Total (Cost $227,825) | 205,083 | |||||||
| SINGAPORE – 0.6% | ||||||||
CSE Global | 138,200 | 43,615 | ||||||
| Total (Cost $46,878) | 43,615 | |||||||
| SOUTH KOREA – 5.5% | ||||||||
†Com2uS | 800 | 120,592 | ||||||
Eugene Technology | 5,600 | 79,139 | ||||||
Interojo | 2,244 | 69,766 | ||||||
Modetour Network | 2,700 | 65,895 | ||||||
†S-1 Corporation | 1,200 | 104,226 | ||||||
| Total (Cost $452,845) | 439,618 | |||||||
| SPAIN – 1.9% | ||||||||
Atento | 22,000 | 150,700 | ||||||
| Total (Cost $192,951) | 150,700 | |||||||
| SWEDEN – 2.3% | ||||||||
Dustin Group | 13,300 | 119,832 | ||||||
Knowit | 3,300 | 63,519 | ||||||
| Total (Cost $137,650) | 183,351 | |||||||
| TAIWAN – 4.1% | ||||||||
†Chailease Holding Company | 20,000 | 65,599 | ||||||
†Gourmet Master | 13,468 | 130,313 | ||||||
Sinmag Equipment | 16,700 | 83,532 | ||||||
TCI | 3,000 | 46,345 | ||||||
| Total (Cost $324,818) | 325,789 | |||||||
| TURKEY – 1.2% | ||||||||
†Soda Sanayii | 70,400 | 95,014 | ||||||
| Total (Cost $82,586) | 95,014 | |||||||
| UNITED KINGDOM – 10.4% | ||||||||
†Biffa | 54,700 | 179,754 | ||||||
| 35,800 | 0 | |||||||
dotdigital group | 78,000 | 77,205 | ||||||
Hilton Food Group | 11,900 | 156,108 | ||||||
†Restore | 24,300 | 165,481 | ||||||
RPC Group | 15,200 | 150,091 | ||||||
†Subsea 7 | 6,200 | 99,231 | ||||||
| Total (Cost $924,387) | 827,870 | |||||||
| TOTAL COMMON STOCKS | ||||||||
| (Cost $7,581,557) | 7,660,090 | |||||||
| REPURCHASE AGREEMENT– 3.7% | ||||||||
| Fixed Income Clearing Corporation, 0.35% dated 6/29/18, due 7/2/18, maturity value $297,009 (collateralized by obligations of various U.S. Government Agencies, 1.125% due 9/30/21, valued at $305,783) | ||||||||
| (Cost $297,000) | 297,000 | |||||||
| TOTAL INVESTMENTS – 99.8% | ||||||||
| (Cost $7,878,557) | 7,957,090 | |||||||
| CASH AND OTHER ASSETS LESS LIABILITIES – 0.2% | 15,667 | |||||||
| NET ASSETS – 100.0% | $ | 7,972,757 | ||||||
| 46 | The Royce Funds 2018 Semiannual Report to Shareholders | THE ACCOMPANYING NOTES ARE AN INTEGRAL PART OF THESE FINANCIAL STATEMENTS |
| June 30, 2018 (unaudited) |
| Royce International Premier Fund |
| Common Stocks – 95.8% |
| SHARES | VALUE | |||||||
| AUSTRALIA – 11.4% | ||||||||
ALS | 650,000 | $ | 3,626,985 | |||||
Bravura Solutions | 1,935,000 | 4,596,710 | ||||||
Cochlear | 25,000 | 3,703,395 | ||||||
Hansen Technologies | 1,800,000 | 4,196,084 | ||||||
IPH | 1,635,000 | 5,384,419 | ||||||
†Technology One | 1,620,000 | 5,095,244 | ||||||
| Total (Cost $24,998,656) | 26,602,837 | |||||||
| AUSTRIA – 2.0% | ||||||||
Mayr-Melnhof Karton | 35,000 | 4,724,919 | ||||||
| Total (Cost $4,597,418) | 4,724,919 | |||||||
| BRAZIL – 4.6% | ||||||||
OdontoPrev | 1,575,000 | 5,311,295 | ||||||
TOTVS | 760,000 | 5,333,677 | ||||||
| Total (Cost $12,148,790) | 10,644,972 | |||||||
| CANADA – 5.8% | ||||||||
†Altus Group | 190,000 | 4,236,033 | ||||||
†Computer Modelling Group | 665,000 | 5,108,964 | ||||||
Morneau Shepell | 203,000 | 4,196,965 | ||||||
| Total (Cost $13,249,240) | 13,541,962 | |||||||
| CHINA – 2.2% | ||||||||
TravelSky Technology | 1,800,000 | 5,242,429 | ||||||
| Total (Cost $4,466,633) | 5,242,429 | |||||||
| FRANCE – 5.4% | ||||||||
Neurones | 169,000 | 4,736,597 | ||||||
†Sartorius Stedim Biotech | 35,000 | 3,658,133 | ||||||
Thermador Groupe | 62,500 | 4,189,483 | ||||||
| Total (Cost $11,600,498) | 12,584,213 | |||||||
| GERMANY – 3.7% | ||||||||
Amadeus Fire | 43,184 | 4,664,800 | ||||||
Carl Zeiss Meditec | 57,500 | 3,924,830 | ||||||
| Total (Cost $7,244,409) | 8,589,630 | |||||||
| INDIA – 3.6% | ||||||||
†AIA Engineering | 200,000 | 4,378,603 | ||||||
SH Kelkar & Company | 1,190,500 | 3,909,546 | ||||||
| Total (Cost $9,607,323) | 8,288,149 | |||||||
| ITALY – 1.6% | ||||||||
DiaSorin | 32,500 | 3,708,057 | ||||||
| Total (Cost $2,063,593) | 3,708,057 | |||||||
| JAPAN – 17.1% | ||||||||
Ai Holdings | 80,000 | 1,735,628 | ||||||
As One | 75,000 | 5,209,321 | ||||||
EPS Holdings | 185,000 | 3,970,194 | ||||||
†Medikit | 38,300 | 2,068,681 | ||||||
Meitec Corporation | 133,000 | 6,390,823 | ||||||
†NSD | 185,000 | 4,217,496 | ||||||
Relo Group | 192,000 | 5,070,749 | ||||||
†TKC Corporation | 115,000 | 4,289,843 | ||||||
USS | 364,000 | 6,930,515 | ||||||
| Total (Cost $37,447,139) | 39,883,250 | |||||||
| NETHERLANDS – 2.0% | ||||||||
†Intertrust | 265,000 | 4,710,088 | ||||||
| Total (Cost $5,443,185) | 4,710,088 | |||||||
| NEW ZEALAND – 4.1% | ||||||||
Fisher & Paykel Healthcare | 470,000 | 4,739,947 | ||||||
Trade Me Group | 1,505,000 | 4,750,107 | ||||||
| Total (Cost $8,528,290) | 9,490,054 | |||||||
| SINGAPORE – 1.8% | ||||||||
XP Power | 92,000 | 4,286,022 | ||||||
| Total (Cost $3,276,390) | 4,286,022 | |||||||
| SWEDEN – 6.2% | ||||||||
Bravida Holding | 600,000 | 4,766,238 | ||||||
Hexpol | 480,000 | 4,994,669 | ||||||
†Lagercrantz Group | 425,000 | 4,631,144 | ||||||
| Total (Cost $13,283,419) | 14,392,051 | |||||||
| SWITZERLAND – 9.9% | ||||||||
Burkhalter Holding | 29,683 | 2,514,797 | ||||||
†Kardex | 25,000 | 3,468,646 | ||||||
LEM Holding | 2,500 | 3,736,241 | ||||||
Partners Group Holding | 9,000 | 6,611,633 | ||||||
VZ Holding | 21,500 | 6,773,705 | ||||||
| Total (Cost $20,771,842) | 23,105,022 | |||||||
| UNITED KINGDOM – 14.4% | ||||||||
Ashmore Group | 900,000 | 4,430,402 | ||||||
Clarkson | 127,600 | 3,873,204 | ||||||
Consort Medical | 250,000 | 3,932,856 | ||||||
Elementis | 1,179,000 | 3,933,532 | ||||||
Equiniti Group | 1,650,000 | 5,378,643 | ||||||
ITE Group | 2,220,000 | 2,343,877 | ||||||
| 3,237,500 | 1,021,173 | |||||||
Spirax-Sarco Engineering | 55,000 | 4,732,625 | ||||||
Victrex | 105,000 | 4,038,041 | ||||||
| Total (Cost $34,397,509) | 33,684,353 | |||||||
| TOTAL COMMON STOCKS | ||||||||
| (Cost $213,124,334) | 223,478,008 | |||||||
| REPURCHASE AGREEMENT– 4.4% | ||||||||
| Fixed Income Clearing Corporation, 0.35% dated 6/29/18, due 7/2/18, maturity value $10,354,302 (collateralized by obligations of various U.S. Government Agencies, 1.125% due 9/30/21, valued at $10,563,860) | ||||||||
| (Cost $10,354,000) | 10,354,000 | |||||||
| TOTAL INVESTMENTS – 100.2% | ||||||||
| (Cost $223,478,334) | 233,832,008 | |||||||
| LIABILITIES LESS CASH AND OTHER ASSETS – (0.2)% | (440,018 | ) | ||||||
| NET ASSETS – 100.0% | $ | 233,391,990 | ||||||
| THE ACCOMPANYING NOTES ARE AN INTEGRAL PART OF THESE FINANCIAL STATEMENTS | The Royce Funds 2018 Semiannual Report to Shareholders | 47 |
Schedules of Investments
| Royce Low-Priced Stock Fund |
| Common Stocks – 96.0% |
| SHARES | VALUE | |||||||
| CONSUMER DISCRETIONARY – 17.2% | ||||||||
| AUTO COMPONENTS - 3.8% | ||||||||
Fox Factory Holding 1 | 47,800 | $ | 2,225,090 | |||||
Modine Manufacturing 1 | 148,500 | 2,710,125 | ||||||
Stoneridge 1 | 103,300 | 3,629,962 | ||||||
Unique Fabricating | 202,989 | 1,774,124 | ||||||
| 10,339,301 | ||||||||
| HOTELS, RESTAURANTS & LEISURE - 3.5% | ||||||||
Century Casinos 1 | 366,300 | 3,205,125 | ||||||
| 214,400 | 3,040,192 | |||||||
| 28,300 | 374,975 | |||||||
| 245,100 | 2,855,415 | |||||||
| 9,475,707 | ||||||||
| INTERNET & DIRECT MARKETING RETAIL - 0.9% | ||||||||
Gaia Cl. A 1 | 126,000 | 2,551,500 | ||||||
| LEISURE PRODUCTS - 1.9% | ||||||||
MCBC Holdings 1 | 81,800 | 2,368,110 | ||||||
Nautilus 1 | 170,013 | 2,669,204 | ||||||
| 5,037,314 | ||||||||
| MEDIA - 0.7% | ||||||||
ITE Group | 1,113,000 | 1,175,106 | ||||||
| 1,798,999 | 567,441 | |||||||
| 1,742,547 | ||||||||
| SPECIALTY RETAIL - 5.4% | ||||||||
Buckle (The) | 110,975 | 2,985,227 | ||||||
Build-A-Bear Workshop 1 | 174,100 | 1,323,160 | ||||||
DSW Cl. A | 100,400 | 2,592,328 | ||||||
| 222,500 | 1,679,875 | |||||||
Kirkland’s 1 | 186,200 | 2,167,368 | ||||||
Shoe Carnival | 118,400 | 3,842,080 | ||||||
| 14,590,038 | ||||||||
| TEXTILES, APPAREL & LUXURY GOODS - 1.0% | ||||||||
Vera Bradley 1 | 191,900 | 2,694,276 | ||||||
| Total (Cost $36,086,980) | 46,430,683 | |||||||
| CONSUMER STAPLES – 2.9% | ||||||||
| BEVERAGES - 1.0% | ||||||||
| 149,700 | 2,618,253 | |||||||
| FOOD PRODUCTS - 1.9% | ||||||||
| 91,500 | 2,795,325 | |||||||
Landec Corporation 1 | 166,900 | 2,486,810 | ||||||
| 5,282,135 | ||||||||
| Total (Cost $7,281,431) | 7,900,388 | |||||||
| ENERGY – 9.3% | ||||||||
| ENERGY EQUIPMENT & SERVICES - 7.8% | ||||||||
Computer Modelling Group | 259,000 | 1,989,807 | ||||||
Gulf Island Fabrication | 154,700 | 1,392,300 | ||||||
| 49,800 | 1,691,208 | |||||||
| 165,800 | 3,912,880 | |||||||
Newpark Resources 1 | 231,700 | 2,513,945 | ||||||
Pason Systems | 70,250 | 1,149,949 | ||||||
Profire Energy 1 | 648,900 | 2,193,282 | ||||||
TGS-NOPEC Geophysical | 52,000 | 1,915,438 | ||||||
Total Energy Services | 260,500 | 2,302,522 | ||||||
Unit Corporation 1 | 77,400 | 1,978,344 | ||||||
| 21,039,675 | ||||||||
| OIL, GAS & CONSUMABLE FUELS - 1.5% | ||||||||
Ardmore Shipping 1 | 285,500 | 2,341,100 | ||||||
Panhandle Oil and Gas Cl. A | 87,300 | 1,667,430 | ||||||
| 4,008,530 | ||||||||
| Total (Cost $18,969,579) | 25,048,205 | |||||||
| FINANCIALS – 11.6% | ||||||||
| BANKS - 4.9% | ||||||||
| 45,200 | 1,959,420 | |||||||
Blue Hills Bancorp | 125,200 | 2,779,440 | ||||||
Brookline Bancorp | 122,400 | 2,276,640 | ||||||
| 124,300 | 2,354,242 | |||||||
†Investar Holding | 41,800 | 1,155,770 | ||||||
| 101,200 | 2,641,320 | |||||||
| 13,166,832 | ||||||||
| CAPITAL MARKETS - 4.7% | ||||||||
†B. Riley Financial | 93,300 | 2,103,915 | ||||||
Hamilton Lane Cl. A | 40,888 | 1,961,397 | ||||||
Silvercrest Asset Management Group Cl. A | 164,300 | 2,678,090 | ||||||
Sprott | 971,000 | 2,245,343 | ||||||
†Westwood Holdings Group | 63,800 | 3,798,652 | ||||||
| 12,787,397 | ||||||||
| DIVERSIFIED FINANCIAL SERVICES - 0.3% | ||||||||
GTY Technology Holdings (Units) 1 | 80,000 | 834,400 | ||||||
| THRIFTS & MORTGAGE FINANCE - 1.7% | ||||||||
†PCSB Financial | 117,500 | 2,334,725 | ||||||
Western New England Bancorp | 202,800 | 2,230,800 | ||||||
| 4,565,525 | ||||||||
| Total (Cost $27,100,050) | 31,354,154 | |||||||
| HEALTH CARE – 10.4% | ||||||||
| BIOTECHNOLOGY - 2.4% | ||||||||
Heron Therapeutics 1 | 65,000 | 2,525,250 | ||||||
Progenics Pharmaceuticals 1 | 250,774 | 2,016,223 | ||||||
| 151,300 | 1,992,053 | |||||||
| 6,533,526 | ||||||||
| HEALTH CARE EQUIPMENT & SUPPLIES - 4.1% | ||||||||
AtriCure 1 | 127,400 | 3,446,170 | ||||||
CryoLife 1 | 120,300 | 3,350,355 | ||||||
| 63,800 | 1,699,632 | |||||||
Surmodics 1 | 44,500 | 2,456,400 | ||||||
| 10,952,557 | ||||||||
| LIFE SCIENCES TOOLS & SERVICES - 1.7% | ||||||||
Harvard Bioscience 1 | 488,300 | 2,612,405 | ||||||
| 131,700 | 1,891,212 | |||||||
| 4,503,617 | ||||||||
| PHARMACEUTICALS - 2.2% | ||||||||
Axsome Therapeutics 1 | 332,400 | 1,063,680 | ||||||
| 670,200 | 1,977,090 | |||||||
| 218,300 | 1,748,583 | |||||||
Paratek Pharmaceuticals 1 | 127,000 | 1,295,400 | ||||||
| 6,084,753 | ||||||||
| Total (Cost $21,083,760) | 28,074,453 | |||||||
| INDUSTRIALS – 17.7% | ||||||||
| AEROSPACE & DEFENSE - 1.6% | ||||||||
CPI Aerostructures 1 | 246,766 | 2,591,043 | ||||||
Kratos Defense & Security Solutions 1 | 150,300 | 1,729,953 | ||||||
| 4,320,996 | ||||||||
| BUILDING PRODUCTS - 0.8% | ||||||||
NCI Building Systems 1 | 98,600 | 2,070,600 | ||||||
| 48 | The Royce Funds 2018 Semiannual Report to Shareholders | THE ACCOMPANYING NOTES ARE AN INTEGRAL PART OF THESE FINANCIAL STATEMENTS |
| June 30, 2018 (unaudited) |
| Royce Low-Priced Stock Fund (continued) |
| SHARES | VALUE | |||||||
| INDUSTRIALS (continued) | ||||||||
| COMMERCIAL SERVICES & SUPPLIES - 1.2% | ||||||||
Atento | 270,900 | $ | 1,855,665 | |||||
Heritage-Crystal Clean 1 | 68,000 | 1,366,800 | ||||||
| 3,222,465 | ||||||||
| CONSTRUCTION & ENGINEERING - 2.8% | ||||||||
Ameresco Cl. A 1 | 269,500 | 3,234,000 | ||||||
IES Holdings 1 | 79,800 | 1,336,650 | ||||||
Northwest Pipe 1 | 156,000 | 3,021,720 | ||||||
| 7,592,370 | ||||||||
| ELECTRICAL EQUIPMENT - 0.3% | ||||||||
| 99,900 | 924,075 | |||||||
| INDUSTRIAL CONGLOMERATES - 0.6% | ||||||||
Raven Industries | 45,300 | 1,741,785 | ||||||
| MACHINERY - 6.2% | ||||||||
ASV Holdings 1 | 273,590 | 1,584,086 | ||||||
FreightCar America 1 | 98,300 | 1,650,457 | ||||||
†Graham Corporation | 126,900 | 3,275,289 | ||||||
| 184,700 | 3,287,660 | |||||||
| 66,200 | 2,889,630 | |||||||
Porvair | 364,400 | 2,346,875 | ||||||
Wabash National | 84,000 | 1,567,440 | ||||||
| 16,601,437 | ||||||||
| MARINE - 0.7% | ||||||||
Clarkson | 60,931 | 1,849,516 | ||||||
| PROFESSIONAL SERVICES - 3.5% | ||||||||
| 145,900 | 2,567,840 | |||||||
Heidrick & Struggles International | 48,240 | 1,688,400 | ||||||
Kforce | 71,274 | 2,444,698 | ||||||
Resources Connection | 158,900 | 2,685,410 | ||||||
| 9,386,348 | ||||||||
| Total (Cost $38,785,220) | 47,709,592 | |||||||
| INFORMATION TECHNOLOGY – 21.2% | ||||||||
| COMMUNICATIONS EQUIPMENT - 0.6% | ||||||||
Harmonic 1 | 360,000 | 1,530,000 | ||||||
| ELECTRONIC EQUIPMENT, INSTRUMENTS & COMPONENTS - 5.4% | ||||||||
CUI Global 1 | 379,100 | 1,125,927 | ||||||
Electro Scientific Industries 1 | 183,500 | 2,893,795 | ||||||
| 57,100 | 2,106,419 | |||||||
LightPath Technologies Cl. A 1 | 715,000 | 1,644,500 | ||||||
Novanta 1 | 30,100 | 1,875,230 | ||||||
PC Connection | 69,100 | 2,294,120 | ||||||
Vishay Precision Group 1 | 72,000 | 2,746,800 | ||||||
| 14,686,791 | ||||||||
| INTERNET SOFTWARE & SERVICES - 3.0% | ||||||||
Amber Road 1 | 312,700 | 2,942,507 | ||||||
Carbonite 1 | 82,200 | 2,868,780 | ||||||
QuinStreet 1 | 172,842 | 2,195,093 | ||||||
| 8,006,380 | ||||||||
| SEMICONDUCTORS & SEMICONDUCTOR EQUIPMENT - 7.5% | ||||||||
| 446,800 | 1,049,980 | |||||||
Brooks Automation | 79,182 | 2,582,917 | ||||||
Cirrus Logic 1 | 31,600 | 1,211,228 | ||||||
FormFactor 1 | 271,500 | 3,610,950 | ||||||
Inphi Corporation 1 | 68,400 | 2,230,524 | ||||||
| 92,100 | 2,509,725 | |||||||
Photronics 1 | 279,600 | 2,229,810 | ||||||
Rudolph Technologies 1 | 68,700 | 2,033,520 | ||||||
Ultra Clean Holdings 1 | 169,800 | 2,818,680 | ||||||
| 20,277,334 | ||||||||
| SOFTWARE - 3.6% | ||||||||
Agilysys 1 | 89,900 | 1,393,450 | ||||||
| 263,237 | 3,056,182 | |||||||
†QAD Cl. A | 55,000 | 2,758,250 | ||||||
Rubicon Project 1 | 368,500 | 1,050,225 | ||||||
SeaChange International 1 | 451,275 | 1,543,360 | ||||||
| 9,801,467 | ||||||||
| TECHNOLOGY HARDWARE, STORAGE & PERIPHERALS - 1.1% | ||||||||
Super Micro Computer 1 | 105,700 | 2,499,805 | ||||||
| 25,000 | 350,000 | |||||||
| 2,849,805 | ||||||||
| Total (Cost $43,820,631) | 57,151,777 | |||||||
| MATERIALS – 4.9% | ||||||||
| CHEMICALS - 1.0% | ||||||||
Trecora Resources 1 | 188,900 | 2,805,165 | ||||||
| METALS & MINING - 3.9% | ||||||||
| 205,763 | 0 | |||||||
†Haynes International | 77,500 | 2,847,350 | ||||||
Major Drilling Group International 1 | 449,100 | 2,370,786 | ||||||
Orocobre 1 | 310,500 | 1,187,991 | ||||||
Pretium Resources 1 | 155,700 | 1,145,263 | ||||||
Schnitzer Steel Industries Cl. A | 52,100 | 1,755,770 | ||||||
Superior Gold 1 | 1,350,000 | 1,252,805 | ||||||
| 10,559,965 | ||||||||
| Total (Cost $11,754,531) | 13,365,130 | |||||||
| TELECOMMUNICATION SERVICES – 0.8% | ||||||||
| DIVERSIFIED TELECOMMUNICATION SERVICES - 0.8% | ||||||||
ORBCOMM 1 | 200,900 | 2,029,090 | ||||||
| Total (Cost $1,367,675) | 2,029,090 | |||||||
| TOTAL COMMON STOCKS | ||||||||
| (Cost $206,249,857) | 259,063,472 | |||||||
| REPURCHASE AGREEMENT– 4.7% | ||||||||
| Fixed Income Clearing Corporation, 0.35% dated 6/29/18, due 7/2/18, maturity value $12,739,372 (collateralized by obligations of various U.S. Government Agencies, 1.375% due 10/07/21, valued at $12,995,593) | ||||||||
| (Cost $12,739,000) | 12,739,000 | |||||||
| COLLATERAL RECEIVED FOR SECURITIES LOANED – 2.9% | ||||||||
| Money Market Funds | ||||||||
Federated Government Obligations Fund (7 day yield-1.7400%) | ||||||||
| (Cost $7,857,308) | 7,857,308 | |||||||
| TOTAL INVESTMENTS – 103.6% | ||||||||
| (Cost $226,846,165) | 279,659,780 | |||||||
| LIABILITIES LESS CASH AND OTHER ASSETS – (3.6)% | (9,600,750 | ) | ||||||
| NET ASSETS – 100.0% | $ | 270,059,030 | ||||||
| THE ACCOMPANYING NOTES ARE AN INTEGRAL PART OF THESE FINANCIAL STATEMENTS | The Royce Funds 2018 Semiannual Report to Shareholders | 49 |
Schedules of Investments
| Royce Micro-Cap Fund |
| Common Stocks – 96.2% |
| SHARES | VALUE | |||||||
| CONSUMER DISCRETIONARY – 14.3% | ||||||||
| AUTO COMPONENTS - 3.4% | ||||||||
Fox Factory Holding 1 | 34,800 | $ | 1,619,940 | |||||
Standard Motor Products | 31,000 | 1,498,540 | ||||||
Stoneridge 1 | 61,800 | 2,171,652 | ||||||
Unique Fabricating | 157,200 | 1,373,928 | ||||||
| 6,664,060 | ||||||||
| HOTELS, RESTAURANTS & LEISURE - 1.9% | ||||||||
Del Taco Restaurants 1 | 122,500 | 1,737,050 | ||||||
| 13,810 | 182,982 | |||||||
| 163,200 | 1,901,280 | |||||||
| 3,821,312 | ||||||||
| HOUSEHOLD DURABLES - 1.1% | ||||||||
Cavco Industries 1 | 6,410 | 1,331,037 | ||||||
| 38,967 | 808,565 | |||||||
| 2,139,602 | ||||||||
| INTERNET & DIRECT MARKETING RETAIL - 0.6% | ||||||||
Gaia Cl. A 1 | 62,000 | 1,255,500 | ||||||
| LEISURE PRODUCTS - 1.7% | ||||||||
MCBC Holdings 1 | 59,000 | 1,708,050 | ||||||
Nautilus 1 | 107,800 | 1,692,460 | ||||||
| 3,400,510 | ||||||||
| SPECIALTY RETAIL - 4.2% | ||||||||
Build-A-Bear Workshop 1 | 137,600 | 1,045,760 | ||||||
Citi Trends | 56,424 | 1,548,274 | ||||||
| 102,200 | 771,610 | |||||||
Haverty Furniture | 69,200 | 1,494,720 | ||||||
Kirkland’s 1 | 103,500 | 1,204,740 | ||||||
Shoe Carnival | 66,411 | 2,155,037 | ||||||
| 8,220,141 | ||||||||
| TEXTILES, APPAREL & LUXURY GOODS - 1.4% | ||||||||
Culp | 31,474 | 772,687 | ||||||
Vera Bradley 1 | 135,000 | 1,895,400 | ||||||
| 2,668,087 | ||||||||
| Total (Cost $19,553,108) | 28,169,212 | |||||||
| CONSUMER STAPLES – 2.4% | ||||||||
| BEVERAGES - 0.9% | ||||||||
Primo Water 1 | 100,500 | 1,757,745 | ||||||
| FOOD PRODUCTS - 1.5% | ||||||||
Farmer Bros. 1 | 47,600 | 1,454,180 | ||||||
John B. Sanfilippo & Son | 20,900 | 1,556,005 | ||||||
| 3,010,185 | ||||||||
| Total (Cost $3,759,988) | 4,767,930 | |||||||
| ENERGY – 6.3% | ||||||||
| ENERGY EQUIPMENT & SERVICES - 4.9% | ||||||||
Basic Energy Services 1 | 71,800 | 797,698 | ||||||
Computer Modelling Group | 132,900 | 1,021,025 | ||||||
Gulf Island Fabrication | 96,518 | 868,662 | ||||||
Independence Contract Drilling 1 | 317,586 | 1,308,454 | ||||||
Natural Gas Services Group 1 | 61,287 | 1,446,373 | ||||||
Newpark Resources 1 | 157,900 | 1,713,215 | ||||||
Profire Energy 1 | 434,912 | 1,470,003 | ||||||
Total Energy Services | 124,400 | 1,099,553 | ||||||
| 9,724,983 | ||||||||
| OIL, GAS & CONSUMABLE FUELS - 1.4% | ||||||||
Ardmore Shipping 1 | 204,475 | 1,676,695 | ||||||
Panhandle Oil and Gas Cl. A | 55,800 | 1,065,780 | ||||||
| 2,742,475 | ||||||||
| Total (Cost $10,959,478) | 12,467,458 | |||||||
| FINANCIALS – 15.3% | ||||||||
| BANKS - 6.5% | ||||||||
Allegiance Bancshares 1 | 31,200 | 1,352,520 | ||||||
| 8,700 | 215,325 | |||||||
Blue Hills Bancorp | 77,000 | 1,709,400 | ||||||
Brookline Bancorp | 65,700 | 1,222,020 | ||||||
Caribbean Investment Holdings 1 | 1,858,138 | 429,149 | ||||||
County Bancorp | 50,500 | 1,388,750 | ||||||
HarborOne Bancorp 1 | 80,400 | 1,522,776 | ||||||
| 7,500 | 211,125 | |||||||
†Investar Holding | 27,800 | 768,670 | ||||||
| 1,858,170 | 0 | |||||||
Stewardship Financial | 94,500 | 1,100,925 | ||||||
TriState Capital Holdings 1 | 56,457 | 1,473,527 | ||||||
Two River Bancorp | 73,100 | 1,398,403 | ||||||
| 12,792,590 | ||||||||
| CAPITAL MARKETS - 4.4% | ||||||||
B. Riley Financial | 57,800 | 1,303,390 | ||||||
Canaccord Genuity Group | 289,100 | 1,596,521 | ||||||
GAIN Capital Holdings | 145,500 | 1,098,525 | ||||||
Gluskin Sheff + Associates | 115,900 | 1,447,593 | ||||||
Silvercrest Asset Management Group Cl. A | 103,100 | 1,680,530 | ||||||
Westwood Holdings Group | 25,672 | 1,528,511 | ||||||
| 8,655,070 | ||||||||
| DIVERSIFIED FINANCIAL SERVICES - 0.4% | ||||||||
| 2,760,000 | 828,000 | |||||||
| INSURANCE - 1.0% | ||||||||
Blue Capital Reinsurance Holdings | 74,600 | 824,330 | ||||||
| 35,400 | 1,145,190 | |||||||
| 1,969,520 | ||||||||
| THRIFTS & MORTGAGE FINANCE - 3.0% | ||||||||
Federal Agricultural Mortgage | 17,700 | 1,583,796 | ||||||
PCSB Financial | 71,300 | 1,416,731 | ||||||
Territorial Bancorp | 47,400 | 1,469,400 | ||||||
Western New England Bancorp | 140,900 | 1,549,900 | ||||||
| 6,019,827 | ||||||||
| Total (Cost $23,998,872) | 30,265,007 | |||||||
| HEALTH CARE – 11.3% | ||||||||
| BIOTECHNOLOGY - 2.1% | ||||||||
BioSpecifics Technologies 1 | 32,600 | 1,462,436 | ||||||
Progenics Pharmaceuticals 1 | 180,000 | 1,447,200 | ||||||
Zealand Pharma 1 | 92,300 | 1,215,244 | ||||||
| 4,124,880 | ||||||||
| HEALTH CARE EQUIPMENT & SUPPLIES - 5.5% | ||||||||
AtriCure 1 | 83,700 | 2,264,085 | ||||||
Chembio Diagnostics 1 | 127,953 | 1,420,278 | ||||||
CryoLife 1 | 74,855 | 2,084,712 | ||||||
| 41,600 | 1,108,224 | |||||||
Surmodics 1 | 38,222 | 2,109,854 | ||||||
| 34,800 | 1,809,600 | |||||||
| 10,796,753 | ||||||||
| LIFE SCIENCES TOOLS & SERVICES - 2.0% | ||||||||
Harvard Bioscience 1 | 320,979 | 1,717,238 | ||||||
NeoGenomics 1 | 104,200 | 1,366,062 | ||||||
| 68,700 | 986,532 | |||||||
| 4,069,832 | ||||||||
| PHARMACEUTICALS - 1.7% | ||||||||
BioDelivery Sciences International 1 | 415,100 | 1,224,545 | ||||||
| 136,164 | 1,090,674 | |||||||
Paratek Pharmaceuticals 1 | 79,200 | 807,840 | ||||||
| 50 | The Royce Funds 2018 Semiannual Report to Shareholders | THE ACCOMPANYING NOTES ARE AN INTEGRAL PART OF THESE FINANCIAL STATEMENTS |
| June 30, 2018 (unaudited) |
| Royce Micro-Cap Fund (continued) |
| SHARES | VALUE | |||||||
| HEALTH CARE (continued) | ||||||||
| PHARMACEUTICALS (continued) | ||||||||
| 196,684 | $ | 0 | ||||||
| 75,800 | 270,606 | |||||||
| 3,393,665 | ||||||||
| Total (Cost $14,495,543) | 22,385,130 | |||||||
| INDUSTRIALS – 19.3% | ||||||||
| AEROSPACE & DEFENSE - 1.5% | ||||||||
Astronics Corporation 1 | 30,340 | 1,091,330 | ||||||
CPI Aerostructures 1 | 176,018 | 1,848,189 | ||||||
| 2,939,519 | ||||||||
| COMMERCIAL SERVICES & SUPPLIES - 1.7% | ||||||||
Acme United | 46,100 | 956,575 | ||||||
Heritage-Crystal Clean 1 | 50,674 | 1,018,547 | ||||||
Viad Corporation | 24,800 | 1,345,400 | ||||||
| 3,320,522 | ||||||||
| CONSTRUCTION & ENGINEERING - 1.2% | ||||||||
| 50,000 | 658,500 | |||||||
Northwest Pipe 1 | 87,400 | 1,692,938 | ||||||
| 2,351,438 | ||||||||
| ELECTRICAL EQUIPMENT - 1.3% | ||||||||
| 171,100 | 1,197,700 | |||||||
Encore Wire | 30,400 | 1,442,480 | ||||||
| 2,640,180 | ||||||||
| INDUSTRIAL CONGLOMERATES - 0.7% | ||||||||
Raven Industries | 33,700 | 1,295,765 | ||||||
| MACHINERY - 7.8% | ||||||||
Alimak Group | 87,200 | 1,335,735 | ||||||
Exco Technologies | 161,900 | 1,094,809 | ||||||
FreightCar America 1 | 82,009 | 1,376,931 | ||||||
Global Brass and Copper Holdings | 40,900 | 1,282,215 | ||||||
Graham Corporation | 67,388 | 1,739,284 | ||||||
Greenbrier Companies (The) | 22,400 | 1,181,600 | ||||||
Kadant | 16,276 | 1,564,938 | ||||||
| 98,000 | 1,744,400 | |||||||
Lindsay Corporation | 16,600 | 1,610,034 | ||||||
Lydall 1 | 34,700 | 1,514,655 | ||||||
Sun Hydraulics | 21,800 | 1,050,542 | ||||||
| 15,495,143 | ||||||||
| MARINE - 0.6% | ||||||||
Clarkson | 38,300 | 1,162,568 | ||||||
| PROFESSIONAL SERVICES - 3.7% | ||||||||
CRA International | 23,083 | 1,174,694 | ||||||
GP Strategies 1 | 74,318 | 1,307,997 | ||||||
Heidrick & Struggles International | 34,700 | 1,214,500 | ||||||
Kforce | 51,658 | 1,771,869 | ||||||
Resources Connection | 104,852 | 1,771,999 | ||||||
| 7,241,059 | ||||||||
| ROAD & RAIL - 0.8% | ||||||||
Marten Transport | 66,355 | 1,556,025 | ||||||
| Total (Cost $25,198,588) | 38,002,219 | |||||||
| INFORMATION TECHNOLOGY – 19.7% | ||||||||
| COMMUNICATIONS EQUIPMENT - 1.0% | ||||||||
Digi International 1 | 92,100 | 1,215,720 | ||||||
EMCORE Corporation 1 | 143,700 | 725,685 | ||||||
| 1,941,405 | ||||||||
| ELECTRONIC EQUIPMENT, INSTRUMENTS & COMPONENTS - 6.5% | ||||||||
| 65,700 | 603,783 | |||||||
CUI Global 1 | 321,474 | 954,778 | ||||||
| 49,100 | 774,307 | |||||||
ePlus 1 | 15,834 | 1,489,979 | ||||||
Fabrinet 1 | 45,249 | 1,669,236 | ||||||
Mesa Laboratories | 8,900 | 1,878,612 | ||||||
| 14,700 | 485,982 | |||||||
Novanta 1 | 21,342 | 1,329,606 | ||||||
PC Connection | 56,700 | 1,882,440 | ||||||
Vishay Precision Group 1 | 48,400 | 1,846,460 | ||||||
| 12,915,183 | ||||||||
| INTERNET SOFTWARE & SERVICES - 1.5% | ||||||||
Amber Road 1 | 155,100 | 1,459,491 | ||||||
QuinStreet 1 | 123,404 | 1,567,231 | ||||||
| 3,026,722 | ||||||||
| IT SERVICES - 1.4% | ||||||||
Cass Information Systems | 24,380 | 1,677,832 | ||||||
Computer Task Group 1 | 143,910 | 1,113,863 | ||||||
| 2,791,695 | ||||||||
| SEMICONDUCTORS & SEMICONDUCTOR EQUIPMENT - 5.4% | ||||||||
Brooks Automation | 44,000 | 1,435,280 | ||||||
| 97,900 | 873,268 | |||||||
NeoPhotonics Corporation 1 | 220,600 | 1,374,338 | ||||||
| 46,600 | 1,269,850 | |||||||
Photronics 1 | 187,700 | 1,496,907 | ||||||
Rudolph Technologies 1 | 43,051 | 1,274,310 | ||||||
Silicon Motion Technology ADR | 28,100 | 1,486,209 | ||||||
Ultra Clean Holdings 1 | 81,700 | 1,356,220 | ||||||
| 10,566,382 | ||||||||
| SOFTWARE - 3.0% | ||||||||
Agilysys 1 | 45,600 | 706,800 | ||||||
Attunity 1 | 188,065 | 2,183,435 | ||||||
QAD Cl. A | 37,000 | 1,855,550 | ||||||
SeaChange International 1 | 320,207 | 1,095,108 | ||||||
| 5,840,893 | ||||||||
| TECHNOLOGY HARDWARE, STORAGE & PERIPHERALS - 0.9% | ||||||||
AstroNova | 30,200 | 569,270 | ||||||
Super Micro Computer 1 | 54,146 | 1,280,553 | ||||||
| 1,849,823 | ||||||||
| Total (Cost $28,285,193) | 38,932,103 | |||||||
| MATERIALS – 4.5% | ||||||||
| CHEMICALS - 1.9% | ||||||||
FutureFuel Corporation | 62,500 | 875,625 | ||||||
Quaker Chemical | 7,660 | 1,186,304 | ||||||
Trecora Resources 1 | 117,400 | 1,743,390 | ||||||
| 3,805,319 | ||||||||
| CONSTRUCTION MATERIALS - 0.5% | ||||||||
U.S. Concrete 1 | 17,300 | 908,250 | ||||||
| METALS & MINING - 2.1% | ||||||||
Haynes International | 41,830 | 1,536,834 | ||||||
Major Drilling Group International 1 | 241,700 | 1,275,928 | ||||||
Schnitzer Steel Industries Cl. A | 38,800 | 1,307,560 | ||||||
| 4,120,322 | ||||||||
| Total (Cost $7,130,512) | 8,833,891 | |||||||
| REAL ESTATE – 2.5% | ||||||||
| EQUITY REAL ESTATE INVESTMENT TRUSTS (REITS) - 0.9% | ||||||||
Community Healthcare Trust | 55,300 | 1,651,811 | ||||||
| REAL ESTATE MANAGEMENT & DEVELOPMENT - 1.6% | ||||||||
FRP Holdings 1 | 23,975 | 1,552,381 | ||||||
| THE ACCOMPANYING NOTES ARE AN INTEGRAL PART OF THESE FINANCIAL STATEMENTS | The Royce Funds 2018 Semiannual Report to Shareholders | 51 |
Schedules of Investments
| Royce Micro-Cap Fund (continued) |
| SHARES | VALUE | |||||||
| REAL ESTATE (continued) | ||||||||
| REAL ESTATE MANAGEMENT & DEVELOPMENT (continued) | ||||||||
Marcus & Millichap 1 | 41,500 | $ | 1,618,915 | |||||
| 3,171,296 | ||||||||
| Total (Cost $2,585,832) | 4,823,107 | |||||||
| TELECOMMUNICATION SERVICES – 0.6% | ||||||||
| DIVERSIFIED TELECOMMUNICATION SERVICES - 0.6% | ||||||||
ORBCOMM 1 | 120,700 | 1,219,070 | ||||||
| Total (Cost $731,525) | 1,219,070 | |||||||
| TOTAL COMMON STOCKS | ||||||||
| (Cost $136,698,639) | 189,865,127 | |||||||
| REPURCHASE AGREEMENT– 4.2% | ||||||||
| Fixed Income Clearing Corporation, 0.35% dated 6/29/18, due 7/2/18, maturity value $8,277,241 (collateralized by obligations of various U.S. Government Agencies, 1.375%- 1.75% due 10/07/21-11/30/21, valued at $8,446,599) | ||||||||
| (Cost $8,277,000) | 8,277,000 | |||||||
| COLLATERAL RECEIVED FOR SECURITIES LOANED – 1.9% | ||||||||
| Money Market Funds | ||||||||
Federated Government Obligations Fund (7 day yield-1.7400%) | ||||||||
| (Cost $3,716,832) | 3,716,832 | |||||||
| TOTAL INVESTMENTS – 102.3% | ||||||||
| (Cost $148,692,471) | 201,858,959 | |||||||
| LIABILITIES LESS CASH AND OTHER ASSETS – (2.3)% | (4,530,358 | ) | ||||||
| NET ASSETS – 100.0% | $ | 197,328,601 | ||||||
| Royce Micro-Cap Opportunity Fund |
| Common Stocks – 95.6% |
| SHARES | VALUE | |||||||
| CONSUMER DISCRETIONARY – 7.0% | ||||||||
| AUTO COMPONENTS - 0.4% | ||||||||
Shiloh Industries 1 | 25,025 | $ | 217,717 | |||||
| DIVERSIFIED CONSUMER SERVICES - 0.9% | ||||||||
| 13,000 | 84,890 | |||||||
| 20,500 | 335,585 | |||||||
| 420,475 | ||||||||
| HOTELS, RESTAURANTS & LEISURE - 1.1% | ||||||||
Del Taco Restaurants 1 | 32,000 | 453,760 | ||||||
| 34,612 | 62,302 | |||||||
| 516,062 | ||||||||
| HOUSEHOLD DURABLES - 2.9% | ||||||||
Beazer Homes USA 1 | 28,026 | 413,384 | ||||||
†Libbey | 32,500 | 264,225 | ||||||
New Home 1 | 73,053 | 728,338 | ||||||
| 1,405,947 | ||||||||
| SPECIALTY RETAIL - 0.3% | ||||||||
New York & Company 1 | 31,365 | 160,589 | ||||||
| TEXTILES, APPAREL & LUXURY GOODS - 1.4% | ||||||||
| 11,000 | 348,700 | |||||||
Vince Holding 1 | 18,553 | 305,939 | ||||||
| 654,639 | ||||||||
| Total (Cost $2,999,151) | 3,375,429 | |||||||
| CONSUMER STAPLES – 2.7% | ||||||||
| BEVERAGES - 0.3% | ||||||||
| 16,925 | 143,862 | |||||||
| FOOD PRODUCTS - 2.4% | ||||||||
Farmer Bros. 1 | 15,001 | 458,281 | ||||||
Landec Corporation 1 | 30,528 | 454,867 | ||||||
| 27,500 | 231,000 | |||||||
| 1,144,148 | ||||||||
| Total (Cost $1,161,414) | 1,288,010 | |||||||
| ENERGY – 8.6% | ||||||||
| ENERGY EQUIPMENT & SERVICES - 7.0% | ||||||||
Aspen Aerogels 1 | 80,608 | 394,979 | ||||||
Basic Energy Services 1 | 46,857 | 520,581 | ||||||
Helix Energy Solutions Group 1 | 9,083 | 75,662 | ||||||
| 75,325 | 310,339 | |||||||
Mammoth Energy Services 1 | 17,471 | 593,315 | ||||||
Newpark Resources 1 | 67,069 | 727,699 | ||||||
Ranger Energy Services Cl. A 1 | 79,589 | 729,831 | ||||||
| 3,352,406 | ||||||||
| OIL, GAS & CONSUMABLE FUELS - 1.6% | ||||||||
| 34,020 | 206,842 | |||||||
| 40,284 | 509,592 | |||||||
| 100,000 | 68,000 | |||||||
| 784,434 | ||||||||
| Total (Cost $4,105,411) | 4,136,840 | |||||||
| FINANCIALS – 9.6% | ||||||||
| BANKS - 2.4% | ||||||||
| 11,000 | 203,940 | |||||||
Old Line Bancshares | 20,022 | 698,968 | ||||||
TriState Capital Holdings 1 | 10,541 | 275,120 | ||||||
| 1,178,028 | ||||||||
| CAPITAL MARKETS - 2.8% | ||||||||
B. Riley Financial | 22,028 | 496,731 | ||||||
Hamilton Lane Cl. A | 17,200 | 825,084 | ||||||
| 1,321,815 | ||||||||
| 52 | The Royce Funds 2018 Semiannual Report to Shareholders | THE ACCOMPANYING NOTES ARE AN INTEGRAL PART OF THESE FINANCIAL STATEMENTS |
| June 30, 2018 (unaudited) |
| Royce Micro-Cap Opportunity Fund (continued) |
| SHARES | VALUE | |||||||
| FINANCIALS (continued) | ||||||||
| INSURANCE - 3.0% | ||||||||
HCI Group | 15,233 | $ | 633,236 | |||||
Heritage Insurance Holdings | 47,500 | 791,825 | ||||||
| 1,425,061 | ||||||||
| THRIFTS & MORTGAGE FINANCE - 1.4% | ||||||||
BofI Holding 1 | 7,300 | 298,643 | ||||||
NMI Holdings Cl. A 1 | 23,063 | 375,927 | ||||||
| 674,570 | ||||||||
| Total (Cost $2,944,484) | 4,599,474 | |||||||
| HEALTH CARE – 14.8% | ||||||||
| BIOTECHNOLOGY - 2.9% | ||||||||
CareDx 1 | 113,267 | 1,386,388 | ||||||
| HEALTH CARE EQUIPMENT & SUPPLIES - 4.3% | ||||||||
Accuray 1 | 145,500 | 596,550 | ||||||
GenMark Diagnostics 1 | 68,300 | 435,754 | ||||||
Invuity 1 | 73,080 | 285,012 | ||||||
SeaSpine Holdings 1 | 61,699 | 778,642 | ||||||
| 2,095,958 | ||||||||
| HEALTH CARE PROVIDERS & SERVICES - 5.7% | ||||||||
BioScrip 1 | 200,000 | 586,000 | ||||||
Civitas Solutions 1 | 34,488 | 565,603 | ||||||
Cross Country Healthcare 1 | 46,271 | 520,549 | ||||||
Fulgent Genetics 1 | 72,411 | 299,781 | ||||||
Surgery Partners 1 | 50,682 | 755,162 | ||||||
| 2,727,095 | ||||||||
| HEALTH CARE TECHNOLOGY - 1.9% | ||||||||
Castlight Health Cl. B 1 | 214,409 | 911,238 | ||||||
| Total (Cost $5,905,087) | 7,120,679 | |||||||
| INDUSTRIALS – 18.1% | ||||||||
| AEROSPACE & DEFENSE - 3.6% | ||||||||
Ducommun 1 | 29,010 | 959,941 | ||||||
KEYW Holding Corporation 1 | 60,045 | 524,793 | ||||||
Kratos Defense & Security Solutions 1 | 21,511 | 247,592 | ||||||
| 1,732,326 | ||||||||
| AIR FREIGHT & LOGISTICS - 1.3% | ||||||||
Atlas Air Worldwide Holdings 1 | 8,800 | 630,960 | ||||||
| BUILDING PRODUCTS - 0.6% | ||||||||
PGT Innovations 1 | 14,570 | 303,784 | ||||||
| CONSTRUCTION & ENGINEERING - 2.1% | ||||||||
Ameresco Cl. A 1 | 75,249 | 902,988 | ||||||
Great Lakes Dredge & Dock 1 | 15,738 | 82,624 | ||||||
| 985,612 | ||||||||
| ELECTRICAL EQUIPMENT - 0.7% | ||||||||
Babcock & Wilcox Enterprises 1 | 100,000 | 238,000 | ||||||
| 8,088 | 74,814 | |||||||
| 312,814 | ||||||||
| MACHINERY - 4.2% | ||||||||
Commercial Vehicle Group 1 | 36,000 | 264,240 | ||||||
FreightCar America 1 | 19,928 | 334,591 | ||||||
Gencor Industries 1 | 45,945 | 742,012 | ||||||
Park-Ohio Holdings | 11,609 | 433,016 | ||||||
Spartan Motors | 16,531 | 249,618 | ||||||
| 2,023,477 | ||||||||
| MARINE - 0.9% | ||||||||
Diana Shipping 1 | 92,000 | 442,520 | ||||||
| ROAD & RAIL - 2.4% | ||||||||
| 155,000 | 463,450 | |||||||
YRC Worldwide 1 | 66,000 | 663,300 | ||||||
| 1,126,750 | ||||||||
| TRADING COMPANIES & DISTRIBUTORS - 2.3% | ||||||||
| 21,100 | 490,364 | |||||||
| 45,025 | 610,089 | |||||||
| 1,100,453 | ||||||||
| Total (Cost $6,724,765) | 8,658,696 | |||||||
| INFORMATION TECHNOLOGY – 25.0% | ||||||||
| COMMUNICATIONS EQUIPMENT - 5.9% | ||||||||
Aerohive Networks 1 | 119,000 | 472,430 | ||||||
Comtech Telecommunications | 16,076 | 512,503 | ||||||
Extreme Networks 1 | 26,000 | 206,960 | ||||||
Quantenna Communications 1 | 46,500 | 722,610 | ||||||
Ribbon Communications 1 | 125,754 | 895,368 | ||||||
| 2,809,871 | ||||||||
| ELECTRONIC EQUIPMENT, INSTRUMENTS & COMPONENTS - 3.6% | ||||||||
Electro Scientific Industries 1 | 45,500 | 717,535 | ||||||
KEMET Corporation 1 | 38,352 | 926,201 | ||||||
| 37,062 | 85,242 | |||||||
| 1,728,978 | ||||||||
| INTERNET SOFTWARE & SERVICES - 4.7% | ||||||||
Amber Road 1 | 58,634 | 551,746 | ||||||
eGain Corporation 1 | 66,139 | 998,699 | ||||||
Limelight Networks 1 | 28,066 | 125,455 | ||||||
Telaria 1 | 139,283 | 562,703 | ||||||
| 2,238,603 | ||||||||
| IT SERVICES - 0.4% | ||||||||
| 7,500 | 197,775 | |||||||
| SEMICONDUCTORS & SEMICONDUCTOR EQUIPMENT - 8.2% | ||||||||
Alpha & Omega Semiconductor 1 | 55,931 | 796,457 | ||||||
Amtech Systems 1 | 12,000 | 72,600 | ||||||
AXT 1 | 90,023 | 634,662 | ||||||
FormFactor 1 | 29,829 | 396,726 | ||||||
Ichor Holdings 1 | 30,675 | 650,924 | ||||||
Kopin Corporation 1 | 106,955 | 305,891 | ||||||
| 20,000 | 460,800 | |||||||
NeoPhotonics Corporation 1 | 39,700 | 247,331 | ||||||
Rudolph Technologies 1 | 12,003 | 355,289 | ||||||
| 3,920,680 | ||||||||
| SOFTWARE - 1.5% | ||||||||
A10 Networks 1 | 10,097 | 62,904 | ||||||
Datawatch Corporation 1 | 22,487 | 213,627 | ||||||
| 33,000 | 94,050 | |||||||
| 29,168 | 363,142 | |||||||
| 733,723 | ||||||||
| TECHNOLOGY HARDWARE, STORAGE & PERIPHERALS - 0.7% | ||||||||
Avid Technology 1 | 47,277 | 245,840 | ||||||
Intevac 1 | 21,503 | 104,290 | ||||||
| 350,130 | ||||||||
| Total (Cost $9,082,449) | 11,979,760 | |||||||
| MATERIALS – 8.2% | ||||||||
| CHEMICALS - 2.7% | ||||||||
Intrepid Potash 1 | 188,349 | 772,231 | ||||||
Kraton Corporation 1 | 10,879 | 501,957 | ||||||
| 1,274,188 | ||||||||
| CONSTRUCTION MATERIALS - 1.9% | ||||||||
Forterra 1 | 95,000 | 924,350 | ||||||
| THE ACCOMPANYING NOTES ARE AN INTEGRAL PART OF THESE FINANCIAL STATEMENTS | The Royce Funds 2018 Semiannual Report to Shareholders | 53 |
Schedules of Investments
| Royce Micro-Cap Opportunity Fund (continued) |
| SHARES | VALUE | |||||||
| MATERIALS (continued) | ||||||||
| METALS & MINING - 3.6% | ||||||||
Haynes International | 14,849 | $ | 545,552 | |||||
†Synalloy Corporation | 25,290 | 504,536 | ||||||
Universal Stainless & Alloy Products 1 | 28,080 | 664,654 | ||||||
| 1,714,742 | ||||||||
| Total (Cost $2,668,088) | 3,913,280 | |||||||
| REAL ESTATE – 0.7% | ||||||||
| EQUITY REAL ESTATE INVESTMENT TRUSTS (REITS) - 0.7% | ||||||||
Armada Hoffler Properties | 23,000 | 342,700 | ||||||
| Total (Cost $299,962) | 342,700 | |||||||
| TELECOMMUNICATION SERVICES – 0.9% | ||||||||
| DIVERSIFIED TELECOMMUNICATION SERVICES - 0.9% | ||||||||
Ooma 1 | 29,287 | 414,411 | ||||||
| Total (Cost $277,265) | 414,411 | |||||||
| TOTAL COMMON STOCKS | ||||||||
| (Cost $36,168,076) | 45,829,279 | |||||||
| REPURCHASE AGREEMENT– 4.7% | ||||||||
| Fixed Income Clearing Corporation, 0.35% dated 6/29/18, due 7/2/18, maturity value $2,245,065 (collateralized by obligations of various U.S. Government Agencies, 1.125% due 9/30/21, valued at $2,293,375) | ||||||||
| (Cost $2,245,000) | 2,245,000 | |||||||
| TOTAL INVESTMENTS – 100.3% | ||||||||
| (Cost $38,413,076) | 48,074,279 | |||||||
| LIABILITIES LESS CASH AND OTHER ASSETS – (0.3)% | (153,754 | ) | ||||||
| NET ASSETS – 100.0% | $ | 47,920,525 | ||||||
| Royce Opportunity Fund |
| Common Stocks – 92.7% |
| SHARES | VALUE | |||||||
| CONSUMER DISCRETIONARY – 14.3% | ||||||||
| AUTO COMPONENTS - 3.5% | ||||||||
American Axle & Manufacturing Holdings 1 | 531,945 | $ | 8,277,064 | |||||
Cooper Tire & Rubber | 206,564 | 5,432,633 | ||||||
Dana | 434,835 | 8,779,319 | ||||||
Modine Manufacturing 1 | 427,010 | 7,792,932 | ||||||
Tower International | 318,567 | 10,130,431 | ||||||
VOXX International Cl. A 1 | 858,563 | 4,636,240 | ||||||
| 45,048,619 | ||||||||
| AUTOMOBILES - 0.2% | ||||||||
Winnebago Industries | 69,900 | 2,837,940 | ||||||
| DIVERSIFIED CONSUMER SERVICES - 0.7% | ||||||||
| 646,393 | 4,944,906 | |||||||
K12 1 | 287,294 | 4,703,003 | ||||||
| 9,647,909 | ||||||||
| HOTELS, RESTAURANTS & LEISURE - 1.6% | ||||||||
Belmond Cl. A 1 | 454,962 | 5,072,826 | ||||||
Carrols Restaurant Group 1 | 366,256 | 5,438,902 | ||||||
Del Taco Restaurants 1 | 287,837 | 4,081,529 | ||||||
| 310,088 | 3,535,003 | |||||||
Jamba 1 | 297,191 | 3,165,084 | ||||||
| 21,293,344 | ||||||||
| HOUSEHOLD DURABLES - 3.1% | ||||||||
Beazer Homes USA 1 | 370,401 | 5,463,415 | ||||||
Dixie Group 1 | 652,520 | 1,500,796 | ||||||
Ethan Allen Interiors | 144,743 | 3,546,203 | ||||||
Hamilton Beach Brands Holding Company Cl. A | 18,604 | 540,446 | ||||||
Libbey | 558,668 | 4,541,971 | ||||||
M.D.C. Holdings | 206,808 | 6,363,482 | ||||||
M/I Homes 1 | 174,248 | 4,614,087 | ||||||
| 167,006 | 2,732,218 | |||||||
†Tupperware Brands | 168,300 | 6,940,692 | ||||||
William Lyon Homes Cl. A 1 | 152,419 | 3,536,121 | ||||||
| 39,779,431 | ||||||||
| MEDIA - 0.4% | ||||||||
Entravision Communications Cl. A | 256,097 | 1,280,485 | ||||||
McClatchy Company (The) Cl. A 1 | 253,454 | 2,521,867 | ||||||
New York Times Cl. A | 54,701 | 1,416,756 | ||||||
| 5,219,108 | ||||||||
| MULTILINE RETAIL - 0.2% | ||||||||
Fred’s Cl. A 1 | 188,825 | 430,521 | ||||||
| 526,041 | 1,604,425 | |||||||
| 2,034,946 | ||||||||
| SPECIALTY RETAIL - 3.2% | ||||||||
American Eagle Outfitters | 199,933 | 4,648,442 | ||||||
Ascena Retail Group 1 | 715,587 | 2,851,614 | ||||||
Barnes & Noble | 280,693 | 1,782,401 | ||||||
| 138,194 | 912,080 | |||||||
Conn’s 1 | 100,770 | 3,325,410 | ||||||
DSW Cl. A | 253,822 | 6,553,684 | ||||||
| 396,200 | 2,991,310 | |||||||
Genesco 1 | 44,866 | 1,781,180 | ||||||
Guess? | 100,626 | 2,153,396 | ||||||
MarineMax 1 | 145,842 | 2,763,706 | ||||||
New York & Company 1 | 382,323 | 1,957,494 | ||||||
Sally Beauty Holdings 1 | 263,928 | 4,230,766 | ||||||
| 255,885 | 537,359 | |||||||
Stage Stores | 809,433 | 1,950,734 | ||||||
Williams-Sonoma | 43,526 | 2,671,626 | ||||||
| 41,111,202 | ||||||||
| 54 | The Royce Funds 2018 Semiannual Report to Shareholders | THE ACCOMPANYING NOTES ARE AN INTEGRAL PART OF THESE FINANCIAL STATEMENTS |
| June 30, 2018 (unaudited) |
| Royce Opportunity Fund (continued) |
| SHARES | VALUE | |||||||
| CONSUMER DISCRETIONARY (continued) | ||||||||
| TEXTILES, APPAREL & LUXURY GOODS - 1.4% | ||||||||
Perry Ellis International 1 | 45,155 | $ | 1,226,861 | |||||
Skechers U.S.A. Cl. A 1 | 269,443 | 8,085,985 | ||||||
Unifi 1 | 170,119 | 5,392,772 | ||||||
Vince Holding 1 | 169,885 | 2,801,404 | ||||||
| 17,507,022 | ||||||||
| Total (Cost $173,678,398) | 184,479,521 | |||||||
| CONSUMER STAPLES – 2.3% | ||||||||
| FOOD & STAPLES RETAILING - 1.4% | ||||||||
Natural Grocers by Vitamin Cottage 1 | 278,804 | 3,551,963 | ||||||
SUPERVALU 1 | 414,449 | 8,504,493 | ||||||
United Natural Foods 1 | 124,454 | 5,309,208 | ||||||
| 17,365,664 | ||||||||
| FOOD PRODUCTS - 0.7% | ||||||||
Landec Corporation 1 | 443,702 | 6,611,159 | ||||||
SunOpta 1 | 349,727 | 2,937,707 | ||||||
| 9,548,866 | ||||||||
| PERSONAL PRODUCTS - 0.2% | ||||||||
| 1,656,706 | 2,683,864 | |||||||
| Total (Cost $28,300,547) | 29,598,394 | |||||||
| ENERGY – 7.8% | ||||||||
| ENERGY EQUIPMENT & SERVICES - 3.4% | ||||||||
Aspen Aerogels 1 | 305,354 | 1,496,235 | ||||||
Basic Energy Services 1 | 485,293 | 5,391,605 | ||||||
| 547,251 | 2,254,674 | |||||||
| 92,012 | 3,124,728 | |||||||
Matrix Service 1 | 406,387 | 7,457,201 | ||||||
Newpark Resources 1 | 933,799 | 10,131,719 | ||||||
Patterson-UTI Energy | 409,585 | 7,372,530 | ||||||
| 153,652 | 1,408,989 | |||||||
U.S. Silica Holdings | 212,798 | 5,466,781 | ||||||
| 44,104,462 | ||||||||
| OIL, GAS & CONSUMABLE FUELS - 4.4% | ||||||||
Ardmore Shipping 1 | 604,496 | 4,956,867 | ||||||
Bonanza Creek Energy 1 | 194,399 | 7,361,890 | ||||||
| 689,414 | 5,267,123 | |||||||
GasLog | 191,704 | 3,661,547 | ||||||
GasLog Partners L.P. | 173,104 | 4,128,531 | ||||||
| 484,575 | 2,946,216 | |||||||
Matador Resources 1 | 214,921 | 6,458,376 | ||||||
| 74,100 | 937,365 | |||||||
| 1,345,777 | 915,128 | |||||||
Scorpio Tankers | 365,140 | 1,026,043 | ||||||
StealthGas 1 | 814,628 | 3,201,488 | ||||||
| 245,764 | 7,896,397 | |||||||
†Teekay LNG Partners L.P. | 22,300 | 375,755 | ||||||
Whiting Petroleum 1 | 144,068 | 7,595,265 | ||||||
| 56,727,991 | ||||||||
| Total (Cost $111,911,715) | 100,832,453 | |||||||
| FINANCIALS – 5.9% | ||||||||
| BANKS - 3.1% | ||||||||
Boston Private Financial Holdings | 196,766 | 3,128,579 | ||||||
CenterState Bank | 215,466 | 6,425,196 | ||||||
| 90,900 | 1,685,286 | |||||||
| 90,400 | 3,399,040 | |||||||
Guaranty Bancorp | 81,567 | 2,430,697 | ||||||
Hilltop Holdings | 278,099 | 6,137,645 | ||||||
Independent Bank Group | 36,100 | 2,411,480 | ||||||
†Old Line Bancshares | 41,692 | 1,455,468 | ||||||
†Renasant Corporation | 67,300 | 3,063,496 | ||||||
Southern National Bancorp of Virginia | 188,390 | 3,360,878 | ||||||
State Bank Financial | 76,526 | 2,555,968 | ||||||
Umpqua Holdings | 164,382 | 3,713,389 | ||||||
| 39,767,122 | ||||||||
| CAPITAL MARKETS - 0.4% | ||||||||
B. Riley Financial | 197,551 | 4,454,775 | ||||||
| CONSUMER FINANCE - 0.2% | ||||||||
Enova International 1 | 79,892 | 2,920,053 | ||||||
| INSURANCE - 1.6% | ||||||||
Aspen Insurance Holdings | 153,004 | 6,227,263 | ||||||
†HCI Group | 71,746 | 2,982,481 | ||||||
Heritage Insurance Holdings | 240,507 | 4,009,252 | ||||||
MBIA 1 | 835,400 | 7,552,016 | ||||||
| 20,771,012 | ||||||||
| INVESTMENT COMPANIES - 0.1% | ||||||||
BlackRock Resources & Commodities | ||||||||
Strategy Trust | 166,529 | 1,547,054 | ||||||
| THRIFTS & MORTGAGE FINANCE - 0.5% | ||||||||
MGIC Investment 1 | 248,372 | 2,662,548 | ||||||
Radian Group | 231,698 | 3,758,141 | ||||||
| 6,420,689 | ||||||||
| Total (Cost $59,857,818) | 75,880,705 | |||||||
| HEALTH CARE – 5.3% | ||||||||
| HEALTH CARE EQUIPMENT & SUPPLIES - 1.8% | ||||||||
| 747,502 | 3,064,758 | |||||||
AngioDynamics 1 | 312,512 | 6,950,267 | ||||||
Invacare Corporation | 623,816 | 11,602,977 | ||||||
RTI Surgical 1 | 379,141 | 1,744,049 | ||||||
| 23,362,051 | ||||||||
| HEALTH CARE PROVIDERS & SERVICES - 2.0% | ||||||||
| 105,879 | 4,331,510 | |||||||
Aceto Corporation | 176,526 | 591,362 | ||||||
BioScrip 1 | 710,445 | 2,081,604 | ||||||
Brookdale Senior Living 1 | 475,009 | 4,317,832 | ||||||
Community Health Systems 1 | 230,514 | 765,307 | ||||||
| 336,113 | 3,781,271 | |||||||
Owens & Minor | 239,423 | 4,000,758 | ||||||
| 364,772 | 5,435,103 | |||||||
| 25,304,747 | ||||||||
| HEALTH CARE TECHNOLOGY - 0.7% | ||||||||
Allscripts Healthcare Solutions 1 | 654,604 | 7,855,248 | ||||||
| 250,497 | 1,064,612 | |||||||
| 8,919,860 | ||||||||
| PHARMACEUTICALS - 0.8% | ||||||||
Mallinckrodt 1 | 557,296 | 10,399,143 | ||||||
| Total (Cost $69,273,742) | 67,985,801 | |||||||
| INDUSTRIALS – 24.3% | ||||||||
| AEROSPACE & DEFENSE - 4.2% | ||||||||
| 324,754 | 9,576,995 | |||||||
Ducommun 1 | 67,532 | 2,234,634 | ||||||
Engility Holdings 1 | 233,750 | 7,162,100 | ||||||
KEYW Holding Corporation 1 | 670,229 | 5,857,801 | ||||||
KLX 1 | 73,313 | 5,271,205 | ||||||
Kratos Defense & Security Solutions 1 | 744,417 | 8,568,240 | ||||||
| THE ACCOMPANYING NOTES ARE AN INTEGRAL PART OF THESE FINANCIAL STATEMENTS | The Royce Funds 2018 Semiannual Report to Shareholders | 55 |
Schedules of Investments
| Royce Opportunity Fund (continued) |
| SHARES | VALUE | |||||||
| INDUSTRIALS (continued) | ||||||||
| AEROSPACE & DEFENSE (continued) | ||||||||
Triumph Group | 295,901 | $ | 5,799,660 | |||||
Wesco Aircraft Holdings 1 | 867,018 | 9,753,952 | ||||||
| 54,224,587 | ||||||||
| AIR FREIGHT & LOGISTICS - 0.6% | ||||||||
| 109,304 | 7,837,097 | |||||||
| BUILDING PRODUCTS - 2.8% | ||||||||
Apogee Enterprises | 154,000 | 7,418,180 | ||||||
Builders FirstSource 1 | 90,395 | 1,653,325 | ||||||
Griffon Corporation | 265,247 | 4,721,397 | ||||||
Insteel Industries | 182,711 | 6,102,547 | ||||||
NCI Building Systems 1 | 305,218 | 6,409,578 | ||||||
PGT Innovations 1 | 216,530 | 4,514,650 | ||||||
Quanex Building Products | 320,958 | 5,761,196 | ||||||
| 36,580,873 | ||||||||
| COMMERCIAL SERVICES & SUPPLIES - 1.9% | ||||||||
Herman Miller | 205,724 | 6,974,044 | ||||||
Interface | 164,896 | 3,784,363 | ||||||
Steelcase Cl. A | 325,401 | 4,392,913 | ||||||
Team 1 | 411,286 | 9,500,707 | ||||||
| 24,652,027 | ||||||||
| CONSTRUCTION & ENGINEERING - 2.3% | ||||||||
Aegion Corporation 1 | 321,685 | 8,283,389 | ||||||
†Granite Construction | 211,082 | 11,748,824 | ||||||
Great Lakes Dredge & Dock 1 | 366,516 | 1,924,209 | ||||||
Northwest Pipe 1 | 426,820 | 8,267,503 | ||||||
| 30,223,925 | ||||||||
| ELECTRICAL EQUIPMENT - 0.7% | ||||||||
| 770,481 | 1,833,745 | |||||||
Encore Wire | 69,086 | 3,278,130 | ||||||
| 146,743 | 1,357,373 | |||||||
Revolution Lighting Technologies 1 | 478,961 | 1,930,213 | ||||||
| 8,399,461 | ||||||||
| MACHINERY - 8.9% | ||||||||
Astec Industries | 145,435 | 8,697,013 | ||||||
Commercial Vehicle Group 1 | 803,646 | 5,898,762 | ||||||
DMC Global | 109,156 | 4,901,104 | ||||||
Federal Signal | 235,974 | 5,495,834 | ||||||
FreightCar America 1 | 448,487 | 7,530,097 | ||||||
Hurco Companies | 149,035 | 6,669,316 | ||||||
Hyster-Yale Materials Handling Cl. A | 122,006 | 7,838,885 | ||||||
Meritor 1 | 454,010 | 9,338,986 | ||||||
Milacron Holdings 1 | 381,984 | 7,230,957 | ||||||
Mueller Industries | 310,837 | 9,172,800 | ||||||
Mueller Water Products Cl. A | 889,472 | 10,424,612 | ||||||
NN | 384,922 | 7,275,026 | ||||||
†REV Group | 100,900 | 1,716,309 | ||||||
Spartan Motors | 388,627 | 5,868,268 | ||||||
TriMas Corporation 1 | 306,310 | 9,005,514 | ||||||
Westport Fuel Systems 1 | 2,902,440 | 7,343,173 | ||||||
| 114,406,656 | ||||||||
| MARINE - 0.5% | ||||||||
Diana Shipping 1 | 575,877 | 2,769,969 | ||||||
Navios Maritime Holdings 1 | 540,917 | 460,807 | ||||||
Scorpio Bulkers | 418,883 | 2,974,069 | ||||||
| 6,204,845 | ||||||||
| ROAD & RAIL - 0.4% | ||||||||
| 473,931 | 1,417,054 | |||||||
Hertz Global Holdings 1 | 208,065 | 3,191,717 | ||||||
| 4,608,771 | ||||||||
| TRADING COMPANIES & DISTRIBUTORS - 2.0% | ||||||||
| 209,916 | 4,878,448 | |||||||
Herc Holdings 1 | 152,998 | 8,619,907 | ||||||
Textainer Group Holdings 1 | 272,609 | 4,334,483 | ||||||
Univar 1 | 315,452 | 8,277,461 | ||||||
| 26,110,299 | ||||||||
| Total (Cost $240,952,655) | 313,248,541 | |||||||
| INFORMATION TECHNOLOGY – 23.6% | ||||||||
| COMMUNICATIONS EQUIPMENT - 4.8% | ||||||||
| 615,334 | 2,442,876 | |||||||
| 343,161 | 8,388,571 | |||||||
Aviat Networks 1 | 185,981 | 3,044,509 | ||||||
Ciena Corporation 1 | 450,473 | 11,942,039 | ||||||
Comtech Telecommunications | 424,030 | 13,518,076 | ||||||
EMCORE Corporation 1 | 454,025 | 2,292,826 | ||||||
Extreme Networks 1 | 618,751 | 4,925,258 | ||||||
Finisar Corporation 1 | 335,007 | 6,030,126 | ||||||
Harmonic 1 | 705,182 | 2,997,024 | ||||||
PCTEL | 102,791 | 641,416 | ||||||
Ribbon Communications 1 | 624,770 | 4,448,362 | ||||||
Westell Technologies Cl. A 1 | 208,087 | 593,048 | ||||||
| 61,264,131 | ||||||||
| ELECTRONIC EQUIPMENT, INSTRUMENTS & COMPONENTS - 7.5% | ||||||||
Benchmark Electronics | 181,003 | 5,276,237 | ||||||
CUI Global 1 | 512,757 | 1,522,888 | ||||||
Daktronics | 273,510 | 2,327,570 | ||||||
Echelon Corporation 1 | 122,929 | 1,012,935 | ||||||
Fabrinet 1 | 286,664 | 10,575,035 | ||||||
Frequency Electronics 1 | 187,032 | 1,507,478 | ||||||
Identiv 1 | 511,671 | 1,980,167 | ||||||
II-VI 1 | 139,968 | 6,081,610 | ||||||
KEMET Corporation 1 | 598,237 | 14,447,424 | ||||||
| 549,055 | 8,400,541 | |||||||
Maxwell Technologies 1 | 700,373 | 3,641,940 | ||||||
Park Electrochemical | 161,466 | 3,744,396 | ||||||
PCM 1 | 249,913 | 3,786,182 | ||||||
Perceptron 1 | 354,087 | 3,735,618 | ||||||
Sanmina Corporation 1 | 310,534 | 9,098,646 | ||||||
SigmaTron International 1 | 184,527 | 1,295,379 | ||||||
TTM Technologies 1 | 429,757 | 7,576,616 | ||||||
Vishay Intertechnology | 449,383 | 10,425,686 | ||||||
| 96,436,348 | ||||||||
| INTERNET SOFTWARE & SERVICES - 1.1% | ||||||||
Amber Road 1 | 229,817 | 2,162,578 | ||||||
Blucora 1 | 156,545 | 5,792,165 | ||||||
Leaf Group 1 | 264,272 | 2,867,351 | ||||||
Limelight Networks 1 | 81,496 | 364,287 | ||||||
Marin Software 1 | 67,801 | 393,246 | ||||||
Telaria 1 | 783,684 | 3,166,084 | ||||||
| 14,745,711 | ||||||||
| IT SERVICES - 1.1% | ||||||||
Computer Task Group 1 | 337,689 | 2,613,713 | ||||||
Perficient 1 | 61,037 | 1,609,546 | ||||||
Unisys Corporation 1 | 727,324 | 9,382,479 | ||||||
| 13,605,738 | ||||||||
| SEMICONDUCTORS & SEMICONDUCTOR EQUIPMENT - 6.7% | ||||||||
Alpha & Omega Semiconductor 1 | 441,534 | 6,287,444 | ||||||
Amtech Systems 1 | 432,370 | 2,615,839 | ||||||
AXT 1 | 502,091 | 3,539,742 | ||||||
| 56 | The Royce Funds 2018 Semiannual Report to Shareholders | THE ACCOMPANYING NOTES ARE AN INTEGRAL PART OF THESE FINANCIAL STATEMENTS |
| June 30, 2018 (unaudited) |
| Royce Opportunity Fund (continued) |
| SHARES | VALUE | |||||||
| INFORMATION TECHNOLOGY (continued) | ||||||||
| SEMICONDUCTORS & SEMICONDUCTOR EQUIPMENT (continued) | ||||||||
Brooks Automation | 86,520 | $ | 2,822,282 | |||||
Cohu | 110,076 | 2,697,963 | ||||||
Cree 1 | 81,378 | 3,382,884 | ||||||
CyberOptics Corporation 1 | 69,775 | 1,214,085 | ||||||
Cypress Semiconductor | 617,461 | 9,620,042 | ||||||
FormFactor 1 | 354,941 | 4,720,715 | ||||||
| 146,500 | 3,108,730 | |||||||
Kopin Corporation 1 | 917,420 | 2,623,821 | ||||||
Kulicke & Soffa Industries | 462,660 | 11,020,561 | ||||||
| 227,300 | 5,236,992 | |||||||
MaxLinear 1 | 363,871 | 5,672,749 | ||||||
Nanometrics 1 | 72,012 | 2,549,945 | ||||||
NeoPhotonics Corporation 1 | 759,536 | 4,731,909 | ||||||
Rudolph Technologies 1 | 72,451 | 2,144,550 | ||||||
| 138,795 | 6,991,104 | |||||||
Ultra Clean Holdings 1 | 172,327 | 2,860,628 | ||||||
| 224,087 | 3,193,240 | |||||||
| 87,035,225 | ||||||||
| SOFTWARE - 0.5% | ||||||||
A10 Networks 1 | 419,606 | 2,614,146 | ||||||
| 114,000 | 124,260 | |||||||
Rubicon Project 1 | 486,366 | 1,386,143 | ||||||
| 169,400 | 2,109,030 | |||||||
| 6,233,579 | ||||||||
| TECHNOLOGY HARDWARE, STORAGE & PERIPHERALS - 1.9% | ||||||||
Avid Technology 1 | 526,006 | 2,735,231 | ||||||
Cray 1 | 387,344 | 9,528,662 | ||||||
Intevac 1 | 582,327 | 2,824,286 | ||||||
| 254,226 | 4,865,886 | |||||||
3D Systems 1 | 333,462 | 4,605,110 | ||||||
| 24,559,175 | ||||||||
| Total (Cost $254,477,707) | 303,879,907 | |||||||
| MATERIALS – 7.8% | ||||||||
| CHEMICALS - 1.0% | ||||||||
Ferro Corporation 1 | 339,684 | 7,082,411 | ||||||
Intrepid Potash 1 | 363,100 | 1,488,710 | ||||||
Kraton Corporation 1 | 91,669 | 4,229,608 | ||||||
| 12,800,729 | ||||||||
| CONSTRUCTION MATERIALS - 0.5% | ||||||||
| 659,279 | 6,414,785 | |||||||
| METALS & MINING - 6.0% | ||||||||
| 1,000,185 | 4,340,803 | |||||||
Allegheny Technologies 1 | 437,639 | 10,993,492 | ||||||
Carpenter Technology | 221,999 | 11,670,487 | ||||||
Cleveland-Cliffs 1 | 503,452 | 4,244,100 | ||||||
Coeur Mining 1 | 499,085 | 3,793,046 | ||||||
Commercial Metals | 402,009 | 8,486,410 | ||||||
Constellium Cl. A 1 | 199,759 | 2,057,518 | ||||||
Haynes International | 252,125 | 9,263,072 | ||||||
Hecla Mining | 627,248 | 2,182,823 | ||||||
| 141,228 | 745,539 | |||||||
| 488,157 | 14,645 | |||||||
Synalloy Corporation | 319,502 | 6,374,065 | ||||||
TimkenSteel Corporation 1 | 589,566 | 9,639,404 | ||||||
| 161,025 | 3,811,462 | |||||||
| 77,616,866 | ||||||||
| PAPER & FOREST PRODUCTS - 0.3% | ||||||||
Louisiana-Pacific Corporation | 146,251 | 3,980,952 | ||||||
| Total (Cost $75,697,489) | 100,813,332 | |||||||
| REAL ESTATE – 0.3% | ||||||||
| REAL ESTATE MANAGEMENT & DEVELOPMENT - 0.3% | ||||||||
Tejon Ranch 1 | 161,106 | 3,914,876 | ||||||
| Total (Cost $3,680,725) | 3,914,876 | |||||||
| TELECOMMUNICATION SERVICES – 0.9% | ||||||||
| DIVERSIFIED TELECOMMUNICATION SERVICES - 0.9% | ||||||||
| 562,293 | 9,052,917 | |||||||
Ooma 1 | 153,405 | 2,170,681 | ||||||
| 152,388 | 803,085 | |||||||
| Total (Cost $10,345,255) | 12,026,683 | |||||||
| UTILITIES – 0.2% | ||||||||
| WATER UTILITIES - 0.2% | ||||||||
Pure Cycle 1 | 255,358 | 2,438,669 | ||||||
| Total (Cost $1,067,396) | 2,438,669 | |||||||
| TOTAL COMMON STOCKS | ||||||||
| (Cost $1,029,243,447) | 1,195,098,882 | |||||||
| REPURCHASE AGREEMENT– 7.5% | ||||||||
| Fixed Income Clearing Corporation, 0.35% dated 6/29/18, due 7/2/18, maturity value $96,756,822 (collateralized by obligations of various U.S. Government Agencies, 1.75% due 11/30/21, valued at $98,690,599) | ||||||||
| (Cost $96,754,000) | 96,754,000 | |||||||
| COLLATERAL RECEIVED FOR SECURITIES LOANED – 1.8% | ||||||||
| Money Market Funds | ||||||||
Federated Government Obligations Fund (7 day yield-1.7400%) | ||||||||
| (Cost $22,685,409) | 22,685,409 | |||||||
| TOTAL INVESTMENTS – 102.0% | ||||||||
| (Cost $1,148,682,856) | 1,314,538,291 | |||||||
| LIABILITIES LESS CASH AND OTHER ASSETS – (2.0)% | (25,194,486 | ) | ||||||
| NET ASSETS – 100.0% | $ | 1,289,343,805 | ||||||
| THE ACCOMPANYING NOTES ARE AN INTEGRAL PART OF THESE FINANCIAL STATEMENTS | The Royce Funds 2018 Semiannual Report to Shareholders | 57 |
Schedules of Investments
| Royce Pennsylvania Mutual Fund |
| Common Stocks – 94.8% |
| SHARES | VALUE | |||||||
| CONSUMER DISCRETIONARY – 8.2% | ||||||||
| AUTO COMPONENTS - 1.9% | ||||||||
Dorman Products 1 | 94,406 | $ | 6,448,874 | |||||
| 39,994 | 1,861,721 | |||||||
Gentex Corporation | 250,231 | 5,760,318 | ||||||
LCI Industries | 96,745 | 8,721,562 | ||||||
Standard Motor Products | 111,662 | 5,397,741 | ||||||
Stoneridge 1 | 191,392 | 6,725,515 | ||||||
STRATTEC SECURITY | 114,779 | 3,506,498 | ||||||
Unique Fabricating | 19,752 | 172,632 | ||||||
| 38,594,861 | ||||||||
| AUTOMOBILES - 0.5% | ||||||||
Thor Industries | 36,682 | 3,572,460 | ||||||
Winnebago Industries | 169,674 | 6,888,764 | ||||||
| 10,461,224 | ||||||||
| DISTRIBUTORS - 0.8% | ||||||||
Core-Mark Holding Company | 373,543 | 8,479,426 | ||||||
Weyco Group | 239,110 | 8,703,604 | ||||||
| 17,183,030 | ||||||||
| HOTELS, RESTAURANTS & LEISURE - 0.3% | ||||||||
Cheesecake Factory | 28,977 | 1,595,474 | ||||||
Lindblad Expeditions Holdings 1 | 338,716 | 4,487,987 | ||||||
| 74,000 | 862,100 | |||||||
| 6,945,561 | ||||||||
| HOUSEHOLD DURABLES - 1.1% | ||||||||
Bassett Furniture Industries | 35,641 | 981,910 | ||||||
Ethan Allen Interiors | 263,059 | 6,444,945 | ||||||
Flexsteel Industries | 60,830 | 2,427,117 | ||||||
La-Z-Boy | 167,276 | 5,118,646 | ||||||
PICO Holdings | 334,791 | 3,900,315 | ||||||
| 35,500 | 2,781,070 | |||||||
| 21,654,003 | ||||||||
| INTERNET & DIRECT MARKETING RETAIL - 0.3% | ||||||||
Nutrisystem | 5,671 | 218,333 | ||||||
| 29,027 | 2,613,301 | |||||||
| 12,500 | 2,335,600 | |||||||
| 5,167,234 | ||||||||
| LEISURE PRODUCTS - 0.2% | ||||||||
MCBC Holdings 1 | 123,549 | 3,576,743 | ||||||
Nautilus 1 | 91,707 | 1,439,800 | ||||||
| 5,016,543 | ||||||||
| MEDIA - 0.6% | ||||||||
E.W. Scripps Company Cl. A | 149,362 | 1,999,957 | ||||||
| 88,151 | 1,708,367 | |||||||
Meredith Corporation | 80,600 | 4,110,600 | ||||||
Saga Communications Cl. A | 118,236 | 4,552,086 | ||||||
| 12,371,010 | ||||||||
| SPECIALTY RETAIL - 2.4% | ||||||||
America’s Car-Mart 1 | 258,064 | 15,974,162 | ||||||
AutoCanada | 329,401 | 4,262,055 | ||||||
Barnes & Noble | 77,048 | 489,255 | ||||||
Caleres | 99,664 | 3,427,445 | ||||||
†Camping World Holdings Cl. A | 112,600 | 2,812,748 | ||||||
DSW Cl. A | 256,284 | 6,617,253 | ||||||
Monro | 147,576 | 8,574,166 | ||||||
Shoe Carnival | 213,874 | 6,940,211 | ||||||
| 49,097,295 | ||||||||
| TEXTILES, APPAREL & LUXURY GOODS - 0.1% | ||||||||
Steven Madden | 54,752 | 2,907,331 | ||||||
| Total (Cost $108,431,115) | 169,398,092 | |||||||
| CONSUMER STAPLES – 1.7% | ||||||||
| BEVERAGES - 0.0% | ||||||||
| 46,000 | 804,540 | |||||||
| FOOD & STAPLES RETAILING - 0.3% | ||||||||
Village Super Market Cl. A | 196,628 | 5,792,661 | ||||||
| FOOD PRODUCTS - 0.8% | ||||||||
Cal-Maine Foods 1 | 81,641 | 3,743,240 | ||||||
Farmer Bros. 1 | 43,705 | 1,335,188 | ||||||
Industrias Bachoco ADR | 66,225 | 3,816,547 | ||||||
John B. Sanfilippo & Son | 20,480 | 1,524,736 | ||||||
Nomad Foods 1 | 143,233 | 2,748,641 | ||||||
Seneca Foods Cl. A 1 | 107,461 | 2,901,447 | ||||||
Seneca Foods Cl. B 1 | 6,448 | 172,806 | ||||||
| 16,242,605 | ||||||||
| PERSONAL PRODUCTS - 0.6% | ||||||||
Inter Parfums | 234,941 | 12,569,343 | ||||||
| Total (Cost $20,432,594) | 35,409,149 | |||||||
| ENERGY – 4.3% | ||||||||
| ENERGY EQUIPMENT & SERVICES - 4.2% | ||||||||
| 15,400 | 363,440 | |||||||
Era Group 1 | 338,963 | 4,389,571 | ||||||
| 137,814 | 1,702,003 | |||||||
Helmerich & Payne | 60,407 | 3,851,550 | ||||||
| 23,747 | 806,448 | |||||||
Natural Gas Services Group 1 | 39,218 | 925,545 | ||||||
Newpark Resources 1 | 88,696 | 962,352 | ||||||
Oil States International 1 | 38,355 | 1,231,195 | ||||||
Pason Systems | 1,066,268 | 17,454,142 | ||||||
Patterson-UTI Energy | 20,000 | 360,000 | ||||||
| 190,000 | 642,200 | |||||||
RPC | 292,091 | 4,255,766 | ||||||
SEACOR Holdings 1 | 243,551 | 13,948,166 | ||||||
| 493,470 | 11,394,222 | |||||||
TGS-NOPEC Geophysical | 564,920 | 20,809,027 | ||||||
Unit Corporation 1 | 180,694 | 4,618,539 | ||||||
| 87,714,166 | ||||||||
| OIL, GAS & CONSUMABLE FUELS - 0.1% | ||||||||
San Juan Basin Royalty Trust | 185,484 | 1,073,952 | ||||||
| Total (Cost $50,678,281) | 88,788,118 | |||||||
| FINANCIALS – 14.6% | ||||||||
| BANKS - 5.0% | ||||||||
Ames National | 29,269 | 902,949 | ||||||
Bar Harbor Bankshares | 47,791 | 1,447,589 | ||||||
Blue Hills Bancorp | 88,936 | 1,974,379 | ||||||
BOK Financial | 144,423 | 13,577,206 | ||||||
Camden National | 98,183 | 4,487,945 | ||||||
City Holding Company | 49,213 | 3,702,294 | ||||||
CNB Financial | 197,408 | 5,934,084 | ||||||
FCB Financial Holdings Cl. A 1 | 51,413 | 3,023,084 | ||||||
Fidelity Southern | 84,176 | 2,138,912 | ||||||
First Citizens BancShares Cl. A | 69,166 | 27,894,648 | ||||||
Heartland Financial USA | 38,302 | 2,100,865 | ||||||
Landmark Bancorp | 22,494 | 641,079 | ||||||
Live Oak Bancshares | 54,389 | 1,667,023 | ||||||
MidWestOne Financial Group | 135,257 | 4,568,981 | ||||||
National Bankshares | 83,263 | 3,863,403 | ||||||
Northrim BanCorp | 88,554 | 3,502,311 | ||||||
Popular | 210,179 | 9,502,193 | ||||||
| 40,000 | 1,044,000 | |||||||
| 58 | The Royce Funds 2018 Semiannual Report to Shareholders | THE ACCOMPANYING NOTES ARE AN INTEGRAL PART OF THESE FINANCIAL STATEMENTS |
| June 30, 2018 (unaudited) |
| Royce Pennsylvania Mutual Fund (continued) |
| SHARES | VALUE | |||||||
| FINANCIALS (continued) | ||||||||
| BANKS (continued) | ||||||||
Unity Bancorp | 48,169 | $ | 1,095,845 | |||||
Webster Financial | 149,888 | 9,547,866 | ||||||
| 102,616,656 | ||||||||
| CAPITAL MARKETS - 4.9% | ||||||||
Ares Management L.P. | 415,731 | 8,605,632 | ||||||
Artisan Partners Asset Management Cl. A | 219,875 | 6,629,231 | ||||||
†B. Riley Financial | 45,500 | 1,026,025 | ||||||
Cohen & Steers | 46,179 | 1,926,126 | ||||||
Diamond Hill Investment Group | 53,082 | 10,320,733 | ||||||
Federated Investors Cl. B | 254,973 | 5,945,971 | ||||||
Houlihan Lokey Cl. A | 138,069 | 7,071,894 | ||||||
Lazard Cl. A | 88,941 | 4,350,104 | ||||||
Moelis & Company Cl. A | 44,240 | 2,594,676 | ||||||
Morningstar | 80,437 | 10,316,045 | ||||||
Oaktree Capital Group LLC Cl. A | 79,500 | 3,231,675 | ||||||
Reinet Investments | 213,721 | 3,893,501 | ||||||
Reinet Investments DR 1 | 116,469 | 2,051,739 | ||||||
Rothschild & Co | 101,069 | 3,416,922 | ||||||
SEI Investments | 158,300 | 9,896,916 | ||||||
Sprott | 2,397,253 | 5,543,414 | ||||||
Virtu Financial Cl. A | 297,835 | 7,907,519 | ||||||
Westwood Holdings Group | 99,629 | 5,931,911 | ||||||
| 100,660,034 | ||||||||
| CONSUMER FINANCE - 0.0% | ||||||||
Nelnet Cl. A | 17,218 | 1,005,703 | ||||||
| DIVERSIFIED FINANCIAL SERVICES - 0.1% | ||||||||
ECN Capital | 48,438 | 130,062 | ||||||
| 145,900 | 1,224,101 | |||||||
| 1,354,163 | ||||||||
| INSURANCE - 2.5% | ||||||||
Ambac Financial Group 1 | 39,797 | 789,971 | ||||||
E-L Financial | 33,157 | 20,681,100 | ||||||
James River Group Holdings | 127,625 | 5,014,386 | ||||||
Kingstone Companies | 86,697 | 1,465,179 | ||||||
MBIA 1 | 709,528 | 6,414,133 | ||||||
ProAssurance Corporation | 101,878 | 3,611,575 | ||||||
Reinsurance Group of America | 32,829 | 4,382,015 | ||||||
RLI Corp. | 103,520 | 6,851,989 | ||||||
| 75,500 | 2,914,300 | |||||||
| 52,124,648 | ||||||||
| INVESTMENT COMPANIES - 0.1% | ||||||||
| 105,000 | 1,063,650 | |||||||
RIT Capital Partners | 11,949 | 325,644 | ||||||
Social Capital Hedosophia Holdings (Units) 1 | 181,910 | 1,995,553 | ||||||
| 3,384,847 | ||||||||
| THRIFTS & MORTGAGE FINANCE - 2.0% | ||||||||
BofI Holding 1 | 330,298 | 13,512,491 | ||||||
Genworth MI Canada | 549,869 | 17,893,277 | ||||||
†PCSB Financial | 24,900 | 494,763 | ||||||
Southern Missouri Bancorp | 19,568 | 763,543 | ||||||
Timberland Bancorp | 94,324 | 3,522,058 | ||||||
TrustCo Bank Corp. NY | 568,056 | 5,055,699 | ||||||
| 41,241,831 | ||||||||
| Total (Cost $218,629,169) | 302,387,882 | |||||||
| HEALTH CARE – 9.5% | ||||||||
| BIOTECHNOLOGY - 0.3% | ||||||||
Flexion Therapeutics 1 | 44,795 | 1,157,951 | ||||||
Progenics Pharmaceuticals 1 | 205,882 | 1,655,291 | ||||||
| 213,372 | 2,809,309 | |||||||
| 5,622,551 | ||||||||
| HEALTH CARE EQUIPMENT & SUPPLIES - 3.0% | ||||||||
AtriCure 1 | 36,445 | 985,837 | ||||||
Atrion Corporation | 8,805 | 5,277,717 | ||||||
CryoLife 1 | 69,794 | 1,943,763 | ||||||
Haemonetics 1 | 12,900 | 1,156,872 | ||||||
Hill-Rom Holdings | 46,945 | 4,100,176 | ||||||
ICU Medical 1 | 39,968 | 11,736,603 | ||||||
Lantheus Holdings 1 | 73,970 | 1,076,264 | ||||||
†LeMaitre Vascular | 52,039 | 1,742,266 | ||||||
Masimo Corporation 1 | 35,721 | 3,488,156 | ||||||
Merit Medical Systems 1 | 375,817 | 19,241,830 | ||||||
Neogen Corporation 1 | 137,681 | 11,040,639 | ||||||
| 61,790,123 | ||||||||
| HEALTH CARE PROVIDERS & SERVICES - 2.6% | ||||||||
| 89,593 | 839,486 | |||||||
| 80,825 | 4,736,345 | |||||||
Encompass Health | 128,591 | 8,708,182 | ||||||
Ensign Group (The) | 109,429 | 3,919,747 | ||||||
HealthEquity 1 | 109,166 | 8,198,367 | ||||||
National Research | 140,164 | 5,242,134 | ||||||
| 86,322 | 3,038,534 | |||||||
U.S. Physical Therapy | 197,133 | 18,924,768 | ||||||
| 53,607,563 | ||||||||
| HEALTH CARE TECHNOLOGY - 0.9% | ||||||||
Medidata Solutions 1 | 230,171 | 18,542,576 | ||||||
| LIFE SCIENCES TOOLS & SERVICES - 2.7% | ||||||||
Bio-Rad Laboratories Cl. A 1 | 39,556 | 11,413,488 | ||||||
Bio-Techne | 158,963 | 23,518,576 | ||||||
ICON 1 | 115,136 | 15,258,974 | ||||||
| 57,836 | 5,399,569 | |||||||
| 46,400 | 666,304 | |||||||
| 56,256,911 | ||||||||
| PHARMACEUTICALS - 0.0% | ||||||||
Paratek Pharmaceuticals 1 | 35,769 | 364,844 | ||||||
| Total (Cost $94,638,643) | 196,184,568 | |||||||
| INDUSTRIALS – 26.7% | ||||||||
| AEROSPACE & DEFENSE - 1.9% | ||||||||
HEICO Corporation | 281,629 | 20,539,185 | ||||||
HEICO Corporation Cl. A | 146,064 | 8,902,586 | ||||||
Teledyne Technologies 1 | 48,704 | 9,695,018 | ||||||
| 39,136,789 | ||||||||
| AIR FREIGHT & LOGISTICS - 0.7% | ||||||||
Forward Air | 161,443 | 9,538,052 | ||||||
Hub Group Cl. A 1 | 117,060 | 5,829,588 | ||||||
| 15,367,640 | ||||||||
| AIRLINES - 0.9% | ||||||||
Allegiant Travel | 30,042 | 4,174,336 | ||||||
Hawaiian Holdings | 178,538 | 6,418,441 | ||||||
| 199,567 | 7,254,261 | |||||||
| 17,847,038 | ||||||||
| BUILDING PRODUCTS - 0.9% | ||||||||
American Woodmark 1 | 29,066 | 2,660,992 | ||||||
Apogee Enterprises | 183,717 | 8,849,648 | ||||||
Gibraltar Industries 1 | 148,073 | 5,552,738 | ||||||
NCI Building Systems 1 | 91,946 | 1,930,866 | ||||||
| 18,994,244 | ||||||||
| THE ACCOMPANYING NOTES ARE AN INTEGRAL PART OF THESE FINANCIAL STATEMENTS | The Royce Funds 2018 Semiannual Report to Shareholders | 59 |
Schedules of Investments
| Royce Pennsylvania Mutual Fund (continued) |
| SHARES | VALUE | |||||||
| INDUSTRIALS (continued) | ||||||||
| COMMERCIAL SERVICES & SUPPLIES - 2.4% | ||||||||
Acme United | 39,998 | $ | 829,959 | |||||
Copart 1 | 207,002 | 11,708,033 | ||||||
Healthcare Services Group | 168,732 | 7,287,535 | ||||||
Heritage-Crystal Clean 1 | 213,852 | 4,298,425 | ||||||
Herman Miller | 84,226 | 2,855,261 | ||||||
Kimball International Cl. B | 429,882 | 6,946,893 | ||||||
Mobile Mini | 152,518 | 7,153,094 | ||||||
Ritchie Bros. Auctioneers | 40,204 | 1,371,761 | ||||||
Steelcase Cl. A | 129,304 | 1,745,604 | ||||||
Team 1 | 160,013 | 3,696,300 | ||||||
UniFirst Corporation | 11,581 | 2,048,679 | ||||||
Viad Corporation | 11,380 | 617,365 | ||||||
| 50,558,909 | ||||||||
| CONSTRUCTION & ENGINEERING - 1.6% | ||||||||
Comfort Systems USA | 33,763 | 1,546,345 | ||||||
Jacobs Engineering Group | 48,381 | 3,071,710 | ||||||
KBR | 485,243 | 8,695,555 | ||||||
Valmont Industries | 135,371 | 20,407,178 | ||||||
| 33,720,788 | ||||||||
| ELECTRICAL EQUIPMENT - 1.8% | ||||||||
Encore Wire | 157,830 | 7,489,034 | ||||||
EnerSys | 92,386 | 6,895,691 | ||||||
Preformed Line Products | 251,489 | 22,327,193 | ||||||
| 36,711,918 | ||||||||
| INDUSTRIAL CONGLOMERATES - 1.2% | ||||||||
Raven Industries | 638,675 | 24,557,054 | ||||||
| MACHINERY - 9.4% | ||||||||
Alamo Group | 11,320 | 1,022,875 | ||||||
CIRCOR International 1 | 402,587 | 14,879,616 | ||||||
| 66,785 | 2,046,960 | |||||||
Federal Signal | 53,938 | 1,256,216 | ||||||
Franklin Electric | 230,594 | 10,399,789 | ||||||
Graco | 258,477 | 11,688,330 | ||||||
Graham Corporation | 45,566 | 1,176,059 | ||||||
Greenbrier Companies (The) | 127,730 | 6,737,758 | ||||||
John Bean Technologies | 199,716 | 17,754,752 | ||||||
Kadant | 97,645 | 9,388,567 | ||||||
| 46,000 | 818,800 | |||||||
Lincoln Electric Holdings | 115,070 | 10,098,543 | ||||||
Lindsay Corporation | 101,213 | 9,816,649 | ||||||
Lydall 1 | 61,793 | 2,697,264 | ||||||
| 266,636 | 5,484,703 | |||||||
Miller Industries | 218,520 | 5,583,186 | ||||||
Nordson Corporation | 70,462 | 9,048,025 | ||||||
RBC Bearings 1 | 73,732 | 9,497,419 | ||||||
Sun Hydraulics | 664,012 | 31,998,738 | ||||||
Tennant Company | 292,827 | 23,133,333 | ||||||
Wabash National | 534,455 | 9,972,930 | ||||||
| 194,500,512 | ||||||||
| MARINE - 0.7% | ||||||||
Clarkson | 238,297 | 7,233,329 | ||||||
Eagle Bulk Shipping 1 | 235,526 | 1,281,262 | ||||||
Kirby Corporation 1 | 75,929 | 6,347,664 | ||||||
| 14,862,255 | ||||||||
| PROFESSIONAL SERVICES - 1.6% | ||||||||
Exponent | 220,898 | 10,669,373 | ||||||
GP Strategies 1 | 71,393 | 1,256,517 | ||||||
Heidrick & Struggles International | 96,097 | 3,363,395 | ||||||
Kforce | 88,919 | 3,049,922 | ||||||
Korn/Ferry International | 46,290 | 2,866,740 | ||||||
ManpowerGroup | 77,994 | 6,712,164 | ||||||
Resources Connection | 57,491 | 971,598 | ||||||
Robert Half International | 40,845 | 2,659,009 | ||||||
TrueBlue 1 | 60,699 | 1,635,838 | ||||||
| 33,184,556 | ||||||||
| ROAD & RAIL - 2.0% | ||||||||
Landstar System | 182,877 | 19,970,168 | ||||||
Marten Transport | 52,238 | 1,224,981 | ||||||
Old Dominion Freight Line | 8,430 | 1,255,733 | ||||||
Saia 1 | 47,974 | 3,878,698 | ||||||
Universal Logistics Holdings | 504,440 | 13,241,550 | ||||||
Werner Enterprises | 26,631 | 999,994 | ||||||
| 40,571,124 | ||||||||
| TRADING COMPANIES & DISTRIBUTORS - 1.6% | ||||||||
Air Lease Cl. A | 377,223 | 15,832,049 | ||||||
Applied Industrial Technologies | 131,469 | 9,222,550 | ||||||
MSC Industrial Direct Cl. A | 22,092 | 1,874,506 | ||||||
Richelieu Hardware | 251,825 | 5,250,465 | ||||||
| 32,179,570 | ||||||||
| Total (Cost $292,389,625) | 552,192,397 | |||||||
| INFORMATION TECHNOLOGY – 18.8% | ||||||||
| COMMUNICATIONS EQUIPMENT - 0.3% | ||||||||
ADTRAN | 55,547 | 824,873 | ||||||
Digi International 1 | 304,942 | 4,025,234 | ||||||
NETGEAR 1 | 3,850 | 240,625 | ||||||
| 47,940 | 1,423,818 | |||||||
| 6,514,550 | ||||||||
| ELECTRONIC EQUIPMENT, INSTRUMENTS & COMPONENTS - 9.9% | ||||||||
Badger Meter | 338,068 | 15,111,640 | ||||||
Benchmark Electronics | 178,464 | 5,202,226 | ||||||
Celestica 1 | 819,474 | 9,727,156 | ||||||
Cognex Corporation | 161,447 | 7,202,151 | ||||||
Coherent 1 | 18,900 | 2,956,338 | ||||||
Dolby Laboratories Cl. A | 97,381 | 6,007,434 | ||||||
Electro Scientific Industries 1 | 310,068 | 4,889,772 | ||||||
ePlus 1 | 9,258 | 871,178 | ||||||
Fabrinet 1 | 402,881 | 14,862,280 | ||||||
FARO Technologies 1 | 307,266 | 16,699,907 | ||||||
FLIR Systems | 774,962 | 40,274,775 | ||||||
HollySys Automation Technologies | 73,680 | 1,631,275 | ||||||
Insight Enterprises 1 | 161,358 | 7,895,247 | ||||||
IPG Photonics 1 | 43,500 | 9,597,405 | ||||||
| 120,900 | 2,212,470 | |||||||
LightPath Technologies Cl. A 1 | 160,384 | 368,883 | ||||||
Mesa Laboratories | 39,073 | 8,247,529 | ||||||
Methode Electronics | 192,882 | 7,773,145 | ||||||
MTS Systems | 59,116 | 3,112,457 | ||||||
National Instruments | 330,171 | 13,860,579 | ||||||
| 23,500 | 776,910 | |||||||
PC Connection | 332,465 | 11,037,838 | ||||||
Richardson Electronics | 141,153 | 1,374,830 | ||||||
Sanmina Corporation 1 | 41,640 | 1,220,052 | ||||||
Vishay Intertechnology | 485,111 | 11,254,575 | ||||||
| 204,168,052 | ||||||||
| INTERNET SOFTWARE & SERVICES - 1.5% | ||||||||
Amber Road 1 | 122,775 | 1,155,313 | ||||||
| 100,798 | 3,386,813 | |||||||
| 60 | The Royce Funds 2018 Semiannual Report to Shareholders | THE ACCOMPANYING NOTES ARE AN INTEGRAL PART OF THESE FINANCIAL STATEMENTS |
| June 30, 2018 (unaudited) |
| Royce Pennsylvania Mutual Fund (continued) |
| SHARES | VALUE | |||||||
| INFORMATION TECHNOLOGY (continued) | ||||||||
| INTERNET SOFTWARE & SERVICES (continued) | ||||||||
| 711,613 | $ | 15,513,163 | ||||||
Etsy 1 | 107,238 | 4,524,371 | ||||||
j2 Global | 73,738 | 6,386,448 | ||||||
| 30,966,108 | ||||||||
| IT SERVICES - 0.0% | ||||||||
MoneyGram International 1 | 33,200 | 222,108 | ||||||
| SEMICONDUCTORS & SEMICONDUCTOR EQUIPMENT - 5.2% | ||||||||
Advanced Energy Industries 1 | 293,692 | 17,060,568 | ||||||
Brooks Automation | 392,438 | 12,801,328 | ||||||
Cabot Microelectronics | 113,651 | 12,224,302 | ||||||
Cirrus Logic 1 | 186,828 | 7,161,117 | ||||||
Cohu | 334,356 | 8,195,066 | ||||||
Diodes 1 | 200,519 | 6,911,890 | ||||||
Entegris | 119,080 | 4,036,812 | ||||||
FormFactor 1 | 137,648 | 1,830,718 | ||||||
Kulicke & Soffa Industries | 363,735 | 8,664,168 | ||||||
MKS Instruments | 148,240 | 14,186,568 | ||||||
Nanometrics 1 | 47,745 | 1,690,650 | ||||||
| 29,800 | 812,050 | |||||||
| 57,300 | 686,454 | |||||||
Photronics 1 | 140,693 | 1,122,027 | ||||||
Rudolph Technologies 1 | 72,759 | 2,153,666 | ||||||
Silicon Motion Technology ADR | 107,270 | 5,673,510 | ||||||
Ultra Clean Holdings 1 | 60,860 | 1,010,276 | ||||||
†Universal Display | 20,300 | 1,745,800 | ||||||
Xcerra Corporation 1 | 12,368 | 172,781 | ||||||
| 108,139,751 | ||||||||
| SOFTWARE - 1.7% | ||||||||
ACI Worldwide 1 | 380,638 | 9,390,340 | ||||||
Fair Isaac 1 | 52,264 | 10,103,677 | ||||||
| 18,808 | 1,669,774 | |||||||
Manhattan Associates 1 | 69,587 | 3,271,285 | ||||||
Monotype Imaging Holdings | 103,171 | 2,094,371 | ||||||
Pegasystems | 27,800 | 1,523,440 | ||||||
| 19,645 | 1,842,897 | |||||||
QAD Cl. A | 31,253 | 1,567,338 | ||||||
TiVo | 157,862 | 2,123,244 | ||||||
Varonis Systems 1 | 4,844 | 360,878 | ||||||
| 33,947,244 | ||||||||
| TECHNOLOGY HARDWARE, STORAGE & PERIPHERALS - 0.2% | ||||||||
Cray 1 | 84,881 | 2,088,072 | ||||||
| 109,124 | 2,580,783 | |||||||
| 4,668,855 | ||||||||
| Total (Cost $241,627,747) | 388,626,668 | |||||||
| MATERIALS – 8.2% | ||||||||
| CHEMICALS - 4.0% | ||||||||
Balchem Corporation | 148,577 | 14,581,347 | ||||||
Chase Corporation | 20,579 | 2,412,888 | ||||||
FutureFuel Corporation | 584,021 | 8,182,134 | ||||||
Ingevity Corporation 1 | 31,657 | 2,559,785 | ||||||
Innospec | 83,929 | 6,424,765 | ||||||
Minerals Technologies | 179,593 | 13,532,332 | ||||||
Platform Specialty Products 1 | 630,108 | 7,309,253 | ||||||
Quaker Chemical | 140,049 | 21,689,389 | ||||||
Umicore | 84,217 | 4,833,834 | ||||||
| 81,525,727 | ||||||||
| CONTAINERS & PACKAGING - 0.5% | ||||||||
AptarGroup | 119,834 | 11,190,099 | ||||||
| METALS & MINING - 2.7% | ||||||||
†Alamos Gold Cl. A | 179,900 | 1,024,950 | ||||||
Compass Minerals International | 96,799 | 6,364,534 | ||||||
Franco-Nevada Corporation | 193,524 | 14,131,122 | ||||||
Haynes International | 28,575 | 1,049,846 | ||||||
Hecla Mining | 155,264 | 540,319 | ||||||
Major Drilling Group International 1 | 1,375,982 | 7,263,770 | ||||||
Pretium Resources 1 | 91,922 | 676,139 | ||||||
Reliance Steel & Aluminum | 144,693 | 12,666,425 | ||||||
Schnitzer Steel Industries Cl. A | 52,143 | 1,757,219 | ||||||
| 288,000 | 1,416,960 | |||||||
Worthington Industries | 202,728 | 8,508,494 | ||||||
| 55,399,778 | ||||||||
| PAPER & FOREST PRODUCTS - 1.0% | ||||||||
Stella-Jones | 583,600 | 21,259,350 | ||||||
| Total (Cost $92,793,422) | 169,374,954 | |||||||
| REAL ESTATE – 2.8% | ||||||||
| REAL ESTATE MANAGEMENT & DEVELOPMENT - 2.8% | ||||||||
FRP Holdings 1 | 384,475 | 24,894,756 | ||||||
Marcus & Millichap 1 | 312,299 | 12,182,784 | ||||||
St. Joe Company (The) 1 | 244,070 | 4,381,057 | ||||||
Tejon Ranch 1 | 646,663 | 15,713,911 | ||||||
| Total (Cost $38,054,235) | 57,172,508 | |||||||
| TOTAL COMMON STOCKS | ||||||||
| (Cost $1,157,674,831) | 1,959,534,336 | |||||||
| REPURCHASE AGREEMENT– 5.0% | ||||||||
| Fixed Income Clearing Corporation, 0.35% dated 6/29/18, due 7/2/18, maturity value $102,603,993 (collateralized by obligations of various U.S. Government Agencies, 2.00% due 10/05/22-11/30/22, valued at $104,655,221) | ||||||||
| (Cost $102,601,000) | 102,601,000 | |||||||
| COLLATERAL RECEIVED FOR SECURITIES LOANED – 0.3% | ||||||||
| Money Market Funds | ||||||||
Federated Government Obligations Fund (7 day yield-1.7400%) | ||||||||
| (Cost $7,149,754) | 7,149,754 | |||||||
| TOTAL INVESTMENTS – 100.1% | ||||||||
| (Cost $1,267,425,585) | 2,069,285,090 | |||||||
| LIABILITIES LESS CASH AND OTHER ASSETS – (0.1)% | (2,669,712 | ) | ||||||
| NET ASSETS – 100.0% | $ | 2,066,615,378 | ||||||
| THE ACCOMPANYING NOTES ARE AN INTEGRAL PART OF THESE FINANCIAL STATEMENTS | The Royce Funds 2018 Semiannual Report to Shareholders | 61 |
Schedules of Investments
| Royce Premier Fund |
| Common Stocks – 95.6% |
| SHARES | VALUE | |||||||
| CONSUMER DISCRETIONARY – 10.6% | ||||||||
| AUTO COMPONENTS - 1.6% | ||||||||
Dorman Products 1 | 535,078 | $ | 36,551,178 | |||||
| AUTOMOBILES - 0.8% | ||||||||
Thor Industries | 190,565 | 18,559,125 | ||||||
| DISTRIBUTORS - 3.2% | ||||||||
Core-Mark Holding Company | 1,517,559 | 34,448,589 | ||||||
Pool Corporation | 248,028 | 37,576,242 | ||||||
| 72,024,831 | ||||||||
| DIVERSIFIED CONSUMER SERVICES - 0.7% | ||||||||
Sotheby’s 1 | 280,584 | 15,246,935 | ||||||
| SPECIALTY RETAIL - 1.4% | ||||||||
†AutoCanada | 550,000 | 7,116,343 | ||||||
Camping World Holdings Cl. A | 1,017,413 | 25,414,977 | ||||||
| 32,531,320 | ||||||||
| TEXTILES, APPAREL & LUXURY GOODS - 2.9% | ||||||||
Columbia Sportswear | 405,154 | 37,059,436 | ||||||
Wolverine World Wide | 834,100 | 29,001,657 | ||||||
| 66,061,093 | ||||||||
| Total (Cost $135,520,774) | 240,974,482 | |||||||
| CONSUMER STAPLES – 2.3% | ||||||||
| FOOD PRODUCTS - 2.3% | ||||||||
Cal-Maine Foods 1 | 754,969 | 34,615,329 | ||||||
Sanderson Farms | 168,167 | 17,682,760 | ||||||
| Total (Cost $29,293,175) | 52,298,089 | |||||||
| ENERGY – 3.6% | ||||||||
| ENERGY EQUIPMENT & SERVICES - 3.6% | ||||||||
Pason Systems | 2,816,062 | 46,097,177 | ||||||
SEACOR Holdings 1 | 608,236 | 34,833,676 | ||||||
| Total (Cost $61,235,733) | 80,930,853 | |||||||
| FINANCIALS – 13.6% | ||||||||
| CAPITAL MARKETS - 8.4% | ||||||||
Ares Management L.P. | 2,458,400 | 50,888,880 | ||||||
Ashmore Group | 9,745,000 | 47,971,411 | ||||||
Lazard Cl. A | 562,927 | 27,532,760 | ||||||
Morningstar | 394,968 | 50,654,646 | ||||||
TMX Group | 212,833 | 13,951,963 | ||||||
| 190,999,660 | ||||||||
| INSURANCE - 3.6% | ||||||||
Alleghany Corporation | 96,063 | 55,233,343 | ||||||
ProAssurance Corporation | 747,427 | 26,496,287 | ||||||
| 81,729,630 | ||||||||
| THRIFTS & MORTGAGE FINANCE - 1.6% | ||||||||
Genworth MI Canada | 1,138,465 | 37,046,768 | ||||||
| Total (Cost $193,473,514) | 309,776,058 | |||||||
| HEALTH CARE – 4.8% | ||||||||
| HEALTH CARE EQUIPMENT & SUPPLIES - 1.4% | ||||||||
IDEXX Laboratories 1 | 144,304 | 31,449,614 | ||||||
| HEALTH CARE TECHNOLOGY - 1.8% | ||||||||
| 511,646 | 41,218,202 | |||||||
| LIFE SCIENCES TOOLS & SERVICES - 1.6% | ||||||||
Bio-Techne | 246,594 | 36,483,582 | ||||||
| Total (Cost $58,420,638) | 109,151,398 | |||||||
| INDUSTRIALS – 32.6% | ||||||||
| AIR FREIGHT & LOGISTICS - 1.6% | ||||||||
Forward Air | 615,564 | 36,367,521 | ||||||
| BUILDING PRODUCTS - 1.5% | ||||||||
Simpson Manufacturing | 567,847 | 35,314,405 | ||||||
| COMMERCIAL SERVICES & SUPPLIES - 3.3% | ||||||||
Copart 1 | 747,910 | 42,301,790 | ||||||
Ritchie Bros. Auctioneers | 957,210 | 32,660,005 | ||||||
| 74,961,795 | ||||||||
| CONSTRUCTION & ENGINEERING - 2.6% | ||||||||
Valmont Industries | 390,764 | 58,907,673 | ||||||
| MACHINERY - 13.3% | ||||||||
| 1,239,443 | 45,809,813 | |||||||
Franklin Electric | 342,175 | 15,432,093 | ||||||
Kadant | 143,323 | 13,780,506 | ||||||
Lincoln Electric Holdings | 766,961 | 67,308,497 | ||||||
Lindsay Corporation | 506,101 | 49,086,736 | ||||||
RBC Bearings 1 | 167,079 | 21,521,446 | ||||||
Sun Hydraulics | 776,191 | 37,404,644 | ||||||
Woodward | 673,610 | 51,773,665 | ||||||
| 302,117,400 | ||||||||
| MARINE - 4.6% | ||||||||
Clarkson | 759,909 | 23,066,476 | ||||||
Kirby Corporation 1 | 971,973 | 81,256,943 | ||||||
| 104,323,419 | ||||||||
| ROAD & RAIL - 2.9% | ||||||||
Landstar System | 607,902 | 66,382,898 | ||||||
| TRADING COMPANIES & DISTRIBUTORS - 2.8% | ||||||||
Air Lease Cl. A | 1,537,271 | 64,519,264 | ||||||
| Total (Cost $387,808,739) | 742,894,375 | |||||||
| INFORMATION TECHNOLOGY – 16.5% | ||||||||
| ELECTRONIC EQUIPMENT, INSTRUMENTS & COMPONENTS - 5.5% | ||||||||
Anixter International 1 | 242,285 | 15,336,641 | ||||||
Cognex Corporation | 669,294 | 29,857,205 | ||||||
IPG Photonics 1 | 125,440 | 27,675,827 | ||||||
National Instruments | 1,259,100 | 52,857,018 | ||||||
| 125,726,691 | ||||||||
| IT SERVICES - 3.5% | ||||||||
Gartner 1 | 205,065 | 27,253,138 | ||||||
Jack Henry & Associates | 408,757 | 53,285,563 | ||||||
| 80,538,701 | ||||||||
| SEMICONDUCTORS & SEMICONDUCTOR EQUIPMENT - 3.7% | ||||||||
Cabot Microelectronics | 374,216 | 40,250,673 | ||||||
MKS Instruments | 465,887 | 44,585,386 | ||||||
| 84,836,059 | ||||||||
| SOFTWARE - 3.8% | ||||||||
Fair Isaac 1 | 324,684 | 62,767,911 | ||||||
Manhattan Associates 1 | 487,876 | 22,935,051 | ||||||
| 85,702,962 | ||||||||
| Total (Cost $101,764,024) | 376,804,413 | |||||||
| MATERIALS – 9.9% | ||||||||
| CHEMICALS - 6.1% | ||||||||
Chase Corporation | 128,562 | 15,073,894 | ||||||
Minerals Technologies | 848,494 | 63,934,023 | ||||||
Quaker Chemical | 160,832 | 24,908,052 | ||||||
Westlake Chemical | 318,349 | 34,263,903 | ||||||
| 138,179,872 | ||||||||
| METALS & MINING - 2.2% | ||||||||
Reliance Steel & Aluminum | 566,837 | 49,620,911 | ||||||
| 62 | The Royce Funds 2018 Semiannual Report to Shareholders | THE ACCOMPANYING NOTES ARE AN INTEGRAL PART OF THESE FINANCIAL STATEMENTS |
| June 30, 2018 (unaudited) |
| Royce Premier Fund (continued) |
| SHARES | VALUE | |||||||
| MATERIALS (continued) | ||||||||
| PAPER & FOREST PRODUCTS - 1.6% | ||||||||
Stella-Jones | 1,016,749 | $ | 37,038,078 | |||||
| Total (Cost $135,565,091) | 224,838,861 | |||||||
| REAL ESTATE – 1.7% | ||||||||
| REAL ESTATE MANAGEMENT & DEVELOPMENT - 1.7% | ||||||||
Jones Lang LaSalle | 142,065 | 23,581,369 | ||||||
Kennedy-Wilson Holdings | 725,000 | 15,333,750 | ||||||
| Total (Cost $17,375,918) | 38,915,119 | |||||||
| TOTAL COMMON STOCKS | ||||||||
| (Cost $1,120,457,606) | 2,176,583,648 | |||||||
| REPURCHASE AGREEMENT– 4.4% | ||||||||
| Fixed Income Clearing Corporation, 0.35% dated 6/29/18, due 7/2/18, maturity value $99,673,907 (collateralized by obligations of various U.S. Government Agencies, 1.75% due 11/30/21, valued at $101,664,876) | ||||||||
| (Cost $99,671,000) | 99,671,000 | |||||||
| TOTAL INVESTMENTS – 100.0% | ||||||||
| (Cost $1,220,128,606) | 2,276,254,648 | |||||||
| CASH AND OTHER ASSETS LESS LIABILITIES – 0.0% | 708,149 | |||||||
| NET ASSETS – 100.0% | $ | 2,276,962,797 | ||||||
| Royce Small-Cap Leaders Fund |
| Common Stocks – 91.8% |
| SHARES | VALUE | |||||||
| CONSUMER DISCRETIONARY – 8.7% | ||||||||
| AUTO COMPONENTS - 2.2% | ||||||||
Gentex Corporation | 21,234 | $ | 488,806 | |||||
LCI Industries | 9,832 | 886,355 | ||||||
†Standard Motor Products | 8,400 | 406,056 | ||||||
| 1,781,217 | ||||||||
| HOUSEHOLD DURABLES - 1.0% | ||||||||
Ethan Allen Interiors | 13,700 | 335,650 | ||||||
PICO Holdings | 37,526 | 437,178 | ||||||
| 772,828 | ||||||||
| LEISURE PRODUCTS - 1.4% | ||||||||
MCBC Holdings 1 | 40,000 | 1,158,000 | ||||||
| MEDIA - 0.9% | ||||||||
E.W. Scripps Company Cl. A | 53,890 | 721,587 | ||||||
| SPECIALTY RETAIL - 2.4% | ||||||||
Caleres | 39,700 | 1,365,283 | ||||||
†Monro | 9,600 | 557,760 | ||||||
| 1,923,043 | ||||||||
| TEXTILES, APPAREL & LUXURY GOODS - 0.8% | ||||||||
Movado Group | 13,500 | 652,050 | ||||||
| Total (Cost $5,166,399) | 7,008,725 | |||||||
| CONSUMER STAPLES – 5.0% | ||||||||
| FOOD PRODUCTS - 3.2% | ||||||||
Cal-Maine Foods 1 | 17,358 | 795,864 | ||||||
Industrias Bachoco ADR | 22,290 | 1,284,573 | ||||||
Tootsie Roll Industries | 16,878 | 520,686 | ||||||
| 2,601,123 | ||||||||
| PERSONAL PRODUCTS - 1.8% | ||||||||
Inter Parfums | 27,030 | 1,446,105 | ||||||
| Total (Cost $2,985,151) | 4,047,228 | |||||||
| ENERGY – 5.0% | ||||||||
| ENERGY EQUIPMENT & SERVICES - 5.0% | ||||||||
Oil States International 1 | 13,040 | 418,584 | ||||||
Pason Systems | 131,840 | 2,158,139 | ||||||
TGS-NOPEC Geophysical | 38,450 | 1,416,319 | ||||||
| Total (Cost $2,174,016) | 3,993,042 | |||||||
| FINANCIALS – 13.3% | ||||||||
| CAPITAL MARKETS - 7.0% | ||||||||
Artisan Partners Asset Management Cl. A | 75,200 | 2,267,280 | ||||||
Federated Investors Cl. B | 26,360 | 614,715 | ||||||
Houlihan Lokey Cl. A | 27,000 | 1,382,940 | ||||||
Lazard Cl. A | 28,470 | 1,392,468 | ||||||
| 5,657,403 | ||||||||
| INSURANCE - 3.2% | ||||||||
†ProAssurance Corporation | 13,600 | 482,120 | ||||||
RLI Corp. | 31,000 | 2,051,890 | ||||||
| 2,534,010 | ||||||||
| THRIFTS & MORTGAGE FINANCE - 3.1% | ||||||||
Genworth MI Canada | 76,060 | 2,475,067 | ||||||
| Total (Cost $7,997,955) | 10,666,480 | |||||||
| HEALTH CARE – 4.3% | ||||||||
| BIOTECHNOLOGY - 1.2% | ||||||||
| 6,300 | 476,658 | |||||||
| 40,500 | 533,233 | |||||||
| 1,009,891 | ||||||||
| HEALTH CARE EQUIPMENT & SUPPLIES - 0.4% | ||||||||
Lantheus Holdings 1 | 21,700 | 315,735 | ||||||
| THE ACCOMPANYING NOTES ARE AN INTEGRAL PART OF THESE FINANCIAL STATEMENTS | The Royce Funds 2018 Semiannual Report to Shareholders | 63 |
| Schedules of Investments |
| Royce Small-Cap Leaders Fund (continued) |
| SHARES | VALUE | ||||||
| HEALTH CARE (continued) | |||||||
| HEALTH CARE PROVIDERS & SERVICES - 0.8% | |||||||
| 10,600 | $ | 621,160 | |||||
| LIFE SCIENCES TOOLS & SERVICES - 1.9% | |||||||
Bio-Rad Laboratories Cl. A 1 | 925 | 266,900 | |||||
Bio-Techne | 8,694 | 1,286,277 | |||||
| 1,553,177 | |||||||
| Total (Cost $2,489,944) | 3,499,963 | ||||||
| INDUSTRIALS – 28.1% | |||||||
| BUILDING PRODUCTS - 3.7% | |||||||
American Woodmark 1 | 4,800 | 439,440 | |||||
Apogee Enterprises | 28,700 | 1,382,479 | |||||
| 17,200 | 645,000 | ||||||
NCI Building Systems 1 | 24,900 | 522,900 | |||||
| 2,989,819 | |||||||
| COMMERCIAL SERVICES & SUPPLIES - 3.0% | |||||||
Kimball International Cl. B | 59,330 | 958,773 | |||||
Ritchie Bros. Auctioneers | 11,700 | 399,204 | |||||
Steelcase Cl. A | 36,300 | 490,050 | |||||
UniFirst Corporation | 3,100 | 548,390 | |||||
| 2,396,417 | |||||||
| CONSTRUCTION & ENGINEERING - 2.7% | |||||||
Comfort Systems USA | 6,800 | 311,440 | |||||
Goldfield Corporation 1 | 114,216 | 485,418 | |||||
| 19,200 | 250,176 | ||||||
Valmont Industries | 7,295 | 1,099,721 | |||||
| 2,146,755 | |||||||
| ELECTRICAL EQUIPMENT - 1.0% | |||||||
EnerSys | 10,500 | 783,720 | |||||
| MACHINERY - 14.3% | |||||||
CIRCOR International 1 | 50,670 | 1,872,763 | |||||
Greenbrier Companies (The) | 42,600 | 2,247,150 | |||||
John Bean Technologies | 9,499 | 844,461 | |||||
Kadant | 8,960 | 861,504 | |||||
Lydall 1 | 14,260 | 622,449 | |||||
| 60,800 | 1,250,656 | ||||||
RBC Bearings 1 | 3,180 | 409,616 | |||||
Sun Hydraulics | 37,700 | 1,816,763 | |||||
Wabash National | 84,000 | 1,567,440 | |||||
| 11,492,802 | |||||||
| PROFESSIONAL SERVICES - 0.5% | |||||||
Heidrick & Struggles International | 10,900 | 381,500 | |||||
| ROAD & RAIL - 2.6% | |||||||
Landstar System | 13,520 | 1,476,384 | |||||
Saia 1 | 7,920 | 640,332 | |||||
| 2,116,716 | |||||||
| TRADING COMPANIES & DISTRIBUTORS - 0.3% | |||||||
MSC Industrial Direct Cl. A | 2,777 | 235,629 | |||||
| Total (Cost $18,756,538) | 22,543,358 | ||||||
| INFORMATION TECHNOLOGY – 20.8% | |||||||
| COMMUNICATIONS EQUIPMENT - 0.8% | |||||||
| 20,300 | 602,910 | ||||||
| ELECTRONIC EQUIPMENT, INSTRUMENTS & COMPONENTS - 9.2% | |||||||
Celestica 1 | 107,400 | 1,274,838 | |||||
| 24,200 | 381,634 | ||||||
Fabrinet 1 | 57,000 | 2,102,730 | |||||
FARO Technologies 1 | 8,660 | 470,671 | |||||
Kimball Electronics 1 | 47,900 | 876,570 | |||||
Methode Electronics | 24,750 | 997,425 | |||||
| 9,600 | 317,376 | ||||||
Vishay Intertechnology | 43,000 | 997,600 | |||||
| 7,418,844 | |||||||
| INTERNET SOFTWARE & SERVICES - 1.8% | |||||||
j2 Global | 16,724 | 1,448,466 | |||||
| SEMICONDUCTORS & SEMICONDUCTOR EQUIPMENT - 9.0% | |||||||
Advanced Energy Industries 1 | 23,000 | 1,336,070 | |||||
Cabot Microelectronics | 8,836 | 950,400 | |||||
Cohu | 75,900 | 1,860,309 | |||||
Kulicke & Soffa Industries | 34,300 | 817,026 | |||||
MKS Instruments | 5,645 | 540,226 | |||||
Nanometrics 1 | 11,738 | 415,643 | |||||
Rudolph Technologies 1 | 10,300 | 304,880 | |||||
Silicon Motion Technology ADR | 18,500 | 978,465 | |||||
| 7,203,019 | |||||||
| Total (Cost $13,364,380) | 16,673,239 | ||||||
| MATERIALS – 4.4% | |||||||
| CHEMICALS - 3.1% | |||||||
Minerals Technologies | 32,956 | 2,483,234 | |||||
| PAPER & FOREST PRODUCTS - 1.3% | |||||||
Stella-Jones | 29,400 | 1,070,982 | |||||
| Total (Cost $2,647,801) | 3,554,216 | ||||||
| REAL ESTATE – 2.2% | |||||||
| REAL ESTATE MANAGEMENT & DEVELOPMENT - 2.2% | |||||||
Marcus & Millichap 1 | 45,020 | 1,756,230 | |||||
| Total (Cost $888,819) | 1,756,230 | ||||||
| TOTAL COMMON STOCKS | |||||||
| (Cost $56,471,003) | 73,742,481 | ||||||
| REPURCHASE AGREEMENT– 7.9% | |||||||
| Fixed Income Clearing Corporation, 0.35% dated 6/29/18, due 7/2/18, maturity value $6,363,186 (collateralized by obligations of various U.S. Government Agencies, 1.125% due 9/30/21, valued at $6,493,119) | |||||||
| (Cost $6,363,000) | 6,363,000 | ||||||
| TOTAL INVESTMENTS – 99.7% | |||||||
| (Cost $62,834,003) | 80,105,481 | ||||||
| CASH AND OTHER ASSETS LESS LIABILITIES – 0.3% | 210,476 | ||||||
| NET ASSETS – 100.0% | $ | 80,315,957 | |||||
| 64 | The Royce Funds 2018 Semiannual Report to Shareholders | THE ACCOMPANYING NOTES ARE AN INTEGRAL PART OF THESE FINANCIAL STATEMENTS |
| June 30, 2018 (unaudited) |
| Royce Small-Cap Value Fund | |||||||
| Common Stocks – 90.7% | |||||||
| SHARES | VALUE | ||||||
| CONSUMER DISCRETIONARY – 13.4% | |||||||
| AUTO COMPONENTS - 2.5% | |||||||
Gentex Corporation | 144,721 | $ | 3,331,477 | ||||
Stoneridge 1 | 71,249 | 2,503,690 | |||||
| 5,835,167 | |||||||
| AUTOMOBILES - 0.1% | |||||||
Thor Industries | 2,879 | 280,386 | |||||
| HOTELS, RESTAURANTS & LEISURE - 0.5% | |||||||
Cheesecake Factory | 20,600 | 1,134,236 | |||||
| HOUSEHOLD DURABLES - 2.4% | |||||||
Bassett Furniture Industries | 29,170 | 803,633 | |||||
Flexsteel Industries | 37,258 | 1,486,594 | |||||
La-Z-Boy | 115,393 | 3,531,026 | |||||
| 5,821,253 | |||||||
| INTERNET & DIRECT MARKETING RETAIL - 1.1% | |||||||
†Nutrisystem | 70,100 | 2,698,850 | |||||
| MEDIA - 1.5% | |||||||
Saga Communications Cl. A | 95,103 | 3,661,466 | |||||
| SPECIALTY RETAIL - 4.3% | |||||||
American Eagle Outfitters | 142,245 | 3,307,196 | |||||
DSW Cl. A | 136,291 | 3,519,034 | |||||
Shoe Carnival | 102,937 | 3,340,306 | |||||
| 10,166,536 | |||||||
| TEXTILES, APPAREL & LUXURY GOODS - 1.0% | |||||||
Steven Madden | 44,133 | 2,343,462 | |||||
| Total (Cost $24,692,454) | 31,941,356 | ||||||
| CONSUMER STAPLES – 2.0% | |||||||
| FOOD & STAPLES RETAILING - 2.0% | |||||||
Village Super Market Cl. A | 164,140 | 4,835,564 | |||||
| Total (Cost $4,921,298) | 4,835,564 | ||||||
| ENERGY – 2.3% | |||||||
| ENERGY EQUIPMENT & SERVICES - 2.3% | |||||||
Helmerich & Payne | 48,584 | 3,097,716 | |||||
Unit Corporation 1 | 91,201 | 2,331,097 | |||||
| Total (Cost $4,104,147) | 5,428,813 | ||||||
| FINANCIALS – 21.7% | |||||||
| BANKS - 10.2% | |||||||
Ames National | 86,003 | 2,653,193 | |||||
†Bar Harbor Bankshares | 44,776 | 1,356,265 | |||||
Camden National | 76,652 | 3,503,763 | |||||
City Holding Company | 32,477 | 2,443,245 | |||||
CNB Financial | 92,567 | 2,782,564 | |||||
Codorus Valley Bancorp | 25,309 | 776,480 | |||||
Landmark Bancorp | 19,733 | 562,390 | |||||
MidWestOne Financial Group | 106,099 | 3,584,024 | |||||
National Bankshares | 63,984 | 2,968,858 | |||||
Northrim BanCorp | 65,300 | 2,582,615 | |||||
Unity Bancorp | 46,256 | 1,052,324 | |||||
| 24,265,721 | |||||||
| CAPITAL MARKETS - 3.3% | |||||||
Federated Investors Cl. B | 138,598 | 3,232,105 | |||||
Houlihan Lokey Cl. A | 45,996 | 2,355,915 | |||||
Moelis & Company Cl. A | 37,238 | 2,184,009 | |||||
| 7,772,029 | |||||||
| INSURANCE - 3.1% | |||||||
James River Group Holdings | 87,630 | 3,442,983 | |||||
Kingstone Companies | 59,165 | 999,888 | |||||
Reinsurance Group of America | 22,536 | 3,008,105 | |||||
| 7,450,976 | |||||||
| THRIFTS & MORTGAGE FINANCE - 5.1% | |||||||
Genworth MI Canada | 174,389 | 5,674,789 | |||||
Southern Missouri Bancorp | 20,141 | 785,902 | |||||
Timberland Bancorp | 59,567 | 2,224,232 | |||||
TrustCo Bank Corp. NY | 389,791 | 3,469,140 | |||||
| 12,154,063 | |||||||
| Total (Cost $36,384,988) | 51,642,789 | ||||||
| HEALTH CARE – 1.4% | |||||||
| HEALTH CARE PROVIDERS & SERVICES - 1.4% | |||||||
| 19,780 | 1,159,108 | ||||||
Ensign Group (The) | 63,085 | 2,259,705 | |||||
| Total (Cost $2,138,556) | 3,418,813 | ||||||
| INDUSTRIALS – 22.2% | |||||||
| AIRLINES - 5.8% | |||||||
Allegiant Travel | 25,839 | 3,590,329 | |||||
Hawaiian Holdings | 132,500 | 4,763,375 | |||||
| 148,712 | 5,405,681 | ||||||
| 13,759,385 | |||||||
| BUILDING PRODUCTS - 2.0% | |||||||
American Woodmark 1 | 11,182 | 1,023,712 | |||||
Apogee Enterprises | 77,626 | 3,739,244 | |||||
| 4,762,956 | |||||||
| COMMERCIAL SERVICES & SUPPLIES - 2.7% | |||||||
Herman Miller | 98,799 | 3,349,286 | |||||
Kimball International Cl. B | 194,886 | 3,149,358 | |||||
| 6,498,644 | |||||||
| CONSTRUCTION & ENGINEERING - 0.5% | |||||||
Comfort Systems USA | 25,057 | 1,147,611 | |||||
| ELECTRICAL EQUIPMENT - 1.2% | |||||||
EnerSys | 38,493 | 2,873,117 | |||||
| MACHINERY - 4.9% | |||||||
Alamo Group | 16,433 | 1,484,886 | |||||
Federal Signal | 47,810 | 1,113,495 | |||||
Miller Industries | 172,214 | 4,400,068 | |||||
Wabash National | 253,146 | 4,723,704 | |||||
| 11,722,153 | |||||||
| PROFESSIONAL SERVICES - 3.8% | |||||||
Heidrick & Struggles International | 31,688 | 1,109,080 | |||||
Kforce | 67,345 | 2,309,934 | |||||
Korn/Ferry International | 38,094 | 2,359,161 | |||||
Robert Half International | 34,507 | 2,246,406 | |||||
TrueBlue 1 | 42,400 | 1,142,680 | |||||
| 9,167,261 | |||||||
| ROAD & RAIL - 1.3% | |||||||
Old Dominion Freight Line | 7,364 | 1,096,941 | |||||
Saia 1 | 14,041 | 1,135,215 | |||||
Werner Enterprises | 23,852 | 895,643 | |||||
| 3,127,799 | |||||||
| Total (Cost $44,251,425) | 53,058,926 | ||||||
| INFORMATION TECHNOLOGY – 25.7% | |||||||
| COMMUNICATIONS EQUIPMENT - 0.5% | |||||||
NETGEAR 1 | 17,117 | 1,069,813 | |||||
| ELECTRONIC EQUIPMENT, INSTRUMENTS & COMPONENTS - 16.3% | |||||||
Benchmark Electronics | 119,574 | 3,485,582 | |||||
| THE ACCOMPANYING NOTES ARE AN INTEGRAL PART OF THESE FINANCIAL STATEMENTS | The Royce Funds 2018 Semiannual Report to Shareholders | 65 |
| Schedules of Investments | |||||||
| Royce Small-Cap Value Fund (continued) | |||||||
| SHARES | VALUE | ||||||
| INFORMATION TECHNOLOGY (continued) | |||||||
| ELECTRONIC EQUIPMENT, INSTRUMENTS & COMPONENTS (continued) | |||||||
Celestica 1 | 445,590 | $ | 5,289,153 | ||||
| 222,606 | 3,510,497 | ||||||
Fabrinet 1 | 131,897 | 4,865,680 | |||||
Insight Enterprises 1 | 119,850 | 5,864,260 | |||||
Methode Electronics | 88,243 | 3,556,193 | |||||
PC Connection | 180,251 | 5,984,333 | |||||
Sanmina Corporation 1 | 37,772 | 1,106,720 | |||||
Vishay Intertechnology | 228,639 | 5,304,425 | |||||
| 38,966,843 | |||||||
| SEMICONDUCTORS & SEMICONDUCTOR EQUIPMENT - 8.0% | |||||||
Advanced Energy Industries 1 | 62,748 | 3,645,031 | |||||
†Cohu | 75,800 | 1,857,858 | |||||
Kulicke & Soffa Industries | 249,000 | 5,931,180 | |||||
MKS Instruments | 21,380 | 2,046,066 | |||||
Silicon Motion Technology ADR | 44,701 | 2,364,236 | |||||
| 228,562 | 3,193,011 | ||||||
| 19,037,382 | |||||||
| TECHNOLOGY HARDWARE, STORAGE & PERIPHERALS - 0.9% | |||||||
| 89,324 | 2,112,513 | ||||||
| Total (Cost $52,697,761) | 61,186,551 | ||||||
| REAL ESTATE – 1.5% | |||||||
| REAL ESTATE MANAGEMENT & DEVELOPMENT - 1.5% | |||||||
Marcus & Millichap 1 | 90,513 | 3,530,912 | |||||
| Total (Cost $2,321,646) | 3,530,912 | ||||||
| UTILITIES – 0.5% | |||||||
| GAS UTILITIES - 0.5% | |||||||
Star Group L.P. | 114,301 | 1,120,150 | |||||
| Total (Cost $1,105,828) | 1,120,150 | ||||||
| TOTAL COMMON STOCKS | |||||||
| (Cost $172,618,103) | 216,163,874 | ||||||
| REPURCHASE AGREEMENT– 8.8% | |||||||
| Fixed Income Clearing Corporation, 0.35% dated 6/29/18, due 7/2/18, maturity value $20,991,612 (collateralized by obligations of various U.S. Government Agencies, 2.00% due 10/05/22, valued at $21,412,644) | |||||||
| (Cost $20,991,000) | 20,991,000 | ||||||
| TOTAL INVESTMENTS – 99.5% | |||||||
| (Cost $193,609,103) | 237,154,874 | ||||||
| CASH AND OTHER ASSETS LESS LIABILITIES – 0.5% | 1,250,556 | ||||||
| NET ASSETS – 100.0% | $ | 238,405,430 | |||||
| Royce Small/Mid-Cap Premier Fund | ||||||||
| Common Stocks – 85.3% | ||||||||
| SHARES | VALUE | |||||||
| CONSUMER DISCRETIONARY – 18.8% | ||||||||
| AUTO COMPONENTS - 1.0% | ||||||||
Dorman Products 1 | 28,000 | $ | 1,912,680 | |||||
| AUTOMOBILES - 0.5% | ||||||||
Thor Industries | 10,015 | 975,361 | ||||||
| DISTRIBUTORS - 4.5% | ||||||||
Core-Mark Holding Company | 139,600 | 3,168,920 | ||||||
LKQ Corporation 1 | 169,313 | 5,401,085 | ||||||
| 8,570,005 | ||||||||
| HOTELS, RESTAURANTS & LEISURE - 1.4% | ||||||||
†Aramark | 72,700 | 2,697,170 | ||||||
| HOUSEHOLD DURABLES - 0.9% | ||||||||
| 37,285 | 1,638,676 | |||||||
| MEDIA - 2.6% | ||||||||
| 102,272 | 0 | |||||||
Meredith Corporation | 55,405 | 2,825,655 | ||||||
Nexstar Media Group Cl. A | 29,131 | 2,138,215 | ||||||
| 4,963,870 | ||||||||
| MULTILINE RETAIL - 0.6% | ||||||||
Dollar Tree 1 | 12,700 | 1,079,500 | ||||||
| SPECIALTY RETAIL - 5.7% | ||||||||
Camping World Holdings Cl. A | 55,214 | 1,379,246 | ||||||
CarMax 1 | 57,674 | 4,202,704 | ||||||
Children’s Place | 26,000 | 3,140,800 | ||||||
Monro | 37,250 | 2,164,225 | ||||||
| 10,886,975 | ||||||||
| TEXTILES, APPAREL & LUXURY GOODS - 1.6% | ||||||||
Wolverine World Wide | 89,000 | 3,094,530 | ||||||
| Total (Cost $33,771,596) | 35,818,767 | |||||||
| CONSUMER STAPLES – 1.1% | ||||||||
| FOOD PRODUCTS - 1.1% | ||||||||
Cal-Maine Foods 1 | 18,100 | 829,885 | ||||||
Hormel Foods | 34,000 | 1,265,140 | ||||||
| Total (Cost $1,874,161) | 2,095,025 | |||||||
| FINANCIALS – 8.2% | ||||||||
| CAPITAL MARKETS - 5.2% | ||||||||
Affiliated Managers Group | 21,688 | 3,224,355 | ||||||
Lazard Cl. A | 67,550 | 3,303,870 | ||||||
Morningstar | 8,500 | 1,090,125 | ||||||
Oaktree Capital Group LLC Cl. A | 32,700 | 1,329,255 | ||||||
SEI Investments | 14,900 | 931,548 | ||||||
| 9,879,153 | ||||||||
| CONSUMER FINANCE - 0.2% | ||||||||
| 6,500 | 477,035 | |||||||
| INSURANCE - 2.8% | ||||||||
Alleghany Corporation | 9,205 | 5,292,599 | ||||||
| Total (Cost $13,477,126) | 15,648,787 | |||||||
| HEALTH CARE – 4.4% | ||||||||
| HEALTH CARE EQUIPMENT & SUPPLIES - 2.4% | ||||||||
DENTSPLY SIRONA | 42,685 | 1,868,323 | ||||||
Hill-Rom Holdings | 31,797 | 2,777,150 | ||||||
| 4,645,473 | ||||||||
| LIFE SCIENCES TOOLS & SERVICES - 2.0% | ||||||||
Bio-Rad Laboratories Cl. A 1 | 10,626 | 3,066,026 | ||||||
PerkinElmer | 10,000 | 732,300 | ||||||
| 3,798,326 | ||||||||
| Total (Cost $7,837,920) | 8,443,799 | |||||||
| 66 | The Royce Funds 2018 Semiannual Report to Shareholders | THE ACCOMPANYING NOTES ARE AN INTEGRAL PART OF THESE FINANCIAL STATEMENTS |
| June 30, 2018 (unaudited) |
| Royce Small/Mid-Cap Premier Fund (continued) | |||||||
| SHARES | VALUE | ||||||
| INDUSTRIALS – 28.5% | |||||||
| AEROSPACE & DEFENSE - 1.6% | |||||||
Hexcel Corporation | 43,301 | $ | 2,874,320 | ||||
Teledyne Technologies 1 | 1,000 | 199,060 | |||||
| 3,073,380 | |||||||
| BUILDING PRODUCTS - 2.0% | |||||||
Lennox International | 11,257 | 2,253,089 | |||||
Simpson Manufacturing | 26,000 | 1,616,940 | |||||
| 3,870,029 | |||||||
| COMMERCIAL SERVICES & SUPPLIES - 2.7% | |||||||
Cintas Corporation | 6,169 | 1,141,697 | |||||
Copart 1 | 70,000 | 3,959,200 | |||||
| 5,100,897 | |||||||
| CONSTRUCTION & ENGINEERING - 2.6% | |||||||
Valmont Industries | 32,660 | 4,923,495 | |||||
| ELECTRICAL EQUIPMENT - 2.7% | |||||||
Hubbell Cl. B | 26,721 | 2,825,478 | |||||
Sensata Technologies Holding 1 | 47,200 | 2,245,776 | |||||
| 5,071,254 | |||||||
| INDUSTRIAL CONGLOMERATES - 2.5% | |||||||
Carlisle Companies | 43,103 | 4,668,486 | |||||
| MACHINERY - 4.8% | |||||||
†Allison Transmission Holdings | 23,900 | 967,711 | |||||
Franklin Electric | 21,960 | 990,396 | |||||
Graco | 21,038 | 951,339 | |||||
Lincoln Electric Holdings | 50,653 | 4,445,307 | |||||
Westinghouse Air Brake Technologies | 18,654 | 1,838,911 | |||||
| 9,193,664 | |||||||
| MARINE - 2.6% | |||||||
Kirby Corporation 1 | 59,000 | 4,932,400 | |||||
| PROFESSIONAL SERVICES - 2.5% | |||||||
IHS Markit 1 | 33,104 | 1,707,835 | |||||
ManpowerGroup | 36,440 | 3,136,027 | |||||
| 4,843,862 | |||||||
| ROAD & RAIL - 1.5% | |||||||
†J.B. Hunt Transport Services | 7,700 | 935,935 | |||||
Landstar System | 18,256 | 1,993,555 | |||||
| 2,929,490 | |||||||
| TRADING COMPANIES & DISTRIBUTORS - 3.0% | |||||||
Air Lease Cl. A | 99,000 | 4,155,030 | |||||
Diploma | 13,585 | 235,047 | |||||
Watsco | 7,300 | 1,301,444 | |||||
| 5,691,521 | |||||||
| Total (Cost $43,246,251) | 54,298,478 | ||||||
| INFORMATION TECHNOLOGY – 6.3% | |||||||
| ELECTRONIC EQUIPMENT, INSTRUMENTS & COMPONENTS - 3.2% | |||||||
AVX Corporation | 96,000 | 1,504,320 | |||||
FLIR Systems | 36,700 | 1,907,299 | |||||
IPG Photonics 1 | 1,853 | 408,827 | |||||
Littelfuse | 4,600 | 1,049,628 | |||||
Zebra Technologies Cl. A 1 | 8,750 | 1,253,438 | |||||
| 6,123,512 | |||||||
| SEMICONDUCTORS & SEMICONDUCTOR EQUIPMENT - 3.1% | |||||||
Cabot Microelectronics | 17,590 | 1,891,980 | |||||
†Entegris | 56,023 | 1,899,180 | |||||
Rudolph Technologies 1 | 71,789 | 2,124,954 | |||||
| 5,916,114 | |||||||
| Total (Cost $10,377,970) | 12,039,626 | ||||||
| MATERIALS – 13.0% | |||||||
| CHEMICALS - 8.7% | |||||||
Innospec | 12,400 | 949,220 | |||||
Minerals Technologies | 76,846 | 5,790,346 | |||||
NewMarket Corporation | 5,362 | 2,168,929 | |||||
Sensient Technologies | 31,342 | 2,242,520 | |||||
Westlake Chemical | 50,350 | 5,419,170 | |||||
| 16,570,185 | |||||||
| METALS & MINING - 2.3% | |||||||
Reliance Steel & Aluminum | 49,655 | �� | 4,346,799 | ||||
| PAPER & FOREST PRODUCTS - 2.0% | |||||||
Stella-Jones | 108,200 | 3,941,504 | |||||
| Total (Cost $20,044,763) | 24,858,488 | ||||||
| REAL ESTATE – 2.8% | |||||||
| REAL ESTATE MANAGEMENT & DEVELOPMENT - 2.8% | |||||||
Jones Lang LaSalle | 14,800 | 2,456,652 | |||||
Kennedy-Wilson Holdings | 72,380 | 1,530,837 | |||||
Realogy Holdings | 55,246 | 1,259,609 | |||||
| Total (Cost $4,387,383) | 5,247,098 | ||||||
| UTILITIES – 2.2% | |||||||
| GAS UTILITIES - 2.2% | |||||||
UGI Corporation | 81,684 | 4,253,286 | |||||
| Total (Cost $2,926,034) | 4,253,286 | ||||||
| TOTAL COMMON STOCKS | |||||||
| (Cost $137,943,204) | 162,703,354 | ||||||
| REPURCHASE AGREEMENT– 15.5% | |||||||
| Fixed Income Clearing Corporation, 0.35% dated 6/29/18, due 7/2/18, maturity value $29,491,860 (collateralized by obligations of various U.S. Government Agencies, 1.125% due 9/30/21, valued at $30,081,438) | |||||||
| (Cost $29,491,000) | 29,491,000 | ||||||
| TOTAL INVESTMENTS – 100.8% | |||||||
| (Cost $167,434,204) | 192,194,354 | ||||||
| LIABILITIES LESS CASH AND OTHER ASSETS – (0.8)% | (1,463,347 | ) | |||||
| NET ASSETS – 100.0% | $ | 190,731,007 | |||||
| THE ACCOMPANYING NOTES ARE AN INTEGRAL PART OF THESE FINANCIAL STATEMENTS | The Royce Funds 2018 Semiannual Report to Shareholders | 67 |
| Schedules of Investments | |||||||
| Royce Smaller-Companies Growth Fund | |||||||
| Common Stocks – 94.3% | |||||||
| SHARES | VALUE | ||||||
| CONSUMER DISCRETIONARY – 8.2% | |||||||
| AUTO COMPONENTS - 0.7% | |||||||
LCI Industries | 21,000 | $ | 1,893,150 | ||||
Stoneridge 1 | 25,000 | 878,500 | |||||
| 2,771,650 | |||||||
| HOTELS, RESTAURANTS & LEISURE - 2.7% | |||||||
Dave & Busters Entertainment 1 | 66,000 | 3,141,600 | |||||
Del Taco Restaurants 1 | 230,700 | 3,271,326 | |||||
Texas Roadhouse | 55,000 | 3,603,050 | |||||
| 10,015,976 | |||||||
| HOUSEHOLD DURABLES - 0.5% | |||||||
| 84,200 | 1,747,150 | ||||||
| LEISURE PRODUCTS - 1.2% | |||||||
Callaway Golf | 226,000 | 4,287,220 | |||||
| MULTILINE RETAIL - 0.5% | |||||||
| 28,000 | 2,030,000 | ||||||
| SPECIALTY RETAIL - 1.9% | |||||||
†Dicks Sporting Goods | 62,000 | 2,185,500 | |||||
| 23,000 | 2,247,330 | ||||||
Monro | 42,000 | 2,440,200 | |||||
| 6,873,030 | |||||||
| TEXTILES, APPAREL & LUXURY GOODS - 0.7% | |||||||
Carter’s | 9,900 | 1,073,061 | |||||
Columbia Sportswear | 15,000 | 1,372,050 | |||||
| 2,445,111 | |||||||
| Total (Cost $21,911,603) | 30,170,137 | ||||||
| CONSUMER STAPLES – 1.7% | |||||||
| FOOD PRODUCTS - 1.7% | |||||||
Farmer Bros. 1 | 109,000 | 3,329,950 | |||||
| 102,000 | 2,799,900 | ||||||
| Total (Cost $5,402,792) | 6,129,850 | ||||||
| ENERGY – 1.8% | |||||||
| ENERGY EQUIPMENT & SERVICES - 0.6% | |||||||
Pason Systems | 130,000 | 2,128,019 | |||||
| OIL, GAS & CONSUMABLE FUELS - 1.2% | |||||||
Centennial Resource Development Cl. A 1 | 142,000 | 2,564,520 | |||||
†Viper Energy Partners L.P. | 60,000 | 1,914,600 | |||||
| 4,479,120 | |||||||
| Total (Cost $4,115,832) | 6,607,139 | ||||||
| FINANCIALS – 13.6% | |||||||
| BANKS - 9.1% | |||||||
Banc of California | 126,000 | 2,463,300 | |||||
Enterprise Financial Services | 138,500 | 7,472,075 | |||||
F.N.B. Corporation | 62,000 | 832,040 | |||||
†Great Western Bancorp | 21,000 | 881,790 | |||||
Live Oak Bancshares | 60,700 | 1,860,455 | |||||
| 22,000 | 839,300 | ||||||
Seacoast Banking Corporation of Florida 1 | 146,000 | 4,610,680 | |||||
ServisFirst Bancshares | 85,000 | 3,547,050 | |||||
†Southern National Bancorp of Virginia | 53,000 | 945,520 | |||||
TriState Capital Holdings 1 | 283,057 | 7,387,788 | |||||
Webster Financial | 43,000 | 2,739,100 | |||||
| 33,579,098 | |||||||
| CAPITAL MARKETS - 2.8% | |||||||
Northern Trust | 51,000 | 5,247,390 | |||||
†PJT Partners Cl. A | 18,000 | 961,020 | |||||
WisdomTree Investments | 431,200 | 3,915,296 | |||||
| 10,123,706 | |||||||
| THRIFTS & MORTGAGE FINANCE - 1.7% | |||||||
Federal Agricultural Mortgage | 33,000 | 2,952,840 | |||||
| 9,000 | 1,924,200 | ||||||
OceanFirst Financial | 50,000 | 1,498,000 | |||||
| 6,375,040 | |||||||
| Total (Cost $35,513,836) | 50,077,844 | ||||||
| HEALTH CARE – 17.7% | |||||||
| BIOTECHNOLOGY - 6.5% | |||||||
| 10,000 | 1,569,500 | ||||||
| 120,000 | 987,600 | ||||||
| 37,000 | 918,340 | ||||||
Myriad Genetics 1 | 67,000 | 2,503,790 | |||||
Oxford Biomedica 1 | 120,000 | 1,561,370 | |||||
Progenics Pharmaceuticals 1 | 357,200 | 2,871,888 | |||||
| 40,000 | 2,870,000 | ||||||
| 27,000 | 1,270,080 | ||||||
| 190,000 | 2,698,000 | ||||||
uniQure 1 | 100,000 | 3,780,000 | |||||
| 75,000 | 700,500 | ||||||
| 180,000 | 1,746,000 | ||||||
Zealand Pharma 1 | 31,799 | 418,674 | |||||
| 23,895,742 | |||||||
| HEALTH CARE EQUIPMENT & SUPPLIES - 5.7% | |||||||
ABIOMED 1 | 2,000 | 818,100 | |||||
| 60,000 | 3,015,000 | ||||||
| 710,000 | 3,088,500 | ||||||
CryoPort 1 | 261,198 | 4,121,704 | |||||
Inogen 1 | 12,755 | 2,376,639 | |||||
| 23,000 | 1,836,550 | ||||||
Penumbra 1 | 17,000 | 2,348,550 | |||||
| 350,000 | 1,214,500 | ||||||
West Pharmaceutical Services | 23,000 | 2,283,670 | |||||
| 21,103,213 | |||||||
| HEALTH CARE PROVIDERS & SERVICES - 0.4% | |||||||
HealthEquity 1 | 19,000 | 1,426,900 | |||||
| LIFE SCIENCES TOOLS & SERVICES - 1.7% | |||||||
Cambrex Corporation 1 | 37,500 | 1,961,250 | |||||
| 38,800 | 558,720 | ||||||
| 414,600 | 2,218,110 | ||||||
| 113,600 | 1,631,296 | ||||||
| 6,369,376 | |||||||
| PHARMACEUTICALS - 3.4% | |||||||
Axsome Therapeutics 1 | 556,000 | 1,779,200 | |||||
BioDelivery Sciences International 1 | 677,000 | 1,997,150 | |||||
| 138,000 | 3,291,300 | ||||||
Intersect ENT 1 | 26,000 | 973,700 | |||||
Paratek Pharmaceuticals 1 | 87,700 | 894,540 | |||||
Supernus Pharmaceuticals 1 | 58,000 | 3,471,300 | |||||
| 12,407,190 | |||||||
| Total (Cost $49,188,657) | 65,202,421 | ||||||
| INDUSTRIALS – 12.5% | |||||||
| AEROSPACE & DEFENSE - 0.5% | |||||||
| 22,500 | 1,607,175 | ||||||
| AIR FREIGHT & LOGISTICS - 3.3% | |||||||
| 146,000 | 3,298,140 | ||||||
| 95,000 | 6,811,500 | ||||||
Forward Air | 33,000 | 1,949,640 | |||||
| 12,059,280 | |||||||
| 68 | The Royce Funds 2018 Semiannual Report to Shareholders | THE ACCOMPANYING NOTES ARE AN INTEGRAL PART OF THESE FINANCIAL STATEMENTS |
| June 30, 2018 (unaudited) |
| Royce Smaller-Companies Growth Fund (continued) | |||||||
| SHARES | VALUE | ||||||
| INDUSTRIALS (continued) | |||||||
| BUILDING PRODUCTS - 0.5% | |||||||
DIRTT Environmental Solutions 1 | 388,000 | $ | 1,891,819 | ||||
| CONSTRUCTION & ENGINEERING - 0.8% | |||||||
NV5 Global 1 | 43,585 | 3,020,441 | |||||
| ELECTRICAL EQUIPMENT - 1.5% | |||||||
| 358,000 | 1,020,300 | ||||||
| 636,000 | 4,280,280 | ||||||
| 5,300,580 | |||||||
| MACHINERY - 2.4% | |||||||
| 177,000 | 3,150,600 | ||||||
| 59,000 | 1,525,740 | ||||||
| 16,000 | 1,903,200 | ||||||
Woodward | 30,000 | 2,305,800 | |||||
| 8,885,340 | |||||||
| MARINE - 2.6% | |||||||
Clarkson | 129,976 | 3,945,325 | |||||
Scorpio Bulkers | 362,000 | 2,570,200 | |||||
Star Bulk Carriers 1 | 244,000 | 3,137,840 | |||||
| 9,653,365 | |||||||
| PROFESSIONAL SERVICES - 0.9% | |||||||
ASGN 1 | 20,000 | 1,563,800 | |||||
| 102,000 | 1,795,200 | ||||||
| 3,359,000 | |||||||
| Total (Cost $37,834,441) | 45,777,000 | ||||||
| INFORMATION TECHNOLOGY – 31.2% | |||||||
| COMMUNICATIONS EQUIPMENT - 1.0% | |||||||
| 65,000 | 3,763,500 | ||||||
| ELECTRONIC EQUIPMENT, INSTRUMENTS & COMPONENTS - 4.7% | |||||||
| 152,411 | 1,400,657 | ||||||
FLIR Systems | 67,600 | 3,513,172 | |||||
II-VI 1 | 73,000 | 3,171,850 | |||||
IPG Photonics 1 | 7,444 | 1,642,370 | |||||
| 1,104,000 | 5,343,360 | ||||||
| 29,200 | 965,352 | ||||||
Seeing Machines 1 | 7,875,700 | 1,299,245 | |||||
| 17,336,006 | |||||||
| INTERNET SOFTWARE & SERVICES - 7.0% | |||||||
Bandwidth Cl. A 1 | 45,000 | 1,709,100 | |||||
Carbonite 1 | 99,000 | 3,455,100 | |||||
Five9 1 | 76,000 | 2,627,320 | |||||
| 266,000 | 5,612,600 | ||||||
| 16,000 | 912,800 | ||||||
| 332,000 | 4,349,200 | ||||||
Shopify Cl. A 1 | 16,000 | 2,334,240 | |||||
2U 1 | 29,348 | 2,452,319 | |||||
| 109,000 | 2,108,060 | ||||||
| 25,560,739 | |||||||
| IT SERVICES - 2.0% | |||||||
Square Cl. A 1 | 15,000 | 924,600 | |||||
Unisys Corporation 1 | 485,000 | 6,256,500 | |||||
| 7,181,100 | |||||||
| SEMICONDUCTORS & SEMICONDUCTOR EQUIPMENT - 7.6% | |||||||
AXT 1 | 323,000 | 2,277,150 | |||||
Brooks Automation | 109,000 | 3,555,580 | |||||
CEVA 1 | 62,000 | 1,872,400 | |||||
CyberOptics Corporation 1 | 208,000 | 3,619,200 | |||||
| 360,000 | 3,690,000 | ||||||
ON Semiconductor 1 | 147,000 | 3,268,545 | |||||
| 29,000 | 2,888,400 | ||||||
Silicon Motion Technology ADR | 57,000 | 3,014,730 | |||||
Universal Display | 43,000 | 3,698,000 | |||||
| 27,884,005 | |||||||
| SOFTWARE - 7.3% | |||||||
| 20,000 | 683,600 | ||||||
| 23,000 | 1,090,660 | ||||||
HubSpot 1 | 19,000 | 2,382,600 | |||||
| 436,577 | 5,666,769 | ||||||
Paylocity Holding Corporation 1 | 107,786 | 6,344,284 | |||||
| 28,600 | 699,270 | ||||||
QAD Cl. A | 128,000 | 6,419,200 | |||||
RingCentral Cl. A 1 | 53,000 | 3,728,550 | |||||
| 27,014,933 | |||||||
| TECHNOLOGY HARDWARE, STORAGE & PERIPHERALS - 1.6% | |||||||
USA Technologies 1 | 422,000 | 5,908,000 | |||||
| Total (Cost $79,097,258) | 114,648,283 | ||||||
| MATERIALS – 5.6% | |||||||
| CHEMICALS - 2.4% | |||||||
Albemarle Corporation | 20,000 | 1,886,600 | |||||
†American Vanguard | 125,000 | 2,868,750 | |||||
Kraton Corporation 1 | 88,000 | 4,060,320 | |||||
| 8,815,670 | |||||||
| CONSTRUCTION MATERIALS - 0.8% | |||||||
Eagle Materials | 28,000 | 2,939,160 | |||||
| METALS & MINING - 2.4% | |||||||
Cobalt 27 Capital 1 | 573,000 | 3,848,621 | |||||
Orocobre 1 | 642,350 | 2,457,669 | |||||
Tahoe Resources 1 | 476,200 | 2,342,904 | |||||
| 8,649,194 | |||||||
| Total (Cost $16,332,065) | 20,404,024 | ||||||
| REAL ESTATE – 2.0% | |||||||
| EQUITY REAL ESTATE INVESTMENT TRUSTS (REITS) - 2.0% | |||||||
Community Healthcare Trust | 128,000 | 3,823,360 | |||||
CyrusOne | 62,000 | 3,618,320 | |||||
| Total (Cost $4,313,809) | 7,441,680 | ||||||
| TOTAL COMMON STOCKS | |||||||
| (Cost $253,710,293) | 346,458,378 | ||||||
| REPURCHASE AGREEMENT– 6.0% | |||||||
| Fixed Income Clearing Corporation, 0.35% dated 6/29/18, due 7/2/18, maturity value $21,889,638 (collateralized by obligations of various U.S. Government Agencies, 1.125% due 9/30/21, valued at $22,326,963) | |||||||
| (Cost $21,889,000) | 21,889,000 | ||||||
| COLLATERAL RECEIVED FOR SECURITIES LOANED – 4.2% | |||||||
| Money Market Funds | |||||||
Federated Government Obligations Fund (7 day yield-1.7400%) | |||||||
| (Cost $15,347,529) | 15,347,529 | ||||||
| TOTAL INVESTMENTS – 104.5% | |||||||
| (Cost $290,946,822) | 383,694,907 | ||||||
| LIABILITIES LESS CASH AND OTHER ASSETS – (4.5)% | (16,398,770 | ) | |||||
| NET ASSETS – 100.0% | $ | 367,296,137 | |||||
| THE ACCOMPANYING NOTES ARE AN INTEGRAL PART OF THESE FINANCIAL STATEMENTS | The Royce Funds 2018 Semiannual Report to Shareholders | 69 |
| Schedules of Investments | |||||||
| Royce Special Equity Fund | |||||||
| Common Stocks – 87.4% | |||||||
| SHARES | VALUE | ||||||
| CONSUMER DISCRETIONARY – 37.3% | |||||||
| AUTO COMPONENTS - 9.1% | |||||||
Cooper Tire & Rubber | 1,500,000 | $ | 39,450,000 | ||||
Gentex Corporation | 850,000 | 19,567,000 | |||||
Standard Motor Products 5 | 1,405,000 | 67,917,700 | |||||
| 126,934,700 | |||||||
| AUTOMOBILES - 1.5% | |||||||
Winnebago Industries | 515,000 | 20,909,000 | |||||
| DIVERSIFIED CONSUMER SERVICES - 3.8% | |||||||
Capella Education | 542,500 | 53,544,750 | |||||
| HOTELS, RESTAURANTS & LEISURE - 0.3% | |||||||
Bowl America Cl. A 5 | 343,000 | 4,990,650 | |||||
| HOUSEHOLD DURABLES - 6.7% | |||||||
Bassett Furniture Industries 5 | 597,591 | 16,463,632 | |||||
Flexsteel Industries 5 | 585,000 | 23,341,500 | |||||
Hooker Furniture 5 | 1,145,000 | 53,700,500 | |||||
| 93,505,632 | |||||||
| MEDIA - 9.3% | |||||||
Meredith Corporation | 1,157,500 | 59,032,500 | |||||
Scholastic Corporation | 1,607,500 | 71,228,325 | |||||
| 130,260,825 | |||||||
| SPECIALTY RETAIL - 6.6% | |||||||
Children’s Place | 620,000 | 74,896,000 | |||||
Haverty Furniture | 820,000 | 17,712,000 | |||||
| 92,608,000 | |||||||
| Total (Cost $358,841,334) | 522,753,557 | ||||||
| CONSUMER STAPLES – 8.0% | |||||||
| FOOD & STAPLES RETAILING - 3.5% | |||||||
Weis Markets | 904,700 | 48,256,698 | |||||
| FOOD PRODUCTS - 4.0% | |||||||
John B. Sanfilippo & Son 5 | 750,000 | 55,837,500 | |||||
| TOBACCO - 0.5% | |||||||
Universal Corporation | 110,000 | 7,265,500 | |||||
| Total (Cost $82,049,969) | 111,359,698 | ||||||
| ENERGY – 0.6% | |||||||
| ENERGY EQUIPMENT & SERVICES - 0.6% | |||||||
RPC | 600,000 | 8,742,000 | |||||
| Total (Cost $8,424,764) | 8,742,000 | ||||||
| INDUSTRIALS – 21.5% | |||||||
| AEROSPACE & DEFENSE - 3.7% | |||||||
National Presto Industries 5 | 412,000 | 51,088,000 | |||||
| BUILDING PRODUCTS - 0.8% | |||||||
Insteel Industries | 345,000 | 11,523,000 | |||||
| COMMERCIAL SERVICES & SUPPLIES - 7.5% | |||||||
Ennis | 475,000 | 9,666,250 | |||||
Herman Miller | 515,000 | 17,458,500 | |||||
UniFirst Corporation | 439,700 | 77,782,930 | |||||
| 104,907,680 | |||||||
| CONSTRUCTION & ENGINEERING - 0.6% | |||||||
Argan | 200,000 | 8,190,000 | |||||
| ELECTRICAL EQUIPMENT - 3.7% | |||||||
Hubbell Cl. B | 495,000 | 52,341,300 | |||||
| MACHINERY - 3.9% | |||||||
| 769,700 | 12,430,655 | ||||||
Hurco Companies 5 | 535,000 | 23,941,250 | |||||
Wabash National | 950,000 | 17,727,000 | |||||
| 54,098,905 | |||||||
| PROFESSIONAL SERVICES - 1.1% | |||||||
Resources Connection | 941,400 | 15,909,660 | |||||
| TRADING COMPANIES & DISTRIBUTORS - 0.2% | |||||||
Central Steel & Wire 2 | 3,788 | 2,322,044 | |||||
| Total (Cost $151,349,495) | 300,380,589 | ||||||
| INFORMATION TECHNOLOGY – 16.1% | |||||||
| ELECTRONIC EQUIPMENT, INSTRUMENTS & COMPONENTS - 8.8% | |||||||
AVX Corporation | 4,335,000 | 67,929,450 | |||||
Park Electrochemical | 500,000 | 11,595,000 | |||||
Vishay Intertechnology | 1,880,000 | 43,616,000 | |||||
| 123,140,450 | |||||||
| IT SERVICES - 2.7% | |||||||
| 765,000 | 37,944,000 | ||||||
| SEMICONDUCTORS & SEMICONDUCTOR EQUIPMENT - 4.6% | |||||||
Kulicke & Soffa Industries | 854,400 | 20,351,808 | |||||
Teradyne | 1,165,000 | 44,351,550 | |||||
| 64,703,358 | |||||||
| Total (Cost $145,504,491) | 225,787,808 | ||||||
| MATERIALS – 0.9% | |||||||
| METALS & MINING - 0.9% | |||||||
Kaiser Aluminum | 117,500 | 12,232,925 | |||||
| Total (Cost $8,931,896) | 12,232,925 | ||||||
| REAL ESTATE – 3.0% | |||||||
| REAL ESTATE MANAGEMENT & DEVELOPMENT - 3.0% | |||||||
Marcus & Millichap 1 | 1,070,000 | 41,740,700 | |||||
| Total (Cost $27,387,596) | 41,740,700 | ||||||
| TOTAL COMMON STOCKS | |||||||
| (Cost $782,489,545) | 1,222,997,277 | ||||||
| REPURCHASE AGREEMENT– 12.7% | |||||||
| Fixed Income Clearing Corporation, 0.35% dated 6/29/18, due 7/2/18, maturity value $178,538,207 (collateralized by obligations of various U.S. Government Agencies, 1.75%- 2.00% due 11/30/21-10/05/22, valued at $182,105,308) | |||||||
| (Cost $178,533,000) | 178,533,000 | ||||||
| TOTAL INVESTMENTS – 100.1% | |||||||
| (Cost $961,022,545) | 1,401,530,277 | ||||||
| LIABILITIES LESS CASH AND OTHER ASSETS – (0.1)% | (2,049,917 | ) | |||||
| NET ASSETS – 100.0% | $ | 1,399,480,360 | |||||
| 70 | The Royce Funds 2018 Semiannual Report to Shareholders | THE ACCOMPANYING NOTES ARE AN INTEGRAL PART OF THESE FINANCIAL STATEMENTS |
| June 30, 2018 (unaudited) |
| Royce Special Equity Multi-Cap Fund | |||||||
| Common Stocks – 85.2% | |||||||
| SHARES | VALUE | ||||||
| CONSUMER DISCRETIONARY – 21.2% | |||||||
| DISTRIBUTORS - 7.4% | |||||||
Genuine Parts | 54,000 | $ | 4,956,660 | ||||
| HOTELS, RESTAURANTS & LEISURE - 3.5% | |||||||
McDonald’s Corporation | 15,000 | 2,350,350 | |||||
| HOUSEHOLD DURABLES - 3.6% | |||||||
Leggett & Platt | 53,500 | 2,388,240 | |||||
| SPECIALTY RETAIL - 6.7% | |||||||
Lowe’s Companies | 47,000 | 4,491,790 | |||||
| Total (Cost $11,171,152) | 14,187,040 | ||||||
| CONSUMER STAPLES – 9.3% | |||||||
| HOUSEHOLD PRODUCTS - 9.3% | |||||||
Kimberly-Clark | 29,500 | 3,107,530 | |||||
Procter & Gamble | 39,500 | 3,083,370 | |||||
| Total (Cost $7,038,032) | 6,190,900 | ||||||
| FINANCIALS – 1.8% | |||||||
| INSURANCE - 1.8% | |||||||
Brown & Brown | 44,000 | 1,220,120 | |||||
| Total (Cost $965,116) | 1,220,120 | ||||||
| INDUSTRIALS – 35.2% | |||||||
| AEROSPACE & DEFENSE - 7.2% | |||||||
General Dynamics | 13,000 | 2,423,330 | |||||
United Technologies | 19,000 | 2,375,570 | |||||
| 4,798,900 | |||||||
| ELECTRICAL EQUIPMENT - 2.9% | |||||||
Emerson Electric | 27,500 | 1,901,350 | |||||
| INDUSTRIAL CONGLOMERATES - 6.2% | |||||||
Carlisle Companies | 28,500 | 3,086,835 | |||||
3M | 5,500 | 1,081,960 | |||||
| 4,168,795 | |||||||
| MACHINERY - 16.9% | |||||||
Cummins | 11,000 | 1,463,000 | |||||
Illinois Tool Works | 41,000 | 5,680,140 | |||||
Parker Hannifin | 20,000 | 3,117,000 | |||||
Stanley Black & Decker | 7,600 | 1,009,356 | |||||
| 11,269,496 | |||||||
| PROFESSIONAL SERVICES - 2.0% | |||||||
ManpowerGroup | 15,500 | 1,333,930 | |||||
| Total (Cost $15,469,173) | 23,472,471 | ||||||
| INFORMATION TECHNOLOGY – 14.7% | |||||||
| COMMUNICATIONS EQUIPMENT - 6.6% | |||||||
Cisco Systems | 103,000 | 4,432,090 | |||||
| TECHNOLOGY HARDWARE, STORAGE & PERIPHERALS - 8.1% | |||||||
Apple | 29,000 | 5,368,190 | |||||
| Total (Cost $4,091,226) | 9,800,280 | ||||||
| MATERIALS – 3.0% | |||||||
| CHEMICALS - 3.0% | |||||||
NewMarket Corporation | 5,000 | 2,022,500 | |||||
| Total (Cost $2,080,467) | 2,022,500 | ||||||
| TOTAL COMMON STOCKS | |||||||
| (Cost $40,815,166) | 56,893,311 | ||||||
| REPURCHASE AGREEMENT– 14.5% | |||||||
| Fixed Income Clearing Corporation, 0.35% dated 6/29/18, due 7/2/18, maturity value $9,659,282 (collateralized by obligations of various U.S. Government Agencies, 1.375% due 10/07/21, valued at $9,854,911) | |||||||
| (Cost $9,659,000) | 9,659,000 | ||||||
| TOTAL INVESTMENTS – 99.7% | |||||||
| (Cost $50,474,166) | 66,552,311 | ||||||
| CASH AND OTHER ASSETS LESS LIABILITIES – 0.3% | 173,541 | ||||||
| NET ASSETS – 100.0% | $ | 66,725,852 | |||||
| THE ACCOMPANYING NOTES ARE AN INTEGRAL PART OF THESE FINANCIAL STATEMENTS | The Royce Funds 2018 Semiannual Report to Shareholders | 71 |
| Schedules of Investments | |||||||
| Royce Total Return Fund | |||||||
| Common Stocks – 94.0% | |||||||
| SHARES | VALUE | ||||||
| CONSUMER DISCRETIONARY – 8.8% | |||||||
| AUTO COMPONENTS - 1.5% | |||||||
Gentex Corporation | 905,241 | $ | 20,838,648 | ||||
LCI Industries | 31,530 | 2,842,430 | |||||
Nokian Renkaat | 142,529 | 5,632,511 | |||||
Standard Motor Products | 80,756 | 3,903,745 | |||||
| 33,217,334 | |||||||
| AUTOMOBILES - 0.6% | |||||||
Thor Industries | 141,287 | 13,759,941 | |||||
| DISTRIBUTORS - 0.4% | |||||||
Weyco Group | 233,624 | 8,503,913 | |||||
| DIVERSIFIED CONSUMER SERVICES - 0.1% | |||||||
Capella Education | 30,797 | 3,039,664 | |||||
Liberty Tax Cl. A | 1,864 | 15,052 | |||||
| 3,054,716 | |||||||
| HOTELS, RESTAURANTS & LEISURE - 0.3% | |||||||
Brinker International | 36,370 | 1,731,212 | |||||
Cheesecake Factory | 69,165 | 3,808,225 | |||||
| 5,539,437 | |||||||
| HOUSEHOLD DURABLES - 1.5% | |||||||
Bassett Furniture Industries | 76,382 | 2,104,324 | |||||
Ethan Allen Interiors | 559,952 | 13,718,824 | |||||
Flexsteel Industries | 103,199 | 4,117,640 | |||||
La-Z-Boy | 464,918 | 14,226,491 | |||||
| 34,167,279 | |||||||
| INTERNET & DIRECT MARKETING RETAIL - 0.3% | |||||||
Nutrisystem | 144,157 | 5,550,044 | |||||
| MEDIA - 1.0% | |||||||
Gannett Company | 279,717 | 2,992,972 | |||||
Meredith Corporation | 239,294 | 12,203,994 | |||||
Saga Communications Cl. A | 180,631 | 6,954,293 | |||||
| 22,151,259 | |||||||
| MULTILINE RETAIL - 0.2% | |||||||
Big Lots | 34,194 | 1,428,625 | |||||
Dillard’s Cl. A | 33,893 | 3,202,889 | |||||
| 4,631,514 | |||||||
| SPECIALTY RETAIL - 2.5% | |||||||
Aaron’s | 34,765 | 1,510,539 | |||||
American Eagle Outfitters | 558,937 | 12,995,285 | |||||
Buckle (The) | 130,266 | 3,504,156 | |||||
Caleres | 54,843 | 1,886,051 | |||||
Cato Corporation (The) Cl. A | 147,456 | 3,630,367 | |||||
Children’s Place | 34,719 | 4,194,055 | |||||
DSW Cl. A | 432,787 | 11,174,560 | |||||
GameStop Corporation Cl. A | 77,795 | 1,133,473 | |||||
†Penske Automotive Group | 96,000 | 4,497,600 | |||||
Shoe Carnival | 336,486 | 10,918,971 | |||||
| 55,445,057 | |||||||
| TEXTILES, APPAREL & LUXURY GOODS - 0.4% | |||||||
J.G. Boswell Company 2 | 1,048 | 702,370 | |||||
Movado Group | 73,240 | 3,537,492 | |||||
Steven Madden | 83,455 | 4,431,460 | |||||
| 8,671,322 | |||||||
| Total (Cost $135,544,900) | 194,691,816 | ||||||
| CONSUMER STAPLES – 3.1% | |||||||
| BEVERAGES - 0.1% | |||||||
Compania Cervecerias Unidas ADR | 87,717 | 2,187,662 | |||||
| FOOD & STAPLES RETAILING - 0.6% | |||||||
Village Super Market Cl. A | 455,058 | 13,406,009 | |||||
| FOOD PRODUCTS - 2.2% | |||||||
Flowers Foods | 278,006 | 5,790,865 | |||||
Fresh Del Monte Produce | 194,133 | 8,648,625 | |||||
Hershey Creamery 2 | 722 | 2,888,000 | |||||
Lancaster Colony | 103,670 | 14,350,002 | |||||
Tootsie Roll Industries | 550,818 | 16,992,735 | |||||
| 48,670,227 | |||||||
| HOUSEHOLD PRODUCTS - 0.1% | |||||||
WD-40 Company | 16,453 | 2,406,251 | |||||
| PERSONAL PRODUCTS - 0.1% | |||||||
Nu Skin Enterprises Cl. A | 31,422 | 2,456,886 | |||||
| Total (Cost $44,703,144) | 69,127,035 | ||||||
| ENERGY – 4.7% | |||||||
| ENERGY EQUIPMENT & SERVICES - 3.8% | |||||||
CARBO Ceramics 1 | 99,038 | 908,179 | |||||
†Computer Modelling Group | 873,000 | 6,706,956 | |||||
Diamond Offshore Drilling 1 | 158,467 | 3,305,622 | |||||
Helmerich & Payne | 208,449 | 13,290,708 | |||||
Hi-Crush Partners L.P. | 92,600 | 1,092,680 | |||||
Oceaneering International 1 | 66,211 | 1,685,732 | |||||
Pason Systems | 946,023 | 15,485,806 | |||||
SEACOR Holdings 1 | 279,082 | 15,983,026 | |||||
| 269,802 | 6,229,728 | ||||||
TGS-NOPEC Geophysical | 530,159 | 19,528,593 | |||||
| 84,217,030 | |||||||
| OIL, GAS & CONSUMABLE FUELS - 0.9% | |||||||
Boardwalk Pipeline Partners L.P. | 172,759 | 2,007,460 | |||||
Dorchester Minerals L.P. | 257,825 | 5,311,195 | |||||
PBF Energy Cl. A | 73,957 | 3,101,017 | |||||
Permian Basin Royalty Trust | 703,552 | 6,564,140 | |||||
Sabine Royalty Trust | 9,401 | 442,317 | |||||
San Juan Basin Royalty Trust | 383,082 | 2,218,045 | |||||
| 19,644,174 | |||||||
| Total (Cost $82,653,329) | 103,861,204 | ||||||
| FINANCIALS – 28.4% | |||||||
| BANKS - 9.2% | |||||||
Ames National | 231,646 | 7,146,279 | |||||
Associated Banc-Corp | 400,350 | 10,929,555 | |||||
Bank of Hawaii | 262,512 | 21,898,751 | |||||
Bank of N.T. Butterfield & Son | 48,300 | 2,208,276 | |||||
Bank of the Ozarks | 89,800 | 4,044,592 | |||||
†Bar Harbor Bankshares | 89,526 | 2,711,742 | |||||
BLOM Bank Cl. B GDR | 225,597 | 2,368,768 | |||||
BOK Financial | 283,904 | 26,689,815 | |||||
Camden National | 187,792 | 8,583,972 | |||||
Canadian Western Bank | 531,861 | 14,018,167 | |||||
City Holding Company | 115,229 | 8,668,678 | |||||
CNB Financial | 237,080 | 7,126,625 | |||||
Codorus Valley Bancorp | 38,608 | 1,184,493 | |||||
Farmers & Merchants Bank of Long Beach 2 | 430 | 3,506,650 | |||||
First Citizens BancShares Cl. A | 62,739 | 25,302,639 | |||||
First National Bank Alaska 2 | 2,619 | 5,633,469 | |||||
Landmark Bancorp | 33,984 | 968,544 | |||||
MidWestOne Financial Group | 269,265 | 9,095,772 | |||||
National Bankshares | 125,932 | 5,843,245 | |||||
Northrim BanCorp | 150,412 | 5,948,795 | |||||
Peapack-Gladstone Financial | 451,335 | 15,611,678 | |||||
Popular | 238,193 | 10,768,705 | |||||
| 72 | The Royce Funds 2018 Semiannual Report to Shareholders | THE ACCOMPANYING NOTES ARE AN INTEGRAL PART OF THESE FINANCIAL STATEMENTS |
| June 30, 2018 (unaudited) |
| Royce Total Return Fund (continued) | |||||||
| SHARES | VALUE | ||||||
| FINANCIALS (continued) | |||||||
| BANKS (continued) | |||||||
†State Bank Financial | 38,537 | $ | 1,287,136 | ||||
Unity Bancorp | 79,297 | 1,804,007 | |||||
| 203,350,353 | |||||||
| CAPITAL MARKETS - 9.2% | |||||||
AllianceBernstein Holding L.P. | 371,187 | 10,597,389 | |||||
Apollo Global Management LLC Cl. A | 256,203 | 8,165,190 | |||||
Ares Management L.P. | 853,667 | 17,670,907 | |||||
Artisan Partners Asset Management Cl. A | 192,000 | 5,788,800 | |||||
Ashmore Group | 2,509,996 | 12,355,880 | |||||
Associated Capital Group Cl. A | 169,226 | 6,422,127 | |||||
Bolsa Mexicana de Valores | 4,831,182 | 8,132,144 | |||||
Cohen & Steers | 271,971 | 11,343,910 | |||||
Coronation Fund Managers | 470,890 | 2,001,647 | |||||
Edmond de Rothschild (Suisse) | 219 | 3,781,581 | |||||
Egyptian Financial Group-Hermes | |||||||
Holding Company 1 | 1,038,708 | 1,340,044 | |||||
Federated Investors Cl. B | 603,275 | 14,068,373 | |||||
GAMCO Investors Cl. A | 225,730 | 6,040,535 | |||||
Houlihan Lokey Cl. A | 86,779 | 4,444,820 | |||||
KKR & Co. L.P. | 538,863 | 13,390,745 | |||||
Moelis & Company Cl. A | 70,287 | 4,122,333 | |||||
Morningstar | 29,992 | 3,846,474 | |||||
MVC Capital | 289,585 | 2,751,057 | |||||
Oaktree Capital Group LLC Cl. A | 75,400 | 3,065,010 | |||||
Oaktree Specialty Lending | 248,411 | 1,187,405 | |||||
Och-Ziff Capital Management Group LLC Cl. A | 615,026 | 1,187,000 | |||||
Oppenheimer Holdings Cl. A | 103,576 | 2,900,128 | |||||
Rothschild & Co | 248,042 | 8,385,757 | |||||
†Sprott | 3,000,000 | 6,937,208 | |||||
Teton Advisors Cl. A 2 | 972 | 47,628 | |||||
TMX Group | 283,861 | 18,608,102 | |||||
Value Partners Group | 9,631,870 | 7,611,603 | |||||
Virtu Financial Cl. A | 102,104 | 2,710,861 | |||||
Vontobel Holding | 64,993 | 4,722,050 | |||||
Waddell & Reed Financial Cl. A | 91,564 | 1,645,405 | |||||
Westwood Holdings Group | 155,629 | 9,266,151 | |||||
| 204,538,264 | |||||||
| DIVERSIFIED FINANCIAL SERVICES - 0.1% | |||||||
First Pacific | 638,477 | 308,431 | |||||
Jefferies Financial Group | 122,251 | 2,779,988 | |||||
| 3,088,419 | |||||||
| INSURANCE - 8.4% | |||||||
Alleghany Corporation | 42,330 | 24,338,480 | |||||
Assured Guaranty | 271,314 | 9,694,049 | |||||
Baldwin & Lyons Cl. B | 230,445 | 5,622,858 | |||||
E-L Financial | 44,018 | 27,455,459 | |||||
Employers Holdings | 70,161 | 2,820,472 | |||||
Erie Indemnity Cl. A | 298,795 | 35,036,702 | |||||
First American Financial | 70,330 | 3,637,468 | |||||
Gallagher (Arthur J.) & Co. | 55,575 | 3,627,936 | |||||
Horace Mann Educators | 17,277 | 770,554 | |||||
James River Group Holdings | 219,390 | 8,619,833 | |||||
Kingstone Companies | 109,364 | 1,848,252 | |||||
Mercury General | 102,783 | 4,682,793 | |||||
National Western Life Group Cl. A | 5,464 | 1,678,869 | |||||
Old Republic International | 493,421 | 9,824,012 | |||||
ProAssurance Corporation | 389,855 | 13,820,360 | |||||
Reinsurance Group of America | 98,854 | 13,195,032 | |||||
RLI Corp. | 117,102 | 7,750,981 | |||||
Selective Insurance Group | 24,241 | 1,333,255 | |||||
State Auto Financial | 158,823 | 4,750,396 | |||||
Universal Insurance Holdings | 87,285 | 3,063,704 | |||||
White Mountains Insurance Group | 2,179 | 1,975,503 | |||||
| 185,546,968 | |||||||
| INVESTMENT COMPANIES - 0.0% | |||||||
RIT Capital Partners | 28,161 | 767,467 | |||||
| THRIFTS & MORTGAGE FINANCE - 1.5% | |||||||
Genworth MI Canada | 566,902 | 18,447,547 | |||||
Southern Missouri Bancorp | 31,995 | 1,248,445 | |||||
Timberland Bancorp | 124,016 | 4,630,758 | |||||
TrustCo Bank Corp. NY | 986,037 | 8,775,729 | |||||
| 33,102,479 | |||||||
| Total (Cost $401,043,787) | 630,393,950 | ||||||
| HEALTH CARE – 1.9% | |||||||
| HEALTH CARE EQUIPMENT & SUPPLIES - 1.2% | |||||||
Atrion Corporation | 8,185 | 4,906,089 | |||||
Hill-Rom Holdings | 120,759 | 10,547,091 | |||||
Meridian Bioscience | 141,351 | 2,247,481 | |||||
Teleflex | 38,413 | 10,302,751 | |||||
| 28,003,412 | |||||||
| HEALTH CARE PROVIDERS & SERVICES - 0.5% | |||||||
Chemed Corporation | 18,667 | 6,007,227 | |||||
Ensign Group (The) | 119,308 | 4,273,613 | |||||
| 10,280,840 | |||||||
| PHARMACEUTICALS - 0.2% | |||||||
Recordati | 91,094 | 3,623,288 | |||||
| Total (Cost $14,297,988) | 41,907,540 | ||||||
| INDUSTRIALS – 25.5% | |||||||
| AEROSPACE & DEFENSE - 1.0% | |||||||
HEICO Corporation | 296,128 | 21,596,578 | |||||
†Magellan Aerospace | 100,000 | 1,221,618 | |||||
| 22,818,196 | |||||||
| AIR FREIGHT & LOGISTICS - 0.9% | |||||||
Expeditors International of Washington | 275,526 | 20,140,951 | |||||
| AIRLINES - 1.0% | |||||||
Allegiant Travel | 65,736 | 9,134,017 | |||||
Hawaiian Holdings | 373,663 | 13,433,185 | |||||
| 22,567,202 | |||||||
| BUILDING PRODUCTS - 1.1% | |||||||
A. O. Smith Corporation | 247,749 | 14,654,353 | |||||
Apogee Enterprises | 204,847 | 9,867,480 | |||||
| 24,521,833 | |||||||
| COMMERCIAL SERVICES & SUPPLIES - 5.2% | |||||||
ABM Industries | 434,743 | 12,685,801 | |||||
Deluxe Corporation | 30,874 | 2,044,168 | |||||
Ennis | 163,629 | 3,329,850 | |||||
Herman Miller | 332,322 | 11,265,716 | |||||
HNI Corporation | 322,396 | 11,993,131 | |||||
Kimball International Cl. B | 1,082,038 | 17,485,734 | |||||
McGrath RentCorp | 259,846 | 16,440,456 | |||||
MSA Safety | 138,913 | 13,382,878 | |||||
Pitney Bowes | 112,082 | 960,543 | |||||
Ritchie Bros. Auctioneers | 603,843 | 20,603,123 | |||||
Tetra Tech | 20,496 | 1,199,016 | |||||
UniFirst Corporation | 19,261 | 3,407,271 | |||||
| 114,797,687 | |||||||
| THE ACCOMPANYING NOTES ARE AN INTEGRAL PART OF THESE FINANCIAL STATEMENTS | The Royce Funds 2018 Semiannual Report to Shareholders | 73 |
| Schedules of Investments | |||||||
| Royce Total Return Fund (continued) | |||||||
| SHARES | VALUE | ||||||
| INDUSTRIALS (continued) | |||||||
| CONSTRUCTION & ENGINEERING - 1.2% | |||||||
†Argan | 187,000 | $ | 7,657,650 | ||||
Comfort Systems USA | 156,378 | 7,162,112 | |||||
EMCOR Group | 51,357 | 3,912,376 | |||||
KBR | 364,467 | 6,531,249 | |||||
| 25,263,387 | |||||||
| ELECTRICAL EQUIPMENT - 2.2% | |||||||
EnerSys | 85,664 | 6,393,961 | |||||
Hubbell Cl. B | 196,973 | 20,827,925 | |||||
LSI Industries | 827,785 | 4,420,372 | |||||
Preformed Line Products | 190,382 | 16,902,114 | |||||
| 48,544,372 | |||||||
| INDUSTRIAL CONGLOMERATES - 0.8% | |||||||
Raven Industries | 453,562 | 17,439,459 | |||||
| MACHINERY - 8.2% | |||||||
Alamo Group | 37,040 | 3,346,934 | |||||
American Railcar Industries | 154,669 | 6,106,332 | |||||
Federal Signal | 91,556 | 2,132,339 | |||||
Franklin Electric | 526,497 | 23,745,015 | |||||
Gorman-Rupp Company (The) | 309,167 | 10,820,845 | |||||
Greenbrier Companies (The) | 94,392 | 4,979,178 | |||||
Hillenbrand | 24,064 | 1,134,618 | |||||
Kadant | 22,650 | 2,177,797 | |||||
Lincoln Electric Holdings | 133,215 | 11,690,948 | |||||
Lindsay Corporation | 143,818 | 13,948,908 | |||||
Miller Industries | 351,434 | 8,979,139 | |||||
| 28,494 | 840,858 | ||||||
Mueller Industries | 290,574 | 8,574,839 | |||||
Nordson Corporation | 41,828 | 5,371,133 | |||||
Standex International | 40,308 | 4,119,478 | |||||
| 421,957 | 2,700,525 | ||||||
Sun Hydraulics | 140,290 | 6,760,575 | |||||
Tennant Company | 263,500 | 20,816,500 | |||||
Trinity Industries | 510,053 | 17,474,416 | |||||
Wabash National | 819,222 | 15,286,683 | |||||
Woodward | 152,028 | 11,684,872 | |||||
| 182,691,932 | |||||||
| MARINE - 0.9% | |||||||
Clarkson | 636,371 | 19,316,571 | |||||
| PROFESSIONAL SERVICES - 2.4% | |||||||
Exponent | 113,428 | 5,478,572 | |||||
Forrester Research | 36,977 | 1,551,185 | |||||
Heidrick & Struggles International | 109,628 | 3,836,980 | |||||
Insperity | 52,352 | 4,986,528 | |||||
†Kforce | 158,246 | 5,427,838 | |||||
Korn/Ferry International | 72,364 | 4,481,503 | |||||
ManpowerGroup | 277,557 | 23,886,555 | |||||
Robert Half International | 65,346 | 4,254,025 | |||||
| 53,903,186 | |||||||
| ROAD & RAIL - 0.1% | |||||||
Werner Enterprises | 56,798 | 2,132,765 | |||||
| TRADING COMPANIES & DISTRIBUTORS - 0.4% | |||||||
Applied Industrial Technologies | 41,450 | 2,907,717 | |||||
Systemax | 187,538 | 6,438,180 | |||||
| 9,345,897 | |||||||
| TRANSPORTATION INFRASTRUCTURE - 0.1% | |||||||
Grupo Aeroportuario del Pacifico | 96,468 | 895,208 | |||||
| Total (Cost $273,762,092) | 564,378,646 | ||||||
| INFORMATION TECHNOLOGY – 6.2% | |||||||
| COMMUNICATIONS EQUIPMENT - 0.1% | |||||||
ADTRAN | 126,880 | 1,884,168 | |||||
TESSCO Technologies | 39,149 | 677,278 | |||||
| 2,561,446 | |||||||
| ELECTRONIC EQUIPMENT, INSTRUMENTS & COMPONENTS - 3.9% | |||||||
AVX Corporation | 871,852 | 13,661,921 | |||||
Bel Fuse Cl. A | 19,293 | 412,870 | |||||
†Benchmark Electronics | 280,978 | 8,190,509 | |||||
Methode Electronics | 595,456 | 23,996,877 | |||||
National Instruments | 224,871 | 9,440,084 | |||||
PC Connection | 409,551 | 13,597,093 | |||||
Vishay Intertechnology | 783,334 | 18,173,349 | |||||
| 87,472,703 | |||||||
| IT SERVICES - 0.1% | |||||||
MAXIMUS | 47,442 | 2,946,623 | |||||
| SEMICONDUCTORS & SEMICONDUCTOR EQUIPMENT - 1.9% | |||||||
Cohu | 161,012 | 3,946,404 | |||||
†Kulicke & Soffa Industries | 416,355 | 9,917,576 | |||||
MKS Instruments | 213,155 | 20,398,934 | |||||
Silicon Motion Technology ADR | 127,450 | 6,740,831 | |||||
Xperi | 55,763 | 897,784 | |||||
| 41,901,529 | |||||||
| SOFTWARE - 0.2% | |||||||
Ebix | 46,674 | 3,558,892 | |||||
| Total (Cost $96,158,034) | 138,441,193 | ||||||
| MATERIALS – 10.9% | |||||||
| CHEMICALS - 5.7% | |||||||
Albemarle Corporation | 141,000 | 13,300,530 | |||||
Balchem Corporation | 125,400 | 12,306,756 | |||||
Cabot Corporation | 294,888 | 18,215,232 | |||||
Chase Corporation | 204,955 | 24,030,974 | |||||
FutureFuel Corporation | 201,809 | 2,827,344 | |||||
Innospec | 28,121 | 2,152,662 | |||||
Minerals Technologies | 78,900 | 5,945,115 | |||||
Quaker Chemical | 231,293 | 35,820,347 | |||||
Trinseo | 31,709 | 2,249,753 | |||||
Umicore | 187,280 | 10,749,380 | |||||
| 127,598,093 | |||||||
| CONTAINERS & PACKAGING - 1.8% | |||||||
AptarGroup | 95,638 | 8,930,677 | |||||
Greif Cl. A | 179,342 | 9,485,398 | |||||
Mayr-Melnhof Karton | 49,643 | 6,701,690 | |||||
Sonoco Products | 265,604 | 13,944,210 | |||||
| 39,061,975 | |||||||
| METALS & MINING - 2.9% | |||||||
Alamos Gold Cl. A | 866,066 | 4,934,267 | |||||
Ampco-Pittsburgh 1 | 124,524 | 1,276,371 | |||||
Carpenter Technology | 115,267 | 6,059,586 | |||||
Compass Minerals International | 211,744 | 13,922,168 | |||||
| 569,803 | 0 | ||||||
Franco-Nevada Corporation | 69,207 | 5,053,495 | |||||
Gold Fields ADR | 1,260,816 | 4,501,113 | |||||
Haynes International | 240,815 | 8,847,543 | |||||
Reliance Steel & Aluminum | 25,231 | 2,208,722 | |||||
Royal Gold | 17,277 | 1,603,997 | |||||
Schnitzer Steel Industries Cl. A | 104,559 | 3,523,639 | |||||
Worthington Industries | 303,867 | 12,753,298 | |||||
| 64,684,199 | |||||||
| 74 | The Royce Funds 2018 Semiannual Report to Shareholders | THE ACCOMPANYING NOTES ARE AN INTEGRAL PART OF THESE FINANCIAL STATEMENTS |
| June 30, 2018 (unaudited) |
| Royce Total Return Fund (continued) | |||||||
| SHARES | VALUE | ||||||
| MATERIALS (continued) | |||||||
| PAPER & FOREST PRODUCTS - 0.5% | |||||||
Domtar Corporation | 97,329 | $ | 4,646,486 | ||||
Neenah | 33,839 | 2,871,239 | |||||
Pope Resources L.P. | 12,075 | 887,513 | |||||
Resolute Forest Products 1 | 82,800 | 856,980 | |||||
Schweitzer-Mauduit International | 34,824 | 1,522,505 | |||||
| 10,784,723 | |||||||
| Total (Cost $119,704,373) | 242,128,990 | ||||||
| REAL ESTATE – 1.4% | |||||||
| EQUITY REAL ESTATE INVESTMENT TRUSTS (REITS) - 0.7% | |||||||
CBL & Associates Properties | 260,275 | 1,449,732 | |||||
†Kite Realty Group Trust | 92,600 | 1,581,608 | |||||
Lexington Realty Trust | 303,511 | 2,649,651 | |||||
†PotlatchDeltic Corporation | 207,860 | 10,569,681 | |||||
| 16,250,672 | |||||||
| REAL ESTATE MANAGEMENT & DEVELOPMENT - 0.7% | |||||||
†Kennedy-Wilson Holdings | 732,200 | 15,486,030 | |||||
| Total (Cost $24,515,749) | 31,736,702 | ||||||
| TELECOMMUNICATION SERVICES – 0.7% | |||||||
| DIVERSIFIED TELECOMMUNICATION SERVICES - 0.4% | |||||||
ATN International | 172,585 | 9,107,311 | |||||
| WIRELESS TELECOMMUNICATION SERVICES - 0.3% | |||||||
Telephone and Data Systems | 219,558 | 6,020,280 | |||||
| Total (Cost $9,497,201) | 15,127,591 | ||||||
| UTILITIES – 2.4% | |||||||
| ELECTRIC UTILITIES - 0.5% | |||||||
ALLETE | 134,248 | 10,392,138 | |||||
| GAS UTILITIES - 0.1% | |||||||
Star Group L.P. | 217,523 | 2,131,725 | |||||
| WATER UTILITIES - 1.8% | |||||||
Aqua America | 408,181 | 14,359,808 | |||||
SJW Group | 318,275 | 21,076,170 | |||||
York Water | 138,001 | 4,388,432 | |||||
| 39,824,410 | |||||||
| Total (Cost $19,150,235) | 52,348,273 | ||||||
| TOTAL COMMON STOCKS | |||||||
| (Cost $1,221,030,832) | 2,084,142,940 | ||||||
| PRINCIPAL | |||||||
| AMOUNT | VALUE | ||||||
| CORPORATE BOND– 0.2% | |||||||
Unit Corporation 6.625% | |||||||
due 5/15/21 | |||||||
| (Cost $3,901,743) | $4,411,900 | $ | 4,400,870 | ||||
| REPURCHASE AGREEMENT– 5.7% | |||||||
| Fixed Income Clearing Corporation, 0.35% dated 6/29/18, due 7/2/18, maturity value $126,084,677 (collateralized by obligations of various U.S. Government Agencies, 1.125%- 1.375% due 9/30/21-10/07/21, valued at $128,605,501) | |||||||
| (Cost $126,081,000) | 126,081,000 | ||||||
| TOTAL INVESTMENTS – 99.9% | |||||||
| (Cost $1,351,013,575) | 2,214,624,810 | ||||||
| CASH AND OTHER ASSETS LESS LIABILITIES – 0.1% | 2,782,710 | ||||||
| NET ASSETS – 100.0% | $ | 2,217,407,520 | |||||
| † | New additions in 2018. |
| 1 | Non-income producing. |
| 2 | These securities are defined as Level 2 securities due to fair value being based on quoted prices for similar securities. See Notes to Financial Statements. |
| 3 | Securities for which market quotations are not readily available represent 0.0%, 0.0%, 0.4%, 0.0% and 0.0% of net assets for Royce International Discovery Fund, Royce Low-Priced Stock Fund, Royce Micro-Cap Fund, Royce Small/Mid-Cap Premier Fund and Royce Total Return Fund. These securities have been valued at their fair value under procedures approved by the Fund’s Board of Trustees. These securities are defined as Level 3 securities due to the use of significant unobservable inputs in the determination of fair value. See Notes to Financial Statements. |
| 4 | All or a portion of these securities were on loan at June 30, 2018. |
| 5 | At June 30, 2018, the Fund owned 5% or more of the Company’s outstanding voting securities thereby making the Company an Affiliated Company as that term is defined in the Investment Company Act of 1940. See Notes to Financial Statements. |
Securities of International Funds are categorized by the country of their headquarters, with the exception of exchange-traded funds. | |
Bold indicates a Fund’s 20 largest equity holdings in terms of June 30, 2018, market value. |
| THE ACCOMPANYING NOTES ARE AN INTEGRAL PART OF THESE FINANCIAL STATEMENTS | The Royce Funds 2018 Semiannual Report to Shareholders | 75 |
Statements of Assets and Liabilities
| Royce Global | ||||||||||||||||
| Royce Dividend | Financial Services | Royce International | Royce International | |||||||||||||
| Value Fund | Fund | Discovery Fund | Premier Fund | |||||||||||||
| ASSETS: | ||||||||||||||||
| Investments at value | ||||||||||||||||
Non-Affiliated Companies | $ | 164,226,702 | $ | 53,454,907 | $ | 7,660,090 | $ | 223,478,008 | ||||||||
| Repurchase agreements (at cost and value) | 2,288,000 | 3,525,000 | 297,000 | 10,354,000 | ||||||||||||
| Cash and foreign currency | 1,884 | 2,384 | 4,541 | 79,544 | ||||||||||||
| Receivable for investments sold | 340,883 | – | 27,205 | – | ||||||||||||
| Receivable for capital shares sold | 91,229 | 3,972 | 895 | 695,096 | ||||||||||||
| Receivable for dividends and interest | 157,877 | 90,931 | 11,228 | 649,072 | ||||||||||||
| Receivable due from investment advisor | – | – | 6,168 | – | ||||||||||||
| Prepaid expenses and other assets | 2,893 | 1,297 | 20,399 | 3,791 | ||||||||||||
| Total Assets | 167,109,468 | 57,078,491 | 8,027,526 | 235,259,511 | ||||||||||||
| LIABILITIES: | ||||||||||||||||
| Payable for investments purchased | 221,185 | – | – | 1,159,758 | ||||||||||||
| Payable for capital shares redeemed | 206,024 | 29,998 | 45,188 | 355,626 | ||||||||||||
| Payable for investment advisory fees | 108,889 | 41,405 | – | 148,518 | ||||||||||||
| Payable for trustees’ fees | 6,794 | 1,865 | 262 | 5,670 | ||||||||||||
| Accrued expenses | 158,824 | 68,703 | 9,319 | 197,949 | ||||||||||||
| Deferred capital gains tax | – | 6,145 | – | – | ||||||||||||
| Total Liabilities | 701,716 | 148,116 | 54,769 | 1,867,521 | ||||||||||||
| Net Assets | $ | 166,407,752 | $ | 56,930,375 | $ | 7,972,757 | $ | 233,391,990 | ||||||||
| ANALYSIS OF NET ASSETS: | ||||||||||||||||
| Paid-in capital | $ | 97,537,278 | $ | 41,398,765 | $ | 7,604,580 | $ | 283,668,202 | ||||||||
| Undistributed net investment income (loss) | (8,193 | ) | (410,120 | ) | (937 | ) | (599,504 | ) | ||||||||
Accumulated net realized gain (loss) on investments and foreign currency | 10,268,953 | 3,873,724 | 290,619 | (60,013,553 | ) | |||||||||||
Net unrealized appreciation (depreciation) on investments and foreign currency | 58,609,714 | 12,068,006 | 78,495 | 10,336,845 | ||||||||||||
| Net Assets | $ | 166,407,752 | $ | 56,930,375 | $ | 7,972,757 | $ | 233,391,990 | ||||||||
Investment Class | $ | 115,434,148 | $ | 171,566,980 | ||||||||||||
Service Class | 48,904,680 | $ | 48,122,520 | $ | 7,972,757 | 43,583,484 | ||||||||||
Consultant Class | 1,302,117 | 9,885,417 | ||||||||||||||
Institutional Class | 766,807 | 8,807,855 | 8,356,109 | |||||||||||||
| SHARES OUTSTANDING (unlimited number of $.001 par value): | ||||||||||||||||
Investment Class | 15,695,919 | 13,527,584 | ||||||||||||||
Service Class | 6,479,641 | 4,436,383 | 676,100 | 2,883,401 | ||||||||||||
Consultant Class | 150,881 | 603,078 | ||||||||||||||
Institutional Class | 105,642 | 630,513 | 658,682 | |||||||||||||
| NET ASSET VALUES (Net Assets ÷ Shares Outstanding): | ||||||||||||||||
Investment Class1 | $7.35 | $12.68 | ||||||||||||||
Service Class1 | 7.55 | $10.85 | $11.79 | 15.12 | ||||||||||||
Consultant Class2 | 8.63 | 16.39 | ||||||||||||||
Institutional Class3 | 7.26 | 13.97 | 12.69 | |||||||||||||
| Investments at identified cost | $ | 105,617,014 | $ | 41,380,189 | $ | 7,581,557 | $ | 213,124,334 | ||||||||
| 1 | Offering and redemption price per share; shares held less than 30 days may be subject to a 1% redemption fee, or a 2% redemption fee (Royce International Discovery Fund and Royce International Premier Fund), payable to the Fund. |
| 2 | Offering and redemption price per share; shares held less than 365 days may be subject to a 1% contingent deferred sales charge, payable to Royce Fund Services, LLC. |
| 3 | Offering and redemption price per share. |
| 76 | The Royce Funds 2018 Semiannual Report to Shareholders | THE ACCOMPANYING NOTES ARE AN INTEGRAL PART OF THESE FINANCIAL STATEMENTS |
| June 30, 2018 (unaudited) |
| Royce Low-Priced | Royce Micro-Cap | Royce Micro-Cap | Royce Opportunity | |||||||||||||
| Stock Fund | Fund | Opportunity Fund | Fund | |||||||||||||
| ASSETS: | ||||||||||||||||
| Investments at value (including collateral on loaned securities)1 | ||||||||||||||||
Non-Affiliated Companies | $ | 266,920,780 | $ | 193,581,959 | $ | 45,829,279 | $ | 1,217,784,291 | ||||||||
| Repurchase agreements (at cost and value) | 12,739,000 | 8,277,000 | 2,245,000 | 96,754,000 | ||||||||||||
| Cash and foreign currency | 8,540 | 9,845 | 402 | 987 | ||||||||||||
| Receivable for investments sold | – | – | 22,365 | 2,605,971 | ||||||||||||
| Receivable for capital shares sold | 9,745 | 12,428 | 4,164 | 2,178,555 | ||||||||||||
| Receivable for dividends and interest | 112,469 | 144,904 | 12,759 | 609,456 | ||||||||||||
| Receivable for securities lending income | 8,472 | 11,571 | – | 53,774 | ||||||||||||
| Prepaid expenses and other assets | – | 280 | 1,168 | 27,739 | ||||||||||||
| Total Assets | 279,799,006 | 202,037,987 | 48,115,137 | 1,320,014,773 | ||||||||||||
| LIABILITIES: | ||||||||||||||||
| Payable for collateral on loaned securities | 7,857,308 | 3,716,832 | – | 22,685,409 | ||||||||||||
| Payable for investments purchased | 691,277 | 388,913 | 20,600 | 4,065,678 | ||||||||||||
| Payable for capital shares redeemed | 281,658 | 194,527 | 100,000 | 2,100,806 | ||||||||||||
| Payable for investment advisory fees | 227,068 | 204,912 | 41,014 | 1,082,858 | ||||||||||||
| Payable for trustees’ fees | 8,608 | 7,414 | 1,624 | 52,918 | ||||||||||||
| Accrued expenses | 674,057 | 196,788 | 31,374 | 683,299 | ||||||||||||
| Total Liabilities | 9,739,976 | 4,709,386 | 194,612 | 30,670,968 | ||||||||||||
| Net Assets | $ | 270,059,030 | $ | 197,328,601 | $ | 47,920,525 | $ | 1,289,343,805 | ||||||||
| ANALYSIS OF NET ASSETS: | ||||||||||||||||
| Paid-in capital | $ | 177,648,170 | $ | 132,863,142 | $ | 31,607,999 | $ | 915,862,641 | ||||||||
| Undistributed net investment income (loss) | (991,149 | ) | (821,058 | ) | (214,427 | ) | (3,624,819 | ) | ||||||||
Accumulated net realized gain (loss) on investments and foreign currency | 40,588,554 | 12,121,146 | 6,865,750 | 211,250,548 | ||||||||||||
Net unrealized appreciation (depreciation) on investments and foreign currency | 52,813,455 | 53,165,371 | 9,661,203 | 165,855,435 | ||||||||||||
| Net Assets | $ | 270,059,030 | $ | 197,328,601 | $ | 47,920,525 | $ | 1,289,343,805 | ||||||||
Investment Class | $ | 60,061,258 | $ | 159,817,813 | $ | 46,631,409 | $ | 804,294,850 | ||||||||
Service Class | 209,997,772 | 13,709,755 | 1,289,116 | 76,213,324 | ||||||||||||
Consultant Class | 23,801,033 | 17,536,116 | ||||||||||||||
Institutional Class | 355,530,216 | |||||||||||||||
R Class | 35,769,299 | |||||||||||||||
| SHARES OUTSTANDING (unlimited number of $.001 par value): | ||||||||||||||||
Investment Class | 6,457,560 | 12,456,862 | 2,188,085 | 56,940,065 | ||||||||||||
Service Class | 22,702,067 | 1,091,203 | 120,473 | 5,796,091 | ||||||||||||
Consultant Class | 2,386,548 | 1,514,528 | ||||||||||||||
Institutional Class | 24,670,863 | |||||||||||||||
R Class | 2,815,875 | |||||||||||||||
| NET ASSET VALUES (Net Assets ÷ Shares Outstanding): | ||||||||||||||||
Investment Class2 | $9.30 | $12.83 | $21.31 | $14.13 | ||||||||||||
Service Class2 | 9.25 | 12.56 | 10.70 | 13.15 | ||||||||||||
Consultant Class3 | 9.97 | 11.58 | ||||||||||||||
Institutional Class4 | 14.41 | |||||||||||||||
R Class4 | 12.70 | |||||||||||||||
| Investments at identified cost | $ | 214,107,165 | $ | 140,415,471 | $ | 36,168,076 | $ | 1,051,928,856 | ||||||||
| Market value of loaned securities5 | 8,449,773 | 6,431,387 | – | 78,543,730 | ||||||||||||
| 1 | See Notes to Financial Statements for additional collateral on loaned securities. |
| 2 | Offering and redemption price per share; shares held less than 30 days may be subject to a 1% redemption fee, payable to the Fund. |
| 3 | Offering and redemption price per share; shares held less than 365 days may be subject to a 1% contingent deferred sales charge, payable to Royce Fund Services, LLC. |
| 4 | Offering and redemption price per share. |
| 5 | Market value of loaned securities backed by non-cash collateral is as of prior business day. |
| THE ACCOMPANYING NOTES ARE AN INTEGRAL PART OF THESE FINANCIAL STATEMENTS | The Royce Funds 2018 Semiannual Report to Shareholders | 77 |
Statements of Assets and Liabilities
| Royce Pennsylvania | Royce Small-Cap | Royce Small-Cap | ||||||||||||||
| Mutual Fund | Royce Premier Fund | Leaders Fund | Value Fund | |||||||||||||
| ASSETS: | ||||||||||||||||
| Investments at value (including collateral on loaned securities)1 | ||||||||||||||||
Non-Affiliated Companies | $ | 1,966,684,090 | $ | 2,130,773,835 | $ | 73,742,481 | $ | 216,163,874 | ||||||||
Affiliated Companies | – | 45,809,813 | – | – | ||||||||||||
| Repurchase agreements (at cost and value) | 102,601,000 | 99,671,000 | 6,363,000 | 20,991,000 | ||||||||||||
| Cash and foreign currency | 117,824 | 310,176 | 15,551 | 471 | ||||||||||||
| Receivable for investments sold | 20,941,686 | 12,912,556 | 409,184 | 2,179,465 | ||||||||||||
| Receivable for capital shares sold | 697,887 | 3,329,097 | 236,841 | 190,704 | ||||||||||||
| Receivable for dividends and interest | 954,753 | 2,704,777 | 35,860 | 186,448 | ||||||||||||
| Receivable for securities lending income | 43,903 | 2,029 | 2,820 | 802 | ||||||||||||
| Prepaid expenses and other assets | 2,869,702 | 15,912 | 22 | 581 | ||||||||||||
| Total Assets | 2,094,910,845 | 2,295,529,195 | 80,805,759 | 239,713,345 | ||||||||||||
| LIABILITIES: | ||||||||||||||||
| Payable for collateral on loaned securities | 7,149,754 | – | – | – | ||||||||||||
| Payable for investments purchased | 17,239,315 | 13,180,291 | 248,723 | 614,244 | ||||||||||||
| Payable for capital shares redeemed | 1,231,092 | 1,494,041 | 62,355 | 179,693 | ||||||||||||
| Payable for investment advisory fees | 1,316,503 | 1,907,996 | 67,402 | 199,314 | ||||||||||||
| Payable for trustees’ fees | 77,361 | 79,281 | 3,392 | 11,843 | ||||||||||||
| Accrued expenses | 1,281,442 | 1,904,789 | 107,930 | 302,821 | ||||||||||||
| Total Liabilities | 28,295,467 | 18,566,398 | 489,802 | 1,307,915 | ||||||||||||
| Net Assets | $ | 2,066,615,378 | $ | 2,276,962,797 | $ | 80,315,957 | $ | 238,405,430 | ||||||||
| ANALYSIS OF NET ASSETS: | ||||||||||||||||
| Paid-in capital | $ | 1,048,250,632 | $ | 934,510,609 | $ | 53,495,989 | $ | 174,184,782 | ||||||||
| Undistributed net investment income (loss) | (244,065 | ) | 1,380,156 | 58,475 | 238,067 | |||||||||||
Accumulated net realized gain (loss) on investments and foreign currency | 216,750,486 | 284,976,156 | 9,489,937 | 20,436,810 | ||||||||||||
Net unrealized appreciation (depreciation) on investments and foreign currency | 801,858,325 | 1,056,095,876 | 17,271,556 | 43,545,771 | ||||||||||||
| Net Assets | $ | 2,066,615,378 | $ | 2,276,962,797 | $ | 80,315,957 | $ | 238,405,430 | ||||||||
Investment Class | $ | 1,592,737,191 | $ | 1,909,485,642 | $ | 43,660,514 | $ | 70,369,678 | ||||||||
Service Class | 51,184,555 | 50,337,489 | 36,655,443 | 144,851,904 | ||||||||||||
Consultant Class | 343,971,037 | 29,797,910 | 12,544,348 | |||||||||||||
Institutional Class | 65,207,956 | 247,483,070 | ||||||||||||||
W Class | 27,747,908 | |||||||||||||||
R Class | 13,514,639 | 12,110,778 | 10,639,500 | |||||||||||||
| SHARES OUTSTANDING (unlimited number of $.001 par value): | ||||||||||||||||
Investment Class | 143,201,727 | 112,153,778 | 6,312,964 | 6,459,338 | ||||||||||||
Service Class | 4,595,148 | 3,043,784 | 5,368,767 | 13,364,830 | ||||||||||||
Consultant Class | 38,660,015 | 2,211,912 | 1,298,718 | |||||||||||||
Institutional Class | 5,848,230 | 14,342,297 | ||||||||||||||
W Class | 1,622,029 | |||||||||||||||
R Class | 1,290,652 | 769,884 | 1,021,220 | |||||||||||||
| NET ASSET VALUES (Net Assets ÷ Shares Outstanding): | ||||||||||||||||
Investment Class2 | $11.12 | $17.03 | $6.92 | $10.89 | ||||||||||||
Service Class2 | 11.14 | 16.54 | 6.83 | 10.84 | ||||||||||||
Consultant Class3 | 8.90 | 13.47 | 9.66 | |||||||||||||
Institutional Class4 | 11.15 | 17.26 | ||||||||||||||
W Class4 | 17.11 | |||||||||||||||
R Class4 | 10.47 | 15.73 | 10.42 | |||||||||||||
| Investments at identified cost | $ | 1,164,824,585 | $ | 1,120,457,606 | $ | 56,471,003 | $ | 172,618,103 | ||||||||
| Market value of loaned securities5 | 45,813,463 | 7,041,361 | 2,150,346 | 8,251,222 | ||||||||||||
| 1 | See Notes to Financial Statements for additional collateral on loaned securities. |
| 2 | Offering and redemption price per share; shares held less than 30 days may be subject to a 1% redemption fee, payable to the Fund. |
| 3 | Offering and redemption price per share; shares held less than 365 days may be subject to a 1% contingent deferred sales charge, payable to Royce Fund Services, LLC. |
| 4 | Offering and redemption price per share. |
| 5 | Market value of loaned securities backed by non-cash collateral is as of prior business day. |
| 78 | The Royce Funds 2018 Semiannual Report to Shareholders | THE ACCOMPANYING NOTES ARE AN INTEGRAL PART OF THESE FINANCIAL STATEMENTS |
| June 30, 2018 (unaudited) |
| Royce Smaller- | ||||||||||||
| Royce Small/Mid-Cap | Companies Growth | Royce Special Equity | ||||||||||
| Premier Fund | Fund | Fund | ||||||||||
| ASSETS: | ||||||||||||
| Investments at value (including collateral on loaned securities)1 | ||||||||||||
Non-Affiliated Companies | $ | 162,703,354 | $ | 361,805,907 | $ | 875,341,890 | ||||||
Affiliated Companies | – | – | 347,655,387 | |||||||||
| Repurchase agreements (at cost and value) | 29,491,000 | 21,889,000 | 178,533,000 | |||||||||
| Cash and foreign currency | 162 | 14,922 | 212,968 | |||||||||
| Receivable for investments sold | 492,783 | 568,273 | 778,446 | |||||||||
| Receivable for capital shares sold | 3,401 | 76,105 | 534,014 | |||||||||
| Receivable for dividends and interest | 136,203 | 97,312 | 457,029 | |||||||||
| Receivable for securities lending income | – | 42,674 | – | |||||||||
| Prepaid expenses and other assets | 3,374 | 405 | 23,597 | |||||||||
| Total Assets | 192,830,277 | 384,494,598 | 1,403,536,331 | |||||||||
| LIABILITIES: | ||||||||||||
| Payable for collateral on loaned securities | – | 15,347,529 | – | |||||||||
| Payable for investments purchased | 1,723,383 | 1,047,847 | 4,007 | |||||||||
| Payable for capital shares redeemed | 138,797 | 153,636 | 1,884,898 | |||||||||
| Payable for investment advisory fees | 136,569 | 308,888 | 1,166,972 | |||||||||
| Payable for trustees’ fees | 7,350 | 13,438 | 52,605 | |||||||||
| Accrued expenses | 93,171 | 327,123 | 947,489 | |||||||||
| Total Liabilities | 2,099,270 | 17,198,461 | 4,055,971 | |||||||||
| Net Assets | $ | 190,731,007 | $ | 367,296,137 | $ | 1,399,480,360 | ||||||
| ANALYSIS OF NET ASSETS: | ||||||||||||
| Paid-in capital | $ | 139,262,384 | $ | 203,415,470 | $ | 886,336,040 | ||||||
| Undistributed net investment income (loss) | (1,120 | ) | (2,041,487 | ) | 9,228,266 | |||||||
| Accumulated net realized gain (loss) on investments and foreign currency | 26,712,439 | 73,173,638 | 63,408,322 | |||||||||
| Net unrealized appreciation (depreciation) on investments and foreign currency | 24,757,304 | 92,748,516 | 440,507,732 | |||||||||
| Net Assets | $ | 190,731,007 | $ | 367,296,137 | $ | 1,399,480,360 | ||||||
Investment Class | $ | 76,858,845 | $ | 124,393,631 | $ | 1,114,110,925 | ||||||
Service Class | 104,968,956 | 223,091,286 | 53,407,732 | |||||||||
Consultant Class | 8,903,206 | 10,065,084 | 40,172,180 | |||||||||
Institutional Class | 9,746,136 | 191,789,523 | ||||||||||
| SHARES OUTSTANDING (unlimited number of $.001 par value): | ||||||||||||
Investment Class | 5,063,409 | 10,292,697 | 51,297,977 | |||||||||
Service Class | 6,941,663 | 18,901,984 | 2,466,222 | |||||||||
Consultant Class | 835,030 | 986,341 | 2,040,507 | |||||||||
Institutional Class | 796,798 | 8,901,910 | ||||||||||
| NET ASSET VALUES (Net Assets ÷ Shares Outstanding): | ||||||||||||
Investment Class2 | $15.18 | $12.09 | $21.72 | |||||||||
Service Class2 | 15.12 | 11.80 | 21.66 | |||||||||
Consultant Class3 | 10.66 | 10.20 | 19.69 | |||||||||
Institutional Class4 | 12.23 | 21.54 | ||||||||||
| Investments at identified cost | $ | 137,943,204 | $ | 269,057,822 | $ | 782,489,545 | ||||||
| Market value of loaned securities5 | – | 44,812,593 | – | |||||||||
| 1 | See Notes to Financial Statements for additional collateral on loaned securities. |
| 2 | Offering and redemption price per share; shares held less than 30 days may be subject to a 1% redemption fee, payable to the Fund. |
| 3 | Offering and redemption price per share; shares held less than 365 days may be subject to a 1% contingent deferred sales charge, payable to Royce Fund Services, LLC. |
| 4 | Offering and redemption price per share. |
| 5 | Market value of loaned securities backed by non-cash collateral is as of prior business day. |
| THE ACCOMPANYING NOTES ARE AN INTEGRAL PART OF THESE FINANCIAL STATEMENTS | The Royce Funds 2018 Semiannual Report to Shareholders | 79 |
| Statements of Assets and Liabilities | June 30, 2018 (unaudited) |
| Royce Special Equity | Royce Total Return | |||||||
| Multi-Cap Fund | Fund | |||||||
| ASSETS: | ||||||||
| Investments at value | ||||||||
Non-Affiliated Companies | $ | 56,893,311 | $ | 2,085,843,285 | ||||
Affiliated Companies | – | 2,700,525 | ||||||
| Repurchase agreements (at cost and value) | 9,659,000 | 126,081,000 | ||||||
| Cash and foreign currency | 886 | 110,296 | ||||||
| Receivable for investments sold | 145,463 | 6,609,653 | ||||||
| Receivable for capital shares sold | 3,970 | 737,686 | ||||||
| Receivable for dividends and interest | 132,628 | 2,145,421 | ||||||
| Receivable for securities lending income | – | 5,487 | ||||||
| Prepaid expenses and other assets | 2,393 | 30,364 | ||||||
| Total Assets | 66,837,651 | 2,224,263,717 | ||||||
| LIABILITIES: | ||||||||
| Payable for investments purchased | – | 1,851,896 | ||||||
| Payable for capital shares redeemed | 31,505 | 1,458,669 | ||||||
| Payable for investment advisory fees | 42,587 | 1,847,643 | ||||||
| Payable for trustees’ fees | 3,738 | 87,584 | ||||||
| Accrued expenses | 33,969 | 1,610,405 | ||||||
| Total Liabilities | 111,799 | 6,856,197 | ||||||
| Net Assets | $ | 66,725,852 | $ | 2,217,407,520 | ||||
| ANALYSIS OF NET ASSETS: | ||||||||
| Paid-in capital | $ | 40,086,730 | $ | 1,096,168,652 | ||||
| Undistributed net investment income (loss) | 426,938 | 5,188,546 | ||||||
| Accumulated net realized gain (loss) on investments and foreign currency | 10,134,039 | 252,445,179 | ||||||
| Net unrealized appreciation (depreciation) on investments and foreign currency | 16,078,145 | 863,605,143 | ||||||
| Net Assets | $ | 66,725,852 | $ | 2,217,407,520 | ||||
Investment Class | $ | 34,812,171 | $ | 1,471,521,877 | ||||
Service Class | 21,239,441 | 115,578,593 | ||||||
Consultant Class | 3,095,928 | 227,078,352 | ||||||
Institutional Class | 7,578,312 | 310,533,196 | ||||||
W Class | 41,769,590 | |||||||
R Class | 50,925,912 | |||||||
| SHARES OUTSTANDING (unlimited number of $.001 par value): | ||||||||
Investment Class | 2,359,003 | 108,359,935 | ||||||
Service Class | 1,435,280 | 8,325,308 | ||||||
Consultant Class | 323,229 | 16,279,169 | ||||||
Institutional Class | 513,753 | 23,175,858 | ||||||
W Class | 3,082,244 | |||||||
R Class | 3,640,883 | |||||||
| NET ASSET VALUES (Net Assets ÷ Shares Outstanding): | ||||||||
Investment Class1 | $14.76 | $13.58 | ||||||
Service Class1 | 14.80 | 13.88 | ||||||
Consultant Class2 | 9.58 | 13.95 | ||||||
Institutional Class3 | 14.75 | 13.40 | ||||||
W Class3 | 13.55 | |||||||
R Class3 | 13.99 | |||||||
| Investments at identified cost | $ | 40,815,166 | $ | 1,224,932,575 | ||||
| Market value of loaned securities4 | – | 1,398,602 | ||||||
| 1 | Offering and redemption price per share; shares held less than 30 days may be subject to a 1% redemption fee, payable to the Fund. |
| 2 | Offering and redemption price per share; shares held less than 365 days may be subject to a 1% contingent deferred sales charge, payable to Royce Fund Services, LLC. |
| 3 | Offering and redemption price per share. |
| 4 | Market value of loaned securities backed by non-cash collateral is as of prior business day. |
| 80 | The Royce Funds 2018 Semiannual Report to Shareholders | THE ACCOMPANYING NOTES ARE AN INTEGRAL PART OF THESE FINANCIAL STATEMENTS |
Statements of Changes in Net Assets
| Royce Global Financial | Royce International | |||||||||||||||||||||||
| Royce Dividend Value Fund | Services Fund | Discovery Fund | ||||||||||||||||||||||
| Six Months Ended | Six Months Ended | Six Months Ended | ||||||||||||||||||||||
| 6/30/18 (unaudited) | Year Ended 12/31/17 | 6/30/18 (unaudited) | Year Ended 12/31/17 | 6/30/18 (unaudited) | Year Ended 12/31/17 | |||||||||||||||||||
| INVESTMENT OPERATIONS: | ||||||||||||||||||||||||
| Net investment income (loss) | $ | 1,329,224 | $ | 2,280,180 | $ | 294,291 | $ | 471,327 | $ | 37,493 | $ | 53,380 | ||||||||||||
Net realized gain (loss) on investments and foreign currency | 5,140,080 | 18,297,291 | 2,367,675 | 2,858,049 | 253,606 | 552,576 | ||||||||||||||||||
Net change in unrealized appreciation (depreciation) on investments and foreign currency | (9,806,409 | ) | 18,224,489 | (1,200,888 | ) | 7,231,886 | (832,355 | ) | 1,128,495 | |||||||||||||||
Net increase (decrease) in net assets from investment operations | (3,337,105 | ) | 38,801,960 | 1,461,078 | 10,561,262 | (541,256 | ) | 1,734,451 | ||||||||||||||||
| DISTRIBUTIONS: | ||||||||||||||||||||||||
| Net investment income | ||||||||||||||||||||||||
Investment Class | (951,345 | ) | (1,688,912 | ) | ||||||||||||||||||||
Service Class | (375,466 | ) | (846,970 | ) | – | (986,382 | ) | – | (107,044 | ) | ||||||||||||||
Consultant Class | (3,790 | ) | (4,237 | ) | ||||||||||||||||||||
Institutional Class | (6,817 | ) | (18,851 | ) | – | (167,148 | ) | |||||||||||||||||
Net realized gain on investments and foreign currency | ||||||||||||||||||||||||
Investment Class | – | (14,477,583 | ) | |||||||||||||||||||||
Service Class | – | (7,304,418 | ) | – | (662,198 | ) | – | – | ||||||||||||||||
Consultant Class | – | (181,382 | ) | |||||||||||||||||||||
Institutional Class | – | (130,731 | ) | – | (120,249 | ) | ||||||||||||||||||
| Total distributions | (1,337,418 | ) | (24,653,084 | ) | – | (1,935,977 | ) | – | (107,044 | ) | ||||||||||||||
| CAPITAL SHARE TRANSACTIONS: | ||||||||||||||||||||||||
| Net capital share transactions | ||||||||||||||||||||||||
Investment Class | (2,502,280 | ) | 16,740,068 | |||||||||||||||||||||
Service Class | (9,379,646 | ) | (64,897,762 | ) | (287,909 | ) | (3,795,110 | ) | 561,294 | 265,620 | ||||||||||||||
Consultant Class | (195,537 | ) | (143,060 | ) | ||||||||||||||||||||
Institutional Class | (336,941 | ) | 243,028 | (47,865 | ) | 871,153 | ||||||||||||||||||
| Shareholder redemption fees | ||||||||||||||||||||||||
Investment Class | 137 | 685 | ||||||||||||||||||||||
Service Class | 63 | 297 | 157 | 803 | – | – | ||||||||||||||||||
Net increase (decrease) in net assets from capital share transactions | (12,414,204 | ) | (48,056,744 | ) | (335,617 | ) | (2,923,154 | ) | 561,294 | 265,620 | ||||||||||||||
| Net Increase (Decrease) In Net Assets | (17,088,727 | ) | (33,907,868 | ) | 1,125,461 | 5,702,131 | 20,038 | 1,893,027 | ||||||||||||||||
| NET ASSETS: | ||||||||||||||||||||||||
| Beginning of period | 183,496,479 | 217,404,347 | 55,804,914 | 50,102,783 | 7,952,719 | 6,059,692 | ||||||||||||||||||
| End of period | $ | 166,407,752 | $ | 183,496,479 | $ | 56,930,375 | $ | 55,804,914 | $ | 7,972,757 | $ | 7,952,719 | ||||||||||||
Undistributed Net Investment Income (Loss) at | $ | (8,193 | ) | $ | 1 | $ | (410,120 | ) | $ | (704,412 | ) | $ | (937 | ) | $ | (38,429 | ) | |||||||
| THE ACCOMPANYING NOTES ARE AN INTEGRAL PART OF THESE FINANCIAL STATEMENTS | The Royce Funds 2018 Semiannual Report to Shareholders | 81 |
Statements of Changes in Net Assets
| Royce International Premier Fund | Royce Low-Priced Stock Fund | Royce Micro-Cap Fund | ||||||||||||||||||||||
| Six Months Ended | Six Months Ended | Six Months Ended | ||||||||||||||||||||||
| 6/30/18 (unaudited) | Year Ended 12/31/17 | 6/30/18 (unaudited) | Year Ended 12/31/17 | 6/30/18 (unaudited) | Year Ended 12/31/17 | |||||||||||||||||||
| INVESTMENT OPERATIONS: | ||||||||||||||||||||||||
| Net investment income (loss) | $ | 1,463,289 | $ | 237,349 | $ | (154,413 | ) | $ | (291,010 | ) | $ | (429,226 | ) | $ | (942,398 | ) | ||||||||
Net realized gain (loss) on investments and foreign currency | 8,253,307 | 3,680,377 | 36,461,926 | 15,097,585 | 10,120,845 | 10,296,764 | ||||||||||||||||||
Net change in unrealized appreciation (depreciation) on investments and foreign currency | (18,461,457 | ) | 27,102,687 | (12,486,630 | ) | 10,250,496 | 8,960,679 | 1,327,812 | ||||||||||||||||
Net increase (decrease) in net assets from investment operations | (8,744,861 | ) | 31,020,413 | 23,820,883 | 25,057,071 | 18,652,298 | 10,682,178 | |||||||||||||||||
| DISTRIBUTIONS: | ||||||||||||||||||||||||
| Net investment income | ||||||||||||||||||||||||
Investment Class | – | (1,090,465 | ) | – | (85,079 | ) | – | (86,233 | ) | |||||||||||||||
Service Class | – | (339,271 | ) | – | – | – | – | |||||||||||||||||
Consultant Class | – | (16,145 | ) | – | – | |||||||||||||||||||
Institutional Class | – | – | – | |||||||||||||||||||||
R Class | – | (528 | ) | – | – | |||||||||||||||||||
K Class | – | – | ||||||||||||||||||||||
Net realized gain on investments and foreign currency | ||||||||||||||||||||||||
Investment Class | – | – | – | (3,133,238 | ) | – | (12,264,977 | ) | ||||||||||||||||
Service Class | – | – | – | (13,190,619 | ) | – | (1,040,573 | ) | ||||||||||||||||
Consultant Class | – | – | – | (1,796,683 | ) | |||||||||||||||||||
Institutional Class | – | – | (510,913 | ) | �� | |||||||||||||||||||
R Class | – | – | – | (63,719 | ) | |||||||||||||||||||
K Class | – | – | ||||||||||||||||||||||
| Total distributions | – | (1,446,409 | ) | – | (16,983,568 | ) | – | (15,188,466 | ) | |||||||||||||||
| CAPITAL SHARE TRANSACTIONS: | ||||||||||||||||||||||||
| Net capital share transactions | ||||||||||||||||||||||||
Investment Class | 75,241,638 | 70,906,431 | 2,346,697 | 30,348,947 | (22,429,039 | ) | (22,312,303 | ) | ||||||||||||||||
Service Class | (3,566,912 | ) | (5,164,114 | ) | (17,903,138 | ) | (80,488,211 | ) | (1,350,964 | ) | (3,223,507 | ) | ||||||||||||
Consultant Class | 990,556 | 2,132,432 | (2,755,000 | ) | (8,442,359 | ) | ||||||||||||||||||
Institutional Class | 8,512,520 | (5,851,516 | ) | (7,324,047 | ) | |||||||||||||||||||
R Class | (72,570 | ) | 1,636 | (1,044,390 | ) | (11,249 | ) | |||||||||||||||||
K Class | (24,050 | ) | (1,100,085 | ) | ||||||||||||||||||||
| Shareholder redemption fees | ||||||||||||||||||||||||
Investment Class | 69 | 124 | – | 1 | 25 | 101 | ||||||||||||||||||
Service Class | 3,880 | 1,070 | 323 | 1,313 | – | 1 | ||||||||||||||||||
Net increase (decrease) in net assets from capital share transactions | 81,109,181 | 67,853,529 | (22,452,024 | ) | (58,573,331 | ) | (26,534,978 | ) | (33,978,067 | ) | ||||||||||||||
| Net Increase (Decrease) In Net Assets | 72,364,320 | 97,427,533 | 1,368,859 | (50,499,828 | ) | (7,882,680 | ) | (38,484,355 | ) | |||||||||||||||
| NET ASSETS: | ||||||||||||||||||||||||
| Beginning of period | 161,027,670 | 63,600,137 | 268,690,171 | 319,189,999 | 205,211,281 | 243,695,636 | ||||||||||||||||||
| End of period | $ | 233,391,990 | $ | 161,027,670 | $ | 270,059,030 | $ | 268,690,171 | $ | 197,328,601 | $ | 205,211,281 | ||||||||||||
Undistributed Net Investment Income (Loss) at | $ | (599,504 | ) | $ | (2,062,792 | ) | $ | (991,149 | ) | $ | (836,737 | ) | $ | (821,058 | ) | $ | (391,832 | ) | ||||||
| 82 | The Royce Funds 2018 Semiannual Report to Shareholders | THE ACCOMPANYING NOTES ARE AN INTEGRAL PART OF THESE FINANCIAL STATEMENTS |
| Royce Micro-Cap Opportunity Fund | Royce Opportunity Fund | Royce Pennsylvania Mutual Fund | ||||||||||||||||||||||
| Six Months Ended | Six Months Ended | Six Months Ended | ||||||||||||||||||||||
| 6/30/18 (unaudited) | Year Ended 12/31/17 | 6/30/18 (unaudited) | Year Ended 12/31/17 | 6/30/18 (unaudited) | Year Ended 12/31/17 | |||||||||||||||||||
| INVESTMENT OPERATIONS: | ||||||||||||||||||||||||
| Net investment income (loss) | $ | (214,257 | ) | $ | (367,349 | ) | $ | (2,148,791 | ) | $ | (4,431,770 | ) | $ | 891,579 | $ | 6,440,543 | ||||||||
Net realized gain (loss) on investments and foreign currency | 4,546,045 | 7,858,653 | 201,268,619 | 216,170,387 | 159,026,286 | 488,742,487 | ||||||||||||||||||
Net change in unrealized appreciation (depreciation) on investments and foreign currency | (837,070 | ) | 3,535,862 | (143,258,827 | ) | 90,098,545 | (46,504,375 | ) | (154,036,247 | ) | ||||||||||||||
Net increase (decrease) in net assets from investment operations | 3,494,718 | 11,027,166 | 55,861,001 | 301,837,162 | 113,413,490 | 341,146,783 | ||||||||||||||||||
| DISTRIBUTIONS: | ||||||||||||||||||||||||
| Net investment income | ||||||||||||||||||||||||
Investment Class | – | – | – | – | – | (7,987,534 | ) | |||||||||||||||||
Service Class | – | – | – | – | – | – | ||||||||||||||||||
Consultant Class | – | – | – | – | ||||||||||||||||||||
Institutional Class | – | – | – | (388,357 | ) | |||||||||||||||||||
R Class | – | – | – | – | ||||||||||||||||||||
K Class | – | – | – | – | ||||||||||||||||||||
Net realized gain on investments and foreign currency | ||||||||||||||||||||||||
Investment Class | – | (3,626,362 | ) | – | (108,241,208 | ) | – | (285,042,653 | ) | |||||||||||||||
Service Class | – | (92,454 | ) | – | (12,864,359 | ) | – | (10,218,444 | ) | |||||||||||||||
Consultant Class | – | (2,689,459 | ) | – | (63,150,785 | ) | ||||||||||||||||||
Institutional Class | – | (83,520,830 | ) | – | (12,499,024 | ) | ||||||||||||||||||
R Class | – | (5,143,569 | ) | – | (2,671,936 | ) | ||||||||||||||||||
K Class | – | (1,024,733 | ) | – | (494,633 | ) | ||||||||||||||||||
| Total distributions | – | (3,718,816 | ) | – | (213,484,158 | ) | – | (382,453,366 | ) | |||||||||||||||
| CAPITAL SHARE TRANSACTIONS: | ||||||||||||||||||||||||
| Net capital share transactions | ||||||||||||||||||||||||
Investment Class | (2,767,406 | ) | (6,319,564 | ) | (33,325,507 | ) | 9,573,855 | (118,528,108 | ) | (542,378 | ) | |||||||||||||
Service Class | 71,284 | 3,024 | (23,152,125 | ) | 18,697,997 | (6,574,160 | ) | (45,893,771 | ) | |||||||||||||||
Consultant Class | (3,673,428 | ) | (1,650,429 | ) | (35,434,408 | ) | (29,481,038 | ) | ||||||||||||||||
Institutional Class | (302,840,427 | ) | 19,603,227 | 8,619,223 | (210,408,701 | ) | ||||||||||||||||||
R Class | (4,832,119 | ) | (1,661,406 | ) | (2,360,891 | ) | (1,566,030 | ) | ||||||||||||||||
K Class | (7,623,085 | ) | 613,559 | (2,826,318 | ) | (330,664 | ) | |||||||||||||||||
| Shareholder redemption fees | ||||||||||||||||||||||||
Investment Class | 2 | 40 | 1,098 | 882 | 336 | 3,623 | ||||||||||||||||||
Service Class | – | 268 | 4,237 | 1,535 | 66 | 3,258 | ||||||||||||||||||
Net increase (decrease) in net assets from capital share transactions | (2,696,120 | ) | (6,316,232 | ) | (375,441,356 | ) | 45,179,220 | (157,104,260 | ) | (288,215,701 | ) | |||||||||||||
| Net Increase (Decrease) In Net Assets | 798,598 | 992,118 | (319,580,355 | ) | 133,532,224 | (43,690,770 | ) | (329,522,284 | ) | |||||||||||||||
| NET ASSETS: | ||||||||||||||||||||||||
| Beginning of period | 47,121,927 | 46,129,809 | 1,608,924,160 | 1,475,391,936 | 2,110,306,148 | 2,439,828,432 | ||||||||||||||||||
| End of period | $ | 47,920,525 | $ | 47,121,927 | $ | 1,289,343,805 | $ | 1,608,924,160 | $ | 2,066,615,378 | $ | 2,110,306,148 | ||||||||||||
Undistributed Net Investment Income (Loss) at End of Period | $ | (214,427 | ) | $ | (170 | ) | $ | (3,624,819 | ) | $ | (1,476,027 | ) | $ | (244,065 | ) | $ | (1,135,644 | ) | ||||||
| THE ACCOMPANYING NOTES ARE AN INTEGRAL PART OF THESE FINANCIAL STATEMENTS | The Royce Funds 2018 Semiannual Report to Shareholders | 83 |
Statements of Changes in Net Assets
| Royce Premier Fund | Royce Small-Cap Leaders Fund | Royce Small-Cap Value Fund | ||||||||||||||||||||||
| Six Months Ended | Six Months Ended | Six Months Ended | ||||||||||||||||||||||
| 6/30/18 (unaudited) | Year Ended 12/31/17 | 6/30/18 (unaudited) | Year Ended 12/31/17 | 6/30/18 (unaudited) | Year Ended 12/31/17 | |||||||||||||||||||
| INVESTMENT OPERATIONS: | ||||||||||||||||||||||||
| Net investment income (loss) | $ | 1,380,157 | $ | (492,893 | ) | $ | 59,622 | $ | 416,289 | $ | 166,050 | $ | 847,504 | |||||||||||
Net realized gain (loss) on investments and foreign currency | 177,282,432 | 459,154,057 | 6,157,290 | 13,922,956 | 15,369,678 | 25,191,109 | ||||||||||||||||||
Net change in unrealized appreciation (depreciation) on investments and foreign currency | (117,482,039 | ) | 29,910,588 | (3,309,054 | ) | (5,697,082 | ) | 486,424 | (24,332,356 | ) | ||||||||||||||
Net increase (decrease) in net assets from investment operations | 61,180,550 | 488,571,752 | 2,907,858 | 8,642,163 | 16,022,152 | 1,706,257 | ||||||||||||||||||
| DISTRIBUTIONS: | ||||||||||||||||||||||||
| Net investment income | ||||||||||||||||||||||||
Investment Class | – | (1,809,066 | ) | – | (283,985 | ) | – | (381,978 | ) | |||||||||||||||
Service Class | – | – | – | (137,349 | ) | – | (408,089 | ) | ||||||||||||||||
Consultant Class | – | – | – | – | ||||||||||||||||||||
Institutional Class | – | (410,543 | ) | – | (7,395 | ) | ||||||||||||||||||
W Class | – | – | ||||||||||||||||||||||
R Class | – | – | – | – | – | – | ||||||||||||||||||
K Class | – | – | (2,874 | ) | ||||||||||||||||||||
Net realized gain on investments and foreign currency | ||||||||||||||||||||||||
Investment Class | – | (267,764,787 | ) | – | (6,411,507 | ) | – | (2,247,083 | ) | |||||||||||||||
Service Class | – | (7,252,558 | ) | – | (5,651,383 | ) | – | (5,138,678 | ) | |||||||||||||||
Consultant Class | – | (4,144,802 | ) | – | (444,590 | ) | ||||||||||||||||||
Institutional Class | – | (33,418,762 | ) | – | (134,011 | ) | ||||||||||||||||||
W Class | – | (4,597,603 | ) | |||||||||||||||||||||
R Class | – | (1,727,921 | ) | – | (257,152 | ) | – | (500,452 | ) | |||||||||||||||
K Class | – | – | (68,590 | ) | ||||||||||||||||||||
| Total distributions | – | (321,126,042 | ) | – | (12,741,376 | ) | – | (9,333,740 | ) | |||||||||||||||
| CAPITAL SHARE TRANSACTIONS: | ||||||||||||||||||||||||
| Net capital share transactions | ||||||||||||||||||||||||
Investment Class | (120,723,987 | ) | 81,514,928 | (1,792,681 | ) | (1,951,684 | ) | (263,152 | ) | (6,999,180 | ) | |||||||||||||
Service Class | (5,600,183 | ) | 4,336,691 | (3,539,679 | ) | (9,943,272 | ) | (17,187,338 | ) | (61,247,469 | ) | |||||||||||||
Consultant Class | (2,340,372 | ) | (2,058,012 | ) | (1,363,479 | ) | (3,351,678 | ) | ||||||||||||||||
Institutional Class | (9,335,151 | ) | (15,282,802 | ) | (3,864,348 | ) | (115,759,482 | ) | ||||||||||||||||
W Class | (5,014,071 | ) | (133,231,371 | ) | ||||||||||||||||||||
R Class | (1,016,657 | ) | (2,049,376 | ) | (1,817,087 | ) | 34,966 | (4,647,769 | ) | (3,502,573 | ) | |||||||||||||
K Class | (507,282 | ) | (1,969,073 | ) | (1,014,434 | ) | ||||||||||||||||||
| Shareholder redemption fees | ||||||||||||||||||||||||
Investment Class | 186 | 1,501 | – | – | 2 | 2 | ||||||||||||||||||
Service Class | 26 | 210 | – | 9 | 49 | 215 | ||||||||||||||||||
Net increase (decrease) in net assets from capital share transactions | (144,030,209 | ) | (66,768,231 | ) | (7,149,447 | ) | (12,367,263 | ) | (29,295,108 | ) | (191,874,599 | ) | ||||||||||||
| Net Increase (Decrease) In Net Assets | (82,849,659 | ) | 100,677,479 | (4,241,589 | ) | (16,466,476 | ) | (13,272,956 | ) | (199,502,082 | ) | |||||||||||||
| NET ASSETS: | ||||||||||||||||||||||||
| Beginning of period | 2,359,812,456 | 2,259,134,977 | 84,557,546 | 101,024,022 | 251,678,386 | 451,180,468 | ||||||||||||||||||
| End of period | $ | 2,276,962,797 | $ | 2,359,812,456 | $ | 80,315,957 | $ | 84,557,546 | $ | 238,405,430 | $ | 251,678,386 | ||||||||||||
Undistributed Net Investment Income (Loss) at | $ | 1,380,156 | $ | (2 | ) | $ | 58,475 | $ | (1,148 | ) | $ | 238,067 | $ | 72,017 | ||||||||||
| 84 | The Royce Funds 2018 Semiannual Report to Shareholders | THE ACCOMPANYING NOTES ARE AN INTEGRAL PART OF THESE FINANCIAL STATEMENTS |
| Royce Smaller-Companies | ||||||||||||||||||||||||
| Royce Small/Mid-Cap Premier Fund | Growth Fund | Royce Special Equity Fund | ||||||||||||||||||||||
| Six Months Ended | Six Months Ended | Six Months Ended | ||||||||||||||||||||||
| 6/30/18 (unaudited) | Year Ended 12/31/17 | 6/30/18 (unaudited) | Year Ended 12/31/17 | 6/30/18 (unaudited) | Year Ended 12/31/17 | |||||||||||||||||||
| INVESTMENT OPERATIONS: | ||||||||||||||||||||||||
| Net investment income (loss) | $ | (3,530 | ) | $ | 255,723 | $ | (1,281,929 | ) | $ | (3,551,983 | ) | $ | 9,218,646 | $ | 7,799,885 | |||||||||
Net realized gain (loss) on investments and foreign currency | 20,372,833 | 27,250,361 | 41,453,764 | 79,279,642 | 49,670,198 | 93,712,628 | ||||||||||||||||||
Net change in unrealized appreciation (depreciation) on investments and foreign currency | (26,679,737 | ) | 12,933,995 | (4,338,494 | ) | (9,991,302 | ) | (68,389,410 | ) | 12,284,811 | ||||||||||||||
Net increase (decrease) in net assets from investment operations | (6,310,434 | ) | 40,440,079 | 35,833,341 | 65,736,357 | (9,500,566 | ) | 113,797,324 | ||||||||||||||||
| DISTRIBUTIONS: | ||||||||||||||||||||||||
| Net investment income | ||||||||||||||||||||||||
Investment Class | – | (118,389 | ) | – | – | – | (5,996,532 | ) | ||||||||||||||||
Service Class | – | – | – | – | – | (342,321 | ) | |||||||||||||||||
Consultant Class | – | – | – | – | – | – | ||||||||||||||||||
Institutional Class | – | – | – | (1,491,423 | ) | |||||||||||||||||||
R Class | – | – | – | – | ||||||||||||||||||||
K Class | – | – | ||||||||||||||||||||||
Net realized gain on investments and foreign currency | ||||||||||||||||||||||||
Investment Class | – | (9,480,846 | ) | – | (21,690,840 | ) | – | (87,581,521 | ) | |||||||||||||||
Service Class | – | (13,095,068 | ) | – | (40,468,096 | ) | – | (8,430,728 | ) | |||||||||||||||
Consultant Class | – | (1,217,825 | ) | – | (1,837,925 | ) | – | (3,556,231 | ) | |||||||||||||||
Institutional Class | – | (1,658,704 | ) | – | (18,778,224 | ) | ||||||||||||||||||
R Class | – | (253,421 | ) | – | (121,248 | ) | ||||||||||||||||||
K Class | – | – | ||||||||||||||||||||||
| Total distributions | – | (24,165,549 | ) | – | (65,776,813 | ) | – | (126,176,980 | ) | |||||||||||||||
| CAPITAL SHARE TRANSACTIONS: | ||||||||||||||||||||||||
| Net capital share transactions | ||||||||||||||||||||||||
Investment Class | (2,227,433 | ) | (11,893,481 | ) | (7,457,952 | ) | 25,645,877 | (23,583,073 | ) | (73,416,864 | ) | |||||||||||||
Service Class | (4,110,769 | ) | (17,897,723 | ) | (26,737,907 | ) | (60,569,518 | ) | (52,427,254 | ) | (18,993,676 | ) | ||||||||||||
Consultant Class | (1,081,677 | ) | (2,055,396 | ) | (1,002,969 | ) | (326,137 | ) | (5,990,198 | ) | (3,257,402 | ) | ||||||||||||
Institutional Class | (522,986 | ) | (12,235,750 | ) | (52,902,498 | ) | 41,944,286 | |||||||||||||||||
R Class | (2,143,847 | ) | 140,638 | (595,855 | ) | (199,205 | ) | |||||||||||||||||
K Class | (4,272,121 | ) | (210,263 | ) | ||||||||||||||||||||
| Shareholder redemption fees | ||||||||||||||||||||||||
Investment Class | 98 | 56 | – | 2 | 703 | 4,736 | ||||||||||||||||||
Service Class | 380 | 31 | 243 | 1,059 | 209 | 874 | ||||||||||||||||||
Net increase (decrease) in net assets from capital share transactions | (9,563,248 | ) | (35,977,996 | ) | (36,317,426 | ) | (47,893,935 | ) | (134,902,111 | ) | (53,718,046 | ) | ||||||||||||
| Net Increase (Decrease) In Net Assets | (15,873,682 | ) | (19,703,466 | ) | (484,085 | ) | (47,934,391 | ) | (144,402,677 | ) | (66,097,702 | ) | ||||||||||||
| NET ASSETS: | ||||||||||||||||||||||||
| Beginning of period | 206,604,689 | 226,308,155 | 367,780,222 | 415,714,613 | 1,543,883,037 | 1,609,980,739 | ||||||||||||||||||
| End of period | $ | 190,731,007 | $ | 206,604,689 | $ | 367,296,137 | $ | 367,780,222 | $ | 1,399,480,360 | $ | 1,543,883,037 | ||||||||||||
Undistributed Net Investment Income (Loss) at | $ | (1,120 | ) | $ | 2,410 | $ | (2,041,487 | ) | $ | (759,557 | ) | $ | 9,228,266 | $ | 9,620 | |||||||||
| THE ACCOMPANYING NOTES ARE AN INTEGRAL PART OF THESE FINANCIAL STATEMENTS | The Royce Funds 2018 Semiannual Report to Shareholders | 85 |
Statements of Changes in Net Assets
| Royce Special Equity | ||||||||||||||||
| Multi-Cap Fund | Royce Total Return Fund | |||||||||||||||
| Six Months Ended | Six Months Ended | |||||||||||||||
| 6/30/18 (unaudited) | Year Ended 12/31/17 | 6/30/18 (unaudited) | Year Ended 12/31/17 | |||||||||||||
| INVESTMENT OPERATIONS: | ||||||||||||||||
| Net investment income (loss) | $ | 426,685 | $ | 971,383 | $ | 15,448,639 | $ | 23,921,732 | ||||||||
| Net realized gain (loss) on investments and foreign currency | 9,082,472 | 3,720,016 | 227,258,546 | 408,831,782 | ||||||||||||
| Net change in unrealized appreciation (depreciation) on investments and foreign currency | (14,653,271 | ) | 11,167,655 | (229,207,259 | ) | (108,501,062 | ) | |||||||||
| Net increase (decrease) in net assets from investment operations | (5,144,114 | ) | 15,859,054 | 13,499,926 | 324,252,452 | |||||||||||
| DISTRIBUTIONS: | ||||||||||||||||
| Net investment income | ||||||||||||||||
Investment Class | – | (391,717 | ) | (8,875,731 | ) | (14,671,278 | ) | |||||||||
Service Class | – | (152,606 | ) | (441,309 | ) | (628,984 | ) | |||||||||
Consultant Class | – | (21,715 | ) | (247,606 | ) | – | ||||||||||
Institutional Class | – | (413,349 | ) | (1,949,317 | ) | (4,157,749 | ) | |||||||||
W Class | (258,918 | ) | (752,370 | ) | ||||||||||||
R Class | (146,861 | ) | (128,596 | ) | ||||||||||||
K Class | (58,254 | ) | (139,421 | ) | ||||||||||||
| Net realized gain on investments and foreign currency | ||||||||||||||||
Investment Class | – | (778,005 | ) | – | (185,609,966 | ) | ||||||||||
Service Class | – | (455,851 | ) | – | (11,988,461 | ) | ||||||||||
Consultant Class | – | (81,754 | ) | – | (29,213,594 | ) | ||||||||||
Institutional Class | – | (752,887 | ) | – | (36,590,353 | ) | ||||||||||
W Class | – | (11,357,934 | ) | |||||||||||||
R Class | – | (6,415,999 | ) | |||||||||||||
K Class | – | (4,389,812 | ) | |||||||||||||
| Total distributions | – | (3,047,884 | ) | (11,977,996 | ) | (306,044,517 | ) | |||||||||
| CAPITAL SHARE TRANSACTIONS: | ||||||||||||||||
| Net capital share transactions | ||||||||||||||||
Investment Class | (4,069,069 | ) | 1,984,319 | (79,484,664 | ) | (295,781,143 | ) | |||||||||
Service Class | (1,647,919 | ) | (16,693,774 | ) | 17,116,884 | (45,762,084 | ) | |||||||||
Consultant Class | (859,878 | ) | (1,317,152 | ) | (20,674,415 | ) | (19,333,580 | ) | ||||||||
Institutional Class | (29,712,595 | ) | (3,303,018 | ) | (259,562 | ) | (116,618,839 | ) | ||||||||
W Class | (55,526,410 | ) | 16,885,446 | |||||||||||||
R Class | (3,995,527 | ) | 1,068,022 | |||||||||||||
K Class | (37,154,510 | ) | (3,354,130 | ) | ||||||||||||
| Shareholder redemption fees | ||||||||||||||||
Investment Class | – | 195 | 231 | 1,178 | ||||||||||||
Service Class | – | 3 | 6,244 | 3,101 | ||||||||||||
| Net increase (decrease) in net assets from capital share transactions | (36,289,461 | ) | (19,329,427 | ) | (179,971,729 | ) | (462,892,029 | ) | ||||||||
| Net Increase (Decrease) In Net Assets | (41,433,575 | ) | (6,518,257 | ) | (178,449,799 | ) | (444,684,094 | ) | ||||||||
| NET ASSETS: | ||||||||||||||||
| Beginning of period | 108,159,427 | 114,677,684 | 2,395,857,319 | 2,840,541,413 | ||||||||||||
| End of period | $ | 66,725,852 | $ | 108,159,427 | $ | 2,217,407,520 | $ | 2,395,857,319 | ||||||||
| Undistributed Net Investment Income (Loss) at End of Period | $ | 426,938 | $ | 253 | $ | 5,188,546 | $ | 1,717,903 | ||||||||
| 86 | The Royce Funds 2018 Semiannual Report to Shareholders | THE ACCOMPANYING NOTES ARE AN INTEGRAL PART OF THESE FINANCIAL STATEMENTS |
| Statements of Operations | Six Months Ended June 30, 2018 (unaudited) |
| Royce Global | ||||||||||||||||
| Royce Dividend | Financial Services | Royce International | Royce International | |||||||||||||
| Value Fund | Fund | Discovery Fund | Premier Fund | |||||||||||||
| INVESTMENT INCOME: | ||||||||||||||||
| INCOME: | ||||||||||||||||
| Dividends | $ | 2,444,048 | $ | 738,991 | $ | 107,418 | $ | 3,049,855 | ||||||||
| Foreign withholding tax | (104,073 | ) | (43,329 | ) | (9,335 | ) | (308,701 | ) | ||||||||
| Interest | 6,823 | 2,891 | 490 | 17,547 | ||||||||||||
| Total income | 2,346,798 | 698,553 | 98,573 | 2,758,701 | ||||||||||||
| EXPENSES: | ||||||||||||||||
| Investment advisory fees | 750,167 | 284,742 | 43,204 | 1,052,084 | ||||||||||||
| Distribution fees | 75,262 | 60,071 | 10,358 | 111,320 | ||||||||||||
| Shareholder servicing | 124,316 | 38,895 | 7,496 | 107,676 | ||||||||||||
| Shareholder reports | 31,915 | 6,891 | 797 | 13,804 | ||||||||||||
| Administrative and office facilities | 28,086 | 7,499 | 1,027 | 19,611 | ||||||||||||
| Registration | 27,366 | 16,280 | 9,626 | 30,613 | ||||||||||||
| Custody | 27,192 | 20,040 | 26,410 | 60,857 | ||||||||||||
| Audit | 19,633 | 17,140 | 18,348 | 20,960 | ||||||||||||
| Trustees’ fees | 11,297 | 3,341 | 479 | 10,026 | ||||||||||||
| Legal | 2,600 | 686 | 857 | 2,699 | ||||||||||||
| Other expenses | 6,962 | 2,311 | 537 | 6,342 | ||||||||||||
| Total expenses | 1,104,796 | 457,896 | 119,139 | 1,435,992 | ||||||||||||
| Compensating balance credits | (1,275 | ) | (281 | ) | (75 | ) | (606 | ) | ||||||||
| Fees waived by investment adviser and distributor | (56,309 | ) | (41,946 | ) | (46,933 | ) | (129,775 | ) | ||||||||
| Expenses reimbursed by investment adviser | (29,638 | ) | (11,407 | ) | (11,051 | ) | (10,199 | ) | ||||||||
| Net expenses | 1,017,574 | 404,262 | 61,080 | 1,295,412 | ||||||||||||
| Net investment income (loss) | 1,329,224 | 294,291 | 37,493 | 1,463,289 | ||||||||||||
REALIZED AND UNREALIZED GAIN (LOSS) ON INVESTMENTS AND FOREIGN CURRENCY: | ||||||||||||||||
| NET REALIZED GAIN (LOSS): | ||||||||||||||||
| Investments | 5,145,326 | 2,371,292 | 262,611 | 8,321,769 | ||||||||||||
| Foreign currency transactions | (5,246 | ) | (3,617 | ) | (9,005 | ) | (68,462 | ) | ||||||||
| NET CHANGE IN UNREALIZED APPRECIATION (DEPRECIATION): | ||||||||||||||||
| Investments and foreign currency translations | (9,806,496 | ) | (1,269,905 | ) | (833,245 | ) | (18,869,564 | ) | ||||||||
| Other assets and liabilities denominated in foreign currency | 87 | 69,017 | 890 | 408,107 | ||||||||||||
Net realized and unrealized gain (loss) on investments and foreign currency | (4,666,329 | ) | 1,166,787 | (578,749 | ) | (10,208,150 | ) | |||||||||
NET INCREASE (DECREASE) IN NET ASSETS FROM INVESTMENT OPERATIONS | $ | (3,337,105 | ) | $ | 1,461,078 | $ | (541,256 | ) | $ | (8,744,861 | ) | |||||
| THE ACCOMPANYING NOTES ARE AN INTEGRAL PART OF THESE FINANCIAL STATEMENTS | The Royce Funds 2018 Semiannual Report to Shareholders | 87 |
Statements of Operations
| Royce Low-Priced | Royce Micro-Cap | Royce Micro-Cap | Royce Opportunity | |||||||||||||
| Stock Fund | Fund | Opportunity Fund | Fund | |||||||||||||
| INVESTMENT INCOME: | ||||||||||||||||
| INCOME: | ||||||||||||||||
| Dividends | $ | 1,696,080 | $ | 1,031,110 | $ | 68,420 | $ | 5,419,816 | ||||||||
| Foreign withholding tax | (28,842 | ) | (30,855 | ) | – | – | ||||||||||
| Interest | 19,303 | 8,793 | 3,573 | 122,590 | ||||||||||||
| Securities lending | 57,250 | 133,260 | – | 856,860 | ||||||||||||
| Total income | 1,743,791 | 1,142,308 | 71,993 | 6,399,266 | ||||||||||||
| EXPENSES: | ||||||||||||||||
| Investment advisory fees | 1,313,909 | 1,206,424 | 229,663 | 7,101,279 | ||||||||||||
| Distribution fees | 256,899 | 133,612 | 1,468 | 309,768 | ||||||||||||
| Shareholder servicing | 191,698 | 109,951 | 24,280 | 555,503 | ||||||||||||
| Shareholder reports | 47,494 | 48,238 | 2,169 | 91,764 | ||||||||||||
| Administrative and office facilities | 40,139 | 30,825 | 6,681 | 214,698 | ||||||||||||
| Registration | 30,354 | 20,970 | 14,803 | 43,858 | ||||||||||||
| Custody | 26,985 | 15,023 | 9,846 | 78,967 | ||||||||||||
| Audit | 18,936 | 17,453 | 13,604 | 21,448 | ||||||||||||
| Trustees’ fees | 16,230 | 12,252 | 2,792 | 93,165 | ||||||||||||
| Legal | 3,717 | 2,839 | 617 | 19,687 | ||||||||||||
| Other expenses | 9,250 | 7,125 | 2,200 | 43,686 | ||||||||||||
| Total expenses | 1,955,611 | 1,604,712 | 308,123 | 8,573,823 | ||||||||||||
| Compensating balance credits | (3,061 | ) | (3,013 | ) | (140 | ) | (5,020 | ) | ||||||||
| Fees waived by distributor | (20,469 | ) | – | – | – | |||||||||||
| Expenses reimbursed by investment adviser | (33,877 | ) | (30,165 | ) | (21,733 | ) | (20,746 | ) | ||||||||
| Net expenses | 1,898,204 | 1,571,534 | 286,250 | 8,548,057 | ||||||||||||
| Net investment income (loss) | (154,413 | ) | (429,226 | ) | (214,257 | ) | (2,148,791 | ) | ||||||||
REALIZED AND UNREALIZED GAIN (LOSS) ON INVESTMENTS AND FOREIGN CURRENCY: | ||||||||||||||||
| NET REALIZED GAIN (LOSS): | ||||||||||||||||
| Investments in Non-Affiliated Companies | 36,478,843 | 10,121,054 | 4,546,045 | 203,563,037 | ||||||||||||
| Investments in Affiliated Companies | – | – | – | (2,295,011 | ) | |||||||||||
| Foreign currency transactions | (16,917 | ) | (209 | ) | – | 593 | ||||||||||
NET CHANGE IN UNREALIZED APPRECIATION (DEPRECIATION): | ||||||||||||||||
Investments in Non-Affiliated Companies and foreign currency translations | (12,486,462 | ) | 8,961,835 | (837,070 | ) | (144,042,803 | ) | |||||||||
| Investments in Affiliated Companies | – | – | – | 783,976 | ||||||||||||
| Other assets and liabilities denominated in foreign currency | (168 | ) | (1,156 | ) | – | – | ||||||||||
Net realized and unrealized gain (loss) on investments and foreign currency | 23,975,296 | 19,081,524 | 3,708,975 | 58,009,792 | ||||||||||||
NET INCREASE (DECREASE) IN NET ASSETS FROM INVESTMENT OPERATIONS | $ | 23,820,883 | $ | 18,652,298 | $ | 3,494,718 | $ | 55,861,001 | ||||||||
| 88 | The Royce Funds 2018 Semiannual Report to Shareholders | THE ACCOMPANYING NOTES ARE AN INTEGRAL PART OF THESE FINANCIAL STATEMENTS |
| Six Months Ended June 30, 2018 (unaudited) |
| Royce | ||||||||||||||||
| Pennsylvania | Royce Premier | Royce Small-Cap | Royce Small-Cap | |||||||||||||
| Mutual Fund | Fund | Leaders Fund | Value Fund | |||||||||||||
| INVESTMENT INCOME: | ||||||||||||||||
| INCOME: | ||||||||||||||||
| Dividends | ||||||||||||||||
Non-Affiliated Companies | $ | 11,932,181 | $ | 15,206,728 | $ | 605,774 | $ | 1,945,396 | ||||||||
Affiliated Companies | 100,867 | – | – | – | ||||||||||||
| Foreign withholding tax | (297,271 | ) | (336,694 | ) | (20,285 | ) | (19,638 | ) | ||||||||
| Interest | 351,442 | 192,220 | 8,408 | 17,064 | ||||||||||||
| Securities lending | 220,770 | 13,190 | 17,983 | 4,299 | ||||||||||||
| Total income | 12,307,989 | 15,075,444 | 611,880 | 1,947,121 | ||||||||||||
| EXPENSES: | ||||||||||||||||
| Investment advisory fees | 7,814,644 | 11,541,249 | 406,002 | 1,186,141 | ||||||||||||
| Distribution fees | 1,854,648 | 251,747 | 48,312 | 274,127 | ||||||||||||
| Shareholder servicing | 843,342 | 929,415 | 51,143 | 183,266 | ||||||||||||
| Shareholder reports | 208,298 | 243,850 | 14,882 | 33,401 | ||||||||||||
| Administrative and office facilities | 319,614 | 331,460 | 12,765 | 45,158 | ||||||||||||
| Registration | 40,968 | 46,593 | 18,119 | 39,726 | ||||||||||||
| Custody | 107,295 | 101,480 | 10,923 | 18,018 | ||||||||||||
| Audit | 24,101 | 24,474 | 13,749 | 17,884 | ||||||||||||
| Trustees’ fees | 128,899 | 139,813 | 5,147 | 17,226 | ||||||||||||
| Legal | 29,597 | 30,391 | 1,183 | 4,300 | ||||||||||||
| Other expenses | 64,292 | 73,328 | 3,857 | 10,994 | ||||||||||||
| Total expenses | 11,435,698 | 13,713,800 | 586,082 | 1,830,241 | ||||||||||||
| Compensating balance credits | (17,870 | ) | (8,952 | ) | (817 | ) | (2,072 | ) | ||||||||
| Fees waived by distributor | – | – | (3,664 | ) | (7,188 | ) | ||||||||||
| Expenses reimbursed by investment adviser | (1,418 | ) | (9,561 | ) | (29,343 | ) | (39,910 | ) | ||||||||
| Net expenses | 11,416,410 | 13,695,287 | 552,258 | 1,781,071 | ||||||||||||
| Net investment income (loss) | 891,579 | 1,380,157 | 59,622 | 166,050 | ||||||||||||
REALIZED AND UNREALIZED GAIN (LOSS) ON INVESTMENTS AND FOREIGN CURRENCY: | ||||||||||||||||
| NET REALIZED GAIN (LOSS): | ||||||||||||||||
| Investments in Non-Affiliated Companies | 158,645,224 | 177,303,792 | 6,160,715 | 15,371,373 | ||||||||||||
| Investments in Affiliated Companies | 396,934 | – | – | – | ||||||||||||
| Foreign currency transactions | (15,872 | ) | (21,360 | ) | (3,425 | ) | (1,695 | ) | ||||||||
NET CHANGE IN UNREALIZED APPRECIATION (DEPRECIATION): | ||||||||||||||||
Investments in Non-Affiliated Companies and foreign currency translations | (50,584,992 | ) | (105,857,215 | ) | (3,309,075 | ) | 486,424 | |||||||||
| Investments in Affiliated Companies | 4,084,743 | (11,608,527 | ) | – | – | |||||||||||
| Other assets and liabilities denominated in foreign currency | (4,126 | ) | (16,297 | ) | 21 | – | ||||||||||
Net realized and unrealized gain (loss) on investments and foreign currency | 112,521,911 | 59,800,393 | 2,848,236 | 15,856,102 | ||||||||||||
NET INCREASE (DECREASE) IN NET ASSETS FROM INVESTMENT OPERATIONS | $ | 113,413,490 | $ | 61,180,550 | $ | 2,907,858 | $ | 16,022,152 | ||||||||
| THE ACCOMPANYING NOTES ARE AN INTEGRAL PART OF THESE FINANCIAL STATEMENTS | The Royce Funds 2018 Semiannual Report to Shareholders | 89 |
Statements of Operations
| Royce Smaller- | ||||||||||||
| Royce Small/Mid-Cap | Companies Growth | Royce Special | ||||||||||
| Premier Fund | Fund | Equity Fund | ||||||||||
| INVESTMENT INCOME: | ||||||||||||
| INCOME: | ||||||||||||
| Dividends | ||||||||||||
Non-Affiliated Companies | $ | 1,104,095 | $ | 877,883 | $ | 8,328,799 | ||||||
Affiliated Companies | – | – | 9,344,085 | |||||||||
| Foreign withholding tax | (2,362 | ) | (6,158 | ) | – | |||||||
| Interest | 32,174 | 18,821 | 177,269 | |||||||||
| Securities lending | 77 | 336,265 | – | |||||||||
| Total income | 1,133,984 | 1,226,811 | 17,850,153 | |||||||||
| EXPENSES: | ||||||||||||
| Investment advisory fees | 840,610 | 1,791,184 | 7,149,446 | |||||||||
| Distribution fees | 185,496 | 324,424 | 315,399 | |||||||||
| Shareholder servicing | 63,877 | 222,102 | 611,763 | |||||||||
| Shareholder reports | 29,228 | 58,239 | 139,177 | |||||||||
| Administrative and office facilities | 30,527 | 55,385 | 219,340 | |||||||||
| Registration | 23,596 | 29,235 | 34,480 | |||||||||
| Custody | 12,744 | 23,685 | 61,971 | |||||||||
| Audit | 18,946 | 16,840 | 19,456 | |||||||||
| Trustees’ fees | 12,484 | 22,303 | 90,470 | |||||||||
| Legal | 2,801 | 5,093 | 20,204 | |||||||||
| Other expenses | 7,437 | 12,272 | 43,367 | |||||||||
| Total expenses | 1,227,746 | 2,560,762 | 8,705,073 | |||||||||
| Compensating balance credits | (2,429 | ) | (2,423 | ) | (8,031 | ) | ||||||
| Fees waived by distributor | (75,645 | ) | (21,922 | ) | – | |||||||
| Expenses reimbursed by investment adviser | (12,158 | ) | (27,677 | ) | (65,535 | ) | ||||||
| Net expenses | 1,137,514 | 2,508,740 | 8,631,507 | |||||||||
| Net investment income (loss) | (3,530 | ) | (1,281,929 | ) | 9,218,646 | |||||||
REALIZED AND UNREALIZED GAIN (LOSS) ON INVESTMENTS AND FOREIGN CURRENCY: | ||||||||||||
| NET REALIZED GAIN (LOSS): | ||||||||||||
| Investments in Non-Affiliated Companies | 20,374,348 | 41,463,583 | 47,953,594 | |||||||||
| Investments in Affiliated Companies | – | – | 1,716,604 | |||||||||
| Foreign currency transactions | (1,515 | ) | (9,819 | ) | – | |||||||
| NET CHANGE IN UNREALIZED APPRECIATION (DEPRECIATION): | ||||||||||||
| Investments in Non-Affiliated Companies and foreign currency translations | (26,677,914 | ) | (4,338,497 | ) | (98,174,735 | ) | ||||||
| Investments in Affiliated Companies | – | – | 29,785,325 | |||||||||
| Other assets and liabilities denominated in foreign currency | (1,823 | ) | 3 | – | ||||||||
| Net realized and unrealized gain (loss) on investments and foreign currency | (6,306,904 | ) | 37,115,270 | (18,719,212 | ) | |||||||
| NET INCREASE (DECREASE) IN NET ASSETS FROM INVESTMENT OPERATIONS | $ | (6,310,434 | ) | $ | 35,833,341 | $ | (9,500,566 | ) | ||||
| 90 | The Royce Funds 2018 Semiannual Report to Shareholders | THE ACCOMPANYING NOTES ARE AN INTEGRAL PART OF THESE FINANCIAL STATEMENTS |
| Six Months Ended June 30, 2018 (unaudited) |
| Royce Special | ||||||||
| Equity Multi-Cap | Royce Total Return | |||||||
| Fund | Fund | |||||||
| INVESTMENT INCOME: | ||||||||
| INCOME: | ||||||||
| Dividends | $ | 889,425 | $ | 30,368,165 | ||||
| Foreign withholding tax | – | (574,355 | ) | |||||
| Interest | 11,006 | 318,995 | ||||||
| Securities lending | – | 81,510 | ||||||
| Total income | 900,431 | 30,194,315 | ||||||
| EXPENSES: | ||||||||
| Investment advisory fees | 374,356 | 11,241,818 | ||||||
| Distribution fees | 46,533 | 1,456,452 | ||||||
| Shareholder servicing | 32,140 | 1,004,620 | ||||||
| Shareholder reports | 4,222 | 236,348 | ||||||
| Administrative and office facilities | 15,622 | 358,842 | ||||||
| Registration | 26,592 | 47,489 | ||||||
| Custody | 8,111 | 127,932 | ||||||
| Audit | 13,703 | 25,505 | ||||||
| Trustees’ fees | 6,356 | 144,718 | ||||||
| Legal | 1,440 | 33,333 | ||||||
| Other expenses | 4,166 | 77,328 | ||||||
| Total expenses | 533,241 | 14,754,385 | ||||||
| Compensating balance credits | (400 | ) | (8,290 | ) | ||||
| Fees waived by investment adviser and distributor | (34,128 | ) | – | |||||
| Expenses reimbursed by investment adviser | (24,967 | ) | (419 | ) | ||||
| Net expenses | 473,746 | 14,745,676 | ||||||
| Net investment income (loss) | 426,685 | 15,448,639 | ||||||
| REALIZED AND UNREALIZED GAIN (LOSS) ON INVESTMENTS AND FOREIGN CURRENCY: | ||||||||
| NET REALIZED GAIN (LOSS): | ||||||||
| Investments in Non-Affiliated Companies | 9,082,472 | 227,638,826 | ||||||
| Investments in Affiliated Companies | – | (398,614 | ) | |||||
| Foreign currency transactions | – | 18,334 | ||||||
| NET CHANGE IN UNREALIZED APPRECIATION (DEPRECIATION): | ||||||||
| Investments in Non-Affiliated Companies and foreign currency translations | (14,653,271 | ) | (228,122,006 | ) | ||||
| Investments in Affiliated Companies | – | (1,087,983 | ) | |||||
| Other assets and liabilities denominated in foreign currency | – | 2,730 | ||||||
| Net realized and unrealized gain (loss) on investments and foreign currency | (5,570,799 | ) | (1,948,713 | ) | ||||
| NET INCREASE (DECREASE) IN NET ASSETS FROM INVESTMENT OPERATIONS | $ | (5,144,114 | ) | $ | 13,499,926 | |||
| THE ACCOMPANYING NOTES ARE AN INTEGRAL PART OF THESE FINANCIAL STATEMENTS | The Royce Funds 2018 Semiannual Report to Shareholders | 91 |
Financial Highlights
This table is presented to show selected data for a share outstanding throughout each year or other indicated period and to assist shareholders in evaluating a Fund’s performance for the periods presented. Per share amounts have been determined on the basis of the weighted average number of shares outstanding during the period.
| Ratio of Expenses to Average Net Assets | |||||||||||||||||||||||||||||||||||||||||||||||||||||||||||||||
| Net Asset Value, Beginning of Period | Net Investment Income (Loss) | Net Realized and Unrealized Gain (Loss) on Investments and Foreign Currency | Total from Investment Operations | Distributions from Net Investment Income | Distributions from Net Realized Gain on Investments and Foreign Currency | Total Distributions | Shareholder Redemption Fees | Net Asset Value, End of Period | Total Return | Net Assets, End of Period (in thousands) | Prior to Fee Waivers, Expense Reimbursements and Balance Credits | Prior to Fee Waivers and Expense Reimbursements | Net of Fee Waivers and Expense Reimbursements | Ratio of Net Investment Income (Loss) to Average Net Assets | Portfolio Turnover Rate | ||||||||||||||||||||||||||||||||||||||||||||||||
| Royce Dividend Value Fund–Investment Class | |||||||||||||||||||||||||||||||||||||||||||||||||||||||||||||||
| 2018† | $ | 7.56 | $ | 0.06 | $ | (0.21 | ) | $ | (0.15 | ) | $ | (0.06 | ) | $ | – | $ | (0.06 | ) | $ | – | $ | 7.35 | (2.01 | )%1 | $ | 115,434 | 1.12 | %2 | 1.12 | %2 | 1.06 | %2 | 1.61 | %2 | 7 | % | |||||||||||||||||||||||||||
| 2017 | 7.18 | 0.10 | 1.43 | 1.53 | (0.13 | ) | (1.02 | ) | (1.15 | ) | – | 7.56 | 21.91 | 121,209 | 1.13 | 1.13 | 1.06 | 1.24 | 16 | ||||||||||||||||||||||||||||||||||||||||||||
| 2016 | 6.84 | 0.12 | 1.02 | 1.14 | (0.11 | ) | (0.69 | ) | (0.80 | ) | – | 7.18 | 16.75 | 99,462 | 1.16 | 1.16 | 1.11 | 1.64 | 21 | ||||||||||||||||||||||||||||||||||||||||||||
| 2015 | 8.12 | 0.12 | (0.57 | ) | (0.45 | ) | (0.13 | ) | (0.70 | ) | (0.83 | ) | – | 6.84 | (5.54 | ) | 116,053 | 1.24 | 1.24 | 1.22 | 1.49 | 14 | |||||||||||||||||||||||||||||||||||||||||
| 2014 | 8.90 | 0.11 | (0.29 | ) | (0.18 | ) | (0.10 | ) | (0.50 | ) | (0.60 | ) | – | 8.12 | (1.90 | ) | 176,002 | 1.21 | 1.21 | 1.19 | 1.25 | 22 | |||||||||||||||||||||||||||||||||||||||||
| 2013 | 7.29 | 0.09 | 2.15 | 2.24 | (0.10 | ) | (0.53 | ) | (0.63 | ) | – | 8.90 | 31.23 | 211,589 | 1.21 | 1.21 | 1.21 | 1.13 | 36 | ||||||||||||||||||||||||||||||||||||||||||||
| Royce Dividend Value Fund–Service Class | |||||||||||||||||||||||||||||||||||||||||||||||||||||||||||||||
| 2018† | $ | 7.76 | $ | 0.05 | $ | (0.20 | ) | $ | (0.15 | ) | $ | (0.06 | ) | $ | – | $ | (0.06 | ) | $ | – | $ | 7.55 | (2.02 | )%1 | $ | 48,905 | 1.46 | %2 | 1.46 | %2 | 1.34 | %2 | 1.31 | %2 | 7 | % | |||||||||||||||||||||||||||
| 2017 | 7.33 | 0.08 | 1.46 | 1.54 | (0.07 | ) | (1.04 | ) | (1.11 | ) | – | 7.76 | 21.66 | 59,641 | 1.40 | 1.39 | 1.31 | 1.04 | 16 | ||||||||||||||||||||||||||||||||||||||||||||
| 2016 | 6.96 | 0.10 | 1.04 | 1.14 | (0.08 | ) | (0.69 | ) | (0.77 | ) | – | 7.33 | 16.36 | 115,547 | 1.43 | 1.43 | 1.37 | 1.39 | 21 | ||||||||||||||||||||||||||||||||||||||||||||
| 2015 | 8.22 | 0.10 | (0.57 | ) | (0.47 | ) | (0.09 | ) | (0.70 | ) | (0.79 | ) | – | 6.96 | (5.72 | ) | 167,165 | 1.49 | 1.49 | 1.47 | 1.25 | 14 | |||||||||||||||||||||||||||||||||||||||||
| 2014 | 8.98 | 0.09 | (0.29 | ) | (0.20 | ) | (0.06 | ) | (0.50 | ) | (0.56 | ) | – | 8.22 | (2.14 | ) | 295,560 | 1.47 | 1.47 | 1.44 | 0.98 | 22 | |||||||||||||||||||||||||||||||||||||||||
| 2013 | 7.35 | 0.07 | 2.16 | 2.23 | (0.07 | ) | (0.53 | ) | (0.60 | ) | – | 8.98 | 30.74 | 407,599 | 1.48 | 1.48 | 1.46 | 0.87 | 36 | ||||||||||||||||||||||||||||||||||||||||||||
| Royce Dividend Value Fund–Consultant Class a | |||||||||||||||||||||||||||||||||||||||||||||||||||||||||||||||
| 2018† | $ | 8.87 | $ | 0.03 | $ | (0.24 | ) | $ | (0.21 | ) | $ | (0.03 | ) | $ | – | $ | (0.03 | ) | $ | – | $ | 8.63 | (2.43 | )%1 | $ | 1,302 | 3.35 | %2 | 3.35 | %2 | 2.09 | %2 | 0.57 | %2 | 7 | % | |||||||||||||||||||||||||||
| 2017 | 8.39 | 0.02 | 1.68 | 1.70 | (0.03 | ) | (1.19 | ) | (1.22 | ) | – | 8.87 | 20.71 | 1,534 | 3.26 | 3.26 | 2.09 | 0.23 | 16 | ||||||||||||||||||||||||||||||||||||||||||||
| 2016 | 7.90 | 0.05 | 1.17 | 1.22 | (0.04 | ) | (0.69 | ) | (0.73 | ) | – | 8.39 | 15.44 | 1,572 | 3.26 | 3.26 | 2.14 | 0.58 | 21 | ||||||||||||||||||||||||||||||||||||||||||||
| 2015 | 9.22 | 0.04 | (0.63 | ) | (0.59 | ) | (0.03 | ) | (0.70 | ) | (0.73 | ) | – | 7.90 | (6.39 | ) | 1,886 | 3.78 | 3.78 | 2.24 | 0.46 | 14 | |||||||||||||||||||||||||||||||||||||||||
| 2014 | 10.00 | 0.01 | (0.27 | ) | (0.26 | ) | (0.02 | ) | (0.50 | ) | (0.52 | ) | – | 9.22 | (2.43 | )1 | 912 | 9.25 | 2 | 9.25 | 2 | 2.24 | 2 | 0.45 | 2 | 22 | |||||||||||||||||||||||||||||||||||||
| Royce Dividend Value Fund–Institutional Class | |||||||||||||||||||||||||||||||||||||||||||||||||||||||||||||||
| 2018† | $ | 7.46 | $ | 0.07 | $ | (0.20 | ) | $ | (0.13 | ) | $ | (0.07 | ) | $ | – | $ | (0.07 | ) | $ | – | $ | 7.26 | (1.84 | )%1 | $ | 767 | 3.11 | %2 | 3.11 | %2 | 0.89 | %2 | 1.70 | %2 | 7 | % | |||||||||||||||||||||||||||
| 2017 | 7.09 | 0.11 | 1.42 | 1.53 | (0.15 | ) | (1.01 | ) | (1.16 | ) | – | 7.46 | 22.21 | 1,112 | 2.79 | 2.79 | 0.89 | 1.43 | 16 | ||||||||||||||||||||||||||||||||||||||||||||
| 2016 | 6.78 | 0.13 | 1.00 | 1.13 | (0.13 | ) | (0.69 | ) | (0.82 | ) | – | 7.09 | 16.70 | 823 | 3.30 | 3.30 | 0.93 | 1.81 | 21 | ||||||||||||||||||||||||||||||||||||||||||||
| 2015 | 8.09 | 0.17 | (0.62 | ) | (0.45 | ) | (0.16 | ) | (0.70 | ) | (0.86 | ) | – | 6.78 | (5.61 | ) | 658 | 1.11 | 1.11 | 1.04 | 1.60 | 14 | |||||||||||||||||||||||||||||||||||||||||
| 2014 | 8.88 | 0.12 | (0.29 | ) | (0.17 | ) | (0.12 | ) | (0.50 | ) | (0.62 | ) | – | 8.09 | (1.76 | ) | 40,942 | 1.10 | 1.10 | 1.04 | 1.42 | 22 | |||||||||||||||||||||||||||||||||||||||||
| 2013 | 7.28 | 0.11 | 2.14 | 2.25 | (0.12 | ) | (0.53 | ) | (0.65 | ) | – | 8.88 | 31.46 | 31,236 | 1.11 | 1.11 | 1.04 | 1.29 | 36 | ||||||||||||||||||||||||||||||||||||||||||||
| Royce Global Financial Services Fund–Service Class | |||||||||||||||||||||||||||||||||||||||||||||||||||||||||||||||
| 2018† | $ | 10.57 | $ | 0.05 | $ | 0.23 | $ | 0.28 | $ | – | $ | – | $ | – | $ | – | $ | 10.85 | 2.65 | %1 | $ | 48,122 | 1.65 | %2 | 1.65 | %2 | 1.49 | %2 | 0.96 | %2 | 5 | % | |||||||||||||||||||||||||||||||
| 2017 | 8.95 | 0.10 | 1.90 | 2.00 | (0.23 | ) | (0.15 | ) | (0.38 | ) | – | 10.57 | 22.46 | 47,197 | 1.68 | 1.68 | 1.49 | 0.83 | 19 | ||||||||||||||||||||||||||||||||||||||||||||
| 2016 | 7.99 | 0.11 | 0.92 | 1.03 | (0.05 | ) | (0.02 | ) | (0.07 | ) | – | 8.95 | 12.93 | 43,629 | 1.67 | 1.67 | 1.49 | 1.25 | 37 | ||||||||||||||||||||||||||||||||||||||||||||
| 2015 | 9.28 | 0.11 | (0.55 | ) | (0.44 | ) | (0.11 | ) | (0.74 | ) | (0.85 | ) | – | 7.99 | (4.71 | ) | 52,013 | 1.65 | 1.65 | 1.49 | 1.19 | 46 | |||||||||||||||||||||||||||||||||||||||||
| 2014 | 9.68 | 0.09 | 0.22 | 0.31 | (0.06 | ) | (0.65 | ) | (0.71 | ) | – | 9.28 | 3.45 | 53,707 | 1.68 | 1.68 | 1.49 | 0.91 | 41 | ||||||||||||||||||||||||||||||||||||||||||||
| 2013 | 6.83 | 0.04 | 2.82 | 2.86 | (0.02 | ) | – | (0.02 | ) | 0.01 | 9.68 | 42.00 | 47,593 | 1.89 | 1.89 | 1.49 | 0.59 | 23 | |||||||||||||||||||||||||||||||||||||||||||||
| 92 | The Royce Funds 2018 Semiannual Report to Shareholders | THE ACCOMPANYING NOTES ARE AN INTEGRAL PART OF THESE FINANCIAL STATEMENTS |
Financial Highlights
This table is presented to show selected data for a share outstanding throughout each year or other indicated period and to assist shareholders in evaluating a Fund’s performance for the periods presented. Per share amounts have been determined on the basis of the weighted average number of shares outstanding during the period.
| Ratio of Expenses to Average Net Assets | |||||||||||||||||||||||||||||||||||||||||||||||||||||||||||||||
| Net Asset Value, Beginning of Period | Net Investment Income (Loss) | Net Realized and Unrealized Gain (Loss) on Investments and Foreign Currency | Total from Investment Operations | Distributions from Net Investment Income | Distributions from Net Realized Gain on Investments and Foreign Currency | Total Distributions | Shareholder Redemption Fees | Net Asset Value, End of Period | Total Return | Net Assets, End of Period (in thousands) | Prior to Fee Waivers, Expense Reimbursements and Balance Credits | Prior to Fee Waivers and Expense Reimbursements | Net of Fee Waivers and Expense Reimbursements | Ratio of Net Investment Income (Loss) to Average Net Assets | Portfolio Turnover Rate | ||||||||||||||||||||||||||||||||||||||||||||||||
| Royce Global Financial Services Fund–Institutional Class b | |||||||||||||||||||||||||||||||||||||||||||||||||||||||||||||||
| 2018† | $ | 13.58 | $ | 0.10 | $ | 0.29 | $ | 0.39 | $ | – | $ | – | $ | – | $ | – | $ | 13.97 | 2.87 | %1 | $ | 8,808 | 1.39 | %2 | 1.39 | %2 | 1.04 | %2 | 1.41 | %2 | 5 | % | |||||||||||||||||||||||||||||||
| 2017 | 11.43 | 0.15 | 2.47 | 2.62 | (0.27 | ) | (0.20 | ) | (0.47 | ) | – | 13.58 | 23.01 | 8,608 | 1.44 | 1.44 | 1.04 | 1.29 | 19 | ||||||||||||||||||||||||||||||||||||||||||||
| 2016 | 10.00 | 0.18 | 1.36 | 1.54 | (0.09 | ) | (0.02 | ) | (0.11 | ) | – | 11.43 | 15.41 | 1 | 6,474 | 1.85 | 2 | 1.85 | 2 | 1.04 | 2 | 1.82 | 2 | 37 | |||||||||||||||||||||||||||||||||||||||
| Royce International Discovery Fund–Service Class | |||||||||||||||||||||||||||||||||||||||||||||||||||||||||||||||
| 2018† | $ | 12.57 | $ | 0.06 | $ | (0.84 | ) | $ | (0.78 | ) | $ | – | $ | – | $ | – | $ | – | $ | 11.79 | (6.21 | )%1 | $ | 7,973 | 2.88 | %2 | 2.87 | %2 | 1.47 | %2 | 0.90 | %2 | 112 | % | |||||||||||||||||||||||||||||
| 2017 | 9.98 | 0.09 | 2.67 | 2.76 | (0.17 | ) | – | (0.17 | ) | – | 12.57 | 27.72 | 7,953 | 3.04 | 3.04 | 1.64 | 0.74 | 90 | |||||||||||||||||||||||||||||||||||||||||||||
| 2016 | 9.54 | 0.07 | 0.53 | 0.60 | (0.16 | ) | – | (0.16 | ) | – | 9.98 | 6.33 | 6,060 | 3.35 | 3.35 | 1.64 | 0.68 | 113 | |||||||||||||||||||||||||||||||||||||||||||||
| 2015 | 9.66 | 0.04 | (0.14 | ) | (0.10 | ) | (0.02 | ) | – | (0.02 | ) | – | 9.54 | (0.99 | ) | 6,102 | 3.14 | 3.14 | 1.67 | 0.44 | 94 | ||||||||||||||||||||||||||||||||||||||||||
| 2014 | 10.04 | 0.06 | (0.30 | ) | (0.24 | ) | (0.14 | ) | – | (0.14 | ) | – | 9.66 | (2.37 | ) | 6,410 | 3.51 | 3.51 | 1.69 | 0.82 | 91 | ||||||||||||||||||||||||||||||||||||||||||
| 2013 | 8.61 | 0.11 | 1.51 | 1.62 | (0.20 | ) | – | (0.20 | ) | 0.01 | 10.04 | 18.95 | 5,209 | 3.86 | 3.86 | 1.69 | 1.22 | 103 | |||||||||||||||||||||||||||||||||||||||||||||
| Royce International Premier Fund–Investment Class c | |||||||||||||||||||||||||||||||||||||||||||||||||||||||||||||||
| 2018† | $ | 13.07 | $ | 0.10 | $ | (0.49 | ) | $ | (0.39 | ) | $ | – | $ | – | $ | – | $ | – | $ | 12.68 | (2.98 | )%1 | $ | 171,567 | 1.22 | %2 | 1.22 | %2 | 1.12 | %2 | 1.56 | %2 | 30 | % | |||||||||||||||||||||||||||||
| 2017 | 9.44 | (0.10 | ) | 3.88 | 3.78 | (0.15 | ) | – | (0.15 | ) | – | 13.07 | 40.08 | 103,032 | 1.37 | 1.37 | 1.19 | 0.32 | 41 | ||||||||||||||||||||||||||||||||||||||||||||
| 2016 | 9.82 | 0.10 | (0.19 | ) | (0.09 | ) | (0.28 | ) | (0.01 | ) | (0.29 | ) | – | 9.44 | (0.79 | ) | 19,556 | 1.59 | 1.59 | 1.19 | 0.96 | 67 | |||||||||||||||||||||||||||||||||||||||||
| 2015 | 8.71 | 0.16 | 1.27 | 1.43 | (0.32 | ) | – | (0.32 | ) | – | 9.82 | 16.42 | 3,623 | 2.80 | 2.80 | 1.38 | 1.72 | 67 | |||||||||||||||||||||||||||||||||||||||||||||
| 2014 | 10.00 | 0.03 | (0.85 | ) | (0.82 | ) | (0.16 | ) | (0.31 | ) | (0.47 | ) | – | 8.71 | (8.16 | )1 | 3,481 | 3.17 | 2 | 3.17 | 2 | 1.44 | 2 | 1.00 | 2 | 62 | |||||||||||||||||||||||||||||||||||||
| Royce International Premier Fund–Service Class | |||||||||||||||||||||||||||||||||||||||||||||||||||||||||||||||
| 2018† | $ | 15.60 | $ | 0.08 | $ | (0.56 | ) | $ | (0.48 | ) | $ | – | $ | – | $ | – | $ | – | $ | 15.12 | (3.08 | )%1 | $ | 43,584 | 1.58 | %2 | 1.57 | %2 | 1.38 | %2 | 1.07 | %2 | 30 | % | |||||||||||||||||||||||||||||
| 2017 | 11.24 | 0.05 | 4.42 | 4.47 | (0.11 | ) | – | (0.11 | ) | – | 15.60 | 39.81 | 48,642 | 1.65 | 1.65 | 1.44 | 0.28 | 41 | |||||||||||||||||||||||||||||||||||||||||||||
| 2016 | 11.64 | 0.06 | (0.19 | ) | (0.13 | ) | (0.26 | ) | (0.01 | ) | (0.27 | ) | – | 11.24 | (1.06 | ) | 38,884 | 1.84 | 1.84 | 1.44 | 0.66 | 67 | |||||||||||||||||||||||||||||||||||||||||
| 2015 | 10.28 | (0.00 | ) | 1.66 | 1.66 | (0.30 | ) | – | (0.30 | ) | – | 11.64 | 16.22 | 9,015 | 2.65 | 2.65 | 1.60 | 1.10 | 67 | ||||||||||||||||||||||||||||||||||||||||||||
| 2014 | 11.67 | 0.17 | (1.13 | ) | (0.96 | ) | (0.12 | ) | (0.31 | ) | (0.43 | ) | – | 10.28 | (8.22 | ) | 4,045 | 2.45 | 2.45 | 1.69 | 1.26 | 62 | |||||||||||||||||||||||||||||||||||||||||
| 2013 | 10.01 | 0.10 | 1.73 | 1.83 | (0.17 | ) | – | (0.17 | ) | – | 11.67 | 18.31 | 9,470 | 2.82 | 2.82 | 1.69 | 1.09 | 51 | |||||||||||||||||||||||||||||||||||||||||||||
| Royce International Premier Fund–Consultant Class d | |||||||||||||||||||||||||||||||||||||||||||||||||||||||||||||||
| 2018† | $ | 16.99 | $ | 0.03 | $ | (0.63 | ) | $ | (0.60 | ) | $ | – | $ | – | $ | – | $ | – | $ | 16.39 | (3.53 | )%1 | $ | 9,885 | 2.36 | %2 | 2.36 | %2 | 2.19 | %2 | 0.36 | %2 | 30 | % | |||||||||||||||||||||||||||||
| 2017 | 12.27 | (0.08 | ) | 4.83 | 4.75 | (0.03 | ) | – | (0.03 | ) | – | 16.99 | 38.73 | 9,281 | 2.73 | 2.73 | 2.19 | (0.52 | ) | 41 | |||||||||||||||||||||||||||||||||||||||||||
| 2016 | 11.59 | 0.01 | 0.85 | 0.86 | (0.17 | ) | (0.01 | ) | (0.18 | ) | – | 12.27 | 7.49 | 1 | 5,086 | 2.70 | 2 | 2.70 | 2 | 2.19 | 2 | (0.04 | )2 | 67 | |||||||||||||||||||||||||||||||||||||||
| Royce International Premier Fund–Institutional Class e | |||||||||||||||||||||||||||||||||||||||||||||||||||||||||||||||
| 2018† | $ | 12.98 | $ | 0.04 | $ | (0.33 | ) | $ | (0.29 | ) | $ | – | $ | – | $ | – | $ | – | $ | 12.69 | (2.23 | )%1 | $ | 8,356 | 1.61 | %2 | 1.61 | %2 | 1.04 | %2 | 1.99 | %2 | 30 | % | |||||||||||||||||||||||||||||
| Royce Low-Priced Stock Fund–Investment Class | |||||||||||||||||||||||||||||||||||||||||||||||||||||||||||||||
| 2018† | $ | 8.49 | $ | 0.00 | $ | 0.81 | $ | 0.81 | $ | – | $ | – | $ | – | $ | – | $ | 9.30 | 9.54 | %1 | $ | 60,061 | 1.26 | %2 | 1.25 | %2 | 1.24 | %2 | 0.08 | %2 | 44 | % | |||||||||||||||||||||||||||||||
| 2017 | 8.26 | (0.00 | ) | 0.80 | 0.80 | (0.02 | ) | (0.55 | ) | (0.57 | ) | – | 8.49 | 9.86 | 52,912 | 1.30 | 1.30 | 1.24 | 0.12 | 26 | |||||||||||||||||||||||||||||||||||||||||||
| 2016 | 7.77 | 0.04 | 1.24 | 1.28 | (0.06 | ) | (0.73 | ) | (0.79 | ) | – | 8.26 | 16.42 | 22,852 | 1.31 | 1.31 | 1.24 | 0.39 | 34 | ||||||||||||||||||||||||||||||||||||||||||||
| 2015 | 9.46 | 0.00 | (0.97 | ) | (0.97 | ) | – | (0.72 | ) | (0.72 | ) | – | 7.77 | (10.21 | ) | 28,732 | 1.28 | 1.28 | 1.24 | 0.03 | 53 | ||||||||||||||||||||||||||||||||||||||||||
| 2014 | 13.60 | 0.06 | (0.58 | ) | (0.52 | ) | (0.01 | ) | (3.61 | ) | (3.62 | ) | – | 9.46 | (3.15 | ) | 50,371 | 1.25 | 1.25 | 1.24 | 0.46 | 29 | |||||||||||||||||||||||||||||||||||||||||
| 2013 | 13.83 | 0.05 | 1.71 | 1.76 | (0.05 | ) | (1.94 | ) | (1.99 | ) | – | 13.60 | 13.17 | 88,568 | 1.37 | 1.37 | 1.24 | 0.18 | 16 | ||||||||||||||||||||||||||||||||||||||||||||
| THE ACCOMPANYING NOTES ARE AN INTEGRAL PART OF THESE FINANCIAL STATEMENTS | The Royce Funds 2018 Semiannual Report to Shareholders | 93 |
Financial Highlights
This table is presented to show selected data for a share outstanding throughout each year or other indicated period and to assist shareholders in evaluating a Fund’s performance for the periods presented. Per share amounts have been determined on the basis of the weighted average number of shares outstanding during the period.
| Ratio of Expenses to Average Net Assets | |||||||||||||||||||||||||||||||||||||||||||||||||||||||||||||||
| Net Asset Value, Beginning of Period | Net Investment Income (Loss) | Net Realized and Unrealized Gain (Loss) on Investments and Foreign Currency | Total from Investment Operations | Distributions from Net Investment Income | Distributions from Net Realized Gain on Investments and Foreign Currency | Total Distributions | Shareholder Redemption Fees | Net Asset Value, End of Period | Total Return | Net Assets, End of Period (in thousands) | Prior to Fee Waivers, Expense Reimbursements and Balance Credits | Prior to Fee Waivers and Expense Reimbursements | Net of Fee Waivers and Expense Reimbursements | Ratio of Net Investment Income (Loss) to Average Net Assets | Portfolio Turnover Rate | ||||||||||||||||||||||||||||||||||||||||||||||||
| Royce Low-Priced Stock Fund–Service Class | |||||||||||||||||||||||||||||||||||||||||||||||||||||||||||||||
| 2018† | $ | 8.46 | $ | (0.01 | ) | $ | 0.80 | $ | 0.79 | $ | – | $ | – | $ | – | $ | – | $ | 9.25 | 9.34 | %1 | $ | 209,998 | 1.54 | %2 | 1.54 | %2 | 1.49 | %2 | (0.16 | )%2 | 44 | % | ||||||||||||||||||||||||||||||
| 2017 | 8.23 | (0.01 | ) | 0.79 | 0.78 | – | (0.55 | ) | (0.55 | ) | – | 8.46 | 9.67 | 209,369 | 1.52 | 1.52 | 1.49 | (0.13 | ) | 26 | |||||||||||||||||||||||||||||||||||||||||||
| 2016 | 7.75 | 0.02 | 1.23 | 1.25 | (0.04 | ) | (0.73 | ) | (0.77 | ) | – | 8.23 | 16.09 | 281,873 | 1.52 | 1.52 | 1.49 | 0.14 | 34 | ||||||||||||||||||||||||||||||||||||||||||||
| 2015 | 9.46 | (0.02 | ) | (0.97 | ) | (0.99 | ) | – | (0.72 | ) | (0.72 | ) | – | 7.75 | (10.42 | ) | 316,475 | 1.49 | 1.49 | 1.47 | (0.20 | ) | 53 | ||||||||||||||||||||||||||||||||||||||||
| 2014 | 13.62 | 0.03 | (0.58 | ) | (0.55 | ) | – | (3.61 | ) | (3.61 | ) | – | 9.46 | (3.37 | ) | 520,905 | 1.55 | 1.55 | 1.49 | 0.21 | 29 | ||||||||||||||||||||||||||||||||||||||||||
| 2013 | 13.84 | (0.00 | ) | 1.72 | 1.72 | (0.00 | ) | (1.94 | ) | (1.94 | ) | – | 13.62 | 12.91 | 1,008,207 | 1.65 | 1.65 | 1.49 | (0.02 | ) | 16 | ||||||||||||||||||||||||||||||||||||||||||
| Royce Micro-Cap Fund–Investment Class | |||||||||||||||||||||||||||||||||||||||||||||||||||||||||||||||
| 2018† | $ | 11.64 | $ | (0.02 | ) | $ | 1.21 | $ | 1.19 | $ | – | $ | – | $ | – | $ | – | $ | 12.83 | 10.22 | %1 | $ | 159,818 | 1.51 | %2 | 1.51 | %2 | 1.49 | %2 | (0.31 | )%2 | 11 | % | ||||||||||||||||||||||||||||||
| 2017 | 11.92 | (0.03 | ) | 0.66 | 0.63 | (0.01 | ) | (0.90 | ) | (0.91 | ) | – | 11.64 | 5.43 | 166,935 | 1.51 | 1.51 | 1.49 | (0.28 | ) | 26 | ||||||||||||||||||||||||||||||||||||||||||
| 2016 | 11.09 | 0.01 | 2.18 | 2.19 | (0.06 | ) | (1.30 | ) | (1.36 | ) | – | 11.92 | 19.74 | 192,731 | 1.48 | 1.48 | 1.48 | 0.03 | 38 | ||||||||||||||||||||||||||||||||||||||||||||
| 2015 | 14.47 | 0.02 | (1.96 | ) | (1.94 | ) | – | (1.44 | ) | (1.44 | ) | – | 11.09 | (13.32 | ) | 219,272 | 1.51 | 1.51 | 1.51 | 0.15 | 41 | ||||||||||||||||||||||||||||||||||||||||||
| 2014 | 16.68 | (0.08 | ) | (0.65 | ) | (0.73 | ) | – | (1.48 | ) | (1.48 | ) | – | 14.47 | (4.13 | ) | 414,120 | 1.52 | 1.52 | 1.52 | (0.49 | ) | 18 | ||||||||||||||||||||||||||||||||||||||||
| 2013 | 14.78 | (0.08 | ) | 3.19 | 3.11 | (0.02 | ) | (1.19 | ) | (1.21 | ) | – | 16.68 | 21.29 | 650,773 | 1.53 | 1.53 | 1.53 | (0.52 | ) | 22 | ||||||||||||||||||||||||||||||||||||||||||
| Royce Micro-Cap Fund–Service Class | |||||||||||||||||||||||||||||||||||||||||||||||||||||||||||||||
| 2018† | $ | 11.41 | $ | (0.03 | ) | $ | 1.18 | $ | 1.15 | $ | – | $ | – | $ | – | $ | – | $ | 12.56 | 10.08 | %1 | $ | 13,710 | 1.90 | %2 | 1.90 | %2 | 1.61 | %2 | (0.43 | )%2 | 11 | % | ||||||||||||||||||||||||||||||
| 2017 | 11.69 | (0.05 | ) | 0.65 | 0.60 | – | (0.88 | ) | (0.88 | ) | – | 11.41 | 5.32 | 13,880 | 1.86 | 1.86 | 1.61 | (0.40 | ) | 26 | |||||||||||||||||||||||||||||||||||||||||||
| 2016 | 10.90 | (0.01 | ) | 2.15 | 2.14 | (0.05 | ) | (1.30 | ) | (1.35 | ) | – | 11.69 | 19.59 | 17,343 | 1.83 | 1.83 | 1.61 | (0.11 | ) | 38 | ||||||||||||||||||||||||||||||||||||||||||
| 2015 | 14.26 | 0.00 | (1.92 | ) | (1.92 | ) | – | (1.44 | ) | (1.44 | ) | – | 10.90 | (13.37 | ) | 20,538 | 1.80 | 1.80 | 1.63 | 0.01 | 41 | ||||||||||||||||||||||||||||||||||||||||||
| 2014 | 16.48 | (0.10 | ) | (0.65 | ) | (0.75 | ) | – | (1.48 | ) | (1.48 | ) | 0.01 | 14.26 | (4.24 | ) | 38,645 | 1.77 | 1.77 | 1.66 | (0.63 | ) | 18 | ||||||||||||||||||||||||||||||||||||||||
| 2013 | 14.61 | (0.10 | ) | 3.16 | 3.06 | – | (1.19 | ) | (1.19 | ) | – | 16.48 | 21.20 | 79,890 | 1.74 | 1.74 | 1.66 | (0.66 | ) | 22 | |||||||||||||||||||||||||||||||||||||||||||
| Royce Micro-Cap Fund–Consultant Class | |||||||||||||||||||||||||||||||||||||||||||||||||||||||||||||||
| 2018† | $ | 9.10 | $ | (0.06 | ) | $ | 0.93 | $ | 0.87 | $ | – | $ | – | $ | – | $ | – | $ | 9.97 | 9.56 | %1 | $ | 23,801 | 2.56 | %2 | 2.56 | %2 | 2.56 | %2 | (1.38 | )%2 | 11 | % | ||||||||||||||||||||||||||||||
| 2017 | 9.41 | (0.13 | ) | 0.53 | 0.40 | – | (0.71 | ) | (0.71 | ) | – | 9.10 | 4.35 | 24,396 | 2.54 | 2.54 | 2.54 | (1.34 | ) | 26 | |||||||||||||||||||||||||||||||||||||||||||
| 2016 | 9.04 | (0.09 | ) | 1.76 | 1.67 | – | (1.30 | ) | (1.30 | ) | – | 9.41 | 18.48 | 33,622 | 2.53 | 2.53 | 2.53 | (1.02 | ) | 38 | |||||||||||||||||||||||||||||||||||||||||||
| 2015 | 12.23 | (0.10 | ) | (1.65 | ) | (1.75 | ) | – | (1.44 | ) | (1.44 | ) | – | 9.04 | (14.21 | ) | 41,024 | 2.54 | 2.54 | 2.54 | (0.90 | ) | 41 | ||||||||||||||||||||||||||||||||||||||||
| 2014 | 14.48 | (0.20 | ) | (0.57 | ) | (0.77 | ) | – | (1.48 | ) | (1.48 | ) | – | 12.23 | (5.03 | ) | 75,868 | 2.48 | 2.48 | 2.48 | (1.45 | ) | 18 | ||||||||||||||||||||||||||||||||||||||||
| 2013 | 13.08 | (0.21 | ) | 2.80 | 2.59 | – | (1.19 | ) | (1.19 | ) | – | 14.48 | 20.08 | 117,538 | 2.52 | 2.52 | 2.52 | (1.51 | ) | 22 | |||||||||||||||||||||||||||||||||||||||||||
| Royce Micro-Cap Opportunity Fund–Investment Class | |||||||||||||||||||||||||||||||||||||||||||||||||||||||||||||||
| 2018† | $ | 19.76 | $ | (0.09 | ) | $ | 1.64 | $ | 1.55 | $ | – | $ | – | $ | – | $ | – | $ | 21.31 | 7.84 | %1 | $ | 46,632 | 1.29 | %2 | 1.29 | %2 | 1.24 | %2 | (0.93 | )%2 | 33 | % | ||||||||||||||||||||||||||||||
| 2017 | 17.19 | (0.14 | ) | 4.38 | 4.24 | – | (1.67 | ) | (1.67 | ) | – | 19.76 | 24.92 | 45,992 | 1.28 | 1.28 | 1.24 | (0.75 | ) | 70 | |||||||||||||||||||||||||||||||||||||||||||
| 2016 | 13.88 | (0.08 | ) | 3.39 | 3.31 | – | – | – | – | 17.19 | 23.85 | 45,135 | 1.30 | 1.30 | 1.24 | (0.55 | ) | 83 | |||||||||||||||||||||||||||||||||||||||||||||
| 2015 | 16.52 | (0.09 | ) | (2.55 | ) | (2.64 | ) | – | (0.00 | ) | (0.00 | ) | – | 13.88 | (15.98 | ) | 34,437 | 1.39 | 1.39 | 1.25 | (0.58 | ) | 105 | ||||||||||||||||||||||||||||||||||||||||
| 2014 | 17.93 | (0.11 | ) | (0.81 | ) | (0.92 | ) | – | (0.51 | ) | (0.51 | ) | 0.02 | 16.52 | (4.97 | ) | 18,221 | 1.56 | 1.56 | 1.28 | (0.60 | ) | 131 | ||||||||||||||||||||||||||||||||||||||||
| 2013 | 12.81 | (0.13 | ) | 5.79 | 5.66 | – | (0.55 | ) | (0.55 | ) | 0.01 | 17.93 | 44.61 | 17,461 | 1.78 | 1.78 | 1.29 | (0.80 | ) | 129 | |||||||||||||||||||||||||||||||||||||||||||
| 94 | The Royce Funds 2018 Semiannual Report to Shareholders | THE ACCOMPANYING NOTES ARE AN INTEGRAL PART OF THESE FINANCIAL STATEMENTS |
Financial Highlights
This table is presented to show selected data for a share outstanding throughout each year or other indicated period and to assist shareholders in evaluating a Fund’s performance for the periods presented. Per share amounts have been determined on the basis of the weighted average number of shares outstanding during the period.
| Ratio of Expenses to Average Net Assets | |||||||||||||||||||||||||||||||||||||||||||||||||||||||||||||||
| Net Asset Value, Beginning of Period | Net Investment Income (Loss) | Net Realized and Unrealized Gain (Loss) on Investments and Foreign Currency | Total from Investment Operations | Distributions from Net Investment Income | Distributions from Net Realized Gain on Investments and Foreign Currency | Total Distributions | Shareholder Redemption Fees | Net Asset Value, End of Period | Total Return | Net Assets, End of Period (in thousands) | Prior to Fee Waivers, Expense Reimbursements and Balance Credits | Prior to Fee Waivers and Expense Reimbursements | Net of Fee Waivers and Expense Reimbursements | Ratio of Net Investment Income (Loss) to Average Net Assets | Portfolio Turnover Rate | ||||||||||||||||||||||||||||||||||||||||||||||||
| Royce Micro-Cap Opportunity Fund–Service Class a | |||||||||||||||||||||||||||||||||||||||||||||||||||||||||||||||
| 2018† | $ | 9.93 | $ | (0.06 | ) | $ | 0.83 | $ | 0.77 | $ | – | $ | – | $ | – | $ | – | $ | 10.70 | 7.75 | %1 | $ | 1,289 | 3.14 | %2 | 3.14 | %2 | 1.49 | %2 | (1.17 | )%2 | 33 | % | ||||||||||||||||||||||||||||||
| 2017 | 8.66 | (0.09 | ) | 2.20 | 2.11 | – | (0.84 | ) | (0.84 | ) | – | 9.93 | 24.61 | 1,130 | 3.36 | 3.36 | 1.49 | (1.00 | ) | 70 | |||||||||||||||||||||||||||||||||||||||||||
| 2016 | 7.01 | (0.06 | ) | 1.71 | 1.65 | – | – | – | – | 8.66 | 23.54 | 995 | 3.37 | 3.37 | 1.49 | (0.81 | ) | 83 | |||||||||||||||||||||||||||||||||||||||||||||
| 2015 | 8.37 | (0.07 | ) | (1.29 | ) | (1.36 | ) | – | (0.00 | ) | (0.00 | ) | – | 7.01 | (16.24 | ) | 1,212 | 3.22 | 3.22 | 1.51 | (0.86 | ) | 105 | ||||||||||||||||||||||||||||||||||||||||
| 2014 | 10.00 | (0.04 | ) | (1.11 | ) | (1.15 | ) | – | (0.51 | ) | (0.51 | ) | 0.03 | 8.37 | (11.11 | )1 | 939 | 10.50 | 2 | 10.50 | 2 | 1.53 | 2 | (0.65 | )2 | 131 | |||||||||||||||||||||||||||||||||||||
| Royce Opportunity Fund–Investment Class | |||||||||||||||||||||||||||||||||||||||||||||||||||||||||||||||
| 2018† | $ | 13.58 | $ | (0.02 | ) | $ | 0.57 | $ | 0.55 | $ | – | $ | – | $ | – | $ | – | $ | 14.13 | 4.05 | %1 | $ | 804,295 | 1.19 | %2 | 1.19 | %2 | 1.19 | %2 | (0.29 | )%2 | 21 | % | ||||||||||||||||||||||||||||||
| 2017 | 12.85 | (0.04 | ) | 2.79 | 2.75 | – | (2.02 | ) | (2.02 | ) | – | 13.58 | 21.88 | 805,660 | 1.18 | 1.18 | 1.18 | (0.28 | ) | 43 | |||||||||||||||||||||||||||||||||||||||||||
| 2016 | 10.57 | (0.02 | ) | 3.19 | 3.17 | – | (0.89 | ) | (0.89 | ) | – | 12.85 | 29.86 | 751,184 | 1.19 | 1.19 | 1.19 | (0.18 | ) | 26 | |||||||||||||||||||||||||||||||||||||||||||
| 2015 | 13.46 | (0.03 | ) | (1.80 | ) | (1.83 | ) | – | (1.06 | ) | (1.06 | ) | – | 10.57 | (13.57 | ) | 746,052 | 1.17 | 1.17 | 1.17 | (0.27 | ) | 27 | ||||||||||||||||||||||||||||||||||||||||
| 2014 | 15.54 | (0.05 | ) | (0.09 | ) | (0.14 | ) | – | (1.94 | ) | (1.94 | ) | – | 13.46 | (0.48 | ) | 1,284,044 | 1.14 | 1.14 | 1.14 | (0.30 | ) | 36 | ||||||||||||||||||||||||||||||||||||||||
| 2013 | 11.95 | (0.05 | ) | 5.18 | 5.13 | – | (1.54 | ) | (1.54 | ) | – | 15.54 | 43.50 | 1,426,214 | 1.16 | 1.16 | 1.16 | (0.36 | ) | 39 | |||||||||||||||||||||||||||||||||||||||||||
| Royce Opportunity Fund–Service Class | |||||||||||||||||||||||||||||||||||||||||||||||||||||||||||||||
| 2018† | $ | 12.66 | $ | (0.04 | ) | $ | 0.53 | $ | 0.49 | $ | – | $ | – | $ | – | $ | – | $ | 13.15 | 3.87 | %1 | $ | 76,214 | 1.53 | %2 | 1.53 | %2 | 1.49 | %2 | (0.60 | )%2 | 21 | % | ||||||||||||||||||||||||||||||
| 2017 | 12.02 | (0.08 | ) | 2.61 | 2.53 | – | (1.89 | ) | (1.89 | ) | – | 12.66 | 21.46 | 96,663 | 1.53 | 1.53 | 1.49 | (0.61 | ) | 43 | |||||||||||||||||||||||||||||||||||||||||||
| 2016 | 9.95 | (0.05 | ) | 3.01 | 2.96 | – | (0.89 | ) | (0.89 | ) | – | 12.02 | 29.61 | 73,517 | 1.53 | 1.53 | 1.49 | (0.48 | ) | 26 | |||||||||||||||||||||||||||||||||||||||||||
| 2015 | 12.80 | (0.07 | ) | (1.72 | ) | (1.79 | ) | – | (1.06 | ) | (1.06 | ) | – | 9.95 | (13.96 | ) | 100,918 | 1.49 | 1.49 | 1.49 | (0.59 | ) | 27 | ||||||||||||||||||||||||||||||||||||||||
| 2014 | 14.92 | (0.09 | ) | (0.09 | ) | (0.18 | ) | – | (1.94 | ) | (1.94 | ) | – | 12.80 | (0.74 | ) | 155,085 | 1.47 | 1.47 | 1.47 | (0.64 | ) | 36 | ||||||||||||||||||||||||||||||||||||||||
| 2013 | 11.55 | (0.09 | ) | 5.00 | 4.91 | – | (1.54 | ) | (1.54 | ) | – | 14.92 | 43.10 | 208,237 | 1.47 | 1.47 | 1.47 | (0.67 | ) | 39 | |||||||||||||||||||||||||||||||||||||||||||
| Royce Opportunity Fund–Consultant Class | |||||||||||||||||||||||||||||||||||||||||||||||||||||||||||||||
| 2018† | $ | 11.19 | $ | (0.08 | ) | $ | 0.47 | $ | 0.39 | $ | – | $ | – | $ | – | $ | – | $ | 11.58 | 3.49 | %1 | $ | 17,536 | 2.28 | %2 | 2.28 | %2 | 2.28 | %2 | (1.38 | )%2 | 21 | % | ||||||||||||||||||||||||||||||
| 2017 | 10.71 | (0.16 | ) | 2.31 | 2.15 | – | (1.67 | ) | (1.67 | ) | – | 11.19 | 20.50 | 20,574 | 2.27 | 2.27 | 2.27 | (1.37 | ) | 43 | |||||||||||||||||||||||||||||||||||||||||||
| 2016 | 9.01 | (0.12 | ) | 2.71 | 2.59 | – | (0.89 | ) | (0.89 | ) | – | 10.71 | 28.59 | 21,116 | 2.28 | 2.28 | 2.28 | (1.27 | ) | 26 | |||||||||||||||||||||||||||||||||||||||||||
| 2015 | 11.79 | (0.15 | ) | (1.57 | ) | (1.72 | ) | – | (1.06 | ) | (1.06 | ) | – | 9.01 | (14.56 | ) | 19,464 | 2.26 | 2.26 | 2.26 | (1.34 | ) | 27 | ||||||||||||||||||||||||||||||||||||||||
| 2014 | 14.02 | (0.19 | ) | (0.10 | ) | (0.29 | ) | – | (1.94 | ) | (1.94 | ) | – | 11.79 | (1.61 | ) | 20,518 | 2.24 | 2.24 | 2.24 | (1.40 | ) | 36 | ||||||||||||||||||||||||||||||||||||||||
| 2013 | 11.01 | (0.20 | ) | 4.75 | 4.55 | – | (1.54 | ) | (1.54 | ) | – | 14.02 | 41.93 | 18,643 | 2.31 | 2.31 | 2.31 | (1.51 | ) | 39 | |||||||||||||||||||||||||||||||||||||||||||
| Royce Opportunity Fund–Institutional Class | |||||||||||||||||||||||||||||||||||||||||||||||||||||||||||||||
| 2018† | $ | 13.84 | $ | (0.01 | ) | $ | 0.58 | $ | 0.57 | $ | – | $ | – | $ | – | $ | – | $ | 14.41 | 4.12 | %1 | $ | 355,530 | 1.07 | %2 | 1.07 | %2 | 1.07 | %2 | (0.16 | )%2 | 21 | % | ||||||||||||||||||||||||||||||
| 2017 | 13.08 | (0.02 | ) | 2.84 | 2.82 | – | (2.06 | ) | (2.06 | ) | – | 13.84 | 22.02 | 639,057 | 1.07 | 1.07 | 1.07 | (0.17 | ) | 43 | |||||||||||||||||||||||||||||||||||||||||||
| 2016 | 10.74 | (0.01 | ) | 3.24 | 3.23 | – | (0.89 | ) | (0.89 | ) | – | 13.08 | 29.94 | 583,975 | 1.07 | 1.07 | 1.07 | (0.06 | ) | 26 | |||||||||||||||||||||||||||||||||||||||||||
| 2015 | 13.64 | (0.02 | ) | (1.82 | ) | (1.84 | ) | – | (1.06 | ) | (1.06 | ) | – | 10.74 | (13.46 | ) | 600,945 | 1.05 | 1.05 | 1.05 | (0.15 | ) | 27 | ||||||||||||||||||||||||||||||||||||||||
| 2014 | 15.71 | (0.03 | ) | (0.10 | ) | (0.13 | ) | – | (1.94 | ) | (1.94 | ) | – | 13.64 | (0.41 | ) | 799,131 | 1.03 | 1.03 | 1.03 | (0.20 | ) | 36 | ||||||||||||||||||||||||||||||||||||||||
| 2013 | 12.06 | (0.03 | ) | 5.23 | 5.20 | (0.01 | ) | (1.54 | ) | (1.55 | ) | – | 15.71 | 43.69 | 853,886 | 1.03 | 1.03 | 1.03 | (0.23 | ) | 39 | ||||||||||||||||||||||||||||||||||||||||||
| THE ACCOMPANYING NOTES ARE AN INTEGRAL PART OF THESE FINANCIAL STATEMENTS | The Royce Funds 2018 Semiannual Report to Shareholders | 95 |
Financial Highlights
This table is presented to show selected data for a share outstanding throughout each year or other indicated period and to assist shareholders in evaluating a Fund’s performance for the periods presented. Per share amounts have been determined on the basis of the weighted average number of shares outstanding during the period.
| Ratio of Expenses to Average Net Assets | |||||||||||||||||||||||||||||||||||||||||||||||||||||||||||||||
| Net Asset Value, Beginning of Period | Net Investment Income (Loss) | Net Realized and Unrealized Gain (Loss) on Investments and Foreign Currency | Total from Investment Operations | Distributions from Net Investment Income | Distributions from Net Realized Gain on Investments and Foreign Currency | Total Distributions | Shareholder Redemption Fees | Net Asset Value, End of Period | Total Return | Net Assets, End of Period (in thousands) | Prior to Fee Waivers, Expense Reimbursements and Balance Credits | Prior to Fee Waivers and Expense Reimbursements | Net of Fee Waivers and Expense Reimbursements | Ratio of Net Investment Income (Loss) to Average Net Assets | Portfolio Turnover Rate | ||||||||||||||||||||||||||||||||||||||||||||||||
| Royce Opportunity Fund–R Class | |||||||||||||||||||||||||||||||||||||||||||||||||||||||||||||||
| 2018† | $ | 12.25 | $ | (0.06 | ) | $ | 0.51 | $ | 0.45 | $ | – | $ | – | $ | – | $ | – | $ | 12.70 | 3.67 | %1 | $ | 35,769 | 1.84 | %2 | 1.84 | %2 | 1.84 | %2 | (0.94 | )%2 | 21 | % | ||||||||||||||||||||||||||||||
| 2017 | 11.67 | (0.12 | ) | 2.53 | 2.41 | – | (1.83 | ) | (1.83 | ) | – | 12.25 | 21.06 | 39,311 | 1.82 | 1.82 | 1.82 | (0.92 | ) | 43 | |||||||||||||||||||||||||||||||||||||||||||
| 2016 | 9.72 | (0.08 | ) | 2.92 | 2.84 | – | (0.89 | ) | (0.89 | ) | – | 11.67 | 29.08 | 38,902 | 1.82 | 1.82 | 1.82 | (0.81 | ) | 26 | |||||||||||||||||||||||||||||||||||||||||||
| 2015 | 12.56 | (0.11 | ) | (1.67 | ) | (1.78 | ) | – | (1.06 | ) | (1.06 | ) | – | 9.72 | (14.15 | ) | 32,599 | 1.82 | 1.82 | 1.82 | (0.90 | ) | 27 | ||||||||||||||||||||||||||||||||||||||||
| 2014 | 14.73 | (0.13 | ) | (0.10 | ) | (0.23 | ) | – | (1.94 | ) | (1.94 | ) | – | 12.56 | (1.12 | ) | 33,699 | 1.78 | 1.78 | 1.78 | (0.93 | ) | 36 | ||||||||||||||||||||||||||||||||||||||||
| 2013 | 11.46 | (0.14 | ) | 4.95 | 4.81 | – | (1.54 | ) | (1.54 | ) | – | 14.73 | 42.56 | 22,730 | 1.82 | 1.82 | 1.82 | (1.02 | ) | 39 | |||||||||||||||||||||||||||||||||||||||||||
| Royce Pennsylvania Mutual Fund–Investment Class | |||||||||||||||||||||||||||||||||||||||||||||||||||||||||||||||
| 2018† | $ | 10.52 | $ | 0.01 | $ | 0.59 | $ | 0.60 | $ | – | $ | – | $ | – | $ | – | $ | 11.12 | 5.70 | %1 | $ | 1,592,737 | 0.92 | %2 | 0.92 | %2 | 0.92 | %2 | 0.27 | %2 | 13 | % | |||||||||||||||||||||||||||||||
| 2017 | 11.02 | 0.06 | 1.68 | 1.74 | (0.06 | ) | (2.18 | ) | (2.24 | ) | – | 10.52 | 16.24 | 1,622,523 | 0.92 | 0.92 | 0.92 | 0.47 | 27 | ||||||||||||||||||||||||||||||||||||||||||||
| 2016 | 9.33 | 0.07 | 2.41 | 2.48 | (0.04 | ) | (0.75 | ) | (0.79 | ) | – | 11.02 | 26.47 | 1,671,848 | 0.92 | 0.92 | 0.92 | 0.60 | 18 | ||||||||||||||||||||||||||||||||||||||||||||
| 2015 | 13.00 | 0.09 | (1.58 | ) | (1.49 | ) | (0.10 | ) | (2.08 | ) | (2.18 | ) | – | 9.33 | (11.43 | ) | 1,925,419 | 0.92 | 0.92 | 0.92 | 0.58 | 21 | |||||||||||||||||||||||||||||||||||||||||
| 2014 | 14.73 | 0.06 | (0.21 | ) | (0.15 | ) | (0.04 | ) | (1.54 | ) | (1.58 | ) | – | 13.00 | (0.70 | ) | 3,869,579 | 0.91 | 0.91 | 0.91 | 0.35 | 21 | |||||||||||||||||||||||||||||||||||||||||
| 2013 | 11.50 | 0.03 | 3.99 | 4.02 | (0.00 | ) | (0.79 | ) | (0.79 | ) | – | 14.73 | 35.25 | 5,033,318 | 0.92 | 0.92 | 0.92 | 0.24 | 26 | ||||||||||||||||||||||||||||||||||||||||||||
| Royce Pennsylvania Mutual Fund–Service Class | |||||||||||||||||||||||||||||||||||||||||||||||||||||||||||||||
| 2018† | $ | 10.56 | $ | (0.01 | ) | $ | 0.59 | $ | 0.58 | $ | – | $ | – | $ | – | $ | – | $ | 11.14 | 5.49 | %1 | $ | 51,184 | 1.32 | %2 | 1.32 | %2 | 1.32 | %2 | (0.13 | )%2 | 13 | % | ||||||||||||||||||||||||||||||
| 2017 | 11.03 | 0.01 | 1.69 | 1.70 | – | (2.17 | ) | (2.17 | ) | – | 10.56 | 15.88 | 54,938 | 1.27 | 1.27 | 1.27 | 0.07 | 27 | |||||||||||||||||||||||||||||||||||||||||||||
| 2016 | 9.35 | 0.03 | 2.41 | 2.44 | (0.01 | ) | (0.75 | ) | (0.76 | ) | – | 11.03 | 25.99 | 100,598 | 1.26 | 1.26 | 1.26 | 0.27 | 18 | ||||||||||||||||||||||||||||||||||||||||||||
| 2015 | 12.96 | 0.05 | (1.56 | ) | (1.51 | ) | (0.02 | ) | (2.08 | ) | (2.10 | ) | – | 9.35 | (11.57 | ) | 102,341 | 1.23 | 1.23 | 1.23 | 0.29 | 21 | |||||||||||||||||||||||||||||||||||||||||
| 2014 | 14.69 | 0.00 | (0.19 | ) | (0.19 | ) | – | (1.54 | ) | (1.54 | ) | – | 12.96 | (1.04 | ) | 333,548 | 1.23 | 1.23 | 1.23 | 0.03 | 21 | ||||||||||||||||||||||||||||||||||||||||||
| 2013 | 11.51 | (0.01 | ) | 3.98 | 3.97 | – | (0.79 | ) | (0.79 | ) | – | 14.69 | 34.77 | 591,534 | 1.25 | 1.25 | 1.25 | (0.08 | ) | 26 | |||||||||||||||||||||||||||||||||||||||||||
| Royce Pennsylvania Mutual Fund–Consultant Class | |||||||||||||||||||||||||||||||||||||||||||||||||||||||||||||||
| 2018† | $ | 8.46 | $ | (0.03 | ) | $ | 0.47 | $ | 0.44 | $ | – | $ | – | $ | – | $ | – | $ | 8.90 | 5.20 | %1 | $ | 343,971 | 1.94 | %2 | 1.93 | %2 | 1.93 | %2 | (0.74 | )%2 | 13 | % | ||||||||||||||||||||||||||||||
| 2017 | 8.90 | (0.05 | ) | 1.35 | 1.30 | – | (1.74 | ) | (1.74 | ) | – | 8.46 | 15.06 | 361,569 | 1.93 | 1.92 | 1.92 | (0.54 | ) | 27 | |||||||||||||||||||||||||||||||||||||||||||
| 2016 | 7.70 | (0.03 | ) | 1.98 | 1.95 | – | (0.75 | ) | (0.75 | ) | – | 8.90 | 25.20 | 402,114 | 1.94 | 1.94 | 1.94 | (0.42 | ) | 18 | |||||||||||||||||||||||||||||||||||||||||||
| 2015 | 11.16 | (0.05 | ) | (1.33 | ) | (1.38 | ) | – | (2.08 | ) | (2.08 | ) | – | 7.70 | (12.31 | ) | 416,862 | 1.94 | 1.94 | 1.94 | (0.44 | ) | 21 | ||||||||||||||||||||||||||||||||||||||||
| 2014 | 12.96 | (0.08 | ) | (0.18 | ) | (0.26 | ) | – | (1.54 | ) | (1.54 | ) | – | 11.16 | (1.72 | ) | 676,347 | 1.91 | 1.91 | 1.91 | (0.64 | ) | 21 | ||||||||||||||||||||||||||||||||||||||||
| 2013 | 10.29 | (0.09 | ) | 3.55 | 3.46 | – | (0.79 | ) | (0.79 | ) | – | 12.96 | 33.94 | 788,017 | 1.94 | 1.94 | 1.94 | (0.78 | ) | 26 | |||||||||||||||||||||||||||||||||||||||||||
| Royce Pennsylvania Mutual Fund–Institutional Class | |||||||||||||||||||||||||||||||||||||||||||||||||||||||||||||||
| 2018† | $ | 10.55 | $ | 0.02 | $ | 0.58 | $ | 0.60 | $ | – | $ | – | $ | – | $ | – | $ | 11.15 | 5.69 | %1 | $ | 65,208 | 0.87 | %2 | 0.87 | %2 | 0.87 | %2 | 0.34 | %2 | 13 | % | |||||||||||||||||||||||||||||||
| 2017 | 11.04 | 0.09 | 1.67 | 1.76 | (0.07 | ) | (2.18 | ) | (2.25 | ) | – | 10.55 | 16.44 | 53,367 | 0.83 | 0.83 | 0.83 | 0.42 | 27 | ||||||||||||||||||||||||||||||||||||||||||||
| 2016 | 9.34 | 0.09 | 2.41 | 2.50 | (0.05 | ) | (0.75 | ) | (0.80 | ) | – | 11.04 | 26.65 | 245,009 | 0.83 | 0.83 | 0.83 | 0.63 | 18 | ||||||||||||||||||||||||||||||||||||||||||||
| 2015 | 13.02 | 0.11 | (1.60 | ) | (1.49 | ) | (0.11 | ) | (2.08 | ) | (2.19 | ) | – | 9.34 | (11.34 | ) | 498,374 | 0.81 | 0.81 | 0.81 | 0.68 | 21 | |||||||||||||||||||||||||||||||||||||||||
| 2014 | 14.75 | 0.07 | (0.20 | ) | (0.13 | ) | (0.06 | ) | (1.54 | ) | (1.60 | ) | – | 13.02 | (0.58 | ) | 802,517 | 0.79 | 0.79 | 0.79 | 0.48 | 21 | |||||||||||||||||||||||||||||||||||||||||
| 2013 | 11.52 | 0.05 | 3.99 | 4.04 | (0.02 | ) | (0.79 | ) | (0.81 | ) | – | 14.75 | 35.34 | 818,212 | 0.79 | 0.79 | 0.79 | 0.40 | 26 | ||||||||||||||||||||||||||||||||||||||||||||
| 96 | The Royce Funds 2018 Semiannual Report to Shareholders | THE ACCOMPANYING NOTES ARE AN INTEGRAL PART OF THESE FINANCIAL STATEMENTS |
Financial Highlights
This table is presented to show selected data for a share outstanding throughout each year or other indicated period and to assist shareholders in evaluating a Fund’s performance for the periods presented. Per share amounts have been determined on the basis of the weighted average number of shares outstanding during the period.
| Ratio of Expenses to Average Net Assets | |||||||||||||||||||||||||||||||||||||||||||||||||||||||||||||||
| Net Asset Value, Beginning of Period | Net Investment Income (Loss) | Net Realized and Unrealized Gain (Loss) on Investments and Foreign Currency | Total from Investment Operations | Distributions from Net Investment Income | Distributions from Net Realized Gain on Investments and Foreign Currency | Total Distributions | Shareholder Redemption Fees | Net Asset Value, End of Period | Total Return | Net Assets, End of Period (in thousands) | Prior to Fee Waivers, Expense Reimbursements and Balance Credits | Prior to Fee Waivers and Expense Reimbursements | Net of Fee Waivers and Expense Reimbursements | Ratio of Net Investment Income (Loss) to Average Net Assets | Portfolio Turnover Rate | ||||||||||||||||||||||||||||||||||||||||||||||||
| Royce Pennsylvania Mutual Fund–R Class | |||||||||||||||||||||||||||||||||||||||||||||||||||||||||||||||
| 2018† | $ | 9.94 | $ | (0.02 | ) | $ | 0.55 | $ | 0.53 | $ | – | $ | – | $ | – | $ | – | $ | 10.47 | 5.33 | %1 | $ | 13,515 | 1.64 | %2 | 1.63 | %2 | 1.63 | %2 | (0.45 | )%2 | 13 | % | ||||||||||||||||||||||||||||||
| 2017 | 10.44 | (0.04 | ) | 1.58 | 1.54 | – | (2.04 | ) | (2.04 | ) | – | 9.94 | 15.25 | 15,136 | 1.73 | 1.73 | 1.73 | (0.36 | ) | 27 | |||||||||||||||||||||||||||||||||||||||||||
| 2016 | 8.90 | (0.01 | ) | 2.30 | 2.29 | – | (0.75 | ) | (0.75 | ) | – | 10.44 | 25.62 | 17,059 | 1.63 | 1.63 | 1.63 | (0.11 | ) | 18 | |||||||||||||||||||||||||||||||||||||||||||
| 2015 | 12.50 | (0.02 | ) | (1.50 | ) | (1.52 | ) | – | (2.08 | ) | (2.08 | ) | – | 8.90 | (12.10 | ) | 18,675 | 1.65 | 1.65 | 1.65 | (0.15 | ) | 21 | ||||||||||||||||||||||||||||||||||||||||
| 2014 | 14.26 | (0.03 | ) | (0.19 | ) | (0.22 | ) | – | (1.54 | ) | (1.54 | ) | – | 12.50 | (1.28 | ) | 36,622 | 1.48 | 1.48 | 1.48 | (0.21 | ) | 21 | ||||||||||||||||||||||||||||||||||||||||
| 2013 | 11.22 | (0.05 | ) | 3.88 | 3.83 | – | (0.79 | ) | (0.79 | ) | – | 14.26 | 34.42 | 44,094 | 1.56 | 1.56 | 1.56 | (0.39 | ) | 26 | |||||||||||||||||||||||||||||||||||||||||||
| Royce Premier Fund–Investment Class | |||||||||||||||||||||||||||||||||||||||||||||||||||||||||||||||
| 2018† | $ | 16.60 | $ | 0.01 | $ | 0.42 | $ | 0.43 | $ | – | $ | – | $ | – | $ | – | $ | 17.03 | 2.59 | %1 | $ | 1,909,486 | 1.16 | %2 | 1.16 | %2 | 1.16 | %2 | 0.14 | %2 | 11 | % | |||||||||||||||||||||||||||||||
| 2017 | 15.51 | 0.00 | 3.63 | 3.63 | (0.02 | ) | (2.52 | ) | (2.54 | ) | – | 16.60 | 23.77 | 1,978,847 | 1.16 | 1.16 | 1.16 | 0.00 | 8 | ||||||||||||||||||||||||||||||||||||||||||||
| 2016 | 14.28 | 0.06 | 3.25 | 3.31 | (0.04 | ) | (2.04 | ) | (2.08 | ) | – | 15.51 | 23.00 | 1,768,580 | 1.16 | 1.16 | 1.16 | 0.35 | 15 | ||||||||||||||||||||||||||||||||||||||||||||
| 2015 | 19.72 | 0.13 | (2.11 | ) | (1.98 | ) | (0.13 | ) | (3.33 | ) | (3.46 | ) | – | 14.28 | (9.90 | ) | 2,015,905 | 1.13 | 1.13 | 1.13 | 0.49 | 13 | |||||||||||||||||||||||||||||||||||||||||
| 2014 | 22.11 | 0.08 | (0.32 | ) | (0.24 | ) | (0.08 | ) | (2.07 | ) | (2.15 | ) | – | 19.72 | (0.86 | ) | 4,097,961 | 1.10 | 1.10 | 1.10 | 0.34 | 9 | |||||||||||||||||||||||||||||||||||||||||
| 2013 | 19.16 | 0.00 | 5.22 | 5.22 | – | (2.27 | ) | (2.27 | ) | – | 22.11 | 27.73 | 5,096,793 | 1.09 | 1.09 | 1.09 | 0.02 | 11 | |||||||||||||||||||||||||||||||||||||||||||||
| Royce Premier Fund–Service Class | |||||||||||||||||||||||||||||||||||||||||||||||||||||||||||||||
| 2018† | $ | 16.15 | $ | (0.02 | ) | $ | 0.41 | $ | 0.39 | $ | – | $ | – | $ | – | $ | – | $ | 16.54 | 2.41 | %1 | $ | 50,337 | 1.53 | %2 | 1.53 | %2 | 1.49 | %2 | (0.20 | )%2 | 11 | % | ||||||||||||||||||||||||||||||
| 2017 | 15.13 | (0.06 | ) | 3.53 | 3.47 | – | (2.45 | ) | (2.45 | ) | – | 16.15 | 23.32 | 54,557 | 1.53 | 1.53 | 1.49 | (0.34 | ) | 8 | |||||||||||||||||||||||||||||||||||||||||||
| 2016 | 13.98 | 0.00 | 3.19 | 3.19 | – | (2.04 | ) | (2.04 | ) | – | 15.13 | 22.63 | 46,550 | 1.50 | 1.50 | 1.49 | 0.02 | 15 | |||||||||||||||||||||||||||||||||||||||||||||
| 2015 | 19.33 | 0.06 | (2.04 | ) | (1.98 | ) | (0.04 | ) | (3.33 | ) | (3.37 | ) | – | 13.98 | (10.13 | ) | 61,969 | 1.44 | 1.43 | 1.43 | 0.23 | 13 | |||||||||||||||||||||||||||||||||||||||||
| 2014 | 21.70 | 0.01 | (0.31 | ) | (0.30 | ) | – | (2.07 | ) | (2.07 | ) | – | 19.33 | (1.16 | ) | 172,810 | 1.38 | 1.38 | 1.38 | 0.05 | 9 | ||||||||||||||||||||||||||||||||||||||||||
| 2013 | 18.89 | (0.07 | ) | 5.15 | 5.08 | – | (2.27 | ) | (2.27 | ) | – | 21.70 | 27.39 | 318,860 | 1.38 | 1.38 | 1.38 | (0.33 | ) | 11 | |||||||||||||||||||||||||||||||||||||||||||
| Royce Premier Fund–Consultant Class | |||||||||||||||||||||||||||||||||||||||||||||||||||||||||||||||
| 2018† | $ | 13.21 | $ | (0.06 | ) | $ | 0.32 | $ | 0.26 | $ | – | $ | – | $ | – | $ | – | $ | 13.47 | 1.97 | %1 | $ | 29,798 | 2.21 | %2 | 2.20 | %2 | 2.20 | %2 | (0.91 | )%2 | 11 | % | ||||||||||||||||||||||||||||||
| 2017 | 12.46 | (0.14 | ) | 2.89 | 2.75 | – | (2.00 | ) | (2.00 | ) | – | 13.21 | 22.49 | 31,489 | 2.21 | 2.21 | 2.21 | (1.06 | ) | 8 | |||||||||||||||||||||||||||||||||||||||||||
| 2016 | 11.89 | (0.09 | ) | 2.70 | 2.61 | – | (2.04 | ) | (2.04 | ) | – | 12.46 | 21.72 | 31,353 | 2.22 | 2.22 | 2.22 | (0.72 | ) | 15 | |||||||||||||||||||||||||||||||||||||||||||
| 2015 | 17.09 | (0.09 | ) | (1.78 | ) | (1.87 | ) | – | (3.33 | ) | (3.33 | ) | – | 11.89 | (10.80 | ) | 32,982 | 2.17 | 2.17 | 2.17 | (0.55 | ) | 13 | ||||||||||||||||||||||||||||||||||||||||
| 2014 | 19.58 | (0.13 | ) | (0.29 | ) | (0.42 | ) | – | (2.07 | ) | (2.07 | ) | – | 17.09 | (1.92 | ) | 56,884 | 2.10 | 2.10 | 2.10 | (0.66 | ) | 9 | ||||||||||||||||||||||||||||||||||||||||
| 2013 | 17.35 | (0.20 | ) | 4.70 | 4.50 | – | (2.27 | ) | (2.27 | ) | – | 19.58 | 26.47 | 66,712 | 2.13 | 2.13 | 2.13 | (1.02 | ) | 11 | |||||||||||||||||||||||||||||||||||||||||||
| Royce Premier Fund–Institutional Class | |||||||||||||||||||||||||||||||||||||||||||||||||||||||||||||||
| 2018† | $ | 16.82 | $ | 0.02 | $ | 0.42 | $ | 0.44 | $ | – | $ | – | $ | – | $ | – | $ | 17.26 | 2.62 | %1 | $ | 247,483 | 1.09 | %2 | 1.09 | %2 | 1.09 | %2 | 0.20 | %2 | 11 | % | |||||||||||||||||||||||||||||||
| 2017 | 15.72 | 0.01 | 3.68 | 3.69 | (0.03 | ) | (2.56 | ) | (2.59 | ) | – | 16.82 | 23.85 | 250,119 | 1.09 | 1.09 | 1.09 | 0.07 | 8 | ||||||||||||||||||||||||||||||||||||||||||||
| 2016 | 14.44 | 0.08 | 3.30 | 3.38 | (0.06 | ) | (2.04 | ) | (2.10 | ) | – | 15.72 | 23.20 | 250,826 | 1.07 | 1.07 | 1.07 | 0.44 | 15 | ||||||||||||||||||||||||||||||||||||||||||||
| 2015 | 19.91 | 0.16 | (2.14 | ) | (1.98 | ) | (0.16 | ) | (3.33 | ) | (3.49 | ) | – | 14.44 | (9.82 | ) | 294,477 | 1.02 | 1.02 | 1.02 | 0.60 | 13 | |||||||||||||||||||||||||||||||||||||||||
| 2014 | 22.31 | 0.12 | (0.34 | ) | (0.22 | ) | (0.11 | ) | (2.07 | ) | (2.18 | ) | – | 19.91 | (0.79 | ) | 594,463 | 0.98 | 0.98 | 0.98 | 0.45 | 9 | |||||||||||||||||||||||||||||||||||||||||
| 2013 | 19.30 | 0.03 | 5.25 | 5.28 | – | (2.27 | ) | (2.27 | ) | – | 22.31 | 27.85 | 989,100 | 0.98 | 0.98 | 0.98 | 0.13 | 11 | |||||||||||||||||||||||||||||||||||||||||||||
| THE ACCOMPANYING NOTES ARE AN INTEGRAL PART OF THESE FINANCIAL STATEMENTS | The Royce Funds 2018 Semiannual Report to Shareholders | 97 |
Financial Highlights
This table is presented to show selected data for a share outstanding throughout each year or other indicated period and to assist shareholders in evaluating a Fund’s performance for the periods presented. Per share amounts have been determined on the basis of the weighted average number of shares outstanding during the period.
| Ratio of Expenses to Average Net Assets | |||||||||||||||||||||||||||||||||||||||||||||||||||||||||||||||
| Net Asset Value, Beginning of Period | Net Investment Income (Loss) | Net Realized and Unrealized Gain (Loss) on Investments and Foreign Currency | Total from Investment Operations | Distributions from Net Investment Income | Distributions from Net Realized Gain on Investments and Foreign Currency | Total Distributions | Shareholder Redemption Fees | Net Asset Value, End of Period | Total Return | Net Assets, End of Period (in thousands) | Prior to Fee Waivers, Expense Reimbursements and Balance Credits | Prior to Fee Waivers and Expense Reimbursements | Net of Fee Waivers and Expense Reimbursements | Ratio of Net Investment Income (Loss) to Average Net Assets | Portfolio Turnover Rate | ||||||||||||||||||||||||||||||||||||||||||||||||
| Royce Premier Fund–W Class | |||||||||||||||||||||||||||||||||||||||||||||||||||||||||||||||
| 2018† | $ | 16.69 | $ | 0.00 | $ | 0.42 | $ | 0.42 | $ | – | $ | – | $ | – | $ | – | $ | 17.11 | 2.52 | %1 | $ | 27,748 | 1.27 | %2 | 1.27 | %2 | 1.27 | %2 | 0.03 | %2 | 11 | % | |||||||||||||||||||||||||||||||
| 2017 | 15.57 | (0.01 | ) | 3.66 | 3.65 | – | (2.53 | ) | (2.53 | ) | – | 16.69 | 23.83 | 31,959 | 1.18 | 1.17 | 1.17 | (0.08 | ) | 8 | |||||||||||||||||||||||||||||||||||||||||||
| 2016 | 14.32 | 0.06 | 3.27 | 3.33 | (0.04 | ) | (2.04 | ) | (2.08 | ) | – | 15.57 | 23.06 | 147,937 | 1.17 | 1.17 | 1.17 | 0.34 | 15 | ||||||||||||||||||||||||||||||||||||||||||||
| 2015 | 19.76 | 0.14 | (2.12 | ) | (1.98 | ) | (0.13 | ) | (3.33 | ) | (3.46 | ) | – | 14.32 | (9.88 | ) | 192,785 | 1.12 | 1.12 | 1.12 | 0.51 | 13 | |||||||||||||||||||||||||||||||||||||||||
| 2014 | 22.16 | 0.09 | (0.33 | ) | (0.24 | ) | (0.09 | ) | (2.07 | ) | (2.16 | ) | – | 19.76 | (0.89 | ) | 446,380 | 1.07 | 1.07 | 1.07 | 0.36 | 9 | |||||||||||||||||||||||||||||||||||||||||
| 2013 | 19.20 | 0.00 | 5.23 | 5.23 | – | (2.27 | ) | (2.27 | ) | – | 22.16 | 27.73 | 552,732 | 1.09 | 1.09 | 1.09 | 0.01 | 11 | |||||||||||||||||||||||||||||||||||||||||||||
| Royce Premier Fund–R Class | |||||||||||||||||||||||||||||||||||||||||||||||||||||||||||||||
| 2018† | $ | 15.39 | $ | (0.04 | ) | $ | 0.38 | $ | 0.34 | $ | – | $ | – | $ | – | $ | – | $ | 15.73 | 2.21 | %1 | $ | 12,111 | 1.83 | %2 | 1.83 | %2 | 1.83 | %2 | (0.53 | )%2 | 11 | % | ||||||||||||||||||||||||||||||
| 2017 | 14.47 | (0.12 | ) | 3.37 | 3.25 | – | (2.33 | ) | (2.33 | ) | – | 15.39 | 22.88 | 12,841 | 1.90 | 1.90 | 1.90 | (0.75 | ) | 8 | |||||||||||||||||||||||||||||||||||||||||||
| 2016 | 13.49 | (0.05 | ) | 3.07 | 3.02 | – | (2.04 | ) | (2.04 | ) | – | 14.47 | 22.18 | 13,889 | 1.84 | 1.84 | 1.84 | (0.33 | ) | 15 | |||||||||||||||||||||||||||||||||||||||||||
| 2015 | 18.82 | (0.03 | ) | (1.97 | ) | (2.00 | ) | – | (3.33 | ) | (3.33 | ) | – | 13.49 | (10.50 | ) | 16,129 | 1.78 | 1.78 | 1.78 | (0.16 | ) | 13 | ||||||||||||||||||||||||||||||||||||||||
| 2014 | 21.25 | (0.06 | ) | (0.30 | ) | (0.36 | ) | – | (2.07 | ) | (2.07 | ) | – | 18.82 | (1.48 | ) | 27,355 | 1.71 | 1.71 | 1.71 | (0.28 | ) | 9 | ||||||||||||||||||||||||||||||||||||||||
| 2013 | 18.61 | (0.13 | ) | 5.04 | 4.91 | – | (2.27 | ) | (2.27 | ) | – | 21.25 | 26.88 | 32,577 | 1.74 | 1.74 | 1.74 | (0.63 | ) | 11 | |||||||||||||||||||||||||||||||||||||||||||
| Royce Small-Cap Leaders Fund–Investment Class | |||||||||||||||||||||||||||||||||||||||||||||||||||||||||||||||
| 2018† | $ | 6.67 | $ | 0.01 | $ | 0.24 | $ | 0.25 | $ | – | $ | – | $ | – | $ | – | $ | 6.92 | 3.75 | %1 | $ | 43,661 | 1.26 | %2 | 1.26 | %2 | 1.24 | %2 | 0.27 | %2 | 24 | % | |||||||||||||||||||||||||||||||
| 2017 | 7.12 | 0.05 | 0.66 | 0.71 | (0.05 | ) | (1.11 | ) | (1.16 | ) | – | 6.67 | 10.47 | 43,875 | 1.24 | 1.24 | 1.24 | 0.62 | 74 | ||||||||||||||||||||||||||||||||||||||||||||
| 2016 | 6.28 | 0.05 | 1.58 | 1.63 | (0.06 | ) | (0.73 | ) | (0.79 | ) | – | 7.12 | 25.84 | 48,128 | 1.23 | 1.23 | 1.23 | 0.62 | 65 | ||||||||||||||||||||||||||||||||||||||||||||
| 2015 | 8.74 | 0.03 | (1.09 | ) | (1.06 | ) | (0.04 | ) | (1.36 | ) | (1.40 | ) | – | 6.28 | (12.21 | ) | 50,410 | 1.24 | 1.24 | 1.24 | 0.40 | 64 | |||||||||||||||||||||||||||||||||||||||||
| 2014 | 10.11 | (0.00 | ) | (0.32 | ) | (0.32 | ) | – | (1.05 | ) | (1.05 | ) | – | 8.74 | (2.95 | ) | 68,898 | 1.22 | 1.22 | 1.22 | (0.03 | ) | 39 | ||||||||||||||||||||||||||||||||||||||||
| 2013 | 8.85 | (0.00 | ) | 2.71 | 2.71 | (0.03 | ) | (1.42 | ) | (1.45 | ) | – | 10.11 | 31.24 | 60,156 | 1.20 | 1.20 | 1.20 | (0.07 | ) | 31 | ||||||||||||||||||||||||||||||||||||||||||
| Royce Small-Cap Leaders Fund–Service Class | |||||||||||||||||||||||||||||||||||||||||||||||||||||||||||||||
| 2018† | $ | 6.59 | $ | 0.00 | $ | 0.24 | $ | 0.24 | $ | – | $ | – | $ | – | $ | – | $ | 6.83 | 3.64 | %1 | $ | 36,655 | 1.62 | %2 | 1.62 | %2 | 1.49 | %2 | 0.01 | %2 | 24 | % | |||||||||||||||||||||||||||||||
| 2017 | 7.03 | 0.03 | 0.66 | 0.69 | (0.03 | ) | (1.10 | ) | (1.13 | ) | – | 6.59 | 10.15 | 38,864 | 1.59 | 1.59 | 1.49 | 0.31 | 74 | ||||||||||||||||||||||||||||||||||||||||||||
| 2016 | 6.21 | 0.03 | 1.56 | 1.59 | (0.04 | ) | (0.73 | ) | (0.77 | ) | ��� | 7.03 | 25.51 | 50,523 | 1.58 | 1.58 | 1.49 | 0.37 | 65 | ||||||||||||||||||||||||||||||||||||||||||||
| 2015 | 8.65 | 0.02 | (1.09 | ) | (1.07 | ) | (0.01 | ) | (1.36 | ) | (1.37 | ) | – | 6.21 | (12.50 | ) | 57,729 | 1.54 | 1.54 | 1.49 | 0.18 | 64 | |||||||||||||||||||||||||||||||||||||||||
| 2014 | 10.05 | (0.04 | ) | (0.31 | ) | (0.35 | ) | – | (1.05 | ) | (1.05 | ) | – | 8.65 | (3.26 | ) | 149,736 | 1.52 | 1.52 | 1.50 | (0.39 | ) | 39 | ||||||||||||||||||||||||||||||||||||||||
| 2013 | 8.81 | (0.04 | ) | 2.70 | 2.66 | (0.00 | ) | (1.42 | ) | (1.42 | ) | – | 10.05 | 30.85 | 231,879 | 1.50 | 1.50 | 1.48 | (0.36 | ) | 31 | ||||||||||||||||||||||||||||||||||||||||||
| Royce Small-Cap Value Fund–Investment Class | |||||||||||||||||||||||||||||||||||||||||||||||||||||||||||||||
| 2018† | $ | 10.16 | $ | 0.02 | $ | 0.71 | $ | 0.73 | $ | – | $ | – | $ | – | $ | – | $ | 10.89 | 7.19 | %1 | $ | 70,370 | 1.26 | %2 | 1.26 | %2 | 1.24 | %2 | 0.41 | %2 | 22 | % | |||||||||||||||||||||||||||||||
| 2017 | 10.03 | 0.04 | 0.50 | 0.54 | (0.06 | ) | (0.35 | ) | (0.41 | ) | – | 10.16 | 5.49 | 66,094 | 1.26 | 1.25 | 1.24 | 0.44 | 61 | ||||||||||||||||||||||||||||||||||||||||||||
| 2016 | 8.74 | 0.08 | 1.79 | 1.87 | (0.08 | ) | (0.50 | ) | (0.58 | ) | – | 10.03 | 21.37 | 72,863 | 1.24 | 1.24 | 1.24 | 0.72 | 56 | ||||||||||||||||||||||||||||||||||||||||||||
| 2015 | 11.81 | 0.10 | (1.43 | ) | (1.33 | ) | (0.09 | ) | (1.65 | ) | (1.74 | ) | – | 8.74 | (11.25 | ) | 77,821 | 1.23 | 1.23 | 1.23 | 0.69 | 60 | |||||||||||||||||||||||||||||||||||||||||
| 2014 | 13.52 | 0.04 | (0.05 | ) | (0.01 | ) | (0.03 | ) | (1.67 | ) | (1.70 | ) | – | 11.81 | 0.27 | 140,163 | 1.18 | 1.18 | 1.18 | 0.32 | 38 | ||||||||||||||||||||||||||||||||||||||||||
| 2013 | 11.37 | 0.02 | 3.13 | 3.15 | (0.03 | ) | (0.97 | ) | (1.00 | ) | – | 13.52 | 28.06 | 196,854 | 1.21 | 1.21 | 1.21 | 0.11 | 51 | ||||||||||||||||||||||||||||||||||||||||||||
| 98 | The Royce Funds 2018 Semiannual Report to Shareholders | THE ACCOMPANYING NOTES ARE AN INTEGRAL PART OF THESE FINANCIAL STATEMENTS |
Financial Highlights
This table is presented to show selected data for a share outstanding throughout each year or other indicated period and to assist shareholders in evaluating a Fund’s performance for the periods presented. Per share amounts have been determined on the basis of the weighted average number of shares outstanding during the period.
| Ratio of Expenses to Average Net Assets | |||||||||||||||||||||||||||||||||||||||||||||||||||||||||||||||
| Net Asset Value, Beginning of Period | Net Investment Income (Loss) | Net Realized and Unrealized Gain (Loss) on Investments and Foreign Currency | Total from Investment Operations | Distributions from Net Investment Income | Distributions from Net Realized Gain on Investments and Foreign Currency | Total Distributions | Shareholder Redemption Fees | Net Asset Value, End of Period | Total Return | Net Assets, End of Period (in thousands) | Prior to Fee Waivers, Expense Reimbursements and Balance Credits | Prior to Fee Waivers and Expense Reimbursements | Net of Fee Waivers and Expense Reimbursements | Ratio of Net Investment Income (Loss) to Average Net Assets | Portfolio Turnover Rate | ||||||||||||||||||||||||||||||||||||||||||||||||
| Royce Small-Cap Value Fund–Service Class | |||||||||||||||||||||||||||||||||||||||||||||||||||||||||||||||
| 2018† | $ | 10.12 | $ | 0.01 | $ | 0.71 | $ | 0.72 | $ | – | $ | – | $ | – | $ | – | $ | 10.84 | 7.11 | %1 | $ | 144,852 | 1.54 | %2 | 1.54 | %2 | 1.49 | %2 | 0.15 | %2 | 22 | % | |||||||||||||||||||||||||||||||
| 2017 | 9.98 | 0.02 | 0.50 | 0.52 | (0.03 | ) | (0.35 | ) | (0.38 | ) | – | 10.12 | 5.27 | 152,232 | 1.51 | 1.51 | 1.49 | 0.17 | 61 | ||||||||||||||||||||||||||||||||||||||||||||
| 2016 | 8.70 | 0.05 | 1.79 | 1.84 | (0.06 | ) | (0.50 | ) | (0.56 | ) | – | 9.98 | 21.06 | 213,067 | 1.49 | 1.49 | 1.48 | 0.48 | 56 | ||||||||||||||||||||||||||||||||||||||||||||
| 2015 | 11.76 | 0.06 | (1.41 | ) | (1.35 | ) | (0.06 | ) | (1.65 | ) | (1.71 | ) | – | 8.70 | (11.51 | ) | 252,814 | 1.48 | 1.48 | 1.48 | 0.45 | 60 | |||||||||||||||||||||||||||||||||||||||||
| 2014 | 13.48 | 0.01 | (0.06 | ) | (0.05 | ) | – | (1.67 | ) | (1.67 | ) | – | 11.76 | (0.02 | ) | 477,999 | 1.45 | 1.45 | 1.45 | 0.04 | 38 | ||||||||||||||||||||||||||||||||||||||||||
| 2013 | 11.34 | (0.02 | ) | 3.13 | 3.11 | – | (0.97 | ) | (0.97 | ) | – | 13.48 | 27.76 | 680,674 | 1.48 | 1.48 | 1.48 | (0.17 | ) | 51 | |||||||||||||||||||||||||||||||||||||||||||
| Royce Small-Cap Value Fund–Consultant Class | |||||||||||||||||||||||||||||||||||||||||||||||||||||||||||||||
| 2018† | $ | 9.06 | $ | (0.03 | ) | $ | 0.63 | $ | 0.60 | $ | – | $ | – | $ | – | $ | – | $ | 9.66 | 6.62 | %1 | $ | 12,544 | �� | 2.35 | %2 | 2.35 | %2 | 2.35 | %2 | (0.71 | )%2 | 22 | % | |||||||||||||||||||||||||||||
| 2017 | 8.98 | (0.06 | ) | 0.45 | 0.39 | – | (0.31 | ) | (0.31 | ) | – | 9.06 | 4.44 | 13,111 | 2.32 | 2.32 | 2.32 | (0.66 | ) | 61 | |||||||||||||||||||||||||||||||||||||||||||
| 2016 | 7.89 | (0.03 | ) | 1.62 | 1.59 | – | (0.50 | ) | (0.50 | ) | – | 8.98 | 20.10 | 16,484 | 2.28 | 2.28 | 2.28 | (0.33 | ) | 56 | |||||||||||||||||||||||||||||||||||||||||||
| 2015 | 10.87 | (0.04 | ) | (1.29 | ) | (1.33 | ) | – | (1.65 | ) | (1.65 | ) | – | 7.89 | (12.24 | ) | 18,404 | 2.27 | 2.27 | 2.27 | (0.36 | ) | 60 | ||||||||||||||||||||||||||||||||||||||||
| 2014 | 12.68 | (0.09 | ) | (0.05 | ) | (0.14 | ) | – | (1.67 | ) | (1.67 | ) | – | 10.87 | (0.74 | ) | 26,716 | 2.21 | 2.21 | 2.21 | (0.71 | ) | 38 | ||||||||||||||||||||||||||||||||||||||||
| 2013 | 10.81 | (0.12 | ) | 2.96 | 2.84 | – | (0.97 | ) | (0.97 | ) | – | 12.68 | 26.61 | 31,604 | 2.29 | 2.29 | 2.29 | (0.97 | ) | 51 | |||||||||||||||||||||||||||||||||||||||||||
| Royce Small-Cap Value Fund–R Class | |||||||||||||||||||||||||||||||||||||||||||||||||||||||||||||||
| 2018† | $ | 9.75 | $ | (0.02 | ) | $ | 0.69 | $ | 0.67 | $ | – | $ | – | $ | – | $ | – | $ | 10.42 | 6.87 | %1 | $ | 10,639 | 1.94 | %2 | 1.94 | %2 | 1.94 | %2 | (0.32 | )%2 | 22 | % | ||||||||||||||||||||||||||||||
| 2017 | 9.63 | (0.02 | ) | 0.48 | 0.46 | – | (0.34 | ) | (0.34 | ) | – | 9.75 | 4.81 | 14,620 | 1.88 | 1.88 | 1.88 | (0.21 | ) | 61 | |||||||||||||||||||||||||||||||||||||||||||
| 2016 | 8.42 | 0.01 | 1.73 | 1.74 | (0.03 | ) | (0.50 | ) | (0.53 | ) | – | 9.63 | 20.60 | 18,059 | 1.85 | 1.85 | 1.85 | 0.11 | 56 | ||||||||||||||||||||||||||||||||||||||||||||
| 2015 | 11.43 | 0.01 | (1.35 | ) | (1.34 | ) | (0.02 | ) | (1.65 | ) | (1.67 | ) | – | 8.42 | (11.71 | ) | 19,200 | 1.83 | 1.83 | 1.83 | 0.09 | 60 | |||||||||||||||||||||||||||||||||||||||||
| 2014 | 13.19 | (0.03 | ) | (0.06 | ) | (0.09 | ) | – | (1.67 | ) | (1.67 | ) | – | 11.43 | (0.34 | ) | 31,043 | 1.77 | 1.77 | 1.77 | (0.26 | ) | 38 | ||||||||||||||||||||||||||||||||||||||||
| 2013 | 11.16 | (0.06 | ) | 3.06 | 3.00 | – | (0.97 | ) | (0.97 | ) | – | 13.19 | 27.21 | 37,409 | 1.83 | 1.83 | 1.83 | (0.52 | ) | 51 | |||||||||||||||||||||||||||||||||||||||||||
| Royce Small/Mid-Cap Premier Fund–Investment Class | |||||||||||||||||||||||||||||||||||||||||||||||||||||||||||||||
| 2018† | $ | 15.66 | $ | 0.01 | $ | (0.49 | ) | $ | (0.48 | ) | $ | – | $ | – | $ | – | $ | – | $ | 15.18 | (3.07 | )%1 | $ | 76,859 | 0.99 | %2 | 0.99 | %2 | 0.99 | %2 | 0.16 | %2 | 33 | % | |||||||||||||||||||||||||||||
| 2017 | 14.64 | 0.05 | 3.05 | 3.10 | (0.03 | ) | (2.05 | ) | (2.08 | ) | – | 15.66 | 21.47 | 81,549 | 0.99 | 0.99 | 0.99 | 0.29 | 54 | ||||||||||||||||||||||||||||||||||||||||||||
| 2016 | 12.87 | 0.04 | 2.30 | 2.34 | (0.06 | ) | (0.51 | ) | (0.57 | ) | – | 14.64 | 18.12 | 88,378 | 1.02 | 1.02 | 1.02 | 0.22 | 67 | ||||||||||||||||||||||||||||||||||||||||||||
| 2015 | 15.21 | 0.12 | (1.09 | ) | (0.97 | ) | (0.11 | ) | (1.26 | ) | (1.37 | ) | – | 12.87 | (6.33 | ) | 89,766 | 1.10 | 1.10 | 1.10 | 0.54 | 66 | |||||||||||||||||||||||||||||||||||||||||
| 2014 | 16.24 | 0.10 | (0.25 | ) | (0.15 | ) | (0.05 | ) | (0.83 | ) | (0.88 | ) | – | 15.21 | (0.81 | ) | 160,558 | 1.09 | 1.09 | 1.09 | 0.66 | 35 | |||||||||||||||||||||||||||||||||||||||||
| 2013 | 14.48 | 0.03 | 3.71 | 3.74 | (0.05 | ) | (1.93 | ) | (1.98 | ) | – | 16.24 | 26.37 | 117,306 | 1.13 | 1.13 | 1.13 | 0.36 | 79 | ||||||||||||||||||||||||||||||||||||||||||||
| Royce Small/Mid-Cap Premier Fund–Service Class | |||||||||||||||||||||||||||||||||||||||||||||||||||||||||||||||
| 2018† | $ | 15.61 | $ | (0.00 | ) | $ | (0.49 | ) | $ | (0.49 | ) | $ | – | $ | – | $ | – | $ | – | $ | 15.12 | (3.14 | )%1 | $ | 104,969 | 1.32 | %2 | 1.32 | %2 | 1.18 | %2 | (0.03 | )%2 | 33 | % | ||||||||||||||||||||||||||||
| 2017 | 14.60 | 0.02 | 3.03 | 3.05 | – | (2.04 | ) | (2.04 | ) | – | 15.61 | 21.21 | 112,520 | 1.32 | 1.32 | 1.19 | 0.10 | 54 | |||||||||||||||||||||||||||||||||||||||||||||
| 2016 | 12.84 | 0.00 | 2.30 | 2.30 | (0.03 | ) | (0.51 | ) | (0.54 | ) | – | 14.60 | 17.84 | 120,254 | 1.36 | 1.36 | 1.25 | (0.01 | ) | 67 | |||||||||||||||||||||||||||||||||||||||||||
| 2015 | 15.17 | 0.05 | (1.05 | ) | (1.00 | ) | (0.07 | ) | (1.26 | ) | (1.33 | ) | – | 12.84 | (6.53 | ) | 120,381 | 1.46 | 1.46 | 1.35 | 0.31 | 66 | |||||||||||||||||||||||||||||||||||||||||
| 2014 | 16.20 | 0.05 | (0.25 | ) | (0.20 | ) | – | (0.83 | ) | (0.83 | ) | – | 15.17 | (1.14 | ) | 175,433 | 1.43 | 1.43 | 1.40 | 0.32 | 35 | ||||||||||||||||||||||||||||||||||||||||||
| 2013 | 14.45 | 0.00 | 3.68 | 3.68 | (0.00 | ) | (1.93 | ) | (1.93 | ) | – | 16.20 | 25.99 | 223,533 | 1.45 | 1.45 | 1.42 | 0.02 | 79 | ||||||||||||||||||||||||||||||||||||||||||||
| THE ACCOMPANYING NOTES ARE AN INTEGRAL PART OF THESE FINANCIAL STATEMENTS | The Royce Funds 2018 Semiannual Report to Shareholders | 99 |
Financial Highlights
This table is presented to show selected data for a share outstanding throughout each year or other indicated period and to assist shareholders in evaluating a Fund’s performance for the periods presented. Per share amounts have been determined on the basis of the weighted average number of shares outstanding during the period.
| Ratio of Expenses to Average Net Assets | |||||||||||||||||||||||||||||||||||||||||||||||||||||||||||||||
| Net Asset Value, Beginning of Period | Net Investment Income (Loss) | Net Realized and Unrealized Gain (Loss) on Investments and Foreign Currency | Total from Investment Operations | Distributions from Net Investment Income | Distributions from Net Realized Gain on Investments and Foreign Currency | Total Distributions | Shareholder Redemption Fees | Net Asset Value, End of Period | Total Return | Net Assets, End of Period (in thousands) | Prior to Fee Waivers, Expense Reimbursements and Balance Credits | Prior to Fee Waivers and Expense Reimbursements | Net of Fee Waivers and Expense Reimbursements | Ratio of Net Investment Income (Loss) to Average Net Assets | Portfolio Turnover Rate | ||||||||||||||||||||||||||||||||||||||||||||||||
| Royce Small/Mid-Cap Premier Fund–Consultant Class | |||||||||||||||||||||||||||||||||||||||||||||||||||||||||||||||
| 2018† | $ | 11.06 | $ | (0.05 | ) | $ | (0.35 | ) | $ | (0.40 | ) | $ | – | $ | – | $ | – | $ | – | $ | 10.66 | (3.62 | )%1 | $ | 8,903 | 2.26 | %2 | 2.26 | %2 | 2.09 | %2 | (0.95 | )%2 | 33 | % | ||||||||||||||||||||||||||||
| 2017 | 10.44 | (0.09 | ) | 2.16 | 2.07 | – | (1.45 | ) | (1.45 | ) | – | 11.06 | 20.10 | 10,328 | 2.24 | 2.24 | 2.09 | (0.81 | ) | 54 | |||||||||||||||||||||||||||||||||||||||||||
| 2016 | 9.37 | (0.09 | ) | 1.67 | 1.58 | – | (0.51 | ) | (0.51 | ) | – | 10.44 | 16.78 | 11,643 | 2.28 | 2.28 | 2.14 | (0.89 | ) | 67 | |||||||||||||||||||||||||||||||||||||||||||
| 2015 | 11.47 | (0.06 | ) | (0.78 | ) | (0.84 | ) | – | (1.26 | ) | (1.26 | ) | – | 9.37 | (7.31 | ) | 11,369 | 2.41 | 2.41 | 2.24 | (0.58 | ) | 66 | ||||||||||||||||||||||||||||||||||||||||
| 2014 | 12.57 | (0.07 | ) | (0.20 | ) | (0.27 | ) | – | (0.83 | ) | (0.83 | ) | – | 11.47 | (2.02 | ) | 13,338 | 2.31 | 2.31 | 2.31 | (0.59 | ) | 35 | ||||||||||||||||||||||||||||||||||||||||
| 2013 | 11.68 | (0.12 | ) | 2.94 | 2.82 | – | (1.93 | ) | (1.93 | ) | – | 12.57 | 24.73 | 15,942 | 2.37 | 2.37 | 2.37 | (0.93 | ) | 79 | |||||||||||||||||||||||||||||||||||||||||||
| Royce Smaller-Companies Growth Fund–Investment Class | |||||||||||||||||||||||||||||||||||||||||||||||||||||||||||||||
| 2018† | $ | 10.93 | $ | (0.03 | ) | $ | 1.19 | $ | 1.16 | $ | – | $ | – | $ | – | $ | – | $ | 12.09 | 10.61 | %1 | $ | 124,394 | 1.19 | %2 | 1.19 | %2 | 1.19 | %2 | (0.50 | )%2 | 27 | % | ||||||||||||||||||||||||||||||
| 2017 | 11.22 | (0.09 | ) | 2.08 | 1.99 | – | (2.28 | ) | (2.28 | ) | – | 10.93 | 18.20 | 119,745 | 1.19 | 1.19 | 1.19 | (0.67 | ) | 64 | |||||||||||||||||||||||||||||||||||||||||||
| 2016 | 11.36 | (0.05 | ) | 1.17 | 1.12 | – | (1.26 | ) | (1.26 | ) | – | 11.22 | 9.67 | 98,962 | 1.15 | 1.15 | 1.15 | (0.41 | ) | 59 | |||||||||||||||||||||||||||||||||||||||||||
| 2015 | 14.36 | (0.06 | ) | (0.19 | ) | (0.25 | ) | – | (2.75 | ) | (2.75 | ) | – | 11.36 | (1.59 | ) | 139,979 | 1.32 | 1.32 | 1.24 | (0.38 | ) | 45 | ||||||||||||||||||||||||||||||||||||||||
| 2014 | 17.03 | (0.07 | ) | 0.68 | 0.61 | – | (3.28 | ) | (3.28 | ) | – | 14.36 | 4.04 | 295,412 | 1.33 | 1.33 | 1.33 | (0.40 | ) | 52 | |||||||||||||||||||||||||||||||||||||||||||
| 2013 | 13.90 | (0.09 | ) | 4.57 | 4.48 | (0.00 | ) | (1.35 | ) | (1.35 | ) | – | 17.03 | 32.59 | 244,269 | 1.37 | 1.37 | 1.37 | (0.59 | ) | 45 | ||||||||||||||||||||||||||||||||||||||||||
| Royce Smaller-Companies Growth Fund–Service Class | |||||||||||||||||||||||||||||||||||||||||||||||||||||||||||||||
| 2018† | $ | 10.69 | $ | (0.04 | ) | $ | 1.15 | $ | 1.11 | $ | – | $ | – | $ | – | $ | – | $ | 11.80 | 10.38 | %1 | $ | 223,091 | 1.52 | %2 | 1.52 | %2 | 1.49 | %2 | (0.81 | )%2 | 27 | % | ||||||||||||||||||||||||||||||
| 2017 | 11.01 | (0.12 | ) | 2.03 | 1.91 | – | (2.23 | ) | (2.23 | ) | – | 10.69 | 17.80 | 228,008 | 1.49 | 1.49 | 1.47 | (0.96 | ) | 64 | |||||||||||||||||||||||||||||||||||||||||||
| 2016 | 11.20 | (0.08 | ) | 1.15 | 1.07 | – | (1.26 | ) | (1.26 | ) | – | 11.01 | 9.37 | 284,640 | 1.51 | 1.51 | 1.49 | (0.74 | ) | 59 | |||||||||||||||||||||||||||||||||||||||||||
| 2015 | 14.23 | (0.08 | ) | (0.20 | ) | (0.28 | ) | – | (2.75 | ) | (2.75 | ) | – | 11.20 | (1.82 | ) | 408,744 | 1.47 | 1.47 | 1.45 | (0.58 | ) | 45 | ||||||||||||||||||||||||||||||||||||||||
| 2014 | 16.93 | (0.09 | ) | 0.67 | 0.58 | – | (3.28 | ) | (3.28 | ) | – | 14.23 | 3.89 | 572,899 | 1.44 | 1.44 | 1.42 | (0.51 | ) | 52 | |||||||||||||||||||||||||||||||||||||||||||
| 2013 | 13.83 | (0.11 | ) | 4.56 | 4.45 | – | (1.35 | ) | (1.35 | ) | – | 16.93 | 32.52 | 835,379 | 1.48 | 1.48 | 1.46 | (0.69 | ) | 45 | |||||||||||||||||||||||||||||||||||||||||||
| Royce Smaller-Companies Growth Fund–Consultant Class | |||||||||||||||||||||||||||||||||||||||||||||||||||||||||||||||
| 2018† | $ | 9.28 | $ | (0.07 | ) | $ | 0.99 | $ | 0.92 | $ | – | $ | – | $ | – | $ | – | $ | 10.20 | 9.91 | %1 | $ | 10,065 | 2.39 | %2 | 2.38 | %2 | 2.24 | %2 | (1.55 | )%2 | 27 | % | ||||||||||||||||||||||||||||||
| 2017 | 9.63 | (0.18 | ) | 1.77 | 1.59 | – | (1.94 | ) | (1.94 | ) | – | 9.28 | 16.92 | 10,119 | 2.36 | 2.36 | 2.24 | (1.73 | ) | 64 | |||||||||||||||||||||||||||||||||||||||||||
| 2016 | 10.01 | (0.14 | ) | 1.02 | 0.88 | – | (1.26 | ) | (1.26 | ) | – | 9.63 | 8.58 | 10,593 | 2.35 | 2.35 | 2.24 | (1.50 | ) | 59 | |||||||||||||||||||||||||||||||||||||||||||
| 2015 | 13.12 | (0.18 | ) | (0.18 | ) | (0.36 | ) | – | (2.75 | ) | (2.75 | ) | – | 10.01 | (2.61 | ) | 14,411 | 2.32 | 2.32 | 2.24 | (1.36 | ) | 45 | ||||||||||||||||||||||||||||||||||||||||
| 2014 | 15.99 | (0.22 | ) | 0.63 | 0.41 | – | (3.28 | ) | (3.28 | ) | – | 13.12 | 3.05 | 17,158 | 2.29 | 2.29 | 2.29 | (1.37 | ) | 52 | |||||||||||||||||||||||||||||||||||||||||||
| 2013 | 13.24 | (0.24 | ) | 4.34 | 4.10 | – | (1.35 | ) | (1.35 | ) | – | 15.99 | 31.31 | 22,614 | 2.36 | 2.36 | 2.36 | (1.58 | ) | 45 | |||||||||||||||||||||||||||||||||||||||||||
| Royce Smaller-Companies Growth Fund–Institutional Class | |||||||||||||||||||||||||||||||||||||||||||||||||||||||||||||||
| 2018† | $ | 11.06 | $ | (0.02 | ) | $ | 1.19 | $ | 1.17 | $ | – | $ | – | $ | – | $ | – | $ | 12.23 | 10.58 | %1 | $ | 9,746 | 1.28 | %2 | 1.28 | %2 | 1.08 | %2 | (0.39 | )%2 | 27 | % | ||||||||||||||||||||||||||||||
| 2017 | 11.35 | (0.09 | ) | 2.11 | 2.02 | – | (2.31 | ) | (2.31 | ) | – | 11.06 | 18.23 | 9,315 | 1.21 | 1.21 | 1.21 | (0.70 | ) | 64 | |||||||||||||||||||||||||||||||||||||||||||
| 2016 | 11.48 | (0.05 | ) | 1.18 | 1.13 | – | (1.26 | ) | (1.26 | ) | – | 11.35 | 9.66 | 20,523 | 1.15 | 1.15 | 1.15 | (0.41 | ) | 59 | |||||||||||||||||||||||||||||||||||||||||||
| 2015 | 14.46 | (0.03 | ) | (0.20 | ) | (0.23 | ) | – | (2.75 | ) | (2.75 | ) | – | 11.48 | (1.45 | ) | 39,763 | 1.10 | 1.10 | 1.10 | (0.22 | ) | 45 | ||||||||||||||||||||||||||||||||||||||||
| 2014 | 17.09 | (0.03 | ) | 0.68 | 0.65 | – | (3.28 | ) | (3.28 | ) | – | 14.46 | 4.26 | 38,718 | 1.06 | 1.06 | 1.06 | (0.16 | ) | 52 | |||||||||||||||||||||||||||||||||||||||||||
| 2013 | 13.94 | (0.03 | ) | 4.57 | 4.54 | (0.04 | ) | (1.35 | ) | (1.39 | ) | – | 17.09 | 32.99 | 142,923 | 1.07 | 1.07 | 1.07 | (0.30 | ) | 45 | ||||||||||||||||||||||||||||||||||||||||||
| 100 | The Royce Funds 2018 Semiannual Report to Shareholders | THE ACCOMPANYING NOTES ARE AN INTEGRAL PART OF THESE FINANCIAL STATEMENTS |
Financial Highlights
This table is presented to show selected data for a share outstanding throughout each year or other indicated period and to assist shareholders in evaluating a Fund’s performance for the periods presented. Per share amounts have been determined on the basis of the weighted average number of shares outstanding during the period.
| Ratio of Expenses to Average Net Assets | |||||||||||||||||||||||||||||||||||||||||||||||||||||||||||||||
| Net Asset Value, Beginning of Period | Net Investment Income (Loss) | Net Realized and Unrealized Gain (Loss) on Investments and Foreign Currency | Total from Investment Operations | Distributions from Net Investment Income | Distributions from Net Realized Gain on Investments and Foreign Currency | Total Distributions | Shareholder Redemption Fees | Net Asset Value, End of Period | Total Return | Net Assets, End of Period (in thousands) | Prior to Fee Waivers, Expense Reimbursements and Balance Credits | Prior to Fee Waivers and Expense Reimbursements | Net of Fee Waivers and Expense Reimbursements | Ratio of Net Investment Income (Loss) to Average Net Assets | Portfolio Turnover Rate | ||||||||||||||||||||||||||||||||||||||||||||||||
| Royce Special Equity Fund–Investment Class | |||||||||||||||||||||||||||||||||||||||||||||||||||||||||||||||
| 2018† | $ | 21.79 | $ | 0.14 | $ | (0.21 | ) | $ | (0.07 | ) | $ | – | $ | – | $ | – | $ | – | $ | 21.72 | (0.32 | )%1 | $ | 1,114,111 | 1.18 | %2 | 1.18 | %2 | 1.18 | %2 | 1.31 | %2 | 5 | % | |||||||||||||||||||||||||||||
| 2017 | 22.02 | 0.13 | 1.56 | 1.69 | (0.12 | ) | (1.80 | ) | (1.92 | ) | – | 21.79 | 7.87 | 1,142,224 | 1.17 | 1.17 | 1.17 | 0.54 | 15 | ||||||||||||||||||||||||||||||||||||||||||||
| 2016 | 17.94 | 0.21 | 5.57 | 5.78 | (0.21 | ) | (1.49 | ) | (1.70 | ) | – | 22.02 | 32.21 | 1,225,095 | 1.17 | 1.17 | 1.17 | 0.99 | 29 | ||||||||||||||||||||||||||||||||||||||||||||
| 2015 | 22.86 | 0.22 | (3.04 | ) | (2.82 | ) | (0.24 | ) | (1.86 | ) | (2.10 | ) | – | 17.94 | (12.36 | ) | 1,098,106 | 1.15 | 1.15 | 1.15 | 0.80 | 15 | |||||||||||||||||||||||||||||||||||||||||
| 2014 | 25.02 | 0.13 | 0.09 | 0.22 | (0.12 | ) | (2.26 | ) | (2.38 | ) | – | 22.86 | 1.09 | 1,950,211 | 1.12 | 1.12 | 1.12 | 0.47 | 21 | ||||||||||||||||||||||||||||||||||||||||||||
| 2013 | 21.13 | 0.03 | 6.09 | 6.12 | (0.03 | ) | (2.20 | ) | (2.23 | ) | – | 25.02 | 29.36 | 2,510,346 | 1.13 | 1.13 | 1.13 | 0.13 | 28 | ||||||||||||||||||||||||||||||||||||||||||||
| Royce Special Equity Fund–Service Class | |||||||||||||||||||||||||||||||||||||||||||||||||||||||||||||||
| 2018† | $ | 21.76 | $ | 0.12 | $ | (0.22 | ) | $ | (0.10 | ) | $ | – | $ | – | $ | – | $ | – | $ | 21.66 | (0.46 | )%1 | $ | 53,408 | 1.56 | %2 | 1.55 | %2 | 1.39 | %2 | 1.13 | %2 | 5 | % | |||||||||||||||||||||||||||||
| 2017 | 21.98 | 0.08 | 1.56 | 1.64 | (0.07 | ) | (1.79 | ) | (1.86 | ) | – | 21.76 | 7.66 | 108,001 | 1.50 | 1.50 | 1.39 | 0.32 | 15 | ||||||||||||||||||||||||||||||||||||||||||||
| 2016 | 17.92 | 0.16 | 5.56 | 5.72 | (0.17 | ) | (1.49 | ) | (1.66 | ) | – | 21.98 | 31.92 | 128,102 | 1.50 | 1.50 | 1.39 | 0.77 | 29 | ||||||||||||||||||||||||||||||||||||||||||||
| 2015 | 22.81 | 0.17 | (3.03 | ) | (2.86 | ) | (0.17 | ) | (1.86 | ) | (2.03 | ) | – | 17.92 | (12.55 | ) | 112,315 | 1.47 | 1.47 | 1.39 | 0.57 | 15 | |||||||||||||||||||||||||||||||||||||||||
| 2014 | 24.97 | 0.06 | 0.09 | 0.15 | (0.05 | ) | (2.26 | ) | (2.31 | ) | – | 22.81 | 0.80 | 233,791 | 1.44 | 1.44 | 1.39 | 0.20 | 21 | ||||||||||||||||||||||||||||||||||||||||||||
| 2013 | 21.12 | (0.03 | ) | 6.08 | 6.05 | – | (2.20 | ) | (2.20 | ) | – | 24.97 | 29.04 | 335,952 | 1.45 | 1.45 | 1.39 | (0.13 | ) | 28 | |||||||||||||||||||||||||||||||||||||||||||
| Royce Special Equity Fund–Consultant Class | |||||||||||||||||||||||||||||||||||||||||||||||||||||||||||||||
| 2018† | $ | 19.86 | $ | 0.03 | $ | (0.20 | ) | $ | (0.17 | ) | $ | – | $ | – | $ | – | $ | – | $ | 19.69 | (0.86 | )%1 | $ | 40,172 | 2.20 | %2 | 2.20 | %2 | 2.20 | %2 | 0.29 | %2 | 5 | % | |||||||||||||||||||||||||||||
| 2017 | 20.16 | (0.10 | ) | 1.43 | 1.33 | – | (1.63 | ) | (1.63 | ) | – | 19.86 | 6.77 | 46,654 | 2.21 | 2.20 | 2.20 | (0.49 | ) | 15 | |||||||||||||||||||||||||||||||||||||||||||
| 2016 | 16.57 | (0.01 | ) | 5.13 | 5.12 | (0.04 | ) | (1.49 | ) | (1.53 | ) | – | 20.16 | 30.91 | 50,514 | 2.20 | 2.20 | 2.20 | (0.04 | ) | 29 | ||||||||||||||||||||||||||||||||||||||||||
| 2015 | 21.27 | (0.05 | ) | (2.76 | ) | (2.81 | ) | (0.03 | ) | (1.86 | ) | (1.89 | ) | – | 16.57 | (13.23 | ) | 42,427 | 2.18 | 2.18 | 2.18 | (0.24 | ) | 15 | |||||||||||||||||||||||||||||||||||||||
| 2014 | 23.57 | (0.13 | ) | 0.09 | (0.04 | ) | – | (2.26 | ) | (2.26 | ) | – | 21.27 | 0.04 | 63,981 | 2.14 | 2.14 | 2.14 | (0.56 | ) | 21 | ||||||||||||||||||||||||||||||||||||||||||
| 2013 | 20.20 | (0.21 | ) | 5.78 | 5.57 | – | (2.20 | ) | (2.20 | ) | – | 23.57 | 27.97 | 71,333 | 2.17 | 2.17 | 2.17 | (0.90 | ) | 28 | |||||||||||||||||||||||||||||||||||||||||||
| Royce Special Equity Fund–Institutional Class | |||||||||||||||||||||||||||||||||||||||||||||||||||||||||||||||
| 2018† | $ | 21.61 | $ | 0.15 | $ | (0.22 | ) | $ | (0.07 | ) | $ | – | $ | – | $ | – | $ | – | $ | 21.54 | (0.32 | )%1 | $ | 191,789 | 1.10 | %2 | 1.10 | %2 | 1.10 | %2 | 1.45 | %2 | 5 | % | |||||||||||||||||||||||||||||
| 2017 | 21.84 | 0.14 | 1.55 | 1.69 | (0.14 | ) | (1.78 | ) | (1.92 | ) | – | 21.61 | 7.96 | 247,004 | 1.09 | 1.09 | 1.09 | 0.60 | 15 | ||||||||||||||||||||||||||||||||||||||||||||
| 2016 | 17.80 | 0.23 | 5.53 | 5.76 | (0.23 | ) | (1.49 | ) | (1.72 | ) | – | 21.84 | 32.35 | 206,270 | 1.07 | 1.07 | 1.07 | 1.10 | 29 | ||||||||||||||||||||||||||||||||||||||||||||
| 2015 | 22.71 | 0.33 | (3.12 | ) | (2.79 | ) | (0.26 | ) | (1.86 | ) | (2.12 | ) | – | 17.80 | (12.27 | ) | 208,952 | 1.04 | 1.04 | 1.04 | 1.02 | 15 | |||||||||||||||||||||||||||||||||||||||||
| 2014 | 24.88 | 0.14 | 0.10 | 0.24 | (0.15 | ) | (2.26 | ) | (2.41 | ) | – | 22.71 | 1.17 | 639,723 | 1.02 | 1.02 | 1.02 | 0.56 | 21 | ||||||||||||||||||||||||||||||||||||||||||||
| 2013 | 21.02 | 0.06 | 6.06 | 6.12 | (0.06 | ) | (2.20 | ) | (2.26 | ) | – | 24.88 | 29.51 | 700,200 | 1.01 | 1.01 | 1.01 | 0.26 | 28 | ||||||||||||||||||||||||||||||||||||||||||||
| Royce Special Equity Multi-Cap Fund–Investment Class | |||||||||||||||||||||||||||||||||||||||||||||||||||||||||||||||
| 2018† | $ | 15.63 | $ | 0.08 | $ | (0.95 | ) | $ | (0.87 | ) | $ | – | $ | – | $ | – | $ | – | $ | 14.76 | (5.57 | )%1 | $ | 34,812 | 1.07 | %2 | 1.07 | %2 | 1.01 | %2 | 1.06 | %2 | 2 | % | |||||||||||||||||||||||||||||
| 2017 | 13.90 | 0.14 | 2.04 | 2.18 | (0.15 | ) | (0.30 | ) | (0.45 | ) | – | 15.63 | 15.77 | 41,081 | 1.04 | 1.04 | 0.99 | 0.96 | 28 | ||||||||||||||||||||||||||||||||||||||||||||
| 2016 | 12.34 | 0.17 | 1.55 | 1.72 | (0.16 | ) | – | (0.16 | ) | – | 13.90 | 13.92 | 34,858 | 1.02 | 1.02 | 0.97 | 1.15 | 50 | |||||||||||||||||||||||||||||||||||||||||||||
| 2015 | 15.55 | 0.40 | (2.48 | ) | (2.08 | ) | (0.35 | ) | (0.78 | ) | (1.13 | ) | – | 12.34 | (13.40 | ) | 43,999 | 1.01 | 1.01 | 0.99 | 1.49 | 31 | |||||||||||||||||||||||||||||||||||||||||
| 2014 | 14.92 | 0.10 | 1.30 | 1.40 | (0.11 | ) | (0.66 | ) | (0.77 | ) | – | 15.55 | 9.53 | 123,545 | 0.97 | 0.97 | 0.96 | 0.95 | 39 | ||||||||||||||||||||||||||||||||||||||||||||
| 2013 | 11.64 | 0.12 | 4.11 | 4.23 | (0.12 | ) | (0.83 | ) | (0.95 | ) | – | 14.92 | 36.62 | 62,387 | 1.16 | 1.16 | 1.15 | 0.93 | 44 | ||||||||||||||||||||||||||||||||||||||||||||
| THE ACCOMPANYING NOTES ARE AN INTEGRAL PART OF THESE FINANCIAL STATEMENTS | The Royce Funds 2018 Semiannual Report to Shareholders | 101 |
Financial Highlights
This table is presented to show selected data for a share outstanding throughout each year or other indicated period and to assist shareholders in evaluating a Fund’s performance for the periods presented. Per share amounts have been determined on the basis of the weighted average number of shares outstanding during the period.
| Ratio of Expenses to Average Net Assets | |||||||||||||||||||||||||||||||||||||||||||||||||||||||||||||||
| Net Asset Value, Beginning of Period | Net Investment Income (Loss) | Net Realized and Unrealized Gain (Loss) on Investments and Foreign Currency | Total from Investment Operations | Distributions from Net Investment Income | Distributions from Net Realized Gain on Investments and Foreign Currency | Total Distributions | Shareholder Redemption Fees | Net Asset Value, End of Period | Total Return | Net Assets, End of Period (in thousands) | Prior to Fee Waivers, Expense Reimbursements and Balance Credits | Prior to Fee Waivers and Expense Reimbursements | Net of Fee Waivers and Expense Reimbursements | Ratio of Net Investment Income (Loss) to Average Net Assets | Portfolio Turnover Rate | ||||||||||||||||||||||||||||||||||||||||||||||||
| Royce Special Equity Multi-Cap Fund–Service Class | |||||||||||||||||||||||||||||||||||||||||||||||||||||||||||||||
| 2018† | $ | 15.69 | $ | 0.06 | $ | (0.95 | ) | $ | (0.89 | ) | $ | – | $ | – | $ | – | $ | – | $ | 14.80 | (5.67 | )%1 | $ | 21,240 | 1.46 | %2 | 1.46 | %2 | 1.24 | %2 | 0.83 | %2 | 2 | % | |||||||||||||||||||||||||||||
| 2017 | 13.95 | 0.12 | 2.02 | 2.14 | (0.10 | ) | (0.30 | ) | (0.40 | ) | – | 15.69 | 15.42 | 24,182 | 1.39 | 1.39 | 1.24 | 0.68 | 28 | ||||||||||||||||||||||||||||||||||||||||||||
| 2016 | 12.38 | 0.13 | 1.57 | 1.70 | (0.13 | ) | – | (0.13 | ) | – | 13.95 | 13.69 | 37,495 | 1.34 | 1.34 | 1.23 | 0.89 | 50 | |||||||||||||||||||||||||||||||||||||||||||||
| 2015 | 15.60 | 0.26 | (2.39 | ) | (2.13 | ) | (0.31 | ) | (0.78 | ) | (1.09 | ) | – | 12.38 | (13.64 | ) | 47,630 | 1.29 | 1.29 | 1.23 | 1.21 | 31 | |||||||||||||||||||||||||||||||||||||||||
| 2014 | 14.96 | 0.10 | 1.27 | 1.37 | (0.07 | ) | (0.66 | ) | (0.73 | ) | – | 15.60 | 9.28 | 94,878 | 1.34 | 1.34 | 1.24 | 0.66 | 39 | ||||||||||||||||||||||||||||||||||||||||||||
| 2013 | 11.68 | 0.09 | 4.12 | 4.21 | (0.10 | ) | (0.83 | ) | (0.93 | ) | – | 14.96 | 36.26 | 78,233 | 1.61 | 1.61 | 1.38 | 0.69 | 44 | ||||||||||||||||||||||||||||||||||||||||||||
| Royce Special Equity Multi-Cap Fund–Consultant Class f | |||||||||||||||||||||||||||||||||||||||||||||||||||||||||||||||
| 2018† | $ | 10.19 | $ | 0.00 | $ | (0.61 | ) | $ | (0.61 | ) | $ | – | $ | – | $ | – | $ | – | $ | 9.58 | (5.99 | )%1 | $ | 3,096 | 2.31 | %2 | 2.31 | %2 | 1.99 | %2 | 0.05 | %2 | 2 | % | |||||||||||||||||||||||||||||
| 2017 | 9.12 | (0.00 | ) | 1.32 | 1.32 | (0.05 | ) | (0.20 | ) | (0.25 | ) | – | 10.19 | 14.50 | 4,190 | 2.73 | 2.73 | 1.99 | (0.06 | ) | 28 | ||||||||||||||||||||||||||||||||||||||||||
| 2016 | 8.15 | 0.02 | 1.03 | 1.05 | (0.08 | ) | – | (0.08 | ) | – | 9.12 | 12.89 | 4,986 | 2.38 | 2.38 | 1.99 | 0.12 | 50 | |||||||||||||||||||||||||||||||||||||||||||||
| 2015 | 10.72 | 0.09 | (1.63 | ) | (1.54 | ) | (0.25 | ) | (0.78 | ) | (1.03 | ) | – | 8.15 | (14.35 | ) | 6,825 | 2.19 | 2.19 | 1.99 | 0.50 | 31 | |||||||||||||||||||||||||||||||||||||||||
| 2014 | 10.00 | (0.04 | ) | 1.48 | 1.44 | (0.06 | ) | (0.66 | ) | (0.72 | ) | – | 10.72 | 14.57 | 1 | 9,233 | 2.54 | 2 | 2.54 | 2 | 1.99 | 2 | (0.05 | )2 | 39 | ||||||||||||||||||||||||||||||||||||||
| Royce Special Equity Multi-Cap Fund–Institutional Class | |||||||||||||||||||||||||||||||||||||||||||||||||||||||||||||||
| 2018† | $ | 15.62 | $ | 0.09 | $ | (0.96 | ) | $ | (0.87 | ) | $ | – | $ | – | $ | – | $ | – | $ | 14.75 | (5.57 | )%1 | $ | 7,578 | 1.03 | %2 | 1.03 | %2 | 0.89 | %2 | 1.10 | %2 | 2 | % | |||||||||||||||||||||||||||||
| 2017 | 13.89 | 0.17 | 2.03 | 2.20 | (0.17 | ) | (0.30 | ) | (0.47 | ) | – | 15.62 | 15.89 | 38,706 | 0.99 | 0.99 | 0.89 | 1.06 | 28 | ||||||||||||||||||||||||||||||||||||||||||||
| 2016 | 12.33 | 0.16 | 1.57 | 1.73 | (0.17 | ) | – | (0.17 | ) | – | 13.89 | 14.04 | 37,339 | 0.99 | 0.99 | 0.89 | 1.22 | 50 | |||||||||||||||||||||||||||||||||||||||||||||
| 2015 | 15.56 | 0.34 | (2.41 | ) | (2.07 | ) | (0.38 | ) | (0.78 | ) | (1.16 | ) | – | 12.33 | (13.32 | ) | 36,864 | 0.94 | 0.94 | 0.89 | 1.56 | 31 | |||||||||||||||||||||||||||||||||||||||||
| 2014 | 14.92 | 0.12 | 1.30 | 1.42 | (0.12 | ) | (0.66 | ) | (0.78 | ) | – | 15.56 | 9.64 | 75,941 | 0.93 | 0.93 | 0.89 | 1.01 | 39 | ||||||||||||||||||||||||||||||||||||||||||||
| 2013 | 11.64 | 0.15 | 4.10 | 4.25 | (0.14 | ) | (0.83 | ) | (0.97 | ) | – | 14.92 | 36.73 | 48,063 | 1.10 | 1.10 | 1.04 | 1.02 | 44 | ||||||||||||||||||||||||||||||||||||||||||||
| Royce Total Return Fund–Investment Class | |||||||||||||||||||||||||||||||||||||||||||||||||||||||||||||||
| 2018† | $ | 13.58 | $ | 0.10 | $ | (0.02 | ) | $ | 0.08 | $ | (0.08 | ) | $ | – | $ | (0.08 | ) | $ | – | $ | 13.58 | 0.59 | %1 | $ | 1,471,522 | 1.18 | %2 | 1.18 | %2 | 1.18 | %2 | 1.49 | %2 | 11 | % | ||||||||||||||||||||||||||||
| 2017 | 13.68 | 0.14 | 1.67 | 1.81 | (0.12 | ) | (1.79 | ) | (1.91 | ) | – | 13.58 | 13.65 | 1,550,893 | 1.19 | 1.19 | 1.19 | 1.00 | 12 | ||||||||||||||||||||||||||||||||||||||||||||
| 2016 | 11.91 | 0.15 | 2.93 | 3.08 | (0.22 | ) | (1.09 | ) | (1.31 | ) | – | 13.68 | 25.86 | 1,835,927 | 1.19 | 1.19 | 1.19 | 1.08 | 16 | ||||||||||||||||||||||||||||||||||||||||||||
| 2015 | 14.74 | 0.17 | (1.23 | ) | (1.06 | ) | (0.12 | ) | (1.65 | ) | (1.77 | ) | – | 11.91 | (7.19 | ) | 1,850,309 | 1.15 | 1.15 | 1.15 | 1.18 | 11 | |||||||||||||||||||||||||||||||||||||||||
| 2014 | 16.47 | 0.17 | 0.00 | 0.17 | (0.28 | ) | (1.62 | ) | (1.90 | ) | – | 14.74 | 1.34 | 3,077,951 | 1.13 | 1.13 | 1.13 | 0.95 | 18 | ||||||||||||||||||||||||||||||||||||||||||||
| 2013 | 13.63 | 0.16 | 4.24 | 4.40 | (0.14 | ) | (1.42 | ) | (1.56 | ) | – | 16.47 | 32.76 | 3,657,904 | 1.13 | 1.13 | 1.13 | 1.00 | 21 | ||||||||||||||||||||||||||||||||||||||||||||
| Royce Total Return Fund–Service Class | |||||||||||||||||||||||||||||||||||||||||||||||||||||||||||||||
| 2018† | $ | 13.88 | $ | 0.08 | $ | (0.02 | ) | $ | 0.06 | $ | (0.06 | ) | $ | – | $ | (0.06 | ) | $ | – | $ | 13.88 | 0.43 | %1 | $ | 115,579 | 1.49 | %2 | 1.49 | %2 | 1.49 | %2 | 1.23 | %2 | 11 | % | ||||||||||||||||||||||||||||
| 2017 | 13.98 | 0.10 | 1.69 | 1.79 | (0.07 | ) | (1.82 | ) | (1.89 | ) | – | 13.88 | 13.24 | 97,854 | 1.49 | 1.48 | 1.48 | 0.72 | 12 | ||||||||||||||||||||||||||||||||||||||||||||
| 2016 | 12.12 | 0.11 | 3.00 | 3.11 | (0.16 | ) | (1.09 | ) | (1.25 | ) | – | 13.98 | 25.60 | 142,606 | 1.46 | 1.46 | 1.46 | 0.80 | 16 | ||||||||||||||||||||||||||||||||||||||||||||
| 2015 | 14.98 | 0.13 | (1.25 | ) | (1.12 | ) | (0.09 | ) | (1.65 | ) | (1.74 | ) | – | 12.12 | (7.48 | ) | 137,594 | 1.43 | 1.43 | 1.43 | 0.90 | 11 | |||||||||||||||||||||||||||||||||||||||||
| 2014 | 16.61 | 0.12 | 0.01 | 0.13 | (0.14 | ) | (1.62 | ) | (1.76 | ) | – | 14.98 | 1.08 | 232,814 | 1.42 | 1.42 | 1.42 | 0.60 | 18 | ||||||||||||||||||||||||||||||||||||||||||||
| 2013 | 13.72 | 0.11 | 4.27 | 4.38 | (0.07 | ) | (1.42 | ) | (1.49 | ) | – | 16.61 | 32.38 | 493,111 | 1.48 | 1.48 | 1.48 | 0.68 | 21 | ||||||||||||||||||||||||||||||||||||||||||||
| 102 | The Royce Funds 2018 Semiannual Report to Shareholders | THE ACCOMPANYING NOTES ARE AN INTEGRAL PART OF THESE FINANCIAL STATEMENTS |
Financial Highlights
This table is presented to show selected data for a share outstanding throughout each year or other indicated period and to assist shareholders in evaluating a Fund’s performance for the periods presented. Per share amounts have been determined on the basis of the weighted average number of shares outstanding during the period.
| Ratio of Expenses to Average Net Assets | |||||||||||||||||||||||||||||||||||||||||||||||||||||||||||||||
| Net Asset Value, Beginning of Period | Net Investment Income (Loss) | Net Realized and Unrealized Gain (Loss) on Investments and Foreign Currency | Total from Investment Operations | Distributions from Net Investment Income | Distributions from Net Realized Gain on Investments and Foreign Currency | Total Distributions | Shareholder Redemption Fees | Net Asset Value, End of Period | Total Return | Net Assets, End of Period (in thousands) | Prior to Fee Waivers, Expense Reimbursements and Balance Credits | Prior to Fee Waivers and Expense Reimbursements | Net of Fee Waivers and Expense Reimbursements | Ratio of Net Investment Income (Loss) to Average Net Assets | Portfolio Turnover Rate | ||||||||||||||||||||||||||||||||||||||||||||||||
| Royce Total Return Fund–Consultant Class | |||||||||||||||||||||||||||||||||||||||||||||||||||||||||||||||
| 2018† | $ | 13.95 | $ | 0.03 | $ | (0.01 | ) | $ | 0.02 | $ | (0.02 | ) | $ | – | $ | (0.02 | ) | $ | – | $ | 13.95 | 0.11 | %1 | $ | 227,078 | 2.17 | %2 | 2.17 | %2 | 2.17 | %2 | 0.49 | %2 | 11 | % | ||||||||||||||||||||||||||||
| 2017 | 14.07 | 0.01 | 1.70 | 1.71 | – | (1.83 | ) | (1.83 | ) | – | 13.95 | 12.53 | 247,914 | 2.16 | 2.16 | 2.16 | 0.04 | 12 | |||||||||||||||||||||||||||||||||||||||||||||
| 2016 | 12.15 | 0.01 | 3.01 | 3.02 | (0.01 | ) | (1.09 | ) | (1.10 | ) | – | 14.07 | 24.73 | 267,083 | 2.16 | 2.16 | 2.16 | 0.11 | 16 | ||||||||||||||||||||||||||||||||||||||||||||
| 2015 | 15.05 | 0.03 | (1.26 | ) | (1.23 | ) | (0.02 | ) | (1.65 | ) | (1.67 | ) | – | 12.15 | (8.15 | ) | 262,131 | 2.16 | 2.16 | 2.16 | 0.18 | 11 | |||||||||||||||||||||||||||||||||||||||||
| 2014 | 16.68 | (0.00 | ) | 0.02 | 0.02 | (0.03 | ) | (1.62 | ) | (1.65 | ) | – | 15.05 | 0.37 | 356,731 | 2.12 | 2.12 | 2.12 | (0.04 | ) | 18 | ||||||||||||||||||||||||||||||||||||||||||
| 2013 | 13.81 | (0.00 | ) | 4.29 | 4.29 | – | (1.42 | ) | (1.42 | ) | – | 16.68 | 31.38 | 404,498 | 2.15 | 2.15 | 2.15 | (0.02 | ) | 21 | |||||||||||||||||||||||||||||||||||||||||||
| Royce Total Return Fund–Institutional Class | |||||||||||||||||||||||||||||||||||||||||||||||||||||||||||||||
| 2018† | $ | 13.40 | $ | 0.11 | $ | (0.02 | ) | $ | 0.09 | $ | (0.09 | ) | $ | – | $ | (0.09 | ) | $ | – | $ | 13.40 | 0.63 | %1 | $ | 310,533 | 1.07 | %2 | 1.07 | %2 | 1.07 | %2 | 1.61 | %2 | 11 | % | ||||||||||||||||||||||||||||
| 2017 | 13.52 | 0.16 | 1.64 | 1.80 | (0.15 | ) | (1.77 | ) | (1.92 | ) | – | 13.40 | 13.80 | 310,603 | 1.06 | 1.06 | 1.06 | 1.13 | 12 | ||||||||||||||||||||||||||||||||||||||||||||
| 2016 | 11.78 | 0.18 | 2.90 | 3.08 | (0.25 | ) | (1.09 | ) | (1.34 | ) | – | 13.52 | 26.13 | 420,375 | 1.05 | 1.05 | 1.05 | 1.22 | 16 | ||||||||||||||||||||||||||||||||||||||||||||
| 2015 | 14.61 | 0.18 | (1.22 | ) | (1.04 | ) | (0.14 | ) | (1.65 | ) | (1.79 | ) | – | 11.78 | (7.17 | ) | 374,555 | 1.03 | 1.03 | 1.03 | 1.28 | 11 | |||||||||||||||||||||||||||||||||||||||||
| 2014 | 16.35 | 0.18 | 0.02 | 0.20 | (0.32 | ) | (1.62 | ) | (1.94 | ) | – | 14.61 | 1.51 | 572,662 | 1.00 | 1.00 | 1.00 | 1.09 | 18 | ||||||||||||||||||||||||||||||||||||||||||||
| 2013 | 13.55 | 0.18 | 4.21 | 4.39 | (0.17 | ) | (1.42 | ) | (1.59 | ) | – | 16.35 | 32.93 | 621,447 | 1.00 | 1.00 | 1.00 | 1.15 | 21 | ||||||||||||||||||||||||||||||||||||||||||||
| Royce Total Return Fund–W Class | |||||||||||||||||||||||||||||||||||||||||||||||||||||||||||||||
| 2018† | $ | 13.56 | $ | 0.09 | $ | (0.02 | ) | $ | 0.07 | $ | (0.08 | ) | $ | – | $ | (0.08 | ) | $ | – | $ | 13.55 | 0.48 | %1 | $ | 41,770 | 1.32 | %2 | 1.31 | %2 | 1.31 | %2 | 1.22 | %2 | 11 | % | ||||||||||||||||||||||||||||
| 2017 | 13.67 | 0.14 | 1.66 | 1.80 | (0.12 | ) | (1.79 | ) | (1.91 | ) | – | 13.56 | 13.59 | 95,955 | 1.21 | 1.21 | 1.21 | 1.00 | 12 | ||||||||||||||||||||||||||||||||||||||||||||
| 2016 | 11.88 | 0.17 | 2.91 | 3.08 | (0.20 | ) | (1.09 | ) | (1.29 | ) | – | 13.67 | 25.96 | 79,702 | 1.20 | 1.20 | 1.20 | 1.03 | 16 | ||||||||||||||||||||||||||||||||||||||||||||
| 2015 | 14.72 | 0.16 | (1.23 | ) | (1.07 | ) | (0.12 | ) | (1.65 | ) | (1.77 | ) | – | 11.88 | (7.28 | ) | 118,167 | 1.18 | 1.18 | 1.18 | 1.17 | 11 | |||||||||||||||||||||||||||||||||||||||||
| 2014 | 16.45 | 0.15 | 0.03 | 0.18 | (0.29 | ) | (1.62 | ) | (1.91 | ) | – | 14.72 | 1.35 | 261,829 | 1.13 | 1.13 | 1.13 | 0.97 | 18 | ||||||||||||||||||||||||||||||||||||||||||||
| 2013 | 13.62 | 0.16 | 4.23 | 4.39 | (0.14 | ) | (1.42 | ) | (1.56 | ) | – | 16.45 | 32.71 | 249,035 | 1.15 | 1.15 | 1.15 | 0.99 | 21 | ||||||||||||||||||||||||||||||||||||||||||||
| Royce Total Return Fund–R Class | |||||||||||||||||||||||||||||||||||||||||||||||||||||||||||||||
| 2018† | $ | 13.99 | $ | 0.06 | $ | (0.02 | ) | $ | 0.04 | $ | (0.04 | ) | $ | – | $ | (0.04 | ) | $ | – | $ | 13.99 | 0.28 | %1 | $ | 50,926 | 1.82 | %2 | 1.82 | %2 | 1.82 | %2 | 0.86 | %2 | 11 | % | ||||||||||||||||||||||||||||
| 2017 | 14.09 | 0.06 | 1.71 | 1.77 | (0.03 | ) | (1.84 | ) | (1.87 | ) | – | 13.99 | 12.97 | 54,979 | 1.80 | 1.80 | 1.80 | 0.40 | 12 | ||||||||||||||||||||||||||||||||||||||||||||
| 2016 | 12.19 | 0.07 | 3.00 | 3.07 | (0.08 | ) | (1.09 | ) | (1.17 | ) | – | 14.09 | 25.14 | 53,896 | 1.78 | 1.78 | 1.78 | 0.49 | 16 | ||||||||||||||||||||||||||||||||||||||||||||
| 2015 | 15.07 | 0.08 | (1.25 | ) | (1.17 | ) | (0.06 | ) | (1.65 | ) | (1.71 | ) | – | 12.19 | (7.79 | ) | 50,684 | 1.77 | 1.77 | 1.77 | 0.56 | 11 | |||||||||||||||||||||||||||||||||||||||||
| 2014 | 16.73 | 0.07 | 0.01 | 0.08 | (0.12 | ) | (1.62 | ) | (1.74 | ) | – | 15.07 | 0.73 | 65,501 | 1.72 | 1.72 | 1.72 | 0.37 | 18 | ||||||||||||||||||||||||||||||||||||||||||||
| 2013 | 13.82 | 0.06 | 4.30 | 4.36 | (0.03 | ) | (1.42 | ) | (1.45 | ) | – | 16.73 | 31.95 | 72,541 | 1.75 | 1.75 | 1.75 | 0.39 | 21 | ||||||||||||||||||||||||||||||||||||||||||||
| †Six months ended June 30, 2018 (unaudited). |
| 1Not annualized |
| 2Annualized |
| aThe Class commenced operations on March 21, 2014. |
| bThe Class commenced operations on January 5, 2016. |
| cThe Class commenced operations on January 22, 2014. |
| dThe Class commenced operations on February 26, 2016. |
| eThe Class commenced operations on May 2, 2018. |
| fThe Class commenced operations on January 27, 2014. |
| THE ACCOMPANYING NOTES ARE AN INTEGRAL PART OF THESE FINANCIAL STATEMENTS | The Royce Funds 2018 Semiannual Report to Shareholders | 103 |
Notes to Financial Statements (unaudited)
Summary of Significant Accounting Policies:
Royce Dividend Value Fund, Royce Global Financial Services Fund, Royce International Discovery Fund, Royce International Premier Fund, Royce Low-Priced Stock Fund, Royce Micro-Cap Fund, Royce Micro-Cap Opportunity Fund, Royce Opportunity Fund, Royce Pennsylvania Mutual Fund, Royce Premier Fund, Royce Small-Cap Leaders Fund, Royce Small-Cap Value Fund, Royce Small/Mid-Cap Premier Fund, Royce Smaller-Companies Growth Fund, Royce Special Equity Fund, Royce Special Equity Multi-Cap Fund and Royce Total Return Fund (the “Fund” or “Funds”), are the seventeen series of The Royce Fund (the “Trust”), a diversified open-end management investment company organized as a Delaware statutory trust. Effective February 1, 2018, Royce International Micro-Cap Fund became Royce International Discovery Fund.
Classes of shares have equal rights as to earnings and assets, except that each class may bear different fees and expenses for distribution, shareholder servicing, registration and shareholder reports, and receive different compensating balance credits and expense reimbursements. Investment income, realized and unrealized capital gains or losses on investments and foreign currency, and expenses other than those attributable to a specific class are allocated to each class of shares based on its relative net assets.
The preparation of financial statements in conformity with accounting principles generally accepted in the United States requires management to make estimates and assumptions that affect the reported amounts of assets and liabilities and the disclosure of contingent assets and liabilities at the date of the financial statements and the reported amounts of income and expenses during the reporting period. Actual results could differ from those estimates.
Each Fund is an investment company and accordingly follows the investment company accounting and reporting guidance of the Financial Accounting Standards Board (FASB) Accounting Standard Codification Topic 946 “Financial Services-Investment Companies”.
At June 30, 2018, officers, employees of Royce & Associates (“Royce”), Fund trustees, the Royce retirement plans and other affiliates owned more than 10% of the following Funds:
| Royce International Discovery Fund | 46% | ||
| Royce Micro-Cap Opportunity Fund | 15% | ||
| Royce Special Equity Multi-Cap Fund | 10% |
Securities are valued as of the close of trading on the New York Stock Exchange (NYSE) (generally 4:00 p.m. Eastern time) on the valuation date. Securities that trade on an exchange, and securities traded on Nasdaq’s Electronic Bulletin Board, are valued at their last reported sales price or Nasdaq official closing price taken from the primary market in which each security trades or, if no sale is reported for such day, at their highest bid price. Other over-the-counter securities for which market quotations are readily available are valued at their highest bid price, except in the case of some bonds and other fixed income securities which may be valued by reference to other securities with comparable ratings, interest rates and maturities, using established independent pricing services. The Funds value their non-U.S. dollar denominated securities in U.S. dollars daily at the prevailing foreign currency exchange rates as quoted by a major bank. Securities for which market quotations are not readily available are valued at their fair value in accordance with the provisions of the 1940 Act, under procedures approved by the Trust’s Board of Trustees, and are reported as Level 3 securities. As a general principle, the fair value of a security is the amount which the Fund might reasonably expect to receive for the security upon its current sale. However, in light of the judgment involved in fair valuations, there can be no assurance that a fair value assigned to a particular security will be the amount which the Fund might be able to receive upon its current sale. In addition, if, between the time trading ends on a particular security and the close of the customary trading session on the NYSE, events occur that are significant and may make the closing price unreliable, a Fund may fair value the security. The Funds use an independent pricing service to provide fair value estimates for relevant non-U.S. equity securities on days when the U.S. market volatility exceeds a certain threshold. This pricing service uses proprietary correlations it has developed between the movement of prices of non-U.S. equity securities and indices of U.S.-traded securities, futures contracts and other indications to estimate the fair value of relevant non-U.S. securities. When fair value pricing is employed, the prices of securities used by a Fund may differ from quoted or published prices for the same security. Investments in money market funds are valued at net asset value per share.
Various inputs are used in determining the value of each Fund’s investments, as noted above. These inputs are summarized in the three broad levels below:
| Level 1 | – | quoted prices in active markets for identical securities. | ||
| Level 2 | – | other significant observable inputs (including quoted prices for similar securities, foreign securities that may be fair valued and repurchase agreements). The table below includes all Level 2 securities. Level 2 securities with values based on quoted prices for similar securities are noted in the Schedules of Investments. | ||
| Level 3 | – | significant unobservable inputs (including last trade price before trading was suspended, or at a discount thereto for lack of marketability or otherwise, market price information regarding other securities, information received from the company and/or published documents, including SEC filings and financial statements, or other publicly available information). |
104 | The Royce Funds 2018 Semiannual Report to Shareholders
VALUATION OF INVESTMENTS (continued):
The following is a summary of the inputs used to value each Fund’s investments as of June 30, 2018. For a detailed breakout of common stocks by sector classification or country, please refer to the Schedules of Investments.
| LEVEL 1 | LEVEL 2 | LEVEL 3 | TOTAL | |||||
| Royce Dividend Value Fund | ||||||||
| Common Stocks | $ | 164,226,702 | $ | – | $ | – | $ | 164,226,702 |
| Cash Equivalents | – | 2,288,000 | – | 2,288,000 | ||||
| Royce Global Financial Services Fund | ||||||||
| Common Stocks | 53,448,203 | 6,704 | – | 53,454,907 | ||||
| Cash Equivalents | – | 3,525,000 | – | 3,525,000 | ||||
| Royce International Discovery Fund | ||||||||
| Common Stocks | 7,660,090 | – | 0 | 7,660,090 | ||||
| Cash Equivalents | – | 297,000 | – | 297,000 | ||||
| Royce International Premier Fund | ||||||||
| Common Stocks | 223,478,008 | – | – | 223,478,008 | ||||
| Cash Equivalents | – | 10,354,000 | – | 10,354,000 | ||||
| Royce Low-Priced Stock Fund | ||||||||
| Common Stocks | 258,139,397 | 924,075 | 0 | 259,063,472 | ||||
| Cash Equivalents | 7,857,308 | 12,739,000 | – | 20,596,308 | ||||
| Royce Micro-Cap Fund | ||||||||
| Common Stocks | 189,037,127 | – | 828,000 | 189,865,127 | ||||
| Cash Equivalents | 3,716,832 | 8,277,000 | – | 11,993,832 | ||||
| Royce Micro-Cap Opportunity Fund | ||||||||
| Common Stocks | 45,223,015 | 606,264 | – | 45,829,279 | ||||
| Cash Equivalents | – | 2,245,000 | – | 2,245,000 | ||||
| Royce Opportunity Fund | ||||||||
| Common Stocks | 1,190,358,342 | 4,740,540 | – | 1,195,098,882 | ||||
| Cash Equivalents | 22,685,409 | 96,754,000 | – | 119,439,409 | ||||
| Royce Pennsylvania Mutual Fund | ||||||||
| Common Stocks | 1,959,534,336 | – | – | 1,959,534,336 | ||||
| Cash Equivalents | 7,149,754 | 102,601,000 | – | 109,750,754 | ||||
| Royce Premier Fund | ||||||||
| Common Stocks | 2,176,583,648 | – | – | 2,176,583,648 | ||||
| Cash Equivalents | – | 99,671,000 | – | 99,671,000 | ||||
| Royce Small-Cap Leaders Fund | ||||||||
| Common Stocks | 73,742,481 | – | – | 73,742,481 | ||||
| Cash Equivalents | – | 6,363,000 | – | 6,363,000 | ||||
| Royce Small-Cap Value Fund | ||||||||
| Common Stocks | 216,163,874 | – | – | 216,163,874 | ||||
| Cash Equivalents | – | 20,991,000 | – | 20,991,000 | ||||
| Royce Small/Mid-Cap Premier Fund | ||||||||
| Common Stocks | 162,703,354 | – | 0 | 162,703,354 | ||||
| Cash Equivalents | – | 29,491,000 | – | 29,491,000 | ||||
| Royce Smaller-Companies Growth Fund | ||||||||
| Common Stocks | 346,458,378 | – | – | 346,458,378 | ||||
| Cash Equivalents | 15,347,529 | 21,889,000 | – | 37,236,529 | ||||
| Royce Special Equity Fund | ||||||||
| Common Stocks | 1,182,731,233 | 40,266,044 | – | 1,222,997,277 | ||||
| Cash Equivalents | – | 178,533,000 | – | 178,533,000 | ||||
| Royce Special Equity Multi-Cap Fund | ||||||||
| Common Stocks | 56,893,311 | – | – | 56,893,311 | ||||
| Cash Equivalents | – | 9,659,000 | – | 9,659,000 | ||||
| Royce Total Return Fund | ||||||||
| Common Stocks | 2,070,523,965 | 13,618,975 | 0 | 2,084,142,940 | ||||
| Corporate Bond | – | 4,400,870 | – | 4,400,870 | ||||
| Cash Equivalents | – | 126,081,000 | – | 126,081,000 | ||||
The Royce Funds 2018 Semiannual Report to Shareholders | 105
Notes to Financial Statements (unaudited) (continued)
VALUATION OF INVESTMENTS (continued):
Certain securities have transferred in and out of Level 1 and Level 2 measurements during the reporting period. The Funds recognize transfers between levels as of the end of the reporting period. For the six months ended June 30, 2018, the following Funds had securities transfer from Level 1 to Level 2 and from Level 2 to Level 1 within the fair value hierarchy:
| TRANSFERS FROM | TRANSFERS FROM | TRANSFERS FROM | TRANSFERS FROM | |||||||
| LEVEL 1 TO LEVEL 2 | LEVEL 2 TO LEVEL 1 | LEVEL 1 TO LEVEL 2 | LEVEL 2 TO LEVEL 1 | |||||||
| Royce Dividend Value Fund | $ – | $ 32,402,085 | Royce Opportunity Fund | $ 2,332,182 | $ – | |||||
| Royce Global Financial Services Fund | – | 12,573,085 | Royce Pennsylvania Mutual Fund | – | 54,941,229 | |||||
| Royce International Discovery Fund | – | 2,679,938 | Royce Premier Fund | – | 71,037,887 | |||||
| Royce International Premier Fund | – | 159,572,517 | Royce Small-Cap Leaders Fund | – | 1,949,552 | |||||
| Royce Low-Priced Stock Fund | – | 10,466,979 | Royce Small/Mid-Cap Premier Fund | – | 235,047 | |||||
| Royce Micro-Cap Fund | – | 3,713,547 | Royce Smaller-Companies Growth Fund | – | 8,120,912 | |||||
| Royce Micro-Cap Opportunity Fund | 463,450 | – | Royce Total Return Fund | – | 106,826,495 | |||||
Level 3 Reconciliation:
| REALIZED | UNREALIZED | |||||
| BALANCE AS OF 12/31/17 | PURCHASES | SALES | GAIN (LOSS) | GAIN (LOSS)1 | BALANCE AS OF 6/30/18 | |
| Royce International Discovery Fund | ||||||
| Common Stocks | $ – | $ 0 | $ – | $ – | $ – | $ 0 |
| Royce Low-Priced Stock Fund | ||||||
| Common Stocks | 0 | – | – | – | – | 0 |
| Royce Micro-Cap Fund | ||||||
| Common Stocks | 828,000 | – | – | – | – | 828,000 |
| Royce Small/Mid-Cap Premier Fund | ||||||
| Common Stocks | 0 | – | – | – | – | 0 |
| Royce Total Return Fund | ||||||
| Common Stocks | 0 | – | – | – | – | 0 |
| 1 | The net change in unrealized appreciation (depreciation) is included in the accompanying Statement of Operations. Change in unrealized appreciation (depreciation) includes net unrealized appreciation (depreciation) resulting from changes in investment values during the reporting period and the reversal of previously recorded unrealized appreciation (depreciation) when gains or losses are realized. Net realized gain (loss) from investments and foreign currency transactions is included in the accompanying Statement of Operations. |
The following table summarizes the valuation techniques used and unobservable inputs approved by the Valuation Committee to determine the fair value of certain Level 3 investments. The table does not include Level 3 investments with values derived utilizing prices from prior transactions or third party pricing information with adjustments (e.g. broker quotes, pricing services, net asset values).
| FAIR VALUE AT | IMPACT TO VALUATION FROM | ||||
| 6/30/18 | VALUATION TECHNIQUE(S) | UNOBSERVABLE INPUT(S) | RANGE AVERAGE | AN INCREASE IN INPUT1 | |
| Royce Micro-Cap Fund | |||||
| Discounted Present Value | |||||
| Common Stocks | $828,000 | Balance Sheet Analysis | Liquidity Discount | 30%-40% | Decrease |
| 1 | This column represents the directional change in the fair value of the Level 3 investments that would result in an increase from the corresponding unobservable input. A decrease to the unobservable input would have the opposite effect. Significant increases and decreases in these unobservable inputs in isolation could result in significantly higher or lower fair value measurements. |
REPURCHASE AGREEMENTS:
The Funds may enter into repurchase agreements with institutions that the Funds’ investment adviser has determined are creditworthy. Each Fund restricts repurchase agreements to maturities of no more than seven days. Securities pledged as collateral for repurchase agreements, which are held until maturity of the repurchase agreements, are marked-to-market daily and maintained at a value at least equal to the principal amount of the repurchase agreement (including accrued interest). Repurchase agreements could involve certain risks in the event of default or insolvency of the counter-party, including possible delays or restrictions upon the ability of each Fund to dispose of its underlying securities. The remaining contractual maturities of repurchase agreements held by the Funds at June 30, 2018 are overnight and continuous.
FOREIGN CURRENCY:
Net realized foreign exchange gains or losses arise from sales and maturities of short-term securities, sales of foreign currencies, expiration of currency forward contracts, currency gains or losses realized between the trade and settlement dates on securities transactions, and the difference between the amounts of dividends, interest, and foreign withholding taxes recorded on each Fund’s books and the U.S. dollar equivalent of the amounts actually received or paid. Net unrealized foreign exchange gains and losses arise from changes in the value of assets and liabilities, including investments in securities at the end of the reporting period, as a result of changes in foreign currency exchange rates.
106 | The Royce Funds 2018 Semiannual Report to Shareholders
SECURITIES LENDING:
The Funds loan securities through a lending agent to qualified institutional investors for the purpose of realizing additional income. Collateral for the Funds on all securities loaned is accepted in cash and cash equivalents, which are invested temporarily by the custodian, as well as non-cash collateral, which includes short and long-term U.S. Treasuries. The collateral maintained is at least 100% of the current market value of the loaned securities. The market value of the loaned securities is determined at the close of business of the Funds and any additional required collateral is delivered to the Funds on the next business day. The Funds retain the risk of any loss on the securities on loan as well as incurring the potential loss on investments purchased with cash collateral received for securities lending. In the event of default or bankruptcy by the other party to the agreement, realization and/or retention of the collateral may be subject to legal proceedings. If the borrower fails to return loaned securities, and cash collateral being maintained by the borrower is insufficient to cover the value of loaned securities and provided such collateral insufficiency is not the result of investment losses, the lending agent has agreed to pay the amount of the shortfall to the Funds or, at the option of the lending agent, to replace the securities. In the event of the bankruptcy of the borrower, the Funds could experience delay in recovering the loaned securities or only recover cash or a security of equivalent value. Loans of securities generally do not have stated maturity dates, and the Funds may recall a security at any time. The Funds’ securities lending income consists of the income earned on investing cash collateral, plus any premium payments received for lending certain securities, less any rebates paid to borrowers and lending agent fees associated with the loan. The lending agent is not affiliated with Royce. The market value of non-cash collateral held by the Funds at June 30, 2018 was as follows:
| Royce Low-Priced Stock Fund | $ 975,481 | Royce Small-Cap Leaders Fund | $ 2,215,902 |
| Royce Micro-Cap Fund | 2,901,730 | Royce Small-Cap Value Fund | 8,418,812 |
| Royce Opportunity Fund | 57,899,092 | Royce Smaller-Companies Growth Fund | 30,452,386 |
| Royce Pennsylvania Mutual Fund | 39,739,066 | Royce Total Return Fund | 1,427,272 |
| Royce Premier Fund | 7,214,888 | ||
The following table presents by financial instrument, a Fund’s assets and liabilities net of related collateral held by the Fund at June 30, 2018:
| SECURITIES ON LOAN | |||
| CASH COLLATERAL 1 | COLLATERALIZED BY CASH COLLATERAL | NET AMOUNT | |
| Royce Low-Priced Stock Fund | |||
| Collateral on Loaned Securities/Securities on Loan | $ 7,857,308 | $ (7,493,878) | $363,430 |
| Royce Micro-Cap Fund | |||
| Collateral on Loaned Securities/Securities on Loan | 3,716,832 | (3,599,021) | 117,811 |
| Royce Opportunity Fund | |||
| Collateral on Loaned Securities/Securities on Loan | 22,685,409 | (21,815,684) | 869,725 |
| Royce Pennsylvania Mutual Fund | |||
| Collateral on Loaned Securities/Securities on Loan | 7,149,754 | (6,959,096) | 190,658 |
| Royce Smaller-Companies Growth Fund | |||
| Collateral on Loaned Securities/Securities on Loan | 15,347,529 | (14,989,803) | 357,726 |
| 1 | Absent an event of default, assets and liabilities are presented gross and not offset in the Statements of Assets and Liabilities. The remaining contractual maturity of cash collateral is overnight and continuous. |
DISTRIBUTIONS AND TAXES:
As qualified regulated investment companies under Subchapter M of the Internal Revenue Code, the Funds are not subject to income taxes to the extent that each Fund distributes substantially all of its taxable income for its fiscal year.
Royce Dividend Value Fund and Royce Total Return Fund pay any dividends from net investment income quarterly and make any distributions from net realized gains annually in December. The other Funds pay any dividends and capital gain distributions annually in December. Dividends from net investment income and distributions from capital gains are determined at a class level. Because federal income tax regulations differ from generally accepted accounting principles, income and capital gain distributions determined in accordance with tax regulations may differ from net investment income and realized gains recognized for financial reporting purposes. Accordingly, the character of distributions and composition of net assets for tax purposes differ from those reflected in the accompanying financial statements.
CAPITAL GAINS TAXES:
The Funds are subject to a tax imposed on short-term capital gains on securities of issuers domiciled in certain countries. The Funds record an estimated deferred tax liability for gains in these securities that have been held for less than one year. This amount, if any, is reported as deferred capital gains tax in the accompanying Statements of Assets and Liabilities, assuming those positions were disposed of at the end of the period, and accounted for as a reduction in the market value of the security.
The Royce Funds 2018 Semiannual Report to Shareholders | 107
Notes to Financial Statements (unaudited) (continued)
INVESTMENT TRANSACTIONS AND RELATED INVESTMENT INCOME:
Investment transactions are accounted for on the trade date. Dividend income is recorded on the ex-dividend date. Non-cash dividend income is recorded at the fair market value of the securities received. Interest income is recorded on an accrual basis. Premiums and discounts on debt securities are amortized using the effective yield-to-maturity method. Realized gains and losses from investment transactions are determined on the basis of identified cost for book and tax purposes.
EXPENSES:
The Funds incur direct and indirect expenses. Expenses directly attributable to a Fund are charged to the Fund’s operations, while expenses applicable to more than one of the Royce Funds are allocated equitably. Certain personnel, occupancy costs and other administrative expenses related to the Funds are allocated by Royce under an administration agreement and are included in administrative and office facilities and legal expenses. The Trust has adopted a deferred fee agreement that allows the Trustees to defer the receipt of all or a portion of trustees’ fees otherwise payable. The deferred fees are invested in certain Royce Funds until distributed in accordance with the agreement.
COMPENSATING BALANCE CREDITS:
The Funds have arrangements with their custodian bank and transfer agent, whereby a portion of the custodian’s fee and transfer agent’s fee is paid indirectly by credits earned on a Fund’s cash on deposit with the bank and transfer agent. These deposit arrangements are an alternative to purchasing overnight investments. Conversely, a Fund pays interest to the custodian on any cash overdrafts, to the extent they are not offset by credits earned on positive cash balances.
LINE OF CREDIT:
The Funds, along with certain other Royce Funds, participate in a $65 million line of credit (“Credit Agreement”) with State Street Bank and Trust Company to be used for temporary or emergency purposes. This revolving Credit Agreement expires on October 12, 2018. Pursuant to the Credit Agreement, each participating Fund is liable for a portion of the commitment fee for the credit facility and for principal and interest payments related to borrowings made by that Fund. Borrowings under the Credit Agreement bear interest at a rate equal to the higher of the federal funds rate or One-Month LIBOR rate. The Funds did not utilize the line of credit during the six months ended June 30, 2018.
Capital Share Transactions (in dollars):
| SHARES SOLD | SHARES ISSUED FOR REINVESTMENT OF DISTRIBUTIONS | SHARES REDEEMED | SHARE CLASS CONVERSIONS | NET INCREASE (DECREASE) FROM CAPITAL SHARE TRANSACTIONS | ||||||||||||||||||||||||||||||||||||
| Period Ended 6/30/18 (unaudited) | Year Ended 12/31/17 | Period Ended 6/30/18 (unaudited) | Year Ended 12/31/17 | Period Ended 6/30/18 (unaudited) | Year Ended 12/31/17 | Period Ended 6/30/18 (unaudited)1 | Year Ended 12/31/172 | Period Ended 6/30/18 (unaudited) | Year Ended 12/31/17 | |||||||||||||||||||||||||||||||
| Royce Dividend Value Fund | ||||||||||||||||||||||||||||||||||||||||
| Investment Class | $ | 10,130,196 | $ | 33,358,164 | $ | 816,344 | $ | 14,559,845 | $ | (13,448,820 | ) | $ | (34,756,532 | ) | $ | 3,578,591 | $ | (2,502,280 | ) | $ | 16,740,068 | |||||||||||||||||||
| Service Class | 980,880 | 4,595,603 | 306,421 | 6,925,218 | (10,666,947 | ) | (72,839,992 | ) | (3,578,591 | ) | (9,379,646 | ) | (64,897,762 | ) | ||||||||||||||||||||||||||
| Consultant Class | 53,267 | 43,403 | 3,425 | 179,517 | (252,229 | ) | (365,980 | ) | (195,537 | ) | (143,060 | ) | ||||||||||||||||||||||||||||
| Institutional Class | 37,043 | 156,698 | 6,817 | 149,582 | (380,801 | ) | (63,252 | ) | (336,941 | ) | 243,028 | |||||||||||||||||||||||||||||
| Royce Global Financial Services Fund | ||||||||||||||||||||||||||||||||||||||||
| Service Class | 9,061,141 | 19,803,777 | – | 1,524,105 | (9,349,050 | ) | (25,122,992 | ) | (287,909 | ) | (3,795,110 | ) | ||||||||||||||||||||||||||||
| Institutional Class | 4,000 | 1,030,249 | – | 287,397 | (51,865 | ) | (446,493 | ) | (47,865 | ) | 871,153 | |||||||||||||||||||||||||||||
| Royce International Discovery Fund | ||||||||||||||||||||||||||||||||||||||||
| Service Class | 773,470 | 625,802 | – | 102,614 | (212,176 | ) | (462,796 | ) | 561,294 | 265,620 | ||||||||||||||||||||||||||||||
| Royce International Premier Fund | ||||||||||||||||||||||||||||||||||||||||
| Investment Class | 99,920,876 | 68,809,358 | – | 879,967 | (24,679,238 | ) | (9,492,960 | ) | 10,710,066 | 75,241,638 | 70,906,431 | |||||||||||||||||||||||||||||
| Service Class | 16,030,330 | 15,361,047 | – | 309,552 | (19,612,330 | ) | (10,148,697 | ) | $ | 15,088 | (10,686,016 | ) | (3,566,912 | ) | (5,164,114 | ) | ||||||||||||||||||||||||
| Consultant Class | 2,102,358 | 2,900,964 | – | 13,784 | (1,111,802 | ) | (782,316 | ) | 990,556 | 2,132,432 | ||||||||||||||||||||||||||||||
| Institutional Class | 8,512,520 | – | – | 8,512,520 | ||||||||||||||||||||||||||||||||||||
| R Class | 200 | 1,108 | – | 528 | (57,682 | ) | – | (15,088 | ) | (72,570 | ) | 1,636 | ||||||||||||||||||||||||||||
| K Class | – | – | – | (24,050 | ) | (24,050 | ) | |||||||||||||||||||||||||||||||||
| Royce Low-Priced Stock Fund | ||||||||||||||||||||||||||||||||||||||||
| Investment Class | 3,073,317 | 4,827,741 | – | 3,042,673 | (5,791,274 | ) | (7,679,466 | ) | 5,064,654 | 30,157,999 | 2,346,697 | 30,348,947 | ||||||||||||||||||||||||||||
| Service Class | 2,881,974 | 5,359,019 | – | 12,483,625 | (21,078,662 | ) | (69,244,052 | ) | 293,550 | (29,086,803 | ) | (17,903,138 | ) | (80,488,211 | ) | |||||||||||||||||||||||||
| Institutional Class | 247,714 | 315,958 | – | 499,044 | (1,034,576 | ) | (8,139,049 | ) | (5,064,654 | ) | (5,851,516 | ) | (7,324,047 | ) | ||||||||||||||||||||||||||
| R Class | 15,465 | 98,627 | – | 63,719 | (766,305 | ) | (173,595 | ) | (293,550 | ) | (1,044,390 | ) | (11,249 | ) | ||||||||||||||||||||||||||
| K Class | 13,656 | – | (42,545 | ) | (1,071,196 | ) | (1,100,085 | ) | ||||||||||||||||||||||||||||||||
| Royce Micro-Cap Fund | ||||||||||||||||||||||||||||||||||||||||
| Investment Class | 2,945,813 | 8,604,513 | – | 11,026,347 | (25,374,852 | ) | (42,144,313 | ) | 201,150 | (22,429,039 | ) | (22,312,303 | ) | |||||||||||||||||||||||||||
| Service Class | 2,766,125 | 3,672,153 | – | 937,168 | (4,117,089 | ) | (7,631,678 | ) | (201,150 | ) | (1,350,964 | ) | (3,223,507 | ) | ||||||||||||||||||||||||||
| Consultant Class | 121,800 | 466,511 | – | 1,683,462 | (2,876,800 | ) | (10,592,332 | ) | (2,755,000 | ) | (8,442,359 | ) | ||||||||||||||||||||||||||||
108 | The Royce Funds 2018 Semiannual Report to Shareholders
Capital Share Transactions (in dollars) (continued):
| SHARES SOLD | SHARES ISSUED FOR REINVESTMENT OF DISTRIBUTIONS | SHARES REDEEMED | SHARE CLASS CONVERSIONS | NET INCREASE (DECREASE) FROM CAPITAL SHARE TRANSACTIONS | ||||||||||||||||||||||||||||||||||||
| Period Ended 6/30/18 (unaudited) | Year Ended 12/31/17 | Period Ended 6/30/18 (unaudited) | Year Ended 12/31/17 | Period Ended 6/30/18 (unaudited) | Year Ended 12/31/17 | Period Ended 6/30/18 (unaudited)1 | Year Ended 12/31/172 | Period Ended 6/30/18 (unaudited) | Year Ended 12/31/17 | |||||||||||||||||||||||||||||||
| Royce Micro-Cap Opportunity Fund | ||||||||||||||||||||||||||||||||||||||||
| Investment Class | $ | 3,173,720 | $ | 2,803,349 | $ | – | $ | 3,283,146 | $ | (5,941,126 | ) | $ | (12,453,128 | ) | $ | 47,069 | $ | (2,767,406 | ) | $ | (6,319,564 | ) | ||||||||||||||||||
| Service Class | 160,017 | 368,449 | – | 82,715 | (88,733 | ) | (401,071 | ) | (47,069 | ) | 71,284 | 3,024 | ||||||||||||||||||||||||||||
| Royce Opportunity Fund | ||||||||||||||||||||||||||||||||||||||||
| Investment Class | 49,061,127 | 95,914,276 | – | 89,555,952 | (82,386,634 | ) | (176,705,384 | ) | 809,011 | (33,325,507 | ) | 9,573,855 | ||||||||||||||||||||||||||||
| Service Class | 21,679,993 | 50,250,124 | – | 11,529,769 | (52,433,017 | ) | (42,272,885 | ) | $ | 7,600,899 | (809,011 | ) | (23,152,125 | ) | 18,697,997 | |||||||||||||||||||||||||
| Consultant Class | 365,266 | 1,258,054 | – | 2,481,422 | (4,038,694 | ) | (5,389,905 | ) | (3,673,428 | ) | (1,650,429 | ) | ||||||||||||||||||||||||||||
| Institutional Class | 24,257,546 | 65,630,056 | – | 77,029,241 | (327,097,973 | ) | (123,056,070 | ) | (302,840,427 | ) | 19,603,227 | |||||||||||||||||||||||||||||
| R Class | 1,248,888 | 7,407,124 | – | 5,142,835 | (6,081,007 | ) | (14,211,365 | ) | (4,832,119 | ) | (1,661,406 | ) | ||||||||||||||||||||||||||||
| K Class | 748,866 | 3,768,309 | – | 1,024,733 | (771,052 | ) | (4,179,483 | ) | (7,600,899 | ) | (7,623,085 | ) | 613,559 | |||||||||||||||||||||||||||
| Royce Pennsylvania Mutual Fund | ||||||||||||||||||||||||||||||||||||||||
| Investment Class | 37,964,805 | 108,329,916 | – | 254,272,581 | (156,492,913 | ) | (364,099,258 | ) | 954,383 | (118,528,108 | ) | (542,378 | ) | |||||||||||||||||||||||||||
| Service Class | 4,437,308 | 21,525,651 | – | 6,601,511 | (13,042,646 | ) | (73,066,550 | ) | 2,031,178 | (954,383 | ) | (6,574,160 | ) | (45,893,771 | ) | |||||||||||||||||||||||||
| Consultant Class | 2,971,549 | 6,858,381 | – | 59,284,622 | (38,405,957 | ) | (95,624,041 | ) | (35,434,408 | ) | (29,481,038 | ) | ||||||||||||||||||||||||||||
| Institutional Class | 16,914,497 | 174,059,170 | – | 12,113,429 | (8,295,274 | ) | (396,581,300 | ) | 8,619,223 | (210,408,701 | ) | |||||||||||||||||||||||||||||
| R Class | 820,350 | 2,869,674 | – | 2,671,302 | (3,181,241 | ) | (7,107,006 | ) | (2,360,891 | ) | (1,566,030 | ) | ||||||||||||||||||||||||||||
| K Class | 55,427 | 356,892 | – | 494,633 | (850,567 | ) | (1,182,189 | ) | (2,031,178 | ) | (2,826,318 | ) | (330,664 | ) | ||||||||||||||||||||||||||
| Royce Premier Fund | ||||||||||||||||||||||||||||||||||||||||
| Investment Class | 76,063,347 | 241,047,460 | – | 223,171,515 | (196,787,334 | ) | (382,949,395 | ) | 245,348 | (120,723,987 | ) | 81,514,928 | ||||||||||||||||||||||||||||
| Service Class | 6,506,891 | 14,869,157 | – | 6,885,399 | (12,107,074 | ) | (17,172,517 | ) | (245,348 | ) | (5,600,183 | ) | 4,336,691 | |||||||||||||||||||||||||||
| Consultant Class | 827,097 | 2,882,510 | – | 3,994,852 | (3,167,469 | ) | (8,935,374 | ) | (2,340,372 | ) | (2,058,012 | ) | ||||||||||||||||||||||||||||
| Institutional Class | 16,396,031 | 261,675,152 | – | 33,768,589 | (25,731,182 | ) | (310,726,543 | ) | (9,335,151 | ) | (15,282,802 | ) | ||||||||||||||||||||||||||||
| W Class | 143,822 | 10,076,719 | – | 2,010,290 | (5,157,893 | ) | (145,318,380 | ) | (5,014,071 | ) | (133,231,371 | ) | ||||||||||||||||||||||||||||
| R Class | 319,803 | 690,774 | – | 1,724,204 | (1,336,460 | ) | (4,464,354 | ) | (1,016,657 | ) | (2,049,376 | ) | ||||||||||||||||||||||||||||
| Royce Small-Cap Leaders Fund | ||||||||||||||||||||||||||||||||||||||||
| Investment Class | 2,235,244 | 3,821,850 | – | 5,604,193 | (4,027,925 | ) | (15,331,606 | ) | 3,953,879 | (1,792,681 | ) | (1,951,684 | ) | |||||||||||||||||||||||||||
| Service Class | 762,862 | 2,089,523 | – | 5,365,200 | (5,936,993 | ) | (13,946,182 | ) | 1,634,452 | (3,451,813 | ) | (3,539,679 | ) | (9,943,272 | ) | |||||||||||||||||||||||||
| R Class | 152,669 | 626,596 | – | 257,152 | (335,304 | ) | (848,782 | ) | (1,634,452 | ) | (1,817,087 | ) | 34,966 | |||||||||||||||||||||||||||
| K Class | 8,625 | – | (13,841 | ) | (502,066 | ) | (507,282 | ) | ||||||||||||||||||||||||||||||||
| Royce Small-Cap Value Fund | ||||||||||||||||||||||||||||||||||||||||
| Investment Class | 2,441,679 | 7,212,852 | – | 2,298,668 | (6,184,471 | ) | (27,843,241 | ) | 3,479,640 | 11,332,541 | (263,152 | ) | (6,999,180 | ) | ||||||||||||||||||||||||||
| Service Class | 1,795,151 | 5,782,230 | – | 4,963,542 | (20,538,727 | ) | (60,660,700 | ) | 1,556,238 | (11,332,541 | ) | (17,187,338 | ) | (61,247,469 | ) | |||||||||||||||||||||||||
| Consultant Class | 85,475 | 528,340 | – | 419,883 | (1,448,954 | ) | (4,299,901 | ) | (1,363,479 | ) | (3,351,678 | ) | ||||||||||||||||||||||||||||
| Institutional Class | 172,026 | 5,715,018 | – | 135,010 | (556,734 | ) | (121,609,510 | ) | (3,479,640 | ) | (3,864,348 | ) | (115,759,482 | ) | ||||||||||||||||||||||||||
| R Class | 808,583 | 2,325,469 | – | 486,662 | (5,456,352 | ) | (6,314,704 | ) | (4,647,769 | ) | (3,502,573 | ) | ||||||||||||||||||||||||||||
| K Class | 323,211 | 515,109 | – | 71,464 | (736,046 | ) | (1,601,007 | ) | (1,556,238 | ) | (1,969,073 | ) | (1,014,434 | ) | ||||||||||||||||||||||||||
| Royce Small/Mid-Cap Premier Fund | ||||||||||||||||||||||||||||||||||||||||
| Investment Class | 2,370,620 | 2,802,152 | – | 9,333,591 | (4,598,053 | ) | (38,615,198 | ) | 14,585,974 | (2,227,433 | ) | (11,893,481 | ) | |||||||||||||||||||||||||||
| Service Class | 1,202,719 | 2,862,831 | – | 12,670,685 | (6,510,887 | ) | (23,075,898 | ) | 1,197,399 | (10,355,341 | ) | (4,110,769 | ) | (17,897,723 | ) | |||||||||||||||||||||||||
| Consultant Class | 41,208 | 203,495 | – | 1,168,599 | (1,122,885 | ) | (3,427,490 | ) | (1,081,677 | ) | (2,055,396 | ) | ||||||||||||||||||||||||||||
| R Class | 55,770 | 325,929 | – | 253,421 | (1,002,218 | ) | (438,712 | ) | (1,197,399 | ) | (2,143,847 | ) | 140,638 | |||||||||||||||||||||||||||
| K Class | 73,214 | – | (114,702 | ) | (4,230,633 | ) | (4,272,121 | ) | ||||||||||||||||||||||||||||||||
| Royce Smaller-Companies Growth Fund | ||||||||||||||||||||||||||||||||||||||||
| Investment Class | 6,947,186 | 8,568,833 | – | 17,465,075 | (14,405,138 | ) | (31,336,604 | ) | 30,948,573 | (7,457,952 | ) | 25,645,877 | ||||||||||||||||||||||||||||
| Service Class | 3,812,086 | 7,939,518 | – | 37,667,971 | (31,173,543 | ) | (75,375,930 | ) | 623,550 | (30,801,077 | ) | (26,737,907 | ) | (60,569,518 | ) | |||||||||||||||||||||||||
| Consultant Class | 74,338 | 436,581 | – | 1,736,168 | (1,077,307 | ) | (2,498,886 | ) | (1,002,969 | ) | (326,137 | ) | ||||||||||||||||||||||||||||
| Institutional Class | 287,759 | 2,292,066 | – | 1,401,477 | (810,745 | ) | (15,929,293 | ) | (522,986 | ) | (12,235,750 | ) | ||||||||||||||||||||||||||||
| R Class | 139,588 | 253,510 | – | 121,248 | (111,893 | ) | (573,963 | ) | (623,550 | ) | (595,855 | ) | (199,205 | ) | ||||||||||||||||||||||||||
| K Class | 10,337 | – | (73,104 | ) | (147,496 | ) | (210,263 | ) | ||||||||||||||||||||||||||||||||
| Royce Special Equity Fund | ||||||||||||||||||||||||||||||||||||||||
| Investment Class | 107,697,003 | 135,718,687 | – | 78,155,944 | (131,280,076 | ) | (287,748,016 | ) | 456,521 | (23,583,073 | ) | (73,416,864 | ) | |||||||||||||||||||||||||||
| Service Class | 7,387,160 | 17,484,310 | – | 7,079,422 | (59,814,414 | ) | (43,100,887 | ) | (456,521 | ) | (52,427,254 | ) | (18,993,676 | ) | ||||||||||||||||||||||||||
| Consultant Class | 1,441,439 | 3,664,645 | – | 3,280,685 | (7,431,637 | ) | (10,202,732 | ) | (5,990,198 | ) | (3,257,402 | ) | ||||||||||||||||||||||||||||
| Institutional Class | 10,633,893 | 119,222,833 | – | 18,780,245 | (63,536,391 | ) | (96,058,792 | ) | (52,902,498 | ) | 41,944,286 | |||||||||||||||||||||||||||||
The Royce Funds 2018 Semiannual Report to Shareholders | 109
Notes to Financial Statements (unaudited) (continued)
Capital Share Transactions (in dollars) (continued):
| SHARES SOLD | SHARES ISSUED FOR REINVESTMENT OF DISTRIBUTIONS | SHARES REDEEMED | SHARE CLASS CONVERSIONS | NET INCREASE (DECREASE) FROM CAPITAL SHARE TRANSACTIONS | ||||||||||||||||||||||||||||||||||||
| Period Ended 6/30/18 (unaudited) | Year Ended 12/31/17 | Period Ended 6/30/18 (unaudited) | Year Ended 12/31/17 | Period Ended 6/30/18 (unaudited) | Year Ended 12/31/17 | Period Ended 6/30/18 (unaudited)1 | Year Ended 12/31/172 | Period Ended 6/30/18 (unaudited) | Year Ended 12/31/17 | |||||||||||||||||||||||||||||||
| Royce Special Equity Multi-Cap Fund | ||||||||||||||||||||||||||||||||||||||||
| Investment Class | $ | 193,049 | $ | 2,451,602 | $ | – | $ | 1,040,135 | $ | (4,262,118 | ) | $ | (5,918,178 | ) | $ | 4,410,760 | $ | (4,069,069 | ) | $ | 1,984,319 | |||||||||||||||||||
| Service Class | 202,213 | 1,980,085 | – | 546,406 | (1,850,132 | ) | (14,809,505 | ) | (4,410,760 | ) | (1,647,919 | ) | (16,693,774 | ) | ||||||||||||||||||||||||||
| Consultant Class | 45,493 | 246,555 | – | 93,069 | (905,371 | ) | (1,656,776 | ) | (859,878 | ) | (1,317,152 | ) | ||||||||||||||||||||||||||||
| Institutional Class | 398,435 | 241,566 | – | 1,120,943 | (30,111,030 | ) | (4,665,527 | ) | (29,712,595 | ) | (3,303,018 | ) | ||||||||||||||||||||||||||||
| Royce Total Return Fund | ||||||||||||||||||||||||||||||||||||||||
| Investment Class | 87,140,010 | 165,438,966 | 6,967,600 | 160,024,214 | (173,592,274 | ) | (621,860,725 | ) | 616,402 | (79,484,664 | ) | (295,781,143 | ) | |||||||||||||||||||||||||||
| Service Class | 10,762,005 | 37,626,452 | 387,783 | 10,955,024 | (28,899,106 | ) | (93,727,158 | ) | $ | 34,866,202 | (616,402 | ) | 17,116,884 | (45,762,084 | ) | |||||||||||||||||||||||||
| Consultant Class | 3,844,042 | 7,849,294 | 215,948 | 26,542,808 | (24,734,405 | ) | (53,725,682 | ) | (20,674,415 | ) | (19,333,580 | ) | ||||||||||||||||||||||||||||
| Institutional Class | 28,516,616 | 267,365,781 | 1,677,472 | 34,156,423 | (30,453,650 | ) | (418,141,043 | ) | (259,562 | ) | (116,618,839 | ) | ||||||||||||||||||||||||||||
| W Class | 3,031,414 | 23,629,518 | 135,043 | 9,432,413 | (58,692,867 | ) | (16,176,485 | ) | (55,526,410 | ) | 16,885,446 | |||||||||||||||||||||||||||||
| R Class | 3,434,616 | 13,477,855 | 146,861 | 6,544,516 | (7,577,004 | ) | (18,954,349 | ) | (3,995,527 | ) | 1,068,022 | |||||||||||||||||||||||||||||
| K Class | 4,184,984 | 10,702,334 | 58,254 | 4,529,233 | (6,531,546 | ) | (18,585,697 | ) | (34,866,202 | ) | (37,154,510 | ) | (3,354,130 | ) | ||||||||||||||||||||||||||
Capital Share Transactions (in shares):
| SHARES SOLD | SHARES ISSUED FOR REINVESTMENT OF DISTRIBUTIONS | SHARES REDEEMED | SHARE CLASS CONVERSIONS | NET INCREASE (DECREASE) IN SHARE OUTSTANDING | ||||||||||||||||||||||||||||||||||||
| Period Ended 6/30/18 (unaudited) | Year Ended 12/31/17 | Period Ended 6/30/18 (unaudited) | Year Ended 12/31/17 | Period Ended 6/30/18 (unaudited) | Year Ended 12/31/17 | Period Ended 6/30/18 (unaudited)1 | Year Ended 12/31/172 | Period Ended 6/30/18 (unaudited) | Year Ended 12/31/17 | |||||||||||||||||||||||||||||||
| Royce Dividend Value Fund | ||||||||||||||||||||||||||||||||||||||||
| Investment Class | 1,332,575 | 4,298,687 | 112,236 | 1,985,078 | (1,778,147 | ) | (4,549,529 | ) | 436,413 | (333,336 | ) | 2,170,649 | ||||||||||||||||||||||||||||
| Service Class | 124,953 | 593,367 | 39,823 | 919,198 | (1,366,322 | ) | (9,162,991 | ) | (427,550 | ) | (1,201,546 | ) | (8,077,976 | ) | ||||||||||||||||||||||||||
| Consultant Class | 6,028 | 4,932 | 382 | 20,882 | (28,386 | ) | (40,367 | ) | (21,976 | ) | (14,553 | ) | ||||||||||||||||||||||||||||
| Institutional Class | 4,941 | 20,750 | 906 | 20,657 | (49,285 | ) | (8,312 | ) | (43,438 | ) | 33,095 | |||||||||||||||||||||||||||||
| Royce Global Financial Services Fund | ||||||||||||||||||||||||||||||||||||||||
| Service Class | 821,188 | 2,011,114 | – | 147,399 | (850,852 | ) | (2,568,417 | ) | (29,664 | ) | (409,904 | ) | ||||||||||||||||||||||||||||
| Institutional Class | 281 | 82,514 | – | 21,641 | (3,673 | ) | (36,663 | ) | (3,392 | ) | 67,492 | |||||||||||||||||||||||||||||
| Royce International Discovery Fund | ||||||||||||||||||||||||||||||||||||||||
| Service Class | 60,958 | 57,050 | – | 8,425 | (17,375 | ) | (40,290 | ) | 43,583 | 25,185 | ||||||||||||||||||||||||||||||
| Royce International Premier Fund | ||||||||||||||||||||||||||||||||||||||||
| Investment Class | 7,548,850 | 5,700,233 | – | 69,180 | (1,901,323 | ) | (801,879 | ) | 840,664 | 5,647,527 | 5,808,198 | |||||||||||||||||||||||||||||
| Service Class | 1,015,841 | 1,104,260 | – | 20,392 | (1,251,219 | ) | (760,763 | ) | 964 | (704,906 | ) | (234,414 | ) | (341,017 | ) | |||||||||||||||||||||||||
| Consultant Class | 121,727 | 185,684 | – | 834 | (64,988 | ) | (54,788 | ) | 56,739 | 131,730 | ||||||||||||||||||||||||||||||
| Institutional Class | 658,682 | – | – | 658,682 | ||||||||||||||||||||||||||||||||||||
| R Class | 16 | 103 | – | 44 | (4,618 | ) | – | (1,202 | ) | (5,804 | ) | 147 | ||||||||||||||||||||||||||||
| K Class | – | – | – | (2,551 | ) | (2,551 | ) | |||||||||||||||||||||||||||||||||
| Royce Low-Priced Stock Fund | ||||||||||||||||||||||||||||||||||||||||
| Investment Class | 347,831 | 577,375 | – | 367,917 | (664,281 | ) | (915,749 | ) | 544,002 | 3,434,852 | 227,552 | 3,464,395 | ||||||||||||||||||||||||||||
| Service Class | 332,389 | 640,080 | – | 1,515,003 | (2,420,215 | ) | (8,306,853 | ) | 33,703 | (3,325,309 | ) | (2,054,123 | ) | (9,477,079 | ) | |||||||||||||||||||||||||
| Institutional Class | 28,573 | 37,701 | – | 60,126 | (114,370 | ) | (959,231 | ) | (543,255 | ) | (629,052 | ) | (861,404 | ) | ||||||||||||||||||||||||||
| R Class | 1,925 | 12,437 | – | 8,190 | (97,337 | ) | (22,168 | ) | (35,709 | ) | (131,121 | ) | (1,541 | ) | ||||||||||||||||||||||||||
| K Class | 9,447 | – | (29,290 | ) | (741,056 | ) | (760,899 | ) | ||||||||||||||||||||||||||||||||
| Royce Micro-Cap Fund | ||||||||||||||||||||||||||||||||||||||||
| Investment Class | 244,238 | 715,505 | – | 965,522 | (2,128,632 | ) | (3,519,967 | ) | 16,447 | (1,884,394 | ) | (1,822,493 | ) | |||||||||||||||||||||||||||
| Service Class | 225,987 | 314,908 | – | 83,750 | (351,759 | ) | (648,355 | ) | (16,790 | ) | (125,772 | ) | (266,487 | ) | ||||||||||||||||||||||||||
| Consultant Class | 13,246 | 49,719 | – | 188,517 | (308,706 | ) | (1,128,904 | ) | (295,460 | ) | (890,668 | ) | ||||||||||||||||||||||||||||
| Royce Micro-Cap Opportunity Fund | ||||||||||||||||||||||||||||||||||||||||
| Investment Class | 153,507 | 148,676 | – | 171,086 | (292,577 | ) | (620,649 | ) | 2,287 | (139,070 | ) | (298,600 | ) | |||||||||||||||||||||||||||
| Service Class | 15,387 | 37,846 | – | 8,572 | (8,665 | ) | (42,970 | ) | (4,548 | ) | 6,722 | (1,100 | ) | |||||||||||||||||||||||||||
110 | The Royce Funds 2018 Semiannual Report to Shareholders
Capital Share Transactions (in shares) (continued):
| SHARES SOLD | SHARES ISSUED FOR REINVESTMENT OF DISTRIBUTIONS | SHARES REDEEMED | SHARE CLASS CONVERSIONS | NET INCREASE (DECREASE) IN SHARES OUTSTANDING | ||||||||||||||||||||||||||||||||||||
| Period Ended 6/30/18 (unaudited) | Year Ended 12/31/17 | Period Ended 6/30/18 (unaudited) | Year Ended 12/31/17 | Period Ended 6/30/18 (unaudited) | Year Ended 12/31/17 | Period Ended 6/30/18 (unaudited)1 | Year Ended 12/31/172 | Period Ended 6/30/18 (unaudited) | Year Ended 12/31/17 | |||||||||||||||||||||||||||||||
| Royce Opportunity Fund | ||||||||||||||||||||||||||||||||||||||||
| Investment Class | 3,577,063 | 6,866,763 | – | 6,779,406 | (5,978,204 | ) | (12,814,149 | ) | 53,934 | (2,401,141 | ) | 885,954 | ||||||||||||||||||||||||||||
| Service Class | 1,686,383 | 3,856,271 | – | 935,858 | (4,129,246 | ) | (3,215,595 | ) | 601,813 | (57,828 | ) | (1,841,050 | ) | 1,518,706 | ||||||||||||||||||||||||||
| Consultant Class | 32,265 | 108,753 | – | 227,862 | (356,407 | ) | (470,217 | ) | (324,142 | ) | (133,602 | ) | ||||||||||||||||||||||||||||
| Institutional Class | 1,725,741 | 4,638,535 | – | 5,718,577 | (23,227,187 | ) | (8,815,496 | ) | (21,501,446 | ) | 1,541,616 | |||||||||||||||||||||||||||||
| R Class | 100,230 | 578,202 | – | 431,446 | (493,824 | ) | (1,134,320 | ) | (393,594 | ) | (124,672 | ) | ||||||||||||||||||||||||||||
| K Class | 66,744 | 331,425 | – | 94,533 | (70,091 | ) | (370,027 | ) | (684,679 | ) | (688,026 | ) | 55,931 | |||||||||||||||||||||||||||
| Royce Pennsylvania Mutual Fund | ||||||||||||||||||||||||||||||||||||||||
| Investment Class | 3,496,822 | 9,353,969 | – | 24,734,687 | (14,484,795 | ) | (31,659,681 | ) | 76,842 | (10,987,973 | ) | 2,505,817 | ||||||||||||||||||||||||||||
| Service Class | 405,584 | 1,905,268 | – | 639,681 | (1,201,775 | ) | (6,382,646 | ) | 188,596 | (77,029 | ) | (607,595 | ) | (3,914,726 | ) | |||||||||||||||||||||||||
| Consultant Class | 342,340 | 752,114 | – | 7,168,636 | (4,423,049 | ) | (10,375,300 | ) | (4,080,709 | ) | (2,454,550 | ) | ||||||||||||||||||||||||||||
| Institutional Class | 1,554,385 | 14,104,272 | – | 1,176,061 | (766,955 | ) | (32,419,747 | ) | 787,430 | (17,139,414 | ) | |||||||||||||||||||||||||||||
| R Class | 80,476 | 268,144 | – | 275,108 | (312,345 | ) | �� | (655,493 | ) | (231,869 | ) | (112,241 | ) | |||||||||||||||||||||||||||
| K Class | 6,293 | 38,113 | – | 58,398 | (96,193 | ) | (127,563 | ) | (230,227 | ) | (320,127 | ) | (31,052 | ) | ||||||||||||||||||||||||||
| Royce Premier Fund | ||||||||||||||||||||||||||||||||||||||||
| Investment Class | 4,440,501 | 14,016,958 | – | 13,759,039 | (11,474,949 | ) | (22,598,666 | ) | 13,233 | (7,034,448 | ) | 5,190,564 | ||||||||||||||||||||||||||||
| Service Class | 393,289 | 901,293 | – | 436,337 | (726,933 | ) | (1,023,456 | ) | (13,608 | ) | (333,644 | ) | 300,566 | |||||||||||||||||||||||||||
| Consultant Class | 60,850 | 217,332 | – | 309,679 | (233,539 | ) | (658,762 | ) | (172,689 | ) | (131,751 | ) | ||||||||||||||||||||||||||||
| Institutional Class | 955,119 | 15,121,922 | – | 2,055,301 | (1,481,900 | ) | (18,265,426 | ) | (526,781 | ) | (1,088,203 | ) | ||||||||||||||||||||||||||||
| W Class | 8,454 | 609,443 | – | 123,331 | (301,209 | ) | (8,321,109 | ) | (292,755 | ) | (7,588,335 | ) | ||||||||||||||||||||||||||||
| R Class | 20,251 | 44,412 | – | 114,717 | (84,690 | ) | (284,373 | ) | (64,439 | ) | (125,244 | ) | ||||||||||||||||||||||||||||
| Royce Small-Cap Leaders Fund | ||||||||||||||||||||||||||||||||||||||||
| Investment Class | 328,247 | 535,267 | – | 862,183 | (591,803 | ) | (2,108,703 | ) | 524,387 | (263,556 | ) | (186,866 | ) | |||||||||||||||||||||||||||
| Service Class | 114,011 | 296,333 | – | 834,401 | (886,561 | ) | (1,966,267 | ) | 247,644 | (461,537 | ) | (524,906 | ) | (1,297,070 | ) | |||||||||||||||||||||||||
| R Class | 16,629 | 64,228 | – | 28,894 | (36,696 | ) | (86,349 | ) | (179,116 | ) | (199,183 | ) | 6,773 | |||||||||||||||||||||||||||
| K Class | 860 | – | (1,392 | ) | (49,764 | ) | (50,296 | ) | ||||||||||||||||||||||||||||||||
| Royce Small-Cap Value Fund | ||||||||||||||||||||||||||||||||||||||||
| Investment Class | 232,546 | 741,807 | – | 231,721 | (597,160 | ) | (2,868,196 | ) | 319,820 | 1,133,254 | (44,794 | ) | (761,414 | ) | ||||||||||||||||||||||||||
| Service Class | 173,809 | 576,985 | – | 502,382 | (2,001,044 | ) | (6,244,261 | ) | 152,722 | (1,140,095 | ) | (1,674,513 | ) | (6,304,989 | ) | |||||||||||||||||||||||||
| Consultant Class | 9,168 | 59,530 | – | 47,444 | (157,704 | ) | (494,608 | ) | (148,536 | ) | (387,634 | ) | ||||||||||||||||||||||||||||
| Institutional Class | 16,201 | 580,786 | – | 13,407 | (54,436 | ) | (12,978,342 | ) | (316,248 | ) | (354,483 | ) | (12,384,149 | ) | ||||||||||||||||||||||||||
| R Class | 81,761 | 248,260 | – | 51,120 | (559,583 | ) | (676,071 | ) | (477,822 | ) | (376,691 | ) | ||||||||||||||||||||||||||||
| K Class | 46,711 | 75,821 | – | 10,448 | (106,029 | ) | (233,932 | ) | (221,047 | ) | (280,365 | ) | (147,663 | ) | ||||||||||||||||||||||||||
| Royce Small/Mid-Cap Premier Fund | ||||||||||||||||||||||||||||||||||||||||
| Investment Class | 152,112 | 180,885 | – | 609,640 | (297,056 | ) | (2,481,762 | ) | 862,565 | (144,944 | ) | (828,672 | ) | |||||||||||||||||||||||||||
| Service Class | 77,595 | 186,926 | – | 829,776 | (422,350 | ) | (1,456,138 | ) | 79,141 | (589,610 | ) | (265,614 | ) | (1,029,046 | ) | |||||||||||||||||||||||||
| Consultant Class | 3,775 | 18,648 | – | 108,003 | (102,684 | ) | (308,411 | ) | (98,909 | ) | (181,760 | ) | ||||||||||||||||||||||||||||
| R Class | 5,564 | 31,664 | – | 25,521 | (101,173 | ) | (43,525 | ) | (121,948 | ) | (217,557 | ) | 13,660 | |||||||||||||||||||||||||||
| K Class | 7,418 | – | (11,712 | ) | (419,319 | ) | (423,613 | ) | ||||||||||||||||||||||||||||||||
| Royce Smaller-Companies Growth Fund | ||||||||||||||||||||||||||||||||||||||||
| Investment Class | 608,529 | 726,175 | – | 1,632,250 | (1,267,894 | ) | (2,610,111 | ) | 2,386,166 | (659,365 | ) | 2,134,480 | ||||||||||||||||||||||||||||
| Service Class | 338,638 | 667,456 | – | 3,597,705 | (2,816,823 | ) | (6,376,008 | ) | 57,897 | (2,426,035 | ) | (2,420,288 | ) | (4,536,882 | ) | |||||||||||||||||||||||||
| Consultant Class | 7,929 | 42,850 | – | 190,998 | (111,975 | ) | (243,879 | ) | (104,046 | ) | (10,031 | ) | ||||||||||||||||||||||||||||
| Institutional Class | 25,104 | 186,029 | – | 129,407 | (70,609 | ) | (1,280,636 | ) | (45,505 | ) | (965,200 | ) | ||||||||||||||||||||||||||||
| R Class | 13,782 | 22,294 | – | 12,448 | (11,097 | ) | (52,310 | ) | (62,268 | ) | (59,583 | ) | (17,568 | ) | ||||||||||||||||||||||||||
| K Class | 1,824 | – | (13,381 | ) | (25,935 | ) | (37,492 | ) | ||||||||||||||||||||||||||||||||
| Royce Special Equity Fund | ||||||||||||||||||||||||||||||||||||||||
| Investment Class | 5,077,875 | 6,201,776 | – | 3,671,017 | (6,188,296 | ) | (13,116,344 | ) | 20,317 | (1,110,421 | ) | (3,223,234 | ) | |||||||||||||||||||||||||||
| Service Class | 347,112 | 799,233 | – | 332,993 | (2,844,463 | ) | (1,975,892 | ) | (20,390 | ) | (2,497,351 | ) | (864,056 | ) | ||||||||||||||||||||||||||
| Consultant Class | 74,436 | 185,121 | – | 169,107 | (383,366 | ) | (510,780 | ) | (308,930 | ) | (156,552 | ) | ||||||||||||||||||||||||||||
| Institutional Class | 505,402 | 5,531,768 | – | 889,637 | (3,032,120 | ) | (4,436,735 | ) | (2,526,718 | ) | 1,984,670 | |||||||||||||||||||||||||||||
| Royce Special Equity Multi-Cap Fund | ||||||||||||||||||||||||||||||||||||||||
| Investment Class | 12,494 | 165,273 | – | 67,983 | (281,904 | ) | (402,101 | ) | 290,182 | (269,410 | ) | 121,337 | ||||||||||||||||||||||||||||
| Service Class | 13,328 | 135,187 | – | 35,573 | (119,207 | ) | (1,028,167 | ) | (289,800 | ) | (105,879 | ) | (1,147,207 | ) | ||||||||||||||||||||||||||
| Consultant Class | 4,458 | 25,805 | – | 9,326 | (92,250 | ) | (171,041 | ) | (87,792 | ) | (135,910 | ) | ||||||||||||||||||||||||||||
| Institutional Class | 27,065 | 16,730 | – | 73,360 | (1,991,780 | ) | (299,588 | ) | (1,964,715 | ) | (209,498 | ) | ||||||||||||||||||||||||||||
The Royce Funds 2018 Semiannual Report to Shareholders | 111
Notes to Financial Statements (unaudited) (continued)
Capital Share Transactions (in shares) (continued):
| SHARES SOLD | SHARES ISSUED FOR REINVESTMENT OF DISTRIBUTIONS | SHARES REDEEMED | SHARE CLASS CONVERSIONS | NET INCREASE (DECREASE) IN SHARES OUTSTANDING | ||||||||||||||||||||||||||||||||||||
| Period Ended 6/30/18 (unaudited) | Year Ended 12/31/17 | Period Ended 6/30/18 (unaudited) | Year Ended 12/31/17 | Period Ended 6/30/18 (unaudited) | Year Ended 12/31/17 | Period Ended 6/30/18 (unaudited)1 | Year Ended 12/31/172 | Period Ended 6/30/18 (unaudited) | Year Ended 12/31/17 | |||||||||||||||||||||||||||||||
| Royce Total Return Fund | ||||||||||||||||||||||||||||||||||||||||
| Investment Class | 6,458,754 | 11,868,856 | 509,083 | 12,067,778 | (12,795,908 | ) | (43,955,697 | ) | 41,593 | (5,828,071 | ) | (19,977,470 | ) | |||||||||||||||||||||||||||
| Service Class | 776,856 | 2,650,293 | 28,397 | 808,230 | (2,078,310 | ) | (6,572,028 | ) | 2,550,563 | (40,740 | ) | 1,277,506 | (3,154,245 | ) | ||||||||||||||||||||||||||
| Consultant Class | 277,036 | 544,363 | 15,130 | 1,953,113 | (1,781,205 | ) | (3,711,048 | ) | (1,489,039 | ) | (1,213,572 | ) | ||||||||||||||||||||||||||||
| Institutional Class | 2,151,108 | 18,520,572 | 124,284 | 2,608,378 | (2,279,288 | ) | (29,035,003 | ) | (3,896 | ) | (7,906,053 | ) | ||||||||||||||||||||||||||||
| W Class | 222,995 | 1,674,617 | 9,918 | 713,915 | (4,227,055 | ) | (1,143,414 | ) | (3,994,142 | ) | 1,245,118 | |||||||||||||||||||||||||||||
| R Class | 245,038 | 934,952 | 10,391 | 480,019 | (544,104 | ) | (1,309,309 | ) | (288,675 | ) | 105,662 | |||||||||||||||||||||||||||||
| K Class | 468,780 | 1,143,530 | 6,516 | 515,092 | (724,647 | ) | (1,995,811 | ) | (3,926,286 | ) | (4,175,637 | ) | (337,189 | ) | ||||||||||||||||||||||||||
| 1 | On April 13, 2018, R Class shares converted to Service Class shares for the following funds: Royce Low-Priced Stock Fund, Royce Small-Cap Leaders Fund, Royce Small/Mid-Cap Premier Fund and Royce Smaller-Companies Growth Fund and K Class shares converted to Service Class shares for the following funds: Royce Opportunity Fund, Royce Pennsylvania Mutual Fund, Royce Small-Cap Value Fund and Royce Total Return Fund. On April 16, 2018, Royce International Premier Fund R Class shares converted to Service Class shares. On June 27, 2018, Institutional Class shares converted to Investment Class shares for Royce Low-Priced Stock Fund and Royce Small-Cap Value Fund. |
| 2 | On February 7, 2017, Royce International Premier Fund K Class shares converted to Service Class shares. On February 24, 2017, K Class shares converted to Service Class shares for the following funds: Royce Low-Priced Stock Fund, Royce Small-Cap Leaders Fund, Royce Small/Mid-Cap Premier Fund and Royce Smaller-Companies Growth Fund. On November 10, 2017, the following funds had certain shares in the Service Class convert to Investment Class shares: Royce Dividend Value Fund, Royce International Premier Fund, Royce Low-Priced Stock Fund, Royce Micro-Cap Fund, Royce Micro-Cap Opportunity Fund, Royce Opportunity Fund, Royce Pennsylvania Mutual Fund, Royce Premier Fund, Royce Small-Cap Leaders Fund, Royce Small-Cap Value Fund, Royce Small/Mid-Cap Premier Fund, Royce Smaller-Companies Growth Fund, Royce Special Equity Fund, Royce Special Equity Multi-Cap Fund and Royce Total Return Fund. |
Investment Adviser and Distributor:
INVESTMENT ADVISER:
Under the Trust’s investment advisory agreements with Royce, Royce is entitled to receive investment advisory fees in respect of each Fund that are computed daily and payable monthly. Royce has contractually agreed, without right of termination, to waive fees and/or reimburse expenses (excluding brokerage commissions, taxes, interest, litigation expenses, acquired fund fees and expenses, and other expenses not borne in the ordinary course of business) to the extent necessary to maintain certain Funds’ net annual operating expense ratios at specified levels through April 30, 2019, and is shown below to the extent that it impacted net expenses for the six months ended June 30, 2018. See the Prospectus for contractual waiver expiration dates.
| ANNUAL CONTRACTUAL | PERIOD ENDED | |||||||||
| ADVISORY FEE AS A | COMMITTED NET ANNUAL OPERATING EXPENSE RATIO CAP4 | JUNE 30, 2018 | ||||||||
| PERCENTAGE OF AVERAGE | Investment | Service | Consultant | Institutional | Advisory fees | |||||
| NET ASSETS1 | Class4 | Class4 | Class4 | Class4 | W Class4 | R Class4 | K Class4 | Net advisory fees | waived | |
| Royce Dividend Value Fund | 0.85% | 1.09% | 1.34% | 2.09% | 0.89% | N/A | N/A | N/A | $696,588 | $53,579 |
| Royce Global Financial Services Fund | 1.00% | N/A | 1.49% | N/A | 1.04% | N/A | N/A | N/A | 245,199 | 39,543 |
| Royce International Discovery Fund | 1.00%2 | N/A | 1.44%5 | N/A | N/A | N/A | N/A | N/A | – | 43,204 |
| Royce International Premier Fund | 1.00% | 1.19% | 1.44% | 2.19% | 1.04% | N/A | 1.74% | N/A | 946,766 | 105,318 |
| Royce Low-Priced Stock Fund | 1.00% | 1.24% | 1.49% | N/A | N/A | N/A | 1.84% | N/A | 1,313,909 | – |
| Royce Micro-Cap Fund | 1.25% | 1.49% | 1.61% | N/A | N/A | N/A | N/A | N/A | 1,206,424 | – |
| Royce Micro-Cap Opportunity Fund | 1.00% | 1.24% | 1.49% | N/A | N/A | N/A | N/A | N/A | 229,663 | – |
| Royce Opportunity Fund | 1.00% | N/A | 1.49% | N/A | N/A | N/A | N/A | N/A | 7,101,279 | – |
| Royce Pennsylvania Mutual Fund | 0.76%3 | N/A | N/A | N/A | N/A | N/A | N/A | 1.99% | 7,814,644 | – |
| Royce Premier Fund | 0.99% | N/A | 1.49% | N/A | N/A | N/A | N/A | N/A | 11,541,249 | – |
| Royce Small-Cap Leaders Fund | 1.00% | 1.24% | 1.49% | N/A | N/A | N/A | 1.84% | N/A | 406,002 | – |
| Royce Small-Cap Value Fund | 1.00% | 1.24% | 1.49% | N/A | N/A | N/A | N/A | 1.99% | 1,186,141 | – |
| Royce Small/Mid-Cap Premier Fund | 0.85% | N/A | N/A | 2.09% | N/A | N/A | 1.69% | N/A | 840,610 | – |
| Royce Smaller-Companies Growth Fund | 1.00% | N/A | 1.49% | 2.24% | 1.08% | N/A | 1.84% | N/A | 1,791,184 | – |
| Royce Special Equity Fund | 1.00% | N/A | 1.39% | N/A | N/A | N/A | N/A | N/A | 7,149,446 | – |
| Royce Special Equity Multi-Cap Fund | 0.85% | N/A | 1.24% | 1.99% | 0.89% | N/A | N/A | N/A | 346,962 | 27,394 |
| Royce Total Return Fund | 0.99% | N/A | 1.49% | N/A | N/A | N/A | N/A | N/A | 11,241,818 | – |
| 1 | From a base annual rate of 1.00% (0.85% for Royce Dividend Value Fund, Royce Small/Mid-Cap Premier Fund and Royce Special Equity Multi-Cap Fund and 1.25% for Royce Micro-Cap Fund), the annual rates of investment advisory fees payable by each of the Funds, other than Royce Pennsylvania Mutual Fund, are reduced by the indicated amount at the following breakpoints applicable to a Fund’s net assets in excess of $2 billion: more than $2 billion to $3 billion – .05% per annum; more than $3 billion to $4 billion – .10% per annum; over $4 billion – .15% per annum. |
| 2 | Royce International Discovery Fund’s base annual contractual advisory fee was reduced from 1.25% to 1.00%, effective February 1, 2018. |
| 3 | Royce Pennsylvania Mutual Fund’s fees are calculated at the annual rate of 1.00% of the first $50 million of the Fund’s average net assets, 0.875% of the next $50 million of average net assets and 0.75% of average net assets in excess of $100 million. |
| 4 | Committed net annual operating expense ratio cap excludes acquired fund fees and expenses. |
| 5 | Royce International Discovery Fund’s committed net annual operating expense ratio cap was reduced from 1.64% to 1.44% for Service Class, effective February 1, 2018. |
112 | The Royce Funds 2018 Semiannual Report to Shareholders
DISTRIBUTOR:
Royce Fund Services, LLC (“RFS”), the distributor of the Trust’s shares, is a wholly owned subsidiary of Royce. RFS is entitled to receive distribution fees that are computed daily and payable monthly.
| ANNUAL CONTRACTUAL DISTRIBUTION FEE AS A | PERIOD ENDED JUNE 30, 2018 | ||
| PERCENTAGE OF AVERAGE NET ASSETS | Net distribution fees | Distribution fees waived | |
| Royce Dividend Value Fund – Service Class | 0.25% | $ 65,526 | $ 2,730 |
| Royce Dividend Value Fund – Consultant Class | 1.00% | 7,006 | – |
| Royce Global Financial Services Fund – Service Class | 0.25% | 57,668 | 2,403 |
| Royce International Discovery Fund – Service Class | 0.25% | 6,629 | 3,729 |
| Royce International Premier Fund – Service Class | 0.25% | 36,685 | 24,457 |
| Royce International Premier Fund – Consultant Class | 1.00% | 50,074 | – |
| Royce International Premier Fund – R Class | 0.50% | 104 | – |
| Royce Low-Priced Stock Fund – Service Class | 0.25% | 235,387 | 20,469 |
| Royce Low-Priced Stock Fund – R Class | 0.50% | 1,043 | – |
| Royce Micro-Cap Fund – Service Class | 0.25% | 15,839 | – |
| Royce Micro-Cap Fund – Consultant Class | 1.00% | 117,773 | – |
| Royce Micro-Cap Opportunity Fund – Service Class | 0.25% | 1,468 | – |
| Royce Opportunity Fund – Service Class | 0.25% | 117,844 | – |
| Royce Opportunity Fund – Consultant Class | 1.00% | 93,741 | – |
| Royce Opportunity Fund – R Class | 0.50% | 92,578 | – |
| Royce Opportunity Fund – K Class | 0.25% | 5,605 | – |
| Royce Pennsylvania Mutual Fund – Service Class | 0.25% | 64,729 | – |
| Royce Pennsylvania Mutual Fund – Consultant Class | 1.00% | 1,753,106 | – |
| Royce Pennsylvania Mutual Fund – R Class | 0.50% | 35,189 | – |
| Royce Pennsylvania Mutual Fund – K Class | 0.25% | 1,624 | – |
| Royce Premier Fund – Service Class | 0.25% | 66,404 | – |
| Royce Premier Fund – Consultant Class | 1.00% | 154,136 | – |
| Royce Premier Fund – R Class | 0.50% | 31,207 | – |
| Royce Small-Cap Leaders Fund – Service Class | 0.25% | 42,131 | 3,664 |
| Royce Small-Cap Leaders Fund – R Class | 0.50% | 2,517 | – |
| Royce Small-Cap Value Fund – Service Class | 0.25% | 172,501 | 7,188 |
| Royce Small-Cap Value Fund – Consultant Class | 1.00% | 61,998 | – |
| Royce Small-Cap Value Fund – R Class | 0.50% | 31,236 | – |
| Royce Small-Cap Value Fund – K Class | 0.25% | 1,204 | – |
| Royce Small/Mid-Cap Premier Fund – Service Class | 0.25% | 59,435 | 75,645 |
| Royce Small/Mid-Cap Premier Fund – Consultant Class | 1.00% | 47,529 | – |
| Royce Small/Mid-Cap Premier Fund – R Class | 0.50% | 2,887 | – |
| Royce Smaller-Companies Growth Fund – Service Class | 0.25% | 252,109 | 21,922 |
| Royce Smaller-Companies Growth Fund – Consultant Class | 1.00% | 49,451 | – |
| Royce Smaller-Companies Growth Fund – R Class | 0.50% | 942 | – |
| Royce Special Equity Fund – Service Class | 0.25% | 102,881 | – |
| Royce Special Equity Fund – Consultant Class | 1.00% | 212,518 | – |
| Royce Special Equity Multi-Cap Fund – Service Class | 0.25% | 21,322 | 6,734 |
| Royce Special Equity Multi-Cap Fund – Consultant Class | 1.00% | 18,477 | – |
| Royce Total Return Fund – Service Class | 0.25% | 121,958 | – |
| Royce Total Return Fund – Consultant Class | 1.00% | 1,180,949 | – |
| Royce Total Return Fund – R Class | 0.50% | 128,834 | – |
| Royce Total Return Fund – K Class | 0.25% | 24,711 | – |
The Royce Funds 2018 Semiannual Report to Shareholders | 113
Notes to Financial Statements (unaudited) (continued)
Purchases and Sales of Investment Securities:
For the six months ended June 30, 2018, the costs of purchases and the proceeds from sales of investment securities, other than short-term securities and collateral received for securities loaned, were as follows:
| PURCHASES | SALES1 | |
| Royce Dividend Value Fund | $ 11,311,814 | $ 22,394,277 |
| Royce Global Financial Services Fund | 2,758,915 | 5,744,443 |
| Royce International Discovery Fund | 9,656,813 | 8,860,927 |
| Royce International Premier Fund | 138,549,995 | 60,228,259 |
| Royce Low-Priced Stock Fund | 108,935,574 | 138,638,352 |
| Royce Micro-Cap Fund | 20,505,961 | 45,558,205 |
| Royce Micro-Cap Opportunity Fund | 14,296,833 | 16,122,876 |
| Royce Opportunity Fund | 281,346,255 | 391,945,721 |
| Royce Pennsylvania Mutual Fund | 264,007,232 | 508,757,852 |
| Royce Premier Fund | 248,263,326 | 244,311,349 |
| Royce Small-Cap Leaders Fund | 18,441,027 | 29,037,090 |
| Royce Small-Cap Value Fund | 49,648,922 | 83,755,308 |
| Royce Small/Mid-Cap Premier Fund | 56,713,144 | 66,598,918 |
| Royce Smaller-Companies Growth Fund | 92,585,776 | 130,226,251 |
| Royce Special Equity Fund | 65,889,173 | 211,572,574 |
| Royce Special Equity Multi-Cap Fund | 1,778,185 | 39,365,748 |
| Royce Total Return Fund | 242,645,951 | 497,068,628 |
| 1 | Excludes the value of securities delivered as a result of redemptions-in-kind. |
Cross trades were executed by the Funds pursuant to Rule 17a-7 under the 1940 Act. Cross trading is the buying or selling of portfolio securities between funds to which Royce serves as investment adviser. At its regularly scheduled quarterly meetings, the Board reviews such transactions as of the most recent calendar quarter for compliance with the requirements and restrictions set forth by Rule 17a-7. Cross trades for the six months ended June 30, 2018, were as follows:
| COST OF PURCHASES | PROCEEDS FROM SALES | REALIZED GAIN (LOSS) | ||||||||||
| Royce Dividend Value Fund | $ | – | $ | 1,047,279 | $ | (480,584 | ) | |||||
| Royce Global Financial Services Fund | 381,287 | 610,994 | 206,490 | |||||||||
| Royce International Premier Fund | 387,602 | – | – | |||||||||
| Royce Low-Priced Stock Fund | – | 92,744 | 56,246 | |||||||||
| Royce Opportunity Fund | – | 51,480 | (12,091 | ) | ||||||||
| Royce Pennsylvania Mutual Fund | – | 18,908,738 | (2,336,454 | ) | ||||||||
| Royce Premier Fund | 6,987,387 | – | – | |||||||||
| Royce Small/Mid-Cap Premier Fund | – | 387,602 | 249,310 | |||||||||
| Royce Total Return Fund | 10,864,790 | 7,244,290 | 6,181,086 | |||||||||
Redemptions-In-Kind:
The Funds may make payment for Fund shares redeemed wholly or in part by distributing portfolio securities to shareholders. The net realized gain will not be realized for tax purposes. For the six months ended June 30, 2018, the following fund had redemptions in kind:
| PROCEEDS | REALIZED GAIN | |
| Royce Opportunity Fund | $ 263,568,680 | $ 111,295,549 |
Class Specific Expenses:
Class specific expenses, for Funds with multiple classes, were as follows for the period ended June 30, 2018:
| NET DISTRIBUTION FEES | SHAREHOLDER SERVICING | SHAREHOLDER REPORTS | REGISTRATION | TRANSFER AGENT BALANCE CREDITS | TOTAL | CLASS LEVEL EXPENSES REIMBURSED BY INVESTMENT ADVISER | ||||||||||||||
| Royce Dividend Value Fund – | ||||||||||||||||||||
Investment Class | $ – | $ 71,026 | $ 17,085 | $ 8,133 | $ (286) | $ 95,958 | $ – | |||||||||||||
| Royce Dividend Value Fund – Service Class | 65,526 | 46,664 | 14,355 | 7,826 | (957) | 133,414 | 12,509 | |||||||||||||
| Royce Dividend Value Fund – | ||||||||||||||||||||
Consultant Class | 7,006 | 3,547 | 421 | 5,794 | (26) | 16,742 | 8,389 | |||||||||||||
| Royce Dividend Value Fund – | ||||||||||||||||||||
Institutional Class | – | 3,079 | 54 | 5,613 | (6) | 8,740 | 8,740 | |||||||||||||
| 72,532 | 124,316 | 31,915 | 27,366 | (1,275) | 29,638 | |||||||||||||||
114 | The Royce Funds 2018 Semiannual Report to Shareholders
Class Specific Expenses (continued):
| NET DISTRIBUTION FEES | SHAREHOLDER SERVICING | SHAREHOLDER REPORTS | REGISTRATION | TRANSFER AGENT BALANCE CREDITS | TOTAL | CLASS LEVEL EXPENSES REIMBURSED BY INVESTMENT ADVISER | |
| Royce Global Financial Services Fund – | |||||||
Service Class | $ 57,668 | $ 35,816 | $ 6,806 | $ 10,160 | $ (274) | $ 110,176 | $ 2,130 |
| Royce Global Financial Services Fund – | |||||||
Institutional Class | – | 3,079 | 85 | 6,120 | (7) | 9,277 | 9,277 |
| 57,668 | 38,895 | 6,891 | 16,280 | (281) | 11,407 | ||
| Royce International Premier Fund – | |||||||
Investment Class | – | 59,865 | 6,897 | 12,520 | (231) | 79,051 | – |
| Royce International Premier Fund – | |||||||
Service Class | 36,685 | 39,725 | 5,832 | 8,035 | (316) | 89,961 | – |
| Royce International Premier Fund – | |||||||
Consultant Class | 50,074 | 5,238 | 1,069 | 6,178 | (44) | 62,515 | 3,502 |
| Royce International Premier Fund – | |||||||
Institutional Class | – | 658 | 6 | 2,398 | – | 3,062 | 3,062 |
| Royce International Premier Fund – R Class | 104 | 2,190 | – | 1,482 | (4) | 3,772 | 3,635 |
| 86,863 | 107,676 | 13,804 | 30,613 | (595) | 10,199 | ||
| Royce Low-Priced Stock Fund – | |||||||
Investment Class | – | 26,267 | 11,476 | 6,093 | (1,655) | 42,181 | 2,327 |
| Royce Low-Priced Stock Fund – Service Class | 235,387 | 159,603 | 35,652 | 9,802 | (1,326) | 439,118 | 27,417 |
| Royce Low-Priced Stock Fund – | |||||||
Institutional Class | – | 3,186 | 259 | 12,512 | (25) | 15,932 | – |
| Royce Low-Priced Stock Fund – R Class | 1,043 | 2,642 | 107 | 1,947 | (19) | 5,720 | 4,133 |
| 236,430 | 191,698 | 47,494 | 30,354 | (3,025) | 33,877 | ||
| Royce Micro-Cap Fund – Investment Class | – | 83,334 | 41,274 | 8,829 | (2,756) | 130,681 | 11,883 |
| Royce Micro-Cap Fund – Service Class | 15,839 | 11,270 | 2,504 | 5,891 | (35) | 35,469 | 18,282 |
| Royce Micro-Cap Fund – Consultant Class | 117,773 | 15,347 | 4,460 | 6,250 | (184) | 143,646 | – |
| 133,612 | 109,951 | 48,238 | 20,970 | (2,975) | 30,165 | ||
| Royce Micro-Cap Opportunity Fund – | |||||||
Investment Class | – | 19,983 | 1,983 | 9,114 | (103) | 30,977 | 12,061 |
| Royce Micro-Cap Opportunity Fund – | |||||||
Service Class | 1,468 | 4,297 | 186 | 5,689 | (8) | 11,632 | 9,672 |
| 1,468 | 24,280 | 2,169 | 14,803 | (111) | 21,733 | ||
| Royce Opportunity Fund – Investment Class | – | 411,406 | 63,987 | 11,476 | (3,745) | 483,124 | – |
| Royce Opportunity Fund – Service Class | 117,844 | 79,538 | 13,766 | 8,863 | (242) | 219,769 | 20,746 |
| Royce Opportunity Fund – Consultant Class | 93,741 | 11,820 | 2,431 | 5,725 | (194) | 113,523 | – |
| Royce Opportunity Fund – Institutional Class | – | 4,043 | 9,561 | 8,894 | (82) | 22,416 | – |
| Royce Opportunity Fund – R Class | 92,578 | 42,507 | 1,742 | 5,036 | (96) | 141,767 | – |
| Royce Opportunity Fund – K Class | 5,605 | 6,189 | 277 | 3,864 | (78) | 15,857 | – |
| 309,768 | 555,503 | 91,764 | 43,858 | (4,437) | 20,746 | ||
| Royce Pennsylvania Mutual Fund – | |||||||
Investment Class | – | 630,280 | 148,075 | 11,782 | (13,080) | 777,057 | – |
| Royce Pennsylvania Mutual Fund – | |||||||
Service Class | 64,729 | 46,726 | 9,865 | 7,093 | (302) | 128,111 | – |
| Royce Pennsylvania Mutual Fund – | |||||||
Consultant Class | 1,753,106 | 142,708 | 43,820 | 8,016 | (2,355) | 1,945,295 | – |
| Royce Pennsylvania Mutual Fund – | |||||||
Institutional Class | – | 4,208 | 4,619 | 5,979 | (175) | 14,631 | – |
| Royce Pennsylvania Mutual Fund – R Class | 35,189 | 15,998 | 1,769 | 4,265 | (189) | 57,032 | – |
| Royce Pennsylvania Mutual Fund – K Class | 1,624 | 3,422 | 150 | 3,833 | (33) | 8,996 | 1,418 |
| 1,854,648 | 843,342 | 208,298 | 40,968 | (16,134) | 1,418 | ||
| Royce Premier Fund – Investment Class | – | 835,505 | 184,200 | 14,171 | (7,127) | 1,026,749 | – |
| Royce Premier Fund – Service Class | 66,404 | 43,937 | 9,586 | 6,495 | (487) | 125,935 | 9,561 |
| Royce Premier Fund – Consultant Class | 154,136 | 14,409 | 3,176 | 5,904 | (176) | 177,449 | – |
| Royce Premier Fund – Institutional Class | – | 4,646 | 36,673 | 10,691 | (113) | 51,897 | – |
| Royce Premier Fund – W Class | – | 16,501 | 9,728 | 6,927 | (624) | 32,532 | – |
| Royce Premier Fund – R Class | 31,207 | 14,417 | 487 | 2,405 | (43) | 48,473 | – |
| 251,747 | 929,415 | 243,850 | 46,593 | (8,570) | 9,561 | ||
The Royce Funds 2018 Semiannual Report to Shareholders | 115
| Notes to Financial Statements (unaudited) (continued) |
| Class Specific Expenses (continued): |
| CLASS LEVEL | ||||||||||||||||||||||||||||
| EXPENSES | ||||||||||||||||||||||||||||
| REIMBURSED BY | ||||||||||||||||||||||||||||
| NET DISTRIBUTION | SHAREHOLDER | SHAREHOLDER | TRANSFER AGENT | INVESTMENT | ||||||||||||||||||||||||
| FEES | SERVICING | REPORTS | REGISTRATION | BALANCE CREDITS | TOTAL | ADVISER | ||||||||||||||||||||||
Royce Small-Cap Leaders Fund – Investment Class | $ | – | $ | 15,536 | $ | 7,702 | $ | 7,557 | $ | (365 | ) | $ | 30,430 | $ | 3,765 | |||||||||||||
Royce Small-Cap Leaders Fund – Service Class | 42,131 | 32,212 | 6,711 | 7,499 | (266 | ) | 88,287 | 19,904 | ||||||||||||||||||||
Royce Small-Cap Leaders Fund – R Class | 2,517 | 3,395 | 469 | 3,063 | (136 | ) | 9,308 | 5,674 | ||||||||||||||||||||
| 44,648 | 51,143 | 14,882 | 18,119 | (767 | ) | 29,343 | ||||||||||||||||||||||
Royce Small-Cap Value Fund – Investment Class | – | 39,023 | 8,607 | 6,335 | (688 | ) | 53,277 | 6,984 | ||||||||||||||||||||
Royce Small-Cap Value Fund – Service Class | 172,501 | 111,503 | 21,728 | 7,688 | (875 | ) | 312,545 | 28,983 | ||||||||||||||||||||
Royce Small-Cap Value Fund – Consultant Class | 61,998 | 8,307 | 1,739 | 5,837 | (124 | ) | 77,757 | – | ||||||||||||||||||||
Royce Small-Cap Value Fund – Institutional Class | – | 3,350 | 258 | 13,356 | (42 | ) | 16,922 | – | ||||||||||||||||||||
Royce Small-Cap Value Fund – R Class | 31,236 | 18,014 | 921 | 2,667 | (108 | ) | 52,730 | – | ||||||||||||||||||||
Royce Small-Cap Value Fund – K Class | 1,204 | 3,069 | 148 | 3,843 | (29 | ) | 8,235 | 3,943 | ||||||||||||||||||||
| 266,939 | 183,266 | 33,401 | 39,726 | (1,866 | ) | 39,910 | ||||||||||||||||||||||
Royce Small/Mid-Cap Premier Fund – Investment Class | – | 11,558 | 3,717 | 7,234 | (319 | ) | 22,190 | – | ||||||||||||||||||||
Royce Small/Mid-Cap Premier Fund – Service Class | 59,435 | 42,053 | 22,753 | 8,170 | (1,831 | ) | 130,580 | – | ||||||||||||||||||||
Royce Small/Mid-Cap Premier Fund – Consultant Class | 47,529 | 6,912 | 2,573 | 5,952 | (181 | ) | 62,785 | 7,908 | ||||||||||||||||||||
Royce Small/Mid-Cap Premier Fund – R Class | 2,887 | 3,354 | 185 | 2,240 | (36 | ) | 8,630 | 4,250 | ||||||||||||||||||||
| 109,851 | 63,877 | 29,228 | 23,596 | (2,367 | ) | 12,158 | ||||||||||||||||||||||
Royce Smaller-Companies Growth Fund - Investment Class | – | 39,800 | 22,980 | 6,489 | (859 | ) | 68,410 | – | ||||||||||||||||||||
Royce Smaller-Companies Growth Fund – Service Class | 252,109 | 168,653 | 32,771 | 8,813 | (1,246 | ) | 461,100 | 6,580 | ||||||||||||||||||||
Royce Smaller-Companies Growth Fund – Consultant Class | 49,451 | 7,765 | 1,745 | 5,837 | (104 | ) | 64,694 | 7,109 | ||||||||||||||||||||
Royce Smaller-Companies Growth Fund – Institutional Class | – | 3,422 | 567 | 5,733 | (19 | ) | 9,703 | 9,510 | ||||||||||||||||||||
Royce Smaller-Companies Growth Fund – R Class | 942 | 2,462 | 176 | 2,363 | (29 | ) | 5,914 | 4,478 | ||||||||||||||||||||
| 302,502 | 222,102 | 58,239 | 29,235 | (2,257 | ) | 27,677 | ||||||||||||||||||||||
Royce Special Equity Fund – Investment Class | – | 511,952 | 87,021 | 13,705 | (4,393 | ) | 608,285 | – | ||||||||||||||||||||
Royce Special Equity Fund – Service Class | 102,881 | 76,649 | 19,815 | 6,043 | (2,486 | ) | 202,902 | 65,535 | ||||||||||||||||||||
Royce Special Equity Fund – Consultant Class | 212,518 | 18,225 | 4,809 | 6,049 | (347 | ) | 241,254 | – | ||||||||||||||||||||
Royce Special Equity Fund – Institutional Class | – | 4,937 | 27,532 | 8,683 | (240 | ) | 40,912 | – | ||||||||||||||||||||
| 315,399 | 611,763 | 139,177 | 34,480 | (7,466 | ) | 65,535 | ||||||||||||||||||||||
Royce Special Equity Multi-Cap Fund – Investment Class | – | 10,980 | 1,669 | 7,109 | (206 | ) | 19,552 | – | ||||||||||||||||||||
Royce Special Equity Multi-Cap Fund – Service Class | 21,322 | 18,095 | 1,997 | 6,582 | (123 | ) | 47,873 | 10,139 | ||||||||||||||||||||
Royce Special Equity Multi-Cap Fund – Consultant Class | 18,477 | (50 | ) | 534 | 5,892 | (61 | ) | 24,792 | 4,689 | |||||||||||||||||||
Royce Special Equity Multi-Cap Fund – Institutional Class | – | 3,115 | 22 | 7,009 | (7 | ) | 10,139 | 10,139 | ||||||||||||||||||||
| 39,799 | 32,140 | 4,222 | 26,592 | (397 | ) | 24,967 | ||||||||||||||||||||||
| 116 | The Royce Funds 2018 Semiannual Report to Shareholders |
Class Specific Expenses (continued):
| CLASS LEVEL | ||||||||||||||||||||||||||||
| EXPENSES | ||||||||||||||||||||||||||||
| REIMBURSED BY | ||||||||||||||||||||||||||||
| NET DISTRIBUTION | SHAREHOLDER | SHAREHOLDER | TRANSFER AGENT | INVESTMENT | ||||||||||||||||||||||||
| FEES | SERVICING | REPORTS | REGISTRATION | BALANCE CREDITS | TOTAL | ADVISER | ||||||||||||||||||||||
| Royce Total Return Fund – Investment Class | $ | – | $ | 715,554 | $ | 163,773 | $ | 12,712 | $ | (5,759 | ) | $ | 886,280 | $ | – | |||||||||||||
| Royce Total Return Fund – Service Class | 121,958 | 70,183 | 11,611 | 6,377 | (254 | ) | 209,875 | 419 | ||||||||||||||||||||
| Royce Total Return Fund – Consultant Class | 1,180,949 | 93,389 | 26,324 | 7,573 | (894 | ) | 1,307,341 | – | ||||||||||||||||||||
| Royce Total Return Fund – Institutional Class | – | 5,466 | 6,559 | 6,920 | (148 | ) | 18,797 | – | ||||||||||||||||||||
| Royce Total Return Fund – W Class | – | 40,693 | 23,032 | 6,846 | (72 | ) | 70,499 | – | ||||||||||||||||||||
| Royce Total Return Fund – R Class | 128,834 | 58,599 | 4,154 | 3,187 | (331 | ) | 194,443 | – | ||||||||||||||||||||
| Royce Total Return Fund – K Class | 24,711 | 20,736 | 895 | 3,874 | (170 | ) | 50,046 | – | ||||||||||||||||||||
| 1,456,452 | 1,004,620 | 236,348 | 47,489 | (7,628 | ) | 419 | ||||||||||||||||||||||
| NET UNREALIZED | GROSS UNREALIZED | ||||||||||||||||
| TAX BASIS COST | APPRECIATION (DEPRECIATION) | Appreciation | Depreciation | ||||||||||||||
| Royce Dividend Value Fund | $ | 107,992,399 | $ | 58,522,303 | $ | 62,081,902 | $ | 3,559,599 | |||||||||
| Royce Global Financial Services Fund | 44,911,416 | 12,068,491 | 14,924,034 | 2,855,543 | |||||||||||||
| Royce International Discovery Fund | 7,880,996 | 76,094 | 615,845 | 539,751 | |||||||||||||
| Royce International Premier Fund | 224,496,982 | 9,335,026 | 21,203,949 | 11,868,923 | |||||||||||||
| Royce Low-Priced Stock Fund | 226,894,361 | 52,765,419 | 62,864,238 | 10,098,819 | |||||||||||||
| Royce Micro-Cap Fund | 148,708,262 | 53,150,697 | 63,180,276 | 10,029,579 | |||||||||||||
| Royce Micro-Cap Opportunity Fund | 38,569,650 | 9,504,629 | 11,618,868 | 2,114,239 | |||||||||||||
| Royce Opportunity Fund | 1,154,286,942 | 160,251,349 | 278,271,838 | 118,020,489 | |||||||||||||
| Royce Pennsylvania Mutual Fund | 1,268,671,504 | 800,613,586 | 831,733,990 | 31,120,404 | |||||||||||||
| Royce Premier Fund | 1,221,028,562 | 1,055,226,086 | 1,088,964,502 | 33,738,416 | |||||||||||||
| Royce Small-Cap Leaders Fund | 62,894,934 | 17,210,547 | 18,629,461 | 1,418,914 | |||||||||||||
| Royce Small-Cap Value Fund | 193,731,114 | 43,423,760 | 48,288,536 | 4,864,776 | |||||||||||||
| Royce Small/Mid-Cap Premier Fund | 167,568,237 | 24,626,117 | 28,131,219 | 3,505,102 | |||||||||||||
| Royce Smaller-Companies Growth Fund | 291,266,272 | 92,428,635 | 105,813,292 | 13,384,657 | |||||||||||||
| Royce Special Equity Fund | 961,068,348 | 440,461,929 | 457,795,894 | 17,333,965 | |||||||||||||
| Royce Special Equity Multi-Cap Fund | 50,474,166 | 16,078,145 | 17,219,936 | 1,141,791 | |||||||||||||
| Royce Total Return Fund | 1,351,738,222 | 862,886,588 | 903,648,540 | 40,761,952 | |||||||||||||
| CHANGE IN NET | |||||||||||||||||||||||||||||||||||||||
| MARKET | REALIZED | UNREALIZED | MARKET | ||||||||||||||||||||||||||||||||||||
| SHARES | VALUE | COST OF | PROCEEDS | GAIN | APPRECIATION | DIVIDEND | SHARES | VALUE | |||||||||||||||||||||||||||||||
| AFFILIATED COMPANY | 12/31/17 | 12/31/17 | PURCHASES | FROM SALES | (LOSS) | (DEPRECIATION) | INCOME | 6/30/18 | 6/30/18 | ||||||||||||||||||||||||||||||
| Royce Opportunity Fund | |||||||||||||||||||||||||||||||||||||||
| Dixie Group1 | 849,935 | $ | 3,272,250 | $ | 16,265 | $ | 546,164 | $ | (453,049 | ) | $ | (788,506 | ) | $ | – | ||||||||||||||||||||||||
| Echelon Corporation1 | 230,152 | 1,298,057 | – | 734,729 | (1,980,275 | ) | 2,429,882 | – | |||||||||||||||||||||||||||||||
| Noranda Aluminum Holding Corporation1 | 593,726 | 7,718 | – | 4,223 | 596 | 10,553 | – | ||||||||||||||||||||||||||||||||
| Northwest Pipe1 | 489,326 | 9,365,700 | 464,640 | 1,717,984 | 314,814 | (159,666 | ) | – | |||||||||||||||||||||||||||||||
| SigmaTron International1 | 282,757 | 2,867,156 | – | 686,392 | (177,097 | ) | (708,287 | ) | – | ||||||||||||||||||||||||||||||
| 16,810,881 | (2,295,011 | ) | 783,976 | – | |||||||||||||||||||||||||||||||||||
| Royce Pennsylvania Mutual Fund | |||||||||||||||||||||||||||||||||||||||
| Preformed Line Products1 | 260,064 | 18,477,547 | 165,580 | 797,611 | 396,934 | 4,084,743 | 100,867 | ||||||||||||||||||||||||||||||||
| 18,477,547 | 396,934 | 4,084,743 | 100,867 | ||||||||||||||||||||||||||||||||||||
| Royce Premier Fund | |||||||||||||||||||||||||||||||||||||||
| CIRCOR International | 878,443 | 42,762,605 | 14,655,735 | – | – | (11,608,527 | ) | – | 1,239,443 | $ | 45,809,813 | ||||||||||||||||||||||||||||
| 42,762,605 | – | (11,608,527 | ) | – | 45,809,813 | ||||||||||||||||||||||||||||||||||
| Royce Special Equity Fund | |||||||||||||||||||||||||||||||||||||||
| Bassett Furniture Industries | 781,000 | 29,365,600 | 1,505,653 | 6,410,788 | (745,073 | ) | (7,251,760 | ) | 174,277 | 597,591 | 16,463,632 | ||||||||||||||||||||||||||||
| Bowl America Cl. A | 343,000 | 5,145,000 | – | – | – | (154,350 | ) | 116,620 | 343,000 | 4,990,650 | |||||||||||||||||||||||||||||
| The Royce Funds 2018 Semiannual Report to Shareholders | 117 |
Notes to Financial Statements (unaudited) (continued)
Transactions in Affiliated Companies (continued):
| AFFILIATED COMPANY | SHARES 12/31/17 | MARKET VALUE 12/31/17 | COST OF PURCHASES | PROCEEDS FROM SALES | REALIZED GAIN (LOSS) | CHANGE IN NET UNREALIZED APPRECIATION (DEPRECIATION) | DIVIDEND INCOME | SHARES 6/30/18 | MARKET VALUE 6/30/18 | |||||||||||||||||||||||||||
| Royce Special Equity Fund (continued) | ||||||||||||||||||||||||||||||||||||
| Capella Education1 | 588,000 | $ | 45,511,200 | $ | – | $ | 4,405,760 | $ | 1,531,803 | $ | 10,907,508 | $ | 505,680 | |||||||||||||||||||||||
| Computer Services | 756,000 | 35,222,040 | 404,133 | – | – | 2,317,827 | 473,370 | 765,000 | $ | 37,944,000 | ||||||||||||||||||||||||||
| CSS Industries1 | 695,900 | 19,366,897 | – | 14,658,217 | 908,590 | (5,617,270 | ) | 69,540 | ||||||||||||||||||||||||||||
| Flexsteel Industries | 567,000 | 26,524,260 | 776,732 | – | – | (3,959,492 | ) | 255,558 | 585,000 | 23,341,500 | ||||||||||||||||||||||||||
| Gencor Industries | 521,979 | 8,638,752 | 3,997,253 | – | – | (205,350 | ) | – | 769,700 | 12,430,655 | ||||||||||||||||||||||||||
| Hooker Furniture | 1,127,000 | 47,841,150 | 681,681 | – | – | 5,177,669 | 319,900 | 1,145,000 | 53,700,500 | |||||||||||||||||||||||||||
| Hurco Companies | 525,000 | 22,155,000 | 437,683 | – | – | 1,348,567 | 169,100 | 535,000 | 23,941,250 | |||||||||||||||||||||||||||
| John B. Sanfilippo & Son | 726,500 | 45,951,125 | 1,347,296 | – | – | 8,539,079 | – | 750,000 | 55,837,500 | |||||||||||||||||||||||||||
| National Presto Industries | 469,000 | 46,642,050 | 99,505 | 7,138,317 | 2,944,792 | 8,539,970 | 2,820,000 | 412,000 | 51,088,000 | |||||||||||||||||||||||||||
| Park Electrochemical 1 | 1,557,000 | 30,595,050 | – | 21,446,445 | (2,931,463 | ) | 5,377,858 | 3,851,620 | ||||||||||||||||||||||||||||
| Standard Motor Products | 1,350,000 | 60,628,500 | 2,768,106 | 251,930 | 7,955 | 4,765,069 | 588,420 | 1,405,000 | 67,917,700 | |||||||||||||||||||||||||||
| 423,586,624 | 1,716,604 | 29,785,325 | 9,344,085 | 347,655,387 | ||||||||||||||||||||||||||||||||
| Royce Total Return Fund | ||||||||||||||||||||||||||||||||||||
| Mueller (Paul) Company1 | 100,714 | 3,927,846 | – | 2,566,645 | (67,625 | ) | (452,718 | ) | – | |||||||||||||||||||||||||||
| Starrett (L.S.) Company (The) Cl. A | 439,557 | 3,780,190 | – | 113,411 | (330,989 | ) | (635,265 | ) | – | 421,957 | 2,700,525 | |||||||||||||||||||||||||
| 7,708,036 | (398,614 | ) | (1,087,983 | ) | – | 2,700,525 | ||||||||||||||||||||||||||||||
| 1 | Not an Affiliated Company at June 30, 2018. |
118 | The Royce Funds 2018 Semiannual Report to Shareholders
Understanding Your Fund’s Expenses (unaudited)
As a shareholder of a mutual fund, you pay ongoing expenses, including management fees and other Fund expenses including, for some funds, distribution and/or service (12b-1) fees. Using the information below, you can estimate how these ongoing expenses (in dollars) affect your investment and compare them with the ongoing expenses of other funds. You may also incur one-time transaction expenses, including redemption fees, which are not shown in this section and would result in higher total costs. The example is based on an investment of $1,000 invested at January 1, 2018, and held for the entire six-month period ended June 30, 2018. Service, Consultant and R Class shares are generally available only through certain brokers or retirement plan administrators who receive distribution and/or service fees from the Fund for services that they perform. Institutional and W Class shares are generally available only to institutions or intermediaries with a minimum account size of $1 million.
Actual Expenses
The first part of the table below provides information about actual account values and actual expenses. You may use the information in this section, together with the amount you invested, to estimate the expenses that you paid over the period. Simply divide your account value at June 30, 2018, by $1,000 (for example, an $8,600 account value divided by $1,000 = 8.6), then multiply the result by the number under the heading entitled “Expenses Paid During the Period” to estimate the expenses you paid on your account during this period.
Hypothetical Example for Comparison Purposes
The second part of the table below provides information about hypothetical account values and hypothetical expenses based on the Fund’s actual expense ratio and an assumed rate of return of 5% per year before expenses, which is not the Fund’s actual return. The hypothetical account values and expenses may not be used to estimate the actual ending account balance or expenses you paid for the period. You may use this information to compare the ongoing costs of investing in the Fund and other funds. To do so, compare this 5% hypothetical example with the 5% hypothetical examples that appear in the shareholder reports of the other funds.
Please note that the expenses shown in the table are meant to highlight your ongoing costs only and do not reflect any transactional costs, such as sales charges (loads), redemption fees, or exchange fees. Therefore, this section is useful in comparing ongoing costs only, and will not help you determine the relative total costs of owning different funds. In addition, if these transactional costs were included, your costs would have been higher.
| ACTUAL | HYPOTHETICAL (5% PER YEAR BEFORE EXPENSES) | ||||||
| Beginning Account Value 1/1/18 | Ending Account Value 6/30/18 | Expenses Paid During the Period1 | Beginning Account Value 1/1/18 | Ending Account Value 6/30/18 | Expenses Paid During the Period1 | Annualized Expense Ratio2 | |
| Investment Class | |||||||
| Royce Dividend Value Fund | $ 1,000.00 | $ 979.89 | $ 5.20 | $ 1,000.00 | $ 1,019.54 | $ 5.31 | 1.06% |
| Royce International Premier Fund | 1,000.00 | 970.16 | 5.47 | 1,000.00 | 1,019.24 | 5.61 | 1.12% |
| Royce Low-Priced Stock Fund | 1,000.00 | 1,095.41 | 6.44 | 1,000.00 | 1,018.65 | 6.21 | 1.24% |
| Royce Micro-Cap Fund | 1,000.00 | 1,102.23 | 7.77 | 1,000.00 | 1,017.41 | 7.45 | 1.49% |
| Royce Micro-Cap Opportunity Fund | 1,000.00 | 1,078.44 | 6.39 | 1,000.00 | 1,018.65 | 6.21 | 1.24% |
| Royce Opportunity Fund | 1,000.00 | 1,040.50 | 6.02 | 1,000.00 | 1,018.89 | 5.96 | 1.19% |
| Royce Pennsylvania Mutual Fund | 1,000.00 | 1,057.03 | 4.69 | 1,000.00 | 1,020.23 | 4.61 | 0.92% |
| Royce Premier Fund | 1,000.00 | 1,025.90 | 5.83 | 1,000.00 | 1,019.04 | 5.81 | 1.16% |
| Royce Small-Cap Leaders Fund | 1,000.00 | 1,037.48 | 6.26 | 1,000.00 | 1,018.65 | 6.21 | 1.24% |
| Royce Small-Cap Value Fund | 1,000.00 | 1,071.85 | 6.37 | 1,000.00 | 1,018.65 | 6.21 | 1.24% |
| Royce Small/Mid-Cap Premier Fund3 | 1,000.00 | 969.35 | 4.83 | 1,000.00 | 1,019.89 | 4.96 | 0.99% |
| Royce Smaller-Companies Growth Fund | 1,000.00 | 1,106.13 | 6.21 | 1,000.00 | 1,018.89 | 5.96 | 1.19% |
| Royce Special Equity Fund | 1,000.00 | 996.79 | 5.84 | 1,000.00 | 1,018.94 | 5.91 | 1.18% |
| Royce Special Equity Multi-Cap Fund | 1,000.00 | 944.34 | 4.87 | 1,000.00 | 1,019.79 | 5.06 | 1.01% |
| Royce Total Return Fund | 1,000.00 | 1,005.85 | 5.87 | 1,000.00 | 1,018.94 | 5.91 | 1.18% |
| Service Class | |||||||
| Royce Dividend Value Fund | 1,000.00 | 979.79 | 6.58 | 1,000.00 | 1,018.15 | 6.71 | 1.34% |
| Royce Global Financial Services Fund | 1,000.00 | 1,026.49 | 7.49 | 1,000.00 | 1,017.41 | 7.45 | 1.49% |
| Royce International Discovery Fund | 1,000.00 | 937.95 | 7.06 | 1,000.00 | 1,017.50 | 7.35 | 1.47% |
| Royce International Premier Fund | 1,000.00 | 969.23 | 6.74 | 1,000.00 | 1,017.95 | 6.90 | 1.38% |
| Royce Low-Priced Stock Fund | 1,000.00 | 1,093.38 | 7.73 | 1,000.00 | 1,017.41 | 7.45 | 1.49% |
| Royce Micro-Cap Fund | 1,000.00 | 1,100.79 | 8.39 | 1,000.00 | 1,016.81 | 8.05 | 1.61% |
| Royce Micro-Cap Opportunity Fund | 1,000.00 | 1,077.54 | 7.68 | 1,000.00 | 1,017.41 | 7.45 | 1.49% |
| Royce Opportunity Fund | 1,000.00 | 1,038.70 | 7.53 | 1,000.00 | 1,017.41 | 7.45 | 1.49% |
| Royce Pennsylvania Mutual Fund | 1,000.00 | 1,054.92 | 6.73 | 1,000.00 | 1,018.25 | 6.61 | 1.32% |
| Royce Premier Fund | 1,000.00 | 1,024.15 | 7.48 | 1,000.00 | 1,017.41 | 7.45 | 1.49% |
| Royce Small-Cap Leaders Fund | 1,000.00 | 1,036.42 | 7.52 | 1,000.00 | 1,017.41 | 7.45 | 1.49% |
| Royce Small-Cap Value Fund | 1,000.00 | 1,071.15 | 7.65 | 1,000.00 | 1,017.41 | 7.45 | 1.49% |
| Royce Small/Mid-Cap Premier Fund3 | 1,000.00 | 968.61 | 5.76 | 1,000.00 | 1,018.94 | 5.91 | 1.18% |
| Royce Smaller-Companies Growth Fund | 1,000.00 | 1,103.84 | 7.77 | 1,000.00 | 1,017.41 | 7.45 | 1.49% |
| Royce Special Equity Fund | 1,000.00 | 995.40 | 6.88 | 1,000.00 | 1,017.90 | 6.95 | 1.39% |
| Royce Special Equity Multi-Cap Fund | 1,000.00 | 943.28 | 5.97 | 1,000.00 | 1,018.65 | 6.21 | 1.24% |
| Royce Total Return Fund | 1,000.00 | 1,004.29 | 7.40 | 1,000.00 | 1,017.41 | 7.45 | 1.49% |
The Royce Funds 2018 Semiannual Report to Shareholders | 119
Understanding Your Fund’s Expenses (unaudited) (continued)
| ACTUAL | HYPOTHETICAL (5% PER YEAR BEFORE EXPENSES) | ||||||
| Beginning Account Value 1/1/18 | Ending Account Value 6/30/18 | Expenses Paid During the Period1 | Beginning Account Value 1/1/18 | Ending Account Value 6/30/18 | Expenses Paid During the Period1 | Annualized Expense Ratio2 | |
| Consultant Class | |||||||
| Royce Dividend Value Fund | $ 1,000.00 | $ 975.66 | $ 10.24 | $ 1,000.00 | $ 1,014.43 | $ 10.44 | 2.09% |
| Royce International Premier Fund | 1,000.00 | 964.69 | 10.67 | 1,000.00 | 1,013.93 | 10.94 | 2.19% |
| Royce Micro-Cap Fund | 1,000.00 | 1,095.60 | 13.30 | 1,000.00 | 1,012.10 | 12.77 | 2.56% |
| Royce Opportunity Fund | 1,000.00 | 1,034.85 | 11.50 | 1,000.00 | 1,013.49 | 11.38 | 2.28% |
| Royce Pennsylvania Mutual Fund | 1,000.00 | 1,052.01 | 9.82 | 1,000.00 | 1,015.22 | 9.64 | 1.93% |
| Royce Premier Fund | 1,000.00 | 1,019.68 | 11.02 | 1,000.00 | 1,013.88 | 10.99 | 2.20% |
| Royce Small-Cap Value Fund | 1,000.00 | 1,066.23 | 12.04 | 1,000.00 | 1,013.14 | 11.73 | 2.35% |
| Royce Small/Mid-Cap Premier Fund3 | 1,000.00 | 963.83 | 10.18 | 1,000.00 | 1,014.43 | 10.44 | 2.09% |
| Royce Smaller-Companies Growth Fund | 1,000.00 | 1,099.14 | 11.66 | 1,000.00 | 1,013.69 | 11.18 | 2.24% |
| Royce Special Equity Fund | 1,000.00 | 991.44 | 10.86 | 1,000.00 | 1,013.88 | 10.99 | 2.20% |
| Royce Special Equity Multi-Cap Fund | 1,000.00 | 940.14 | 9.57 | 1,000.00 | 1,014.93 | 9.94 | 1.99% |
| Royce Total Return Fund | 1,000.00 | 1,001.05 | 10.77 | 1,000.00 | 1,014.03 | 10.84 | 2.17% |
| Institutional Class | |||||||
| Royce Dividend Value Fund | 1,000.00 | 981.61 | 4.37 | 1,000.00 | 1,020.38 | 4.46 | 0.89% |
| Royce Global Financial Services Fund | 1,000.00 | 1,028.72 | 5.23 | 1,000.00 | 1,019.64 | 5.21 | 1.04% |
| Royce International Premier Fund | 1,000.00 | 977.66 | 1.69 | 1,000.00 | 1,006.51 | 1.72 | 1.04% |
| Royce Opportunity Fund | 1,000.00 | 1,041.18 | 5.42 | 1,000.00 | 1,019.49 | 5.36 | 1.07% |
| Royce Pennsylvania Mutual Fund | 1,000.00 | 1,056.87 | 4.44 | 1,000.00 | 1,020.48 | 4.36 | 0.87% |
| Royce Premier Fund | 1,000.00 | 1,026.16 | 5.48 | 1,000.00 | 1,019.39 | 5.46 | 1.09% |
| Royce Smaller-Companies Growth Fund | 1,000.00 | 1,105.79 | 5.64 | 1,000.00 | 1,019.44 | 5.41 | 1.08% |
| Royce Special Equity Fund | 1,000.00 | 996.76 | 5.45 | 1,000.00 | 1,019.34 | 5.51 | 1.10% |
| Royce Special Equity Multi-Cap Fund | 1,000.00 | 944.30 | 4.29 | 1,000.00 | 1,020.38 | 4.46 | 0.89% |
| Royce Total Return Fund | 1,000.00 | 1,006.31 | 5.32 | 1,000.00 | 1,019.49 | 5.36 | 1.07% |
| W Class | |||||||
| Royce Premier Fund | 1,000.00 | 1,025.16 | 6.38 | 1,000.00 | 1,018.50 | 6.36 | 1.27% |
| Royce Total Return Fund | 1,000.00 | 1,004.76 | 6.51 | 1,000.00 | 1,018.30 | 6.56 | 1.31% |
| R Class | |||||||
| Royce Opportunity Fund | 1,000.00 | 1,036.73 | 9.29 | 1,000.00 | 1,015.67 | 9.20 | 1.84% |
| Royce Pennsylvania Mutual Fund | 1,000.00 | 1,053.32 | 8.30 | 1,000.00 | 1,016.71 | 8.15 | 1.63% |
| Royce Premier Fund | 1,000.00 | 1,022.09 | 9.18 | 1,000.00 | 1,015.72 | 9.15 | 1.83% |
| Royce Small-Cap Value Fund | 1,000.00 | 1,068.72 | 9.95 | 1,000.00 | 1,015.17 | 9.69 | 1.94% |
| Royce Total Return Fund | 1,000.00 | 1,002.83 | 9.04 | 1,000.00 | 1,015.77 | 9.10 | 1.82% |
| 1 | Expenses are equal to the Fund’s annualized expense ratio multiplied by the average account value for the period, multiplied by 181 days in the most recent fiscal half-year divided by 365 days (to reflect the half-year period for all classes existing for the full half-year period; Royce International Premier Fund Institutional Class multiplied by 60 days). |
| 2 | Annualized expense ratio used to derive figures in the table is based on the most recent fiscal half-year. |
| 3 | GiftShare accounts pay an annual $50 trustee fee to Alliance Trust Company, as trustee. If these fees were included above, your costs would be higher. |
120 | The Royce Funds 2018 Semiannual Report to Shareholders
Trustees and Officers
All Trustees and Officers may be reached c/o The Royce Funds, 745 Fifth Avenue, New York, NY 10151
Charles M. Royce, Trustee1
Age: 78 | Number of Funds Overseen: 22 | Tenure: Since 1982
Non-Royce Directorships: Director of Oxford Square Capital Corp.
Principal Occupation(s) During Past Five Years: Chairman of the Board of Managers of Royce & Associates, LP (“Royce”), the Trust’s investment adviser; Chief Executive Officer (1972-June 2016), President (1972-June 2014) of Royce.
Christopher D. Clark, Trustee1, President
Age: 53 | Number of Funds Overseen: 22 | Tenure: Since 2014
Principal Occupation(s) During Past Five Years: Chief Executive Officer (since July 2016), President (since July 2014), Co-Chief Investment Officer (Since January 2014), Managing Director of Royce, a Member of the Board of Managers of Royce, having been employed by Royce since May 2007.
Patricia W. Chadwick, Trustee
Age: 69 | Number of Funds Overseen: 22 | Tenure: Since 2009
Non-Royce Directorships: Trustee of ING Mutual Funds and Director of Wisconsin Energy Corp.
Principal Occupation(s) During Past 5 Years: Consultant and President of Ravengate Partners LLC (since 2000).
Christopher C. Grisanti, Trustee
Age: 56 | Number of Funds Overseen: 22 | Tenure: Since 2017
Non-Royce Directorships: None
Principal Occupation(s) During Past Five Years: Co-Founder and Chief Executive Officer of Grisanti Capital Management LLC, an investment advisory firm (since 1999). Mr. Grisanti’s prior business experience includes serving as Director of Research and Portfolio Manager at Spears Benzak, Salomon & Farrell (from 1994 to 1999) and a senior associate at the law firm of Simpson, Thacher & Bartlett (from 1988 to 1994).
Stephen L. Isaacs, Trustee
Age: 78 | Number of Funds Overseen: 22 | Tenure: Since 1989
Non-Royce Directorships: None
Principal Occupation(s) During Past Five Years: Attorney and President of Health Policy Associates, Inc., consultants. Mr. Isaacs’s prior business experience includes having served as President of the Center for Health and Social Policy (from 1996 to 2012); Director of Columbia University Development Law and Policy Program and Professor at Columbia University (until August 1996).
Arthur S. Mehlman, Trustee
Age: 76 | Number of Funds Overseen: 41 | Tenure: Since 2004
Non-Royce Directorships: Director/Trustee of registered investment companies constituting the 19 Legg Mason Funds.
Principal Occupation(s) During Past Five Years: Director of The League for People with Disabilities, Inc.; Director of University of Maryland Foundation (non-profits). Formerly: Director of Municipal Mortgage & Equity, LLC (from October 2004 to April 1, 2011); Director of University of Maryland College Park Foundation (non-profit) (from 1998 to 2005); Partner, KPMG LLP (international accounting firm) (from 1972 to 2002); Director of Maryland Business Roundtable for Education (from July 1984 to June 2002).
David L. Meister, Trustee
Age: 78 | Number of Funds Overseen: 22 | Tenure: Since 1982
Non-Royce Directorships: None
Principal Occupation(s) During Past Five Years: Consultant. Chairman and Chief Executive Officer of The Tennis Channel (from June 2000 to March 2005). Mr. Meister’s prior business experience includes having served as Chief Executive Officer of Seniorlife.com, a consultant to the communications industry, President of Financial News Network, Senior Vice President of HBO, President of Time-Life Films, and Head of Broadcasting for Major League Baseball.
G. Peter O’Brien, Trustee
Age: 72 | Number of Funds Overseen: 41 | Tenure: Since 2001
Non-Royce Directorships: Director/Trustee of registered investment companies constituting the 19 Legg Mason Funds.
Principal Occupation(s) During Past Five Years: Trustee Emeritus of Colgate University (since 2005); Board Member of Hill House, Inc. (since 1999); Formerly Director of TICC Capital Corp (from 2003-2017): Trustee of Colgate University (from 1996 to 2005), President of Hill House, Inc. (from 2001 to 2005) and Managing Director/Equity Capital Markets Group of Merrill Lynch & Co. (from 1971 to 1999).
Michael K. Shields, Trustee
Age: 60 | Number of Funds Overseen: 22 | Tenure: Since 2015
Principal Occupation(s) During Past Five Years: President and Chief Executive Officer of Piedmont Trust Company, a private North Carolina trust company (since May 2012). Mr. Shields’s prior business experience includes owning Shields Advisors, an investment consulting firm (from April 2010 to June 2012).
Francis D. Gannon, Vice President
Age: 50 | Tenure: Since 2014
Principal Occupation(s) During Past Five Years: Co-Chief Investment Officer (since January 2014) and Managing Director of Royce, having been employed by Royce since September 2006.
Daniel A. O’Byrne, Vice President
Age: 56 | Tenure: Since 1994
Principal Occupation(s) During Past Five Years: Principal and Vice President of Royce, having been employed by Royce since October 1986.
Peter K. Hoglund, Treasurer
Age: 51 | Tenure: Since 2015
Principal Occupation(s) During Past Five Years: Chief Financial Officer, Chief Administrative Officer, and Managing Director of Royce, having been employed by Royce since December 2014. Prior to joining Royce, Mr. Hoglund spent more than 20 years with Munder Capital Management in Birmingham, MI, serving as Managing Director and Chief Financial Officer and overseeing all financial aspects of the firm. He began his career at Munder as a portfolio manager.
John E. Denneen, Secretary and Chief Legal Officer
Age: 51 | Tenure: 1996-2001 and Since 2002
Principal Occupation(s) During Past Five Years: General Counsel, Managing Director, and, since June 2015, a Member of the Board of Managers of Royce. Chief Legal and Compliance Officer and Secretary of Royce.
Lisa Curcio, Chief Compliance Officer
Age: 58 | Tenure: Since 2004
Principal Occupation(s) During Past Five Years: Chief Compliance Officer of The Royce Funds (since October 2004) and Compliance Officer of Royce (since June 2004).
| The Royce Funds 2018 Semiannual Report to Shareholders | 121 |
Board Approval of Investment Advisory Agreements
At meetings held on June 4-5, 2018, the Board of Trustees of The Royce Fund (the “Board”), including all of the non-interested trustees, approved the continuation of investment advisory agreements between Royce & Associates, LP (“R&A”) and The Royce Fund (“TRF”) relating to each of Royce Pennsylvania Mutual Fund, Royce Micro-Cap Fund, Royce Premier Fund, Royce Low-Priced Stock Fund, Royce Total Return Fund, Royce Small/Mid-Cap Premier Fund, Royce Opportunity Fund, Royce Special Equity Fund, Royce Small-Cap Value Fund, Royce Smaller-Companies Growth Fund, Royce Small-Cap Leaders Fund, Royce Dividend Value Fund, Royce Micro-Cap Opportunity Fund, Royce Special Equity Multi-Cap Fund, Royce Global Financial Services Fund, Royce International Discovery Fund (formerly Royce International Micro-Cap Fund), and Royce International Premier Fund (each, an “Investment Advisory Agreement” and collectively, the “Investment Advisory Agreements”). In reaching these decisions, the Board reviewed, among other things, information prepared internally by R&A and independently by Broadridge Financial Solutions, Inc. (“Broadridge”) using the database and methodology of Morningstar Associates, LLC (“Morningstar”) containing detailed investment advisory fee, expense ratio, and investment performance comparisons for each series of TRF (each, a “Fund” and collectively, the “Funds”) with other mutual funds in its “peer group” and “category”, information regarding the past performance of the Funds and other registered investment companies managed by R&A and a memorandum outlining the legal duties of the Board prepared by independent counsel to the non-interested trustees. R&A also provided the trustees with an analysis of its profitability with respect to providing investment advisory services to each Fund. In addition, the Board took into account information furnished throughout the year at regular Board meetings, including reports on investment performance, shareholder services, distribution fees and expenses, regulatory compliance, brokerage commissions and research, brokerage and other execution products and services provided to the Funds. The Board also considered other matters it deemed important to the approval process, such as allocation of Fund brokerage commissions, “soft dollar” research services R&A receives, payments made to affiliates of R&A, as well as payments made by R&A relating to distribution of Fund shares and other direct and indirect benefits to R&A and its affiliates from their relationship with the Funds. The trustees also met throughout the year with investment advisory personnel from R&A. The Board also noted R&A’s efforts to provide enhanced analytical tools to its investment staff along with the ongoing meetings conducted by R&A’s Co-Chief Investment Officers with portfolio managers experiencing performance challenges in an attempt to address such challenges. The Board, in its deliberations, recognized that, for many of the Funds’ shareholders, the decision to purchase Fund shares included a decision to select R&A as the investment adviser and that there was a strong association in the minds of Fund shareholders between R&A and each of the Funds. In considering factors relating to the approval of the continuance of the Investment Advisory Agreement for each Fund, the non-interested trustees received assistance and advice from, and met separately with, their independent legal counsel. While continuation of the investment advisory and administrative arrangements for each Fund was considered at the same Board meeting, the trustees dealt with each Fund separately. Among other factors, the trustees considered the following:
The nature, extent and quality of services provided by R&A:
The Board considered the following factors to be of fundamental importance to its consideration of whether to approve the continuance of the Investment Advisory Agreement for each Fund: (i) R&A’s more than 40 years of value investing experience and track record; (ii) the history of long-tenured R&A portfolio managers managing many of the Funds; (iii) R&A’s focus on mid-cap, small-cap and micro-cap value investing; (iv) the consistency of R&A’s approach to managing each Fund, other open-end mutual funds, and closed-end funds over more than 40 years; (v) the integrity and high ethical standards adhered to at R&A; (vi) R&A’s specialized experience in the area of trading small- and micro-cap securities; (vii) R&A’s historical ability to attract and retain portfolio management talent; and (viii) R&A’s focus on shareholder interests as exemplified by capping expenses on smaller funds, closing funds to new investors when R&A believed such closings were in the best interests of existing shareholders, establishing breakpoints for a number of funds and providing expansive shareholder reporting and communications. The Board also noted that R&A’s compensation policy arrangements strongly encourage portfolio manager investment in each Fund that they manage. The Board also reviewed the services that R&A provides to each Fund, including, but not limited to, managing each Fund’s investments in accordance with the stated policies of each Fund. The Board considered the fact that R&A provided certain administrative services to the Funds at cost pursuant to the Administration Agreement between TRF and R&A. The Board determined that the services to be provided to the Funds by R&A would be the same as those that it previously provided to the Funds. The Board also took into consideration the histories, reputations and backgrounds of R&A’s portfolio managers for each Fund, finding that these would likely have an impact on the continued success of such Fund. The Board also noted R&A’s ability to attract and retain qualified and experienced personnel. Lastly, the Board noted that R&A officers, employees, and their families had substantial amounts invested in various Funds. The Board concluded that the investment advisory services provided by R&A to each Fund compared favorably to services provided by R&A to other R&A client accounts, including other funds, in both nature and quality, and that the scope of services provided by R&A would continue to be suitable for each Fund.
Although the Funds currently span a wider risk spectrum than they have historically, R&A generally emphasizes a risk-averse approach to investing. In light of that approach, the trustees believe that risk-adjusted performance continues to be the most appropriate measure of each Fund’s investment performance. One measure of risk-adjusted performance the trustees have historically used in their review of each Fund’s performance is the Sharpe Ratio. The Sharpe Ratio is a risk-adjusted measure of performance developed by Nobel Laureate William Sharpe. It is calculated by dividing a Fund’s annualized excess returns by its annualized standard deviation to determine reward per unit of risk. The higher the Sharpe Ratio, the better a Fund’s historical risk-adjusted performance. The Board attaches primary importance to risk-adjusted performance over relatively long periods of time, typically 3 to 10 years.
| 122 | The Royce Funds 2018 Semiannual Report to Shareholders |
Board Approval of Investment Advisory Agreements (continued)
Cost of the services provided and profits realized by R&A from its relationship with each Fund:
The Board considered the cost of the services provided by R&A and the profits realized by R&A from its relationship with each Fund. As part of the analysis, the Board discussed with R&A its methodology in allocating its costs to each Fund and concluded that R&A’s allocations were reasonable. The Board noted that at times in the past R&A had closed certain of the Funds to new investors because of the rate of growth in Fund assets. The Board also noted that RMI and Royce International Small-Cap Fund (liquidated as of May 1, 2017) were not profitable to R&A during the year ended December 31, 2017. The Board concluded that R&A’s profits with respect to each Fund that was profitable during such period were reasonable in relation to the nature and quality of services provided.
The extent to which economies of scale would be realized as the Funds grow and whether fee levels would reflect such economies of scale:
The Board considered whether there have been economies of scale in respect of the management of each Fund, whether each Fund has appropriately benefited from any economies of scale and whether there is potential for realization of any further economies of scale. The Board noted the time and effort involved in managing portfolios of small- and micro-cap stocks and that they did not involve the same efficiencies as do portfolios of large-cap stocks. The Board also noted that in 2004 breakpoints were added to the investment advisory fees for all of the then-existing Funds except PMF (PMF’s fee schedule already had breakpoints) and that the investment advisory fees for all Funds organized since 2004 included breakpoints. The Board further noted the reduced contractual breakpoint levels for each
| The Royce Funds 2018 Semiannual Report to Shareholders | 123 |
Board Approval of Investment Advisory Agreements (concluded)
Fund, other than PMF, that became effective as of July 1, 2017. The trustees concluded that the current fee structure for each Fund was reasonable and that the relevant shareholders sufficiently participated in economies of scale.
The Board reviewed the investment advisory fee paid by each Fund and compared both the services to be rendered and the fees to be paid under the Investment Advisory Agreements to other contracts of R&A and to contracts of other investment advisers to registered investment companies investing in micro-, small-, and mid-cap stocks, as provided by Broadridge. The trustees noted that, except for PMF, ROS, and RIP, the contractual advisory fee rate for each Fund exceeded the median of its Broadridge-assigned peers. The Board noted the importance of the net expense ratio in measuring a fund’s efficiency, particularly in light of the variations in the mutual fund industry as to which entity is responsible for particular types of expenses.
| 124 | The Royce Funds 2018 Semiannual Report to Shareholders |
Notes to Performance and Other Important Information
This material contains forward-looking statements within the meaning of the Securities Exchange Act of 1934, as amended (the “Exchange Act”), that involve risks and uncertainties, including, among others, statements as to:
| • | the Funds’ future operating results, |
| • | the prospects of the Funds’ portfolio companies, |
| • | the impact of investments that the Funds have made or may make, the dependence of the Funds’ future success on the general economy and its impact on the companies and industries in which the Funds invest, and |
| • | the ability of the Funds’ portfolio companies to achieve their objectives. |
A copy of the policies and procedures that The Royce Funds use to determine how to vote proxies relating to portfolio securities and information regarding how each of The Royce Funds voted proxies relating to portfolio securities during the most recent 12-month period ended June 30 is available, without charge, on The Royce Funds’ website at www.roycefunds.com, by calling (800) 221-4268 (toll-free) and on the website of the Securities and Exchange Commission (“SEC”) at www.sec.gov.
The Funds file their complete schedules of investments with the SEC for the first and third quarters of each fiscal year on Form N-Q. The Funds’ Forms N-Q are available on the SEC’s website at www.sec.gov. The Royce Funds’ holdings are also on the Funds’ website approximately 15 to 20 days after each calendar quarter end and remain available until the next quarter’s holdings are posted. The Funds’ Forms N-Q may also be reviewed and copied at the SEC’s Public Reference Room in Washington, D.C. To find out more about this public service, call the SEC at (202) 942-8090. The Funds’ complete schedules of investments are updated quarterly and are available at www.roycefunds.com.
| The Royce Funds 2018 Semiannual Report to Shareholders | 125 |
 | |||||
| About The Royce Funds | Contact Us | ||||
Unparalleled Knowledge + Experience Pioneers in small-cap investing, with 40+ years of experience, depth of knowledge, and focus. Independent Thinking The confidence to go against consensus, the insight to uncover opportunities others might miss, and the tenacity to stay the course through market cycles. | GENERAL INFORMATION General Royce Funds information including: • How to open an account • An overview of our firm and Funds • Ordering literature including Prospectuses (800) 221-4268 | ||||
Specialized Approaches Strategies that use value, core, or growth investment approaches to select micro-cap, small-cap, and mid-cap companies. | ACCOUNT INFORMATION Speak with a representative about: • Your account, transactions, and forms (800) 841-1180 | ||||
| Unwavering Commitment | |||||
Our team of 18 portfolio managers have significant personal investments in the strategies they manage. | FINANCIAL ADVISORS, CONSULTANTS, AND INSTITUTIONS Speak with your regional Royce contact regarding: • Scheduling a meeting or call • Information about our firm, strategies, and funds • Resources for financial professionals, such as portfolio attribution reports (800) 337-6923 | ||||
| AUTOMATED ACCOUNT INFORMATION 24-hour Automated Telephone Service (800) 878-6923 | |||||
 |  |  | |||
Item 2. Code(s) of Ethics. Not applicable to this semi-annual report.
Item 3. Audit Committee Financial Expert. Not applicable to this semi-annual report.
Item 4. Principal Accountant Fees and Services. Not applicable to this semi-annual report.
Item 5. Audit Committee of Listed Registrants. Not Applicable.
Item 6. Investments.
(a) See Item 1.
(b) Not Applicable
Item 7. Disclosure of Proxy Voting Policies and Procedures for Closed-End Management Investment Companies. Not Applicable.
Item 8. Portfolio Managers of Closed-End Management Investment Companies. Not Applicable.
Item 9. Purchases of Equity Securities by Closed-End Management Investment Company and Affiliated Purchasers. Not Applicable
Item 10. Submission of Matters to a Vote of Security Holders. Not Applicable.
Item 11. Controls and Procedures.
(a) Disclosure Controls and Procedures. The Principal Executive and Financial Officers concluded that the Registrant’s Disclosure Controls and Procedures are effective based on their evaluation of the Disclosure Controls and Procedures as of a date within 90 days of the filing date of this report.
(b) Internal Control over Financial Reporting. There were no significant changes in Registrant’s internal control over financial reporting or in other factors that could significantly affect this control subsequent to the date of the evaluation, including any corrective actions with regard to significant deficiencies and material weaknesses during the second fiscal quarter of the period covered by this report.
Item 12. Exhibits. Attached hereto.
(a)(1) Not applicable to this semi-annual report.
(a)(2) Separate certifications by the Registrant’s Principal Executive Officer and Principal Financial Officer as required by Rule 30a-2(a) under the Investment Company Act of 1940.
(a)(3) Not Applicable
(b) Separate certifications by the Registrant’s Principal Executive Officer and Principal Financial Officer, pursuant to Section 906 of the Sarbanes-Oxley Act of 2002 and required by Rule 30a-2(b) under the Investment Company Act of 1940.
Pursuant to the requirements of the Securities Exchange Act of 1934 and the Investment Company Act of 1940, the registrant has duly caused this report to be signed on its behalf by the undersigned, thereunto duly authorized.
THE ROYCE FUND
| BY: | /s/ Christopher D. Clark |
| Christopher D. Clark | |
| President | |
| Date: August 28, 2018 | |
Pursuant to the requirements of the Securities Exchange Act of 1934 and the Investment Company Act of 1940, this report has been signed below by the following persons on behalf of the registrant and in the capacities and on the dates indicated.
| THE ROYCE FUND | THE ROYCE FUND | |||
| BY: | /s/ Christopher D. Clark | BY: | /s/ Peter K. Hoglund | |
| Christopher D. Clark | Peter K. Hoglund | |||
| President | Chief Financial Officer | |||
| Date: August 28, 2018 | Date: August 28, 2018 | |||